Multimodal non-rigid registration methods based on local variability measures in computed tomography...
12
1 Multimodal Non-Rigid Registration Methods Based on Local Variability Measures in CT and MR Brain Images Isnardo Reducindo a , Aldo R. Mejia-Rodriguez b,c , Edgar R. Arce-Santana a , Daniel U. Campos-Delgado a , Flavio Vigueras-Gomez a , Elisa Scalco c , Anna M. Bianchi b , Giovanni M. Cattaneo d , and Giovanna Rizzo c a Faculty of Sciences, Autonomous University of San Luis Potosi, Mexico b Bioengineering Department, Politecnico di Milano, Milan, Italy c Institute of Molecular Bioimaging and Physiology (IBFM)-CNR, Milan, Italy d Medical Physics Department, Ospedale San Raffaele, Scientific Institute, Milan, Italy Abstract Non-rigid registration (NRR) of multimodal images is a common task in diagnostic and therapeutic procedures based on medical imaging, which at the same time imposes remarkable technical challenges. This work presents a novel non-rigid multimodal registration method that relies on three basic steps: first, an initial approximation of the deformation field is obtained by a parametric registration technique based on particle filtering; second, an intensity mapping based on local variability measures (LVM) is applied over the two images in order to overcome the multimodal restriction between them; and third, an optical flow method is used in an iterative way to find the remaining displacements of the deformation field. Hence the new methodology offers a solution for multimodal NRR by a quadratic optimization over a convex surface, which allows independent motion of each pixel, in contrast to methods that parameterize the deformation space. To evaluate the proposed method, a set of MR/CT clinical studies (pre- and post-radiotherapy treatment) of three patients with cerebral tumor deformations of the brain structures was employed. The resulting registration was evaluated both qualitatively and quantitatively by standard indices of correspondence over anatomical structures of interest in radiotherapy (brain, tumor and cerebral ventricles). These results showed that one of the proposed LVM (entropy) offers a superior performance in estimating the non-rigid deformation field. Key words: Non-rigid registration, multimodal images, medical imaging, radiotherapy. 1. Introduction Image registration (IR) is an important research topic addressed through image processing and optimization tools. IR can be divided into two main streams: rigid or parametric registration, and elastic or non-rigid registration (NRR) [1,2]. The parametric registration has been studied extensively [3], where techniques based on gradient descent [4,5] are most commonly used to optimize a similarity measure (e.g. Mutual Information [6-8]) and to obtain the spatial transformation (e.g. affine or perspective [9]) that aligns the target and source images [1,2]. Other options based on global optimization methods such as genetic algorithms [10] and particle filtering (PF) [11], have begun to play an important role in this field [12,13]. In fact, NRR is a more complex and involved problem, especially for multimodal images, where the selected images could not have an intensity correspondence between them, due to the acquisition with different imaging technologies or acquisition parameters. Thus direct NRR techniques based on intensity alignment cannot be employed. Nowadays, multimodal NRR has a vast number of applications in medical imaging [14]. For instance, multimodal NRR is useful in radiotherapy (RT), where different types of medical images could lead to better identifying the structures of interest for the RT plan, such as the tumor and the organs at risk, and for studying the efficiency of RT and its collateral effects [14,15]. For example, when 3D conformal radiotherapy treatment planning (CRTP) is employed for tumor treatment, the relative position between the tumor and its adjacent tissues could be obtained accurately through analyzing the medical data sets, which fuse the information of functional and anatomical images [15]. In the literature, the most common methods to solve the elastic
-
Upload
independent -
Category
Documents
-
view
2 -
download
0
Transcript of Multimodal non-rigid registration methods based on local variability measures in computed tomography...
1
Multimodal Non-Rigid Registration Methods Based on Local Variability Measures in CT and MR Brain Images Isnardo Reducindoa, Aldo R. Mejia-Rodriguezb,c, Edgar R. Arce-Santanaa, Daniel U. Campos-Delgadoa, Flavio
Vigueras-Gomeza, Elisa Scalcoc , Anna M. Bianchib, Giovanni M. Cattaneod, and Giovanna Rizzoc
aFaculty of Sciences, Autonomous University of San Luis Potosi, Mexico
bBioengineering Department, Politecnico di Milano, Milan, Italy cInstitute of Molecular Bioimaging and Physiology (IBFM)-CNR, Milan, Italy
dMedical Physics Department, Ospedale San Raffaele, Scientific Institute, Milan, Italy
Abstract
Non-rigid registration (NRR) of multimodal images is a common task in diagnostic and therapeutic procedures based on medical imaging, which at the same time imposes remarkable technical challenges. This work presents a novel non-rigid multimodal registration method that relies on three basic steps: first, an initial approximation of the deformation field is obtained by a parametric registration technique based on particle filtering; second, an intensity mapping based on local variability measures (LVM) is applied over the two images in order to overcome the multimodal restriction between them; and third, an optical flow method is used in an iterative way to find the remaining displacements of the deformation field. Hence the new methodology offers a solution for multimodal NRR by a quadratic optimization over a convex surface, which allows independent motion of each pixel, in contrast to methods that parameterize the deformation space. To evaluate the proposed method, a set of MR/CT clinical studies (pre- and post-radiotherapy treatment) of three patients with cerebral tumor deformations of the brain structures was employed. The resulting registration was evaluated both qualitatively and quantitatively by standard indices of correspondence over anatomical structures of interest in radiotherapy (brain, tumor and cerebral ventricles). These results showed that one of the proposed LVM (entropy) offers a superior performance in estimating the non-rigid deformation field.
Key words: Non-rigid registration, multimodal images, medical imaging, radiotherapy.
1. Introduction
Image registration (IR) is an important research topic addressed through image processing and optimization tools. IR can be divided into two main streams: rigid or parametric registration, and elastic or non-rigid registration (NRR) [1,2]. The parametric registration has been studied extensively [3], where techniques based on gradient descent [4,5] are most commonly used to optimize a similarity measure (e.g. Mutual Information [6-8]) and to obtain the spatial transformation (e.g. affine or perspective [9]) that aligns the target and source images [1,2]. Other options based on global optimization methods such as genetic algorithms [10] and particle filtering (PF) [11], have begun to play an important role in this field [12,13]. In fact, NRR is a more complex and involved problem, especially for multimodal images, where the selected images could not have an intensity correspondence between them, due to the acquisition with different imaging technologies or acquisition parameters. Thus direct NRR techniques based on intensity alignment cannot be employed. Nowadays, multimodal NRR has a vast number of applications in medical imaging [14]. For instance, multimodal NRR is useful in radiotherapy (RT), where different types of medical images could lead to better identifying the structures of interest for the RT plan, such as the tumor and the organs at risk, and for studying the efficiency of RT and its collateral effects [14,15]. For example, when 3D conformal radiotherapy treatment planning (CRTP) is employed for tumor treatment, the relative position between the tumor and its adjacent tissues could be obtained accurately through analyzing the medical data sets, which fuse the information of functional and anatomical images [15]. In the literature, the most common methods to solve the elastic

2
registration employ splines, where a family of functions is used to approximate the complex deformations, but the main drawback of these methods is their complexity and high computational cost [16-18], mostly in terms of the number of interpolation points.
As described in [19], a most recent proposal to solve the NRR problem is based on iterative optical flow (OF) in order to find the deformation vector field that aligns the target and source images, after conducting an initial parametric registration by using the PF. This combined algorithm (PF+OF) has shown promising results in [20] and [21]. Nonetheless, an important restriction of this approach is the hypothesis of intensity constancy between the target and source images, restricting the methodology to monomodal images. In this context, this work pursues to overcome the monomodal restriction of the PF+OF algorithm in [19], by applying a local intensity mapping over the images, after an initial parametric registration. In this proposal, the multimodal images are mapped into a space where their intensities can be compared, in order to perform an OF algorithm iteratively, as proposed in [22].
The rest of the paper is organized as follows: in subsection 2.1, we briefly describe the monomodal NRR based on PF+OF, and in subsection 2.2 the proposed multimodal NRR methodology is detailed; subsection 2.3 presents the characteristics of the images datasets (clinical and synthetic) to perform the evaluation, and in subsection 2.4 the standard indices used to evaluate the accuracy of the NRR are described. Section 3 presents the NRR results for the synthetic and clinical datasets, and in section 4, we discuss those findings. Finally, in section 5, the principal conclusions about the algorithm performance in multimodal NRR of anatomical structures of interest in RT are outlined.
2. Methodology
The NRR problem can be formulated as to find the displacements vector field 𝑉 𝐫 such that it can align a source image (𝐼!), with a target one (𝐼!). Then, the problem can be mathematically written as follows
𝐼! 𝐫 = 𝐹 𝐼! 𝐫 + 𝑉 𝐫 , (1)
where 𝐫 = 𝑥, 𝑦 ⊺ denotes a position within the rectangular domain Ω ⊂ ℝ! of the images, and 𝐹 ∙ represents the relation between the intensities of both images 𝐼! and 𝐼!. According to (1), 𝐹 is the identity if the two images are monomodal, and the registration problem can be formulated as to find the OF between them. However, standard OF techniques can only find the correspondence between small displacements in the pixels of the images 𝐼! , 𝐼! , and then it is recommended to have an initial approximation 𝑑! 𝐫 of the vector field 𝑉 𝐫 by using a parametric registration algorithm. Thus, the NRR problem is addressed in two steps: first an initial parametric registration is performed, and next an iterative optical flow solution is computed [19]. This approach is described briefly in the following subsection.
2.1 Monomodal non-rigid registration based on PF+OF
The basic idea of the parametric registration based on PF, proposed in [13], is to estimate the parameter vector 𝜃 of a geometrical transformation 𝑇 𝐫 𝜃 (e.g. affine or perspective) applied to each pixel r by a stochastic search over an optimization surface (cost function) [23], where the estimated parameter vector 𝜃 is a statistic over the particles (e.g. the mean value). For specific details about the implementation of the parametric registration based on PF, the reader refers to [11, 13, 21, 25]. Once the parametric registration has been carried out, an initial estimation of the elastic vector field 𝑑! 𝐫 = 𝐫 − 𝑇 𝐫 𝜃 can be obtained, and the remaining displacements 𝑑! 𝐫 that accomplish the NRR between the target 𝐼! and the transformed 𝐼! 𝐫 ≜𝐼! 𝐫 + 𝑑! 𝐫 images are expected to be small. If the images are monomodal, it is possible to find these displacements by using an OF technique without parameterizing the deformation space. Our approach for OF estimation is based on optimizing the following quadratic energy function:
Ψ 𝑑 𝐫 = 𝐼! 𝐫 − 𝐼! 𝐫 + 𝑑 𝐫!
∀𝐫 + 𝜆 𝑑 𝐫 − 𝑑 𝐬 !!
𝐫,𝐬 , (4)

3
where 𝐫, 𝐬 denotes that pixels 𝐫 and 𝐬 are neighbors, 𝜆 is a regularization term to control flow homogeneity, and ∙ ! represents the Euclidean norm. Note that equation (4) describes a discrete version of the classical Horn-Schunck method [28], which is the basis of most OF algorithms proposed in the literature [27]. To optimize the non-linear quadratic cost function in (4), the data term can be linearized by conducting a first order Taylor approximation:
𝐼! 𝐫 + 𝑑 𝐫 ≈ 𝐼! 𝐫 + ∇𝐼! 𝐫 ⊺𝑑 𝐫 , (5)
where ∇𝐼! 𝐫 is the gradient of 𝐼! and ∙ ⊺ denotes transposition. Therefore, the minimum solution for the quadratic problem in (4) can be obtained by a direct calculation of the stationary optimality conditions with respect to 𝑑 𝐫 , and then solving the resulting system of linear equations with efficient iterative methods (e.g. Gauss-Seidel technique [29]). For more implementation details of this strategy, the reader is referred to [19,20].
Hence, the initial estimation 𝑑! 𝐫 can be refined by accumulating the displacements obtained after solving the optimization in (4) recursively. Thus, the monomodal PF+OF algorithm can be summarized in the next three steps:
1. Parametric registration. Find the parameters vector 𝜃 of the perspective transformation 𝑇 𝐫 𝜃 that provide the best alignment between 𝐼! 𝐫 and 𝐼! 𝐫 , and compute the initial (rigid) displacement vector field 𝑑! 𝐫 . In this work, the parameters vector is defined as 𝜃 = 𝜙,𝑑! ,𝑑! , 𝑒! , 𝑒! , 𝑠! , 𝑠!
⊺where 𝜙
denotes rotation (degrees), 𝑑! and 𝑑! displacements in x and y-axis (mm), 𝑒! and 𝑒! scales, and 𝑠! and 𝑠! skewness in each axis.
2. Optical Flow. Find the displacements between 𝐼! and 𝐼! by an iterative scheme of OF, 𝑑 𝐫 = 𝑑! 𝐫 +𝑑! 𝐫 +⋯+𝑑! 𝐫 , until convergence is achieved; where at each k-th iteration the OF is computed over 𝐼! 𝐫 and 𝐼!! 𝐫 , where 𝐼!! 𝐫 ≜ 𝐼! 𝐫 + 𝑑! 𝐫𝒌!𝟏
𝒊!𝟏 . 3. Non-rigid registration. Finally, we can obtain the vector field of the non-rigid deformation by adding the
rigid vector field to the one obtained by the iterative OF, i.e., 𝑉 𝐫 ≜ 𝑑! 𝐫 + 𝑑 𝐫 . Consequently, we can deduce the elastic registered image as 𝐼! 𝐫 ≜ 𝐼! 𝐫 + 𝑉 𝐫 .
2.2 Multimodal algorithm for NRR based on local variability measures
In the case of multimodal NRR, the algorithm in [19] suggests approximating the transfer function of intensities between the target and source images by using the joint histogram, but this approach is only feasible if the intensity relation 𝐹 ∙ in (1) is injective. Hence, in this work, we propose an extension of this methodology in order to overcome these limitations by applying an intensity mapping over the images, once the target and source images are roughly aligned by a parametric registration, by using measures that describe the intensity variability around each pixel [22]. This mapping transforms both images into a space where each pixel intensity in one image could be compared with its corresponding in the other image, despite their intrinsic multimodal characteristics; namely, establishing a mapping 𝐺 ∙ such that
𝐺 𝐼! 𝐫 = 𝐺 𝐼! 𝐫 + 𝑉 𝐫 . (6)
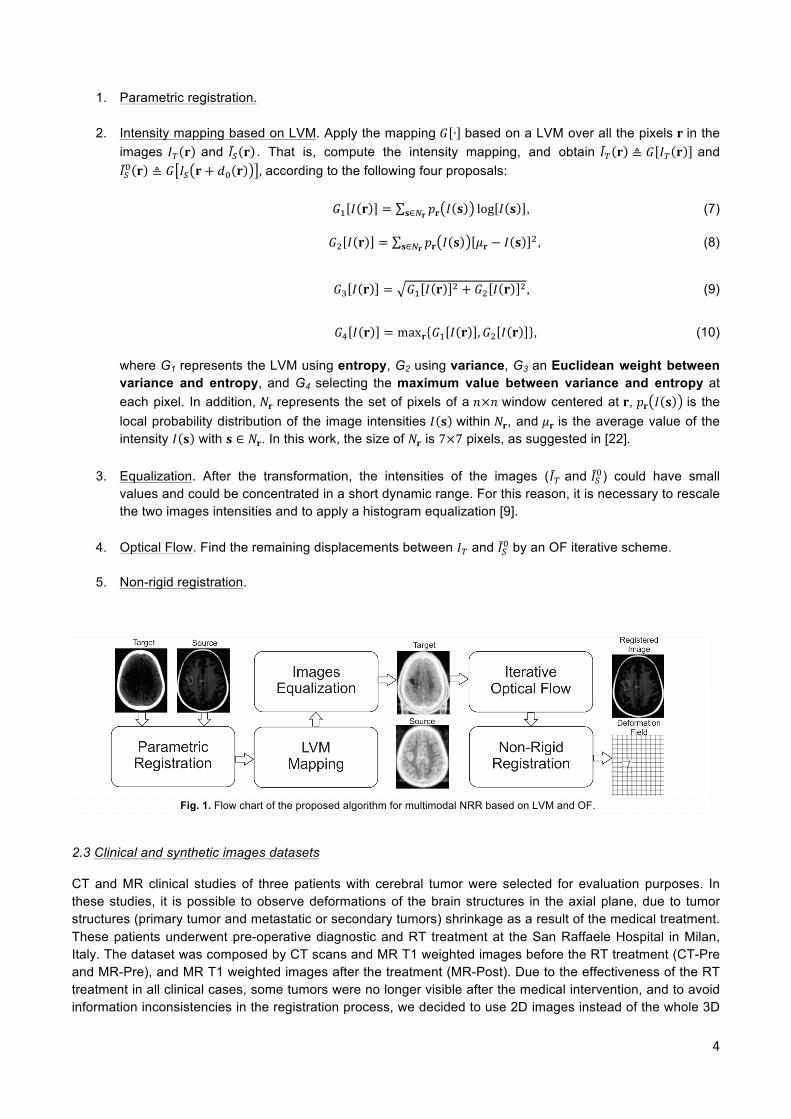
In order to define this mapping, we propose to employ measures that do not depend on the gray level of the pixels, but on their intensity variability around neighbor elements. Two measures that meet the above description are the entropy and the variance, computed over a window centered in the pixel of interest, which we call Local Variability Measures (LVM). In addition, we also propose to employ a combination of these two metrics in order to take advantage of the local information that they capture. Euclidean and maximum weights are used, similarly to the two and infinity norms of 2-D vectors. The proposed methodology PF+LVM+OF for multimodal NRR adds two intermediate steps to the algorithm described in the previous subsection (see flow chart of the proposed method in Fig. 1):
4
1. Parametric registration.
2. Intensity mapping based on LVM. Apply the mapping 𝐺 ∙ based on a LVM over all the pixels 𝐫 in the images 𝐼! 𝐫 and 𝐼! 𝐫 . That is, compute the intensity mapping, and obtain 𝐼! 𝐫 ≜ 𝐺 𝐼! 𝐫 and 𝐼!! 𝐫 ≜ 𝐺 𝐼! 𝐫 + 𝑑! 𝐫 , according to the following four proposals:
𝐺! 𝐼 𝐫 = 𝑝𝐫 𝐼 𝐬 log 𝐼 𝐬𝐬∈!𝐫 , (7)
𝐺! 𝐼 𝐫 = 𝑝𝐫 𝐼 𝐬 𝜇𝐫 − 𝐼 𝐬 !𝐬∈!𝐫 , (8)
𝐺! 𝐼 𝐫 = 𝐺! 𝐼 𝐫 ! + 𝐺! 𝐼 𝐫 !, (9)
𝐺! 𝐼 𝐫 = max𝐫 𝐺! 𝐼 𝐫 ,𝐺! 𝐼 𝐫 , (10)
where G1 represents the LVM using entropy, G2 using variance, G3 an Euclidean weight between variance and entropy, and G4 selecting the maximum value between variance and entropy at each pixel. In addition, 𝑁𝐫 represents the set of pixels of a 𝑛×𝑛 window centered at 𝐫, 𝑝𝐫 𝐼 𝐬 is the local probability distribution of the image intensities 𝐼 𝐬 within 𝑁𝐫, and 𝜇𝐫 is the average value of the intensity 𝐼 𝐬 with 𝐬 ∈ 𝑁𝐫. In this work, the size of 𝑁𝐫 is 7×7 pixels, as suggested in [22].
3. Equalization. After the transformation, the intensities of the images (𝐼! and 𝐼!!) could have small
values and could be concentrated in a short dynamic range. For this reason, it is necessary to rescale the two images intensities and to apply a histogram equalization [9].
4. Optical Flow. Find the remaining displacements between 𝐼! and 𝐼!! by an OF iterative scheme.
5. Non-rigid registration.
Fig. 1. Flow chart of the proposed algorithm for multimodal NRR based on LVM and OF.
2.3 Clinical and synthetic images datasets
CT and MR clinical studies of three patients with cerebral tumor were selected for evaluation purposes. In these studies, it is possible to observe deformations of the brain structures in the axial plane, due to tumor structures (primary tumor and metastatic or secondary tumors) shrinkage as a result of the medical treatment. These patients underwent pre-operative diagnostic and RT treatment at the San Raffaele Hospital in Milan, Italy. The dataset was composed by CT scans and MR T1 weighted images before the RT treatment (CT-Pre and MR-Pre), and MR T1 weighted images after the treatment (MR-Post). Due to the effectiveness of the RT treatment in all clinical cases, some tumors were no longer visible after the medical intervention, and to avoid information inconsistencies in the registration process, we decided to use 2D images instead of the whole 3D
5
scan. Thus, from the three clinical studies, ten pairs of CT/MR 2D images from different sections of the head were carefully selected, in order to have anatomic correspondence between Pre and Post images, and to study different morphological structures. Each image has a dimension of 512 x 512 pixels with a pixel size of 1.0 ×1.0 mm. The slice-by-slice correspondence between CT-Pre and both MR images (Pre and Post) was obtained by using the software available in the Eclipse Treatment Planning System [30].
In addition to the clinical dataset, we generated new synthetic data for the algorithm evaluation, where two MR-Pre images of different sections of the head were deformed in a controlled way (three deformations per image) by using the Moving Least Squares (MLS) algorithm [31], in order to simulate a tumor evolution during RT treatment. In this way, the NRR process was evaluated between a CT-Pre image and the synthetically modified MR-Pre image. Moreover, our interest was to use the proposed algorithm to follow the tumor evolution during RT treatment. For this reason, in the clinical images, the proposed algorithm was adapted to compute the OF over the tumor area and its near structures, where the displacements at the edges of the selected regions were controlled through the regularization term in equation (4), and by the vector field obtained by PF.
2.4 Registration accuracy
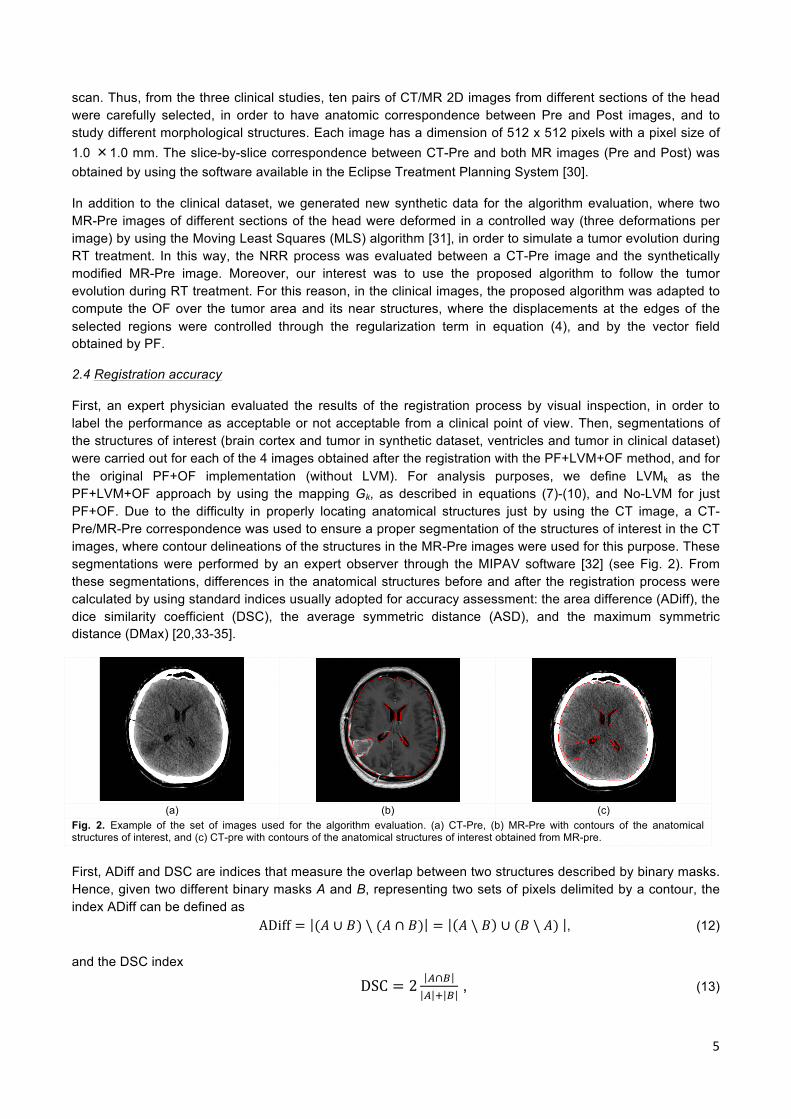
First, an expert physician evaluated the results of the registration process by visual inspection, in order to label the performance as acceptable or not acceptable from a clinical point of view. Then, segmentations of the structures of interest (brain cortex and tumor in synthetic dataset, ventricles and tumor in clinical dataset) were carried out for each of the 4 images obtained after the registration with the PF+LVM+OF method, and for the original PF+OF implementation (without LVM). For analysis purposes, we define LVMk as the PF+LVM+OF approach by using the mapping Gk, as described in equations (7)-(10), and No-LVM for just PF+OF. Due to the difficulty in properly locating anatomical structures just by using the CT image, a CT-Pre/MR-Pre correspondence was used to ensure a proper segmentation of the structures of interest in the CT images, where contour delineations of the structures in the MR-Pre images were used for this purpose. These segmentations were performed by an expert observer through the MIPAV software [32] (see Fig. 2). From these segmentations, differences in the anatomical structures before and after the registration process were calculated by using standard indices usually adopted for accuracy assessment: the area difference (ADiff), the dice similarity coefficient (DSC), the average symmetric distance (ASD), and the maximum symmetric distance (DMax) [20,33-35].
(a) (b) (c)
Fig. 2. Example of the set of images used for the algorithm evaluation. (a) CT-Pre, (b) MR-Pre with contours of the anatomical structures of interest, and (c) CT-pre with contours of the anatomical structures of interest obtained from MR-pre.
First, ADiff and DSC are indices that measure the overlap between two structures described by binary masks. Hence, given two different binary masks A and B, representing two sets of pixels delimited by a contour, the index ADiff can be defined as
ADiff = (𝐴 ∪ 𝐵) \ (𝐴 ∩ 𝐵) = 𝐴 \ 𝐵 ∪ (𝐵 \ 𝐴) , (12)
and the DSC index
DSC = 2 !∩!! ! !
, (13)

6
where ∙ denotes the cardinality of the set, \ represents the set difference, ∪ and ∩ the union and intersection, respectively. In our evaluations, we had an equivalence of the area associated to each pixel in the images. In this way, it is possible to quantify ADiff in area units (mm2). Note that ADiff equals to zero means a complete overlap. On the other hand, DSC ranges from 0 (no spatial overlap) to 1 (complete overlap).
Likewise, given contours 𝐶! and 𝐶! of the binary masks A and B respectively, the ASD index calculates the average distance between two contours. To compute it, first calculates for each contour pixel 𝐩𝑩 ∈ 𝐶!, the Euclidean distance between 𝐩𝑩 and its closest pixel in 𝐶!. In order to provide symmetry, the same process is applied to the contour pixels of 𝐩𝑨 ∈ 𝐶! with respect to 𝐶!. The ASD is then defined as the average of all computed distances:
ASD = !!! ! !!
𝑑 𝐩!,𝐶!𝐩!∈!! + 𝑑 𝐩! ,𝐶!𝐩!∈!! , (14)
where 𝑑 𝐩,𝐶 = min𝐪∈! 𝐩 − 𝐪 !. Therefore, a perfect match between contours 𝐶!and 𝐶! is expressed as a zero value for ASD. Meanwhile, DMax calculates the maximum distance between the analyzed overlapped contours, where zero means a perfect overlap. As a result, DMax provides an estimation of the worst local distance mismatch and is defined as:
DMax = max max𝐩!∈!! 𝑑 𝐩!,𝐶! ,max𝐩!∈!! 𝑑 𝐩! ,𝐶! , (15)
To avoid bias in the quantitative evaluation due to differences in the dimensions of the structures of interest, the resulting indices were analyzed for each type of anatomical structure (brain cortex, tumor and ventricles). So the evaluation results are presented as mean ± std for each structure. Additionally, in the synthetic images, eight markers were placed around the tumor with the goal of estimating the Euclidean distance between the coordinates of the markers in the images, before and after the registration process.
3. Results
3.1 Synthetic images
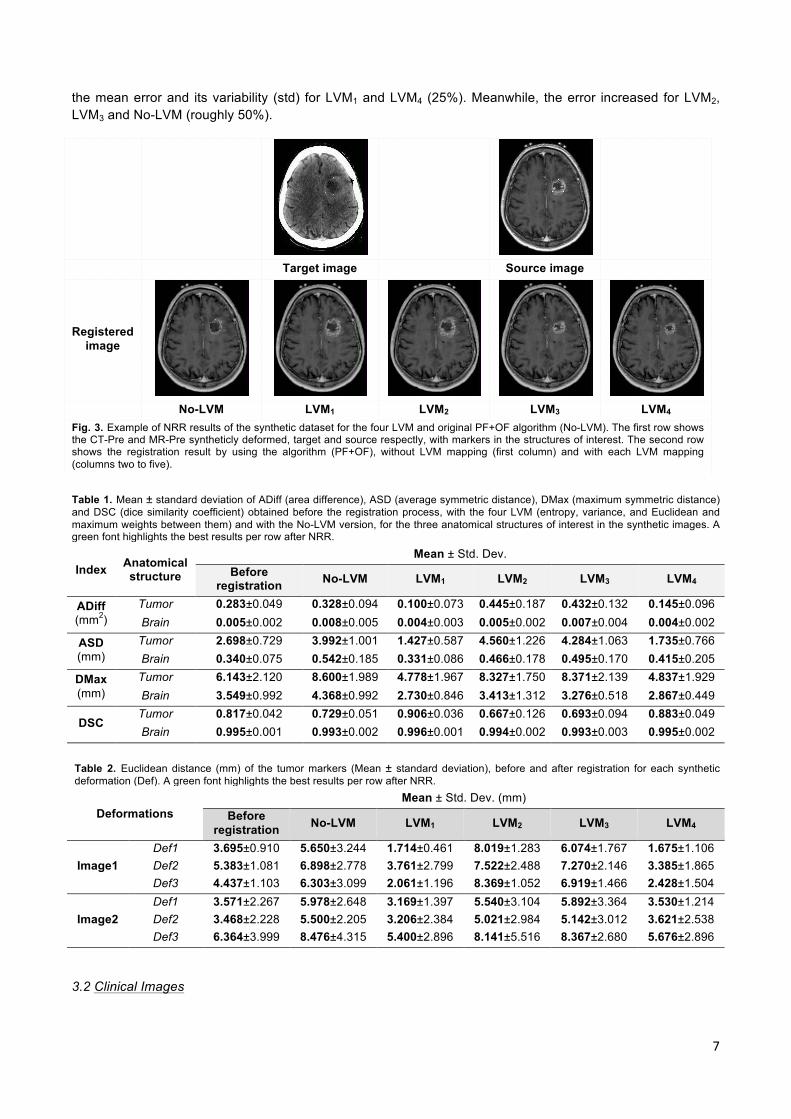
Figure 3 shows an example of the registration results obtained by the different LVM proposed in this paper, where a CT-Pre image is used as 𝐼! , and an MR-Pre synthetically deformed as 𝐼! . In the parametric registration, the PF estimated the following parameters 𝜃 = −0.838,−4.805,−4.218, 1.074, 1.066,−0.020,−0.022 ⊺. Table 1 presents the overall results for the brain contour and tumor by using the accuracy indices described earlier. The results show a similarity in ADiff for the brain contour, before and after the registration process (for any LVM); while in the tumor, a considerable decrease of about 60% is observed in LVM1 and LVM4, and an increase of about 50% is presented for LVM2, LVM3, and No-LVM. For the ASD index, the NRR results for the brain structure show a slight decrease only by LVM1 with respect to the initial registration value. At the same time, an increment of about 20% is found in ASD for the rest of the LVM. In the tumor, a considerable decrease (around 45%) was accomplished by LVM1 and LVM4, with respect to the ASD value before registration; LVM2, LVM3 and No-LVM presented an increment of approximately twice its initial value. Analyzing the brain contour for the DMax index, a slightly decrease is observed in LVM1 and LVM4 (around 20%), although LVM2 and LVM3 remain approximately at the same value before the NRR process, and No-LVM presented an increase of 23%. For the tumor, a 20% decrease is presented in LVM1 and LVM4 for DMax. Although a 35% increase is presented with the other two LVM and No-LVM case. Finally, the NRR average performance for the brain structure with the DSC index was always above 0.9 for all cases, before and after the NRR process. In the tumor, DSC shows an increase after the NRR process with LVM1 (10%) and LVM4 (7%), and a decrease of about 15% with LVM2, LVM3 and No-LVM. The overall evaluation in Table 1 shows that the NRR with LVM1 achieved the best mean index in 75% of the cases, and the lowest variability (std) in 63%.
In addition to the accuracy indices, the Euclidean error is calculated between the tumor markers before and after the NRR process in Table 2. For each deformation (Def), the mean ± std value of the distance between the eight markers around the tumor is presented for each LVM. In this table, we can observe a decrease in
7
the mean error and its variability (std) for LVM1 and LVM4 (25%). Meanwhile, the error increased for LVM2, LVM3 and No-LVM (roughly 50%).
Target image Source image
Registered image
No-LVM LVM1 LVM2 LVM3 LVM4
Fig. 3. Example of NRR results of the synthetic dataset for the four LVM and original PF+OF algorithm (No-LVM). The first row shows the CT-Pre and MR-Pre syntheticly deformed, target and source respectly, with markers in the structures of interest. The second row shows the registration result by using the algorithm (PF+OF), without LVM mapping (first column) and with each LVM mapping (columns two to five). Table 1. Mean ± standard deviation of ADiff (area difference), ASD (average symmetric distance), DMax (maximum symmetric distance) and DSC (dice similarity coefficient) obtained before the registration process, with the four LVM (entropy, variance, and Euclidean and maximum weights between them) and with the No-LVM version, for the three anatomical structures of interest in the synthetic images. A green font highlights the best results per row after NRR.
Index Anatomical structure
Mean ± Std. Dev. Before
registration No-LVM LVM1 LVM2 LVM3 LVM4
ADiff (mm2)
Tumor 0.283±0.049 0.328±0.094 0.100±0.073 0.445±0.187 0.432±0.132 0.145±0.096 Brain 0.005±0.002 0.008±0.005 0.004±0.003 0.005±0.002 0.007±0.004 0.004±0.002
ASD (mm)
Tumor 2.698±0.729 3.992±1.001 1.427±0.587 4.560±1.226 4.284±1.063 1.735±0.766 Brain 0.340±0.075 0.542±0.185 0.331±0.086 0.466±0.178 0.495±0.170 0.415±0.205
DMax (mm)
Tumor 6.143±2.120 8.600±1.989 4.778±1.967 8.327±1.750 8.371±2.139 4.837±1.929 Brain 3.549±0.992 4.368±0.992 2.730±0.846 3.413±1.312 3.276±0.518 2.867±0.449
DSC Tumor 0.817±0.042 0.729±0.051 0.906±0.036 0.667±0.126 0.693±0.094 0.883±0.049 Brain 0.995±0.001 0.993±0.002 0.996±0.001 0.994±0.002 0.993±0.003 0.995±0.002
Table 2. Euclidean distance (mm) of the tumor markers (Mean ± standard deviation), before and after registration for each synthetic deformation (Def). A green font highlights the best results per row after NRR.
Deformations Mean ± Std. Dev. (mm)
Before registration No-LVM LVM1 LVM2 LVM3 LVM4
Image1 Def1 3.695±0.910 5.650±3.244 1.714±0.461 8.019±1.283 6.074±1.767 1.675±1.106 Def2 5.383±1.081 6.898±2.778 3.761±2.799 7.522±2.488 7.270±2.146 3.385±1.865 Def3 4.437±1.103 6.303±3.099 2.061±1.196 8.369±1.052 6.919±1.466 2.428±1.504
Image2 Def1 3.571±2.267 5.978±2.648 3.169±1.397 5.540±3.104 5.892±3.364 3.530±1.214 Def2 3.468±2.228 5.500±2.205 3.206±2.384 5.021±2.984 5.142±3.012 3.621±2.538 Def3 6.364±3.999 8.476±4.315 5.400±2.896 8.141±5.516 8.367±2.680 5.676±2.896
3.2 Clinical Images
8
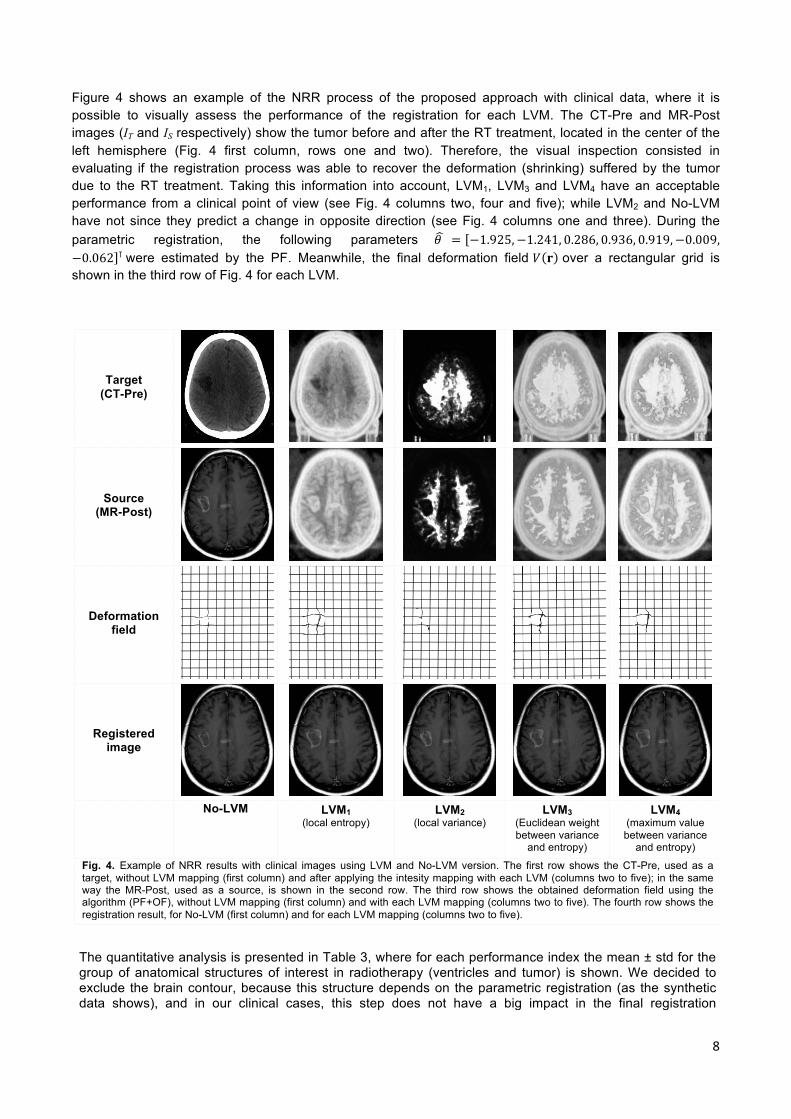
Figure 4 shows an example of the NRR process of the proposed approach with clinical data, where it is possible to visually assess the performance of the registration for each LVM. The CT-Pre and MR-Post images (IT and IS respectively) show the tumor before and after the RT treatment, located in the center of the left hemisphere (Fig. 4 first column, rows one and two). Therefore, the visual inspection consisted in evaluating if the registration process was able to recover the deformation (shrinking) suffered by the tumor due to the RT treatment. Taking this information into account, LVM1, LVM3 and LVM4 have an acceptable performance from a clinical point of view (see Fig. 4 columns two, four and five); while LVM2 and No-LVM have not since they predict a change in opposite direction (see Fig. 4 columns one and three). During the parametric registration, the following parameters 𝜃 = −1.925,−1.241, 0.286, 0.936, 0.919,−0.009,−0.062 ⊺ were estimated by the PF. Meanwhile, the final deformation field 𝑉 𝐫 over a rectangular grid is shown in the third row of Fig. 4 for each LVM.
Target (CT-Pre)
Source (MR-Post)
Deformation field
Registered image
No-LVM
LVM1 (local entropy)
LVM2 (local variance)
LVM3 (Euclidean weight between variance
and entropy)
LVM4 (maximum value between variance
and entropy)
Fig. 4. Example of NRR results with clinical images using LVM and No-LVM version. The first row shows the CT-Pre, used as a target, without LVM mapping (first column) and after applying the intesity mapping with each LVM (columns two to five); in the same way the MR-Post, used as a source, is shown in the second row. The third row shows the obtained deformation field using the algorithm (PF+OF), without LVM mapping (first column) and with each LVM mapping (columns two to five). The fourth row shows the registration result, for No-LVM (first column) and for each LVM mapping (columns two to five). The quantitative analysis is presented in Table 3, where for each performance index the mean ± std for the group of anatomical structures of interest in radiotherapy (ventricles and tumor) is shown. We decided to exclude the brain contour, because this structure depends on the parametric registration (as the synthetic data shows), and in our clinical cases, this step does not have a big impact in the final registration

9
performance. However, it is necessary to continue considering the parametric registration, since in many clinical cases this step could be very helpful, as has been described in the literature [1-3,14]. As shown in Table 3, for the ventricles and the tumor, a more evident decrease was presented in all LVM and No-LVM case. For the ventricles, a decrease was found with all four LVM, where LVM2 showed the largest improvement (15%). Table 3. Mean ± standard deviation of ADiff (area difference), ASD (average symmetric distance), DMax (maximum symmetric distance) and DSC (dice similarity coefficient) obtained before the registration process, with the four LVM (entropy, variance, 2-Norm and Infinity-Norm) and with the No-LVM version for the three anatomical structures of interest. A green font highlights the best results per row after NRR.
Index Anatomical structure
Mean ± Std. Dev. Before
registration No-LVM LVM1 LVM2 LVM3 LVM4
ADiff (mm2)
Tumor 0.420±0.263 0.389±0.350 0.252±0.365 0.415±0.292 0.366±0.310 0.278±0.340 Ventricles 0.964±2.163 0.501±0.879 0.520±0.915 0.679±1.973 0.692±2.108 0.665±1.084
ASD (mm)
Tumor 4.265±3.285 4.804±4.265 3.517±4.123 4.669±3.752 4.009±3.926 3.590±3.694 Ventricles 2.197±1.241 1.868±1.441 1.891±1.157 1.811±1.234 1.829±1.081 1.970±1.202
DMax (mm)
Tumor 9.398±4.046 10.362±5.713 7.980±4.710 10.144±4.843 9.031±5.228 8.368±4.560 Ventricles 7.841±6.372 8.042±7.424 7.308±6.599 6.604±5.447 6.918±4.875 7.833±6.783
DSC Tumor 0.683±0.264 0.652±0.322 0.746±0.319 0.661±0.289 0.710±0.301 0.741±0.294
Ventricles 0.608±0.198 0.681±0.205 0.659±0.191 0.662±0.213 0.645±0.214 0.656±0.185
Finally, the DSC in the ventricles shows a slight increase after NRR (about 8%) with all LVM´s and No-LVM scenarios. Analyzing the tumor in Table 3, LVM2 and No-LVM did not improve ASD, DMax and DSC after the NRR process. An improvement in all four indices is found only for LVM1, LVM3 and LVM4; being the best improvements of 40% for the ADiff, 17% for the ASD, 15% for the DMax, and 9% for the DSC, all of them by using LVM1.
4. Discussion
4.1 Synthetic Images
In the analysis of the synthetic evaluation, only the brain contour, the biggest rigid structure presented in the images, and the tumor, which is the structure that presents complex deformations, were considered as structures of interest for RT. Therefore, as expected, the values of all four accuracy indices (ADiff, DSC, ASD and DMax) calculated for all the LVM and No-LVM at the contour of the brain did not change significantly compared to their values before NRR. For the tumor, an improvement was presented only for LVM1 and LVM4 in all indices, being LVM1 the one with the largest improvement. The analysis of the Euclidean error among markers in the tumor section provided an estimation of the NRR accuracy on specific points for a structure of interest; anew, the corresponding results show positive performance only for LVM1 and LVM4. However, by considering the results in [22], where LVM were first proposed for the registration of medical images, an acceptable performance was found in all four LVM. Moreover, the performance analysis in [22] was only based on the mean error of the entire vector field after applying the NRR algorithm; while in this paper, we analyze the performance of the different LVM methodologies by specifically addressing the anatomical structures of clinical interest.
4.2 Clinical Images
The resulting images after the NRR process show that LVM1 (entropy) provides qualitatively and quantitatively the best results on the set of evaluation images, followed by LVM4 (maximum weight between entropy and variance), appropriately aligning the anatomical structures in MR-Post with CT-Pre. Although LVM2 and LVM3 (variance and Euclidean weight between both metrics) achieve an adequate alignment for some structures of
10
interest, these metrics generated anatomically inconsistent deformations, and changes in the textures of tissues in the registered images (figures omitted due to space limitations). The inconsistent deformations obtained after NRR by LVM2 might be caused by highly textured (in MR) and low contrast areas (in CT), as in several brain regions, where the values obtained by computing local variance are constant due to low variability of the intensities in these regions. This phenomenon becomes similar to estimate the OF between two constant-intensity areas, where any displacement in any direction keeps unchanged the cost function. In the same way, within a homogeneous area, there is high probability of obtaining values of variance and entropy for two different locations with similar magnitudes, generating an identical problem for LVM3 (Euclidean weight). These effects explain the inconsistent deformations generated by LVM2 and LVM3, which do not occur in LVM1, because in highly textured areas, the entropy values are very different among pixels, due to the high uncertainty in the intensities of these regions (see Fig. 4).
In fact, the quantitative analysis on the tumor shows that the best results for the NRR algorithm were obtained by using LVM1 and LVM4, despite some problems with the contrast in the CT-Pre images. Moreover, the No-LVM approach does not provide good results to estimate the tumor deformation, because the tissue intensities at each modality (CT and MR) are very different. Contrarily, the No-LVM approach gave the best results in terms of ADiff and DSC in the ventricles (along with LVM1) and also presented positive results for the ASD index (see Table 3). This behavior could be related to the similarity of intensities in the ventricles, for both CT and MR.
The positive results found with the No-LVM implementation follow the performance shown in [19,20], where it is stated that the use of the PF+OF method is a valuable tool for complex NRR problems. In the meantime, the negative results support the disadvantage of this methodology for multimodal cases, so that it reinforces the motivation for using LVM to achieve a multimodal registration that does not parameterize the elastic deformation space, in contrast to most of the methods reported in the literature [16-18]. Furthermore, a parameterization of the deformation space (e.g., using splines) limits the vector fields that can be achieved and increases the computational cost, because the optimization processes used by these methods are typically nonlinear [16-18]. These two problems are solved with the technique proposed in this work PF+LVM+OF, since each pixel can move independently, thus increasing the manifoldness of deformations that can be reproduced. Also, the OF estimation process is formulated as a quadratic optimization over a convex surface (see equation (4)), and its global solution is computed by a system of linear equations, which ensures a low computational cost.
Making a comparison between the four LVM and the No-LVM implementation (see Tables 1, 2 and 3), it is possible to see a consistent advantage of LVM1 (entropy) over the other LVM and No-LVM approach in mean performance, and even in some cases, with less variability. This idea suggests that the local entropy is the best performing LVM under a quantitative analysis of anatomical structures of interest for RT brain images. Furthermore, the results found in this work suggest that the PF+LVM+OF algorithm could be useful in RT for some important tasks, such as the monitoring of medical treatment. Additionally some aspects of the NRR methodology could be still improved in future studies, such as: modifying the regularization term in equation (4) through an spatial adaptive structure, which could be more consistent with the behavior of the deformations in medical imaging; and evaluating different alternatives for OF computation.
5. Conclusions
In this work, local intensity transformations were suggested to perform a multimodal NRR based on PF and iterative OF. These transformations map the target and source images into a space where the multimodal property was overcome, such that an efficient OF solution can be pursued. The evaluation of the proposal was based on CT and MR brain images deformed synthetically, and on real clinical cases. The results showed that the local entropy is the LVM with the best performance, both qualitatively and quantitatively, by analyzing the anatomical structures of interest in RT (brain, tumor and ventricles). In addition, the proposal offers a solution for multimodal NRR based on quadratic optimization over a convex surface, which allows independent motion of each pixel. This property increases the elastic deformations that could be achieved; in contrast to methods that parameterize the deformation space that limit the accuracy and increase the

11
computational cost by nonlinear optimization processes. Therefore, our NRR proposal could be considered as a new option for medical image registration in RT applications by extending and evaluating the proposed approach in a 3D context.
References
[1] Zitová B, Flusser J. Image registration methods: a survey. Image and Vision Computing 2003; 21: 977–1000. [2] Modersitzki J. Numerical methods for image registration. New York: Oxford University Press; 2004. [3] Pluim JP, Fitzpatrick JM. Image registration. IEEE Transactions on Medical Imaging 2003; 22(11): 1341–1343. [4] Nocedal J, Wright SJ. Numerical Optimization. New York: Springer; 2006. [5] Pluim JP, Maintz JB, Viergever MA. Image registration by maximization of combined mutual information and gradient information. IEEE Transactions on Medical Imaging 2000; 19(8): 809–814. [6] Wells WM, Viola P, Atsumi H, Nakajima S, Kikinis R. Multi–modal volume registration by maximization of mutual information. Medical Image Analysis 1996; 1(1):35–51. [7] Maes F, Collignon A, Vandermeulen D, Marchal G, Suetens P. Multimodality image registration by maximization of mutual information. IEEE Transactions on Medical Imaging 1997; 16(2): 187–198. [8] Pluim JP, Maintz JB, Viergever MA. Mutual-information-based registration of medical images: a survey. IEEE Transactions on Medical Imaging 2003; 22(8):986–1004. [9] Gonzalez RC, Woods RE,Eddins SL. Digital Image Processing Using MATLAB. Gatesmark Publishing; 2009. [10] Man KF, Tang KS, Kwong S. Genetic Algorithms Concepts and Designs. London: Springer; 2001. [11] Arulampalam MS, Maskell S, Gordon N, Clapp T. A tutorial on particle filters for online nonlinear/non-gaussian bayesian tracking. IEEE Transactions on Signal Processing 2002; 50(2): 174–188. [12] Das A, Bhattacharya M. Affine-based registration of ct and mr modality images of human brain using multiresolution approaches: comparative study on genetic algorithm and particle swarm optimization. Neural Computing and Applications 2010; 20(2): 223–237. [13] Arce-Santana E.R., Campos-Delgado D.U., Alba A. Affine image registration guided by particle filter. IET Image Processing 2012; 6(5): 455–462. [14] Rueckert D, Aljabar P. Nonrigid registration of medical images: theory, methods, and applications. IEEE Signal Processing Magazine 2010; 27(4): 113–119. [15] Bin L, Lianfang T, Shanxing O. Rapid Multimodal Medical Image Registration and Fusion in 3D Conformal Radiotherapy Treatment Planning. Proceedings of the International Conference on Bioinformatics and Biomedical Engineering; 2010: 1–5. [16] Xuan J, Wang Y, Freedman MT, Adali T, Shields P. Nonrigid medical image registration by finite-element deformable sheet-curve models. International Journal of Biomedical Imaging 2006; 2006:1–9. [17] Serifovic-Trbalic A, Demirovic D, Prljaca N, Szekely G, Cattin PC. Intensity-based elastic registration incorporating anisotropic landmark errors and rotational information. International Journal of Computer Assisted Radiology and Surgery 2009; 4(5): 463-468. [18] Klein A, Andersson J, Ardekani BA, Ashburner J, Avants B, et al. Evaluation of 14 nonlinear deformation algorithms applied to human brain mri registration. Neuroimage 2009; 46(3): 786–802. [19] Arce-Santana E.R., Campos-Delgado D.U., Alba A. A non-rigid multimodal image registration method based on particle filter and optical flow. Proceedings of the 6th International Conference on Advances in Visual Computing 2010.LNCS 6453: 35–44. [20] Mejia-Rodriguez A, Arce-Santana E.R., Scalco E, Tresoldi D, Mendez M.O., et al. Elastic registration based on particle filter in radiotherapy images with brain deformations. Proceedings of the Annual International Conference of the IEEE Engineering in Medicine and Biology Society; 2011:8049–8052.

12
[21] Reducindo I, Arce-Santana E.R., Campos-Delgado D.U., Alba A. Evaluation of multimodal medical image registration based on particle filter. Proceedings of the 7th International Conference on Electrical Engineering, Computing Science and Automatic Control; 2010: 406–411. [22] Reducindo I, Arce-Santana E.R., Campos-Delgado D.U., Vigueras-Gomez F. Non-rigid multimodal image registration based on local variability measures and optical flow. Proceedings of the Annual International Conference of the IEEE Engineering in Medicine and Biology Society; 2012: 1133–1136. [23] Simon D. Optimal State Estimation. New Jersey: John Wiley& Sons; 2006. [24] Studholme C, Hill DL, Hawkes DJ. An overlap invariant entropy measure of 3d medical image alignment. Pattern Recognition 1999; 32(1): 71–86. [25] Reducindo I, Arce-Santana E.R., Campos-Delgado D.U., Alba A, Vigueraz-Gomez F. An exploration of multimodal similarity metrics for parametric image registration based on particle filtering. Proceedings of the 8th International Conference on Electrical Engineering, Computing Science and Automatic Control; 2011: 1–6 [26] Baker S, Scharstein D, Lewis J, Roth S, Black M, Szeliski R. A database and evaluation methodology for optical flow. International Journal of Computer Vision 2011; 92: 1–31. [27] Van Trees HL. Detection, Estimation and Modulation Theory: Part 1. New Jersey: John Wiley & Sons;2001. [28] Horn BK,Schunck BG. Determining optical flow: a retrospective. Artificial Intelligence 1993; 59(1-2): 81–87. [29] Biswal PC. Numerical Analysis. New Delhi: Prentice-Hall of India Pvt. Ltd.; 2008. [30] Varian Medical Systems. Eclipse Treatment Planning Systems, 2013, http://www.varian.com/media/oncology/products/eclipse/pdf/EclipseSellSheet.pdf [31] Schaefer S, McPhail T, Warren J. Image Deformation Using Moving Least Squares. ACM Transactions on Graphics (TOG) - Proceedings of ACM SIGGRAPH 2006; 25(3): 533–540. [32] McAuliffe MJ, Lalonde FM, McGarry D, Gandler W, Csaky K, et al. Medical Image Processing, Analysis and Visualization in Clinical Research. Proceedings of the Fourteenth IEEE Symposium on Computer-Based Medical Systems; 2001: 381–386. [33] Faggiano E, Fiorino C, Scalco E, Broggi S, Cattaneo M, et al. An automatic contour propagation method to follow parotid glands deformation during head-and-neck cancer Tomotherapy. Physics in Medicine and Biology 2011; 56(3): 775–791. [34] Wang H, Garden AS, Zhang L,Wei X, Ahamad A, et al. Performance evaluation of automatic anatomy segmentation algorithm on repeat or four-dimensional computed tomography images using deformable image registration method. International Journal of Radiation Oncology-Biology-Physics 2008; 72(1): 210–219. [35] Heimann T, Van Ginneken B, Styner M, Arzhaeva Y, Aurich V, et al. Comparison and evaluation of methods for liver segmentation from CT datasets. IEEE Transactions on Medical Imaging 2009; 28(8):1251–1265.