Investigate the Performance of Document Clustering Approach Based on Association Rules Mining
Upload
independentCategory
view
5download
0
Pergamon Information Processing & Management, Vol. 32, No. 3, pp. 287-304, 1996
Copyright © 1996 Elsevier Science Ltd Printed in Great Britain, All fights reserved
0306-4573/96 $15.00+0.00
0306-4573(95)00070-4
MULTIMEDIA DOCUMENT MANAGEMENT: AN ANTHROPOCENTRIC APPROACH
NADIA BIANCHI, ~ PIERO MUSSIO, 2 MARCO PADULA 3 and GIULIANA RUBBIA RINALDI'
' Dipartimento Fisica, Universit~t di Milano, via Viotti 5, 20133 Milano, Italy, 2 Dipartimento di Scienze dell'Informazione, Universit~ La Sapienza, via Salaria 113, 00198 Roma, Italy and ~ ITIM-lstituto
Tecnologie Informatiche Multimediali CNR, via Ampere 56, 20131 Milano, Italy
(Received June 1995; accepted October 1995)
Abstract--The architecture of an anthropocentric Biomedical Information Management System is proposed. The system is based on a network of computational components (agents) that users---experts in the biomedical domain, but not in computer science--can define, use, and refine to serve their own communication and documentation habits and needs. The innovation of the proposal lies in the adoption of the Participatory Design methodology, which involves users in the design of tools and their implementation, organization and integration to perform the required biomedical activities. Copyright © 1996 Elsevier Science Ltd
1. THE USER'S PERSPECTIVE OF INFORMATION MANAGEMENT SYSTEMS
This paper introduces BIMS, a Biomedical Information Management System created in an anthropocentric style of system design, meaning by this a style "aimed at enhancing the skills and abilities of users as one important way to improve system performance" (AT&S, 1990). BIMS, which capitalizes on various specific experiences (Bottoni et al., 1990b; Mussio et al., 1991a, b, 1992b; Di Nubila et al., 1994), has been designed to address situations in which users exploit data management technologies to perform a complex task for which the users are fully responsible--such as for example, clinical diagnosis.
Physicians usually arrive at a diagnosis by integrating clinical data obtained by direct inspection with data from stored documents, or data analysis and simulation programs; they then comment on this information in a clinical report. The reports of physicians responsible for making a diagnosis need to be readily accessible, as well as easily read and understood by other physicians. However, users of data management systems face a general problem: they must not only be able to rely on the data stored, but also communicate the results obtained and in turn enrich the archives. These users must be enabled to access data and obtain results they can (Levialdi et al., 1993)
• properly understand within the context of their system of values, goal, and purposes; • evaluate with reliability; • handle in order to pursue their activity; • profitably communicate to other users.
Moreover, users expect the system to allow them to perform a task without being computer experts, accepting that the effort involved be proportional to the complexity of the task. Consequently, the anthropocentric style adopted for BIMS design led us to organize data and programs as a whole, called the data space. The system is presented to its users by a set of hypermedia documents (c-logbooks) that are readily understood and managed. These documents allow a uniform style of interaction for navigating through the data space, managing its items, modifying existing documents, and defining new ones, adapting BIMS to new specific application needs. This is a new capability with respect to traditional systems, and it is crucial
287

288 Nadia Bianchi et al.
in enabling the users to improve system performance. As this potential must be understood and governed even by users who are not computer experts, hypermedia documents must be:
• expressed in a notation meaningful to the user; • observable in their dynamic behavior by the user.
As regards the first point, experts in several fields of science and technology (Mussio et al., 1991 a, b) reason and communicate by diagrammat ic notations, i.e. notations where verbal parts are intermingled with images, plots, diagrams and sketches (Arbib and Manes, 1975; Mariott, 1977; Tufte, 1983; Dioguardi, 1984; Bottoni et al., 1991). These notations can be formalized as Visual Languages and adopted as the notations for human-machine communication (Golin and Reiss, 1990; Bianchi et al., 1993a). This presents some problems since Visual Languages schematize traditional notations: symbols, icons and images are generated, combined, and used in their digital versions, subject to the constraints of present-day technologies. On the other hand, Visual Languages enhance traditional notations, extending their expressive power, embodying the computer's capability of active symbol manipulation.
As for the need for observability, this stems from the fact that users are often unaware of these constraints and possibilities, and do not realize that the use of data management systems causes an evolution in their working culture. Therefore, tools integrated into BIMS allow users to produce a prototype of the computerized working environment and progressively specialize it in line with the evolving working situation. It is the responsibility of the users to determine and modify the system configuration and the interaction style.
This is the strength of BIMS: users become empowered co-designers of the system, completely reversing the common view that the working style of the users must adapt to the tools of the information system and taking to the extreme the Participatory Design approach (Clement and Van den Besselaar, 1993; Carmel et al., 1993). A BIMS prototype is already in operation; its exploitation in a cardiological case has been exemplified and illustrated in (Bianchi et al., 1993a). In this paper we discuss the architectural and functional characteristics that make BIMS an effective support for participatory system design and realization.
2. MOTIVATIONS FOR SYSTEM DESIGN
During the following up of a clinical case different types of data are produced. These data characterize the clinical documents, which we shall call the diagrammat ic or mult imedia documents (the former term used in the Visual Language field, the latter in the IR).
With time the clinical document grows in both dimensions and complexity, causing confusion in that physicians have to specify their information needs, search the available data (Salton and McGill, 1983; Van Rijsbergen, 1979), and decide on the strategies to adopt when peforming the activities addressing their goals (Hancock-Beaulieu, 1990; Belkin et al., 1990; Belkin & Marcbetti, 1990; Ellis, 1989; Kuhlthau,1991). In such a situation they must be given some support to (a) handle heterogeneous data and to organize them in a network of semantic relationships among their items (Agosti, 1993), and (b) define and organize the set of activities that contribute to the performance of a complex (clinical) task, that is the defining of activity strategies.
According to Belkin et al., 1993, we hold that these activity strategies should be considered interactions between the user and the computational environment, but, since we follow an anthropocentric approach, we also believe that the dimensions identifying the activity strategies should account for user definition of the interaction: computational agents available for building activities should be included among the considered resources.
Taking these considerations into account, BIMS has been built as a plastic visual system (Bianchi et al., 1992a, b) that enables the users to bootstrap (Mussio et al., 1992b) the definition of their own evolving working environment, use it, and refine it as a hierarchy of environments which promote and support effective user interaction
• to identify the agents needed to perform an activity;

Multimedia document management 289
• to organize the computing procedures and others to control and validate these; • to specialize the procedure and relative interfaces to their own needs and to specific types
of data; • to communicate smoothly and reliably with other systems; • to define the interaction languages; • to navigate through the system to solve their problems; = to produce and organize the documentation produced by the activity and regarding both
results and the procedures that automatically manage these.
3. THE USER'S DEFINITION OF HIS ACTIVITY STRATEGIES
The activity strategies are partly established according to the external and internal rules of the organization in which activities are performed, and partly decided autonomously by a team of users, in this case biologists/physicians with different levels of skill and responsibility (senior expert, expert, end user), together with a computer scientist. The experience gained in collaborating with physicians in different fields (Mussio et al., 1991a; Bottoni et al., 1990a, b; Di Nubila et al., 1994) has led to the structuring of hierarchy with four-functional levels for the organization of the set of c-logbooks (see Fig. 1). At each level a set of homogeneous programming activities is performed, using diagrammatic forms of user interaction. Users exploit meta-information to visually specify the activity to be executed at the lower level: they define the information items to be accessed and processed, the programs, the necessary interactions to undertake their execution and the visualization mode of the results. The four levels identified are:
• a Global Logbook;
1 ~ ~ Global LOgbook Computer Scientist
Senior Expert
Expe~
End user
D~inition Logbook
Fig. 1. The logbook hierarchy levels.
[PH 32-3-C
290 Nadia Bianchi et al.
• a Laboratory Definition Logbook; • an Experiment Definition Logbook; • an Experiment Execution Logbook.
The Global LOgbook (GLO) records general data and provides libraries of tools required for the organization of other c-logbooks. A computer scientist interacts with the GLO to define the tools that allow the construction of the c-logbooks employed at the lower levels.
The Laboratory Definition Logbook (LDL) uses the tools offered by a User Interface Development Environment (UIDE) to define the specific organization of the computational tools to be used. At this level the computer scientist is still involved in the definition and implementation of tools, but space is provided for the intervention of a senior expert, who
• decides what tools to select from the GLO and supply to the c-logbooks at lower levels;
• defines the structure and interaction style of the interface; • defines the different views for presenting the data and the agents. At this level end users
must refer to the senior expert in order to re-mold the interface and adapt it, as the need arises, to their modified requirements.
An expert responsible for a specific class of activities interacts with the Experiment Definition Logbook (EDL) to define the specific activities executed at the bottom level c-logbook.
In a working environment different EDLs are generally needed, depending on the different experiments to be performed. The current version of BIMS has entailed the defining of c- logbooks for Diagrammatic Data Interpretation Definition and Result Comparison Definition; the realization of these c-logbooks is still being refined. Computer scientists are not involved in the use of these definition c-logbooks, which is completely reserved to the physicians.
The Experiment Execution Logbook (EEL) provides end users with the tools to perform their experiments. Already available are c-logbooks for Receiving, Querying, Retrieving, Complet- ing, Updating, Diagrammatic Data Interpretation, Data Space Exploration, Image Exploration, and Result Comparison.
The agents that constitute the computational kernel for c-logbook building are described in Section 4.2; user interaction through c-logbooks is exemplified in Section 6.
4. BIMS ARCHITECTURE
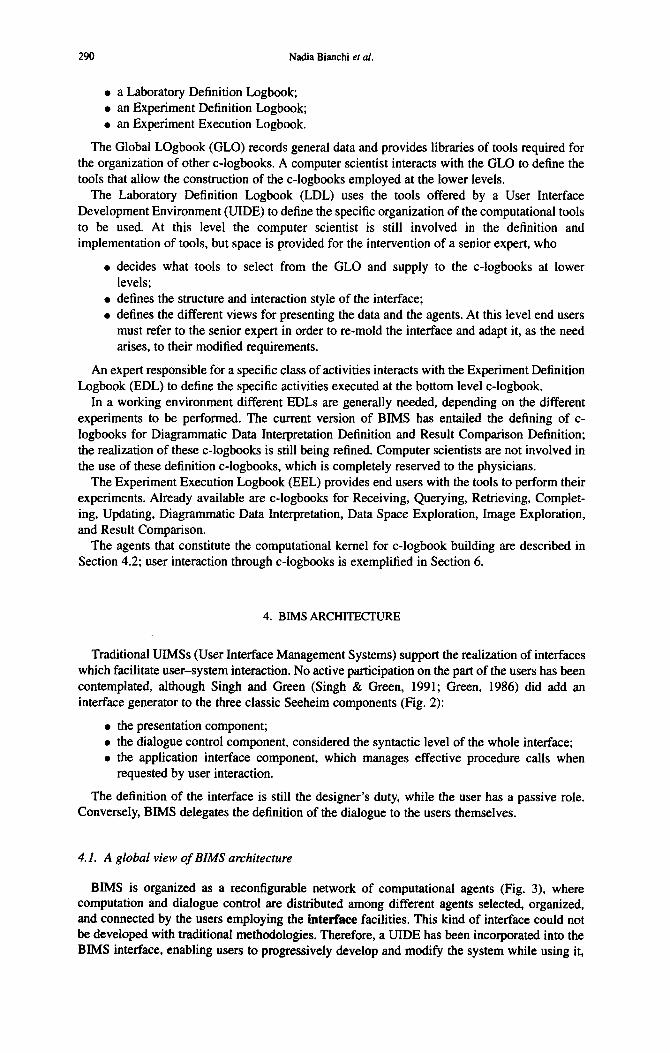
Traditional UIMSs (User Interface Management Systems) support the realization of interfaces which facilitate user-system interaction. No active participation on the part of the users has been contemplated, although Singh and Green (Singh & Green, 1991; Green, 1986) did add an interface generator to the three classic Seeheim components (Fig. 2):
• the presentation component; • the dialogue control component, considered the syntactic level of the whole interface; • the application interface component, which manages effective procedure calls when
requested by user interaction.
The definition of the interface is still the designer's duty, while the user has a passive role. Conversely, BIMS delegates the definition of the dialogue to the users themselves.
4.1. A global view of BIMS architecture
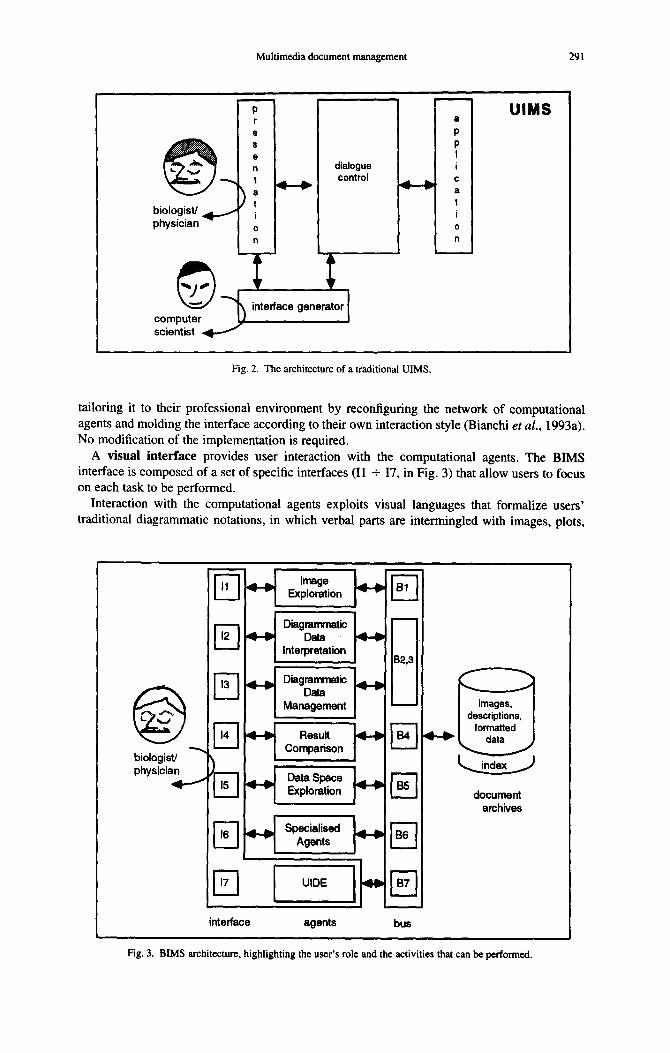
BIMS is organized as a reconfigurable network of computational agents (Fig. 3), where computation and dialogue control are distributed among different agents selected, organized, and connected by the users employing the interface facilities. This kind of interface could not be developed with traditional methodologies, Therefore, a UIDE has been incorporated into the BIMS interface, enabling users to progressively develop and modify the system while using it,
Multimedia document management 291
, • interface generator :oimPtu~tr I
UIMS
Fig. 2. The architecture of a traditional UIMS.
tailoring it to their professional environment by reconfiguring the network of computational agents and molding the interface according to their own interaction style (Bianchi et al., 1993a). No modification of the implementation is required.
A visual interface provides user interaction with the computational agents. The BIMS interface is composed of a set of specific interfaces (I1 + I7, in Fig. 3) that allow users to focus on each task to be performed.
Interaction with the computational agents exploits visual languages that formalize users' traditional diagrammatic notations, in which verbal parts are intermingled with images, plots,
biologist/ physician
II1, [
,2 ]
Image Exploration B1
Diagrammatic ~ . ~ ~ ~ ,
Interpretation 32,31
13
14
15
16
D
Diagrammatic Data ~ b Management I
1
Result ~ B4 Comparison / Data Space Exploration ~ t P I~
S p~gi:lidsed i ~ 1 B6
interface agents bus
document archives
Fig. 3. BIMS architecture, highlighting the user's role and the activities that can be performed.
292 Nadia Bianchi et al.
diagrams and sketches. The experts develop these notations to express their reasoning and data models describing the tasks to be performed in their specific domains of activity.
Sentences programmed in visual languages are graphically schematized and computationally enriched versions of sentences in the traditional notations found in paper-based documents. The interaction language is
• plain: users can combine operators and entities in sentences which are synthetic, but at the same time expressive, by means of a limited number of simple syntactic rules. Both operators and entities represent known activities and objects;
• suitable: users can formulate all the computational solutions required by their activities; • polymorphic (Cardelli & Wegner, 1985): the same activity is always fired through the
same icon, even when applied in different contexts, or on different types of data; hence, the user--environment interaction style is uniform;
• syntactically homogeneous: the interface layout organizes the available tools so that portions of the screen with the same functional meaning preserve their position and appearance (Bianchi et al., 1992a).
The UIDE has been flanked with computational agents that allow the data space to be explored, its data and tools checked and managed, and its data indexed. Data space exploration tools are: Image Exploration, Result Comparison, and Data Space Exploration. The data indexing tool is Diagrammatic Data Interpretation. The tool for data use is the Diagrammatic Data Management. Furthermore, the BIMS architecture can be extended by including other specialized agents requested by the user to detail laboratory activity, or satisfy new requirements.
The archives contain the permanent data necessary to perform BIMS activities. These are mostly raw documents (clinical documents, mammograms, histological images and their descriptions) and indexes (which synthesize documents) to effectively and efficiently access documents by inquiry or navigation. Indexes are document descriptions in an internal form suitable for computer processing.
Data involved in BIMS activities are retrieved from the archive or supplied by computations as intermediate results.
The BIMS 5us is dedicated to organizing data--requests, documents and indexes--and dispatching them upon request. Each computational agent accesses the BIMS bus by a specialization designed to handle the agent data.
At present, the running version of the BIMS computational agents illustrated here is still undergoing refinement. A prototype of the UIDE has been implemented, and we are now porting the refined agents to encapsulate them in BIMS. The C language, under UNIX/XWindow and DOS/Windows, has been adopted as the development environment; C/SQL Informix has been used for archive management.
4.2. BIMS agents and their funct ions
Data in the form of images are widely used in clinical research. Therefore an Image Exploration agent (IE) has been built and dedicated to the exploration of the class of images studied. Biologists/physicians employ a set of tools--typically, histograms, cross-sections, filters--to extract the characteristics of the image that will be used in the interpretation strategy. A set of known Image Processing operators has been implemented. A new operator for topographic segmentation has been developed, and its application to astronomical images (Accomazzi et al., 1989), cytological images (Mussio et al., 1991b), chromosome images (Rubbia Rinaldi et al., 1995; Bianchi et al., 1994), and remote sensed images (Bianchi et al., 1993b) judged satisfactory.
The Result Comparison agent (RC) allows comparison of pairs of images and descriptions to control the development of the image interpretation process, so that the further steps to be taken can be decided. The numerical results of the comparison are presented as confusion matrices. A confusion matrix is an array used to compare two interpretations of the same data. Each entry represents the number of elements in a set of data classified by a first interpreter as
Multimedia document management 293
the name specified by the column label and by a second interpreter as the name specified by the row label. The numbers in the descending diagonal indicate coincidence in the classifications of the two interpreters; other entries indicate disagreement (Schowengerdt, 1982). A prototype of the agent has been implemented and employed in the field of cardiology (Bianchi et al., 1993a). It will be further refined to include various types of distance measuring of both images and descriptions.
The Data Space Exploration agent (DSE), which knows the data space organisation, allows users to navigate through the data and access items of interest. Different specific versions of the DSE have been implemented to provide for browsing through specific data: description schemes of images, knowledge bases for textual indexing, multimedia documents.
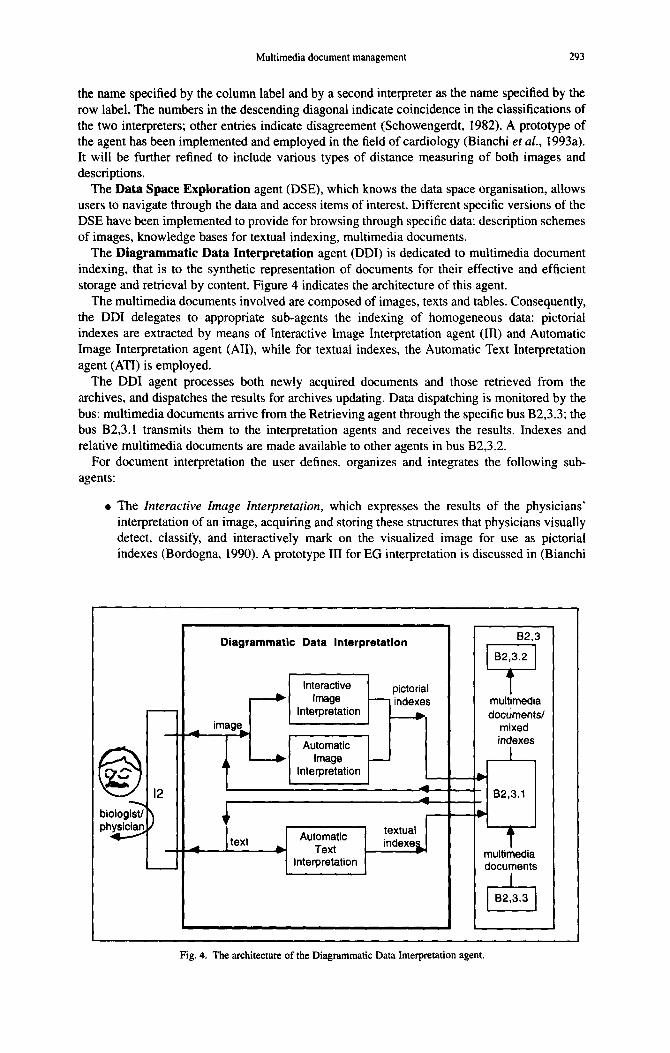
The Diagrammatic Data Interpretation agent (DDI) is dedicated to multimedia document indexing, that is to the synthetic representation of documents for their effective and efficient storage and retrieval by content. Figure 4 indicates the architecture of this agent.
The multimedia documents involved are composed of images, texts and tables. Consequently, the DDI delegates to appropriate sub-agents the indexing of homogeneous data: pictorial indexes are extracted by means of Interactive Image Interpretation agent (III) and Automatic Image Interpretation agent (AII), while for textual indexes, the Automatic Text Interpretation agent (ATI) is employed.
The DDI agent processes both newly acquired documents and those retrieved from the archives, and dispatches the results for archives updating. Data dispatching is monitored by the bus: multimedia documents arrive from the Retrieving agent through the specific bus B2,3.3; the bus B2,3.1 transmits them to the interpretation agents and receives the results. Indexes and relative multimedia documents are made available to other agents in bus B2,3.2.
For document interpretation the user defines, organizes and integrates the following sub- agents:
• The Interactive Image Interpretation, which expresses the results of the physicians' interpretation of an image, acquiring and storing these structures that physicians visually detect, classify, and interactively mark on the visualized image for use as pictorial indexes (Bordogna, 1990). A prototype III for EG interpretation is discussed in (Bianchi
Diagrammatic Data Interpretation
==_ Interactive pictorial
Image indexes Interpretation
Automatic ~1 Image
Interpretation
I,o,, t"'u'°mat'c I t°*tua' indexe~l,. Text Interpretation I
B2,3
multimedia documents/
mixed indexes
multimedia documents
Fig. 4. The architecture of the Diagrammatic Data Interpretation agent.
294 Nadia Bianchi et al.
et al., 1992b). Its use has indicated two advantages: the results of interactive interpretation lead to a refinement of automatic interpretation strategies, while the storage of these results enriches the stored documents recording the physicians' judgement. In the application presented in this paper, the III has been used to annotate a radiogram, i.e. to associate a Region of Interest (ROI) in the image to a phrase of the report that describes it. To annotate an image (see Section 6) the physician outlines the ROI with the cursor, clicks on it to have the III capture the region, moves the cursor to the window with the text, highlighting the phrase to be associated, and clicks on the cursor to have the III classify the region.
• The Automatic Image Interpretation is the adaptation of an ISIID--Interactive System for Image Interpretation Definition (Cugini et al., 1986) to the class of images involved here. The AII has been applied satisfactorily in various fields, on both real (biological, remote sensed, astronomical) and artificial images (technical drawings), as discussed in (Bottoni et al., 1991, 1992; Mussio et al., 1991b). The basis for the interactive and automatic interpretation processes and for the storage of their results is a multilevel hierarchical scheme (Bordogna, 1990), which describes the attributes and relationships of the structures present in the image.
• The Automatic Text Interpretation adopts the method proposed by Farradane (Farradane et al., 1973; Farradane, 1980a, 1980b) for text indexing by content. The text indexing process has been automated (Di Nubila et al., 1994) by exploiting the Semantic Graph, a knowledge base which organizes the meta information needed to associate the correct concept (textual index) with each term in the text. A prototype ATI is being used to index mammogram reports: flanked with an III, it provides a tool to annotate radiograms with the concepts expressed in the report, logically overlapping the pictorial and textual intepretation/indexing of the same radiogram.
The multilayer image description scheme and the linguistic knowledge base are the meta information used to drive document indexing. The physician controls document indexing by interacting withthe appropriate EDL (see DDI Definition environment in Sections 5 and 6) of the BIMS functional hierarchy. Here he navigates, browses, and updates meta information for the conceptual modeling of information retrieval items (Agosti et al., 1992), producing the scheme of concepts that describe the information in which he is interested.
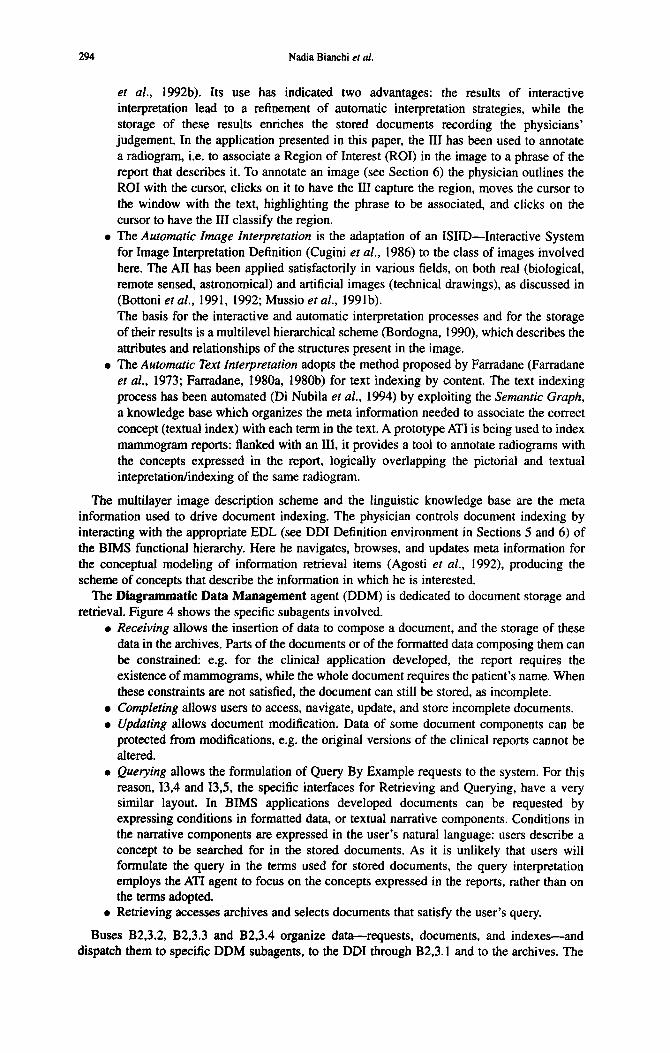
The Diagrammatic Data Management agent (DDM) is dedicated to document storage and retrieval. Figure 4 shows the specific subagents involved.
• Receiving allows the insertion of data to compose a document, and the storage of these data in the archives. Parts of the documents or of the formatted data composing them can be constrained: e.g. for the clinical application developed, the report requires the existence of mammograms, while the whole document requires the patient's name. When these constraints are not satisfied, the document can still be stored, as incomplete.
• Completing allows users to access, navigate, update, and store incomplete documents. • Updating allows document modification. Data of some document components can be
protected from modifications, e.g. the original versions of the clinical reports cannot be altered.
• Querying allows the formulation of Query By Example requests to the system. For this reason, 13,4 and I3,5, the specific interfaces for Retrieving and Querying, have a very similar layout. In BIMS applications developed documents can be requested by expressing conditions in formatted data, or textual narrative components. Conditions in the narrative components are expressed in the user's natural language: users describe a concept to be searched for in the stored documents. As it is unlikely that users will formulate the query in the terms used for stored documents, the query interpretation employs the ATI agent to focus on the concepts expressed in the reports, rather than on the terms adopted.
• Retrieving accesses archives and selects documents that satisfy the user's query.
Buses B2,3.2, B2,3.3 and B2,3.4 organize data--requests, documents, and indexes--and dispatch them to specific DDM subagents, to the DDI through B2,3.1 and to the archives. The

Multimedia document management 295
13
biologist/ ) physician
113.31
113,41
1~3,51
Diagrammatic Data Management
~ [ Receiving
Updating
Completing
B2,3
m. indexes
m. docs
m'd°cs I Retrieving ~ m 'd °CS l
query =.j "7 Querying
request
m. docs/ m. indexes
Fig. 5. Detailed architecture of the Diagrammatic Data Management agent, m.docs=multimedia documents; re.indexes-mixed indexes.
application of DDM spares physicians the time-consuming management of their paper-based archives; it also guarantees data consistency.
5. THE USER'S EXPLOITATION OF BIMS FUNCTIONS
The information unit that summarizes the patient's clinical situation is the clinical document. This is composed of parts of three different types: a Clinical Form which stores formatted personal data and the case history; a set of Examination Evaluation Forms, each form recording formatted data concerning patient examination; and, associated with each Examination Evaluation Form, a set of images, mammograms, for example, or histological images, together with their reports, that is textual and possibly pictorial descriptions. These images document the clinical tests the patient has undergone during examination. At times, some significant parts of the clinical document may be missing: some information concerning the patient may be unknown or, as often happens, the report of the acquired images/tests has not yet been written up. Any support to the physician in information management must meet hospital needs, and be in line with constraints imposed by medical conventions for the definition and execution of the physician's activity strategies. Such constraints, which include protocols for the compilation of clinical documents, influence not only the kind of operation the BIMS allows on specific document components, but also what environments can be accessed at a given time.
A BIMS environment inter-connection network is illustrated in Fig. 6: the nodes correspond to the environments, the direction of the arrows represents the way to access these environments, the dotted arrows indicate reentrance from an accessed environment after the conclusion of a specific activity. For example, the Retrieving environment can be entered from the DSE only if requested by the Retrieving environment. Any BIMS activity starts in the Presenting environment, allowing access to Receiving, Querying, and Completing. The Receiving environment is entered to add a new clinical document to the archives. In the first patient interview, the physician fills out a new clinical form with the typical personal data (name, family name, date of birth, and Social Security Number). This causes an implicit (not formulated by the

296 Nadia Bianchi et al.
reentrance to the calling environment
free a c c e s s
Fig. 6. Reachability among the environments of BIMS.
user) request to verify that the patient is actually being seen for the first time. As no report of diagnosis can be formulated yet, the new document is stored as incomplete until the patient has been examined.
When the physician requires clinical documents, he enters the Querying environment, formulating constraints by QBE (Query By Example) techniques (see Elmasri & Navathe, 1989) on both the formatted data and the reports the desired documents must satisfy. The retrieved clinical documents are visualized in the Retrieving environment, where the user browses through them, choosing and specifying the instances and components of interest. Here he can leaf through the reported images of a particular examination through the evaluation forms for a particular patient, or through the different forms of personal data (going from patient to patient). The hierarchical model of the document also allows the physician to navigate through the retrieved documents by directly accessing any component instance with no constraint. To do this the Data Space Exploration must be entered. The documents are completed in the Completing environment; accessing it fires an implicit request to retrieve all incomplete documents present in the archives: at this point any missing information can be inserted. Radiological reporting is a particular completion activity which is performed in the Diagrammatic Data Interpretation (DDI) environment. The DDI was realized to integrate clinical documents and image data, interactively report them (see Section 4.2), and complete the Examination Evaluation Form by formulating a diagnosis. The interpretation activity is driven by the definition of new indexes. This requires access to the DDI Definition environment to update the Semantic Graph with the introduction of new terms, their meaning, and their semantic role, to modify the pictorial description scheme and establish an image interpretation strategy. Furthermore, in the Result Comparison environment the physician and biologist can evaluate the reliability of the strategies used to perform automatic or interactive pictorial interpretation. The RC activity is planned and refined in the RC Definition environment by establishing which description parts to compare (Section 4.2) (Bianchi et al., 1992a, 1993a).
When defining new indexes, or comparing those already produced, or interactively

Multimedia document management 297
interpreting an image, the physician finds support for the task in the tools offered by the Image Exploration (Bianchi et al., 1993b) environment; these allow him to extract and measure the geometrical, topological, morphometrical, and color properties of the image.
Finally, the UIDE environment is supplied so that the physician can adapt BIMS to his particular needs. The authorized physician can access the UIDE from any other environment during the execution of an activity to modify the inter-connection network, and add a new environment, or cancel an existing one, or modify the organization and presentation of an environment and its relationships with the other environments.
6. THE USER'S INTERACTION WITH THE ENVIRONMENTS
All the resources, both information and computational agents, employed by BIMS users are organized and described by hypermedia documents. Exploitation and navigation among the resources--in agreement with the user activity strategies--is performed through a set of computerized logbooks (c-logbooks) (Mussio et al., 1992b, Bianchi et al., 1992a) which describe the activities. These logbooks are similar to the traditional records of activities and data kept by physicians. In a traditional environment tools related to the same task are grouped in a laboratory. Similarly, c-logbooks referring to the same activity are grouped in a c-laboratory. Each c-logbook is organized as a sequence of c-pages displayed on the screen one at a time inside a c-cover. A c-cover is characterized by a title area that communicates the environment in which the users are working, a command area containing icons for operating in the system environments, and a working area. The working area contains a set of superimposed c-pages that can be leafed through. A c-page offers interaction to access the data and operations needed to perform a homogeneous sub-task and visualize the results. Every c-page is organized in a set of non-overlapping windows, with each window presenting a perspective on the available resources. A window is a collection of non-overlapping functional areas which simulate the areas of the traditional paper logbook where users write notes and draw or paste figures, graphs and data obtained with their instruments. Each window is equipped with a title area and, where called for, a set of gadgets and tools.
A brief sampling of c-logbooks and documents illustrates the visual homogeneity and possibilities offered the user in performing activity strategies (the clinical documents shown in the figures have been left in the original Italian version to reflect the real case concerned).
We start from the Querying environment (Fig. 7). Its c-cover bears the environment title, Querying Execution Logbook, the ordinal of the active c-page, and the command area with the icons [ ] and ~ for leafing through these, ~ and ~ to access the c-logbooks in the upper levels of the functional hierarchy, ~ to print the c-page, ~ to access BIMS online help and ~ to exit BIMS. Shadowed icons are inhibited.
In this example the c-cover encloses the first c-page, which is composed of three windows: Patient's Personal Data, Clinical Form, Activities. Physicians interact with the first two windows to express their queries. The other components of the clinical document are reached by clicking on the command icons [ ] and [ ] , while a new query can be formulated by clicking on [ ] to clear the current form. The third window contains the icon commands to access the environments of ~ , ~ or
When physicians access the Completing environment (Fig. 8), the incomplete documents are submitted to them for browsing and compilation. The Querying and Completing c-pages have different command and activity icons. In fact, [ ] and [ ] allow leafing through the instances of the same document component (an operation useless in Querying). The Activities window is also different, as it offers the possibility of reaching other environments in agreement with the network shown in Fig. 6.
When a clinical document is incomplete, having been stored before some of the mammograms were reported, the physician browses through it looking for the mammograms to be reported on, and accesses the Diagrammatic Data Interpretation environment [Fig. 9(a)] by clicking on ~ ~ : ~ - ~ ] . Here he interacts with the Examination Evaluation Form window to insert indications regarding the patient's symptoms, tests performed to date,

298 Nadia Bianchi et al.
',~lit'lJt',, IJtfr~Oll~l l)nt,
: ° 'n° ' ° : I ~ '~ I " ° ' ' : I . . ' - - I Nata: ] ]Luogodinascita:[ ] Prov.: ~ -~
• . , ° d , . . , °nz . . I I ~o..: 1---1
,o,,.zo" I I ~'-(.~.i" I I t inical Forn
o.,. co.p,,.~,ooo: I I so,°d°: I I
R.°~o: I I ~,c~,o° d,,o.~o: I I
,,°.co ~..... I I o°. ~.°o... ooo,.o,o. I i
........... ll:i:i!:,;!i!i] ~:!;::~.il[~i~!"i.][~l ~ ~'~~ Fig. 7. Page 1 of the Querying Execution Logbook.
Cognome: I ]R~si I
Nata: 112/04/1~34 J Luogo di nascita: I MIImB
Luogo di residenza: ( Mllam
Indidzzo: I via P, JsezTbmme
"°m": I " - - I
Prov.:
Fig. 8. Completing a document.

Multimedia document management 299
Cognome: I Rossi I N°me: I Az°m
(~.SITO: l=-negativo; 2--positivo; 3=dubbio LATO: D='des~o; S=sinistro; B-b~latexale CITOLOGICO: ~=secreto mature. CE.NTP~TU[~: M=tnanuno~rafica, C=cl~ca; E=eco@~ca RADIOLOGICO: M=m~c~o c alcific eaio~; C=c alcific ~oni; O=maeuao g~afia ~adiop ac a )
CLIH. RADIO F_~OG. CITOL. ISTO I)CISTI : .... .I_ ......................................................
2)FIBROADENOMA . . . . . l . . . . . . . . . . . . . . . . . . . . . . . . . . . . . . . . . . . . . . . . . . . . . . . . . . . . . . 3)DISPLASIA BF.~,IIGIqA : .... ..3. . . . . . . . ._2._S__.C . . . . . . . . . . . . . . . . . . . . . . . . . . . . . . . . . . . . . .
Involumone ~bro-ad~osa del p~encl'=ma mamme~rio nel cm contesto bileterdmetxLe si apptez_ ZAt3.O ~lJ.tIAe~r O B e E I1NI4W~lVOb 'Zz~ ~ O l ~ l ~ W l l ~ a
A dest~a al cl~ad~ante supe£o estemo si ossefva ~zza fonu~one nodulare d~ c~ca l cm. di ~a metro a m=~mi ~ett~. Non muaa~;Lm sospette m senso eteri-formahvo, si fitiene cotaungue utile un ulteriore cont~ollo
'~ciivitie s
:.~a~:,~.~i:.-,~ ~ i ~
rd2 10mb r d 3 1 0 m b
rd4 10mb
Mlmml J l . . . . !
Fig. 9. (a) The physician interacts to formulate his report and index it. (b) One of the four windows where the physician can visually analyze and annotate radiograms.

300 Nadia Bianchi et al.
and, finally, a diagnosis. Four Radiogram windows [Fig. 9(b) shows one of them] display the images that the physician inspects visually before writing his comments in the Report window. Clicking on the ~ icon automatically indexs the report, highlighting the terms associated with a concept, one at a time. The images must now be annotated: the physician must manually mark the regions of interest and assign them the corresponding terms highlighted in the report.The icons [ ] [ ] [ ] [ ] allow the selection of one of the four screens available for visualizing the mammograms, to which the cursor is then switched. Each Radiogram window has four icons: ~ 1 to send the cursor back to the Report window;
to outline the ROI with a dark contour line indicating that it has been definitely classified; to outline the ROI with a light contour line indicating that its classification is doubtful; to undo a classification;
D to undo the last action. To annotate the image the physician outlines the regions of interest, clicks on the regions to
be associated with the same concept, sends the cursor back to the Report window, highlights the phrase describing the regions, and clicks on it.
At the end of the report, indexing terms that are unknown to the ATI agent (see Section 4.2) are underlined. This means that users must access the functional upper level where interaction with the DDI Definition Logbook (Fig. 10) is supplied to navigate through the Semantic Graph (Di Nubila et al., 1994) and update the meta information that defines the semantics of the medical language. The first c-page is composed of six windows: Summary, Item Type, Item List, Semantic Graph, Relationships and Operators.
Supposing the term mammario (mammary) has been highlighted as 'unknown' during indexing, the Summary window reports the progressive term classification. The physician chooses Synonym in the Item Type window, to classify the term. Consequently, the Item List window shows the set of synonym terms already defined. None of these satisfy the physician,
tern fyp~
iiiiiiiiiiiiiiiiiiiiiiiiiiiiiiiiill ~' 5~lo=t3mu 3 (Ta
a]cmd atlmtp.ta alone a]terazioue
I,,==,." I
)p=i~,atO~,.
)nO.
F Iml
P dubbio ne~liol le !l
IN m i = l B l J l Fig. 10. The physician interacts to update the meta information (Semantic Graph) that drives report
indexing.

Multimedia document management 301
who therefore selects Semantic Set, and the semantic sets in the present configuration of the Semantic Graph is shown in the Item List. Mammella (breast) appears in the list. He selects this, the classification of mammario in the Summary window is updated, and a visual representation of the Semantic Graph extension is visualized in the homonymous window. To add mammella to the Semantic Graph, the user continues to interact and defines its links with the other nodes by selecting the appropriate Farradane's relationship in the Relationships window, perhaps selecting a modifier from the Operators window that marks the relationship as suspicious, doubtful or non existent, and, finally, selecting the target node in the Item List. The result of each selection is shown in the Semantic Graph window.
Similar operations are performed to define a synonym class for mammario. Once the physician has concluded his DDI definition activity, he reenters the DDI
( ~ ) , annotates the image with the new terms, and saves the clinical document , now complete with the mammogram report and annotations. The physician can also leaf
through the completed reports by clicking on [ ] and [ ] : each time the windows of the DDI c-page are filled with the data of the new report. The mammograms appear with their annotation, and the physician can explore the different forms of the concepts (indexes) extracted during the last reporting activity: a click on the marked regions of interest will highlight the linguistic form used in the report and, vice versa, a click on a phrase will indicate the associated regions.
If during the execution of a task the physician is not completely satisfied with the interface organization or the environment connections, he clicks on the icon ~ and enters UIDE. Figure 11 shows an example of the first page of the UIDE logbook, beating the reduced version of a c-page, which can be defined or modified through direct manipulation. Interaction with this first page allows for example:
• object creation and deletion: clicking the icons [ ] , [ ] add respectively a new c- logbook, a new c-page while [ ] deletes each of them;
• object characterization: ~ provides for: setting the title of a c-logbook, a c-page, or
m II!
Fig. 11. The physician defines a new logbook.

302 Nadia Bianchi et al.
a window, defining icons and gadgets, their localization on the screen (position and dimensions), defining the type of data a window can visualize or acquire, and the activity that processes these data. A c-logbook has access to other c-logbooks through the Activities window which can be edited to add or delete the icon corresponding to the target. data connection." [ ] provides for the connection of hierarchically ordered objects: a c- page with a c-logbook, a window with a c-page; [ ] allows the definition of relationships between windows so that they share data or actions.
7. CONCLUSIONS
In this paper we have described the prototype of the anthropocentric system BIMS, conceived for the management of biomedical information. The objective of the prototype is to supply a set of tools, structured as a network of computational agents, that users can organize and employ, according to their own communication and documentation habits, to perform a complex task, and refine to their own needs as the working situation evolves. This possibility is provided by the UIDE encapsulated in the BIMS interface that allows even users who are not computer scientists to design their computerized working environment and define the interaction language, as well as the logical organization of data and activities. Users interact with the system at different functional levels, according to skills and responsibilities exercised in their working community. An example of interaction in BIMS illustrates the management of clinical documents in mammography.
To provide the functional organization of BIMS with the necessary plasticity, BIMS incorporates a structural organization (Bianchi et al., 1993a) of a three layer network of objects. Each layer is, in turn, a network of active objects that exchange messages. At the bottom layer, the executive objects perform computational activities, e.g. image processing, archive access, data storing and updating. At the middle layer, a network of observer objects receives, organizes, and dispatches data to the various agents. Each observer coordinates the activity of one or more executive objects. In the top layer the vision objects reflect the organization of the computerized page layout and manages user interaction. Therefore, each vision object arranges the results of one observer's activity, so that these results appear to the user; conversely each vision object can acquire, from the user, data to be submitted to the observer. Furthermore, different types of links have been defined to manage data communication, links, and coordination among the objects. Interlayer links connect an observer to the corresponding vision and execution object. The composition links connect the computerized pages to their environment, the windows to the relative c-page, and the functional areas to the window. An object uses an action link to send messages to a set of objects. For data exchange, data links enable an object to send a message to a destination object.
The adoption of the Object-Oriented approach has facilitated the inclusion of computational agents already developed in specific fields. Software could be reused by building both executive objects which encapsulate it and the corresponding observer objects. Software reuse was helpful for the prototyping, as it made it easier to extend the BIMS configuration which runs today under the Windows operating system.
REFERENCES
Accomazzi, A., Bordogna, G., Mussio, P., & Rampini, A. (1989). An approach to heuristic exploitation of astronomers' knowledge in automatic interpretation of optical pictures. In E Murtagh (Ed.), Knowledge based systems in astronomy (pp. 191-212). Berlin: Springer.
Agosti, M. (1993). Hypertext and information Retrieval. Information Processing & Management, 29(3), 283-285. Agosti, M., Gradenigo. G., & Marchetti, E G, 0992). A hypertext environment for interacting with large textual
databases. Information Processing & Management, 28(3), 371-387. Arbib, M. A., and Manes, E. G. (1975). Arrows, structures and functors -- The categorical imperative. London:
Academic Press.
Multimedia document management 303
AT&S (1990). Anthropocentric Technology & Systems Newsletter. Commission of the European Communities, DGXII, Science Research & Development-FAST Unit, l
Belkin, N. J., & Marchetti, P. G. (1990). Determining the functionality and features of an intelligent interface to an information retrieval system. In J. L. Vidick (Ed.), Proceedings of the 13th International Conference on Research and Development in Information Retrieval (pp. 151-177). Brussels: Presses Universitaires de Bruxelles.
Belkin, N. J., Marchetti, P. G., & Cool, C. (1993). BRAQUE: Design of an interface to support user interaction in information retrieval. Information Processing & Management, 29(3), 325-344.
Belkin, N. J., Chang, S., Bowns, T., Saracevic, T., & Zhao, S. (1990). Taking account of user tasks, goals and behavior for the design of online public access catalogs. In D. Henderson (Ed.), Proceedings of the 53rd Annual Meeting of the American Society for Information Science (pp. 69-79). Medford, N. J.: Learned Information Inc.
Bianchi, N., Bottoni, P., & Mussio, P. (1992a). Visual interfaces design based on user's models. In T. Catarci, E Costabile, & S. Levialdi (Eds), Advanced visual interfaces (pp. 273-286). Singapore: World Publishing Press.
Bianchi, N., Mussio, P., & Rubbia Rinaldi, G. (1994). Topographic image segmentation as detection of emergent properties. In Proceedings of the European Workshop on Artificial Emergence, Munich, Germany.
Bianchi. N., Bottoni, P., & Mussio, E (1993a). Cooperative visual environments for the design of effective visual systems. Journal of Visual Languages and Computing, 4(4), 357-381.
Bianchi, N., Bottoni, P., Mussio, P., & Tosoni, L. (1993b). Design of a GIS interface based on the user's perception of computational capabilities of the system. In J. Harts, H. E L. Ottens, & H. J. Scholten (Eds), Proceedings of EGIS'93 (Vol. I, pp. 274-283). Utrecht: EGIS Foundation.
Bianchi, N., Bottoni, P., Protti, M., & Mussio, P. (1992b). Plastic visual tools. Proceedings 1992 IEEE Symposium on Visual Languages (pp. 252-254). IEEE Computer Society Press.
Bordogna, G., Carrara, P., Gagliardi, I., Merelli, D., Mussio, P., Naldi, E, & Padula, M. (1990). Pictorial indexing for an integrated pictorial and textual IR environment. Journal oflnformation Science, 16, 165-173.
Bottoni, P., Mussio, P., & Pro ti, M. (1990a). Definition of image interpretation strategies in APL. APL Quote Quad, 20(4), 50-60.
Bottoni, P., Cigada, M., DeGiuli, A., Di Cristofaro, B., & Mussio, E (1990b). Towards a user usable system for ECG description. In R. O'Moore, S. Bengtsson, J. S. Bryant & J. S. Bryden (Eds), Medical Informatics Europe '90 (pp.- 334-337). Berlin: Springer.
Bottoni, P., Mussio, P., & Protti, M. (1991). An APL rule-based system architecture for image interpretation strategies. APL Quote Quad, 21(4), 51-61.
Bottoni, P., Mussio, P., & Protti, M. 0992). Meta reasoning as a tool for pattern recognition. Proceedings ofl l th IAPR Conference on Pattern Recognition (pp. 285-289). IEEE Computer Society Press.
Carmel, E., Withaker, R. D., & George, .I. E (1993). PD and joint application design: A transatlantic comparison. Communications of the ACM, 36(4), 40-48.
Cardelli, L., & Wegner, P. (1985). On understanding types, data abstraction, and polymorphism. ACM Computing Surveys, 17(4), 471-522.
Clement, A. P., & Van den Besselaar, P. (1993). A retrospective look at PD projects. Communications oftheACM, 36(4), 29-37.
Cugini, U., Mauri, P., Mussio, P., & Protti, M. (1986). A procedure for knowledge elicitation in image interpretation experiments. In V. Cantoni, S. Levialdi, & G. Musso (Eds), Image analysis and Processing (pp. 177-186). Oxford: Plenum Press.
Dioguardi, N. (1984). II Fegato ua Sistema Aperto. Milano: Masson Italia. Di Nubila, B., Gagliardi, L, Macchi, D., Milanesi, L., Padula, M., & Pagani R. (1994). Concept-based indexing and
retrieval of multimedia documents. Journal of Information Science, 20(3), 203-214. Ellis, D. (1989). A behavioural approach to information retrieval system design. Journal of Documentation, 45(3),
171-212. Elmasri, R., & Navathe, S. B. (1989). Fundamentals of database systems. Redwood City, Ca: Benjamin/Cummings. Farradane, J. (1980a). Relational indexing: part I. Journal of Information Science, 1, 267-276. Farradane, J. (1980b). Relational indexing: part II. Journal of Information Science, I, 313-324. Farradane, J., Russell, J. M., & Yates-Mercer, P. A. (1973). Problem in information retrieval: Logical jumps in the
expression of information. Information Storage and Retrieval, 9, 65-77. Golin, E. J., & Reiss, S. P. (1990). The specification of visual language syntax. Journal of Visual Languages and
Computing, 1(1), 141-157. Green, M. (1986). A survey of three dialogue models. ACM Transaction on Graphics, 5(3), 244-275. Hancock-Beaulieu M. (1990). Evaluating the impact of an online library catalogue in subject searching behavior at the
catalogue and at the shelves. Journal of Documentation, 46(4), 318-338. Kuhlthau, C. (1991). Inside the search process: Information seeking from the user's perspective. Journal of the
American Socie~ for Information Science, 42(5), 361-371. Lcvialdi, S., Mussio, P., Protti, M., & Tosoni, L. (1993). Reflections on icons. In Proceedings 1993 IEEE Symposium
on l~sual Languages (pp. 249-259). IEEE Computer Society Press. Marriott, H. J. L. (1977). Practical electrocardiography. Baltimore, Md: Williams & Wilkins. Mussio, P., Pietrogrande, M., & Protti, M. (1991a). Simulation of hepatological models: A study in visual interactive
exploration of scientific problems. Journal of Visual Languages and Computing, 2(1), 75-95. Mussio, P., Pawlina Bonati, A., & Rubbia Rinaldi, G. (1992a). Handling of data objects in the interpretation of 3D radar
images. In V. Cantoni. M. Ferretti, S. Levialdi, R. Negrini, & R. Stefanelli (Eds), Progress in image analysis and Processing H (pp. 687--691). Singapore: World Scientific.
Mussio, P., Finadri, M., Gantini, P. & Colombo, E (1992b). A bootstrap approach to visual user interface design and development. The Visual Computer, 8(2), 75-93.
Mussio, P., Pietrogrande, M., Bottoni, P., DelrOca, M., Arosio, E., Sartirana, E., Finanzon, M. R., & Dioguardi, N. (1991b). Automatic cell count in digital images of liver tissue sections. In Proceedings of4th IEEE Symposium on Computer-Based Medical Systems (pp. 153-160). IEEE Computer Society Press.
Rubbia Rinaldi, G., Bianchi, N., Marveggio, G., Morabito, A., Mussio, P., & Di Lernia, R. (1995). Topographic modeling of n. 1 G-banded chromosome. Journal of Biological Systems 3(1), 23-29.

304 Nadia Bianchi et al.
Salton G., & McGill, M. J. (1983). Introduction to modern information retrieval. Cheshire, Conn.: McGraw-Hill. Schowengerdt, R. A. (1982). Techniques for image processing and classification in remote sensing. New York:
Academic Press. Singh, G., & Green, M. (1991). Automating the lexical and syntactic design of graphical user interfaces: the UofA*
UIMS. ACM Transactions on Graphics, 10(3), 213-254. Tufte, E. R. (1983). The visual display of quantitative information. Cheshire, Conn.: Graphics Press. Van Rijsbergen, C. J. (1979). Information retrievals. London: Butterworths.
Copyright © 2022 FDOKUMEN