Multidimensional scaling of northwest coast faunal assemblages: A case study from southern haida...
25
Research Reports Multidimensional Scaling of Northwest Coast Faunal Assemblages: A Case Study from Southern Haida Gwaii, British Columbia Trevor J. Orchard † and Terence Clark †‡ Abstract. Multidimensional scaling (MDS) has been previously applied successfully to the analysis of artifact assemblages from archaeological contexts. Despite the suitability of archaeological faunal data to such analysis, MDS has not been applied to faunal data. In this study, MDS analysis was applied to 21 faunal assemblages from 14 Graham Tradition sites in the Kunghit region of southern Haida Gwaii. A separation of salmon-dominated and rockfish-dominated assemblages provided the strongest result of this analysis, strengthening previous interpretations made for these data. Additionally, MDS analysis revealed functional and regional variability that had not been pre- viously identified. Functionality was reflected in the separation of differing site types, while regional distribution of resources was also highlighted by the analysis. These results con- tribute to an understanding of Kunghit Haida subsistence and settlement while demonstra- ting the utility of MDS for faunal analysis. Résumé. Dans le passé, le « multidimensio- nal scaling » (MDS) a été utilisé avec succès pour analyser des ensembles d’artefacts dans nombreux contextes archéologiques. Malgré l’apparente pertinence d’une telle analyse pour les données fauniques, le MDS n’a pas été appliqué aux études fauniques. Dans cette étude, nous avons utilisé le MDS pour analy- ser 21 collections fauniques provenant de 14 sites de la tradition Graham, dans la région de Kunghit dans le sud de Haida Gwaii. La séparation entre les ensembles dominés par le saumon et ceux dominés par le sébaste est le résultat le plus pertinent de notre étude, appuyant ainsi les interprétations antérieures de ces données. De plus, l’analyse MDS a révélé pour la première fois une variabilité fonctionnelle et régionale. La variabilité fonctionnelle s’est reflétée par la reconnais- sance de différents types de sites, tandis que l’analyse a permis la mise en évidence de la distribution des ressources dans la région. Ces résultats contribuent à la compréhension des schèmes d’établissement et de subsistance des Kunghit Haida, tout en démontrant l’utilité du MDS pour les analyses fauniques. M ultidimensional scaling (MDS) has been applied within archaeol- ogy for the analysis of artifactual assem- blages, producing results that are useful for aiding interpretation of temporal and regional patterns of archaeological vari- ability (Clark 2000; Matson 1974; Matson and True 1974; Matson et al. 1980). In this paper we discuss the application of MDS to the analysis and interpretation of archaeological faunal assemblages. A sample of 21 faunal components from 13 sites in the Kunghit Island region of southern Haida Gwaii (Queen Char- lotte Islands), British Columbia, was analyzed using MDS. The results of this analysis revealed a number of factors that structured faunal assemblages from the region. Specifically, aspects of tem- † Department of Anthropology, University of Toronto 100 St. George Street, Toronto, ON, M5S 3G3 [[email protected]] ‡ [[email protected]] Canadian Journal of Archaeology/Journal Canadien d’Archéologie 29: 88–112(2005)
Transcript of Multidimensional scaling of northwest coast faunal assemblages: A case study from southern haida...

Re
sea
rc
h R
ep
or
ts
Multidimensional Scaling of Northwest Coast Faunal Assemblages: A Case Study from Southern Haida Gwaii, British Columbia
Trevor J. Orchard† and Terence Clark†‡
Abstract. Multidimensional scaling (MDS) has been previously applied successfully to the analysis of artifact assemblages from archaeological contexts. Despite the suitability of archaeological faunal data to such analysis, MDS has not been applied to faunal data. In this study, MDS analysis was applied to 21 faunal assemblages from 14 Graham Tradition sites in the Kunghit region of southern Haida Gwaii. A separation of salmon-dominated and rockfish-dominated assemblages provided the strongest result of this analysis, strengthening previous interpretations made for these data. Additionally, MDS analysis revealed functional and regional variability that had not been pre-viously identified. Functionality was reflected in the separation of differing site types, while regional distribution of resources was also highlighted by the analysis. These results con-tribute to an understanding of Kunghit Haida subsistence and settlement while demonstra-ting the utility of MDS for faunal analysis.
Résumé. Dans le passé, le « multidimensio-nal scaling » (MDS) a été utilisé avec succès pour analyser des ensembles d’artefacts dans nombreux contextes archéologiques. Malgré l’apparente pertinence d’une telle analyse pour les données fauniques, le MDS n’a pas été appliqué aux études fauniques. Dans cette étude, nous avons utilisé le MDS pour analy-ser 21 collections fauniques provenant de 14 sites de la tradition Graham, dans la région de Kunghit dans le sud de Haida Gwaii. La séparation entre les ensembles dominés par le saumon et ceux dominés par le sébaste est le résultat le plus pertinent de notre étude, appuyant ainsi les interprétations antérieures
de ces données. De plus, l’analyse MDS a révélé pour la première fois une variabilité fonctionnelle et régionale. La variabilité fonctionnelle s’est reflétée par la reconnais-sance de différents types de sites, tandis que l’analyse a permis la mise en évidence de la distribution des ressources dans la région. Ces résultats contribuent à la compréhension des schèmes d’établissement et de subsistance des Kunghit Haida, tout en démontrant l’utilité du MDS pour les analyses fauniques.
Multidimensional scaling (MDS) has been applied within archaeol-
ogy for the analysis of artifactual assem-blages, producing results that are useful for aiding interpretation of temporal and regional patterns of archaeological vari-ability (Clark 2000; Matson 1974; Matson and True 1974; Matson et al. 1980). In this paper we discuss the application of MDS to the analysis and interpretation of archaeological faunal assemblages. A sample of 21 faunal components from 13 sites in the Kunghit Island region of southern Haida Gwaii (Queen Char-lotte Islands), British Columbia, was analyzed using MDS. The results of this analysis revealed a number of factors that structured faunal assemblages from the region. Specifically, aspects of tem-
† Department of Anthropology, University of Toronto 100 St. George Street, Toronto, ON, M5S 3G3 [[email protected]]
Canadian Journal of Archaeology/Journal Canadien d’Archéologie 29: 88–112(2005)

Journal Canadien d’Archéologie 29 (2005)
MULTIDIMENSIONAL SCALING OF NW COAST FAUNAL ASSEMBLAGES • 89
porality, site function, and site location corresponded to variations in the rela-tive frequencies of different faunal taxa. Overall, the success of this application demonstrates the utility of MDS analy-sis as an interpretive tool for studies of archaeological faunal assemblages.
Multidimensional scaling refers to a series of statistical procedures that compress complex data sets into what is essentially a map of variation (Hodson et al. 1966; Kruskal and Wish 1978). A number of related multivariate statistics fall under the rubric of MDS. These include principle components analysis (PCA), factor analysis (FA), and correspondence analysis (CA), which, along with MDS proper, are in widespread use in the sciences (Baxter 2003; James and McCulloch 1990). All of these related scaling statistics seek to describe variability spatially in a series of dimensional plots. Each of these proce-dures has strengths and limitations and is more or less appropriate depending on the nature of the data under study. MDS is particularly suited to data that have metric differences between cases and where the goal of analysis is seria-tion (Baxter 2003; James and McCulloch 1990). It has been used widely in archae-ology (Doran and Hodson 1966; Hall 1982; Hodson et al. 1996; Matson and True 1974; Usman 2003) and in the field of ecology where it is often referred to as principle coordinates analysis (Gauch 1982; James and McCulloch 1990).
Metric MDS has been used success-fully in the analysis of archaeological data. On the Northwest Coast, for example, it has been used to depict variability between artifact assemblages. Matson et al. (1980) and Clark (2000) used metric MDS to examine variability within the Marpole culture type on the southern coast of British Columbia,
and Thom (1992) looked at the Gulf of Georgia culture type using metric MDS. Results of these studies found important correlations within the data that linked some site components while excluding others. These patterns were interpreted as representing chronological, spatial, and/or functional differences amongst the site components.
Archaeological faunal assemblages are in many ways analogous to the arti-fact assemblages that have previously been analyzed using metric MDS. Faunal assemblages consist of abundant items that can be quantified with statistical confidence, and the sorting of fauna by taxonomic categories is similar to typological classifications of artifacts. Furthermore, differing cultural activities and adaptations produce correspond-ingly different faunal assemblages. As such, faunal assemblages would seem to provide ideal data for the application of MDS analysis. Despite the very useful and interesting results obtained through previous archaeological applications of MDS, and the suitability of archaeologi-cal faunal assemblages for such analysis, to our knowledge no study has applied MDS to faunal data. In a recent study, Betts and Friesen (2004) employed correspondence analysis, a related tech-nique, in the interpretation of faunal data from arctic Canada. Though cor-respondence analysis proved useful in Betts and Friesen’s (2004) analysis, MDS is more suited to the nature of our cur-rent study and also provides continuity with previous analyses of Northwest Coast archaeological material. In part, the lack of previous faunal applications of MDS may reflect the general lack of attention that has traditionally been paid to faunal remains in comparison to other classes of archaeological data. Though faunal analysis has become a
Canadian Journal of Archaeology 29 (2005)
90 • ORCHARD AND CLARK
standard component of Northwest Coast archaeological research, only rarely have faunal analyses been more detailed than the calculation and discussion of relative frequencies of different taxa. Regard-less, the increasing quality and quantity of faunal analyses in recent decades has provided considerable faunal data that are highly suited to statistical analyses such as metric MDS.
The project we describe here is aimed at testing the viability and util-ity of applying MDS to archaeological faunal data, as well as providing addi-tional insight into previously analyzed faunal assemblages. It is expected, as with the previous applications of MDS to artifact assemblages summarized above, that MDS of faunal assemblages will produce a number of dimensions of variability that correspond to culturally-derived or culture-influencing factors. Specifically, we anticipate that time, site location, seasonality, site type, and site function may all comprise dimensions that significantly influence the variability in faunal assemblages.
MATERIALS AND METHODSFor the purposes of this study, we wanted to test the viability of a faunal applica-tion of MDS with a pre-existing, well-analyzed, regional faunal sample. Such a sample was produced as part of the Kunghit Haida Culture History Project (Acheson 1998; Acheson et al. 1986; Wigen 1990). Faunal assemblages from 18 archaeological sites in the Kunghit region of southern Haida Gwaii were analyzed by Wigen (1990), and provide an appropriate faunal sample from a well-defined region in southern Haida Gwaii.
All of the sites studied by Acheson (1998) and Wigen (1990) come from a relatively small region at the southern
tip of Haida Gwaii in the general vicin-ity of Kunghit Island (Figure 1). Based on radiocarbon dates (Table 1) and on the reconstructed sea-level history for the region (Fedje 1993), all of the sites analyzed in this study roughly date to within the past 2,000 years. This places all of these sites within the Graham Tradition as defined by Fladmark (1989; Fladmark et al. 1990), or, more specifi-cally, within the late Graham Tradition as recently revised by Mackie and Acheson (in press). In contrast to the preceding Moresby Tradition, which is character-ized by a predominance of unifacially flaked stone tools and microblades (Fladmark 1989; Fladmark et al. 1990), Graham Tradition sites are character-ized by the presence of shell middens, increased pecked and ground stone, increased ground bone and antler, the absence of microblades, and a decrease in the prevalence of flaked stone (Flad-mark 1989; Fladmark et al. 1990; Mackie and Acheson in press). All of the sites excavated by Acheson (1998) fit well within these general characteristics, given their association with shell midden material and artifact assemblages domi-nated by ground bone (Acheson 1998; Mackie and Acheson in press).
Although all of the excavated sites reported by Acheson are relatively cultur-ally homogeneous, and are temporally and geographically constrained, they represent a variety of site types. Acheson (1998) classified these sites into four cat-egories: (1) large shell middens; (2) small shell middens; (3) rock shelters; (4) and caves. Shell middens were separated into the two categories on the basis on an arbitrary size division of 1,000 m2, though this fit well with a natural bimodality in the site sizes. The larger midden category, termed group 1 by Acheson, represents settlements or villages that are generally

Journal Canadien d’Archéologie 29 (2005)
MULTIDIMENSIONAL SCALING OF NW COAST FAUNAL ASSEMBLAGES • 91
associated with features indicating the previous presence of houses (Acheson 1998: 33). The smaller midden category, group 2, contains smaller encampments or villages that have been subject to consid-
erable erosion (Acheson 1998: 33). Caves and rock shelters are generally associated with small midden deposits and likely functioned as temporary camps or small habitations (Acheson 1998: 33–34).
Figure 1. Map of southern Haida Gwaii showing the location of sites.

Canadian Journal of Archaeology 29 (2005)
92 • ORCHARD AND CLARK
Table 1. List of sites and components included in the analysis (compiled from Acheson 1998 and Wigen 1990). Radiocarbon dates have been corrected for δ13C (Acheson 1998).
Code Borden Comp. Dates (14C yrs BP) Site TypeSize (m2)
Total NISP
R3A FaTr–3 Comp.1 1265±100 (BGS1328); 1470±70 (BGS1355)
Group 1 Midden
2,700 12,637
R3B FaTr–3 Comp.2 contact; 490±130 (BGS1327) Group 1 Midden
2,700 10,389
S1 FaTs–1 n/a 1190±90 (BGS1324); 1210±90 (WAT1622; basal date)
Cave 72 327
S3 FaTs–3 n/a 745±70 (BGS1352) Group 1 Midden
2,625 2,574
S20A FaTs–20 Comp.1 905±130 (BGS1332); 2040±270 (BGS1333; basal date)
Group 2 Midden
612 286
S20B FaTs–20 Comp.2 Group 2 Midden
612 612
S27 FaTs–27 n/a late contact; 50±60 (WAT1711) Cave 500 162S31 FaTs–31 n/a 895±70 (BGS1334) Group 2
Midden264 223
S35 FaTs–35 n/a Group 2 Midden
200 508
T9 FaTt–9 n/a 300±75 (WAT1625); 410±100 (BGS1320); 570±70 (WAT1624); 590±70 (BGS1326); 670±65 (WAT1699); 680±70 (BGS1325); 765±80 (BGS1321); 770±65 (WAT1626); 935±120 (BGS1322); 980±65 (WAT1637)
Group 1 Midden
2,505 42,663
T16A FaTt–16 Comp.1 1170±70 (BGS1353); 1431±70 (BGS1354; basal date)
Group 1 Midden
4,800 574
T16B FaTt–16 Comp.2 850±180 (BGS1335) Group 1 Midden
4,800 341
T16C FaTt–16 EU1 Group 1 Midden
4,800 686
T22a FaTt–22a n/a 1140±80 (WAT1621; basal date) Group 1 Midden
900 1,827
T22b FaTt–22b n/a 1420±80 (WAT1640B; basal date) Rock Shelter 20 2,284T23A FaTt–23 Comp.1 1000±100 (BGS1338) Group 2
Midden675 2,860
T23B FaTt–23 Comp.2 Group 2 Midden
675 1,131
T28A FaTt–28 Comp.1 840±80 (WAT1644); 995±110 (BGS1318); 1120±70 (WAT1612); 1180±70 (WAT1933); 1400±90 (WAT1631)
Group 1 Midden
4,500 2,735
T28B FaTt–28 Comp.2 300±65 (WAT1690); 590±70 (WAT1652)
Group 1 Midden
4,500 6,531
T28C FaTt–28 EU2 1040±70 (WAT1645; basal date) Group 1 Midden
4,500 1,631
S4 FbTs–4 n/a contact; 1375±400 (BGS1296) Group 1 Midden
10,600 4,667

Journal Canadien d’Archéologie 29 (2005)
MULTIDIMENSIONAL SCALING OF NW COAST FAUNAL ASSEMBLAGES • 93
Of Acheson’s (1998) original sample of 18 sites, 13 sites (representing 21 discrete components or faunal assem-blages) contained adequate sample sizes for the purposes of the current project. Specifically, components or sites with identified faunal assemblages of less than one hundred were excluded from further analysis as they were deemed unrepresentative (cf. Clark 2000). As indicated in Table 1, the analyzed com-ponents represent primarily group 1 and group 2 middens, as cave and rock shelter sites typically produced only very small faunal assemblages. Wigen’s (1990) division of the excavated sites into multiple components was retained for the current analysis. In the majority of cases, components were distinguished based on an increase in features in the upper, or more recent layers of the site
(Acheson 1998; Wigen 1990). Specifi-cally, Acheson (1998: 39–44) and Wigen (1990: 2) note a shift from earlier, undif-ferentiated refuse midden deposits to more discreet living floor features in more recent deposits. In two of the sites where two components were distin-guished, isolated excavation units could not be assigned to either component, and were thus treated separately. The final sample of sites and assemblages is summarized in Table 1, with site loca-tions illustrated in Figure 1.
To facilitate the MDS analysis of the faunal assemblages identified and sum-marized by Wigen (1990), a number of alterations were made to the original faunal data to provide a simplified and standardized set of taxonomic categories that could be applied across all of the various assemblages (Table 2). A major
Table 2. List of taxonomic categories employed in multidimensional scaling analysis.
Common Name Scientific Name Common Name Scientific Name
Fish: Mammals:Dogfish Squalus acanthias Whale/Porpoise CetaceaRatfish Hydrolagus colliei River Otter Lutra canadensisSalmon Oncorhynchus sp. Sea Otter Enhydra lutrisPacific Cod Gadus macrocephalus Northern Fur Seal Callorhinus ursinusPacific Hake Merluccius productus Northern Sea Lion Eumetopias jubatusSurfperch Embiotocidae Harbour Seal Phoca vitulinaPricklebacks Stichaeidae Birds:Wolf-eel Anarrhichthys ocellatus Loon Gavia sp.Pacific Sand Lance Ammodytes hexapterus Grebe PodicipedidaeRockfish Sebastes sp. Albatross Diomedea sp.Sablefish Anoplopoma fimbria Northern Fulmar Fulmarus glacialisGreenling Hexagrammidae Shearwater Puffinus sp.Lingcod Ophiodon elongatus Cormorant Phalacrocorax sp.Red Irish Lord Hemilepidotus
hemilepidotusGoose Duck
Anatidae Anatidae
Cabezon Scorpaenichthys marmoratus
Gull Alcid
Larus sp. Alcidae
Other Sculpin Cottidae Bald Eagle Haliaeetus leucocephalusFlatfish Pleuronectiformes Common Raven Corvus coraxPacific Halibut Hippoglossus stenolepis Songbird Passeriformes

Canadian Journal of Archaeology 29 (2005)
94 • ORCHARD AND CLARK
potential bias in the original faunal data involves the differential use of 3-mm and 6-mm-screens at the various exca-vated sites. Acheson (1998: 149) indi-cates that while at least one excavation unit at each site was screened through 3-mm-mesh, not all the samples were screened through the finer mesh. This results in an uneven representation of very small-boned taxa across the faunal assemblages presented by Wigen (1990). To avoid introducing such sampling bias into the data analyzed through MDS, herring (Clupeidae), anchovy (Engraulis mordax), and eulachon (Thaleichthys pacificus)—small taxa likely to be affected by screen size—were eliminated from consideration. Anchovy and eulachon were exceedingly rare in the assem-blages, being represented by a combined total of three isolated specimens in three separate assemblages. Herring, despite an expected under-representation, was relatively widespread in the assemblages (Table 3). Quantities of herring were highly variable, however, and only in site FaTt–9 did they make a substan-tial contribution to the overall faunal assemblage (Table 3). Not surprisingly, Wigen notes that this site was subject to better recovery techniques than the other excavated sites, and points to this as an example of the problems inherent in quantifying the remains of small fish (1990: 32).
Further simplification of the data involved the consolidation of similar categories and an attempt to reduce non-mutually exclusive categories. For example, pricklebacks were represented by two categories in Wigen’s (1990) data, namely “Pricklebacks (Xiphister sp.)” and “Pricklebacks (Stichaeidae).” These were converted to a single, inclusive category of “Prickleback (Stichaeidae).” Similarly, some broad taxonomic categories were
divided by size, such as large, medium, and small cormorants. In such cases, the data were compressed into generic or familial categories such as “Cormorant (Phalacrocorax sp.).”
A number of additional taxonomic categories were removed from the sample for varied reasons. For example, deer mice are likely a natural, rather than a cultural addition to the faunal assem-blages, and thus they were removed from consideration. Furthermore, taxonomic categories that were present in five or fewer of the assemblages were removed in order to reduce the number of zero frequency cases in the data set. Finally, the broad categories of “unidentified fish,” “unidentified mammals,” and “unidentified birds” were removed from the sample. Although these categories are useful in terms of broad comparisons of the relative frequencies of taxa at the class level, they mask the finer variability that is of interest in the current analysis.
Ultimately, these various alterations to the original data resulted in a set of 37 taxonomic categories, from an initial set of greater than 100 categories provided by Wigen (1990), as summarized in Table 2. These 37 categories produced a total number of identified specimens (NISP1) of 95,648 for the 21 analyzed components (Table 3). Within this total sample, 88,193 (92.2%) of the identi-fied specimens are fish, 2,467 (2.6%) are mammals, and 4,988 (5.2%) are birds (Table 3). Though unidentified specimens were not included for the purposes of the MDS analysis, it is worth noting their relative frequencies. The total numbers of unidentified specimens for each of the three broad taxonomic classes are 227,019 fish, 5,186 mammals, and 1,572 birds. Comparing the identi-fied and unidentified categories for each of these classes, we can see that 30% of

Journal Canadien d’Archéologie 29 (2005)
MULTIDIMENSIONAL SCALING OF NW COAST FAUNAL ASSEMBLAGES • 95
the fish bones were identifiable, com-pared to 32% for mammals and 76% for birds. Thus, despite the strong numeri-cal dominance of fish within the total NISP of the analyzed sample, fish are also the least identifiable and therefore the most under-represented of the three major classes.
Statistical MethodologyAs discussed above, the final ana-lyzed data set, presented in Table 3, took the form of raw NISP counts by taxonomic category for each of the 21 site components in this study. These data were analyzed using Torgerson’s metric MDS routine with the computer program Tscale (Matson n.d.). This computer program has been used in previous archaeological studies (Clark 2000, Matson et al. 1980, Thom 1992). Tscale was chosen for this study based on its previous use and the author’s familiarity with the program, although other statistical packages are also avail-able that can utilize metric MDS. The program converted the raw NISP data into proportional scores by site com-ponent by dividing by total sample size. This gives all site components equal weight and avoids problems of sample size skewing results (Matson et al. 1980). All faunal taxa were treated equally. Differences in rank order of categories between components were averaged to create a distance matrix, which is a pair-wise expression of the similarity of each component to all others. The distance matrix was transferred to dimensional space using a measure, in this case, city block distance. The MDS output depicts the complex patterns of variation found in the data as a series of dimensions, with each dimension representing an axis of the variation found in the data. Each analyzed component is assigned
a score for each dimension. The scores were then plotted both individually by dimension and in a combination of two dimensions to graphically represent the relationships between the components.
RESULTS AND DISCUSSIONMDS analysis of the Kunghit region faunal sample outlined above resulted in the identification of five dimensions of variability, which accounted for a total of 98% of the variance present within the data. The majority of the variance was contained within dimension 1, which accounted for 51.91% of the total vari-ability. Subsequent dimensions contrib-uted 23.71%, 10.93%, 7.24% and 4.33% respectively. An initial attempt was made to graph these results in combinations of two dimensions. As outlined below in more detail, only dimensions 2 and 3 showed any relationship across dimen-sions. Dimensions 1 and 4 revealed strong patterns in single dimensions, and were best interpreted individually. Though many previous archaeological applications of MDS have employed two-dimensional plots, these analyses have typically interpreted dimensions individually (Burley 1980; Clark 2000; Matson 1974; Matson et al. 1980; Thom 1992). Furthermore, one-dimensional plots have been utilized in some contexts (Hodson 1970; Hodson et al. 1966; LeB-lanc 1975), and other authors highlight the utility and validity of analyzing single dimensions (Cowgill 1968; Shepard 1966, 1974). Thus, in order to better represent the variability seen in individual dimen-sions, we plotted dimensions 1 and 4 on one-dimensional plots. Dimensions 2 and 3, as outlined below, were considered heavily related, and thus were combined and analyzed together. The results and interpretations for each dimension are discussed separately below.

Canadian Journal of Archaeology 29 (2005)
96 • ORCHARD AND CLARK
Taxon
Assemblage Code
R3A R3B S1 S3 S20A S20B S27 S31 S35 T9
Dogfish 114 175 0 42 2 6 23 4 0 266Ratfish 37 15 0 0 0 1 0 0 1 2Salmon 2,893 6,876 169 161 2 82 127 113 485 37,419Pacific Cod 1 3 0 0 0 0 0 0 0 24Pacific Hake 0 1 0 0 1 0 0 0 0 1Surfperch 4 6 0 22 0 0 0 0 0 21Prickleback 547 62 27 28 2 1 2 1 0 124Wolf-eel 3 1 0 1 0 0 0 0 0 0Sand Lance 4 13 0 0 0 0 0 0 1 48Rockfish 6,966 1,142 57 1,231 207 215 1 79 0 1,831Sablefish 2 3 0 6 0 0 0 0 0 275Greenling 88 95 5 62 1 0 0 0 0 79Lingcod 77 27 2 28 4 0 0 1 0 25Irish Lord 60 30 0 5 1 0 1 0 0 10Cabezon 34 25 1 1 1 0 1 0 0 2Sculpin 10 1 0 0 0 0 1 0 2 14Flatfish 24 90 1 0 0 0 0 0 1 4Halibut 288 197 3 15 3 0 4 2 2 1,073Cetacean 75 66 1 41 0 1 0 0 0 452River Otter 8 25 1 2 0 0 0 0 0 12Sea Otter 49 106 2 5 5 15 1 7 5 387Fur Seal 10 6 0 2 15 2 0 0 0 14Sea Lion 11 12 0 1 2 0 0 0 0 36Harbour Seal 41 76 1 7 10 6 1 0 6 177Loon 1 3 0 0 0 1 0 1 0 5Grebe 1 1 0 0 0 0 0 0 0 7Albatross 33 4 2 1 1 3 0 1 0 7Fulmar 4 2 0 0 0 0 0 0 0 4Shearwater 3 0 1 0 0 1 0 0 0 2Cormorant 18 15 0 1 1 1 0 0 0 37Goose 3 3 0 0 0 1 0 0 0 9Duck 8 4 4 2 0 0 0 0 4 35Gull 2 6 2 1 0 2 0 0 0 46Alcid 1,201 1,237 43 904 26 274 0 12 0 151Bald Eagle 13 52 0 4 2 0 0 1 0 15Raven 0 3 0 0 0 0 0 1 1 11Songbird 4 6 5 1 0 0 0 0 0 38Total 12,637 10,389 327 2,574 286 612 162 223 508 42,663Herring 84 13 0 4 1 0 0 0 0 3829V' 0.405 0.364 0.545 0.431 0.413 0.474 0.348 0.498 0.119 0.185
Table 3. Faunal data (NISP) for assemblages analyzed through MDS. Assemblage codes are identified in Table 1. Herring has been included for comparative purposes.

Journal Canadien d’Archéologie 29 (2005)
MULTIDIMENSIONAL SCALING OF NW COAST FAUNAL ASSEMBLAGES • 97
Assemblage Code
T16A T16B T16C T22a T22b T23A T23B T28A T28B T28C S4
4 4 3 7 19 2 11 25 68 21 630 0 0 0 0 0 0 1 6 2 8
53 23 482 1,306 667 609 224 2,309 3,676 1,105 3,7750 0 0 0 0 0 0 1 8 5 20 0 0 0 0 0 1 0 4 1 14 8 0 4 15 43 7 0 73 4 09 4 10 6 42 276 91 1 8 3 412 0 0 1 6 0 0 0 0 0 00 0 0 0 0 0 1 0 0 0 3
392 191 46 155 1,334 1,183 503 225 1,445 269 1091 22 2 13 3 215 56 6 314 41 13
14 20 1 3 9 183 51 3 103 45 3016 7 0 7 82 6 6 7 49 4 40 11 0 3 1 7 13 0 12 1 110 0 0 3 10 0 0 1 0 4 160 0 0 1 0 2 2 1 7 2 00 0 0 0 0 0 0 1 4 2 0
32 26 15 39 30 287 143 55 559 75 910 0 40 175 2 25 2 0 5 1 50 0 2 6 6 3 2 3 28 0 25 10 3 19 3 6 5 13 19 8 467 0 5 2 2 4 1 6 20 4 40 0 1 3 2 1 1 2 7 11 8
20 14 5 39 21 1 1 48 30 6 450 0 0 0 2 0 0 5 1 0 20 0 0 1 1 0 0 0 1 1 01 0 2 1 2 0 1 2 2 1 00 0 1 2 0 2 1 2 2 0 40 0 2 3 0 0 0 0 4 2 40 0 1 1 0 1 0 3 6 0 80 0 0 1 2 0 2 0 5 0 20 0 0 1 3 0 0 0 0 1 111 1 0 5 1 3 2 3 4 3 36 0 64 10 15 0 0 3 18 7 3431 0 0 8 1 0 0 7 23 2 61 0 0 0 0 0 0 0 0 0 15 0 1 2 3 1 4 2 20 0 6
574 341 686 1,827 2,284 2,860 1,131 2,735 6,531 1,631 4,6672 5 8 2 22 5 3 0 78 3 31
0.456 0.655 0.406 0.349 0.375 0.564 0.545 0.218 0.416 0.367 0.269
Table 3 continued. Equitability (V') represents the degree to which the taxa are repre-sented evenly (V'=1) or unevenly (V'=0) across the assemblage (Reitz and Wing 1999: 105).

Canadian Journal of Archaeology 29 (2005)
98 • ORCHARD AND CLARK
Dimension 1—Rockfish to Salmon Transition As indicated above, dimension 1 accounts for the majority of the explained variabil-ity in the data (51.91%). Scaling results for it are illustrated in Figure 2. An examination of these results in concert with the initial faunal data indicated that dimension 1 was heavily influenced by the relative frequencies of salmon (Oncorhynchus spp.) and rockfish (Sebastes spp.). This is illustrated in Table 4, which presents the archaeological components in dimension 1 order with the top four most prevalent taxa for each compo-nent. The scaling results create a perfect split of salmon-dominated assemblages and non-salmon dominated assemblages (Table 4). Non-salmon dominated assemblages are, for the most part, domi-nated by rockfish. The single exception to this pattern is evident in the assem-blage from site FaTs–20, where alcids are the most prevalent taxon at roughly 45%, followed closely by rockfish at 35%. In addition to salmon and rockfish, two other taxa appear to be moderately well correlated with the ordering of compo-nents by dimension 1. Lingcod (Ophiodon elongatus) are roughly similar to rockfish
in their patterning, being most common in the rockfish-dominated components, and very scarce in salmon-dominated components. The correlation between lingcod and rockfish is perhaps not sur-prising given that these two taxa tend to occupy similar habitats (Eschmeyer et al. 1983; Hart 1973) and are often caught on identical fishing gear (Orchard, per-sonal experience; cf. Lamb and Edgell 1986). Harbour seal is the only other taxon that shows any patterning along dimension 1 upon visual inspection of the faunal data. The three components with the greatest frequencies of harbour seal (Phoca vitulina Linnaeus) remains all fall among the most heavily rockfish-dominated components. Across the remaining components, harbour seal is more varied. Nevertheless, the greatest frequencies of harbour seal appear to correspond to the greatest frequencies of lingcod and rockfish and the lowest frequencies of salmon.
Within the broad groupings of rock-fish-dominated and salmon-dominated components, there is a more linear pat-tern of steadily increasing prevalence of salmon and steadily decreasing preva-lence of rockfish across the dimension 1
Figure 2. Metric multidimensional scaling results for dimension 1.

Journal Canadien d’Archéologie 29 (2005)
MULTIDIMENSIONAL SCALING OF NW COAST FAUNAL ASSEMBLAGES • 99
values. Correlation analysis (Systat 8.0 [SPSS 1998]) supports this relationship, indicating a very high level of correla-tion between the relative frequencies of salmon and the eigenvectors assigned to each component (Pearson’s r = 0.931). A slightly lower correlation is produced from a comparison of Rockfish fre-quencies and eigenvectors (Pearson’s r = −0.857), while a regression analysis simultaneously comparing both salmon and rockfish to the eigenvector values produced a slightly stronger relation-ship (Multiple R = 0.932) (Systat 8.0 [SPSS 1998]). This regression analysis identified both FaTs–27 and FaTt–9 as outliers, a pattern that is also evident
from a simple visual inspection of the faunal data.
Site FaTs–27 presents the most obvi-ous exception to the pattern produced by the dimension 1 values. Despite a rela-tively high frequency of salmon (78%), this assemblage falls at the margin of the salmon-dominated components (Figure 2), where the frequency of salmon in the adjacent assemblages is considerably lower (Table 4). Similarly, FaTs–27 contains only 0.62% rockfish, well below the frequencies of rockfish found in the adjacent components. Despite these significant differences, it is interesting that FaTs–27 clusters most closely with FaTs–1 (see Figure 2).
Table 4. Summary of cluster data for dimension 1.
Group Site Component Taxon 1 (%) Taxon 2 (%) Taxon 3 (%) Taxon 4 (%)
Salm
on-D
omin
ated
FaTt–9 n/a Salmon 87.71 Rockfish 4.29 Halibut 2.52 Cetaceans 1.06
FaTs–35 n/a Salmon 95.47 Harbour Seal
1.18 Sea Otter
0.98 Ducks 0.79
FbTs–4 n/a Salmon 80.89 Alcids 7.35 Rockfish 2.34 Halibut 1.95
FaTt–28 Comp. 1 Salmon 84.42 Rockfish 8.23 Halibut 2.01 Harbour Seal
1.76
FaTt–22a n/a Salmon 71.48 Cetaceans 9.58 Rockfish 8.48 Halibut/ Harbour Seal
2.13
FaTt–16 EU1 Salmon 70.26 Alcids 9.33 Rockfish 6.71 Cetaceans 5.83
FaTr–3 Comp. 2 Salmon 66.19 Alcids 11.91 Rockfish 10.99 Halibut 1.90
FaTt–28 EU2 Salmon 67.75 Rockfish 16.49 Halibut 4.60 Greenling 2.76
FaTt–28 Comp. 2 Salmon 56.29 Rockfish 22.13 Halibut 8.56 Sablefish 4.81
FaTs–31 n/a Salmon 50.67 Rockfish 35.43 Alcids 5.38 Sea Otter 3.14
FaTs–1 n/a Salmon 51.68 Rockfish 17.43 Alcids 13.15 Prickleback 8.26
FaTs–27 n/a Salmon 78.40 Dogfish 14.20 Halibut 2.47 Prickleback 1.23
Roc
kfish
-Dom
inat
ed
FaTt–22b n/a Rockfish 58.41 Salmon 29.20 Lingcod 3.59 Prickleback 1.84
FaTt–23 Comp. 1 Rockfish 41.36 Salmon 21.29 Halibut 10.03 Prickleback 9.65
FaTr–3 Comp. 1 Rockfish 55.12 Salmon 22.89 Alcids 9.50 Prickleback 4.33
FaTt–23 Comp. 2 Rockfish 44.47 Salmon 19.81 Halibut 12.64 Prickleback 8.05
FaTs–20 Comp. 2 Alcids 44.77 Rockfish 35.13 Salmon 13.40 Sea Otter 2.45
FaTt–16 Comp. 1 Rockfish 68.29 Salmon 9.23 Halibut 5.57 Harbour Seal
3.48
FaTs–3 n/a Rockfish 47.82 Alcids 35.12 Salmon 6.25 Greenling 2.41
FaTt–16 Comp. 2 Rockfish 56.01 Halibut 7.62 Salmon 6.74 Sablefish 6.45
FaTs–20 Comp. 1 Rockfish 72.38 Alcids 9.09 Fur-seal 5.24 Harbour Seal
3.50
Canadian Journal of Archaeology 29 (2005)
100 • ORCHARD AND CLARK
These are the only two assemblages from cave sites, and they tend to group together along many of the dimensions as discussed below. The second unusual site, FaTt–9, is less problematic. It is iso-lated by dimension 1 (Figure 2) despite salmon and rockfish frequencies that would place it well within the salmon-dominated components (Table 4). An examination of the raw data suggests that this may be an indirect factor of total sample size. FaTt–9 is by far the largest of the analyzed assemblages with a total NISP of 42,663, more than three times the size of the next nearest assem-blage (Table 1). This greater sample size corresponds to a greater diversity of taxa, with few of the taxa selected for this analysis not present in the sample. It is this greater diversity that appears to isolate FaTt–9 in its own cluster. A con-sideration of the limited data on herring prevalence (Table 3) reveals that FaTt–9 also contains by far the greatest propor-tion of herring. Though the herring data are likely biased by unequal sampling (as outlined above), the prevalence of herring at FaTt–9 further supports the uniqueness of this assemblage resulting from the large sample size.
To provide an additional perspec-tive on the variability evident across dimension 1, an equitability index was employed (Reitz and Wing 1999)2. Equi-tability values range from 0 to 1, with values closer to 1 representing an even distribution across the various taxa and values closer to 0 representing special-ization on one or a few select taxa. A consideration of equitability values for the components analyzed here (Table 3) indicates that salmon-dominated assemblages tend to be more special-ized (mean V' = 0.3404), while rockfish-dominated assemblages tend to be more even (mean V' = 0.4798). Furthermore,
the eight most specialized components all fall within the salmon-dominated group.
The general pattern of a contrast between rockfish-dominated and salmon-dominated assemblages was previously identified by Wigen (1990) based on a consideration of the quantita-tive results of her analysis of the faunal assemblages, and was further emphasized by Acheson (1998) in his overview of the excavations. Specifically, both authors note a correlation between salmon and rockfish frequencies and the presence of refuse and living floor-type deposits, with salmon being more common in living floor deposits and rockfish generally being more common in refuse deposits (Acheson 1998: 48; Wigen 1990: 23). Though this pattern is relatively robust, it does not hold in all of the excavated assemblages, and Acheson notes that apparent mixing of deposits and the gen-erally small excavated samples may cloud these distinctions (1998: 40). Several factors may contribute to the patterning evident in rockfish and salmon frequen-cies. A prevalence of salmon vertebrae recovered from living floor deposits suggests that salmon consumed at these village sites was processed elsewhere and stored for winter consumption3, while recovery of rockfish vertebrae and cra-nial bones from refuse deposits points to the processing and consumption of fresh rockfish at habitation sites with the remains deposited in middens (Acheson 1998: 49; Wigen 1990: 25). Perhaps more significantly, Acheson (1998) and Wigen (1990) suggest a temporal shift from earlier, rockfish-dominated assemblages, to later, salmon-dominated assemblages, indicating a more general shift in Kung-hit Haida subsistence to a stronger focus on salmon harvesting. In contexts where cultural deposits show a stratigraphic

Journal Canadien d’Archéologie 29 (2005)
MULTIDIMENSIONAL SCALING OF NW COAST FAUNAL ASSEMBLAGES • 101
shift from earlier refuse deposits to later living floor deposits, salmon almost invariably rises to dominance in the more recent deposits (Acheson 1998: 48; Wigen 1990: 23). Thus, “while the exact proportion of rockfish to salmon bone is affected by their different depo-sition environments, the sudden influx of salmon indicates other changes, cor-responding in time with the projected increase in size and complexity of a number of sites” (Acheson 1998: 48; cf. Wigen 1990).
Acheson (1998) and Wigen (1990) specifically suggest that the shift from refuse deposits to living floor-type depos-its evident at several of the excavated sites, and, by extension, the rise in the prevalence of salmon, centres around a date of approximately 800 BP (Acheson 1998: 43; Wigen 1990: 2). Dates for the assemblages under consideration are varied, and insufficient to state con-clusively that dimension 1 represents a directly temporal pattern. It is also often difficult to directly associate the radiocarbon dates outlined by Acheson (1998) with the faunal components described by Wigen (1980). Many of the dates, for example, are basal dates that do not directly date the cultural deposits from which the faunal assemblages were derived. Nevertheless, a consideration of the dates summarized in Table 1 in relation to the patterns revealed through dimension 1 of the MDS analysis reveals some interesting temporal insights (see Figure 3). Specifically, all three components that are known to have contact period occupations are located within the salmon-dominated clusters. Furthermore, there are twelve dates of less than 800 BP associated with salmon-dominated assemblages, and an addi-tional date, 1840 ± 80 BP (WAT1644) from FaTt–28, may fall below 800 BP
given its one standard deviation error margin. In contrast, only a single date from a rockfish-dominated assemblage, 745 ± 70 BP (BGS1352) from FaTs–3, falls below 800 BP, and this date overlaps the 800 BP point at one standard devia-tion. These data suggest, as illustrated in Figure 3, that the period following 800 BP was dominated by salmon. The period preceding 800 BP is more nebulous, and appears to represent a transitional period in which both salmon and rockfish played significant roles in local economies (Figure 3), although rockfish-dominated assemblages are moderately more common prior to ca. 1400 BP. An increased sample size from assemblages dating prior to 1400 BP may clarify this issue.
The shift from rockfish to salmon in the Kunghit Haida economy, which was apparently complete by 800 BP, is interesting given the generally great importance assigned to salmon in gen-eral discussions of Northwest Coast culture history and its apparent role in the rise of the Developed Northwest Coast Pattern (Matson and Coupland 1995; cf. Ames and Maschner 1999). The 800 BP date, or even the transitional 1400 BP to 800 BP period, places the rise of salmon dominance much later in the southern Queen Charlotte Islands than it has been argued to occur elsewhere on the coast (Acheson 1998; Ames and Maschner 1999; Cannon 1991; Matson and Coupland 1995). We suggest sev-eral possible explanations for the delay of salmon dominance in Haida Gwaii, including (a) the relative isolation of the Kunghit region and related lack of persistent culture contact; (b) the lack of major salmon streams in the area; and (c) a lack of resource stress or resource scarcity that may have elsewhere encour-aged a focus on an aggregated, storable

Canadian Journal of Archaeology 29 (2005)
102 • ORCHARD AND CLARK
resource. A more detailed discussion of these possibilities is beyond the scope of the current paper and will require further data and further consideration in the future.
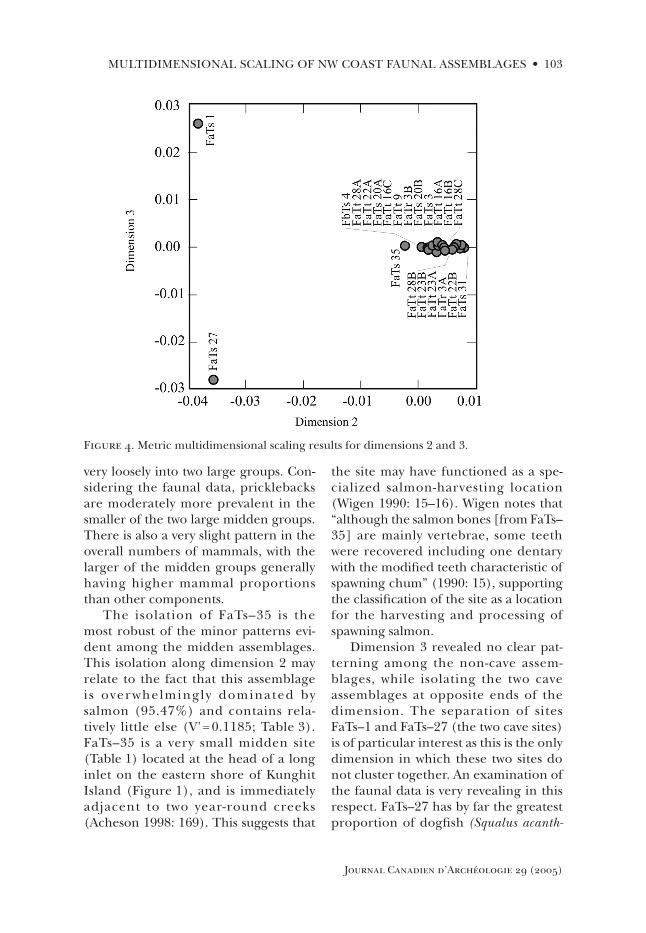
Dimensions 2 and 3—Site TypeThese dimensions, which account for 23.71% and 10.93% of the variation, respectively, proved somewhat more difficult to interpret despite revealing a strong pattern along both dimensions (Figure 4). This likely reflects a lack of depth in our descriptive data for each site and component, rather than a lack of clarity in the dimensions themselves. Data on seasonality, exposure, site type,
and site size, for example, are very coarse, and do not reflect the finer pat-terning revealed by the MDS analysis. Despite these problems, one charac-teristic was similar in both dimensions, namely that the isolated sites FaTs–1 and FaTs–27 were significantly different from the remaining assemblages (Figure 4). As these represent the only two cave sites in the sample, this suggested that dimen-sions 2 and 3 both represented some aspect of site type.
Along dimension 2, aside from the complete isolation of the two cave sites, some very minor patterning is evident. Specifically, site FaTs–35 is isolated, while the remaining components form
Figure 3. Radiocarbon age estimates for dated components. Error bars depict a range of one standard deviation. Lab and date number are listed below each date. Line at 800 BP repre-sents Acheson (1998) and Wigen’s (1990) suggested point of shift from rockfish-dominated economies to salmon-dominated economies.
Journal Canadien d’Archéologie 29 (2005)
MULTIDIMENSIONAL SCALING OF NW COAST FAUNAL ASSEMBLAGES • 103
very loosely into two large groups. Con-sidering the faunal data, pricklebacks are moderately more prevalent in the smaller of the two large midden groups. There is also a very slight pattern in the overall numbers of mammals, with the larger of the midden groups generally having higher mammal proportions than other components.
The isolation of FaTs–35 is the most robust of the minor patterns evi-dent among the midden assemblages. This isolation along dimension 2 may relate to the fact that this assemblage i s over whelmingly dominated by salmon (95.47%) and contains rela-tively little else (V' = 0.1185; Table 3). FaTs–35 is a very small midden site (Table 1) located at the head of a long inlet on the eastern shore of Kunghit Island (Figure 1), and is immediately adjacent to two year-round creeks (Acheson 1998: 169). This suggests that
the site may have functioned as a spe-cialized salmon-harvesting location (Wigen 1990: 15–16). Wigen notes that “although the salmon bones [from FaTs–35] are mainly vertebrae, some teeth were recovered including one dentary with the modified teeth characteristic of spawning chum” (1990: 15), supporting the classification of the site as a location for the harvesting and processing of spawning salmon.
Dimension 3 revealed no clear pat-terning among the non-cave assem-blages, while isolating the two cave assemblages at opposite ends of the dimension. The separation of sites FaTs–1 and FaTs–27 (the two cave sites) is of particular interest as this is the only dimension in which these two sites do not cluster together. An examination of the faunal data is very revealing in this respect. FaTs–27 has by far the greatest proportion of dogfish (Squalus acanth-
Figure 4. Metric multidimensional scaling results for dimensions 2 and 3.

Canadian Journal of Archaeology 29 (2005)
104 • ORCHARD AND CLARK
ias) of any other assemblage (14.2%), also dominating in terms of “other sculpins,” although at a low frequency (0.62%). FaTs–1, on the other hand, surpasses all other assemblages in terms of percentages of ducks (1.22%), gulls (0.61%), albatross (0.61%), shearwaters (0.31%) and songbirds (1.53%), while bird remains are completely lacking in the FaTs–27 assemblage. The two caves are also highly divergent in terms of their relative proportions of rockfish, halibut (Hippoglossus stenolepis), and alcids. Interestingly, the single rockshel-ter site in the sample clusters among the midden sites, and not with the very dis-tinct cave sites. This is perhaps not sur-prising, as the rockshelter (FaTt–22b) is directly associated with a midden site (FaTt–22a), and is not geographically isolated as are the two caves.
Generally, the patterning along both dimensions 2 and 3 suggests that these dimensions represent some vari-ability in the function of the sites. The splitting of the two cave assemblages by dimension 3 seems to be based on the presence of relatively large quantities of otherwise rare taxa at these sites, which further suggests a degree of activity specialization at these sites. The possi-
bility that site FaTs–35 may represent a special activity site focussed on salmon harvesting may account for the ten-dency of this assemblage to fall slightly closer to the special activity cave sites along dimension 2. The remainder of the assemblages all contain a relatively diverse set of common taxa, though represented at varying relative frequen-cies, and thus may be considered as general activity locations. This explains the close grouping of these assemblages along these two dimensions.
Dimension 4—LocationDimension 4 accounted for only 7.24% of the variability in the data. With such a low variability, this should not be given much interpretive weight. Nevertheless, it is worth considering the patterns reflected within this dimension (Figure 5). An initial examination of the dimension 4 ordering of components in relation to the available site data revealed a pattern in the Borden units in which the sites were located. This suggested a possible spatial factor, which was examined further by considering the locations of the sites (Figure 1) in relation to their position within the dimensional pattern (Figure 5). This suggested that the components could be split into east-
Figure 5. Metric multidimensional scaling results for dimension 4.

Journal Canadien d’Archéologie 29 (2005)
MULTIDIMENSIONAL SCALING OF NW COAST FAUNAL ASSEMBLAGES • 105
ern and western groups along one of the largest natural breaks in the dimension 4 order (Figure 5). These two groups were then plotted on the map of the study area (Figure 6), revealing, with two excep-tions, a fairly robust east-west pattern along dimension 4. The exceptions are discussed below.
An examination of the faunal data within the context of the dimension 4 groups reveals a number of very clear
patterns. Perhaps the most striking involves the relative frequencies of alcids. The eastern group sites all have alcid frequencies of between 5 and 45%, while the western group assemblages, with one exception, have alcid frequen-cies of less than 2%. Interestingly, the one exception again involves the cave sites. Site FaTs–1 contains 13.15% alcids, a frequency that should place it well within cluster 1. In fact, an examination
Figure 6. Map of study area showing the distribution of components assigned to the eastern and western groups from dimension 4.

Canadian Journal of Archaeology 29 (2005)
106 • ORCHARD AND CLARK
of Figure 6 suggests that FaTs–1 would fit well within the eastern cluster. The placement of this site within the western assemblage appears to once again result from the tendency of the two cave sites to cluster together. Other faunal patterns within the dimension 4 groups involve a series of fish taxa, most prominently halibut. Though the pattern is not per-fect, the vast majority of the sites with the greatest frequencies of halibut occur within the western group. A similar pat-tern is evident amongst the surfperch, sablefish, greenling, and red Irish lord taxa, where the highest frequencies all occur within the western group. Not surprisingly, this is further reflected in greater total frequencies of fish in the western sites and greater total frequen-cies of birds in the eastern sites.
Generally, dimension 4 presents a pattern of eastern sites containing greater quantities of alcids, with western sites dominating in terms of a suite of fish taxa. These site groups appear to designate differing resource locations, or differing environments correspond-ing to eastern and western zones. The alcid category is composed primarily of small alcids that, according to Wigen (1990), are probably Cassin’s auklets (Ptychoramphus aleuticus). As noted by Harfenist et al. (2002), the majority of the breeding colonies of Cassin’s auklet in the Gwaii Haanas region occur along the east coast. Two exceptions to this pat-tern occur within the study area, namely major colonies on Anthony Island and the Gordon Islands (Harfenist et al. 2002), but these colonies are not imme-diately adjacent to sites included in the western sample analyzed here and may have been controlled by occupants of villages on the islands housing the colonies. Although comparable data on marine fish distributions at such a
fine level within the Kunghit Island area are still being compiled for publica-tion (Norm Sloan, pers. comm. 2005), it may be that the fish taxa prevalent among the west coast sites are similarly reflecting utilization of local resources. Nevertheless, the eastern emphasis on what is almost definitely Cassin’s auklet further suggests that this dimension is highlighting locational aspects of the faunal data.
Finally, it is worth revisiting the two exceptions to the eastern and western nature of the pattern, in light of the pre-ceding considerations of the faunal data associated with dimension 4. Site FaTs–35 assemblage contains no alcids, which likely accounts for its assignment to the western cluster despite its eastern loca-tion. In contrast to the western pattern, however, this assemblage also contains few to none of the various fish taxa char-acteristic of other assemblages in this cluster. As indicated above in the discus-sion of dimensions 2 and 3, the FaTs–35 assemblage is completely dominated by salmon, which likely points to the use of the site as a specialized salmon harvest-ing location (Wigen 1990: 15–16). As such, the site occupants would not have been accessing the fauna, namely small alcids, that would otherwise highlight its eastern location. The second exception, site FaTt–16 (Excavation Unit 1), con-tains a relatively high frequency of alcids (9.33%), which explains its assignment to the eastern cluster. It also, however, produced a relatively large amount of halibut remains (2.19%) in contrast to most of the eastern cluster assemblages. A more thorough explanation for the relatively high frequency of alcids in this component of site FaTt–16 is not possible given the current data, though it may simply indicate access by some inhabitants of the site to a Cassin’s auklet
Journal Canadien d’Archéologie 29 (2005)
MULTIDIMENSIONAL SCALING OF NW COAST FAUNAL ASSEMBLAGES • 107
colony located nearby, such as that on Anthony Island.
In summary, dimension 4 represents an aspect of site location, with sites clus-tering into eastern or western groups. These groups may represent economic foci on different sets of geographically limited resources. The strength of this interpretation is lessened, however, by the low degree of variability accounted for by dimension 4 in the MDS analysis. Nevertheless, the interpretation pre-sented above suggests that resource avail-ability in the Kunghit Haida region may have led to different resource harvesting patterns in different local areas, with variability evident between eastern and western zones within the region.
Other ConsiderationsThe final dimension of variability identified by the MDS analysis, dimen-sion 5, accounted for only 4.33% of the variation in the data, providing very weak interpretive strength. This dimension has not revealed any easily explainable patterns, and will not be examined in any detail here. This dimension likely represents minor variability in some of the less prevalent taxa that did not con-tribute to the variability explained for the previous dimensions.
Of interest in the results as a whole, however, is the lack of any obvious rela-tionship between the dimensions gener-ated by MDS and the seasonality of site use. While seasonality was initially identi-fied as a factor likely to influence faunal assemblage variability, and thus likely to be picked out by the MDS analysis as a significant dimension of variability, none of the identified dimensions corresponds to the limited seasonal data available for the site assemblages. This may be biased by the very limited seasonality data pro-vided by Wigen (1990). The necessity of
removing herring from the analysis due to sampling concerns eliminated a taxon that is often considered a good seasonal indicator, and may have further clouded possible seasonal interpretations. Exam-ining the limited, and likely biased, herring data (Table 3) reveals no pat-terning of herring diversity along any of the dimensions of variation identified by the MDS analysis. There does appear to be a pattern, however, when comparing the herring data to Acheson’s (1998) site classifications. Acheson’s (1998) group 1 middens generally represent the largest proportions of herring. In contrast, her-ring is rare or absent in group 2 middens and in the single rockshelter site, and is completely absent in the two cave sites. We cannot comment on the robustness of this pattern given the sampling bias in the herring data.
Perhaps the single exception to the lack of seasonal indicators in the site assemblages involves site FaTs–35, which, as discussed above, is almost entirely dominated by salmon and may thus indicate a specialized salmon-har-vesting locality. Perhaps FaTs–35 was occupied only in the fall during the salmon spawning runs. The lack of any other obvious seasonal influence on the variation within the assemblages is intriguing, even given the acknowledged problems with seasonality data. Acheson (1998) has suggested that a major sea-sonal round may not have existed in the Kunghit region prior to European con-tact. Instead, occupations may have been characterized by small, local villages subsisting on locally available resources year round. Specifically, Acheson notes that “the seasonal range and variety of fauna found at many sites alludes to a … fluid subsistence-settlement pattern with little distinction between winter and summer site use” (Acheson 1998:

Canadian Journal of Archaeology 29 (2005)
108 • ORCHARD AND CLARK
56). The MDS analysis presented above, while not providing direct evidence of a lack of seasonal variation between sites, provides some support for Acheson’s (1998) suggestion that such variation was limited.
CONCLUSIONS AND FUTURE PROSPECTS
This project has demonstrated the util-ity of applying MDS analysis to faunal assemblages, as well as to other types of archaeological data. MDS analysis of the Kunghit region faunal assemblages both strengthened arguments made during the original analysis and interpretation of these data, and contributed new insights into Kunghit Haida subsistence and settlement not evident in a more traditional faunal analysis. Specifically, the analysis identified five dimensions of variation within the analyzed faunal assemblages. The most influential of these dimensions is directly related to the relative proportions of salmon and rockfish in the assemblages, a relation-ship that likely relates to the dates of site occupations and to corresponding temporal changes in Kunghit Haida subsistence. The second and third dimensions relate to a more ambiguous combination of various faunal taxa, and appear to be weakly associated with site types or site function. Specifically, these dimensions isolate the two cave sites in the data set, as well as highlighting the only other special activity site (FaTs–35) as being significantly different from the more general activity midden sites. The fourth dimension, though account-ing for a very low degree of variability (7.24%), may relate to site location, drawing on patterns among taxa that are more prevalent in eastern and western contexts. The fifth dimension identified by the MDS analysis accounted for only
4.33% of the variation within the data, and did not have any obvious cultural or non-cultural correlates.
This application of MDS analysis to archaeological faunal data is considered a success. It provided statistically derived support for Acheson (1998) and Wigen’s (1990) previous contention that there was a ca. 800 BP shift to a universal dominance of salmon in Kunghit faunal assemblages from a previous emphasis on rockfish, while linking this shift to concurrent changes in the utilization of other faunal taxa. It also suggested a pre-viously unrecognized regional difference in resource availability and use, with dif-ferences between western and eastern locations. More generally, this project demonstrated that MDS analysis of faunal data provides a means of directly assessing variability in subsistence pat-terns, rather than the more indirect subsistence information gained through analysis of artifact assemblages.
This project was intended partly as a pilot project to explore the feasibility of applying MDS to faunal assemblages. Ultimately, we hope to expand our sample of components into a larger, more comprehensive application of faunal MDS. Additional assemblages are available from a variety of sources. The first author is in the final stages of completing a faunal-based regional research project in an area immediately to the north of the Kunghit study area discussed here. This new research will provide assemblages from an additional nine sites (Orchard 2001, 2003a, 2004; Orchard and Mackie 2004). Further faunal assemblages related to a southern Haida Gwaii sample are available from various sources (e.g., Sumpter 1999). In addition to expanding the faunal appli-cation of MDS, we plan to combine such faunal analyses with MDS analyses of

Journal Canadien d’Archéologie 29 (2005)
MULTIDIMENSIONAL SCALING OF NW COAST FAUNAL ASSEMBLAGES • 109
artifactual data to examine the correla-tion between multiple lines of archaeo-logical evidence. To this end, a second project is also in early stages, relating to the second author’s ongoing examina-tion of the culture historical sequence in the Gulf of Georgia region on the southern coast of British Columbia. This project is employing MDS analysis of artifact assemblage data to examin-ing variability within components within the Gulf of Georgia. An MDS analysis of faunal assemblages from this region will undoubtedly aid in refining this prob-lematic culture sequence.
Acknowledgments. We thank Steve Acheson and Becky Wigen for their positive endorse-ment of this re-analysis of their Kunghit Haida faunal data. R. G. Matson provided the multidimensional scaling program, Tscale, which we employed for this analysis. Steve Acheson, Gary Coupland, Gay Frederick, Quentin Mackie, Marty Magne, R. G. Matson, George Nicholas, Christian Crowder, and Lesley Harrington provided useful comments on an earlier draft of this paper. Andre Polsky generously provided the French translation of the abstract. Financial support during the preparation of this manuscript was pro-vided by the Social Science and Humanities Research Council and by the University of Toronto. We would particularly like to thank George Nicholas for facilitating the publica-tion of this paper.
NOTES1. The Number of Identified Speci-
mens (NISP) is simply a count of the number of bones or bone fragments in an assemblage identified for each taxonomic category (Grayson 1984; Reitz and Wing 1999). Though several criticisms have been levelled against the use of NISP for considerations of relative frequencies of taxa (Grayson
1984; Orchard 2003b), it represents the least derived and most widely employed means of quantifying faunal assemblages.
2. Following Reitz and Wing (1999: 105–106; cf. Betts and Friesen 2004) equitability (V') was calculated as:
V' = H'/Loge S
where S is the number of identified taxa present in the assemblage, and H’ is the Shannon-Weaver function:
H' = –Σ(pi)(Loge pi)
where pi is the relative abundance of the ith taxon within the sample.
3. The practice of the delayed con-sumption or storage of salmon may be interpreted through the system-atic recovery and analysis of salmon bones. Specifically, where salmon vertebrae dominate assemblages of recovered salmon remains, and thus the ratio of cranial to post-cranial bones is very small, salmon storage can be inferred (Boehm 1973; Butler 1983; Casteel 1976; Wigen 1980). This is based on the ethnographic pattern of the removal of the salmon head prior to drying at the procure-ment sites (Stewart 1977; Suttles 1951), which leads to the transport of preserved post-cranial remains to the habitation sites for winter use. Such an approach has not been universally accepted (Butler and Chatters 1994; Cannon 1996).
REFERENCES CITEDAcheson, S.
1998 In the Wake of the ya’áats’ xaat-gáay [Iron People]: A Study of Changing Settlement Strategies Among the Kunghit Haida. British Archaeological Reports, International Series 711.

Canadian Journal of Archaeology 29 (2005)
110 • ORCHARD AND CLARK
Acheson, S. R., S. K. Zacharias, and R. Wigen
1986 Kunghit Haida Culture History Project Archaeological Investigations 1985. Report on file, Culture Resource Library, Ministry of Sustainable Resource Management, Victoria.
Ames, K. M., and H. D. G. Maschner 1999 Peoples of the Northwest Coast: Their Archaeology and Prehistory. Thames and Hudson, London.
Baxter, M. 2003 Statistics in Archaeology. Hodder Arnold, London.
Betts, M. W., and T. M. Friesen 2004 Quantifying Hunter-Gatherer Intensification: A Zooarchaeological Case Study from Arctic Canada. Jour-nal of Anthropological Archaeology 23: 357–384.
Boehm, S. G. 1973 Cultural and Non-cultural Varia-tion in the Artifact and Faunal Samples from the St. Mungo Cannery Site, DgRr 2. Unpublished M.A. thesis, University of Victoria, Victoria, B.C.
Burley, D. V. 1980 Marpole: Anthropological Reconstruc-tions of a Prehistoric Northwest Coast Cul-ture Type. Department of Archaeology, Simon Fraser University, Burnaby, B.C.
Butler, V. L.1983 Fish Remains from the Black River Sites (45KI59 and 45KI51-D). Unpub-lished M.A. thesis, University of Wash-ington.
Butler, V. L., and J. C. Chatters 1994 The Role of Bone Density in Structuring Prehistoric Salmon Bone Assemblages. Journal of Archaeological Science 21: 413–424.
Cannon, A. 1991 The Economic Prehistory of Namu.
Archaeology Press, Simon Fraser Uni-versity, Burnaby, B.C.
1996 Scales of Variability in North-west Salmon Fishing. In Prehistoric Hunter-Gatherer Fishing Strategies, edited by M. G. Plew, pp. 25–39. Department of Anthropology, Boise State Univer-sity, Boise, Idaho.
Casteel, R. 1976 Fish Remains from Glenrose. In The Glenrose Cannery Site, edited by R. G. Matson, pp. 82–87. National Museum of Man, Mercury Series, Paper 52, Archaeological Survey of Canada, Ottawa.
Clark, T. N. 2000 Prehistoric Culture Change on South-ern Vancouver Island: The Applicability of Current Explanations of the Marpole Transition. Unpublished M.A. thesis, University of Victoria, Victoria, B.C.
Cowgill, G. L. 1968 Archaeological Applications of Factor, Cluster, and Proximity Analy-sis. American Antiquity 33(3): 367–375.
Doran, J. E., and F. R. Hodson 1966 A Digital Computer Analysis of Palaeolithic Flint Assemblages. Nature 210: 688–689.
Eschmeyer, W. N., E. S. Herald, and H. Hammann
1983 A Field Guide to Pacific Coast Fishes of North America. Houghton Mifflin Company, Boston.
Fedje, D. W.1993 Sea Levels and Prehistory in Gwaii Haanas. Unpublished M.A. Thesis, Department of Archaeology, Univer-sity of Calgary.
Fladmark, K. R.1989 The Native Culture History of the Queen Charlotte Islands. In The Outer Shores, edited by G. G. E. Scudder
Journal Canadien d’Archéologie 29 (2005)
MULTIDIMENSIONAL SCALING OF NW COAST FAUNAL ASSEMBLAGES • 111
and N. Gessler, pp. 199–221. Queen Charlotte Islands Museum Press, Ski-degate, B.C.
Fladmark, K. R., K. M. Ames, and P. D. Sutherland
1990 Prehistory of the Northern Coast of British Columbia. In Hand-book of North American Indians, Vol. 7: Northwest Coast, edited by W. Suttles, pp. 229–239. Smithsonian Institution Press, Washington, D.C.
Gauch, H. G. 1982 Multivariate Analysis in Communi-ty Ecology. Cambridge University Press, Cambridge.
Grayson, D. K. 1984 Quantitative Zooarchaeology. Academic Press, Inc., Orlando.
Hall, M. 1982 Quantifying Trends in Site Loca-tion with Multidimensional Scaling. World Archaeology 14(1): 131–152.
Harfenist, A., N. A. Sloan, and P. M. Bartier
2002 Living Marine Legacy of Gwaii Haanas. III: Marine Bird Baseline to 2000 and Marine Bird-Related Man-agement Issues Throughout the Haida Gwaii Region. Parks Canada Technical Reports in Ecosystem Science Report 036. Parks Canada, Halifax.
Hart, J. L. 1973 Pacific Fishes of Canada. Fisheries Research Board of Canada, Ottawa.
Hodson, F. R. 1970 Cluster Analysis and Archaeol-ogy: Some New Developments and Applications. World Archaeology 1(3): 299–320.
Hodson, F. R., P. Sneath, and J. Doran 1966 Some Experiments in the Numerical Analysis of Archaeological Data. Biometrika 53: 311–324.
James, F. C., and C. E. McCulloch 1990 Multivariate Analysis in Ecology and Systematics: Panacea or Pandora’s Box? Annual Review of Ecology and Sys-tematics 21: 129–166.
Kruskal, J. B., and M. Wish 1978 Multidimensional Scaling. Sage, Beverly Hills.
Lamb, A., and P. Edgell 1986 Coastal Fishes of the Pacific North-west. Harbour Publishing, Madeira Park, B.C.
LeBlanc, S. A. 1975 Micro-seriation: Method for Fine Chronological Differentiation. American Antiquity 40(1): 22–38.
Mackie, Q., and S. Acheson in press The Graham Tradition. In Haida Gwaii: Human History and Envi-ronment from the Time of Taadl [Loon] to the Time of the ya’aats’xaatgaay [Iron People], edited by D. Fedje and R. Mathewes. Pacific Rim Archaeology Series, UBC Press, Vancouver.
Matson, R. G. 1974 Clustering and scaling of Gulf of Georgia sites. Syesis 7: 101–114.
n.d. Tscale. Computer Program.
Matson, R. G., and G. Coupland 1995 The Prehistory of the Northwest Coast. Academic Press, San Diego.
Matson, R. G., D. Ludowicz, and W. Boyd
1980 Excavations at Beach Grove (DgRs 1) in 1980. Report on file, Culture Resource Library, Ministry of Sustainable Resource Management, Victoria, B.C.
Matson, R. G., and D. True 1974 Site Relationships at Quebrada Tarapaca, Chile: A Comparison of Clustering and Scaling Techniques. American Antiquity 39(1): 51–74.

Canadian Journal of Archaeology 29 (2005)
112 • ORCHARD AND CLARK
Orchard, T. J. 2001 Environmental Archaeology in Gwaii Haanas. Canadian Zooarchaeology 19: 2–8.
2003a Gwaii Haanas Environmental Archaeology Project 2002: Report on 2002 Field Activities. Unpublished report to Parks Canada, Cultural Resource Ser-vices, Western Canada Service Centre, Victoria, B.C.
2003b An Application of the Linear Regression Technique for Determining Length and Weight of Six Fish Taxa: The Role of Selected Fish Species in Aleut Paleo-diet. British Archaeological Reports, International Series 1172. Archaeo-press, Oxford.
2004 Gwaii Haanas Environmental Archaeology Project 2003: Report on 2003 Field Activities. Unpublished report to Parks Canada, Cultural Resource Ser-vices, Western Canada Service Centre, Victoria, B.C.
Orchard, T. J., and Q. Mackie 2004 Environmental Archaeology: Principles and Case Studies. In Back to the Future: Advances in Methodology for Modelling and Evaluating Past Eco-systems as Future Policy Goals, edited by T. J. Pitcher, pp. 64–73. Fisheries Centre Research Reports, Volume 12, Number 1. UBC Fisheries Centre, Vancouver, B.C.
Reitz, E. J., and E. S. Wing 1999 Zooarchaeology. Cambridge University Press, Cambridge.
Shepard, R. N. 1966 Metric Structures in Ordinal Data. Journal of Mathematical Psychology 3: 287–300, 308–311, and 313–315.
1974 Representation of Structure in Similarity Data: Problems and Pros-pects. Psychometrika 39(4): 373–421.
SPSS 1998 Systat. Version 8.0. SPSS Inc.
Stewart, H. 1977 Indian Fishing: Early Methods on the Northwest Coast. Douglas & McIntyre, Vancouver.
Sumpter, I. D. 1999 1998 Archaeological Investiga-tions—Site 922T Gunlai Kin (Hotspring Island), Gwaii Haanas. Unpublished report on file, Cultural Resource Ser-vices, Parks Canada Western Service Centre, Victoria, B.C.
Suttles, W. 1951 Economic Life of the Coast Salish of Haro and Rosario Straits. Unpublished Ph.D. Dissertation, University of Washington.
Thom, B. 1992 An Investigation of Inter-assemblage Variability within the Gulf of Georgia Phase. Canadian Journal of Archaeology 16: 24–31.
Usman, A. A. 2003 Ceramic Seriation, Sites Chro-nology, and Old Oyo Factor in North-central Yorubaland, Nigeria. African Archaeological Review 20(3): 149–169.
Wigen, R. J. 1980 A Faunal Analysis of Two Middens on the East Coast of Vancouver Island. Unpublished M.A. thesis, University of Victoria, Victoria, B.C.
1990 Identification and Analysis of Ver-tebrate Fauna from Eighteen Archaeologi-cal Sites on the Southern Queen Charlotte Islands. Unpublished report to the British Columbia Heritage Trust.
Manuscript received November 24, 2004. Final revisions March 1, 2005.


![[5]S4 Clark olmec](https://static.fdokumen.com/doc/165x107/631a7d74bb40f9952b020797/5s4-clark-olmec.jpg)