Multi Objective Six Sigma Methodology: Application on Chromojet Printing
16
American Journal of Research Communication www.usa-journals.com Multi Objective Six Sigma Methodology: Application on Chromojet Printing M.I. El Santty* & A.A. Tharwat** & R.A. Zein Eldin* Cairo University, Cairo, Egypt Abstract Using multi objective techniques within quality improvement methodologies open and enhance the link between operations research tools and techniques and quality improvement techniques. In this paper we propose a methodology that link between multi objective techniques and six sigma methodology which considered one of most important quality improvement strategy used in continuous quality improvement in manufacturing, services, and health care sectors through project basis frame work. Using the proposed methodology “multi objective six sigma” improve the current six sigma methodology to be able to deal with two or more critical process output simultaneously. Here we present this methodology and its main steps and techniques, and the application of the proposed methodology in Chromjet printing process. By developing two characteristic models that link between the main process input and two process output separately using Design of experiment technique (DOE) and then we formulate Multi-objective Mathematical model and solve the model using weighting method to get efficient solution satisfy and improve the two process output. Keywords: Multi-objective, Six Sigma, Design of experiment, Chromjet printing {Citation: M. I. El Santty, A. A. Tharwat, R.A. Zein Eldin. Multi objective six sigma methodology: application on chromojet printing. American Journal of Research Communication, 2013, 1(7): 100-115} www.usa-journals.com , ISSN: 2325-4076. 1. Introduction: Dealing with one process output in quality improvement is not enough in today’s complex business environment. In most cases we deal with more than one requirement needed to be satisfied. In this paper we present the proposed methodology which improves the six sigma methodology based on the multi-objective techniques and Design of experiment. El Santty, et al., 2013: Vol 1(7) [email protected] 100
-
Upload
independent -
Category
Documents
-
view
0 -
download
0
Transcript of Multi Objective Six Sigma Methodology: Application on Chromojet Printing

American Journal of Research Communication www.usa-journals.com
Multi Objective Six Sigma Methodology: Application on Chromojet Printing
M.I. El Santty* & A.A. Tharwat** & R.A. Zein Eldin*
Cairo University, Cairo, Egypt
Abstract
Using multi objective techniques within quality improvement methodologies open and
enhance the link between operations research tools and techniques and quality improvement
techniques. In this paper we propose a methodology that link between multi objective techniques and
six sigma methodology which considered one of most important quality improvement strategy used
in continuous quality improvement in manufacturing, services, and health care sectors through
project basis frame work. Using the proposed methodology “multi objective six sigma” improve the
current six sigma methodology to be able to deal with two or more critical process output
simultaneously. Here we present this methodology and its main steps and techniques, and the
application of the proposed methodology in Chromjet printing process. By developing two
characteristic models that link between the main process input and two process output separately
using Design of experiment technique (DOE) and then we formulate Multi-objective Mathematical
model and solve the model using weighting method to get efficient solution satisfy and improve the
two process output.
Keywords: Multi-objective, Six Sigma, Design of experiment, Chromjet printing
Citation: M. I. El Santty, A. A. Tharwat, R.A. Zein Eldin. Multi objective six sigma
methodology: application on chromojet printing. American Journal of Research Communication,
2013, 1(7): 100-115 www.usa-journals.com, ISSN: 2325-4076.
1. Introduction:
Dealing with one process output in quality improvement is not enough in today’s complex
business environment. In most cases we deal with more than one requirement needed to be satisfied.
In this paper we present the proposed methodology which improves the six sigma methodology
based on the multi-objective techniques and Design of experiment.
El Santty, et al., 2013: Vol 1(7) [email protected]
100
American Journal of Research Communication www.usa-journals.com
Six sigma was launched by Motorola in 1987. It was the result of a series of changes in the quality
area starting in the late 1970s, with ambitious ten-fold improvement drives. The top-level
management along with CEO Robert Galvin developed a concept called Six Sigma. After some
internal pilot implementations, Galvin, in 1987, formulated the goal of “achieving Six-Sigma
capability by 1992” in a memo to all Motorola employees (Bhote, 1989). The results in terms of
reduction in process variation were on-track and cost savings totaled US$13 billion and improvement
in labor productivity achieved 204% increase over the period 1987–1997 (Losianowycz, 1999). Six
sigma phases described as Define, Measure, Analyze, Improve, and Control (DMAIC). The proposed
methodology is to dived the Improve phase in DMAIC to be Modeling, Optimize and implement,
and back to control so the proposed methodology will be Define, Measure, Analyze, Modeling,
Optimize, Implementation and Control (DMAMOIC) and application of modified methodology in
chromojet printing process which used in carpet printing.
In section 2 we present an over view on the multi objective definition and techniques, in section 3 we
present the six sigma definition and methodology, in section4 we present an over view on the design
of experiments (DOE), in section 5 we present overview on chromojet printing, in section 6 we
present the proposed methodology, in section 7 we present the application details in chromojet
printing, section 8 discussion and conclusion.
2. Multi objective optimization
In this section we present the definition and mathematical model and solution technique of multi
objective optimization problems.
Multi-objective problems are those problems where the goal is to optimize simultaneously k
objective functions on the form of
Minimize f1(x), f2(x) . . . fk(x) 2.1
Subject to x є S,
Where k ≥2 objective functions the objective function
F(x) = the decision variable vectors . Belong to the
(nonempty) feasible region set (S), which is a subset of the decision variable space . (Kaisia
Miettinen, 1994),
Multi-objective problems (as a rule) present a possibly uncountable set of solutions. Two Euclidean
spaces from Rn are considered in multi-objective problems.
• The n-dimensional space of the decision variables in which each coordinate axis corresponds
to a component of vector x;
El Santty, et al., 2013: Vol 1(7) [email protected]
101
American Journal of Research Communication www.usa-journals.com
• The k-dimensional space of the objective functions in which each coordinate axis
corresponds to a component vector fk(x).
The evaluation function of a multi-objective problem, F: Ω → Λ, maps the decision variables
(x = x1, . . . ,xn) to vectors (y = a1, . . . , ak). The set of solutions is found through the use of the
Pareto Optimality Theory (M. Ehrgott, 2000).
2.1. Solution techniques:
The solving of multi-objective optimization problem helps the decision maker in finding the
best solution that fits the specified preferences. The decision maker can be one or more experts in the
problem domain with the main task of selecting one of the Pareto optimal solutions. Multi-objective
optimization is a multi-disciplinary field which combines ideas from mathematical programming
with multiple criteria decision making, glued together by the computer programming techniques.
Multiple criteria decision making is the research domain which considers decision problems with
multiple conflicting objectives (Branke et al., 2008; Hakanen, 2006; Miettinen, 1999; Rangaiah,
2009). Methods available for multi-objective optimization can be classified in different ways. In the
classification adopted by Miettinen (1999), multi-objective optimization methods are split into two
main groups: generating methods and preferences-based methods. Methods from the first class
generate one or more Pareto-optimal solutions without any inputs from the decision maker. The
solutions obtained are then provided to the decision maker for selection. The generating methods are
divided into two subgroups: no-preference methods (in which additional preference information are
not required from the decision maker) and a posterior methods (which use posterior information to
select a solution from the generated Pareto front). Preference-based methods use the preferences
specified by the decision maker at some stage in solving the multi-objective optimization problem.
These have been divided in a priori methods (Pareto optimal solution is found using preference
information given by the decision maker at the beginning of the process) and interactive methods.
Interactive methods require multiple interactions with the decision maker during the optimization
procedure. For each interaction, the decision maker analyzes the generated Pareto optimal solution(s)
and specifies preferences. These preferences are used in formulating and solving the optimization
problem during the next iteration. The main steps of an interactive method are (Branke et al., 2008;
Rangaiah, 2009):
1. Initialization: calculating an ideal and/or nadir vector and presenting them to the decision maker;
2. Generation of a Pareto optimal starting point;
3. Requesting preference information from the decision maker;
El Santty, et al., 2013: Vol 1(7) [email protected]
102
American Journal of Research Communication www.usa-journals.com
4. Generation of a new Pareto optimal solution(s) based on specified preferences;
5. If several solutions were generated, the decision maker is asked to select the preferred one;
6. If the decision maker is satisfied with the obtained solution it comes to the end, else it goes to
step3.
2.2. Weighting Method:
In the weighting method the idea is to associate each objective function with a weighting
factor and minimize the weighted sum of objectives. In this way the multiple objective functions are
transformed into single objective function. We suppose that weighting coefficients are real
numbers such that for all it usually supposed to the weight are normalized, that
is and the multi objective optimization problem will modified to the following problem
(Kaisia Miettinen, 1994).
2.2
Subject to x є S
Where for all and
3. Six Sigma Methodology
In this section we present the definition of six sigma and main phases of six sigma
methodology known as DMAIC and the main target of each phase.
Six Sigma is defined by Linderman et al.(2003) as “an organized and systematic method for
strategic process improvement and new product and service development that relies on statistical
methods and the scientific method to make dramatic reductions in customer defined defect rates.’’
Academic research, such as Zu et al (2008) and Schroeder et al (2008), has tried to determine which
elements in Six Sigma make it effective. Besides its role structure and focus on metrics, Six Sigma’s
structured improvement procedure is seen as a novel and effective contribution to quality
management. This improvement procedure is generally known under the acronym DMAIC, standing
for Define, Measure, Analyze, Improve and Control. DMAIC is similar in function as its
El Santty, et al., 2013: Vol 1(7) [email protected]
103
American Journal of Research Communication www.usa-journals.com
predecessors in manufacturing problem solving, such as Plan-Do-Check-Act and the Seven Step
method of Juran and Gryna (Balakrishnan et al., 1995).
3.1. Six Sigma’s DMAIC method
The Six Sigma phenomenon does not refer to a single, clearly delineated method. Rather, it
refers to a related collection of practices in organizations, De Koning and DeMast (2006) make a
rational reconstruction of Six Sigma’s as a system of prescriptions; they discern four classes of
elements of the method:
A model of the function and purpose for which the method applies.
A stage model (DMAIC) providing a stepwise procedure.
A collection of techniques.
Concepts and classifications, such as Critical-to-Quality (CTQ) characteristics and the
distinction between the vital few and the trivial many causes.
Based on an extensive analysis of descriptions of these elements in the practitioners’ literature, De
Koning and DeMast (2006) conclude that these various accounts have enough commonalities to
consider them variations of a single method, thus claiming convergent validity for the method. From
a large number of sources, the functions of the DMAIC stages and their steps and prescribed actions
are reconstructed,
Define: problem selection and benefit analysis
Identify and map relevant processes, Identify stakeholders, Determine and prioritize customer needs
and requirements, and Make a business case for the project.
Measure: translation of the problem into a measurable form, and measurement of the current
situation; refined definition of objectives
Select one or more CTQs, Determine operational definitions for CTQs and requirements, Validate
measurement systems of the CTQs, Assess the current process capability, and Define objectives.
Analyze: identification of influence factors and causes that determine the CTQs’ behavior
Identify potential influence factors, and Select the vital few influence factors
Improve: design and implementation of adjustments to the process to improve the
performance of the CTQs
Quantify relationships between Xs and CTQs, Design actions to modify the process or settings of
influence factors in such a way that the CTQs are optimized, and Conduct pilot test of improvement
actions
Control: empirical verification of the project’s results and adjustment of the process
management and control system in order that improvements are sustainable
El Santty, et al., 2013: Vol 1(7) [email protected]
104
American Journal of Research Communication www.usa-journals.com
4. Design Of experiments (DOE):
Design of Experiments provides the foundation for experimenters to systematically investigate
hypotheses about systems and processes. By outlining a series of structured tests in which well
thought out adjustments are made to the controllable inputs of a process or system, then the effects of
these changes on a pre-defined output or response variable can be observed and their significance
evaluated. The importance of applying such a structured method is found in its ability to minimize
the number of factors influencing a system, maximize the responses deemed desirable in the system
by manipulating the factors, and minimize the amount of experimentation required to effectively
cover the design space characterized by the factors. It not only serves as a useful tool, but usually a
necessary tool in cases where performing ’one change at a time’ masks the interaction effects of
multiple, concurrent inputs on the system response. In comparison DOE plans for all of the possible
combinations of input variables initially. It then imposes data requirements which enable the
experimenter to determine the significance of that effect on the system response, and the
independence of that effect from the influence of others (Ahmed Abdallah, 2008).
DOE can be used in a wide variety of circumstances. Typically though the most common uses of
DOE are in the following situations (A. Dean and A. Voss, 1999):
• To help establish the main sources for variation in a measured response of a system,
• To uncover the conditions or sets of factor levels which create a maximum or minimum in the
response?
• To compare the effect which different levels of controllable variables have on the response?
• And to derive a mathematical model enabling the prediction or estimation of future responses.
These methods are well established and have been widely used in other fields of engineering. Their
application fields are widely varied and include manufacturing, industry, fabrication, IC design and
process calibration, biological science, social science, medicine, marketing, and even software
engineering.
5. Chromjet printing
Chromo jet is a computer-controlled design system, which applies the air-pressurized printing
dye point by point by means of high speed valves (jets) to the material to be printed. The open / close
control of the jets is performed by the machine computer (PC) connected using the stored color
information (= pattern). An intensity control is not available. To apply the printing dye according to
the pattern stored in the PC in a point-precise way onto the material, jets are used to control the dye
which is under air pressure. To obtain a precise switching on and cutting off of the dye streams, the
El Santty, et al., 2013: Vol 1(7) [email protected]
105
American Journal of Research Communication www.usa-journals.com
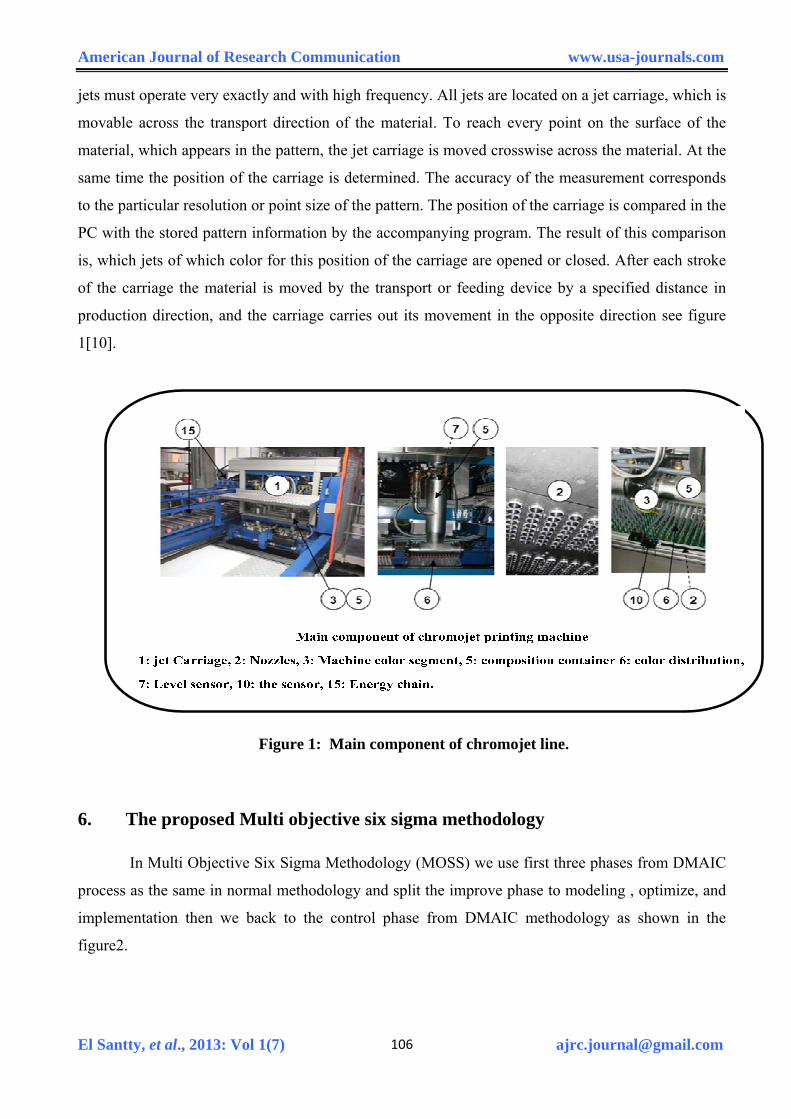
jets must operate very exactly and with high frequency. All jets are located on a jet carriage, which is
movable across the transport direction of the material. To reach every point on the surface of the
material, which appears in the pattern, the jet carriage is moved crosswise across the material. At the
same time the position of the carriage is determined. The accuracy of the measurement corresponds
to the particular resolution or point size of the pattern. The position of the carriage is compared in the
PC with the stored pattern information by the accompanying program. The result of this comparison
is, which jets of which color for this position of the carriage are opened or closed. After each stroke
of the carriage the material is moved by the transport or feeding device by a specified distance in
production direction, and the carriage carries out its movement in the opposite direction see figure
1[10].
Figure 1: Main component of chromojet line.
6. The proposed Multi objective six sigma methodology
In Multi Objective Six Sigma Methodology (MOSS) we use first three phases from DMAIC
process as the same in normal methodology and split the improve phase to modeling , optimize, and
implementation then we back to the control phase from DMAIC methodology as shown in the
figure2.
El Santty, et al., 2013: Vol 1(7) [email protected]
106
American Journal of Research Communication www.usa-journals.com
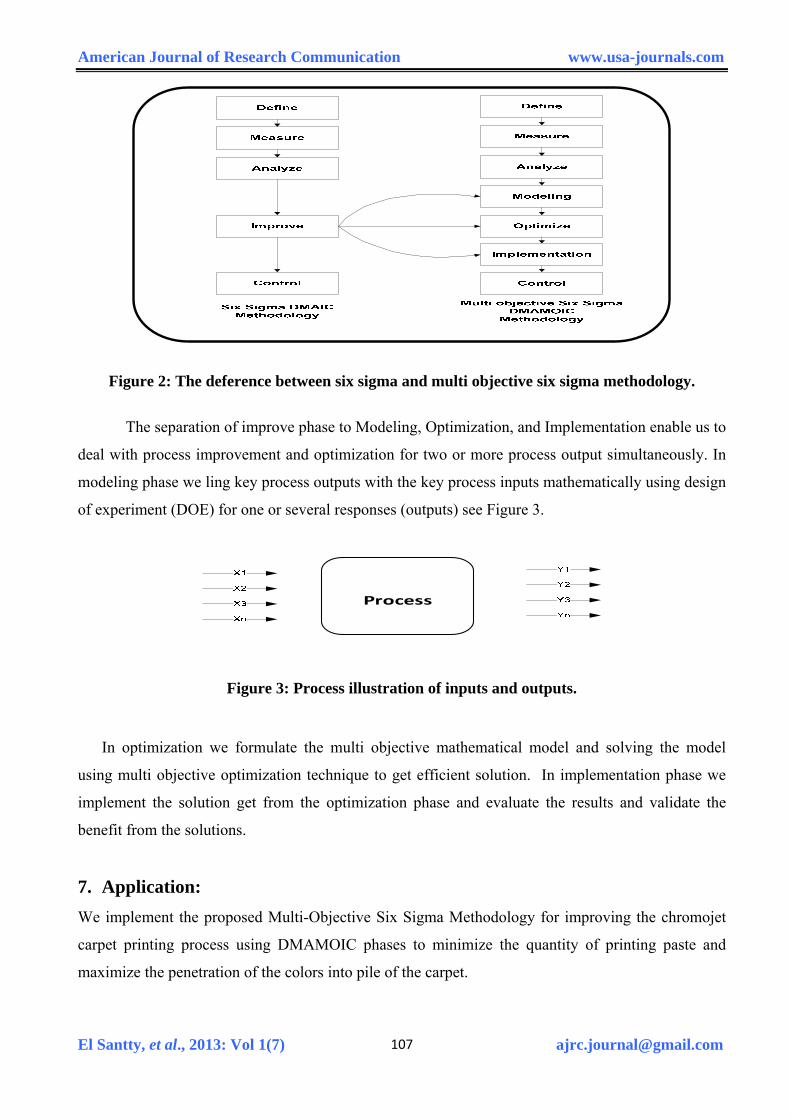
Figure 2: The deference between six sigma and multi objective six sigma methodology.
The separation of improve phase to Modeling, Optimization, and Implementation enable us to
deal with process improvement and optimization for two or more process output simultaneously. In
modeling phase we ling key process outputs with the key process inputs mathematically using design
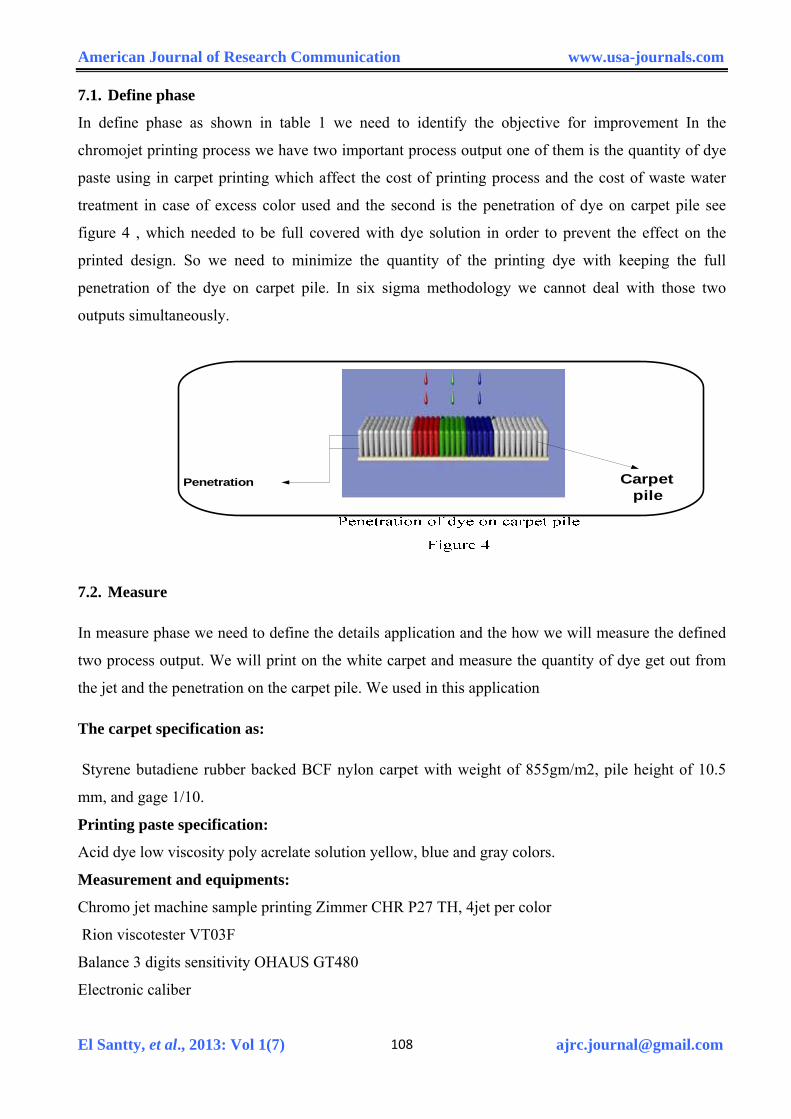
of experiment (DOE) for one or several responses (outputs) see Figure 3.
Process
Figure 3: Process illustration of inputs and outputs.
In optimization we formulate the multi objective mathematical model and solving the model
using multi objective optimization technique to get efficient solution. In implementation phase we
implement the solution get from the optimization phase and evaluate the results and validate the
benefit from the solutions.
7. Application:
We implement the proposed Multi-Objective Six Sigma Methodology for improving the chromojet
carpet printing process using DMAMOIC phases to minimize the quantity of printing paste and
maximize the penetration of the colors into pile of the carpet.
El Santty, et al., 2013: Vol 1(7) [email protected]
107
American Journal of Research Communication www.usa-journals.com
7.1. Define phase
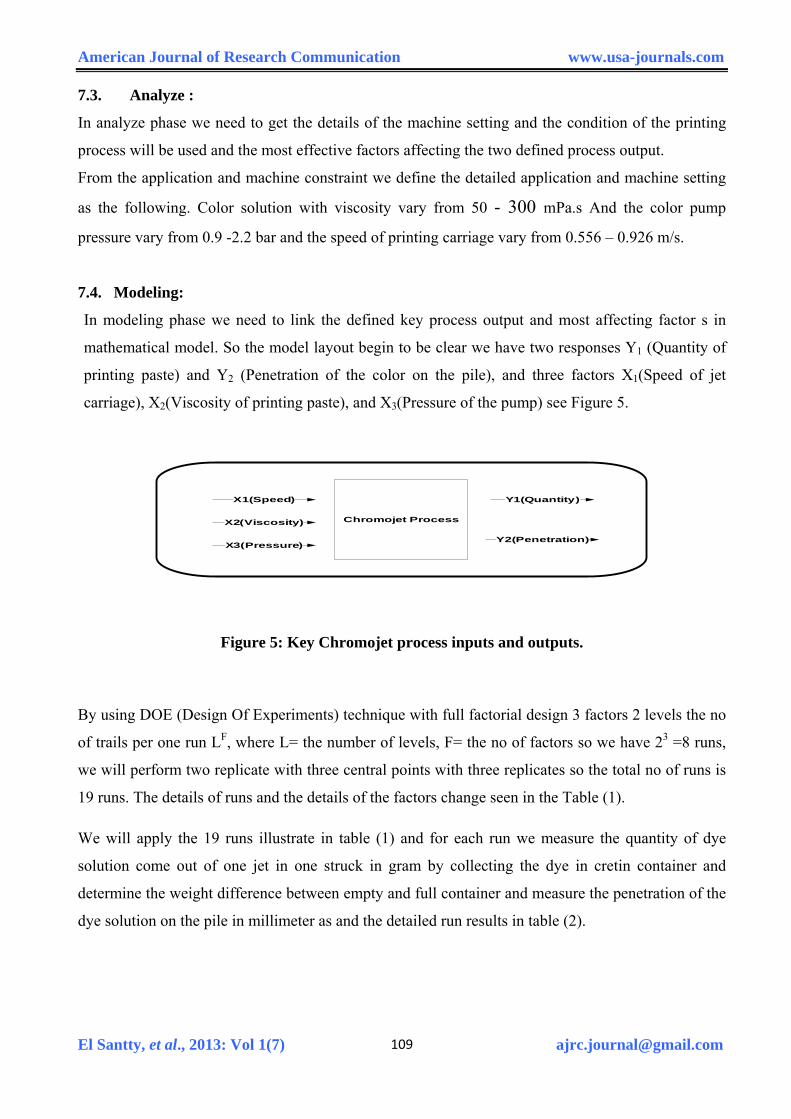
In define phase as shown in table 1 we need to identify the objective for improvement In the
chromojet printing process we have two important process output one of them is the quantity of dye
paste using in carpet printing which affect the cost of printing process and the cost of waste water
treatment in case of excess color used and the second is the penetration of dye on carpet pile see
figure 4 , which needed to be full covered with dye solution in order to prevent the effect on the
printed design. So we need to minimize the quantity of the printing dye with keeping the full
penetration of the dye on carpet pile. In six sigma methodology we cannot deal with those two
outputs simultaneously.
Carpet pile
Penetration
7.2. Measure
In measure phase we need to define the details application and the how we will measure the defined
two process output. We will print on the white carpet and measure the quantity of dye get out from
the jet and the penetration on the carpet pile. We used in this application
The carpet specification as:
Styrene butadiene rubber backed BCF nylon carpet with weight of 855gm/m2, pile height of 10.5
mm, and gage 1/10.
Printing paste specification:
Acid dye low viscosity poly acrelate solution yellow, blue and gray colors.
Measurement and equipments:
Chromo jet machine sample printing Zimmer CHR P27 TH, 4jet per color
Rion viscotester VT03F
Balance 3 digits sensitivity OHAUS GT480
Electronic caliber
El Santty, et al., 2013: Vol 1(7) [email protected]
108
American Journal of Research Communication www.usa-journals.com
7.3. Analyze :
In analyze phase we need to get the details of the machine setting and the condition of the printing
process will be used and the most effective factors affecting the two defined process output.
From the application and machine constraint we define the detailed application and machine setting
as the following. Color solution with viscosity vary from 50 - 300 mPa.s And the color pump
pressure vary from 0.9 -2.2 bar and the speed of printing carriage vary from 0.556 – 0.926 m/s.
7.4. Modeling:
In modeling phase we need to link the defined key process output and most affecting factor s in
mathematical model. So the model layout begin to be clear we have two responses Y1 (Quantity of
printing paste) and Y2 (Penetration of the color on the pile), and three factors X1(Speed of jet
carriage), X2(Viscosity of printing paste), and X3(Pressure of the pump) see Figure 5.
Chromojet Process
X1(Speed)
X2(Viscosity)
X3(Pressure)
Y1(Quantity)
Y2(Penetration)
Figure 5: Key Chromojet process inputs and outputs.
By using DOE (Design Of Experiments) technique with full factorial design 3 factors 2 levels the no
of trails per one run LF, where L= the number of levels, F= the no of factors so we have 23 =8 runs,
we will perform two replicate with three central points with three replicates so the total no of runs is
19 runs. The details of runs and the details of the factors change seen in the Table (1).
We will apply the 19 runs illustrate in table (1) and for each run we measure the quantity of dye
solution come out of one jet in one struck in gram by collecting the dye in cretin container and
determine the weight difference between empty and full container and measure the penetration of the
dye solution on the pile in millimeter as and the detailed run results in table (2).
El Santty, et al., 2013: Vol 1(7) [email protected]
109

American Journal of Research Communication www.usa-journals.com
Table (1): the DOE run details
Run
Order Speed (m/s)
Viscosity
(mPa.s) Pressure(bar)
Run
Order Speed (m/s)
Viscosity
(mPa.s) Pressure(bar)
1 0.556 300 2.2 11 0.926 80 2.2
2 0.764 190 1.55 12 0.764 190 1.55
3 0.764 190 1.55 13 0.926 80 0.9
4 0.556 80 0.9 14 0.556 80 2.2
5 0.926 300 2.2 15 0.556 80 0.9
6 0.926 300 2.2 16 0.556 80 2.2
7 0.556 300 0.9 17 0.926 80 2.2
8 0.926 80 0.9 18 0.556 300 2.2
9 0.926 300 0.9 19 0.926 300 0.9
10 0.556 300 0.9
Table (2): The results of the trail runs
Run
Order S V P
Qty/1
jet(gm)
Penetration
(mm)
Run
Order S V P
Qty/1
jet(gm)
Penetration
(mm)
1 0.556 300 2.2 1.0342 4.64 11 0.926 80 2.2 0.9352 6.67
2 0.764 190 1.55 0.7654 5.58 12 0.764 190 1.55 0.7352 4.85
3 0.764 190 1.55 0.7241 5.24 13 0.926 80 0.9 0.459 5.9
4 0.556 80 0.9 0.7938 6.19 14 0.556 80 2.2 1.513 9.47
5 0.926 300 2.2 0.6188 5.29 15 0.556 80 0.9 0.926 5.73
6 0.926 300 2.2 0.5628 4.86 16 0.556 80 2.2 1.7416 8.98
7 0.556 300 0.9 0.61 5.96 17 0.926 80 2.2 0.8523 6
8 0.926 80 0.9 0.4355 5.38 18 0.556 300 2.2 1.2284 6.46
9 0.926 300 0.9 0.2229 3.39 19 0.926 300 0.9 0.2191 4.26
10 0.556 300 0.9 0.3754 4.53
S: Speed, V: Viscosity, and P: pressure
By using the Minitab 14 in analysis of the data got from DOE. We can conclude that for the response
Y1 (Quantity of the printing paste) we will take in consideration the Main effects of factors speed,
Viscosity, and Pressure, and the neglect the other effects, For response Y2 (Penetration of dye on
pile) we will take in consideration the main effects of Factors speed, Viscosity, and Pressure, and
El Santty, et al., 2013: Vol 1(7) [email protected]
110
American Journal of Research Communication www.usa-journals.com
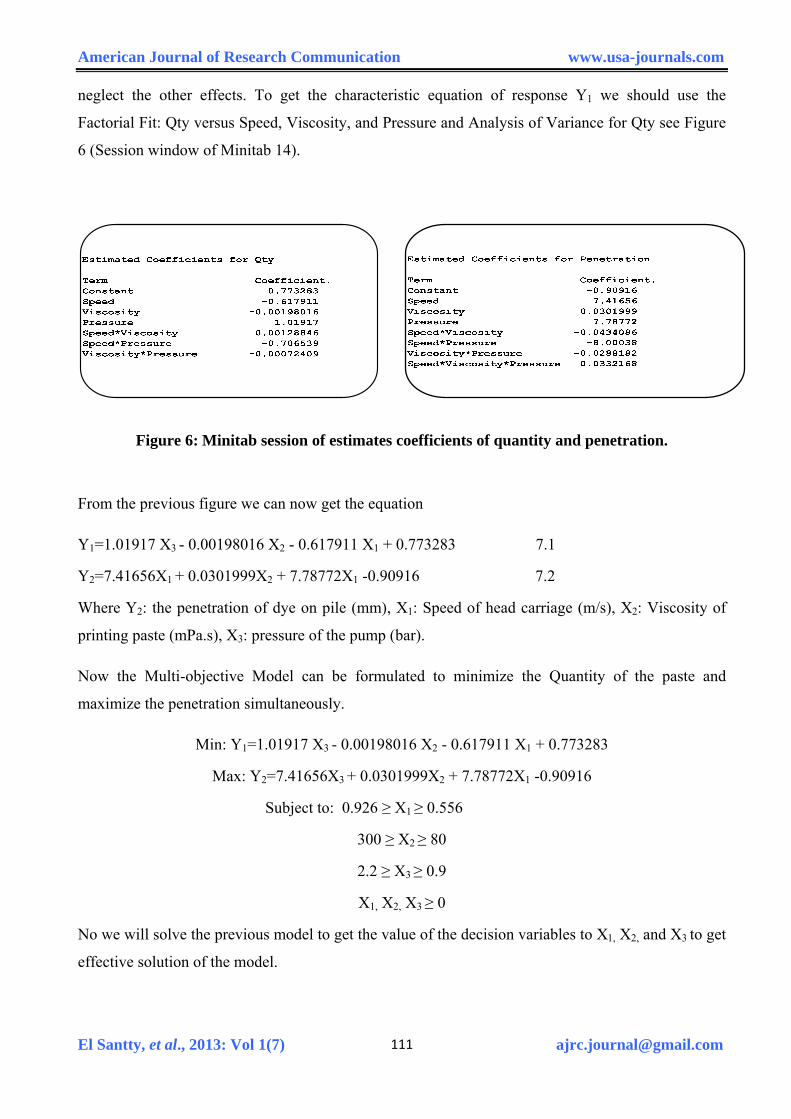
neglect the other effects. To get the characteristic equation of response Y1 we should use the
Factorial Fit: Qty versus Speed, Viscosity, and Pressure and Analysis of Variance for Qty see Figure
6 (Session window of Minitab 14).
Figure 6: Minitab session of estimates coefficients of quantity and penetration.
From the previous figure we can now get the equation
Y1=1.01917 X3 - 0.00198016 X2 - 0.617911 X1 + 0.773283 7.1
Y2=7.41656X1 + 0.0301999X2 + 7.78772X1 -0.90916 7.2
Where Y2: the penetration of dye on pile (mm), X1: Speed of head carriage (m/s), X2: Viscosity of
printing paste (mPa.s), X3: pressure of the pump (bar).
Now the Multi-objective Model can be formulated to minimize the Quantity of the paste and
maximize the penetration simultaneously.
Min: Y1=1.01917 X3 - 0.00198016 X2 - 0.617911 X1 + 0.773283
Max: Y2=7.41656X3 + 0.0301999X2 + 7.78772X1 -0.90916
Subject to: 0.926 ≥ X1 ≥ 0.556
300 ≥ X2 ≥ 80
2.2 ≥ X3 ≥ 0.9
X1, X2, X3 ≥ 0
No we will solve the previous model to get the value of the decision variables to X1, X2, and X3 to get
effective solution of the model.
El Santty, et al., 2013: Vol 1(7) [email protected]
111
American Journal of Research Communication www.usa-journals.com
7.5. Optimization:
In optimization phase we need to solve the previous model to get the value of Xi which satisfy the
constraint and achieve acceptable solution for the objective functions (efficient solution).
We use in solving this model the weighting method with W=0.7 for Y1 and 0.3 for Y2 (1-W).
The Model will be:
Min: Y1=1.01917 X3 - 0.00198016 X2 - 0.617911 X1 + 0.773283
Min: - Y2=-7.41656X3 - 0.0301999X2 - 7.78772X1 +0.90916
Subject to: 0.926 ≥ X1 ≥ 0.556
300 ≥ X2 ≥ 80
2.2 ≥ X3 ≥ 0.9
X1, X2, X3 ≥ 0
We transfer the objective function of Y2 to Minimize by multiplying in by -1 the two side of the
function.
The Model will be:
Min: Q = -2.76885 X1 -0.01045 X2 -1.51155 X3 +0.814046
Subject To: 0.926 ≥ X1 ≥ 0.556
300 ≥ X2 ≥ 80
2.2 ≥ X3 ≥ 0.9
X1, X2, X3 ≥ 0
We will neglect the fixed no added to the equation in mathematical model then we will add it to the
final solution value of objective function.
So the model will be:
Min: Q = -2.76885 X1 -0.01045 X2 -1.51155 X3
Subject To: 0.926 ≥ X1 ≥ 0.556
300 ≥ X2 ≥ 80
2.2 ≥ X3 ≥ 0.9
X1, X2, X3 ≥ 0
El Santty, et al., 2013: Vol 1(7) [email protected]
112
American Journal of Research Communication www.usa-journals.com
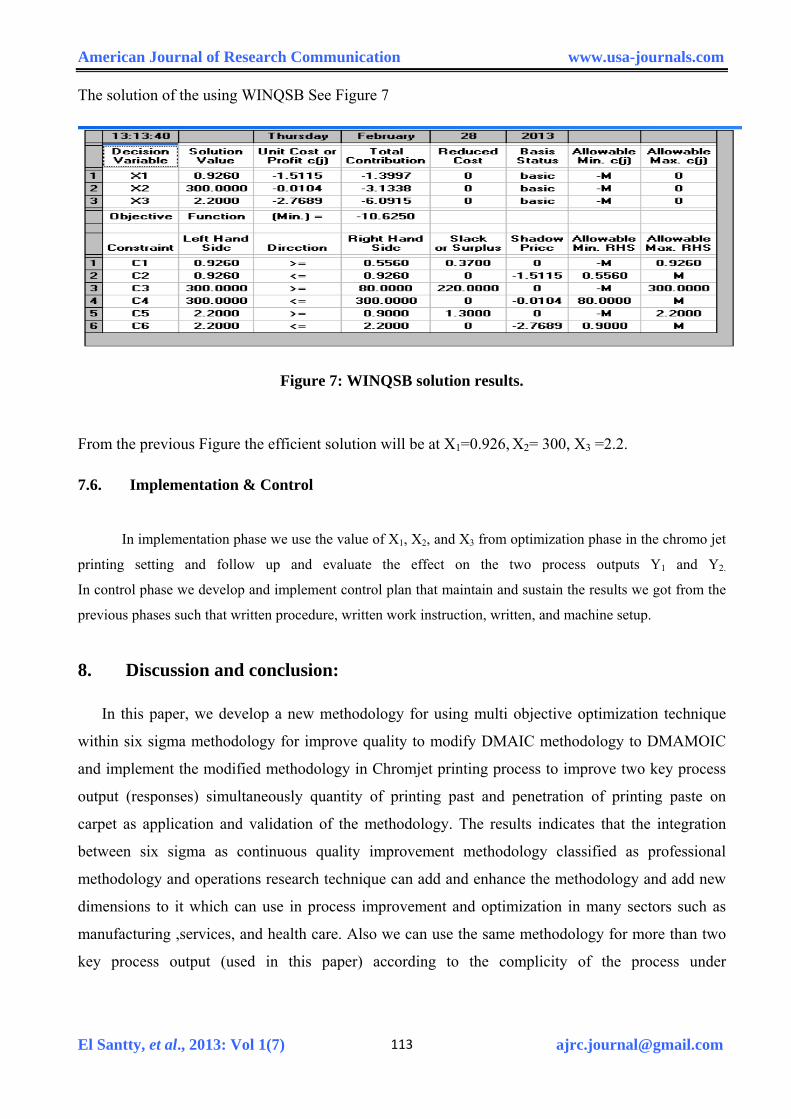
The solution of the using WINQSB See Figure 7
Figure 7: WINQSB solution results.
From the previous Figure the efficient solution will be at X1=0.926, X2= 300, X3 =2.2.
7.6. Implementation & Control
In implementation phase we use the value of X1, X2, and X3 from optimization phase in the chromo jet
printing setting and follow up and evaluate the effect on the two process outputs Y1 and Y2.
In control phase we develop and implement control plan that maintain and sustain the results we got from the
previous phases such that written procedure, written work instruction, written, and machine setup.
8. Discussion and conclusion:
In this paper, we develop a new methodology for using multi objective optimization technique
within six sigma methodology for improve quality to modify DMAIC methodology to DMAMOIC
and implement the modified methodology in Chromjet printing process to improve two key process
output (responses) simultaneously quantity of printing past and penetration of printing paste on
carpet as application and validation of the methodology. The results indicates that the integration
between six sigma as continuous quality improvement methodology classified as professional
methodology and operations research technique can add and enhance the methodology and add new
dimensions to it which can use in process improvement and optimization in many sectors such as
manufacturing ,services, and health care. Also we can use the same methodology for more than two
key process output (used in this paper) according to the complicity of the process under
El Santty, et al., 2013: Vol 1(7) [email protected]
113
American Journal of Research Communication www.usa-journals.com
investigation. The challenge now how to merge the operations research tools and techniques in the
quality improvement methodologies to be easy to use for non academic teams.
9. References
1. A. Dean and A. Voss., Design and Analysis of Experiments, New York: Springer-Verlag, 1999.
2. Ahmed Abdallah, Design of Experiments and the Empirical Development of Embedded System
Platforms, ProQuest LLC,2008
3. Balakrishnan, A., Kalakota, R., Si, Ow, P., Whinston, A.B., 1995.Document-centered
information systems to support reactive problem-solving in manufacturing. International Journal
of Production Economics 38,31–58
4. Bhote, K.R. (1989). Motorola’s long march to the Malcolm Baldrige National Quality Award,
National Productivity Review, 8 (4), pp.365-376.
5. Branke, J., Deb, K., Miettinen, K., & Slowinski, R. (2008). Multi objective optimization
Interactive and Evolutionary Approaches. Berlin: Springer.
6. De Koning, H., DeMast, J., 2006.A rational reconstruction of Six Sigma’s Breakthrough Cook
book. International Journal of Quality and Reliability Management 23(7), 766–787.
7. Hakanen, J., Kawajiri, Y., Miettinen, K., & Biegler, L. T. (2006). Interactive Multiobjective
optimization of simulated moving bed processes using IND-NIMBUS and IPOPT. Helsinki
School of Economics, Working Paper.
8. Kaisa Miettinen, on the methodology of multi-objective optimization with applications,
Jyvaskyla, 1994.
9. Linderman, K., Schroeder, R.G., Zaheer, S., Choo, A.S., 2003.Six Sigma: a goal- theoretic
Perspective, journal of operation management, 21,193-203.
10. Losianowycz, G., (1999). Six Sigma Quality: A Driver to Cultural Change& Improvement, an
invited lecture by Korean Standards Association at Seoul.
11. M. Ehrgott, Multi-criteria Optimization, Springer, Berlin, 2000.
12. Miettinen, K. M., (1999). Nonlinear multi objective optimization. Massachusetts: Kluwer
Academic Publisher.
13. Rangaiah, G. P., (2009). Advances in process systems engineering – Vol. 1. Multi-objective
optimization techniques and applications in chemical engineering. Singapore: World Scientific
Publishing.
El Santty, et al., 2013: Vol 1(7) [email protected]
114

American Journal of Research Communication www.usa-journals.com
El Santty, et al., 2013: Vol 1(7) [email protected]
115
14. Zu, X., Fredendall, L.W., Douglas, T.J., 2008.The evolving theory of quality management: the
role of Six Sigma. Journal of Operations Management26, 630–650.
15. Zimmer company Manual for model of CHR P27 TH, 4jet per color, from the site
www.zimmer.com.