Multi-Objective Optimization of Osmotic–Ultrasonic Pretreatments and Hot-Air Drying of Quince...
13
ORIGINAL PAPER Multi-Objective Optimization of Osmotic–Ultrasonic Pretreatments and Hot-Air Drying of Quince Using Response Surface Methodology Mohammad Noshad & Mohebbat Mohebbi & Fakhri Shahidi & Seyed Ali Mortazavi Received: 26 August 2010 / Accepted: 4 April 2011 / Published online: 23 June 2011 # Springer Science+Business Media, LLC 2011 Abstract In this study, application of a multi-objective optimization technique based on response surface methodology has been presented. Quince slices were dehydrated using osmotic dehydration with sucrose solutions at different concentration (40 and 60 Brix), processing time (1, 1.5, and 2 h), and ultrasonication time (0, 15, and 30 min) were the factors investigated with respect to water loss, solid gain, and weight reduction. Response surface methodology was used to determine the optimum processing conditions that yield maximum water loss and weight reduction and minimum solid gain during osmotic dehydration of quinces. Dehydrated quince slices at optimized osmo-ultrasound condition were then subjected to air-drying at 60 and 80 °C. Rehydration ratio, shrinkage, and moisture content of dried samples were regarded as responses to the non-thermal and air-drying conditions. Multi-objective optimization led to obtaining the best condition for production of dried quince slices with lowest moisture content, and shrinkage. Keywords Air-drying . Optimization . Quince . Response surface methodology . Ultrasonic–osmotic dehydration Introduction Quince (Cydonia oblonga Mill) is a member of pomes fruit family; 83.8% water and 15.3% carbohydrates (wet basis) are the main constituents of quince. Minor ingredients of quince are proteins (0.4%, wet basis) and fats (0.1%, wet basis). It is presumed to be a good source of fiber, potassium, and vitamin C. The mean of the last 10 years’ (1998–2008) world production of quince is estimated to be 510,000 t (FAO 2010). Fruit drying is a well-known process mostly used for preservation of fruits. Dried quince can also be used as ingredient of traditional Iranian food such as quince Khoresh and chowder. The traditional way, which is often used in Iran for quince drying, is to spread it into the direct sunlight. In such traditional drying methods, serious decreases of nutritive and sensorial values are possible, damaging mainly the flavor, color, and nutrients of the product (Lenart 1996; Lin et al. 1998). Therefore, it is essential to find better ways for drying quince. Since air-drying is a simultaneous heat and mass transfer process, which results in phase change, it is an energy intensive and consequently expensive process (Barbanti et al. 1994). To reduce initial water content or to modify the fruit tissue structure and decreasing drying time, different pre- treatment have been applied by researchers. Osmotic dehydration is the most reported pretreatment used prior to air-drying (Antonio et al. 2008; Pani et al. 2008; Lombard et al. 2008; Fernandes et al. 2008; Azoubel et al. 2009; Bchir et al. 2011; Sosa et al. 2011). Among emergent new technologies, ultrasonication is an encourag- ing process, which is commonly regarded as a non-thermal process; such process is favorable because of reduction in food degradation. No liquid phase change will occur in this process for water removal (Povey and Mason 1998; Fernandes et al. 2008). The ultrasonic pretreatment includes the immersion of the fruit in water or in a hypertonic aqueous solution to which ultrasound is applied. Ultrasonic waves in frequency range of 20–100 kHz can cause rapid series of alternative compressions and expansions in a similar way to a sponge M. Noshad (*) : M. Mohebbi : F. Shahidi : S. Ali Mortazavi Department of Food Science and Technology, Ferdowsi University of Mashhad, Mashhad, Iran e-mail: [email protected] Food Bioprocess Technol (2012) 5:2098–2110 DOI 10.1007/s11947-011-0577-8
-
Upload
independent -
Category
Documents
-
view
2 -
download
0
Transcript of Multi-Objective Optimization of Osmotic–Ultrasonic Pretreatments and Hot-Air Drying of Quince...
ORIGINAL PAPER
Multi-Objective Optimization of Osmotic–UltrasonicPretreatments and Hot-Air Drying of Quince Using ResponseSurface Methodology
Mohammad Noshad & Mohebbat Mohebbi &Fakhri Shahidi & Seyed Ali Mortazavi
Received: 26 August 2010 /Accepted: 4 April 2011 /Published online: 23 June 2011# Springer Science+Business Media, LLC 2011
Abstract In this study, application of a multi-objectiveoptimization technique based on response surfacemethodologyhas been presented. Quince slices were dehydrated usingosmotic dehydration with sucrose solutions at differentconcentration (40 and 60 Brix), processing time (1, 1.5, and2 h), and ultrasonication time (0, 15, and 30 min) were thefactors investigated with respect to water loss, solid gain, andweight reduction. Response surface methodology was used todetermine the optimum processing conditions that yieldmaximum water loss and weight reduction and minimum solidgain during osmotic dehydration of quinces. Dehydratedquince slices at optimized osmo-ultrasound condition werethen subjected to air-drying at 60 and 80 °C. Rehydration ratio,shrinkage, and moisture content of dried samples wereregarded as responses to the non-thermal and air-dryingconditions. Multi-objective optimization led to obtaining thebest condition for production of dried quince slices with lowestmoisture content, and shrinkage.
Keywords Air-drying . Optimization . Quince . Responsesurface methodology . Ultrasonic–osmotic dehydration
Introduction
Quince (Cydonia oblonga Mill) is a member of pomes fruitfamily; 83.8% water and 15.3% carbohydrates (wet basis)are the main constituents of quince. Minor ingredients ofquince are proteins (0.4%, wet basis) and fats (0.1%, wet
basis). It is presumed to be a good source of fiber,potassium, and vitamin C. The mean of the last 10 years’(1998–2008) world production of quince is estimated to be510,000 t (FAO 2010).
Fruit drying is a well-known process mostly used forpreservation of fruits. Dried quince can also be used asingredient of traditional Iranian food such as quinceKhoresh and chowder. The traditional way, which is oftenused in Iran for quince drying, is to spread it into the directsunlight. In such traditional drying methods, seriousdecreases of nutritive and sensorial values are possible,damaging mainly the flavor, color, and nutrients of theproduct (Lenart 1996; Lin et al. 1998). Therefore, it isessential to find better ways for drying quince.
Since air-drying is a simultaneous heat and mass transferprocess, which results in phase change, it is an energyintensive and consequently expensive process (Barbanti et al.1994). To reduce initial water content or to modify the fruittissue structure and decreasing drying time, different pre-treatment have been applied by researchers.
Osmotic dehydration is the most reported pretreatmentused prior to air-drying (Antonio et al. 2008; Pani et al.2008; Lombard et al. 2008; Fernandes et al. 2008; Azoubelet al. 2009; Bchir et al. 2011; Sosa et al. 2011). Amongemergent new technologies, ultrasonication is an encourag-ing process, which is commonly regarded as a non-thermalprocess; such process is favorable because of reduction infood degradation. No liquid phase change will occur in thisprocess for water removal (Povey and Mason 1998;Fernandes et al. 2008).
The ultrasonic pretreatment includes the immersion ofthe fruit in water or in a hypertonic aqueous solution towhich ultrasound is applied. Ultrasonic waves in frequencyrange of 20–100 kHz can cause rapid series of alternativecompressions and expansions in a similar way to a sponge
M. Noshad (*) :M. Mohebbi : F. Shahidi : S. Ali MortazaviDepartment of Food Science and Technology, FerdowsiUniversity of Mashhad,Mashhad, Irane-mail: [email protected]
Food Bioprocess Technol (2012) 5:2098–2110DOI 10.1007/s11947-011-0577-8

when it is squeezed and released repeatedly (sponge effect).In addition, ultrasound produces cavitations, which may behelpful to remove strongly attached moisture. The spongeeffect caused by ultrasound application may be responsiblefor the creation of microscopic channels in porousmaterials, such as fruits, that reduces the diffusion boundarylayer and increases the convective mass transfer in thefoodstuff (Tarleton 1992; Tarleton and Wakeman 1998; Dela Fuente-Blanco et al. 2006). This process can be carriedout at ambient temperature, and no heating is required;therefore, the probability of food degradation will decrease(Povey and Mason 1998). If distilled water is used as theliquid medium, the ultrasonic treatment will not incorporatesoluble solids into the fruit changing its natural taste(Fernandes et al. 2008).
Optimization has been used in food engineering for theefficient operation of processing systems and unit processesyielding a highly acceptable product. Response surfacemethodology (RSM) is the process, which combinesmathematics with statistics. In multifactor experiments,RSM can be used to comprehensively examine variousparameters with minimum experimental times and deter-mine the most relevant factors and their influence ranges aswell as interactions among the factors. This experimentalstrategy has been widely used in the development of foodprocesses (Emadzadeh et al. 2011; Corzo et al. 2008;Chakraborty et al. 2007; Yao et al. 2007; Sharma andPrasad 2006; Varnalis et al. 2004).
In industrial processes, several response variables describequality characteristics of the final products; such exestuationcan be carried out with multi-objective optimization. One ofthe critical points in these procedures is the opposing nature ofdifferent variables in some statues. This fact makes optimiza-tion procedure a challenging issue in food industries, whichshould lead to a compromise between several objectives.Constrained optimization technique can overcome this prob-lem. On the other hand, superimposing the contour plot ofdifferent response variation and solving the problem ofmultiple responses by defining a multi-objective functionincluding all responses may be regarded to as an alternativestrategy (Eren and Kaymak-Ertekin 2007).
Making response variable dimensionless, deciding weight-ing coefficient, composing objective function and solution,and applying fuzzy similar precedable ratio method areseveral approaches for defining desirability functions in anoptimization problem (Erbay and Icier 2009; Shi et al. 2008).
For optimization or assessing multiple responses andinitiating logical mathematical model with easy graphicalexplanation of a process, RSM can be utilized (Fermin andCorzo 2005; Corzo and Gomez 2004; Madamba 2002;Garrote et al. 1993; Guillou and Floros 1993).
The main objective of this study was: (1) to investigatemain effects of process variables on the product quality
during ultrasound-osmotic dehydration pretreatment ofdrying quince; (2) to investigate main effects of processvariables on the product quality during hot air-drying ofquince; (3) to determine optimum process conditions fordrying of quince.
Material and Methods
Preparation of Samples
Fresh quinces (varieties of Nishabur) were purchased atlocal market in Mashhad, Iran. Ripe quinces were sorted,washed, and hand-peeled. The peeled quince samples werecut to obtain cylinders of the same dimensions (0.01 maverage in height and 0.026 m average diameter) and thenimmersed in 1% sodium Meta bisulphate solution for 5 minin order to prevent enzymatic browning reactions. Themoisture content was determined upon AOAC method931.04(AOAC 1990).
Ultrasonication
An experimental set of four quince samples was immersed indistilled water and submitted to ultrasonic waves for 0–30 min.The experiments with ultrasound treatment were carried out inseparate 250-ml Erlenmeyer flasks to avoid interferencebetween the samples and runs. The experiments were carriedout under ambient temperature (30 °C) in an ultrasonic bath(SCHAPER model Unique USC 25 kHz) without mechanicalagitation. The ultrasound frequency was 25 kHz, and the poweroutput of ultrasonic bath was 500 W. The temperature increasewas measured using a thermometer and was lower than 2 °Cafter 30 min of ultrasonic treatment. To determine the effect ofultrasound, the same experimental procedure was carried outwithout applying ultrasound. After removal from the distilledwater, the samples from each group were drained and blottedwith absorbent paper to remove the excess water. Weight andmoisture content were measured individually. At the end,samples were transferred to osmotic solution.
Osmotic Dehydration
Each experimental group consisting of three quincecylinders was immersed in the osmotic solution for 1, 1.5,or 2 h. The osmotic solution used in each experiment wasprepared by mixing food-grade sucrose with distilled waterto give a concentration of 40–60°Brix. The osmoticsolution to fruit ratio was maintained at 20:1 (weight basis).Experiments were performed with the same constantmagnetic agitation. The temperature was monitored by thethermocouple and heating plate of the rotary shaker andwas set at 50 °C. After removal from the solution, the
Food Bioprocess Technol (2012) 5:2098–2110 2099

dehydrated samples from each group were drained andblotted with absorbent paper to remove the excess solution.Weight and moisture content were measured individually.The concentration of the solution was monitored during theruns for determining the osmotic solution soluble solidscontent (°Brix) using a refract meter.
Weight and moisture content of the samples were used tocalculate the response variables of the experimentalplanning: weight reduction (WR), water loss (WL), andsolid gain (SG), according to the following equation:
WL ¼ mizi � mf zfmi
� 100 g=100 g fresh sampleð Þ ð1Þ
SG ¼ mf sf � misimi
� 100 g=100 g fresh sampleð Þ ð2Þ
WR ¼ WL� SG g=100 g fresh sampleð Þ ð3Þ
where mi and mf are the initial and final weight (g) of thesamples, respectively; zi and zf are the initial and final massfraction of water (g water/g sample), respectively; si and sfare the initial and final mass fraction of total solids (g totalsolids/g sample), respectively. All experiments were donein triplicate.
Air-Drying
Hot air-drying was performed in a laboratory drier (SoroushMedical Company) operating with air velocity of 1.5 m/s.Before each drying experiment, the drier was run withoutsample for about 0.5 h to set desired conditions. The quincesamples pretreated with osmotic dehydration and ultrasonicwere subjected to air-drying at 60–80 °C. Air-drying wascarried out for 4, 5, and 6 h. Finally, the moisture content ofdried quince was determined upon AOAC method 931.04(AOAC 1990). The experiments were conducted with fourreplications.
Determination of Shrinkage, Moisture Content,and Rehydration Ratio
Percentage of shrinkage was determined from the changesof the bulk volume of the quince slices using the liquiddisplacement method (Eq. 4) (Ko et al. 2008). In this study,toluene was used instead of water because it causedreduction of liquid absorption into the fruits.
Sh ¼ V0 � V
V0� 100 ð4Þ
Where V0 and V are initial and final volume of the sample.
The moisture content, based on dry basis, was deter-mined as follows (Eq. 5) (Ayensu 1997):
Xi ¼ Mi �Md
Mdð5Þ
Where Mi is weight in time i, Md is the weight of the driedproduct.
Rehydration ratio (RR) was evaluated by soaking knownweight (5–10 g) of each sample in a sufficient volume ofwater (approximately 30 times the weight of dried quince) in aglass beaker at 95 °C for 20 min. After soaking, the excesswater was removed with the help of absorbent paper, andsamples were weighed. The rehydration ratio was computedusing Eq. 6 (Alam et al. 2010; Johnson et al. 1998):
RR ¼ Wr
Wdð6Þ
Where, Wr is the drained weight of rehydrated sample (g) andWd is the weight of dried sample used for rehydration (g).
Experimental Design and Statistical Analysis
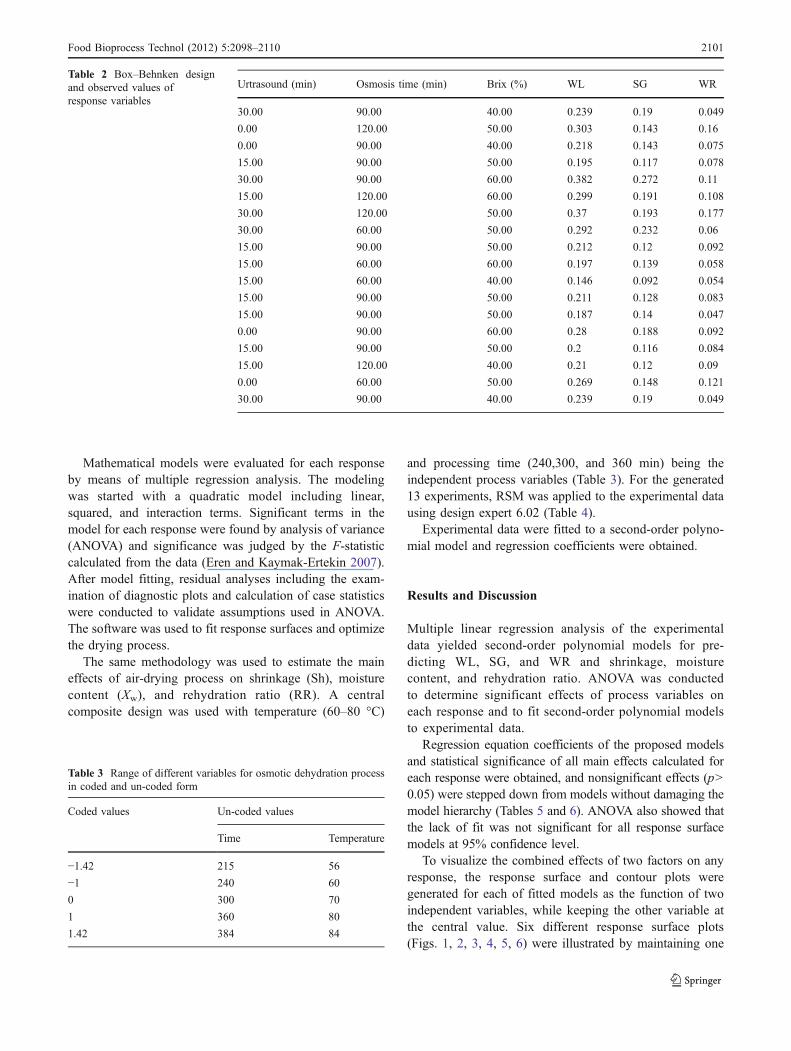
In the first step, the response surface methodology was usedto estimate the main effects of the process variables on WL,WR, and SG in quince slice. A Box–Behnken design wasused with sugar concentration (40–60%, w/w), osmoticdehydration (60–120 min), and ultrasonic (0-30 min) beingthe independent process variables (Table 1). This generated17 experiments with five replications at the center point(Table 2). The RSM was applied to the experimental datausing a commercial statistical package, Design-Expertversion6.02 (Stat ease Inc., Minneapolis, USA). Thefollowing polynomial model was fitted to the data:
Y ¼ b0 þ b1X1 þ b2X2 þ b3X3 þ b11X12 þ X22X2
2
þ b33X32 þ b12X1X2 þ b13X1X3 þ b23X2X3 ð7Þ
Where bn are constant regression coefficients; Y is theresponse (i.e., WL, SG, and WR); X1, X2, and X3 areultrasound time (min), osmosis time (min), and Brix (%),respectively.
Table 1 Range of different variables for osmotic dehydration processin coded and uncoded form
Coded values Uncoded values
Ultrasound min Osmosis time (min) Brix (%)
−1 0 60 40
0 15 90 50
1 30 120 60
2100 Food Bioprocess Technol (2012) 5:2098–2110
Mathematical models were evaluated for each responseby means of multiple regression analysis. The modelingwas started with a quadratic model including linear,squared, and interaction terms. Significant terms in themodel for each response were found by analysis of variance(ANOVA) and significance was judged by the F-statisticcalculated from the data (Eren and Kaymak-Ertekin 2007).After model fitting, residual analyses including the exam-ination of diagnostic plots and calculation of case statisticswere conducted to validate assumptions used in ANOVA.The software was used to fit response surfaces and optimizethe drying process.
The same methodology was used to estimate the maineffects of air-drying process on shrinkage (Sh), moisturecontent (Xw), and rehydration ratio (RR). A centralcomposite design was used with temperature (60–80 °C)
and processing time (240,300, and 360 min) being theindependent process variables (Table 3). For the generated13 experiments, RSM was applied to the experimental datausing design expert 6.02 (Table 4).
Experimental data were fitted to a second-order polyno-mial model and regression coefficients were obtained.
Results and Discussion
Multiple linear regression analysis of the experimentaldata yielded second-order polynomial models for pre-dicting WL, SG, and WR and shrinkage, moisturecontent, and rehydration ratio. ANOVA was conductedto determine significant effects of process variables oneach response and to fit second-order polynomial modelsto experimental data.
Regression equation coefficients of the proposed modelsand statistical significance of all main effects calculated foreach response were obtained, and nonsignificant effects (p>0.05) were stepped down from models without damaging themodel hierarchy (Tables 5 and 6). ANOVA also showed thatthe lack of fit was not significant for all response surfacemodels at 95% confidence level.
To visualize the combined effects of two factors on anyresponse, the response surface and contour plots weregenerated for each of fitted models as the function of twoindependent variables, while keeping the other variable atthe central value. Six different response surface plots(Figs. 1, 2, 3, 4, 5, 6) were illustrated by maintaining one
Table 3 Range of different variables for osmotic dehydration processin coded and un-coded form
Coded values Un-coded values
Time Temperature
−1.42 215 56
−1 240 60
0 300 70
1 360 80
1.42 384 84
Urtrasound (min) Osmosis time (min) Brix (%) WL SG WR
30.00 90.00 40.00 0.239 0.19 0.049
0.00 120.00 50.00 0.303 0.143 0.16
0.00 90.00 40.00 0.218 0.143 0.075
15.00 90.00 50.00 0.195 0.117 0.078
30.00 90.00 60.00 0.382 0.272 0.11
15.00 120.00 60.00 0.299 0.191 0.108
30.00 120.00 50.00 0.37 0.193 0.177
30.00 60.00 50.00 0.292 0.232 0.06
15.00 90.00 50.00 0.212 0.12 0.092
15.00 60.00 60.00 0.197 0.139 0.058
15.00 60.00 40.00 0.146 0.092 0.054
15.00 90.00 50.00 0.211 0.128 0.083
15.00 90.00 50.00 0.187 0.14 0.047
0.00 90.00 60.00 0.28 0.188 0.092
15.00 90.00 50.00 0.2 0.116 0.084
15.00 120.00 40.00 0.21 0.12 0.09
0.00 60.00 50.00 0.269 0.148 0.121
30.00 90.00 40.00 0.239 0.19 0.049
Table 2 Box–Behnken designand observed values ofresponse variables
Food Bioprocess Technol (2012) 5:2098–2110 2101
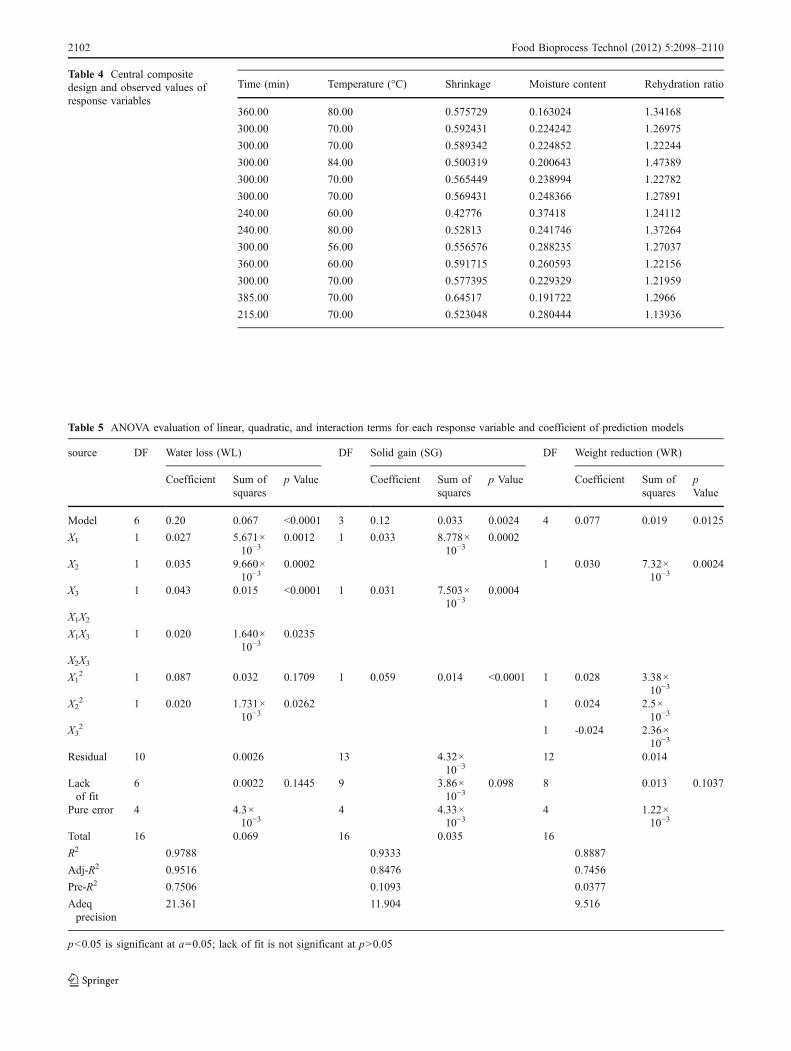
Table 5 ANOVA evaluation of linear, quadratic, and interaction terms for each response variable and coefficient of prediction models
source DF Water loss (WL) DF Solid gain (SG) DF Weight reduction (WR)
Coefficient Sum ofsquares
p Value Coefficient Sum ofsquares
p Value Coefficient Sum ofsquares
pValue
Model 6 0.20 0.067 <0.0001 3 0.12 0.033 0.0024 4 0.077 0.019 0.0125
X1 1 0.027 5.671×10⁻³
0.0012 1 0.033 8.778×10⁻³
0.0002
X2 1 0.035 9.660×10⁻³
0.0002 1 0.030 7.32×10⁻³
0.0024
X3 1 0.043 0.015 <0.0001 1 0.031 7.503×10⁻³
0.0004
X1X2
X1X3 1 0.020 1.640×10⁻³
0.0235
X2X3
X12 1 0.087 0.032 0.1709 1 0.059 0.014 <0.0001 1 0.028 3.38×
10−3
X22 1 0.020 1.731×
10−30.0262 1 0.024 2.5×
10−3
X32 1 -0.024 2.36×
10−3
Residual 10 0.0026 13 4.32×10⁻³
12 0.014
Lackof fit
6 0.0022 0.1445 9 3.86×10⁻³
0.098 8 0.013 0.1037
Pure error 4 4.3×10⁻³
4 4.33×10⁻³
4 1.22×10⁻³
Total 16 0.069 16 0.035 16
R2 0.9788 0.9333 0.8887
Adj-R2 0.9516 0.8476 0.7456
Pre-R2 0.7506 0.1093 0.0377
Adeqprecision
21.361 11.904 9.516
p<0.05 is significant at a=0.05; lack of fit is not significant at p>0.05
Time (min) Temperature (°C) Shrinkage Moisture content Rehydration ratio
360.00 80.00 0.575729 0.163024 1.34168
300.00 70.00 0.592431 0.224242 1.26975
300.00 70.00 0.589342 0.224852 1.22244
300.00 84.00 0.500319 0.200643 1.47389
300.00 70.00 0.565449 0.238994 1.22782
300.00 70.00 0.569431 0.248366 1.27891
240.00 60.00 0.42776 0.37418 1.24112
240.00 80.00 0.52813 0.241746 1.37264
300.00 56.00 0.556576 0.288235 1.27037
360.00 60.00 0.591715 0.260593 1.22156
300.00 70.00 0.577395 0.229329 1.21959
385.00 70.00 0.64517 0.191722 1.2966
215.00 70.00 0.523048 0.280444 1.13936
Table 4 Central compositedesign and observed values ofresponse variables
2102 Food Bioprocess Technol (2012) 5:2098–2110
of factors constant for each figure. These figures weretypical examples plotted for center points of constant factor.Effects of variables on responses were discussed byevaluation of these plots.
Model adequacy checking may be carried out steppingdown the effects that are not significant (p>0.05) andpredicted R2. A predicted-R2 comparable to fitted R2
implies that the fitted is adequate to predicting. Predicted-
Table 6 ANOVA evaluation of linear, quadratic, and interaction terms for each response variable and coefficient of prediction models
Source DF Shrinkage DF Moisture content DF Rehydretion ratio
Coefficient Sum ofsquares
p Value Coefficient Sum ofsquares
p Value Coefficient Sum ofsquares
pValue
Model 3 0.58 0.029 <0.0001 3 0.23 0.032 <0.0001 2 1.24 0.084 0.0035
X1 1 0.061 0.019 <0.0001 1 −0.047 0.013 <0.0001
X2 1 −0.053 0.017 <0.0001 1 0.076 0.035 0.0052
X1X2 1 −0.029 4.692×10⁻³
0.0033
X12
X22 1 −0.044 5.630×
10−30.0019 1 0.017 1.4×
10−30.1482 1 0.084 0.023 0.0162
Residual 9 3×10⁻³
9 1.33×10⁻³
10 0.027
Lackof fit
5 2.45×10⁻³
0.1262 5 9.05×10⁻³
0.4243 6 0.024 0.0798
Pureerror
4 5.65×10⁻⁴
4 4.29×10⁻⁴
4 8×10⁻³
Total 12 0.030 12 0.033 12 0.089
R2 0.904 0.9594 0.8404
Adj-R2 0.8827 0.9478 0.6769
Pre-R2 0.6 0.8946 −1.2059Adeqprecision
19.958 29.382 9.070
P value <0.05 is significant at a=0.05; lack of fit is not significant at p value >0.05
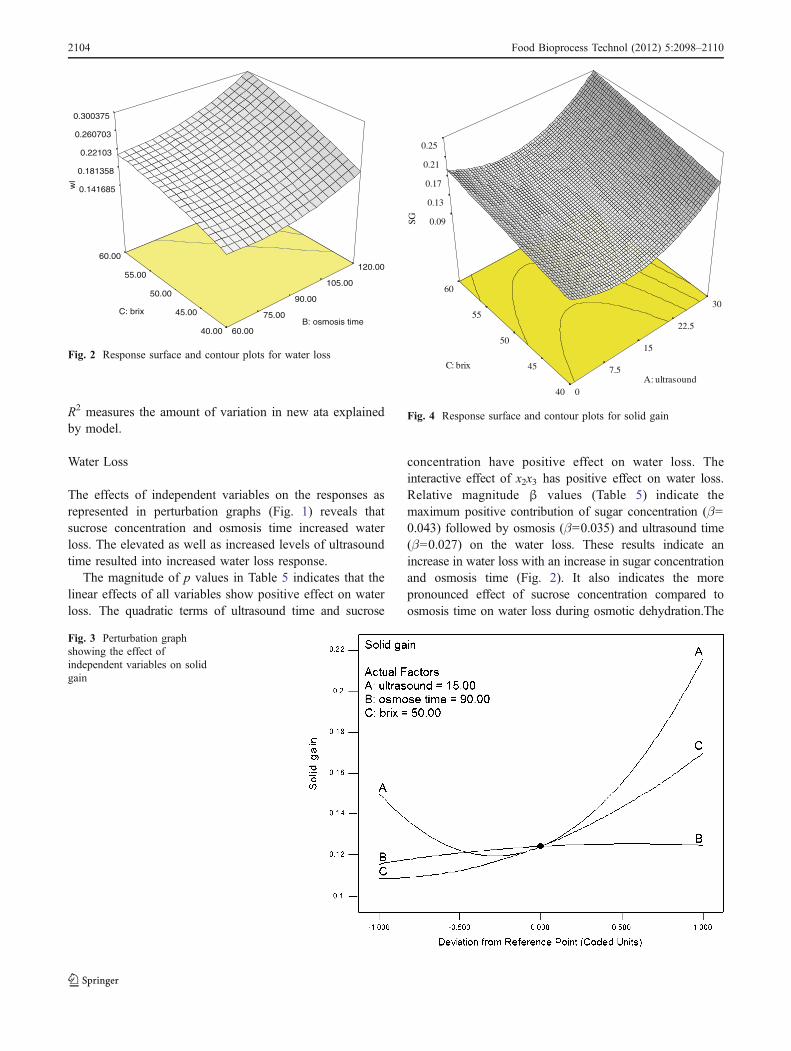
Fig. 1 Perturbation graphshowing the effect ofindependent variables on waterloss
Food Bioprocess Technol (2012) 5:2098–2110 2103
R2 measures the amount of variation in new ata explainedby model.
Water Loss
The effects of independent variables on the responses asrepresented in perturbation graphs (Fig. 1) reveals thatsucrose concentration and osmosis time increased waterloss. The elevated as well as increased levels of ultrasoundtime resulted into increased water loss response.
The magnitude of p values in Table 5 indicates that thelinear effects of all variables show positive effect on waterloss. The quadratic terms of ultrasound time and sucrose
concentration have positive effect on water loss. Theinteractive effect of x2x3 has positive effect on water loss.Relative magnitude β values (Table 5) indicate themaximum positive contribution of sugar concentration (β=0.043) followed by osmosis (β=0.035) and ultrasound time(β=0.027) on the water loss. These results indicate anincrease in water loss with an increase in sugar concentrationand osmosis time (Fig. 2). It also indicates the morepronounced effect of sucrose concentration compared toosmosis time on water loss during osmotic dehydration.The
0.09
0.13
0.17
0.21
0.25
SG
0
7.5
15
22.5
30
40
45
50
55
60
A: ultrasound
C: brix
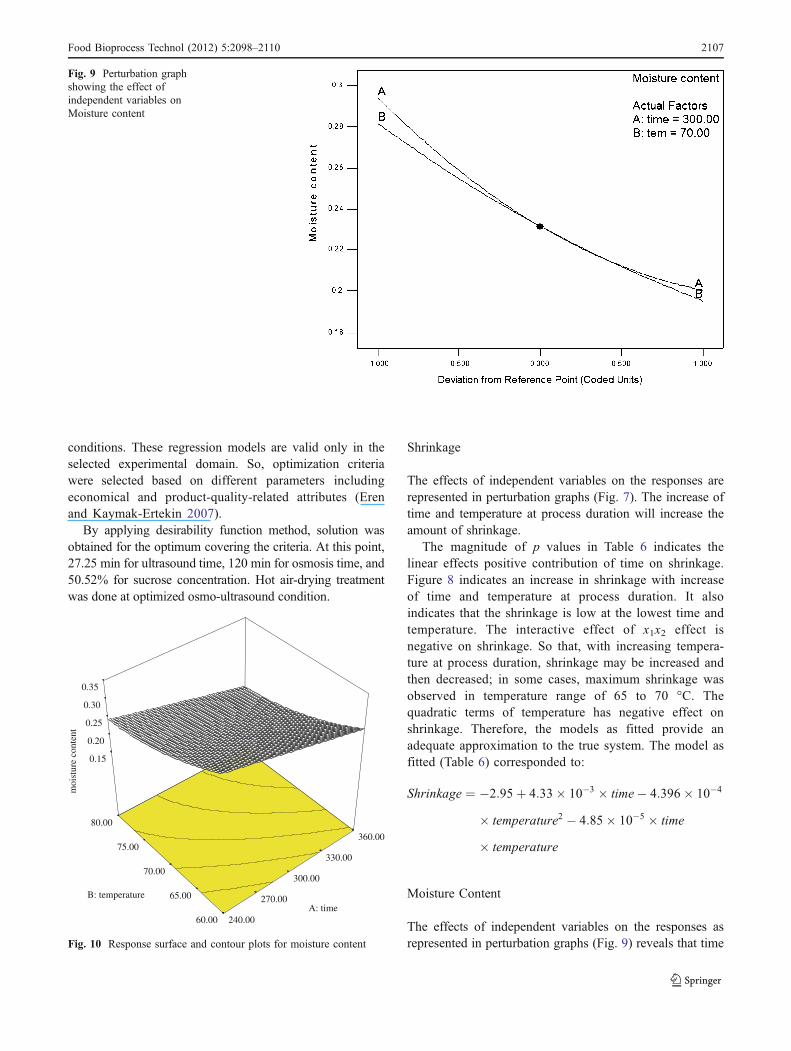
Fig. 4 Response surface and contour plots for solid gain
0.141685
0.181358
0.22103
0.260703
0.300375
w
l
60.00
75.00
90.00
105.00
120.00
40.00
45.00
50.00
55.00
60.00
B: osmosis time C: brix
Fig. 2 Response surface and contour plots for water loss
Fig. 3 Perturbation graphshowing the effect ofindependent variables on solidgain
2104 Food Bioprocess Technol (2012) 5:2098–2110

quadratic terms of ultrasound time and osmosis time havepositive effect on water loss. Further, the interactions ofimmersion time and sucrose concentration’ have positive andsignificant effect, whereas the interactions of “ultrasoundtime and immersion time” and “ultrasound time and sucroseconcentration” have no significant effect on water loss.
Therefore, the models as fitted provide an adequateapproximation to the true system.
The model as fitted (Table 5) corresponded to:
WL ¼ 0:2174� 0:01652� ultrasound time� 2:808
� 10�3 � osmosis timeþ 2:288� 10�3 � Brix
þ 3:848� 10�4 � ultrasound time2 þ 2:21� 10�5
� osmosis time2 þ 1:35� 10�3 � osmosis time
� Brix
Solid Gain
The effects of independent variables on the responses arerepresented in perturbation graphs (Fig. 3).The increase inthe level of ultrasound time and sugar concentration had anincreased solid gain response, while osmosis time had noeffect on solid gain response.
The linear effects of ultrasound time and sugarconcentration have positive effects on solid gain. Rela-tive magnitude β values (Table 5) indicate the maximumpositive contribution of ultrasound time (β=0.033) fol-lowed by sugar concentration (β=0.031), and osmosistime has no significant effect on solid gain (Fig. 4). It alsoindicates an increase in solid gain with an increase inultrasound time, and sugar concentration also indicates themore pronounced effect of sucrose concentration than
0.03
0.06
0.08
0.11
0.13
WR
60
75
90
105
120
40
45
50
55
60
B: osmosis
C: brix
Fig. 6 Response surface and contour plots for weight reduction
Fig. 5 Perturbation graphshowing the effect ofindependent variables on weightreduction
Food Bioprocess Technol (2012) 5:2098–2110 2105

ultrasound time on water loss during osmotic dehydration. Anonly just quadratic term of ultrasound time has positive effecton solid gain. The quadratic model developed in the uncodedform of process variables (at 5% level of significance) is:
SG ¼ 2:375� 10�3 � 5:67� 10�3 � ultrasound time
þ 3:062� 10�3 � sugar concentrationþ 2:635
� 10�4 � ultrasound time2
Weight Reduction
The effects of independent variables on the responses asrepresented in perturbation graphs (Fig. 5).The increase inthe level of osmosis time and sugar concentration had anincreased solid gain response, while ultrasound time hadhad a reduced weight reduction.
The magnitude of p values in Table 5 indicates onlyjust the linear effects positive contribution of osmosis timeon the weight reduction. Figure 6 indicates an increase inweight reduction with increase of osmosis time at120 min of process duration. The quadratic terms ofultrasound time and osmosis time have positive effect,and sucrose concentration has negative effect on weightreduction.
Weight reduction ¼ �0:247� 5:1� 10�3 � osmosis time
þ 1:26� 10�4 � ultrasound time2
þ 2:706� 10�5 � osmosis time2
� 2:364� 10�4
In the research, maximum WL and WR and minimumSG were regarded for developing a multi-objectivefunction.
Optimum condition for osmotic dehydration of quinceswas determined to obtain maximum water loss and weightreduction and minimum solid gain. Second-order polyno-mial models obtained in this study were utilized for eachresponse in order to determine the specified optimum
0.44
0.49
0.54
0.59
0.64
shr
inka
ge
240.00
270.00
300.00
330.00
360.00
60.00
65.00
70.00
75.00
80.00
A: time B: temperature
Fig. 8 Response surface and contour plots for shrinkage
Fig. 7 Perturbation graphshowing the effect ofindependent variables onshrinkage
2106 Food Bioprocess Technol (2012) 5:2098–2110
conditions. These regression models are valid only in theselected experimental domain. So, optimization criteriawere selected based on different parameters includingeconomical and product-quality-related attributes (Erenand Kaymak-Ertekin 2007).
By applying desirability function method, solution wasobtained for the optimum covering the criteria. At this point,27.25 min for ultrasound time, 120 min for osmosis time, and50.52% for sucrose concentration. Hot air-drying treatmentwas done at optimized osmo-ultrasound condition.
Shrinkage
The effects of independent variables on the responses arerepresented in perturbation graphs (Fig. 7). The increase oftime and temperature at process duration will increase theamount of shrinkage.
The magnitude of p values in Table 6 indicates thelinear effects positive contribution of time on shrinkage.Figure 8 indicates an increase in shrinkage with increaseof time and temperature at process duration. It alsoindicates that the shrinkage is low at the lowest time andtemperature. The interactive effect of x1x2 effect isnegative on shrinkage. So that, with increasing tempera-ture at process duration, shrinkage may be increased andthen decreased; in some cases, maximum shrinkage wasobserved in temperature range of 65 to 70 °C. Thequadratic terms of temperature has negative effect onshrinkage. Therefore, the models as fitted provide anadequate approximation to the true system. The model asfitted (Table 6) corresponded to:
Shrinkage ¼ �2:95þ 4:33� 10�3 � time� 4:396� 10�4
� temperature2 � 4:85� 10�5 � time
� temperature
Moisture Content
The effects of independent variables on the responses asrepresented in perturbation graphs (Fig. 9) reveals that time
0.15
0.20
0.25
0.30
0.35
m
oist
ure
cont
ent
240.00
270.00
300.00
330.00
360.00
60.00
65.00
70.00
75.00
80.00
A: time B: temperature
Fig. 10 Response surface and contour plots for moisture content
Fig. 9 Perturbation graphshowing the effect ofindependent variables onMoisture content
Food Bioprocess Technol (2012) 5:2098–2110 2107
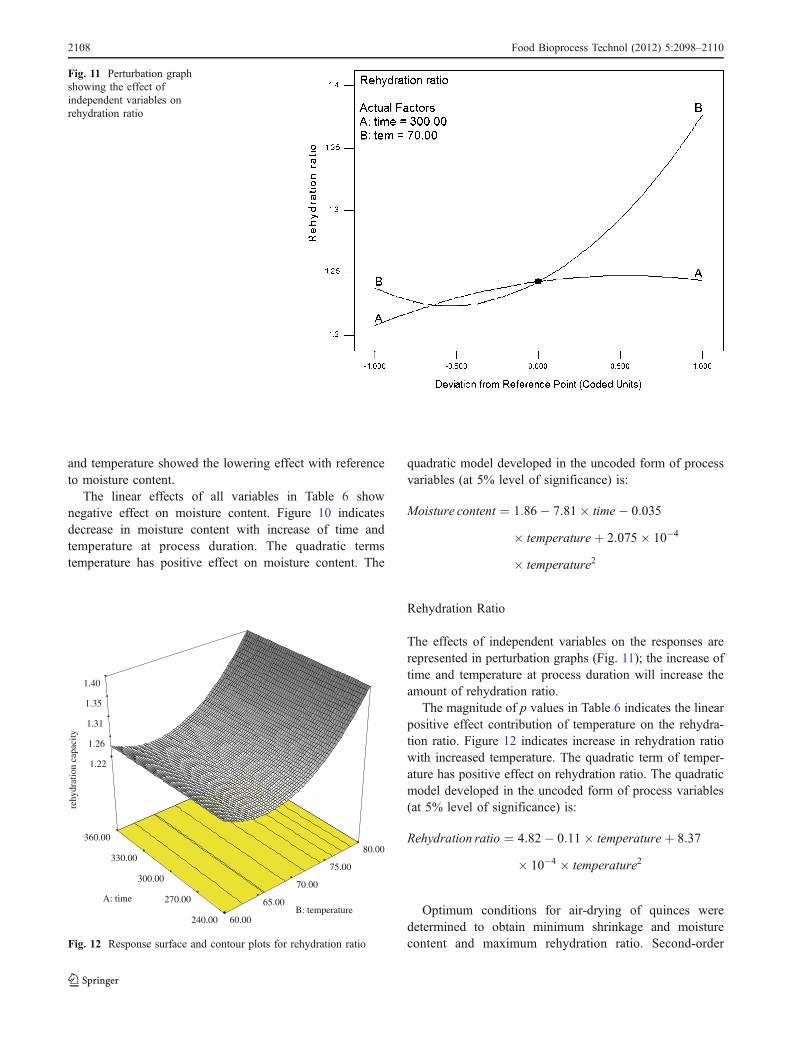
and temperature showed the lowering effect with referenceto moisture content.
The linear effects of all variables in Table 6 shownegative effect on moisture content. Figure 10 indicatesdecrease in moisture content with increase of time andtemperature at process duration. The quadratic termstemperature has positive effect on moisture content. The
quadratic model developed in the uncoded form of processvariables (at 5% level of significance) is:
Moisture content ¼ 1:86� 7:81� time� 0:035
� temperatureþ 2:075� 10�4
� temperature2
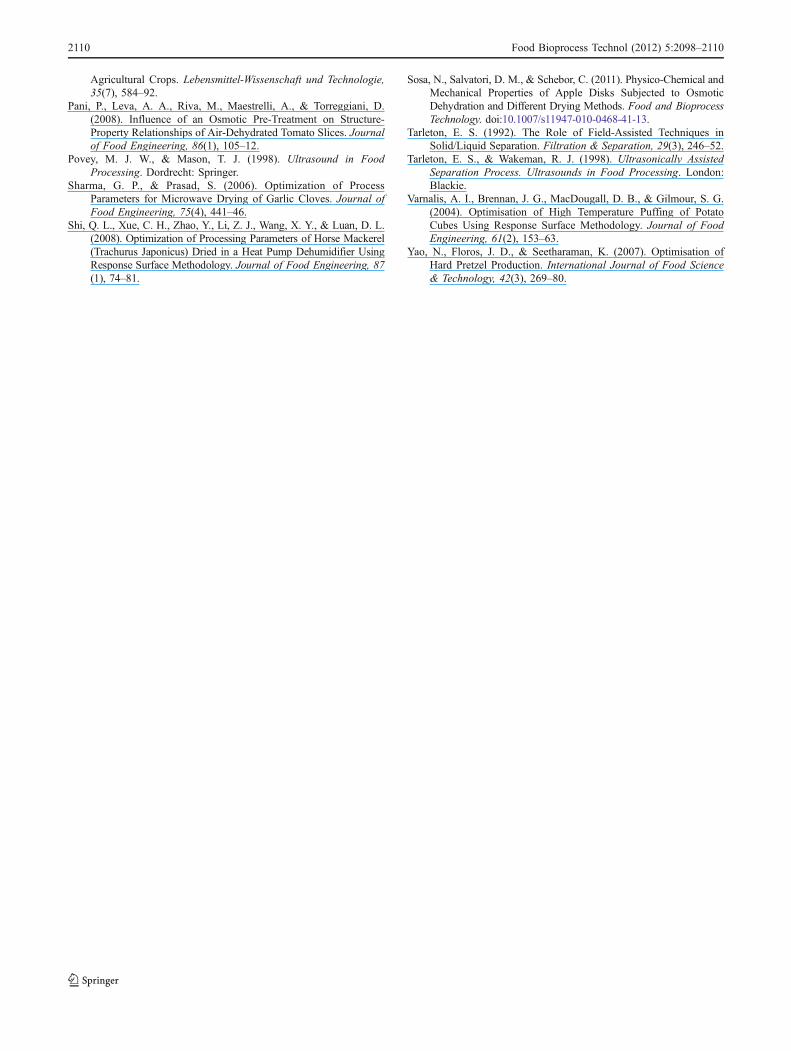
Rehydration Ratio
The effects of independent variables on the responses arerepresented in perturbation graphs (Fig. 11); the increase oftime and temperature at process duration will increase theamount of rehydration ratio.
The magnitude of p values in Table 6 indicates the linearpositive effect contribution of temperature on the rehydra-tion ratio. Figure 12 indicates increase in rehydration ratiowith increased temperature. The quadratic term of temper-ature has positive effect on rehydration ratio. The quadraticmodel developed in the uncoded form of process variables(at 5% level of significance) is:
Rehydration ratio ¼ 4:82� 0:11� temperatureþ 8:37
� 10�4 � temperature2
Optimum conditions for air-drying of quinces weredetermined to obtain minimum shrinkage and moisturecontent and maximum rehydration ratio. Second-order
Fig. 11 Perturbation graphshowing the effect ofindependent variables onrehydration ratio
1.22
1.26
1.31
1.35
1.40
reh
ydra
tion
capa
city
60.00
65.00
70.00
75.00
80.00
240.00
270.00
300.00
330.00
360.00
B: temperature A: time
Fig. 12 Response surface and contour plots for rehydration ratio
2108 Food Bioprocess Technol (2012) 5:2098–2110

polynomial models obtained in this study were utilized foreach response in order to determine the specified optimumconditions. Since the regression models are only valid inthe selected domain, a few economical and quality-relatedconstraints were considered for determining operatingregion (Eren and Kaymak-Ertekin 2007).
By applying desirability function method, one solutionwas obtained for the optimum covering the criteria; at thispoint, 297.86 min for time and 80 °C for temperature.
Conclusion
Response surface method was used to determine theoptimum operating conditions that yield maximum waterloss, weight reduction, and rehydration ratio and minimumsolid gain, shrinkage, and moisture content in drying ofquince. The second-order polynomial models for all theresponse variables were found to be statistically significant.
The optimal conditions for maximum water loss andweight reduction and minimum solid gain, were27.25 min for ultrasound time, 120 min for osmosistime, and 50.52% for sucrose concentration in order toobtain water loss of 34.68 (g/100 g fresh sample), solidgain of 18.66 (g/100 g fresh sample), and weightreduction of 16.21(g/100 g fresh sample) and optimalconditions for maximum rehydration ratio and minimummoisture content and shrinkage, were 297.86 min fortime, and 80 °C for temperature in order to obtainshrinkage of 52.84%, moisture content of 0.1971, andrehydration ratio of 1.451. The model equation for theresponse variables predicted values under the identifiedoptimum conditions, which were experimentally verified tobe in general agreement with the model.
References
Alam, M. S., Amarjit, S., & Sawhney, B. K. (2010). Response SurfaceOptimization of Osmotic Dehydration Process for Aonla Slices.Journal of Food Science and Technology, 47(1), 47–54.
Antonio, G. C., Alves, D. G., Azoubel, P. M., Murr, F. E. X., & Park,K. J. (2008). Influence of Osmotic Dehydration and HighTemperature Short Time Processes on Dried Sweet Potato(Ipomoea Batatas Lam.). Journal of Food Engineering, 84(3),375–82.
AOAC. (1990). Official Methods of Analysis of the Association ofOfficial Analytical Chemists. Washington, DC: AOAC.
Ayensu, A. (1997). Dehydration of Food Crops Using a SolarDryer with Convective Heat Flow. Solar Energy, 59(4–6),121–26.
Azoubel, P. M., El-Aouar, Â. A., Tonon, R. V., Kurozawa, L. E.,Antonio, G. C., Murr, F. E. X., et al. (2009). Effect of OsmoticDehydration on the Drying Kinetics and Quality of CashewApple. International Journal of Food Science & Technology, 44(5), 980–86.
Barbanti, D., Mastrocola, D., & Severini, C. (1994). Air Drying ofPlums. A Comparison among Twelve Cultivars. Sciences desaliments, 14(1), 61–73.
Bchir, B., Besbes, S., Karoui, R., Attia, H., Paquot, M., & Blecker, C.(2011). Effect of Air-Drying Conditions on Physico-ChemicalProperties of Osmotically Pre-Treated Pomegranate Seeds. Foodand Bioprocess Technology. doi:10.1007/s11947-010-0469-31-13.
Chakraborty, S. K., Kumbhar, B. K., & Sarkar, B. C. (2007). ProcessParameter Optimization for Instant Pigeonpea Dhal UsingResponse Surface Methodology. Journal of Food Engineering,81(1), 171–78.
Corzo, O., Bracho, N., Vasquez, A., & Pereira, A. (2008). Optimization ofa Thin Layer Drying Process for Coroba Slices. Journal of FoodEngineering, 85(3), 372–80.
Corzo, O., &Gomez, E. R. (2004). Optimization of Osmotic Dehydrationof Cantaloupe Using Desired Function Methodology. Journal ofFood Engineering, 64(2), 213–19.
De la Fuente-Blanco, S., de Sarabia Riera-Franco, E., Acosta-Aparicio, V. M., Blanco-Blanco, A., & Gallego-Juárez, J. A.(2006). "Food Drying Process by Power Ultrasound".Ultrasonics, 44, e523–e27.
Emadzadeh, B., Razavi, S. M. A., & Mahallati, M. N. (2011). Effects ofFat Replacers and Sweeteners on the Time-Dependent RheologicalCharacteristics and Emulsion Stability of Low-Calorie PistachioButter: A Response Surface Methodology. Food and BioprocessTechnology. doi:10.1007/s11947-010-0490-61-11.
Erbay, Z., & Icier, F. (2009). Optimization of Hot Air Drying of OliveLeaves Using Response Surface Methodology. Journal of FoodEngineering, 91(4), 533–41.
Eren, I., & Kaymak-Ertekin, F. (2007). Optimization of OsmoticDehydration of Potato Using Response Surface Methodology.Journal of Food Engineering, 79(1), 344–52.
FAO. (2010) http://Faostat.Fao.Org/Fermin, W. J., & Corzo, O. (2005). Optimization of Vacuum Pulse
Osmotic Dehydration of Cantaloupe Using Response SurfaceMethodology. Journal of Food Processing and Preservation, 29(1), 20–32.
Fernandes, F. A. N., Gallão, M. I., & Rodrigues, S. (2008). Effect ofOsmotic Dehydration and Ultrasound Pre-Treatment on CellStructure: Melon Dehydration. LWT Food Science and Technology,41(4), 604–10.
Garrote, R. L., Coutaz, V. R., Luna, J. A., Silva, E. R., & Bertone, R.A. (1993). Optimizing Processing Conditions for ChemicalPeeling of Potatoes Using Response Surface Methodology.Journal of Food Science, 58(4), 821–26.
Guillou, A. A., & Floros, J. D. (1993). Multiresponse OptimizationMinimizes Salt in Natural Cucumber Fermentation and Storage.Journal of Food Science, 58(6), 1381–89.
Johnson, P. N., Brennan, J. G., & Addo-Yobo, F. Y. (1998). Air-Drying Characteristics of Plantain (Musa Aab). Journal of FoodEngineering, 37(2), 233–42.
Ko, B., Eren, I., & Kaymak Ertekin., F. (2008). Modelling BulkDensity, Porosity and Shrinkage of Quince During Drying: TheEffect of Drying Method. Journal of Food Engineering, 85(3),340–49.
Lenart, A. (1996). Osmo-Convective Drying of Fruits and Vegetables:Technology and Application. Drying Technology, 14(2), 391–413.
Lin, T. M., Durance, T. D., & Scaman, C. H. (1998). Characterizationof Vacuum Microwave, Air and Freeze Dried Carrot Slices. FoodResearch International, 31(2), 111–17.
Lombard, G. E., Oliveira, J. C., Fito, P., & Andrés, A. (2008).Osmotic Dehydration of Pineapple as a Pre-Treatment for FurtherDrying. Journal of Food Engineering, 85(2), 277–84.
Madamba, P. S. (2002). The Response Surface Methodology: AnApplication to Optimize Dehydration Operations of Selected
Food Bioprocess Technol (2012) 5:2098–2110 2109
Agricultural Crops. Lebensmittel-Wissenschaft und Technologie,35(7), 584–92.
Pani, P., Leva, A. A., Riva, M., Maestrelli, A., & Torreggiani, D.(2008). Influence of an Osmotic Pre-Treatment on Structure-Property Relationships of Air-Dehydrated Tomato Slices. Journalof Food Engineering, 86(1), 105–12.
Povey, M. J. W., & Mason, T. J. (1998). Ultrasound in FoodProcessing. Dordrecht: Springer.
Sharma, G. P., & Prasad, S. (2006). Optimization of ProcessParameters for Microwave Drying of Garlic Cloves. Journal ofFood Engineering, 75(4), 441–46.
Shi, Q. L., Xue, C. H., Zhao, Y., Li, Z. J., Wang, X. Y., & Luan, D. L.(2008). Optimization of Processing Parameters of Horse Mackerel(Trachurus Japonicus) Dried in a Heat Pump Dehumidifier UsingResponse Surface Methodology. Journal of Food Engineering, 87(1), 74–81.
Sosa, N., Salvatori, D. M., & Schebor, C. (2011). Physico-Chemical andMechanical Properties of Apple Disks Subjected to OsmoticDehydration and Different Drying Methods. Food and BioprocessTechnology. doi:10.1007/s11947-010-0468-41-13.
Tarleton, E. S. (1992). The Role of Field-Assisted Techniques inSolid/Liquid Separation. Filtration & Separation, 29(3), 246–52.
Tarleton, E. S., & Wakeman, R. J. (1998). Ultrasonically AssistedSeparation Process. Ultrasounds in Food Processing. London:Blackie.
Varnalis, A. I., Brennan, J. G., MacDougall, D. B., & Gilmour, S. G.(2004). Optimisation of High Temperature Puffing of PotatoCubes Using Response Surface Methodology. Journal of FoodEngineering, 61(2), 153–63.
Yao, N., Floros, J. D., & Seetharaman, K. (2007). Optimisation ofHard Pretzel Production. International Journal of Food Science& Technology, 42(3), 269–80.
2110 Food Bioprocess Technol (2012) 5:2098–2110