Multi-level examination of correlates of active transportation to school among youth living within 1...
14
RESEARCH Open Access Multi-level examination of correlates of active transportation to school among youth living within 1 mile of their school Kathleen M Gropp 1 , William Pickett 1,2 and Ian Janssen 1,3* Abstract Background: Active transportation to school is a method by which youth can build physical activity into their daily routines. We examined correlates of active transportation to school at both individual- (characteristics of the individual and family) and area- (school and neighborhood) levels amongst youth living within 1 mile (1.6 km) of their school. Methods: Using the 2009/10 Canadian Health Behaviour in School-Aged Children (HBSC) survey, we selected records of students (n = 3 997) from 161 schools that resided in an urban setting and lived within 1 mile from their school. Student records were compiled from: (1) individual-level HBSC student questionnaires; (2) area-level administrator (school) questionnaires; and (3) area-level geographic information system data sources. The outcome, active transportation to school, was determined via a questionnaire item describing the method of transportation that individual students normally use to get to school. Analyses focused on factors at multiple levels that potentially contribute to student decisions to engage in active transportation. Multi-level logistic regression analyses were employed. Results: Approximately 18% of the variance in active transportation was accounted for at the area-level. Several individual and family characteristics were associated with engagement in active transportation to school including female gender (RR vs. males = 0.86, 95% CI: 0.80-0.91), having ≥2 cars in the household (RR vs. no cars = 0.87, 0.74-0.97), and family socioeconomic status (RR for ‘not well off’ vs. ‘very well off’ = 1.14, 1.01-1.26). Neighborhood characteristics most strongly related to active transportation were: the length of roads in the 1 km buffer (RR in quartile 4 vs. quartile 1 = 1.23, 1.00-1.42), the amount of litter in the neighborhood (RR for ‘major problem’ vs. ‘no problem’ = 1.47, 1.16-1.57), and relatively hot climates (RR in quartile 4 vs. quartile 1 = 1.33 CI, 1.05-1.53). Conclusion: Engagement in active transportation to school was related to multiple factors at multiple levels. We identified gender, perception of residential neighborhood safety, the percentage of streets with sidewalks, and the total length of roads as the most important correlates of active transportation to school. Keywords: Active transportation, Adolescent, School, Neighborhood * Correspondence: [email protected] 1 Department of Community Health and Epidemiology, Queen’s University, Kingston, ON, Canada 3 School of Kinesiology and Health Studies, Queen’s University, Kingston, ON K7L 3N6, Canada Full list of author information is available at the end of the article © 2012 Gropp et al.; licensee BioMed Central Ltd. This is an Open Access article distributed under the terms of the Creative Commons Attribution License (http://creativecommons.org/licenses/by/2.0), which permits unrestricted use, distribution, and reproduction in any medium, provided the original work is properly cited. Gropp et al. International Journal of Behavioral Nutrition and Physical Activity 2012, 9:124 http://www.ijbnpa.org/content/9/1/124
-
Upload
independent -
Category
Documents
-
view
2 -
download
0
Transcript of Multi-level examination of correlates of active transportation to school among youth living within 1...

Gropp et al. International Journal of Behavioral Nutrition and Physical Activity 2012, 9:124http://www.ijbnpa.org/content/9/1/124
RESEARCH Open Access
Multi-level examination of correlates of activetransportation to school among youth livingwithin 1 mile of their schoolKathleen M Gropp1, William Pickett1,2 and Ian Janssen1,3*
Abstract
Background: Active transportation to school is a method by which youth can build physical activity into their dailyroutines. We examined correlates of active transportation to school at both individual- (characteristics of theindividual and family) and area- (school and neighborhood) levels amongst youth living within 1 mile (1.6 km) oftheir school.
Methods: Using the 2009/10 Canadian Health Behaviour in School-Aged Children (HBSC) survey, we selectedrecords of students (n = 3 997) from 161 schools that resided in an urban setting and lived within 1 mile from theirschool. Student records were compiled from: (1) individual-level HBSC student questionnaires; (2) area-leveladministrator (school) questionnaires; and (3) area-level geographic information system data sources. The outcome,active transportation to school, was determined via a questionnaire item describing the method of transportationthat individual students normally use to get to school. Analyses focused on factors at multiple levels that potentiallycontribute to student decisions to engage in active transportation. Multi-level logistic regression analyses wereemployed.
Results: Approximately 18% of the variance in active transportation was accounted for at the area-level. Severalindividual and family characteristics were associated with engagement in active transportation to school includingfemale gender (RR vs. males = 0.86, 95% CI: 0.80-0.91), having ≥2 cars in the household (RR vs. no cars = 0.87,0.74-0.97), and family socioeconomic status (RR for ‘not well off’ vs. ‘very well off’ = 1.14, 1.01-1.26). Neighborhoodcharacteristics most strongly related to active transportation were: the length of roads in the 1 km buffer(RR in quartile 4 vs. quartile 1 = 1.23, 1.00-1.42), the amount of litter in the neighborhood (RR for ‘major problem’ vs.‘no problem’ = 1.47, 1.16-1.57), and relatively hot climates (RR in quartile 4 vs. quartile 1 = 1.33 CI, 1.05-1.53).
Conclusion: Engagement in active transportation to school was related to multiple factors at multiple levels. Weidentified gender, perception of residential neighborhood safety, the percentage of streets with sidewalks, and thetotal length of roads as the most important correlates of active transportation to school.
Keywords: Active transportation, Adolescent, School, Neighborhood
* Correspondence: [email protected] of Community Health and Epidemiology, Queen’s University,Kingston, ON, Canada3School of Kinesiology and Health Studies, Queen’s University, Kingston, ONK7L 3N6, CanadaFull list of author information is available at the end of the article
© 2012 Gropp et al.; licensee BioMed Central Ltd. This is an Open Access article distributed under the terms of the CreativeCommons Attribution License (http://creativecommons.org/licenses/by/2.0), which permits unrestricted use, distribution, andreproduction in any medium, provided the original work is properly cited.

Gropp et al. International Journal of Behavioral Nutrition and Physical Activity 2012, 9:124 Page 2 of 14http://www.ijbnpa.org/content/9/1/124
IntroductionActive transportation is the engagement in physicalactivity specifically for travel and includes methods suchas walking and bicycling [1]. Active transportation is onemeans by which children and youth can incorporatephysical activity into their daily routines. Indeed, childrenand youth who walk or bicycle to school have higher over-all physical activity [2] and cardiorespiratory fitness levels[3] and a healthier body composition [3]. Unfortunately,the proportion of children and youth who engage in activetransportation to school has decreased by 8-10% inCanada over the last two decades [4] and by 25% in theUnited States over the last four decades [5], which is ofobvious concern to public health. Evidence about thevarious factors that lead to decisions to engage in activetransportation to school is fundamental to the develop-ment of effective health promotion strategies.Correlates of active transportation to school exist at
multiple levels, including characteristics of individualstudents and their families (individual-level) and charac-teristics of the students’ schools and their neighborhoods(area-level). Individual and family characteristics thatmay be relevant include living in close proximity toschool [6-9], male gender [6,9-11], ethnicities other thanCaucasian [6,12,13], low family socio-economic status[14,15], and a non-traditional family structure [14,15].While there is little information about the influence ofschools and school policies on active transportation toschool, one school-based active transportation studyfound that students attending private school were 40%less likely to engage in regular active transportation [16].At the neighborhood-level, students who live in denselypopulated areas are more likely to engage in activetransportation to school [12]. Another relevant neigh-borhood factor is the presence of sidewalks, which hasconsistently been shown to be a strong correlate [11,16-19].Associations between active transportation and the designof road networks are less clear. A recent systematic reviewreported varying associations for intersection density, blocklength, and route directness [20]. Despite the interest incharacteristics of the neighborhood, certain variableshave not been examined, including neighborhood aesthetics(e.g., litter, condition of houses and buildings) and safetyfeatures (e.g., speed limits of roads surrounding the school).Although the correlates of active transportation to school
occur at multiple levels, the vast majority of existingstudies on this topic have not simultaneously consideredmultiple factors at the various levels [7-9,11,13,18,21-25].The few multi-level studies that exist have been conductedwithin small geographic areas [8,9,11,17,22,26], whichlimits their generalizability. Multi-level research thatexamines a multitude of potential correlates could helpillustrate the complexity behind decisions that governwhether or not youth travel to school in an active or
passive manner. Furthermore, such research would helpidentify the strongest correlates, which in the short-term may be identified for more focused study, and in thelong-term may be addressed via preventive interventions.We conducted a national analysis of possible individual-
level and area-level correlates of active transportation toschool among urban Canadian youth aged 11–15 yearswho lived within 1 mile (1.6 km) of their school. Our goalwas to identify major factors at multiple levels that governdecisions to engage in active transportation amongstyouth not eligible for bussing and who live within areasonable walking or biking distance from school. Thisstudy was exploratory and no a priori hypotheses wereassumed, although our choices of variables for study weregoverned by existing literature.
MethodsOverview of study design and measuresThe basis for this study was the 2009/10 CanadianHealth Behaviour in School-Aged Children (HBSC) Survey.HBSC is a general health survey of grades 6–10 studentsconducted in affiliation with the World Health Organization.The 2009/10 Canadian HBSC, or the 6th Canadian cycle,consisted of three main components: (1) a questionnairecompleted by students that asked about their healthbehaviors (such as active transportation), lifestyle factors,and demographics, (2) an administrator questionnairedistributed to each school principal that inquired aboutschool demographics, policy, infrastructure, and aboutthe school neighborhood setting, and (3) geographicinformation systems (GIS) measures of built and socialfeatures in the school neighborhoods that were laterlinked with the HBSC data.
ParticipantsIn Canada, the HBSC survey follows a systematic multi-stage cluster sample where individual students are nestedin school classes, which in turn are nested within schools,followed by school boards. This sampling approachadheres to the standard international protocol [27]. In2009/10 the HBSC survey was administered to 26 078Canadian students in grades 6–10 from 436 schools in11 territories and provinces (all jurisdictions with theexception of Prince Edward Island and New Brunswickparticipated). With respect to human subjects, consentto participate was obtained from school boards, individualschools, parents or guardians (either explicitly or impli-citly determined by school board policy), and from indi-vidual students. Ethics approval for the Canadian HBSCwas granted by the General Research Ethics Board ofQueen’s University.For this study, we only included participating students
who attended school in an urban core, as indicated bythe school postal codes. An urban core is defined as a

26 078 Studentsin
436 Schools
3 997 Studentsin
161 Schools
Schools that are not in areas classified as urban core
Live more than 1.6km from school(Euclidian distance)
Did not answer active transportation to school question or
answered other
Did not answer postal code question, and are considered “far”
from school*
10 154 Students
3 928 Students
734 Students
3 730 Students
200 Schools
Insufficient data for sidewalks using Google Earth
1 697 Students
20 Schools
Data missing for variables of interest in the principal’s survey
1 277 Students
48 Schools
Data missing for variables of interest in the student’s survey
519 Students
Students coming from schools with no Google Street View data for
sidewalks on school’s street
Students from schools with no hot and cold days weather data
21 Students 2 Schools
42 Students 4 Schools
Figure 1 Exclusion flow-chart. *Far from school: More than15 minutes walking, or more than 5 minutes by bike, bus, train,subway, streetcar, ferry/boat, car, motorcycle, moped.
Gropp et al. International Journal of Behavioral Nutrition and Physical Activity 2012, 9:124 Page 3 of 14http://www.ijbnpa.org/content/9/1/124
large urban area that has a population of at least 50 000in the urban core in the case of a Census MetropolitanArea, or a population of at least 10 000 in the urbancore for a Census Agglomeration”. In Canada, postalcodes provide specific indicators of location of residencein urban core settings, but not in rural locations [28].To be included in this study we required that the
participants lived within a reasonable walking distanceof their school, estimated at 1 mile (1.6 km) or less.Walking distances were conservatively estimated usingdirect distance from the geographical center of theirpostal code to the school address. The inclusion criterialimited the study base to students who had a realisticopportunity to regularly engage in active transportationto school. By school board policy, Canadian studentswho live more than 1 mile from school are typically offeredtransportation by school bus, although this distance canvary. A large percentage (43%) of urban students did notreport their postal code in the HBSC survey, and toincrease the study sample size, for these students we usedtheir answers to questions about “travel time to school”and “usual mode of transportation to school” to estimatewhether they lived within the 1 mile distance. Studentswho reported that their travel time to school was 15 minutesor less by walking, or less than 5 minutes for every othermode of transportation (bicycle, car, bus, etc.), weretherefore also included. The final sample size of urbanyouth available for analysis was 3,997 (see Figure 1 for aparticipant flow diagram).
Outcome – active transportation to schoolThe outcome of interest was regular engagement in activetransportation to school, either via walking or bicycling.Participants answered the following HBSC survey ques-tion: “On a typical day, the MAIN part of your journeyTO school is made by. . .” with the following options: 1)walking; 2) bicycle; 3) bus, train, streetcar, subway, or boat/ferry; 4) car, motorcycle, or moped; 5) other. Responseswere grouped dichotomously: those who answered“walking” or “bicycle” were categorized as students whoregularly engage in active transportation to school, whilethose who answered ‘bus, train, streetcar, subway, boat/ferry, car, motorcycle, moped’ were categorized as indivi-duals who do not. Participants who answered ‘other’ tothis question were excluded to minimize possible mis-classification. Intra-rater reliability analyses for the HBSCactive transportation question suggest there is an excellentlevel of agreement (Cronbach’s alpha ≥0.80) between mul-tiple student reports, including reports examined acrossseasons [29].
Possible correlates of active transportationWe constructed a list of possible correlates of activetransportation to school based on the evidence in
existing literature. We then cross-referenced this listagainst the HBSC and GIS data available to our researchteam and examined all of the possible correlates that wecould.
Individual and family correlates (individual-level data)Eight items describing potential correlates of the individualparticipants and their families were obtained via the HBSCstudent questionnaire: gender (male or female), grade (6–8and 9–10), ethnicity (four composite categories consistingof: Caucasian only, Caucasian and other, Aboriginal,and other), number of siblings (0, 1, 2 or more), familystructure (living with both parents, living with one parentand a step-parent, living with a single parent, and all otherliving situations), family socio-economic status (SES) asmeasured by perceived relative affluence (5 categoriesfrom “very well off” to “not well off at all”), the number ofcars in the household (0, 1, 2 or more), and perceived resi-dential neighborhood safety (where you live, is it safe for

Gropp et al. International Journal of Behavioral Nutrition and Physical Activity 2012, 9:124 Page 4 of 14http://www.ijbnpa.org/content/9/1/124
children to play outside? (5 categories: “strongly agree” to“strongly disagree”).
School correlates (area-level data)Three items of the school were measured using theHBSC administrator questionnaire. These items focusedon school active transportation policies, programs, andinfrastructure. A series of questions inquired aboutwhether the school promoted active transportation by:(1) having walk and/or bike to school days or walkingschool buses; (2) identifying safe routes to walk or bicycleto school; and (3) providing bicycle racks in safe locations.All three of these items were dichotomized as “yes” or“no” for analytical purposes. Schools with administratorswho answered “don’t know” to these questions wereclassified as “no”.
Neighborhood correlates (area-level data)Aesthetics Two items that reflect neighborhood aestheticswere measured using the HBSC administrator question-naire: (1) presence of litter in the school neighborhood;and (2) vacant or shabby housing in the school neighbor-hood. Four possible response categories were available,ranging from “no problem” to “major problem”.Twelve items of the neighborhood were measured with
GIS using the CanMap Route Logistics database (DMTISpatial Inc., Markham, ON) in ArcView version 9.3 soft-ware, PCensus for MapPoint software (Tetrad ComputerApplications Inc., Vancouver, BC), Google Earth and GoogleStreet View software (Google Inc., Mountain View, CA),and Environment Canada data (National Climate Dataand Information Archive). Some of these variables wereobtained from a 1-km radius circular buffer surroundingthe school, some were obtained at the exact school address,and others were obtained for the municipality where theschool was located.
Sidewalk measures The first of the GIS measures con-sisted of whether there was at least one sidewalk leadingdirectly to the school. This was measured using GoogleStreet View. If the Google Street View image confirmedthat there was a sidewalk on either side of the street onwhich the school was located, this variable was categorizedas “yes”, otherwise it was categorized as a “no”. The use ofGoogle Street View as an alternative to physical audit hasbeen validated, and measures (such as the presence ofrecreational buildings and parks) have produced observedagreement correlations of 0.92 and 0.95, respectively [30].The percentage of roads with sidewalks in the 1 km
(0.62 miles) buffer surrounding each school was obtainedfrom Google Earth and ArcGIS, as previously described indetail [31]. The length of roads with a sidewalk (on eitherside) was gathered and divided by the total length ofroads. This variable was then categorized into quartiles.
This was done by first calculating the distance of roads inthe buffer using the CanMap Route Logistics database inArcGIS. The road network was exported from ArcGISinto Google Earth, and within Google Earth the roadsegments were superimposed onto the street view images.Road segments that did not have a sidewalk were deletedfrom the road network within Google Earth. After dele-tions, the revised road network was imported back intoArcGIS so that the sidewalk distances could be calculated.
Road measures Four neighborhood road measures(total length of roads, percentage of roads with speedlimits less than or equal to 60 km/h, speed limit of theschool’s road, and street connectivity) were obtainedfrom CanMap Route Logistics in ArcGIS software. TheCanMap Route Logistics database provides geospatialinformation on roads and their segments (e.g., blocks)across the country. This includes information on thelength of each road segment and its speed limit. Totallength of roads was calculated in ArcGIS as the distanceof all road segments within the 1 km buffer. The percent-age of roads with speed limits ≤60 km/h (37 miles/h)was calculated by dividing the length or all roadsegments within the buffer with speed limits ≤60 km/hby the total length or roads within the buffer. The speedlimit of each school’s road was categorized as ≤40 km/h(25 miles/h), 50 km/h (31 miles/h), or ≥60 km/h basedon the speed limit of the road segment at the school’smain entrance. The remaining three variables wereobtained for the 1 km radial buffer surrounding theschool. Street connectivity was calculated as a compositemeasure of intersection density, average block length,and connected node ratio, similar to measures identifiedby others [32-34]. Intersection density was calculated asthe number of intersections divided by the total landarea in each buffer. Average block length was calculatedas the total length of roads divided by the number ofintersections. The connected node ratio was calculatedby dividing the number of true intersections by thenumber of all intersections including cul-de-sacs anddead ends. Based upon prior work [34], a principal compo-nent factor analysis showed that each street connectivityvariable was related; factor loadings were: 0.93, 0.66, 0.89for intersection density, average block length, and con-nected node ratio variables respectively (Cronbach’salpha standardized = 0.78). These variables were com-bined with equal weight, than ranked as a compositevariable.
SES Neighborhood SES was measured in the 1 km buffersurrounding each school, based upon the 2006 CanadianCensus, using PCensus for MapPoint software. The over-all median household income was calculated by weighting

Table 1 Individual-level (individual and family)characteristics of urban youth (n = 3 997) sampled forstudy of active transportation in Canada
Characteristic N (%)
Gender
Male 1 930 (48.3)
Female 2 067 (51.7)
Grade
6 918 (22.8)
7 915 (22.9)
8 932 (23.3)
9 599 (15.0)
10 639 (16.0)
Ethnicity
Caucasian only 2 443 (61.1)
Caucasian and other 201 (5.0)
Aboriginal 396 (9.9)
Other 957 (23.9)
Number of siblings
0 608 (15.2)
1 1 729 (43.3)
2+ 1 660 (41.5)
Adults at home
Both mother and father 2 655 (66.4)
One parent and one step-parent 418 (10.5)
Single parent 775 (19.4)
Other 149 (3.7)
Family SES
Very well off 904 (22.6)
Well off 1 317 (32.9)
Average 1 405 (35.2)
Not very well off 266 (6.7)
Not at all well off 105 (2.6)
Number of cars in household
0 176 (4.4)
1 1 186 (29.7)
2+ 2 635 (65.9)
Residential neighborhood is safe for children
Strongly agree 1 109 (27.7)
Agree 1 792 (44.8)
Neither agree nor disagree 750 (18.8)
Disagree 242 (6.1)
Strongly disagree 104 (2.6)
Gropp et al. International Journal of Behavioral Nutrition and Physical Activity 2012, 9:124 Page 5 of 14http://www.ijbnpa.org/content/9/1/124
each census block by the total population. This variablewas categorized into quartiles.
Climate Annual climate variables (calculated from atleast 15 years of data between 1971 and 2000) wereobtained for each school using the Environment CanadaNational Climate Data as inferred from the most proximalweather station to each school. These measures included:average temperature (°C), average annual rainfall (mm),average annual snowfall (cm), average annual numberof extreme hot days (maximum temperature >30°C or>80°F), and average number of extreme cold days (mini-mum temperature < −20°C or < −4°F). Each climate variablewas categorized into quartiles.
Statistical analysisStatistical analyses were performed with SAS version 9.2(SAS Inc., Carry, NC). Potential correlates of activetransportation were initially described for the sampleusing conventional descriptive statistics. They werefurther described by the percentage of individuals in eachcategory that engaged in active transportation to school.Prior to performing multi-level analyses, an empty
model was run to calculate the intra-class correlation(ICC), which reflects the proportion of the total variancein the active transportation outcome explained by thearea-level. An ICC value of 18% was obtained, suggestingthat a large amount of variation was accounted for byschool and neighborhood characteristics [35]. This justifiedthe use of multi-level analytical techniques in subsequentanalyses.Our approach to statistical modeling was governed by
the following strategy. Due to the exploratory nature ofour investigation, a backwards selection approach wasemployed. Studies of the built environment and walkingand bicycling have found more variation at the individual-vs. area-levels [36,37]. Therefore, we performed multi-level modeling in steps, beginning with building a modelat the individual-level (individual and family), followed bythe introduction of variables at the area-level (school andneighborhood). Our goal was to create a parsimoniouslist of potential correlates of active transportation toschool while controlling for all of the selected variablesat multiple levels.Our multi-level models were then built using the fol-
lowing hierarchal approach: 1) all individual-level variableswere considered in bivariate models with active transpor-tation to school as the outcome (multivariate model 1);2) backwards selection methods were performed next,with a cut-off value of p < 0.05 for retention ofindividual-level variables; 3) area-level variables werethen added to the significant individual-level variablesfrom multivariate model 1 to create multivariate model 2;4) backwards selection was performed for the area-level

Table 2 Area-level characteristics of the schools andneighborhoods of urban Canadian youth (n = 3 997)
N (%) Median (IQR)
School Characteristics
Bicycle storage available in a safe location
No 835 (20.9)
Yes 3 162 (79.1)
Has walk/bike to school days and/or walking school bus programs
No 2 751 (68.8)
Yes 1 246 (31.2)
Identification of safe walking/biking routes to school
No 2 347 (58.7)
Yes 1 650 (41.3)
Neighborhood Characteristics
Sidewalk leading to school
No 161 (4.0)
Yes 3 836 (96.0)
% of roads with sidewalks 64.6 (47.4 - 83.0)
Speed limit of school’s road (km/h)
≤40 311 (7.8)
50 3 390 (84.8)
≥60 296 (7.4)
% of roads with speed limit ≤60 km/h
<90 493 (12.3)
90 – 93.99 851 (21.3)
94 – 99.99 1 196 (29.9)
100 1 457 (36.5)
Total length of roads (km) 36.7 (29.5 – 40.9)
Street connectivity
1 (lowest connectivity) 1 176 (29.4)
2 1 034 (25.9)
3 951 (23.8)
4 (highest connectivity) 836 (20.9)
Litter in neighborhood
No problem 1 285 (32.1)
Minor problem 2 216 (55.4)
Moderate problem 399 (10.0)
Major problem 97 (2.4)
Vacant or shabby housing
No problem 2 999 (75.0)
Minor problem 750 (18.8)
Moderate problem 192 (4.8)
Major problem 56 (1.4)
Neighborhood SES(median family income, $CAD)
70 432 (58 129 – 84 063)
Average temperature (°C) 4.7 (2.5 - 7.6)
Average annual rain (mm) 1 369 (609 – 1 747)
Table 2 Area-level characteristics of the schools andneighborhoods of urban Canadian youth (n = 3 997)(Continued)
Average annual snow (cm) 231 (195–304)
Average number of hot days 4.5 (0.5 - 11.4)
Average number of cold days 26.0 (0.6 - 47.7)
IQR = interquartile range.
Gropp et al. International Journal of Behavioral Nutrition and Physical Activity 2012, 9:124 Page 6 of 14http://www.ijbnpa.org/content/9/1/124
variables in multilevel model 2, this time with a cut-offvalue of p < 0.20 as power was less for the area-level vari-ables, to create the final model (multivariate model 3). Ifany variable or dummy variable had significance at p < 0.05(p < 0.20 for the area level variables), or the test for lineartrend across categories was significant (p < 0.05), theywere retained in the backwards selection modeling ap-proach. Because the analyses were exploratory, weselected a p < 0.20 for the area-level variables. This wasdone to ensure that we did not exclude area-level vari-ables in the model building process that could achievesignificance, but only after controlling for other covariates.All models were fit as generalized linear models and
were built with the SAS GLIMMMIX procedure with abinomial distribution and a logit link to account for theclustered nature of the data. We assumed random inter-cepts but fixed effects. A Newton–Raphson with ridgingtechnique was applied to all multilevel logistic models tooptimize convergence. Odds ratios were converted torelative risks (RR), as per existing precedents [38], RR =OR/ [ (1 – Po) + (OR x Po) ], where Po is the prevalence ofactive transportation in the referent group for eachvariable.Additionally, we calculated the population attributable
risk (PAR) to estimate the proportion of active transpor-tation to school attributed to the correlates at the differentlevels. PAR was calculated based upon the RR estimatesgenerated in multivariate model 3 with the followingequation: (Pe(RR-1)) / (1 + Pe(RR-1)) where Pe is the pro-portion of individuals exposed in similar populations [39].For variables with more than two categories, PAR wascalculated for each of the non-referent categories andthen summed to obtain an overall PAR estimate. Forvariables with an RR less than 1, the effect was invertedto obtain an RR > 1 prior to calculation of the PAR.
ResultsIndividual and family characteristics (individual-level) ofthe urban sample of students who lived in close proximityof their school are profiled in Table 1. A total of 3 997students were available for analysis, with approximatelyequal numbers of boys and girls. The majority of thestudents were in grades 6 to 8, and there was considerablevariation in social factors relevant to Canadian familiesand students’ possible choices to engage in active

Table 3 Bivariate and multivariate (Model 1) relationships of individual-level characteristics and active transportationto school (N = 3 997)
Individual-level characteristics % Engaged inactive
transportation
Bivariate model Multivariate model 1
RR (95% CI) RR (95% CI)
Gender
Male 67.6 1.00 1.00
Female 57.9 0.86 (0.81 - 0.91) 0.85 (0.80 - 0.90)
Grade
6 58.6 1.00 1.00
7 62.3 1.06 (0.97-1.15) 1.08 (0.99 - 1.17)
8 64.1 1.07 (0.97-1.17) 1.09 (0.99 - 1.19)
9 61.9 1.12 (0.99-1.23) 1.11 (0.99 - 1.23)
10 67.3 1.14 (1.01-1.25) 1.13 (1.00 - 1.24)
P trend 0.03 0.05
Ethnicity
Caucasian only 60.3 1.00 1.00
Caucasian and other 70.2 1.09 (0.95 - 1.21) 1.11 (0.97 - 1.23)
Aboriginal 69.2 1.08 (0.98 - 1.18) 1.03 (0.92 - 1.14)
Other 64.1 0.92 (0.84 - 1.00) 0.92 (0.84 - 1.00)
Number of siblings
0 65.5 1.00 1.00
1 60.1 0.92 (0.84 - 1.00) 0.96 (0.88 - 1.03)
2+ 64.2 0.97 (0.90 - 1.05) 1.01 (0.93 - 1.08)
P trend 0.88 0.38
Adults at home
Both mother and father 59.6 1.00 1.00
One parent and one step-parent 67.5 1.11 (1.02 - 1.20) 1.08 (0.98 - 1.17)
Single parent 69.0 1.13 (1.06 - 1.19) 1.06 (0.98 - 1.14)
Other 69.1 1.13 (0.97 - 1.26) 1.08 (0.92 - 1.23)
Family SES
Very well off 57.1 1.00 1.00
Well off 62.3 1.09 (1.00 - 1.21) 1.07 (0.99 - 1.15)
Average 66.1 1.17 (1.10 - 1.25) 1.15 (1.07 - 1.23)
Not very well off 66.2 1.16 (1.04 - 1.28) 1.14 (1.00 - 1.26)
Not at all well off 59.1 1.02 (0.82 - 1.20) 0.97 (0.77 - 1.16)
P trend 0.0005 0.009
Number of cars in household
0 76.7 1.00 1.00
1 68.6 0.94 (0.82 - 1.04) 0.94 (0.82 - 1.03)
2+ 59.0 0.85 (0.72 - 0.95) 0.85 (0.73 - 0.97)
P trend <.0001 0.0001
Residential neighborhood is safe for children
Strongly agree 63.5 1.00 1.00
Agree 57.9 1.02 (0.96 - 1.08) 1.01 (0.94 - 1.07)
Neither agree nor disagree 63.6 0.99 (0.91 - 1.06) 0.96 (0.88 - 1.04)
Disagree 63.0 0.87 (0.75 - 0.99) 0.84 (0.72 - 0.96)
Gropp et al. International Journal of Behavioral Nutrition and Physical Activity 2012, 9:124 Page 7 of 14http://www.ijbnpa.org/content/9/1/124

Table 3 Bivariate and multivariate (Model 1) relationships of individual-level characteristics and active transportationto school (N = 3 997) (Continued)
Strongly disagree 62.2 0.98 (0.81 - 1.14) 0.96 (0.77 - 1.12)
P trend 0.14 0.036
RR (95% CI) = relative risk (95% confidence interval).
Gropp et al. International Journal of Behavioral Nutrition and Physical Activity 2012, 9:124 Page 8 of 14http://www.ijbnpa.org/content/9/1/124
transportation to school. With respect to the study out-come, 62.6% engaged in regular active transportation toschool. Table 2 further describes the distribution of thestudent sample by school and neighborhood characteris-tics (area-level) that could potentially impact active trans-portation choices.Table 3 summarizes bivariate, then adjusted (multivariate
model 1), associations between each individual-level vari-able and engagement in active transportation to school.While the bivariate analyses indicated that a number ofindividual-level factors are potential correlates of activetransportation, multivariate model 1 (individually adjusted)results suggested a more modest list of correlates. Table 4extends these results through the examination of area-levelcorrelates of the school and neighborhood; few of thesefactors achieved statistical significance. The final multi-level model (multivariate model 3) is presented in Table 5.The final multivariate model indicates that factors at
both individual and area-levels were associated with activetransportation. Individual and family characteristics(individual-level) included: gender (female: RR = 0.86,95% CI: 0.80-0.91); living with one parent and one step-parent (RR = 1.10, 95% CI: 1.00-1.19); “well off” (RR = 1.08,95% CI: 1.00-1.16) to “not very well off” (RR = 1.14, 95%CI: 1.01-1.26) perceived family affluence; two or morecars in the household (RR = 0.87, 95% CI: 0.74-0.97);and “disagree” that the residential neighborhood is safe forchildren (RR = 0.83, 95% CI: 0.70-0.95). School characteris-tics (area-level) included: presence of a walk/bike toschool day program or a walking school bus program (RR= 0.89, 95% CI: 0.74-1.03). Neighborhood characteristics(area-level) included: a higher percentage of roads withsidewalks (quartile 3: RR = 1.17, 95% CI: 0.96-1.34); ahigher speed limit of the school’s road (50 km/h: RR = 1.22,95% CI: 0.92-1.43; ≥60 km/h: RR = 1.26, 95% CI: 0.96-1.47);increased total length of roads (quartile 4: RR = 1.23, 95%CI: 1.00-1.42,); litter in neighborhoods perceived as a majorproblem (RR = 1.47, 95% CI: 1.16-1.57); presence of vacantor shabby housing (ptrend = 0.19); a lower average dailytemperature (quartile 2: RR = 0.77, 95% CI: 0.54-1.00; quar-tile 3: RR = 0.76, 95% CI: 0.46-1.08); higher amounts ofrain (quartile 4: RR = 1.25, 95% CI: 0.91-1.45); and moreextreme hot days in a year (quartile 4: RR = 1.33, 95%CI: 1.05-1.53).Table 6 displays the PAR estimates for the correlates
of active transportation to school that were present inthe final model (multivariate model 3). We did not
calculate the PAR for three variables, including the lack ofwalk/bike to school days, the presence of litter in theneighborhood, and the speed limit of the school’s streetdue to the confusing RRs. These variables were ignored,as it does not make sense to reduce active transportationprograms in schools, or to increase litter in neighbor-hoods, or to increase the speed limit of the school’s roadin order to increase active transportation to school. PARestimates ranged from 2.3% to 10.8% (10.8% being thenumber of cars in the household) for the individual-levelvariables and from 6.9% to 16.6% (16.6% being averagetemperature) for the area-level variables. The ratingsunder potential to intervene column in Table 6 were basedupon our judgment on the feasibility of intervening uponeach of the listed correlates.
DiscussionWe identified the most important hypothesized corre-lates of active transportation to school in Canadianyouth residing close to their school using indicators of:1) the strength of associations identified via regressionanalyses; 2) population attributable risk; and 3) the po-tential for intervention. The most important finding ofthis national study was that the choice to engage inactive transportation to school was governed by multiplefactors at the individual- and area-levels, as opposed toone or more very specific factors.There are major differences between our study design
and methods from those used in previous studies in thisfield. Our study involved a geographically diverse samplefrom across the country, but at the same time waslimited to urban youth who lived in close proximity totheir school (ie, within 1 mile or 1.6 km) and wouldtherefore likely not be eligible for school bussing. Wemeasured multiple active transportation correlates atmultiple levels, and because of this, employed multi-level analytical approaches.Despite differences in study design and methods, many
of the individual and family correlates that were identi-fied in our study have been identified in previous studiesthat examined determinants of active transportation,such as gender [6,9-11], family structure [14,15], and thenumber of cars in the household [17]. However, unlikeprevious American studies which found that Hispanicand Black students were more likely to engage in activetransportation to school [6,12,13], we did not find anyassociations for ethnicity. This may be related to the

Table 4 Bivariate and multivariate (Model 2) relationships of area-level characteristics and active transportation toschool (N = 3 997)
Area-level characteristic % Engaged inactive
transportation
Bivariate model Multivariate model 2
RR (95% CI) RR (95% CI)
School Characteristics
Bicycle storage available in a safe location
No 68.3 1.00 1.00
Yes 61.1 0.89 (0.74 - 1.01) 0.94 (0.77 - 1.09)
Has walk/bike to school days and/or walking school bus programs
No 64.3 1.00 1.00
Yes 58.8 0.90 (0.77 - 1.02) 0.91 (0.74 - 1.06)
Identification of safe walking/biking routes to school
No 64.4 1.00 1.00
Yes 60.1 0.93 (0.80 - 1.05) 0.95 (0.79 - 1.09)
Neighborhood Characteristics
Sidewalk leading to school
No 57.1 1.00 1.00
Yes 62.8 1.11 (0.79 - 1.37) 1.10 (0.74 - 1.39)
% of roads with sidewalks
1 (1.45 - 47.20) 58.1 1.00 1.00
2 (47.21 - 64.30) 58.3 1.06 (0.87 - 1.23) 1.11 (0.87 - 1.32)
3 (64.31 - 84.49) 64.2 1.12 (0.93 - 1.27) 1.14 (0.88 - 1.35)
4 (84.50 – 100) 70.4 1.16 (0.97 - 1.32) 1.03 (0.76 - 1.27)
P trend 0.071 0.86
Speed limit of school’s road (km/h)
≤40 59.5 1.00 1.00
50 62.3 1.15 (0.92 - 1.34) 1.27 (0.90 - 1.50)
≥60 69.6 1.23 (0.94 - 1.43) 1.32 (0.96 - 1.53)
P trend 0.12 0.13
% of roads with speed limit ≤60 km/h
1 (<90) 60.9 1.00 1.00
2 (90 – 93.99) 65.1 1.10 (0.89 - 1.27) 1.06 (0.82 - 1.27)
3 (94 – 99.99) 60.1 1.06 (0.85 - 1.24) 1.08 (0.84 - 1.29)
4 (100) 63.8 1.03 (0.83 - 1.21) 1.05 (0.81 - 1.25)
P trend 0.94 0.78
Total length of roads (km)
1 (10.7 – 29.2) 55.6 1.00 1.00
2 (29.3 – 37.0) 60.8 1.10 (0.92 - 1.27) 0.99 (0.72 - 1.25)
3 (37.1 – 41.7) 60.8 1.16 (0.97 - 1.33) 1.10 (0.79 - 1.37)
4 (41.71 – 73.7) 73.7 1.32 (1.15 - 1.46) 1.27 (0.94 - 1.52)
P trend 0.0005 0.070
Street connectivity
1 (lowest connectivity) 55.8 1.00 1.00
2 66.0 1.20 (1.02 - 1.36) 1.07 (0.81 - 1.30)
3 60.7 1.16 (0.97 - 1.32) 0.96 (0.65 - 1.25)
4 (highest connectivity) 70.2 1.24 (1.06 - 1.39) 0.91 (0.56 - 1.25)
Gropp et al. International Journal of Behavioral Nutrition and Physical Activity 2012, 9:124 Page 9 of 14http://www.ijbnpa.org/content/9/1/124

Table 4 Bivariate and multivariate (Model 2) relationships of area-level characteristics and active transportation toschool (N = 3 997) (Continued)
P trend 0.020 0.45
Litter in neighborhood
No problem 62.1 1.00 1.00
Minor problem 61.6 1.03 (0.89 - 1.15) 1.05 (0.88 - 1.19)
Moderate problem 62.9 0.99 (0.77 - 1.18) 1.11 (0.82 - 1.33)
Major problem 91.8 1.48 (1.24 - 1.57) 1.48 (1.17 - 1.58)
P trend 0.13 0.055
Vacant or shabby housing
No problem 62.7 1.00 1.00
Minor problem 59.7 0.98 (0.81 - 1.13) 0.91 (0.71 - 1.10)
Moderate problem 72.4 1.07 (0.81 - 1.28) 0.76 (0.44 - 1.09)
Major problem 60.7 1.07 (0.59 - 1.40) 0.73 (0.23 - 1.29)
P trend 0.70 0.11
Neighborhood SES (median family income, $CAD)
1 (32 984 – 56 979) 66.5 1.00 1.00
2 (56 980 – 67 400) 66.1 1.01 (0.85 - 1.15) 0.97 (0.75 - 1.16)
3 (67 400 – 80 300) 60.7 0.94 (0.77 - 1.10) 1.02 (0.80 - 1.19)
4 (80 301 – 108 010) 58.9 0.88 (0.72 - 1.04) 0.95 (0.69 - 1.16)
P trend 0.086 0.77
Average temperature (°C)
1 (−4.45 – 2.75) 62.4 1.00 1.00
2 (2.76 – 4.40) 58.9 1.00 (0.82 - 1.16) 0.71 (0.34 - 1.13)
3 (4.41 – 7.40) 59.5 1.00 (0.83 - 1.16) 0.79 (0.30 - 1.30)
4 (7.41 – 10.60) 68.3 1.04 (0.87 - 1.19) 0.88 (0.27 - 1.42)
P trend 0.64 0.95
Average annual rain (mm)
1 (326 – 615) 61.7 1.00 1.00
2 (616 – 1335) 62.1 1.02 (0.84 - 1.18) 0.93 (0.59 - 1.23)
3 (1336 – 1700) 66.3 1.01 (0.84 - 1.16) 1.25 (0.79 - 1.50)
4 (1701 – 3360) 60.6 1.02 (0.85 - 1.18) 1.27 (0.82 - 1.50)
P trend 0.82 0.33
Average annual snow (cm)
1 (87 – 200) 68.2 1.00 1.00
2 (201 – 240) 70.0 1.04 (0.89 - 1.16) 1.10 (0.87 - 1.26)
3 (241 – 310) 51.7 0.85 (0.69 - 0.99) 0.88 (0.59 - 1.13)
4 (311 – 690) 61.8 0.94 (0.79 - 1.07) 0.84 (0.46 - 1.17)
P trend 0.11 0.19
Average annual number of hot days
1 (0 – 0.63) 56.4 1.00 1.00
2 (0.64 – 4.65) 63.5 1.13 (0.94 - 1.30) 1.19 (0.84 - 1.46)
3 (4.66 – 10.50) 67.8 1.12 (0.92 - 1.28) 1.07 (0.70 - 1.39)
4 (10.51 – 26.00) 65.4 1.14 (0.95 - 1.31) 1.15 (0.74 - 1.46)
P trend 0.16 0.69
Gropp et al. International Journal of Behavioral Nutrition and Physical Activity 2012, 9:124 Page 10 of 14http://www.ijbnpa.org/content/9/1/124

Table 4 Bivariate and multivariate (Model 2) relationships of area-level characteristics and active transportation toschool (N = 3 997) (Continued)
Average annual number of cold days
1 (0 – 4.5) 63.3 1.00 1.00
2 (4.6 – 26.0) 60.9 0.99 (0.82 - 1.14) 1.17 (0.75 - 1.42)
3 (26.1 – 50) 64.9 1.03 (0.86 - 1.18) 1.17 (0.62 - 1.46)
4 (50.1 – 110.5) 61.5 0.96 (0.78 - 1.13) 1.14 (0.45 - 1.49)
P trend 0.87 0.69
Model 2 controls for the significant variables by backwards selection from the first model (gender, family structure, family SES, number of cars in household, andperceived residential neighborhood safety).RR (95% CI) = relative risk (95% confidence interval).
Gropp et al. International Journal of Behavioral Nutrition and Physical Activity 2012, 9:124 Page 11 of 14http://www.ijbnpa.org/content/9/1/124
differing ethnic minority compositions in the UnitedStates and Canada. We also did not find an associationbetween the number of siblings and active transporta-tion, while several others have identified such an associ-ation [8,14,15,40]. Finally, most other studies have foundthat youth with a lower family SES were more likely toengage in active transportation to school [8,14,15,21].Our results showed more of a U-shape pattern with SES,wherein students in the middle SES categories were themost likely to engage in active transportation to school.School correlates of active transportation are not well
understood as few studies have investigated these asso-ciations. Our main finding for schools was that, of thethree potential school correlates examined, only one wasassociated with active transportation. Specifically, and toour surprise, the presence of active transportation pro-grams (walk/bike to school days and walking school busprograms) was negatively associated with active trans-portation to school. This may be an artifact of the lackof temporality in our cross-sectional study design. Thatis, it is possible that schools with lower active transpor-tation rates implemented walk/bike to school days andwalking school bus programs in an attempt to addressthis public health issue.Several neighborhood factors were also correlated with
active transportation to school. Consistent with findingsfrom a recent systematic review, we found no associ-ation with street connectivity (a measure of the direct-ness of travel routes), but a positive association with thepercentage of streets with sidewalks and the total lengthof streets [20]. Our finding that climate measures wereassociated with active transportation to school differsfrom other studies that were not as geographicallydiverse [6,23]. We also investigated several neighbor-hood variables that, to date, have been unstudied. Ofthese, our findings suggest that there is a relationshipbetween aspects of the environment that are related tosafety and aesthetics (e.g., presence of sidewalks, pres-ence of shabby housing, presence of litter).As discussed above, several individual and area-level
variables were correlated with active transportation in
our study. In order to supply information for the develop-ment of informed policy, we identified the most importantcorrelates based upon the strength of the identified as-sociation, its population attributable risk, and the potentialfor intervention (see Table 6). Using these criteria, themost important correlates of active transportation toschool were gender, the perception of residential neigh-borhood safety, the percentage of roads with sidewalks,and the total length of streets. In order to increase femaleengagement in active transportation to school, interven-tions could follow similar existing programs, such as theLEAP program implemented in South Carolina [41].Additionally, other programs, such as ENACT suggestthat resident-led neighborhood programs are effective atincreasing active transportation to school by improving per-ception of neighborhood safety, with safety in numbers [42].At the area-level, we propose that the type of interven-
tion would vary depending on whether it is an existingschool or a newly constructed school. For existing schools,improvements to the existing active transportation infra-structure (e.g., traffic calming strategies, cross-walks,bicycle paths, new sidewalks and traffic diversion efforts),such as done by the Safe Routes to School intervention inCalifornia, may improve rates of active transportation toschool [19]. Newly constructed schools should be built inactive transportation friendly environments.The main limitations of our study include the follow-
ing methodological issues. First, this study may havebeen affected by selection, as after excluding multipleschools and students, our final sample was reduced from26 078 to 3 997 (many students were removed becausethey did not reside in an urban core, and because theydid not live within ~1 mile of their school). Third, theremay be measurement error with the distance fromschool inclusion, as the geographical center of the postalcode area was considered as a proxy for the students’home location. Due to the fact that these analyses werelimited to urban areas, the estimated locations should berelatively precise [28]. Fourth, we only have informationon the trip from home to school; differences in mode oftransportation may exist between journeys going to and

Table 5 Final multivariate model of the relationships ofcharacteristics of the individual and family, school, andneighborhood with active transportation to school(N = 3 997)
Characteristic Multivariate model 3
RR (95% CI)
Individual and Family Characteristics (Individual-level)
Gender
Male 1.00
Female 0.86 (0.80 - 0.91)
Family structure, living with:
Both mother and father 1.00
One parent and one step-parent 1.10 (1.00 - 1.19)
Single parent 1.07 (0.99 - 1.14)
Other 1.10 (0.94 - 1.24)
Family SES
Very well off 1.00
Well off 1.08 (1.00 - 1.16)
Average 1.16 (1.08 - 1.24)
Not very well off 1.14 (1.01 - 1.26)
Not at all well off 1.00 (0.80 - 1.19)
P trend 0.0041
Number of cars in household
0 1.00
1 0.94 (0.82 - 1.04)
2+ 0.87 (0.74 - 0.97)
P trend 0.0003
Residential neighborhood is safe for children
Strongly agree 1.00
Agree 1.00 (0.94 - 1.07)
Neither agree nor disagree 0.95 (0.86 - 1.03)
Disagree 0.83 (0.70 - 0.95)
Strongly disagree 0.95 (0.76 - 1.11)
P trend 0.019
School Characteristics (Area-Level)
Has walk/bike to school days and/or walking school bus programs
No 1.00
Yes 0.89 (0.74 - 1.03)
Neighborhood Characteristics (Area-Level)
% of roads with sidewalks
1 (1.45 - 47.20) 1.00
2 (47.21 - 64.30) 1.11 (0.90 - 1.30)
3 (64.31 - 84.49) 1.17 (0.96 - 1.34)
4 (84.50 – 100) 1.09 (0.87 - 1.28)
P trend 0.35
Table 5 Final multivariate model of the relationships ofcharacteristics of the individual and family, school, andneighborhood with active transportation to school(N = 3 997) (Continued)
Speed limit of school’s road (km/h)
≤40 1.00
50 1.22 (0.92 - 1.43)
≥60 1.26 (0.96 - 1.47)
P trend 0.13
Total length of roads (km)
1 (10.7 – 29.2) 1.00
2 (29.3 – 37.0) 1.00 (0.76 - 1.22)
3 (37.1 – 41.7) 1.08 (0.85 - 1.29)
4 (41.71 – 73.7) 1.23 (1.00 - 1.42)
P trend 0.031
Litter in neighborhood
No problem 1.00
Minor problem 1.05 (0.89 - 1.18)
Moderate problem 1.09 (0.83 - 1.29)
Major problem 1.47 (1.16 - 1.57)
P trend 0.061
Vacant or shabby housing
No problem 1.00
Minor problem 0.95 (0.77 - 1.11)
Moderate problem 0.83 (0.52 - 1.13)
Major problem 0.76 (0.29 - 1.26)
P trend 0.19
Average temperature (°C)
1 (−4.45 – 2.75) 1.00
2 (2.76 – 4.40) 0.77 (0.54 - 1.00)
3 (4.41 – 7.40) 0.76 (0.46 - 1.08)
4 (7.41 – 10.60) 0.87 (0.53 - 1.19)
P trend 0.71
Average annual rain (mm)
1 (326 – 615) 1.00
2 (616 – 1335) 0.94 (0.68 - 1.18)
3 (1336 – 1700) 1.16 (0.76 - 1.42)
4 (1701 – 3360) 1.25 (0.91 - 1.45)
P trend 0.20
Average number of hot days
1 (0 – 0.63) 1.00
2 (0.64 – 4.65) 1.24 (0.95 - 1.46)
3 (4.66 – 10.50) 1.18 (0.90 - 1.41)
4 (10.51 – 26.00) 1.33 (1.05 - 1.53)
P trend 0.057
RR (95% CI) = relative risk (95% confidence interval).
Gropp et al. International Journal of Behavioral Nutrition and Physical Activity 2012, 9:124 Page 12 of 14http://www.ijbnpa.org/content/9/1/124
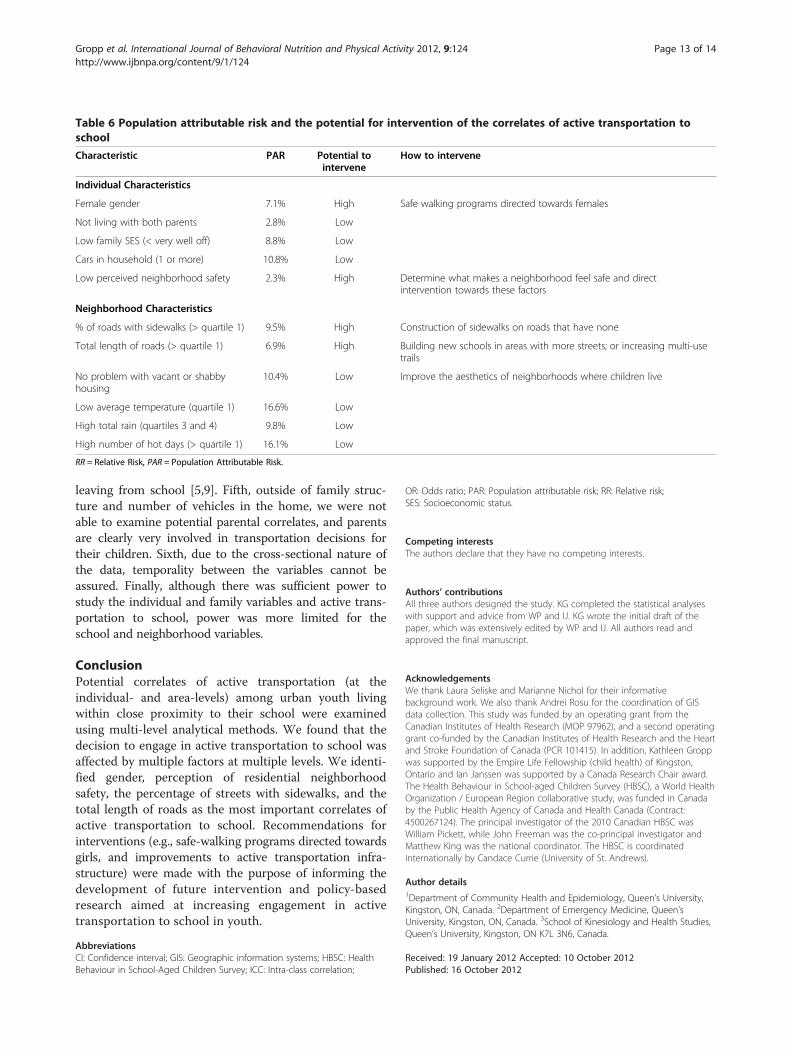
Table 6 Population attributable risk and the potential for intervention of the correlates of active transportation toschool
Characteristic PAR Potential tointervene
How to intervene
Individual Characteristics
Female gender 7.1% High Safe walking programs directed towards females
Not living with both parents 2.8% Low
Low family SES (< very well off) 8.8% Low
Cars in household (1 or more) 10.8% Low
Low perceived neighborhood safety 2.3% High Determine what makes a neighborhood feel safe and directintervention towards these factors
Neighborhood Characteristics
% of roads with sidewalks (> quartile 1) 9.5% High Construction of sidewalks on roads that have none
Total length of roads (> quartile 1) 6.9% High Building new schools in areas with more streets; or increasing multi-usetrails
No problem with vacant or shabbyhousing
10.4% Low Improve the aesthetics of neighborhoods where children live
Low average temperature (quartile 1) 16.6% Low
High total rain (quartiles 3 and 4) 9.8% Low
High number of hot days (> quartile 1) 16.1% Low
RR = Relative Risk, PAR = Population Attributable Risk.
Gropp et al. International Journal of Behavioral Nutrition and Physical Activity 2012, 9:124 Page 13 of 14http://www.ijbnpa.org/content/9/1/124
leaving from school [5,9]. Fifth, outside of family struc-ture and number of vehicles in the home, we were notable to examine potential parental correlates, and parentsare clearly very involved in transportation decisions fortheir children. Sixth, due to the cross-sectional nature ofthe data, temporality between the variables cannot beassured. Finally, although there was sufficient power tostudy the individual and family variables and active trans-portation to school, power was more limited for theschool and neighborhood variables.
ConclusionPotential correlates of active transportation (at theindividual- and area-levels) among urban youth livingwithin close proximity to their school were examinedusing multi-level analytical methods. We found that thedecision to engage in active transportation to school wasaffected by multiple factors at multiple levels. We identi-fied gender, perception of residential neighborhoodsafety, the percentage of streets with sidewalks, and thetotal length of roads as the most important correlates ofactive transportation to school. Recommendations forinterventions (e.g., safe-walking programs directed towardsgirls, and improvements to active transportation infra-structure) were made with the purpose of informing thedevelopment of future intervention and policy-basedresearch aimed at increasing engagement in activetransportation to school in youth.
AbbreviationsCI: Confidence interval; GIS: Geographic information systems; HBSC: HealthBehaviour in School-Aged Children Survey; ICC: Intra-class correlation;
OR: Odds ratio; PAR: Population attributable risk; RR: Relative risk;SES: Socioeconomic status.
Competing interestsThe authors declare that they have no competing interests.
Authors’ contributionsAll three authors designed the study. KG completed the statistical analyseswith support and advice from WP and IJ. KG wrote the initial draft of thepaper, which was extensively edited by WP and IJ. All authors read andapproved the final manuscript.
AcknowledgementsWe thank Laura Seliske and Marianne Nichol for their informativebackground work. We also thank Andrei Rosu for the coordination of GISdata collection. This study was funded by an operating grant from theCanadian Institutes of Health Research (MOP 97962), and a second operatinggrant co-funded by the Canadian Institutes of Health Research and the Heartand Stroke Foundation of Canada (PCR 101415). In addition, Kathleen Groppwas supported by the Empire Life Fellowship (child health) of Kingston,Ontario and Ian Janssen was supported by a Canada Research Chair award.The Health Behaviour in School-aged Children Survey (HBSC), a World HealthOrganization / European Region collaborative study, was funded in Canadaby the Public Health Agency of Canada and Health Canada (Contract:4500267124). The principal investigator of the 2010 Canadian HBSC wasWilliam Pickett, while John Freeman was the co-principal investigator andMatthew King was the national coordinator. The HBSC is coordinatedinternationally by Candace Currie (University of St. Andrews).
Author details1Department of Community Health and Epidemiology, Queen’s University,Kingston, ON, Canada. 2Department of Emergency Medicine, Queen’sUniversity, Kingston, ON, Canada. 3School of Kinesiology and Health Studies,Queen’s University, Kingston, ON K7L 3N6, Canada.
Received: 19 January 2012 Accepted: 10 October 2012Published: 16 October 2012

Gropp et al. International Journal of Behavioral Nutrition and Physical Activity 2012, 9:124 Page 14 of 14http://www.ijbnpa.org/content/9/1/124
References1. Sallis JF, Frank LD, Saelens BE, Kraft MK: Active transportation and physical
activity: opportunities for collaboration on transportation and publichealth research. Transport Res A-Pol 2004, 38:249–268.
2. Dollman J, Lewis NR: Active transport to school as part of a broader habitof walking and cycling among South Australian youth. Pediatr Exerc Sci2007, 19:436–443.
3. Lubans DR, Boreham CA, Kelly P, Foster CE: The relationship betweenactive travel to school and health-related fitness in children andadolescents: a systematic review. Int J Behav Nutr Phys Act 2011, 8:5.
4. Buliung RN, Mitra R, Faulkner G: Active school transportation in theGreater Toronto Area, Canada: an exploration of trends in space andtime (1986–2006). Prev Med 2009, 48:507–512.
5. Ham SA, Martin S, Kohl HW: Changes in the percentage of students whowalk or bike to school-United States, 1969 and 2001. J Phy Act Health2008, 5:205–215.
6. Babey SH, Hasert TA, Huang W, Brown ER: Sociodemographic, family, andenvironmental factors associated with active commuting to schoolamong US adolescents. J Public Health Policy 2009, 30:203–220.
7. McDonald NC: Active transportation to school. Am J Prev Med 2007,32:509–516.
8. McMillan TE: The relative influence of urban form on a child’s travelmode to school. Trans Res A 2007, 41:69–79.
9. Larsen K, Gilliland J, Hess P, Tucker P, Irwin J, He M: The influence of thephysical environment and sociodemographic characteristics onchildren’s mode of travel to and from school. Am J Public Health 2009,99:520–526.
10. Robertson-Wilson JE, Leatherdale ST, Wong SL: Social-ecological correlatesof active commuting to school among high school students. J AdolescHealth 2008, 42:486–495.
11. Bungum T, Lounsbery M, Moonie S, Gast J: Prevalence and correlates ofwalking and biking to school among adolescents. J Commun Health 2009,34:129–134.
12. Braza M, Shoemaker W, Seeley A: Neighborhood design and rates ofwalking and biking to elementary school in 34 California communities.Am J Health Promot 2004, 19:128–136.
13. Evenson KR, Huston SL, McMillen BJ, Bors P, Ward DS: Statewideprevalence and correlates of walking and bicycling to school. ArchPediatr Adolesc Med 2003, 157:887–892.
14. Pabayo R, Gauvin L, Barnett TA: Longitudinal changes in activetransportation to school in Canadian youth aged 6 through 16 years.Pediatrics 2011, 128:e404–e413.
15. Pabayo RA, Gauvin L, Barnett TA, Morency P, Nikiema B, Seguin L:Understanding the determinants of active transportation to schoolamong children: evidence of environmental injustice from the QuebecLongitudinal Study of Child Development. Health Place 2012, 18:163–171.
16. Merom D, Tudor-Locke C, Bauman A, Rissel C: Active commuting to schoolamong NSW primary school children: implications for public health.Health Place 2006, 12:678–687.
17. Ewing R, Schroeer W, Greene W: School location and student travel:analysis of factors affecting mode choice. Transport Res Rec 2004,1895:55–63.
18. Martin SL, Lee SM, Lowry R: National prevalence and correlates of walkingand bicycling to school. Am J Prev Med 2007, 33:98–105.
19. Boarnet MG, Anderson CL, Day K, McMillan T, Alfonzo M: Evaluation of theCalifornia Safe Routes to School legislation: urban form changes andchildren’s active transportation to school. Am J Prev Med 2005,28:134–140.
20. Wong BY, Faulkner G, Buliung R: GIS measured environmental correlatesof active school transport: a systematic review of 14 studies. Int J BehavNutr Phys Act 2011, 8:39.
21. McDonald NC: Critical factors for active transportation to school amonglow-income and minority students. Evidence from the 2001 NationalHousehold Travel Survey. Am J Prev Med 2008, 34:341–344.
22. McDonald NC, Deakin E, Aalborg AE: Influence of the social environmenton children’s school travel. Prev Med 2010, 50(Suppl 1):S65–S68.
23. Sirard JR, Ainsworth BE, McIver KL, Pate RR: Prevalence of activecommuting at urban and suburban elementary schools in Columbia, SC.Am J Prev Med 2009, 95:236–237.
24. Kerr J, Rosenberg D, Sallis JF, Saelens BE, Frank LD, Conway TL: Activecommuting to school: Associations with environment and parentalconcerns. Med Sci Sports Exerc 2006, 38:787–794.
25. Booth ML, Okely AD, Denney-Wilson E, Hardy LL, Dobbins T, Wen L, Rissel C:Characteristics of travel to and from school among adolescents in NSW,Australia. J Paediatr Child Health 2007, 45:755–761.
26. Timperio A, Ball K, Salmon J, Roberts R, Giles-Corti B, Simmons D, Baur LA,Crawford D: Personal, family, social, and environmental correlates ofactive commuting to school. Am J Prev Med 2006, 30:45–51.
27. Currie C, Nic Gabhainn S, Godeau E: The Health Behaviour in School-agedChildren: WHO Collaborative Cross-National (HBSC) study: origins,concept, history and development 1982–2008. Int J Public Health 2009, 54(Suppl 2):131–139.
28. Bow CJ, Waters NM, Faris PD, Seidel JE, Galbraith PD, Knudtson ML, GhaliWA: Accuracy of city postal code coordinates as a proxy for location ofresidence. Int J Health Geogr 2004, 3:5.
29. Roberts C, Alexander D, Currie D, Haug E, Komkov A, Tynajala J: Physicalactivity. In Health Behaviour in School-aged Children (HBSC): Researchprotocol for the 2005/06 survey. Edinburgh: Child and Adolescent HealthResearch Unit; 2006.
30. Clarke P, Ailshire J, Melendez R, Bader M, Morenoff J: Using Google Earth toconduct a neighborhood audit: reliability of a virtual audit instrument.Health Place 2010, 16:1224–1229.
31. Janssen I, Rosu A: Measuring sidewalk distances using Google Earth. BMCMed Res Methodol 2012, 12:39.
32. Dill J: Measuring network connectivity for bicycling and walking. Washington,D.C: Transport Research Board 2004 Annual Meeting (CD-ROM); 2004.
33. Tresidder M: Using GIS to Measure Connectivity: An Exploration of Issues.School of Urban Studies and Planning: Portland State University; 2005.
34. Mecredy G, Pickett W, Janssen I: Street connectivity is negativelyassociated with physical activity in Canadian youth. Int J Environ ResPublic Health 2011, 8:3333–3350.
35. Snijders TAB, Bosker RJ: Multilevel analysis: an introduction to basic andadvanced multilevel modeling. London: SAGE Publications Ltd.; 1999.
36. Cerin E, Saelens BE, Sallis JF, Frank LD: Neighborhood environmentWalkability scale: validity and development of a short form. Med SciSports Exerc 2006, 38:1682–1691.
37. de Vries SI, Hopman-Rock M, Bakker I, Hirasing RA, van Mechelen W: Builtenvironmental correlates of walking and cycling in Dutch urbanchildren: results from the SPACE study. Int J Environ Res Public Health 2010,7:2309–2324.
38. Zhang J, Yu KF: What’s the relative risk? A method of correcting the oddsratio in cohort studies of common outcomes. JAMA 1998, 280:1690–1691.
39. Rothman KJ, Greenland S: Modern epidemiology. New York, NY: Lippincott,Williams and Wilkins; 1998.
40. McDonald NC: Children’s mode choice for the school trip: the role ofdistance and school location in walking to school. Transportation 2008,35:22–35.
41. Ward DS, Saunders R, Felton GM, Williams E, Epping JN, Pate RR:Implementation of a school environment intervention to increasephysical activity in high school girls. Health Educ Res 2006, 21:896–910.
42. ENACT strategy: safe communities. [http://eatbettermovemore.org/sa/enact/neighborhood/safety.php]
doi:10.1186/1479-5868-9-124Cite this article as: Gropp et al.: Multi-level examination of correlates ofactive transportation to school among youth living within 1 mile oftheir school. International Journal of Behavioral Nutrition and PhysicalActivity 2012 9:124.