MTHE INVESTIGATION OP RADIATIONS OF LOW SPECIFIC ...
234
MTHE INVESTIGATION OP RADIATIONS OF LOW SPECIFIC ACTIVITIES AND I COGNATE PROBLEMS" by Henry W. Wilson, . Department of Natural Philosophy, University of Glasgow. Presented as a thesis for the degree of Ph.D. in the University of Glasgow. December, 1952.
-
Upload
khangminh22 -
Category
Documents
-
view
0 -
download
0
Transcript of MTHE INVESTIGATION OP RADIATIONS OF LOW SPECIFIC ...

MTHE INVESTIGATION OP RADIATIONS OF LOW SPECIFIC ACTIVITIES ANDICOGNATE PROBLEMS"
by
Henry W. Wilson,.Department of Natural Philosophy,
University of Glasgow.
Presented as a thesis for the degree of Ph.D.
in the University of Glasgow. December, 1952.
ProQuest Number: 13838580
All rights reserved
INFORMATION TO ALL USERS The quality of this reproduction is dependent upon the quality of the copy submitted.
In the unlikely event that the author did not send a com p le te manuscript and there are missing pages, these will be noted. Also, if material had to be removed,
a note will indicate the deletion.
uestProQuest 13838580
Published by ProQuest LLC(2019). Copyright of the Dissertation is held by the Author.
All rights reserved.This work is protected against unauthorized copying under Title 17, United States C ode
Microform Edition © ProQuest LLC.
ProQuest LLC.789 East Eisenhower Parkway
P.O. Box 1346 Ann Arbor, Ml 48106- 1346

CONTENTS,
PREFACE « a » cat . » * « ♦ , e » » (* a • c • • . o » • • # a e * ixx.
PART 1: INTRODUCTION,
A. THEORETICAL ............... . ... ... ,.. ... 1.
1, Historical Difficulties in Beta-Decay. 2, The Neutrino
Hypothesis. 3* The Energy Available for Decay, 4. The Fermi
Theory of Beta Disintegration. 5* ft Values. 6, The Verification of Fermi*s Theory. 7* Gamow-Teller Selection
Rules. 8. Evidence for the Neutrino Hyj’othesis, 9* The
Mass of the Neutrino,
B. EXPERIMENTAL............... ............. 26.
1. Instruments and Techniques used in Beta- and Gamma™ Ray
Spectroscopy. 2, The Proportional Counter Technique.
3. Description of the Gaseous Discharge. 4. Theory of the
Proportional Counter Action. 5* Development of the
Proportional Counter. 6. Construction of a Proportional
Counter. 7® Preparation of Sources. 8. The Effect of Wall
Curvature on the Spectrum Shape (Wall Effect). 9* The
Distortion of an Electron Peak due to the Wall Effect.
10, The Correction of a Spectrum Distorted due to the Wall
Effect. 11, Calibration. 12. The Experimental Technique.
13. The Purpose of this Research.
PART 2; RADIOACTIVITY OF NICKEL ... ... ... ... ... ... 8l,
1. Introductory. 2. Chemical Purification and Source
Preparation. 3. Absorption Experiment. 4» The Charge of
the Beta-Rays. 5® The Search for Annihilation Radiation.
6, Coincidence Experiment. 1. The Beta-Spectrum of Ni^\
8. Possible Sources of Distortion of the Spectrum Shape.

599, The Radioactivity of Ni , 10. Search for other5QElectromagnetic Radiations. 11, The Half Lives of HSi. and
>T. 63Ni ;
PART 3* RADIOACTIVITY OF MERCURY 203 ... ... .........
1, Introductory, 2. The Radioactivity of Hg^0 -. 3, The
Integrating Properties of a Proportional Counter, 4* Source
Preparation, 5® Preliminary Experiments, 6. The Beta-Ray 203Spectrum of Hg . 7« Fermi Plots, 8. The Internal
Conversion Coefficients. 9* Energy of the Gamma-Radiation.
10, The Half Life of Hg20'. 11. The Decay Scheme of Hg20\12, Conclusion, 13* Future Use of the Technique,
PART 4s THE SAMARIUM 151 AND EUROPIUM 155 ACTIVITIES .........1, Introduction. 2. Brief Review of Other Investigations.
3. Preliminary Experiments. 4* Gamma-Radiation.
5. Beta-Spectra. 6, Coincidence Studies.
PART 5; THE NATURAL RADIOACTIVITY OF RUBIDIUM ...............
1. Introduction, 2. Previous Work on the Radioactivity of
Rb^. 3. The Beta-Spectrum. 4* Gamma-Radiation and
Conversion. 5* The Period X . 6. Conclusions and
Discussion. 7* Preliminary Work on Nd^°. 8, Recent Work87on Rb
APPENDIXt EXPERIMENTS ON THE FLUORESCENCE OF ANTHRACENE ...
105,
128.
146.
166.

PREFACE
This thesis describes the work of the writer in the field of low
intensity beta- and gamma.-ray spectroscopy, - This work was carried out
between October 1947 and September 195^® Part 1A contains a theoretical
introduction to the subject and part IB a discussion of the experimental
techniques used in this field. The remainder of the thesis, parts
2,3,4,5 and the appendix, is concerned with the investigations carried
out by the writer and the conclusions reached as a result of these
investigations.
The introduction is rather longer than is perhaps usual. This is
due in part to the wide scope of the investigations and although the
matter included in the discussion of the different methods of analyzing
beta- and gamma- radiations is not new. it represents an analysis by the
writer with special regard to his own field of weak activities. Moreover
it should be noted that the introduction contains a certain amount of
original work (the theory of the "Wall Effect”, experiments on calibration)
which seemed to fit most naturally into part 1,
The study of the unstable nickel isotopes started in the proposal
of Dr. S.C.Curran to investigate the reported low energy positron emission 59of Ni ' » This earlier work, done in collaboration with Dr, Curran,
resulted in the discovery of the low energy negatron emitter Ni^. Later
the writer resumed, on his own initiative, the investigation of nickel
to elucidate the mode of decay and period of Ni'"', In this way theRQcapture decay of Ni' ' was discovered with no evidence of positron emission,
201Regarding the work on' Hg , the investigations were extended by the
suggestion of Dr. Curran that the integrating properties of the proportional
counter would prove useful in elucidating the decay. The writer was wholly
iv,responsible for undertaking and prosecuting the work on samarium and
europium, on the "Wall Effect”, Part IB, Sections 8,9 and 10 and the
experiments on calibration, Part IB, Section 11. The work on rubidium
and neodymium v/as part of a general investigation of low intensity of
sources carried out in the department. The work described in the appendix
was carried out at the suggestion of Dr. J.B. Birks.
At a late stage in the examination of the samarium and europium
activities the writer asked Mr. G.M. Lewis to collaborate in coincidence
studies (Part A, Section 6) since he had suitable scintillation counting
equipment. Also the writer was assisted by Mr, D. Dixon in the later sta
ges of the work on samarium and europium andin the work on rubidium. The
remaining investigations described in Parts IB, 2, 1, A and in the appendix
were carried out entirely by the writer.
■References in the text are given in the style now used by British
journals of physics, viz, by giving the name or names of the author or
authors followed by the date of publication. The full references are
given at the end.
Finally I should like to thank Professor Dee for his kind interest
and siipport in the course of this work. Dr. Curran for his guidance and
for many helpful suggestions and Mr. J.T,Lloyd and the workshop staff for
their assistance in the construction of apparatus,I
H.W.W.

PART 1. INTRODUCTION.
A, Theoretical,
1. Historical Difficulties in Beta-Decay.
The study- of beta-rays emitted by radioactive substances has been
actively and continuously carried out since the discovery of radio
activity in the closing years of the last century. An immense amount
of experimental data has resulted from this study accompanied by equally
extensive theoretical investigations and yet it is only within recent
years, since the war, in fact, that the theory of beta-deca.y about to be
described briefly has become so trusted that disagreement of experimental
results with theory makes the data suspect rather than the theory (at any
rate, when the beta-transition is known tc be "allowed").
The phenomenon of beta-decay raised several theoretical problems of
considerable difficulty especially after Chadwickfs results of 1914*
Earlier, von Baeyer and Halm (l91C>), by magnetic analysis of beta-rays
from a radioactive source, showed that the beta-rays possessed homogeneous
electron groups or "lines", Von Baeyer, Halm and Meitner (1911, 1912) and
Rutherford and Robinson (1913) using the more accurate 180° focusing spectrometer of Danysz, discovered and investigated many such "lines".
Between 1910 and 1914> only this line structure was investigated or,
apparently, expected.
However in the latter year, Chadwick (1914) first showed that the
beta-spectrum of RaB possessed, in addition to a prominent line spectrum,
a continuum of beta-particles having a well defined upper energy limit and
found that the number of particles in the continuum far exceeded the
number in the monoenergetic groups. The difficulty which this discovery

raised, and others which became apparent as time went on, occupied the
attention of many physicists for almost twenty years and were as follows.
I. Let us consider the decay of an isotope A into another isotope B, with
the emission of a negative electron, or negatron, i.e. A-*B + (3”’. We
will show later that this is energetically possible, if the atomic mass
of A is greater than the atomic mass of B, and the energy released is
given by the difference of these masses, since, by Einstein's energy
relation, mass and energy are equivalent and, in a nuclear reaction, are
interchangeable. It is found that the energy corresponding to this mass
difference is equal (within experimental error) to the upper limit of the
beta-spectrum, However by far the greater number of the emitted electrons
have an energy less than this, and, in fact, the average energy is nearly
always less than half the maximum energy. Evidently the electrons must
lose energy somehow, or else the law of conservation of energy does not
hold in this case. Although the latter possibility was seriously suggested
by so great a physicist as Bohr, there was naturally a great reluctance to
accept this explanation. Ellis and Wooster (192?) carried out their
calorimeter experiment in an endeavour to find evidence of the former
explanation. A RaE source was placed in a calorimeter which was surrounded
by 1.2mm of lead which was sufficient to stop all ionizing radiations
emitted by the source. The energy lost by the source and trapped by the
calorimeter corresponded to an average energy of 0.35£ 0.04 MeV per
disintegration. The upper energy limit of the beta-spectrum was 1.2
MeV while the mean energy was estimated to be 0.34 MeV, agreeing with the
value found by Ellis and Wooster. As a result we can say that, if the law
of conservation of energy holds, the energy must be carried off by a
radiation which is not trapped by the calorimeter.
II9 Another difficulty was that the law of conservation of angular
momentum did not appear to hold. An electron has an intrinsic spin
In beta-decay an isotope decays to a neighbouring iscbar, i.e. its
atomic weighty considered approximately as a whole number, remains,
unaltered. Now it is to be expected theoretically and is known experi
mentally that a nucleus of even mass number will have a spin value which
is an integer, and is generally zero. If and when beta-decay takes place,
the nucleus will be left still with integral spin, as its mass number is
unaltered. On the other hand the electron car; carry off only half
integral total angular momentum. This would leave the product nucleus
with half-integer spin which as we have seen is not the case. A similar
argument applies to the case of a nucleus of odd mass number, which
possesses a half-integral spin value, as does the product nucleus. We
will postpone further discussion of this difficulty.
III. If we consider the process of beta-decay as being the result of
the process n + P'we are faced with an apparent violation of the law of conservation of
statistics, since all three particles have Fermi statistics,
2, The Neutrino Hypothesis.
To remove the.se difficulties, Pauli postulated the existence of a
new elementary particle, now called the "neutrino" (Italian: "the small
neutral one") which is produced at the same instant as the beta-particle.
It must be light, possessing no charge, have spin y and Fermi statistics.
Such a particle could carry off the surplus energy whenever the electron-
left the nucleus with less than the maximum energy. That it should have
no charge is necessary in order to conserve charge in the process of
beta-decay. Its spin of \ allows it to carry away the half-integral spin

which caused the second difficulty. It requires to he light in order to
explain the agreement of the maximum energy of the "beta-decay with the
mass difference between the parent and product atoms which had been
measured in some cases. We shall discuss experiments proving the light
ness of the neutrino later, but it may be said here that the evidence is
in favour of it having less than l/300th, of the mass of an electron.
Also direct experimental evidence of the existence of a neutrino will be
given. It is easy now to understand the result of Ellis and Y/ooster,
assuming the existence of this light neutral particle. Its interaction
with matter is extremely small, Hahmias having placed the upper limit of
probability of capture by a nucleus at one primary encounter in 300,000km-30 2
of air. This corresponds to a cross-section of «v10 cm, per atom.
This means that practically always, the neutrino would go right through
the calorimeter. A rough calculation shows that it would capture less 8than one in 10 neutrinos emitted.
3. The Energy Available for Decay.
Using this suggestion of Pauli's, Fermi (l?34) formulated the first
detailed theory of the process. He suggested that radio active decay
took place as followss-
Negatron emission;-
n -*• p + + v
where V represents the neutrino. For theoretical convenience, one
usually assumes that a neutrino is absorbed from a state of negative
energy and that an "anti-neutrino” is emitted.
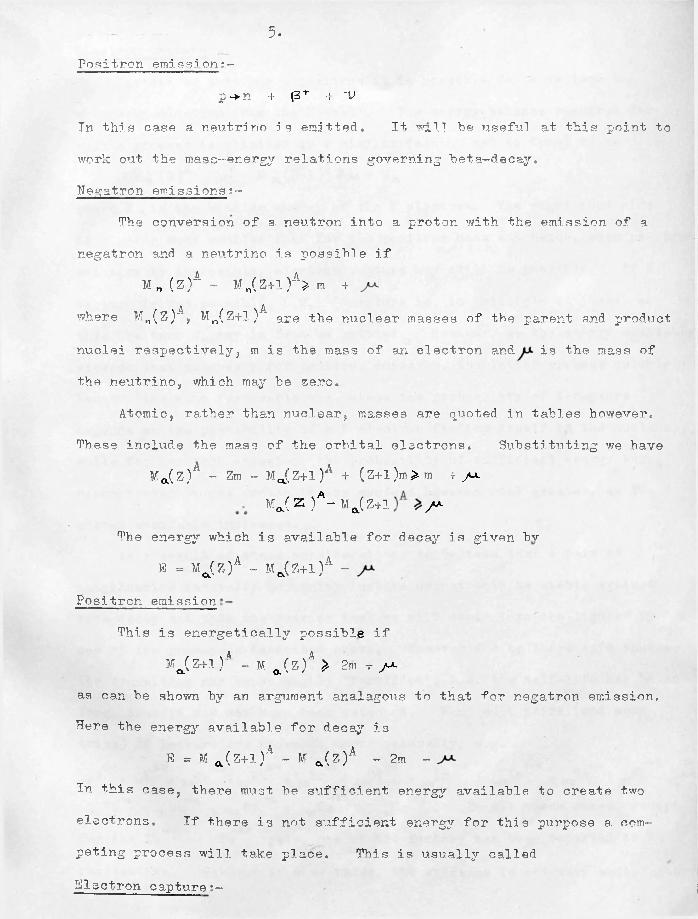
5.Positron emission;-
p-*n + (3+ + ~v
In this case a neutrino is emitted. It m i l he useful at this point to
work out the mass-energy relations governing beta-decay.
Negatron emissions?-
The conversion of a neutron into a proton with the emission of a
negatron and a neutrino is possible if
M n (Z)A - M n(Z+l)A> m +
where M„(Z)A , M n(Z+l)A are the nuclear masses of the parent and product
nuclei respectively, m is the mass of an electron and is the mass of
the neutrino, which may he zero.
Atomic, rather than nuclear, masses are quoted in tables however.
These include the mass of the orbital electrons. Substituting we have
M a(Z )A - Zm - Mjjz+l )A + (Z+l)m^m + yu.M J Z )A- M ft( Z+l / a
The energy which is available for decay is given hv
E = M J Z ) A - Mj Z + l ) A -
Positron emission
This is energetically possible if
Mjz+l )A - M a(z)A > 2 m + yJ-
as can be shown by an argument analagous to that for negatron emission.
Here the energy available for decay is
E = M a (Z+l)A - M a( Z)A - 2m -
In this case, there must be sufficient energy available to create two
electrons. If there is not sufficient energy for this purpose a com
peting process will take place. This is usually called
Electron capture;-

6.Electron capture •-
Instead of emitting a positron it is possible for a nucleus to
absorb an electron from the K-shell. The energy balance required for
such a process is obtained in a similar fashion and is found to be
M a (Z)A - M a (Z-l)A ^ + E*
where E is the binding energy of the K electron. The right hand side
is clearly much smaller than for the positron case and hence, when positron
emission is impossible, electron capture may still be possible. If K
capture is not possible, L,M, capture is, in principle at least, eo
that the term E K may in fact be omitted. However, as the energy available
exceeds that necessary for positron emission, the latter process quickly
becomes the more favourable one, since the probability of K-capture
depends on the probability of a E electron finding itself in the nucleus,
while for positron emission, the probability of sufficient energy being
concentrated on one proton in the nucleus becomes much greater, as the
energy available increases.
As a result of these considerations we believe that a pair of
neighbouring naturally occurring isobars cannot both be stable against
beta-decay and that the heavier isobars will decay into the lighter by
one of the processes described above, However due to large spin changes
the transition may be so highly "forbidden", i.e. the half-life may be so
long, that it may not have been detected. Many such pairs (and even
trios) of isobars are known to occur naturally, e.g.4-0 i+ o l -o 8 7 8 7 " 3 11 'J U S M S ' , a 3 ,-:23_A , K Ca ; Rb . , 3r : _Cd , In ; In , _ Sn ; Sb Te;tw ’ 14 f 2 c . 3 7 > } 5-0 & 5 2 ■
..176 I'ic. IVC. * 7 I'S'f7o ' i ? >7j Hf ; ^Re , £>3 . In all these cases, except
for the Sb - Te pair, one of the isobars has been reported to be
radioactive. However in some cases, the evidence is not very satisfactory
Os - The proportional counter technique employed hy the writer will,
probably be used in the examination of these isobars at some future date*
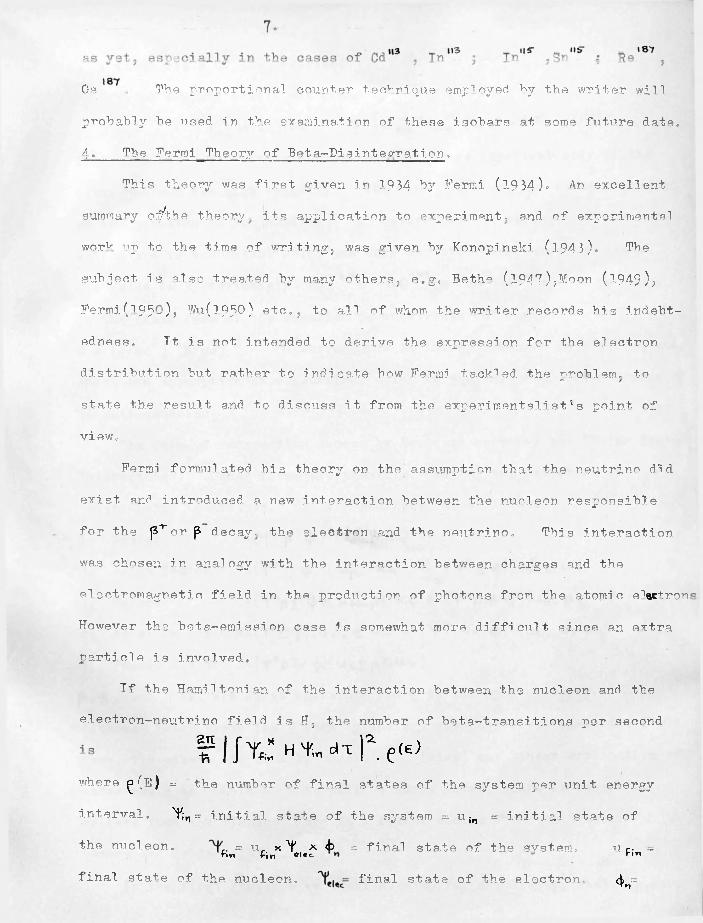
4* The Fermi Theory of Beta-Disintegration.
This theory was first given in 1934 by Fermi (l934)« An excellent
summary oj^bbe theory, its application to experiment, and of experimental
worv up to the time of writingj was given by Konopinski (l943)» The
subject is also treated by many others. e „ gf Bethe (1947),Moon (1949),
Fermi(T95-)> Wu(l950) etc., to all of whom the writer records his indebt
edness. It is not intended to derive the expression for the electron
distribution but rather to indicate how Fermi tackled the problem, to
state the result and to discuss it from the experimentalist’s point of
view.
Fermi formulated hi3 theory on the assumption that the neutrino did exist end introduced a new interaction between the nucleon responsible
for the p^or P decay, the electron and the neutrino* This interaction
was chosen in analogy with the interaction between charges and the
electromagnetic field in the production of photons from the atomic electron
However the beta-emission case is somewhat more difficult since an extra
particle is involved,
Tf the Hamiltonian of the interaction between the nucleon and the
eleetron-neutrino field is H ; the number of beta-transitions per second
f I K H t , d - c r e (E)where ^(E) = the number of final states of the system per unit energy
interval, Y;n = initial state of the system = u in = initial state of
the nucleon, = u x Y x fa = final state of the svstem. Ur* -fin fin el«c ri«final sta+e of the nucleon, final state of the electron- ^

8.- final state of the neutrino*
Fermi assumed that H was given by
f Y Z HTi« dX = <3 ] u ^ X u c u i „ d T
This neglects relativistic corrections which are important only if the
heavy nucleon has high velocity* The wave functions are to he evaluated
at the position of the nucleon, "g" determines the strength of the inter
action and is a constant which can only he determined experimentally*- V* o _2Its value is appyoximately 10 — lO gm cmy sec * - It is usual
in the final form of the equation to substitute "G" where
G = (g/mc‘ ) (ti/mc) \ corresponds to the emission of an electron and
dfn+.o the absorption of a neutrino, which is equivalent to the emission of
an anti-neutrino.
The form of interaction chosen by Fermi is known as the "Polar Vector
Interaction" Other forms are possible, obeying the criterion of
relativistic invariance, A list of these forms follows?
1. Sealar S - O f ^ <j>) (<*»?„p Uin)2, Polar Vector v=(Y* 4>) ( u £ u;„) ~ 4> Uin) ,
3. Tensor Is X + CvTp P S* U,r')4. Axial Tensor A = ( Y*cg<|>) ( U** £T - ('M'* 4>) (m A Uin)
5* Pseudo Scalar P=(V*(3*t ftlfj-Uiy,
j3 , , and 05- are Dirac operators and <T" is the spin operator*
Although Fermi chose the V form by analogy with the electromagnetic field
case, the others are equally possible. Indeed any linear combination of
these would he possible. As will be shown later, there is reason to
believe that the "Tensor" form is a better choice than the "Vector"
(Gamow and Teller- 1936).
In the first instance we shall assume, for simplicity, that the wave

9.
functions of the neutrino and the electron &r© plane waves i.e.
where pn . pft are the<j>n . axp [ -i (ph v/h )] and f —i (p€ • r Y )1
momenta of the neutrino and the electron. This is true for the neutrino
ince it has very little interaction with anything, b in the case of
the el@< 1 ''on, is equivalent to neglecting the CoulomJ) energy of the
electron. This is small compared with the disintegration energy if Z
is small and the energy of the electron not too small. On this assumption,
we can write the probability of a transition, occurring between W arid
Z h I LA r • _ Uu_ etCD -/tn 1 dX£Tt3 t,
j - ‘ ■ iii jici j g the total energy (including?
T*tdW as 0G a m e | *W (W .-W )*d W
\ 2rest energy; in me units* w is the maxinrun 1 ctron energy..w«/xp n. h'1 - ' r of each other by the relation |oa — W — I
If bfe and are of the order of magnitude me, the exponent is of the_Ri/»
and the matrix element reduces to
order — —— ~ 1 Ifh Hence the ■’"'onertial is approximate"1'' ’--'■it = i / w » c * J rx “
thi 3. pi cture, if 0, m/ o and this is an -allowed" transition.
Tf M=0, the transition i~ said to be forbidden. The exronential must be
expanded as a power series. The order of forbiddeness is the number of
the first term which rives a non—vanishing 'matrix element* SinceJ L _ ~ 1, 100, the transition probabilities are reduced by approximate- ly a factor of 10^ per order*
If we include a term F (Z. W ) which takes account of the Coulomb field
of the nucleus we can write that the probability of emission of a
hota-particle of total energy between W and W+dW in time dt isN (w )dW . d t = £1, F ( Z , W ) jbW(w0 - W ) a d.W. d t

10.
Let uij row consider the effect of +h.,a different rants of this2
equation. We see that pW/'W —-W) represents the orcbability ^er uni t
energy interval of sharing the total energy W© between the electron and
neutrino such that the former met9 W and the latter We —W. This factor
zero when W=0 or W=sW0 . Also since pW alters slowly as WtW© « the, ,9shop© of +.... - r."«r>+w >m 3 s affected mainly by the factor (Wo—W ) ,
i.e. the spectrum approaches the energy axi s paraholica.ilv
The effect of the Coulomb field of the nucleus is to attract
negatrons and repel positrons. As a result of this factor there are
relatively more negatrons and. fewer positrons at the low energy end of
the spectrum. P(2,W), usually termed the "Fermi function" is given byA _ ( * n ) i ( a t » R J ^ 1.itir<w'/|’ :|r’(s+«,*zw/i.)|*
F ( z ; [p(as+ owhere Z is the atomic number of the product nucleus, and is negative for
positron emission, v ig the nuclear radius in units h/2TLmc, s—(2 — ° lZa)'/z
oC is the "fine■structure constant". In order to calculate ft values
and to draw Fermi p1ots, as will be described later, it is necessary to
caloud ate the value of F(Z,W). Approximations which may b© used in
different cases are given below. (Feister,I960).
The variable part, of the function may be written\2.(a**-* e w i |r(S + i<j)|:
V/her© U — ^ '(i ) Fermi in his original paper used 0 form of very limited applicability
For Z— 82.2, it took the form.
F ( « a x , h ) ®= ^ y ^ 1 &
(ii) Furie, F.ichardson and Paxton (1936) gave the "ITon—rel ativi sti c
approximation"*a-n-u,
F ( z , w ) «=l - e"*"?

ii.
Thi s useful for Z 4.30, 1 • It gives one per cent accuracy for Z 4 10
and fcr energies between 100 KeV and 2,8 MeV.
(ixi) Bethe end Bacher (1936J gave another form which, as written by
Lonvmire and Brown (l949a runsF (z w) «= arT f 0 +!=>*>( n-»«»z»)
j 'i _ e -™i I 4-This is accurate to one per cent for Z ^ 8/1.
(iv) Fordheim and Yost (1937) provided a fourth approximation
F (z , w ) C - a s ) ^ * - 3-This gives one per cent accuracy up to Z = 20, and may he used for Fermi
plot purposes up to Z--3S,
Feister states that he p? ans to calculate F(Z,W) for negatrons and
positrons for all values of Z between 1 and 10C, and of p between O.OF
and 7 ( W between 0.67 KeV and 3.1 MeV). This was to have been completed
by the end of 1949> but so far it has not appeared c.A further refinement which has not yet been taken into account is the
screening effect of the atomic electrons, the effect of which has been
studied by Longmire and Brown (l949> a,b) and Reitz (19?0 ). The first
two authors showed that the effect was negligible for S- 5 but of more64importance in the case of Cu and RaE. According to Reitz, the effect
on electrons is negligable but is more important in the case of positrons,
especially for E < 300 KeV and Z>25.
5* ft Values.t
"Before going or tc consider to what extent the Fermi theory has been
supported by experiment, it will be well to say something about the "ft"
values so often referred to in work in this field.
In 1933, an attempt was made by Sargent to fit the natural bota-
emitters into some system similar to that of Geiger and Nuttal1 for
S-H

12.
alpha—emiiters. (Sargent,1933)• On plotting the logarithm of the decay
constant against the logarithm of the maxi mum tpta-rav ftnerw. he found
that the points foil, very roughly, on two fairly well defined straight
lines. Those lying on the upper one were later referred to as "allowed"
transitions and those on the lower as "first forbidden". Only AcB
appeared to lie off the curves to any considerable extent. Xt is
interesting, in passing, that ten years later Koropinski agreed exactly
with the classification resulting from the original Sargent Diagram.
This quite empirical classification can be extended to the whole periodic
table. In. extending it in this way it customary to plot it for short
ranges of Z« a good example for low Z is given by Moon,(1949» p.45) and
for short regions of high. Z, by Feather and Richardson (1948).
After Fermi's theory was published, it was possible to consider the
matter theoretically• Fop allowed transitions the total transition
probability, i.e. the reciprocal of the life—+ime is obtained from the
relation-L =t
VAJhere f"(Wo) =
For simplicity, if we i lect F(Z,W), f(W0) can be integrated fairlyl,
easily, remembering that p = (Wa -l)2 . The result varies rapidly with
W0 and has the approximate value W© /30 for W© 1 and 0,2l6(W© -lj^ for W0~ 1.
It is evident that if the ' calculation, including the factor F(Z,W)
were carried out exactly, and if [H| were to remain constant, theproduct ft would be a constant equal to 2.TT? I
G a m e 2- |Ml2*

The chief difficulty lies in calculating M. However for "mirror-nuclei »>transitions, M roust "be near unity since the wave functions are so alike.
(Mirror-nuclei are two neighbouring nuclei such, that in one the number of
protons exceeds the number of neutrons by ore, and in the other the
reverse is true).
Using recently published data on the mirror nuclei transitions,
F3 He3 , C" -* B" , and So,fl -* Os* , the life-times of which, are
12.46 yr, 20.5 min and 0,87 sec, we find that the ft values are 11^0,
389$ and 71Q0 respectively. This is remarkable agreement in view of theqfact that the life-times vary by a factor of about 10 . In the case of
the lightest mirror-nuclei, it is possible to calculate the value of
G ( ~10 11 ) and therefore g ( ~ 10 ^ ^rg cm ). The smallness of the
coupling between the electron-neutrino field and the nucleon is the cause
of the slowness of beta-decay compared to most other nuclear reactions.
The value of ft is not constant. It rises with increasing Z and,
if the transition 5s '‘forbidden", it rises by a factor of roughly 100 for
each degree of "forbiddenness". Approximate values are given below.
(Moon, 1949)♦
Z Allowed First Forbidden Second Forbidden
Z <20. 3 x 10³ 2. * 105" 3 * 10*
< Z < 80 8 x 10**" 2. x 106 5 * 10*
Z > 80 2 x l O C* 2*10* 10*
If one uses this technique to give an indication of the degree of
forbiddenness, the calculated ft value should be compared with ft values
in the same region of Z to eliminate the effect of Z-change.

14.However the conclusions arrived at thus should he considered tentative
and used only as confirmatory evidence.
Since the publication of a recent paper by Feenberg and Trigg(l950)
the simplest method of calculating f has been to use the graphs which they
provide. A very complete list of ft values based on the most accurate
data available has been published by Feingold (l95l)*
6. The Verification of Fermi!s Theory,
We shall how consider the various ways in which the theory can be
tested.
(i) The comparison of the shape of bet a-ra.y spectra as measured with
the predicted shape.
(ii) The predictions made by the different forms of the theory
(Fermi, Gamow-Teller, hereafter abbreviated as G-T) with regard to life
time and degree of forbiddenness. This may serve to distinguish between
the different forms of - interaction.
(iii) The existence of the neutrino. If this can be shown experi
mentally to exist, the fundamental basis of the theory will have been made
so much more certain by direct evidence of the postulated mode of decay.
To compare experiment with theory it is usual to draw a "Fermi" or
"Kurie" plot. (Both terms are in use and there is not a consistent way
of using them. In what follows, the term "Fermi Plot" will be used and
m i l be understood to take into account the Coulomb effect). Considering
the expression for the energy distribution of the beta-particles, it is
evident that if jJN(W)/pWF(Z,W ) is plotted against the energy of the
particles a straight line will result provided |m | remains effectively2constant. fFor forbidden decays \M| may vary with energy). This
straight line will cut the energy axis at W = WQ . This plot, then, does

15*two things. It shows whether the shape is the same as that predicted
by Fermi theory for an allowed spectrum and it gives a more accurate
value for W0 than can he obtained by inspection of the spectrum (due to
the parabolic approach).
The calculation of F(Z,W) is often laborious even when the approxi
mations mentioned previously are employed. The tables promised by
Feister will therefore be very acceptable indeed. However mention should
be made of a very useful method of mailing the plot due to Bleuler and
Ziinti (1946). They put the negatron spectrum into the formN ( w ) d w = C [z ] w 1 ( W o - w ) 2 e tz .,w ] dW
and give curves showing 9 as a function of W for 40 — Z - 90 and Z © as
a function of W for 0 Z — A0t Z 0 is given for low Z because, as
Z.-* 0 ©-? 00 but Z © remains finite. To make a ”B1 euler-Zunti plot”, one plots ~ /NOfV) against W, since G(z) is constant for a /^iven isotope.1 w 4 e wFor positrons ® must be multiplied by e _ where P is the value of
Z© for Z=0. This method of making the plots was used by the writer in201 1SI 155the examination of the spectra of Hg , Sm " and Eu
If the transition is not allowed, it may show a departure from the
allowed shape, although many first forbidden spectra do show an allowed
shape. In the event of departure from allowed shape, correction factors,
given first by Greuling (1942), are used which, if the spin and parity
changes assumed are correct, will lead, to straight line plots. However
in the case of higher degrees cf forbiddenness there is often an unknown
variable, the ratio of the matrix elements, which can be chosen only
arbitrarily to fit the spectrum shape obtained.
In the early days, spectra which should have given straight line
Fermi plots in fact did not. Konopinski and Uhlenbeckf1935) introduced a

16,
modified form of the theory to explain this. In the equation for the9
electron energy distribution, the (We —W ) factor was replaced "by (wo~w)4 . However a MKonopinski — Uhlenbeck” plot predicted too high a
value of W c and more refined experiments of Tyler (1.939) cn the positron
spectrum of C u ^ , of Feldman and Wu (1949) on and. RaE and ofAlbert and Wu (1948) on s35 showed that the poor spectrum shapes previously
obtained were due to the use of thick sources. For example, in the caserp
of 335, 1 and 2 i/gm/cm sources gave straight line Fermi plots but a
5 ixgni/cin showed departure from linearity at low energies. Much other
work has also demonstrated the necessity of using not only sources of
small average source thickness but also that the sources must be uniform.
Sources possessing local variations of thickness of, say, 100 to 1, (as
is, or was, common) lead to distortion of the spectrum.
The first decay which gave reasonable agreement with Fermi theory
was In , The plot was linear from the end-point at 1.99 MeV tc about
400 KeV. The lower end of the spectrum is affected by the presence of
conversion electrons emitted in the decay of the SOday excited state ofIn Since then considerable evidence has come forward supporting the
Fermi distribution for allowed spectra. Indeed as the experimental
techniques got better, it began to seem as though the allowed shape was
universal. For a long time only the spectrum of RaE appeared to have a
forbidden shape and its departure from the allowed, shape was evidently real#
Recently, however, a large number of forbidden shape spectra have been found.
Before mentioning the evidence from this work it is necessary to mention
the variation in the theory introduced by Gamow and Teller,

17.7. Hamow-Tellep Selection Rifles.
There is good, evidence that the selection rule for allowed trans
itions, A I“0, is not always obeyed, in the K-capture7disintegration of B e •
7 7•Re + k -> Li + -0L i ’ is produced both in the ground state and in a 440 KeV excited state.
If one assumes that |M| . is equal for the two modes of beta.-decay, the
calculated, ratio of the intensities of the decay to the ground state and
the decay to the erc'i ted ^t te i p 10*1, 3:5 nee this agrees with the
experimentally measured intensity, there is good reason to believe that
both transitions are allowed (this being assumed in making the calculation).
However the excited and ground states of Li ar»/not expected to have the
same spin values, It is likely that I=lr for the excited state andu 2.
for the ground state. Thus A I cannot be zero for both transitions.
This suggests A 1=1 may also give an allowed transition.
Further evidence comes from the reaction He6 -* Li6 + + V
W e can consider Li to be composed of an alpha—particle (l»0) plus a
deuteron (l=l), Therefore the spin of Li is expected to he 1*1,
is in agreement with the experimentally det ' led value* In a similar wey o- ! ' r>k n TJ • :•? i: 0 muds up of an alpha-particle plus two
neutrons* rnv.. 'p in of the double neutron, in th . y 1 state, should be
zero. Hence we expect the spin of He to bo .zero, like all nuclei having
even numbers of protons and. neutrons, whose spins have been measured.
Thus the spin change in the beta-decay is A 1=1 and, on Fermi theory, the
transition is forbidden. However the half-life of the decay corresponds to
a "super-allowed11 transition (ft*»ic?Mo3 , t : co .d c). LI ju k ; 77--u.j
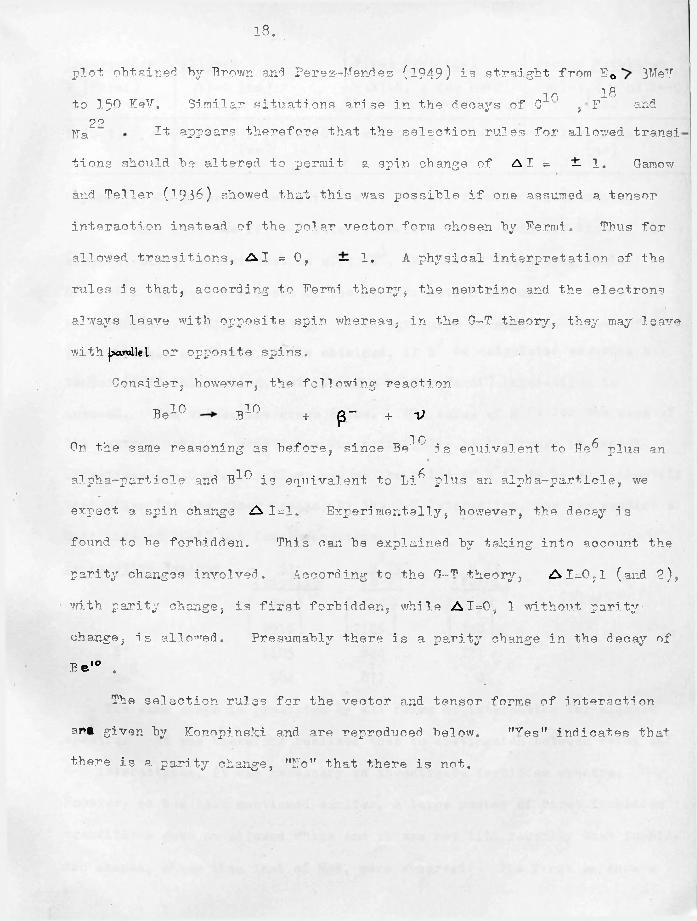
18.
plot obtained by Brown and Perez—Mendez (1949) is straight from E 0 3MeV10 18to 150 KeV. Similar situations arise in the decays of C , F and
20Na It appears therefore that the selection rules for allowed transf
tions should be altered to permit a spin change of A I = — 1. Gamow
and Teller (1936) showed that this was possible if one assumed a tensor
interaction instead of the polar vector form chosen by Fermi. Thus for
allowed transitions, A I = 0, — 1. A physical interpretation of the
rules is that, according to Fermi theory, the neutrino and the electrons
always leave with opposite spin whereas, in the G-T theory, they may leave
with {?artjllei. or opposite spins,
Consider, however, the following reaction
Be1C B10 + (3" + V
On the same reasoning as before, since B e ^ is equivalent to He^ plus an
alpha-particle and B ^ 1 j_s equivalent to Li^’ plus an alpha-particle, we
expect a spin change 4^1=1. Experimentally, however, the decay is
found to be forbidden. This can be explained by taking into account the
parity changes involved. According to the G-T theory, A 1=0,1 (and 2), with parity change, is first forbidden, while A 1=0 , 1 without parity
change, is allowed. Presumably there is a parity change in the decay of Be'° .
The selection rules for the vector and tensor forms of interaction
ana given by Konopinski and are reproduced below. "Yes" indicates that
there is a parity change, "Ho" that there is not.

Interaction Allowed First Forbidden Second ForbiddenV (Fermi) AI=0 (no) AI=0, 1 (no 0«-*0) AI=1,2. (no l*-*0)
(yes) (no)
T (G-T) Zil=0, 1 (no 0~*0) (no)
A 1=0, 1, 2 (yes) ^1=2, 3 and O ^ O (no)
Skyrrae (1950) gives the selection rules for all forms of interaction.
Further evidence for G-T rules cornea from fuller consideration of the
simplest mirror nuclei such as n,p; h \ HeJ and of the simple nuclei 6 , .6He > 1)1 , the relative sizes of the nuclear matrix elements of which can
2be calculated. (Wigner, 1939)* Good agreement between the values of M ft/ 2
for the cases of H3 and He is obtained, if M is calculated assuming atensor (G-T) interaction, but not if a vector(Fermi) interaction is
2assumed. The values are given below. The value of M ft for the case ofthe neutron covers a wide range due principally to the range in quoted
2life-times (9-30 min). If we assume the value of M ft to be approximately that given for the other decays, by the G-T interaction, one can predict a
half-life of 10-12 min for the neutron.
Radioactive Nucleus II2M ft
m i
M ft (Fermi")
n f 875' f 656 ) r 219’1 2916 (2186 } 728
H3 1125 844 271He6 584 877 0
The same shape is predicted by all forms of interaction for allowed
spectra. It was therefore realised that to distinguish betv/een Fermi and
G-T interactions, it was necessary to investigate forbidden spectra.
However, as has been mentioned earlier, a large number of first forbidden
transitions gave an allowed shape and it was not till recently that forbid
den shapes, other than that of RaE, were observed. The first to show a

20.Q1definitely forbidden shape was Y" in the decav
Y' — + Zr' + p" + V
The spin change was believed to be 2 and the parity change "Yes",
According to Fermi rules AI=2 is second forbidden but it can be first
forbidden by G-T rules. If A I is one unit greater than the degree of
forbiddenness, as is permissible on G-T rules, a unicue energy dependence
differing from an allowed shape by a factor
o< ~ (W° - 1 ) + (WQ -W)2
is predicted. The "allowed" Fermi plot was definitely curved, but use
of the o( -factor resulted in a perfectly straight line. This provided
further evidence of the correctness of the G—T choice of interaction,38 42 v?0 qqFurther work showed that the decays of Cl , K ‘ > Y 5 Sr' ,
91 ^ 1 2 4 123 12S 137Sr' j Sb Sn' " , Sn " and Cs ’ were in the same class. The
nuclear shell model (Haxel, Jensen and Suess, 195^) predicts AI=2 for each
of these disintegrations. All required the ol—factor correction. Also2 10 it was shown that the value of ft (E0 —1) was always /vlO , which was in
agreement with theoretical expectations.
The decay of Be"1 ' will be considered next. The spin change is
A I = 3 and the half-life is 4*4 x 10 sec. On Fermi rules this would
be third forbidden, while on G-T rules it could be second forbidden, Use
of the second forbidden factorD a = JL [ 3 (Wo - W ) * 4- IO ( W 2 - l ) ( W o - W ) l + 3 ( w a - l ) a]
which was predicted by Marshak (1949) on the basis of the G-T interaction
gave a straight Fermi plot. The spectrum shape is again unique.
Similarly the use of the unique factorX ) 3 = ( W o - w ) h+ ”7( Wo - w j^ fw 2, ~i)-h 7 (w 0—w)a(wa — i)2+ (w *~ 1)^
in. the case of gives good agreement from 1.38 MeV to 5^0 KeV
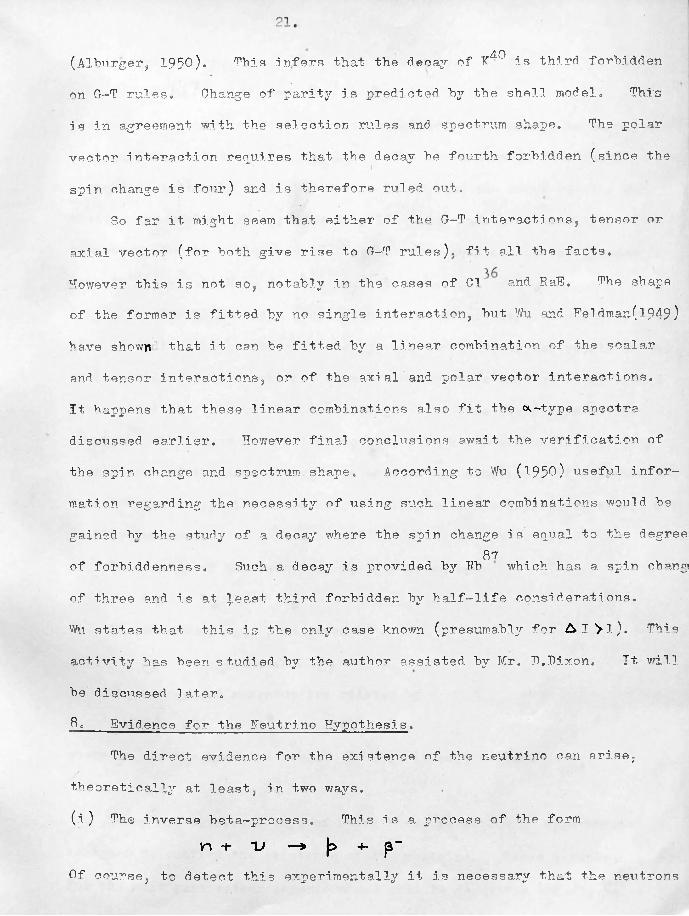
(Alburger, 1950). This infers that- the decay of K40 is third forbidden
on G-T rules. Change of parity is predicted by the shell model. This
is in agreement with the selection rules and spectrum shape. The polar
vector interaction requires that the decay be fourth forbidden (since theI
spin change is four) and is therefore ruled out.
So far it might seem that either of the G-T interactions, tensor or
axial vector (for both give rise to G-T rules), fit all the facts.
However this is not so5 notably in the cases of Cl and RaH. The shape
of the former is fitted by no single interaction, but Wu and Feldman(l949)
have shown that it can be fitted by a linear combination of the scalar
and tensor interactions, or of the axial and polar vector interactions.
It happens that these linear combinations also fit the <*-type spectra
discussed earlier. However final conclusions await the verification of
the spin change and spectrum shape. According to Wu 0-950) useful infor
mation regarding the necessity of using such linear combinations would be
gained bv the study of a decay where the spin change is equal to the degree87of forbiddenness. Such a decay is provided by T?b which has a spin change
of three and is at }.east third forbidden by half-life considerations.
Wu states that this is the only ca.se known (presumab^ for A I Vl), This
activity has been studied, by the author assisted by Mr. D.Dixon. It will
be discussed later.
8. Evidence for the Neutrino Hypothesis.
The direct evidence for the existence of the neutrino can arise,
theoretically at least> in two ways.
(i) The inverse beta-process. This is a, process of the formn -t* v —» \> +• p”
Of course, to detect this experimentally it is necessary that the neutrons

b<> jn some nucleus, e.TsLi 7 -t* ~ V — * B e.7 + (3 "
The incident neutrinos would have to have sufficient energy to supply the7 . 7mass difference between "Be• and Li'* The cross—section for such a
proc< s is extremely small however. If take the cross-section for-PA 2hitting the nucleus as approximately 10 cm and the probability of
—20beta—decay in the nucleus as 10 . the crcss—section for the process is-A 6 7/v 10 '• ■ Qjji ■ ... 3i j s r too s 11 4:o A 'J -set,
(ii) The Recell Method• This method offers more hope of success, how—
ever. Tt is evident that the enervy, end momentum. of the recoil in the
nucleus will depend- on whether or not a neutrino is emitted aloro with a
given electron* A neutrino travelling in the same hemisphere as the
electron will cause the nucleus tc have a higher momentum than if only
an electron of the same energy were emitted and conversely if the neutrino
travels in the opposite direction it will cause the nucleus to travel with
s in all er moment urn»
The enersrv of the ^cutr^no. Em . is fiver. bv " / v / O' V
F _ F ~ F,~r V - o p
Its momentum, p v r is given by
I-V ~ Jr" C*ln.cl*i*s) +• P p
The energy and momentum are related by
Pv ^ + 2EV /*Ovwhere u is the neutrino mass* I4* this is p.ero we have
Pv c = E v
There ere different ways of using these relations in experiments
designed tc confirm the existence of the neutrino. These experiments are
for the roost part rather ingenious and will he described brief!v below.

One of the earliest attempts was due tc Leipunski (1936). His work
or the recoil of charged B-1 ions arising from the decay of the 21 min1 1positron emitter 0J~, gave evidence of recoils more e n e r g e t i c than those
expected in the absence of a neutrino. The experimental results were
very uncertain however.
Crane and Halpern (1938,1939) used Cl which is a conveniently long-
lived source (37 min) having high energy beta.—rays (up tc ru 5 MeV) which3qis of course an advantage. The 01- was put into a cloud chamber and
photographs were taken with a short delay after expansion. This allowed
the ions to diffuse and the energy of .recoil was estimated by counting
the number of drops. The momentum of the beta-particle was measured by
its curvature in 3 magnetic field. Their results were inconsistent with
the recoil being due to the emission of a beta-particle alonf and therefore
supported the neutrino hypothesis.
The next experiment to be mentioned is that of Allen (194 2 ) ■ This/ \ 7followed a suggestion of Wang (194-2) that if the recoils due to He'
(a. K-capture source) were measured, the recoil energy should be mono-
energetic. since in each decay the neutrino should carry off the entire
decay energy (apart from a. negligable K X—ray recoil )* The mass of Be
is 7.01916 and that of Li^ is 7.01822, Thus the energy available for2the transition is 0.00094 Me . Since the neutrino is very light practi
cally all this energy appears as kinetic energy and its momentum is thus
0,00094 Me (neglecting the neutrino mass). This is equal to the momentum n 7of the recoiling Li- nucleus, whose energy is therefore ^ 60 eV, Allen
devised as ingenious method of detecting and measuring the recoil energy
of t!-.ese nuclei, which he found tc have a maximum value of 48 ©V,

24.
There is a gamma—ray of energy O.dS MeV hot this could give rise to a
recoil of only 8,6 eV. ' To confirm that the recoils were not due to the
gamma-”rays, Allen showed that there were no coincidences "between the
recoils and the gamma--rays,
In a fourth attempt, Jacobsen and Kofoed-Hansen (1948) used thep p 88 88radioactive gas Vr ' which decays with a 2„7 hr period to Rb . Rb'
ondecays in turn to Sr ‘,J with a half-life of 18 min. The recoil energies
88of the Rb ~ ions were measured as a function of a varying negative voltage, 88The Rb ions were detected by allowing them tc deposit on a foil, the
activity of which was afterwards measured. This gave a maximum energy
of recoil of 51•5 ^n good agreement with the value calculated from the
maximum bet a-ray energy, 2,4 MeV. This in itself- of course, does not
prove the existence of a neutrino., but gives more confidence in the
results. -The experimental curve they obtain is different from that
expected for decay without neutrino emission. Correction for the
various errors in the experiment make the result more conclusive.
A recent experiment of Smith and Allen (l95l) on the Be^ decay gave
recoil nuclei of maximum energy 86.6 i 1.0 eV, They did not succeed in
getting a monoenergetic group of recoil energies,
9, The Mass of the Neutrino»
That the mass of the neutrine is very - small can be seen from several,
experiments. Firstly, the agreement between the upper energy limit of
certain spectra agrees very well with the mass difference of the nuclides
concerned, Haxby. Shoupp, Stephens and Wells (1940) showed, by consider
ation of the decay of into that the mass of the neutrino must bp
less than l/lOth. of the mass of the electron.
Secondly, the shape of the spectrum of tritium near the end-point is

2St
ver^ sensitively dependent on the mass of the neutrino. Curran, Angus
and Cooler oft (1949 ‘hjc) have shown that the mass is less than l/3Q0th« of
the electron mass. Experiments of Hanna, and Pontecorvo (1949) give a
value of less than l/^OO th., while Cook. Iianger and Price (1948) showed35as a result of their investigation of S'", that the mass was less than
l/lOOth.. of the mass of an electron.
Thirdly, if the neutrino mass were an appreciable fraction of the
mass of the electron, the energy considerations given earlier would lead
one to expect a greater number of stable neighbouring isobars, since there
would have to be a certain mass difference in order to create the neutrino.
Good reviews of the experimental verifications of the neutrino hypothesis
have been given by Pontecorvo (1949) and Crane (1948). These articles go
into more detail than has been possible here.
To sum up, the situation in the theoretical side of the field of
beta-decay has been considerably improved in recent years and especially
in the period during which this research was being prosecuted. The
reasons for, and the'result of the various investigations carried out by
the writer will be considered later, but it may be said here that the
results were generally in agreement with the predictions of Fermi theory,
using the G-T interaction. These and the large number of other experi
ments which have been performed have therefore justified the basic neutrino
hypothesis of Pauli. Experiments to detect the neutrino have been, at
least, in favour of its existence though none can. yet be considered to
offer certain proof.

26.
"R E'”-'" T'i ment r- 1 — - _ ...
!. Ins t mmsnts end Techniques used j.r- Beta— and Gamma—Ray Spectroscopy
There are several quite distinct methods of analj jing the radiations
emitted "by radioactive substances. It is proposed to describe and com-
pure these different methods which are listed below:-
I. Absorption - simple, critical and coincidence.
II, Cloud Chambers,
III. Magnetic Spectrometers,
IV, Electrostatic Spectrometers,
V. Proportional Counters.
VI . Scintillation Counters,
VII, Electron Sensitive Emulsions.
VIII. Other Methods of Measuring Gamma-Ray Energies.
There are separate sub-divisions in the above categories. Also
sometimes a technique in on© group will be associated with a technique in
another. For example, absorption experiments may be carried out in which
the particles absorbed are in coincidence with others lying in a given
energy interval selected by a magnetic spectrometer.JSf\
l(a). Simple Absorption.
A good review article cn the technique of simple absorption has been
given by Glendenin (1948). This method of analysis requires relatively
simple apparatus, is sensitive and can give quick though somewhat rough
measurements of particle and photon energies in cases of fairly simple
decays. It has been much used in the course of the present research for
preliminary identification.and examination of radioactive sources. For
beta-ray energy measurements, the set-up consists merely of a source, a
series of absorbers and a detecting device. This device, in the case of

97t *
stronger sources, may be an electroscope* Alternatively a Geiger
counter is employed. The absorbers are inserted as close to the detect™
ing device as is convenient• and the counting rate, or intensity of
ionisation, is noted as the absorber thiclones- is increased. As the
thickness of the absorbing foils used in beta-analysis is rather small,
it is customary to weigh the foils and express their thickness as an9areal density - in mgm per cm . It is found that if homogeneous electrons
are being examined, a plot of intensity against absorber thickness yields
a fairly straight line which, at the limit of electron range, turns quite
sharply to a horizontal line which may, correspond to the background
intensity, or perhaps to background plus gamma-radiation. On the other
hand, if a beta-'spectrum is being investigated, it is sometimes found that
graphing the logarithm of the intensity against absorber thickness yields
a fairly straight line with a reasonably defined end-point. Because of
the approximate straightness of these lines, it used to bo the custom to
quote the relative "hardnesses” of beta-spectra in terms of the apparent
absorption coefficients which the slope of the lines yielded. In many
cases the absorption curve had a distinct curvature and the initial slope
was used. This method is now rather uncommon.
At the present day it is customary to read off the end-point of the
curve and estimate from some range-energy relationship the corresponding
electron energy. The writer has usually employed a graph given by
Glendenin (194S, fig.12). This seems in general to load to consistent
results. A formula due to FIammersfeld (1946) has also been foundsuccessful. It can be used in the range 5^ KeV — E 4= 3 MeV and runs
2 1 E - 1.92 (R -i- 0.22R)^
where R is the range in gm/cm/' and E is in MeV.

28
Feather gav$ a rule for determining bet a-—ray energies in 193*2
(Feather, 1?30). Using the more recent constants (Feather,1938) it takes*
the form
R = O.54E ~ 0.160 where R and E have the same significance as before. He describes a
technique which appears to give a more precise end-point energy and tells
one something about the shape of the spectrum. As usually carried out,
the absorption curve is compared with that of a standard and well known
source in an absolutely standard experimental arrangement. He himself
chose RaE since its spectrum was the only one in 1938 whose shape was
known to be measured reliably. However in view of it.s unusual spectrum
shape, it might not be his choice now, since other more convenient spectra
have been accurately measured.
When a beta-spectrura is complex, it is often possible to identify
only the highest energy component end-point if the corresponding transi
tion is of the same order of intensity as the ether transitions. However/ 203occasionally two, and even three, end—points can be seen (e.g. Hg
absorption curves; -see later). The maximum energies in the case of
beta-spectra must not be too close together if this is to be possible.
In the case of gamma-rays one always plots the logarithm of the
intensity against absorber thickness, since the intensity is reduced
exponentially. From the graph one deduces the half-thickness, or mass
absorption coefficient- and the energy is determined from tables or
graphs (e.g. Glendenin, 1948, figs. 15, 1?j Handbook of Chemistry and
Physics, 1949)* If two or more gamma-rays are present, their energies
can be measured only if they are well separated. If this is so, two or
more regions of distinctly different slope are observed and by subtracting

29.the v&wsibf corresponding to the highest energy gamma—ray, one can graph
the logarithm of the intensity of the second gamma-ray against thickness
and thus measure its energy. However in the case of sources emitting
many gamma-rays, as was the co.se with neutron irradiated samarium (see
later), this method fails completely. Another disadvantage of the method
is that, if the photon energy is high, the absorption coefficient alters
slowly with energy and even starts to rise at high energies, which means
that two different absorbers must be used to give an unequivocal result.
For gamma-rays the coincidence method, due to Curran, Dee and
Petrizilki. f l^lS may be envoioved » The mamma-rays impinge on a thin convert-\ s1 / «/ a. v' o c/ a.er which emits Compton and photo - electrons. These pass across a thin
walled counter into a second thin window counter. The coincidence rate
of the counters is plotted against increasing thickness of absorber placed
between the counters. At the end-point, the absorberAhickness, plus air
gap and window thickness, is measured and the energy of the gamma.-ray
deduced. This method reduces the difficulty of measuring a gamma-ray
energy to that of measuring a beta-ray energy by absorption and is simple
and sensitive. However it still fails for two gamma—rays close in energy.
To sum up, the absorption method has important advantages and disad
vantages. It is very sensitive and quick, and can therefore be used for
preliminary examination of new radioactivities and to check the existence
of suspected activities in a radioactive source. The technique was used
for both purposes in the course of this research. It is also very simple
and requires very little apparatus. However it does not normally yield,
accurate energy values, its energy resolution is low and it is easy to drew
wrong conclusions on the basis of absorption methods alone.

30,T (h V- Critical A.bsorrt'i o n ,- . • j..- .---- . -1 ■ ~
Thd method whd ’ p Ides only to the measurement of gamma—rays. may
p;- -iiq.q,'1 up to a*"*0° TCelT, Tt makes use of the fact th • the ahs< rption
coefficient of any element is very much hdgher for energies slightly
greater th an ■? ts v ©hs.crrtion edsre ehersor than for energies somewhat less.
To use this to ,'thod ? series of absorbers of increasiro* atomic number, whose
It ed energies are in tl regd on of the gamma—fay energy, are inserted in
turn h otween the source end. the detector, % increases • th ■ irtensitv
fa] t g «] owlv and at some value 2 sa ~ rd ses arnlv, Tt"' an—csry
of t] 9 a — _rav Id es b ©tw© t. the K absorption edsre en -r^ies of t ■I raent
Qf • + • * Lumb srs 17 and 2—1 Tb ■* s m thod determines the en *rgy to a/
for lower ©ner^ic3 and t< a/ 2—3% for hd sher ©her ?d4t ( q ] _ Ooi nod d en c e *"l,‘ s0 w t 4 on M 01h od «
Under thi leadd ig will I cchside nethods distinct frci t%
coincidence method of measuring gamma—ray energd s due to Curran et al«,
mentioi ed earlier. Ccincider.ces between gamma—rays and beta- rays,
between gamma—rays and gamma—rays* or between beta—rays and conversioi
electrons from a source are investigated and the ral t •’ nd qu d s
rt{ it J_ 0 I in the unravelling of complex spectra. Good reviews of the
t shnd giv* „ by D 3rth (1940)• Mitchell (1942), Curran and Craggs
(I9 * y po» 1^8—icl' ■ ■’ d ’hell not o 4 nio the si byect in-detail, but shall consider 0. few special cases which "ill demon trate the technique and reveal something of its usefulness* * For example, consider
a gamma—decay scheme such as is shown in fig*4?(A).e If the source d:
question is placed between two gam '-counters giving IT, , ITa counts per
minute in each counter, the accidental coincidence rate 'Tc , due tc v its
occutting within the finite resolving time,hti 3 of the circuit wil 1 b s

31.TT - PTT TVT 'T
C ~ X X U
But if an appreoiable fraction of the nuclei decay tc the ground state by the 7 c- T'" V---Ce Tr or i - - ■ + t 1 ■-1 q + j r - n m m h< t of coincidences will
be observed, provided that the 85 KeV transition follows the 15' KeV with a 1 ,1f "life not appreciably greater than the circuit resolving time• It is
usually much less, it is possible to calculate from, the coincidence rate
and the efficiencies of the counters, the fraction of nuclei de—exciting
by ©ach mod - of dec ay * ’c if absorber s'- err \ 1 aced in front of one
counter, the resulting absorption curve may be split into two regions
corresponding tc the 1.5 KeV and the 85 KeV gamma—rays. provided there is not too much internal converse on of either. Alternatively the gamma—rav
counters may he of the scintillation type sc that one can select a particu
lar gamma—ray energy, say 8 KeV, and show by absorption, or by pulse size
analvsis* that the gamma—rays in coincidence have an ebergy of 15 KeV*
Fuller details of the experimental technique are tc be found, in the refer
ences 'iven previousl~r„
The examination of the beta—gamma coincidence rate can often lead to
further information about the complex!ty of a beta—spectrum* Let us
consider again in the decay of fig*47(A), but for simplicity, let us
neglect the I6* and 8 b KeV "'.a.mna—transitions« Often it is difficult, or
even impossible, to detect or measure the energy of the lower energy beta—
transition by absorption or other means* However if the source is piaced
between a gamma—ray counter and a. bet a—ray counter, the only coincidences
observed, excluding the accidental and background ones, are due to coinci
dences in time between the bata—particles of the 150—KeV transition and the gamma—rays, again providing the half-life of the gamma—transition is not
longer than the resolving time of the circuit. By placing absorbers in

32.
front of the electron counter, one can measure th© energy of the beta—rays
in coincidence with the gamma—rays, Xt i? customary tc graph the ratio
■r _ Humber of beta—D,amms' col ci dencps . . , I- ... .. ■ , ,Humber of beta.—particles detected
agaii st absorber thickness as the number of betaspartic! es recorded per
minute i._, reduced by the absorbers. The thickness of absorber givinv zero
coincidence rate (after subtracting the accidental and background rate)
gives the maximum energy of the lower energy transition (here 150 KeV)*It should be noted that if a spectrum consisting of a beta-ray followed by
a- gamma—ray is examined in thi z way, the ratio p. will remain core toot as
the absorber thickness increases.
If the beta-ray counter is replaced by s. magnetic spectrometer, the
maximum energy and spectrum shape of the lower energy transition can be
examined free from the higher energy beta—rays» "This way of determining
th( se properties is more precise than by deducting them from analysis of a
Fermi plot.
In coincidence work it is an advantage tc have ** strong source since
(a) data is accumulated more quickly (b) the effect of background is less.
However a strong source gives rise to a relatively much higher accidental
coincidence rate, Tunworth (1940) has shown that little advantage is
gained by having a source with a disintegration rate* Ho ? greater than
that given byi ■«TT0 «* _
2 X
where X is the resolving time of the circuit and is generally I yuuec.
provided T does not varv with counting rate* It is usually measured by
placing the two counters well apart and irradiating each with a separate
strong sotirce. If the individual counting rates, IT, , , and the

33.
coincidence Tate • ITC , ere measured, *X can "be evaluated "by use of* the
nrn1 ati on' " i
X - J 3 _2N, F a
When using a magnetic spectrometer, the source strength, must "be high which
introduces further difficulties of sources thickness, et o. For example
if we consider a semi—circular* spectrometer of resolution IjC and trans
mission 1^, the efficiency for heta—ray counting is 10 « .A gamma counteris unlikely to have an overall efficiencv .greater than 10 . Xn a source
r<;giving, say, 10 disintegrations per second and’ giving a gamma—ray fcr each
"beta-particle this would give only ore true co jncidence per 10 seconds,? Obviously one would wish tc use a. more efficient sreofremoter* The answer
would appear to lie with the scintillation counter, which detects-gamma—ravs
much more efficiently and has a higher solid anvle fcr beta-particles, liven
in the case simp!e coincidence—absorption investigations it is well worth
while replacing the gamma detecting Geiger counter by a scintillation
detector as was done by Mr. Lewis and the author in the study of the decay
schemes of samarium and europium. This is believed tc be one of the first
experiments in which a scintillation counter and a Geiger counter were used
in coincidence*
Tinally it should be pointed out that if the decay scheme is more thaa-i
complicated|those discussed^ it is still possible tc solve it by absorption
methods- as has been pointed in the review articles already mentioned.
A good method, probably, is tc select different energies of gamma—rays by
the scintillation spectrometer and measure the intensity and energy of the
beta—rays in coincidence with these gamma—rays-.

34.II, Cloud Chambers.
This well known technique, originally used by O.T.H. Wilson, has been
employed to a considerable extent in beta-rays spectroscopy, though not so
much in recent years as formerly. In the course of time it has been
improved and its facilities extended. In beta—nay spectroscopy it is
possible to use the source in gaseous form, if this is chemically and
physically suitable, which is of great value since it eliminates source
thickness and backing problems; or as a solid source. In the latter
case the source may, if necessary, be spread over a relatively large area,
which is a help if the source is. weak. However the efficiency of detection
is rather low. The actual efficiency during an expansion may bp ~i0*p
but since the "dead—time" of a cloud chamber is very long compared to the
sensitive period, the overall efficiency is much lower, The method is of
value since it gives the nearest approach we may ever have of a picture of
the motion of the decay electron, and ever: of the recoil atom. (The
photographic emulsion technique shares some of the properties of a cloud
chamber and will be mentioned later). One can measure directly (a) the
point of origin of the particle or particles (this can be of value in com
plex decay, pair production, etc.), (b) the range, if not too great for the
chamber, (o) the density of ionisation along the track and (d) the radius
of curvature in a magnetic field which gives the momentum and sign of
charge of the particle. In preliminary investigations it may yield less
misleading results than other techniques.
However it has disadvantages, too. One, the low efficiency, has
already been mentioned. Another is the time and labour involved in getting
good statistics, As the number of tracks per exposure is limited hVconsi-
35.derations of ease of measurement, a large number of exposures is necessary
and the time involved in measuring the radius of curvature of a large
number of tracks (which is the best way of deducing the momentum, or
energy, of the particle) is very considerable. The result/ is that in most
work done by this technique, the number of particles per momentum interval
was too low fcr accurate comparison of experiment with theory, or to deter
mine the end—point accurately or, in some cases, to determine whether the
spectrum was complex. Another difficulty in attaining high accuracy is %
due to the scattering of electrons in the gas, as has been pointed out by
Gupta and Ghosh (1946). These authors give a theoretical treatment of the
effect, which can lead to fairly serious errors in the measurement of curva
ture. Further information on the cloud chamber technique is given in the
paper just referred to.
ITT. Magnetic Spectrometers,— - .«k, ...... .....The use of a magnetic field to separate particles of different energies
was first made in the early experiments of von Baeyer and Hahn, previously
mentioned, Tn their arrangement, a vertical slit was placed between a
radioactive source and a photographic plate. A uniform magnetic field
acted parallel tc the slit. This constituted a crude non-focusing
spectrograph, Since particles were deflected to different extents accord
ing to their momenta, a spectrum was obtained on the plate. The resolving
power was sufficient to observe electron conversion lines superposed on
continuous spectra and to measure the corresponding momenta.
In 1913, Hanysz suggested the well-known l80r focusing spectrometer which has remained the most important type in general use to the present
day, (Danysz, 1913 ). This utilises the property that, if a bundle of rays
of equal radius of curvature is emitted from a source into a fairly small

36solid angle, the rays tend to focus at a point distant along a line
p e r p e nd i cul ar tc the mean direction of emission of tlie bat a—rays * where
p is the radius of curvature*
This 5 dec was fruitfully exploited by Rutherford and Robi nscn (1913)
who measured the energy of many electron lines with an accuracy far exceed
ing that of von Haeyer and Hahn* Other workers, notably Ellis, improved
the apparatus to such an extent that energy measurements could be made to a,
relative accuracy of 1 in 1000 and an absolute accuracy of 1 in 56*0 (0"* i s end Skinner, 1??4 ), Among °ther things thi c involves the measure
ment of the field strength to that degree of accuracy and such, work has
scarcely been bettered to-day* However it has to be noted that the
naturally radioactive sources which were used have generally a very high
specific activity which permitted the use of very thin sources of small
area, which we shall see is desirable.
In the usual arrangement the source consists of a wire or narrow strip
of thin aluminium, nylon film or other material which is coated with a thin
layer of source* The source and source support must be thin and the latter
made of low Z material, to avoid distortion of the spectrum shape. In front
of the source is placed a slit whose long dimension is parallel to the magne
tic field and perpendicular to the median plane of the path of the beta-
particles. Its purpose is to limit the solid angle of emission of the
particles. The narrower the source and slit, the-better will be the
resolving power of the instrument, at the expense, however, of intensity.
The particles then pass through a system of baffles (to stop scattered elec
trons ) and are detected by a photographic plate or by a Geiger counter,
which has a slit in front of the window. In the first case, which is the
original method, many energies are recorded at one time, thus giving a

37 *spectrum "between two widely distributed ©nergjas. Used thus, the instru
ment is sometimes called a "spectrograph." by and ~g,r J the opt j •• • 1 ^pectro—
graph* When a Geiger counter and slit are ©teployed* a particular momentumw X - w g 1
range is sel ected. This instrument may he termed a. "spectrometer”, since it
i • acting as a monochromator* Both methods have their advantages and.
disadvantages* The plate, has the useful prbperty of "being able to collect
dat'T ever a wide ©nervy range simultaneously and can do sc over a long
period* integrating the intensity* Also no lifetime corrections need "b
made if the spectrum.is contained on one plate* For high accuracy,
especially with weak sources, it is an advantage to use a permanent magnet
since the field strength i o rot likely tc vary as an electro-magnetic. field
mi ?ht, How— st iJ- 4 •• not possible by this ib'ethod to measure relative intensities accurately* Thd not of such ent when i : irest
concentrated in the measurement of electron line energies and. the relation
of the values tc the energy levels.of the nuclei involved but new that
interest is, to a much greater extent; concerned with the examination of
the shapes of beta-spectra this disadvantage becomes important* It may be,
however, that the use of electron sensitive emulsions, enabling the tracks
of individual electrons to b© distinguished, will alter the position* The
use of these emulsions will bo- considered later.
When th© counter technique is used, however, the sensitivity is much
increased and, since each electron entering the counter gives a count, it
is possible to make quantitative measurements bn the intensity distribjxtioi
of the spectrum* However there are the difficulties of having to measure
each momentum interval separately, of having to allow for the decay of the
source, of greater electrical complication and of window thickness. The
latter, like the question of source thickness, is very important. The

presence of a window allows only a fraction of electrons in the lower energljj
region to enter the counter and thus the spectrum shape in the lower energy!
region is distorted, tc a greater or less extent. This problem has M e n
tackled in several ways. The obvious way is to reduce the window thickness
to a minimum. Recent workers have used windows as thin as 0.03 mgm/cm'"
(Langer and Cook, 1948), which corresponds to an energy of about 5 KeV
and probably affects the spectrum shape up to ML 5 KeV. Larger and Cook
also tried to use an electrostatic potential of 25,000 volts between the exit slit and the counter window in order to give the electrons sufficient
energy to pass through the window. The attempt was not completely
successful.
Absolute measurement of energy in a beta- or gamma-ray spectrometer
is both laborious and difficult. However when it is necessary, the semi
circular spectrometer is the best of the magnetic resolvers for the purpose,
since it utilises a uniform field which can be measured absolutely and thus
the energy of a particle of a given radius of curvature can be determined
absolutely. However it is more common to measure energies relative to a
standard electron line, e.g. the ThB F-line (241 KeV) and the ThC" gamma-
ray (2.62 MeV). The flux is usually measured by the flip coil or the
rotating disc techniques.
In the case of gamma-rays, it. is usual to provide more shielding,
usually lead, between the source andthe detector than is necessary for
beta-ray work. * Two techniques have been employed. In the first the
gamma-rays are allowed to pass through a low Z absorber of thickness
sufficient to stop all the foeta-rays from the source. The Compton elec
trons ejected by the photons and going in the forward direction are
detected. Their energy is related to that of the gamma-ray by the relation

39.£ _ Ev___
I +• m c y^EvI : Be is the ' ■ ,rn electron energy and E* is the quantum er
A continuous spectrum of electrons is obtained by this technique and the
;rgy ?imit is used in calculating B#
Alternatively the source and low Z absorber may be surrounded by
a thin high—Z foil* The photons eject photo—electrons from this foil and,
provided it is thin enough, these give sharp lines superposed on the
Compton background corresponding to conversion in the PC,L and, sometimes,
M shells. Also the photoelectrons arising from internal conversion in the
source itself may be measured• By measuring either internal or external
conversion lines an accuracy of 1% or better is obtainable and a. separation
of gamma—rays of energy difference less than 10,1 can be effected (Ellis and
Skinner, 1924, Siegbahn, 1946).
A theoretical treatment of the spectrometer has been given by Li (1937)
by Geoffrior (1949) and is reviewed by Persico and Geoffrion (1952).
It is not proposed to repeat it here. One finds that, using the Rayleigh
criterion, the resolution R, defined as the reciprocal of resolving power,
is given by the general expression
■ R - f - i p * *where s and w are the source and detector slit widths respectively, p is
the fadius of curvature, oL and p are the semi—angles subtended bythe slit
at the source and p is the momentum. It can further be shown that the
intensity factor, or fraction of electrons leaving each square centimetrea O 5/ak, ' :u.v ■ ■ ”1.:’ ?L •■■r:vuve at thv col lector is proportional to P •
Thus one wants a large radius of curvature and an increase of resolving
power of the instrument involves a much greater reduction in the intensity,
A. typical instrument might give if resolution and 0*1 fc transmi ss.i on, thus

An
giving an efficiency (or ratio of transmission to resolution) of one
tenth. Xt is actually possible to attain an sffiency of one eighth, In
order to examine weak sources there seems no reason why the resolving power
should not be considerably decreased with -a correspondin sly large
increase in transmission.
An interesting modification of this spectrometer was made by
H^elepow Hopjova end Vorobiov (1946) whs, to increase the transmission,
-' ~ ■■±-r — circo"1 ar spectrometers of fairly low resolving power in onevacuum chamber in order to measure the very weak activity of However
the accuracy of their results appears to be suspect in view of later work
and theoretical predictions.
Magnetic Lens Spectrometers:
The property of "helical focusing" was first proposed by Kapitza(l924)
and tried by Tricker (l92|4-)» In this method the source is a small disc
placed on the axis of a uniform solenoidal magnetic field and particles of
a given energy emitted at a small angle to the axis come to an approximate
focus on the axis after describing one complete helical turn. Witcher(1941
showed that, in fact, the best focus was a ring whose centre lay on the
axis and whose plane was perpendicular to it. He constructed a spectro
meter using this principle, a theoretical treatment of which was given by
Persi co 0-949)» This method has two advantages over the "lens" type
spectrometers developed from it, that (a) the calculations of path, and
energy, are rigorous and (b) sources of fairly large area can be used
(about 16 times that of a short’lens spectrometer of the same performance). Also the instrument is easily adjusted and is less sensitive to magnetic
disturbances. The performance figures of Witcher’s apparatus were if.
transmission and resolution. However, the power consumption was large

41.
and the apparatus was of large dimensions.
The short col? lens spectrometer uses essentially the same method of
focusing hut employs a coil of limited dimensions si+nat?1 midway between the source and the detector. A ring "baffle is situated at the centre to
select a given angular spread of electrons. "First suggested by Klemperer
(193? )> the theory was worked out by Deutsch, Elliott and Evans (1944)•
Apart from spherical aberration, the lens may be treated as a simple optical
lens. Typical performance figures worked out theoretically were T «>0,47°
and R ?.Sy which are slightly better than those of Witcher’s spectrometer.
However Witcher’s apparatus was not as efficiently designed as it might
have been and probably the only advantage which the short lens spectrometer
possesses over the uniform solenoids! field method, is that it is more
economical to build, and operate.
Another variation is the "long lens spectrometer" introduced by
Siegbahn (1943) and -used by SI ati s and Siegbahn (1949) and by Agnew and
Anderson (1949)* Spherical aberration is reduced by this design.
It may be pointed out that to distinguish between positive and
negative electrons in the lens type spectrometers it is necessary to insert
helical baffles which select only particles travelling with the correct
direction of rotation.
The Tens tvne spectrometers, in veneral- give a higher transmission
at the expense of resolving power. The relation between intensity and
resolution, R, is of the same form as before, i.e. the former is proportion
al to S , This type of spectrometer appears most useful when relative
ly weak sources are being handled, but for precise work the semi-circular
spectrometer or the double focusing instrument (about to be described) is
to be rreferred.

42,
Doub 1 e Focusing Spectrometer*
Thes emi-circular spectrometer provides focusin ■ in the piano perpendi-^
cular to the magnetic field only. It would obviously "be of value if rays
emitted at an. angle to this plane were also focused to the same point as the
parti elss in the plane. Svartholm and. Siegbahn (1946) showed that a
magnetic field of the tvpe used in betatron, design would have fche desired
property, The field has the formH= Ho ( £ ) " o < n < i .
)
If n = ,. the radial and social frequencies are equal and the ima-^e roint
is at. an annular distance of from the objectf Shull and Dennison
(1QA7 a b) have considered the field expression in the more general formH = h „ [ i - ■ ' ( ^ h p W - - ]
For double focusing, ok must bQ -1. to nrovide radj - 2 and axial focusing,* ' ' 07 M / <E ^
If B has tl value l/:8j second order raddal aberration is eliminated, • if
3/8} second order axial aberration is eliminated. The compromise value
of |3 = 4 appears to give the smallest image.
This type of spectrometer has several advantages. It has a resolving
power as mood as that of the semi—circular instrument but has a much better
transmission. A resolution of 0.3$ and a transmission of 0.3$ are easily
obtained. ' The efficiency, which is about unity, is higher than that of
the other types. It has twice the linear dispersion of the semi-circular
instrument of the same radius. There is, however, the difficulty of
obtaining the .correct shape of pole piece and. unlike the lens spectrometers
the relation between current and momentum is not linear., though, of course,
the field—moment um relation is,

4 3 1
Spiral Orbit Spectrometer,
ftwntbfly interesting magnetl c resolver is the so—call,ed ”Spiral Orbi tM
spectrometer developed principally in Japan and the University of
California,. (Miyamoto, 1942} 1943>Sakai, 1950> Sag '"'1 3S.1951) and
used by Saganes Gardner and Hubbard (1951) tc measure the ©nerry spectrum
f th 3 ' f ■■. jx. ■ on scaj • In this apparatus parti o3 es are
emitted from a source in th.© centre of circular pole pieces^ the field.
jtb b ©twe^r. :'h5 oh ic n o n—uni f 0 r m in suoh 0 way tv at parti ''3 l. 0 of a given momentum are focused in © *’stable orbitfT. Since the particles can
leave at any angle in the horizontal r!on© and with a fairly lar^e vertical
lar 1 J <1 d angle or transmission, is very high indeed.
Typical figures quoted by Miyamoto for an actual spectrometer are #?*iven
belowTJp (gau£.. cm) 1666 1925
A H p /H ¥ l i >/*■
Sol id. Angl © j . /-
The t) y 3] that 9 provided the area, of the source is am all 9 or the
diameter of the t is largej th fficiency i s higher then for the
other types of spectrometers•
Each type of spectrometer has its advantages and disadvantages. These
have already been pointed out? but one may say that the semi-circular
spectrometer is the simplest in principle and is best suited for absolute
energy measurements. Thus it is likely tc remain the basic instrument
in use. The lens spectrometer is useful if a large transmission is
required though at the expense of resolution. The double focusin-0,to
instrument gives a resolution comparable^tha.t of the semi—circular
spectrometer but has a. higher transmission. In compard sen w3 th other

4 4.
techni '■ th© Yiagnetic methods ©re preci se. Can b< used at high ©nergies
hut require relatively strong sources.
Before leaving the subject of magnetic spectrometers. mention should
be mad© of the ai r spectrometer tc mo c- ti- ;■ i^cr; les of gamma—ray|jj
in the energy region above MeV (Walker and McDaniel 1.194$)• In this
region, the most important interaction of gamma—rays with matter is pair
production and if the sum of the momenta of the pair electrons is constant,
so is the sum of the energies and, therefore, the energy of the original
photon giving rise to the pair is constant# This property is utilised by
the spectrometer in the following way, Gamma—rays are.allowed to produce
pairs in a thin sheet of metal of relatively large area. The positive and0negative electrons of each pair travel through, an angle of 180 in opposite
directions under the influence of a magnetic field. Banks of counters
are situated on either side and a coincidence circuit is arranged in such
a way that'all coincidences due tc the two electrons of each pair, which
have a constant energy sum, record or a. given scaler. With the eight
counters of Walker and. McDani ell (four on each side) it was possible to
select and record seven different energy intervals simultaneously. The
instrument build by Rae at Glasgow University has five counters on either
side giving nine channels. The coincidence circuit and counters are
arranged so that any pair of counters can be used to record a given energy
pair, provided they have the correct separation ~ 2(jgi+£») where and N
are the radii of curvature of the positron and negatron respectively.
This means that a large area of radiator can be employed.
ITr, fflectrostatic Spectrometers.
The simplest form of electrostatic sepctrometer is that used by
Watt and Williams (19/J6) to determine the end-point energy of the tritium beta—spectrum* A voltage between the source and the counter opposed the
passage of electrons from one to the other and this voltage was increased
until no particles were able tc get into the counter. Actually, since the
window thickness was *»12 KeV (measured hy accelerating electrons from a
filament to a sufficient energy just to penetrate the window) they had to
use as "zero" voltage, a value of + 1? KeV, This method gave an end-point
energy of about 11 KeV instead of the more recently accepted value of */l8 KeV, Evidently it is not an accurate method, at least in this energy
range. Alsc it cannot he used conveniently for higher energies because
of the high voltages necessary. It dees not give the spectrum shape since
the electrons travel at- different angles relative to the field and only the
component of velocity parallel to the field is measured.
It is possible to build an electrostatic spectrometer on the lines of
the magnetic instrument, but as it possesses no particular advantage over
the latter there does not appear tc be much point in constructing such an
instrument. The field, and therefore voltage, across the deflecting
electrodes must be very high. However such instruments have been used by
Backus (l945) ~n the study of Cu and by “Rogers, McReynolds and Rogers(1940)
in the measurement of m/e and v for various electron lines of RaB, The
theory of the instrument has been given by Hughes*and Rojansky (1929)*
They show that, using cylindrical section electrodes, the best focus is at 127° H ' and not at 180° as in the case of the magnetic spectrometer.
However a considerably modified form of the instrument of Watt and
Williams has been built by Hamilton and Gross (iQSQ) and used by them in

46,their study of the low energy (0—30 Kevj region of the S spectrum
(Gross -and Hamilton, 1950). Here the source was placed at the centre of
a sphere and the particles passed through a variable retarding potential
between two spherical grids concentric with the outer conductor which acted
as a col1cctor fcr the electrons. The current arriving at this electrode
was measured as the retarding potential was increased to its maximum of
30 KeV, This method eliminated the angular distortion effect of the Watt
and Williams apparatus* The transmission, or solid angle, was very high
( /v 2ft 9 not A TI f since the collector and grids were actually hemi-spheri-
cal) but this was offset by the fact that current, rather than individual
particle, detection was employed,
V, Proportional Counters.
The use of proportional counters for the examination of beta-spectra,
X-rays and soft gamma—spectra was started in Glasgow in 1947* This
technique has several great advantages, as follows? (i) It is very well
suited to the examination of spectra at low energies- since sources can be
put inside the counter thus avoiding window difficulties. Also radiations
of energy <1 KeV can be measured with considerable accuracy as will be shown
later, provided an extremely thin source and source backing is employed
e.g, a gaseous source, (ii) Source and source mount thickness difficulties
have often been avoided by the use of the source in a gaseous form,
(iii ) The solid angle is always very high, being usually 2Ti or 4TI ,
generally the latter. This permits its use for weak radioactivities which
could not otherwise be analysed. (iv) A large source area can be utilised, 21000 cm " in the bigger counters, so that even 1 gm of source yields a
source thickness of only 1 mgm/cm . (v) The fact that the counter is
operating as a spectrometer has a great advantage over methods using

47.Geiger counters, with regard to “background **. The “background** spectrum
of a large counter operating at high, pressure ( n 5 atmospheres) is spread out, more or less uniformly, over a. range of energy a/SOO KeV or more.
Thus if one considers a K~captore source whose radiation is concentrated
in a range of less than say 5 KeV, the sensitivity of the counter is /n/100
times better than in the case of a Geiger tube. The same is true for
gamma- or X—radiations or for conversion electrons. This means that the
presence of a weak source giving rise tc such radiations might give no
appreciable increase in counting rate over the “background” value but still
give good-and easily measured peaks. This was the case, for example, in
the discovery of Hi'", as will be described in Part 2, In the case of
bets—spectra, the position is somewhat altered but is still very favourable.
For example if the beta-spectrum is spread over a range of SO KeV, the
ratio of counting rate with the source present the rate with it absent is
increased, by a fraction <s*10 and if one considers only the region near the
end-point, the factor is much greater. There are other, less important,
advantages some of which will appear in the work about to be described.
More recent work in Glasgow has extended the facilities of these counters
in two ways (a) the extension of the upper energy limit which can be
measured and (b) the elimination of "end-effect”. As the writer employed
the proportional counter technique to a great extent in the work described
in this thesis, it is proposed to postpone further discussion of it until
the remaining two techniques have been described,
VI, Scintillation Counters,
The scintillation technique may be considered to be a development of
one of the earliest methods of detecting radiations, viz, the flourescent
screen, which was first used to detect X-rays and cathode rays, However,

48, ■
combined with a microscope, it was shown to be capable of detecting single
events, for example the arrival of individual alpha—particles• Much of
this work is associated with Lord Rutherford who, for example, used the
method tc detect the protons arising frcm the first artificial disintegra
tion of the nucleus (Rutherford 1919)* In the modern technique the
scintillations arising from some nhosphor, instead of being observed bv eye
are detected by the very sensitive photomultiplier tube and recorded on a
scaler or displayed on an oscilloscope screen. In 1944 > Curran and Baker
(1944 1947) first used this technique to detect alpha—particles« Zinc
sulphide, used by these workers, has a high efficiency for the detection
of alpha—particles provided the sulphide layer is thin. This is necessary
since zinc sulphide absorbs the radiations which it emits. The use of
larger crystals which did. not have this disadvantage has provided a very
useful tool in nuclear physics. If it is large, and transparent to its
own radiations, particles can be wholly stopped in the ofcystal giving a
light pulse the size of which is a function of the energy of the particle.
Also higher energy gamma-rays can be detected with an efficiency unapproach
ed by gas counters, because of the increased stopping power of the crystal.
There are several important properties which a phosphor used for
scintillation counting should possess* It should be possible to grow large
uniform crystals which have high efficiency for the conversion of particle
or gamma-energy 1 osr. into radistion in a spectral region in which tk .. photomultiplier tube 1 .trots efficiently. It should have a sbort res'olvir-'
time(short afterglow), high transparency to its own flourescent radiations,
good stability and, for some purposes, high density and containing an
element of high atomic number.
Crystals having the desired properties have been developed, notably

49.
anthracene, naphtl 1 ne, stilbene, sodium i 3.5 ' (thallium activated) stc.—P)
The first three have very short resolving times ( ^,10 .sec) and are very
useful in the detection of electrons and soft gamma-wayaf Because of the
high atomic number of iodine and the high density of sodium iodide this
material is very efficient for the detection of hirh energy gamma—rays.
It has a resolvii g 'u:■ * > of ^10 sec. Oso th sphoi no ay be in the
form of a solution, in a suitable solvent, of a flcurescent material.
It is obviously an advantage if the phosphor responds linearly to
increasing energy* Hopkins (1951) showed anthracene is linear in the
recion 100 KeV—lMeV but not at lover energies. West, Meyerhof and
Hofstadter (1951) showed sodium iodidee is linear from 2 KeV — 500 KeV,
while the work of Bannermanj Lewis and Curran (195!-) showed, that it is
linear to 27 MeV.
A review of work done using T al(T1) crystals has been given by
Hofstadter and McIntyre,(195*^ Bannerman et al, give a useful
discussion of different ways in which the scini.ll at ion technique can be
used. It has been used more for the detection and measurement of gamma-
radiations than for beta-rays though uses in both fields will be discussed
Gramma-rays interact in three ways, (i) Photoelectric effect. This/effect,
which is important at energies, 0.25 MeV, gives a single peak if
monoenergetic photons are captured. High Z materials are more efficient
than low Z« (ii) Compton process. The electrons scattered by this
process have a wide range of energies with a well defined upper energy
limit but are homogeneous in energy for a given direction, a fact that is
made use of in one method of examining gamma-rays. (iii) Pair production
This process becomes possible at energies exceeding 1.02 MeV and is of

RQ5
importance at energies greater than «>2 MeV.
The technique can "be used down to fairly low energies "but dees not
compete with the proportional counter in the low energy region due partly
to the high background counting rate, (which can be much reduced by working
at low temperatures, using liquid air or solid carbon dioxide etc.) and
also due to the poor resolving power expected on the basis of the relatively
low number of primary electrons released at the photo-sensitive cathode.
"Beta™ or gamma—spectra are most simply measured by the single crystal
technique. In the case of beta-rays the source can be held near the
crystal or even imbedded in it as was done by Bannerman in the examination 203of Hg . Good (1951) used a potassium iodide crystal (an excellent
phosphor; to investigate the shape of the beta-spectrum of K' . This wassimilar, in principle, to the technique of using radio-active gases in
proportional counters. Probably this would be a good method of investi-
gating the natural, weak activity offeb •. The crystal should not be too
small in order to minimise the effect on the spectrum shape due to the
loss of electrons emitted near the surface. Perhaps the liquid
scintillation technique might be applied here.
In the case of gamma-rays it is usual tc estimate the energy from the
“Compton edge" of the energy distribution in the case of low Z crystals.
If sodium iodide is used, a good photoelectric peak can often be obtained
which yields a more accurate value. It is customary to calibrate with60sources emitting one, or a small number, of gamma-rays e.g. Co . To count
beta-rays against a background of gamma-rays, one can use a very thin
anthracene crystal which will not capture gamma-rays efficiently but will
record every incident electron.
If a radioactive isotope possesses several gamma-rays it is very

difficult, or 5 mpo lbl©, when using the single oryst el ieckriooe, to
distinguish between the peaks due to the different gamma—rays because of
the overlapping’ Compton distributions, one of which exists for each energyf
This is especially so if the energies are not widely separated. In such
a case, and indeed in all gamma—ray work- a method, described by Hofstadter
and McIntyre (1950b) is useful. It makes use of the fact that the elec
trons associated with photons scattered by th - C--n-.pt.cn process at a •
particular angle are homogeneous in energy. Also at angles near l8o ,
the rate of change of energy with angle is small• For example, between 150 and l80°, the energy increases by /v°f- for a gamma—ray of 1 MeV. If
a collimated beam of gamma—rays is allowed to impinge on a crystal I and the
photons scattered at a particular angle, usually as near l80° as possible, are detected by a second crystal II (shielded from the direct gamma beam),
then the pulse distribution of electrons in I, which are in coincidence with
the gamma—pulses in II, will give well defined peaks corresponding to each
gamina-ray energy which stand out clearly with little or no background since
there are no longer continuous overlapping Compton distributions. The
energy of the gamma-ray is easily calculated from the electronic energy,
Hofstadter and McIntyre used this technique to measure the gamma-rays 60,emitted by Co
The usefulness of the method in coincidence studies has already been
mentioned and will be obvious for three important reasons. Firstly, its
efficiency for gamma-ray detection, compared to a Geiger counter, can
increase the sensitivity of the technique by a factor of from ten to a hundred. Secondly, the' fact that the scintillation counter is also a.
spectrometer. means that a particular energy interval can be selected by
kick-sorter and only the gamma-rays (or beta-rays) in coincidence with the

5?*
particular event selected, are studied. Also the resolving times of
scintillation counter coincidence arrangements can be made very much
smaller than for the Geiger counter case, because of the much shorter
resolving times of the crystals* This cuts down the random coincidence
rate, permits the use of stronger sources and allows one to measure much
shorter lifetimes of excited states. It is not intended at this poiht
to go into any detail regarding coincidence techniques as these have
already been mentioned. Hov/ever Bannerman et al, have discussed some of
the uses of the scintillation detectors in this field* They also suggest an
interesting Application of the scintillation technique to the “pair
spectrometer“. The two arrays of counters are replaced by two large
crystals or liquid phosphors the output voltages of which are fed to a,
fast coincidence circuit and the amplitudes added. If the spectrum of the
added amplitudes is analysed, the gamma-ray spectrum is obtained. This
method avoids the complicated circuitry associated with the Geiger counter
method and, too, is equivalent to the use of a very large number of Geiger
counters, the accuracy being limited mainly by the resolving power of the
scintillation c cunter s.
The integrating properties of the crystal technique are similar to
those of the proportional counter. If a source is placed inside a crystal
the energies of all events in coincidence are added and this can be a
considerable advantage, It is intended to discuss this matter at some201length in the section dealing with the radioactivity of Hg , since the
property was used to good effect in that case, with both proportional and
scintillation counters.
To sum up, the scintillation spectrometer technique is very sensitive,
has a. high efficiency for the capture of high, energy radiations, has a short

resolving ■time and, using Mligbt pii " can be put in confined j>ac
On ill© other hand, at low »r argies, it does 'not coiqj are 0 ourably wi th
the proportional counter, to which it is closely akin, in resolving power,
accuracy of measureraent or background countin*" rates.
VII. The Electron sensitive Photographic Emulsion.
The development of the 05 emulsion hv Ilford Ltd. the FT2a and FTA
emulsions hv Kodak, Ltd. and the TTTB3 emulsion by Eastman Kodak. Inc. . all
of which are electron sensitive, suggests new ways of examining beta-radia-
tions, Three t echni cue3 suggest themselves -Firstly, one may replace the pl ate of a - magnetic plots spectrograph
by such an emulsion. By counting the number of electrons actually recorded
at different parts of the platej an accurate measurement of relative
intensities can be made. It will he recalled that the me 3 cement of the
density of an ordinary photographic plate does not .vive accurate intensity
values, Also the method is more sensitive since each individual electron
is counted, as in the counter type spectrometer. If a permanent magnet
spectrograph were used, a plate might - well be left in it for several weeks
before the increasing background became too serious, especially if the
apparatus were stored underground.
Secondly, one might place a thin layer of a weak radioactive source
over the surface of the emulsion and measure the track lengths produced by
the decay electrons. Alternatively the plate might be/soaked in a weak
solution of the source, provided this had no deleterious effect on the
■properties of the emulsion. This would eliminate source thickness
difficulties and would be equivalent to the use of a radioactive gas in a.
proportional counter. The chief advantages of this method are*(a) Its
great sensitivity. Calculations by the author show it to compare favour-

ably with the most sensitive of* the other techniques-and he is investi?at— its ossibiliti 33 (b) Tt si— >licity, T7- ------ •? ->■
d. i s ad vs,] 11 ges, principally tha [ th res lying 1 o irer 5..---t lik ly tc he
b tter than *y20 'a--•• tc fa ..+ rag li| i 3 ;att ‘ Also th®
1 ’i °> is iedi -n +>,~i-t-r*-1- ni r m t — g more so than in some of the
3cl 1 rues r Bon tti (l9p0) has actually used sucl a techi i ’usQn , oin the examination of Rb ; - TT -• ^r--A - ■'"goo..•.'r-- • go’irce exposed 0.3 mm
ahovs 9. 10° micron Oc- r>lat-e f ir seven davs- TTe mot on end-point not
Lnc 3 ' tent wi -*■'’* that ob tain sJ 1— % ibby i.e 1 3C jr sV b^t - ~ os
this c Id be 1c due tc ( ' oor P,eoni trv by + ’••• * v ~ — - > - > v-? -v
background ~ he used one month old plates. Re suggests selecting electrons
going in a particular direction and using fresh plates with emulsions of
thickness up to 1 mrrg or even more. In order to relate the range of the
electron to its energy, the results of Zajac and Ross (1949) may be used. This method would be specially useful for weak long-lived sources such as
those in which the writer is interested.
Finally the technique at present under investigation by Reynolds at
the Radiation Laboratory, University of Californi• is of interest. A
source containing gravimetripally minute quantities of one or more activi
ties is analysed by a mass spectrometer. The plate on which the separated
masses fall is pressed against the surface of.a OR plate. The radioactive
isotopes show up as lines of electron tracks on the plates and he hopes
to analyse the ranges and. hence find the maximum energy of the electrons
for each active mass. His first results seem promising.
VITT. n e1- - ■ -'f I Ip a -1-ri ug r- -- R ~ g T~'~"... ~\g .. -■
Brief mention should be made of two other methods of measuring gamma—
ray energies. The method of diffraction by a crystal is weI1 known.

5.5.0
tt- Hy, lays, a curved crystal and photc ultiplier detector ate
employ i.d i] th fc susing property of the former and the sensitivity
of the latter make the technique much more sensitive* nevertheless* it
requires a very strong source and cannot be rood much ab< re 1 MeV. Howeveri
in the region in which it is useful it is a very accurate technique*
Also* the nuclear photc—effect has "been used for the measurement of
high energy gamma-rays* Deuterium is commonly used for gamma-rays "between
2.2 MeV (threshold) and *vl0 MeV (at which energy .other processes bevin
to take place and also the cress—section falls off). Gibson et«al*(1947) ;
impregnated an Ilford nuclear piate.with heavy water and measured the
ranges of the protons produced in the plate due to gamma—radiation from the
(p, ok.) reaction in flourine.
This concludes the review of the various methods of analysing the
radiations emitted "by radioactive sources. Now follows a fuller descrip
tion of fche proportional counter technique.
2. The Proportional Counter Technique.
The earliest form of proportional counter was that devised "by
Rutherford and Geiger in. 1908 (Rutherford and Geiger,1Q08 )» This might
he considered as a development of the ionization chambers, or electroscopes,
which had been used previously* Their apparatus consisted of a cylindrical
cathode inside which was a co-axial anode wire. When a sufficiently high
voltage was applied across the wire and cylinder it was found that the entry
of a, single alpha,—particle gave an observable deflection or the quadrant
electrometer used as a measuring instrument. It was found possible to
count alpha—particles at a rats of three tc five per minute. The technique
was later improved when Geiger and Rutherford (1Q12) replaced the quadrant
electrometer by the faster and more sensitive string electrometer. The

56 =
pulses were recorded or photographic film at rates up to 1,000 per minute. These counters had the property, often useful, of being able to detect
alpha—rays in the presence of intense beta— and gamma—ray background,
because of the larger pulses of the alpha—particles. Further development
by Geiger and Klemperer (1928) showed that, by raising the voltage suffi
ciently, pulses due tc beta— , as well as alpha— , particles could be obtained.
Provided it was not raised too much, beta- and alpha-particles could still
be distinguished. In the period up till 1948, proportional counters were
used mainly for the detection of alpha—party el os, other energetic nuclei
and neutrons. In 1948, Curran, Angus and Cockcroft (1948, 1949=0 extended
the technique tc bet a—ray energy measurement. A good description of
early work in this field is given by Rutherford, Chadwick and hllis (1930).
More recently Lewis (1942) and, especially, Korff (7946) and Curran and.
Craggs (l949) have written very useful and detailed monographs which deal
fully with proportional counter theory and technique. A very readable
review by Curran (1950) presents a clear picture of the development of the
present technique and how it is applied to the measurement of beta- and
soft gamma-ray energies. Also Korff (l95Ca, 1950b, 1951) has reviewed the
technique in three articles in ’’Fucleonics’’= The first deals with the
theory of the proportional counter, the second with its design and use
while the third deals with the associated circuits, especially the
amplifier. An earlier review was given by the same author (1942) add a general review of Corson and Wilson (1948) includes 3. section on the
proportional counter as does the book ’’Ionization Chambers and Counters”
by Rossi and Staub (1949). The theory of the action of the proportional
counter was given originally by Rose and Korff (1941) and is given fully by
Curran and Craggs (1949).

Let us consider the "basic type of counter consisting fundamentally of
a cylindrical cathode and co-axial anode wire. Fig. 1, which shows the
type of counter used in early work in Glasgow, will indicate what is meant, f
Here the cathode consists of a thick aluminium foil relied into a cylindri
cal form and placed inside a cylindrical glass vessel. If a variable
e.m.f, is applied between the cathode and the anode of the counter, inside
or hear which is placed a source of radiation, and if we measure the current
or charge collected by the wire in a given time as the e.m.f. increases,
the following events take place,
I, The current increases with voltage, because as the field strength
increases, the ions formed inside the counter by the radiation travel
faster (have a higher mobility) and suffer less recombination.
II, The current then becomes stationary as voltage increases, This
saturation effect is due tc the fact that recombination is now negligable
and the current is now equal to the number of ions originally formed per
second. The ionization chamber operates in this region. Such a chamber
can be used tc measure the current produced by a source of radiation, or
the charge collected in e given time if the source is weak. It can even be
used tc detect the passage of single particles of high ionizing power if it
is connected to a very sensitive -amplifier, The size of the pulse, d.V,
appearing on the central wire is given by
dV = ne/c—19where e is the electronic charge, 1.6 x 10 ; coulombs, C is the capacity
of the chamber and associated circuit and n is the number of ion-pairs
formed. The height of the pulse produced is usually governed by the
number of the electrons only since they possess a much higher mobility than

58,
do the positive ions and are therefore collected in a much shorter time,
ft simple calculation, taking 0 as aiIOy^u-F shows that an alpha—particle
from RaA (<S*0 MeV) will g£ive rise tc a pulse of about 2 .7 " 10 volts
which is well above the noise' level of a good amplifier, say; ** 10 " v< 1 t -, Thus the passage of a densely ionizing particle is fairly easily measurable*
However it would be very difficult to measure the pulses produced by
beta-particles passing through the chamber.
ITT, If the voltage is further increased, the current, or pulse height
due tc individual events, starts increasing again, due to ionization by
collision. In a cylindrical counter the f i eld increases rapidly as the
distance from the wire decreases. The equation relating the field
strength E r at a distance r is
E r - T logeOx/r,where V is the applied voltage, rx and r ( are the radii of the cathode
cylinder and of the wire respectively, In the case of a proportional
counter having, typically, ra and r , equal to 2.75" and 0.002" ’’ respec
tively and operating at a typical voltage of 4000 volts, the field varies
from 79*7 volts per cm at the cathode to 96 Kilovolts per cm at the wire.
The threshjlold of the proportional region is the voltage at which an
electron is able in its lust mean free pat1"' length before hitting, the wire,
tc cause an ionizing collision. As the volt age increases further, elec
trons commence making such collisions at greater distances from the wire*
Each collision provides an additional electron which in turn car: make
further ionizing collusions. The average number of electrons collected
at the wire due to a single initial electron is called the gas amplification
factor and is usually denoted by the symbol A. The voltage of the pulse
on the wire is given bydV =Ane/c

eg
where the other symbols have the same raeaninr as "before, the ioniz
ation chamber region, A has the vain® unity, A usually lies in the regior
1—10' for accurate propertionality. provided suitable 30s mixtures are used. Practically ahy gas, or gas mixture, will give s at.i sf act cry proportionality
up tc a value of A of 100. The property of the cylindrical counter, that
the field which is strong enough to cause multiplication of electrons by
ionizing collisions exists only at very short distances from the wire, is a
very useful one for true proportional counting. Tt means that electrons of
any given, energy originating in any part of the counter apart from an
infinitesimal volume around the wire form the same number of electrons by
multiplication. This property is shared by a spherical counter- having
a small spherical ball at the centre tc collect the' electrons. However,
the cylindrical form is the easier to realise in practise, In the case of
a parallel plate counter, it is obvious that the pulse size will be bigger
the further the original electron is from the positive plate.
This region is called the "proportional region" because the output
pulse, dV, arising from the initial formation of a number of ions, n, is
accurately proportional to n. In other words, a proportional counter not
merely distinguishes between particles of different ionizing powers, a.e.,
alpha-particles, protons, electrons, etc., but can also be used to measure
energies. The method can be extended to electrons, even of very low
energy, as can easily be demonstrated by calculation. Consider the case
of a well designed amplifier having a noise level at the first grid of, say,
^ 2-3 x 10 ■ volts. Assuming that one can measure fairly accurately the
energy of a particle giving rise to a pulse of approximately three times
that value, that the capacity of the system is <v 10/ T F and that the gas
amplification is a»100, the energy of the corresponding radiation is only

60.
ArJ 1.5 KeV* By increasing the gas amplification tc 10 as can easily -be
done by the use of suitable gases, an energy of only 1> oV is obtained.Of course such, an electron could not produce even one ion-pair, but this
shows that the method is capable of detecting single electrons. Indeed
Curran, Cockroft and Angus (1949) measured the pulse distribution from
single slow electrons liberated, by light from the aluminium cathode of a
proportional tube. This gave information regarding the statistical
fluctuations in the gas amplification. They also showed that it is
possible to obtain gas gains in excess of 10 and remain within the propor
tional region, provided the initial amount of ionization is small.
IV. If the voltage is further increased the counter operates in the s6-
cailed "region of limited proportionality". The value of A is about4- 710' -10 ? though these figures depend on the gas employed. In this region,^
the pulse height is no longer proportional to energy, since A doss not
increase so rapidly for energetic as for less energetic particles. This is
mainly because the positive ion sheath begins to have an appreciable effect.
Also the gain goes up more rapidly because of liberation of photoelectrons
at the cathode, electrons produced by positive ion bombardment of the cathode
and ionization by the positive ions. This .region can still be employed
usefully to differentiate between particles of widely different energies.
V. Further increase of vol tage brings us to be "Geiger region". Here pulses
of constant size arise from all events which ionize the gas in the counter
even if only one ion pair is formed. In this region very great sensitivity
is achieved, but all discriminating power, except by external means,is lost,
VI. Finally, if the voltage is increased beyond the end of the Geiger
"plateau", where the counting rate stays roughly constant with increasing
voltage, the counter enters a "region of continuous discharge". (Actually

61.
the discharge is not really continuous, hut consists of a 1arge number of little pulses. In it the value of A generally ex d 10 ). Finally it should he noted that these regions are not sharply defined but pass
gradually from one to the other.
j „ Theory of the Proportional Counter Action.
As has previously been mentioned, the theory of the action of the
proportional counter has been developed by Hose and Korff(1941)• On the
basis of certain assumptions regarding the nature of the discharge, which
will be mentioned.briefly below, they derived an expression for A, the gas
amplification factor. Since the derivation is given fully by Rose’and
Korff and also by Curran and Craggs (1949) it is not proposed to repeat it
here. In the form given by Curran and Craggs, the expression runs
A - « p M e 3 ) 4 [where V* is the total voltage across the tube, V, is the voltage at which
multlpli ’ ' ' jollision begins, ri and r*a ate the radii of the wire
cathode cylinder reflectively and cx is the rate of increase of2ionization cross—section with energy in cm per volt.
The assumptions made are as follows ?- (i) The positive ions formed
in the discharge move in a field which is usually low and which decreases
as they move. They do not therefore contribute appreciably to the number
of ions formed by collision. They travel Very slowly compared to the
electrons and give rise to a space charge. In the proportional region this
effect is small and is neglected in tie theoretical treatment, (ii) Recom
bination of electrons and positive ions can be neglected since this is a
very small effect, (iii) Statistical fluctuations in the number of ions
formed in a given length of path of a particle or given energy are neglect
ed, (iv) Strongly electro-negative gases and vapours, such as

<9
j etc. capture electrons to form negative ions. The
movement of such ions is very slow and the whole character of the avalanche
is altered if such gases are present. It is assumed that this is not the
case. (v) The effect of photons formed in the avalanche can he neglected
Especially when complex molecules are present, is this justified. If the
affect is present, it gives rise to larger pulses than would otherwise he ••
the case. (vi) The effect of secondary emission at the cathode surface
due to positive ion and photon "bombardment is neglected.\
(v) and (vi), if present, tend to increase A, while (i), (ii) and (iv)
tend to decrease A. The effect of (l) has been discussed by Montgomery
and Montgomery (l9';0). The region of limited proportionality, where A does
not increase as rapidly for high energy events as for low. is probably due± w O Uy / J- w
to the voltage shielding effect of the positive ion apace charge. The
effect o^ (vi ) secondary emission, becomes of importance in the case of
monatomic or diatomic gases if A rises much above 100. However polyatomic
gases do not show the effect, which appears to be due to the formation of
metastable states in the noble and other gases. Such states may have
lifetimes of /v 10 sec. instead of the normal lifetime for an excited-8atomic state, viz. rj 10 sec, Such atoms relea.se photo—electrons from
the wall with a relatively high probability ( /v few per cent) and they
cannot normally lose their energy by coif ision with similar atoms or
molecules. However if a polyatomic gas is mixed with the gas the effect
is much reduced, or even eliminated because the excitation energy is
transferred by collision to the polyatomic molecule which predissociates
instead of radiating or de—exciting at the wall. In our experiments, argon
and methane was used; or, occasionally, argon and nitrogen. There are two
slight disadvantages involved in using polyatomic gases (a) the operating

Fig.l. A glass-type proportional counter.

63.
v 1 ty : ■ high r and (b) the rife to 'the counter is limited- since the
■nol vatomic molecules are di rsoci atsd .in absorbing the excitation nersv.-v. ”* o - - w „ ... Ot>As in this research it was customary to refill the counter before each
q griment, the 1 att dis idvantage was of no i portance
That tl a 3 sumptions made are valid has he<n shown by experiments of Hose and Korff ■ 10.41 lid o-r Curran- Anms and 0 ochre ft (,TQAQa')» General*1 v/ O - \ S ' * J - ~ ~*~u /
if the value of A. is desired^ it is measured experimentally rather than by
use of the formula. In the normal use of the technique- however, one does
not measure A at all but compares the pulse distribution due to the unknown
radiations with that of some standard radiation as will be described in the
section dealing with calibration.
Development of the Proportional Counter,,A-nn.,„. JIF< ■ ...W1— ■—...1 , ■ — . .. . rL....,„W . ....
The counter shown in fig,1. which is reproduced by permission from the
paper of Curran. Angus and Cocicroft (1949 ); was the' t}pne first employed in
Glasgow for the examination of beta— and gamma—ray spectra, end is of•a
standard type. The cathode, a cyl inder of sheet aluminium,, is contained in
■ glass envelope which.has a window of very thin glass W, There is a hole
in the cathode at that position. The wire; generally 3 or 4 mil tungsten, is held under tension by a spring and is mounted as nearly axially as
issible, The wire itself must be free of kinks and of uniform diameter.
The wire ic connected to the first grid of the head amplifier, while the
cathode is coi *ted to a source of high negative potential. The wire is
protected by "guard Tubes".G. which are ojE glass covered with "Aquadag" and
earthed, These prevent leakage of charge from the cathode to the wire and
else keep the wire from "seeing" charged insulators, which would induce
charges on the wire. The parts of the counter; T. are coated with
"Aquadag" for the same purpose. A counter of this construction, if well

. 6dA- , #
cleaned and pumped before filling nd afterwards sealed permanently,
maintained its properties for many months. However it was mere usual, in
the case of all-metal countert especd allj- to re—fill the counter before
each run.
The dimensions of the counter must he large enough to prevent distor
tion of spectra, due to— the original electrons hitting the wall. With the
first counters used, principally for the examination of the beta— spectrum
of tritium, it was easy to ensure that no appreciable distortion arose from
this cause. However as more energetic radiations were investigated, e.g. q -4 c«iD ITi •- etc. 5it became necessary to increase the dimensions and the
pp ssure. A rl-c ublin of pressure corresponds, of course, to s d Dublin
of dimensions’. This required that the counters ho made of metal instead
of :rlass. Pressures up to P atmospheres could be used easily. Above tha
pres ur< it became necessary tc purify the gases rather carefully. Counter
r@re built tc operate at ten atmospheres* Also one can use gases of higher
Z, and therefore of higher stopping pow< r, e.g. krypton, xenon, - tc.
Unfortunately these gases ore father expensive, although experiments were
made using cjnon* Another difficulty arises ih this case, however, In
argon, a monoenergetic group of photons will give rise tc a single peak
because of the high "Auger effect", whereas in the case of the other gases
named, where the effect in much smaller; there will be several peaks and
the results will be more difficult tc interpret»
A biv advance in the energy tange covered was accomplished by the use
of magnetic fields tc cc refill the particles within the gas. There are two
'' yt of doing this. Firstly, one may place the counter in the fringing
field of •? magnet; the axis of the counter being parallel tc the targent
to the circumference of the pole pieces, assumed to be circular. (Curran,

65.
Gooteroft d Insch. 1950)• Electrons from a source situated within the
•oui t 3? are fore *d ' Jirc ilate round the periphery of the pol ss, Thi32thod ed t< ixamii tl b ?ta—sp ctrun of p which has an end— point
r'f 1*5 MeV. The mere common, though less powerful method, however,, is to1place the counter in a uniform magnetic field with the axis in the direction
of the field, as shown in fig#31* In this arrangement electrons with a
onent of velocity srj endicular to the field, which would otherv/ise
strike the wall, are forced to travel in the direction of the field with a.
helical motion* Provided the rath in the directi on of the f 1 eld d 3 loienough, at the gas pressure used, to stop the most energetic electrons
emitted by the source- no distortion due to the size of the vessel will
ur. This method due to Cockroft, is described briefly by Gurran (l95G)«
By these methods it is now possible tc investigate beta— and photo—electron
spectra, with upper .energy limits well in excess of 1 HeV*There is one unf ortunat-r feature marking the simrle proportional coun—
*
ter shown in f ig«”* i.e. "end effect". The value of A increases from zero
at the end of the guard tube tc its maximum value at a dictai.ee which h:
usi ally of the order of the radius of the counter. If the source is locatei
near the centra of the counter e n d the .pressure is such that no particles£ *>
enter the region of non—uniform A, as was the case in the Mi investi
gation, or if one allows the radiations to enter by the window, this effect
is of no importance. Tut if the source is in the form of a mas (as in the 3 b "I A \case of u-y q -v C •, etc.; or if particles from solid sources can penetrate
as far as the non—uniform region of the counter, it must be considered.
Its effect is to give too many low energy pulses at the expense of high
energy ones- There are various ways of minimising or eliminating this
effect. Firstly, the counter may be made with a very large length-diameter

66.
■ •• • - ■ n ' ' 1 — of tl tritium spectrum. Such. srror
as remained - o •• • x 1 h ■ ■ • • ■ ■' i ■- . - d . +i • (Curran, ^ngus and
Cockroft, 1945b)* '• loth r techni iue, introduced by Angus, Cooler oft and
Curran (1949) was to divide tht ire ii to r: equal lengths by s glass bead,
and to subtract the spectrum obtained from the shorter portion from that
ol tained from the longer portion in the same length of time* This elimi
nates the end—effect but requires considerably more labour for the same
acci racy than would be necessary if an end—corrected counter were used.
The most satisfactorv method of eliminating t b3 effect is that due tc
CocUroft and Curran (1°^!3 who placed "and—correction tubes" round, andial with the guard tubes and extending slightly beyond them. To these
tubes is applied the voltage corresponding to their radial distance from
the wire. The formula used is
V ( robe ) 1 og P3 /r,iVA log t x /r,
re rt , rx and r3 are the radii of the wire, cathode and end-correction
tube respectively* , In practice it Is best to compare the p d ,■:? ’right dr.
to monoenergetic X-rays fired through a window in the wall opposite the end
of the end-correction tube with that due to X-rays fired into the middle
region of the counter and adjusting the voltage till these are equal.
Two other methods have been described by Hossi and Staub (1949 )• In
the first, which is probably applicable only to heavy particle detection,
two sheets of glass placed perpendicularly to the wire, which is sealed in
the glass* define an accurate end-effect-free counting volume since the
potential distribution across the sheets is the same as that across the gas
In the second method the guard tubes wire are made of equal, or approx
imately equal, radius. Hypodermic needle has been used for the guard tubes
but this gives only approximate end-correction and the method is obviously

OR64V&fflZZZZZZZZZZZZZZA
\ Of? 11 EBONITE
OR2AEND CORRECTION TUBE ,N v/,„)y}r
GUARD TUBE KNURLED LOCKING NUTS
KOVAR SEAL
Hi
( a )
Pig. 2, Drawing of the end plate assembly of a typical
proportional counter, designed to operate at pressures
up to ten atmospheres.
Fig, 3. Photograph of end plate assembly.

6 ?.
difficult tc apply.
hrief mention sh.ou.ld "be mad© tc th© "Maze” tyre counter in which, the
cathode consists of a 1 oyer of ”Apuad eg” on the outside of a. w] •
velope (Ms ze, 1946, HocVnoft ...d 'TT- i _g . p_ro_Nt Th construction
of such cou iter is >imple- "but the main advantage is that the surface of
metal—exposed to th.e_.gas filling is very much, reduced. Thus the counter
is more easily cleaned and outgassed, and.is less likely to become contami
nated by radioactive sources- hence distortion of the spectrum due to
so roe deposition on the wall is avoided. This is especially important
when gaseous sources are employed. Finally the multiple- wire counter-
described by Rossi and Staub, should, be mentioned, Tt provides a disc-
shaped counter through v*HHH particles can he fired'from end to end. The
ends are1 two discs of wire mesh screens, while a grid, ef parallel wires is
placed between the ends, The ’’drum counter” described by Cockroft and
Curran (l?Bl) could be used for similar purposes,
6. Constru.ct.icn of a Proportional Counter,
In fig, ° is sbr,wr: a drawing ef the end -of a proportional counter
incorporating the various improvements introduced from time tc time. This
particular counter was designed b r the author for the study of the radia- 2c 1tio] of Jig ~ . A O.ogdM tvrgs+sn vd re passes through a guard tube, thrdg hi
a. narrow hoie in an. ebonite plug and is held by a small screw which is
connected te the head amplifier by a stronger wire. The guard tube sup
ports the end—correct ion tube. On the other end of the wire is sealed, a
small glass bead which presses against a spring as shown in fig.2(b), This
ensures that the wire is kept taut, -As this counter was designed to oper
ate at. a pressure of ten atmospheres.. the end plates are securely held by
six bolts and nuts at each end.. The counter tube, end plates, end-correc-

Fig,4. Various types of proportional counters.

68,tion tubes and guard tub eg are all of steel and the other metal parts are
of br • s s Ebonite 1 us >d for insul atior
One ira] J nt feature tt a c jiruction of thi s Count sr is that all
joints are sealed with rubber O-rings. The cods numbers indicated in the fe ----- —i.-p-.-- + +v,., Th? ■ o.-'rstoTotion has two advantages. In the
more usual design of counter a certain amount of trouble was of t <n exper—
i mc< d 3n king t• @ couni • sufficiently gas—tight. In this design.
however, the counter was practically always gas-tight on first assembly*
Also the time of assemble was very much reduced, A ohotcvrarh of the end
d a t e asserbl,r is shown in fi i". 3,
Finally, to give some idea of the range of size of proportional
counters, fig, 4- shows four of the counters used by the author at different
times. The longest .is over sA ~-r feet long. In each of these Counters one
can see clearly the windows through which ore passed radiations from exter
nal sources, or X-raysfor calibration purposes. It was fairly standard to
use 0,0COM alud nium windows except when soft particle radiations were being
-"mri.;v;d r Thon a much thinner glass window was used, as in the case of the
counter shown in fig, 1.
7* Preparation of lources-
It is always desirable; especially when soft radiations are being
studied, to"have a source which is as thin,as possible and on as thin and
low-Z support as possible* At first this was achieved by the use of
gaseous sources. This proved possible in the examinations of h (tritium
gas)- C : (carbon dioxide) and 5 (hydrogen sulphide), however the m e t h o d
is by no means universally aprli cable - for (i) no gaseous compound may exist
(ii) if one does, it may capture electrons strongly as was found to be the
case with the vapour of nickel carbonyl and of, possibly, lead tetramethyl.

■ 69,6 3used in attempts to investigate th . radioactivity of Hi r.
(iii) the gas may react with tl + eria,ls of which the counter is made.
When the gaseous method is employed it is important than the range of the
high>st nergy electro] • be small with respect to the diameter of the
counter, since an electron which strikes the wall does not give up its
full energy, This tends to give too many low energy electrons at the
expense of high energy electrons,
A second method was to deposit a thin layer of the source on a thin
bad in mat ri 1 support d or a wire loop* As the reflection of electrons
by the source bad ii g tends to give rise to a type of distortion similar to
that mentioned, .above, it is important to use backings made of low at mic
number materials* A1 — inium 1 3sf ( *»0«l6 mgm/cm ) and nylon films2( JOyugm/cm ) were commonly used by the writer for thi purpose* The
effect of the s ui ce s port or t^e spectrum °h ■v' * rro" he ar:" roximately
timated by use of electron back—scattering data due to Burtt (1949)' mi‘s
importance of using thin sources was mentioned earlier. The slowing dc
of electrons leaving the inside of the source vives rise to a distortion of
the spectrum (Feldman and Wu, 1949)♦ Langer, Motz and Price (1950) found/ 2th source s of thi n < ] 3 yu_ • c g ■■ -r~ . t- d -viati . ir the
erect rum ohare below 8- KeV*
Wot only must, a source be thin but it must be uniform in +' i '"ness,
T ?er (194-9 ) showed th^t a source nr spared b*r "■vo o r •-+ ’ f r r' ~ so- lu ti or
can easily 1... vari itior '■ thickness of 1 0011. The best way of prepar
ing o thin, uniform source is bp- evaporati ' of the source in vacuo, as
described in the section dealing with the preparation of the mercury source*.
However Langer described, another technique which gave sources of fairly good
uniformity. ■ This method has been much used by the writer and is as follows!

70,To 1 1 o f 1 ■ ad 3 cl ~ r 1— vo l ilia f ui 1 ^Bur i_ ghs
/ \ mountWelloe >0 units/ rn' lutio] 3 J he... ;.■■■■ ’ ] J_1 jup y nd
V! ■ p t d t lj ibher in ■vacuo, op by infra-red beating#
Bp 3 1 X* (191-3) showed the imp opt ance of th 1 f ct _p th chapp
ing ■■ r source r ■''irk ■ due to the em3 s .... >3 >f 1 ar d r1 j *! ■■■ . I] th ip24perim nt • ising Ha ‘ the mount charged to 20 Tr ■■rT in 300 he
lagr jti 3 speotr -t jr it is essential that some means of conducting vay
th char h . 3 treduced but in the portional counter it is probable that
13| ions of the gas atoms with the source mount perform that duty.
v • ■' sless th ' ithof t.tim dog sit'-"0 a thin layer cf carbon on nylon
film supports.
T' third ethod of pp paring sources the source 1 aterial is di stri-
buted as a thin layer over a large area of aluminium foil which as then
rolled in cylindrical form and placed inside the counter pressing against50 63 15°the wall. This method, which was used in the studies of Hi , Hi , Hd
07and Hb .’ to be described later, is especially useful when the specific
a
ctivity of the source is very low, as has been mentioned, . However, there
is one important consideration to be borne in mind when this method is used
The maximum range, of th . parti cl s must bo fairly small compared with the
- •■-hius of the counter as otherwd particles hitting the wall will hot give
up their full energy in the gas. and this will lead to distortion of the
spectrum shape. This effect will in future be referred to as the ’’wall
effect”. Since this method of supporting sources was much used in the
course of this research, 1 t was felt essential by the writer that the wall
effect should be investigated mathematically. This treatment follows and
it is shown that, as a rough guide, if the range of a particle of maximum
energy is less than half the radius of the counter, the spectrum is not

Fig, 5* Wall effect. Diagram representing a proportional
counter with a source on the inside wall. A small element of area of source situated at A is considered in.the text*

3 t + "• iEDportant e x te n t ~ A3 sc a method o f c o r re c t in g a spectrum
j q ZL O 9 "b e
P a •pvi.o Iffoct of ,13 Cu rvai'1 )!*« or th 2 Sn vCtru.511 o1-- g-i * T*- -..11 Ff f act ) <
ryiy ■ ~too 3 to find 1 --- rti c*i s of ^xvQji range hit
•jijje wall* f tiie counter "before living up si 1 their enerj0i’y* Gon.sio.er*P*i ry C f <a 1 wVi i -p oT»T*fiiJC! (*'*11 "h Vi p f oijiitsT of p a d i 13 p. Con P T’ P ^ ma "1 1 o 9 > \ - u ^ A -a . •• " r i * V --------------------- -' • >
t t ' ' t J A th. ... 3 3 r d
1 ' This lii ’ r ' le t]
x gjci 3 i<5 in a plane p©rpsrcLicu3 ar to the axi s of the counter as shown.
I 1 O'” * fee ~ 1 1 fOX rot t ' ■■ — i ; - gj <|) #
fTi1- ] 1 ‘ 1 ■■ ■ j- ter 5n "" 113 '.... i". fi r( ))
Its 1 ;: xf" ccsa4> ^a x a*
.. - o* fi)
Consider 1 Partic3es of some fixed o-nop.<•.•*■>• o.orros"oplinn* to a rang©or pc2 cos"2- + = a?
1 in th e ?as • Then from fix'* R fh )R a = (o.-^)2 + oc2 (ii)
j. , -t o-i. -c- q such th J 13 pari 3 f
© in t] ir .' 1 an ; wi 13 ’
the wall* From the fi^nre
■X2 -+- = R 2 + ~ 2-o.R co-s 0 ------------ (ii?-)
f i i "bft wT*i ■fc*hpti\--/ - --XA - - - -x ? ■+- + aa — Q.ol^ = f 2-
From fiia) and fiii}. it fnilov/s that
cos e = ^_aa ----------------------—R(i) and (ii ) r 3olv j.d for . From these equations
coSa<f) + '°L*3 0 3 I -+- Cos2-) + R2 CoS1- = o
fiia
fix)

i-CO
Sd
0-8
0-6
(a ) P . /2 » 6 0 K E V
(b) R = A/4 * 4 IK E V Cc) R - 'B «28KEV
0-4
0-2
20 4030 50 60 70 80 90
Fig. 6. Wall effect. The variation of 0 with dp and R.

1 a *fe ■a z1 jp-fr . ■ 11 f± o "fc i ■r> V ,ve
— OL COS^4> £ »/c*.a- R^Sin^ cos1^^ sin* 4»
of ^ ( .". " )
9 - a + ~ Ra *»"M> c o ^ »COS R sina<the negative sign "ives p?
© = CoSt — a/ Ci*- - (?z s m 1 ) cos1-) R si
(Vi)
3 (|) * j • 1 ‘ '
0.
T1 rn ■■ "H •-■ t e °rl t1' 1-ines
cj? +dl<£C» “T» O
r; p -•'}*n 5 A Op 31? P i'
0ne3?p*v i ti
n1 im - ■' ■'"* ppi i + "f* •T
AP 3 - 'i ■f p *or the ereo ^RT to tli° ere3 PST
d$ f WzJJ d A = J* J sin 0 • cL0- cU|> = cos 0. c*4>
cL<£'■’ -r. -1- ■■■ + ■’
■ • ' ^sirt1 ' 3 ih j r tl aj t full valTotel numb_ cl <£ — CoS 0. c!L>
d$>
■ f p rticles emi tted
= — cos e (vi d ^
vlisre 0 3 3 river. b?-r (vi V
Th in rhich 1 „ * c*a,ti " it h R 3 ■ h ' f 6 fo.
.-p t> .. a &, Th vs] ' 1 jaded fcha * **. 9 ^
33,3 9 of the counter end roe pressure used in the enslvoie or the "ond? ■->+-ons

INTE
NS
ITY
ORIGINAL SPECTRUM
CORRECTED SPECTRUM
6 058 62KEV5 0 54 5652
4 0 ORIGINAL PEAK
PEAK MODIFIED BY WALL
3 0
20
20 3 0 4 0 50 7 0 KEY6 0
Fig. 7* (a) Distortion of an electron peak due to the wall
effect. (b) Correction of a spectrum distorted due to
the wall effect.

73.61■ -j*q o T;r v 'ti to ~v - F| op, v or , 3tiv 5ly, Si K 3 3
3 1 1 ” 1 'j J: . . ■ • ‘ • 1 g 3 h v r ' 3 than the . " ’ th f i sjur©
shows 1 it 1 f* •+ vi 1 1 ■ f P ' 3 ' ' ■ p . of th s ctrui tc 3 i£ i --"1
extent, This i 11 he iemo] tmt in g >onvj oi. ■ r in th 3
-p 11 v / i rseot "i on ,
9. The "P-’ s tort ion of gin Electron Peak due to the Wall Effect <
rm, iff >ot ~ p tv wall bhe sha )f ah 1 ■ 1 3 now he1© 1 r»1 " ’ jproximatsly monokinetio rou of / • ayi ns? b.
ran ’ R 55 ^ (th© worist of fig* 6) is shown in fig, 7(a), Th© corres™
p ©ndin ' ’ / 60 KeV. is that sal sul at ,:i fc r the c e© tv - + . r • - - a
fo” the experiments on ui ckel operating at two atmosuheres pr ■ ire of
argon, n 3 ■ 1 j tt 1 methane* Foi 3 • of calculation the line sha— is
~ , , 1 ■ ro'113.a r . A t cp =0, (fig, 6), it i ... th« J- on© " rteroof the e3?ctron£ hit tl wall. From th© symmetry of fi ■ 6 about p =45
g that ura jinsr over all valu of 9 2 on© ej hth of 3,13 thy “ “‘CO I CJ>
electrons hit the wall. Therefor© the number of unaffected electrons is
sented Toy the lower triangle whe.se area is seven eighths of th© origin
nal trj an rle The difference in area cc rres jnd to electrons which have
given up less than 60 K©V in the gas and which go tc form th© low energy
"i.11” of the opiotru 1 wo shown in the fi our©* Hence the shape of the line
as modified by th© wa!3 consists of th* smaller triangl and the tail,
Tt is now obvious th at, even for the highest energy j.nvolved in the case of
Hi ; th© effect of th © wall was very small,
Qtrictly speaking, to th© 3.eft side of the triangle should be added
the parti jl< ir that portion of the tail which lies between 99 and 66 KeV,
However it is impossibl.© to reproduce in a sma3.3 phot ©graph the very sms'1.!
additional correction that results,

76.
7.0, Th e 9 v r-'* o o t i or. ' f ^ ot rum Ij ~<t. nrt ©d due t .. tl,© f e.i1 vi'f f* e o t .
t- . i- ' f t 1 it] x>' ><3 - aJc as in th • previous section*""■0 ’ ' ^ J* . . . . . . . -- j, ***” .?
6 73 livi ' ■ tt ■_ tr f ,g., Ki fj 7(b) into ri ?s of si -
tr n peal . now f aguls h nd coi sid jx s] a modifi ,n ak
I] t] cas ... the 1 tl .gl' c* "" snd f tt ctr m i divid ed ini c "
K Tr nergy 7 ■ 4 -iv ••;•."• *« 7.:' ■;-+ the 7 ; 7 L i it ; dj 3 cuss in ' d at ail
the Calculations involved in the adjustment of the spectrum hut merely to
sketch the method. In constructing the tai *1 of fi &a 7t a ) th 3 en 3 raw intervals into which the tail was divided corresponded to equal angular
intervals of 0 •••>• ■■ t ir tb n the crl tical value at which a 60 KeV electron
jt r h ,r' th ■ vail . i,e for a jiv •:.. ''r' lu * cf 0 th 3 nergy ig thatgiven up hy a 60 KeV 3I • • - travelling at le 0 b fore hitting
. V
th ill.. R it irnini to fi 7(h) consider th il ctron group of m
• y 6^ KeV, Tf 3 1 h 3 fc 1 s __ f th 11 * t r0uld t — "been hi srh r
hy •- fa st ... 0,16* Pof th sak • f arity, the magnitude of th correct!* r
1'. n 1 Iti n : d hy twc However the pulses going into the 60 KeV
?rou mu 3t he subtracted ~pn'1 th 3 rest 2)f the spectrum« 8 Mtai 1 ** for the6n K©V group ? s c al it ed s - in the ca s the sin rl e 1 sak of 1 -)and 7/’; are 1 s mad \ jual t< th area which has be >n added tc the 60 KeV rou This tail is now subtr; cted from "I"1 the 1 ower energy ^rouj and
is indicated by a dashed 1 in 3 the 96 KeV and 90 KeV eneroy srrouns in th9 f j[ gure» How the 56 KeV g eak is modif j in en exactly simil ar manner, th
height being increased by o«Id (multiplied by two to exaggerate the iffeet)
and the tail is subtracted’ from the rest of the spectrum* The chs ss di -•
t the Correction of the second peak are indicated bv dot-dashed lines*
Unf: Ptui " tely 710 th© f7 tnire the tail bus. by error- besn added, to the• :0 . . / V 7
9° KeV peak inst ead of being subtracted * By gr3ceed.ing in this w?v the

7%
n tr ■ be c >r ■; 3 n th 1"" ff it t iv " ' r ~ 3 4
of o ccur.wc’r a
17., 0 w libr"-tio: ~■.
m arry x ac t 1 I r sctrc see v vi 11_ th ore optional
' is si lit3 3,1 to hay < urat nd * i • ' ■ - -
13 bp t3 At f3 vnt,. it was sugsrested that X *r r ■p"‘ icted hy — *y t
L artici n..." ... 1 ivht "b ised. TT 7. XL. jrii t 1 t u 1 ~
in fig* 8 the writ jp — 3 ' out • ••' • ■... ’ •• * G siger count 3r
t ■ + r, Us. n of the resolution obtainable by th3 ■ sirn 1
ratu f ■' p 1 tt 1 nii11ed x‘~* fct x j. ..., t ar — ■4 of> 9-2 $ -a. w w#
th -r;. x ' ib , T h i 3 ] d x * letl J t • 1 ui13 or ■ ■x " 1 - for 3 1 j.-
' t • Jf i for thi ... ' ■ 1 3x 1 would 7. a set x
th ' '1 — lir t th y ' sir d Since the rel at 3 t o] v
313sensitive G .... sr c ft r av 3 200” 3 00 3• ' tt 3 ‘ • •• ( 11 ]j Tr"7
it 4 s vi d nt th t there would b id squat * int nsitv for xhe roT— ?t3 n al
J rh3 ..lop allv used nsid 1 ~ hi ?k sr sf f i o ! * 3V f ''r‘
th ■ detection of v--r"'rc;. relative xc the Gei?<>r countsr,
T,_ -■ ver shortly after this 3 A w s found t'_ p fc by holdi] +’ : ■ met 1' °foil ■ • 3sit' tt window of the ■proportional counter- at an angle of 45
x • tt ■ X-ray beam and t th- r rpendi cul r + the counter at the window,
th X-raye ref 1.. ctsd int the count ir * nsisted almost entirely of the
X-rays oh raCteristic of the metal used* The most prominent line 3s
ily x1' K * (and T if the L X—reys are examined )«. The. rb’soluti on
obtainable r°e=y— ^h4~ ■ 4 — g7 may be observed in ficu 10. which sbows tl. ?
X-rays of silver. This very simple method has remained the one most used.
er since. Most io ly, c jr foil (Kj = 8*04 KeV) or silver foil (K^ « 2c 4 KeV) 1 been used but chlorine (in the form of chloride )

3/« LEAD S H IE LD
I m m L E A T 1 . S L I T SC A LC ITE C R Y S T A L
•X-RAYS '20COLLIMATOR
G e i g e r C O U N T E R
L E A P S H I E L D
Fig. 8, X-ray monochromator experimental arrangement.
oOO
200
11°8° 10° 0GLANCING ANG LE
Fig. 9® L # X-ray peak of tungsten.

76.a3 3ium mail m< 3 tbd ;num« "tin. barium*, samarium and- 3 t i nm have/ / 9J / ) / * ' £ - - - -
also been used. So n th. s 3 mients ivere us d in the t< Hit form
oth'rTs ;*s chemical compounds.
For c libri ti or It th.6 hi ' er energy rsgions the cbaract erist i c
tung t( n radi ati< f q th +- tb i L 1 f 3 ave be ... s d* I:: thio c ise the X— ■_ r fired throu jj 1 oo] ■ wall of th count er. Ini t i ally the
ri tic : 'c' the intensitii s of th< Trp to th Trci r dlations is 0.36*1*
9 ft ;r ass in tl r i h th it" soppsi — 3 ised in most c f the z ui : r t h
ti .. bee s about 7.1! "*. Thus the i ptk 1.r' & oi 1st ■ mainlv of tl
p ~--rays.
inoth i mg bhod of u lil r fci is tc wni-ttin monoerervetjj s
X-rays or electrons. (insch 1950 Rothwell and West 1950)* Particu.."-si 5C .6s 71rly 5uit bl are the & • - pti r« • urces such as Ot , Fe , Zn : , Ge ^
7 tr 3_ 0 3 3.13 3 6 '" / i'd. j Sn znd Tb which mit the characteristic I—ravs of
Vj Mn, Cus Ga, As. Rh« In and. Tm respectively. Also the isomeric transition114
of In gi v ••• se to a 190 KeV gamma—ray which internally converts ^v-:• -
'n icing I. - „ '» Insch also she wed that, if X-o ys from isotope of
given Z were passed through or reflected by a thin layer or foil of mat?rial
of Iok er % the Xhrsiy s r f the lo wer Z material were strongly excited. In
the reflection case the thickness of the reflector did not matter but in the
transmission ” s< the thickness was Chosen to give a high p ati of modified
to unmodified X—rays. Rothwell and Vest tried to excite characteristic
X-rays by electron bombardment of myt-als but were unsuccessful.
1 ?« TT: .. Xxporimeut.?I Tochnique,
The signal from the count er passed tc a head amplifier described by
Curran, Angus and Oockroft (l949a)» It was then amplified by i _ ish- p ill
amplifier designed and built by A.L. Ccckroft and described bv Curran end

7 7
Cra^g- (1^45* A. J l n )t Usually the pulse was then displaved or th-; screen
of ■ ■■ ’’ ,' ~"y o’! ill as pe., rn"!'1 defleciioT of J_1 beam 1 s • proportito I h< n sr 0 th v nt Tivin rise to the puls©» T1 uls sr
/
recorded o n a moving is mm film which, after p r o s s i n - wa e nalyzed by
pro’dectino* the pu3 ses cr rid of 5cu? .. . " 3 ■ 3, The u31-. 1. t. ... ... 3ured in arbritrarv units and oom'oared with a 1 j,rd pu3
size arising, fro tl s of a lil tit X—rays. At other times the
■mlses were fed into 0 one channel kick—sorter# The first method
f »lt tc b< lepej dab3 in all th 3 d? t< could he accumul ated in a
few minutes of operation as it was easy to record up. to 50,000 events per linut — rovi led the source was of sufficient stren 'th tc "iv such
cour1 in rate . The main disadvantage of the photo graphic method was the
3 th of tim 'as 3ary to analyze the results. When using the one
channel kick—sorter method, runs of many hours duration >r oft in necess
ary and the reuuipemenis of yoltav stabii.3.ty b • much, mor stringent
as a. result. The use of multi—channel kick—sorters would reduce the ti
of experiment cchsiddrably. Work is proceeding on the development of such
kick—0 c rt er s.Before commencing an experiment with. the proportional counter, it was
customary tc fill it with a fresh gas mixture. The count er was then left
with the (approximate!.v) correct voltages applied tc the cathode and end
correction tubes for at least half an hour before filming or making other
observations. In the case of the class walled counters used in the early
expqfiments. it was not so essential t-c refill them before use since the
counter action did not deteriorate for some weeks at least- but the normal
metal counter usually showed evidence of deterioration in a period of a
days if it was not refiiledi A few counters deteriorated more rapidly

120 Ag KaKa
80
w 6016% HALF -WIDTH . Ca KaH 40
a 20(a)
IO 20 30 4 0 50O 60PULSE HEIGHT
Fig. 10. Calibration X-rays (a) just after filling;
(b) after 32 days.

ry O; 6
than this for no obvious reason* On th© other hand count d by
the wrdter to examine the beta—rays from long-lived samarium actually im
proved with time. In fig. 10(a) a histogram of the silver IC X—raj made
when the counter was just filled is compared with the b.i.stovrem obtained
\? days later, fig., 10 (b). Tt will be noticed that the line width is
red iced from 16$ to 11$ and that th< K& line is resolved in the second
36, 101 days after filling the silver group was amain examined end even
after this period the line width appeared tc be as narrow as before. The
counter did not receive any special treatment in filling. It is believed
that the presence of d? ~ • -live source inside th- counter during thi 3
period may have had some purify/ing action on the gas. The copper peak
shown in fig. 10(a) is due to the silver X—rays striking the copper window
support.
13, The Purpose of this Research,
As has been mentioned earlier, two of the great advantages of the
proportional counter technique are its abilities (a) tc measure low energies
i 5curatsly and (b) to detect and accurately measure the energies of very
weak radioactivities. Whereas the first property was tho more important
in the earliest studies with this technique (on tritium), the principal,
object of this research was tc exploit the second. Weak radioactivities
which could not otherwise have been examined and which were of particular
interest were therefore investigated. In many cases a weak radioactivity
infers a long half life and this is often associated with low energy radis
tions, since, fore fixed ft value, if t is large, f is small (relatively
speaking) and therefore the maximum energy released tends to be small.
Fop this reason the first property mentioned above was generally also of
considerable value in this work.

•70Is*
The research commenced with, the study of* th Ion lived radioactivity
of nickel, which, because of low activity, had been invest! -k 3 reviously
only by absorption. The particul&r reasons which, made this activity one of
considerable interest are giver, at the beginning of part 2, which fellows.
TheIradioactivity of Hg"'' was undertaken because the integrating properties
of the proportional counter were of great Value in this case fon rsason
lich will be made clear in the introduction tc part 3» The activities ^ 1^1 1 bSof r ..j-1 Eu " had not been reliably investigated when the research
described in this thesis began and know! jdge of th 3 decay sch smes was Very
imperfect Since the 7 rvclvcd repo low end the activities were
rather weak, it appeared that utilisation of the properties of the propor
tional counter would afford, much help in arriving at a clearer understand
ing of the decays-
Tt was avident that the- sensitivity of the counter would be of most
value in the study of the weak natural radioactivities which occur in +1
rogj ;r> of etomic number 1 < 80. In this region a number of rad! o
stiyiti .. o have been renopted in rec nt vears, as has been mentioned earl! sp180 176 187 147 Tjg° g ’, Fd~' , Lu ‘ , Re ‘ Sm~ ‘ ‘, Gd '‘w etc.- Rubidium and potassium were
very early shown to be radioactive (in 1905> by Sir J.J. Thomson). In.
spite of the fact that considerable work, had been carried cut on .these
activities, it is only recently that any accurate results and understanding
of the decay schemes involved have been attained and this, up till the time40 87of this research, in the case of Kb only. When the research on Rb
Was ccmr.onced, the end—point of the beta—spectrum was reported variously as
10 KeV, 130 KeV, 14.4 KeV, 280 KeV, 860 KeV, 1.1 MeV. This uncertainty was
mainly due tc the difficulty of measuring such a weak activity with any
accuracy. -However the source strength available was sufficient to allow

80e
an accurate investigation tc be^made by the proportional counter technique.
Th only techna pile rivalling th 2 c aunter in thi o fi lf1 5 - th sointill at ion
~~ cxr >meter He jve r ■£>-^ accuracy in the low. energy region of the beta—
spectrum the proportional count or i s tc bo rreferred alfh.ou.vh the scintill—
at!an counter is unequalled in its ability tc measure weak ^amma—radiationISOi 1 ove, say, 50 KeV accurately. The data on the radioactivity of Hd was
also felt to be worthy of confirmation and preliminary work was carried out
on this activity, which incidentally did not agr at I"1 with the previous
findings. In the introduction to part 8* which deals with the invest?-•87 1 Rations into the radioactivities of Rb and Rd-■ , there is a fuller discus
sion of the natural radioactive decays, end of the role of the proportional,
and scinti 11 ation counters in unravelling, these decays.
Further work on these weak activities is being carried, out in Glasgow
and the writer is at present investigating the possibilities of a new method
(electron’sensitive emulsions) in this field. There are at least half 0. dozen activities of the nature described which ought tc be investi sited.
The possibility of usino the proportional counter method in the
investigation of possible double t ta decay.shculd hot be overlooked.
The half lif: for such a process d p- r.ds markedlv or whether or not two
neutrinos are emitted. In either case the half lif expected is extremely
long and only the most sensitive methods hold any promise of providing an
answer.

PART ?. RADIOACTIVITY OF HIQVT1Tf
1., Introductory.
When this research wag und.ert3.k0n 0ar 1 v in 19d8. th.- onlv 1 on7 lived isotope of nickel reported was Hi'" . Accordint to several
publicatione (Science 1 °/l6 Rosenfeld, IQd^y Hi'’- was he",ics ed to he a •
positron emitter of upper energy limit 50 KeV and of half life 15 years th decay being prosum ,hly
50 5cHi — +. Cc +. p+
If th< f cts er. corn ct, this was a very interesting source since no
positron emitter of comparable low energy limit- exists. A search of59the nuclear tables shows that the 1 owest energy emit t or, apart frora Hi .
6 5is 2n ^. which has a positron energy iiir.it of 320 KeV and a half 1 ife of
950 days. A loo this is the Ioj st half life issociat 3d with any other59citron emitter. The long half life attributed +0 Hi is tc be ex
pected because of the lew energy limit> and corresronds to an allowed
transition.
If the energy lic.it were correct th* overage energy of the beta-rays
would be of the sxme order os the K—shell energy of the daughter nucleus.
Careful examinations of the spectrum shape might have been expected to give
evidence of, and information about; extra-nuclear effects doe to the atomic
electron shells.
For these reasons it was thought that the source was well worthwhile
investigating and it seemed that the proportional counter technique was
admir'ably suited .to it, because of its low energy and long life, and there**
fore, presumably, its low activity. Tt was hoped that it would he
possible to use the nickel source in the form of nickel carbonyl vapour,
Ni (COLv so that no source thickness difficulties would present themselve

p p
m . 3 1 A 35Thi1 was th technique used in the examination of H , C and S .The first sources were prepared from several grams of metallic
8nickel irradiated for three months at a neutron, flux of 2x10 neutronspwcmper second in the early pile, MGLEBPM7 at A.B.R.E. lar,f,e?.l, Later
10 Zirradiations were carried out in the pile "BfiPO” at fluxes of 10 -10“|oer cm1
neutrons I per second. Iron— and cobalt—free nickel, oxide was used in
the later irradiations. The active nickel was always allowed to stand
for several months to allow short lived a tivities to decay.
2, Chemical .Puri^icati on and. Source Preparation,
I. Plated Sources? Although for counter examination it was desired to
use the nickel as a vapour nickel carbonyl, for preliminary examination
a solid sourcb seemed preferable* The source as received from Harwell
appeared to be quite strongly radioactive and emitted penetrating radia—60tions attributed mainly to 2o * It was evident that careful chemical
purification was necessary* The plated. -•? were prepared by dis
solving the nickel in hot concentrated nitric acid, neutralising and
precipitating the nickel by adding dimethviclvoxime solution which ^re—
cipitates nickel in the presence of its chemically very similar neighbours,
iron and cohalt.. The details of this process will be given later.
The precipitate was filtered, dried, oxidised, rapidly and the residue
dissolved in sulphuric acid. The solution was neutralised by adding
ammonium hydroxide and then used as an electrolyte in the formation of
nickel sources by electroplating. The cathode material was generally
copper foil.
Sources prepared in this way showed, a beta—activity of low energy
accompanied, by a little high energy beta- and gamma- activity which was

A')f ' J ,
ascribed to small traces of radioactive impurities still present.
The chemical curification. technique about to be described completely
eliminated these impurities• Their presence, however, did not mat-^ri ally
affect the results of the preliminary experiments,
11, Hickel Carbonyl Preperati on• The process of preparing nickel
carbonyl was found to be neither easynor straightforward * Hieke1 is
prepared in a very finely—divided metallic state and carbon monoxide gaso Ois passed over it at a temperature of less than 100 C. Tip to 100
increase of temperature increases the rate of reaction. The process
given by Mellor (1932) was first tried, Hickel oxide was reduced to
nickel hy passing a stream of hydrogen over it at a. temperature of be— o otween 300 and 400 . Then carbon monoxide was passed over the nickel
c oat 30" — 50 • However no nickel carbonyl wag formed.
After a considerable amount of effort, a modified form of the pro
cess described by Fernellus (1946) and due to Gilliland and Blanchard
was found to give satisfactory results. The whole chemical procedure
can be considered in two parts (a) the preparation of pure nickel hydro
xide for the manufacture of nickel carbonyl and (b) the preparation of
the carbonyl. Details of these preparations are given for two reasons.
Firstly, work has been published on the radioactivity of nickel which is
not a*t all in accord with experiments carried out, with considerable care,
by the author/ nor with more recent work in the United States (which sub
stantially confirms the work described in this thesis). It is evident
that the chemical purification of the source was not carried oiit sufficient
ly carefully or completely. Secondly, no process of preparing nickel

carbonyl given in the literature which came under the wri ter * s attention
was successful as written. It seems wise, therefore to put the following
information °n record. The quantities used are based on starting with one
gram of nickel.O '
(i )- Hi ssol vs the nickel {°r nickel oxide) in. boh concentrated nitric
acid , 'Evaporate ventlv to dryness, .Add concentrated hydrochloric acid
and ap-ain evaporate to dryness, Repeat with hydro chi ori c aoide This
converts the ni okel ni trate to nickel chloride.
(ii) Precipitation of cobalt by nitroso — p — naphtha!. Dilute $d,th
water and add as carrier 0.05 ST* cobalt, as chloride, per 100 cc solution.
H at to boiling and add hot fresh <fr nitroso - p — naphthol solution at the
rate of 50 cc per 0.^5 git of cobalt. The Method of preparing the of- i tro—
so naphthol solution is given by Mellon and Thomson (193$). Heat
for a. few minutes, stirring well, allow tc stand for two hours and filter.
The precipitate always showed some activity, even when pure cobalt— and
iron. - free nickel oxide was irradiated in the pile, the activity being
weakest in a sample of pure nickel oxide which was irradiated in the
thermal column of the pile.
(iii). Precipitation of nickel by dimethylglyoxime, "Boil off the acetic
acid left after last siege. Dilute the soluti on to 2700*' cc. Add ammoniaQ #solution till just alkaline, heat to 60" and add, while stirring, H O C cc
of a vfo solution of dimethylglyoxime in alcohol. Stand for half an
hour and filter.
(iv). Dry the precipitate in 115° oven and convert to oxide by heating inV
a silica crucible. As the precipitate is somewhat volatile this must be
carried out rapidly and in a well ventilated fume cupboard.
(v). Dissolve the residue in concentrated nitric acid, evaporate gently

HEATED COPPER WIRETO FAN
FUME HOOD
WATER COOLING COILS
GLASS WOOL HEATER WINDINGS NICKEL THERMOMETER
TESTCOCK HYDROGEN
TO VAR I ACDEWAR FLASKS "
m e r c u r / GAUGENICKEL CARBONYL
PHOSPHORUSPENTOXIDE
a u L iu l u , IN ACETONE
CALCIUM CHLORIDE
-CARBONMONOXIDE
"-GASOM ETER
J Fig.HI. Apparatus used in the preparation of nickel
carbonyl.

and dissolve in. water. Precipitate nickel as hydroxide by adding
ammonium hydroxide. This precipitate dissolves in excess ammonia but
can be re-precipitated by boiling. Filter, Precipitation of nickel
hy the obvious method of adding sodium or potassium hydroxide was found
to give b form of nickel hydroxide from which it was impossible to pre
pare nickel carbonyl. Pry the hydroxide precipitate very gently, at a
temperature not exceeding 100 C.
(vi). The hydroxide is now mixed with if of its weight of mercuric
oxide. This acts as a catalyst in the subsequent process.
The remaining part of the process was carried out using the apparatus
shown in .fig. 11. Hydrogen from a cylinder was passed through a tube
containing red-hot copper wire to remove all traces of oxygen which appear
to act as a poison. The ends of the tube were water-cooled. The hydro
gen was dried hy passing over calcium chloride followed hy phosphorus
pentoxide, It was then passed over the nickel hydroxide (mixed with
mercuric oxide) in a specially constructed Pyrex combustion tube at a0temperature not exceeding 250 C, The tube was heated hy a Nichrome
resistance wire winding, the current through which was controlled by a
MVariacM transformer. When the hydroxide was completely reduced to
nickel (indicated by the cessation of production of water) the tube was
allowed to cool with hydrogen still passing over it. The. nickel was now
very finely divided indeed. (On opening the tube to the atomsphere after
a week's run, the remaining nickel would catch fire spontaneously).
Carbon monoxide, prepared, by adding concentrated sulphuric acid to
sodium formate, was contained in a gasometer of 50 litres capacity. The
gas, dried hy calcium chloride and phosphoirus pentoxide, was passed very

slowly over the active nickel forming nickel carbonyl« The carbonyl,owhich boils at 43 C, at atmospheric pressure and has a vapour pressure
o ^of 300 mm of mercury at 18 C. passed as vapour into a series of two
source bottles which were immersed ir- a solid carbon dinxide—acetonemixture, or liquid oxygen, contained in Dewar flosks , It was possible
to test whether or not the reaction was proceeding by examining the colour
of the flame with which the carbon monoxide burned. In the presence of
even slight traces of nickel carbonyl, the flame was bright- yell ow instead
of the faint blue flame of carbon monoxide burning alone. This test had
to be carried out under a well ventilated hood. Quite apart from the
radioactivity of the nickel, nickel carbonyl is a very'poisonous gas.
This process was carried on for about a week, the temperature never_ Obeing allowed to exceed 80 C, Not only does the rate of decomposition
of the carbonyl increase if this temperature is exceeded hut also the
nickel appears to become less active. After a period of about a week,
the reaction slowed down so much that the nickel had to be reactivated.
However enough carbonyl for the experiments on hand was produced in that
time. Nickel carbonyl does not keep well. It had always to be kept
surrounded by a solid carbon dioxide-acetone mixture.
Unfortunately it was found that nickel carbonyl vapour had a poison
ing effect on a proportional counter even in very small amounts so that,
after all, solid sources had to be used, Nevertheless, this process had
two great advantages, (a) It is an excellent method of purifying nickel,
since only nickel, of all metals, forms a volatile carbonyl. Thus, even
if any impurity did remain in the active nickel, only nickel would have
been transferred from the combustion tube to the source bottle, (b). It

ASBESTOS PAPERHEATER WINDINGSALU M IN IU M FOIL
TH E R M O M ETER
NICKEL CARBONYL VACUUM GAUGE
Fig. 12. Apparatus used in depositing nickel from nickel carbonyl,

8^
is possible to form extremely thin and perfectly uniform sources over
large areas "by decomposing the carbonyl on a hot sort*ace. The uniformity
of source deposition is equalled only "by evaporation techniques (i.e.
evaporation of solids in vacuum.) The method of depositing the nickel
i s described in the next section.
III. Preparation of Nickel Sources from okel Carbonyl.
The apparatus employed is shown in fig. 12. A bottle containing
nickel carbonyl was attached to a large Pyrex tube on the inside wall
of which was rol 1 ed. a sheet of aluminium of thickness one or two thousandths
of an inch, The foil was bested by passing a current from a "Variac"
through an ext erne "I coil of "Mi chrome wi re wound on asbestos paper wraoned
round the tube. The whole apparatus was evacuated as thoroughly asnpossible with a Hy vac11 pump and the temperature raised to 200 C* The
pumpinv tube stop-cock was then cl osed and the carbonyl, allowed to warm
ur to room temrenature, Then the ve.rour was allowed to enter the evacuat
ed tube. As soon, es it came in contact with the hot aluminium surface
it decomposed and formed a black deposit on the fell. In early experiments
the apparatus was left at this stage for a considerable time. The current |
wa then ■ itched off and the bottle immersed in liquid air to trap all
the carbonyl vapour 'remaining in the apparatus. In the last experiment
(a search for X-rays emitted, by the source) the process was repeated
several times, the large tube being evacuated each time between cooling
a n d he at i n ~~ of the source b o 111 e *
3. Absorption Experiment.
Preliminary experiments on the deflection by a magnetic field of
the particles entering a Geiger counter seemed to indicate that the
particles were negative instead of positive. • This seemed to contradict

600SOURCE
500FO IL
400
2 300
200
O IOO
20m'gm/cm2 OF ALUMINIUM
Fig, 13. Absorption curve of the beta-particles emitted by
radioactive nickel

pp
the inf o mation published in th© lit 3r atur©« In tkl s ex'cerim t the
s< uroe was mounted inside the same glass ©nvel o] s.s the Geivgr counter
in order to Bliminate window losses. If this had not "b06n don© onecould rot hsv© stir© that the hi gher energy parti • le? wbl ch onlrr
would hav© "boon transmitted through the window, wore not duo to the
resence (in ill -.';u entity) of another activity in the source. As it
was necessary to "bo sure that we were investigating the same radiation5Qos in at attributed to Nit*’ , it was thought wise to carry out on absorption
experiment to determine the energy of the beta—rays approximately* The
results of two experiments are shown "by circles (first experiment) and
crosses (second experiment) in fig. 13. An inset figure shows the
nature of the Geiger counter used to measure the counting rate of the
particles. The source, which consisted of radio-nickel plated on to a
copper foil was attached to a brass support which in turn was rigidly
fixed +0 a rlux in the end of the counter. This plum could be removed
erd as absorbing foil placed over the sourc, which was situated as near
the end of the counting read.on as possible to avoid absorption in the
counter gas. This arrangemaut avoided the window difficulties Which
•’rise when the exrcrimsnt is carried out in the usual wav. The plug
was replaced very accurately each time another absorbing foil was added
and, on re-filling, the gas mixture was made as nearly identical to the
original as possible. A good end-point was obtained in this'manner at2IS 5 mgm/cnS of aluminium. Allowing for the gas between the source and
the counting volume, this corresponds to an energy of *60 KeV, (Glendenin
1948). This was in reasonable agreement with the figure of 50 KeV quoted earlier for the long life activity of nickel and is in excellent agreement
with the end—point of 63 KeV determined by the proportional counter

ny „
method (to "he described later). This vavs confidence that the activitv
investigated by previous workers and the present activity were identical*
It was then considered necessary to determine the charge carried by
the particles more definitely, as this was of fundamental importance.
■ * Iho Charge of the Botg—Ravs •
The more obvious methods of determining the charge of the particles
could not be employed since the counting rates of the sources available
were far too sa.mil. The negative beta—spectrometer is out of the question
even now with the stronger sources now available (due to higher neutron
flux densities in the pile). The use of an electroscone or electrometer
was si so out of the question as a simple calculation will show* Taking
the capacity of an electroscope of the type available as, say, ltyy»F and
the change in voltage reasonably easily detectable as 10 volts, then a0 _10charge of 10x10x10 ~ = 10 coulombs would be necessary. Since the
-19 8charge on an electron is 1,6x10 " coulombs, about 6x10 electronic$
charges would be required, or 3x10' decays if use was made of the charge
^eft on the nucleus. As the strongest sources then available gave about
10,000 counts/minute (over large areas), 3x10 ~ minutes, or over 8 hours,
would be necessary to observe the required change in voltage - during which
time the leakage losses would have been much larger,
Although the magnetic spectrometer was out of the question it was
decided to use the sign discrimination properties of a magnetic field in
conjunction with the integrating properties of a photographic plate.
In the arrangement employed, the condition of high resolving power,
normally important in a spectrometer, was relaxed. By having no energy
discrimination a high solid angle was obtainable (probable about l/6th.W ‘w* \ Jm v I
of 2Tt) and because of this, and the fact that electrons impinged on the

AC TIV E WIRE
-RUBBERBUNGP O LE PIEC
EVACUATED CHAMBERPHOTOGRAPHIC
PLATE
(d
W IR E ^ 'P L A T EA ,
(b)
I
A
Fig. 14. Experiment to determine the charge of the beta-particles.

plate over a fairly smal1 area - the experiment was possible. The
arrangement is shown in fig*14« A platinum wire- on which radi oactive
nich.el was electrolytic&l.Iy deposited was placed on a photographic plate
which was inserted into a tuhe whioh conId be evacuated, Tho&ubs was
painted black and was covered with, black tape to make it 1ight—tivht»
The arrangement was j.nserted in a permanent magnetic field of. about
25OO gauss, with the wire parallel to the lines of force. The apparatus
was evacuated and put into a light—tight boy; where it remained for 30 hours
How 50 KeV electrons would have a radius of curvature of a little less than 0,5 cm in such a field, Fxg.14 (b) shows the effect of the field
on positive and negative electrons. If positive thev would be deflected
to the left; if negative, to the ri ght • The blackening on the plate
showed, that the particles were for the most part negative and its extent
corresponded rouvhlv to that expected for *10 KeV electrons,
b. The Search for Annihilation Radiation,
To confirm this finding, i.e. that the particles were negative a
search for annihi 1 ation radiation was made since -snob radiation would
certainly be present if there was any appreciable positron activity,
A special (ledger counter with a 1 end cathode (to increase the efficiency of hard gamma.—ray detection) was constructed, 0,015" lead sheet,
thoroughly cleaned with alcohol, was used for the cathode. A foil giving
5^,000 counts per minute of beta-particles, prepared by deposition from
nickel carbonyl w§s wrapped round the outside of the'counter. The
length of foil, parallel to the axis of the counter, was4^'"» The
counting rate of the counter without the foil (i„s, the background
counting rate of the counter) was
153.2 — R.l counts per minute.

With the foil wrapped round it the countin# rate wag
148 *-8 ± 2.1 count a pen minute,
jf* w© a,©sum© the particles to he all positive, two q_u antum annihilation
of the particles would h w e pi van rise to an additi onal S00 counts ner
minute. assuming the solid angle to he approximately 2rt sud. the efficiency
of dete/fetion of the counter for such radiations to he The result
implies that less than of the uartini es could in fact he nositrons,
Nxamination of a nuclear chart shows that the only likely mode of . S9 .decay of Hi"'' is "by positron emission or hy electron capture to form
RQCo'' „ 11 o positrons were detected and it was evident that verv few K
X-rays of cohalt or Auger electrons could ho present experiments at
this stage failing to reveal such radiations. Therefore the amount ofactivity. RQ/ .Ni Yj resent in th© source must have "been very small (I t may h© well +'
state at this point, that a. vsrv careful search carried out more than a
year later did reveal the uresenoe of the K .X—ravs of cohalt. thus indicat—. hQm g the existance of Ni'' , However the intensity was found to he onlv
ahout 1 part in 1200 of the negative particle.intensitv)*
The ouestinn then arose as to which isotope of nickel the negative
electron activitv was to he ascribed, ThR existence of a 2,6 hour beta—
act.ivitv h.ad. been known for some time and work bv Swartout. et al , (1946)6Rand Conn et a"!. (194-6) ird.ictoied th^t this activitv belonged to Ni
^ 3This left Ni as the only possible isotope resnonsihle for the soft
beta—activity under investigation,, This could be formed by an (n.^ )6 2reaction on. the relatively rare (3*?^) isotope.. Ni # and the resulting
63nucleus Ni ' would decav h-"- beta—emission thus> _> « «u
Ni/ ' — * Cuk1} +• (3~It is evident that the Interesting soft positron activity ascribed to

. I.
Fig. 15* Apparatus to detect coincidences between beta-•' i . ■ 1 i s i • i } . •. d .1 ! ; i •
particles and soft electromagnetic radiations or electrons.

O'-'
r 5° 6 3Ni is in fact the negatron activity of !Ti . It was considered well
worth while to investigate the spectrum of this activity which, hod
previously been measured only by absorption. "Before discussing this
work, ■ n cp riment which ws 3 carried out to detect the presence of coincidences between the beta—hartisles and X^r stv iisma—ravs or other
* ^ / -- W
electrons; will be described,
^• Coincidence Experiment
The apparatus employed is shown in fig'15' Two Geiger counters
were enclosed co—axially in the same envelope, The cathode of the left
hand counter consisted of g, ©opper cylinder on the inside of which
electrolytically deposited e layer of radioactive niche1 The other
cathode, also of copper, foil, was inactive« in electromagnet was posit”"
ion d go that a deflecting field could be applisd between the counters
if desired.
Tn the first experiment the sincle counting rate of the non-active
cathode counter was measured without and then with the field on- The
counting rate dropped considerably su£rp,estinfi" that rarticles which foriherl
came from the active* cathode to the non—active counter were now being
cut out by the magnetic field* The results ore as follows*—
Field off 2 119.2 ± 3.1 counts per minute.
Field on * 7^.9 — 2,6 counts r>er minute.
Tf the above explanation is correct this 1 caves AO,3 t 4*1 counts per
minute due to electrons coming from the active to the non— active counter.
To confirm this view; the coincidence counting rate between the two
counters was then measured. first"1 y; with the field, off- and then with
the field on- This gave--

I -L
Fig, 16. Photograph of the proportional counter used in the63 59investigation of Ni and Ni
TC HEAD
Fig. 17* Drawing of the proportional counter shown in fig,16.

Field of*!? * 38.' 2*2 coincidences r>er mi nute,
Field on ? 2*3 — 0* coincidences ner minute,
Thus the coincidence counting rate fell by 3£ ♦ 3 ~ 2t 3 ©otmts aer minute
whi h is in agreement with "the drop in counting rate of* the non—a,ctive
counter, The coincidence counting rote nbserved.. therefore, is not
due to true coincidences between ‘beta—revs and electronr -"netic or other
radiations* Indeed* since the activity of* the foil was *y?.8.000 countsper minute, the low coincidence counting? rate with, the field, on shows
that a negligable number of soft gamma— or X~ are in in id nee£3with the bota-rays emitted by i-i . It i5 unlikely that the coincidence
rate observe with the field off is due to true beta—e coincidences, €• since l r - 'r ; x coincidence© ar " >1 s ; 1 . tt ig almost ji ’ ■ j ■■ ly
t •• single beta-rarticles making a count in each counter in course of
flight*«w>
Sine the experiment ' ,:1 1: try fc leteci • ihi 1 atio] radi ati on
g we] 7 a s other exneri m 3nts to d et ant s,annr s --r•• i" ■ ■ sh - ■ ' — • t th 11 rd* *- - V j
■ roma- rty intensity of the source was negligible and since the experiment
iu t described shows that very few coincidences exist between slectrons
■■1 soft* 1fctromagnetic radiations, we may conclude that the spectrum is simple* . The unsuccessful search for X-rays, mentioned earlier, con—
f i rra3 this view*2 . The Bet a—Spectrum of ITif a
. 63It was now decided to investigate the srectrum of Hi with the
aid of the proportional counter, A photejro.bh _'f th.e ccuntr ••• -~A is
shown in fig.16 while a drawing showing its construction is shown in
fig 17. The tube was lOi?** in length and 23M in diameter. The active

length of the counter was about 7!? and ti wire was of 4 mil i J ■ n#Th•? -ttrr;gt7 tr ' bo^-rve the spectrum were made using nickel in the
f< rm of ni 3k 3 carbc n 3 v ■ AiT, The ni ckel c::e»?l?r"!rl "•■• j transferred
from the source bottles of fig# 11 to a 3 arger container of • • i ty 3? 5 cc# The vapour pressure of the csrbonvi vapour was 7#7 cm of mercury(3atur«tion vapour pressure at room temperature is about 28# 5 cm)* A
small lh cc container was then filled, with vapour from the first con
tainer and this was shared with the proportional counter which bed a
volume of 45® cc and bs round counting rate of <v35® per minute#
Th-■ -v r •• ■uh.,_ nickel, carbonyl in the countenwas about 2*5 mm ofmercurv, Armor end. methane were added in the usual proportions but the
counter did nut operate as counter with this amount of nickel carbonyl,Th r was nc pl< teau, no ‘"roper pulses visible on the oscilloscope screen,
and. the counting rate' as observed with a sealer was very variable but of
the order of the background value« By a sharing technioue. the pressure
of the carbonyl in the counter was reduced to about one tenihp i#e# to
«n.0c mm of mercurv. The counter behaviour but little butter than
previously The carbonyl precerr'"' ° f<- a fact"-r •~f t r f
to *0.025 mm# Pulses were now apparent but the counting rate was too
1 o # v 280 yer minute. This is actually less than the normal background
rate, showing clearly that the carbonyl vapour was acting as a -poisoning
agent, Also when Y X-rays of silver and copper- and the X—radiations
emitted, by BaD and Zn sources were allowed to enter the counter. r*o
homogeneous groups of pulses could be observed. The pressure of carbonyl
vapour was again reduced by a factor of ten, giving a pressure of*0.*">025 mm
of mercury. The counting rate now rose to the background value but still

- •' j*jj) 1 • - •' jroupin * wag y ’• - 10 • •
wer, f*-i '• 3jj t - the counter. Xt is Bxtremely sur] ri !ing th t thr, t f fnet
f tile VapOUr ehon'le ho ' • • r-1-. d et hgi "> r-> • TOO ••••••■ t
The counter now punr'ed. for about f ive miro'tes and fi1 led with
the usual o-Mfj mixture> hut with, no nickel cs.rtnryi r It now operatedperfectly and ■ --- k -• • • • • i- • h - g • vr -r • ■ ■ - •• a , -„r + ,-r This
sbowed that the abnormal behaviour of the counter was duo to the oarbonvl
vapour and further that the amount of vapour retained or dissoci ated by the
wall was negligihle®.Another experiment wac? carried out to, determine the snecific activity
of the source* The 1R ec "bottle was filled with nickel carbonyl vanour
to a pressure of 6,7 mrn of mercury. This was deposited on an aluminium
foil with the gp-naratus of fig, 1?. This gave a. counting rate in excess
of background of 3 800 counts p@r minute with a solid angle was about 2TC *Tf the counter contained carborvl. to a pressure of 0.002^ tin? of mercuryfthe lowest oressure used about &.1 counts per minute would he expected*This countinp* rate is much too lew to he of a.nv use and.• even at the very
1ri" pressure corresponding to this counting rate we have seen that the
counter did not operate satisfactorily. Furthermore it was obvious that
the hichfcr pile neutron fluxes expected when- the larger pile came into• 63or oration still would not yield a high enoi.igh specific activity of Fi
to malee the use of a. vapour source possible» It was evident that the
vanour must centure electrons very stronglv indeed.
For comparison, an aluminium—glass counter of the type shown in fig.1 was filled with gas mixtures which contained various pressures of the
halogens which are well known to have a poisoning effect. Both iodine
nnd bromine vapours were tried, A change of partial pressure of iodine

9 6 o
from 0.n03 mm to 0*2 rr,m of* piPTcn.rv was "found to have* no appreciableeffect on the behavi our of the counter, However there was some reason
to believe that the rate of diffusion of th© iodine into the counter
fron the vessel 3r: whi ch it was ooc twined w®o ■"•■ttho*r cl. nr end the w r~-
pei*iment was rejc, ?»ted u^ir." bromine +.?vjstepr to ensure that the
rnrtial pressures reported were actual !v attained . Wh;r. the counter
filled with th© usual gas mixture plus bromine to a partial pressure
of 31 *5 nnn, no homogeneous. group? ng of pul sec was observed when the
counter was irradiated with mcnoerergetic X-rays, By the sharing tech—
niori.e/ the pressure of the bromine was reduced to 3 ibp« It still did
not operate as a nroportional counter, The pressure was further reduced
to 0.3 nun* > Th-sre was now slight evidence of a mono energetic group of
pulses and the behaviour ,,ras considerably better than with nickel carbonyl.
at 0.002b mm ores sure. On red.ucin.fi’ the pressure to 0.03 nwn the groupingwas much better though not perfect. However it was evident that nickel
mor«carbonyl had. a. much\ha.rmfu 1 effect on the operation o f the counter than
bad bromine. The poisoning effect of the carbonyl is presumed to be duo
to the hich carture cross—section o f the .-carbonyl molecule for electrons
1 n which it resembles oxygen, water the halogens and. other substances in.
effect though by no means in degree. Since Professor H.S.W, Massey has
done much work in this field, his opinion was sought on the above exp!an—
ation of the phenomenon. He agreed that nickel carbonyl was very likely
to have a high electron affinity but could not say so definitely.
It was now decided to investigate the spectrum with nickel deposited
on an aluminium, foil, using the apparatus shown in fig, 1.2*
.As has been stated, this .gave a thin, finely divided, uniform and tenacious
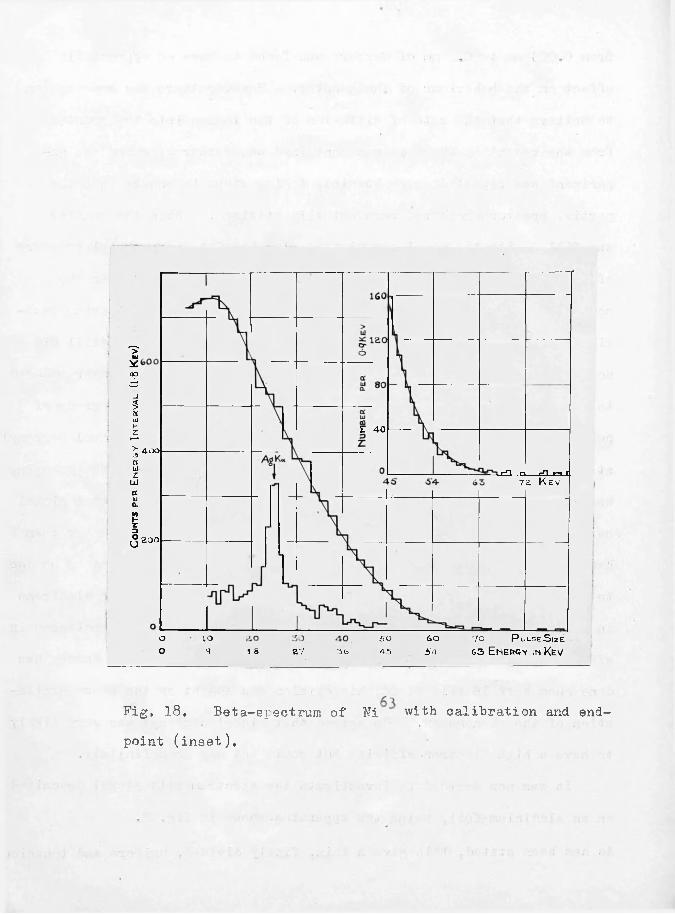
Co
un
ts
per
En
ergy
Interval (1-8
Ke
v)
Z 4 0
400
r - n n c H n j
7Z K e v
200
P ulse S ize60lO 50 70oo 1 18 2 7 3b 4 . 5 5 4 6 3 E N E R G Y .N K e V
Fig, 18, Beta-spectrum of Ni with calibration and endpoint (inset).

07, I «
film of metallic nickel• The score©- which, covered on area of about
6" -r 3«, had activity of c»50« 000 disintegr&ti ons per mi nut ©, Thisp
correspendcd to a l ro ' j ■ s of •• out n„ *>7 mgm/cm , The foil was
inserted iiftc th< centre of the proportional tube with d ts shorter 7 ©ngth parallel to the wire* The counter was filled with 15 cm of methane and
argon to a total, pressure of two atmospheres, The K X—radiations of
silver were used for calibration (K«( = 22,07 KeV for silver) and th©
pul sos ware record ad on a. moving photographic f* lm in the usual way.
The energy spectrum obtained is shown in fig,18, The calibration histo
gram is underneath the spectrum and the inset figure gives the endpoint of
the spectrum with better statistics, A good end point was'obtained and
was estimated to beDm ax ~ ^3 — 2 KeV,
The histogram of the spectrum is composite,. ' The low energy region of
the spectrum was examined, at higher gain and is fitted to the main spectrum
The maximum intensity occurs about 10 KeV, A Fermi plot of the spectrum
? s diown in fig,19, N is the intensity per energy interval p the momentum
W th© total energy (including rest energy) and G(W,Z) the correction factor
for the Coulomb field, 0 is given by
G(W,Z) - const, x p^s £,/(e ^-l)o p iwhere s = (l-«(“Z )k;, c( = 1/3-37 and £ = 2Tl z/137. The plot is straight
over most of its length though it drops at lower energies (below 1.5 KeV), This might suggest a first forbidden spectrum but in view of the source
support thickness this conclusion is very tentative. With the energy
obtained here and the half life of 61 years obtained by the author (as will be described later) a log ft value of 6eA0 is obtained. In a paper

PV£W
Gr\
20E
6050 7010 40E n e R G Y (W -rrioC51) in K e v
Fig* 19* Fermi p].ot of spectrum.

of Feenberg and Trigg (1-950 )y the remark is made in reference to fig,10i
e histogram of 1 og ft +hat the peak at l eg ft _ f-, ° is "predorri naht~
ly first forbidden". The value of log ft quoted here indicates that the
spectrum could therefore be either first forbidden or allowed with the
evidence slightly in favour of the former classification*
8, Possible Sources of Distortion of the Spectrum Shape,
It might be well to mention the possible sources of distortion in the
spectrum shape obtained. The one usually of most importance, "end effect",
does not concern us here- since the source was confined to the central region
of the counter. The "walT effect", investigated in the introduction to the
thesisj was shown there to have a very small effect in this case* A more
serious effect might have been caused by the source support which was of
aluminium. This metal was chosen in view of the smaller amount of electron
reflection caused b r a low Z material. For the* energies involved it is
likely that not more than of the particles going into the support will
be reflected. At any rate this is more likely to give, rise to an increase
in the number of low energy particle whereas a decrease was observed. The
source thickness was very small and should not have affected the spectrum
shape above, say- 10 KeV, It would cause a loss in the number of low
energy particles. This work was published in the Philosophical Magazine
(Wi Ison and Cur r an, 1949 } •>
9. The Radioactivity of F i ' ,About a year after the above experiments were completed; it was
decided to carry out a very careful search for soft electromagnetic
radiations. These might arise from complexity of the F i ^ spectrum- or
from F-capto.je in hi, # Hi55 must certainly be present in a source
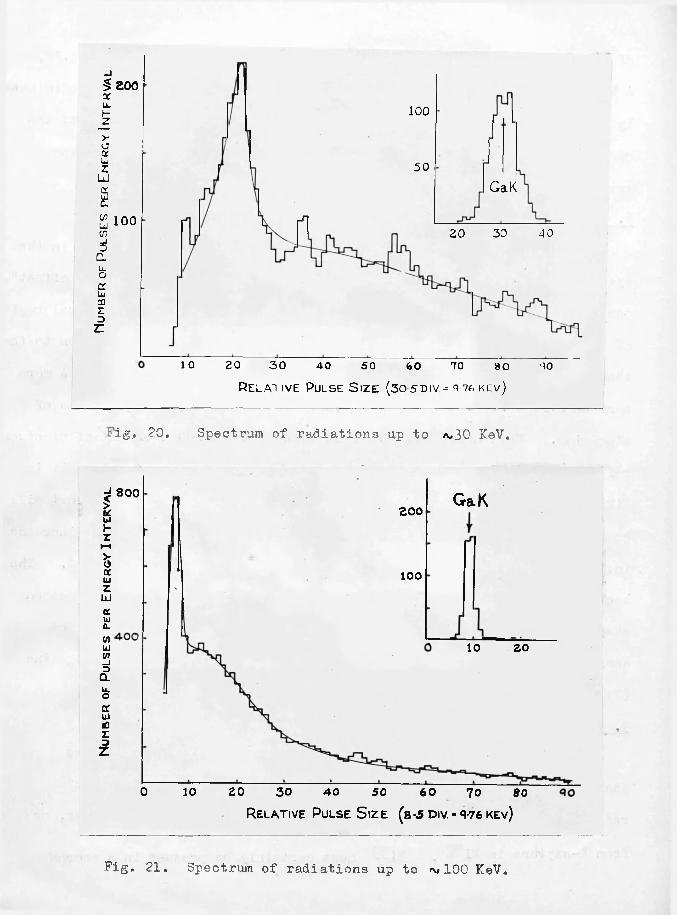
Nu
mb
er
of P
uls
es
per
Ene
rg-y
I
nt
er
va
l
- N
um
be
r
of
Pu
lse
s
per
En
er
gy
Int
er
va
l 200100
50GaK
100 r-n3020 40
30201 0 4-0 50 70eo 80 70R e l a t i v e P u l s e S i z e (3o s d i v = q 76 k e v )
ig, 20. Spectrum of radiations up to /v30 KeV.
800 GaK200
100
10 20
0 20 3010 50 6040 70 80R elative P u l s e S ize (s %5 div.- q-76 k e v)
Fig, 21, Spectrum of radiations up to rv, 100 KeV,

SRirradiated by glow neutrons, since there 3x1sts a stable isotope, Ni ,
j »h ig p ssent in ordinar, i 3 cke3 t tl 3 extent of *■>7,67- end whichhas a reasonably high ct*c eetion for therm? or.’tro1 earture. io crdiz
•, n - . 1 gtory (1948^1949) th b sorntior cross—^ection of niche? forcP.'i . 3 x. ' fcron is betw en 4*2 an3 %2 bi r] nd ’ . mainly li to Ni
. RQ■■ g r - o - - jntioned before* 3Si woul.d "bo '"w ’*-1 ■■ t a ~ -r r*, — ~
b°gs3 on or by TC—co vtrro or both t give Go. ' „ The search for annihil
ation radiation cave a negative result, sc it was more likely to decay by1—> ' '—■ J 6> ZJ
K-canture. However the low-intensit 2 ' X radi ition found rreviou 3lylife r
showed that the half I of Ni , if it existed, must be very long indeed*.63The counter used in the examination of Hi was also used for this
rim =>nt. A source giving rt counting rat^ int^ 2TX . of 34 nr)r' per
minute was inserted and covered with an aluminuim foil of thickness 1 mil*^3This was sufficient to. stop all the beta-radiations of Ni . The counter
Was filled to n total, pressure of two atmospheres. With the absorber
foil the countin • rete was reduced to the background rate of the counter,
"d thin ~t•••> + iett cal f?uctuations, but nevertheless it was thought dooirabl
to examine the pulse distribution carefully* The results for two energy
ranges are shown in figs* 20 and ?!a Pig.20 was taken at high gain (extending to *30 KeV) and fig* 21 at 1ow gain (to /v1 0^ KcV)* A peek is
olearly seen in both histograms, superposed on the spectrum of the counter71 71background. The K—capture radiation of Ge • (X—rays of Ga ? was used for
\ 71calibration in each case (inset figures)* The Ga X—rays passed through Perspex of such a thickness that the and the Ka intensities were
approximately equal• • The and the Kp peaks are shown slightly resolved
in fig. 20. Tailing the mean energy of these radiations as 9 NeV, the

COUNTS PER ENERGY
INTERVAL
120
IOO
80
60
40
20
20 KEV
Fig, 22, Spectrum of counter background.

energy corresponding to thi ak observed on th ■ -•+ r>.~. -■ - ^. o + o# v--vp
Th,© Kw X-ray energy of cobalt is 6,93 KeV* Because of the nearly perfect
agreement between these values, it is almost certain that the radio' ! .r 35C hOobserved are due to Fi*'*' decaying by Th-capture to Oo. " , and emitting
the X—rays of cobalt.
To show that the peak was due to the radioactive nickel, the source
■ id from the counter and rip3aced by a thicknes . of aluminium
equivalent to the source mount and absorbing foil. This ^ave the true
background spectrum of the counter which was analysed and is shown in fig,2 The spectrum shows no evidence whatsoever of a peak at the energv correspon
ing to the peak observed in the previous case,
The radiation is of verv Tow intsnsitv indeed, Bv countinv the
number of pulses under the peak of fig,20, and subtracting the background;
the counting rate was estimated to be ^22 per minute. Allowing for the
efficiency of the counter and "its solid angle of 2Ti , this corresponds to
49 disintegrations per minute in a source weighing approximately 17,3 mgm. This very low activity explains why it has escaped detection hitherto; -
The proportional.counter technique is possibly unique in its ability to
reveal and. give accurately the energy of a radiation of such low intensity
and energy. The half life was estimated at a 1ater date (see later) to be5 / r r - N7*5 — 10 years. This work was published by the author (Wilson, 195*3/*
About this time Thomas and Kurbatov (1950) described a search which
they had made for photons emitted by long lived nickel isotopes by the
absorption method and, by cloud chamber, for the continuous spectrum of
Hi" They found evidence of the former but not of the latter activity.
However the experiments just described, showed that a relatively intense

.63bat a—emission of Hi is accompanied by a weak* K—capture emission of . hQHi*"' . The ratio of the activities is about 1200:1# it is evident
that, if they detected photons from nickel, they should also have observed6 3the relatively much stronger activity of Hi J. It seems very probable
that the radiations which they detected were spurious and due to impurities
in the source. The work done in Glasgow showed that very careful chemical
purification of the source is required and the results of Thomas and
Kurbatov fully justify the preparation of nickel carbonyl as an intermediate
step in spite of the difficulty involved and thus, although the attempt to
use the carbonyl vapour itself as a source was unsuccessful, its manufact
ure proved well worth while*
10 Search for otheT* FIectromagnstic Radiations.
The values obtained by Thomas and Kurbatov by absorption for the
energies of the photons observed were as foil o w s * 7*5 — 1 KeV, Ip — 2 KeV
38 — 3 KeV and 8Qi 5 KeV in the intensity ratios 6:1:1:1 and possibly oneof greater than 50n KeV, As it was possible, though not likely, that
radiations corresponding to these values might exist in our source, hut
of such an intensity that they could not have been observed in the spectra
obtained, it was decided to use a much stronger source. Accordingly a
source was prepared from nickel irradiated at a much higher neutron flux 10 ^density, /vlO neutrons per cm’ per second. Also the technique of deposit
ing the nickel on the foil was modified as described in section 2 so that a much larger mass was obtained. With this foil in the counter, the beta-
counting rate was too high to measure with the scalers in use. It was
believed to be in excess of 500,000 per minute and had an end-point corres
ponding to the H i 63 Spe<>trum. The Source was covered with an absorber to

INTENS
ITY
INTENS
ITY
INTENSITY
200 50
100
5 0IOO
3 0 KEV20(a)
30 <EV20IOO
(b) 5 0'OO ~ £0 pea,k
at 3 o o o4020
10080604020
IOO
50Al K
KEV
Fig, 23, Histograms of radiations of long lived nickel.

cut out the "bet a—rays and a mono energetic groupinp* of pulses cowresnond in°"
to the X—rays of coba.lt was observed. The ratio of the intensities of
the present and former sources was measured to be 21*1, The radiations
were analysed, using the K X-rays of copper fur calibration, and the resuits
are shown in fig, 23* Graph (? ) covers the region 0*~3G KeV* vraph (b),
0—100 KeV and graph (c). under P> KeV, A very strong peak due to K—capture
in nickel (X—rays of cobalt) was observed as before and the energv of this
neak i O i Va^T } ives i r> -^r>fon,t *> '••reenent vr4 +1- +> • KY-rev er @r— Of■*' ® - tr> v * ^ *■ Q | |
cobalt, The only other radiation observed was taken to be the X X—rays
of* pbimi ■**ium evented bv the cobelt X—ravs (crsnh (o \ ho evidence of , j " t / v CP J» \ / /
the camna—rays. of Thorn as and Kurbatov could be detected. Allowing for the
efficiency of the counter, the IS KeV and 3$ KeV gamma—rays could have b^en
detected if their intensities had been more than one—twentieth and one-*enth.
of the intensity of tlie cobalt X—rays - respectively. The 80 KeV radiationwould have been detected, only if its intensity was of the same order as
that of the X—rays,
Tbs results (Wilson, 1951 ) confirm the existence of the K—capture
radiation of ili but indicate strongly that the gamma,—rays detected, by
Thomas and Kurbatov arise from the oresen.ee of some contaminant in their*source,
11. The Half Lives of TTi^ and Ni.nj.
The half life of a radio—isotope prepared by neutron capture can be
determined by the so-called "yield method", if one knows the mean neutron
flux density which produced' the isotope, F say, the isotopic abundance, v,
the neutron capture croso-section of the parent nuclide. 0*“ , the time of
irradiation. t and the snecific activity of the source produced, Tf the' * 7 7 **•

103.
source is long 1 ~ ' d (half 1 .ife much greater than the time of irradiation) *0 may vnpite
V °*«?3 ^
wh ere is the half life, A H is the number of disintegrations per second
in a massj M gm say^ o f source and Ho is the number of atoms of the radio
active isotope in the source which is viver hv
No = 8a02 x 10 x FMITcr t/A
"’bere T'T''? F K,<rand t are defined, as above and A is the mass number of
the parent nuclide, Xti the c«se of Ni , Hose and Story (194°"’1949 /
gave the thermal neutron cross—section of nickel as A 12—4• 8 barns and.58 /stated that this absorption is due mainly to Hi , Later workvSenftle
end Leavitt 1Q80, Pomerance iQ/lo) gave values of A»? and A. 17 i 10§£.62 / o \respectively* In the- case of Ni - Segre (194° ) Quoted a value of 0,51
barns. on the bp.sio however, of a. wrong mass assignment of the 6 hr,activity of nickel«. More recent work (Senftie and Leavitt 195n? Pomerance
I.949) gave 15 and 14.8± 10^ re spectively. Using these values- the half
lives were calculated to he (Wilson-. 1251 ) ’bQ bNi"“ • 7. b t 10 vr.— *■ i * —* - v
Ni ? 61 vr,
These values"disagreed somewhat with the half lives quoted by Seaborg andb bQ .63Perlman ( I.Q4® }> who gave 5 — 1 0" yr for Ni and 300 yr for Ni , Later
work by Friedlander (194?) and Bros! and Oriess (1949)j in unpublishedbo b breports, give the half life nf Ni"' a-s P—g^lO" yr and 1, |>v.l0" yr respective—
. 63Ly while Bros! and Oriess give 8b yr for the half life of Ni
The estimation of the activity was made as follows*- About 3 mgmof verv nure radioactive nickel was weighed accurately, converted to nitrate

cl 5 posited svenly on a sheet ©f 002” alumi ihm. w 0r< -> - 6cm x 8 onj by the insulin technique* described in the introducti<The foil was inserted ifttc th© centre of the pro]— rtionai counter end
th ' counting rat© obtained at fair! r high gain T,ri''' counting ■cate, less
background- when corrected for solid angle and reflection at the source
mount, crave AN, The value of F was obtained from A,T0.‘R.E--Harweli end.v W ▼ ~ ~ /
since it was known, the half life could be calculated.
Since this work was published . there smeared a rarer by Brosi-
Bari-ow'ski Or y -1 Griess (1951) on the Ten"’ 1 i Tred activities of ni ckel#
Their f indinars confirm in the main- the work carried out in G las vow., 2Th y used, for the analysis the beta—rays, a- lO.iAgm/cm source on a
platinum foil* Tn smite of the hi°*h Z source mount used, a, linear Hcrmi
plot was obtained which wave a» value of Fo of 67 — 2 kev, The half life
was estimated to be 8b vr. Thi s is probably the came determination ae
that due to Brosi and Gri.ess, mentioned earlier.
This concludes the work on the radio-activity of nickel. To
summarise the charge, mass as si vmnent uooer enersrv limit snectrum
shape and half life of the lone* 1. i ved ni ckel beta—activity' have been
found and it has been shown- that no X-ravs or o*a.mma—raTr« accompany thebQdecay* The ''‘existence of Hi"' has been demonstrated and its half life
measured.

H,203 Tl203
208 KeV
280 KeV
203Pig.24. Decay scheme of Hg

'pm 3, RADIOACTIVITY OV MERCURY 203,Irtrcd iicto'
g h mentioned in n art 1 of* Chi t e -m , +1_ .*> i^te^ratd n k
rty ox the proportions.! counter is one which can. he of* very consider
hi ■ jftyj J'■ in th sluci ci ati of ■ oi m m shapes* decay schemes ai d..4.1. gj* feature s of j■’ ~ active r> — --- Thi s proi erty de snd 8 oi the -p -.+
th^b if two transi ti ons whi cl are 3 n - - - - - rj -> - oc Guerins? wi thin say ^ ^ -@ cond s are hob1 Setected ’u~~ the ~ t er tl ■ 11 pu t puls— sn erV
is equal to tl „ sum f bk pi 3 rgies "'j:> th ’ idivid . 1 t: n iti ■ \.
rr” -■ •• feature an ' t *- "be disad.......it..hut ij t].. case of d ...OO 1h 3 Her RaD and bhers it i a verv- useful ouertv. Th ■W ? “ W ^ ^ X ~ O
I*j ■ use ade gf the )©ri— was 4 the uni „+ ion he 1 ’ if*A f l l dee ' hi 1 v f ini “ sst i] i ’ ■ slf and also one well suited to
th ■ i i t i on of the i] t xr-ati3 method. T„.. the foil ing ‘ ' ti
x • tilts r> pr vi work are utlinod and th * r ? son? ' hich made it desiih-
able - to investigate the si ot " i ' y f r ii s hi I 1h thix 3 cti on
will ?i v ' th +’ >ry >f the inte rating action in more detail*
Th: radio .activity of h20 ■>,Th > radioactivi fey of Hg has 1 .... st idi <1 by number of workers
whose results will now be reviewed briefly* The mtial p atures of
the dec ay scheme are represented in fig, 24 ® A beta—transition of r| y
/v °n'Q Y ,Tr - fallowed by a garnma^r*ay of /v?80 KeV which is strongly inter-203rally cc&verted. ITo direct transition to the ground state °f Tl has b
observed. The first investigation of this activity was by Friedlander and
Wu (l943) who obtained a value for Ec of 4^0 KeV by absorption in alumii iuir
mv - also reported a half life of 5--*5 days* Millar and Curtiss (1945)
measured the maximum beta-energy by spectrometer and found it to be less thai

1 C'f,
■ ' ' " ° n j y r T T n - - + ] ■ . . - -* y w x v '
( lA/i 0 Q - ppjL; d O':t f r "1 r*l T fl» 1 ’ ft *t x '• - tl -" £*o
1 h 11 at ion sli f tl " ckn a/ r 1 ; y 1/ ° . / 20.1 ... nd ... ._ [ov 1 iclc n 0# 05 ind 0*2 <>
It was impossibl@ to i ■ ,'1 I— ~ J ■ f tl 1 fa ■ tr 1 J the
f y that ■ 3 1 ■ Tr v >t si line >f th 280 KeV " is
-r>r>Q j»d r'-n the Hi sh eiierarv* t ail of +.\...... 1.. Howev "■ S • , • 3 3a. w w “ ■*■ '■ J o “”* ............................. . *w>c/ ■ . ' J r w
>i ’ ' _ g-1 ■ y h? vs] th limited ran r" »v .q
wi4c Tr Tr and bj setr o 1 atio! r" tb.6 F x nl , >btained r yi • ..; j„ _ .f a»205 t" V* yjamw; rs found to be w 286 KeV* The
onversi< ffi *i .. . ere 1 ted t,c b o(j, —18| : L t.
o(M < Q.,5$. Henc °(k o(u =3> > 12. v lue of 43*5 *F
for tb© half life* Slat! a 3 ^ie bahn (19495 I-* 1 fee 3 the v rsion
lin 1 j onl f the b sta ctiol • y in ooi icidenoe* vith
■ hubs "■ rB» However a small peak remained due to K photoelectrons which
were in coincidence with their own X-rays* Hevertl 1 ■ th work
able to show. that the pect i ci \ « of allowed shape over s larger rang
tl ■„ h ad been possible before and concluded that F.- was about 208 KeV. Th
- ' £ : r ■ 5 . atimated '■... be o<70 KeV* and the i fe .... 5. t jrsior
coefficient ratios were t*2 and o(i_ 'oIm ^ 2* The latter figure is
an estimate of the w r i t e r o n the basis of the publish d graphs•
T4: ip ■ clear from the above that d. certain amov'ut of unoert-ainty oxisted
3 ... "n th data. For mple it is liffn cult to obtain a precise
y U p r °ner~y "* xmi t of the beta—spectltim. du 5 to the oc nve csionlines* One cannot compare the shape of the sp >ctr 1 i ith t’- ry at
•- • p the end—point* ilso the low energy region of the spectrum
1 ad not been investigated^ A consideroble variation existed in th suot sd

— lu g x fe0 fe fef 7..1 f (43.5 — 57. c 1 ■ ■ \. Th ■ >rnal conversion'
coefficients were not very ’well known add th »ir tios. as quoted fey Saxon. ... i >_-n 33 egbahn diff »r mewb „t. It was th r jfore of importance
to examine the decay in more detail with tl 9 ••• an at disposal which
were able to resolve many of those Questions*
Alec relativsly soft beta—emitters of fe? gh 2—value such as Hg feo,d.
not "been examined in detail in the past and it was "believed possible that
they could exhibit rather unusual features in this region* Thus one might
expect rather large effects from the atomjc 3 sctrons* M >c radiative
transit!or . of the type discussed by Ivanenko and Lebedev (195Q-) might b
. . 4 They sug 3si 3 that sc ro 5times fe@t • .cl es mi jht be captured
into unoccupied levels of the out >r 7. > etrc sh >13 , d th tfe e 13 ssi of s.
photon. This could reduce the probability of escape of fe t-—particles by
several t th for very soft spectra of fe sayy s + om - ud it i 7 cl aimed thatIt cc i3 ’ »our t •;’ anti tativ 1 • for [email protected] results of work on the
203radiaaotititias of M jThl and MsTh2, Since Hg fulfils both the condi
tion-'5 nf high atomic number and low maximum beta—ray energy* it is evident
that the spc ctruro ,1_ mi -lit be ap ?r ■ G3 ably affected due to this cause* Schwartz ^19^2) fe as very recently discussed the possibility that r.
relative bet a— spectrum may be affected at the 7 c.ver energy* end by the
energy liberated as a result of the readjustment of the atomic electron20 3svstem due to the chanve in nuclear charge* In the case•of Hg' “ the
energy rel ease is <v!5 KeV. If all* or most, of this, energy were carried
off by the beta-particles- the spectrum wo.nld possess a "hole" between zero
ensrmr and ft/V KeV- However- although, earlier writers cons? dor ad tfe:
nergy would be taken up in this way- Sofewartst does not believe this likely.203
A study of the shape of the Hg spectrum at low energies would help to

>I -
HZ
IOO 200 3 00 '400 5 0 0 MEV
Fig. 25* Modified spectrum formed by integrating action of the
proportional counter. A hypothetical primary spectrum shape
(group I) was assumed.

IQo.
3.nswor this o1.1 ft sti o n .
3 > |n1~ " 't - J~•' Prop -•4 :' 12 pf r‘ Ir g ti ~r •-■.1 " " t ar.
C cnt-iler t k ■- d e c a v ~ c h e m : o f f i r’»2'i* "**f t h e s o u r c e i 3 ^ i t u a t e d
with, in a proportional counter £ solid angl < f 4.TC JL three di 3 tinctpossibilities arise whioli are as follows.
M ) fh ■ ,n convert sd ys largely ee 3a from the d 81ector sin c 3th efficiency of detection of such radi tions is ^1®, while all the heta-ray 3 of the primary ctrum are recorded - This gives a normel
spectrum distribution extendin'" v " 1 .t ^OB IleV,
(ii Seme of the gamma—rays convert in th T’’ shell and ph< > *1 ;tr< r .
of mer y a»200 KeV are omitted in coincidence with the primary het
particle»« This gives rise to a spectrum of the same shape as the primary
q12 hut di" j)l« ced aloni th •• energy axis hy 200 KeV* However since the
@Q]3<y@rsioh of the4amiaa-rays in the ~,,r shell normally jives ri „ " to L ft "*h
,. „ X—radiations together with K X—radiations and since the former are
detected with aliao3t lOCp* effici r.oy the 00 tvul disgl acement of g.rc1 ip— (i -)
s&d group (ii) will • I1 y h ■ hv —hv^ , i.e. 208 KeV*(iii ) The p’amma—rays will also convert in the L.21,11* * > . * shell s riving
-• tc th0 corresponding photc lectrons and X—rays• This gives rise to
■■1 hum due t - th beta-rays in coincidence with these radiati ons and
since ell the photcelectrons and practically all the 1, M. ». X—rays will
1 3 c etured, the spectrum will he displaced hy the full energy of the gamin a”
via* 280 KeV. Since the efficiency o f d e t e c t i o n of t h e K X-rays of
thallium is about °/C in the counter and experimental, arrangement used,
occasional-*v processes of group (ii 1 will he displaced into group (i.ri)Fi •..oc; shows dia ramatically the kind of resultant spectrum shape or
might expect. The area marked 1 corresponds to group (i ) and +1' jrefore to

109.
th primary S] eirum* For +" ■ pur o , s hy oih 4 3 ■■ 1 : s-c truss s 1 ap
i "beer 1 m’ res mark >d TX oorr ss] and tc 4' roup (ii)
ils .. ■: j g di i ogd ■1 c v': % th® si] sir ”r axi s by 1 K iV ( J""'' s ■ o3nt
coincident, "by chance, with the end—point of the primary strum)* Ar
XXX jorr is ond • t tl t1 j rd ro hie! is di spi c d hy 280 K•■’V . Katurr
ally t' - j— [) dn •' ■ thi 3 grout) must h ■ dr~i -d to 1 1.■■x d.u® to th - con
-*• the final shape of 4 I •’ •• t • ■ - obt ined would "b ?iv in hv
the uppermost line, viz. ABFGE, provided the detector has perf set resolute
i on ft t •?.! 1 »n -ro*i •••? s, ■
Ti ■ dvj 4 ^ ti m jtl od ■ re imm idi at ly ?hvi cus, (a) m' - ;roup
(i ) ulses “viv€ th shap '■ of 4‘*-' 'trum xc ipt near J~' upp r u 3 1 stNir
■ ■ limits. (%) Tl 1 ‘ ning of the group (ii) pulse distribution' :
iv 3 th sh of th ■■ s 3 icfr at 1 \z ~ e s in 1 iti il free from many
of the difficult! of i il in ■ surem >nt s in 4 v 3 ■ r gfon. (Ofcarrse, th
source must still he thin and on thin hackina*). ( c ) The port? on OX) of
the composite spectrum gives th© true shape of the snd—point region of th
sosstrum free from confusion dr ? to -leotron lines. (d) The upg?r ~n srgy
limit of th ■ st— m can he sstimated from ti oint H), provid ■:5' thi g&i
roy enorwv is known - It was re—mo a sur od in th-; course of this work yi aid—
in ■ r It in agri m nt (within srimental error) with that of Slatis
nd Sisgbahh* Thus tbs whole spjctrum 3an he e$i^ined in detail end- com—
pored with theory, (a) The relative intensities of th throe group-s can.
h® sstimat d hv pnmp rison pf th three are-as and so one can determine the
K and L, K, . * . . conversion cooffici©nt-s rother precisely. To carry out
thi- op gration, the line FC is drawn in th • sg ictrum h;r 3omj ari son ' it’: th®
group (i) puls distrihiition or hy ilcu’lation from the Fermi plot*
In the following sera s of experiments th ) spectrum shaps "rs ex rained
in detail and compared with theory from 20 KeV to the end-point, whose

VACUUM PUMP TO COUNTER VACUUM PUMP
MERCURY VACUUM GAUGE
(A) (B)
Fig. 26. Experimental arrangements used to measure the
beta-activity of the radioactive mercury vapour.

y f 1 tli by Fei i 3 ' _ ■ 7 d.i4 tl^ r!7v
i~ '. ' ametj ti ’ id J internal
Pf i lent v ?naf- )d as iUst described, The h 7 f 1 j.f. ‘ ons id. abl' y ' ’ j f> th ] ■
with reference to spin ai d 3rdty 'han " j ■ towai?ds the end ofthis irt ' - j ;h i jc luded 7.... 7 ■ *'~ ■. . 1 r> ! 1 • -1 - c --v,
including its nt icn tr- scii J ■' 7 1 ' i " nt' r _■ hie1_ s 1 s '-■ 5 o <s p. t in t. nt ■" r e t i r vr~ r r ty.
,1 Pr'f-'narnti nn.• * ________.— i. _____________-
sources used 3 th■ fc 77 ~ sn J~_ idie>c 1 7 1neui r ■ 1 ■ t ’ >f fit t ly mercuric xid id 3 at
W & .S
3" t 1 3 : f777 ' j[ u d out in the pile at JL*E#R»®e Harwell#
Xi tl arli ’ rinie I fch ur ' dually of s thi: lay r
p ■ p • • ' ■ o ■ ; read iv^r 3 " 7 t 1 " 1 X1 c xid
■ ■• ■ e t adh 1 ’ thin 3 ■ *of — 7 ■ tat - n t ■ . r tl
u \" another of these experiments■ the source was deposited on a
thin aluminium wire which was then used as th central wire f a >rop. rtj . h-
7 nt r Urndni i *e was used to provide a low—Z support. However
not much success attended those early _ grim nts nd it was foui 7 t 1 be 1 ormelv due to certain faults ? n the. counteri
It '"as then believed that it might be -possibl ? to 1 '.se the vapour f
+. pp-j • rcurv a *g 3 ' iur ■ Tests to determine th# 30urc©
tr rth av ■ 37 7 1 wei ■ ad 5 and sine these -- ndi 3afc s d th g t fche metl 0dfeasible -;:i 7'" 07 res ure steel.—wall ad counter '"00 dor;? gn ■*<! purp< ' - The tests were carried out. using the experimental arrangements
3} 3tch d in f 5 26, In the first ease j fig. 26 (?) a small g7 obul • f

radioactive mercury was contained in a short tube in a vessel, which,
together with a Geiger counter attached to the system, was evacuated. The
mercury vessel, which had a volume equal to that of the counter, was then
filled with argon to twice the pressure normally used in the Geiger counter
and the gas (including mercury vapour) in the mercury vessel was shared with
the counter. The specific activity of the mercury vapour was then esti
mated since its vapour pressure at room temperature was known. However
the rate was not nearly as much as previous rough calculation had suggested
and therefore a new technique was tried. The apparatus employed is shown
in fig. 26(b). In this case the vessel containing the mercury was thor
oughly evacuated and then left for 2-J- hours. It was hoped that, by this
time, the vapour pressure of the mercury would be at equilibrium throughout
the volume at its saturation value. Then the Geiger counter, already filled
to 1.5 cm of alcohol, was filled to its usual pressure of argon (10 cm),
the argon being passed through the mercury vessel thus sweeping out the
mercury vapour with it. The counting rate of the Geiger counter, in ex
cess of the background rate, was found and the specific activity calculated.
This procedure was repeated several times as described except that the
mercury vessel was left evacuated for increasing periods, to ensure that
equilibrium was reached. From the results it was calculated that a
counter 6* long and 4" in diameter, if filled with mercury vapour at the
saturation vapour pressure at l8°C, i.e. 0.001009nJinj would give a counting
rate of ^40,000 counts per minute. This was evidently a practicable
method of carrying out the spectrum analysis from the point of view of inten
sity. Since these experiments were carried out a value for the slow neu-202tron capture cross-section of Hg has been published and a calculation of
the counting rate expected after a four week bombardment at a neutron flux

COLD WATER IN
.NYLON FILM ON
Fig. 27* Apparatus used for the preparation and evaporation
of mercuric sulphide. .

11 2of 10 per cm per second, gives *>32,000 per minute. The flux was
usually 1-3 times the value quoted so that the calculated value agrees
reasonably well with that obtained experimentally.
However the main analysis was carried out using a solid source in
a counter which was placed in a magnetic field, as shown later in fig. 31.
The source was prepared by the evaporation technique which, as we have seen,
gives a very uniform source thickness. In the first attempts mercuric
chloride (corrosive sublimate) was used since its sublimation temperature
(302°C) was fairly low. However it had a harmful effect on the source
mounting materials used, viz. aluminium foil and nylon film, causing them
to break. Finally mercuric sulphide, which evaporates at normal pressure
at 583°C, was found to be satisfactory, in that it had no bad effects on
the source mounts. The apparatus used is sketched in fig. 27. The
metallic mercury was dissolved in concentrated nitric acid in the outer tube
and evaporated very gently to dryness. The residue was dissolved in water
and again evaporated to dryness to get rid of any acid. The mercuric
nitrate was again dissolved in water, a little hydrochloric acid added and
hydrogen sulphide bubbled through till the mercury was completely precipi
tated as sulphide. The supernatant liquid was decanted off and the source
dried. The inner tube was then inserted. This consisted of a water cool
ing tube against which was held the source mount, which consisted, in one
experiment, of a nylon foil supported by a wire loop and, in another exper
iment, of 0.16 mgm/cm^ aluminium foil supported in a similar manner. To
localise the source on the central zone of the foil, away from the wire
loop, a mask with a small circular hole was held over the source loop.
Cold water was passed through the cooling tube and the outer tube was
evacuated by normal high vacuum methods. The source was now heated till

LOG
COUN
TING
RA
TE
ibooo
y 5 0 00
Z 2000
IOOO
40 60 80 IOO 120MGM/CM* OF ALUMINIUM
Fig. 28. Absorption of beta-rays in aluminium.
4 0
3-5
3 0
2-5
2060 702 0 3 0 4 0
MI3M/CM2 ALUMINIUM50IOO
20
M(£*7GM/CM -300K EV
GM/CM2 OF ALUMINIUM
Fig. 29. Fig. 30.Fig, 29. Absorption of beta-rays in aluminium.
Fig, 30. Absorption of gamma-rays in aluminium.

113.
sublimation took place. This gave, in each case, an almost invisible
source, which in the case of the aluminium foil source mount, had a mass
minute. The nylon film source had an activity approximately one third
less.
5. Preliminary Experiments.
A series of absorption experiments were carried out in the course of
a preliminary examination of the activity. In the first instance these
experiments were carried out to confirm previous findings and also to
ensure that the activity observed in the source was due largely to Hg*^.
In addition to this, however, further information was elicited from the
curves obtained, with regard to the possible existence of a higher energy
ground state-to-ground state transition. Fig.28 shows an absorption
curve giving the detail at its end-point. The absorber mass scale has been
corrected for counter window thickness and air gap (total ^6 mgm/cm ).
A good end-point is apparent and according to Glendenin (194-8)» the range
corresponds to an energy of 280 KeV. This confirms the gamma-ray energy
measurement which was made later since there are photoelectrons present
having practically all the quantum energy. Fig. 29 shows a distinct break
about 42 mgm/cm which corresponds to an energy of ~200 KeV, i.e. the
limiting energy of the beta-rays. The counting rate beyond this value is
mainly due to photoelectrons. Fig.30 is an aluminium absorption curve of
the gamma-rays emitted by the source. This yields a good straight line on
a logarithmic plot and the gradient corresponds to a gamma-ray energy of
'v 300 KeV which is in good agreement with previous and present work.
From these results it appears that the activity is almost entirely due to 203Hg , that the results obtained are m agreement with those previously
of about 3 total activity of ^12,000 disintegrations per

114.quoted, and that there is no evidence of a ground-to-ground transition
which would have an upper energy limit of 490 KeV, or ^160 mgm/cm .
Confirmation of the last comes from other experiments, especially the
magnetic spectrometer results which showed no beta-activity beyond the
highest energy photoelectron peak at aj 280 KeV. Indeed it is believed
that the transition to the excited state is more probable than the
transition to the ground state by a factor >100.
A number of investigations on the beta-spectrum shape were made using
a brass-walled, aluminium-lined counter of active length 10.5” and. diameter
5.5". At first the source was in the form of a thin layer of mercuric
oxide on a dystrene source holder which was inserted through a window
situated in the middle of the counter wall. Since the spectrum shape
obtained was not very satisfactory, a new method of mounting the source was
tried. A thin layer of source was deposited on a perspex backing which
was held by a steel rod in the middle of the counter, 0,875" from, and
accurately parallel to, the wire. The correct voltage, corresponding to
its position in the field was applied to it. Again the spectrum shape
obtained was unsatisfactory and the source coated aluminium wire described
in section 4 was inserted into the counter as the counting wire. Finally
in a fourth attempt, active mercury was electroplated on to the central
wire of the counter. Much labour was expended in analysing the results
of these experiments but, although the energy distributions obtained
possessed a certain similarity -to fig.25, the energy resolution was quite
inadequate. This was confirmed by the broadness of the calibration peaks.
It was evident that the counter was responsible for the poor results
obtained and repeated efforts were made to improve the situation by
thoroughly cleaning the counter, using carefully purified gases and so on

S /N /N /
MAGNETIC FIELD
CASE (COPPER) SOURCE
END CORRECTION TUBE / GUARD TUBE 4 MIL TUNGSTEN WIRE
Fig. 31. Experimental arrangement of proportional counter
in magnetic field.

115.without success. Finally the counter was completely rebuilt, only the
cylindrical case and end-plates being retained. Advantage was taken to
incorporate end-correction tubes. After this the counter operated perfect
ly and was used by the writer in studies on the long lived activities of
samarium and europium. Meanwhile, however, the activity was investigated
using another counter specially built by A.L. Cockroft for use in magnetic
fields. This work is described in the following section.2036. The Beta-Ray Spectrum of Hg
The experimental arrangement for the examination of the spectrum was
as shown in fig. 31. The counter, which was end-correctet^and had an
active length of 8” and a diameter of 5*5" was placed within a uniform
magnetic field of 1400 gauss, parallel to the wire. The source was mounted
on a separate probe terminating in a circular loop in diameter. The
plane of the loop was parallel to the end plates of the counter. As was
mentioned earlier, the loop supported a thin foil of aluminium (0.16 mgm/cm^)
on which was sublimed a 3 yugm/cm^ thickness of mercuric sulphide having a
total activity of '*12,000 counts per minute. The probe was at a distance ,
of 1.1” from the wire and the voltage applied to it was adjusted to the
correbt value corresponding to its position in the counter. The source
was confined to the centre of the counter and the recorded rays were emitted
into a solid angle of , half the number, of course, passing through the
thin supporting film. The counter was filled with methane to a partial
pressure of 20 cm of mercury and argon to a total pressure of 3*75 atmos
pheres. The pressure and magnetic field were such that no particles
emitted by the source could reach the cylindrical wall or escape into the
non-counting volumes at the ends of the counter.}
The counter was calibrated by use of the Kg radiations of tungsten,

3001200-
IOOO-fi 200-
80 0 -
600-
I-400 500 KeV40 0 -
200-
260 360 500400IOOKeV
Fig* 32. Complete spectrum of pulses observed in proportional
, counter. Detail near end point shown in inset figure.
1200
1000
H 800
600
3 200
400 KEV300200IOO
Fig. 33. Spectrum of background pulses in proportional counter.

obtained by firing the X-rays from the X-ray tube directly at the wall
of the counter as described in part IB, section 11. The pulses were
recorded in two ways, viz. (i) by photographing on a moving film the
pulses displayed on a cathode ray oscilloscope and (ii) by passing the
pulses into a single channel kicksorter. Both methods gave very similar
results and the form of the spectrum obtained is shown in fig. 32. It is
evident that the spectrum is repeated as expected (see fig.25); groups
I, II and III correspond to the groups similarly marked in fig.25, The
end-point of the spectrum is shown in more detail in the inset figure. No
serious effort was made to carry the analysis of group I particles to very
low energies since the beginning of group II gives the shape in the very
low energy region. Nevertheless the spectrum was examined at higher gain
to give the shape of the low energy spectrum more precisely and the spec
trum shape below 130 KeV in fig. 32 is taken from this examination.
The spectrum shape includes the background particle spectrum ( ^ 7 0 0
counts per minute). This was deducted in making the calculations for the
Fermi plot, fig. 34* and in calculating the internal conversion coefficients
The shape of the background spectrum is shown in fig. 33. The calibration
radiation, X-rays of tungsten, is included. The points marked "x"
were obtained at four times the gain at which the points marked "o” were
observed.
7. Fermi Plots.
The Fermi plots are shown in fig.34. This figure appeared in an
account of this work published in the Philosophical Magazine (Wilson and
Curran, 1951) &&& the 3 referred to in the figure is fig. 32 of this
thesis. The Fermi plots were made as follows: (i) The middle range,
marked with circles, is taken from the group I pulses. It will be noticed

PORTIONS MARKED THUS ° FROM GROUP I FIG 3 v FROM PORTION AB FIG 3 x FROM END POINT INSET FIG 3
|z|©
Fig* 34* Composite Fermi plot for Hg

that the line obtained deviates from straightness at low energies due to
the difficulties of analysis at low energies. (ii) The end-point region,
marked with crosses, is taken from the high energy region of fig. 32
(inset figure). This region lies on the same straight line as the main
portion and the freedom from distortion due to photoelectron lines,
observed in magnetic spectrometer studies, will he noticed, (iii) The
low energy region, indicated hy triangles, was obtained from the portion
AB of fig. 32, i.e. the start of the second spectrum. The Fermi plot was
calculated hy the Bleular and Ziinti method as described in Part I. The
fitting together of the three regions results in an excellent straight line
with an end-point at 210 - 5 KeV. The end-point energy is given more
precisely hy the limiting energy of the spectrum, provided the energy of
the gamma-radiation is known. This was found to he 278 KeV, as described
later, and the end-point was again calculated to he 210± 5 KeV. This
agrees with the value given hy Sl'dtis and Sieghahn. The Fermi plot is
shown as linear to zero energy, the point at 0 KeV being taken from the
corresponding point on AB, fig. 32. However in view of the source support
thickness, this linearity to such a low energy must he regarded as coinci
dental.
However, there is no evidence of any fall-off in intensity at the
lower energy end of the spectrum. This supports the view of Schwartz
(see section 2) that the atomic binding energy liberated is not carried off,
mainly, hy the electrons. The neutrino appears to carry off most of the
energy. It i3 quite probable, in fact, that the energy is shared between
the electron and the neutrino in much the same way as the nuclear transfor
mation energy is shared.

8. The Internal Conversion Coefficients*
As has been mentioned, it is easy to calculate the internal conversion
coefficients using this technique. In fig. 32 the second spectrum is
continued, as a dotted line, by comparison with the main spectrum. By
comparing areas under the second and third spectra, (corresponding to the j
areas BFCB and FGECF of fig. 25) with the area under the main spectrum the
internal conversion coefficients (defined as the number of conversion j;
electrons divided by the total number of gamma-ray disintegrations) were|
found to be
o ( 15.6 0; * 4.2$ ; o( = 19.8$.The ratio o(K is 3*71 • Saxon gives the value of o( as 0.24 .
If we define ol in the more usual way as the ratio of the number of conver
sion electrons to the number of gamma-rays emitted, our value of rises
to 0.247? in good agreement with Saxon. The work of Sl'atis and Siegbahn
yields a ratio of 3.0 for cK* /c(Ui1A . . ..
Taylor and Mott (1932) predicted a value for o<„ of 14/ for the2internal conversion of electric quadrupole radiation of energy me /hv
« I.83 and Z a 83. Since in this case Z = 81, these results strongly
suggest that the gamma-ray transition is electric quadrupole in type. This 1 result is of importance in a discussion of spin assignments which will be
made later.
9. Energy of the Gamma-Radiation.
The gamma-transition energy was measured using the semi-circular
magnetic spectrometer designed by Dr. E.R. Rae. The resolution of this
instrument is 2%, The detector consists of two Geiger counters, situated
one behind the other, operating in coincidence, which results in a very low
background counting rate. This was desirable since the original total

119.
source strength available was rather small, viz. ^30 microcuries. Two
sets of measurements were made. In the first, the mercury source, which2was contained in a small glass tube, was surrounded by a 50 mgm/om lead
foil. In the second, this was replaced by a much thinner platinum radiator,
having a thickness of 4 mgm/cm . The electron spectrum obtained using
the platinum radiator is shown in fig. 35. Prom the strong K and L
conversion electron peaks which were observed, the gamraa-ray energy was
estimated to be 278 - 3 KeV. This is in good agreement with the result
of Slatis and Siegbahn. Saxon’s'result (286 KeV) appears to be a little
high.
10. The Half Life of Hg203.
In view of the considerable variation in the value of the half life
as determined by different workers (43.5 - 51*5 days), a careful measurement ij
was made. The apparatus used is sketched diagramatically in fig. 36.i iTwo similar Geiger counters were enclosed in a single envelope in such a
fashion that each could be individually irradiated. One was exposed to a
source of Hg2^3 (as mercuric oxide) and the other to a source of (as
barium carbonate). The latter, which possesses a long half life, *'6500
years, was intended as a constant control. Actually a very slight variation;14of counting rate with temperature was observed in tie case of C , which did
203not show in the decay curve for Hg . This variation was allowed for by14finding experimentally the law relating the C counting rate to tempera
ture and reducing all readings to a standard temperature of 17°C. The
apparatus was so designed that the chance of a particle from one source
being scattered into the other counter was extremely small. The lead j203shield was used to keep the gamma-rays of Hg from affecting the standard
14C counter. The plateaux of the two counters are shown in fig. 37.

io • 15FLUXMETER DEFLECTION (F)
Fig. 35* Photoelectric spectrum of the,gamraa-ray of Hg
with 4 mgm/cm platinum radiator.
203
MERCURY SOURCE
v.
rCARBON SOURCE
Fig* 36, Controlled Geiger tube apparatus used for half life
determination.

120.
The working voltages are indicated by arrows. It was found that the
starting and working voltages remained the same throughout the duration
of the experiment which gave confidence in the apparatus. Before starting
counting, the apparatus was switched on for 15 minutes to allow it tosettle down and then the total number of counts from each counter in the
same interval of time was recorded. Counting was continued until more
than 400,000 counts were obtained from the counter possessing the lower
counting rate. In view of the fairly high counting rates, counter dead
time corrections had to be made to the observed rates. The experiment
was continued for 62.3 days, corresponding to 1.36 half lives. The half
life graphs are shown in fig. 38. Graph (a) is the logarithm of the
mercury counting rate (after correction for dead time losses) plotted with
respect to time as abscissa, while (b) is the logarithm of the ratio of the
mercury counting rate to the standard carbon counting rate. (a) gave a
value of 45*84 days and (b), a value of 45*95 days for the half life. The
final value of the half life was taken as
* 45*9 — 0.5 days.which lies within the range of previously measured values.
20311. The Decay Scheme of Hg
The decay scheme of Hg^-^ will now be discussed in more detail, with
reference to the spin changes involved. It will be well to review the
facts which give some indication as to the correct spin assignment.
(a) The ft Value. The value of "f11 was calculated from the curves of
Feenberg and Trigg (1950) to be 0.6. Combining this value with the half
life, t * 46 days, we obtain an ft value of 2.4 x 10^, or log ft * 6,38.It is not certain from this whether the beta-transition is allowed or first
forbidden although Feenberg and Trigg remark, with regard to fig.10 of

3 0 .0 0 0
25POO
20,000
15.000
H 10,000
5 0 0 0
1300 0 2 0 0 4 0 1360 1380 MOO 1420 M 4 0 M 60VOLTAGE ON WIRE
\ ,• I
Fig. 37. Plateaux of half life Geiger counters.
2-41z
2-3
1-82-2
706020 30DAYS
Fig. 38. Graph of half life results.

121.
their paper, that the peak at log ft « 6.2 is "predominantly first203forbidden". The log ft value for Hg lies a little above this value.
(b) Sargent Diagrams. Feather and Richardson (1948) have published
Sargent diagrams for the limited region of atomic number, 80 £= Z 84.If we fit the data to these diagrams we find that a first forbidden
transition with A l s - 1 and a change of parity is suggested for the 210 KeV
beta-transition. Both (a) and (b) would lead one to expect a spectrum
having an allowed shape.
(c) Internal Conversion Coefficients. As has been mentioned earlier,
the value of 0 ( 15.6C$) strongly suggests that the gamma-transition is electric quadrupole in type. This corresponds to a spin change of one or
two with no parity change.
(d) Half Life of the Excited State. The experiments of Deutsch and
Wright (1950) showed that the half life on the 0.28 MeV excited state is -8< 0.3 x 10 sec., and independently Binder (1950) showed it to be
—8< 2 x 10 sec. This suggests that the gamma-ray transition is likely to
be not more forbidden than electric quadrupole or magnetic dipole. (Moon,
fig. 20, 1949).
(e) Ground State to Ground State Transition. According to our experi
ments, this transition, of energy 490 KeV, is less probable than the 210
KeV transition by a factor &100. Also it has never been observed by
other workers. According to calculations of Feenberg and Trigg in the
paper referred to previously, the energy releases favour the higher energy
transition by a factor of about 17. Hence the ft value for thi3 mode of
decay must exceed that for the lower energy decay by a factor of > 1700.
(f) Shell Model. The predictions of the shell model (Haxel,Jensen and
Suess, 1950) do not seem sufficiently precise in the region of atomic

number about 80 to assist materially in the assignment of spin values.203 /However it appears reasonable to suppose that Hg has a spin of 1/2 or
3/2 and it is much less-likely to have a still higher spin value. Also
it is significant to note that almost all nuclei in the neighbourhood of
mercury have spin values in the range 0 ^ 1 ^ 3/2. The ground state of2 0 1 201T1 hausen measured and has the value l/2. The spin value of Hg
in the ground state is experimentally found to be 3/2 and it is very203reasonable to suppose that the addition of two neutrons to form Hg
would leave the spin unchanged.
In view of the shell model and spin arguments just made, one may
tentatively construct the decay scheme of fig. 39(a) . The gamma-ray
transition is obviously in line with the experimental facts, (c) and (d).
Both beta-transitions are allowed according to Gamow-Teller rules, although
experimentally the (-l,no) transition is apparently forbidden relative to
the (0,no). This is evidently the weak link in the chain. Also the ft
value and Sargent diagram considerations, (a) and (b), suggest that the
lower energy transition is first forbidden which also is in disagreement
with the decay scheme.
It appears to the writer that the decay scheme represented by fig.39(b)
is in better accordance with the facts. A spin value of 5/2 is assigned 203to Hg andit is now possible to assign a spin change of -1 with parity
change to the observed beta-transition . This brings it into agreement
with Feather and Richardson's Sargent diagram and also satisfies the ft
value conclusions. The gamma-ray transition is left unchanged. The
ground state to ground state beta-transition is now assigned a spin change
of -2 with parity change. Although this is also classified by Gamow-Teller
rules as first forbidden, there is considerable evidence that transitions

1203203 203
-21 0 , n.o
K v -29 - I , no E.Q.
1211 lb)
203Fig. 39• Possible spin and parity changes in decay of Hg .
#

2of the type ( AI=2, yes) have exceptionally large (Eq - l) ft values,
which are about 10^® and are remarkably consistent (Shull and Feenberg,
1949* Wu, 1950)» Since the ft value of the lower energy transition is 62.4 x 10 , this is in agreement with the argument (e) which concludes
that the ratio of the ft values has to be >;1700. On the whole, therefore,
the scheme of fig. 39(b) is probably the most satisfactory from the point
of view of both experiment and theory. Its main difficulty lies in its
inconsistency with the shell model.
An interesting method of classification of beta-emitters due to
Dr. K.M. Guggenheimer suggests that the 210 KeV transition is allowed. His
calculations indicate that, if the upper energy transition is second
forbidden, and the other allowed, the former will be less probable than the
latter by a factor *»224. These conclusions could be satisfied by a
scheme in which the beta-transitions of fig. 39(b) are changed from
( Al=-2, yes) and ( AI=~l, yes) to ( Al=-2, no) and ( AI»~1, no).
This introduces, of course, disagreement with the method of classification
of Feather and Richardson.
Much of the uncertainty as to the decay scheme would be removed by
the experimental measurement of the spin value of Hg . This would
resolve between fig. 39(a) and fig. 39(b) (and eliminate other less likely
schemes which are not considered here) but would not distinguish between
fig. 39(b) ancj/its modified form mentioned above. If, also, the ratio of
the probabilities of each mode of decay and the spectrum shape of the
upper energy transition were measured accurately, assuming it were possible
to do so, all doubt as to the correct form of the decay scheme would almost
certainly be removed.

12. Conclusion*
It is evident that the use of the integrating method has "been very
successful and has confirmed the original predictions regarding it. The 203spectrum of Hg has been examined and a Fermi plot drawn, from the end
point to 20 KeV, free from the difficulties of superposed conversion
electrons in the upper energy region and free from many of the difficulties
usually associated with measurements in the low energy region. It has
heen possible to measure the internal conversion coefficients with what
appears to be considerable accuracy. If future work is done on this
activity two experimental modifications should be made. Firstly, a
source on a thinner backing should be employed (probably nylon film) and,
secondly, the gas should be continuously purified to improve the resolution
of the instrument, thus making the experimentally obtained spectrum resem
ble even more closely the spectrum drawn in fig. 25 (apart, of course, from
the arbitrary spectrum shape chosen when drawing the latter).
13» Future Use of the Technique.203The lines along which future research on the activity of Hg should
run have been indicated above (Section 11). The purpose of this concluding
section is to discuss future possible applications of the integrating
technique. In general, it may be said that the method is one which offers
considerable advantages in those types of decay in which the beta-rays are
followed by photo-electrons which are more energetic than the highest energy
beta-rays. As has been seen, the details of the low energy part of the
spectrum are readily investigated by examining the spectra carried out to
higher energies by the photo-electrons. Also internal conversion coeffici
ents can be accurately determined. In the case of decays followed by
complex gamma-ray spectra, one may be able to obtain the shape of the beta-

125.spectrum which, by normal methods, would be swamped by the presence of
photo-electron lines, especially with weak sources at low energies when
the resolving power is usually low. Work on RaD is being carried out by
this technique, together with other experiments using scintillation coun
ters, which it is hoped will clear up the long sought form of the decay
scheme. Among other sources which might prove suitable for examination by
this technique are Ir19°(Eo ru 91 KeV, E* = 250 KeV), ffb9^ (EQ = 67 KeV,
* 1.03 MeV) etc. It is not known with certainty in the case of I r ^ ^96and Nb , however, whether or not the gamma-transition follows the beta-
transition, or, if it does, whether it is delayed. If the gamma-rays are
not appreciably converted, the scintillation counter, which has a much
higher efficiency for the capture of gamma-rays, may be used in the same
way as the proportional counter. The obvious method is to split a crystal
into halves and to insert the source between the portions which would then
be pressed^ together again. Such an arrangement constitutes a solid
proportional counter identical in principle with the gas-filled proportional
counter, and possessing a solid angle of 4IL • If the efficiency of
capture of the gamma-radiation was *100% a single spectrum would be observed
which would be displaced along the energy axis by an amount equal to the
energy of the gamma-ray. If the efficiency were less than 100$ for the
gamma-ray, but ^100$ for the X-rays of the daughter isotope, two groups
would be observed corresponding to the primary spectrum and the spectrum
displaced by the energy of the gamma-ray respectively. This method of
employing the scintillation spectrometer was first applied to the radiations 203of Hg itself (Bannerman, Lewis and Curran, 1951)* Th-e source, which
was that used in the proportional counter experiments, was clamped between
two sodium iodide (thallium activated) crystals. The double crystal was

126.large enough to capture almost all the T1 X-rays hut not all the unconvert
ed gamma-rays. Thus group I, corresponding to transitions in which uncon
verted gamma-rays escaped, remained while group II was displaced to the
right and coincided with group III, Fig.10 of their paper shows the
results obtained. If a larger crystal were employed, one which would
capture *vl00$ of the gamma-rays, group I would also coincide with group
III thus yielding a single spectrum identical in shape to the primary
spectrum but starting at r*278 KeV and having an end-point at ^488 KeV. Bannerman et al. point out that in the case of gamma-rays of high energy,
possibly up to several MeV, liquid phosphors offer considerable promise,
since the problem of making larger crystals of good optical quality is not
an easy one.
This method also promised to provide a powerful tool to investigate
the beta-spectrum of RaD. The hardest gamma-ray emitted by this source
is 46.7 KeV. If a crystal big enough to stop all 46.7 KeV and softer
electromagnetic radiations were employed one might expect to find the
primary beta-spectrum free from conversion lines, displaced along the
energy axis by 46.7 KeV, provided only one beta-transition was involved.The main disadvantage is the low resolving power which the crystal possesses
in the region of the beta-spectrum energies (0- ~18 KeV). This study was
undertaken and has recently been published (Bannerman and Curran, 1952).
The spectrum was examined (a) by measuring the beta-rays in coincidence
with higher energy gamma-rays and (b), by the integrating technique. The
first method gave a spectrum, probably simple, with an end-point, corrected
for resolution, of 18 KeV. The second method did not give the simple pri
mary spectrum expected and it is surmised that one of the excited levels of
the daughter nucleus is metastable, having a half life greater than lyasec.,

the resolving time of the circuit.
It should he emphasised at this point that, when using a scintillation
spectrometer hig enough to stop most of the gamma radiation, it is not
essential that the gamma-ray energy should exceed the maximum beta-ray
energy. This was necessary before in view of the fact that the two or
three spectra obtain would overlap and cause confusion. However in the
case of the large crystal, only one spectrum is obtained. Hence in
addition to the sources mentioned previously as probably being suitable
for investigation by the integrated spectrum technique one might add such2 A a8 92 105 198 199sources as Ha , Sc4 , Nb , Rh , Au , Au and others.

' " : ■»Gd
64
1
Gd 152 0 -2 %
or, < 125 »
Gd 153 K. « “ ■ V
1 155, 225 d c— -22 ,-40 K -026,-100, •26 r others |
Gd 154 2-15%
Gd 155 14-78%
a 6 5 (0 0 0 f
Gd 156 2 0 -5 9 %
t
Gd 157 15-71%
o- 240,OOOf
Gd 158 24-78%
a 4 |
Gd 159 ‘
t 18 h A ‘85, -95 i -30 ,-055
Gd 160 21-79%
cr 0-1 , 0 -2
Gd 161 1
A~. *13-6,4-5 mA i-si -37
E u63
Eu 147
1 4 0 ,53 d
i 42_ 1-0 |
Eu 149
t 14 d
-5 ,
Eu 150
t 27h
1
: Eu 151 4 7 -7 7 %
; cr 5 2 0 0 icr. 1500.2500
E u 152 ' li. e“ K
t 9-2h fl-36,-9, 1-9 IS -123, -163,
•725 etc |
Eu 153 t 52-23%
o- 2 4 01
Eu 154 1A', K, K
t> 2 0 y , S -6y\ A 1-9
% 1-2 O* 8 8 0 |
Ed 155 1A " > *t 2y
/S-15,-24, 2-23 X -084 , 0-1 O 7 9 0 0 3 - I0 f
Eu 156 i A~, *
t l5-4d /5 0-5 , 2-5 t 2 -0
- 4 _
Eu 157 1
A , *t 15-4 h
& 1 1-7d-2 0 -6
Eu 158 1 A~
t 6 0 mf i 2-6
62S
Sm l44316%
Sm 145K , / &+ ( Vt 410 d
1
Sm 147 {15 0 7 %
cr% 6 0 |
Sm 148 11*27%
f
Sm 149 * 13-84%
cr t 6 5 0 0 0 1
SmISO * 7-47%
i|, Sml5l T
1 t - f o y1' -lO O O y \ f i ‘0 7 5 j t -021 |
Sm 152 | 26-63%
t IO , l y oc ~ 2
cn 135.280
Sm 153 1
A', I , «‘t 47h
A -780 It -0 7 , -10
•6! |
Sm 154 | 22-53%
cr, 5-5
Sm 155 I
A ', it 25m
& 1-9 i -3
Sm 156 IA
t lOh f i -8
t.
, Pm 14 3 K, <
I 200d . ly
l! 0-67
Pm 145 t
t 3 0 /
Pm 146cr , it 2 7h
Pm 147 1cr
t 3-7y A -223 No i
f
Pm 140 ■cr, <t 5-3d £ 2*5, 2 t 0*8
Pm 149
A ■ *t 47h /5 l-l % ‘35
i Pm 151 |
! f5 t 12m^ 1*9
Pm 153 1
t < 5m
Pm 156
t < 5m
MO■ K. t .t >3a
* '> 2
Nd 141
A * . *t 2-42h A -fi 1 0 5
Nd 142 2 7 -0 %
cr < 12-
,Nd 143 » 12 2 0 %
<r 2 4 0
■ Nd 144 23-87 %
cr C 15
Nd 145 f 8 3G°/o
o- < 30
Nd (46 17 18%
c K 2 0 a l 1-4
Nd 147AT. i i-t lid
f i -4 -9* *5
Nd I4B5 72°/o
a < 4 5 cri 2* B
Nd 149A , 1!
t 1-7 h (S 1-6
Nd 150 5 -6 0 %
cr < *15
) Nd 151
11 short •
'mm
cr k CROSS SECTION FOR |pi|_E NEUTRONS a t = CROSS SECTION FOR I THERMAL NEUTRON
Fig. 40. Isotope chart in the region of samarium and europium
(More recent research indicates that the natural alpha activity147 \of samarium should be identified with Sm ).

128.
PART 4. THE SAMARIUM 151 AMD EUROPIUM 155 ACTIVITIES.
1. Introduction.
When the experiments about to be described were undertaken, it
appeared that the proportional counter technique might be well suited to181the examination of thelong life, low activity source, Sm J . It had been
shown, by absorption in aluminium, to have a limiting energy of ^60-65 KeV
(Parker, Lantz, Ruch and Hebert, 1948, Parker and Lantz, 1948). Using a
magnetic spectrometer, Ketelle and Parker (1949)> obtained an end-point
energy of 79 KeV, but due to counter window and source thickness difficul
ties, were unable to obtain any information as to the spectrum shape.
It seemed desirable to obtain the spectrum shape of this source and as the
energy and the specific activity obtainable were low it appeared, as men
tioned above, that the proportional counter method was that best suited to
carry out the investigation. Ketelle and Parker used a source obtained
from pile products. Such a source was not available to the writer, but it
was hoped that by neutron bombardment of pure samarium in the pile at181Harwell, sufficient Sm would be formed to make the analysis possible.
There were, however, other activities which could be formed by neutron
bombardment but it was hoped, in view of experimental results of other 181workers, that Sm J might predominate; for example, Inghram, Hayden and
Hess (1947) were able to detect and measure the half life of Sm '*' in a
sample of samarium exposed to long pile irradiation. (it should be mention
ed, however, that it is not quite clear from their letter whether the half
life quoted was in fact their own measurement)
To give a clearer idea of the activities with which one might be
concerned , fig.40 has been prepared. This shows the isotopes in the
region of samarium in the form of a chart. The boxes which are heavily

outlined indicate naturally occurring isotopes. The other isotopes are
artificially radioactive. The presumed mode of beta-decay is indicated
by arrows. The chart is brought up to date in the light of information
published up to the summer of 1951 > and it must therefore be realised that
it does not show the state of affairs at the commencement of this study.
Now, from the chart it will be seen that the following activities might be
formed by ( n , ) reactionss- 145(^) Sm Since Inghram, Hess, Hayden and Parker (1947) were unable to
detect this isotope in studies of radioactive samarium, it was hoped that
this isotope would not interfere.. 151\13L/ Sm Already mentioned.
(iii) S m ^ ^ . This is short-lived (47 hours) and would not interfere with
the other activities, provided the short-lived activities were allowed to
die before any work was carried out on the source.155(^v ) Sm .This is also short-lived ( < 25 minutes) but it decays into
155Eu which also is radioactive and has a half life of m2 years.
In addition second order activities might take place as follows/ \ 154 « 153vv / Since Eu is formed in considerable quantity in the pile
153 153and since Eu ^ , to which Sm decays, has a high neutron capture cross-154section, Eu ^ might well be formed with an appreciable activity.
1 \ 56 1S5vvi; Sm This could be formed by neutron bombardment of Sm156However since Sm decays with half life of 10 hours, and the product
156nucleus, Eu , also radioactive, decays with a half life of 15*4 days,this activity would not introduce complications./ . \ 156 155(vii; Eu This might arise from neutron bombardment of Eu .
However, as mentioned above, Eu^*^ decays with a half life of 15.4 days,and again no difficulty would be caused by such a reaction.

It appeared, therefore, that Sm^'*, and E u ^ ^ could145he present. As has already been mentioned, Sm was not expected to
155cause trouble. However Eu might well have been formed with an activity
comparable, with, or much exceeding, that of Sm1^ . Since the slow neutron150cross-section of Sm J was not known (and still is not) it was not possible
to calculate the relative activities expected. It was hoped, however, that151 155 155either Sm or Eu would predominate. Very little was known about Eu
at the time and it was evident that it also would well repay investigation •
Finally the activity to be expected due to Eu^^, relative to that of Eu^^^,
was calculated. This could be done only approximately since the slow152neutron cross-section of Sm was given variously as 135 and 280, while the
cross-section of Eu^-^ was quoted at values ranging from 240 to 1000. The154cross-section of Sm was taken as 5*5« Even assuming the most favourable
conditions for the production of Eu'*'^, i,e, assuming the highest cross-
section quoted, it was calculated that the ratio of the activity of Eu^-^154to that of Eu ^ at the time of leaving the pile would be ^ 935*1 and,
154after six months, 616:1. Thus Eu was not expected to introduce any
complication, provided the original sample of samarium to be irradiated was
sufficiently free from europium. The purest obtainable samarium oxide,
provided by Ru-metals, Ltd., was therefore used. 0.050 gm of this was
irradiated for eight weeks in the pile at Harwell at a neutron flux of_l3i 2 ,3.5 x 10 per cm per second.
To anticipate some of the results of the experiments to be described,151 155it was found that the Sm ' and Eu ■'*' activities predominated and that the
155ratio of the intensities was ^1:3. The amount of Eu present was higher
than was expected but, because of the different energies involved in this
decay, it did not complicate matters very much. Since the intensities of

131.151 155Sm and Eu were of the same order, it did not prove possible to
examine the spectrum shape of either activity in detail. However the
various experiments carried out, examination of the beta- and gamma-ray
spectra by proportional counter and p-'V , ^ a n d coincidence
absorption studies, led to considerable elucidation of the decay schemes 151 155of Sm and Eu . No attempt to construct a decay scheme of either had
145been made previously. Other information concerning the intensity of Sm formed in the pile and of the end point energies of the beta-spectra
154associated with the decay of Eu , was also obtained.
If the chemical separation of the europium and samarium had been151 155carried out, it would have been possible to examine Sm and Eu
separately. However in view of the great difficulty involved in carrying
out such a separation and since, as far as could be ascertained, no one
in the University of Glasgow possessed experience of rare earth separation
techniques, it was not considered advisable to attempt it.
2. Brief Review of Other Investigations.
The results of other investigations on these activities will now be
briefly mentioned. No distinction will be made between results published
before the commencement of this study and results obtained subsequently.145Sm : This has been reported in earlier work to have a half life greater
than 150 days, and to possess gamma-rays of energy 242 and 950 KeV. However
recent wbrk of Butement (l95l) showed that there were no hard gamma-rays
and that K X-rays characteristic of promethium (Pm) were present, thus
indicating K capture as the principal mode of decay. He determined the
half life to be 410 days.151Sm s The earlier work has already been described. Recently Agnew (1950),
using a double magnetic lens spectrometer, obtained a beta-spectrum which

132.
gave a linear Perm! plot indicating an end point of 75*5 KeV. Marinsky
(1949), in work as yet unpublished, obtained an upper energy limit of15174 KeV. Both Agnew and Marinsky used Sm prepared from fission products,
Parker et al. (1948) and Marinsky could detect no gamma-rays. However
Scharff-Goldhaber, der Mateosian, McKeown and Sunyar, using an argon-filled
proportional counter, detected gamma-rays of energy ^21 KeV, and also
L X-rays (Scharff-Goldhaber et al., 1950)* They used Sm'*"' separated
from fission products by Marinsky and Glendenin. The half life value is
not known with any certainty. Inghram, Hayden and Hess give a value of
20 years, while private communications of Inghram and Marinsky to
Ketelle and Parker (1949) give cu2Q0 years and cv»1000 3b 350 years, respectively.
E u ^ ^ : Seaborg and Perlman (1948) suggest that there are two groups of
beta-rays, with end points at 180 and 230 KeV, as determined by absorption
methods. The Trilinear Chart (Sullivan, 1949) gives the end points as
160 and 240 KeV but does not give the source of information. Marinsky
states that there are two beta-transitions. One, which occurs with 80$
probability, has a maximum energy of 154 KeV, measured by spectrometer,
while the other transition, occuring with 20$ probability, has a maximum
energy of 243 KeV. No experimental errors are quoted. With regard to
gamma-radiation, Winsberg (1950) detected a gamma-ray of energy 84.4 KeV, as measured by the critical absorption technique. The Trilinear Chart
gives three gamma-rays of energies, 84 KeV, 102 KeV and 1.2 MeV (weak).
Marinsky, using a magnetic spectrometer, finds only two, of energies 85 KeV and 99 KeV, occuring with 60$ and <\»40$ probability respectively. It
would appear that the 84, 84.4 and 85 KeV gamma-rays are identical as are
the 99 and 102 KeV gamma-rays. Marinsky states that only the 154 KeV

spectrum is in coincidence with the gamma-radiation, that there are no
gamma?gamma coincidences and that there are no delayed beta-gamma coinciden
ces. The half life is given as 1.7 years hy Hayden, Reynolds and Inghram
(1949) and as 2 years by Winsberg.154Eu : According to Hayden et al. and Marinsky, this activity probably
possesses three beta-transitions, measured by absorption, of 300 KeV,
700 KeV and 1.9 MeV with intensities in the ratios 5 :4*1. A gamma-ray
of 1,2 MeV (measured by absorption) is also reported. Marinsky states
that the electrons giving rise to the 300 KeV and 700 KeV spectra are
probably in coincidence with this gamma-ray. Hayden et al. state that if
K capture takes place, it does so with an intensity relative to beta-emissicn
of less than 0.05.In addition to these radiations, other radiations have been observed
and are given here although it is not known at present whether they belong A ^ 154 _ 152to Eu or Eu , both of which are formed by neutron capture in europium
and which have almost equal half lives. Certain gamma-rays have been
observed in our studies which seem to correspond somewhat to these given
below. This might suggest that these radiations belong to E u ^ ^ rather 152than Eu . However there is reason to believe that a very small amount
of europium may have been present in the original sample of samarium in
sufficient quantity to make it doubtful. These radiations are as follows
Beta-spectra possessing end points of 750 KeV and 1.57 MeV have been found
by Shull (1948) and Cork, Schreffler and Fowler (1948)? using magnetic spectrometers. In addition these workers have reported gamma-rays of the
following energies: 0.040, 0.122, 0.247? 0.286, 0.343, 0.410, 0.442,
0.772, 0.959? 1.082 and 1.402 MeV, measured by spectrometer, while Cork et
al. and Krisberg,Pool and Hibdon (1948) also reported gamma-rays of

134.energies 1.23 and 0.9 MeV by absorption. Finally, Hayden et al. report a
154ha}.f life of 5*3 years for Eu
3. Preliminary Experiments.
The first experiments were carried out in an attempt to elucidate
the main activity present in the source. The source proved to be more
complex than had been hoped and it was evident that a number of different
activities must have been present. Several separate absorption studies2
were made on the beta-radiations using mainly a thin window (1.7 mgm/cm )
Geiger counter and aluminium absorbers. Then an attempt to measure the
energy of the gamma-rays by absorption was made. This was done by deflect
ing the electrons away from the counter window by use of a strong magnetic
field. However it was not possible to draw any conclusions from the
gamma-ray absorption curves except that a considerable number of gamma-
radiations of different energies were present. Fig. 41 shows a typical
beta absorption curve in which the intensity scale is drawn both linearly
(A) and logarithmically (B). From (A) it is evident that most of the155particles were less than 250 KeV, and were therefore probably due to Eu
151and Sm . Fairly well defined end points on curve (B) can be observed at
75 KeV and <*250 KeV. These values agree with the quoted upper energy151 155limits of the Sm and Eu beta-spectra.
Since it was evident that the original hope to have a source consisting151 155mainly of Sm > Eu > was not realised, an examination of the beta-
radiations using a magnetic spectrometer was attempted. Even using thick
sources, it was not found possible to obtain a sufficiently high counting
rate to examine the spectrum with any accuracy. From this experiment it
appeared that, although the spectrum had not finished by 400 KeV, the
highest energy examined, most of the particles had energies less than 300
KeV.

150 004 0
l o p o oHiH13zi— 30;(B)5 0 0 0
2-5(A)
3 0 0 m g m / c m * alu m in iu mo IO O 200O 160260 300 4 00 500 6 00 700 8 0 0 KEV
Fig'. 41* Absorption of beta-rays in aluminium.

135*
An attempt was then made to examine the gamma-radiations using a
xenon-filled proportional counter which has a relatively high gamma-ray
detection efficiency, compared to an argon-filled counter. It has the
disadvantage that, since the Auge^effect in xenon is not complete, a single
gamma-ray gives rise to a number of electron peaks instead of only one, as
with argon. Since it was not possible to resolve the separate peaks in
this experiment it was evident that the number of gamma-rays present was
too large to be isolated by this method. It was therefore decided to use
an argon-filled counter to investigate the soft gamma-ray spectrum.
4» Gamma Radiation.
A proportional tube, diameter 5»5n and active length 8", filled with
methane and argon to partial pressures of 15 cm and 60 cm of mercury, was used to examine the soft gamma-rays emitted by the source. The source
holder consisted of a perspex block in a groove in which the radioactive
samarium oxide was placed. The oxide was covered w|th mil aluminium
foil. This was placed on the centre window (2 mil aluminium) of the
counter. The resulting pulse distribution was analysed both by the single
channel kicksorter method and by photographic recording. The results by
each method agreed though those observed by the latter method were more
precise and the histograms opposite and on succeeding pages were obtained
by this method.
Fig.42 shows the existence of two gamma-rays of energies 15*2 KeV and
19.3 KeV. The peak at about 8 KeV is due to the excitation at the counter
wall of the K X-rays of copper by the gamma-rays of the source as was
proved by a separate experiment. The K X-radiation of gallium, due to 71K-capture in Ge , was used for calibration and the resulting histogram is
shown in the inset figure. The two peaks at 15.2 and 19.3 KeV do not

NUMBER OF
PULSES
PER E
NERGY
INTERVAL
400200
ISO-300-
IOO-
50-200- GaK
IOO
20KeV
Fig. 42. Low energy gamma-ray spectrum.

correspond to any X-rays in the region of the atomic number of samarium
and are therefore true nuclear gamma-rays. As has been mentioned previous
ly, Scharff-Goldhaber et al. by the proportional counter method detected151gamma-rays of energy 21 KeV emitted by Sm . The gamma-ray here estimat
ed to have an energy of 19*3 KeV is presumably of the same origin. The
source which they used was a fission product and was therefore expected
to be relatively pure samarium. The fact that these workers did not
detect a gamma-ray of energy 15*2 KeV, although of comparable intensity,155suggests strongly that it is associated with the decay of Eu . (Butement
found that X-rays, but no gamma-rays, are associated with the decay of 145Sm and the other possible activities are much too weak to give rise to
a gamma-ray of such intensity). By measuring the area under the two peaks
and making allowance for the X-ray capture efficiency of the counter it is
estimated that the ratio of the intensity of the 15*2 KeV to that of the
19*3 KeV radiation is /u0.7*l.155Marinsky and others have found two gamma-radiations of Eu of energy
85 and 99 KeV. It was natural to relate the 15*2 KeV transition to the
difference between 85 and 99 KeV, so that the 85 and 15*2 KeV gamma-rays would be emitted in cascade, as an alternative mode of decay to the 99 KeV
transition. The 85 and 99 KeV transitions were measured by means of internal conversion electrons in a magnetic spectrometer and thus the very
low energy radiation found here (15*2 KeV) would presumably escape detection.
To confirm that the 8 KeV peak of fig. 42 was due to copper K X-rays,
an examination of the low energy gamma-spectrum was made using a glass
walled, aluminium cathode counter having no copper or brass components at
all. The spectrum obtained is shown in fig. 43* Calibration was effected
by the use of copper X-rays, (inset figure). No peak corresponding to the

200-
i
IOO-
I
fCuKoc'
Kev
Fig. 43. Gamma-ray spectrum "below 10 KeV.

137.copper K X-ray energy was found but the figure shows a broad peak about 5 KeV which can be ascribed to the L X-rays emitted by the source due to K-and L-capture and to internal conversion. The intensity of this radiation was evidently considerable since there must have been a large amount of absorption in the aluminium window and source cover.
The higher part of the gamma-ray spectrum is shown in fig. 44* There is an intense peak centred at ^40 KeV. The calibration peak on the same figure is due to the and flourescence X-radiations of samarium excited by allowing X-rays to fall on a thin layer of samarium oxide. The position and width of the source peak suggests that X-rays of energy higher and lower than the K* X-rays of samarium are emitted by the radioactivematerial. It was thought that the peak was due mainly to K-capture in
145 155Sm and internal conversion of the gamma-rays of Eu f giving rise to
the X-rays of promethium and gadolinium respectively. It would appear145that the activity of Sm J was roughly of the same intensity as that of
151 , ^ 155Sm and EuIt is impossible by the proportional counter technique to resolve
X-rays peaks as close in energy as the K X-rays in this region, so an attempt was made to resolve them using a motor driven X-ray crystal spectrometer which was borrowed from the Chemistry Department of the University. X-ray film was used as a detector and a calcite crystal for reflection of the X-rays. A preliminary run of a»24 hours, using all the available source, seemed to give a very slight indication of a first order reflection but on repeating the experiment no darkening could be observed indicating that the first result was probably due to a defect in the film. As it was necessary to go out to a much higher order to obtain adequate
resolving power, and as the intensity falls off rapidly with increasing

300
>200
g 100
Ii
IO 2 0 3 0 4 0 5 0 6 0 7 0QUANTUM ENERGY IN KEV
Fig. 44* Gamma-ray spectrum near 40 KeV.

order, it was evident that this method was not sufficiently sensitive. It
is possible that the use cf a curved crystal spectrometer might have proved successful but none was available. It might also have been possible to
gain some idea as to the structure of the X-ray peak by the use of the critical absorption technique. However, in view of the fact that X-rays of this energy are to be expected in any case, the attempt to resolve the X-rays was not carried further.
Mr. R.C. Bannerman of this department carried out an investigation of the higher energy gamma-rays emitted by the source, using a scintillation spectrometer. The intensity of such rays was rather low so that it was not possible to use the double crystal technique as would have been desirable in view of the complexity of the gamma-ray spectrum. Nevertheless he obtained the following, somewhat tentative, values of energy and intensity of gamma-rayss- ;
Energy(MeV) : 1.31 1.13 0.90 O .6 4 0.44 0.35 0.26 ^0.1Intensity : 1 1 1 0,3 weak 4 1*5 20(?)
152,154By referring to the gamma-ray energies ascribed to Eu , mentionedearlier, it is evident these gamma-rays could have been due to the sameactivity of activities.
145If Sm were to decay partly or wholly by positron emission, onewould expect to observe annihilation gamma-radiation. In view of thisand of earlier absorption and scintillation spectrometer results, which
suggested the existence of gamma-rays of &500 KeV, an experiment to observepossible coincidences between the gamma-rays was carried out. The sourcewas completely surrounded by l/l6th inch lead and the coincidence rate withtwo scintillation detectors noted (a) with an angle of 90°> and (b) with an
oangle of 180 , between the directions of the two detectors. If there had
been present an appreciable intensity of annihilation radiation, one would

139.
have expected an increase in the counting rate in the second case. Actually*using 1" crystals each at a distance of approximately 3", the coincidencerate remained constant within experimental error. The rates were (a)13.5 — 2.1. counts per minute and (b) 13.8 - 2,1. counts per minute. Theserates are ’’true” coincidence ra/tes, i.e. the ’’random" coincidence rate has
145been deducted. These results show that Sm , if present in quantity (as was believed to be the case), decays almost entirely by K-capture.5. Beta Spectra.
The beta-rays emitted by the source were examined using an end-correct
ed proportional counter of 8” operating length and 5*5H diameter placed in a magnetic field of 1400 gauss, parallel to the wire. The source was prepared as follows: 1 mgm of samarium oxide was dissolved in concentrated nitric acid, evaporated over a water bath to dryness, the residue dissolved in water and evaporated to dryness again. The samarium nitrate thus obtained, now free from acid, was dissolved in two drops of 1 Ofo insulin solution. This was transferred to a nylon film supported on a wire loop of diameter 0.35 A thin layer of "Aquadag" was depositedon the other side of the film to render it conducting, though, as was mentioned in Part 1, this was probably not necessary. The source and holder were then attached to a thin rod, held parallel to the wire, so that the source was situated half-way along the length of the counter. Thecounter was filled with methane to a pressure of 10 cm and argon to a total
2pressure of 50 lbs/in .Fig. 45 is representative of the spectrum analysis achieved using the
single channel kick-sorter. The upper energy end of the spectrum is shown
multiplied by a factor of ten for the sake of clarity. Discontinuities
on the spectrum, indicated by arrows, appear at (i) 70-80 KeV, (ii) ^ 1 5 0

5000-
4 00 0
3 00 0
2000
1000
KEV
Fig. 45* Beta-spectrura obtained using proportional tube
spectrometer.

140.
KeV, (iii) ^2^0 KeV, (iv) ~4Q0 KeV, (v) ~700 KeV. These various
end-points are associated with Sm ^ (70-80 KeV), E u * ^ (150 and 250 KeV) 154and Eu (400 and 700 KeV). As has been mentioned earlier, previous work
154by the absorption technique indicated that Eu emitted beta-rays having
spectrum end-points of 0.3 and 0.7 MeV.
Separate examination of the low energy region of the beta-spectra was
carried out and the spectrum shape obtained is shown in fig. 46. The
shape was considerably affected by the superposition of a number of peaks
due to conversion electrons and X-rays. These peaks can be satisfactorily
explained in terms of the conversion electrons of the various gamma-radia-
tions known to be present, bearing in mind the integrating properties of
the proportional counter described in part 3.
From the various spectra observed, and assuming an approximately
allowed form for the beta-spectra, it was estimated that the ratio of the155 151intensity of Eu to the intensity of Sm was approximately 3*1* Also
154the intensity of Eu is much greater than expected. The ratio of the154 155intensity of Eu to that of Eu is roughly 1*5 which is much greater
than thB maximum calculated ratio ( ''>1:600). This may be explained by
the presence of a very small amount of europium in the original spectro
scopically pure sample of samarium oxide (the (nrV ) cross-section for the
production of E u ^ ^ is very high), or oleO' reactions other than (n,If ) may
have taken place to an appreciable extent-,— e.g.— Sm^--- (n >p)Eu^ ^ .
6. Coincidence Studies.
In view of the complexity of the beta- and gamma-spectra indicated
by the proportional counter and by other experiments it was decided to
invoke the aid of the coincidence absorption technique which has been

COUNTS PER ENERGY
INTERVAL
1200
IOOO
800
600
400
200
END POINT OF Sm SPECTRUM
20 40 60 80 IOO 120 140 KEV
Fig, 46, Low energy region of beta-spectrum.

described in some detail in part 1* As a result of the experiments performed up to this point it was believed that the decay schemes associated
with the decay of (a) and (b) Sm^'^ were shown ir^fig. 47* In fig*
47 (A) the 15 KeV gamma-transition has been shown proceeding the 85 KeV transition* Ho clue is provided by the present experiments which allows
any decision to be made regarding the correct sequence of these gamma-rays.
The first set of experiments to test the decay schemes was to investi
gate the way in which the number of beta-gamma coincidences relative to the
total beta-counting rate varied as absorbers of increasing thickness were
inserted in front of the beta-counter. In the initial experiment a thin
window (1.7 mgm/cm ) G.M, counter was used to detect the beta-rays while
a lead-walled counter was used to detect the gamma-rays. (This counter
was the one used in the search for the possible emission of annihilation
gamma-rays in the decay of long-lived nickel, as described in part 2. )
Due to the low counting rate it was difficult to attain good statistical
accuracy, and the gamma counter was replaced by a scintillation detector
to improve the efficiency for detecting gamma-radiation. This detector
was shielded by 5/^4” of copper to stop electrons and soft X-rays. It is
believed that this may have been the first time that a scintillation
counter and a Geiger counter had been used in coincidence. It was found
fairly simple to operate them in this way and the set-up had a resolving
time of <^0*7^3ec. This was measured by irradiating the two counters
separately, giving risaccounting rates of Hp and Ng respectively, and
measuring the random coincidence rate, Ur, obtained. The resolving time,
't , is given by the simple formula
TT - Nr /2 H ! Hg
The results obtained using the two techniques were similar, except

Eu155 G d 155 Sm'51 Eu151
fiT 150 KEV
15 KEV
IOOKEV
250 KEV85 KEV
fiT 75 KEV
2 0 KEV
(A) (B)
155 151Pig, 47* Proposed decay schemes of Eu and Sm .

that smaller errors are associated with the second method and a typical
set of results using the scintillation detector is shown in fig. 48, in
which the beta-gamma coincidences per beta-particle are plotted in terms
of the thickness of , aluminium between the source and the beta-counter.
The experimental arrangement used is shown diagrammatically in an inset
figure. The coincidence absorption curve receives a ready interpretation
in terms of the decay schemes of fig.47* The first steep rise of the curve151to a/80 KeV is due to the elimination of the beta-rays of Sm , Since the
19*3 KeV gamma-ray which follows the decay is not detected by the scintill-151ation counter, the beta-rays of Sm do not contribute to the coincidence
rate but only to the single beta-counting rate. The less steep rise to
*■*150 KeV is presumably associated with the absorption of the bete-rays of1 RRhigher energy ( **250 KeV) of Eu since they do not contribute to the
coincidence rate. The elimination of coincidences arising from the 150 KeV155spectrum of Eu results in the break in the curve at *150 KeV, assuming
the proposed decay scheme is correct. The gradual falling off to lower154values is mainly due to the small amount of Eu present which gives rise
to beta-rays of energy as high as 0.7 MeV.
Some experiments on the variation of the electron-electfon ((£-&“ )
coincidence rate with increasing absorber thickness were carried out. In
the first experiment two thin window G.M. counters were placed opposite each
other, windows facing inwards, the absorbers being inserted between the
source and one of the counters. However as a large increase in the coin
cidence counting rate was caused by the particles making a count in one
counter and then being reflected by the gas or the wall into the other
counter giving another count within the resolving time of the circuit,
a second arrangement was adopted in which the counters were situated side

i-M
o i _ c . i
ABSORBER SOURCE SCINTILLATION/COUNTER150 KEV80 KE^
G M COUNTER l» COPPER
loo 200MGM/CMa ALUMINIUM
300 400
Pig. 48. Ratio of number of beta-gamma coincidences to the
number of beta counts as a function of aluminium absorber
thickness.

by side with the source about 1” in front of the windows, midway between
the counter tube axes. These experiments gave results consistent with
the interpretation of the beta-gamma coincidence experiments.155In the work of Marinsky on Eu , described earlier, he found that
this isotope possessed two beta-spectra of upper energy limits 154 and 243 KeV, and gamma-rays of energy 85 and 99 KeV. He found that the lower
energy beta-rays were coincident with gamma-radiation but he concluded
that there were no gamma-gamma coincidences. The above work leads to the
conclusion that the 99 KeV gamma-transition corresponds to the difference
between the two beta-spectrum end-points and that the soft gamma-ray detect
ed here (15*2 KeV) corresponds to the difference between the energies of
the harder quanta. The writer*s measurements of the beta-spectra are
consistent with a difference of 99 KeV (see section 5)* It is easy to155understand Marinsky*s failure to find gamma-gamma coincidences with Eu .
The 15 KeV quanta are not detected efficiently by most normal G.M. counters
and it is difficult to detect or measuie gamma-rays of such low energy with
the magnetic spectrometer. Moreover the presence of intense L-radiation
and theoretical reasons suggest strongly that the quanta are very highly
converted.
In spite of the high conversion of the 15 KeV quanta it was decided
to make a direct test of the scheme of fig. 6 (A) by seeking to establish155that the beta-rays belonging to the softer spectrum of Eu were followed
by gamma-radiation of energy 15 KeV. A beta-ray counter was covered with
sufficient material to stop all the beta-rays of (75 equivalent
thickness). Opposite this counter was placed a special G.M. counter de
signed to detect 15 KeV quanta efficiently. It contained ethyl alcohol

of on© atmosphere. In spite of the high pressure employed, the counter
operated in a stable manner and possessed a good plateau. This counter |;
was covered with polythene of thickness 270 mgm/cm which was adequate ;
to stop all beta-particles from the source while transmitting quanta of
15 KeV fairly efficiently. Polythene contains only hydrogen and carbon
and is therefore much more effieient in this respect than most other j
materials, even other plastics, which usually contain oxygen in addition j!
to hydrogen and carbon. The source was placed between the two counters
and the beta-gamma coincidence rate recorded as a function of the thickness
of aluminium placed between the source and the gamma-ray counter. It was
hoped that the coincidence rate might, initially, fall exponentially at a
rate corresponding to 15 KeV and then, as the absorber thickness increased
further, at a rate corresponding to the K X-ray energy of gadolinium, thusj rc
showing that the beta-rays of Eu were in coincidence with 15 KeV quanta
beta-rays do not interfere since they are completely absorbed).
The results are shown in fig,49 and indicate the prominence of two radiations,
The lesser slope corresponds to the absorption coefficient in aluminium
of quanta of energy 40 KeV which is approximately the energy of gadolinium
K X-rays. The initial slope, after the subtraction of the harder radia
tion, corresponds to an energy of 6 KeV, which is approximately the L X-ray
energy. Thus, while the test did not directly confirm the decay scheme of
fig, 6 (a ), this is the result one would expect if the 15 KeV quanta were
strongly internally converted.
When the absorber in front of the beta-ray counter was removed, thus
allowing the "beta-rays to enter, (total window thickness was then21.7 mgm/cm ), the number of beta-gamma coincidences per beta-particle

ILl£■UJOzUJQOZ83
300IOOm g m /c m 2 a l um i n i u m
200
Fig* 49* The logarithm of the number of. beta-soft gamma
coincidences as a function of gamma absorber thickness#

— 9 premained almost constant (l.l8 x 10 ^ and 1.14 %■ 10“ " respectively)
although the single beta counting rate had increased considerably. From151this it is deduced that the Sm beta-particles are likewise in coincid
ence with soft gamma quanta (19 *3 KeV) or with L X-rays arising from
internal conversion. This result affords direct support to the scheme
of fig. 6 (B).i
At the same time another test was carried out in an endeavour to
show that the 15 KeV quanta were in coincidence with 85 KeV quanta. Two j
sodium iodide crystals were used on opposite sides of the source with j
sufficient polythene in front of each to eliimrjaifce all beta-ray3 and the
gamma-gamma coincidence rate was observed as an increasing thickness of
absorber was placed in front of one of the counters. A straight line of
slope corresponding to ^40 KeV wa3 obtained, but no initial slope correspond-!KeV
ing ^15 KeV or a,$ KeV. Again this is easily understood if the l^jquanta
are strongly internally converted, since the discriminator setting of the
scintillation counter circuits made the counters insensitive to energies
as low as 6 KeV.
In conclusion it may be said that, while it did not prove possible
to fulfill the original purpose of the study, i.e. to investigate the151spectrum shape of Sm , much useful information regarding the bet a-and
151 155 154gamma-ray spectra of Sm , Eu ^ and Eu ^ was obtained and decay schemes,
consistent with the findings, were presented for the first two for the first
time. This work was published in the Proceedings of the Physical Society
(Wilson and Lewis, 1952)*

146*
PART 5. THB NATURAL RADIOACTIVITY OF RUBIDIUM,
1. Introduction*Since the principal purpose of the writer*s researches was to
investigate ’’radiations of low specific activity”, it was natural (as has
been mentioned in part l) to turn onQ*s attention to the natural radio
activities in the region of Z<80. These activities are, without exception,
very long-lived and hence of very low specific activity. Some of these
activities, e.g. K40 and Rb^, were discovered to be radioactive by actual observation of the radiations emitted. The activities of others, e.g.
In'*'^, In^^^, Re^^, etc., were deliberately searched for since the presence
of a neighbouring naturally occurring isobar made it seem likely that one
or other of the pair of isobars would prove radioactive.
The experimental results obtained for these activities have up till
now been very unreliable indeed, with the exception, in recent years, of
data on K4^. Using separated isotopes and the scintillation counter tech
nique, it has proved possible to determine the end-point, beta-spectrum
shape and decay scheme of k4° with some precision. In each of the other
cases, if an upper beta-ray energy limit is quoted, this value is fairly
low and well within the range of the proportional counter. The proportion
al counter is well-suited for other reasons which have been dealt with in
Part 1, but will be briefly recapitulated here. These reasons are; (a)
high solid angle, 2K for sources mounted on the wall, as will normally be
the case for these activities5 (b) large source area available; (c) since
the background is spread over a wide energy range, the ratio of counting
rate with the source present to the fraction of the background in the region
of the spectrum is greater than would be the case if only the counting rates
themselves were observed, as is the caae with Geiger-Muller counters, for

example. A programme of work was therefore embarked upon in Glasgow, the purpose of which was to investigate some of these activities using,
mainly, the proportional counter technique. A comprehensive investigationOn
of the activity of Rh was made and will he described in the following150pages, together with a brief account of preliminary results on Nd .
It may be worthwhile at this point to mention the method used by
Libby to examine the natural radioactivities (Libby, 1934 a,b, Libby and
Lee, 1939, Libby, 1939* etc. ). The apparatus used by him is known as the
"screen wall counter" and consists of a tube inside which is a coaxial wire
mesh cylinder which acts as a Geiger counter cathode. An axial tungsten
wire forms the anode. The counting volume is limited to one half of the
cylinder length. The source, mounted on a half length cylinder which just
fits inside the outer case, can be moved magnetically in and out of the
counting volume. Hence the counting rate with and without the source can
be determined. Ofcourse this method does not possess the background advant
ages of the proportional counter method, mentioned above. In an endeavour
to estimate the energies of the radiations an electromagnetic field is
applied axially and the smallest current necessary to keep the particles
from entering the counter through the screen wal}/is noted. Calibration of
current against limiting energy is carried out with known sources. This
method of energy estimation has not proved very reliable however, and has
tended to give low values as will be shown later. Also Libby sometimes
used absorption methods to measure the particle energies. The technique14has been used recently to measure the amount of C occurring in various
materials with a view to estimating their ages. It has been necessary
to cut down the background counting rate considerably and this has been
done by surrounding the counter by an 8" thick steel cylinder and a cylind-

rical array of anticoincidence counters which reduce the background from
45° counts per minute to 4.5 counts per minute (Anderson, Arnold and Libby,
1951).0*7
2. Previous Work on the Radioactivity of Rb .
This activity was first discovered by Sir J.J. Thomson as long ago-
as 1905 and has been the subject of many investigations since that time, in
spite of which, this present research was the first to yield reliable in
formation concerning the maximum beta-ray energy spectrum shape and the decay
scheme. In this rather remarkable work of Thomson (l905)> he investigated
the emission of electrons from rubidium and from a sodiura-potassium alloy,
with and without incident light falling on the surface, using a high vacuum
electroscope to detect the particles. He found that, even without light
shining on these metals, ionizing particles were emitted which he showed to
be negatively charged. Hence he concluded that rubidium and potassium or
sodium (or both) were radioactive, decaying by beta emission. He showed
that lead, silver and mercury gave no such effect. Two members of his
research team, Campbell and Wood (1906), further investigated the radio
activities and showed, by absorption, that the radiation of rubidium was
heterogeneous and less penetrating than that of potassium which they proved
to be the active constituent in Thomson*s alloy. They showed that sodium
and lithium were not radioactive. More recent work is summarised in the
following table (Table l) which gives the source thickness in mgm/cm , thexohalf life,T-, in 10 years, the end-point energy, E0, in MeV and the gamma-
ray energies, hp , in MeV,

149.
Table, 1.
Author mg/cm^ T E0 hv Remarks
Muhlhoff,1930 5:8 to 12 1.1 - Comparison of., „ absorption with RaE
Klemperer 1935 >i - 0.25 - Examination of Muhlhoff data
Libby and Lee1939 ? - 0.132 - Screen-wall counter
Ollano 1941 thick ~0.13 0.0340.0530.0620.1020.129
Gamma rays deduced from conversion photoelectron
Saha 1946. 300 - 0.144 - Modified Libby device
Eklund 1946 0.1 5.8 - - Counter with internal source
Fazzini and Franchetti 1948 - O.56 - Cloud chamber
Haxel and Houtermans 1948 *-0.1 6*9 ~0.01 *"0.135 Coincidences in
G.M. tubes
Haxe1,Houtermans and Kemmerich 1948
^0.1. 6.0 "6.01 ^0.135 Tentative allocation of decay (3-rays and electrons
Kemmerich 1949 0.03 6.0 - - Study of effect of source thickness.
The value of°£ is very important in connection with the question
of the age of the earth and of mineral deposits and separate studies have
been made with the evaluation of'TT as a principal object. Hemmendinger
and Smythe (1937) showed, by isotope separation, that the activity ofO r *
rubidium was due to Rb V Hahn, Strassman and Walling (1937) showed that

the rubidium-containing ore, lepidolite (Canadian mica), contained a
considerable quantity of strontium. (1012 gm of lepidolite containedQfj
7.16 gm of Rb - allowing for the 27*2^ abundance of this isotope - and
O.I56 gm of strontium). Mattauch (1937) showed that only the mass 87iR7isotope of strontium was present (*>99$ Sr ) thus inferring that its
Qf7presence was due to the decay of Rb . Using the above figures, Strassman
and Walling (193$) estimated the half life of Rb by comparison with the
uranium - lead ratio method of estimating the age of minerals and obtained
a value of 6.3 x 1 0 ^ years. This disagreed with the value obtained by
Muhlhoff but this could be partly explained by the fact that Muhlhoff was
unable to allow for the abundance of the radioactive isotope. This would
have reduced his value of 12x10^ years. The present agreement between the
geological value of the half life and the values obtained directly by
Kemmerich, 6.0 x 1 0 ^ years, and in this research, 6.15 x 1 0 ^ years, gives
one confidence in the use of the Rb-Sr ratio method of estimating the age
of minerals, as has been pointed out by Curran (1952) in his review on the
age of the earth and of mineral deposits.
Table 1 indicates the great uncertainty and mutual disagreement that
existed in the published values'of E0 and the number and energy of gamma-an
rays emitted. It isjinteresting fact that, after 45 years, so little should
be known of the decay and that such a wide range of values of Eo should be
quoted ( a^IO KeV -*1,1 MeV). These data will be considered in more detail
later when the results obtained in this research are discussed.O *7 p *7
From the stand-point of beta-ray theory the transition Rb St J + f3~
is of special interest. The spins of the ground states of both nuclei are
known5 the spin of Rb®^ is 3/2 (Jackson, 1933, Kopfermann, 1933, Miliman

f\*7and. Fox, 1936, Mi liman and Kusch, 1940) and of Sr 1 is q/? (Heyd a n and
Kopfermann, 1938) giving a spin change A I = 3 in the ground state to
ground state transition. The log ft value calculated by Feingold. (1951)
on the basis of EQ = 130 KeV and a half life of 6x10^ years, is 16.5?
corresponding to a third forbidden transition. Both Konopinski (1943)
and Greuling (1942) point out that the decay cannot be "second forbidden"
since the half life would have to be shorter by a factor of l-2xlC)\ whileif "fourth forbidden", the half life would belonger by a factor <vlO ,.
According to Gamow-Teller rules a spin change of three corresponds to a j
second or third forbidden transition, while by Fermi rules, it is third
or fourth forbidden. Wu (1950) has pointed out that this, probably unique,!
case in which the degree of forbiddenness (greater than unity) equals the j:
spin change .offers a seaching test of beta-ray theory. This fact, together1
with what has been mentioned previously, makes the investigation of the •87radioactivity of Rb of very great interest indeed.
3. The Beta Spectrum.
The experimental arrangement used was, firstly, an end-corrected
proportional tube, diamter 5*5"> active length 10", surrounded by a lead
shield of thickness 2". Later, an array of Geiger tubes, 2" in diameter,
operating in anticoincidence with the proportional counter, was added as
shown in figure 50. The first arrangement reduced the background counting
rate from ^1200 c.p.m. to ^400 c.p.m., and, in addition, the maximum of
the background pulse spectrum moved to higher energies. The addition of the
anticoincidence array reduced the background rate still further to ~100 cp,m
The spectrum was analysed both by the photographic and&y the single channel
"kicksorter" methods. The fluorescence X-rays of silver, used at high gain,
were used to calibrate the spectrometer which was filled with methane to a

Fig. 50. Proportional counter with lead and anticoincidence shielding.

partial pressure of 20 cm. plus argon to a total pressure of five ,
atmospheres. !
The source was prepared by depositing spectroscopically pure rubidium
chloride evenly on the inner surface of an aluminium cylinder which wasj
inserted into the counter tube and which acted as the cathode. The surface
of the aluminium was firstly thoroughly cleaned with hot concentrated
sodium hydroxide solution. The rubidium chloride ( ^1 gm) was dissolved[
in hot water and laid down smoothly using a fine brush, over an area* 2 2 ^ 700 cm giving a source thickness of ^1.5 mgm/cm , Later when a
2thinner source (0.128 mgm/cm ) was used to investigate the low energy region and to determine the half life accurately, a slightly different technique j
was used to ensure that all of the carefully weighed chloride was deposited j
on the foil. In this case a specially prepared glass wiper was used to i
spread the source evenly. “Both sources appeared to be uniform in thickness
and care was taken to keep the sources sufficiently far from the non-count
ing regions so that no particles could enter these regions, 1
Using the thicker source at two different gain settings in the exact
ratio? of 4*1» ‘the spectrum shape indicated by the open circles and dots
in fig. yi was obtained. These two sets of results were fitted by divid
ing the intensity values of the higher energy readings (dots) by four and j
multiplying the abscissae by four, since the time of running at each gain
setting was the same. As can be seen from fig. a good fit was obtained.
The shape of the spectrum at high energies is shown in greater detail in
the inset figure. From this graph, after subtracting the background
spectrum, the upper energy limit, E qs was calculated to be ^275 KeV, a
result which was confined by the Fermi plot, shown later. The region of j
low energy, i.e. below 40 KeV, was examined separately using the thinner |

NUMBER OF
PULSES PER ENERGY
INTERVAL
1400 800
6001200
IOOO 400
200800
600 200 250 300 350 KEV150
400
200
IOO 150 200 250 300 350 KEV50
Fig. 51* Beta-spectruna of RB .

c.source (0.128 mgm/cm ). Fig. 52 shows the results obtained. Tbe curve
A is that obtained from the spectrometer, curve G is the separately deter
mined background spectrum and B is the spectrum shape with background
subtracted. This curve was fitted to be spectrum of fig. 51 (shown by-
triangles) and smooth coincidence over the range 30 - 40 KeV was obtained.
Fig. 51 was obtained from photographic analysis results while fig. 52 was
obtained from single channel "kick-sorter” data. It is evident that,
below 30 KeV, serious absorption of the beta-particles took place in the
thicker source (see dashed line). It is believed that the final form of
the spectrum shape obtained is accurate down to ^ 10 KeV. No maximum
appears on the curve which falls steeply at first with increasing energy
and then exhibits an extremely long tail.
The "allowed” Fermi plot is shown in fig. 53* N is the number of2particles per energy interval, p the momentum, W the energy in Me units
and F is given by if nS-|F ( z ' w ) = J r 1 ' ^
F* (ZW) = -AD"2-*w _ J _________^ | _ g-wra-w/fS ~ ijl o C t o( — — ■ af.m»c rto., n u tU w radios in h/iTTm.*
‘ wwiH.The factor contained in the square brackets is constant and was omitted.
At this particular value of Z the simpler Bleuler and Zunt Method of
constructing Fermi plots cannot be employed. The curve departs very marked
ly from the straight line form given by an allowed transition. The shape
of the curve is in qualitative agreement with that expected for a third
forbidden transition with a spin change of three. The plot is linear in
the region of the maximum energy, E0, and extrapolation of this line gives
B0 = 275 KeV which is in agreement with direct observation. When this
result is combined with the value of the half life obtained in this work,

COUN
TS
PER
ENER
GY
INTE
RV
AL
1200-
8 0 0 -
4 0 0 -
O t------r~IO — i— 20 i—
3 0 4 0 KEV
87 2F ig . 52. Beta-spectrum of Rb , using 0.128 mgm/cm source,
100
80-
60-
255 240 280 KEV40-
20-
~\20 135 2 5 5 240 260 KEV40 80
87Fig. 53. Fermi plot of beta-spectrum of Rb

the log ft value becomes 17*6 , using the date, supplied by Feer.berg and
Trigg (l949)» The correction factor C ip given by Greuling (1942) can be put in the following, slightly simplified forms™
Q:j(prxr,r) in Greuling’s notation) for which different values must be substituted until a straight line Fermi plot is obtained. Thus the correction factor is not unique and is very laborious to calculate; hence the calculation was not completed. It is probable, however, that the adjustment can be made. *
It will be seen that the value of EQ obtained here is in agreement with that estimated by Klemperer on the basis of data obtained by Muhlhoff. The value obtained by Libby and Lee is much lower, viz. 132 KeV. This can be understood in terms of the peculiar shape of the spectrum and of the thick source Libby and Lee are believed to have used. If one considers
fig. 5 1, it is easily seen that the addition of a large background spectrum
2Where WQ is the maximum energy in Me units, W is the energy for which the calculation is being made, p is the momentumis an adjustable factor (the ratio of the matrix elements ^(ge^r) and
* See section 8.

155.87to the Rb spectrum, with its long tail, could easily lead one to
estimate the end-point to he *'130 KeV, The background spectrum of87Libby and Lee was relatively much larger in relation to the Rb counting
rate. Also the use of a thick source tends to reduce the number of high
energy electrons and increase the number of low energy ones, thus further
emphasising the peculiar spectrum shape. Also it should be noted that
the values of Bq for other activities obtained at this time by Libby and
Lee using the screen - wall counter are also low by later and more precise
work. In the following list of values of E0 obtained by these workers,
the modern value of E0 follows in brackets S ^ , 107 KeV (169 KeV)| Au19® 770 KeV(970 KeV);
K40. 725 KeV (1.4 MeV)? Rb87, 132 KeV(275 KeV).
It might be supposed that the long tail of the spectrum is due to the
integrating properties of the proportional counter i.e. due to the addition
of one or more coincident conversion electrons to the beta-particles.
However work still to be discussed shows that there is no appreciable X-ray
or gamma-ray intensity and also, since 2TC geometry is employed, one would
expect to observe strong conversion lines superposed on the spectrum if
such a process were taking place.
Saha's value (144 KeV) was also obtained with a screen-wall counter
of almost identical design to Libby's and he, too, used a very thick source
(o.3 gm/cm^). His valiie of EQ for 103 KeV, is likewise low and is
almost the same as Libby's. Hence the same criticism applies to his work.
Although Ollano is quoted as giving a value of 130 KeV for E0, he merely
points out that the spectral limit which he obtained was not inconsistent
with Libby's and that "the spectrum limit .... does not fall precisely at
130 KeV, as is said by Libby and Lee, b£t a little above this value."

As a matter of fact the electron spectrum published by Ollano consists
mainly of a series of peaks and the intensity actually approaches a
maximum near 130 KeV, beyond which energy he did not make any observations.
Further discussion of his results will follow in section 4.
The work of Haxel, Houtermans and Kemmerich seemed to indicate that
two particles of energies «vlQ KeV and «>135 KeV were emitted in coincidence
per disintegration. They examined the radiations from the two sides of
a thin layer of rubidium chloride evaporated on a 0.1 mgm/cm^ silver coated
Zapon foil which formed the dividing wall between two Geiger counters.
Their suggestion that the 135 KeV electrons were photoelectrons and that the
10 KeV electrons formed the beta-spectrum was based on the following
grounds: (a) 10 KeV suits the Sargent Diagram better, (b) Ollano's conver
sion lines and (c) it is difficult to imagine a conversion line of such low
energy as 10 KeV in coincidence. Anticipating some later findings, the
suggestion of the emission of 'two electrons per disintegration can be elimi
nated. It is clear that the unusually high intensity of the beta-spectrum
at low energies explains to some extend their observations and it seems
fairly certain that the coincidences were due to electrons making counts
and then being reflected by the counter wall or gas into the other counter,
thus giving two counts in coincidence. They used this experiment to deter-Q *7
mine the half life of Rb but in such a way that the question as to the
decay scheme did not affect the result. They thus got a value of T in good
agreement with the geological method and with the value obtained in the
present research. *
4. Gamma Radiation and Conversion.
As was mentioned earlier, the non-appearance of conversion lines
superposed on the spectrum was in disagreement with Ollano's results,since* See also section 8.

COUN
TS
PER
ENER
GY
INTE
RVA
L
12 O -
IOO “
80-
60-
40-
20-
RbKf t
Sri
—I--- 1 r-- r_— i--'--- 1---1IO 20 30 4 0 K E V
OnFig* 54* K X-rays observed with Rb •

his spectrum seemed to consist mainly of conversion lines. Hence a
sensitive search for the X-rays which would result from such conversion2was undertaken. The thick source (1.5 mgrn/cm ) of RbGl was covered with
2sufficient aluminium to stop all heta-rays. (5$ mgm/cm )» This absorber
reduces the int ensity of the K X-rays of strontium to about 5Of0* The
spectrum of such X-rays was observed at two different values of gain and
one of the resulting histograms is shown in fig. 54» in which a peak of low
intensity sppears. The average efficiency of the counter, at two atmos
pheres pressure of argon, for such rays was assessed at ^8 4 By estimat
ing the area under the peak, the total number of X-rays emitted in unit
time was determined from the histogram and comparison with the number of
beta-rays emitted in unit time showed that the X-rays were down in intensity
relative to the beta-rays by a factor of more that 500* The extremely low
intensity of X-radiation made accurate atomic number assignment of the
X-rays difficult but from fig. 54 it appears that allocation to rubidium
rather than strontium is preferable. This intensity of X-rays-js not
inconsistent with the view that the X-rays are generated by bombardment of
the rubidium by the beta-radiation. In any case it seems certain that
internal conversion in the K-shell of do83 not occur in more than
0.2$ of the disintegrations. This result completely contradicts the con
clusions of Ollano and leads to the suggestion that the electron groups
observed by him are spurious and are the result merely of statistical
fluctuations.
However it was still possible, though only remotely so, that the
gamma-radiation, if any, might convert in the L-shell only. Hence a
separate search for L X-ray quanta was carried out. Since the L X-rays
of strontium ( rj 1.8KeV) would be almost completely absorbed by an aluminium

w 2800- zZ>
; u .; OI g 2000-
I' Iz >
hO 73 . 3 0 KEV
55* Search for L X-rays. Counting rate as discriminator biasis varied over a range including the L-radiation.
I

158.
■beta absorbing screen, another method had to be devised, as follows. The
counter with the thicker rubidium source, but with no absorber, was conn
ected through a discriminator unit to a scaler. Using as calibration the71X-rays emitted in the decay of Ge , the discriminator bias setting corres
ponding to an energy of 1.8 KeV was determined. How if L X-rays are
emitted in some disintegrations, in 50$ of such cases the X-ray will not
be detected in. coincidence with a beta-particle (due to the use of 2TT
geometry). Hence if the bias setting is varied over a wide range below
and above the setting corresponding to 1.8 KeV, a sharp rise in counting
rate should accur at that setting* Fig. 55 shows that no appreciable
discontinuity can be found. Even if the slow rise on the curve is distort
ed to create a discontinuity as shown by the dashed line in the figure an
upper limit of 3$ is found for the number of disintegrations accompanied
by L X-rays. It is very much more probable, however, that the upper limit
is not greater than for the K-radiation, ie. 0,2$. Thus there is ho real
evidence of conversion of gamraa-radiation in either K- or L-shells in more
than 0.2$ of the disintegrations.
A sensitive search for gamraa-radiation itself was carried out by
Mr. Bannerman of the Natural Philosophy Department. He used a sodium
iodide (thaJlium activated) scintillation crystal surrounded by /v5»6 gm.
of rubidium chloride. The crystal was shielded from the beta-rays with
aluminium. There appeared to be a very small additional counting rate with
the source in position, but there was no indication whatever of homogeneity
of the pulses produced, which were almost certainly due to bremsstrahlung
excited by the passage of beta-rays through the aluminium. Whatever the
origin of the pulses, it can be said with certainty that gamma-radiations
in the range 20-100 KeV cannot be released in more than one per 5000
159.
disintegrations and in more than one per 1000 disintegrations in the range
100-300 KeV.
Thus as a result of the search for K X-rays, L X-rays and gamma-quanta
and because of the lack of conversion peaks in the heta-ray spectrum, it
appears certain that the probability of the beta-decay leaving the nucleus S r ^ in an excited state is negligibly small. The decay process consists
of a beta-transition between the ground states of R b ^ and Sr^.
5. The Period HT.
The most recent accurate value of ''C obtained directly from the radio
activity is that due to Haxel, Houtermans and Kemmerich. It has already
been pointed out that the work was based on wrong assumptions regarding the87mode of decay of Rb , though, as they themselves pointed out, their method
of deducing the number of disintegrations gives a value which'is independent
of their assumptions regarding the decay scheme. In fact it is equivalent
to correcting for the reflection of the beta-particles. It was thought of
importance to make a separate, very careful determination of TLto compare
with theirs, and with the geological value.
The thin source used formthe examination of the low energy part of the
spectrum (0.128 mgm/cm ) was also used for the determination of X . The
rubidium chloride employed was spectroscopically pure and was shown to
contain only 0.018$ of moisture, i.e. a negligible amount. 0.10075 gra» of
the chloride was weighed out and deposited very carefully and evenly on an
aluminium backing as described in section 2. This source gave rise to an
additional 1477 counts per minute with a statistical accuracy of better than
1$. Allowing for the solid angle of 2TT , chemical composition and^ 10isotopic abundance, this gives directly a value for X of 5*95*10 years.
This value must, however, be corrected for (a) reflection of particles

in the source and support and (b) the self-absorption of the source,. In
the estimation of (a), data on reflection due to both Yaffe (1950) and
Burtt (1950,1949) was used. Their results are in reasonably good agreement
but both plot the reflection coefficient as a function of the maximum
energy EQ. However in view of the remarkable shape of the R b ^ spectrum
it appears more desirable to estimate the reflection in terms of the averageQn
energy, E, of the beta-rays. Thus, although the value of EQ for Rb
(275 KeV)js considerably in excess of those of S^(l69 KeV) and (l58KeV),87the average energy of Rb is only 44 KeV, less than the values of 54 KeV14and 52 KeV for 3 J and G respectively. As result of much consideration
a value of 7*5$ was finally adopted for the reflection coefficient. In the
estimation of (b) it was assumed that the source was equivalent in thickness
to electrons of energy 5 KeV. Then the number of 4 KeV, 3 KeV, 2 KeV and
1 KeV electrons absorbed by the source was calculated and thus the fraction
of all electrons of energies less than 5 KeV, failing to get out of the
source, was found. The ratio of the number of these electrons to the
total number emitted was calculated by extrapolating the spectrum of fig.51 as a straight line to zero energy. The value deduced was 4*5$* Thus the
total contribution to the counting rate due to these causes is (7»5 - 4«5)$»
giving a value of 'Hof 5»95 x 1.03 or 6,15 x 1 0 ^ years. The chief uncer
tainties in the value arise from the estimation of the errors and,allowing
for these and for the statistical error, an error of ^ 4 $ was believed to
be possible. Thus with these rather conservative limits the final value
of 'T becomesX - 6.15 0.3 x 10 years.
6. Conclusions and Discussion,87The experiment showed that the beta-decay of Rb is simple, involving
87 87a transition from the ground state of Rb to the ground state of Sr ♦

161.The maximum energy, E0j ±3 found to he 275 KeV* The shape of the spectrum
is qualitatively in agreement with that predicted for a spin change of
three with a change of parity. So far as future work is concerned it does
not seem that any outstanding experimental work requires still to he done
(unless for confirmation) and further interest in the decay must lie prin
cipally with the theorists. However, since Nal and KI crystals have heen
used successfully as scintillators, the writer feels it would he of interest
to re-investigate the heta-spectrum and possible very weak electromagnetic
radiations by the use of a Rbl crystal.
There are, however, many other interesting problems in the field of
natural radioactivity and for this purpose a new type of counter has been
designed by the writer specially for this purpose. It is shown in fig.56.
It is so arranged that one of the end plates can be removed to insert a
source without removing the wire as is always the case in the ordinary
design of counter. It is often necessary in studies of this kind to open
the counter frequently e.g. to compare the counting rate with and without*
the source present, to investigate the beta activity of a source and then
the gamma activity with the beta-particles absorbed out, to compare differ
ent sources, etc. The counter is end-corrected and possesses two 0.002"
aluminium windows, one at the centre of the counting volume, the other at
one end of the counting volume. The counting volume is 10" long and 5*5" in diameter.
A very interesting fact with regard to the natural radioactivities has
been pointed out by Dr. S.C. Curran. In table 2 are listed the calculated
log ft values for the natural radioactivities.-

0-002" ALUMINIUM WINDOWS.
END CORRECTION TUBES
:xx x\xxx\: x : x X ;X X s \ X N \ \ \ X X X X X S X X x X
_6L J
Fig. 56. Special counter“built for investigation of natural
radioactivities.

Table 2*
Source Eo(MeV)
TO1010 yr 1 o g
87Rb 0 .2 75 6.15 17*6K40 1.36 0.11 1 8 .0 5
Lu1?6 f 2 .4 f 18.021187 \ or 0.4 J lor 18 .91J
Re f 0 .04 3 4 . 0 17 .73150Nd 0.011 5 13*73
87Usiing the new value of Bo, 275 KeV, the value of log ft for Rb rises from
16.5 to 17.6. A remarkable grouping about log ft = 18 is immediately
apparent. A considerable gap exists between this value and that of the
next well - established value of 13*65 for the artificially radioactive
isotope Be"^ though a fairly uniform distribution exists below this value.
The value of log ft for calculated for E 0 = 11 KeV and "T = 5 x10¹⁰ years appears as an obvious exception. However preliminary work
carried out in Glasgow and in America has shown that these values, which
are due to Libby (l934)> are almost certainly wrong. This work will be
briefly described in the following section. One may predict, on the basis
of this fact, that the half life and/or the value of E0 should be greater.
If Libbyfs value of the half life were used, an upper energy limit of 250
KeV would be predicted.
A brief account of this work was published by Curran, Dixon and Wilson
(1951) and a fuller account by the same authors appears in the Philosophical Magazine (1952).7. Preliminary Work on N d ^ 0
Libby (1934) using the screen-wall counter obtained a half life of
163,12
1.5 x 10 years for the activity and an upper energy limit for the ‘beta-
spectrum of 11 KeV. Kohman (194-8) corrected Libby's value of the half150life for isotopic abundance on the assumption that Nd was the active
10isotope and this gave a half life of *»8 x 10 years.
On the basis of these figures it was calculated that 1 gm. of
neodymium should give a total counting rate of 5920 counts per minute, an
easily detectable activity. Of course, only half this rate is expected
if the source is mounted on the wall of the counter. The source was
prepared by disolving 0.413 gm. of spectroscopically pure neodymium in \
hydrochloric acid, the solution evaporated to dryness, the residue dissolved
in a % solution of insulin in water and the solution brushed evenly over
a hot aluminium liner, as in the case of rubidium. The liner was inserted
in a large proportional counter which was filled to a pressure of two
atmospheres of argon plus methane to a partial pressure of 10 cm. of
mercury. From 0.413 gm. one woiild expect a counting rate of 1225 counts
per minute above background. Actually the increase in counting rate was
certainly not more than 50 counts per minute above background and the spectrum obtained by pulse analysis did not differ to a significant extent
from the background spectrum.
It appears, therefore, that the activity, if it exists, is of very
much longer half life than that stated by Libby, Also there is no evi-
dende, within the limitations of the apparatus, of a spectrum ending at
11 KeV. However this experiment was operated without the anticoincidence
counters with the result that the background rate was rather high, ^400
counts per minute. It is hoped to make another attempt in the near future
with larger quantities of source and lower backgrounds, since, at the
present time, nothing definite appears to be known regarding this decay.

In a very recent article of Mulbolland and Kohman (1952) and in a.
private communication of Kohman*s to the author, an investigation of the
activity of Nd^''^ was described. A 15 gm. layer of highly purified
neodymium oxide in a proportional tube gave a counting rate in excess of
background ( 60 counts per minute) of 4 counts per minute. If this were150 1 cdue to Nd ^ , it would correspond to a half life of 2 x 10 ^ years.
However it is believed to be due to the increase in the garama-ray detection
sensitivity of the counter, caused by the source layer. This increase in
sensitivity was calculated to be <*11$. All that can be said, therefore,15is that the half life of the activity is greater than 2 x 10 years.
8. Recent Work on R b ^ .
Two very recent papers on this activity should be mentioned. Firstly,
MacGreipr and Wiedenbeck (1952) made another determination of the half life
obtaining a value of 6.23 0.3 x 1 0 ^ years which is in good agreement
with our own value. They also repeated Haxel, Houtermans and Kemmerich's
experiment but showed that the decay is simple, in agreement with our own
work and in contradistinction to the results of Haxel et al. Secondly,
Tomozawa, Umezawa and Nakamura, (1952) applied the C^, correction factor to
the Fermi plot obtained in this work and showed that it gives a straight
line from 100 KeV to the end-point at 275 KeV. If the effect of screening
is allowed for, theplot is linear down to 50 KeV. They suggest that the
lack of linearity below this could be due to "internal bremsstrahlung"
electrons or to experimental difficulties. They also showed that the
factor, as well as the C^, fits the spectrum, but that no other factor does. It will be remembered that vector (V), scalar (s) and pseudoscaler (P) interactions all yield Fermi selection rules, while tensor (T) and axial
vector (A) interactions yield Gamow-Teller selection rules. Thus, in view

165.
of the weight of evidence supporting Gamow-Teller rules, this experiment
suggests strongly that the "tensor" interaction is the correct choice,
though it may finally prove impossible to explain all spectra by the use
of any one interaction alone.Q r j
Mr. G.M. Lewis has recently examined the beta-spectrum of Rb by the technique suggested in section 6, viz. using a rubidium iodide crystal in
a scintillation spectrometer arrangement. He obtained a spectrum whose
shape is in good agreement with that obtained in this work.

APPENDIX.
EXPERIMENTS QN THE FLUORESCENCE OF ANTHRACENE.
The experiments to he described were undertaken at the suggestion
of Dr. J.B. Birks in order to test a prediction which he had made.
The absorption spectrum of anthracene in the crystalline form has
been investigated severe! times, for example, by Kortum and Finkh (1942)
and it may be represented, in a somewhat simplified form, as in fig. 57•
The fluorescence spectrum is a mirror image of the first absorption band.
This phenomenon is discussed by Pringsheim (1949? P*302) and is to be expected on theoretical grounds.
oSince another absorption band has been shown to exist about 2500 A
(fig. 57), one might expect to find a fluorescence band displaced somewhat
to longer wavelengths and, probably, forming a mirror image of the second
absorption band. The predicted fluorescence band is shown dotted in
fig. 57.Before describing the experiments designed to test the prediction,
it will be useful to consider the "potential curve" or"Jablonski" method
of indicating excited and grhund states which is more commonly used in the
present type of study than the ordinary energy level diagrams and is more
useful since it gives some indication of the intensities of the various
transitions. Fig.58 shows such a diagram for the case of a diatomicmolecule, which is the simplest one to consider. t7 is the potential
energy of the molecule at different distances J* of one atom from the other.
One atom may be considered to be at the origin. D corresponds to the
dissociation energy of the molecule. The horizontal lines represent the
vibrational energy levels and the length of each line corresponds to the
amplitude of that vibration. Now, since (a) the atoms spend most of their

2ND ABSORPTION BAND 1ST ABSORBTION BAND
ABSORPTION
FLUORESCENCE
2 5 0 0 4 0 0 0 4 6 0 0
Fig* 57* Absorption and fluorescence spectra of crystalline anthracene.
u
p
Pig. 58. Jablonski diagram for diatomic molecule.

167.
time at the ends of the vibrational motions, the most probable transitions
take place from the ends of the vibrations and since (b) the electronic
motion is very much more rapid than the nuclear motion, the transitions
are represented by vertical lines - since r does not change appreciably
in the time for an electronic transition to take place (Frank - Condon
principle). Such transitions are shown in fig. $8. The molecule in the
diagram is excited from the lowest vibrational level of the ground state
to the eighth level of the first excited state and then energy is lost by
transitions between vibrational levels. Eventually a transition is made
from some level (in the diagram, the lowest level) of the first excited stsbe
to the ground state (fluorescence radiation). Two possible transitions
are shown. One transition goes diredtly to thelowest vibrational level in
the ground state while the other goes to the eighth vibrational level, the
remaining energy being reduced by further transitions between vibrational
levels. An important point must be noted here. From what has been said
one might expect all the transitions to take place in one molecule alone.
This is not the case. Transitions between vibrational levels are
normally associated with a collision between the excited molecule and
another, which carries off the energy, less the small amount corresponding
to the energy difference between the vibrational levels. In this way fig.
58 might correspond to transitions taking place in seven or fifteen different molecules.
The existence of the vibrational levels gives the reason, of course,
for the broadness of the absorption and fluorescence bands. In the case
of a more complex molecule like anthracene, the picture becomes much more
complicated. Fig.58 may be considered to represent the oa.se of anthracene, though not quantitatively, if r is interpreted as the distance between two

1POLONIUM SOURCE
ANTHRACENE CRYSTALLIGHT TIGHT BOXANTHRACENE CRYSTAL
QUARTZ CELL AND FILTER SOLUTION
QUARTZ LENS
CADMIUM SPARKCOLLIMATORCOLLIMATORQUARTZ SPECTROSCOPE
(a.) (b)
Fig. 59* Experimantal arrangement (a) using alpha-source,
(b) using ultra-violet illumination.

atoms, or two parts, of the molecule.
Experimental Procedure*
In the first instance it was decided to escite the molecules of
anthracene by exposing an anthracene crystal to alpha-particle bombardment,
A strong polonium source ) was placed close to a crystal and the
emitted spectrum examined using a Hilger Quartz Spectroscope, which could
be used to measure wavelengths between 1800 A and 7000 1. The experimen
tal arrangement is shown in fig. 59(&)• An exposure of several hours
duration was made using the fastest plate obtainable, i.e. Ilford HP3.
This exposure gave only a very faint image at the first fluorescent band,
but nothing at the supposed position of the second. An exposure of ^ 48 hours was then made. It was noticed at the end of this period that the
crystal fluoresced scarcely at all, although the initial fluorescence had
been quite apparent. The crystal itself was discovered to have a very
distinct brownish discolouration. This was believed to be due to decom
position bf the anthracene molecules. It was known that many fluorescent
materials were somewhat easily altered (generally for the worse from the
fluorescent standpoint) by strong overexposure to ultra-violet light, but
it is believed that it had not been observed before with particle bombard
ment, at any rate for organic phosphors. The result is not surprising but
it is nevertheless important in view of the considerable and extending use
of scintillation counting techniques. The fact was reported by Birks in a
letter to the Physical Society (Birks, 1950) and the phenomenon was further
investigated by Birks and Black (1951)> who found that the number of
scintillations remained constant but that the pulse size was reduced12considerably ( to ^ 3 of the original) after bombardment by a 3 x 10
alpha-particles per square centimetre. The law governing the reduction

169.
of pulse size was approximatelyI = I Io I + AN
where l/lQ is the ratio of the pulse amplitudes after and before2bombardment by N alpha-particles per cm . A is a constant having the
-11value ~ 10
Returning to the search for the proposed second fluorescence band, it
was decided to use instead of the polonium source, the cadmium 2469.8 A line whose wavelength coincides approximately with the centre of the
second absorption band. The apparatus used is shown in fig. 59(b). The
light from the cadmium spark was passed through a quartz condensing lensoof short focal length, through a filter which absorbed light above 3500 A
and focutsed on the anthracene crystal. To cut down the stray light
reaching the plate the crystal was arranged at such an angle that the
light from the cadmium spark was reflected away from the slit. This,
however, did not prevent the fluorescence radiations entering the
collimator. The filter solution was prepared using a formula due to
Bowen, i.e. 49 gra. of hydrated nickel sulphate and 13 gm. of hydrated
cobalt sulphate dissolved in 100 c.c. of water. The sulphates must be
pure and, especially, iron-free. The solution thickness was 1.5 cm.
Several exposures were made, on HP.3. plates, with different exposures and
different distances of the cadmium spark. In none of these plates was
there any indication whatsoever of a second fluorescence band. Indeed,
if one does exist, the intensity relative to the fluorescence band is
less than one part in two hundred.
The result can be explained by saying that the transition from the
second excited state to the first is radiationless and is accomplished
entirely by a series of transitions from one vibrational level to another.

In this case the potential curve of the second excited state must
intersect the first excited state as in the tentative curve drawn (dashed)
in fig. 58* (Pringsheim, 1949> p.246). This means that the energy
could he transferred from a low vibrational energy level inthe second
excited state hf one molecule to a higher vibrational energy level of the
first excited state of a second molecule and no fluorescent radiation
being emitted.
This experiment, therefore, showed no evidence of a fluorescence band
corresponding to the second absorption band. However it would be interest
ing to find out whether excitation to higher energy levels (probably by
electron or X-ray excitation) would give rise to other fluorescence bands.

171
REFERENCES Agnew, H.M., 1950? Phys, Rev. 77. 655*Agnew, H.M. and Anderson, H.L., 1949? Rev. Soi. Inst.20, 8 6 9.Albert, R.D. and Wu, C.S., 1 9 4 8, Phys. Rev. 74. 847*Alburger, D.E., 1950, Phys. Rev. 79. 236.Allen, J.S., 1942* Phys. Rev. 61, 6 9 2.
Anderson, E.C., Arnold, J.R. and Libby, W.F., 1951, Rev.Soi.Inst.22,225. Angus, J., Cockroft, A.L. and Curran, S.C., 1949? Phil. Mag.40. 522.
Backus, J., 1945? Phys. Rev. 68,- 59*von Baeyer, 0. and Hahn, 0., 1910, Phys. Zeit. 1JL, 4 8 8.
von Baeyer, 0., Hahn, 0. and Meitner, L., 1911? Phys. Zeit. 12, 273, 378$ 1912, Phys. Zeit. 13. 2 6 4.
Bannerman, R.C. and Curran, S.C., 1952, Phys. Rev. 8^, 134*
Bannerman, R.C., Lewis, G.M. and Curran, S.C., 1951, Phil. Mag.42, 1097* Bethe, H.A., 1947, '’Elementary Nuclear Theory” (Wiley).Bethe, H.A. and Bacher, R.F., 1936, Rev. Mod. Phys. j5, 194*Binder, D., 1950, Phys. Rev. J_8, 325*Birks, J.B., 1950, Proc. Phys. Soc. A 63. 1294.Birks, J.B. and Black, F.A., 1951, Proc. Phys. Soc. A 6 4, 5H«Bleuler, E. and Zunti, W., 1946, Helv. Phys. Acta, 19, 375*Bonetti, A., 1950, Bull, du Centre de Phys. Nuc. de Bruxelles^May, No.19* Braden, C.H., Owen, G.E., Townsend, J., Cook, C.S. and Shull, F.B., 1948,
Phys. Rev. 74. 1539*Brosi, A.R., Borkowski, G.J., Conn, E.E. and Griess, J.C., 1951,
Phys. Rev. 8l„ 391.
Brosi, A.R. and Griess, J.C., 1949, ORNL - 499 (unpublished)
Brown, H. and Perez - Mendez, V., 1949, Phys. Rev. 7£, 1286.

172,
Burtt, B.P., 1950* "Absolute Beta Counting", Nuclear Science Series, Prelira. Report No. 8 .
Burtt, B.P., 1949, Nucleonics No..2, 28.Butement, F.D.S., 1951, Nature 167. 400.Campbell, N.R. and Wood, A., 1906, Proc. Camb. Phil. Soc. 14. 15* Chadwick, J., 1914, Verh.d.D. Phys. Ges. 16. 383.Cockroft, A.L. and Curran, S.C., 1951, Rev. Sci. Inst. 22. 37*Cockroft, A.L. and Valentine, J.M., 1950, Jour. Sci. Inst. 2j[, 262. Conn, E.E., Brosi, A.R., Swartout, J.A., Cameron, A.E., Carter, R.L.,
and Hill, D.G., 1946, Phys. Rev. JO, 7 6 8.Cook, C.S., Langer, L.M. and Price, H.C., 1948, Phys. Rev. 73. 1395* Cork, J.M., Shreffler, R.G. and Fowler, C.M., 1948, Phys. Rev. 74. 240. Corson, D.R. and Wilson, R.R., 1948, Rev. Sci. Inst. 19. 207.Crane, H.R., 1948, Rev. Mod. Phys. 20. 2 7 8.Crane, H.R. and Halpern, J., 1938, Phys. Rev. 53. 789*Crane, H.R. and Halpern, J., 1939, Phys. Rev. 5 6, 232.Curran, S.C., 1950, Atomics JL, 221.Curran, S.C., 1952, Atomics 3., 5*Curran, S.C., Angus, J. and Cockroft, A.L., 1948, Nature 162, 302.
Curran, S.C., Angus, J. and Cockroft, A.L., 1949a, Phil. Mag. 40. 36.Curran, S.C., Angus, J. and Cockroft, A.L., 1949L, Phil. Mag. 40. 53.Curran, S.C., Angus, J. and Cockroft, A.L., 1949©, Phys. Rev. 7 6, 853.Curran, S.C. and Baker, W., 1944, Rad. Lab. Rep. 7*6 ,16,Nov.17.Curran, S.C. and Baker, W., 1947, Rev. Sci. Inst. 19. 116.Curran, S.C., Cockroft, A.L, and Angus, J., 1949, Phil. Mag, 40, 929*
Curran, S.C., Cockroft, A.L. and Insch, G.M., 1950, Proc. Phys.Soc.
A 63, 8 4 5.

173.
Curran, S.C. and Graggs, J.B., 1949? "Counting Tubes" (Butterworths).
Curran, S.C., Bee, P.I. and Fetrizilka, V., 1938, Proc. Roy.Soc. A 169. 269.
Curran, S.C., Bixon, B. and Wilson, H.W., 1951, Phys. Rev. 8 4 , 151.Curran, S.C., Bixon, B. and Wilson, H.W., 1952, Phil. Mag. 43. 82.
Banysz, J., 1913, Le Radium, LO, 4 .Beutsch, M., Elliott, L.G. and Evans, R.B., 1944, Rev. Sci.Inst.15. 178.
Beutsch, M. and Wright, W.E., 1950, Phys. Rev. 77. 139*Bunworth, J.W., 1940, Rev. Sci. Inst. 11, I6 7 .Bzelepow, B,, Kopjova, M. and Vorobjov, E., 1 9 4 6, Phys. Rev. 6 9 . 538.
Ellis, C.B. and Wooster, W.A., 1927, Proc. Roy. Soc. A 117. 109*Ellis, C.B. and Skinner, H.W.B., 1924, Proc. Roy. Soc.A 105. 60.Eklund, S., 1 9 4 6, Arkiv. Mat. Astron. Fysik 33A. 60.Fazzini, T, and Franchetti, S., 1948, Nuovo Cimento, j), 311.
Feather, N., 1930, Phys. Rev. 3J5., 1559.Feather, N., 1938, Proc. Camb. Phil. Soc. 34, 599*Feather, N. and Richardson, H.O.W., 1948, Proc. Phys. Soc. 61. 452.Feenberg, E. and Trigg, G., 1950, Rev. Mod. Phys. _22, 399*Feingold, A.M., 1951, Rev. Mod. Phys. 23. 10.Feister, I., 1950, Phys. Rev. 7 8 , 375*Feldman, L. and Wu, C.S., 1949, Phys. Rev. J6, 6 9 7.
Fermi, E., 1934, Zeits. fur Phys. 88. 161.Fermi, E., 1950, "Nuclear Physics" (University of Chicago Press)
Fernelius, W., 1946, "Inorganic Syntheses", Vol.2 (McGraw-Hill), p.234*
Flammersfeld, A., 1946, Naturwiss. 33. 280.Friedlander, G.F., 1949, BNL - AS - 2 (unpublished).
Friedlander, G.F. and Wu, C.S., 1943, Phys. Rev. 63, 227.

174.
Gamow, G. and Teller, E., 1936, Phys. Rev. 49, 895*
Geiger, H. and Klemperer, G., 1928, Zeits. fur Phys. 49. 753.Geiger, H. and Rutherford, E., 1912, Phil. Mag. 24. 6l8 .Geoffrion, C., 1949? Rev. Sci. Inst. 20. 6 3 8.Gibson, W.M., Green, L.L. and Livesley, D.L., 1947, Nature l60, 534*Glendenin, L.E., 1948, Nucleonics j?, No.l, 12.
Good, M.L., 1951, Phys. Rev. 8 3. 1054*Greuling, E., 1942, Phys. Rev. 61, 5 6 8.Gross, L. and Hamilton, D.R., 1950, Phys. Rev. 78. 318.das Gupta, N.N, and Ghosh, S.K., 1946, Rev. Mod. Phys. 18, 225.
Hahn, 0., Strassraan, F. and Walling, E., 1937, Naturwiss. 25. 1 8 9. Hamilton, D.R. and Gvoss, L., 1950, Rev. Sci. Inst. 21, 912."Handbook of Chemistry and Physics", 1949, 31st. ed.(Chemical Rubber
Publishing Co.), p. 2031.Hanna, G.C. and Pontecorvo, B., 1949, Phys, Rev, 75. 983.Hayden, R.J., Reynolds, J.H. and Inghrara, M.G., 1949, Phys. Rev.j ji, 1500. Haxby, R.O., Shoupp, W.E., Stephens, W.E. and Wells, W.H., 1940. Phys.
Rev. 5 8, 1035*Haxel, 0. and Houtermans, F.G., 1948, Zeits. fur Phys. 124, 705*Haxel, 0., Houtermans, F.G. and Kemmerich, M., 1948, Phys.Rev. 74,1886. Haxel, 0., Jensen, J.H.D. and Suess, H.E., 1950, Zeits, fur Phys.1 2 8, 295* Hemmsndinger, A.H. and Smythe, W.R., 1937, Phys. Rev. 51. 1052.Heyden, M. and Kopfermann, H., 1938, Zeits, fur Phys. 108, 232.Hofstadter, R, and Mclnture, J.A., 1950a, Nucleonic 8_ L No,3, 32. Hofstadter, R« and McIntyre, J.A., 1950b, Phys. Rev. 78, 6 1 9.Hopkins, J.I., 1951, Phys, Rev. JJ_, 406.

175*
Hughes, A.L, and Rojansky, V. , -1-929, Phys. Rev. 34, 284.Inghram, M.G., Hayden, R.J. and Hess, B.C., 1947, Phys. Rev. Jl_, 643. Inghram, M.G., Hess, P.O., Hayden, R.J. and Parker, G.W., 1947, Phys.
Rev. 71? 743.Insch, G.M., 1950, Phil. Mag. 41. 857*Isotope Committee, 1946, Science 103. 697*Ivanenko, P. and Lebedev, V., 1950, Jour. Exp. Theor. Phys. U.S.S.R.20.
91 (Jan.). (English translation in Guide Russ. Sci.Period. Lit., Brookhaven, 1950, 3., June, 162 - 1 6 3).
Jackson, P.A., 1933, Proc. Roy. Soc. A 139. 673.Jacobsen, J.C. and Kofoed - Hansen, 0 . , 1948, Phys. Rev, 73. 675* Kapitaa, P.L., 1924, see p. 454 of Tricker (1 9 2 4) reference.Kemmericb, M., 1949, Zeits. fur Phys. 126, 399*Ketelle, B.H. and Parker, K.W., 1949, Phys. Rev. 76, 1416.
Klemperer, 0., 1935, Phil. Mag. 20, 545*Klempeter, 0., 1935, Proc. Roy. Soc. A 1 4 8, 6 3 8.Kohroan, T.P., 1948, Phys. Rev. 73. 16.Konopinski, E.J., 1943, Rev. Mod. Phys. 1^, 209.Konopinski, E.J. and Uhlenbeck, G.E., 1935, Phys. Rev. 4 8 . 7*
Kopfermann, H., 1933, Zeits. fur Phys. 8 3, 417*Korff, S.A., 1942, Rev. Mod. Phys. 14. 1.Korff, S.A., 1946, "Electron and Nuclear Counters" (Van Nostrand).Korff, S.A,, 1950a, Nucleonics 6, No.6, 5; 1950b, Nucleonics
No.5, 46; 1951, Nucleonics, fi>, No.l, 3 8.Kortum, G. and Finkh, B., 1942, Z. Physikal. Chem. B 32, 263.Krisberg, N.L., Pool, M.L. and Hibdon, C.T., 1948, Phys. Rev.74. 44.
Kurie, F.N.P., Richardson, J.R. and Paxton, H.C., 1936, Phys. Rev.49. 368.

176*
Langer, L.M., 1949, Rev. Sci. Inst. 20, 216.
Langer, L.M. and Cook, C.S., 1948, Rev. Soi.19. 257*Langer, L.M., Motz, J.W. and Price, H.C., 1950, Phys. Rev.77. 79®.Leipunslci, A.I., 1936, Proc, Camb. Phil. Soc. 32^ 301.Lewis, W.B., 1942, "Electrical Counting" (Cambridge)
Li, K.T., 1937, Proc. Camb. Phil. Soc. j>3, 1 6 4.Libby, W.F. 1934a, Phys. Rev. £*, 845? 1934b, Phys.Rev.4 6 ,196.Libby, W.F., 1939, Phys. Rev. 56. 21.Libby, W.F. and Lee, P.P., 1939, Phys. Rev. 55. 245*Longmire, C. and Brown, H., 1949a, Phys. Rev. 75. 2 6 4, 1102.Longmire, C. and Brown, H., 1949b, Phys. Rev.Jj), 328.MacGregor, M.S. and Wiedenbeck, M.L., 1952, Phys. Rev.86, 420.Marinsky, J.A., 1949, PhJ>. Thesis, Massachussetts Institute of
Technology, and, 1949, Prog.Rep.Lab, Nuc. Sci. Eng.No.13.July*
Marshak, R.E., 1949, Phys. Rev. 513*Mattauch, J., 1937a, Naturwiss. 25. 1 8 9| 1937b, Phys.Z.S. _38, 951*Maze, R., 1946, J. Phys. Radium^, 1 6 4.Mellor, J.W., 1932, "Comprehensive Treatise of Inorganic and
Theoretical Chemistry", Voib.V (Longmans), p.953*Mellor, J.W, and Thomson, H.V., 1938, "Treatise on Quantitative
Inorganic Analysis" (Griffins), p.420.Millar, L.C. and Curtiss, L.F., 1945, Pu. Proj. Rep. CP-3102 (August). Millman, S. and Fox, M., 1936, Phys. Rev. 50. 220.Millman, S. and Kopfermann, H., 1938, Zeits. fur Phys. 108,232.Millman, S. and Kusch, P., 1940, Phys. Rev. 5 8, 438.
Mitchell, A.C.G., 1948, Rev. Mod. Phys. 20, 296.
Miyamoto, G., 1942, Proc. Phys. Math. Soc. Japan, 24,676; 1943,

Proc. Phys. Math. Soc. Japan 17. 5&7* (in Japanese, translations available from author).
Montgomery, C.G., and Montgomery, D.D., 1940, Phys. Rev.- 57. 1030.
Moon, P.B., 1949, "Artificial Radioactivity" (Cambridge).
Muhlhoff, W., 1930, Ann. Physik. J., 205*Mulholland, G.I. and Kohman, T.P., 1952, Phys. Rev. 8 5 . 144*Nordheim, N.W. and Yost, F.L., 1937, Phys. Rev. ^1, 942.Ollano, Z., 1941, Nuovo Cimento 18, 11.Parker, G.W,, and Lantz, P.M., 1948, AECD-2160.Parker, G.W., Lantz, P.M., Ruch, J.W. and Hebert, G.M., 1948, Pu.
Proj. Rep. ORNL-6 5, 105*Persico, E., 1949, Rev* Sci. Inst. 20. 191.Persico, E. and Geoffrion, C., 1950, Rev. Sci,Inst. 21. 945*Pomerance, H., 1949, Atomic Energy Commission Declassified Document
No.2502 (unpublished).
Pontecorvo B., 1946-1947, Reports on Progress in Physics 11. 32.Pringsheim, P., 1949, "Fluorescence and Phosphorescence"
(interscience Inc.).
Reitz, J.R., 1950, Phys. Rev. 21, JO.Rogers, M.M., McReynolds, A.W. and Rogers, F.T., 1940, Phys. Rev.57*379*
Rose, M.E. and Korff, S.A., 1941, Phys. Rev. 59< 8 5 0.Rosenfeld, L., 1948, "Nuclear Forces" (North-Holiand Publishing Co.,
Amsterdam), Vol. 1, p,506.Ross, M. and Story, J.S., 1948 - 1949, Reports on Progress in Physics
12. 2 9 1.
Rossi, B.B. and Staub, H.H., 1949, "Ionization Chambers and Counters"
(McGraw-Hill).

Rothwell, P. and West, D., 1950, Proc,, Phys. Soc. A 63. 541.
Rutherford, E, 1919? Phil. Mag. 37. 581.Rutherford, E., Chadwick, J. and Ellis, C.D., 1930, "Radiations from
Radioactive Substances" (Cambridge).Rutherford, E. and Geiger, H., 1908, Proc. Roy. Soc. A 8l, 141. Rutherford, E. and Robinson, H., 1913, Phil. Mag. 26, 717*
Sagane, R., Gardner, W.E. and Hubbard, H.W., 1951? Phys. Rev. 82. 577.
Sagane, R. and Giles, P.C., 1951? Phys. Rev. 8l. 153.Saha, A.K., 1946, Proc. Nat. Inst. Sci. Ind. 12, 159*
Sakai, M., 1950? J.Phys. Soc. Japan 178.Sargent, B.W., 1933? Proc. Roy. Soc. A 139. 659•Saxon, D., 1948, Phys. Rev, 74. 8 4 9.Scharff-Goldhaber, G., der Mateosian, E., McKeown, M. and Sunyar,
A.W., 1950, Phys. Rev. J8, 3 2 5.
Schwartz, H.M,, 1952? Phys. Rev. 86, 195*Seaborg, G.T. and Perlman, I., 1948, Rev. Mod.Phys. 20, 5 8 5.Segre, 1948, Isotope Chart AECD 2404Senftle, F.E. and Leavitt, W.S., 1950? Nucleonics No.5? 54*Shull, F.B., 1948, Phys. Rev. J±9 917.Shull, F.B. and Dennison, D.D., 1947a? Phys. Rev.71,681; 1947b,
Phys. Rev. 72, 2 5 6.Shull, F.B. and Feenberg, E.F., 1949? Phys. Rev. 75. 1768.
Siegbahn, K., 1946, Phys. Rev. 70. 127.Siegbahn, K., 1943? Arkiv. Mat, Astron. R^s. Bd. 30A. No. 1.Skyrme, T.H.R., 1950, "Progress in Nuclear Physics", Vol.l.
(Butterworths), p.l!5»
Slatis, H. and Siegbahn, K., 1949? Phys. Rev. 7£, 1955,

179.
Slatis, H. ar.\d Siegbahn, K„ 5 1949? Phys. Rev. 75.? 318.
Smith, P.B. and Allen, J.S., 1951, Phys. Rev. 81. 381.Strassman, P. and Walling, E., 1938, Ber.d.d. Chem. Ges. ]!_. 1.Sullivan, W.H., 1949, "Trilinear Chart" (John Wylie and Sons, Inc.)Svartholm, N. and Siegbahn, K., 1946, Arkiv. Mat. Astron. Ttys. Bd.33A,
No.4, p.2 2.Swartout, J.A., Boyd, G.E., Cameron, A.E., Keim, C.P. and Larson,
C.E., 1946, Phys. Rev. JO, 232.Taylor, H.M. and Mott, N.F., 1932, Proc. Roy. Soc. A 138. 6 6 5.Thomas, D.G. and Kurbatov, J.D., 1950, Phys. Rev. 77. 151*Thomson, J.J., 1905* Phil. Mag. 10, 5^4*Tomozawa, V., Umezawa, M. and Nakamura, S., 1952, Phys. Rev. 8 6 .791.
Tricker, R.A.R., 1924, Proc. Camb. Phil.Soc. 22. 454*
Tyler, A.W., 1939, Phys. Rev. 125.Walker, R.L. and McDaniell, B.D., 1948, Phys. Rev.74. 315*Wang, K.C., 1942, Phys. Rev. 97.Watt, R.J. and Williams, D., 1946, Phys. Rev. 70. 6 4 0.West, H.W., Meyerhof, W.E. and Hofstadter, R., 1951, Phys.8l. 141.
Wigner, E.P., 1939, Phys. Rev. 519.Wilson, H.W.,1 9 5 0, Phys.Rev. 79* 1032.Wilson, H.W., 1951, Phys. Rev. 82, 54$.Wilson, H.W. and Curran, S.C., 1949, Phil.Mag.40. 631.Wilson, H.W. and Curran, S.G., 1951, Phil. Mag. 42. 762.Wilson, H.W. and Lewis, G.M., 1952, Proc. Phys. Soc.A65. 6 5 6.
Winsberg, L,, 1950, NNES j?,paper 199*Witcher, C.M., 1941, Phys, Rev, 60, 32.
Wu, C.S., 1950, Rev. Mod. Phys. 22, 3 8 6.

Wu, C.S. and Feldman, L., 1949, Phys. Rev. JjS, 693.Yaffe, L., 1950, "Absolute Beta Counting," Nuclear Science Series,
Prelim. Report No. 8.
Zajac, B. and Ross, M.A.S, 1949, Nature, 164. 311.