MSc THESIS GALMESA ABEBE APRIL 2018 HARAMAYA ...
79
ADOPTION OF IMPROVED SOYABEAN VARIETIES: THE CASE OF BUNO BEDELE AND EAST WOLLEGA ZONES OF OROMIA REGION, ETHIOPIA MSc THESIS GALMESA ABEBE APRIL 2018 HARAMAYA UNIVERSITY, HARAMAYA
-
Upload
khangminh22 -
Category
Documents
-
view
2 -
download
0
Transcript of MSc THESIS GALMESA ABEBE APRIL 2018 HARAMAYA ...

ADOPTION OF IMPROVED SOYABEAN VARIETIES: THE CASE OF BUNO
BEDELE AND EAST WOLLEGA ZONES OF OROMIA REGION, ETHIOPIA
MSc THESIS
GALMESA ABEBE
APRIL 2018
HARAMAYA UNIVERSITY, HARAMAYA
Adoption of Improved Soyabean Varieties: The Buno Bedele and East
Wollega Zones of Oromia Region, Ethiopia
A Thesis Submitted to the School of Agricultural Economics and Agribusiness
Postgraduate Program Directorate
HARAMAYA UNIVERSITY
In Partial Fulfillment of the Requirements for the Degree of
MASTER OF SCIENCE IN AGRICULTURE
(AGRICULTURAL ECONOMICS)
Galmesa Abebe Gerbaba
April 2018
Haramaya University, Haramaya
HARAMAYA UNIVERSITY

ii
SCHOOL OF GRADUATE STUDIES
I hereby certify that I have read and evaluated this Thesis entitled “Determinants of
Adoption of Improved Soya bean varieties: The Case of Chewaka and Gobusayo Districts,
Oromia Region, Ethiopia.” prepared under my guidance by Galmesa Abebe. I recommend
that it will be submitted as fulfilling the thesis requirement.
Jema Haji (PhD)
Major Advisor Signature Date
Workneh Kassa(PhD )
Co-advisor Signature Date
As members of the Board of Examiners of the MSc Thesis Open Defense Examination, I
certify that I have read and evaluated the Thesis prepared by Galmesa Abebe Gerbaba and
examined the candidate. I recommend that the thesis be accepted as fulfilling the thesis
requirement for the Degree of Master of Science in Agriculture (Agricultural Economics).
___________________ _________________ _______________
Chair Person Signature Date
__________________ _________________ ________________
Internal Examiner Signature Date
_________________ _______________ _______________
External Examiner Signature Date
Final approval and acceptance of the Thesis is contingent upon the submission of its final
copy to the Council of Postgraduate Program (CPGP) through the candidate’s School
Graduate Committee (SGC or DGC).

iii
DEDICATION
I dedicate this piece of work in memory of my late sister Hinsene Abebe for her kindness,
devotion and endless support. Let God keep her soul in Heaven.

iv
STATEMENT OF THE AUTHOR
By my signature below, I declare that this thesis is my own work. I have followed all
ethical and technical principles of scholarship in the preparation, data collection, data
analysis and compilation of the Thesis. Any scholarly matter that is included in the Thesis
has been recognition through citation.
This thesis has been submitted in partial fulfillment of the requirements for MSc. degree at
Haramaya University. The Thesis is deposited at the University Library and is made
available to borrowers under rules of the library. I solemnly declare that this thesis has not
been submitted to any other institution anywhere for the award of any academic degree,
diploma, or certificate.
Brief quotations from this Thesis may be made without special permission provided that
accurate acknowledgement of the source is made. Requests for permission for extended
quotation from or reproduction of this Thesis in whole or in part may be granted the Head
of the School or Department when in his or her judgment the proposed use of the material
is in the interest of scholarship. In all other instances, however, permission must be
obtained from the author of the Thesis.
Name: Galmesa Abebe Gerbaba Signature: _______________
Date of submission: August 2017
School: Agricultural Economics

v
BIOGRAPHICAL SKETCH
The author was born in West Shoa Zone, Bakko Tibe district in 1992. He completed his
primary education in Bosha primary school in Bakko Tibe district. He attended his high
school education at Guder Senior Secondary School from 2005-2009. He then joined
Hawassa University in September 2009 and graduated with BSc degree in Agricultural
Resource Economics and Management (AREM) in July 2011. After his graduation, he
worked in Oromia Agricultural Research Institute (OARI), Bako Agricultural Research
Center (BARC) as a socioeconomic researcher until he joined Haramaya University for his
postgraduate study in October 2015.

vi
ACKNOWLEDGEMENTS
First and foremost, I thank my Lord Jesus, who has made everything to be favorable by His
almighty generosity throughout my life.
I express my deepest gratitude to my major advisor Dr Jema Haji for his support, guidance,
suggestion and encouragement throughout the development of this thesis starting from the
inception of the proposal. I also extend my sincere appreciation to my co-advisor Dr
Workneh Kassa for his precious time invested in reviewing the proposal and the thesis
thoroughly and giving critical comments and suggestions which became an important part
of this thesis.
I would like to thank my sponsor N2 Africa Project for the opportunity and the research
fund given to me to carry out my study. My appreciation and great thanks also goes to
Oromia Agricultural research Institute for giving me this study. I would like to thank
respondents, enumerators for their cooperation in this study.
I must express my very profound gratitude to my sister Likellesh Soressa, Hinsene Abebe
and my brother Tariku Abebe for their support and continuous encouragement throughout
my life. Words fail to convey my deepest thanks for them.
Finally, I express my thanks to all individuals and institutions for their support and
encouragement in the entire work of the research.

vii
ACRONYMS AND ABBREVIATIONS
BARC
BCR
Bako Agricultural Research Center
Benefit Cost Ratio
CIMMYT International Maize and Wheat Improvement Center
CSA Central Statistical Agency
DARD District Agriculture and Rural Development
DSA Development Studies Associates
FAO Food and Agriculture Organization
FDRE Federal Democratic Republic of Ethiopia
GDP
MT
Gross Domestic Product
Metric Tone
MoARD Ministry of Agriculture and Rural Development
MRR Marginal Rate of Return
N2Africa
Putting Nitrogen Fixation to Work for Smallholder Farmers in
Africa
NFI Net Farm Income
NGO
NPV
Non-Governmental Organization
Net Present Value
OARI Oromia Agricultural Research Institute
TLU Tropical Livestock Unit

viii
TABLE OF CONTENTS
STATEMENT OF THE AUTHOR iv
BIOGRAPHICAL SKETCH v
ACKNOWLEDGEMENTS vi
ACRONYMS AND ABBREVIATIONS vii
LIST OF TABLES x
LIST OF FIGURES xi
LIST OF TABLES IN THE APPENDIX xii
ABSTRACT xiii
1. INTRODUCTION 1
1.1. Background of the study 1
1.2. Statement of the Problem 3
1.3. Objectives of the Study 5
1.4. Scope and Limitations of the Study 5
1.5. Significance of the Study 5
1.6. Organization of the Thesis 6
2. LITERATURE REVIEW 7
2.1. Definition of Basic Terms 7
2.2. Demand and Supply of Soya bean in Ethiopia 8
2.3. The Role of Soya bean in Food Security 9
2.4. Production and Productivity Gaps of Soya bean in Ethiopia 11
2.5. Analytical Framework of the Study 12
2.6. Empirical Studies on Technology Adoption 13
2.7. Conceptual Framework of the Study 16
3. RESEARCH METHODOLOGY 18
3.1. Description of the Study Areas 18

ix
3.1.1. Location and physical features 18
3.1.2. Agriculture 19
3.1.3. Population 20
3.2. Sampling Methods and Sample Size 20
Source: Districts agricultural office, 2017 21
3.3. Sources and Types of Data and Data Collection Methods 21
3.4. Methods of Data Analysis 21
3.4.1. Descriptive statistics 21
3.4.2. Econometric model 22
3.5. Definitions of Variables and Hypothesis 24
3.5.1. Dependent variables 24
3.5.2. Independent variables 24
4. RESULTS AND DISCUSSION 30
4.1. Descriptive Results 30
4.1.1. Demographic characteristics households 30
4.1.2. Socio economic characteristics 31
4.1.3. Participation in off/nonfarm activities and Access to credit 33
4.1.4. Distance to nearest market 34
4.1.5. Major crops produced 35
4.1.6. Perceptions about soya bean varieties attributes 35
4.1.7. Sources of improved seed 36
4.2. Econometric Results 37
5. SUMMARY, CONCLUSION AND RECOMMENDATIONS 42
5.1 Summary and Conclusion 42
5.2. Recommendations 44
6. REFERENCES 47
7. APPENDICES 54

x
LIST OF TABLES
Table Page
Table 1: Supply and demand of soya bean 9
Table 2: Estimate of Area, Production and Yield of soya bean 12
Table 3: Sample size of soya bean producers by kebeles 21
Table 4: Summary of independent variables, their definitions and expected effect 29
Table 5: Sex and marital status of sample households 30
Table 6: Age of sample households 31
Table 7: Socio-economic characteristics of sample households 33
Table 8: Participation in off/nonfarm activities and Access to credit of households 34
Table 9: Distance to nearest market of households 34
Table 10: Major crops produced by sampled households (Qt) 35
Table 11: Perceptions about soya bean technology attribute 36
Table 12: Sources of seed for improved soya bean varieties 36
Table 13: Test statistics of Double-hurdle model 37
Table 14: Determinants of adoption and intensity of adoption soya bean varieties 38

xi
LIST OF FIGURES
Figure Page
1. Conceptual framework of adoption of improved soya bean varieties 17
2. Map of the study areas 19

xii
LIST OF TABLES IN THE APPENDIX
Appendix Table page
1. Maximum likelihood estimation of Double-hurdle Versus Tobit model 55
2. Goodness-of-fit test of the model 55
3.Conversion factor for adult equivalents 56
4.Conversion factor for livestock unit 56

xiii
ADOPTION OF IMPROVED SOYA BEAN VARIETIES: THE CASE OF BUNO
BEDELE AND EAST WOLLEGA ZONES OF OROMIA REGION, ETHIOPIA
ABSTRACT
Achieving national food security and diversifying export earnings from agricultural
products is one of the major challenges currently facing developing countries like
Ethiopia. Pulse crops in general and soya bean in particular play great role in improving
households’ food security, increasing income for smallholder farmers. Despite the high
production potential and the economic importance of the crop, adoption and dissemination
of improved soya bean varieties is constrained by various factors. To this end, this study
aimed at identifying determinants of adoption of improved soya bean varieties in Chewaka
and Gobusayo districts, Buno Bedele and East Wollega zones of Oromia Region, Ethiopia
with the specific objectives of identifying factors affecting adoption and intensity of
adoption of improved soya bean varieties. The study was based on cross sectional data
collected from 146 randomly selected soya bean producing farmers. Descriptive and
econometric analyses were used to analyze data. The results show that about 32.88% and
67.12% were adopters and non-adopters of the crop respectively. Double hurdle model
results showed that sex of household, age, education level, farm experience and training
affected the probability of adoption of improved soya bean varieties positively and
significantly while distance to nearest market affects it negatively and significantly. Age,
farm experience, training and livestock holding affected the intensity adoption of improved
soya bean varieties positively and significantly. This study suggests that the high
importance of institutional and government support in the areas of education, extension
service, training, infrastructural development (especially roads) and credit. Therefore,
policy and development interventions should give emphasis to the improvement of such
institutional support system and decrease gender disparities in access to such institutions
so as to achieve the adoption practice which increases production and productivity of
small scale farmers.
Keywords: Adoption, intensity of adoption, soya bean, double hurdle

1. INTRODUCTION
1.1. Background of the study
Agriculture is a dominant sector of Ethiopian economy which makes a lion share
contribution to the Gross Domestic Product, employment and foreign exchange earnings.
Agriculture is still believed to remain a sector that plays an important role in stimulating
the overall economic development of the country in the years to come. This would be
realized if and only if strenuous efforts are made by the government and other concerned
stakeholders including farmers to increase agricultural production and productivity (CSA,
2016).
Several factors can influence agricultural production and productivity improvement.
Among other factors, the increased use of modern farm inputs, modernization of farming
activities by using improved farm implements as well as introduction of modern farming
technologies to the sector are the major ones. In order identify, plan, implement and
monitor agricultural projects and programs, availability of reliable, comprehensive and
timely statistical data on the overall performance of the sector is essential (CSA, 2016).
In many developing countries including Ethiopia, agriculture plays a vibrant role in
promoting economic growth and development. The importance of agriculture in Ethiopia is
evidenced by its share in GDP (43%), its employment generation (80%), share of export
(70%) and providing about 70% raw material for the industries in the country in
2012/13(UNDP, 2013). Furthermore, 90% of the poor earn their livelihood from this sector
(Yu et al,. 2011). Thus, it is not surprising that policy action in Ethiopia is largely based on
influencing the dynamism of the agricultural sector.
Ethiopian agriculture is dominated by subsistence, low input, low output, rainfed farming
system. The use of chemical fertilizer and improved seeds is quite limited despite
government’s efforts to encourage the adoption of modern, intensive agricultural practices.
Low agricultural productivity can be attributed to limited access by smallholder farmers to
agricultural inputs, financial services, improved production technologies, irrigation and
agricultural markets and more importantly poor land management practices that have led to
severe land degradation (MoARD, 2010).

2
Following these facts, successive Ethiopian governments have focused on promoting
technology-led initiatives to enhance productivity, particularly in smallholder agriculture
(FDRE, 2010). Crop production is a subsector on which the country has unfailingly
depended to bring about a livelihood transformation of the poor. Currently, the government
is undertaking a strategy of improving agricultural productivity primarily through
agricultural intensification, involving an increased use of inputs, including seeds of
improved crop varieties.
Soya bean is a multipurpose crop, which can be used for a variety of purposes including
preparation of different kinds of soya bean foods, animal feed, soy milk, raw material for
the processing industry, and it counter effects depletion of plant nutrients in the soil
resulting from continuous mono-cropping of cereals, especially maize and sorghum,
thereby contributing to increasing soil fertility (Hailegiorgis, 2010). Producing and
consuming more soya bean would improve food insecurity and malnutrition as soya bean
provides a nutritious combination of both calorie and protein intake. It is the most
nutritionally rich crop, as its dry seed contains the highest protein and oil content among
grain legumes (40 to 42% protein) with a good balance of the essential amino acids and has
18-20% oil on a dry seed weight basis (FAO 2010).
Soya bean is a high value and profitable crop. The economic viability of soya bean
production is determined by the commercial utilization of both its sub-products, meal and
oil, which, respectively, account for about two thirds and one third of the crop’s economic
value. Soya bean oil and meal is consumed worldwide as food and animal feedstuff
respectively (FAO, 2015).
Despite the significance of soya bean to address food security and malnutrition problems
prevailing in the country, little emphasis has been given to production, supply and export
of this important commodity. The major areas currently growing the soya bean are western
and south-western part of the country, notably Benishangul-Gumuz, Gambela and parts of
Oromia Region. Oromia and Benishangul-Gumuz regions account for the highest
production of soya bean in the country, 51% and 40% respectively (Sopov, M. et al.,
2015). From Oromia region Chewaka and Gobusayo are potential producers of soya bean
and no study was conducted on adoption and intensity of adoption of improved soya bean

3
varieties previously in this areas. This study therefore conducted to examine the
determinants of adoption and intensity of adoption of improved soya bean varieties with a
purpose of generating information that help understand and evaluate the key challenges to
the adoption of improved soya bean in the study areas which will enhance informed
decision making to improve adoption of soya bean, their production and by increasing
productivity in the study areas.
1.2. Statement of the Problem
Though soya bean can be grown in different parts of Ethiopia, the major areas currently
growing the crop are situated in the western and south-western part of the country, notably
Benishangul-Gumuz, Gambela and parts of Oromia Region. Oromia and Benishangul-
Gumuz regions account for the highest production of soya bean in the country, 51% and
40% respectively (Sopov, M. et al., 2015). Chewaka and Gobusayo districts of East
Wollega and Buno Bedele zones of Oromia region are the potential area for production of
soya bean. BARC and N2 Africa project promoted improved varieties of soya bean
(Dedessa, Katta, jalale and Ethio-Yugoslavia) for the last four years.
The major challenges facing most of developing countries such as Ethiopia is improving
rural livelihoods as well as food security and to stimulate underlying food system
development. There is an ever-increasing concern that it is becoming more and more
difficult to achieve and sustain the needed increase in agricultural production based on
intensification, because there are limited opportunities for area expansion. Hence, the
solution to food insecurity problem would depend on measures which help to increase
yield through intensification. In Ethiopia, adoption of improved agricultural technologies
has been a long term concern of agricultural experts, policy makers, and agricultural
research and many others linked to the sector. However, evidence indicates that adoption
rate of modern agricultural technologies in the country is very low (Kebede et al., 1990).
Adoption of agricultural innovations in developing countries attracts considerable attention
because it can provide the basis for increasing production and income. Small-scale
farmers’ decision to adopt or reject agricultural technologies depends on their objectives
and constraints as well as costs and benefits accruing to it (Million and Belay, 2004).
Hence, farmers will adopt only technologies that suit their needs. Several factors influence

4
adoption of agricultural technologies. Among these, economic factors (farm size ,farm
income ,livestock ownership and off /non-farm income), social factors (sex, education, age
and labor availability), institutional factors ( distance to market, access to market, access
to credit, extension contact, demonstration, training and participation on field day) are the
main variables that affect adoption and intensity of adoption.
Chewaka and Gobusayo districts are mainly characterized by irregular rainfall condition,
meagre resource endowment, and diverse, complex and risk prone farming systems.
Agriculture in the area is mainly rainfed. The nature of the rainfall is also erratic, low in
amount and uneven in distribution. As a result, crop production has become unpredictable
and unsatisfactory which leads to food insecurity. Food security of the majority of rural
farmers can be improved if the performance of the agricultural sector is enhanced.
Improvement and diffusion of soya bean varieties have an invaluable role in reversing the
present situation of food insecurity in the study areas. To this end, improved soya bean
varieties have been generated and promoted for five years in the study areas. Promotion
and diffusion activities have been continued still now. N2Africa project being executed by
BARC is one of the major efforts extended to the farmers which aimed at improving soya
bean productivity in the study areas. The project mainly promoted improved soya bean
varieties. Despite such an intervention the adoption of improved soya bean varieties is still
very low and there is also variation among farmers in their intensity of adoption.
Moreover, there is no empirical information on the various factors determining adoption,
intensity of adoption of improved soya bean varieties in the study areas. Therefore, this
study was proposed to identify the determinants of adoption and intensity of adoption of
improved soya bean varieties to fill the existing knowledge gap
The study tries to answer the following research questions:
1. What are the determinants of adoption of improved soya bean varieties in the study
areas?
2. What are the determinants of intensity adoption of improved soya bean varieties in the
study areas?

5
1.3. Objectives of the Study
The general objective of the study was to analyze the determinants of adoption and
intensity of adoption of improved soya bean varieties.
The specific objectives of the study were:
1. To identify factors affecting adoption of improved soya bean varieties in the study areas
2. To identify factors affecting intensity of adoption of improved soya bean varieties in the
study areas
1.4. Scope and Limitations of the Study
The time and financial resource limitations have forced the researcher to limit the study to
only two districts of the Oromia Region. Accordingly, the study was confined only to
Chewakka and Gobusayo districts with specific crop category soya bean. The
generalizations made based on the findings would be more applicable to the location of the
study. In addition, the result of this study might be applicable to other areas of the region
and the country where similar situations may prevail.
The study focused only on adoption and intensity of adoption of improved soya bean
varieties. Therefore it was restricted to identifying the determinants of adoption and
intensity of adoption of improved soya bean varieties in the study areas. In addition, this
study was also limited in terms of finance, time, resource availability and being cross-
sectional data. Nevertheless, the result of this study has practical validity mainly to areas
having similar features and can be used as a reference for other similar areas.
1.5. Significance of the Study
Farmers are not always adopting the newly introduced technologies that come to them
from any extension organization as it is. They try to evaluate according to its match with
their social, environment and economic importance. So understanding these factors is

6
important for the scientists to develop and generate agricultural technologies, which suits
to the current conditions of farmers. There are several reasons to invest in studying the
adoption of agricultural technologies. These include improving the efficiency of
technology generation, assessing the effectiveness of technology transfer, understanding
the role of policy in the adoption of new technology, and demonstrating the impact of
investing in technology generation.
Soya bean is one of the crops which are produced in the study areas. It has a multi-purpose
utilization type by the farmers. In the research areas various soya bean technologies have
been promoted by BARC in collaboration with N2Africa project. However, the flow of
research outputs has been uni-directional for long time. The participation of farmers in
technology development through provision of their preference and incorporation of local
idea was very limited otherwise non-existent. Now it is known that adoption and intensity
of adoption of improved soya bean varieties is conditioned on socioeconomic, institutional
and farmers’ perceptions. Therefore, the study tried to identify important factors which
hinder success in the adoption and intensity of use of improved soya bean varieties. All
development partners like technology generators, technical assistants, extension agents,
policy makers, NGOs (especially N2 Africa project) and development agents involved in
agricultural development must be aware and understand the factors affecting the adoption
of improved soya bean varieties and level of adoption of improved soya bean varieties.
Policy makers will benefit from the research output since they require micro level
information to formulate and revise policies and strategies. This could facilitate allocation
of major resources for research, extension and development programs.
1.6. Organization of the Thesis
The thesis is organized in to seven chapters. The first chapter introduces the background,
statement of the problem, the objective, research question as well as the scope and
limitation of the study. The theoretical framework, analytical framework and relevant
literature are reviewed in the second chapter. The third chapter discusses the research
methodology used to undertake the study. Results are presented and discussed in the fourth
chapter. Chapter five present summary, conclusion and recommendations. The last two
chapters present the references and appendixes respectively.

7
2. LITERATURE REVIEW
In this chapter, key concepts, theoretical explanations and empirical evidences relating to
technology adoption are explored. The chapter is divided into seven sections. The first
section discusses the definition of basic terms of adoption followed by concepts of current
demand and supply and the role of soya bean in food security in Ethiopia. The fourth
section shows an overview of production and productivity gaps of soya bean in Ethiopia.
The remaining three sections discuss a review of analytical studies on adoption for
analyzing factors affecting adoption and intensity of adoption of improved soya bean
varieties on the basis of the insights gained from literature review and the actual context of
the study areas, empirical studies and conceptual framework on adoption of technologies.
2.1. Definition of Basic Terms
Adoption: Adoption of an innovation within a social system takes place through its
adoption by individuals or groups. According to Feder et al. (1985), adoption may be
defined as the integration of an innovation into farmers’ normal farming activities over an
extended period of time. Dasgupta (1989) noted that adoption, however, is not a permanent
behavior. This implies that an individual may decide to discontinue the use of an
innovation for a variety of personal, institutional, and social reasons one of which might be
the availability of another practice that is better in satisfying farmers’ needs. Feder et al.
(1985) classified adoption as an individual (farm level) adoption and aggregate adoption.
Adoption at individual farmers’ level is defined as the degree of use of new technology in
long run equilibrium when the farmer has full information about the new technology and
it’s potential. In the context of aggregate adoption behavior they defined diffusion process
as the spread of new technology within a region. This implies that aggregate adoption is
measured by the aggregate level of specific new technology with a given geographical area
or within the given population.
Adoption Process: Rogers (1983) defines the adoption process as the mental process
through which individual passes from first hearing about an innovation or technology to
final adoption. This indicates that adoption is not a sudden event but a process. Farmers do
not accept innovations immediately; they need time to think over things before reaching a
decision.

8
Rate of adoption: The rate of adoption is defined as the percentage of farmers who have
adopted a given technology. The intensity of adoption is defined as the level of adoption of
a given technology. The number of hectares planted with improved seed (also tested as the
percentage of each farm planted to improved seed) or the amount of input applied per
hectare will be referred to as the intensity of adoption of the respective technologies
(Nkonya et al, 1997).
2.2. Demand and Supply of Soya bean in Ethiopia
According to Sopov, M. et al., 2015, Ethiopia produced an estimated volume of 150,000
tons in 2014/15, the result of combined production by smallholders and commercial
farmers. The growth in production is attributed mainly to the increase in area cultivated
and productivity. The total area of land under soya bean production during the last 10 years
has increased tenfold, while the total volume of production during the same period
increased 21 times. Productivity level of soya bean is 2.1 tons per hectare and this level is
very low compared to its potential, which could go up to 4 tons per hectare if improved
varieties are used. Though soya bean can be grown in different parts of Ethiopia, the major
areas currently growing the crop are situated in the western and south-western part of the
country, notably Benishangul-Gumuz, Gambela and parts of Oromia Region. Oromia and
Benishangul-Gumuz regions account for the highest production of soya bean in the
country, 51% and 40% respectively.
Over the last several years, soya bean production has doubled from 35,000 metric tons in
MY11/12 to 72,000 metric tons in MY14/15. Most of this growth in production was due to
an increase in the area planted and to a lesser extent improved yields. Owing to the late
rains and uneven rainfall distribution in some of the main soya bean-producing areas,
production for MY 2015/16 is forecast downward to 66,000 metric tons, a drop of 6,000
metric tons from previous year. Going forward, production is expected to rebound and
continue its upward climb in order to meet some of the increasing local demand for edible
oil and soya bean meal for livestock feed, most notably soya bean meal for poultry
production. These anticipated increases in production will come with improved yields and
expanded acreage planted in soya beans, some of which will be done on commercial farms.

9
Soya beans contribute nearly 9 percent to the country’s total oilseed production and
account for only 4 percent of area planted to oilseeds (FAS/Addis Staff, 2016).
Soya bean consumption, which continues to grow, is forecast to reach 41,000 metric tons
in MY15/16. Consumption is expected to continue its upward climb as consumers demand
more soy-based edible oil and as the poultry sector demands more soya bean meal. In
addition to oil, soya beans are used to make a variety of local foods, such as bread,
chappati, porridge, soy milk, yoghurt as well as the traditional Ethiopian stew, shero wot.
Soya beans are also used to make corn-soy blend (CSB) for emergency food assistance
programs run by international organizations and the Ethiopian government.
Table 1: Supply and demand of soya bean (Qt)
Year Supply Demand
2014/15 72,000 113,810
2015/16 81,241 119,500
2016/17 81,234 125,470
Source: CSA (2017)
2.3. The Role of Soya bean in Food Security
Despite the enormous progress over recent years, much of Ethiopia's rural population lives
in a state of chronic food insecurity and malnutrition. Average daily energy intake is
estimated at 16–20% below the accepted minimum, while diseases due to nutrient
deficiencies are widespread. Malnutrition in children is high. One out of every two children
under the age of five is stunted or too short for their age (chronically malnourished).
Stunting is irreversible and affects the physical and mental development, which later on
translates into reduced labor productivity. Furthermore, 33% of children and pregnant and
lactating mothers are classified as underweight (below a weight considered normal for
one’s age) (Sopov, M. et al., 2015).
Soya bean provides a wide range of opportunities for improving household food and
nutrition security, as well as an important source of cash. The majority of the population in

10
Ethiopia does not have access to expensive animal protein sources such as egg, milk and
meat, while child and maternal malnutrition are among the highest in the world. This,
added to the fact that more than 40 million people in Ethiopia avoid eating animal protein
for nearly 200 days a year during the fasting season, means that domestic consumption of
soya beans has great potential. When roasted and milled, soy flour as a product on its own,
or blended with other cereals such as maize and wheat, has a multitude of uses in the
production of bread, biscuits, cakes, porridge and sauces. A number of soy food products
can be integrated into the Ethiopian diet. Therefore, supporting local or household milling
and food processing is important. Besides the technology, practical coaching and training
in home economics is important to get the soy food-chain off the ground. There is a
difficult market situation for soy, as all processing is concentrated around the Addis Ababa
market including animal feed, edible oils and emergency feed (Sopov, M. et al., 2015).
How important is soya bean for human nutrition, in particular in developing countries? The
contribution of oils and fats to human diets is best estimated by measuring their
contribution to overall available dietary energy supplies (DES) expressed in calories (see
table 3). While total oils/fats (from all sources) in the diet account for about 24% of DES
globally, the percentage figure is 21 for developing countries and 33 for developed nations.
Among developing nations, this percentage appears to be consistently below the group
average in countries with a high prevalence of hunger. These figures refer to the total
intake of oils/fats in whatever form and from whatever origin (FAO 2017).
How does the situation described here affect domestic food security in developing
countries? The reliable supply of competitively priced soyoil and meals, together with the
on-going liberalization of agricultural trade have allowed imports of many low-income,
food insecure developing countries to grow at a steady and fast pace, contributing to stable
and normally rising levels of per caput consumption. In general, the fact that this
development tends to increase the dependence on imports is not in conflict with strategies
aimed at improving national food security (FAO 2017).
Food and water security will be a major national security focus in the coming decades as
both climate change and population increases affect food production worldwide. Countries
lacking basic food resources to feed their growing urban populations may become hotbeds
for conflict, unrest and terrorist activities. While many solutions for food insecurity should

11
be addressed and considered by lawmakers, scientists and farmers alike, soya bean
technology is a first step in addressing the needs of poverty stricken regions by providing a
modified crop that can meet multiple goals. Re-engineered soya beans are an innovative
(and healthy) way to help address local food security issues worldwide. Not only do they
provide a good food source, but their wide use in products from oils to food to animal feed
guarantee a lucrative market for local farmers. Reducing poverty through innovative
changes in the way staple crops are traditionally grown is an economical and feasible way
to bring food security, in light of climate and population challenges, to developing regions
of the world (Andrea Blinkhorn, 2014).
2.4. Production and Productivity Gaps of Soya bean in Ethiopia
There are favorable climatic and soil conditions for soya bean production in South and
Western Ethiopia which is essential both for commercial purposes as well as for
subsistence farming. The problems of producing soya bean is not only limited to market
access but also low productivity and production, lack of processing facilities, lack of
capital to increase production and no market information system for effective agricultural
marketing (Bezabih 2010).
Soya bean is a high value and profitable crop. The economic viability of soy production is
determined by the commercial utilization of both its sub-products, meal and oil, which,
respectively, account for about two thirds and one third of the crop’s economic value. Soy
oil and meal are consumed worldwide as food and animal feedstuff respectively. Soy meal
accounts for over 60% of world meal production (vegetable and animal meal) and occupies
a prominent position among protein feedstuffs used for the production of feed concentrates.
Soya bean oil is the second most important vegetable oil (after palm oil); it accounts for
25% of global vegetable/animal oils and fats consumption. The widespread use of soya
bean oil in particular as edible oil is due to its plentiful and dependable supplies, its
competitive price, and its neutral flavor and stability in both un hydrogenated and partially
hydrogenated form. Moreover, the rapid rise in the demand for compound feed - und thus
soya meal - has contributed considerably to the rise in soy oil production. Oil palm is a
major competitor with soya bean oil. Although the palm produces far more oil per unit area
than soya bean, soya bean’s role is expected to be secure because soya meal is in huge
demand and oil is a very lucrative by-product. It is also true that oil palm is generally

12
grown in different ecologies than soya bean, so there is a certain amount of geographical
complementarities (P. P. Thoenes, 2014).
Soya bean varieties selected for drought tolerance have the potential of improving
agricultural productivity and hence livelihoods if adopted by farmers. Soya bean grows in
areas where maize and common beans are grown. It grows to a height of 60–120 cm,
maturing in 3 to 6 months depending on variety, climate, and location. Soya bean is
drought tolerant. Depending on the variety, the crop can be grown from 0-2200m altitude
and under rainfall ranging from 300 to 1200mm. Altitude influences temperature that in
turn affects the initiation of flowering and maturity. At very high altitudes, flowering may
not occur and the crop remains vegetative. Soya bean is therefore a crop that requires warm
climates and is suitable for low to medium altitudes. It grows best when planted in pure
stands. The presence of Rhizobium japonicum in the roots of soya bean enables the crop to
fix nitrogen in the soil contributing to improved soil fertility (Kasasa P. et al., 2000)
Table 2: Estimate of Area, Production and Yield of soya bean
Crop
Area in Hectares
Production in Quintals Yield(Quintals/Hectare)
2015/16 2016/17 %
change
2015/16 2016/17 %
change
2015/16 2016/17 %
change
soya
bean
38,166.0
4
36,635.7
9
-4.01
812,418.
33
812,346.
59
-0.01
21.29
22.17
4.13
Source: CSA, 2017
2.5. Analytical Framework of the Study
Most adoption studies used Tobit model (Tobin, 1958) to identify factors affecting the
status and intensity of technology adoption. Tobit model is, however, very restrictive for
both economic and statistical reasons, which makes this model unsuitable for certain
empirical applications. It is also restrictive because it assumes that the same set of variables
determine both the probability of adoption and level of adoption. This is not realistic in
most situations.

13
Some farmers adopt and cultivate improved soya bean varieties and some do not. Also,
there are differences in level of adoption among the adopters. We have two questions to
answer: why are some adopting and some not and why does the level of adoption vary
among the adopters? Cragg’s double-hurdle model answers these two questions. Use of
Cragg’s model for analyzing adoption and level or intensity of adoption is common in
agricultural economics literature (Cooper and Keim, 1996; Gebregziabher and Holden,
2011; Shiferaw et al., 2008; Teklewold et al., 2006; Solomon et al., 2011; Hassen et al
2012). Another alternative here might be the Heckman selection model. According to
Jones (1989), one of the important differences between these two models concerns the
sources of zeros. In the Heckman model, the non-adopters will never adopt under any
circumstances. On the other hand, in a double-hurdle model, non-adopters are considered
as a corner solution in a utility-maximizing model. In the case of soya bean, the assumption
of Heckman’s seems to be too restrictive. Changes in input price or extensive extension
programs may encourage non-adopters to adopt. Hence, use of Double-hurdle model
instead of Heckman’s is appropriate. In this study Double-hurdle model was used to
identify determinants of adoption and intensity of adoption of improved soya bean
varieties.
2.6. Empirical Studies on Technology Adoption
Different adoption studies were undertaken by different scholars in the smallholder
agricultural sector of Ethiopia. Some of the studies are discussed as follows:
Samuel (2017) studied Factors affecting adoption and degree of adoption of soya bean in
Ilu-Ababora Zone; Southwestern Ethiopia. The study was based on cross sectional data of
185 soya bean producing farmers. The study used the Logistic regression model to identify
factors affecting probability of adoption and Tobit model to identify intensity of adoption.
Training, use of soy food at home affected positively and significantly while age, farm size
and distance to nearest market affected negatively and significantly adoption of Soya bean.
Sex, Farm size and training positively and significantly while distance to cooperatives and
use of soy food at home affected negatively and significantly intensity of adoption of Soya
bean.

14
E. F. Fabiyi (2015) studied Adoption of Improved Soya bean Technologies in Bauchi
Local Government Area, Bauchi State, Nigeria. The study was based on cross sectional
data of 45 maize producing farmers. The study used the multiple regression analysis.
House hold size, Labor source affected positively and significantly while processing
experience affected a negatively and significant adoption of improved Soya bean
Technologies varieties.
Yenealem et al. (2013) studied determinants of adoption of improved maize varieties for
male headed and female headed households in West Harerghe zone. The study was based
on cross sectional data of 148 maize producing farmers. The study used the logistic
regression model applied to assist in estimating the probability of adoption of improved
maize verities. Cultivated farm size, number of Livestock (TLU), Extension contact
affected positively and significantly while Age and Distance to the nearest input market
affected a negatively and significant the probability of adoption of improved maize
varieties.
Afework and Lemma (2015) conducted a study on the determinants of improved rice
varieties adoption in Fogera district of Ethiopia. The study was based on cross sectional
data of 151rice producing farmers. The study used Univariate Probit model in order to
address factors that influence the decision to participate in improved rice varieties
adoption. Household size, education of the household head, land, rice farming experience,
access to new cultivars of rice, off-farm income and institutions affected positively and
significantly while distance to the nearest village market, access to main market, distance
to access agricultural extension office affected negatively and significantly the probability
of participation in improved rice cultivation.
Ermias (2013) conducted a study on adoption of improved sorghum varieties and farmers’
varietal trait preference in Kobo district, north Wolo zone, Ethiopia. The study was based
on cross sectional data of 150 sorghum producing farmers. The study used Tobit to trace
determinants of adoption and intensity of use of improved sorghum varieties among the
sample households. Tropical Livestock Unit, participation in off-farm, perception on taste
quality of improved sorghum, irrigated farm size (ha), striga infested land (ha) and
perception on yield capacity of improved sorghum affected positively and significantly
while farm size (ha) proportion of sorghum area from total crop land, distance from

15
farmers training center to home and active labor ratio affected a negatively and
significantly adoption of improved maize varieties.
Mekuria (2013) identified factors influencing adoption of improved maize varieties in
Gorogutu Woreda of Eastern Hararghe, Ethiopia. The study was based on cross sectional
data of 130 improved maize producers. The study used Tobit model to analyze factors
affecting probability and intensity of adoption of improved maize seed. Educational level
of household head, size of own cultivated land, off-farm employment, access to credit,
contact with extension agent, membership in cooperative, income from chat, land size and
affects positively and significantly while cosmopolitan affect negatively and significantly
adoption of improved maize varieties.
Sisay (2016) conducted a study on the agricultural technology adoption, crop
diversification and efficiency of maize-dominated smallholder farming system in Jimma
Zone, South-Western Ethiopia. This study used cross-sectional data collected in 2013/14
production season from a sample of 385 farm households selected through multi-stage
sampling techniques. The study used Tobit, Count data and Multivariate probit models for
identifying factors influencing status and intensity, speed of technology adoption and
decision to adopt recommended agronomic practices in maize farming, respectively. The
results showed that age, family size, level of education, family education, ownership of
mobile phone, extension services, cooperative membership, livestock holding and farm
size positively and significantly while distance to development negatively and significantly
influence adoption of improved agricultural technologies. The results also showed that age,
extension services, livestock holding, landholding, cooperative membership and ownership
of mobile phone positively and significantly while sex, distance to development and
market centers negatively and significantly influence the speed of improved maize variety
adoption. The decision to adopt recommended agronomic practices was significantly
influenced by, family education, and ownership of mobile phone, livestock holding and
extension services positively and significantly while sex and distance to development
centers negatively and significantly influence decision to adopt recommended agronomic
practices.
Hassen et al. (2012) studied determinants of chemical fertilizer technology adoption in
North Eastern highlands of Ethiopia. The study was based on cross sectional data of

16
randomly selected 252 farmers. This study used a double hurdle model to identify factors
affecting the probability of adoption and intensity of use of inorganic fertilizers. About 45
(3%) were adopters and 207 (97%) were non-adopters. Extension service access, Distance
from Development Agent, credit service influence significantly and positively while
distance to market, distance to input supply, credit distance influence significantly and
negatively the probability adoption of chemical fertilizer technology. Sex, age, education,
adult equivalent, total cultivated land, livestock owned, off/non-farm income, extension
service access, influence significantly and positively while Active labor force, distance to
market, distance to road, number of plots, distance to input supply, DA distance, credit
service, credit distance influence significantly and negatively the intensity adoption of
chemical fertilizer technology.
2.7. Conceptual Framework of the Study
Agricultural technology adoption and diffusion patterns often vary from location to
location. The variations in adoption patterns were created due to the presence of disparity
in agro ecology, institutional and social factors. Moreover, farmers’ adoption behavior,
especially in low-income countries is influenced by a complex set of socio-economic,
demographic, technical, institutional and bio-physical factors (Feder et al., 1985).
Adoption of technologies is the outcome of several interactions of farmers’ internal and
external contexts. Demographic factors(sex, marital status, age and family size),
socioeconomic factors (livestock ownership, land holding, education and off/non-farm
income), institutional factors (distance to nearest market, access to credit, frequency of
extension contact, demonstration, training and participation on field day) and farm
characteristics factors (size of farm and farm experience) are the main key variables that
were expected to influence the adoption of improved soya bean varieties in the study areas
were summarized in figure 1.

17
source: Adopted from Hadush, 2015
Figure 11: Conceptual framework of adoption of improved soya bean varieties
Adoption and
intensity of
adoption of
improved soya
bean varieties
Socioeconomic factors
-livestock holding
-Education
-Off /non-farm income
Demographic
factors
-Sex
-Age
-Marital statues
-family size
Institutional factors
-Distance to market
-Access to credit
-Extension Contact
-Training
-Field day
(demonstration)
Farm characteristics
-Farm size
-Farm Experience

18
3. RESEARCH METHODOLOGY
In this chapter a brief description of the study areas, sampling methods and sample size,
sources and types of data and data collection methods, methods of data analysis,
measurement and definitions of variables and cost benefit analysis are presented.
3.1. Description of the Study Areas
3.1.1. Location and physical features
Chewaka is located in Buno Bedele zone, Oromia Regional state about 570 kilometers
southwest of Addis Ababa. It covers a total area of 342.167 km2. It is situated in lowland
areas of Dhidhessa valley, which lies below 1500m above sea level. The area is found
between Dabena and Dhidhessa rivers. Dhidhessa River bounds the district from east to
north and at the same time it is the boundary between Illubabor and East Wollega zone. On
the other hand Dabena River bounds the area from west to north which joins Dhidhessa
and finally leads to Blue Nile.
GobuSayo district is located in East Wellega Zone of Oromia region 265 km west of Addis
Ababa. Its altitude is in the range of 1556-1680 meter above sea level. The capital town of
Gobu Seyo (Ano) is located 65 K.M to East from Nekemte, the capital town of East
Wellega Zone. The district consists of 9 Kebele Administrations.

19
Figure 22: Map of the study areas, own sketch, 2017
3.1.2. Agriculture
Agriculture is the economic base of Chewaka district. Agriculture is mainly rain-fed and is
characterized by low productivity. The majority of the residents depend on agriculture for
their livelihood. The farmers are using traditional technologies and with limited accesses to
agricultural inputs. Moreover, the sector in the zone is characterized by low-level use of
farm inputs, traditional farm practice, and other related problems. Farmers of the study area
produce agricultural crops for consumption and commercial purposes. The major crops
produced in the area include maize and sorghum mainly for consumption while soya bean
is produced for sale. Other crop types produced include rice, ground nut among others. It is
one of the areas that produce cash crops mainly soya bean. The farmers slash and burn the
area to prepare farmlands. The district is also potential for livestock production.
Agriculture is also the main stay of the people in the Gobusayo district and the district is

20
high potential for crop and livestock production. The major crops produced in the area
include maize sorghum, and soya bean.
3.1.3. Population
The population of Chewaka district was 67,623 in 2015 and about 14,000 households while
the total population of the Gobusayo district was 45,887 (49.44% males, 50.56% female) in
which 7241 are male headed and 1055 are female headed households. The family members
in both households are 14,772 males and 22,819 females.
3.2. Sampling Methods and Sample Size
A three stage sampling technique was employed to select sample respondents. In the first
stage, Chewaka and Gobusayo districts were purposively selected for this study, due to the
fact that improved soya bean varieties was widely popularized by Bakko Agricultural
Research Center (BARC) and N2 Africa project in the study areas. In the second stage,
five Kebeles were randomly selected. Three Kebeles from Chewaka district and two
Kebeles from Gobusayo district were selected for this study. Households in sample kebeles
were stratified into producers and non-producers of soya bean and representative samples
were selected from producers of soya bean.
The sample size was determined by using a formula developed by Cochran’s (1977):
2
2
e
pqZn = (1)
Where n is the sample size for the study, Z is the selected critical value of desired
confidence level (1.96), p is the estimated proportion of an attribute that is present in the
population which is 0.32 in this study. q =1-p that is 0.68 and e is the desired level of
precision which is 0.07.

21
Table 3: Sample size of soya bean producers by kebeles
District kebeles Population Sample Total
sample Improved
soya bean
producers
Local
soya bean
producers
Adopter
s
Non-
adopters
Gobusayo Jagan
Burqa Anani
Madda Jalala
151
118
136
309
242
279
11
9
10
22
18
20
33
27
30
Chewaka Ongobo Bekenisa
Gambela Tare
112
140
230
285
8
10
17
21
25
31
Total 657 1345 48 98 146
Source: Districts agricultural office, 2017
3.3. Sources and Types of Data and Data Collection Methods
Both primary and secondary data were used. For this study primary data were collected on
one-to-one interview using a structured survey questionnaire (see Appendix II) pre-tested
and administered by well trained and experienced enumerators who have knowledge of the
farming system and the local language. During the personal interview information on soya
bean varieties grown, socio-economic elements (age, gender, education level, family size,
asset ownerships, distance of a residence from input and output markets and frequency of
extension contact and institutional and other relevant) factors were collected. Secondary
data source include books, journals and other published and unpublished documents from
Bako agricultural research center, N2Africa (Putting nitrogen fixation to work for
smallholder farmers in Africa), zonal and district agricultural offices, internet and other
related sources to supplement primary data.
3.4. Methods of Data Analysis
In this study, both descriptive statistics and econometric model were used to analyze the
data.
3.4.1. Descriptive statistics
Descriptive statistics such as mean, standard deviation, frequencies distribution, and
percentages were used to have a clear picture of the characteristics of sample units. Chi-

22
square test and t-tests were also used to compare adopters and non-adopters in terms of
explanatory variables.
3.4.2. Econometric model
According to Cragg’s model, a farmer faces two hurdles while deciding on soya bean
cultivation. The first is to decide whether to cultivate soya bean. The second hurdle is
related to the level of adoption, or how much land or capital to allocate to soya bean
production. The most important underlying assumption of the model is that these two
decisions are made in two different stages. At the beginning of a cropping season a farmer
may decide to cultivate soya bean without making exact plans about the quantity of land.
Many factors can influence a farmer’s decision afterwards, i.e., price and availability of
inputs, potential to cultivate competing crops, information about production technology,
etc.
The first stage of Cragg’s model is a probit model to identify the determinants of adoption,
and the second stage is a truncated model for identifying the determinants of the level of
adoption (Cragg, 1971). Let di* is the latent variable describing a farm’s decision to
adopt, yi* is the latent variable describing its decision on the level of adoption,
and di and yi are their observed counterparts, respectively. Based on the specification by
Cragg (1971) and Moffatt (2005), the two hurdles for a farmer can be written as:
di* = α zi + vi (2)
yi* = β xi + εi , (3)
Where
=
=
otherwiseif
dandyifyyand
dif
difd
iii
i
i
i
i
,0
00,
0,0
0,1
Where zi is the vector of variables explaining whether a farmer adopts improved soya bean
varieties, xi is a vector of variables explaining level of adoption, and vi and εi are the error
terms.
The dependent variable in the first stage is the farmer’s adoption decision. This variable is
binary in nature, taking numeric value 1 for adopters, and 0 for non-adopters. In the second

23
stage, the dependent variable is area of improved soya bean varieties cultivated in hectare.
In the double-hurdle model, both hurdles have equations associated with them,
incorporating the effects of farmer's characteristics and circumstances. Such explanatory
variables may appear in both equations or in either of them (Teklewold et al., 2006).
According to Carroll et al (2005), equations 1 and 2 are assumed to be independent, and
therefore the error terms are randomly and independently distributed, vi ∼ N(0,1) and
εi ∼ N(0, σε2).
The log-likelihood function for the double hurdle model is:
( )
−+
−=
ii
ii
i
XYZ
XZL
1ln)('(1lnlog (4)
Where Φ and ϕ are the standard normal cumulative distribution function and density
function, respectively. The log-likelihood function is estimated using the maximum
likelihood estimation (MLE) technique.
The double-hurdle model is reduced to the Tobit model when the probit mechanism (di* >
0) is absent in Equation 2. This can also be seen in the log-likelihood function presented
in Equation 3, when Φ (zi α) = 1. The Tobit model arises if α = β/σ and x = z (Martinez-
Espineira, 2006). Absence of the probit mechanism implies that the decision about
adoption and level of adoption are made simultaneously. We also develop a Tobit model
and do standard likelihood ratios test between the Tobit and double-hurdle model to know
how these decisions are made. Following Gujarati (2003), the Tobit model for our specific
case can be written as:
=
otherwiseo
soybeanforallocatedlandifyy i
i
0 (5)
Where, β0…, βk are the unknown parameters to be estimated and x1i…xki are the same set
of explanatory variables used in the second stage of the Cragg model. Using MLE, the
Tobit model is estimated. According to Maddala (1992), the likelihood function for the
Tobit model can be written as
( ) ( )
I
i
i
i
X
V
xyi
V
FfL −=
−
0
1
0
(5 (6)

24
Through maximizing the function with respect to β and σ, we get the MLE estimates of
these parameters.
As the Tobit model is nested in the Cragg model, it is possible to compare these two
models through a standard likelihood ratio test when the determinants in both hurdles are
the same (Buraimo et al, 2010). The test statistics can be computed as in Greene (2000):
Γ = -2[ln LT − (ln LP + ln LTR)] ∼ χk2 , (7)
Where LT, LP, and LTR are log-likelihoods of the Tobit, probit, and truncated regression
models, respectively. Rejection of the null hypothesis (Γ > χk2) argues for superiority of the
double-hurdle model over the Tobit model and establishes that the decisions about
adoption and level adoption are made in two different stages.
3.5. Definitions of Variables and Hypothesis
3.5.1. Dependent variables
Adoption decision: The dependent variable for probit model takes a dichotomous value
depending on the farmers’ decision either to adopt (at least one) or not to adopt any of the
improved soya bean varieties.
Intensity of adoption: The dependent variable for truncated regression model would have
a continuous value which is the intensity of use of the technology. In this case, it indicates
the proportion of area cultivated under improved soya bean varieties in hectare. Adopters
are farmers who produce either of Dedessa, Katta, Jalale and Ethio-Yugoslavia varieties.
Non-adopters are farmers who did not produce those improved varieties during the
production year.
3.5.2. Independent variables
Adoption literature provides a long list of factors that may influence the adoption of
agricultural technologies. Generally, farmers’ decision to use improved agricultural
technologies and the intensity of the use in a given period of time are hypothesized to be
influenced by a combined effect of various factors such as household characteristics,

25
socioeconomic and physical environments in which farmers operate. Based on the previous
studies conducted on the adoption of improved crop technologies and the experience of the
farming system of the study areas, the following listed explanatory variables in the table
were selected for this study.
Sex of the household head: This is a dummy independent variable indicating sex of the
household head. It was represented by 1 for males and 0, otherwise. The gender difference
is found to be one of the factors influencing adoption of new technologies. Female headed
households are not efficient and able to adopt new technology as compared to their male
counterpart (Yemane, 2014, Samuel et al 2017). Therefore, it is hypothesized that male
farmers are more likely to adopt new technologies.
Age of the household head: Age is a continuous variable and is one of the factors that
affect adoption, intensity of adoption and speed of adoption in one of the several ways. The
direction of influence is not, however, very clear and there are always mixed results from
empirical analysis. Older farmers may have more experience, resource, or authority that
would allow them more possibilities for trying new technologies. On the other hand, it may
be that young farmers are more likely to adopt new technologies, because they may have
more schooling than older farmers and have been exposed to new ideas and hence more
risk takers (Assefa and Gezahegn, 2010). Hence, age of the household head may have
positive or negative effect on the adoption and intensity of adoption of improved soya bean
varieties.
Education level of the household head: It is a continuous variable measured in terms of
the level of education a farmer attended. It is expected that the more years an individual is
exposed to education, the more open he/she would be to new ideas. Educated farmers may
also be more aware of the benefits of modern technologies and may have a greater ability
to learn new information hence easily adopt new technologies. Hence, educational level of
the household head has a positive effect on the status, intensity and speed of technology
adoption (Sisay, 2016, Hassen et al., 2012, Afework and Lemma, 2015). Education thus
was expected to have a positive effect on the decision to adopt and intensity of adoption of
improved soya bean varieties.

26
Contact with extension agents: It is a continuous variable measured in terms of the
frequency of contact between the extension agent and the farmers is hypothesized to be the
potential force, which accelerates the effective dissemination of adequate agricultural
information to the farmers, thereby enhancing farmers’ decision to adopt new crop
technologies. According to Yemane (2014) contact with extension agents has positively
influenced the adoption of improved upland rice varieties. A similar study of Hassen et al.,
(2012) indicated that, more contacts with extension agents will increase farmers’ adoption
of technologies. It was hypothesized that contact with extension workers will increase a
farmer’s likelihood of adoption and intensity of adoption of improved soya bean varieties.
Farm size: It is a continuous variable measured in hectares. Farm size is an indicator of
wealth and social status and influence within a community. This means that farmers who
have relatively large farm size will be more initiated to adopt new technologies and the
reverse is true for small size farmers. The land holding size returned a positive and
significant relationship with adoption of new technology (Yenealem et al., 2013; Solomon
and Bekele, 2010). Therefore, it is expected to be positively associated with the decision to
adopt and intensity of adoption improved soya bean varieties.
Area allocated under improved soya bean: It is a continuous variable measured in
hectares. Therefore, it is expected to be positively associated with the intensity of adoption
improved soya bean varieties.
Participation in training: Training is one of the means by which farmers acquire new
knowledge and skill. It is a dummy variable which have a value of 1 if the famer had been
participated in training at least once in the last three years and 0, otherwise. Farmers who
participated on training, their probability of adoption and intensity of adoption of new
technologies increase (Wuletaw and Daniel, 2015; Hadush, 2015). Hence, participation in
training is expected to positively influence adoption and intensity of adoption of improved
soya bean varieties.
Participation in demonstration: It is a dummy variable which have a value of 1 if the
famer had been participated in demonstration at least once in the last three years and 0,
otherwise. Participation in field days is expected to positively influence farmers’ adoption
of improved technology (Alemitu, 2011; Hadush, 2015). Hence, participation in

27
demonstration is expected to positively influence adoption and intensity of adoption of
improved soya bean varieties.
Access to credit: It is a dummy variable that takes a value of 1 if households have access
to credit and 0, otherwise. Farmers who have access to credit may overcome their financial
constraints and therefore buy inputs. The credit availability positively affects the adoption
of improved technologies (Tiamiyu et al., 2014; Leake and Adam, 2015). Therefore, it is
expected that access to credit will increase the probability of adoption and intensity of
adoption of improved soya bean varieties.
Livestock holding: It is a continuous variable measured in TLU. A household with large
livestock holding can obtain more cash income from the sales of animal products. This
income in turn helps smallholder farmers to purchase farm inputs. Leake and Adam (2015)
reported that being owner of more livestock increases the level of adoption of improved
agricultural technology. Therefore, livestock ownership is hypothesized to be positively
related to the adoption and intensity of adoption of improved soya bean varieties.
Family size: It is a continuous variable measured in terms of adult equivalent of persons
living together in the household. Adoption of soya bean requires adequate labor supply to
carry out the production processes. It is obvious that large families may have adequate
labor that would enhance the adoption of technologies. The labor availability is positively
related with the adoption of improved new technologies (Hassen et al., 2012; Debelo
2015). Hence, it is hypothesized that availability of labor has positively influenced the
adoption and intensity of adoption of improved soya bean varieties.
Market distance: It is a continuous variable measured in kilometers. Market distance is
one of the determining factors in the adoption of technology. Better access to the market
can influence the use of output and input markets, and the availability of information. It is
expected that farmers living near the market would easily access market for their farm
produce hence readily adopt and intensively use new technology (Afework and Lemma
2015; Hassen et al., 2012). Therefore, it is hypothesized that market distance is inversely
related to adoption and intensity adoption of soya bean improved soya bean varieties.

28
Non/off-farm activity: It is treated as a dummy variable taking the value of 1 if a
household head participated in non/off-farm income generating activities and 0, otherwise.
The households engaged in non/off-farm activities are better endowed with additional
income to purchase inputs. The study by Olalekan and Simeon (2015) indicated that
participation in non/off farm income activities has a positive influence on the adoption new
technology. Therefore, it is expected that the participation in non/off-farm income is
positively related to adoption and intensity of adoption of improved soya bean varieties.
Farm experience: It is a continuous variable measured in years of soya bean production. It
is expected that farmers who have adequate farm experience more likely to adopt new
technologies than less experienced farmers. Aman and Tewodros (2016) indicated that
farm experience affect adoption and intensity adoption of improved varieties positively.
Therefore, it is expected that the farm experience is positively related to adoption and
intensity of adoption of improved soya bean varieties.

29
Table 4: Summary of independent variables, their definitions and expected effect
Dependent variables
1. Adoption of improved soya bean varieties Dummy (1.Yes
0.No)
2. Proportion of area under improved soya bean varieties Continuous
(hectare)
Independent
Variables
Definitions of variables Unit of
measurement
Expecte
d sign
District District of study areas Dummy
1.Chewaka
0.Gobusayo
+/-
Age Age of household head Years +/-
Sex Sex of the household head 1.Male
0.Female
+
Family size Number of persons per household No +
Marital statues Marital status of household heads 0. Married
1.Divorced
2.Widowed
3.Single
+/-
Education Formal education level of household
head
Grade attended +
non/off farm participation on off/ non-farm activities 1.Yes 2.No +
Farming
experience
Soya bean farming experience of the
household head
Years +
Training Participation on training of soya bean
production
1. Yes 0. No +
Livestock Number of livestock owned TLU +
Distance to
market center
Distance of farmers house from nearby
market
Hour -
Credit Use of cash credit in maize framing 1= Yes 0=No +
Farm size Total land holding size of the household
head
Hectares +
Extension Contact with extension agents No +

30
4. RESULTS AND DISCUSSION
This chapter presents the major findings of the study and discusses it in comparison with
the results of other studies. Both descriptive and econometric methods were used to
analyze the primary data. Descriptive statistics were employed to describe the general
demographic, socio-economic and institutional characteristics of sample soya bean
producing farmers. Econometric analysis was also used to identify factors affecting
adoption and intensity of adoption of improved soya bean varieties in the study areas. Cost-
benefit analysis was used to assess the profitability of improved soya bean varieties
adopted in the study areas.
4.1. Descriptive Results
4.1.1. Demographic characteristics households
The sample size handled during the survey was 146. Out of the total interviewed soya bean
producers 94 (64.38%) were from Chewaka district and the remaining 52 (35.62%) were
from Gobusayo district. Among the sample respondents from chewaka district, 74
(78.72%) were male headed and the remaining 20 (21.28%) were female headed while in
Gobusayo 47 (90.38%) and 5 (9.62%) were male and female headed producers,
respectively. The chi-square test of sex distribution between the adopters and non-adopters
was found to be insignificant. Out of the total respondents, 97.26%, 1.37% and 1.37% were
married, single and widowed respectively. The chi-square test of marital status between the
adopters and non-adopters was found to be insignificant (table 5).
Table 5: Sex and marital status of sample households
Variable Adopters (N=48) Non- adopters
(N=98)
Total (N=146)
No % No % 𝑥2-test No (%)
Sex Male 41 85.4 80 81.6 0.33 121 78.7
Female 7 14.6 18 18.4 25 21.3
Marit
al
status
Married 47 97.9 95 96.9
1.25
142 97.3
Single 1 2.1 1 1 2 1.4
Widowed 0 0 2 2 2 1.4
Source: Survey result, 2017

The average age of the adopters was 40.17 years and while it is about 38.55 years for non-
adopters. The t-test of age between adopters and non-adopters was found to be
insignificant. That means there is no statistical mean difference between adopters and non-
adopters in terms of age (Table 6).
Table 6: Age of sample households
Variables Adopter (N=48) Non-adopters (N=98)
mean Std Mean Std t-test
Age 40.17 1.91 38.55 1.22 -0.73
Source: Survey result, 2017
4.1.2. Socio economic characteristics
Family size is one of the variables that characterize farm households. The average family
size of the adopters was 2.83 people and while it is about 2.66 persons for non-adopters.
The t-test of family size between adopters and non-adopters was found to be insignificant
(Table 7).
Experience in soya bean production is taken to be the number of years that an individual
was continuously engaged in soya bean production. The average years of soya bean
production experience for the adopters was about 10.44 years and 8.58 years for non-
adopters with standard deviation of 1.77 and 1.2 respectively. A producer with better
experience in soya bean production is expected to adopt new technologies than less
experienced. The t-test of farm experience between adopters and non-adopters was
insignificant (Table 7).
Education can influence productivity of producers and adoption of newly introduced
technologies and innovations. Hence, literate producers are expected to be in a better
position to get and use information which contributes to improve their soya bean
production practices. According to the survey results, on average adopters have about 6
grades of formal educations while non-adopters have 3. The t-test result indicates that
education level of household was found to be significant between adopters and non-
adopters at 1% level of significance. That means adopters have higher level of education
compared to non-adopters (Table 7).
32
Farm animals have an important role in rural economy. They are source of draught power,
food, such as, milk and meat, cash, animal dung for organic fertilizer and fuel and means
of transport. The districts where known by livestock production as major occupation.
Livestock holding size is also one of the indicators of wealth status of the households in the
study areas. Livestock is kept both for generating income and traction power. As it
confirmed in many studies, farmers who have better livestock ownership status are likely
to adopt improved agricultural technologies because livestock can provide cash through
sales of products which enables farmers to purchase different agricultural inputs like seeds
and used as traction power.
The livestock species found in the study areas are cows, oxen, bulls, heifers, calves, sheep,
goat, donkey, mule and poultry. To help the standardization of the analysis, the livestock
number was converted to tropical livestock unit (TLU).The conversion factors used were
based on Storck et al., (1991) and it is shown in Appendix I- Table 4. The average
livestock ownership of adopters was 5.17 and 4.13 TLU for the non-adopters. The t-test of
livestock holding between adopters and non-adopters was found to be insignificant. That
means there is no statistical mean difference between adopters and non-adopters in terms
of livestock holding (Table 7).
The average total land holding, total cultivable land and land allocated for improved soya
bean for adopters is 2.00, 1.84 and 0.25 hectares respectively while it is 2.2, 1.97, and 0
hectares for non-adopters. The t-test of total land holding and total cultivable land between
adopters and non-adopters was found to be insignificant. That means there is no statistical
mean difference between adopters and non-adopters in terms of total land holding and total
cultivable land but the t-test of land allocated for improved soya bean between adopters
and non-adopters was found to be significant at 1% level of significance indicating that
there is statistical mean difference between adopters and non-adopters in terms of land
allocated for improved soya bean varieties (Table 7).
Frequency of extension contact refers to the number of contacts per year that the
respondent made with extension agents. The effort to disseminate new agricultural
technologies is within the field of communication between the change agent (extension
agent) and the farmers at the grass root level. Here, the frequency of contact between the
extension agent and the farmers is hypothesized to be the potential force which accelerates

33
the effective dissemination of adequate agricultural information to the farmers, thereby
enhancing farmers' decision to adopt new technologies. The mean extension contact for
adopters and non-adopters was 10.56 and 1.7 respectively. The t-test of extension contact
between adopters and non-adopters is significant at 1% level of significance indicating that
there is statistical mean difference between adopters and non-adopters in terms of
frequency of extension contact (Table 7).
Table 7: Socio-economic characteristics of sample households
Variable Adopter (N=48) Non-adopters (N=98)
mean Std Mean Std t-test
Family size 2.83 0.24 2.66 0.13 -0.70
Farm experience 10.44 1.77 8.58 1.20 -0.40
Education level 6.29 0.43 3.20 0.33 -5.46***
Livestock holding(TLU) 5.17 0.97 4.13 0.47 -1.0937
Total land holding 2 0.14 2.20 0.16 0.88
Total cultivated land 1.84 0.12 1.97 0.13 0.62
Land allocated for
improved soya bean
0.25 0.02 0 0 -14.8***
Extension contact 10.56 2.87 1.7 0.56 -4.11***
Source: Survey result, 2017 *** significance level at 1 %
4.1.3. Participation in off/nonfarm activities and Access to credit
Participation on off /non-farm can affect the decision to adopt new technologies. This is
particularly true if the adoption of the new technology would require a minimum
investment in purchased inputs. Most of the farmers interviewed reported that they didn’t
participate on off/non-farm because of poor infrastructure development in the area. About
18.75% of adopters and 13.27% of non-adopters participate on off farm while about
81.25% of adopters and 86.73% of non-adopters did not participate on off farm activities.
25% of adopters and 19.39% of non-adopters participate on non- farm while 75% of
adopters and 80.61% of non-adopters did not participate on non- farm activities. The 𝑥2 test
of off farm and off farm participation between adopters and non-adopters was found to be
insignificant. That means there is no difference between adopters and non-adopter in off
farm and non-farm participation (Table 8).

34
Credit is an important institutional service to finance poor farmers who cannot purchase
input from own savings especially at early stage of adoption. As presented in table 11,
about 81.25% and 40.43% adopters and non-adapters access credit respectively while
about 18.75% and 59.57% does not access credit. The result of 𝑥2 test revealed that there is
difference in access to credit between adopters and non-adopters farmers at 1% level of
significance (Table 8).
Table 8: Participation in off/nonfarm activities and Access to credit of households
Variables Adopters (N=48) Non-adopters
(N=98)
Total (N=146)
No % No % 𝑥2 test No %
Off farm Yes 9 18.75 13 13.27 0.76 22 15.07
No 39 81.25 83 86.73 124 84.93
Non-
farm
Yes 12 25 19 19.39 0.61 31 21.23
No 36 75 79 80.61 115 78.77
credit Yes 39 81.25 38 40.43 23.32***
77 52.74
No 9 18.75 60 59.57 69 47.26
Source: Survey result, 2017 *** significance level at 1 %
4.1.4. Distance to nearest market
The time taken to travel from home to the nearest soya bean market place where farmers
sell their product (soya bean), are presented in table 12. Adopters and non-adopters travel
on average 0.24 and 0.97 hour respectively to reach nearest market. The t-test of distance
to nearest market between adopters and non-adopters is significant at 1% level of
significance indicating that non-adopters travel more hours to reach nearest market than
adopters.
Table 9: Distance to nearest market of households
Variable Adopter (N=48) Non-adopter (N=98)
mean Std Mean Std t-test
Distance to nearest
market
0.24 0.02 0.97 0.08 5.81***
Source: Own survey result, 2017 *** significance level at 1 %

35
4.1.5. Major crops produced
As presented in table 13, in the study areas, maize is the dominant crop produced with
mean 20.77 quintals for adopters and 20.36 for non-adopters and it is the basis of
livelihood in the study areas. The second dominant crop produced is sorghum with mean of
8.9 and 5.6 quintals for adopters and non-adopters respectively. Rice is the third dominant
crop produced with mean of 5.41 and 4.07 quintals for adopters and non-adopters
respectively. Soya bean is also the major crop produced in the study areas with mean of
5.12 and 1.65 quintals for adopters and non-adopters respectively. This low productivity of
soya bean is due to disease (rust) which occurs in the study areas for the last two years. The
result of t- test revealed that there is significant mean difference between adopters and non-
adopters farmers in terms of amount of soya bean produced and amount of sorghum
produced at 1% and 5% significance level respectively.
Table 10: Major crops produced by sampled households (Qt)
Variables Adopters (N=48) Non-adopters (N=98)
Mean Std Mean Std t-test
Amount of soya bean produced 5.12 1.30 1.65 0.63 -4.37***
Amount of maize produced 20.77 3.56 20.36 2.19 -0.10
Amount of sorghum produced 8.90 1.21 5.60 0.68 -2.56**
Amount of rice produced 5.41 1.47 4.07 0.98 -0.77
Source: survey result, 2017 **and*** significance level at 5% & 1 % respectively
4.1.6. Perceptions about soya bean varieties attributes
In order to get insight on farmers’ decisions of new technology use, looking at their
perceptions about each attributes of a given technology is of paramount important. Hence,
knowledge of respondent farmers’ evaluative criteria as regard to technology attributes is
needed. These include: yield, drought resistance, early maturity, shattering, marketability,
disease resistance, and non-logging. Three descriptions, i.e., superior, the same and inferior
were used to facilitate the comparison by farmers of the recommended improved soya bean
varieties against their local seed.
About 2.63%, 2.63%, 7.89%, 19.44%, 7.89% and 18.42% respondents perceived that the
traits yield, drought resistance, early maturity, shattering, disease resistance, and non-

36
logging of the improved soya bean varieties are inferior to the local ones. About 44.74%,
13.16%, 41.67%, 71.05%, 23.68% and 21.05% respondents perceived that the traits
drought resistance, early maturity, shattering, marketability, disease resistance, and non-
logging of the improved soya bean varieties are the same to the local ones while About
97.37%, 52.63%, 78.95%, 38.89%, 28.95%, 68.42% and 60.53% respondents perceived
that yield, drought resistance, early maturity, shattering, marketability, disease resistance,
and non-logging of the improved soya bean varieties are superior to the local one.
Table 11: Perceptions about soya bean technology attribute
Attributes Percent
Inferior The same Superior
Yield 2.63 0 97.37
Drought resistance 2.63 44.74 52.63
Early maturity 7.89 13.16 78.95
Shattering 19.44 41.67 38.89
Marketability 0 71.05 28.95
Disease resistance 7.89 23.68 68.42
Non-logging 18.42 21.05 60.53
Source: survey result, 2017
Therefore the most perceived preference attributes of new varieties are yield, early
maturity, disease resistance and non-logging.
4.1.7. Sources of improved seed
According to sample respondents about 68.75% obtained improved soya bean varieties
from research center (BARC) in collaboration with N2Africa project. About 16.67%
respondents obtained improved soya bean varieties from market while about 14.58%
respondents obtained from other farmers.
Table 12: Sources of seed for improved soya bean varieties
Sources of seed Frequency Percent Cumulative
Researcher center(BARC) 33 68.75 68.75
Purchase from market 8 16.67 85.42
From farmer 7 14.58 100.00
Total 48 100.00
Source: survey result, 2017

37
4.2. Econometric Results
In this sub-section, the results of the Double hurdle regression model is presented and
discussed. Adoption decision of farm households is influenced by different socioeconomic,
technical and institutional factors. Different variables are important across different space
and over time in explaining adoption of technologies by farmers. Many factors are
hypothesized to influence the adoption of improved soya bean varieties based on
theoretical models and empirical evidences.
Table 13: Test statistics of Double-hurdle model
Probit, D Truncated Regression, Tobit
Wald χ2 163.46 18.52 206.72
Prob > χ2 0.000 0.0295 0.000
LOG-L -10.73 57.66 -27.32
Number of observation (N) 146 48 146
𝑥2-Test Double Hurdle versus Tobit: Γ = 148.5 > χ2(16) = 30.58
Since 𝑥2-Test Double Hurdle versus Tobit: Γ =148.5 > χ2 (15) = 30.58, double hurdle is
appropriate model than Tobit model for this study.
Out of 15 explanatory variables included in the model, six were found to be significant in
influencing farmers’ decision to adopt improved soya bean varieties at 1%, 5% and 10 %
significant levels. The variables include sex, age, education, farm experience, training on
soya bean and distance to nearest market in hour and four variables were found to be
significant in influencing intensity of adoption at 1%, 5% and 10% significant levels. The
variables include age, soya bean farm experience, training and livestock holding (table 14).

38
Table 14: Determinants of adoption and intensity of adoption improved soya bean varieties
Variables Probit regression Truncated regression
Coef. Std. Err. Marginal
Effect
Coef. Std. Err. Marginal
Effect
DIST 0.798 1.262 0.047 0.046 0.070 0.046
SEX 2.050* 1.181 0.060 0.052 0.076 0.052
MART -0.700 23.683 -0.052 0.032 0.138 0.032
AGE 0.218** 0.1027 0.030 0.010*** 0.003 0.010
EDUC 2.779** 1.176 0.012 -0.004 0.046 -0.004
FARMEXP 0.190* 0.101 0.003 0.009* 0.005 0.009
FAMSIZE 0.175 0.320 0.006 -0.003 0.018 -0.003
CONSUDA 0.031 0.031 0.006 0.001 0.001 0.001
DEMO 0.842 1.193 0.016 0.403 0.2293 0.403
TRAINING 5.995*** 2.036 0.342 0.627*** 0.181 0.627
DISTMARK -6.370** 2.925 -0.506 0.058 0.077 0.058
OFFFARM -1.083 1.136 -0.065 -0.118 0.055 -0.118
NONFARM 0.937 1.217 0.094 -0.001 0.047 -0.001
CREDIT 0.331 6.445 0.076 -0.007 0.079 -0.007
LIVESTOCK -0.069 0.079 0.008 0.021** 0.010 0.021
constant -3.124 0.756
sigma 0.060
Number of obs =146
LR chi2(15) =163.46
Prob > chi2 = 0.0000
Log likelihood = -10.73
Pseudo R2 =0.884
Limit: lower = 0
Upper = +inf
Number of obs = 48
Wald chi2 (15) = 18.52
Log likelihood = 57.66
Prob > chi2 = 0.0295
Source: Own Estimation Result, 2017 *, **and*** significant level at10%, 5% & 1 %
respectively.
The six explanatory variables which have been found to significantly influence the
decision by the sample farm households with regard to whether or not to adopt improved
soya bean varieties and the five explanatory variables which have been found to
significantly influence intensity of adoption of improved soya bean are interpreted and
discusses below.
Sex of household head (SEX): Sex of a house hold head is one of the determinants of
improved soya bean adoption. As the probit model indicates sex of house hold head had
positive and significant influence on the adoption of improved soya bean production
technology at 10% significance level. This shows that being male headed households have

39
better access to information on improved soya bean production technologies and are more
likely to adopt new varieties than female headed households and also increase their soya
bean production. Yenealem (2013) the binary logit model results revealed that the adoption
of improved maize variety is biased by gender, where female headed households adopt the
improved varieties less.
Age (AGE): Age was positively related to adoption and intensity of adoption of improved
soya bean varieties at 5% and 1% level of significance respectively. The result of the
probit model showed that one more unit (year) increase in farmers age increases the
probability of adoption of improved soya bean varieties increase by 3%. The result of
truncated regression indicate that old age households are more likely to devote significant
amount of land to improved soya bean varieties than less old households. One more unit
(year) increase in farmers age increases the intensity of adoption of improved soya bean
varieties increase by 1%. The implication is that the increase in farmer’s age increases
farmers’ experience in farming and understanding more the benefits of the technology.
Studies by Fitsum (2016), Sisay (2016) also obtained a similar result in their studies.
Education (EDU): Education level of the household head, which is one of the important
indicators of human capital, has a positive and significant effect on adoption of improved
soya bean varieties at 5% level of significance, implying that the likelihood of adoption
increases with farmer’s formal education level. Each additional year of education of the
household head increases the probability adoption of improved soya bean varieties by 1.2
%. This is consistent with the research results of Hassen et al. (2012), Moti et al. (2013),
Afework and Lemma (2015) and Sisay (2016), who stated that education, affect adoption
of improved technologies positively.
Farm experience (FARMEXP): Experience of the household head in soya bean farming
is one of the factors that affect technology adoption process in soya bean farming. That is,
experienced farmers are expected to have greater access to productive resources (such as
land and labor) and be able to apply improved agricultural technologies and expected to be
faster in adopting improved soya bean varieties than inexperienced farmers. Farm
experience has a positive and significant relationship at 10% level of significance with
probability of adoption and intensity of improved soya bean varieties. Each additional year
of farm experience of the household head increases the probability of adoption of improved

40
soya bean varieties by 0.3% and intensity of adoption of improved soya bean varieties by
0.9%. This is consistent with the research results by Aman and Tewodros (2016) and Musa
et al (2016).
Training (TRAINING): Training was positively related to adoption and intensity of
adoption of improved soya bean varieties at 1% level of significance. The result of probit
regression indicate that as compared to farmers who participated on soya bean training,
those farmers who did not participated on soya bean training their probability of adoption
of improved soya bean varieties decrease by 34.2%. The result of truncated regression
indicate that households who participated on training are more likely to devote significant
amount of land to improved soya bean varieties than households who did not participated
on training of improved soya bean varieties. As compared to households who did not
participated on training, the intensity of adoption of improved soya bean increases by
62.7% for households who participated on training. This is in line with previous studies by
Alemitu (2011), Hadush (2015) and Wuletaw and Daniel (2015) who found that training
influence adoption and intensity of adoption of new technology positively. According to
Alemitu (2011), Hadush (2015) and Wuletaw and Daniel (2015) training affect adoption
and intensity of adoption improved haricot bean varieties in Dale Woreda, SNNPRS ,
upland rice in Tselemti district, North Western zone of Tigray and malt-barley technology
in North Gondar positively and respectively.
Distance to nearest market (DISTMARK): Distance to market center has a negative and
significant relationship with probability of adoption of improved soya bean varieties at 5%
level of significance.. The model result indicates that as the distance from market center
increase by one hour, the probability of adoption of improved soya bean varieties decreases
by 50.6%. The possible explanation for this is that farmers who are far away from market
centers might face greater transaction and transport costs and lack of information on the
availability of the latest released technology provided by extension system. This is in line
with previous studies by Yenealem et al. (2013), Berihun et al. (2014), Debelo (2015) and
Sisay (2016) who found that distance to nearest market influence adoption of new
technology negatively. According to Yenealem et al. (2013), Berihun et al. (2014), Debelo
(2015) and Sisay (2016) distance to nearest market affect adoption of improved maize
varieties in West Harerghe zone, agricultural technologies in southern Tigray, Quncho Tef
in Wayu Tuqa District and maize technology in Jimma Zone negatively and respectively.

41
Livestock (LIVESTOCK): Livestock holding positively and significantly related to
intensity of adoption of improved soya bean varieties at 5% level of significance, implying
that farmers with more livestock holding are more likely to devote significant amount of
land to improved soya bean varieties than those households with less livestock holding. A
household with large livestock holding can obtain more cash income from the sales of
animal products. This income in turn helps smallholder farmers to purchase farm inputs. A
one unit increase in livestock holding (TLU) increases the intensity of adoption of
improved soya bean varieties by 2.1%. This is consistent with the studies by Solomon et
al. (2011), Hassen et al. (2012) and Leake and Adam (2015). According to Leake and
Adam, Hassen et al and Solomon et al livestock holding affect intensity of adoption of
improved chickpea varieties in Ethiopia , chemical fertilizer technology adoption in North
Eastern highlands of Ethiopia and improved wheat variety in northern Ethiopia positively
and respectively.

42
5. SUMMARY, CONCLUSION AND RECOMMENDATIONS
5.1 Summary and Conclusion
This study aimed at analyzing the determinants of adoption of improved soya bean
varieties in Chewaka and Gobusayo districts, Buno Bedele and East Wollega zones of
Oromia region, Ethiopia with the specific objectives of the identifying factors affecting
adoption and intensity of adoption of improved soya bean varieties and to assess the
profitability of improved soya bean varieties adopted in the study areas.
The data were generated from both primary and secondary sources. The primary data were
generated from individual interview using pre-tested semi-structured questionnaire. The
primary data for this study were collected from 146 randomly selected households from 5
Kebeles (3 Kebeles from Chewaka district and 2 Kebeles from Gobusayo district).
The analysis was made using descriptive statistics and econometric model. Different
analytical techniques were applied to analyze the collected data. Percentage, frequency,
means, standard deviation, chi-square and t-tests were used. Chi-square and t-tests were
used to compare between the independent variables and farmers adoption decisions of
improved soya bean varieties. Double hurdle model was applied to analyze factors
affecting adoption and intensity of adoption of improved soya bean varieties. Cost and
benefit analysis was used to assess profitability of improved soya bean varieties adopted in
the study areas.
Out of the total interviewed soya bean producers 94 (64.38%) were from Chewaka district
and the remaining 52 (35.62%) were from Gobusayo district. Among the sample
respondents from Chewaka district, 74 (78.72%) were male respondents and the remaining
20 (21.28%) were female while in Gobusayo 47 (90.38%) and 5 (9.62%) were male and
female respondents, respectively. Out of the total respondents 97.26%, 1.37% and 1.37%
are married, single and widowed respectively.
The average age of the adopters was 40.17 years and while it is about 38.55 years for non-
adopters. The t-test of age between adopters and non-adopters was found to be
insignificant. The average family size of the adopters was 2.83 people and while it is about

43
2.66 persons for non-adopters. The t-test of family size between adopters and non-adopters
was found to be insignificant. The average years of soya bean production experience for
the adopters was about 10.44 years and 8.58 years for non-adopters respectively. The t-test
of farm experience between adopters and non-adopters was found to be insignificant.
According to the survey results, on average adopters have about 6 grades of formal
educations while non-adopters have 3. The t-test result indicates that education level of
household was found to be significant between adopters and non-adopters at 1% level of
significance. That means adopters have higher level of education compared to non-
adopters.
The average livestock ownership was 5.17 and 4.13 TLU for adopters and the non-adopters
respectively. The average annual off farm income received by improved soya bean
adopters and non- adopters were about 1725.83 and 264.28 Birr respectively and it is about
2806.25 and 1082.65 from non-farm activities. The average total land holding, total
cultivable land and land allocated for improved soya bean for adopters is 2.00, 1.84 and
0.25 hectares respectively while it is 2.2, 1.97, and 0 hectares for non-adopters.
The mean extension contact of adopters and non-adopters was 10.56 and 1.7 respectively.
About 81.25% and 40.43% adopters and non-adapters access credit respectively while
about 18.75% and 59.57% does not access credit. The result of 𝑥2 test revealed that there is
difference in access to credit between adopters and non-adopters farmers at 1% level of
significance. Adopters and non-adopters travel on average 0.24 and 0.97 hour respectively
to reach nearest market.
In the study areas, maize is the dominant crop produced with mean 20.77 quintals for
adopters and 20.36 for non-adopters and it is the basis of livelihood in the study areas. The
second dominant crop produced is sorghum with mean of 8.9 and 5.6 quintals for adopters
and non-adopters respectively. Rice is the third dominant crop produced with mean of 5.41
and 4.07 quintals for adopters and non-adopters respectively. Soya bean is also the major
crop produced in the study areas with mean of 5.12 and 1.65 quintals for adopters and non-
adopters respectively.
About 2.63%, 2.63%, 7.89%, 19.44%, 7.89% and 18.42% respondents perceived that the
traits yield, drought resistance, early maturity, shattering, disease resistance, and non-

44
logging of the improved soya bean varieties are inferior to the local ones. About 44.74%,
13.16%, 41.67%, 71.05%, 23.68% and 21.05% respondents perceived that the traits
drought resistance, early maturity, shattering, marketability, disease resistance, and non-
logging of the improved soya bean varieties are the same to the local ones while About
97.37%, 52.63%, 78.95%, 38.89%, 28.95%, 68.42% and 60.53% respondents perceived
that yield, drought resistance, early maturity, shattering, marketability, disease resistance,
and non-logging of the improved soya bean varieties are superior to the local one.
About 68.75% obtained improved soya bean varieties from BARC in collaboration with
N2Africa project. About 16.67% respondents obtained improved soya bean varieties from
market while about 14.58% respondents obtained from other farmers.
Sex of household head, age of household head, education, soya bean farm experience,
participation in training affect adoption of improved soya bean variety positively and
significantly while distance to nearest market affect adoption of improved soya bean
varieties negatively and significantly. On the other hand, intensity of adoption was affected
by age, soya bean farm experience, participation in training and size of livestock holding.
5.2. Recommendations
On the basis of the results of this study, the following recommendations are suggested as to
be considered in the future intervention strategies which are aimed at promotion of
improved soya bean varieties.
Sex has a significant positive impact on adoption of improved soya bean varieties. To
increase and instigate the likelihood of adopting modern agricultural technologies like
improved soya bean by smallholder farmers, policy makers should put emphasis on
empowering female headed households to be participants and agents of change by
considering a comprehensive and an integrated development of the country where their
involvement is pertinent in all endeavors of the country’s overall development. From the
finding of the study adoption of improved soya bean varieties has a positive impact on
farm income; therefore, scaling up and diffusion of improved soya bean varieties in the
study area should be broadened.
45
The results of the study revealed that age of household head influences the adoption of
improved soya bean positively and significantly. Older household heads are more likely to
adopt a new technology such as use of improved soya bean varieties. Hence, introduction
of new agricultural technology in the areas may be successful if it focuses more on old
farmers.
Education has a significant positive impact on adoption of improved soya bean varieties.
Hence, strengthening adequate and effective basic educational opportunities to the rural
farming households in general and to the study areas in particular is required. In this
regard, the regional and local governments need to strengthen the existing provision of
formal and informal education through facilitating all necessary materials.
Farm experience increases probability of adoption and intensity of adoption of improved
soya bean varieties. This indicates that as farm experience get increases the household
acquires new information, know the benefits of new technologies and develop confidence
to use improved technologies. Thus, concerned bodies need to give emphasis to involve
farmers to exercise and use new technologies through demonstration, training and field
days. Besides, development agents, local leaders, and other participants should create the
room for experience sharing among farmers regarding the importance of improved
technologies.
Training on soya bean production was found to be positively and significantly influenced
adoption and intensity of adoption of improved soya bean varieties. Hence, concerned
bodies should provide adequate and effective training on soya bean production to the rural
farming households in general and to the study areas in particular. Thus, systematic
arrangements of farmer training should be implemented in order to acquaint farmers with
different agricultural technologies. In this regard, N2 Africa and BARC need to focus on
training of farmers about improved soya bean varieties.
Distance to nearest market was statistically significant and negatively affected adoption of
improved soya bean varieties. Hence, concerned bodies need to establish market center for
the farmers around their home which increase the probability of adoption of improved soya
bean varieties.

46
The size of livestock owned has a significant positive impact on intensity adoption of
improved soya bean varieties. Strengthening the existing livestock production system
through providing improved health services, better livestock feed (forage), targeted credit
and adopting agro-ecologically based high-yielding breeds and disseminating artificial
insemination in the areas improve intensity of adoption of improved soya bean varieties.

47
6. REFERENCES
A.D. Alene, D. Poonyth and R.M. Hassan. 2000. Determinants of adoption and intensity
of use of improved maize varieties in the central highlands of Ethiopia. A Tobit
analysis. Agrekon, 39(4) 633-643.
Afework Hagos and Lemma Zemedu. 2015. Determinants of improved rice varieties
Adoption in Fogera District of Ethiopia. Science, Technology and Arts Research
Journal, 4(1): 221-228.
Alemitu Mulugeta. 2011. Factors affecting adoption of improved haricot bean varieties
and associated agronomic practices in Dale Woreda, SNNPRS. MSc Thesis,
Hawassa university, Hawassa, Ethiopia.
Aman Tufa and Tewodros Tefera. 2016. Determinants of improved barley adoption
intensity in Malga district of Sidama Zone, Ethiopia. International Journal of
Agricultural Economics, 1(3): 78-83.
Andrea Blinkhorn. 2014. Soya beans and Global Food Security. Daily Trust, United
Nations Conference on Trade And Development, Intech, NASA, VOA News, World
Food Programme, Stop Hunger Now
Assefa Admassie and Gezahegn Ayele. 2010. Adoption of improved technology in
Ethiopia. Ethiopian Journal of Economics, 1(5): 155-178.
Bedru Beshir and Dagne Wegary. 2014. Determinants of small holder farmers’ hybrid
maize adoption in the drought prone Central Rift Valley of Ethiopia. African
Journal of Agricultural Research, 9(17): 1334-1343.
Berihun Kassa, Bihon Kassa and Kibrom Aregawi. 2014. Adoption and impact of
agricultural technologies on farm income: evidence from southern Tigray, Northern
Ethiopia. International Journal of Food and Agricultural Economics, 2(4): 91-106.
Bezabih Emana. 2010. “Market Assessment and Value Chain Analysis in Benishangul
Gumuz Regional State, Ethiopia”, SID‐Consult‐Support Integrated Development,
pp.1-84
Buraimo, B., Humphreys, B., & Simmons, R. 2010. Participation and engagement in
sport: A double hurdle approach for the United Kingdom (Working Paper).
Preston, United Kingdom: University of Central Lancashire.
Carroll, J., McCarthy, S., and Carol, N. 2005. An econometric analysis of charitable
donations in the Republic of Ireland. The Economic and Social Review, 36: 229-
249.

48
Cochran, W. G. 1977. Sampling techniques (3rd ed.). New York: John Wiley & Sons.
Cooper, J.C., and Keim, R.W. 1996. Incentive payments to encourage farmer adoption of
water quality protection practices. American Journal of Agricultural
Economics, 78(1): 54-64.
Cragg, J.G. 1971. Some statistical models for limited dependent variables with
application to the demand for durable goods. Econometrical, 39(5): 829-844.
CSA (Central Statistical Agency) 2016. Agricultural sample survey 2015/16 (2008E.C):
volume v- report on area, production and farm management practice of belg season
crops for private peasant holdings. Statistical Bulletin, Central Statistical Agency,
Addis Ababa, Ethiopia.
CSA(Central Statistical Agency) 2017. Agricultural sample survey 2016/2017 (2009 E.C.):
Volume I- report on crops area and production of major. Statistical Bulletin,
Statistical Agency, Addis Ababa, Ethiopia.
Dasgupta, S. 1989. Diffusion of agricultural innovations in village India. Department
of Sociology and Anthropology, University of Prince Edward Island, Canada.
Debelo Duressa. 2015. Analysis of factors influencing adoption of Quncho Tef: The case
of Wayu Tuqa district. International Journal of African and Asian Studies, 12:
2409-6938.
DSA (Development Studies Associates). 2008. Project profile on the establishment of
soya bean production farm Addis Ababa.
E. F. Fabiyi 2015. Adoption of Improved Soya bean Technologies in Bauchi Local
Government Area, Bauchi State, Nigeria. American Journal of Experimental
Agriculture. 6(4): 223-230
Ermias Tesfaye. 2013. Adoption of improved sorghum varieties and farmers’ varietal
trait preference in kobo district, north Wolo zone, Ethiopia. MSc Thesis, Haramaya
University, Haramaya, Ethiopia.
FAS/Addis Staff. 2016. USDA Foreign Agricultural service. Global Agricultural
Information Network.
FAO (Food and Agriculture Organization of the United Nations). 2010. Food outlook.
Oil Seeds Business Opportunities Ethiopia, 2009; J.H.M. Wijnands, J.Biersteker,
E.N. van Loo.
FAO (Food and Agriculture Organization of the United Nations). 2015. Background
paper for the Competitive Commercial Agriculture in Sub–Saharan Africa
(CCAA), Study Soya bean International Commodity Profile.

49
FAO (Food and Agricultural Organization). 2017. Commodities and Trade Division, Basic
Foodstuffs Service. The role of soya bean in fighting world hunger.
FDRE (Federal Democratic Republic of Ethiopia). 2010. Growth and transformation
plan 2010/11- 2014/15. Volume I: Main Text, Ministry of Finance and Economic
Development November 2010. Addis Ababa, Ethiopia.
Feder, L.,R.E.,Just and O., Zilberman. 1985. Adoption of agricultural innovation in
developing countries: A survey, Economic Development and Cultural Change,
32(2): 255- 297.
Fitsum Miruts. 2016. Analysis of the factors affecting adoption of Soya bean production
technology in Pawe District, Metekele Zone of Benshangul Gumuz Regional State,
Ethiopia. World Scientific News. 53(3): 122-137.
Gebregziabher, G., and Holden, S. 2011. Does irrigation enhance and food deficits
discourage fertilizer adoption in a risky environment? Evidence from Tigray,
Ethiopia. Journal of Development and Agricultural Economics, 3(10): 514-52.
Greene, W.H. 2000. Econometric analysis, 4th edition. Englewood Cliffs, NJ: Prentice
Hall.
Gujarati, D. 2003. Basic econometrics (4th edition). New York: McGraw Hill.
Hadush Hagos. 2015. Factors affecting adoption of upland rice and its implication on
system innovation: the case of Tselemti district, North Western zone of Tigray,
Ethiopia. MSc Thesis, Haramaya University, Ethiopia.
Hailegiorgis Biramo. 2010. Export performance of oilseeds and its determinants in
Ethiopia. Haramaya University, College of Agriculture and Environmental
Science, Department of Agricultural Economics.
Hassen Beshir, Bezabih Emana, Belay Kassa and Jema Haji. 2012. Determinants of
chemical fertilizer technology adoption in North Eastern highlands of Ethiopia: the
double hurdle approach. Journal of Research in Economics and International
Finance, 1(2): 39-49.
Jones, A.M. 1989. A double-hurdle model of cigarette consumption. Journal of Applied
Econometrics, 4(1): 23-39.
Kasasa P, Mpepereki S. and Giller K.E. “Quantification of nitrogen fixed by promiscuous
soya bean varieties under Zimbabwean field conditions”, in forum 4 working
Document 1, Programme extended abstracts, Fourth regional meeting of the Forum
for Agricultural Husbandry, Lilongwe, Malawi (2000).

50
Kebede, Y, K. Gunjal and G. Coffin. 1990. Adoption on new technologies in Ethiopia
agriculture: the case of Tegulet-Bulga district, Shoa province. Agricultural
Economics, 4 (1): 27-43.
Leake G.Silassie and Adam Bekele. 2015. Factors determining allocation of land for
improved wheat variety by smallholder farmers of northern Ethiopia. Journal of
Development and Agricultural Economics, 7(3): 105-112.
Maddala, G.S. 1992. Limited dependent and qualitative variables in econometrics. New
York: Cambridge University Press.
Martinez-Espineira, R. 2006. A box-cox double-hurdle model of wildlife valuation:
The citizen’s perspective. Ecological Economics, 1: 192-208.
Mekuria Aweke. 2013. Factors influencing adoption of improved maize varieties: the
case of Goro- Gutu Woreda of Eastern Hararghe, Ethiopia. MSc Thesis, Haramaya
University, Haramaya, Ethiopia.
Million Tadesse and Belay Kasa. 2004. Determinants of fertilizer use in Gununo area,
Ethiopia. Pp. 21-31. In Tesfaye Zegeye, Legesse Dadi and Dawit Alemu (Eds).
Proceedings of Agricultural technology evaluation adoption and marketing.
Workshop held to discuss results of 1998-2002, august 6-8, 2002.
MoARD (Ministry of Agriculture and Rural Development). 2010. Federal Democratic
Republic of Ethiopia: Ministry of Agriculture and Rural Development;
Ethiopia’s agricultural sector policy and investment framework (pif) 2010-2020,
draft final report 15 September 2010,Addis Ababa.
Moti Jaleta, Chilot Yirga, Menale Kassie, Groote. H.D. and Bekele Shiferaw. 2013.
Knowledge, adoption and use intensity of improved maize technologies in Ethiopia.
Invited paper presented at the 4th International Conference of the African
Association of Agricultural Economists, September 22-25, 2013. Hammamet,
Tunisia.
M.S Sadiq, M.T. Yakasai, M.M. Ahmad and Mohammed Abubakar. 2013. Profitability
and production efficiency of small-scale maize production in Niger State,
Nigeria.IOSR Journal of Applied Physics (IOSR-JAP), 3(4): 19-23.
Musa H. Ahmed, Hiwot M.Mesfin, seltena Abady, Wendmagegn Mesfin and Amhare
Kebede. 2016. Adoption of improved groundnut seed and its impact on rural
households’ welfare in Eastern Ethiopia. Congent economics and Finance.
http://dx.doi.org/10.1080/23322039.2016.1268747 (Accessed on 18 August
2017).

51
Nkonya, E., T. Schroeder and D. Norman. 1997. Factors affecting adoption of
improved maize seed and fertilizer in North Tanzania. Indian journal of
Agricultural Economics, 48(1): 1-12.
Ogisi, O.D., Begho, T. and Alimeke, B.O. 2013. Productivity and profitability of cassava
in Ika South and Ika North East Local Government Areas of Delta State, Nigeria.
Journal of Agriculture and Veterinary Science, 6(1): 52-56.
Olalekan, A.W and Simeon, B.A. 2015. Discontinued use of improved maize varieties in
Osunstate, Nigeria. Journal of Development and Agricultural Economics, 7(3): 85-
91.
Olujenyo, O. F. 2008. The determinants of agricultural production and profitability in
Akoko Land, Ondo-State, Nigeria. A Journal of Social Sciences, 4(1): 37-41.
Peter G. Moffatt. 2015. Stochastic Choice and the Allocation of Cognitive Effort.
Experimental Economics, 8(4):369–388.
P. Thoenes (2014). Background paper for the Competitive Commercial Agriculture in
Sub–Saharan Africa (CCAA) Study. Soya bean International Commodity Profile.
Markets and Trade Division Food and Agriculture Organization of the United
Nations.
Rogers, E.M. 1983. Diffusion of innovations, 3rd edition. New York: Macmillan
Publishing Co.Inc.
Samuel Diro, Efrem Asfaw, Beza Erko and Misganaw Anteneh. 2017. Factors affecting
adoption and degree of adoption of soya bean in Ilu-Ababora Zone; Southwestern
Ethiopia. Agricultural Science Research Journal, 7(1): 15 -26.
Shiferaw, B.A., Kebede, T.A., and You, L. 2008. Technology adoption under seed
access constraints and the economic impacts of improved pigeon pea varieties in
Tanzania. Agricultural Economics, 22(3): 217-232.
Sisay Debebe Kaba. 2016. Agricultural technology adoption, crop diversification and
efficiency of maize-dominated smallholder farming system in Jimma Zone, South-
Western Ethiopia. PhD Dissertation, Haramaya University, Haramaya, Ethiopia.
Solomon Asfaw and Bekele Shiferaw. 2010. Agricultural technology adoption and rural
poverty: Application of Endogenous Switching regression for selected East
African countries. Poster Presented at the joint 3rd African Association of
Agricultural Economics (AAAE): 19-23.

52
Solomon Asfaw, Bekele Shiferaw, Franklin Simtowe and Mekbib Gebretsadik Haile. 2011.
Agricultural technology adoption, seed access constraints and commercialization in
Ethiopia. Journal of Development and Agricultural Economics, 3(9), 436-447.
Sopov, M. et al., 2015, Business Opportunities Report Soy #9 in the series written for the
"Ethiopian Netherlands business event 5-6 November 2015, Rijswijk, The
Netherlands”
Storck, H., Bezahih Emana, Berhanu Adnew, A. Borowiecki and Shimelis Wolde
Hawariat,S. 1991. Farming systems and farm management practices of
smallholders in the Hararge highlands (Vol.II). Farming systems and resource
Economics in the tropics.Wisssenschafts, Vauk, Kiel, Germany.
Teklewold H., Dadi L.,Yami A. and Dana N. 2006.Transforming village poultry systems
into small agro-business ventures: a partnership model for the transfer of livestock
technologies in Ethiopia. Livestock Research for Rural Development. 18 (3), Article
#169.
Tiamiyu, S.A., Usman, A. and Ugalahi, U.B. 2014. Adoption of On-farm and Post-
harvest Rice Quality Enhancing Technologies in Nigeria. Tropicultura, 32(2): 67-
72.
Tobin, J. 1958. Estimation of relationships for limited dependent variables. Econometrica,
26:26-36.
UNDP (United Nation Development Program). 2013. Towards building resilience and
supporting transformation in Ethiopia. Annual Report, 2013. www.et.undp.org.
(Accessed on March, 2016).
Urgessa Tilahun Bekabil, (2015). Empirical review of production, productivity and
marketability of soya bean in Ethiopia. Oromia Agricultural Research Institute,
Haro Sabu Agricultural Research Center, Kellem Wollega, Dale Sadi District.
Wuletaw Mekuria and Daniel Tadesse. 2015. Determinants affecting adoption of malt-
barley technology: Evidence from North Gondar Ethiopia. Journal of Food Security
3(3): 75-81.
Yemane Asmelash. 2014. Determinants of adoption of upland rice varieties in Fogera
district, Ethiopia. Journal of Agricultural Extension and Rural Development, 8
(12): 332-338.
Yenealem Kassa, Ranjan S. Kakrippai and Belaineh Legesse. 2013. Determinants of
adoption of improved maize varieties for male headed and female headed

53
households in West Harerghe Zone, Ethiopia. International Journal of Economic
Behaviour and Organization, 1(4): 33-38.
Yu, B., A. Nin-Pratt, J. Funes, and S. Asrat Gemessa. 2011. Cereal Production and
Technology Adoption in Ethiopia. ESSP II Working Paper 31. Addis Ababa,
Ethiopia: Ethiopia Strategy Support Program II, International Food Policy Research
Institute.

54
7. APPENDICES

55
Appendix I: Tables
Appendix Table 151: Maximum likelihood estimation of Double-hurdle Versus Tobit
model
Variables Probit regression Truncated regression Tobit regression
Coef. Std. Err. Coef. Std. Err. Coef. Std. Err.
DIST 0.798 1.262 0.046 0.070 -0.102 0.128
SEX 2.050* 1.181 0.052 0.076 0.151 0.126
MART -0.700 23.683 0.032 0.138 .021** 0.009
AGE 0.218** 0.1027 0.010*** 0.003 -0.204 0.216
EDUC 2.779** 1.176 -0.004 0.046 0.374*** 0.092
FARMEXP 0.190* 0.101 0.009* 0.005 0.017* 0.010
FAMSIZE 0.175 0.320 -0.003 0.018 0.016 0.031
CONSUDA 0.031 0.031 0.001 0.001 0.002 0.002
DEMO -0.842 1.193 0.403 0.2293 0.063 0.176
TRAINING 5.995*** 2.036 0.627*** 0.181 1.135*** 0.159
DISTMARK -6.370** 2.925 0.058 0.077 -0.895*** 0.212
OFFFARM -1.083 1.136 -0.118 0.055 0.019 0.119
NONFARM 0.937 1.217 -0.001 0.047 0.051 0.112
CREDIT 0.331 6.445 -0.007 0.079 0.304*** 0.109
LIVESTOCK -0.069 0.079 0.021** 0.010 -0.001 0.009
constant -3.124 0.756 -0.769** 0.349
sigma 0.060 0.325 0.035
Wald χ2 (LR χ2) 163.46 18.52 206.72
Prob > χ2 0.000*** 0.0295** 0.000***
LOG-L -10.73 57.66 27.32
Number of
observation
146 48 146
*, **and*** significant level at10%, 5% & 1 % respectively.
Appendix Table 162: Goodness-of-fit test of the model
Probit model for goodness-of-fit test
Number of observations = 146
Number of covariate patterns = 146
Pearson chi2 (93) = 70.69
Prob > chi2 = 0.9589

56
Appendix Table 173: Conversion factor for adult equivalents
Age groups (years) Male Female
< 10 0.6 0.6
10-13 0.9 0.8
14-16 1.0 0.75
17-50 1.0 0.75
> 50 1.0 0.75
Source: Storck et al., (1991)
Appendix Table 184: Conversion factor for livestock unit
Animals Livestock units Animals Livestock units
Heifer 0.75 Donkey (young) 0.35
Calf 0.25 Camel 1.25
Weaned calf 0.34 Sheep and goat
(adult)
0.13
Cow and Oxen 1.00 Sheep and goat
(young)
0.06
Horse 1.10 Chicken 0.013
Donkey (adult) 0.70
Source: Storck et al., (1991)

57
Appendix II: The questionnaire used for the survey
Adoption of Improved Soya bean Varieties: The Case of Chewaka and
Gobusayo Districts, Buno Bedele and East Wollega Zones of Oromia
Region, Ethiopia
MSc Thesis Research
Survey Questionnaire
Prepared by Galmessa Abebe (MSc Student, Haramaya University)
Instruction: Please introduce yourself before starting the interview, the institute you are
working in and explain the objective of the survey. Please ask each question patiently until
the farmer get the point. Fill the answers to the question accordingly to the farmer’s
response.
1. General information
1.1. Questionnaire no: _______ 1.2.Date of interview (DD/MM/YYY):__________
1.3. Zone: __________________ 1.4. District: _________________________
1.5. Peasant Association (Kebele) ________________________________________
1.6. Name of respondent_______________________________________________
1.7. Name of Enumerator_______________________________________________
2. Household Characteristics
2.1). Name of household head: _______________________________
2.2). Sex of household head: 1. Male 2. Female
2.3). Age of household head (year): ____________________

58
2.4. Marital status of the household head 1. Married 2. Single 3. Divorced 4.
Widowed
2.5. Educational level of household head (in grade):_____________
2.6. Farming experiences of household head, since he started farming [in year]:______
3. Demographic Characteristics
3.1. Number of family members by sex and age Composition
No
By age category By Sex category
Male Female
1 Below 15 years
3 15 to 35 years
4 35 to 65 years
5 Above 65 years
6 Total
3.2. How many of your family members do permanently work on farm activities: ____
4. Socio economics Characteristics
4.1.What is the source of income for your household in order?
1. Crop cultivation 2.Animal husbandry 3. Crafts man 4. Employed (salary)
5. Trading 6. Other (please specify) _________________
4.2. Landholding status (ha):
4.1. Total landholding: _______
4.2. Total cultivable land: ______
4.3. Land allocated for improved soya bean production in 2008/2009 E.C: _____
4.3. What are the main uses of soya bean grain for you in 2008/2009 E.C?
1. for consumption 2. For sale 3. Source of livestock feed 4. Improving soil fertility
5. For other purpose (Please Specify)___________________________________
5. Cultural practices for soya bean
5.1. What are the farming culture that you implement in cultivation soya bean?
Practice used by farmers Soya bean
Frequency of land preparation
Planting time
Seed rate per hectare
Fertilizer rate per hectare 1.DAP
2. Inoculant

59
Planting method (1.row planting 2. Broadcast)
Weeding frequency
Harvesting time
5.2. List the major problems in soya bean production?
1. Lack of seed 2. Lack of inoculant 3.Disease 4. Lack of rainfall (drought) 5. Lack
of market6. Others (specify) ________________________________________
6. Livestock production
6.1. Do you practice rearing livestock? 1. Yes 2. No
6.2. If yes, fill the table bellow
Class of
livestock
Number Amount sold last
year(2008 E.C)
Unit price Total
price
Local Improved Total Local Improved Local Improved
Cows
Oxen
Heifers
Bulls
Calves
Sheep
Goats
Donkeys
Horses
Mules
Poultry
7. Adoption status of soya bean production practices
7.1. What is the length of time since you first heard about improved Soya bean varieties
and inoculant bio-fertilizer? _______________Years (in E.C.)
7.2. From whom/where did you first heard about the improved Soya bean varieties and
inoculant bio-fertilizer,
1. Development agent 2.Research Center 3.Neighbors 4. Farmers’ organizations
5. Radio 6. Others (specify) ______________________________________________
7.3. Have you ever used improved seed varieties of soya bean on your farm? 1.Yes
2.No

60
7.4. If yes, when did you start planting? ________________year (in E.C)
7.5. If yes for Q#7.3 how much land did you allocated for improved soya bean varieties for
the last three years?
No Name of varieties 2006/07 E.C 2007/08 E.C 2008/09 E.C
1 Dedessa Area(ha) Yield Area(ha) Yield Area(ha) Yield
2 Korme
3 EthioYugoslavia
4 Kata
7.6. If yes, for Q#7.3, where do you get these seed?
1. Research Center 4. Supply of development partners (e.g. NGO)
2. Government supply 5. Other source (please specify)___________________
3. Purchase from market
7.7. Have you ever used inoculant on your farm? 1. Yes 2.No
7.8. If your answer is yes for Q #7.7 , fill the the following table
S.N Type of Fertlizer Qunatity utilized per croping
season/2008/09/
Purchase Price
per packet
1 Innoculant (bio-
fertlizer)
7.10. Why you are using improved soya bean varities (multiple answer is possible)?
1. Improving yield performance 2. Reducing cost of production 3.Offsetting environmental
effect 4. Increasing income 5.improving soil fertility 6.food security
7. Other (please specify…) ________________________
7.11. If you say no for Q#7.3, why you are not in a position to use these improved
technology inputs?

61
1.High purchase price 2.Acecebility problem 3.Incopatible weather condition 4.Lack of
information 5. Fear of risk 6.Other (please specify) ______________________
7.13. Do you face any challenge in adoption process of farm inputs (inoculants bio-
fertilizer and improved seed)? 1. Yes 2. No.
7.14. If your answer is Yes for Q#7.13 what are the major challenges that affect the use of
these farm inputs (multiply answer is possible)?
1. Lack of improved seed 2. Lack of inoculant 3. Disease 4. Lack of information about
these technology 5. Others (specify).___________________________________
7.15. Do you think the improved soya bean are better than local varieties in terms of the
following traits (mark <X> for the better one in the table below)?
Traits Soya bean bean
characteristics Local Improved
Yield
Colour
Taste
Drought resistance
Maturity period
Disease resistance
Storability
Other (please specify..................)
8. Extension Service
8.1. Did you consulted by DAs in the last cropping season (20008/09 E.C)? 1. Yes 2.
No
8.2 If your answer is yes, for the question Q#8.1, how many days did DA contacted you in
2008/09 cropping season for purpose of soya bean production and mgt?___________
8.3. If yes for Q#8.1 how can the DA helped you?
1.Practical assistance at farm 2.Demonistartion 3.Training at FTC
4.other (please specify) _____________________________________________
8.4. Have you ever attended any demonstration or field days arranged by DAs or research
center on soya bean? 1. Yes 2.No
8.5. Have you ever participated in training on soya bean production? 1. Yes 2. No

62
8.6. Which institution was your first source of information about improved soya bean and
inoculant? 1) BOA 2) Other farmers 3) Research center (BARC)
4) NGOs (specify)_________________ 5) Relatives 6) other (specify) __________
9. Market service and price
9.1. Do you have market for soya bean? 1. Yes 2. No
9.2. Did you sold your soya bean crop during the 2008/09 E.C year of cropping Season?
1. Yes 2.No
9.3. If yes, where do you sell your crop? 1. at farm gate 2. village market 3. District
market 4.Secondary market 5.Tertiary market 6.Others (specify)_________________
9.4. At what season do you usually sell soya bean product? 1. Right at harvest 2. Latter
after harvest 3. Any time I face problem 4. Other (specify):_____________________
9.5. Distance to the nearest market center (in hr.) __________
9.5. Distance to the all-weather road (in hr.) ___________
10.) Uses of crop produced
10.1) what are the major crops you cultivate in your farm for 2008/09 cropping season?
Please fill the requested information here below:
Crop Unit Amount produced Amount to be used for
Seed Food Sale Price
Maize
Sorghum
Wheat
Soya bean
Barely
Chickpea
Field pea
Fababean
Haricot bean
11. Participation on off/non-farm income
11.1. Did you participate on off farm activities last year? 1. Yes 2.No
11.2. Did you participate on non-farm activities last year? ? 1. Yes 2.No
11.3. Cash income from livestock products
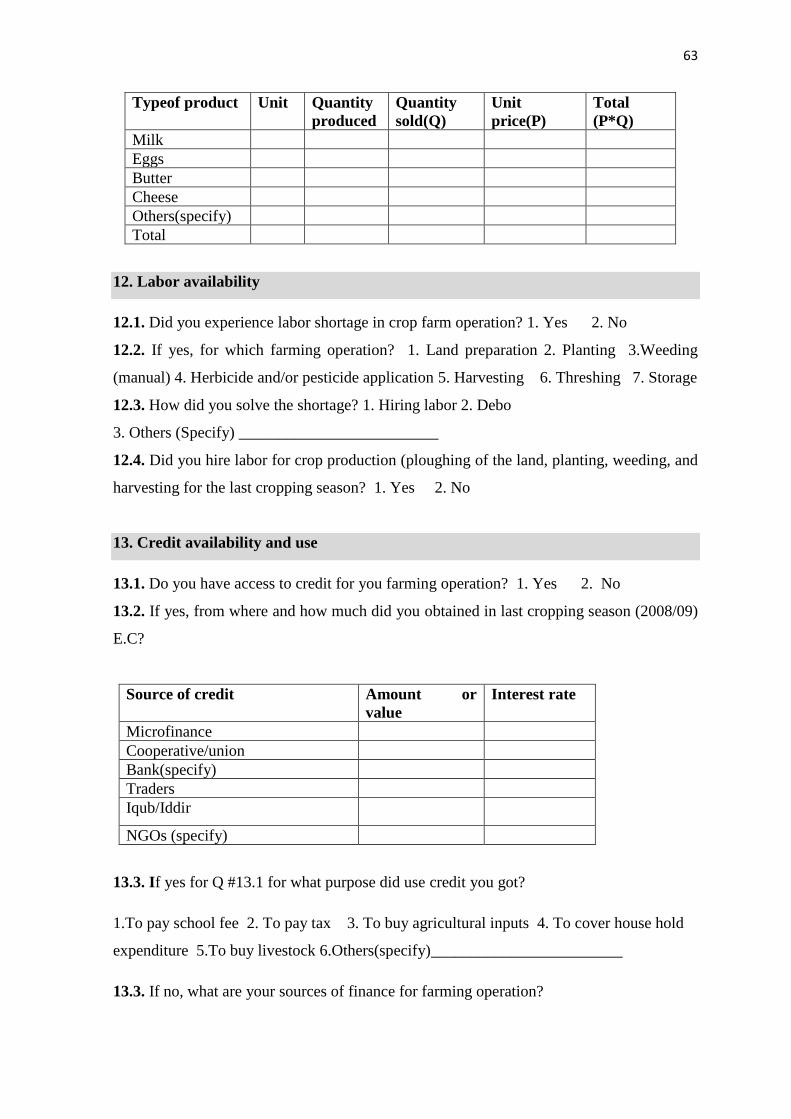
63
Typeof product Unit Quantity
produced
Quantity
sold(Q)
Unit
price(P)
Total
(P*Q)
Milk
Eggs
Butter
Cheese
Others(specify)
Total
12. Labor availability
12.1. Did you experience labor shortage in crop farm operation? 1. Yes 2. No
12.2. If yes, for which farming operation? 1. Land preparation 2. Planting 3.Weeding
(manual) 4. Herbicide and/or pesticide application 5. Harvesting 6. Threshing 7. Storage
12.3. How did you solve the shortage? 1. Hiring labor 2. Debo
3. Others (Specify) _________________________
12.4. Did you hire labor for crop production (ploughing of the land, planting, weeding, and
harvesting for the last cropping season? 1. Yes 2. No
13. Credit availability and use
13.1. Do you have access to credit for you farming operation? 1. Yes 2. No
13.2. If yes, from where and how much did you obtained in last cropping season (2008/09)
E.C?
Source of credit Amount or
value
Interest rate
Microfinance
Cooperative/union
Bank(specify)
Traders
Iqub/Iddir
NGOs (specify)
13.3. If yes for Q #13.1 for what purpose did use credit you got?
1.To pay school fee 2. To pay tax 3. To buy agricultural inputs 4. To cover house hold
expenditure 5.To buy livestock 6.Others(specify)________________________
13.3. If no, what are your sources of finance for farming operation?

64
1) Crop sales 2) Livestock sales 3) Off-farm activities 4) Others (specify) __________
13.4. How far is from your home to credit office (in Km) ______________
13.5. Do you have any problems in getting credit? 1. Yes 2. No
13.6. If yes, what is the nature of your credit problems?
1.) Bank loans not available 2.) Do not have required collateral
3.) Loans from informal sources not available 4.) Repayment terms are unfavorable
6.) Interest rates are too high 7.) Others (specify) _____________________________
14. Perception of farmers on soya bean technology attributes
14.1 Characteristics of improved soya bean varieties as compared to local variety
No Characteristic Inferior The same Superior
1 Yield 1 2 3
2 Drought resistance 1 2 3
3 Earl maturity 1 2 3
4 Shattering 1 2 3
5 Marketability 1 2 3
7 Disease resistance 1 2 3
8 Logging 1 2 3
15. Cost –benefit analysis
15.1. How much did you get from soya bean production in 2008/09 E.C from improved
varieties?
No varieties Area(ha) Quantity obtained
in quintal(Q)
Price per
quintal (P)
Total
profit(p*Q)
1 Dedessa
2 korme
3 Ethio-
Yugoslavia
4 Katta
14.4. How much did you spent for soya bean production in 2008/09 cropping season on
improved varieties?
No Input Cost of input
per unit
Price of input
per unit
Total input
cost
1 Land rent(ha)
2 Seed(Kg)
3 Herbicide(L)
4 Pesticide (L)
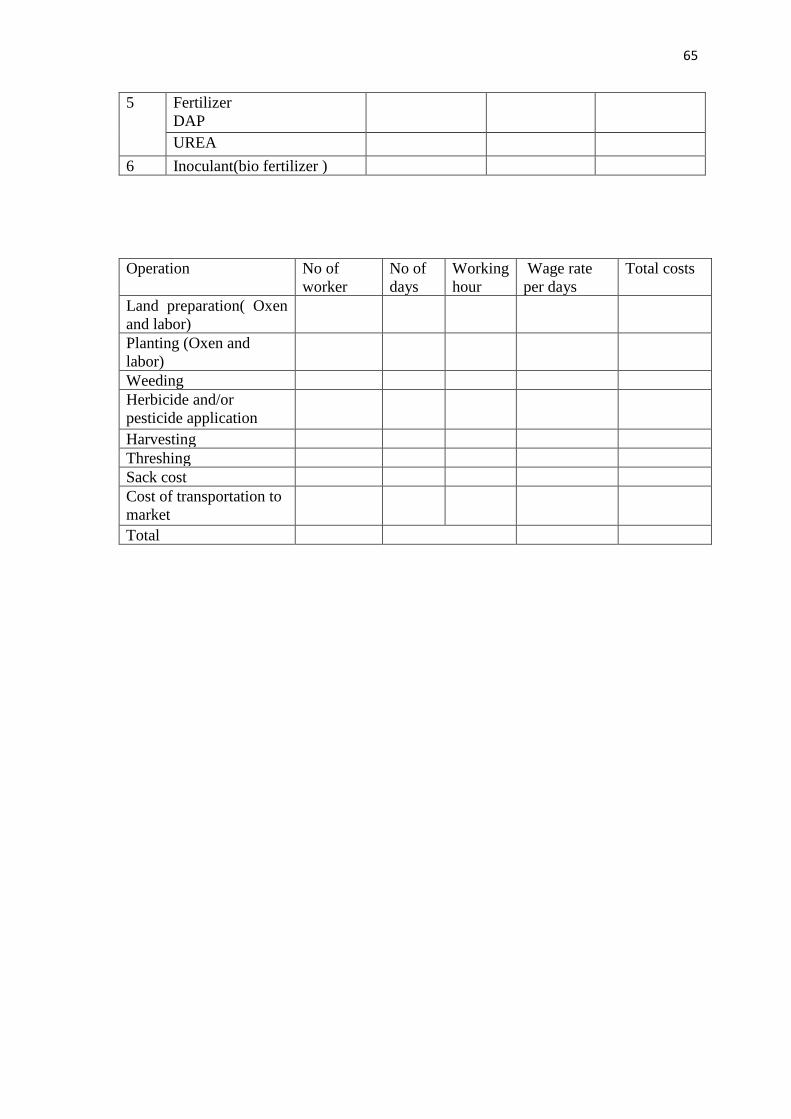
65
5 Fertilizer
DAP
UREA
6 Inoculant(bio fertilizer )
Operation No of
worker
No of
days
Working
hour
Wage rate
per days
Total costs
Land preparation( Oxen
and labor)
Planting (Oxen and
labor)
Weeding
Herbicide and/or
pesticide application
Harvesting
Threshing
Sack cost
Cost of transportation to
market
Total