Volume I - haramaya university
185
i
-
Upload
khangminh22 -
Category
Documents
-
view
3 -
download
0
Transcript of Volume I - haramaya university

i

32nd Annual Research Bulletin, April 2015, Haramaya University
ii

32nd Annual Research Bulletin, April 2015, Haramaya University
iii
Office of the Vice President for Research Affairs
32nd Annual Research and Extension Workshop 2015
Edited and Compiled by:
Wassu Mohammed(PhD) Prof. Nigussie Dechassa (PhD)
Nega Assefa (PhD) Mengistu Ketema (PhD) Kidesena Sebesibe (MSc)

32nd Annual Research Bulletin, April 2015, Haramaya University
iv
Copyright ©Haramaya University All rights reserved No part of this publication may be reproduced, stored in, or introduced into a retrieval system, or transmitted in any form or by any means (electronic, mechanical, photocopying, recording, or otherwise) without prior written permission of Haramaya University Printed in Addis Ababa, Ethiopia Inquiries should be addressed to: Office of Research Affairs P. O. Box 116, Haramaya University, Ethiopia Tel: (+251) 25 553 0324 / (+251) 25 553 0329 Fax: (+251) 25 553 0106 / (+251) 25 553 0325

32nd Annual Research Bulletin, April 2015, Haramaya University
v
Table of Contents Page No 1. Carrot (Daucus carota L.) Variety Development
Wassu Mohammed Ali 1
2. Collection and Evaluation of Eastern Ethiopia Hot Pepper (Capsicum spp.) for Yield and Yield Components Wassu Mohammed Ali
13
3. Impacts of Invasive Plants (Lantana camara and Parthenium hysterophoru) on Livestock and Rangeland Production in Pastoral and Agro Pastoral Areas of Somali Region, Ethiopia Dawit Terefe
24
4. Beekeeping Practices, Production Potential and Challenges of –Beekeeping Among Beekeepers in Haramaya District, Eastern Ethiopia Biressaw Serda, Tessema Zewudu, Moges Dereje and Mohammed Aman
33
5. Influence of Nitrogen Application Rates and Maize Varieties on the Grain Yield and Some Agronomic Traits of Maize (Zea mays L.) Habtamu Zeleke
39
6. Genetic Gain of Tuber Yield and Late Blight [Phytophthora infestans (Mont.) de Bary] Resistance in Potato (Solanum tuberosum L.) Varieties in Ethiopia from 1987 to 2011 Wassu Mohammed Ali
43
7. Genetic Variability in Potato (Solanum tuberosum L.) Genotypes for Late blight [Phytophthora infestans (Mont.) de Bary] Resistance and Yield at Haramaya, Eastern Ethiopia Wassu Mohammed
58
8. Effect of Integrated Climate Change Resilience Strategies on Faba Bean Rust (Uromyces viciae-fabae) Epidemics in Hararghe Highlands, Ethiopia Habtamu Terefe, Chemeda Fininsa, Samuel Sahile
72
9.
Evaluation and Identification of Potato (Solanum tuberosum L.) Varieties for Yield and Resistance to Late blight [Phytophthora infestans (Mont.) de Bary] in Eastern Ethiopia Wassu Mohammed Ali
84
10. Maintenance and Enhancement of Sweet potato Accessions at Haramaya University Wassu Mohammed Ali
97
11. Maintenance and Enhancement of Potato (Solanum tuberosum L.) Genotypes at Haramaya University Wassu Mohammed Ali
105
12. Camel Slaughtering Practices, Meat Production and Preservation in Eastern Ethiopia Mitiku Eshetu Guya, Getachew Neme
116
13. Effect of Integrating Climate Change Resilience Strategies on Common Bacterial Blight of Common Bean in Semi-arid Agro-ecology of Eastern Ethiopia Negash Hailu, Chemeda Fininsa , Tamado Tana
123
14. Evaluation of Improved Pepper (Capsicum spp.) Varieties for Yield and Yield Components in Eastern Ethiopia Wassu Mohammed Ali
131
15. Biodegradation of Locally Available Organic Wastes by Composting and Vermicomposting for Improvement of Soil Fertility and Crop Production R. Hiranmai Yadav, Kibebew Kibret, Anteneh Argaw and Teferi Taddesse
143

32nd Annual Research Bulletin, April 2015, Haramaya University
vi
16. Influence of Combined Use 0f Orga and Nitrogen Fertilizer on Soil Water Content, Yield and Yield Components of Maize (Zea mays L.) in Water Stressed Babile Area, eastern Hararghe, Ethiopia Solomon Tamiru , AyeleAkuma
151
17. Assessment of Commercial Feedlot Finishing Practices at Eastern Shoa, Ethiopia Tsegay Teklebrhan, Mengistu Urge
156
18. Value Chain Analysis of Tomato in Erer Valley, Eastern Ethiopia Wesagn Berhane, Ranjan S.Karippai, Debebe Tolossa, Chanyalew Seyoum, Hailu Kassaye, Tibebu Bezabih
165

32nd Annual Research Bulletin, April 2015, Haramaya University
1
1. Carrot (Daucus carota L.) Variety Development Wassu Mohammed Ali Haramaya University, College of Agriculture and Environmental Sciences, School of Plant Sciences, E-mail:[email protected]
Abstract: Haramaya 1 is the common name for the carrot (Daucus carota L.) variety with the original collection name AUA-108. The variety was developed through selection in the eastern highlands of Ethiopia. It was selected from 64 carrot genotypes collected from Haramaya woreda (district). The genotypes were maintained by farmers for a long period of time through an open-pollinated seed production system. The released carrot variety was found to be superior in marketable and total root yields and other desirable traits to the commercial Nantes variety, which was used as the standard check, and a famers‘ open pollinated cultivar, which was used as a local check. Furthermore, this variety was superior to the Nantes variety and the farmers‘ open-pollinated cultivar in terms of producing lower proportions of small-sized, cracked, forked, and hairy roots. The variety had also a margin of seed production potential amounting to 11.81% over the Nantes variety. Moreover, its root yield was found to be stable over seasons and locations. Therefore, it could be cultivated sustainably by smallholder farmers in the highlands of eastern Ethiopia and in other places with similar agroecology.
Keywords: Core-size; Farmers‘ Cultivar; Commercial Cultivar; Root Yield; Seed Yield; Yield Stability
1. Introduction Carrot (Daucus carota L.) is a widely grown root vegetable of the Apiaceae family. The first certain recorded use of carrot roots as a vegetable was in the 10th century in what is today known as Afghanistan. Orange carrots first appeared as a genetic variant in Europe in the 16th century and these more refined orange carrots quickly spread around the world, and by the early 20th century they became the predominate carrots in most growing regions of the world (www.seedalliance.org). Carrot is an important source of alpha- and beta-carotene, the precursors of vitamin A in human nutrition in many countries worldwide. The carotenoids contained in the edible portion of carrots can range from 6000 to more than 54,000 µg per 100g (60–540 ppm) (Simon and Wolff, 1987). Although the exact time of introduction of carrots to Ethiopia is not known, the crop has been known since the early 1960s in the research system. Research on carrots in Ethiopia was started at Alemaya College of Agriculture (now Haramaya University) using imported seeds of eight varieties from Kenya in the early 1960s. Among the eight varieties tested, Nantes and Chantenay were identified as high yielders (Kifle-Iyesus, 1994; Kidanemariam, 1969). Carrot production has been expanding since then and the total production reached 12345.8 tonnes on 2215 hectares of land (CSA, 2010/11). On the other hand, vitamin A deficiency is widespread in the country (Haile-Meskel, 2011). The prevalence is 2 to 15-fold higher than the World Health Organization (WHO) cut-off point (0.5%) for public significance. The Nantes carrot has become popular in Hararghe Zone of Ethiopia because it produces quality roots as a result of which it obtained niche market in neighbouring Djibouti and Somalia. Farmers also produce seeds of this carrot variety albeit the poor quality of the seed. The crop is cross-pollinated. Although there is a possibility to produce inbred lines for F1 hybrid production to attain plant uniformity, inbreeding results in severe depression. Therefore, mass selection using root-to-seed production method is preferred to improve the crop. Haramaya University initiated research on carrots two decades ago with the attempt to improve the locally produced Nantes variety for root uniformity, high yield, good root texture, small core diameter, resistance to cracking, and adaptation to different agroecolgical conditions. Eventually, the university has come up with the variety named Haramaya 1 from the locally collected 64 genotypes through successive selections.
2. Materials and Methods 2.1. Description of the Study Area The field experiment was conducted for a long period which included all the breeding procedures starting from screening carrot genotypes to verification trial which was conducted at 12 locations starting screening carrot genotypes to verification trial. The screening and multi-location trials were conducted mainly at Haramaya (Raare), Hirna, Kulbi and Chelenko Haramaya University research farm is located at 2022 m.a.s.l., 9°41''N latitude and 42°03''E longitude. The area has a bimodal rainfall distribution with mean annual rainfall of 760 mm. The long rainy season extends from June to October and accounts for about 45% of the total rainfall. The mean maximum temperature is 23.40C while the mean minimum annual temperature is 8.250C (Tekalign, 2011). The soil of the experimental site is a well-drained deep alluvial with a sub-soil stratified with loam and sandy loam. Hirna sub-station is situated at a distance of about 134 km to the west of Haramaya. The site is located at 9 o12‘ North latitude, 41 o4‘East longitude, and at an altitude of 1870 meters above sea level. The area receives mean annual rainfall ranging from 990 to 1010 mm. The average temperature of the area is 24.0o C (Tekalign, 2011). The soil of Hirna is vertisol (HURC, 1996). Kulbi is located at 2330 m.a.s.l. with mean annual rainfall of 862 mm, mean annual maximum and minimum temperature of 19.50C and 7.30C, respectively(Tekalign, 2011).

32nd Annual Research Bulletin, April 2015, Haramaya University
2
2.2. Experimental Materials Sixty-four carrot genotypes were collected from Haramaya Woreda.These genotypes were originally introduced into the region by overseas seed companies. Farmers maintained and used the genotypes for a long period of time through an open pollinated seed production system. The genotypes were initially evaluated for root yield potential under Haramaya condition using single rows. Seventeen of the genotypes were promoted to replicate yield trials. Trials were conducted for evaluation of total and marketable root yields for a number of years. Finally, two candidate varieties were promoted to a regional trial and evaluated for two years at three locations along with farmers‘ cultivars and commercial local Nantes. Verification trial was conducted at nine locations using the same genotypes and finally one variety (AUA-108) was approved for release.
3. Results 3.1. Regional Variety Trial Analysis of variance conducted for six environments (three locations and for two years) during regional trial revealed that there is significant effect of location, growing season (year) and the interaction of location x season (year) on both total and marketable root yield of four carrot genotypes. In addition, significant difference among genotypes was observed for marketable root yield (Table 1). Root length, root diameter and root core diameter were influenced by location during regional trial (Table 2). The released variety Haramaya 1 (AUA-108) showed superiority for total and marketable root yield as well as for most of the desirable root characters (Table 3 and Table 4). The total yield and marketable root yield increase of Haramaya 1 (AUA-108) over other three genotypes (other candidate genotype, AUA-22; standard check, Nantes and local check) was up to 16.23% (Table 5 and Table 6). 3.2. Variety Verification Trial The released variety of Haramaya 1 (AUA-108) along with standard check (commercial Nantes) and local check were evaluated during 2013 cropping season. This was a verification trial conducted at three locations but genotypes were grown at nine sites (three sites for each location). The analysis of variance was conducted for total and marketable root yield; however, non-significant difference was observed among genotypes (Table 7). The released variety exhibited 39.46% total root yield advantage over standard check (commercial Nantes) and local check as well as up to 19.53% marketable root yield advantage (Table 8). Similarly, the released variety showed superiority over the standard check (commercial Nantes) and local check for all desirable root characters (Table 9). 3.3. Yield Stability Test The yield stability of the released variety along with the two checks (the commercial Nantes variety and the farmers‘ open pollinated cultivar) and one other candidate variety (AUA-22) was tested using the two stability models. The AMMI model was used since it combines the analysis of variance with the principal component analysis (Zobel et al., 1988) and joint linear regression model as proposed by Eberhart and Russell (1966). In addition, AMMI stability value (ASV) was calculated as proposed by Purchase (1997) and Purchase et al. (2000). The released variety (Haramaya 1) had the first lowest ASV values for both total and marketable root yields, and it produced the highest total and marketable root yields. On the basis of Eberhart and Russel‘s Model, Haramaya 1 had the lowest value of deviation from the regression (S2di) which is near zero (0.16) and regression coefficient (bi) value (0.98) which is near unity for total root yield. Although the deviations from regression stability parameter values for marketable root yield were negative and higher for all genotypes, Haramaya 1 had relatively lower values of deviation from regression and regression coefficients (Table 11). Table 1. Mean squares from combined analysis of variance for total and marketable root yield (t ha-1) over three locations (Haramaya, Hirna and Chelenko) and two years (2010/11 and 2011/12 cropping seasons) of regional carrot variety trial.
Source df Total root yield t ha-1 Marketable root yield t ha-1
Replication 2 120.1 88.02
Genotype 3 33.91 86.82*
Location 2 4322.25** 3578.3**
Year 1 6835.02** 8244.72**
Genotype x Location 6 38.71 22.92
Genotype x Year 3 120.49 46.74
Location x Year 2 2231.31** 2022.44**
Genotype x Location x Year 6 99.51 72.21 Error 46 37.44 32.74
Grand mean 47.27 38.60 CV (%) 12.94 14.82

32nd Annual Research Bulletin, April 2015, Haramaya University
3
Table 2. Mean squares from combined analysis of variance root and leaf characters of four carrot genotypes over three locations (Haramaya, Hirna and Chelenko) and two years (2010/11 and 2011/12 cropping seasons) of regional carrot variety trial .
Rep (2) Geno (3) Loc (5)
Geno x Loc (6) Error (22)
Root length (cm) 16.24 4.928 18.135* 0.912 2.562
Root diameter (cm) 0.04504 0.14802 0.33787* 0.04011 0.07039
Root core diameter (cm) 0.08569 0.19803 0.26652* 0.02469 0.06989
Root weight (g) 2105.4 1006.2 163 530.2 859.6
Leaf length (cm) 8.54 167.34 23.82 6.39 48.64
Leaf weight (g/plant) 864.9 598 373.9 551.4 468.3

32nd Annual Research Bulletin, April 2015, Haramaya University
4
Table 3. Summary of total and marketable root yield of four genotypes in carrot regional variety trial at three locations over two years (2010/11 & 2011/12 cropping season).
Genotype
Total root yield t ha-1
Overall mean
Haramaya Hirna Chelenko
2011 2012 Mean 2011 2012 Mean 2011 2012 Mean
V1 (Commercial Nantes) 46.61 76.39 61.5 37.74 34.22 35.98 26.93 51.22 39.08 45.52
V2 (AUA-108 candidate variety) 45.99 77.17 61.58 34.42 38.89 36.66 29.64 62.89 46.26 48.17
V3 (AUA-22) 42.4 86.56 64.48 40.61 35.78 38.19 22.97 57.67 40.32 47.66
V4 (open pollinated famers Nantes) 53.39 68.06 60.72 32.63 33.39 33.01 29.01 54.94 41.98 45.24
Mean 47.1 42.47 32.12 38.35 35.57 36.96 27.14 57.68 42.41 47.27
SD 4.59 7.63 1.65 5.99 2.42 2.96 3.01 3.68 2.66 2.3
Genotype
1.1.1
Marketable root yield t ha-1
Overall mean
Haramaya Hirna Chelenko
2011 2012 Mean 2011 2012 Mean 2011 2012 Mean
V1 (Commercial Nantes) 35.42 67.5 51.46 27.8 28.67 28.24 20 42.56 31.28 36.99b
V2 (AUA-108 candidate variety) 39.94 73.78 56.86 29.18 34.89 32.53 24.21 56.11 38.16 42.52a V3 (AUA-22) 34.11 69.55 51.83 33.94 29.83 31.88 15.68 48.78 32.23 38.65ab
V4 (open pollinated famers Nantes) 36.98 60.39 48.68 24.66 28.56 26.61 16.77 44.94 30.86 35.38b
Mean 35.61 68.81 52.21 28.4 30.24 29.31 18.17 47.1 32.63 38.6
SD 1.19 7.97 3.41 3.94 2.5 2.35 2.29 4.21 2.42 1.9

32nd Annual Research Bulletin, April 2015, Haramaya University
5
Table 4. Summary of root characters of improved carrot candidate varieties (V3= AUA-22 and V2= AUA-108) and the standard check (commercial Nantes) and local check (farmers open pollinated cultivar) in carrot regional variety trial (2010/11-2011/12).
Genotype RL(cm) LL(cm) RW(g) LW(g) RD(cm) CD(cm)
V1 (Commercial Nantes) 18.36ab 55.7a 108a 39.8a 2.83b 1.38b
V2 (AUA-108 candidate variety) 17.12b 48.4b 107.2a 23a 2.88ab 1.41b
V3 (AU-22 candidate variety) 18.89a 58.6a 130a 40.8a 3.12a 1.71a V4 (farmers open pollinated cultivar) 18.12ab 54.3ab 115.1a 34.6a 2.94ab 1.50ab
Mean 18.12 54.3 115.1 34.6 2.95 1.50
SE 0.76 3.29 13.82 10.2 0.13 0.12 LSD (5%) 1.57 6.82 28.66 21.16 0.26 0.26
CV (%) 8.8 12.9 25.5 24.6 9 17.6
RL (cm) = root length, RD(cm) = root diameter, CD(cm) = root core diameter, RW(g) = root weight, LL(cm) = leaf length & LW(g) = leaf weight. Table 5. Total root yield advantage of improved carrot candidate varieties over the standard check (commercial Nantes) and local check (farmers‘ open pollinated cultivar) in carrot regional variety trial (2010/11-2011/12).
Location
Year
Total root yield (t/ha) Percent increase over V1
Percent increase over V4
V3 V1 V2 V4 V3 V2 V3 V2
Haramaya
2010/11 42.4 46.61 45.99 53.39
2011/12 86.56 76.39 77.17 68.06
Mean 64.48 61.5 61.58 60.72 4.85 0.13 6.19 1.42
Hirna
2010/11 40.61 37.74 34.42 32.63
2011/12 35.78 34.22 38.89 33.39
Mean 38.19 35.98 36.66 33.01 6.14 1.89 15.69 11.06
Chelenko
2010/11 22.97 26.93 29.64 29.01 2011/12 57.67 51.22 62.89 54.94
Mean 40.32 39.08 46.26 41.98 3.17 18.37 -3.95 10.20
Overall mean 47.66 45.52 48.17 45.24 4.70 5.82 5.35 6.48

32nd Annual Research Bulletin, April 2015, Haramaya University
6
Table 6. Marketable root yield advantage of improved carrot candidate varieties over the standard check (commercial Nantes) and local check (farmers‘ open pollinated cultivar) in carrot regional variety trial (2010/11-2011/12) .
Location
Year
Marketable root yield (t/ha)
Percent increase over V1
Percent increase over V4
V3 V1 V2 V4 V3 V2 V3 V2
Haramaya
2010/11 34.11 35.42 39.34 36.98 2011/12 69.55 67.5 73.78 60.39
Mean 51.83 51.46 56.86 48.68 0.72 10.49 6.47 16.80
Hirna
2010/11 33.94 27.8 27.18 24.66
2011/12 29.83 28.67 33.89 28.56
Mean 31.88 28.24 30.53 26.61 12.91 8.13 19.8 14.73
Chelenko
2010/11 15.68 20 20.21 16.77 2011/12 48.78 42.56 52.11 44.94
Mean 32.23 31.28 36.16 30.86 3.04 15.6 4.44 17.17
Overall mean 40.32 36.99 39.51 35.38 5.56 11.41 10.24 16.23
V1= Commercial Nantes as standard check, V4= open pollinated famers cultivar as local check and V3= AUA-22 and V2= AUA-108 are considered as improved varieties through selection by Haramaya University

32nd Annual Research Bulletin, April 2015, Haramaya University
7
Table 7. Mean squares for total and marketable root yield of three carrot genotypes over three locations (Haramaya, Hirna and Chelenko) during 2013 cropping season (verification trial).
Source df Total root yield t ha-1 Marketable root yield t ha-1
Replication 2 193 6.5
Genotype 2 220.7 316.9
Genotype x Location 2 350.3 256.5
Error 4 51.3 74.9
Grand mean 16 290.1 169
Table 8. Marketable and total root yield advantage of improved carrot variety (Haramaya 1) over the standard check (commercial Nantes) and local check (farmers‘ open pollinated cultivar) during 2013 cropping season (verification trial).
Location
Marketable root yield t ha-1 Percent increase over
Haramaya 1 Local Nantes Nantes Local
Haramaya 30.8 17.5 25.8 19.38 76
Hirna 36.7 23.3 25.8 42.25 57.51
Chelenko 41.7 37.5 26.7 56.18 11.2
Grand mean 36.4 26.1 26.1 39.46 39.46
LSD (5%) 12.99
Location
Total root yield t ha-1 Percent increase over
Haramaya 1 Local Nantes Nantes Local
Haramaya 54.2 47.2 47.9 13.15 14.83
Hirna 63.3 54.6 49.2 28.66 15.93
Chelenko 64.2 67.5 55 16.73 -4.89
Grand mean 60.6 56.4 50.7 19.53 7.45
LSD (5%) 17.02

32nd Annual Research Bulletin, April 2015, Haramaya University
8
Table 9. Summary of root and leaf characters of Haramaya 1 carrot variety, Nantes (standard check) and local check over three locations (Haramaya, Hirna and Chelenko) during regional and verification trial (2011-2013).
Character Haramaya 1 Local Nantes Mean SE LSD (5%) CV (%)
CD_cm 1.38b 1.71a 1.41b 1.50 0.24 0.51 19.8
LL_cm 55.71a 58.65a 48.39b 54.3 5.96 12.63 13.4
LW_g 39.8a 40.83a 23.05a 34.6 9.81 21.99 28.35
RD_cm 2.83a 3.12a 2.88a 2.95 0.24 0.52 10.2
RL_cm 18.89a 18.36a 17.12a 18.12 1.45 3.07 9.8
RW_g 108a 130a 107.2a 115.1 26.49 56.16 28.2
SSR 32.67a 40.78b 67.22c 46.89 4.27 6.29 9.07
Cracked 0.22b 3.22a 1.89ab 1.78 1.22 1.59 68.53
Forked 2.56b 8.56a 6ab 5.7 1.73 2.59 30.43
Hairy 8.33ab 12a 12.67a 11 1.53 6.32 13.91
Twisted 25.22a 24.11a 17.56a 22.3 2.04 8.01 18.56
Means with the same letters in the column not significantly different at P<0.05. CD (cm) =root core diameter, LL (cm)= leaf length, LW (g)= leaf weight, RD (cm)= root diameter, RL (cm)= root length, RW (g)= root weight, SSR=proportion of small size root production

32nd Annual Research Bulletin, April 2015, Haramaya University
9
3.4. Agronomic and Morphological Characteristics The released variety with local name Haramaya 1 can be grown medium to high altitudes of eastern Ethiopia (1600-2400 m.a.s.l.) and similar areas of the country either under rain-fed or irrigation. It had deep orange root color. The released variety has long roots with small cores and smaller proportions of small-size roots, cracked roots, forked, and hairy roots. The released variety has attractive root size, colour, and shape. In addition to these, the variety is mainly released for its total root yield advantage of 11.41 and 16.23% over commercial variety ―Nantes‖ and farmers‘ open pollinated cultivar, respectively. It has also 5.82 and 6.48% marketable root yield advantage over commercial variety ―Nantes‖ and farmers‘ open pollinated cultivar, respectively. The seed production of Haramaya 1 was 5.87 g/plant and had an advantage of 11.81% increase from the commercial variety. The yield and some agronomic and morphological characteristics of the released variety are given in Table 10. Table 10. Agronomic characters of Haramaya 1 carrot variety.
Characteristic Description
Adaptation area Medium to high altitudes of eastern Ethiopia (1600-2400 m.a.s.l.) Rainfall 760-1010 mm Planting season All year round both under rain-fed and irrigation Planting date At the start of main rainy season and at any time with irrigation Seeding rate (kg ha-1) 3.5 to 5 Row spacing (cm) 25 Spacing between plant (cm) 5 Fertilizer rate (kg ha-1) 46 kg P2O5 (100 kg DAP) and 64 kg N (100 kg Urea) Fertilizer application time All DAP at planting but half N rate at planting and half at active growth stage Fertilizer application method Drilling in row Leaf length (cm) 55.71 Leaf width (cm) 39.8 Root colour Deep orange Root core diameter (cm) 2.83 Root length (cm) 18.89 Root weight (gm) 108 Proportion of small size roots (%) 32.67 Proportion of cracked roots (%) 0.22 Proportion of forked roots (%) 2.56 Proportion of hairy roots (%) 8.33 Proportion of twisted roots (%) 17.56 Root yield (t ha-1) at research field 52.65 (total root yield) Root yield (t ha-1) at farmers‘ field 42.52 (marketable root yield) and 48.17 (total root yield) Seed yield (g/plant) 5.87g per plant Release year 2014 Breeder/Maintainer Haramaya University

32nd Annual Research Bulletin, April 2015, Haramaya University
10
Table 11. Stability parameters for total and marketable root yield from AMMI analysis (environment and genotypes IPCA 1 & 2 scores, ASV, and ASV based rank) and from Eberhart and Russel‘s Model (regression coefficient (bi) and deviation from regression (S2di) of four carrot genotypes tested at three locations and two cropping seasons
Trait
Genotype
2011 cropping season 2012 cropping season Pooled Mean & Rank
AMMI model stability parameters ER‘s Model stability
Haramaya Hirna Chelenko Haramaya Hirna Chelenko IPCA 1 IPCA 2 ASV ASV rank bi S2di
Total root Yield
Commercial Nantes
46.61 37.74 26.93 76.39 34.22 51.22 45.52 (3) -1.06 -2.02 2.21
2 0.98 1.76
Haramaya 1 45.99 34.42 29.64 77.17 38.89 62.89 48.17 (1) 0.66 2.18 2.16 1 0.98 0.16 AU-22 42.4 40.61 22.97 86.56 35.78 57.67 47.66 (2) -2.58 0.56 5.51 3 1.19 0.47 Local check 53.39 32.63 29.01 68.06 33.39 54.94 45.24 (4) 2.97 -0.72 5.99 4 0.82 13.38
Environment
Mean 47.10 36.35 27.14 77.05 35.57 56.68 46.65 IPCA1 2.22 -1.53 1.49 -2.72 0.23 0.31
Marketable root yield
Commercial Nantes
35.42 27.8 20 67.5 28.67 42.56 36.99 (3) -0.59 1.59 1.55
2 0.97 -6.28
Haramaya 1 39.34 27.18 20.21 73.78 33.89 52.11 42.52 (1) 1.25 -1.64 1.22 1 0.95 -2.51 AU-22 34.11 33.94 15.68 69.55 29.83 48.78 40.32 (2) -2.75 -0.59 5.97 4 1.21 -2.55 Local check 36.98 24.66 16.77 60.39 28.56 44.94 35.38 (4) 2.09 0.64 3.83 3 0.86 -3.26
Environment
Mean 36.46 28.40 18.17 67.81 30.24 47.10 38.05 IPCA1 1.31 -1.24 1.16 -2.82 0.99 0.59
Numbers in parenthesis are mean yield rank of genotypes. IPCA1 and IPCA2 = the first and the second interaction principal component scores, respectively, ASV = AMMI stability value, ER’s= Eberhart and Russel’s, bi = regression coefficient and S2di = deviation from linear regression.

32nd Annual Research Bulletin, April 2015, Haramaya University
11
4. Discussion and Recommendation Carrot (Daucus carota L.) is a widely grown root vegetable in eastern Ethiopia. Carrot is grown as an annual for its fleshy root, but it is a true biennial requiring two seasons for flowering and seed production. The eastern Ethiopia farmers produce carrot from their own seeds for longer period of time. This gives the opportunity for breeders/horticulturist to collect seeds from farmers and select genotypes for uniformity of the roots and other desirable traits to develop better variety. After a number of years selection, it was possible to develop Haramaya 1 carrot variety with deep orange root colour, higher total and marketable root yield than the commercial variety Nantes. The variety was developed through mass selection using root-to-seed production method. The released variety has many desirable traits as compared the commercial variety Nantes and farmers cultivars. Moreover, this variety has a seed production potential of 5.87g/plant. The carrot seed production spacing in the world is in the range between 75 and 95 cm between row and 20 to 30 between plants. Open pollinated carrot cultivars produced about 600 to 1000 kg ha-1 in the temperate regions while about 300 kg ha-1 in the tropical regions. The 1000 grain weight is 0.8g (George, 1999). The released variety Haramaya 1 has a seed production potential of 391.33 kg ha-1 at the lower spacing of 75 and 20cm between rows and plants, respectively. Carrot roots have highest content of carotenes (alpha- and beta-carotene) which are cleaved in the human body to create Vitamin A molecules. It is an important source of vitamin A in human nutrition in many cultures worldwide (www.seedalliance.org). For instance, in the USA, carrots are the single most important source of dietary pro-vitamin A carotenoids accounting for 30% of the total vitamin A available to consumers (Simon, 1992). In Ethiopia, malnutrition of vitamin A in the country was estimated as high which is 2 to 15-fold higher than the World Health Organization (WHO) cut-off point (0.5%) for public health significance (Haile-Meskel, 2011). This might be due to the low production and consumption of vegetables rich in Vitamin A content such as carrots. The carrot production has been expanding in eastern Ethiopia starting in the early 1960s at the start of carrot research in Alemaya College of Agriculture (now Haramaya University), however, the region is known with high prevalence of vitamin A malnutrition. This indicated that the potential of the crop to overcome the public health problem is not well exploited. This might be due to the low production and consumption of carrot in the region. The lower productivity of the crop might be due to the use of low yielding genotypes grown from farmers saved seed in the region. Therefore, the newly released variety (Haramaya 1) may be as one of the remedy measure to alleviate the problem since it had total root yield margins of 11.41 and 16.23% over the commercial Nantes variety and the farmers‘ open pollinated cultivar, respectively. Moreover, the variety is stable for root yield and could be recommended for cultivation in a wider range of environments. The variety Haramaya 1 has been released in 2014 after decades of researchers‘ effort. The variety has root yield and root quality attributes advantages over the commercial variety and farmers‘ cultivars. However, this superiority of the variety over existing cultivars may not be sufficient to exploit the genetic potential of the variety. The proper seed production and distribution, appropriate agronomic managements recommendations are required to increase the productivity of the variety. But, the proper plant spacing to obtain optimum seed yield, proper isolation distance from other cultivars to maintain the genetic identity of the variety and other agronomic managements for the production of higher root yield are not studied. Therefore, the future research must focus on these areas to make recommendations to exploit the genetic potential of the variety in the region or elsewhere in the country. Carrot is a cross pollinated crop and there is the highest probability of losing its identity with short period of time. Therefore, it is necessary to maintain the identity of the variety and improve the variety every time through mass selection breeding method using root-to-seed production.
5. Conclusion The results of the long period research have demonstrated that the released variety Haramaya 1 is superior to the commercial Nantes variety as well as the farmers‘ open-pollinated cultivar in terms of root and seed production potential. The results have also revealed the variety was stable over locations and seasons for root yield, and has desirable root quality attributes and higher seed production potential. The high seed production potential of the variety implies the higher possibility of reducing the purchase of unknown quality imported carrot seeds with high price from the market since farmers could produce and save seeds easily from this variety. In conclusion, the newly released variety Haramaya 1 could be cultivated profitably and sustainably in the highlands of Hararghe zones and other places with similar agroecologies, and could lead to enhancing income of smallholder farmers.
6. References CSA (Central Statistics Authority). 2011. Agricultural sample surveys 2004/5-2010/11. Reports on area and production of crops (private
peasant holdings, Meher season), Addis Ababa. Eberhart, S. A. and Russell, W. A. 1966. Stability parameters for comparing varieties. Crop Science 6: 36 - 40. Haile-Meskel B. 2011. Experience of World Vision Ethiopia Micronutrient Program in promoting the production of vitamin A–rich foods. Food
and Nutrition Bulletin, vol. 22, no. 4. The United Nations University, pp. 366 - 369. Kidanemariam, H. 1969. Vegetable production guide for eastern Ethiopia. Experiment Station Bulletin No. 62. College of Agriculture, Haile
Sellassie I University. Organic Seed Alliance. 2010. Principles and practices of organic carrot seed production in the Pacific Northwest. Organic Seed Alliance
www.seedalliance.org (Accessed, 2010).

32nd Annual Research Bulletin, April 2015, Haramaya University
12
Purchase, J. L., Hatting, H., and Van Deventer, C.S. 2000. Genotype x environment interaction of winter wheat (T .aestivum) in South Africa: Stability analysis of yield performance. South Africa Journal of Plant Soil 17 (3):101 - 107.
Purchase, J. L. 1997. Parametric analysis to described G x E interaction and yield stability in winter yield. Ph.D Thesis. Department of Agronomy, Faculty of Agriculture, University of Orange Free State, Bloemfontein, South Africa. pp.4 - 83.
Simon, P. W. 1992. Genetic improvement of vegetable carotene content. Biotechnology and Nutrition, Proceedings of the Third International Symposium. Butterworth-Heinemann, London, pp. 291-300.
Simon, P.W., and Wolff, X.Y. 1987. Carotene in typical and dark orange carrots. Journal of Agriculture and Food Chemistry 35: 101 - 1022. Simret K. 1994. Horticultural development in peasant agriculture. pp. 29-36. In: Herath E. and Lemma Dessalegn (eds) Horticultural Research
and development in Ethiopia. Proceedings of the second national horticultural workshop of Ethiopia. 1-3 Dec. 1992. Institute of Agricultural Research and Food and Agriculture Organization. Addis Ababa, Ethiopia.
Zobel, R. W., M. J. Wright, and H. G. Gauch, 1988. Statistical analysis of a yield trial. Agronomy Journal 80:388 - 393.

32nd Annual Research Bulletin, April 2015, Haramaya University
13
2. Collection and Evaluation of Eastern Ethiopia Hot Pepper (Capsicum spp.) for Yield and Yield Components Wassu Mohammed Ali Haramaya University, College of Agriculture and Environmental Sciences, School of Plant Sciences, E-mail:[email protected]
Abstract: Seventy hot pepper (Capsicum spp.) collections obtained by single plant selection from eastern Ethiopia and four improved varieties used as checks were planted at Haramaya University research field during 2013/14 cropping season using Augmented design with five blocks and each block consisted of 14 new entries and five checks. Data were collected for growth, yield and yield components but the evaluation of accessions were made for major yield and yield components (total and marketable dry pod yield t/ha, number of dry pod/plant, number of marketable dry pod/plant and average dry pod weight in grams). The differences among the tested genotypes were significant (P<0.05) for total and marketable dry pod yield t/ha while significant differences were observed between test vs. control, among tests and checks for all traits. The Hararghe hot pepper collections exhibited up to 3.26 and 2.56 total and marketable dry pod yield t/ha, respectively, while the high yielding variety produced 1.91 and 1.22 t/ha total and marketable dry pod yield, respectively. A total of 22 and 20 accessions exhibited higher total and marketable dry pod yield, respectively, over yields of high yielding variety. The high yielding accessions total and marketable dry pod yield advantages ranged from 0.26 to 70.5 and 2.95 to 110.5%, respectively. The new selections showed superiority over the improved varieties not only for dry pod yields but also for other traits. It was computed as highest (21.16%) genetic advance that could be made through selection of 5% of the accessions for marketable dry pod yield t/ha. Genetic variability among collections and improved varieties was observed and high genetic distances were computed. The observed high genetic distance, advance and high marketable dry pod yield in eastern Ethiopia hot pepper collections was encouraging to continue collection and selection to improve the crop for yield and other desirable traits in the region.
Keywords: Collections; Genetic Distance; Genetic gain; Genetic variability; Hot pepper
1. Introduction Hot pepper (Capsicum annuum L.) is a new world crop that belongs to the Solanaceae family, and the genus Capsicum. Capsicums or red peppers are the berries of capsicum plant and they form an indispensable ingredient of the culinary throughout the world. It is closely related to tomato, eggplant, potato and tobacco. The genus Capsicum is the second most important vegetable crop of the family after tomato (Rubatzky and Yamaguchi, 1997). Hot pepper is produced in all the continents of the world except Antarctica and historically associated with the voyage of Columbus (Heiser, 1976). Columbus has been given credit for introducing hot pepper to Europe, and subsequently to Africa and Asia. Production of pepper is also well known in Ethiopia (Rehima, 2006). The history of pepper in Ethiopia is perhaps the most ancient than the history of any other vegetable product (EEPA, 2003). Ethiopians has strong attachment to dark red pepper, which has high value principally for its high pungency. The fine powdered pungent product is an indispensable flavoring and coloring ingredient in the common traditional sauce ―wot‖ whereas the green pod is consumed as a vegetable with other food items. There is a general belief among Ethiopians that a person who frequently consumes hot pepper has resistance to various diseases. It is in the daily diet of most Ethiopians. The average daily consumption of hot pepper by Ethiopian adult is estimated 15 gram, which is higher than tomatoes and most other vegetables (Rehima, 2006). Hararghe is one of the main centers of cultivation (Alkamper, 1972 cited by Jansen, 1981), where diversity of the crop is expected. Therefore, ccollection, evaluation and selection of farmers Capsicum cultivars in eastern Ethiopia may be one of the preferable breeding methods to improve the crop for the region. Thus collection on plant basis of capsicum plants is necessary in the region. Therefore, this research was initiated to collect and evaluate Hararghe hot pepper.
2. Materials and Methods 2.1. Experimental Materials and Design Seeds of Capsicum spp. cultivars were collected from western Hararghe around Hirna and grown at Haramaya University during 2012/13 cropping season. Selection was practiced on the single plant basis at nursery where plants were grown very closely and severely competed for growth resources. Seventy hot pepper (Capsicum spp.) accessions were selected based on fruit characteristics, plant growth, and reaction to diseases (Powdery and Downey mildew). The seeds of selected plants were raised at nursery and planted at field at Haramaya research field during 2013/14 cropping season using Augmented design in five blocks which each block consists of 14 new entries and five varieties as a check. Four improved varieties viz. Marko Fana, Marko Dima, Melka Eshet and PBC-660 (Melka Awaze) were obtained from National Vegetable Research Project and the local cultivar from the region were used as checks. The selected 70 accessions and the five checks were planted using unreplicated design (Augmented) where the checks were replicated five times while the new entries were not replicated. The unreplicated design

32nd Annual Research Bulletin, April 2015, Haramaya University
14
Augmented consisted of five blocks which each block consisted of 14 new entries and five checks. One block consisted of 19 genotypes and each genotype was planted in one plot with three rows. Twelve plants were planted in one row at spacing of 75 cm between rows and 30 cm between plants. The accessions were planted at Haramaya University research field. The testing site is located at 9 o26' N latitude, 42 o3' E longitudes and at an altitude of 2020 m.a.s.l. The mean annual rainfall is 760 mm (Belay et al., 1998). The mean maximum temperature is 23.40C while the mean minimum annual temperature is 8.250C. The soil of the experimental site is a well-drained deep alluvial with a sub-soil stratified with loam and sandy loam. Previous work showed it has organic carbon content of 1.15%, total nitrogen content of 0.11%, available phosphorus content of 18.2 mg kg soil-1, exchangeable potassium content of 0.65 cmolc kg soil-1 (255 mg K kg soil-1), pH of 8.0, and percent sand, silt, and clay contents of 63, 20, and 17, respectively (Simret, 2010). 2.2. Data Collection and Analysis Data were collected for fruit, growth, yield and yield components but the report included major yield and yield components; total dry pod yield tons per hectare, marketable dry pod yield tons per hectare, number of dry pod/plant, number of marketable dry pod/plant and average dry pod weight in grams. Total and marketable yield t/ha were estimated from plants grown in the central row of each plot (10 plants) left the two plants grown at both end of the row in each block and other yield components were estimated from five randomly selected plants in the central row of each plot. Data were subjected to analysis of variance for Augmented design using SPAD statistical software. The genetic advance that can be made also computed along with heritability, genotypic and phenotypic coefficient of variation. The yield advantage of the new selection over the checks was also computed to evaluate the extent of yield advantage of the high yielding accessions. The phenotypic and genotypic variance and coefficient of variation were estimated according to the methods suggested by Burton and Devane (1953). Heritability (H2) in broad sense was computed using the formula adopted by Allard (1960) and Falconer (1990) as: H2 = [2g/ 2p] x 100, where,2g=genotypic variance, 2p= phenotypic variance and 2e= error variance. Genetic advance/gain as percent of the mean (GA) for each trait was computed using the formula adopted by Johnson et al., (1955) and Allard (1960) as: GA= (k) (p)* (H2), and GA (as
% of the mean) = 𝐺𝐴
𝑋 𝑥100, where, k= selection differential (k=2.06 at 5% selection intensity), p= phenotypic standard deviation, H2=
heritability in broad sense and xgrand mean. Euclidean distance (ED) was computed from the five yield and yield components of 75 hot pepper accessions after standardization (subtracting the mean value and dividing it by the standard deviation) as:
EDjk = 22
1
n
i
XikXij (Sneath and Sokal, 1973), where EDjk = distance between accessions j and k; xij and xik = yield and yield components values
of the ith trait for accession j and k, respectively; and n = number of yield and yield component traits used to calculate the distance. The distance matrix from yield and yield components was used to construct dendrograms based on the Unweighted Pair-group Method with Arithmetic means (UPGMA) and the results were presented in the form of dendrogram.
3. Results 3.1. Analysis of Variance and Mean Performance of Accessions 3.1.1. Analysis of variance The analysis of variance (ANOVA) for dry pod yield (t/ha) and yield components of pepper collections revealed that the presence of significant (P<0.05) variation among accessions for total and marketable dry pod yield (t/ha). But non-significant variation was observed for other yield components viz. number of dry pod/plant, number of marketable dry pod/plant and average dry pod weight (g) (Table 1). Table 1. Mean squares from analysis of variance (ANOVA) for dry pod yield (t/ha) and yield components of pepper collections under preliminary yield trial (2013/14).
Trait Block(Adj.)(4) Genotype (Adj.) (74) Error (16)
Marketable dry pod yield (t/ha) 0.130 0.256* 0.082 Total dry pod yield (t/ha) 0.387 0.375* 0.250
Number of dry pod/plant 59.260 33.49ns 32.985
Number of marketable dry pod/plant 19.840 11.534ns 9.840 Average dry pod weight (g) 1.100 1.282ns 0.575
* & ns, significant at P<0.05 and non-significant, respectively.

32nd Annual Research Bulletin, April 2015, Haramaya University
15
Table 2. Adjusted mean yield and yield components of pepper collections and improved varieties.
Block MDPYt/ha TDPYt/ha ADPW (g) NTDP/pl NMDP/plant
Marako Fana 1.22 1.91 2.4 16 8
Marako Dima 0.73 1.11 3 8 4
Checks PBC-660 0.91 1.34 1.4 21 13
Melka Eshet 1.11 1.62 3 11 6
Local cultivar 0.69 1.43 2.2 17 9
Mean check 0.93 1.48 2.40 15 8
HU11 1.43 2.50 3.4 17 8
HU10 1.98 2.29 4.4 14 8
Block I HU12 1.08 1.58 1.4 20 11
HU9 0.78 1.20 3.4 9 4
HU14 2.41 2.92 5.4 14 9
HU4 1.00 1.92 3.4 13 5
HU8 0.91 1.61 2.4 13 5
HU7 1.26 1.49 2.4 12 8
HU13 0.49 1.03 3.4 8 2
HU1 1.27 1.92 1.4 19 9
HU2 0.61 1.01 1.4 11 5
HU5 1.01 1.48 5.4 9 4
HU3 1.75 2.34 6.4 10 5
HU6 0.47 0.94 2.4 9 3
Block Mean 1.17 1.73 3.33 12 6
HU27 0.85 1.53 1.4 36 1
HU26 0.56 0.94 2.4 5 1
HU25 0.59 1.22 2.4 11 3
HU24 1.93 2.92 6.4 7 2
Block II HU23 1.19 1.74 3.4 10 4
HU22 1.77 2.59 4.4 9 3
HU21 1.27 2.22 2.4 14 5
HU20 0.60 1.35 3.4 7 1
HU19 1.15 1.88 4.4 7 1
HU17 0.80 1.63 4.4 5 1
HU18 1.19 1.98 4.4 6 1
HU15 1.00 1.72 1.4 19 5
HU16 0.91 1.65 2.4 14 4
Eshet-01 1.41 2.15 4.4 9 3
Block Mean 1.09 1.82 3.40 11 3

32nd Annual Research Bulletin, April 2015, Haramaya University
16
Table 2. Continued.
Block Acession MDPYt/ha TDPYt/ha ADPW (g) NTDP/pl NMDP/plant
HU28 0.76 1.34 3.6 11 7
HU29 0.35 0.90 1.6 16 7
HU30 0.25 0.68 1.6 12 6
HU31 0.99 2.09 2.6 18 9
HU32 1.56 2.50 2.6 23 13
Block III HU33 2.56 3.26 3.6 21 13
HU34 0.84 1.80 2.6 20 8
HU35 0.33 1.08 1.6 16 6
HU36 1.37 2.10 1.6 24 14
HU37 0.94 1.30 2.6 13 8
HU38 0.41 1.09 1.6 16 7
HU39 1.30 1.95 2.6 21 12
HU40 0.24 0.58 1.6 10 5
HU41 0.79 1.18 2.6 13 9
Block Mean 0.91 1.56 2.31 16 8
HU55 0.87 1.11 2.2 9 8
HU54 0.34 0.69 2.2 10 4
HU53 1.18 1.56 3.2 11 8
HU52 0.55 0.81 2.2 7 5
HU51 1.35 1.77 2.2 16 11
HU50 1.08 1.43 2.2 21 13
Block IV HU49 0.61 0.85 2.2 9 5
HU48 1.17 1.62 2.2 17 11
HU47 1.09 1.22 2.2 12 10
HU46 1.29 1.94 3.2 11 6
HU45 1.11 1.53 4.2 8 7
HU44 0.72 0.96 2.2 10 7
HU43 0.16 0.27 2.2 5 3
HU42 0.52 0.77 3.2 3 3
Block Mean 0.86 1.18 2.56 10 7

32nd Annual Research Bulletin, April 2015, Haramaya University
17
Table 2. Continued.
Block Acession MDPYt/ha TDPYt/ha ADPW (g) NTDP/pl NMDP/plant
HU57 0.08 0.73 2.4 7 1
HU58 1.20 1.92 3.4 13 7
HU59 0.77 1.19 2.4 11 4
HU60 1.50 2.32 2.4 19 9
HU61 2.32 3.09 4.4 15 9
HU62 0.86 1.77 2.4 15 6
Block V HU63 0.84 1.37 2.4 11 5
HU64 1.12 1.60 3.4 8 5
HU65 1.36 2.39 3.4 16 6
HU66 0.89 1.47 2.4 11 5
HU67 0.82 1.42 2.4 12 6
HU68 0.46 1.22 1.4 17 4
HU69 0.66 1.23 3.4 7 3
HU56 1.54 2.74 3.4 16 8
Block Mean 1.030 1.748 2.829 13 6
Grand mean 1.011 1.608 2.886 13 6
Critical difference
Two Control Treatments
5% 0.74 0.90 1.10 7.70 5.97
1% 1.02 1.24 1.52 10.61 8.23
Two Test Treatments (Same Block)
5% 1.66 2.01 2.46 17.22 13.35
1% 2.29 2.77 3.39 23.72 18.40
Two Test Treatments(Different Blocks)
5% 2.35 2.84 3.48 24.35 18.89
1% 3.24 3.92 4.80 33.55 26.02
A Test Treatment and A Control Treatment
5% 1.66 2.01 2.46 17.22 13.35
1% 2.29 2.77 3.39 23.72 18.40
3.1.2. Mean performance of accessions The adjusted mean yield and yield components of pepper collections and improved varieties is presented in Table 2. The minimum and maximum total and marketable dry pod yield (t/ha) were 0.27 & 3.26 and 0.08 & 2.56 with the grand mean of 1.6 and 1.01 t/ha, respectively. Average dry pod weight was recorded as low as 1.4 and as high as 6.4 g with the overall mean of 2.85 g. Number of total dry pods per plant was ranged from 3 to 36 and number of marketable dry pods/plant recorded as high as 14 and as low as 1 (Table 3). Moreover, 13 accessions were performing higher than the best yielding checks for all the three important yield and yield component (average dry pod weight, total and marketable dry pod yield t/ha). Comparison of accessions on the basis of mean performance with the mean dry pod yield and yield components of improved varieties and high performing improved variety was made and presented in Table 4. The mean total and marketable dry pod yield t/ha were 1.48 and 0.93, respectively. The high yielding variety was Marako Fana which produced 1.91 and 1.22 t/ha total and marketable dry pod yield, respectively. Considerable numbers of new selections were performing better than the high yielding variety; 22 and 20 accessions exhibited higher total and marketable dry pod yield, respectively, over yields of Marako Fana. These accession total and marketable dry pod yield advantages ranged from 0.26 to 70.5 and 2.95 to 110.5%, respectively. The absolute total and marketable dry pod yield advantages were as high as 1.35 and 1.34 t/ha, respectively. Similarly, 28 and 3 accessions recorded higher average dry pod weight and number of total dry pods/plant, respectively, over the high performing improved varieties in the experiment. The accessions average dry pod weight and number of total dry pods/plant advantages

32nd Annual Research Bulletin, April 2015, Haramaya University
18
ranged from 6.67 to133.33 and 7 to 72%, respectively. The observed dry pod weight advantage was as high as 3.4 g and the advantage of 5 and 6 dry pods per plant. Table 3. Comparison of accessions with the mean dry pod yield and yield components of pepper collections.
Trait
Mean and range of entries
SD
Number of accessions
Mean Minimum Maximum Above mean Below Mean
Marketable dry pod yield (t/ha) 1.01 0.08 2.56 0.5 32 38
Total dry pod yield (t/ha) 1.60 0.27 3.26 0.62 33 37
Average dry pod weight 2.85 1.4 6.4 1.13 28 42
Number of total dry pods per plant 13 3 36 5 30 40
Number of marketable dry pods/plant 6 1 14 3 29 41
Table 4. Comparison of accessions means with the mean dry pod yield and yield components of improved varieties and high performing improved variety.
Trait Mean of Checks
No. accessions Above high performing check
Above checks mean
Below checks mean
No. of accessions
Absolute advantage range
Percent Advantages range
Marketable dry pod yield (t/ha) 0.93 35 35 20 0.04-1.34 2.95-110.5
Total dry pod yield (t/ha) 1.48 40 30 22 0.01-1.35 0.26-70.5
Average dry pod weight (g) 2.40 34 36 28 0.2-3.4 6.67-133.33
Number of total dry pods/plant 15 24 46 3 5 & 6 7 to 72
Number of marketable dry pods/plant 8 23 47 1 1 7.69
3.2. Genetic Advance Genetic advance as percent mean that could be made through selection at 5% selection intensity for dry pod yield (t/ha) and yield components of pepper collections along with heritability estimate, phenotypic (PCV) and genotypic (GCV) coefficient of variation are presented in Table 5. The highest genetic advance as per cent mean was recorded for marketable dry pod yield (t/ha) followed by average dry pod weight (g) with 21.16 and 12.48%, respectively. The lowest genetic advance as per cent mean was recorded for number of dry pod/plant followed by marketable dry pod number/plant with 0.27 and 3.37%, respectively. Similar trend was observed for the heritability of traits where higher broad sense heritability was computed for marketable dry pod yield (t/ha) followed by average dry pod weight (g) with 29.76 and 19.74%, respectively. Higher phenotypic and environmental coefficients of variation than genotypic coefficient of variation were computed for all traits. Table 5. Genetic advance through selection of pepper collections for dry pod yield (t/ha) and yield components.
Trait GCV PCV ECV H2 GAM
Marketable dry pod yield (t/ha) 18.83 34.52 28.93 29.76 21.16
Total dry pod yield (t/ha) 10.05 33.30 31.75 9.11 6.25
Number of dry pod/plant 2.41 43.65 43.58 0.31 0.27
Marketable dry pod number/plant 8.96 49.12 48.30 3.33 3.37
Average dry pod weight (g) 13.64 30.69 27.50 19.74 12.48
3.3. Clustering of Accessions The dendrograms from UPGMA cluster analysis based on Euclidean distance (ED) matrixes are presented in Figure 1. The clustering resulted in the formation of six clusters of which the first cluster was comprised high yielding varieties Marko Fana, PBC-660 and other 17 accessions.

32nd Annual Research Bulletin, April 2015, Haramaya University
19
The second and the third clusters comprised of 20 and 23 accessions including the low yielding variety Marko Dima and processing variety Melka Eshet, respectively. Cluster IV, V and VI comprised of 8, 4 and 1 accessions, respectively. Table 6. List of peeper accessions in six clusters.
Cluster I Cluster II Cluster III Cluster IV
Marako Fana Marako Dima Melka Eshet HU5
HU31 HU9 HU53 HU19
HU34 HU69 HU4 HU18
Local cultivar HU13 HU46 HU17
HU1 HU20 HU58 HU22
HU60 HU26 HU23 Eshet-01
HU39 HU42 HU64 HU3
HU51 HU43 HU28 HU24
HU48 HU57 HU45 Cluster V
PBC-660 HU2 HU8 HU10
HU12 HU30 HU16 HU14
HU50 HU40 HU62 HU61
HU15 HU6 HU63 HU33
HU32 HU54 HU66 Cluster VI
HU36 HU52 HU67 HU27
HU11 HU49 HU25
HU56 HU29 HU59
HU65 HU38 HU7
HU21 HU35 HU37
HU68 HU41
HU47
HU55 HU44
The first cluster was characterized by containing accessions which had higher marketable and total dry pod number/plant more than the mean pod number of the accessions while majority of the accessions had lower average dry pod weight and majority of the accessions had marketable and total dry pod yield (t/ha) above the mean yield of accessions. Cluster II was characterized by producing marketable and total dry pod yield than lower than the mean of the accessions also produced lower number of total and marketable dry pod/plant than the mean. Cluster III was characterized by containing accessions with higher total dry pod yield t/ha but lower marketable dry pod yield t/ha than mean of accessions except few number of accessions. The member of this cluster had also lower marketable and total dry pod number/plant than mean of the accessions. The member of the Cluster IV except one accessions had higher marketable and total dry pod yield t/ha than mean of accessions higher average dry pod weight but lower marketable and total dry pod number/plant than mean of the accessions. Cluster V was characterized by containing accessions which had highest yield in the experiment and higher mean values for all other traits. Cluster VI which represented one accession characterized with extremely lower mean values for all traits except extremely highest total dry pod number/plant. The mean of the accessions in each cluster and the range as well as the list of the members in each cluster are presented in Table 6 and 7.

32nd Annual Research Bulletin, April 2015, Haramaya University
20
Table 7. Range and mean values of the six clusters for yield and yield components of pepper accessions
Trait Marketable dry pod yield (t/ha)
Total dry pod yield (t/ha)
Average dry pod weight (g)
Number of dry pod/plant
Marketable dry pod number/plant
Cluster
Mean Range Mean
Range Mean
Range Mean Range
Mean Range
Cluster I
1.21 0.69-1.56
1.96 1.43.-2.74
2.31 1.4-3.4
18.63 14-24 1.09 5 - 14
Cluster II
0.47 0.08-0.91
0.95 0.27-1.65
2.29 1.4-3.4
9.95 3 -17 4.00 1- 7
ClusterIII
0.93 0.59-1.29
1.43 0.96-1.94
2.71 2.2-4.2
11.42 8 -15 6.21 3 - 10
Cluster IV
1.09 0.8-1.93 1.63 1.48-2.92
3.51 4.4-6.4
9.86 5 -10 4.96 1 -5
Cluster V
2.32 1.98-2.56
2.89 2.29-3.26
4.45 3.6-5.4
16 14-21 9.75 8-13
Cluster VI
0.85 1.53 1.4 36 1
Grand mean
1.011 1.608
2.886
13 6

32nd Annual Research Bulletin, April 2015, Haramaya University
21

32nd Annual Research Bulletin, April 2015, Haramaya University
22
4. Discussion In this experiment, the Hararghe hot pepper collections exhibited up to 3.26 and 2.56 total and marketable dry pod yield t/ha, respectively, while the high yielding variety produced 1.91 and 1.22 t/ha total and marketable dry pod yield, respectively. A total of 22 and 20 accessions exhibited higher total and marketable dry pod yield, respectively, over yields of high yielding variety. Generally, the high yielding accessions total and marketable dry pod yield advantages ranged from 0.26 to 70.5 and 2.95 to 110.5%, respectively. The yields obtained from the new selections were better than the improved varieties and the national average yields indicating the possibility of improving dry pod yield through collection and selection of hot pepper in the region. The national average yields have been reported that 7.6 t ha-1 for green and 1.6 t ha-1 for the dry pods (CSA, 2006). FAO (2009) report also indicated that the estimated production of peppers in Ethiopia were 220,791 t from 97,712 ha in green form and 118,514 t of dry pepper from an area of 300,000 ha. This means that the average production of pepper was 2.26 t ha-1 green and 0.395 t ha-1 for dry pepper production in the country. On the other hand, other researchers reported the highest dry pod yield of 3000 kg/ha (Jansen, 1981). The new selections showed superiority over the improved varieties not only for dry pod yields but also for other traits. About 28 and 3 accessions recorded higher average dry pod weight and number of total dry pods/plant, respectively, over the high performing improved varieties in the experiment. The accessions average dry pod weight and number of total dry pods/plant advantages ranged from 6.67 to133.33 and 7 to 72%, respectively. The Hararghe collections showed superiority over the improved varieties, it is possible to improve hot pepper yields and other desirable traits through collection and selection. Donald (1968) describes two basic principles for plant breeding, ‗selection for yield‘ and ‗defect elimination‘. Therefore, the basic principles behind plant breeding programme are to develop cultivars with better yield potential and to develop cultivars that have genetic resistance against production hazards that can prevent a cultivar from expressing its yield potential (Acquaah , 2007). Based on these principles, the hot pepper breeding programme in eastern Ethiopia relies on improvement of dry pod yield, improved quality, resistance to frost, drought, disease and pests through collection and selection of local cultivars in the region. In this experiment, it was computed as high 21.16 and as low as 0.27% for marketable dry pod yield t/ha and number of dry pod/plant, respectively, for the genetic advance that could be made. Similar trend was also observed for the heritability of traits where higher broad sense heritability was computed for marketable dry pod yield t/ha. However, higher phenotypic and environmental coefficients of variation than genotypic coefficient of variation were computed for all traits. Heritability is the proportion of the observed variation in a progeny that is inherited (Acquaah, 2007). Heritability in broad sense is the proportion of the genotypic variability to the total variance (Allard, 1960). It is a measure of the degree to which a phenotype is genetically influenced and can be modified by selection (Schlegel, 2010). In crop improvement, only the genetic component of variation is important since only this component is transmitted to the next generation. Therefore, the observed high genetic advance and heritability for marketable dry pod yield t/ha is encouraging to continue collection and selection to improve the crop in the region. Selection for a particular trait depends largely upon the genetic and non-genetic factors that affect the expression of phenotypic differences among genotypes. Therefore, heritability is an important estimate for the selection of traits in improving crop. Single plant selection is much effective for a trait that is highly heritable as compared to the trait which is less heritable. Heritability estimates would be reliable if accompanied by a high estimate genetic advance (Singh and Choudhry, 1985). Though, low genetic advance and heritability were computed for three traits in the present study, genetic advance and heritability were in the combinations of high and moderate for marketable dry pod yield t/ha and average dry pod weight which was an indication of more additive gene action (Panse, 1957) and suggested that these traits are amenable for selection. However, the estimated phenotypic and environmental coefficients of variations were relatively greater than the genotypic coefficient of variation in magnitude for all the traits. This indicates the higher sensitivity of traits to environmental modifications which the improvement of traits through selection may be complicated. The presence of significant differences among collections and between collections and improved varieties was evident from analysis of variance results. It was calculated large genetic distance between local collections and between collections and improved varieties and among improved varieties (results not presented because of its bulkiness). The accessions were grouped into six clusters where none of the improved varieties were a member of Cluster V which comprised collections with highest yield and yield components. Moreover, the overall mean values of local collections within considerable numbers in each trait were performed greater than the high performing improved varieties. This indicated that the presence of considerable genetic divergence between local collections and improved varieties which encourage breeders to commence collection and selection of local materials to improve yield and other desirable traits of hot pepper. The genetic divergence analysis result was in line with other researcher who reported that Hararghe is one of the main centers of cultivation (Alkamper, 1972 cited by Jansen, 1981), which diversity of the crop is expected. Variation and/or genetic divergence are the occurrence of difference among individuals due to difference in their genetic composition and/or the environment in which they are raised (Falconer., 1990; Allard, 1960; Welsh, 1990). If the character expression of two individuals could be measured in an environment exactly identical for both, difference in expression would result from genetic control and hence such variation is called genetic variation (Falconer, 1990). The presence of variation in the germplasm for the trait of interest is, therefore, very important. Information on the nature and magnitude of genetic variability greatly helps in formulating sound crop breeding and improvement program (Welsh, 1990). Genetic variability, which is due to genetic differences among individuals within a population, is the core of plant breeding because proper management of diversity can produce permanent gain in the performance of plant and can buffer against seasonal fluctuations (Welsh, 1981). In addition, estimation of the magnitude

32nd Annual Research Bulletin, April 2015, Haramaya University
23
of variation within germplasm collections for important plant attributes will enable breeders to exploit genetic diversity more efficiently. Therefore, the observed variation among collections was due to genetic factors and showed the higher possibilities of collecting distant accessions in eastern Ethiopia that could be used to improve yield and other desirable traits of hot pepper.
5. Summary and Conclusion This study showed that the presence of considerable genetic distance among eastern Ethiopian hot pepper collections and improved varieties. In both the local collections and improved varieties, large genetic distances were computed. Relatively, large number of local collections showed superiority over improved varieties for yield and yield components. Moreover, clustering of accessions showed that the possibility of obtaining group of local collections with highest yield and yield components which were genetically distinct from improved varieties and other collections. This indicates the need to collect, evaluate and characterize large number of local collections to improve yield and other traits of desirable traits of hot pepper as well as to maintain the genetic resource in eastern Ethiopia.
6. References Acquaah G. 2007. Principles of Plant Genetics and Breeding. Blackwell publishing, Main Street, Malden, USA. Allard, R. W. 1960. Principles of Plant Breeding. Wiley, New York, USA. Belay, S. C., W. Wortman and G. Hoogen boom, 1998. Haricot bean agro-ecology in Ethiopia: definition using agro-climatic and crop growth
stimulation models.African Crop Science Journal. 6: 9 - 18. Burton, G. A. and Devane, E. H.1953. Estimation of heritability in tall festca (Festuca arundinacea) from replicated clonal materials.
AgronomyJournal 45: 478 - 479. CSA (Central Statistical Authority). 2006. Agricultural sample survey of the year 2005/2006. Donald, C. M., 1968. The breeding of ideotype. Euphytica Journal, 17: 385 - 403. Ethiopian Export Promotion Agency (EEPA) (). 2003. Spice Potential and Market Study. Product Development and Market Research
Directorate, Addis Ababa. Falconer, D. S. 1990. Introduction to Quantitative Genetics,3rd ed. John Wiley and Sons, Inc. New York, USA. Food and Agriculture Organization (FAO) (). 2009. FAO STAT Database for production of peppers. Rome, Italy. Heiser, C. B. 1976. Peppers capsicum (Solanaceae). pp. 265 - 268. In: Simmonds, N.W. (ed.), The Evolution of Crops Plants. Longman Press,
London. Johnson, H. W., Robinson, H. F. and Comstock, R.E. 1955. Estimates of genetic and environmental variability in soybeans. Agronomy. Journal
47: 314 - 318. Jansen PCM, 1981. Spices, Condiments and Medicinal Plants in Ethiopia, their Taxonomy and Agricultural Significance. Wageningan, The Netherlands. Panse, U. G. 1957. Genetics of quantitative characters in relation to plant breeding. IndianJournal of Genetics 17: 318 - 328. Rahman, M. J., Uddin, M. S., Bagum, S. A., Mondol, A. T. M. A. I., and Zaman, M. M. 2006. Effects of mulches on the growth and yield of
tomato in the coastal area of Bangladesh under rain-fed condition. International Journal of Sustainable Crop Production 1: 06 - 10. Rubatzky, V. E, and Yamaguchi, M. M. 1997. World Vegetables: Principles, production and nutritive values, 2nd ed., Chapman and Hall International
Thomson Publishing, New York, USA. Schlegel R. H. J., 2010. Dictionary of Plant Breeding. 2ndedu. CRC Press Taylor & Francis Group 6000 Broken Sound Parkway New York. Simret B., 2004. Influence of inorganic nitrogen and potassium fertilizers on seed tuber yield and size distribution of potato (Solanum tuberosum
L.). An. M. Sc Thesis Presented to the School of Graduate Studies, Haramaya University, Ethiopia, p. 65. Singh, R .K., Chaudhry, B. D.1985. Biometrical Methods in Quantitative Genetic Analysis. Kalynani Publishers, Ludhiana, India. Sneath, P. H. and Sokal, R. R. 1973. Numerical Taxonomy. Freeman and Company, San Francisco,USA. Welsh, J. R., 1981. Fundamentals of Plant Genetics and Breeding. John Willey and Sons, Inc., New York. USA. Welsh, R. J., 1990. Fundamentals of Plant Genetics and Breeding. John Wiley and Sons, New York, USA.

32nd Annual Research Bulletin, April 2015, Haramaya University
24
3. Impacts of Invasive Plants (Lantana camara and Parthenium hysterophoru) on Livestock and Rangeland Production in Pastoral and Agro Pastoral Areas of Somali Region, Ethiopia Dawit Terefe Haramaya University, School of Animal and Range Sciences, P. O. Box: 138, Dire Dawa, Ethiopia E-mail: [email protected]
Abstract: This study was conducted to assess the impact of invasive plants: Lantana camara and Parthenium hysterophoru on livestock production and feed resources in Jijiga Zone of Somali National Regional State. Three districts Gursum, Jijiga and Tulugulade were purposively selected to represent L. camara, P. hysterophoru and none invaded study sites/areas, respectively. Studies on primary livelihood options were assessed. The socio-economic study revealed changes in major livelihood means of pastoralists. Significant difference (P<0.05) were observed in the primary means of livelihood as well as in livestock holding per household across the three study sites. Herd diversification was lesser in Tulugulade district with a Simpson index (SI) of 0.65, than that of Gursum and Jijiga districts where the SI values were 0.49 and 0.40, respectively. Majority of the respondents (66.7%) of Jijiga and all (100%) of Gursum districts believed that the rate of P. hysterophoru and L. camara invasion was still increasing in their respective districts. Most of the respondents (94%) in Jijiga district believed that invasion control strategies were partially effective. However, 60% of the respondents in Gursum district believed that invasion control strategies were failed. Majority of the respondents in Gursum (96.7%) and Tulugulade (100%) districts responded that they had ceased mobility. However, most of the respondents (93.3%) in Jijiga district responded that they practice mobility so far. The average loss of animals per household due to consumption of L. camara was found to be 0.92 TLU. Almost all of the respondents of Gursum and Jijiga districts agreed on adverse effects of these invasive plants on the qualities of animal products as well as their suppressive effect on the growth of valuable forage plants. L. camara and P. hysterophoru posed a serious problem on pastoralist livelihood strategies, livestock production and feed resources availability in Jijiga Zone. Therefore, prompt interventions to curb the expansion of these invasive plants are inevitable.
1. Introduction Invasive alien species (IAS) are those plants, animals, and microbes which are introduced to new regions, mainly through human activities, where they establish and spread impacting negatively on biodiversity, agriculture, water resources, and human health that directly and/or indirectly affect economic growth and livelihoods of exposed communities. With an estimated number of 480,000 alien species that have been introduced to various ecosystems around the world, majority of them have been contributing significantly to human welfare. However, only a few introduced species actually become problematic (Arne Witt, 2004). Poor rangeland management in Ethiopia has resulted in serious land degradation, reduced biodiversity, and decline in both quality and quantity of feed production, and gradual replacement of important plant species by unpalatable and noxious ones (Alemayehu, 2004). Foremost among these, Parthenium weed (Parthenium hysterophorus), mesquite (Prosopis juliflora), water hyacinth (Eichhornia crassipes), cactus (Euphorbia stricta) and lantana weed (L. camara) are commonly reported in different parts of the country (EIB, 2012). The Somali National Regional State (SNRS), which is the second largest regional state, is found in the south eastern part of Ethiopia, covering about 281,900 km2. The biodiversity of the region has recently been threatened by encroaching weeds and woody plants (EARO, 2003). Increasing deforestation, recurrent droughts and over-grazing might have caused the deterioration of the rangeland vegetation, thereby weakening the grazing and browsing capacities of the rangelands (Belaynesh, 2006). At present, most of the rangelands in SNRS are invaded by noxious weeds/invasive plant species such as: Parthenium hysterophorus, Xanthium spinosum, Prosopis juliflora, L.camara (SERP, 1995). P. hysterophorus and L.camara has been threatening the rangeland ecology of the region in general, and that of Jijiga Zone in particular, for over three decades now. However, little attempt has been made so far in terms of research and management of such IAS (Taye, 2007). Parthenium hysterophorus (Asteraceae), is an annual herb with a deep taproot and an erect stem that becomes woody with age. It was first reported at Dire-Dawa, , Eastern Ethiopia in 1988. As an exotic invasive weed, P. hysterophorus is expected to continue its invasion until all suitable habitats are occupied, unless suitable measures taken timely. The expansion of P. hysterophorus on grazing lands has critically endangered the biodiversity, particularly grass and forb species in North-Eastern Ethiopia (Lisanework et al., 2010). Another case in point is that of Lantana camara, an ornamental shrub, introduced to all parts of the tropics. L.camara is well-known in Ethiopia especially as a showy garden plant. Until now, this species had not been perceived as a problem in Ethiopia although it is known as one of the most troublesome weeds in much of the tropics. Studies reported that the species has the capacity to transform productive land into lantana scrub (wasteland), while it is unpalatable to animals, and prevents grass growth (Binggeli and Desalegn, 2002). All the above mentioned effects of the Alien Invasive Species (AIS) contribute to increased pressure on grazing land that has been frequently threatened by recurrent drought, and thereby affect livestock production and productivity in the pastoral and agro pastoral areas. Though this is the general fact, so far, only few and scattered researches have been done regarding the impacts of these two AIS in some pastoral areas; while

32nd Annual Research Bulletin, April 2015, Haramaya University
25
no research has been undertaken so far in the Somali Region particularly on the impact of invasive plants in relation to livestock and rangeland production. Thus, this research aimed to study the impacts of two invasive plants (L.camara and P. hysterophorus) on livestock, and rangeland feed resources in Somali Region with the following specific objectives.
Objectives The objectives of this study were to:
assess the impacts of L. Camara and P. Hysterophoru on livestock management and herd structure and health in Somali region; and.
assess the impacts of L. Camara and P. hysterophoru on rangeland feed resources in Somali region.
2. Materials and Methods 2.1. Description of the Study Area Jijiga Zone is one of the nine administrative Zones of the Somali National Regional State (SNRS).It is located at 750 km southeast of Addis Ababa. The Zone is situated in the northern part of SNRS and neighbors in the east with the Republic of Somalia, in the west with Oromia Regional State and Fik Zone of the SRS, and in the south with Degahbour Zone. The Zone is divided into seven administrative districts: Jijiga, Kebribeyah, Harshin, Babile, Awbare, Tulgulade and Gursum. The total land cover of Jijiga Zone is 40,861 km2 of which the rangeland extends over 36,629 km2 (World Bank, 2001). The Somali Regional State has a bimodal pattern of rainfall regime (IPS, 2002). According to the National Meteorological Service Agency (NMSA, 2000), in Jijiga Zone, there is generally low, unreliable and uneven distribution of rainfall. The mean annual rainfall in this area is 660 ml. The mean minimum and the mean maximum temperature in this area are 200C and 350C, respectively. Potential evapo-transpiration (PET) is always high ranging from 1,800 to 2,500 mm of annual PET (IPS, 2002). 2.2. Data Collection The survey was conducted in three districts of Jigjiga Zone of Somali Regional State The study areas were selected based on secondary information. Purposive sampling technique was used to select the districts with the intention of covering those invaded areas . 2.2.1. Selection of the study sites Out of the seven districts in Jijiga Zone, three districts were selected for the study. The three districts selected were Gursum, Jijiga and Tulgulade representing L.camara invaded, P. hysterophorus invaded and none invaded woredas, respectively. Thus, from Jijiga Haroris, from Gursum woreda kubijaro and from Tulgulade woreda Chefe Lega kebeles were selected for the survey. Haroris kebele is found at 37 km from the Zone capital Jijiga, 090 21 274 N and 0430 05. 520 E and has an altitude of 1813 m.a.s.l. Kubijaro is found at 50 km from the Zone capital Jijiga, about 090 21 274 N and 0420 31. 301 E and has an altitude of 1533 m.a.s.l. Chefe Lega is found at 42 km from the Zone capital Jijiga, about 090 32.208 N and 042032.311 E and has an altitude of 2119 m.a.s.l. 2.2.2. Sampling and data collection procedure Questionnaire that consisted of a wide range of questions was prepared in both open-ended and close-ended form. It was divided into components to cover the following major themes: household characteristics, rangeland resources, livestock management practices, livestock composition, local people‘s perception towards the impacts of the invasive plants on livestock management practices and pastoral and agro pastoral livelihood and invasive plants control interventions. The questionnaire was administered by 6 enumerators who have knowledge about the study areas and familiarity with the local language. Interviews were also conducted with key informants. Participatory rural appraisal (PRA) techniques were used and administered on group discussions (group discussions were held with 9-12 individuals in each kebeles). In addition, information relevant for this study were collected from secondary sources, and used to make comparison between Parthenuim and L.camara invaded and none invaded kebeles. 2.3. Data Analysis To assess the socioeconomic characteristics of households and their perception on Parthenuim and Lantana invasion, information which was gathered through questionnaire based formal survey was analyzed using Statistical Package for Social Sciences (SPSS) version 16. Livestock compositions (diversity) among the three selected kebeles were performed using the Simpson Index (SI).The calculation of SI involves first converting the number of animals into Tropical Livestock Unit (TLU) equivalents (FAO, 1987). SI = [(TLU cattle)2 + (TLU camels)2 + (TLU goats)2 +(TLU sheep)2 +(TLU donkey)2]/(TLU total)2

32nd Annual Research Bulletin, April 2015, Haramaya University
26
3. Results and Discussion 3.1. Socio-Economic Conditions and Households Characteristics 3.1.1. Family size and age composition Overall, family size in the study areas was found to be 8.2 ± 3.8. The mean household size in the non invaded kebele was found to be relatively higher (11.67) than the other two, L.camara invaded (5.8) and Parthenium invaded (7.1). With regard to the mean age categories of family members in all the study kebeles, large numbers of the family members were found to be in the active age category (15-64 years) whereas very few members of the families were found to be elder (> 65 years) (Appendix Table 1). The presence of large number of the family members in the active age category tells as the available labour in the area to practice the simplest and cheapest (manual clearing) invasive plants control method. The difference in mean age categories of family members in active age category was significant (P< 0.05). 3.1.2. Livelihood means Pastoralism is the most prevalent livelihood strategy comprising about 60% of the region‘s rural population (SRAR, 2012). However, information obtained from the formal survey (Table 1) shows the change in livelihood means of pastoralists in the study areas. For instance,67% of the pastoralists in L.camara invaded and and 93% in none invaded kebeles use crop farming as a primary livelihood means. Whereas in Parthenium invaded kebele, 100% of the respondents reported that their primary livelihood means is livestock production, though they also produce crops. Livestock production is the second livelihood means in the L. camara invaded kebele (70 %). But in none invaded kebeles, the second livelihood means is trading (50%) followed by work in government (30%). The x2 test shows significant difference (P<0.05) in the importance of livestock as primary livelihood means in the three districts (Appendix Table 2). This shows the changes in livelihood means of pastoralists, for which 90% of household income was expected to come from livestock production. Table 1. Livelihood means of respondents.
Livelihood means Invasion status Lantana (N=30) Parthenium (N=30) none (N=30)
Primary fq % fq % fq % Livestock production 10 33 30 100 1 3 Crop farming 20 67 0 0 28 93 Trading 0 0 0 0 1 3
Secondary Livestock production 21 70 0 0 4 13 Work in government 0 0 0 0 9 30 Crop farming 9 30 30 100 1 3 Trading 0 0 0 0 15 50 Contractor 0 0 0 0 1 3
fq = frequency, 3.2. Land Ownership and Land Use Systems Unlike other pastoralists/ agro-pastoralists in Ethiopia, land is not a clan (common) property in the study area. In the Zone, every household has its own private land. infact, there is a little clan interference in decision making over land related issues. For example if an individual wants to rent his land, the organization or individual who is going to rent the land should be accepted by the clan, otherwise the person can‘t make decision by himself. Land area measured locally by ‗KOTI‘ which is equivalent to 22 X 22 adult pace or ≈ 0.049 hectare. Large area of land was band from cultivation or devoid of grazing due to the seriousness of both invasive plants. For instance, on average, every household in Lantana and Parthenium invaded areas lost 3.4 and 2.3 koti of farming land, respectively (Table 2). This observable fact results a serious threat for the emerging crop farming activity (agro-pastoralism) in Jijiga Zone. Table 2. Average land holding and farming land lost due to invasion per house hold.
Land use type Farm land* Invaded land*
Lantana invaded Mean 11.6 3.4 Std. Deviation 8.0 1.6
Parthenium invaded Mean 19.9 2.3 Std. Deviation 1.0 1.2
None invaded Mean 40.3 - Std. Deviation 9.6 -
*Area in Koti

32nd Annual Research Bulletin, April 2015, Haramaya University
27
3.3. Livestock Production Constraints Pastoralists mentioned different factors as constraints to livestock production in their respective areas. According to respondents, in the Parthenium invaded district the main livestock production constraints were reported to be water shortage, subsequent feed shortage, expansion of crop production, animal diseases, Parthenium invasion and predators‘ attack. According to the respondents Parthenium invasion doesn‘t impose a serious problem in livestock production activity. However, it is the main challenge for crop production. On the other hand, Lantana invasion was mentioned as the second major constraint for livestock production in the Lantana invaded district. Predators attack was mentioned as the main threat for livestock production. Animal disease and feed shortage were ranked 3rd and 4th, respectively. In the non invaded kebeles, feed shortage, animal disease and water shortage were listed as 1st, 2nd and 3rd, threat, respectively (Table 3). Table 3. Livestock production constraints.
Problem Parthenium invaded Lantana invaded Non invaded
Rank
Feed shortage 2 4 1 Animal disease 4 3 2 Invasion 5 2 - Expansion of crop production 3 5 4 Predators 6 1 5 Water shortage 1 6 3
3.4. Pastoralists’ Perceptions towards Lantana and Parthenium Invasion Pastoralists in the study area suffer from invasive plants. Particularly three invasive plants: Parthenium, L.camara and cactus (in Gursum district) are the main threats for pastoralists/agro-pastoralists livelihood in Jijiga Zone. All of the respondents in invaded as well as non invaded areas heard about both invasive plants and they do have information about their impacts on the livestock and crop farming activities. Most of the respondents (60% and 83.3% in L. camara and P. hysterophorus invaded areas, respectively) rate the current invasion level in their respective areas as heavy. In Jijiga district, Haroris kebele Parthenium was first seen during Ethio-Somali war (40 years ago). Pastoralists in the woreda believed that this invasive plant was introduced by Cuba solders. In Somali, the local name of P. hysterophorus is ‗Shuk Shuk‘ (which means problem creator). The local name indicates how pastoralists suffer because of this invasive plant. All of the household respondents in Parthenium invaded areas and 90% of the households in Lantana invaded areas reported that invasive plants have been creating serious problem in their livelihood activities and perceived them totally harmful. However, 10% of the respondents in Gursum woreda, kubijaro kebele said that L.camara has some uses and should not be seen as a harmful plant. Most of the respondents reported that L.camara has been seen in their area four decades ago during the ethio-Somali war. Locally Somali pastoralists call L.camara as ―Berkalet‖.All of the respondents in Gursum woreda said that L.camara is a harmful plant and since its introduction into the area, it posed lots of problem on Agricultural activities. The main seed dispersion mechanisms of L. camara reported in descending order were flood (56%), wind (26.7%), and human being (10%). Whereas in Parthenium invaded area, majority of the respondents (63.3%) said that livestock and flood are the main seed dispersion mechanisms. Only about 36.7% of them put flood as the main way of the dispersion (Appendix Table 3). 3.4.1. Perceived harmful effects of L. Camara and P. Hysterophorus Perceptions towards the harmfulness of L. camara and P. hysterophorus invasion do not vary between L. camara and P. Hysterophorus invaded areas. All of the respondents reported that both invasive plants are not used for income generation in one way or in the other. However, the respondents pointed out that starved animals often forced to feed on these weeds during periods of feed scarcity. Besides, L. Camara has been used as a fuel wood, if these could be mentioned as uses. Nevertheless, all respondents do not like to mention the benefits. In both areas (L. camara and P. hysterophorus invaded) the most severe problem caused by invasive plants is their impact on crop production. In Parthenium invaded kebele, the impact of the Parthenium on livestock was reported as a second problem associated with P. hysterophorus invasion,(Affect livestock health), whereas in L. camara invaded kebele the second problems was its impact on feed resources through its suppressive effect on herbaceous plant growth. Pastoralists also reported that Parthenium affect human health and it causes itching, allergy, and asthma. A study in the same region have also revealed that P. hysterophorus causes asthma, bronchitis, dermatitis, and high fever (Shashe, 2007). By and large, the two invasive plants L.camara and Parthenium have imposed a serious challenge on agro-pastorals livelihood by affecting theier main activities (crop and livestock production). The overall harmful effects of L. camara and Parthenium on the pastoral livelihood were ranked in Table 4.

32nd Annual Research Bulletin, April 2015, Haramaya University
28
Table 4. Perceived harmful effects of Lantana and Parthenium.
Problems associated with invasive plants Parthenium invaded Lantana invaded rank
Affect livestock health 2 4 Affect feed resources 3 2 Affect human health 4 * Affect Crop production 1 1 Affect Water points * 3
* = not mentioned and ranked in group discussion. 3.4.2. Effectiveness of Lantana and Parthenium control programs Most of the respondents (94%) in Parthenium invaded kebele believed that invasion control strategies were partially effective. For the effectiveness of the control program, the nature of the plant has played significant role. According to pastoralists, Parthenium plant root is shallow and it is easy to uproot it from the soil. Therefore, it can be controlled using simple hand tools or even with a bare hand. However, 60% of the respondents in lantana invaded area believe that invasion control strategies were failed. In addition, majority of the respondents (66.7%) and 100% of the respondents from Parthenium and Lantana areas, respectively, believed that the rate of Parthenium and Lantana invasion is still increasing. There have been little or no traditional practices used to limit the infestation of Lantana and Parthenium in the study districts. Only few respondents practiced to get rid off the weed when it occurs in the farm land or residential area. Most of the respondents (53.3%) expressed that cutting is an effective method to control Lantana infestation. While, for Parthenium control clearing (hand weeding) and Burning were indicated by most of the respondents (75%) to curb the spread of the weed (Appendix Table 4). 3.5. Impact of Lantana and Parthenium Invasion on Livestock Holding Livestock holding per household declined over time in the study sites (Appendix Table 5). A comparison made between the current livestock holding and that of 10 years ago has shown significant difference (P< 0.05) except for donkey and camel (Appendix Table 6). In both Lantana and Parthenium invaded kebeles, the average livestock holding per household at present has shown a declining trend than before ten years; however, in the non invaded area, the average holding of cattle, sheep and donkey shown an increasing trend. This shows that in the non invaded area, people become more agrarians and sedentary than they used to be.Respondents in L. camara invaded area reported that from all livestock species, the impact of invasive plant is higher on cattle. Normally cattle do not graze Parthenium since it is not palatable due to its bad taste. However, they eat it while they are starved in dry season. This study also revealed that the number of camel per house hold is one and this is below the zonal average which is nine camels per household. The highest camel holding was found in L.camara invaded area. Form the result, it can be conclude that the impact of invasive plants on livestock holding per household as well as on a particular animal species is minimal. Other factors like the change in browse species is much more pronounced. For example in Parthenium invaded area, the grazing land has become open grassland, available browse species in the area were eroded through time and the area is no more suitable for camel and goat rearing. 3.5.1. Impact of Lantana and Parthenium Invasion on livestock composition /Herd Structure The computation for the current herd diversification gave SI value of 0.49, 0.40, and 0.65 for Lantana, Parthenium invaded and non invaded areas, respectively (Table 5). The lower index values 0.40 and 0.49 for Parthenium and L. camara invaded areas, respectively implies the greater species diversity in the household. The higher index values SI (0.65) in the non invaded area shows that herd diversification is low at present. This implies that herd composition tends to be dominated by a single animal species than in the non invaded kebeles, because, pastoralists in these kebeles keep higher number of cattle to use them as a source of power to cultivate their land.However, the SI value before 10 years were 0.58, 0.46 and 0.57 for L. camara invaded, Parthenium invaded and none invaded areas, respectively. This shows that there was a better herd diversification at present than before ten years in L. camara invaded and none invaded areas. However, there was a better herd diversification before ten years and at present in the non invaded area. In general,herd diversification is lower in the non invaded area than in invaded areas.
Table 5. Livestock diversity of the study area.
Invasion state Current SI Before 10 years SI
Lantana invaded 0.49 0.58 Parthenium invaded 0.40 0.46 None invaded 0.65 0.57
SI= Simpson index

32nd Annual Research Bulletin, April 2015, Haramaya University
29
Thus, we can conclude that people in the non invaded area are more dependent on cattle and sheep rearing than their forefathers. Thus, from this result, it can be concluded that herd diversification begin to fade as a herd management tool to cope with livestock production constraints in the non invaded area, but it is still practiced in invaded areas. 3.5.2. Impact of Lantana and Parthenium on livestock management practices Related to the arid nature of the study Zone, water resources both for human being as well as for livestock were scarce. Both invaded districts have been challenged with severe shortage of water resources. Pastoralists in Parthenium invaded area obtain water from birka/pond and ration during dry season/, while in wet season, they harvest rain water and use it for livestock for some time. Water shortage is a serious problem in haroris kebele, particularly during drought season the problem is severe and the regional government distribute water by trucks in the district. Availability of water is better in L. camara invaded and uninvaded areas. Pastoralists in L. camara invaded areas obtain water from ela/pond/ during dry season and in wet season river and rain water is available. While, pastoralists in none invaded kebeles obtain water from river, streams and springs. Encroachment of invasive plants around water points has direct and indirect consequences. Directly, it causes loss of drinking water and indirectly it increases predators attack on livestock by serving as hideout for predators and by narrowing paths to water points. It also affects species composition and the mobility of livestock and people by closing paths, grazing areas and colonizing temporary settlement areas (Dawit, 2010). The same phenomenon has been seen in Lantana invaded area. Unlike in the Parthenium invaded Haroris kebele, water sources were considered to be highly affected by lantana invasion in Kubijaro kebele (Lantana invaded). Pastoralists indicated that many streams such as: Setale, Elgore and Bedigudot were lost due to Lantana invasion. Majority of the respondents (63.3%) said that the average distance livestock travel for watering is less than 1 km;33.3% of the respondents said it is between 1 and 5 km;2.2% of the respondents said it is between 6 and 10 km; and 1.1% said it is greater than 10 km (Appendix Table 7). Majority of the respondents get water for their livestock in 5km radius. Therefore, Lantana and Parthenium invasion seems not that much pronounced impact on increasing livestock trekking distance to get water and on livestock watering frequency. 3.5.3. Livestock injuries and death in Lantana and Parthenium invaded areas Pastoralists in Gursum woreda blame Lantana invasion for the increased attack by predators and feed shortage. They put lantana invasion as the second threat of livestock production in their area. Respondents also said that thickets of Lantana not only shelter predators in the grazing land but also allows them to hide around residential areas without being noticed by people. Lantana has been implicated in poisoning of a number of animals including cattle, sheep and goats since its leaves and seeds contain toxic substances. Ingestion of the plant parts can cause pink nose disease, jaundice and muzzle in cattle. Heavy outbreaks of Lantana poisoning occur during drought times (Sankaran, 2007). Respondents in Gursum wereda also reported that consumption of Lantana plant parts cause metabolic disorder, muzzle and nose wound and if it is consumed as sole feed it causes death to cattle. Considerable amount of animals were also lost due to Lantana invasion directly by the consumption of the plant and indirectly by predators attack. The average loss of animals per household due to consumption of Lantana was found to be 0.92 TLU. However, loss of animals in TLU per household due to predators attack accounts 1.05 (Table 6). Respondents in Parthenium invaded area did not report loss of animal due to Parthenium consumption. In the contrary, animals consume Parthenium during dry season and if it is in small proportion, it has no effect on health of animals. However, they said that calves consumed Parthenium at young stage will not able to stand (suffer from lameness). Table 6. Lost animals in Lantana invaded area.
Cause of loss Mean animal loss in TLU
Consumption of Lantana 0.92 Predators attack 1.05 Total 1.97
3.5.4. Impact of Lantana and Parthenium Invasion on livestock products quality In the study area, the pastoralists expressed their views concerning the quality of animal Products. According to them, consumption of Lantana and Parthenium plant parts has adverse effect on livestock products. Respondents also reported that selling milk from animals that fed Lantana and Parthenium plant parts would face a market problem. They indicated that nobody would purchase the milk because it tests bitter/bad. Goat and camel milk from Parthenium fed animal has a bitter taste. They also claim that meat from Parthenium fed animal has poor quality in terms of appearance and flavor. Trounce (1998) reported that meat from animals that graze the Parthenium is badly tainted and unfit for the table unless the animals grazed on Parthenium-free paddocks for at least a month prior to slaughter. Consumption of L camara also gives milk that have a bitter taste and causes the meat to be tasteless. Pastoralists also said that consumption of both Lantana and Parthenium plant parts reduce milk yield. By and large, these invasive plants are unpalatable to livestock when there is enough

32nd Annual Research Bulletin, April 2015, Haramaya University
30
grazing (feed). However, during dry season or in drought time, feed shortage is inevitable and animals are obliged to eat the plants, but their productivity will be poor. 3.6. Impact of Lantana and Parthenium Invasion on Feed Resources Research has shown that the allelopathic effect of Lantana reduces the vigour of native plant species and limits their productivity. P. hysterophorus invasion also causes changes in above-ground vegetation and below-ground soil nutrient contents, disturbing the entire grassland ecosystem. Parthenium is a menace to agriculture because it competes with pastures and reduces carrying capacity (Trounce, 1998; Sankaran, 2007). In this study, during group discussion, respondents mentioned that some of the valuable browses and grasses have been disappearing due to Lantana and Parthenium invasion (Table 8). However, species that have disappeared in the infested area are still in existence in areas that are not yet infested by Lantana and Parthenium (group discussion). Similarly, Belaynesh (2006) and Shashie (2007) indicated that due to invasive plants, in Jijiga Zone most of the valuable species are disappearing and as a result there is forage scarcity in the area. Extensive area of land in the study area have been infested and covered by Lantana, Parthenium, cactus and Prosopis. Thus, invasive plants indiscriminately suppress the growth of grass, forb and legume plants and cause declined in herbaceous cover and disappearance of the most essential palatable species. These plants are basically main feed items, and their unavailability will influence the livestock production system of the area. Therefore, if not appropriate grazing management practices are implemented promptly, the impact of invasive plants will greatly hamper livestock production in the area.Respondents listed valuable species which were essential for livestock production in the area, but have already been disappeared due to the continued increase of Lantana and Parthenium invasion (Table 7). Table 7a. Endangered plant species due to Parthenium invasion.
Grass name Legume name
Somali Scientific Somali Scientific
Ris Harama Anole Burhan Panicum coloratum Mujili Solanum nigrum Serdi Chloris gayana Anjil Derema Chrysopogon plumulosus Kerendo Beresh Shufaah
Table 7b. Endangered plant species due to Lantana invasion.
Grass name Legume name Tree name Somali Scientific Somali Scientific Somali Scientific
Harfo Aristida adoenis Hochst. Gerewa Wadi Serdi Nyla Kobis Tenharir Burawlet Pennisetum sp. Barti Eswodwd Gergor Elusine spp. Furelay Ipomea eriocarpa Agemse Awast Uspodenan Debi Kelebe (Qalabe)
Hyparrhenia hirta
Methekom
Burhan Debobes Ebetiti Medeyo
Respondents from L. camara and Parthenium invaded areas reported that the status of grasses and legume plants shows a decreasing trend. However, respondents in the non invaded area have different perception on the status of browse plants. The majority of these respondents (73.4%) believe that there is no change in the browse plants status (Appendix Table 8). Others (23.3%) said that it shows a decreasing trend while the remaining (3.3%) of them said browse plants are increasing in their area. All of the respondents in L. camara invaded kebeles said that there were enough feed in their kebele for livestock before L. camara invasion, however, only 36.7% of the respondents in Parthenium invaded area said Parthenium invasion has created feed shortage in their kebele.
4. Summary and Conclusion The result of this study indicated that pastoralists have similar perception towards invasive plants in this study area. Most of the respondents (60% and 83.3% from L.camara and Parthenium invaded areas, respectively) rate the current invasion level as heavy. The main seed dispersion mechanisms in L.camara and Parthenium invaded areas were flood (56.7%) and (63.3%) livestock, and flood,

32nd Annual Research Bulletin, April 2015, Haramaya University
31
All of the respondents opted for complete eradication of invasive plants from their district. Majority of the respondents, 66.7% and 100% for Parthenium and Lantana areas, respectively believed that the rate of Parthenium and Lantana invasion is still increasing. Only few respondents practiced to get rid off the weed when it occurs in the farm land or residential area. Most of the respondents (53.3%) expressed that cutting is an effective method to control Lantana infestation. While, for Parthenium control clearing (hand weeding) and burning were indicated by most of the respondents (75%) to curb the spread of the weed. The computation for the current herd diversification gave SI value of 0.49, 0.40, and 0.65 for Lantana, Parthenium, and non invaded areas, respectively (Table 6). The lower index values 0.40 and 0.49 for Parthenium and L.camara invaded areas, respectively implies the greater species diversity in the household. The higher index values SI (0.65) in the non invaded area shows herd diversification is low at present. Thus, from this result, it can be concluded that herd diversification begins to fade as a herd management tool to cope with livestock production constraints in the non invaded area…, but it is still practiced in invaded areas. Majority of the respondents in Lantana invaded and none invaded areas were 96.7% and 100%, respectively said that they had ceased mobility. The major reasons for abandoning mobility were shortage of grazing land mainly due to invasive plants and some of them due to the possession of small numbers of livestock. However, most of the respondents (93.3%)‘ in Parthenium invaded kebele still practice mobility. Respondents in Gursum wereda also reported that consumption of Lantana plant parts causes metabolic disorder, muzzle and nose wound and if it is consumed as sole feed it causes death to cattle. Animals consume Parthenium during dry season and if it is in small proportion it has no effect on health of animal. However, they said that calves consumed Parthenium at young stage will not able to stand (suffer from Lameness). Considerable amount of animals lost due to Lantana invasion directly by the consumption of the plant and indirectly by predators attack. The average loss of animals per household due to consumption of Lantana was found to be 0.92 TLU. In the study area, the pastoralists expressed their views concerning the quality of animal Products. According to them, consumption of Lantana and Parthenium plant parts has adverse effect on livestock products. Respondents also reported that selling milk from animals that fed Lantana and Parthenium plant parts would face a market problem.. Goat and camel milk from Parthenium fed animal has a bitter taste.However, respondets also claimed that meat from Parthenium fed animal has poor quality in terms of appearance and flavor. Respondents during group discussion mentioned that most of the valuable species are disappearing in the area, some of valuable browses and grasses have been disappearing due to Lantana and Parthenium invasion. However, species that have disappeared in the infested area are still in existence in areas that are not yet infested by Lantana and Parthenium (group discussion).
5. Recommendation Past invasive plants control endeavours need to be revised to achieve better result in the area. Becides, new invasive plants control plans need to be designed not to affect livestock herding and mobility and need to be participatory. The exact impact of both invasives on:
• Grasses and browse plants;
• Livestock productivity; and
• Livestock products quality need to be investigated in a laboratory/by feeding trials/ under nursery condition (for the allelopathic effect) to get empirical evidences and better explain the impact based on statistical results.
6. Acknowledgements This research was funded by Ethiopian agricultural research organization. Additional support was provided by Haramaya University Research and Extension Office. I would like to thank Dr. Mengistu and Mrs. Hirut Yirga for their valuable support
6. References Association of Official Analytical Chemists (AOAC). 1990. Official methods of Analysis. 15th edition. AOAC, Inc. Anc. Arlington, Virginia, USA. Alemayehu Menigistu. 2004. Rangeland: Biodiversity Concepts, Approaches and the way forward. Addis Ababa University, Faculty of Science, Addis
Ababa, Ethiopia. Arne W. 2004. Impacts of alien invasive plants on soil nutrients are correlated with initial site conditions in NW Europe. CABI Africa, NRB. Belaynesh D. 2006. Floristic composition and diversity of the vegetation, soil seed bank flora and condition of the rangelands of the Jijiga zone,
Somali Regional State, Ethiopia. An. MSc. Thesis Presented to School of Graduate Studies of Alemaya University. Binggeli, P. and Desalegn D. 2002. L.camara - the invasive shrub that threatens to drive people out of their land. Newsletter of the Ethiopian
Wildlife and Natural History Society April-June, pp. 4 - 6. Dawit Terefe. 2010. Assessment of Perceptions and Major Feed Resources on Grazing Lands at Different Levels of Invasion by Mesquites
(Prosopis Juliflora) in Amibara District of Afar Regional State, Northern Ethiopia. MSc Thesis Presented to the School of Graduate Studies, Haramaya university.
Ethiopian Agricultural Research Organization (EARO). 2003. National dry land research strategic planning pastoral and agro pastoral research program. Addis Abeba, Ethiopia.

32nd Annual Research Bulletin, April 2015, Haramaya University
32
Food and Agricultural Organization of the United Nations (FAO). 1987. Master Land Use Plan, Ethiopian Range Livestock Consultancy Report Prepared for the Government of the Peoples Republic of Ethiopia. Technical Report. AG/ETH/82/020/FAO, Rome. p. 94.
Lisanework N, Asresie H, Janmejai S. and Steve W. A. 2010. Impact of Parthenium Hysterophorus on Grazing Land Communities in North-Eastern Ethiopia. Weed Biology and Management 10 (3):143 - 152.
Sankaran, K.V. 2007. Asia Pacific Forest Invasive Species Network. The fact sheet is supported by the Food and Agriculture, Organization of the United Nations (FAO) and USDA Forest Service.
South Eastern Rangelands Development Project (SERP).1995. Parthenium hysterophorus and other weeds in Eastern Hararghe, Ethiopia. SERP Technical report (Draft). p. 81.
Shashie A. 2007. The impact of parthenium (parthenium hysterophorus l.) on the range ecosystem dynamics of the Jijiga rangeland, Ethiopia, MSc. Thesis, Haramaya University.
Somali Region Analysis and Report (SRAR), 2012. Multiagency deyr/karan 2012 seasonal assessment report. Jijiga, November 24 – December 18, 2012.
Taye T. 2007. Invasive alien plant species in Ethiopia: Impacts, challenges and responses. Hamburg ―Biophysical and socio-economic frame conditions for the sustainable management of natural resources‖ Tropentag, October 6 - 8.
Tothil, J. C., Jones, R.M. and Hargreaves, N.G. 1997. BOTANAL:A field and computing package for assessment of plant biomass composition. Ecology and management of world savannah.
Trounce, R.1998. Parthenium weed, new south wales department of agriculture, ag-fact 07.6.15, 4th ed, http://www.agric.nsw.gov.au/reader/1894, (Accessed April 14, 2003) .

32nd Annual Research Bulletin, April 2015, Haramaya University
33
4. Beekeeping Practices, Production, Potential, and Challenges of Beekeeping among Beekeepers in Haramaya District, Eastern Ethiopia Biressaw Serda1, Tessema Zewudu2, Moges Dereje2 and Mohammed Aman2
1Haramaya University, College of Veterinary Medicine; 2College of Agriculture and Environmental Sciences, P. O. Box: 138, Dire Dawa, Ethiopia, Corresponding author: [email protected]
Abstract: Beekeeping is a long-standing practice in the rural communities of Ethiopia and appears as ancient history of the country. A cross sectional study, in which 97 households were purposively included, was conducted in Haramaya distr ict to assess the current beekeeping practices, production potentials and production constraints. Most (99%) of the beekeepers in the study area have owned only traditional hives and produce honey for home consumption. The beekeeping practice was dominated by male. A mild stimulant, Kate edulis (khat), is the main income source for the residents. Lack of adequate bee forages, poor market, lack of trained development agents and bee pests are the major problems facing the beekeeping sub sector in the area. The most important constraints of beekeeping in the study area were insecticides, birds and bee diseases (1st), Misuse of pesticides (2nd), Insecticides, birds and pesticides together (3rd), Pests, insecticides and predators (4th), lack of training (5th), shortage of bee forage (6th), shortage of water (7th) and absconding (8th). There are enormous opportunities to boost the production of honey in the villages. Thus, introducing modern beehives, limiting the use of pesticides in 'khat' production and awareness creation and assistance to empower women in the beekeeping activity are needed interventions.
Keywords: Beekeeping; Constraints; Pests; Production; Traditional Hives
1. Introduction In Ethiopia, beekeeping has been practiced for centuries and its potential is well documented. Of all the countries in the world, no country has such a long tradition of beekeeping than Ethiopia (Nebiyu and Messele, 2000). Despite its long history, beekeeping in Ethiopia is still an undeveloped sector of agriculture. The knowledge and skill of honey production and honey and beeswax extraction of Ethiopian farmers is still very traditional (MoARD, 2006). Most of local beehives are hanged over tall trees. Productivity of the hives is very low and averaged 5-6 kg of honey per hive per year, while from the improved one average of 15-20 kg even more is possible. Honey and beeswax collected after the rainy season starts in October and extends until December. In the South and Eastern parts, in addition to the main, there is minor harvesting period during May-June. According to CSA, (2001) the major honey and beeswax producing regions in Ethiopia are Oromia (41%), SNNPR (22%), Amhara (21%) and Tigray (5%). However, the country is suffering from the ecological degradation of its natural resources and this means the basis for any honey production is threatened and affected. In many regions of the country, beekeeping is considered as one of the income-generating activities for resource-poor farmers including women, youth, and the unemployed sectors of the community (Gezahegn, 2001). About 10% of the honey produced in the country is consumed by beekeeping households. The remaining 90% is sold for income generation; of this amount, it is estimated that 70% is used for brewing 'Tej' (local alcoholic beverage) and the balance is consumed as table honey. Additionally, beeswax is collected and traded. Honey is a vital factor in job creation and maintaining livelihoods. However, current honey production estimate represents only 8.6% of the country‘s production potential. Productivity from traditional hives is very low, with an average of 5-6 kg per year, while production from improved hives (including transitional hives) reaches 18-30 kg per year (Nebiyu and Messele, 2000; Paulos, 2011; ARSD, 2000; MoRAD, 2006). Beekeeping is still operating in the old traditional ways implying the need for modernization. Low productivity and poor quality of bee products are the major economic impediments for rural beekeepers (Nuru, 1999); however, they face another primary economic concern; i.e. lack of skill to manage their bees and bee products. Most of the rural beekeepers cannot afford to invest in modern beekeeping inputs, processing, packaging, and transport their products to market to maximize profit. They produce a low quality product that they are forced to sell locally to wholesale buyers at prices much lower than in domestic commercial markets (Amsalu et al., 2004). The major constraints that hinder beekeeping development in Ethiopia can be stringent rules and conditions set by honey importing countries (MoRAD, 2003), very limited domestic market, only basic knowledge of honey production and limited access to market information and technologies, unreliable transport, poor storage of products, lack of quality monitoring and control plan in place and inadequate laboratory facilities and poor institutional set-up for assuring quality (Nebiyu and Messele, 2000; Paulos, 2011;. MoRAD, 2003). In line with this, the government of Oromia region recently identified potential areas for beekeeping. According to Haramaya district bureau of Agriculture, there is no well-established study on the potential and challenges of beekeeping in the district. Therefore, the objective of this study is to identify the current practices, production potentials, and constraints of beekeeping in Haramaya District, Eastern Ethiopia.
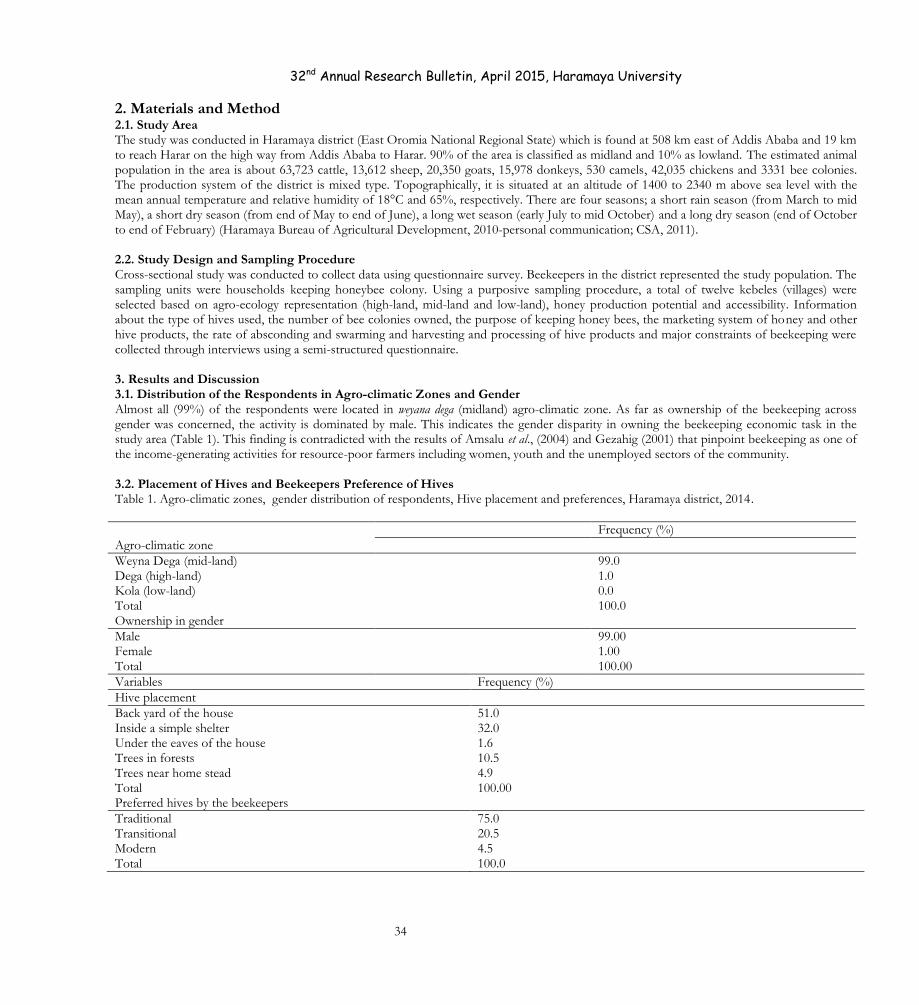
32nd Annual Research Bulletin, April 2015, Haramaya University
34
2. Materials and Method 2.1. Study Area The study was conducted in Haramaya district (East Oromia National Regional State) which is found at 508 km east of Addis Ababa and 19 km to reach Harar on the high way from Addis Ababa to Harar. 90% of the area is classified as midland and 10% as lowland. The estimated animal population in the area is about 63,723 cattle, 13,612 sheep, 20,350 goats, 15,978 donkeys, 530 camels, 42,035 chickens and 3331 bee colonies. The production system of the district is mixed type. Topographically, it is situated at an altitude of 1400 to 2340 m above sea level with the mean annual temperature and relative humidity of 18°C and 65%, respectively. There are four seasons; a short rain season (from March to mid May), a short dry season (from end of May to end of June), a long wet season (early July to mid October) and a long dry season (end of October to end of February) (Haramaya Bureau of Agricultural Development, 2010-personal communication; CSA, 2011). 2.2. Study Design and Sampling Procedure Cross-sectional study was conducted to collect data using questionnaire survey. Beekeepers in the district represented the study population. The sampling units were households keeping honeybee colony. Using a purposive sampling procedure, a total of twelve kebeles (villages) were selected based on agro-ecology representation (high-land, mid-land and low-land), honey production potential and accessibility. Information about the type of hives used, the number of bee colonies owned, the purpose of keeping honey bees, the marketing system of honey and other hive products, the rate of absconding and swarming and harvesting and processing of hive products and major constraints of beekeeping were collected through interviews using a semi-structured questionnaire. 3. Results and Discussion 3.1. Distribution of the Respondents in Agro-climatic Zones and Gender Almost all (99%) of the respondents were located in weyana dega (midland) agro-climatic zone. As far as ownership of the beekeeping across gender was concerned, the activity is dominated by male. This indicates the gender disparity in owning the beekeeping economic task in the study area (Table 1). This finding is contradicted with the results of Amsalu et al., (2004) and Gezahig (2001) that pinpoint beekeeping as one of the income-generating activities for resource-poor farmers including women, youth and the unemployed sectors of the community. 3.2. Placement of Hives and Beekeepers Preference of Hives Table 1. Agro-climatic zones, gender distribution of respondents, Hive placement and preferences, Haramaya district, 2014.
Frequency (%)
Agro-climatic zone
Weyna Dega (mid-land) 99.0 Dega (high-land) Kola (low-land)
1.0 0.0
Total 100.0 Ownership in gender
Male 99.00 Female 1.00 Total 100.00
Variables Frequency (%)
Hive placement
Back yard of the house 51.0 Inside a simple shelter 32.0 Under the eaves of the house 1.6 Trees in forests 10.5 Trees near home stead Total
4.9 100.00
Preferred hives by the beekeepers
Traditional 75.0 Transitional 20.5 Modern 4.5 Total 100.0

32nd Annual Research Bulletin, April 2015, Haramaya University
35
3.2. Placement of Hives and Beekeepers Preference of Hives Most (51%) of the beekeepers in the study area kept the traditional bee hives at the back yard of the house, 32 % kept inside a simple shed built for hive placement, 1.6% kept under the eaves of the house, 10.5% kept on trees in forests and 4.9% kept on trees near home stead (Table 1). Some of the traditional bee hives placement are presented in figure 1. According to Kerealem (2005), most beekeepers of Amaro wereda kept their bee colonies by hanging on trees near homestead and in forest areas. Majority (75%) of the beekeepers of the study area preferred traditional hives over transitional (20.5%) and modern hives (5.5%). This is mainly because of the high cost of constructing and purchasing of modern and transitional hives and due to lack of harvesting and processing equipment‘s to use modern and improved hives. Similarly, Mahari (2007) reported that in east Tigray modern beekeeping require more expensive establishment cost, accessories, (further cost) and skill training, though they yield better quality and quantity of honey.
A. Hives under shed B. hives under tree Figure 1. Placement of traditional hive in Haramaya District, 2014.
3.3. Feed Source for Bees and Trend of Colony Population As the type and source of feed determines the success of beekeeping, the respondents were asked to indicate the source of feed for their bees. Accordingly, 94% of them indicated foraging as the main source of feed for their bees. As far as the colony population is concerned, only 45.4% of them indicated a decreasing trend (Table 2). The trend of colony population is decreasing over the years due to absconding, lack of using improved bee hives, pests and predators, drought and lack of bee forage. Similarly, a result reported by Tessega (2009) in Bure district indicated that hive products were in a decreasing trend due to shortage of bee forages, drought, pesticides and herbicide application, lack of water and poor management in order of importance. 3.4. Harvesting and Processing of Hive Products This study pointed out that the only hive product harvested and utilized by beekeepers of the study area was honey. During harvesting they mainly use fire as a smoking material. None of the beekeepers in the study area strain the harvested crude honey. Their main reasons for not straining were due to the reduction in the amount of honey after harvesting (55%), lack of knowledge on how to strain crude honey (20.5%) and lack of straining materials (24.5%). None of the beekeepers of the study area collect crude beeswax. According to the respondents the main reasons for not collecting beeswax were lack of knowledge on the importance of bees wax as an income generating hive product unlike honey (77.7%), lack of processing skills (12%), lack of market for wax in their locality (5.3%) and lack of processing material (9.6%) (Table 2). The finding was similar to that of Wilson (2006) and Tallonitire (2006) that lack of appropriate production technologies, weak market and absence of value chain development largely resulted in much lower contribution of the honey production sub-sector and much lower than its potential.

32nd Annual Research Bulletin, April 2015, Haramaya University
36
Table 2. Frequency distribution of feed source colony population and reasons for not straining honey and collecting bees wax.
Feed sources Frequency Percent
Foraging 91 93.8 Supplementary feeding 3 3.1 Others 3 3.1 Total 97 100.0
Trend of colony population
Decreasing 44 45.4 Increasing 45 46.4 No difference 8 8.2
Total 97 100.0
Reason for not straining honey (n=97) % Reason for not collecting Beeswax (n=97) %
Amount of honey will be reduced 55.0 Lack of knowledge 77.7
Lack of material 24.5 Lack of processing skills 12.0 Lack of knowledge 20.5 Lack of market 5.3 Lack of processing material 5.0 Total 100.0 100.0
3.5. Economic Dependence and Major Constraints The result of this study identified beekeeping practices is very traditional in Haramaya district with very low production, which is produced only for home consumption. Thus, economically, the respondents depend mainly on non-beekeeping activities (Table 3). Since the product is insufficient, there is no market chain for honey and honey products in the district. According to Tessega (2009) in Bure district of Amhara region, the main purposes of keeping bees were for source of income and home consumption. Apart from this statement, Paulos (2011) stated that pollination of crops and natural vegetation yields more than honey, both per hive and per hectare. Moreover; even if more than half of the respondents are having different sources of income, most of them (44.3%) were relying on 'Khat'. Besides, there is no household that indicated beekeeping as the only income source. Rather, it is used as a supplementary to livestock, vegetable and fruits, and poultry income sources. Major constraints in beekeeping were also identified as, insecticide usage and birds constitute the highest share followed by misuse of pesticides. This is mainly due to expansion in 'Khat' production which uses heavy application of pesticides that adversely affect the beekeeping practices. Therefore, the most important constraints of beekeeping in the study area were insecticides, birds and diseases (1st), misuse of pesticides (2nd), insecticides, birds and pesticides together (3rd), pests, insecticides and predators (4th), lack of training (5th), shortage of bee forage (6th), shortage of water (7th) and absconding (8th) (Table 4). According to SOS-Sahel-Ethiopia (2006), the major constraints in Ethiopia are lack of beekeeping knowledge, shortage of trained manpower, shortage of beekeeping equipment, pests and predators and inadequate research and extension services to support apiculture development programmes. 3.6. Opportunities of Beekeeping Currently, Ethiopian government is highly supporting self contained watershed developing program in which beekeeping is part and parcel the program. Low cost modern hives is being produced using locally available materials and efforts are being made to organize farmers in groups and link them with local carpenters who produce modern bee hive. Farmers from selected kebeles of the study area are currently obtaining beekeeping training by the community development works of Haramaya University. There is an increasing demand for honey for domestic consumption and export by different customers and organizations. Though scarce in dry seasons, there are many bee forage species throughout the year in most part of the study area. Availability of rich culture and tradition of beekeeping, suitable environment with different agro ecology, availability of farmers having indigenous knowledge, skills and keen interest to adopt improved technologies and to undertake beekeeping as a way of life are among the few to mention.

32nd Annual Research Bulletin, April 2015, Haramaya University
37
Table 3. Economic dependence of activities in the villages, Haramaya district, 2014.
Non-beekeeping Economic activities
Kebeles/villages Crop Crop and livestock Trade Crop and trade All Total
Amuma 4 2 6 Baatee 5 2 1 1 9
Fandisha Leencaa 1 1 Daamota 4 4 Iffa Oromia 18 6 24 T/Gabisaa 19 19 B/Gadaa 9 9 I/Balinaa 7 7 Haaqa 1 12 13 A/Baatee 1 1 Kuroo 1 1 Bacaqee 3 3
Total 53 40 1 1 2 97
Table 4. Major beekeeping problems in the Haramaya district, 2014.
Major problems Frequency Percent
Insecticides 9 9.3 Birds 2 2.1 Misuse of pesticides 17 17.5 Lack of bee forage 6 6.2 ―Hamma‖ (honey badger) 1 1.0 Insecticide, birds and diseases 27 27.8
Insecticides and pesticides 3 3.1
Insecticides and lack of bee forage 5 5.2
Insecticides and dry spell 2 2.1 Birds and pesticides 1 1.0 Pesticides and lack of bee forage 9 9.3
Insecticides, birds and pesticides 12 12.4
Insecticides, birds and ―Hamma‖ (honey badger) 1 1.0 Insecticides, pesticides and dry spell 2 2.1
Total 97 100.0
4. Conclusion and Recommendations Majority of the beekeepers in the study district produce honey for home consumption than for the market. The most widely used type of beekeeping in the study area is traditional due to the high cost of the improved hives and their accessories. From the study, it was understood that the colony population is decreasing from time to time due to destruction of forest areas for crop cultivation and different constraints particularly insecticides, predators and bee diseases. With the expansion and reliance of the households in 'Khat' production in the study area, insecticide and birds as well as misuse of pesticides are constraining the beekeeping practices. Unless some measures and regulations are put in place on type of pesticides to be used for 'Khat' production, the continuity of beekeeping remains in challenge. There is a need of intervention in introducing modern beehives that can make households produce more for market than home consumption. Awareness creation and assistance is needed to empower women in the beekeeping activity. Introducing the modern beehives in the study district is needed to supplement the households‘ income sources from beekeeping. Finally, there is a need for limiting the use of pesticides in 'Khat' production and proper identification of bee diseases and their prevention measures to sustain the beekeeping activity.
5. Acknowledgement The research was funded by Haramaya University Research Office to which we are grateful. We would like to express our thanks to Haramaya Woreda Agricultural offices for their assistance during data collection. The research team is also grateful to study participants for their collaboration, enthusiasm and willingness to share us information.

32nd Annual Research Bulletin, April 2015, Haramaya University
38
6. References Amsalu, B., Nuru, A., Radloff. S. E., Hepburn, H. R. 2004. Multivariate morphometeric analysis of honeybees in the Ethiopian region. J.
Apidologie 35: 71 - 81. Apiculture Research Strategy Document (ARSD). 2000. Apiculture research strategy document. EARO (Ethiopian Agricultural Research
Organization), Addis Ababa, Ethiopia. Nebiyu, Y. and Messele, T. 2000. Honeybee production in the three Agro-ecological districts of Gamo Gofa zone of southern Ethiopia with
emphasis on constraints and opportunities. Agricultural and Biological JOurnal of North Am. 4 (5): 560 - 567. Central Statistical Authority (CSA). 2003. Statistical report on livestock and livestock products. Vol. V. CSA, Addis Ababa, Ethiopia. Official
document. Gezahegn T. 2001. Apiculture development strategies. MoARD (Ministry of Agriculture and Rural Development), Addis Ababa, Ethiopia. Keralem, E. 2005. Honey bee production system, opportunities and challenges in Enebse Sar Midir Woreda (Amhara Region) and Amaro
Special Wereda (Southern Nations, Nationalities and peoples Region), Ethiopia. M.Sc. thesis presented to Alemaya University, p. 133. Mehari, G. 2007. Impact of Beekeeping on Household Income and Food Security: The Case of Atsbi Wemberta and Kilte Awlailo Woredas of
Eastern Tigray, Ethiopia M.Sc. Thesis, Mekelle University. Ministry of Agriculture and Rural Development (MoARD) . 2003. Honey and beeswax production and marketing plan. Amharic version.
MoARD, Addis Ababa, Ethiopia. Nuru, A. 1999. Quality state of grading Ethiopian honey. In: Proceedings of the first national conference of the Ethiopian Beekeepers Association, Addis
Ababa, Ethiopia. Paulos, D. 2011. Ethiopian Honey: Accessing International Markets with Inclusive Business and Sector Development.
www.snvworld.org/en/sectors/agriculture. (Accessed on...) SOS-Sahel-Ethiopia. 2006. Smallholders apiculture development and trade promotion project terminal report (submitted to the ANRS Food
Security Program Coordination and Disaster Prevention Office), Addis Ababa, Ethiopia. Tallontire, A. 2006. Partnerships in Fair Trade: Reflections from a Case Study of Café direct. Development in Practice 10: 166 - 77. Tessega, B. 2009. Honeybee Production and Marketing Systems, Constraints and Opportunities in Burie District of Amhara Region, Ethiopia
M.Sc. Thesis, Bahir Dar University. Wilson, R.T. 2006. Current Status and Possibilities for Improvement of Traditional Apiculture in Sub-Saharan Africa. Bartridge House, Umberleigh, UK.

32nd Annual Research Bulletin, April 2015, Haramaya University
39
5. Influence of Nitrogen Application Rates and Maize Varieties on the Grain Yield and Some Agronomic Traits of Maize (Zea mays L.) Habtamu Zeleke
Haramaya University, College of Agriculture and Environmental Science, Department of Natural Resource Management, P. O. Box 38, Dire Dawa, Ethiopia Author Email: [email protected].
Abstract: A study was made on the effects of different rates of nitrogen and maize varieties at Haramaya University main campus, eastern Ethiopia for two years (2012/13 and 2013/14 cropping seasons). The purpose of the study was to determine the effects of the application different rates of nitrogen and maize varieties on yield and some yield related traits. The nitrogen application rates were 18, 36, 72, 108 and 144 kg/ha nitrogen and the four late maturing maize varieties were Jibat, AMH 760Q, BH 660 and BH 661A. The experiment was laid out 5 x 4 factorial arrangements in randomized complete block design (RCBD) with three replications. Statistically significant difference for grain yield was found between the varieties in their response due to treatment combinations. Significant and increasing trend of grain yield when the nitrogen dose increased. The interaction effect of nitrogen rates and maize varieties were also highly significant. All the four varieties included in the study gave relatively similar yield and over 10000 kg/ha of grain yield when 72 kg/ha of N/ha was applied indicating the already recommended rate nitrogen is still valid for maize production under similar soil types in Haramaya area.
Keywords: Nitrogen Application; Rate; Late Maturing; Agronomic Trait; Zea Mays L.
1. Introduction According to a 2012 FAO report, Ethiopia is the fourth largest maize producing country in Africa, and first in the East African region. It is also significant that Ethiopia produces non-genetically modified (GMO) of mainly kernel white maize, the preferred type of maize in neighboring markets as cited in (CSA, 2014). According to Tadesse et al. (2011) maize is also most dominant and known cereal crop of in areas such as West Oromia zones. Hybrid cultivars have played a vital role in increasing acreage and productivity of maize. In Ethiopia, Maize production was boosted by 9.1% in 2005-2013, whereas averages yield t/ha at national level was increased by 4.8% in the same years. Ethiopia‘s current national maize yield is 3.25 metric tons per hectare, 28% above the developing world average of 2.5 MT/ha. The ‗developed‘ world, however, see average yields of 6.2 MT/ha, with some countries actually exceeding 10 MT/ha (CSA, 2014). Maize (Zea mays L.) is one of the three most important cereal crops in the world together with wheat and rice in terms of area of production. However, maize surpasses both wheat and rice (FAOSTAT, 2012) in terms of total grain production. The current productivity of the crop in developed countries such as in USA is 10.3 t/ha; in Germany 9.7 t/ha; in Canada 8.4 t/ha and South Africa 4.96 t/ha with the world average grain yield of 5.1 t/ha (FAOSTAT, 2010). Hybrid cultivars have played a vital role in increasing acreage and productivity of maize.Currently, in Ethiopia, Maize production was boosted by 9.1% in 2005-2013, whereas averages yield t/ha at national level was increased by 4.8% in the same years. Ethiopia‘s current national maize yield is 3.25 metric tons per hectare, 28% above the developing world average of 2.5 MT/ha. The ‗developed‘ world, however, see average yields of 6.2 MT/ha, with some countries actually exceeding 10 MT/ha (CSA, 2014). It can be seen that despite the large are allocated for maize production in Ethiopia, the productivity is very low contributing to low total production due to both biotic stresses (diseases, insect pests and weeds) and abiotic stresses such as drought; declining soil fertility, poor agronomic practices, limited use inputs as well as insufficient technology generation including nutrient efficient improved varieties. According to Hefny and Aly (2008), nitrogen along with phosphorus, is one of the most limiting macronutrients to maize grain yield. Nitrogen availability influences the uptake, not only of itself, but also of other nutrients (Onasanya et al., 2009), as N-fertilized plants usually have larger root systems, which enhances the capture of other nutrients (Masaka, 2006). According to Abd El-Lattief (2011), since nitrogen is highly mobile, its use and demand is continuously increasing as it is subjected to high loss from the soil plant system. Even under the best management practices 30-50% of applied N is lost through different agencies and hence farmers are forced to apply sufficient to meet the amount of nitrogen to meet demand of the maize crop for increased nitrogen. In high and medium altitude maize growing areas of Ethiopia, where rainfall is high, most of the nitrogen is lost through leaching and most also probably due to denitrification making the nutrient unavailable during the critical stages of crop growth. Different strategies have been used in order to mitigate nutrient leaching and improve the nutrient use efficiency (NUE). Nitrification inhibitors, which slow the oxidation of NH4, and enhance slow and controlled release fertilizers, have been used to reduce N leaching (Sitthaphanit et al., 2010). Furthermore, soil management practices, such as incorporating straw with a high C: N ratio and minimum tillage can reduce N leaching.

32nd Annual Research Bulletin, April 2015, Haramaya University
40
Currently, more or less similar dose of N is used as a blanket recommendation for most soil types and also for different varieties. In principle, it is advised to determine nutrient requirement for different varieties and also revisit the past recommendations in light of the changing climatic conditions. Thus, this experiment was conducted with the objective to determine the optimum nitrogen fertilizer for maize varieties Jibat, AMH 760Q, BH 660 and BH 661 and to assess the interaction effects of maize varieties on yield and yield related characters of maize.
2. Materials and Methods The experiment was conducted at Haramaya University main campus Raare research site, eastern Ethiopia during 2012/13 and 2013/14 cropping seasons. The geographical coordinate of the site is 9 o26'N latitude, 42o3'E longitude, and it is situated at an altitude of 1980 meters above sea level. The weather condition during the cropping seasons was favorable for crop development, except during the month of June where there was dry spell (Appendix table 1). The soil of the experimental site is a well-drained deep alluvial with a sub-soil stratified with loam and sandy loam. The experiment consisted of a factorial combination of five levels of N (18, 36, 72, 108 and 144kg ha-1) and four maize varieties (Jibat, AMH 760Q, BH 660 and BH 661) arranged in randomized complete block design (RCBD) with three replications. The major sources of N were urea (46% N). Phosphorus was applied uniformly to all plots at the rate of 46 kg/ha at planting. The land was prepared by tractor driven tilling equipment to obtain proper seed bed. There were four rows per plot with 5.1m row length. The middle two rows were used for data collection. The distance between rows and plants within the row were 0.75m and 0.30m, respectively. Plots within a replication were separated by 1.5m space and blocks were spaced 1.5 m apart. Half dose of N applied at planting and the remaining half was applied close to flowering stage of the maize crop. All other cultural practices including application of chemical (Cypermethrin granule) against stalk were done as required. Data were collected on plant height, ear height, the ratio between plant height (cm) and ear height (cm), rust, blight, stand count at harvest, 1000 kernel weight (g) and grain yield (kg/ha). Statistical analysis was done for the data using Statistical Analysis System (SAS) Version 9.2 (SAS Inc., 2002) following the procedures suggested by Gomez and Gomez (1984) and mean separation was done using least significant difference (LSD) at 5% level of significance.
3. Results and Discussion The analysis of variance indicated that grain yield (kg/ha) was highly significantly (P<0.01) influenced by the combination of variety and nitrogen fertilizer rates and growing season (year). The interaction of year and combination of treatments (variety and nitrogen fertilizer rates) had also highly significantly influence on grain yield of maize (Table 1). The obtained results showed in general there is increasing trend of grain yield when the rates of nitrogen increased from 18 kg N/ha to 144 kg/ha (Table 2). Variety Jibat produced the lowest (6563.00 kg/ha) at 18 kg N/ha and high at 36 and 72 kg/ha N with 11400.00 and 11030.00 kg/ha of grain yield, respectively. Similarly variety AMH 760Q produced the lowest grain yield per hectare (6987.00 kg/ha) at 18 kg N/ha and highest at 72 kg/ha (10440.00 kg/ha). Varieties BH 660 and BH 661 produced (7363.00 and 8272.00 kg/ha, respectively) a bit better yield at 18 kg N/ha level compared to Jibat and AMH 760Q, except that variety BH 660 gave consistently over 10000.00 kg/ha of grain yield starting 36 kg N per ha rate indicating that this hybrid may be considered as nitrogen se efficient variety. The results obtained by different authors in their study on different levels of nitrogen in maize was similar to the findings of this study (Thair et al., 2001; Muhammad et al., 2012; FarshadSorkhi; Tilahun et al., 2013 and MojtabaFateh, 2014). Table 1. Analysis of Variance for Grain Yield of Nitrogen Fertilizer Trial on Maize (Haramaya, 2012/13 and 2013/14.
Source of variation Degrees of freedom Sum of squares Mean square
Replication 2 55474320.787 27737160.394 Treatments(T) 19 316766810.414 16671937.390** Year (Y) 1 1752498727.620 1752498727.620** T x Y 19 278260186.079 14645272.952** Error 78 462552467.471 5930159.839 Total 119 2865552512.371
Coefficient of Variation: 22.99% .

32nd Annual Research Bulletin, April 2015, Haramaya University
41
Table 2. Influence of Variety and N Fertilizer on Yield Related Traits and Yield of Maize at Haramaya Eastern Ethiopia.
Treatment No.
Treatment Combination Traits
Variety N rate (kg/ha) PHT EHT EHT/PHT RUST BLIGHT STH 1000 Kernel weight (g)
Grail yield (kg/ha)
1 Jibat 18 kg/ha 202 97.5 0.48 1.5 1.5 43 420.73 6563.00
2 Jibat 36 kg/ha 198 94 0.47 1.5 1.5 48 423.43 11400.00
3 Jibat 72 kg/ha 186 83 0.45 1.5 1.5 41 434.80 11030.00
4 Jibat 108 kg/ha 195 87 0.45 1.5 1.5 38 426.07 9424.00
5 Jibat 144 kg/ha 186 92 0.50 1.5 1.5 40 423.40 9714.00 6 AMH 760Q 18 kg/ha 209 119 0.57 1.5 1.5 42 397.23 6987.00
7 AMH 760Q 36 /kg/ha 210 126 0.60 1.5 1.5 40 425.10 9341.00 8 AMH 760Q 72 kg/ha 198 112 0.57 1.5 1.5 36 413.77 10440.00
9 AMH 760Q 108 73 kg/ha 203 114 0.56 1.5 1.5 37 406.83 9415.00
10 AMH 760Q 144 kg/ha 209 123 0.59 1.5 1.5 40 394.33 9806.00
11 BH 660 18 kg/ha 222 120 0.54 1.5 1.5 39 458.70 7363.00 12 BH 660 36 kg/ha 241 137 0.57 1.5 1.5 38 466.60 11260.00
13 BH 660 72 kg/ha 239 140 0.59 1.5 1.5 42 460.83 11550.00 14 BH 660 108 kg/ha 242 143 0.59 1.5 1.5 39 501.50 9106.00
15 BH 660 144 kg/ha 230 124 0.54 1.5 1.5 39 447.50 8925.00 16 BH 661 18 kg/ha 228 122 0.54 1.5 1.5 47 433.10 8272.00 17 BH 661 36 kg/ha 227 115 0.51 1.5 1.5 44 418.33 11400.00
18 BH 661 72 kg/ha 221 114 0.52 1.5 1.5 42 456.60 14050.00
19 BH 661 108 kg/ha 230 119 0.52 1.5 1.5 44 453.83 13620.00
20 BH 661 144 kg/ha 220 114 0.52 1.5 1.5 47 457.03 11600.00
C.V 8.03 11.40 1.42 NS NS NS 15.39 22.99 LSD (5%) 3491.00

32nd Annual Research Bulletin, April 2015, Haramaya University
42
4. Recommendation From the results obtained in this study, it can be concluded that farmers in Haramaya woreda and areas with similar soil type in eastern Ethiopia may apply 72 kg N/ha to get good grain yield from maize, particularly hybrid varieties Jibat, AMH 760Q, BH 660 and BH 661.
5. Acknowledgement The author is grateful to Haramaya University for providing the research grant and all other supports during execution of the research. The contribution of all technical assistants of Maize Research Program at Haramaya University, particularly, Mr. Elias Abrahim is highly acknowledged. Without their assistance, the successful completion of this research might have been impossible.
6. Reference Abd El-Lattief, E.A. 2011. Nitrogen management Effect on the Production of Two Sweet Sorghum Cultivars under Arid Regions Conditions.
AsianJournal of Crop Sci.ences 3. (2):77-84. CSA (Central Statistical Agency). 2014. Agricultural sample survey report on area and production of major crops. Private peasant holdings,
Meher season. Statistical. Bulletin. Addis Ababa, Ethiopia. CSA (Central Statistical Agency). 2013.Agricultural sample survey. Report on farm management practices. Private peasant holdings, Meher
season. Statistical. Bulletin. Addis Ababa, Ethiopia. pp. 6-9. CSA (Central Statistical Agency). 2012. Agricultural Sample survey: report on area and production of major crops (private peasant holdings,
Meher season). Statistical, (1). Addis Ababa. FAOSTAT. 2010. Available online at http://faostat.fao.org/ (verified Jan 2011). For private and public intervention to promote growth. Food
Pol. 35: 323-331. FAOSTAT. 2011. World Agricultural Production. [Online] Available at: http://faostat.fao.org/default.aspx. (Accessed 14 April. 2012). FAO. 2011. World Agricultural Production. [online] Available at:http://faostat.fao.org/default.aspx. (Accessed 14 April. 2012). FAO (Food and Agriculture Organization). 010. The importance of soil organic matter. National Resources Management and Environment
Department. Hefny, M., Aly, A.A. 2008. Yielding ability and nitrogen use efficiency in maize inbred lines and their crosses. International Journal of .Agricultural.
Research. 3.(1):27-39. Farshad S. and Mojtaba F. 2014. Effect of nitrogen fertilizer on yield component of maize. International Journal of Biosciences 5 (6):16-20. Tahir M., M., Maqsood, M., Tahir H. A., and Rashid S. 2001. Effect of different levels of nitrogen and intra-row spacing on yield and yield
components of maize (Zea mays L.), Pak. J. Agri. Sci. 38 (1-2): 48-49. Muhammad A. S., Muhammad M., Muhammad A. B., Wahid A., and Muhammad R.Ss. 2012. Effects of nitrogen rate and harvest time on
maize (Zea mays L.) fodder yield and its quality attributes. Asian Journal of Pham Biological Research 2:19-26. Tilahun T., Alemayehu A., Minale L., and Zelalem T. 2013. The effect of nitrogen fertilizer split application on the nitrogen use efficiency, grain
yield and economic benefit of maize production. International Journal of Agricultural. Sciences. 3 (5):493-499. Onasanya R.O, Aiyelari O.P, Onasanya A, Nwilene FE, Oyelakin OO (2009). Effect of different levels of nitrogen and phosphorous fertilizers
on the growth and yield of maize (Zea mays L.) in Southwest Nigeria. International Journal of Agriculture 4 (6):193-203. Sitthaphanit, S., Limpinuntana, V., Toomsan, B., Panchaban, S., Bell, R. W. 2010. Growth and yield responses in maize to split and delayed
fertilizer applications on sandy soils under high rainfall regimes. Kasetsart Journal of. Natural. Sciences. 44: 991-1003.

32nd Annual Research Bulletin, April 2015, Haramaya University
43
6. Genetic Gain of Tuber Yield and Late Blight [Phytophthora infestans (Mont.) de Bary] Resistance in Potato (Solanum tuberosum L.) Varieties in Ethiopia from 1987 to 2011 Wassu Mohammed Ali Haramaya University, College of Agriculture and Environmental Sciences, School of Plant Sciences Author E-mail: [email protected]
Abstract: Since the introduction of potato, it has been considered as a strategic crop aiming at enhancing food security and economic benefits to Ethiopia. Potato improvement program has been started in 1975 and the first variety was released in 1987. Periodic evaluation of improvements in economic importance traits is necessary to assess breeding progress over time; however, no study has been attempted in Ethiopia. Therefore, this study was conducted with the objectives of determining the rate and magnitude of progress in tuber yield and resistant to late blight in historical potato varieties and to determine the contribution of late blight disease to tuber yield variation. Sixteen improved varieties released between 1987 and 2011 and two farmers‘ cultivars were planted in three environments with randomized complete block design with three replications. The combined analysis of variance revealed the presence of significant difference among varieties for tuber yield and resistant to late blight due to genotype, location and genotype x location interaction. Total and marketable tuber yield increased linearly with year of varieties release at a rate of 0.14 and 0.18 t ha-1, respectively, per year. Late blight severity score reduced at a rate of -0.31% year-1. Late blight severity score explained total tuber yield variations between 31.39 to 80.1% across environments. The research revealed progressive improvement of the crop over 25 years in the country for tuber yield and controlling late blight disease through use of resistant varieties. However, most of the varieties became susceptible for late blight in favourable environment for the pathogen and only few varieties performed better for tuber yield and late blight resistance across environments. This suggested the need to change the existing potato breeding approach that depends on separate efforts of breeders at different research centers to develop varieties for specific agro-ecologies. This call for the organized and complementary efforts of researchers in the country to develop high yielding varieties that match the changing market and end-user demands, and resistance to the new virulent pathogen races for larger target areas of Ethiopia.
Keywords: Genetic gain; Genotype x Location; Late blight severity; Potato varieties
1. Introduction Food security is a key priority for ever increasing population in Eastern Africa. The need to feed this population puts increasing pressure on the fixed land for food production. This is further aggravated by the increasingly degraded environment and the uncertainties resulting from climate change. This declining and variable environment requires robust crops adapted to a wide range of agro-ecologies in the region. Potato is the best crop for food and nutrition security in the sub-region because of its plasticity to environmental regimes and higher yield per unit area (Kyamanywa et al., 2011). Potato is considered as cheap source of human diet in many countries, because it is a high-energy staple food, provides high productivity per unit area and time, supply carbohydrates, quality protein (lysine), minerals, nutrient salts and several vitamins from group B and large amount of vitamin C (Horton, 1987). Potato was introduced to Ethiopia in 1858 by the German botanist Schimper (Pankhurst, 1964). Since its introduction, potato has been considered as a strategic crop aiming at enhancing food security and economic benefits to the country. Ethiopia is one of the principal potato producing countries in Africa. Approximately, 1.3 million farmers (CSA, 2011) grow potato in mid and highlands of Ethiopia. The country has a potential to grow potato in 70% of the 10 million hectares of arable land of the country (FAO, 2008). The area planted with potato increased from 30,000 to about 164,146 hectares between 2002 and 2007. In the last 10 years, potato productivity has progressed from 7 to 11 t ha-
1. Nevertheless, the current area cropped with potato and the average yield (< 10 t ha-1) far below the country‗s potential (Baye and Gebremedhin, 2013). The low acreage and yield are attributed to many factors, but lack of high quality seed potatoes, proper management of the crop and high yielding varieties are the major factors (Gildemacher et al., 2009; Endale et al., 2008). Of these, developing crop varieties which withstand the changing climate is becoming a priority activity for breeders. In Ethiopia, strategic research for potato variety development and other agronomic managements began in 1975 (Gebremedhin, 2013). Starting the release of the first potato variety (987), more than 27 potato varieties were developed and registered by the government research institutions (MoA, 2013; MoA, 2012). The major focus was developing varieties for high yield and resistant to late blight for different agroecologies of the country by separate effort of different research centers and Haramaya University. However, considerable number of released varieties becomes susceptible to late blight (lost their resistant) due to the pathogen [Phytophthora infestans (Mont.) de Bary] has the ability to rapidly evolve to overcome resistance major genes (Stewart et. al., 2003, Wastie, 1991). The major task of the breeders is to develop high yielding varieties, resistance or tolerance to stress and varieties that match the existing end use of the crop. Breeders have often been unable to forecast future cropping scenarios and the economics of production. Therefore, periodic

32nd Annual Research Bulletin, April 2015, Haramaya University
44
evaluation of potato varieties for yield and disease resistance is necessary to assess breeding progress over time. The generated genetic gain information from such experiment helps plant breeders to know how much the varieties match the changing cropping scenarios and the economics of production. However, such research has not been attempted in the country for the last 25 years of potato variety development. Therefore, this experiment was conducted; i) to determine the rate and magnitude of progress for tuber yield in historic potato varieties in Ethiopia; ii) to evaluate varieties resistant to late blight and progress made in selection of resistant varieties in the last 25 years and iii) to determine the contribution of late blight to tuber yield variation..
2. Materials and Methods 2.1. Description of the Study Sites The field experiment was carried out at three environments namely; Haramaya, Hirna and Arberkete which are considered as the representative mid and highland potato growing areas of eastern and western Hararghe. The experiment was conducted for one cropping season in 2013. Haramaya University, Rare research farm is located at 2020 m.a.s.l., 9°41''N latitude and 42°03''E longitude. The area has a bimodal rainfall distribution and is representative of a sub-humid mid altitude agro-climatic zone. The mean annual rainfall is 760 mm. The short rainy season extends from March to April and constitutes about 25% of the annual rainfall whereas the long rainy season extends from June to October and accounts for about 45% of the total rainfall (Belay et al., 1998). The mean maximum temperature is 23.40C while the mean minimum annual temperature is 8.250C (Tekalign, 2011). The soil of the experimental site is a well-drained deep alluvial with a sub-soil stratified with loam and sandy loam. Previous work showed that it has organic carbon content of 1.15%, total nitrogen content of 0.11%, available phosphorus content of 18.2 mg kg soil-1, exchangeable potassium content of 0.65 cmolc kg soil-1 (255 mg K kg soil-1), pH of 8.0, and percent sand, silt, and clay contents of 63, 20, and 17, respectively (Simret, 2010). Hirna research sub-station of Haramaya University is located at 9 o12‘ North latitude, 41 o4‘ East longitude, and at an altitude of 1870 metres above sea level. The area receives mean annual rainfall of 990 to 1010 mm (HURC, 1996). The mean maximum and minimum annual temperatures are 21.8°C and 8.6°C, respectively (Tekalign, 2011). The soil of Hirna is vertisol type with silty clay in texture, which contain organic carbon 1.75%, total Nitrogen 0.18%, available Phosphorus 32 mg kg soil-1, exchangeable Potassium 0.68 cmolc kg soil-1and pH of 7.09 (Nebret , 2011). The third site was Arberekete, which is located at a distance of about 171 km to the west of Haramaya. The site is located at 9 o14‘ North latitude, 41 o2‘East longitude, and at an altitude of 2280 meters above sea level. 2.2. Experimental Materials A total of 16 potato varieties were used. These varieties were released by five research centers and Haramaya University during 1987 to 2011. In addition, two farmers‘ cultivars were included. The description of the varieties including the recommended growing altitudes is given in Table 1. 2.3. Experimental Design and Procedures The experiment was laid out as a Randomized Complete Block Design (RCBD) with three replications in each environment. Each potato genotype was assigned to one plot in each replication and six rows with 12 plants. The gross plot size was 16.2 m2 with 75 and 30 cm between rows and within plant spacing, respectively. The spacing of 1.5m and 1m was maintained between plots and replications, respectively. The experimental fields except at Arberekete were cultivated by a tractor to a depth of 25-30 cm and levelled then after ridges were made by hand. Medium sized (39-75g) and well sprouted tubers were planted at the sides of ridges (Lung‘aho et al., 2007). Tubers was planted at the end of June and first week of July during the main growing season after the rain commenced and when the soil was moist enough to support emergence. The planting depth was maintained at 10 cm. Fertilizer was applied as the recommendation made by Haramaya University at the rate of 75 kg N and 92 kg P2O5 ha-1. The source of N and P2O5 were DAP (18% N, 46% P2O5), and Urea (46 % N). The entire DAP fertilizer rate was applied at the depth of 10 cm below the seed tuber at planting, while Urea was applied 7-10 cm away from the plant as two side dressings for subsequent split applications (50% + 50% in two installment of 30 and 50 day after planting). Other agronomic managements were applied as per the recommendation made for the crop. The haulm was mowed two weeks before harvesting to thicken tuber periderm; as yellowing or senescence observed apparent on the lower leaves. For yield estimation, tubers were harvested from forty plants from the four middle rows, leaving the plants growing in the two border rows as well as those plants growing at both ends of each row to avoid edge effects.

32nd Annual Research Bulletin, April 2015, Haramaya University
45
Table 1. Name, accession code, year of release, maintainer center of potato varieties.
No. Variety Accession code Year of release Breeding Center Recommended Altitude (m.a.s.l.)
1 Alemaya 624 Al-624 1987 Haramaya University 1700 - 2400 2 Chirro AL-111 1998 Haramaya University 2700 - 3200 3 Zemen AL-105 2001 Haramaya University 1700 - 2000 4 Bedasa AL-114 2001 Haramaya University 2400 - 3350
5 Gorebela CIP-382173.12 2002 Sheno Research Center 1700 - 2400 6 Guasa CIP-384321.9 2002 Adet Research Center 2000 - 2800 7 Jalenie CIP-37792-5 2002 Holeta Research Center 1600 - 2800
8 Gera KP-90134.2 2003 Sheno Research Center 2700 - 3200 9 Chala CIP-387412-2 2005 Haramaya University 1700 - 2000 10 Bulle CIP-387224-25 2005 Hwassa Research Center 1700 - 2700 11 Gabbisa CIP-3870-96-11 2005 Haramaya University 1700 - 2000 12 Mara Charre CIP-389701-3 2005 Hwassa Research Center 1700 - 2700 13 Gudanie CIP-386423.13 2006 Holeta Research Center 1600 - 2800 14 Araarsaa CIP-90138.12 2006 Sinnana Research Center 2400 - 3350 15 Belete CIP-393371.58 2009 Holeta Research Center 1600 - 2800 16 Bubu CIP-384321-3 2011 Haramaya University 1700 - 2000 17 Bete Local cultivar 18 Jarso Local cultivar
** Plant Variety Release, Protection and Seed Quality Control Directorate, Crop Variety Register Issue No.16 (MoA, 2013, June, Addis Abeba, Ethiopia), pp.161-164. 2.4. Data Collection Total tuber yield of each genotype was estimated from plants counted at harvest in the four middle rows. Tubers were carefully collected after the hills were hand dug. The collected total tubers in each plot were weighted and converted to yield tons per hectare. Tubers which were free from diseases, insect pests and greater than or equal to 20g in weight were sorted, weighted for each plot and recorded as marketable yield (t ha-
1). Disease assessment was conducted starting 30 August 2013 after 46 days of planting as soon as disease symptoms appear in susceptible genotypes and then after every 20 days until majority of the genotypes attained physiological maturity. Disease incidence and severity were assessed following CIP (2006) guideline and other established procedures. Assessment of severity late blight under field conditions in percent was recorded on plot basis taking in account the number of plants developing disease symptoms in a leaf and/or many leaves and plants free from disease Henfing (1987) as described in Table 2. Disease assessment was done by the same three evaluators without knowing the value given at the previous reading. 2.5. Data Analysis Data were subjected to analysis of variance (ANOVA) for each location and combined over environments following the standard procedure for RCBD given by Gomez and Gomez (1984) using the General Linear Model (GLM) of the SAS procedure of version 9.1 (SAS, 2007). Significant genotypes x environment mean squares were observed for tuber yield and disease severity parameters. For these traits homogeneity of variances were tested using Bartlett‘s test. Heterogeneity of the error variances of the individual environment experiments was observed and analysis was made for each environment. Linear regression analysis was used to calculate the genetic gain of yield potential and disease resistance (disease severity reduction). The average annual rate of genetic gain for each trait was estimated by regressing of the mean value of each trait against the corresponding year of release of each variety (Singh and Chaudhary, 2007). Linear regression analysis was also used to estimate disease severity as cause of genetic gain in tuber yield. In this regression analysis tuber yield was considered as independent variable while disease severity was considered as dependent variables. Correlation of year of release and mean value of each variety for each trait was also calculated to understand the association of year of release and the mean performance of varieties. The annual rate of genetic gain achieved over the last 25 years of potato improvement was determined as the ratio of genetic gain to the corresponding mean value of the oldest variety and expressed as percentage. Annual rate of gain = Cov (X, Y)/Var (X), where, X is the year of variety release, Y is the mean value of each trait for each variety; Cov is the covariance of X and Y and Var is variance of X (year of variety release). Percent genetic gain per year for each variety was calculated as Percent Genetic Gain Year-1 = {[(XG-XAL-624)/XAL-624]/YG-YAL-624*100, where, X is the mean value of observations for a given trait and Y is the year of release of each variety (G) and Alemaya 624 (AL-624). The increment over farmers‘ cultivars for each trait was calculated as Percent

32nd Annual Research Bulletin, April 2015, Haramaya University
46
Increment of Variety (%) = XG – XFC/XFC*100, where, XG is the mean value of each variety for each trait and XFC is the mean value of the two farmers‘ cultivars (Jarso and Bete) in eastern Ethiopia. In this experiment, Alemaya 624 was considered as the oldest var iety since it was the first potato variety released in the country in 1987. Table 2. Assessment of severity late blight (%) under field conditions Henfing (1987).
Phytophthora infestans (%) Symptoms Average Boundaries
0 0 P. infestans not observed 2.5 Trace < 5 P. infestans present. Maximum 10 injuries per plant 10 5 < 15 Plants seem to be healthy, but injuries can be easily observed. There are no more than 20 affected
leaves 25 15< 35 P. infestans is easily observed on the plants. About 25% of the leaf area is affected by injuries. 50 35< 65 Plants look green, but each one is affected by the pathogen, lower leaves are necrotic. About 50%
of the leaf area is destroyed 75 65< 85 Plants look green with brown spots. About 75% of the leaf area is affected. Leaves in the middle
of the plant are destroyed 90 85< 95 Only upper leaves are green. Most of leaves are affected and many stems have external injuries 97.5 95< 100 Plants look brown, few upper leaves are green and most of the stems are hardly affected or dead 100 Leaves and stems are destroyed
3. Results 3.1. Analysis of Variance and Mean Performance of Varieties The analysis of variance for total and marketable tuber yield and t ha-1 as well as late blight severity score in each environment/location revealed significant differences (P<0.01) among genotypes (Table 3). The combined analysis across the three environments revealed the presence of significant differences among environments, genotypes and environment x variety interaction for all traits (Table 4). Absence of homogeneity of error variances for these traits leads to conduct the analysis separately for each environment. Table 3. Mean square from the analyses of variance for tuber yields and late blight severity score of potato varieties at three locations during the 2013 cropping season.
Location Source of Variation
Trait
Total tuber yield t ha-1
Marketable tuber yield t ha-1 Late blight severity (%)
Haramaya Replication (2) 40.35 27.12 267.13 Variety (17) 295.48** 236.63** 2430.94** Error (34) 8.82 7.61 62.23
Hirna Replication (2) 4.95 6.43 15.7 Variety (17) 269.38** 254.36** 1889.3** Error (34) 7.58 7.43 252 Arberkete Replication (2) 4.06 3.02 162.02 Variety (17) 134.95** 112.86** 1298.1** Error (34) 2.59 2.39 83.65
* and ** = significant at P<0.05 and P<0.01, respectively. Numbers in parenthesis are degrees of freedom. At Haramaya, all varieties except five (Mara Charre, Gudanie, Bubu, Belete and Gera) produced lower total and marketable tuber yield than the oldest variety (Alemaya 624). At Arberekete, five varieties including Belete (released in 2009) had lower total and marketable tuber yield (t ha-1) than the oldest variety. On the other hand, all varieties except Gorebela (released in 2002) produced total tuber yield higher than the old and farmers varieties at Hirna. All improved varieties except two at Haramaya and Arberekete exceeded the mean tuber yield of farmers‘ cultivars. Considering the performance of varieties across environments, most varieties except four exceeded the oldest variety in producing tuber yield. Particularly, Mara Charre, Bubu, Gudanie and Gera exceeded the oldest variety by about 6.67 to 18.73 t ha-1 (Table 5 and 6). Eight out of 16 varieties scored lower late blight severity than the oldest variety at Haramaya. All varieties except one (Chirro) had lower late blight severity scores than the mean of two farmers cultivars. In this environment, only 4 out of 11 varieties released between 1998 and 2005 scored lower late blight severity than the oldest variety (Alemaya 624). At Hirna all varieties except Gorebela and at Arberkete all varieties

32nd Annual Research Bulletin, April 2015, Haramaya University
47
except Bedasa and Gorebela recorded lower late blight severity scores than the oldest variety (Alemaya 624). At Hirna all varieties but at Arberkete all varieties except Bedasa and Gorebela recorded lower late blight severity scores than mean late blight severity score of the two farmers cultivars. The two recently released varieties (Bubu and Belete) consistently recorded lowest late blight severity scores (<15%) in all the three environments. Other four varieties, Gera, Bulle, Mara Charre and Araarsaa had late blight severity scores not more than 30% in all environments (Table 7). Table 4. Mean squares from combined analysis of variance for tuber yield and quality attributes of potato varieties tested at three locations during the 2013 cropping season.
Source of Variation
Trait
Total tuber yield t ha-1 Marketable tuber yield t ha-1 Late blight severity (%)
Replication (2) 18.37 16.35 267.7 Variety (17) 444.13** 386.59** 4468.4** Environment (2) 3965.18** 3281.24** 11460.4** Variety x Environment (34) 127.85** 108.63** 575.12** Error (106) 6.68 5.97 130.9
* and ** = significant at P<0.05 and P<0.01, respectively. Numbers in parenthesis are degrees of freedom.

32nd Annual Research Bulletin, April 2015, Haramaya University
48
Table 5. Trends of genetic gain in potato varieties released in each year (1987-2011) for total tuber yield (t ha-1): percent genetic gain year-1 over AL-624 (oldest variety) and percent increment over mean of the two farmers‘ cultivars.
Variety Year of release
Haramaya Hirna Arberkete
Average PGGY AL-624 Mean TTY PGGY AL-624 PIMFC Mean TTY PGGY AL-624 PIMFC Mean TTY PGGY AL-624 PIMFC
Alemaya 624 1987 27.26cd 62.55 33.53hi 14.09 33.6d 19.66 Chirro 1998 17.19hij -3.36 2.50 44.64de 3.01 51.89 41.96ab 2.26 49.43 0.91
Zemen 2001 16.89ij -2.72 0.72 45.21de 2.49 53.83 34.8d 0.26 23.93 0.19 Bedasa 2001 23.12deg -1.08 37.87 38.52fg 1.06 31.06 27.08f -1.39 -3.56 -0.43 Gorebela 2002 19.27ghi -1.95 14.91 21.15k -2.46 -28.04 18.36h -3.02 -34.62 -2.52 Guasa 2002 15.44ij -2.89 -7.93 50.45c 3.36 71.66 40.15bc 1.30 42.98 0.82 Jalenie 2002 16.59ij -2.61 -1.07 42.93ef 1.87 46.07 34.18d 0.12 21.72 -0.05 Gera 2003 28.47c 0.28 69.77 55.27ab 4.05 88.06 30.67e -0.55 9.22 1.33 Chala 2005 26.07cde -0.24 55.46 51.49bc 2.98 75.20 34.8d 0.20 23.93 1.06 Bulle 2005 25.78cde -0.30 53.73 35.13gh 0.27 19.53 22.73g -1.80 -19.05 -0.63 Gabbisa 2005 21.93e-h -1.09 30.77 47.64cd 2.34 62.10 37.75c 0.69 34.44 0.76 Mara Charre 2005 54.31a 5.51 223.85 56.52a 3.81 92.31 39.79bc 1.02 41.70 3.31 Gudanie 2006 38.58b 2.19 130.05 43.95de 1.64 49.54 34.09d 0.08 21.40 1.24 Araarsaa 2006 24.3c-f -0.57 44.90 43.63de 1.59 48.45 37.5c 0.61 33.55 0.62 Belete 2009 28.76c 0.25 71.50 45.54de 1.63 54.95 30.25e -0.45 7.73 0.49 Bubu 2011 35.56b 1.27 112.05 46.94cde 1.67 59.71 43.2a 1.19 53.85 1.38 Jarso 13.94j 30.52il 25.32fg Bete 19.59f-i 28.26j 30.83e
Mean released varieties 26.22 -0.49 56.35 43.91 1.95 49.40 33.81 0.03 20.39 0.56 Mean farmers cultivars 16.77 29.39 28.08
LSD (5%) 4.93 4.57 2.67
CV (%) 11.8 6.5 4.8
Means with the same letters are not significantly different at P<0.05. LSD = least significant difference, TTY = total tuber yield tons per hectare, PGGY AL-624 = percent genetic gain year-1 over AL-624, PIMFC = percent increment over mean of farmers cultivars, CV = coefficient of variation in percent, Average PGGY AL-624 = average percent genetic gain year-1 over AL-624 over three locations.

32nd Annual Research Bulletin, April 2015, Haramaya University
49
Table 6. Trends of genetic gain in potato varieties released in each year (1987-2011) for marketable tuber yield (t ha-1): percent genetic gain year-1 over AL-624 (oldest variety) and percent increment over mean of the two farmers‘ cultivars
Variety Year of release
Haramaya Hirna Arberkete
Average PGGY AL-624 Mean MTY PGGY AL-624 PIMFC Mean MTY PGGY AL-624 PIMFC Mean MTY PGGY AL-624 PIMFC
Alemaya 624 1987 24.59cd 68.89 28.69hi 12.33 29.89gh 22.65 Chirro 1998 15.94fgh -3.43 9.48 41.45de 4.04 62.29 37.84ab 2.42 55.27 1.32 Zemen 2001 15.85fgh -2.72 8.86 43.59cd 3.71 70.67 31.71efg 0.43 30.12 0.69 Bedasa 2001 21.33de -1.19 46.50 35.12fg 1.60 37.51 24.6j -1.26 0.94 -0.18 Gorebela 2002 17.78efg -2.03 22.12 18.44j -2.38 -27.80 16.82l -2.92 -30.98 -2.41 Guasa 2002 13.92gh -3.04 -4.40 46.73bc 4.19 82.97 36.33bc 1.44 49.08 1.11 Jalenie 2002 15.66fgh -2.59 7.55 38.43ef 2.26 50.47 31.02g 0.25 27.29 0.16 Gera 2003 26.59c 0.24 82.62 51.38a 4.94 101.17 27.98hi -0.40 14.81 1.71 Chala 2005 24.52cd -0.23 68.41 47.07abc 3.56 84.30 32.28efg 0.44 32.46 1.38 Bulle 2005 23.63cd -0.43 62.29 32.22gh 0.68 26.16 20.41k -1.76 -16.25 -0.46 Gabbisa 2005 20.14def -1.18 38.32 43.21cd 2.81 69.19 34.06cde 0.78 39.76 0.95 Mara Charre 2005 47.48a 4.75 226.10 50.11ab 4.15 96.20 35.07cd 0.96 43.91 3.31 Gudanie 2006 35.85b 2.11 146.22 41.41de 2.33 62.14 31.23fg 0.24 28.15 1.60 Araarsaa 2006 22.81cd -0.57 56.66 41.25de 2.30 61.51 33.64def 0.66 38.04 0.92 Belete 2009 27.26c 0.30 87.23 41.82de 2.08 63.74 28.16hi -0.26 15.55 0.77 Bubu 2011 33.48b 1.28 129.95 43.91cd 2.21 71.93 39.54a 1.35 62.25 1.69 Jarso 12.07h 26.41i 21.62k Bete 17.04efg 24.67i 27.11ij
Mean released varieties 24.18 -0.58 66.05 40.30 2.57 57.80 30.66 0.16 25.82 0.84
Mean farmers cultivars 14.56 25.54 24.37
LSD (5%) 11.9 4.52 2.57
CV (%) 4.58 7.1 5.2
Means with the same letters are not significantly different at P<0.05. LSD = least significant difference, MTY = marketable tuber yield tons per hectare, PGGY AL-624 = percent genetic gain year-1 over AL-624, PIMFC = percent increment over mean of farmers cultivars, CV = coefficient of variation in percent, Average PGGY AL-624 = average percent genetic gain year-1 over AL-624 over three locations.

32nd Annual Research Bulletin, April 2015, Haramaya University
50
Table 7. Trends of genetic gain in potato varieties released in each year (1987-2010) for late blight severity: percent genetic gain year-1 over AL-624 (oldest variety) and percent increment over mean of the two farmers‘ cultivars
Variety Year of release
Haramaya Hirna Arberkete
Average PGGY AL-624 Mean Severity PGGY AL-624 PIMFC Mean Severity PGGY AL-624 PIMFC Mean Severity PGGY AL-624 PIMFC
Alemaya 624 1987 50cd -45.05 32b -48.39 23d -36.11 Chirro 1998 95a 8.18 4.40 12cd -5.68 -80.65 13def -3.95 -63.89 1.30 Zemen 2001 87a 5.29 -4.40 12cd -4.46 -80.65 18def -1.55 -50.00 0.82 Bedasa 2001 68b 2.57 -25.27 23bc -2.01 -62.90 37bc 4.35 2.78 1.56 Gorebela 2002 48d -0.27 -47.25 60a 5.83 -3.23 60a 10.72 66.67 4.00 Guasa 2002 67b 2.27 -26.37 8cd -5.00 -87.10 10ef -3.77 -72.22 -1.27 Jalenie 2002 62bc 1.60 -31.87 17bcd -3.13 -72.58 20def -0.87 -44.44 -0.38 Gera 2003 25fg -3.13 -72.53 5d -5.27 -91.94 23d 0.00 -36.11 -3.10 Chala 2005 70b 2.22 -23.08 8cd -4.17 -87.10 20def -0.72 -44.44 -0.37 Bulle 2005 10h -4.44 -89.01 15cd -2.95 -75.81 22de -0.24 -38.89 -3.07 Gabbisa 2005 50cd 0.00 -45.05 15cd -2.95 -75.81 20def -0.72 -44.44 -1.06 Mara Charre 2005 30ef -2.22 -67.03 5d -4.69 -91.94 13def -2.42 -63.89 -3.02 Gudanie 2006 40de -1.05 -56.04 12cd -3.29 -80.65 23d 0.00 -36.11 -1.50 Araarsaa 2006 27f -2.42 -70.33 10cd -3.62 -83.87 18def -1.14 -50.00 -2.51 Belete 2009 13gh -3.36 -85.71 8cd -3.41 -87.10 15def -1.58 -58.33 -2.99 Bubu 2011 13gh -3.08 -85.71 4d -3.65 -93.55 8f -2.72 -77.78 -3.17 Jarso 95a 60a 47b Bete 86.67a 63a 25cd
Mean released varieties 47 0.14 -48.15 15 -3.23 -75.20 21 -0.31 -40.45 -0.98
Mean farmers cultivars 91 62 36
LSD (5%) 13.09 15.47 12.46
CV (%) 15.2 45.4 32.4
Means with the same letters are not significantly different at P<0.05. LSD = least significant difference, Mean severity = severity of late blight in percent, PGGY AL-624 = percent genetic gain year-1 over AL-624, PIMFC = percent increment over mean of farmers cultivars, CV = coefficient of variation in percent, Average PGGY AL-624 = average percent genetic gain year-1 over AL-624 over three locations.

32nd Annual Research Bulletin, April 2015, Haramaya University
51
3.2. Estimates of Gain for Tuber Yield The highest estimates for annual percent genetic gain of total tuber yield was noted at Hirna (Gera= 4.05%) and the lowest was -3.02% at Arberkete for Gorebela (released in 2002). Mara Charre and Bubu which were released in 2005 and 2011, respectively, had highest percent genetic gain over the oldest variety (Alemaya 624) for total tuber yield across the three environments (Table 5). These varieties also exhibited consistently higher percent genetic gain across three environments while Gorebela recorded consistently lower genetic gain for marketable tuber yield (t ha-1). Chirro had lowest (-3.43%) at Haramaya and Gera (4.94%) at Hirna had highest percent genetic gain relative oldest variety for marketable tuber yield (t ha-1) (Table 6). The annual rate of gain over the oldest variety (Alemaya 624) in percent ranged between -1.62 (Haramaya) and 2.44% (Hirna) for total tuber yield while it was in the range between -1.77 and 2.68% for marketable tuber yield t ha-1. The overall annual rate of gain over the oldest variety in percent was 1.79 and 1.86% for total and marketable tuber yield, respectively (Table 8). Total tuber yield and varieties year of release had positive but weak (r = 0.09) association at Arberkete while relatively strong (r = 0.39) for total and marketable tuber yield at Hirna. The coefficient of determination (R2) was as low as 0.079 for total tuber yield at Arberkete and high (R2 = 0.1523) for marketable tuber yield at Hirna (Figure 1 and 2). It was observed the reduction of -0.04 and -0.02 t ha-1 year-1 of total and marketable tuber yield, respectively, at Haramaya while the highest increase of 0.46 and 0.58 t ha-1 year-1 of total and marketable tuber yield, respectively, at Hirna. The absolute reduction and increase of tuber yields t ha-1 year-1 were computed as absolute reduction and increase of 15 varieties mean yield over Alemaya 624 divided by 25 years (starting 1987 the first variety release year) to 2011 (the year of recently released variety, Bubu in the experiment) (Table 8). Table 8. Estimation of coefficient of determination (R2), average rate of gain (b), the annual absolute and relative genetic gain (RGG) for average tuber weight and quality related traits of potato varieties
Trait CD (R2) AAGG-AL-624 RAGG AL-624 (%) AGIFC RGIFC (%) Annual rate of gain (b) (%)
HU TTY t ha-1 10.49 -0.04 -0.16 0.06 0.24 -1.62 Hirna TTY t ha-1 14.78 0.46 1.38 0.38 2.25 2.44
Arber TTY t ha-1 7.9 0.01 0.03 0.23 0.68 0.34
Average TTY t ha-1 11.86 0.14 0.45 0.23 1.06 1.79 HU MTY t ha-1 10.16 -0.02 -0.07 0.11 0.50 -1.77 Hirna MTY t ha-1 15.23 0.58 2.11 0.59 2.31 2.68 Arber MTY t ha-1 9.8 0.03 0.11 0.25 0.82 0.38
Average MTY t ha-1 15.77 0.18 0.64 0.32 1.21 1.86
HULB Severity 25.24 -0.13 -0.25 -1.76 -1.93 -10.40 Hirna LB Severity 7.4 -0.74 -2.31 -1.88 -3.03 -1.00
Arberkete LB Severity 26.94 -0.07 -0.30 -0.60 -2.86 -8.30
Average LB Severity 32.21 -0.31 -0.89 -1.39 -2.22 -5.74
CD (R2) = Coefficient of determination, AAGG-AL-624 = absolute annual average genetic gain over Alemaya 624 (oldest variety), RAGG-AL-624 (%) = relative annual average genetic gain over Alemaya 624 (oldest variety), AGIFC = absolute annual average increment over mean of farmers cultivars, RGIFC (%) = relative annual average increment over mean of farmers cultivars The lowest absolute increase of total tuber yield (0.06 t ha-1 year-1) over the mean of two farmers‘ cultivars was recorded at Haramaya while the highest (0.38 t ha-1 year-1) was registered at Hirna. The lowest (0.11 t ha-1 year-1) and highest (0.59 t ha-1 year-1) absolute increase of marketable tuber yield over the mean of two farmers‘ cultivars was recorded for the same locations over the last 25 years (Table 8).

32nd Annual Research and Extension Review Proceeedings, March 2015, Haramaya University
52
Figure 1. Linear regression of potato total tuber yield on year of variety release with equation of best-fit line for three environments.
Figure 2. Linear regression of potato marketable tuber yield on year of variety release with equation of best-fit line for three environments.

32nd Annual Research and Extension Review Proceeedings, March 2015, Haramaya University
53
3.3. Estimates of Gain for Late blight Resistance Late blight severity score was higher than the oldest variety at Haramaya while all varieties except Gorebela both at Hirna and Arberkete and Bedasa at Arberkete had lower percent late blight severity score. Percent genetic gain relative to Alemaya 624 ranged from the increase of 10.72% (Gorebela) at Arberkete to the reduction of 5.68% late blight severity year-1 (Chirro) at Hirna. The two farmers‘ cultivars recorded the highest percent late blight severity in all environments except Chirro at Haramaya, Bedasa at Arberkete and Gorebela at Hirna and Arberkete. Percent reduction of late blight severity ranged from -4.4% (Zemen) at Haramaya to -93.55% (Bubu) at Hirna as compared to mean late blight severity score of farmers‘ cultivars (Table 8). The absolute reduction of late blight severity was as high as 0.74% at Hirna and as low as -0.07% year-1 at Arberkete over Alemaya 624 (oldest variety) with average annual absolute reduction of 5.74%. Improved varieties absolute reduction of late blight severity for the last 25 years was highest (-1.88% year-1) at Hirna and lowest (--0.60% year-1) at Arberkete as compared to the mean of two farmers cultivars. Annual rate of gain (b) reduction of late blight severity due to the improved and released varieties for the last 25 years was highest (-10.4%) at Haramaya but it was lowest (-1%) at Hirna with average Annual rate of reduction of 5.74% (Table 8). The late blight severity score for varieties showed negative association with release year of varieties and had strong negative association at Arberkete (r=-0.52) and Haramaya (r=-0.51) and weak association at Hirna (r=-0.086). The R2 was as high as 0.2694 and as low as 0.0074 at Arberkete and at Hirna, respectively (Figure 4). Late blight severity scores explained the observed yield variations by about 31.39, 80.1 and 67.89% at Haramaya, Hirna and Arberkete, respectively (Figure 5). Mean total tuber yield variation over environments was also explained by about 43.71% due to late blight severity. Late blight severity score and tuber yield had negative association ranged from r = -0.024 (Haramaya) to r = -0.895 (Hirna) (Figure 3).
Figure 3. Linear regression of average late blight severity over three locations on average total tuber yield of varieties with equation of best-fit
line

32nd Annual Research and Extension Review Proceeedings, March 2015, Haramaya University
54
Figure 4. Linear regression of potato late blight severity on year of variety release with equation of best-fit line for three environments
Figure 5. Linear regression of average late blight severity on total tuber yield of varieties of at three environments with equation of best-fit line.

32nd Annual Research and Extension Review Proceeedings, March 2015, Haramaya University
55
4. Discussion Potato varieties developed for different agroecologies of the country by separate efforts of breeders at different research centers exhibited significant differences for tuber yield. Relatively, most of the varieties released in 2005 and onwards produced higher tuber yield across locations while most of other varieties released before 2005 performing highest yield in one environment but low in other environment. The percent genetic gain of varieties calculated relative to varieties year of release and oldest variety and annual rate of gain in percent for tuber yield also varied across locations. However, the average annual rate of gain in percent was 1.79 and 1.86 for total and marketable tuber yield, respectively, which can be consider as highest gain. One of the many potential new cultivars will be best in all environments and selection in one type of environment has consequences for performances in different types of environment (Falconer and Mackay, 1996). This might be due to that quantitative traits such as yield are highly influenced by environment than qualitative traits (Bernardo, 2010). Because, yield depends on many factors which is controlled by many genes and subject to considerable modification by differences in environment (Beukema and Vander Zaag, 1990, Briggs and Knowles, 1985). The significant variation of tuber yields in potato due to variety, environment and genotype x environment interaction were also reported by other researchers (Flis et al., 2014; Mulugeta, and Dessalegn, 2013; Elfinesh, 2008; Mulema et al., 2008; Mateo et al., 2007). Potato improvement for late blight resistance seems successful in Ethiopia when the successive released varieties were compared to the oldest variety and farmers‘ cultivars. But, most of the varieties were more susceptible for late blight as compared to oldest variety in hot spot area (Haramaya). On average -5.74% annual rate of gain in percent was computed for late blight severity score, coefficient of determination was relatively higher and the correlation between varieties year of release and severity score was negative and strong in two locations. This showed that the general trend in the last 25 years potato improvement was in developing more resistant varieties. Late blight severity score explained the tuber yield variations as less than 31% and at most 80% across environments with average of 66.1% over locations. This was very high for the single factor contribution to tuber yield and it suggested the impossibility of attaining notable progress in tuber yield without incorporating resistance to late blight in potato varieties. Late blight is the most serious fungal disease, occurs almost everywhere and if not controlled, losses may reach 100 percent (Henfling, 1987). In highland areas of Ethiopia, late blight disease cause potato production loss estimated up to 70% (Mekonen et al., 2011). This fact was also observed in this study by the inverse relation of tuber yield and late blight severity score in percent. The general trend of potato improvement as evaluated from average annual rate of gain in percent for tuber yield and late blight resistance could be considered as high in the country for a quarter of a century. On the other hand, highly significant differences were among varieties for tuber yield and late blight resistance due to environment/location and genotype x environment/location interaction. The annual gain rates of varieties and percent annual genetic gain across environment/locations varied for tuber yield and late blight resistance. Only few varieties developed by three centers consistently performed better for both traits. Majority of varieties (10 out of 16 varieties) had disease score >40% which can be considered as susceptible at disease hot spot area (Haramaya). If genotypes are performing differentially at different environments, it is possible to increase genetic gains in yield from narrowing the environment(s) favourable the varieties and thus maximizing yield in particular areas by exploiting genotype x environment interaction (Teferi, 2009; Dixon et al., 1991). This supported the current potato breeding approach where each research center is developing varieties for their respective agro-ecology for which they are responsible and located. But, the susceptibility of the majority of the varieties for late blight at environment favorable for the pathogen showed either the appearance of new race of the pathogen (A2 type) because it is not restricted to one region (Drenth et al., 1995, Goodwin and Sujkowski, 1995) and can be dispersed anywhere in the country. On the other hand, varieties might loose resistance due to the ability of P. infestans to rapidly evolve to overcome resistance major genes (Stewart et.al., 2003, Wastie, 1991) and the new aggressive race of the pathogen can be distributed throughout the country. Varieties might also carry varying number of R-genes, but they were all considered as resistant in the absence of the races or where the environment was not favored the pathogen (Beukema and Van Der Zaag, 1979). But, either the environment is becoming favourable for the pathogen or the races are introduced in the region, the varieties that showed susceptible reaction to the pathogen will not be considered for cultivation unless other disease control measures are employed. Demand is in progress for varieties for large scale production, export and specific processing industries. The evolution of new virulent pathogen races, changing market and end-user demands with larger target areas force breeders to consider a wider range of production constraints, multiple traits and make heavy investments in breeding. The country cannot afford the required huge investment and skill human power for the existing potato breeding approach (development of varieties for different agroecologies) to match the changing cropping scenarios and economics of production. This demands a dynamic cooperation among scientists in the country for complementary efforts to achieve essential operational sizes; draw sound hypotheses and strategies that can be translated into breeding objectives. This includes testing of germplasm across a wide range of environments, exchange information among researchers and develop wide adaptable varieties for all desirable traits.
5. Summary and Conclusion The understanding of the changes produced by plant breeding on potato tuber yield and yield determinants (mostly late blight), through the study of the behaviour of cultivars released at different times is important. Because it is a useful tool to define and suggest future selection criteria and future breeding approach in the country. This research was conducted for the first time in the country aiming to examine the genetic improvement of potato tuber yield and reduction of late blight severity through successive development and release of varieties for the last 25 years. The research revealed progressive improvement of the crop over years in the country for tuber yield and reduction of late blight severity. Potato improvement achieved highest annual rates of gain in percent for tuber yield and late blight resistance (>1.7%), because raising the rate

32nd Annual Research and Extension Review Proceeedings, March 2015, Haramaya University
56
of genetic gain from 1% to more than 2% annually for a quarter of a century is a key component of agricultural transformation. The change in tuber yield was associated with changes in lower late blight severity score with changing of scores across environments in different varieties. Susceptibility of most of the varieties for late blight in the environment which was favourable for the pathogen and few varieties performed better for tuber yield and late blight resistance across environments. This suggested the need to change the existing potato breeding approach that depends on separate efforts of breeders to develop varieties for specific agro-ecologies and local consumption (traditional meals). This call for the joint and nationally coordinated efforts of researchers to develop wide adaptable varieties that match the changing market and end-user demands, economics of scale and the evolution of new virulent pathogen races for larger target areas.
6. References Baye, B., and Gebremedhin, W. 2013. Potato research and development in Ethiopia achievements and trends. In: Gebremedhin, W., Schulz, S.
and Baye, B. (eds.) Seed Potato Tuber Production and Dissemination: Experiences, Challenges and Prospects. Proceedings of the National Workshop on Seed Potato Tuber Production and Dissemination, 12-14 March 2012, pp. 35-38, Bahir Dar, Ethiopia.
Belay, S. C., Wortman, W. and Hoogen, B.G. 1998. Haricot bean agro-ecology in Ethiopia: definition using agro-climatic and crop growth stimulation models. African . Crop Science Journal 6: 9-18.
Beukema, H. P. and De Van Der Zaag. 1979. Potato Improvement, Some Factors and Facts. International Agricultural Centre, Wageningen, the Netherlands.
Briggs, F. N., and Knowles, P. F. 1985. Introduction to Plant Breeding. University of California, Davis, California, U.S.A. CIP (International Potato Center). 2006. Procedures for standard evaluation trials of advanced potato clones. An International Cooperators‘
Guide. pp. 41 - 54. CSA (Central Statistical Agency). 2011. Agricultural sample survey: Report on area and production of crops, Addis Abeba, Ethiopia, p. 126. Dixon, A. G. O. and E. N. Nukenine, 1997. Statistical analysis of cassava yields with the additive main effects and multiplicative interaction
(AMMI) model. African Journal of Root and Tuber Crops 3:46-80. Drenth, A., E. M. Janssen and F. Govers, 1995. Formation and survival of oospores Phytophthora infestans under natural condit ions. Plant
pathology 44 (1): 86 - 94. Elfinesh F. 2008. Processing quality of improved Potato (Solanum tuberosum L.) varieties as influenced by growing environment, genotype and
blanching. An M. Sc. Thesis submitted to the school of graduate studies of Haramaya University, Ethiopia. Endale, G., Gebremedhin, W., and Lemaga, B. 2008. Potato seed management. In W. Gebremedhin, G. Endale, and B. Lemaga (eds), Root and
Tuber Crops: The untapped resources. pp. 53–78, Institute of Agricultural Research., Addis Abeba: Ethiopian Falconer, D. S. and Mackay, T. F. C. 1996. Introduction to Quantitative Genetics 4th ed. Longman Group Limited, Malaysia. FAO (Food and Agriculture Organization). 2008. Potato World: Africa International Year of the Potato 2008. Available at
http://www.potato2008.org/en/world/africa.html.(Accessed....) Flis, B., Domański, L.,Zimnoch-Guzowska, E., Polgar, Z., Pousa, S. Á., and Pawlak, A. 2014. Stability analysis of agronomic traits in potato
cultivars of different origin. American. Journal of Potato Research.13: 9364 - 9366. Gebremedhin, W. 2013. Potato variety development strategies and methodologies in Ethiopia. In: W. Gebremedhin, S. Schulz and B. Baye
(eds.). Seed potato tuber production and disseminations, experiences, challenges and prospects. pp.45 – 59. Ethiopian Institute of Agricultural Research and Amhara Region Agriculture Research Institute, 12 - 14 Mach 2012, Bahir Dar, Ethiopia.
Gildemacher, P. R., W. Kaguongo, O. Ortiz, A. Tesfaye, W. Gebremedhin , W. W. Wagoire, R. Kakuhenzire, P. M. Kinyae, M. Nyongesa, P. C. Struik and C. Leeuwis, 2009. Improving potato production in Kenya, Uganda and Ethiopia: A System Diagnosis. Potato Research 52: 173 - 205.
Gomez, K. A. and Gomez, A. A. 1984. Statistical Procedures for Agricultural Research. 2nd edition. International Rice Research Institiute (IRRI). John Wiley and Sons, Inc., New York. 680pp.
Goodwin, S. B., Sujkowski, L. S., Dyers, B. A., Fry, A. T., and Fry, W. E. 1995. Direct detection of gene few and probable sexual reproduction of Phytophthora infestans in northern North America. Phytopathology 85 (4): 473 - 479.
Henfling, J. W. 1987. Late blight of potato, Phytophthora infestans Technical information bulletin 4.CIP, Lima, Peru. Horton, D.1987.Potatoes: Production, Marketing, and Program for Developing. West vies Press. Boulder.pp.243. Available at
http://www.cropscience.org.au/icsc2004/copyright.htm. HURC (Haramaya University Research Centre), 1996. Proceedings of the 13th annual Research and extension review meeting. pp. 26 - 28. Kyamanywa, S., Kashaija, I., Getu, E., Amata, R., Senkesha, N., and Kullaya, A. 2011.Enhancing Food Security through Improved Seed
Systems of Appropriate Varieties of Cassava,Potato and Sweetpotato Resilient to Climate Change in Eastern Africa. ILRI , Nairobi, Kenya,.
Lung‘aho, C., Lemaga, B., Nyongesa, M., Gildermacher, P., Kinyale, P., Demo, P. and Kabira, J. 2007. Commercial seed potato production in eastern and central Africa. Kenya Agricultural Institute. pp.140.
Mateo, A., Hinojosa, C., Margarita, D. V., Remigio, A., Guzm, P., Sylvia, F. P., and Niklaus, J. G. 2007. Late blight resistance of five Mexican potato cultivars in the Eastern Sierra of the State of M xico. Amer Journal of Potato Research. 84 :385 - 392.

32nd Annual Research and Extension Review Proceeedings, March 2015, Haramaya University
57
Mekonen, S., Alemu, T., Kassa, B., and Forbes, G. 2011. Evaluation of contact fungicide sprays regimes for control of late blight (Phytophthora infestans) in southern Ethiopia using potato cultivars with different levels of host resistance. Tropical Plant Pathology 36: 21 - 27.
MoA (Ministry of Agriculture). 2012. Animal and Plant Health Regulatory Directorate Crop Variety Register Issue No. 12, pp.37 & 38. Addis Ababa, Ethiopia.
MoA (Ministry of Agriculture). 2013. Plant Variety Release, Protection and Seed Quality Control Directorate, Crop Variety Register Issue No.1 6, pp.161 - 164. , Addis Abeba, Ethiopia.
Mulema, J.M.K., Adipala, E., Olanya, O.M., and Wagoire, W. 2008. Yield stability analysis of late blight resistant potato selections. Experimental Agriculture 44: 145 - 155.
Mulugeta, G., and Dessalegn, Y. 2013. Genotype by environment interaction analysis for tuber yield of potato (Solanum tuberosum L.) using a GGE biplot method in Amhara Region, Ethiopia. International Journal of Applied Sciences and Engineering Research 2 : 31 - 40.
Nebret Tadesse, 2011. The effect of Nitrogen and Sulfer on yield and yield component of common bean in Eastern Ethiopia. Unpublished M.Sc. Thesis presented to the school of graduate studies of Haramaya University, p.25.
Pankhurst, R.1964. Notes for a history of Ethiopian agriculture. Ethiopian Observer, 7: 210 - 240. SAS (Statistical Analysis Software), 2007. Stat. Jahrbuch tuber Ernahrung, Landwirtschaft und Forsten In German, Landwirtschaftsverlag
Munster-Hiltrup, Germany, 2008. Simret, B. 2010. Influence of inorganic nitrogen and potassium fertilizers on seed tuber yield and size distribution of potato (Solanum
tuberosum L.). An M. Sc Thesis presented to the School of Graduate Studies of Haramaya University, Ethiopia. p.65. Singh, R. K. and Chaudhary, B. D. 2007. Biometrical Methods in Quantitative Genetic Analysis (revised edition). Kalyani Publishers, New Delhi-
Ludhiana, India. 318pp. Stewart, H. E., Bradshaw, J. E., Pande, B. 2003. The effect of the presence of R-genes for resistance to late blight (Phytophthora infestans) of
potato (Solanum tuberosum) on the underlying level of field resistance. Plant Pathology 52: 193 - 8. Teferi, A. 2009. Genotype x Environment Interaction and Stability in Upland Rice Varieties in North Western Ethiopia. A M.Sc. (Unpublished
MSc. Thesis), Haramaya University. Ethiopia. Pp .3 - 17. Tekalign, T. 2011.Genotype x environmental interaction for tuber yield, dry matter content and specific gravity in elite tetraploid potato
(Solanum tuberosum L.) genotypes. East Africa Journal of Sciences 5 (1): 1 - 5. Wastie, R. L. 1991. Phytophthora infestans, the cause of late blight of potato. In: D. S. Ingram and D.S. Williams (eds.) Breeding for Resistance,
Advances in Plant Pathology, 7. pp 193 - 224. Academic Press Ltd, London.

32nd Annual Research and Extension Review Proceeedings, March 2015, Haramaya University
58
7. Genetic Variability in Potato (Solanum tuberosum L.) Genotypes for Late blight [Phytophthora infestans (Mont.) de Bary] Resistance and Yield at Haramaya, Eastern Ethiopia Wassu Mohammed Haramaya University, School of Plant Sciences, P O Box 138, Dire Dawa, Ethiopia Author Email: [email protected]
Abstract: Late blight (Phytophthorainfestans de Bary) is the most important and destructive disease of potato (Solanumtuberosum L). The pathogen has the ability to rapidly evolve and overcome resistance genes, leading commercial potato varieties to succumb to the disease. Therefore, evaluation of commercial varieties for resistance should not be a one time task, but a routine breeding activity. This study was, therefore, conducted to determine the genetic variability of potato varieties in terms of resistance to the late blight and yield potential at Haramaya in 2013/14 cropping season under natural epiphytotic conditions. A total of 21 potato genotypes (Alemaya 624, Araarsaa, Belete, Bubu, Bulle, Chala, Chiro, CIP-384321/3A, CIP-384321/3B, Gabbisa, Gera, Gorebela, Guasa, Gudanie, Jalanie, Jarso, Mara Charre, Moti, and Zemen) were evaluated using a randomized complete block design (RCBD) with three replications. The genotypes showed highly significant (P<0.01) differences in reaction to the disease (disease intensity, severity, score and AUDPC) and yield potential. Only three varieties (Bubu, Belete and Bulle) were found to be resistant to the disease, with the other three varieties (Gera, Araarsaa and Mara Charre) being moderately resistant. High broad sense heritability (H2) (47.78 to 91.02%) and genetic advance in percent mean (GAM) (58.87 to 96.31%) were computed for both disease and yield parameters. High genotypic and phenotypic variances were recorded with low magnitude of differences for all parameters, and the environmental variance was much lower than the two other variances. Strong and positive genotypic and phenotypic correlations were observed among the disease score parameters and unmarketable tuber yield while strong and negative correlations were observed between disease score and the two yield parameters (total and marketable tuber yields). This indicated that the traits are highly heritable with the involvement of more additive gene action and are amenable for selection. The dendrogram of the 21 potato genotypes using Unweighted Pair-group Method with Arithmetic means (UPGMA) analysis and Euclidean distances separated the genotypes into three clusters and four sub-groups where resistant, moderately resistant, and high yielding varieties were grouped into the first cluster while all susceptible and low yielding genotypes were grouped under Cluster III. The resistant varieties were found to be the most distant from many of the genotypes but were closer to each other. However, genetic similarities were observed among the susceptible genotypes. The presence of genetic variability and the high heritability, coupled with high genetic gain of the traits, suggest the potential of improving for disease resistance and yield through selection. The study also suggests utilization of the identified resistant varieties for producing the crop. However, sustaibable production of thes varieties is unlikely since the disease rapidly evolves to overcome the resistance genes of the plant, impying that integrated management of the diasease is the most practical option.
Keywords: AUDPC (Area under Disease Progress Curve); Broad sense heritability; Euclidean distance; Genetic distance; Genetic variability; Varieties
1. Introduction Potato (Solanum tuberosum L.) is one of the most widely grown food crops after the three cereals viz., maize, rice and wheat (Vleeshouwers et al., 2011). In Eastern Africa, potato is the best crop for food and nutrition security where food security is a key priority for the over 200 million people whose number is predicted to double by 2030 (Kyamanywa et al., 2011). Under such increasing pressure on the fixed land, increasingly degraded environment and uncertainties resulting from climate change, producing crops like potato with high plasticity to environmental regimes and higher yield per unit area is indispensable. However, existing climate change may also increase the risk of epidemic disease development for potato production particularly of late blight of potato which may result in yield reductions (Baker et al., 2005; Hijmans, 2003). Late blight [Phytophthorainfestans (Mont.) de Bary] affects all parts of the crop and can destroy a potato field within a few days (Razukas et al., 2008). Late blight is not only the most serious fungal disease, but it also occurs almost everywhere where potatoes are grown and is especially important in the traditional potato growing areas. If not controlled, losses may reach 100 percent (Rubio-Covarrubias et al., 2005) and even lower infection levels may make the crop unfit for storage (Henfling, 1987). In the highlands of Ethiopia, late blight and bacteria wilt (Ralstoniasolanacearum) are the most important economic diseases that cause an estimated yield loss of up to 70% (Mekonen et al., 2011). Host resistance is the best control measure as compared to fungicide spray since the latter is expensive while the former is more economical and environmentally sustainable. Potato breeding for resistance to late blight has been going on worldwide for several decades. Despite this effort, the majority of commercially grown potato varieties succumb to to late blight too soon. In the early 1900s, potato breeders successfully introgressed resistance from wild species (Solanum demissum Lindl.) into the cultivated potato. However, this major gene resistance was quickly overcome by P. infestans (Wastie, 1991). Subsequently, a total of 11 major dominant resistance genes (R genes) were identified, but these genes

32nd Annual Research and Extension Review Proceeedings, March 2015, Haramaya University
59
have been defeated by P. infestans. Even so, there is some evidence that they may be useful when combined with other sources of resistance (Stewart et al., 2003). In Ethiopia, 30 potato varieties have been released by the research system since 1987; however, considerable number of varieties have become susceptible to late blight and, hence, gone out of production (Gebremedhin, 2013). However, no attempt has yet been made to assess the variability of potato varieties released in the country for resistance to late blight. The varieties are merely described as resistant or moderately resistant in the variety registry books (issued by the Ministry of Agriculture) as observed at the time of the release. This is because i) the varieties were tested for late blight resistance and released by different research centers at different times for different agro-ecological areas of the country; ii) the varieties may not show differential resistance for they carry different R-genes which confer resistance in the absence of virulent races of the pathogen and environment favourable to the pathogen; iii) each center maintains a portion of the released varieties for its geographic area; iv) centers are located at different agro-ecologies which may not equally favor all races at same cropping season or v) there may be a race change, i.e., the presence of A2 type of the pathogen because this race is dispersed worldwide and not restricted to temperate region (Drenth et al., 1995, Goodwin et al., 1995). Researchers in Ethiopia obtained the germplasm for selection in the form of advanced clones, tuber families, and true potato seed. The variations were generated by crossing different genotypes and selfing the heterozygotes at International Potato Center (CIP) in Peru. (Gebremedhin et al., 2008). Most of the potato varieties that have been released before 2008 possessgenes for either vertical resistance or horizontal resistance to late blight in the presence of unknown resistance major R genes (Gebremedhin, 2013). Earlier genetic analyses demonstrated that 11 known R genes introgressed from Solanum demissum (Black et al., 1953). The clustering of functional genes for qualitative and quantitative resistance to various pathogens suggests their evolution from common ancestors by local gene duplication, followed by functional diversification (Gebhardt and Valkonen, 2001; Oberhagemann et al., 1999; Leister et al., 1996; Leonards-Schippers et al., 1994). Therefore, varieties released in Ethiopia for different agroecologies at different periods, carrying different genes for resistance and tested at different environments, are expected to have wide genetic variations. However, genetic variability study has not been conducted to estimate the extent of the variations and genetic distance among the released potato varieties in the country. In addition, the late blight disease of potato has mutable features so that it can overpass any resistance. When limited potato cultivars are used for resistance against it, the disease can violate large potato cultivar groups in different years. As a result, potato cultivars described as resistant to Phytophtora infestans today might not be resistant in subsequent season (Song et al., 2003). Therefore, analyzing the late blight resistance helps to determine differences in disease development not only between various susceptibility potato cultivars, but also to find differences in the same potato cultivar every separate research year (Razukas et al., 2008). A group of scientists have opinion that it is necessary to apply few methods for potato cultivars evaluation for susceptibility to the late blight such as testing of all cultivars in area where the environment favours the pathogen (Lee et al., 2001).Therfore, it is believed that potatoes meant for breeding programs have to be tested not only under field conditions with the natural late blight infection, but also in the laboratory making artificial infection settings (Asakaviciute et al., 2006; Razukas and Jundulas, 2005). This is because, in the case of selection for stress conditions, the genotype x environment interaction is of basic importance and the breeder is greatly challenged. Therefore, for stress conditions, direct selection is more effective in the same environment than selection for the mean of both favorable and unfavorable environments (Kirigwi et al., 2004; Cecarelli et al., 1998; Calhoun et al., 1994). Specifically, it is better to conduct studies on genetic variability of potatoes for late blight resistance in one environment where conditions favour the pathogen. Potato late blight occurs when meteorological conditions are suitable (Hansen et al., 2005). The majority of released potato varieties in the country were planted at Haramaya in 2013/14 cropping season when the environmental conditions were luckly most favourable for the occurrence of the disease, which created a good opportunity for evaluating the varieties for resistance to late blight. Therefore, this study was conducted to determine the degree of resistance to late blight by potato varieties realeased in Ethiopia and to elucidate their genetic variability in terms of resistance to the disease and yield potential.
2. Materials and Methods 2.1. Description of the Study Site A field experiment was conducted under rain-fed condition during the 2013/14 main cropping season at the research field of Haramaya University on the main campus. The research site is located at 9 o26' N latitude, 42 o3' E longitude and at an altitude of 2022 meters above sea level. The mean annual rainfall is 760 mm (Belay et al., 1998). The mean maximum and minimum annual temperatures are 23.4°C and 8.5°C, respectively (Tekalign, 2011). The mean relative humidity is 50%, varying from 20 to 81%. The soil of the experimental site is a well-drained deep alluvial soil with a sub-soil stratified with loam and sandy loam (Tamire, 1973). The soil has pH of 8.0, organic carbon, total nitrogen, available phosphorus, and exchangeable potassium contents of 1.15%, 0.11%, 18.2 mg kg soil-1, 0.65 cmolc kg soil-1, respectively ((Simret, 2010). 2.2. Experimental Materials and Design A total of 21 potato genotypes i.e. seven potato varieties, which were released by Haramaya University at different times for eastern Ethiopia, 10 potato varieties, which were released by different Research Centers for different agro-ecologies of the country, two local cultivars susceptible to late blight and two potato genotypes which are under yield trial were used for the experiment (Table 1). Two farmers‘ cultivars (Jarso and Batte) which are known to be susceptible to late blight were used as control plants. The oldest or the first released variety (Al-624) in the country and recently released variety (Moti) were used as having one and more than one resistant genes (R-genes), respectively, which were used

32nd Annual Research and Extension Review Proceeedings, March 2015, Haramaya University
60
to compare other varieties with the oldest and most recently released ones. Other varieties are under cultivation throughout the country and they were evaluated as resistant and moderately resistant to late blight at time of their release in different years. The experiment was laid out as a Randomized Complete Block Design (RCBD) where each genotype was replicated three times. Each plot was 3.60 m x 4.50 m (16.2 m2) consisting of six rows, that contained a total of 12 plants per row and 72 plants per plot. The spacing between plots and adjacent replications were 1.0 and 1.5 m, respectively. Medium-sized and well sprouted potato tubers were planted at the spacing of 75 cm between rows and 30cm between plants. All agronomic practices were applied as per the recommendation made by the Haramaya University for the region. Table 1. Name, accession code, year of release, and yield potential under researchers‘ and farmers‘ management practices, maintainer center of potato varieties and recommended growing altitude.
No.
Variety or genotype Accession code
Year of release
Yield (t/ha) Breeding Center
Recommended Altitude (m.a.s.l.) RM FM
1 Moti KP-90147-41 2012 4.27-7.98 3.35-6.496 Sinnana Research Center 2350-3350 2 Bubu CIP-384321-3 2011 39-42 35-39 Haramaya University 1700-2000 3 Belete CIP-393371.58 2009 47.2 28-33.8 Holeta Research Center 1600-2800 4 Araarsaa CIP-90138.12 2006 20-42 37-50 Sinnana Research Center 2400-3350 5 Gudanie CIP-386423.13 2006 29.0 21 Holeta Research Center 1600-2800 6 Mara Charre CIP-389701-3 2005 33.3 28.4 Hwassa Research Center 1700-2700 7 Gabbisa CIP-3870-96-11 2005 40.0 31 Haramaya University 1700-2000 8 Bulle CIP-387224-25 2005 39.3 38.3 Haramaya University 1700-2000 9 Chala CIP-387412-2 2005 42.0 35 Haramaya University 1700-2000 10 Gera KP-90134.2 2003 25.9 ----- Sheno Research Center 2700-3200 11 Jalanie CIP-37792-5 2002 40.3 29.10 Holeta Research Center 1600-2800 12 Guasa CIP-384321.9 2002 24.4-33.0 22-25 Adet Research Center 2000-2800 13 Gorebela CIP-382173.12 2002 30-52 26-30 Sheno Research Center 1700-2400 14 Badhasa AL-114 2001 40.6 ----- Haramaya University 2400-3350 15 Zemen AL-105 2001 37.2 ----- Haramaya University 1700-2000 16 Chiro AL-111 1998 32-40 25-35 Haramaya University 2700-3200 17 Alemaya 624 Al-624 1987 ----- ----- Haramaya University 1700-2400 18 Batte Local cultivar ----- ----- ----- East Hararghe 19 Jarso Local cultivar ----- ----- ----- East Hararghe 20 CIP-384321/3A ----- ----- ----- Under yield trial 21 CIP-384321/3B ----- ----- ----- Under yield trial
Source: MoA, 2013 and 2012. Varieties with initial AL are the old potato genotypes (before 1987) maintained by Haramaya University; varieties with initial CIP are materials introduced from International Center for Potato, Peru after the first release of potato varieties in the country (1987) and varieties with KP initial are introductions other than from CIP.

32nd Annual Research and Extension Review Proceeedings, March 2015, Haramaya University
61
Table 2. Assessment of late blight severity under field conditions (%) (Henfling, 1987).
Phytophthora infestans (%) Symptoms Average Boundaries
0 0 P. infestans not observed 2.5 Trace < 5 P. infestans present. Maximum 10 injuries per plant 10 5 < 15 Plants seem to be healthy, but injuries can be easily observed. There are no more than 20 affected leaves 25 15< 35 P. infestans is easily observed on the plants. About 25% of the leaf area is affected. 50 35< 65 Plants look green, but each one is affected by the pathogen, lower leaves are necrotic. About 50% of the leaf
area is destroyed. 75 65< 85 Plants look green with brown spots. About 75% of the leaf area is affected. Leaves in the middle of the plant
are destroyed 90 85< 95 Only upper leaves are green. Most of leaves are affected and many stems have external injuries 97.5 95< 100 Plants look brown, a few upper leaves are green and most of the stems are affected or dead 100 Leaves and stems are destroyed
2.3. Data Collection and Analysis 2.3.1. Disease assessment and yield data collection Disease assessment began on 30 August 2013, i.e., 46 days after planting as soon as disease symptoms appeared on susceptible genotypes and then carried every 20 days until the majority of the genotypes attained physiological maturity. Disease incidence and intensity were assessed following CIP (2006) guideline and other established procedures described below. Area under the Disease Progress Curve (AUDPC) was also calculated from disease intensity recorded at different fixed date intervals. Disease assessment was done by the same three evaluators without knowing the value given at the previous reading. The total tuber yield of each genotype was taken from plants in the four middle rows. Tubers were carefully collected after the hills were dug by hand. The collected total tubers in each plot were weighted and converted to tons per hectare. Tubers which were free from diseases, insect pests, and greater than or equal to 20 g in weight were sorted, and weighed for each plot and converted as marketable yield (t ha-1). The remaining tubers (diseased, insect-attacked and small-sized, i.e.< 20 g) were recorded as unmarketable tuber yield (t ha-1). Assessment of the severity of late blight under field conditions in percent was recorded on plot basis taking into account the number of plants developing disease symptoms in a leaf and/or many leaves and plants free from disease following the procedures of Henfling (1987). Disease intensity (percent severity index) was recorded on the basis of the percentage of leaf area affected by late blight and calculated for each disease assessment as follows.
Late blight intensity % =Summation of numerical rating
No .plants examined ×Maximum disease score× 100 1
The intensity of foliar blight that was expressed in percent of the infected leaf area was used for the disease rating scale as suggested by Mohan and Thind (1999). Depending on the final record of disease intensity (%), the genotypes were classified as resistant, moderately resistant, and susceptible as per the scale (Anonymous,1997) (Table 3). The area under disease progress curve value (AUDPC) was calculated using the following formula (Campbell and Madden, 1990) and it was interpreted directly without transformation as the higher the AUDPC, the more susceptible is the genotype (CIP, 2006).
AUDPC = ii
n
i
ii ttyy
1
1
1 2
1
2
Where ―t‖ is the time of each reading, ―y‖ is the percent of affected foliage at each reading and ―n‖ is the number of readings. The variable ―t‖ can represent Julian days, days after planting.
Table 3. Disease score and description, intensity (%), and resistance category.
Disease Score Score description in terms of foliage infected (%)
Disease intensity (%) Category
0 No visible symptoms Up to 5 Highly Resistant 1 1-10 5-20 Resistant 2 11-25 21-40 Moderately Resistant 3 26-50 Above 40 Susceptible 4 51-75 5 >75

32nd Annual Research and Extension Review Proceeedings, March 2015, Haramaya University
62
2.3.2. Data analysis Data for AUDPC, disease score, severity, and intensity and yield parameters were subjected to analysis of variance (ANOVA). Least significant difference (LSD) at 5% probability) was used to compare the means of the evaluated genotypes. The phenotypic and genotypic variance and coefficients of variation were estimated according to the methods suggested by Burton and Devane (1953). Heritability (H2) in broad sense was computed using the formula adopted by Allard (1960) and Falconer and Mackay (1996) as: H2 = [2g/ 2p] x 100, where,2g=genotypic variance, 2p= phenotypic varianceand 2e= error variance. Genetic advance (GA) for each trait was computed using the formula adopted by Johnson et al., (1955) and Allard (1960) as:
GA= (k) (2p) * (H2), and GA (as % of the mean) = GA
X x100 3
Where, k= selection differential (k=2.06 and 1.76 at 5% and 10%, respectively, selection intensity),2p= phenotypicstandard deviation, H2= heritability in broad sense andx=grand mean. Phenotypic and genotypic correlations between tuber yield and genotype resistance traits were estimated using the method described by Miller et al. (1958). Genetic distance of genotypes was estimated using Euclidean distance (ED) calculated from the seven disease score and yield traits of 21 potato genotypes after standardization (subtracting the mean value and dividing it by the standard deviation) as established by Sneath and Sokal, (1973) as follows:
EDjk = 22
1
n
i
XikXij
4
Where, EDjk = distance between clones j and k; xij and xik= disease score and yield traits mean values of the ith character for genotypes j and k, respectively; and n= number of traits used to calculate the distance. The distance matrix from disease score and yield traits was used to construct dendrograms based on the Unweighted Pair-group Method with Arithmetic means (UPGMA). The results of the cluster analysis were presented in the form of dendrogram. In addition, mean average distance (ED) was calculated for each genotype by averaging the distance of a particular potato genotype over the other 20 genotypes. The calculated average distance was used to estimate which potato genotype is closest or distant to the others.
3. Results 3.1. Analysis of Variance and Mean Performance of Genotypes Analysis of variance computed for seven late blight disease score and tuber yield parameters of 21 potato genotypes is presented in Table 4. The analysis of variance indicated highly significant (P<0.01) variation among genotypes for all traits. The disease severity computed for each evaluation day and the last evaluation ranged from 14 to 100% (Table 6). The two farmers‘ cultivars (Batte and Jarso) and the two released varieties; Chiro and Zemen (old varieties, released in 1998 and 2001 next to the first released variety) were evaluated as the most susceptible genotypes with 100% disease severity. The lowest disease severity (14%) was recorded for three varieties, namely, Bubu, Belete and Bulle of which the former two were released as recently as in 2011 and 2009 while the third variety was released in 2005. Disease severity for the other three varieties, namely, Gera, Mara Charre and Araarsaa was calculated as 29% (Table 6). Table 4. Mean squares from analysis of variance (ANOVA) for yield and late blight as evaluated in 2013/14 cropping seasons at Haramaya.
Traits Replication (2) Genotype (20) Error (40) SE CV (%)
Disease severity (%) 213.27 2145.98** 68.32 8.27 16.4
Disease intensity (%) 169.44 2142.90** 73.61 7.01 16.1
Disease score 0.4286 3.83** 0.312 0.56 16.8
AUDPC 135887 2148278** 73263 270.70 20.5
TTY t ha-1 69.99 212.50** 23.05 4.80 20.3
MTY t ha-1 68.06 269.72** 20.06 4.48 22.5
UNMTY t ha-1 0.464 9.629** 1.571 1.60 23.2
** =Significant at P<0.01;numbers in parenthesis indicates degrees of freedom; SE= standard error; CV (%)= coefficient of variation in percent;AUDPC= area under the disease progress curve;TTY t ha-1 = total tuber yield tons per hectare; MTY t ha-1 = marketable tuber yield tons per hectare; UNMTY t ha-1 = unmarketable tuber yield tons per hectare.

32nd Annual Research and Extension Review Proceeedings, March 2015, Haramaya University
63
Table 5. Mean disease severity, score, AUDPC and tuber yield (t ha-1) of 21 potato genotypes as evaluated in 2013/14 cropping season at Haramaya.
Genotype Disease severity (%)
Disease score AUDPC TTY t ha-1 MTY t ha-1 UNMTY t ha-1
Moti 51cd 3bc 1788de 9.48i 5.04k 4.44bcde Bubu 13hi 2c 225j 35.56ab 33.48ab 2.07ef Belete 13hi 2c 225j 28.74bcd 27.26bc 1.48f Araarsaa 27fgh 3bc 507ij 24.3def 22.81cde 1.48f Gudanie 40def 3bc 704ghi 38.52a 35.85a 2.67def Mara Charre 30efg 2c 736ghi 25.18de 20.15cdefg 5.04abcd Gabbisa 50cd 3bc 1146fg 21.93defg 14.81fghij 7.11a Bulle 10i 1cd 125j 25.78de 21.63cdef 4.15bcde Chala 70b 4b 1955cd 26.07de 22.52cde 3.56def Gera 25gh 2c 544hij 28.44bcd 24.59cd 3.85cdef Jalanie 62bc 4b 1535def 16.59fghi 13.33ghij 3.26def Guasa 67b 4b 1546def 15.41ghi 9.19jk 6.22abc Gorebela 48cd 3bc 1133fg 19.26efgh 17.78defgh 1.48f Badhasa 69b 4b 1445ef 23.11defg 16.59efghi 6.52ab Zemen 87a 5a 2341bc 16.89fghi 11.85hijk 5.04abcd Chiro 95a 5a 2761ab 17.19fghi 13.93ghij 3.26def Alemaya 624 50cd 3bc 957gh 27.26cd 24.59cd 2.67def Batte 87a 5a 2553ab 11.26i 5.04k 6.22abc Jarso 95a 5a 2994a 13.93hi 10.07ijk 3.85cdef CIP-384321/3A 30efg 3bc 993g 34.37abc 32.89ab 1.48f CIP-384321/3B 42de 3bc 1498ef 37.33a 35.26a 2.07ef LSD (5%) 13.64 0.9216 446.7 7.922 7.392 2.646
Means followed by the same letter with in a column are not significantly different at 5% level of significance; AUDPC= area under the disease progress curve;TTY t ha-1 = total tuber yield tons per hectare; MTY t ha-1 = marketable tuber yield tons per hectare; UNMTY t ha-1 = unmarketable tuber yield tons per hectare. The varieties were grouped according to their year of release and their disease severity was compared with the mean of the two farmers‘ cultivars and the variety released for the first time in the county (AL-624 in 1987), which is the oldest variety. All genotypes except Chiro and Zemen had reduced disease severity varying from 10 to 86% as compared to the two farmers‘ cultivars. When the genotypes were compared to the oldest variety, only eight genotypes had lower disease severity. Among the varieties released from 2003 onwards, only Chala and Moti had higher disease severity than the oldest variety (Table 6). Based on the calculated AUDPC, the five varieties, namely, Bulle, Bubu, Belete, Araarsaa and Gera had the lowest AUDPC ranging from 125 to 544 while the others had the highest range, i.e., 704 to 2994. None of the genotypes had a disease score 1 except Bulle. Only four varieties (Bubu, Belete, Araarsaa and Gera) had a disease score of 2 and the remaining ones had a score of 3 and above (Table 5). The mean marketable tuber yield ranged from 5.04 to 35.85 t ha-1 (Table 5). The highest total tuber yield was recorded for Gudanie (35.85 t ha-
1) and CIP-384321/3B (35.26 t ha-1) while the lowest marketable tuber yield (5.04 t ha-1) was obtained from Moti (released in 2012) and Batte (farmers‘ cultivar). The varieties which scored lower disease severity and AUDPC had also higher marketable tuber yields. The lowest unmarketable tuber yields were registered for Belete, Gorebela, Araarsaa and CIP-384321/3-A while the highest was recorded for Gabbisa (7.11 t ha-1) followed by Jarso (6.52 t ha-1), Badhasa (6.52 t ha-1), Batte (6.22 t ha-1), and Guasa (6.22 t ha-1).

32nd Annual Research and Extension Review Proceeedings, March 2015, Haramaya University
64
Table 6. Disease intensity (%) in four different disease assessments and disease resistant category of potato genotypes.
Genotype Days after planting Decrease/increase intensity (%) over
Disease resistance category
46 62 77 92 Farmers First released
Batte 14 38 90 100a Susceptible
Jarso 17 38 100 100a Susceptible Mean farmers 16 38 95 100
AL-624 1987 3 11 33 56c -44 Susceptible Chiro 1998 14 33 100 100a 0 44 Susceptible Zemen 2001 4 29 100 100a 0 44 Susceptible Badhasa 2001 0 14 38 67b -33 44 Susceptible
Mean (2001) 2 21.5 69 84 -16 44 Gorebela 2002 4 11 38 56c -44 0 Susceptible
Guasa 2002 1 14 56 90a -10 34 Susceptible
Jalenie 2002 4 14 56 61b -39 5 Susceptible
Mean (2002) 3 13 50 69 -31 13
Gera 2003 0 4 17 29e -71 -27 Moderately resistant
Chala 2004 4 33 61 67b -33 11 Susceptible
Bulle 2005 0 0 1 14f -86 -42 Resistant
Gabbisa 2005 4 11 38 56c -44 0 Susceptible
Mara Charre 2005 1 3 29 29e -71 -27 Moderately resistant
Mean (2005) 2 5 23 33 -67 -23
Gudanie 2006 0 4 17 38d -62 -18 Susceptible
Araarsaa 2006 0 4 14 29e -71 -27 Moderately resistant
Mean (2006) 0 4 15 34 -66 -22
Belete 2009 0 0 4 14f -86 -42 Resistant
Bubu 2011 0 0 4 14f -86 -42 Resistant
Mean (2010) 0 0 4 14 -86 -42
Moti 2012 4 21 76 90a -10 34 Susceptible
CIP-384321/3 A 1 11 38 42 42cd -58 -14 Susceptible
CIP-384321/3 B 4 14 56 90 90a -10 34 Susceptible LSD (5%) 14.16
3.2. Genetic Variability Components Genetic variability estimates including genotypic and phenotypic variances, phenotypic (PCV) and genotypic (GCV) coefficients of variation, heritability, and genetic advance as percent mean were computed for disease score and yield parameters (Table 7). The results of the study revealed the presence of considerable variations among genotypes for the seven parameters considered. The phenotypic variances were higher than the genotypic variances for all the traits studied. Although the phenotypic coefficients of variation were higher than the genotypic coefficients of variation, the differences were low in magnitude.

32nd Annual Research and Extension Review Proceeedings, March 2015, Haramaya University
65
Table 7. Variability components for late blight resistance and tuber yield parameters in 21 potato genotypes as evaluated in 2013/14 cropping season at Haramaya.
Traits Mean GV PV EV GVC (%) PCV (%) ECV (%) H2 (%) GAM (5%)
Disease severity (%) 60.4 692.55 760.87 68.32 43.57 45.67 13.68 91.02 85.63 Disease intensity (%) 53.4 689.76 763.37 73.61 49.18 51.74 16.07 90.36 96.31
Disease score 3 1.17 1.48 0.312 36.10 40.62 18.62 78.99 66.09 AUDPC 1980 691671 764934 73263 42.00 44.17 13.67 90.42 82.28 TTY t ha-1 23.65 63.15 86.20 23.05 33.60 39.26 20.30 73.26 59.25 MTY t ha-1 19.94 83.22 103.28 20.06 45.75 50.97 22.46 80.58 84.60 UNMTY t ha-1 3.71 2.35 4.92 2.571 41.34 59.81 43.22 47.78 58.87
GV = genetic variance; PV = phenotypic variance; EV = environmental variance; GCV = genotypic coefficient of variation; PCV = phenotypic coefficient of variation; ECV = environmental coefficient of variation; H2 = heritability in broad sense in percent; GAM (5%) = genetic advance in percent mean at 5% selection intensity; AUDPC= area under the disease progress curve;TTY t ha-1 = total tuber yield tons per hectare; MTY t ha-1 = marketable tuber yield tons per hectare; UNMTY t ha-1 = unmarketable tuber yield tons per hectare. High heritability in broad sense was computed for disease severity (91.02%), AUDPC (90.42%), disease intensity (90.36%), while relatively low heritability was estimated for unmarketable tuber yield (47.78%) and total tuber yield (73.26%). Similarly, the highest genetic advances as a percent mean (96.31%) was recorded for disease intensity while the lowest was recorded for unmarketable tuber yield (58.87). Among the yield parameters, marketable tuber yield exhibited higher heritability (80.58%) and genetic advance as a percent mean (84.6%). 3.3. Phenotypic and Genotypic Correlations According to the procedures for standard evaluation trials of advanced potato clones (CIP, 2006), correlation between yield and genotype resistance can be calculated if yield has been evaluated in addition to the AUDPC. In this study, genotypic correlation coefficients were computed in addition to phenotypic correlation coefficients to obtain better estimates of the associations between tuber yield and disease resistance (Table 8). Positive and highly significant (rg=0.96) genetic correlation was observed between late blight intensity and AUDPC, whereas the two disease scores had negative and highly significant (rg=-0.97) correlations with marketable tuber yield. The AUDPC exhibited significant but negative correlations with total tuber yield (rg=-0.66) and marketable tuber yield (rg=-0.58), but positive and significant correlation with unmarketable tuber yield (rg=0.62). In general, total and marketable tuber yield were negatively and highly significantly correlated with disease parameters, while unmarketable tuber yield was positively correlated. The two yield parameters also exhibited negative genotypic correlation with unmarketable tuber yield. Disease intensity showed positive and highly significantly phenotypic correlation with other disease parameters but highest with AUDPC (rp=0.96). Unmarketable tuber yield showed positive and significant phenotypic correlation with disease intensity while total and marketable tuber yield showed negative correlations. AUDPC also showed negative and highly significantly phenotypic correlation with total and marketable tuber yield (rp=-0.63). Table 8. Genotypic and phenotypic correlation coefficients above and below diagonal, respectively, for late blight and yield parameters in 21 potato genotypes as evaluated in 2013/14 cropping season at Haramaya.
Disease intensity Disease Incidence
Disease Score
AUDPC TTY t ha-1
MTY t ha-1
UNMTY t ha-1
Disease intensity 0.29* 0.43** 0.96** -0.64** -0.97** 0.58** Disease severity 0.32* 0.31* 0.96** -0.56** -0.55** 0.58** Disease Score 0.34* 0.32 0.38* -0.54** -0.57** 0.34**
AUDPC 0.96** 0.96** 0.35* -0.66** -0.58** 0.62**
TTY t ha-1 -0.32* -0.66** -0.58** -0.65** 0.89** -0.43**
MTY t ha-1 -0.54** -0.67** -0.57* -0.65** 0.91** -0.66** UNMTY t ha-1 0.59** 0.61** 0.48** 0.63** -0.53** -0.81**
* & ** =significant at P<0.05 and P<0.01, respectively. AUDPC= area under the disease progress curve, TTY t ha-1 = total tuber yield tons per hectare, MTY t ha-1 = marketable tuber yield tons per hectare, UNMTY t ha-1 = unmarketable tuber yield tons per hectare.

32nd Annual Research and Extension Review Proceeedings, March 2015, Haramaya University
66
3.4. Genetic Distance and Clustering of Potato Genotypes Genetic distances among the 21 potato genotypes were estimated using Euclidean distance (Table 9). Euclidean distance ranged from 0.71 (between Chiro and Jarso) to 7.23 (between Bubu and Batte) with a mean and a standard deviation of 3.43 and 1.47, respectively. Bubu and Belete were most distant from Zemen, Chiro, Batte and Jarso with Euclidean distance >6.07. Bulle was also most distant with Batte (6.6), Jarso (6.69), Chiro (6.44) and Zemen (6.1). On the other hand, Belete was close to Bubu, Gera, Bulle, Araarsaa and CIP-384321/3 A and Bubu exhibited closeness to Gudanie, Gera and CIP-384321/3 A with Euclidean distance of <2. Based on average Euclidean distance value, AL-624 (2.67) followed by Jalenie (2.86), Chala (2.87) and Gorebela (2.91) were closest to others while Batte (4.32) and Jarso (4.16) followed by Bubu (3.97), Bulle (3.92), and Chiro (3.92) were the most distant genotypes to others. The dendrograms from UPGMA cluster analysis based on ED matrixes are presented in Figure 1. When the dendrograms cut at 2, which is above the standard deviation of the genotypic distance, the tested potato genotypes were separated into three clusters (Cluster I, II and II). Cluster I, included five released varieties with sub-group I (Belete and Bubu) and sub-group II (Gera, Mara Charre and Bulle) while Cluster II comprised of one released variety (Gudanie) and the two genotypes (CIP-384321/3-A and CIP-384321/3-B) which are under yield trial. All the other genotypes were grouped in Cluster III with two big sub-groups viz., sub-group III and sub-group IV which consists of 5 and 8 genotypes, respectively. The four out of six old varieties (released by Haramaya University) were grouped in Cluster III sub-group IV with the two farmers‘ cultivars. In this sub-group, the most recently released variety (Moti) was also included. Sub-group III consists of the first potato variety released in the country and varieties released starting in 2002 to 2006. The first Cluster only included relatively recently released varieties (2005 to 2011) except one variety (Gera) which was released in 2003.
.

32nd Annual Research Bulletin, April 2015, Haramaya University
67
Table 9. Euclidean distance of 21 potato genotypic clones measured from seven late blight and tuber yield evaluation parameters and means Euclidean distance obtained by averaging each genotype distance to other 20 clones.
Genotype Bubu Gorebela Gudanie Guasa Gera Jalenie Chala Zemen Chiro Bulle Moti Batte Gabbisa Araarsaa Mara Badhasa Jarso AL-624
CIP-A CIP-B (3.68)
Belete(3.7) 1.09 2.78 2.30 5.35 1.55 4.03 4.04 6.07 6.13 1.87 5.06 6.82 4.24 1.37 2.39 4.69 6.53 2.40 1.90 3.47
Bubu(3.97) 3.47 1.73 5.76 1.78 4.59 4.23 6.42 6.50 2.25 5.70 7.23 4.48 2.13 2.69 4.89 6.94 2.68 1.71 3.20
Gorebela(2.91) 3.16 3.28 2.49 1.61 2.18 3.69 3.61 3.36 2.78 4.44 3.18 1.60 2.59 3.13 3.97 1.38 2.54 3.09
Gudanie(3.54) 4.99 2.11 3.93 3.08 5.35 5.38 3.25 5.30 6.31 3.96 2.36 2.83 3.96 5.91 1.94 1.03 1.96
Guasa(3.38) 4.19 1.96 2.57 1.69 2.65 4.97 1.69 1.81 1.94 4.30 3.58 1.43 2.58 3.38 4.88 4.62
Gera (3.09) 3.29 3.20 5.10 5.37 1.33 4.14 5.76 2.80 1.67 0.95 3.42 5.70 1.75 2.06 3.11
Jalenie(2.86) 1.61 2.26 2.44 4.22 1.95 2.92 2.50 2.80 2.99 2.04 2.67 2.14 3.56 3.75
Chala(2.87) 2.37 2.37 4.42 3.06 3.39 2.68 3.02 3.09 1.90 2.84 1.77 2.90 2.64
Zemen(3.69) 1.17 6.10 2.60 1.21 3.27 4.90 4.68 2.22 1.13 3.83 5.17 4.66
Chiro(3.92) 6.44 3.05 2.06 4.05 4.93 5.09 3.02 0.71 3.90 5.09 4.52
Bulle(3.92) 4.70 6.60 3.46 2.48 1.53 4.37 6.69 2.97 3.18 4.29
Moti(3.59) 2.60 2.69 4.04 3.59 2.72 2.92 3.44 4.90 4.80
Batte(4.32) 3.55 5.66 5.18 2.75 1.58 4.72 6.13 5.71
Gabbisa(3.24) 3.57 2.03 1.29 4.13 2.77 4.06 4.17
Araarsaa(3.13) 2.21 3.78 5.33 1.54 1.75 3.13
Mara (3.1) 2.87 5.33 2.04 2.82 3.61
Badhasa(3.12) 3.17 2.70 4.06 3.90
Jarso(4.16) 4.35 5.60 5.09
AL-624 (2.67) 1.64 2.12
CIP-A (3.34) 1.80
Numbers in parenthesis indicates mean ED of potato genotypes, CIP-A= CIP-384321/3 A, CIP-B= CIP-384321/3 B and Mara= Mara Charre.

32nd Annual Research and Extension Review Proceeedings, March 2015, Haramaya University
68
4. Discussion Genetic variability was evident in potato genotypes (the released varieties, farmers‘ cultivars, and the genotypes under yield trial). Highly significant differences among the genotypes for late blight resistance and yield were revealed by the analysis of variance. This could be attributed to the fact that the released varieties carry varying numbers of R-genes, but were all considered as resistant in the absence of the races or where the environment did not favor the pathogen (Beukema and Van Der Zaag, 1979). This suggestion may be strengthened by the superiority of recently released varieties over the old ones in terms of resistance to late blight and tuber yield potential. In early 1900s, potato breeders successfully introgressed resistance from wild species (Solanum demissum Lindl.) into cultivated potato. A total of 11 major dominant resistance genes (R genes) were identified although they were later defeated by the disease. However, these genes are still useful when combined with other sources of resistance (Stewart et al., 2003; Wastie, 1991). Most of the potato genotypes that have been released before 2008 were either with major genes for vertical resistance against late blight or were developed for horizontal resistance against the disease in the presence of unknown resistance major R genes (Gebremedhin, 2013), and named population A clones (Landeo et al.,1997). However, such resistance was short-lived because of the ability for the causal organism to overcome it (Landeo et al., 2000a, 2000b). But, breeding efforts on population A was stopped at CIP (starting from 1990s), and the emphasis shifted to the formation of a new population where horizontal resistance is improved in the absence of major resistance (R) genes. The new population was named as population B. The main feature of this population is that testing and selection were mainly done for horizontal resistance to late blight (unlike those applied for population A), which are simplified significantly in the absence of major (R) genes. Because of the elimination of the interference effect of major R genes, breeding material can be exposed readily to any local isolates in favorable environments and allow effective screening and selection for horizontal resistance (Landeo et al., 1997). Therefore, the recently released varieties may carry either many R-genes as compared to the old varieties or were improved with horizontal resistance in the absence of major resistance (R) genes. Many of the released genotypes have become susceptible to the disease and are known either as resistant or moderately resistant. This may be because: i) the mycelia of different types of the fungus (mating types A1 and A2 ) grow together, one of them may form male cells (antheridia) and the other female cell (oogonia). The fertilized oogonium can resist unfavorable conditions such as drought and low temperatures (Henfling, 1987). This happens because the distribution of P. infestans type A2 is worldwide not restricted to the temperate region (Fry and Goodwin, 1997; Drenth et al., 1995, Goodwin et al., 1995), ii) Phytophtora infestans have mutable features so that it can overpass any resistance and potato cultivars which were described as resistant to the disease may hardly resist the new late blight race (Song et al., 2003). As suggested by Sivasubramanina and Madhavamenon (1973), genotypic and phenotypic coefficients of variations can be categorized as low (<10%), medium (10-20%) and high (>20%). In this study, high genotypic and phenotypic coefficients of variations were calculated for both late blight resistance and yield parameters. The estimated phenotypic coefficient of variation was relatively greater than the genotypic coefficient of variation for all the traits; however, the differences were low for most of the traits. This showed that the expressions of the traits were mainly the function of genetic factors with less sensitivity to environmental factors. This in turn indicates the presence of substantial genetic variability among the released potato varieties in the country. Selection for a particular trait depends largely upon the genetic and non-genetic factors that affect the expression of phenotypic differences among genotypes. Therefore, heritability is an important estimate for the selection of traits in improving crops. Heritability estimates would be reliable if accompanied by a high estimate genetic advance (Singh and Chaudhry, 1985). As demonstrated by Robinson et al. (1949), heritability can be categorized as low (0-30%), moderate (30-60%) and high (60% and above) and as Johnson et al., (1955) suggested genetic advance as percent mean can be categorized as low (0-10%), moderate (10-20%) and high (20% and above). In the present study, high heritability (78.99 to 91.02%) and genetic advance as percent of mean (GAM) (66.09 to 96.31%) were computed for disease resistance parameters as compared to yield parameters (H2, 47.78 to 80.58% and GAM, 58.87 to 84.6%). However, for both parameters a combination of high heritability with high genetic advance was observed, which signifies more additive gene action (Panse, 1957), and suggesting that these traits are amenable for selection. Positive and highly significant correlations were observed among late blight parameters both at genotypic and phenotypic levels. Late blight intensity and AUDPC exhibited negative and highly significant correlations with total and marketable tuber yields, but positive and highly significant correlations with unmarketable tuber yield. These results suggest that high intensity of the disease reduced marketable yield but favored production of unmarketable tuber yield. If yield has been evaluated in addition to the AUDPC, the correlation between yield and genotypic resistance can be calculated as a value close to unity, indicating a very high linear association between tuber yield and resistance to the disease (CIP, 2006). The dendrogram efficiently separated the more resistant, higher yielding and recent varieties (Cluster I, sub-group I) than the susceptible and the low yielding genotypes (Cluster III, sub-group IV). This research results are in line with the history of potato improvement in Ethiopia and in the world at large. Researchers in Ethiopia obtained the germplasm for selection in the form of advanced clones, tuber families, and true potato seed from International Potato Center (CIP) in Peru (Gebremedhin et al., 2008). The clones introduced at different time carry varied number and different resistance genes either they were developed for vertical or horizontal resistance.The measured genetic distance was also capable in grouping the old introduction (population A) in separate clusters different from the recently introduced clones. Potato genotypes that have been developed and released before 2008 were from population type A (Gebremedhin, 2013). Other researchers also suggested that the clustering of functional genes for the resistance to various pathogens indicates they were from common ancestors (Gebhardt and Valkonen, 2001; Oberhagemann et al., 1999; Leister et al., 1996; Leonards-Schippers et al., 1994). Most of the varieties released before 2008 lost their resistance and exhibited genetic divergence from the recently released varieties. This might be due to the old varieties carry the race specifc

32nd Annual Research and Extension Review Proceeedings, March 2015, Haramaya University
69
genes for resistance but this might not be true in the recent varieties. The R genes conferring race specific resistance provided only transient resistance to late blight, as new races rapidly overcame the R gene-mediated resistance (Fry and Goodwin, 1997; Wastie, 1991). The results of this study are in agreement with the findings reported by different researches both for potato and other crops. Consistent with the results of this study, Abou-Taleb et al., (2010) found that potatao cultivars with high, moderate, and low late blight resistance were grouped in different categories as estimated from RAPD marker. According to this author, the lowest genetic similarity was obtained with the susceptible cultivars. Pattanayak et al. (2002) studied the genetic diversity among resistant and susceptible potato cultivars to late blight using RAPD markers and found no clear groupings based on late blight resistance and susceptibility. But they found that susceptible and resistant potato cultivars showed narrow and wider genetic variations, respectively.
5. Conclusion The presence of genetic viability was evident in potato genotypes from the analyses of both variance and genetic distance. The recently released varieties (Bubu and Belete) were more resistant to late blight than the others. They were grouped together and found to be most distant from many of the other genotypes, but being close to each other. The identified late blight resistant potato varieties; Bubu, Belete and Bulle could be used for potato production as a management option to control late blight in Ethiopia. High yielding and moderately resistant varieties (Gera, Araarsaa and Mara Charre) may be considered for production with less frequent chemical spray before the disease symptom observed. The high yielding variety (Jalenie) and the two genotypes (CIP-384321/3A and CIP-384321/3B) but susceptible to late blight may be recommend for dry season production under irrigation or during ―belg‖ where environmental conditions are not favourable for the disease if the two genotypes are approved to be released. However, it is hardly possible to make recommendation for the use of resistant varieties alone as best option due to the pathogen ability to rapidly evolve to overcome resistance genes and varieties are not absolutely immune and the observed disease severity was unexpected, which might be due to the presence of the two races. Therefore, it is better to apply integrated disease control method i.e. reduction of primary sources of inoculum and less frequent applications of fungicides on varieties to extend the durable resistance. The application of fungicides must depend on the characteristics of chemicals, disease pressure and growth stage of potato crop, because this integrated approach increases the efficacy of control, reduces the costs and environmental side effects.
6. Acknowledgments The author thanks Haramaya University for the financial support, Holeta, Adet and Sinna Research Centers for providing planting materials and technical staff of Horticulture Program at Haramaya University for their careful management of the experiment and data recording. Finally, the author thanks Dr. Mashila Dejene, senior Pathologist at Haramaya University for his technical support both in executing the experiment and writing the article.
7. References Abou-Taleb, Eid, M., Sayed, M., Aboshosha, Ebtsam, M., El-Sherif and Mahmoud, H. El-Komy. 2010. Genetic diversity among late blight
resistant and susceptible potato genotypes. Saudi Journal of Biological Science.17 (2): 133 - 138. Allard, R. W. 1960. Principles of plant breeding. John Willy and Sons, Inc., New York, USA. Anonymous.1997. The International Potato Centre Annual Report. International Potato Centre, Lima, p.59. Asakaviciute, R., Razukas, A., Jundulas, J. 2006. Lithuanian potato cultivars resistance to late blight (Phytophthora infestans). Third
International Conference on Non Chemikal Crop Protection Methods, Lille, France: 705 - 708. Baker, K. M., Kirk, W. W., Stein, J. M., Andresen, J. A. 2005. Climatic trends and potato late blight risk in the Upper Great Lakes region. Hort
Technology 15: 510 - 518. Belay, S. C., Wortman, W. and Hoogen, B.G. 1998. Haricot bean agro-ecology in Ethiopia: definition using agro-climatic and crop growth
stimulation models. African Crop Science Journal. 6: 9-18. Beukema, H. P. and De Van Der Zaag. 1979. Potato Improvement, Some Factors and Facts. International Agricultural Centre, Wageningen, the
Netherlands. Black, W., Mastenbroek, C., Millsand, W. R. and Paterson, L. C. 1953. A proposal for an international nomenclature of races of
Phytophthorainfestans and of genes controlling immunity in Solanumdemissum derivatives. Euphytica 2: 173 - 178. Burton, G. A. and Devane, E. H. 1953. Estimation of heritability in tall festca (Festucaarundinacea) from replicated clonal materials. Agronomy
Journal. 45: 478 - 479. Calhoun, D. S., Gebeyehu, G., Miranda, A., Rajaram, S. and Van Ginkel, M. 1994. Choosing evaluation environments to increase wheat grain
under drought conditions. Crop Science 34: 673 - 678. Campbell, C. L. and Madden, L. V. 1990. Introduction to plant disease epidemiology. Wiley, New York, USA. Cecarelli, S., Grando, S. and Impiglia, A. 1998. Choice of selection strategy in breeding barley for stress environments. Euphytica 103: 307 - 318. CIP (International Potato Center). 2006. Procedures for standard evaluation trials of advanced potato clones. An Internationa l Cooperators‘
Guide. pp. 41 - 54. Drenth, A., E.M. Janssen and F. Govers, 1995. Formation and survival of oospores Phytophthorainfestans under natural conditions. Plant
pathology. 44 (1): 86 - 94. Falconer, D. S., and Trudy F. C. Mackay. 1996. Introduction to quantitative genetics 4th ed. Longman Group Limited, Malaysia.

32nd Annual Research and Extension Review Proceeedings, March 2015, Haramaya University
70
Fry, W. E. and Goodwin, S. B.1997. Resurgence of the Irish potato famine fungus. Bioscience 47: 363 - 371. Gebhardt, C. and Valkonen, J. P. T. 2001. Organization of genes controlling disease resistance in the potato genome. Phytopathol 39: 79 - 102. Gebremedhin W. 2013. Potato variety development strategies and methodologies in Ethiopia. In: W. Gebremedhin, S. Schulz and B. Baye
(eds.). Seed potato tuber production and disseminations, experiences, challenges and prospects. pp.45 – 59, Ethiopian Institute of Agricultural Research and Amhara Region Agriculture Research Institute, 12 - 14 Mach 2012, Bahir Dar, Ethiopia.
Gebremedhin, W., Endale, G. and Lemaga, B. 2008. Potato variety development. In: Gebremedhin, W., G. Endale, and B. Lemaga (eds) Root and tuber crops: The untapped resources, pp.15 - 32. Institute of Agricultural Research,. Addis Ababa Ethiopian
Goodwin, S. B., Sujkowski, L. S., Dyers, B. A., Fry, A. T. and Fry, W. E. 1995. Direct detection of gene few and probable sexual reproduction of Phytophthorainfestans in northern North America. Phytopathology 85 (4) : 473 - 479.
Hansen, J. G., Koppel, M., Valskyte, A., Turka, I. and Kapsa, J. 2005. Evaluation of foliar resistance in potato to Phytophthorainfestans based on an international field trial network. Plant Pathology 54: 169 - 179.
Henfling, J. W. 1987. Late blight of potato, Phytophthorainfestans Technical information bulletin 4. CIP, Lima, Peru. Hijmans, R. J. 2003. The effect of climate change on global potato production. American. Journal of Potato Research. 80:271 - 280. Johnson, H. W., Robinson, H. F. and Comstock, R. E. 1955. Estimates of genetic and environmental variability in soybeans. Agronomy Journal
47: 314 - 318. Kirigwi, F. M., Van Ginkel, M., Trethowan, R., Sears, R. G., Rajaram, S. and Paulsen, G. M. 2004. Evaluation of selection strategies for wheat
adaptation across water regimes. Euphytica 135: 361 - 371. Kyamanywa, S., I., Kashaija, E., Getu, R., Amata, N. Senkesha, and Kullaya, A. 2011. Enhancing Food Security through Improved Seed
Systems of Appropriate Varieties of Cassava, Potato and Sweet potato Resilient to Climate Change in Eastern Africa. Nairobi, Kenya, ILRI.
Landeo, J. A., Gastelo, M., Forbes, G., Zapata, J. L., and Forbes, F. J. 1997. Developing horizontal resistance to late blight in potato. CIP program Report 1995 - 1996. pp. 122-126.
Landeo, J.A., Gastelo, M., Roncal, E., and Mendoza, A. 2000b. Phenotype stability for horizontal resistance to potato late blight in population B. American Journal of Potato 77 : 406.
Landeo, J. A., Gastelo, M., Beltran, G., and Diaz, G. 2000a. Quantifying genetic variance to horizontal resistance to late blight in potato breeding population B3C1. CIP program Report 1999 - 2000. pp. 63 - 68.
Lee, T., Robold, A., Testa, A., Klooster, J. W., Govers, F. 2001. Mapping of avirulence genes in Phytophthorainfestans with Amplified Fragment Length Polymorphism markers selected by bulked segregant analysis. Genetics 157: 949 - 956.
Leister, D., Ballvora, A., Salamini, F. and Gebhardt, C. 1996. A PCR based approach for isolating pathogen resistance genes from potato with potential for wide application in plants. Nature Genet. 14: 421-429.
Leonards-Schippers, C., Gieffers, W., Scha È fer-Pregl, R., Ritter, E., Knapp, S. J., Salamini, F. and Gebhardt, C. 1994. Quantitative resistance to Phytophthorainfestans in potato: A case study for QTL mapping in an allogamous plant species. Genetics 137: 67 - 77.
Mekonen, S., T. Alemu, B. Kassa and G. Forbes. 2011. Evaluation of contact fungicide sprays regimes for control of late blight (Phytophthorainfestans) in southern Ethiopia using potato cultivars with different levels of host resistance. Tropical Plant Pathology 36: 21 - 27.
Miller, P. A., Williams, J. C. Robinson, H. F, Comstock, R. F. 1958. Estimation of genotypic and environmental variances and covariances in upland cotton and their implications in selection. Agronomy Journal 50: 126 - 131.
Ministry of Agriculture (MoA). 2012. Animal and Plant Health Regulatory Directorate Crop Variety Register Issue No. 15, pp.37&38. Addis Ababa, Ethiopia
Ministry of Agriculture (MoA). 2013. Plant Variety Release, Protection and Seed Quality Control Directorate, Crop Variety Register Issue No.1 6, pp.161 - 164. , Addis Ababa, Ethiopia.
Mohan, C. and Thind, T. S. 1999. Resistance and relative performance of some new fungicides for active management of potato late blight in Punjab. Indian Journal of Mycology and Plant Pathology 29 (1): 23 - 37.
Oberhagemann, P., Chatot-Balandras, C., Bonnel, E., Scha È fer-Pregl, R., Wegener, D., Palomino, C., Salamini, F. and Gebhardt, C. 1999. A genetic analysis of quantitative resistance to late blight in potato: towards marker assisted selection. Mol. Breed.5: 399 - 415.
Panse, U .G. 1957. Genetics of Quantitative characters in relation to plant breeding. Indian Journal of Genetics 17: 318 - 328. Pattanayak D., Chakrabarti,S. K. and Naik, P. S. 2002. Genetic diversity of late blight resistant and susceptible Indian potato cultivars revealed
by RAPD markers. Euphytica 128: 183 - 189. Razukas, A., Jundulas, J. and Asakaviciute, R. 2008. Potato cultivars susceptibility to potato late blight (Phytophtorainfestans). Applied Ecology and
Environmental Research 6(1): 95 - 106. Razukas, A., Jundulas, J. 2005. Potatoes breeding in Lithuania. Lithuanian Institute of Horticulture 24 (3): 187 - 195. Robinson, H. F., Comstock, R. E. and Harvery, V. H. 1949. Estimates of heritability and degree of dominance in corn. Agronomy Journal 41 :
353 - 359. Rubio-Covarrubias, O. A., Douches, D.S., Hammershmidt, R., daRocha, A. and Kirk, W. W. 2005. Effect of temperature and photoperiod on
symptoms associated with resistance to Phytophthorainfestans after leaf penetration in susceptible and resistant potato cultivars. American Journal of Potato Research 82: 139-146.

32nd Annual Research and Extension Review Proceeedings, March 2015, Haramaya University
71
Simret Burga. 2010. Influence of inorganic nitrogen and potassium fertilizers on seed tuber yield and size distribution of potato (Solanum tuberosum L.). An M. Sc Thesis presented to the School of Graduate Studies of Haramaya University, Ethiopia. p.65.
Singh, R. K., Chaudhry, B. D.1985. Biometrical methods in quantitative genetic analysis. Kalynani Publishers, Ludhiana, India. Sivasubramanian, S. and Menon, M. 1973. Heterosis and inbreeding depression in rice. Madras Agricultural Journal 60: 1139. Sneath, P. H. and Sokal, R. R. 1973. Numerical Taxonomy. Freeman and Company, San Francisco, USA. Song, J., Bradeen, J. M., Naess, S. K., Raasch, J. A., Wielgues, M., Haberlach, G. T., Liu, J., Kuang, H., Phillips, S. A., Buell, C. R., Helgeson,
J.P. and Jiang, J. 2003. Gene RB cloned from Solanumbulbocastanum confers broad spectrum resistance to potato late bl ight. PNAS 100(16): 9128-9133.
Stewart, H. E., Bradshaw, J. E., Pande, B. 2003. The effect of the presence of R-genes for resistance to late blight (Phytophthorainfestans) of potato (Solanum tubero sum) on the underlying level of field resistance. Plant Pathology 52: 193 - 8.
Tamire, H., 1973. Characterization of Alemaya Soils. Soil Science Paper, Series No,1. p. 45. Tekalign T. 2011. Genotype x environmental interaction for tuber yield, dry matter content and specific gravity in elite tetraploid potato
(Solanum tubero sum L.) Genotypes. East Africa Journal of Sciences 5 (1): 1 - 5. Vleeshouwers, V. G., Raffaele, S., Vossen, J. H., Champouret, N., Oliva, R., Segretin, M .E., Rietman, H., Cano, L. M., Lokossou, A., Kessel,
G., Pel, M. A. and Kamoun, S. 2011. Understanding and exploiting late blight resistance in the age of effectors. Annual Review of Phytopathology 49: 507-531.
Wastie, R. L. 1991. Phytophthorainfestans, the cause of late blight of potato. In: D. S. Ingram and D. S. Williams (eds.) Breeding for Resistance, Advances in Plant Pathology, 7, pp 193 - 224.. Academic Press Ltd, London.

32nd Annual Research and Extension Review Proceeedings, March 2015, Haramaya University
72
8. Effect of Integrated Climate Change Resilience Strategies on Faba Bean Rust (Uromyces viciae-fabae) Epidemics in Hararghe Highlands, Ethiopia Habtamu Terefe1*, Chemeda Fininsa1 and Samuel Sahile2
1Haramaya University, School of Plant Sciences, P. O. Box 138, Dire Dawa, Ethiopia 2College of Natural and Computational Science, University of Gondar, P. O. Box 196, Gondar, Ethiopia Corresponding Author: Email: [email protected], Tell: +251 910309552 or +251 911590636
Abstract: Field studies were conducted at Haramaya and Arbarakate during 2012 and 2013 to assess effects of integrated climate change resilience strategies on faba bean rust (Uromyces viciae-fabae) in Hararghe highlands, Ethiopia. Three on-farm based climate change resilience strategies: species mixture (intercropping), compost application and furrow planting alone and in integration were evaluated using Degaga and Bulga-70 faba bean varieties and Melkassa IV maize variety. Treatments were factorial arranged in a randomized complete block design with three replications. Faba bean with maize row intercropping and intercropping-integrated cropping systems significantly reduced disease severity, AUDPC and disease progress rate and increased grain yield per unit area. These treatments reduced rust mean severity by up to 36.5% (in 2012) and 27.4% (in 2013) at Haramaya, and up to 27% in 2013 at Arbarakate on both faba bean varieties as compared to sole planting. Compost fertilization also slowed epidemic progression of faba bean rust and significantly reduced disease parameters when integrated with maize row intercropping. Compost fertilization in row intercropping recorded the lowest (23.1%) final mean disease severity and the highest (36.5%) percentage reduction in mean disease severity compared to sole cropping in 2012 at Haramaya. The trend was similar in 2013 at both locations. Degaga had the lowest rust disease parameters studied compared to Bulga-70 at both locations over years. The overall results indicated that integrated climate change resilience strategies were effective to slow the epidemics of rust and to maintain and sustainably boost faba bean productivity. Hence, integrated climate change resilience strategies along with other crop management systems are recommended in the study areas.
Keywords: Climate change resilience strategies; Epidemics; Rust; Uromyces viciae-fabae; Vicia faba
1. Introduction Faba bean (Vicia faba L.) is among the most important pulse crops produced in the world for both human diet and animal feed as source of protein and carbohydrate. It is also an excellent complement of crop rotations for fixing atmospheric N and as green manure (Salmeron et al., 2010). China is the largest producer of faba beans which gives East Asia the largest share in world, followed by Egypt and Ethiopia (Salmeron et al., 2010; Akibode and Maredia, 2011). In Africa, Egypt is the dominant producer of faba bean followed by the Sudan, Ethiopia and Morocco (Akibode and Maredia, 2011). In Ethiopia, faba bean production is estimated to account for 4.7% of the total grain production (CSA, 2013). However, yields of faba beans have seen more fluctuations than area harvested in all the top producers and the world cultivated area has decreased in the last 50 years (Rosegrant, 2010). Climate variability, diseases, weeds and other pests are the major constraints of faba bean production. Diseases have always been the major limiting factors (Agegnehu et al., 2006) and faba bean is susceptible to several pathogenic fungi, the major ones include ascochyta blight (Ascochyta fabae Speg.), rust (Uromyces viciae-fabae (Pers.) J. SchrÖt.) and chocolate spot (Botrytis fabae Sard.) in Ethiopia (Dereje and Tesfaye, 1993). Faba bean rust is a major disease of faba bean in almost every area in the world where faba bean is grown (Torres et al., 2006; Stoddard et al., 2010) that can cause up to 70% of yield loss in early infection (Torres et al., 2006). The disease is severe and influences yield in areas like the Middle East, North Africa and parts of Australia (Stoddard et al., 2010). It is also widely distributed in Ethiopia (Berhanu et al., 2003). In Ethiopia, rust is devastating next to chocolate spot, and depending on severity of infection, it can cause a seed yield loss ranging from 2 to 15% in lower altitudes and 14-21% for intermediate altitudes (Dereje and Tesfaye, 1993). Yield loss could be even higher when in mixed infection with chocolate spot disease (MacLeod, 2006). Climate variability due to increased temperature and reduced precipitation over time increase susceptibility of faba bean and could also favour disease development. Faba bean production which is seriously affected by diseases and parasitic weeds are also worsened by cl imate change (Khan et al., 2010). Food legume growers are experiencing frequent droughts due to climate change and variability. Drought predisposes resistant varieties to be easily attacked by pathogens, which are not problems during normal growing seasons and new diseases may happen (Ahmed et al., 2011) and could decrease yield grains. Thus, climate change and associated changes in disease scenarios will demand changes in crop and disease management strategies in order to respond to changes in environmental conditions for sustainable crop production. But research has concentrated on the impacts of one or two of the changing climatic factors on host, pathogen, or the interaction of the two under-controlled conditions. Others are based on modelling of data from controlled experiments (Coakley et al., 1999; Garett et al., 2006; Newton et al., 2010) far different from those in the field. Such studies could be more difficult in conditions where historical weather and crop disease data are not available and where available facilities are not enabling to generate sound data. Hence, climate change effects studies could be approached through climate change resilience strategies. These are strategies that enhance the capacity of an ecological system to absorb stresses and maintain functioning in the face of external stresses imposed upon it by climate change

32nd Annual Research and Extension Review Proceeedings, March 2015, Haramaya University
73
and to adapt to reduce harm or risk of harm to improve the sustainability of the system, leaving it better prepared for future climate change impacts. They are generally designed to reduce climate change and its impacts in order to sustain ecosystem functioning/agricultural crop production, as it is part of the ecosystem (used in the sense of mitigating/adaptive strategy in this paper). The most important resilience strategies include enhancing functional crop diversification (Newton et al., 2010) through use of species and cultivar mixtures in the form of intercropping (Fininsa and Yuen, 2001; Tamado et al., 2007; Tilahun et al., 2012), effective soil nutrient management (Katungi et al., 2009), and efficient soil moisture conservation via furrow planting and mulching (Wang et al., 2008; Zhao et al., 2012). Integrating these on-farm climate change resilience strategies for the management of crop diseases and sustainable crop production has a dual role for understanding the effects of climate change and the role of these cropping strategies for mitigation or adaptation. However, despite the significance of crop diseases in limiting crop productions and food supply, there has been limited field-based empirical research to assess the potential effects of climate change on plant diseases (Coakley and Scherm, 1996; Garrett et al., 2006). The integral role of climate change resilience strategies for the management of plant diseases and sustaining crop production in the face of climate change is not well addressed. Therefore, the objective of this study was to assess the effects of integrated climate change resilience strategies on the epidemics of faba bean rust in Hararghe highlands, Ethiopia.
2. Materials and Methods 2.1. Experimental Sites Field-based experiments were conducted at two locations in 2012 and 2013. The 2012 field experiment was conducted at Haramaya University main campus experimental field station during the main cropping season (June to September) on loam aluvial soil. The station is located at 9o26‘N and 42o3‘E with an altitude of 1980 m.a.s.l. The highest mean annual rainfall for the location is 790 mm with mean minimum and maximum temperatures of 14.0 oC and 23.4 oC, respectively. The 2013 field experiment was conducted both at Haramaya University and Arbarakate Farmers' Training Center (FTC) on clay vertisol soil during the main cropping season. Arbarakate FTC is located at 9o2.86'N and 40o54.79'E with an altitude of 2274 m.a.s.l. in West Hararghe zone at about 180 km away from Haramaya. Arbarakate was characterized by extended higher precipitation (estimated to exceed 1300 mm per annum) and rainy days than Haramaya during the cropping periods with mean daily temperatures ranging between 13.1 and 17.5 oC. 2.2. Experimental Sites' Weather Data for 2012 and 2013 Daily maximum and minimum temperatures (oC), relative humidity (%), and total rainfall (mm) were obtained for Haramaya University experimental site for both seasons from its weather station. The weather data obtained for Arbarakate from the nearby stations were found unrepresentative. However, the weather trend at Arbarakate was characterized by extended period of rainfall and many rainy days and relatively mild temperature levels. The daily mean minimum and maximum temperatures of Arbarakate were derived using the Adiabatic Lapse Rate Model (Brunt, 2007) from nearby meteorological stations; and the daily minimum temperatures range from 5.31 to 12.43 oC and the daily mean maximum temperatures range from 20.17 to 22.61 o C (June to November) in 2013.The monthly total rainfall and the monthly average temperature in the cropping seasons are presented in Table 1. Table 1. Monthly mean temperature (oC) and monthly total rainfall (mm) during faba bean growing periods at Haramaya and Arbarakate, Ethiopia in 2012 and 2013 main cropping seasons.
Cropping month Mean of temperature (oC) Monthly rainfall (mm)
Haramaya Arbarakate Haramaya
2012 2013 2013 2012 2013
June 19.97 19.30 17.52 0.00 15.80 July 18.56 17.63 15.81 214.00 215.40 August 18.90 18.25 16.48 149.50 185.10 September 18.73 18.43 16.62 105.00 142.10 October 15.50 16.82 15.47 4.60 71.60 November 14.68 15.04 13.14 0.50 81.70
Mean 17.72 17.58 15.84 78.93 118.62
2.3. Treatments, Experimental Design and Management Three on-farm based climate change resilience strategies and two faba bean varieties (considered as treatments) were used in this study. They were crop diversification (as species-mixtures of faba bean and maize in row intercropping), moisture conservation (as planting in furrow) and soil nutrient management (as compost application). Thus, the treatments included faba bean-maize row intercropping, furrow planting, compost application and faba bean sole planting. The treatments were applied as sole and in integration using two varieties of faba bean and one variety of maize (Table 2).

32nd Annual Research and Extension Review Proceeedings, March 2015, Haramaya University
74
Table 2. Treatment combinations used for faba bean field experiments at Haramaya and Arbarakate during 2012 and 2013 main cropping seasons and their respective descriptions.
S.No. Treatment Treatment combination description
1 SP Sole faba bean planting (control) 2 FP Faba bean furrow planting 3 CA Planting using compost application (compost fertilization) 4 RI Faba bean-maize row intercropping 5 FP + CA Faba bean furrow planting with compost application 6 FP + RI Faba bean furrow planting in row intercropping 7 CA + RI Faba bean planting using compost application in row intercropping 8 FP + CA + RI Faba bean furrow planting with compost application in row intercropping
The two faba bean varieties used were Degaga (moderately resistant to faba bean diseases) and Bulga-70 (moderately susceptible) and their characteristic features are presented in Table 3. Both faba bean varieties were obtained from Holleta Agricultural Research Center, Ethiopia. The maize variety used as a component crop was Melkassa-IV (ECA-EE-36), which was obtained from Melkassa Agricultural Research Center, Ethiopia. Melkassa IV was released in 2006 with an agronomic attribute: area of adaptation (1000-1600 m.a.s.l altitude and 500-700 mm annual rainfall), early maturing (105 days) and a production potential of 2-4 t ha-1. The compost used in this study was mainly made of a pile of khat (Catha edulis) residuals collected from the nearby markets of Awaday, eastern Ethiopia. A well decomposed and matured compost were evacuated air dried and sieved. Composite random samples were taken for chemical analysis before application and hence, it was composed of organic carbon (8.01%), organic matter (13.80%), total nitrogen (0.69%), available phosphorus (234.80 mg kg-1) and C:N ratio of 11.61. Compost was applied at a rate of 8 t ha-1and mixed with the soil a week before maize planting and four weeks before faba bean planting in 2012 and three weeks in 2013 cropping seasons. Furrows were prepared by digging about 20 cm deep rows once faba bean was planted and established to seedling stages in order to harvest rain water. Table 3. Characteristic features of faba bean varieties used for the field experiment at Haramaya and Arbarakate, Ethiopia during the 2012 and 2013 main cropping seasons.
Variety Year of release
Area of adaptation Maturity (days)
Seed size (g) Yield (kg/ha)
Altitude (m) Rainfall (mm) On-station On-farm
Degaga 2002 1800-3000 800-1200 116-135 400-450 25-50 20-45 Bulga-70 1994 2300-3000 800-1100 143-150 400-450 20-45 15-35
A total of 16 treatments (for both faba bean varieties and maize as a component crop) were laid out in a randomized complete block design in a factorial arrangement with three replications. In a gross plot size of 4 m x 3 m, a 1 maize: 1 faba bean planting pattern of row intercropping was maintained by planting maize rows spaced 80 cm apart and planting one row of faba bean between the two maize rows. In row intercropping 5 rows of maize were intercropped with 4 rows of faba bean variety each at the center of the two maize rows per plot. In addition, sole faba bean was included as experimental treatment, which was planted at 40 x 10 cm inter-row and intra-row spacing. In case of sole planting, there were 9 faba bean rows per plot. In species-mixtures, maize was planted three weeks before faba bean planting in 2012 and two weeks before faba bean planting in 2013. Spacing between blocks was 1.5 m and rows was 1 m. Sowing of maize was done manually by planting two seeds per hill and later thinned to one plant per hill. Faba bean varieties were also manually planted. Maize was planted on 21 June 2012 and 27 June 2013 at Haramaya; and 3 July 2013 at Arbarakate. Faba bean was planted on 11 July 2012 at Haramaya; and on 12 July 2013 at Haramaya and 16 July 2013 at Arbarakate. The crops were grown without any chemical fertilizer and no artificial pathogen inoculation was performed relying on the natural onset of the disease. Weeding and other agronomic practices were done properly and uniformly as per the recommendations to grow a successful crop. 2.4. Disease Severity Assessment Disease severity of faba bean rust was recorded during the disease epidemic period. Disease severity was assessed six times at Haramaya and four times at Arbarakate on weekly intervals on both varieties starting from the first visible disease symptoms in the experimental plots both in 2012 and 2013. For disease severity assessments, 12 plants were randomly selected from central rows of each plot and tagged prior to disease symptom appearance. Disease severity assessment began on 50 days after planting (DAP) in 2012 and 44 DAP in 2013 at Haramaya. At Arbarakate, disease severity recording began from 65 DAP onwards during 2013. Disease severity was scored using a 1-9 scale of ICARDA (1986); where, 1 = no pustules or very small non-sporulating flecks; 3 = few scattered pustules on leaves, few or no pustules on stem; 5 = pustules common on leaves, some pustules on stem; 7 = pustules very common on leaves, many pustules on stem; and 9 = extensive pustules

32nd Annual Research and Extension Review Proceeedings, March 2015, Haramaya University
75
on the leaves, petioles and stem, many leaves dead and plant defoliated. Disease severity scores were converted into percentage severity index (PSI) for analysis (Wheeler, 1969); where,
1 From disease severity data, area under disease progress curve (AUDPC) in %-days were calculated as used in Campbell and Madden (1990):
2
where, xi = percentage of disease severity index (PSI) of disease at ith assessment; ti = time of the ith assessment in days from the first assessment date; and n = total number of disease assessments. AUDPC was calculated separately for disease assessments made on different DAP for each climate change resilience strategy used and the control treatment. Since the epidemic period of the two locations varied in 2013, AUDPC were standardized by dividing the values by the epidemic period of the respective locations (Campbell and Madden, 1990). The epidemic periods were 35 days at Haramaya and 21 days at Arbarakate; and AUDPC values were standardized accordingly. 2.5. Data Analysis Analysis of variance (ANOVA) was run for disease severity data and AUDPC values of faba bean rust on both varieties to determine treatment effects on disease severity and AUDPC in each year across locations using SAS GLM Procedure (SAS Institute, 2001). Mean separations were made using LSD at 0.05 probability level. To determine the disease progress rate from the linear regression, a logistic model was used. Logistic model, ln[(y/1-y)] (Van der Plank, 1963) was used to estimate the disease progression from each separate treatment. The transformed data were regressed over time, DAP to determine the disease progress rate. The slope of the regression line estimated the disease progress rate in different climate change resilience strategies. Regression was computed using Minitab (Release 15.0 for windows®, 2007). The two locations and seasons were considered as different environments because of heterogeneity of variances tested using Bartlett's test (Gomez and Gomez, 1984) and the F-test was significant. As a result, data were not combined for analysis.
3. Results 3.1. Rust Severity Faba bean rust appeared during the flowering growth stage of both faba bean varieties both in 2012 and 2013 at Haramaya and during pod formation growth stage at Arbarakate in 2013 cropping season. The mean disease severity of faba bean rust in the two cropping seasons was significantly different (P<0.05) between climate change resilience strategies and the control, among climate change resilience strategies used and between varieties both at Haramaya and Arbarakate experimental areas (Table 4). In both cropping seasons, mean disease severity assessments at different DAP showed significant variation between treatments starting from 57 DAP in 2012 and 51 DAP in 2013 at Haramaya in the disease epidemic periods. Whereas at Arbarakate, it was started from 65 DAP during 2013. Higher rust severity was observed on both faba bean varieties in 2013 than in 2012 and it was severe after pod filling growth stage at Haramaya. The lowest final mean disease severity on 85 DAP in 2012 was recorded on both faba bean varieties at Haramaya from integrated climate change resilience strategies treated-plots (referring to the combined use of two or more of the strategies hereafter unless stated) as compared to sole planting. A similar trend was obtained in 2013 on both varieties at both experimental locations. Intercropping and intercropping-integrated climate change resilience strategies (referred to furrow planting in row intercropping and/or compost fertilization in row intercropping and/or furrow planting with compost fertilization in row intercropping or intercropping-integrated cropping systems hereafter) had the lowest mean disease severity records on both varieties and locations over years in comparison to sole planting. On the final disease severity assessment days, intercropping-integrated climate change resilience strategies-treated plots recorded up to 23.14% compared to 36.42% of sole plot in 2012 and 32.72% compared to 45.06% of sole plot in 2013 on both faba bean varieties at Haramaya. At Arbarakate, the trend was 16.67% as compared to 22.84% of sole plot on both varieties in 2013. Thus, intercropping-integrated climate change resilience strategies-treated plots were found to highly reduce disease severity of rust compared to control plots. The highest mean disease severity reductions reached 36.46% (in 2012) and 27.39% (in 2013) on both varieties at Haramaya. Similarly, the reduction was up to 27.01% on both varieties studied at Arbarakate. Moreover, although there was no consistent significant (p>0.05) difference among compost fertilization, furrow planting, furrow planting with compost fertilization and sole planting, compost fertilization and furrow planting with compost fertilization had lower faba bean rust severity on both faba bean varieties in 2012 and 2013 at Haramaya. In 2012, compost fertilization and furrow planting along with compost fertilization lowered the final mean disease severity of faba bean rust in the range between 9.31 and 10.16% on both varieties at Haramaya. A similar trend was also indicated in 2013 on both varieties at both locations (Table 4). Furthermore, at both locations and seasons, the overall mean disease severity records showed that the two faba bean varieties were varied significantly. Degaga variety registered lower mean disease severities than Bulga-70 variety studied. The interaction between faba bean varieties and climate change resilience strategies used was not significant during both cropping seasons at both locations.

32nd Annual Research and Extension Review Proceeedings, March 2015, Haramaya University
76
Table 4. Effects of climate change resilience strategies on faba bean rust (Uromyces viciae-fabae) severity (%) and standard area under disease progress curve (%-days) at Haramaya during 2012 and 2013 and at Arbarakate during 2013 main cropping seasons.
Means in each column followed by the same letter are not significantly different according to the least significant difference test at 5% probability level. a SP, sole planting (control); FP, furrow planting; CA, compost application; RI, row intercropping; FP + CA, furrow planting with compost application; FP + RI, furrow planting in row intercropping; CA + RI, compost application in row intercropping; and FP + CA + RI, furrow plating with compost application in row intercropping. b Percent severity index on 85 days after planting (DAP) in 2012 and 79 DAP in 2013 at Haramaya and on 86 DAP at Arbarakate during 2013 main cropping season. c rAUDPC, standard area under disease progress curve of faba bean rust. 3.2. Disease Progress Curve The effects of climate change resilience strategies for the management of faba bean rust were also observed on trends of disease progress curves on both faba bean varieties where disease progress curves showed differences among treatments (Figure 1). On both faba bean varieties, disease severity progressed increasingly starting from onset to the final severity at both locations and seasons. The eight disease progress curves for each faba bean variety indicated that the rate of disease progress was not similar for each climate change resilience strategy applied. Disease in sole plots exhibited relatively high progressive curves and displayed the highest levels of faba bean rust. The furrow planting, compost fertilization and furrow planting with compost fertilization-treated plots followed similar curves as sole cropped plots but lied intermediate between sole planting and intercropped and intercropping-integrated climate change resilience strategies-treated plots with intermediate levels of faba bean rust severity. Whereas, disease progress curves of plots treated with intercropping and intercropping-integrated climate change resilience strategies at different levels of integration slowly progressed at both locations on both faba bean varieties over years. Moreover, plots with these integrated climate change resilience strategy treatments displayed the lowest levels of faba bean rust at different DAPs. The disease progress curve in Figure 1 depicted only three of the main treatment categories (sole planting, furrow planting with compost fertilization and compost fertilization in row intercropping) based on faba bean rust severity levels for the sake of clarity and ease graphic presentation. Accordingly, furrow planting and compost fertilization treatments were lied in between sole planting and furrow planting with compost fertilization whereas treatments like row intercropping, furrow planting in row intercropping and furrow planting with compost fertilization in row intercropping were intermediate between furrow planting with compost fertilization and compost fertilization in row intercropping treatments. However, for Bulga-70, furrow planting with compost fertilization was found intermediate between sole planting and compost fertilization during 2012 at Haramaya.
Treatment a Haramaya Arbarakate
2012 2013 2013
PSI b rAUDPC c PSI b rAUDPC c PSI b rAUDPC c
Variety Bulga-70 31.79a 26.07a 42.67a 24.59a 21.99a 16.20a Degaga 27.01b 22.18b 34.34b 20.92b 17.60b 14.30b Mean 29.40 24.13 38.51 22.76 19.80 15.25 LSD (0.05) 1.09 0.76 1.14 0.57 0.46 Resilience strategy SP 36.42a 29.50a 45.06a 26.48a 22.84a 18.06a FP 34.57ab 28.30ab 44.45b 25.68a 22.22ab 16.87b CA 32.72b 27.01b 41.98b 24.54b 21.60b 16.36b RI 25.00cd 20.37cd 33.95c 20.56c 17.90c 13.94c FP + CA 33.03b 27.59b 41.98b 24.35b 21.60b 16.05b FP + RI 26.55c 21.30c 34.57c 20.77c 18.21c 13.99c CA + RI 23.14d 19.07d 32.72c 19.60d 16.67d 13.17c FP + CA + RI 23.77d 19.84cd 33.34c 20.05cd 17.29cd 13.58c Mean 29.40 24.12 38.51 22.75 19.79 15.25 LSD (0.05) 2.19 1.52 2.27 0.93 1.15 0.91 CV (%) 6.31 5.36 5.00 3.48 4.92 5.07

32nd Annual Research and Extension Review Proceeedings, March 2015, Haramaya University
77
0
10
20
30
40
50
44 51 58 65 72 79Dis
eas
e s
eve
rity
(%
)
Days after planting
Degaga, Haramaya, 2013
0
10
20
30
40
50
44 51 58 65 72 79
Dis
eas
e s
eve
rity
(%
)
Days after planting
Bulga-70, Haramaya, 2013
0
10
20
30
40
50
50 57 64 71 78 85
Dis
eas
e s
eve
rity
(%
)
Days after planting
Degaga, Haramaya, 2012
0
10
20
30
40
50
50 57 64 71 78 85
Dis
eas
e s
eve
rity
(%
)
Days after planting
Degaga, Haramaya, 2012

32nd Annual Research and Extension Review Proceeedings, March 2015, Haramaya University
78
Figur.1. Faba bean rust (Uromyces viciae-fabae) disease progress curves as affected by different climate change resilience strategies (FP + CA, furrow planting with compost application and CA + RI, compost application in row intercropping) and SP, sole planting on Degaga and Bulga-70 faba bean varieties at Haramaya in 2012 and 2013 (A) and at Arbarakate in 2013 (B) main cropping seasons 3.3. Area Under Disease Progress Curves (AUDPC) AUDPC values calculated from disease severity assessed at different DAP on both faba bean varieties for both locations and cropping seasons significantly (P<0.05) varied between climate change resilience strategies and the control, among climate change resilience strategies used and between faba bean varieties studied (Table 4). AUDPC values were lower on intercropped and intercropping-integrated climate change resilience strategies-treated plots than on other treatments. In 2012, sole plots had the highest AUDPC values, while the lowest AUDPC values were calculated from compost fertilization in row intercropping-treated plots. The values indicated that intercropping and intercropping-integrated climate change resilience strategies-treated plots showed consistent reduction in AUDPC values. In 2013, a similar trend was also calculated for the sole cropped and integrated climate change resilience strategies-treated plots for both varieties and locations. The reduction in AUDPC values, which were caused by intercropping and intercropping-integrated climate change resilience strategies treatments, was also exhibited by compost fertilization and furrow planting along with compost fertilization treatments, even though there was no significant difference among compost fertilization, furrow planting with compost fertilization and furrow planting treated-plots and sole cropped plots. That is, compost fertilization and furrow planting with compost fertilization treatments generally lowered the AUDPC values of rust on both faba bean varieties at both locations in 2012 and 2013. 3.4. Disease Progress Rate Disease progress rates and parameter estimates of faba bean rust are tabulated in Tables 5-7. The disease progress rates computed from mean disease severity records showed variations among climate change resilience strategies used in both faba bean varieties, locations and seasons. Disease progress rates calculated from severity records of Degaga variety ranged from 0.0182 to 0.0288 units/day in 2012 and from 0.0340 to 0.0456 units/day in 2013 (Table 5), whereas for Bulga-70, the rates ranged from 0.0234 and 0.0331 units/day in 2012 and 0.0461 and 0.0546 units/day at Haramaya in 2013 (Table 6). The rates computed were also from 0.0158 to 0.0309 units/day for Degaga and 0.0279 to 0.0412 unit/day for Bulga-70 at Arbarakate in 2013 (Table 7). The disease progress rate was relatively higher at Haramaya in 2013 and relatively fast on both varieties in 2012 and 2013 at Haramaya than at Arbarakate. On Bulga-70 variety, at both locations and in both cropping seasons, the disease progress rate was higher as compared to Degaga. It was also observed that disease progressed relatively at faster rates on sole and non intercropped and non intercropping-integrated climate change resilience strategies-treated plots across locations and over years for both faba bean varieties. The results indicated that the rate at which faba bean rust progressed was slower when climate change resilience strategies were applied in integration than the untreated plots to manage the disease.
0
10
20
30
40
50
65 72 79 86
Dis
eas
e s
eve
rity
(%
)
Days after planting
Bulga-70, Arbarakate, 2013
SP FP+CA CA+RI
B
0
10
20
30
40
50
65 72 79 86
Dis
eas
e s
eve
rity
(%
)
Days after planting
Degaga, Arbarakate, 2013

32nd Annual Research and Extension Review Proceeedings, March 2015, Haramaya University
79
Table 5. Mean initial (PSIi) and final (PSIf) severity index and parameter estimates of faba bean rust (Uromyces viciae-fabae) on Degaga variety at Haramaya, Ethiopia during 2012 and 2013 main cropping seasons.
Year Treatment a Percent severity b Intercept c SE of intercept d
Disease progress rate (Logit/day)
SE of Rate d
R2 (%) e
PSI i PSI f
SP 14.19 33.33 -3.14 0.2439 0.0288 0.0033 81.4 FP 15.43 31.48 -2.85 0.2131 0.0244 0.0029 80.4 CA 14.19 29.63 -3.05 0.2036 0.0256 0.0028 83.2 RI 12.34 22.84 -3.03 0.1647 0.0212 0.0022 83.8 2012 FP + CA 13.58 30.25 -3.07 0.2586 0.0265 0.0035 76.6 FP + RI 11.73 24.69 -3.23 0.2213 0.0246 0.0030 79.4 CA + RI 11.73 21.60 -3.03 0.1762 0.0200 0.0024 80.2 FP + CA + RI 12.96 22.22 -2.83 0.1817 0.0182 0.0025 75.8
SP 12.96 39.51 -4.36 0.1477 0.0438 0.0020 96.5 FP 11.73 38.89 -4.54 0.1257 0.0456 0.0017 97.7 CA 11.73 37.04 -4.41 0.0951 0.0431 0.0013 98.5 RI 11.11 30.86 -4.22 0.1193 0.0375 0.0016 96.9 2013 FP + CA 11.73 37.04 -4.42 0.1187 0.0432 0.0016 97.7 FP + RI 11.73 31.48 -4.13 0.1636 0.0365 0.0022 94.0 CA + RI 11.73 29.63 -4.01 0.1684 0.0340 0.0023 92.8 FP + CA + RI 11.11 30.25 -4.15 0.1369 0.0362 0.0019 95.7 a SP, sole planting (control); FP, furrow planting; CA, compost application; RI, row intercropping; FP + CA, furrow planting with compost application; FP + RI, furrow planting in row intercropping; CA + RI, compost application in row intercropping; and FP + CA + RI, furrow plating with compost application in row intercropping. Parameter estimates are from a linear regression of ln(y/(1-y)) disease severity (PSI) proportions at different days after planting (DAP). b Initial and final disease severity (PSI) of chocolate spot recorded at 50 DAP and 85 DAP in 2012 and at 44 DAP and 79 DAP in 2013, respectively. c Intercept of the regression equation. d Standard error of parameter estimates. e Coefficient of determination of the logistic model. Table 6. Mean initial (PSIi) and final (PSIf) severity index and parameter estimates of faba bean rust (Uromyces viciae-fabae) on Bulga-70 variety at Haramaya, Ethiopia during 2012 and 2013 main cropping seasons.
Year Treatment a Percent severity b Intercept c SE of intercept d
Disease progress rate (Logit/day)
SE of Rate d
R2 (%) e
PSI i PSI f
SP 15.43 39.51 -3.23 0.3264 0.0331 0.0044 76.2 FP 14.81 37.66 -3.18 0.3053 0.0314 0.0042 76.8 CA 14.81 35.81 -3.07 0.2959 0.0296 0.0040 75.7 RI 15.43 35.81 -3.01 0.2880 0.0289 0.0039 75.8 2012 FP + CA 12.96 27.16 -3.21 0.1912 0.0261 0.0026 85.4 FP + RI 14.20 28.40 -2.98 0.2199 0.0237 0.0030 78.4 CA + RI 12.34 24.68 -3.09 0.1990 0.0234 0.0027 81.3 FP + CA + RI 11.73 25.31 -3.20 0.2264 0.0251 0.0031 79.4
SP 12.96 50.62 -4.93 0.1512 0.0546 0.0021 97.6 FP 12.96 50.00 -4.92 0.1645 0.0538 0.0022 97.1 CA 12.34 46.92 -4.90 0.1376 0.0527 0.0019 97.9 RI 11.11 37.04 -4.74 0.1700 0.0471 0.0023 96.1 2013 FP + CA 12.34 46.91 -4.97 0.1246 0.0534 0.0017 98.3 FP + RI 11.11 37.66 -4.78 0.1443 0.0480 0.0020 97.2 CA + RI 11.11 35.80 -4.72 0.1627 0.0461 0.0022 96.2 FP + CA + RI 11.11 36.42 -4.74 0.1475 0.0467 0.0020 97.0 a SP, sole planting (control); FP, furrow planting; CA, compost application; RI, row intercropping; FP + CA, furrow planting with compost application; FP + RI, furrow planting in row intercropping; CA + RI, compost application in row intercropping; and FP + CA + RI, furrow plating with compost application in row intercropping.

32nd Annual Research and Extension Review Proceeedings, March 2015, Haramaya University
80
Parameter estimates are from a linear regression of ln(y/(1-y)) disease severity (PSI) proportions at different days after planting (DAP). b Initial and final disease severity (PSI) of chocolate spot recorded at 50 DAP and 85 DAP in 2012 and at 44 DAP and 79 DAP in 2013, respectively. c Intercept of the regression equation. d Standard error of parameter estimates. e Coefficient of determination of the logistic model. Table 7. Mean initial (PSIi) and final (PSIf) severity index and parameter estimates of faba bean rust (Uromyces viciae-fabae) on Degaga and Bulga-70 varieties at Arbarakate, Ethiopia during 2013 main cropping season.
Variety Treatment a Percent severity b Intercept c SE of intercept d
Disease progress rate (Logit/day)
SE of Rate d
R2 (%) e
PSI i PSI f
SP 12.34 20.37 -3.76 0.2052 0.0276 0.0027 90.6 FP 11.11 19.75 -4.08 0.2319 0.0309 0.0030 90.5 CA 11.11 19.14 -3.98 0.3233 0.0293 0.0042 81.2 RI 11.11 16.05 -3.44 0.2021 0.0205 0.0026 84.4 Degaga FP + CA 11.11 19.14 -4.06 0.1770 0.0301 0.0023 93.9 FP + RI 11.73 16.05 -3.19 0.2609 0.0172 0.0034 69.3 CA + RI 11.11 14.82 -3.15 0.1490 0.0158 0.0019 85.7 FP + CA + RI 11.11 15.44 -3.26 0.2021 0.0177 0.0026 80.2
SP 12.96 25.31 -4.43 0.2423 0.0391 0.0032 93.3 FP 12.34 24.69 -4.58 0.3533 0.0398 0.0046 87.0 Bulga- 70
CA 12.34 24.07 -4.51 0.2838 0.0385 0.0037 90.8 RI 11.73 19.75 -3.96 0.2796 0.0286 0.0036 84.7 FP + CA 11.73 24.07 -4.75 0.2097 0.0412 0.0027 95.4 FP + RI 11.11 20.37 -4.33 0.1676 0.0336 0.0022 95.6 CA + RI 11.11 18.52 -3.97 0.2360 0.0279 0.0031 88.2
FP + CA + RI 11.11 19.14 -4.13 0.2865 0.0303 0.0037 85.6 a SP, sole planting (control); FP, furrow planting; CA, compost application; RI, row intercropping; FP + CA, furrow planting with compost application; FP + RI, furrow planting in row intercropping; CA + RI, compost application in row intercropping; and FP + CA + RI, furrow plating with compost application in row intercropping. Parameter estimates are from a linear regression of ln(y/(1-y)) disease severity (PSI) proportions at different days after planting (DAP). b Initial and final disease severity (PSI) of chocolate spot recorded at 65 DAP and 86 DAP in 2012, respectively. c Intercept of the regression equation. d Standard error of parameter estimates. e Coefficient of determination of the logistic model.
4. Discussion The overall results of the study indicated that severity of rust was higher and rapidly increasing at the later stages of the epidemic period at Haramaya both in 2012 and 2013. However, in both cropping seasons at Haramaya and Arbarakate, rust severity, AUDPC and disease progress rate were reduced and grain yield per unit area was increased by integrated climate change resilience strategies compared to sole planting. Among the climate change resilience strategies, intercrops and intercropping-integrated cropping systems had the lowest disease parameters of faba bean rust and chocolate spot as well (Habtamu et al. submitted) as compared to sole cropping. Such effects could be attributed to effects of intercropping in reducing plant density of component crops and acting as a physical barrier that might hamper inoculum spread and disease progress. In addition, intercrops might have also modified the microclimate by modifying the density of host plants thereby changing canopy microenvironment. Previous studies indicated that deploying crop diversity is necessary to adapt to climatic changes and to new pathogens that might arise due to changing climates (Fadda, 2011). Intercropping is one way of introducing more biodiversity into agroecosystems and results from intercropping studies showed that increased crop diversity increases the number of ecosystem services provided. Higher species richness may be associated with significant reduction in the negative impacts of diseases (Fininsa, 1996; Bannon and Cooke, 1998) and weeds (Hauggaard-Nielsen et al., 2001). Increasing the complexity of crop environment through intercropping also limits the places where pests can find optimal foraging or reproductive conditions (Lithourgidis et al., 2011). Similarly, mixtures play a major role in reducing the efficiency of the pathogen through the dilution effect (Mundt, 2002) and mixed crop species can also delay the onset of diseases by reducing the spread of disease carrying spores and by modifying environmental conditions to less favorable to the spread of certain pathogens (Altieri, 1999; Lithourgidis et al., 2011). In addition, under Ethiopian conditions, mixed cropping has also been reported to reduce disease severity of faba bean rust (Adet Agricultural Research Center, 2000).

32nd Annual Research and Extension Review Proceeedings, March 2015, Haramaya University
81
In faba bean-maize intercrops and intercrop-integrated cropping systems of this study, the population of faba bean per plot was reduced by more than half. The microclimate of the faba bean canopy might be modified in such a way that there was free air-circulation, low leaf wetness and reduced damp sites. Likewise, Biddle and Catline (2007) stated that densely planted faba beans encourage humid microclimate within the canopy, thereby, encouraging infection and spore production in the presence of warm temperatures and light film of moisture on the leaf surface. Thus, Fernández-Aparicio et al. (2006) noted that intercropping faba bean with cereals has been proposed as a means to lessen the incidence of faba bean rust. The cereal favors aeration and prevents the formation of a dense faba bean canopy that might enhance disease damage. Reddy (2013) also indicated that varietal mixtures reduce disease epidemics by reducing the spatial density of susceptible plants where the deposition probability of released spores on susceptible tissue from a lesion is reduced. It was also observed that compost fertilization alone and in integration with furrow planting and row intercropping in particular highly reduced faba bean rust and decreased chocolate spot severity and increased grain yield of faba bean (Habtamu et al. submitted). In addition to the roles explained by intercropping, possibly compost fertilization could enhance the health and vigority of plants that might have increased plant chances to withstand pathogen attack and to activate the host defense system. Neher et al. (2014) found that compost amended soils reduced disease severity of ear blight on brassicas compared to the bare soil. Haggag and Saber (2007) reported that compost teas significantly reduced disease incidence and population counts of alternaria blight and significantly increased the activities of both peroxidase, β-1,3-glucanase and chitinase that could increase plant resistance both under greenhouse and field planted tomato and onion. Similar results were also observed by Sang et al. (2010) against Phytophthora capsici in pepper plants by compost water extracts and the test again activates expression of pathogenesis-related genes and peroxide generation in the leaves and lignin accumulation in the stems. In addition, composted paper mill residuals suppressed leaf spot of field grown cucumber and bacterial spot of field grown snap bean and anthracnose in greenhouse grown snap beans likely due to induced systemic resistance (Stone et al., 2003). Sang et al. (2010) showed the same result on the suppression of Colletotrichum coccodes in pepper leaves and C. orbiculare in cucumber leaves. Faba bean rust progressed rapidly from onset to the end of the epidemic period at both locations in 2012 and 2013. The epidemic was appeared early and higher at Haramaya than Arbarakate areas. This could be associated with the weather conditions and the altitude differences of the two locations. Arbarakate was characterized by many rainy days with extended period of rainfall and mild temperature (15.8 to 16.6 oC) during the cropping season which might have delayed the onset of rust and its epidemics. Haramaya was relatively warm (temperature ranging from 14.7 to 19.8 oC) with high relative humidity and fair rainfall distribution. Moreover, the results also demonstrated that rust severity was relatively higher late in the epidemic period during 2013 than 2012 at Haramaya. This might be partially explained by early termination of rainfall that would in turn reduce leaf wetness and infection in 2012. Supporting the current study, Hawthorne et al. (2004) stated that rust infection is favored by humid and warm temperatures. This infection can occur following six hours of leaf wetness (so does not require extended wet periods) and humidity plays an important role in causing this epidemic disease (Li-juan et al., 1993). The development of both primary and secondary inoculum sources of faba bean rust are also influenced by environmental factors; cloudy weather with high humidity and 17-22 oC favors development of the disease (Stoddard et al., 2010). That is, spore production is encouraged by high humidity and warm temperatures and once spores are released and deposited on a susceptible host crop, germination occurs quickly in the presence of a light film of moisture on the leaf surface to cause infection (Biddle and Catline, 2007). Of course, Dipak et al. (2012) also found that rainy days are negatively correlated with disease development of Uromyces viciae-fabae; which could be the most probably reason for the delayed onset of faba bean rust at Arbarakate in 2013. Faba bean rust epidemics might also be associated with altitude in which Arbarakate recorded lower rust severity than Haramaya since the former location is more highland than the later. In accordance with this study, a survey conducted by Shifa et al. (2011) in Hararghe highlands of Ethiopia in the 2009 cropping season to determine the incidence and severity of faba bean rust, and its association with environmental factors and cultural practices found that the incidence and severity of faba bean rust showed higher association with altitudes. The results indicated that those surveyed locations with an altitude above 2450 m.a.s.l had relatively low incidence and severity than locations below 2450 m.a.s.l. The variation could be partly due to the difference in the relative warmness of locations, as faba bean rust epidemic is lower in lower and intermediate altitudes (<2300m.a.s.l) and usually late in the season (Nigussie, 1991).
5. Conclusions In conclusion, row intercropping and intercropping-integrated climate change resilience strategies are highly reduced disease parameters of faba bean rust and recommended to manage the disease. Similarly, compost fertilization of the soil also plays an important role to manage faba bean rust; and the role of compost fertilization is highly magnified when integrated in row intercropping. It is, therefore, promising to grow faba bean with maize intercropping, compost fertilization in row intercropping in addition to using host resistance to manage rust of faba bean in Hararghe highlands. Further studies on integrated control of rust should continue that include host resistance and cultivar mixtures in the system. Moreover, much more can be done with compost on quality as well as quantity and the effects on soil physico-chemical properties and the mechanisms through which compost fertilization reduces foliar diseases' severity.
6. Acknowledgements The study was financed by the Swedish International Development Agency (SIDA) and Haramaya University, Ethiopia. We thank Mr. Getahun Tessema (Farmers' Development Agent, Arbarakate) and Ms. Woinshet Feleke, Mr. Berhanu Asefaw and Tefera Birhanu, School of Plant

32nd Annual Research and Extension Review Proceeedings, March 2015, Haramaya University
82
Sciences, Haramaya University for their assistance during field follow up and data collection; and staff members of West Hararghe Bureau of Agriculture and Rural Development who facilitated the allotment of experimental land at Arbarakate.
7. References Adet Agricultural Research Center (AARC). 2000. Progress report. Adet Agricultural Research Center, Ethiopia. Agegnehu, G., Ghizaw, A. and Sinebo, W. 2006. Yield performance and land-use efficiency of barley and faba bean mixed cropping in
Ethiopian highlands. European Journal of Agronomy 25 : 202 - 207. Ahmed, S., Muhammad, I., Kumar, S., Malhotra, R. and Maalouf, F. 2011. Impact of Climate Change and variability on diseases of food
legumes in the dry areas. International Center for Agricultural Research in the Dry Areas (ICARDA), Aleppo, Syria. Akibode, S. and Maredia, M. 2011. Global and regional trends in production, trade and consumption of food legume crops. Report submitted
to SPIA, 27 March 2011. Michigan State University, USA. Altieri, M. A. 1999. The ecological role of biodiversity in agroecosystems. Agriculture, Ecosystems and Environment 74: 1931. Bannon, F. J. and Cooke, B. M. 1998. Studies on dispersal of Septoria tritici pycnidiospores in wheat-clover intercrops. Plant Pathology 47: 49 -
56. Berhanu, B., Getachew, M., Teshome, G. and Temesgen, B. 2003. Faba Bean and Field Pea Diseases Research in Ethiopia. In: Ali, K.,
Gemechu, K., Ahmed, S., Malhotra, R., Beniwal, S., Makkouk, K. and Halila, M.H. (eds.), Food and Forage Legumes of Ethiopia: Progress and Prospects. Proceedings of the Workshop on Food and Forage Legumes, 22 - 26 September 2003, pp. 221 - 227.. Addis Ababa, Ethiopia.
Biddle, A. J. and Cattlin, N. D. 2007. Pests, Diseases and Disorders of Peas and Beans: A Color Handbook. Manson Publishing Ltd., London, UK.
Brunt, D. 2007. The adiabatic lapse-rate for dry and saturated air. Quarterly Journal of the Royal Meteorological Society, 59 (252) : 351 - 360. Campbell, C. L. and Madden, L. V. 1990. Introduction to plant disease epidemiology. Raleigh, North Carolina, Wooster Ohio. Coakley, S. M. and Scherm, H. 1996. Plant Disease in changing global environment. Applied Biology, 45 : 227 - 238. Coakley, S. M., Scherm, H. and Chakraborty, S. 1999. Climate Change and plant disease management. Annual Review of Phytopathology 37 :
399 - 426. CSA (Central Statistics Authority). 2013. Agricultural sample survey (2012/2013). Report on area and production of major crops. Statistical
Bulletin 532, Central Statistical Authority, Addis Ababa, Ethiopia. Dereje, G. and Tesfaye, B. 1993. Faba bean diseases in Ethiopia. In: Asfaw, T., Geletu, B. Saxena, M.C. and Solh, M.B. (eds.), Cool Season
Food Legumes of Ethiopia. Proceedings of the First National Cool Season Food Legumes Review Conference, 16 - 20 December 1993, pp. 328 - 345. Addis Ababa, Ethiopia.
Dipak, S., Tripathi, H. S. and Kumar, S. A. 2012. Influence of environmental factors on development of field pea rust caused by Uromyces Viciae-Fabae. Journal of Plant Disease Sciences 7 (1) : 13 - 17.
Fadda, C. 2011. Climate Change and Pests and Diseases: a quick overview. Vol. VII, July 20, 2011. Fernández-Aparicio, M., Rubiales, D., Flores, F. and Hauggard-Nielsen, H. 2006. Effects of sowing density, nitrogen availability and cop
mixtures on faba bean rust (Uromyces viciae-fabae) infection. pp. 143 - 147. In: Avila, C. M., Cubero, J. I., Moreno, M. T., Suso, M. J. and Torres, A. M. (eds.), International Workshop on faba bean breeding and agronomy. Co´rdoba, Spain.
Fininsa, C. 1996. Effect of intercropping bean with maize on bean common bacterial blight and rust diseases. International Journal of Pest Management 42: 51 - 54.
Fininsa, C. and Yuen, J. 2001. Association of bean rust and common bacterial blight epidemics with cropping systems in Hararghe highlands, Eastern Ethiopia. International Journal of Pest Management 47 (3) : 211 - 219.
Garrett, K. A., Dendy, S. P., Frank, E. E., Rouse, M. N. and Travers, S. E. 2006. Climate change effects on plant disease: genome to ecosystem. Annual Review of Phytopathology 44: 489 - 509.
Gomez, K. A. and Gomez, A. A. 1984. Statistical Procedures for Agricultural Research. 2nd Edition. John Wiley and Sons Inc., New York. Haggag, W. M. and Saber, M. S. M. 2007. Suppression of early blight on tomato and purple blight on onion by foliar sprays of aerated and non-
aerated compost teas. Journal of Food Agriculture and Environment 5 (2): 302 - 309. Hauggaard-Nielsen, H., Ambus, P. and Jensen, E. S. 2001. Interspecific competition, N use and interference with weeds in pea-barley
intercropping. Field Crops Research, 70: 101 - 109. Hawthorne, W., Bretag, T., Raynes, M., Davidson, J., Kimber, R., Nikandrow, A., Matthews, P. and Paull, J. 2004. Faba bean diseases
management strategy for the southern region. Available at www.sardi.sa.gov.au/pdf (Accessed 05 April 2014). ICARDA (International Center for Agricultural Research in the Dry Areas). 1986. Screening techniques for disease resistance in faba beans.
International Center for Agricultural Research in the Dry Areas (ICARDA), Aleppo, Syria. Khan, H. R., Paull, J. G., Siddique, K. H. M. and Stoddard, F. L. 2010. Faba bean breeding for drought-affected environments: A Physiological
and agronomic perspective. Field Crops Research, 115: 279 - 286. Li-juan, L., Zhao-hai, Y., Zhao-jie, Z., Ming-shi, X. and Han-qing, Y. 1993. Faba Bean in China: State-of-the-art Review. International Center
for Agricultural Research in Dry land Areas (ICARDA), Aleppo, Syria.

32nd Annual Research and Extension Review Proceeedings, March 2015, Haramaya University
83
Lithourgidis, A. S, Derdas, C. A. Damalas, C. A. and Vlachostergios, D. N. 2011. Annual intercrops: An alternative pathway for sustainable agriculture. Australian Journal of Crop Science, 5 (4) : 396 - 410.
MacLeod, B. 2006. Faba Bean: Rust disease. Farmnote 114/96, Department of Agriculture, Government of Western Australia. Mundt, C. C. 2002. Use of multiline cultivars and cultivar mixtures for disease management. Annual Review of Phytopath. 40: 381 - 410. Neher, D. A., Weicht, T. R. and Dunseith, P. 2014. Compost for management of weed seeds, pathogen, and early blight on Brassicas in organic
farmer fields. Agroecology and Sustainable Food Systems 1 - 27. Newton, A. C., Johnson, S. N. and Gregory, P. 2010. Implications of climate change for diseases, crop yields and food security. BGRI Technical
Workshop, 30 - 31 May, 2010. St. Petersburg, Russia. Nigussie, T. 1991. Expansion of rust focus in faba beans (Vicia faba L.). Wageningen Agricultural University, Wageningen, The Netherlands. Reddy, P. P. 2013. Recent advances in crop protection. Springer, New York. Rosegrant, M. W. 2010. Impacts of climate change on food security and livelihoods. In: Solh, M. and Saxena, M.C. (eds.), Food Security and
Climate Change in the Dry Areas. Proceedings of International conference, 1 - 4 February, 2010, pp. 24 - 27.. Amman, Jordan. Salmeron, J. I. C., Avila, C. and Torres, A. M. 2010. Faba bean and its importance in food security in developing countries. In: ICARDA, Food
Security and Climate Change in Dry Areas. International Conference, 1 - 4 February 2010, p. 13.. Amman, Jordan. Sang, M. K.,. Kim, J.-G and Kim, K. D. 2010. Biocontrol activity and induction of systemic resistance in pepper by compost water extracts
against Phytophthora capsici. Phytopathology 100(8): 774 - 783. SAS Institute. 2001. SAS/STAT User‘s Guide, Version 8.2. SAS Institute Inc., Cary, NC, USA. Shifa, H., Hussien, T. and Sakhuja, P. K. 2011. Association of faba bean rust (Uromyces viciae-fabae) with environmental factors and cultural
practices in the Hararghe highlands, Eastern Ethiopia. East African Journal of Sciences 5 (1) : 58 - 68. Stoddard, F. L., Nicholas, A. H., Rubiales, D., Thomas, J. and Villegas-Fernández, A. M. 2010. Integrated pest management in faba bean. Field
Crops Research 115: 308 - 318. Stone, A. G., Vallad, G. E., Cooperband, L. R., Rotenberg, D., Darby, H. M., James, R. V., Stevenson, W. R. and Goodman, R. M. 2003. The
effect of organic amendments on soilborne and foliar diseases in field grown snap bean and cucumber. Plant Disease 87: 1037 - 1042. Tamado, T., Fininsa, C. and Worku, W. 2007. Agronomic performance and productivity of common bean (Phaseolus vulgaris L.) varieties in
double intercropping with maize (Zea mays L.) in Eastern Ethiopia. Asian Journal of Plant Sciences 6 (5) : 749 - 756. Tilahun, T., Minale, L. and Alemayehu, A. 2012. Role of maize (Zea mays L.)- fababean (Vicia faba L.) intercropping planting pattern on
productivity and nitrogen use efficiency of maize in northwestern Ethiopia highlands. International Research Journal of Agricultural Science and Soil Science 2 (3) : 102 - 112.
Torres, A. M., Roman, B., Avila, C. M., Satovic, Z., Rubiales, D., Sillero, J. C., Cubero, J. I. and Moreno, M. T. 2006. Faba bean breeding for resistance against biotic stresses: Towards application of marker technology. Euphytica 147: 67 - 80.
Van der Plank, J. E. 1963. Plant diseases: Epidemics and Control. Academic Press, London. Wang, Q., E. Zhang, F. Li and F. Li, 2008. Runoff efficiency and the technique of micro water harvesting with ridges and furrows for potato
production in semi-arid areas. Water Resources Management 22 : 1431 - 1443. Wheeler, B.E.J. 1969. An Introduction to Plant Diseases. Wiley and Sons, London. Zhao, H., Xiong, Y.-C. Li, F.-M. Wang, R.-Y. Qiang, S.-C. Yao, T.-F. and Mo, F. 2012. Plastic film mulch for half growing-season maximized
WUE and yield of potato via moisture-temperature improvement in a semi-arid agroecosystem. Agricultural Water Management 104 : 68 - 78.

32nd Annual Research and Extension Review Proceeedings, March 2015, Haramaya University
84
9. Evaluation and Identification of Potato (Solanum tuberosum L.) Varieties for Yield and Resistance to Late Blight [Phytophthora infestans (Mont.) de Bary] in Eastern Ethiopia Wassu Mohammed Ali Haramaya University, College of Agriculture and Environmental Sciences, School of Plant Sciences, Haramaya, Ethiopia Author E-mail: [email protected]
Abstract: Eastern Ethiopia highlands are potentials for potato (Solanum tuberosum L.) production. Potato is the second most important crop next to khat (Chata edulis Forsk) in supporting farmers‘ livelihoods. The production is market oriented with considerable amounts being exported to the neighboring countries; however, the tuber yield is remained low on farmers, field. As one option, the availability of high yielding varieties has given attention to increase the productivity of the crop in the region. Therefore, this research was conducted to evaluate the yield and late blight resistance of majority of the improved potato varieties (15) in the country and two farmers‘ cultivars as a check under eastern Ethiopia condition to identify high yielding, disease resistance and wide adaptable varieties. The trial was conducted at three locations which are representative of potato growing areas in eastern Ethiopia for two consecutive cropping seasons at Hirna and Arberkete and three seasons at Haramaya. The combined analysis of variance over seasons and locations revealed the presence of significant effects of genotype, environment and location and genotype x environment interaction on late blight resistance, total and marketable tuber yield t ha-1. Therefore, Additive Main Effects and Multiplicative Interaction (AMMI) and Eberhart and Russell models were employed to estimate the contribution of genotype x environment interaction, genotype and environment and to identify high yielding and wide adaptable varieties. However, both models revealed the predominant importance of genotype and environment than genotype x environment interaction for tuber yields while the significant effect of genotype and genotype x environment interaction for late blight resistance. This suggested the varieties can be predictable on their genetic potential and the environments where they grow except few. Considering all stability parameters of the two models, high yield and resistance to late blight, Bubu (38.61 t ha-1) had highest marketable tuber yield and the lowest late blight score. It was identified as stable but responsive to the environments with the tendency of higher performances towards to favourable environments. Belete had the second highest marketable tuber yield (38.26 t ha-1) and disease severity score while Gera (37.34 t ha-1), Mara Charre (36.95 t ha-1) and Gudanie (34.18 t ha-1) had the 3rd, 4th, and 5th highest marketable tuber yield in the trial. The former variety had <30% disease severity score and stable for all traits while the two had >30% severity scores. Based on all analyses results, it is possible to recommend Bubu, Belete and Gera for potato production in eastern Ethiopia even under high pressure of late blight, but it is hardly possible to recommend Mara Charre and Gudanie unless less frequent chemical spray is considered to control the disease late blight.
Keywords: Additive Main effect and Multiplicative Interaction (AMMI); Genotype; Eberhart and Russell Models;, Environment, Late blight; Variety
1. Introduction Potato has better ability to provide a high yield of high-quality product per unit input with a shorter crop cycle (mostly <120 days) compared to major cereal crops like maize (Hirpa et al., 2010). As a result, the crop is appreciated as a good source of nutritious food and cash by large number of food insecure smallholder farmers and pastoralists in Ethiopia (Haverkort, 2012). Ethiopia has huge potential to produce potato (70% of the 10 million hectares of arable land) (FAO, 2008). The current area covered with potato is very small about 0.16 million hectare and the average yield is below 10 t ha-1 (Baye and Gebremedhin, 2013). The Central, the Eastern, the Northwestern and the Southern regions of Ethiopia constitute approximately 83% of the potato farmers. Potato is the second most important crop in eastern Ethiopia next to khat (Chata edulis Forsk) in supporting farmers‘ livelihoods with 75.9% increase in income over sorghum [Sorghum bicolor (L.) Moench] (Mulatu et al., 2006). The potato production in this region is market oriented with considerable amounts being exported to the neighbouring countries Djibouti and Somalia (Adane et al., 2010).Despite Eastern highlands are agronomic potentials for potato production, the tuber yield is remained low on farmers, field. In Ethiopia, the low acreage and yield are attributed to many factors, but lack of high quality seed potatoes and high yielding varieties are the major factors (Gildemacher et al., 2009; Endale et al., 2008). More than 27 potato varieties were recommended for production in different regions of Ethiopia. The varieties were developed by different research centers in the country. The total tuber yield of the varieties ranged from 20 to 47 t ha-1 (MoA, 2013 and 2012). The differences of varieties for tuber yield might be due to the differences of the varieties genetic potential but also the adaptability of the varieties in the recommended area of cultivation. The role of geographical location in creating varied genetic material even in the absence of genome differentiation was reported in potato (Hawkes, 1990). The difference in tuber yield was also recorded in European Union countries which ranged from 10 to 50 t ha−1 (Flis et al., 2014). This difference might be due to the genetic potential of the genotypes, environments and the significant role of genotype × environment interaction. The performance of genotype is determined by its genetic potential, the environment where it grows and the interaction of genotype and environment (Yan et al., 2007; Prabhakaran and Jain, 1994). The agronomic performance of the recommended potato varieties for different regions of the country has not been tested in eastern Ethiopia. In the absence of genotype x environment interaction, the superior genotype in one environment may be regarded as the superior genotype in all. But,

32nd Annual Research and Extension Review Proceeedings, March 2015, Haramaya University
85
the presence of genotype x environment interaction complicated the selection of superior genotypes for target environments, since the superior genotype in one environment may or may not be superior in other or in all environments. Therefore, evaluation of breeding materials across environments is a must either to select varieties that perform well consistently in all environments or to make specific recommendations of varieties for each environment (Yan et al., 2007; Gauch, 2006). The growing of varieties with stable yield is an advantage for farmers to obtain larger harvest due to large genotypic effect and small genotype x environment interaction (Flis et al., 2014). This suggested that the high mean yield of the variety is not the only criterion for selection unless its high performance is established over the different environmental conditions. The varieties stability test better to be extended to late blight [Phytophthora infestans (Mont.) de Bary] resistance in eastern Ethiopia in particular and in the country in general. This is because; the loss of potato production due to this disease is estimated up to 70% in highland areas of Ethiopia (Mekonen et al., 2011). Therefore, the objectives of this research were: (i) to evaluate the performance of improved potato varieties in eastern Ethiopia, thereby to identify high yielding, resistance to disease and stable varieties, and (ii) to determine the environment and genotype x environment interaction on the performance of potato varieties, and iii) to test stability of tuber yield and reaction to late blight across environments.
2. Materials and Methods 2.1. Description of the Study Sites The field experiment has been carried out at three locations namely; Haramaya, Hirna and Arberkete which are considered the representative potato growing areas of eastern Ethiopia. The experiment was conducted for two cropping season (2012 and 13) in all the three locations while at Haramaya, potato varieties were additionally evaluated during 2014 cropping season to generate reliable information about the late blight resistance of varieties since this location is hot spot area for the disease. This made the total of seven environments considering one location and one cropping season as one environment. Haramaya University research farm is located at 2022 m.a.s.l., 9°41''N latitude and 42°03''E longitude. The area has a bimodal rainfall distribution with mean annual rainfall of 760 mm. The long rainy season extends from June to October and accounts for about 45% of the total rainfall. The mean maximum temperature is 23.40C while the mean minimum annual temperature is 8.250C. The soil of the experimental site is a well-drained deep alluvial with a sub-soil stratified with loam and sandy loam. Hirna sub-station is situated at a distance of about 134 km to the west of Haramaya. The site is located at 9 o12‘ North latitude, 41 o4‘East longitude, and at an altitude of 1870 meters above sea level. The area receives mean annual rainfall ranging from 990 to 1010 mm. The average temperature of the area is 24.0o C (Tekalign, 2011). The soil of Hirna is vertisol (HURC, 1996). Arberekete field experiment was conducted on farmer‘s filed, which is located at a distance of about 171 km to the west of Haramaya. The site is located at 9 o14‘ North latitude, 41 o2‘East longitude, and at an altitude of 2280 meters above sea level (CZWADO, 2011). 2.2. Experimental Materials The experiment included 15 improved potato varieties released for different regions of Ethiopia by five Research Centers and Haramaya University and two farmers‘ cultivars. The description of the varieties is given in Table 1. 2.3. Experimental Design and Procedures The experimental was laid out as a Randomized Complete Block Design (RCBD) with three replications in each location and season. Each potato genotype was assigned to one plot in each replication and six rows with 12 plants. The gross plot size was 16.2 m2 with 75 and 30 cm between rows and within plant spacing, respectively. The spacing between plots and replications was maintained at1.5m and 1 m, respectively. For yield estimation, tubers were harvested from forty plants from the four middle rows, leaving the plants growing in the two border rows as well as those growing at both ends of each row to avoid edge effects. The experimental fields were cultivated by a tractor to a depth of 25-30 cm and ridges were made by hand. Medium sized (39-75 g) and well sprouted tubers were planted at the sides of ridges (Lung‘aho et al., 2007). Planting was at the end of June and first week of July during the main growing season after the rain commenced and when the soil was moist enough to support emergence. The planting depth was maintained at 10 cm. The whole recommended rate of Phosphorus fertilizer (92 kg P2O5 ha-1) was applied at planting in the form of Diammonium Phosphate. Nitrogen fertilizer was applied at the rate of 75 kg N ha-1 in the form of Urea in two splits, half rate after full emergence (two weeks after planting) and half rate at the initiation of tubers.
Table 1. Description of potato varieties.
Released/local name of genotype Release year Breeder Center Yield (t ha-1) at research field
Recommended Altitude (m.a.s.l.)
Bubu 2011 Haramaya University 39-42 1700-2000
Belete 2009 Holeta Research Center 47.2 1600-2800
Araarsaa 2006 Sinnana Research Center 20-42 2400-3350
Gudanie 2006 Holeta Research Center 29 1600-2800
Mara Charre 2005 Hwassa Research Center 33.3 1700-2700
Gabbisa 2005 Haramaya University 40 1700-2000

32nd Annual Research and Extension Review Proceeedings, March 2015, Haramaya University
86
Bulle 2005 Haramaya University 39.3 1700-2000 Chala 2005 Haramaya University 42 1700-2000
Gera 2003 Sheno Research Center 25.9 2700-3200 Jalenie 2002 Holeta Research Center 40.3 1600-2800 Guasa 2002 Adet Research Center 24.4-33 2000-2800 Gorebela 2002 Sheno Research Center 30-52 1700-2400 Bedasa 2001 Haramaya University 40.6 2400-3350 Zemen 2001 Haramaya University 37.2 1700-2000 Chirro 1998 Haramaya University 32-40 2700-3200 Bete (Local cultivar) ---------- ---------------------------- ------------------- Eastern Ethiopia
Jarso (Local cultivar) ---------- ---------------------------- ------------------- Eastern Ethiopia
Source: MoA, 2013 and 2012. Varieties recommended for Central Ethiopia was by Holeta Agriculture Research Center, for Northern by Adet and Sheno Agriculture Research Centers, for Southern by Hwassa Agriculture Research Center, for Southeastern by Sinnana Agriculture Research Center and for Eastern Ethiopia by Haramaya University. 2.4. Data Collection Total tuber yield (t ha-1) was calculated and recorded at harvest from the total tuber yield of 40 plants per plot. Marketable tuber yield (t ha-1) was estimated by sorting tubers in each plot which were free from diseases, insect pests and greater than or equal to 20g in weight. Disease assessment was started after 46 days of planting as soon as disease symptoms appear in susceptible genotypes and then after every 20 days until majority of the genotypes attained physiological maturity. The disease was assessed following CIP (2006) guideline and other established procedures. Assessment of severity late blight under field conditions in percent was recorded on plot basis taking in account the number of plants developing disease symptoms in a leaf and/or many leaves and plants free from disease (Henfing, 1987). 2.5. Data Analysis Total and marketable tuber yields data were subjected to unbalanced general analysis of variance considering the three seasons and locations. Additive Main Effects and Multiplicative Interaction (AMMI) (Zobel et al., 1988) and Eberhart and Russell (1966) models analyses of variances were conducted for seven environments considering each location and one season as one environment. Late blight disease severity data was subjected only for AMMI and Eberhart and Russell analyses of variance for four environments. Stability parameters of Eberhart and Russell (1966) i.e. regression coefficient (bi) and deviation from linear regression (S2di) were computed using the established procedure for the model. The interaction principal component axes (IPCA) scores of a genotype and an environment were computed in the AMMI analysis. In AMMI biplot, the main effects i.e. genotype and environment means were plotted on the abscissa and the IPCA 1 scores for the same genotypes and environments on the ordinate. In addition, AMMI stability value (ASV) was calculated as proposed by Purchase (1997) and Purchase et al. (2000) as follows:
ASV= IPCAISS
IPCA 2SS scoreIPCA1
2+ IPCA2score
2
Where, ASV = AMI stability value; SS = sum squares of IPCA1 and IPCA 2 (the first and the second interaction principal component axes, respectively), and thus genotypes with lower ASV was considered more stable than those with higher ASV values.
3. Results 3.1. General Analysis of Variance and Mean Performance of Genotypes The general analysis of variance results revealed highly significant (P<0.01) effects of the three main factors (genotype, location and season) and all the possible interactions (genotype x location, location x season and genotype x location x season) on total and marketable tuber yield (Table 2a). The combined analysis of variance results from AMMI model revealed the significant effect of all sources of variation (of genotype, environment and genotype x environment interaction) on all traits except nonsignificant influence of environment on late blight severity (Table 3a and 3b). Similar results were obtained from analysis of variance of Eberhart and Russel‘s Model where sum squares due to genotypes and genotype x environment (linear) were highly significant (P<0.01) for all the traits. Pooled deviation mean square was also significant for all traits except for late blight severity. On the other hand, the mean squares were nonsignificant for all traits and genotypes except for total and marketable tuber yields of Gorebela and late blight severity score of Bete (Table 4a and 4b). The treatment sum of squares had the highest contribution for total sum squares ranged from 78.48 (late blight severity) to 90.91% (marketable tuber yield) while error sum squares contributed less in the range between 7.98 (total tuber yield) and 12.39% (late blight severity). Genotype sum squares accounted the highest proportion of treatment sum squares for disease severity (71.86%). Environment sum squares contributed the highest share for treatment sum squares of total tuber yield (45.5%) while genotype x environment sum squares had the lowest

32nd Annual Research and Extension Review Proceeedings, March 2015, Haramaya University
87
share of treatment sum squares for all traits. The first principal component axis (IPCA 1) sum square contributed the highest share for genotype x environment sum squares for all traits in the range between 37.04 (total tuber yield) and 66.16% (disease severity) (Table 3a and 3b). On the basis of pooled mean over locations and seasons showed the wide range of performance of potato genotypes for total tuber yield (21.15 to 41.96 t ha-1) with overall mean of 33.18 t ha-1. Marketable tuber yield was in the range between 16.7 and 38.61 t ha-1 with genotypes overall mean of 29.81 t ha-1. Eight and seven genotypes including farmers‘ cultivars had mean performance less than the average performance of genotypes for total and marketable tuber yield, respectively (Table 5a). The four varieties, Bubu, Belete, Mara Charre and Gera had highest mean total (>40 t ha-1) and marketable tuber yield (>36 t ha-1). These varieties also had lowest disease severity score where the former two varieties with <20% while the later two varieties <35% (Table 5b). Growing of the first four AMMI selections in seven environments for total tuber yield t ha-1 has an advantage of 6.16 t ha-1 than growing all genotypes in eastern Ethiopia. Bubu, Belete, Mara Charre and Gera were selected as the first selections by AMMI model in all environments and growing of these three varieties had the advantage of 11.17 t ha-1 total tuber yield than growing of all genotypes and all selected four AMMI selections (Table 6). Table 2. Mean squares from unbalanced analysis of variance for average tuber weight and tuber yields of 17 potato genotypes as evaluated at seven environments.
Source of variation DF TTY t ha-1 MTY t ha-1
Replication 2 21.92 23.10 Genotype (G) 16 751.53** 875.96** Location (L) 2 7035.52** 7218.94** Season (S) 2 787.85** 1578.74** Genotype x Location 32 156.80** 197.70** Genotype x Season 32 92.89** 81.21** Location x Season 2 1211.55** 1205.15** G x L x S 32 50.94** 62.40**
Error 236 16.99 18.85 SE
1.1.2
4.122 4.341
CV (%) 12.42 14.56
**, significant at P < 0.01. DF = degree of freedom, ATW (g) = average tuber weight, TTY t ha-1 = total tuber yield tons per hectare and MTY t ha-1 = marketable tuber yield tons per hectare. Table 3a. AMMI analysis of variance for total and marketable tuber yield of 17 potato genotypes tested at seven environments.
Sources of variation DF
Total tuber yield t ha-1 Marketable tuber yield t ha-1
Sum of squares
Mean squares
Sum of square explained
Sum of squares
Mean squares
Sum of square explained
% total % G x E
% total % G x E
Treatment 118 39714 336.6** 90.74 44943 380.9** 90.91 Genotype 16 12025 751.5** 30.28 14015 876** 31.18
Environment 6 18070 3011.6** 45.50 20006 3334.3** 44.51
Rep within E 14 563 40.2 1.42 517 36.9 1.15 G x E 96 9620 100.2** 24.22 10922 113.8** 24.30
IPCA 1 21 3563 169.6** 37.04 4740 225.7** 43.40 IPCA 2 19 2902 152.7** 30.17 3014 158.6** 27.60 Residuals 56 3155 56.3 32.80 3169 56.6 29.01 Error 224 3491 15.6 7.98 3977 17.8 8.04
Total 356 43768 122.9 49437 138.9

32nd Annual Research and Extension Review Proceeedings, March 2015, Haramaya University
88
Table 3b. AMMI analysis of variance for late blight disease severity score of 17 potato genotypes tested at four environments.
Sources of variation DF Sum of squares Mean squares
Sum of square explained
% total % G x E
Treatment 67 157794 2355** 78.48
Genotype 16 113385 7087** 71.86 Environment 3 15512 5171 9.83 Rep within E 8 18363 2295 11.64 G x E 48 28897 602** 18.31
IPCA 1 18 19117 1062** 66.16 IPCA 2 16 8954 560** 30.99 Residuals 14 827 59 2.86 Error 128 24903 195 12.39
Total 203 201060 990
**, significant at P < 0.01. DF = degree of freedom, Rep within E = replication within environments, G x E = genotype by environment interaction, IPCA 1 and 2, interaction principal component axis one and two, respectively. Table 4a. Analyses of variance from Eberhart and Russel‘s Model for tuber yield and average tuber weight of 17 potato genotypes tested at seven environments.
Source of variation DF TTY (t ha-1) MTY (t ha-1)
Genotypes 16 250.51** 291.99**
Environment + (Geno x Env.) 102 90.49** 101.07**
Environment ( linear ) 1 6023.28 6668.57 Genotypes x Env. ( linear ) 16 61.55** 82.25** Pooled Deviation 85 26.14** 27.35**
Bubu 5 7.63 5.68 Belete 5 44.18 42.6 Chala 5 12.83 16.93 Gudanie 5 17.9 16.31 Bulle 5 17 21.09 Chirro 5 28.27 20.86 Araarsaa 5 19.03 17.55 Zemen 5 3.6 6.34 Jalenie 5 2.53 6.43 Jarso 5 27.89 27.45 Gabbisa 5 8.25 8.27 Gorebela 5 75.44** 80.61*
Mara Charre 5 35.79 34.97 Bete 5 35.38 43.45 Bedasa 5 29.83 28.49 Gera 5 50.74 51.34 Guasa 5 28.12 36.61 Pooled Error 238 5.68 6.29
* and **, significant at P < 0.05 and P < 0.01, respectively. TTY (t ha-1) = total tuber yield tons per hectare, MTY (t ha-1) = marketable tuber yield tons per hectare and ATW (g) = average tuber weigh in gram.

32nd Annual Research and Extension Review Proceeedings, March 2015, Haramaya University
89
Table 4b. Analyses of variance from Eberhart and Russel‘s Model for late blight disease severity score of 17 potato genotypes tested at four environments.
Source of variation DF Mean square
Genotypes 16 2362.18** Environment + (Geno x Env.) 51 290.26 Environment ( linear ) 1 5170.8** Genotypes x Env. ( linear ) 16 379.95** Pooled Deviation 34 104.51
Bubu 2 8.24 Belete 2 223.18 Chala 2 44.30 Gudanie 2 56.84 Bulle 2 14.19 Chirro 2 18.89
Araarsaa 2 311.58 Zemen 2 40.85 Jalenie 2 132.84 Jarso 2 4.54 Gabbisa 2 52.25 Gorebela 2 2.66 Mara Charre 2 132.93 Bete 2 352.29* Bedasa 2 50.91 Gera 2 47.39 Guasa 2 282.78 Pooled Error 136 106.04
*and **, significant at P<0.05 and P<0.01, respectively. 3.3. Stability Analyses from AMMI and Eberhart and Russel’s Models The stability parameters estimated for 17 potato genotypes of total and marketable tuber yields are presented in Table 5a. According to the ASV ranking, Gera, Bete and Mara Charre for total tuber yield; Bedasa, Araarsaa and Bete for marketable tuber yield had lowest ASV. However, Bete and Bedasa had the lowest tuber yields but Gera and Mara Charre were among the four high yielding varieties. The high yielding varieties (Bubu and Belete) had also relatively lower ASV for total and marketable tuber yield. Regression coefficient (bi) was significant and deviation from regression (S2di) was nonsignificant for all genotypes except the two varieties for both total and marketable tuber yields. In the AMMI biplot, genotype and environment means were plotted on the abscissa and the IPCA 1 scores for the same genotypes and environments on the ordinate. The dotted vertical line shows the grand means of all genotypes whereas the dotted horizontal line shows the zero point for the IPCA scores. Bubu, Chirro and Gudanie distributed in top right quadrant for both total and marketable tuber yields while Mara Charre, Gera, Belete and Gabbisa plotted in bottom right quadrant of both biplots (total and marketable tuber yields) (Figure 1 and Figure 2). Other three varieties viz. Chala, Araarsaa and Zemen also distributed in the right quadrant either for total or marketable tuber yield. Arbrekete in both seasons (2012 and 2013), Hirna in 2013 distributed in top right while Hirna and Haramaya in 2012 cropping season plotted in bottom right in both biplots. Haramaya in 2013 and 2014 cropping seasons distributed in the left quadrants of the two biplots. The two varieties (Bubu and Bulle) that scored lowest disease severity had relatively higher ASV while seven varieties had low ASV (<1) for late blight severity. Among the seven varieties, Belete had scored lower severity (<20%) while Mara Charre, Gudanie and Araarsaa had disease severity scores in the range between 30 and 35%. All genotypes deviation from regression (S2di) did not show significant difference from zero while nine genotypes had regression coefficient (bi) significantly different from unity (Table 5b). Most of the genotypes with higher and lower disease severity scores were distributed in the right and left side of the biplot, respectively. Bubu and Bule with lowest disease severity scores were plotted in the left bottom while Belete located in the left top quadrant (Figure 3).

32nd Annual Research Bulletin, April 2015, Haramaya University
90
Table 5a. Stability parameters for total and marketable tuber yield from AMMI analysis and Eberhart and Russel‘s Models of 17 potato genotypes tested at three locations and two cropping seasons.
Genotype Pooled mean
Total tuber yield t ha-1
Pooled mean
Marketable tuber yield t ha-1
AMMI model stability ER‘s Model stability AMMI model stability ER‘s Model stability
IPCA 1 IPCA 2 ASV bi S2di IPCA 1 IPCA 2 ASV bi S2di
Bubu 40.55 (3) 0.67 0.92 0.57 (7) 0.54** 1.96 38.61(1) 1.06 0.32 1.92 (9) 0.5** -0.61 Belete 40.53 (4) 1.35 -2.1 1.09 (9) 1.00** 38.5 38.26 (2) 0.86 -2.15 0.54 (6) 0.95** 36.3
Chala 34.96 (7) -0.89 -0.1 2.60 (11) 1.33** 7.15 33.29 (6) -1.56 -0.67 2.37 (11) 1.45** 10.64 Gudanie 36.28 (5) 1.53 1.17 1.76 (10) 0.43* 12.22 34.18 (5) 1.63 0.33 3.62 (15) 0.42* 10.01 Bulle 27.36 (14) 2.22 1.3 2.89 (12) 0.28* 11.32 23.37 (15) 2.71 0.78 5.04 (17) 0.19 14.8 Chirro 33.41 (8) -2.18 0.26 6.27 (17) 1.55** 22.59 30.15 (9) -1.81 0.82 2.7 (13) 1.48** 14.56 Araarsaa 32.62 (10) -0.57 1.26 0.38 (5) 0.89** 13.35 30.64 (8) 0.03 0.92 0.01 (2) 0.8** 11.25 Zemen 32.83 (9) -1.74 -0.38 3.70 (14) 1.61** -2.07 30.12 (10) -1.95 0.31 4.86 (16) 1.68** 0.05 Jalenie 31.1 (13) -0.99 -0.09 3.26 (13) 1.29** -3.15 27.15 (12) -0.59 0.83 0.5 (5) 1.15** 0.13
Jarso 21.15 (17) 0.59 2.38 0.29 (4) 0.58* 22.21 16.7 (17) 1.73 2 1.62 (8) 0.45* 21.15 Gabbisa 36.02 (6) -0.76 -0.85 0.72 (8) 1.3** 2.57 31.67 (7) -1.29 -0.5 2.08 (10) 1.45** 1.98 Gorebela 26.2 (16) 2.7 -0.98 4.49 (16) 0.58* 69.76* 23.89 (14) 2.53 -1.46 3.32 (14) 0.55 74.32* Mara Charre 41.96 (1) -0.51 -1.7 0.28 (3) 1.19** 30.11 36.95 (4) -1 -1.51 0.81 (7) 1.22** 28.67 Bete 24.64 (15) 0.36 1.84 0.16 (2) 0.72* 29.71 19.37 (16) 0.58 2.01 0.31 (3) 0.86** 37.16 Bedasa 31.2 (12) 0.65 -1.68 0.40 (6) 1.02** 24.16 26.92 (13) -0.02 -1.62 0.00 (1) 1.09** 22.19 Gera 40.72 (2) 0.01 -1.99 0.01 (1) 1.17** 45.06 37.34 (3) -0.62 -2.21 0.33 (4) 1.16** 45.04 Guasa 32.54 (11) -2.45 0.75 4.44 (15) 1.51** 22.44 28.19 (11) -2.29 1.8 2.58 (12) 1.59** 30.32 Mean 33.18 29.81
* and **, significant at P<0.05 and P<0.01, respectively. Numbers in parenthesis represent the mean and ASV rank of genotypes in descending and ascending order, respectively. IPCA 1 and IPCA 1 = interaction principal component axis one and two, respectively, ASV = AMMI stability value, ER’s = Eberhart and Russel’s mmodel, bi and S2di, regression coefficient and deviation from regression, respectively.

32nd Annual Research Bulletin, April 2015, Haramaya University
91
Table 5b. Stability parameters for late blight disease severity score from AMMI analysis and Eberhart and Russel‘s Models of 17 potato genotypes.
Genotype Pooled mean
Late blight disease severity score (%)
AMMI model stability ER‘s Model stability
IPCA 1 IPCA 2 ASV bi S2di
Bubu 10 (16) -1.84 -0.51 3.49 (11) 0.05 -97.8 Belete 18 (14) 0.11 2.85 0.02 (1) 1.04 117.14 Chala 54 (5) 3.33 -0.25 12.29 (16) 2.63** -61.74 Gudanie 30 (12) -0.51 -1.39 0.31 (3) 0.7 -49.2 Bulle 11 (15) -2.4 -0.6 4.79 (13) -0.29 -91.85 Chirro 79 (2) 3.2 0.04 27.72 (17) 2.60** -87.15 Araarsaa 35 (10) -1.46 3.29 0.98 (7) 0.3 205.54 Zemen 71 (3) 3.55 1.18 6.16 (15) 2.84** -65.2 Jalenie 37 (9) 2.18 -2.22 2.16 (9) 2.14** 26.8 Jarso 95 (1) -1.41 0.42 2.57 (10) 0.26* -101.5
Gabbisa 41 (8) -1.08 -1.37 0.96 (6) 0.44 -53.8 Gorebela 43 (6) -0.5 0.24 0.72 (5) 0.76** -103.38 Mara Charre 32 (11) 0.6 2.11 0.32 (4) 1.25* 26.89 Bete 71 (3) -3.48 -2.84 3.85 (12) -0.61 246.24 Bedasa 64 (4) 0.28 1.32 0.13 (2) 1.18** -55.14 Gera 28 (13) -2.88 0.83 5.36 (14) -0.42 -58.66 Guasa 42 (7) 2.31 -3.1 1.99 (8) 2.13* 176.74 Mean 45
* and **, significant at P<0.05 and P<0.01, respectively. Numbers in parenthesis represent the mean and ASV rank of genotypes in descending and ascending order, respectively. IPCA 1 and IPCA 1 = interaction principal component axis one and two, respectively, ASV = AMMI stability value, ER’s = Eberhart and Russel’s mmodel, bi and S2di, regression coefficient and deviation from regression, respectively.

92
Table 6. The first four AMMI selections in seven environments for total and marketable tuber yield t ha-1.
Environment HU12 HU13 HU14 HIR12 HIR13 AR12 AR13 Advantage t ha-
1
Total tuber yield t ha-1 Mean 33.95 22.83 23.89 40.94 43.11 34.41 33.14
33.18
1st Be (48.31) Bu (33.45) Be (33.56) Mar (56.75) Mar (53.39) Bu (43.7) Bu (41.28) 11.17
2nd Ge (46.1) Gu (32.01) Bu (32.79) Ge (55.78) Ge (50.51) Gud (40.48) Gu (41.1) 9.50
3rd Mar (45.83) Be (31.03) Mar (31.3) Be (53.98) Gua (50.12) Mar (40.2) Chir (39.9) 8.59 4th Bu (40.28) Mar (27.68) Ge (31.06) Gab (48.07) Chir (50.12) Be (39.64) Mar (38.54) 6.16
Advantage t ha-1 11.18 8.2125 8.2875 12.705 7.925 6.595 7.065 8.85
Marketable tuber yield t ha-1
Mean 31.73 18.88 19.41 38.54 38.74 31.99 29.4 29.81
1st Be (45.62) Bu (31.1) Be (31.39) Ge (54.84) Mar (47.98) Bu (42.71) Ara (37.74) 11.82 2nd Ge (43.77) Be (29.94) Bu (30.61) Mar (53.29) Cha (46.84) Gu (39.03) Bu (37.66) 10.35
3rd Mar (41.55) Gud (28.52) Gud (27.58) Be (51.48) Ge (46.58) Be (37.83) Chir (35.47) 8.62
4th Bu (40.56) Ge (24.27) Ge (26.87) Cha (48.53) Gua (46.07) Mar (35.24) Ze (33.89) 6.68
Advantage t ha-1 11.15 9.58 9.70 13.50 8.13 6.71 6.79 9.37
Numbers in parenthesis indicated total and marketable tuber yield t ha-1 varieties in of respective growing site. HU12, HU13 & HU14 = Haramaya site in 2012, 2013 and 2014, respectively, HIR12 and HIR 13 = Hirna site in 2012 and 2013, respectively, AR12 and AR13 = Arberkete in 2012 and 2013, respectively. Be = Belete, Bu = Bubu, Mar = Mara Charre, Ge = Gera, Gu = Gudanie, Chir = Chirro, Gab = Gabbisa, Ara = Araarsaa, Cha = Chala, Gua = Guasa and Ze = Zemen.

32nd Annual Research Bulletin, April 2015, Haramaya University
93
Figure 1. AMMI biplot of 17 potato genotypes evaluated for total tuber yield t ha-1 at seven environments in eastern Ethiopia.
Figure 2. AMMI biplot of 17 potato genotypes evaluated for marketable tuber yield t ha-1 at seven environments in eastern Ethiopia.
Figure 3. AMMI biplot of 17 potato genotypes evaluated for late blight disease severity at four environments in eastern Ethiopia.

32nd Annual Research Bulletin, April 2015, Haramaya University
94
4. Discussion Highly significant differences among genotypes for tuber yields and late blight resistance showed the presence of wide variations among the varieties for all traits. Environment and genotype x environment interaction had highly significant effect on all traits except late blight resistance was not significantly affected by environment. This indicated the unstable expression of traits across environments. Significant variations among genotypes due to environment and genotype x environment interactions for tuber yields and late blight resistance were also reported by other authors (Flis et al., 2014; Mulugeta, and Dessalegn, 2013; Mulema et al., 2008; Mateo et al., 2007). The higher contribution of genotype and environment sum squares than genotype x environment interaction to treatment sum squares for total and marketable tuber yields suggested the two components were more important for the observed variations among genotypes. But, the higher contribution of genotype sum square (71.86%) to treatment sum square for late blight severity score as compared to genotype x environment interaction (18.3%) and insignificant mean square of environment in both models indicating the more importance of the resistance gene(s) the genotypes carry. This was also supported by the large share of IPCA 1 sum square (66.16%) to genotype x environment interaction sum square. The significant effect of genotype x environment interaction on yield is a common phenomenon that has been reported in many species of crop plants including potato (Flis et al., 2014; Tatarowska et al., 2012; Blanche et al., 2009; Mulema et al., 2008; Mallory and Porter 2007). The mean square deviation from regression (S2di) was nonsignificant from zero for each genotype in all traits except one variety, Gorebela for total and marketable tuber yields indicating the genotypes were not sensitive/stable in the changing environments. However, most of the genotypes regression coefficient (bi) for all traits was significantly different from unity suggested most of genotypes were responsive for the changing environments. According to the Eberhart and Russell (1966) regression coefficient (bi) approximating unity along with deviation from regression (S2di) near zero indicated the average stability of genotypes. The absolute ASV combines IPCA1 and IPCA2 and the genotypes with lower ASV indicate the more stable (Purchase, 1997). Accordingly, Gera followed by Bete Mara Charre for total tuber yield and Bedasa followed by Araarsaa and Bete for marketable tuber yield were the most stable genotypes. Belete followed by Bedasa and Gudanie for late blight disease severity was most stable. However, Bedasa and Bete had the lower tuber yield than average yield of the genotypes while Bedasa had the higher late blight severity score indicating poorly adaptability of the genotypes for the traits which performed low. Relatively, more number of genotypes had lower IPCA scores (<1) for total and marketable tuber yield (10 and 6 out of 17, respectively) than only 5 out of 17 genotypes for late blight severity. The genotypes that had lower IPCA scores closer to zero are considered the more stable across testing environments (Tarakanovas and Ruzgas, 2006). Accordingly, Gera followed by Bete and Mara Charre had the lowest IPCA score (<0.5) for total tuber yield while Bedasa, Araarsaa, Zemen and Gudanie had the lowest score (<0.35) for marketable tuber yield. Belete and Bedasa had lowest scores (<0.3) for late blight severity. Though these genotypes IPCA scores were not zero, they can be considered as stable because they had the scores approaching to zero. However, Bedasa had high severity score (>40%) indicating this variety was susceptible across the environments. The more the IPCA scores approximate to zero, the more stable the genotypes are over ll environments sampled (Tarakanovas and Ruzgas, 2006; Gauch and Zobel, 1988). Bubu, Gudanie and Chirro were distributed in top right quadrant of both in total and marketable tuber yield biplots indicating these varieties were high yielding in favourable environment while Belete, Mara Charre, Gera and Gabbisa were plotted in bottom right quadrant of both biplots suggested the varieties were producing tuber more than the favorable environment mean yield. Araarsaa and Zemen for total tuber yield and Chala for marketable tuber yield plotted in top right quadrant, but distributed for marketable tuber either in bottom right (Chala) or left of the biplot indicating the varieties response to environments were different for total and marketable tuber yield. Bubu was plotted at distant top and Mara Charre was at distant bottom right quadrant indicating these varieties were producing highest total and marketable tuber yield more than the mean of favorable environments. On the other hand, Chala and Jalenie for total tuber yield and Zemen for marketable yield plotted close to the centers of biplots indicating the varieties were stable to the respective yields they placed to center of biplots. Varieties being nearest to the origin showed non-sensitivity t the environmental and interactive forces. The stable genotypes are those that are placed near the origin of the axes or score near to zero (Carbonell et al., 2004). Chirro Zemen and Bedasa were distributed in top right and Chala, Jarso and Bete in bottom right quadrants of the biplot indicating the former varieties were highly affected by late blight in an environment with high disease incidence. All these genotypes were either local cultivars or old varieties released before 2001 except one (Chirro) in 2005. This might be due to the genetic structure of the genotypes with low levels of heterogeneity for resistance (Shagol and Tadawan, 2008; Becker and Leon, 1988) or they may not carry as many resistant R genes or the resistance gene were overcome by the pathogen (Beukema and Van Der Zaag, 1979). All the other genotypes (11 out of 17) were distributed in the left side of the biplot indicating the genotypes had lower disease severity scores. Belete plotted at distant in top left quadrant and Bubu and Bule distributed at distant in bottom left quadrant of the biplot indicating the former variety had high disease severity scores in environments with high late blight incidence. But the latter two varieties had the lowest severity score in all environments. Potato genotypes differing in their interaction effects for late blight incidence were also reported (Shagol and Tad-awan, 2008). Arberkete and Hirna in both seasons (2012 and 2013 and Haramaya in 2012 distributed in right side of both total and marketable yield biplots indicating the environments were good in producing high tuber yields. The tuber yields (both total and marketable) and disease severity score/incidence had inverse relationship. For instance, the lowest tuber yields were produced during 2013 and 2014 seasons at Haramaya, but the disease incidence was high in both seasons (2013 and 2014) at Haramaya. This showed that Haramaya had favourable environment for the pathogen and exerted high pressure on the crop. Yield is controlled by many genes and a product of many factors (Beukema and Vander Zaag, 1990). Characters controlled by many genes with small effects are subject to considerable modification by differences in environments (Briggs

32nd Annual Research Bulletin, April 2015, Haramaya University
95
and Knowles, 1985). In this research, environments with high disease incidence also produced low tuber yields. This research suggested that tuber yields were most probably affected by late blight more than other environmental factors. Late blight caused by the Phytophthora infestans (Mont.) de Bary is the most important disease of potatoes worldwide (Fry and Goodwin, 1997) which cause up to total loss of yield.
5. Summary and Conclusion In this trial, the contribution of genotype and environment was much higher than genotype x environment interaction effect for total and marketable tuber yield. This suggested obtaining higher yield is possible through selection of high performing potato varieties. However, the larger effect of environment and the presence of genotype x environment interaction suggested the importance of selecting stable varieties or suitable environment and management for the production of higher yield rather than depending on the overall mean yields due to genotypic difference alone. The late blight resistance of varieties was significantly affected by the genotype and genotype x environment interaction not by environment (AMMI model analysis of variance). The genotype x environment interaction sum square (18.31%) had much lower contribution to the treatment sum square as compared to the largest contribution of genotype (71.86%) sum square. This suggested that late blight resistance of varieties was mainly a function of genetic factor than environment but some of the varieties resistant to the pathogen varied from environment to environment. This suggested that it is possible to select genotypes for late blight resistance at one environment with high disease incidence/favourable environment for the pathogen. The genotypes selected as high resistant to the disease in this environment had the higher chance of being resistant in all environments. Several models for evaluating stability have been proposed, however, no single model is adequately explains genotype performance across environments. The stability statistics must be combined with performance to be informative and useful in selection. Considering all stability parameters of the two models and the performance of the varieties, Bubu was identified as high performing variety and relatively stable for all the traits measured. Bubu produced the highest marketable tuber yield in the trial and the estimate of stability parameters indicated that it was stable and responsive to environments with the tendency of higher performance in favourable environments. This variety also recorded the lowest severity score for late blight and stable across environments or this variety reaction to late blight was not varied across environments. Belete had the second highest marketable tuber yield and disease severity score but responsive to environment for yield but not late blight. Mara Charre, Gera and Gudanie were among the varieties that had highest total and marketable tuber yields. Gera had <30% disease severity score while Mara Charre and Gudanie had >30% disease severity scores. Therefore, it is possible to recommend Bubu, Belete and Gera for potato production in eastern Ethiopia even under high pressure of late blight, but it is hardly possible to recommend Mara Charre and Gudanie for cultivation in environments that favour late blight unless less frequent chemical spray is also considered.
6. References Adane, H. M., Meuwissen, P. M., Agajie, T., M.Willemien, J., Lommen, A., Oude, L., Admasu, T., and Struik, P. C. 2010. Analysis of seed
potato systems in Ethiopia. American Journal of Poteto Research 87:537 - 552. Baye, B. and Gebremedhin, W. 2013. Potato research and development in Ethiopia: achievements and trends. In: Gebremedhin, W., Schulz, S.
and Baye, B. (eds.) Seed Potato Tuber Production and Dissemination: Experiences, Challenges and Prospects. Proceedings of the National Workshop on Seed Potato Tuber Production and Dissemination, 12 - 14 March 2012, pp. 35 - 38, Bahir Dar, Ethiopia.
Beukema, H. P. and De Van Der Zaag. 1979. Potato Improvement, Some Factors and Facts. International Agricultural Centre, Wageningen, the Netherlands.
Blanche, S. B., Utomo, H.S., Wenefrida, I., and Myers, G. O. 2009. Genotype × environment interactions of hybrid and varietal rice cultivars for grain yield and milling quality. Crop Science 49: 2011 - 2018.
Briggs, F. N., and Knowles, P. F. 1985. Introduction to Plant Breeding. University of California, Davis, California, U. S. A. Carbonell, S. A., Filho, J. A., Dias, L. A., Garcia, A. A., and Morais, L. K. 2004. Common bean cultivars and lines interactions with
environments. Sci. Agric. 61 (2): 169 - 177. CIP (International Potato Center). 2006. Procedures for Standard Evaluation Trials of Advanced Potato Clones. An Internationa l Cooperators‘
Guide. pp. 41 - 54. Eberhart, S. A., and Russell, W. A. 1966. Stability parameters for comparing varieties. Crop Science 6: 36 - 40. Endale, G., Gebremedhin, W. and Lemaga, B. 2008. Potato seed management. pp. 53 - 78. In W. Gebremedhin, G. Endale, and B. Lemaga
(eds), Root and Tuber Crops: The untapped resources. Addis Abeba: Ethiopian Institute of Agricultural Research. FAO (Food and Agriculture Organization). 2008. Potato World: Africa International Year of the Potato 2008.
(http://www.potato2008.org/en/world/africa.html). Flis, B., Domański, L., Zimnoch-Guzowska, E., Polgar, Z., Pousa, S. Á. and Pawlak, A. 2014. Stability analysis of agronomic traits in potato
cultivars of different origin. American . Journal of Potato Research.13: 9364 - 9366. Fry, W. E. and Goodwin, S. B.1997. Resurgence of the Irish potato famine fungus. Bioscience 47: 363 - 371. Gauch, H. G. and Zobel, R. W.1988. Predictive and postdictive success of statistical analysis of yield analysis. Theories Of Applied Genetics 76:
1 - 10. Gauh, H. G. 2006. Statistical analysis of yield trials by AMMI and GGE. Crop Science 46: 1488 - 1500.

32nd Annual Research Bulletin, April 2015, Haramaya University
96
Gildemacher, P. R., W. Kaguongo, O., Ortiz, A., Tesfaye, W., Gebremedhin , W. W., Wagoire, R. Kakuhenzire, P. M., Kinyae, M., Nyongesa, P.C., Struik and C. Leeuwis, 2009. Improving potato production in Kenya, Uganda and Ethiopia: A System Diagnosis. Potato Research 52 : 173 - 205.
Haverkort, A., Koesveld, F., Schepers, H., Wijnads, J., Wustman, R. and Zhang, X. 2012. Potato prospects for Ethiopia: on the road to value addition. Praktijkonderzoek Plant and Omgeving (Applied Research). pp. 66. PPO Publication no. 528. The Netherlands.
Hawkes, J. C. 1990. The potato: Evolution, Biodiversity and Genetic Resources. Belhaven Press, London. P.259. Henfling, J.W. 1987. Late blight of potato, Phytophthora infestans Technical information bulletin 4.CIP, Lima, Peru. Hirpa, A., Meuwissen, M. P. M., Agajie, T., Lommen, W. J. M., Lansink, A. O., Admasu, T. and Struik, P.C. 2010. Analysis of seed potato
systems in Ethiopia. American Journal of Potato Research. 87: 537 - 552. Lung‘aho, C., B., Lemaga, M., Nyongesa, P., Gildermacher, P., Kinyale, P., Demo and Kabira, J. 2007. Commercial seed potato production in
eastern and central Africa. Kenya Agricultural Institute. pp.140. Mallory, E.B. and Porter, G.A. 2007. Potato yield stability under contrasting soil management strategies. Agronomy Journal 99 (2): 501 - 510. Mateo, A., Hinojosa, C., Margarita, D.V., Remigio, A., Guzm, P., Sylvia, F. P, and Niklaus, J. G. 2007. Late blight resistance of five Mexican
potato cultivars in the Eastern Sierra of the State of M xico. American Journal of potato Research 84: 385 - 392. Mekonen, S., Alemu, T., Kassa, B. and Forbes, G. 2011. Evaluation of contact fungicide sprays regimes for control of late blight (Phytophthora
infestans) in southern Ethiopia using potato cultivars with different levels of host resistance. Tropical Plant Pathology 36: 21 - 27. MoA (Ministry of Agriculture). 2012. Crop Variety Register. Animal and Plant Health Regulatory Directorate. Issue No. 12. Addis Ababa,
Ethiopia. Mulatu, E., Ibrahim, O., and Bekele, E. 2006. Improving potato seed tuber quality and producers‘ livelihoods in Hararghe, Eastern Ethiopia.
Journal of New Seeds 7 (3): 19 - 29. Mulema, J. M. K., Adipala, E., Olanya, O. M. and Wagoire, W. 2008. Yield stability analysis of late blight resistant potato selections. Experimental
Agriculture 44: 145 - 155. Mulugeta, G. and Dessalegn, Y. 2013. Genotype by environment interaction analysis for tuber yield of potato (Solanum tuberosum L.) using a
GGE biplot method in Amhara Region, Ethiopia. International Journal of Applied Sciences and Engineering Research 2 : 31 - 40. Purchase, J. L. 1997. Parametric analysis to described G x E interaction and yield stability in winter yield. Ph.D Thesis. Department of
Agronomy, Faculty of Agriculture, University of Orange Free State, Bloemfontein, South Africa. pp.4 - 83. Purchase, J. L., Hatting, H. and Van Deventer, C. S. 2000. Genotype x environment interaction of winter wheat (T .aestivum) in South Africa:
Stability analysis of yield performance. South Africa Journal of Plant Soil 17 (3) : 101 - 107. Tarakanovas, P. and Ruzgas, V. 2006. Additive Main Effect and Multiplicative Interaction Analysis of grain yield of wheat varieties in Lithuania.
Agronomy Research 4 (1):91 - 98. Tatarowska, B., Flis, B. and Zimnoch, G. E. 2012. Biological stability to Phytophthora infestans (Mont.) de Bary in 22 Polish potato cultivars
evaluation in field experiments. American Journal of Potato Research 89: 73–81. Tekalign, T. 2011.Genotype x environmental interaction for tuber yield, dry matter content and specific gravity in elite tetraploid potato
(Solanum tuberosum L.) genotypes. East Africa Journal of Sciences 5 (1): 1 - 5. Zobel, R. W., Wright, M. J. and Gauch, H. G.1988. Statistical analysis of a yield trial. Agronomy Journal 80 :388 - 393.

32nd Annual Research Bulletin, April 2015, Haramaya University
97
10. Maintenance and Enhancement of Sweet potato Accessions at Haramaya University Wassu Mohammed Ali
Haramaya University, College of Agriculture and Environmental Sciences, School of Plant Sciences, Haramaya, Ethiopia Author E-mail: [email protected]
Abstract: Haramaya University maintained 116 sweet potato accessions of which 24, 37and 52 were obtained from Local collections, Nigeria and Asia Vegetable Centers, respectively, The accessions were also maintained for two years (213 and 214) knowing the potential of accessions to be used in improving the crop for eastern Ethiopia, used as germplasm deposit for the Nation and used for a number of scientific researches. Therefore, the objectives of the project were to maintain, characterize, evaluate, and document accessions for future use. The sweet potato accessions were evaluated for phenology, growth, yield, yield components and quality attributes of the crop using Augmented design with 19 replications (blocks) in 2012/13 cropping season. The evaluation revealed significant variations among accessions for most of the traits, which can be exploited for the improvement of the crops. Moreover, 13, 12, and 20 accessions exhibited superiority over the mean of improved varieties for total storage root yield (t/ha), marketable storage root yield (t/ha), and dry matter content (%), respectively. The total and marketable storage root yield advantages of accessions were as high as 87.66 and 75.58, respectively. This indicated the need to study promising accessions in replicated trials and maintaining the rest of accessions for future use.
Keywords: Accessions; Augmented Design; Marketable and Total Storage Root Yield
1. Introduction Sweet potato is cultivated in Ethiopia mostly for human consumption and as animal feed. It ranks third after Enset [Ensete ventricosum (Wele) Cheesman] and Potato (Solanum tuberosum L.) which is one of the most important root crops produced in the country. The total area under production reaches 33,070 hectares and the production is estimated to be over 2,628,539 quintals(CSA, 2003). According to FAO (2000) and CSA( 2003 and 2006 ), the Ethiopian national average storage root yield of sweet potato ranges between 8 to 10 t ha-1. Under experimental field, storage root yields ranges between 30 to 73 t ha-1 (Hall and Harmon, 1989; Bhansari and Ashley, 1990).
Current knowledge of the distribution of sweet potato genetic resources indicates that maximum diversity of sweet potato in northwestern and southern America and Africa. In the same trend as in other major crop plant, the sweet potato genetic resources are facing a high risk of losing significant amount of variation. (Zosimo, 987). Haramaya University emphasises on the importance of intensive collection of sweet potato germplasm. The University maintained 116 sweet potato germplasm from International and National collections for number of years. The germplasm collections not only used by the University but also by the National research institutes. Therefore, it is necessary to maintain these valuable materials for future use. There are many reasons for the establishment of a germplasm collection. In many cases a germplasm collection is needed for the crop improvement programme. Plant breeders require genetically diverse material to develop improved crop varieties. The more diverse the gene pool, the higher is the probability that it would contain desirable genes. Germplasm collection is also needed to conserve endangered species. Moreover, it is needed to conserve for future requirements (De Silva et al., 1995). Conservation of germplasm has many components including collection, documentation, characterization, evaluation, and maintenance. Systematic conservation of germplasm depends on proper documentation with passport and characterization data. Morphological characterization along with molecular markers helps to identify duplicates. The number of accessions for maintenance can be drastically reduced by eliminating duplicates (Huaman, 1992). Since genetic variability is a prerequisite for the improvement of the crop, it is necessary to maintain sweet potato accessions for long period of the success of the crop improvement. Therefore, this research was initiated with the objectives of maintaining sweet potato genotypes collected by Haramaya University and enhancing through evaluation, characterization and documenting of agronomic and physicochemical attributes of the accessions.
2. Materials and Methods 2.1. General Description of the Research The research activity consisted of two sub-activities, i.e. i) maintaining of sweet potato collections and accessions introduced from different International Centers and ii) characterizations and evaluation of accessions for further breeding program. One hundred sixteen(116) sweet potato accessions including the two released varieties were planted in a non-replicated trial at Haramaya University for two years to maintain the accessions. The accessions were also planted in separate field using Augmented design to characterize, and evaluate for yield and quality. One hundred fourteen (114) sweet potato accessions and two released varieties (Adu and Berkome) are listed in Table 1.The accessions were collected from eastern Ethiopia, other regions of the country and International Research Canters. The two varieties, Adu and Berkome were released for eastern Ethiopia by Haramaya University in 2007 after fulfilling the requirements set by the National Variety Release Committee. The accessions were planted at Haramaya University research field using augmented design in 2012/13 main growing season for yield and quality evaluation.

32nd Annual Research Bulletin, April 2015, Haramaya University
98
Table 1 List of sweet potato accessions.
No Accession No Accession No Accession No Accession
1 Tis-8441-3 30 Tis-8441-4 59 CEMSA 88 CN-1753-16 2 Tis-8441-3 31 Tis-9465-2 60 Bacariso 89 CN-1752-14 3 Tis-82/0602-12 32 Tis-80/043-3 61 Awassa-83 90 CN-2065-18 4 Tis-70357-7 33 Tis-9465-10 62 Nefissie 91 CN-2059-9 5 Tis-9465-7 34 Tis-9068-8 63 CN-2065-5A 92 CN-2065-16 6 Tis-8250-9 35 Tis-70357-5 64 CN-2065-11 93 CN-2065-15 7 Tis-9065-5 36 Tis-9465-8 65 CN-2065-1 94 CN-1753-5 8 Tis-82/0602-2 37 Becale type-3 66 CN-2065-11 95 CN-1775-4 9 Tis-80/043-1 38 Koka-26 67 CN-2065-7 96 CN-1775-3 10 Tis-9068-6 39 Wondogenet 68 CN-2065-8 97 CN-1753-1 11 Tis-82/0602-6 40 Tis-9068-2 69 CN-2065-10 98 CN-1753-7 12 Tis-82/0602-1A 41 Koka-9 70 CN-2065-5B 99 CN-1753-8 13 Tis-70357-4 42 Guracha 71 CN-2065-6 100 CN-1754-6 14 Tis-8250-4 43 Arbaminch 72 CN-2066-4 101 CN-1754-5 15 Tis-9465-1 44 Abadiro 73 CN-2066-2 102 CN-1754-3 16 Tis-9465-8 45 Koka-14 74 CN-1752-8 103 CN-1753-11 17 Tis-9065-1 46 Cuba-1 75 CN-1752-9 104 CN-1753-12 18 Tis-8441-1 47 Koka-12 76 CN-1752-15 105 CN-1753-13 19 Tis-9468-7 48 Bacale 77 CN-2059-4 106 CN-1753-14 20 Tis-80/043-2 49 Bacale type-1 78 CN-2059-3 107 CN-1753-17 21 Tis-82/062-11 50 Alemaya-local-2 79 CN-2059-20 108 CN-1753-18 22 Tis-8250-7 51 Alemaya-local-3 80 CN-2059-5 109 CN-1754-12 23 Tis-9465-9 52 Becale-type-1 81 CN-2059-8 110 CN-2054-5 24 Tis-9068-3 53 Lesh type—1 82 CN-1752-5 111 CN-2054-7 25 Tis-8250-8A 54 Korojo-1 83 CN-1752-6 112 CN-1754-11 26 Tis-8250-2 55 Becale-B 84 CN-2054-1 113 CN-1753-20 27 Tis-8250-1 56 Korojo 85 CN-2054-2 114 CN-1753-19 28 Tis-70357-2 57 Becale-B 86 CN-1754-9 115 Adu 29 Tis-82/0602-1B 58 Korojo-2 87 CN-1753-15 116 Berkome
2.2. Experimental Design and Procedure The Accessions were tested in augmented block design with 19 replications. Each replication contained six accessions and two checks. Each check was appearing once in each block. The checks were replicated 19 times and 114 entries/tests were not replicated. Young portion of 30 cm length of the vine cuttings were planted and 2/3 of their length was covered by soil. 100cm and 30cm were maintained between rows and plant, respectively. Twelve holes per plot were prepared and one vine cutting was planted in each hole of the ridge. Replanting was done to substitute the dead vine after one week of planting. All plots received recommended cultural practices uniformly. Harvesting was done after 90% of the sweet potato leaves changed into yellowish color. From each plot 10 plants were taken for both physical and proximate analysis. In the field the physical attributes were characterized immediately after harvest. From the total harvest, five sweet potato storage roots were randomly selected for laboratory analysis immediately after physical and yield related data were recorded. Cleaning debris and dust were done before proximate analysis. Hundred fifty two samples were analyzed in laboratory; among those two checks were replicated 19 times. The remaining 114 accessions were not replicated. The optimum temperature during the analysis was estimated 25 oC. 2.3. Data Collection Data were not collected from plants grown at maintenance field; however, data were collected from plants grown at evaluation field on both plant and plot basis. The data were collected and recorded according to International Board of Plant Genetic Resource (IPBGR, 1991) to evaluate the sweet potato accessions. Five storage roots were taken for proximate analysis. The physicochemical evaluation was also conducted as per the laboratory procedure (Mazumdar et al., 2003) and according to International Board of Plant Genetic Resource (IPBGR, 1991).
3. Results 3.1. General Description of Accessions under Maintenance Among 116 accessions, 44.83% were obtained from Asian Vegetable Center which accounted relatively large proportion of accessions and followed by accessions obtained from Nigeria Vegetable Center which accounted 31.93%. The accessions obtained from Asian Vegetable Center had initials Tis and CN, respectively. Sweet potato accessions that were collected from the country accounted 20.69%. Only two

32nd Annual Research Bulletin, April 2015, Haramaya University
99
accessions (1.72%) were collected from Cuba including one released variety. The number of accessions from different sources is presented in Figure 1.
Figure 1. Number of sweet potato accessions from different sources. 3.2. Evaluation of Sweet Potato Accessions 3.2.1. Analysis of variance Accessions were evaluated for three phenology and growth characters, nine quality related traits and 10 traits of yield and yield components which totally summed to 22 traits. Analysis of variance was computed considering all the collected traits. Analysis of variance computed for 22 phenological, growth, yield, yield components, physical and chemical attributes of sweet potato accessions are presented in Table 2. The result revealed the presence of highly significant differences (P<0.01) among accessions for reducing sugar, total sugar, total starch content, pH, total soluble solid, days to physiological maturity and specific gravity. Significant differences (P<0.5) were also observed for root fresh weight, total storage root yield, marketable storage root yield, dry matter content and peel content. However, non-significant differences were observed among accessions for number of branches per plant, vine length, above ground dry biomass yield, average number of storage roots per plant, average mass of storage roots, marketable storage root number/plant, unmarketable storage root number/plant and moisture content. The study also revealed the presence of highly significant (P<0.01) differences between the control (check) varieties for days to physiological maturity, storage root fresh weight, dry matter content, reducing sugar, total sugar, total starch content and total soluble solid. Significant (P<0.5) differences were also observed for above ground fresh biomass yield, above ground dry biomass yield, marketable storage root yield, peel content. However, non-significant differences were observed between the check varieties for number of branches per plant, vine length, average number of storage root, marketable storage root number, unmarketable storage root number, average mass of storage root, total storage root yield, pH, moisture content and specific gravity. Analysis of variance also exhibited highly significant (P<0.01) differences among tests for days to physiological maturity, total storage root yield, reducing sugar, total sugar, total starch content, pH and specific gravity. Likewise significant (P<0.5) differences were also exhibited among test entries for dry matter content, peel content and total soluble solid. However, number of branch per plant, vine length, above ground fresh biomass, above ground dry biomass, storage root fresh biomass, average number of storage root, marketable storage root number, unmarketable storage root number, average mass of storage root, marketable storage root yield, unmarketable storage root yield and moisture content found to be non significant. The results of analysis of variance also revealed the presence of highly significant (P<0.01) differences among test versus control for days to physiological maturity, storage root fresh weight, total storage root yield, marketable storage root yield, total starch content, pH and moisture content while significant differences (P<0.5) was observed for average mass storage root and reducing sugar. However, non-significant differences among test versus control were observed for number of branch per plant, vine length, above ground fresh biomass, above ground dry biomass, average number of storage root, marketable storage root number, unmarketable storage root number, unmarketable storage root yield, dry matter content, peel content, total sugar, total soluble solid, and specific gravity. 3.2.2. Mean Performances of Accessions The mean, minimum and maximum mean values in the experiment for each trait is presented in Table 3. Accessions were exhibited higher mean values than the mean values of the two checks (Adu and Berkome) with varying numbers ranged from 9 accessions for days to physiological maturity to 79 accessions for above ground fresh biomass yield. However, if early maturity is becoming a breeding objective, 92.11% accessions were exhibited early maturity than the two check varieties. Majority of the accessions were superior over released varieties for vine length, above ground fresh and dry biomass and specific gravity where 69.3, 62.28 and 62.28% of the accessions, respectively, had higher mean values than the mean values of the check varieties. For other traits such as number of branches and average mass of storage root, 41.23 and 47.37% accessions, respectively, had greater mean values than the mean of the check varieties. On the other hand, 49.12 and 38.84% of the accessions had higher moisture and peel content of storage roots, respectively, which was in undesirable direction. For yield and yield
0
10
20
30
40
50
60
Nigeria Asian Cuba Local Released

32nd Annual Research Bulletin, April 2015, Haramaya University
100
component, with varying number of accessions that ranged from 10.53% (marketable storage root yield t/ha) to 29.82% (unmarketable storage root yield t/ha) had mean values greater than the mean values of the check varieties. More importantly, 11.4, 17.54 and 28.07% accessions exhibited higher mean values for total storage root yield t/ha, dry matter content and total storage root number per plant, respectively, greater than the mean values of the check varieties. Total storage root yield (t/ha) ranged from 2.261 to 28.461 with average yield of 12.025. Marketable storage root yield and unmarketable storage root yield (t/ha) ranged from 0.512 to 22.08 and 0.01 to 13.63, respectively. More interestingly, 15, 13, 12 and 20 accessions were performed for storage root fresh weight, total storage root yield, marketable storage root yield and dry matter content, respectively, better than the mean performance of check varieties Adu and Berkome.

32nd Annual Research Bulletin, April 2015, Haramaya University
101
Table 2. Mean squares for 22 traits of sweet potato [Ipomoea batatas (L.) Lam.] collections on the basis of adjusted means.
Trait Replication (18) Accession (115) Error (18) Among control (5) Among tests (109) Tests vs control (1)
Days to physiological maturity 2 380.71** 2.58 351.4** 261** 463.4** Number of branches per plant 2.32 4.81 ns 2.85 4 ns 4.89 ns 7.12 ns
Vine length (cm) 336.38 436.66 ns 231.39 151.6 ns 436.23 ns 81.03 ns Above ground fresh biomass yield (g/plant) 161301.68 106538.44 ns 56312.68 221885.81* 97485.46 ns 106516.65 ns Root fresh weight (g/plant) 55646.28 66130.4* 26267.22 351318.6 ** 44089.43 ns 2271536.94** Above ground dry biomass yield (g/plant) 161301.68 106538.44 ns 56312.68 212975.84* 95178.10 ns 230199.24 ns Average number of storage roots per plant 5.35 2.88 ns 3.96 7.5 ns 1.52 ns 6.87 ns Average mass of storage roots (g) 0.006 0.002 ns 0.002 0.01 ns 0.02 ns 0.01 * Marketable storage root number/plant 1.36 0.95 ns 0.8 1.8 ns 0.6 ns 0.29 ns Unmarketable storage root number/plant 2.62 1.15 ns 2.07 3.2 ns 0.78 ns 5.31 ns Total storage root yield (t/ha) 20.02 24.79* 9.59 53.8 ns 14.23** 234.46** Marketable storage root yield (t/ha) 10.4 15.15* 5.79 30.7* 9.09 ns 141.93** Unmarketable storage root yield (t/ha) 8.84 4.67 ns 3.67 4.71 ns 1.38 ns Dry matter content (%) 13.01 21.61* 6.16 23.1* 16.83* 16.47 ns Peel content (%) 61.77 95.2* 37.86 212** 80.84* 1.68 ns Reducing sugar(mg/100 gm-1) 0.42 2.18** 0.23 2.6** 2.12** 2.22* Total Sugar (mg/100 gm-1) 1.29 2.72** 0.55 5.7** 2.25** 0.94ns Total starch content (mg/100g-1) 1.16 3.55** 0.49 11.9** 2.02** 5.8* pH 0.04 2933.79** 0.04 0.05ns 3204.2** 117.35** Total soluble solid (TSS) 0.75 2.85** 0.9 5.6** 2.27* 0.22ns Moisture content (%) 2.72 4.71ns 2.78 7.1ns 4.27ns 48.39** Specific gravity 0.73 15.26** 0.8 0.50 ns 18.63** 2.67 ns
*, ** and ns, significant at P<0.05, P<0.01 and non significant, respectively.

32nd Annual Research Bulletin, April 2015, Haramaya University
102
Table 3. Mean, minimum, maximum values and standard deviation for phenological and growth traits of 116 sweet potato accessions on the basis of adjusted means.
Trait
Mean, minimum and maximum values for accessions
SD
Number accession above mean
Number accession below mean
Mean of check Varieties
Number accession above mean of check varieties
Number accession below mean of checks
Mean Min Max
Days to physiological maturity 173 111 199 18.03 54 60 189 9 105
Number of branches/plant 8.139 1.447 20.447 2.445 60 54 8.447 47 67 Vine length (cm) 67.729 3.62 138.862 26.213 67 47 58.487 76 38 Above ground fresh biomass yield 1875.877 265 5060 899.516 46 68 1365 79 35 Above ground dry biomass yield 952.3 210 2145 398.04 55 59 785.5 71 43 Storage root fresh weight 542.7807 103 1439 262.400 54 60 825 15 99 Average mass of storage root 0.149 0.018 0.318 0.053 54 60 0.189 54 60 Marketable storage root number 3.105 0.695 5.395 1.023 47 67 3.89 24 90
Unmarketable storage root number 3.712 0.816 6.316 1.284 49 65 4.316 24 90
Total storage root number 6.84 2 11 1.819 50 64 6.5 32 82
Marketable storage root yield 8.143 0.512 22.088 3.958 40 74 11.77 12 102
Unmarketable storage root yield 3.9 0.001 13.631 2.606 44 70 4.431 34 80
Total storage root yield 12.025 2.261 28.461 5.178 37 77 16.21 13 101
Dry matter 24.878 13.275 40.215 5.238 40 74 28.42 20 94
Specific gravity 1.194 1.046 1.334 4.043 37 77 1.75 71 43
Moisture content 80.5 70.03 86.69 2.848 54 60 8.8 56 58
Peel content 24.71 14.41 28.04 11.256 47 67 37.225 42 72
Min and Max = minimum and maximum mean values in the experiment, respectively. SD = standard deviation.

32nd Annual Research Bulletin, April 2015, Haramaya University
103
4. Discussion The variation among accessions and check varieties were observed for the studied characteristics such as morphology, phenology, physical and chemical qualities of storage roots. Considerable number of accessions maintained at Haramaya University had desirable attributes better than the released varieties in many of the traits studied which can be exploited in sweet potato improvement program. Variation is the occurrence of difference among individuals due to difference in their genetic composition and/or the environment in which they are raised (Falconer., 1990; Allard, 1960; Welsh, 1990). If the character expression of two individuals could be measured in an environment exactly identical for both, difference in expression would result from genetic control and hence such variation is called genetic variation (Falconer, 1990). The results of the study indicated that the presence of genetic variability among accessions and the importance of maintaining accessions for long period to utilize the accessions for different breeding objectives in the process of improving the crop. More importantly, 10 accessions had average marketable storage yield advantage of 32.49% over the mean of two check varieties which ranged from 6.78% to 87.66% yield advantages. These accessions also exhibited average marketable storage root yield advantage of 19.59% over the best performing check variety, Adu with the highest advantage of 69.39%. Similarly, 10 accessions exhibited 37.17%, 24.37%, and 52.91% average total storage root yield advantages over the mean of the two check varieties. Marketable as well as unmarketable storage root or total storage yield in general are inherited genetically or highly controlled by genetic constitution as well as environment (Huaman et al., 1999, Mukhtar et al., 2010). The observed differences among accessions in this study might be due to genetic differences since all accession as well as checks receive equal management and treatment. This indicated the highest yield advantages of accessions and the need to test accessions for yield and yield components. Generally, it was observed significant differences among entries, among test versus control/check varieties, between check varieties of sweet potato for considerable number of traits which can be exploited in breeding program or that will allow breeders to select entries for desirable trait(s) that they wish to improve. Donald (1968) describes two basic principles for plant breeding, ‗selection for yield‘ and ‗defect elimination‘. Therefore, the basic principles behind plant breeding programme are to develop cultivars with better yield potential and quality attributes as well as to develop cultivars that have genetic resistance against production hazards that can prevent a cultivar from expressing its yield potential (Acquaah , 2007). Based on these principles the sweet potato breeding programme may relies on improvement of storage roots yield and improved the quality of the storage roots as per the end use and the observed differences among entries may allow the breeders to use accessions for different objectives. Therefore, information generated in this study on variation of accessions justify to maintain accessions to be utilized by breeders since variability greatly helps in formulating sound crop breeding and improvement program (Welsh, 1990).
5. Summary and Conclusion Sweet potato [Ipomoea batatas (L.) Lam] is cultivated in Ethiopia mostly for human consumption. Sweet poteto stands third after Enset [Ensete ventricosum (Wele) Cheesman] and Potato (Solanum tuberosum L.) as the most important root crops produced in the country. Sweet potato is the cash and home consumption crop for eastern region of Ethiopia. The world as well as the country needs to increase food production to feed the increasing population. Plant genetic resources constitute the foundation upon which agriculture and world food securities are based on. The genetic diversity in the germplasm collections is critical to the world‘s and the country‗s fight against hunger. They are the raw material for breeding new plant varieties and are a reservoir of genetic diversity. Haramaya University has released two sweet potato varieties namely; Berkume and Adu and made recommendation for cultivation in Eastern part of the country. Moreover, Haramaya University maintained 114 accessions and two released varieties for years. These collections are obtained from international and local sources. As our knowledge permits, we cannot found such large number of accessions maintained anywhere in the country. Therefore, maintaining these accessions is not only for the benefit of Haramaya University and thereby eastern Ethiopia in developing sweet potato varieties but it is also for the whole nation. This justifies the importance of maintaining accessions for long period though the associated higher cost is a major problem for the University. Haramaya University has maintained 116 sweet potato accessions for decades for research and academic purpose. However, extensive agronomic and physicochemical attributes of collections has not been carried out to identify which accession(s) attributed what and potentially used for which purpose(s). Therefore, documenting the agronomic and physicochemical attributes of accessions was necessary. Based on this assumption, this research was conducted to evaluate, characterized and document agronomic, physical and chemical attributes of sweet potato collection obtained from international as well as local sources. The collections were tested in augmented block design with 19 replications or blocks. Each replication/block contained six entries/tests and two checks. Each check was appearing once in each block. The checks (Adu and Berkume) were replicated 19 times and 114 entries/tests were not replicated. Accessions showed significant differences for 12 out of 22 traits measured viz., days to physiological maturity, root fresh weight (g/plant), total storage root yield (t/ha), marketable storage root yield (t/ha), dry matter content (%), peel content (%), reducing sugar(mg/100 gm-1), total sugar (mg/100 gm-1), total starch content (mg/100g-1), pH, total soluble solid (TSS) and specific gravity. Tests vs control also showed significant differences for many traits. The result showed the possibility to improve many of the characters through selection of accessions for traits which performed best. The observed significant differences among accessions, entries/tests and tests vs control for many of the traits including yield will allow testing accessions in replicated trial for which they exhibited significantly highest performance.
6. References Acquaah G. 2007. Principles of Plant Genetics and Breeding. Black Well Publishing. Main Street, Malden, USA..

32nd Annual Research Bulletin, April 2015, Haramaya University
104
Allard, R. W. 1960. Principles of Plant Breeding. John Willy and Sons, Inc., New York. USA. Bhagsari, A. S. and Ashley. D.A. 1990. Relationship of photosynthesis and harvest index of sweet potato yield. Journal of Horticultural Sciences 111:
288 - 293. CSA ( Central Statistical Authority of Ethiopia). 2005. Ethiopian Agricultural Sample Enumeration, 2004/05 (1997); report on Area and
Production of crops (private peasant holding, Meher Season ) statistical bulletin, 331.Addis Ababa. CSA (Central Statistical Authority of Ethiopia). 2003. Ethiopian Agricultural Sample Enumeration, 2001/02 (1994) result for Amhara Region.
Statistical report on area of production of crops. CSA (Central Statistical Authority of Ethiopia). 2003. Ethiopian Agricultural Sample Enumeration, 2001/02 (1994) result for Amhara Region.
Statistical report on Area of production of crops. Part II B.May, 2003. CSA (Central Statistical Authority of Ethiopia). 2005. Ethiopian Agricultural Sample Enumeration, 2004/05 (1997); report on Area and
Production of crops ( private peasant holding, Meher Season ) statistical bulletin, 331.Addis Ababa. De Silva, K. P. U. and Premathilake, A. 1995. Screening of sweet potato genotypes in rice fallow environments. Incorporation of users‘ criteria
in variety development of sweet potato. Selected Research Papers 1994/95. Sweet potato 2: 1 - 7. Donald, C. M. 1968. The breeding of ideotype. Euphytica Journal 17: 385 - 403. Falconer, D. S. 1990. Introduction to Quantitative Genetics.3rd ed. John Wiley and Sons, Inc. New York., USA.. FAO (Food and Agricultural Organization).2000. Production year book 1999. Rome. FAO(Food and Agricultural Organization). 2009. World information and early warning system on plant genetic resources. Food and Agriculture
Organization of the United Nations, Rome. Fuglie, K. O. and Hermann, M. 2004. Sweet potato post-harvest research and development in China. Proceedings of an International
Workshop, Chengdu, Sichuan, Republic of China, p 160, 7 - 8 November, 2001. Hall, M. R. and Harmon, S. A. 1989. ‖Coestal red‖ sweet potato. Journal of Horticultural Sciences 24: 196 - 177. Huaman, Z. 1992. Morphologic identification of duplicates in collections of Ipomoea batatas. CIP Research Guide 36. International Potato
Center, Lima, Peru. p.28. Huaman, Z., Aguilar, C. and Ortiz, R. 1999. Selecting a Peruvian sweet potato core collection on basis of morphological, co-geographical, and
disease and pest reaction data. Theoretical and Applied Genetics 98: 840 - 845. IPBGR (International Board of Plant Genetic Resources). 1991. Descriptor for Sweet Potato. Rome, Italy. Mazumdar B. C. and Mazumdar, K. 2003. Method of Physicochemical Analysis of Fruits. Daya publishing house, Delhi. Welsh, R. J. 1990: Fundamentals of Plant Genetics and Breeding. John Wiley and Sons, New York, USA. Zosimo, H. 1987.Current status of maintaining sweet potato germplasm resources at CIP. International Potato Center (CIP).

32nd Annual Research Bulletin, April 2015, Haramaya University
105
11. Maintenance and Enhancement of Potato (Solanum tuberosum L.) Genotypes at Haramaya University Wassu Mohammed Ali Haramaya University, College of Agriculture and Environmental Sciences, School of Plant Sciences, Haramaya, Ethiopia Author E-mail: [email protected]
Abstract: Keeping in view the importance of maintaining germplasms for the improvement of crops Haramaya University maintained 329 potato genotypes which were introduced at the start of introducing the crop in Ethiopia. Three hundred genotypes were evaluated to late blight resistance where 42 accessions found as moderately resistant. Twenty accessions were evaluated for heat tolerance at Dire Dawa where 13 accessions were produced more than 10 t/ha total tuber yield. The observed variability among accessions for disease resistance and heat tolerance justified the importance of maintaining accessions and released varieties for long period though the cost related to maintaining is very high. Therefore, maintaining, characterization, evaluation and documentation of genotypes are necessary.
Keywords: Accession; Heat Tolerance; Late Blight
1. Introduction Potato (Solanum tuberosum L.) is one of the most widely grown food crops after the three cereals, namely maize, rice and wheat (Vleeshouwers et al., 2011). In eastern Africa, potato is the best crop for food and nutrition where food security is a key priority for the over 200 million people that are envisaged to double by 2030 (Kyamanywa et al., 2011). Potato is regarded as a high-potential food security and stable food crop because of its better ability to provide a high yield of high-quality product per unit input with a shorter crop cycle (mostly <120 days) compared to major cereal crops like maize (Hirpa et al., 2010). The crop is also appreciated for its high yield per unit area of land, and as a good source of nutritious food and cash by large number of food insecure smallholder farmers and pastoralists in Ethiopia (Haverkort, 2012). Approximately 1.3 million farmers (CSA, 2012) grow potato in mid and highlands of Ethiopia. In the last 10 years, potato productivity in Ethiopia has progressed from 7 to 11 tons/ha. Nevertheless, the current area cropped with potato (about 0.16 million ha) is very small and the average yield is below 10 tons/ha far below the country‗s potential (Baye and Gebremedhin, 2013). It is also very low compared to the world‘s average of 16.4 tons ha -1 and to other potato producing countries of the world, such as New Zealand (50 tons ha -1), Netherlands (44.7 tons ha -1), USA (44.6 tons ha-1), South Africa (34 tons ha-1), Egypt (24.8 tons ha-1), and Morocco (24.2 tons ha-1) (FAOSTAT, 2010). The major contributing factors to the low yields have been the use of inferior and/or poorly adapted varieties, high prevalence of diseases and insect pests, poor soils, and unfavorable weather conditions. Germplasm source is a very crucial in variety development and release. In most cases, the richer the source materials and germplasms the more and the best varieties can be developed and released. However, countries in East and Central Africa have different approaches to accelerated release of acceptable varieties. They also follow different approaches on how they can build their source materials and germplasms. Some countries depend entirely on CIP for materials for their breeding programmes, while others generate own crosses using both local and exotic materials. When we consider Ethiopian condition, the Ethiopian Agricultural Research Institution (EARI) has a national mandate to conduct and coordinate research, but institutions of higher education (Universities and Colleges) are also engaged in research on potato and other crops. The organization has a strong collaborative research with international agricultural research centers such as CIP for potatoes. The variety development, which involves evaluation, selection, release and registration procedures pass through several stages (George and Otim, 2007). With this strength and mainly depending on CIP for potato germplasm source, the Institution along with Universities such as Haramaya University released considerable number of potato varieties for different regions. The presence of genetic variability is considered to be the prerequisite in any plant breeding program. Therefore, maintaining the available potato germplasm is crucial for the success of the crop improvement. Haramaya University is pioneer in starting potato research in the country and it is also known in maintaining accessions obtained from International Research Centers and other sources. The collection that the University maintained could also served as deposit for the national potato research program. Therefore, maintaining the collections for long period is necessary for the success of potato improvement. This research activity was executed for a number of years by Haramaya University and reinitiated to continue in maintaining and evaluating the genotypes for different purpose.
2. Materials and Methods The research consisted of two activities: 1) maintenance of the genotypes and 2) evaluating of the genotypes for some agronomic traits, particular for late blight resistance and yield potential at lowland conditions. Three hundred twenty nine potato genotypes including the released potato varieties by Haramaya University and other Research Centers were maintained at Haramaya University for last two years. The genotypes were planted in a non-replicated trial with three rows each has 12 meters length. Medium size and well sprouted potato tubers were planted at a spacing of 75 cm between rows and 30 cm between plants. All agronomic practices have been applied as per the recommendation made for the crop.

32nd Annual Research Bulletin, April 2015, Haramaya University
106
Three hundred potato accessions were evaluated to late blight resistance at Haramaya conditions as genotype enhancement activity which was superimposed on the maintenance activity for two years. The remaining 29 genotypes were the released varieties (22), heat tolerant (5) and other two genotypes were evaluated for yield and yield related traits. The released varieties evaluation report is separately prepared which is not the part of this project. Evaluation of genotypes for heat tolerance was conducted using five heat tolerant potato varieties, which have been developed elsewhere in the world for low land agro- ecology and other 22 potato genotypes, which have been performed best at Dire Dawa in the past trial. The genotypes were evaluated for one season using randomized block design (RCBD) with three replications. The plot size of 3 × 3 m was used for each accession. A distance of 1m between blocks and 1m between plots was maintained. Each plot was consisted of 4 rows of 10 plants. Land was prepared according to the recommendation made for the crop. Medium size and well sprouted potato tubers were planted at a spacing of 75 cm between rows and 30 cm between plants. Weeding, fertilizer application, cultivation, ridging were done to facilitate root, stolon and tuber growth. Total tuber yield, marketable and unmarketable tuber yield, tuber number per plant and dry matter content were collected. Data were collected from the two central rows excluding the two plants grown at both ends of the rows.
3. Results 3.1. Maintenance of the Genotypes A total of 329 genotypes were maintained of which 75 were with initial AL which are the old accessions. Others were with CIP, UK and K initials which accounted 215, 6 and 4, respectively. The released varieties, lowland and other clones were 22, 5 and 2, respectively (Fig. 1). The list of the genotypes is presented in Table 1. Table 1. Potato genotypes under maintenance.
No. Genotype No. Genotype No.
1 AL-1(moger) 43 AL-436-2 85 UK-94-10 2 AL-100 44 AL-436-3 86 UK-94-18B 3 AL-100-1 45 AL-436B 87 UK-96-1 4 AL-107 46 AL-441B 88 HU01 5 AL-118 47 AL-448-3 89 HU6 6 AL-119 48 AL-450 90 HU16 7 AL-148 49 AL-450-5 91 HU19 8 AL-148-1 50 AL-456 92 Vivilda 9 Al-148-12 51 AL-471 93 C1P-372146-27B 10 AL-148-4 52 AL-472 94 C1P-377046-20 11 AL-148-B-1 53 AL-501 95 C1P-377308-10 12 AL- 148-6 54 AL-503 96 C1P-377412-2 13 AL-200 55 AL-517 97 C1P-377838-1c 14 AL-204 56 AL-528 98 C1P-378313-18B 15 AL-207 57 AL-531 99 C1P-378326-6 16 AL-208 58 AL-536-2 100 C1P378328-6 17 AL-209 59 Al-553-1 101 C1P-378329-2 18 AL-212 60 AL-556 102 C1P-378361-5B 19 AL-214 61 Al-556-2 103 C1P-378371-19 20 AL-214B 62 AL-560 104 C1P-378371-3 21 AL-216 63 AL-562 105 C1P-378501-9A 22 AL-221 64 AL-567 106 C1P-382121-6 23 AL-250 65 AL-570 107 C1P-383032-15 24 AL-252 66 AL-601 108 C1P-386034-4f 25 AL-253 67 AL-624-2 109 C1P-386040-8 26 AL-254 68 AL-624-2 110 C1P387143-33A 27 AL-255 69 Al-624-3 111 C1P388452-4 28 AL-258 70 AL-624-3 112 C1P-389701-3 29 AL-259 71 AL-624-33 113 C1P391058-506 30 AL-259B 72 AL-624-35 114 C1P-391058-512 31 AL-268 73 AL-624-5 115 C1P391058-555 32 AL-269 74 AL-624-9 116 C1P-391058-557

32nd Annual Research Bulletin, April 2015, Haramaya University
107
33 AL-270 75 AL-635 117 C1P-391058-558 34 AL-280 76 CIP-K-59a(26)2b 118 C1P-392622524 35 AL-348 77 CIPUK-97-6 119 C1P-392640-540 36 AL-350 78 clone#77 120 C1P-396029-18C 37 AL-406 79 K-59a(26)2b2 121 C1P-399665-4 38 AL-406B 80 K-59a(26)2b2-1 122 C1P-90134-2 39 AL-406c 81 K-59A(26)2B2B 123 C1P-90162-3 40 AL-416 82 SIRO 124 C1P-90178-8 41 AL-416B 83 UK-90-3 125 CIP-377143-33 42 AL-436 84 UK-94-1 126 CIP-377164-20
Table 1. Continued.
No. Genotype No. Genotype No. Genotype
127 CIP-377176-2 169 CIP-378501-16 211 CIP-387046-20 128 CIP-377808-10B 170 CIP-378501-16A 212 CIP-3870808-10H 129 CIP-377808-10B1 171 CIP-378501-5 213 CIP-387096-11A 130 CIP-377823-2 172 CIP-378501-5b3 214 CIP-387096-5 131 CIP-377838-1 173 CIP-378501-7A 215 CIP387096-5A 132 CIP-377838-1A 174 CIP-3785019-1 216 CIP387146-20 133 CIP-377852-2 175 CIP-378501-9A 217 CIP-387146-26A 134 CIP-378194-28 176 CIP-378551-7A 218 CIP-387146-6B 135 CIP-378194-6A 177 CIP-378554-8A 219 CIP387224-25 136 CIP-378313-22A 178 CIP-378554-8B 220 CIP-387292-27c 137 CIP-378313-27A 179 CIP378570-2 221 CIP-387308-10I 138 CIP-378321-7B 180 CIP-378570-4B 222 CIP387808-10 139 CIP-378323-2 181 CIP-378570-6 223 CIP-387808-10A 140 CIP378323-2A 182 CIP-378571-5A 224 CIP-388313-18 141 CIP-378323-2B 183 CIP-381058-516 225 CIP-388313-18A 142 CIP-378326-2 184 CIP381381-20 226 CIP-388370-12B 143 CIP-378328-6 185 CIP-381403-5 227 CIP-388443-3A 144 CIP-378329-2 186 CIP-382018-520 228 CIP-388452-10 145 CIP-37834333B 187 CIP-382121-5 229 CIP-388452-2 146 CIP-378348-8 188 CIP-382146-27B 230 CIP-388452-2A 147 CIP-378361-5B 189 CIP-382171-3B 231 CIP-388452-3b2 148 CIP-378366-2 190 CIP-382174-4 232 CIP-388453-3A 149 CIP-378370-14 191 CIP-382180-2 233 CIP-388453-3b2 150 CIP378370-3 192 CIP-382620-511 234 CIP-388453-3b5 151 CIP-378371 193 CIP-382640-508 235 CIP-388464-6 152 CIP-378371-12 194 CIP-382650-506 236 CIP-388764-26 153 CIP-378371-12A 195 CIP-383667-3D 237 CIP389658-5 154 CIP-378371-13A 196 CIP-384321-3 238 CIP-389668-4 155 CIP378371-16 197 CIP-384321-3B 239 CIP-389673-2 156 CIP-378371-19 198 CIP-385012-26 240 CIP-389673-2B 157 CIP-378371-21 199 CIP-385383-12 241 CIP-389701-1 158 CIP-378371-23 200 CIP-386029-10A 242 CIP-389701-3 159 CIP-378371-3A 201 CIP-386029-18A 243 CIP-390010-8A 160 CIP-378371-51 202 CIP-386029-18B 244 CIP-391058-504 161 CIP-378371-9B 203 CIP-386029-18C 245 CIP-391058-506 162 CIP-378371-9c 204 CIP-386031-4A 246 CIP-391058-507 163 CIP-378371-9G 205 CIP-386031-4A1 247 CIP391058-513 164 CIP-378376-2B 206 CIP-386034-4 248 CIP-391058-514 165 CIP-378453-3B 207 CIP-386034-4 249 CIP-391058-520 166 CIP-378454-3b 208 CIP-386034-4B 250 CIP-391058-522 167 CIP-378501-10A 209 CIP-386040-8 251 CIP-391058-523

32nd Annual Research Bulletin, April 2015, Haramaya University
108
168 CIP-378501-10B 210 CIP-386423-13 252 CIP-391058-538
Table 1. Continued.
No. Genotype No. Genotype
253 CIP-391058-545 295 CIP-90134-5 254 CIP-391058-548 296 CIP90138-1 255 CIP-391058-554 297 CIP-90147-34 256 CIP-391058-558 298 CIP-90147-91 257 CIP-391058-563 299 CIP-90162-18 258 CIP-391240-2 300 CIP-90162-2 259 CIP-392140-516 301 CIP-90162-34 260 CIP-392140-526 302 CIP-90162-3B 261 CIP392618-517 303 CIP-90170-46 262 CIP-392622-514 304 CIP-90178-8 263 CIP-392622-516 305 CIP-90178-8A 264 CIP-392622-517 306 CIP-384321/3A 265 CIP-392622-519 307 CIP-384321/3B 266 CIP-392622-521 308 AL-624 267 CIP-392627-508 309 Ararsa 268 CIP-392627-517 310 Awassa 269 CIP-392637-500 311 Bedasa 270 CIP-392640-501 312 Belete 271 CIP-392640-502 313 Bete 272 CIP-392640-504 314 Bubu 273 CIP-392640-514 315 Bule 274 CIP-392640-516 316 Chiro 275 CIP-392640-517 317 Gabisa 276 CIP-392640-518 318 Gera 277 CIP-392640-520 319 Gorebella 278 CIP-392640-521 320 Guassa 279 CIP-392640-523 321 Gudenie 280 CIP-392640-525 322 Harchasa 281 CIP-392640-528 323 Jalenie 282 CIP-392640-531 324 Jarso 283 CIP-392640-539 325 Marachere 284 CIP-392640-540 326 Menagasha 285 CIP392640-540B 327 Moti 286 CIP-392640--541 328 Wechacha 287 CIP-392640-544 329 Zemen 288 CIP-392640-560 330 Jarso (Local cultivar) 289 CIP-392650-517 331 Bete (Local cultivar) 290 CIP-396029-18 291 CIP-575049 292 CIP-702867-51NA 293 CIP-702867-51NB 294 CIP-90134-2
Note: AL, CIP, UK and K represented the old Alemaya accessions, CIP-Peru, England and Korea accessions, respectively.

32nd Annual Research Bulletin, April 2015, Haramaya University
109
Figure 1. Potato genotypes maintained at Haramaya University. 3.2. Evaluation of Genotypes to Phytophthora Infestans (Mont.) de Bary Resistance Disease assessment was conducted starting as soon as disease symptoms appeared on susceptible genotypes the onset of the disease in the most susceptible accessions near to 40 days after planting for two years. The activity was repeated every 20 days interval for subsequent two disease assessments which the final disease was recorded when majority of the genotypes attained physiological maturity. Disease severity was assessed following CIP (2006) and assessment of late blight severity under field conditions described by Henfing (1987). Three hundred potato accessions and released varieties along with two local cultivars and promising genotypes were evaluated to late blight resistance as separate trial and only the 300 accessions result is presented. During 2004/05 cropping season, 216 accessions were evaluated as the most susceptible which recorded average Phytophthora infestans severity of more than 75%. The remaining 24, 17 and 28 accessions recorded 0 to <2.5, 2.5 to <10 and 10 to <25%, respectively, which are considered as resistant and moderately resistant. Other 10 and 5 accessions evaluated with 25 to <50 and 50 to <75% disease severity, respectively (Fig. 2).
Figure 2. Potato accessions and Phytophthora infestans severity in percent (2004/05) During 2005/06 cropping season, none of the accessions were evaluated as resistant with <10% disease severity. Only 5 and 37 accessions were evaluated with 10 to <25 and 25 to <50%, respectively. Most of the accessions (85%) were severely affected by the pathogen Phytophthora infestans with average severity >75% (Fig. 3.).
0
50
100
150
200
250
Al-Old
CIP-P
eru
Released
UK-Intro
duction
Lowland
K-Kore
a Intro
duction
Other c
lones
0
50
100
150
200
250
0<2.5 2.5<10 10<25 25<50 50<75 >75%

32nd Annual Research Bulletin, April 2015, Haramaya University
110
Figure 3. Potato accessions and Phytophthora infestans severity in percent (2005/06). The two years disease assessment was averaged to identify accessions which are resistant and moderately resistant to Phytophthora infestans. Accessions recorded average severity of 25% and below can be used for further evaluation using replicated trial which include preliminary yield trial. Only 13.33% of the accessions recorded 10 to <25% severity and other two accessions recorded 25%. The list of accessions and average disease severity along with two consecutive year‘s assessment data are presented in Table 2. None of the accessions recorded less than 10% severity rather 72.33% of the accessions registered average disease severity >75% and 7.67 and 6.67% of the accessions recorded 50 to <75% and 25 to <50% severity, respectively. Number of accessions along with the calculated average disease severity in percent is presented in Figure 4.
Figure 4. Average disease severity in percent corresponding number of accessions as evaluated for two cropping season (2004/05 and 2005/06).
0
50
100
150
200
250
300
0<2.5 2.5<10 10<25 25<50 50<75 >75%
0
50
100
150
200
250
0<2.5 2.5<10 10<25 25<50 50<75 >75%

32nd Annual Research Bulletin, April 2015, Haramaya University
111
Table 2. Potato accessions with less severity late blight (<25%) under field conditions.
No. Accession 2004/05 severity 2005/06 severity Average severity
1 CIP-377046-20 25 25 25 2 CIP-377308-10 0 20 10 3 CIP-377412-2 5 25 15 4 CIP-377838-12 10 30 20 5 CIP-378194-6A 5 35 20 6 CIP-378326-2 15 25 20 7 CIP-378326-6 10 20 15 8 CIP-378328-6 3 35 19 9 CIP-378329-2 5 35 20 10 CIP-378321-13A 0 40 20 11 CIP-378454-3b1 3 35 19 12 CIP-378501-91 2 40 21 13 CIP-381403-5 20 20 20 14 CIP-383032-15 20 20 20 15 CIP-384321-13B 3 25 14 16 CIP-384321-3 10 35 23 17 CIP-386029-10A 0 25 13 18 CIP-386029-18B1 15 25 20 19 CIP-386029-18B 15 25 20 20 CIP-386034-4F 10 25 18 21 CIP-387096-5 10 25 18 22 CIP-387143-33A 10 25 18 23 CIP-388313-18A 0 30 15 24 CIP-388370-12B 5 25 15 25 CIP-388452-4 0 30 15 26 CIP-389701-03 0 25 13 27 CIP-390010-10 5 30 18 28 CIP-390010-8A 10 25 18 29 CIP-391058-506 15 25 20 30 CIP-391058-554 10 30 20 31 CIP-391058-555 0 25 13 32 CIP-392618-517 15 25 20 33 CIP-392622-516 15 25 20 34 CIP-392640-501 0 25 13 35 CIP-392640-525 15 20 18 36 CIP-392640-528 0 35 18 37 CIP-392640-540 5 40 23 38 CIP-587146-6B 10 25 18 39 CIP-90162-3 0 30 15 40 CIP-90162-3B 10 25 18 41 CIP-391058-558 20 30 25 42 CIP-378313-27A 0 35 18
Severity late blight in percent under field condition was assessed as per Henfing (1987). 3.3. Evaluation of Accessions for Heat Tolerance Field trial was conducted during 2004/05 of cropping season to evaluate 22 accessions which were under maintenance and five heat tolerance genotypes along with the recently released potato variety Bubu at Dire Dawa during the hottest period of the area. The list of the accessions along with mean performance of yield and yield component is presented in Table 4. One of the planted 27 genotypes was failed to grow under heat stress and data were collected for 26 genotypes. The analyzed data are presented below.

32nd Annual Research Bulletin, April 2015, Haramaya University
112
3.3.1. Analysis of variance The analysis of variance result revealed that the presence of significant differences among genotypes for total and marketable tuber yields tons/ha, unmarketable tuber number per plant and dry matter content (%). However, non-significant differences among genotypes were observed for unmarketable tuber yield t/ha, tuber number per plant and marketable tuber number per plant. Table 3. Mean squares from ANOVA for seven yield and yield components of 26 potato genotypes grown at Dire Dawa, eastern Ethiopia.
Trait Replication (2) Variety (25) Error (50)
Total tuber yield tons/ha 210.73 56.15** 23.65
Marketable tuber yield tons/ha 271.96 66.35** 21.20
Unmarketable tuber yield tons/ha 5.785 1.955 1.599
Tuber number per plant 0.681 2.864 3.546
Marketable tuber number per plant 14.865 3.819 2.447
Unmarketable tuber number per plant 17.394 2.608* 1.014
Dry matter content (%) 53.229 6.793** 2.307
* & **, significant at P<0.01 and P<0.05, respectively. 3.3.2. Performances of potato genotypes In this research, total tuber yield was recorded as high as 24.3 t/ha for introduced heat tolerant accession (Vivadial) and as low as 7.41 t/ha for the old introduction of potato genotypes. Therefore, it was evident the possibility of obtaining average total tuber yield of 12.89 t/ha (Table 4). Only seven genotypes were performing below 10 t/ha and six genotypes were performing above 15 t/ha. The remaining 13 genotypes including Bubu (recently released variety) produced between 10 and 15 t/ha which was more than the national average yield. Some of the accessions were performed better than one or more (even more than four) the introduced heat tolerant genotypes. Regarding the economic importance parameter i.e. marketable tuber yield, genotypes produced 4.44 to 22.52 t/ha with average of 10.62 t/ha. Unmarketable tuber yield tons/ha was ranged from 0.62 to 3.85 with overall mean of 2.28. Dry matter of potato tubers ranges from about 15.7% to 20.96% with mean dry matter content of 17.79%. Only three genotypes including Vivadial (heat tolerant genotype) recorded more than 20% dry matter content. The remaining genotypes including Bubu exhibited <20% dry matter content.

32nd Annual Research Bulletin, April 2015, Haramaya University
113
Table 4. Mean Performance of 26 Potato Genotypes for Yield and Yield Components Grown at Dire Dawa, eastern Ethiopia.
Genotype TTYt/ha MTYt/ha UNMTYt/ha TN/plant MTN/plant UNMTN/plant DM (%)
CIP-392640-516 13.04 11.25 1.78 7.6 4.73 2.67 18.54
HU19 11.26 7.41 3.85 7.67 3.53 4.13 20.96 HU16 17.18 16 1.19 6.8 5.33 1.47 17.34 Al-100 7.41 4.44 2.97 6.13 2.53 3.6 17.36 CIP-392640-541 15.7 13.33 2.37 8.33 5.07 3.33 17.95 Al-348 13.33 10.96 2.37 5.87 2.87 3 17.26 AL-503 10.37 6.82 3.56 7.33 3 4.33 15.7
CIP-392640-528 15.14 14.52 0.62 5.8 4.4 1.4 17.55 CIP-386029-18c 7.4 4.74 2.67 5.6 2.4 3.2 17.24 AL-209 9.78 6.22 3.56 6.67 2.6 4.07 18.81 CIP-392140-526 21.63 19.85 1.78 7.4 5.27 2.13 17.25 CIP-392640-525 17.78 16 1.78 6.8 5.27 1.53 16.52 Al-269 13.63 10.07 3.55 6.33 3.67 2.67 16.3
CIP-378371-9c 7.4 5.04 2.37 7 2.13 4.87 20.81 Al-119 8.59 6.82 1.78 6.87 3.4 3.47 18.45
CIP-378323-2B 12.77 11.85 0.92 5.53 4.13 1.4 16.65
Al-270 9.33 6.67 2.67 5.6 2.9 2.7 14.89 Vivadial 24.3 22.52 1.78 8.73 6.33 2.4 20.08 CIP-378501-10A 14.52 12.44 2.08 7.47 4.6 2.87 17.8 CIP-391058-506 8 6.22 1.78 5 2.67 2.33 17.52 CIP-391058-520 15.73 13.33 2.4 6.07 4.33 1.73 18.66 CIP-392037-500 13.63 11.56 2.08 7.47 4.47 3 15.92 HU01 13.96 11.85 2.37 7 4.67 2.33 19.17 HU14 11.85 8.89 2.97 6.13 3.6 2.53 16.24 CIP-378371-19 7.7 5.33 2.37 5.07 2.4 3 19.02 Bubu 13.78 12 1.78 5.6 3.5 2.1 18.67 Mean 12.89 10.62 2.28 7 4 3 17.79 LSD (5%) 7.98 7.55 2.07 3 2.57 1.65 2.491 CV (%) 22.1 20.5 20.6 2.4 19.7 19.4 8
TTYt/ha = Total tuber yield tons/ha, MTYt/ha = Marketable tuber yield tons/ha, UNMTYt/ha = Unmarketable tuber yield tons/ha, TN/plant = Tuber number per plant/hill, MTN/plant = Marketable tuber number per plant, UNMTN/plant = Unmarketable tuber number per plant and DM (%) = Dry matter content (%).
3.3.3. Genetic gain and heritability Genotypic and phenotypic coefficient of variation values ranged from 6.85 to 36.53 and 10.96 to 57.48%, respectively. The estimated phenotypic coefficient of variation was relatively greater than the genotypic coefficient of variation in magnitude and the differences between the two were high for all the traits. Heritability in broad sense ranged from 6.09% to 41.52% where the lowest value was computed for tuber number per plant followed by unmarketable tuber yield t/ha (6.91%). Genetic gain (advance) at 5% selection intensity ranged from 3.48% (tuber number per plant) to 48.49% (marketable tuber yield t/ha) (Table 5). Unmarketable tuber yield t/ha and dry matter content also recorded less than 10% genetic advance.
Table 5. Genetic gain and heritability in 26 potato genotypes tested at Dire Dawa.
Trait Range Mean σ2 g σ2 p GCV PCV H2 GA
Total Tuber Yield tons/ha 7.4-24.3 12.89 10.83 34.48 25.53 45.56 31.42 29.48
Marketable Tuber Yield tons/ha 4.44-22.52 10.62 15.05 36.25 36.53 56.69 41.52 48.49 Unmarketable Tuber Yield tons/ha 0.92-3.85 2.28 0.12 1.72 15.11 57.48 6.91 8.18 Tuber Number per plant 5-9 7 0.23 3.78 6.85 27.76 6.09 3.48 Marketable Tuber Number per plant 2-6 4 0.46 2.90 16.91 42.61 15.75 13.82 Unmarketable Tuber Number per plant 1-4 3 0.53 1.55 24.30 41.44 34.38 29.35
Dry matter content (%) 14.89-20.96 17.79 1.50 3.80 6.87 10.96 39.33 8.88
σ2 g = genotypic variance, σ2 p = phenotypic variance, GCV = genotypic coefficient of variation, PCV = phenotypic coefficient of variation, H2 = broad sense heritability and GA = genetic advance at 5% selection intensity.

32nd Annual Research Bulletin, April 2015, Haramaya University
114
4. Discussion Genetic viability was observed among potato accessions for late blight resistance though small proportion of accessions was found to be moderately resistant. Late blight resistance and susceptibility of accessions ranged from <25% to 100%. Particularly, the old accessions which had AL initial were highly susceptible and none of the accessions from this group exhibited <75% disease severity. This might be due to that accessions carried a varying number of R-genes. The observed resistance to Phytophthora infestans (Mont) de Bary in accessions introduced at different time was in line with other authors who reported the history of Ethiopian potato varieties development. The National potato research programs in sub-Saharan Africa obtained the germplasm for selection from the International Potato Center (CIP) in Peru (Gebremedhin et al., 2008; E1-Bedewy et al., 2005). Most of the potato genotypes that have been introduced, developed and released in Eastern Africa before 2008 either have genes for vertical resistance to late blight or have been developed for horizontal resistance in the presence of unknown resistance (major R) genes which were named population A clones (Landeo et al.,1997). Similarly, in Ethiopia, varieties which were released up to 2008 were from population A (Gebremedhin, 2013). Therefore, many of the accessions introduced some decades back which showed differential reaction to Phytophthora infestans may be due to the R genes they carry and are from population A. The analysis of variance computed for seven yield and yield components of potato accessions grown at Dire Dawa revealed that the presence of significant differences among accessions for total tuber yields t/ha, marketable tuber yield tons/ha, unmarketable tuber number per plant and dry matter content (%).The presence of significant difference among accessions for most of economic importance traits suggested the existence of variability among potato accessions which selection can be effected. In addition, the result also suggested including many potato accessions as much as possible, since variability to heat stress tolerance was evident from this single trial which only consisted of few potato accessions. In other words, the more the accessions tested under heat stress there will be the higher probability of obtaining high yielding heat tolerant genotypes. The total area cropped with potato in Ethiopia was 59,508.67 ha (CSA, 2011/12) which was very low as compared to the existing potential that the crop can be grown on about 70% of the 10 million hectares of arable land in the country and the average yield (8 tones ha-1) was far below the potential (FAO, 2008). The low acreage and yield are attributed to many factors, but lack of high quality seed potatoes and high yielding varieties are the major factors (Endale et al., 2008a; Gildemacher et al., 2009). Particularly high yielding varieties are lacking for lowland areas or there is no report regarding to heat tolerant varieties in the country. In this research, total tuber yield was recorded as high as 24.3 t/ha for introduced heat tolerant accession (Vivadial) and as low as 7.4 t/ha for the old introduction of potato accession. It was evident the possibility of obtaining average total tuber yield of 12.89 t/ha and few accessions produced yield <10 t/ha. This indicated that the accessions have a potential of producing more than the average national yield of potato under mid and high altitude agro-ecologies which suggested the inclusion of more accessions to obtain high yielding genotypes under lowland condition. Dry matter is particularly significant when frying as the greater the Dry matter the less fat uptake because there is less water for it to replace (Lisika and Leszcy, 1989). In this study the average dry matter of potato was17.79 and with the range of 14.89 to 20.96% which indicated that i) genotypes had not dry matter content below the minimum range for the crop, ii) genotypes had an acceptable dry matter content under heat stress conditions and iii) it is possible to select genotypes that can be used for wide array of end use i.e. for table potato (boiled potato) to French fries. In this experiment both GCV and PCV values were moderate to high as described by Siva Subramanian and Menon (1973). As the authors indicated genotypic and phenotypic coefficient of variation values can be categorized as low (0-10 %), moderate (10- 20%) and high (20 % and above). The estimated phenotypic coefficient of variation was relatively greater than the genotypic coefficient of variation in magnitude for all the traits and the differences between the two were high indicating the more sensitivity of these traits to environmental modifications. As per the description given by Robinson et al. (1949) for heritability and Johnson et al.(1955) for genetic advance, heritability was moderate to total tuber yield t/ha, marketable tuber yield t/ha, unmarketable tuber number per plant and dry matter content. Similarly, the expected genetic advance values or genetic gain was high for total tuber yield and marketable tuber yield t/ha. The observed high genetic advance coupled with moderate heritability was an indication of more additive gene action (Panse, 1957). For these traits which had moderate heritability and high genetic advance, selection may be effective in improving the yield of potato at lowland condition since this indicated the masking effect of environment on the genotypic effect was minimal. Generally, by selecting 5% of the genotypes it was possible to have 29.48% and 48.49% genetic gain of total tuber and marketable yield, respectively, in the genotypes tested.
5. Summary and Conclusion The richer the source materials and germplasms the more and the best varieties can be developed and released. Though, the potato accessions were introduced starting many decades back and might be considered as obsolete, it is necessary to maintain accessions to use as a source of genes or to select accessions to other desirable traits. The observed variability among accessions for disease resistance and heat tolerance justified the importance of maintaining accessions and released varieties for long period though the cost related to maintaining is very high.
6. References Baye B. and Gebremedhin W. 2013. Potato research and development in Ethiopia: Achievements and trends., In: Gebremedhin, W., Schulz, S.
and Baye, B. (eds.) Seed Potato Tuber Production and Dissemination: Experiences, Challenges and Prospects. Proceedings of the National Workshop on Seed Potato Tuber Production and Dissemination, 12 - 14 March 2012, pp. 35 – 38, Bahir Dar, Ethiopia.

32nd Annual Research Bulletin, April 2015, Haramaya University
115
CIP (International Potato Center). 2006. Procedures for standard evaluation trials of advanced potato clones. An Internationa l Cooperators‘ Guide. pp. 41 - 54.
CSA (Central Statistical Agency of Ethiopia). 2011. Agricultural Sample Survey: Report on area and production of crops, p. 135., Addis Ababa, Ethiopia,
CSA (Central Statistical Agency). 2012. Agricultural sample survey of area and production of crops of 2012/2013 in Ethiopia. Government annual report on area and production of crops, pp.19-28., Addis Ababa, Ethiopia,
E1-Bedewy, R., Olanya, M., Adipala, E., Ewell, P., Kabira, J., Walingo, A., Lun‗gaho, C., Hakiza, J . J., Wagoire, W., Kakuhenzire, R., Anginyah, P. S., Ojiambo, P. S. and Nakitandwe, J. 2005. Performance of potato genotype and resistance of Phytophora infestans in standard International Field Trials in selected locations of East Africa. African Crop Science Conference Proceedings, 5: 461 - 468.
Endale, G., Gebremedhin, W. and Lemaga, B. 2008.. Potato seed management. pp. 53 - 78. In W. Gebremedhin, G. Endale, and B. Lemaga (eds), Root and Tuber Crops: The untapped resources. Addis Abeba: Ethiopian Institute of Agricultural Research.
FAO (Food and Agriculture Organization).2010. Strengthening Potato Value Chains: Technical and Policy Options for Developing Countries (Cromme, N., A. B. Prakash, N. Lutaladio, and F. Ezeta, coordinators), Rome, p.148 .
FAO (Food and Agriculture Organization). 2008. Potato World: Africa International Year of the Potato 2008. (http://www.potato2008.org/en/world/africa.html).
Gebremedhin, W. 2013. Potato variety development strategies and methodologies in Ethiopia., In: Gebremedhin, W., Schulz, S. and Baye, B. (eds.) Seed Potato Tuber Production and Dissemination: Experiences, Challenges and Prospects. Proceedings of the National Workshop on Seed Potato Tuber Production and Dissemination, 12 - 14 March 2012, pp. 45 – 59, Bahir Dar, Ethiopia.
George W. and Otim-Nape. 2007. Harmonization of Variety Release Procedures for Potato and Sweet Potato in Ethiopia, Kenya, Rwanda and Uganda.
Gildemacher, P. R., Kaguongo, W., Ortiz, O., Tesfaye, A., Gebremedhin, W., Wagoire, W. W., Kakuhenzire, Kinyae, R., P. M., Nyongesa, M., Struik, P. C. and Leeuwis, C. 2009. Improving Potato Production in Kenya, Uganda and Ethiopia: A System Diagnosis. Potato Research 52: 173 - 205.
Haverkort, A., Koesveld, F., Schepers, H., Wijnads, J., Wustman, R. and Zhang, X. 2012. Potato prospects for Ethiopia: On the road to value addition. Praktijkonderzoek Plant and Omgeving (Applied Research). pp. 66. PPO Publication no. 528. The Netherlands.
Henfling, J. W.1987. Late blight of Potato, Phytophthora infestans. Technical Information Bulletin 4. CIP, Lima, Peru. Hirpa, A., Meuwissen, M. P. M., Agajie, T., Lommen, W. J. M., Lansink, A. O., Admasu, T. and Struik, P. C. 2010. Analysis of seed potato
systems in Ethiopia. Amer. J. Potato Res. 87: 537 - 552. Johnson, H. W., Robinson, H. F. and Comstock, R. E. 1955. Estimates of genetic and environmental variability in soybeans. Agronomy Journal
47: 314 - 318. Kyamanywa, S., Kashaija, I., Getu, E., Amata, R., Senkesha, N. and Kullaya, A. 2011.Enhancing Food Security through Improved Seed Systems
of Appropriate Varieties of Cassava, Potato and Sweet potato Resilient to Climate Change in Eastern Africa. Nairobi, Kenya, ILRI. Landeo, J. A., Gastelo, M., Forbes, G., Zapata, J. L., and Forbes, F. J. 1997. Developing horizontal resistance to late blight in potato CIP
program Report 1995 - 1996. pp. 122 - 126. Lisinska G. and Leszynski, W. 1989. Potato Science and Technology. Elsevier Applied Science, London. Panse, U. G. 1957. Genetics of quantitative characters in relation to plant breeding. Indian Journal of Genetics 17: 318-328. Robinson, H. F., Comstock, R. E. and Harvery, V. H. 1949. Estimates of heritability and degree of dominance in corn. Agronomy Journal 41: 353-
359. Sivasubramanian, S. and Menon, M. 1973. Heterosis and inbreeding depression in rice. Madras Agricultural Journal. 60 : 1139. Vleeshouwers, V.G., Raffaele, S., Vossen, J.H., Champouret, N., Oliva, R., Segretin, M.E., Rietman, H., Cano, L.M., Lokossou, A., Kessel, G.,
Pel, M.A. and Kamoun, S. 2011. Understanding and exploiting late blight resistance in the age of effectors. Annual Review of Phytopathology 49: 507-531.

32nd Annual Research Bulletin, April 2015, Haramaya University
116
12. Camel Slaughtering Practices, Meat Production and Preservation in Eastern Ethiopia Mitiku Eshetu Guya1 and Getachew Neme2
1School of Animal and Range Sciences, Haramaya University, Ethiopia 2School of Food Science, Post Harvest Technology and Process Engineering, Haramaya University, Ethiopia
Abstract: This study was conducted in Jigjiga and Shinile Zones of Somali National Regional State and Afar region from April to June 2012 to assess camel slaughtering practices and camel meat processing and preservation technologies in the regions. The result of this study revealed that camels are slaughtered first immobilizing the camel by cutting the hind leg at the Achilus tendon. Then the animal becomes immobile and guided to slaughtering floor to cut its throat. Subsequently, flying, evisceration, and dressing are undertaken. Then, the meat was transported to butcher house. The butcher house could sell the meat either fresh or traditionally process and preserve it. Preservation of meat was conducted by boiling the meat to reduce the water content as well as to reduce the water activity of the meat. Butter was also added while boiling to enhance flavor and eating quality of the product. This preservation method was common in Ethiopian Somali region among Somali tribes and the preserved camel meat is called Mukmud or Muremure. This product is claimed to have up to six months shelf life. While slaughtering camel, the animal was suffering from an excruciating pain from broken cut hock as well as from the act of cutting the throat. Therefore, camel slaughtering practice in Somali region was not following the ethical animal slaughtering practice and it breaks the animal welfare protection law. Therefore, immediate interventions need to be taken to stop such cruel act of cutting the legs of live animal while the animal is conscious and feel the pain. There was no practice of cutting Achilles tendon in Afar region.
Keywords: Animal Welfare; Meat Preservation; Muremure
1. Introduction Ethiopia possesses 2.4 million heads of camel and majority of these camels are found in the eastern part of Ethiopia mainly in Somali and Afar National Regional states. Camels are slaughtered to produce meat especially during holidays and festivals. Camels are mainly reared for production of milk and milk products. Meat production from camel was not common in the pastoral and agro-pastoral production system of Ethiopia. But the current national economic growth coupled with the increased demand for camel meat from neighboring Middle East countries awaken pastoralists to reconsider camel for meat production. Camel slaughtering in local abattoirs was investigated and found to be substandard and special way of immobilizing camel was practiced in Jigjiga, Hartichek and Dire Dawa abattoirs. In this slaughter practice, the camel hind legs were first cut at Achilus tendon to immobilize the animal. Then the camels were guided to slaughtering floor where cutting of the throat takes place. In this slaughter method, the animal suffer from the broken hind leg and pre-slaughter mishandling. Therefore, slaughter camels need due attention to control and to prevent such needless suffering in almost all aspects of animal handling and husbandry. Camel has a big role in earning foreign currency through export of live camel. In 2011, of the total exported live animals, camel accounted for 13% and 25% to the revenue generated (NBIIA, 2011). Future research efforts need to focus on exploring the potential of the camel as a source of meat through multi-disciplinary research into efficient production systems, and improved meat technology and marketing. In addition, camel meat is becoming popular among consumers due to its medicinal and health enhancing properties. According to Kurtu (2004), camel meat is considered as a high quality food with medicinal value and a least cost source of meat in Jigjiga and Harar towns. Moreover, the price of camel meat is increasing from time to time as a result of increased urbanization, economic growth and consumers‘ awareness about the unique quality of camel meat compared to the common meat of cattle and small ruminants. But the slaughter practice of camel is not well documented and there is no sufficient information. Somali and Afar region are the main camel producing regions of the country and possess majority of the camel population. This research is therefore designed to evaluate camel meat production and to elucidate procedures followed to slaughter camel in the light of animal handling ethics and welfare issues.
2. Materials and Methods 2.1. Description of the Study Area Jigjiga is the capital city of the Ethiopian Somali National Regional State and found 630 km East of Addis Ababa at a latitude of 90 21‘N and longitude of 420 48‘ E. The area is characterized by unreliable and erratic rainfall with precipitation ranging from 300 to 600 mm per annum (Bekele, 2001). Altitude of Jigjiga Wereda ranges from 500-1500 m.a.s.l. and majority of the camel herders are Somali ethnic groups. Numerically, camels are the most abundant domestic animals in the area followed by goat. In Jigjiga city, there is one municipal slaughter house where all livestock species are slaughtered and then distributed to the different butcher houses. Slaughtering of animals was takes place starting from 2:00 AM and completed early in the morning. Dire Dawa is one of commercial city in the Eastern part of Ethiopia. It is found in 515 km East of Addis Ababa at 90 27‘N latitude and 420 89‘ E longitude. It is bounded in the north west and east by Somali National Regional State and in the north by Oromiya National Regional State.

32nd Annual Research Bulletin, April 2015, Haramaya University
117
The mean annual and temperature and precipitation were about 25.3 and 640 mm, respectively (IRDMP, 2004). Dire Dawa town has one municipal slaughter house where different livestock species are slaughtered and distributed to different butcher houses. Pastoralists and agro-pastoralis in Dire Dawa Administrative town and in Shinile Zone were the main supplier of camel for Dire Dawa municipal slaughterhouse. 2.2. Method of Data Collection The objectives of this paper are to review camel meat production, assess camel slaughtering practices, and recommend possible interventions. To this effect, meat production data were collected from Dire Dawa Administrative and Ethiopian Somali and Afar regional states. Meat vendors and key informants were interviewed and focused group discussions were also undertaken to collect data on method of camel slaughtering, meat processing and preservation methods. Moreover, data on use of preserved meat, type of meat used for the preparation such products were collected. Data on slaughter practices were collected from Jigjiga and Dire Dawa municipal slaughterhouses through observation and interview using pre-tested questionnaire. Moreover, secondary data were collected and reviewed. Body condition score of slaughter camels Body condition score (BCS) of camels was assessed following six scale scoring method developed by Faye et al (2001) where zero is for very thin camel and five for fat camel. 2.3. Data Analysis Data collected from slaughterhouses and meat preservation methods were analyzed using descriptive statistics.
3.Result and Discussion 3.1. Camel Meat Production Camel takes longer time to reach slaughter weight and age, hence meat production from camel is costly and less common or less heads of camel slaughtered per day. In rural area, slaughtering of camel is also restricted to special occasions like holidays and wedding. Many authors indicated that camel meat, especially young camel meat, is similar in taste and texture to that of beef. The average birth weight is 35 kg, and adult male and female camels weigh 486 ± 81.3 kg and 427 ± 62.2 kg, in Jigjiga area and 384 ± 80.8 kg and 326 ± 62.9 kg in Shinile area, respectively (Tezera Getahun, 1998). The average dressing percentage found to be 50 - 55%. Many authors indicated that camel meat, especially young camel meat, is similar in taste and texture to that of beef. The amino acid and mineral contents of camel meat are often higher than beef, probably due to lower intramuscular fat levels as most of the fat is deposited in the hump leaving minimal marbling of the red meat. Due to the low fat content, camel meat is therefore believed to be nutritionally healthier and is getting more acceptance than before. In Somali region, there is a long tradition of processing camel meat into stable dried and oiled meat products. This processed meat product is highly regarded and present to honorable guests and wife presents to her husband as a symbol of respect. 3.2. Body condition of slaughtered camels The result of this study indicated that out of the total 25 and 30 camels slaughtered in Jigjiga and Dire Dawa slaughterhouses during this study period, 90% and 85% were having two BCS (thin camels), respectively. The remaining slaughtered camels BSC score were three (good camel). Therefore, it is possible to conclude that majority of slaughtered camels were of poor body condition and unfit for production of good quality and quantity meat. Such meat will have poor palatability and short shelf life. Type of camel slaughtered in Jigjiga and Dire slaughter house were found to be of poor body condition and aged camels. The number of camels slaughtered per day was significantly lower than other livestock species especially cattle, goat and sheep. The average camels slaughtered per day was three camels. The respondents indicated the reason for slaughtering of camels in poor body condition was that young and good body condition camels were used for legal as well as for illegal cross boarder export trade as the export market fetch more money to the producer. Hence there was fierce competition between the local and cross boarder export market. 3.3. Camel Meat Consumption Camel is usually slaughtered during holidays, wedding and mourning. In Afar region, camels are slaughtered by a group of men who intended to build up themselves for defending their community. In this practice, a total of 10 youngsters make a group and depart to a forest area having a slaughter camel. In the forest they slaughter camel and consume the camel meat without mixing it with other food ingredients. While eating camel meat in the forest, drinking of water is strictly prohibited due to the perception that drinking water in such occasion will have bad impact on their performance. This practice is called Dasiga. There was such practice in Somali region, but preservation of camel meat in the form of dried meat is very common and widely practiced in Jigjiga and to some extent in Dire Dawa and Shinile. This processed camel meat is highly regarded and can be kept for a long period of time with extended shelf life where there is no refrigeration facilities coupled with high ambient temperature suitable for spoilage microorganisms. Camel was slaughtered for the following reasons: when a camel gets broken due to accident or fighting; wedding; circumcision; mourning (prominent & celebrity personality); holidays; Sedqua/feeding poor sickness; and to injured and bone fractured person mainly due to conflict.

32nd Annual Research Bulletin, April 2015, Haramaya University
118
3.4. Camel Slaughtering Practice Camel slaughter procedure followed at Jigjiga and Dire Dawa slaughterhouse was that first the animal leg was cut at Achilles tendon (hock) to immobilize it and then the animal became unable to walk and drag its hind legs. Then restraining was done by holding the neck and making the animal in squat position after which severing of the neck was undertaken. In this practice, it was observed that the animal was conscious and suffering from the excruciating pain. Such method was practiced in Jigjiga, Hartichk and Dire Dawa slaughterhouses. There was no practice of cutting Achilles tendon in Afar region. With regard to meat quality, it is possible to harvest wholesome and nutritious meat whenever slaughter animals are treated as per humane slaughter procedure as pre-mortem handling of animals has determinant effect on meat quality and subsequent meat processing. Result of observation of Dire Dawa and Jigjiga Municipal slaughterhouse revealed that these slaughter houses were not fulfilling the requirement for standard slaughterhouse. Hence, it can negatively influence humane handling of slaughter animals. This leads to mishandling of slaughter animals which will have impact on the quality and quantity of meat harvested. This could raise issue of slaughter animal welfare, how slaughter animals are treated in slaughterhouses found in the country as whole. There was no exception to slaughter camel even it was the worst if we consider what has been practiced in Jigjiga and Dire Dawa Municipal slaughterhouses. In this slaughterhouses camel slaughtering begin with cutting the Achilles tendon at hock to immobilize the animal. Then severing of the neck takes place with little effort to immobilize the camel. The British Humane Slaughter Act of 1933, make stunning compulsory, and permit use of modern methods, such as the captive bolt pistol and electric tongs. The wording of the 1933 act specifically outlaws the poleaxe. Hence, Ethiopia need also to develop such regulation to protect slaughter camels from such malpractices prevailing in Jigjiga and Dire Dawa slaughterhouses in particular and the whole animal slaughtering practices in the country in general. In USA Humane Method of Livestock Slaughter Act (HMLSA), the first Human Slaughter Act (1902) stated that either all animals are rendered insensible to pain or by slaughtering in accordance with the ritual requirements of the Islamic and Jewish faith whereby the animal suffers loss of consciousness by anemia of the brain caused by the simultaneous and instantaneous severance of the carotid arteries with a sharp instrument and handling in connection with such slaughtering. According to the law, animals should be stunned into unconsciousness prior to their slaughter to ensure a death with less suffering than in killing methods used earlier. The most common methods are electrocution and CO2 stunning for swine and captive bolt stunning for cattle, sheep, and goats. An animal is considered properly stunned when there is no "righting reflex"; that is, the animal must not try to stand up and right itself. Only then can it be considered fully unconscious. It can then proceed down the line, where slaughterhouse workers commence in cutting up its body. Ethical concern for animals is often based on assessment of their mental capacities, especially the capacity to feel pain consciously (Allen, 1998). Even though the methods used for slaughtering livestock species such as cattle, sheep and pigs have improved considerably (Gregory, 1998), there is no government policy that protect animal rights including slaughtering of meat animals in Ethiopia. Hence animal slaughtered practices differ from region to region. Animals should move quietly at a walk through pens and races with a minimum of visible excitement or agitation. Most animals should walk calmly into a stunning pen or a restrainer without the use of an electric goad (Gregory, 1998). The importance of reducing stress during slaughter is clear. In pigs, reducing excitement and agitation during handling in the stunning race will improve welfare and help to preserve meat quality ( Barton-Gade, 1984; Grandin, 1994). A study by Warriss et al (1994) indicated that the sound level of vocalizing pigs in a slaughter plant was correlated with reduced pork quality. Furthermore, Voisinet et al (1997) found that cattle which become agitated during handling and restraint had tougher meat, and more borderline dark cutters. In many different pork slaughter plants, it was observed that reducing the use of electric goads and preventing pig pile-ups in the stunning race resulted in a reduction of PSE (pale soft exudative meat) by approximately 10%. Pork slaughter-plant managers have reported that when handling practices were improved, 10% more pork was accepted for export to Japan. Even though such information is lack in came meat quality in relation to mishandling of slaughter camel. Camels were slaughtered on concert floor (Dire Dawa slaughterhouse) and even on dusty floor (Jigjiga slaughterhouse). Flying, dressing and cut up were done on concrete floor. Such practices adversely affect meat quality. Both slaughterhouses workers indicated that new slaughter houses were under construction.

32nd Annual Research Bulletin, April 2015, Haramaya University
119
Figure 1. Slaughter camel restrained after the Achilles tendon was cut.
1.1.3
Figure 2. The way camel drag its hind legs after cut at Achilles. tendon
But it is possible to harvest wholesome and nutritious meat from animals that are treated properly during pre-mortem handling as it has determinant effect on meat quality and subsequent meat processing.
Figure 3. Hanging of camel meat using robes at Jigjiga Market.
Afar First the camel is guided to crouch/squat and then tightly tie the legs to immobilize. Then severing of the neck at atlas region and then at the bottom. Sometimes cutting of Achilles tendon practiced for aggressive slaughter cattle. 3.5. Meat Fabrication The result of the study showed that there are 12 main cut up at Jigjiga and Dire Dawa Slaughter houses. These are four legs; two ribs; two loins; two sirloins; and two sternums. Digestive organs were mostly regarded as inedible and wasted away except some organs like liver which was consumed in raw state in Afar region. Meat fabrication at Dire Dawa slaughter house was in the following order:
1. Cut Achilles tendon 2. Severing the neck 3. Totally separate the neck along with the head from the body

32nd Annual Research Bulletin, April 2015, Haramaya University
120
4. Cut the leg at hock & knee 5. Flying 6. Removal of forelegs with scapula 7. Removing ribs coverings (M. Latissimus dorsi and M. External abdominal oblique) 8. Cutting the ribs into two parts 9. Removal of spinal cords 10. Removal of internal organs 11. Separation of hind legs
In Somali region, preparation of dried processed preserved meat was common. For example, in Hartichek there were people involved in muremure production and marketing. In Dire Dawa, this dried preserved meat can be purchased from open market. It was claimed to have medicinal values to sick people especially for recovering from bone fracture, and from weakness and depressed immunity. Moreover, during wedding wife present this processed meat to her husband to express her regard and respect. This type of processed meat was also being exported to Somali and even to Europe as it was reported by some of respondents in the study area. Some respondents also indicated that muremure can prevent hypertension. But in Afar region there was no processed meat.
Figure 4. Ways of cutting meat for making Figure 5. Processed muremure.
3.6. Camel Hide Flaying of camel hide was conducted by cutting it into small pieces without giving due care in Jigjiga, Dire Dawa, and Afar region. The result of group discussion indicated that camel hide was not processed into leather as done for cattle hide and small ruminant skin, but only locally processed to manufacture some local containers, shoe and belts. This attribute for poor attention to harvest quality and quantity hide that could further processed to manufacture good quality leather products. Some literature indicated that camel hide is as strong as cattle hide and even stronger and thicker. There is also lack of information on the properties of camel meat which renders it to be less important in the face of lucrative market and increasing demand for leather products in the country. According to Gitao (2006) camel hides are an important resource that could contribute a significant income to pastoralists if there is a reliable market and if they are properly cured. Foxwell (1999) observed that pastoralist use poor methods of curing camel hides leading to poor quality of hides as a result of this many tanneries have rejected camel hides. Camel hides have more fats than cow hides or goats skins and unless it is well removed, the hides rot (Foxwell 1999). For camel keepers to get maximum profit from camel hides proper curing methods, f laying and proper animal husbandry practices are paramount. According to Kagunyu and Matiri (2012), in Kenya, camel hides are used to make the roofs for traditional pastoral houses, for making ropes, guards, drums, seats, sandals, praying mats used by Muslims, and water and milk containers. Moreover, vegetable tanned camel hides by pastoral communities are used to make hand crafts such as key holders, maps, belts, folders which are sold to tourists. According to the same author camel hides tanned in Kenyan tanneries into wet blues and large amount was exported to Middle East and to other African countries. A small percentage was used by domestic leather manufacturers, where they were used to make leather boots used by Kenyan army, shoes, saddles, bags and jackets among other products.

32nd Annual Research Bulletin, April 2015, Haramaya University
121
Figure 6. Flying of camel hide.
4. Summary and Conclusion Camel is a good source of meat and has high potential as meat animal. It has also a big role in earning foreign currency through export of live camel, and processed meat. The current scenario of camel production and marketing indicated that there are lucrative market opportunities especially from Middle East and North African countries for slaughter camel. Moreover, processed camel meat can be improved in terms of quality and safety for wider distribution and marketing which would in turn improves the livelihood of pastoralists and peoples involved in this business. There are animal ethics and welfare issues related with camel slaughtering and pre-slaughter handling. This is because slaughtering of camel was conducted in cruel manner than any other livestock species in the country. This was manifested by cutting a live camel at knee (Acilles tendon) and makes the animal to drag its hind leg with excruciating pain. Such practice will not only break animal welfare and slaughter animals handling ethics but also affects meat quality and safety that will be harvested. Therefore, attention should be given concerning proper handling during pre-slaughter and at slaughter to reduce animal suffering and to maintain quality of harvested meat. Proper feeding and slaughtering of camel in good body condition is another area that need due attention for production of good quality and quantity camel meat. According to compassion in World Farming, all slaughter should be humane, which means that animals must be stunned prior to slaughter using a method that causes immediate unconsciousness or, in the case of gas stunning, does not cause distress during the period before loss of consciousness. Both EU and UK legislation on the welfare of animals at slaughter allow exemptions for religious communities. Whilst valuing religious freedom, this should not extend to practices which inflict suffering on animals. Drafting regulation and getting approved on procedures to be followed in camel slaughtering will have a paramount importance to safeguard camel against unethical and cruel handling during slaughtering. Establishment of modern slaughter house could also serve the purpose and will enable production of quality and quantity camel meat. Training of individuals involved in camel slaughtering, and camel meat traders about humane handling and slaughtering of animal will contribute in averting the current inhumane and substandard slaughter practices. Future research efforts need to focus on exploring the potential of the camel as a source of meat through multi-disciplinary research approach. Improved meat technology and marketing is equally important. Further research is also recommended for in depth study of camel meat preservation and its quality. Possibilities of hide and leather production and its quality could the other issues that need to be addressed in the future.
5. References Allen C. 1998. Assessing animal cognition: Ethological and Philosopical perspectives. Journal of Animal Sciences 76: 42 - 47. Barton, P. A. 1984. Influence of Halothane genotype on eeat quality in pigs subjected to various pre-slaughter treatments. 30th Proceeding
Europeean Meet meat Research workers, Bristol, England, pp. 8 - 9. Bekele Tafesse. 2001. Studies on Cephalopina titilator, the cause of ―Senegal‖ in camels (Camelus dromedaries) in Semi-arid area of Somali
State, Ethiopia. Trop. Animal Health and Production 33: 489 - 500. Faye , B., Bengoumi, M., Cleradin, A., Tabarani, A. and Chilliard, Y. 2001. Body condition score in dromedary camel: A tool for management of
reproduction. Journal of Agricultural Science 13: 01 - 06. Foxwell, S. 1999. The camel marketing of system of Kenya: Process, constraints and improvements, University of New Castle. Gitao, G .C. 2006. Camel Husbandry: A practical Guide to camel Husbandry, Immediate communications Ltd, Nairobi. Grandin, T. 1994. Euthanasia and slaughter of livestock. Journal of the American Veterinary Medical Association 204: 1354 - 1360. Gregory, N. G. 1998. Animal Welfare and Meat Science. CABI publishing, UK. Humane Slaughter Method, Wikipedia the free Encyclopedia. http://en.wikipedia.org/wiki/Humane_Slaughter_Act

32nd Annual Research Bulletin, April 2015, Haramaya University
122
IRDMP. 2004. Integrated Resource Development Master Plan (IRDMP) Study of Dire Dawa. Addis Ababa, Ethiopia. Kagunyu, A. and Lengarite, M. 2012. Analysis of Camel Hides Production, Marketing and Utilization by Local Leather Goods Manufactures in
Kenya. In: Proceedings of the 3rd Conference of the International Society of Camelid Research (ISOCARD), Sultan Qaboos University, Muscat.
NBIIA (Norman Borlaug Institute for International Agriculture). 2011. Ethiopia‘s Meat and Lives Animal Exports Registered Dramatic Increase, SPS-LMM.
Tezera Getahun. 1998. Characterization of camel husbandry practices and camel milk and meat utilization in Jijiga and Shinile Zone , Somali Region. MSc Thesis, Alemaya University of Agriculture, pp.
Voisinet, B. D., Grandin, T., O'Connor, S. F., Tatum, J. D. and Deesing, M. J. 1997. Bos indicus cross feedlot cattle with excitable temperaments have tough meat and a higher incidence of borderline dark cutters. Meat Science 46:367-377.
Warriss, P. D., Brown, S. N. and Adams, S. M. 1994. Relationships between subjective and objective assessments of stress at slaughter and meat quality in pigs. Meat Science 38: 329 - 340.

32nd Annual Research Bulletin, April 2015, Haramaya University
123
13. Effect of Integrating Climate Change Resilience Strategies on Common Bacterial Blight of Common Bean in Semi-arid Agro-ecology of eastern Ethiopia Negash Hailu*, Chemeda Fininsa and Tamado Tana
School of Plant Sciences, Haramaya University, P. O. Box 138, Dire Dawa, Ethiopia
Abstract: Common bacterial blight (CBB) caused by Xanthomonas axonopodis pv. phaseoli is the most important biotic production constraints to common bean in eastern Ethiopia. Climate change could have an impact on the disease epidemiology of CBB by influencing both common bean growth and the pathogen reproduction. The effects of climate change needs to be mitigated using climate change resilience strategies. Field experiments were conducted in the 2012 and 2013 cropping seasons at Haramaya and Babile research stations in eastern Ethiopia to assess the effects of integrating climate change resilience strategies on CBB of common bean. These strategies used alone and in integration were compost application, row intercropping and furrow planting. Sixteen treatment combinations including sole planting (SP) were arranged in a randomized complete block design with three replications. Disease severity data were recorded from 10 randomly tagged plants from four central rows per plot. Disease severity, area under disease progress curve (AUDPC) and disease progress rate were significantly different among treatments, between varieties, cropping seasons and locations. Disease severities, AUDPC and disease progress rate were consistently less on row intercropping + compost application + furrow planting and row intercropping + compost application than less integrated and SP plots in both locations and seasons. The disease epidemic was relatively higher on Mexican 142 than Gofta and during 2012 than 2013 at Babile than Haramaya. Integrated climate resilience strategies reduced CBB epidemics could be applied as a component in management of the disease in eastern Ethiopia and in areas with similar agro-ecological zones. Keywords: Xanthomonas axonopodis pv. phaseoli; Climate Change Resilience; Phaseolus vulgaris
1. Introduction There are several biotic and abiotic production constraints of common bean (Phaseolus vulgaris L.) in semi arid agro-ecologies of eastern Ethiopia. Diseases, insect pests, low soil fertility and periodic water stress are the major constraints (Tana et al., 2007; Katungi et al., 2009). The major diseases of common bean in the tropical regions, including Ethiopia that should be targeted for management are common bacterial blight (CBB) caused by Xanthomonas axonopodis pv. phaseoli, halo blight caused by Pseudomonas syringae pv. phaseolicola, bacterial brown spot caused by Pseudomonas syringae pv. syringae, rust caused by Uromyces appendiculatus, anthracnose caused by Colletotrichum lindemuthianum and other viral and root rot diseases (Fininsa and Tefera, 2002; Fininsa and Yuen, 2002; Lemessa et al., 2011). These diseases are frequently occurring and widely distributed in Ethiopia and are destructive agents of common bean production causing heavy yield loss and seed quality (Fininsa and Yuen, 2001; Fininsa, 2003; Fininsa and Tefera, 2006; Lemessa et al., 2011). Of the major diseases of common bean, CBB is the most important constraint to common bean production in eastern Ethiopia. CBB is one of the most destructive bean diseases when environmental conditions are favourable for the pathogen during long periods of warm and humid weather causing reductions in both yield and seed quality (Abo-Elyousr, 2006). CBB incidence (53%) and severity (63%) were recorded in sole cropping system of common bean in eastern Ethiopia (Fininsa, 2003). Relative yield loss of 22-40% was found in pure stand cropping system. Change in rainfall pattern, soil moisture, soil temperature, and soil fertility has direct impact on the disease epidemiology by influencing host plant growth and susceptibility; pathogen reproduction, spread, survival, activity and host-pathogen interaction (Ghini et al., 2008). According to International Panel for Climate Change (IPCC, 2007) the average global surface temperature increases by 2.8oC ranging from 1.8 to 4.0oC during 2050 assuming no emission control policies. Climate models suggest that Ethiopia will see further warming in all seasons of +1.2 (0.7°C - 2.3°C) by the 2020‘s and of +2.2 (1.4°C- 2.9°C) by the 2050s (EPA, 2010). It is likely that this warming will be associated with heat waves and higher evapotranspiration. Nowadays, the debate on climate change is not on its occurrence and effects, but rather on how to mitigate the ever-happening effects of climate change to manage crop production and protection to ensure food security of the ever-growing population and the proper functioning of the natural ecosystem. This needs to set resilience strategies that can mitigate the existing and ever happening effects of climate change. As favorable environment of pathogen and diseases are closely related, climate change variables may create favourable conditions for pathogens and alter the spatial and temporal distribution of disease epidemics. The host plant agro-climate will be altered and pathogens and other microorganisms related to the disease will be affected negatively or positively. To this effect, new diseases may arise in certain regions, and other diseases may cease to be economically important, especially if the host plant is introduced into new areas (Coakley et al., 1999; Chakraborty et al., 2011). Pathogens tend to follow the host plant in their geographical distribution, but the rate at which pathogens become established in the new environment is a function of the mechanism of pathogen dispersal, suitability of the environment for dispersal, overseasoning, and physiological and ecological changes in the host plant (Chakraborty et al., 2011). Climate variability has the potential to modify host physiology and disease resistance and to change the stages and rates of development of pathogens. The most likely impacts would be shifts in the spatial distribution of host and pathogen, changes in the physiology of host-pathogen interaction, alteration in crop loss and

32nd Annual Research Bulletin, April 2015, Haramaya University
124
changes in the efficacy of management strategies (Doll and Baranski, 2011; Gautam et al., 2013). Climate variability itself may be an important factor of pathogen selection pressure (Garette et al., 2006). Inspite of crop diseases reducing crop productivity and food supply, there has been limited field based empirical research to assess the potential effect of climate change on plant disease (Boland et al., 2004; Ghini et al., 2008; Newton, et al., 2011). Most research on how climate change influences plant disease has concentrated on the effects of one or two of the changing climatic factors on the host, pathogen, or the interaction of the two under controlled conditions that are very different from those in the real field. Other situational studies are based on modelling of data from controlled experiments (Doll and Baranski, 2011). Research in climate change related issues could result in improved understanding and management of crop diseases in the face of current and future climate extremes (Garette et al., 2006; Doll and Baranski, 2011). Understanding the effect of climate change resilience strategies such as plant nutrients through compost application (Sullivan, 2004; Luske, 2010), soil and water conservation (Aydinalp and Cresser, 2008; Toulmin, 2011), and species mixture combination (Fininsa, 2003) management practices on disease intensities will assist identification of the most important variables and focus efforts in developing integrated management packages. The epidemics of CBB needs to be assessed under sole and integrated field based climate change resilience strategies such as intercropping, compost application and furrow planting. The objective of this study, therefore, was to assess the effects of climate change resilience strategies against CBB epidemiology of common bean.
2. Materials and Methods 2.1. Experimental Location Field experiments on CBB of common bean were conducted at Haramaya University experimental field stations at Babile and Haramaya, eastern Ethiopia during 2012 and 2013 main cropping seasons (June to November each year). Haramaya is located at 09° 26´ N and 42° 3´ E. The altitude of the area is 1980 meters above sea level with average annual rainfall of 786.8 mm, mean minimum temperature of 10.4oC, maximum temperature of 23.4oC and mean temperature of 16.8°C. The soil of Haramaya is alluvial type with organic matter content of 1%, total nitrogen of 0.17%, available phosphorus of 8.72 mg kg soil-1, pH of 7.13 with percent sand, silt and clay content of 62.92, 19.64 and 17.44, respectively. Babile is situated at 09˚13´ N and 42˚19´ E, with altitude of 1655 meters above sea level with annual total rainfall of 719.2 mm. The mean minimum and maximum temperatures are 15.4 and 28.3˚C, respectively, with an average temperature of 21.8. The soil of Babile is characterized with organic matter content of 1.71%, total nitrogen of 0.01%, available phosphorus of 1.28 mg kg soil-1, pH of 6.6 with percent sand 45%, silt 24% and clay 31%. Both locations represent important common bean growing areas and are conducive for CBB disease of common bean. Babile is a representative of semi-arid agro ecology whereas Haramaya is a representative of midland agro ecology, and both locations are highly affected by climate change events (increased temperature, variable rainfall pattern, and frequent drought). The weather variables (mean maximum and minimum monthly temperature, mean monthly total rainfall and mean monthly relative humidity) for 2012 and 2013 of both locations during experimental months are presented in Figure 1. 2.2. Experimental Design and Management Three field based climate change resilience strategies and a control were used as treatments. The strategies consist of crop diversification (row intercropping), moisture conservation (furrow planting) and soil nutrient management (composting). The treatments were common bean-sorghum row intercropping, furrow planting, compost application, sole planting and their combination. The treatments were applied separately and in integration (minimum of two) using Gofta (G 2816) and Mexican 142 (G 11239) common bean varieties. Gofta is moderately resistant while Mexican 142 is susceptible to CBB. The varieties were obtained from Melkasaa Agricultural Research Center, Ethiopia. Sorghum variety, Teshale (3442-2 OP).

32nd Annual Research Bulletin, April 2015, Haramaya University
125
Figure 7. The weather variables (mean maximum and mean minimum temperature (oC), mean relative humidity (%) and total monthly rainfall (mm) at Babile in 2012 (A), in 2013 (B), at Haramaya in 2012 (C) and in 2013 (D). Developed for the semi-arid environment as moisture stress and striga weed tolerant was used. Sixteen treatment combinations were arranged in a randomized complete block design in three replications on a plot size of 3.4 m x 3.6 m (12.24 m2). Compost was applied two weeks before sowing at a rate of 8 tons per hectare, about half the rate recommended for cereals (Stutz et al., 2003) for both crops. Close-ended furrows were prepared by digging 20 centimeters deep rows two weeks before sowing in order to harvest the rainwater. Sorghum seeds were sown on 21 June 2012 and 28 June 2013 at Babile, 20 June 2012 and 02 July 2013 at Haramaya by drilling seeds at the seed rate of 5kg ha -1. Common bean seeds were sown on 11 July 2012 and 05 July 2013 at Babile, 07 July 2012 and 09 July 2013 at Haramaya manually by planting two seeds per hill. A standard intra and inter-row spacing for both crops were used according to the recommended spacing. Sorghum was planted in 0.8 m inter-row and 0.25 m intra-plant spacing. In row intercropping, a row of common bean was planted in the center of sorghum rows at 0.1 m intra-plant and 0.4 m inter-row spacing. In row intercropping, simultaneous planting was used. Similarly, in sole planting of common bean 0.4 m inter-row and 0.1 m inter-plant spacing with nine rows per plot were used. Spacing between blocks was 1.2 m and between plots was 1 m. After emergency and establishment of seedlings, the rows were thinned to one plant per hill. Recommended agronomic practices were used for sole common bean planting. Fertilizer application and artificial inoculation were not applied for common bean. Plants were hand weeded three times at Haramaya and two times at Babile and cultivated once during the growth periods at both locations. The treatment combinations for a susceptible variety are listed in Table 1 and the treatments were repeated for resistant variety constituting 16 treatments. 2.3. Disease Data All disease data were collected from four central rows. Disease severity (leaf area showing characteristic CBB symptom) was assessed six times at an interval of seven days during the experimental periods beginning from 48-51 days after planting (DAP). Disease severity rating was performed on 10 randomly pre-tagged plants per treatment plot at both locations and seasons. Severity was rated using standard scales of 1 – 9 (CIAT, 1987; Buruchara et al., 2010) where 1 = no visible symptom and 9 = disease covering more than 25% of the foliar tissue and the severity grades were converted into percentage severity index (PSI) for analysis using:
PSI =Sum of numerical ratings X 100
Number of plants scord X maximum score on scale
Disease progress rate (r) and area under disease progress curve (AUDPC) were calculated from the severity data. AUDPC was computed from PSI data calculated on each date of assessment as described by Madden (2006).
AUDPC = 0.5 xi + 1 − xi (ti + 1 − ti)
n−1
i=1
Where n is the total number of assessments, ti is the time of the ith assessment in days from the first assessment date, xi is the percentage of disease severity at ith assessment. AUDPC was expressed in percent-days because the severity (x) was expressed in percent and time (t) in days. The rates of disease progress were obtained from regression of PSI data fit to Logistic Model ln [Y/1-Y))] with dates of assessments.

32nd Annual Research Bulletin, April 2015, Haramaya University
126
2.4. Weather Data Weather data of each location were collected from the nearby meteorological station (as means of five years) for both experimental stations. Weather variables of minimum temperature at 09:00 h and maximum daily air temperature at 18:00 h (oC), relative humidity (%) at 06:00 h, 09:00 h, 12:00 h, 15:00 h and 18:00 h, and daily rainfall (mm) were collected and the averages were of 2012 and 2013 cropping seasons were calculated and presented in Figure 1. 2.5. Data Analysis Mean disease severity from each variety and treatment were examined and used for data analysis. Disease severity at different DAP and AUDPC were subjected to analysis of variance using the PROC GLM procedure of Statistical Analysis System or SAS version 9.1, (SAS Institute. 2003) to determine the treatment effects. Homogeneity of variances was tested using F-test as described by Gomez and Gomez (1984) and the F-test was significant. Thus, separated analysis of the two-year and two location data was performed. Differences among treatment means were compared using the Fisher's least significant difference (LSD) test at 5% level of significance. Regression analysis of PSI data was carried out to fit to Logistic Model ln [Y/1-Y))] with dates of assessments to determine the disease progress rate.
3. Results 3.1. Disease Severity Common bacterial blight epidemics appeared on both varieties during both cropping seasons varied among the climate change resilience strategies significantly. Disease severity was consistently less on the most integrated plots than sole planted plots. Disease severity in the two cropping seasons was significantly different (P<0.01) among the climate change resilience strategies and between varieties. During both cropping seasons, the disease severity was significantly different (P<0.01) among climate change resilience strategies throughout the whole disease recording dates while significant difference (P<0.01) of disease severity between the two varieties were at late disease recording days. In 2012, the highest initial disease severity (20%) at 50 days after planting (DAP) was recorded from sole planted plots of Gofta variety, while the lowest was recorded in row intercropping + compost application + furrow planting plots of Gofta and in row intercropping of Mexican 142 at Haramaya (Figure 3). Similarly, the highest final disease severity at 85 DAP was recorded from sole planning on Mexican 142 (56%) and on Gofta (48%) whereas lowest disease final disease severity was recorded from row intercropping + compost application on Gofta (40%) and from row intercropping + compost application + furrow planting on Mexican 142 (42.9%). During the 2013 cropping season, higher final disease severity at 86 DAP on Gofta (43%) and on Mexican 142 (54.8%) were obtained from sole planting followed by furrow planting while lower final disease severity on Gofta (28% ) and on Mexican 142 (40% ) were obtained from row intercropping + compost application + furrow planting at Haramaya (Figure 3). With respect to mean initial and final disease severity of two varieties during 2012 cropping season, the highest mean initial disease severity was 18.2% at Babile and 19.8% at Haramaya in sole planting. The row intercropping + compost application had the lowest 13.3% at Babile and row intercropping + furrow planting had the lowest (14.08 %) mean initial disease severity at Haramaya (Figure 3). The highest mean final disease severity (53.9%) was recorded in sole planting at Babile and 52.4% at Haramaya. The lowest mean final disease severity was from row intercropping + compost application + furrow planting (40.7%) at Babile (Figure 2) and 41.8% at Haramaya during 2012 (Figure 3). The remaining climate change resilience strategies reduced CBB severity intermediately, showed similar pattern of disease progress curve from the first to last dates of disease recording, and were not presented in the figure for clarity.

32nd Annual Research Bulletin, April 2015, Haramaya University
127
Figure 8. Disease progress curve of common bean common bacterial blight on (A) Gofta in 2012 (B) Gofta in 2013, (C) Mexican 142 in 2012 and (D) Mexican 142 in 2013 at Babile. RI + CA + FP, row intercropping + compost application + furrow planting; RI + FP, row intercropping + furrow planting; SP, sole planting. During 2013 cropping season, the highest mean initial disease severity at 50 DAP was 16.3% in sole planting at Babile (Figure 2) and at 51 DAP was 17.8% in sole planting at Haramaya (Figure 3), while the row intercropping + compost application + furrow planting had the lowest mean initial disease severity 12.6% at Babile and 13% at Haramaya. The highest mean final disease severity at 85 DAP (46.7%) was recorded in sole planting at Babile and at 86 DAP was 48.9% at Haramaya while the lowest mean final disease severity was from row intercropping + compost application + furrow planting (33.5%) at Babile and 34.1% at Haramaya. The other climate change resilience strategies reduced CBB severity intermediately and showed similar trend of disease reduction form the first to last date of disease recording and the data were not presented in the figure for clarity.
Figure 9. Disease progress curve of common bean common bacterial blight on (A) Gofta in 2012 (B) Gofta in 2013, (C) Mexican 142 in 2012 and (D) Mexican 142 in 2013 at Haramaya. RI + CA + FP, row intercropping + compost application + furrow planting; RI + FP, row intercropping + furrow planting; SP, sole planting. In both 2012 and 2013, CBB appeared on both varieties were not varied during early disease recording dates. However, significant variations in the disease severity between varieties started from 55 to 69 DAP at Babile and from 64 to 83 DAP at Haramaya during 2012, whereas 50 to 85 DAP at Babile and 65 to 86 DAP at Haramaya during 2013 (Figure 3). At both locations and seasons, significantly higher disease severity was recorded from Mexican 142 than Gofta variety. Likewise, higher mean initial disease severity (15.8%, 15.3%) and final disease severity

32nd Annual Research Bulletin, April 2015, Haramaya University
128
(45.5% and 42.7%) were recorded on Mexican 142, during 2012 and 2013 respectively than on Gofta variety at Babile. A higher disease severity was observed in the year 2012 compared with the 2013 cropping season. The interaction between and among the climate change resilience strategies, varieties and location was not significant. Considering the range of disease severity and percentage of disease severity reduction, the solely applied climate change resilience strategies had higher disease severity and lower reduction compared to most integrated and integrated ones. The most integrated climate change resilience strategy: row intercropping + compost application + furrow planting and row intercropping + compost application caused higher CBB severity reduction. The resilience strategies reduced final disease severity from 4.7-25.6% (mean 13%) during 2012 (Figure 2) and from 8.6-36.2% (mean 20.7%) during 2013 (Figure 2) on Gofta variety at Babile. Similarly, the resilience strategies reduced final disease severity from 12.1-34.5% (mean 20.3%) on Gofta and from 10.8-27% (mean 13.9%) on Mexican 142 (Figure 3) at Haramaya during 2013. 3.2. Disease Progress Rate Comparisons of disease progress rates among treatments were made based on the Logistic model by fitting severity data with dates of assessment. The rates of disease progress were significantly different among treatments, between locations and seasons. Table 1. Common bean common bacterial blight disease progress rate (r) logit per day and adjusted coefficient of determination (R2) percentage on Gofta and Mexican 142 varieties at Babile and Haramaya during 2012 cropping season.
Treatment
Babile 2012 Haramaya 2012
Gofta Mexican Gofta Mexican
Rate R2 Rate R2 Rate R2 Rate R2
SP 0.046 90.8 0.048 88.4 0.040 83.7 0.050 83.1
FP 0.046 89.7 0.046 87.0 0.040 79.0 0.044 82.1
CA 0.053 92.7 0.048 89.9 0.043 81.7 0.055 86.9
RI 0.046 89.3 0.042 86.9 0.042 82.0 0.049 84.2
CA + FP 0.050 93.9 0.050 84.6 0.042 79.5 0.052 85.1
RI + FP 0.043 87.6 0.041 86.5 0.043 79.0 0.046 84.2
RI + CA 0.048 87.8 0.044 84.1 0.040 81.2 0.045 83.8
RI + CA + FP 0.044 86.7 0.039 86.0 0.044 80.8 0.044 82.7
FP, furrow planting; CA, compost application; RI, row intercropping; CA + FP, compost application + furrow planting; RI + FP, row-intercropping + furrow planting; RI + CA + FP, row intercropping + compost application + furrow planting; RI + CA, row intercropping + compost apllication; SP, sole planting. During 2012 cropping season, the highest disease progress rate (0.055-logit day-1) was on Mexican 142 variety at Haramaya while the lowest epidemic rate (0.027 logit day-1) was from Gofta variety during 2013 cropping season at Haramaya. The disease progress rates calculated for varieties, climate change resilience strategies, years and locations were different and presented in Table 1 for 2012 and Table 2 for 2013 seasons. The reduction of disease progress rate by climate change resilience strategies did not completely have similar trend to the disease severity and area under disease progress curve in varieties, locations and cropping seasons. In the 2012 cropping season, the disease progress rate was higher on the Gofta (0.053 logit day-1) treated with compost application, on Mexican 142 (0.050 logit day-1) treated with compost application + furrow planting at Babile and on Mexican (0.055 logit day-1) treated with compost application, at Haramaya (Table 1). Application of row intercropping + furrow planting reduced disease progress rate by 6.5% on Gofta and application of row intercropping + compost application + furrow planting reduced disease progress rate by 18.7% on Mexican 142 compared to sole planting at Babile during 2012 cropping season (Table 1).

32nd Annual Research Bulletin, April 2015, Haramaya University
129
Table 2. Common bean common bacterial blight disease progress rate (r) logit per day and adjusted coefficient of determination (R2) percentage on Gofta and Mexican 142 varieties at Babile and Haramaya during 2013 cropping season.
Treatment
Babile 2013 Haramaya 2013
Gofta Mexican Gofta Mexican
Rate R2 Rate R2 Rate R2 Rate R2
SP 0.040 90.3 0.048 90.1 0.035 91.0 0.054 93.3
FP 0.037 87.2 0.044 88.5 0.036 84.7 0.048 93.4
CA 0.034 83.5 0.041 86.2 0.033 80.1 0.055 95.3
RI 0.031 77.9 0.041 89.7 0.029 82.1 0.047 90.4
CA + FP 0.036 83.6 0.039 88.2 0.033 85.9 0.048 89.2
RI + FP 0.030 77.6 0.042 92.9 0.031 82.9 0.046 88.8
RI + CA 0.029 87.6 0.037 69.0 0.028 78.5 0.048 88.4
RI + CA + FP 0.031 86.1 0.041 90.7 0.027 82.9 0.046 91.1
FP, furrow planting; CA, compost application; RI, row intercropping; CA + FP, compost application + furrow planting; RI + FP, row-intercropping + furrow planting; RI + CA + FP, row intercropping + compost application + furrow planting; RI + CA, row intercropping + compost apllication; SP, sole planting. Lower rate of disease progress was obtained from row intercropping + compost application on Gofta (0.040-logit day-1) and from row intercropping + compost application + furrow planting on Mexican 142 (0.44 logit day-1). Generally, application of row intercropping + compost application + furrow planting reduced the rate of disease progress by 12% on Mexican 142 variety at Haramaya during 2012. In 2013 cropping season, a lower disease progress rate was observed on Gofta (0.029 logit day-1) and on Mexican 142 (0.037 logit day-1) treated with row intercropping + compost application at Babile and on Gofta (0.027 logit day-1) and on Mexican 142 (0.046 logit day-1) treated with row intercropping + compost application + furrow planting at Haramaya. In 2013 the disease progress rate on compost applied was faster (0.055 logit day-1) than the remaining climate change resilience strategies on Mexican 142 (Table 2), and sole planting had faster disease progress rate (0.04 logit day-1) on Gofta and (0.048 logit day-1) on Mexican 142 at Babile. The disease progress rate in compost application was highest in both cropping seasons on Mexican 142 at Haramaya. Application of the most integrated climate change resilience strategy: row intercropping + compost application + furrow planting reduced the rate of disease progress by 22.9% on Gofta variety and by 14.8% on Mexican variety during 2013 cropping season at Haramaya (Table 2).
4. Discussion CBB epidemics significantly varied among and between climate change resilience strategies, between common bean varieties, locations and cropping seasons. Variety Mexican 142 had higher disease severity and higher area under disease progress curve than variety Gofta. Variety Mexican 142 is moderately susceptible for different bacterial and fungal diseases of common bean including CBB and variety Gofta is moderately resistant to CBB. Higher disease epidemic was found during 2012 cropping season than 2013 cropping season at both locations. In both location, higher relative humidity, higher minimum and maximum temperatures (Figure 1) recorded in August and September months during 2012 cropping season may be favourable for CBB disease progress than 2013 cropping season. Similarly, lower relative humidity, higher minimum and maximum temperatures were recorded at Babile than at Haramaya during both cropping seasons (Figure 1). At Haramaya, lower disease severity and lower area under disease progress curve were computed than at Babile during both cropping seasons. The result was similar with the findings of Fininsa (2003) as high temperature and low relative humidity favor higher common bacterial blight. Climate change resilience strategies had lower final disease severity (8.6-36.2%) and lower area under disease progress curve than the sole planting on both varieties of common bean during 2012 and 2013 cropping seasons at both locations. The variation of final disease severity was based on the type of climate change resilience strategy, resistance level of common bean, suitability of location and weather variables of two cropping seasons. Intercropping common bean with sorghum has significantly lowered the severity level of CBB compared with sole planting control. Row intercropping + compost application + furrow planting and row intercropping + compost application showed significantly lower CBB severity than the sole plantings during both cropping seasons and locations. All types of common bean–sorghum intercropping systems (row intercropping, row intercropping + furrow planting, row intercropping +compost application, row intercropping +compost application +furrow planting) significantly reduced the final disease severity (13-36.2%) and area under disease progress curve compared to sole planted plots at both locations and seasons. Similarly, Fininsa (2003) reported reduction of 17-40% common bacterial blight severity in bean-maize intercropping. In sorghum-common bean intercropping CBB disease epidemics were reduced because the sorghum may be used as physical barrier against Xanthomonas axonopodis pv. phaseoli inoculum from reaching to common bean and may cause common bean to be poorer hosts. Changes in microclimate such as temperature and wind velocity reduction may disfavor the pathogen and cause reduction in disease. Higher temperature and relative humidity are favorable conditions for CBB disease epidemics and

32nd Annual Research Bulletin, April 2015, Haramaya University
130
a decrease in temperature in the intercropping system might have lowered the severity of CBB. A cool microclimate in row intercropping + compost application + furrow planting disfavours CBB pathogen infection that could be initiated from infected seeds, infested soil or infested debris in the soil. The microclimate may also retard proliferation and spread of the bacteria between plants as the result of non-host nature of component crop sorghum for Xanthomonas axonopodis pv. phaseoli. Intercropping common bean with sorghum therefore could have been reduced the CBB severity and area under disease progress curve compared to sole planting, during 2012 and 2013 cropping seasons at both location. Matusso et al. (2014) reported that the principal reasons for intercropping are soil conservation and improvement of soil fertility, diseases control and balanced nutrition. Furrow planting reduced the final disease severity during both cropping seasons at both locations when applied singly (2.7-18.4%) or in combination (5.7-34.5%) with other resilience strategies such as compost application and intercropping. Furrow planting could conserve soil moisture and create sufficient water availability in the root system of common bean may enabled common bean to escape disease epidemics in agreement with the results of Aydinalp and Cresser, (2008), which states periodic low soil moisture make plant easily susceptible to diseases. Compost application reduced the final CBB disease severity (3.9-17.3) when applied singly and (14.2-36%) of disease severity reduction when combined with other resilience strategies during 2013 cropping season. The result of this experiment is in agreement with the results of Vallad et al. (2003) and Abdasi et al. (2002). Vallad et al (2003) revealed that compost showed 34-65% of disease symptom reduction of bacterial speck of Arabidopsis thaliana caused by Pseudomonas syringae pv. tomato compared with non-amended soil. Abbasi et al. (2002) found that application of compost resulted in reduced bacterial spot incidence on fruit by 28-33%, compared with non-amended soil. Disease control with compost has been attributed to successful competition for nutrients by beneficial microorganisms, antibiotic production by beneficial microorganisms and activation of disease-resistant genes in plants. Using compost not only could supply plant nutrients, but also can increase tolerance and resistance to diseases, retains soil moisture (Barker and Bryson, 2006). Composts‘ contribution to nutrient fertility must also be taken into account because nutrient effects may influence the severity of pathogens and consequently reduce greenhouse gas emission (Luske, 2010). When the climate change strategies are integrated their synergetic effect significantly reduced disease severity, area under disease progress curve and disease progress rate. Row intercropping + compost application and Row intercropping + compost application + furrow planting have shown significant difference in disease severity reduction compared to less integrated climate change resilience strategies and sole planted plots at Babile and Haramaya. Compost application aggravated the diseases severity on the susceptible variety of Mexican 142 when applied solely, at Haramaya during both cropping seasons. This was because compost application could have enhanced the growth of Mexican 142 variety at fast rate and created closed canopy earlier, consequently increased temperature, which in turn could create favorable condition for CBB development and spread. Generally, there were higher disease progress rates on Mexican 142 than on Gofta during both seasons and both locations. Intercropping and furrowing had smaller effect in reduction of disease epidemics when applied singly. When composting and furrowing are integrated to intercropping, they are highly effective in reducing disease severity, disease progress rate and the area under disease progress curve as the result of synergetic effect .In addition to reduce disease epidemics, they are responsible to reduce the greenhouse gas emission. Comparisons of disease progress rates among climate change resilience strategies between verities, locations and cropping seasons have shown different trends when compared to disease severity and area under disease progress curve. The resilience strategies having lower disease severity exhibited higher disease progress rate. High disease rates were observed in some of resilience strategies that had lower disease severity. This could be due to high density of initial inoculum from the infected seeds, infested debris or infested soil. Experimental studies have shown that the rates of disease increase were considerably influenced by the number of initial inoculum (Jerger et al., 2004). In an experiment with southern blight of processing carrot, the rate of disease increase generally increased as the number of initial foci increased (Smith et al, 1988). Furrow planting had promising potential of mitigating climate change and reducing disease severity when integrated with intercropping and compost application. It is more effective when the soil has good water holding capacity, like soil of Haramaya and less effective in sand soils with high drainage capacity like soil of Babile. These climate change resilience strategies of disease management are cheaper, sustainable and could be easily adopted by small-scale farmers in eastern Ethiopia. The results obtained from this study suggested the importance of climate change resilience strategies singly and in combination as management option of CBB and other common bean diseases in the eastern Ethiopia and in areas with similar agro-ecological conditions. The compost application rate of common bean should also need further investigation in the study area.
5. Acknowledgments We would like to thank Masresha Lebie, Woinishet Feleke, Birhanu Asfaw, Azeb Tegenu and the late Cholamu Faltamo, field assistants in the School of Plant Sciences of Haramaya University, for their assistance in data collection and fieldwork. The project was financed by Haramaya University Research office (Government fund coded as common bean resilience).
6. References Abbasi, P. A., Al-Dahmani, J., Sahin, F., Hoitink, H. A. J. and Miller, S. A. 2002. Effect of compost amendments on disease severity and yield of
tomato in conventional and organic production systems. Plant Disease 86 (2): 156 - 161. Abo-Elyousr, K. A. 2006. Induction of systemic acquired resistance against common blight of bean (Phaseolus vulgaris) caused by
Xanthomonas campestris pv. Phaseoli. Egyptian Journal of Phytopathology 34 (1): 41 - 50. Aydinalp, C. and Cresser, M.S. 2008. The effects of global climate change on agriculture. American-Eurasian Journal of Agriculture and Environmental
Sciences 3 (5): 672 - 676.

32nd Annual Research Bulletin, April 2015, Haramaya University
131
Barker, A.V. and Bryson, G.M. 2006. Comparisons of composts with low or high nutrient status for growth of plants in containers. Soil Science and Plant Analysis 37 (1): 1303 - 1319.
Boland, G. J., Melzer, M. S., Hopkin, A., Higgins, V. and Nassuth, A. 2004. Climate change and plant diseases in Ontario. Canadian Journal of Plant Pathology 26 (1): 335 - 350.
Buruchara, R., Mukankusi, C. and. Ampofo, K . 2010. The handbooks for small-scale seed producers on Bean Disease and Pest Identification and Management. International Centre for Tropical Agriculture (CIAT), Kampala, Uganda.
Chakraborty, S. and Newton, A.C. 2011. Climate change, plant diseases and food security. Plant Pathology 60 (1): 2 - 14. CIAT (Centro Internacional De Agricultura Tropical). 1987. Standard System for the Evaluation of Bean Germplasm. CIAT, Cali, Colombia. Coakley, S.M., Scherm, H. and Chakraborty, S. 1999. Climate change and plant disease management. Annual Review of Phytopathology 37 (1):
399 - 426. Doll, J. E. and Baranski, M. 2011. Climate change and agriculture. Fact Sheet Series E3149 on Field Crop Agriculture and Climate change.
Michigan State University, East Lancing, USA. EPA (Environmental Protection Authority). 2010. Ethiopia‘s vision for a climate resilient green economy. EPA, Addis Ababa. Ethiopia. Fininsa, C. and Yuen, J. 2001. Association of bean rust and common bacterial blight epidemics with cropping systems in Hararghe highlands,
eastern Ethiopia. International Journal of Pest Management 47 (3): 211 - 219. Fininsa, C. and Yuen, J. 2002. Temporal progression of bean common bacterial blight (Xanthomonas campestris pv. phaseoli) in sole and
intercropping systems. European Journal Plant Pathology 108 (8): 485 - 495. Fininsa, C. and Tefera, T. 2002. Inoculum sources of bean anthracnose and their effect on bean epidemics and yield. Tropical Science 42 (1): 30 -
34. Fininsa, C. 2003. Relationship between common bacterial blight severity and bean yield loss in pure stand and bean-maize intercropping
systems. International Journal of Pest Management 49 (3): 177 - 185. Fininsa, C and Tefera, T. 2006. Multiple disease resistance in common bean genotypes and their agronomic performance in eastern Ethiopia.
International Journal of Pest Management 52 (4): 291 - 296. Garrett, K. A., Dendy, S. P., Frank, E. E., Rouse, M. N. and Travers, S. E. 2006. Climate change effects on plant disease: Genomes to
ecosystems. Annual Review of Phytopathology 44 (1): 489 - 509. Gautam R. H., Bhardwaj, M. L., and Kumor, R. 2013. Climate change and its impact on plant diseases. Current Science 105 (12): 1685 - 1691. Ghini, R., Hamada, E. and Bettiol, W.2008. Review on climate change and plant diseases. Science and Agriculture Journal 65 (1): 98 - 107. Gomez, K. A. and A. A. Gomez. 1984. Statistical Procedures for Agricultural Research. 2nd Edition. John Willey and Sons, Inc, New York, USA. IPCC (Inter-governmental Panel on Climate Change). 2007. Fourth Assessment Report on Climate Change Mitigation. Contribution of
working group of the intergovernmental panel on climate change. Cambridge University Press, Cambridge, USA. Jerger, M. J., Termorshuizen, A J., Nagtzaam, M. P. M. and Van den Bosch, F. 2004. The effects of spatial distributions of mycoparasites on
biocontrol efficacy: a modelling approach. Biocontrol Science and Technology 14 (1): 359 - 373. Katungi, E., Farrow, A., Chianu, J., Sperling, L. and Beebe, S. 2009. Base Line Research report on common bean in eastern and southern
Africa: A Situation and outlook analysis of targeting breeding and delivery efforts to improve the livelihoods of the poor in drought prone areas. ICRISAT, Kampala, Uganda.
Lemessa F., Sari, W. and Wakjira, M. 2011 Association between angular leaf spot (Phaeoisariopsis griseola (Sacco) Ferraris) and common bean (Phaseolus vulgaris L.) Yield Loss at Jimma, Southwestern Ethiopia. Plant Pathology Journal 110 (2): 57 - 65.
Luske, B. 2010. Reduced greenhouse gas emissions due to compost production and compost use in Egypt Comparing two scenarios. Louis Bolk Institute, Amestardem, Netherlands.
Madden L.V. 2006. Botanical epidemiology: some key advances and its continuing role in disease management. European Journal of Plant pathology 115 (1): 3-23.
Matusso, J. M. M., Mugwe, J. N., and Mucheru-Muna, M. 2014. Potential role of cereal-legume intercropping systems in integrated soil fertility management in smallholder farming systems of Sub-Saharan Africa. Research Journal of Agriculture and Environmental Management 3 (3): 162 - 174.
Newton, A. C., Johnson, S. N. and Gregory, P. 2011. Implications of climate change for diseases, crop yields and food security. Euphytica, 17 9 (1): 3 - 18.
Smith, V. L, Campbell, C. L, Jankins, S. F. and Benson, D. M. 1988. Effects of host density and number of disease foci on epidemics of southern blight of processing carrot. Phytopathology 78 (1): 595 - 600.
Sullivan, P. 2004. Soil system guide on sustainable management of soilborne plant diseases with compost and organic amendments. Appropriate Technology Transfer for Rural Areas (ATTRA), Butte, Davis, California.
Tana, T., Fininsa, C. and Worku, W. 2007. Agronomic performance and productivity of common bean (Phaseolus vulgaris L.) varieties in double intercropping with maize (Zea mays L.) in eastern Ethiopia. Asian Journal of Plant Sciences 6 (1):749-756.
Toulmin, C. 2011. Prospering Despite Climate Change: New Directions for Smallholder Agriculture. PP 1-25. Paper presented at the international fund for agricultural development (IFAD) conference. 24-25 January 2011. IFAD, Rome. Italy.
Vallad, G. E., Cooperband, L. and Goodman, R. M. 2003. Plant foliar disease suppression mediated by composted forms of paper mill residuals exhibits molecular features of induced resistance. Physiological and Molecular Plant Pathology 63 (1): 65 - 77.

32nd Annual Research Bulletin, April 2015, Haramaya University
132
14. Evaluation of Improved Pepper (Capsicum spp.) Varieties for Yield and Yield Components in eastern Ethiopia Wassu Mohammed Ali Haramaya University, College of Agriculture and Environmental Sciences, School of Plant Sciences, Haramaya, Ethiopia Author E-mail: [email protected]
Abstract: Pepper (Capsicum spp.) is widely produced in eastern Ethiopia, however, the productivity of the crop is very low. This is may be due to absence of high yielding varieties. Therefore, this research was conducted to evaluate four improved pepper varieties (Marko Fana, Melka Dima, Melka Eshet and PBC-660 (Melka Awaze)) along with local cultivar as check for dry pod yields and yield components. The genotypes were tested at Hirna and Dire Dawa for two cropping seasons and at Haramaya for three cropping seasons, using randomized complete design (RCBD) with three replications. The combined analysis of variance over locations and seasons revealed the significant effect of genotype and environment on all the traits while genotype x environment interaction (G x E) significantly affected only number of dry pod per plant, total and marketable dry pod yield t ha-1. On the basis of pooled mean values, only Marko Fana performed highest dry pod yields with higher men values than local cultivar for other dry pod traits. Additive Main effects and Multiplicative Interaction (AMMI) analysis of variance exhibited significant effect of genotype, environment and genotype x environment interaction on number of dry pod per plant, total and marketable dry pod yield, while the Eberhart and Russel‘s analysis of variance revealed the only significant effect of genotype on these traits. The AMMI model revealed that the contribution of G x E interaction sum squares to treatment sum squares were minimum for all traits ranged as compared to the sum of genotype and environment sum squares contribution. The two principal component axes (IPCA 1 and IPCA 2) contributed the largest proportion (>87%) to G x E interaction sum squares, moreover, the IPCA 1 explained more than 50% of G x E interaction sum squares. This indicated that the number of dry pod and yields of the genotypes can be more explained by the genetic potential of genotypes and the environment they were grown than the G x E interaction. Considering all stability parameters of the two models and performance of cultivars, Marko Fana can be recommend for production in eastern Ethiopia since it was high yielding (3.86 and 2.6 t ha-1 of total and marketable yield, respectively) and having all desirable pod traits. The other two varieties viz. PBC-660 (Melka Awaze) and Melka Eshet can be also considered for production of chilli (pungent pepper) and as sweet pepper for processing, respectively, since they produced dry pod yields greater than the local cultivar.
Keywords: AMMI (Additive Main effects and Multiplicative Interaction); Eberhart and Russell; Variety; Yield and Yield Components
1. Introduction Hot pepper (Capsicum annuum L.) berries form an indispensable ingredient of the culinary throughout the world (Sanatombi and Jitendra, 2006). The available archaeological evidence showed that peppers are the first spices that have been used by human beings (Hill et al., 2013). In contemporary world, the genus Capsicum is the second most important vegetable crop after tomato (Berhanu et al., 2011). Besides vitamins A, C and E in high concentrations, the fruits contain mixtures of antioxidants notably carotenoids, ascorbic acid, flavanoids and polyphenols (Nadeem et al., 2011). The vitamins and antioxidant compounds have a considerable contribution in protecting widespread noncommunicable human diseases and in some parts of the world it is also used for the treatment of fevers, colds, indigestion, constipation and pain killing (Dagnoko et al., 2013, Howard et al., 2000). Red pepper is also used in pharmaceutical industries (Sanatombi and Jitendra, 2006). The history of pepper in Ethiopia is perhaps the most ancient (EEPA, 2003). The hot pepper was introduced in Ethiopia probably by the Portuguese in the 17 century (Hafnagel, 1961). It is cultivated in many parts of the country and the powder of hot pepper is a major spice of the traditional sauce called ‗wot‘. In Ethiopia, vegetables account only for about 0.95% of the total area under cultivations. Of which the area under vegetables, 68.85% is under red pepper production. The average national yield per hectare of red and green pepper is 2.56 and 9.98 t ha-1, respectively (CSA, 2011). However, it was also reported that the dry fruit yield was estimated about 0.4 t ha-1in small holder farmers‘ and at experimental plot in the range between 2.5-3 t ha-1 (Fekadu et al., 2008). Hararghe is one of the main centers of cultivation (Alkamper, 1972 cited by Jansen, 1981). However, high yielding varieties were not developed and recommended for this part of the region to increase the productivity of the crop. Though considerable number of improved varieties for processing, vegetable and dry fruit yield were recommended for cultivation in the country (MoA, 2012; MoARD, 2009; EARO), these varieties have not been evaluated for dry pod yield and yield components in eastern Ethiopia. Therefore, it is necessary to identify superior varieties for dry pod yield performance. This requires testing of varieties at different locations over multiple years. The performance of a genotype is the result of its genetic potential and the interaction to the environment where it grows that hinders the achievable improvement (Yang et.al., 2009; Zobel et al., 1988). The field evaluation not only helps the breeders to identify superior genotypes but also to distinguish repeatable and non-repeatable genotype x environment interaction and to discern fixed (locations) and random (year) effects (Affleck et al.,

32nd Annual Research Bulletin, April 2015, Haramaya University
133
2008; Tai, 2007). Therefore, this research was conducted to evaluate four improved pepper varieties and one local cultivar at three locations in eastern Ethiopia with the objectives: i) to determine the influence of genotype x environment interaction on yield components and dry pod yield production of pepper varieties, and ii) to identify the high yielding and stable pepper varieties for dry pod yield production in eastern Ethiopia.
2. Materials and Methods 2.1. Description of the Study Area The field experiment was conducted at three locations viz. Haramaya, Hirna and Dire Dawa which represented middle altitude cool area, middle altitude and humid and lowland altitude (hot area), respectively. The varieties were evaluated for three consecutive cropping seasons at Haramaya (2012 to 2014), while at Hirna and Dire Dawa for two cropping seasons. Haramaya is located at 9 o26' N latitude, 42 o3' E longitudes, and at an altitude of 2020 m.a.s.l. The mean annual rainfall is 760 mm (Belay et al., 1998). The mean maximum temperature is 23.40C while the mean minimum annual temperature is 8.250C. The soil of the experimental site is a well-drained deep alluvial with a sub-soil stratified with loam and sandy loam. Dire Dawa is located between 090 28.1 N latitude and 410 38 .1 E longitude. The altitude of the experimental site is 1116 m.a.s.l. The temperature is generally high with monthly mean maximum of 28.10C (December) and 34.60C (June) with the mean annual temperatures in the range between 190C to 31.50C. The mean annual rainfall in the study area is 550 mm (Levoyageur Weather, 2012). Hirna is situated at a distance of about 134 km to the west of Haramaya. The site is located at 9 o12‘ North latitude, 41 o4‘East longitude, and at an altitude of 1870 m.a.s.l. The area receives mean annual rainfall ranging from 990 to 1010 mm. The average temperature of the area is 24.0o C. The soil of Hirna is vertisols (HURC, 1996). 2.2. Experimental Material Four improved varieties viz. Marko Fana, Melka Eshet, PBC-660 (Melka Awaze) and Melka Dima were obtained from National Vegetable Research Project and local cultivar from the region and evaluated for dry pod yield and yield components. Marko Fana was released in 1976 (Alemu and Ermias, 2000). and has large pod size and weight with dark red color, pungent with high oleoresin content (Lemma, 1998). Mareko Fana is the only cultivar being used for a long time by the local factories for the extraction of capsicum oleoresin for the export market (MARC, 2003). Melka Dima (Papri King) and Melka Eshet (Papri Queen) are released in 2004 by Melkassa Agriculture Center as improved sweet pepper. Melka Awaze (PBC 600) is released in 2006 by the same Ceneter as chili pepper (MoA, 2012). 2.3. Treatments and Experimental Design Seeds of the five pepper cultivars were sown on seedbeds of 1 m wide and 5 m length. Seedlings were transplanted to the actual field when the seedlings attained 20 to 25 cm height or near to two months (64 to 70 days) after seeds sown. The seedlings were spaced at 60 cm between rows and 30 cm between plants as the recommendation made for the crop. The cultivars were planted in randomized complete block design (RCBD) with three replications. One replication consisted of five plots where each plot allocated for one variety/cultivar and each plot consisted of six rows with 12 plants. Data were collected from plants at four middle rows left the two extreme border rows and plants grown at the end of each row as border rows and plants, respectively. Fertilizer was applied as per the national recommendation for the crop, i.e., 92 kg P2O5 ha-1 or 200 kg ha-1 in the form of DAP as a side dressing during the transplanting operation and 84 kg N ha-1 in the form Urea (100 kg ha-1 UREA). Half of the recommended N applied during transplanting and half of it at 15 days after transplanting (EARO, 2004). Other agronomic managements were applied uniformly as per the recommendation made for the crop. 2.4. Data Collection and Analysis 2.4. 1. Data Collection Data were collected for dry pod yield and yield components. Number of dry pods per plant were counted from experimental plants from the central rows of each plot at each harvest, summed up and divided by the number of plants after the final harvest. Red dry pod length and width were measured from randomly taken five fruits from each plot in each harvest and the mean values were computed. The length of pod was measured excluding the pedicel and width was measured at the base of the fruits. Surface area (cm2) of the dry pod was obtained as product of pod length and width. Average weight of dry pod was recorded as the mean weight of all harvested pods in each plot. These fruits were dried under shade until the pods attained the constant weight. The seeds of five dry fruits at each harvest that were used to estimate fruit length and width were extracted, bulked and dried. From these bulked and dried seeds, thousand seeds were counted and weighted. Total dry pod yield (t ha-1) was estimated and recorded from the total fruits harvested from the four central rows after drying. The total weight of dry pods per plot was used to estimate dry pod yield t ha-1. The total dry pods harvested from the net plot were sorted as marketable and unmarketable dry pods. Deformed shape, turned to white color and small size fruits were discarded as unmarketable dry pods and the remaining were weighted and recorded as marketable dry pod yield per plot and used to estimate dry marketable pod yield t ha -1. 2.4.1. Data analysis Data were subjected to analysis of variance considering each cropping season in each location as one environment which summed to seven environments. The pooled analysis of variance revealed non-significant mean squares of genotype x location for average dry pod weight, length, width and surface area as well as thousand seeds weight. For these traits, the pooled mean values of pepper varieties over locations and seasons

32nd Annual Research Bulletin, April 2015, Haramaya University
134
were subjected to mean comparison using least significant difference (LSD) at 5 and 1% significance levels. However, the mean squares of genotype x location interaction were significant for number of dry pods per plant, total and marketable dry pod yield t ha -1 and further genotype x location interaction and stability analyses were conducted. These analyses were conducted using Additive Main effects and Multiplicative Interaction (AMMI) (Zobel et al., 1988), and joint linear regression model as proposed by Eberhart and Russell (1966). In addition, AMMI stability value (ASV) was calculated as proposed by Purchase (1997) and as Purchase et al. (2000) as follows.
ASV= IPCAISS
IPCA 2SS scoreIPCA1
2+ IPCA2score
2
Where, ASV=AMMI stability value; SS=sum of squares of IPCA1 and IPCA2 (the first and the second interaction principal component axes, respectively). The varieties with lower ASV were considered more stable than those with higher ASV values.
3. Results 3.1. Analysis of Variance and Yield Advantages of Improved Varieties The mean squares of genotype and environment were significant for dry pod yield and yield components except non-significant environment mean square was computed for dry pod width. However, the mean squares of genotype x environment interaction were significant (P<0.05) only for number of dry pods per plant, total and marketable dry pod yield t ha-1(Table 1). The nonsignificant influence of genotype x environment interaction on average dry pod weight, dry pod length, width and surface area, thousand seeds weight allowed to compare pepper genotypes based on pooled mean values over locations and seasons. But, further genotype x environment interaction and stability analyses were conducted to identify wide adaptable and high performing varieties for those traits which exhibited significant mean squares for genotype x environment interaction. Marko Fana produced significantly highest total and marketable dry pod yield t ha-1 followed by PBC-660 (Melka Awaze) and Melka Eshet. However, Melka Dima produced dry pod yield lower than local cultivar (Table 5). However, the local cultivar had statistically non-significant and higher mean values as equal to high performing improved varieties for dry pod traits except Marko Fana showed superiority over local cultivar for dry pod width (Table 2 and Table 3). Marko Fana had 41.87 and 44.65% total and marketable dry pod yield advantages over local cultivar, respectively. Marko Fana variety also exhibited 30.43, 5.49 and 3.72% advantages of number of dry pod per plant, average dry pod weight and dry pod width over local cultivar, respectively. Melka Eshet showed 15.50, 20.93 and 13.04% superiority over local cultivar for total dry pod yield, marketable dry pod yield and number of dry pod per plant, respectively (Table 3). Regarding the environments, Haramaya site was better for the production of dry pod yields and yield components during 2012 cropping season, but it was not good during 2014 cropping season due to frost incidence (Table 2 and Table 3). Table 1. Mean squares from combined analysis of variance for dry pod yield and dry pod characters of pepper varieties as tested at seven environments.
Source of variation CV (%)
Trait Rep (2) Geno (4) Env (6) G x E (24) Error (68) SE
Total dry pod yield t ha-1 6.49 7.69** 24.20** 1.38* 0.273 0.522 17.24 Marketable dry pod yield t ha-1 3.1599 4.797** 15.10** 2.016* 0.263 0.513 20.67 Average dry pod weight (g) 1.252 1.931* 14.904** 0.829 0.258 0.508 19.7 Number of dry pod/plant 1030.3 1231.00** 3528.30** 315.10* 57 7.55 26.77 Dry pod length (cm) 1.848 7.687** 7.615** 1.325 1.391 0.681 7.75 Dry pod width (cm) 0.042 5.309** 0.257 0.125 0.118 0.198 8.64 Dry Pod Surface Area (cm2) 17.29 489.74** 289.02** 39.53 31.88 3.26 17.06 Thousand seeds weight (g) 0.643 4.364** 3.657** 0.740 0.489 0.404 6.46
* and **, significant at P<0.05 and P<0.01, respectively. Numbers in parenthesis represents degree of freedom. Rep = replication, Geno = genotype, Env = environment, G x E = genotype by environment interaction, SE = standard error and CV (%) = coefficient variation in percent.

32nd Annual Research Bulletin, April 2015, Haramaya University
135
Table 2. Mean performance of varieties over locations and years for dry fruit traits as tested in seven environments.
Environment ADPW (g) DPL (cm) DPW (cm) DPSA (cm2) TSW (g)
Haramaya (2012) 2.41b 9.67a 2.375 23.16ab 7.14a Haramaya (2013) 2.21b 9.18a 2.185 20.24bc 6.07cd Haramaya (2014) 2.30b 8.96ab 2.327 20.88abc 6.34bc Hirna (2012) 4.81a 7.99c 2.301 13.82d 5.96cd Hirna (2013) 1.90b 7.99c 2.301 13.82d 5.96cd Dire Dawa (2012) 2.20b 8.24bc 2.071 16.87cd 5.67d Dire Dawa (2014) 2.21b 9.51a 2.477 24.93a 6.59b
Genotype
Marko Fana 2.88a 8.94a 2.79a 23.76a 6.41a Melka Eshet 2.59a 8.13b 2.47b 19.38b 6.52a Marako Dima 2.62a 9.51a 1.78c 15.27c 5.87b PBC-660 2.07b 8.21b 1.73c 13.25c 5.68b Local Cultivar 2.73a 9.18a 2.69ab 23.86a 6.76a
Mean 2.58 8.79 2.29 19.11 6.25 LSD (5%) 1.25 1.92 0.559 9.19 1.139 CV (%) 19.8 13.4 15 19.6 11.21
Means in the same column with similar letter(s) are not significantly different each other at P<0.05. LSD (5%) = least signif icant difference at P<0.05 and CV (%) = coefficient variation in percent. ADPW (g) = average dry pod weight in grams, DPL (cm) = dry pod length in centimeter, DPW (cm) = dry pod width in centimeter, DPSA (cm2) = dry pod surface area in centimeter square and TSW (g) = thousand seeds weight in gram. Table 3. Percent advantage of improved varieties over local pepper cultivar for dry pod yield and yield components as tested in seven environments.
Trait Marko Fana Melka Eshet Melka Dima PBC-660 Mean advantage of varieties
Total dry pod yield t ha-1 41.87 15.50 -18.07 16.97 14.07
Marketable dry pod yield t ha-1 44.65 20.93 -12.56 24.19 19.30
Number of dry pod per plant 30.43 13.04 -4.35 78.26 29.35 Average dry pod weight (g) 5.49 -5.13 -4.03 -24.18 -6.96 Dry pod length (cm) -2.61 -11.44 3.59 -10.57 -5.26 Dry pod width (cm) 3.72 -8.18 -33.83 -35.69 -18.49 Dry pod surface area (cm2) -0.42 -18.78 -36.00 -44.47 -24.92
Thousand seeds weight in gram (g) -5.18 -3.55 -13.17 -15.98 -9.47
3.2. Genotype x Environment Interaction Analysis The AMMI model analysis of variance results showed significant mean squares for treatment, genotype, environment and genotype x environment interaction for number of pods per plant and marketable dry pod yield (Table 4). However, analysis of variance results from Eberhart and Russel‘s model revealed highly significant (P<0.01) mean squares only for genotype for all the three traits (Table 5). The treatment sum squares (69.44 to 72.54%) accounted the largest proportion of the total sum of squares as compared to error sum squares (13.27 to15.3%). The environment sum squares (62.9 to 69.42%) had the largest share from treatment sum squares as compared to genotype (14.3 to 14.7%) and genotype x environment interaction (15.88 to 22.47%) for number of pods per plant, total and marketable dry pod yield. Both IPCA 1 and IPCA 2 (interaction principal component axes one and two, respectively) explained the G x E interaction sum of squares to the minimum 87.03% (marketable dry pod yield) and maximum of 96.83% (number of dry pods per plant) while residuals sum of squares accounted only 3.17 to 12.96% to G x E interaction sum of squares for all the three traits(Table 4). 3.3. Stability Analysis Melka Dima had the largest IPCA 1 values and the highest ASV for total dry pod yield, while the local pepper cultivar had the lowest ASV. Melka Eshet followed by Marko Fana had second and third lowest ASV, respectively (Table 6). Melka Eshet, PBC-600 and Marko Fana were plotted at the right side of AMMI biplot for total dry pod yield where the former variety located nearest to the origin but the other two far from the origin. Melka Dima and the local cultivar were located at the left side (Figure 1). Melka Eshet followed by PBC-660 had lowest ASV while Marko Fana followed by Melka Dima had the highest ASV for marketable dry pod yield. Melka Eshet, PBC-660 and Marko Fana located above the origin at the right side on AMMI biplot, but Marko Fana plotted far from the origin (Figure 2). Regarding number of pods per plant, Marko

32nd Annual Research Bulletin, April 2015, Haramaya University
136
Fana followed by Marako Dima had lowest ASV values. In addition, the former variety was plotted at the right side but other two to the left above the origin of the biplot (Figure 3). All cultivars had regression coefficient (bi) values significantly different from zero for both total and marketable dry pod yield, but all had sdi2 (deviation from regression) values nonsignificant different from unity (Table 6). The bi and sdi2 values for all cultivars were not significantly different from zero and unity, respectively, except the bi value of PBC-660 was significantly (P<0.01) different from zero. Regression analysis was computed taking environmental indices as independent variable and the three traits as dependent variable (response variable) to test the change in the magnitude of differences between cultivars performances and the changing environment. The correlation between cultivars performance and environmental indices was strong for total dry pod yield (r >0.89) (Figure 4) and number of dry pods per plant (r>0.71) (Figure 6) while none of cultivars had correlation coefficient r>0.7 for marketable dry pod yield(Figure 5). Coefficient of determination (R2) values were higher (R2 >0.51) for total dry pod yield and number of dry pods per plant in all cultivars while except Marko Fana and local cultivar other varieties R2 values for marketable dry pod yield were R2<0.40. In general, Marko Fana followed by PBC-600 and Melk Eshet had higher mean values, coefficient of determination and strong correlation with environmental indices.

32nd Annual Research Bulletin, April 2015, Haramaya University
137
Table 4. AMMI analysis of variance for total and marketable dry pod yield, and number of dry pods per plant of four improved pepper varieties and one local cultivar used as a check in seven environments.
Sources of variation
DF
Total dry pod yield (t ha-1) Marketable pod yield (t ha-1) Number of dry pods per plant Sum of squares
Mean squares Sum of square Explained
Sum of squares
Mean squares Sum of square Explained
Sum of squares
Mean squares Sum of square Explained
% Total %G x E % Total %G x E % Total % G x E
Treatment 34 209.17 6.152** 69.44 134.17 3.946** 72.03 33655 989.9** 72.54 Genotype 4 30.75 7.688** 14.70 19.19 4.797** 14.30 4924 1231** 14.63 Environment 6 145.21 24.202** 69.42 90.59 15.099** 67.52 21170 3528.3** 62.90 Rep within E 14 50.57 3.612 24.18 27.37 1.955 20.40 5642 403 16.76 G x E 24 33.21 1.384* 15.88 24.39 1.016** 18.18 7561 315.1** 22.47 IPCA 1 9 16.62 1.847 50.05 13.76 1.529 56.42 6068 674.2 80.25 IPCA 2 7 13.27 1.896 39.96 7.47 1.067 30.63 1253 179 16.57 Residuals 8 3.32 0.415 10.00 3.16 0.395 12.96 240 30 3.17 Error 56 41.47 0.741 13.77 24.71 0.441 13.27 7098 126.7 15.30 Total 104 301.21 2.896 186.26 1.791 46395 446.1
* and **, significant at P<0.05 and P<0.01, respectively. DF= degree of freedom, Rep within E = replication within environments, G x E = genotype by environment interaction, IPCA 1 and IPCA 2 = interaction principal component axis one and two, respectively. Table 5. Analyses of variance from Eberhart and Russel‘s Model for number of dry pods per plant, total and marketable dry pod yield.
Source of variation DF TDPY t ha-1 MDPY t ha-1 NDPP
Genotypes 4 2.563** 1.599** 410.339** Environment + (Geno x Env.) 30 1.982 1.278 319.233 Environment ( linear ) 1 48.404 30.198 7056.59 Genotypes x Env. ( linear ) 4 1.138 0.559 476.773 Pooled Deviation 25 0.261ns 0.236ns 24.533ns Marko Fana 5 0.215 ns 0.148 ns 9.978 ns Melka Eshet 5 0.130 ns 0.107 ns 21.111 ns Melka Dima 5 0.083 ns 0.096 ns 67.895 ns PBC-660 5 0.605 ns 0.501 ns 10.443 Local Cultivar 5 0.271 ns 0.328 ns 13.236 ns Pooled Error 70 0.438 0.248 60.665
** and ns, significant at P<0.01 and nonsignificant, respectively. DF= degree of freedom, Geno x Env = genotype by environment interaction, Genotypes x Env. (Linear) = genotypes by environment interaction linear, TDPY t ha -1 = total dry pod yield tons per hectare, MDPY t ha-1 = marketable dry pod yield tons per hectare and NDPP = number of dry pods per plant.

32nd Annual Research Bulletin, April 2015, Haramaya University
138
Table 6. Stability parameters from AMMI and Eberhart and Russel‘s models for number of dry pods, total and marketable dry pod yield of four varieties and one local check tested at seven environments.
Trait
Genotype Pooled mean Mean based rank AMMI model stability ER‘s Model stability
IPCA 1 IPCA 2 ASV ASV based rank bi S2di
Marko Fana 3.863a 1 -0.64 -0.27 1.02 3 1.25** -0.22ns
TDPY (t ha-1)
Melka Eshet 3.145b 3 -0.46 0.14 0.81 2 1.13** -0.31ns
Melka Dima 2.231c 5 1.07 0.73 1.48 5 0.40** -0.36ns
PBC-660 3.185b 2 0.56 -1.10 1.03 4 1.19** 0.17ns
Local cultivar 2.723bc 4 -0.53 0.50 0.21 1 1.03** -0.17ns
Mean 3.03
LSD (5%) 1.76
CV (%) 20.56
Marko Fana 3.11a 1 0.97 0.14 2.56 5 1.06** -0.01ns
MDPY (t ha-1)
Melka Eshet 2.60bc 3 0.25 -0.27 0.11 1 1.09** -0.14ns
Melka Dima 1.88d 5 -1.03 -0.22 2.25 4 0.50** -0.15ns
PBC-660 2.67ab 2 0.10 -0.51 0.51 2 1.33** 0.25ns
Local cultivar 2.15cd 4 -0.29 0.86 0.84 3 1.03** 0.08ns
Mean 2.48
LSD (5%) 1.33
CV (%) 19.11
NDPP Marko Fana 30b 2 -0.07 1.30 1.30 1 0.99ns -50.69ns
Melka Eshet 26bc 3 0.81 2.46 2.50 4 0.80ns -39.55ns
Melka Dima 22c 5 3.39 -3.18 1.46 2 0.48ns 7.23ns
PBC-660 41a 1 -5.55 -1.39 11.17 5 1.99** -50.22ns
Local cultivar 23c 4 1.42 0.82 2.04 3 0.75ns -47.43ns
Mean 28
LSD (5%) 10.42
CV (%) 28.85
** & NS, significantly different (P<0.01) from unity and non-significant different from zero, respectively. Means with same letter(s) are not significantly different each other. ASV = AMMI stability value, ER’s = Eberhart and Russel’s, TDPY (t ha-1) = total dry pod yield tons per hectare, MDPY (t ha-1) = marketable dry pod yield tons per hectare.

32nd Annual Research Bulletin, April 2015, Haramaya University
139
Figure 1. AMMI 1 biplot of five pepper genotypes evaluated for total dry pod yield t ha-1 at seven environments in eastern Ethiopia.
Figure 2. AMMI 1 biplot of five pepper genotypes evaluated for marketable dry pod yield t ha-1 at seven environments in eastern Ethiopia.
Figure 3. AMMI 1 biplot of five pepper genotypes evaluated for number of dry pods per plant at seven environments in eastern Ethiopia.
Figure 4. Regression of pepper total dry pod yield t ha-1 on environment indices with equation of best-fit line for combined average of seven environments.
Figure 5. Regression of pepper marketable dry pod yield t ha-1 on
environment indices with equation of best-fit line for combined average of
seven environments.
Figure 6. Regression of pepper number of pods per plant on environment indices with equation of best-fit line for combined average of seven environments.

32nd Annual Research Bulletin, April 2015, Haramaya University
140
4. Discussion The observed significant differences among genotypes and environments with nonsignificant interaction of the two for dry pod traits (dry pod length, width and surface area, average dry pod weight and thousand seeds weight) indicated the importance of genetic differences and test environments for the expression of these traits. This suggested the possibility of selecting genotypes on the basis of their performance. In the absence of genotype x environment interaction, the superior genotype in one environment may be regarded as the superior genotype in all, whereas the presence of the interaction confirms particular genotypes being superior in particular environments (Samonte et al., 2005). Srividhya and Ponnuswami (2010) in paprika and Datta and Jana (2014) in chilli genotypes reported the significant influence of genotype and environment on pod characters. Except Marko Fana for dry pod width, none of the varieties show superiority over local cultivar for pod traits. These suggested the higher possibility of obtaining local cultivars that perform better than the improved varieties. In the development of successful new genotypes stability is the key that the new genotypes must be performed consistently (Lin et al., 1986). The main effect of genotype concerns broad adaptation and for farmers, growing cultivars with stable performance (with large genotype effect and small genotype x environment interaction) results in a larger harvest (Gauch, 2006). Besides the significant differences due to genotype and environment, it was evident that the significant differences in the number of dry pods per plant, total and dry pods yield t ha-1 was due to genotype x environment interaction. This suggested the importance of testing genotypes under different environments to identify the best genetic makeup that perform high in all environments and wide adaptable or adaptable in a particular environment. Other researchers (Datta and Jana, 2014; Abu et al., 2011; Srividhya and Ponnuswami, 2010; Reddy and Sadashiva, 2003) also reported the differential response of Capsicum genotypes for yield when it grew under different environments. The AMMI model analysis of variance revealed that more than 77% of treatment variations for number of dry pods per plant, total and marketable dry pod yield t ha-1 were explained due to environment and genotype but more of by environment. In addition, more than 50% of genotype × environment interaction sum squares were explained by IPCA 1. The Eberhart and Russel‘s Model analysis of variance also revealed only genotype mean squares were highly significant for these traits. This indicated the observed variations were mainly due to the genetic potential differences of pepper cultivars and the environments as compared to varied response of genotypes due to the G x E interactions. The observed high proportion of variation due to environment effect on yield and number of pods per plant suggested the need of more testing sites or the importance of controlling environments at different locations (Gill et al.,1984). In general, the result suggested the importance of giving more attention for selection of high performing genotypes and growing them in most favourable environments to increase dry pod yields and number of dry pods per plant. Datta and Dey (2009) also reported the significant effect of genotype x environment interactions on pepper yield and yield components, but lesser importance as compared to genotype and environment. The observed bi values significantly different from zero for all genotypes in total and marketable dry pod yield and non-significant Sdi2 values from unity suggested the responsiveness of cultivars to the changed environments but not sensitive to the changing environments (Dabholkar, 1998). Though, the effect of genotype x environment interaction was less as compared to the effects of genotype and environment, some of the cultivars performance was inconsistencies for dry pod yields and number of pods. This suggested the importance of identifying superior and stable genotype, since all the genotypes may not be consistently superior in all environments (Yan and Kang, 2003). In the presence of genotype x environment interaction the targeting of cultivars to specific locations is difficult, since yield is less predictable and cannot be interpreted based only on genotype and environment means (Samonte et al., 2005; Akcura et al., 2005). This suggested that both predictable (locations) and unpredictable (year) environmental factors were important sources of variation. The potentiality of the genotype to express greater mean over the environment must be the most important stability parameter. Because, S2di and bi values being nonsignificant have not practical utility as far as the genotype has low mean yield (Dabholkar, 1998). The stability statistics must be combined with performance to be informative and useful in selection. It is also difficult to identify single genotype that is stable for all measured characters (Yan and Kang, 2003). For instance, local cultivar and Melka Eshet identified as most stable for total and marketable dry pod yield, respectively, while PBC-660 for total and Marko Fana for marketable identified as most unstable. But, the former cultivars were not high yielding as compared the later varieties. Therefore, considering all stability parameters along with the performance of genotypes, the increase and decrease rates of performance both under favourable and unfavourable environments is necessary to recommend the genotype for production in the target region. Marko Fana had highest mean values for most of the traits measured including total and marketable dry pod yield. Though it was identified less stable variety for some of the traits across locations and seasons, its response was proportional to the favorability and unfavorability of environments but more responsive to favorability environments. Therefore, Marko Fana can be recommended for production in eastern Ethiopia as spices and processing of oleoresin due to its large pod size and weight with dark red color, pungent with high oleoresin content (Lemma, 1998). PBC-660 and Melka Eshet also had second and third highest total and marketable dry pod yield t ha -1 but the former had small pod size but highest number of pods per plant. These varieties were identified as stable for most of the traits and less stable for some of the traits measured. Therefore, it is possible to recommend Melka Eshet (Papri Queen) as sweet pepper and industrial processing while Melka Awaze (PBC 600) as chili pepper (MoA, 2012). But it is not necessry to consider Melka Dima for production in the region since it performed lower than local cultivar.

32nd Annual Research Bulletin, April 2015, Haramaya University
141
5. Summary and Conclusion The study showed the existence of significant variability among the pepper cultivars for dry pod yield and yields components. Dry pod traits were not significantly influenced due to genotype x environment interaction justify the selection of genotypes depending on their performances. But, significant effect of genotype x environment interaction on number of dry pods per plant, total and marketable dry pod t ha-1 indicated the performance of genotypes differed as the environments changed suggested selection of varieties is important considering their yield performance and stability across environments. Marko Fana and local cultivar had comparable performances for all dry pod traits while all other improved varieties were inferior to local cultivar. This suggested the higher chance of improvement of dry pod traits through selection of local cultivars and assembling with high yielding varieties in breeding programs. Marko Fana could be recommended for production in eastern Ethiopia due to its high yield and desirable dry pod traits across the environments. Though the variety was identified less stable for total and marketable dry pod yield t ha-1 on the basis of AMMI stability parameters, the correlations between the performance of the variety and environmental indices for number of dry pods per plant, total and marketable dry pod yield were strong with high coefficient of determination. This indicated the high performance and predictability of the variety across environments for all the traits. Melka Awaze (PBC-660) Melka Eshet also could be recommended for the production of chilli (pungent pepper) and processing as sweet pepper, respectively, since these varieties were producing higher yields than local cultivar. Generally, it could be concluded that the importance of selection of varieties on the basis of their performances for dry pod yield and its components through testing across multiple environments is necessary.
6. References Abu, N. E., Uguru, M. I..and Obi, I. U. 2011. Genotype by trait relations of yield and yield components in aromatic peppers (Capsicum
annuum) based on GT biplot. Journal of Plant Breeding and Crop Science 3 (14): 382 - 390. Affleck, I., Sullivan, J. A., Tarn, R. and Falk, D.E. 2008. Genotype by environment interaction effect on yield and quality of potatoes. Canadian
Journal of Plant Science 88: 1099 - 1107. Akcura, M., Ceri, S., Taner, S., Kaya, Y., Ozer, E. and Ayranci, R. 2005. Grain yield stability of winter oat (Avena sativa L.) Cultivars in the
central Anatolian region of Turkey. Journal of Central Europe Agriculture 6 (3): 203 - 209. Alemu Hailiye and Ermias Abate, 2000. Horticultural crops production and associate constraints in North West Ethiopia. Working paper.
Agricultural Economics Research Division. Agricultural Research Centere, Adet. p. 18. Belay, S., Wortman, C. W. and Hoogen, G. 1998. Haricot bean agro-ecology in Ethiopia: definition using agro-climatic and crop growth
stimulation models. African Crop Science Journal 6: 9 - 18. Berhanu, Y., Derbew, B., Wosene, G. and Fekadu, M. 2011. Variability, heritability and genetic advance in hot pepper (Capsicum annuum L.)
genotypes in west Shoa, Ethiopia. American-Eurasian Journal of Agriculture and Environmental Science 10 (4), 587 - 592. CSA (Central Statistical Authority). 2011. Ethiopian Agricultural Sample Survey, 2010/11 (2003 E.C.): Report on area and production of crops
(Private peasant holdings, main season). Statistical Bulletin Vol. 14. Central Statistical Agency, Addis Ababa, Ethiopia. Dagnoko, S., Yaro-Diarisso, N., Sanogo, P. N., Adetula, O., Dolo-Nantoume, A., Gamby-Toure, K., Traore-Thera, A., Katile, S. and Diallo-
Ba, D. 2013. Overview of pepper (Capsicum spp.) breeding in West Africa. African Journal of Agricultural Research 8 (13): 1108 - 1114. Datta, S. and Jana, J. C. 2014. Studies on stability of chilli genotypes at different fertility levels under terai zone of West Bengal. Journal of Spices
and Aromatic Crops 23 (1):26 - 31. Datta, L S. and Dey, A. N. 2009. Stability analysis in chilli (Capsicum annuum L.) under open and mahogany (Swietenia mahagoni L.) based
agroforestry system. Journal of Spices and Aromatic Crops 18 (2): 84 - 87. Debholkar, A. R. 1998. Elements of Biometrical Genetics. Concept Publishing Company, New Delhi, India. EARO (Ethiopian Agricultural Research Organization). 2004. Released crop varieties and their recommended cultural practices. Progress report
Addis Ababa, Ethiopia, pp.670 - 675 Eberhart, S. A., and Russell, W. A. 1966. Stability parameters for comparing varieties. Crop Science 6: 36 - 40. EEPA (Ethiopian Export Promotion Agency). 2003. Spice Potential and Market Study: Product Development and Market Research
Directorate, Addis Ababa, Ethiopia. Fekadu, M., Lemma, D., Singh, H., Fininsa, C. and Roland, S. 2008. Genetic components and heritability of yield and yield related traits in Hot
pepper. Research Journal of Agriculture and Biological Sciences 4 (6): 803 - 809. Gauh, H. G., 2006. Statistical analysis of yield trials by AMMI and GGE. Crop Science 46: 1488 - 1500. Gill, K. S., Nanda, G. S. and Singh, G. 1984. Stability analysis over seasons and locations of multilines of wheat (Triticum aestivum L.). Euphytica
33: 489 - 495. Hafnagel, H. P. 1961. Agriculture in Ethiopia. Food and Agricultural Organization of United Nations, Rome, Italy. Hill, T.A., Ashrafi, H., Reyes-Chin-Wo, S., Yao, J., Stoffel, K., Truco, M.A., Kozik, A., Michelmore, R.W., and Deynze, A.V. 2013.
Characterization of Capsicum annuum genetic diversity and population structure based on parallel polymorphism discovery with a 30K Unigene Pepper GeneChip. Plos One 8 (2): 1 - 16.
Howard, L.R., Talcott, S.T., Brenes, C.H. and Villalon, B. 2000. Changes in phytochemical and antioxidant activity of selected pepper cultivars (Capsicum sp.) as influenced by maturity. Journal of Agriculture and Food Chemistry 48: 1713 - 1720.
HURC (Haramaya University Research Centre). 1996. Proceedings of the 13th Annual Research and Extension Review Meeting. pp. 26-28.

32nd Annual Research Bulletin, April 2015, Haramaya University
142
Jansen, P.C.M. 1981. Spices, Condiments and Medicinal Plants in Ethiopia, Their Taxonomy and Agricultural Significance. Centre for Agricultural Publishing and Documentation, Wageningen, The Netherlands.
Lemma, D. 1998. Seed production guideline for tomatoes, onion, and hot pepper. Institute of Agricultural Research. Addis Ababa, Ethiopia, pp.11-27.
Levoyageur Weather: Djibouti. 2012. http://en.wikipedia.org/w/index (Retrieved 11 July 2012). Lin, C. S., Binns, L. P. and Lefkovitch, L. P. 1986. Stability analysis: Where do we stand?. Crop Sciences 26: 894 - 900. MARC (Melkasa Agricultural Research Center). 2004. Progress report on completed activities. pp.1-7. MoARD (Ministry of Agricultural and Rural Development). 2009. Variety Register. Issue No 9. Addis Ababa, Ethiopia. MoA (Ministry of Agriculture). 2012. Crop Variety Register. Animal and Plant Health Regulatory Directorate. Issue No. 12. Addis Ababa,
Ethiopia. Nadeem, M., Muhammad, F., Anjum Khan, A. M. R., Saed, M., and Riaz, A. 2011. Antioxidant potential of Bell Pepper (Capsicum annum L.).
Pakistan Journal of Food Science 21 (14): 45 - 51. Purchase, J. L., Hatting, H. and Van Deventer, C. S. 2000. Genotype x environment interaction of winter wheat (T.aestivum) in South Africa:
Stability analysis of yield performance. 17 (3): 101 - 107. Purchase, J. L. 1997. Parametric analysis to described G x E interaction and yield stability in winter yield.Ph.D Thesis. Department of
Agronomy, Faculty of Agriculture, University of Orange Free State, Bloemfontein, South Africa. pp.4 - 83. Reddy K M. and Sadashiva, A. T. 2003. Studies on yield stability in chilli (Capsicum annuum L.). indian Journal of Horticulture 60: 183 - 187. Sanatombi, K. and Jitendra, S. G. 2006. In vitro regeneration and mass multiplication of Capsicum annuum L. Journal of Food, Agriculture and
Environment 4 (1): 205 - 208. Samonte, S.O.P.B., Wilson, L.T., McClung, A. M. and Medley, J. C. 2005. Targeting cultivars onto rice growing environments using AMMI and
SREG GGE biplot analyses. Crop Science 45: 2414 - 2424. Srividhya, S. and Ponnuswami, V. 2010. G × E interaction and stability of yield in paprika genotypes (Capsicum annuum var longum) in
Tamil Nadu. Electronic Journal of Plant Breeding, 1(3): 297-300. Tai, G. C. C. 2007. The canon of potato science: Genotype-by-environment interaction. Potato Research 50: 231 - 234. Weiss, E. A. 2002. World Production and Trade. CABI Publishing, CAB International, Wallingford, UK. Yan, W. and Kang, S. M. 2003. GGE biplot Analysis: A Graphical Tool for Breeders, Geneticists and Agronomists. CRC press, London. Yang, C. R., Crossa, J., Cornelius, L. P. and Burgueno, J. 2009. Biplot analysis of genotype x environment interaction, Proced with caution. Crop
Sciences 49:1564 - 1576 Zobel, R. W., Wright, M. J. and Gauch, H. G. 1988. Statistical analysis of a yield trial. Agronomy Journal. 80: 388 - 393.

32nd Annual Research Bulletin, April 2015, Haramaya University
143
15. Biodegradation of Locally Available Organic Wastes by Composting and Vermicomposting for Improvement of Soil Fertility and Crop Production R. Hiranmai Yadav, Kibebew Kibret, Anteneh Argaw and Teferi Taddesse Haramaya University, College of Agriculture and Environmental Sciences, School of Natural Resources Management and Environmental Sciences, Dire Dawa, Ethiopia. Contact Email: [email protected] Mobile: 0919231748
Abstract: Low soil organic matter in Ethiopia soils is the major constraint for crop production. Integrated soil fertility management is the need of the present agriculture to improve the soil fertility and crop production. Therefore the present study was an attempt to produce the vermicompost of Parthenium, Lantana, Catha edulis and paper wastes admixed with farm wastes and different animal manures (Cow dung, Goat manure, Poultry manure and Swine manure) conducted in the research fields of Haramaya University, Ethiopia. The vermicompost was prepared using the earthworm variety Eisenia foetida, the red worm. The resultant product was analyzed for its nutrient content and suitability to be used as manure. The pH, Organic Carbon, Organic matter, Total Nitrogen, Phosphorus, Potassium, Sodium, Calcium, Magnesium, Copper, Iron, Zinc and Manganese contents were analyzed and found that these nutrient contents are improved after decomposition. The Parthenium and lantana vermicomposts were applied in different dosages along with fertilizer to potato crop and assessed for its performance. The different vermicomposts were found to be effective in improving different growth parameters of the crop. This could be a promising technology to improve the soil fertility in an economic way by the farmers of developing countries. Keywords: Parthenium; Catha edulis and Paper Wastes; Lantana; Vermicompost; Nnutrients; Soil Fertility; Potato
1. Introduction In Ethiopia, declining soil fertility presents a major challenge to bring about increased and sustainable productivity in order to feed the ever-increasing population of the country. As result, millions are suffering from poverty and malnutrition. Eyasu (2002) indicated that under increasing demographic pressure, cultivation becomes permanent. According to same author, the traditional farming systems in SSA lead to the mining of the natural soil fertility when cultivation becomes more permanent due to increasing population pressure. In many cases, removal of vegetation cover, depletion of soil nutrients and organic matter (OM), and accelerated soil erosion have all led to the drastic decline in soil productivity. Biodegradable materials of microbial, plant or animal origin shall form the basis of the fertilization programme in organic farming. Composting is a controlled process of decomposition used to transform organic material such as kitchen scraps, yard wastes, weeds, paper products and other organic wastes into humus. Vermi-composting on the other hand, is a bio-oxidation and stabilization process of organic materials that involves joint action of earthworms and bacteria, but does not undergo a thermophilic stage. The present project aimed for preparation of compost and vermicompost using Parthenium hysterophorus plant, Lantana camara plant, Catha edulis plant wastes and paper wastes from Haramaya university campus enriched by different combinations of crop residues and organic manures. The compost and vermicompost was applied to potato to assess its efficacy on growth, quality and yield of crops. Through this method aneco friendly manure could be developed that is useful for sustainable agriculture. The weed menace can be reduced and it may be utilized in a beneficial manner by the society in terms of compost and vermicompost units and entrepreneurship activities.
2. Materials and Methods 2.1. Description of the Site Research field of RARE of Haramaya University campus is located in East Hararghe zone of western Oromiya National Regional state. The experimental field is located at 90 26‘N latitude and 420 3‘E longitude. The average altitude is about 1980 masl. It is located in the semi arid tropical belt of eastern Ethiopia and is characterized by a sub humid type of climate with mean annual rainfall of 777mm. The site receives bimodal rainfall March – April 25% rain and june to September 45%. The mean monthly temperature ranges from 9.2 to 23.20 C. 2.2. Experimental Procedure Phase I Collection of Materials for Vermicomposting
Collection of farm wastes and organic manures (cow dung, goat manure, poultry manure and swine manure) Haramaya University farms and fields
Collection of invasive weeds ( Parthenium hysterophorus , Lantana camara)
Collection of paper wastes from Haramaya University campus and Catha edulis from Awadey

32nd Annual Research Bulletin, April 2015, Haramaya University
144
Phase II Preparation of Collected Materials for Degradation The collected materials are processed according to the work plan designed for the study. The plants were collected and cut into small pieces. The paper wastes were made into small pieces and chat wastes were also reduced in its size. The farm wastes were collected from fields and they were also cut into smaller pieces. The animal manures were obtained from agricultural farm. Cement tanks measuring 1m x 1m X 1m were used for the vermicomposting. The mixtures were left with moisture for 21 days in order to semi compost the feed so that it becomes palatable for the worms. The moisture and temperature were maintained by sprinkling water and turning the mixture. Composting earthworm species Eisenia fetida commonly known as red worm were cultured in the compost unit and after 21 days the earthworm were introduced. The moisture content was maintained to 60-70 % and the tanks were covered with moist jute bags to protect the worms and prevent moisture loss. After 60 days the samples were collected and analyzed for quality. The treatment combination prepared as follows :
1. Parthenium hysterophorus + crop residues + Cow dung 2. Parthenium hysterophorus + crop residues + Goat manure 3. Parthenium hysterophorus + crop residue + Poultry manure 4. Parthenium hysterophorus + crop residue + Swine manure 5. Lantana camara plants+ crop residue + Cow dung 6. Lantana camara plants + crop residue + Goat manure 7. Lantana camara plants + crop residue + Poultry manure 8. Lantana camara plants + crop residue + Swine manure 9. Catha edulis plant wastes+ crop residue + Cow dung 10. Catha edulis plant wastes+ crop residues + Goat manure 11. Catha edulis plant wastes+ crop residue + Poultry manure 12. Catha edulis plant wastes+ crop residue + Swine manure 13. Paper wastes + crop residue + Cow dung 14. Paper wastes + crop residue + Goat manure 15. Paper wastes + crop residue + Poultry manure 16. Paper wastes + crop residue + Swine manure
Phase III Evaluation of the Vermicomposts for Nutrient Status The vermicompost samples were tested in Soil Chemistry laboratory, Haramaya University. The samples were collected and shade dried. They were tested for selected physico-chemical parameters. The pH was measured with 1:10(w/v) using double distilled water. Total organic carbon content in the samples was measured by Walkley and Black (1936) method and the organic matter was calculated by multiplying the percent organic carbon by 1.724 assuming that organic matter is composed of 58% carbon and total nitrogen by microkjeldahl method (Humphries, 1956). The phosphorus was estimated by the method of Jackson (1973) and the Potassium by Piper (1966).The Calcium and Magnesium contents were estimated by the method of Hesse (1971). The micro nutrients namely Zinc, Copper, Iron and Manganese were assessed by Jackson (1973) method. C : N ratio was calculated by dividing the total carbon by total nitrogen. Phase IV Field experiments for assessment of the manurial value of decomposed products Field experiments were conducted at Rare with potatoes

32nd Annual Research Bulletin, April 2015, Haramaya University
145
Treatments
T0 Control- ½ RDF
T1 Parthenium vermicompost + ½ RDF
T2 Lantana camara plants+ Farm wastes + Cow dung + ½ RDF T3 Lantana camara plants + Farm wastes + Goat manure + ½ RDF T4 Lantana camara plants + Farm wastes + Poultry manure + ½ RDF T5 Lantana camara plants + Farm wastes + Swine manure + ½ RDF
Plot size- 3 X 4 m2 (Each plot with three replications) Dosage – 4.2 kg/ plot (3.5 tonnes/ ha) 3. Results and Discussion The physicochemical characters of the vermicomposts quantify their nutrient value. It depends on the factors like nature of substrate used and the vermicomposting process. The vermicomposts obtained was brownish black in colour with an earthy smell that indicated the complete decomposition of the raw material. When different nutrients were analysed in the vermicomposts from different combinations they exhibited different values that indicated the quality of vermicomposts.

32nd Annual Research Bulletin, April 2015, Haramaya University
146
Table 1. Physico chemical parameters of composts prepared from Parthenium and Lantana vermicomposts.
Treat ments
PH %OC %Om %TN P (ppm)
K (ppm)
Na (ppm)
Ca (ppm)
Mg (ppm)
Cu (ppm)
Fe (ppm)
Zn (ppm)
Mn (ppm)
9.09 21.84 37.65 1.88 113.89 621.30 156.22 957.14 144.22 0.72 7.29 4.51 3.28
8.77 24.96 43.03 2.15 111.94 557.20 145.06 1051.43 144.22 0.57 3.67 4.48 2.96 8.7 25.935 44.71 2.24 112.69 581.85 133.90 1205.71 143.58 0.58 3.04 4.56 3.19 8.54 24.96 43.03 2.15 112.87 522.68 137.62 1128.57 145.14 0.58 4.04 4.57 3.67
9.81 24.57 42.36 2.12 116.57 616.37 111.59 622.86 123.12 0.65 3.44 4.41 3.68 9.46 26.325 45.38 2.27 115.37 498.03 107.87 711.43 126.70 0.50 2.23 4.49 3.57 8.46 25.545 44.04 2.20 120.00 611.44 152.50 957.14 143.21 0.32 1.27 4.63 3.75
8.46 24.375 42.02 2.10 119.26 414.20 111.59 780.00 132.94 0.36 1.73 4.56 3.78
Table 2. Chemical properties of Lantana vermicompost.
S no Parameters T1 T2 T3 T4
1 OC(%) 2.507 2.421 2.786 2.614 32 Om(%) 4.322 4.175 4.803 4.507 33 TN(%) 0.28 0.322 0.224 0.238 4 4 P(ppm) 39.458 25.687 24.139 24.294
5 5 Cu(ppm) 4.37 4.25 2.41 3.33 6 6 Fe(ppm) 308 168 124 164 77 Zn(ppm) 5.13 3.96 3.79 5.07 88 Mn(ppm) 92.06 96.8 96.39 94.63

147
Table 3. Chemical parameters of paper waste vermicomposts.
S no Parameters T5 T6 T7 T8
1. OC(%) 1.886 2.529 1.993 2.55
2. OM(%) 3.251 4.359 3.436 4.396 3. TN(%) 0.462 0.518 0.546 0.476 4. P(ppm) 59.729 60.426 59.729 59.729
5. Cu(ppm) 4.14 2.07 20.7 4.37
6. Fe(ppm) 308 106 450 236 7. Zn(ppm) 5.91 6.81 42.3 10.8 8. Mn(ppm) 102.5 100.2 97.73 108.2
Figure 1. Plant height at flowering stage.
Figure 2. Leaf length at flowering stage .
Figure 3. Number of leaves during flowering stage.
Figure 4. Leaf area during flowering stage.
4. Discussion ―Eradication by Utilization‖ is phrase first coined by Tessema (2012) to explain the economic exploitation of invasive species as a means of harnessing their economic potentials for meeting basic human needs and at the same time control its spread and possibly eradicate them. Proper utilization of Lantana biomass through appropriate technologies like composting and mulch etc. may help in supplementing chemical fertilizer besides adding organic matter to the soil. It proved highly useful raw material for compost production, particularly in combination with cattle dung and rock phosphate (Singh and Angiras, 2011). Vermicompost is a controlled degradation or composting of organic waste, by earthworms, resulting in a stable nontoxic material with good structure which has a potentially high economic value as soil conditioner for plant growth. Agricultural waste (stem, leaves, husk peels orchard leaf litter, processed food wastes), forestry food wastes (wood shavings, peels, sawdust, and pulp), city leaf litter (mango, guava, grasses and certain seeds), waste paper and cotton cloths, city refuge, kitchen waste, biogas slurry industrial wastes can be used to produce biological
0 50 100 150
T1
T2
T3
T4
T5
T6
Plant height(cm)
plant height(cm)
0
1
2
3
4
5
6
7
8
9
T1 T2 T3 T4 T5 T6
Leaf length ~Plant 1Leaf length Plant 2Leaf length Plant 3 Leaf length Plant 4
0
50
100
150
200
250
300
350
400
450
500
T1 T2 T3 T4 T5 T6
No of leaves ~Plant 1
No of leaves Plant 2
No of leaves Plant 3
0
500
1000
1500
2000
2500
3000
3500
4000
T1 T2 T3 T4 T5 T6
Leaf area ~Plant 1
Leaf area Plant 2
Leaf area Plant 3
Leaf area Plant 4

32nd Annual Research Bulletin, April 2015, Haramaya University
148
fertilizer through vermicomposting. The production and use of vermicomposts in agriculture is economical and eco-friendly. The unique advantage of using vermicomposting is that it helps to build and sustain soil condition and fertility, which is necessary for, sustained agricultural activities. Vermicomposting reduces bad odors and prevents pollution of soil, air, and water. Vermicompost has been shown to have higher level of organic matter, organic carbon, total and available NPK, micronutrients, microbial and enzyme activities and growth regulators (Gupta, 2003). Ansari and Ismail(2008) have reported that the application of vermicomposts improves the soil organic matter , organic carbon, available nitrogen carbonate ions, calcium ions , sodium ions and exchangeable sodium percentage. The pH and electrical conductivity are also influenced by the addition of vermicomposts. These changes in the soil indicate the improvement of soil quality by addition of vermicomposts as an organic source. To increase the per capita income of the agriculture, there is a need to reduce the soil fertility depletion which can be achieved through the use of integrated organic and inorganic inputs (Sharma and Singh, 2011). Ghadge and Jadhav (2013) have reported that instead of eradicating Lantana camara with physical, mechanical and biological methods or burning it can be converted into manure by decomposition. It will be rich organic manure to improve soil fertility and increase the yield. Suthar and Sharma(2013) have vermicomposted Lantana with cowdung using Eisenia foetida and recorded a decrease in pH, total organic carbon and C/N ratio while there was an increase in ash content, total nitrogen, available phosphorus, exchangeable potassium and calcium and nitrate nitrogen. The microbial population was also increased and the population of actinomycetes indicated the maturity of composts. And from these results it could be stated that Lantana can be a potential source for vermicomposts production for sustainable agriculture. Reddy et al.(2012) observed that the vermicomposts extracts preparation from weeds like Lantana can be a method for weed control and litter management. Yadav et al.(2013) have indicated that cow dung and biogas plant slurry could be decomposed by vermicomposting. The vermicomposting leads to the reduction of pH, total organic carbon, organic matter and C/N ratio and higher electrical conductivity, nitrogen, phosphorus and potassium content than the substrate. During decomposition the substrates get converted into homogeneous, odourless and stabilized humus like material. This can be an effective method to utilize the animal excreta to produce value added products. Bhat and Limaye (2012) has also reported that the vermicomposting improves the physic chemical properties of the product that in turn improves the soil nutrient content and soil fertility. The physical and biochemical properties of substrates can be modified by vermicomposting, a bio oxidative process where the earthworms interact with micro organisms and other fauna within decomposer community. The physical process of degradation of organic substrates involves substrate fragmentation, thereby increasing the surface area of work, turn over and aeration. The biochemical changes during degradation are enhanced by micro organisms through enzymatic digestion, enrichment by nitrogen excrement and transport of inorganic and organic materials(Edwards et al., 1998; Aira et al.,2002; Loh et al., 2005; Molina et al., 2013 ).The vermicomposting is also beneficial in recycling of animal wastes, crop residues and industrial wastes(Bansal and kapoor, 2000; Kaushik and Garg,2003; Yadav and Garg, 2010; Garg et al., 2012). The earthworm of suitable species also has significance in the degradation process. The epigeic earthworms are widely used and Eisenia foetida is most widely used for vermicomposting of organic materials such as agricultural wastes and animal manures. Animal manures have been effectively used as manures due to their high nitrogen content and they provided the nutrients required by the plants (Sloan et al., 2003; Burton and Turner, 2003). Inappropriate disposal of wastes causes environmental pollution and the utilization of nutrients available in the animal manures can be utilized effectively for agriculture (Roeper et al., 2005; Williams et al., 1999; Mattson, 1998). Co-composting is a preferred method to turn organic wastes to high nutrient content products that can be soil conditioners and amendments ( Butler et al., 2001). It is an integrated waste management system by biological stabilization of wastes that complement each other in decomposition and nutrient addition under thermophilic condition with elimination of pathogens and plant seeds (Ahring et al., 1992; Angelidake and Ahring, 1997; Gopinathan and Thirumurthy, 2012).The co-composting also allows a humification process that mineralizes the organic matter(Campitelli et al., 2006; Smidt et al.,2007). The organic substances are the greatest carbon reservoirs on the earth that adds organic matter to the soil (Pena- Mendez et al.,2005). The earthworms and vermicomposts are helpful in maintaining the nutrient balance in soil cycling of organic waste. The African species Eudrillus eugeniae used to decompose the waste paper and found to be effective with paper waste and cowdung in 1:1 ratio (Basheer et al., 2013). According to Arancon et al. (2008) vermicomposts produced from cattle manure, food wastes and paper wastes was found to be beneficial for the growth of Petunia plants. This might be due to improvement of physical structure of the potting medium, increased microbes, availability of plant growth promoting substances like hormones and humates probably contribute to the increased germination, growth and flowering of Petunia. The decomposition of Parthenium hysterophorus, Eichornia crassipes and Cannabis sativa using Eisenia foetida was found to increase nitrogen,phosphorus and potassium and decreased the organic carbon, C/N ratio and C/P ratio considerably(Chauhan and Joshi,2006). Eisenia foetida help to increase the microbial acivity and release nitrogen, potassium and calcium (Edwards, 1995). Before vermicomposting, thermocomposting is beneficial for waste stabilization as well as for mass reduction and effective in reducing the pathogens (Jaya Nair et al., 2006). The important factor influences the stability of the final product of decomposition (Hu et al., 2008). Compost maturity is the level of decomposition that can be defined by the microbial biomass and decomposition of phytotoxic compounds in compost (Wu et al., 2000; Wu and Ma, 2001). Reduction of wastes by co-composting using chicken slurry and pineapple wastes by Angelidake and Ahring(1997) have been found to be a digestibility of solid waste and improved nutrient balance. The co-composting by improved nutrient release reduces the cost and use of fertilizers.The cattle manure, food waste and paper vermicomposts was found to be rich in nutrients and vermicomposts contains plant growth

32nd Annual Research Bulletin, April 2015, Haramaya University
149
regulating materials like plant growth hormones and humic acids that can increase the germination, growth and yield of plants (Atiyeh et al., 2002; Arancon et al., 2006b; Arancon and Edwards, 2006b).
5. Summary and Conclusion The present study was conducted to utilize the biological wastes for crop production and improving soil fertility. These wastes could be effectively utilized by the decomposition using the earthworms and produce a valuable vermicomposts. The vermicomposts can be prepared by the farmers and utilized in integrated soil nutrient management. The experiment reveals that the obnoxious weeds, paper wastes, and chat wastes along with farm wastes and available animal manures can be convered into a organic manure within short duration by the farmers. This benefits the farmers, cleans the environment, and reduces the utility of fertilizer.
6. Recommendation This study needs further research that could be carried out by Agricultural offices for famers.The result obtained indicates the positive effects for use of biodegradable wastes for vermicompost production and use as organic manure.
7. Acknowledgement The authors are grateful to Haramaya University for funding the project and facilitating the research activities. They are also thankful to the technical staffs and field assistants in the School of Natural Resources Management and Environmental Sciences, College of Agriculture and Environmental Sciences, Haramaya University.
7. References Ahring, B., Angelidaki, I and Johansen, K. 1992. Anaerobic treatment of manure together with industrial waste. Water Science Technology 25 (7):
311 - 318. Aira,m., Monroy, F., Dominguez, J and Mato, S.2002. How earthworm density affects microbial biomass and activity in pig manure. European
Journal of soil Biology 38: 7 - 10. Angelidaki, I. and Ahring, B.K. 1997. Co-digestion of olive mill waste water with manure, house hold waste or sewage sludge. Biodegradation
8: 221 - 226 Ansari, A and Ismail, S. A. 2008. Paddy cultivation in sodic soil through vermitech. International Journal of Sustainable Crop Production 3 (5): 1 - 4 Arancon, N.Q., Edwards,C.A., Lee, S. and Byrne, R. 2006b. Effects of humic acids from vermicomposts on plant growth. European Journal of Soil
Biology 46: 65 - 69. Arancon, N.Q., Edwards, C.A., Babenko, A., Cannon, J., Galvis, P. and Metzger, J.D. 2008. Influences of vermicomposts, produced by
earthworms and microorganisms from cattle manure, food waste and paper waste, on the germination, growth and flowering of Petunias in the green house. Applied Soil Ecology 39(1):91-99
Atiyeh, R.M., Lee, S., Edwards, C.A., Arancon, N.Q and Metzger, J.D. 2002. The influence of humic acids derived from earthworms- processed organic wastes on plant growth. Bioresour Technol. 84: 7-14
Bansal, S. and Kapoor, K. K. 2000. Vermicomposting of crop residues and cattle dung with Eisenia foetida. Bioresource Technology 73: 95 - 98. Bhat, M.R. and Limaye, S. R. 2012. Nutrient status and plant growth promoting potential of prepared vermicomposts. International Journal of
Enviromental Sciences 3: 312 - 321. Burton, C.H. and Turner, C. 2003. Manure management treatment strategies for sustainable agriculture. 2nd Edn proceedings of the
MATRESA,EU Accompanying Measure project(2003) Silsoe Research Institute ,Wrest Park, Silsoe, Bedford, UK. Butler,T.A., Sikora, L.J., Steinhilber, P.M. and Douglass, L.W. 2001. Compost age and sample storage effects on maturity indicators of biosolids
compost. Journal of Environmental Quality 30: 2141 - 2148. Campitelli, P. A., Velasco, M. I. and Ceppi, S. B. 2006. Chemical and physic chemical characteristics of humic acids extracted from the compost,
soil and amended soil. Talanta 69: 1234 - 1239. Chauhan, A. and Joshi, P. C. 2010. Composting of some dangerous and toxic weeds using Eisenia foetida. American Science 6 (3): 1 - 6. Edwards,C.A., Dominguez,J. and Neuhauser, E.F. 1998. Growth and reproduction of Perionyx excavatus(Perr.) (Megascolecidae) as factors in
organic waste management. Biol. Fertil. Soils. 27: 155-161. Edwards, C. A. 1995. Historical overview of vermicomposting. Biocycle. pp.56 - 58. Garg, V. K., Suthar, S. and Yadav, A. 2012. Management of food industry waste employing vermicomposting technology. Bioresource Technology
126 : 437 - 444. Ghadge, S. and Jadhav, B. 2013. Effect of Lantana manures on nutrient content of fenugreek (Trigonella foenum graecum L.). Bioscience
Discovery 4 (2): 189 - 193. Gopinathan, M. and Thirumurthy, M. 2012. Evaluation of phytotoxicity for compost from organic fraction of municipal solid waste and paper
and pulp mill sludge. Environ Res Engineer Manage. 1 (59): 47 - 51. Gupta, P. K. 2003. Vermicomposting for sustainable agriculture. Agrobio (India), Jodhpur.

32nd Annual Research Bulletin, April 2015, Haramaya University
150
Hu, Z., Lane, R. and Wen, Z. 2008. Composting clam processing wastes in a laboratory and pilot scale in vessel system. Waste Management 29 (1): 180 - 185.
Jaya Nair, Sekiozoic,V.and Anda,M. 2006. Effect of precomposting on vermicomposting of kitchen waste. Bioresource Technology 97: 2091 - 2095. Loh, T. C., Lee,Y. C., Liang, J. B. and Tan, D. 2005. Vermicomposting of cattle and goat manures by Eisenia foetida and their growth and
reproduction performance. Bioresource Technology 96: 111 - 114. Molina, M. J., Soriano, M. D., Ingelmo, F. and Llinares, J. 2013. Stabilisation of sewage sludge and vinasse bio wastes by vermicomposting with
rabbit manure using Eisenia foetida. Bioresource Technology137:88 - 97. Pena-Mendez, E.M., Havel, J and Patocka, J.2005. Humic substances- compounds of still unknown structure: applications in agriculture,
industry, environment and biomedicine. J.Appl Biomed. 3: 13 - 24. Reddy, S.A., Bagyaraj, D. J. and Kale, R. D. 2012. Vermicompost as a biocontrol agent in suppression of two soil- borne plant pathogens in the
field. Acta Biologica Indica. 1: 137 - 142. Roeper,H., Khan, S., Koerner,I and Stegman, R. 2005. Low tech options for chicken manure treatment and application possibilities in
agriculture. Proceedings Sardinia(2005) Tenth International Waste management and Landfill Symposium S.Margherita di Pula, Cagliari,Italy.
Sloan,D. R., Kidder ,G. and Jacobs, R. D. 2003. Poultry manure as a fertilizer. PS1 IFAS extension. University of Florida, Gainesville,FL.p.241 Smidt, E., Meissl, K., Schmutzer, M. and Hinterstoisse, B. 2007. Co composting of lignin to build of humic substances- strategies in waste
management to improve compost quality. Ind Crop Prod. 27: 196 - 201. Suthar, S. and Sharma, P. 2013. Vermicomposting of toxic weed- Lantana camara biomass: chemical and microbial properties changes and
assessment of toxicity of ebnd product using seed bioassay. Ecotoxicol Environ Saf. 95:179 - 187. Tessema, Y. A. 2012. Ecological and Economic Dimensions of the Paradoxical Invasive Species Prosopis juliflora and Policy Challenges in
Ethiopia. Journal of Economics and Sustainable Development 3 (8): 62 - 70. Williams, C. H and Steinbergs, A. 1959. Soil sulphur fractions as chemical indices of available sulphur in some Australian soils. Australian Journal
of Agricultural Research 10: 340 - 352. Wu, L. and Ma, L. Q. 2001. Effects of sample storage on biosolids compost stability and maturity evaluation. J.Environ Qual. 30: 222-228 Wu, L., Ma, L. Q. and Martinez,G. A. 2000. Comparation of methods for evaluating stability and maturity of biosolids compost. J. Environ Qual.
29: 424 - 429. Yadav, A and Garg,V. K. 2011. Vermicomposting - An effective tool for the management of invasive weed Parthenium hysterophorus.
Bioresource Technology 102: 5891 - 5895.

32nd Annual Research Bulletin, April 2015, Haramaya University
151
16. Influence of Combined Use of Orga and Nitrogen Fertilizer on Soil Water Content, Yield and Yield Components of Maize (Zea mays L.) in Water Stressed Babile Area, Eastern Hararghe, Ethiopia Solomon Tamiru and AyeleAkuma Haramaya University, College of Agriculture and Environmental Science, Department of Natural Resource Management, P. O. Box 20, Dire Dawa, Ethiopia Solomon Tamiru, [email protected], and AyeleAkuma, [email protected]
Abstract: A field experiment was conducted during the 2014/15 growing season to evaluate the influence of combined use of orga and nitrogen fertilizer on soil water content, yield and yield components of a maize variety. The experiment was conducted at Babile area which is located in eastern Ethiopia. The site is is known for the presence of water stress in the soil for crops. Three levels of orga (0, 1.5 and 3 tons/ha) were arranged with three levels of nitrogen fertilizer (0, 100 and 200 kg/ha) in a two factor randomized complete block design with nine orga-nitrogen fertilizer combinations involving three replications. It can be seen from the results that seed yield and plant height (5%) and ear length (1%) were significantly affected by the main effect of nitrogen fertilizer application while the other parameters yield with cob, number of cobs per plant, above ground biomass yield excluding the seed yield and number of ears per plant remain unaffected by nitrogen application. The main effect of orga application significantly affected maize yield with cob, seed yield, plant height (1%) and number of ear per plant but not number of cobs per plant, above ground biomass yield without the seed and ear length per plant.The maximum yield was obtained with the O2 rate (3ton/ha) of orga application. Interaction effect was observed on maize yield with cob, seed yield, plant height, and ear length per plant. However, no interaction effect was seen on number of cobs per plant, above ground biomass yield and number of ears per plant. Day 2, day 4 and day 5 moisture contents were affected significantly by the main effect of nitrogen application; however, except day 6 moisture content, all other soil moisture contents were significantly affected by orga application. Interaction effect was detected between nitrogen and orga applications on all moisture content measurements except day 6 moisture content (at 1% and 5% on day 5).
1. Introduction Ethiopia is a country that is endowed with a wide variety of climatic regimes and soil types. The agro-climatic zonation classifies the nation in to three major climatic areas, Dega (to mean highland), Kolla (arid and semi-arid) and Weynadega (between Dega and Kolla). While there is sufficient or more rainfall in the highland areas for crop production, there is severe shortage of soil water for crops throughout their growth period in the dry lands that cover quiet a large area. This has caused severe food shortage among the communities and continues to undermine the efforts of the government and other organizations working on food security in drought prone areas. Agricultural systems that give less attention to the use of organic fertilizers are partly responsible for reduced agricultural production in many areas of the country. This is because organic fertilizers not only improve the nutrient supplying power of the soil but also make the soil physically fit for cropping. Climate change and variability is a considerable threat to agricultural communities, particularly in lower altitudes. This threat includes the likely increase of extreme weather conditions, increased water stress and drought, and desertification. Use of organic fertilizers (organic farming) together with inorganic ones is found to have potential for climate change and variability adaptation in terms of soil water content improvement (Mbagwu and Ekwealor, 1990). Organic farming emphasizes the use of management practices in preference to the use of off-farm inputs, taking into account that regional conditions require locally adapted systems. However, organic fertilizers alone do not often fulfill all the nutrient needs of crops as they contain small amount of nutrients per given quantity compared to synthetic fertilizers. Therefore, use of organic and inorganic fertilizers together is considered essential and allows recycling of nutrients; thus, contributing to sustainability of agriculture. Combined use of organic and inorganic plant nutrient sources in improving soil properties for improved crop performance and yield had been reported (Palm et al., 1997; Celiket al., 2004). Past experiences in organic and inorganic fertilizer application studies have indicated that the organic fertilizer in addition to releasing nutrients slowly is important to improve soil structure (Avnimelech and Cohen, 1988), improved infiltration rate and soil water content (Ebaid and El-Refaee, 2007) and reduction in bulk density (Hagan et al., 2010). Orga is an organic fertilizer which is locally manufactured by National Fertilizer Manufacturing Pvt. Ltd. Co. (NAFMAC) and contains 1% N + 23% P2O5 which provides prominent level of phosphorus. Basically orga fertilizer is made up of bones, stomach paunch, horns and hooves by the action of phosphate solubilizing and nitrogen fixing bacteria (NAFMAC, 2002). Usually, organic fertilizers do not have phosphorus content more than 10%. However, orga contains a minimum of 23% Phosphorus (P2O5) and 21% Calcium oxide (CaO). In addition, application of most organic fertilizers is much bulky since they have low P content. But the application rate of orga is much more reduced since it has relatively high nutrient content compared to other organic fertilizers. Although the effect of combined organic and inorganic fertilizer use on soil conditions and yield of crops was examined by many researchers, there has not been any attempt to evaluate Orga in combination with nitrogen fertilizer on maize in relation to yield and soil water content at water deficit Babile area. Therefore, this research was proposed with the objectives, i) to determine the performance of a maize variety supplied with both orga and N fertilizers in the water deficit area of Babile, and ii) to identify the contribution of orga towards soil water conservation.

32nd Annual Research Bulletin, April 2015, Haramaya University
152
2. Materials and Methods 2.1. Description of Experimental Site The experiment was conducted at Babile area in the 2014/15 growing season. Babille is a small town located 36km east of Harar town. It is located at N09013.234‘‘ and E042019.407‘‘ and has an altitude of 1669 M.a.s.l. 2.2. Experimental Treatments and Design Three levels of Orga (0, 1.5 and 3 ton/ha) were arranged with 3 levels of N fertilizer (0, 100 and 200kg urea/ha) in a two factor RCBD experiment with three replications. There would be a total of 27 experimental units. Spacing of 70cm x 30 cm was used between plants and a plot size of 2.1m x 4.9m which is 10.29m2 was used which has 8 rows and 7 plants in a row. A Spacing of 1m was used between plots and 2m between blocks. No other source of phosphorous fertilizer was used.Treatment combinations were: N0O0- no (zero) nitrogen + no Orga N0O1- no nitrogen + 1.5ton/ha Orga N0O2- no nitrogen + 3ton/ha Orga N1O0- 100kg urea/ha + no (zero) Orga N1O1- 100kg urea/ha + 1.5ton/ha Orga N1O2- 100kg urea/ha + 3ton/ha Orga N2O0- 200kg urea/ha + no (zero) orga N2O1- 200kg urea/ha + 1.5 ton/ha Orga N2O2- 200kg urea/ha + 3ton/ha Orga 2.3. Soil Water Content Measurement Soil samples were taken throughout the growing season at an interval of time to determine the soil moisture content using gravimetric method. It was determined gravimetrically six times in the growing season at a constant time interval (every 2 weeks). 2.4. Data Collection Agronomic data was collected on maize yield with the cob attached, number of cobs per plot, above ground biomass yield excluding seed yield, seed yield, plant height, number of ear per plant, and ear length per plant. Five plants were randomly sampled from each plot at maturity and ears were counted for each plant and the average was treated as ear number per plant. From the same five plants, plant height was measured from the base of the stalk to the tip and averaged to give plant height values. The number of cobs per plot was obtained after counting the cobs harvested from each plot at maturity. Ear length was determined from the ears set on the five plants and the average of the five was computed to be used for the analysis. Maize plants were harvested from each plot at physiological maturity leaving the boarder rows on every end. The yield with the cob intact was determined from the central rows and treated as yield with the cob attached after dividing the total yield to the number of plants considered. Grain yield was obtained by adjusting the moisture level to appropriate level. After recording the seed yield, for each plot, five plants were taken randomly from the central rows and oven dried at 700C to constant weight and above ground dry matter yield without seed yield was determined. 2.5. Data Analysis The collected data was analyzed using SAS software.
3. Results and Discussion As it can be seen from Table 1, seed yield was significantly (at 5%) affected by the main effect of nitrogen. The maximum seed yield was registered with a nitrogen level of N2 (200kg urea/ha). The other parameters yield with cob, number of cobs per plot, above ground biomass yield excluding seed yield were not found to be significantly affected by the main effect of nitrogen. Yield of maize with cob and seed yield were significantly (at 5%) affected by the main effect of orga application. However, the main effect of orga application did not affect number of cobs per plant and above ground biomass yield excluding the seed yield. The maximum yield was obtained with the O2 rate (3ton/ha) of orga application (Table.1). Plant height (5%) and ear length per plant (at 1%) were found to be significantly and highly significantly affected by the main effect of nitrogen application. Both 100kg and 200kg urea application rates were significantly different from the control where nitrogen is not applied even though they are statistically at par with each other. The number of ear per plant has not shown significant difference from the control due to nitrogen application. Application of orga affected plant height highly significantly (1%) and number of ear per plant significantly although it did not have any effect on ear length per plant (Table 2).

32nd Annual Research Bulletin, April 2015, Haramaya University
153
Table 1. Main effect of nitrogen and Orga application on yield of maize with the cob attached, no of cobs per plot, above ground biomass yield without seed yield and seed yield.
YLCB= yield with the cob attached, NCP= number of cons per plant, AGBY= above ground biomass yield excluding the seed yield, SYLD= seed yield. Means within a column followed by the same letter (s) are not significantly different.
Table 2. Main effects of nitrogen and Orga application on plant height, number of ears per plant and ear length per plant.
PLHT= plant height, NERPP = number of ear per plant, ERLGPP = ear length per plant. Means within a column followed by the same letter (s) are not significantly different.
Table 3. Interaction effect of nitrogen and orga application on yield of maize with the cob attached, no of cobs per plot, above ground biomass yield without seed yield, seed yield, plant height, number of ears per plant and ear length per plant.
YLCB= yield with the cob attached, NCP= number of cons per plant, AGBY= above ground biomass yield excluding the seed yield, SYLD= seed yield.PLHT= plant height, NERPP= number of ear per plant, ERLGPP= ear length per plant. Means within a column followed by the same letter (s) are not significantly different.
Treatment YLCB Kg/plant
NCP No/plot
AGBY Kg/ha
SYLD Kg/ha
Nitrogen
N0 N1 N2
4.13a 4.57a 5.02a
34.33a 39a 37.44a
387a 527.59a 479.21a
3870b 4958.4a 5230.5a
Orga
O0 O1 O2
3.98b 4.5ab 5.24a
37.11a 37.33a 36.33a
412.7a 452a 529.1a
4232.8b 4489.8ab 5336.4a
CR CV (%) EMS
0.856 18.9 0.75
5.17 14.14 27.26
199.1 43.27 40415.73
943.6 20.33 907714
Treatment
PLHT cm
NERPP No/plant
ERLGPP cm
Nitrogen
N0 N1 N2
158.76a 173.58b 175.84b
1.07a 1.09a 1.2a
13.11a 15.41b 15.44b
Orga O0 O1 O2
156.47b 174.38a 177.33a
1.02b 1.09ab 1.24a
13.9a 14.98a 15.08a
CR CV (%) EMS
12.21 7.28 151.95
0.209 18.85 0.044
1.207 8.32 1.49
Treatment combinations
YLCB Kg/plant
NCP No/plot
AGBY Kg/ha
SYLD Kg/ha
PLHT cm
NERPP No/plant
ERLGPP cm
N0O1 N1O2 N2O0 N1O0 N0O0 N0O2 N2O2 N2O1 N1O1
3.93b 5.13ab 4.17ab 4.18ab 3.58b 4.87ab 5.72a 5.17ab 4.4ab
33a 39a 34.67a 40a 36.67a 33.33a 36.67a 41a 38a
276.6a 557.8a 312.9a 585a 340.1a 544.2a 485.3a 639.5a 439.9a
3537.4c 5623.6a 4263abc 4716.6abc 3718.8bc 4353.7abc 6031.7a 5396.8ab 4535.1abc
164.07ab 182.73a 161.53ab 162.33ab 145.53b 166.67ab 182.6a 183.4a 175.67a
1a 1.2a 1.07a 1a 1a 1.2a 1.33a 1.2a 1.07a
13.93a 15.6a 15.57a 14.93a 11.2b 14.2a 15.43a 15.31a 15.7a
CR CV (%) EMS
1.48 18.9 0.75
8.96 14.14 27.26
344.9 43.27 40415.73
1634 20.33 907714
21.15 7.28 151.95
0.36 18.85 0.044
2.09 8.32 1.49

32nd Annual Research Bulletin, April 2015, Haramaya University
154
Interaction effect was observed in maize yield with cob, seed yield, plant height, and ear length per plant. The lowest values were recorded for the control treatment where nitrogen and orga were not applied. There was no interaction effect of nitrogen and orga application on number of cobs per plot, above ground biomass yield and number of ears per plant (Table 3). The maximum yield recorded with 200kg urea and 3 ton/ha orga was not found to be different from all combinations where nitrogen fertilizer was added at any level in terms of seed yield. However, it is significantly superior to the control treatment. In general, the moisture contents of the soil samples from the experimental site can be considered as small due to the sandy texture of the soil. It was found that the moisture content of the soil on day 2, day 4 and 5 were significantly affected by the main effect of nitrogen. In this case, the lower value of moisture with no nitrogen application was may be due to the less cover provided by the maize plants to the soil and the sparse canopy resulting from low nitrogen in the soil. Significant effect was not detected on day 1, day 3 and day 6 moisture contents due to nitrogen application. However, all moisture content values were highly significantly (1%) affected by the main effect of orga application except day 6 moisture content (Table 4). Table 4. Main effect of nitrogen and orga application on soil moisture content.
MC= moisture content,Means within a column followed by the same letter (s) are not significantly different. Interaction effect was detected between nitrogen and orga applications on all moisture content measurements except day 6 moisture content (at 1% and 5% on day 5). The moisture content values are consistently lower for those treatment combinations where orga was not applied in comparison to those with orga application. This indicates the significance of orga in improving the water holding capacity of soils. Orga application at a rate of 3ton/ha resulted in the highest values of moisture in the soil compared to the other treatments (Table 5). Table5. Interaction effect of nitrogen and orga application on soil moisture content.
Treatment combinations
Day 1 MC (%)
Day 2 MC (%)
Day 3 MC (%)
Day 4 MC (%)
Day 5 MC (%)
Day 6 MC (%)
N0O1 N1O2 N2O0 N1O0 N0O0 N0O2 N2O2 N2O1 N1O1
20.71bc 30.97a 11.4e 13.98de 10.71e 18.9dc 25.89ab 16.34cde 15.41cde
21.07b 26.6a 13.92de 13.26e 12.85e 18.74bc 25.85a 18.11c 16.19cd
17.74b 21.82a 11.93c 12.63c 12.47c 17.41b 21.82a 17.41b 17.19b
21.37a 22.67a 12.93cd 12.49d 11.41d 15.85cb 23.97a 17.74b 16.85b
10.74cd 14.38bc 8.64d 9.15d 7.82d 11.69bcd 22.74a 16.23b 15.59b
19.42a 10.76a 10.3a 10.71a 12.39a 10.79a 8.7a 7.55a 7.92a
CR CV (%) EMS
5.75 18.37 11.25
2.45 7.7 2.03
3.06 10.68 3.18
3.18 10.74 3.43
4.21 18.88 6.02
11.16 59.41 42.31
MC = moisture content,Means within a column followed by the same letter (s) are not significantly different.
4. Summary and Conclusion
Treatment
Day 1 MC (%)
Day 2 MC (%)
Day 3 MC (%)
Day 4 MC (%)
Day 5 MC (%)
Day 6 MC (%)
Nitrogen N0 N1 N2
16.77a 17.55b 20.12a 18.68ab 17.88a 19.3a
15.87a 17.21a 17.05a
16.21b 17.33ab 18.21a
10.09c 13.04b 15.87a
14.2a 9.8a 8.9a
Orga O0 O1 O2
12.03c 13.34c 17.49b 18.46b 25.25a 23.73a
12.34c 17.45b 20.35a
12.28c 18.65b 20.83a
8.54b 14.19a 16.27a
11.13a 11.63a 10.08a
CR CV (%) EMS
3.32 1.41 18.37 7.7 11.25 2.03
1.77 10.68 3.18
1.84 10.74 3.43
2.43 18.88 6.02
6.44 59.41 42.31

32nd Annual Research Bulletin, April 2015, Haramaya University
155
The use of integrated nutrient management which involves use of commercial as well as organic fertilizers is advertised by many professionals because it is believed that it has advantage on the physical structure of the soil in addition to provision of nutrients. Therefore, the use of this approach to increase productivity of soils extends the purpose of integrated nutrient management beyond the sole yield improvement. The present study was conducted to examine the effect of combined use of orga and nitrogen fertilizer on soil water content, yield and yield components of maize. The experiment which was conducted at Babile in the 2014/15 growing season involved three levels of orga and three levels of nitrogen fertilizer laid out in a two-factor RCBD experiment with three replications. Seed yield, plant height and ear length per plant were found to be significantly affected by the main effect of nitrogen fertilizer application. Whereas, yield with cob, seed yield, plant height and number of ears per plant were significantly affected by the main effect of orga application. Interaction effect was observed in maize yield with cob, seed yield, plant height, and ear length per plant. All treatment combinations where nitrogen fertilizer was added were not statistically different from each other with respect to seed yield although they are numerically different.Day 2, day 4 and day 5 moisture contents were found to be significantly affected by nitrogen application and all moisture content measurements except day 6 were significantly affected by the main effect of orga application. Therefore, in the current study it can be concluded that neither of these treatment combinations can be recommended for a significantly superior seed yield production. However, the use of the integrated approach has many other advantages beside the sole seed yield production. This is because reduced dependence on chemical fertilizer source and attention to farming practices that favour the more economically viable and environmentally prudent system will benefit both agriculture and the environment and contributes to sustainability. The study indicated that the combined use of orga and nitrogen can improve the soil water status and help to better supply plants with water. The 3 ton/ha rate of orga is the one with the highest values of moisture level. The results of the present study have indicated that it is important to promote the combined use of orga and nitrogen fertilizer through national research programs. Efforts should be made, wherever possible, to conduct more research with different levels in different areas based on standard research methods. For alternative use 3 ton/ha orga application can be recommended.
5. Acknowledgements We thank all those who gave us constructive ideas in shaping this manuscript and those who supported us financially to complete this research. However, only the authors did participate in the conduction of the study, data collection and interpretation and manuscript preparation.
6. References Avnimelech, Y. and Cohen, A. 1988. On the use of organic manures for amendment of compacted clay soils: Effects of aerobic and anaerobic
conditions. Biological Wastes 26 (4): 331 - 339. Celik, I., Ortas, I., Kilik, S. 2004. Effects of compost, mycorrhiza, manure and fertilizer on some physical properties of a Chromoxerent Soil.
Soil Tillage Res. 78: 59 - 67. Ebaid, R.A., El-Refaee, I.S. 2007. Utilization of rice husk as an organic fertilizer to improve productivity and water use efficiency in rice field.
Africa Crop Science Conference Proceedings. 8: 1923 - 1928. Hagan, D., Escobedo, F., Toor, G., Mayer, H., Klein, J. and Dobbs, C. 2010. Soil bulk density and organic matter in urban Miami-Dade County,
Florida. The Institute of Food and Agricultural Sciences (IFAS) Document SL 327. Available at http://edis.ifas.ufl.edu/ss537, (Accessed on the January 5, 2011).
Mbagwu, J. S. C. and Ekwealor, G. C. 1990. Agronomic potentials of brewer‘s spent grains. Biologi. Wastes 163: 94 - 102. NAFMAC. 2002. Orga fertilizers and utilization for user‘s guidance. NAFMAC (national fertilizers manufacturing private limited company),
Addis Ababa, Ethiopia. Palm, C. A., Myers, R. J. K. and Nandwa, S. M. 1997. Combined use of organic and inorganic nutrient sources for soil fertility maintenance and
replacement. In: Replenishing soil fertility in Africa. Buresh RJ, Sanchez, PA, Calhoun PG, (eds.). Soil Science Society of America Special Publication 51: 193 - 217.

32nd Annual Research Bulletin, April 2015, Haramaya University
156
17. Assessment of Commercial Feedlot Finishing Practices at Eastern Shoa, Ethiopia Tsegay Teklebrhan1*, Mengistu urge1
1College of Agriculture, School of Animal and Range Sciences, Haramaya University Dire Dawa, Ethiopia;
Corresponding Author Email: [email protected]
Abstract: This study was conducted to characterize and identify husbandry practice and major constraints of commercial feedlot industries in the study area. Forty eight commercial feedlot farms were used to collect data. Data were analyzed using Statistical Package for the Social Sciences (SPSS). The results showed that livestock species such as cattle, shoat and camels were used in commercial fattening though significant variation in demand among species. Cattle had got highest acceptance in feedlot industries followed by shoat however; camel and swine had least preference. All cattle breeds had equal requirement by domestic market. However, there is variation in demand among cattle breeds for export market. Boran was the most preferred cattle breed compared to the rest of cattle by the importers. Uncast rated bull demanded for export market however, castrated and female cattle were not used for export markets. Pastoralists were the potential supplier of feeder livestock followed by small holders to feedlot industries. Tef straw was predominantly used roughage feed in most of commercial feedlot farms and agro-industrial by products as a source of concentrate. However, sorghum and maize grains were utilized by very few farms. Vitamin and mineral supplementation were not often available except, common salt in all feedlot rations. Market was noted as the most potential constraints followed by feed and type of livestock coming to the markets in the commercial feedlot industries. The study suggested that, government and other development partners should provided and improve all services to pastoralists or producers in an organized way at their locality that would ensure sustainable supply of livestock to the market.
Keywords: Constraints; Feedlot; Livestock
1. Introduction Ethiopia owned a large livestock population (CSA, 2010). It is home to Africa‘s largest livestock population, and is Africa‘s top livestock producer and exporter (principally to the Middle East). Ethiopia is the world‘s tenth largest producer of livestock, and the livestock sector represents about one-fifth of its gross domestic product (GDP). The government has indicated a strong interest in increased foreign investment in the agriculture sector, among others, commercial breeding and production of meat, milk, and eggs. Although domestic demand for animal products in Ethiopia is increasing driven by the urban middle and upper class export potential is a key force encouraging expansion and intensification of livestock production. In 2008, Ethiopia exported nearly 300,000 live animals primarily cattle as well as 6,000 metric tons of meat products, earning about U.S.$56 million.7 In 2009, the government sought to double the previous year‘s income from live animal exports ($40 million8) and raise the number of animals exported to 400,000.9 The government is keen to foster an upward trend. For 2009–10, it set targets for export of meat products of nearly 16,000 metric tons, a nearly four-fold increase over the 2007 level. While the contribution of the livestock industry to the country‘s total exports is currently low compared to its potential, this is due to the fact that livestock production has mostly been subsistence oriented and characterized by very low reproductive and production performance which is not even enough to meet the domestic requirement of community for animal protein. This is because of major limiting factors on farm conditions, among others, feed shortage, low genetic potential and diseases. However, market oriented livestock production has been gradually emerging in very recent years. The government of Ethiopia is trying to expand sector by motivating investors to meet projected increase in demand from both export and domestic markets. Export of meat and live animals that can contribute to market-led economic growth and poverty reduction in the country. Accordingly, live animal export accounts 4.5%, meat and meat products 1.7%, from the total export potential of the country (CSA, 2010). The goal is to increase annual export of live animal and meat from Ethiopian cattle, sheep and goats by about three fold though; the markets are sophisticated and extremely competitive for high quality product. Feedlot provides the means to maximize the opportunities offered by these markets for a consistent supply of high quality product for the particular needs of the market. The continuing growth of the feedlot sector is necessary to meet projected increase in demand from both export and domestic markets. However, such growth must progress according to community expectations and requirements to develop and maximize the profit from the livestock business. Information about commercial fattening or feedlot practices and its constraints is important for researchers, policy makers to take serious measures and suggest possible technologies to improve the productivity of the sector and hence maximize its contribution to the total Gross Domestic Product (GDP) or economy of the country. However, there is no documented information on fattening practices of commercial feedlot and their challenges in Ethiopia. Therefore, the paper is designed to characterize and identify husbandry practice and major constraints of commercial feedlot industries in the study area.

32nd Annual Research Bulletin, April 2015, Haramaya University
157
2. Materials and Methods 2.1. Description of Study Area The study was conducted in Adama, Methara and Mojo towns found in east Shoa Zone, Oromiya Regional State, Ethiopia. It is located at about an altitude of 1650 meters above sea level and its annual temperature ranges from 13.9oC – 29oC. The mean annual rainfall of the area is 1024 mm. The livestock population of the area was estimated to be 70,622 cattle, 36,142 sheep, 42,968 goats and 2,193 equines (CSA, 2004). 2.2. Sampling and Data Collection Three towns Adama, Methara and Mojo were purposely selected based on their potential for feedlot industry. From which a total of 48 feedlot farms were randomly selected and used for the study. Primary data were collected using pre tested semi-structured questionnaire through interview and discussion with the feedlot operators. In addition, secondary information was gathered from literature and Central Statistical Agency (CSA) reports. Physical observation of commercial farms was also used as an instrument to collect data during the study. Data on the types of livestock species used for feedlot, pattern of livestock preferences, breeds of cattle and market demand, value chain of marketing, fattening cycle and duration, feed resources feeding procedure and constraints and housing of commercial fattening were collected from the commercial fatteners. 2.3. Statistical Analysis Data were subjected to Statistical Package for the Social Sciences (SPSS, 2003) and analyzed using simple descriptive statistics such as frequency and percentage.
3. Results and Discussion 3.1. Commercial Fattening and Livestock Species Commercial feedlot is a confined yard area with watering and feeding facilities where livestock are completely handled or mechanically fed for the purpose of production. Number of heads that would fatten at a cycle was variable across the farms depending on the capacity of the farms. From that reason, commercial feedlots finished relatively large number of animals at a time than small scale fattening. Accordingly, most of commercial farms had 100-500 heads followed by 1000-1500 heads at a time as shown in Table 1. Table 1. Livestock species and type of cattle breed used for commercial feedlot
No of livestock head N Percentage
100-500 42 87.5 1000-1500 6 12.5 Livestock species Boran 39 81.25 Boran, Bale and Arsi 5 10.42 Hararghe Highland and Ogaden Cattle 1 2.08 Shoat and camel 3 6.25 Total 48 100 Age of animal purchased 4-6 years 45 93.75 Not known 3 6.25 Total 48 100
N = number of respondents Livestock species such as cattle, shoat, and camels are used in commercial fattening and then exported as live animal and meat; however; cattle breeds were usually used for fattening in the study areas as listed in table 1. Among the cattle breeds, feed lot operators showed highest preference on Boran followed by Bale and Arsi cattle. In consistent to this study, Asfaw (2011) reported that the main live animal species exported include cattle, sheep, goats, and camels. In addition, discussants revealed that Boran cattle are docile temperament, short horn and efficient as well as better in carcass conformation this would attributed to be breed of demand for export. This result is consistent to the reports of Aynalem (2011). However, Hararghe Highland and Ogaden cattle breeds had least acceptance for commercial fattening in the study area. This variation on the cattle breed requirement might be associated with available export market demands and fattening performance of the breeds. For example, discussants argued that Hararghe Highland shrunk its body weight when came from its original place (highland) to the fattening unit (lowland). Likewise, most of feedlot fatteners during discussion also noted that they knew nothing about the performance of Ogaden cattle. All fatteners agreed that uncast rated bull was required for export market as compared to castrated cattle (steer and stag). In this regard fatteners explained that the export market demand is lean meat than that of castrated from which fatty meat with high fat coverage is actually produced. In all commercial fattening areas, male livestock was preferred than female. This is because of male having better carcass

32nd Annual Research Bulletin, April 2015, Haramaya University
158
conformation compared to female cattle. In addition, discussants also strongly argued that export of female is impossible. This study also showed that 93.75% respondents noted that bulls were purchased at about age of 4-6 years. 3.2. Pattern of Preferences of Livestock species in Commercial Feedlot Industries All livestock species were preferred for fattening industry though there was significant variation among farms on degree of choices as shown in Table 2. For that reason, 89.58 % feed lot farms consider cattle as their 1st choice for commercial fattening. Physical observation also confirmed that except the three farms in Methhara all farms of the study areas were only engaged in cattle fattening enterprises. All discussants, agreed that fattening of cattle was advantageous because of low mortality, better tolerance for some diseases, frequent availability at the market place, best suitable and manageable and, required small space particularly as compared to camel. Shoat was found as the 2nd important livestock species for commercial fattening by most of the feedlot farms in the study area. For that reason, the discussants elaborated that, shoat required low amount of feed and space as compared to cattle and camel. However, shoats had higher mortality and rapid lost or shrink of live weight particularly during long distance travel for long time from the country to export destination because of in appropriate transport systems. This study also showed that camel was preferred as third important livestock used for fattening and highest requirement in the export market. However, most of feedlots retained camel for short period of time until it is exported. This could be due the fact that camel requires large area of land and because of feeding habits needs browses rather than stall feeding. This study confirmed that pig was least required for commercial fattening by most of the farms, though it is considered as the first choice of most of the Asian and European countries involved in fattening enterprises. This is may be due to lack of knowledge on the importance of this livestock and mainly because of socio-cultural and religious barratries. In addition some discussants believed that swine is a livestock species required large amount of feed per unit of gain and never satisfied and domestic market demand problems. However, it is known that swine is rapid growing, efficient feed converter and even fed on most of least cost feeds and organic wastes. Table 2. Ranking of livestock species for commercial fattening.
Livestock N 1st P 2nd P 3rd P 4th P
Cattle 45 43 89.5 2 4.1 0 0 0 0
Shoat 37 2 4.1 24 50.0 11 22.9 0 0
Cmel 25 3 6.2 12 25.0 10 20.8 0 0
Pig 11 0 0 0 0 0 0 11 22.9
N = number of respondents; P = percentage 3.3. Fattening Cycles and Duration of cattle in Commercial Feedlot Almost all fattening farms finish the bull for about an average of 3-4 months in table 3. In agreement to this study, previous result reported a range of 80 to 145 days to finish steers (Leupp et al., 2009). However, few farms finished the bull at 6 months and very few at 1 month. Table 3. Fattening cycles and duration of cattle.
Fattening duration N P Fattening cycle N P
3-4 moths 42 87.5 Two 9 18.8 6 months 5 10.4 Three 30 62.5 1 months 1 2.0 Four 9 18.8 Total 48 100 Total 48 100
N = number of respondents; P = percentage Generally, feedloters agreed on the strong relation between age of bull at purchase and for how long the bull will be retained on fattening. Accordingly, bull entered as feeder at relatively younger age will retain for long time and the reverse is true for relatively older bull. Fattening cycles of beef cattle is important to secure continued supply of meat for consumption as well as local and export markets. Most of the respondents engaged in the fattening venture agreed on three cycles of fattening per year but very few feedlot fatteners fattened two and four time per year as reported in table 3. Discussants declared that, the reason of variation in fattening cycles among feedlots were fattening duration, types of feed, market situation and weight of cattle. 3.4. Effect of Breed, Sex and Gender of Cattle on Market Demand All cattle breeds are preferred for export market; however, there is variation in demand among breeds as shown in Table 4. Accordingly, most of the feedlot operators exported Boran cattle than the rest of cattle breeds. This is the reflection of the inherent quality of the specified breed in that it possessed docile temperament, heavier live weight, better feed conversion efficiency and lean carcass compared to the rest of the cattle breeds. However, all cattle breeds had equal benefit for the domestic markets as shown in Table 4.

32nd Annual Research Bulletin, April 2015, Haramaya University
159
Table 4. Effect of Breed, sex and gender of cattle on market demand.
Export market N Percentage Sex class N percentage
Boran 29 60.4 Castrated 0 0 Boran, Bale, Arsi and Hararghe Highland
16 33.3 uncast rated 48 100
All breeds 3 6.2 Gender Domestic market Male 48 100 All breeds 48 100 Female 0 0 Value addition Yes 0 0 No 48 100
N= number of respondents. Feedloters mentioned that cattles which were not fit for export markets were dumped to domestic market. Generally, the export volume of the country is limited to very few destination countries principally to Middle East. This may be associated with international standard quality of the product and demand of importers. In addition, some of the trade and zoonotic diseases; foot and mouth disease, contagious bovine pleuropheumonia (CBPP), Peste des petits ruminants (PPR), lumpy skin disease (LSD), contagious caprine pleuropneumonia (CCPP), sheep and goat pox and brucellosis are not controlled in the country (MoARD, 2007). Moreover, discussants argued that long horned cattle breed like Afar were not required by the Arab importers. With regard to value addition and diversification of products, none of the feedlot farms were engaged in value addition, though government is showing commitment to support and encourage the business. However, all feedloters have an interest to add value and diversify the export commodities from the fattened livestock for the future rather than exporting of only live cattle. 3.5. Value Chain of Livestock Marketing in Commercial Feedlot As shown in Figure 1, pastoralists were the potential supplier of livestock followed by smallholders to feedlot industries in study area. Respondents noted that usually marketing of livestock in commercial feedlot followed the trend as indicated by the block arrows staring from producers up to destinations. Accordingly, small local trades bought small number of livestock at the farm gate and in turn sold to the other intermediate actors in the chain and continued in such away. Similarly, Negassa and Jabbar (2008) reported same role of pastoralists and small holder farmers at livestock marketing. However, in rare cases, livestock marketing followed a different and short path that is a direct purchase of livestock from producer by the commissions or larger traders and feedlot operators. Similarly, the marketing root was also organized from the producers to the farmer union/ other cooperatives and this in turn to fattening farms as indicated in the direct line arrows of Figure 1. This seems to be best alternative to minimize and avoid unprofitable transactions in the chain to assured fair and legitimate market systems.

32nd Annual Research Bulletin, April 2015, Haramaya University
160
Lebanon, Egypt Oman, Yemen & Dubai Emirates, Pastoralist, Small holder (Producers) KSA Butchers, Restaurants and Hotel Domestic Export Small group Pastoralist/small holder trader Farmer union/cooperatives commission agents (large traders) Feedlot Figure 1. Flow chart of value chain of commercial feedlot marketing (interview, 2013). 3.6. Feed Resources for Commercial Feedlots As shown in Table 5, all commercial feedlots were depending on purchased feed sources for fattening because of shortage of land for feed production. Accordingly, native grass hay was purchased from Sululta, and straws from Welenchiti. Agro-industrial byproducts were also bought from the factories in and around East Shewa. This could be mainly because almost all commercial farms were found around this areas and this gives them easy access to agro-industrial byproducts which in turn forms a major portion of the concentrate mix fed to feeder livestock. 3.6.1. Roughage Roughage feeds are characterized by relatively higher fiber content and lower energy and protein contents than concentrates. The source of roughage used for commercial feedlot includes crop reside (tef straw, wheat straw) and native grass hay. In consistent to this result, Solomon (2008) and Yayneshet (2010) reported that crop residues from cereals used as source of roughages for livestock feeding. In this study, tef straw was usually utilized by most of feedlot operators whereas the other roughages were rarely utilized in the study areas (Table 5). According to the information obtained from the fatteners the type of roughage used was directly related with cost effectiveness and availability of the roughage nears to fattening units. Discussants noted that the availability of crop residues is closely related to the farming system, type of crops produced and intensity of cultivation. 3.6.2. Agro industrial byproducts Agro-industrial byproducts are widely used as source of livestock feed include those resulting from flour mills, oil processing factories, and sugar factory. The agro-industrial byproducts (concentrate) feeds are used as energy and/or protein. Accordingly, they classified as energy or protein sources. The source of concentrate feeds commonly used by almost all farms in the study area includes weat bran, wheat middling, whole cotton seed, cotton seed cake, noug seed cake, Soybean, lentil bran, haricot bean bran, haricot bean shorts, and lentil shorts. However, sorghum and maize grains were utilized by few farms as shown in table 6. Similarly, the grains and agro-industrial byproducts were utilized as concentrate feed sources in feedlot industries (Leupp et al., 2009; Yayneshet, 2010; USDA, 1985; Roy, 1994). Most feedlot farms used wheat bran, wheat shorts, whole cotton seed and its cake Noug-seedcake, Soy bean and wheat middling; however, sorghum and maize grains were utilized as an ingredient to the compound concentrate feed by few farms (Table 5).

32nd Annual Research Bulletin, April 2015, Haramaya University
161
Table 5. Feed stuffs used for commercial fattening.
Feed resources N Percentage Non-conventional feeds N percentage
Purchased 48 100 Poultry feces 3 6.25 Own 0 0 Not used 47 93.75 Roughage sources Growth promoters Tef straw 24 50.0 Yes 0 0 Grass hay 6 12.5 no 48 100 Tef and wheat straw 5 10.4 pre-mixes (vitamin and mineral mix) use Tef straw and hay 6 12.5 yes 0 0 All 7 14.6 no 48 100 Total 48 100 Water Source of concentrate feeds Ad libitum 48 100 Agro industrial by-products1 41 85.4 Restricted 0 0 Sorghum and maize grain 7 14.6
Agro-industrial by-products = Wheat bran, wheat middlings, whole cotton seed, cotton seed cake, noug seed cake, Soybean, lentil bran, haricot bean bran, haricot bean shorts, lentil shorts; N= number of commercial feedlot 3.6.3. Non conventional feeds and other feed stuffs These are assumed to be off value and wastes by most of the producers. Accordingly, 93.75% of feedlot enterprises did not use the non-conventional feed stuffs though 6.25 % feed lot farms included as one of feed resources for fattening. As shown in table five, poultry feces were used as protein source in some farms. Minerals such as major minerals (Ca and P) as well as trace mineral (cobalt, copper, iodine, iron, manganese and zinc) are also used as the important component of the feed in growing and finishing steers (Leupp et al., 2009; Secrist, 1997). In the study areas, only salt was mixed in feeder ration in all farms as a mineral supplement. However, components of other mineral supplements were not included to the ration. Vitamins were not also used in all feedlot farms in the study area.Vitamins like, A, D and E are widely utilized in commercial farms for better performance ( Leupp et al., 2009). Water is one of the indispensable nutrients in feedlot industries. It is available as free choice every day throughout fattening in all farms in the study area. Synthetic steroid hormones are known for better efficiency and faster growth of livestock. In all feedlot farms synthetic hormones were not used. This could be due to lack of familiarities of fatteners with the implants and their application, notion of producing organic product and the risks in wellbeing of the consumers that is the issue of wholesomeness of the product. 3.7. Feeding Procedure in Commercial Feedlots With regards to feeding procedure, initially, animals were not weighed and feed was provided by common sense. Moreover, the ratio of concentrate to roughage was not known in all commercial farms as show in Table 6. The daily feeding frequency followed by almost all commercial farms was twice except few farms were followed three times of feeding. In addition, almost all farms followed the classical daily feeding procedure that is initially gave the roughage and then concentrate on the top of roughage whereas; the reverse procedure was noted by only one farm. Generally, all farms provided roughage and concentrate at mix which is uncommon in the trials usually conducted in stations. The 70.8% of feedlot owners provide roughage as an ad libtum. However, in 29.2% of farms roughage offered was restricted. As a common procedure, in 72.9 % of commercial farms roughage was provided twice a day at the morning and evening before provision of concentrate in both cases. This result also noted that by all feedlot farms no attempt had been done to improve the nutritional value of the roughage feeds. All feed lot farms provided concentrate twice a day. Usually all farms offered concentrate mix, though the ratio of mixing of ingredients was so variable or not uniform across the farms. Concentrate was offered every day throughout the fattening period. The amount of concentrate mix provided was different from farm to farm as shown in table 6. From that reason, most feed lot farms offered 9-10 kg of concentrate mix per head/day followed by 7-8 kg. Whereas, few feedlot farms reported that least amount of daily concentrate was offered (3-4kg/head/day) as reveled in Table 6. Feed was given by common sense in all feedlot farms without considering whether the traditional ration meets the nutritional requirement of feeder or not. Therefore, generally livestock were provided feed without knowing the age and body weight of by conventional agreement. This could be resulted because of lack skilled personnel or particularly nutritionist in the farm to improve the profitability and sustainability of the business, involvement of skilled personnel has to be planned for the future as one of the requirement.

32nd Annual Research Bulletin, April 2015, Haramaya University
162
Table 6. Feeding procedures in commercial feedlot
Is roughage provided every day/throughout fattening
N Percent Roughage treatment N percent
Yes 48 100 yes 0 0 No 0 0 no 48 100 Daily feeding frequency Ration formulation Twice 35 72.9 yes 0 0 Three 13 27.1 no 48 100 Is feed given based on body weight Ratio of concentrate to roughage known Yes 0 0 Yes 0 0 No 48 100 no 48 100 Is concentrate every day/throughout fattening Amount of concentrate (kg) Yes 46 95.8 3kg 3 6.2 No 2 4.2 5-7kg 5 10.4 Roughage provision 8-10kg 31 Ad libtum 34 70.8 11-12kg 9 18.8 Restricted 14 29.2 total 48 100 Total 48 Daily feeding procedure Concentrate-roughage mix 1 2.1 Roughage-concentrate mix 47 97.9
N = number of respondents. 3.8. Housing Facilities of Commercial Feedlots In all commercial farms, fattening animals were fed and drunk in group because there had no compartment with a specific dimension in both feeding and watering troughs during physical observation of the farms. Most feeding troughs were made up of woody materials but few from cement concrete. Furthermore, most of shelters were exposed to sun, rain and wind without over head shed, but there were sheds for watering and feeding troughs. In few farms isolated house had not available for patient livestock. Moreover, in all feedlot farms there were no drainage systems and the out late for the waste materials produced. 3.9. Constraints of Commercial Feedlots Challenges of commercial fattening are listed based on their order of importance as shown in Table 7. Most of feedlot farms noted that market was considered as the most challenging in failure or success of the enterprise. This is could be due to unorganized market systems in both local and export markets. In addition, most of the existed markets as a whole and export market in particular lacked consistency and continuity. Usually, feedlot owners or investors were considered as the only role player in identification and searching of market for the finished livestock. Feedloters also noted conflicts in the region and informal or smuggling trade of livestock throughout the border of the country had significant effect on marketing of the fattened animals. Similar to this study, Negassa and Jabbar (2008), Aklilu (2002), Hurissa and Eshetu (2003) and Hurissa and Legesse (2008) reported several constraints violating the smooth flow livestock market from the producer to the feedlots, processing, and consumption points in Ethiopia. As shown in Table 7, feed was the 2nd limiting factor followed by type or quality of livestock coming to feedlot and water shortage. All discussants argued that feed availability was season dependent and lead to variation in cost between seasons. From that reason, ample amount of hey is produced starting from end of October to beginning of March and within which the price of hay is reasonable. Whereas, the availability of hay decreased and cost of hay/bale is very high in the period starting from April to September. Similarly, the availability of concentrate decreased starting from March to the end of June because at that time there is shortage of pasture and crop resides and leads to high competition between farmers and feedlot operators in purchasing of concentrate to their livestock. Whereas, almost all feedlot farms noted that diseases and skilled manpower had least effect on commercial fattening.

32nd Annual Research Bulletin, April 2015, Haramaya University
163
Table 7. Ranking of constraints for commercial fattening
List of constraints Total 1st 2nd 3rd 4th 5th 6th
Market 48 32 15 0 1 0 0 Feed 41 5 11 12 2 11 13 Type of livestock 35 7 2 13 5 0 8 Water shortage 27 0 2 5 10 0 15 Disease 20 1 2 0 8 9 0 Skilled personnel 19 0 0 11 0 1 7
Hence, to overcome the challenges, almost all fatteners declared that Ethiopian Commodity Exchange (ECX) should be developed for livestock marketing like that of other commodities in the country. A link has to be created starting from producer to the end of consumer. Furthermore, feedloters suggested that pastoralists or producers should be supplied all the necessary services and improvement strategies in an organized way at their locality so as to ensure sustainable supply of livestock to the industries. In addition, development of quarantine has to be available in all livestock source areas.
4. Conclusion and Recommendation This study revealed that Borona cattle were the most preferred cattle breed compared to the rest of cattle to the export;however, all cattle breeds had equal acceptance by domestic market. Pastoralist was the potential suppliers of feeder animal followed by small holders to feed lot industries in the study area and the market system was unorganized and dominated by informal and unprofitable transactions. The major feed resources used in commercial feedlot includes, roughage feeds, agro-industrial by products and grains in few farms. Non-conventional feed stuffs were also used by few farms as feed for fattening. Vitamins and mineral supplementations were not often available except, common salt in all feedlot rations. This study also confirmed that almost all fattening farms finish the bull for about an average of 3-4 months and followed three times of finishing per year. The present study recommended that to develop the sector and bring change, Ethiopian Commodity Exchange (ECX) should be incorporated to develop the livestock marketing sector like that of other commodities in the country to create a link staring from producer to the end of consumer. Finally, the study recommended that the government should be hand-in-hand with the investors to organize market in a very short run to eradicate the informal market and ensure successful development of the sector and secure food security in the country.
5. Acknowledgement The authors duly acknowledged Ethiopian Ministry of Education for sponsoring the study. The authors further like to thank Dr. Kimia quarantine head of animal section for her assistance and facilitation during survey work.
6. References Aklilu, Y. 2002. An Audit of the Livestock Marketing Status in Kenya, Ethiopia and Sudan. Volume I. Community-Based Animal Health and
participatory Epidemiology Unit. Pan African Program for the Control of Epizootics, Organization of African Unity/ Interafrican Bureau for Animal resources.
Asfaw, N., Shahidur, R. and Berhanu, G. 2011. Livestock Production and Marketing, working paper number 26, Ethiopia Strategy Support Program II, Ethiopia.
Aynalem, H., Workneh, A., Noah, K., Tadelle, D. and Azage, T. 2011. Breeding strategy to improve Ethiopian Boran cattle for meat and milk production. IPMS (Improving Productivity and Market Success) of Ethiopian Farmers Project Working Paper 26. Nairobi, Kenya, ILRI.
CSA (Central Statistical Authority). 2004. Ethiopian Agricultural Sample Survey 2004, Vol.II. Report on Livestock and Livestock Characteristics, Bulletin 468.
CSA (Central Statistical Authority). 2010. Ethiopian Agricultural Sample Survey 2010, Vol.II. Report on Livestock and Livestock Characteristics, Bulletin 468.
Hurissa, B., and Eshetu, J. 2003. Challenges and opportunities of livestock marketing in Ethiopia, Y. Jobre, and G. Gebru (edts). Proceeding of 10th Annual conference of the Ethiopian Society of Animal Production (ESAP), Challenges and Opportunities of Livestock Marketing in Ethiopia, held in Addis Ababa, Ethiopia, August 22 - 24, 2002. Addis Ababa: ESAP.
Hurissa, B., and Legesse, G. 2008. Livestock marketing in Ethiopia: Development Opportunities and Constraints. A paper presented on a Workshop Organized by Ministry of Federal Affairs and Afar Regional State. August 3 - 4,2008.
Leupp, J.L., Lardy, G. P., Bauer, M. L., Karges, K. K., Gibson, M. L., Caton, J. S. and Maddock, R.J. 2009. Effects of dried distillers grain with soluble on growing and finishing of steer intake, performance, and carcass characteristics, color and sensory attributes. North Dakota State University (NDSU) Beef feedlot research report, 2009.
MoARD (Ministry of Agriculture and Rural Development). 2007. A comprehensive plan for supporting the meat export industry Part I, Addis Ababa, Ethiopia.

32nd Annual Research Bulletin, April 2015, Haramaya University
164
Negassa, A. and Jabbar, M. 2008. Livestock ownership, commercial off-take rates and their determinants in Ethiopia. Research Report 9. Nairobi, Kenya: ILRI (International Livestock Research Institute).
Roy, Katty, H. and Robert, Katting, M. 1994. Value and quality assurance by- product feeds. Cattle producer‘s library, US Department of Agriculture, Coperative Extension Service.
Secrist, D. S., Owens, F. N. and Gill, D. R. 1997. Effects of vitamin E on performance of feedlot cattle: A review. The professional Animal scientist 13: 47 - 54.
Solomon, B., Solomon, M. and Alemu, Y. 2008. Potential use of crop residues as livestock feed resources under smallholder farmer conditions in Bale Highlands of Ethiopia. tropical and subtropical agro ecosystems, ano/volume 8, numero 001. Universidad Autonoma de Yucatan, Mexico pp. 107 - 114.
SPSS, (Statistical Package for Social Sciences). 2003. SPSS Base 10.0. Application Guide. SPSS Inc. USDA (United State Department of Agriculture, Economic Research Service). 1985. Feed: Outlook and Situation Report. Washington, DC: US
Government Printing Office, December. Yayneshet, T. 2010. Feed Resources Availability in Tigray Region, northern Ethiopia, for Production of Export Quality Meat and Livestock.
Ethiopia Sanitary & Phytosanitary Standards and Livestock & Meat Marketing Program (SPS-LMM) Report. p. 77.

32nd Annual Research Bulletin, April 2015, Haramaya University
165
18. Value Chain Analysis of Tomato in Erer Valley, Eastern Ethiopia Wesagn Berhane, Ranjan S.Karippai, Debebe Tolossa, Chanyalew Seyoum, Hailu Kassaye, Tibebu Bezabih
College of Agriculture, Department of Rural Development and Agricalture Extension, Haramaya University Dire Dawa, Ethiopia Abstract: Ethiopia is endowed with diverse climatic condition that supports the production of horticultural crops. Among these crops, tomato production is among the lucrative ones. Though tomato is one of the most important crops in a household consumption and contributes in generating foreign currency, there are no enough multi-location studies made in its value chain. The study was intended to analyze the value chain of tomato with its attributes of actors‘ linkage, benefit distribution and constraints and opportunities in Eastern Haraghe, Erer Valley. It generated and used data from producers, wholesalers, retailers, and consumers in the analysis. The results showed that actors are linked in a multidirectional manner with actors. A gap exists between producers and wholesalers in the link. The chain is confronted with some constraints which include problems of disease/pest in production, lack of producers‘ price satisfaction, rotting, shortage of place in the market etc. On the contrary, there are some opportunities that could help in commercializing the sector. Consumers‘ desire for quality, shortage during low supply season, and irrigation facilities are some of the opportunities. The alleviation of the problems created by the constraints and the utilization of the opportunities would help in commercializing the chain. Areas for further research have been identified. Finally, organizing producers under cooperatives, establishment of mini market within the community, introduction of production technology to improve quality and product are some of the recommendations made.
1. Introduction Fruits and vegetables production is usually lucrative compared to staple cereal crops. Horticultural produce has high value addition and income generation potential. The production of fruits and vegetables has a comparative advantage particularly under conditions where arable land is scarce, labor is abundant and markets are accessible (Weinberger and Lumpkin, 2005: 19). Diversification into horticultural crops is becoming attractive for many poor farmers around the world. Worldwide production of fruit and vegetable crops has grown faster than that of cereal crops, albeit from a much lower base. Review of worldwide trends in horticultural production shows that the production of horticultural crops has grown faster than that of cereal crops regardless of the vast resources channeled to improvement of cereal grains. Between 1960 and 2000, the area under horticultural crops worldwide has grown more than double. While in 1970 only 3.9% of world arable land was under fruit and vegetable production, by the year 2000 this share had risen to 6.7% (Weinberger and Lumpkin, 2005:6-12). Ethiopia has an immense potential to develop intensive horticulture on small as well as commercial scale. The diverse climatic condition of the country is suitable for the production of various horticultural crops. Regarding the production status of horticultural crops, CSA (2010) reported the area coverage of 90,584.55 ha of vegetables, 36,780.09 ha of fruits and 265,754.27 ha of root and tuber crops, all the three together, constituting about 4% and 18.3% of total crop area and production respectively by 2001/02 production year. The report only addressed the private holding and did not include non-private holdings such as state farms. Ethiopia has a variety of vegetable crops grown in different agro ecological zones produced through commercial as well as small farmers both as a source of income as well as food. However, the type is limited to few crops and production is concentrated to some pocket areas. In spite of this, the production of vegetables varies from cultivating a few plants in the backyards for home consumption up to a large-scale production for domestic and export markets (Dawit et al., 2004). Banks of Erer valley which is part of Babile woreda of Oromia and Harari region is one of the potential tomato growing areas. The high irrigation potential (more than 2000 ha) has given better opportunity to farmers to produce different vegetable crops of which tomato is the major one. In an effort to improve the production and productivity of the crop, different improved tomato cultivars were introduced to the area by the research system. However, so far, there is no empirical study conducted in the area and hence there is no information about the value chain of vegetable and fruit crops in general, and tomato in particular. As a result, this study is designed to fill the gap with regard to what has been stated above. Objectives of the Study The general objective of this study was to undertake value chain analysis of tomato crop in Erer Vally. The specific objectives were to:
conduct in-depth value chain analysis of tomato in the study area;
make comparative assessment of the profit margins of farmers and other actors in the value chain of tomato;
identify linkages among different actors and benefit distribution, and
analyze the constraints and opportunities for market oriented tomato production in the study area.

32nd Annual Research Bulletin, April 2015, Haramaya University
166
2. Research Methodology 2.1. Research Design Descriptive research design preceded by an exploratory survey research with the help of a check list, has been initially conducted with flexible sampling design representing different actors in the value chain, from producers up to final consumers. The necessary information has been gathered to frame the descriptive research design. Erer valley covering parts of Babile woreda of Oromia and of Harari region is selected purposively for two reasons. First, the site belongs to the mandate area of Haramaya University and second, it produces a lot of tomatoes using irrigation from Erer river. Four PAs having tomato cultivation have been selected for the study. The sampling frame for farmers‘ related inquiry has been farmers growing tomato in Erer valley. From this sampling frame, 120 farmers were selected randomly as sample respondents for the primary survey on production aspects. Since this is a value-chain analysis, other categories of respondents have also formed the sample of the study. Hence, wholesaler, retailer and consumers were added to the sample. Except for wholesalers category, 25 sample respondents were taken for data collection. In the case of wholesalers, all the available were taken since they were 17 in number. Hence, the total sample respondents for primary data of this study were about 187 belonging to different categories of actors. In addition, qualitative data on market linkages, and constraints and opportunities for commercialization of this horticultural crop were analyzed. Primary data were collected from producers, intermediaries, and consumers and analyzed using appropriate statistical tools like chi-square test and independent sample t-test with the help of SPSS software. Qualitative data was analyzed using descriptions, narrations and interpretations.
3. Results and Discussion This section provides the research results along with their discussion. In the first place, the nature of the link of the value chain of tomato in the study area will be presented. Then, profit distribution among actors of the value chain will be discussed. Thirdly, constraints and opportunities to commercialize tomato production in the study area will be illustrated. 3.1. Production/Business Facilities and Actors’ Decision In this section factors that, at face value, have relation with the efficiency of the value chain of tomato and the response of actors with respect to these factors will be presented. 3.1.1. Farmland allocation by producers At the production level, producer make decisions which may affect the nature of the value chain of a product. Among these, farmland allocation is one. Producers divide their farmland among alternative crops on the basis of their evaluative framework in making production decision. It has been tried to determine the amount of farmland allocated by producer for the production of tomato and a comparison is made between the total farmland size producers have and the proportion of it that has been allocated for tomato production, Table 1. Table 2. Farmland allocation for tomato production
Type of farmland Observed Mean Std. Deviation Std. Error Mean 95% Confidence Interval of the
Lower Upper
total land 120 1.6115 1.68024 0.15338 0.78161 1.42860 tomato land 120 .5064 0.62759 0.05729
Source: Own Survey result (2012) Note: - *** statistically significant at 1% level.
One possible reason that could justify the lesser amount of farmland allocated to tomato crop could be the permanently occupied fragment of farmland that might be allotted to the "khat" crop which could be more preferred than tomato.
3.1.2. Access to and ownership of water pump Producers‘ ability to efficiently utilize farmland contributes in improving profitability. To efficiently utilize farmland farmers who are engaged in the production of annual crops like tomato should be able to produce the maximum number of times possible in a year. Access to irrigation facilities play important role in this regard. The result obtained in relation to producers status to access and own water pump for irrigation is illustrated in Table 2 below.

32nd Annual Research Bulletin, April 2015, Haramaya University
167
Table 3. Producers access and ownership to water pump.
Status
Facility
Access to Water Pump*** Ownership of water pump**
Observed Percent Observed Percent
Yes 80 66.67 49 40.86 No 40 33.33 71 59.17 Total 120 100.0 120 100.0
Source: Own Survey result (2012) Note: ***statistically significant a 1% level, **statistically significant a 5% level 3.1.3. Production season Given the condition of producers with regard to ownership and access to irrigation facilities like water pump, they tend to behave in some manner in relation to producing more than once in a year depending on the nature of the crop. Tomato is a crop which can be cultivated at least three times a year. Table 3 illustrates the result found in this regard. Table 4. Number of times tomato is produce in a year.
Season of production*** Observed Percentage One 52 43.3
Two 47 39.2
Three and above 21 17.5 Total 120 100.0
Source: Own Survey result (2012) Note: ***statistically significant a 1% level. Even though almost half of the producers owned water pump; it is less than 20% of them who crop tomato three times a year. These contradictory results might reflect the priority that the "Khat" crop has in the study area. The mere ownership of water pump may not mean that it is as profitable to use pumps for tomato production as that for "khat". 3.1.4. Post harvest management issues Among the factors that either encourage or discourage the commercialization of tomato production are the ways by which producers deal with the produce after the harvest. Since tomato is among the perishable crops it needs careful post harvest management. Besides, the proportion of the produce that is marketed out can be an indicator for the tendency that the sector has for commercialization. In relation to these, sample producers have been asked to crudely estimate the proportions of their produce that is consumed at household level, marketed out and wasted. These results are summarized in Table 4 below. Table 5. Proportion of product marketed out by producers
Category Proportion Observed(N=120) Percentage
marketed out*** <25% 5 4.17
25 - 75% 6 5.0 >75% 109 90.8 Consumed*** <25% 112 93.3 25 - 75% 5 4.2 >75% 3 2.5 Wasted*** <25% 112 93.3 25 - 75% 5 4.2 >75% 3 2.5
Source: Own Survey result (2012) Note: ***statistically significant at 1% level, N = Total number of observations in each category.

32nd Annual Research Bulletin, April 2015, Haramaya University
168
3.1.5. Storage facility In commercial agriculture, storage plays significant role for producers and other businessmen in the chain. In a market where the demand and price of a product vary, frequent access to storage facilities are basic requirements. The status of sample actors with regard to this important issue has been assessed. The result found is shown in Table 5 below. Table 6. Actors' access to adequate storage facility.
Presence of access to storage facility
Actors
Produces*** (N=120) wholesalers** (N=17) Retailers*** (N=25)
Observed Percent Observed Percent Observed Percent yes and it is enough 5 4.2 5 29.4 0 0 yes but not enough 11 9.2 1 5.9 0 0 no but I would need to 104 86.6 11 64.7 25 100
Source: Own Survey result (2012) Note: *** statistically significant at 1% level, ** statistically significant at 5% level, **** variable is constant, 3.1.6. Value addition Actors in a given value chain are assumed to perform something to add value on the product they handle in the chain. Variety selection, separation and grading and packaging, are some of the value addition processes that have been considered in this study. Table 6 provides the response of sample actors on these activities of value addition. Table 7. Value added by actors.
value addition
Actors
Produces (N=120) wholesalers (N=17) Retailers (N=25)
Response
Observed Percentage Response Observed Percentage Response Observed
Percentage
variety selection
Yes*** 114 95.0 Yes*** 16 94.1 Yes* 16 94.1
No 6 5.0 No 1 5.9 No 9 5.9 cleaning produce
Yes*** 77 64.2 Yes**** 17 100.0 Yes**** 25 100.0
No 43 35.8 No 0 0.0 No 0 0.0 separation and grading
Yes*** 107 89.2 Yes**** 17 100.0 Yes**** 25 100.0
No 13 10.8 No 0 0.0 No 0 0.0
Source: Own Survey result (2012) Note: * not statistically significant, *** statistically significant at 1% level, ****variable is constant, chi-square test cannot be performed. The above result shows that almost greater proportion of actors from all categories involved the indicated value addition activities. This might be an indicative of the notion that the actors have difference in the value with in the market. 3.1.6.1. Variety selection Value addition in the value chain of a given crop starts from the decision made on the variety of the crop to be cultivated. Producers add value on the crop through their decision of variety choice. The survey result in relation with this activity is given below in Table 7. Table 8 Producers‘ preference ranking to first rank tomato variety.
Variety*** Observed Percent
Kukurfa 39 32.5 Metehara 26 21.7 Roma vf 24 20.0 Areb 22 18.3 Others (Freng, Dedelo, Shashemene, Deilo, t-1) each contribute < 3%. 9 7.5 Total 120 100.0
Source: Own Survey result (2012) Note: *** statistically significant at 1% level

32nd Annual Research Bulletin, April 2015, Haramaya University
169
3.1.6.1.1. Reason for variety choice Among the activities agricultural producers do in a value chain in the production of a crop is variety selection. A given variety is selected based on either some physical factors such as its availability or some other perceptual factors. Table 8 provides the reasons that producers have given for their preference of one variety over another. The two most cited reasons in variety selection might be considered as indicative of the primary market orientation goal of producers in the production of tomato. This result seems to coincide with the tendency of producers to market out greater proportion of the produce as indicated above in Table 4. Table 9. Reason given by tomato producer for tomato variety preference
Reasons for variety of choice*** Observed N Percent
high demand 45 37.5 cheap production 18 15.0 easy seed availability 10 8.3 high seed quality availability 8 6.7
high yield 39 32.5
Total 120 100.0
Source: Own Survey result (2012) Note: *** statistically significant at 1% level 3.1.7. Motivational factors and actors behavior Any of the conscious activities done by actor of the value chain of tomato is supposed to be motivated by some factors. Leaving alone the factors for which the actors might be unconscious, it deemed to be important to identify the other factors. On this basis, the survey has tried to get respondents‘ views on this regard. 3.1.8. Importance attached with tomato value chain One of the issue that might affect the behavior of actors in a given value chain is the degree of importance they attach with the product compared with other competing alternatives. The importance that tomato value chain actors attach to tomato business has been considered and presented in Table 9. In addition, Table 10 illustrated the rank that sampled tomato consumers give to the consumption of tomato in their diet. Table 10. Importance of tomato business as perceived by actors
Level
Actors
Produces* (N=120) wholesalers*** (N=17) Retailers* (N=25)
Observed Percent Observed Percent Observed Percent
most important 59 49.2 12 70.6 9 36.0 among the most important ones 61 50.8 4 23.5 16 64.0
not that important 0 3.3 1 5.9 0 0
Source: Own Survey result (2012) Note: *** statistically Significant at 1% level, ** statistically Significant at 5% level, * not statistically significant. The result shown above (Table 9) could not say conclusively that producers and retailers considered the chain of tomato as the most important one. The likely reason for this could be that producers may be compelled by the popularity and profitability of "Khat" whereas retailers as they are involved in the retailing of diversified items may have other comparable alternative like onion, for instance. Table 11. Rank of tomato consumption compared with other vegetables as ranked by consumers.
Rank given**** Observed Percent
First 24 96.0 Second 1 4.0 Total 25 100.0
Source: Own survey result (2012). Note: *** statistically significant at 1% level.

32nd Annual Research Bulletin, April 2015, Haramaya University
170
3.1.8. Price satisfaction It is believed that price plays an important role in determining the amount of product that producers are willing to bring to the market. Hence, the satisfaction that different actors get from the price of the produce they provide to customers at different level is among the motivational factors that influence the behavior of actors in the value chain of the product. The survey result of this motivational factor is i llustrated in Table 11 below. Table 12. Price satisfaction in selling as perceived by actors.
Price satisfaction Actors
Produces*** (N=120) wholesalers*** (N=17) Retailers* (N=25)
Observed Percent Observed Percent Observed Percent
Satisfied 32 26.7 15 88.2 13 52.0 Unsatisfied 88 73.3 2 11.8 12 48.0
Source: own survey result (2012). Note: *** statistically significant at 1% level, * not statistically significant. As it is evidenced by the result shown in the above table, the majority of producers are unsatisfied by the market price with which they trade tomato. One probable reason for this may be the inability of these producers to find a place in the market where they can store the produce. In this condition, unless they are willing to sell with the price they are offered, it may be difficult to take home back what they bring to market place since bringing it back home may result another worse decision because they have to pay for transportation again. 3.2. Transportation Among the backup services that support a value chain of tomato in the study area is transportation. Producers opt to use among the available transportation means to the chain. In this study, respondents have been inquired regarding the transportation means they use. The survey result of this is summarized in Table 12 below. Table 13. Usage of transportation means by producers.
Use
Transportation means
Animals*** Human labor*** Vehicle***
Observed Percent Observed Percent Observed Percent
Yes 2 1.7 29 24.2 110 91.7 No 118 98.3 91 75.8 10 8.3 Total 120 100 120 100.0 120 100.0
Source: own survey result (2012). Note: *** statistically significant at 1% level. What the result tells is that more than 90% of producers are able to access vehicle transport facilities. This situation is very conducive to strengthen the value chain if other drawbacks of can be tackled properly. 3.3. Actors’ Linkage One of the characteristic features of a value chain is the kind and nature of the link that exists between actors. In this study, producers, wholesalers, retailer, broker and consumers were found to be the main actors for examining the link. The kind and nature of the link have been treated from the perspective of each actor‘s preference of actors for business interaction, presence of multidirectional link among actors, and actor‘s location preference. 3.3.1. Linkage Pattern among Actors In a given chain, actors may have their own preference with which actor to be linked. The actor may prefer to get linked with one, two or more actors in the chain for some personal or interpersonal reasons. Here in this study, the survey result indicated the presence of multiple ways of linkage between actors as shown in Table 13 below.

32nd Annual Research Bulletin, April 2015, Haramaya University
171
Table 14. Actors business contact linkage matrix.
Actors Producers Wholesalers retailers Consumers brokers
Producers - * * * * Wholesalers * * * * * Retailers * * * * * Consumers * * * - -
Brokers * * * - No information
Source: own survey result (2012). * indicates presence of business interaction among actors. Even though actors seem to be linked with every other actor in the chain, it does not mean that the strength of those links are the same as measured by the ranking made by the respective actor to their most preferred actor in the chain. Linkages among actors of the value chain are characterized by different forms of business interactions they make with other actors. As has been shown in Table 13 above, the linkage matrix tells that there exists multidirectional linkage among actors. This means that a given actor is interacting with remaining other and/or actors of same category with or without the need for other actors‘ mediation. Hence, producers can directly sell their products either to consumers, retailer, and/or wholesalers independently. Though that is truly visible from the result of the survey, the same also tells that there is difference in the weights of preference actors attach with other actors. This is clearly shown in the ranking made by each actor to the most important actors for them in the chain. The information presented in Table 14 and Table 15 illustrate the ranking made by producers and wholesalers to their customers and wholesalers and retailers‘ preferred tomato providers respectively. Table 16 shows location preferences of wholesalers for co llecting tomato. Lastly, consumers‘ preference ranking of market fragment, wholesale or retail, and criteria of choice in selecting tomato sellers are depicted in Table 17 and Table 18. Table 15. Preference ranking made by actors to their respective customers in selling tomato.
Preferred customer
Actors
Producers***(N=120) Wholesaler ***(N=17)
Observed Percent Observed Percent
Consumer 30 25.0 4 23.5 Retailers 55 45.8 6 35.3 Brokers 9 7.5 7 41.2 Large suppliers 26 21.7 - -
Source: own survey result (2012). Note: *not statistically significant, *** statistically significant at 1% level.. Producer put retailers as their first choice customers in the business interaction. Out of the total number of sample producers around 46% of them indicated that choice while putting consumers and wholesaler in the second and third place leaving brokers as the least preferred actors in the chain. One plausible reason for producer to take brokers as the least preferred customer might be the low price offer brokers they make to producers as brokers are added in the supply chain and they should get their compensation by optionally reducing the price that producers get. Besides, the low operating cost that retailers may face which in turn enable them to make better price offer to producers could also be one likely reason for retailers to be most preferred by producers. Table 16. Preference ranking made by actors to tomato providers in buying tomato.
Tomato Providers
Actors
Wholesaler*** Retailers***
Observed Percent Observed Percent
Brokers 16 94.1 23 92.0 Large suppliers 1 5.9 1 4.0 Retailers - - 1 4.0
Source: own survey result (2012). Note: *** statistically significant at 1% level.

32nd Annual Research Bulletin, April 2015, Haramaya University
172
The other dimension with which linkage among actors have been considered is with regard to the preference of actors to tomato providers. The result on this issue indicated that wholesalers depend on brokers to greater extent in procuring tomato. This is implied from that 94.1% of them preferred brokers as their first rank tomato provider preferably from regions outside the study area which includes Adama, Bole, Meki and Ziway areas as has been indicated by 88.2% of sample wholesalers. One likely reason for brokers‘ domination might be that of producers dependence on brokers as they may lack bargaining skill and power with customers. Table 17. wholesalers' preference ranking of tomato buying location.
Buying location *** Observed N Percentage
within region 2 11.8 out of region 15 88.2 Total 17
Source: own survey result (2012). Note: *** statistically significant at 1% level. The result found in the preference of wholesalers to tomato providers demonstrated one big problem reflecting the presence of a weak linkage between producers and wholesalers found within the study area. But for the value chain under consideration, strengthening and improving the linkage between these two actors is mandatory. Among the indicated reasons by wholesalers for this weak linkage is the inability of producers within the study area to provide the commodity with the required quality and quantity. One likely reason for producers‘ failure to do so might be the importance they attach with tomato production since they probably have ―khat‖ production as a better and lucrative optional crop. One finding of this survey that goes in line with this likely assumption is that the proportion of farmland size that producers allocate for the production of tomato. It is only around one third of the total farmland holding that is allocated for tomato production. On the part of retailers, sample respondents preferred brokers as their first rank tomato providers with 92% of sample retailers showing their preference to brokers as their first rank tomato providers. Wholesalers and other retailers are all ranked second. Table 18. Consumers ranking of fragment of market in buying tomato.
Market fragment* Observed N Percentage
wholesale market 11 12.5 retail market 14 12.5 Total 25
Source: own survey result (2012). Notice: * not statistically significant. Actor preference of customers in buying tomato has been treated differently for some technical reason. Instead of mentioning actors specifically the choice has been provided as wholesale and retail market. This is because of the technical reason that consumers may not have the exact information to recognize produces from other retailers acting in the market. On the basis of this, sample consumers are found to be indifferent in getting the produce whether it is from the wholesale or retail market. Nevertheless, the reason they mention to go to either of the markets seem to be statistically different with 76% of the respondents saying quality as the main driving factor to the choice they make and the remaining 24% of them mentioned cheap price as the driving factor. Table 19. Criteria used by consumers to select tomato sellers.
Criteria*** Observed N Percentage
quality of product provided 19 76.0 cheap price 6 24.0
Total 25 100.0
Source: own survey result (2012). Notice: *** result is statistically significant at 1% level. 3.3.2. Price setting Price setting can be considered as one of the ways by which the linkage among actors of the value chain can be characterized. Along with price setting actors may have different feeling towards the price set. The following tables, Table 19, and 20, display the response of actors on price setting when selling and buying tomato respectively.

32nd Annual Research Bulletin, April 2015, Haramaya University
173
Table 20. Price setting when selling as perceived by actors
who set price
Actors
Producers***(N=120) Wholesalers***(N=17) Retailers***(N=25)
Observed Percent Observed Percent Observed Percent
Me 22 18.3 14 82.4 20 80.0
Buyer 35 29.2 - - - -
Bargaining 58 48.3 3 17.6 20 80.0
market condition 5 4.2 - - - -
Source: own survey result (2012). Note: *** statistically significant at 1% level. Price setting is one of the most important factors which determine the nature of a given market. The results found in this survey shows that the majority (48.3%) of producers mentioned bargaining as the main role playing factor in price setting when selling the commodity. Lesser proportions of wholesalers (17.6%) and retailers (20.0%) mentioned it as a main factor in price setting. Greater proportions of the later two actors said that they set price without the influence of other parties in the deal. The likely reason for most producers in the study area to have the option of bargaining rather than simply delivering their produce to customers at a specified price might be that they have the choice of selling to wholesalers, retailers, brokers and consumers as well in the same market place. Table 21. Price setting when buying as perceived by actors.
who set price
Actors
Wholesaler** Retailers**
Observed Percent Observed Percent
Seller 13 76.5 18 72.0
Bargaining 4 23.5 7 28.0
Source: own survey result (2012). Note: ** statistically significant at 5% level. On the contrary, the opposite happens when both parties, retailers and wholesalers, buy the commodity. In that case greater proportion of wholesalers (76.5%) and retailers (72.0%) indicated that the power to set price is of the providers. In this case this may happen as brokers have the tendency of hiding information from other parties for the sake of manipulating prices as they want. 3.4. Benefit Distribution and Marketing Margins There might be different ways to be employed to understand the nature of benefit distribution taking place among actors of value chain. Among them are profit distribution and marketing margin. This part, therefore, make use of these two mechanism for presenting and discussing the result. 3.4.1. Profit distribution The Profit that sampled actors gained in the production and/or marketing of tomato has been compared in such a way that it is possible to weigh it against the cost incurred by each actor. To create a clear picture of this, the mean profit earned by each actor as percentage of the mean total cost incurred by the respective actor has been calculated as shown in Table 23 below. This helps the comparison of the proportionate benefits earned by the actors. Table 22. Comparison of the mean profit as percentage of total cost between actors.
Compared Category N Mean Profit Std. Deviation Std. Error Mean
Producer** 120 82.6807 234.37416 21.39534
Wholesaler 17 35.2200 26.65108 6.46384 wholesaler** 17 35.2200 26.65108 6.46384 Retailer 25 44.2556 24.83129 4.96626 Producer** 120 82.6807 234.37416 21.39534
Retailer 25 44.2556 24.83129 4.96626
Source: own survey result (2012). Note: ** statistically significant at 5% level.

32nd Annual Research Bulletin, April 2015, Haramaya University
174
Producers seem to gain profit which is greater in percentage (82.68%) of the cost they incur. On the other hand wholesalers and retailers gain 35.22% and 44.26 % respectively. But this may not mean the money gains exactly corresponds the percentages indicated here since the percentage also depends on the amount of cost incurred. (Refer Table 27). 3.4.2. Marketing margins In addition to the above information given on the profit distribution among the actor of tomato value chain, Table 24 provides the nature of marketing margin in the chain. Table 23. Marketing Margins.
Actors Mean selling price
Marketing margin
When the link is ―A‖ type
When the link is ―B‖ type
When the link is ―C‖ type
When the link is ―D‖ type
Producer 7.09 0 35.37 48.40 48.40 whole seller 10.97 - - - 20.16
retailer 13.74 - - - -
consumers 10.95 - - - -
Source: Own survey (2012)
Note: “A” type link: Producer Consumer
“B” type link: Producer WholesalerConsumer
“C” type link: Producer Retailer Consumer
“D” type link: Producer Wholesaler Retailer Consumer The marketing margins of producers and wholesaler have been calculated using data of the survey. The marketing margins are calculated considering all the possible ways by which the product can reach the final consumers. The results tell that there is money spent for marketing function which could possibly be earned by producer. But the decision to be made out of this result requires further research and careful analysis since marketing function has its own cost and there are efficiency issues that might be achieved through division of labor. 3.5. Constraints and Opportunities for Commercializing the Chain Actors from different category ranked the constraints they have been experiencing in undertaking tomato business. Producers mentioned disease/pest problems, poor access to irrigation and poor storage facility as the first with 45.0% vote, second with 19.2% vote, and third with 10.0% vote respectively, among other, to be the most important constraints for the business. Retailers on the other hand cited rotting, lack of area in the market, pressure from authority and lack of access to credit to be the top prioritized business constraints on equal basis. On the third place wholesalers put rotting and quality related problems, lack of space and access to credit and running cost to be the equally ranked business constraints they confront.

32nd Annual Research Bulletin, April 2015, Haramaya University
175
Table 24. First rank constraints in the value chain as perceived by Actors.
Actors Production constraints Observed N Percent
Producers*** Disease/pest 54 45.0
Poor access to irrigation 23 19.2 Poor storage 12 10.0 Others (Absence of market place, Poor access to high quality seeds,
Poor access to credit, Poor access to transportation, Poor labor availability, Shortage of technical knowledge and skill, Shortage of labor, Shortage of land, Poor access to information) each contribute less than 8% to this category.
11 25.8
Total 120 100.0 Retailers* Rotting 2 8.0 Lack of space 8 32.0
Access to credit 7 28.0
Pressure from authority 8 32.0
Total 25 100.0 Wholesalers* Rotting and quality related 7 41.2
Lack of space 7 41.2
Running cost and access to credit 3 17.6
Total 17 100.0
Source: own survey result (2012). Note: *** statistically significant at 1% level.. * not statistically significant Price satisfaction of sellers is also a concern in sustaining a given chain. Here in this study the result indicated, 73.3% of the producers being unsatisfied with the price of tomato they transact. On the other side, 88.2% of wholesalers said they are in general satisfied with the price in the marketing of tomato while the satisfaction level of retailers remained indeterminate. It should be noted that the starting point of the chain are producers. Therefore, the existence of the chain will be in question if this segment of the chain cannot be benefited. Hence, this situation should be taken as one of the challenges of an effort directed at commercializing the value chain of tomato in the study area. The chain under consideration is not characterized only by the constraints rather there are also opportunities for commercialization. Concerning the weight consumers put on price and quality of tomato, the result shows, 96.0% of them prefer quality to be the most important attribute which is indicative of the presence of market environment conducive to commercialize the sector since quality improvement is one of the ways by which we add value on a product. Table 25. Weight consumers give to price and quality of tomato.
Most important of Product*** Observed N Percentage cumulative percentage
Price 1 4.0 4.0 Quality 24 96.0 100.0 Total 25
Source: own survey result (2012). Note: *** statistically significant at 1% level. Consumers‘ preference in any of the features of a given product might be taken as starting point for the value addition function of entrepreneurs. Hence, the identification of those features can play a role in the efforts made to commercialize the production of tomato. The weights consumers attach with what they perceived as quality, the preference they give to quality and price and the extent to which they are able to manage purchasing the amount of tomato they need during low supply season have been examined and presented in Table 27, Table 28 and Table 29 below.

32nd Annual Research Bulletin, April 2015, Haramaya University
176
Table 26. Consumers reaction to cheaper price of tomato.
Buy more if cheaper Observed N Percentage
yes, if good in quality 14 56.0
yes, regardless of quality 2 8.0
no, what I buy now is enough 9 36.0
Total 25 100.0
Source: Own survey (2012). Note: ** statistically significant at 5% level. If it is somehow possible to implement a production technology that decreases production cost which increases production and improves quality then the market may have absorptive capacity to the increased product with cheaper price. This is because 56.0% of the sample consumers are willing to increase purchase of tomato if they are cheaper and good in quality as well. Moreover, the commercialization of the sector could be backed up by the inability of the current market condition to satisfy the demand of consumers during low supply seasons since 92.0% of the sample consumers are not able to either partially or completely manage to get what they demanded during the season. Table 27. Consumers ability to purchase the amount they need during low supply season.
manage to purchase during off-season Observed N Percentage
Yes 2 8.0 yes, but less than in the season 20 80.0 No 3 12.0
Total 25 100.0
Source: Own survey (2012). Note: * statistically significant at 1% level.
4. Conclusion In the value chain of tomato, actors are found to be linked in multiple manners. A given actors can be linked with any other actors in the chain. Linkages among actors do not have the same strength as the strength of the linkage producers‘ form with wholesalers and consumers might be different as measured by the percentage of producers who preferred any one of the two actors as the most important for them. The most important actors found in the value chain of tomato under consideration are Producers, wholesalers, retailers and brokers. The linkage between producers and wholesalers in the study area is found to be weak since wholesalers prefer to get the commodity from areas outside of the region. In general, the three actors involved in the production or marketing of tomato seem to benefit from the chain as the benefit they get is measured in terms of the profit as percentage of the total cost they incur in the production or marketing of tomato. Producers get the greatest percentage followed by retailer while wholesalers earning the lowest percentage. But this may not be indicative of the amount of the real amount of money the actors earned since the percentage depends on the cost they incur. In addition, there is money spent by consumers as marketing margins. The marketing margins depend on the kind of link established in delivering tomato to consumers. The value chain has both constraints and opportunities to commercialize it. Among the constraints some are faced by producers while wholesalers and retailers confronted the other. Disease/pest, lack of area in the market and rotting and quality related problems are among the constraints mentioned by the actors. Despite the multidimensional constraints the chain faces there are also many opportunities which could be utilized to commercialize the chain. These opportunities emanate from different corners. Some come from the behavior of consumers. For instance consumers want to increase the quantity they purchase if quality improves and price decreases. Most producers cultivate tomato more than once in a year. Besides, the market has additional absorptive capacity since it cannot satisfy consumers demand during low supply season.
5. Recommendation Although it is possible to speculate probable reasons for the presence of linkage gap among producers and wholesalers, speculation is not enough. Therefore it will be necessary to conduct additional researches which deal with examining the proper reasons for this gap. Concerned bodies in the area should find a way by which produces can improve the quality of tomato they produce since quality is found to be a drive factor in choosing market segment by consumers. If there is an interest in improving the living condition of farmer producers, it will be necessary to improve their market power. Hence, necessary arrangement should be made to provide tomato producers with convenient selling location in Harar city in the absence of which they are forced to give their produce to either wholesalers or retailer or even consumers at a lesser price. One of the manageable ways to carry out

32nd Annual Research Bulletin, April 2015, Haramaya University
177
this task could be through organizing tomato producer under producers cooperative and arrange a place in the central market where this producer can do their business. Concerned agricultural offices and research institution in the area should help producers through proposing workable solution for the problems of tomato disease/pest. The establishment of multi-location mini market in different places within the vicinity of dweller and provision of selling area to retailer could alleviate the pressure retailers have from the lack of area in the central market and the pressure they face from authority as a consequence of lack of area. Among the results found some urge the agricultural office in the area to find a technology that improves quality, reduce cost of production and increase production since an increased production with good quality and cheaper price can be taken up by consumers
6. Acknowledgment The research team would like to express its warmest gratitude to Haramaya University Office of Research and Extension for its facilitation through the provision of necessary financial requirements and other services. We also want to thank all the research participant involved in this study for willingly providing information required from them. All the data collectors also deserve to be appreciated.
7. References Abay, A. 2007. Vegetable marketing chain analysis in the case of Fogera Wereda, in Amehara National regional state of Ethiopia. An MSc
Thesis Presented to School of Graduate Studies of Haramaya University. Bammann, H. 2007. Participatory value chain analysis for improved farmer incomes, employment opportunities and food security, Pacific
Economic Bulletin Volume 22 Number 3 Bezabih Emana. 2008. Participatory Value Chain Analysis at Kombolcha district of East Hararghe, Ethiopia. Action Aid Ethiopia. Bezabih, E., and Hadera, G., 2007. Constraints and opportunities of horticulture production and marketing in eastern Ethiopia. Dry Lands
Coordination Group Report No 46. Grensen 9b. Norway. CSA (Central Statistical Authority). 2008. Agricultural Sample Survey, 2007 - 2008 CSA (Central Statistical Authority). 2010. Agricultural Sample Survey, 2009 - 2010 CSA (Central Statistical Authority). 2003, Statistical Report on Area and Production of Crops. Part II-A. Addis Ababa, Ethiopia. Dawit, A., Abera D., Lemma D., and Chemdo A. 2004. Domestic vegetable seed production and marketing. Research Report No 5. EARO,
Ethiopia. Dawit, A., Abera D., Lemma D., and Chemdo A. 2004. Domestic vegetable seed production and marketing. Research Report No 5. EARO,
Ethiopia. 17p Fairbairn-Dunlop, P. 1996. ‗Pacific sustainable human development: building on the subsistence systems‘, in D.N. Norman, M. Tofinga, M.
Umar and H. Bammann (eds), The Farming Systems Approach to Sustainable Development in the South Pacific, Proceedings of the FAO/IRETA Workshop, Suva, 5-8 August.
FAO (Food and Agriculture Organization). 1986. Marketing improvement in the developing world. Marketing and Credit Service.. Rome, Italy. Hobbs, J. E., Cooney, A. and Fulton, M. 2000. Value Chains in the Agri-Food Sector College of Agriculture, University of Saskatchewan,
Saskatoon, Canada. Jema, H. 2008. Economic efficiency and marketing performance of vegetable production in the eastern and central parts of Ethiopia. PhD
Dissertation. Uppsala Kaplinsky, R. and Morris, M. 2008. ‗Value chain analysis: a tool for enhancing export supply policies‘, International Journal of Technological
Learning, Innovation and Development, 1, No. 3, pp.283 - 308. Kohls, Richard L. and Joseph N. Uhl. 1985. Marketing of agricultural products. 6th-edition. Macmillan publishing company, New York. Million T. and Belay K., 2004. Ethiopian Agricultural Research Organization, Addis Ababa, Ethiopia.21 - 30p. MoARD (Ministry of Agriculture and Rural Development) 2005. Irrigation Development Package Manual. Published in Amharic Language. Moraket Thomas. 2001. Overcoming transaction costs Barriers to market participation of Small holder farmers in the Northern Province of
South Africa. PhD Dissertation, university of Pretoria. Moti J. 2007. Econometric analysis of horticultural production and marketing in Central and Eastern Ethiopia. PhD Dissertation. Wageningen
University. The Netherlands. Nonnocke, I. L. 1989. Vegetable production. AVI. Nostrand Reinhold, New York. Rehima Musema. 2007. Analysis of red pepper marketing: the case of Alaba and Silitie in SNNPRS of Ethiopia. An MSc Thesis Presented to
School of Graduate Studies of Haramaya University. Weinberger, K. & Lumpkin, T. 2005. Horticulture for poverty alleviation: The unfunded revolution. Shanhua, Taiwan, AVRDC – The World
Vegetable Center.

32nd Annual Research Bulletin, April 2015, Haramaya University
178

32nd Annual Research Bulletin, April 2015, Haramaya University
179