MRI assessment of drug-induced fluid accumulation in humans: validation of the technology
9
MRI assessment of drug-induced fluid accumulation in humans: validation of the technology Chun S. Zuo a, ⁎ , Rosemond A. Villafuerte a , Michael E. Henry a , Robert L. Dobbins b , Chunnin Lee a , Younghoon Sung a , Charlotte Haws a , Michelle Butman a , Sam Miller c , Alan Manos a , Barbara S. Orban b , Andrew P. Brown b , Rebecca Hodge b , Derek J. Nunez b , Perry F. Renshaw a a Brain Imaging Center, McLean Hospital, Harvard Medical School, Belmont, MA 02478, USA b Clinical Pharmacology Discovery Medicine, GlaxoSmithKline, Research Triangle Park, NC 27709, USA c Discovery Statistics, GlaxoSmithKline, Harlow, CM19 5AW, UK Received 9 August 2007; revised 4 December 2007; accepted 6 January 2008 Abstract Purpose: The purpose of this study was to evaluate the feasibility of using proton and sodium magnetic resonance imaging (MRI) to detect fluid accumulation produced by fludrocortisone and nifedipine — two drugs known to cause salt/water retention by different mechanisms. Materials and Methods: Twelve young healthy male subjects were randomly assigned to one of two groups and treated with either fludrocortisone or nifedipine for 14 or 25 days, respectively. The change in sodium MRI, as well as in proton T 2 value and T 1 -weighted signal intensity in the calf following postural change [referred to here as ‘postural delta signal’(PDS)], was evaluated before, during and after drug administration. The changes in MRI PDS were compared to conventional physiological parameters, including body weight, calf volume and pitting edema. Results: When compared to the baseline pretreatment values, the subjects treated with fludrocortisone showed a 5.5% increase in sodium MRI PDS (P=.01), a 2-ms increase in proton T 2 PDS of the gastrocnemius muscle (P=.06) and a body weight gain of 2.3% (P=.001) within 1 week. In the nifedipine-treated subjects, the sodium MRI PDS increased by 6% versus baseline (P=.03), while the proton T 2 PDS of the gastrocnemius muscle increased by 3.7 ms (P=.01), associated with a 0.5% weight gain (P=.55), within 3 weeks. No significant changes were noted in the T 1 -weighed images following postural change. Measurements of calf circumference, volume and pitting edema did not show consistent changes associated with the drug administration. Conclusion: The postural change in sodium MRI and proton T 2 signals provides a sensitive method for detecting the fluid accumulation produced by fludrocortisone and nifedipine. The MRI results are consistent with treatment-induced increases in extracellular fluid volume and correlate well with the observed weight gain. These findings support the potential utility of MRI for the evaluation of medication-induced fluid retention. © 2008 Elsevier Inc. All rights reserved. Keywords: MRI; Assess; Fluid changes; Human calf 1. Introduction Marketed drugs are not magic bullets, and their admin- istration is frequently associated with side effects, some of which are acute while others are cumulative. Fluid retention is commonly encountered in clinical practice, either through impaired function of organs such as the heart and kidneys or as a side effect associated with long-term use of drugs [1–4]. Peripheral edema in the lower extremities can be an early manifestation of salt/water accumulation, but when severe, the latter can lead to hypertension, congestive heart failure or pulmonary edema [5,6]. Clinically, fluid retention may be diagnosed by assessing weight gain and ‘pitting’ peripheral edema [7]. The pitting Available online at www.sciencedirect.com Magnetic Resonance Imaging 26 (2008) 629 – 637 ⁎ Corresponding author. Tel.: +1 617 855 3277; fax: +1 617 855 2770. E-mail address: [email protected] (C.S. Zuo). 0730-725X/$ – see front matter © 2008 Elsevier Inc. All rights reserved. doi:10.1016/j.mri.2008.01.003
Transcript of MRI assessment of drug-induced fluid accumulation in humans: validation of the technology
Available online at www.sciencedirect.com
ng 26 (2008) 629–637
Magnetic Resonance ImagiMRI assessment of drug-induced fluid accumulation in humans:validation of the technology
Chun S. Zuoa,⁎, Rosemond A. Villafuertea, Michael E. Henrya, Robert L. Dobbinsb,Chunnin Leea, Younghoon Sunga, Charlotte Hawsa, Michelle Butmana, Sam Millerc,
Alan Manosa, Barbara S. Orbanb, Andrew P. Brownb, Rebecca Hodgeb,Derek J. Nunezb, Perry F. Renshawa
aBrain Imaging Center, McLean Hospital, Harvard Medical School, Belmont, MA 02478, USAbClinical Pharmacology Discovery Medicine, GlaxoSmithKline, Research Triangle Park, NC 27709, USA
cDiscovery Statistics, GlaxoSmithKline, Harlow, CM19 5AW, UK
Received 9 August 2007; revised 4 December 2007; accepted 6 January 2008
Abstract
Purpose: The purpose of this study was to evaluate the feasibility of using proton and sodium magnetic resonance imaging (MRI) todetect fluid accumulation produced by fludrocortisone and nifedipine — two drugs known to cause salt/water retention bydifferent mechanisms.Materials and Methods: Twelve young healthy male subjects were randomly assigned to one of two groups and treated with eitherfludrocortisone or nifedipine for 14 or 25 days, respectively. The change in sodium MRI, as well as in proton T2 value and T1-weightedsignal intensity in the calf following postural change [referred to here as ‘postural delta signal’(PDS)], was evaluated before, during and afterdrug administration. The changes in MRI PDS were compared to conventional physiological parameters, including body weight, calf volumeand pitting edema.Results: When compared to the baseline pretreatment values, the subjects treated with fludrocortisone showed a 5.5% increase in sodiumMRI PDS (P=.01), a 2-ms increase in proton T2 PDS of the gastrocnemius muscle (P=.06) and a body weight gain of 2.3% (P=.001) within 1week. In the nifedipine-treated subjects, the sodium MRI PDS increased by 6% versus baseline (P=.03), while the proton T2 PDS of thegastrocnemius muscle increased by 3.7 ms (P=.01), associated with a 0.5% weight gain (P=.55), within 3 weeks. No significant changes werenoted in the T1-weighed images following postural change. Measurements of calf circumference, volume and pitting edema did not showconsistent changes associated with the drug administration.Conclusion: The postural change in sodium MRI and proton T2 signals provides a sensitive method for detecting the fluid accumulationproduced by fludrocortisone and nifedipine. The MRI results are consistent with treatment-induced increases in extracellular fluid volumeand correlate well with the observed weight gain. These findings support the potential utility of MRI for the evaluation of medication-inducedfluid retention.© 2008 Elsevier Inc. All rights reserved.
Keywords: MRI; Assess; Fluid changes; Human calf
1. Introduction
Marketed drugs are not magic bullets, and their admin-istration is frequently associated with side effects, some ofwhich are acute while others are cumulative. Fluid retention
⁎ Corresponding author. Tel.: +1 617 855 3277; fax: +1 617 855 2770E-mail address: [email protected] (C.S. Zuo).
0730-725X/$ – see front matter © 2008 Elsevier Inc. All rights reserved.doi:10.1016/j.mri.2008.01.003
.
is commonly encountered in clinical practice, either throughimpaired function of organs such as the heart and kidneys oras a side effect associated with long-term use of drugs [1–4].Peripheral edema in the lower extremities can be an earlymanifestation of salt/water accumulation, but when severe,the latter can lead to hypertension, congestive heart failure orpulmonary edema [5,6].
Clinically, fluid retention may be diagnosed by assessingweight gain and ‘pitting’ peripheral edema [7]. The pitting
630 C.S. Zuo et al. / Magnetic Resonance Imaging 26 (2008) 629–637
measurements are very subjective and difficult to quantifyrobustly, and they may not be sensitive in the early stages offluid retention.
Several types of instruments based on bioelectricalimpedance analysis have been developed to detect changesin fluid compartments [8,9]. However, these measurementsrely heavily on diverse proprietary mathematical modelsused to calibrate the instruments; these models areconfounded when more than one body compartment changeat the same time [10]. The current ‘gold-standard’method forquantifying fluid in vivo relies on the dilution of a knownamount of a tracer substance that may distribute, by choice,in different water pools such as blood, intracellular fluid orextracellular fluid [8]. However, dilution methods can becomplex and require the administration of highly purifiedtracers, which can be expensive.
Magnetic resonance imaging (MRI) has been exploited toassess the efficacy of drugs in increasing tissue perfusion inthe heart and other regions [11]. Water proton relaxationtimes T1 and T2 are highly sensitive to changes in interstitialfluid and to the presence of paramagnetic substances, andhave been used for the diagnosis of edema resulting fromtumors or other pathological conditions [12–15]. Sodium(23Na) MRI, on the other hand, is highly sensitive to changesin extracellular fluid because 23Na exists predominantly inthis compartment. It may provide complementary informa-tion on changes in fluid that are less confounded by signalsarising from the intracellular environment [16,17].
We have investigated whether the novel application ofMRI can detect and quantify fluid changes in the lower limbsafter postural change from the upright position to the supineposition [17]. In this pilot study, we hypothesized that adependent limb would accumulate fluid, which would ‘drainout’ on assumption of a horizontal position. We reasoned thatthe rate of change in the fluid signal would be directlyproportional to the amount of fluid accumulated, so wedeveloped the concept of the ‘postural delta signal’ (PDS) torefer to that difference in the rate of change in an MR signalthat accompanies a postural change.
To our knowledge, there have been no reports in theliterature on the use of MRI to detect drug-induced fluidaccumulation. We have therefore extended our studies in thisdirection because of the importance of detecting early signalsof fluid retention produced by drugs such as thiazolidine-diones [18]. The present study was designed to investigatethe performance of MRI in healthy subjects using two drugsknown to cause fluid retention: fludrocortisone and nifedi-pine. These drugs cause fluid retention by differentmechanisms. Nifedipine acts principally through peripheralvasodilatation and secondary renal effects, while fludrocor-tisone, a mineralocorticoid, acts directly on sodium channelsin the kidney, without much effect on the vasculature [19].Fludrocortisone acetate is a potent mineralocorticoid usedfor partial replacement therapy in primary and secondaryadrenocortical insufficiencies in Addison's disease and forthe treatment of salt-wasting adrenogenital syndrome
[4,20,21]. It is known to result in temporary fluid retentionin healthy subjects, in whom there is early salt/waterretention, followed by the well-known phenomenon of‘mineralocorticoid escape’ natriuresis that is seen 4–7 daysafter starting treatment [18,20–22]. Nifedipine, a calciumchannel blocker that is widely used to treat hypertension,causes mild to moderate peripheral edema in a dose-dependent manner. This edema is a localized phenomenonand is thought to be caused by vasodilatation of arteriolesand small blood vessels in the dependent limbs, and not byleft ventricular dysfunction or generalized fluid retention[3,11,23–25]. Unlike fludrocortisone, nifedipine is notassociated with a reduction of edema comparable to themineralocorticoid escape.
In this study, we have assumed that the fluid retentioncaused by these drugs leads to more salt/water accumulationin the lower extremities and that, following posturalchange, this fluid redistributes at a rate that is dependenton the amount present. In addition, to assess the relativeutility of the proton and sodium MRI-based methods, weperformed standard clinical measurements of body weight,calf circumference and volume, and assessment of lowerleg pitting, even though these measurements have theirown limitations.
2. Materials and methods
2.1. Subjects
The study was conducted in 12 healthy male subjects(age: 25±5 years; range: 20–33 years; body weight: 77.7±8.0kg) under a protocol approved by the Institutional ReviewBoard of McLean Hospital and the protocol reviewprocedure of GlaxoSmithKline. The 12 subjects wererandomly divided into two groups: six were administeredfludrocortisone treatment (14 days; administered as 0.1 mgbid) and six received nifedipine treatment (25 days). Tocomply with the dosing guideline, subjects started at 30 mgdaily and were titrated to 60 mg after 5 days and to 90 mgafter 10 days if blood pressure was maintained withoutdifficulties. Subjects then returned to 60 mg on Day 16 andto 30 mg on Day 21. Each subject received both a protonscan and a sodium scan during each weekly MR visit. Therewere two baseline (BL) visits 1 week apart to assessreproducibility, followed by two (fludrocortisone) or three(nifedipine) weekly treatment visits to measure the effect ofthe drugs, and one follow-up visit to assess the residualeffects 7 days after fludrocortisone discontinuation or 3 daysafter nifedipine discontinuation.
Because of the importance of dietary sodium as a factorregulating fluid retention in healthy individuals [26], thesubjects were asked to comply with a sodium diet ofapproximately 4 g/day for the 2 days prior to each MRI visit.Before going into an MRI scanner, the subjects wererequested to sit still in an upright posture for 1 h, withtheir feet resting gently on the floor for both the proton and
631C.S. Zuo et al. / Magnetic Resonance Imaging 26 (2008) 629–637
the sodium scans. The midcalf of each subject was markedduring the whole study for consistency of image location andmeasurement of calf circumference. The volume of the calfwas measured using a volume-displacement apparatus [27],with the leg inserted into the apparatus at the same level ateach visit.
2.2. MRI
Both proton and sodiumMRI were used to detect possiblefluid level changes in this study. The proton MRI wasconducted on a 3-T MR scanner (Trio; Siemens AG,Germany) using a volume coil for transmission andreception, and the sodium MRI was conducted on a 4-TMR scanner (INOVA; Varian, Inc., California) with aquadrature surface array for transmission and reception.
To take into account individual differences in calf T2values, the calf T2 was measured twice during each MRvisit, ∼10 and ∼90 min after the postural change fromsitting upright to lying supine (PDS). The difference in T2PDS values between the two time points was consideredto be proportional to the body fluid shifted out of theimaged volume. The proton T2 was measured using ascheme of multi-TE spin echoes [n=12, TE1=15 ms, TEstep=15 ms and TR=3600 ms, with gradient crushersaround the 180° radiofrequency (RF) pulses to reduce freeinduction decays resulting from imperfect 180° RFpulses]. The T2 measurement was added on after thestudy had started and, hence, only performed in 9 of the12 subjects (n=5 for the fludrocortisone group; n=4 forthe nifedipine group). Between these two T2 measure-ments, T1-weighted images were acquired repeatedly at atemporal resolution of 3 min/scan for approximately 81 min.The T1-weighted spin-echo images were acquired withTE/TI/TR=15/180/600, field of view (FOV)=270 mm, slicethickness=8 mm, matrix=150×256, TA=2.42 min andgap=35 s. To avoid possible interference from eddy currents,no regional RF saturation and gradient crushers were usedbetween the T1-weighted scans to suppress pulsatile flowartifacts. A saline vial and vitamin E capsules were used asimaging markers to align slice positions between differentMR visits.
The sodium images were acquired with a 3D gradientecho sequence at TR/TE=20/2.5, α=45°, matrix=16×64×128,slab thickness=192 mm, FOV=280×280, TA=5.6 min andtime gap=5 s. Due to its rapid quadrupole relaxation, the 5-stime gap appeared to be adequate for the sodiummagnetization to recover fully.
2.3. Data analysis
Proton T2 maps were constructed from the multi-TEspin-echo images based on the relationship ln(s/so)=−TE/T2.We have attributed the difference in T2 PDS valuesbetween the two time points mainly to the movement offluid out of the lower leg imaging region of interestbecause posture was not changed between these time points
(subjects were at supine position). Subtraction of the T2maps between the two time points indicated that thegastrocnemius muscle had the largest T2 changes comparedto the anterior and posterior tibials and the soleus muscle inthe calf cross section. Hence, T2 values of the gastro-cnemius muscle were extracted from the T2 maps, and theT2 difference between the beginning and the end of the MRscans (the PDS) was considered to be proportional to theamount of fluid shifted out of the imaged slice. The T2difference for the gastrocnemius muscle was averaged forthe subjects in a group, and the values at BL werecompared to those at subsequent visits during the drugintervention and washout phases.
For proton and sodium signals versus time series, regionsof interest were placed within the calf muscles across thetime series of postpostural change. The proton and sodiumMR signals were normalized to the values of the first timepoint, and the MR signal–postural time curves were thenaveraged over the treatment group for each visit. The amountof change in the signal after the postural change (the PDSvalue) is assumed to be proportional to the volume of fluidthat has moved out of the region of interest [17].
To derive a single measure that is representative of theamount of fluid redistributed out of the calf muscle after thepostural change for each subject at each visit, a nonlinearmodel was fitted to each MR signal–postural time curve ofthe form y=a+b(rt), where y is the signal intensity (inarbitrary units) and t is time (in hours). The parameters a, band r can be interpreted as follows: a is a horizontalasymptote representing the eventually stabilized signalintensity; a+b is the initial signal intensity immediatelyfollowing postural change; and 1−r represents the factor bywhich the signal declines per hour. The quantity 100×b/(a+b)provides a robust estimate of the PDS value expressed as thepercent change between the initial MR signal and thestabilized signal after the subject had remained supine for90 min.
The proton and sodium signal changes were averagedover each treatment group for each visit before, during andafter the drug administration. The means of the first twoweekly visits were used as the values of the BL fluid level,and the difference between the BL and the subsequentweekly visits [Day 7, Day 14 and washout (7 Days TRX, 14Days TRX, and 7 Days WASH) for subjects on fludrocorti-sone; Day 7, Day 14, Day 21 and washout for subjects onnifedipine] was considered to reflect the change in fluid levelproduced by these drugs.
Weight, calf circumference and calf volume weremeasured prior to the MRI scans during the visits and werealso averaged over the treatment groups and normalized tothe values at the BL visits. The assessment of pitting edemawas graded as normal, mild edema, edema and severe, andthe scores were averaged over the treatment groups.
Mixed-effect repeated-measures analysis-of-variancemodels were fitted to each MR and clinical measurementindividually. The models included terms for treatment, visit
632 C.S. Zuo et al. / Magnetic Resonance Imaging 26 (2008) 629–637
and their interaction, with subject as a random effect. Fromthis analysis, the mean differences from BL (defined as themean of the first and second visits) of each treatment andfollow-up visit were calculated for each treatment group.Ninety-five percent confidence intervals were also calculatedto show the precision with which these differences could beestimated for each measurement.
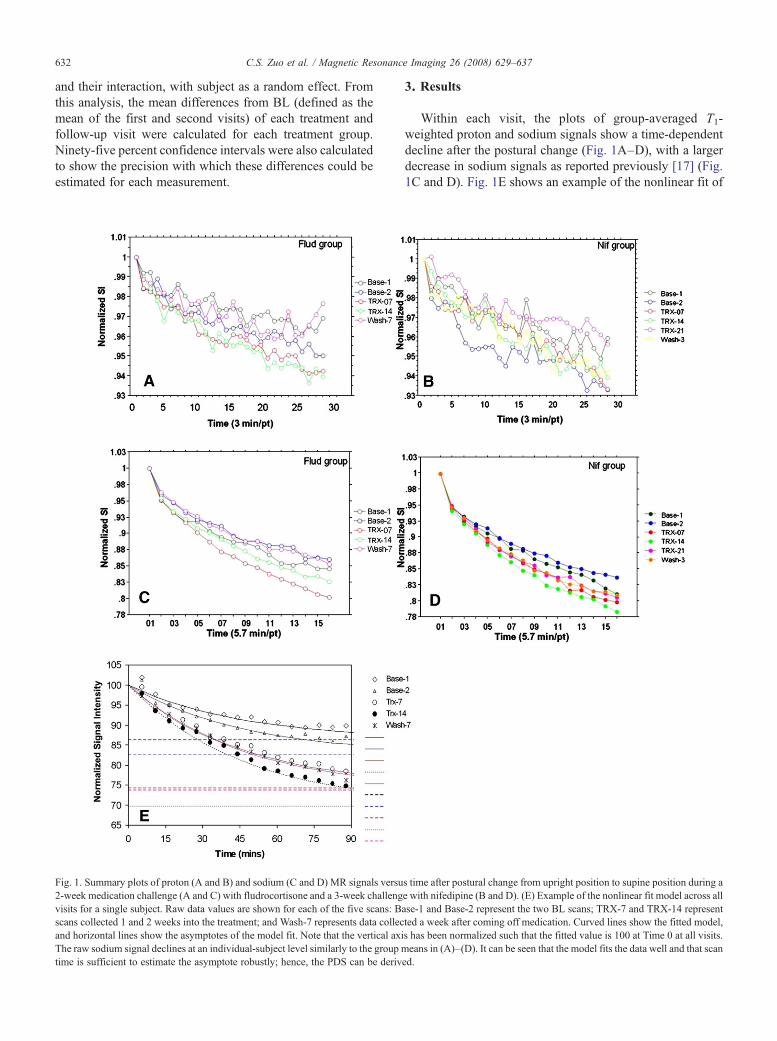
Fig. 1. Summary plots of proton (A and B) and sodium (C and D) MR signals versu2-week medication challenge (A and C) with fludrocortisone and a 3-week challengvisits for a single subject. Raw data values are shown for each of the five scans: Bascans collected 1 and 2 weeks into the treatment; and Wash-7 represents data collecand horizontal lines show the asymptotes of the model fit. Note that the vertical axiThe raw sodium signal declines at an individual-subject level similarly to the group mtime is sufficient to estimate the asymptote robustly; hence, the PDS can be deriv
3. Results
Within each visit, the plots of group-averaged T1-weighted proton and sodium signals show a time-dependentdecline after the postural change (Fig. 1A–D), with a largerdecrease in sodium signals as reported previously [17] (Fig.1C and D). Fig. 1E shows an example of the nonlinear fit of
s time after postural change from upright position to supine position during ae with nifedipine (B and D). (E) Example of the nonlinear fit model across alse-1 and Base-2 represent the two BL scans; TRX-7 and TRX-14 represented a week after coming off medication. Curved lines show the fitted models has been normalized such that the fitted value is 100 at Time 0 at all visitseans in (A)–(D). It can be seen that the model fits the data well and that scan
ed.
lt,.
633C.S. Zuo et al. / Magnetic Resonance Imaging 26 (2008) 629–637
the signal decline over time, where curved lines show thefitted model and horizontal lines show the asymptotes of themodel fit. The nonlinear fit model shows (a) that the signaldeclines at an individual-subject level similarly to the group-averaged signals, and (b) how the signal drop is quantified,and that this quantification model fits the data well. Theasymptote is well estimated because the total scan time issufficient to approach it. The sample values derived here fora, b and r were 101.7, 36.4 and 0.28, respectively.
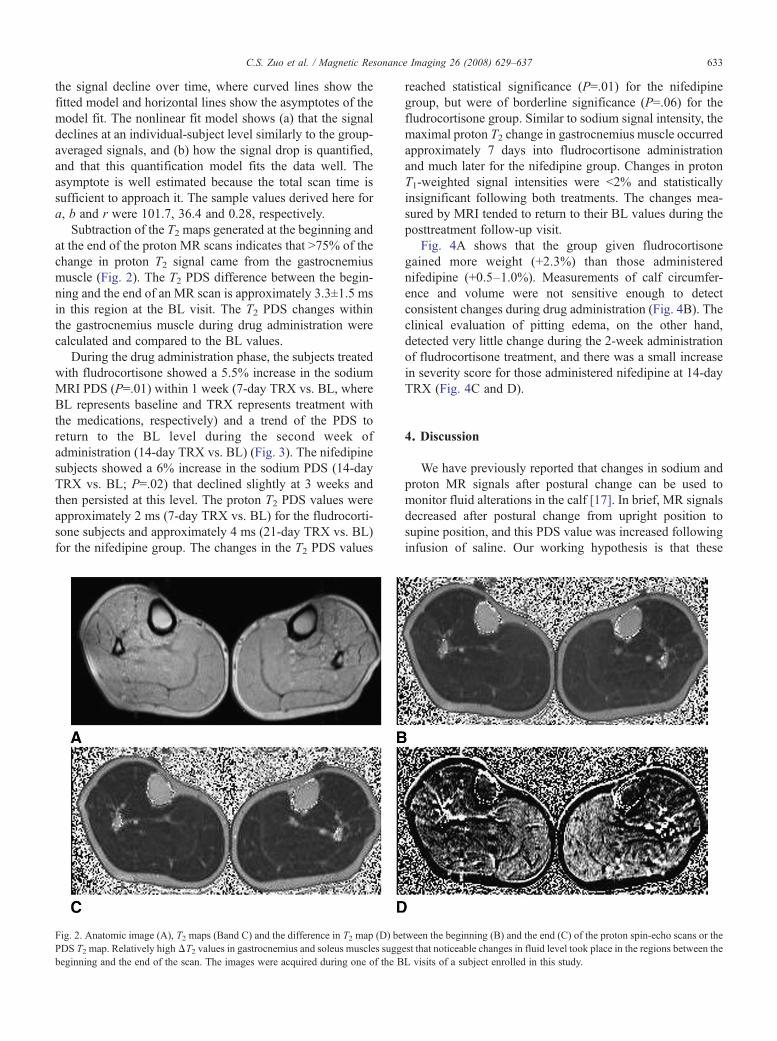
Subtraction of the T2 maps generated at the beginning andat the end of the proton MR scans indicates that N75% of thechange in proton T2 signal came from the gastrocnemiusmuscle (Fig. 2). The T2 PDS difference between the begin-ning and the end of an MR scan is approximately 3.3±1.5 msin this region at the BL visit. The T2 PDS changes withinthe gastrocnemius muscle during drug administration werecalculated and compared to the BL values.
During the drug administration phase, the subjects treatedwith fludrocortisone showed a 5.5% increase in the sodiumMRI PDS (P=.01) within 1 week (7-day TRX vs. BL, whereBL represents baseline and TRX represents treatment withthe medications, respectively) and a trend of the PDS toreturn to the BL level during the second week ofadministration (14-day TRX vs. BL) (Fig. 3). The nifedipinesubjects showed a 6% increase in the sodium PDS (14-dayTRX vs. BL; P=.02) that declined slightly at 3 weeks andthen persisted at this level. The proton T2 PDS values wereapproximately 2 ms (7-day TRX vs. BL) for the fludrocorti-sone subjects and approximately 4 ms (21-day TRX vs. BL)for the nifedipine group. The changes in the T2 PDS values
Fig. 2. Anatomic image (A), T2 maps (Band C) and the difference in T2 map (D) bePDS T2 map. Relatively highΔT2 values in gastrocnemius and soleus muscles suggbeginning and the end of the scan. The images were acquired during one of the B
reached statistical significance (P=.01) for the nifedipinegroup, but were of borderline significance (P=.06) for thefludrocortisone group. Similar to sodium signal intensity, themaximal proton T2 change in gastrocnemius muscle occurredapproximately 7 days into fludrocortisone administrationand much later for the nifedipine group. Changes in protonT1-weighted signal intensities were b2% and statisticallyinsignificant following both treatments. The changes mea-sured by MRI tended to return to their BL values during theposttreatment follow-up visit.
Fig. 4A shows that the group given fludrocortisonegained more weight (+2.3%) than those administerednifedipine (+0.5–1.0%). Measurements of calf circumfer-ence and volume were not sensitive enough to detectconsistent changes during drug administration (Fig. 4B). Theclinical evaluation of pitting edema, on the other hand,detected very little change during the 2-week administrationof fludrocortisone treatment, and there was a small increasein severity score for those administered nifedipine at 14-dayTRX (Fig. 4C and D).
4. Discussion
We have previously reported that changes in sodium andproton MR signals after postural change can be used tomonitor fluid alterations in the calf [17]. In brief, MR signalsdecreased after postural change from upright position tosupine position, and this PDS value was increased followinginfusion of saline. Our working hypothesis is that these
tween the beginning (B) and the end (C) of the proton spin-echo scans or theest that noticeable changes in fluid level took place in the regions between theL visits of a subject enrolled in this study.
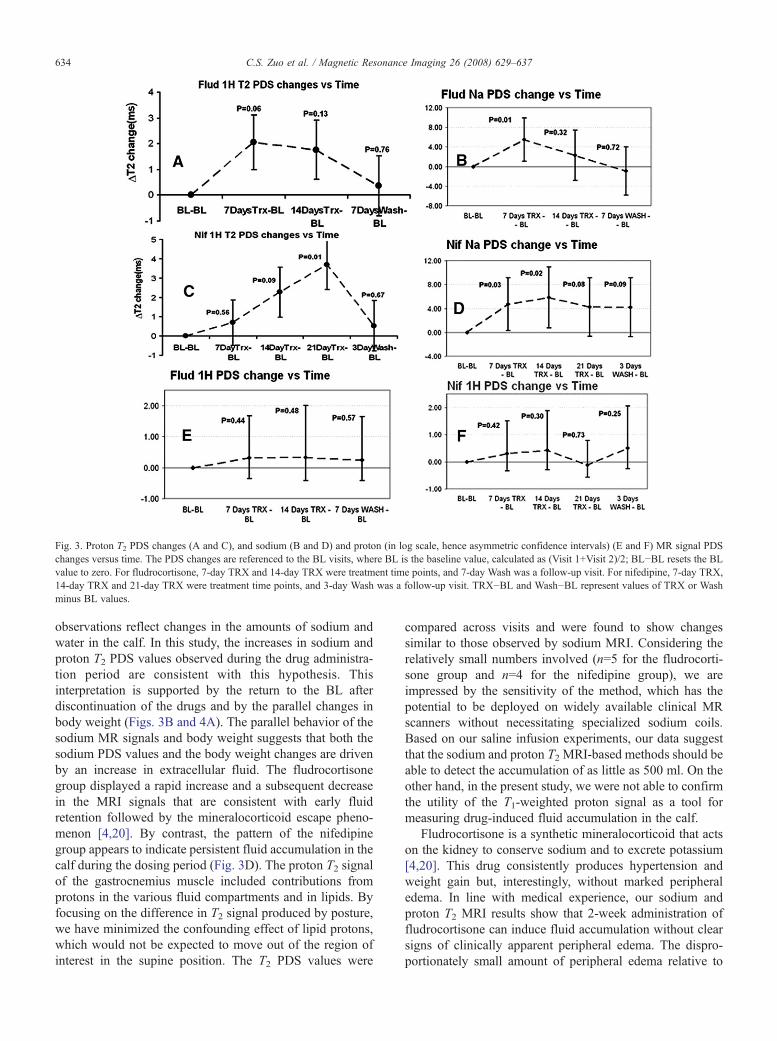
Fig. 3. Proton T2 PDS changes (A and C), and sodium (B and D) and proton (in log scale, hence asymmetric confidence intervals) (E and F) MR signal PDSchanges versus time. The PDS changes are referenced to the BL visits, where BL is the baseline value, calculated as (Visit 1+Visit 2)/2; BL−BL resets the BLvalue to zero. For fludrocortisone, 7-day TRX and 14-day TRX were treatment time points, and 7-day Wash was a follow-up visit. For nifedipine, 7-day TRX14-day TRX and 21-day TRX were treatment time points, and 3-day Wash was a follow-up visit. TRX−BL and Wash−BL represent values of TRX or Washminus BL values.
634 C.S. Zuo et al. / Magnetic Resonance Imaging 26 (2008) 629–637
observations reflect changes in the amounts of sodium andwater in the calf. In this study, the increases in sodium andproton T2 PDS values observed during the drug administra-tion period are consistent with this hypothesis. Thisinterpretation is supported by the return to the BL afterdiscontinuation of the drugs and by the parallel changes inbody weight (Figs. 3B and 4A). The parallel behavior of thesodium MR signals and body weight suggests that both thesodium PDS values and the body weight changes are drivenby an increase in extracellular fluid. The fludrocortisonegroup displayed a rapid increase and a subsequent decreasein the MRI signals that are consistent with early fluidretention followed by the mineralocorticoid escape pheno-menon [4,20]. By contrast, the pattern of the nifedipinegroup appears to indicate persistent fluid accumulation in thecalf during the dosing period (Fig. 3D). The proton T2 signalof the gastrocnemius muscle included contributions fromprotons in the various fluid compartments and in lipids. Byfocusing on the difference in T2 signal produced by posture,we have minimized the confounding effect of lipid protons,which would not be expected to move out of the region ofinterest in the supine position. The T2 PDS values were
,
compared across visits and were found to show changessimilar to those observed by sodium MRI. Considering therelatively small numbers involved (n=5 for the fludrocorti-sone group and n=4 for the nifedipine group), we areimpressed by the sensitivity of the method, which has thepotential to be deployed on widely available clinical MRscanners without necessitating specialized sodium coils.Based on our saline infusion experiments, our data suggestthat the sodium and proton T2 MRI-based methods should beable to detect the accumulation of as little as 500 ml. On theother hand, in the present study, we were not able to confirmthe utility of the T1-weighted proton signal as a tool formeasuring drug-induced fluid accumulation in the calf.
Fludrocortisone is a synthetic mineralocorticoid that actson the kidney to conserve sodium and to excrete potassium[4,20]. This drug consistently produces hypertension andweight gain but, interestingly, without marked peripheraledema. In line with medical experience, our sodium andproton T2 MRI results show that 2-week administration offludrocortisone can induce fluid accumulation without clearsigns of clinically apparent peripheral edema. The dispro-portionately small amount of peripheral edema relative to
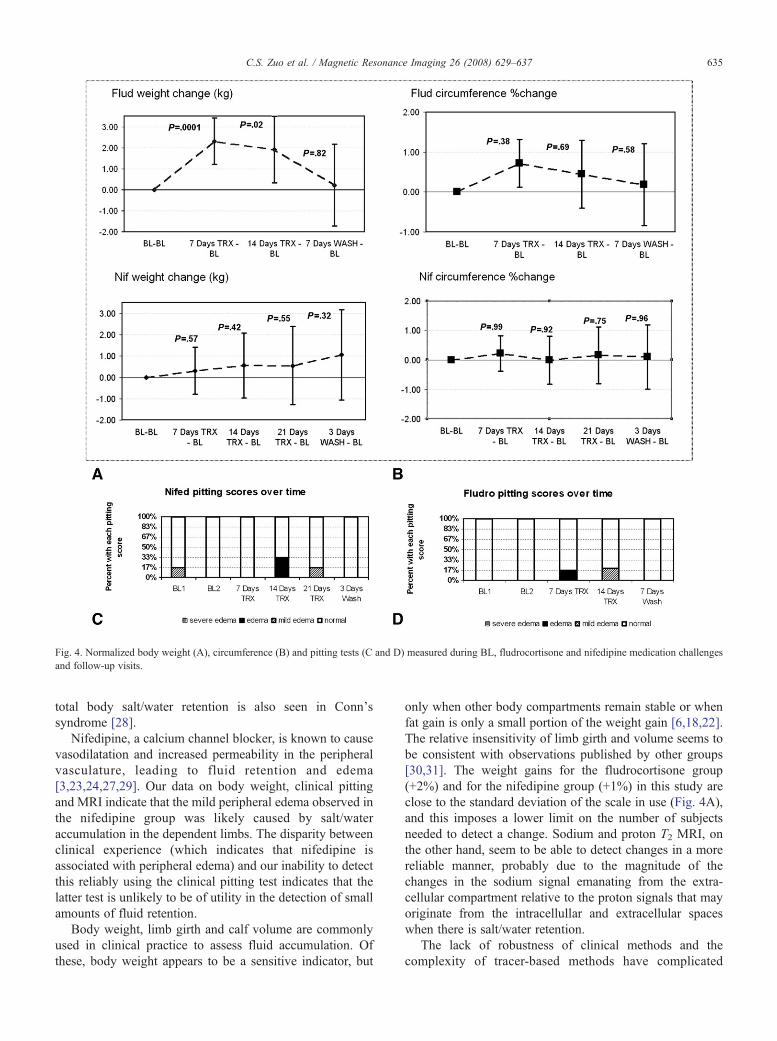
Fig. 4. Normalized body weight (A), circumference (B) and pitting tests (C and D) measured during BL, fludrocortisone and nifedipine medication challengesand follow-up visits.
635C.S. Zuo et al. / Magnetic Resonance Imaging 26 (2008) 629–637
total body salt/water retention is also seen in Conn'ssyndrome [28].
Nifedipine, a calcium channel blocker, is known to causevasodilatation and increased permeability in the peripheralvasculature, leading to fluid retention and edema[3,23,24,27,29]. Our data on body weight, clinical pittingand MRI indicate that the mild peripheral edema observed inthe nifedipine group was likely caused by salt/wateraccumulation in the dependent limbs. The disparity betweenclinical experience (which indicates that nifedipine isassociated with peripheral edema) and our inability to detectthis reliably using the clinical pitting test indicates that thelatter test is unlikely to be of utility in the detection of smallamounts of fluid retention.
Body weight, limb girth and calf volume are commonlyused in clinical practice to assess fluid accumulation. Ofthese, body weight appears to be a sensitive indicator, but
only when other body compartments remain stable or whenfat gain is only a small portion of the weight gain [6,18,22].The relative insensitivity of limb girth and volume seems tobe consistent with observations published by other groups[30,31]. The weight gains for the fludrocortisone group(+2%) and for the nifedipine group (+1%) in this study areclose to the standard deviation of the scale in use (Fig. 4A),and this imposes a lower limit on the number of subjectsneeded to detect a change. Sodium and proton T2 MRI, onthe other hand, seem to be able to detect changes in a morereliable manner, probably due to the magnitude of thechanges in the sodium signal emanating from the extra-cellular compartment relative to the proton signals that mayoriginate from the intracellullar and extracellular spaceswhen there is salt/water retention.
The lack of robustness of clinical methods and thecomplexity of tracer-based methods have complicated
636 C.S. Zuo et al. / Magnetic Resonance Imaging 26 (2008) 629–637
studies aimed at dissecting the mechanisms by which drugsmay cause fluid retention and peripheral edema. The MRI-based methods discussed here should overcome some of thesebarriers and offer investigators the ability to track fluidretention more precisely and sensitively, especially whenevaluating the behavior of new compounds that are beingdeveloped on the basis that theywill have less liability to causefluid retention than established drugs. In this situation, it isimportant to be able to detect reliably a change in a ‘fluid-derived’ parameter in every subject when only a small fractionof these subjects manifest fluid retention using, for example,peripheral edema as detected by physical examination.
In summary, we have evaluated various MRI-basedmethods as tools to detect fluid retention in healthy subjectsduring administration of fludrocortisone or nifedipine.Sodium and proton T2 MRI in the gastrocnemius musclewere sensitive enough to detect fluid accumulation in boththe fludrocortisone and the nifedipine groups within 2 and 3weeks of administration, respectively. The fludrocortisonegroup demonstrated a pattern that is consistent with fluidretention and later mineralocorticoid escape. Sodium andproton T2 MRI were more sensitive than T1-weighted protonMR signal intensity for the detection of fluid accumulation.Of the clinical procedures tested, only body weight wassensitive enough to detect the changes in fluid retentionproduced by short periods of drug administration. Our studydemonstrates that MRI-based methods may provide valuabletools for the assessment of early fluid retention during thedevelopment of new drugs and for monitoring patients aspart of their clinical management.
Acknowledgment
This study was supported by a grant from GlaxoSmithK-line. C.S.Z. was supported, in part, by a grant from theNational Alliance for Research on Schizophrenia andDepression (YI 2004). P.F.R. was supported, in part, bygrants from the National Institutes of Health (DA15116,DA14178 and DA09448).
References
[1] Niemeyer N, Janney L. Thiazolidinedione-induced edema. Pharma-cotherapy 2002;22(7):924–9.
[2] Shih T, Chang C, Tseng W, et al. Effect of calcium channel blockers onvertebral bone marrow perfusion of the lumbar spine. Radiology 2004;231(1):24–30.
[3] Taherzadeh M, Das A, Warren J. Nifedipine increases microvascularpermeability via a direct local effect on postcapillary venules. Am JPhysiol 1998;275(4 Pt 2):H1388–94.
[4] Wilkinson S, Smith I, Moodie H, Poston L, Williams R. Studies onmineralocorticoid ‘escape’ in cirrhosis. Clin Sci (Lond) 1979;56(5):401–6.
[5] Delea T, Edelsberg J, Hagiwara M, Oster G, Phillips L. Use ofthiazolidinediones and risk of heart failure in people with type 2diabetes: a retrospective cohort study. Diabetes Care 2003;26(11):2983–9 [Comment in Diabetes Care, 2004 Nov;2927(2983):2850–2981; author reply, 2852–2983].
[6] Gorson D. Significant weight gain with rezulin therapy. Arch InternMed 1999;159(1):99.
[7] Yale S, Mazza J. Approach to diagnosing lower extremity edema.Compr Ther 2001;27(3):242–52.
[8] Thomas L, Vander Velde D, Schloerb P. Optimum doses of deuteriumoxide and sodium bromide for the determination of total body waterand extracellular fluid. J Pharm Biomed Anal 1991;9(7):581–4.
[9] Simpson J, Lobo D, Anderson J, et al. Body water compartmentmeasurements: a comparison of bioelectrical impedance analysis withtritium and sodium bromide dilution techniques. Clin Nutr 2001;20(4):339–43.
[10] Lukaski H. Requirements for clinical use of bioelectrical impedanceanalysis (BIA). Ann N YAcad Sci 1999;873:72–6.
[11] Vignaux O, Allanore Y, Meune C, et al. Evaluation of the effect ofnifedipine upon myocardial perfusion and contractility using cardiacmagnetic resonance imaging and tissue Doppler echocardiography insystemic sclerosis. Ann Rheum Dis 2005;64(9):1268–73.
[12] Caruthers S, Paschal C, Pou N, Harris T. Relative quantification ofpulmonary edema with noncontrast-enhanced MRI. J Magn ResonImaging 1997;7(3):544–50.
[13] Fleckenstein J, Chason D. Skeletal muscles. In: Stark D, Bradley W,editors. Magnetic resonance imaging, Vol. 2. St. Louis: Mosby, Inc;1999. p. 1057.
[14] Ploutz-Snyder L, Nyren S, Cooper T, Potchen E, Meyer R. Differenteffects of exercise and edema on T2 relaxation in skeletal muscle.Magn Reson Med 1997;37(5):676–82.
[15] Schedel H, Reimers C, Vogl T, Witt T. Muscle edema in MR imagingof neuromuscular diseases. Acta Radiol 1995;36(3):228–32.
[16] Binzoni T, Quaresima V, Barattelli G, et al. Energy metabolism andinterstitial fluid displacement in human gastrocnemius during shortischemic cycles. J Appl Physiol 1998;85(4):1244–51.
[17] Zuo CS, et al. Proton and sodium MRI assessment of fluid level in calftissue. JMRI 2006;24(1):191–6.
[18] Rennings A, Smits P, Stewart M, Tack C. Fluid retention and vasculareffects of rosiglitazone in obese, insulin-resistant, nondiabetic subjects.Diabetes Care 2006;29(3):581–7.
[19] Hardman JG, Limbird LE, Goodman Gilman A, editors. Goodman andGilman's the pharmacological basis of therapeutics. 10th ed. NewYork: McGraw Hill; 2001. p. 1459–86.
[20] Cappuccio F, Markandu N, Buckley M, Sagnella G, Shore A,MacGregor G. Changes in the plasma levels of atrial natriureticpeptides during mineralocorticoid escape in man. Clin Sci (Lond)1987;72(5):531–9.
[21] Smith S, MacGregor G, Markandu N, et al. Evidence that patients withAddison's disease are undertreated with fludrocortisone. Lancet 1984;1(8367):11–4.
[22] Zhang H, Zhang A, Kohan D, Nelson R, Gonzalez F, Yang T.Collecting duct-specific deletion of peroxisome proliferator-activatedreceptor gamma blocks thiazolidinedione-induced fluid retention. ProcNatl Acad Sci U S A 2005;102(26):9406–11.
[23] MacGregor G. Nifedipine and systemic hypertension. Am J Cardiol1989;64(11):46F–50F.
[24] van Hamersvelt H, Kloke H, de Jong D, Koene R, Huysmans F.Oedema formation with the vasodilators nifedipine and diazoxide:direct local effect or sodium retention? J Hypertens 1996;14(8):1041–5.
[25] Pedrinelli R, Dell'Omo G, Melillo E, Mariani M. Amlodipine,enalapril, and dependent leg edema in essential hypertension.Hypertension 2000;35(2):621–5.
[26] Guyton A, Hall J. Textbook of medical physiology. Philadelphia: W.B.Saunders Co.; 2000.
[27] van der Heijden A, Huysmans F, van Hamersvelt H. Foot volumeincrease on nifedipine is not prevented by pretreatment with diuretics.J Hypertens 2004;22(2):425–30.
[28] Conn J, Knopf R, Nesbit R. Clinical characteristics of primaryaldosteronism from an analysis of 145 cases. Am J Surg 1964;107:159–72.

637C.S. Zuo et al. / Magnetic Resonance Imaging 26 (2008) 629–637
[29] Husted S, Nielsen H, Christensen C, Lederballe Pedersen O. Long-term therapy of arterial hypertension with nifedipine given alone or incombination with a beta-adrenoceptor blocking agent. Eur J ClinPharmacol 1982;22(2):101–3.
[30] Christie S, Walker A, Hicks S, Abeyasekera S. Flavonoid supplementimproves leg health and reduces fluid retention in pre-menopausal
women in a double-blind, placebo-controlled study. Phytomedicine2004;11(1):11–7.
[31] Oelkers W, Marsen B, Molzahn M, Hammerstein J. Spontaneouschanges in weight, leg volume, renin, aldosterone and sex hormonesin patients with cyclical oedema. Klin Wochenschr 1975;53(11):509–17.