
Mr Krishan - ENC Software Solutions (P) Limited - PhillipCapital
103
Vol 8. Issue 2. 1 - 31 MAY 2021 | For Private Circulation Only pg 4. From MAKE-IN-INDIA to MAKE-FOR-THE-WORLD pg 95. Indian Economy: Trend Indicators pg 60, 62, 78, 90. Interviews: Mr Krishan Sachdev, Mr Nipun Singhal, Mr Saurabh Gupta, Mr Maulesh Chhaya pg 97. PhillipCapital Coverage Universe
-
Upload
khangminh22 -
Category
Documents
-
view
1 -
download
0
Transcript of Mr Krishan - ENC Software Solutions (P) Limited - PhillipCapital

Vol 8. Issue 2. 1 - 31 MAY 2021 | For Private Circulation Only
pg 4. From MAKE-IN-INDIA to MAKE-FOR-THE-WORLD
pg 95. Indian Economy: Trend Indicators
pg 60, 62, 78, 90. Interviews: Mr Krishan Sachdev, Mr Nipun Singhal, Mr Saurabh Gupta, Mr Maulesh Chhaya
pg 97. PhillipCapital Coverage Universe

3GROUND VIEW GROUND VIEW 1 - 31 MAY 2021 1 - 31 MAY 2021 2
1st Mar 2021 Vol 8. Issue 1 1st Nov 2020 Vol 7. Issue 4
1st Sep 2020 Vol 7. Issue 3 1st Jul 2020 Vol 7. Issue 2
1st Feb 2020 Vol 7. Issue 1 1st Oct 2019 Vol 6. Issue 6
Ground View - Previous Issues
GROUND VIEW Vol 8. Issue 2. 1 - 31 MAY 2021
FOR EDITORIAL QUERIESPhillipCapital (India) Private Limited. No. 1, 18th Floor, Urmi Estate, 95 Ganpatrao Kadam Marg, Lower Parel West, Mumbai 400 013
MANAGING DIRECTOR & CEO Vineet Bhatnagar
EDITORIAL BOARDManish AgarwallaKinshuk Bharti Tiwari
DESIGN & ILLUSTRATION Chaitanya Modakwww.inhousedesign.co.in
EDITORRoshan Sony
HEAD- INSTITUTIONAL EQUITIES Kinshuk Bharti Tiwari
RESEARCHAUTOMOBILESSaksham KaushalAmar Kant Gaur
AGRI INPUTSDeepak Chitroda
BANKING, NBFCsManish AgarwallaSujal Kumar Pradeep Agrawal
CONSUMERVishal GutkaBinay Shukla
CEMENTVaibhav Agarwal
ECONOMICS Anjali VermaNavneeth Vijayan
ENGINEERING, CAPITAL GOODS Jonas BhuttaSandesh Shetty
HEALTHCARE, SPECIALTY CHEMICALS Surya PatraHrishikesh PatoleRishita Raja
IT SERVICESVibhor SinghalKaran Uppal
INFRASTRUCTUREVibhor SinghalDeepika Bhandari
LOGISTICS, TRANSPORTATIONVikram Suryavanshi
MEDIA, CONSUMER DISCRETIONARY Ankit Kedia Rahul Jain
METALS Vikash Singh
MIDCAPS Deepak AgarwalVineet ShankerKeshav Bharadia
REAL-ESTATEVaibhav Agarwal
STRATEGYAnjali VermaManoj Rawat
TECHNICALSSubodh Gupta
PRODUCTION MANAGERGanesh Deorukhkar
EQUITY SALES & EVENTSRosie Ferns
SALES & DISTRIBUTION Archan VyasAshka GulatiJignesh KananiSneha BaxiAmarinder Sabharwal
CORPORATE COMMUNICATIONS Zarine DamaniaMrunal Pawar

3GROUND VIEW GROUND VIEW 1 - 31 MAY 2021 1 - 31 MAY 2021 2
4. COVER STORY
From MAKE-IN-INDIA to MAKE-FOR-THE-WORLDBy Deepak Agarwal, Vineet Shanker &
Keshav Bharadia
78. INTERVIEW
Mr Saurabh Gupta, CFO, Dixon Technologies
62. INTERVIEW
Mr Nipun Singhal, MD and CEO, Amstrad (OVOT Pvt. Ltd
60. INTERVIEW
Mr Krishan Sachdev, Chairman, Carrier Midea India
90. INTERVIEW
Mr Maulesh Chhaya, Industry Expert, Mentor
CONTENTSLetter from the MD I want to express my sincere gratitude to all the frontline COVID-19
warriors who continue to manage and fight the crisis, especially in this
second wave. I am also proud to see how our country has successfully
rolled out its vaccination strategy and hope that most of our people
are vaccinated by the end of June, bringing an end to this dreaded
second wave. Although the vaccination drive is in full swing, the threat
is very real, so we need to take ample care of ourselves and our fellow
human beings. There is no doubt that fighting and overcoming the
pandemic is going to take collective effort.
The pandemic has caused an economic fallout across sectors.
However, the consumer electronics industry has shown its resilience
and has performed better than anticipated. As people were working
from home, demand for products that offer convenience and provide
a better life (such as washing machines, dryers, air conditioners, TVs,
and other home appliances) increased significantly. Traditionally, the
Indian electronics industry, especially consumer electronics, has been
largely dependent on imports. However, our government’s strong
emphasis is on becoming self-reliant ‘Atmanirbhar’ and promoting
domestic manufacturing (by bringing in schemes like Production
Linked Incentives (PLI) and imposing import restrictions) – which has
started leading to reduction in imports.
The pandemic has exposed the frailties of the supply chain and the
importance of de-risking it at a global scale; the world is keen to adopt
a China +1 strategy in preparation of more challenging times. This, our
midcaps team believes, can lead to an unprecedented opportunity
for the Indian consumer electronics industry, especially for Electronic
Manufacturing Services (EMS). Deepak Agarwal, Vineet Shanker, and
Keshav Bharadia, our midcaps team members, dug deep into the
electronics manufacturing industry from the perspective of its current
very-low global market share, and how India is likely to be a major
electronics manufacturing hub in the future.
In addition to this, the team interviewed Mr Krishan Sachdev, Chairman,
Carrier Midea India, Mr Saurabh Gupta, CFO, Dixon Technologies, Mr
Nipun Singhal, MD & CEO, Amstrad (OVOT Pvt. Ltd) and some other
industry leaders and experts – to understand how well electronics
manufacturing is positioned to capture domestic demand and increase
value addition, and to gauge the global exports opportunity.
Cheers and Best Wishes, Vineet Bhatnagar
95. Indian Economy: Trend Indicators
97. PhillipCapital Coverage Universe Valuation Summary
INTERVIEWS

5GROUND VIEW GROUND VIEW 1 - 31 MAY 2021 1 - 31 MAY 2021 4
COVER STORY
BY DEEPAK AGARWAL, VINEET SHANKER, KESHAV BHARADIA
COVER STORY
BY DEEPAK AGARWAL, VINEET SHANKER, KESHAV BHARADIA
India will see an increase in domestic value-addition across product segments (currently quite below the global average). With the setting up of a
components ecosystem, and scaling up of large-scale electronics manufacturing capabilities in the country, this industry should see tremendous growth.
Manufacturing is the next big theme
From MAKE-IN-INDIA to MAKE-FOR-THE-WORLD

5GROUND VIEW GROUND VIEW 1 - 31 MAY 2021 1 - 31 MAY 2021 4
The Indian electronics industry is in a sweet spot because of the government’s initiatives such as Make-in-India, Aatmanirbhar Bharat, and the de-risking of the global supply chain coupled with an increased adoption of the China+1 strategy worldwide. India has essentially been a net importer of electronics goods and components in the past, due to drawbacks and challenges in local manufacturing. However, this is changing rapidly and experts believe that various government incentives such as PLI, EMC 2.0, SPECS, NPE, along with reformed labour laws, will prove conducive to manufacturing in India for the world.
As a result, There is likely to be huge capex over the next 3-5 years in the electronics industry. India has already seen an influx of investments coming in to scale up manufacturing, from both domestic and international companies.
The global supply chain disruption arising out of China last year has increased awareness amongst companies worldwide about the consequences of doing most of their manufacturing in China. This has led to companies relocating to other countries. India has the lowest penetration rates across consumer durables, a large domestic market, supportive government policies, lower tax rates and the lowest wages, making it a lucrative destination for many global giants and domestic companies.
India will see an increase in domestic value-addition across product segments (currently quite below the global average). With the setting up of a components ecosystem, and scaling up of large-scale electronics manufacturing capabilities in the country, this industry should see tremendous growth.
pg. 6 INDIA’S ELECTRONICS INDUSTRY
Eyeing a bigger share of the global supply chain
_______________________________________ pg. 17 GOVERNMENT’S INCENTIVES FOR INDIA INC
Government is the catalyst that is driving growth
_______________________________________pg. 31 CHINA + 1 STRATEGY
De-risking the global supply chain
_______________________________________ pg. 46 PRODUCTS
Lower penetration and a large domestic market = huge growth
_______________________________________ pg. 91 OUTLOOK
Make in India! But how soon will India make for the world?
_______________________________________
7GROUND VIEW GROUND VIEW 1 - 31 MAY 2021 1 - 31 MAY 2021 6
INDIA’S ELECTRONICS INDUSTRY
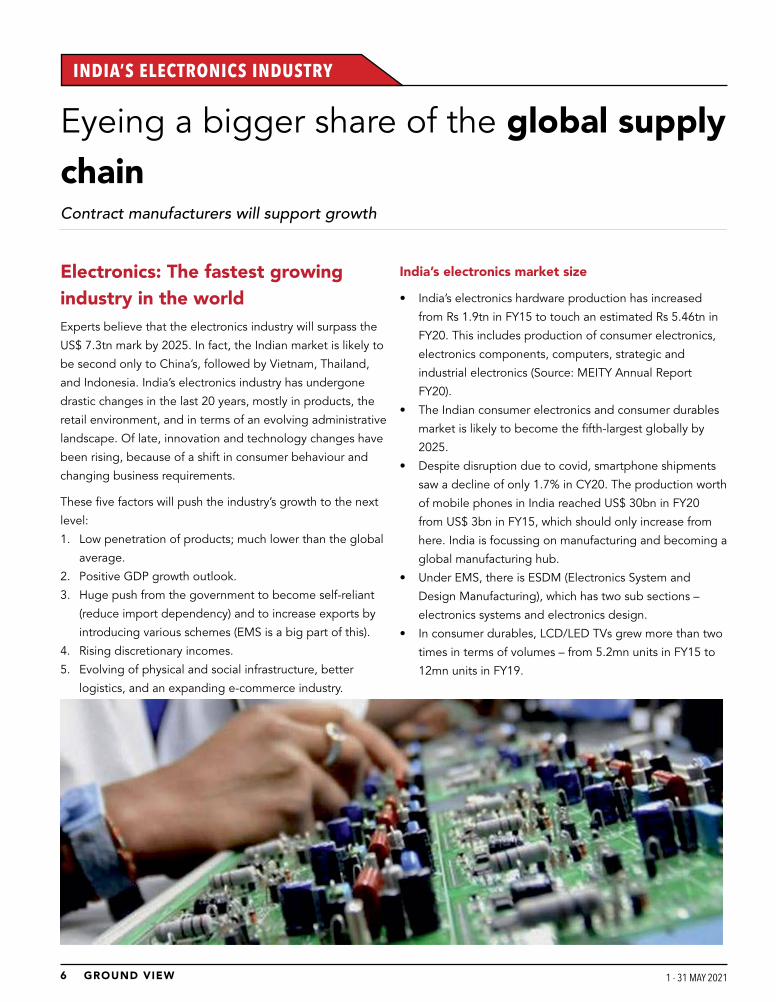
Eyeing a bigger share of the global supply chain Contract manufacturers will support growth
Electronics: The fastest growing industry in the worldExperts believe that the electronics industry will surpass the
US$ 7.3tn mark by 2025. In fact, the Indian market is likely to
be second only to China’s, followed by Vietnam, Thailand,
and Indonesia. India’s electronics industry has undergone
drastic changes in the last 20 years, mostly in products, the
retail environment, and in terms of an evolving administrative
landscape. Of late, innovation and technology changes have
been rising, because of a shift in consumer behaviour and
changing business requirements.
These five factors will push the industry’s growth to the next
level:
1. Low penetration of products; much lower than the global
average.
2. Positive GDP growth outlook.
3. Huge push from the government to become self-reliant
(reduce import dependency) and to increase exports by
introducing various schemes (EMS is a big part of this).
4. Rising discretionary incomes.
5. Evolving of physical and social infrastructure, better
logistics, and an expanding e-commerce industry.
India’s electronics market size
• India’s electronics hardware production has increased
from Rs 1.9tn in FY15 to touch an estimated Rs 5.46tn in
FY20. This includes production of consumer electronics,
electronics components, computers, strategic and
industrial electronics (Source: MEITY Annual Report
FY20).
• The Indian consumer electronics and consumer durables
market is likely to become the fifth-largest globally by
2025.
• Despite disruption due to covid, smartphone shipments
saw a decline of only 1.7% in CY20. The production worth
of mobile phones in India reached US$ 30bn in FY20
from US$ 3bn in FY15, which should only increase from
here. India is focussing on manufacturing and becoming a
global manufacturing hub.
• Under EMS, there is ESDM (Electronics System and
Design Manufacturing), which has two sub sections –
electronics systems and electronics design.
• In consumer durables, LCD/LED TVs grew more than two
times in terms of volumes – from 5.2mn units in FY15 to
12mn units in FY19.

7GROUND VIEW GROUND VIEW 1 - 31 MAY 2021 1 - 31 MAY 2021 6
Work-from home culture is driving growth in electronics
After the government lifted the lockdown in India, the
consumer durables sector saw healthy growth, led by a
strong surge in online sales across product categories.
Restrictions and paranoia caused a drastic shift in the
working style – which is now firmly work-from-home (WFH)
for many job profiles. Compared to metros, consumer
durables sales saw a sharper rise in non-metros due to lower
penetration of appliances, combined with lower intensity of
lockdowns, which resulted in many first-time buyers. Sales
of laptops and tablets saw a sharp uptick due to schooling
from home and WFH. TVs also saw robust sales, as majority
houses had only one TV and found the need for a spare
one, with more members spending most of their time at
home. The need for washing machines, air conditioners,
dishwashers, microwaves increased for the same reasons.
The fact that India’s nationwide penetration for consumer
durables is less than 10%, provides massive headroom for
growth. With an increasing shift towards work-from-home
and bans on imports of ACs with refrigerants and ban on LED
TV imports, domestic companies are set to gain. The uptrend
in growth of the consumer durables sector could continue,
with increase in GDP per capita as shown in the figure given
below, which could lead to higher consumption and higher
consumer spending.
India can use this moment to emerge as a leading electronics
and components manufacturer. COVID-19, along with the
anti-China sentiment is leading to a seismic shift in global
supply chains. Some of the factors that support India are as
follows:
• A post pandemic reality: There has been a change in
global supply chains due to the pandemic. Companies
have realised the drawbacks of being dependant on
only one nation (China) as a single source of supply,
as they faced disruptions to the flow of materials from
there. Trade tensions between the US and China have
added to diversification in supply chains. As multinational
companies look for alternate destinations to set up their
manufacturing bases, they view India as an attractive
option.
• Anti-China sentiment: The US-China trade and tariff
war and increasing anti-China sentiment offer India
an ideal base to leverage the strong push by the
Indian government for manufacturing and to attract
multinational companies looking to set up new bases and
to diversify their supply chains.
• Ease of doing business and policy support: India has
made significant progress in its ‘ease of doing business’
parameters in recent years. This, coupled with many
new government initiatives towards boosting domestic
manufacturing (PLI, SPECS. EMC (2.0), M-SIPS, NPE, PMP,
Make in India, Digital India and Start-up India) should
increase FDI inflows into electronics manufacturing.
Sales of laptops and tablets saw a sharp uptick due to schooling from home and WFH
Companies have realised the drawbacks of being dependant on only one nation (China) as a single source of supply, as they faced disruptions to the flow of materials from there
The government expects PLI schemes for mobile phone manufacturing, AC components, and LEDs to generate total revenues of around Rs 12tn
Trend showing an increase in GDP per capita over the years
Sour
ce: W
orld
ban
k

9GROUND VIEW GROUND VIEW 1 - 31 MAY 2021 1 - 31 MAY 2021 8
• PLI scheme for mobile manufacturing, AC, LED
lighting, laptops, tablets, etc.: The government
has cleared 16 proposals, both from domestic and
international companies, constituting an investment of Rs
110bn under the PLI scheme for mobile manufacturing
worth Rs 10.5tn over the next five years. In the PLI
scheme for AC components and LED lights, the
government has approved an outlay of Rs 62.4bn and
in the PLI for laptops, tablets, and for all-in-one PCs, it
has approved Rs 73.2bn. The government expects PLI
schemes for mobile phone manufacturing to bring in tax
revenues of around Rs 800bn over the next five years,
apart from making India a destination for manufacturing
electronic goods (exports hub) for global giants such as
Apple and Samsung. It expects GST revenues of around
Rs 720bn from Rs 4tn worth of domestically produced
mobile phones. It believes it can generate exports of c.Rs
6.5tn through the PLI scheme over the next five years.
Recent PLI is looking to create component ecosystem in
India.
• Electronics is at the heart of world trade: Electronics
will always remain an integral part of the global
manufacturing processes. India has given electronics and
component manufacturing special attention through its
progressive policies and regulatory frameworks.
• New labour codes: The Indian parliament has passed
four codes on wages, industrial relations, social security,
and occupational safety and health (OSH), which will
ultimately rationalize 44 central labour laws. The code on
wages was passed in 2019, while the three other codes
got clearance from both the Houses in 2020. These
codes are favourable for both employers and employees;
some of the provisions like 14 days of notice prior to
strikes remove the uncertainty in day-to-day operations,
and give some time to employers to come up with an
alternate plan of action, which was not there in previous
labour laws. Experts highlighted that with an increasing
share of contract-labour under the new labour code,
contract manufacturers can scale up manufacturing.

9GROUND VIEW GROUND VIEW 1 - 31 MAY 2021 1 - 31 MAY 2021 8
Structure of the industry
The Indian electronics industry consists of consumer
electronics, industrial electronics, electronic components,
LED products, strategic electronics, computer hardware, and
broadcasting electronics. Communication and broadcasting
devices along with consumer electronics constitute c.40%
of the revenues of the Indian electronics industry; industrial
electronics make up 20.5% and electrical components 22%.
In domestic electronics production, mobiles have seen highest 64% CAGR over FY15-20
Consumer electronics constitute 31% of the electronics industry
Communication and broadcasting devices along with consumer electronics constitute c.40% of the revenues of the Indian electronics industry
Source: meity.gov.in, PhillipCapital Estimates
Sour
ce: m
eity
.gov
.in
11GROUND VIEW GROUND VIEW 1 - 31 MAY 2021 1 - 31 MAY 2021 10
Focus is on self-reliance via ‘Atmanirbhar Bharat’Imports fuel the electronics demand in India; the country
imported c.40% of its electronic goods in FY20, but
this number is lower than 54% in FY15. The reduction
is mainly due to the government’s phased
plans of imposing duties on imported goods
and simultaneously promoting domestic
manufacturing of electronics by incentivizing
production. India exports c.16% of its total
electronics production. The Government
of India is focused on the development of
a component ecosystem in the country to
promote manufacturing, which will substantially
reduce imports and increase exports. Over the
next 2-3 years, we expect a sharp reduction in
mobile phones, TVs, ACs imports.
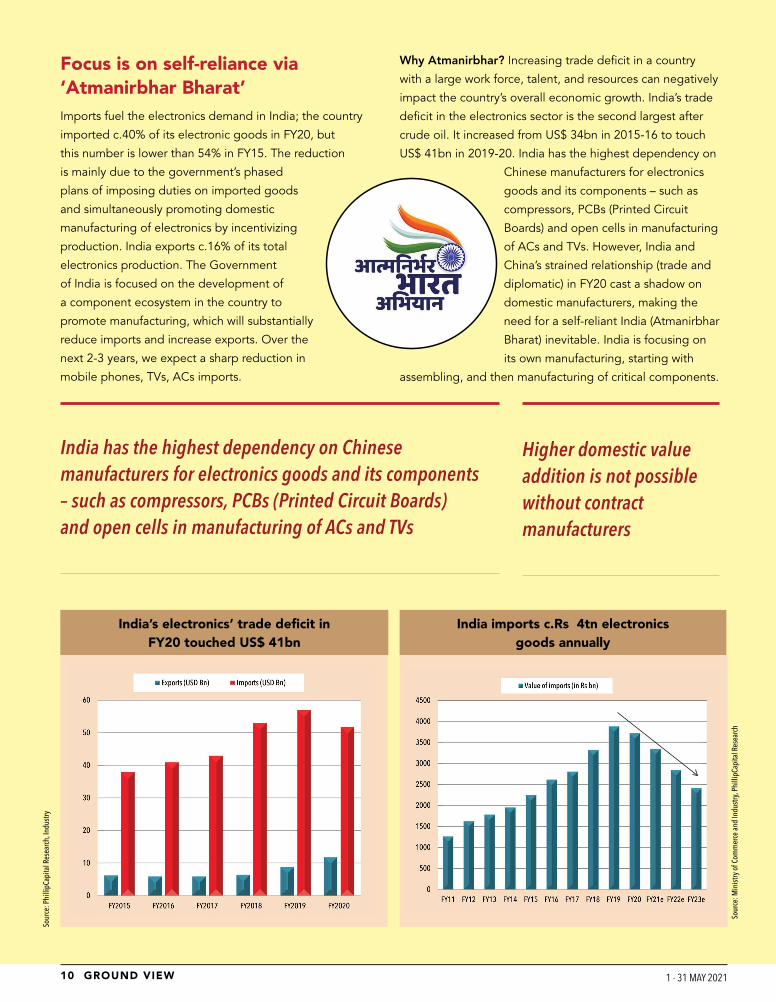
Why Atmanirbhar? Increasing trade deficit in a country
with a large work force, talent, and resources can negatively
impact the country’s overall economic growth. India’s trade
deficit in the electronics sector is the second largest after
crude oil. It increased from US$ 34bn in 2015-16 to touch
US$ 41bn in 2019-20. India has the highest dependency on
Chinese manufacturers for electronics
goods and its components – such as
compressors, PCBs (Printed Circuit
Boards) and open cells in manufacturing
of ACs and TVs. However, India and
China’s strained relationship (trade and
diplomatic) in FY20 cast a shadow on
domestic manufacturers, making the
need for a self-reliant India (Atmanirbhar
Bharat) inevitable. India is focusing on
its own manufacturing, starting with
assembling, and then manufacturing of critical components.
India has the highest dependency on Chinese manufacturers for electronics goods and its components – such as compressors, PCBs (Printed Circuit Boards) and open cells in manufacturing of ACs and TVs
Higher domestic value addition is not possible without contract manufacturers
India’s electronics’ trade deficit in FY20 touched US$ 41bn
India imports c.Rs 4tn electronics goods annually
Sour
ce: M
inist
ry o
f Com
mer
ce a
nd In
dust
ry, P
hilli
pCap
ital R
esea
rch
Sour
ce: P
hilli
pCap
ital R
esea
rch,
Indu
stry

11GROUND VIEW GROUND VIEW 1 - 31 MAY 2021 1 - 31 MAY 2021 10
Due to the Atmanirbhar initiative, over next two years, imports of products like air conditioners, LED TVs, and mobile phones will significantly fall
Product Domestic growth % (last 5 year CAGR)
Current domestic value addition (%)
Domestic manufac-turing can increase
to %
Domestic Market size (in Rs bn)
Current India import %
Mobile 47% 12-15% 30-35% 3165 50-60%
TV 17% 12-15% 25-30% 694 70-80%
RAC 16% 25-30% 70-75% 112 34%
WM 15% 50%-70% 90% 104 15%
Ref 15% 50%-70% 90% 120 35%
LED Lighting 15% 70% 90% 201 22%
Other Small Appliances* 16% 70-90% 90% 100 20-30%
Domestic value addition to increase across product segments over the next 5-7 years
Source: PhillipCapital Estimates
• OEM (original equipment manufacturer): Produces parts and equipment that may be marketed and retailed by
another manufacturer. Could also focus on product innovation and development, and outsource manufacturing to
partners.
• ODM (original design manufacturer): Designs and manufactures a product that is subsequently rebranded and
retailed by other companies that do not carry out their own manufacturing.
• EMS (electronics manufacturing services): Contract electronics manufacturer that makes products for OEMs; could
also aid in design, software development, supply chain management, testing, distribution, and repairs. EMS is a
generally an accepted term for contract manufacturers in the electronics field.
How does the government plan to reduce trade deficit in electronics?
The government wants to increase domestic value addition in electronics
manufacturing. To develop a robust manufacturing base, it has started making
the following moves – providing fiscal incentives to set up local manufacturing
facilities, large-scale cluster development, world-class testing facilities,
and skilling ecosystems – to name a few. Higher domestic value addition is
not possible without contract manufacturers. This is because, for OEMs it
becomes difficult to scale or integrate production of its components. Contract
manufacturers offer skills beyond just manufacturing – in terms of design
and other value-added services. Thus, a big part of the domestic electronics
industry is likely to be in the form of Electronic Manufacturing Service (EMS) or
contract manufacturing.

13GROUND VIEW GROUND VIEW 1 - 31 MAY 2021 1 - 31 MAY 2021 12
Contract manufacturing is projected to grow at a rapid pace, outperforming the entire electronics industry
History of EMS (Electronics Manufacturing Services)
The shift in manufacturing – from in-house to outsourced
– began decades ago. Today, companies are extending
their outsourcing to almost every aspect of production,
from design manufacturing to final product assembly. They
have extended the array of outsourcing activities, beyond
just component manufacturing, to complete production
of a branded product. EMS players have become active
partners in product designing and development, including
extension of the companies they service. In fact, top EMS
executives say that the sustained growth of their companies
depends on the ability to extend their responsibilities to
running the complete supply chain for global players. At
present, domestic EMS companies play a key role in reducing
shipments into India.
However, it was not always like this. Initially, EMS providers
started providing services for PCBA (printed control board
assembly) and consignment work, where they did not own
any material and just executed simple assembly operations.
This industry saw substantial growth in the 1990s due to
downsizing by many OEMs in the economic recession early in
that decade. During the recession, companies were strapped
for capital and were hence loath to invest in new equipment.
However, cash-rich EMS providers were able to enhance
and increase their production capabilities. They continued
investments in latest technologies and expanded their
services within the industry. OEMs, starved of capital, started
focusing on becoming asset-light, which gave agility to their
business models, leading to high profitability and return on
capital employed.
Many OEMs soon realized that hiring contract manufacturers
for producing most of their components was viable, because
with their large client bases, EMS providers were able to
leverage the benefits of year-long full-volume productions
and provide cheaper services. As a result, even after the
economic recovery, global companies continued to shift
their business models towards more contract manufacturing,
instead of ramping up their in-house manufacturing
Contract manufacturing is projected to grow at a rapid pace,
outperforming the entire electronics industry. Companies
have now started focusing more on new, smaller, and online
brands. They focus more on marketing, and outsource
manufacturing to EMS companies. This is likely to benefit
OEM/ODM players of all sizes.
EMS companies are no longer just vendors, but assume full responsibility for the engineering, production, and distribution of products
EMS industry is becoming more difficult
Getting a pie of the rapidly growing contract manufacturing
industry is more difficult than it seems, as economies of
scale, purchasing power, and global logistics are making
the business an increasingly concentrated one. Here,
one must either be a big player or serve a niche market.
Historically, the preferred path in contract manufacturing
was to grow with a major global client, but today, the capital
investment required by an EMS provider is enormous. In
fact, the introduction of surface-mount technology in PCB
(printed control boards) assembly has increased the capital
expenditure. Short product life cycles and declining prices
have prompted contract manufacturers to launch their
own products across geographies and to indulge in a
broad range of services, not just manufacturing.
Electronics System Design and Manufacturing (ESDM)
Electronics hardware manufacturing is an integral part of
the government’s Make in India, Digital India, and Start Up
India initiatives. ESDM plays an imperative role, and has
high weightage, in the government’s vision of garnering US$
1tn economic value from the digital economy by 2025. The
demand for electronics products has been rising in recent
years, mainly due to the surge in the internet penetration
rate in India. Manufacturing has gained traction in this
segment, with increased production and product assembly
taking place across consumer electronics.

13GROUND VIEW GROUND VIEW 1 - 31 MAY 2021 1 - 31 MAY 2021 12
Outlook of ESDM in India
IBEF (Indian Brand Equity Foundation) predicts India’s
ESDM sector reaching US$ 220bn by 2025 expanding at a
16% CAGR between 2019 and 2025, fuelled by a pickup in
public and private investments, rising demand for electronic
products, and a strong policy framework in place. Currently
electronics manufacturing in India contributes to 1.7%
of the GDP, while in China, Taiwan, and South Korea,
the sector’s contribution is significantly large at 12-15%;
as India’s consumption increases, and the dependency on
India has been one of the largest consumers of electronics goods in the past decade
India will see an increase in domestic value-addition across product segments (currently quite below the global average). With the setting up of a components ecosystem, and scaling up of large-scale electronics manufacturing capabilities in the country, this industry should see tremendous growth.
India has just 2% market share in EMS globally; China has the largest share
Sour
ce: I
ndus
try, P
hilli
pCap
ital R
esea
rch
imports decreases, its electronics industry’s contribution to
GDP will also be in a similar range as these countries (over
the next 7-8 years). Industry watchers attribute the growth
in the domestic consumption of electronics mainly to rising
disposable incomes, an increasing middle-class population,
and a drop in prices of need-based electronics in the country.
The Indian electronics industry has the lowest contribution to GDP at 1.7% vs. 12.7% for China
Sour
ce: I
ndus
try, P
hilli
pCap
ital R
esea
rch

15GROUND VIEW GROUND VIEW 1 - 31 MAY 2021 1 - 31 MAY 2021 14
Name HQ Manufacturing locations Revenue (US $mn)
HonHai Precision (Foxconn) Taiwan China, India, Japan, Vietnam, Malaysia, US 1,78,600
Pegatron Taiwan China, Indonesia, US, Europe, India 45672
Wistron Taiwan US, Europe, China, Taiwan, India 29358
Jabil Inc US US, China, Malaysia, India, Europe 25282
Flex Singapore US, China, India, Malaysia, Indonesia 24210
Sanmina US China, Canada, Europe, India, Malaysia, Thailand, US 8234
BYD Electronics China China 7616
Celestica Canada Canada, US, China, Malaysia, Europe, Thailand 5888
Universal Scientific Industrial China China, Taiwan, Mexico, Poland 5343
New Kinpo Group Taiwan US, China, Thailand, Malaysia, Brazil, Mexico, Philippines 4598
Kaga Electronics Japan Japan 4123
Plexus Corp US US, China, Malaysia, UK 3164
Venture Corporations Singapore Singapore, US, China, Malaysia 2702
Benchmark Electronics US US, China, Malaysia, Netherlands, Romania 2268
SIIX Corp Japan Japan, China, Thailand, Indonesia 2052
Shenzhen Kaifa China China, Malaysia, Philippines 1899
Fabrinet Cayman Islands China, Thailand, Japan, US 1584
UMC Electronics Japan Japan, China, Vietnam, Thailand 1310
Integrated Micro Electronics Philippines Philippines, China, Europe, Japan US 1250
Kimball Electronics US US Thailand, China and Poland 1182
Top EMS companies of the world
Government measures to increase local ESDM
manufacturing
The Government of India has allowed 100% FDI in the
ESDM segment under the automatic route even for
Original equipment manufacturers (OEMs) and Integrated
Device Manufacturers (IDMs). PLI will also boost domestic
manufacturing.
Increasing localisation in supply chain and miniaturisation of electronic products have been the two main trends in Indian electronics market
Sour
ce: I
ndus
try, P
hilli
pCap
ital R
esea
rch
Domestic EMS market share in India
Phill
ipca
pita
l res
earc
h
*Note: we have taken only domestic contract manufacturing companies.
15GROUND VIEW GROUND VIEW 1 - 31 MAY 2021 1 - 31 MAY 2021 14
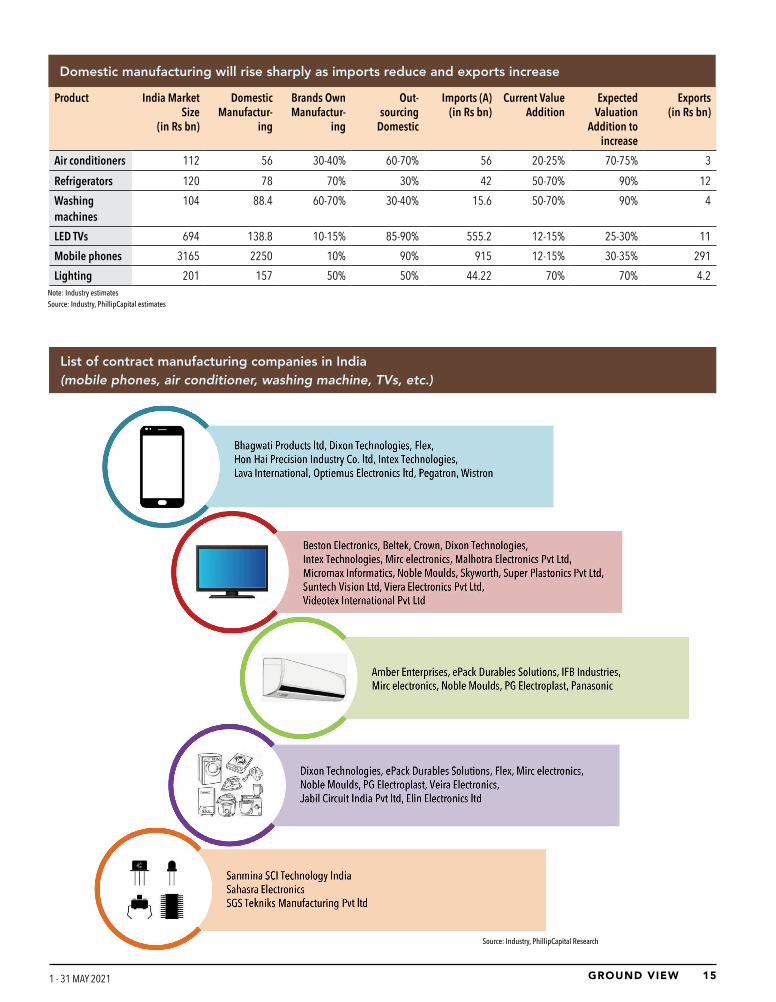
Product India Market Size
(in Rs bn)
Domestic Manufactur-
ing
Brands Own Manufactur-
ing
Out- sourcing
Domestic
Imports (A) (in Rs bn)
Current Value Addition
Expected Valuation
Addition to increase
Exports (in Rs bn)
Air conditioners 112 56 30-40% 60-70% 56 20-25% 70-75% 3
Refrigerators 120 78 70% 30% 42 50-70% 90% 12
Washing machines
104 88.4 60-70% 30-40% 15.6 50-70% 90% 4
LED TVs 694 138.8 10-15% 85-90% 555.2 12-15% 25-30% 11
Mobile phones 3165 2250 10% 90% 915 12-15% 30-35% 291
Lighting 201 157 50% 50% 44.22 70% 70% 4.2Note: Industry estimatesSource: Industry, PhillipCapital estimates
Domestic manufacturing will rise sharply as imports reduce and exports increase
List of contract manufacturing companies in India (mobile phones, air conditioner, washing machine, TVs, etc.)
Source: Industry, PhillipCapital Research

17GROUND VIEW GROUND VIEW 1 - 31 MAY 2021 1 - 31 MAY 2021 16
Major contract manufacturers companies in India Mobile phone and component manufacturing ecosystem on the Indian map. A large numbers of contract manufacturers are located in and around the national capital region
Source: Industry, PhillipCapital Research
Many global companies (Wistron, Foxconn, etc.) have started coming to India. Domestic manufacturers have increased their capacity significantly and are focusing on contract manufacturing

17GROUND VIEW GROUND VIEW 1 - 31 MAY 2021 1 - 31 MAY 2021 16
Source: Company, PhillipCapital Research
GOVERNMENT’S INCENTIVES FOR INDIA INC
Government is the catalyst that is driving growthIt has implemented several policy measures to kick-start electronic manufacturing in India
List of GoI schemes, funds, and cluster programs over the years
Government’s push for domestic manufacturing
Electronics Development Fund (EDF)
The Government of India set
up EDF as a Fund of Fund
(FOF), through which it has
invested into several other
funds (also known as Daughter
Funds”). These daughter
funds then invest in companies
that have business around
electronics. EDF enables
creation of an ecosystem
for providing risk capital to
companies developing new
technologies in the areas of
electronics, nano-electronics,
and IT. This fund fosters
R&D and innovation in these
technology sectors. This was
one of the most important
strategies to enable creating an
electronics industry ecosystem
in India.

19GROUND VIEW GROUND VIEW 1 - 31 MAY 2021 1 - 31 MAY 2021 18
Name of the daugh-ter fund
Amount in-vested by EDF
(in Rs mn)
Total amount invested by the daughter fund
start-up/ companies (in Rs mn.)
No of investee start-ups/ Compa-nies of Daughter
fund
Portfolio Companies (Investee)
Endiya Seed Co-cre-ation fund
243.3 1158.8 12 Steradian Semi, AiCS Advance AI Compute, Cell Propulsion
KARSEMVEN Fund 131.1 441.5 10 Graphene, Prodigy Technoventions, SenseGiz, Pinaka, Greendzine, Remido, CNB Technologies, Aptener Mechatronics, Open Appliances, Bellatrix Aerospace and Bionic Yantra
YourNest India VC Fund II
117.1 434 14 Argoid, Koinearth, Uptime AI, Xpedize, Lightspeed Labs, Dozee, Mauna.ai, Miko, Cron AI, Practically, Lavelle Networks, Trezi, CredRight, Orbo
PI Venture Fund-1 70.1 872.3 10 Sigtuple, Ten3T Health (Cicer), Zenatix, Niramai, Customer Suc-cess Box, Locus, OweMe, True Lark, SwitchOn, Wysa, Agnikul, Pyxis
Unicorn India Venture Fund
128.6 494.8 17 Boxx.ai, ChitMonks, Clootrack, Fedo, Finin, Finsall, Fund Our-selves, GamerJi, Genrobotics, GrabonRent, Goldex, Inc42, inntot, iDefigo, Libryo, Moteefe, SmartCoin, supplyCompass, Sascan, Sequretek, Probus, Perfit 3D
Aaruha Technology Fund-I
40.2 134.9 8 Aus, Aibono, Singularity, CloudSEK, Bellatrix, Anlyz, Aics, Steradi-anSemi, SmarterBiz
Venture East Proac-tive Fund II
448.4 2073.5 11 Infinite uptime, Acko, Moengage, Portea, Kissht, Sresta's 24 Mantra, Edge Networks, Seclore, Mardil Medical, Perpetual, Ben Franklin, iNurture, Boonbox, Indus OS, Orca System, ekincare, Iqlect, Bog Orchid, Orion Edutech, E2E Retail, Richcore, CPO, Diabetomics, iMedX, Onebreath
Total 1178.8 5609.8 75
Daughter funds, funded by Electronics Development Fund (EDF), set up by the GoI
Source: MEITY Annual Report
Preference given to domestic manufacturers over importers
To promote ‘Make-in India’, the
government issued a public
procurement order, where it gives
preference to ‘Class 1 local suppliers’
in procurement of all goods, services
or works; the government defines
these supplier or service providers as
those whose goods, services, or work
offered for procurement have local
content equal to or more than 50%.

19GROUND VIEW GROUND VIEW 1 - 31 MAY 2021 1 - 31 MAY 2021 18
National Policy on Electronics, 2019
NPE, 2019 envisages India as a global hub for ESDM, with
a thrust on exports, by encouraging and driving capabilities
in the country for developing core components, including
chipsets, and creating an enabling environment for the
industry to compete globally. The NPE aims to create a
competitive electronic manufacturing sector and to achieve
a turnover of about US$ 400bn by 2025, and targets a
production of 1bn mobile handsets for export. It also aims
to create 10mn employment opportunities in the country by
2025.
NPE aims for a turnover of about US$ 400bn by 2025, and production of 1bn mobile handsets for exports
Phased manufacturing plans
Phased manufacturing plans first introduced basic custom
duty in products that can be easily sourced domestically
and then in products that are difficult to source, and are
high in terms of domestic value addition. Under this, in
the near term, products like display assemblies and PCBs
(printed circuit boards) that have lower domestic output,
large domestic opportunity, and high value addition – offer
the most obvious investment opportunities for domestic
manufacturers. Although PCB manufacturing has already
begun in India, it still needs to undergo changes to happen
at a larger scale.
India has been investing in capabilities in the manufacturing
of cells and antennas over a longer period; these products
could be the high value adding components and a realistic
long-term goal for the country. Manufacturers could
consider these products for sub-assembly in India. With the
announcement of levies on imports of display units, India
should witness a rise in domestic manufacturing. However,
components such as camera modules, ICs, semiconductors
require substantial investments and would most likely
continue to be imported. Domestic manufacturing in these
components would take time and would need to develop
gradually over time.
Year Sub-assembly Value addition
Basic Cus-tom Duty
(BCD)
2016-17 (i) Charger/ Adapter, (ii) Battery Pack, (iii) Wired Headset
Low 15%
2017-18 (iv) Mechanics, (v) Die Cut Parts, (vi) Microphone and Receiver, (vii) Key Pad, (viii) USB Cable
Moderate 15%
2018-19 (ix) Printed Circuit Board Assem-bly (PCBA)
High 20%
2018-19 (x) Camera Module, (xi) Connectors
High 10%
2019-20 (xii) Display Assembly, (xiii) Touch Panel/ Cover Glass Assembly (xiv) Vibrator Motor / Ringer
High 10%
Phased manufacturing plans in cell phones
Source: meity.gov.in
Tariff rationalization
Rationalization of tariff structures is an ongoing process. The
government rationalised tariff structures to promote domestic
manufacturing of electronic goods (such as cellular mobile
handsets, televisions, LED products). It started a phased
manufacturing programme (PMP) to promote domestic value
addition in mobile handsets and air conditioners (including
parts and components), manufacturing of mobile handsets
and their parts/ components has been steadily moving from
semi-knocked down (SKD) to completely-knocked down
(CKD), increasing value addition.
Item BCD up to 13.12.17 BCD w.e.f 14.12.17
Cellular Mobile Handsets
10% 15% (Further increased to 20% in FY19 budget)
Set top box TV 10% 20%
Colour TV 10% 20%
Microwave ovens 10% 20%
DVR/ Network Video Recorder
10% 15% (further increased to 20% in FY20 budget)
CCTV Camera/ IP Camera
10% 20%
LED Lamps 10% 20%
Smart meters 10% 15%
Power banks* 10% 20%
Increase in BCD (Basic custom duty) in products, which can be sourced/ assembled in India
*w.e.f 30.01.2019, BCD on power banks has increased from 10% to 20%

21GROUND VIEW GROUND VIEW 1 - 31 MAY 2021 1 - 31 MAY 2021 20
Rate of Duty
Appliances From To
Electronic goods, parts thereof
Copper and articles thereof used in manu-facturing of specified electronic items
Nil Applicable BCD
PCBA of cellular mobile phones (with effect from 01.04.2020)
10% 20%
Fingerprint readers for use in cellular mobile phones
nil 15%
Vibrator/ringer of cellular mobile phones (with effect from 01.04.2020)
nil 10%
Display panel and touch assembly of cellular mobile phones (with effect from 01.10.2020)
nil 10%
Headphones and earphones Applicable BCD
15%
Following parts of microphone for use in manufacture of microphone namely
10% nil
Government of India announced an increase in duty on electronics goods in the Annual Budget FY22
Electronic Manufacturing Cluster (EMC 2.0)
Purpose: To create and strengthen the infrastructure
ecosystem for electronics manufacturing and provide
support for creating world-class infrastructure – for attracting
investments in the ESDM sector
• The scheme was notified in October 2012.
• It helps with projects in ‘greenfield electronics
manufacturing clusters’ – here, aid is available up to 50%
of the project cost, subject to a ceiling of Rs 500mn for
every 100acres of land.
• For brownfield EMC (common facility centre), it offers aid
(as a grant) up to 75% of the cost of infrastructure, subject
to a ceiling of Rs 500mn.
• EMCs are poised to attract an investment of over Rs
548bn over the next 5-7 years, and are likely to generate
employment opportunities for about 640,000 people
once fully operational.
EMCs are poised to attract an investment of over Rs 548bn over the next 5-7 years
Production Linked Incentives (PLI) scheme – a game changer
The domestic electronics manufacturing sector in India is
not at par with competing nations, as it faces a ‘disability’
of around 8.5-11.0% due to the following – lack of proper
infrastructure, logistics framework and domestic supply chain,
high finance cost, lack of good quality power, insufficient
training in required skills, limited design capabilities, and
insufficient focus on R&D by the industry.
To alleviate its debility, the government introduced the
PLI (Production Linked Incentive) scheme on 1 April
2020, to boost manufacturing of electronics in India,
especially attracting large-scale investments in smartphone
manufacturing. PLI entails not just manufacturing, but also
assembly, testing, marking, and packaging units. The scheme
has the potential to boost the domestic manufacturing
of electronics in India and make the country globally
competitive. The scheme entails an incentive of 4-6% on
incremental sales of goods manufactured (over the base
year) under target segments, to eligible companies, for a
duration of five years after the base year. Base year for the
PLI scheme is 2019-2020 and the target segments covered
under the scheme include mobile phones, ACs, LED lighting,
laptops/notebooks, computer hardware, and IoT devices. PLI
schemes could extend to other electronics categories with
high import dependency, if the response is encouraging.
Sector Total outlay (in Rs bn)
Advanced cell chemistry battery storage 181
High efficiency solar PV modules 45
Large scale electronics manufacturing 410
Electronics (Laptops/Notebooks, Server, IoT devices, Computer Hardware)
50
Automobiles & Auto components 570
Pharmaceutical drugs APIs and KSMs 56
Medical devices 34
Pharmaceutical drugs (Specialised pharma prod-ucts, APIs/KSMs/Dis etc)
300
Telecom & Networking products 152
Textiles 107
Food processing 154
Specialty steel 63
White goods (Air conditioners & LED) 62
Total 2185
Outlay for PLI - 5-year period
Sour
ce: m
eity
.gov
.in
Sour
ce: m
eity
.gov
.in

21GROUND VIEW GROUND VIEW 1 - 31 MAY 2021 1 - 31 MAY 2021 20
Electronics manufacturing cluster (EMC) sites approved by GoI
Source: meity.gov.in
Tamil Nadu: Electronics and Hardware Manufacturing Policy aims at an output of US$ 100bn by 2025
Uttar Pradesh government: In August 2020, the UP government unveiled a new electronics manufacturing policy to attract foreign investors willing to shift their production base to India, aiming to garner US$ 540bn in the next five years

23GROUND VIEW GROUND VIEW 1 - 31 MAY 2021 1 - 31 MAY 2021 22
Mobile PLI
• Incentive: 4-6% PLI for 5 years.
• Outlay: Rs 409.95bn (US$ 5.5bn).
• Tenure: 5 years. Base year FY19-20. Incentives applicable
from 1 August 2020.
• Despite recent challenging times, mobile PLI will lead
to production worth Rs 350bn and investments worth Rs
130bn by applicant companies.
• Additional employment generation is 22,000 jobs.
AC / LED PLI
• Incentives are 4-6% on incremental sales for 5 years.
• Effective 1 April 2021.
• Open for applications for 6 months.
• Expected incremental investment from AC / LED PLI is Rs
79.2bn for an incremental production of Rs 1.68tn over
five years.
• The export opportunity due to AC / LED PLI is of
Rs 644bn over five years; it can create additional
employment of 100,000 jobs.
• Tax revenue likely at Rs 113bn in direct taxes and Rs
380bn through GST over the next five years
Domestic companies International com-panies
Electronic component companies
Lava Hon Hai Precision Industry Co Ltd
AT&S
Bhagwati Products Ltd
Rising Star Ascent circuits
Padget Electronics Samsung Visicon
UTL Neolyncs Wistron Walsin
Optiemus Electronics Pegatron Sahasra Electronics
NeoLync
PLI highlights Benefits
Incentives for ACs & LED 4-6% on incremental sales for 5 years
W.e. f 1/4/2021
Incremental investment Rs 79.2bn
Incremental production Rs 1.7tn
Exports Rs 644bn
Incremental employment 1lakh jobs
Direct tax revenue Rs 113bn
GST Rs 380bn
Companies approved under PLI for mobile phone manufacturing
Production-linked incentives scheme’s benefits over the next 5 years
Source: meity.gov.in, media reportsSource: meity.gov.in
Mobile PLI will lead to production worth Rs 350bn and investments worth Rs 130bn by applicant companies
The export opportunity due to AC / LED PLI is of Rs 644bn over five years
Modified special incentive package scheme (M-SIPS)
To promote large-scale manufacturing in the country, the Government of India’s M-SIPS scheme will offset disability and
attract investments in ESDM. The scheme entails incentives for investments on capital expenditure, of which 20% is for
investments in Special Economic Zones (SEZs) and 25% for non-SEZs. The scheme provides incentives for both new and
expanding units. For some high-capital-investment projects like fabrications, it reimburses central taxes and duties. The
goal of this scheme is to reach net zero imports in electronics by creating an indigenous manufacturing ecosystem for
electronics in India.

23GROUND VIEW GROUND VIEW 1 - 31 MAY 2021 1 - 31 MAY 2021 22
The key objective of the PLI scheme is to increase the
domestic value addition in ACs to 75% from the current 25%
in the next five years, and in LED lighting to 75% from the
current 40%.
• This will lead to an increase in manufacturing of
components of Air Conditioners:
n Components include High Value / Low Value
Intermediates or sub-assemblies or a combination
thereof.
n High Value Intermediates: namely Copper Tubes,
Aluminium Foil and Compressors.
n Low Value Intermediates: namely PCB assembly for
controllers, BLDC motors, Service Valves and Cross
Flow fans for AC and other components.
• Components of LED lighting will see higher
manufacturing in India:
n LED lighting products (core components like LED
chip packaging, resisters, ICs, fuses and large-scale
investments in other components, etc.)
n Components of LED lighting products (like LED
chips, LED drivers, LED engines, mechanicals,
packaging, modules, wire wound inductors and other
components).
Overall, with this PLI, the industry will see a capex of more
than Rs 80bn over the next 5-6 years in ACs and LED
lighting.
Large Investment Normal Investments
Segment & % of BOM
Total Invest-
ment (Rs mn)
-A
Total Reve-
nue (Rs mn) -B
Total Incen-
tive (Rs mn) -C
Avg. In-centive
(%)
Invest-ment/Incen-
tive (x) (A/C)
Sales/Asset
(x)
Total Invest-
ment (Rs mn)
Total Reve-
nue (Rs mn)
Total Incen-
tive (Rs mn)
Avg. In-centive
(%)
Invest-ment/Incen-
tive (x) (A/C)
Sales/Asset
(x)
AC
ACs (Components)* 6,000 97,500 4,800 4.9% 1.3 3.82 3,000 41,250 1,988 4.8% 1.5 3.67
High Value inter-mediates of ACs**
40%-50% % of BOM
4,000 53,750 2,575 4.8% 1.6 3.64 2,500 37,500 1,825 4.9% 1.4 3.75
Lower Value intermediates of ACs***
20% of BOM 1,000 15,000 730 4.9% 1.4 3.75 500 7,500 365 4.9% 1.4 3.75
LED light
LED Lights # 3,000 60,000 2,970 5.0% 1.0 4.62 1,000 18,000 876 4.9% 1.1 4.50
Components of LED Lights ##
250 4,500 219 4.9% 1.1 4.50 100 1,800 88 4.9% 1.1 4.50
Source: DPIIT, Ministry of Commerce and Industry, PhillipCapital India Research
Note:AC: * High Value Intermediates or Low Value intermediates or sub-assemblies or a combination thereof. **Aluminum Foil, Cu tube, Compressor. ***PCB Assembly for Controllers, BLDC Motors, Service Valves for ACs, Cross Flow Fans and other components. LED light: # (Core Components like LED Chip Packaging, Resisters, ICs, Fuses and large scale investments in other components etc.) ## LED Chips, LED Drivers, LED Engines, Mechanicals, Packaging, Modules, Wire Wound Inductors and other components.
PLI Scheme: Details of the next five years

25GROUND VIEW GROUND VIEW 1 - 31 MAY 2021 1 - 31 MAY 2021 24
PLI for solar PV modules
The government has extended the PLI scheme to the
manufacturing of solar PV modules, with a budgetary outlay
of Rs 45bn. The PLI scheme for solar photo voltaic modules
is expected to add 10,000 MW capacity of integrated solar
PV manufacturing plants and bring direct investment of
around Rs 172bn, thus creating 30,000 direct jobs. The
scheme comes in the backdrop of India’s decision to impose
40% BCD on solar modules and 25% on solar cells from 1st
April 2022, a move that would make imports costlier and
encourage local manufacturing.
PLI Segment (in Rs mn) PC: est. no of Players each investment
segment* Incentive
Large Invest-ment
Normal Invest-ment
Total
ACs (Components) 4 4,800 1,988 6,788
High Value intermediates of Acs 3 2,575 1,825 4,400
Lower value intermediates of Acs 9 730 365 1,095
LED Lights 3 2,970 876 3,846
Components of LED Lights 8 219 88 307
Total (A) 27 11,294 5,141 16,435
Government has approved the PLI for AC and LED Lights (B) 62,380
Average. No. of Players each segment & investment size (B/A =C)
4
Total Approx. players can apply (C*Segment*Investment type) 38
PC Estimates: In AC- Major Players in Lower Value intermedi-ates & In Components of LEDs
53
Revised PLI: c.40+ applications should come in if all segments receive applications
Source: DPIIT, Ministry of Commerce and Industry, PhillipCapital EstimatesThrough this PLI we expect 40+ applications, companies globally will come to set up manufacturing for lower value intermediaries and components in AC and LED components. Indian manufacturers will form JVs with global companies to set up manufacturing for high value AC intermediaries.
PLI for IT hardware
• Incentive: 4-1% on net incremental sales over base year
of FY20
• Outlay: Rs 73.25bn
• Duration: 4 years
• 15 companies will benefit; 5 global players, 10 domestic
• PLI for IT hardware incentives will generate additional
investments of Rs 27bn and incremental production of Rs
3.26tn, of which 75% would be exported
PLI for IT hardware incentives will generate additional investments of Rs 27bn and incremental production of Rs 3.26tn
Making India a global hub of electronics (Production linked incentive (PLI) scheme for IT hardware approved)
• The government expects this PLI to reduce import
dependency for IT hardware, which is currently at 80%.
• It expects domestic value addition to rise from 5-10% at
present to 20-25% by 2025.
• The scheme could generate 180,000 direct and indirect
jobs over the 4-year period.
Sour
ce: I
ndus
try, m
eity
.gov
.in

25GROUND VIEW GROUND VIEW 1 - 31 MAY 2021 1 - 31 MAY 2021 24
Ince
ntiv
eAn
dhra
Pra
desh
Utta
r Pra
desh
Tela
ngan
aM
ahar
asht
raTa
mil
Nadu
Karn
atak
a
Capi
tal
Subs
idy
10%
of t
otal
inve
stmen
t up
to
Rs 5
0mn
• 15
% o
r Rs 1
00m
n (m
axi-
mum
) for
inve
stmen
ts up
to
Rs 2
bn.
• 15
% o
r Rs 1
.5bn
max
imum
fo
r inv
estm
ents
from
Rs
2-10
bn.
• Ad
ditio
nal s
ubsid
y of 1
0%
or R
s 1bn
on
FCI e
xcee
ding
Rs
10b
n.
Capi
tal s
ubsid
y of 2
0% w
ith
a cei
ling
of R
s 100
mn
per
com
pany
in ca
se o
f mob
ile
man
ufac
turin
g un
its
Fo
r lar
ge e
nter
prise
s, 15
%
for A
, 20%
for B
, 25%
for C
wi
th e
mpl
oym
ent o
f ove
r 500
pe
ople
. For
meg
a ent
erpr
ises,
18%
for A
, 24%
for B
and
30%
fo
r C w
ith e
mpl
oym
ent o
f ove
r 2,
000
peop
le
10%
up
to a
max
of R
s 10
0mn
for r
egist
ered
KES
DM
com
pani
es
Powe
r Su
bsid
y50
% to
micr
o, 4
0% to
smal
l, 25
% to
med
ium
and
10%
to
larg
e sc
ale
indu
stry l
imite
d to
Rs
5m
n fo
r a p
erio
d of
5 ye
ars
from
the
date
of C
oCO
Ex
empt
ion
of e
lectr
icity
dut
y fo
r a p
erio
d of
10
year
sEl
igib
le n
ew E
SDM
uni
ts ex
empt
from
pay
ing
elec
tric-
ity d
uty f
or 1
5 ye
ars.
Powe
r su
bsid
y to
the
tune
of R
s 1 p
er
unit
for a
per
iod
of 3
year
s in
cate
gory
A &
B an
d 5
year
s in
othe
rs su
bjec
t to
ceili
ng.
Exem
ptio
n of
ele
ctrici
ty co
st fo
r 5 ye
ars
Powe
r sub
sidy i
s app
licab
le
for a
ll KE
SDM
regi
stere
d co
mpa
nies
Land
25%
reba
te o
n la
nd co
st lim
ited
to R
s 1m
n pe
r acr
e25
% re
bate
on
land
cost
25%
reba
te o
n la
nd co
st fo
r a
perio
d of
10
year
s
Re
bate
on
land
cost
Tax R
e-im
burs
e-m
ent
100%
tax r
eim
burs
emen
t for
a p
erio
d of
10
year
s sub
ject
to a
max
of 1
00%
FCI o
ther
th
an la
nd
100%
stat
e GS
T rei
mbu
rse-
men
t up
to a
max
FCI o
f 100
%
(exc
ept l
and)
100%
tax r
eim
burs
emen
t for
a pe
riod
of 5
year
s for
micr
o an
d sm
all c
ompa
nies
or m
ax o
f Rs
50m
n. R
eim
burs
emen
t is
appl
icabl
e fo
r 7 ye
ars f
or la
rge
com
pani
es
Reim
burs
emen
t for
GST
Skill
Up
grad
a-tio
n
Skill
upg
rada
tion
train
ing
50%
re
imbu
rsem
ents
with
a ca
pSk
ill u
pgra
datio
n up
to 5
%
of FC
ISk
ill u
pgra
datio
n by
pro
visio
n of
75%
of t
rain
ing
fee
for
train
ing
cour
ses
Stam
p du
ty e
x-em
ptio
n
100%
reim
burs
emen
t of
stam
p du
ty o
n sa
le/le
ase
of
deed
s on
first
trans
actio
n an
d 50
% th
ereo
f on
the
seco
nd
trans
actio
n
100%
reim
burs
emen
t on
stam
p du
ty fo
r ind
ividu
al
ESDM
uni
ts
100%
reim
burs
emen
t of
stam
p du
ty
Elig
ible
uni
ts ex
empt
ed
from
pay
ing
stam
p du
ty fo
r ac
quiri
ng la
nd an
d fo
r loa
n te
rm p
urpo
ses
50%
exe
mpt
ion
for A
&B
distr
ict. 1
00%
exe
mpt
ion
for
C di
strict
100%
for s
tartu
ps an
d M
SMEs
75
% fo
r lar
ge an
d m
ega
ente
rpris
es
Inve
st-m
ent
subs
idy
20%
lim
ited
to R
s 2m
n fo
r M
SME,
and
addi
tiona
l 5%
in-
vestm
ent s
ubsid
y for
wom
en/
SC/S
T ent
repr
eneu
r
20
% o
r a m
ax o
f Rs 2
0mn
for
first
25 e
ligib
le la
rge
com
pa-
nies
. Rs 5
mn
for fi
rst 5
0 sm
all
and
micr
o co
mpa
nies
Stat
e p
olic
ies
for
man
ufac
turi
ng o
f el
ectr
oni
cs a
nd e
lect
roni
c co
mp
one
nts
Note
: Diff
eren
t dist
ricts
in Ta
mil
Nadu
are
segr
egat
ed in
to d
iffer
ent c
ateg
orie
s nam
ely A
, B a
nd C
Sou
rce:
Sta
te g
ovt.,
Indu
stry
. Phi
llipC
apita
l res
earc
h

27GROUND VIEW GROUND VIEW 1 - 31 MAY 2021 1 - 31 MAY 2021 26
Impact of government policies
• Private investment: The electronics sector has attracted
US$ 14bn investment in the past five years for capacity
expansion. The higher import percentage provides
business opportunity to manufacture goods locally, which
can attract even more investment from Indian players.
• Employment opportunity: The sector employs close to
300,000 people, across product categories, including air
conditioners, refrigerators, mobile phones and washing
machines. With an increase in localisation, it has the
potential to employ additional 200,000 people in the
next five years. India has a competitive advantage over
other emerging market countries in Asia due to its wide
availability of cheap labour.
• Positive impact on component manufacturers and
adjacent sectors: Localisation of components for air
conditioners, mobile phones, refrigerators, etc, at scale,
can help reduce the cost gap with China and can also
help galvanize the micro, small, and medium enterprise
(MSME) sector.
• Operational efficiencies: The Indian consumer durables
industry has seen supply-chain disruption in all major
product categories due to heightened supply chain
localization. However, dependency on external factors
can be reduced, achieving efficiencies in supply chain,
operational procedures, inventory volumes, and logistics.
• Economies of scale and automation: With more
investments coming in, India’s economies of scale have
the potential to mirror that of China’s, which is where
the world’s largest home-appliances manufacturing
takes place. China is also the source of imports across
the world, driven by its large domestic market and early
investments in scale. The number of units sold of ACs/
washing machines/refrigerators in China are 19x/65x/9x
those in India. China has the largest AC compressor
manufacturing hub, with a total installed capacity of 86%
of the world. It has emerged as a low-cost manufacturing
spot for consumer durables, and is responsible for 33.5%
of the global AC exports and 23% of global refrigerator
exports. However, India will eventually secure a decent
portion of the total global exports market for air
conditioners and other consumer durables. In the current
environment, when the world is looking for an alternate
hub, India is amongst the top countries that stand to
benefit. The opportunity is ripe for Indian manufacturers
to step up and make a dent at the global level in the
consumer durable industry.
• Becoming competitive in products like washing
machines, refrigerators, etc., and mobile phones. With
the government’s initiatives, Indian manufacturers have
a strong chance of becoming cost competitive in some
products. Although, washing machines and refrigerators
have no direct schemes (such as PLI), a robust electronics
components ecosystem due to PLI in large-scale
electronics manufacturing will lead to the already
indigenised product category, i.e., semi-automatic
washing machines and refrigerators (of capacity below
300 litres) becoming competitive in terms of exports.
India aims to become a strong electronics component manufacturing base
The number of units sold of ACs/washing machines/refrigerators in China are 19x/65x/9x those in India

27GROUND VIEW GROUND VIEW 1 - 31 MAY 2021 1 - 31 MAY 2021 26
Mechanism Impact on disability Remarks
Production linked incentives scheme 4%-6% Financial incentives on large scale production
SPECS 0-1.6% 20% capex subsidy annualised on 8% capital cost
EMC 2.0 1% Logistics, Plug and Play infrastructure
RoDTEP 0.2%-0.7% In lieu of MEIS as a duty-free scrip administered by DGFT
Concessional Rate of Income Tax 0.2%-0.9%
Ease of doing business measure 0.50% Custom bonded warehouse, Port logistics, ECB reforms
Total 5.9%-10.7%
Impact of new and existing schemes
Recent investments in EMS in India The impact of the government’s policies has led to an
increase in global interest, which in turn has boosted
investments in the country. According to DPIIT (Department
for Promotion of Industry and Internal Trade), FDI inflows into
the electronics sector between FY01 and FY20 stood at US$
2.91bn.
Some key investments and developments in the Indian
ESDM and electronics segment are as follows:
• Apple’s contract manufacturers: In September 2020,
Wistron, Pegatron, and Foxconn announced investments
of +US$ 900mn over the next five years. The investments
are mainly for capacity expansions and ramping up of
domestic production of mobile phones.
• Samsung Electronics and Apple Inc.’s assembly
partners: Announced investments worth US$ 110bn to
establish mobile-phone manufacturing units in August
2020.
• Hon Hai Precision Industry Co Ltd: Plans to invest US$
1bn to ramp up production at its Sriperumbudur plant
in Tamil Nadu over the next three years and hopes to
generate 6,000 additional jobs.
• Aequs: In October 2020, it committed to an investment
of Rs 35bn towards setting up of a consumer electronics
cluster in Karnataka.
• Tata Group: Announced its plan to invest Rs 50bn in
October 2020 to set up an Apple phone component
plant in Hosur, Tamil Nadu.
• Sahasra Electronics: In October 2020, it announced
plans to invest Rs 3.5bn in assembling mobile phone
memory chipsets, laptop hard drives, and motherboards
in India over the next four years. The company also set up
two manufacturing facilities in UP and Rajasthan.
• PG Electroplast: Started production at its AC ODU
(outdoor unit) assembly line in 2020; the complete
ODU plant will begin manufacturing in 2021. The plant
is at Ahmednagar in Maharashtra and should generate
revenue of Rs 1bn for the company in the first year.
• Phillips: In May 2020, it announced investments worth Rs
2.5-3.0bn to boost its manufacturing and R&D facilities in
India.
• Nokia: It partnered with Flipkart in November 2019 to
enter the consumer durables market in India.
• Godrej Appliances: In January 2020, it announced plans
to foray into the air cooler segment with a target of
acquiring 15% market share in the next five years.
Source: Industry, PhillipCapital research
Key Segments (USD Bn)
Global Market Size
India
Market Size ExportsTargeted Produc-
tion in FY25Targeted Value
Addition by FY25
2019 2025 CAGR % 2019 2025 CAGR % 2019 2025 CAGR %
Mobile Phone 495 640 4% 24 80 22% 0.16 110.0 197% 190 34%
Personal Comput-ers & Monitors
237 237 0% 5.53 5.5 0% 0.04 41.9 218% 47.4 25%
Network Equip-ment*
49.7 112.27 15% 1.3 2.87 14% 0.01 13.8 229% 15.6 18%
Note: * Ethernet Switches, WLAN & Routers. Source: IT, Industry, PhillipCapital estimates
Government policies will lead to better in value addition, domestic production, and strong exports growth

29GROUND VIEW GROUND VIEW 1 - 31 MAY 2021 1 - 31 MAY 2021 28
Company name CAPEX ( in Rs
mn.)
For PLI*
State Comments Capacity Date of Announce-
ment
Haier Appliances 30,690 Noida, NCR Refrigerators, washers, ACs are expected to start 1st phase by June'21
2019
HP Ltd 36,000 South India Capex over the next 5 years for computers and laptops 2019
Godrej Appliances 11,000 Shirwal and Mohali
Will invest till 2022; with this will be increasing capacity by 33% for premium products
6.5mn units p.a
2019
Xiaomi India 35,000 Noida, UP Xiaomi Corp (still on)* 2019
Jaina Group 10,000 Manufacturing hub for Sansui brand products; will export to other geographies, including the neighbouring South East Asian markets. Capex will be over the next 3 years.
2019
VIVO India 35,000 Smart phone (120mn annual capacity) 2019
Amber Enterprises 3,000 PLI Pune & South India
Greenfield facilities 3mn units p.a 2020
Samsung India 48,250 NCR, Uttar Pradesh
Mobile and IT display production unit 2020
Lava International 8,000 Shifting operation from China to India, capex will be over the next 5 years.
2020
Dixon Technologies 2,500 PLI South India Padget Electronics 2020
Thomson 10,000 Will invest in the next 5 year for home appliances. 2020
Daikin* 500 R&D 2020
GMCC 8,000 Compressor plants 2020
Highly* 500 Increasing the capacity of compressor plant 2020
TCL 24,000 Capex for TV plants 2020
ABAJ 1,000 For a manufacturing unit with a capacity of 2.5mn TVs and 0.6mn ACs
2020
Voltas* 5,000 PLI Planning to set up an AC plant in South India 2020
Realme 3,000 Eight new SMT lines for TVs in Noida 2020
Tata Group 70,000 For mobile phones in south India 2020
Micromax 5,000 PLI For mobile phones, 2mn/month current capacity; increasing it to 3mn/month.
2021
Pegatron Corporation 11,000 PLI Chennai Leased 500,000 sq. ft. of land 2021
Hon Hai Precision Industry Co Ltd
39,000 PLI Tamil Nadu Expanding manufacturing capacity 2021
Sahasra Semiconductors 1,500 ELCINA, Bhiwadi ELCINA 2021
ePack Durables Solution 1,000 PLI ELCINA, Bhiwadi ELCINA 2021
Havells India 2,500 PLI Sri city, Chittoor AC plant 0.56mn units p.a.
2021
PG Electroplast 1,000 PLI Ahmednagar AC plant AC: 0.9mn p.a. -IDU + 0.4mn
-ODU
2021
Panasonic 3,000 Jhajjar Panasonic Technopark 2021
Super Plastronics 3,000 Building IOT capabilities 2021
SPPL - Kodak TV 3,000 Expanding capacity for TV assembly 2021
Bosch 8,000 Dishwashers, washers, refrigerators 2021
Blue Star 1,350 PLI Wada Capacity expansion 2021
Burly Home Appliances 500 Set up a manufacturing plant in Telangana for air coolers 2021
Total 394,600
Total Ex. Of Expected PLI
349,940
India will see total capex of Rs 323bn over the next 3-4 years in the electronics industry
Note
: * e
stim
ates
. So
urce
: med
ia re
ports
, Phi
llipC
apita
l Res
earc
h

29GROUND VIEW GROUND VIEW 1 - 31 MAY 2021 1 - 31 MAY 2021 28
Some industry views
“ICEA welcomes the new UP Electronics
Manufacturing Policy 2020, which is aligned
towards the fulfilment of the NPE 2019 goals.
On the basis of such policies, India should
be able to focus its efforts on capturing the
investment opportunities from global as well
as domestic stakeholders to establish itself
as the world’s number one mobile phone
manufacturing destination. UP is already home to
60% of the total manufacturing units related to
mobile phones and components, and with such
policy support the state would further witness
accelerated establishment of units in the short
to medium periods. These policy interventions
would pave the way for shifting of production
bases from China and elsewhere to UP and
India.”
Pankaj Mohindroo, Chairman,
Indian Cellular & Electronics Association (ICEA)
“Over the next five years, the PLI scheme is likely to
lead to production of mobiles and components worth
Rs 11.5 lakh crore (Rs 11.5tn). Of these over 7 lakh
crore (7tn) worth of products will be exported. This
scheme is also expected to generate 3 lakh (300,000)
direct jobs and over 9 lakh (900,000) indirect jobs in
the country.”
Ravi Shankar Prasad,
Minister for Electronics and Information Technology
(MeitY), Government of India
“Electronics manufacturing in India has registered 23
percent cumulative annual rate of growth over past
5 years. The growth is likely to be 30% yoy for the
next 5 years. Mobile manufacturing in the country
has grown from 6 crore (60mn) handsets five years
ago to 33 crore (330mn) handsets at present, with
90% of the mobile phone requirements being met
through domestic production. In next 5 years, growth
in exports could be 40-50% at a bare minimum.”
Ajay Prakash Sawhney, Secretary,
Electronics and Information technology (MeitY)
Currently, planned capex
amount is Rs 349.9bn*
Total expected capex is Rs 565bn
Mobile PLI capex
amount is Rs 110bn
AC and AC components,
LED PLI capex is Rs 99bn
Laptop and tablet
capex is Rs 33bn
+
+

31GROUND VIEW GROUND VIEW 1 - 31 MAY 2021 1 - 31 MAY 2021 30
31GROUND VIEW GROUND VIEW 1 - 31 MAY 2021 1 - 31 MAY 2021 30
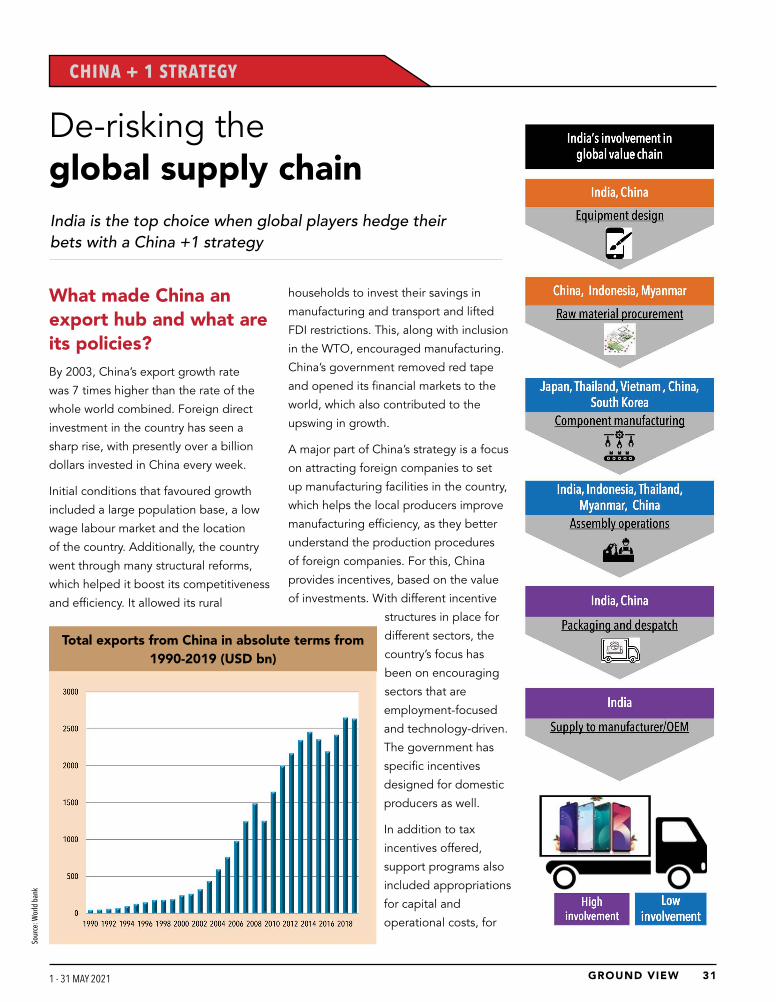
De-risking the global supply chainIndia is the top choice when global players hedge their bets with a China +1 strategy
CHINA + 1 STRATEGY
What made China an export hub and what are its policies?By 2003, China’s export growth rate
was 7 times higher than the rate of the
whole world combined. Foreign direct
investment in the country has seen a
sharp rise, with presently over a billion
dollars invested in China every week.
Initial conditions that favoured growth
included a large population base, a low
wage labour market and the location
of the country. Additionally, the country
went through many structural reforms,
which helped it boost its competitiveness
and efficiency. It allowed its rural
households to invest their savings in
manufacturing and transport and lifted
FDI restrictions. This, along with inclusion
in the WTO, encouraged manufacturing.
China’s government removed red tape
and opened its financial markets to the
world, which also contributed to the
upswing in growth.
A major part of China’s strategy is a focus
on attracting foreign companies to set
up manufacturing facilities in the country,
which helps the local producers improve
manufacturing efficiency, as they better
understand the production procedures
of foreign companies. For this, China
provides incentives, based on the value
of investments. With different incentive
structures in place for
different sectors, the
country’s focus has
been on encouraging
sectors that are
employment-focused
and technology-driven.
The government has
specific incentives
designed for domestic
producers as well.
In addition to tax
incentives offered,
support programs also
included appropriations
for capital and
operational costs, for
Total exports from China in absolute terms from 1990-2019 (USD bn)
Sour
ce: W
orld
ban
k

33GROUND VIEW GROUND VIEW 1 - 31 MAY 2021 1 - 31 MAY 2021 32
e.g., financial aid for R&D, transport of
labour and workforce training, exemption
in costs for construction of dormitories,
etc. The Chinese government made sure
that the working conditions were safe,
infrastructure facilities were improved,
land was easily available, good quality
and reasonably priced power supply was
ensured, and that the location of the SEZs was usually close
to the airports. The government conducted periodic reviews
to examine the impact of its policies.
Factors that helped China become an exports hub
Chinese people from Hong Kong and Taiwan were the first
to open factories in China. They gradually learned and
conquered mass manufacturing. They had a large domestic
workforce, many of whom aspired to jobs in foreign factories.
The Chinese government became involved in motivating its
citizens to work in factories and loosened controls on them,
allowing them to move around the country and find their
own jobs.
American corporations that were pro-outsourcing moved
their manufacturing bases to China in the early 1990s.
Wall Street fostered globalization and outsourcing as
captivating world trends – which further helped the
country achieve great export growth. China attracted a
lot of foreign investment from the US, Japan, and other
developed economies through Hong Kong or Taiwan. In
exchange for paying lower wages, these companies trained
workers by providing base knowledge in
supply management, manufacturing, and
engineering. China has not only mustered
huge capital by producing every tangible
product possible, but also developed a robust
industry framework. It has also developed
strong R&D capabilities that has allowed it to
expand the outsourcing of manufacturing to
non-labour-intensive industries as well.
Lower wages: Most of the Chinese were lower-middle class
and poor until late 20th century. The minimum wage was
very low and people were willing to work for low wages and
benefits.
Business ecosystem: A sustainable business ecosystem
demands a nexus of suppliers, component manufacturers,
distributors, government agencies and customers who all
work in tandem. China has built an ecosystem to support the
manufacturing supply chain, which includes low-cost workers,
technical workforce, assembly suppliers and customers.
Global companies took advantage of China’s supply chain
efficiencies to keep their overheads low and margins high.
Lower compliance: Chinese companies kept long shift
hours, sometimes employed under-age labour, and were
not required to provide their workers with reimbursement
insurance. Some factories even had policies where the
workers were paid only once a year – which prevented them
from quitting before the year was over.
Taxes and duties: Exported goods were liable to zero VAT;
few input materials in the production of consumer goods
were exempted from import duties. The lower tax rates
helped to keep the cost of production low, enabling the
country to attract investors and global companies looking to
make inexpensive goods.
Currency: China kept the currency from appreciating by
buying dollars and selling yuan.
Policy interventions that helped boost exports
China implemented export promotion measures such
as tax rebate, export subsidy, and foreign-exchange
retention quotas – nationwide. Its central government
rolled out a series of massive reforms across sectors,
including finance, banking, taxation, budget, etc. It began
formal talks with GATT (General Agreement on Tariffs and
Trade), contracting parties to get legal inclusion in the WTO
(World Trade Organization). It became a formal member of
China attracted a lot of foreign investment from the US, Japan, and other developed economies through Hong Kong or Taiwan
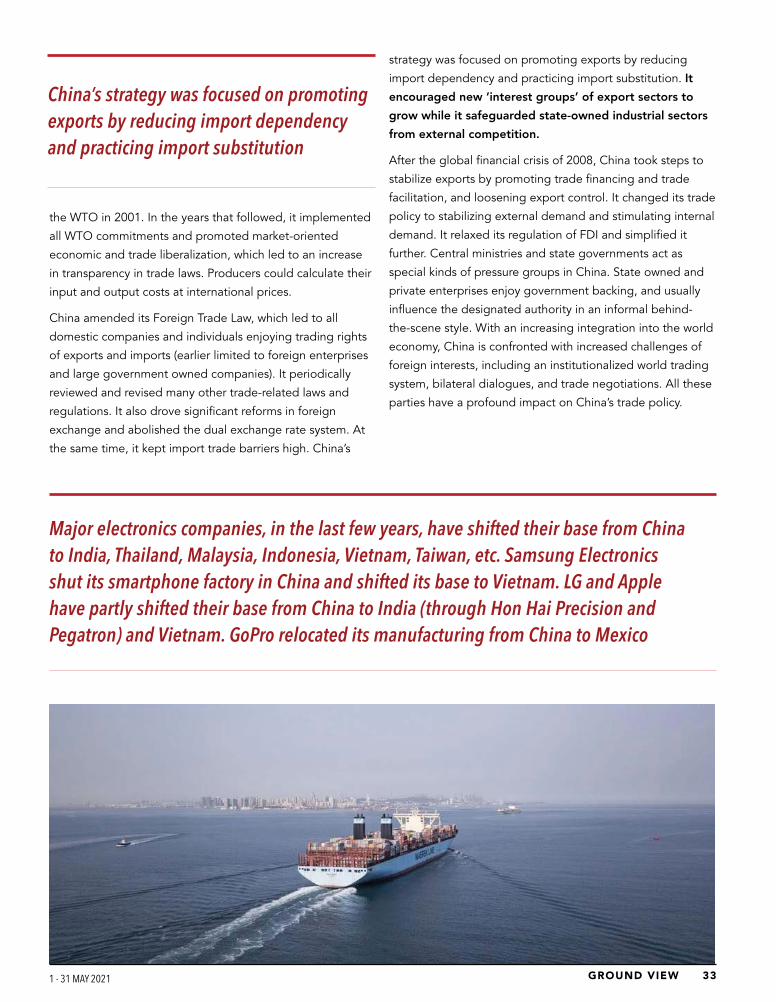
33GROUND VIEW GROUND VIEW 1 - 31 MAY 2021 1 - 31 MAY 2021 32
the WTO in 2001. In the years that followed, it implemented
all WTO commitments and promoted market-oriented
economic and trade liberalization, which led to an increase
in transparency in trade laws. Producers could calculate their
input and output costs at international prices.
China amended its Foreign Trade Law, which led to all
domestic companies and individuals enjoying trading rights
of exports and imports (earlier limited to foreign enterprises
and large government owned companies). It periodically
reviewed and revised many other trade-related laws and
regulations. It also drove significant reforms in foreign
exchange and abolished the dual exchange rate system. At
the same time, it kept import trade barriers high. China’s
China’s strategy was focused on promoting exports by reducing import dependency and practicing import substitution
strategy was focused on promoting exports by reducing
import dependency and practicing import substitution. It
encouraged new ‘interest groups’ of export sectors to
grow while it safeguarded state-owned industrial sectors
from external competition.
After the global financial crisis of 2008, China took steps to
stabilize exports by promoting trade financing and trade
facilitation, and loosening export control. It changed its trade
policy to stabilizing external demand and stimulating internal
demand. It relaxed its regulation of FDI and simplified it
further. Central ministries and state governments act as
special kinds of pressure groups in China. State owned and
private enterprises enjoy government backing, and usually
influence the designated authority in an informal behind-
the-scene style. With an increasing integration into the world
economy, China is confronted with increased challenges of
foreign interests, including an institutionalized world trading
system, bilateral dialogues, and trade negotiations. All these
parties have a profound impact on China’s trade policy.
Major electronics companies, in the last few years, have shifted their base from China to India, Thailand, Malaysia, Indonesia, Vietnam, Taiwan, etc. Samsung Electronics shut its smartphone factory in China and shifted its base to Vietnam. LG and Apple have partly shifted their base from China to India (through Hon Hai Precision and Pegatron) and Vietnam. GoPro relocated its manufacturing from China to Mexico

35GROUND VIEW GROUND VIEW 1 - 31 MAY 2021 1 - 31 MAY 2021 34
different economies, there arose tremendous opportunity out
of the supply-chain disruption in China that followed. India
did well in gaining from this disarray, as did others. However,
while many other countries possess better infrastructure and
ease of doing business, India’s unique advantage is that it
has a large domestic market.
As per the WEF, China has 28% share in the total global
manufacturing output while India is at the sixth position, with
only 3%. The supply chain disruption out of China due to
the pandemic, coupled with the trade war between USA and
China, led to a change in many global companies’ priorities
and them investing in other (more democratic) countries –
presenting opportunities for countries like India.
China has become the leading manufacturer of goods in the
world – in fact, it is called ‘the world’s factory’, but economic
China + 1: A new global trade strategyThe pandemic has caused major world powers to rethink
their dependency on one nation for manufacturing – a
strategy which is equal to risking everything on the success
of one venture. When lockdowns across the world led to
a complete halt in trade of goods and services between
Cheap labour, low costs, and rising government support through various incentives has attracted a lot of global attention for India
India’s unique advantage is that it has a large domestic market
Samsung hassignificant sharein Vietnam’s economy and contributes +20% to its GDP
Companies moving out of China, over last 2-3 years

35GROUND VIEW GROUND VIEW 1 - 31 MAY 2021 1 - 31 MAY 2021 34
changes in the country are causing a shift in its priorities
and are reducing its earlier advantages. Wages have tripled
in the past decade, along with a substantial increase in the
cost of production; these factors are causing manufacturers
to shift to other low-wage countries; this is where India
stands to gain. India has the second-largest population in the
world with relatively lower penetration, which provides huge
headroom for growth. Cheap labour, low costs, and rising
government support through various incentives has attracted
a lot of global attention for India.
The trade war has led to reallocation of supply chains from
China to India. Many global companies are interested in
setting up a manufacturing base in India. For companies,
outsourcing production to contract manufacturers (in India)
helps rationalise costs and achieve economies of scale.
A ban on imports of consumer durables and an increase
in the basic customs duties has helped boost India’s
domestic manufacturing. The government has been working
hard on providing the required infrastructure for global
manufacturing, by setting up manufacturing clusters that are
conducive for production.
Vietnam has been one of the key beneficiaries of the
China +1 strategy, and has seen a massive scale up in its
electronics production
Vietnam has been one of the key beneficiaries of the China
+1 strategy, and has seen a massive scale up in its electronics
production
The US-China trade war and the rising costs of manufacturing
in China have been beneficial for Vietnam, which has taken
full advantage by participating in regional and global supply
chains. Mobile exports from Vietnam stood at over US$
50bn in 2019, ranked second worldwide, and the country
has established itself as a key electronics exporter; it went
from 47th place in 2001 to 12th place in 2019. Vietnam’s
electronic exports rose from US$ 47.3bn to US$ 96.9bn in
2019, whereas its electronic imports have nearly doubled
from 2015 to 2019. Electronics exports made up 36% of
total exports from Vietnam, an increase of 1.15% over 2018.
Electronics imports accounted for 30% of total imports,
increasing by 2.01% over 2018. Sales of electronics in the
country have also increased by 12.1% over 2018. Export
share of foreign-based electronics companies accounted for
over 90% of total exports and covered 80% of the domestic
demand. As of June 2020, many notable global giants have
finished relocating to Vietnam; LG’s smartphone production
has moved entirely from South Korea to Hai Phong; Apple
moved part of its AirPods production, and Nintendo has
shifted a part of its Switch Lite game console to Vietnam.
Only Singapore and Hong Kong rank higher overall than
Taiwan on ease of doing business in East Asia. There are
better considerations for manufacturers in Taiwan like paying
taxes, enforcing contracts, and getting electricity. China
ranks 10th overall in East Asia for ease of doing business
after Malaysia, Thailand, Vietnam, and Indonesia (ranked 4th,
5th, 8th and 9th respectively). Although prices in China are
cheaper, manufacturing in Taiwan is better in terms of lead
times and trade-related overhead costs.
In February 2021, production by electronic component
makers rose 16% over the previous year, marking it the 15th
successive month of double-digit increase in the light of
rising shipments of tech devices such as 5G communications
and HPC devices, automotive electronics, and the IoT. Flat
panel suppliers enjoyed a 49.81% yoy increase in production
in February, as a booming stay-at-home economy boosted
demand for screens for IT products and TV use.
Now, going forward, we can expect a massive uptick in
electronics production in India as well, as India is fully
focused towards ramping up its large-scale electronics
manufacturing with several global giants coming in to the
country.
Outsourcing production to contract manufacturers (in India) helps rationalise costs and achieve economies of scale

37GROUND VIEW GROUND VIEW 1 - 31 MAY 2021 1 - 31 MAY 2021 36
Ease of doing business metric Mainland China Taiwan
Ease of doing business rank (out of 190 economies) 78 15
Trading across borders rank (out of 190 economies) 97 55
Time to export: Border compliance (hours) 23 17
Cost to export: Border compliance (USD) 533 335
Time to export: Documentary compliance (hours) 14 5
Cost to export: Documentary compliance (USD) 90 84
Taiwan ranks higher than China in every single metric related to trading across borders in the world
Vietnam export-import share; highest share with China
China USA South Korea Hong Kong Japan Commodities
Exports from Vietnam 19.30% 18.20% 9.10% 4.90% 4.89% Transmission apparatus
Mobile phones
TVs
Cameras (41%)
Electrical apparatus (18.2%)
Electronic integrated circuits
Micro assemblies (11.9%)
Imports to Vietnam 33% 6.52% 31% - 7.99% Electronic integrated circuits
Micro assemblies (40%)
Electrical apparatus (17%)
Semiconductor devices (6%)
Not only does Taiwan rank better than China in the above metrics, but is also a leader in South East Asia in this regardSource: Industry, PhillipCapital Research
Source: Industry, PhillipCapital Research
Not only does Taiwan rank better than China in the above metrics, but is also a leader in South East Asia in this regard

37GROUND VIEW GROUND VIEW 1 - 31 MAY 2021 1 - 31 MAY 2021 36
Why does the world need a China +1 strategy?
1) Risk diversification: Chinese operations face several
potential risks. Therefore, operations in other countries
can safeguard from any such losses. Problems of quality
concern can also be offset by diversifying operations to
other countries. Political, social, and economic changes
can further hurt the production processes, thus by
diversifying, companies can protect themselves against
such risks.
2) Lower costs: China no longer provides the lowest
costs for many goods and services. Wages have tripled
in the country over the past decade, and the average
age of the population is rising. The “one family one
child” policy has created labour shortages due to no
replacement for old workers. Government reforms
(covering pension and insurance compensation) have
also added to the wage bills of international companies.
3) Reducing overdependence: Over reliance on one
country for production of all goods and services is
a concern – business activities become too heavily
concentrated. Any disruption in production processes
can lead to a global shortage. Expanding manufacturing
Note: 1 being the best. Source: competitive index, WEF, PhillipCapital Research
Key indicators comparison for global manufacturing opportunity China India Brazil Vietnam Indonesia
Domestic market consumption
Export market opportunity
Smartphone user penetration
Average wage (manufacturing)
Barriers to entry for new players
Barriers to entry for manufacturing
AC penetration
White goods penetration
High Mid Low
Indicators comparing competitive strength of China, Brazil, Vietnam, and Indonesia
to other countries can help prevent this.
4) Access to new markets: In selecting a country for
manufacturing, global players do not just look at
business environment sustainability for manufacturing,
but also the size of the new market, the opportunities
for growth, etc. While China was once seen as just a
low-cost site, it has developed into one of the most
important markets in the world, which consideration can
be applied for all the “plus-one” candidates.
5) Disappearing tax incentives: Since 2009, most tax
incentives offered to foreign enterprises have expired.
China’s unification of its corporate tax system has led to
an increase in tax outgo for some enterprises operating
in the country.
6) Knowledge transfer: The China’s plus-one strategy
can help in identifying potential important markets.
Companies can apply valuable lessons learnt in
production processes in China to other geographically
or culturally similar economies, as they could throw up
similar challenges. The transfer of learning is particularly
valuable where the second economy is an attractive one
and has huge headroom for growth.
Why is India the chosen one in the China +1 strategy?In the +1 strategy, India’s closest competitors are Indonesia,
Thailand, Philippines, Vietnam, and Bangladesh. However,
among these, India ranks either #1 or #2 in factors such
as institutions (skill development, professionalism, etc),
infrastructure, macro stability, financial system, and market
size.

39GROUND VIEW GROUND VIEW 1 - 31 MAY 2021 1 - 31 MAY 2021 38
India’s rank among its closest competitors: Indonesia, Thailand, Philippines, Vietnam,
and Bangladesh
Advantages of choosing India as a manufacturing destination
• Investments in making India an export hub can provide
an exports opportunity, as well as the chance to cater
to the huge Indian market: India caters to only 3% of
the total global exports market, while China contributes
With the recent advent of the EMS industry in India, companies who want to relocate to India without making significant investments can outsource their manufacturing and reduce their capital risk. This can help them achieve economies of scale and be assured of the quality standard of products
close to 30%. There is huge legroom available to India
to boost its GDP through an increase in manufacturing.
In addition, India has a large domestic market with
significantly lower penetration compared to the global
average, this provides an incentive to global firms to set
up manufacturing units in the country.
• One of the major reasons in picking China was the low
wage structure, which does not apply anymore. China’s
cost of production and minimum wage levels have
increased significantly in the last decade. India’s labour
costs are about half of China’s labour costs.
• Due to the lack of focus on manufacturing, India has
lagged in its share of exports compared with its peers.
Improper policies, lack of ease in doing business, and
procedural complexities, were all reasons due to which
India could not expand its export footprint. With its
recent jump to 63rd position in Ease of Doing Business
and strong government-backed incentives such as PLI,
EMC, SPECS, India could attract the investments required
for it to become a major global player.
• With the recent advent of the EMS industry in India,
companies who want to relocate to India without
making significant investments can outsource their
Can India mirror China in becoming a manufacturing/export hub?
Sour
ce: I
ndus
try, P
hilli
pCap
ital R
esea
rch

39GROUND VIEW GROUND VIEW 1 - 31 MAY 2021 1 - 31 MAY 2021 38
India’s domestic production has seen 25% CAGR over FY15-19
Sour
ce: M
eity
Ann
ual R
epor
t FY2
0
manufacturing and reduce their capital risk. This can help
them achieve economies of scale and be assured of the
quality standard of products. Outsourcing manufacturing
can help them direct their focus towards innovation,
marketing, and sales. Outsourcing also helps companies
bring down other production-related costs and provides
an array of customized manufacturing designs to choose
from.
• India has been working on developing a component
ecosystem to boost domestic manufacturing of
electronics. This could help in increasing domestic value
addition to the tune of 50% (from the current 34%) in the
next five years.
• Political disengagement with China, along with an anti-
China sentiment is compelling many global players to
find alternate destinations for their supply chains.
India aims to cater to its demand of electronics via domestic
manufacturing by FY25. The country’s demand currently
outstrips its manufacturing; majority of its electronics are
imported. This has led to widening of the fiscal deficit.
With import bans and hike in custom duties, and demand
expected to more than triple by FY25, companies looking to
move to India could be huge beneficiaries.
Can India mirror China in becoming a manufacturing/export hub?
India is the sixth largest economy and one of the most
populous countries in the world, with a population of 1.3 bn.
As per the WEF, India’s share in total world export stood at
3-4% in 2019 whereas China was responsible for 30% of the
total manufacturing output – which shows huge headroom
for growth. India has one of the largest domestic markets and
has improved its rankings by 79 positions in the last five years
in terms of ease of doing business. The country ranks 63rd
among 190 nations. The pandemic and the trade war have
led to a shift in thought towards expanding manufacturing
to more countries to not be overdependent on China. India
could achieve its goal of becoming a manufacturing hub and
gain sizeable market share in total world exports.
India has a large domestic market
Globally, companies have been looking to expand their
manufacturing bases to more South East Asian countries,
to offset risks posed by over-dependency on just one
country. In selecting a destination to conduct operations
in, a company not only makes decisions based on the cost
India has the largest domestic market after China and the penetration of consumer appliances is low, which provides a huge headroom for growth
India’s consumer durables and electronics penetration (%)
Sour
ce: I
ndus
try, P
hilli
pCap
ital R
esea
rch

41GROUND VIEW GROUND VIEW 1 - 31 MAY 2021 1 - 31 MAY 2021 40
of production, policies, etc., but also on the opportunity
the country presents. India has the largest domestic market
after China and the penetration of consumer appliances is
low, which provides a huge headroom for growth. There
has been an increasing interest in companies globally to set
up manufacturing units and supply chains out of India, to
grab the opportunity domestically and internationally. The
penetration across consumer durables is relatively lower
than the global average, thus providing huge headroom for
growth.
Indian government’s incentives
India has come a long way from the 1900s, when there was
a system of licenses and permits required for companies to
manufacture goods and set up production units (License
Raj), to 2020, where the government is coming out with
incentives across sectors to boost domestic manufacturing
through import substitution. India’s government, in recent
years, has been hiking import duties and banning imports
of many products – to achieve self-reliance and boost
domestic manufacturing. In the last two years, it has come
out with schemes such as PLI, SPECS, and EMC 2.0 which
offer various incentives to companies wanting to manufacture
in India. Special clusters are being set up with adequate
infrastructure facilities and proper power supply to ensure
there is no disruption in the production process. It has
offered incentives under PLI and SPECS on incremental
sales of goods, which had led to a surge in global interest. It
passed NPE in October 2019 and introduced M-SIPS, which
should fuel the growth of the consumer durables industry.
Outsourcing or contract manufacturing is a new concept
that is gaining traction in India
Outsourcing of manufacturing helps companies to focus
more on marketing, sales, and the innovation aspect of
their businesses. Many well-established companies have
been outsourcing their production activities to contract
manufacturers – to focus on other integral parts of their
businesses. Contract manufacturing can help companies
reduce costs and save time by manufacturing only those
products bearing the highest margins. They can outsource
other production activities. India has seen its share of
manufacturing through ODMs increase, where companies
have outsourced their entire end-to-end production cycle.
It is a significant leap for Indian contract manufacturers, as
large electronics enterprises have started believing in the
skills of Indian ODMs and their capabilities. Going ahead,
the share of ODMs in contract manufacturing will increase,
as they provide contract manufacturers higher margins
and profitability. The increasing trend of outsourcing is
also supporting established companies such as Lloyd,
IFB Industries, MIRC Electronics, etc., with huge installed
capacity, as they are using their unutilized capacity to
manufacture for other companies, leading to improvement
in their operating efficiencies. Also, online and modern
trade companies (and their respective brands) are increasing
their share in India; these companies will continue focus on
branding, distribution, and selling. For manufacturing, they
will depend on outsourcing partners.
Technical skill development is essential for improving
overall factor productivity
To increase the share of manufacturing the government must
conduct nationwide training camps to help develop the
technical skills required for manufacturing under electronics,
biotechnology, healthcare etc. Investments by the private
sector in skill training can increase productivity and reduce
the skill gap between India’s labour and China’s labour.
India’s government, in recent years, has been hiking import duties and banning imports of many products – to achieve self-reliance and boost domestic manufacturing
India AC penetration vs. other countries
Sour
ce: I
BEF,
Phill
ipCa
pita
l res
earc
h

41GROUND VIEW GROUND VIEW 1 - 31 MAY 2021 1 - 31 MAY 2021 40
Tax reforms to boost manufacturing
To boost manufacturing, the Indian government has worked
proactively towards a more business-friendly tax structure.
Last year the government slashed corporate taxes from 25%
to 15% for all manufacturing firms incorporated after October
2019 and beginning operations before March 31, 2023. India
has one of the lowest corporate tax rates globally. This move
has helped India to compete with other ASEAN countries
such as Thailand, Vietnam, and Indonesia for a greater
market share of total manufacturing. State governments have
also been providing tax incentives to specific sectors, for
which there is no major capital outgo.
New labour codes
The Indian parliament has passed four codes on wages,
industrial relations, social security and Occupational Safety
and Health (OSH), which will ultimately rationalize 44 central
labour laws. The code on wages was passed by Parliament
in 2019, while the three other codes got clearance from both
the Houses in 2020. These codes are favourable for both
employers and employees; some of the provisions like 14
days of notice prior to strikes remove uncertainty in day to
day operations and give some time to employers to have an
alternate plan of action, which wasn’t there in previous labour
laws.
Other factors
Improvement in ease of doing business, conducive
environment for manufacturing, focus on skill development,
availability of land, proper supply of power, creation of SEZ’s,
reforms in labour and tax laws, and proper policy structuring
can help India become an export hub to the world.
• FDI reforms – Government allowed 100% FDI
through the automatic route in electronics hardware
manufacturing and 51% in multi-brands. These reforms
will attract more investments, which should boost
manufacturing.
• Replacement market – With disposable incomes rising,
and easier financing options available, the consumer
durables industry has seen a shortened product cycle,
which had led to growth in the replacement market for
consumer durables, which provides further opportunities
for growth.
• Rising exports – Steps taken towards boosting
manufacturing has led to a steady growth in consumer
durables, with exports rising year-on-year and imports
staying relatively flat.
FY14 FY17 FY21
Mobile Phone India China India China India China
Raw material 70% 60% 65% 55% 55% 53%
Utilities 12% 13% 12% 14% 13% 15%
Labour and Over heads 12% 13% 13% 18% 13% 20%
FY14 FY17 FY21
Washing machines India China India China India China
Raw material 58% 54% 54% 52% 45% 50%
Utilities 13% 12% 12% 13% 12% 14%
Labour and overheads 12% 13% 13% 16% 13% 18%
FY14 FY17 FY21
LED Lamps India China India China India China
Raw material 70% 65% 60% 50% 50% 48%
Utilities 12% 13% 12% 14% 13% 15%
Labour and overheads 12% 13% 12.50% 16% 13% 18%
Price difference between India and China is likely to narrow
Source: Dixon DRHP

43GROUND VIEW GROUND VIEW 1 - 31 MAY 2021 1 - 31 MAY 2021 42
Theme Disability % Reason Factors to consider
Local supply chain
3-4% 1) Limited raw material available in India. 2) Limited component suppliers/distributors.
India needs larger availability of components; needs to build a component ecosystem.
Transportation 2% 1) India has 13 major ports and less than 200 minor ports; China has 30 major ports and 2,000 minor ports. India’s minor ports are under-performing because of serious logistical and connectivity problems. 2) India does not have international transhipment ports. It depends on Oman and Sri Lanka (GoI has recently announced its plan for building a transhipment port in the Nicobar Islands).
1) Private public partnerships are necessary for expediting the development of the transport infrastructure. 2) Supply chains vary from state to state, and depend on the availabil-ity of raw material, local talent, and govt. support. Greater focus should be given to regional and cluster development.
Power The cost of power in India remains lower than that of other Southeast Asian countries.
Labour India lacks a skilled workforce that can be scaled to meet the electron-ics industry’s demands.
India should focus on increasing the pace of skilling its workforce. India’s cost of labour is lower than China, but China’s labour quality and efficiency is far higher.
Custom clearance
1% In this, India is below the world’s standards. These are major challenges: (1) Uncertainty of the head under which new products are to be cleared and (2) duty claims with retrospective effect.
Tax 2-3% India's tax rate is significantly high. Corporate tax rate in India is 25%; it is 17% in Singapore; 20% in Vietnam, Thailand, and the Philippines.
In Sept 2019, GoI introduced a favourable tax regime for new manu-facturing companies - offering an effective tax rate of 17%.
India’s disability
Comparing India’s manufacturing environment with other global manufacturing hubs
Sour
ce: I
ndus
try, M
AIT,
Phill
ipCa
pita
l Res
earc
h
Theme China Vietnam Malaysia Taiwan Brazil India
Freight (as % of cost of production)
1% 8-10% NA NA NA 13-15%
Turnaround time (TAT) (in days)
0.5-1.0% 2.5% 0.5-1.0% 0.5-1.0% 1.5% 2.0-10.0%
Direct tax 25% Tax exemption and 10% for high-tech manufacturing
24% 20% 15% 25% overall, for new manufacturing units at 17%
Indirect tax 0% on exports, refund-able VAT
Import tax holiday Tax exemption - 20-70% for increased value exported goods.
Exported goods do not attract tax
1) Expenses carried out for technological research and innova-tion are deductible from income tax. 2) Expenses carried out for technological research and innova-tion are deductible from income tax.
Exported goods do not attract tax.
Cost of borrowing 4.30% 4% 5.52% 2.30% NA 8-10%
Cost of labour (in USD per month)
950-1,200 237-350 1,000-1,100 1,800 750-950 250-300
Availability of power Uninterrupted Uninterrupted Uninterrupted Uninterrupted Interrupted Uninterrupted
Component eco-system
Localised Import dependent Semi- localized Localized Import dependent Import dependent
Incentives 1) Rebate of 17% to export companies, ECR companies exempted from paying VAT. 2) Exempts exported goods from any kind of consumption tax. 3) Tax deduction on R&D expenses for small and medium technology-based enterprises.
1) Import tax breaks. 2) Offsets in the form of refunds on import duties. 3) Exemption from VAT for exporters.
1) Allowance on increased exports. 2) Income tax exemp-tion for significant increase in exports.
1) Tax incentives for exporting in free trade zones. 2) R&D tax credit up to 15% of the total R&D expenditures.
Exemption from the taxes levied on import of certain products used for the final exported product.
2-5% MEIS scheme,4-6% PLI scheme
Sour
ce: I
ndus
try, M
AIT,
Phill
ipCa
pita
l Res
earc
h

43GROUND VIEW GROUND VIEW 1 - 31 MAY 2021 1 - 31 MAY 2021 42
POSITIVE
• Some Japanese companies are
planning for higher backward
integration. They are planning
to set up critical AC components
in India. With this, India can see
significant improvement in value
addition.
• Although self-reliance is far
away, this time, the industry/
government is walking towards it.
We are starting with assembling
and then will move towards
manufacturing.
• Ban on imports is helping to
improve domestic manufacturing,
but also resulting in an increase
in costs, as customs duty has
increased on components.
Component manufacturing should
be the first aim of Atmanirbhar
Bharat.
• Global component manufacturing
companies are planning to shift
to India. Like TCL (putting up an
open cell plant), Samsung (mobile
open-cell plant), and GMCC
(compressor) etc.
• Exports: Expect middle-east to be
low hanging fruit for exports.
• In TVs, India already has higher
installed capacity for assembly;
currently players are operating at
50% CUF.
• E-com players and modern retail
channel partners are gaining
market share in the consumer
durables industry, as they are
selling under own brands or have
tied-up with national brands
such as BPL, Kelvinator, Nokia,
Motorola, etc.
• Modern Retail (MR)/E-com
gaining share from regional retail
and brick and mortar stores.
These chains have the advantage
of sourcing at better prices.
• In Modern Retail, Reliance
Digital is seeing higher growth,
increasing its presence, and
gaining market share. Exclusive
tie-ups with brands such as
BPL and Kelvinator are helping
Reliance to offer products at
competitive rates.
• For Samsung, a change in
management in Korea has led
to a higher focus on driving
its appliance business in India.
Samsung is committed to make
huge investments in mobile panel
manufacturing in India, as it will
assemble LCMs in India. ACs are
now seeing very high production
in-house.
NEGATIVE• Contract manufacturing
is a service industry. Such
manufacturers must provide timely
service to companies. Costs are
secondary; everyone knows the
cost matrix.
• Top priority in OEM activity is
to reduce operating costs and
improve operating efficiency .
OEMs need constant innovation
and efficiency improvement to
keep costs maintained.
• Getting the right costs and
converting these into right
pricing and margins is very
important. Companies chose
China for manufacturing due to
the low costs of manufacturing
that it offered. If India can
manufacture at better costs than
China, only then is there merit in
manufacturing in the country.
• Unless and until component
manufacturing shifts to India there
will be no breakthrough in the
industry, as there will be no cost
benefit.
• Companies has seen a sharp
increase in the waiting period for
availability of containers for critical
components such as compressors
or microprocessors, even after
paying 2-3 times more than the
actual costs.
Inputs from industry experts
45GROUND VIEW GROUND VIEW 1 - 31 MAY 2021 1 - 31 MAY 2021 44
In the last 2-3 months, several
companies have made
announcements in line with their
vision of making India a global hub
for electronics. The excitement in
this sector is still intact, and the
companies are aggressively targeting
increased localization in the country.
• Samsung Electronics: Is likely
to apply for the Rs 121.95bn
PLI for telecom gear and other
equipment. The company has tied
up with Reliance Jio for the supply
of telecom gear from its factory
coming up in Uttar Pradesh. The
investment entailed within the
scheme will be Rs 1bn towards
machinery and setting up of
production lines.
• Xiaomi India: Has deferred
its plans to export to other
countries due to a huge spurt in
domestic demand. The company
is looking to take advantage of
the PLI program to scale up its
manufacturing capabilities, as it
has been unable to fulfil the rising
domestic demand. Xiaomi has
also tied up with BYD and DBG
for smartphones and Radiant will
help augment the capacity of
smart TVs in India.
• Foxconn India: Its country head
is very bullish on India, as he
expects local manufacturing and
product designing in the country
to increase substantially, to meet
the goal of becoming a US$
400bn electronics manufacturing
industry by 2025. He expects
exports and increased domestic
consumption to fuel growth.
• Apple: It announced plans to
manufacture and assemble iPads
in India and is expected to take
benefits of the PLI scheme for
laptops, notebooks, and servers.
Apple has been lobbying for a
bigger budgetary outlay of Rs
200bn to scale up manufacturing
and has been pushing for this
at a time when Wistron is just
resuming production at its south
India plant.
• Tata Sons: Recently announced
an MoU with the Tamil Nadu
government to set up a facility
for manufacturing mobile
components. The company is
keen to invest Rs 46.84bn for its
new plant in Krishnagiri.
• Panasonic: Is betting big on
India by ensuring 90-100% of
each of its products sold in India
are locally built. The company is
already exporting ACs and some
other products, and plans to
double its RACs business in the
next three years. The company
is looking to collaborate with
component manufacturers for
parts such as motors, aluminium,
and compressors.
• MeitY has recently invited
expressions of interest by
companies who wish to set up a
display fabrication unit in India.
Displays account for over 25% of
the BoM in case of smartphones
and over 50% in the case of LCD/
LED TV’s. India’s panel market
is expected to grow from $7bn
presently to $15bn by 2025 while
current requirements are met
mostly through exports.
• Xiaomi has pledged Rs 1bn to
expand its offline retail presence.
The company aims to double
its exclusive store count from
3000 currently to 6000+ in the
next 2 years, generating direct
employment for 10,000 people in
its offline retail channel.
• Samsung Electronics is the
only company among 16 that
has surpassed both investment
and output targets under the
PLI scheme for handsets and
Capex is the buzz on the ground
45GROUND VIEW GROUND VIEW 1 - 31 MAY 2021 1 - 31 MAY 2021 44
The Government of India has started inviting applications for the second round of large-scale electronics manufacturing under PLI with a focus on electronics components such as motherboards and semiconductor devices among others. The second round has expanded the window for up to 30 eligible companies and the new guidelines have identified components like transistors, diodes, resistors, capacitors, PCBs, and ATMP
components this year.
• Apple is looking to expand its
retail presence in India on the back
of strong demand. The company
has already announced 7 new
store openings across North and
West India. Apple sold nearly
2.8mn iPhones in 2020, a growth
rate of 93% despite nationwide
lockdowns.
• India is offering more than $1bn
in cash to each semiconductor
company that sets up
manufacturing units in the
country as it seeks to build on its
smartphone assembly industry and
strengthen its electronics supply
chain.
• The worldwide shortage of
components has made it
difficult for companies to meet
output targets set by the Indian
government under its new PLI
scheme. Foxconn expects the
component shortage to continue
till mid-2022.
• Apple and Samsung are expanding
their production of mobile phones
from their Indian plants. Buoyed
by the surge in interest from global
manufacturers, the government
is also planning PLI for wearable
devices such as smart watches.
• Government of India has approved
the PLI scheme for LED lights and
AC’s with a budgetary outlay of Rs
62.38bn.
• The new PLI scheme for AC’s may
have long term potential to boost
the local component ecosystem in
the country as the manufacturers
will receive 4-6% incentive on
incremental production, only
if they add value by growing
component production. Mere
assembly of finished goods will not
be incentivized.
• Mobile manufacturers shortlisted
under PLI invested Rs 13bn and
produced goods worth Rs350bn in
Q3FY21.
• Electronic manufacturers such
as HP, Dell, Wistron, Foxconn
and Samsung have requested
the government to revise the
targets and extend the timelines
in the upcoming PLI scheme for
hardware, to avoid the situation
mobile phone manufacturers found
themselves in, where only one of
the 16 companies achieved the
targets for FY21.
• Nineteen companies including
Dell, Foxconn, Dixon Technologies,
Lava, and Micromax have applied
under the PLI scheme for IT
hardware to avail incentives.
Domestic value addition in IT
hardware is expected to rise from
5-12% currently to 16-35% in the
next 4 years.
• The TV prices are expected to rise
by 3-5% by October 2021, as the
government is planning to hike
customs duty on open cell panels.
The plan is to increase the import
duty gradually to 10-12%, which
is currently at 5%, over the next 3
years.
• The government has come out
with EOIs to incentivise setting
up of display fabrication units in
India. Display FAB manufacturing
requires an investment of Rs 750bn
over 2-3 years. The government
expects the Indian display panel
market to grow from US$ 7bn
presently to US$ 15bn by 2025.
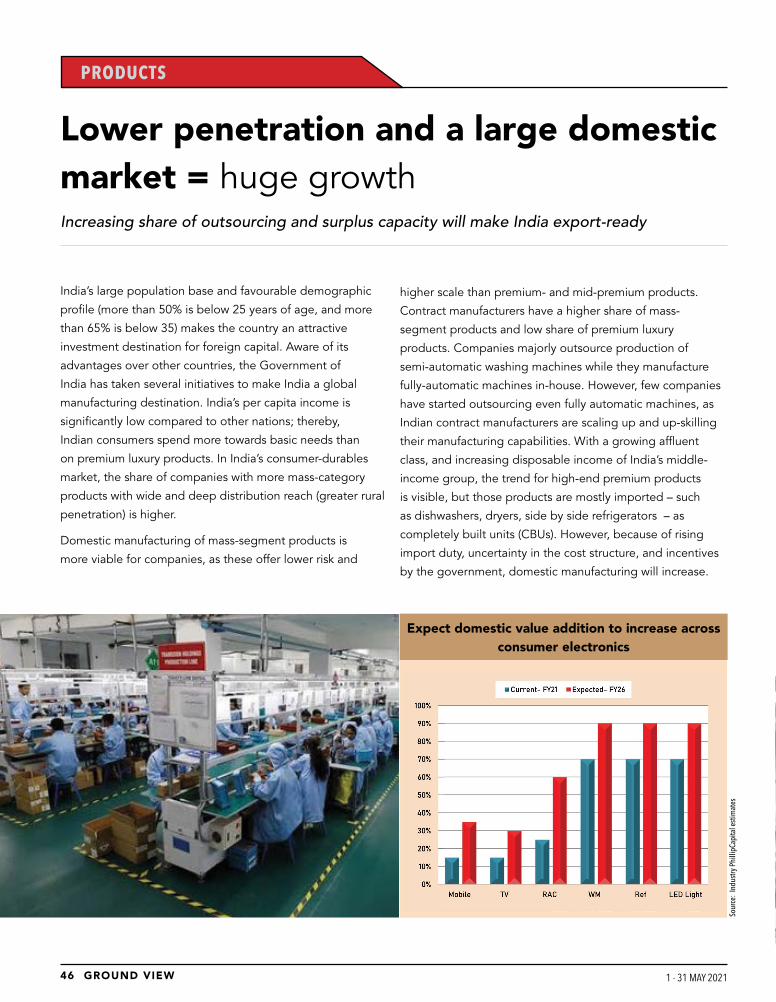
47GROUND VIEW GROUND VIEW 1 - 31 MAY 2021 1 - 31 MAY 2021 46
PRODUCTS
Lower penetration and a large domestic market = huge growthIncreasing share of outsourcing and surplus capacity will make India export-ready
India’s large population base and favourable demographic
profile (more than 50% is below 25 years of age, and more
than 65% is below 35) makes the country an attractive
investment destination for foreign capital. Aware of its
advantages over other countries, the Government of
India has taken several initiatives to make India a global
manufacturing destination. India’s per capita income is
significantly low compared to other nations; thereby,
Indian consumers spend more towards basic needs than
on premium luxury products. In India’s consumer-durables
market, the share of companies with more mass-category
products with wide and deep distribution reach (greater rural
penetration) is higher.
Domestic manufacturing of mass-segment products is
more viable for companies, as these offer lower risk and
higher scale than premium- and mid-premium products.
Contract manufacturers have a higher share of mass-
segment products and low share of premium luxury
products. Companies majorly outsource production of
semi-automatic washing machines while they manufacture
fully-automatic machines in-house. However, few companies
have started outsourcing even fully automatic machines, as
Indian contract manufacturers are scaling up and up-skilling
their manufacturing capabilities. With a growing affluent
class, and increasing disposable income of India’s middle-
income group, the trend for high-end premium products
is visible, but those products are mostly imported – such
as dishwashers, dryers, side by side refrigerators – as
completely built units (CBUs). However, because of rising
import duty, uncertainty in the cost structure, and incentives
by the government, domestic manufacturing will increase.
Expect domestic value addition to increase across consumer electronics
Sour
ce:
Indu
stry
Phi
llipC
apita
l est
imat
es

47GROUND VIEW GROUND VIEW 1 - 31 MAY 2021 1 - 31 MAY 2021 46
ACs: To see higher localization and rapid growth due to lower penetrationDespite the pandemic, which led to lockdowns, and the
economic slowdown in 2019-20, it was a good time for the
air-conditioning industry. India’s air-conditioning market
in FY20 was an estimated Rs 175bn, of which central air-
conditioning, including central plants, packaged and
ducted systems, and VRFs was c.Rs 32.5bn; other ancillary
equipment was c.Rs 30.5bn, and RACs was the highest
segment at Rs 112bn.
Demand for ACs is growing at 15-20% annually. A tropical
climate, large population, increasing discretionary income,
low penetration, reduction in operating cost, easy finance,
and rising aspirations of millions of households (to own
room air conditioners) are all factors driving demand for
ACs in India. It remains very difficult for such a large tropical
population to upgrade their lifestyle without air conditioners
– therefore, in anticipation of the expected rise in demand,
India remains a crucial market for the AC industry and global
AC companies. Rapid urbanization and a growing population
have created demand for sustainable, clean, and energy
efficient cooling solutions in India.
Demand scenario for ACs
A major chunk of the demand for air cooling solutions comes
from emerging populous economies such as India, China,
and Indonesia. These three are predicted to account for half
Growth of India’s AC industry
Sour
ce: I
ndus
try, P
hilli
p Ca
pita
l Res
earc
h
of the global air-cooling demand by 2050. From roughly
8% of households air conditioned in March 2018, it is likely
to rise to 50% by 2050. Better data collection on cooling
needs across different sections of the society, urban and rural
areas, commercial and residential areas will lead to more
reliable estimates of cooling requirements, energy demand
projections, and appropriate technical solutions. With the
right steps, in the coming decade, it is possible that India will
become home to the most efficient air-cooling technologies
deployed at scale.
AC penetration in India
AC penetration in India is still low at around 5% and
consumers no longer view RACs are as luxury products
entirely but more as necessities. Due to the scorching
summers, demand comes from not only metros, but also
tier-2 and 3 cities, where heightened economic activity
has created affordability. Additionally, energy-efficient
norms have helped cut operating costs of ACs, and easy
financing has supported demand. Newer product features
and technological advancement in RACs have created a
replacement demand for products, with people upgrading
ACs every seven odd years. However, the Indian market
remains sub-par; global penetration is close to 30%. This
provides sufficient headroom for growth. Market penetration
should improve with an increase in rural penetration and
increasing affordability.

49GROUND VIEW GROUND VIEW 1 - 31 MAY 2021 1 - 31 MAY 2021 48
China’s penetration of RACs has gone up to 100% in 2017
from 54% in 2008, a significant growth rate compared to
other home appliances. The potential for RACs in India is
huge; should see substantial increases in the coming years
due to relatively lower penetration.
Energy-efficient norms have helped cut operating costs of ACs, and easy financing has supported demand
China domestic consumption at 100% penetration is 60-65mn units and India’s domestic consumption at 5% penetration level is 7mn
AC penetration world-wide
Developments in urban spaces has led to reduced greenery
and an increase in dark roofs, which contributes to the ‘urban
heat island’ effect, thus raising temperatures around the
globe. This has contributed to RACs’ demand. Increasing
customer awareness about the benefits of efficient RACs has
resulted in a manufacturing shift to split ACs from window
ACs.
AC industry overview amid the pandemic
The industry achieved normalised inventory levels on
sustained retail and OEM demand between October to
December 2020. Demand in metros and tier-1 cities showed
resilience, while uptick in demand for ACs continued from
tier-2 and tier-3 cities. Import bans placed on refrigerants
by the government created a plethora of opportunities
for domestic manufacturers. Over Rs 400bn of RACs
were imported into India (1.5-2mn units) of which 70-75%
consisted of CBUs (completely built units) with refrigerants,
and the remaining were IDUs (indoor units). The import ban
will boost domestic manufacturing of CBUs and components
India’s per-capita consumption for cooling is 69Kwh, below the world’s average of 272Kwh
Indi
a Co
olin
g Ac
tion
Plan
(ICA
P) re
port
2019
Sour
ce: I
ndus
try, P
hilli
pCap
ital R
esea
rch
RAC remains under-penetrated in rural households
Sour
ce: P
hilli
pCap
ital R
esea
rch,
Indu
stry
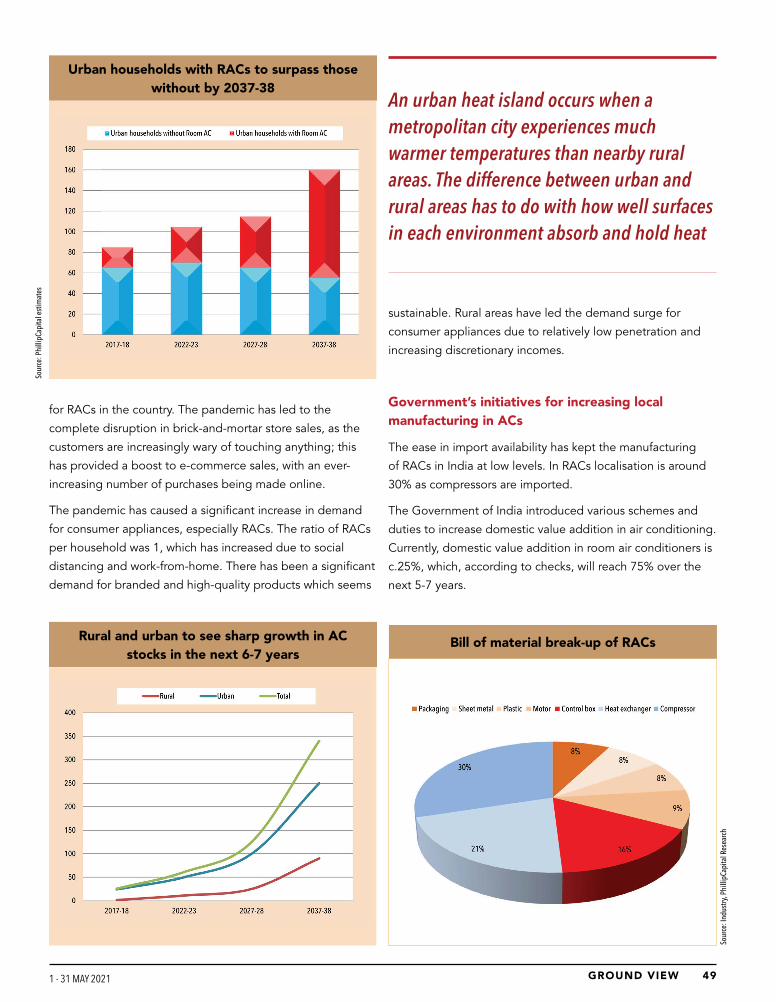
49GROUND VIEW GROUND VIEW 1 - 31 MAY 2021 1 - 31 MAY 2021 48
for RACs in the country. The pandemic has led to the
complete disruption in brick-and-mortar store sales, as the
customers are increasingly wary of touching anything; this
has provided a boost to e-commerce sales, with an ever-
increasing number of purchases being made online.
The pandemic has caused a significant increase in demand
for consumer appliances, especially RACs. The ratio of RACs
per household was 1, which has increased due to social
distancing and work-from-home. There has been a significant
demand for branded and high-quality products which seems
sustainable. Rural areas have led the demand surge for
consumer appliances due to relatively low penetration and
increasing discretionary incomes.
Government’s initiatives for increasing local manufacturing in ACs
The ease in import availability has kept the manufacturing
of RACs in India at low levels. In RACs localisation is around
30% as compressors are imported.
The Government of India introduced various schemes and
duties to increase domestic value addition in air conditioning.
Currently, domestic value addition in room air conditioners is
c.25%, which, according to checks, will reach 75% over the
next 5-7 years.
Urban households with RACs to surpass those without by 2037-38
Rural and urban to see sharp growth in AC stocks in the next 6-7 years
An urban heat island occurs when a metropolitan city experiences much warmer temperatures than nearby rural areas. The difference between urban and rural areas has to do with how well surfaces in each environment absorb and hold heat
Bill of material break-up of RACs
Sour
ce: I
ndus
try, P
hilli
pCap
ital R
esea
rch
Sour
ce: P
hilli
pCap
ital e
stim
ates

51GROUND VIEW GROUND VIEW 1 - 31 MAY 2021 1 - 31 MAY 2021 50
Split AC imports in India
Imports of compressors (AC+Ref)
Sour
ce: c
omm
erce
.gov
.in
Ban on imports of refrigerant or gas-filled ACs
GoI banned completely built air conditioner units or
refrigerants – to boost domestic manufacturing and prevent
Chinese companies from disrupting the local markets
by taking business away from local players. This move is
consistent with the government’s self-reliance vision and
should help India to gain a greater share of the global AC
market and create additional jobs. Domestic companies
have cheered this move, and expect it to significantly
increase domestic production. Companies such as GMCC,
Highly and Hitachi are dedicated to making investments in
manufacturing of motors and compressors to further reduce
import dependency.
Currently, India imports Rs 30bn worth of ACs, 30% of the
total market. Of this, 75-80% are refrigerant filled CBU/ODU
and the balance are IDU units without refrigerants. The top-5
brands make up 40-50% of the total 2mn CBU units imported
into India. The ban on refrigerants should increase the share
of outsourcing in India, which is currently at 38-40%.
Out of the 6mn ACs in India, in 2019, c.1mn ACs had locally manufactured compressors. Component manufacturing is still lacking and needs to pick up to really boost manufacturing in India. Component manufacturing requires larger investments and incentives
Players like Amber Enterprises, PG Electroplast, and Mirc Electronics have put up lines for gas charging. As India scales up its domestic manufacturing, the industry expects imports to come down to 500,000-600,000 units from 1.5-2mn units
Sour
ce: c
omm
erce
.gov
.in

51GROUND VIEW GROUND VIEW 1 - 31 MAY 2021 1 - 31 MAY 2021 50
Increase in BCD on compressors and motors
GoI increased customs duty on imports of compressors for
ACs – to 15% from 12.5%, and AC motors to 15% from 10%.
This move is likely to reduce import dependency and boost
manufacturing of ACs locally and to bring investments in
component manufacturing into India. Compressors make
up 25-30% of total AC costs. Investments in compressor
manufacturing can provide a much-needed fillip to AC
manufacturing in the country.
Sharp reduction in imports because ACs with refrigerants face import restrictions
PLI: The expenditure committee has approved the PLI scheme for ACs, which will extend an incentive of 4-6% to eligible companies on incremental sales of goods over five years to boost domestic manufacturing of ACs and components. Finished goods imports of RACs should reduce sharply, as the government imposed a ban on refrigerant-fill ACs. Also, higher duties and logistics costs are making importing costlier than local sourcing
Ex. factory -
China cost
(Rs 14,500-15,000)
20% import duty + sharp increase in
freight cost.
Gas charging + packing and unpacking
+ logistic = 1,000-1,500 additional
cost
India Landing cost:
(Rs 18,500-19,000)
Final cost to
the company
(Rs 20,000-21,000)
Domestic contract manufacturers are
offering at Rs 18,000-19,000
Price difference in sourcing from China vs. India
Sour
ce: c
omm
erce
.gov
.in

53GROUND VIEW GROUND VIEW 1 - 31 MAY 2021 1 - 31 MAY 2021 52
AC/LED lighting PLI: The objective is to more than just
assemble in India
• Incentives are 4-6% on incremental sales for 5 years.
• Effective 1 April 2021.
• Open for applications for 6 months.
• Expected incremental investment from AC / LED PLI is Rs
79.2bn for an incremental production of Rs 1.68tn over
five years.
• The export opportunity due to AC / LED PLI is of
Rs 644bn over five years; it can create additional
employment of 100,000 jobs.
• Tax revenue likely at Rs 113bn in direct taxes and Rs
380bn through GST over the next five years.
PLI highlights Benefits
Incentives for ACs & LED 4-6% on incremental sales for 5 years
W.e. f 1/4/2021
Incremental investment Rs 79.2bn
Incremental production Rs 1.7tn
Exports Rs 644bn
Incremental employment 1lakh jobs
Direct tax revenue Rs 113bn
GST Rs 380bn
Production-linked incentives scheme’s benefits over the next five years
The exports opportunity due to AC / LED PLI is of Rs 644bn over five year
Source: meity.gov.in
The cabinet has recently approved the PLI scheme for room
air conditioners. The scheme will have long term potential
to boost the local component ecosystem in India. The
manufacturers will receive 4-6% incentive on incremental
production, only if they add value by growing component
production. The selection of companies for the scheme shall
be done, so as to incentivise manufacturing of components
or sub-assemblies which are not manufactured in India
presently with sufficient capacity. “Mere assembly of finished
goods shall not be incentivised”, says the government. This
scheme is expected to help India in growing the local AC
manufacturing base and make India more competitive in the
global market.
Currently, in the Rs 180bn local AC market, 70% of the
cost material used in assembly is imported. Key parts like
compressors, variable speed motors in IDU’s, and high
quality copper pipes, among others, are imported. Please
click here for our recent report on PLI.
Source: DPIIT, Ministry of Commerce and Industry, PhillipCapital India Research
Note:AC: * High Value Intermediates or Low Value intermediates or sub-assemblies or a combination thereof.**Aluminum Foil, Cu tube, Compressor.***PCB Assembly for Controllers, BLDC Motors, Service Valves for ACs, Cross Flow Fans and other components.
PLI Scheme: Details over the next five years
Segment Large Investment Normal Investment
% of BOM Total Invest-
ment (Rs mn) -A
Total Revenue
(Rs mn) -B
Total Incen-
tive (Rs mn) -C
Avg. Incen-
tive (%)
Invest-ment/In-
centive (x) (A/C)
Sales/As-set (x)
Total Invest-
ment (Rs mn)
Total Revenue
(Rs mn)
Total Incen-
tive (Rs mn)
Avg. Incen-
tive (%)
Invest-ment/In-
centive (x) (A/C)
Sales/As-set (x)
AC
ACs (Components) 6,000 97,500 4,800 4.9% 1.3 3.82 3,000 41,250 1,988 4.8% 1.5 3.67
ACs High Value intermediates
40%-50% 4,000 53,750 2,575 4.8% 1.6 3.64 2,500 37,500 1,825 4.9% 1.4 3.75
ACs Lower value intermediates
15% - 20% 1,000 15,000 730 4.9% 1.4 3.75 500 7,500 365 4.9% 1.4 3.75

53GROUND VIEW GROUND VIEW 1 - 31 MAY 2021 1 - 31 MAY 2021 52
PLI Segment PC: est. no of Players each investment
segment*
Incentive
Large Invest-ment
Normal Invest-ment
Total
ACs (Components) 4 4,800 1,988 6,788
High Value intermediates of Acs 3 2,575 1,825 4,400
Lower value intermediates of Acs 9 730 365 1,095
Actual Capex Required Product Segment % of BOM Capex (Rs mn)
ACs (Components) Sub-assemblies 20% 1500-2000
High Value intermediates of Acs Aluminium Foil 5-10% 5,000
Copper Tube 12-15% 5,000-6,000
Compressor 22-25% 6,000
Lower value intermediates of Acs PCB Assembly for Controllers 15-18% 500
BLDC Motors 8-10% 1000-1500
Service Valves for Acs 3%* 500
Cross Flow Fans and other components 2%* 500
This PLI could receive c.20+ applications. If all segments receive applications, more applicants would be in lower-value intermediates
Average capex in different product segments of AC
Source: PhillipCapital estimates
Source: PhillipCapital estimates
Source: PhillipCapital estimates
Rs/Unit* Bill of Material Imported RM
Copper Aluminium Compressor PCBs Total % of Total BOM
Fixed Speed 14,000 2500 1100 3750 n.a. 7350 53%
Invertor 17,000 2500 1100 3750 3000 10350 61%
India has higher raw material import dependency at 60%; expected to come down by c.20% over 2-3 years
In high value goods, the industry expects. players such as GMCC, Highly, Daikin to apply for compressors; Hindalco and Mettube could apply for aluminium and copper

55GROUND VIEW GROUND VIEW 1 - 31 MAY 2021 1 - 31 MAY 2021 54
Major raw-material sourcing countries are China (majority share) Thailand, and Malaysia
Manufacturers are hedging their bets through India
RAC companies have been setting up manufacturing
facilities in India due to increasing duties and a recent ban
on the import of refrigerant or gas-fill ACs. China, which
had the lowest manufacturing costs, has seen costs rising
due to supply-chain issues, logistics costs, rising wages,
and increase in duties. Therefore, manufacturers have been
hedging their bets through India. Global RAC companies
now prefer India for exports and domestic demand. Local
manufacturing through OEMs/ODMs or in-house has led
to competitiveness. Branded companies are trying to find
the right proportion between manufacturing in house and
through contract manufacturers.
Historically, capacity utilization for RACs has been at c.60%/
lower with dependency on imports for addressing the
remaining demand. As the need for localization grows
stronger, players will try full-fledged manufacturing (vs
assembly). Imports are seen declining, as local manufacturers
and OEMs/ODMs ramp up capacities. Currently, the total
AC industry size is c.6.5-7.0mn units, of which the industry
imported c.2m units in FY20. Total installed capacity is
sufficient to make c.10mn units. With the government’s push
for domestic manufacturing and attractive schemes like PLI,
more capacities will be added in component manufacturing
and assembly. Total capacities will increase to c.12-15mn
units.
Manufacturers have been hedging their bets through India. Global RAC companies now prefer India for exports and domestic demand
In the past, contract manufacturing for air conditioners was limited to 5-6 players; now the number has almost doubled to 9-10
Sour
ce: I
ndus
try, P
hilli
pCap
ital r
esea
rch

55GROUND VIEW GROUND VIEW 1 - 31 MAY 2021 1 - 31 MAY 2021 54
Companies Units in Lac.
Sales Total
Win-dow
ACSplit
AC
In-House - Production Out-Sourced
Installed Capacity
Planned Capaci-ty Expansion#
Total Expected production*
Expected Out-Sourcing
IDU ODUs W -AC IDU ODUs IDU ODUs IDU ODUs IDU ODUs IDU ODUs
Brands
Voltas 12-15 1.1 11.5 - 10.0 1.1. 11.0 - - 12.0 6.0 6.0 4.2 14.2 12.8 -
LG 7.0 0.4 6.6 10.0 10.0 0.4 - - 18.0 18.0 - - 10.0 10.0 - -
Blue Star 6.0 1.1 4.9 3.9 2.9 0.3 1.0 1.0 4.5 4.5 6.0 6.0 8.1 7.1 - -
Daikin AC 8.0 0.6 7.4 6.4 6.4 0.6 1.0 1.0 12.0 12.0 6.0 6.0 10.6 10.6 - -
Johnson Con-trols- Hitachi
7.0 0.8 6.2 7.0 7.0 0.8 - - 10.0 10.0 - - 7.0 7.0 - -
Lloyd 6.0 0.7 5.3 6.0 6.0 - - - 12.0 12.0 6.0 6.0 10.2 10.2 - -
Carrier Midea 5.0 0.6 4.4 - 4.4 - 4.4 - - 12.0 - - - 4.4 6.0 -
Samsung 2.0 0.3 1.7 1.7 1.7 - - - 6.0 6.0 6.0 6.0 5.9 5.9 - -
Panasonic 3.5 0.2 3.3 2.1 2.1 0.2 1.2 1.2 3.0 3.0 - - 2.1 2.1 2.1 2.1
Godrej Appliances
4.0 0.4 3.6 1.1 1.1 0.4 2.5 2.5 3.0 3.0 - - 2.6 2.6 1.0 1.0
Others 8.5 0.8 7.7 1.0 1.0 1.0 1.0 9.2 9.2
Total 70.0 7.0 62.6 68.5 92.5 30 30 61.7 75.1 31.1 12.3
ACs: India is ready for domestic manufacturing; total installed capacity of 6.9mn units in IDUs and 9.3mn in ODUs. Now brands will be going slow on assembly capex, focusing more on components
ACs: Total production from contract manufacturers to reach 5.4mn units in IDUs and 4.6mn units in ODUs
Source: Channel check, Industry, PhillipCapital research# Capacity expansion over the next 2-3 years
#Capacity expansion in 2-3 years. Source: Industry, *PhillipCapital Research
Over the next 2-3 years, India may see capacity addition in components. Small and new OEMs will apply under lower value intermediates in PLI
Companies Units in Lac.
Installed Capacity Planned Capacity Expansion# Total Expected production*
IDU ODUs IDU ODUs IDU ODUs
Contract Manufacturers
IFB Industries 4.2 4.2 6.0 6.0 7.1 7.1
Amber Enterprises 22.8 22.8 10.0 10.0 23.0 23.0
PG Electroplast 6.0 6.0 6.0 - 8.4 4.2
ePack Durables Solutions 6.5 6.5 6.0 8.7 4.5
Subros 4.0 4.0 2.8 2.8
And others include ABAJ, Mirc, Panasonic, etc 6.0 6.0 4.2 4.2
Total 43.5 43.5 34.0 22.0 54.2 45.8

57GROUND VIEW GROUND VIEW 1 - 31 MAY 2021 1 - 31 MAY 2021 56
• The capacity expansion
announced by branded
companies is not entirely through
the PLI program, but also to cater
to the high demand witnessed
across consumer durables.
• Companies that have been
announcing fresh investments in
India for manufacturing are more
focused on manufacturing for
their own brands.
• Demand across product segments
continues to be so strong that
despite the capacity expansion
measures taken by several
companies, dependence on
contract manufacturers may not
reduce any time soon.
• The Government of India has kept
a strict control on FDI into India
by neighbouring countries. This is
to not lose control of operations
to overseas companies. Despite
this, excitement in the consumer
electronics sector is palpable, and
investments have been increasing
month on month, which shows
that demand is robust and growth
prospects are favourable.
• Any company that is looking to
be a significant player in the AC
industry, must have a full focus on
the HVAC range of products.
• ACs manufactured in India are
comparable to those in any other
country in terms of product quality
and efficiency; in terms of IoT-
based technology, China has the
edge.
• Installed capacity in
manufacturing in India is majorly
done by multinational companies
and Amber Enterprises.
• 2019 was a great year for the
AC industry due to scorching
summers; the industry grew by 10-
15% reaching the size of 7.5-8mn
units in a year.
• Daikin, which was more premium-
focused in the past decade, has
been targeting the mass market
aggressively with a vision of
gaining a larger piece of the
mass-market globally.
• Inverter ACs were 15% of the
high-wall category in the past few
decades, and have jumped to
50% at present, mainly driven by
regulations.
• The entire investment in the
AC manufacturing capacity has
been done by multinational
corporations, with domestic
companies missing this altogether.
• Voltas is known to be able to
source products locally or from
overseas at the best possible
prices, which is one of its core
strengths.
• China’s market is roughly 70-
80mn units, while India (the
second largest) is 7-8mn, which
shows huge potential for the AC
business.
Chat with industry experts
Increasing focus on exports
Over the next 2-3 years, India could have surplus capacity in
ACs for the domestic market, which will be used for global
demand. India’s RAC exports are currently insignificant
compared to China’s total RAC exports of c.65mn units.
Many global branded companies such as Hitachi, Daikin,
Haier, Carrier Midea, Mitsubishi, Panasonic, and Toshiba, with
strong global distribution and product knowhow, are getting
into agreements with Indian ODMs/OEMs for manufacturing
– as the country is seen as an exports source for many
countries in the Middle East, South Asia, and Africa. The
trend should expand domestic manufacturing capabilities.
Domestic branded companies such as Lloyd are also
talking about white-label exports. PLI focus on component
manufacturing, this will add in increasing exports.
Many global branded companies such as Hitachi, Daikin, Haier, Carrier Midea, Mitsubishi, Panasonic, and Toshiba, with strong global distribution and product knowhow, are getting into agreements with Indian ODMs/OEMs for manufacturing

57GROUND VIEW GROUND VIEW 1 - 31 MAY 2021 1 - 31 MAY 2021 56
Exports trend of ACs
Global exports market, China has the biggest share
India gaining share in the exports market
Countries such as South Korea, US, and Japan have
already shown interest in shifting their production facilities
to India. Vietnam, Thailand, and Indonesia are constantly
competing with India for a piece of the global supply chain,
but India ranks higher than its competitors in each of the
important parameters in the GCI (Global Competitive
Index). The country’s large domestic market provides not
just the advantage of cheaper exports, but would also allow
companies to benefit from domestic consumption.
India is working towards an enabling environment for
manufacturing for the world
India’s exports are likely to contribute to c.8% of the total
global consumption. GoI has taken certain steps that
directly/indirectly support AC manufacturers in exporting
– from lowering corporate tax to 17% and looking for an
area of 461,589 hectares across the country for foreign
manufacturing – India is working towards an enabling
environment for manufacturing for the world.
Here are some ways how:
• The country is committed to making investments worth
US$ 1.4tn in 2021-2025 to improve last-mile connectivity,
which will bring transportation time to hours from days.
• To achieve effective integration, India is developing DFCs
(Dedicated Freight Corridors).
• It is likely to be home to a billion digital users by 2028.
• The country also has a domestic advantage over China
and many other economies at the average population
age is 28.4 years (China’s is 38.4 years).
Sour
ce: c
omm
erce
.gov
.inSo
urce
: Ind
ustry
, Phi
llipC
apita
l est
imat
esSo
urce
: Ind
ustry
, Phi
llipC
apita
l est
imat
es

59GROUND VIEW GROUND VIEW 1 - 31 MAY 2021 1 - 31 MAY 2021 58
Why do AC companies outsource?
• Outsourcing allows companies to focus on differentiation,
marketing, innovation, and distribution.
• Partnering with ODMs and OEMs for lowering logistics
and warehousing costs.
• There is a substantial reduction in working capital cycles.
• Flexibility in offering multiple RAC models with a quick
turnaround time.
• Economies of scale – another advantage provided by
OEM/ODM players; leading companies will partner with
these players for design, manufacturing, and reverse-
logistics requirements.
• Innovation as a function to enhance productivity
and profitability is propelling the consumer durables
(branded) companies to embrace the services of OEM/
ODM players.
JCHAC imports around 40% of its ACs, of which 50% are China-sourced. It will focus on cutting down imports by half over the next one year (FY22) and double its exports to c.50,000 units (from the present c.25,000) to the Middle East and Africa
OEMs dominate outsourced manufacturing, ODMs emerge well
• ODMs provides benefits of faster product development
and design support.
• RAC companies save on R&D costs by partnering with
ODM players.
• Newer market participants find ODMs an attractive
option for faster penetration.
• OEM collaboration is more transactional while ODM
collaboration is more strategic.
• ODMs gain the confidence of consumer durables
companies, thereby acquiring a higher wallet share
Way forward for air conditioner companies in India
Not only could India be the largest growth market for air
conditioner companies, it is likely to become the largest
in the world. GoI should develop a sustainable cooling-
challenge program in partnership with the private sector to
create meaningful air-cooling solutions that would deliver
massive reductions in cooling wastage. This, combined with
Make in India type of incentives would not only create jobs,
but also give a much-needed boost to the manufacturing
sector, and thus, a boost to the Indian economy. Also, with
PLI and higher focus on increasing value addition in India,
the country can become an exports hub for ACs. Companies
focussing on exports will provide a huge delta, as this is
a huge opportunity. In terms of pricing, with PLI coming
in, companies will increase capacity, and to achieve the
threshold revenue, they will pass on incentives to consumers,
which will put realisations under pressure. The recent
government notification approving PLI scheme for ACs will
help in creating a component ecosystem in India. Local value
addition is expected to go up from current 25% to 75% in
the coming years with critical components coming in India.
Countries Export markets
Johnson control - Hitachi
UAE, Qatar, Oman, Bahrain, Iraq, Kuwait, Saudi Arabia
Daikin Air-condition-ing
Middle East, SAARC, East Africa, Bangladesh, Nepal, Sri Lanka
Voltas Middle East, South East Asia, and Africa
Blue Star Middle East, SAARC, Africa, and ASEAN markets
LG India Middle East, Africa
Lloyd Exploring market for exports
Countries that have an export presence
Source: Company, PhillipCapital Research

59GROUND VIEW GROUND VIEW 1 - 31 MAY 2021 1 - 31 MAY 2021 58
“To make the AC industry reach Rs 1tn from the current size of Rs 160bn, 35% of industry demand
should be coming out of exports, and the remaining from domestic consumption. The first objective is to
manufacture, not assemble in India, as currently a lot of product components still come from elsewhere.
Before the ban on import of ACs with refrigerants, 1.5mn units of ACs were coming from elsewhere,
which is almost 30% of the total ACs sold in the country, whereas 70% were getting produced in the
country. The second objective is to take the current value addition of 25% – to 75% in the next five
years, and backward integrate. The market size in India for air conditioners is just above 7.5mn units.
China is 120mn units and out of this, it exports 50mn units. It is the responsibility of multinational
companies to ensure that they establish the global supply chain footprint in the country. And that is
Panasonic’s objective too – to make India an exports destination.”
– Mr Manish Sharma, President and CEO, Panasonic India, and Chairperson,
FICCI Electronics and White Goods Manufacturing Committee.
Source: Media reports
Steps towards cleaner technologies
A focus on clean and energy-efficient solutions will not only save the customers’
money, but also reduce overall energy consumption and emit less carbon dioxide
over products’ lifetimes. ICAP (India cooling action plan) highlights the importance
of an accelerated HFC (hydro-fluorocarbon) phasedown process, and further
development of cooling technologies to tackle the rise in demand. The current
range of high-efficiency ACs are either unaffordable to the Indian consumer, or
their benefits are unknown to most. There is also a need for a systematic scaling
down of HFC usage in a way that best suits India’s economic conditions. Policy
reforms should ideally focus on controlling the use of refrigerants with high GWP
and promote the use of natural refrigerants.
The councils should amend building codes to ensure all new buildings are
designed such that a passive design is incorporated – passively cooled buildings
help reduce cooling loads and minimize peak-power requirements.

61GROUND VIEW GROUND VIEW 1 - 31 MAY 2021 1 - 31 MAY 2021 60
AC Industry received a set-back due
to the lockdown during the peak
season. But it showed resilience and
performed better than expected.
How is RAC demand shaping up
currently and what do you expect
from the upcoming season?
There is an air of optimism in the
market. All economic indicators
suggest a strong year ahead. For the
HVAC industry in particular, all reports
are pointing towards a strong season.
Summer has already set in in many
parts of the country, with the south and
central region seeing temperatures
rising in February, while the rest of the
country is warming up in March. We are
optimistic about consumer sentiments
and are anticipating a strong year.
There is a strong push from the
government towards domestic
manufacturing – Make-in-India
and Atmanirbhar Bharat. Do you
expect India to become self-reliant,
and be able to do significant value
addition in RACs over the next 3-5
years? What steps do you think the
industry and the government should
take in order to promote domestic
manufacturing?
While various RAC companies have
set up their manufacturing units
in India, the government is also
supporting domestic manufacturing.
Carrier Midea India has also shifted
its manufacturing base from Bawal,
Haryana, to SUPA, Maharashtra, last
year. This is one of the largest room air
conditioner factories in India spread
across 25 acres. The initial capacity
is 0.8mn air conditioners per year.
Phase two will take this capacity up
to 1.5mn. Carrier Midea’s predilection
for maintaining a local presence in
every aspect of its operations sets it
apart, and has been the company’s
focus for years. But it is particularly
applicable in the new facility in SUPA,
where some of the company’s suppliers
are also establishing new facilities to
streamline logistics and production
Carrier Midea India is a joint venture between Carrier and Midea Group Co. Ltd. While Carrier is a leading provider of heating, ventilating, air conditioning, and refrigeration solutions, the Midea group is a high-technology holding, specializing in HVAC, home appliances, robotics and automation, smart home and IoT, and smart logistics and components.
Carrier Midea India has manufacturing facilities in SUPA, Ahmednagar, and Maharashtra, and exclusive rights to manufacture and sell Carrier and Midea brand room air conditioners and Midea brand light commercial air conditioners in India. With offices in 21 cities across India, Carrier Midea India has a pan-India presence.
INTERVIEW – Mr Krishan Sachdev, Chairman, Carrier Midea India

61GROUND VIEW GROUND VIEW 1 - 31 MAY 2021 1 - 31 MAY 2021 60
for both sides of the supply chain.
Recently, the govt. has also announced
the production linked incentive (PLI)
scheme, which is aimed at boosting
domestic component manufacturing
and exports. The key to becoming
self-reliant for India is to promote
component manufacturing for items
such as compressors, controls, and
others. Capacity of AC assembly is very
high even at present.
Few global AC and AC component
giants have set up their
manufacturing units in India and
many global AC giants are viewing
India as an attractive manufacturing
destination, do you think in next few
years some part of the global AC
supply chain can shift to India?
Yes, with the setting up of more and
more RAC manufacturing units in
India, the global AC supply chain
should follow, and shift to India. For
e.g., GMCC, one of the world’s largest
manufacturer of compressors, has
already established its manufacturing
unit in SUPA, Maharashtra, and is
expected to start production later this
year.
What do you think are the major
challenges being faced by AC
industry currently in India and
the steps that need to be taken
to be competitive with the likes
of Vietnam, Taiwan, and other
competitors?
The AC industry in India is dependent
on other countries for key components
i.e. compressors, motors, PCB and
IGT Copper. Localization of key
components is missing as of now.
Carrier Midea India is also reaching out
to it’s suppliers to consider India as a
production hub. The second issue is
the higher cost of commodities in India
such as steel. There is also the issue of
components/SKD/units coming in duty-
free from some FTA countries.
What level of capacity addition do
you expect the industry to see over
the next 2-3 years? And with these
additions, how much would our total
domestic installed capacity for ACs
reach? Will the capacity be sufficient
to fulfil domestic demand, and by
any chance, could installed capacity
be in surplus?
The AC industry is expected to see
a CAGR of c.10% after it catches
back volume (from last year’s COVID
issues) significantly this year as per
our estimates. Although the installed
capacity is higher than the domestic
demand even today, the industry is
unable to make use of this capacity
because of the cost competitiveness
offered by other countries. In the
longer term, we should focus on
making local industry competitive
rather than using tariff and other
barriers to make imports uncompetitive
or difficult.
What kind of exports opportunity
exists in the AC segment, and any
steps in your opinion that could help
India take full benefit of the exports
opportunity?
The growth of the local market will
add scale to make India more exports
competitive. Countries with similar
weather conditions like Sri Lanka,
Nepal, Middle East, and African
countries need to be targeted for
export. Special support on exports
agreements will be helpful to take
the benefit; FTA’s with importing
economies will also support local
exports development.
India’s penetration in ACs is 5%
while China’s is above 100%. What
kind of realistic penetration level
can we expect in next 5-6 years,
once there is a ramp up in local
manufacturing of the necessary
components?
With the govt. encouraging local
manufacturing, we expect a gradual
increase to double digits in a span
of five years. The increase in AC
penetration also depends on per capita
income.
Traditional distribution channel is
being disrupted by e-commerce and
modern retail, which is providing
new and smaller players a channel
to enter the market. Can small
new players with their asset-light
business models, entering through
e-commerce and modern retail,
provide strong competition, and
do they have the potential to gain
decent market share?
As of now, the contribution of the
traditional retail/distribution channel
is more than 60% for RACs, while the
e-commerce contribution is under 10%,
though growing. With the impending
increase in the overall market for RACs,
there will be enough volumes to keep
all channels fully occupied. While
e-commerce may be an entry route
for new players, the real success will
probably depend on their presence in
all significant channel segments. But
it is too early to make any statement
about their market share.
Note: This interview was taken in March 2021

63GROUND VIEW GROUND VIEW 1 - 31 MAY 2021 1 - 31 MAY 2021 62
How is demand shaping as we are getting ready
for the upcoming season?
ACs have seen c.15% price increase in the last few
months due to commodity inflation. India is a price
sensitive country; demand could be impacted in the
short term due to these increases. This can be seen
in other consumer products too, where the price
increase have taken place.
AC imports have sharply reduced in the last
6-9 months over the corresponding period;
does it indicate India is on the path to become
Atmanirbhar soon?
Prohibition on imports of ACs with refrigerants, has
led to a reduction in imports; however, the import of
components hasn’t changed, rather it has increased.
The industry has shifted from importing completely
built units (CBUs) to importing components,
effective reduction in imports will be 15-20%.
India will become self-sufficient in the assembly
of ACs first, which will lead to 100% localization
of sheet metals, plastic injection moulding, and
gas charging. All 3 combined is 25% of total bill of
materials. Global companies are setting up their
plants for critical AC components, which will also
increase domestic value addition. At domestic value
addition of 25-30%, India needs to build a strong
component ecosystem to become Atmanirbhar;
until then, the industry will continue to import.
What about in other consumer durables products
such as refrigerators and washing machines – are
we self-reliant in these categories?
Semi-automatic washing machines and refrigerators
(direct cool and frost free till capacity of 300ltrs) are
all indigenized. Even compressors, fabrication, and
other key products all are made in India. Only few
components like glass door are imported.
How are you planning to scale? Do you have any
plans to set up any manufacturing unit?
Yes, we are planning to set up a manufacturing
unit – we will be manufacturing sheet metals, plastic
injection moulding, and gas charging along with
assembling of components.
Note: This interview was taken in March 2021
INTERVIEW – Mr Nipun Singhal, MD and CEO, Amstrad (OVOT Pvt. Ltd)
Amstrad is marketed by OVOT Pvt. Ltd, derived from the concept of One Vision One Team. It is a unique creation by channel partners and experienced industry veterans to give the best product, services, and prices on consumer electronics to Indian consumers. OVOT is head quartered in Pune, and its distribution network is spread across the country.

63GROUND VIEW GROUND VIEW 1 - 31 MAY 2021 1 - 31 MAY 2021 62
Mobile phones: Making India a global hub Mobile technologies and services contributed US$ 4.1tn
to the world GDP in 2019. As at June 2020, there were
8bn smartphone users globally, which are likely to reach
8.9bn by the end of 2025. The unique number of mobile
subscribers makes up around 81% of the world’s population.
Smartphones have become an everyday need for people of
all ages, cultures, and economic statuses. Rapid technology
advancements, increasingly available content, rising
discretionary incomes, and numerous use-cases have all
contributed to making this product an important everyday
lifestyle device.
Handset and component manufacturing in India
The annual production of mobile phones in India has grown
over five times – from 60mn units valued at Rs 189bn in
FY15 to 320mn units valued at Rs 2.25tn in FY20. Mobile
manufacturing in India started with Nokia, Samsung,
Motorola, LG, and Sony Ericsson in the mid-2000s and grew
steadily between 2008 and 2012, reaching over 155mn
handsets per annum. India exported nearly 70% of the
mobile phones it manufactured, valued at Rs 122bn as of
2012. However, due to a freeze on assets because of a tax
dispute, Nokia stopped production in 2014. As a result, the
component ecosystem that Nokia had built in India had to
shut down. In 2014, India’s production dipped to just 58mn
units, with marginal exports.
From SKD to CKD – progress
At present, India has significantly upped its mobile-phone
manufacturing capabilities, fuelled by constant policy
support from the government and a growing domestic
handset manufacturing market. Domestic manufacturing
of handsets and its components has emerged as one of
the flagship sectors of the “Make in India” initiative. The
implementation of the phased manufacturing plan (PMP) has
helped the sector move from Semi Knocked Down (SKD) to
Completely Knocked Down (CKD) level of manufacturing.
Top global handset manufacturers have set up rigorous
assembly operations in India but the component
manufacturing remains nascent. India still imports a
significant number of components and raw materials required
for the manufacturing of mobile phones, due to limited
Mobile phones production in India has seen 64% CAGR
Sour
ce: M
IETY
Ann
ual R
epor
t FY2
0So
urce
: IBE
F

65GROUND VIEW GROUND VIEW 1 - 31 MAY 2021 1 - 31 MAY 2021 64
availability locally. However, the sector has seen an increasing
share of its imports to be SKDs or small components, rather
than completely built units (CBUs). This which signals a shift
consumption to manufacturing.
Currently, the manufacturing capabilities for mobile-
phone components such as gift boxes, APTP (assembly,
Factors that lead to cost reduction in mobile phone mfg. India Vietnam China
Cost of power 0% 1% 1%
Interest subvention on working capital 0% 1.5-2% 3-3.5%
Logistics 0% 0.50% 1%
Labour subsidy Negligible 0.50% 2%
Corporate income tax exemption/ reduction 0.73-0.95% 1.5-2% 2%
Subsidy for machinery and equipment Nil 0.20% 3%
R&D Subsidy 0.15% 0.4%-1% 3-3.5%
Exemption/reduction of land rental 0% 0.50% 0.60%
Incentive for supporting industry 0% 0.5-1% 0%
Production Linked Incentive scheme 4-6%* 0% 1to 2%
Total 5-7% 7-9% 17-18%
India’s disability vs. Vietnam and China in mobile-phone manufacturing; PLI is an attempt to fill the gap
Source: Industry, PhillipCapital Research
Mobile phone key component share of bill of materials (BoM%)
Sour
ce: I
ndus
try, P
hilli
pCap
ital R
esea
rch
India still imports a significant number of components and raw materials required for the manufacturing of mobile phones, due to limited availability locally
programming, testing, and packaging), chargers, USB
cables, battery packs, chargers, die-cut parts, mechanics,
keypads, and PCB assembly already exist in India. These
sub-assemblies contribute around 67.5% to the BoM (bill of
materials) of an average-priced smartphone. Localisation at
the component level remains much lower when compared to
the sub-assembly level. Components such as PCBs, display
assemblies, image sensors, and camera modules contribute
significantly to the Bill of Materials of the handset and
India does not manufacture them, rather it imports these
components from countries such as China, Vietnam, USA,
South Korea, and Japan.

65GROUND VIEW GROUND VIEW 1 - 31 MAY 2021 1 - 31 MAY 2021 64
Global electronics giants are putting up manufacturing units for key components in India; Samsung Electronics has invested Rs 40bn for manufacturing of display units
Factors in favour of making India a global manufacturing hub for mobile phones
Mobile PLI
To boost domestic manufacturing of mobile phone and its
components, the government introduced production linked
incentives scheme for production of mobile phones under
Rs 15,000 and over Rs 15,000. It has approved a total 16
companies under the scheme. Key highlights of the PLI
scheme:
• Incentive: 4-6% PLI for five years.
• Outlay: Rs 409.95bn (US$ 5.5bn).
• Tenure: 5 years. Base year FY19-20. Incentives applicable
from 1 August 2020.
• Despite recent challenging times, mobile PLI will lead
to production worth Rs 350bn and investments worth Rs
130bn by applicant companies.
• Additional employment generation is 22,000 jobs.
• Domestic value addition in mobile phones is expected to
grow from 15-20% to 35-40%
Domestic value addition in mobile phones is expected to grow to 35-40% from 15-20%
Source: Industry, PhillipCapital estimates
Particular USD Bn
Global Market CAGR over Next 5 years 4%
India Market CAGR over Next 5 years 22%
India Market by FY25 (USD Bn) 80
India Exports CAGR over next 5 years 197%
India Exports by FY25 (USD Bn) 110
Targeted Production in FY25 (USD Bn) 190
Targeted Value Addition by FY25 34%
Industry expect strong exports with improvement in value addition

67GROUND VIEW GROUND VIEW 1 - 31 MAY 2021 1 - 31 MAY 2021 66
Company name CAPEX ( in Rs mn.)
State Type of CAPEX Date of Announcement
Samsung India 49150 Noida, Uttar Pradesh Samsung (South Korea)
Optiemus Electronics 2850 Sale of commercial property in Noida 2020
Samsung India 48250 NCR, Uttar Pradesh Mobile and IT display production unit 2020
Lava international 8000 2021
Pegatron corporation 11000 Chennai Leased 500,000 sq. feet of land 2021
Hon Hai Precision Industry Co Ltd 39000 Tamil Nadu Expanding manufacturing capacity 2021
Dixon Technologies 2500 South India Padget Electronics 2021
Intex Technologies 600 Technology software and IoT start-ups 2018
Micromax Informatics 6510 Consumer electronics 2020
Tata Electronics 46840 Krishnagiri, Tamil Nadu Plant for manufacturing mobile components 2018
Capex announced by companies: Capacity expansion will help to increase domestic value addition
Sour
ce: M
edia
repo
rts, P
hilli
pCap
ital R
esea
rch
Source: meity.gov.in, media reports
Sour
ce: M
EITY
, Phi
llipc
apita
l res
earc
h
Domestic companies International companies
Electronic component companies
Lava Hon Hai Preci-sion Industry Co Ltd
AT&S
Bhagwati Products (Micromax)
Rising Star Ascent circuits
Padget Electronics Samsung Visicon
UTL Neolyncs (Kar-bonn)
Wistron Walsin
Optiemus Electronics
Pegatron
Sahasra ElectronicsNeoLync
Companies approved under PLI for mobile phone manufacturing
Mobile total India industry (Smart Phones c.160mn) (Features phones c.120mn units)
Working of Mobile PLI capex
Min/Threshold Max/Ceiling
Companies No of Cos.
Capex/ Com-pany (Over
3 years)
Revenue (per Com-
pany)
Total Revenue
Revenue/Capex (x)
Total Capex
Revenue (per Com-
pany)
Total Revenue
Capex/ Com-pany (Over 3
years)
Total Capex
Global Cos. 5 10,000 250,000 1,250,000 25 50000 500,000 2,500,000 20,000 100,000
Domestic Cos. 5 2,500 50000 250,000 20 12500 100,000 500,000 5,000 25,000
Component 6 1000 5000 30,000 5 6000 30000 180,000 6,000 36,000
Total 16 1,530,000 68,500 3,180,000 161,000
Sour
ce: P
hilli
pcap
ital r
esea
rch
estim
ates
Company name (Units mn) Current Capacity
Capacity Addition##
Sales Volumes
% Share
Brands
Samsung India 80-100 0 42.4 27%
MI 2.-3 1-2 48 30%
Oppo, Vivo & 1+ 40-60 20-30# 44 28%
Lava International 36 100 3.2 2%
Apple 3.2 2%
Others# 1-2 5 19.2 12%
Total 160-200 125-130 160 100%
OEM’s % Share**
Dixon Technologies* 3 15 3 8%
Bhagwati Products 10 5 0.9 7%
Optiemus Electronics# 18 3 0.5 9%
Hon Hai Precision Industry (Foxconn) 50 72 45 54%
Pegatron n.a. 5 0 2%
Wistron 2.5 2.4 2.5 2%
UTL Neolyncs (Karbonn)# 26.4 13.2 25 18%
Total 109.9 115.6 76.9 100%
% S
hare
bas
ed o
n To
tal E
xpec
ted
Capa
city (
OEM
s)**
Note
: # P
C es
timat
es. #
# Ove
r nex
t 2-3
year
s **
Mar
ket s
hare
will
chan
ge w
ith ca
pacit
y add
ition
.

67GROUND VIEW GROUND VIEW 1 - 31 MAY 2021 1 - 31 MAY 2021 66
Mobile phone shipment data: Market share of major brands in India
Mobile phone exports monthly data: Exports reached pre-pandemic levels in Nov/Dec 2020
Sour
ce: C
ount
erpo
int r
esea
rch
Rising exports of mobile phones
Challenges faced by mobile and mobile component
manufacturers
Low value addition: Despite the presence of global handset
makers in India and a rise in domestic demand, the country
still does not manufacture high-value components such as
camera modules and display units. It manufactures only low-
value-added components such as batteries and chargers.
Fierce global competition: Many nations are fighting for
investments into their economies for the manufacturing of
high-value-added components for mobile handsets. There
are many entry barriers for new players who want to start
manufacturing in India.
Lack of an integrated supply chain: One of the major
barriers to indigenous manufacturing in the country is an
inadequate supply chain. Despite a large domestic market
and an enabling regulatory environment, the growth of this
sector is highly dependent on this factor.
Infrastructure and resource unavailability: Uninterrupted
supply of power, clean water, and infrastructure are
imperative for producing mobile handsets in India.
Financial setbacks: High-value-added components
(that India currently imports) require huge investments
to be produced locally, in terms of installation of large
manufacturing plants and purchase of costly machineries.
The ROCE is also generally lower due to lower productivity
and there is a dire need for financial incentives by the
government to raise the required funding from the private
sector.
Unavailability of skilled labour: India needs to focus on
up-skilling its labour if it wants to set up large manufacturing
plants and complex machineries. There is a huge gap
between the skills required for manufacturing of electronics
in India and other countries, which the country needs to
cover to become an exports hub.
Sour
ce: c
omm
erce
.gov
.inSo
urce
: com
mer
ce.g
ov.in

69GROUND VIEW GROUND VIEW 1 - 31 MAY 2021 1 - 31 MAY 2021 68
TVs: Looking at becoming a global manufacturing hub…
TVs: Industry overview
The colour televisions market in India was c.18mn sets
in 2020 – 12.5mn smart TVs, 3mn analog sets from the
organised market, and 2.5mn from the unorganized segment.
TV manufacturers faced difficulties and had huge inventories
stockpiled when the pandemic hit, leading to a total
washout in terms of sales. When the lockdown was gradually
lifted, work-from-home and school-from-home led to an
unprecedented increase in demand, with growth coming
from tier-3 and 4 cities. Households across the country were
inclined to upgrade their TV sets, as most of their time was
being spent at home.
This excess demand outstripped supply and the prices of
ICs (integrated circuits), panels, commodities, transportation,
and freight increased considerably. The squeeze in supply
led to rising prices throughout the sector. Increases in prices
of steel, copper, and aluminium, the re-imposition of basic
custom duty of 5% on open-cells (open-cell panels are
Domestic value addition in TVs is c. 15-20%, which will increase to 30% over the next two years
Open cell is a part of an TV panel without the back-light. India needs to manufacture open cells, which are 65-70% of Bill of Materials (BOM), to increase its domestic value addition. This would require high investments of Rs 8-10bn. TCL is putting up an open-cell facility in India
Smart TVs dominate the market with c.69% market share
Sour
ce: T
VJ, P
hilli
pCap
ital r
esea
rch
used in manufacturing LCD/LED screens for televisions),
and a spike in freight charges to c.Rs 320,000 per container
from c.Rs 65,000 – added to the disruption. Most brands
took price increases of more than 30%. The pandemic also
disrupted the launches of new TV technologies scheduled for
2020.
Currently, the Indian TV manufacturing industry largely
assembles TVs, with most of the high-value components
coming from Vietnam and China. To provide a fillip to
domestic manufacturing and to emerge as a global hub for
televisions, India needs to start producing open cells, among
other components that are crucial to produce TVs.

69GROUND VIEW GROUND VIEW 1 - 31 MAY 2021 1 - 31 MAY 2021 68
TV market share in India
Sour
ce: T
VJ, P
hilli
pCap
ital R
esea
rch
TVs: Market share
Samsung, LG, and Xiaomi hold a combined market share of
64%, with Samsung at the #1 position, and LG and Xiaomi
almost neck-to-neck in 2019. Sony slipped by quite a bit in
2019. Panasonic, Haier, and TCL have established a strong
foothold for themselves. The unorganized segment and
regional companies’ brands have also been gaining some
market share – from 10% in 2017 to touch 16.5% in 2019.
Some of the smaller TV players include Onida Electronics,
Wybor, Intex Technologies, Micromax Informatics, Mitashi,
Lloyd, Sharp, Sansui, Phillips, Veira Electronics, BPL, Sanyo,
T-series and some companies that have just forayed into
the Indian market are OnePlus, Motorola, Nokia, and Hero
Electronics.
Demand for TVs
Penetration for TVs has crossed more than 99mn homes
in rural India; it is no longer just an urban phenomenon.
Decreasing prices of TVs has created a replacement market
for TVs with an average replacement cycle of 5 years.
Increased innovation in this segment along with lower price
points has augmented the penetration of TVs across all
income groups in the country.
The exponential growth of internet connectivity across
the country, especially in tier 2 and 3 regions is another
contributor to demand as it gives more access to OTT
platforms to the tech-savvy generation. 2019 saw an increase
in demand for Korean and Chinese brands, with innovations
and newer product offerings in different price segments to
cater to the mass market. Gradually, with a drop in prices,
demand was seen shifting towards large screen premium
TVs. Sales from e-commerce segment have been gaining
traction, with companies gradually foraying into smart
televisions. Looking at the steep growth in demand, OnePlus
plans to leverage its position of being a leading mid-
premium mobile-phone company and brand to gain some
market share in the 18mn-units Indian TV industry. OnePlus
also plans to set up a production hub for global supply of
TVs, by manufacturing its televisions in India.
2019 saw an increase in demand for Korean and Chinese brands, with innovations and newer product offerings in different price segments to cater to the mass market

71GROUND VIEW GROUND VIEW 1 - 31 MAY 2021 1 - 31 MAY 2021 70
Dixon Technologies, market leader with 51% share
Sour
ce: I
ndus
try, P
hilli
pCap
ital R
esea
rch
Pre-covid prices of 32’’ TVs were at Rs 12,000 and due to a sharp increase in open-cell panels, prices have reached Rs 20,000
OEM market for TVs
The OEM market for colour televisions is estimated at
6.5mn sets in 2020, up 44% yoy. Few players such as Dixon
Technologies are expanding their production, and are all
geared up for higher numbers going forward. The Indian
OEM market in 2019 was pegged at 4.5mn sets. It witnessed
a 12% yoy rise in 2017, 22% in 2018, and a whopping 59%
rise in 2019. SVL and Dixon Technologies were the biggest
benefactors of this jump in production. Many companies had
shut their plants due to the imposition of BCD on open-cell
panels, which the government eventually revoked. However,
in the interim period, OEMs such as Dixon saw an upsurge
in orders. In November 2020, the government re-imposed
BCD on open-cell panels. We believe OEMs are set to
benefit again from the re-imposition of BCDs.
In case of supplies to Indian television makers, panel
suppliers preferred to go with large OEM players, and there
has been an increase in the trend of advance payments for
Panel suppliers preferred to go with large OEM players
Government initiatives like import duties and license will result in a third of imports being sourced from domestic contract manufacturers
Mirc Electronics (ONIDA) is increasing its capacity; its current capacity is 1mn units. Its key customers include BPL, Reliance and TCL
PG Electroplast, a contract manufacturer for ACs and washing machines, is also planning to manufacture TVs
supplies. The government has been supporting domestic
manufacturing by imposing tariff hikes, schemes, and
initiatives. GoI imposed import duties on many LCD sets in
July 2020, as part of the Aatmanirbhar campaign. Moreover,
the DGFT (Directorate General of Foreign Trade) has
mandated an import license for importing television sets.

71GROUND VIEW GROUND VIEW 1 - 31 MAY 2021 1 - 31 MAY 2021 70
Government intervention for the TV industry
Government initiatives are the key drivers that will drive
domestic electronics manufacturing in India. Production
Linked Incentive scheme (PLI), Scheme for Promotion
of Manufacturing of Electronics Components and Semi-
conductor (SPECS) and EMC 2.0 (Electronics Manufacturing
Cluster) are some of the initiatives that are making large-scale
domestic manufacturing of electronics attractive for investors.
• PLI includes semiconductor fab (fabrication) and display
fab.
• SPECS is aimed at helping eliminate the disability of
domestic manufacturing of electronic components and
semiconductors.
• EMC 2.0 is likely to strengthen the supply-chain
Mfg. Own brand Major Customers
Dixon Technologies NA Xiaomi, Panasonic, Reconnect, Koryo, Phillips, Croma, Sanyo, Intex Technologies, Akai and Lloyd
Hon Hai Precision Industry Co Ltd NA Sony
MEPL Wybor, Ego-Vision Akai, Panorama, Intex Technologies, HOM, Truvision, Abaj, Nextview, Hyundai, Dyanora, Blueberry, VG, and BPL
Noble Moulds Daenyx and Golf Haier and regional brands
SVL Group Suzlon, Suntek, SVL Kodak (online and offline) and Thomson (online)
Veira Electronics Iconic JVC, T-series, Noble, Abaj and Crown
Videotex International Daiwa, Telefunction and Shinco (only online)
T-series, Intex Technologies, Hyundai, Sansui, Haier and Lloyd.
Skyworth NA Panasonic (32”)
MIRC electronics Onida Reliance, BPL, TCL, others etc
List of leading TV contract manufacturers and their major customers
OEM volume for TVs in FY20 was up 44% yoy to 6.5mn sets
Sour
ce: I
ndus
try, P
hilli
pCap
ital R
esea
rch
responsiveness, decrease the time-to-market, consolidate
suppliers, and lower logistics cost.
• In July 2020, to promote domestic manufacturing, the
government imposed restrictions on imports of TVs.
Together, these schemes will help enable large-scale
electronics manufacturing, domestic supply chain of
components/state-of-the-art infrastructure, and common
facilities for large anchor units and their supply-chain
partners. The PLI outlay has provided incentives for setting
up new factories for home-grown TV manufacturers.
However, for such a large scheme to work, it needs the
centre and the states to be aligned in terms of vision. States
such as Maharashtra, Andhra Pradesh, Karnataka, Tamil
Nadu, Telangana, and Uttar Pradesh have provided support
in terms of capital and power subsidies, tax reimbursement,
and skilling.
Sour
ce: I
ndus
try, P
hilli
pCap
ital e
stim
ates

73GROUND VIEW GROUND VIEW 1 - 31 MAY 2021 1 - 31 MAY 2021 72
Recent ban on imports of CBUs of TVs and higher import duties on open cell will lead to
reduction in import
Strong demand resulted in supply shortages of open cell, impacting the volumes
Sour
ce: c
omm
erce
.gov
.in
Company name CAPEX ( in Rs mn.)
State Comments Capacity Date of Announcement
Haier appliances 500 Noida, NCR TV plant 2019
Jaina Group 10,000 Manufacturing hub for Sansui brand products; will ex-port to other geographies, including neighbouring South East Asian markets. Capex is for the next three years.
2019
Dixon Technolo-gies
500 Tirupati Padget Electronics 2020
Thomson 10,000 Will invest in the next five years for home appliances. 2020
TCL 24,000 Capex for TV 2020
ABAJ 500 For manufacturing of 2.5mn TVs 2020
PG Electroplast 300 Pune TV plant AC: 0.9mn p.a. -IDU + 0.4mn
-ODU
2021
SPPL - Kodak TV 3,000 To increase the capacity 2021
Mirc Electronics 300 Maharashtra TV
TV assembly plants require a lower capex of Rs 300-350mn, but it is imperative to reach high utilisation levels
TV CBUs have seen a sharp reduction in imports due to restrictions
Source: Industry, PhillipCapital estimates

73GROUND VIEW GROUND VIEW 1 - 31 MAY 2021 1 - 31 MAY 2021 72
Massive capacity addition taking place
The government’s initiatives for increasing domestic value
addition have allowed domestic contract manufacturers
such as Dixon Technologies, PG Electroplast, MIRC, Kodak,
and ABAJ to increase manufacturing capacities. Over the
next two years, India will see a massive capacity addition
in LED TVs by companies (with own brands) and OEMs for
assembling. This aggressive capacity addition by brand-
name companies and OEMs will help in increasing exports
from India. However, value addition will remain a challenge
as India depends on imports for open cells.
The pandemic and TV prices
In FY20, LCD TV panels had a rollercoaster of a year, with
three inflection points in the H12020 and huge increases
in prices in the second half. Samsung, LG, and other TV
manufacturers’ announcements of shutting down their plants
Current capacity and additional capacity announced by TV makers
Company name Brands/OEM Current capacity (mn) Additional capacity announced
Production (mn)##
Samsung India Brand 0.5 0.45
LG Brand 2 1.8
Panasonic India Brand 0.5 0.45
Haier India Brand 1 Added 0.4
Onida Electronics/MIRC Brand 0.2 0.18
Total 4.2 3.28
Dixon technologies OEM 4.4 1.1 2.275
MEPL (Trader+Small Assem.) OEM 0.5 -1.0 0.6
SVL Group (Sunteck Vision) OEM 0.5 -1.0 0.375
Foxconn OEM 0.5 -1.0 0.45
Noble Moulds OEM 0.5 -1.0 0.05
Videotex International OEM 2 2 0.3
Veira Electronics OEM 1.2 0.2
Genus Electronics OEM 0.5 0.5
Onida Electronics OEM 1.2 1.2 0.4
Micromax (Bhagwati products) OEM 0.5 -1.0 0.5
Super Plastronics OEM 0.5-1 0.2
Beston Electronic OEM 0.5-1 0.2
ABAJ – ABZ OEM 1 0
TCL OEM 0 4-5
PG Electroplast OEM 0 0.5
Skyworth (Brand+OEM) New OEM 1.-2 3-4
Others OEM 0.45
Total 6.5
Total Domestic Manufacturing OEM + Brands 9.78
Sour
ce: P
hilli
pCap
ital R
esea
rch
and
Chan
nel C
heck
s Not
e: ##
PC
Estim
ates
Leading TV brands are reducing production of 32 inch and 43 inch TVs as it is unprofitable for them. Small players will continue to make smaller TVs while bigger brands will produce more high-end and premium TVs

75GROUND VIEW GROUND VIEW 1 - 31 MAY 2021 1 - 31 MAY 2021 74
(US, Europe, and China) partly contributed to an increase
in prices. The pandemic led to chaos and panicked price
reductions, as the whole world saw an eventual collapse in
demand, but then it surged due to stay-at-home orders and
lockdowns. From February 2020 to Q4FY21 prices for open
cell increased 2-3x.
TV exports from India
TV exports monthly data
Sour
ce: M
inist
ry o
f com
mer
ce a
nd In
dust
ry, G
ovt.
of In
dia
Sour
ce: c
omm
erce
.gov
.in
TV prices monthly trend
TV prices saw sharp rise in FY21
Sour
ce: I
ndus
try, D
SCC,
Phi
llipC
apita
l Res
earc
hSo
urce
: Ind
ustry
, DSC
C, P
hilli
pCap
ital R
esea
rch
Trade war and TV prices
Fear and uncertainty due to the trade war between the US
and China, and a much-anticipated tariff hike by the US in
the second half of 2019, pushed branded TV companies to
move panel orders to the first half of 2019. Fears that TV
prices would rise due to tariffs led to reduced panel demand
and increasing inventories. Panel prices also started falling.
By the end of FY19, supply outstripped demand. Fierce
competition led to massive reductions in panel prices,
pushing prices below even cash costs for some products.

75GROUND VIEW GROUND VIEW 1 - 31 MAY 2021 1 - 31 MAY 2021 74
Technology adding value
Mini LEDs
2021 is likely to be a good year for the mini-LED technology,
as it is introduced in multiple applications. It will compete
fiercely with OLED technology. Samsung has targeted 2mn
unit’s shipment of mini-LEDs in 2021. LG introduced its mini-
LED TVs at the CES (Consumer Electronics Show) in January
2021. TCL has been shipping LCDs with mini-LEDs and has
expanded its range with lower-priced models.
Sour
ce: I
ndus
try, P
hilli
pCap
ital R
esea
rch
Smart TVs volume grow – 4% CAGR over 2019-25
Smart TVs
The global unit shipments of smart TVs are likely to increase
from 209mn in 2019 to 267mn in 2025, a 4.1% CAGR. Falling
prices and the demand for next-generation features, such
as 4K and HDR continue to be the strongest drivers for TV
sales. Even as the price of high-end models continues to
soar as screen sizes and device sophistication at the high
end continues to grow, there is a falling disparity between
traditional and smart TV price points at the lower end of
the product lines. Manufacturers are trying to drive up
interest among content creators and consumers for the
next technological breakthrough after 4K, such as HDR and
quantum dots.
OLED technology
OLED is an important step towards the future of the
television industry. OLED sales should add 2mn units each
year, bringing the market close to 11.5mn units by 2023.
These currently make up a mere 1-2% of overall global
TV sales, but 30-34% of the premium segment. These
shipments were at 3.2mn units in 2019, and so far, remain
the exclusive domain of LG Display, one of the world’s
largest manufacturer and supplier of LCD, OLED, and flexible
displays, although new players have entered OLED in 2020,
and many more are likely to enter ahead. The price of an
OLED TV has dropped significantly over the years, and has
now become a viable option for more consumers.
64-inch trumps 55-inch for the first time
The global market for OLED TVs should reach US$ 18.6bn
by 2027, 16% CAGR over 2020-2027. It currently occupies
30-34% of the premium category global TV sales. These
TV shipments rose to 3.38mn units in 2020; 65-inch OLED
TVs were 41% of the global OLED TV market; 55-inch were
39%. For the first time, 65-inch shipments surpassed 55-inch
shipments, as people increasingly prefer larger screens in
their homes. Up until 2019, 55-inch made up 49% of the
annual OLED TV production, but in 2021, 65-inch is set to
reach 49% of total shipments (55-inch at 36%). Although
branded companies are setting ambitious targets for OLED
TV production, this segment might not have an entirely
optimistic demand outlook for high-end TVs. Aside from
pandemic-induced lockdowns that are hurting demand,
flexible pricing of QLEDs is a potential threat to OLEDs.
QLED TVs
Owing to its technology and cost advantages, QLED TVs
have grown 230% over 2019-20. Global shipments of these
were 5.83mn units in FY20 and even with the downturn, the
market for OLED products thrived on a flourishing stay-at-
home economy, which resulted in retail price cuts of more
than 20% for 65-inch QLEDs in the North American market,
creating a wave of replacement demand for TV sets.
Most QLED TVs have leveraged their existing LCD designs,
where the quantum dots are embedded within the filtering
For the first time, 65-inch shipments surpassed 55-inch shipments, as people increasingly prefer larger screens in their homes

77GROUND VIEW GROUND VIEW 1 - 31 MAY 2021 1 - 31 MAY 2021 76
layers comprising the stack. A few manufacturers are looking
at integration of QDs (quantum dots display) into OLED TVs
in a unique hybrid system that combines the flawless black
uniformity of OLEDs with the efficiency and vivid colours of
quantum dots.
Global OLED TV market share (size wise)
Indian TVs: Screen-wise market share
The 4K and 8K wave
Customers have been prioritising their purchase of
appliances; smartphones shipments are losing steam,
while TVs have seen their sales increase. This phenomenon
has given a boost to sales of 4K TVs, according to Onida
Electronics. The pandemic has impacted 4K sales in some
parts, as customers have been buying small non-4K TVs in
rural regions. Onida Electronics expects 800mn 4K-enabled
homes by 2024. While the number of 4K channels has been
growing, launches are delayed, in part due to the Tokyo
Olympics.
The 8K made its debut at CES 2019, but has made up a very
minor portion of the premium TV sales, as they come with
hefty price tags. These sets’ sales are likely to reach US$
5bn by 2021, with larger TV sets becoming a standard. Also,
sales of equipment related to the creation and production
of 8K content could generate hundreds of millions of dollars
globally in next 2-3 years.
Sour
ce: T
VJ, I
ndus
trySo
urce
: TVJ
, Ind
ustry

77GROUND VIEW GROUND VIEW 1 - 31 MAY 2021 1 - 31 MAY 2021 76
• For CY20, the industry size is c.12mn units.
The industry has seen a decline of 20-30%,
mainly because of COVID-19. India has
banned imports of LEDs (TVs). The industry
imports in the SKD format at present. In
CY19, it imported 7-8mn units as FG; industry
size was c.14mn units. Companies like Sony
and Samsung were primarily big importers at
c.3-4mn units.
• The bigger challenge currently is importing
open-cells for LEDs. The industry is seeing
a supply chain issue. Open-cell prices have
drastically increased. Last year’s 32” panel
open cell at c.US$ 32 now going for c.US$
96. This has resulted in a sharp increase
in LED prices. Majority of the sourcing for
open-cell is done from China; c.80% of
global supply. Prices have increased mainly
because of strong demand, and reduction
in capacity of open cells from 4.8bn to 4.5bn
units (as manufacturers are not making
money, because panel prices have gone
down sharply. Dependency on China for TVs
is very high as panels and IC manufacturing is
mostly done there.
• Companies like LG are shifting to OLED
technology. This is a premium product
(supply is not an issue), as it can source from
its plants in Vietnam, Korea, etc. But OLED
TV prices are very high; for e.g., a 55” TV
costs Rs 150,000 vs. a normal LED at Rs
60,000.
• For LED assembly, India has huge capacity.
Currently, companies are operating at lower
utilization levels. Dixon has c. 4mn, Onida
1.5-3.0mn (underutilised), ABZ c.0.5mn,
Videotex c.1mn, etc. Additionally, some
companies are also putting up assembling
plant (such as Haier), increasing capacity to
1mn, TCL 4-5mn units etc (expected to start
in June 2021).
• In terms of demand for 2021, there will
be growth, but it might still be lower than
2019. Value growth may be higher, as
big-screen TVs are seeing more demand
than smaller screens. 2021 is a game of
supply-chain management, as sourcing is a
challenge. Large players are having benefit
vs. small players in sourcing and some price
difference.
Takeaways from interactions with a TV industry expert

79GROUND VIEW GROUND VIEW 1 - 31 MAY 2021 1 - 31 MAY 2021 78
Will Make in India and Atmanirbhar Bharat lead to
significant value addition in India over the next 3-5
years?
We at Dixon have a very strong conviction that the
consumer durables and electronic goods sold in India will
be manufactured largely in India after the government’s
‘vocal for local’ theme. As more companies are focusing
on branding, distribution, and technological upgradation,
manufacturing of a critical part of the value chain will
see an increase in outsourcing in coming years. Even the
designing aspect of mass products will see higher OEM
participation.
Over the last three years, the tariff structures in electronics
imports have been rationalized, one to promote domestic
manufacturing in India, and two, to deepen the level of
manufacturing locally. As part of the government’s Phased
Manufacturing Programme, duties are being levied or
increased on various components of the electronics goods
which were majorly imported in India a move that will
increase the domestic value addition in India. As far as
the components ecosystem is concerned, it is a journey,
and I am sure that in the next 2-3 years, we will have
a large component ecosystem in the country, starting
with manufacturing of finished goods, where the import
intensity is relatively higher. Once the industry acquires
economies of scale, the component ecosystem will grow
domestically.
INTERVIEW – Mr Saurabh Gupta, CFO, Dixon Technologies
Dixon Technologies Ltd. is a leading
electronics manufacturing services
(EMS) provider in India. A home-
grown manufacturing company,
Dixon Technologies provides design-
focused EMS solutions in consumer
durables, home appliances, lighting,
mobile phones, and security devices
to customers across the globe.

79GROUND VIEW GROUND VIEW 1 - 31 MAY 2021 1 - 31 MAY 2021 78
Also, to become 100% self-reliant, what steps do you
expect India to work on?
The government needs to formalize and rationalise land
and labour reforms in the country in order to complement
the recent tax cuts, and to remove structural hindrances to
capital investments, higher focus has to be on infrastructure
and logistics. The government should continue to focus on
the “Make in India” theme and provide further incentives
for investment to companies setting up manufacturing
units, including for the electronics industry. Also, another
issue that requires policy attention is foreign trade strategy.
India’s competitiveness can help it to become an integral
part of the global supply chain at a time when international
companies are looking at expanding their footprint beyond
China, and locating to other markets. Some additional steps
include the actual realization of ease of doing business,
strong skilled resources base, and promotion of R&D
initiatives.
With a higher focus on domestic manufacturing, do you
expect global manufacturers to move towards India?
India’s suffers from a disability of about 6-7% in various
sectors as compared to China, which we can attribute to
lack of adequate infrastructure, domestic supply chain
and logistics issues, high cost of financing, inadequate
availability of quality power, limited design capabilities and
limited focus on R&D by the industry, and inadequacies
in skill development. The government is trying to address
these through the Production-Linked Incentive (PLI) scheme
in various sectors. Global manufacturers have jumped on the
opportunity to set up manufacturing bases in India, and are
optimistic about the kind of incentives proposed under the
PLI scheme. The schemes will attract large-scale investments
and generate huge employment. In the current scenario, the
PLI scheme will provide a huge thrust to companies that are
looking at relocating beyond China.
However, the government of India has to ensure that
– companies incurring capex to set up manufacturing
do not face delays and capital cost overruns, effective
scheme implementation, and business sustainability. The
government needs to promise foreign companies stability,
predictability, and continuity in the wide policy stance.
How important is R&D now that India is expected to
grow its manufacturing for the next 5-6 years? Can India
take a lead in this?
It is India’s turn to ramp up its R&D, technology,
manufacturing, and innovation, which will help to create
more jobs, improve workforce efficiency, and attract larger
cost savings in manufacturing, logistics, and the technology
employed. With the intellectual capital available in the
country, and competitive talent costs, global and domestic
companies have the opportunity to establish their R&D
centres in India, which can ultimately drive localisation.
How big is the exports opportunity? In what products
can India look for exports and in which markets?
In the electronics sector, I feel confident that we are currently
sitting on an inflexion point, where we can think of new
investments and expanding our capacities; over a period
of time, I am confident that India will emerge not only as a
contract manufacturing base for serving domestic markets,
but also for the exports markets, because once scale kicks
in, and operating leverage comes into the system, the
country becomes globally competitive – both in terms of
productivity and skill sets. Government policies are aimed at
creating global champions out of Indian manufacturing.
The government has imposed restrictions on the
import of TV sets; how do you see this panning out for
contract manufacturers such as yourself? How big is the
opportunity size?
As per government data, TVs worth Rs 72.2bn were
imported in 2018-19 out of the total market size of Rs 250bn
– from China and other Asean countries such as Vietnam,
Hong Kong, Malaysia, Korea, Indonesia, and Thailand. LED
TVs were being imported at reduced/zero duty under the
Asean-India FTA and such imports could not be controlled
through increased duty. Hence, non-duty actions, like import
restrictions, were one of the main actions available to the
government. Putting LED TVs under the restricted category
will not only boost domestic manufacturing but will largely
accelerate sourcing by companies from domestic contract
manufacturers that provide Indian-designed solutions, which
will be a significant positive for the contract manufacturing
industry. It will also help deepen the level of manufacturing
in India. In Dixon, we are strengthening our R&D and trying
to get a larger share of customers’ business to our self-
designed solutions.

81GROUND VIEW GROUND VIEW 1 - 31 MAY 2021 1 - 31 MAY 2021 80
Open cells, which make up a majority of BOM (bill of
materials) in TVs, are completely sourced from China.
What steps are being taken by the government to
increase local manufacturing of components? What
challenges do Indian manufacturers and companies face?
Open cell contributes more than 60% of the BOM in LED
TVs and with no localisation in India, the government is keen
on expanding domestic production of critical components
such as open cells, but this entails huge capex. And If
India wants to become a manufacturing hub for LED TVs,
the government will have to set up an ecosystem that
manufactures open cells. As part of the government’s Phased
Manufacturing Programme, it is increasing duties on various
components of the LED TVs, which will eventually lead to
higher domestic value addition in India, and is in line with its
vision of creating a component eco-system in India. As per
recent news articles, the Vedanta Group is in talks with the
government for setting up a display fabrication plant.
The biggest challenges that LED TV manufacturers and
brands are facing at present are – 28% GST on LED TVs of
more than 32 inches, a 5% duty on importing open cells,
and prices of open cells rising by more than 3x in the last six
months.
Washing machines and refrigerators are majorly
indigenized (domestic value addition of c.70%); do
you think it is a potential category for exports? What
challenges are we facing in tapping the larger exports
markets?
The total washing-machine market in India is around 7mn
units per annum and Dixon is the leader in manufacturing
with the largest capacity of 2.1mn units (semi and fully
automatic top-loading machines). We provide 100% own-
design solutions with the largest product basket and we
have a presence both in north and south India.
In semi-automatic washing machines, Dixon has the largest
capacity of 1.5mn per annum and has the largest portfolio
of 150 models ranging from 6-10kg. Our top-loading fully
automatic washing machines plant construction is on time
and almost complete; mass production is expected to start
from Q2FY22 this year. We will have c.40 variants ranging
from 6-10kg and will create an annual capacity of 600,000
units per annum. We have already closed an agreement with
a large MNC brand for this. In another 12-15 months, we
will become competitive globally in fully automatic washing
machines. We have set up a plant in Tirupati (Andhra
Pradesh), just 120kms from the Chennai port, for easier
access to exports.
We have requested the government to choose consumption-
based countries and not manufacturing-based countries
while signing FTAs (free trade agreements), as they would
then boost our manufacturing. Since logistics costs are
high in washing machines, and Indian manufacturers have
a huge disability due to the logistics costs, there should
be a compensation framework in place to overcome this
impediment. Also, the government should encourage SMEs
to set up factories for manufacturing of components such as
motors, timers, and gearboxes – which account for 30% of
BOM and are presently imported.
We are creating a capacity of 700,000 direct-cool
refrigerators, and we expect to go on stream in the first
half of FY23. The total market for refrigerators is 14mn
units, with direct cool contributing more than 70% at
10mn. Refrigerators also have huge exports potential in
the next 2-3 years, and are similar to washing machines.
Manufacturing of key components for refrigerators –
compressors, steel sheets, PCM, PCB-assembly, dryer,
chemicals – etc. should be incentivised in India.
The size of the Indian mobile-phone market is c.280mn
phones, of which 120mn phones are feature and 160mn
phones are smart phones. Given that our country is a
growing economy with 65% population under 35 years
of age, where do you see the mobile phone market in
the next 5-7 years?
India is the world’s second-largest smartphone market
with annual volumes of around 160m units. It is growing
faster than the overall global smartphone market. All major
smartphone makers are present in India. The Indian mobile
phones market was valued at Rs 1.6tn in FY19-20 and is
estimated to touch Rs 2tn by FY23 at a CAGR of 6%. The
industry believes 5G will be the next big trigger for growth.
Exports are also supporting domestic mobile phone
manufacturers. Over FY15-20, India saw a sharp reduction in
mobile phone imports led by global brands gradually setting
up manufacturing plants in India. Imports have declined
to Rs 74bn in FY20 from Rs 486bn in FY15, and exports of
mobile phones have increased manifold to Rs 272bn in the
same period from Rs 15bn.

81GROUND VIEW GROUND VIEW 1 - 31 MAY 2021 1 - 31 MAY 2021 80
Under PLI, many global and domestic contract
manufacturing companies are expanding their capacities,
which should reduce shipments into India. However,
our current domestic value addition in mobile phones is
only c.20%. Where do you see this going and in which
components we will start localising?
Even for high-volume products such as smartphones,
localisation is low, largely involving PCB assembly, final
assembly, and accessories. The increase in localisation in
recent years has been due to the government’s differential
duty structure strategy under PMP. The next leg of
localisation will have to be fuelled by investments in critical
components manufacturing, and we can see that there are
early signs of positive developments, with announcements
from Samsung Display, Holitech, and Salcomp etc. In the
next 4-5 years, domestic value addition is likely to grow to
35-40% from the current 15-20% in case of mobile phones,
and to 45-50% for electronics components.
How is the demand for wearables in India currently?
What can we expect out of this segment in the long
term, and does it have the potential to gain sizeable
market share in the overall electronics industry?
India’s wearable’s market is approximately Rs 5bn, and
has been one of the most rapidly growing ones in India.
According to a report by International Data Corporation
(IDC), the Indian wearables market posted 144% yoy growth
in 2020, in which year shipments from India were 36.4mn
units. Further, India was the only country in the top-20 to
see triple-digit growth in wearables last year, and continues
to be the third-largest wearables market globally. TWS (twin
wireless speakers) earbuds also saw the highest gains in
exports, with a total of 11.3mn units shipped in 2020.
We have started manufacturing TWS for boAt and we
see the relationship getting stronger every month with
manufacturing of more products for them. This is an
opportunity for us to back an emerging brand not only
for India, but for a global market. The government is in
discussions to come up with a PLI scheme for this category,
to increase domestic manufacturing.
The government has announced a PLI scheme in laptops
and IT hardware as well. What opportunity size are we
looking for in laptops and IT hardware manufacturing?
What are Dixon’s plans for this segment?
According to IDC, the market size for laptops in India was
approximately 7.5mn units in 2019-20 valued at Rs 339.5bn
(US$ 4.85bn). Similarly, the market size for tablets was
around 2.4mn units, valued at Rs 35bn (US$ 0.5bn). The
server market stood at 200,000 units valued at Rs 91bn (US$
1.3bn).
Currently, laptop and tablet demand in India is largely
catered to through imports valued at US$ 4.21bn and US$
0.41bn, respectively, in 2019-20. The unutilized installed
manufacturing capacity is an impediment to scaling up
manufacturing in the country.
ICEA estimates that India has a US$ 100bn opportunity to
manufacture laptops and tablets in the country over the next
five years, which can contribute 18% to global exports of
these devices.
The total budgetary outlay is Rs 73.3bn over the PLI period
of four years, with higher incentives for the domestic sector.
For a domestic company such as ours, the investment
required is Rs 200mn, with a maximum incentive of Rs 1.1bn
on the max revenue potential of Rs 49bn over a period of
the PLI. There are guidelines laid down for value addition
relating to PCB assembly, battery packs, power adapters,
and cabinets over the PLI period. It is our core target
segment, and we will pursue it quite aggressively.

83GROUND VIEW GROUND VIEW 1 - 31 MAY 2021 1 - 31 MAY 2021 82
The Indian washing machines market was estimated at 7mn
units in 2019-20, valued at Rs 104bn. Despite the pandemic,
this product segment is not likely to decline in 2020-21. The
increase in number of dual-income households, along with
insufficient time for doing laundry, has driven the demand for
this under-penetrated product. Manufacturers are focusing
on increasing capacity, new product developments, and
adoption of advanced technologies. Haier’s second facility
(being set up in Noida) is enhancing its capacity. This
provides an opportunity to vendors and leading OEMs to
scale and expand their business. Currently, the OEM market
is mostly catered by Dixon Technologies, PG Electroplast,
Noble Group, and Empire Home Appliances. Other small
companies with installed capacity are also planning to enter
the OEM model for better capacity utilization.
Market composition of washing machines
The semi-automatic segment has 57% volume market share,
and 56% value share, largely because it is cheaper than the
front-loading segment or the fully automatic top loading
one. LG dominates this segment, but it has lost some market
share to Bosch, Whirlpool of India, and Haier in recent
years. Godrej Appliances and Samsung have gained some
share as well. IFB Industries holds 6% share (only present in
fully automatic machines). Panasonic, Carrier Midea, Onida
Electronics, Lloyd, Toshiba, TCL, Voltas Beko have their own
niche clientele – which is the middle-income group. Xiaomi,
Thomson, and Sansui have forayed into the semi-automatic
washing machine segment due to demand coming in from
tier-2 and tier-3 cities. E-commerce front was limited to sale
of front-loading washing machines, but the pandemic has
changed that, and almost all categories are now sold online.
Currently, major brands are sourcing semi-automatic washing
machines from the domestic contract manufacturers and for
fully automatic, they have their own manufacturing facilities.
However, many brands have started contracting to ODMs
like Dixon Technologies and PG Electroplast, even for fully
automatic machines.
E-commerce was limited to sale of front-loading washing machines, but the pandemic has changed that, and almost all categories are now sold online
Semi-automatic dominates the washing machines market with 57% market share
FA-TL: Fully Automatic Top Load, FA-FL: Fully Automatic Front LoadSource: Media reports, PhillipCapital Research
Brands Own Manufac-turing
Out Sourc-ing %
Out-sourcing Partners (Name)
LG 100% 0
Whirlpool of India
100% 0 PG Electroplast for components
Samsung 50-60% 40%-50% Dixon Technologies
Haier 80% 20% PG Electroplast for components
Onida Elec-tronics
100% 0%
Private labels
0% 100% Dixon, PG, Mirc, Noble and others
Lloyd 0% 100% PG Electroplast
Own manufacturing and outsourcing mix in washing machines
Sour
ce: I
ndus
try, P
hilli
pCap
ital R
esea
rch
Washing machines: Huge potential and a possible exports opportunity
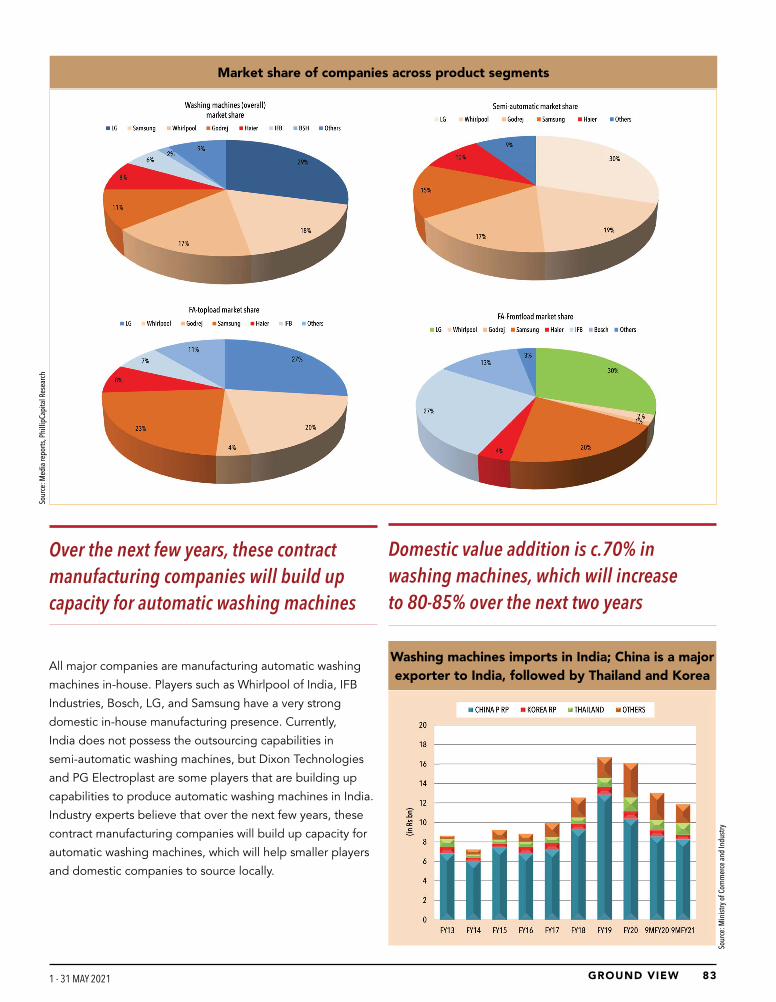
83GROUND VIEW GROUND VIEW 1 - 31 MAY 2021 1 - 31 MAY 2021 82
Market share of companies across product segments
Sour
ce: M
edia
repo
rts, P
hilli
pCap
ital R
esea
rch
All major companies are manufacturing automatic washing
machines in-house. Players such as Whirlpool of India, IFB
Industries, Bosch, LG, and Samsung have a very strong
domestic in-house manufacturing presence. Currently,
India does not possess the outsourcing capabilities in
semi-automatic washing machines, but Dixon Technologies
and PG Electroplast are some players that are building up
capabilities to produce automatic washing machines in India.
Industry experts believe that over the next few years, these
contract manufacturing companies will build up capacity for
automatic washing machines, which will help smaller players
and domestic companies to source locally.
Domestic value addition is c.70% in washing machines, which will increase to 80-85% over the next two years
Over the next few years, these contract manufacturing companies will build up capacity for automatic washing machines
Washing machines imports in India; China is a major exporter to India, followed by Thailand and Korea
Sour
ce: M
inist
ry o
f Com
mer
ce a
nd In
dust
ry
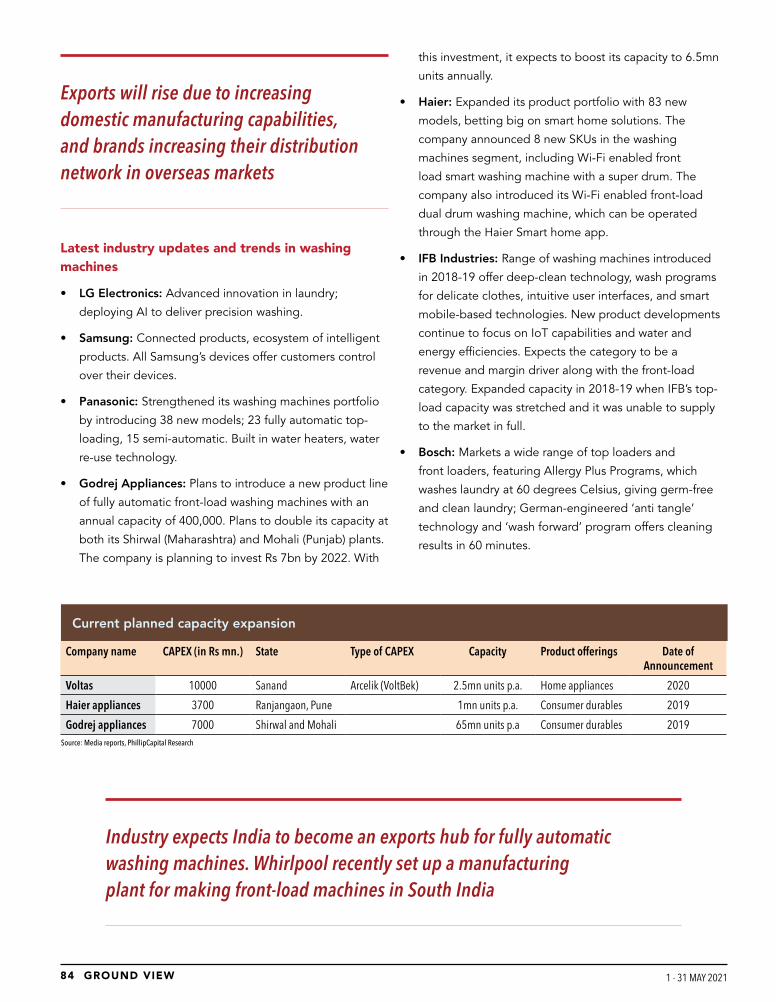
85GROUND VIEW GROUND VIEW 1 - 31 MAY 2021 1 - 31 MAY 2021 84
Exports will rise due to increasing domestic manufacturing capabilities, and brands increasing their distribution network in overseas markets
Latest industry updates and trends in washing machines
• LG Electronics: Advanced innovation in laundry;
deploying AI to deliver precision washing.
• Samsung: Connected products, ecosystem of intelligent
products. All Samsung’s devices offer customers control
over their devices.
• Panasonic: Strengthened its washing machines portfolio
by introducing 38 new models; 23 fully automatic top-
loading, 15 semi-automatic. Built in water heaters, water
re-use technology.
• Godrej Appliances: Plans to introduce a new product line
of fully automatic front-load washing machines with an
annual capacity of 400,000. Plans to double its capacity at
both its Shirwal (Maharashtra) and Mohali (Punjab) plants.
The company is planning to invest Rs 7bn by 2022. With
this investment, it expects to boost its capacity to 6.5mn
units annually.
• Haier: Expanded its product portfolio with 83 new
models, betting big on smart home solutions. The
company announced 8 new SKUs in the washing
machines segment, including Wi-Fi enabled front
load smart washing machine with a super drum. The
company also introduced its Wi-Fi enabled front-load
dual drum washing machine, which can be operated
through the Haier Smart home app.
• IFB Industries: Range of washing machines introduced
in 2018-19 offer deep-clean technology, wash programs
for delicate clothes, intuitive user interfaces, and smart
mobile-based technologies. New product developments
continue to focus on IoT capabilities and water and
energy efficiencies. Expects the category to be a
revenue and margin driver along with the front-load
category. Expanded capacity in 2018-19 when IFB’s top-
load capacity was stretched and it was unable to supply
to the market in full.
• Bosch: Markets a wide range of top loaders and
front loaders, featuring Allergy Plus Programs, which
washes laundry at 60 degrees Celsius, giving germ-free
and clean laundry; German-engineered ‘anti tangle’
technology and ‘wash forward’ program offers cleaning
results in 60 minutes.
Company name CAPEX (in Rs mn.) State Type of CAPEX Capacity Product offerings Date of Announcement
Voltas 10000 Sanand Arcelik (VoltBek) 2.5mn units p.a. Home appliances 2020
Haier appliances 3700 Ranjangaon, Pune 1mn units p.a. Consumer durables 2019
Godrej appliances 7000 Shirwal and Mohali 65mn units p.a Consumer durables 2019
Current planned capacity expansion
Source: Media reports, PhillipCapital Research
Industry expects India to become an exports hub for fully automatic washing machines. Whirlpool recently set up a manufacturing plant for making front-load machines in South India

85GROUND VIEW GROUND VIEW 1 - 31 MAY 2021 1 - 31 MAY 2021 84
Current capacity and additional capacity announced by washing machine makers
Global market scenario in washing machines
Increasing globalization will play an important role in driving
the demand for washing machines ahead.
Factors driving the demand for automatic washing
machines:
• Increasing female labour-force participation
• Increasing middle class populations
• Nuclear families rising
• Increasing media participation
• Growing awareness about technology
Newer technologies have taken over old technologies to
address the demand for energy-efficient new-generation
products. Governments the world over are urging consumers
Company name (Units mn)
Capacity Capacity Addition
S.A. AUTO S.A. AUTO##
Brands
LG 1.7-2.0 1.00 -
Whirlpool 1.0-1.5 0.5-0.7 -
Samsung 0.5-1.0 0.5-0.7 -
Godrej Appliances 0.5-1.0 0.10 -
Haier India 0.5-0.6 - 1.00
IFB - 0.5-0.7
Bosch - 0.35 - 0.5-1.0
Other Brands - -
OEM’s
Dixon Technologies 1.20 0.30 0.60
PG Electroplast 0.80-1.0 - 0.50
Mirc Electronics 0.25-0.30 - 0.2-0.5
Noble 0.25-0.35
Vimal 0.25-0.30
Others 0.25-0.30
to use products which are energy-efficient (Bureau of Energy
Efficiency – BEE rated). This has led to manufacturing of
more energy-efficient technologies. Globally, the front-load
segment enjoys the highest market share as it requires less
space, is efficient, and has the best performance. The semi-
automatic machines are simple to use, very affordable, and
can handle laundry in two drums for washing and drying. The
fully automatic machine segment has shown decent growth
as well, due to its price, convenience, and wide range of
options.
Leading companies in the market have been investing
in smarter AI-based technologies. Key market players
are developing voice control integration with Alexa and
Google assistant to help control a combination of washers
and dryers. One of the trends seen in the market is the
use of technology that reduces the water for washing. The
realisation that water is limited has compelled manufacture to
develop solutions that minimise the use of water.
Smart washing machines
The global smart washing machines market is likely to see
21% CAGR in 2020-27. Technological advancements in
the smart home category are causing a rise in demand for
connected washing machines. Growing scarcity of water
across the globe is compelling manufacturers to make
products with technologies that restrict the use of water.
Globally, smart washing machines with a capacity of 6-10kg
held the largest share of 66% in 2019. Rapid nuclearization
of families due to increasing urbanisation increased the need
for washing machines with capacity of 7.5 kg. A wash cycle
of 7.5 kg uses less water, electricity and detergent when
compared to two cycles of 3.5 kg.
Industry experts believe that smart-washing-machines in
countries such as India, China, Vietnam, and Indonesia are
likely to see the fastest expansion at 21% CAGR. Increasing
internet penetration and technological advancements in
countries like China and India are likely to
fuel product demand. Increased adoption of
automatic washing process as an essential
part of everyday housekeeping activity has
created lucrative growth prospects in Asia.
Sour
ce: P
hilli
pCap
ital r
esea
rch
estim
ates

87GROUND VIEW GROUND VIEW 1 - 31 MAY 2021 1 - 31 MAY 2021 86
The Indian market for refrigerators was valued at Rs 120bn
in 2019-20, a 12.5% rise over the previous year; 14.2mn
units were sold, up 15%. LG, Samsung, and Whirlpool of
India have been dominating the washing-machines segment
in India since last 10-15 years. Panasonic and Hitachi cater
mostly to the premium segment; LG, Samsung, Haier, Godrej
Appliances, and Whirlpool of India cater pre-dominantly
to the mass segment, with an aggressive stance. Bosch,
Liebherr, Mitashi, BPL, Intex Technologies, TCL, Siemens,
Carrier Midea, Electrolux, and many other players have less
than 15-20% market share. Samsung has started counting on
India’s small towns and rural cities to consolidate its position
as the leader in the refrigerator segment.
There has been constant innovation and change in consumer
preferences in the refrigeration segment over the years.
While single-door products constitute most refrigerator
sales, double-door refrigerators have been gaining market
share consistently. New product offerings in this segment
are focused on energy efficiency. Refrigerators fall under the
mandatory ‘standard’ and ‘labelling’ program, introduced by
the BEE under the Ministry of Power. Prices of refrigerators
rose by 3-8% in 2020 varying from model to model as
new energy norms were introduced. Prices of high-end
refrigerators increased by Rs 5,000-8,000 as manufacturers
were compelled to shift to vacuum panels (from traditional
foams) to attain higher energy efficiency.
In frost free, 241-270 litre capacity is most sold; 190-199 litre in direct cool
Sour
ce: I
ndus
try, P
hilli
pCap
ital R
esea
rch
Frost free capacity-wise market share
Direct cool / FF market share
DC vs. FF capacity-wise market share
Refrigerators: Premiumization to drive growth

87GROUND VIEW GROUND VIEW 1 - 31 MAY 2021 1 - 31 MAY 2021 86
Refrigerators: Pandemic-driven changes in buying
There has been a major shift in the way consumers are
buying appliances now. Traditionally, customers preferred
buying refrigerators with long replacement cycles from brick-
and-mortar stores; the need to see and feel products first-
hand played an imperative role. Dealers had huge inventory
levels and were eager to liquidate their inventory during the
lockdown.
A clear demand shift from ‘want’ to ‘need’ was evident
during the pandemic. As people stockpiled food, the need
for more storage, thus higher-capacity refrigerators, was
noticeable. The trend for eating at home contributed to this
upsurge in demand considerably. During the pandemic,
e-commerce sales saw a huge uptick, as people were forced
to shop online due to closure of brick-and-mortar stores.
The global percent of online sales for domestic appliances –
small and large – rose 10% over 2019. Online growth did not
stop once the retail stores opened, showing a change in in
consumer buying habits. Consumers preferred to buy those
solutions which would support them and save time in a busy
work and schooling from home scenario, which drove the
demand for high-quality and energy-efficient products.
Manufacturing status: Majorly in-house manufacturing, low share of out-sourcing
Industry pegs the production volume of refrigerators in
India at over 12mn units in FY20; 27% of the total consumer
appliances market.
Refrigerators imports in FY20 were Rs 42bn, saw CAGR of 9% over FY13-20 to Rs 42bn
Refrigerator monthly imports
Refrigerator monthly exports: Remained steady since May 2020
Sour
ce: M
inist
ry o
f Com
mer
ce a
nd In
dust
ry
Sour
ce: M
inist
ry o
f Com
mer
ce a
nd In
dust
rySo
urce
: Min
istry
of C
omm
erce
and
Indu
stry
EMS providers like Dixon are looking to add refrigerators in their manufacturing bucket

89GROUND VIEW GROUND VIEW 1 - 31 MAY 2021 1 - 31 MAY 2021 88
Increasing focus on domestic manufacturing: Capacity
expansion
Due to the recent surge fuelled by the pandemic and
the trade war, refrigerator manufacturers have gone on
a localisation drive. Rs 75bn worth of investments were
made in the past five years for capacity expansion, and
new capacity deployment has started in the industry. The
government’s improved duty structure has also led to
encouragement of backward-integration of the production
component amongst manufacturers, with a stronger push
towards in house manufacturing.
Most companies are making investment commitments
towards energy-efficient technologies, including inverter
technology. The thermocouple, which senses the
temperature inside the refrigerator, plays an important role in
these technologies. Refrigerators built in the past and built
now differ greatly in terms of the energy they use, which has
led to a replacement market, as more consumers switch to
the latest technology. Manufacturers are hustling to meet
standards, thus making energy efficient products. Companies
have been providing user-friendly features like water tap on
the door, door through the ice, and other such technological
advancements.
Company name CAPEX (Rs mn)
State Type of CAPEX Capacity Product offerings Date of Announcement
Voltas 10000 Sanand Arcelik (VoltBek) 2.5mn units p.a. Home appliances 2020
Whirlpool of India 5900 Puducherry, Faridabad 2mn p.a. Refrigerators 2019
Haier 40000 Noida Refrigerators Refrigerators, WM 2019
Panasonic 3000 Jhajjar Panasonic Technopark Refrigerators
Capex announced by branded companies in the refrigerator segment
Source: Media reports, PhillipCapital Research
In recent media interviews, Whirlpool of India’s MD evinced an interest to make India an export hub for washing machines and refrigerators
Contract manufacturing will increase their game by adding frost free in their portfolio, supplying to white label and small brands
Currently, major brands are manufacturing refrigerators in-house; some premium refrigerators (such as side-by-side and frost-free) are imported. Small brands are majorly sourcing direct-cool refrigerators from the domestic market
Global market dynamics in refrigerators
The global household refrigerators market is likely to expand
at a CAGR of 5% between 2019 and 2023 – to a size of
US$ 42.9bn by 2023. The French-door bottom-freezer (also
known as bottom-mounted refrigerators) segment accounts
for a majority share, whereas side-by-side refrigerators
are likely to see the highest rate of growth among all the
categories due to the low base and increasing need of
higher capacity. The need for higher capacity and frost-free
products has been driving demand and manufacturers have

89GROUND VIEW GROUND VIEW 1 - 31 MAY 2021 1 - 31 MAY 2021 88
been focusing on premium and high-end spectrum products
to generate a higher profit.
Sale of refrigerators through e-commerce has been gaining
every year and is likely to gain higher market share by 2026
due to higher sales and better incentives offered through the
e-commerce platforms and company portals. Companies are
devoted to providing advanced offerings, faster delivery, and
convenience.
Refrigerators built in the past and built now differ greatly in terms of the energy they use, which has led to a replacement market
IoT-enabled refrigerators
The advent of IoT and AI technology has brought in a
new wave of innovation to create a smart refrigerator. The
integration of IoT to produce refrigerators will lead to a
higher quality product and a more convenient life. Unlike a
traditional refrigerator, smart refrigerators can remind users
of food stored, prompt maintenance, and help them use it
in a much-more efficient way, thus making lives easier. The
smart refrigerator market is likely to expand at a CAGR of
17% between 2019 and 2026. Global shipments are likely
to reach 2mn units by 2026. Growing smart households,
increasing demand for intelligent appliances, and a higher
standard of living are driving the smart refrigerator sales
globally. Smartphone connectivity allows users to operate
these appliances even from distant locations. Technologically
advanced product launches, coupled with regional expansion
by refrigerator manufacturers, has created opportunities for
this market.
• The industry restored its production in August 2020 (post lockdown). From then, production and demand for home appliances has been increasing every month, as people are working from home and most students are being schooled online. Also, the government has taken up many reforms (PLI, etc.) to push domestic manufacturing over the last 7-8 months.
• The industry expects huge capex/production, as companies have increased capacity, as they have taken a positive call on local manufacturing and aim for 30-40% localization. All OEMs are ramping up in-house production/capacity; LG and Samsung have ramped up capacity. However, companies won’t take an aggressive call on capacity expansion till the market is highly volatile and unpredictable and dependency on ODMs will be quite high. In ACs, companies that imported last year are planning in-house production
or domestic sourcing this year (Samsung is increasing in-house production for ACs). All companies are producing higher than last year.
• Contract manufacturers are also increasing capacity. A leading contract manufacturer has increased the capacity of TVs and has started a new line for washing machines and looking to add a refrigerator plant in south India. In ACs, contract manufacturers such as Amber, PG Electroplast, and E-durables are increasing their capacity. Amber is highly backward integrated in terms of board manufacturing.
• The contract manufacturing model is here to stay based on the following: (1) Entry-level models are not sustainable to be made in house, so ODM expertise is needed for such products, which have thin margins. (2) Small players will not put up capacity; they will focus on marketing and selling.
And (3) if there is over capacity, even then contract manufacturers have tremendous scope in terms of component manufacturing.
• The government will come up with a PLI for electronics components. Companies as well as ODMs will apply.
• Supply chain issue: Saw some disruption initially in November and December due to logistics. But current issues are about availability of raw material/components; micro-controller shortages have led to some supply issues in the market. Impact was also seen in refrigerators and washing machines due to higher input prices. The worry is not about costs, but about shortages due to insufficient availability of raw materials such as ICs, steel, and styrene are facing a shortage in the market.
Excerpts from interaction with the sourcing head of a leading consumer durables company

91GROUND VIEW GROUND VIEW 1 - 31 MAY 2021 1 - 31 MAY 2021 90
INTERVIEW – Mr Maulesh Chhaya, Industry Expert, Mentor
What is your view on the future of
electronics manufacturing in India?
Do you think it will contribute largely
to the economic growth of the
country?
It has huge potential to boost
economic growth for the country,
considering the penetration levels of
TVs, and the younger generation – who
is consuming electronics every minute.
We are the largest suppliers of mobiles
globally.
We can be largest suppliers of mobiles,
but not the largest manufacturers, as
most of the current manufacturing
is conversion of CKDs received from
China happening in India.
We are yet to create a component-
suppliers’ eco system in India. We
are dependent on China, Taiwan, and
Vietnam for this.
In case of TVs, we do not have any
open-cell manufacturers, as it is highly
capital intensive and needs a huge
R&D base to support it. TCL was about
to start manufacturing of open cells of
TVs in India, but the India-China issues
delayed this.
Given the government push
to domestic manufacturing, by
imposing bans on few products,
and introducing PLIs, do you think
imports will reduce significantly?
What value addition (in %) do you
expect in electronics going ahead?
PLI scheme for electronics is good, and
has again shifted CKD supplies to India
from China, Korea and Vietnam, and a
majority of the conversion to finished
products is happening in India, barring
ultra-premium products that are still
supplied as CBUs, mainly from Korea
for Samsung, LG Electronics, and Sony.
Maximum value addition will be 10-
15% in the near future.
Major global companies are de-
risking their supply chain and looking
for alternate countries to China,
such as India, Thailand, Malaysia,
Vietnam, etc. What is your view on
India increasing its share in global
electronics manufacturing?
With focused PLI schemes by GOI,
there are chances for India to play a
major role in the global supply chain,
but the most important is to get the
core technologies and R&D to India for
global manufacturers. GOI needs to
incentivise and work on labour reforms
aggressively to attract this, else they
will settle down in other countries like
Malaysia, Vietnam, Thailand. Recent
reports – that China is helping Pakistan
and Bangladesh to establish the
factories for mobile phones to ensure
India does not play a key role – are
worrying.
Combining the push from the
government for domestic
manufacturing and building
an ecosystem for component
manufacturing, which product
category will see exports increasing
first?
Mobile and TVs will be the first
products that would see immediate
exports to other countries.
Can you give some insight on
the current demand scenario into
electronics, and the growth expected
over the next 5-7 years?
TV will see moderate growth of 8-10%
in the near future. To push demand,
manufacturers, GoI, and Indian retailers
need to work on bringing down the
cost to end consumers. 28% GST +
15% overheads for brands + retailers
margins of 25% totals 60%, which
should be brought down to 40% to
boost local consumption and become
globally competitive.
Mobiles could see growth of 10%+,
as 5G would drive the growth for the
industry.
Interview with industry expert – Mr Maulesh Chhaya –
Mentor, The White Lotus Consultants; Ex- regional manager (Gujarat,
Madhya Pradesh and Chhattisgarh,) LG Electronics.
The White Lotus Consultants provide consulting programs
for MSME in core business domains
91GROUND VIEW GROUND VIEW 1 - 31 MAY 2021 1 - 31 MAY 2021 90
OUTLOOK
Make in India! But how soon will India make for the world?
Extensive interactions with companies
(both listed and unlisted), channel
partners, and industry observers
indicates that Indian electronics
contract manufacturing is bound to
grow exponentially, given the efforts
being taken by the government
and large industry bodies. The real
questions are about the extent and the
timing – when will the industry hit a
tipping point?
Short/mid termIncreased localization will boost
domestic manufacturing, reducing
import dependency
Incentives offered by the government
in the form of PLI, SPECS, EMC 2.0 will
provide a necessary boost to the much-
required localization in India. In the
last few months, imports of consumer
electronics have been decreasing and
exports have been rising, and this
trend will continue. Many companies,
domestic and international, have
made considerable investments in
setting up manufacturing bases in
India, to cater to the large domestic
market and to take part in the global
supply chain. Higher tariffs imposed
on imports of goods from China have
reduced India’s import dependency,
giving local companies an opportunity
to ramp up their manufacturing and
cater to the large domestic market.
However, critical components remain
a challenge and this is why India will
first focus on assembling, and then
turn to component manufacturing. In
the medium term, due to supply chain
disruption (as capacities shift to India)
the industry could go through some
price instability (prices could rise across
consumer durables products).
India will become an attractive
destination for global giants
Due to the trade war between USA
and China, and the pandemic, many
companies globally have realized the
pitfalls of their overdependence on
one nation (China) for manufacturing
electronics. Growing anti-china
sentiment has led to many companies
hedging, by shifting a part of their
production to other countries such as
Vietnam, Thailand, India, Indonesia,
Taiwan, and Malaysia. India is ahead of
much of its competition, as it not only
provides a favourable environment for
large scale electronics manufacturing
but also has a large domestic market
which is largely untapped. Many
companies have announced fresh
investments in India and the trend is
likely to continue, going forward.
Bridging the disability gap between
India and its competitors
India has had a rollercoaster of a year,
with many companies announcing
fresh investments and relocation
of their production bases to the
country, although the country still
lacks the necessary resources (to an
extent) that it needs to become a
global export hub. Increased global
attention towards India will lead to
further contraction of the disability
gap between India and its competition
as the government will focus on
creating the required infrastructure
for large-scale manufacturing in the
country. Necessary steps will be taken
to address the water, power supply,
, and infrastructure issues; necessary
technical skills will be instilled in the
workforce. for manufacturing.
Mid/long termHigh domestic value addition
Current domestic value addition is
under 25-30% in product categories
such as air conditioners, TVs, mobile
phones, and small appliances. As the
disability decreases and domestic
companies invest in adding capacities
and increasing capabilities, the
component manufacturing ecosystem
in the country is expected to see
robustness in output. Also, the
global component manufacturers
would be looking to come to India.
Domestic contract manufacturing,
which currently assembles and

93GROUND VIEW GROUND VIEW 1 - 31 MAY 2021 1 - 31 MAY 2021 92
sources key components from outside
India, will source components within
India. In the mid- to long-term,
except for raw materials, majority of
input components will be sourced
domestically. As the industry sees
domestic manufacturing of key
components such as compressors,
motors, etc., within 5-7 years, current
value addition is expected to increase
from 25% to 80-90% over 5-7 years.
Similarly, in mobile phones and TVs,
with domestic manufacturing of
components like display and open cell
over the next 5-7 years, the industry
will see value addition of c.50%-70%
from current 12-15%.
High penetration across product
categories
India has relatively low penetration in
consumer durables compared to its
peers. In air conditioners, penetration
is only 5%, which is significantly
lower compared to 100% in China.
Given the current lower penetration,
India’s demography, and improving
lifestyle, many global companies have
found India an attractive destination.
Moreover, factors supporting domestic
contract manufacturing such as PLI
schemes and capacity addition, is
expected to increase at a higher rate
than in the past. Robust supply, and
a majority of the supply chain being
within India, will support the durables
industry in bringing costs down, which
in turn will make products affordable
to the country’s middle-income group
and push up demand for products. In
key product categories such as ACs,
penetration level is expected to see
low double-digit penetration within few
years of the government introducing
schemes, and high penetration levels in
the mid to long term.
India becoming an export hub,
making for the world: The
Government of India and domestic
electronics industry has a strong
intention to make India not just self-
reliant, but also globally competitive,
and this reflects in government
schemes such as PLI, SPEC, etc.,
which bridges the disability gap
with competing nations such as
Vietnam and China. Currently, Indian
manufacturers are far from achieving
the dream of make for the world, as
certain challenges such as raw-material
sourcing, skilled labour, and import
dependency in key components
lies. However, given the push by the
government in terms of bringing
in schemes, companies’ de-risking
China+1 strategy, India’s favourable
demographic, and lower penetration
in consumer durables gives investment
comfort to foreign capital. India’s
make-in-India to ‘make-for-the-world’
dream isn’t far. Global giants will
invest in critical components in India
and making it an exports hub. Indian
electronics manufacturing’s contribution
to the GDP currently stands low, and
with all efforts being made, over the
next 5-7 years, its contribution to GDP
and India’s share in global electronics
exports are bound to increase.

93GROUND VIEW GROUND VIEW 1 - 31 MAY 2021 1 - 31 MAY 2021 92
India moving towards Atmanirbhar

95GROUND VIEW GROUND VIEW 1 - 31 MAY 2021 1 - 31 MAY 2021 94
Channel Check
Interaction with one of the largest electrical regional retail chains of Andhra Pradesh
• AC is doing better than refrigerators and washing machines.
• In ACs, we are stocking up from December 2020, but from March 2021 secondary sales are
picking up.
• This time, Samsung is going aggressive; offering good prices and products. In refrigerators
and washing machines, the brand has not taken any price hikes.
• Now, all companies are focusing on volume push, so price hike is not on the cards.
Interaction with regional retail chain (westzone )
• In ACs, channel has not stocked up much. Secondary sales growth is equal to primary sales
growth. Over the last two months, this segment has seen 10-15% volume growth. Companies
like Voltas and LG saw higher growth. Some supply-chain issues by companies such as
Mitsubishi, etc. Overall industry price hike is c.8% over the last two months.
• In refrigerators, higher growth in FF (above 350ltrs) of 15-20%. DC flat yoy.
• In washing machines, higher growth in automatic at 15-20%; semi-automatic at c.10%
• Voltas-Beko: This is the first year for DC, so there is higher focus on placement.
• Samsung is aggressive in all products; higher focus on placement and price.
Interaction with one of the largest distributors from north India
• Refrigerator sales are hurt mainly because of the wedding season getting impacted. But we
expect a strong season for ACs. Already, companies are seeing supply shortages.
• In ACs, branded companies have hiked prices by 8-10% over the last two months.
Interaction with residential air conditioner distributor in Madhya Pradesh
• In ACs, banned imports of air conditioners with refrigerants has resulted in shortages. Some
small companies are not able to import. Expects this to help Voltas, Lloyd, and Midea in
gaining market share.
• In January and February 2020, the AC industry saw a growth of 10-15% in volumes; increase
in RM costs has resulted in a price hike of 10-12%.
Second wave of Covid impacted secondary sales of consumer durables in the month of April, channel expects c.40-60% impact on sales. Cooling products have seen a higher impact with inventories hovering at 3-4 weeks. Lower demand has led manufacturers and brands to cut their production by 20-30%

95GROUND VIEW GROUND VIEW 1 - 31 MAY 2021 1 - 31 MAY 2021 94
Indian Economy – Trend Indicators
Monthly Economic Indicators
Quarterly Economic Indicators
Growth Rates (%) Feb-20 Mar-20 Apr-20 May-20 Jun-20 Jul-20 Aug-20 Sep-20 Oct-20 Nov-20 Dec-20 Jan-21 Feb-21 Mar-21
IIP 5.2 -18.7 -57.3 -33.4 -16.6 -10.5 -7.1 1.0 4.5 -1.6 1.6 -0.9 -3.6
PMI 54.5 51.8 27.4 30.8 47.2 46.0 52.0 56.8 58.9 56.3 56.4 57.7 57.5 55.4
Core sector 6.4 -8.6 -37.9 -21.4 -12.4 -7.6 -6.9 0.6 -0.5 -1.1 0.2 0.9 -4.6
WPI 2.3 0.4 -1.6 -3.4 -1.8 -0.2 0.4 1.3 1.3 2.3 2.0 2.5 4.2 7.4CPI 6.6 5.8 7.2 6.3 6.2 6.7 6.7 7.3 7.6 6.9 4.6 4.1 5.0 5.5
Money Supply 10.2 8.8 10.7 11.7 12.3 13.2 12.6 12.2 11.6 12.5 12.4 12.1 12.7 11.8Deposit 10.0 7.9 9.8 10.7 11.0 12.0 10.9 10.5 10.1 10.9 11.3 11.1 12.0 11.4Credit 7.5 6.2 6.7 6.2 6.2 6.3 5.5 5.1 5.1 5.8 6.1 6.0 6.6 5.6Exports 3.2 -34.3 -60.3 -36.5 -12.4 -10.2 -12.7 6.0 -5.1 -8.7 0.1 6.2 0.7 60.3Imports 3.6 -28.0 -58.6 -51.0 -47.6 -28.4 -26.0 -19.6 -11.5 -13.3 7.6 2.0 7.0 53.7Trade deficit (USD Bn) 4.5 -9.2 -55.9 -79.5 -105.2 -64.0 -51.2 -76.6 -25.9 -22.6 23.7 -5.0 24.1 39.4Net FDI (USD Bn) 2.7 4.0 0.2 -0.2 -0.8 3.5 18.2 2.9 4.6 5.7 6.5 3.5 -2.9
FII (USD Bn) -1.5 -15.0 -1.8 -0.4 3.3 0.7 5.6 1.4 3.0 9.8 8.6 1.2 2.7
ECB (USD Bn) 4.2 7.4 1.0 1.5 1.0 2.1 1.8 5.2 2.0 2.0 3.0 3.7 2.6
Dollar-Rupee 71.5 74.4 76.2 75.7 75.7 75.0 74.6 73.5 73.5 74.3 73.6 73.1 72.8 72.8
FOREX Reserves (USD Bn) 481.5 475.6 479.5 493.5 506.8 534.6 541.4 542.0 560.7 574.8 580.8 590.2 584.6 579.3
NRI Deposits (USD Bn) 132.5 130.6 129.3 131.1 132.7 135.1 137.8 137.3 138.0 139.3 140.5 142.2 142.4
Balance of Payment (USD Bn) Q3FY19 Q4FY19 Q1FY20 Q2FY20 Q3FY20 Q4FY20 Q1FY21 Q2FY21 Q3FY21
Exports 83.1 87.4 82.7 80.0 81.2 76.5 52.4 75.6 77.2
Imports 132.4 122.6 129.5 119.6 117.3 111.6 63.2 90.4 111.8
Trade deficit -49.3 -35.2 -46.8 -39.6 -36.0 -35.0 -10.8 -14.8 -34.5
Net Invisibles 31.5 30.6 31.8 32.1 33.4 35.6 29.8 29.9 47.4
CAD -17.8 -4.6 -15.0 -7.6 -2.6 0.6 19.0 15.1 -1.7
CAD (% of GDP) -2.7 -0.7 -2.1 -1.1 -0.4 0.1 3.7 2.4 0.2
Capital Account 13.8 19.2 28.6 13.6 23.6 17.4 1.2 16.1 33.5
BoP -4.3 14.2 14.0 5.1 21.6 18.8 19.8 31.6 32.5
GDP and its Components (YoY, %) Q3FY19 Q4FY19 Q1FY20 Q2FY20 Q3FY20 Q4FY20 Q1FY21 Q2FY21 Q3FY21
Agriculture & allied activities 2.6 1.6 3.3 3.5 3.4 5.9 3.3 3.0 3.9
Industry 4.3 1.4 1.0 -2.7 -3.0 0.0 -31.1 -1.6 1.4
Mining & Quarrying -7.3 -4.8 -1.3 -5.2 -3.6 5.2 -18.0 -7.6 -5.9
Manufacturing 5.6 2.1 0.6 -3.0 -2.9 -1.4 -35.9 -1.5 1.6
Electricity, Gas & Water Supply 8.7 5.5 6.9 1.7 -3.1 4.5 -9.9 2.3 7.3
Services 6.5 8.3 6.8 7.3 5.8 3.5 -24.8 -10.9 0.0
Construction 7.0 6.0 3.7 1.0 -1.3 -2.2 -49.4 -7.2 6.2
Trade, Hotel, Transport and Communications 9.7 6.9 6.2 6.8 7.0 2.6 -47.6 -15.3 -7.7
Finance, Insurance, Real-Estate & Business Services 4.5 8.7 8.8 8.9 5.5 2.4 -5.4 -9.5 6.6
Community, Social & Personal Services 4.7 11.6 5.6 8.8 8.9 10.1 -9.7 -9.3 -1.5
GDP at FC 5.3 5.6 5.0 4.6 3.4 3.0 -22.4 -7.3 1.0
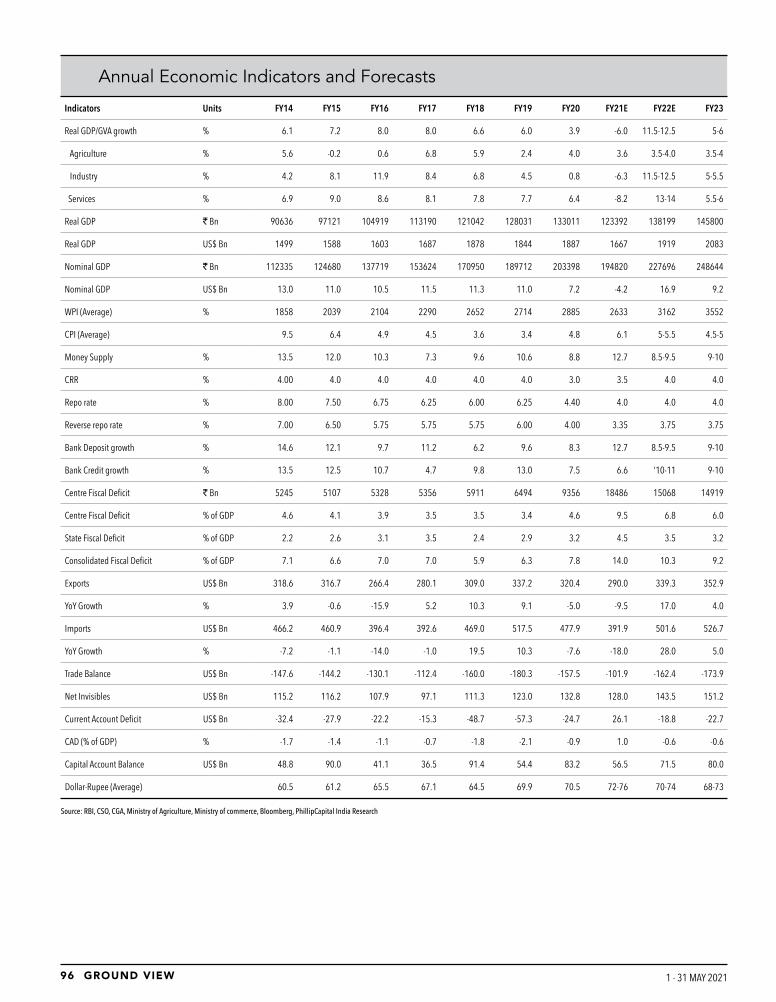
97GROUND VIEW GROUND VIEW 1 - 31 MAY 2021 1 - 31 MAY 2021 96
Annual Economic Indicators and Forecasts
Indicators Units FY14 FY15 FY16 FY17 FY18 FY19 FY20 FY21E FY22E FY23
Real GDP/GVA growth % 6.1 7.2 8.0 8.0 6.6 6.0 3.9 -6.0 11.5-12.5 5-6
Agriculture % 5.6 -0.2 0.6 6.8 5.9 2.4 4.0 3.6 3.5-4.0 3.5-4
Industry % 4.2 8.1 11.9 8.4 6.8 4.5 0.8 -6.3 11.5-12.5 5-5.5
Services % 6.9 9.0 8.6 8.1 7.8 7.7 6.4 -8.2 13-14 5.5-6
Real GDP ` Bn 90636 97121 104919 113190 121042 128031 133011 123392 138199 145800
Real GDP US$ Bn 1499 1588 1603 1687 1878 1844 1887 1667 1919 2083
Nominal GDP ` Bn 112335 124680 137719 153624 170950 189712 203398 194820 227696 248644
Nominal GDP US$ Bn 13.0 11.0 10.5 11.5 11.3 11.0 7.2 -4.2 16.9 9.2
WPI (Average) % 1858 2039 2104 2290 2652 2714 2885 2633 3162 3552
CPI (Average) 9.5 6.4 4.9 4.5 3.6 3.4 4.8 6.1 5-5.5 4.5-5
Money Supply % 13.5 12.0 10.3 7.3 9.6 10.6 8.8 12.7 8.5-9.5 9-10
CRR % 4.00 4.0 4.0 4.0 4.0 4.0 3.0 3.5 4.0 4.0
Repo rate % 8.00 7.50 6.75 6.25 6.00 6.25 4.40 4.0 4.0 4.0
Reverse repo rate % 7.00 6.50 5.75 5.75 5.75 6.00 4.00 3.35 3.75 3.75
Bank Deposit growth % 14.6 12.1 9.7 11.2 6.2 9.6 8.3 12.7 8.5-9.5 9-10
Bank Credit growth % 13.5 12.5 10.7 4.7 9.8 13.0 7.5 6.6 '10-11 9-10
Centre Fiscal Deficit ` Bn 5245 5107 5328 5356 5911 6494 9356 18486 15068 14919
Centre Fiscal Deficit % of GDP 4.6 4.1 3.9 3.5 3.5 3.4 4.6 9.5 6.8 6.0
State Fiscal Deficit % of GDP 2.2 2.6 3.1 3.5 2.4 2.9 3.2 4.5 3.5 3.2
Consolidated Fiscal Deficit % of GDP 7.1 6.6 7.0 7.0 5.9 6.3 7.8 14.0 10.3 9.2
Exports US$ Bn 318.6 316.7 266.4 280.1 309.0 337.2 320.4 290.0 339.3 352.9
YoY Growth % 3.9 -0.6 -15.9 5.2 10.3 9.1 -5.0 -9.5 17.0 4.0
Imports US$ Bn 466.2 460.9 396.4 392.6 469.0 517.5 477.9 391.9 501.6 526.7
YoY Growth % -7.2 -1.1 -14.0 -1.0 19.5 10.3 -7.6 -18.0 28.0 5.0
Trade Balance US$ Bn -147.6 -144.2 -130.1 -112.4 -160.0 -180.3 -157.5 -101.9 -162.4 -173.9
Net Invisibles US$ Bn 115.2 116.2 107.9 97.1 111.3 123.0 132.8 128.0 143.5 151.2
Current Account Deficit US$ Bn -32.4 -27.9 -22.2 -15.3 -48.7 -57.3 -24.7 26.1 -18.8 -22.7
CAD (% of GDP) % -1.7 -1.4 -1.1 -0.7 -1.8 -2.1 -0.9 1.0 -0.6 -0.6
Capital Account Balance US$ Bn 48.8 90.0 41.1 36.5 91.4 54.4 83.2 56.5 71.5 80.0
Dollar-Rupee (Average) 60.5 61.2 65.5 67.1 64.5 69.9 70.5 72-76 70-74 68-73
Source: RBI, CSO, CGA, Ministry of Agriculture, Ministry of commerce, Bloomberg, PhillipCapital India Research

97GROUND VIEW GROUND VIEW 1 - 31 MAY 2021 1 - 31 MAY 2021 96
CMP
Mkt
Cap
Ne
t Sal
es (`
mn)
EB
IDTA
(`
mn)
PAT (
` m
n)EP
S (`
) EP
S Gr
owth
(%)
P/E
(x)
P/B
(x)
EV/E
BITD
A (x
) R
OE (%
) RO
CE (%
)
Nam
e of
com
pany
Sect
or`
` bn
FY22
EFY
23E
FY22
EFY
23E
FY22
EFY
23E
FY22
EFY
23E
FY22
EFY
23E
FY22
EFY
23E
FY22
EFY
23E
FY22
EFY
23E
FY22
EFY
23E
FY22
EFY
23E
Mar
uti S
uzuk
iAu
tom
obile
s 7
,096
2
,144
8
,48,
143
9,4
1,84
0 1
,02,
824
1,2
7,94
8 8
3,80
5 1
,02,
954
277
3
41
65
23
25.
6 2
0.8
3.9
3
.4
20.
0 1
5.7
15.
1 1
6.5
14.
5 1
6.2
Baja
j Aut
oAu
tom
obile
s 3
,746
1
,084
3
,22,
631
3,6
6,00
0 6
1,52
0 7
3,90
8 5
7,62
3 6
7,75
3 1
99
234
2
1 1
8 1
8.8
16.
0 4
.1
3.5
1
7.3
14.
2 2
1.6
21.
8 2
2.5
22.
8
Mah
indr
a & M
ahin
dra
Auto
mob
iles
856
1
,064
5
,82,
097
6,3
2,97
1 9
0,33
9 9
5,33
7 6
0,73
5 6
5,64
7 5
1 5
5 3
2 8
1
6.8
15.
5 2
.4
2.2
1
0.8
9.7
1
4.6
13.
9 1
3.4
12.
9
Tata
Mot
ors
Auto
mob
iles
318
1
,124
3
2,71
,940
3
9,06
,561
4
,69,
307
6,3
3,66
8 1
,11,
789
2,1
4,40
3 3
6 6
9 4
57
92
8.8
4
.6
1.3
1
.0
4.4
3
.3
14.
8 2
2.3
5.5
8
.1
Hero
Mot
oCor
pAu
tom
obile
s 3
,351
6
69
3,7
8,64
3 4
,15,
968
58,
587
66,
571
44,
621
50,
942
223
2
55
47
14
15.
0 1
3.1
3.7
3
.2
11.
3 9
.8
24.
7 2
4.1
25.
0 2
4.7
Asho
k Ley
land
Auto
mob
iles
122
3
58
2,1
8,29
0 2
,82,
815
21,
976
35,
447
10,
456
20,
898
4
7
-474
1
00
34.
3 1
7.1
7.1
5
.9
16.
9 9
.9
20.
7 3
4.3
13.
2 2
3.1
Bhar
at Fo
rge
Auto
mob
iles
617
2
87
90,
736
1,0
7,54
8 1
7,61
1 2
2,45
8 8
,934
1
2,47
5 1
9 2
7 1
,554
4
0 3
2.1
23.
0 4
.9
4.1
1
8.3
14.
1 1
5.2
17.
9 1
0.4
12.
9
Esco
rts
Auto
mob
iles
1,3
81
186
7
9,46
0 8
2,04
7 1
1,67
5 1
2,22
7 8
,964
9
,386
7
5 7
9 1
3 5
1
8.4
17.
6 3
.2
2.7
1
4.8
13.
5 1
7.5
15.
5 1
8.3
16.
1
Endu
ranc
e Tec
hnol
-og
ies
Auto
mob
iles
1,4
08
198
8
1,29
9 9
1,31
2 1
4,10
7 1
5,93
4 7
,393
8
,633
5
3 6
1 6
5 1
7 2
6.8
22.
9 5
.0
4.3
1
3.5
11.
7 1
8.6
18.
6 1
8.8
19.
3
Apol
lo Ty
res
Auto
mob
iles
239
1
52
1,8
3,27
2 1
,96,
040
28,
493
30,
691
9,4
01
11,
021
16
19
27
17
14.
6 1
2.4
1.2
1
.1
6.8
6
.0
8.3
9
.0
5.5
6
.0
Ceat
Auto
mob
iles
1,6
13
65.
3 8
0,19
5 8
7,09
6 9
,661
1
0,70
8 3
,915
4
,647
9
7 1
15
0
19
16.
7 1
4.0
1.8
1
.6
8.7
7
.7
10.
9 1
1.6
9.7
1
0.1
Hind
usta
n Un
ileve
rFM
CG 2
,205
5
,180
5
,24,
963
5,9
0,52
5 1
,35,
946
1,5
5,97
2 9
5,57
9 1
,09,
937
41
47
20
15
54.
2 4
7.1
10.
7 1
0.4
37.
2 3
2.3
19.
8 2
2.0
19.
3 2
1.5
ITCFM
CG 2
05
2,5
26
4,9
3,23
0 5
,48,
198
1,9
1,87
2 2
,16,
184
1,5
7,90
9 1
,78,
309
13
15
22
13
15.
9 1
4.1
3.7
3
.5
12.
7 1
1.3
23.
0 2
5.0
22.
8 2
4.8
Nestl
eFM
CG 1
6,72
2 1
,612
1
,49,
222
1,6
7,43
5 3
7,50
4 4
3,31
9 2
5,45
6 2
9,71
8 2
64
308
1
8 1
7 6
3.3
54.
2 4
5.9
35.
4 4
2.2
36.
2 7
2.5
65.
3 4
2.3
40.
4
Dabu
r Ind
ia
FMCG
523
9
25
1,0
6,05
1 1
,16,
963
22,
998
25,
738
19,
558
21,
995
11
12
11
12
47.
3 4
2.0
10.
9 9
.6
39.
4 3
4.8
23.
1 2
2.9
23.
9 2
3.8
Godr
ej C
onsu
mer
Pr
oduc
tsFM
CG 6
86
702
1
,19,
682
1,3
1,90
3 2
7,82
3 3
0,88
5 1
9,75
2 2
2,24
8 1
9 2
2 1
4 1
3 3
5.5
31.
5 7
.5
6.9
2
5.4
22.
7 2
1.1
21.
9 1
8.8
20.
0
Brita
nnia
FMCG
3,4
34
827
1
,35,
625
1,5
3,13
7 2
5,60
2 3
0,37
8 1
8,58
8 2
2,24
7 7
7 9
3 -1
2
0 4
4.4
37.
1 2
0.9
17.
0 3
2.9
27.
5 4
7.2
45.
9 3
9.5
43.
7
Mar
ico In
dustr
ies
FMCG
394
5
09
88,
897
98,
292
18,
353
20,
622
13,
203
14,
921
10
12
14
13
38.
5 3
4.1
13.
4 1
1.8
27.
4 2
4.2
34.
8 3
4.6
37.
4 3
7.3
Colg
ate
FMCG
1,6
22
441
5
1,94
4 5
6,58
3 1
5,23
8 1
6,45
3 1
0,04
7 1
0,87
8 3
7 4
0 5
8
4
3.9
40.
6 2
2.0
19.
4 2
8.3
26.
0 5
0.2
47.
8 4
9.5
48.
1
Emam
iFM
CG 4
87
217
3
0,42
9 3
3,54
2 9
,585
1
0,59
6 5
,419
7
,646
1
2 1
7 2
5 4
1 4
0.0
28.
3 1
1.7
9.6
2
2.3
19.
8 2
9.3
33.
8 3
0.5
36.
7
Baja
j Cor
pFM
CG 2
70
40
9,3
46
10,
158
2,5
48
2,9
03
2,4
11
2,7
94
16
19
8
16
16.
5 1
4.3
4.2
3
.5
14.
6 1
2.2
25.
6 2
4.7
27.
6 2
6.7
Agro
Tech
Food
sFM
CG 8
22
20.
0 9
,775
1
0,97
1 8
12
1,0
94
447
6
53
18
27
28
46
44.
8 3
0.7
4.2
3
.7
24.
0 1
7.3
9.4
1
2.2
9.9
1
3.0
Titan
Com
pany
Reta
il 1
,483
1
,316
2
,43,
852
2,8
9,58
5 3
1,86
7 3
9,41
6 2
1,29
2 2
6,72
7 2
4 3
0 1
05
26
61.
8 4
9.2
14.
7 1
2.1
40.
6 3
2.3
23.
9 2
4.5
23.
5 2
4.9
Jubi
lant
Food
work
sRe
tail
2,9
72
392
4
5,52
4 5
6,19
2 1
1,54
0 1
4,54
5 4
,728
6
,572
3
6 5
0 2
06
39
82.
9 5
9.6
24.
7 2
0.5
32.
9 2
5.8
29.
8 3
4.3
45.
7 4
9.3
Trent
*Re
tail
877
3
12
43,
577
54,
216
6,6
06
8,7
60
1,8
43
3,2
27
5
9
-228
7
5 1
69.1
9
6.6
13.
3 1
2.0
50.
6 3
8.5
7.9
1
2.4
8.3
1
0.1
Phill
ipC
apita
l Ind
ia C
over
age
Uni
vers
e: V
alua
tio
n Su
mm
ary

99GROUND VIEW GROUND VIEW 1 - 31 MAY 2021 1 - 31 MAY 2021 98
CMP
Mkt
Cap
Ne
t Sal
es (`
mn)
EB
IDTA
(`
mn)
PAT (
` m
n)EP
S (`
) EP
S Gr
owth
(%)
P/E
(x)
P/B
(x)
EV/E
BITD
A (x
) R
OE (%
) RO
CE (%
)
Nam
e of
com
pany
Sect
or`
` bn
FY22
EFY
23E
FY22
EFY
23E
FY22
EFY
23E
FY22
EFY
23E
FY22
EFY
23E
FY22
EFY
23E
FY22
EFY
23E
FY22
EFY
23E
FY22
EFY
23E
FY22
EFY
23E
ABFR
L*Re
tail
219
2
02
92,
845
1,0
4,40
5 1
4,42
2 1
6,65
7 1
,917
2
,909
2
3
-1
36
52
106
.9
70.
5 6
.2
5.7
1
6.4
14.
2 5
.8
8.0
7
.3
8.5
V-M
art*
Reta
il 2
,834
5
6 1
8,88
7 2
3,59
7 2
,652
3
,251
8
34
1,0
28
46
57
-498
2
3 6
1.7
50.
0 1
0.0
8.4
2
2.6
18.
5 1
6.2
16.
8 1
4.5
15.
2
Shop
pers
Sto
p*Re
tail
237
2
6 2
9,86
8 3
3,23
2 5
,384
6
,264
8
4 6
86
1
6
-103
7
22 3
10.5
3
7.8
15.
9 1
1.6
7.6
6
.1
5.1
3
0.8
11.
1 1
6.8
Than
gam
ayil
Reta
il 6
12
8
23,
576
27,
075
1,7
31
2,0
29
1,0
08
1,2
04
74
88
11
19
8.3
7
.0
2.1
1
.7
5.5
4
.5
25.
6 2
3.9
19.
0 1
7.1
KDDL
Reta
il 2
85
3.3
6
,203
7
,102
8
52
984
6
8 1
75
6
15
-176
1
59
49.
1 1
9.0
1.8
1
.7
5.5
4
.7
3.7
9
.0
5.0
6
.8
Asia
n Pa
ints
Pain
ts/Til
es 2
,401
2
,303
2
,36,
140
2,7
2,15
6 5
4,03
1 6
2,87
6 3
6,32
4 4
3,12
2 3
8 4
5 1
8 1
9 6
3.4
53.
4 1
6.5
14.
3 4
1.9
35.
7 2
6.0
26.
7 2
6.5
27.
3
Kaja
ria C
eram
icsPa
ints/
Tiles
1,0
00
159
3
2,11
2 3
5,81
5 6
,047
6
,786
3
,793
4
,322
2
4 2
7 3
0 1
4 4
1.9
36.
8 7
.2
6.4
2
5.7
22.
6 1
7.3
17.
5 1
6.7
17.
1
Som
any C
eram
icsPa
ints/
Tiles
436
1
8.5
18,
773
21,
289
1,9
96
2,4
32
747
1
,064
1
8 2
5 6
2 4
3 2
4.8
17.
4 2
.6
2.3
1
0.6
8.3
1
0.6
13.
5 1
0.5
12.
8
Have
lls In
dia
Con
Elec
trica
ls 1
,103
6
91
1,2
5,65
4 1
,44,
596
17,
907
21,
534
12,
703
15,
446
20
25
21
22
54.
3 4
4.6
12.
6 1
1.0
38.
2 3
1.6
23.
3 2
4.7
22.
4 2
4.3
Volta
sCo
n El
ectri
cals
1,0
53
348
8
7,74
7 9
9,45
1 7
,398
8
,825
6
,367
7
,457
1
9 2
3 3
5 1
7 5
4.7
46.
7 6
.9
6.2
4
7.0
39.
1 1
2.5
13.
3 1
3.5
14.
2
Polyc
abCo
n El
ectri
cals
1,3
60
203
1
,02,
212
1,1
4,74
9 1
3,22
7 1
5,15
2 9
,419
1
0,64
3 6
3 7
1 2
1 1
3 2
1.5
19.
0 3
.9
3.4
1
5.1
13.
1 1
8.2
17.
7 1
9.6
19.
0
VGua
rd In
dustr
ies
Con
Elec
trica
ls 2
30
99
27,
471
30,
014
2,9
14
3,2
43
2,1
08
2,3
18
5
5
21
10
46.
7 4
2.4
7.6
6
.7
33.
0 2
9.8
16.
3 1
5.8
16.
9 1
6.4
Finol
ex C
able
s Co
n El
ectri
cals
403
6
2 2
1,77
8 2
4,39
3 -4
,273
-3
,915
-4
,298
-4
,077
-2
8 -2
7 -7
6 -5
-14.
3 -1
5.1
1.9
1
.8
-12.
1 -1
2.9
-13.
5 -1
1.7
-13.
9 -1
2.0
KEI I
ndus
tries
Con
Elec
trica
ls 4
95
44
50,
916
57,
373
5,5
73
6,4
09
4,4
28
5,2
56
57
67
76
19
8.8
7
.4
1.9
1
.6
8.3
7
.2
21.
6 2
1.7
22.
8 2
2.9
Baja
j Ele
ctrica
ls Co
n El
ectri
cals
1,0
25
117
5
3,70
0 5
9,78
5 3
,741
4
,573
2
,280
2
,928
2
3 2
9 6
6 2
8 4
5.6
35.
5 6
.1
5.4
3
1.8
25.
8 1
3.4
15.
2 1
2.1
14.
0
Orie
nt E
lectr
ic Lt
dCo
n El
ectri
cals
295
6
3 2
3,34
4 2
6,52
6 2
,595
3
,004
1
,494
1
,759
7
8
3
3 1
8 4
1.9
35.
6 1
1.0
9.0
2
3.8
20.
4 2
6.2
25.
3 3
0.0
28.
6
John
son
Cont
rol H
itach
Con
Elec
trica
ls 2
,711
7
4 2
3,56
9 2
6,75
6 2
,060
2
,495
1
,015
1
,323
3
7 4
9 3
13
30
72.
6 5
5.7
9.1
7
.9
36.
4 2
9.8
12.
6 1
4.2
12.
4 1
4.3
Huht
amak
i PPL
Ltd
Pack
agin
g 2
78
21
32,
209
- 3
,816
-
1,9
62
- 2
6 -
24
- 1
0.7
- 2
.1
- 5
.6
- 1
9.3
- 1
9.2
-
Indo
Cou
nt In
dustr
ies
Cons
umer
- Ot
123
2
4.3
25,
540
26,
541
3,6
86
3,9
00
2,2
92
2,4
26
12
12
1 6
1
0.6
10.
0 1
.8
1.5
7
.0
6.6
1
6.7
15.
2 1
9.4
18.
2
HDFC
Ban
kBa
nks
1,5
52
8,5
53
7,7
7,51
7 9
,11,
903
6,5
2,59
0 7
,70,
754
3,7
1,52
4 4
,40,
192
68
80
19
18
22.
9 1
9.3
3.7
3
.1
13.
1 1
1.1
17.
2 1
7.4
2.0
2
.1
ICIC
I Ban
kBa
nks
613
4
,237
4
,50,
208
5,1
3,73
4 3
,87,
566
4,3
6,21
6 2
,08,
882
2,4
4,34
3 3
0 3
5 3
2 1
7 2
0.3
17.
4 2
.7
2.4
1
0.9
9.7
1
3.4
13.
9 3
.0
3.1
Kota
k Mah
indr
a Ban
kBa
nks
1,9
35
3,8
35
1,7
6,27
7 2
,03,
321
1,3
6,36
0 1
,64,
031
88,
377
1,0
5,79
5 4
5 5
3 3
0 2
0 4
3.3
36.
2 5
.4
4.7
2
8.1
23.
4 1
3.2
13.
8 2
.2
2.3
Stat
e Ba
nk o
f Ind
iaBa
nks
381
3
,401
1
2,24
,968
1
3,20
,109
7
,05,
092
7,4
2,46
3 3
,42,
672
3,8
5,27
6 3
8 4
3 7
8 1
2 9
.9
8.8
1
.4
1.2
4
.8
4.6
1
4.3
14.
1 0
.8
0.8
AXIS
Ban
kBa
nks
751
2
,299
3
,45,
127
3,9
4,15
8 2
,84,
566
3,2
2,78
5 1
,46,
524
1,6
8,48
6 4
7 5
4 1
44
14
15.
8 1
3.8
2.1
1
.8
8.1
7
.1
13.
8 1
4.1
1.5
1
.5
Indu
sind
Bank
Bank
s 1
,023
7
75
1,4
5,68
0 1
,62,
875
1,1
9,03
0 1
,27,
370
47,
604
59,
698
62
77
60
25
16.
6 1
3.2
1.7
1
.5
6.5
6
.1
10.
9 1
2.1
1.4
1
.6
Phill
ipC
apita
l Ind
ia C
over
age
Uni
vers
e: V
alua
tio
n Su
mm
ary

99GROUND VIEW GROUND VIEW 1 - 31 MAY 2021 1 - 31 MAY 2021 98
CMP
Mkt
Cap
Ne
t Sal
es (`
mn)
EB
IDTA
(`
mn)
PAT (
` m
n)EP
S (`
) EP
S Gr
owth
(%)
P/E
(x)
P/B
(x)
EV/E
BITD
A (x
) R
OE (%
) RO
CE (%
)
Nam
e of
com
pany
Sect
or`
` bn
FY22
EFY
23E
FY22
EFY
23E
FY22
EFY
23E
FY22
EFY
23E
FY22
EFY
23E
FY22
EFY
23E
FY22
EFY
23E
FY22
EFY
23E
FY22
EFY
23E
FY22
EFY
23E
Bank
of B
arod
a Ba
nks
77
400
3
,25,
156
- 2
,03,
808
- 5
2,68
7 -
11
- 1
50
- 6
.8
- 0
.5
- 2
.0
- 7
.6
- 0
.4
-
Indi
an B
ank
Bank
s 1
32
149
1
,82,
415
- 1
,16,
000
- 3
6,11
8 -
32
- 9
9 -
4.1
-
0.4
-
1.3
-
10.
9 -
0.6
-
DCB
Bank
Bank
s 1
15
36
14,
628
16,
337
9,3
97
10,
288
4,1
79
5,3
93
13
17
11
29
8.6
6
.6
0.8
0
.7
3.8
3
.5
10.
3 1
1.7
1.1
1
.2
HDFC
Lim
ited
NBFC
2,5
68
4,6
30
1,6
8,75
5 1
,88,
430
1,7
9,32
7 2
,05,
363
1,2
9,47
0 1
,47,
497
72
83
33
14
35.
5 3
1.1
3.9
3
.6
25.
8 2
2.5
12.
7 1
3.3
2.1
2
.1
Mut
hoot
Fina
nce
NBFC
1,2
78
513
7
9,45
8 8
4,56
1 5
7,52
5 5
9,24
0 4
0,73
9 4
2,07
1 1
02
105
6
3
1
2.6
12.
2 2
.8
2.4
8
.9
8.7
2
4.4
21.
1 -
-
Shrir
am Tr
ansp
ort F
inNB
FC 1
,325
3
35
93,
476
1,0
8,04
8 7
3,92
7 8
5,78
1 3
6,92
2 4
5,34
7 7
12
818
1
5 1
5 1
.9
1.6
1
.9
1.6
4
.5
3.9
1
6.3
17.
5 -
-
Chol
aman
dala
m F
inNB
FC 5
32
436
5
2,39
0 6
2,18
1 3
8,89
9 4
5,97
8 2
0,41
1 2
4,44
7 1
28
154
2
6 2
0 4
.1
3.4
4
.1
3.4
1
1.2
9.5
1
9.1
19.
1 -
-
LIC H
ousin
g Fin
ance
NBFC
430
2
17
60,
475
67,
991
53,
823
60,
678
36,
037
40,
745
71
81
19
13
6.0
5
.3
0.9
0
.8
4.0
3
.6
16.
2 1
5.9
1.5
1
.5
Mah
& M
ah Fi
nanc
eNB
FC 2
09
258
5
9,35
0 6
4,38
8 4
2,80
9 4
6,02
3 1
3,93
7 1
4,75
9 1
1 1
2 1
04
6
18.
5 1
7.5
2.1
2
.1
6.0
5
.6
9.0
8
.9
- -
Man
appu
ram
Fina
nce
NBFC
164
1
39
43,
504
49,
348
30,
713
35,
539
20,
061
23,
336
24
28
14
16
6.9
5
.9
1.6
1
.3
4.5
3
.9
24.
8 2
3.4
- -
Shrir
am C
ity U
nion
Fin
NBFC
1,5
21
100
3
8,84
5 4
3,53
5 2
5,55
6 2
8,43
1 1
1,44
1 1
2,52
3 1
73
- 1
2 -1
00
8.8
-
1.1
1
.0
3.9
3
.5
13.
4 1
3.1
- -
Repc
o Ho
me
Finan
ce
NBFC
347
2
2 5
,610
-
4,7
66
- 3
,264
-
52
- 3
0 -1
00
6.7
-
0.9
-
4.6
-
15.
0 -
2.6
-
ICIC
I Lom
bard
NBFC
1,4
71
669
1
,14,
493
1,2
8,52
3 2
4,89
6 2
9,26
0 2
4,89
6 2
9,26
0 3
8 4
5 1
5 1
8 3
8.5
32.
6 7
.4
6.2
2
6.9
22.
9 2
0.6
20.
7 -
-
HDFC
AM
CNB
FC 3
,063
6
52
25,
445
29,
790
21,
289
25,
268
21,
289
25,
268
59
64
36
7
51.
6 4
8.1
15.
1 1
4.5
30.
6 2
5.8
35.
6 3
2.7
- -
Nipp
on Li
fe A
MC
NBFC
347
2
12
14,
389
16,
223
9,0
94
10,
111
9,0
94
10,
111
11
11
63
1
31.
3 3
1.1
7.3
6
.7
23.
4 2
1.0
24.
6 2
2.6
- -
SBI L
ifeNB
FC 9
14
914
1
,30,
015
1,4
9,51
7 2
5,74
3 2
9,93
3 1
9,30
2 2
1,78
3 2
2 2
3 1
3 7
4
2.0
39.
2 7
.5
6.5
3
5.5
30.
5 1
7.8
16.
5 -
-
Mag
ma F
inco
rpNB
FC 1
33
36
11,
698
14,
302
7,3
59
9,0
82
2,4
72
3,3
41
9
12
74
35
14.
5 1
0.7
1.5
1
.3
4.9
4
.0
22.
7 -
- -
Hind
usta
n Zi
ncM
etal
s 3
02
1,2
76
2,6
0,00
4 2
,84,
533
1,4
4,44
1 1
,57,
009
95,
335
1,0
6,10
4 2
3 2
5 2
7 1
1 1
3.4
12.
0 3
.7
3.9
7
.8
7.3
2
7.8
32.
5 2
5.2
29.
6
JSW
Ste
elM
etal
s 4
19
1,0
12
8,9
5,25
5 1
0,19
,242
2
,23,
772
2,4
5,69
4 8
6,71
3 9
3,96
2 3
6 3
9 2
6 8
1
1.6
10.
7 2
.0
1.7
6
.7
5.9
1
7.1
15.
8 1
4.2
14.
1
Veda
nta
Met
als
221
8
23
9,5
6,17
2 9
,77,
281
2,9
3,23
0 3
,02,
004
96,
190
97,
933
26
26
23
2
8.6
8
.4
1.4
1
.3
4.3
4
.1
15.
8 1
5.3
15.
4 1
5.3
Tata
Ste
elM
etal
s 7
20
830
1
5,39
,250
1
5,26
,887
2
,95,
876
2,8
6,77
1 1
,03,
348
1,0
1,94
3 8
6 8
5 3
1 -1
8
.4
8.5
0
.9
0.9
5
.3
5.1
1
1.2
10.
1 8
.8
8.1
Hind
alco
Met
als
330
7
42
14,
39,4
55
14,
75,6
83
1,9
6,15
4 2
,02,
683
72,
263
76,
765
32
35
33
6
10.
2 9
.6
1.1
0
.9
6.3
5
.8
10.
3 9
.6
8.0
8
.0
NMDC
Met
als
134
3
93
1,6
2,08
9 1
,62,
067
85,
538
75,
049
64,
161
55,
566
22
19
-4
-13
6.1
7
.1
1.2
1
.1
4.3
4
.9
19.
9 1
6.2
20.
3 1
6.3
Jinda
l Ste
el &
pow
erM
etal
s 3
18
324
4
,41,
429
4,3
0,13
1 1
,36,
413
1,2
6,03
0 5
1,97
5 4
4,39
1 5
1 4
4 -6
-1
5 6
.2
7.3
0
.8
0.7
3
.9
3.7
1
2.1
9.4
1
1.3
9.7
SAIL
Met
als
73
301
7
,70,
648
7,8
0,30
7 1
,48,
344
1,3
6,89
9 6
6,84
1 5
8,09
0 1
6 1
4 8
4 -1
3 4
.5
5.2
0
.6
0.5
4
.5
4.6
1
2.9
10.
1 1
1.4
9.9
Phill
ipC
apita
l Ind
ia C
over
age
Uni
vers
e: V
alua
tio
n Su
mm
ary

101GROUND VIEW GROUND VIEW 1 - 31 MAY 2021 1 - 31 MAY 2021 100
CMP
Mkt
Cap
Ne
t Sal
es (`
mn)
EB
IDTA
(`
mn)
PAT (
` m
n)EP
S (`
) EP
S Gr
owth
(%)
P/E
(x)
P/B
(x)
EV/E
BITD
A (x
) R
OE (%
) RO
CE (%
)
Nam
e of
com
pany
Sect
or`
` bn
FY22
EFY
23E
FY22
EFY
23E
FY22
EFY
23E
FY22
EFY
23E
FY22
EFY
23E
FY22
EFY
23E
FY22
EFY
23E
FY22
EFY
23E
FY22
EFY
23E
FY22
EFY
23E
NALC
OM
etal
s 5
9 1
09
89,
804
- 1
2,03
7 -
6,5
88
- 4
-
33
- 1
6.6
- 1
.1
- 7
.2
- 6
.4
- 5
.5
-
Penn
ar In
ds.
Met
als
21
3
19,
385
21,
583
1,6
22
1,9
57
360
5
62
3
4
-387
5
6 8
.1
5.2
0
.4
0.4
4
.5
3.9
5
.2
7.5
8
.9
10.
6
Lars
en &
Toub
roCa
p Go
ods
1,5
14
2,1
26
15,
48,5
28
17,
24,9
32
1,7
5,61
8 2
,02,
559
88,
251
1,0
6,31
4 6
3 7
5 2
9 2
0 2
4.2
20.
1 2
.7
2.4
1
8.7
16.
3 1
1.0
12.
0 6
.1
6.5
Siem
ens
Cap
Good
s 1
,919
6
83
1,2
7,31
9 1
,44,
640
15,
172
17,
490
11,
175
12,
642
31
36
48
13
61.
1 5
4.0
6.6
6
.0
42.
5 3
6.3
10.
8 1
1.2
10.
1 1
0.4
ABB
Indi
aCa
p Go
ods
1,4
71
312
6
6,34
8 7
5,94
3 4
,929
6
,864
3
,650
5
,175
1
7 2
4 8
4 4
2 8
5.4
60.
2 8
.0
7.2
5
9.3
42.
1 9
.4
12.
0 9
.3
12.
1
Bhar
at E
lectr
onics
Cap
Good
s 1
40
341
1
,53,
155
1,6
8,06
5 3
2,10
9 3
5,08
0 2
1,41
8 2
3,60
4 9
1
0 2
2 1
0 1
5.9
14.
5 2
.8
2.5
9
.9
8.7
1
8.7
18.
4 1
9.4
19.
1
BHEL
Cap
Good
s 5
3 1
86
2,4
8,26
0 2
,72,
203
15,
300
18,
694
7,7
94
11,
230
2
3
-227
4
4 2
3.9
16.
6 0
.6
0.6
7
.6
4.3
2
.7
3.7
2
.5
3.3
Cum
min
s Ind
iaCa
p Go
ods
884
2
45
52,
628
58,
578
7,4
65
8,7
62
7,0
56
8,1
17
25
29
16
15
34.
7 3
0.2
5.2
4
.9
30.
7 2
5.8
15.
6 1
6.8
14.
3 1
5.7
Ther
max
Cap
Good
s 1
,399
1
67
53,
768
63,
742
4,4
21
5,5
31
3,2
17
4,0
76
27
34
32
27
51.
8 4
0.9
4.8
4
.4
35.
8 2
8.7
9.3
1
0.8
8.9
1
0.3
KEC
Inte
rnat
iona
lCa
p Go
ods
461
1
18
1,4
0,93
9 1
,50,
935
13,
418
15,
131
6,6
94
7,8
68
26
31
24
18
17.
7 1
5.1
3.1
2
.6
10.
6 9
.3
17.
3 1
7.4
12.
8 1
3.4
Kalp
atar
u po
wer
Cap
Good
s 3
97
59
1,3
8,39
4 1
,49,
007
14,
707
17,
076
4,9
79
7,1
24
33
48
5
43
11.
9 8
.3
1.3
1
.2
4.9
3
.8
11.
3 1
4.2
11.
0 1
3.9
Engi
neer
s Ind
iaCa
p Go
ods
83
52
31,
843
30,
442
3,7
75
4,3
23
3,9
48
4,2
57
7
8
13
8
11.
8 1
0.9
2.3
2
.2
8.3
7
.1
20.
4 2
0.6
23.
8 2
3.8
Bhar
at D
ynam
icsCa
p Go
ods
363
6
6 2
7,82
3 3
9,19
9 5
,360
8
,048
4
,466
6
,291
2
4 3
4 1
6 4
1 1
4.9
10.
6 2
.1
1.9
8
.3
6.6
1
4.3
17.
6 1
3.9
17.
3
Coch
in S
hipy
ard
Cap
Good
s 3
82
50
40,
139
39,
129
7,4
86
5,6
48
6,4
22
4,4
06
49
33
20
-31
7.8
1
1.4
1.1
1
.0
5.7
8
.1
14.
1 9
.2
13.
0 8
.6
GE T&
DCa
p Go
ods
132
3
4 3
3,54
1 3
9,91
0 1
,777
3
,326
5
38
1,8
20
2
7
-4,2
26
238
6
2.9
18.
6 3
.3
2.8
2
0.3
10.
4 5
.2
15.
2 7
.0
17.
0
Praj
Inds
.Ca
p Go
ods
182
3
3 1
4,40
1 1
8,81
9 1
,309
2
,079
9
38
1,5
05
5
8
65
60
35.
5 2
2.2
4.2
3
.8
25.
1 1
5.7
11.
9 1
6.9
12.
1 1
7.6
VA Te
ch W
abag
Cap
Good
s 2
61
16
26,
626
31,
548
2,1
67
2,7
90
1,1
28
1,5
43
18
25
57
37
14.
4 1
0.5
1.1
1
.0
7.6
6
.0
7.7
9
.7
6.7
8
.1
Ultra
tech
Cem
ent
Cem
ent
6,6
38
1,9
14
5,3
6,81
8 6
,06,
732
1,2
6,67
7 1
,42,
416
64,
487
77,
420
223
2
68
39
20
29.
7 2
4.7
3.9
3
.4
15.
4 1
3.3
13.
1 1
3.7
11.
0 1
2.4
Shre
e Ce
men
tCe
men
t 2
7,70
2 9
99
1,7
0,63
1 1
,92,
989
46,
492
50,
859
26,
191
27,
893
726
7
73
42
6
38.
2 3
5.8
5.8
5
.1
20.
0 1
8.1
15.
3 1
4.2
15.
8 1
5.4
Ambu
ja C
emen
tCe
men
t 2
90
575
2
,88,
159
n.a
. 5
3,66
7 -
24,
502
-2,7
00
12
- 3
0 -
23.
5 -
2.4
-
9.8
-
10.
4 -
10.
4 -0
.7
ACC
Cem
ent
1,7
88
336
1
,58,
665
1,6
3,25
7 2
5,85
2 2
7,64
1 1
6,73
0 1
6,65
2 8
9 8
9 4
-0
2
0.1
20.
2 2
.4
2.2
1
0.4
10.
0 1
1.9
10.
9 1
1.5
10.
2
Dalm
ia B
hara
tCe
men
t 1
,475
2
75
1,2
7,00
9 1
,47,
055
26,
405
28,
672
7,8
56
11,
256
42
60
41
43
35.
0 2
4.4
2.3
2
.2
11.
1 9
.8
6.7
8
.8
5.9
7
.9
JK C
emen
tCe
men
t 2
,925
2
26
69,
845
74,
021
-25,
455
-24,
707
-35,
007
-35,
041
-453
-4
53
21
0
-6.5
-6
.4
5.6
4
.6
-9.4
-9
.2
-87.
0 -7
1.2
-49.
0 -5
0.3
Heid
elbe
rgCe
men
t Ce
men
t 2
27
52
23,
455
25,
133
5,5
50
6,0
47
3,1
76
3,4
63
14
15
24
9
16.
2 1
4.9
2.7
2
.3
7.7
6
.4
16.
8 1
5.5
13.
3 1
2.6
Star
Cem
ent
Cem
ent
100
4
1 2
5,68
8 2
8,82
1 4
,626
5
,152
2
,617
2
,759
6
7
5
2 5
1
5.8
15.
0 1
.9
1.8
9
.2
8.7
1
2.3
11.
7 1
1.7
10.
7
Phill
ipC
apita
l Ind
ia C
over
age
Uni
vers
e: V
alua
tio
n Su
mm
ary

101GROUND VIEW GROUND VIEW 1 - 31 MAY 2021 1 - 31 MAY 2021 100
CMP
Mkt
Cap
Ne
t Sal
es (`
mn)
EB
IDTA
(`
mn)
PAT (
` m
n)EP
S (`
) EP
S Gr
owth
(%)
P/E
(x)
P/B
(x)
EV/E
BITD
A (x
) R
OE (%
) RO
CE (%
)
Nam
e of
com
pany
Sect
or`
` bn
FY22
EFY
23E
FY22
EFY
23E
FY22
EFY
23E
FY22
EFY
23E
FY22
EFY
23E
FY22
EFY
23E
FY22
EFY
23E
FY22
EFY
23E
FY22
EFY
23E
FY22
EFY
23E
JK La
kshm
i Cem
ent
Cem
ent
429
5
0 4
6,58
4 5
3,57
3 9
,287
1
0,59
7 3
,614
4
,250
3
1 3
6 1
4 1
8 1
4.0
11.
9 2
.2
1.9
7
.5
6.3
1
5.9
16.
1 1
3.0
13.
3
Indi
a Cem
ent
Cem
ent
172
5
3 6
0,01
9 -
9,0
81
- 2
,788
-
9
- 8
4 -
19.
2
1.0
9.0
-
5.0
-
4.9
-
Sang
hi C
emen
tCe
men
t 4
4 1
1 1
6,19
1 1
8,08
5 3
,525
4
,016
9
39
1,3
30
4
5
85
42
11.
8 8
.4
0.6
0
.6
7.3
6
.4
5.0
6
.7
5.8
7
.0
Man
gala
m C
emen
tCe
men
t 2
85
8
13,
661
15,
964
2,7
88
3,3
29
1,3
74
1,8
35
51
69
22
34
5.5
4
.1
0.9
0
.7
3.2
2
.4
16.
2 1
7.9
14.
0 1
6.1
Tata
Con
sulta
ncy
IT Se
rvice
s 3
,058
1
1,31
2 1
8,41
,165
2
0,52
,423
5
,11,
561
5,8
0,15
0 3
,90,
796
4,4
8,40
5 1
04
120
2
1 1
5 2
9.3
25.
6 1
3.0
10.
7 2
2.0
19.
3 4
4.5
41.
8 4
3.1
41.
4
Info
sys T
echn
olog
ies
IT Se
rvice
s 1
,375
5
,857
1
1,58
,270
1
3,02
,640
3
,15,
570
3,5
4,12
7 2
,25,
523
2,5
4,57
7 5
3 6
0 1
3 1
3 2
5.9
23.
0 6
.9
6.0
1
7.1
15.
6 2
6.5
26.
0 2
8.3
27.
7
HCL T
echn
olog
ies
IT Se
rvice
s 9
79
2,6
57
8,5
8,43
0 9
,56,
877
2,1
5,13
6 2
,40,
125
1,3
8,53
3 1
,58,
062
51
58
3
14
19.
2 1
6.8
3.6
3
.0
12.
2 1
0.9
18.
5 1
8.0
18.
4 1
8.0
Wip
roIT
Serv
ices
425
2
,330
6
,68,
645
7,2
6,61
1 1
,48,
526
1,6
0,31
4 1
,10,
865
1,2
2,60
0 1
9 2
2 3
1
1 2
1.8
19.
7 4
.0
3.5
1
5.4
14.
3 1
8.3
17.
7 1
8.4
17.
8
Tech
Mah
indr
aIT
Serv
ices
1,0
03
971
4
,10,
018
4,4
2,75
1 7
0,66
8 7
4,77
7 4
6,80
3 5
0,69
5 5
4 5
8 3
8
1
8.7
17.
3 3
.2
2.8
1
3.7
12.
9 1
7.4
16.
5 1
3.2
12.
9
L&T I
nfot
ech
IT Se
rvice
s 4
,016
7
02
1,4
1,88
3 1
,62,
466
28,
863
32,
991
21,
582
25,
222
124
1
45
14
17
32.
4 2
7.7
8.3
6
.8
24.
0 2
0.8
25.
6 2
4.6
24.
6 2
4.0
L&T T
echn
olog
y Se
rvice
sIT
Serv
ices
2,7
42
288
6
2,01
2 6
9,99
2 1
2,16
7 1
4,07
9 8
,773
1
0,39
4 8
3 9
8 2
9 1
8 3
3.0
27.
8 7
.4
6.3
2
3.8
20.
5 2
2.4
22.
6 2
3.5
23.
8
Min
dtre
e IT
Serv
ices
1,8
72
308
8
9,26
0 9
9,71
3 1
7,75
0 2
0,04
1 1
1,97
4 1
3,73
3 7
3 8
3 1
0 1
5 2
5.7
22.
4 6
.0
4.9
1
7.1
15.
0 2
3.2
21.
7 2
3.9
22.
6
NIIT
Tech
nolo
gies
IT Se
rvice
s 2
,722
1
65
53,
271
60,
468
9,3
05
10,
753
5,8
60
7,0
39
97
116
2
3 2
0 2
8.1
23.
4 6
.3
5.3
1
6.0
13.
4 2
2.2
22.
5 2
2.9
23.
1
Pers
isten
t Sys
tem
sIT
Serv
ices
1,7
83
136
4
6,12
3 5
1,59
8 7
,241
8
,089
5
,231
5
,928
6
8 7
8 2
0 1
3 2
6.0
23.
0 4
.2
3.6
1
7.3
15.
2 1
6.0
15.
8 1
5.9
15.
8
Cyie
nt Li
mite
dIT
Serv
ices
680
7
5 4
4,67
4 4
8,68
3 6
,433
6
,947
4
,120
4
,569
3
7 4
2 1
2 1
1 1
8.1
16.
4 2
.3
2.1
1
0.3
9.3
1
2.9
12.
9 1
2.5
12.
6
Mph
asis
Ltd
IT Se
rvice
s 1
,617
3
02
1,0
9,51
1 1
,22,
300
20,
221
22,
295
14,
031
15,
892
75
85
14
13
21.
7 1
9.1
4.7
4
.4
13.
8 1
2.4
21.
7 2
3.2
20.
8 2
1.8
Sun
Phar
ma
Phar
ma
614
1
,472
3
,71,
108
4,0
1,87
4 9
1,78
4 1
,02,
679
59,
121
68,
302
25
28
-1
16
24.
9 2
1.6
2.6
2
.4
15.
1 1
2.9
10.
6 1
1.0
9.4
9
.9
Dr R
eddy
's La
bs.
Phar
ma
4,4
27
736
2
,14,
350
2,4
8,13
8 4
9,30
0 6
5,50
9 2
7,01
7 3
8,37
1 1
59
225
1
4 4
2 2
7.9
19.
7 3
.9
3.3
1
4.8
10.
8 1
4.1
17.
0 1
1.0
13.
7
Divi'
s Lab
orat
orie
sPh
arm
a 3
,512
9
32
85,
104
1,0
6,04
8 3
2,42
5 4
1,35
9 2
2,65
0 2
9,12
4 8
5 1
10
18
29
41.
2 3
2.0
8.6
6
.9
28.
5 2
2.2
20.
9 2
1.7
26.
9 2
7.7
Cipl
a Ph
arm
a 8
06
650
2
,15,
242
2,5
5,77
9 4
5,20
1 6
2,66
6 2
6,09
1 3
9,25
6 3
2 4
9 1
5
0 2
4.8
16.
5 3
.3
2.8
1
4.3
9.8
1
3.3
17.
2 1
6.8
21.
9
Lupi
nPh
arm
a 1
,050
4
76
1,7
7,37
0 1
,95,
109
33,
666
38,
617
16,
338
19,
851
36
44
45
22
29.
1 2
3.9
3.2
2
.9
14.
7 1
2.5
11.
0 1
2.0
16.
8 2
1.9
Bioc
onPh
arm
a 4
00
480
9
6,52
8 1
,17,
401
26,
193
35,
153
12,
604
18,
321
11
15
64
45
38.
1 2
6.2
5.6
4
.6
19.
1 1
4.0
14.
6 1
7.7
13.
5 1
7.3
Auro
bind
o Ph
arm
aPh
arm
a 8
48
497
2
,62,
660
2,8
2,18
5 5
8,57
3 6
4,90
3 3
6,60
4 4
0,75
9 6
3 7
0 5
1
1 1
3.5
12.
1 2
.1
1.8
8
.3
7.0
1
5.5
14.
8 1
7.2
16.
8
Cadi
la H
ealth
care
Phar
ma
443
4
53
1,6
5,82
7 1
,84,
220
37,
719
42,
278
22,
985
26,
153
22
26
17
14
19.
7 1
7.3
3.5
3
.1
13.
2 1
1.5
17.
4 1
7.5
12.
4 1
3.2
Ipca
Labo
rato
ries
Phar
ma
1,9
53
248
6
3,54
8 7
4,68
4 1
6,30
3 2
0,29
1 1
1,77
9 1
4,94
3 9
3 1
18
8
27
20.
9 1
6.5
4.4
3
.5
14.
6 1
1.3
20.
8 2
1.3
20.
4 2
1.4
Phill
ipC
apita
l Ind
ia C
over
age
Uni
vers
e: V
alua
tio
n Su
mm
ary

103GROUND VIEW GROUND VIEW 1 - 31 MAY 2021 1 - 31 MAY 2021 102
CMP
Mkt
Cap
Ne
t Sal
es (`
mn)
EB
IDTA
(`
mn)
PAT (
` m
n)EP
S (`
) EP
S Gr
owth
(%)
P/E
(x)
P/B
(x)
EV/E
BITD
A (x
) R
OE (%
) RO
CE (%
)
Nam
e of
com
pany
Sect
or`
` bn
FY22
EFY
23E
FY22
EFY
23E
FY22
EFY
23E
FY22
EFY
23E
FY22
EFY
23E
FY22
EFY
23E
FY22
EFY
23E
FY22
EFY
23E
FY22
EFY
23E
FY22
EFY
23E
Adan
i Por
ts &
SEZ
Infra
struc
ture
728
1
,479
1
,63,
095
1,8
1,88
0 1
,08,
413
1,2
1,47
2 6
1,09
7 7
0,80
7 3
0 3
5 3
5 1
6 2
4.2
20.
9 4
.1
3.4
1
6.0
13.
9 1
6.8
16.
5 1
0.3
10.
6
PNC
Infra
tech
In
frastr
uctu
re 2
60
67
59,
755
71,
706
8,3
66
10,
039
4,7
01
5,7
43
18
22
30
22
14.
2 1
1.6
2.0
1
.7
8.2
6
.9
15.
0 1
5.8
15.
1 1
5.8
NCC
Infra
struc
ture
87
53
96,
160
1,1
5,39
2 1
1,53
9 1
3,84
7 4
,722
6
,474
8
1
1 5
5 3
7 1
1.3
8.2
0
.9
0.8
6
.0
4.9
8
.3
10.
3 1
0.1
11.
6
KNR
Cons
tructi
onIn
frastr
uctu
re 2
12
60
30,
665
37,
105
6,1
33
7,4
21
3,4
29
4,3
51
12
15
28
27
17.
4 1
3.7
2.7
2
.3
9.6
7
.6
16.
9 1
8.1
17.
1 1
8.1
Asho
ka B
uild
con
Infra
struc
ture
109
3
1 4
6,30
4 5
5,56
5 5
,325
6
,668
3
,945
4
,865
1
4 1
7 7
2
3 7
.8
6.3
0
.9
0.8
6
.4
5.0
1
1.9
12.
8 1
2.4
13.
4
IRB
Infra
struc
ture
Infra
struc
ture
122
4
3 5
5,92
6 5
7,93
2 2
5,45
0 2
7,05
5 -4
01
-2,0
07
-1
-6
-139
4
00
-106
.7
-21.
3 0
.6
0.6
7
.3
6.8
-0
.5
-2.7
2
.7
2.3
Sadb
hav E
ngin
eerin
gIn
frastr
uctu
re 7
3 1
3 2
7,02
0 3
2,42
4 3
,242
3
,891
7
31
1,0
98
4
5
1,0
12
50
20.
8 1
3.9
0.7
0
.7
9.2
7
.6
3.3
4
.8
4.1
4
.9
Ahlu
walia
Con
tracts
Infra
struc
ture
300
2
0 2
1,57
5 2
6,32
1 2
,265
3
,290
1
,281
2
,017
1
9 3
0 8
7 5
7 1
5.7
10.
0 2
.0
1.7
7
.9
5.2
1
3.7
18.
4 1
4.8
19.
1
ITD C
emen
tatio
n In
frastr
uctu
re 8
4 1
4 3
2,18
3 3
8,62
0 3
,379
4
,055
1
,041
1
,433
6
8
-1
,103
3
8 1
3.8
10.
0 1
.3
1.1
5
.2
4.3
9
.2
11.
2 1
1.3
12.
7
Cont
aine
r Cor
p Of
Indi
aLo
gisti
cs 5
77
352
7
2,12
5 8
7,41
5 1
6,03
1 2
2,22
8 9
,924
1
4,32
0 1
6 2
4 4
0 4
4 3
5.4
24.
6 3
.2
3.0
2
0.7
14.
6 9
.1
12.
4 9
.4
12.
7
VRL L
ogist
ics
Logi
stics
244
2
2 2
2,07
6 2
4,64
2 3
,388
3
,853
1
,112
1
,382
1
2 1
5 1
28
24
19.
8 1
5.9
2.9
2
.6
7.4
6
.4
14.
8 1
6.1
12.
1 1
3.2
Allca
rgo
Logi
stics
Logi
stics
133
3
3 1
,04,
767
1,1
1,29
7 7
,019
7
,371
2
,240
2
,512
9
1
0 1
2 1
2 1
4.6
13.
1 1
.4
1.3
5
.9
5.5
9
.4
9.8
7
.9
8.2
Gate
way D
istrip
arks
Logi
stics
185
2
3 1
3,20
7 1
5,18
0 3
,253
3
,749
1
,118
1
,503
9
1
2 6
4 3
4 2
0.7
15.
4 2
.6
2.6
8
.2
6.9
7
.0
9.0
9
.4
11.
4
Aegi
s Log
istics
Lo
gisti
cs 3
05
107
5
9,75
4 6
9,38
0 6
,365
7
,850
3
,907
5
,089
1
1 1
4 3
0 3
0 2
7.6
21.
2 5
.1
4.3
1
7.3
13.
8 1
8.6
20.
1 1
9.2
21.
6
Mah
indr
a Log
istics
Lim
ited
Logi
stics
566
4
1 4
0,33
1 4
7,59
0 2
,283
2
,897
9
32
1,3
07
13
18
135
4
0 4
3.2
30.
8 6
.3
5.4
1
7.9
13.
9 1
4.7
17.
5 1
4.7
17.
3
Trans
port
Corp
orat
ion
Logi
stics
244
1
9 3
1,61
4 3
4,97
3 2
,918
3
,200
1
,770
2
,007
2
3 2
6 2
4 1
3 1
0.6
9.4
1
.4
1.2
7
.6
7.0
1
3.4
13.
4 1
1.6
11.
5
Navk
arLo
gisti
cs 4
3 6
7
,472
8
,529
1
,733
1
,987
5
49
747
4
5
1
44
36
11.
7 8
.6
0.3
0
.3
6.5
5
.5
2.9
3
.9
3.6
4
.3
UPL
Agri
Inpu
t 6
20
474
4
,14,
690
4,4
7,09
7 8
9,15
8 9
9,70
3 3
5,85
0 4
3,20
8 4
7 5
6 1
5 2
1 1
3.2
11.
0 1
.9
1.7
6
.9
5.7
1
3.1
13.
7 9
.8
11.
2
PI In
dustr
ies
Agri
Inpu
t 2
,248
3
41
52,
245
63,
248
11,
867
14,
686
7,7
17
9,6
33
51
64
9
25
44.
2 3
5.4
5.7
5
.0
28.
5 2
2.7
12.
9 1
4.0
13.
4 1
4.7
Coro
man
del I
nter
Agri
Inpu
t 7
73
227
1
,47,
203
1,5
4,39
2 2
0,83
3 2
3,11
3 1
4,13
8 1
5,79
0 4
8 5
4 9
1
2 1
6.0
14.
3 3
.3
2.7
1
0.1
8.6
2
0.9
19.
2 3
0.3
27.
9
Cham
bal F
ertil
iser
Agri
Inpu
t 2
35
98
1,3
0,62
9 1
,34,
058
22,
690
23,
486
13,
760
14,
578
33
35
5
6
7.1
6
.7
1.7
1
.4
5.2
4
.4
23.
6 2
0.3
25.
5 2
4.8
SRF
Sp C
hem
icals
5,5
99
332
8
8,84
6 1
,07,
188
20,
879
25,
725
11,
431
14,
461
190
2
40
11
27
29.
5 2
3.3
4.4
3
.7
17.
4 1
4.1
14.
9 1
6.1
11.
4 1
2.5
Aarti
Indu
strie
sSp
Che
mica
ls 1
,284
2
24
63,
076
74,
373
13,
687
16,
734
7,4
33
9,5
86
43
55
40
29
30.
1 2
3.3
5.1
4
.3
17.
8 1
4.7
28.
0 1
8.5
15.
6 1
7.2
Atul
Sp
Che
mica
ls 6
,784
2
01
44,
705
51,
341
11,
087
12,
835
7,6
48
8,9
28
258
3
01
18
17
26.
3 2
2.6
4.7
4
.0
17.
3 1
4.5
17.
9 1
7.9
22.
9 2
2.9
Vina
ti Or
gani
csSp
Che
mica
ls 1
,457
1
50
13,
026
17,
437
4,9
44
6,3
50
3,5
63
4,6
22
35
45
27
30
42.
0 3
2.4
8.8
7
.2
30.
0 2
3.0
20.
9 2
2.4
26.
6 2
8.8
Cam
lin Fi
ne S
cienc
esSp
Che
mica
ls 1
40
18
15,
421
17,
694
2,8
68
3,5
56
1,4
56
1,9
04
9
12
46
31
15.
1 1
1.5
2.9
2
.3
7.6
5
.7
19.
0 1
9.9
17.
6 1
9.6
Phill
ipC
apita
l Ind
ia C
over
age
Uni
vers
e: V
alua
tio
n Su
mm
ary
Sour
ce: P
hilli
pCap
ital I
ndia
Res
earc
h Es
timat
es
103GROUND VIEW GROUND VIEW 1 - 31 MAY 2021 1 - 31 MAY 2021 102
Disclosures and Disclaimers
PhillipCapital (India) Pvt. Ltd. has three independent equity research groups: Institutional Equities, Institutional Equity Derivatives and Private Client Group. This report has been prepared by Institutional Equities Group. The views and opinions expressed in this document may or may not match or may be contrary at times with the views, estimates, rating, target price of the other equity research groups of PhillipCapital (India) Pvt. Ltd.
This report is issued by PhillipCapital (India) Pvt. Ltd. which is regulated by SEBI. PhillipCapital (India) Pvt. Ltd. is a subsidiary of Phillip (Mauritius) Pvt. Ltd. References to "PCIPL" in this report shall mean PhillipCapital (India) Pvt. Ltd unless otherwise stated. This report is prepared and distributed by PCIPL for information purposes only and neither the information contained herein nor any opin-ion expressed should be construed or deemed to be construed as solicitation or as offering advice for the purposes of the purchase or sale of any security, investment or derivatives. The information and opinions contained in the Report were considered by PCIPL to be valid when published. The report also contains information provided to PCIPL by third parties. The source of such information will usually be disclosed in the report. Whilst PCIPL has taken all reasonable steps to ensure that this information is correct, PCIPL does not offer any warranty as to the accuracy or completeness of such information. Any person placing reliance on the report to undertake trading does so entirely at his or her own risk and PCIPL does not accept any liability as a result. Securities and Derivatives markets may be subject to rapid and unexpected price movements and past performance is not necessarily an indication to future performance.
This report does not have regard to the specific investment objectives, financial situation and the particular needs of any specific person who may receive this report. Investors must undertake independent analysis with their own legal, tax and financial advisors and reach their own regarding the appropriateness of investing in any securities or investment strategies discussed or recommend-ed in this report and should understand that statements regarding future prospects may not be realized. In no circumstances it be used or considered as an offer to sell or a solicitation of any offer to buy or sell the Securities mentioned in it. The information contained in the research reports may have been taken from trade and statistical services and other sources, which we believe are reliable. PhillipCapital (India) Pvt. Ltd. or any of its group/associate/affiliate companies do not guarantee that such information is accurate or complete and it should not be relied upon as such. Any opinions expressed reflect judgments at this date and are subject to change without notice
Important: These disclosures and disclaimers must be read in conjunction with the research report of which it forms part. Receipt and use of the research report is subject to all aspects of these disclosures and disclaimers. Additional information about the issuers and securities discussed in this research report is available on request.
Certifications: The research analyst(s) who prepared this research report hereby certifies that the views expressed in this research report accurately reflect the research analyst’s personal views about all of the subject issuers and/or securities, that the analyst have no known conflict of interest and no part of the research analyst’s compensation was, is or will be, directly or indirectly, related to the specific views or recommendations contained in this research report. The Research Analyst certifies that he /she or his / her family members does not own the stock(s) covered in this research report.
Independence: PhillipCapital (India) Pvt. Ltd. has not had an investment banking relationship with, and has not received any compensation for investment banking services from, the subject issuers in the past twelve (12) months, and PhillipCapital (India) Pvt. Ltd does not anticipate receiving or intend to seek compensation for investment banking services from the subject issuers in the next three (3) months. PhillipCapital (India) Pvt. Ltd is not a market maker in the securities mentioned in this research report, although it or its affiliates may hold either long or short positions in such securities. PhillipCapital (India) Pvt. Ltd does not hold more than 1% of the shares of the company(ies) covered in this report.
Suitability and Risks: This research report is for informational purposes only and is not tailored to the specific investment objectives, financial situation or particular requirements of any individual recipient hereof. Certain securities may give rise to substantial risks and may not be suitable for certain investors. Each investor must make its own determination as to the appropriateness of any securities referred to in this research report based upon the legal, tax and accounting considerations applicable to such investor and its own investment objectives or strategy, its financial situation and its investing experience. The value of any security may be positively or adversely affected by changes in foreign exchange or interest rates, as well as by other financial, economic or political factors. Past performance is not necessarily indicative of future performance or results.
Sources, Completeness and Accuracy: The material herein is based upon information obtained from sources that PCIPL and the research analyst believe to be reliable, but neither PCIPL nor the research analyst represents or guarantees that the information contained herein is accurate or complete and it should not be relied upon as such. Opinions expressed herein are current opinions as of the date appearing on this material and are subject to change without notice. Furthermore, PCIPL is under no obligation to update or keep the information current.
Copyright: The copyright in this research report belongs exclusively to PCIPL. All rights are reserved. Any unauthorized use or disclosure is prohibited. No reprinting or reproduction, in whole or in part, is permitted without the PCIPL’s prior consent, except that a recipient may reprint it for internal circulation only and only if it is reprinted in its entirety.
Caution: Risk of loss in trading/investment can be substantial and even more than the amount / margin given by you. Investment in securities market are subject to market risks, you are requested to read all the related documents carefully before investing. You should carefully consider whether trading/investment is appropriate for you in light of your experience, objectives, financial resources and other relevant circumstances. PhillipCapital and any of its employees, directors, associates, group entities, or affiliates shall not be liable for losses, if any, incurred by you. You are further cautioned that trading/investments in financial markets are subject to market risks and are advised to seek independent third party trading/investment advice outside PhillipCapital/group/associates/affiliates/directors/employees before and during your trading/investment. There is no guarantee/assurance as to returns or profits or capital protection or appreciation. PhillipCapital and any of its
employees, directors, associates, and/or employees, directors, associates of PhillipCapital’s group entities or affiliates is not inducing you for trading/investing in the financial market(s). Trading/Investment decision is your sole responsibility. You must also read the Risk Disclosure Document and Do’s and Don’ts before investing.
Kindly note that past performance is not necessarily a guide to future performance.
For Detailed Disclaimer: Please visit our website www.phillipcapital.in
IMPORTANT DISCLOSURES FOR U.S. PERSONSThis research report is a product of PhillipCapital (India) Pvt. Ltd. which is the employer of the research analyst(s) who has prepared the research report. PhillipCapital (India) Pvt Ltd. is authorized to engage in securities activities in India. PHILLIPCAP is not a registered broker-dealer in the United States and, therefore, is not subject to U.S. rules regarding the preparation of research reports and the independence of research analysts. This research report is provided for distribution to “major U.S. institutional investors” in reliance on the exemption from registration provided by Rule 15a-6 of the U.S. Securities Exchange Act of 1934, as amended (the “Exchange Act”). If the recipient of this report is not a Major Institutional Investor as specified above, then it should not act upon this report and return the same to the sender. Further, this report may not be copied, duplicated and/or transmitted onward to any U.S. person, which is not a Major Institutional Investor.Any U.S. recipient of this research report wishing to effect any transaction to buy or sell securities or related financial instruments based on the information provided in this research report should do so only through Rosenblatt Securities Inc, 40 Wall Street 59th Floor, New York NY 10005, a registered broker dealer in the United States. Under no circumstances should any recipient of this research report effect any transaction to buy or sell securities or related financial instruments through PHILLIPCAP. Rosenblatt Securities Inc. accepts responsibility for the contents of this research report, subject to the terms set out below, to the extent that it is delivered to a U.S. person other than a major U.S. institutional investor.The analyst whose name appears in this research report is not registered or qualified as a research analyst with the Financial Industry Regulatory Authority (“FINRA”) and may not be an associated person of Rosenblatt Securities Inc. and, therefore, may not be subject to applicable restrictions under FINRA Rules on communications with a subject company, public appearances and trading securities held by a research analyst account.Ownership and Material Conflicts of InterestRosenblatt Securities Inc. or its affiliates does not ‘beneficially own,’ as determined in accordance with Section 13(d) of the Exchange Act, 1% or more of any of the equity securities mentioned in the report. Rosenblatt Securities Inc, its affiliates and/or their respective officers, directors or employees may have interests, or long or short positions, and may at any time make purchases or sales as a principal or agent of the securities referred to herein. Rosenblatt Securities Inc. is not aware of any material conflict of interest as of the date of this publicationCompensation and Investment Banking Activities Rosenblatt Securities Inc. or any affiliate has not managed or co-managed a public offering of securities for the subject company in the past 12 months, nor received compensation for investment banking services from the subject company in the past 12 months, neither does it or any affiliate expect to receive, or intends to seek compensation for investment banking services from the subject company in the next 3 months.Additional DisclosuresThis research report is for distribution only under such circumstances as may be permitted by applicable law. This research report has no regard to the specific investment objectives, financial situation or particular needs of any specific recipient, even if sent only to a single recipient. This research report is not guaranteed to be a complete statement or summary of any securities, markets, reports or developments referred to in this research report. Neither PHILLIPCAP nor any of its directors, officers, employees or agents shall have any liability, however arising, for any error, inaccuracy or incompleteness of fact or opinion in this research report or lack of care in this research report’s preparation or publication, or any losses or damages which may arise from the use of this research report.PHILLIPCAP may rely on information barriers, such as “Chinese Walls” to control the flow of information within the areas, units, divisions, groups, or affiliates of PHILLIPCAP.Investing in any non-U.S. securities or related financial instruments (including ADRs) discussed in this research report may present certain risks. The securities of non-U.S. issuers may not be registered with, or be subject to the regulations of, the U.S. Securities and Exchange Commission. Information on such non-U.S. securities or related financial instruments may be limited. Foreign companies may not be subject to audit and reporting standards and regulatory requirements comparable to those in effect within the United States.The value of any investment or income from any securities or related financial instruments discussed in this research report denominated in a currency other than U.S. dollars is subject to exchange rate fluctuations that may have a positive or adverse effect on the value of or income from such securities or related financial instruments. Past performance is not necessarily a guide to future performance and no representation or warranty, express or implied, is made by PHILLIPCAP with respect to future performance. Income from investments may fluctuate. The price or value of the investments to which this research report relates, either directly or indirectly, may fall or rise against the interest of investors. Any recommendation or opinion contained in this research report may become outdated as a consequence of changes in the environment in which the issuer of the securities under analysis operates, in addition to changes in the estimates and forecasts, assumptions and valuation methodology used herein. No part of the content of this research report may be copied, forwarded or duplicated in any form or by any means without the prior written consent of PHILLIPCAP and PHILLIPCAP accepts no liability whatsoever for the actions of third parties in this respect.PhillipCapital (India) Pvt. Ltd.Registered office: 18th floor, Urmi Estate, Ganpatrao Kadam Marg, Lower Parel (West), Mumbai – 400013, India.