Moving UMRED towards ODF+ through FSSM - PAS
161
Center for Water and Sanitation & AIILSG Moving UMRED towards ODF+ through FSSM Prepared for Umred Municipal Council April 2018
-
Upload
khangminh22 -
Category
Documents
-
view
2 -
download
0
Transcript of Moving UMRED towards ODF+ through FSSM - PAS
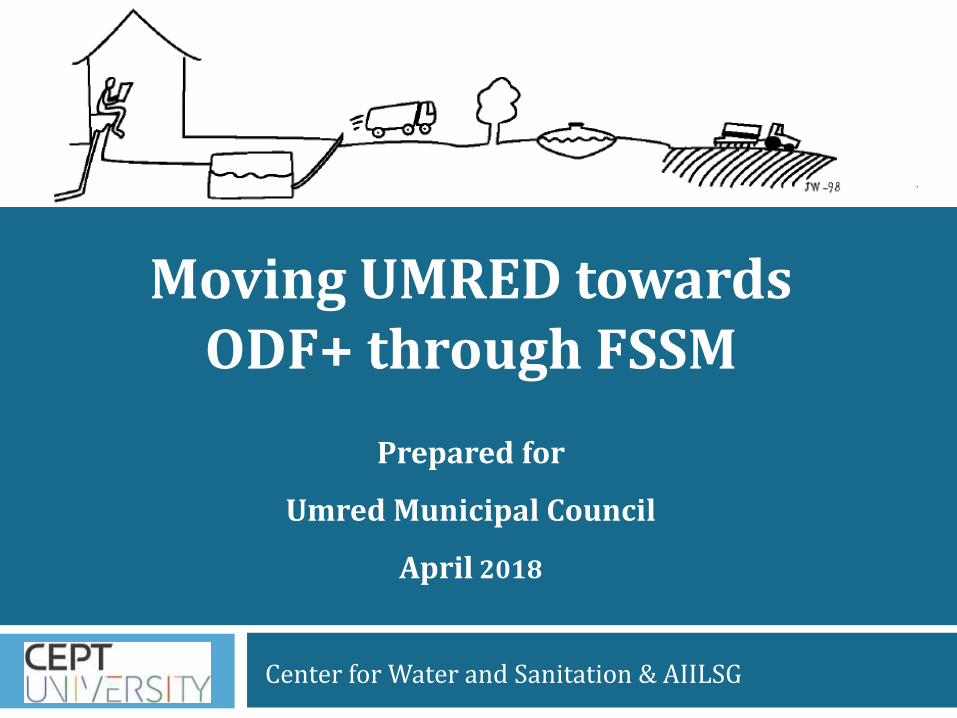
Center for Water and Sanitation & AIILSG
Moving UMRED towards ODF+ through FSSM
Prepared for
Umred Municipal Council
April 2018

Support Umred Municipal Council
for moving towards ODF+
through Faecal Sludge and Septage
Management (FSSM) Plans
Timeline of support – August 2017 to December 2018

Concept of ODF , ODF +, ODF ++ by GoM
80% HHs have access to
individual toilets and rest dependent on
CTs
Citywide FSSM Plan

1. Introduction
2. Current Sanitation Situationa. Access to Toilets
b. Collection
c. Conveyance
d. Treatment / Disposal
3. Grey Water Management
4. Solid Waste Management
5. Proposed Projects
6. Financial Assessment
7. Summary of Challenges
8. Proposals
Content

1. Introduction

Umred is class ‘B’ council located 45 km south-east of the district headquarter i.e. Nagpur. Umred is taluk headquarter.
The population of the city is 58,225 spread over an area of 12.95 sq km.
It is situated on a latitude of the 200-50` and longitude of 790-19
The old municipal limit of Umred includes the Gaothan area of today. The municipal area was extended in the year 1989. (85% increase in area)
Introduction
Umred
Major highways passing through the city are: NH 353, MSH 9 and SHs 258, 261 and 262. Narrow Gauge Railway: Nagpur to Itwari- Naghbir. The nearest airport to Umred is in Nagpur.
It is predominantly agricultural, with upcoming industrial area on the southern side.
Umred is known for coal mines on North Western side and the Karhandla Wildlife Sanctuary on the Eastern Side
Umred has been declared as ODF by QCI in Sept. 2016(Source-Field visit, 2017)

Sources: Census 2011, PAS SLB Data 2016-17, Umred Growth Centre DP, Water Audit 2009
Introduction: Demographics & Topography
2011 2017
Population 54,043 58,225
No. of HHs 11,880 13,450
Slum population (%) 9 12
Literacy (%) 75 -
Growth Rate 2001-11 2011-2017
8.10 9.01
Topography
The area has a gentle slope from south to north
Soil type- Majra/Murrum
Average Ground water level : 120 ft
There are 8 water bodies. 2 major lakes out of them are Gandhisagar and Hirwatalav. There are 3 major Nalas in the city.
Average rainfall is 1179 mm

Municipal Limits- Satellite Imagery
Legend
Municipal boundary
Slum Area

Settlement Pattern and Natural Features
Densely Populated Area
Organic Growth
Planned Settlement
Legend
Municipal Boundary
Slum Area
Water Bodies
Coal Mines

Out Growth Areas
Dhurkheda settlement along Mangrud Rd. is 4.5 Km towards South
MIDC Area and Kumbhari Village is 3.5 Km towards South
3.5 Km
4.5 Km
The distances mentioned are from the City Centre

Out Growth Areas
1.5 Km
Bhandarkar layout is 1.5 Km towards South
WCL Colony and Waygoan is 6 Km towards North West
6 Km
The distances mentioned are from the City Centre

Number of Electoral Wards 12
Number of Administrative Wards 24
Electoral Wards
Source: Umred Municipal Council

Administrative Wards
Source: Umred Municipal Council
Ward no. 3, 9, 10, 12, 13, 11, 16, 17, 19, 18, 21 comesunder Gaothan area limit and small area covered byWard no. 4,8, 22, 15 of Gaothan area.
Wards within Gaothan area limithas high density and irregulardevelopment is observed.
Those wards outside theGaothan area limit has lowdensity and are well plotted.
Gandhi Sagar lake is located inward no. 8.
WCL Quarry is located in wardno. 6.
The new spatial development is taking place along MangrudRoad towards South of Umred beyond ward no. 24, 23. of city.
Number of Electoral Wards 12
Number of Administrative Wards 24

Administrative Wards
Source: Umred Municipal Council
Ward No.
Population Ward No.
Population
1 2102 13 1977
2 2264 14 1982
3 2144 15 2437
4 1972 16 2026
5 2150 17 1581
6 1779 18 1733
7 2326 19 1724
8 2777 20 3933
9 2040 21 1855
10 2184 22 2748
11 1887 23 3242
12 2105 24 3352
Maximum population lives in core areas of city i.e. the Gaothan areas
New Development is taking place towards Southern, Northern and North-West of city.
Density Map
Legend
Low Density
Medium Density
High Density

Chief Officer
Deputy Chief Officer
AccountingConstruction Department Water Electricity
Fire-fighting
Health Departme
nt
1 Engineer
2 Sanitary Inspector
65 Sweepers
Outsourced operations
EducationE-Gov,
CompOthers
President Smt. Bhadoria
Chief Officer Mr. Ravindra Bhelave
Organogram of Administrative Wing of Council and Departments Concerned with Sanitation
Source: Umred Municipal Council
Number of Electoral Wards 12
Number of Administrative Wards 24
Local government structure
Organogram

Housing Typology
61%
34%
5 %
77%
20 %
3 %Dilapidated
Livable
Good
Rented
Owned
Any Other
Housing Condition Housing Ownership
Source: Census 2011
Good means those houses which do not require any repairs and are in good condition. Livable means those houses which requires minor repairs. Dilapidated means those houses which are showing sign of decay and require major repairs.

Apartments in the City
Ward No.
Apartments Flats No.
8 1 10
12 5 51
15 2 82
16 2 15
17 1 4
21 4 24
22 3 19
24 1 13
High Low
Apartment in Budhwari PethApartment in Vikas ColonyApartment in Adyalwale Layout
Most of the apartments are located towardsSouth and South-West of the city.
Out of total residential properties 2 % of apartments

Housing Typology- Gangapur Area
The housing typology is mixed in this area with Pucca and Semi-pucca type
Mostly single storied structures with concrete/ tiles as a roofmaterial
Medium Density Access road width is 3.5 m in majority of the areas

Housing Typology- Kawara Peth Area
The housing typology is mixed in this area with Puccaand Semi-pucca type
Mostly single storied structures with concrete/ tiles as a roof material
Medium Density Access road width is 3.5 m
in majority of the areas
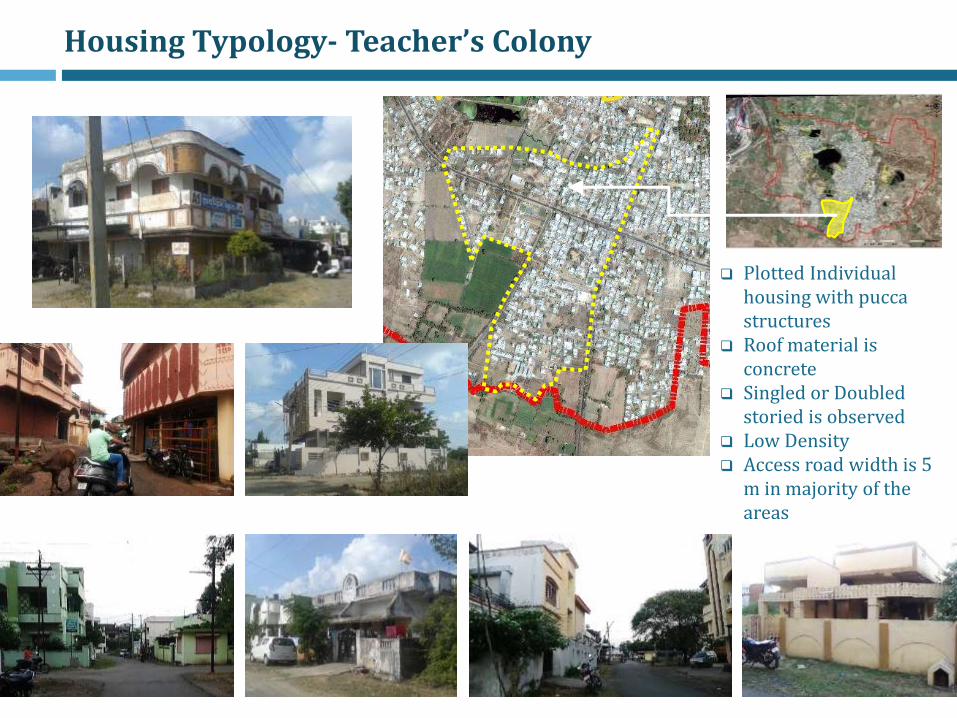
Housing Typology- Teacher’s Colony
Plotted Individual housing with puccastructures
Roof material is concrete
Singled or Doubled storied is observed
Low Density Access road width is 5
m in majority of the areas

Housing Typology- Adyalwale Layout
Plotted Individual housing with pucca structures
Roof material is concrete Singled or Doubled storied
is observed Low Density Access road width is 5 m in
majority of the areas

Housing Typology- Itwari Peth Area
The housing typology is mixed in this area with Pucca and Semi-pucca
Mostly single storied structures with tiles as roof material is observed in interior parts
High Density Access road in interior part is
mainly 2.5m making some part inaccessible

Housing Typology- Jogithana Peth Area
High Density The housing typology is
mixed in this area with Puccaand Semi-pucca type
Access road in interior part is mainly 2.5m making some part inaccessible
Mostly single storied structures with tiles as roof material is observed in interior parts

Housing Typology- Mangalwari Peth Area
The housing typology is mixed in this area with Pucca and Semi-puccatype
Mostly single storied structures with tiles as roof material is observed in interior parts
High Density Access road in interior part is mainly 2.5m
making some part inaccessible

Housing Typology- Sindhi Colony
The housing typology ismostly Pucca type
Mostly G+1 structures withconcrete as roof material isobserved.
Access road in interior part ismainly 3m.
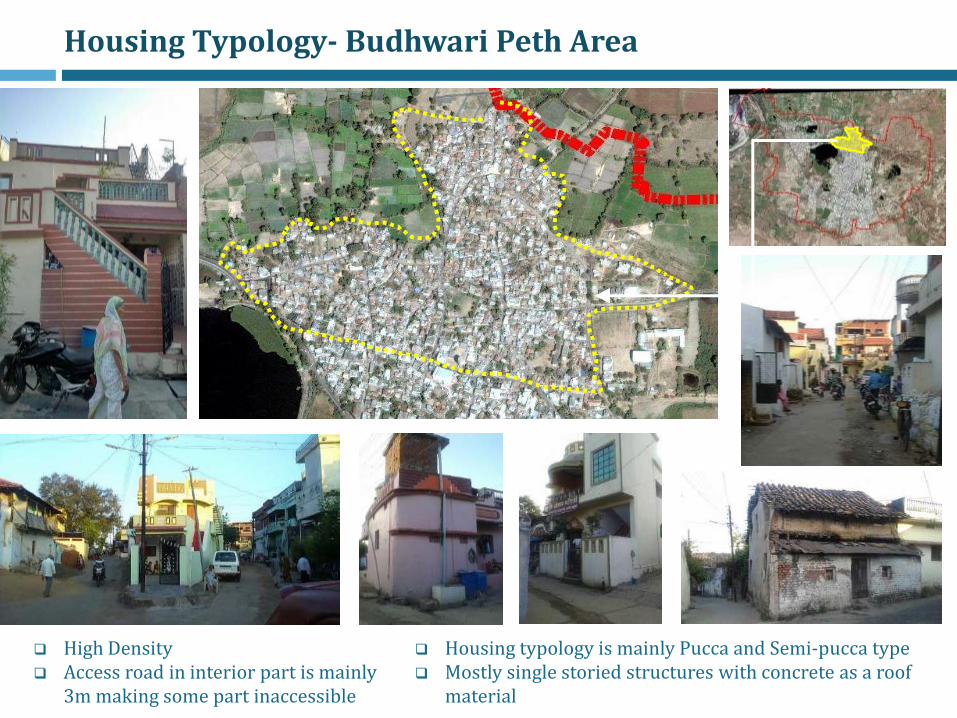
Housing Typology- Budhwari Peth Area
High Density Access road in interior part is mainly
3m making some part inaccessible
Housing typology is mainly Pucca and Semi-pucca type Mostly single storied structures with concrete as a roof
material

Housing Typology- Outgrowth Area Wayagaon
High Density Access road in interior part is mainly
3m making some part inaccessible
Housing typology is mainly Pucca and Semi-pucca type Mostly single storied structures with concrete as a roof
material
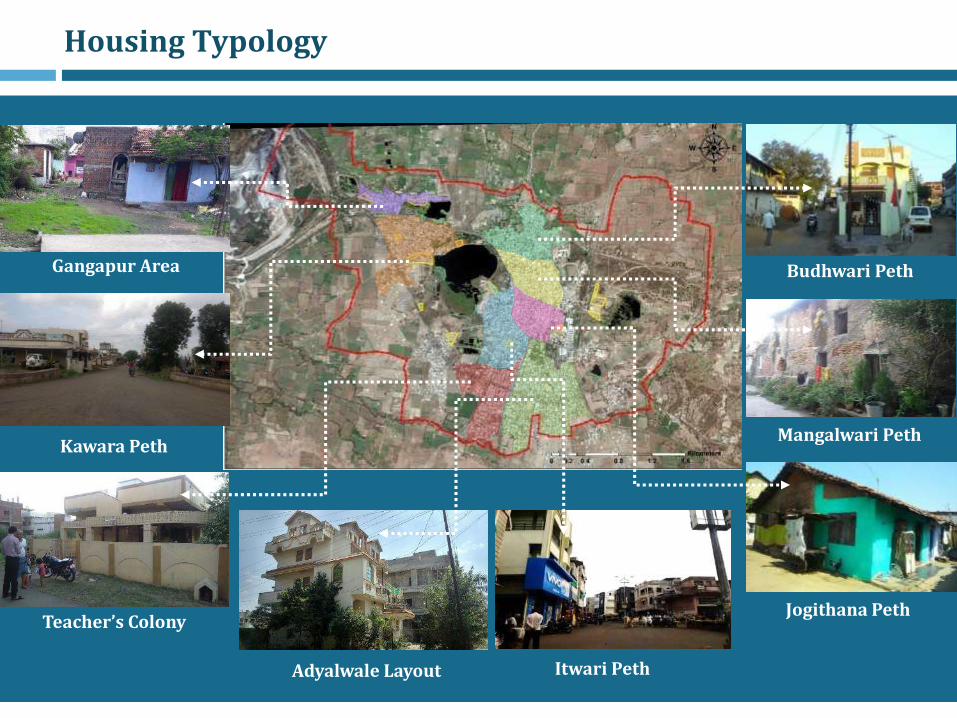
Housing Typology
Gangapur Area
Kawara Peth
Teacher’s Colony
Budhwari Peth
Itwari PethAdyalwale Layout
Jogithana Peth
Mangalwari Peth

2011 2017
Slum Population % 9 12
Population in Slums 5216 6,930
No. of Slum HHs 1106 1,385
No. of Slums 10 12
Notified Slums 0 0
Sr.
No.Name of Slum
Ward
No.
1 Gangapur Idgah Slum 6
2Gangapur Thombara
Road Slum5
3 Kawrapeth Slum 7
4 Rajivnagar Slum 8
5 Bypass Road Slum 8
6 Amrai bypass 20
7 Sonezari Slum 21
8 Bail Bazar Slum 15
9 Belgaon 9
10 Shantinagar Slum 14
11 Railway Station Slum 14
12 Malak Nagar 22
Source: Census ,DCHB 2011, PAS SLB 2015-16, Umred Municipal Council
Slum Details
Service Level Benchmarking Data for 2016-17
Coverage of water supply connections in slums 21.1%
Coverage of individual toilets in slums 39%
Household level coverage of solid waste management
services in slums
99.3%

Ongoing and Implemented Programs in Slums
Schemes Implemented in the Past
Integrated Housing and Slum Development Programme (IHSDP): 276 HHs beneficiaries from 4 slums and 2 Vastis. Status: Implemented.
Ramai Awas Yojana:
• Launched in 2014
• Eligibility: Beneficiary should be Below poverty line and belonging to Scheduled Caste
• Subsidy Rs. 1.5 lakh
• HH beneficiaries are 232, of which 40% houses have been built
Ongoing Schemes
Pradhan Mantri Awas Yojana: The council has not started collecting applications under PMAY since they have not yet received Funds for the scheme implementation

Gangapur Idqa Slum Housing Typology
Housing typology is Semi-pucca type with access road width is 3 m.
Ground structures with tiles as a roof material.
Presence of open drainage system.

Gangapur Giratkar Moholla Slum Housing Typology
Housing typology is Semi-pucca type with access roadwidth is 3 m.
Ground structures with tilesas a roof material.
Presence of open drainagesystem.

Kawarapeth Slum Housing Typology
Housing typology is Semi-pucca & Kaccha type with access road width is < 2 to 3 m.
Ground structures with tiles as a roof material.
Presence of closed drainage system.

Amrai Bypass Slum Housing Typology
Housing typology is Puccatype with access road width is 7 m.
Ground structures with tiles as a roof material.
Absence of drainage system.

Sonezari Slum Housing Typology
Housing typology is Semi-pucca type with accessroad width is 3 m.
Ground structures withpartial concrete & tiles as aroof material.
Presence of closed drains.
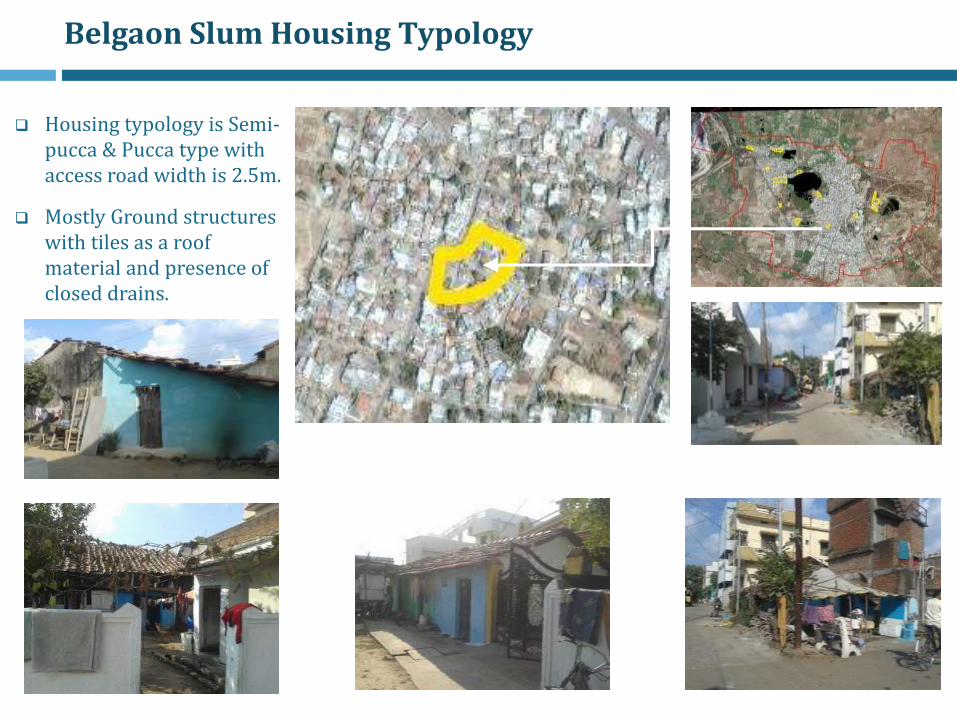
Belgaon Slum Housing Typology
Housing typology is Semi-pucca & Pucca type with access road width is 2.5m.
Mostly Ground structures with tiles as a roof material and presence of closed drains.

Shantinagar Slum Housing Typology
Housing typology is Kaccha & Semi-pucca type with access road width is < 2.5m.
Mostly Ground structures with tiles as a roof material and presence of open drains.

Malak Nagar Slum Housing Typology
Housing typology isSemi-pucca type &Access road is 2 m.
Mostly singlestoried structureswith tiles as a roofmaterial.
Absence of drainagesystem.

Slum Housing Typology
Shantinagar SlumGangapur Giratkar Slum
Amrai Bypass Slum
Gangapur Idqa Slum
Belgaon Slum
Malaknagar Slum
Musalman Moholla Slum Sonezari Slum

Housing Typology- Outgrowth Area
MIDC Area
DhurkhedaVillage

Housing Typology: Outgrowth Area Wayagaon Gotori
WCL Colony and Wayagoan Gotori is 6 Km towards North West
6 Km
The distances mentioned are from the City Centre
Single or G+1 Pucca Individual housing structure with roof material concrete is observed.
All parts of the area are accessible with > 3 m access road width.

Housing Typology- Outgrowth Area WCL Colony
WCL Colony and Wayagoan Gotori is 6 Km towards North West
6 Km
The distances mentioned are from the City Centre
Single storied Pucca Individual bungalow type housing structure with tiles as roof material is observed.
All parts of the area are accessible with > 3 m access road width.

9.42
8.4
7.92
7.80
Water Supply
2 Dams + Ground Water
Umred falls under the jurisdiction of MJP
Almost 100% metering in the city
In total there are 22 water stand post in the city.
Individual household bore well are observed in the city.
Source: SLB 2016-17, Field data 2017
New WTP Umred
City Demand: 8 MLD
Current LPCD: 135 LPCD
GangapurMangalwari Peth
Service Level Benchmarking Data for 2016-17
Coverage of water supply connections 86.5 %
Per capita supply of water 132 LPCD
NRW 17.20
Cost recovery in water supply services 74.3 %
Collection efficiency of water supply related charges 90.16 %

Metering in Umred
Source: SLB 2016-17, Field data 2017
• Almost all properties covered under metered connections
• Installation of metering completed: September 2016
• Billing Process commenced: April 2017
• Volumetric Tariff for metering based on usage
0-60 units Rs. 10 per unit
60-100 units Rs. 12 per unit
Above 100 units Rs. 15 per unit
• HHs which do not have meters are charged Rs. 1800 per year
Service Level Benchmarking Data for 2016-17
Extent of metering of water supply connections NA
2. Current Sanitation Situation:a. Access to Toilet
Access to Toilets

Access to Individual Toilets
Total HH HH withIndividual
toilet
HH depend on CT
OD
Overall 13450 11303 2147 0
• City already achieved ODF+ status in terms of IHHL coverage
Total HH
HH with Individual
toilet
HH depends
on CT
OD
Overall 11880 9269 874 1737
Slum 1106 538 146 422
Access to types of sanitation facility (2011) Access to types of sanitation facility (2017)
Source- Field visit (2017)
Service Level Benchmarking Data for 2016-17
Coverage of toilets 100 %
Coverage of households with adequate sanitation system 89 %
79%
49%
7%
13%
14%
38%
OV ERAL L SL U M
IHHL Community Toilet OD
84%
16%
0%
IIHL
CT
OD

Target - 1567
Application received
Verified Approved RejectedConstructed
toiletCommenced
toilet
Offline 1808 1484 1484 304 1216 -
Online 1808 1484 1484 304 1169 39
Swachh Bharat Mission (SBM) Status
82% applications of 1703 received applications have been approval for construction.
Of the SBM target of 1567 IHHL construction, 78% toilets have been constructed.
Current IHHL toilet coverage: 11,303(84%) of 13450 HHs.
SBM application receiving date has been freeze to 31st March 2018 by the GB.
Tentative cost of construction is Rs. 30,000.
Source: Umred Budget 2017-18,
FundsReceived (Rs.
in Cr.)Utilized
in %Utilized for Available Planning to use
14 Finance Commission
5.01 93 %Solid Waste
Management7 %
Two DEWATS Sewage Treatment Plant Project and FSTP
SBM or SMM 4.10 75 % IHHL construction 25 % Construction of Toilets
Fines 0.02 0 % - 100% -
SBM Incentive Fund
3.00 0% - 100 % FSTP
SBM Status for IHHL
Fund Utilization for SBM
Central Govt -Rs. 4,000 +State Govt. Rs- 8,000 +Nagar Palika-Rs. 2,000
= Rs. 14,000 Total Subsidy
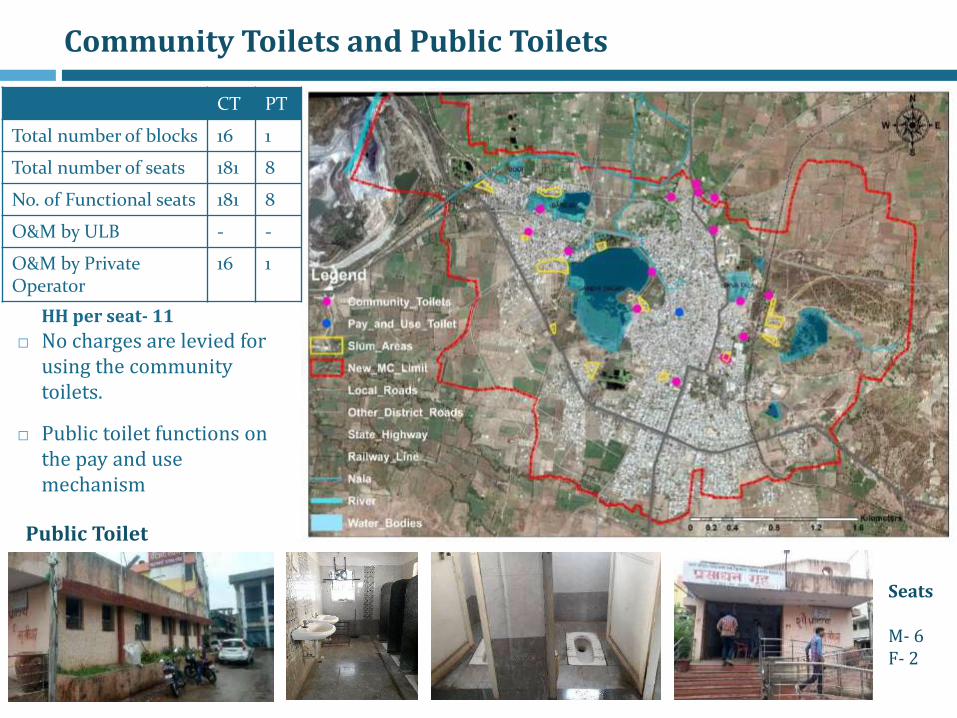
Community Toilets and Public Toilets
No charges are levied for using the community toilets.
Public toilet functions on the pay and use mechanism
CT PT
Total number of blocks 16 1
Total number of seats 181 8
No. of Functional seats 181 8
O&M by ULB - -
O&M by Private Operator
16 1
HH per seat- 11
Public Toilet
Seats
M- 6F- 2

Community Toilets and Public Toilets
All the 16 CTs and 1 PT have been visited and assessed.
Functionality- Although most of the CTs are old, all the seats in these CTs are in functional condition
Opening Timings- All the CTs are open for 24 hours.
Water Supply- All toilets either have piped supply to water tanks located outside the toilet block by taps.
All the CTs had no water taps inside the toilets but all the blocks are provided with common water tanks outside
Availability of Light- All the toilets have lights outside the block. None of the toilets have lighting inside. The reasons the Council has given for some toilets not having lights is thievery of lights and the street lights nearby being sufficient at night time.

Community Toilets and Public Toilets
Clogging of toilet pans-None of the toilet pans clog.
Frequency of Toilet Cleaning- Official and locals have stated that toilets are cleaned everyday once in the morning. Toilets were found to be clean.
Wash Basins: None of the CTs have wash basins
Doors: Some of the CTs do not have appropriate doors. Most of the ladies toilets have half height doors
Septic Tanks: All the CTs and PT are connected to Septic tanks. Septic tanks of one of the CT with 40 seats is cleaned once in a week while the others are cleaned once in a month

Community Toilets and Public Toilets

Community Toilets and Public Toilets
Ithwari BailbazzarNaidu Bazzar
Hirva Talav
40 seats Gotekhani
Mahila Samudayik
Gandhisagar Talav
Pradhan Pura
Pay & Use

Community Toilets and Public Toilets
BudhwariKawara Chambharpur
Kawarapeth Slum
Kawarapeth DurgapurIthwari Belgaon Malaknagar Slum
Amboli Naka
Kotgaon Rd

Community Toilets and Public Toilets
• The 20 seater Pradhanpura CT caters to approx. 25 HHs• The area is moderately dense and has few space
constraints to construct individual toilets.• High numbers of application have received from this
area i.e. 161 and rejected around 76 due to doubleapplying, space constraint, family internal issue, andfew are planning to construct under Ghar kul yojana.
4 Seats
4 Seats
20 Seats
40 Seats
• The 40 seater Gothekhani CT caters to the approx. 65HHs.
• The area is moderately dense and has no spaceconstraints to construct individual toilets.
• High no. of applications are received from this area alsoi.e. around 151 application and 63 rejected of them.

Community Toilets and Public Toilets
Budhwari area near PradhanpuraCT (20 seater)
Budhwari area near GothekhaniCT (40 seater)

Community Toilets
CT in Sindhi Colony
CT in Kawara Peth
CT near Fish Market
CT in Gangapur
40 seater CT
CT in
Although most of the CTs are old, all of them are functional and are maintained in Good Condition with water availability

OD Spots in the Past
There were 23 OD spots in the city.Most of the OD spots were found tobe near the Slums and along thewater bodies like lakes and nalas.
Gangapur chowk
Railway stationVikas colony
Behind Budhwari peth
Itnakar School

OD Spots in the Past
There were 23 OD spots in the city.Most of the OD spots were found tobe near the Slums and along thewater bodies like lakes and nalas.
Gav Talav Pal
Pradhanpura
Malaknagar SlumS0nezari Hirva Talav
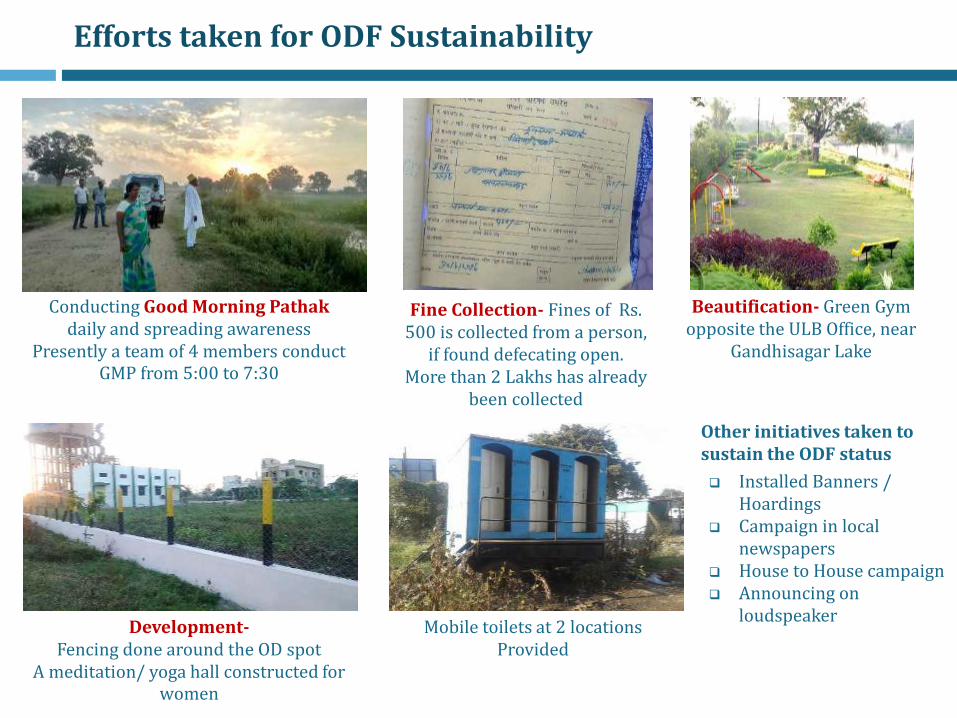
Efforts taken for ODF Sustainability
Other initiatives taken to sustain the ODF status
Installed Banners / Hoardings
Campaign in local newspapers
House to House campaign Announcing on
loudspeaker
Conducting Good Morning Pathak daily and spreading awareness
Presently a team of 4 members conduct GMP from 5:00 to 7:30
Fine Collection- Fines of Rs. 500 is collected from a person,
if found defecating open.More than 2 Lakhs has already
been collected
Beautification- Green Gym opposite the ULB Office, near
Gandhisagar Lake
Development-Fencing done around the OD spot
A meditation/ yoga hall constructed for women
Mobile toilets at 2 locations Provided

Efforts taken for ODF Sustainability: Updated banners
Posters for awareness generation among citizens for construction of IHHL

2.Current Sanitation Situation:b. Collection
Access to Toilets Collection
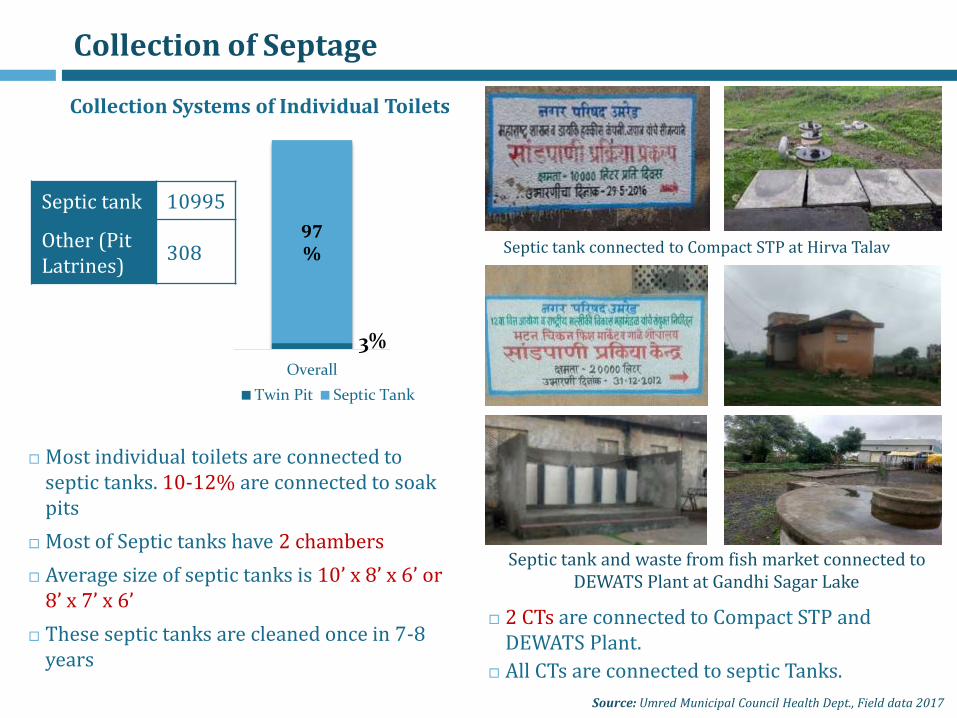
Collection of Septage
Most individual toilets are connected to septic tanks. 10-12% are connected to soak pits
Most of Septic tanks have 2 chambers
Average size of septic tanks is 10’ x 8’ x 6’ or 8’ x 7’ x 6’
These septic tanks are cleaned once in 7-8 years
2 CTs are connected to Compact STP and DEWATS Plant.
All CTs are connected to septic Tanks.
3%
97%
Overall
Twin Pit Septic Tank
Source: Umred Municipal Council Health Dept., Field data 2017
Septic tank connected to Compact STP at Hirva Talav
Septic tank and waste from fish market connected to DEWATS Plant at Gandhi Sagar Lake
Collection Systems of Individual Toilets
Septic tank 10995
Other (Pit Latrines)
308

Individual Household Septic Tank
Avg. septic tank size in this area is 2.4*2.1*1.8m But different size of septic tank are alsoobserved other than this size of septic tanks.
Septic Tanks
Not to Scale
All dimensions are in ‘m’
Section at AA’
Top View (Dim: 2.4*2.1*1.8 m)
A’A
Access Cover
Bathroom
Outlet
Inlet
Ventilation
Open Drains
0.3 to 0.6 m
1.8
m
Sludge
Septic Tank
Baffle
Outlet Scum
Access Cover
Inlet

Community Septic Tank
Avg. septic tank size of community Toilets is6*3’*1.8 m and 3*2.4*1.8 m This two type ofseptic tank are observed in community toilets.
Section at AA’
Top View (Dim: 6*3*1.8 m)
A’A
Access Cover
Inlet
1.8
m
Septic Tanks
Sludge
Inlet
3 or 6 m
3 m
Not to Scale
All dimensions are in ‘m’
Septic Tank
Outlet
Outlet
CT Block
Baffle
Scum
Access Cover

Apartment Septic Tank
Avg. septic tank size in Apartments is3.6*3’*1.8 m.
The septic tank is located at thebasement or backyard of the apartment.
Section at AA’
Top View (Dim: 3.6*3.0*1.8 m)
A’A
Access Cover
Outlet
Inlet
Open Drains
0.3 to 0.6 m
1.8
m
Sludge
Apartments
Inlet
Not to Scale
All dimensions are in ‘m’
Septic Tank
Baffle
Scum
Access Cover

Septic Tank and Drain’s Assessment- Gangapur Area
Avg. septic tank size in this area is 8’*7’*6’. Access to clean the septic tank is provided. The septic tank over flow is connected to partial open and closed drains. Drainage System
IHHL & Septic Tanks

Septic Tank and Drain’s Assessment- Kawara Peth Area
Avg. septic tank size in this area is 8’*6’*6’. Access to clean the septic tank is provided. The septic tank over flow is connected to open drains in layout areas and closed drains in old areas.
Drainage System
IHHL & Septic Tanks

Septic Tank and Drain’s Assessment- Teacher’s Colony
Avg. septic tank size in this area is 8’*10’*6’. Access to clean the septic tank is provided. The septic tank over flow is connected to open drains in this areas.
Drainage System
IHHL & Septic Tanks
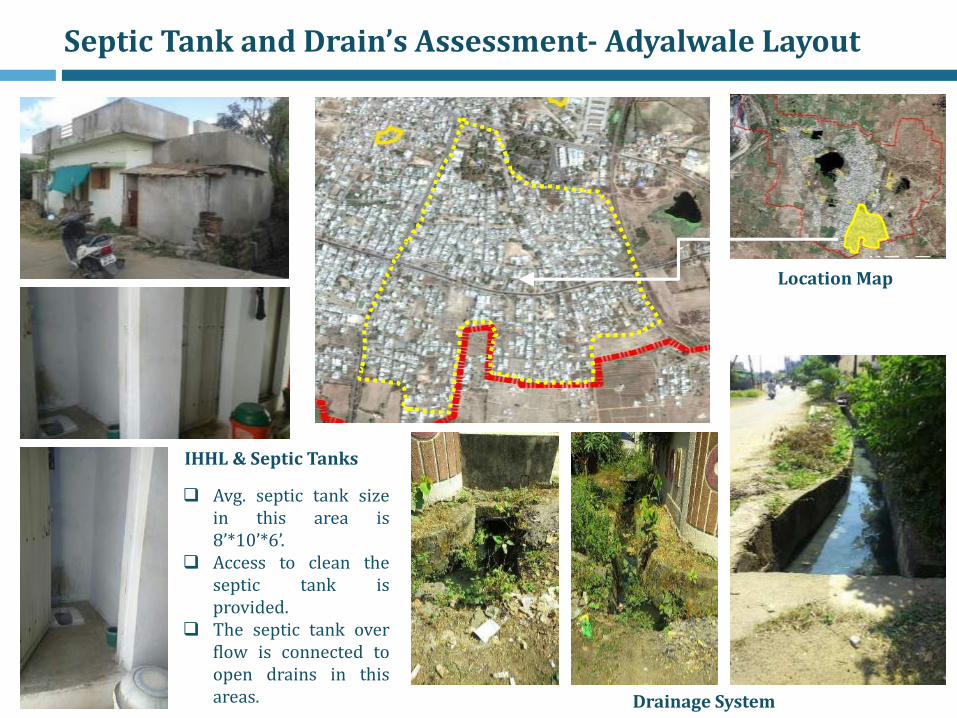
Septic Tank and Drain’s Assessment- Adyalwale Layout
Avg. septic tank sizein this area is8’*10’*6’.
Access to clean theseptic tank isprovided.
The septic tank overflow is connected toopen drains in thisareas. Drainage System
IHHL & Septic Tanks
Location Map

Septic Tank and Drain’s Assessment- Itwari Peth Area
Avg. septic tank size in this area is 8’*7’*6’. Access to clean the septic tank is provided but the area is
inaccessible due to narrow roads. The septic tank over flow is connected to closed drains in this areas.
Drainage System
IHHL & Septic Tanks
Location Map

Septic Tank and Drain’s Assessment: Jogithana Peth Area
Avg. septic tank size in this area is6’*6’*6’.
Access to clean the septic tank isprovided.
The septic tank over flow is connectedto closed drains in old areas. Drainage System
IHHL & Septic Tanks
Location Map

Septic Tank and Drain’s Assessment- Mangalwari Peth Area
Avg. septic tank size in this area is 8’*6’*6’. Access to clean the septic tank is provided. The septic tank over flow is connected to
closed drains in old areas. Drainage System
IHHL & Septic Tanks
Location Map

Septic Tank and Drain’s Assessment- Sindhi Colony
Avg. septic tank size in this area is 8’*7’*6’. Access to clean the septic tank is
provided. The septic tank over flow are partially
connected to open drains and closed drains.
Drainage System
IHHL & Septic Tanks
Location Map

Septic Tank and Drain’s Assessment- Budhwari Peth Area
Avg. septic tank size in this area is8’*6’*6’.
Access to clean the septic tank isprovided.
The septic tank over flow is connectedto closed drains in this areas.
Drainage System
IHHL & Septic Tanks
Location Map

Septic Tank and Drain’s Assessment
Gangapur Area
Kawara Peth
Jogithana Peth
Budhwari Peth
Itwari PethAdyalwale Layout
Mangalwari Peth
Teacher’s Colony

Collection Of Septage
At Household level, Collection of septage mostly take place into the 2 chambered septic tank
Toilets are partially constructed above septic tanks with access provided for emptying

Collection Of Septage- Community Toilets
All the Community toilets and the Public toilet have Septic tanks for the collection of Septage

WCL Colony and Wayagoan Gotoriis 6 Km towards North West
6 Km
The distances mentioned are from the City Centre
Septic Tank and Drain’s Assessment WCL Colony
Avg. septic tank size in this area is 8’*10’*6’.
Access to clean the septic tank is provided.
The septic tank over flow is connected to open drains in layout areas.
Drainage System
IHHL & Septic Tanks

WCL Colony and Wayagoan Gotoriis 6 Km towards North West
6 Km
The distances mentioned are from the City Centre
Septic Tank and Drain’s Assessment Wayagaon Gotori
Avg. septic tank size in this area is 8’*10’*6’.
Access to clean the septic tank is provided.
The septic tank over flow is connected to open drains in layout areas.
Drainage System
IHHL & Septic Tanks

Septic Tank and Drain’s Assessment Dhurkheda
Avg. septic tank size in this area is 8’*10’*6’. Access to clean the septic tank is provided. The septic tank over flow is connected to
partially open drains and closed drains.
Drainage System
IHHL & Septic Tanks
Dhurkheda settlement along MangrudRd. is 4.5 Km towards South
3.5 Km
4.5 KmThe distances mentioned are from the City Centre
2.Current Sanitation Situation:c. Conveyance
Access to Toilets Conveyance

On an average 5-12 septic tanks cleaned in a week (demand- based);
5% cleaned annually (Benchmark 33%)
Septic tank desludging
Desludging Capacity
1 ULB owned vehicle: Capacity of 3000 L
1 Private Vehicle: Capacity of 5000 L
1 vehicle of 1000L capacity is defunct.
Total septage generated in year 2016-17 is 10824 cu.m. (Source: SLB data 16-17)
User Charges
Rs 400 per trip by ULB
Rs 800 per trip by Private Operator
All CTs are cleaned by private operator free of cost
The ULB owned vehicle is also outsourced to private operator.
Source: SLB data 2016-17, Field Visit 2017
Desludging of septic tank by Private Operator using ULB Owned Tractor ?? in Umred
Desludging Trucks Owned by Private Operator in Umred
Septage Conveyance

2. Current Sanitation Situation:d. Disposal
Access to Toilets Conveyance
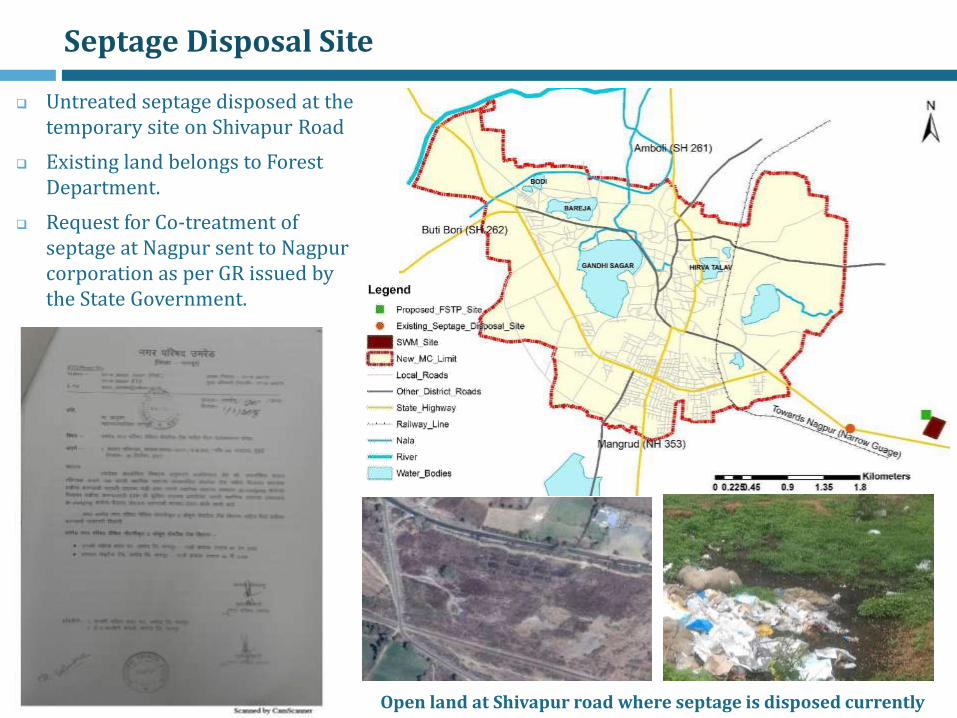
Septage Disposal Site
Untreated septage disposed at the temporary site on Shivapur Road
Existing land belongs to Forest Department.
Request for Co-treatment of septage at Nagpur sent to Nagpur corporation as per GR issued by the State Government.
Open land at Shivapur road where septage is disposed currently

3. Grey Water Management

HHs waste water into open drains
Open and Closed drains
Gandhi Sagar Talav
Drainage in Umred
• Grey water and black water from septic tanks areconnected to roadside drains.
• 100% coverage in town
• These drains flow to nallahs, that flow into the AmbRiver and Gandhi Sagar Lake untreated.

Open drains are observed alongmajor roads of the city.
Open drains are approximately2.5 feet wide and 3 feet in depth
The connector minors roadshave closed drains
Closed drains are approximately2 feet wide and 4 feet in depth
Currently the new drains whichare being laid through precastpipes having diameter of 300mmand 450mm.
Areas with presence of Open Or Closed Drains
60-70% of closed drains
40-30 % of open drains
Approx. Figures
Length of covered drainage network (km)
41
Length of open drainage network (km)
27.2

Areas with presence of Closed Drains :New drainage system
New drainage system is being laid in areas of MangalwariPeth
New drainage pipeline have been laid for approx. 3.5 km

Areas with presence of Open Or Closed Drains
Partially opened and closed drains are observed.
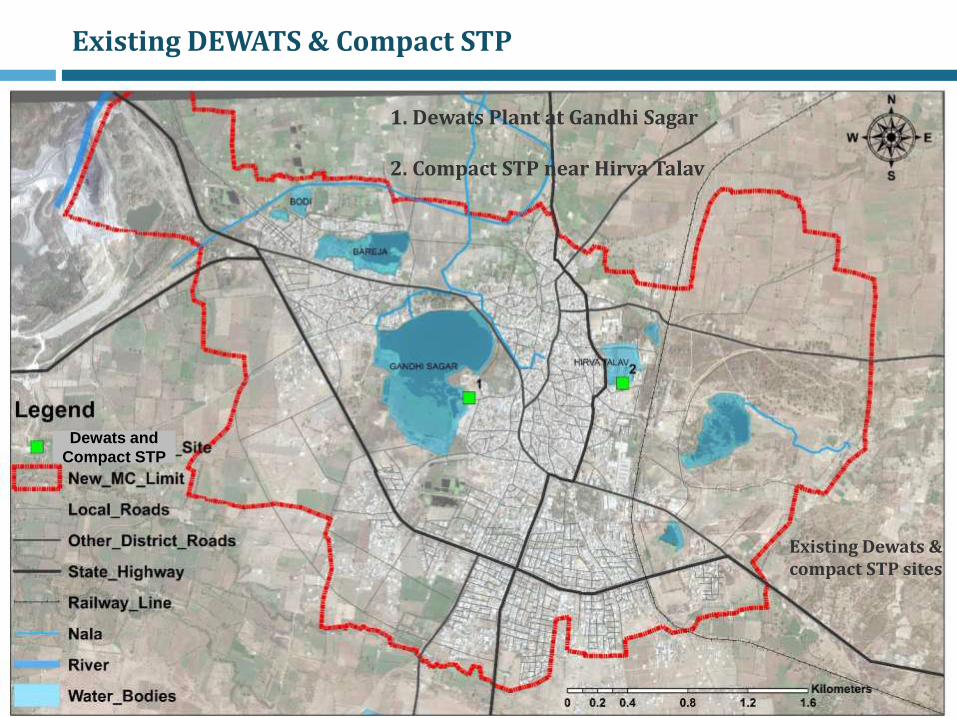
Existing DEWATS & Compact STP
1. Dewats Plant at Gandhi Sagar
2. Compact STP near Hirva Talav
Existing Dewats & compact STP sites
Dewats and
Compact STP

1. Existing DEWATS Plant at Gandhi Sagar
Supported by CDD for a slaughter house, fish market and community toilet in 2012
Funded through 12th Finance Commission and National Fisheries Development Board
Plant installed to treat the waste from slaughter house, fish market, urinal and community toilet before discharging in the lake
Total installed capacity 20m3/day
O&M of plant is managed by the ULB
Treated effluent discharged into Gandhi Sagar
Fish market near DEWATS PlantCT (12 seats) near DEWATS plant
Effluent Disposal point
Slaughter house
Gandhi Sagar
DEWATS plant
Inflow point

1. Existing DEWATS Plant at Gandhi Sagar
The DEWATS plant contains:
o Biogas Settler (for waste from slaughter house)
o Settler (for waste from urinal and CT)
o Anaerobic Baffle Reactor (ABR)
o Anaerobic Filter
o Planted Gravel Filter (PGF)
o Collection Tank Parameter CPCB
(disposal on to surface inland water)
PGF Outlet at peak hour
pH 5.5-9 7.41
TSS (mg/l) 100 10
BOD (mg/l) 30 19.2
COD 250 131.6
Suspended Solids 35.0 396.0
Oil and Grease 10 0.2
Phosphorous(mg/l)
5 6.95
AmmonicalNitrogen
50 145.9
According to the waste water quality report:
o Ammonical nitrogen exceeds the permissible limits
o The bio gas released from the plant is not being utilized and is released in the air.
o Treated effluent discharged into the Gandhi sagar without any resuse
Influent Quality
Effluent Quality
COD (mg/l) 4628 <60
BOD (mg/l) 2282 <20
TSS (mg/l) <200 >20
Quality assessment at time of installation:

2. Compact STP at Hirva Talav for Community Toilet
Compact STP by Daiki AxisCommunity toilet (10 seats) at Compact STP
Out flow of treated effluent into Hirva lake
Donated and installed by Japan based Daiki Axis Company in May 2016
Capacity of 10 m3 /day which costs Rs6 Lakhs
Treats waste from 1 community toilet of 10 seats
Anaerobic biodegradation of organic waste
Effluent BOD less than 20mg/l
O&M of the plant is managed by the ULB
Treated effluent discharged into HirvaTalav

2. Compact STP at Hirva Talav for Community Toilet
The plant has a capacity ranging from 1 m3 to 50 m3 per day
Decomposes fecal matter using a high-grade bacteria, converting it to methane and water
It requires desludging at least once a year and regular maintenance of other systems of the plant e.g. blower, sludge transfer pipe, media level checks etc.
Unit is made of fibre-reinforced plastic with a life span of 50 years.
It needs uninterrupted power supply, and involves maintenance

4. Solid Waste Management

Segregation at source
(dry and wet waste)
Door to Door collection
(10 Veh, capacity 500kg/Veh)
Transport to SWM Site
(Dist. 5km)
Segregation of dry waste
(Segregator cap. 6 m^3)
Composting of wet waste
(4 composter & 1 VC)
Solid Waste ManagementS
WM
Pro
cess
SWM Site- Map
Collection of door to door waste is done by a private service provider while transportation, segregation and composting is done by the ULB
Council has a total staff of 11 (9 M, 2 F) for segregation of waste
Total waste generated 13 MTD.
DPR of SWM is Available of year 2007.

SWM Disposal Site
Weigh Bridge Segregation Unit
Vermi Composting Unit Waste Composter
SWM Site

Landuse Around SWM Site
Legend
SWM Site
Forest land
Commercial
Agricultural land
Proposed FSTP Site

5. Proposed Projects

S.N Proposals Funding Status
1 DEWATS at Hirva lake14th Finance Commission
Submitted for technical approval to MJP
2 DEWATS at Kotgaon Naka14th Finance Commission
Submitted for technical approval to MJP
Proposals
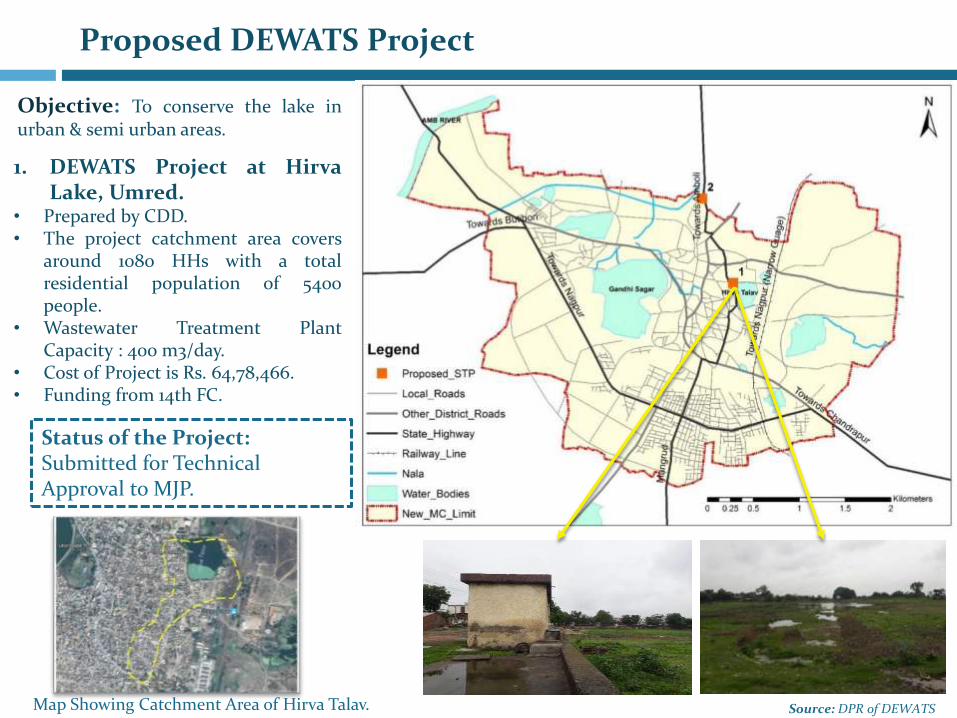
Proposed DEWATS Project
Objective: To conserve the lake inurban & semi urban areas.
1. DEWATS Project at HirvaLake, Umred.
• Prepared by CDD.• The project catchment area covers
around 1080 HHs with a totalresidential population of 5400people.
• Wastewater Treatment PlantCapacity : 400 m3/day.
• Cost of Project is Rs. 64,78,466.• Funding from 14th FC.
Map Showing Catchment Area of Hirva Talav. Source: DPR of DEWATS
Status of the Project:Submitted for Technical Approval to MJP.

Proposed DEWATS Project
2. DEWATS Project at Kotgaon Naka, Umred. • Prepared by CDD.• The project catchment area covers around 940 HHs with a
total residential population of 4700 people.• Wastewater Treatment Plant Capacity: 400 m3/day.• Cost of Project is Rs. 75,56,284.• Funding from 14th FC
Status of the Project:
Submitted for Technical Approval to MJP.
Map Showing location of STP Site at Kotgaon Naka. Source: DPR of DEWATS
Road side open drains at Kotgaon Naka.
Proposed DEWATS Site at Kotgaon Naka.

6. Financial Assessment

Umred Budget
Category
2011-12Actual
2012-13
Actual
2013-14(Actual)
2014-15(Actual)
2015-16(Actual)
2016-17(RE)
2017-18(BE)
Amount (INR in Cr.)
Opening Balance 5.61 7.92 14.68 23.1 23.95 20.26 15.75
Revenue Account
Revenue Receipt 12.47 13.09 17.59 19.97 21.63 21.73 22.64
Revenue Expenditure 12.01 11.84 15.95 16.76 20.32 24.96 25.75
Capital Account
Capital Receipt 8.28 24.53 20.25 15.43 17.93 40.95 28.29
Capital Expenditure 15.07 19.02 13.47 17.79 22.94 42.22 39.24
Summary
Total Receipt 20.75 37.62 37.84 35.4 39.56 62.68 50.93
Total Expenditure 27.08 30.86 29.42 34.46 43.26 67.18 64.99
Closing Balance 7.92 14.68 23.10 23.95 20.26 15.75 16.90
Operating Ratio 0.96 0.90 0.90 0.83 0.93 1.14 1.14
Revenue surplus Cr. 0.46 1.25 1.64 3.21 1.31 -3.23 -3.11
Umred Budget
Note: Ratio of revenue expenditures to revenue receipts, core measure of financial health for a ULB. So
urc
e: U
mre
d B
ud
get
20
17-1
8

13.09
17.59
19.9721.63 21.73
22.64
11.84
15.9516.76
20.32
24.9625.75
0.9
0.90.83
0.93
1.14 1.14
0
0.2
0.4
0.6
0.8
1
1.2
0
5
10
15
20
25
30
2012-13 2013-14 2014-15 2015-16 2016-17 2017-18
Am
t. in
Cr.
Revenue Receipt Revenue Expenditure Operating Ratio
Note: Ratio of revenue expenditures to revenue receipts, core measure of financial health for a ULB.
Source: Umred Budget 2017-18
• The municipal council revenue receipt is increasing steadily over the years which indicate that thecouncil has taken efforts to increase the collection efficiency of revenue.
• Revenue Expenditures are Less than Revenue Income at earlier years and drastically increase innext two years.
Revenue Receipt Vs Revenue Expenditures

Revenue Receipt Share Umred
Source: Umred Budget 2017-18
As per graph, Council received most of the revenue in the form of Grants and contributions followed bythe non tax and tax revenue. As the year passes , it is observed that slightly increase in the property taxrevenue and decreases non-tax revenue.
1.88 2.26 2.95 3.20 3.08 3.352.33
3.04
6.03 4.773.19 2.95
15.12 12.27
10.98 13.6515.44 16.33
0.00
5.00
10.00
15.00
20.00
25.00
2012-13 2013-14 2014-15 2015-16 2016-17 2017-18
Am
t. i
n C
r.
Year
Tax Non Tax Grants & Contributions

Tax Revenue Receipt Share Umred
Source: Umred Budget 2017-18
From the above bar graph it is observed that the property tax is the major tax revenue source followingwater tax, education, fire brigade, tree, Swachhta tax.While property tax and water tax collection efficiency is increasing every year.
0
0
0
1
1
1
1
1
2
2012-13 2013-14 2014-15 2015-16 2016-17 2017-18
Am
t. i
n C
r.
Years
Tax Revenue ReceiptProperty tax
Water tax
Education tax
tree tax
Swachhta Service tax
Advertisement Tax
Tax over programs andExperiments performed
Entry tax
Firebrigade tax
Others

Non Tax Revenue Receipt Share Umred
Source: Umred Budget 2017-18
0
0.2
0.4
0.6
0.8
1
1.2
1.4
1.6
1.8
2
2012-13 2013-14 2014-15 2015-16 2016-17 2017-18
Am
t. i
n C
r.
Years
Non Tax Revenue Receipt Asserted Revenue and compensation
Income from Rental
Fines, fees and Charges
Sales and Rents charges
Income from Interest
Deposit
Other Income
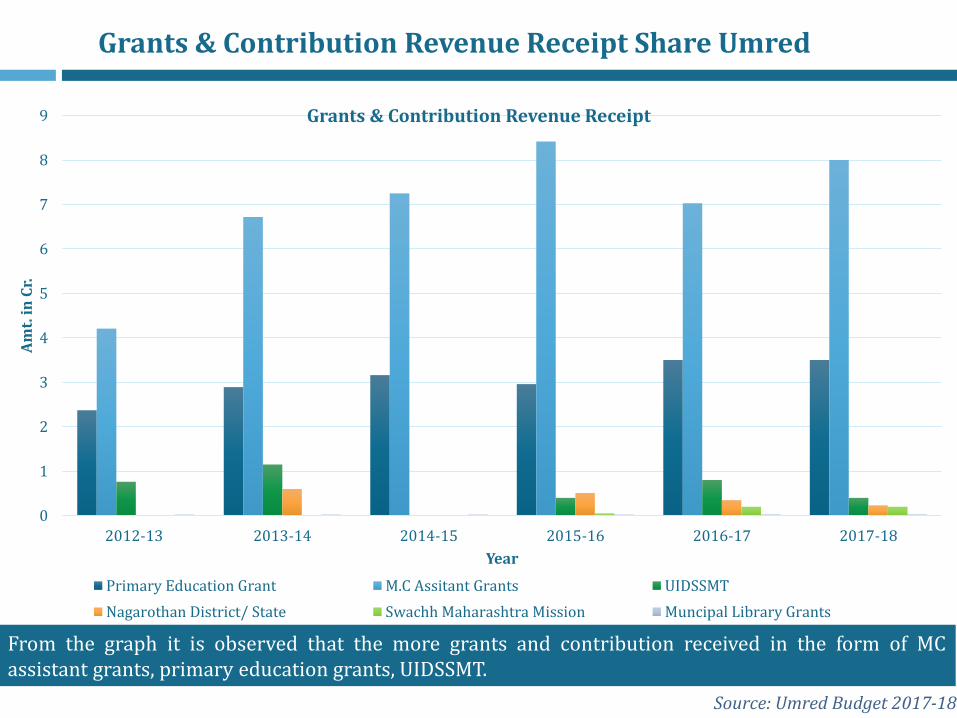
Grants & Contribution Revenue Receipt Share Umred
Source: Umred Budget 2017-18
From the graph it is observed that the more grants and contribution received in the form of MCassistant grants, primary education grants, UIDSSMT.
0
1
2
3
4
5
6
7
8
9
2012-13 2013-14 2014-15 2015-16 2016-17 2017-18
Am
t. i
n C
r.
Year
Grants & Contribution Revenue Receipt
Primary Education Grant M.C Assitant Grants UIDSSMT
Nagarothan District/ State Swachh Maharashtra Mission Muncipal Library Grants

Revenue Expenditure Share Umred
Source: Umred Budget 2017-18
• Above graph it is observed that the M.C spend more money on general administration and followed by publichealth expenditure and less money are spend on social security.
• From year 2014-15, expenditure on general administration is more or less constant and the expenditure on publichealth has increased.
8.97
10.62
11.8212.31
13.14 13.41
0.08 0.1 0.14 0.14 0.27 0.32
2.18
4.58
3.01
6.8
9.6610.25
0
2
4
6
8
10
12
14
16
2012-13 2013-14 2014-15 2015-16 2016-17 2017-18
Am
t. i
n C
r.
Revenue Expenditure
General Social Public Health

Revenue Expenditure Share Umred
Source: Umred Budget 2017-18
• Above graph it is observed that the M.C spend more money on general administration and followedby public health expenditure and less money are spend on social security.
• From year 2014-15, expenditure on general administration is more or less constant and theexpenditure on public health has increased.
79.9%69.4%
79.0%
63.9%57.0% 55.9%
0.7%
0.7%
0.9%
0.7%1.2% 1.3%
19.4%29.9%
20.1%
35.3%41.9% 42.7%
2012-13 2013-14 2014-15 2015-16 2016-17 2017-18
Revenue Expenditure
General Social Public Health

Demand & Collection of Property Tax
Source: Umred Budget 2017-18
The collection of property tax over the years is more or less same as 68 %. The council need to takemeasures to improve the collection efficiency of its property tax revenue. As it is the measure source ofrevenue for the council.
2.01 1.95 1.95
1.351.47 1.49
67%75% 76%
0
0.5
1
1.5
2
2.5
2014-15 2015-16 2016-17
Am
t. i
n C
r.
Years
Property Tax Demand & Collection
Demand Collection Collection Efficiency

Demand & Collection of Water Charges
Source: Umred Budget 2017-18
1.02
1.49 1.49
0.78
1.291.36
77%
87% 91%
0
0.2
0.4
0.6
0.8
1
1.2
1.4
1.6
2014-15 2015-16 2016-17
Am
t. in
Cr.
Year
Water Charge
Demand Collection Collection Efficiency
The demand for water is increasing and at the same time council is supplying quality waterto consumers and consumers are willing to pay for the service provided by the council. Thecollection efficiency is also increasing steadily.
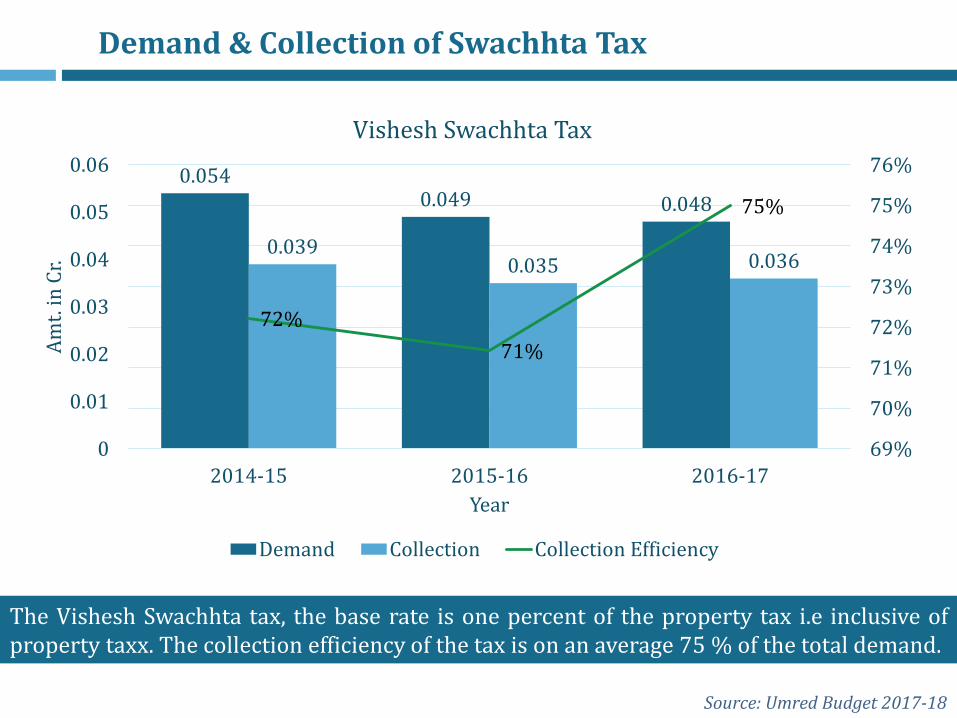
Demand & Collection of Swachhta Tax
Source: Umred Budget 2017-18
The Vishesh Swachhta tax, the base rate is one percent of the property tax i.e inclusive ofproperty taxx. The collection efficiency of the tax is on an average 75 % of the total demand.
0.0540.049 0.048
0.0390.035 0.036
72%
71%
75%
69%
70%
71%
72%
73%
74%
75%
76%
0
0.01
0.02
0.03
0.04
0.05
0.06
2014-15 2015-16 2016-17
Am
t. i
n C
r.
Year
Vishesh Swachhta Tax
Demand Collection Collection Efficiency

Capital Receipts Vs Capital Expenditure
From the year 2014-15, the capital expenditure exceeds the capital receipts.
24.53
20.25
15.4317.93
40.95
28.29
19.02
13.47
17.79
22.94
42.2239.24
0
5
10
15
20
25
30
35
40
45
2012-13 2013-14 2014-15 2015-16 2016-17 2017-18
Am
t. in
Cr.
Capital Receipt Vs Capital Expenditure
Capital Receipt Capital Expenditure
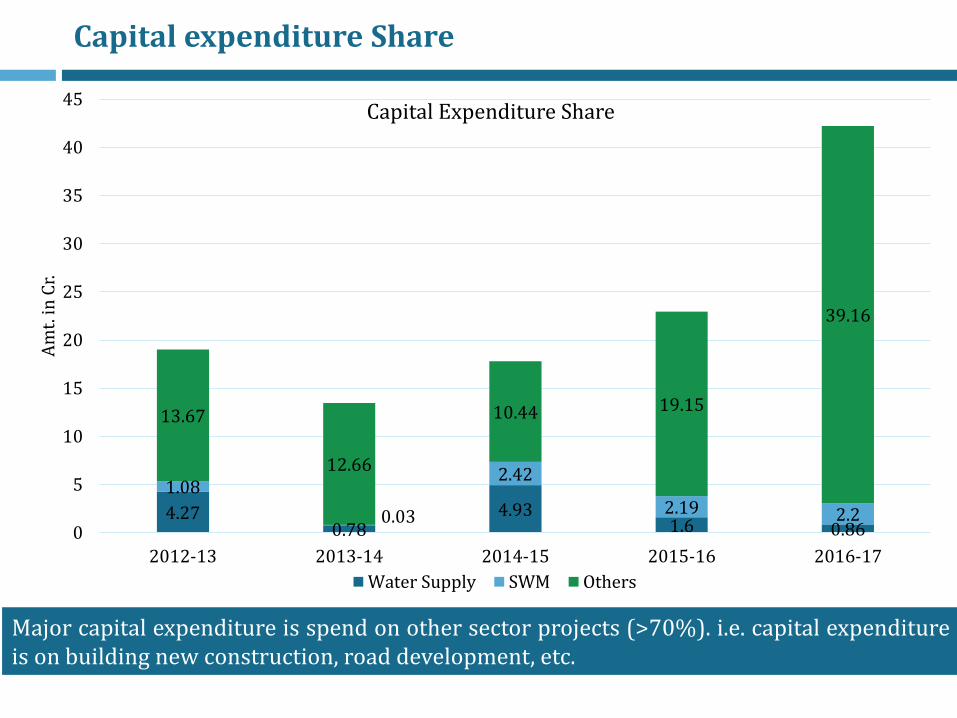
Capital expenditure Share
4.270.78
4.931.6 0.86
1.08
0.03
2.42
2.19 2.2
13.67
12.66
10.44 19.15
39.16
0
5
10
15
20
25
30
35
40
45
2012-13 2013-14 2014-15 2015-16 2016-17
Am
t. in
Cr.
Capital Expenditure Share
Water Supply SWM Others
Major capital expenditure is spend on other sector projects (>70%). i.e. capital expenditureis on building new construction, road development, etc.

13th FC Funds Utilization
Source: Umred DCB table 2017-18
• The major capital used in the year 2013-14 is on water supply and other projectworks like fish market construction, Firefighting building construction, employeesoutstanding amount payment.
• Of the received fund in the year 2012-13 is utilized in the year 2013-14 for capital project.
0
0.5
1
1.5
2
2.5
2012-13 2013-14 2014-15
Am
t. in
Cr
13th FC Fund Utilizaion
Water Supply Sanitation SWM Others
1.36
2.37
1.62
0.22
4.15
1.22
0
0.5
1
1.5
2
2.5
3
3.5
4
4.5
2012-13 2013-14 2014-15A
mt.
in
Cr.
Recevied Vs Utilized
Received Utilized

Source: Umred DCB table 2017-18
14th FC Fund Utilization
• 14th FC funds in year 2015-16 is utilized for all sector uniformly except water supply. Andfor year 2016-17 more fund is utilized on SWM sector and on other sectors like roadconstruction.
0 0
0.48
0
0.35
1.9
0.4
1.04
0
0.2
0.4
0.6
0.8
1
1.2
1.4
1.6
1.8
2
2015-16 2016-17
Am
t. in
Cr.
14th FC Funds Utilization
Water Supply Sanitation SWM Others
3.01
2.07
1.23
2.94
0
0.5
1
1.5
2
2.5
3
3.5
2015-16 2016-17A
mt.
in C
r.
Received Vs Utilized
Received Utilized

Demand-Collection Table for Various Taxes
Taxes Rate (in Rs.) YearDemand (in
Cr.)
Collection
Amount (in Cr.)
Efficiency in %
Property Tax
Charged per sq./ft. Based on the building typology and zone in
which property is located
2016-17 1.96 1.49 76
2015-16 1.96 1.47 75
2014-15 2.06 1.35 65
Water Tax
1800 annually and for metered Rs.10/1000 litres for Residential)
2016-17 1.49 1.36 91
2015-16 1.49 1.29 87
2014-15 0.72 0.59 77
Swachhta Tax
1 % of Property Tax2016-17 0.041 0.040 97
2015-16 0.04 0.035 87
2014-15 0.05 0.042 84
Municipal Finance
Source: Umred DCB table 2017-18

7. Summary of Challenges
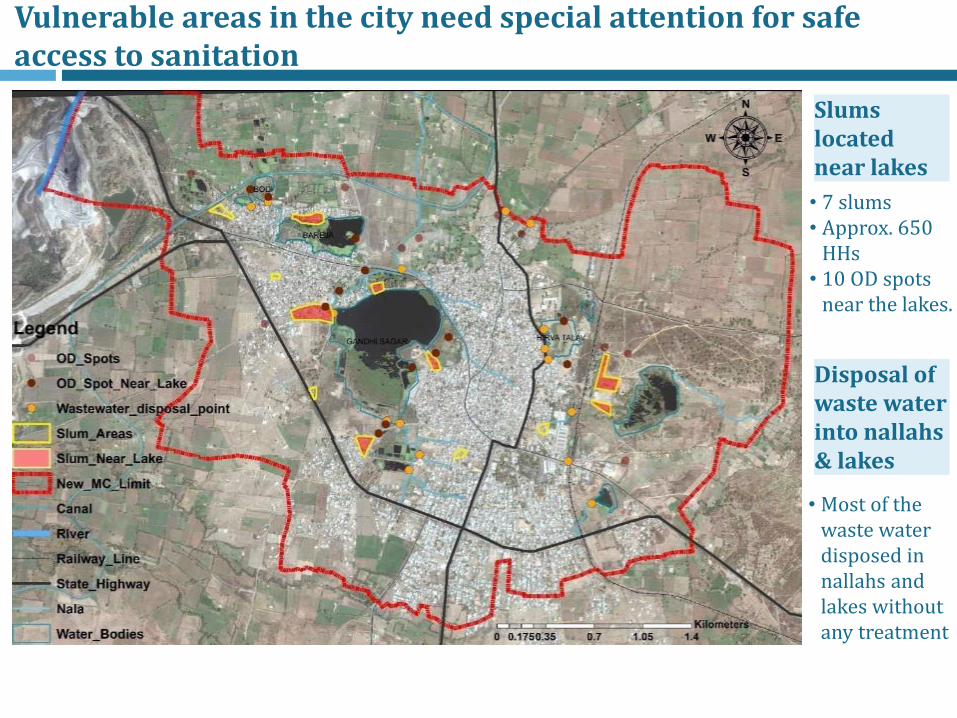
Vulnerable areas in the city need special attention for safe access to sanitation
Slums located near lakes
• 7 slums• Approx. 650
HHs• 10 OD spots
near the lakes.
Disposal of waste water into nallahs & lakes
• Most of the waste water disposed in nallahs and lakes without any treatment

Summary of Challenges for Collection
Access Collection Conveyance Treatment Disposal / Reuse
Access Collection Conveyance Treatment Disposal / Reuse
Unimproved Septic Tanks & Single pit
Toilets
Septic tanks not sealed at the bottom (filled with porous material to allow seepage)
No information on location & number of such tanks
1 3Presence of Pit toilets of small sizes in pethareas
2
• There are approx. 300 single pit toilets
• This single pit toilets are mainly located in the dense peth areas
• Some toilets mainly in Makalnagar slum have sealed the overflow pipe of the septic tank with porous material due to absence of drainage network.

Summary of Challenges for Conveyance
Access Collection Conveyance Treatment Disposal / Reuse
Access Collection Conveyance Treatment Disposal / Reuse
• Cleaning cycle is approx. 5-8 years
• Emptying is only done when the tank is full
• There are approx. 1000 HHs that could have issue of inaccessibility
• Road width less than 2.5m have been considered as susceptible to inaccessibility
Suction Emptier Trucks
Only 5% of septic tanks cleaned annually
1 Some dense areas in the city face issue of accessibility for suction emptier trucks
2

Summary of Challenges for Conveyance
Kawara Peth Budhwari PethItwari Peth
Budhwari Peth
Jogithana Peth Mangalwari Mangalwari
Summary of Challenges for Conveyance
Access Collection Conveyance Treatment Disposal / Reuse
Access Collection Conveyance Treatment Disposal / Reuse
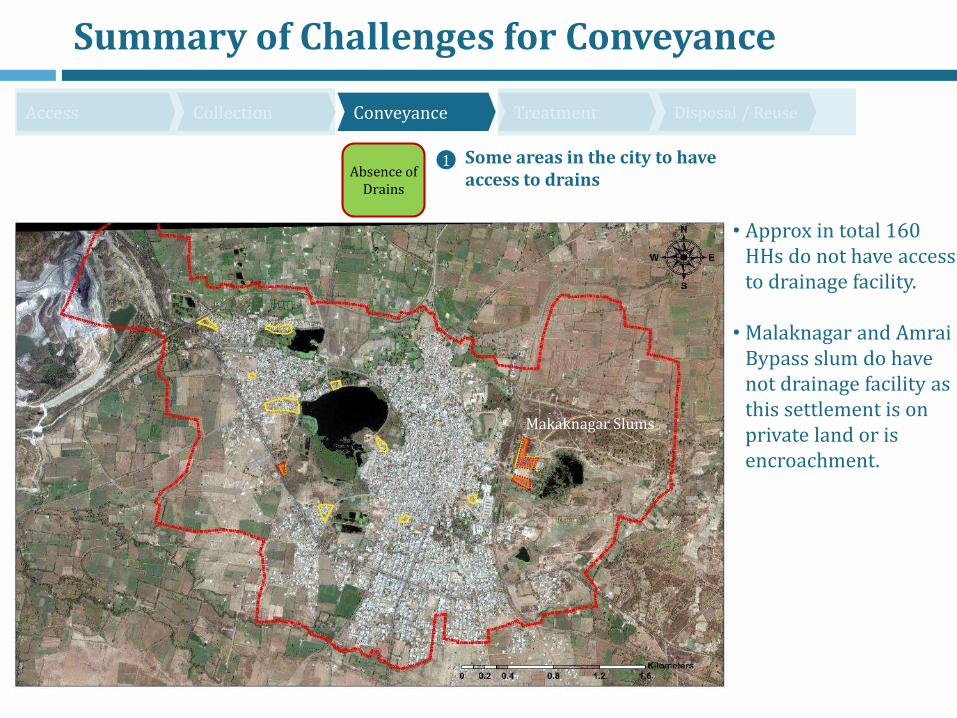
• Approx in total 160 HHs do not have access to drainage facility.
• Malaknagar and AmraiBypass slum do have not drainage facility as this settlement is on private land or is encroachment.
Absence of Drains
Some areas in the city to have access to drains
1
Makaknagar Slums

Malak Nagar SlumMalak Nagar SlumMalak Nagar Slum
Malak Nagar Slum
Amboli Naka slum
Summary of Challenges for Conveyance
Summary of Challenges for Treatment
Access Collection Conveyance Treatment Disposal / Reuse
Access Collection Conveyance Treatment Disposal / Reuse
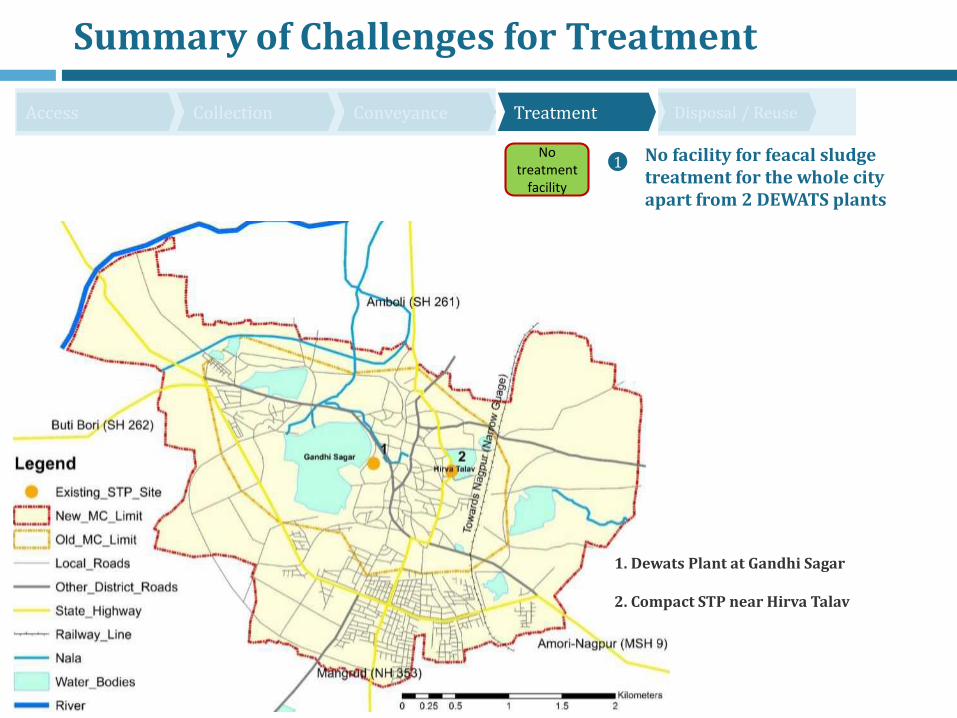
No treatment
facility
No facility for feacal sludge treatment for the whole city apart from 2 DEWATS plants
1
1. Dewats Plant at Gandhi Sagar
2. Compact STP near Hirva Talav
Summary of Challenges for Treatment
Access Collection Conveyance Treatment Disposal / Reuse
Access Collection Conveyance Treatment Disposal / Reuse
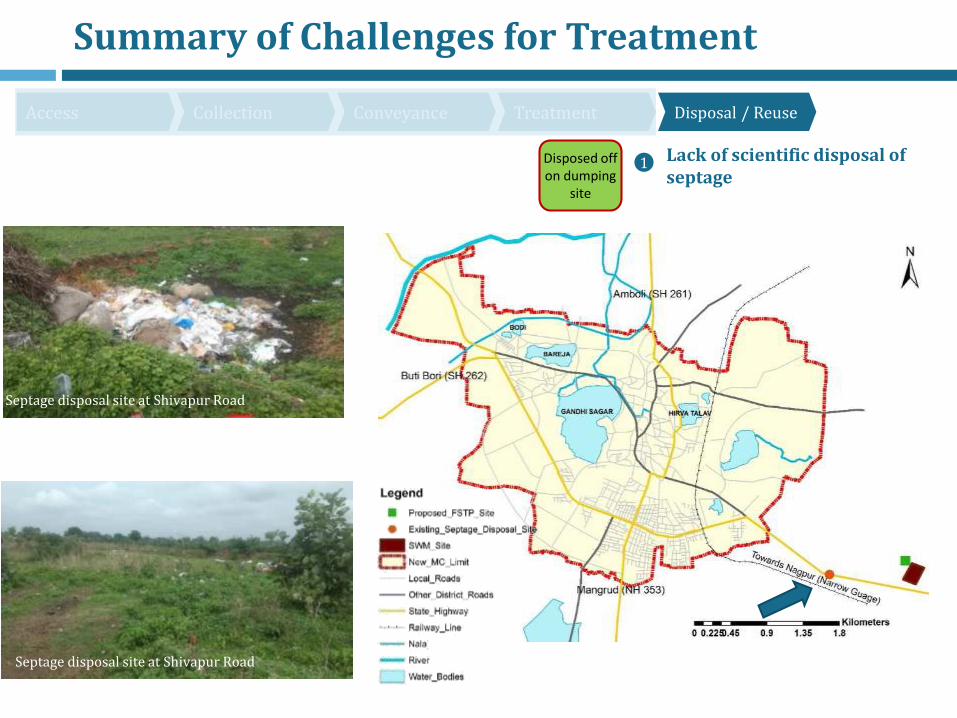
Disposed off on dumping
site
Lack of scientific disposal of septage
1
Septage disposal site at Shivapur Road
Septage disposal site at Shivapur Road

Summary: Current Sanitation Service Chain in Umred
Access Collection Conveyance Treatment Reuse/Disposal
Pour flush latrines and CTs
Septic Tanks Liquid
Solid
Open Drains
Vacuum Emptier Truck
Empty into the Aam River
No treatment of fecal sludge
Dumping on land at allocated disposal site
• 84% coverage ofIHHLs• 16 CTs, 181 seats•Spatial coverage ofCTs more or lessadequate,•No open defecation• Applications to bereceived by 31 March2018
•100% IHHLsconnected to septictanks.•Large sized, 2-chambered tanks, mosthave access covers.•Cleaned only whenfully filled•Septic tanks directlyconnected to drains
100% coverage ofdrains
•Both septage andliquid effluentsuntreated for now.•Two dewats plantsexisting
•Water quality innallahs is moderate.•Lack of scientificdisposal of wastewater and septage atthe moment.
No treatment
•Municipal Councilprovides service, owns1 truck of capacity 3cum on demand basis•Approx. 800 HHsinaccessible byvacuum truck

8. Proposal to move towards ODF+
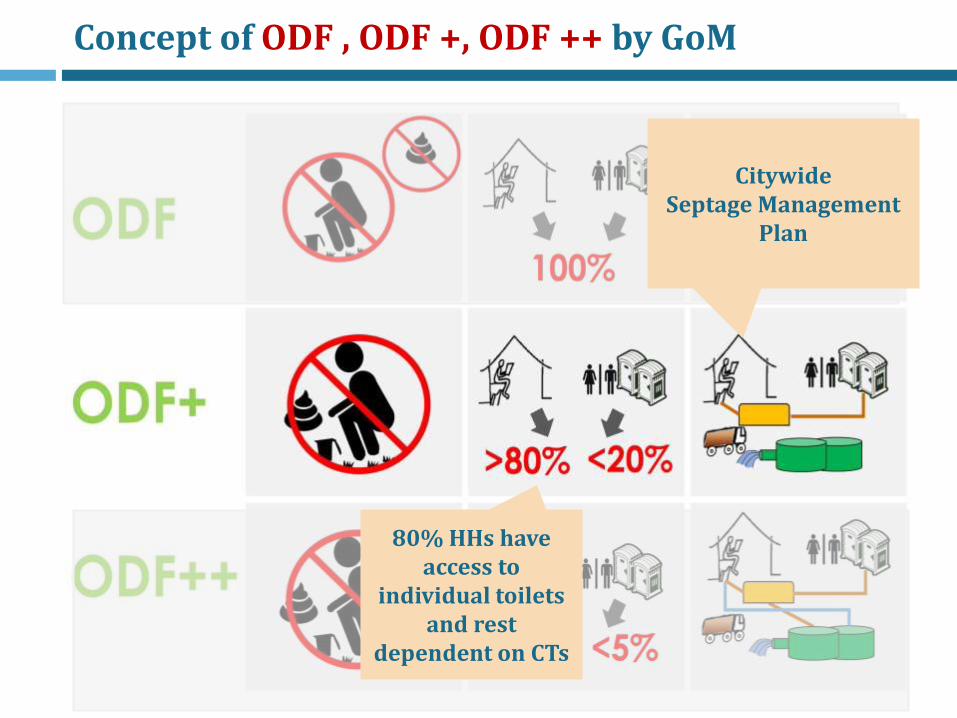
Concept of ODF , ODF +, ODF ++ by GoM
80% HHs have access to
individual toilets and rest
dependent on CTs
Citywide Septage Management
Plan

1 truck of Faecal Sludge and Septage
carelessly dumped
= 5,000 people shitting in the open!
1 Gram of Feaces may contain:
100 parasites eggs
1000 Protozoa
1,000,000 Bacteria
10,000,000 VirusSource : Chary, Srinivas, (2017), “City Wide Approach to Sanitation : Operationalizing FSM Regulations A Case study of Warangal City” at Ujjain Workshop by Water Aid, ASCI (mimeo)
Why is Septage Management important ! ! !

Recognition to Septage Management at National level . . .
National Policy on FSSM by MoHUA, GoI
National declaration on Septage Management by
MoHUA, GoI
One of the major thrust areas of AMRUT
Primer on septage Management and Rapid
Assessment tool for estimating budget
requirements for FSSM
Septage Management Advisory of Government of
India provides references to CPHEEO guidelines,
BIS standards, and other resources for preparing
SMP / FSSM plan.

CEPT support for moving cities towards ODF+
Support for Onsite systems
Support in Planning & Technology selection for Emptying & Treatment
For new toilets that are under
construction: Ensuring
suitable technology option
• Dos and Don’ts Flyer
• Training to masons
1 Regular desludging of septic tanks
within the city limit and exploring
possibility of desludging septic tanks
outside city limit
2
CE
PT
Su
pp
ort
• Exploring scheduled v/s demand based desludging
• Deciding type & number of vacuum emptier
• Deciding the model of operation (ULB v/s Private)
• Support in development of contract for emptying ( if required)
• Support in development of monitoring process / awareness programs
CE
PT
Su
pp
ort
• Carrying out septage quality
tests to assess quality of septage to be treated.
• Carrying out Ground /river water quality tests
• Identification of suitable treatment technology based on technical and financial assessment and requirement of the ULB
• Support in development of monitoring process
• Market assessment for byproducts /reuse
CE
PT
Su
pp
ort
Suitable technology options for
treatment of septage
3

CEPT support for moving cities towards ODF+
Support for Onsite systems
Support in Planning & Technology selection for Conyeyance & Treatment
For new toilets that are under
construction: Ensuring
suitable technology option
• Dos and Don’ts Flyer
• Training to masons
• CT/PT Assessment
1 Regular desludging of septic tanks
within the city limit and exploring
possibility of desludging septic tanks
outside city limit
2
CE
PT
Su
pp
ort
• Exploring scheduled v/s demand based desludging
• Deciding type & number of vacuum emptier
• Deciding the model of operation (ULB v/s Private)
• Support in development of contract for emptying ( if required)
• Support in development of monitoring process / awareness programs
CE
PT
Su
pp
ort
• Carrying out septage quality
tests to assess quality of septage to be treated.
• Carrying out Ground /river water quality tests
• Identification of suitable treatment technology based on technical and financial assessment and requirement of the ULB
• Support in development of monitoring process
• Market assessment for byproducts /reuse
CE
PT
Su
pp
ort
Suitable technology options for
treatment of septage
3

Support for Conveyance Mechanism - Demand v/s Scheduled
Current practice – Demand based emptying
(Complaint redressal mode)
Cleaning is done on-call by the household who raises a
complaint regarding this with either the ULB or Private when the
tank is full
A fee is charged by the ULB or Private for provision of these
services
Leads to low toilet usage due to the fear of tanks filling up and high
cost of emptying
Proposed practice – Scheduled based emptying
( Regular service mode)
Septic tanks are cleaned on a pre-determined schedule.
Households / property owners pay a local tax and get this services
on regular intervals
Scheduled emptying is being used in Wai, Sinnar, Malaysia,
Vietnam and Indonesia
From a Consumer complaint system to Regular service . . .
Zone 2
Zone 1
Zone 3
Zone 4
Zone 5

Benefits of Scheduled Emptying
Equitable services - all households / properties are covered by services
Pricing – Services are offered at lower prices, due to efficiency gains
Behavior change - Contribution to ODF sustainability as toilet usage can
increase
Eradicate Manual scavenging - Removal of need for manual scavenging due to
regular emptying
Infrastructure optimization - More predictable loads for treatment facility and
route optimization of trucks
Environmental benefits - Likely reduction in BOD and coliform in septic tank
effluent, as well as lower likelihood of septic tank overflows

Support in operationalizing emptying services . . .
City Demand Desludging (Existing)
Scheduled Desludging(5 year cycle)
No. of tanks emptied at
present
Number of trucks
No. of tanks to be emptied
daily
Number of trucks
required *
Umred 1-2 daily 1 – 3000 L1 – 5000 L (Private)
7 2 trucks
Support in • Setting up Monitoring mechanism to monitor ULB / Private sector
operations
• Support in development of contract for emptying ( if required)
• Awareness for regularly desludging of septic tanks
Pri
vate
se
cto
r is
re
ad
y
to i
nve
st f
or
the
se t
ruck
s
Note : * - Truck sizes may range from 3000 – 5000 L based on road width and average size of septic tanks
Zone 2
Zone 1
Zone 3
Zone 2
Zone 1
Zone 3
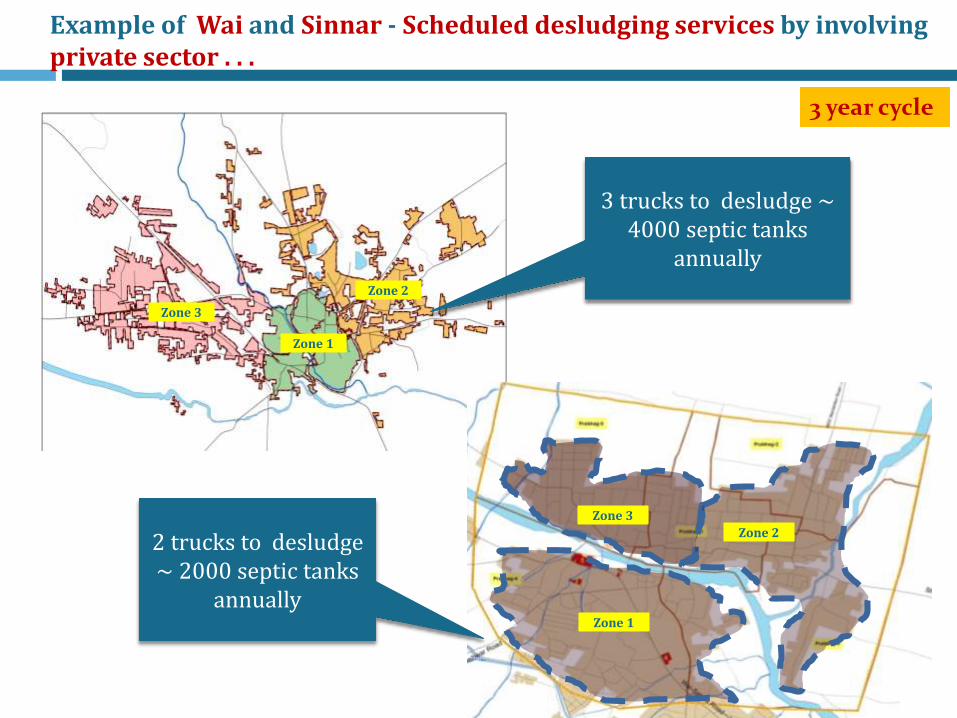
3 trucks to desludge ~ 4000 septic tanks
annually
2 trucks to desludge~ 2000 septic tanks
annually
Example of Wai and Sinnar - Scheduled desludging services by involving private sector . . .
3 year cycle

Possible Zoning of the Town for Emptying of Septic Tanks
Approx. 2260 septic tanks of individual toilets in the city needs to be cleaned annually.
Emptying service – Scheduled emptying
The town could be divided into 5 zones for the septic tank desludging cycle. The septic tanks of each zone
will be cleaned in turn every year during the 5 year cycle. The zones have been divided based on the distribution of households. The zones have beenapproximately delineated.
Zones Ward
I 5,6,7,8
II 1,2,3,4,14
III 9,10,11,12,13,19
IV 18,20,21,24
V 15,16,17,22,23

CEPT support for moving cities towards ODF+
Support for Onsite systems
Support in Planning & Technology selection for Emptying & Treatment
For new toilets that are under
construction: Ensuring
suitable technology option
• Dos and Don’ts Flyer
• Training to masons
• CT/PT Assessment
1 Regular desludging of septic tanks
within the city limit and exploring
possibility of desludging septic tanks
outside city limit
2
CE
PT
Su
pp
ort
• Exploring scheduled v/s demand based desludging
• Deciding type & number of vacuum emptier
• Deciding the model of operation (ULB v/s Private)
• Support in development of contract for emptying ( if required)
• Support in development of monitoring process / awareness programs
CE
PT
Su
pp
ort
• Carrying out septage quality
tests to assess quality of septage to be treated.
• Carrying out Ground /river water quality tests
• Identification of suitable treatment technology based on technical and financial assessment and requirement of the ULB
• Support in development of monitoring process
• Market assessment for byproducts /reuse
CE
PT
Su
pp
ort
Suitable technology options
for treatment of septage
3
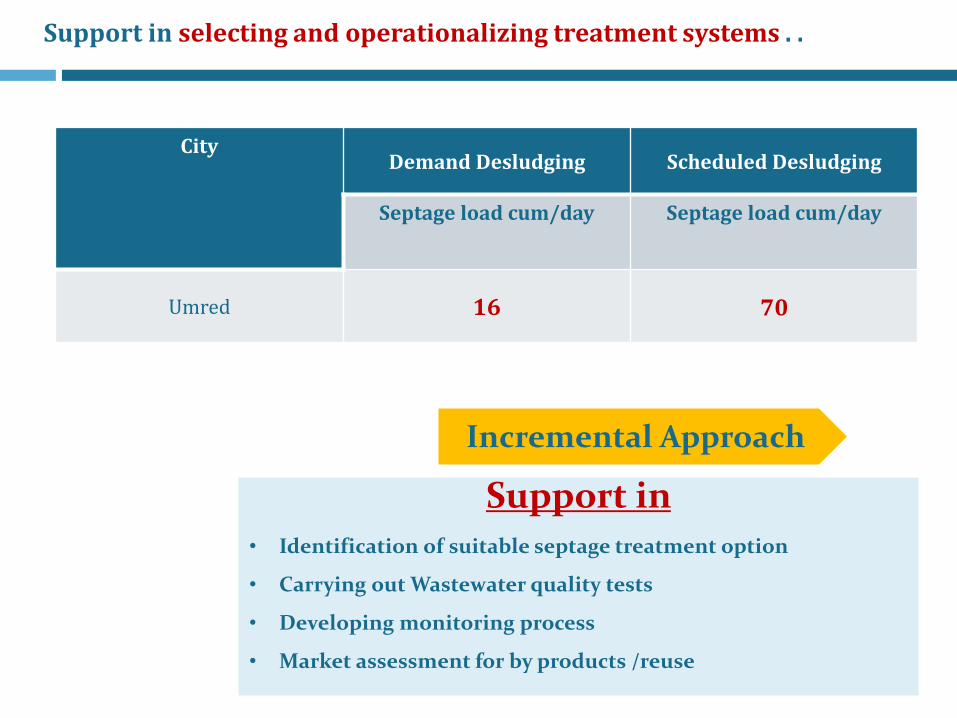
Support in selecting and operationalizing treatment systems . .
Support in • Identification of suitable septage treatment option
• Carrying out Wastewater quality tests
• Developing monitoring process
• Market assessment for by products /reuse
Incremental Approach
City Demand Desludging Scheduled Desludging
Septage load cum/day Septage load cum/day
Umred 16 70

Need to start treating the existing septage that is being
dumped at dump site
Need to select treatment technology which is modular in
approach
Need to move towards scheduled desludging gradually
Develop a DPR
Take technical and administrative approvals
Roll out contracts for construction and O&M
Need for Incremental Approach . . .
Incremental

Septage Treatment
Options for cities without STP
a. Co-treatment at nearby STP
b. Co-treatment with SWM treatment facility
c. Cluster based FSTP
d. Independent FSTP
Options for Umred

Treatment Options for FSSM Services
Scenario 1: Co -Treatment at STP in Nagpur
Location of STP at Nagpur: Approx 45 Km
Installed Capacity of the STP: 230 MLD
Volume of wastwater actually treated : 110 MLD
Septage would be only 0.015%: If demand based0.064 % : If Scheduled basedof total wastewater currently received at Nagpur STP
This is within prescribed range of 1-2%
(Described in Manas co-treatment note as "Some research shows that as long as septage is less than 1-2% of the total wastewater, it can be safely treated by the STP" )

Technology Options for FSSM Services- Emptying & Treatment
Scenario 1: Co -Treatment at STP in Nagpur
Factors for consideration:
1. Septage input into the STP:
• Nearest manhole upstream of the STP for dilution of the septage.• At the upstream of the screening and grit removal processes at the STP• Septage addition to sludge digesters/sludge drying beds.
2. Procurement of land for construction of a transfer station
3. Decision on whether Scheduled emptying V/S Demand based emtying
4. Cost Assessment regarding feasibility in terms of number of trucks to be purchased, number of trips to the STP V/S Independent FSTP
5. Agreement with Nagpur Corporation regarding quantity of septage that could be discharged, location of input, upcoming STPs etc
6. Identifying private operators for transferring septage from Transfer station to STP

Cost Assessment of Co-Treatment and Independent FSTP
Scenario 1: Co -Treatment at STP in Nagpur
Scenario 2 : Independent FSTP -UASB/MBBR/SBR*
Note: Cost of FSTP is based on Sinnar quotation for 70 cum plant)* Land cost is not considered
• Co-treatment at STP option seems to be an economical option for scheduled emptying for five
years and may be viable till 10 years of operations.
• For co-treatment option at Nagpur STP, the city has to initially invest in CapEx for the transfer
station and procure bigger suction trucks although role of private sector could be explored.
Scheduled emptying
70 cum/day
Scheduled Emptying (70 cum/day; 5 year cleaning cycle) FSTP cost (70 cum/day; 5 year schedule cleaning)
Capital cost 63,00,000 Rs. Capital Cost 1,60,00,000 Rs.
O&M cost 15,00,000 Rs./year O&M cost 8,00,000 Rs./year
Total cost (Capex+Opex) (Considering 5 year
lifecycle) 146 Rs. in lakhsTotal cost (Capex+Opex)
(Considering 5 year lifecycle) 204 Rs. in lakhs
Note: Cost of FSTP is based on Sinnar quotation for 70 cum plant
Demand emptying
16 cum/day
Demand Emptying (16 cum/day) FSTP cost (16 cum/day; 5 year demand based cleaning)
Capital cost 40,00,000 Rs. Capital Cost* 48,00,000 Rs.
O&M cost 10,00,000 Rs./year O&M cost (assuming 5% of capex cost) 2,00,000 Rs./year
Total cost (Capex+Opex) (Considering 5 year
lifecycle) 96 Rs. in lakhsTotal cost (Capex+Opex)
(Considering 5 year lifecycle) 59Rs. in lakhs
Note: Assuming 0.03 cr per Cum cost of FSTP; based on the per cum cost of Sinnar FSTP

How do we financeFSSM Services??
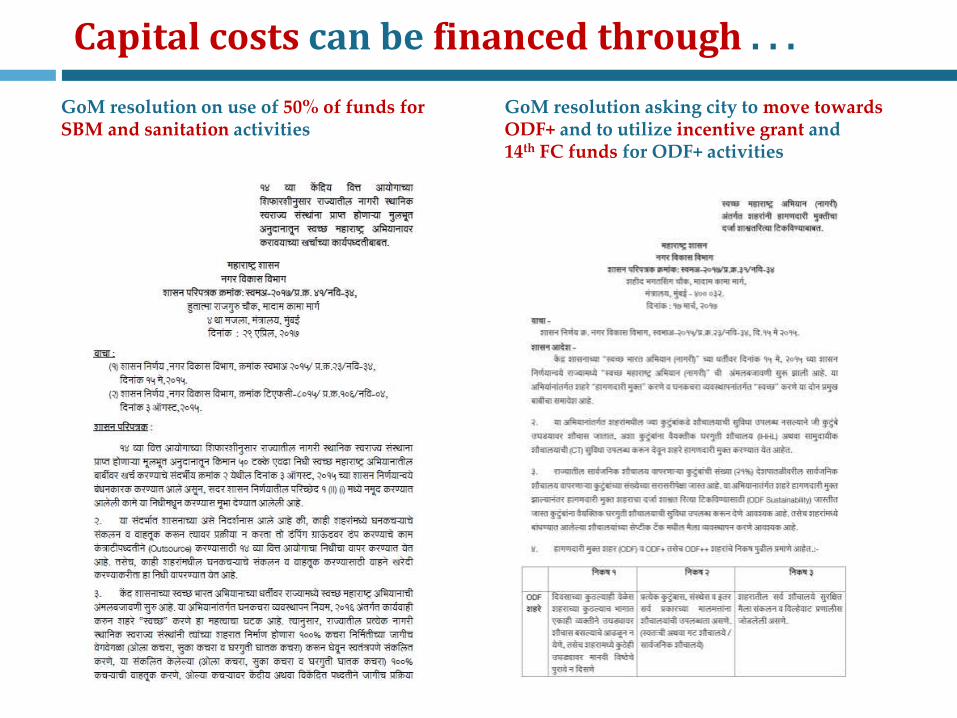
Capital costs can be financed through . . .
GoM resolution on use of 50% of funds for SBM and sanitation activities
GoM resolution asking city to move towards ODF+ and to utilize incentive grant and 14th FC funds for ODF+ activities

Capital costs can be financed through . . .
GoM resolution on use of 50% of funds for SBM and sanitation activities
GoM resolution asking city to move towards ODF+ and to utilize incentive grant and 14th FC funds for ODF+ activities

GoM resolution for incentive funds for ODF+ activities
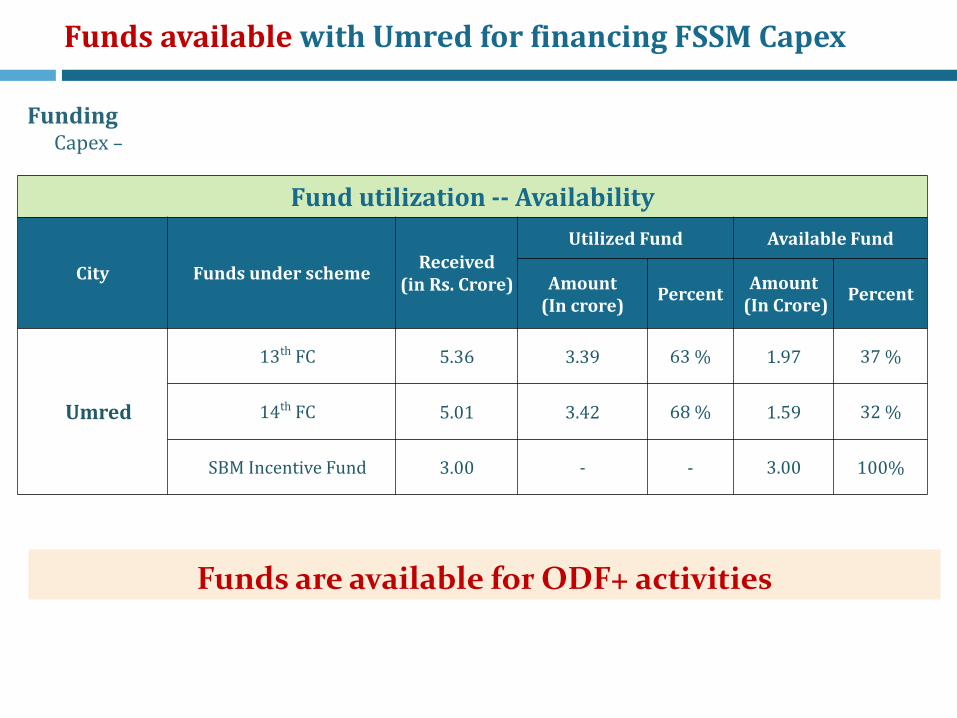
FundingCapex –
Funds available with Umred for financing FSSM Capex
Fund utilization -- Availability
City Funds under scheme Received
(in Rs. Crore)
Utilized Fund Available Fund
Amount(In crore)
PercentAmount
(In Crore)Percent
Umred
13th FC 5.36 3.39 63 % 1.97 37 %
14th FC 5.01 3.42 68 % 1.59 32 %
SBM Incentive Fund 3.00 - - 3.00 100%
Funds are available for ODF+ activities

Sinnar has financed the CaPEX and OpEX of FSTP through 14th FC funds
Sinnar Municipal Council has passed
resolution to fund FSTP project cost through
14th FC funds.
The project cost includes:
Capex
Opex for 3 years

O & M can be financed through Charges or taxation . . .
Funding : OpexIncluding tax ,user charges, fines and so on.
Only 14% increase in property tax will finance the scheduled desludging services
Also revenue from sale of septage compost under HARIT
Can partly finance O&M of services
Taxation can be done as per the Maharashtra Municipal Councils, Nagar
Panchayats and Industrial Townships Act, 1965, Chapter IX : Municipal
taxation, Section 108 only if it is provided as a service
Sr No. Amount Sanitation Tax
Existing sanitation tax Rs -40/- 2.14 % of existing property tax
Average Existing Property Tax Rs-1866/- -
For scheduled emptying sanitation tax
Rs -278/- -
Property tax with scheduled emptying sanitation tax
Rs-2144/- 13 % of modified property tax

Sinnar has levied differential tax on all properties for financing FSSM services
City level resolution for taxation
Differential taxation rates
Residential Properties with / without toilets–Rs. 300 / annum
Non Residential Properties with toilets –
Rs. 300 / annum
Non-residential properties without toilets–Rs. 100 / annum
Wai has levied tax on all properties for financing FSSM services

Incremental approach: Moving towards ODF++
Source: PAS SLB 2016-17
City Waste Water generated (MLD)
Cost for interceptor sewer (Rs in Cr)
Treatment cost(Rs in Cr)
Umred 6.4 0.3 - 0.5 6 - 7
ULBs should take incremental approach for liquid waste management
The city topographic profile suits for incremental approach for liquid waste treatment
First step to tap the liquid waste from existing discharge points either diverted
through interceptor sewer or in-situ decentralized treatment system as per
availability of land
Need to carry out quick preliminary technical and financial feasibility assessment
for possible options

Stakeholder Engagement for FSM and ODF Sustainability
1. Achieving universal access to IHHL
Mobilizing applications, assessmentof need of sanitation loans andmobilizing them
2. CTs/PTs assessment
Quantitative and qualitativeassessment of the CTs/PTs andsuggest ways to improve it
3. ODF Validation and OD Watch
Help the city with the MoUDvalidation process and OD watch
4. OD spots development
Identifying OD spots and suggesting waysof development, identify financing options
Assessing sanitation status ofschools and suggesting ways toimprove it

5. Self-Help Groups
315 Active SHG groups in Umred who can help in Awareness
generation and loan mobilization
6. Elected and Administrative wing
PAS team briefed the elected and administrative wing of UMC about the
ODF+ work. Their support will be required to plan and implement the project.
8. Citizens
Citizens participation is solicited for effecting planning and implantation of scheme.
Team will identify various platforms and events to involve them in the process.
9. Local Gov. of Outgrowth Areas
Villages near Umred(Dhukheda, Wayegaon) will be consulted while
making the septage management plan.
7. Industries
Umred MIDC. Assess their interest for CSR funding
Umred has a strong presence of private service providers mainly for
CT cleaning.
10. Private Service Providers
Stakeholder Engagement for FSM and ODF Sustainability

Summary: Proposals Across Sanitation Service Chain
Access Collection Conveyance Treatment Reuse/Disposal
Pour flush latrines and CTs
Septic Tanks Liquid
Solid
Drains
Vacuum Emptier Truck
Empty into the Aam River
Treatment of fecal sludge
Reuse of sludge as gas/ energy
•Achieve atleast 95%coverage of IHHLs.•Improve conditionsof CTs.•Close or modifyunderused CTs.
•Ensure new septictanks built are ofadequate size andspecifications.•Clean IHHL septic ofentire town once everyfive years.
• Co-treatment orFSTP plantconstruction totreat septage.•Quality of effluentemptying intodrains will be better
•Improved quality of water innallahs, saving contaminationof river.•Reuse of manure or gasproduced after treatmentcreating a better environment,and could bring additionalincome for M.Cl.
•Implement scheduledseptic tank emptying inentire town for a 3-5year cycle.•Council canoperate/hire operatorservice with new fleet oftrucks.

Discussion Points . . .
What are the next steps of action
City Resolution of taking up this activity
Co-treatment at Nagpur STP or individual FSTP
Land Allocation
Private sector participation
Fund allocation for Capex
Taxes/Charges
Time frame for initiating implementation of FSSM

Pe
rfo
rma
nc
e M
ea
sure
me
nt
Fra
me
wo
rk f
or
de
ve
lop
ing
co
un
trie
s
Online Module for performance assessment
Annual Data for UWSS of 900+ cities
Capacity
Building of
Govt. Officials
SLB cell formation at city/state level
City
Ranking
Pe
rfo
rma
nc
e
Imp
rov
em
en
t P
lan
s
Inte
gra
tio
n w
ith
e-g
ov
ern
an
ce
syst
em
Performance Improvement
Planning (PIP) tool : SaniPlan
Targ
et
Se
ttin
g
too
l
Tariff
se
ttin
g
too
l
Support to
Maharashtra
State
Government in
implementing
Swachh
Maharashtra
MissionIntegrated
faecal sludge
management plan for cities
Demand
Based
Scheme for making
cities ODF
City Sanitation Plans for
small and medium townIn
no
va
tiv
e
Sa
nita
tio
n
Fin
an
cin
g
Na
tio
na
lRo
ll-O
ut
SA
NI Ta
b A
pp
for
Sa
nita
tio
n
Su
rve
y
SAN Benchmarks citywide sanitation
assessment frameworkRepository of 1800 city
Benchmarks over 3
years
Information system improvement plan
IFSM
toolkit
C-WAS, CEPT University, Ahmedabad, India
Project Directors : Prof. Meera Mehta and Prof. Dinesh Mehta | www.pas.org.in | [email protected] Research Associate : Aasim Mansuri and Dhruv Bhavsar