Hydrochemical processes in lowland rivers - University of ...
Movement patterns of adult pike (Esox lucius L.)in a Belgian lowland riverIne S. Pauwels1,2, Peter L.M. Goethals1, Johan Coeck2, Ans M. Mouton1,21Laboratory of Environmental Toxicology and Aquatic Ecology, Ghent University, J. Plateaustraat 22, B-9000, Ghent, Belgium2Research Institute for Nature and Forest (INBO), Kliniekstraat 25, B-1070, Brussels, Belgium
Accepted for publication July 6, 2013
Abstract – Northern pike, Esox lucius, needs different habitats to survive and reproduce and thus depends on theavailability and accessibility of these habitats. To efficiently manage pike, information is needed on its spatial andtemporal patterns of migration. In this study, we investigated the occurrence of adult pike migration and whichenvironmental variables influenced migration. From December 2010, we followed 15 pike for 1 year by use of radiotelemetry in the River Yser, a typical lowland river characterised by anthropogenic impacts such as artificialembankments. Pike migrated most in February and March, which could indicate they frequented spawning habitat inthis period. Four environmental variables significantly affected pike migration, ranging from the location where pikewere observed (strongest effect), over water temperature and flow to diel water temperature change (weakest effect). Therelation between migration and the location where pike were observed could demonstrate that pike preferred specificregions in the river. Increasing water temperature triggered migration for both sexes, and males started migrating atlower temperatures than females, which suggests that males start migrating earlier. This was the only substantialdifference observed between male and female pike migration. The results suggest that migration was inhibited by highflow, as no migration was observed at high flow. River managers can use this information to efficiently manage theirpike populations, for example, by removing or temporarily opening hydraulic structures like valves, weirs and sluices.This may facilitate access to suitable habitats at moments pike needs these habitats to fulfil its life cycle.
Key words: northern pike (Esox lucius); patterns of movement; radio telemetry; river management; fisheries management
Introduction
Loss of natural habitat by canalisation, water pollu-tion and migration barriers causes pike (Esox luciusLinnaeus 1758) population declines and impedessuccessful restoration programmes (Chapman & Mac-kay 1984; Radomski & Goeman 2001; Ovidio &Philippart 2003). Indeed pike requires diversehabitats to successfully survive and reproduce, andtherefore regularly migrates, specifically during thespawning season (Casselman & Lewis 1996; Ovidio& Philippart 2003; Koed et al. 2006; Vehanen et al.2006; Craig 2008; Knight et al. 2008). Consequently,insight into pike migration and the environmentalvariables that affect migration is needed for effectiveconservation and restoration of the species.Fish migration was defined as those movements
that result in an alteration between two or more sepa-
rate habitats, occurring with a regular periodicity(sometimes annual but certainly within the lifespanof an individual) and involving a large fraction of thepopulation. It is predominantly directional and mostlyoccurs to and away from the feeding habitat, forinstance to suitable spawning habitat (Northcote1978). As the feeding and spawning habitat rarelyoverlap, migration mostly equals movement over alonger distance. In contrast, displacement is regardedas the daily movement between resting, hiding andforaging habitat and is therefore short distance andless directional. Most of the studies that have beendevoted to pike movement thus far analysed patternsof displacement (Diana 1980; Cook & Bergersen1988; Burkholder & Bernard 1994; Jepsen et al.2001; Kobler et al. 2008). The few studies on pikemigration have focused on sedentary versus activebehaviour and have evaluated the periodicity of
Correspondence: I. S. Pauwels, Laboratory of Environmental Toxicology and Aquatic Ecology, Ghent University, J. Plateaustraat 22, B-9000 Ghent, Belgium.E-mail: [email protected]
doi: 10.1111/eff.12090 373
Ecology of Freshwater Fish 2014: 23: 373–382 � 2013 John Wiley & Sons A/S. Published by John Wiley & Sons Ltd
ECOLOGY OFFRESHWATER FISH

migration (Masters et al. 2003; Koed et al. 2006; Ve-hanen et al. 2006).Thus far, little is known about the environmental
factors influencing migration (Ovidio & Philippart2003; Koed et al. 2006). It is assumed that migrationto spawning grounds is initiated by high flows afterice-out (Craig 1996) and is triggered by an increasein water temperature (Ovidio & Philippart 2003).Nothing is known about the effect of diel temperaturechange on migration and a potential time lag betweenmigration and water temperature or flow. Further-more, it is possible that these effects differ betweenlatitudes. This study is unique in the sense that itinvestigates the relation between diel water tempera-ture change and migration and that it accounts forpotential effects of the location where the pike wereobserved. Besides Masters et al. (2003), this is theonly study investigating this in a lowland river at alatitude of 51°N. In addition to Masters et al. (2003),this river is characterised by anthropogenic impacts.The aim of this study was to identify the occur-
rence of adult pike migration and which environmen-tal variables influenced migration. Therefore, wefirstly described the pattern of pike movement during1 year and evaluated when migration occurred. Fur-ther, the effect of temperature, diel temperature
change, flow and photoperiod on migration was anal-ysed, taking into account sex, length and mass differ-ences and potential dependence on the location in theriver. If certain thresholds of, for example, tempera-ture and flow could be identified at which pike startsmigrating towards spawning areas, river managerscan use this information, for instance, to temporarilyopen migration barriers in the river by adjusted bar-rier management.
Materials and methods
Study area
Pike were studied in the 44-km-long Belgian part ofthe River Yser and its tributaries (Fig. 1). The drain-age area is 1101 km², and it has a rainfall-dominatedhydrology with an average annual flow of1.44 m³�s�1, a peak flow of 5.7 m³�s�1 and a baseflow of 0.8 m³�s�1 (Mouton et al. 2012). The RiverYser is a navigable waterway. A tidal sluice at theestuary prevents tidal-water-level fluctuation andinflow of salt water. Upstream of the sluice, there isno migration barrier in the main river, and pike canfreely move between the main river and most of itstributaries. Average water depth is 2.5 m (Mouton
0
0
N50°0′0′′N
51°0′0′′N
2°0′0′′E 4°0′0′′E 6°0′0′′E 2°40′0′′E 2°50′0′′E
2040 80 Kilometers
5 10 20 Kilometers
A
BCD
51°0′0′′N
1 (16 km)
2 (22 km)
3R, 4L (24 km)
6R, 7L (26 km)5 (25 km)
0 1.5 3 6Kilometers
N
Fig. 1. The Belgian part of the River Yser, in Flanders (Belgium), and the fyke locations. Capture locations are described by an index(1–7), the position of the fyke near the left (L) or right (R) bank and the distance to the tidal sluice at the river mouth (km). Locationswhere temperature was logged are marked by a vertical line. (A = Handzamevaart, B = canal from the city of Ieper to the River Yser,C = Kemmelbeek, D = Boezingegracht; white triangles = pike caught for tagging, grey dots = no pike caught by fykes).
374
Pauwels et al.
et al. 2012). Near the French border, the river is8–10 m wide, and at the mouth, it is 25 m wide(Mouton et al. 2012). Due to canalisation, depth, sub-strate and flow velocity are distributed relatively uni-formly. The water quality of the River Yser varieslittle throughout the year (Flemish EnvironmentAgency, www.vmm.be). The conductivity averages0.75 mS�cm�1, but can exceed 1 mS�cm�1 in extre-mely dry periods. In the study area, different river-bank types can be distinguished: artificial banks,foreshores, spawning grounds and seminatural banks(Mouton et al. 2012). Seminatural banks and spawn-ing grounds are the most natural riparian habitats inthe study area. Water temperature was logged every30 min at three locations in the study area by Tidbittemperature loggers (Onset) with an accuracy of0.01 °C. Daily flow data (�0.01 m³�s�1) were pro-vided by the Hydrographic Information Centre (HIC,www.waterstanden.be).
Fish capture and tagging
Although historical evidence of a high-density popu-lation of pike in the River Yser exists, densities havebeen low since the first standardised observations in1996 (vis.inbo.be). For the tracking study, pike weresampled at 15 different locations in the river between3 and 32 km upstream of the tidal sluice (Fig. 1) byfyke sampling during nine events between 24November and 13 December 2010. At each sampling,two double fykes were placed in the river for 48 h.To maximise catch likelihood, locations were chosensuch that they maximally covered the study area. Intotal, nine females and six males were caught at fivedifferent locations during seven different samplingevents (Table 1). The pike were anaesthetised imme-
diately in a 1:9:10000 clove oil–ethanol–water solu-tion (C8392; Sigma, Bornem, Belgium), measured,weighed and tagged with a 68-mm-long and 18-mm-wide body implant radio transmitter (Model: F1230,coil antenna; Advanced Telemetry Systems Inc., Isan-ti, MN, USA; weight: 23 g in air, battery life:502 days). Each transmitter had a different frequencybetween 40,000 and 41,000 MHz. The averagefemale and male mass and length were 4213 � 2889and 4832 � 2640 g, and 75 � 16 and 81 � 12 cm,respectively. Thus, the transmitters never exceeded2% of the body mass (Jepsen et al. 2002). The trans-mitters were inserted into the body cavity through aventral 20- to 25-mm incision between the pelvic gir-dle and the anal fin, which was then closed with threesutures. The sex was determined during surgery bygonad inspection. The duration of the operations ran-ged from 5 to 10 min, and the pike needed about10 min to recover. One hour after recovery, the pikewere released at their catch location.
Tracking
Radio tracking was performed manually from landwith a magnetic dipole antenna (Advanced TelemetrySystems Inc., Isanti, MN, USA) to firstly track thepike at a precision of 2000 m² and with a low-fre-quency loop antenna (Advanced Telemetry SystemsInc., Isanti, MN, USA) to subsequently localise thepike by triangulation (Diana et al. 1977; Rogers &Bergersen 1996; Rogers 1998; Jepsen et al. 2001) ata precision of 1–4 m² depending on the distancebetween the pike and the observer. The antennaswere connected to a R2000 receiver (AdvancedTelemetry Systems Inc., Isanti, MN, USA) thatsearched each frequency at 4-s intervals. The precise
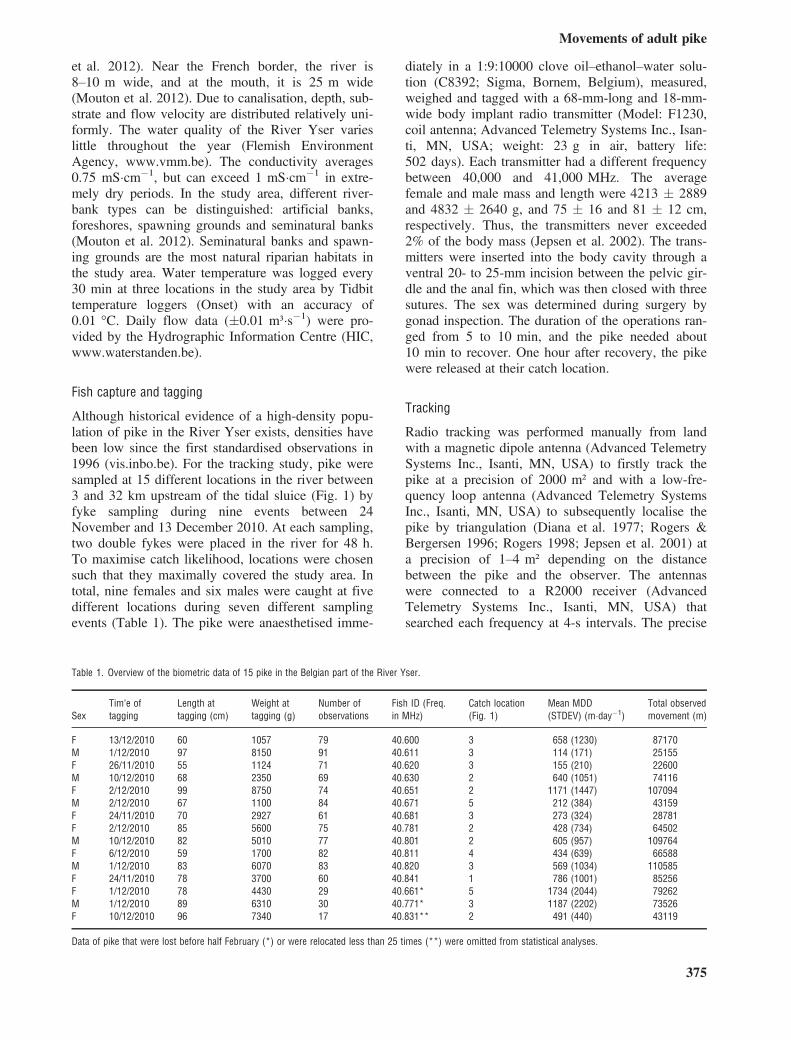
Table 1. Overview of the biometric data of 15 pike in the Belgian part of the River Yser.
SexTim‘e oftagging
Length attagging (cm)
Weight attagging (g)
Number ofobservations
Fish ID (Freq.in MHz)
Catch location(Fig. 1)
Mean MDD(STDEV) (m�day�1)
Total observedmovement (m)
F 13/12/2010 60 1057 79 40.600 3 658 (1230) 87170M 1/12/2010 97 8150 91 40.611 3 114 (171) 25155F 26/11/2010 55 1124 71 40.620 3 155 (210) 22600M 10/12/2010 68 2350 69 40.630 2 640 (1051) 74116F 2/12/2010 99 8750 74 40.651 2 1171 (1447) 107094M 2/12/2010 67 1100 84 40.671 5 212 (384) 43159F 24/11/2010 70 2927 61 40.681 3 273 (324) 28781F 2/12/2010 85 5600 75 40.781 2 428 (734) 64502M 10/12/2010 82 5010 77 40.801 2 605 (957) 109764F 6/12/2010 59 1700 82 40.811 4 434 (639) 66588M 1/12/2010 83 6070 83 40.820 3 569 (1034) 110585F 24/11/2010 78 3700 60 40.841 1 786 (1001) 85256F 1/12/2010 78 4430 29 40.661* 5 1734 (2044) 79262M 1/12/2010 89 6310 30 40.771* 3 1187 (2202) 73526F 10/12/2010 96 7340 17 40.831** 2 491 (440) 43119
Data of pike that were lost before half February (*) or were relocated less than 25 times (**) were omitted from statistical analyses.
375
Movements of adult pike

positions of every tracked pike were directly recordedon a 1:500 map.Pike were followed between November 2010 and
December 2011. During the weeks immediately aftertheir release, they were tracked daily. However, whenthe distance between consecutive observations wasless than 500 m for more than 2 weeks, we startedtracking less intensively (e.g., from 2/3 days toweekly), whereas tracking was intensified whenincreased activity was observed and when behaviourwas less predictable such as at the expected start ofspawning migration (i.e., when the distance betweentwo consecutive observations exceeded 500 m whenwe were tracking weekly, and when the distancebetween the first and last of five consecutive observa-tions exceeded 500 m when we tracked with 2/3 dayintervals). During each tracking campaign, pike weretracked along 47 km of the river and tributaries bycar. When pike were missing, they were searched byfoot in the small tributaries. Except the three individ-uals that were omitted from data analysis, no fishwere often missing.Additionally, the occurrence of young-of-the-year
pike (YOY) was evaluated by an electro- and fykefishing campaign for YOY in the (artificial) spawninggrounds and the tributaries in the study area in Mayand June 2011. In total, 26 locations were fished, ofwhich five were located in spawning grounds, 13 intributaries and eight in tributaries of tributaries. Twolocations were situated in the same tributary. Threelocations had been visited by tagged adult pike, andeight locations were within 500 m of a pike reloca-tion.
Data exploration and analysis
Pike movement was quantified by the minimum aver-age daily distance moved (MDD). The MDD wasdefined as the distance along the midline of the riverbetween the positions of two consecutive observa-tions of the same fish divided by the number of daysbetween the observations. Data of two pike that weremissing before half February and of one that wasrelocated too little were omitted from the analyses(Table 1). One (fish # 661; Table 1) of the two pikethat were lost before half February lost his tag. Theother pike (fish # 771; Table 1) could have beencaught by anglers or could have migrated farupstream to spawn. We lost the animal on the 3rd ofFebruary 2011. We evaluated whether this fish had adifferent spawning location than the remaining fishduring the days following this date by checking allaccessible small tributaries, potential spawninggrounds and the River Yser in the area till 12 kmupstream of the study area. Nonetheless, it is possiblethat we missed this pike. Data from the first 2 weeks
after tagging were deleted, to avoid potential distor-tion of results following tag implantation (Beaumontet al. 2002).To evaluate the movement patterns of the pike and
identify when migration occurred, we analysed theobservations from December 2010 to December 2011.The analysis on the environmental variables affectingmigration only included data from December 2010 toMay 2011. MDD values were not normally distrib-uted (Shapiro–Wilk P-value: 2.62156 9 10�39) andwere log(x + 1)-transformed.We analysed the impact of eight different variables
on pike migration: the water temperature, which isthe average of 1 day at three locations in the studyarea (Fig. 1), the diel (24 h) water temperaturechange, which is the difference in temperaturebetween consecutive days, flow, the location in thestudy area where pike were observed, the photope-riod, mass, length and sex. However, initial dataexploration (following Zuur et al. 2009) showedstrong collinearity based on the variance inflation fac-tor (VIF) between length and mass and between pho-toperiod and water temperature (Table 2), and lengthand photoperiod were thus omitted from further anal-ysis. To avoid loss of information by removinglength, we evaluated a potential effect of pike length,but no significant effect was found during backwardselection in the GAM (t-value = 1.35, P = 0.18).To investigate the impact of temperature and flow
on migration, these variables were included in theanalysis, but we also evaluated whether a time lag
Table 2. P-values of the F-statistic for two linear regression models: onemodel with all nine covariates (initial model) and one model without thecovariates having a high collinearity (reduced model) and the varianceinflation factor (VIF) values for the initial model. In the initial model, pikeminimal average daily distance moved (MDD) is modelled as a function ofthe covariates listed in the first column. Sex is not included because this isa discrete covariate. In the second and third columns, the P-values and VIFvalues for the initial model are presented (note that no covariates havebeen removed yet). In the fourth column, P-values are presented for themodel after collinearity has been removed by sequentially deleting eachcovariate for which the VIF value was highest until all remaining VIFs werebelow 3. The initial and reduced model differed significantly (P-value:0.012).
Covariate
P-value(initialmodel) VIF
P-value(collinearityremoved)
Water temperature 0.308 38.645 0.311Water temperature with time lag 0.008 40.429 Removed 1stDiel water temperature change 0.838 2.638 0.054Flow 0.012 8.413 0.035Flow with time lag 0.097 8.824 Removed 3rdPike mass 0.339 26.081 0.332Pike length 0.115 26.184 Removed 2ndPhotoperiod 0.068 7.475 Removed 4thLocation where pike wereobserved
0.000 1.038 7.833 9 10�5
376
Pauwels et al.
existed between peaks in pike migration, defined asthe MDDs exceeding the 85% percentile of theMDDs per individual, and peaks in water temperatureand flow. Specifically, we analysed the impact oftemperature and flow on time lags of 1–5 days bydefining the cumulative temperature and flow overthese time lags. As these variables were highly corre-lated with the water temperature and flow (Table 2),we did not include the cumulative temperature andflow in the further analysis.Because a full model with the remaining six cova-
riates and all their interactions would still be toocomplex, we first evaluated whether all covariatesand interactions are expected to have a significanteffect on the MDD (Zuur et al. 2009). We found thatpike mass did not significantly explain the remainingvariance in the residuals of a LM containing allselected covariates besides mass, while other covari-ates did (F = 1.77, d.f. = 1, P = 0.18). Therefore,we omitted mass from further statistical analysis.Based on our ecological knowledge and interest, weevaluated whether the effect of temperature and flowon MDD differed between sexes, whether the effectof temperature on MDD depended on flow and viceversa and whether the effects of temperature and flowdiffered according to the location of the individual inthe study area. Consequently, we started modeldevelopment with five covariates and five-two-wayinteractions in the basic full model F1:
LogMDDi ¼ aþ b1i � water temperaturei þ b2i� diel water temperature changeiþ b3i � flowi þ b4i � locationi þ b5i� sexi þ b6i � water temperaturei� sexi þ b7i � flowi � sexi þ b8i� water temperaturei � flowi þ b9i� water temperaturei � locationiþ b10i � flowi � locationi þ ei
where a is the intercept, bji are the covariate coeffi-cients, j is the index of the covariate and i is the ithrecord in the data set. To investigate how these vari-ables and interactions affected pike migration, differ-ent models were fitted to the data: a linear model(LM), a general additive model (GAM), a general lin-ear mixed model (GLMM) and a general additivemixed model (GAMM). Models were comparedusing the Aikake information criterion (AIC), andautocorrelation was evaluated using the autocorrela-tion function (ACF). All analyses were conductedusing the nlme and mgcv libraries in R (Hastie &Tibshirani 1990; Wood 2006).Starting from the full model (F1), we firstly inves-
tigated the addition of a random part to F1. We anal-ysed the effect of adding individual pike as a random
intercept and extended this with random slopes fortemperature, diel temperature change, flow and loca-tion. Adding individual pike as random intercept sub-stantially reduced the autocorrelation betweenconsecutive observations. Specifically, in the LM(M1 in Table 3), autocorrelation was found between10 consecutive observations, whereas this wasreduced to correlation between only three consecutiveobservations when individual pike was added as arandom intercept (M2 in Table 3). The GLMM withindividual pike as random intercept and water tem-perature as random slope performed best.Further exploration of the GLMM residuals indi-
cated the need for nonparametric smooth functions tobetter describe the effects of the numerical covariates.The GLMM was therefore extended to a GAMM(M6 in Table 3), and similarly, the LM was extendedto a GAM (M3 in Table 3). In both models (M6 andM3), a model selection was performed that led to M4and M7, respectively. The difference existed in thesmoothing function on water temperature and flowthat contained two smoothers (one for each sex) inthe GAM (M4 in Table 3), whereas this was onlyone for temperature and none for flow in the GAMM(M7 in Table 3). Although the autocorrelationbetween consecutive observations in the GAM washigher, it had a lower AIC than the correspondingGAMM (Table 3). Therefore, the GAM (M4,Table 3) was selected as the final model.
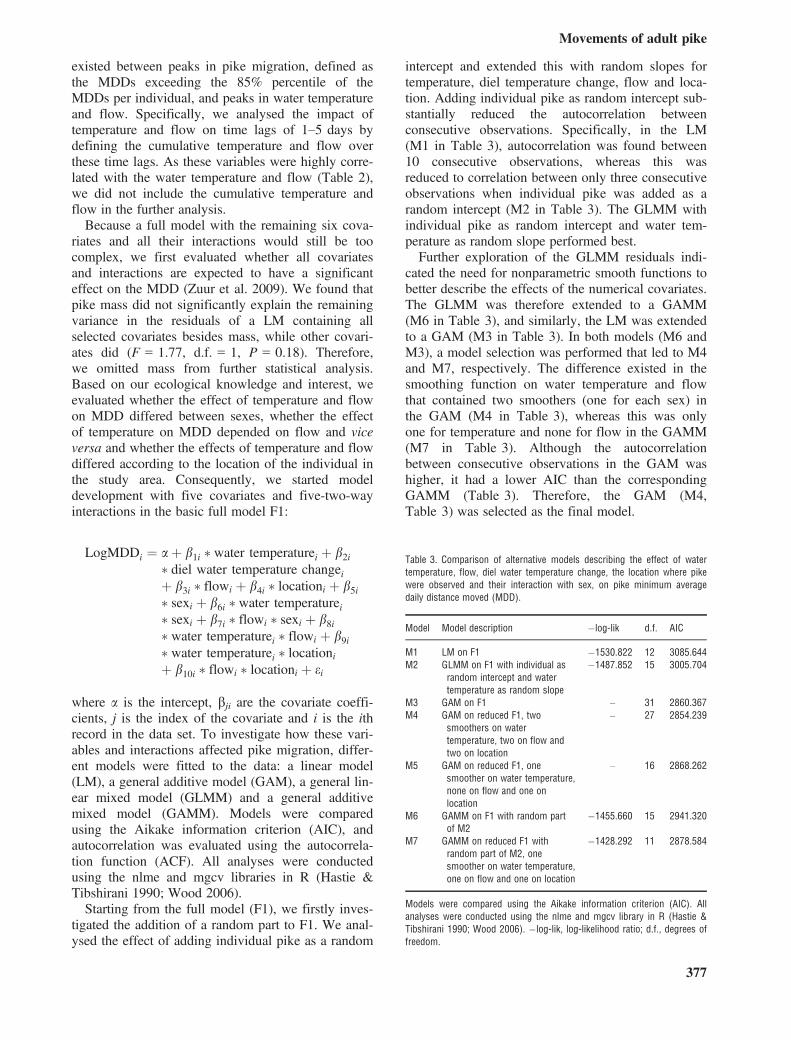
Table 3. Comparison of alternative models describing the effect of watertemperature, flow, diel water temperature change, the location where pikewere observed and their interaction with sex, on pike minimum averagedaily distance moved (MDD).
Model Model description �log-lik d.f. AIC
M1 LM on F1 �1530.822 12 3085.644M2 GLMM on F1 with individual as
random intercept and watertemperature as random slope
�1487.852 15 3005.704
M3 GAM on F1 – 31 2860.367M4 GAM on reduced F1, two
smoothers on watertemperature, two on flow andtwo on location
– 27 2854.239
M5 GAM on reduced F1, onesmoother on water temperature,none on flow and one onlocation
– 16 2868.262
M6 GAMM on F1 with random partof M2
�1455.660 15 2941.320
M7 GAMM on reduced F1 withrandom part of M2, onesmoother on water temperature,one on flow and one on location
�1428.292 11 2878.584
Models were compared using the Aikake information criterion (AIC). Allanalyses were conducted using the nlme and mgcv library in R (Hastie &Tibshirani 1990; Wood 2006). �log-lik, log-likelihood ratio; d.f., degrees offreedom.
377
Movements of adult pike
LogMDDi ¼ aþ f1iðwater temperaturei � sexiÞþ b2i � diel temperature changeiþ f 2iðflowi � sexiÞþ f 3iðlocationi � sexiÞ þ ei
(M4)
Results
Annual movement
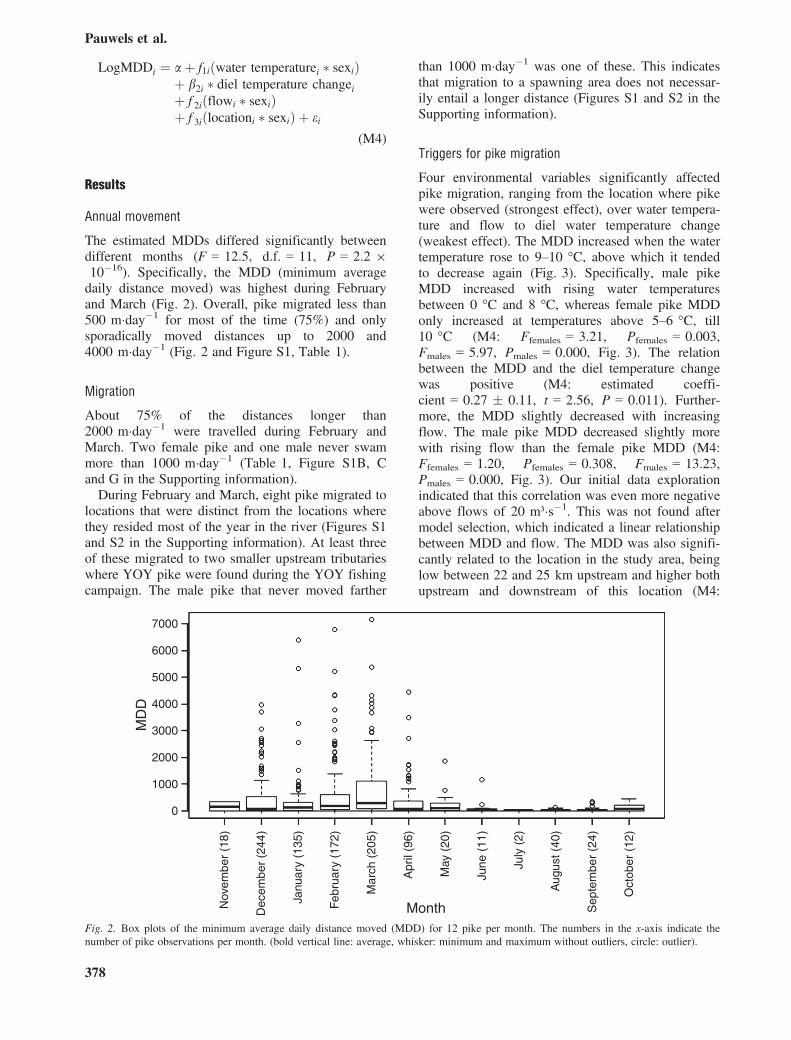
The estimated MDDs differed significantly betweendifferent months (F = 12.5, d.f. = 11, P = 2.2 910�16). Specifically, the MDD (minimum averagedaily distance moved) was highest during Februaryand March (Fig. 2). Overall, pike migrated less than500 m�day�1 for most of the time (75%) and onlysporadically moved distances up to 2000 and4000 m�day�1 (Fig. 2 and Figure S1, Table 1).
Migration
About 75% of the distances longer than2000 m�day�1 were travelled during February andMarch. Two female pike and one male never swammore than 1000 m�day�1 (Table 1, Figure S1B, Cand G in the Supporting information).During February and March, eight pike migrated to
locations that were distinct from the locations wherethey resided most of the year in the river (Figures S1and S2 in the Supporting information). At least threeof these migrated to two smaller upstream tributarieswhere YOY pike were found during the YOY fishingcampaign. The male pike that never moved farther
than 1000 m�day�1 was one of these. This indicatesthat migration to a spawning area does not necessar-ily entail a longer distance (Figures S1 and S2 in theSupporting information).
Triggers for pike migration
Four environmental variables significantly affectedpike migration, ranging from the location where pikewere observed (strongest effect), over water tempera-ture and flow to diel water temperature change(weakest effect). The MDD increased when the watertemperature rose to 9–10 °C, above which it tendedto decrease again (Fig. 3). Specifically, male pikeMDD increased with rising water temperaturesbetween 0 °C and 8 °C, whereas female pike MDDonly increased at temperatures above 5–6 °C, till10 °C (M4: Ffemales = 3.21, Pfemales = 0.003,Fmales = 5.97, Pmales = 0.000, Fig. 3). The relationbetween the MDD and the diel temperature changewas positive (M4: estimated coeffi-cient = 0.27 � 0.11, t = 2.56, P = 0.011). Further-more, the MDD slightly decreased with increasingflow. The male pike MDD decreased slightly morewith rising flow than the female pike MDD (M4:Ffemales = 1.20, Pfemales = 0.308, Fmales = 13.23,Pmales = 0.000, Fig. 3). Our initial data explorationindicated that this correlation was even more negativeabove flows of 20 m³�s�1. This was not found aftermodel selection, which indicated a linear relationshipbetween MDD and flow. The MDD was also signifi-cantly related to the location in the study area, beinglow between 22 and 25 km upstream and higher bothupstream and downstream of this location (M4:
0
1000
2000
3000
4000
5000
6000
7000
MD
D
MonthNov
embe
r (1
8)
Dec
embe
r (2
44)
Janu
ary
(135
)
Feb
ruar
y (1
72)
Mar
ch (
205)
Apr
il (9
6)
May
(20
)
June
(11
)
July
(2)
Aug
ust (
40)
Sep
tem
ber
(24)
Oct
ober
(12
)
Fig. 2. Box plots of the minimum average daily distance moved (MDD) for 12 pike per month. The numbers in the x-axis indicate thenumber of pike observations per month. (bold vertical line: average, whisker: minimum and maximum without outliers, circle: outlier).
378
Pauwels et al.

Ffemales = 8.53, Pfemales = 3.62 9 10�10, Fmales =7.17, Pmales = 2.46 9 10�9, Fig. 3).Model selection revealed that the interactions
between the environmental variables and location inthe study area were insignificant. Specifically, thesignificant relationship between pike MDD and loca-tion in the study area does not mean that the pike’sreaction to temperature and flow depended on theirlocation. Although the location in the study areaappeared to have the strongest impact on MDD, thisdoes not imply that location is triggering migration.
Discussion
Pike MDDs were highest between December andMay with a peak in February and March. Higher
MDDs from December to February could beexplained by a high competition for food duringthese months (Chapman 1968; Dawson et al. 1991;Knight et al. 2008), whereas higher MDDs betweenFebruary and May could coincide with the spawningmigration, which is often observed to encompasslonger distances compared with the distances movedduring the rest of the year (Ovidio & Philippart 2003;Koed et al. 2006). The higher MDDs in Februaryand March correspond with earlier observations byKoed et al. (2006) and Knight et al. (2008). Cook &Bergersen (1988) reported a higher pike activity dur-ing April and May and the lowest activity duringOctober. In contrast, Kobler et al. (2008) and Veha-nen et al. (2006) both reported a higher pike activityfrom the beginning of June to September and a lower
5000
0 10 20 30 40 0 10 20 30 40
–4
–2
0
2
4
6 Female Male
Female Male
Female * Male
8
10 000 15 000 20 000
Location upstream (m)
Lo
g (
MD
D+1
)
–4
–2
0
2
4
6
8
Lo
g (
MD
D+1
)
–4
–2
0
2
4
6
8L
og
(M
DD
+1)
Location upstream (m)25 000 30 000 35 000 5000 10 000 15 000 20 000 25 000 30 000 35 000
*
*
* *
Flow (m3·s–1) Flow (m3·s–1)
5 1510
Temperature (°C)5 1510
Temperature (°C)
(a) (b)
(c) (d)
(e) (f)
Fig. 3. Smoothers and 95% pointwise confidence intervals from model M4 (a to f), illustrating the nonlinear relations between log(MDD+1) and water temperature (a, b), flow (c, d) and location in the study area (e, f) for each sex. Significant relations are marked by as-terics. (a: P = 0.0034, b: P = 0.0001, c: P = 0.3079, d: P = 0.0003, e: P = 3.62 9 10�10, f: P = 2.46 9 10�9).
379
Movements of adult pike
pike activity from December to March and fromOctober to April, respectively, whereas Baktoft et al.(2012) observed no consistent seasonal trend in pikeactivity.Our analysis on the relation between environmental
variables and migration revealed that four environ-mental variables significantly affected pike migration,ranging from the location where pike were observed(strongest effect), over water temperature and flow tothe diel water temperature change (weakest effect).Specifically, the relation between the location wherepike were observed and the MDD revealed a lowerMDD in an area between 22 and 25 km upstream ofthe tidal sluice. This may suggest a preference of pikefor this specific area or habitat type. The area is char-acterised by a seminatural riparian habitat, which isassumed to be the most suitable habitat type avail-able. Other characteristics such as river morphologyand prey densities may also affect the low MDDs inthis area, but this was not further investigated in thisstudy. Despite the significant relation between thelocation where pike were observed and the MDD,this location had no significant influence on the rela-tions between temperature and MDD, and flow andMDD.The relation between water temperature and MDD
showed an increase in MDD with rising temperaturesuntil a maximum of 10 °C, above which MDDdecreased again. This corresponds with the assump-tion that pike spawning migration is stimulated byrising temperatures (Craig 1996; Lucas et al. 2001;Ovidio & Philippart 2003) and is in line with theanalysis of Lucas (1992), who found highest dailypike movement between 8 and 10 °C. In the study ofOvidio & Philippart (2003), pike started the upstreammigration at temperatures between 6.7 and 8.7 °C.We hypothesise that 9–10 °C is a threshold level formigration in our study, as the activity was highest atca. 9 °C, and there was only a 1-day time lag betweenmigration peaks and temperature peaks exceeding10 °C. The decrease in MDD at temperatures above10 °C could indicate that pike have arrived at theirspawning area by then. Although we could notobserve spawning after migration, the occurrence ofYOY pike at two locations visited by tagged pikesuggests that at least some tagged pike visited habitatsthat are most likely to be suitable for spawning.The different effects of water temperature on MDD
of male versus female pike found in our study indi-cate that male pike are triggered to migrate at lowertemperatures than female pike. Male pike MDDsincreased when temperature exceeded 0 °C, whilefemale pike MDDs only increased when temperatureexceeded 5–6 °C. Craig (1996) also reported thatmales started spawning migration earlier thanfemales.
The relation between diel water temperaturechange and MDD was linear and indicated that theMDD slightly increased with increasing diel watertemperature change. This relation was, however, lesssignificant than the relation between MDD and watertemperature, which may indicate that water tempera-ture more strongly affects pike migration than the dieltemperature change.Although Craig (1996) demonstrated that migration
was triggered by increased flow, we observed a nega-tive relation between MDD and flow. This discrep-ancy may be because the water velocity in the RiverYser often exceeded the critical velocity that inhibitspike movement during the study period (Jones et al.1974).Sex had no significant effect on pike MDD and
only affected the relations between MDD and watertemperature, flow and the location where pike wereobserved. The insignificant relation between sex andMDD is in line with the study of Burkholder & Ber-nard (1994), but contrasts with the observation ofsex-dependent movement rates by Lucas (1992) andKoed et al. (2006). Lucas (1992) observed a higheractivity of males, whereas Koed et al. (2006) found ahigher activity of females. The dissimilarity of thediscussed studies is notable and was also observed instudies on pike’s diurnal activity, on the grouping ofpike into sedentary and active animals and on thepike length–movement rate relation. As Kobler et al.(2008) and Jepsen et al. (2001) already stated, thesedifferences might reflect not only variation in pikebehaviour among different ecosystems, but also dif-ferences in method and study design.In this respect, we suggest the most important dif-
ferences between our study and the aforementionedpike telemetry studies are the shape (lake versusriver) and the length of the study area, besides thestatistical method applied compared with the migra-tion studies. Compared with the aforementioned stud-ies, we also studied between 5 and 40 pike. Wetracked the pike for 1 year at different samplingintervals, which is comparable with the protocols ofthe aforementioned studies on pike in rivers (Ovidio& Philippart 2003; Koed et al. 2006; Vehanen et al.2006), but contrasts with most of the studies in lakes,specifically with those of Diana (1980) and Baktoftet al. (2012), in which pike were tracked at equal,short time intervals over 50 days and 2 years, respec-tively. Apparently, the tracking protocols in radiotelemetry are highly dependent on the shape andextent of the study area. Continuous monitoring oftagged fish to a few metres precisely using acoustictelemetry and stationary radio receivers is only possi-ble in a small lake. Consequently, the sampling inter-vals are larger and more variable in telemetry studieson rivers, specifically on large river systems.
380
Pauwels et al.

The study of Baktoft et al. (2012) indicated thatlong sampling intervals may entail a great samplingerror. This is also applicable to our study, eventhough this sampling error was minimised by onlylowering the tracking frequency when reduced activ-ity was observed. For instance, pike were observed tobe less active from May to November, so samplingerror is expected to be relatively low in this period,even though our tracking frequency was lowered(Cook & Bergersen 1988; Koed et al. 2006; Knightet al. 2008). Our study area entailed >60 km ofaccessible river channels, whereas this was between 2and 30 km in other studies (Masters et al. 2002,2003; Ovidio & Philippart 2003; Koed et al. 2006;Vehanen et al. 2006). In a study area of this size, itis practically impossible to track more than 15 pikeat equal small (daily) sampling intervals for morethan one season. This is further evidenced by Koedet al. (2006), who studied 10 pike, and Ovidio &Philippart (2003), who studied six pike. We suggestthat studies with a similar approach therefore com-bine periods of high (daily) tracking frequency withperiods of low (weekly) tracking frequency or applymore sophisticated approaches to allow detailed tag-ging of a high number of pike in a large study area.The lack of complete certainty on the occurrence
of spawning after migration was encountered as alimitation here to exclusively investigate the triggersfor spawning migration. To overcome this problem,future research on the triggers of migration could beexpanded by an identification of the true purpose ofeach migration. For instance, accelerated failure timeor Cox regression (Castro-Santos & Haro 2003)could be applied to analyse the triggers for spawningmigration. Besides, it could reveal how many individ-uals of the population spawn and migrate to spawnand how many spawning migrations occur per indi-vidual during one spawning period.Based on our results, river managers could con-
sider the impact of water temperature on pike migra-tion to facilitate accessibility of small tributaries andspawning grounds, for example, by opening valvesat water temperatures between 0 and 12 °C. Theapparent inhibition of pike migration at high flowssuggests that pike could benefit from the buffering ofpeak flows, for example, by restoring floodplainsand increasing lateral connectivity. Our study notonly provides further insight into pike migration, butalso presents a statistically underpinned approach toanalyse the complex nonlinear relation between envi-ronmental variables and fish migration in general.This information may be crucial for effective conser-vation worldwide and to evaluate managementactions, such as the restoration of connectivity tospawning habitat.
Acknowledgements
Emilie Gelaude, Raf Baeyens, Seth Martens, Yves Jacobs,Valerie Villers, Pieterjan Verhelst, Gert Everaert, Pieter Boets,Nancy De Saeyer, Roland Deurinck, Teis Deurinck and DiegoVancutsem assisted with the data collection. I. Pauwels wasfunded by the Flemish Institute for the Promotion of Scien-tific-Technological Research in the Industry (IWT Flanders).
References
Baktoft, H., Aarestrup, K., Berg, S., Boel, M., Jacobsen, L.,Jepsen, N., Koed, A., Svendsen, J.C. & Skov, C. 2012. Sea-sonal and diel effects on the activity of northern pike studiedby high-resolution positional telemetry. Ecology of Freshwa-ter Fish 21: 386–394.
Beaumont, W.R.C., Cresswell, B., Hodder, K.H., Masters,J.E.G. & Welton, J.S. 2002. A simple activity monitoringradio tag for fish. Hydrobiologia 483: 219–224.
Burkholder, A. & Bernard, D.R. 1994. Movements and distri-bution of radio-tagged northern pike in Minto Flats. FisheryManuscript. Anchorage, USA: Alaska Department of Fishand Game. 48 pp.
Casselman, J.M. & Lewis, C.A. 1996. Habitat requirements ofnorthern pike (Esox lucius). Canadian Journal of Fisheriesand Aquatic Sciences 53: 161–174.
Castro-Santos, T. & Haro, A. 2003. Quantifying migratorydelay: a new application of survival analysis methods. Cana-dian Journal of Fisheries and Aquatic Sciences 60: 986–996.
Chapman, D.W. 1968. Production. In: Ricker, W.D., ed. Meth-ods for assessment of fish production in fresh waters. Oxford,Edinburgh: Blackwell scientific publications, pp. 182–196.
Chapman, C.A. & Mackay, W.C. 1984. Direct observation ofhabitat utilization by northern pike. Copeia 1984: 255–258.
Cook, M.F. & Bergersen, E.P. 1988. Movements, habitatselection, and activity periods of northern pike in 11 MileReservoir, Colorado. Transactions of the American FisheriesSociety 117: 495–502.
Craig, J.F. 1996. Pike: biology and exploitation. London, UK:Chapman & Hall. 298 pp.
Craig, J.F. 2008. A short review of pike ecology. Hydrobiolo-gia 601: 5–16.
Dawson, F.H., Clinton, E.M.F. & Ladle, M. 1991. Macroin-vertebrates on cut weed removed during weed-cutting opera-tions along an English River, the River Frome, Dorset.Aquaculture and fisheries management 22: 113–122.
Diana, J.S. 1980. Diel Activity Pattern and Swimming Speedsof Northern Pike (Esox-Lucius) in Lac Ste Anne, Alberta.Canadian Journal of Fisheries and Aquatic Sciences 37:1454–1458.
Diana, J.S., Mackay, W.C. & Ehrman, M. 1977. Movementsand habitat preference of northern pike (Esox-Lucius) in LacSte Anne, Alberta. Transactions of the American FisheriesSociety 106: 560–565.
Hastie, T. & Tibshirani, R.J. 1990. Generalized additive mod-els. London: Chapman and Hall. 335 pp.
Jepsen, N., Beck, S., Skov, C. & Koed, A. 2001. Behavior ofpike (Esox lucius L.) > 50 cm in a turbid reservoir and in aclearwater lake. Ecology of Freshwater Fish 10: 26–34.
381
Movements of adult pike
Jepsen, N., Koed, A., Thorstad, E.B. & Baras, E. 2002. Surgi-cal implantation of telemetry transmitters in fish: how muchhave we learned? Hydrobiologia 483: 239–248.
Jones, D.R., Kiceniuk, J.W. & Bamford, O.S. 1974. Evalua-tion of the swimming performance of several fish speciesfrom the Mackenzie River. Journal of the Fisheries Board ofCanada 31: 1641–1647.
Knight, C.M., Gozlan, R.E. & Lucas, M.C. 2008. Can sea-sonal home-range size in pike Esox lucius predict excursiondistance? Journal of Fish Biology 73: 1058–1064.
Kobler, A., Klefoth, T., Wolter, C., Fredrich, F. & Arlinghaus,R. 2008. Contrasting pike (Esox lucius L.) movement andhabitat choice between summer and winter in a small lake.Hydrobiologia 601: 17–27.
Koed, A., Balleby, K., Mejlhede, P. & Aarestrup, K. 2006.Annual movement of adult pike (Esox lucius L.) in a low-land river. Ecology of Freshwater Fish 15: 191–199.
Lucas, M.C. 1992. Spawning activity of male and female pike,Esox-Lucius L, Determined by acoustic tracking. CanadianJournal of Zoology 70: 191–196.
Lucas, M.C., Baras, E., Thom, T., Duncan, A. & Slavik, O.2001. Migration of freshwater fishes. Oxford, UK: Black-well Science Ltd. 420 pp.
Masters, J.E.G., Welton, J.S., Beaumont, W.R.C., Hodder,K.H., Pinder, A.C., Gozlan, R.E. & Ladle, M. 2002. Habitatutilisation by pike Esox lucius L. during winter floods in asouthern English chalk river. Hydrobiologia 483: 185–191.
Masters, J.E.G., Hodder, K.H., Beaumont, W.R.C., Gozlan,R.E., Pinder, A.C., Kenward, R.E. & Welton, J.S. 2003.Spatial behaviour of pike Esox lucius L. in the River Frome,UK. Proceedings of the Fifth Conference on Fish Telemetryheld in Europe. Aquatic telemetry: advances and applica-tions: 179–190.
Mouton, A.M., Buysse, D., Stevens, M., Van den Neucker, T.& Coeck, J. 2012. Evaluation of riparian habitat restorationin a lowland river. River Research and Applications 28:845–857.
Northcote, T.G. 1978. Migratory strategies and production infreshwater fish. In: Gerking, S.D., ed. Ecology of freshwaterfish production. Oxford: Blackwell Scientific Publications,pp. 326–359.
Ovidio, M. & Philippart, J.C. 2003. Long range seasonalmovements of northern pike (Esox lucius L.) in the barbelzone of the River Ourthe (River Meuse basin, Belgium).
Proceedings of the Fifth Conference on Fish Telemetry heldin Europe Aquatic telemetry: Advances and applications:191–202.
Radomski, P. & Goeman, T.J. 2001. Consequences of humanlakeshore development on emergent and floating-leaf vege-tation abundance. North American Journal of Fisheries Man-agement 21: 46–61.
Rogers, K.B. 1998. Habitat use by largemouth bass and north-ern pike on the Rocky Mountain Arsenal, Colorado.PhDthesis. Fort Collins, Colorado: Colorado State University.414 pp.
Rogers, K.B. & Bergersen, E.P. 1996. Application of geo-graphic information systems in fisheries: habitat use by north-ern pike and largemouth bass. Multidimensional Approachesto Reservoir Fisheries Management 16: 315–323.
Vehanen, T., Hyvarinen, P., Johansson, K. & Laaksonen, T.2006. Patterns of movement of adult northern pike (Esoxlucius L.) in a regulated river. Ecology of Freshwater Fish15: 154–160.
Wood, S. 2006. Generalized additive mixed models: an intro-duction with R. Boca Raton: Chapman & Hall/CRC Press.391 pp.
Zuur, A.F., Ieno, E.N., Walker, N., Saveliev, A.A. & Smith,G.M. 2009. Mixed effects models and extensions in ecologywith R. New York: Springer. 578 pp.
http://vis.milieuinfo.be, July 9th 2013, Flemish government.http://www.vmm.be, July 9th 2013, Flemish EnvironmentAgency (VMM).
http://www.waterstanden.be, July 9th 2013, HydrologischInformatie Centrum (HIC)- Waterbouwkundig Laboratorium(2013).
Supporting Information
Additional Supporting Information may be found inthe online version of this article:Figure S1. Water temperature and flow versus
minimum average daily distance moved (MDD) of12 pike (A to L).Figure S2. Location where pike were observed
versus water temperature and flow of 12 pike (A toL).
382
Pauwels et al.
Copyright © 2022 FDOKUMEN