colonial City: The Case of Georgetown in Penang, Malaysia LI
Upload
khangminh22Category
view
6download
0
GHD | Hunter & Central Coast Development Corporation | 12548506 Mt Penang Parklands Traffic Study Report Stage 2 | iThis document is in draft form. The contents, including any opinions, conclusions or recommendations contained in, or which may be implied from, this draft document must not be relied upon. GHD reserves the right, at any time, without notice, to modify or retract any part or all of the draft document. To the maximum extent permitted by law, GHD disclaims any responsibility or liability arising from or in connection with this draft document.
Mount Penang Parklands Traffic and Transport Impact Study
Stage 2 Additional Traffic Modelling and Analysis
Hunter & Central Coast Development Corporation
30 March 2022
The Power of Commitment

GHD | Hunter & Central Coast Development Corporation | 12548506 Mt Penang Parklands Traffic Study Report Stage 2 | iiThis document is in draft form. The contents, including any opinions, conclusions or recommendations contained in, or which may be implied from, this draft document must not be relied upon. GHD reserves the right, at any time, without notice, to modify or retract any part or all of the draft document. To the maximum extent permitted by law, GHD disclaims any responsibility or liability arising from or in connection with this draft document.
GHD Australia Pty Ltd | ABN 55 120 617 021
133 Castlereagh Street, Level 15
Sydney, New South Wales 2000, Australia
T +61 2 9239 7100 | F +61 2 9239 7199 | E [email protected] | ghd.com
Printed date 30/03/2022 10:15:00 PM
Last saved date 30 March 2022
File name C:\Users\pguo\Desktop\12548506 Mount Penang Parklands Traffic and Transport Impact Study - Stage 2 (Final Rev C) 30032022.docx
Author Profita Keo, Rosie Harris, Phil Guo
Project manager Phil Guo
Client name Hunter & Central Coast Development Corporation
Project name Mt Penang Parkland Additional Traffic Study
Document title Mt Penang Parklands Traffic Study - Additional Traffic Modelling and Analysis
Revision version Rev [00]
Project number 12548506
Document status
Status Code
Revision Author Reviewer Approved for issue
Name Signature Name Signature Date
Draft A See above Phil Guo
Jayme Akstein
13/12/2021
Draft Final
B See above Phil Guo
Phil Guo
31/1/2022
Final C See above Phil Guo
Phil Guo
30/3/2022
© GHD 2022
This document is and shall remain the property of GHD. The document may only be used for the purpose for which it was commissioned and in accordance with the Terms of Engagement for the commission. Unauthorised use of this document in any form whatsoever is prohibited.

GHD | Hunter & Central Coast Development Corporation | 12548506 Mt Penang Parklands Traffic Study Report Stage 2 | iiiThis document is in draft form. The contents, including any opinions, conclusions or recommendations contained in, or which may be implied from, this draft document must not be relied upon. GHD reserves the right, at any time, without notice, to modify or retract any part or all of the draft document. To the maximum extent permitted by law, GHD disclaims any responsibility or liability arising from or in connection with this draft document.
Acknowledgment of Country
We acknowledge Aboriginal and Torres Strait Islander peoples as the Traditional Owners of all lands throughout Australia on which we do business,
and we pay our respects to Elders, past, present and emerging.

GHD | Hunter & Central Coast Development Corporation | 12548506 Mt Penang Parklands Traffic Study Report Stage 2 | ivThis document is in draft form. The contents, including any opinions, conclusions or recommendations contained in, or which may be implied from, this draft document must not be relied upon. GHD reserves the right, at any time, without notice, to modify or retract any part or all of the draft document. To the maximum extent permitted by law, GHD disclaims any responsibility or liability arising from or in connection with this draft document.
Executive summary
This report has been prepared by GHD for Hunter and Central Coast Development Corporation (HCCDC) as part of Stage 2 of Mt Penang Traffic and Transport Impact Study (TTIS). The study is intended to support proposals to upgrade and develop Mt Penang Parklands, with consideration to land-use controls and development standards. An updated microsimulation traffic model, derived from Stage 1, was used to quantify the impact of new developments on the broader road network.
Overall, the following conclusions may be drawn:
– A clockwise one-way system (Option 2) on Parklands Road and The Avenue was found to be superior to both a two-way system and anti-clockwise system (Option 1), observing a traffic volume reduction.
– The extension of Festival Drive was effective at distributing traffic between Central Coast Highway and Mt Penang Parklands with Option 2. Though it was not essential for the one-way network.
– It was found that the proposed Kangoo Road / Baxter Track intersection layout is anticipated to operate within capacity.
– Mitigations, such as road upgrades, are recommended at CCH | Kangoo Road and CCH | The Avenue due to traffic signals prioritising through movements on Central Coast Highway, resulting in traffic build-up and queueing on Kangoo Road and The Avenue.
– Additional investigations should be carried out as a consequence of the school expansions, with respect to pedestrian infrastructure, public transport and traffic management.
It should also be noted that, if the Parklands owned by HCCDC are not realised, then traffic demand by HCCDC on Festival Drive and The Avenue will consequently be reduced.
Proposed one-way system on The Avenue and Parklands Road
Assessment of the proposed one-way system on The Avenue and Parklands Road was undertaken. Two options were assessed: Option 1 that follows an anti-clockwise direction, and Option 2 that follows a clockwise direction (see Figure 1). One-way systems are recognised as carrying positive safety benefits, including reduced road exposure, crash conflict points, and crash impact speeds. Kerbside functions are improved through upgrades in footpaths, shared paths, green space and kerbside parking.
Option 1 (anti-clockwise) Parklands Road (SB) / The Avenue (NB)
Option 2 (clockwise) Parklands Road (NB) / The Avenue (SB)
Figure 1 Overview of proposed one-way system options

GHD | Hunter & Central Coast Development Corporation | 12548506 Mt Penang Parklands Traffic Study Report Stage 2 | vThis document is in draft form. The contents, including any opinions, conclusions or recommendations contained in, or which may be implied from, this draft document must not be relied upon. GHD reserves the right, at any time, without notice, to modify or retract any part or all of the draft document. To the maximum extent permitted by law, GHD disclaims any responsibility or liability arising from or in connection with this draft document.
The results indicate that Option 2 is the preferred option out of the two, observing:
– A reduction of traffic volume on The Avenue, of up to 220 vehicles per hour by 2031, in comparison to the existing two-way arrangement.
– A reduction of traffic volume on The Avenue, of up to 175 vehicles per hour by 2031, in comparison to Option 1.
– A reduction in traffic volume on Festival Drive in the eastbound direction, consequently improving vehicular access to Kariong Mountains High School.
– Additional queueing capacity and a more direct route for vehicles exiting Mt Penang, via the Avenue toward Central Coast Highway, which is critical in the congested PM peak.
It should also be noted that Option 2 will remain as the preferred option, in the circumstances where Carinya Street has an eastbound movement. The road network has also identified as a feasible network from a bushfire perspective (Planning for Bush Fire Protection 2019, NSW Rural Fire Service).
Festival Drive extension
Festival Drive extension acts as a direct link between Central Coast Highway and the one-way system.
Key findings related to the Festival Drive extension include:
– On the existing Festival Drive, 54% of traffic was generated from Highway Commercial Precinct.
– On the proposed Festival Drive extension, 80% of traffic was generated from Highway Commercial Precinct.
The above demonstrated that the traffic from Highway Commercial Precinct would heavily rely on the Festival Drive and would be predominantly benefited from the extension, compared to the traffic from the rest of the Parklands. It is important to note the traffic impact on Festival Drive was assessed assuming the full development of Mt Penang Parklands. Provided that the full development may not be realised as assumed in this document, the traffic generation and the resultant traffic impact will be reduced.
CCH | Kangoo Road and CCH | The Avenue
Consistent with findings from Stage 1, the intersections at CCH | Kangoo Road and CCH | The Avenue remain a constraint within the road network. This is a result of traffic signals prioritising through movements on Central Coast Highway, resulting in traffic build-up on Kangoo Road and The Avenue, exacerbated by traffic generated by land use development in Mt Penang, predominantly from Highway Commercial Precinct and Kangoo Road Precinct. Refer to Table 3 for a breakdown of traffic generation for each precinct in Mt Penang Parklands.
Therefore, it is imperative that proponents investigate the following mitigations at both intersections, in collaboration with TfNSW’s ITP:
– Investigating the widening of Central Coast Highway in the eastbound direction, and in turn, the re-allocation of signal capacity to Kangoo Road, discharging traffic build-up from Mt Penang.
– Investigating the potential changes at the Central Coast Highway | The Avenue intersection, and providing additional capacity for The Avenue, as the current geometric layout is limited by heritage constraints.
– Promoting travel mode shift away from private car usage within Mt Penang, and exploring public transport and active transport alternatives for the region.
– Reviewing the development staging plan of both Highway Commercial Precinct and Kangoo Road Precinct
Ensuring the development traffic would be sufficiently facilitated by the proposed upgrades on CCH and both intersections.
Ensuring developers provide a mitigation plan in the case that projected development traffic exceeds capacity provided at both intersections on CCH (currently being investigated by TfNSW’s ITP).
Parklands North
Kangoo Road / Baxter Track intersection is anticipated to operate within capacity, with the proposed design layout provided by HCCDC being a priority-controlled intersection. Based on the results from the microsimulation traffic model, it is expected to experience excellent traffic service (i.e. Level of Service A) and minor delays. It was predicted that the proposed single lane (per direction) on Baxter Track provided adequate capacity.

GHD | Hunter & Central Coast Development Corporation | 12548506 Mt Penang Parklands Traffic Study Report Stage 2 | viThis document is in draft form. The contents, including any opinions, conclusions or recommendations contained in, or which may be implied from, this draft document must not be relied upon. GHD reserves the right, at any time, without notice, to modify or retract any part or all of the draft document. To the maximum extent permitted by law, GHD disclaims any responsibility or liability arising from or in connection with this draft document.
Further road safety investigation is undertaken as part of the road safety audit during the later stages of design.
Potential impact of school access and expansion
With Festival Drive as a two-way road, the proposed one-way arrangement on The Avenue and Parklands Road is anticipated to have a limited impact on school access to Kariong Mountains High School. Also, the majority of students were found accessing schools by foot at the site inspection, and often using the pedestrian crossing at the Central Coast Highway | The Avenue intersection.
Due to proposed expansions by both Central Coast Sports College and Kariong Mountains High School, it is recommended that investigations be made to:
– Address potential improvements for key pedestrian crossing movements on CCH e.g. pedestrian overbridge
– Provide improved public transport for school students
– Provide coordination of both general and school traffic to/from Central Coast Highway, particularly during peak hours within the school term
– Mitigate pinch points at the CCH | Kangoo Road and CCH | The Avenue intersections, to prevent vehicles queuing back onto Festival Drive and Parklands Road, causing disruptions of access to schools
Discussion was made on the potential impact of increasing enrolment of Central Coast Sports College to 1,200 students. Whilst it is anticipated that additional vehicle trips would be generated associated with the additional enrolments, the traffic impact would be minimum during the typical evening peak hours (between 4 and 6 p.m.). Further assessment of school expansions may be required to include:
– Traffic impact including the increase in picking up and dropping off activities, associated with the increase in enrolment
– A review of the patronage of the existing school bus services, to determine if they can accommodate additional students or whether additional bus capacity will be required.

GHD | Hunter & Central Coast Development Corporation | 12548506 Mt Penang Parklands Traffic Study Report Stage 2 | viiThis document is in draft form. The contents, including any opinions, conclusions or recommendations contained in, or which may be implied from, this draft document must not be relied upon. GHD reserves the right, at any time, without notice, to modify or retract any part or all of the draft document. To the maximum extent permitted by law, GHD disclaims any responsibility or liability arising from or in connection with this draft document.
Contents
Executive summary iv Proposed one-way system on The Avenue and Parklands Road iv Festival Drive extension v CCH | Kangoo Road and CCH | The Avenue v Parklands North v Potential impact of school access and expansion vi
1. Introduction 1
1.1 Project background 1
1.2 Study area 1
1.3 Previous submission (Stage 1) 2
1.4 Scope and limitations 2 1.4.1 Context and current scope of work (Stage 2) 2 1.4.2 Limitations 5
1.5 Traffic modelling glossary 5
2. Future traffic growth 6
2.1 Methodology 6
2.2 Overview of land use within Mt Penang Parklands 6
2.3 Trip generation update for Mt Penang Parklands 8
3. Traffic modelling for internal road network within Mt Penang Parklands 9
3.1 Summary of assessed scenarios 9
3.2 The Avenue and Parklands Road proposed one-way network 11 3.2.1 Reducing traffic volume on The Avenue (Heritage core) 12
3.2.1.1 Summary 12 3.2.1.2 One-way vs. two-way system 14 3.2.1.3 Option 1 (The Avenue northbound) vs. Option 2 (The Avenue southbound) 16
3.2.2 Impact on Festival Drive 17 3.2.2.1 Summary 17 3.2.2.2 Impact on the Festival Drive (existing section and proposed extension) 20
3.2.3 Safety benefits 22 3.2.4 Kerbside function 22
3.3 Intersection performance on Central Coast Highway 25
3.4 Parklands North 28
3.5 Potential impact of school access and expansion 29
4. Conclusion 32 Proposed one-way system on The Avenue and Parklands Road 32 Festival Drive extension 33 CCH | Kangoo Road and CCH | The Avenue 33 Parklands North 34 Potential impact of school access and expansion 34
Commentary 1 – Land use case study 43
Case study: Manns Road industrial estate 43 Directional distribution 45 Daily profile 46 Heavy vehicle proportion 46 Public transport 46
GHD | Hunter & Central Coast Development Corporation | 12548506 Mt Penang Parklands Traffic Study Report Stage 2 | viiiThis document is in draft form. The contents, including any opinions, conclusions or recommendations contained in, or which may be implied from, this draft document must not be relied upon. GHD reserves the right, at any time, without notice, to modify or retract any part or all of the draft document. To the maximum extent permitted by law, GHD disclaims any responsibility or liability arising from or in connection with this draft document.
Commentary 2 – Review of Trip Generation Rates (RMS 2013) 47
Commentary 3 – Nominated trip generation rate for Mt Penang 49
Commentary 4 – Safe System Approach 49
Table index
Table 1 Mt Penang development land-use summary 7 Table 2 Assumed staging development (2031 and 2041) 7 Table 3 Development traffic for Mt Penang Parklands (full development) 8 Table 4 Summary of assessed scenarios for Mt Penang Parklands 10 Table 5 Overall objectives in assessing traffic efficiency of upgrades 11 Table 6 Traffic volumes comparison on the internal road network 16 Table 7 Other benefits and impacts of Option 2 17 Table 8 Summary of traffic generation and performance benefits on Festival Drive, Option 2, 2031
AM peak 18 Table 9 Breakdown of vehicles on Festival Drive generated to and from Highway Commercial
Precinct (Option 2, 2031 AM peak) 21 Table 10 Breakdown of vehicles on Festival Drive generated to and from Highway Commercial
Precinct, Option 4, 2031 AM peak 22 Table 11 Proposed upgrades at CCH | Kangoo Road and CCH | The Avenue 25 Table 12 Assumed Staging Development (2031 and 2041) 27 Table 13 Summary of one-way system traffic impact for Mt Penang Parklands 32 Table 14 Manns Road trip generation summary 45 Table 15 Trip distribution 45 Table 16 Daily trip distribution 46 Table 17 Heavy vehicle proportion 46 Table 18 RMS (2013) average trip rates for business parks and industrial estates 47 Table 19 RMS (2013) trip rates for business parks and industrial estates (Hunter and Central
Coast surveys) 47 Table 20 Average trip generation rates for the Hunter and Central Coast Region 48 Table 21 Trip generation rate comparison 49
Figure index
Figure 1 Overview of proposed one-way system options iv Figure 2 Land-use precincts in Mt Penang Parklands 1 Figure 3 Stage 2 in the wider context 3 Figure 4 Extended traffic model network (using AIMSUN as a microsimulation software) 4 Figure 5 Methodology to update and finalise the trip generation in Mt Penang Parklands 6 Figure 6 Potential one-way arrangement with Parklands Road southbound and The Avenue
northbound only 11 Figure 7 Potential one-way arrangement with Parklands Road northbound and The Avenue
southbound only 12 Figure 8 Comparison of traffic volume between Option 1 & 2 (2031) 13

GHD | Hunter & Central Coast Development Corporation | 12548506 Mt Penang Parklands Traffic Study Report Stage 2 | ixThis document is in draft form. The contents, including any opinions, conclusions or recommendations contained in, or which may be implied from, this draft document must not be relied upon. GHD reserves the right, at any time, without notice, to modify or retract any part or all of the draft document. To the maximum extent permitted by law, GHD disclaims any responsibility or liability arising from or in connection with this draft document.
Figure 9 Reduction of traffic volumes on The Avenue and Parklands Road – AM peak 14 Figure 10 Reduction of traffic volumes on The Avenue and Parklands Road – PM peak 15 Figure 11 Option 2 – The Avenue southbound one-way: vehicles using Festival Drive and
Parklands Road to access Parklands North 16 Figure 12 Traffic volume / speed results in Option 4, 2031 19 Figure 13 Northbound route from Highway Commercial Precinct to Parklands North via Festival
Drive (Option 2) 20 Figure 14 Northbound route from CCH to Parklands North via Festival Drive, Option 2: One-way
system / The Avenue (southbound) 21 Figure 15 Economic analysis of kerbside function: daily revenue generated by different kerbside
usage 23 Figure 16 Two-way arrangement example 24 Figure 17 One-way arrangement example: improved kerbside function and widening of footpath 24 Figure 18 Bankstown City Plaza: extended kerbsides to reduce length of raised pedestrian
crossing 25 Figure 19 Predicted traffic delay at CCH and Kangoo Road intersection – 2031 (Option 2) 26 Figure 20 Predicted traffic delay at CCH and The Avenue intersection – 2031 (Option 2) 26 Figure 21 Traffic volumes at Kangoo Road and Baxter Track intersection (2031 and 2041) 28 Figure 22 concept design layout, Kangoo Road / Baxter Road 29 Figure 23 Existing accesses to schools within Mt Penang 29 Figure 24 Key crossing location for students 30 Figure 25 Overview of proposed one-way system options 32 Figure 26 Manns Road Industrial Area location 43 Figure 27 Industrial area access locations 44 Figure 28 Survey locations 48 Figure 29 Safe system approach overview 50 Figure 30 Treatment summary relevant to the proposed one-way system in Mt Penang 51

GHD | Hunter & Central Coast Development Corporation | 12548506 | 12548506 Mt Penang Parklands Traffic Study Report Stage 2 1This document is in draft form. The contents, including any opinions, conclusions or recommendations contained in, or which may be implied from, this draft document must not be relied upon. GHD reserves the right, at any time, without notice, to modify or retract any part or all of the draft document. To the maximum extent permitted by law, GHD disclaims any responsibility or liability arising from or in connection with this draft document.
1. Introduction
1.1 Project background This report has been prepared by GHD for Hunter and Central Coast Development Corporation (HCCDC) as part of the Stage 2 works for the Mt Penang Traffic and Transport Impact Study (TTIS). The study is intended to support proposals to upgrade and develop Mt Penang Parklands, with consideration to land-use controls and development standards. It is proposed that the subdivision and consequent development of specific precincts are enabled within the Parklands. This will assist in planning for the future, accounting for rises in population, tourism and wider economic trends.
Stage 1 of this study was completed in August 2020. It evaluated the impact of proposed and potential developments on the operation of the Central Coast Highway and broader road network. A microsimulation traffic model was developed for Stage 1, and was used to quantify the impact of new developments on the broader road network.
1.2 Study area Figure 2 depicts the location of Mt Penang Parklands. The Mt Penang Parklands site is located north of the Central Coast Highway and south of the M1 Pacific Motorway, in the suburb of Kariong. The site is located approximately 70 km north of Sydney and is situated close to the township of Gosford. The Parklands host multiple land-uses including bushlands, community facilities, heritage assets and potential commercial developments. It is to be noted that for the purpose of this traffic study, Mt Penang Parklands refers to the areas owned by HCCDC, which excludes Highway Commercial Precinct and Kangoo Road Commercial Precinct, however traffic generation from these sites are included in the microsimulation model.
Figure 2 Land-use precincts in Mt Penang Parklands

GHD | Hunter & Central Coast Development Corporation | 12548506 | 12548506 Mt Penang Parklands Traffic Study Report Stage 2 2This document is in draft form. The contents, including any opinions, conclusions or recommendations contained in, or which may be implied from, this draft document must not be relied upon. GHD reserves the right, at any time, without notice, to modify or retract any part or all of the draft document. To the maximum extent permitted by law, GHD disclaims any responsibility or liability arising from or in connection with this draft document.
1.3 Previous submission (Stage 1) Mount Penang (Stage 1) Traffic and Transport Study Report (hereafter referred as Stage 1 Traffic Study) involved the development of a microsimulation base traffic model used to quantify the impact of new developments on Central Coast Highway and the broader road network. It included an assessment of the traffic impact of the proposed developments based on land use, including trip generation and distribution of all modes of transport. The final version was submitted to HCCDC in August 2020.
The recommendations of the Stage 1 traffic study include:
– A proposed left-in / left-out access (at Highway Commercial Precinct) to Central Coast Highway to be built by 2030, or before the completion of Stage 1 development of Highway Commercial Precinct. However, following the review by Transport for New South Wales (TfNSW), the access will be modified to a left-in only and reflected in the Stage 2 study.
– Upgrades at The Avenue to be investigated and implemented prior to 2030 or the completion of Stage 1 developments within Highway Commercial Precinct. The indicative dual right turn layouts assessed in the traffic model may be used as a reference for a minimum upgrade and carried through in Stage 2.
– Upgrades at Kangoo Road to be investigated and implemented prior to 2030 or 60% completion of developments within Kangoo Road Precinct. The indicative dual right turn layouts assessed in the traffic model could be used as a reference for a minimum upgrade and carried through in Stage 2.
– Investigation of travel demand management to be undertaken, targeting a 20% reduction of car trips based on the standard trip rate by 2030. The traffic generation analysis was revisited based on sample locations in the Gosford industrial area. This is detailed in Section 2 of this study.
– Investigation of further upgrades at The Avenue and Kangoo Road with preliminary design layout produced for HCCDC.
1.4 Scope and limitations
1.4.1 Context and current scope of work (Stage 2) The primary objective of the Mt Penang Parklands Traffic and Transport Study is to assess the potential traffic impact of proposed developments on the operation of the road network within the Parklands, and the broader road network including Central Coast Highway. Concurrent to this study, TfNSW is developing an Integrated Transport Plan (ITP) for the Mt Penang, Kariong and Somersby areas. The purpose of the ITP is to identify and quantify the traffic and transport impacts of proposed planning, and to determine the required upgrades to the wider transport network as an appropriate response. Within the context of future land use plan for the Mt Penang Parklands developed by HCCDC (Figure 2) and the ITP being developed by TfNSW, the Stage 2 TTIS works include the following:
– Finalisation of the traffic generation and staging assumptions for Mt Penang Parklands traffic, including those to be generated from the Highway Commercial Precinct and Kangoo Road Precinct. Background traffic growth along Central Coast Highway is also updated according to the forecast in TfNSW’s latest strategic model, namely the Regional and Outer Metropolitan Strategic Transport Forecasting Model (ROM STFM). The details of the update are provided in Section 2 of this document. The details of the update are provided in Section 2 of this document
– Assessment of the evolving internal road network within Mt Penang Parklands, including assessment of the potential one-way system and Festival Drive extension. This is documented in Section 3.2.
– Update the impact on two access points to Central Coast Highway at The Avenue and Kangoo Road, producing preliminary design layout as inputs to be further assessed in TfNSW’s ITP. This is detailed in Section 3.3.
– Assessment of the acceptability of the Parklands Road north layout, as documented in 3.4
– Commentary on the transport requirements if the schools within Mt Penang increase enrolments in the future, as documented in Section 3.5.
It is understood that the wider network impact, e.g. on Central Coast Highway, following those already assessed in Stage 1 study, are investigated in detail in TfNSW’s ITP.

GHD | Hunter & Central Coast Development Corporation | 12548506 | 12548506 Mt Penang Parklands Traffic Study Report Stage 2 3This document is in draft form. The contents, including any opinions, conclusions or recommendations contained in, or which may be implied from, this draft document must not be relied upon. GHD reserves the right, at any time, without notice, to modify or retract any part or all of the draft document. To the maximum extent permitted by law, GHD disclaims any responsibility or liability arising from or in connection with this draft document.
Figure 3 Stage 2 in the wider context
GHD | Hunter & Central Coast Development Corporation | 12548506 | 12548506 Mt Penang Parklands Traffic Study Report Stage 2 4This document is in draft form. The contents, including any opinions, conclusions or recommendations contained in, or which may be implied from, this draft document must not be relied upon. GHD reserves the right, at any time, without notice, to modify or retract any part or all of the draft document. To the maximum extent permitted by law, GHD disclaims any responsibility or liability arising from or in connection with this draft document.
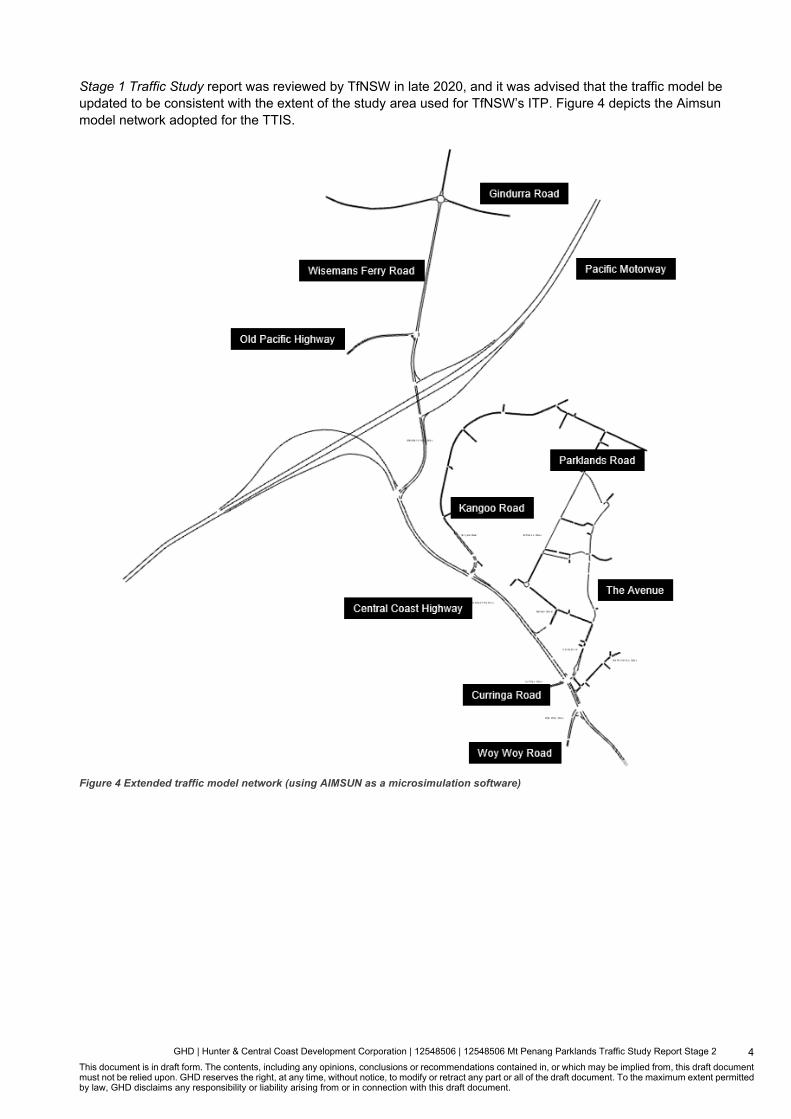
Stage 1 Traffic Study report was reviewed by TfNSW in late 2020, and it was advised that the traffic model be updated to be consistent with the extent of the study area used for TfNSW’s ITP. Figure 4 depicts the Aimsun model network adopted for the TTIS.
Figure 4 Extended traffic model network (using AIMSUN as a microsimulation software)

5 GHD | Hunter and Central Coast Development Corporation | Mt Penang Parklands Traffic Study (Stage 2)
This document is in draft form. The contents, including any opinions, conclusions or recommendations contained in, or which may be implied from, this draft document must not be relied upon. GHD reserves the right, at any time, without notice, to modify or retract any part or all of the draft document. To the maximum extent permitted by law, GHD disclaims any responsibility or liability arising from or in connection with this draft document.
1.4.2 Limitations This report: has been prepared by GHD for Hunter & Central Coast Development Corporation and may only be used and relied on by Hunter & Central Coast Development Corporation for the purpose agreed between GHD and Hunter & Central Coast Development Corporation as set out in section 1 of this report.
GHD otherwise disclaims responsibility to any person other than Hunter & Central Coast Development Corporation arising in connection with this report. GHD also excludes implied warranties and conditions, to the extent legally permissible.
The services undertaken by GHD in connection with preparing this report were limited to those specifically detailed in the report and are subject to the scope limitations set out in the report.
The opinions, conclusions and any recommendations in this report are based on conditions encountered and information reviewed at the date of preparation of the report. GHD has no responsibility or obligation to update this report to account for events or changes occurring subsequent to the date that the report was prepared.
The opinions, conclusions and any recommendations in this report are based on assumptions made by GHD described in this report (section 1 of this report). GHD disclaims liability arising from any of the assumptions being incorrect.
1.5 Traffic modelling glossary A glossary of technical terms of traffic modelling is set out below to assist in the interpretation of this document.
Assignment – The path that vehicles take through the model network.
Base Traffic Model – A model calibrated and validated to observed traffic data.
Calibration – A process of modifying model parameter values until model outputs replicate observed data to within a specified tolerance level.
Density – The number of vehicles occupying a unit length of roadway (e.g. vehicles / kilometre)
Microsimulation Modelling – Microsimulation models are dynamic, stochastic, discrete time modelling techniques that simulate the movement of individual vehicles based on car-following, lane changing and gap acceptance algorithms that are updated several times every second. (RMS, 2013)
Model Analysis Period – The time period that traffic performance is to be analysed over.
Model Seed – A number utilised in the random number generator of a model package to vary model outputs stochastically. This is also referred to be Random Seed.
Modelling Methodology – Also called Modelling Type. It is the type of the analysis that a model undertakes, either Strategic, Mesoscopic, Hybrid or Microscopic.
SCATS – Sydney Coordinated Adaptive Traffic System, an adaptive traffic signal system.
Strategic Modelling – A broad term for Macrosimulation, Macroscopic and Macroanalytical Modelling.
Traffic Demand – The volume of traffic assigned to traffic zone, rather than completing a journey.
Traffic Distribution – The locations where journeys start and end.
Validation – An evaluation of the model’s ability to predict behaviour through comparisons of information not used in the calibration process.
Vehicle Class – The categorisation of a set of vehicles based on a common attribute.

6 GHD | Hunter and Central Coast Development Corporation | Mt Penang Parklands Traffic Study (Stage 2)
This document is in draft form. The contents, including any opinions, conclusions or recommendations contained in, or which may be implied from, this draft document must not be relied upon. GHD reserves the right, at any time, without notice, to modify or retract any part or all of the draft document. To the maximum extent permitted by law, GHD disclaims any responsibility or liability arising from or in connection with this draft document.
2. Future traffic growth
2.1 Methodology Background traffic (e.g. through traffic on Central Coast Highway) for this project was estimated through the latest update of Regional and Outer Metropolitan Strategic Traffic Forecast Model, as agreed upon by TfNSW in October 2021.
Development traffic was previously estimated using trip generation rates acquired from the RMS Guide to Traffic Generating Developments Version 2.2, 2002 and Guide to Traffic Generating Developments – Updated Traffic Surveys, 2013 in the Stage 1 study. To improve the robustness of these estimates, it was recommended that a trip generation rate review was undertaken using traffic data obtained from similar areas (in terms of land use profile and access) to the Mt Penang Parklands, in accordance with the steps shown in Figure 5.
Figure 5 Methodology to update and finalise the trip generation in Mt Penang Parklands
This trip generation review has been developed based on the following assumptions:
– Automatic Traffic Counts (ATC) data collected by Matrix, for the week commencing 3 June 2021, is error-free and represents traffic movements at the specified locations on the survey dates. Comparison of traffic counts with those collected in February 2020, indicated that the traffic volumes are comparable with minimal impact from COVID-19.
– The access locations are used solely for access to lots located within the Manns Road industrial precinct.
– Due to the commonality of land-uses within the industrial area in Manns Road industrial precinct, there are negligible internal trips generated (i.e. vehicle trips that do not leave the precinct).
2.2 Overview of land use within Mt Penang Parklands An overview of the proposed land-use category and likely developments in each precinct, including the total gross floor area (GFA) of the anticipated developments, is provided in Table 1. This was approved by HCCDC for the Stage 1 scope of work and was advised it is still applicable to this project.
Industrial estates and business parks are anticipated to be the future predominant land-use within Mt Penang, comprising approximately 58 % (~99,400 m2) of the total GFA (close to 172 m2). The majority (~61,500 m2) of this land use will be contained within the Kangoo Road Commercial Precinct. However, if Mt Penang Parklands developments are not realised, then HCCDC’s demand on major mitigation works is reduced.

7 GHD | Hunter and Central Coast Development Corporation | Mt Penang Parklands Traffic Study (Stage 2)
This document is in draft form. The contents, including any opinions, conclusions or recommendations contained in, or which may be implied from, this draft document must not be relied upon. GHD reserves the right, at any time, without notice, to modify or retract any part or all of the draft document. To the maximum extent permitted by law, GHD disclaims any responsibility or liability arising from or in connection with this draft document.
Table 1 Mt Penang development land-use summary
Precinct Land-Use Anticipated Developments New developments (Total GFA)
1 Kangoo Road Commercial
Business Development
Industry, offices, warehouse, commercial, hotels, manufacturing, education and training facilities.
27
(103,595 m2)
2 Highway Commercial
Mixed Use Supermarket, fast food, specialty shops, gymnasium, child care, workshop, car wash, nursing home, car dealership, pub and hotel.
17
(14,300 m2)
3 Festival / Gardens
Public Recreation
Restaurant, functions space, tourist information centre, offices and business parks.
12
(14,079 m2)
4 Baxter Track Mixed Use
Mixed Use Offices and business parks. 9 (24,975 m2)
5 Heritage Precinct Mixed Use Art galleries, school building, village hall.
5 (1,424 m2)
6 Sports Precinct Mixed Use Recreational facilities. 6 (3,436 m2)
7 Phillip House Mixed Use Precinct
Environmental Living
No development. N/A
8 Bushland Environmental Conservation
No development. N/A
9 Transitional Mixed Use
Mixed Use Tourist accommodation, community facilities
3 (10,127 m2)
Total developments 79 (171,936 m2)
Table 2 summarises the assumed staging development for the forecast years 2031 and 2041 respectively.
Table 2 Assumed staging development (2031 and 2041)
Precinct 2031 2041
Kangoo Road Commercial (Borg) 60% 100%
Highway Commercial Precinct (Stevens Group)
Stage 1 (3 fast food restaurants and
vehicle repair centre)
100% development
Mt Penang Parklands 100% development in Baxter Track and Transitional Mixed-Use Areas only
100% development of all areas.
Refer to Appendix C for a case study regarding the land use summary of Manns Road industrial estate, which is a neighbouring area to Mt Penang Parklands.

8 GHD | Hunter and Central Coast Development Corporation | Mt Penang Parklands Traffic Study (Stage 2)
This document is in draft form. The contents, including any opinions, conclusions or recommendations contained in, or which may be implied from, this draft document must not be relied upon. GHD reserves the right, at any time, without notice, to modify or retract any part or all of the draft document. To the maximum extent permitted by law, GHD disclaims any responsibility or liability arising from or in connection with this draft document.
2.3 Trip generation update for Mt Penang Parklands Table 3 summarises the AM and PM trips generated for each precinct. The revised trip generation rates have resulted in a decrease of 357 vehicle trips in the AM peak and 503 trips in the PM peak, a reduction of 16% and 21% respectively. In the Saturday peak, the number of trips has stayed roughly the same.
– Trip generation rates for the business park and industrial estates land use are as follows:
0.48 trips per 100 m2 GFA between 7 and 9 am for the weekday AM assessment
0.40 trips per 100 m2 GFA between 4 and 6 pm for the weekday PM assessment
0.24 trips per 100 m2 GFA between 12 pm and 2 pm for the weekend assessment.
– For other land uses: consistent with those shown in RMS Guide and adopted in Stage 1 study
It is recommended that the revised trip rates are used for Stage 2 of the traffic modelling work in this project.’
Refer to Appendix C for an understanding of the derivation of the above trip generation rates, through use of the RMS Guidelines.
Table 3 Development traffic for Mt Penang Parklands (full development)
Precinct Hourly AM Peak Development Traffic (Vehicle Trips) (7 – 9 am)
Hourly PM Peak Development Traffic (Vehicle Trips) (4 – 6 pm)
Hourly Saturday Peak Development Traffic (Vehicle Trips) (12 – 2 pm)
RMS Guide
Revised trip rates
Difference (%)
RMS Guide
Revised trip rates
Difference (%)
RMS Guide
Revised trip rates
Difference (%)
1: Kangoo Road Commercial
835 568 -32 884 517 -42 225 215 -4
2: Highway Commercial
895 895 0 986 986 0 1023 1023 0
3: Festival / Gardens
95 66 -31 142 91 -36 58 70 +21
4: Baxter Track Mixed Use
175 120 -31 175 100 -43 39 60 +54
5: Heritage Precinct
20 19 -5 20 18 -10 20 20 -
6: Sports Precinct
92 92 - 92 92 - 92 92 -
7: Phillip House Mixed Use Precinct
0 0 - 0 0 - 0 0 -
8: Bushland (no development)
0 0 - 0 0 - 0 0 -
9: Transitional Mixed Use
86 81 -6 88 80 -9 104 83 -20
Total 2198 1841 -16 2387 1884 -21 1561 1563 0
Note: RMS Guide refers to Regional Average

9 GHD | Hunter and Central Coast Development Corporation | Mt Penang Parklands Traffic Study (Stage 2)
This document is in draft form. The contents, including any opinions, conclusions or recommendations contained in, or which may be implied from, this draft document must not be relied upon. GHD reserves the right, at any time, without notice, to modify or retract any part or all of the draft document. To the maximum extent permitted by law, GHD disclaims any responsibility or liability arising from or in connection with this draft document.
3. Traffic modelling for internal road network within Mt Penang Parklands
3.1 Summary of assessed scenarios This section details the results for the investigation of network performance in associated with the internal road network within Mt Penang Parklands as proposed by HCCDC, based on the traffic modelling scenarios provided in Table 4. Each scenario was assessed for a two-hour AM (between 7:00 and 9:00 am) and PM (between 4:00 and 6:00 pm) peak, and for forecast years of 2031 and 2041.
It is to be noted that all the narratives presented in this section are based on the results between 8 and 9 am (AM peak) and between 5 and 6 pm (PM peak) respectively for 2031 forecast year. The results for 2041 indicated excessive delay on both CCH and Mt Penang, consistent with the results from the Stage 1 study. Therefore, they were not used for comparing the impacts between each option.
A summary of results for the assessed scenarios are presented in Table 4. The overall performance of each option / upgrade was determined with respect to the objectives outlined in Table 5.

10 GHD | Hunter and Central Coast Development Corporation | Mt Penang Parklands Traffic Study (Stage 2)
This document is in draft form. The contents, including any opinions, conclusions or recommendations contained in, or which may be implied from, this draft document must not be relied upon. GHD reserves the right, at any time, without notice, to modify or retract any part or all of the draft document. To the maximum extent permitted by law, GHD disclaims any responsibility or liability arising from or in connection with this draft document.
Table 4 Summary of assessed scenarios for Mt Penang Parklands
Option The Avenue and The Parklands Road Parklands North Festival Drive extension CCH | Kangoo Road CCH | The Avenue
Option 1
One-way anticlockwise system: The Avenue (northbound) / Parklands Road (southbound)
As per design from HCCDC Included Dual right turn at Kangoo
Road approach
Upgrades at The Avenue approach
One-way system and improved kerbside function reduces crash likelihood and severity, and improves street amenity
Worse than Option 2 by:
Increase of 175 veh/hr on The Avenue
Increase of 75 veh/hr on existing Festival Drive (eastbound)
Reduced capacity for vehicles exiting Mt Penang Parklands via The Avenue
Minor delays (i.e. LoS A) experienced; capacity is
adequate
Has no impact on CCH intersections; rather increases traffic on internal road network, which could be mitigated by directing traffic to utilise Baxter Track
Worse than Option 2 by:
Increase of 60 veh/hr on Festival Drive (extension)
Over 70s delay (i.e. LoS F) experienced
Over 70s delay (i.e. LoS F) experienced
Option 2
One-way clockwise system: The Avenue (southbound) / Parklands Road (northbound)
As per design from HCCDC Included Dual right turn at Kangoo
Road approach Upgrades at The Avenue
approach
One-way system and improved kerbside function reduces crash likelihood and severity, and improves street amenity
Better than benchmark by:
Reduction of 220 veh/hr (PM) on The Avenue
Better than Option 1 by:
Reduction of 175 veh/hr (AM) on The Avenue
Reduction of 75 veh/hr on existing Festival Drive (eastbound)
Additional capacity for vehicles exiting Mt Penang via The Avenue
Minor delays (i.e. LoS A) experienced; capacity is
adequate
Has no impact on CCH intersections; rather increases traffic on internal road network, which could be mitigated by directing traffic to utilise Baxter Track
Better than Option 1 by:
Reduction of 60 veh/hr on Festival Drive (extension)
Better than Option 4 by:
Reduction of 90 veh/hr on one-way system
Over 70s delay (i.e. LoS F) experienced
Over 70s delay (i.e. LoS F) experienced
Option 3
One-way anticlockwise system: The Avenue (northbound) / Parklands Road (southbound)
As per design from HCCDC Excluded Dual right turn at Kangoo
Road approach
Upgrades at The Avenue approach
Similar to Option 1 Minor delays (i.e. LoS A) experienced; capacity is
adequate
Over 70s delay (i.e. LoS F) experienced
Over 70s delay (i.e. LoS F) experienced
Option 4
One-way clockwise system: The Avenue (southbound) / Parklands Road (northbound)
As per design from HCCDC Excluded Dual right turn at Kangoo
Road approach
Upgrades at The Avenue approach
Similar to Option 2 Minor delays (i.e. LoS A) experienced; capacity is
adequate
Worse than Option 2 by:
Increase of 90 veh/hr on one-way system
Over 70s delay (i.e. LoS F) experienced
Over 70s delay (i.e. LoS F) experienced
Benchmark Scenario (developed for TfNSW’s ITP and for comparison only)
Two-way system on The Avenue and Parklands Road As per design from HCCDC Included Dual right turn at Kangoo
Road approach Upgrades at The Avenue
approach

11 GHD | Hunter and Central Coast Development Corporation | Mt Penang Parklands Traffic Study (Stage 2)
This document is in draft form. The contents, including any opinions, conclusions or recommendations contained in, or which may be implied from, this draft document must not be relied upon. GHD reserves the right, at any time, without notice, to modify or retract any part or all of the draft document. To the maximum extent permitted by law, GHD disclaims any responsibility or liability arising from or in connection with this draft document.
Table 5 Overall objectives in assessing traffic efficiency of upgrades
# Objectives Discussion Section
1 Reducing traffic on The Avenue within Heritage core area 3.2.1
2 Investigating the impact on Festival Drive including the extension 3.2.2
3 Promoting safety benefits 3.2.3
4 Promoting kerbside function 3.2.4
5 Investigating the impact on Kangoo Road / Central Coast Highway intersections and The Avenue / Central Coast Highway intersections
3.3
3.2 The Avenue and Parklands Road proposed one-way network
Two potential one-way arrangements on Parklands Road and The Avenue were investigated as presented in Figure 6 and Figure 7 (highlighted as red dash line) respectively, aiming to achieve:
– Reduction of traffic impact on The Avenue by reducing traffic throughput, particularly within the ‘heritage core’
– Improved outcomes for pedestrian and cyclist safety and connectivity
To maintain reasonable accessibility, both options retain a two-way arrangement (as per existing conditions) on some roads, as highlighted in green in both Figures. This is recommended on Festival Drive and the southern section of Parklands Road in the south, to provide two-way access to Kariong Mountains High School, the Gardens and the Café. It is also recommended that this is provided at Parklands Road north of McCabe Road to facilitate two-way access to the Parklands from Kangoo Road.
The different directions of the one-way arrangement were assessed to determine which would operate more efficiently, also noting that the directional distribution of traffic would differ in the AM and PM peak periods.
Figure 6 Potential one-way arrangement with Parklands Road southbound and The Avenue northbound only
12 GHD | Hunter and Central Coast Development Corporation | Mt Penang Parklands Traffic Study (Stage 2)
This document is in draft form. The contents, including any opinions, conclusions or recommendations contained in, or which may be implied from, this draft document must not be relied upon. GHD reserves the right, at any time, without notice, to modify or retract any part or all of the draft document. To the maximum extent permitted by law, GHD disclaims any responsibility or liability arising from or in connection with this draft document.
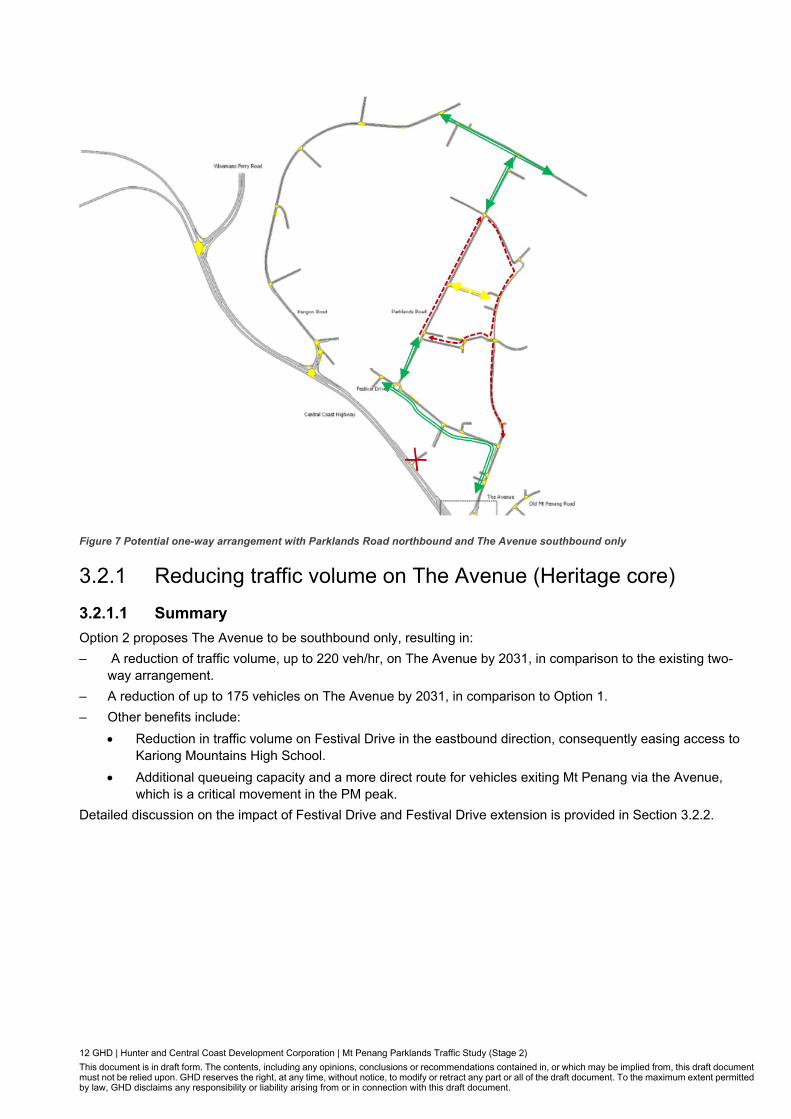
Figure 7 Potential one-way arrangement with Parklands Road northbound and The Avenue southbound only
3.2.1 Reducing traffic volume on The Avenue (Heritage core)
3.2.1.1 Summary
Option 2 proposes The Avenue to be southbound only, resulting in:
– A reduction of traffic volume, up to 220 veh/hr, on The Avenue by 2031, in comparison to the existing two-way arrangement.
– A reduction of up to 175 vehicles on The Avenue by 2031, in comparison to Option 1.
– Other benefits include:
Reduction in traffic volume on Festival Drive in the eastbound direction, consequently easing access to Kariong Mountains High School.
Additional queueing capacity and a more direct route for vehicles exiting Mt Penang via the Avenue, which is a critical movement in the PM peak.
Detailed discussion on the impact of Festival Drive and Festival Drive extension is provided in Section 3.2.2.

13 GHD | Hunter and Central Coast Development Corporation | Mt Penang Parklands Traffic Study (Stage 2)
This document is in draft form. The contents, including any opinions, conclusions or recommendations contained in, or which may be implied from, this draft document must not be relied upon. GHD reserves the right, at any time, without notice, to modify or retract any part or all of the draft document. To the maximum extent permitted by law, GHD disclaims any responsibility or liability arising from or in connection with this draft document.
2031 8-9 AM Option 1
2031 5-6 PM Option 1
2031 8-9 AM Option 2
2031 5-6 PM Option 2
Figure 8 Comparison of traffic volume between Option 1 & 2 (2031)

14 GHD | Hunter and Central Coast Development Corporation | Mt Penang Parklands Traffic Study (Stage 2)
This document is in draft form. The contents, including any opinions, conclusions or recommendations contained in, or which may be implied from, this draft document must not be relied upon. GHD reserves the right, at any time, without notice, to modify or retract any part or all of the draft document. To the maximum extent permitted by law, GHD disclaims any responsibility or liability arising from or in connection with this draft document.
3.2.1.2 One-way vs. two-way system
The benefits of both Option 1 and Option 2 include the potential reduction of vehicular movement on The Avenue within the Heritage core area. For demonstration purposes, the comparison was made between Option 2 (i.e. one-way arrangement where The Avenue is southbound) and Benchmark Scenario (two-way arrangement) as listed in Table 4.
Comparing the traffic volume for each option, as shown in Figure 9 and Figure 10, the results demonstrate that:
– During the AM peak, traffic volume reduced from over 210 vehicles (Benchmark) to 50 vehicles (Option 2) i.e. up to 160 veh/hr, within the Heritage core area
– During the PM peak, a reduction in traffic volume, up to 220 veh/hr, on The Avenue was simulated for Option 2 compared to Benchmark Scenario
Figure 9 Reduction of traffic volumes on The Avenue and Parklands Road – AM peak

15 GHD | Hunter and Central Coast Development Corporation | Mt Penang Parklands Traffic Study (Stage 2)
This document is in draft form. The contents, including any opinions, conclusions or recommendations contained in, or which may be implied from, this draft document must not be relied upon. GHD reserves the right, at any time, without notice, to modify or retract any part or all of the draft document. To the maximum extent permitted by law, GHD disclaims any responsibility or liability arising from or in connection with this draft document.
Figure 10 Reduction of traffic volumes on The Avenue and Parklands Road – PM peak
The results also demonstrated that an increase in traffic volume on Parklands Road and Festival Drive is anticipated, particularly for traffic accessing the Parklands North. They are no longer able to use The Avenue following its conversion to a southbound one-way arrangement. This is demonstrated in Figure 11.

16 GHD | Hunter and Central Coast Development Corporation | Mt Penang Parklands Traffic Study (Stage 2)
This document is in draft form. The contents, including any opinions, conclusions or recommendations contained in, or which may be implied from, this draft document must not be relied upon. GHD reserves the right, at any time, without notice, to modify or retract any part or all of the draft document. To the maximum extent permitted by law, GHD disclaims any responsibility or liability arising from or in connection with this draft document.
Figure 11 Option 2 – The Avenue southbound one-way: vehicles using Festival Drive and Parklands Road to access Parklands North
3.2.1.3 Option 1 (The Avenue northbound) vs. Option 2 (The Avenue southbound)
Differences in traffic volume Option 1 (The Avenue northbound) and Option 2 (The Avenue southbound) are provided in Table 6 for the AM peak. Figure 8 also depicts the traffic volume results for both options.
It becomes obvious that the one-way system proposed in Option 2 would significantly reduce the traffic volume on The Avenue, particularly in the AM peak. Observed in Option 2, an increase in traffic on Festival Drive in westbound direction is also anticipated, facilitating the northbound traffic via Parklands Road.
Table 6 Traffic volumes comparison on the internal road network
Predicted traffic volumes
Option 1 (one-way) Option 2 (one-way)
AM Northbound Southbound Northbound Southbound
The Avenue, north of Festival Drive
225 - - 50
Parklands Road, north of Festival Drive
100 65 270 20
AM Eastbound Westbound Eastbound Westbound
Festival Drive, west of The Avenue
380 175 305 350
Festival Drive extension 215 280 230 230
Traffic volumes summarised from Figure 8 (rounded to nearest 5 vehicles / hour)
Ancillary benefits provided by Option 2 are listed in Table 7.

17 GHD | Hunter and Central Coast Development Corporation | Mt Penang Parklands Traffic Study (Stage 2)
This document is in draft form. The contents, including any opinions, conclusions or recommendations contained in, or which may be implied from, this draft document must not be relied upon. GHD reserves the right, at any time, without notice, to modify or retract any part or all of the draft document. To the maximum extent permitted by law, GHD disclaims any responsibility or liability arising from or in connection with this draft document.
Table 7 Other benefits and impacts of Option 2
Other Benefits
Reduction in eastbound traffic on Festival Drive
With The Avenue converted to a single direction in Option 2, the southbound section on The Avenue provides a more direct route for vehicles to access Central Coast Highway via the intersection with The Avenue, instead of using Festival Drive in the eastbound direction, which provides access to the Kariong Mountains High School. This is discussed in more detail in Section 3.2.2.
Additional queuing storage space for existing Mt Penang
Queuing is anticipated at The Avenue accessing CCH in the future. As such, the arrangement in Option 2 provides additional road capacity and queueing space for the southbound vehicles, as vehicles can use both The Avenue and Festival Drive to exit the Parklands, rather than just Festival Drive in Option 1.
More opportunities for route choice within Mt Penang
In order to arrive at Central Coast Highway through the Avenue, Option 2 provides more direct routes for those from the Parklands.
3.2.2 Impact on Festival Drive
3.2.2.1 Summary
In summary, Festival Drive (existing) observed greater traffic volume, i.e. over 100 vehicles per hour, in Option 2 compared to Option 1. 54% of traffic using the link eastbound was generated from the Highway Commercial Precinct in Option 2.
Festival Drive extension observed a slightly smaller traffic volume, i.e. up to 60 vehicles per hour, in Option 2 when compared to Option 1. On this link, 80% of traffic was generated from the Highway Commercial Precinct in Option 2.
Option 2 observed a reduction in traffic volume on Parklands Road (NB) and The Avenue (SB), i.e. over 90 vehicles per hour when compared to Option 4 (exclusion of Festival Drive extension). This indicates acceptable traffic levels, which are reduced with the inclusion of Festival Drive extension that acts as a direct link between

18 GHD | Hunter and Central Coast Development Corporation | Mt Penang Parklands Traffic Study (Stage 2)
This document is in draft form. The contents, including any opinions, conclusions or recommendations contained in, or which may be implied from, this draft document must not be relied upon. GHD reserves the right, at any time, without notice, to modify or retract any part or all of the draft document. To the maximum extent permitted by law, GHD disclaims any responsibility or liability arising from or in connection with this draft document.
Central Coast Highway and the one-way system. Alternate ways to mitigate traffic levels are to reduce development and encourage people to access the site via Baxter Track in the AM period.
Table 8 Summary of traffic generation and performance benefits on Festival Drive, Option 2, 2031 AM peak
Precinct Traffic on Festival Drive (Extension) Generated by
Precinct (%) Performance Benefits
Name Direction
Highway Commercial
Precinct
To Precinct (Eastbound)
Minimum (predominantly use left turn in from CCH) Option 2 vs 1: Reduction of 60 veh/hr
Option 2 vs 4 (Exclusion of Festival Drive extension): Reduction of 90 veh/hr From Precinct
(Westbound) 80%
Precinct Traffic on Festival Drive (Existing) Generated by
Precinct (%) Performance Benefits
Name Direction
Highway Commercial
Precinct
From Precinct (Eastbound)
Minimum
Option 2 vs 1: Additional 100 veh/hr To Precinct
(Westbound) 54%
19 GHD | Hunter and Central Coast Development Corporation | Mt Penang Parklands Traffic Study (Stage 2)
This document is in draft form. The contents, including any opinions, conclusions or recommendations contained in, or which may be implied from, this draft document must not be relied upon. GHD reserves the right, at any time, without notice, to modify or retract any part or all of the draft document. To the maximum extent permitted by law, GHD disclaims any responsibility or liability arising from or in connection with this draft document.
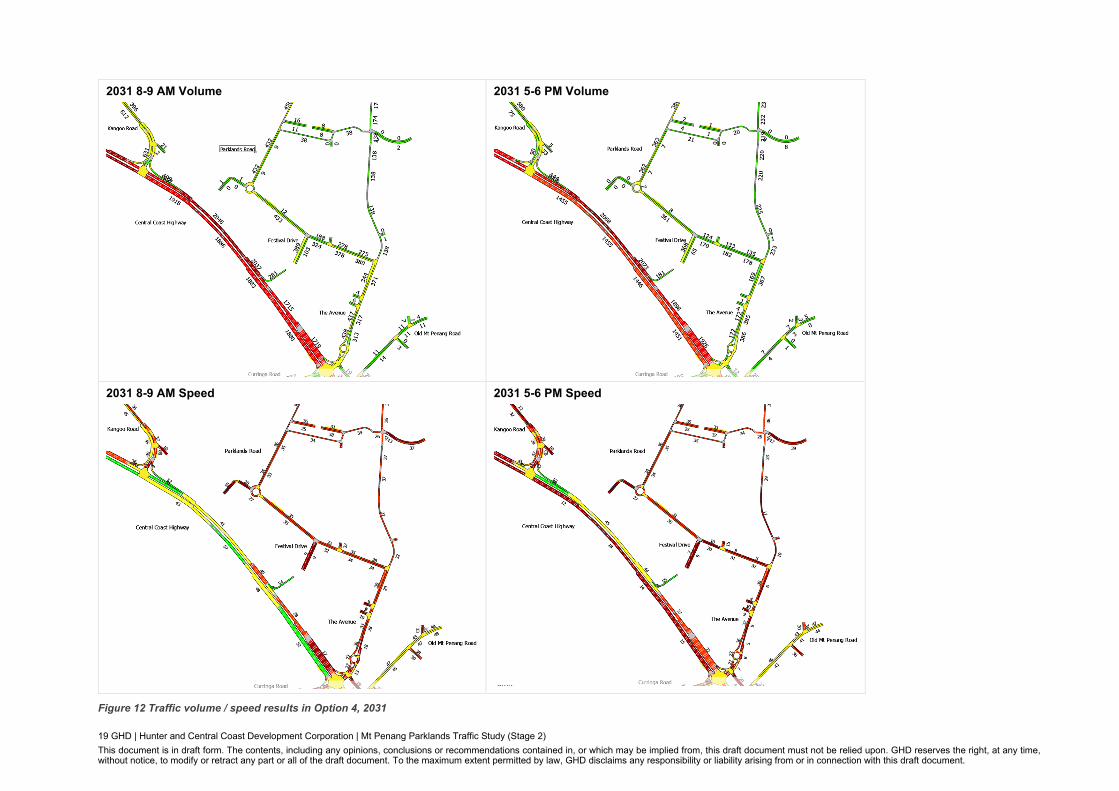
2031 8-9 AM Volume
2031 5-6 PM Volume
2031 8-9 AM Speed
2031 5-6 PM Speed
Figure 12 Traffic volume / speed results in Option 4, 2031

20 GHD | Hunter and Central Coast Development Corporation | Mt Penang Parklands Traffic Study (Stage 2)
This document is in draft form. The contents, including any opinions, conclusions or recommendations contained in, or which may be implied from, this draft document must not be relied upon. GHD reserves the right, at any time, without notice, to modify or retract any part or all of the draft document. To the maximum extent permitted by law, GHD disclaims any responsibility or liability arising from or in connection with this draft document.
3.2.2.2 Impact on the Festival Drive (existing section and proposed extension)
Festival Drive (existing) experiences greater traffic volume in Option 2 in comparison to Option 1, due to the limited routing choice of northbound vehicles travelling from Central Coast Highway (via The Avenue) toward Parklands North, after the adoption of the one-way system. This route choice is displayed in Figure 14.
More specifically, volume differences in 2031 were found to be (see Figure 8):
– An increase of over 100 vehicles per hour from Option 1 to Option 2 in AM peak
– An increase of up to 10 vehicles per hour from Option 1 to Option 2 in PM peak
This increase in vehicles is acceptable, with mitigation measures including additional access via Festival Dr extension and Baxter Track.
In Option 2 for the 2031 AM peak (see example of the route in Figure 13), Highway Commercial Precinct traffic comprises 54% of all vehicles using Festival Drive (existing), as detailed in Figure 14.
Similarly, Highway Commercial Precinct traffic comprises 80% of all vehicles using Festival Drive extension in Option 2.
Figure 13 Northbound route from Highway Commercial Precinct to Parklands North via Festival Drive (Option 2)

21 GHD | Hunter and Central Coast Development Corporation | Mt Penang Parklands Traffic Study (Stage 2)
This document is in draft form. The contents, including any opinions, conclusions or recommendations contained in, or which may be implied from, this draft document must not be relied upon. GHD reserves the right, at any time, without notice, to modify or retract any part or all of the draft document. To the maximum extent permitted by law, GHD disclaims any responsibility or liability arising from or in connection with this draft document.
Figure 14 Northbound route from CCH to Parklands North via Festival Drive, Option 2: One-way system / The Avenue (southbound)
Table 9 Breakdown of vehicles on Festival Drive generated to and from Highway Commercial Precinct (Option 2, 2031 AM peak)
Highway Commercial Precinct Proportion of traffic on existing Festival Drive (east of Parklands Road) generated by Highway Commercial precinct.
To Precinct (eastbound) 3%; predominantly use left turn in from CCH
From Precinct (westbound) 54%
The proposed section of Festival Drive extension (west of Parklands Road) observes a larger traffic volume in Option 1 in comparison to Option 2, due to the feasibility of southbound vehicles accessing Central Coast Highway from the one-way network via Parklands Road. Volume differences in 2031 were observed to be (see Figure 8):
– An increase of up to 60 vehicles per hour in Option 1 from Option 2 in AM peak
– An increase of over 10 vehicles per hour in Option 1 from Option 2 in PM peak
Moreover, an added benefit of Festival Drive extension, whilst being critical to Highway Stage 1, is the reduction of traffic within the Parklands in the AM, without having to encourage users to access from the North. This is supported by the comparison of Option 2 (inclusion of Festival Drive extension) and Option 4 (exclusion of Festival Drive extension), observing:
– An increase of up to 90 vehicles per hour on Parklands Road (NB) and over 100 vehicles per hour on The Avenue (SB) in AM peak, in Option 4 from Option 2.
– An increase of over 50 vehicles per hour on Parklands Road (NB) and up to 50 vehicles per hour on The Avenue (SB) in PM peak, in Option 4 from Option 2.

22 GHD | Hunter and Central Coast Development Corporation | Mt Penang Parklands Traffic Study (Stage 2)
This document is in draft form. The contents, including any opinions, conclusions or recommendations contained in, or which may be implied from, this draft document must not be relied upon. GHD reserves the right, at any time, without notice, to modify or retract any part or all of the draft document. To the maximum extent permitted by law, GHD disclaims any responsibility or liability arising from or in connection with this draft document.
– Similar speeds were observed within the Parklands vicinity for both options, though Option 2 experienced slightly higher vehicle speeds on Festival Drive, which can be addressed through speed limits and traffic calming.
Snapshots of traffic volume and speed results for Option 4 are provided in Figure 12.
It is noted that 80% of the traffic on the Festival Drive extension (westbound) was made up of traffic originating from Highway Commercial Precinct, whilst the remainder are from Central Coast Highway or the remainder of Mt Penang Parklands. Table 10 provides a breakdown of the traffic using Festival Drive from the Highway Commercial Precinct in Option 4.
Table 10 Breakdown of vehicles on Festival Drive generated to and from Highway Commercial Precinct, Option 4, 2031 AM peak
Highway Commercial Precinct Proportion of traffic on Festival Drive (extension) (west of Parklands Road) generated by Highway Commercial Precinct
To Precinct (eastbound) 1%; predominantly use left turn in from CCH
From Precinct (westbound) 80%
3.2.3 Safety benefits There is an evolving perception of the function of roads, from solely transporting people and goods, to now also providing safety, liveability and enjoyment of a road in a community, particularly within Heritage and Sports Precinct. The anticipated benefits of the one-way system proposed in both Option 1 and Option 2 are primarily derived from the reduction of vehicular movement on Parklands North or The Avenue, as well as the one-way nature of the movement. This results in positive amenities and a safer road environment for all users including pedestrians and cyclists, particularly near facilities such as schools, cafés and gardens. Increased space efficiency resulting from reduced lanes in the one-way system gives rise to the opportunity for safety infrastructures like pedestrian fencing and pedestrian crossings, shared lanes and cycling facilities. Therefore, it becomes imperative to manage vehicle volumes and provide a more inclusive road environment in order to see these positive benefits.
Further safety benefits in relation to the Safe System approach can be found in Appendix C.
3.2.4 Kerbside function Kerbsides are commonly associated with private vehicle parking, however contemporary views are shifting this perception, placing a larger emphasis on pedestrian-friendly environments. Particularly in local areas attracting valued communities and visitors, such as residential, recreational and commercial areas, an evolution of kerbside function observes a balancing act between road access and mixed usage, including parklets, café dining and bike parking. This is still in parallel with providing adequate connections with the wider transport network, facilitating the safe, reliable and efficient movement of people and goods (Austroads. Integrating Safe System with Movement and Place for Vulnerable Road Users. 2020).
Benefits of these kerbsides experienced by people include positive amenity, increased on-street activity, increased active and public transport use, long-term sustainability, reduced noise and emissions pollution, as well as social equity. Economic benefits are also experienced by local businesses (Austroads. Integrating Safe System with Movement and Place for Vulnerable Road Users. 2020). Urbis (2021) have conducted research, showing kerbsides to provide over 1.7 times more revenue for dining parklets or bike parking in comparison to vehicle parking, shown in Figure 15.

23 GHD | Hunter and Central Coast Development Corporation | Mt Penang Parklands Traffic Study (Stage 2)
This document is in draft form. The contents, including any opinions, conclusions or recommendations contained in, or which may be implied from, this draft document must not be relied upon. GHD reserves the right, at any time, without notice, to modify or retract any part or all of the draft document. To the maximum extent permitted by law, GHD disclaims any responsibility or liability arising from or in connection with this draft document.
Figure 15 Economic analysis of kerbside function: daily revenue generated by different kerbside usage
Kerbside function that reduces vehicle volume and speed, helps aim to eliminate death and serious injury under the Safe System Approach. Increased space efficiency also gives rise to infrastructure to provide additional protection to pedestrians, such as fencing, speed management and pedestrian crossings (Austroads. Integrating Safe System with Movement and Place for Vulnerable Road Users. 2020).
Converting the existing two-way (undivided) road to a one-way road would improve the kerbside function along Parklands Road and The Avenue, improving street accessibility and amenities through:
– Widening of existing footpaths
– Additional shared paths for both pedestrians and cyclists
– Additional green space or plants along the kerb and footpaths
– Kerbside parking for visitors of local facilities, in addition to designated car parks.
This transformation is shown as an example in Figure 16 and Figure 17, whereby the northbound carriageway (represented by the ‘up’ arrow) is used to extend the footpath and provide parklets containing green space and plants.

24 GHD | Hunter and Central Coast Development Corporation | Mt Penang Parklands Traffic Study (Stage 2)
This document is in draft form. The contents, including any opinions, conclusions or recommendations contained in, or which may be implied from, this draft document must not be relied upon. GHD reserves the right, at any time, without notice, to modify or retract any part or all of the draft document. To the maximum extent permitted by law, GHD disclaims any responsibility or liability arising from or in connection with this draft document.
Figure 16 Two-way arrangement example
Figure 17 One-way arrangement example: improved kerbside function and widening of footpath
An analysis of Bankstown City Plaza, as a similar case study with a dense pedestrian environment, boasts a one-way traffic lane, a shared zone, and pedestrian amenities featuring lighting, seating and wayfinding. Wide footpaths neatly accommodate large pedestrian volumes, on top of alfresco dining and outdoor retail displays. A low number of vehicles, shorter crossing distances, as well as plants in lieu of pedestrian fencing, help to reduce the possibility of crashes between vehicles and pedestrians. Kerbsides have also been extended to reduce the length people walk over a raised pedestrian crossing, shown in Figure 18. The slow road environment ultimately promotes a comfortable active transport experience, whilst still maintaining adequate connections to bus and rail (NSW Centre for Road Safety. Safe System Assessment Framework for Movement and Place Practitioners. 2021).

25 GHD | Hunter and Central Coast Development Corporation | Mt Penang Parklands Traffic Study (Stage 2)
This document is in draft form. The contents, including any opinions, conclusions or recommendations contained in, or which may be implied from, this draft document must not be relied upon. GHD reserves the right, at any time, without notice, to modify or retract any part or all of the draft document. To the maximum extent permitted by law, GHD disclaims any responsibility or liability arising from or in connection with this draft document.
Figure 18 Bankstown City Plaza: extended kerbsides to reduce length of raised pedestrian crossing
3.3 Intersection performance on Central Coast Highway Central Coast Highway / Kangoo Road intersection and Central Coast Highway / The Avenue intersection form the two access points for the traffic from Mt Penang to the wider road network. Therefore, the intersection operational performances at both intersections are vital to the traffic performance for vehicles entering and exiting Mt Penang. Table 11 depicts the adopted upgrade layouts at both intersections. These were also adopted as an upgrade option in the Stage 1 study.
The results demonstrate that with the proposed upgrades at Kangoo Road, The Avenue and the Festival Drive extension, the network would have insufficient capacity to accommodate the estimated traffic produced by both Highway Commercial Precinct and Kangoo Road Precincts, with the assumed development staging by 2031 (see Table 12).
Table 11 Proposed upgrades at CCH | Kangoo Road and CCH | The Avenue
Additional right turn lane from Kangoo Road to Central Coast Highway
Additional right turn lane from The Avenue to Central Coast Highway
Consistent with the findings from Stage 1 work, both intersections remain as a constraint within the road network. This is to maintain the capacity (e.g. signal phase time) allocated for the through movements on Central Coast Highway, whilst the traffic volumes from both Kangoo Road and The Avenue would increase substantially due to

26 GHD | Hunter and Central Coast Development Corporation | Mt Penang Parklands Traffic Study (Stage 2)
This document is in draft form. The contents, including any opinions, conclusions or recommendations contained in, or which may be implied from, this draft document must not be relied upon. GHD reserves the right, at any time, without notice, to modify or retract any part or all of the draft document. To the maximum extent permitted by law, GHD disclaims any responsibility or liability arising from or in connection with this draft document.
the land use development in Mt Penang, particularly from Highway Commercial Precinct and Kangoo Road Precinct. Highlighted in Figure 19 and Figure 20, the predicted traffic delay on both Kangoo Road and The Avenue would significantly increase and resulting in LoS F (e.g. over 70 seconds) and congestion at both approaches by 2031.
Figure 19 Predicted traffic delay at CCH and Kangoo Road intersection – 2031 (Option 2)
Figure 20 Predicted traffic delay at CCH and The Avenue intersection – 2031 (Option 2)

27 GHD | Hunter and Central Coast Development Corporation | Mt Penang Parklands Traffic Study (Stage 2)
This document is in draft form. The contents, including any opinions, conclusions or recommendations contained in, or which may be implied from, this draft document must not be relied upon. GHD reserves the right, at any time, without notice, to modify or retract any part or all of the draft document. To the maximum extent permitted by law, GHD disclaims any responsibility or liability arising from or in connection with this draft document.
Table 12 Assumed Staging Development (2031 and 2041)
Precinct 2031 2041
Kangoo Road Commercial (Borg) 60% 100%
Highway Commercial Precinct (Stevens Group)
Stage 1 (3 fast food restaurants and
vehicle repair centre)
100% development
Mt Penang Parklands 100% development in Baxter Track and Transitional Mixed-Use Areas only
100% development of all areas.
It is therefore imperative that proponents of activities investigate future upgrades at both intersections, in conjunction with the TfNSW’s ITP:
– Investigating the widening of Central Coast Highway in the eastbound direction, and in turn the re-allocation of signal capacity to Kangoo Road approach, discharging the traffic from Mt Penang,
– Investigating the potential changes at Central Coast Highway and The Avenue intersection, providing additional capacity for The Avenue, with the geometric layout currently limited by the heritage constraint,
– Promoting the travel mode shift for the traffic within the Mt Penang within the wider context of improving public transport and active transport alternatives for the region,
– Review the development staging plan of both Highway Commercial Precinct and Kangoo Road Precinct:
Ensuring the development traffic would be sufficiently facilitated by the proposed upgrades on CCH and both intersections.
Ensuring the developers provide a mitigation plan provided that the projected development traffic would exceed the capacity provided at both intersections and CCH (being investigated by TfNSW’s ITP).

28 GHD | Hunter and Central Coast Development Corporation | Mt Penang Parklands Traffic Study (Stage 2)
This document is in draft form. The contents, including any opinions, conclusions or recommendations contained in, or which may be implied from, this draft document must not be relied upon. GHD reserves the right, at any time, without notice, to modify or retract any part or all of the draft document. To the maximum extent permitted by law, GHD disclaims any responsibility or liability arising from or in connection with this draft document.
3.4 Parklands North The future location of Parklands connection to Baxter is currently under review with the intention to provide a north-south link between existing Parklands to Baxter to suit the future urban design of this area. It is also noted that:
– The traffic on Kangoo Road north of Baxter Track was predicted to be limited. As part of the Stage 1 traffic modelling, GHD has estimated the bidirectional future volumes on Kangoo Road north of Baxter Track to be less than 100 veh/h, as shown in Figure 21.
– Existing land-uses would also use Baxter Track and Parklands Road following the extension of Parklands Road to Baxter Track and the formalisation of the Kangoo Road / Baxter Track intersection. These include the Sunnyfield Community Services Hub and the Juvenile Justice Centre. These land-uses are not major contributors to peak hour traffic. Conservatively, it is assumed that these trips contribute approximately 50 vehicles / hour on the North South Link during peak periods.
Kangoo Road / Baxter Track intersection will operate within capacity with the proposed design layout (Figure 22) as a priority-controlled intersection, experiencing an LoS A, acceptable DoS and minor delays, based on the results from the microsimulation traffic model. It was predicted that the traffic will be accommodated by the proposed single lane (per direction) of Baxter Track.
Figure 21 Traffic volumes at Kangoo Road and Baxter Track intersection (2031 and 2041)

29 GHD | Hunter and Central Coast Development Corporation | Mt Penang Parklands Traffic Study (Stage 2)
This document is in draft form. The contents, including any opinions, conclusions or recommendations contained in, or which may be implied from, this draft document must not be relied upon. GHD reserves the right, at any time, without notice, to modify or retract any part or all of the draft document. To the maximum extent permitted by law, GHD disclaims any responsibility or liability arising from or in connection with this draft document.
Figure 22 concept design layout, Kangoo Road / Baxter Road
3.5 Potential impact of school access and expansion Two schools are located within Mt Penang: the Kariong Mountains High School and Central Coast Sports College. Locations are shown in Figure 23.
Figure 23 Existing accesses to schools within Mt Penang

30 GHD | Hunter and Central Coast Development Corporation | Mt Penang Parklands Traffic Study (Stage 2)
This document is in draft form. The contents, including any opinions, conclusions or recommendations contained in, or which may be implied from, this draft document must not be relied upon. GHD reserves the right, at any time, without notice, to modify or retract any part or all of the draft document. To the maximum extent permitted by law, GHD disclaims any responsibility or liability arising from or in connection with this draft document.
GHD’s site inspection in February 2020 (Stage 1 study) and 2nd November 2021 (as part of TfNSW ITP work) observed the following for the activities at Kariong Mountains High School and Central Coast Sports College within Mt Penang:
– The majority of students access schools by walking. School drop-offs don’t appear to be centred in any specific area and students were witnessed accessing walking to Kariong High School from The Avenue and the adjacent parking area.
– A dedicated indented kiss and ride and bus zone has been constructed on Kariong Mountains High School on the northern side of Festival Drive.
– Students crossing Central Coast Highway | The Avenue intersection in groups during peak periods of school activity e.g. 3 pm – 3:30 pm. This is consistent with students residing in Kariong walking to/from school. Figure 24 indicates the location of the key crossing point.
– Pedestrian activity was observed at Central Coast Sports College: students using pedestrian crossings on The Avenue and Carinya Street frequently.
– Note school hours for Central Coast Sports College is between 9 am and 4 pm, whilst the Kariong Mountains High School finishes around 3:15 pm. This supports an offset of peak hour activity between the two schools in the afternoon.
Figure 24 Key crossing location for students
The NSW Department of Education new planning guidelines, prioritises the use of sustainable modes of transport, particularly for students living with a 15-minute walking catchment (up to 1,200 m) and 15-minute cycling catchment (up to 3,600 m) from a school. Preliminary high-level analysis suggests that most of Kariong is within the walking catchment and all of it is within the cycling catchment.
It is understood that the proposed expansions are planned by both Central Coast Sports College and Kariong Mountains High School. It is anticipated with the expansion that the key travel modes for the students would still be walking or taking school buses.
Supporting the desired line between Kariong and the schools in Mt Penang is very important. Provided that the signalised pedestrian crossings at CCH | The Avenue are currently heavily used, it would be beneficial for TfNSW to investigate potential improvements, e.g. pedestrian overbridge. Further pedestrian phasing on signalised junctions on arterial roads are typically quite short so an overbridge (or similar) would significantly improve accessibility for students and the general public.

31 GHD | Hunter and Central Coast Development Corporation | Mt Penang Parklands Traffic Study (Stage 2)
This document is in draft form. The contents, including any opinions, conclusions or recommendations contained in, or which may be implied from, this draft document must not be relied upon. GHD reserves the right, at any time, without notice, to modify or retract any part or all of the draft document. To the maximum extent permitted by law, GHD disclaims any responsibility or liability arising from or in connection with this draft document.
Apart from the safety benefits on pedestrians, including students, it is recommended that proponents investigate the potential coordination of school traffic and the general traffic from/to Central Coast Highway, particularly during the peak hours within the school term (e.g. 8-9 a.m.), as a result of the capacity constraint at both CCH | Kangoo Road and CCH | The Avenue intersections discussed in section 3.3.
Both the Kariong Mountains High School and Central Coast Sports College are served by a relatively high number of school bus services.
– Key destinations for bus services of the Kariong Mountain High School include Calga, Central Mangrove and Mount White.
– Key destinations for bus services of the Central Coast Sports College include Swansea, Bensville, Woy Woy, Avoca and Bateau Bay.
It is noted that students in private schools typically travel further from their residences, and this is reflected by the bus services at the Central Coast Sports College.
Any assessment of school expansions should include:
– Traffic impact including the increase in picking up and dropping off activities, associated with the increase in enrolment
– A review of the patronage of the existing school bus services, to determine if they can accommodate additional students or whether additional bus capacity will be required.
With Festival Drive as a two-way road, the proposed one-way arrangement on The Avenue and Parklands Road is anticipated to have a limited impact on car or bus access to Kariong Mountains High School.
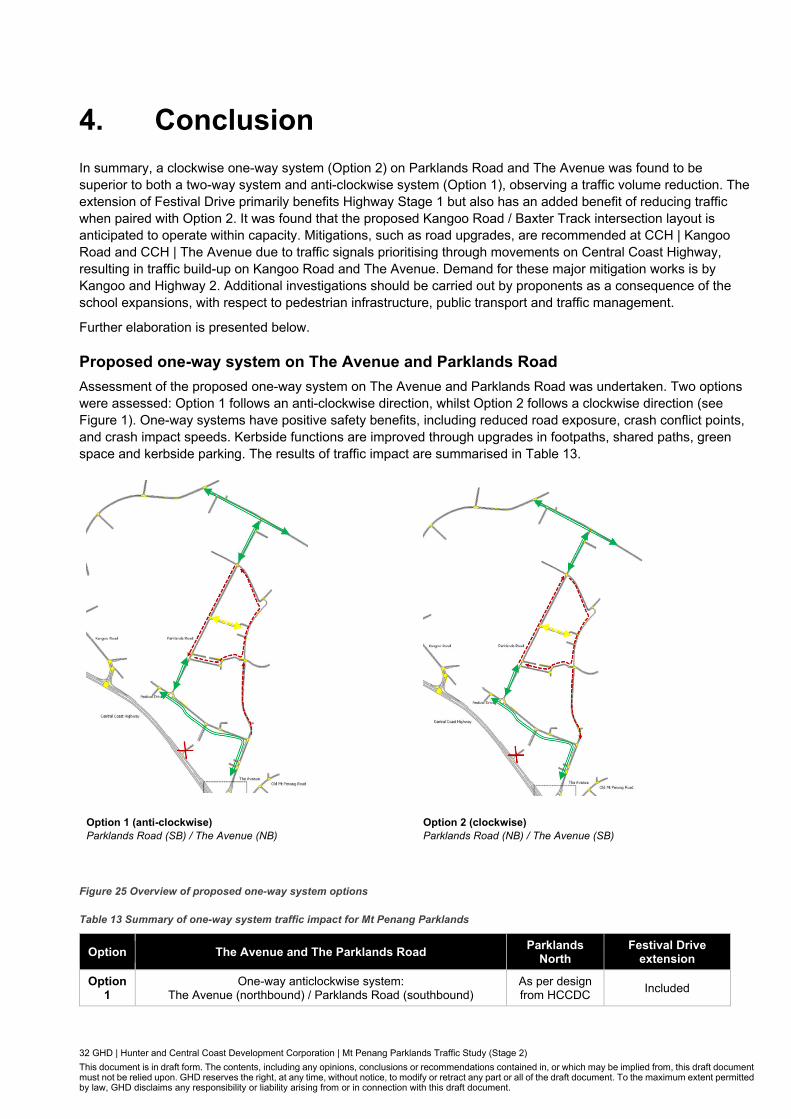
32 GHD | Hunter and Central Coast Development Corporation | Mt Penang Parklands Traffic Study (Stage 2)
This document is in draft form. The contents, including any opinions, conclusions or recommendations contained in, or which may be implied from, this draft document must not be relied upon. GHD reserves the right, at any time, without notice, to modify or retract any part or all of the draft document. To the maximum extent permitted by law, GHD disclaims any responsibility or liability arising from or in connection with this draft document.
4. Conclusion
In summary, a clockwise one-way system (Option 2) on Parklands Road and The Avenue was found to be superior to both a two-way system and anti-clockwise system (Option 1), observing a traffic volume reduction. The extension of Festival Drive primarily benefits Highway Stage 1 but also has an added benefit of reducing traffic when paired with Option 2. It was found that the proposed Kangoo Road / Baxter Track intersection layout is anticipated to operate within capacity. Mitigations, such as road upgrades, are recommended at CCH | Kangoo Road and CCH | The Avenue due to traffic signals prioritising through movements on Central Coast Highway, resulting in traffic build-up on Kangoo Road and The Avenue. Demand for these major mitigation works is by Kangoo and Highway 2. Additional investigations should be carried out by proponents as a consequence of the school expansions, with respect to pedestrian infrastructure, public transport and traffic management.
Further elaboration is presented below.
Proposed one-way system on The Avenue and Parklands Road
Assessment of the proposed one-way system on The Avenue and Parklands Road was undertaken. Two options were assessed: Option 1 follows an anti-clockwise direction, whilst Option 2 follows a clockwise direction (see Figure 1). One-way systems have positive safety benefits, including reduced road exposure, crash conflict points, and crash impact speeds. Kerbside functions are improved through upgrades in footpaths, shared paths, green space and kerbside parking. The results of traffic impact are summarised in Table 13.
Option 1 (anti-clockwise) Parklands Road (SB) / The Avenue (NB)
Option 2 (clockwise) Parklands Road (NB) / The Avenue (SB)
Figure 25 Overview of proposed one-way system options
Table 13 Summary of one-way system traffic impact for Mt Penang Parklands
Option The Avenue and The Parklands Road Parklands
North Festival Drive
extension
Option 1
One-way anticlockwise system: The Avenue (northbound) / Parklands Road (southbound)
As per design from HCCDC
Included
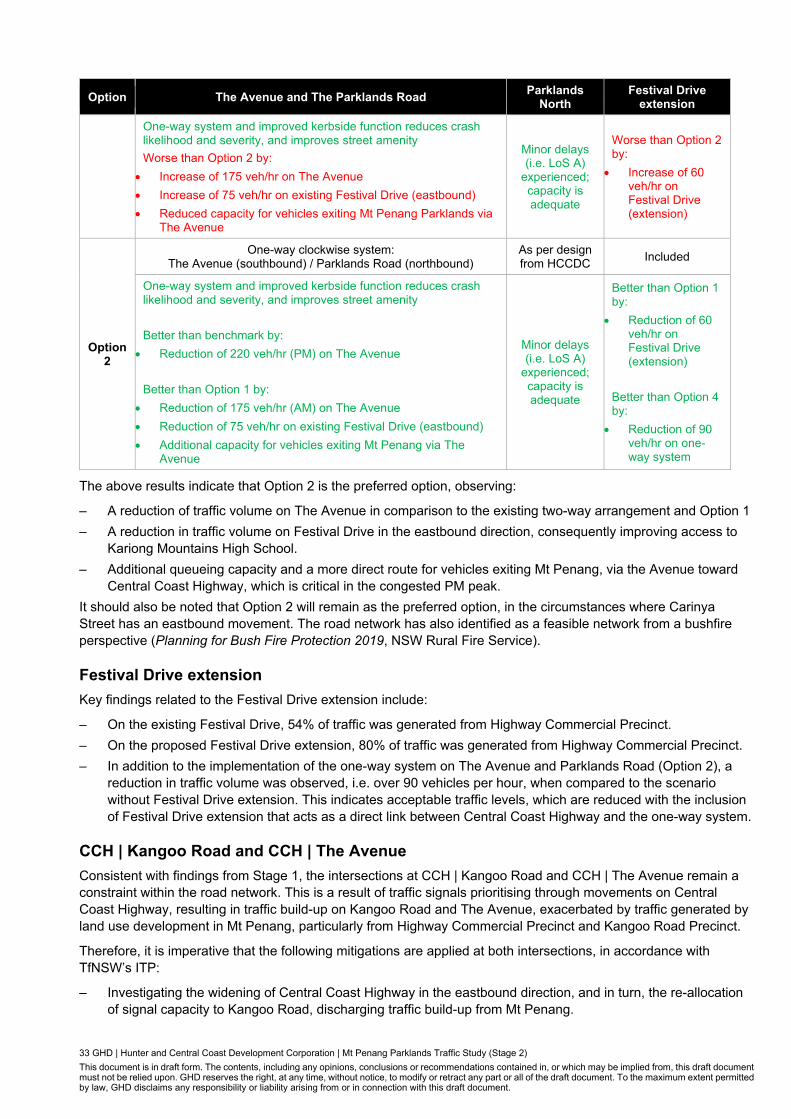
33 GHD | Hunter and Central Coast Development Corporation | Mt Penang Parklands Traffic Study (Stage 2)
This document is in draft form. The contents, including any opinions, conclusions or recommendations contained in, or which may be implied from, this draft document must not be relied upon. GHD reserves the right, at any time, without notice, to modify or retract any part or all of the draft document. To the maximum extent permitted by law, GHD disclaims any responsibility or liability arising from or in connection with this draft document.
Option The Avenue and The Parklands Road Parklands
North Festival Drive
extension
One-way system and improved kerbside function reduces crash likelihood and severity, and improves street amenity
Worse than Option 2 by:
Increase of 175 veh/hr on The Avenue
Increase of 75 veh/hr on existing Festival Drive (eastbound)
Reduced capacity for vehicles exiting Mt Penang Parklands via The Avenue
Minor delays (i.e. LoS A)
experienced; capacity is adequate
Worse than Option 2 by:
Increase of 60 veh/hr on Festival Drive (extension)
Option 2
One-way clockwise system: The Avenue (southbound) / Parklands Road (northbound)
As per design from HCCDC
Included
One-way system and improved kerbside function reduces crash likelihood and severity, and improves street amenity
Better than benchmark by:
Reduction of 220 veh/hr (PM) on The Avenue
Better than Option 1 by:
Reduction of 175 veh/hr (AM) on The Avenue
Reduction of 75 veh/hr on existing Festival Drive (eastbound)
Additional capacity for vehicles exiting Mt Penang via The Avenue
Minor delays (i.e. LoS A)
experienced; capacity is adequate
Better than Option 1 by:
Reduction of 60 veh/hr on Festival Drive (extension)
Better than Option 4 by:
Reduction of 90 veh/hr on one-way system
The above results indicate that Option 2 is the preferred option, observing:
– A reduction of traffic volume on The Avenue in comparison to the existing two-way arrangement and Option 1
– A reduction in traffic volume on Festival Drive in the eastbound direction, consequently improving access to Kariong Mountains High School.
– Additional queueing capacity and a more direct route for vehicles exiting Mt Penang, via the Avenue toward Central Coast Highway, which is critical in the congested PM peak.
It should also be noted that Option 2 will remain as the preferred option, in the circumstances where Carinya Street has an eastbound movement. The road network has also identified as a feasible network from a bushfire perspective (Planning for Bush Fire Protection 2019, NSW Rural Fire Service).
Festival Drive extension
Key findings related to the Festival Drive extension include:
– On the existing Festival Drive, 54% of traffic was generated from Highway Commercial Precinct.
– On the proposed Festival Drive extension, 80% of traffic was generated from Highway Commercial Precinct.
– In addition to the implementation of the one-way system on The Avenue and Parklands Road (Option 2), a reduction in traffic volume was observed, i.e. over 90 vehicles per hour, when compared to the scenario without Festival Drive extension. This indicates acceptable traffic levels, which are reduced with the inclusion of Festival Drive extension that acts as a direct link between Central Coast Highway and the one-way system.
CCH | Kangoo Road and CCH | The Avenue
Consistent with findings from Stage 1, the intersections at CCH | Kangoo Road and CCH | The Avenue remain a constraint within the road network. This is a result of traffic signals prioritising through movements on Central Coast Highway, resulting in traffic build-up on Kangoo Road and The Avenue, exacerbated by traffic generated by land use development in Mt Penang, particularly from Highway Commercial Precinct and Kangoo Road Precinct.
Therefore, it is imperative that the following mitigations are applied at both intersections, in accordance with TfNSW’s ITP:
– Investigating the widening of Central Coast Highway in the eastbound direction, and in turn, the re-allocation of signal capacity to Kangoo Road, discharging traffic build-up from Mt Penang.

34 GHD | Hunter and Central Coast Development Corporation | Mt Penang Parklands Traffic Study (Stage 2)
This document is in draft form. The contents, including any opinions, conclusions or recommendations contained in, or which may be implied from, this draft document must not be relied upon. GHD reserves the right, at any time, without notice, to modify or retract any part or all of the draft document. To the maximum extent permitted by law, GHD disclaims any responsibility or liability arising from or in connection with this draft document.
– Investigating the potential changes at the Central Coast Highway | The Avenue intersection, and providing additional capacity for The Avenue, as the current geometric layout is limited by heritage constraints.
– Promoting travel mode shift away from private car usage within Mt Penang, and exploring public transport and active transport alternatives for the region.
– Reviewing the development staging plan of both Highway Commercial Precinct and Kangoo Road Precinct
Ensuring the development traffic would be sufficiently facilitated by the proposed upgrades on CCH and both intersections.
Ensuring developers provide a mitigation plan in the case that projected development traffic exceeds capacity provided at both intersections on CCH (currently being investigated by TfNSW’s ITP).
Parklands North
Kangoo Road / Baxter Track intersection is anticipated to operate within capacity, with the proposed design layout provided by HCCDC being a priority-controlled intersection. Based on the results from the microsimulation traffic model, it is expected to experience an LoS A, acceptable DoS and minor delays. It was predicted that the proposed single lane (per direction) on Baxter Track provided adequate capacity.
Further road safety investigation is undertaken as part of the road safety audit during the concept design stage.
Potential impact of school access and expansion
With Festival Drive as a two-way road, the proposed one-way arrangement on The Avenue and Parklands Road is anticipated to have a limited impact on school access to Kariong Mountains High School. Also, the majority of students were found accessing schools by foot at the site inspection, and often using the pedestrian crossing at the Central Coast Highway | The Avenue intersection.
Due to proposed expansions by both Central Coast Sports College and Kariong Mountains High School, it is recommended that investigations be made to:
– Address potential improvements for key pedestrian crossing movements on CCH e.g. pedestrian overbridge
– Provide improved public transport for school students
– Provide coordination of both general and school traffic to/from Central Coast Highway, particularly during peak hours within the school term
– Mitigate pinch points at the CCH | Kangoo Road and CCH | The Avenue intersections, to prevent vehicles queuing back onto Festival Drive and Parklands Road, causing disruptions of access to schools

35 GHD | Hunter and Central Coast Development Corporation | Mt Penang Parklands Traffic Study (Stage 2)
This document is in draft form. The contents, including any opinions, conclusions or recommendations contained in, or which may be implied from, this draft document must not be relied upon. GHD reserves the right, at any time, without notice, to modify or retract any part or all of the draft document. To the maximum extent permitted by law, GHD disclaims any responsibility or liability arising from or in connection with this draft document.
Appendix A Mt Penang Base Model Development Report
Mt Penang Traffic and Transport Impact Study Stage 2 Base Model and Existing Conditions Report
Hunter and Central Coast Development Corporation
7 September 2021
The Power of Commitment

The Power of Commitment
GHD Pty Ltd ACN 008 488 373
Level 9, 145 Ann Street
Brisbane, Queensland 4000, Australia
T +61 7 3316 3000 | F +61 7 3316 3333 | E [email protected] | ghd.com
Printed date 7/09/2021 11:12:00 AM
Last saved date 7 September 2021 11:12 AM
File name 12548506_REP_B_BaseModelReport
Author R Harris
Project manager Phil Guo
Client name Hunter and Central Coast Development Corporation
Project name Mt Penang Traffic and Transport Impact Study
Document title Stage 2 Base Model and Existing Conditions Report
Revision version Rev 1
Project number 12548506
Document status
Status Code
Revision Author Reviewer Approved for issue
Name Signature Name Signature Date
Draft 1 Rosie Harris Mingjie Ding On File Ali Syed On File 14/7/2021
Final 2 Rosie Harris Phil Guo
Phil Guo
07/9/2021
© GHD 2021
This document is and shall remain the property of GHD. The document may only be used for the purpose for
which it was commissioned and in accordance with the Terms of Engagement for the commission. Unauthorised
use of this document in any form whatsoever is prohibited.

GHD | Hunter and Central Coast Development Corporation | 12548506 | Mt Penang Traffic and Transport Impact Study i
Contents
Introduction 1
1.1 Background 1
1.2 Purpose of this report 1
1.3 Mt Penang site location 2
1.4 Objectives 2
1.5 Scope and limitations 3
1.6 Report contents 3
1.7 Assumptions 3
1.8 Glossary of key terminology 4
Existing traffic conditions 5
2.1 Major road network 5
2.1.1 Road hierarchy 5 2.1.1.1 Road classification 5 – State Roads 5 – Regional Roads 5 – Local Roads 5 2.1.1.2 Functional hierarchy 5
2.1.2 Central Coast Highway 6
2.1.3 Other roads 7
2.2 Site inspection 8
2.2.1 Central Coast Highway observations 9
2.2.2 Mt Penang Parklands site observations 13
2.3 Public transport 16
2.4 Traffic data 17
2.4.1 Overview 17
2.4.2 Intersection count data 17
2.4.3 Mid-block count data 19
2.4.4 Pacific Motorway traffic count data 2
2.4.5 Travel time surveys 3
2.4.6 Signal timing data 5
2.4.7 Aerial imagery 5
2.4.8 Strategic model outputs 5
Base model development 1
3.1 Model area 1
3.2 Base model development methodology 1
3.3 Network development 2
3.3.1 Road geometry 2
3.3.2 Signal operations 2
3.3.3 Public transport 3
3.3.4 Road types 3
3.4 Demand development 3
3.4.1 Development of zone system 3
3.4.2 Matrix Estimation 4
3.4.3 Stage 2 matrix extension 5
3.4.4 Temporal profile 6
3.5 15 minute profile 7

GHD | Hunter and Central Coast Development Corporation | 12548506 | Mt Penang Traffic and Transport Impact Study ii
Model calibration and validation 9
4.1 Overview 9
4.2 Model assignment 9
4.3 Convergence 10
4.4 Model stability 10
4.5 Calibration 13
4.5.1 Network adjustments 13
4.5.2 AM peak calibration results 14
4.5.3 PM peak calibration results 15
4.5.4 Weekend calibration results 17
4.6 Model validation 18
4.6.1 Network changes 18
4.6.2 AM validation results 19
4.6.3 PM validation results 21
4.6.4 Weekend validation results 23
4.7 Queue observations 26
Summary and conclusion 32
Table index
Table 1: Central Coast Highway road characteristics 6
Table 2: Road characteristics 7
Table 3: Central Coast Highway site visit observations 9
Table 4: Central Coast Highway intersections site visit observations 11
Table 5: Mt Penang area bus services 16
Table 6: School bus routes 17
Table 7 Intersection survey details 17
Table 8 Pacific Motorway traffic counts 2
Table 9 Travel time survey details 3
Table 10: Travel times and speeds on Central Coast Highway between Woy Woy Road and Wisemans Ferry Road 4
Table 11: Road type information 3
Table 12: Model assignment parameters 9
Table 13: Calibration criteria for link and turn counts in microsimulation model 13
Table 14: AM peak calibration summary results 14
Table 15: PM peak calibration summary results 15
Table 16: Weekend calibration summary results 17
Table 17: Travel time validation criteria 18
Table 18: AM peak travel time results 19
Table 19: PM peak travel time summary 21
Table 20 Weekend peak travel time summary 24

GHD | Hunter and Central Coast Development Corporation | 12548506 | Mt Penang Traffic and Transport Impact Study iii
Figure index
Figure 1: Mt Penang study area 1
Figure 2: Mt Penang Parklands boundary 2
Figure 3: Central Coast Highway northbound 7
Figure 4: Central Coast Highway southbound 7
Figure 5: Mt Penang Parklands AM snapshots 14
Figure 6: Mt Penang Parklands PM snapshots 15
Figure 7: Bus service map (source: www.busways.com.au) 16
Figure 8 Weekday AM traffic count comparison 18
Figure 9 Weekday PM traffic count comparison 18
Figure 10 Weekend traffic count comparison 19
Figure 11: Traffic count survey locations 1
Figure 12 Pacific Motorway traffic counter location 2
Figure 13: Surveyed travel time route 3
Figure 14: 2018 STFM link volumes (7:00 am - 9:00 am) 6
Figure 15: 2018 STFM link volumes (4:00 pm - 6:00 pm) 6
Figure 16: Model development process diagram 1
Figure 17: Zone structure 4
Figure 18: Process of OD matrix estimation 5
Figure 19 Stage 1 zone system 6
Figure 20: Weekday AM - classified 15-minute traffic profile 7
Figure 21: Weekday PM - classified 15 minute traffic profile 8
Figure 22: Weekend - classified 15 minute traffic profile 8
Figure 23: Variability in VKT, AM peak 10
Figure 24: Variability in VHT, AM peak 11
Figure 25: Variability in VKT, PM peak 11
Figure 26: Variability in VHT, PM peak 12
Figure 27: Variability in VKT, weekend 12
Figure 28: Variability in VHT, weekend 12
Figure 29: Observed vs. modelled traffic volumes (7:00 am - 8:00 am) 14
Figure 30: Observed vs. modelled traffic volumes (8:00 am - 9:00 am) 15
Figure 31: Observed vs. modelled traffic volumes (4:00 pm - 5:00 pm) 16
Figure 32: Observed vs. modelled traffic volumes (5:00 pm - 6:00 pm) 16
Figure 33: Observed vs. modelled traffic volumes (12:00 pm - 1:00 pm) 17
Figure 34: Observed vs. modelled traffic volumes (1:00 pm - 2:00 pm) 18
Figure 35: AM peak modelled and observed travel times (northbound, 7:00 am - 8:00 am) 19
Figure 36: AM peak modelled and observed travel times (southbound, 7:00 am - 8:00 am) 20
Figure 37: AM peak modelled and observed travel times (northbound, 8:00 am - 9:00 am) 20
Figure 38: AM peak modelled and observed travel times (southbound, 8:00 am - 9:00 am) 21
Figure 39: Southbound travel times without outlier observation (8:00 am - 9:00 am) Error! Bookmark not defined.
Figure 40: PM peak modelled and observed travel times (northbound, 4:00 pm - 5:00 pm) 22
Figure 41: PM pe ak modelled and observed travel times (southbound, 4:00 pm - 5:00 pm) 22
Figure 42: PM peak modelled and observed travel times (northbound, 5:00 pm - 6:00 pm) 23
Figure 43: PM peak modelled and observed travel times (southbound, 5:00 pm - 6:00 pm) 23
Figure 44: Weekend modelled and observed travel times (northbound, 12:00 pm - 1:00 pm) 24

GHD | Hunter and Central Coast Development Corporation | 12548506 | Mt Penang Traffic and Transport Impact Study iv
Figure 45: Weekend modelled and observed travel times (southbound, 12:00 pm - 1:00 pm) 25
Figure 46: Weekend modelled and observed travel times (northbound, 1:00 pm - 2:00 pm) 25
Figure 47: Weekend modelled and observed travel times (southbound, 1:00 pm - 2:00 pm) 26
Figure 48: Southbound queue on Central Coast Highway, north (8:32 am) 27
Figure 49: Southbound queue on Central Coast Highway, south (8:32 am) 28
Figure 50: Model snapshot, north Central Coast Highway (5:46 pm) 30
Figure 51: Model snapshot, south Central Coast Highway (5:46 pm) 31
Appendices
Appendix A Detailed calibration results

GHD | Hunter and Central Coast Development Corporation | 12548506 | Mt Penang Traffic and Transport Impact Study 1
Introduction
1.1 Background This report has been prepared by GHD for Hunter and Central Coast Development Corporation (HCCDC) as part
of the Stage 2 works for the Mt Penang Traffic and Transport Impact Study (TTIS). The study will support the
planning proposal to amend the land-use controls and development standards for the parklands. It is proposed
that planning controls are amended to enable the subdivision and consequent development of specific precincts
within the parklands. The proposed rezoning will assist in planning for the future, accounting for increases in
population, tourism and wider economic trends.
Stage 1 of this study was completed in 2020, evaluating the impact of proposed and potential developments on the
operation of the Central Coast Highway and broader road network. A microsimulation traffic model was developed
for Stage 1, which was used to quantify the impact of the new developments on the broader road network.
In response to ongoing engagement between HCCDC and Transport for New South Wales (TfNSW), TfNSW has
recommended that the study area of this model be expanded to include the proximate interchange with the M1
Pacific Motorway. This was recommended to ascertain the level of queueing on the M1 ramps that has resulted
from the proposed developments. This necessitates a full recalibration and validation of the existing year base
model developed in Stage 1 of the TTIS. This calibration and validation of the model is line with the comments on
the original base model, and the original methodology was agreed upon by TfNSW.
1.2 Purpose of this report The purpose of this report is to document the development, calibration and validation of the existing condition
microsimulation base model for the extended (Stage 2) study area shown in Figure 1. This report is a revision of
the Stage 1 existing conditions base model report. The final version of the Mount Penang Base Case Modelling
Report (Stage 1) was submitted to HCCDC on Tuesday 9 June 2020.
Figure 1: Mt Penang study area

GHD | Hunter and Central Coast Development Corporation | 12548506 | Mt Penang Traffic and Transport Impact Study 2
1.3 Mt Penang site location Figure 2 depicts the location of the Mt Penang Parklands site, as defined in the Gosford Development Control
Plan, 2013. The Mt Penang Parklands site is located north of the Central Coast Highway and south of the M1
Pacific Motorway in the suburb of Kariong. The site is located approximately 70 km north of Sydney and is situated
close to the township of Gosford. The parklands host multiple land-uses, including bushlands, community facilities,
heritage assets and potential commercial development locations.
Figure 2: Mt Penang Parklands boundary
1.4 Objectives The primary objective of the Mt Penang Parklands Traffic and Transport Study is to assess the potential impact of
proposed developments on the operation of the Central Coast Highway and the broader road network.
The main objectives of the Traffic and Transport Study are:
– Review of all previous transport and traffic studies relating to the project study area
– Microsimulation traffic modelling in accordance with the Roads and Maritime Services (RMS) traffic model
requirements
– Assessment of the traffic impact of the proposed developments, including trip generation and distribution of all
modes of transport
– Testing of development scenarios based on the staged development of the site over the next 2, 10 and 20
years in accordance with the proposed land use zones and development standards
– Testing of the proposed internal road network and recommendations of key access points and staging of road
delivery to mitigate impacts of development
– Consideration of the capacity, limitations and constraints of the road network

GHD | Hunter and Central Coast Development Corporation | 12548506 | Mt Penang Traffic and Transport Impact Study 3
– Recommendations of key road upgrades that may be required to mitigate the impacts of development on the
operation of the Central Coast Highway based on modelling outputs, and indicative costs estimates of these
works
1.5 Scope and limitations
This report: has been prepared by GHD for Hunter and Central Coast Development Council (HCCDC) and may only be used and relied on by HCCDC for the purpose agreed between GHD and HCCDC as set out in Section 1.2 of this report.
GHD otherwise disclaims responsibility to any person other than HCCDC arising in connection with this report. GHD also excludes implied warranties and conditions, to the extent legally permissible.
The services undertaken by GHD in connection with preparing this report were limited to those specifically detailed in the report and are subject to the scope limitations set out in the report.
The opinions, conclusions and any recommendations in this report are based on conditions encountered and information reviewed at the date of preparation of the report. GHD has no responsibility or obligation to update this report to account for events or changes occurring subsequent to the date that the report was prepared.
The opinions, conclusions and any recommendations in this report are based on assumptions made by GHD described in this report (Section 1.7). GHD disclaims liability arising from any of the assumptions being incorrect.
GHD has prepared this report on the basis of information provided by HCCDC and others who provided information to GHD, which GHD has not independently verified or checked beyond the agreed scope of work. GHD does not accept liability in connection with such unverified information, including errors and omissions in the report which were caused by errors or omissions in that information.
1.6 Report contents This document details the analysis being undertaken for the existing network condition and demonstrates the
calibrated and validated microsimulation base model, to meet the satisfactory standard and validates performance
against the existing network conditions. The report outlines the overall methodology followed and is split into four
sections as follows:
– Section 2: A summary of existing network conditions, including the analysis of traffic survey data and an
inventory of site visit observations.
– Section 3: Microsimulation model development: presents the steps in the model development process
including the data usage, data analysis, model development methodology, network development and demand
development.
– Section 4: Microsimulation model calibration and validation: provides the base model outputs and results of
the calibration and validation of network performance.
– Section 5: Summary of the existing network condition assessment at a network-wide and intersection level.
1.7 Assumptions The development, calibration and validation of the Mt Penang Parklands microsimulation base model assume that:
– Data provided by HCCDC and Matrix Traffic and Transport adequately reflect existing traffic conditions. The
data includes the following:
• Intersection turning movement count data
• Road mid-block count data
• Signal timing data
• Aerial imagery
• Travel time data

GHD | Hunter and Central Coast Development Corporation | 12548506 | Mt Penang Traffic and Transport Impact Study 4
1.8 Glossary of key terminology A glossary of technical terms of traffic modelling is set out below to assist in the interpretation of this document.
Assignment – The path that vehicles take through the model network.
Base Traffic Model – A model calibrated and validated to observed traffic data.
Calibration – A process of modifying model parameter values until model outputs replicate observed data to
within a specified tolerance level.
Convergence – A condition where no or negligible amount of vehicles can achieve a reduced travel time by
choosing an alternate route.
Dynamic Model – A model that changes variables used in the simulation over the model temporal period.
Frataring / Furnessing – A statistical process used to ensure that the values assigned between each Origin-
Destination pair match the recorded total flows in and out of each zone/centroid, to within a given margin of error.
Matrix Estimation – Manual manipulation of a demand matrix to match observed values.
Microsimulation Modelling – Microsimulation models are dynamic, stochastic, discrete time modelling
techniques that simulate the movement of individual vehicles based on car-following, lane changing and gap
acceptance algorithms that are updated several times every second. (RMS, 2013)
Mesoscopic Modelling – Mesoscopic simulation is a [combination] of macro-simulation and micro-simulation.
Vehicles are modelled as individual vehicle units (as in micro-simulation) but vehicle movements are based on
macro-simulation techniques (rather than car-following models used in micro-simulation). (Austroads, 2010)
Model Analysis Period – The time period that traffic performance is to be analysed over.
Model Seed – A number utilised in the random number generator of a model package to vary model outputs
stochastically. This is also referred to be Random Seed.
Modelling Methodology – Also called Modelling Type. It is the type of the analysis that a model undertakes,
either Strategic, Mesoscopic, Hybrid or Microscopic.
SCATS – Sydney Coordinated Adaptive Traffic System, an adaptive traffic signal system.
Static Model – A model that does not changes variables over the model temporal period.
Strategic Modelling – A broad term for Macrosimulation, Macroscopic and Macroanalytical Modelling.
Temporal Period – A predefined unit of time.
Traffic Demand – The volume of traffic assigned to traffic zone , rather than completing a journey.
Traffic Distribution – The locations where journeys start and end.
Validation – An evaluation of the models ability to predict behaviour through comparisons of information not used
in the calibration process.
Vehicle Class – The categorisation of a set of vehicles based on a common attribute.
Warm-up Period – An additional period of time prior to the Model Analysis Period to enable the model to be pre-
populated with traffic.
Cool-down Period – An additional period of time after the Model Analysis Period to enable an assessment of the
decay in traffic
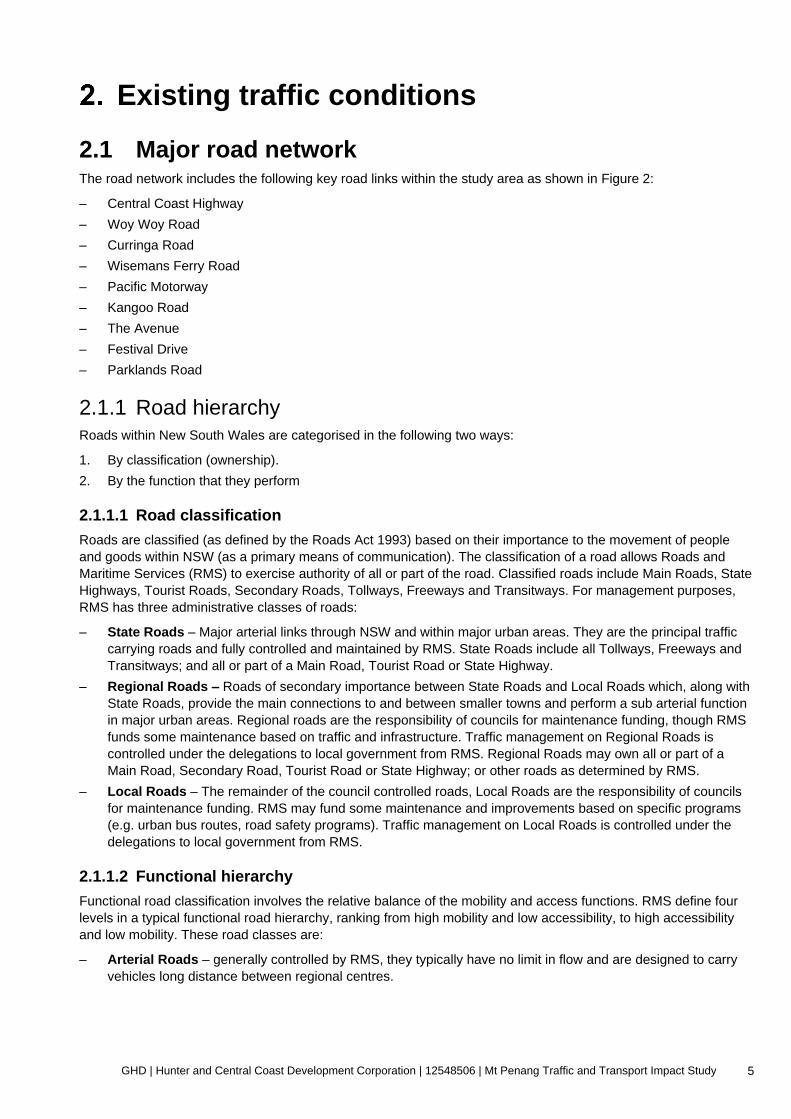
GHD | Hunter and Central Coast Development Corporation | 12548506 | Mt Penang Traffic and Transport Impact Study 5
Existing traffic conditions
2.1 Major road network The road network includes the following key road links within the study area as shown in Figure 2:
– Central Coast Highway
– Woy Woy Road
– Curringa Road
– Wisemans Ferry Road
– Pacific Motorway
– Kangoo Road
– The Avenue
– Festival Drive
– Parklands Road
2.1.1 Road hierarchy
Roads within New South Wales are categorised in the following two ways:
1. By classification (ownership).
2. By the function that they perform
2.1.1.1 Road classification
Roads are classified (as defined by the Roads Act 1993) based on their importance to the movement of people
and goods within NSW (as a primary means of communication). The classification of a road allows Roads and
Maritime Services (RMS) to exercise authority of all or part of the road. Classified roads include Main Roads, State
Highways, Tourist Roads, Secondary Roads, Tollways, Freeways and Transitways. For management purposes,
RMS has three administrative classes of roads:
– State Roads – Major arterial links through NSW and within major urban areas. They are the principal traffic
carrying roads and fully controlled and maintained by RMS. State Roads include all Tollways, Freeways and
Transitways; and all or part of a Main Road, Tourist Road or State Highway.
– Regional Roads – Roads of secondary importance between State Roads and Local Roads which, along with
State Roads, provide the main connections to and between smaller towns and perform a sub arterial function
in major urban areas. Regional roads are the responsibility of councils for maintenance funding, though RMS
funds some maintenance based on traffic and infrastructure. Traffic management on Regional Roads is
controlled under the delegations to local government from RMS. Regional Roads may own all or part of a
Main Road, Secondary Road, Tourist Road or State Highway; or other roads as determined by RMS.
– Local Roads – The remainder of the council controlled roads, Local Roads are the responsibility of councils
for maintenance funding. RMS may fund some maintenance and improvements based on specific programs
(e.g. urban bus routes, road safety programs). Traffic management on Local Roads is controlled under the
delegations to local government from RMS.
2.1.1.2 Functional hierarchy
Functional road classification involves the relative balance of the mobility and access functions. RMS define four
levels in a typical functional road hierarchy, ranking from high mobility and low accessibility, to high accessibility
and low mobility. These road classes are:
– Arterial Roads – generally controlled by RMS, they typically have no limit in flow and are designed to carry
vehicles long distance between regional centres.

GHD | Hunter and Central Coast Development Corporation | 12548506 | Mt Penang Traffic and Transport Impact Study 6
– Sub-Arterial Roads – can be managed by either RMS or local council. Typically, their operating capacity
ranges between 10,000 and 20,000 vehicles per day, and their aim is to carry through traffic between specific
areas in a sub region, or provide connectivity from arterial road routes (regional links).
– Collector Roads – provide connectivity between local roads and the arterial road network and typically carry
between 2,000 and 10,000 vehicles per day.
– Local Roads – provide direct access to properties and the collector road system and typically carry between
500 and 4,000 vehicles per day.
2.1.2 Central Coast Highway
The Central Coast Highway is a major corridor through the Central Coast region running east from Kariong to
Wamberal, then north from Wamberal to Doyalson. Within Kariong, the Central Coast Highway is a State Arterial
Road that runs between the intersection of the Pacific Highway and Wisemans Ferry Road at the north-west, to
the boundary point of the study area in the south. Road characteristics of the Central Coast Highway within the
study area are outlined in Table 1. Figure 3 and Figure 4 show snapshots of the Central Coast Highway taken by
GHD staff during the site visit.
Table 1: Central Coast Highway road characteristics
Feature Description
Carriageway Central Coast Highway is a major arterial road. The road is primarily four-lane two-way, with additional turning lanes provided at all intersections within the study area. The road is undivided south of the Woy Woy Road intersection, and divided by a small median (approximately 1 m wide) everywhere else.
Parking Parking is not provided on Central Coast Highway.
Speed Limit Speed on Central Coast Highway is 70 km/h from the Pacific Highway to 300 m south of the intersection with Kangoo Road. South of this point, the speed is 60 km/h.
Pedestrian Facilities Pedestrian crossings provided across Wisemans Ferry Road and Kangoo Road. Pedestrian crossings provided along each approach of Central Coast Highway / The Avenue intersection, and on two of three approaches of the Central Coast Highway / Woy Woy Road intersection.
Bicycle Facilities Bike paths are provided south of Wisemans Ferry Road. Between Wisemans Ferry Road and Kangoo Road the bike path is a shared footpath for both pedestrians and cyclists, and accommodates both northbound and southbound movements for cyclists.
South of Kangoo Road, there are on-road cycle paths on both the northbound and southbound shoulders.
There is a dedicated crossing for bicycles across the south approach of the Central Coast Highway / Kangoo Road intersection that enables northbound cyclists to switch to the off-road shared cycle path on the opposite side of the road.
Public Transport Northbound bus stops are located north of the Curringa Road intersection and south of Wakefield Close.
There is one southbound bus stop south of Woy Woy Road.

GHD | Hunter and Central Coast Development Corporation | 12548506 | Mt Penang Traffic and Transport Impact Study 7
Figure 3: Central Coast Highway northbound
Figure 4: Central Coast Highway southbound
2.1.3 Other roads
Table 2 provides a description of other roads within the study area.
Table 2: Road characteristics
Road Name Description
Pacific Motorway
– Motorway providing direct access between Sydney, Newcastle and the Central Coast
– Six-lane, two-way divided configuration with 110 km/h posted speed within study area
– Recently upgraded as part of Kariong to Somersby M1 Pacific Motorway Ugprade
Wisemans Ferry Road
– Arterial Road that provides access to and from the Pacific Highway north of the site.
– Four-lane, two-way divided configuration with 70 km/h posted speed on lead up to intersection with Central Coast Highway
– On-road cycle path in southbound shoulder.
Kangoo Road – Local road primarily providing access to industrial facilities.
– Two-lane, two-way undivided configuration with 50 km/h posted speed.
– On-street parking along length of road in both directions.
The Avenue – Primary access road into the Mt Penang Parklands.
– Local road with 40 km/h speed limit.

GHD | Hunter and Central Coast Development Corporation | 12548506 | Mt Penang Traffic and Transport Impact Study 8
Road Name Description
– Primarily a two-lane, two-way undivided configuration. The road becomes one-way north of Carinya Street. Between the Central Coast Highway and the roundabout providing access to the Kariong Fire Station there is a dividing median.
– Four pedestrian zebra crossings along the length of the road.
Festival Drive – Local road contained within the parklands running between The Avenue and Parklands Road.
– Two-lane, two-way undivided with 40 km/h posted speed.
– Set-down areas along length of road for school drop-off.
Parklands Road
– Local road contained within parklands providing access to café and park areas.
– Two-lane, two-way undivided with 40 km/h posted speed.
– Width only fit to accommodate one lane of traffic. Dirt and gravel shoulders are damaged and worn due to passing traffic.
Woy Woy Road
– Collector road connecting Central Coast Highway to residential streets in Kariong. The road eventually terminates at Woy Woy.
– The road is primarily two-lane, two-way undivided with on-street parking. Close to the intersection with Central Coast Highway, there is an additional lane in each direction.
– The road has a 60 km/h posted speed within the study area.
Curringa Road – Collector road connecting Central Coast Highway to residential streets in Kariong.
– The road is two-lane, two-way undivided with on-street parking.
2.2 Site inspection GHD staff conducted site inspections during the AM (8:00 am – 9:00 am) and PM (3:00 pm – 4:00 pm) peak
periods on Wednesday 19 February 2020. The site visits were conducted during these time periods to coincide
with the traffic surveys described in Section 2.4. The weather was clear during the site visit, and there did not
appear to be any traffic incidents or road works affecting normal operations within the study area.
Note that observations pertain to the original study area for Stage 1, as indicated in Figure 1. No observations
were recorded for the extension to the study area along the Pacific Motorway or Wisemans Ferry Road.

GHD | Hunter and Central Coast Development Corporation | 12548506 | Mt Penang Traffic and Transport Impact Study 9
2.2.1 Central Coast Highway observations Table 3 summarises the traffic conditions Central Coast Highway observed during the site visit.
Table 3: Central Coast Highway site visit observations
Peak Direction Observations
AM Northbound Medium to heavy traffic. Vehicles travelling at free flow speed between intersections, with slowing at intersections. Some queues were observed at The Avenue intersection but these did not cause blockages at the upstream Woy Woy Road intersection. Offsets were observed between the two intersections for the both northbound and southbound movements.
Southbound Highly trafficked with heavy queuing from the Central Coast Highway / The Avenue intersection affecting upstream intersection performance from 8:15 am to 9:00 am. Queues spillback along Central Coast Highway to Wisemans Ferry Road, leading to queues for vehicles turning left from Wisemans Ferry Road onto Central Coast Highway. Downstream of intersection at Woy Woy Road vehicles were travelling at free flow speed.
Central Coast Highway south of The Avenue, northbound view (8:38 am)
Central Coast Highway, north of The Avenue, northbound view (8:19 am)
Wisemans Ferry Road left-turn queue, southbound view (8:23 am)

GHD | Hunter and Central Coast Development Corporation | 12548506 | Mt Penang Traffic and Transport Impact Study 10
Peak Direction Observations
PM Northbound Medium traffic with conditions similar to AM period. Regular queuing at Central Coast Avenue / The Avenue intersection but queues did not spillback to upstream intersections. Free-flow between intersections, particularly north of intersection with The Avenue.
Southbound Heavy traffic with semi-regular long queues at intersection with The Avenue. Generally, vehicles were travelling at free-flow speed, except when queues are long at intersection with The Avenue. Queues did not appear to spill back to upstream intersections as in AM peak.
Table 4 summarises observations at the major intersections along the Central Coast Highway.
Central Coast Highway south of The Avenue, southbound view (3:20 pm)
Central Coast Highway, north of The Avenue, northbound view (3:52 pm)

GHD | Hunter and Central Coast Development Corporation | 12548506 | Mt Penang Traffic and Transport Impact Study 11
Table 4: Central Coast Highway intersections site visit observations
# Intersection Observations
1 Woy Woy Road
In both AM and PM peak there were high traffic volumes on both Coast Highway and on Woy Woy Road. Right-turning vehicles from Central Coast Highway to Woy Woy Road generally took up all right-turn storage. All queues generally dissipated every cycle.
Low utilisation for left-most lane on south approach due to lane ending north of The Avenue.
2 The Avenue / Curringa Road
In AM peak, this intersection was unable to accommodate southbound through traffic volumes resulting in massive queues that spillback to other intersections. The northbound movement had a high demand with regular queues, however, queues generally discharged every cycle.
In PM peak, both north and south approaches had long queues, but queues did not appear to be any spillback to other intersections. On north approach, right turns have to wait more than one cycle to move through intersection.
On the east approach (The Avenue), queues were generally short, but were identified to occasionally spillback past the upstream roundabout due to limited storage. Vehicles were also witnessed using the right-turn only lane to make a through movement if trapped behind a left-turn vehicle waiting for pedestrians to cross.
There were limited traffic volumes on Curringa Road in both peaks.
Pedestrians identified primarily using the south approach pedestrian crossings to access the service station.
Low utilisation for left-most lane on south approach due to lane ending north of intersection.
Central Coast Highway / Woy Woy Road, southbound view (3:33 pm)
Central Coast Highway / Woy Woy Road, southbound view (8:32 am)

GHD | Hunter and Central Coast Development Corporation | 12548506 | Mt Penang Traffic and Transport Impact Study 12
# Intersection Observations
3 Kangoo Road
Primarily through demand from Central Coast Highway in both directions. In AM peak, there were queues in southbound direction as a result of queuing spilling back from the Central Coast Highway / The Avenue / Curringa Road intersection. Queues were also observed in PM peak but they are discharged each cycle.
Right turning traffic volumes to and from Kangoo Road were minimal and discharged every cycle.
Central Coast Highway, view from Curringa Road northbound (3:45 pm)
Central Coast Highway, exiting The Avenue intersection northbound (8:19 am)
Central Coast Highway / Kangoo Road, northbound view (3:53 pm)
Central Coast Highway / Kangoo Road, southbound view (8:26 am)

GHD | Hunter and Central Coast Development Corporation | 12548506 | Mt Penang Traffic and Transport Impact Study 13
# Intersection Observations
4 Wisemans Ferry Road
High traffic volumes were observed from Central Coast Highway south turning right, and from Wisemans Ferry Road turning left. In the AM, there were queues on Wisemans Ferry Road as a result of left-turning movement being obstructed by upstream queues.
2.2.2 Mt Penang Parklands site observations
The below points summarise the observed traffic conditions within the Mt Penang Parklands:
– Generally low traffic demands at all areas of the parklands in both AM and PM peak.
– Posted speed within the parklands is 40 km/h. Vehicles are generally travelling at posted speed unless limited
by pedestrians or passing vehicles.
– Peak period traffic demand within the parklands appears to be driven by the two schools (Kariong Mountains
High School and Central Coast Sports College) as well as the Parklands / Café area off Parklands Road.
– Drop-off and pick-up times different between two schools. Kariong Mountains High School appears to be
standard school hours whereas Central Coast Sports College is 9:00 am to 4:00 pm.
– No formal drop-off area for Kariong Mountains High School. Many students walking from bus stop on Central
Coast Highway. Many areas for drop-offs including the parking off The Avenue.
– Traffic controller monitoring drop-offs at Central Coast Sports College close to the commencement of school
time (9:00 am). Students generally arriving by bus.
– School buses were observed using The Avenue, as well as turning right into Carinya Drive from Parklands
Road.
– On Parklands Road, vehicles are required to pull into the shoulder to enable opposing vehicles to pass due to
the narrow width of the road.
– High pedestrian interaction due to low speeds and students travelling to and from school. Multiple pedestrian
zebra crossings within the parklands.
Wisemans Ferry Road left-turn, southbound view (8:24 am)
Central Coast Highway / Wisemans Ferry Road, northbound view (3:53 pm)
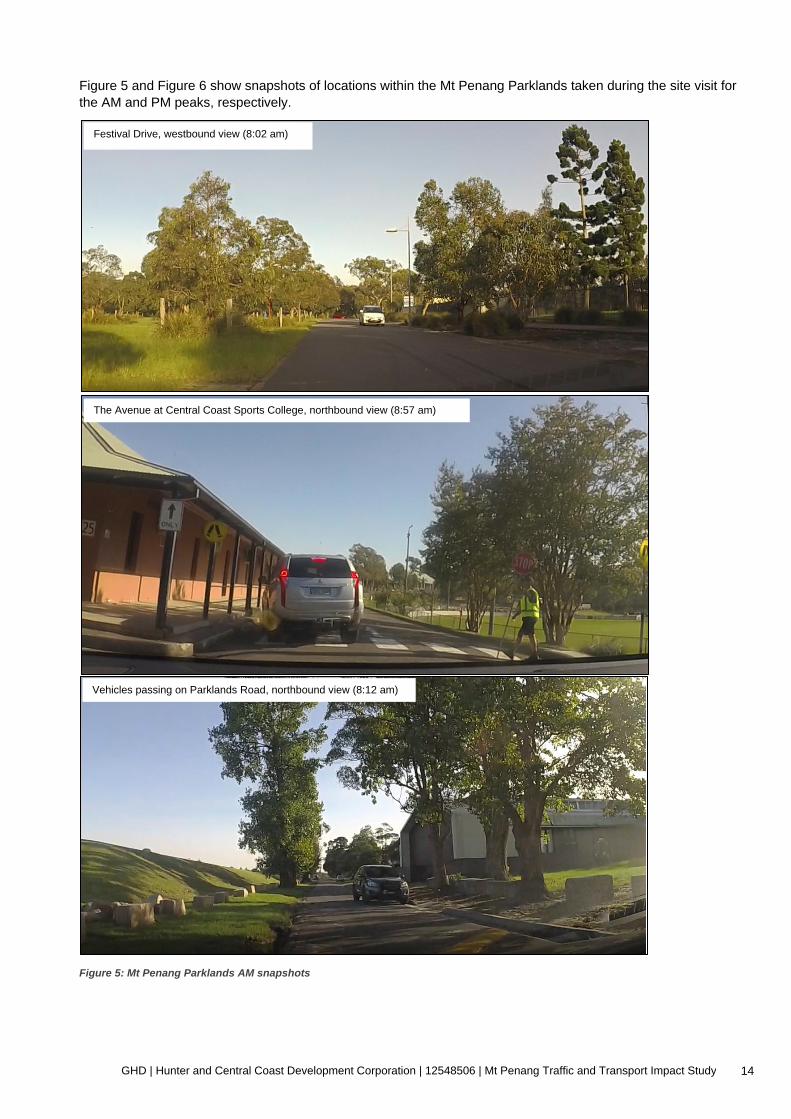
GHD | Hunter and Central Coast Development Corporation | 12548506 | Mt Penang Traffic and Transport Impact Study 14
Figure 5 and Figure 6 show snapshots of locations within the Mt Penang Parklands taken during the site visit for
the AM and PM peaks, respectively.
Figure 5: Mt Penang Parklands AM snapshots
Festival Drive, westbound view (8:02 am)
The Avenue at Central Coast Sports College, northbound view (8:57 am)
Vehicles passing on Parklands Road, northbound view (8:12 am)

GHD | Hunter and Central Coast Development Corporation | 12548506 | Mt Penang Traffic and Transport Impact Study 15
Figure 6: Mt Penang Parklands PM snapshots
Festival Drive, eastbound view (3:12 pm)
Central Coast Sports College, westbound view (3:14 pm)
Parklands Road, southbound view (3:11 pm)

GHD | Hunter and Central Coast Development Corporation | 12548506 | Mt Penang Traffic and Transport Impact Study 16
2.3 Public transport Busways operates a small number of bus services within and in proximity to the study area, as displayed in Figure
7.
Figure 7: Bus service map (source: www.busways.com.au)
A brief description of the available Busways services in the study area is provided in Table 5.
Table 5: Mt Penang area bus services
No. Route Frequency
32 Gosford to Spencer via Central Coast Highway and Wisemans Ferry Road
1 AM service
4 PM services (including school detour service to Kariong Mountains High School).
Spencer to Gosford via Central Coast Highway and Wisemans Ferry Road
1 AM service (includes school detour to Kariong Mountains High School)
33 Gosford to Somersby via Kangoo Road 4 AM services
Somersby to Gosford via Kangoo Road 5 PM services
34 Gosford to Kariong loop service via Langford Drive (anti-clockwise)
Services approximately every half-hour from 5:30 am to 11:30 pm on weekdays.
Services approximately every hour from 7:30 am to 11:30 pm on Saturdays.
32/4 Mangrove Mountain to Gosford via Kariong 3 AM services

GHD | Hunter and Central Coast Development Corporation | 12548506 | Mt Penang Traffic and Transport Impact Study 17
No. Route Frequency
33/4 Gosford to Somersby industrial Estate and Kariong (Loop Service)
4 AM services
34/2 Gosford to Mangrove Mountain via Kariong 1 PM service on weekdays
2 Saturday services
Further, there are a number of school bus routes operated both privately and by Busways. These are listed in
Table 6.
Table 6: School bus routes
School AM Routes PM Routes
Kariong Mountains High School
Busways: 2019, 2010, 2014 Busways: 2510, 2507, 2503
Central Coast Sports College
Busways: 2082, 2083
Private: North, South, Central 1 and Central 2
Busways: 2606
Private: North, South, Central 1 and Central 2
2.4 Traffic data
2.4.1 Overview
The following data was utilised for base year model development, calibration, and validation:
– Intersection turning movement count data
– Road mid-block count data
– Signal timing data
– Aerial imagery
– Travel time data
Details of the data used are provided in the following sections.
2.4.2 Intersection count data
15-minute intersection count data was collected by Matrix Traffic and Transport in February 2020 for the Stage 1
scope of works, and in June 2021 to geographically cover the extended section of the model. Table 7 provides a
summary of this data.
Table 7: Intersection survey details
Year Sites Date / Time of Collection Classifications
2020 Site 1: Central Coast Highway / Woy Woy Road
Site 2: Central Coast Highway / The Avenue / Curringa Road
Site 3: Central Coast Highway / Kangoo Road
Site 4: Central Coast Highway / Wisemans Ferry Road
Wednesday 19 February 2020
– 7:00 am – 9:00 am
– 3:00 pm – 6:00 pm
Saturday 15 February 2020
– 12:00 pm – 2:00 pm
– Light vehicles
– Heavy vehicles
– Pedestrians
2021 Site 4: Central Coast Highway / Wisemans Ferry Road
Site 13: Wisemans Ferry Road / Pacific Motorway Exit Ramp
Site 13: Wisemans Ferry Road / Pacific Motorway Entry Ramp
Site 13: Wisemans Ferry Road / Pacific Highway
Thursday 3 June 2021
– 6:00 am – 9:00 am
– 3:00 pm – 6:00 pm
Saturday 5 June 2021
– 11:00 am – 2:00 pm
– Light vehicles
– Heavy vehicles
Figure 11 shows the location of the intersection counts.
The impact of COVID-19 on the appropriateness of the traffic counts at these dates is assumed to be minor, given
that:
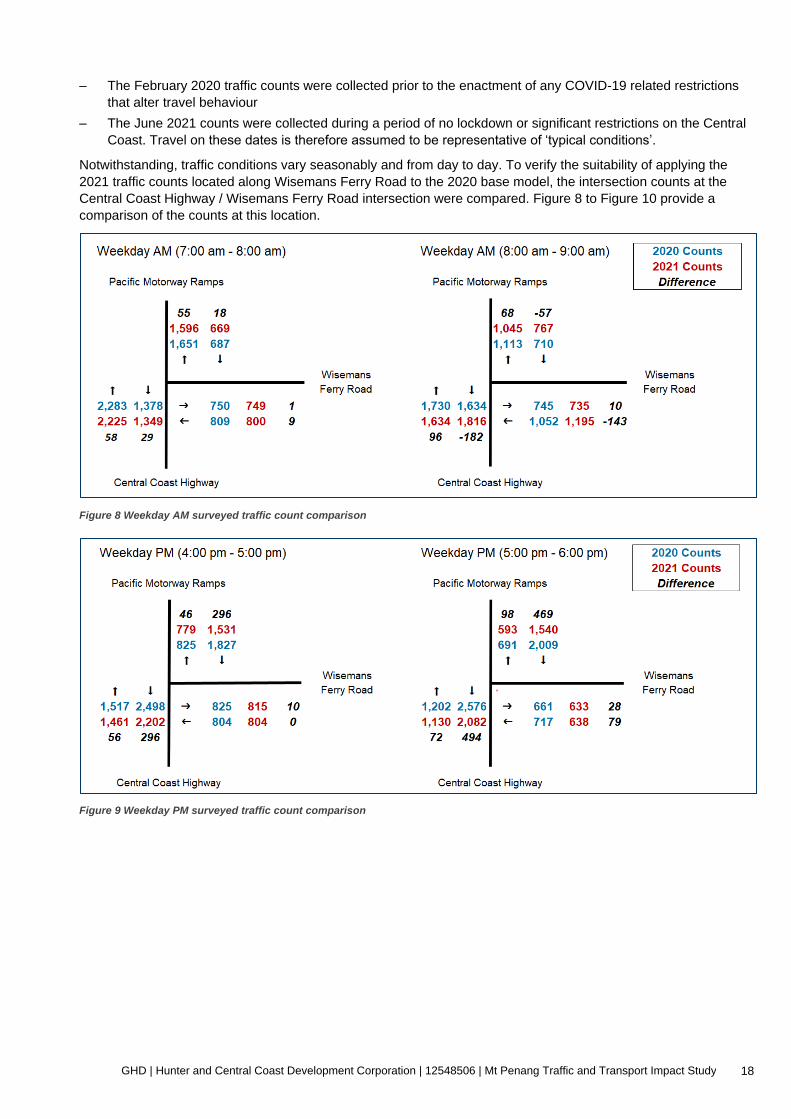
GHD | Hunter and Central Coast Development Corporation | 12548506 | Mt Penang Traffic and Transport Impact Study 18
– The February 2020 traffic counts were collected prior to the enactment of any COVID-19 related restrictions
that alter travel behaviour
– The June 2021 counts were collected during a period of no lockdown or significant restrictions on the Central
Coast. Travel on these dates is therefore assumed to be representative of ‘typical conditions’.
Notwithstanding, traffic conditions vary seasonably and from day to day. To verify the suitability of applying the
2021 traffic counts located along Wisemans Ferry Road to the 2020 base model, the intersection counts at the
Central Coast Highway / Wisemans Ferry Road intersection were compared. Figure 8 to Figure 10 provide a
comparison of the counts at this location.
Figure 8 Weekday AM surveyed traffic count comparison
Figure 9 Weekday PM surveyed traffic count comparison

GHD | Hunter and Central Coast Development Corporation | 12548506 | Mt Penang Traffic and Transport Impact Study 19
Figure 10 Weekend surveyed traffic count comparison
The above plots indicate that:
– The different in traffic travelling eastbound and westbound Wisemans Ferry Road is minor (< 100 vehicles) for
the hours of 7:00 am – 8:00 am, 4:00 pm – 5:00 pm and 5:00 pm – 6:00 pm, indicating the 2021 data can be
used in conjunction with the 2020 data without adjustment.
– For the hour of 8:00 am – 9:00 am, the difference in vehicles travelling eastbound on Wisemans Ferry Road is
minor. In the westbound direction, there is a difference of 143 vehicles. As this only represents a 14%
increase from the 2020 counts, it is reasonable the two sets of counts can be used together in the model
without adjustment.
– In the weekend peak period, there are differences of greater than 80 vehicles for both peak hours and in both
directions on Wisemans Ferry Road. For consistency with weekday peak periods and noting that the
differences can be accommodated in the calibration process, the 2021 counts can again be adopted without
adjustment.
It is therefore reasonable to adopt the 2021 intersection counts for use in calibration of the following intersections:
– Site 13: Wisemans Ferry Road / Pacific Motorway Exit Ramp
– Site 14: Wisemans Ferry Road / Pacific Motorway Entry Ramp
– Site 15: Wisemans Ferry Road / Pacific Highway
It is also noted that the mainline traffic counts on the Central Coast Highway are generally consistent between the
two sets of counts, except for the weekday PM peak (5:00 pm – 6:00 pm). In the southbound direction, there are
approximately 500 fewer vehicles in the 2021 counts than in the 2020 counts.
2.4.3 Mid-block count data
Bidirectional mid-block section counts were obtained from the 2018 Mt Penang Gardens Traffic Assessment
Report (Teraffic, 2018), provided by HCCDC to GHD. Mid-block section counts were provided within this report for
the following locations:
– Site 5: The Avenue: Between Festival Drive and Holystone Drive
– Site 6: The Avenue: Between Corinya Road and Wapole Drive
– Site 7: McCabe Drive: Between Parklands Road and The Avenue
– Site 8: Festival Drive: Near The Avenue
– Site 9: Carinya Road: East of The Avenue
– Site 10: Parklands Road: Between Festival Drive and Carinya Road
– Site 11: Parklands Road: Between Carinya Road and Vernon Street
– Site 12: Parklands Road: Between Vernon Street and McCabe Road

GHD | Hunter and Central Coast Development Corporation | 12548506 | Mt Penang Traffic and Transport Impact Study 20
Mid-block counts were collected during the week of 24 November 2017 to 1 December 2017, with the exception of
Parklands Road between Vernon Street and McCabe Road, which was recorded only for Thursday 23 November
2017. Total vehicular counts were recorded at hourly intervals for each day of the survey.
Hourly classified counts, averaged over each day of the survey for each site, were also provided.
Figure 11 shows the location of the mid-block counts.

GHD | Hunter and Central Coast Development Corporation | 12548506 | Mt Penang Traffic and Transport Impact Study 1
Figure 11: Traffic count survey locations

GHD | Hunter and Central Coast Development Corporation | 12548506 | Mt Penang Traffic and Transport Impact Study 2
2.4.4 Pacific Motorway traffic count data In absence of traffic count data on the Pacific Motorway within the study area, data from Transport for New South
Wale’s (TfNSW) open-source Traffic Volume Viewer was used.
The closest traffic counter on the Pacific Motorway to the study area is located 330 m West of Peats Ridge Road
(approximately 6 km west of the study area). This is assumed to be a reasonable representation of the traffic
demand on the Pacific Motorway within the study area as there are no Pacific Motorway interchanges between the
Gosford Interchange (captured in the microsimulation model) and the Peats Ridge Road exit. Figure 12 depicts the
location of the counter.
Figure 12 Pacific Motorway traffic counter location
Traffic data was obtained for a typical weekday (Thursday) and weekend (Saturday) for the month of February
2020. Table 8 summarises the traffic counts at this location.
Table 8 Pacific Motorway traffic counts
Peak Hour Light Vehicles Heavy Vehicles
Eastbound Westbound Eastbound Westbound
Weekday AM
7:00 am – 8:00 am 1496 2967 375 413
8:00 am – 9:00 am 1465 2054 359 391
Weekday PM
4:00 pm – 5:00 pm 3601 1796 538 289
5:00 pm – 6:00 pm 3622 1655 409 249
Saturday 12:00 pm – 1:00 pm 2571 2251 204 166
1:00 pm – 2:00 pm 2305 2152 188 173
Regardless, as this data is not recorded precisely within the study area, it cannot be used for calibration of the
model. The through movement on the Pacific Motorway will therefore be indicative only. This is acceptable for the
purpose of the model extension, which only requires ramp movements to be calibrated so to robustly assess the
impact of the Mt Penang developments on the Pacific Motorway ramps.
Central Coast Highway
Pacific Motorway
Traffic Counter

GHD | Hunter and Central Coast Development Corporation | 12548506 | Mt Penang Traffic and Transport Impact Study 3
2.4.5 Travel time surveys Travel time surveys were undertaken by Matrix Traffic and Transport in February 2020 and in June 2021. Travel
times were surveyed using the floating car method. Table 9 summarises the surveys details while Figure 13
depicts the surveyed routes.
Table 9 Travel time survey details
Year Route Route Length Date / Time of Collection
2020 Central Coast Highway between Woy Woy Road and Wisemans Ferry Road
1,950 m Wednesday 19 February 2020
– 7:00 am – 9:00 am
– 3:00 pm – 6:00 pm
Saturday 15 February 2020
– 12:00 pm – 2:00 pm
2021 Central Coast Highway / Wisemans Ferry Road between Pacific Highway and 400 m south of Woy Woy Road.
2,671 m Thursday 3 June 2021
– 6:00 am – 9:00 am
– 3:00 pm – 6:00 pm
Saturday 5 June 2021
11:00 am – 2:00 pm
Figure 13: Surveyed travel time route
The number of survey runs in each hour is detailed in Table 10.

GHD | Hunter and Central Coast Development Corporation | 12548506 | Mt Penang Traffic and Transport Impact Study 4
Table 10 Number of travel time survey runs
Travel time
data set Direction
Saturday Weekday
12:00 -1:00 pm
1:00 -2:00 pm
7:00 -8:00 am
8:00 – 9:00 am
4:00 – 5:00 pm
5:00 – 6:00 pm
Number of survey runs
2020 Northbound 6 7 6 5 5 6
Southbound 7 5 6 4 6 6
2021 Northbound 6 6 6 6 5 6
Southbound 7 6 7 6 6 6
Table 11 summarises the average travel time and speed along the travel time route. For comparison, the 2021
travel time route has been subdivided to the following two routes:
– Central Coast Highway between Woy Woy Road and Wisemans Ferry Road (as per 2020 survey)
– Wisemans Ferry Road between Central Coast Highway and Pacific Highway
Table 11: Travel times and speeds on Central Coast Highway between Woy Woy Road and Wisemans Ferry Road
Travel time data set Direction
Saturday Weekday
12:00 -1:00 pm
1:00 -2:00 pm
7:00 -8:00 am
8:00 – 9:00 am
4:00 – 5:00 pm
5:00 – 6:00 pm
Travel Time: mm:ss
(Speed: km/h)
2020 (Woy Woy Road - Wisemans
Ferry Road)
Northbound 02:45 (31) 02:08 (39) 02:16 (37) 02:55 (29) 02:43 (31) 02:17 (37)
Southbound 02:50 (30) 02:40 (31) 02:41 (31) 05:21 (16) 03:53 (22) 03:48 (22)
2021 (Woy Woy Road - Wisemans
Ferry Road)
Northbound 02:35 (32) 03:02 (27) 01:51 (45) 02:39 (31) 03:16 (25) 02:22 (35)
Southbound 01:58 (42) 01:54 (43) 01:39 (50) 01:49 (46) 02:50 (29) 02:10 (38)
2021 (Central Coast Highway - Pacific
Highway)
Northbound 00:49 (60) 00:49 (60) 00:51 (58) 00:52 (57) 00:49 (59) 00:50 (58)
Southbound 01:52 (26) 01:50 (27) 01:27 (34) 02:03 (24) 01:54 (26) 01:56 (25)
The average travel time and speed results indicate:
– For most time periods, the average speed was recorded between 30 km/h and 40 km/h.
– For the 2020 travel time data, the AM peak records travel times below 3 minutes in both directions, except for
the southbound route between 8:00 am and 9:00 am, where the travel time jumps to above 5 minutes. This is
in line with the congestion witnessed at this time. The 2021 southbound travel time is below 2 minutes,
indicating that this congestion is not present in 2021, which is likely due to southbound traffic being more
evenly distributed across the peak hour.
– In 2020, the northbound route (Woy Woy Road to Wisemans Ferry Road) in the PM demonstrates travel
times of under 3 minutes, however, the southbound route is close to 4 minutes in both the 4:00 pm – 5:00 pm
and 5:00 pm – 6:00 pm periods. This is likely to be occurring as a result of high traffic demand in the
southbound route in the PM peak. Conversely, the travel time is higher in the northbound direction for the
2021 data.
– The travel time in the southbound direction of Central Coast Highway is consistently lower in 2021. This is
partly due to a different exit point at Woy Woy Road. In 2020, vehicles exited the intersection by turning right
into Woy Woy Road, which incurs a higher delay. In 2021, vehicles finished the route by continuing straight
along Central Coast Highway.
– For the section between the Central Coast Highway and Pacific Highway, travel times are consistent across
all time periods, indicating that there is very little fluctuation in congestion levels on this segment of road.

GHD | Hunter and Central Coast Development Corporation | 12548506 | Mt Penang Traffic and Transport Impact Study 5
To align with the location and year of collection of the traffic counts used in the calibration of the model, validation
is to be completed for a single route (Central Coast Highway + Wisemans Ferry Road), where the following travel
times are used:
– 2020 travel time data: Central Coast Highway between Woy Woy Road and Wisemans Ferry Road
– 2021 travel time data: Wisemans Ferry Road between Central Coast Highway and Pacific Highway
2.4.6 Signal timing data
SCATS Intersection Diagnostic Monitor (IDM) data for the four signalised intersections within the microsimulation
model study area were obtained for the dates of Wednesday 19 February 2020 and Saturday 15 February 2020, to
coincide with the dates of the traffic surveys. Data was also provided for the dates of Tuesday 10 December 2019
and Saturday 14 December 2019. The locations of the signalised intersections are:
– Site 1: Central Coast Highway / Woy Woy Road (TCS 3073)
– Site 2: Central Coast Highway / The Avenue / Curringa Road (TCS 3074)
– Site 3: Central Coast Highway / Kangoo Road (TCS 3757)
– Site 4: Central Coast Highway / Wisemans Ferry Road (TCS 3749)
Note: The intersection numbering is consistent with those used in Section 2.4.2.
Following upgrades as a part of the M1 Pacific Motorway Upgrades – Somersby to Kariong, the Wisemans Ferry
Road / Pacific Motorway Entry Ramp intersection was converted to a signalised intersection. Average signal times
at this intersection were inferred from the survey footage accompanying the intersection counts.
2.4.7 Aerial imagery
Aerial imagery was obtained from NearMap and verified using footage from the site visit.
2.4.8 Strategic model outputs GHD has been provided with outputs from the latest version of Strategic Traffic Forecasting Model (STFM) from
Transport for New South Wales (TfNSW). The model has been developed using the Emme transport modelling
suite of software. The latest version of STFM is:
– Based on the travel demand from Strategic Travel Model (STM) v 3.6
– Based on land use forecast TZP16 v1.5
Link volumes and cordon matrices were provided for the years of 2018, 2021, 2031 and 2041, for the AM (7:00 am
-9:00 am) and PM (4:00 pm – 6:00 pm) periods. Figure 14 and Figure 15 show the link volumes for the 2018 AM
and PM models respectively.

GHD | Hunter and Central Coast Development Corporation | 12548506 | Mt Penang Traffic and Transport Impact Study 6
Figure 14: 2018 STFM link volumes (7:00 am - 9:00 am)
Figure 15: 2018 STFM link volumes (4:00 pm - 6:00 pm)

GHD | Hunter and Central Coast Development Corporation | 12548506 | Mt Penang Traffic and Transport Impact Study 7
The following observations can be made about the STFM model outputs:
– On the Central Coast Highway, the AM peak direction is northbound and the PM peak direction is
southbound.
– There is a large volume of traffic (~ 2000 vehicles) originating from Woy Woy Road in the AM, and terminating
in the same location in the PM peak.
– Traffic on Kangoo Road is small, with a maximum volume of 147 vehicles travelling northbound in the AM
peak.
– There is only one zone representing the parklands and nearby residential area off Old Mt Penang Road, with
connection to the modelled network on Kangoo Road. This is unlike the actual arrangement, where the
access to the Parklands is provided at The Avenue.
– Only six zones are included in the cordon matrices – 5 external zones (Central Coast Highway south, Woy
Woy Road, Curringa Road, Pacific Highway ramps, Wisemans Ferry Road and Kangoo Road) and one
internal zone (5342 – representing the Parklands).
– No road links within the Parklands are modelled.

GHD | Hunter and Central Coast Development Corporation | 12548506 | Mt Penang Traffic and Transport Impact Study 1
Base model development
The development of base year model includes model network coding, traffic demand estimation, model calibration
and validation. This section details model network coding and traffic demand estimation for the 2020 base year
traffic model.
3.1 Model software The Mt Penang microsimulation model has been developed using Aimsun Next Version 20.0.1.
3.2 Model area The study area denoted by Figure 1 is located at the south-west periphery of the Central Coast Highway. The
model is bounded by Central Coast Highway in the west, the Parklands boundary in the east and the Pacific
Highway in the north. Approximately 1.5 km of the Central Coast Highway is included within the model, extending
from Woy Woy Road in the south to the Pacific Motorway in the north.
3.3 Base model development methodology The overall proposed traffic modelling methodology is summarised in Figure 16, complying with the Roads and
Maritime (RMS) Traffic Modelling Guidelines (February 2013):
– Model Development detailed in Section 3.4
– Demand Development detailed in Section 3.5
– Model Calibration and Validation in Section 4
Figure 16: Model development process diagram

GHD | Hunter and Central Coast Development Corporation | 12548506 | Mt Penang Traffic and Transport Impact Study 2
3.4 Network development
3.4.1 Road geometry
Prior to the network coding in Aimsun, the study area was thoroughly checked using aerial photography from
Nearmap and Google Map street view as well as site inspection observations to ensure the base model details
match the existing road network. The key road network features included but are not limited to:
– Intersection configurations and layouts
– Road configurations, including the length of short/turning lanes
– Posted speed limits
– Priority control types at intersections (giveaway or stop signs)
– Bus stop and bus bays
To align with the network layout at the time of the Stage 2 traffic data collection, the network has been coded to
reflect the current (2021) network. This includes all upgrades as part of the M1 Pacific Motorway Upgrades –
Somersby to Kariong project. It is recognised that some parts of this project were still under construction at the
time of the collection of the Stage 1 traffic counts.
3.4.2 Signal operations
SCATS Intersection Diagnostic Monitor (IDM) data for four of the five signalised intersections within the
microsimulation model study area were collected on 15 February 2020 and 19 February 2020 by TfNSW, to
coincide with the dates of the Stage 1 (2020) traffic surveys. Data was also provided for Tuesday 10 December
2019 and Saturday 14 December 2020.
There are five signalised intersections within the study area:
– Central Coast Highway / Woy Woy Road (TCS 3073)
– Central Coast Highway / The Avenue / Curringa Road (TCS 3074)
– Central Coast Highway / Kangoo Road (TCS 3757)
– Central Coast Highway / Wisemans Ferry Road (TCS 3749)
– Wisemans Ferry Road / Pacific Motorway entry ramp
The fix time signal setting was based on the average cycle and phase times with separate control plans developed
for each hour of microsimulation model. The February 2020 IDM data was used for all signal plans, with the
exception of the weekday AM and PM cases for the Central Coast Highway / Kangoo Road intersection and the
Wisemans Ferry Road / Pacific Motorway entry ramp intersection. The data from 19 February 2020 for the Kangoo
Road intersection did not provide separate phase times for this intersection, and consequently, the data from the
10 December 2019 was used. For the Wisemans Ferry Road / Pacific Motorway entry ramp intersection, phase
times were inferred from the intersection survey video footage provided by Matric Traffic and Transport.
As part of the development of these control plans, the following adjustments were made to the observed data to
facilitate the modelling process:
– Addition to the average green time of the low-frequency alternative phase, to allow for a minimum of 6
seconds time during each traffic signal cycle.
– Coordination of signals on key corridors to ensure an appropriate cycle time was modelled (e.g. the same
cycle times at the adjacent traffic signals).
– A standard inter-green time of 6 seconds was applied, incorporating 4 seconds of amber time and 2 seconds
of all-red time.
– Allowance for pedestrian crossing with the 6 seconds late start of the conflicted turn where late-start was
identified.
Although not specified in the SCATS IDM data, review of the AM peak intersection survey videos showed that at
the Central Coast Highway / The Avenue intersection, the phase permitting right turns from Central Coast Highway
would regularly be replaced with a split phase for the Central Coast Highway south approach. Accordingly, the

GHD | Hunter and Central Coast Development Corporation | 12548506 | Mt Penang Traffic and Transport Impact Study 3
8:00 am – 9:00 am signal plan was duplicated within the model, with every second cycle permitting the south
approach split phase.
3.4.3 Public transport
Public transport plans comprising the bus services listed in Section 2.3 were coded in the model, with bus stop
locations obtained from Google Maps. Bus dwell times were assumed to be 20 seconds.
3.4.4 Road types
Table 12 lists the road types, capacities and speeds incorporated within the model.
Table 12: Road type information
Road Type Divided / Undivided
Speed Capacity (per lane)
Roads in model
Motorway Divided 110 km/h 1600 PCUs/h Pacific Motorway
Major Arterial Divided 70 km/h 1300 PCUs/h Central Coast Highway (north extent to south of Kangoo Road), Wisemans Ferry Road, Motorway Ramps, Pacific Highway
Major Arterial Divided 60 km/h 1300 PCUs/h Central Coast Highway (north of The Avenue to Woy Woy Road)
Major Arterial Undivided 60 km/h 1100 PCUs/h Central Coast Highway (south of Woy Woy Road)
Local Undivided 50 km/h 600 PCUs/h Woy Woy Road, Curringa Road and Kangoo Road
Local Undivided 40 km/h 600 PCUs/h Internal Parklands roads
Local Undivided 10 km/h 200 PCUs/h Carparks and access roads.
Roundabout - 20 km/h 600 PCUs/h Roundabouts
3.5 Demand development
3.5.1 Development of zone system Due to the limitation of the strategic model details within the Mt Penang study area (detailed in Section 2.4.8) the
traffic demands of the microsimulation model was primarily developed based on the traffic counts and the land use
information.
Splitting of larger traffic zones into a number of smaller connected zones can help to reflect more detailed network
operation. This is because demand loading points are spread across the whole network. The zone split strategy
used in the Mt Penang microsimulation traffic model was based on the following criteria:
– The surrounding road network and level of existing connectivity required to access the various local areas.
– The broader land use categories such as education, industrial, community facilities and residential.
Figure 17 presents the zone locations in the Mt Penang microsimulation traffic model. There are 22 zones within
the model, including 7 external and 15 internal zones. The six external zones include:
– Zone 1: Central Coast Highway (south)
– Zone 2: Woy Woy Road (west)
– Zone 3: Curringa Road (west)
– Zone 4: Pacific Motorway (west)
– Zone 7: Pacific Motorway (east)
– Zone 21: Pacific Highway
– Zone 22: Wisemans Ferry Road

GHD | Hunter and Central Coast Development Corporation | 12548506 | Mt Penang Traffic and Transport Impact Study 4
Figure 17: Zone structure
Land-use of internal zones vary, however, the land-uses can be broadly grouped by their location as follows:
– Old Mt Penang Road (Zone 5 and 6): residential
– Kangoo Road (Zones 8 to 12): industrial, commuter parking, community facilities.
– Mt Penang Parklands (Zones 14 to 20): education, community facilities, parklands.
3.5.2 Matrix Estimation
In the Stage 1 model calibration process, matrix estimation was used to develop the travel demand for each peak
period. Matrix estimation is the process whereby travel demand is adjusted to produce an estimated matrix that
represents the most likely travel pattern consistent with the observed counts and the routing within the model
assignment. Aimsun provides a built in ‘macro adjustment’ process that utilises the macro level assignment
process to provide a set of paths between origins and destinations which are then used to estimate trip demands
that align with the traffic counts.
The workflow of estimating the origin-destination (OD) matrix in Mt Penang microsimulation model is described in
Figure 18. OD0 is the starting matrix, ODF is the matrix obtained after the furnessing operation, and ODs is the
matrix produced by static OD adjustment in AIMSUN. The detail of each step will be introduced in the following
sections.

GHD | Hunter and Central Coast Development Corporation | 12548506 | Mt Penang Traffic and Transport Impact Study 5
Figure 18: Process of OD matrix estimation
Due to the limitation of the strategic model details within the Mt Penang study area, the OD0 matrix was employed
as the prior hourly OD matrix. As described below, OD0 matrix is a matrix with all entries with 1 and diagonal
equalling to zero (due to zero travels departure from and end at the same zone), which is presented as:
𝑂𝐷0 =
[ 0 1 11 0 11 1 0
… 1… 1… 1
⋮ ⋮ ⋮1 1 1
⋱ ⋮… 0]
To improve the accuracy of proceeding operations, known OD pairs from the traffic counts (i.e. where a turn from
an external zone leads to another external zone) substituted its ‘1’ entry within the above starting matrix.
The ‘furness’ function in the Aimsun was utilised to adjust the prior matrix to the trip end values at the model
boundaries. Trip ends for internal zones were estimated through determining trip generation rates associated with
each zone’s respective land-use. External zone trip totals were determined from the traffic count surveys.
The furnessed matrix was then used as a starting point to undertake static matrix estimation. This matrix
estimation was undertaken using Aimsun’s ‘Static OD Adjustment’ tool, which fits the matrix to observed traffic
counts. Following this, manual refinement of the estimated matrices was executed for the PM and weekend
matrices only. Minor manual adjustments were implemented as the resultant trip totals for Zone 3 did not align with
the observed counts.
3.5.3 Stage 2 matrix extension
The matrix estimation process described in Section 3.5.2 was completed for the Stage 1 model extent. The zone
structure for the Stage 1 model is shown in Figure 19.

GHD | Hunter and Central Coast Development Corporation | 12548506 | Mt Penang Traffic and Transport Impact Study 6
Figure 19 Stage 1 zone system
To convert the demand matrices from the Stage 1 zone system to the extended Stage 2 system, a process of zone
splitting was completed, whereby the traffic entering and exiting the Stage 1 Zone 7 (Wisemans Ferry Road) was
proportionately divided into the following Stage 2 zones based on the 2021 traffic counts:
– Zone 7: Pacific Motorway (East)
– Zone 21: Pacific Highway
– Zone 22: Wisemans Ferry Road
In absence of through movement traffic data on the Pacific Motorway within the study area, open source data from
Transport for New South Wales was used to represent the demand between zones 4 and 7. This data is detailed
in Section 2.4.4.
3.5.4 Temporal profile
The model has been developed for the following 2-hour peak periods for the AM, PM and Weekend cases:
– Weekday AM: 7:00 am – 9:00 am
– Weekday PM: 4:00 pm – 6:00 pm

GHD | Hunter and Central Coast Development Corporation | 12548506 | Mt Penang Traffic and Transport Impact Study 7
– Weekend: 12:00 pm -2:00 pm
In addition, the use of the warm-up and cool-down periods provides an opportunity for the network to ‘load’ and
‘unload’ traffic at both the beginning and end of the peak periods. One hour is allocated to each warm-up and cool-
down period. In absence of survey data outside these model periods, an 80 % factor has been used to estimate
demands for the warm-up and cool-down hours. This factor is applied to the first model hour demand to determine
the warm-up demand, and likewise is applied to the second model hour to determine the cool-down demand. This
is excepting the warm-up hour for the PM case, where there was 2020 intersection count data available for the
hour of 3-4 pm. Here, a factor of 87% was used.
3.6 15 minute profile The traffic demand profile within the Mt Penang microsimulation model has been disaggregated in 15 minutes
intervals based on the classified intersection counts within the study area. The 15 minutes profiles presented in
Figure 20 (AM), Figure 21 (PM) and Figure 22 (Weekend) have been developed to enable the proportion of traffic
released at network wide is consistent with those from the traffic survey for both light and heavy vehicles.
15 minutes profile was utilised to reflect the actual traffic arrival pattern (using 2020 traffic count data) with all the
peak period. Particularly within AM Peak, extensive queuing was observed and the application of 15 minutes
profile enable that the demand inputs to match the throughput recorded at the intersections.
Figure 20: Weekday AM - classified 15-minute traffic profile
7:15 7:30 7:45 8:00 8:15 8:30 8:45 9:00
Light Vehicles 22% 24% 26% 28% 25.3% 27.8% 25.0% 21.9%
Heavy Vehicles 20% 25% 25% 30% 23% 23% 26% 28%
0%
5%
10%
15%
20%
25%
30%
35%
Pe
rce
nta
ge
of h
ou
rly tra
ffic

GHD | Hunter and Central Coast Development Corporation | 12548506 | Mt Penang Traffic and Transport Impact Study 8
Figure 21: Weekday PM - classified 15 minute traffic profile
Figure 22: Weekend - classified 15 minute traffic profile
16:15 16:30 16:45 17:00 17:15 17:30 17:45 18:00
Light Vehicles 25% 26% 24% 25% 26% 26% 25% 23%
Heavy Vehicles 30% 28% 24% 18% 31% 29% 20% 20%
0%
5%
10%
15%
20%
25%
30%
35%P
erc
en
tag
e o
f h
ou
rly tra
ffic
12:15 12:30 12:45 13:00 13:15 13:30 13:45 14:00
Light Vehicles 25% 24% 26% 24% 25% 24% 27% 24%
Heavy Vehicles 29% 32% 22% 17% 24% 24% 28% 24%
0%
5%
10%
15%
20%
25%
30%
35%
Pe
rce
nta
ge
of h
ou
rly tra
ffic

GHD | Hunter and Central Coast Development Corporation | 12548506 | Mt Penang Traffic and Transport Impact Study 9
Model calibration and validation
4.1 Overview Calibration of the Mt Penang microsimulation model was undertaken in accordance with the criteria recommended
for microsimulation models within Traffic Modelling Guidelines’, Roads and Maritime Services, NSW, 2013
Version 1.0. Calibration was undertaken through comparison of modelled and observed traffic counts.
4.2 Model assignment To ensure the vehicle pathways were logical and realistic, and that network issues could be rectified before
confronting complications with model run-time, the Mt Penang model was developed using a three-stage traffic
assignment method. The following assignments were run in sequence, with each assignment using path files
determined from the previous stage:
– Stage 1: Mesoscopic Dynamic User Equilibrium (DUE)
– Stage 2: Microsimulation DUE
– Stage 3: Microsimulation Stochastic Route Choice (SRC)
Under the framework of DUE, drivers would continue to change routes until their travel time is a minimum. In other
words, they would gain no travel time saving in changing to another route. The SRC assignment introduces
variability into individual vehicular route choice, and consequently, requires multiple runs to ensure a reliable result
is attained.
Table 13 lists the parameters used in all dynamic traffic assignment stages.
Table 13: Model assignment parameters
Type Parameter Adopted Value
Stopping criteria (DUE) Maximum iterations 20varia
Relative gap 0.5%
Lane changing Look-ahead distance variability 40%
Micro parameters Queue entry speed 1 m/s
Queue exit speed 3 m/s
Reaction time Reaction time at stop 1.3 seconds
Reaction time at traffic light 1.6 seconds
Simulation step Simulation step 0.85 seconds
Arrival type Global arrivals Exponential
Dynamic assignment Feedback cycle 15 minutes
Number of intervals 1
Attractiveness weight Not applied
User-defined cost weight Not applied
Stochastic route choice model C-Logit
Dynamic user equilibrium model Gradient-Based
Initial Step Size Start the Assignment Process
Maximum paths from path assignment results
3 –DUE
All - SRC
Maximum paths per interval 3
Do not consider paths with a percentage below
10 %

GHD | Hunter and Central Coast Development Corporation | 12548506 | Mt Penang Traffic and Transport Impact Study 10
4.3 Convergence A DUE traffic assignment approach at the mesoscopic and microsimulation level has been used to develop the
base model. In this type of traffic assignment, it is assumed that all the users of a transportation network are
familiar with the network and always seeking to minimize their travel time/cost from origins to their respective
destinations. At the end of this type of assignment:
– The journey times of all routes actually used (for any pair of origin-destination) are equal, and less than those
which would be experienced by a single vehicle on any unused route (user optimisation)
– The average journey time of the network is minimal (system-optimisation).
To confirm that the baseline model reaches a stable condition and no vehicle can choose a faster or shorter path,
Aimsun uses a convergence calculation. Aimsun’s DUE measures the relative gap for each 15-minute period
during the simulation. To guarantee reasonable convergence, a stopping criteria of a 0.5 % relative gap was
applied to the DUE assignments.
4.4 Model stability The flow of traffic and the associated traffic conditions are a randomly variable phenomena and microsimulation
models attempt to capture this variability by varied release of traffic into the network. Whether or not a vehicle is
released from a zone in any given second is dependent on the outcome of a random number generator. This
generator is controlled by the seed value. The same model run under different seed values will result in a different
simulation result. For this reason, microsimulation models are generally run using a range of seed values with
results being reported for each individual seed value and the median of the simulated runs. The model was run
using the standard RMS seed values of 28, 560, 2849, 7771 and 86524. The calibration statistics were reported as
the average of these five seed values.
Model stability results, in the form of plots of Vehicle Hours Travelled (VHT) and Vehicle Kilometres Travelled
(VKT) for each seed value over the model duration, are presented in Figure 23 to Figure 28.
Generally, all plots indicate acceptable variability between the seed values. There is some minor variability in
Vehicle Hours Travelled (VHT) in the AM model arounf 8:45 am. At this point, the southbound queues on the
Central Coast Highway were at their maximum. It is likely that fluctuations in demand release for vehicles travelling
southbound could have a major impact on the queue length on this link. Accordingly, as the southbound traffic on
the Central Coast Highway constitutes a large proportion of the demand, the total travel time of the network would
be impacted, thereby causing the limited variance in the VHT across the different seed values.
Figure 23: Variability in VKT, AM peak
2000
3000
4000
5000
6000
7000
8000
To
tal D
ista
nce
Tra
ve
lled
(km
)
Time
Seed 28 Seed 560 Seed 2849
Seed 7771 Seed 86524 Average

GHD | Hunter and Central Coast Development Corporation | 12548506 | Mt Penang Traffic and Transport Impact Study 11
Figure 24: Variability in VHT, AM peak
Figure 25: Variability in VKT, PM peak
0
50
100
150
200
250
To
tal T
rave
l T
ime
(H
ou
rs)
Time
Seed 28 Seed 560 Seed 2849
Seed 7771 Seed 86524 Average
2000
3000
4000
5000
6000
7000
8000
To
tal D
ista
nce
Tra
ve
lled
(km
)
Time
Variability in VKT - PM Peak
Seed 28 Seed 560 Seed 2849
Seed 7771 Seed 86524 Average

GHD | Hunter and Central Coast Development Corporation | 12548506 | Mt Penang Traffic and Transport Impact Study 12
Figure 26: Variability in VHT, PM peak
Figure 27: Variability in VKT, weekend
Figure 28: Variability in VHT, weekend
0
50
100
150
200
250
To
tal T
rave
l T
ime
(H
ou
rs)
Time
Variability in VHT - PM Peak
Seed 28 Seed 560 Seed 2849
Seed 7771 Seed 86524 Average
2000
3000
4000
5000
6000
7000
8000
To
tal D
ista
nce
Tra
ve
lled
(km
)
Time
Variability in VKT - Weekend
Seed 28 Seed 560 Seed 2849
Seed 7771 Seed 86524 Average
0
50
100
150
200
250
To
tal T
rave
l T
ime
(H
ou
rs)
Time
Seed 28 Seed 560 Seed 2849
Seed 7771 Seed 86524 Average

GHD | Hunter and Central Coast Development Corporation | 12548506 | Mt Penang Traffic and Transport Impact Study 13
4.5 Calibration The 2020 base year traffic models were calibrated to the mid-block and intersection turn traffic count data, listed in
Section 2.4.
In order to evaluate the accuracy of the model in replicating the observed behaviour of the network, GHD used the
following measures:
– Scatter plot of modelled flows and observed counts, with regression statistics (R2 values)
– Geoff E Havers (GEH) statistic, which is a form of the Chi‐squared statistic that incorporates both relative and
absolute differences.
The GEH is defined as:
𝐺𝐸𝐻 = √(𝐹𝑚𝑜𝑑 − 𝐹𝑜𝑏𝑠)
2
0.5(𝐹𝑚𝑜𝑑 + 𝐹𝑜𝑏𝑠)
where: Fmod = Modelled flow
Fobs = Observed counts
The calibration criteria and acceptability guidelines for link and turning movement traffic flows have been adopted
from Traffic Modelling Guidelines, Roads and Maritime Services, NSW, 2013, which is accepted by TMR and are
summarised in Table 14. Validation criteria is outlined in Section 4.6.
Table 14: Calibration criteria for link and turn counts in microsimulation model
Indicator/ measure Description of criteria Acceptability Guidelines
Scatter Plot Coefficient of determination, R2 greater than
90% Overall observations
GEH GEH less than or equal to 5 for individual flows
Greater than or equal to 85% (especially on key locations)
GEH GEH less than or equal to 10 for individual flows
100% of observations
Source: ‘Traffic Modelling Guidelines’, Roads and Maritime Services, NSW, 2013
4.5.1 Network adjustments
The following network changes were incorporated in the model to calibrate to the observed counts:
– Removal of left-turn to side road from Old Mt Penang Road to prevent unlikely re-routing
– High cost functions applied at the left-turn to The Avenue from Central Coast Highway to limit unlikely
alternative southbound paths.
– High cost functions applied at the right-turn onto Old Mt Penang road to limit rat-running.
– Introduction of increased look-ahead distances where necessary to prevent missed turns and re-routing.
– Introducing keep clears at several intersections to avoid blockages.

GHD | Hunter and Central Coast Development Corporation | 12548506 | Mt Penang Traffic and Transport Impact Study 14
4.5.2 AM peak calibration results Table 15 summarises the GEH values for the AM peak, showing that the AM peak clearly meets the criteria for
proportion of GEH values under 5.
Table 15: AM peak calibration summary results
GEH range 7:00 – 8:00 AM 8:00 – 9:00 AM
Light Vehicle Heavy Vehicle Light Vehicle Heavy Vehicle
GEH < 5
(observations) 57 57 55 57
GEH < 5
(%) 100% 100% 97% 100%
GEH > 5
(observations) 0 0 2 0
GEH > 10
(observations) 0 0 0 0
Total turn counts 57 57 57 57
Figure 29 and Figure 30 present the scatterplot of modelled total vehicle flows and observed counts for the hours
of 7:00 – 8:00 am and 8:00 – 9:00 am respectively.
Figure 29: Observed vs. modelled traffic volumes (7:00 am - 8:00 am)
y = 0.9765xR² = 0.999
0
500
1000
1500
2000
2500
0 500 1000 1500 2000 2500
Mo
de
lled
vo
lum
e (
ve
hic
les)
Observed volume (vehicles)

GHD | Hunter and Central Coast Development Corporation | 12548506 | Mt Penang Traffic and Transport Impact Study 15
Figure 30: Observed vs. modelled traffic volumes (8:00 am - 9:00 am)
Both hours have an R2 value greater than 0.95 for both light and heavy vehicles, meeting the calibration criteria of
R2 greater than 0.9. Given both the GEH and R2 criteria are met, it can be concluded that the AM peak model is
calibrated to the observed counts.
The detailed statistics of the AM peak model calibration are presented in Appendix A.
4.5.3 PM peak calibration results
Table 16 summarises the GEH values for the AM peak, showing that the PM peak clearly meets the criteria for
proportion of GEH values under 5.
Table 16: PM peak calibration summary results
GEH range 4:00 – 5:00 PM 5:00 – 6:00 PM
Light Vehicle Heavy Vehicle Light Vehicle Heavy Vehicle
GEH < 5
(observations) 56 56 57 57
GEH < 5
(%) 98% 98% 100% 100%
GEH > 5
(observations) 1 1 0 0
GEH > 10
(observations) 0 0 0 0
Total turn counts 57 57 57 57
Figure 29 and Figure 30 present the scatterplot of modelled total vehicle flows and observed counts for the hours
of 4:00 – 5:00 pm and 5:00 – 6:00 pm respectively.
y = 1.0837xR² = 0.9973
0
400
800
1200
1600
2000
0 200 400 600 800 1000 1200 1400 1600 1800
Mo
de
lled
vo
lum
e (
ve
hic
les)
Observed volume (vehicles)

GHD | Hunter and Central Coast Development Corporation | 12548506 | Mt Penang Traffic and Transport Impact Study 16
Figure 31: Observed vs. modelled traffic volumes (4:00 pm - 5:00 pm)
Figure 32: Observed vs. modelled traffic volumes (5:00 pm - 6:00 pm)
All R2 values are greater than 0.9, so the criteria for R2 is met, indicating a close correlation between the observed
and modelled values. Therefore, the PM peak is calibrated, given it meets both the GEH and R2 criteria.
The detailed statistics of the PM peak model calibration are presented in Appendix A.
y = 0.9511xR² = 0.9984
0
500
1000
1500
2000
2500
0 500 1000 1500 2000 2500 3000
Mo
de
lled
vo
lum
e (
ve
hic
les)
Observed volume (vehicles)
y = 0.9627xR² = 0.9976
0
400
800
1200
1600
2000
2400
2800
0 500 1000 1500 2000 2500 3000
Mo
de
lled
vo
lum
e (
ve
hic
les)
Observed volume (vehicles)

GHD | Hunter and Central Coast Development Corporation | 12548506 | Mt Penang Traffic and Transport Impact Study 17
4.5.4 Weekend calibration results Table 17 summarises the GEH values for the weekend model, showing that the weekend model clearly meets the
criteria for proportion of GEH values under 5.
Table 17: Weekend calibration summary results
GEH range 12:00 – 1:00 PM 1:00 – 2:00 PM
Light Vehicle Heavy Vehicle Light Vehicle Heavy Vehicle
GEH < 5
(observations) 56 57 57 57
GEH < 5
(%) 98% 100% 100% 100%
GEH > 5
(observations) 1 0 0 0
GEH > 10
(observations) 0 0 0 0
Total turn counts 57 57 57 57
Figure 33 and Figure 34 present the scatterplot of modelled total vehicle flows and observed counts for the hours
of 12:00 – 1:00 pm and 1:00 – 2:00 pm respectively.
Figure 33: Observed vs. modelled traffic volumes (12:00 pm - 1:00 pm)
y = 0.9882xR² = 0.999
0
200
400
600
800
1000
1200
1400
1600
1800
2000
0 500 1000 1500 2000
Mo
de
lled
vo
lum
e (
ve
hic
les)
Observed volume (vehicles)

GHD | Hunter and Central Coast Development Corporation | 12548506 | Mt Penang Traffic and Transport Impact Study 18
Figure 34: Observed vs. modelled traffic volumes (1:00 pm - 2:00 pm)
All R2 values are greater than 0.9, so the criteria for R2 is met. Therefore, the weekend model is calibrated, given it
meets both the GEH and R2 criteria.
The detailed statistics of the weekend model calibration are presented in Appendix A.
4.6 Model validation Validation is conducted during model development with the objective of producing an accurate and credible model.
For validation, the outputs of calibrated models are compared against observed data (which are preferably not
used for model calibration) and satisfy pre-agreed criteria.
The industry approved and recommended measure for travel time validation is the percentage difference between
modelled and observed travel times, subject to an absolute maximum difference. The validation criterion and
acceptability guideline for travel times are defined in Table 18 below.
Table 18: Travel time validation criteria
Topic Criteria
Journey time average Modelled times along routes should be within 15% of surveyed times (or 60 seconds, if higher)
Section time average Within 15% of surveyed times
Source: ‘Traffic Modelling Guidelines’, Roads and Maritime Services, NSW, 2013
Travel time surveys were undertaken along the Central Coast Highway between Woy Woy Road and Wisemans
Ferry Road in both the northbound and southbound direction. Details of this survey are provided in Section 2.4.4.
4.6.1 Network changes
To validate the model to existing travel time data, the following network changes were made:
– Dividing the right-turn and through-lanes between The Avenue and Woy Woy Road southbound. This
required all vehicles turning right at Woy Woy Road to queue in the right-most through lane at The Avenue,
thereby altering the queue behaviour along Central Coast Highway southbound.
– Extending solid lines at some intersections to prevent last-minute lane-changing.
– Dividing the signal plans at Central Coast Highway / The Avenue intersection into separate half-hour plans.
This was done to reflect the high phase time for The Avenue traffic during school peak time.
y = 1.0409xR² = 0.9976
0
400
800
1200
1600
2000
0 200 400 600 800 1000 1200 1400 1600 1800
Mo
de
lled
vo
lum
e (
ve
hic
les)
Observed volume (vehicles)

GHD | Hunter and Central Coast Development Corporation | 12548506 | Mt Penang Traffic and Transport Impact Study 19
4.6.2 AM validation results Table 19 summarises the observed and modelled travel time for the AM peak.
Table 19: AM peak travel time results
Period Direction Survey (mm:ss)
Model (mm:ss)
Diff (seconds)
Diff % Criteria
7:00 - 8:00 am
Northbound 03:06 03:17 11 6% YES
Southbound 04:08 03:56 -12 -5% YES
8:00 – 9:00 am
Northbound 03:46 03:17 -29 -13% YES
Southbound 07:24 08:03 39 9% YES
Figure 35 to Figure 38 show the travel time results for the two AM model hours in both directions.
Figure 35: AM peak modelled and observed travel times (northbound, 7:00 am - 8:00 am)
Curringa Road
Kangoo Road
Wisemans Ferry Road
M1 SB off-ramp
M1 NB on-ramp
Pacific Highway
00:00
01:00
02:00
03:00
04:00
05:00
0 500 1000 1500 2000 2500
Tra
vel tim
e (
mm
:ss)
Distance (m)
Surveyed Travel Time Survey - 15% Survey + 15% Modelled Travel Time

GHD | Hunter and Central Coast Development Corporation | 12548506 | Mt Penang Traffic and Transport Impact Study 20
Figure 36: AM peak modelled and observed travel times (southbound, 7:00 am - 8:00 am)
Figure 37: AM peak modelled and observed travel times (northbound, 8:00 am - 9:00 am)
M1 NB on-ramp
M1 SB off-ramp
Wisemans Ferry Road
Kangoo
Curringa Road
Woy Woy Road
00:00
01:00
02:00
03:00
04:00
05:00
0 500 1000 1500 2000 2500
Tra
vel tim
e (
mm
:ss)
Distance (m)
Central Coast Highway / Wisemans Ferry Road (southbound) - 7:00 - 8:00 am
Surveyed Travel Time Survey - 15% Survey + 15% Modelled Travel Time
Curringa Road
Kangoo Road
Wisemans Ferry Road
M1 SB off-ramp
M1 NB on-ramp
Pacific Highway
00:00
01:00
02:00
03:00
04:00
05:00
0 500 1000 1500 2000 2500
Tra
vel tim
e (
mm
:ss)
Distance (m)
Central Coast Highway / Wisemans Ferry Road (northbound) - 8:00 - 9:00 am
Surveyed Travel Time Survey - 15% Survey + 15% Modelled Travel Time

GHD | Hunter and Central Coast Development Corporation | 12548506 | Mt Penang Traffic and Transport Impact Study 21
Figure 38: AM peak modelled and observed travel times (southbound, 8:00 am - 9:00 am)
All modelled travel times fall within the 15% window, indicating there is a close correlation between the modelled
and observed travel times. The modelled travel times also appear to fit the travel time trend lines closely, with the
exception of the southbound route in the 8:00 am -9:00 am hour, which trends faster than the surveyed travel
times between the M1 southbound exit ramp and Kangoo Road, and slower between Kangoo Road and Curringa
Road. Regardless, the route still meets the 15% criteria and queues observed in the site visit were matched in the
model (as shown in Section 4.7).
In the northbound direction, the modelled travel time trend along the lower 15% band. This is primarily because of
the modelled travel time between Woy Woy Road and Curringa Road being lower than the surveyed times. It
should be noted that the surveyed travel time data only approaches the northbound route from Woy Woy Road,
rather than a mixture of Woy Woy Road and Central Coast Highway. The survey therefore does not capture the
lower travel times for vehicles approaching from the Central Coast Highway due to coordination of the two
signalised intersections. The modelled travel times captures a mixture of vehicles approaching from Central Coast
Highway at the south and Woy Woy Road at the west. Accordingly, the modelled travel times appear lower during
high congestion periods.
4.6.3 PM validation results
Table 20 summarises the PM modelled and observed travel times on the Central Coast Highway.
Table 20: PM peak travel time summary
Period Direction Survey (mm:ss)
Model (mm:ss)
Diff (seconds)
Diff % Criteria
4:00 -5:00 pm Northbound 03:43 03:54 11 5% YES
Southbound 05:48 05:28 -20 -6% YES
5:00 – 6:00 pm Northbound 03:07 03:24 17 9% YES
Southbound 06:00 06:29 29 8% YES
Figure 39 to Figure 42 plot the travel time results for each modelled hour and route direction.
M1 NB on-ramp
M1 SB off-ramp
Wisemans Ferry Road
Kangoo Road
Curringa Road
Woy Woy Road
00:00
01:00
02:00
03:00
04:00
05:00
06:00
07:00
08:00
09:00
0 500 1000 1500 2000 2500
Tra
vel tim
e (
mm
:ss)
Distance (m)
Central Coast Highway / Wisemans Ferry Road (southbound) - 8:00 - 9:00 am
Surveyed Travel Time Survey - 15% Survey + 15% Modelled Travel Time

GHD | Hunter and Central Coast Development Corporation | 12548506 | Mt Penang Traffic and Transport Impact Study 22
Figure 39: PM peak modelled and observed travel times (northbound, 4:00 pm - 5:00 pm)
Figure 40: PM pe ak modelled and observed travel times (southbound, 4:00 pm - 5:00 pm)
Curringa Road
Kangoo Road
Wisemans
M1 SB
M1 NB on-ramp
Pacific Highway
00:00
01:00
02:00
03:00
04:00
05:00
0 500 1000 1500 2000 2500
Tra
vel tim
e (
mm
:ss)
Distance (m)
Central Coast Highway / Wisemans Ferry Road (northbound) - 4:00 - 5:00 pm
Surveyed Travel Time Survey - 15% Survey + 15% Modelled Travel Time
M1 NB on-ramp
M1 SB off-ramp
Wisemans Ferry Road
Kangoo
Curringa Road
Woy Woy Road
00:00
01:00
02:00
03:00
04:00
05:00
06:00
07:00
0 500 1000 1500 2000 2500
Tra
vel tim
e (
mm
:ss)
Distance (m)
Central Coast Highway / Wisemans Ferry Road (southbound) - 4:00 - 5:00 pm
Surveyed Travel Time Survey - 15% Survey + 15% Modelled Travel Time

GHD | Hunter and Central Coast Development Corporation | 12548506 | Mt Penang Traffic and Transport Impact Study 23
Figure 41: PM peak modelled and observed travel times (northbound, 5:00 pm - 6:00 pm)
Figure 42: PM peak modelled and observed travel times (southbound, 5:00 pm - 6:00 pm)
Evidently, all modelled travel times fall within 15 % or one minute of the observed travel times. The travel time
plots also indicate that the modelled travel times follow the trend of the observed closely for both hours and route
directions. Consequently, the PM model can be deemed validated.
4.6.4 Weekend validation results
Table 21 summarises the weekend modelled and observed travel times on the Central Coast Highway.
Curringa Road
Kangoo Road
Wisemans Ferry Road
M1 SB off-ramp
M1 NB on-ramp
Pacific Highway
00:00
01:00
02:00
03:00
04:00
05:00
0 500 1000 1500 2000 2500
Tra
vel tim
e (
mm
:ss)
Distance (m)
Central Coast Highway / Wisemans Ferry Road (northbound) - 5:00 - 6:00 pm
Surveyed Travel Time Survey - 15% Survey + 15% Modelled Travel Time
M1 NB on-ramp
M1 SB off-ramp
Wisemans Ferry Road
Kangoo Road
Curringa Road
Woy Woy Road
00:00
01:00
02:00
03:00
04:00
05:00
06:00
07:00
08:00
09:00
0 500 1000 1500 2000 2500
Tra
vel tim
e (
mm
:ss)
Distance (m)
Central Coast Highway / Wisemans Ferry Road (southbound) - 5:00 - 6:00 pm
Surveyed Travel Time Survey - 15% Survey + 15% Modelled Travel Time

GHD | Hunter and Central Coast Development Corporation | 12548506 | Mt Penang Traffic and Transport Impact Study 24
Table 21 Weekend peak travel time summary
Period Direction Survey (mm:ss)
Model (mm:ss)
Diff (seconds) Diff % Criteria
12:00 -1:00 pm Northbound 03:34 03:20 -14 -7% YES
Southbound 04:42 04:19 -23 -8% YES
1:00 -2:00 pm Northbound 02:57 02:57 0 0% YES
Southbound 04:30 04:22 -8 -3% YES
Figure 43 to Figure 46 show the modelled and observed travel time plots along the length of the route.
Figure 43: Weekend modelled and observed travel times (northbound, 12:00 pm - 1:00 pm)
Curringa Road
Kangoo Road
Wisemans Ferry Road
M1 SB off-ramp
M1 NB on-ramp
Pacific Highway
00:00
01:00
02:00
03:00
04:00
05:00
0 500 1000 1500 2000 2500
Tra
vel tim
e (
mm
:ss)
Distance (m)
Central Coast Highway / Wisemans Ferry Road (northbound) - 12:00 -1:00 pm
Surveyed Travel Time Survey - 15% Survey + 15% Modelled Travel Time

GHD | Hunter and Central Coast Development Corporation | 12548506 | Mt Penang Traffic and Transport Impact Study 25
Figure 44: Weekend modelled and observed travel times (southbound, 12:00 pm - 1:00 pm)
Figure 45: Weekend modelled and observed travel times (northbound, 1:00 pm - 2:00 pm)
M1 NB on-ramp
M1 SB off-ramp
Wisemans Ferry Road
Kangoo Road
Curringa Road
Woy Woy Road
00:00
01:00
02:00
03:00
04:00
05:00
06:00
0 500 1000 1500 2000 2500
Tra
vel tim
e (
mm
:ss)
Distance (m)
Central Coast Highway / Wisemans Ferry Road (southbound) - 12:00 -1:00 pm
Surveyed Travel Time Survey - 15% Survey + 15% Modelled Travel Time
Curringa Road
Kangoo Road
Wisemans Ferry Road
M1 SB off-ramp
M1 NB on-ramp
Pacific Highway
00:00
01:00
02:00
03:00
04:00
05:00
0 500 1000 1500 2000 2500
Tra
vel tim
e (
mm
:ss)
Distance (m)
Central Coast Highway / Wisemans Ferry Road (northbound) - 1:00 - 2:00 pm
Surveyed Travel Time Survey - 15% Survey + 15% Modelled Travel Time

GHD | Hunter and Central Coast Development Corporation | 12548506 | Mt Penang Traffic and Transport Impact Study 26
Figure 46: Weekend modelled and observed travel times (southbound, 1:00 pm - 2:00 pm)
All travel times fall within the 15% window, indicating they meet the RMS criteria for validation. Further, the trends
along the length of the route appear to align with the observed data, indicating there is a good fit between the
modelled and observed travel times. Consequently, the model can be deemed validated for the weekend case.
4.7 Queue observations Figure 47 and Figure 48 show the southbound queues on Central Coast Highway during AM peak, e.g. at 8:30 am.
The queues at this time were near their maximum length. Queues have been reported using the seed value of 28,
as this aligned most with the average seed value for total VHT in Figure 24.
The snapshots show the queues commencing at the intersection with The Avenue and extending back to the
Wisemans Ferry Road intersection. This aligns reasonably well with the observed behaviour, where queues were
observed to extend from The Avenue past Kangoo Road intersection.
The Wisemans Ferry Road / Central Coast Highway intersection shows little congestion, indicating the intersection
is capable of meeting the demand. Further, there appears to be very little congestion in the northbound direction,
which is consistent with the behaviour observed on the site visit.
M1 NB on-ramp
M1 SB off-ramp
Wisemans Ferry Road
Kangoo Road
Curringa Road
Woy Woy Road
00:00
01:00
02:00
03:00
04:00
05:00
06:00
0 500 1000 1500 2000 2500
Tra
vel tim
e (
mm
:ss)
Distance (m)
Central Coast Highway / Wisemans Ferry Road (southbound) - 1:00 - 2:00 pm
Surveyed Travel Time Survey - 15% Survey + 15% Modelled Travel Time

GHD | Hunter and Central Coast Development Corporation | 12548506 | Mt Penang Traffic and Transport Impact Study 27
Figure 47: Southbound queue on Central Coast Highway, north (8:30 am)

GHD | Hunter and Central Coast Development Corporation | 12548506 | Mt Penang Traffic and Transport Impact Study 28
Figure 48: Southbound queue on Central Coast Highway, south (8:32 am)

GHD | Hunter and Central Coast Development Corporation | 12548506 | Mt Penang Traffic and Transport Impact Study 29
Figure 49 and Figure 50 present a snapshot of the simulation of PM peak e.g. at 5:16 pm. It can be seen there is
limited queueing both southbound and northbound on the Central Coast Highway. There is some queueing on the
north approach to the Central Coast Highway / Wisemans Ferry Road intersection, which appears to extend
slightly onto the Pacific Motorway Ramps. Given that the vehicles are spaced apart further downstream (at
Kangoo Road intersection), it can be inferred that this queueing has resulted from a high demand from the Pacific
Motorway onto the Central Coast Highway. There does not appear to be a major issue with the propagation of
queueing from downstream intersections onto the Wisemans Ferry Road intersection.
The congestion appears to ease after the intersection with The Avenue. The snapshots also indicate low
congestion northbound on the Central Coast Highway.

GHD | Hunter and Central Coast Development Corporation | 12548506 | Mt Penang Traffic and Transport Impact Study 30
Figure 49: Model snapshot, north Central Coast Highway (5:16 pm)

GHD | Hunter and Central Coast Development Corporation | 12548506 | Mt Penang Traffic and Transport Impact Study 31
Figure 50: Model snapshot, south Central Coast Highway (5:16 pm)
GHD | Hunter and Central Coast Development Corporation | 12548506 | Mt Penang Traffic and Transport Impact Study 32
Summary and conclusion
Following the completion of Stage 1 works in 2020, GHD was commissioned by the Hunter and Central Coast
Development Corporation to undertake additional works for the Mt Penang Parklands Traffic and Transport Impact
Study (TTIS). As a part of these additional works (Stage 2), GHD has extended the 2020 base year
microsimulation traffic model to include the proximate connections to the M1 Pacific Motorway. It is anticipated that
the extension of the model will provide a more robust assessment of the impact of the Parklands development on
the Pacific Motorway connections.
Leveraging the base model developed for the Stage 1 works in the Aimsun suite of software, GHD has undertaken
a full model calibration and validation so to include the extension of the study area to the north. Additional traffic
data on Wisemans Ferry Road was identified to be suitable for use in the 2020 base model, given its reasonable
alignment at the interface with the 2020 data at the Wisemans Ferry Road / Central Coast Highway intersection.
The calibration and validation of the model was completed in line with the comments on the original base model,
and the original methodology was agreed upon by TfNSW.
The base year traffic model was developed for the weekday AM peak period of 7:00 am – 9:00 am, the weekday
PM peak period of 4:00 pm – 6:00 pm and a weekend period of 12:00 pm – 2:00 pm. Traffic demand matrices
developed in the Stage 1 works (via a process of matrix furnessing and Aimsun’s ‘Static OD Adjustment’ tool) were
adjusted to account for the reconfigured zone structure. The model network, signal phasing and timing, and public
transport was coded to the available data.
The models were calibrated and validated in accordance with the RMS Traffic Modelling Guidelines 2013.
Observed traffic counts were used to calibrate the microsimulation traffic model. RMS criteria advocates that 95%
of intersection traffic movements must have a GEH statistic less than or equal to 5 and the coefficient of
determination (R2) between the observed and modelled flows must exceed 0.9. It was determined that the
modelled traffic counts were a good fit to the observed counts in both peak hours.
Travel time data on the Central Coast Highway both northbound and southbound was used to validate the
microsimulation model. RMS criteria used to validate the model advises that 95% of modelled routes must have
travel times falling within ±15% or ±1 minute of the observed time, if higher than 15%. All routes met this criteria,
although it was recognised that the southbound route during the 8:00 am to 9:00 am period did not fit the trend of
the data, however, it was identified to still fit within the 15% bounds.
Given that the model was found to be well calibrated to the observed counts, and met the criteria for validation, it is
reasonable to conclude that the 2020 base year Aimsun microsimulation models provide a sound representation of
the current traffic conditions in the study area during weekday AM, weekday PM and weekend periods. Following
the technical review of the traffic models by TfNSW in August 2021, we have addressed the comments and
updated this report accordingly. Therefore, we believe that the Mt Penang microsimulation base year traffic
models would be suitable to assess the impacts of any proposed network upgrades and land-use changes within
the study area in the future years.

GHD | Hunter and Central Coast Development Corporation | 12548506 | Mt Penang Traffic and Transport Impact Study 33
Appendices

GHD | Hunter and Central Coast Development Corporation | 12548506 | Mt Penang Traffic and Transport Impact Study 34
Appendix A Detailed calibration results

Observed Modelled GEH Observed Modelled GEH
South Left 116 115 0.1 4 4 0.1
South Through 1335 1263 2.0 64 64 0.0
North Through 836 857 0.7 91 81 1.1
North Right 288 269 1.1 16 13 0.8
West Left 700 710 0.4 7 7 0.2
West Right 248 244 0.3 7 6 0.4
South Left 27 32 0.9 4 4 0.1
South Through 1880 1838 1.0 66 60 0.8
South Right 84 80 0.5 2 5 1.8
East Left 11 15 1.0 2 1 0.6
East Through 9 0 4.2 0 0 0.0
East Right 23 44 3.7 4 0 2.4
North Left 71 63 1.0 3 9 2.5
North Through 997 1027 1.0 100 91 0.9
North Right 49 53 0.5 7 7 0.0
West Left 274 294 1.2 1 2 0.8
West Through 36 15 4.3 0 0 0.9
West Right 80 84 0.5 3 1 1.8
South Through 2166 2086 1.7 67 58 1.2
South Right 90 82 0.9 3 6 1.4
East Left 30 24 1.2 4 9 2.1
East Right 33 36 0.5 5 8 1.3
North Left 137 139 0.2 10 8 0.8
North Through 1110 1134 0.7 109 99 1.0
South Through 1572 1512 1.5 29 29 0.0
South Right 640 609 1.2 42 38 0.7
East Left 686 711 0.9 73 63 1.2
East Right 21 19 0.4 29 29 0.0
North Left 47 47 0.1 21 20 0.2
North Through 574 569 0.2 45 44 0.2
South Northbound 84 90 0.7 21 12 2.3
North Southbound 7 7 0.0 2 0 1.9
The Avenue: Between Corinya Road and Wapole
DriveSouth Northbound 19 22 0.7 4 0 2.8
West Eastbound 0 0 0.0 0 0 0.0
East Westbound 8 11 1.1 3 0 2.5
Woy Woy Road / Central Coast Highway
The Avenue / Central Coast Highway
Weekday AM 7:00 am - 8:00 am
Heavy VehiclesLight VehiclesLocation Approach Turn
Kangoo Road / Central Coast Highway
Wisemans Ferry Road / Central Coast Highway
The Avenue: Between Festival Drive and Holystone Drive
McCabe Drive: Between Parklands Road and The
Avenue

Observed Modelled GEH Observed Modelled GEH
Weekday AM 7:00 am - 8:00 am
Heavy VehiclesLight VehiclesLocation Approach Turn
West Eastbound 29 27 0.5 5 1 2.4
East Westbound 12 29 3.8 2 2 0.3
West Eastbound 60 60 0.0 10 12 0.6
East Westbound 6 3 1.6 1 0 1.4
South Northbound 6 4 0.8 1 0 1.6
North Southbound 9 8 0.5 2 0 2.0
South Northbound 2 3 0.9 0 0 0.8
North Southbound 10 9 0.1 2 0 2.1
South Through 678 655 0.9 55 58 0.4
East Left 658 652 0.2 34 25 1.7
East Right 220 203 1.2 20 14 1.4
North Through 73 87 1.5 41 68 3.7
South Through 439 442 0.1 55 58 0.5
South Right 460 416 2.1 22 13 2.0
North Left 38 38 0.1 22 20 0.4
North Through 77 87 1.1 41 68 3.7
South Left 188 189 0.1 11 8 1.0
South Through 251 252 0.1 44 50 0.9
North Through 80 91 1.2 42 55 1.8
North Right 20 23 0.6 0 0 0.0
West Left 7 6 0.4 6 5 0.3
West Right 30 34 0.7 24 33 1.8
Wisemans Ferry Road / Pacific Motorway Off-Ramp
Wisemans Ferry Road / Pacific Motorway On-Ramp
Wisemans Ferry Road / Pacific Highway
Parklands Road: Between Festival Drive and Carinya
Road
Parklands Road: Between Carinya Road
Festival Drive: Near The Avenue
Carinya Road: East of The Avenue

Observed Modelled GEH Observed Modelled GEH
South Left 169 161 0.6 1 1 0.0
South Through 1017 1125 3.3 74 82 0.9
North Through 1112 1182 2.1 108 107 0.1
North Right 287 282 0.3 13 9 1.3
West Left 576 589 0.5 15 14 0.3
West Right 395 392 0.1 6 5 0.3
South Left 47 73 3.3 2 3 0.5
South Through 1354 1500 3.9 80 84 0.4
South Right 157 138 1.6 5 9 1.4
East Left 87 81 0.6 4 6 0.7
East Through 83 80 0.3 3 3 0.0
East Right 62 61 0.1 1 5 2.3
North Left 118 114 0.4 6 13 2.3
North Through 1152 1283 3.7 114 106 0.7
North Right 81 83 0.2 2 4 1.2
West Left 211 213 0.1 4 2 0.9
West Through 170 162 0.7 0 0 0.6
West Right 99 95 0.4 1 3 1.5
South Through 1608 1723 2.8 77 83 0.6
South Right 70 69 0.1 8 9 0.2
East Left 25 15 2.2 6 6 0.1
East Right 20 23 0.7 8 11 1.0
North Left 113 123 0.9 8 7 0.4
North Through 1371 1541 4.5 127 124 0.2
South Through 1028 1126 3.0 31 32 0.1
South Right 612 631 0.8 59 61 0.3
East Left 913 1112 6.3 85 89 0.4
East Right 26 25 0.3 28 26 0.4
North Left 57 54 0.3 17 15 0.4
North Through 589 563 1.1 47 45 0.2
South Northbound 137 134 0.2 34 16 3.6
North Southbound 28 22 1.2 7 2 2.1
The Avenue: Between Corinya Road and Wapole
DriveSouth Northbound 69 87 2.1 14 12 0.7
West Eastbound 1 0 1.7 1 0 1.1
East Westbound 14 53 6.6 6 12 2.0
West Eastbound 193 156 2.8 31 11 4.4Festival Drive: Near The
McCabe Drive: Between Parklands Road and The
Avenue
Weekday AM 8:00 am - 9:00 am
Location Approach TurnLight Vehicles Heavy Vehicles
Woy Woy Road / Central Coast Highway
The Avenue / Central Coast Highway
Kangoo Road / Central Coast Highway
Wisemans Ferry Road / Central Coast Highway
The Avenue: Between Festival Drive and Holystone Drive

Observed Modelled GEH Observed Modelled GEH
Weekday AM 8:00 am - 9:00 am
Location Approach TurnLight Vehicles Heavy Vehicles
East Westbound 125 117 0.7 20 5 4.2
West Eastbound 25 34 1.6 4 4 0.2
East Westbound 3 4 0.9 0 0 0.9
South Northbound 46 25 3.4 10 2 3.4
North Southbound 27 30 0.6 6 7 0.3
South Northbound 16 12 1.1 4 2 1.1
North Southbound 30 31 0.1 7 9 0.8
South Through 649 684 1.4 55 76 2.6
East Left 972 1012 1.3 34 42 1.2
East Right 185 198 0.9 20 17 0.7
North Through 109 118 0.8 41 76 4.6
South Through 406 467 2.9 55 71 2.0
South Right 445 416 1.4 22 22 0.1
North Left 35 33 0.3 22 18 1.0
North Through 113 118 0.5 41 76 4.6
South Left 115 146 2.7 11 13 0.6
South Through 291 321 1.7 44 58 1.9
North Through 123 123 0.0 42 60 2.5
North Right 13 14 0.3 0 0 0.0
West Left 10 8 0.6 6 7 0.4
West Right 27 29 0.4 24 34 1.9
Wisemans Ferry Road / Pacific Highway
Avenue
Carinya Road: East of The Avenue
Parklands Road: Between Festival Drive and Carinya
Road
Parklands Road: Between Carinya Road
Wisemans Ferry Road / Pacific Motorway Off-Ramp
Wisemans Ferry Road / Pacific Motorway On-Ramp

Observed Modelled GEH Observed Modelled GEH
South Left 298 280 1.0 4 3 0.5
South Through 1037 1056 0.6 64 52 1.5
North Through 1526 1421 2.7 91 73 1.9
North Right 835 770 2.3 16 14 0.4
West Left 317 319 0.1 7 9 0.6
West Right 195 199 0.3 7 1 3.1
South Left 106 110 0.4 4 4 0.1
South Through 1183 1210 0.8 66 56 1.3
South Right 46 56 1.4 2 1 0.5
East Left 98 78 2.1 2 5 1.4
East Through 67 61 0.7 0 0 0.0
East Right 95 91 0.4 4 5 0.4
North Left 45 44 0.2 3 1 1.4
North Through 2166 2041 2.7 100 83 1.8
North Right 219 195 1.6 7 3 1.7
West Left 84 90 0.6 1 0 1.4
West Through 20 7 3.6 0 0 0.0
West Right 81 82 0.1 3 0 2.4
South Through 1335 1359 0.6 67 54 1.6
South Right 27 31 0.7 3 6 1.3
East Left 130 133 0.3 4 8 1.5
East Right 86 88 0.3 5 9 1.4
North Left 47 56 1.3 10 14 1.1
North Through 2317 2197 2.5 109 81 2.9
South Through 745 747 0.1 29 26 0.7
South Right 705 693 0.5 42 39 0.5
East Left 719 696 0.9 73 63 1.2
East Right 50 47 0.4 29 2 6.8
North Left 62 58 0.5 21 15 1.4
North Through 1709 1582 3.1 45 32 2.2
South Northbound 52 37 2.2 13 1 4.4
North Southbound 74 86 1.4 18 6 3.6
The Avenue: Between Corinya Road and Wapole
DriveSouth Northbound 14 27 2.9 3 1 1.4
West Eastbound 1 0 1.7 1 0 1.1
East Westbound 14 36 4.3 6 4 0.9
McCabe Drive: Between Parklands Road and The
Avenue
Weekday PM 4:00 pm - 5:00 pm
Location Approach TurnLight Vehicles Heavy Vehicles
Woy Woy Road / Central Coast Highway
The Avenue / Central Coast Highway
Kangoo Road / Central Coast Highway
Wisemans Ferry Road / Central Coast Highway
The Avenue: Between Festival Drive and Holystone Drive

Observed Modelled GEH Observed Modelled GEH
Weekday PM 4:00 pm - 5:00 pm
Location Approach TurnLight Vehicles Heavy Vehicles
West Eastbound 15 47 5.6 3 3 0.3
East Westbound 58 52 0.8 10 1 4.0
West Eastbound 3 3 0.0 0 0 0.9
East Westbound 25 38 2.3 4 4 0.1
South Northbound 10 8 0.6 2 0 2.1
North Southbound 50 35 2.3 11 3 3.0
South Northbound 8 5 1.3 2 0 1.9
North Southbound 43 40 0.4 9 5 1.7
South Through 789 749 1.5 71 54 2.2
East Left 500 465 1.6 43 27 2.7
East Right 37 39 0.3 29 30 0.2
North Through 270 279 0.5 56 38 2.6
South Through 194 223 2.0 79 72 0.8
South Right 620 566 2.2 22 12 2.4
North Left 396 395 0.0 28 29 0.1
North Through 274 279 0.3 56 38 2.6
South Left 38 46 1.2 19 13 1.4
South Through 147 177 2.4 58 59 0.2
North Through 442 454 0.6 57 54 0.5
North Right 6 7 0.5 0 0 0.0
West Left 27 30 0.6 0 0 0.0
West Right 216 219 0.2 26 14 2.8
Wisemans Ferry Road / Pacific Highway
Festival Drive: Near The Avenue
Carinya Road: East of The Avenue
Parklands Road: Between Festival Drive and Carinya
Road
Parklands Road: Between Carinya Road
Wisemans Ferry Road / Pacific Motorway Off-Ramp
Wisemans Ferry Road / Pacific Motorway On-Ramp

Observed Modelled GEH Observed Modelled GEH
South Left 358 352 0.3 2 2 0.1
South Through 908 908 0.0 25 30 0.9
North Through 1559 1467 2.4 49 50 0.1
North Right 845 820 0.9 6 7 0.5
West Left 287 293 0.3 7 7 0.1
West Right 214 213 0.1 3 3 0.0
South Left 135 131 0.3 2 3 0.6
South Through 997 1026 0.9 26 33 1.3
South Right 34 47 2.0 1 0 0.7
East Left 26 56 4.7 0 2 2.0
East Through 36 24 2.2 0 0 0.0
East Right 26 45 3.2 0 0 0.0
North Left 33 33 0.1 3 1 1.4
North Through 2301 2171 2.7 55 48 1.0
North Right 292 282 0.6 4 4 0.2
West Left 74 79 0.5 2 0 2.0
West Through 18 15 0.8 0 0 0.0
West Right 79 82 0.4 0 0 0.6
South Through 1133 1121 0.4 27 25 0.4
South Right 19 26 1.5 1 8 3.3
East Left 110 108 0.2 5 7 0.9
East Right 62 73 1.3 2 5 1.5
North Left 49 50 0.2 5 8 1.2
North Through 2497 2371 2.6 55 51 0.6
South Through 630 655 1.0 7 8 0.2
South Right 544 574 1.3 21 23 0.3
East Left 632 650 0.7 31 28 0.6
East Right 52 57 0.7 2 2 0.3
North Left 83 47 4.4 13 14 0.3
North Through 1886 1751 3.2 27 30 0.6
South Northbound 30 24 1.0 7 1 3.1
North Southbound 45 36 1.4 11 1 4.0
The Avenue: Between Corinya Road and Wapole
DriveSouth Northbound 9 17 2.1 2 1 0.7
West Eastbound 1 0 1.7 1 0 1.1
East Westbound 12 22 2.4 5 0 2.7
McCabe Drive: Between Parklands Road and The
Avenue
Weekday PM 5:00 pm - 6:00 pm
Location Approach TurnLight Vehicles Heavy Vehicles
Woy Woy Road / Central Coast Highway
The Avenue / Central Coast Highway
Kangoo Road / Central Coast Highway
Wisemans Ferry Road / Central Coast Highway
The Avenue: Between Festival Drive and Holystone Drive

Observed Modelled GEH Observed Modelled GEH
Weekday PM 5:00 pm - 6:00 pm
Location Approach TurnLight Vehicles Heavy Vehicles
West Eastbound 80 51 3.6 13 1 4.8
East Westbound 53 43 1.5 9 0 4.2
West Eastbound 3 3 0.1 0 0 0.9
East Westbound 12 20 1.9 2 1 0.8
South Northbound 11 4 2.3 2 0 2.2
North Southbound 34 22 2.3 8 1 3.4
South Northbound 6 4 0.7 1 0 1.2
North Southbound 34 30 0.9 8 1 3.3
South Through 603 616 0.5 26 37 1.9
East Left 451 473 1.0 11 21 2.5
East Right 15 16 0.4 3 5 0.8
North Through 178 238 4.2 6 9 1.1
South Through 129 172 3.5 19 33 2.7
South Right 468 467 0.0 9 9 0.1
North Left 201 210 0.7 7 6 0.2
North Through 183 238 3.8 6 9 1.1
South Left 18 31 2.7 6 11 1.6
South Through 103 142 3.5 13 22 2.1
North Through 263 315 3.0 6 9 1.2
North Right 1 2 0.5 1 1 0.4
West Left 11 11 0.1 1 0 0.7
West Right 108 132 2.2 5 6 0.4
Wisemans Ferry Road / Pacific Highway
Festival Drive: Near The Avenue
Carinya Road: East of The Avenue
Parklands Road: Between Festival Drive and Carinya
Road
Parklands Road: Between Carinya Road
Wisemans Ferry Road / Pacific Motorway Off-Ramp
Wisemans Ferry Road / Pacific Motorway On-Ramp

Observed Modelled GEH Observed Modelled GEH
South Left 251 248 0.2 1 0 1.0
South Through 952 969 0.5 29 31 0.3
North Through 1236 1188 1.4 20 24 0.9
North Right 507 494 0.6 8 9 0.5
West Left 419 414 0.2 8 11 1.1
West Right 190 186 0.3 2 2 0.3
South Left 108 102 0.6 3 3 0.1
South Through 1214 1246 0.9 33 37 0.7
South Right 34 36 0.3 1 2 1.1
East Left 47 53 0.9 1 3 1.2
East Through 13 6 2.3 0 0 0.0
East Right 15 19 0.9 0 0 0.0
North Left 19 18 0.3 0 0 0.0
North Through 1611 1560 1.3 25 30 0.9
North Right 146 141 0.4 0 0 0.0
West Left 110 118 0.7 1 0 1.4
West Through 20 16 1.0 0 0 0.0
West Right 84 80 0.4 1 1 0.4
South Through 1329 1362 0.9 36 37 0.2
South Right 21 20 0.2 0 0 0.0
East Left 36 39 0.5 0 0 0.0
East Right 17 21 0.9 0 0 0.0
North Left 28 30 0.3 0 0 0.0
North Through 1735 1682 1.3 27 30 0.5
South Through 992 966 0.8 14 12 0.4
South Right 363 418 2.8 22 25 0.5
East Left 752 721 1.1 20 23 0.7
East Right 21 19 0.5 19 17 0.4
North Left 46 50 0.6 14 13 0.3
North Through 1023 991 1.0 7 6 0.3
South Northbound 14 19 1.0 4 1 2.1
North Southbound 5 19 4.0 1 2 0.8
The Avenue: Between Corinya Road and Wapole
DriveSouth Northbound 7 6 0.7 2 0 1.7
West Eastbound 2 0 2.1 1 0 1.3
East Westbound 3 14 3.9 1 0 1.5
McCabe Drive: Between Parklands Road and The
Avenue
Weekend 12:00 pm - 1:00 pm
Location Approach TurnLight Vehicles Heavy Vehicles
Woy Woy Road / Central Coast Highway
The Avenue / Central Coast Highway
Kangoo Road / Central Coast Highway
Wisemans Ferry Road / Central Coast Highway
The Avenue: Between Festival Drive and Holystone Drive
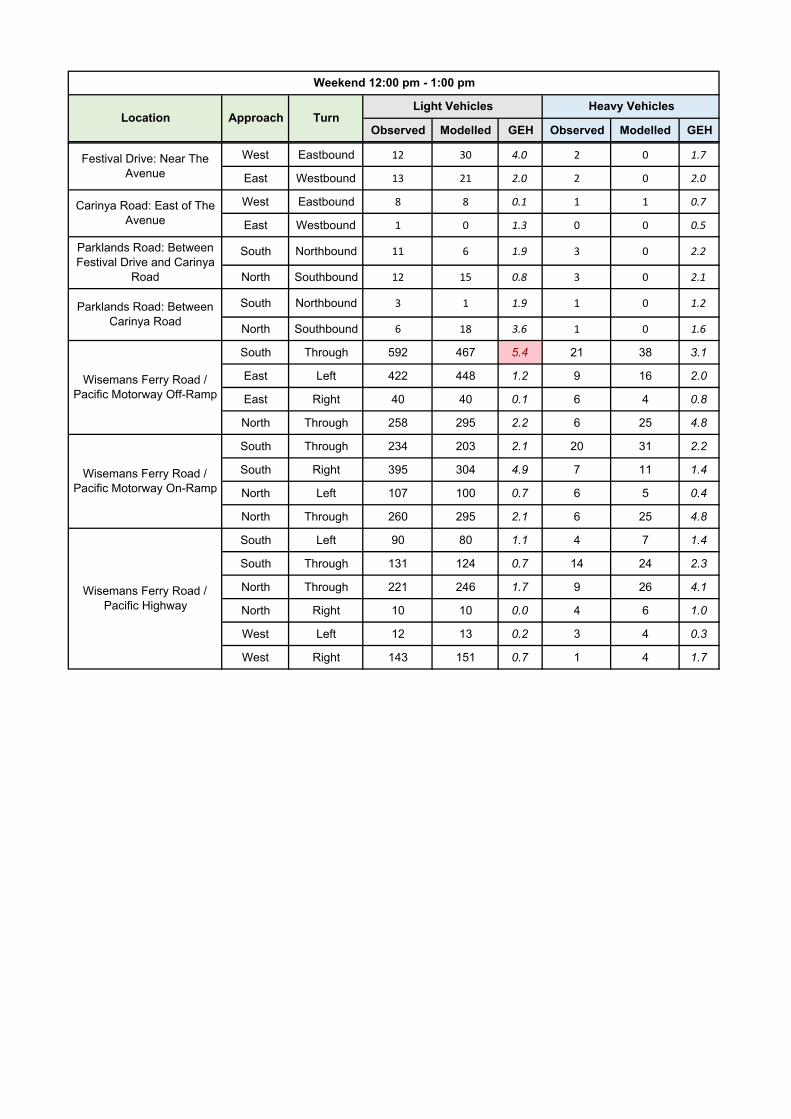
Observed Modelled GEH Observed Modelled GEH
Weekend 12:00 pm - 1:00 pm
Location Approach TurnLight Vehicles Heavy Vehicles
West Eastbound 12 30 4.0 2 0 1.7
East Westbound 13 21 2.0 2 0 2.0
West Eastbound 8 8 0.1 1 1 0.7
East Westbound 1 0 1.3 0 0 0.5
South Northbound 11 6 1.9 3 0 2.2
North Southbound 12 15 0.8 3 0 2.1
South Northbound 3 1 1.9 1 0 1.2
North Southbound 6 18 3.6 1 0 1.6
South Through 592 467 5.4 21 38 3.1
East Left 422 448 1.2 9 16 2.0
East Right 40 40 0.1 6 4 0.8
North Through 258 295 2.2 6 25 4.8
South Through 234 203 2.1 20 31 2.2
South Right 395 304 4.9 7 11 1.4
North Left 107 100 0.7 6 5 0.4
North Through 260 295 2.1 6 25 4.8
South Left 90 80 1.1 4 7 1.4
South Through 131 124 0.7 14 24 2.3
North Through 221 246 1.7 9 26 4.1
North Right 10 10 0.0 4 6 1.0
West Left 12 13 0.2 3 4 0.3
West Right 143 151 0.7 1 4 1.7
Wisemans Ferry Road / Pacific Highway
Festival Drive: Near The Avenue
Carinya Road: East of The Avenue
Parklands Road: Between Festival Drive and Carinya
Road
Parklands Road: Between Carinya Road
Wisemans Ferry Road / Pacific Motorway Off-Ramp
Wisemans Ferry Road / Pacific Motorway On-Ramp

Observed Modelled GEH Observed Modelled GEH
South Left 210 215 0.4 3 5 0.8
South Through 940 982 1.3 22 20 0.5
North Through 1076 1144 2.0 22 22 0.1
North Right 481 482 0.0 4 3 0.5
West Left 365 385 1.0 5 5 0.2
West Right 186 183 0.2 3 2 0.4
South Left 99 112 1.3 2 1 0.6
South Through 1124 1191 2.0 32 21 2.2
South Right 56 61 0.6 0 3 2.3
East Left 73 48 3.2 1 2 0.7
East Through 19 6 3.6 0 0 0.0
East Right 22 21 0.2 1 1 0.2
North Left 20 21 0.1 2 2 0.0
North Through 1404 1480 2.0 21 17 0.9
North Right 138 147 0.7 1 1 0.2
West Left 92 96 0.4 0 0 0.0
West Through 19 15 0.9 0 0 0.0
West Right 93 101 0.8 4 2 1.0
South Through 1234 1287 1.5 21 18 0.6
South Right 14 18 1.0 0 3 2.6
East Left 37 36 0.1 0 0 0.6
East Right 21 21 0.1 2 0 2.0
North Left 26 26 0.1 1 1 0.4
North Through 1534 1600 1.7 27 21 1.3
South Through 868 901 1.1 10 7 1.0
South Right 388 407 1.0 13 11 0.5
East Left 654 694 1.6 16 12 1.0
East Right 23 21 0.5 18 14 0.9
North Left 47 42 0.8 11 14 0.7
North Through 907 941 1.1 12 9 0.8
South Northbound 35 46 1.6 9 4 1.8
North Southbound 32 30 0.3 8 5 1.0
The Avenue: Between Corinya Road and Wapole
DriveSouth Northbound 1 6 2.9 0 0 0.6
West Eastbound 1 0 1.2 0 0 0.7
East Westbound 2 8 2.5 1 0 1.3
McCabe Drive: Between Parklands Road and The
Avenue
Weekend 1:00 pm - 2:00 pm
Location Approach TurnLight Vehicles Heavy Vehicles
Woy Woy Road / Central Coast Highway
The Avenue / Central Coast Highway
Kangoo Road / Central Coast Highway
Wisemans Ferry Road / Central Coast Highway
The Avenue: Between Festival Drive and Holystone Drive

Observed Modelled GEH Observed Modelled GEH
Weekend 1:00 pm - 2:00 pm
Location Approach TurnLight Vehicles Heavy Vehicles
West Eastbound 10 22 2.9 2 0 1.8
East Westbound 13 22 2.2 2 0 1.8
West Eastbound 35 31 0.7 6 4 0.8
East Westbound 29 16 2.7 5 5 0.3
South Northbound 7 8 0.2 2 0 1.5
North Southbound 11 8 0.9 2 0 2.2
South Northbound 4 1 1.6 1 0 1.3
North Southbound 6 8 0.9 1 0 1.6
South Through 525 453 3.3 17 25 1.7
East Left 386 452 3.2 9 9 0.0
East Right 35 31 0.6 4 5 0.6
North Through 195 260 4.3 11 17 1.7
South Through 198 191 0.5 16 25 2.0
South Right 371 287 4.6 5 5 0.2
North Left 88 96 0.8 3 7 1.6
North Through 196 260 4.2 11 17 1.7
South Left 72 70 0.3 2 6 1.9
South Through 125 121 0.4 14 20 1.4
North Through 143 188 3.5 10 22 3.0
North Right 5 7 0.8 1 5 2.4
West Left 16 17 0.1 1 2 0.9
West Right 138 166 2.3 4 2 1.3
Wisemans Ferry Road / Pacific Highway
Festival Drive: Near The Avenue
Carinya Road: East of The Avenue
Parklands Road: Between Festival Drive and Carinya
Road
Parklands Road: Between Carinya Road
Wisemans Ferry Road / Pacific Motorway Off-Ramp
Wisemans Ferry Road / Pacific Motorway On-Ramp

GHD | Hunter and Central Coast Development Corporation | 12548506 | Mt Penang Traffic and Transport Impact Study 2
ghd.com The Power of Commitment

36 GHD | Hunter and Central Coast Development Corporation | Mt Penang Parklands Traffic Study (Stage 2)
This document is in draft form. The contents, including any opinions, conclusions or recommendations contained in, or which may be implied from, this draft document must not be relied upon. GHD reserves the right, at any time, without notice, to modify or retract any part or all of the draft document. To the maximum extent permitted by law, GHD disclaims any responsibility or liability arising from or in connection with this draft document.
Appendix B Addendum to Mt Penang Base Model and Existing Conditions Report

This document is in draft form. The contents, including any opinions, conclusions or recommendations contained in, or which may be implied from, this draft document must not be relied upon. GHD reserves the right, at any time, without notice, to modify or retract any part or all of the draft document. To the maximum extent permitted by law, GHD disclaims any responsibility or liability arising from or in connection with this draft
document.
The Power of Commitment
Traffic Modelling – Mt Penang Somersby and Kariong: Base Model Update 1
Addendum to Mt Penang Base Model and Existing Conditions Report with the extension of Gindurra Road and Wisemans Ferry Road roundabout
08 October 2021
To Transport for NSW (TfNSW) Tel +61 421 836 634
From Profita Keo Reviewed by Phil Guo, Rosie Harris
Approved by Ali Syed Ref. No. 12548506
Subject Addendum to Mt Penang Base Model and Existing Conditions Report
1. Introduction
GHD was commissioned by TfNSW to undertake traffic modelling for the Integrated Transport Plan (ITP) of
Mt Penang, Somersby and Kariong. This technical addendum summarises the update to the existing
microsimulation base traffic model that was developed for the Mt Penang Parklands Transport and Traffic
Impact Study for Hunter and Central Coast Development Corporation (HCCDC) in 2021.
The traffic model update involves a road network expansion at the northern end of the network, additional
surveyed traffic data, and revision of the calibration and validation of the traffic model. The model was
updated for two-hour AM and PM evaluation periods of 7:00 – 9:00 am and 4:00 – 6:00 pm respectively.
The objective of the model update is to enable robust assessment of future traffic conditions under
projected land-use and regional growth, so the model would be fit for purpose of assessing the ITP.
This document should be read in conjunction with the Mt Penang Traffic and Transport Impact Study Stage
2 Base Model and Existing Conditions Report (GHD / HCCDC, October 2021). The update of the
microsimulation model was maintained in Aimsun Next 20.
2. Road Network Expansion
The existing base model encompasses Central Coast Highway from Woy Woy Road to the Pacific Highway
/ Wisemans Ferry Road intersection, in addition to the internal Mt Penang Parklands network.
Following the discussion with TfNSW, the road network was expanded on Wisemans Ferry Road at the
northern section. Previously bordering the network at its intersection with Pacific Highway, the modelled
network has now been extended to also include its intersection with Somersby Falls Road / Gindurra Road,
which is a roundabout intersection. The existing and updated model boundaries are shown in Figure 2-1.

12548506 2
Figure 2-1 Model study area
Specific coding modifications in the Aimsun model involved the road network layout, road types and
corresponding posted speed limits, public transport line routes and additional zone centroids. Aerial
photography from Nearmap and Google Street View were used to complete the updates.
Table 1 lists the road features, including types, capacities and speeds, incorporated within the model.
Table 1 Road features for additional roads
Additional Roads Divided / Undivided Speed Capacity (per lane) Road Type
Wisemans Ferry Road Divided 70 km/h 1300 PCUs / h Major Arterial
Somersby Falls Road Undivided 60 km/h 1100 PCUs / h Major Arterial
Gindurra Road Divided 50 km/h 600 PCUs / h Local
Roundabout - 40 km/h 600 PCUs / h Roundabout
Figure 2-2 presents the zone structure in the microsimulation traffic model, with a total of 24 zones. There
are three newly added zones at the northern end of the model:
– Zone 22: Wisemans Ferry Road
– Zone 23: Somersby Falls Road
– Zone 24: Gindurra Road

12548506 3
Figure 2-2: Zone structure
3. Traffic Data
3.1 Data Selection Methodology
Prior to the model update of focus, surveyed traffic count data from 2020 and 2021 was provided by Matrix
Traffic and Transport Data to HCCDC to develop the Mt Penang Base Model. Additional data, surveyed in
2021, was provided by Matrix Traffic and Transport Data to TfNSW to facilitate the current model update.
The locations of all traffic data collected are shown in Figure 3-1.
It is important to note that the traffic counts were collected in February 2020, prior to the COVID-19
outbreak, as well as early June 2021, which observed limited restriction in NSW due to COVID-19. The
comparison of traffic data was documented in the following section.

12548506 4
Figure 3-1 Overview of traffic count data provided by HCCDC and TfNSW
The differences in intersection volume counts provided by HCCDC and TfNSW were identified to be
minimal, as visibly demonstrated within Figure 3-2 and Figure 3-3 for the AM peak and PM peaks
respectively. The largest difference of 9%, between 2020 and 2021 data, is observed for Site 3: Central
Coast Highway / Kangoo Road intersection in the PM peak.
Figure 3-2 Comparison of surveyed intersection count data between HCCDC (2020/21) and TfNSW (2021), AM peak

12548506 5
Figure 3-3 Comparison of surveyed intersection count data between HCCDC (2020/21) and TfNSW (2021), PM peak
Due to minimal differences in the traffic counts between 2020 and 2021, it was agreed that the original
dataset provided by HCCDC is reasonable to use for the current model update. This dataset would be
supplemented with TfNSW traffic survey data to enable calibration of the extension to the Somersby Falls
Road / Gindurra Road roundabout, as detailed in Section 3.2.
To maintain consistency with the traffic data used in calibration, GHD have opted to validate the traffic
model using surveyed travel time results along Central Coast Highway in 2020. This also helps to depict a
representation of pre-COVID-19 traffic conditions. The traffic model will be further validated with queue
length results provided by TfNSW for 2021 and supplemented by GHD’s site observations in 2020.
3.2 Additional Data for Road Network Expansion
Table 2 provides a summary of the additional surveyed traffic data to accommodate for the road network
extension encompassing Somersby Falls Road / Gindurra Road roundabout intersection, provided by
TfNSW (2021). This data was used for model development, calibration, and validation.
Table 2: Surveyed intersection count data details
Site Peak Collection Period Classifications
Wisemans Ferry Road / Somersby Falls Road / Gindurra Road
2021 AM Wednesday 9 June 2021
7:00 am – 10:00 am
Light vehicles,
Heavy vehicles
2021 PM Tuesday 8 June 2021
2:30 pm – 5:30 pm
Light vehicles,
Heavy vehicles
The intersection count volumes at Wisemans Ferry Road / Somersby Falls Road / Gindurra Road
roundabout intersection were extrapolated for the time period between 5:30 pm – 6:00 pm, based on the
traffic profile at Wisemans Ferry Road / Pacific Highway intersection.
The impact of COVID-19 on the appropriateness of the traffic data at these dates is assumed to be minor,
given that it was not collected during a period of lockdown or significant restrictions in the Central Coast
LGA. Traffic on these dates is therefore assumed to be representative of ‘typical conditions’.

12548506 6
4. Calibration and Validation
Calibration and validation are intricate processes of customising a model to enable it to replicate local
conditions. GHD have calibrated and validated the models to the TfNSW Traffic Modelling Guidelines to
ensure that the models accurately represent existing (2020) traffic conditions, so that they are fit-for-
purpose to assess future year scenarios. Calibration was undertaken using traffic counts provided by
TfNSW, whilst model validation was assured by comparison of observed and modelled queue lengths and
travel times.
The model assignment process, modelling parameters and calibration and validation criteria are
documented within the ‘Mt Penang Traffic and Transport Impact Study: Stage 2 Base Model and Existing
Conditions Report’, prepared by GHD in September 2021. This section documents the calibration and
validation results from the extended base model, to provide assurance that the base model remains fit-for-
purpose.
4.1 Model Stability
Model stability results, in the form of plots of Vehicle Hours Travelled (VHT) and Vehicle Kilometres
Travelled (VKT) for each seed value over the model duration, are presented in Figure 4-1 to Figure 4-4.
Figure 4-1 Variability in VKT, AM peak
Figure 4-2 Variability in VHT, AM peak

12548506 7
Figure 4-3 Variability in VKT, PM peak
Figure 4-4 Variability in VHT, PM peak
Generally, all plots indicate acceptable variability between the seed values. Though, there is some minor
variability in Vehicle Kilometres Travelled (VKT) and Vehicle Hours Travelled (VHT) around 8:30 am and
4:45 pm. At these regions, the southbound queues on Central Coast Highway were relatively significant. It
is likely that fluctuations in demand release for vehicles travelling southbound could have a major impact on
the queue length on this link. Accordingly, as the southbound traffic on Central Coast Highway constitutes a
large proportion of the demand, the total travel time of the network would be impacted, thereby causing an
observed variance in VKT and VHT across the different seed values.
4.2 Calibration Results
4.2.1 AM Peak
Table 3 summarises the breakdown of GEH values for the AM peak, showing that the AM peak clearly
meets the calibration criteria with regards to the GEH-statistic.

12548506 8
Table 3: AM peak calibration summary results
GEH 7:00 – 8:00 AM 8:00 – 9:00 AM
Light Vehicle Heavy Vehicle Light Vehicle Heavy Vehicle
GEH ≤ 5
(observations) 69 69 68 69
GEH ≤ 5
(%) 100% 100% 99% 100%
GEH ≤ 10
(observations) 69 69 69 69
GEH ≤ 10
(%) 100% 100% 100% 100%
Total Turn Counts 69 69 69 69
Figure 4-5 and Figure 4-6 present the scatterplot of modelled total vehicle flows and observed counts for
the hours of 7:00 – 8:00 am and 8:00 – 9:00 am respectively. Both hours have an R2 value greater than
0.99 for both light and heavy vehicles, meeting the calibration criteria regarding R2.
Figure 4-5: Observed vs. modelled traffic volumes (7:00 am - 8:00 am)

12548506 9
Figure 4-6: Observed vs. modelled traffic volumes (8:00 am - 9:00 am)
Given that the GEH and R2 calibration criteria are met, it can be concluded that the AM peak model is
calibrated to the observed counts.
4.2.2 PM Peak
Table 4 summarises the breakdown of GEH values for the PM peak, showing that the PM peak clearly
meets the calibration criteria for the GEH-statistic.
Table 4 PM peak calibration summary results
GEH 4:00 – 5:00 PM 5:00 – 6:00 PM
Light Vehicle Heavy Vehicle Light Vehicle Heavy Vehicle
GEH ≤ 5
(observations) 67 69 69 69
GEH ≤ 5
(%) 97% 100% 100% 100%
GEH ≤ 10
(observations) 69 69 69 69
GEH ≤ 10
(%) 100% 100% 100% 100%
Total Turn Counts 69 69 69 69
Figure 4-7 and Figure 4-8 present the scatterplot of modelled total vehicle flows and observed counts for
the hours of 4:00 – 5:00 pm and 5:00 – 6:00 pm respectively. All R2 values are greater than 0.99, allowing
the criteria for R2 to be met, indicating a close correlation between the observed and modelled values.
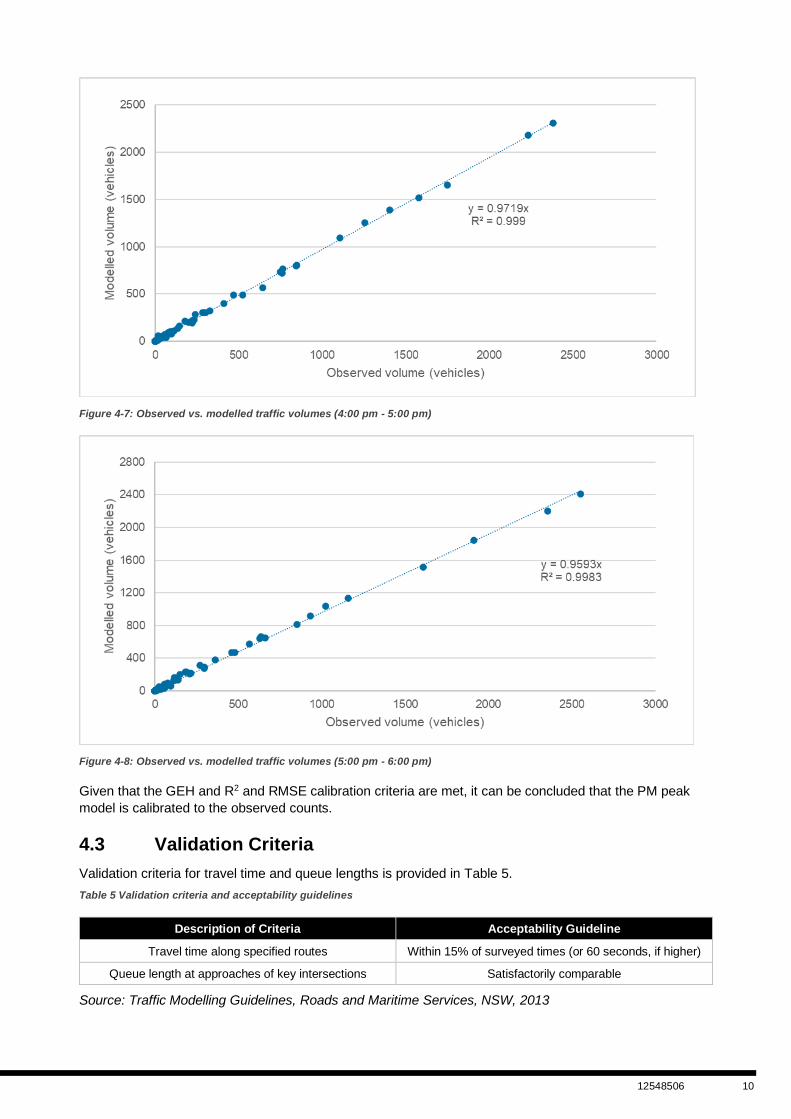
12548506 10
Figure 4-7: Observed vs. modelled traffic volumes (4:00 pm - 5:00 pm)
Figure 4-8: Observed vs. modelled traffic volumes (5:00 pm - 6:00 pm)
Given that the GEH and R2 and RMSE calibration criteria are met, it can be concluded that the PM peak
model is calibrated to the observed counts.
4.3 Validation Criteria
Validation criteria for travel time and queue lengths is provided in Table 5.
Table 5 Validation criteria and acceptability guidelines
Description of Criteria Acceptability Guideline
Travel time along specified routes Within 15% of surveyed times (or 60 seconds, if higher)
Queue length at approaches of key intersections Satisfactorily comparable
Source: Traffic Modelling Guidelines, Roads and Maritime Services, NSW, 2013

12548506 11
4.4 Validation Results
4.4.1 AM Peak
Table 6 summarises the observed and modelled travel time for the AM peak in the northbound and
southbound directions.
Table 6: AM peak travel time results
Period Direction Surveyed Travel
Time (mm:ss) Modelled Travel Time (mm:ss)
Difference (sec)
Difference (%)
Criteria
7:00 - 8:00 am Northbound 03:06 03:15 9 5% ✓
Southbound 04:08 03:56 -12 -5% ✓
8:00 – 9:00 am Northbound 03:46 03:31 -15 -7% ✓
Southbound 07:24 06:52 -32 -7% ✓
Figure 4-9 to Figure 4-12 show the travel time results for the two AM peak hours in both directions.
Figure 4-9 AM peak modelled and observed travel times (northbound, 7:00 am - 8:00 am)

12548506 12
Figure 4-10: AM peak modelled and observed travel times (southbound, 7:00 am - 8:00 am)
Figure 4-11: AM peak modelled and observed travel times (northbound, 8:00 am - 9:00 am)

12548506 13
Figure 4-12: AM peak modelled and observed travel times (southbound, 8:00 am - 9:00 am)
All modelled travel times fall within 15%, and one minute of the observed travel times. The travel time plots
also indicate that the modelled travel times follow the trend of the observed closely for both hours and route
directions. An exception to this involves Curringa Road in the northbound direction between 8:00 – 9:00 am
(see Figure 4-11), where the modelled travel time is slightly lower than its surveyed counterpart. However,
given the overall modelled travel times fall within the 15% range and the trend closely aligns with the
observed, the model can be deemed validated.
4.4.2 PM Peak
Table 6 summarises the observed and modelled travel time for the AM peak in the northbound and
southbound directions.
Table 7: AM peak travel time results
Period Direction Surveyed Travel
Time (mm:ss) Modelled Travel Time (mm:ss)
Difference (sec)
Difference (%)
Criteria
4:00 – 5:00 pm
Northbound 03:43 04:01 18 8% ✓
Southbound 05:48 05:17 -31 -10% ✓
5:00 – 6:00 pm Northbound 03:07 03:18 11 6% ✓
Southbound 06:00 05:59 -1 0% ✓
Figure 4-13 to Figure 4-16 show the travel time results for the two PM peak hours in both directions.
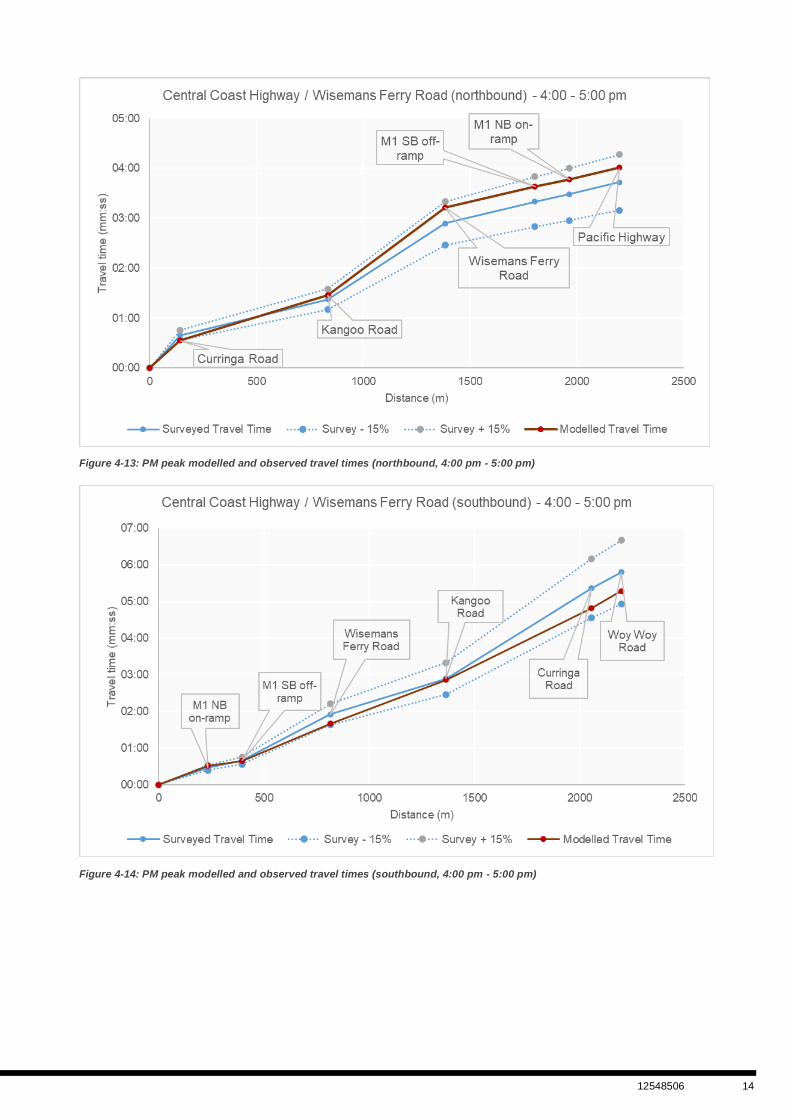
12548506 14
Figure 4-13: PM peak modelled and observed travel times (northbound, 4:00 pm - 5:00 pm)
Figure 4-14: PM peak modelled and observed travel times (southbound, 4:00 pm - 5:00 pm)

12548506 15
Figure 4-15: PM peak modelled and observed travel times (northbound, 5:00 pm - 6:00 pm)
Figure 4-16: PM peak modelled and observed travel times (southbound, 5:00 pm - 6:00 pm)
All modelled travel times fall within 15%, and one minute of the observed travel times. The travel time plots
also indicate that the modelled travel times follow the trend of the observed closely for both hours and route
directions. Consequently, the PM model can be deemed validated.
4.5 Queue Observations
Figure 4-17 and Figure 4-18 show the southbound queues on Central Coast Highway during AM peak, at
around 8:30 am. The queues at this time were near their maximum length. Queues have been reported

12548506 16
using the seed value of 28, as this aligned most similarly with the average seed value for total VHT in
Figure 4-2.
The snapshots show southbound queues commencing at its intersection with The Avenue and extending
past Kangoo Road intersection, aligning reasonably well with the observed behaviour. The Wisemans Ferry
Road / Central Coast Highway intersection shows reasonable congestion on the northern and eastern legs.
Generally, there appears to be very little congestion in the northbound direction along Central Coast
Highway, with the exception of the intersection at The Avenue where there is some northbound queuing
observed.
Overall, the model shows reasonable consistency with the behaviour observed on the site visit.
Figure 4-17: Southbound queue on Central Coast Highway, north (8:33 am)

12548506 17
Figure 4-18: Southbound queue on Central Coast Highway, south (8:33 am)

This document is in draft form. The contents, including any opinions, conclusions or recommendations contained in, or which may be implied from, this draft document must not be relied upon. GHD reserves the right, at any time, without notice, to modify or retract any part or all of the draft document. To the maximum extent permitted by law, GHD disclaims any responsibility or liability arising from or in connection with this draft
document.
The Power of Commitment
Traffic Modelling – Mt Penang Somersby and Kariong: Base Model Update 18
Figure 4-19 and Figure 4-20 present a snapshot of the simulation of PM peak at around 4:51 pm. Queues
have been reported using the seed value of 86524, as this aligned most similarly with the average seed
value for total VHT in Figure 4-4.
Generally, it can be seen there is some queueing in the southbound direction on Central Coast Highway,
particularly at its intersection with The Avenue that propagates past Kangoo Road. Moreover, there is
moderate southbound queuing at its intersection with Wisemans Ferry Road, which stems from an
increased demand from the M1 Pacific Highway.
In the northbound direction, there is very limited queuing along Central Coast Highway.
Figure 4-19: Model snapshot, north Central Coast Highway (4:51 pm)

12548506 19
Figure 4-20 Model snapshot, south Central Coast Highway (5:14 pm)
The above simulated queue lengths are correlated with site observations made in February 2020 and documented in Base Model and Existing Conditions Report, as referenced overleaf.

This document is in draft form. The contents, including any opinions, conclusions or recommendations contained in, or which may be implied from, this draft document must not be relied upon. GHD reserves the right, at any time, without notice, to modify or retract any part or all of the draft document. To the maximum extent permitted by law, GHD disclaims any responsibility or liability arising from or in connection with this draft
document.
The Power of Commitment
Traffic Modelling – Mt Penang Somersby and Kariong: Base Model Update 0
Table 8: Central Coast Highway and Mt Penang site visit observations
Peak Direction Observations
AM Northbound Medium to heavy traffic. Vehicles travelling at free flow speed between intersections, with slowing at intersections. Some queues were observed at The Avenue intersection but these did not cause blockages at the upstream Woy Woy Road intersection. Offsets were observed between the two intersections for both northbound and southbound movements.
Southbound Highly trafficked with heavy queuing from the Central Coast Highway / The Avenue intersection affecting upstream intersection performance from 8:15 am to 9:00 am. Queues spillback along Central Coast Highway to Wisemans Ferry Road, leading to queues for vehicles turning left from Wisemans Ferry Road onto Central Coast Highway. Downstream of intersection at Woy Woy Road vehicles were travelling at free flow speed.
Central Coast Highway south of The Avenue, northbound view (8:38 am)
Wisemans Ferry Road left-turn queue, southbound view (8:23 am)

12548506 1
Peak Direction Observations
PM Northbound Medium traffic with conditions similar to AM period. Regular queuing at Central Coast Avenue / The Avenue intersection but queues did not spillback to upstream intersections. Free-flow between intersections, particularly north of intersection with The Avenue.
Southbound Heavy traffic with semi-regular long queues at intersection with The Avenue. Generally, vehicles were travelling at free-flow speed, except when queues are long at intersection with The Avenue. Queues did not appear to spill back to upstream intersections as in AM peak.
Central Coast Highway, north of The Avenue, northbound view (8:19 am)
Central Coast Highway south of The Avenue, southbound view (3:20 pm)
Central Coast Highway, north of The Avenue, northbound view (3:52 pm)

12548506 2
5. Summary
Leveraging the existing microsimulation base model (2020) developed for the Mt Penang Parklands
Transport and Traffic Impact Study for Hunter and Central Coast Development Corporation (HCCDC), GHD
has undertaken a complete revision of the model’s calibration and validation with regards to the extension
of the study area to the north. Additional traffic data at Wisemans Ferry Road / Somersby Falls Road /
Gindurra Road roundabout intersection was supplied by TfNSW (2021) as input to the model update, after
determining that it was reasonable to extend the model using 2021 traffic data due to its similarity with 2020
traffic data.
As the model was found to be well-calibrated with respect to observed turning counts and validated with
respect to route travel times and queue lengths, in addition to holding reasonable model stability, it is
appropriate to conclude that the Aimsun microsimulation base model provides a sound representation of
current traffic conditions (2020) in the study area during weekday AM and PM peak periods. As a result,
there is large confidence that this base traffic model can be used as a basis in assessing proposed network
upgrades and land-use changes within the study area in the future years.

42 GHD | Hunter and Central Coast Development Corporation | Mt Penang Parklands Traffic Study (Stage 2)
This document is in draft form. The contents, including any opinions, conclusions or recommendations contained in, or which may be implied from, this draft document must not be relied upon. GHD reserves the right, at any time, without notice, to modify or retract any part or all of the draft document. To the maximum extent permitted by law, GHD disclaims any responsibility or liability arising from or in connection with this draft document.
Appendix C Technical Notes

43 GHD | Hunter and Central Coast Development Corporation | Mt Penang Parklands Traffic Study (Stage 2)
This document is in draft form. The contents, including any opinions, conclusions or recommendations contained in, or which may be implied from, this draft document must not be relied upon. GHD reserves the right, at any time, without notice, to modify or retract any part or all of the draft document. To the maximum extent permitted by law, GHD disclaims any responsibility or liability arising from or in connection with this draft document.
Commentary 1 – Land use case study
Case study: Manns Road industrial estate An existing light industrial / business park development, located off Manns Road in West Gosford, was selected for trip generation survey based on the similar land-use and proximity to the Mt Penang site. The locations of the development with reference to the Mt Penang site is shown in Figure 26.
Figure 26 Manns Road Industrial Area location
The area is accessible by only three access points from Manns Road: Dell Road, Merinee Road and Nells Road, as shown in Figure 27. Automatic Tube Counts (ATC) surveys were conducted at these access points, which were designed to capture all vehicles to and from the developments, from Thursday 3 June 2021 to Wednesday 9 June 2021, 24 hours per day with 13 vehicle classifications. The surveys, in agreement with HCCDC and TfNSW, were completed outside of any COVID-19 lockdown period, during a period of few restrictions that would impact travel behaviour to workplaces.

44 GHD | Hunter and Central Coast Development Corporation | Mt Penang Parklands Traffic Study (Stage 2)
This document is in draft form. The contents, including any opinions, conclusions or recommendations contained in, or which may be implied from, this draft document must not be relied upon. GHD reserves the right, at any time, without notice, to modify or retract any part or all of the draft document. To the maximum extent permitted by law, GHD disclaims any responsibility or liability arising from or in connection with this draft document.
Figure 27 Industrial area access locations

45 GHD | Hunter and Central Coast Development Corporation | Mt Penang Parklands Traffic Study (Stage 2)
This document is in draft form. The contents, including any opinions, conclusions or recommendations contained in, or which may be implied from, this draft document must not be relied upon. GHD reserves the right, at any time, without notice, to modify or retract any part or all of the draft document. To the maximum extent permitted by law, GHD disclaims any responsibility or liability arising from or in connection with this draft document.
To represent the “typical” weekday traffic, counts recorded on a Tuesday, Wednesday and Thursday were averaged. The overall average trip generation rates were then calculated by dividing these average weekday vehicle counts by the total GFA across the industrial area. The results are presented in Table 14, including the results for the AM, PM and Saturday site peak hours.
The definition of GFA in RTA (2002) is “the sum of the areas of each floor of a building where the area of each floor is taken to be the area within the outer face of the external enclosing walls as measured at the height of 1400 millimetres above each floor level excluding columns, fin walls, lift towers, car-sparking and loading spaces etc.” Considering these exclusions, the building area for each lot was measured conservatively to estimate the GFA, with the understanding that this would result in a higher trip rate per 100 m2 GFA. GFA for the Manns Road industrial area was estimated as 145,155 m2.
Table 14 Manns Road trip generation summary
Time Period # Trips Trip Rate (per 100 m2 GFA)
Daily 8,803 6.06
AM Site Peak Hour (9:00 am – 10:00 am)
754 0.52
PM Site Peak Hour (3:00 pm – 4:00 pm)
898 0.62
Saturday Site Peak Hour (11:00 am – 12:00 pm)
497 0.34
The estimated local trip generation rates of industrial and warehouse developments are discussed below in more detail with directional distribution, daily and hourly profile of the trip generation, Heavy vehicles, and public transport mode split.
Directional distribution The average weekday total inbound and outbound trips have been summarised separately for the AM and PM peak periods. The results are shown in Table 6 for three hours in the AM and PM peaks.
Table 15 Trip distribution
Peak Hour Vehicle Trips % of Site Peak Hour Trip Distribution
Inbound Outbound Total Inbound % Outbound %
AM
7:00 – 8:00 am (Mt Penang Model Hour 1)
418 202 620 Average 92%, range 82% - 97%
67% 33%
8:00 – 9:00 am (Mt Penang Model Hour 2)
470 262 732 64% 36%
9:00 – 10:00 am (Site AM peak hour)
408 346 754 100% 54% 46%
PM
3:00 – 4:00 pm (Site PM peak hour)
369 898 1267 100% 29% 71%
4:00 – 5:00 pm (Mt Penang Model Hour 1)
293 746 1039 Average 65%, range
47% - 82%
28% 72%
5:00 – 6:00 pm (Mt Penang Model Hour 2)
158 440 598 26% 74%
SAT
11:00 am – 12:00 pm
(Site Saturday Peak Hour) 216 281 497 100 % 43% 57%
12:00 pm – 1:00 pm (Mt Penang Model Hour 1)
184 231 415 Average 71%, range
57% - 85%
44% 56%
1:00 pm – 2:00 pm (Mt Penang Model Hour 2)
124 167 291 43% 57%
Based on the average survey results, the directional distributions are:

46 GHD | Hunter and Central Coast Development Corporation | Mt Penang Parklands Traffic Study (Stage 2)
This document is in draft form. The contents, including any opinions, conclusions or recommendations contained in, or which may be implied from, this draft document must not be relied upon. GHD reserves the right, at any time, without notice, to modify or retract any part or all of the draft document. To the maximum extent permitted by law, GHD disclaims any responsibility or liability arising from or in connection with this draft document.
– 54% inbound trips and 46% outbound trips during the AM site peak hour
– 29% inbound trips and 71% outbound trips during the PM site peak hour
– 43% inbound trips and 57% outbound trips during the Saturday peak hour.
It is recognised that:
– The site peak hours generally sit outside the road network peak hour (e.g. 7-9 am, 4-6 pm and 12-2 pm on Saturdays), particularly in the PM peak.
– In the AM peak, the proportion of inbound trips is higher for the two hours prior to the site peak.
Daily profile To verify that there is no significant variation across the weekday trips into and out of the precinct, Table 16 summarises the daily total and peak hour traffic volumes, associated trip rates, and the average of rates for the daily, AM and PM peaks.
Table 16 Daily trip distribution
Site Peak results Monday Tuesday Wednesday Thursday Friday
Daily traffic 9236 8915 8844 8649 8638
Daily trips per 100 m2 GFA 6.36 6.14 6.09 5.96 5.95
AM peak traffic 736 704 746 821 776
AM trips per 100 m2 GFA 0.51 0.48 0.51 0.57 0.53
PM peak traffic 891 939 925 830 789
PM trips per 100 m2 GFA 0.61 0.65 0.64 0.57 0.54
The results demonstrated that within the site there is:
– A generally consistent level of daily generation across each weekday of the surveyed week, with the highest trip generation rate on Monday and the lowest on Friday.
– A consistent level of AM and PM peak hour trip generation across the week. There is some variation in the PM peak, as the Friday PM peak traffic is lower than the remaining days of the week.
– The variation between the Tuesday, Wednesday and Thursday trips are not major, indicating that the average traffic across these days is reasonable to represent the ‘typical’ weekday traffic.
Heavy vehicle proportion The heavy vehicle component of the traffic generation is summarised in Table 17. Results are summarised based on the average of the Tuesday, Wednesday, and Thursday ATC counts. The results demonstrate that the heavy vehicle percentage is approximately 24% on a weekday and ranges between 20% and 26% during the AM and PM peak hours.
Table 17 Heavy vehicle proportion
Daily AM PM Saturday
Heavy Vehicle Trips 2089 198 181 87
Total Vehicle Trips 8803 754 898 497
Heavy Vehicle Proportion 24% 26% 20% 18%
Public transport There are a small number of infrequent bus services currently operating near the Mt Penang Parklands. It is possible that public transport services could be expanded in the future, however, it has been assumed that private vehicles account for all trip generations to and from the study area at this stage.
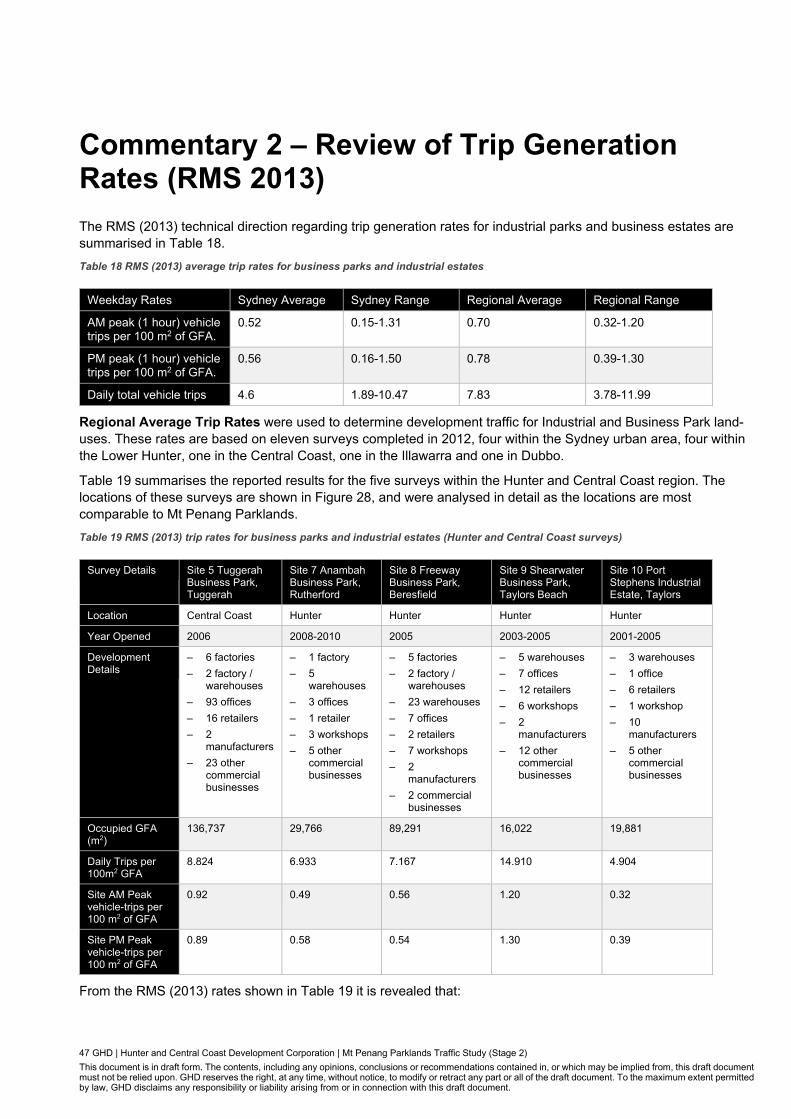
47 GHD | Hunter and Central Coast Development Corporation | Mt Penang Parklands Traffic Study (Stage 2)
This document is in draft form. The contents, including any opinions, conclusions or recommendations contained in, or which may be implied from, this draft document must not be relied upon. GHD reserves the right, at any time, without notice, to modify or retract any part or all of the draft document. To the maximum extent permitted by law, GHD disclaims any responsibility or liability arising from or in connection with this draft document.
Commentary 2 – Review of Trip Generation Rates (RMS 2013)
The RMS (2013) technical direction regarding trip generation rates for industrial parks and business estates are summarised in Table 18.
Table 18 RMS (2013) average trip rates for business parks and industrial estates
Weekday Rates Sydney Average Sydney Range Regional Average Regional Range
AM peak (1 hour) vehicle trips per 100 m2 of GFA.
0.52 0.15-1.31 0.70 0.32-1.20
PM peak (1 hour) vehicle trips per 100 m2 of GFA.
0.56 0.16-1.50 0.78 0.39-1.30
Daily total vehicle trips 4.6 1.89-10.47 7.83 3.78-11.99
Regional Average Trip Rates were used to determine development traffic for Industrial and Business Park land-uses. These rates are based on eleven surveys completed in 2012, four within the Sydney urban area, four within the Lower Hunter, one in the Central Coast, one in the Illawarra and one in Dubbo.
Table 19 summarises the reported results for the five surveys within the Hunter and Central Coast region. The locations of these surveys are shown in Figure 28, and were analysed in detail as the locations are most comparable to Mt Penang Parklands.
Table 19 RMS (2013) trip rates for business parks and industrial estates (Hunter and Central Coast surveys)
Survey Details Site 5 Tuggerah Business Park, Tuggerah
Site 7 Anambah Business Park, Rutherford
Site 8 Freeway Business Park, Beresfield
Site 9 Shearwater Business Park, Taylors Beach
Site 10 Port Stephens Industrial Estate, Taylors
Location Central Coast Hunter Hunter Hunter Hunter
Year Opened 2006 2008-2010 2005 2003-2005 2001-2005
Development Details
– 6 factories
– 2 factory / warehouses
– 93 offices
– 16 retailers
– 2 manufacturers
– 23 other commercial businesses
– 1 factory
– 5 warehouses
– 3 offices
– 1 retailer
– 3 workshops
– 5 other commercial businesses
– 5 factories
– 2 factory / warehouses
– 23 warehouses
– 7 offices
– 2 retailers
– 7 workshops
– 2 manufacturers
– 2 commercial businesses
– 5 warehouses
– 7 offices
– 12 retailers
– 6 workshops
– 2 manufacturers
– 12 other commercial businesses
– 3 warehouses
– 1 office
– 6 retailers
– 1 workshop
– 10 manufacturers
– 5 other commercial businesses
Occupied GFA (m2)
136,737 29,766 89,291 16,022 19,881
Daily Trips per 100m2 GFA
8.824 6.933 7.167 14.910 4.904
Site AM Peak vehicle-trips per 100 m2 of GFA
0.92 0.49 0.56 1.20 0.32
Site PM Peak vehicle-trips per 100 m2 of GFA
0.89 0.58 0.54 1.30 0.39
From the RMS (2013) rates shown in Table 19 it is revealed that:

48 GHD | Hunter and Central Coast Development Corporation | Mt Penang Parklands Traffic Study (Stage 2)
This document is in draft form. The contents, including any opinions, conclusions or recommendations contained in, or which may be implied from, this draft document must not be relied upon. GHD reserves the right, at any time, without notice, to modify or retract any part or all of the draft document. To the maximum extent permitted by law, GHD disclaims any responsibility or liability arising from or in connection with this draft document.
– Site 5 and Site 10 yield trip rates higher than the Regional Average listed in Table 18, while the trip rates at Sites 7, 8 and 10 are lower and more in line with the Sydney Average.
– The highest peak hour trip generation rate of 1.30 vehicles per 100 m2 GFA occurs at the Shearwater Business Park at Taylor’s Beach (Site 9). Review of the land-uses at this business park indicates that the predominant land-use is big box retail (e.g. bulky goods) which may have yielded the higher trip generation rates. This business park is therefore not considered in the assessment.
Average trip generation rates for the Hunter and Central Coast Region (excluding site 9) are presented in Table 20, based on:
– Site 5 Tuggerah Business Park, Tuggerah
– Site 7 Anambah Business Park, Rutherford
– Site 9 Shearwater Business Park, Taylors Beach
– Site 10 Port Stephens Industrial Estate, Taylors.
It is also comparable to the median results of all sites and sits between the Sydney Average and Regional (NSW) Average.
Table 20 Average trip generation rates for the Hunter and Central Coast Region
Survey Item (RMS 2013) Average (excl. Site 9) Median (all Sites) for reference
Range
Daily trips per 100m2 GFA 6.96 7.16 4.9 – 8.8
AM peak vehicle-trips per 100 m2 of GFA 0.57 0.56 0.32 – 0.92
PM peak vehicle-trips per 100 m2 of GFA 0.60 0.58 0.39 – 0.89
Figure 28 Survey locations

49 GHD | Hunter and Central Coast Development Corporation | Mt Penang Parklands Traffic Study (Stage 2)
This document is in draft form. The contents, including any opinions, conclusions or recommendations contained in, or which may be implied from, this draft document must not be relied upon. GHD reserves the right, at any time, without notice, to modify or retract any part or all of the draft document. To the maximum extent permitted by law, GHD disclaims any responsibility or liability arising from or in connection with this draft document.
Commentary 3 – Nominated trip generation rate for Mt Penang
Table 21 compares the average trip generation rates summarised from:
– RMS 2013 guidelines
– RMS 2012 surveys for the Hunter and Central Coast Region only
– Manns Road industrial area (case study in Appendix C).
Table 21 Trip generation rate comparison
Items (Site Peak) RMS Guidelines (2013) (Sydney Average)
RMS Guidelines (2013) (Regional Average)
RMS Guidelines (2013) (Regional Range)
RMS Surveys (Hunter and Central Coast)
Manns Road Industrial Area (GHD, Proposed Stage 2 Trip Rates)
Daily trips per 100m2 GFA
4.6 7.83 3.78-11.99 6.96 6.06
AM peak trips per 100m2 GFA
0.52 0.70 0.32-1.20 0.57 0.52 for 9 – 10 am
Adopting 0.48 for 7- 9 am based on Table 15
PM peak trips per 100m2 GFA
0.56 0.78 0.39-1.30 0.60 0.62 for 3 – 4 pm
Adopting 0.40 for 4 – 6 pm based on Table 15
Saturday peak trips per 100m2 GFA
N/A N/A N/A N/A 0.34
From Table 21, it is observed that:
– Trip generation rates for both the surveys specific to the Hunter and Central Coast region, and the rates for the Manns Road Industrial Area are lower than the RMS Regional Average rate for business parks and industrial estates. However, they are both within the Regional Range provided in RMS 2013 and marginally higher than Sydney Average.
– There is a close alignment between the trip rates for the Hunter and Central Coast RMS surveys and the Manns Road Industrial Area, which provides confidence that the trip generation rates for Mt Penang are likely to be lower than Regional Average specified in the RMS guidelines.
– The trip rates determined for the Manns Road Industrial Area fall within the expected range.
Therefore, based on the most recent and proximate trip generation rates to the Mt Penang site, it is recommended to adopt the rates calculated for the Manns Road Industrial Area for all industrial and business park developments in Mt Penang Parklands for the Stage 2 work of this project:
– 0.52 AM peak trips per 100 m2 GFA for Site peak hour (9 am -10 am), or 0.48 (92%) between 7 and 9 am
– 0.62 PM peak trips per 100 m2 GFA for Site peak hour (3 pm - 4 pm), or 0.40 (65%) between 4 and 6 pm
– 0.34 Saturday peak hour trips per 100 m2 GFA for Site peak hour (11 am – 12 pm), or 0.24 (71%) between 12 and 2 pm.
Commentary 4 – Safe System Approach

50 GHD | Hunter and Central Coast Development Corporation | Mt Penang Parklands Traffic Study (Stage 2)
This document is in draft form. The contents, including any opinions, conclusions or recommendations contained in, or which may be implied from, this draft document must not be relied upon. GHD reserves the right, at any time, without notice, to modify or retract any part or all of the draft document. To the maximum extent permitted by law, GHD disclaims any responsibility or liability arising from or in connection with this draft document.
The Safe System approach is a framework that works towards achieving the ultimate goal of zero deaths and serious injuries on NSW roads. It is underpinned by principles including the human nature of drivers, crash minimisation and safety as a shared responsibility. Through reducing vehicular movement and reducing lanes on local roads, the ‘safer roads’ element is being positively focused under the overarching Safe System approach (see Figure 29).
Figure 29 Safe system approach overview
Source: Towards Zero (NSW Government), Safe System Approach, 2021
More specifically, the proposed one-way system assists in meeting these three criteria for formal appraisals of the Safe System (see Figure 30):
– Road user exposure
A lower number of vehicles results in reduced exposure to the road, and consequently potential crashes.
– Crash likelihood
A one-way system reduces the potential number of conflict points, eliminates possibility of opposing crash incidents, and increases space efficiency that allows for safety features like pedestrian fencing.
– Crash severity
Impact speeds for opposing vehicles produce a greater risk of injury than vehicles travelling in the same direction in a one-way system.
(NSW Centre for Road Safety. Safe System Assessment Framework for Movement and Place Practitioners. 2021).
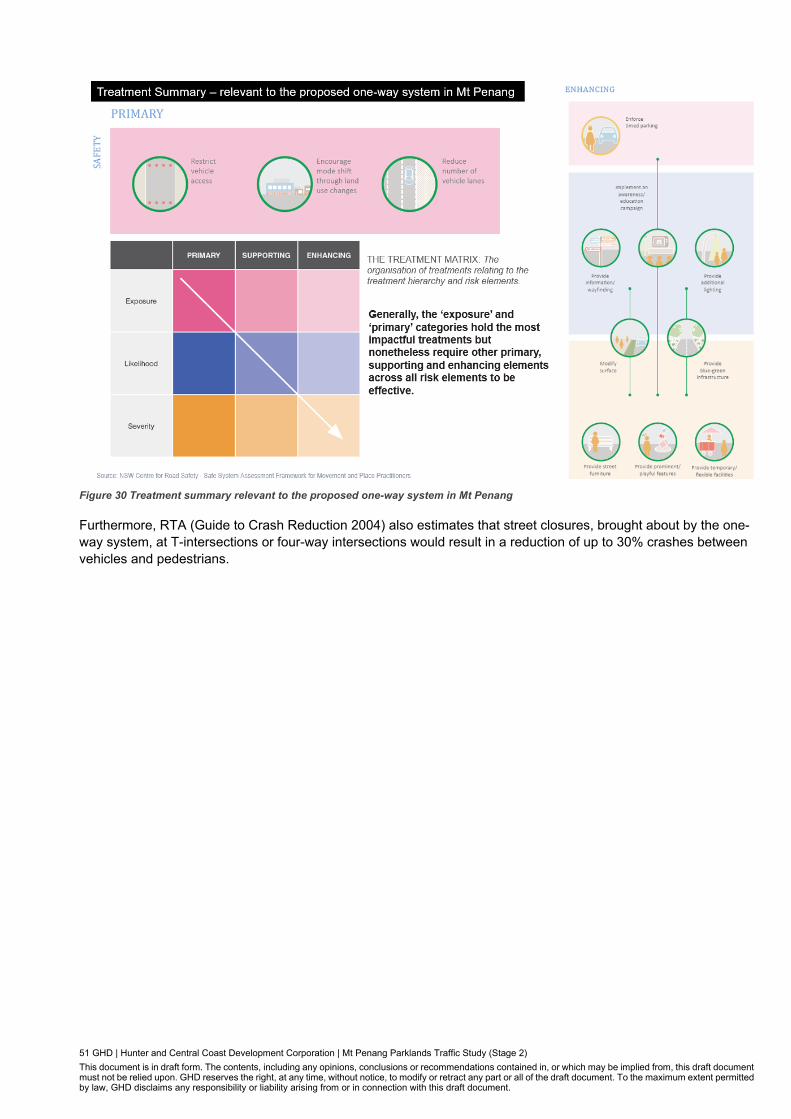
51 GHD | Hunter and Central Coast Development Corporation | Mt Penang Parklands Traffic Study (Stage 2)
This document is in draft form. The contents, including any opinions, conclusions or recommendations contained in, or which may be implied from, this draft document must not be relied upon. GHD reserves the right, at any time, without notice, to modify or retract any part or all of the draft document. To the maximum extent permitted by law, GHD disclaims any responsibility or liability arising from or in connection with this draft document.
Figure 30 Treatment summary relevant to the proposed one-way system in Mt Penang
Furthermore, RTA (Guide to Crash Reduction 2004) also estimates that street closures, brought about by the one-way system, at T-intersections or four-way intersections would result in a reduction of up to 30% crashes between vehicles and pedestrians.

52 GHD | Hunter and Central Coast Development Corporation | Mt Penang Parklands Traffic Study (Stage 2)
This document is in draft form. The contents, including any opinions, conclusions or recommendations contained in, or which may be implied from, this draft document must not be relied upon. GHD reserves the right, at any time, without notice, to modify or retract any part or all of the draft document. To the maximum extent permitted by law, GHD disclaims any responsibility or liability arising from or in connection with this draft document.

53 GHD | Hunter and Central Coast Development Corporation | Mt Penang Parklands Traffic Study (Stage 2)
This document is in draft form. The contents, including any opinions, conclusions or recommendations contained in, or which may be implied from, this draft document must not be relied upon. GHD reserves the right, at any time, without notice, to modify or retract any part or all of the draft document. To the maximum extent permitted by law, GHD disclaims any responsibility or liability arising from or in connection with this draft document.
ghd.com The Power of Commitment
Copyright © 2022 FDOKUMEN