Motor imagery after stroke: Relating outcome to motor network connectivity
13
Motor Imagery After Stroke: Relating Outcome to Motor Network Connectivity Nikhil Sharma, PhD, Jean-Claude Baron MD, and James B. Rowe, PhD Objective: Neuroplasticity is essential for recovery after stroke and is the target for new stroke therapies. During recovery from subcortical motor stroke, brain activations associated with movement may appear normal despite residual functional impairment. This raises an important question: how far does recovery of motor performance depend on the processes that precede movement execution involving the premotor and prefrontal cortex, rather than recovery of the corticospinal system alone? Methods: We examined stroke patients with functional magnetic resonance imaging while they either imagined or executed a finger-thumb opposition sequence. In addition to classical analyses of regional activations, we studied neuroplasticity in terms of differential network connectivity using structural equation modeling. The study included 8 right-handed patients who had suffered a left-hemisphere subcortical ischemic stroke with paresis, and 13 age-matched healthy controls. Results: With good functional recovery, the regional activations had returned to normal in patients. However, connectivity within the extended motor network remained abnormal. These abnormalities were seen predominantly during motor imagery and correlated with motor performance. Interpretation: Our results indicate that neuroplasticity can manifest itself as differences in connectivity among cortical areas remote from the infarct, rather than in the degree of regional activation. Connection strengths between nodes of the cortical motor network correlate with motor outcome. The altered organization of connectivity of the prefrontal areas may reflect the role of the prefrontal cortex in higher order planning of movement. Our results are relevant to the assessment and understanding of emerging physical and neurophysiological therapies for stroke rehabilitation. Ann Neurol 2009;66:604 – 616 The human brain reorganizes itself throughout life, in health and disease. This neuroplasticity not only under- pins human adaptation and learning, 1 but is especially important for recovery after brain injury. Understanding and influencing the processes of neuroplasticity are therefore crucial in providing more effective therapies for patients. Functional neuroimaging can reveal the al- terations in large-scale brain networks following brain injury, 2,3 physical training, 4–6 and pharmacological therapy. 7 After a subcortical stroke, functional magnetic reso- nance imaging (fMRI) during movement reveals corti- cal reorganization that is associated with the recovery of function. 8 –10 The reorganization includes overactiv- ity of cortical motor areas, 11 alterations in the inter- hemispheric balance, 4,9,12–15 and dysfunctional cou- pling between cortical regions. 10,16 However, the cortical activation patterns associated with some motor tasks may appear normal in patients despite residual functional impairment. 11,13,14,17–19 An explanation for this paradox is that hemiparetic stroke disrupts both corticospinal output and important motor processes prior to the execution of movement, for example, mo- tor attention, imagination, preparation, or plan- ning. 18,20 We set out to examine the extent to which recovery of motor performance after stroke is associated with changes in the movement-related cognitive processes that precede movement, as opposed to changes in cor- ticospinal function. There are 3 key aspects to our study. First, we studied a carefully selected subgroup of patients with a left hemisphere subcortical stroke. Changes in their cortical motor systems are therefore not confounded by cortical infarction, and can be in- terpreted as remote neuroplasticity. Second, we studied both motor imagery (MI) and executed movement (EM). Motor imagery utilizes many aspects of the mo- tor system, 21–24 and has been suggested as an adjunct to rehabilitative physical therapies as well as a method to study the motor system without actual movement. For example, in stroke patients with normal activations during executed movement, motor imagery has been associated with abnormal hemispheric lateralization that in turn correlated with recovery of motor func- tion. 20 The third critical aspect was that rather than simply defining the activation within isolated regions, From the Department of Clinical Neurosciences, University of Cambridge, Cambridge, UK. Address correspondence to Dr Baron, Cambridge University De- partment of Clinical Neurosciences, Box 83, Addenbrooke’s, Hos- pital, Hills Road, Cambridge CB2 2QQ, UK. Potential conflict of interest: Nothing to report. Received Mar 10, 2009, and in revised form Jul 16. Accepted for publication Jul 16, 2009. Published online, in Wiley InterScience (www.interscience.wiley.com). DOI: 10.1002/ana.21810 604 © 2009 American Neurological Association
-
Upload
independent -
Category
Documents
-
view
0 -
download
0
Transcript of Motor imagery after stroke: Relating outcome to motor network connectivity
Motor Imagery After Stroke:Relating Outcome to Motor Network Connectivity
Nikhil Sharma, PhD, Jean-Claude Baron MD, and James B. Rowe, PhD
Objective: Neuroplasticity is essential for recovery after stroke and is the target for new stroke therapies. During recovery fromsubcortical motor stroke, brain activations associated with movement may appear normal despite residual functional impairment.This raises an important question: how far does recovery of motor performance depend on the processes that precede movementexecution involving the premotor and prefrontal cortex, rather than recovery of the corticospinal system alone?Methods: We examined stroke patients with functional magnetic resonance imaging while they either imagined or executed afinger-thumb opposition sequence. In addition to classical analyses of regional activations, we studied neuroplasticity in terms ofdifferential network connectivity using structural equation modeling. The study included 8 right-handed patients who hadsuffered a left-hemisphere subcortical ischemic stroke with paresis, and 13 age-matched healthy controls.Results: With good functional recovery, the regional activations had returned to normal in patients. However, connectivitywithin the extended motor network remained abnormal. These abnormalities were seen predominantly during motor imageryand correlated with motor performance.Interpretation: Our results indicate that neuroplasticity can manifest itself as differences in connectivity among cortical areasremote from the infarct, rather than in the degree of regional activation. Connection strengths between nodes of the corticalmotor network correlate with motor outcome. The altered organization of connectivity of the prefrontal areas may reflect therole of the prefrontal cortex in higher order planning of movement. Our results are relevant to the assessment and understandingof emerging physical and neurophysiological therapies for stroke rehabilitation.
Ann Neurol 2009;66:604–616
The human brain reorganizes itself throughout life, inhealth and disease. This neuroplasticity not only under-pins human adaptation and learning,1 but is especiallyimportant for recovery after brain injury. Understandingand influencing the processes of neuroplasticity aretherefore crucial in providing more effective therapies forpatients. Functional neuroimaging can reveal the al-terations in large-scale brain networks following braininjury,2,3 physical training,4–6 and pharmacologicaltherapy.7
After a subcortical stroke, functional magnetic reso-nance imaging (fMRI) during movement reveals corti-cal reorganization that is associated with the recoveryof function.8–10 The reorganization includes overactiv-ity of cortical motor areas,11 alterations in the inter-hemispheric balance,4,9,12–15 and dysfunctional cou-pling between cortical regions.10,16 However, thecortical activation patterns associated with some motortasks may appear normal in patients despite residualfunctional impairment.11,13,14,17–19 An explanation forthis paradox is that hemiparetic stroke disrupts bothcorticospinal output and important motor processesprior to the execution of movement, for example, mo-
tor attention, imagination, preparation, or plan-ning.18,20
We set out to examine the extent to which recoveryof motor performance after stroke is associated withchanges in the movement-related cognitive processesthat precede movement, as opposed to changes in cor-ticospinal function. There are 3 key aspects to ourstudy. First, we studied a carefully selected subgroup ofpatients with a left hemisphere subcortical stroke.Changes in their cortical motor systems are thereforenot confounded by cortical infarction, and can be in-terpreted as remote neuroplasticity. Second, we studiedboth motor imagery (MI) and executed movement(EM). Motor imagery utilizes many aspects of the mo-tor system,21–24 and has been suggested as an adjunctto rehabilitative physical therapies as well as a methodto study the motor system without actual movement.For example, in stroke patients with normal activationsduring executed movement, motor imagery has beenassociated with abnormal hemispheric lateralizationthat in turn correlated with recovery of motor func-tion.20 The third critical aspect was that rather thansimply defining the activation within isolated regions,
From the Department of Clinical Neurosciences, University ofCambridge, Cambridge, UK.
Address correspondence to Dr Baron, Cambridge University De-partment of Clinical Neurosciences, Box 83, Addenbrooke’s, Hos-pital, Hills Road, Cambridge CB2 2QQ, UK.
Potential conflict of interest: Nothing to report.
Received Mar 10, 2009, and in revised form Jul 16. Accepted forpublication Jul 16, 2009. Published online, in Wiley InterScience(www.interscience.wiley.com). DOI: 10.1002/ana.21810
604 © 2009 American Neurological Association
we analyzed the interactions between brain regions bystructural equation modeling of the fMRI signal in ananatomically specified causal model.25,26 Inferencesabout changing regional neuronal interactions can bemade from the changing interactions at the level ofblood oxygenation level-dependent (BOLD) fMRI sig-nals.27,28 In the absence of significant neuronal loss orregeneration, such changes in connectivity are heavilydependent on changes in synaptic density, structure,and efficacy.29 Inferences can be drawn in terms ofchanges in systems-level effective connectivity, inwhich the strength of a physiological connection be-tween 2 regions (eg, path coefficient) is modulated byexperimental context (eg, MI vs EM) and/or conditioneffects (eg, patient group).
We used fMRI to examine the connectivity withinthe extended motor network during motor imageryand executed movement in subcortical stroke patientswho were nearly fully recovered. Our first hypothesiswas that although activations may normalize afterstroke, analysis of effective connectivity would revealpersisting abnormalities. Our second hypothesis wasthat atypical connectivity will be more prominent dur-ing motor imagery than executed movement, becauseof the emphasis on the cognitive processes that precedemovement execution. Finally, we predicted that con-nectivity among prefrontal and premotor cortex wouldcorrelate with upper limb motor function.
Materials and MethodsSubjectsEight patients (6 females; mean age, 67 years; standarddeviation [SD], 11 years) were prospectively recruitedfrom local stroke services. Inclusion criteria were thatthe stroke was the first clinical stroke episode in previ-ously right-handed adults, affected the left hemispheresubcortically, and was associated with right hemiparesisinvolving the hand with reduced power (nadir) �2/5on the Medical Research Council scale.30 Exclusioncriteria included carotid artery stenosis/occlusion; ne-glect or inattention; inability to pass the Chaotic Mo-tor Imagery Assessment Battery20,23,24,31; renal andliver impairment; concurrent treatment with a selectiveserotonin reuptake inhibitor or benzodiazepine; signif-icant small vessel disease on routine computed tomog-raphy; current depression; and contraindications toMRI.
Thirteen right-handed control subjects (9 males;mean age, 57.6 years; SD, 8.5 years) were recruitedthrough local advertisement. Control subjects had nohistory of neurological or psychiatric disorder and werenot taking regular medication. All subjects gave writtenconsent in accordance with the declaration of Helsinki.The protocol was approved by the Cambridge ResearchEthics Committee.
Chaotic Motor Imagery Assessment BatteryChaotic motor imagery is defined as either an inabilityto perform motor imagery accurately or temporal un-coupling of otherwise accurate imagery.23 Subjectswere assessed using the Chaotic Motor Imagery Assess-ment Battery,20,23,24 which has 3 components thatprovide an objective measure of motor imagery com-pliance (see online supplementary material for a fulldescription). The first component used a hand mentalrotation task to assess implicit motor imagery; subjectswho score below 75% are excluded. The second com-ponent used a variation of the fMRI task with a vari-able block length to ensure motor imagery perfor-mance. The third component used principles of motorcontrol to ensure subjects are using motor imagery;subjects using alternative cognitive strategies such ascounting are excluded. During all motor imagery tasks,subjects were instructed to perform first-person motorimagery; not to view the scene from the 3rd person;and not to count, or assign numbers or tones to eachfinger. Subjects were excluded if they were unable toperform motor imagery.
Additional TestsPatients were assessed with the National Institutes ofHealth Stroke Scale; the Action Research Arm Test (aquantitative test of upper limb extremity function mea-suring grasp)32,33; and the Motricity Index,34 whichmeasures the motor function of the arm in terms ofpinch, elbow flexion, and shoulder abduction as well asthe leg and trunk. Thumb to index finger tapping over15 seconds (TIT ratio) and mirror synkinesia were alsomeasured. Vasomotor reactivity was assessed in patientsusing transcranial Doppler.35
fMRI
MOTOR PARADIGM AND FMRI. The fMRI used an es-tablished block design,24,36 with auditory pacing (1Hz)of a right-hand finger-thumb opposition sequence (2,3, 4, 5, 2. . .) with 2 separate runs (MI & Rest andEM & Rest). Subjects were instructed to keep theireyes closed. We used individually calibrated bilateral fi-beroptic gloves (Fifth Dimension Technologies, Preto-ria, South Africa) to monitor finger movements, to ex-clude inappropriate movement, and to assess theperformance of motor imagery. After each motor im-agery block, subjects confirmed whether the finger theywere currently imagining was the correct “stop finger”for the length of sequence. After scanning, subjectswere asked to rate the difficulty of motor imagery per-formance on a 7-point scale.37
A 3-Tesla Brucker (Billerica, MA) MRI scanner wasused to acquire T2-weighted and proton density ana-tomical images and T2*-weighted MRI transverse
Sharma et al: Motor Imagery After Stroke 605
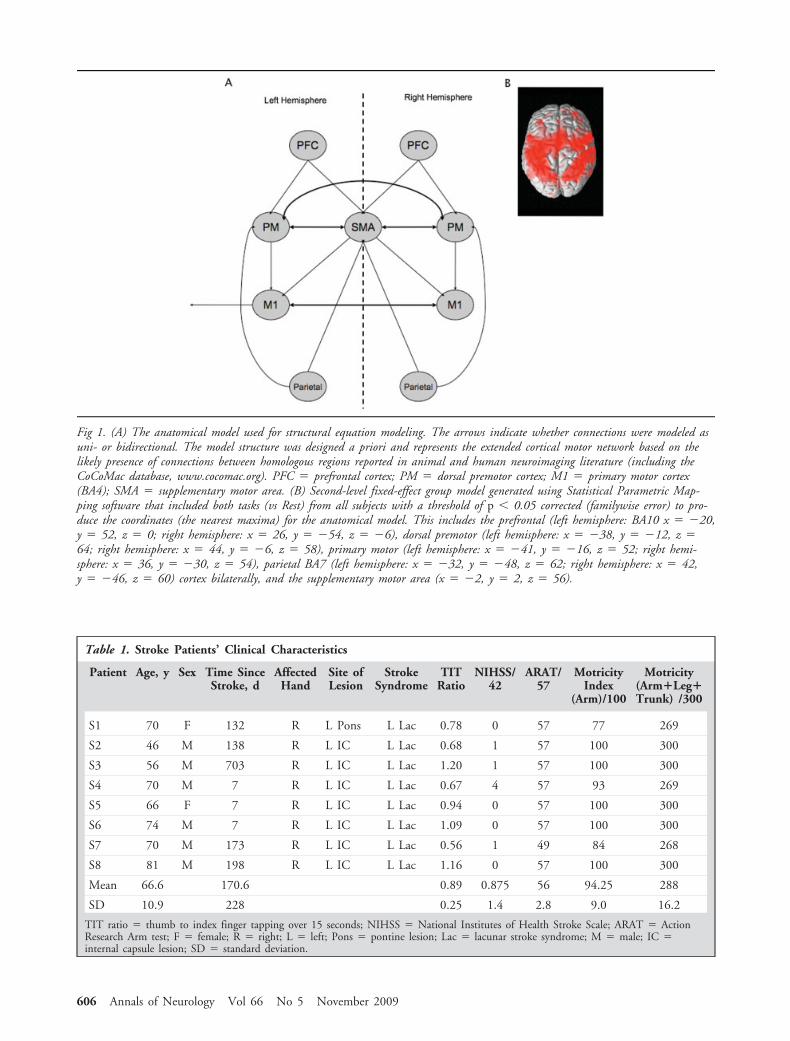
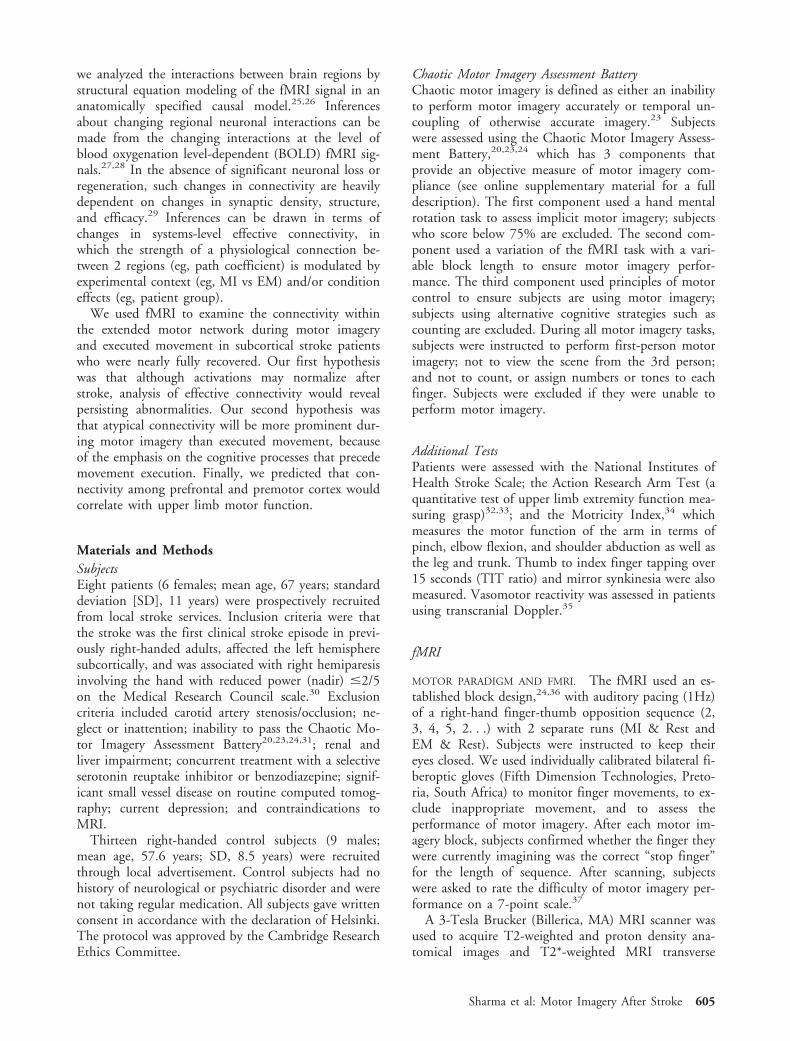
Fig 1. (A) The anatomical model used for structural equation modeling. The arrows indicate whether connections were modeled asuni- or bidirectional. The model structure was designed a priori and represents the extended cortical motor network based on thelikely presence of connections between homologous regions reported in animal and human neuroimaging literature (including theCoCoMac database, www.cocomac.org). PFC � prefrontal cortex; PM � dorsal premotor cortex; M1 � primary motor cortex(BA4); SMA � supplementary motor area. (B) Second-level fixed-effect group model generated using Statistical Parametric Map-ping software that included both tasks (vs Rest) from all subjects with a threshold of p � 0.05 corrected (familywise error) to pro-duce the coordinates (the nearest maxima) for the anatomical model. This includes the prefrontal (left hemisphere: BA10 x � �20,y � 52, z � 0; right hemisphere: x � 26, y � �54, z � �6), dorsal premotor (left hemisphere: x � �38, y � �12, z �64; right hemisphere: x � 44, y � �6, z � 58), primary motor (left hemisphere: x � �41, y � �16, z � 52; right hemi-sphere: x � 36, y � �30, z � 54), parietal BA7 (left hemisphere: x � �32, y � �48, z � 62; right hemisphere: x � 42,y � �46, z � 60) cortex bilaterally, and the supplementary motor area (x � �2, y � 2, z � 56).
Table 1. Stroke Patients’ Clinical Characteristics
Patient Age, y Sex Time SinceStroke, d
AffectedHand
Site ofLesion
StrokeSyndrome
TITRatio
NIHSS/42
ARAT/57
MotricityIndex
(Arm)/100
Motricity(Arm�Leg�Trunk) /300
S1 70 F 132 R L Pons L Lac 0.78 0 57 77 269
S2 46 M 138 R L IC L Lac 0.68 1 57 100 300
S3 56 M 703 R L IC L Lac 1.20 1 57 100 300
S4 70 M 7 R L IC L Lac 0.67 4 57 93 269
S5 66 F 7 R L IC L Lac 0.94 0 57 100 300
S6 74 M 7 R L IC L Lac 1.09 0 57 100 300
S7 70 M 173 R L IC L Lac 0.56 1 49 84 268
S8 81 M 198 R L IC L Lac 1.16 0 57 100 300
Mean 66.6 170.6 0.89 0.875 56 94.25 288
SD 10.9 228 0.25 1.4 2.8 9.0 16.2
TIT ratio � thumb to index finger tapping over 15 seconds; NIHSS � National Institutes of Health Stroke Scale; ARAT � ActionResearch Arm test; F � female; R � right; L � left; Pons � pontine lesion; Lac � lacunar stroke syndrome; M � male; IC �internal capsule lesion; SD � standard deviation.
606 Annals of Neurology Vol 66 No 5 November 2009
echo-planar images sensitive to the BOLD fMRI signal(64 � 64 � 23; field of view, 20 � 20 � 115; 23slices of 4mm; repetition time, 1.5 seconds; echo time,30 milliseconds; voxel size, 4 � 4 � 4). Each run waspreprocessed separately using Statistical ParametricMapping software (SPM 5, Wellcome Trust Centre forNeuroimaging, London, UK). Images were correctedfor acquisition delays, spatially realigned (movement�1.5mm), transformed into the standard space of theMontreal Neurological Institute,38 and smoothed witha Gaussian kernel full width at half maximum of 6mm.
STATISTICAL NONPARAMETRIC MAPPING: VOXEL-BASED
ANALYSIS OF REGIONAL EFFECTS. A first-level generallinear model was used for each subject. The block de-sign (task vs Rest) was convolved by the canonical he-modynamic response function (high pass filter 128 sec-onds). Contrast images (either [MI vs Rest] or [EM vsRest]) were entered into second-level models usingthe Statistical nonParametric Mapping (SnPM) tool-box (SnPM 5b, www.sph.umich.edu/ni-stat/SnPM/).SnPM was used at the second level for several reasons.First, with low subject numbers, the correction for
Table 2. Chaotic Motor Imagery Assessment: Individual and Group Mean Scores for Accuracy, Break Point, andSelf-Assessment of the Motor Imagery Task
Subject HandRotation, %
Correcta
FingerSequenceb
Break Point, MI-EM %c
Subjective Post-MRIMI Score
C1 91 � �50 7
C2 97 � 0 6
C3 91 � �28 6
C4 93 � �5 5
C5 94 � �9 6
C6 88 � �30 7
C7 86 � �24 5
C8 94 � �25 6
C9 99 � �25 4
C10 90 � �69 7
C11 100 � �43 4
C12 100 � �44 5
C13 95 � �18 5
Mean (SE) 94 (0.2) �28 (5) Median 6, range (4–7)
S1 91 � �14 6
S2 89 � �42 4
S3 95 � �67 5
S4 85 � �20 4
S5 100 � �21 4
S6 94 � �6 6
S7 77 � �19 6
S8 98 � �69 7
Mean (SE) 91 (2) �32 (7) Median 5.5, range (4–7)
aNinety-six A4-sized picture cards of hands were presented, and subjects were asked to identify whether the picture was of a left or righthand. Entry criteria include performance over 75%.bSubjects are asked to perform motor imagery of a finger sequence task (2,3,4,5,2. . .; paced using auditory cues at 1Hz). � �performed accurately.cSubjects performed a finger-tapping sequence using executed movement and then using motor imagery. Pacing rate starts at 40 beats/min and is increased by 10 beats every 5 seconds. The break point is defined as the time when the subject is unable to perform thetask accurately. Subjects are excluded if the break point is greater for motor imagery than for executed movement.MI � motor imagery; EM � executed movement; MRI � magnetic resonance imaging; SE � standard error.
Sharma et al: Motor Imagery After Stroke 607
multiple comparisons using SPM’s random field theoryis too conservative. Second, the heterogeneity of thestroke group could lead to violations of the assump-
tions of equal and normally distributed error varianceacross groups. One-sample pseudo t tests were used toexamine the effects of the tasks, whereas pseudo paired
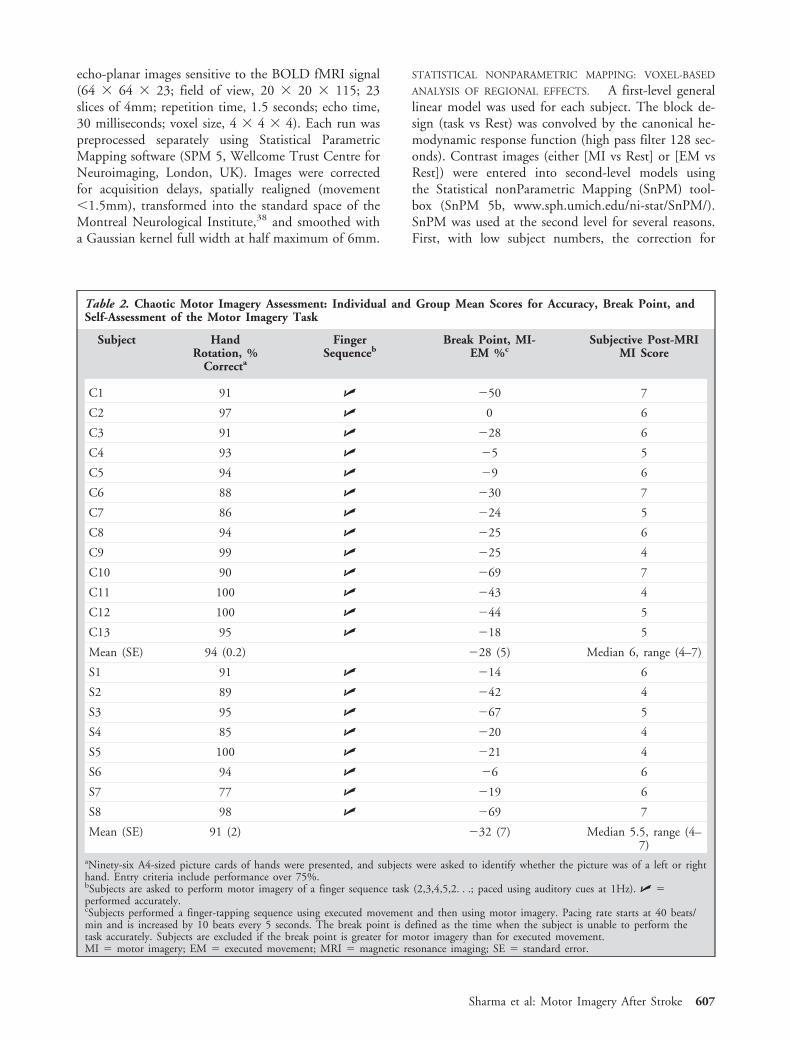
Fig 2. Structural T2-weighted magnetic resonance imaging of stroke patients indicating the subcortical lesions. The slice is chosenfor each patient at the maximum extent of the infarct.
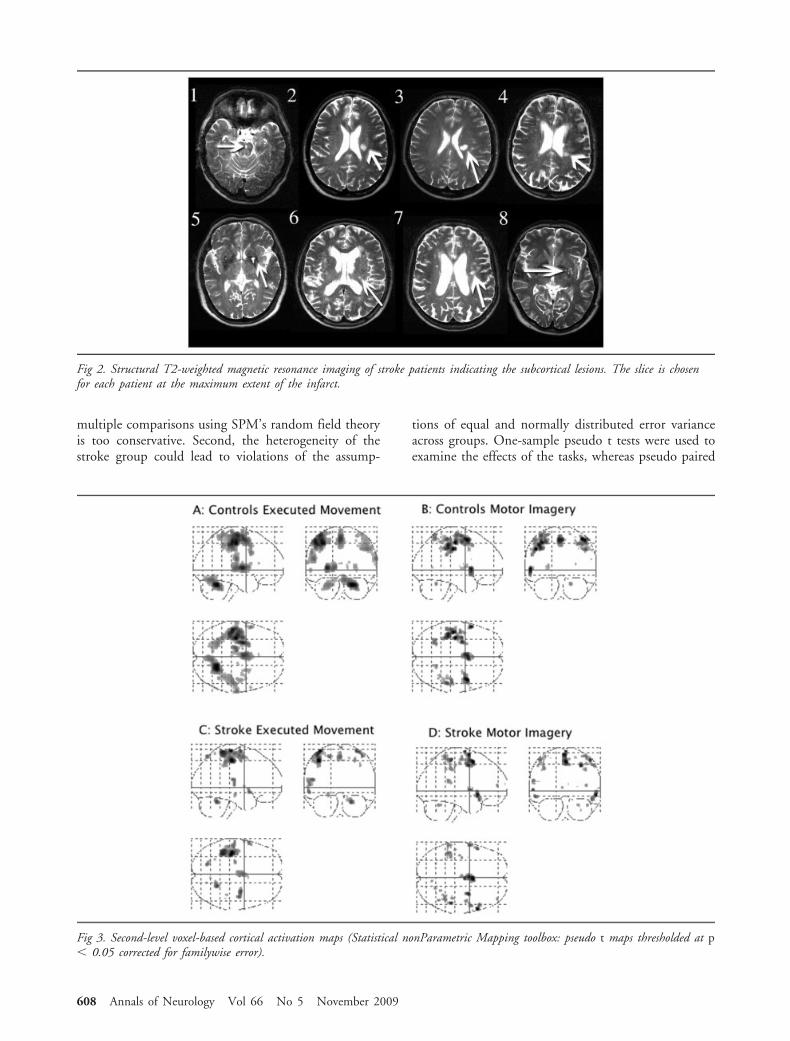
Fig 3. Second-level voxel-based cortical activation maps (Statistical nonParametric Mapping toolbox: pseudo t maps thresholded at p� 0.05 corrected for familywise error).
608 Annals of Neurology Vol 66 No 5 November 2009
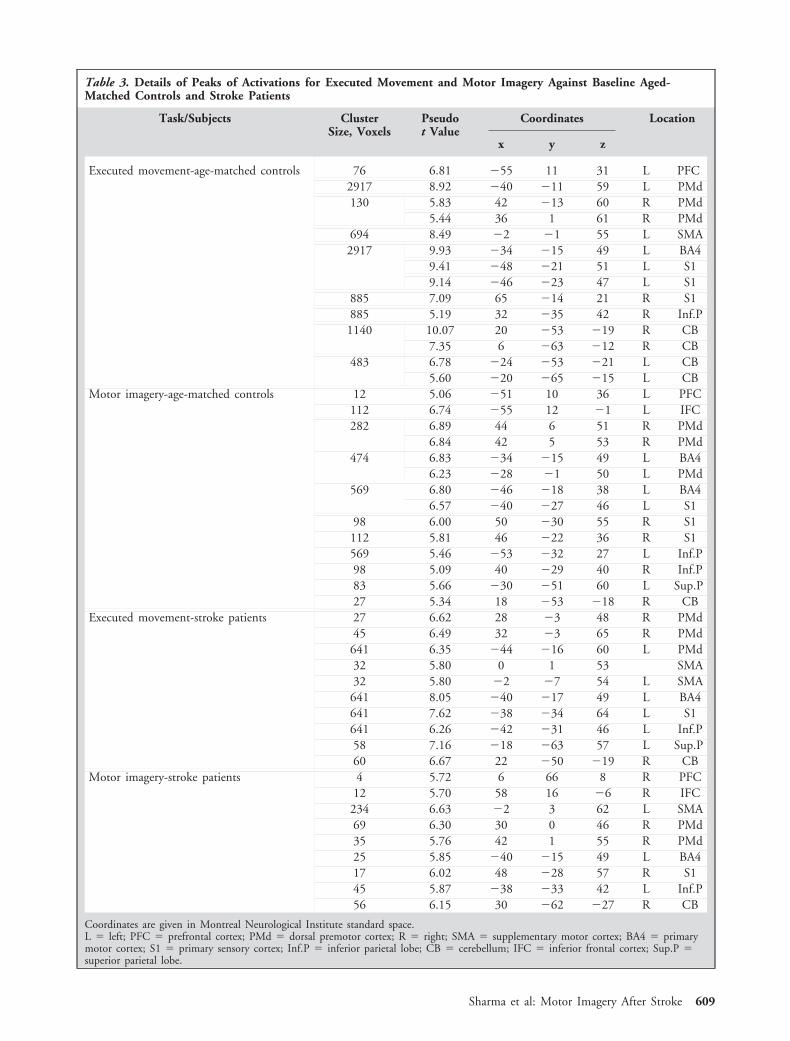
Table 3. Details of Peaks of Activations for Executed Movement and Motor Imagery Against Baseline Aged-Matched Controls and Stroke Patients
Task/Subjects ClusterSize, Voxels
Pseudot Value
Coordinates Location
x y z
Executed movement-age-matched controls 76 6.81 �55 11 31 L PFC2917 8.92 �40 �11 59 L PMd130 5.83 42 �13 60 R PMd
5.44 36 1 61 R PMd694 8.49 �2 �1 55 L SMA2917 9.93 �34 �15 49 L BA4
9.41 �48 �21 51 L S19.14 �46 �23 47 L S1
885 7.09 65 �14 21 R S1885 5.19 32 �35 42 R Inf.P1140 10.07 20 �53 �19 R CB
7.35 6 �63 �12 R CB483 6.78 �24 �53 �21 L CB
5.60 �20 �65 �15 L CBMotor imagery-age-matched controls 12 5.06 �51 10 36 L PFC
112 6.74 �55 12 �1 L IFC282 6.89 44 6 51 R PMd
6.84 42 5 53 R PMd474 6.83 �34 �15 49 L BA4
6.23 �28 �1 50 L PMd569 6.80 �46 �18 38 L BA4
6.57 �40 �27 46 L S198 6.00 50 �30 55 R S1112 5.81 46 �22 36 R S1569 5.46 �53 �32 27 L Inf.P98 5.09 40 �29 40 R Inf.P83 5.66 �30 �51 60 L Sup.P27 5.34 18 �53 �18 R CB
Executed movement-stroke patients 27 6.62 28 �3 48 R PMd45 6.49 32 �3 65 R PMd641 6.35 �44 �16 60 L PMd32 5.80 0 1 53 SMA32 5.80 �2 �7 54 L SMA641 8.05 �40 �17 49 L BA4641 7.62 �38 �34 64 L S1641 6.26 �42 �31 46 L Inf.P58 7.16 �18 �63 57 L Sup.P60 6.67 22 �50 �19 R CB
Motor imagery-stroke patients 4 5.72 6 66 8 R PFC12 5.70 58 16 �6 R IFC
234 6.63 �2 3 62 L SMA69 6.30 30 0 46 R PMd35 5.76 42 1 55 R PMd25 5.85 �40 �15 49 L BA417 6.02 48 �28 57 R S145 5.87 �38 �33 42 L Inf.P56 6.15 30 �62 �27 R CB
Coordinates are given in Montreal Neurological Institute standard space.L � left; PFC � prefrontal cortex; PMd � dorsal premotor cortex; R � right; SMA � supplementary motor cortex; BA4 � primarymotor cortex; S1 � primary sensory cortex; Inf.P � inferior parietal lobe; CB � cerebellum; IFC � inferior frontal cortex; Sup.P �superior parietal lobe.
Sharma et al: Motor Imagery After Stroke 609
t tests were used to compare tasks within subjects.Pseudo unpaired t tests examined task differences be-tween groups. A threshold of p � 0.05 corrected (fam-ily wise error) was used for all contrasts based on per-mutations tests.
STRUCTURAL EQUATION MODELING OF NETWORK CON-
NECTIVITY. The structural model (Fig 1A) includedan extended cortical motor network that has been im-plicated in stroke recovery. The specific connectionswere based on consensus human and primate data(www.cocomac.org). The coordinates for the regionswere taken from the nearest maxima in a second-levelfixed-effect group model generated using SnPM (MIand EM vs Rest) from all subjects with a threshold ofp � 0.05 corrected (familywise error) (Fig 1B).
The first eigenvector of the adjusted BOLD signalwas extracted from a 6mm sphere for each region fromeach subject. These time series were used for structuralequation modeling27,28,39,40 to estimate the affects ofan experimental manipulation on task-related effectiveconnectivity within the specified anatomical model.These changes in connectivity represent psychophysio-logical interactions within hypothesis-led stationarycausal models.28
Inferences at the group level used the subject-specificpath coefficients in a 3-way repeated-measures analysisof variance (ANOVA) with within-subject factors ofTask (MI vs EM) and Connections (20 connectionsshown in Fig 1A). Group was a between-subject factor(Control vs Stroke). Significant effects were exploredwith post hoc t tests. Given our hypothesis that effec-tive connectivity would correlate with measurement ofmotor function, we performed 2-tailed Spearman cor-relations between path coefficients and measurementsof upper limb function.
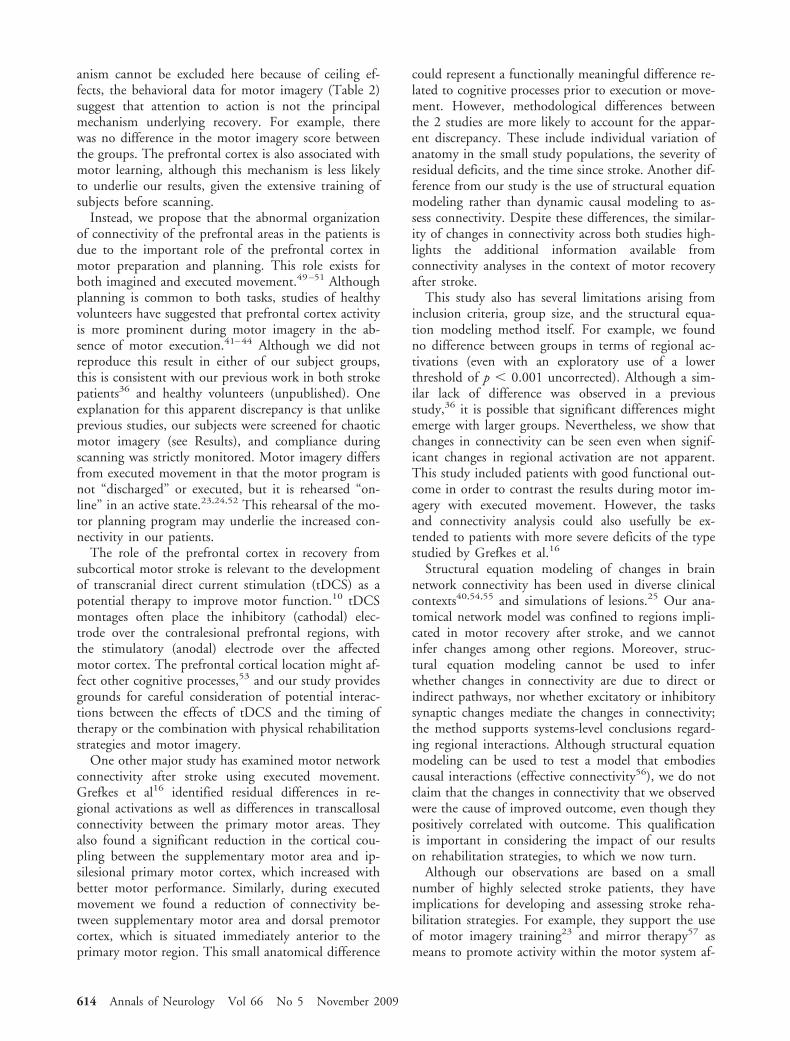
ResultsThe demographic details of participants are shown inTable 1. The results of the behavioral assessment areshown in Table 2. For patients, Figure 2 shows the T2structural scans at the maximum infarct size slice. Va-somotor reactivity was normal in all patients.
SnPM: Voxel-Based Analysis of Regional EffectsMotor imagery and executed movement (vs Rest) wereassociated with similar activations throughout the mo-tor network in both groups (Fig 3, Table 3) includingprimary motor cortex (BA4), primary sensory cortex,supplementary motor area (SMA), prefrontal cortex(PFC), bilateral dorsal premotor cortex, parietal cortex,right cerebellum, and inferior frontal cortex (IFC).
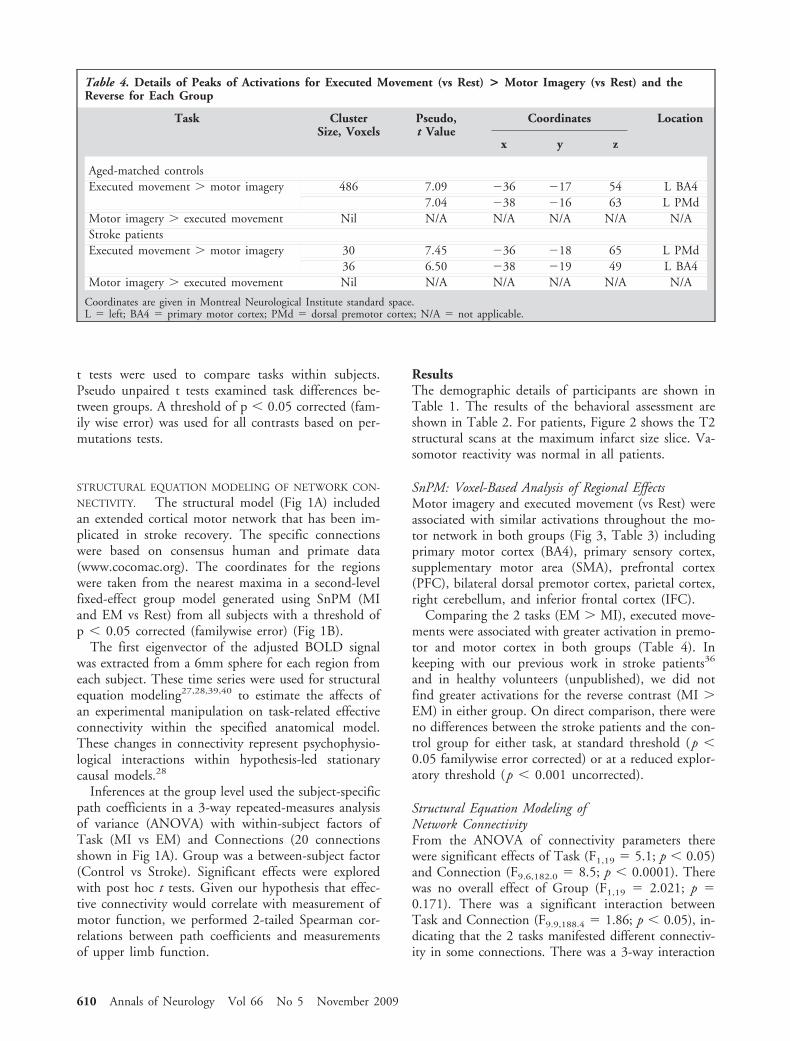
Comparing the 2 tasks (EM � MI), executed move-ments were associated with greater activation in premo-tor and motor cortex in both groups (Table 4). Inkeeping with our previous work in stroke patients36
and in healthy volunteers (unpublished), we did notfind greater activations for the reverse contrast (MI �EM) in either group. On direct comparison, there wereno differences between the stroke patients and the con-trol group for either task, at standard threshold (p �0.05 familywise error corrected) or at a reduced explor-atory threshold (p � 0.001 uncorrected).
Structural Equation Modeling ofNetwork ConnectivityFrom the ANOVA of connectivity parameters therewere significant effects of Task (F1,19 � 5.1; p � 0.05)and Connection (F9.6,182.0 � 8.5; p � 0.0001). Therewas no overall effect of Group (F1,19 � 2.021; p �0.171). There was a significant interaction betweenTask and Connection (F9.9,188.4 � 1.86; p � 0.05), in-dicating that the 2 tasks manifested different connectiv-ity in some connections. There was a 3-way interaction
Table 4. Details of Peaks of Activations for Executed Movement (vs Rest) > Motor Imagery (vs Rest) and theReverse for Each Group
Task ClusterSize, Voxels
Pseudo,t Value
Coordinates Location
x y z
Aged-matched controlsExecuted movement � motor imagery 486 7.09 �36 �17 54 L BA4
7.04 �38 �16 63 L PMdMotor imagery � executed movement Nil N/A N/A N/A N/A N/AStroke patientsExecuted movement � motor imagery 30 7.45 �36 �18 65 L PMd
36 6.50 �38 �19 49 L BA4Motor imagery � executed movement Nil N/A N/A N/A N/A N/A
Coordinates are given in Montreal Neurological Institute standard space.L � left; BA4 � primary motor cortex; PMd � dorsal premotor cortex; N/A � not applicable.
610 Annals of Neurology Vol 66 No 5 November 2009
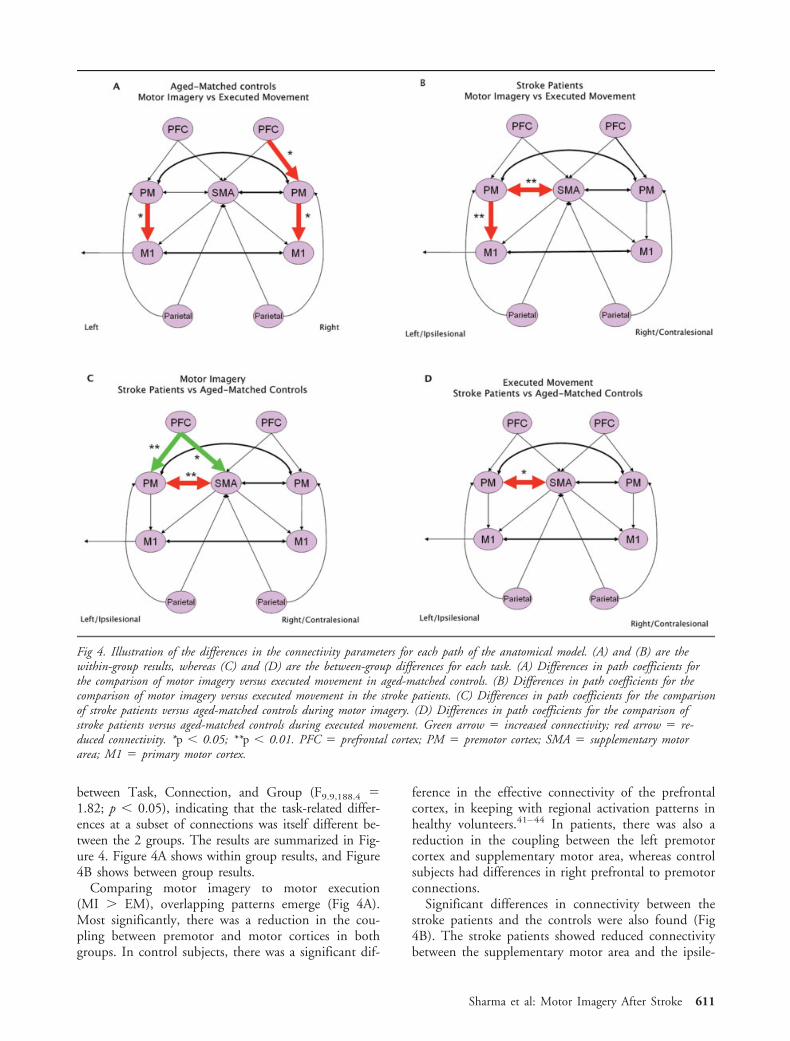
between Task, Connection, and Group (F9.9,188.4 �1.82; p � 0.05), indicating that the task-related differ-ences at a subset of connections was itself different be-tween the 2 groups. The results are summarized in Fig-ure 4. Figure 4A shows within group results, and Figure4B shows between group results.
Comparing motor imagery to motor execution(MI � EM), overlapping patterns emerge (Fig 4A).Most significantly, there was a reduction in the cou-pling between premotor and motor cortices in bothgroups. In control subjects, there was a significant dif-
ference in the effective connectivity of the prefrontalcortex, in keeping with regional activation patterns inhealthy volunteers.41–44 In patients, there was also areduction in the coupling between the left premotorcortex and supplementary motor area, whereas controlsubjects had differences in right prefrontal to premotorconnections.
Significant differences in connectivity between thestroke patients and the controls were also found (Fig4B). The stroke patients showed reduced connectivitybetween the supplementary motor area and the ipsile-
Fig 4. Illustration of the differences in the connectivity parameters for each path of the anatomical model. (A) and (B) are thewithin-group results, whereas (C) and (D) are the between-group differences for each task. (A) Differences in path coefficients forthe comparison of motor imagery versus executed movement in aged-matched controls. (B) Differences in path coefficients for thecomparison of motor imagery versus executed movement in the stroke patients. (C) Differences in path coefficients for the comparisonof stroke patients versus aged-matched controls during motor imagery. (D) Differences in path coefficients for the comparison ofstroke patients versus aged-matched controls during executed movement. Green arrow � increased connectivity; red arrow � re-duced connectivity. *p � 0.05; **p � 0.01. PFC � prefrontal cortex; PM � premotor cortex; SMA � supplementary motorarea; M1 � primary motor cortex.
Sharma et al: Motor Imagery After Stroke 611
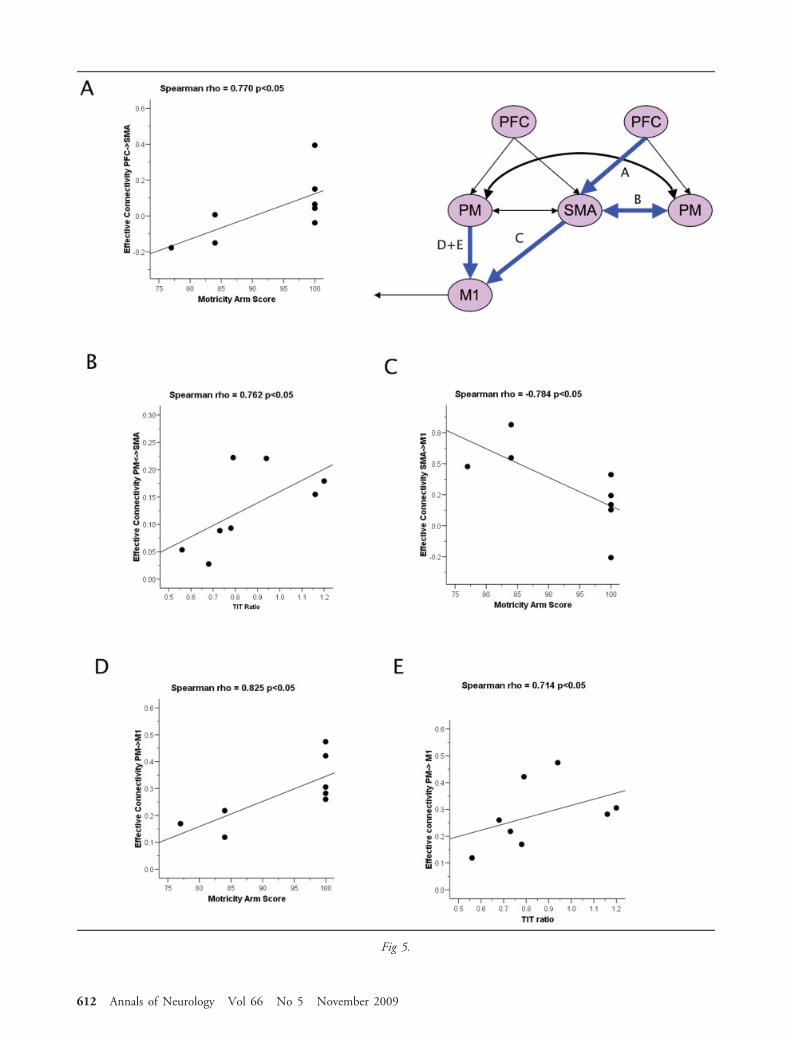
Fig 5.
612 Annals of Neurology Vol 66 No 5 November 2009
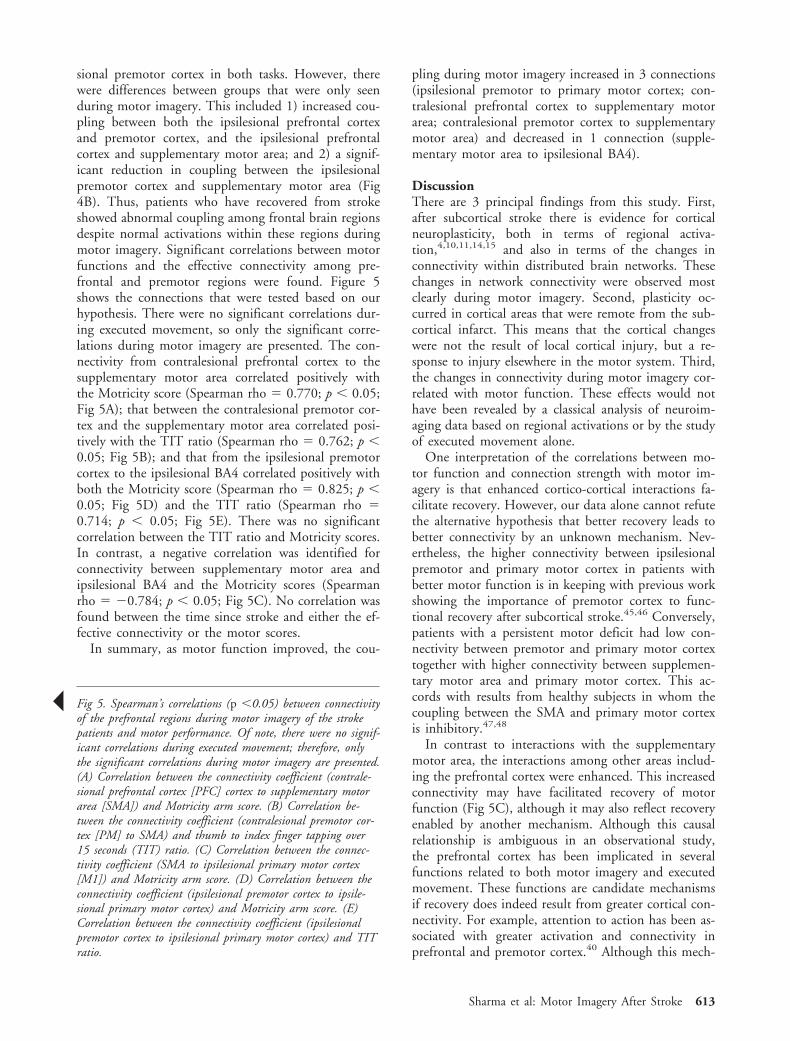
sional premotor cortex in both tasks. However, therewere differences between groups that were only seenduring motor imagery. This included 1) increased cou-pling between both the ipsilesional prefrontal cortexand premotor cortex, and the ipsilesional prefrontalcortex and supplementary motor area; and 2) a signif-icant reduction in coupling between the ipsilesionalpremotor cortex and supplementary motor area (Fig4B). Thus, patients who have recovered from strokeshowed abnormal coupling among frontal brain regionsdespite normal activations within these regions duringmotor imagery. Significant correlations between motorfunctions and the effective connectivity among pre-frontal and premotor regions were found. Figure 5shows the connections that were tested based on ourhypothesis. There were no significant correlations dur-ing executed movement, so only the significant corre-lations during motor imagery are presented. The con-nectivity from contralesional prefrontal cortex to thesupplementary motor area correlated positively withthe Motricity score (Spearman rho � 0.770; p � 0.05;Fig 5A); that between the contralesional premotor cor-tex and the supplementary motor area correlated posi-tively with the TIT ratio (Spearman rho � 0.762; p �0.05; Fig 5B); and that from the ipsilesional premotorcortex to the ipsilesional BA4 correlated positively withboth the Motricity score (Spearman rho � 0.825; p �0.05; Fig 5D) and the TIT ratio (Spearman rho �0.714; p � 0.05; Fig 5E). There was no significantcorrelation between the TIT ratio and Motricity scores.In contrast, a negative correlation was identified forconnectivity between supplementary motor area andipsilesional BA4 and the Motricity scores (Spearmanrho � �0.784; p � 0.05; Fig 5C). No correlation wasfound between the time since stroke and either the ef-fective connectivity or the motor scores.
In summary, as motor function improved, the cou-
pling during motor imagery increased in 3 connections(ipsilesional premotor to primary motor cortex; con-tralesional prefrontal cortex to supplementary motorarea; contralesional premotor cortex to supplementarymotor area) and decreased in 1 connection (supple-mentary motor area to ipsilesional BA4).
DiscussionThere are 3 principal findings from this study. First,after subcortical stroke there is evidence for corticalneuroplasticity, both in terms of regional activa-tion,4,10,11,14,15 and also in terms of the changes inconnectivity within distributed brain networks. Thesechanges in network connectivity were observed mostclearly during motor imagery. Second, plasticity oc-curred in cortical areas that were remote from the sub-cortical infarct. This means that the cortical changeswere not the result of local cortical injury, but a re-sponse to injury elsewhere in the motor system. Third,the changes in connectivity during motor imagery cor-related with motor function. These effects would nothave been revealed by a classical analysis of neuroim-aging data based on regional activations or by the studyof executed movement alone.
One interpretation of the correlations between mo-tor function and connection strength with motor im-agery is that enhanced cortico-cortical interactions fa-cilitate recovery. However, our data alone cannot refutethe alternative hypothesis that better recovery leads tobetter connectivity by an unknown mechanism. Nev-ertheless, the higher connectivity between ipsilesionalpremotor and primary motor cortex in patients withbetter motor function is in keeping with previous workshowing the importance of premotor cortex to func-tional recovery after subcortical stroke.45,46 Conversely,patients with a persistent motor deficit had low con-nectivity between premotor and primary motor cortextogether with higher connectivity between supplemen-tary motor area and primary motor cortex. This ac-cords with results from healthy subjects in whom thecoupling between the SMA and primary motor cortexis inhibitory.47,48
In contrast to interactions with the supplementarymotor area, the interactions among other areas includ-ing the prefrontal cortex were enhanced. This increasedconnectivity may have facilitated recovery of motorfunction (Fig 5C), although it may also reflect recoveryenabled by another mechanism. Although this causalrelationship is ambiguous in an observational study,the prefrontal cortex has been implicated in severalfunctions related to both motor imagery and executedmovement. These functions are candidate mechanismsif recovery does indeed result from greater cortical con-nectivity. For example, attention to action has been as-sociated with greater activation and connectivity inprefrontal and premotor cortex.40 Although this mech-
Š Fig 5. Spearman’s correlations (p �0.05) between connectivityof the prefrontal regions during motor imagery of the strokepatients and motor performance. Of note, there were no signif-icant correlations during executed movement; therefore, onlythe significant correlations during motor imagery are presented.(A) Correlation between the connectivity coefficient (contrale-sional prefrontal cortex [PFC] cortex to supplementary motorarea [SMA]) and Motricity arm score. (B) Correlation be-tween the connectivity coefficient (contralesional premotor cor-tex [PM] to SMA) and thumb to index finger tapping over15 seconds (TIT) ratio. (C) Correlation between the connec-tivity coefficient (SMA to ipsilesional primary motor cortex[M1]) and Motricity arm score. (D) Correlation between theconnectivity coefficient (ipsilesional premotor cortex to ipsile-sional primary motor cortex) and Motricity arm score. (E)Correlation between the connectivity coefficient (ipsilesionalpremotor cortex to ipsilesional primary motor cortex) and TITratio.
Sharma et al: Motor Imagery After Stroke 613
anism cannot be excluded here because of ceiling ef-fects, the behavioral data for motor imagery (Table 2)suggest that attention to action is not the principalmechanism underlying recovery. For example, therewas no difference in the motor imagery score betweenthe groups. The prefrontal cortex is also associated withmotor learning, although this mechanism is less likelyto underlie our results, given the extensive training ofsubjects before scanning.
Instead, we propose that the abnormal organizationof connectivity of the prefrontal areas in the patients isdue to the important role of the prefrontal cortex inmotor preparation and planning. This role exists forboth imagined and executed movement.49–51 Althoughplanning is common to both tasks, studies of healthyvolunteers have suggested that prefrontal cortex activityis more prominent during motor imagery in the ab-sence of motor execution.41–44 Although we did notreproduce this result in either of our subject groups,this is consistent with our previous work in both strokepatients36 and healthy volunteers (unpublished). Oneexplanation for this apparent discrepancy is that unlikeprevious studies, our subjects were screened for chaoticmotor imagery (see Results), and compliance duringscanning was strictly monitored. Motor imagery differsfrom executed movement in that the motor program isnot “discharged” or executed, but it is rehearsed “on-line” in an active state.23,24,52 This rehearsal of the mo-tor planning program may underlie the increased con-nectivity in our patients.
The role of the prefrontal cortex in recovery fromsubcortical motor stroke is relevant to the developmentof transcranial direct current stimulation (tDCS) as apotential therapy to improve motor function.10 tDCSmontages often place the inhibitory (cathodal) elec-trode over the contralesional prefrontal regions, withthe stimulatory (anodal) electrode over the affectedmotor cortex. The prefrontal cortical location might af-fect other cognitive processes,53 and our study providesgrounds for careful consideration of potential interac-tions between the effects of tDCS and the timing oftherapy or the combination with physical rehabilitationstrategies and motor imagery.
One other major study has examined motor networkconnectivity after stroke using executed movement.Grefkes et al16 identified residual differences in re-gional activations as well as differences in transcallosalconnectivity between the primary motor areas. Theyalso found a significant reduction in the cortical cou-pling between the supplementary motor area and ip-silesional primary motor cortex, which increased withbetter motor performance. Similarly, during executedmovement we found a reduction of connectivity be-tween supplementary motor area and dorsal premotorcortex, which is situated immediately anterior to theprimary motor region. This small anatomical difference
could represent a functionally meaningful difference re-lated to cognitive processes prior to execution or move-ment. However, methodological differences betweenthe 2 studies are more likely to account for the appar-ent discrepancy. These include individual variation ofanatomy in the small study populations, the severity ofresidual deficits, and the time since stroke. Another dif-ference from our study is the use of structural equationmodeling rather than dynamic causal modeling to as-sess connectivity. Despite these differences, the similar-ity of changes in connectivity across both studies high-lights the additional information available fromconnectivity analyses in the context of motor recoveryafter stroke.
This study also has several limitations arising frominclusion criteria, group size, and the structural equa-tion modeling method itself. For example, we foundno difference between groups in terms of regional ac-tivations (even with an exploratory use of a lowerthreshold of p � 0.001 uncorrected). Although a sim-ilar lack of difference was observed in a previousstudy,36 it is possible that significant differences mightemerge with larger groups. Nevertheless, we show thatchanges in connectivity can be seen even when signif-icant changes in regional activation are not apparent.This study included patients with good functional out-come in order to contrast the results during motor im-agery with executed movement. However, the tasksand connectivity analysis could also usefully be ex-tended to patients with more severe deficits of the typestudied by Grefkes et al.16
Structural equation modeling of changes in brainnetwork connectivity has been used in diverse clinicalcontexts40,54,55 and simulations of lesions.25 Our ana-tomical network model was confined to regions impli-cated in motor recovery after stroke, and we cannotinfer changes among other regions. Moreover, struc-tural equation modeling cannot be used to inferwhether changes in connectivity are due to direct orindirect pathways, nor whether excitatory or inhibitorysynaptic changes mediate the changes in connectivity;the method supports systems-level conclusions regard-ing regional interactions. Although structural equationmodeling can be used to test a model that embodiescausal interactions (effective connectivity56), we do notclaim that the changes in connectivity that we observedwere the cause of improved outcome, even though theypositively correlated with outcome. This qualificationis important in considering the impact of our resultson rehabilitation strategies, to which we now turn.
Although our observations are based on a smallnumber of highly selected stroke patients, they haveimplications for developing and assessing stroke reha-bilitation strategies. For example, they support the useof motor imagery training23 and mirror therapy57 asmeans to promote activity within the motor system af-
614 Annals of Neurology Vol 66 No 5 November 2009
ter stroke. It is possible that both pharmacological andnonpharmacological approaches can enhance distrib-uted cortical connectivity and thereby facilitate recov-ery from stroke. However, further studies includinglongitudinal design are needed to establish a causal linkbetween increased connectivity and recovery. It wouldbe of particular interest to study whether effective ther-apy by motor imagery or mirror training enhances con-nectivity in the motor system. Our data suggest thatfor such studies the formal analysis of effective connec-tivity may be more sensitive than classical analysis ofregional activations, and complement behavioral testsof recovery in heterogeneous patient populations.
The heterogeneity of stroke patients must also beconsidered. It is possible that benefits of motor imagerymay not apply to patients with chaotic motor imagery.These patients were excluded from our study and mayrequire alternative strategies for therapy.20,23 Addi-tional inclusion criteria were used. We restricted thestudy to right-handed patients with subcortical strokeaffecting the dominant hand. Stringent selection hasthe advantage of minimizing patient variance andhence increasing power, reducing common confoundsand preventing ambiguity over interpretation of tasksthat patients cannot perform.58 However, it also re-stricts the generalization of inferences to other patients.
In conclusion, this study shows abnormal cortico-cortical connectivity in the motor system after subcor-tical stroke even after significant recovery. Moreover,the strength of connectivity among frontal motor re-gions correlated with motor function. We propose thatthe altered connectivity from the prefrontal cortex re-lates to its role in planning movement. Our results un-derpin the concepts of recovery of function that arerelevant to the development (and assessment) of phys-ical or neurophysiological therapies for stroke. Keyquestions for future studies will be the generalization ofour findings to other stroke syndromes, and the causalrelationship between changing connectivity and motorrecovery.
This work was supported by The Stroke Association (grant TSA2003/10 to J. C. B.), the Medical Research Council (MRCG0001219 to J. C. B.), and a National Institute for Health Re-search Biomedical Research Centre grant to Cambridge UniversityMedical School. N. S. is also supported by a Brain Entry Scholar-ship and a Sackler Fellowship. J. B. R. is supported by WellcomeTrust (077029).
We thank P. Simon Jones, Diana J. Day, T. AdrianCarpenter, Lucy Simmons, Prof Valerie Pomeroy, andDr E. A. Warburton for their contributions to thiswork.
References1. Wolpert D, Ghahramani Z. Computational principles of move-
ment neuroscience. Nat Neurosci 2000;3(suppl):1212–1217.
2. Cramer S. Repairing the human brain after stroke. II. Restor-ative therapies. Ann Neurol 2008;63:549–560.
3. Cramer S. Repairing the human brain after stroke: I. Mecha-nisms of spontaneous recovery. Ann Neurol 2008;63:272–287.
4. Johansen-Berg H, Dawes H, Guy C, et al. Correlation betweenmotor improvements and altered fMRI activity after rehabilita-tive therapy. Brain 2002;125:2731–2742.
5. Dong Y, Dobkin BH, Cen SY, et al. Motor cortex activationduring treatment may predict therapeutic gains in paretic handfunction after stroke. Stroke 2006;37:1552–1555.
6. Takahashi CD, Der-Yeghiaian L, Le V, et al. Robot-based handmotor therapy after stroke. Brain 2008;131:425–437.
7. Nagano-Saito A, Leyton M, Monchi O, et al. Dopamine de-pletion impairs frontostriatal functional connectivity during aset-shifting task. J Neurosci 2008;28:3697–3706.
8. Fregni F, Pascual-Leone A. Hand motor recovery after stroke:tuning the orchestra to improve hand motor function. CognBehav Neurol 2006;19:21–33.
9. Calautti C, Baron J-C. Functional neuroimaging studies of mo-tor recovery after stroke in adults: a review. Stroke 2003;34:1553–1566.
10. Ward NS, Cohen LG. Mechanisms underlying recovery of mo-tor function after stroke. Arch Neurol 2004;61:1844–1848.
11. Calautti C, Leroy F, Guincestre J-Y, Baron J-C. Dynamics ofmotor network overactivation after striatocapsular stroke: a lon-gitudinal PET study using a fixed-performance paradigm.Stroke 2001;32:2534–2542.
12. Calautti C, Naccarato M, Jones PS, et al. The relationship be-tween motor deficit and hemisphere activation balance afterstroke: a 3T fMRI study. Neuroimage 2007;34:322–331.
13. Cramer SC, Nelles G, Benson RR, et al. A functional MRIstudy of subjects recovered from hemiparetic stroke. Stroke1997;28:2518–2527.
14. Ward NS, Brown MM, Thompson AJ, Frackowiak RSJ. Neuralcorrelates of motor recovery after stroke: a longitudinal fMRIstudy. Brain 2003;126:2476–2496.
15. Ward NS, Brown MM, Thompson AJ, Frackowiak RSJ. Neuralcorrelates of outcome after stroke: a cross-sectional fMRI study.Brain 2003;126:1430–1448.
16. Grefkes C, Nowak D, Eickhoff S, et al. Cortical connectivityafter subcortical stroke assessed with functional magnetic reso-nance imaging. Ann Neurol 2008;63:236–246.
17. Gerloff C, Bushara K, Sailer A, et al. Multimodal imaging ofbrain reorganization in motor areas of the contralesional hemi-sphere of well recovered patients after capsular stroke. Brain2006;129:791–808.
18. Raghavan P, Krakauer JW, Gordon AM. Impaired anticipatorycontrol of fingertip forces in patients with a pure motor or sen-sorimotor lacunar syndrome. Brain 2006;129:1415–1425.
19. Chollet F, DiPiero V, Wise R, et al. The functional anatomy ofmotor recovery after stroke in humans: a study with positronemission tomography. Ann Neurol 1991;29:63–71.
20. Sharma N, Simmons LH, Jones PS, et al. Motor imagery aftersubcortical stroke: a functional magnetic resonance imagingstudy. Stroke 2009;40:1315–1324.
21. Jeannerod M, Decety J. Mental motor imagery: a window intothe representational stages of action. Curr Opin Neurobiol1995;5:727–732.
22. Lotze M, Cohen LG. Volition and Imagery in neurorehabilita-tion. Cogn Behav Neurol 2006;19:135–140.
23. Sharma N, Pomeroy VM, Baron J-C. Motor imagery: a back-door to the motor system after stroke? Stroke 2006;37:1941–1952.
24. Sharma N, Jones PS, Carpenter TA, Baron J-C. Mapping theinvolvement of BA 4a and 4p during motor imagery. Neuro-image 2008;41:92–99.
Sharma et al: Motor Imagery After Stroke 615

25. Kim J, Horwitz B. How well does structural equation modelingreveal abnormal brain anatomical connections? An fMRI simu-lation study. Neuroimage 2009;45:1190–1198.
26. Penny WD, Stephan KE, Mechelli A, Friston KJ. Modellingfunctional integration: a comparison of structural equationand dynamic causal models. Neuroimage 2004;23(suppl 1):S264–S274.
27. Buchel C, Friston KJ. Modulation of connectivity in visualpathways by attention: cortical interactions evaluated withstructural equation modelling and fMRI. Cereb Cortex 1997;7:768–778.
28. Friston KJ, Buchel C. Attentional modulation of effective con-nectivity from V2 to V5/MT in humans. Proc Natl Acad SciU S A 2000;97:7591–7596.
29. Hayashi Y, Majewska AK. Dendritic spine geometry: functionalimplication and regulation. Neuron 2005;46:529–532.
30. Oldfeld R. The assessment and analysis of handedness: the Ed-inburgh inventory. Neuropsychologia 1971;9:97–113.
31. Simmons L, Sharma N, Baron J, Pomeroy V. Feasibility studyof motor imagery after stroke. Neurorehabil Neural Repair2008;22:458–467.
32. Lang CE, Wagner JM, Dromerick AW, Edwards DF. Measure-ment of upper-extremity function early after stroke: propertiesof the action research arm test. Arch Phys Med Rehabil 2006;87:1605–1610.
33. Hsieh C-L, Hsueh IP, Chiang F-M, Lin P-H. Inter-rater reli-ability and validity of the Action Research arm test in strokepatients. Age Ageing 1998;27:107–113.
34. Collin C, Wade D. Assessing motor impairment after stroke: apilot reliability study. J Neurol Neurosurg Psychiatry 1990;53:576–579.
35. Markus HS, Harrison MJ. Estimation of cerebrovascular reac-tivity using transcranial Doppler, including the use of breath-holding as the vasodilatory stimulus. Stroke 1992;23:668–673.
36. Sharma N, Simmons L, Jones PS, et al. Motor imagery aftersub-cortical stroke: an fMRI study. Stroke 2009;40:1315–1324.
37. Alkadhi H, Brugger P, Boendermaker SH, et al. What discon-nection tells about motor imagery: evidence from paraplegic pa-tients. Cereb Cortex 2005;15:131–140.
38. Collins DL, Neelin P, Peters TM, Evans AC. Automatic 3Dintersubject registration of MR volumetric data in standardizedTalairach space. J Comput Assist Tomogr 1994;18:192–205.
39. Rowe JB, Siebner H, Filipovic SR, et al. Aging is associatedwith contrasting changes in local and distant cortical connec-tivity in the human motor system. Neuroimage 2006;32:747–760.
40. Rowe J, Stephan KE, Friston K, et al. Attention to action inParkinson’s disease: impaired effective connectivity among fron-tal cortical regions. Brain 2002;125:276–289.
41. Hanakawa T, Dimyan MA, Hallett M. Motor planning, imag-ery, and execution in the distributed motor network: a time-course study with functional MRI. Cereb Cortex 2008;18:2775–2788.
42. Binkofski F, Amunts K, Stephan K, et al. Broca’s region sub-serves imagery of motion: a combined cytoarchitectonic andfMRI study. Hum Brain Mapp 2000;11:273–285.
43. Gerardin E, Sirigu A, Lehericy S, et al. Partially overlappingneural networks for real and imagined hand movements. CerebCortex 2000;10:1093–1104.
44. Lacourse MG, Orr ELR, Cramer SC, Cohen MJ. Brain activa-tion during execution and motor imagery of novel and skilledsequential hand movements. Neuroimage 2005;27:505–519.
45. Fridman EA, Hanakawa T, Chung M, et al. Reorganization ofthe human ipsilesional premotor cortex after stroke. Brain2004;127:747–758.
46. Johansen-Berg H, Rushworth MF, Bogdanovic MD, KischkaU, Wimalaratna S, Matthews PM. The role of ipsilateral pre-motor cortex in hand movement after stroke. Proc Natl AcadSci U S A 2002;99:14518–14523.
47. Kasess CH, Windischberger C, Cunnington R, et al. The sup-pressive influence of SMA on M1 in motor imagery revealed byfMRI and dynamic causal modeling. Neuroimage 2008;40:828–837.
48. Solodkin A, Hlustik P, Chen EE, Small SL. Fine modulation innetwork activation during motor execution and motor imagery.Cereb Cortex 2004;14:1246–1255.
49. Marois R. The cortical basis of motor planning: does it taketwo to tango? Nat Neurosci 2002;5:1254–1255.
50. Connolly JD, Goodale MA, Menon RS, Munoz DP. HumanfMRI evidence for the neural correlates of preparatory set. NatNeurosci 2002;5:1345–1352.
51. Rowe JB, Owen AM, Johnsrude IS, Passingham RE. Imagingthe mental components of a planning task. Neuropsychologia2001;39:315–327.
52. Jeannerod M. Mental imagery in the motor context. Neuropsy-chologia 1995;33:1419–1432.
53. Fecteau S, Knoch D, Fregni F, et al. Diminishing risk-takingbehavior by modulating activity in the prefrontal cortex: a directcurrent stimulation study. J Neurosci 2007;27:12500–12505.
54. Laird AR, Robbins JM, Li K, et al. Modeling motor connec-tivity using TMS/PET and structural equation modeling. Neu-roimage 2008;41:424–436.
55. Rosenbaum RS, Furey ML, Horwitz B, Grady CL. Altered con-nectivity among emotion-related brain regions during short-term memory in Alzheimer’s disease. Neurobiol Aging (inpress).
56. de Marco G, Devauchelle B, Berquin P. Brain functional mod-eling, what do we measure with fMRI data? Neurosci Res 2009;64:12–19.
57. Pomeroy VM, Clark CA, Miller JS, et al. The potential forutilizing the “mirror neurone system” to enhance recovery ofthe severely affected upper limb early after stroke: a review andhypothesis. Neurorehabil Neural Repair 2005;19:4–13.
58. Price C, Friston K. Scanning patients with tasks they can per-form. Hum Brain Mapp 1999;8:102–108.
616 Annals of Neurology Vol 66 No 5 November 2009