MORE OF WHAT WE WANT - The Nielsen Company
25
THE CROSS-PLATFORM SERIES | Q1 2014 MORE OF WHAT WE WANT THE CROSS-PLATFORM REPORT JUNE 2014
-
Upload
khangminh22 -
Category
Documents
-
view
6 -
download
0
Transcript of MORE OF WHAT WE WANT - The Nielsen Company
Copyright © 2014 The Nielsen Company THE CROSS-PLATFORM SERIES | Q1 2014
M O R E O F W H AT W E WA N TTHE CROSS-PLATFORM REPORTJUNE 2014
2 Copyright © 2014 The Nielsen Company
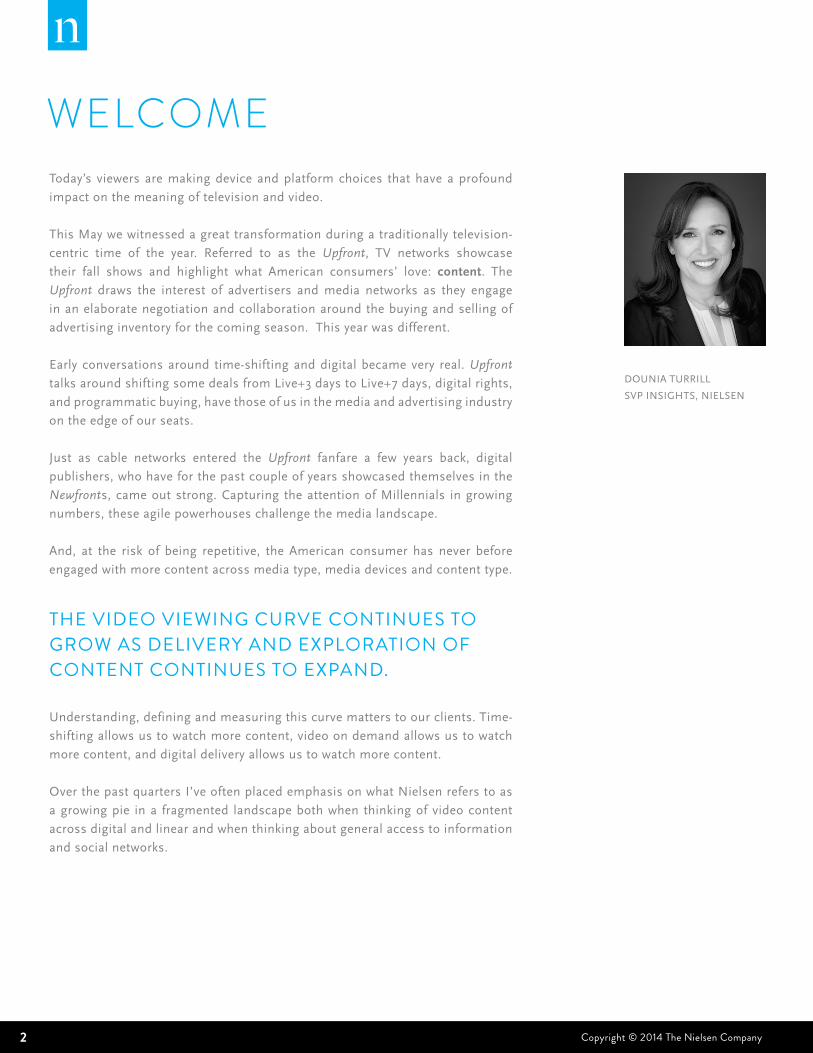
Today’s viewers are making device and platform choices that have a profound
impact on the meaning of television and video.
This May we witnessed a great transformation during a traditionally television-
centric time of the year. Referred to as the Upfront, TV networks showcase
their fall shows and highlight what American consumers’ love: content. The
Upfront draws the interest of advertisers and media networks as they engage
in an elaborate negotiation and collaboration around the buying and selling of
advertising inventory for the coming season. This year was different.
Early conversations around time-shifting and digital became very real. Upfront
talks around shifting some deals from Live+3 days to Live+7 days, digital rights,
and programmatic buying, have those of us in the media and advertising industry
on the edge of our seats.
Just as cable networks entered the Upfront fanfare a few years back, digital
publishers, who have for the past couple of years showcased themselves in the
Newfronts, came out strong. Capturing the attention of Millennials in growing
numbers, these agile powerhouses challenge the media landscape.
And, at the risk of being repetitive, the American consumer has never before
engaged with more content across media type, media devices and content type.
THE VIdEO VIEwIng CuRVE COnTInuES TO gROw AS dELIVERy And ExPLORATIOn OF COnTEnT COnTInuES TO ExPAnd.
Understanding, defining and measuring this curve matters to our clients. Time-
shifting allows us to watch more content, video on demand allows us to watch
more content, and digital delivery allows us to watch more content.
Over the past quarters I’ve often placed emphasis on what Nielsen refers to as
a growing pie in a fragmented landscape both when thinking of video content
across digital and linear and when thinking about general access to information
and social networks.
WElcOME
DOUNIA TURRILL
SVP INSIGHTS, NIELSEN
3Copyright © 2014 The Nielsen Company THE CROSS-PLATFORm REPORT | Q1 2014
D O U N I A
THE VIdEO VIEwIng CuRVE, POwEREd by InCREASEd MObILE dEVICE PEnETRATIOn, SIMPLy HIgHLIgHTS wHAT wE’VE COME TO ACCEPT OVER TIME: wE CAn dO MORE In LESS TIME.
As device penetration grows, as content reaches people in ways it never
could before, so does the appetite to engage with video. With only 24 hours
in a day, how can we manage all this screen time? We do; we condense more
information into a finite amount of time. Second screen experiences, the
ultimate in multitasking, allow us to connect in ways that are immediate.
Over the last two years, video on demand has matured into a significant platform
for content delivery and discovery. Available in over 60% of households video
on demand (VOD) is increasingly contributing to the viewing potential. While
on average VOD contributes 4-5 percent in the coveted 18-49 demo, individual
shows have seen upward of 15-20% increase in viewership from VOD. It’s also
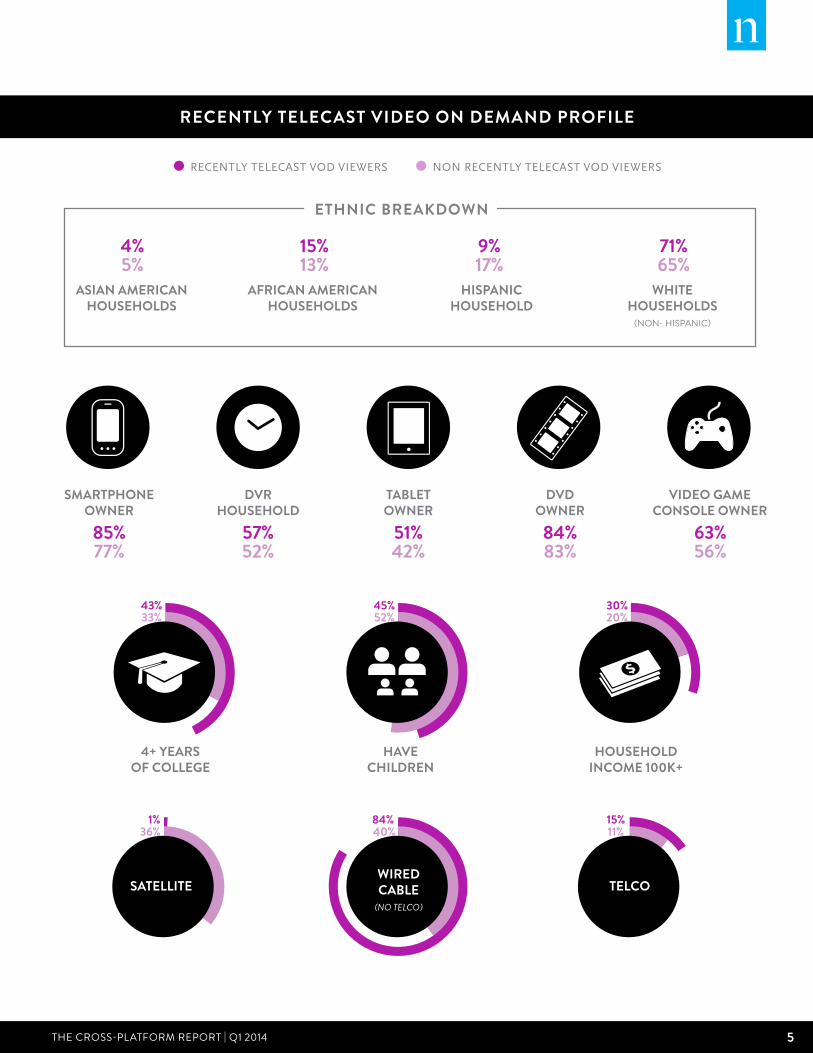
a platform that is appealing to younger demos as well as Asian-Americans
whose overall contribution through VOD is 8%.
Add to the opportunity for discovery and catch-up viewing VOD provides,
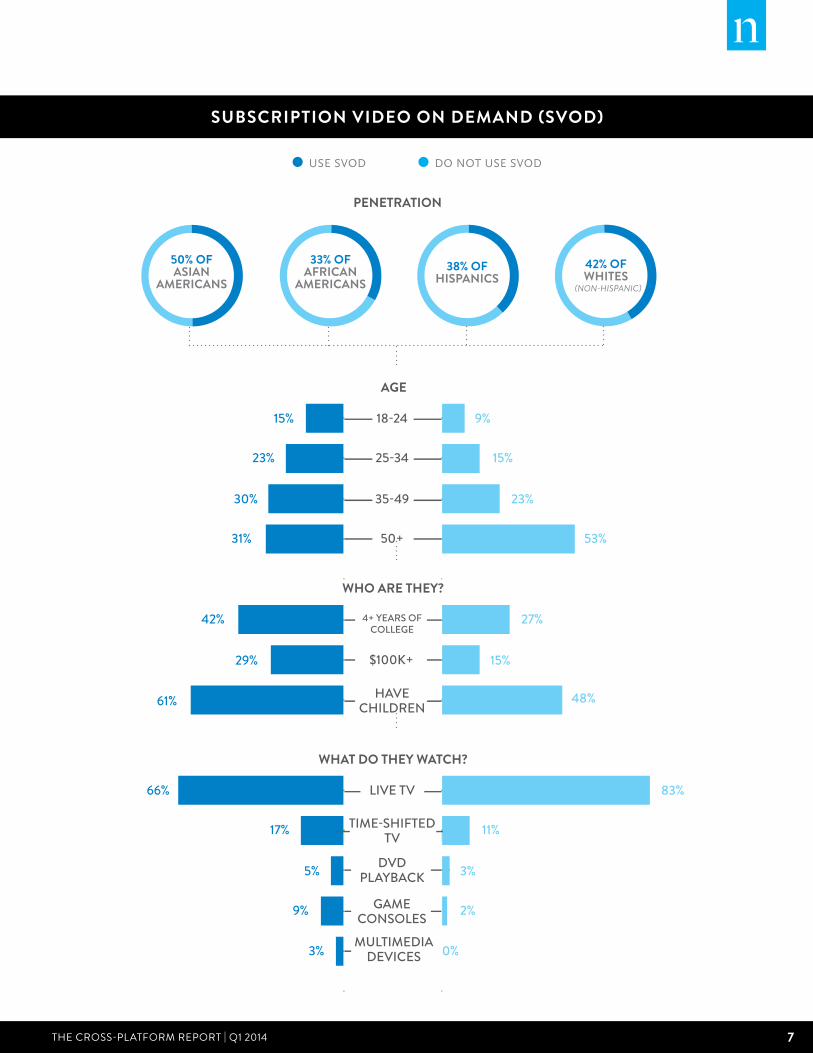
subscription VOD (SVOD) has capitalized on another desire for content. With
over 40% of US TV households currently subscribing to at least one SVOD
service and the opportunity to use these platforms has grown among younger
segments. These SVOD subscribers are more likely to have children, more
likely to be educated and more likely to have a higher income—all very coveted
demos.
Connecting all the pieces that make this Video Viewing Curve leaves us with a
fundamental question. Who are we reaching, when, where and how? We reach
the answer by understanding and measuring consumer behavior. Data into
viewer and buyer preferences and habits inform the industry’s decisions and
negotiations. As Nielsen offers both linear and digital content and advertising
measurement, the marketplace enters the 2014-2015 season armed with
solutions that rely on comprehensive, representative and industry standard
setting measurement.
With ever-growing fragmentation of content and delivery, media companies
and advertisers create the messages around the consumer. The consumer is
selective and the viewer has more options than any other time in history. At
the end of the day, or the Upfront/Newfront period, content continues to be
king and viewers make more and more time to view what matters to them.
4 Copyright © 2014 The Nielsen Company
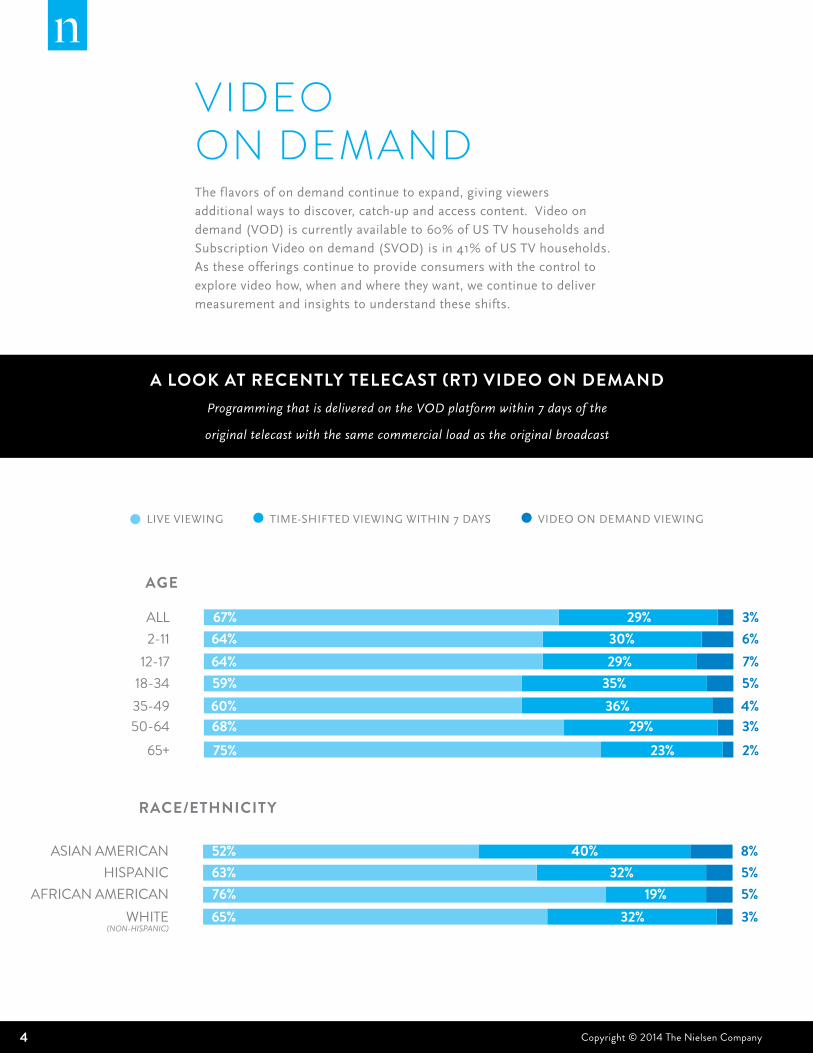
VIDEO ON DEMAND
The flavors of on demand continue to expand, giving viewers
additional ways to discover, catch-up and access content. Video on
demand (VOD) is currently available to 60% of US TV households and
Subscription Video on demand (SVOD) is in 41% of US TV households.
As these offerings continue to provide consumers with the control to
explore video how, when and where they want, we continue to deliver
measurement and insights to understand these shifts.
64%67%
64%
60%59%
68%75%52%63%76%65%
6%3%
7%
4%5%
3%2%8%5%5%3%
12%
30%29%
29%
36%35%
29%23%
40%32%
19%32%
2-11ALL
12-17
35-4918-34
50-6465+
ASIAN AMERICANHISPANIC
AFRICAN AMERICANWHITE
(NON-HISPANIC)
64%67%
64%
60%59%
68%75%52%63%76%65%
6%3%
7%
4%5%
3%2%8%5%5%3%
12%
30%29%
29%
36%35%
29%23%
40%32%
19%32%
2-11ALL
12-17
35-4918-34
50-6465+
ASIAN AMERICANHISPANIC
AFRICAN AMERICANWHITE
(NON-HISPANIC)
RACE/ETHNICITY
AGE
TIME-SHIFTED VIEWING WITHIN 7 DAYSLIVE VIEWING VIDEO ON DEMAND VIEWING
A LOOK AT RECENTLY TELECAST (RT) VIDEO ON DEMANDProgramming that is delivered on the VOD platform within 7 days of the
original telecast with the same commercial load as the original broadcast
5Copyright © 2014 The Nielsen Company THE CROSS-PLATFORm REPORT | Q1 2014
VIDEO ON DEMAND VIEWING
ASIAN AMERICANHOUSEHOLDS
4%5%
15%13%
9%17%
71%65%
AFRICAN AMERICAN HOUSEHOLDS
HISPANICHOUSEHOLD
WHITE HOUSEHOLDS
(NON- HISPANIC)
43%33%
45%52%
30%20%
4+ YEARSOF COLLEGE
HAVECHILDREN
HOUSEHOLD INCOME 100K+
1%36%
84%40%
15%11%
SATELLITEWIRED CABLE
(NO TELCO)
TELCO
ETHNIC BREAKDOWN
SMARTPHONEOWNER
85%77%
DVRHOUSEHOLD
57%52%
TABLETOWNER
51%42%
DVDOWNER
84%83%
VIDEO GAME CONSOLE OWNER
63%56%
RECENTLY TELECAST VIDEO ON DEMAND PROFILE
RECENTLY TELECAST VOD VIEWERS NON RECENTLY TELECAST VOD VIEWERS
6 Copyright © 2014 The Nielsen Company
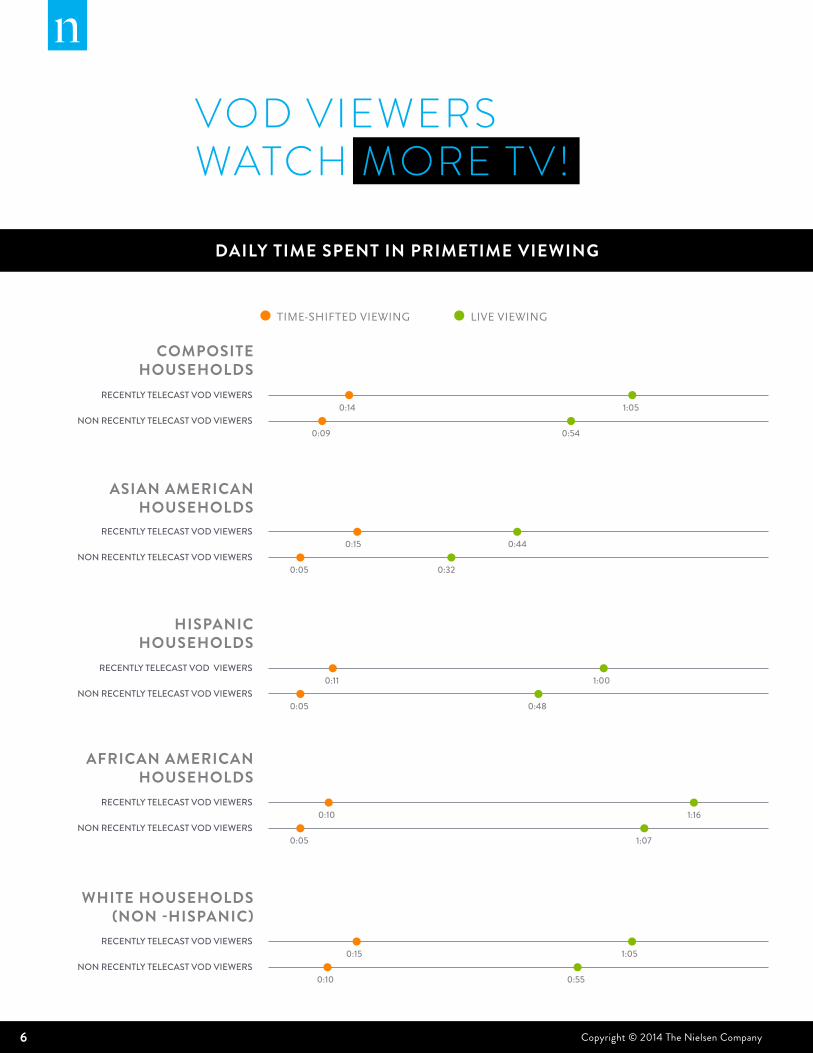
DAILY TIME SPENT IN PRIMETIME VIEWING
RECENTLY TELECAST VOD VIEWERS1:050:14
NON RECENTLY TELECAST VOD VIEWERS0:540:09
RECENTLY TELECAST VOD VIEWERS0:440:15
NON RECENTLY TELECAST VOD VIEWERS0:320:05
RECENTLY TELECAST VOD VIEWERS1:000:11
NON RECENTLY TELECAST VOD VIEWERS0:480:05
RECENTLY TELECAST VOD VIEWERS1:160:10
NON RECENTLY TELECAST VOD VIEWERS1:070:05
RECENTLY TELECAST VOD VIEWERS1:050:15
NON RECENTLY TELECAST VOD VIEWERS0:550:10
TIME-SHIFTED VIEWING LIVE VIEWING
COMPOSITE HOUSEHOLDS
ASIAN AMERICAN HOUSEHOLDS
HISPANIC HOUSEHOLDS
AFRICAN AMERICAN HOUSEHOLDS
WHITE HOUSEHOLDS (NON -HISPANIC)
VOD VIEWERs WATcH MORE TV!
7Copyright © 2014 The Nielsen Company THE CROSS-PLATFORm REPORT | Q1 2014
SUBSCRIPTION VIDEO ON DEMAND (SVOD)
50% OFASIAN
AMERICANS
33% OFAFRICAN
AMERICANS38% OF
HISPANICS42% OFWHITES
HAVE CHILDREN
4+ YEARS OF COLLEGE
18-24
25-34
35-49
50+
15%
23%
30%
31%
10.2%
10.1%
9%
15%
23%
53%
19.5%
27%
15%
48%
42%
29%
AGE
PENETRATION
61% 12.4%
87.6%
WHO ARE THEY?
$100K+
LIVE TV
TIME-SHIFTED TV
DVDPLAYBACK
GAME CONSOLES
MULTIMEDIADEVICES
66%
17%
5%
9%
3%
10.1%
83%
11%
3%
2%
0%
27%42%
29%
WHAT DO THEY WATCH?
(NON-HISPANIC)
USE SVOD DO NOT USE SVOD
8 Copyright © 2014 The Nielsen Company
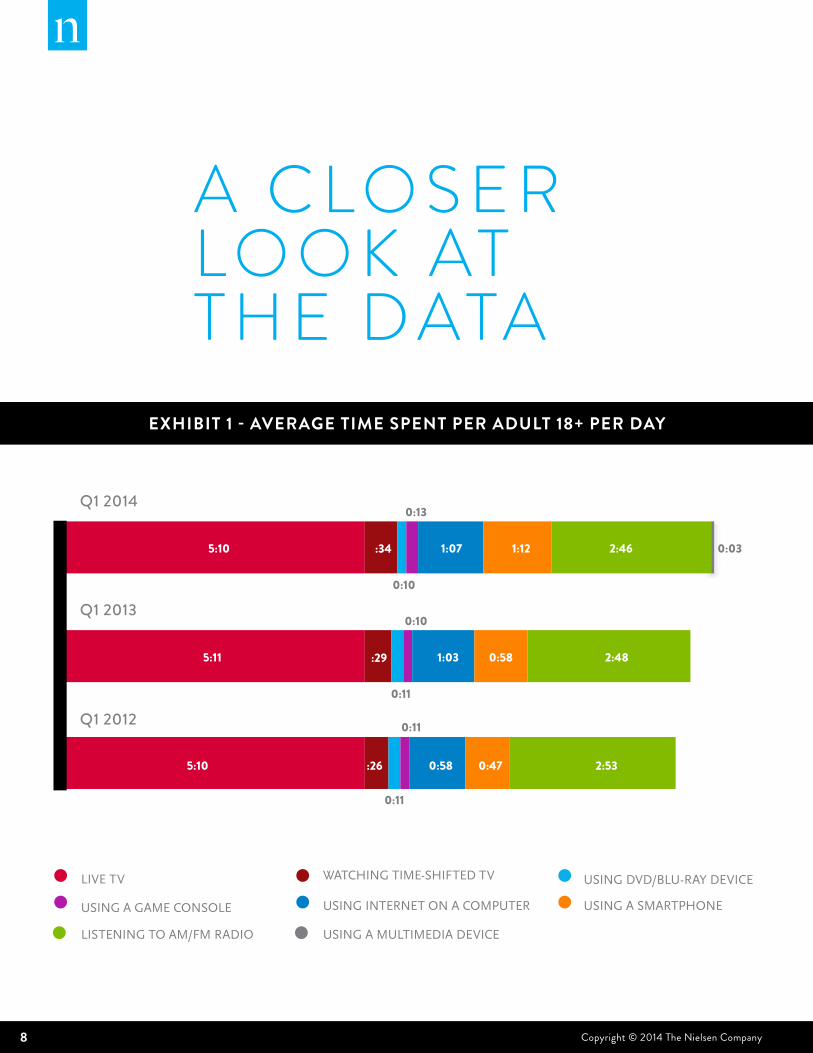
0:58 0:47 2:53
1:03 0:58 2:48
:26
:34
5:10
5:11
5:10 1:07 1:12 2:46 0:03
0:13
0:10
0:10
0:11
0:11
0:11
:29
4:24
Q1 2012
Q1 2013
Q1 2014
WATCHING TIME-SHIFTED TV
USING A GAME CONSOLE
LIVE TV
USING INTERNET ON A COMPUTER
LISTENING TO AM/FM RADIO
USING DVD/BLU-RAY DEVICE
USING A SMARTPHONE
USING A MULTIMEDIA DEVICE
A c l O s E R l O O K ATT H E D ATA
EXHIBIT 1 - AVERAGE TIME SPENT PER ADULT 18+ PER DAY
9Copyright © 2014 The Nielsen Company THE CROSS-PLATFORm REPORT | Q1 2014
USING A SMARTPHONE
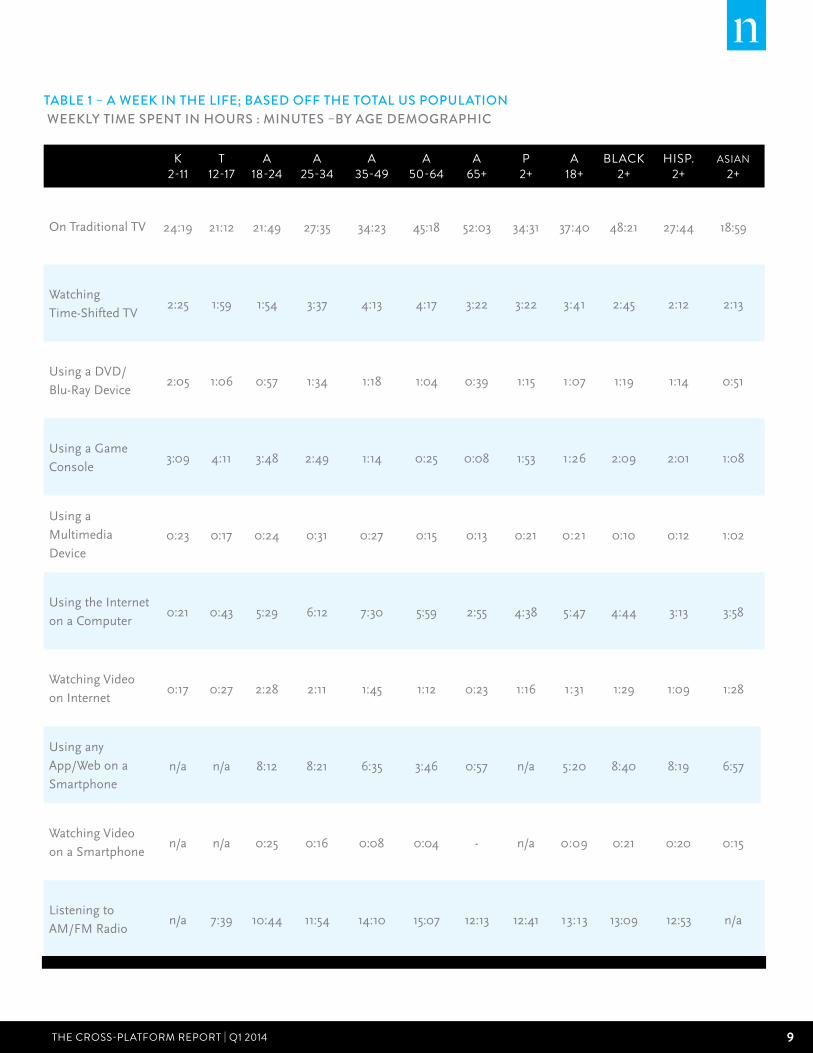
TAblE 1 – A WEEK IN THE lIFE; bASED OFF THE TOTAl US POPUlATION WEEKly TImE SPENT IN HOUrS : mINUTES –by AgE DEmOgrAPHIc
K 2-11
T 12-17
A 18-24
A 25-34
A 35-49
A 50-64
A 65+
P 2+
A 18+
bLACK 2+
HISP. 2+
ASIAn 2+
On Traditional TV 24:19 21:12 21:49 27:35 34:23 45:18 52:03 34:31 37:40 48:21 27:44 18:59
Watching
Time-Shifted TV2:25 1:59 1:54 3:37 4:13 4:17 3:22 3:22 3:41 2:45 2:12 2:13
Using a DVD/
Blu-Ray Device2:05 1:06 0:57 1:34 1:18 1:04 0:39 1:15 1:07 1:19 1:14 0:51
Using a Game
Console3:09 4:11 3:48 2:49 1:14 0:25 0:08 1:53 1:26 2:09 2:01 1:08
Using a
Multimedia
Device0:23 0:17 0:24 0:31 0:27 0:15 0:13 0:21 0:21 0:10 0:12 1:02
Using the Internet
on a Computer0:21 0:43 5:29 6:12 7:30 5:59 2:55 4:38 5:47 4:44 3:13 3:58
Watching Video
on Internet0:17 0:27 2:28 2:11 1:45 1:12 0:23 1:16 1:31 1:29 1:09 1:28
Using any
App/Web on a
Smartphonen/a n/a 8:12 8:21 6:35 3:46 0:57 n/a 5:20 8:40 8:19 6:57
Watching Video
on a Smartphonen/a n/a 0:25 0:16 0:08 0:04 - n/a 0:09 0:21 0:20 0:15
Listening to
AM/FM Radion/a 7:39 10:44 11:54 14:10 15:07 12:13 12:41 13:13 13:09 12:53 n/a
10 Copyright © 2014 The Nielsen Company
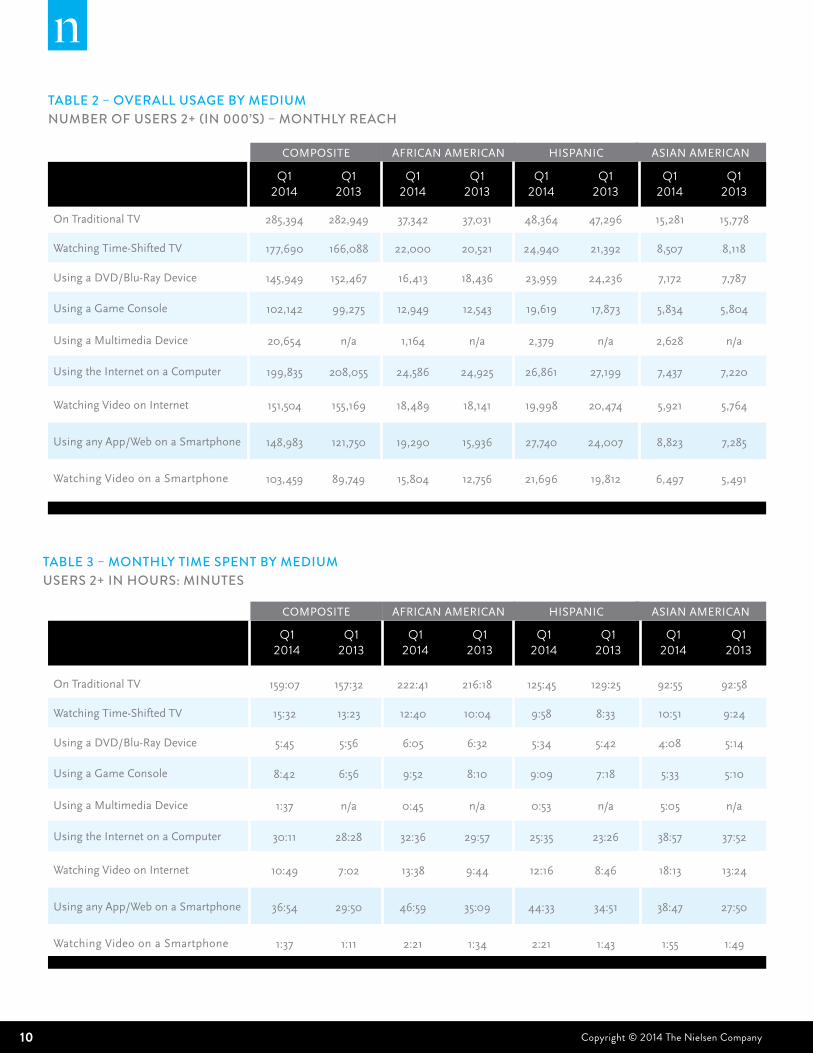
TAblE 2 – OvErAll USAgE by mEDIUm NUmbEr OF USErS 2+ (IN 000’S) – mONTHly rEAcH
Q1 2014
Q1 2013
Q1 2014
Q1 2013
Q1 2014
Q1 2013
Q1 2014
Q1 2013
On Traditional TV 285,394 282,949 37,342 37,031 48,364 47,296 15,281 15,778
Watching Time-Shifted TV 177,690 166,088 22,000 20,521 24,940 21,392 8,507 8,118
Using a DVD/Blu-Ray Device 145,949 152,467 16,413 18,436 23,959 24,236 7,172 7,787
Using a Game Console 102,142 99,275 12,949 12,543 19,619 17,873 5,834 5,804
Using a Multimedia Device 20,654 n/a 1,164 n/a 2,379 n/a 2,628 n/a
Using the Internet on a Computer 199,835 208,055 24,586 24,925 26,861 27,199 7,437 7,220
Watching Video on Internet 151,504 155,169 18,489 18,141 19,998 20,474 5,921 5,764
Using any App/Web on a Smartphone 148,983 121,750 19,290 15,936 27,740 24,007 8,823 7,285
Watching Video on a Smartphone 103,459 89,749 15,804 12,756 21,696 19,812 6,497 5,491
AFRICAN AMERICAN HISPANIC ASIAN AMERICANCOMPOSITE
TAblE 3 – mONTHly TImE SPENT by mEDIUmUSErS 2+ IN HOUrS: mINUTES
Q1 2014
Q1 2013
Q1 2014
Q1 2013
Q1 2014
Q1 2013
Q1 2014
Q1 2013
On Traditional TV 159:07 157:32 222:41 216:18 125:45 129:25 92:55 92:58
Watching Time-Shifted TV 15:32 13:23 12:40 10:04 9:58 8:33 10:51 9:24
Using a DVD/Blu-Ray Device 5:45 5:56 6:05 6:32 5:34 5:42 4:08 5:14
Using a Game Console 8:42 6:56 9:52 8:10 9:09 7:18 5:33 5:10
Using a Multimedia Device 1:37 n/a 0:45 n/a 0:53 n/a 5:05 n/a
Using the Internet on a Computer 30:11 28:28 32:36 29:57 25:35 23:26 38:57 37:52
Watching Video on Internet 10:49 7:02 13:38 9:44 12:16 8:46 18:13 13:24
Using any App/Web on a Smartphone 36:54 29:50 46:59 35:09 44:33 34:51 38:47 27:50
Watching Video on a Smartphone 1:37 1:11 2:21 1:34 2:21 1:43 1:55 1:49
AFRICAN AMERICAN HISPANIC ASIAN AMERICANCOMPOSITE
11Copyright © 2014 The Nielsen Company THE CROSS-PLATFORm REPORT | Q1 2014
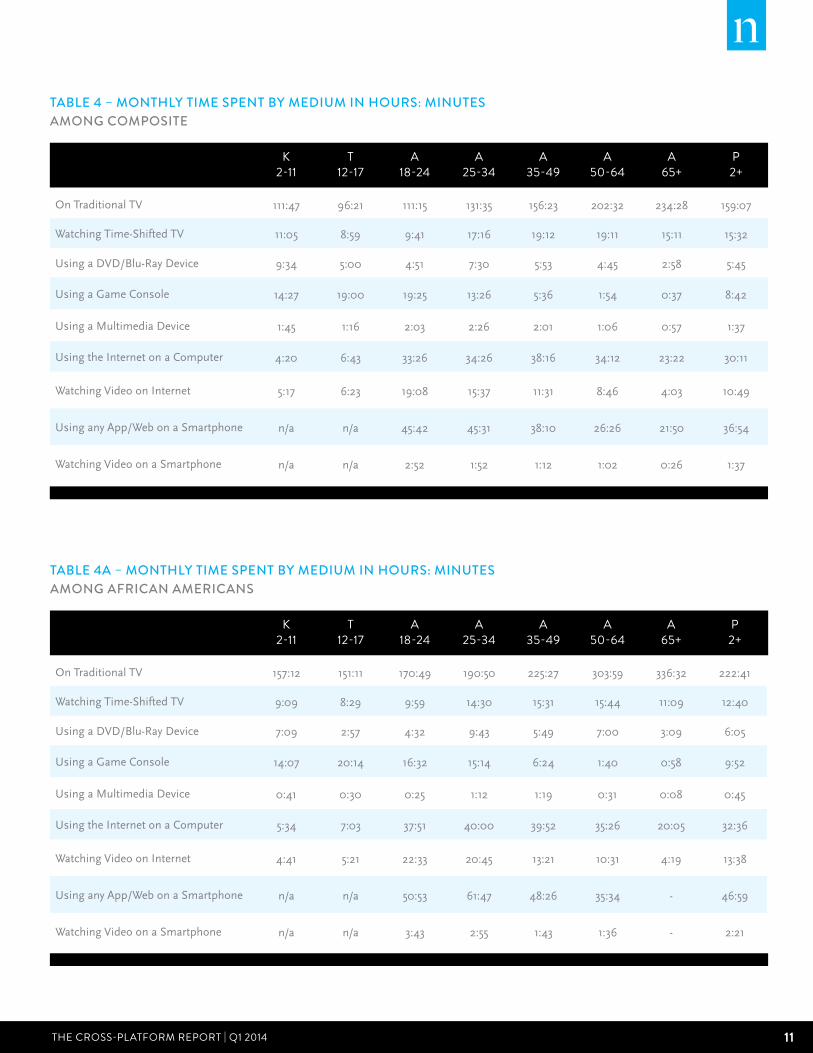
TAblE 4A – mONTHly TImE SPENT by mEDIUm IN HOUrS: mINUTES AmONg AFrIcAN AmErIcANS
K 2-11
T 12-17
A 18-24
A 25-34
A 35-49
A 50-64
A 65+
P 2+
On Traditional TV 157:12 151:11 170:49 190:50 225:27 303:59 336:32 222:41
Watching Time-Shifted TV 9:09 8:29 9:59 14:30 15:31 15:44 11:09 12:40
Using a DVD/Blu-Ray Device 7:09 2:57 4:32 9:43 5:49 7:00 3:09 6:05
Using a Game Console 14:07 20:14 16:32 15:14 6:24 1:40 0:58 9:52
Using a Multimedia Device 0:41 0:30 0:25 1:12 1:19 0:31 0:08 0:45
Using the Internet on a Computer 5:34 7:03 37:51 40:00 39:52 35:26 20:05 32:36
Watching Video on Internet 4:41 5:21 22:33 20:45 13:21 10:31 4:19 13:38
Using any App/Web on a Smartphone n/a n/a 50:53 61:47 48:26 35:34 - 46:59
Watching Video on a Smartphone n/a n/a 3:43 2:55 1:43 1:36 - 2:21
TAblE 4 – mONTHly TImE SPENT by mEDIUm IN HOUrS: mINUTES AmONg cOmPOSITE
K 2-11
T 12-17
A 18-24
A 25-34
A 35-49
A 50-64
A 65+
P 2+
On Traditional TV 111:47 96:21 111:15 131:35 156:23 202:32 234:28 159:07
Watching Time-Shifted TV 11:05 8:59 9:41 17:16 19:12 19:11 15:11 15:32
Using a DVD/Blu-Ray Device 9:34 5:00 4:51 7:30 5:53 4:45 2:58 5:45
Using a Game Console 14:27 19:00 19:25 13:26 5:36 1:54 0:37 8:42
Using a Multimedia Device 1:45 1:16 2:03 2:26 2:01 1:06 0:57 1:37
Using the Internet on a Computer 4:20 6:43 33:26 34:26 38:16 34:12 23:22 30:11
Watching Video on Internet 5:17 6:23 19:08 15:37 11:31 8:46 4:03 10:49
Using any App/Web on a Smartphone n/a n/a 45:42 45:31 38:10 26:26 21:50 36:54
Watching Video on a Smartphone n/a n/a 2:52 1:52 1:12 1:02 0:26 1:37
12 Copyright © 2014 The Nielsen Company
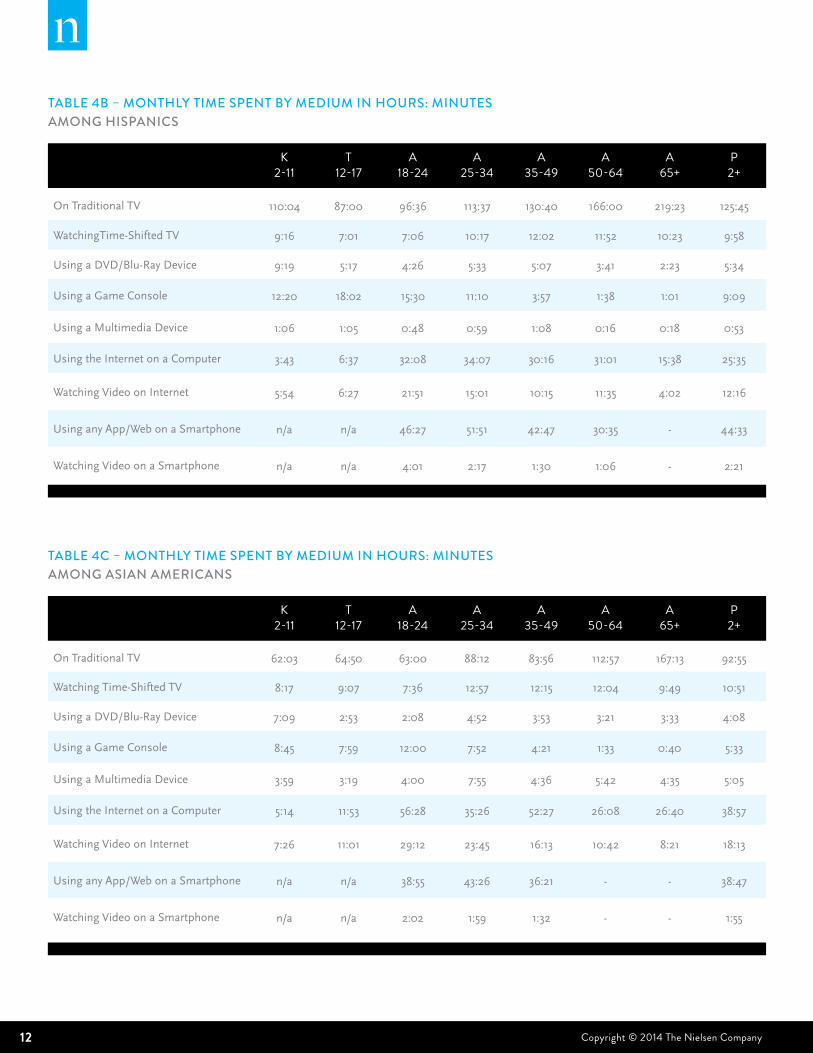
TAblE 4c – mONTHly TImE SPENT by mEDIUm IN HOUrS: mINUTES AmONg ASIAN AmErIcANS
K 2-11
T 12-17
A 18-24
A 25-34
A 35-49
A 50-64
A 65+
P 2+
On Traditional TV 62:03 64:50 63:00 88:12 83:56 112:57 167:13 92:55
Watching Time-Shifted TV 8:17 9:07 7:36 12:57 12:15 12:04 9:49 10:51
Using a DVD/Blu-Ray Device 7:09 2:53 2:08 4:52 3:53 3:21 3:33 4:08
Using a Game Console 8:45 7:59 12:00 7:52 4:21 1:33 0:40 5:33
Using a Multimedia Device 3:59 3:19 4:00 7:55 4:36 5:42 4:35 5:05
Using the Internet on a Computer 5:14 11:53 56:28 35:26 52:27 26:08 26:40 38:57
Watching Video on Internet 7:26 11:01 29:12 23:45 16:13 10:42 8:21 18:13
Using any App/Web on a Smartphone n/a n/a 38:55 43:26 36:21 - - 38:47
Watching Video on a Smartphone n/a n/a 2:02 1:59 1:32 - - 1:55
TAblE 4b – mONTHly TImE SPENT by mEDIUm IN HOUrS: mINUTES AmONg HISPANIcS
K 2-11
T 12-17
A 18-24
A 25-34
A 35-49
A 50-64
A 65+
P 2+
On Traditional TV 110:04 87:00 96:36 113:37 130:40 166:00 219:23 125:45
WatchingTime-Shifted TV 9:16 7:01 7:06 10:17 12:02 11:52 10:23 9:58
Using a DVD/Blu-Ray Device 9:19 5:17 4:26 5:33 5:07 3:41 2:23 5:34
Using a Game Console 12:20 18:02 15:30 11:10 3:57 1:38 1:01 9:09
Using a Multimedia Device 1:06 1:05 0:48 0:59 1:08 0:16 0:18 0:53
Using the Internet on a Computer 3:43 6:37 32:08 34:07 30:16 31:01 15:38 25:35
Watching Video on Internet 5:54 6:27 21:51 15:01 10:15 11:35 4:02 12:16
Using any App/Web on a Smartphone n/a n/a 46:27 51:51 42:47 30:35 - 44:33
Watching Video on a Smartphone n/a n/a 4:01 2:17 1:30 1:06 - 2:21
13Copyright © 2014 The Nielsen Company THE CROSS-PLATFORm REPORT | Q1 2014
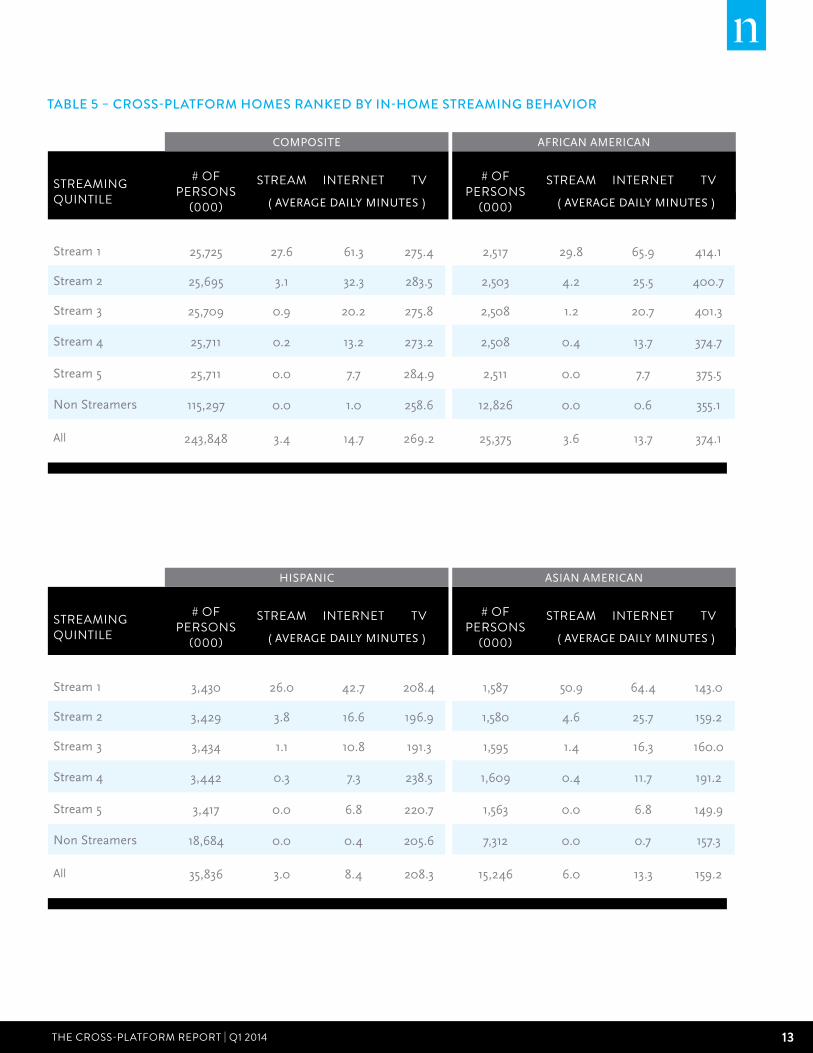
STREAMIng QuInTILE
# OF PERSOnS
(000)
STREAM InTERnET TV
Stream 1 25,725 27.6 61.3 275.4
Stream 2 25,695 3.1 32.3 283.5
Stream 3 25,709 0.9 20.2 275.8
Stream 4 25,711 0.2 13.2 273.2
Stream 5 25,711 0.0 7.7 284.9
Non Streamers 115,297 0.0 1.0 258.6
All 243,848 3.4 14.7 269.2
COMPOSITE
( AVERAGE DAILY MINUTES )
TAblE 5 – crOSS-PlATFOrm HOmES rANKED by IN-HOmE STrEAmINg bEHAvIOr
# OF PERSOnS
(000)
STREAM InTERnET TV
2,517 29.8 65.9 414.1
2,503 4.2 25.5 400.7
2,508 1.2 20.7 401.3
2,508 0.4 13.7 374.7
2,511 0.0 7.7 375.5
12,826 0.0 0.6 355.1
25,375 3.6 13.7 374.1
( AVERAGE DAILY MINUTES )
AFRICAN AMERICAN
STREAMIng QuInTILE
# OF PERSOnS
(000)
STREAM InTERnET TV
Stream 1 3,430 26.0 42.7 208.4
Stream 2 3,429 3.8 16.6 196.9
Stream 3 3,434 1.1 10.8 191.3
Stream 4 3,442 0.3 7.3 238.5
Stream 5 3,417 0.0 6.8 220.7
Non Streamers 18,684 0.0 0.4 205.6
All 35,836 3.0 8.4 208.3
HISPANIC
( AVERAGE DAILY MINUTES )
# OF PERSOnS
(000)
STREAM InTERnET TV
1,587 50.9 64.4 143.0
1,580 4.6 25.7 159.2
1,595 1.4 16.3 160.0
1,609 0.4 11.7 191.2
1,563 0.0 6.8 149.9
7,312 0.0 0.7 157.3
15,246 6.0 13.3 159.2
( AVERAGE DAILY MINUTES )
ASIAN AMERICAN
14 Copyright © 2014 The Nielsen Company
InTERnET QuInTILE
# OF PERSOnS
(000)
STREAM InTERnET TV
Internet 1 34,201 15.5 75.9 335.6
Internet 2 34,199 5.4 19.0 281.9
Internet 3 34,198 1.9 6.5 258.1
Internet 4 34,207 0.8 1.8 252.2
Internet 5 34,199 0.2 0.3 253.6
Non Internet
Users72,844 0.0 0.0 251.7
All 243,848 3.4 14.7 269.2
COMPOSITE
( AVERAGE DAILY MINUTES )
TAblE 5 – crOSS-PlATFOrm HOmES rANKED by IN-HOmE INTErNET bEHAvIOr
# OF PERSOnS
(000)
STREAM InTERnET TV
3,376 17.5 75.1 489.6
3,369 5.9 17.5 384.6
3,368 2.1 6.4 357.7
3,368 0.8 1.7 352.8
3,377 0.2 0.3 336.8
8,516 0.0 0.0352.6
25,375 3.6 13.7 374.1
( AVERAGE DAILY MINUTES )
AFRICAN AMERICAN
InTERnET QuInTILE
# OF PERSOnS
(000)
STREAM InTERnET TV
Internet 1 4,503 15.5 49.0 240.8
Internet 2 4,491 5.0 10.5 196.2
Internet 3 4,495 1.7 4.3 206.4
Internet 4 4,514 0.8 1.4 191.5
Internet 5 4,481 0.2 0.2 205.8
Non Internet
Users13,352 0.1 0.0 208.4
All 35,836 3.0 8.4 208.3
HISPANIC
( AVERAGE DAILY MINUTES )
# OF PERSOnS
(000)
STREAM InTERnET TV
2,018 27.9 71.2 164.6
2,051 12.0 20.1 149.8
2,038 2.4 6.4 185.1
2,027 2.0 1.7 156.5
2,040 0.3 0.2 161.4
5,071 0.0 0.0150.4
15,246 6.0 13.3 159.2
( AVERAGE DAILY MINUTES )
ASIAN AMERICAN
15Copyright © 2014 The Nielsen Company THE CROSS-PLATFORm REPORT | Q1 2014
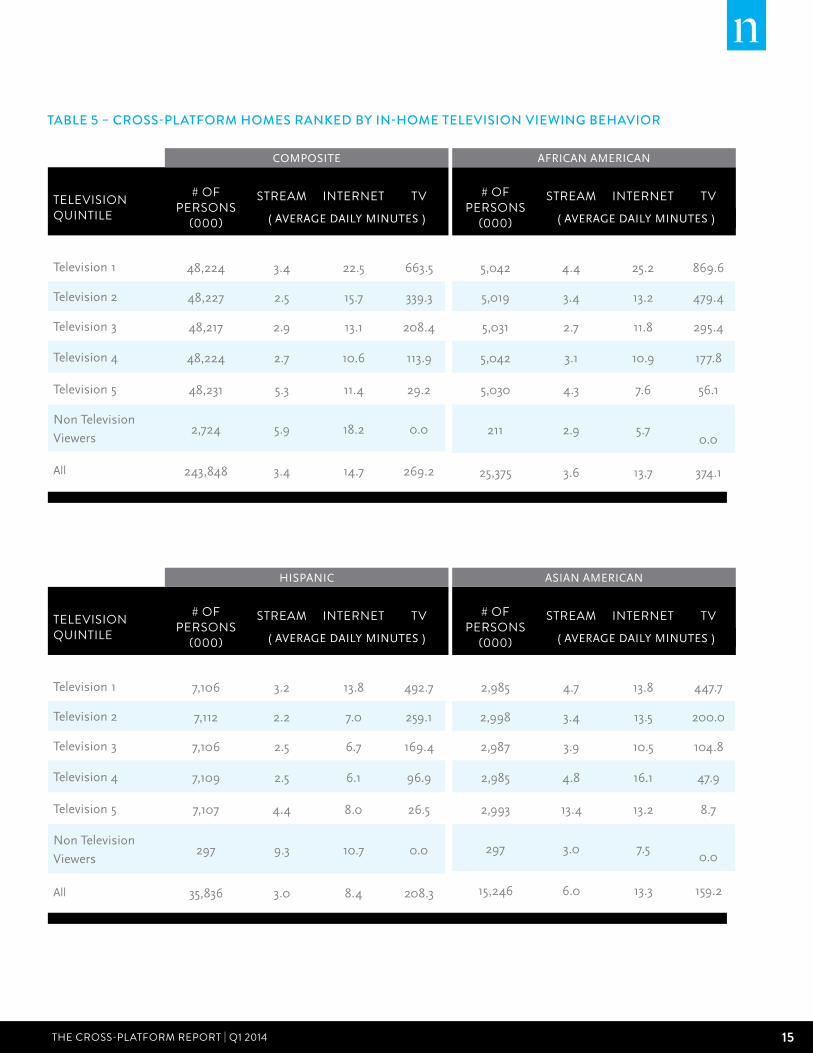
TELEVISIOn QuInTILE
# OF PERSOnS
(000)
STREAM InTERnET TV
Television 1 48,224 3.4 22.5 663.5
Television 2 48,227 2.5 15.7 339.3
Television 3 48,217 2.9 13.1 208.4
Television 4 48,224 2.7 10.6 113.9
Television 5 48,231 5.3 11.4 29.2
Non Television
Viewers2,724 5.9 18.2 0.0
All 243,848 3.4 14.7 269.2
COMPOSITE
( AVERAGE DAILY MINUTES )
TAblE 5 – crOSS-PlATFOrm HOmES rANKED by IN-HOmE TElEvISION vIEWINg bEHAvIOr
# OF PERSOnS
(000)
STREAM InTERnET TV
5,042 4.4 25.2 869.6
5,019 3.4 13.2 479.4
5,031 2.7 11.8 295.4
5,042 3.1 10.9 177.8
5,030 4.3 7.6 56.1
211 2.9 5.70.0
25,375 3.6 13.7 374.1
( AVERAGE DAILY MINUTES )
AFRICAN AMERICAN
TELEVISIOn QuInTILE
# OF PERSOnS
(000)
STREAM InTERnET TV
Television 1 7,106 3.2 13.8 492.7
Television 2 7,112 2.2 7.0 259.1
Television 3 7,106 2.5 6.7 169.4
Television 4 7,109 2.5 6.1 96.9
Television 5 7,107 4.4 8.0 26.5
Non Television
Viewers297 9.3 10.7 0.0
All 35,836 3.0 8.4 208.3
HISPANIC
( AVERAGE DAILY MINUTES )
# OF PERSOnS
(000)
STREAM InTERnET TV
2,985 4.7 13.8 447.7
2,998 3.4 13.5 200.0
2,987 3.9 10.5 104.8
2,985 4.8 16.1 47.9
2,993 13.4 13.2 8.7
297 3.0 7.50.0
15,246 6.0 13.3 159.2
( AVERAGE DAILY MINUTES )
ASIAN AMERICAN
16 Copyright © 2014 The Nielsen Company
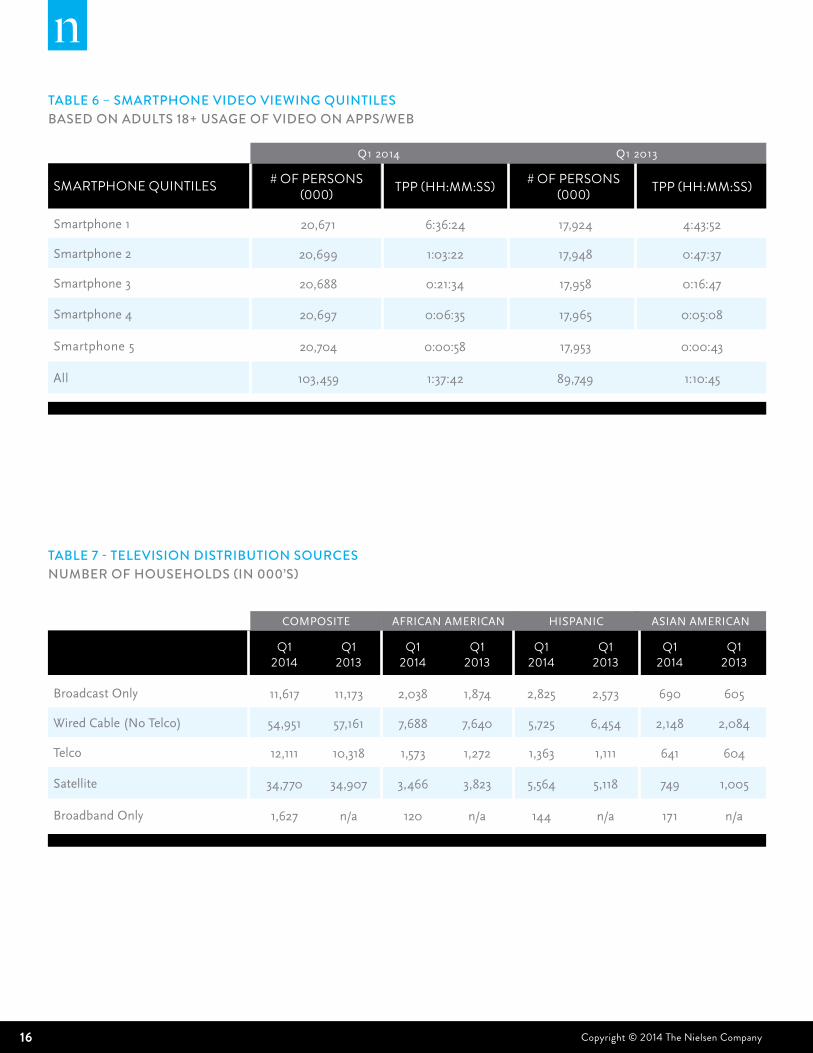
TAblE 6 – SmArTPHONE vIDEO vIEWINg QUINTIlESbASED ON ADUlTS 18+ USAgE OF vIDEO ON APPS/WEb
SMARTPHOnE QuInTILES # OF PERSOnS (000) TPP (HH:MM:SS) # OF PERSOnS
(000) TPP (HH:MM:SS)
Smartphone 1 20,671 6:36:24 17,924 4:43:52
Smartphone 2 20,699 1:03:22 17,948 0:47:37
Smartphone 3 20,688 0:21:34 17,958 0:16:47
Smartphone 4 20,697 0:06:35 17,965 0:05:08
Smartphone 5 20,704 0:00:58 17,953 0:00:43
All 103,459 1:37:42 89,749 1:10:45
TAblE 7 - TElEvISION DISTrIbUTION SOUrcESNUmbEr OF HOUSEHOlDS (IN 000’S)
Q1 2014
Q1 2013
Q1 2014
Q1 2013
Q1 2014
Q1 2013
Q1 2014
Q1 2013
Broadcast Only 11,617 11,173 2,038 1,874 2,825 2,573 690 605
Wired Cable (No Telco) 54,951 57,161 7,688 7,640 5,725 6,454 2,148 2,084
Telco 12,111 10,318 1,573 1,272 1,363 1,111 641 604
Satellite 34,770 34,907 3,466 3,823 5,564 5,118 749 1,005
Broadband Only 1,627 n/a 120 n/a 144 n/a 171 n/a
AFRICAN AMERICAN HISPANIC ASIAN AMERICANCOMPOSITE
Q1 2013Q1 2014
17Copyright © 2014 The Nielsen Company THE CROSS-PLATFORm REPORT | Q1 2014
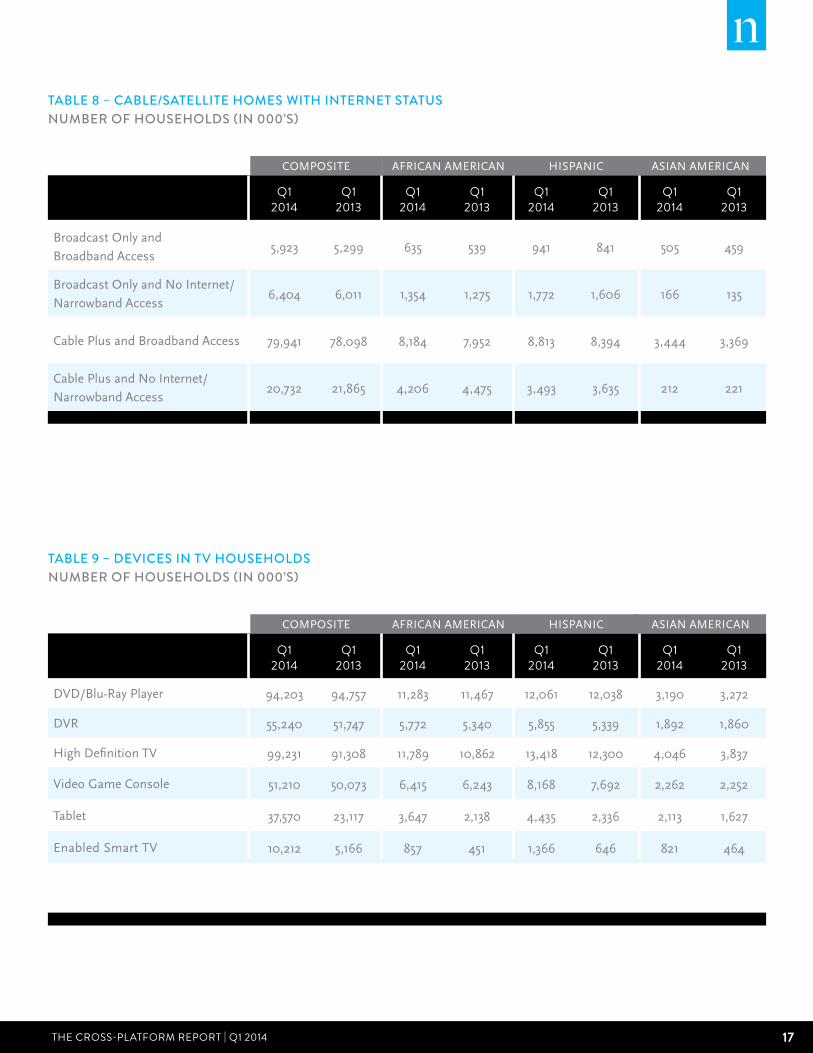
TAblE 8 – cAblE/SATEllITE HOmES WITH INTErNET STATUSNUmbEr OF HOUSEHOlDS (IN 000’S)
Q1 2014
Q1 2013
Q1 2014
Q1 2013
Q1 2014
Q1 2013
Q1 2014
Q1 2013
Broadcast Only and
Broadband Access5,923 5,299 635 539 941 841 505 459
Broadcast Only and No Internet/
Narrowband Access6,404 6,011 1,354 1,275 1,772 1,606 166 135
Cable Plus and Broadband Access 79,941 78,098 8,184 7,952 8,813 8,394 3,444 3,369
Cable Plus and No Internet/
Narrowband Access20,732 21,865 4,206 4,475 3,493 3,635 212 221
AFRICAN AMERICAN HISPANIC ASIAN AMERICANCOMPOSITE
TAblE 9 – DEvIcES IN Tv HOUSEHOlDS NUmbEr OF HOUSEHOlDS (IN 000’S)
Q1 2014
Q1 2013
Q1 2014
Q1 2013
Q1 2014
Q1 2013
Q1 2014
Q1 2013
DVD/Blu-Ray Player 94,203 94,757 11,283 11,467 12,061 12,038 3,190 3,272
DVR 55,240 51,747 5,772 5,340 5,855 5,339 1,892 1,860
High Definition TV 99,231 91,308 11,789 10,862 13,418 12,300 4,046 3,837
Video Game Console 51,210 50,073 6,415 6,243 8,168 7,692 2,262 2,252
Tablet 37,570 23,117 3,647 2,138 4,435 2,336 2,113 1,627
Enabled Smart TV 10,212 5,166 857 451 1,366 646 821 464
AFRICAN AMERICAN HISPANIC ASIAN AMERICANCOMPOSITE
18 Copyright © 2014 The Nielsen Company
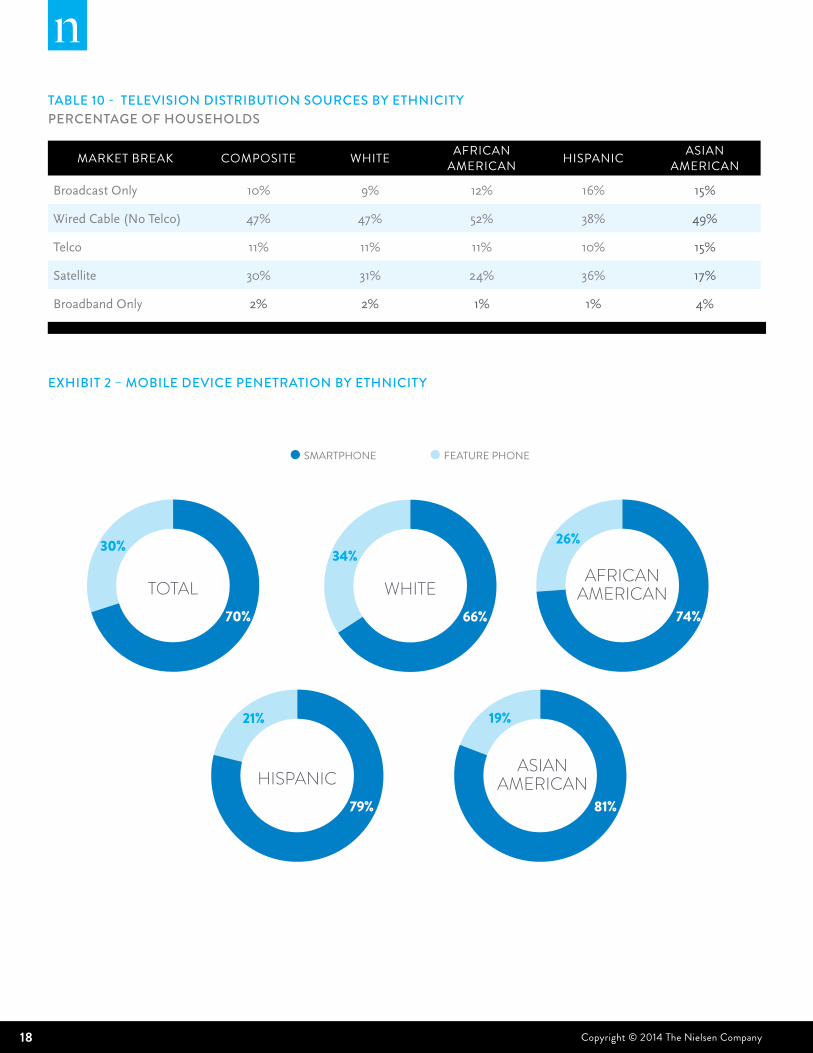
ExHIbIT 2 – mObIlE DEvIcE PENETrATION by ETHNIcITy
SMARTPHONE FEATURE PHONE
TOTAL
30%
70%
WHITE
34%
66%
AFRICANAMERICAN
26%
74%
HISPANIC
21%
79%
19%
81%
ASIANAMERICAN
TAblE 10 - TElEvISION DISTrIbUTION SOUrcES by ETHNIcITy PErcENTAgE OF HOUSEHOlDS
MARKET bREAK COMPOSITE wHITE AFRICAn AMERICAn HISPAnIC ASIAn
AMERICAn
Broadcast Only 10% 9% 12% 16% 15%
Wired Cable (No Telco) 47% 47% 52% 38% 49%
Telco 11% 11% 11% 10% 15%
Satellite 30% 31% 24% 36% 17%
Broadband Only 2% 2% 1% 1% 4%
19Copyright © 2014 The Nielsen Company THE CROSS-PLATFORm REPORT | Q1 2014
sOURcING & METHODOlOGIEsGLOSSARY
TV HouseHold: Nielsen defines a TV household as a home with at least one operable
TV/monitor with the ability to deliver video via traditional means of antennae, cable STB or
Satellite receiver and /or with a broadband connection.
TradiTional TV: Watching live or time-shifted content on a television set.
Wired Cable: Traditional cable delivered through wires to your home.
TelCo: A paid TV subscription delivered fiber-optically via a traditional telephony provider.
saTelliTe: A paid TV subscription where the signal is distributed to an orbiting
satellite. The amplified signal is then re-transmitted to the home and received via a dish.
(Sometimes also referred to as “dish”).
broadband aCCess: A paid, high-speed Internet access delivered via DSL, Cable
Internet through cable provider, Fiber-Optic Service, U-Verse, Satellite Internet, Data Card
(aircard that connects to a cellular phone network) or PC tethered to cell phone (cellular
phone network).
narroWband aCCess: A household that accesses the Internet via a telephone line
(often referred to as dial up).
broadCasT only: A mode of television content delivery that does not involve satellite
transmission or cables (ie—a paid service). Also commonly referred to as “Over-the-air.”
broadband only: A household with at least one operable TV/monitor that receives
video exclusively through a broadband internet connection instead of traditional means
(over the air, wired cable, telco, satellite)
aM/FM radio: Listening to programming from AM/FM radio stations
or network programming.
MulTiMedia deViCe: Viewing on an Apple TV, Boxee, Roku, Google Chromecast, or
other internet connected device through the television. This does not include DVD / Blu-
Ray Devices, Game Consoles, or Computers.
enabled sMarT TV: A household with at least one television set that is capable and
enabled to access the internet.
20 Copyright © 2014 The Nielsen Company
TELEVISION METHODOLOGY
On Traditional TV includes Live usage plus any playback viewing within the measurementperiod. Time-shifted TV is playback primarily on a DVR but includes playback from VOD,DVD recorders, server based DVR’s and services like Start Over.
On Traditional TV reach includes those viewing at least one minute within themeasurement period. This includes Live viewing plus any playback within the measurementperiod. First Quarter 2014 Television data is based on the following measurement interval: 12/30/13-03/30/14. As of February 2011, DVR Playback has been incorporated into thePersons Using Television (PUT) Statistic.
Metrics for Using a DVD/Blu-Ray Device and Using a Game Console are based on whenthese devices are in use for any purpose, not just for accessing media content. Forexample, Using a Game Console will also include time when the game console is beingused to play video games.
ONLINE METHODOLOGY
In July 2011 an improved hybrid methodology was introduced in Nielsen’s NetView and VideoCensus product. This methodology combines a census level accounting of page views and video streams where Nielsen measurement tags have been deployed in order to project audience and behavior to the full universe of all Internet users. For VideoCensus, the portion of the total video streams calibrated by census data, previously allocated to Home/Work computers, are now allocated to other devices and locations such as smartphones and viewing outside of home and work. This change affects both “Watching Video on the Internet” and “Using the Internet” figures. Beginning in Q1 2012, Cross-Platform metrics are derived from the new hybrid panel. Year over year trends are available beginning in Q3 2012. Data should not be trended to previous quarters’ published editions.
Hours:minutes for Internet and video use are based on the universe of persons who used the Internet/watched online video. All Internet figures are weekly or monthly averages over the course of the quarter. All “Using the Internet on a Computer” metrics are derived from Nielsen NetView product, while all “Watching Video on the Internet” metrics are derived from Nielsen VideoCensus product. Watching video on the Internet is a subset of Using the Internet on a computer.
Due to a processing error, YouTube brand-level stream and duration metrics were inflated from May 2012 – May 2013 which impacted “Watching Video on Internet”. The current report contains the corrected metrics for the prior year data in the year over year comparisons.
As of January 2014, two factors led to an increase in “Watching Video on the Internet”.
Secure or “https” streaming of videos was added into reporting for entities such as
Facebook. Additionally, YouTube mobile streams became included within the hybrid
reporting.
21Copyright © 2014 The Nielsen Company THE CROSS-PLATFORm REPORT | Q1 2014
RADIO METHODOLOGY
AM/FM RADIO METHODOLOGY: Audience estimates for 48 large markets are based on a panel of people who carry a portable device called PPM that passively detects exposure to content that contains inaudible codes embedded within the program content. Audience estimates from the balance of markets and counties in the US are based on surveys of people who record their listening in a written diary for a week.
The estimates in this report are based on RADAR and the National Regional Database. RADAR reports national network radio ratings covering the US using both PPM and Diary measurement and it is based on a rolling one-year average of nearly 400,000 respondents aged 12+ per year. The National Regional Database reports national and regional radio ratings for individual radio stations using both PPM and Diary measurement. It is published twice a year and the annual sample is more than 600,000 respondents aged 12+.
NOTES: Listening to HD radio broadcasts, Internet streams of AM/FM radio stations and Satellite Radio is included the Persons Using Radio estimates in this report where the
tuning meets our reporting and crediting requirements.
MOBILE METHODOLOGY
Nielsen’s Electronic Mobile Measurement (EMM) is an observational, user-centric approach that uses passive metering technology on smartphones to track device and application usage on an opt-in convenience panel. Results are then reported out through Nielsen Mobile NetView 3.0. There are approximately 5,000 panelists in the US across both iOS and Android smartphone devices, and this method provides a holistic view of all activity on a smartphone as the behavior is being tracked without interruption. A number of steps are taken after the data collection process to ensure the reported data is representative of the mobile population. Weighting controls are applied across five characteristics (gender, age, income, race, and ethnicity) while independent enumeration studies are carried out on a continuous basis to provide the most current estimates of the mobile population (aka Universe Estimation). This mobile population is drawn from a combination of Mobile Insights, as well as surveying the National People Meter (NPM) panel that is the industry standard and currency for TV Ratings.
Figures reported in Nielsen’s Mobile NetView 3.0 include those individuals who are P18+ who have used an iOS or Android smartphone device in the US during Q1 of 2014. In particular:“Using any App/Web on Smartphone” refers to consuming mobile media content through a web browser or via a mobile app. It does not include other types of activity such as making/receiving phone calls, sending SMS/MMS messages etc, which has been excluded for this report“Watching Video on a Smartphone” is a subset of “Using any App/Web on Smartphone” and refers to those individuals who visit a website or use a mobile app specifically designed to watch video content
Due to this methodology change from survey based data to EMM as of the Qtr 4 2013 report, data should not be trended to previous quarters’ published editions. The current report contains the revised metrics for the prior year data in the year over year comparisons.
22 Copyright © 2014 The Nielsen Company
SOURCING
TAbLES 1, 2, 3, 4 - A wEEK In THE LIFE, OVERALL uSAgE by MEdIuM, MOnTHLy TIME SPEnT by MEdIuM In HOuRS:MInuTES uSERS 2+, MOnTHLy TIME SPEnT by MEdIuM In HOuRS: MInuTES Source: Traditional TV, Time-shifted TV, DVD, Game Consoles, Multimedia Devices 12/30/13-03/30/14 via Nielsen NPOWER/NPM Panel, Online 01/01/14-03/31/14 via Nielsen Netview and Nielsen VideoCensus, Mobile 01/01/14-03/31/14 via Nielsen Electronic Mobile Measurement, Radio 01/03/13-12/04/13 via RADAR 120 Table 1 is based on the total US population whether or not they have the technology. Tables 2-4 are based on users of each medium.
Electronic Mobile Measurement is based on P18+. Radio RADAR 120 data is based on P12+.
Therefore, P2+ would be based on P18+ for Smartphone and P12+ for Radio.
TAbLE 5 – CROSS-PLATFORM HOMES RAnKEd by In-HOME bEHAVIOR
Source: 01/01/14-03/31/14 via Nielsen NPOWER/Cross-Platform Homes Panel for P2+.
Internet and Streaming based on home PC only.
TAbLE 6 – SMARTPHOnE VIdEO VIEwIng QuInTILE
Source: 01/01/14-03/31/14 via Electronic Mobile Measurement for P18+. Smartphone video
viewing quintiles are grouped based on users’ time per person per month watching video
on a Smartphone. It refers to those individuals who visit a website or use a mobile app
specifically designed to watch video content.
TAbLE 7, 8, 9–TELEVISIOn dISTRIbuTIOn SOuRCES, CAbLE/SATELLITE HOMES wITH InTERnET STATuS, dEVICES In TV HOuSEHOLdS
Source: Based on the Universe Estimates for the 15th of each month within the quarter via
Nielsen NPOWER/NPM Panel.
TAbLE 10 - TELEVISIOn dISTRIbuTIOn SOuRCES - PERCEnTAgE OF HOuSEHOLdS
Source: Based on the scaled installed counts for 12/30/13-03/30/14 via Nielsen
NPOWER/NPM Panel.
23Copyright © 2014 The Nielsen Company THE CROSS-PLATFORm REPORT | Q1 2014
ExHIbIT 1 – AVERAgE TIME SPEnT PER AduLT 18+ PER dAy
Source: Traditional TV, Time-shifted TV, DVD, Game Consoles, Multimedia Devices
12/30/13-03/30/14 via Nielsen NPOWER/NPM Panel, Online 01/01/14-03/31/14 via Nielsen
Netview, Mobile -01/01/14-03/31/14 via Nielsen Electronic Mobile Measurement, Radio
01/03/13-12/04/13 via RADAR 120
Exhibit 1 is based on users of each medium.
ExHIbIT 2 – MObILE dEVICE PEnETRATIOn by ETHnICITy
Source: Mobile 01/01/14-03/31/14 via Nielsen Mobile Insights.
Note: - represents insufficient sample size while n/a represents data unavailability.
PAgES 4-7
reCenTly TeleCasT Vod - Defined as programming that is delivered on the VOD
platform within 7 days of the original telecast of a show, with the same commercial load.
Delivered this way, the viewing contributes to the linear telecast of the program for 7 days,
including the Live+3 Day Commercial (C3) rating
subsCripTion Vod - refers to those with access to Netflix, Amazon Prime, and/or Hulu
Plus. The collection of Subscription VOD in Nielsen’s National People Meter panel (US
only) began in Q2 2013. SVOD service is determined by a survey question which is asked
during the initial demographic collection questionnaire and during the six month scheduled
updates. In addition, households are asked to notify Nielsen of any changes to their SVOD
status, and field can make updates at any time. Only households with Internet access are
being asked this question.
RECEnTLy TELECAST VIdEO On dEMAnd
Nielsen NPOWER, 031014-042014, Based on prime telecasts with recently telecast VOD
contribution among externally reportable networks, includes only programming encoded for
measurement, Live+7, P2+
SubSCRIPTIOn VIdEO On dEMAnd
Nielsen NPOWER, NPM among TV homes, Profile - 031514, P2+; Share of viewership -
031014-031614, Prime, P2+
AbOuT nIELSEn Nielsen Holdings N.V. (NYSE: NLSN) is a global information and measurement company
with leading market positions in marketing and consumer information, television and
other media measurement, online intelligence, mobile measurement, trade shows
and related properties. Nielsen has a presence in approximately 100 countries, with
headquarters in New York, USA and Diemen, the Netherlands.
For more information, visit www.nielsen.com.
Copyright © 2014 The Nielsen Company. All rights reserved. Nielsen and the Nielsen logo
are trademarks or registered trademarks of CZT/ACN Trademarks, L.L.C. Other product
and service names are trademarks or registered trademarks of their respective companies.
13/ 7807

25