Monthly Report on Oilseeds September 2018.cdr - SMC Global
10
11 September, 2018 Monthly Report On Oilseeds September 2018
-
Upload
khangminh22 -
Category
Documents
-
view
2 -
download
0
Transcript of Monthly Report on Oilseeds September 2018.cdr - SMC Global

11September,2018
Monthly Report On
OilseedsSeptember 2018

Domestic Fundamentals: Soybean Futures (October)Domestic Fundamentals: Soybean Futures (October)
Fundamentals
Ÿ Looking at the charts & tracking the fundamentals, it seems like soybean futures (October)is expected to trade on a bearish note & may even test 3100 levels,
facing resistance near 3300 levels.Apart from this, the market participants may avoid fresh buying ahead of the monthly report to be published by the USDA
providing comprehensive forecast of supply and demand for U.S soybean, along with season-average price forecasts due on September 12.
Ÿ Farmers in the country had sown soybean across 11.19 mln ha, up 6.3% from a year ago, according to data from the farm ministry.Higher sowing in the key growing areas of
Madhya Pradesh, Maharashtra, and Rajasthan due to adequate rain boosted the acreage under the oilseed,
Ÿ India's soybean output is set to jump about 20 percent to over 10 million tonnes in the 2018/2019 crop year that starts in October, according to the Solvent Extractors'
Association of India (SEA).
Ÿ New crop soybean has hit the Sangli market, while in Latur, another key market for the oilseed, soybean arrivals will commence from October and the crop is in the flowering stage.
Ÿ The amount of land in India planted with soybeans for the 2018/2019 crop year had risen to 111.92 lakh hectares as of Sept 7, according to government data, up from 105.26
lakh hectares at the same time the previous year.
Ÿ Going ahead, the market participants would keep an eye on the weather & the development of the crop, along with the quality. In news, it is reported that soybean crop in
Madhya Pradesh is at risk with pest attack threatening yields may give a word of caution to the sellers in the domestic market. In some cases, the pest attacks have been found
to be above the economic threshold level. The humid weather at present is turning congenial for breeding of pests on the crop.
Ÿ Regarding crop status of this Kharif season, soybean crop in Madhya Pradesh is at risk with pest attack threatening yields.
Ÿ Incidents of attacks by white grub, semi looper caterpillar, girdle beetle, red spider, tobacco caterpillar and white fly have been reported in many parts of the state. They are
quite likely to pose a threat on the productivity if not controlled in time.In some cases, the pest attacks have been found to be above the economic threshold level.Early sown
crop is in pod-formation to grain-filling stage, while late sown crop is in vegetative stage.
Ÿ In Rajasthan, incessant rains have been a major cause of concern for farmers, who fear destruction of the maturing soybean crops after two days of heavy rainfall in the
Source:Reuters&SMCResearchSource:NCDEX
S2 S1 Pivot R1 R2
2989 3105 3275 3391 3561
Forward Curve of Soybean Futures (NCDEX) Historic return of Soybean futures (NCDEX) in the month of September Hadauti region.Soybean crop would mature after September 22 so there is no major loss to such crops.According to the figures of Kharif crop cultivation, soybean is sown in
around 5.50 lakh hectares.
Ÿ In Maharashtra, among the eight districts of Marathwada, Aurangabad has received the lowest rainfall &soybean are among kharif crops that have suffered some damage in
some areas of the district due to deficient rainfall.
Ÿ In news, with growing import dependence on cooking, the government is likely to announce a over Rs 10,000 crore scheme under which oilseeds farmers will be
compensated if the rates fall below the minimum support price. The agriculture ministry has prepared a cabinet note proposing a new mechanism 'Price Deficiency Payment'
on the lines of Madhya Pradesh government's BhavantarBhugtanYojana (BBY) to protect oilseeds farmers.Under the proposed scheme, the government will pay to farmers
the difference between the MSP and monthly average price of oilseeds quoted in major wholesale markets.
21
Closingason10thSeptember,2018
3236
3256
3304
3368
3437
3200
3250
3300
3350
3400
3450
Oct Nov Dec Jan Feb
-0.64%
-13.30%
-18.90%
1.76%
-8.78%
6.67%
-0.68%
-2.64%
-25%
-20%
-15%
-10%
-5%
0%
5%
10%
2010 2011 2012 2013 2014 2015 2016 2017
International fundamentals: Soybean Futures (November)International fundamentals: Soybean Futures (November)
Source:Reuters&SMCResearchSource:CBOT
Fundamentals
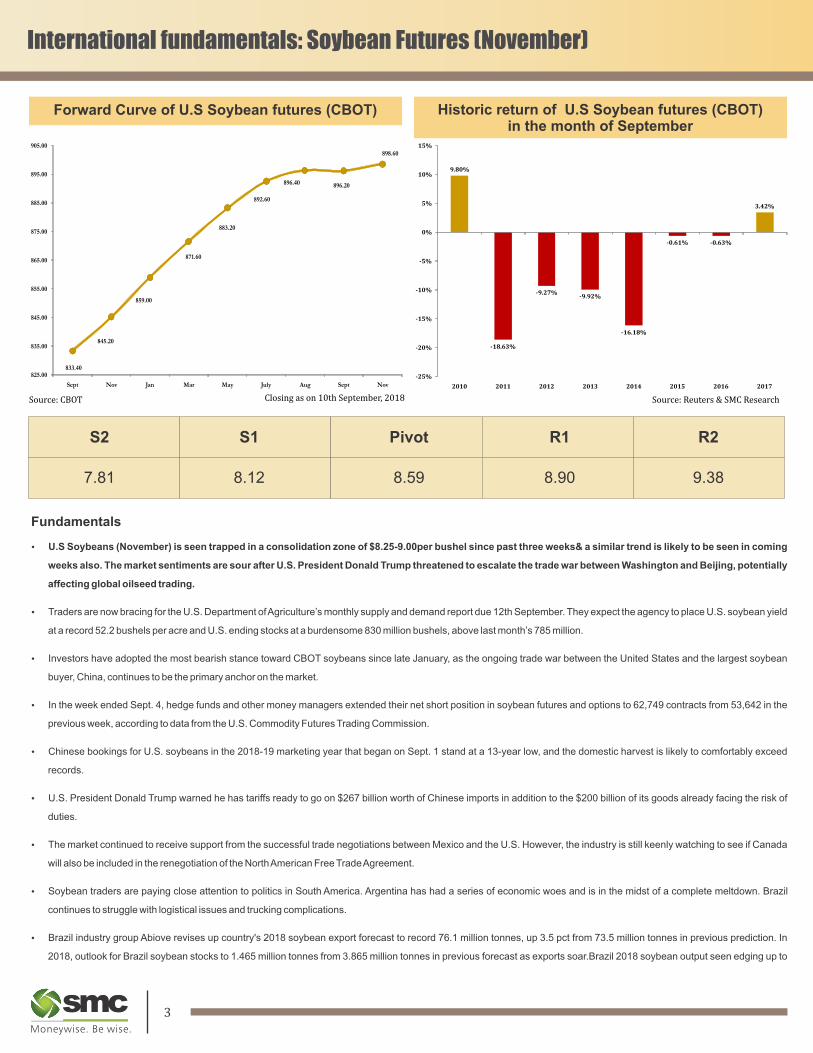
Ÿ U.S Soybeans (November) is seen trapped in a consolidation zone of $8.25-9.00per bushel since past three weeks& a similar trend is likely to be seen in coming
weeks also. The market sentiments are sour after U.S. President Donald Trump threatened to escalate the trade war between Washington and Beijing, potentially
affecting global oilseed trading.
Ÿ Traders are now bracing for the U.S. Department of Agriculture’s monthly supply and demand report due 12th September. They expect the agency to place U.S. soybean yield
at a record 52.2 bushels per acre and U.S. ending stocks at a burdensome 830 million bushels, above last month’s 785 million.
Ÿ Investors have adopted the most bearish stance toward CBOT soybeans since late January, as the ongoing trade war between the United States and the largest soybean
buyer, China, continues to be the primary anchor on the market.
Ÿ In the week ended Sept. 4, hedge funds and other money managers extended their net short position in soybean futures and options to 62,749 contracts from 53,642 in the
previous week, according to data from the U.S. Commodity Futures Trading Commission.
Ÿ Chinese bookings for U.S. soybeans in the 2018-19 marketing year that began on Sept. 1 stand at a 13-year low, and the domestic harvest is likely to comfortably exceed
records.
Ÿ U.S. President Donald Trump warned he has tariffs ready to go on $267 billion worth of Chinese imports in addition to the $200 billion of its goods already facing the risk of
duties.
Ÿ The market continued to receive support from the successful trade negotiations between Mexico and the U.S. However, the industry is still keenly watching to see if Canada
will also be included in the renegotiation of the North American Free Trade Agreement.
Ÿ Soybean traders are paying close attention to politics in South America. Argentina has had a series of economic woes and is in the midst of a complete meltdown. Brazil
continues to struggle with logistical issues and trucking complications.
Ÿ Brazil industry group Abiove revises up country's 2018 soybean export forecast to record 76.1 million tonnes, up 3.5 pct from 73.5 million tonnes in previous prediction. In
2018, outlook for Brazil soybean stocks to 1.465 million tonnes from 3.865 million tonnes in previous forecast as exports soar.Brazil 2018 soybean output seen edging up to
Forward Curve of U.S Soybean futures (CBOT) Historic return of U.S Soybean futures (CBOT)in the month of September
S2 S1 Pivot R1 R2
7.81 8.12 8.59 8.90 9.38
118.8 million tonnes versus 118.7 million tonnes previously.
Ÿ Meanwhile, China imported 9.15 million tonnes of soybeans in August, up 14 percent from July, customs data showed, as buyers in the world's top importer continued to buy
from Brazil after Beijing imposed tariffs on U.S. shipments.
Ÿ China will start allowing soybean imports from Ethiopia, customs authorities said on Friday, as the world’s top importer seeks to reduce its reliance on supplies of the oilseed
from the United States amid a trade row with Washington.
Ÿ China’s domestic soybean market is being closely watched as the world’s top consumer of the oilseed may rely more heavily on its domestic crop than previously, after Beijing
slapped 25 percent tariffs on American cargoes in early July.
Ÿ Imports in the coming months before November should be over 7 million tonnes per month, but supplies might tighten afterwards, as Brazil’s soybean season neared its end.
Ÿ Going forward, market attention will be turning toward the monthly U.S. government crop report on 12th September that will update officialcorn and soybean harvest
forecasts.
Ÿ The market participants expect the report will raise the government's forecast for soybean production to 4.649 billion bushels, basedon yields of 52.2 bushels per acre.
Ÿ Heavy rains across the U.S. Midwest and a murky outlook on international trade appear ready to drive down the soybean market.
Ÿ Weather issues will continue to hang over the market in the near-term.
43
Closingason10thSeptember,2018
833.40
845.20
859.00
871.60
883.20
892.60
896.40 896.20
898.60
825.00
835.00
845.00
855.00
865.00
875.00
885.00
895.00
905.00
Sept Nov Jan Mar May July Aug Sept Nov
9.80%
-18.63%
-9.27%-9.92%
-16.18%
-0.61% -0.63%
3.42%
-25%
-20%
-15%
-10%
-5%
0%
5%
10%
15%
2010 2011 2012 2013 2014 2015 2016 2017

International fundamentals: Soybean Futures (November)International fundamentals: Soybean Futures (November)
Source:Reuters&SMCResearchSource:CBOT
Fundamentals
Ÿ U.S Soybeans (November) is seen trapped in a consolidation zone of $8.25-9.00per bushel since past three weeks& a similar trend is likely to be seen in coming
weeks also. The market sentiments are sour after U.S. President Donald Trump threatened to escalate the trade war between Washington and Beijing, potentially
affecting global oilseed trading.
Ÿ Traders are now bracing for the U.S. Department of Agriculture’s monthly supply and demand report due 12th September. They expect the agency to place U.S. soybean yield
at a record 52.2 bushels per acre and U.S. ending stocks at a burdensome 830 million bushels, above last month’s 785 million.
Ÿ Investors have adopted the most bearish stance toward CBOT soybeans since late January, as the ongoing trade war between the United States and the largest soybean
buyer, China, continues to be the primary anchor on the market.
Ÿ In the week ended Sept. 4, hedge funds and other money managers extended their net short position in soybean futures and options to 62,749 contracts from 53,642 in the
previous week, according to data from the U.S. Commodity Futures Trading Commission.
Ÿ Chinese bookings for U.S. soybeans in the 2018-19 marketing year that began on Sept. 1 stand at a 13-year low, and the domestic harvest is likely to comfortably exceed
records.
Ÿ U.S. President Donald Trump warned he has tariffs ready to go on $267 billion worth of Chinese imports in addition to the $200 billion of its goods already facing the risk of
duties.
Ÿ The market continued to receive support from the successful trade negotiations between Mexico and the U.S. However, the industry is still keenly watching to see if Canada
will also be included in the renegotiation of the North American Free Trade Agreement.
Ÿ Soybean traders are paying close attention to politics in South America. Argentina has had a series of economic woes and is in the midst of a complete meltdown. Brazil
continues to struggle with logistical issues and trucking complications.
Ÿ Brazil industry group Abiove revises up country's 2018 soybean export forecast to record 76.1 million tonnes, up 3.5 pct from 73.5 million tonnes in previous prediction. In
2018, outlook for Brazil soybean stocks to 1.465 million tonnes from 3.865 million tonnes in previous forecast as exports soar.Brazil 2018 soybean output seen edging up to
Forward Curve of U.S Soybean futures (CBOT) Historic return of U.S Soybean futures (CBOT)in the month of September
S2 S1 Pivot R1 R2
7.81 8.12 8.59 8.90 9.38
118.8 million tonnes versus 118.7 million tonnes previously.
Ÿ Meanwhile, China imported 9.15 million tonnes of soybeans in August, up 14 percent from July, customs data showed, as buyers in the world's top importer continued to buy
from Brazil after Beijing imposed tariffs on U.S. shipments.
Ÿ China will start allowing soybean imports from Ethiopia, customs authorities said on Friday, as the world’s top importer seeks to reduce its reliance on supplies of the oilseed
from the United States amid a trade row with Washington.
Ÿ China’s domestic soybean market is being closely watched as the world’s top consumer of the oilseed may rely more heavily on its domestic crop than previously, after Beijing
slapped 25 percent tariffs on American cargoes in early July.
Ÿ Imports in the coming months before November should be over 7 million tonnes per month, but supplies might tighten afterwards, as Brazil’s soybean season neared its end.
Ÿ Going forward, market attention will be turning toward the monthly U.S. government crop report on 12th September that will update officialcorn and soybean harvest
forecasts.
Ÿ The market participants expect the report will raise the government's forecast for soybean production to 4.649 billion bushels, basedon yields of 52.2 bushels per acre.
Ÿ Heavy rains across the U.S. Midwest and a murky outlook on international trade appear ready to drive down the soybean market.
Ÿ Weather issues will continue to hang over the market in the near-term.
43
Closingason10thSeptember,2018
833.40
845.20
859.00
871.60
883.20
892.60
896.40 896.20
898.60
825.00
835.00
845.00
855.00
865.00
875.00
885.00
895.00
905.00
Sept Nov Jan Mar May July Aug Sept Nov
9.80%
-18.63%
-9.27%-9.92%
-16.18%
-0.61% -0.63%
3.42%
-25%
-20%
-15%
-10%
-5%
0%
5%
10%
15%
2010 2011 2012 2013 2014 2015 2016 2017
Mustard Futures (October)
Source:Reuters&SMCResearchSource:NCDEX
Fundamentals
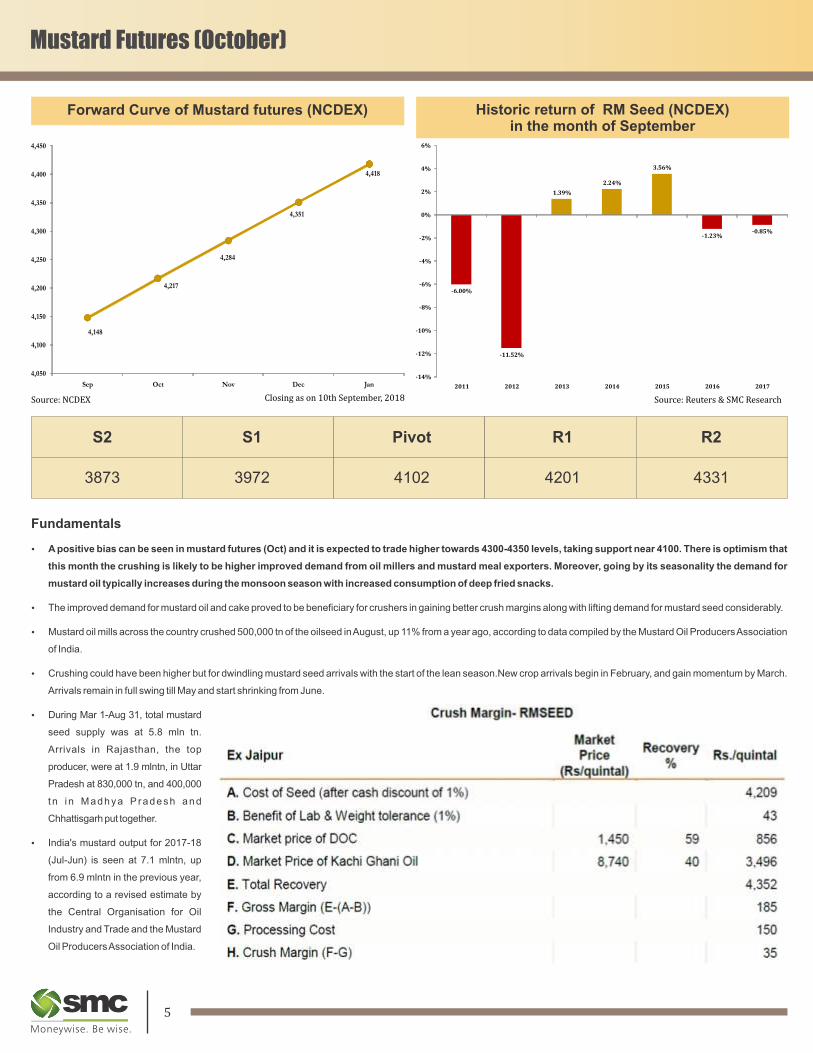
Ÿ A positive bias can be seen in mustard futures (Oct) and it is expected to trade higher towards 4300-4350 levels, taking support near 4100. There is optimism that
this month the crushing is likely to be higher improved demand from oil millers and mustard meal exporters. Moreover, going by its seasonality the demand for
mustard oil typically increases during the monsoon season with increased consumption of deep fried snacks.
Ÿ The improved demand for mustard oil and cake proved to be beneficiary for crushers in gaining better crush margins along with lifting demand for mustard seed considerably.
Ÿ Mustard oil mills across the country crushed 500,000 tn of the oilseed in August, up 11% from a year ago, according to data compiled by the Mustard Oil Producers Association
of India.
Ÿ Crushing could have been higher but for dwindling mustard seed arrivals with the start of the lean season.New crop arrivals begin in February, and gain momentum by March.
Arrivals remain in full swing till May and start shrinking from June.
Ÿ During Mar 1-Aug 31, total mustard
seed supply was at 5.8 mln tn.
Arrivals in Rajasthan, the top
producer, were at 1.9 mlntn, in Uttar
Pradesh at 830,000 tn, and 400,000
tn i n Madhya P radesh and
Chhattisgarh put together.
Ÿ India's mustard output for 2017-18
(Jul-Jun) is seen at 7.1 mlntn, up
from 6.9 mlntn in the previous year,
according to a revised estimate by
the Central Organisation for Oil
Industry and Trade and the Mustard
Oil Producers Association of India.
Historic return of RM Seed (NCDEX)in the month of September
Forward Curve of Mustard futures (NCDEX)
S2 S1 Pivot R1 R2
3873 3972 4102 4201 4331
Closingason10thSeptember,2018
65
Fundamentals
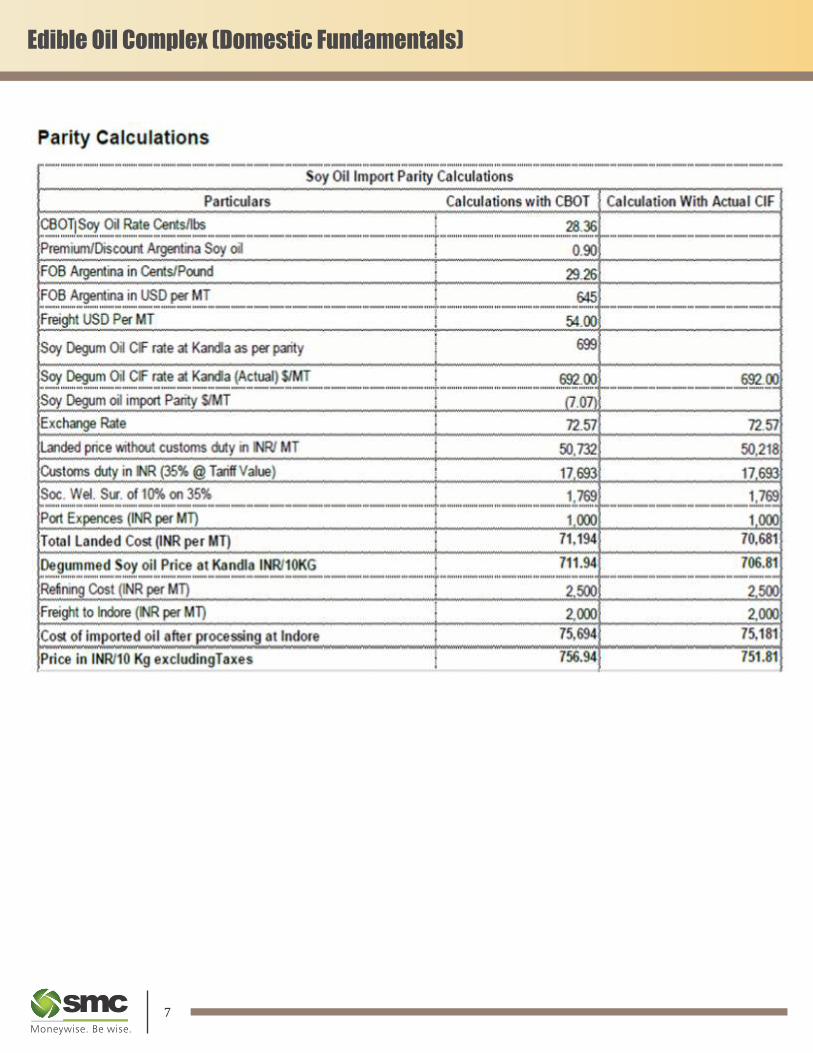
Ÿ In the present scenario, the prices of edible oil counters in the domestic market are being driven by weaker Rupee against Dollar, orelse the demand is lethargic. Adding to it,
the international prices of oilseeds and oils are trading sideways to down since many weeks due to ongoing trade war between U.S & China.
Ÿ Back at home, the Rupee is trading at all time low, because risk appetite was hit due to prospects of trade relations between the US and China worsening and as upbeat US
jobs report led to gains in the greenback globally. As Rupee gets weaker, the importers feel the heat as the imports gets costlier. The current calculation show that the cost of
imported soy oil after processing at Indore Rs.756.94/10kg (Calculations with CBOT) &Rs. 751.81 (Calculation With Actual CIF).
Ÿ India imports about 15 million tonnes of edible oil annually, but this year it may be around 14.5 million tonnes. There are three reasons for this drop — hike in import duty on
edible oils, better oilseed production in the country and a weak rupee that may put pressure on importers.
Ÿ In the past three months, edible oil is falling in the domestic market mainly on continuous decrease in tariff prices on edible oil prices and higher stock positions. The tariff value
(base import price) crude soya oil has been the lowest in three years, while CPO is at its lowest in two and half years. Tariff value is revised every fortnight by government and
is determined taking into account the prices in international markets as well as changes in the foreign exchange rate.
Ÿ Day’s ahead, the downside is looking limited in CPO futures (October)as the counter is expected to take support near 585 levels, while the upside can get
extended towards 620-625, once it surpasses the resistance near 612 levels.
Ÿ Refined soy oil futures(October)is expected to trade a volatile note in the range of 740-755 levels. Apart from the above said positive factors, the one which will
possibly exert downside pressure is the bearish trend of soybean. In coming days, the harvest of soybean is likely to catch pace & this phenomenon may cap the
upside.
Historic return of Soybean Oil futures (NCDEX)in the month of September
Forward Curve of Refined Soy oil futures (NCDEX)
Edible Oil Complex (Domestic Fundamentals)
Source:Reuters&SMCResearchSource:NCDEX
Commodity S2 S1 Pivot R1 R2
CPO (October) 575 587 596 608 616
Ref. Soy Oil (October) 729 734 739 744 748
Closingason10thSeptember,2018
4,148
4,217
4,284
4,351
4,418
4,050
4,100
4,150
4,200
4,250
4,300
4,350
4,400
4,450
Sep Oct Nov Dec Jan
744.15
747.55
746.35
743.60 743.60 743.60 743.60 743.60
742.00
743.00
744.00
745.00
746.00
747.00
748.00
Sep Oct Nov Dec Jan Feb Mar Apr
-6.00%
-11.52%
1.39%
2.24%
3.56%
-1.23%-0.85%
-14%
-12%
-10%
-8%
-6%
-4%
-2%
0%
2%
4%
6%
2011 2012 2013 2014 2015 2016 2017
0.59%
-7.06%
-16.18%
-2.42%
0.55%
4.16%
2.55%
0.61%
-20%
-15%
-10%
-5%
0%
5%
10%
2010 2011 2012 2013 2014 2015 2016 2017

Mustard Futures (October)
Source:Reuters&SMCResearchSource:NCDEX
Fundamentals
Ÿ A positive bias can be seen in mustard futures (Oct) and it is expected to trade higher towards 4300-4350 levels, taking support near 4100. There is optimism that
this month the crushing is likely to be higher improved demand from oil millers and mustard meal exporters. Moreover, going by its seasonality the demand for
mustard oil typically increases during the monsoon season with increased consumption of deep fried snacks.
Ÿ The improved demand for mustard oil and cake proved to be beneficiary for crushers in gaining better crush margins along with lifting demand for mustard seed considerably.
Ÿ Mustard oil mills across the country crushed 500,000 tn of the oilseed in August, up 11% from a year ago, according to data compiled by the Mustard Oil Producers Association
of India.
Ÿ Crushing could have been higher but for dwindling mustard seed arrivals with the start of the lean season.New crop arrivals begin in February, and gain momentum by March.
Arrivals remain in full swing till May and start shrinking from June.
Ÿ During Mar 1-Aug 31, total mustard
seed supply was at 5.8 mln tn.
Arrivals in Rajasthan, the top
producer, were at 1.9 mlntn, in Uttar
Pradesh at 830,000 tn, and 400,000
tn i n Madhya P radesh and
Chhattisgarh put together.
Ÿ India's mustard output for 2017-18
(Jul-Jun) is seen at 7.1 mlntn, up
from 6.9 mlntn in the previous year,
according to a revised estimate by
the Central Organisation for Oil
Industry and Trade and the Mustard
Oil Producers Association of India.
Historic return of RM Seed (NCDEX)in the month of September
Forward Curve of Mustard futures (NCDEX)
S2 S1 Pivot R1 R2
3873 3972 4102 4201 4331
Closingason10thSeptember,2018
65
Fundamentals
Ÿ In the present scenario, the prices of edible oil counters in the domestic market are being driven by weaker Rupee against Dollar, orelse the demand is lethargic. Adding to it,
the international prices of oilseeds and oils are trading sideways to down since many weeks due to ongoing trade war between U.S & China.
Ÿ Back at home, the Rupee is trading at all time low, because risk appetite was hit due to prospects of trade relations between the US and China worsening and as upbeat US
jobs report led to gains in the greenback globally. As Rupee gets weaker, the importers feel the heat as the imports gets costlier. The current calculation show that the cost of
imported soy oil after processing at Indore Rs.756.94/10kg (Calculations with CBOT) &Rs. 751.81 (Calculation With Actual CIF).
Ÿ India imports about 15 million tonnes of edible oil annually, but this year it may be around 14.5 million tonnes. There are three reasons for this drop — hike in import duty on
edible oils, better oilseed production in the country and a weak rupee that may put pressure on importers.
Ÿ In the past three months, edible oil is falling in the domestic market mainly on continuous decrease in tariff prices on edible oil prices and higher stock positions. The tariff value
(base import price) crude soya oil has been the lowest in three years, while CPO is at its lowest in two and half years. Tariff value is revised every fortnight by government and
is determined taking into account the prices in international markets as well as changes in the foreign exchange rate.
Ÿ Day’s ahead, the downside is looking limited in CPO futures (October)as the counter is expected to take support near 585 levels, while the upside can get
extended towards 620-625, once it surpasses the resistance near 612 levels.
Ÿ Refined soy oil futures(October)is expected to trade a volatile note in the range of 740-755 levels. Apart from the above said positive factors, the one which will
possibly exert downside pressure is the bearish trend of soybean. In coming days, the harvest of soybean is likely to catch pace & this phenomenon may cap the
upside.
Historic return of Soybean Oil futures (NCDEX)in the month of September
Forward Curve of Refined Soy oil futures (NCDEX)
Edible Oil Complex (Domestic Fundamentals)
Source:Reuters&SMCResearchSource:NCDEX
Commodity S2 S1 Pivot R1 R2
CPO (October) 575 587 596 608 616
Ref. Soy Oil (October) 729 734 739 744 748
Closingason10thSeptember,2018
4,148
4,217
4,284
4,351
4,418
4,050
4,100
4,150
4,200
4,250
4,300
4,350
4,400
4,450
Sep Oct Nov Dec Jan
744.15
747.55
746.35
743.60 743.60 743.60 743.60 743.60
742.00
743.00
744.00
745.00
746.00
747.00
748.00
Sep Oct Nov Dec Jan Feb Mar Apr
-6.00%
-11.52%
1.39%
2.24%
3.56%
-1.23%-0.85%
-14%
-12%
-10%
-8%
-6%
-4%
-2%
0%
2%
4%
6%
2011 2012 2013 2014 2015 2016 2017
0.59%
-7.06%
-16.18%
-2.42%
0.55%
4.16%
2.55%
0.61%
-20%
-15%
-10%
-5%
0%
5%
10%
2010 2011 2012 2013 2014 2015 2016 2017
Edible Oil Complex (Domestic Fundamentals) Edible Oil Complex (International Market Fundamentals)
Source:Reuters&SMCResearchSource:CBOT Closingason10thSeptember,2018
Fundamentals
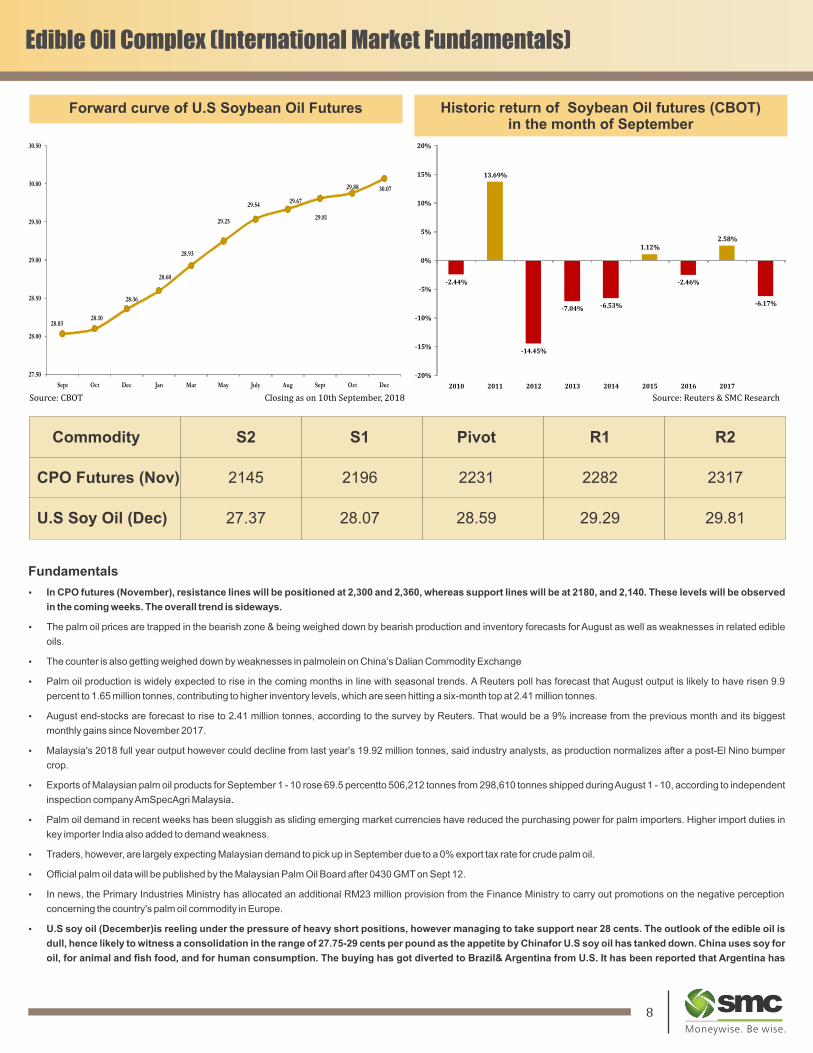
Ÿ In CPO futures (November), resistance lines will be positioned at 2,300 and 2,360, whereas support lines will be at 2180, and 2,140. These levels will be observed
in the coming weeks. The overall trend is sideways.
Ÿ The palm oil prices are trapped in the bearish zone & being weighed down by bearish production and inventory forecasts for August as well as weaknesses in related edible
oils.
Ÿ The counter is also getting weighed down by weaknesses in palmolein on China’s Dalian Commodity Exchange
Ÿ Palm oil production is widely expected to rise in the coming months in line with seasonal trends. A Reuters poll has forecast that August output is likely to have risen 9.9
percent to 1.65 million tonnes, contributing to higher inventory levels, which are seen hitting a six-month top at 2.41 million tonnes.
Ÿ August end-stocks are forecast to rise to 2.41 million tonnes, according to the survey by Reuters. That would be a 9% increase from the previous month and its biggest
monthly gains since November 2017.
Ÿ Malaysia's 2018 full year output however could decline from last year's 19.92 million tonnes, said industry analysts, as production normalizes after a post-El Nino bumper
crop.
Ÿ Exports of Malaysian palm oil products for September 1 - 10 rose 69.5 percentto 506,212 tonnes from 298,610 tonnes shipped during August 1 - 10, according to independent
inspection company AmSpecAgri Malaysia.
Ÿ Palm oil demand in recent weeks has been sluggish as sliding emerging market currencies have reduced the purchasing power for palm importers. Higher import duties in
key importer India also added to demand weakness.
Ÿ Traders, however, are largely expecting Malaysian demand to pick up in September due to a 0% export tax rate for crude palm oil.
Ÿ Official palm oil data will be published by the Malaysian Palm Oil Board after 0430 GMT on Sept 12.
Ÿ In news, the Primary Industries Ministry has allocated an additional RM23 million provision from the Finance Ministry to carry out promotions on the negative perception
concerning the country's palm oil commodity in Europe.
Ÿ U.S soy oil (December)is reeling under the pressure of heavy short positions, however managing to take support near 28 cents. The outlook of the edible oil is
dull, hence likely to witness a consolidation in the range of 27.75-29 cents per pound as the appetite by Chinafor U.S soy oil has tanked down. China uses soy for
oil, for animal and fish food, and for human consumption. The buying has got diverted to Brazil& Argentina from U.S. It has been reported that Argentina has
Commodity S2 S1 Pivot R1 R2
CPO Futures (Nov) 2145 2196 2231 2282 2317
U.S Soy Oil (Dec) 27.37 28.07 28.59 29.29 29.81
Historic return of Soybean Oil futures (CBOT)in the month of September
Forward curve of U.S Soybean Oil Futures
87
28.0328.10
28.36
28.60
28.93
29.25
29.5429.67
29.81
29.88 30.07
27.50
28.00
28.50
29.00
29.50
30.00
30.50
Sept Oct Dec Jan Mar May July Aug Sept Oct Dec
-2.44%
13.69%
-14.45%
-7.04% -6.53%
1.12%
-2.46%
2.58%
-6.17%
-20%
-15%
-10%
-5%
0%
5%
10%
15%
20%
2010 2011 2012 2013 2014 2015 2016 2017
Edible Oil Complex (Domestic Fundamentals) Edible Oil Complex (International Market Fundamentals)
Source:Reuters&SMCResearchSource:CBOT Closingason10thSeptember,2018
Fundamentals
Ÿ In CPO futures (November), resistance lines will be positioned at 2,300 and 2,360, whereas support lines will be at 2180, and 2,140. These levels will be observed
in the coming weeks. The overall trend is sideways.
Ÿ The palm oil prices are trapped in the bearish zone & being weighed down by bearish production and inventory forecasts for August as well as weaknesses in related edible
oils.
Ÿ The counter is also getting weighed down by weaknesses in palmolein on China’s Dalian Commodity Exchange
Ÿ Palm oil production is widely expected to rise in the coming months in line with seasonal trends. A Reuters poll has forecast that August output is likely to have risen 9.9
percent to 1.65 million tonnes, contributing to higher inventory levels, which are seen hitting a six-month top at 2.41 million tonnes.
Ÿ August end-stocks are forecast to rise to 2.41 million tonnes, according to the survey by Reuters. That would be a 9% increase from the previous month and its biggest
monthly gains since November 2017.
Ÿ Malaysia's 2018 full year output however could decline from last year's 19.92 million tonnes, said industry analysts, as production normalizes after a post-El Nino bumper
crop.
Ÿ Exports of Malaysian palm oil products for September 1 - 10 rose 69.5 percentto 506,212 tonnes from 298,610 tonnes shipped during August 1 - 10, according to independent
inspection company AmSpecAgri Malaysia.
Ÿ Palm oil demand in recent weeks has been sluggish as sliding emerging market currencies have reduced the purchasing power for palm importers. Higher import duties in
key importer India also added to demand weakness.
Ÿ Traders, however, are largely expecting Malaysian demand to pick up in September due to a 0% export tax rate for crude palm oil.
Ÿ Official palm oil data will be published by the Malaysian Palm Oil Board after 0430 GMT on Sept 12.
Ÿ In news, the Primary Industries Ministry has allocated an additional RM23 million provision from the Finance Ministry to carry out promotions on the negative perception
concerning the country's palm oil commodity in Europe.
Ÿ U.S soy oil (December)is reeling under the pressure of heavy short positions, however managing to take support near 28 cents. The outlook of the edible oil is
dull, hence likely to witness a consolidation in the range of 27.75-29 cents per pound as the appetite by Chinafor U.S soy oil has tanked down. China uses soy for
oil, for animal and fish food, and for human consumption. The buying has got diverted to Brazil& Argentina from U.S. It has been reported that Argentina has
Commodity S2 S1 Pivot R1 R2
CPO Futures (Nov) 2145 2196 2231 2282 2317
U.S Soy Oil (Dec) 27.37 28.07 28.59 29.29 29.81
Historic return of Soybean Oil futures (CBOT)in the month of September
Forward curve of U.S Soybean Oil Futures
87
28.0328.10
28.36
28.60
28.93
29.25
29.5429.67
29.81
29.88 30.07
27.50
28.00
28.50
29.00
29.50
30.00
30.50
Sept Oct Dec Jan Mar May July Aug Sept Oct Dec
-2.44%
13.69%
-14.45%
-7.04% -6.53%
1.12%
-2.46%
2.58%
-6.17%
-20%
-15%
-10%
-5%
0%
5%
10%
15%
20%
2010 2011 2012 2013 2014 2015 2016 2017

SMC Global Securities Ltd. (hereinafter referred to as “SMC”) is regulated by the Securities and Exchange Board of India (“SEBI”) and is licensed to carry on the business of broking, depository services and related
activities. SMC is a registered member of National Stock Exchange of India Limited, Bombay Stock Exchange Limited, MSEI (Metropolitan Stock Exchange of India Ltd.) and M/s SMC Comtrade Ltd is a registered
member of National Commodity and Derivative Exchange Limited and Multi Commodity Exchanges of India and other commodity exchanges in India. SMC is also registered as a Depository Participant with CDSL and
NSDL. SMC’s other associates are registered as Merchant Bankers, Portfolio Managers, NBFC with SEBI and Reserve Bank of India. It also has registration with AMFI as a Mutual Fund Distributor.
SMC is a SEBI registered Research Analyst having registration number INH100001849. SMC or its associates has not been debarred/ suspended by SEBI or any other regulatory authority for accessing /dealing in
securities/commodities market.
The views expressed by the Research Analyst in this Report are based solely on information available publicly available/internal data/ other reliable sources believed to be true. SMC does not represent/ provide any
warranty expressly or impliedly to the accuracy, contents or views expressed herein and investors are advised to independently evaluate the market conditions/risks involved before making any investment decision. The
research analysts who have prepared this Report hereby certify that the views /opinions expressed in this Report are their personal independent views/opinions in respect of the subject commodity.
DISCLAMIER: This Research Report is for the personal information of the authorized recipient and doesn't construe to be any investment, legal or taxation advice to the investor. It is only for private circulation and use. The Research Report is based upon information that we consider reliable, but we do not represent that it is accurate or complete, and it should not be relied upon as such. No action is solicited on the basis of the contents of this Research Report. The Research Report should not be reproduced or redistributed to any other person(s)in any form without prior written permission of the SMC. The contents of this material are general and are neither comprehensive nor inclusive. Neither SMC nor any of its affiliates, associates, representatives, directors or employees shall be responsible for any loss or damage that may arise to any person due to any action taken on the basis of this Research Report. It does not constitute personal recommendations or take into account the particular investment objectives, financial situations or needs of an individual client or a corporate/s or any entity/s. All investments involve risk and past performance doesn't guarantee future results. The value of, and income from investments may vary because of the changes in the macro and micro factors given at a certain period of time. The person should use his/her own judgment while taking investment decisions.
Please note that SMC its affiliates, Research Analyst, officers, directors, and employees, including persons involved in the preparation or issuance if this Research Report: (a) from time to time, may have long or short positions in, and buy or sell the commodity thereof, mentioned here in or (b) be engaged in any other transaction involving such commodities and earn brokerage or other compensation or act as a market maker in the commodities discussed herein(c) may have any other potential conflict of interest with respect to any recommendation and related information and opinions. All disputes shall be subject to the exclusive jurisdiction of Delhi High court. All disputes shall be subject to the exclusive jurisdiction of Delhi High court.
Edible oil complex (International market fundamentals)
resumedsoyoil exports to China.
• As a side note, Brazilian farmers are now pushing to begin a South American soybean contract that would trade on either a Brazilian or Argentine exchange specifically to
better facilitate trade between South America and China.
• The managed-money soybean oil short continues to linger at historically bearish levels, increasing to 88,029 futures and options contracts through Sept. 4 from the previous
week’s 86,485.
CFTC POSITION – U.S SOYBEAN OIL
9