FARM FINANCIAL STRUCTURE DECISIONS UNDER DIFFERENT INTERTEMPORAL RISK BEHAVIORAL CONSTRUCTS

Research Article
48
Received: 16 April 2009, Revised: 1 June 2009, Accepted: 12 June 2009, Published online in Wiley InterScience: 31 July 2009
(www.interscience.wiley.com) DOI:10.1002/nbm.1425
Monitoring angiogenesis in soft-tissueengineered constructs for calvariumbone regeneration: an in vivolongitudinal DCE-MRI studyMarine Beaumonta,b, Marc G. DuValc, Yasir Loaid, Walid A. Farhata,d,George K. Sandorc,e,f and Hai-Ling Margaret Chenga,b,g*
Tissue engineering is a promising technique for bone
NMR Biom
repair and can overcome the major drawbacks of conventionalautogenous bone grafting. In this in vivo longitudinal study, we proposed a new tissue-engineering paradigm:inserting a biological soft-tissue construct within the bone defect to enhance angiogenesis for improved boneregeneration. The construct acts as a resorbable scaffold to support desired angiogenesis and cellular activity and as avector of vascular endothelial growth factor, known to promote both vessel and bone growth. Dynamic contrast-enhanced magnetic resonance imaging was performed to investigate and characterize angiogenesis necessary forbone formation following the proposed paradigm of inserting a VEGF-impregnated tissue-engineered constructwithin the critical-sized calvarial defect in themembranous parietal bone of the rabbit. Results show that amodel-freequantitative approach, the normalized initial area under the curve metric, provides sensitive and reproduciblemeasures of vascularity that is consistent with known temporal evolution of angiogenesis during bone regeneration.Copyright � 2009 John Wiley & Sons, Ltd.
Keywords: angiogenesis; bone regeneration; dynamic contrast-enhanced magnetic resonance imaging (DCE-MRI); tissueengineering
* Correspondence to: H.-L. M. Cheng, The Hospital for Sick Children, 555University Avenue, Toronto, Ontario M5G 1X8, Canada.E-mail: [email protected]
a M. Beaumont, W. A. Farhat, H.-L. M. Cheng
The Research Institute, The Hospital for Sick Children, Toronto, Canada
b M. Beaumont, H.-L. M. Cheng
Diagnostic Imaging, The Hospital for Sick Children, Toronto, Canada
c M. G. DuVal, G. K. Sandor
Department of Oral and Maxillofacial Surgery, University of Toronto, Toronto,
Canada
d Y. Loai, W. A. Farhat
Division of Urology, The Hospital for Sick Children, Toronto, Canada
e G. K. Sandor
Regea Institute for Regenerative Medicine, University of Tampere, Tampere,
Finland
f G. K. Sandor
Department of Oral and Maxillofacial Surgery, University of Oulu, Oulu,
Finland
g H.-L. M. Cheng
Department of Medical Biophysics, University of Toronto, Toronto, Canada
Contract/grant sponsor: Canadian Institutes of Health Research, Pediatric
Regenerative Medicine Fund.
Abbreviations used: ACM, acellular matrix; AIF, arterial input function; BW,
bandwidth; DCE-MRI, dynamic contrast-enhanced magnetic resonance ima-
ging; FA, flip angle; HA, hyaluronic acid; IAUC, initial area under the curve; IV,
intravenous; micro-CT, micro-computed tomography; NEX, number of exper-
iments; VEGF, vascular endothelial growth factor; ROI, region of interest; SPGR,
spoiled gradient recalled echo.
INTRODUCTION
Autogenous bone grafting is considered the gold standard forrepair and regeneration of extensive bony defects following trauma,cancer resection, or non-united fractures (1). However, grafting boneis non-ideal: a second surgical site, usually involving the iliac crest,tibia, calvarium, or scapula, is required; the bony skeleton doesnot offer a limitless supply of bone to harvest; the procedure isassociated with increased operating room time usage andincreased patient morbidity (2). Tissue engineering is one of themost promising techniques to overcome these major drawbacksof autogenous bone grafting (3). Successful tissue regenerationmainly depends on the establishment of a vascular bed, whichconnects the implanted construct to the host tissue and suppliesnecessary nutrients for bone regeneration (4). The differentmechanisms underlying bone repair and regeneration have beenextensively studied and identified (5,6), but very few studies havefocused on monitoring the angiogenesis process during bonewound healing.As a noninvasive imaging technique, MRI is well suited to
in vivo longitudinal evaluation of tissue repair following graftingprocedures. In tissue-engineered constructs, MRI has been usedto determine cellularization and maturation of the construct in vivoin cartilage (7,8), but bony constructs have been studied onlyin vitro (9,10). In either case, the vascular status and evolution ofangiogenesis with tissue growth were not investigated. Angiogen-esis in tissue-engineered constructs was first evaluated in bladderconstructs in vivo (11–13) using dynamic contrast-enhanced MRI(DCE-MRI). The foray of DCE-MRI into tissue-engineering
ed. 2010; 23: 48–55 Copyright � 2009 John Wiley & Sons, Ltd.
DCE-MRI IN TISSUE-ENGINEERED CALVARIUM BONE
applications remains limited despite its well-established role inassessing the microvasculature in clinical and research studies(14). A few exceptions are found in in vivo longitudinal studiesconducted using DCE-MRI to evaluate the wound-healing processfollowing subcutaneous insertion of wound chambers (15) andmassive bone allograft (16). In this latter study, revascularizationwas assessed at the osteotomy site but not at the graft site. To ourknowledge, longitudinal in vivo characterization of angiogenesisin bony constructs has never been reported.In order to quantify angiogenesis using DCE-MRI derived data,
one can use numerous analysis techniques. The quantitativeapproach using pharmacokinetic modeling of tracer concen-tration (17) provides parameters related to physiology, such asblood volume and vascular permeability. This approach dependson the knowledge of the tracer concentration evolution in theblood, or arterial input function (AIF). However, determination ofthe AIF may be compromised by tracer concentration-MR signalnon-linearity, low temporal resolution, and partial volume effects,which are especially problematic in small animal brain imaging.Moreover, it has been shown that errors in AIF measurement canstrongly influence pharmacokinetic parameter accuracy (18,19).To overcome this limitation, a model-free quantitative approachhas been proposed (20), which uses the initial area under thetracer concentration-time curve (IAUC) as an empirical quanti-tative parameter. Change in the IAUC has been shown to correlatewith vessel density (13) and tumor response to anti-vascular treat-ment (21,22). Also, this non-model-based analysis is very robust,and reproducibility is often comparable to or even better thanthat obtained with traditional model-based parameters (23–25).In this in vivo longitudinal study, we propose a new tissue-
engineering paradigm: inserting a biological soft-tissue constructwithin the bone defect to enhance angiogenesis for improvedbone regeneration. The construct acts as a resorbable scaffold tosupport desired angiogenesis and cellular activity and as a vectorof vascular growth factor (VEGF), known to promote both vesseland bone growth (26). DCE-MRI was performed to investigate andcharacterize angiogenesis necessary for bone formation follow-ing the proposed paradigm of inserting a VEGF-impregnatedtissue-engineered construct within the critical-sized calvarialdefect in themembranous parietal bone of the rabbit (27). Resultsshow that an IAUC approach provides sensitive and reproduciblemeasures of vascularity that is consistent with known temporalevolution of angiogenesis during bone regeneration.
4
EXPERIMENTAL
This study was approved by the institutional Animal Care Com-mittee (protocol #7578).
Construct preparation and implantation
Tissue-engineered construct preparation began with the acellu-larization of urinary bladder harvested from 20–50 kg porcines.Bladders were washed with sterile phosphate buffer saline,longitudinally sectioned and stirred in hypotonic solution for 48 hat 48C to effectively break down cellular structures and inhibitproteases. Bladders were placed in hypertonic solution for 48 h at48C to denature protein residues and degrade all DNA and RNAcomponents. Bladders were washed with Hank’s Balanced SaltSolution (Invitrogen, #14175, USA) containing 2U/mL Benzonase(Novagen, #70746, Germany) overnight at 378C and transferred to0.25% CHAPS-containing detergent based solution. Acellular
NMR Biomed. 2010; 23: 48–55 Copyright � 2009 John Wiley &
matrices (ACMs) were repeatedly washed with sterile dH2O andstored in 70% ethanol prior to use. H&E staining was used toconfirm acellularity. ACMs were cut into 1.5 cm diameter discs,weighed, and immersed in gradually increasing concentrations ofethanol for full dehydration. ACMs were lyophilized (ViTis-temp,120 millitorr and vacuum) for 24 h, then rehydrated withincreasing concentrations of HA (0.05, 0.1, 0.2, and 0.5mg/100mL) (Sigma, product #H5388, USA). Alcian blue staining wasused to confirm HA incorporation. In addition, HA-ACMs weredehydrated in alcohol, lyophilized, and rehydrated with VEGF121(Sigma, #V3388, USA) 10 ng/g of ACM. Finally, a critical-sized(non-spontaneous healing) calvarial defect (15mm in diameter)was created surgically in the parietal bones of the rabbits, thecenter of the defect was 9.5mm from the midline to allow 2mmfor the sagittal sinus. The tissue-engineered HA-VEGF containingconstruct was grafted to the calvarium.
Experimental protocol
Surgery and MR imaging were performed on 12 New Zealandwhite rabbits (3.5–4 kg). Imaging sessions were held 1, 2, 3, 6, and12 weeks after the surgery. All MR experiments were performedunder anesthesia using two different protocols. Five rabbits wereanesthetized with an intravenous (IV) injection of pentobarbital(25mg/kg) through the ear vein. During the MRI (about 1 h),anesthesia was maintained with an IV dose of 0.25mg/kg/min;and the animals were kept under 100% oxygen with a face mask.For the other seven rabbits, anesthesia was performed with 5% ofisoflurane for induction, and 2� 0.2% for maintenance, in 100%oxygen using a face mask. All the animals were equipped witha catheter in the ear vein for the contrast agent injection(Gd-DTPA – Magnevist, Berlex Canada, Lachine, Canada) andcontinuous hydration (4mL of saline/kg/h). Heart rate and pO2
were monitored during the scan time. Five animals wereeuthanized after the fourth imaging session (6 weeks aftersurgery) while the remaining animals were euthanized after thelast imaging session (12 weeks after surgery). In each animal, thecalvarium was excised for subsequent histological procedures.
MRI
MRI was performed on a 1.5 T GE scanner (Signa EXCITE TwinSpeed;GE Healthcare, Milwaukee, WI, USA) using a three-inch diameterreceive surface coil and a body transmit coil. Animals were placedin prone position and an axial orientation was chosen for all theslices. Construct localization was achieved using a gradient echosequence: TR/TE¼ 6.5/2.3ms, FA¼ 308, bandwidth (BW)¼ 23.4 kHz,16� 12� 8 slices (thickness¼ 2mm, space between slices¼ 1mm),matrix¼ 192� 192, FOV¼ 12� 12cm2, and number of experiments(NEX)¼ 2. A rapid 3D T1-mapping method, based on variable flipangles and integrating B1 correction (28), was employed prior toGd-DTPA injection to acquire the baseline T1 map: 3D fast spoiledgradient recalled echo (SPGR), TR/TE¼ 8.8/3.4ms, FA¼ 28, 108and 208, bandwidth (BW)¼ 31.2 kHz, matrix¼ 256� 160� 10,FOV¼ 10� 10� 3 cm3, and number of experiments (NEX)¼ 4.Dynamic T1-weighted images were acquired using a 3D fast SPGRsequence: TR/TE¼ 10.2/3.4ms, FA¼ 158, BW¼ 31.2 kHz, matrix¼256� 128� 10, FOV¼ 10� 10� 3 cm3, and NEX¼ 0.75. After theacquisition of 5 baseline images, Gd-DTPA was administered as arapid bolus (0.1mmol of Gd/kg) and imaging continued for 6minpost-injection with a time resolution of 8.2 s (300 images in total).
Sons, Ltd. www.interscience.wiley.com/journal/nbm
9

M. BEAUMONT ET AL.
50
MRI data analysis
All analyses were performed on a pixel-wise basis using in-houseprograms developed with Matlab (V.7.0, Mathworks Inc., Natick,MA, USA). Analysis of the 3D T1 maps followed the methoddescribed previously (28). DCE-MRI data were converted into Gdconcentration maps using the pre-injection T1 map, the SPGRsignal equation (29) and the Gd-DTPA relaxivity r1 (4.1 s
�1mM�1,in plasma at 1.5 T and 378C (30)). Finally, the initial area under theGd concentration time curve for 60 s after contrast agent injec-tion (IAUC60) was computed for each pixel. Only physiologicallymeaningful pixels were retained. Pixels were excluded if they metany of the following conditions: T1 values outside of the range0–4000ms, Gd concentration mean value over time outside ofthe range 0–2mM and for which the standard deviation of Gdconcentration along the baseline was greater than 0.1mM. Threeregions of interest (ROI) were manually drawn. On the IAUC60map, two ROIs were defined on the construct: the periphery,which corresponds to the early enhancing region, and the center(Fig. 1c); and one ROI surrounding the whole brain. For each ROIand for each MR acquisition time point, the mean IAUC60 valuewas computed as well as the percentage of physiologicallymeaningful pixels in the ROI involved in this calculation. Tominimize effects from inter-individual physiological variation andcontrast agent dose variability, each IAUC60 mean value wasnormalized to a reference, the IAUC60 mean value measured inthe brain.Statistical analysis was based on the permutation test (also
called randomization test, (31)), which, unlike the widely usedt-test, is suited to data originating from small-sized groups andwith unknown distributions. This test determines the significanceof the difference of means d between two populations A and Bwith nA and nB samples, respectively, as follows. A difference ofmeans d’ is calculated between all possible groupings A’ and B’,where A’ and B’ represent a different partition of values from Aþ Binto two groups of size nA and nB. The p-value p is equal to theratio of the number of events where d’>d to the total number ofevents. Paired permutation tests were applied to compare IAUC60at different time points, and statistical significance was set atp< 0.05. Evolution of the IAUC60 mean value with time was alsodetermined for each individual animal and in each ROI bycomparing the mean value of the estimate at week (i) with themean� SEM value at week (i�1).
Micro-computed tomography
Calvarial specimens were scanned by an Explore Locus SP1
micro-CT scanner (GE Medical Systems, London, Ontario, Canada)using the fast mode with 0.05mm sections. Reconstruction of
Figure 1. T1-weighted images (a) before, (b) 60 s after Gd-DTPA injection, and
zoomed-in version of the implanted VEGF-impregnated soft-tissue construct is
and center) on images (b) and (c). The periphery ROI is delineated on the in
www.interscience.wiley.com/journal/nbm Copyright � 200
scanned images was done using Microview software (GE MedicalSystems, London, Ontario, Canada) after calibrating using thebone water and air standard values. The reconstructed 3D imagewas then traced in 3 dimensions to the circumference of theoriginal defect margins. This allowed the creation of a 3Dreconstruction of the defect, referred to as the ROI. A thresholdlevel was selected manually based on 25% of the bone standardprovided by the manufacturer.
RESULTSMRI
Figure 1 illustrates that the soft-tissue construct was clearlyidentifiable on MR images even prior to contrast agent injection(Fig. 1a). The T1-weighted MR signal increased in the wholeconstruct after contrast agent injection with a more pronouncedenhancement in the periphery than in the center of the graft(Fig. 1b). Note that contrast uptake was observed from the firstimaging time point (1 week after surgery) up to the last (12 weeksafter surgery) in all rabbits. The IAUC60 map provided the bestsupport to draw the different ROIs with very clean contours of theconstruct (Fig. 1c).Table 1 shows the evolution of the percentage of physiologi-
cally meaningful pixels in these ROIs that are retained forDCE-MRI analysis. The percentage of pixels retained is generallyhighest (� 91%) in the construct periphery compared to thecenter or normal brain tissue. An exception occurs at 12 weeks,where fewer useful pixels are detected in the entire construct. Inthe center, the percentage of retained pixels increases withangiogenic growth. In the normal brain where contrast agentuptake is lowest, at least 75% of pixels were retained consistentlythroughout the 12 weeks, which supports the robustness of theproposed method for pixel selection. Table 2 reports theevolution of the size of the ROIs normalized to week 1. Forboth periphery and center of the construct, the size of the ROI6 weeks after the surgery is almost half of the initial size. The sizeof the ROI defined on the brain remains constant with time.Figure 2 illustrates in one rabbit typical uptake curves in the
periphery and the center of the construct at four time points (1, 3,6, and 12 weeks after surgery). The uptake curves in the peripherywere characteristic of highly permeable vessels usually found inpresence of active angiogenesis. At the early time point, theperiphery enhancement curve (Fig. 2, Week 1) exhibits the mostrapid initial uptake followed by a distinct washout. Later timepoints may also show significant enhancement, but the initialuptake is more gradual and washout is not always evident (e.g.Fig. 2, Week 6). In the center of the construct, the uptakedynamics were distinct from those in the periphery, characterized
(c) the corresponding IAUC60map. Imaging time is 3 weeks post-surgery. A
shown in insets. Note the two distinct regions of the construct (periphery
set of (c).
9 John Wiley & Sons, Ltd. NMR Biomed. 2010; 23: 48–55
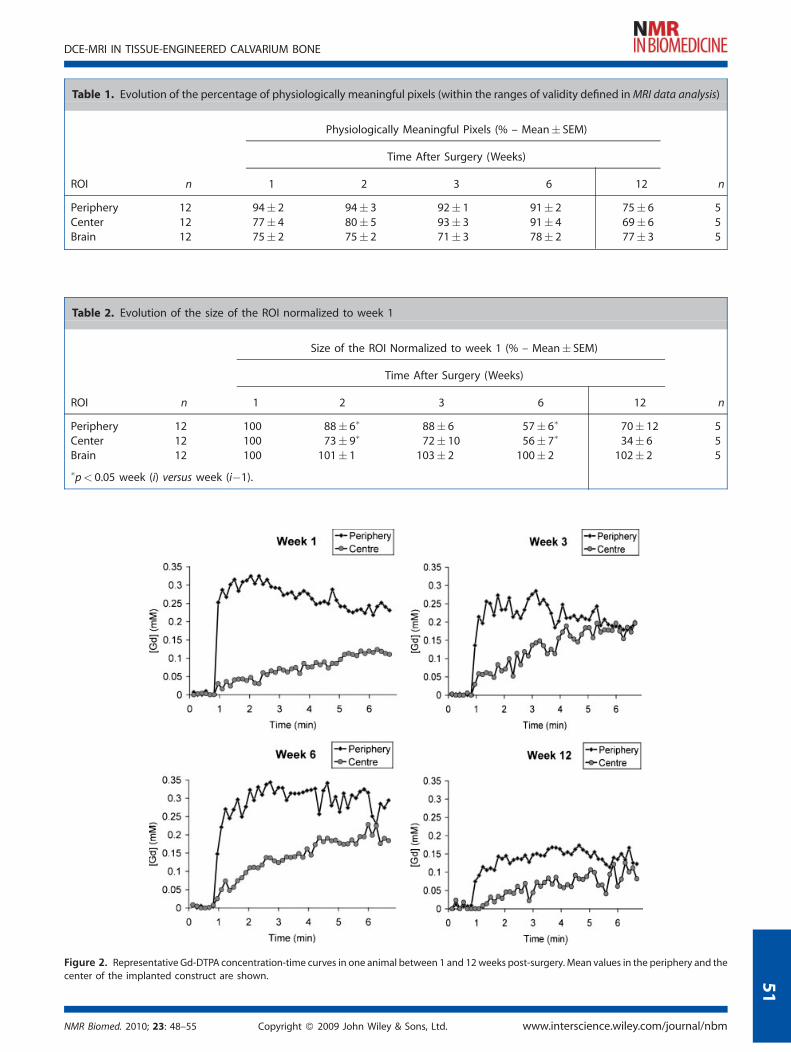
Table 2. Evolution of the size of the ROI normalized to week 1
Size of the ROI Normalized to week 1 (% – Mean� SEM)
Time After Surgery (Weeks)
ROI n 1 2 3 6 12 n
Periphery 12 100 88� 6� 88� 6 57� 6� 70� 12 5Center 12 100 73� 9� 72� 10 56� 7� 34� 6 5Brain 12 100 101� 1 103� 2 100� 2 102� 2 5
�p< 0.05 week (i) versus week (i�1).
Figure 2. Representative Gd-DTPA concentration-time curves in one animal between 1 and 12weeks post-surgery. Mean values in the periphery and thecenter of the implanted construct are shown.
Table 1. Evolution of the percentage of physiologically meaningful pixels (within the ranges of validity defined inMRI data analysis)
Physiologically Meaningful Pixels (% – Mean� SEM)
Time After Surgery (Weeks)
ROI n 1 2 3 6 12 n
Periphery 12 94� 2 94� 3 92� 1 91� 2 75� 6 5Center 12 77� 4 80� 5 93� 3 91� 4 69� 6 5Brain 12 75� 2 75� 2 71� 3 78� 2 77� 3 5
NMR Biomed. 2010; 23: 48–55 Copyright � 2009 John Wiley & Sons, Ltd. www.interscience.wiley.com/journal/nbm
DCE-MRI IN TISSUE-ENGINEERED CALVARIUM BONE
51

Figure 3. Evolution of angiogenesis in the periphery and center of the
implanted construct in all animals (n¼ 12, n¼ 5 for 12 weeks) using the
normalized IAUC60 metric. Results are presented as mean� SEM. p< 0.05:� different relative to week 1, # different relative to week 6.
Figure 4. Time points showing significant changes in angiogenic devel-
opment in all animals. Evolution of the vascular response does not differbetween the two anesthetic procedures (isoflurane (dashed lines) and
pentobarbital (solid lines)). On each graph, the number of rabbits showing
an increased ("), decreased (#), or constant (¼) change is indicated.
M. BEAUMONT ET AL.
52
by a much lower and gradual uptake. Both ROIs exhibited less Gduptake at the last time point of 12 weeks after graft implantation.Figure 3 shows the evolution of the mean IAUC60 values
normalized to the reference (IAUC60 in the brain) in both theperiphery and center of the construct throughout the 12 weeks.The periphery exhibited the highest value at the early time point,followed by a plateau and a two-fold decrease at 12 weekspost-surgery. The center of the construct exhibited differentcharacteristics. Normalized IAUC60 values were significantly lowerat all time points, and a progressive increase was observed atearly times up to 3 weeks post-surgery. The one common traitobserved in both the center and periphery was a decrease inuptake at 12 weeks. Values for all animals are shown in Table 3.Figure 4 shows how angiogenesis evolves in individual animals
at time points where significant changes were observed, namely,between weeks 1 and 3 and weeks 6 and 12. It also distinguishesgroups administered different anesthetics (solid versus dashedlines). Several key results are noted in this figure. First, the
Table 3. Evolution of normalized IAUC60 values presented in all a
ROI n 1 2
Periphery All 12 8.42� 0.48 6.44�Pentobarbital 5 7.93� 0.83 5.14�Isoflurane 7 8.78� 0.60 7.37�
Center All 12 1.92� 0.29 2.15�Pentobarbital 5 1.49� 0.13 1.64�Isoflurane 7 2.23� 0.47 2.51�
�p< 0.05 pentobarbital versus isoflurane.
www.interscience.wiley.com/journal/nbm Copyright � 200
proposed DCE-MRI approach yields reproducible trends inangiogenic development in most animals: a significant earlydecrease in the periphery versus an increase in the center (in eachcase, the trend was observed on 8 animals out of 12), followed bya decrease in the entire construct at 12 weeks. Second, thisapproach is insensitive to differential vascular response toanesthesia that is independent of angiogenesis. An exception tothis is seen at 12 weeks (Table 3), where normalized IAUC60 valuesare significantly higher in the isoflurane group. Although thesample size was small (n¼ 2), the possibility of anesthesiainfluence on vascular development at 12 weeks could not bedisregarded, and these two animals were excluded from the
nimals and in each anesthetic group
IAUCROI60 /IAUC
brain60 (Mean� SEM)
Time After Surgery (Weeks)
3 6 12 n
0.47 6.56� 0.39 6.40� 0.57 3.44� 0.45 50.41� 6.73� 0.70 5.41� 0.44 3.44� 0.45� 50.53� 6.44� 0.50 7.10� 0.86 7.46� 0.69� 20.26 2.44� 0.22 2.41� 0.34 1.35� 0.22 50.13 2.13� 0.37 2.19� 0.73 1.35� 0.22� 50.39 2.65� 0.26 2.57� 0.32 2.95� 0.61� 2
9 John Wiley & Sons, Ltd. NMR Biomed. 2010; 23: 48–55

Figure 5. Evaluation of bone growth with micro-CT images. (a) At
6 weeks after the surgery, new bone is present mostly at the periphery
of the bony defect containing the HA-VEGF construct. (b) At 12 weeks,there were islands of newly formed bone in the center of the defect. The
dotted line indicates the midline and the circle is an estimate of the
original defect.
DCE-MRI IN TISSUE-ENGINEERED CALVARIUM BONE
12 weeks mean values in Fig. 3 and Table 3. It is important to notethat aside from the 12-week discrepancy, these two animalsfollowed the general trend at earlier time points and were part ofthe 8 out of 12 animals showing the same behavior betweenweek 1 and week 3. Further investigations are required to confirmthis hypothesis regarding anesthesia-induced differences.
Micro-computed tomography
Figure 5 shows representative micro-CT images of excisedcalvarium. Micro-CTevaluation supported the MRI findings. Therewas new bone noted at 6 weeks, mostly at the periphery of thebony defects containing the HA-VEGF constructs, while at12 weeks islands of newly formed bone had appeared in thecenter of the defects.
5
DISCUSSION
Tissue engineering is a promising technique for bone repair andcan overcome the major drawbacks of conventional autogenousbone grafting. Instead of using a surgically harvested bone graft,a biological soft-tissue construct is placed within the bony defect.This construct acts as a resorbable scaffold to support twointimately linked processes during tissue regeneration: cellularcolonization and angiogenesis. Monitoring angiogenesis long-itudinally, for instance, using DCE-MRI, provides a means to assessbone development non-invasively. In this study, a model-freeanalysis of DCE-MRI data was used to investigate and characterizeangiogenesis in a VEGF-impregnated tissue-engineered con-struct within the rabbit calvarial defect. Vessel network initiationand establishment within the construct, leading to successfulbone regeneration, were demonstrated in vivo using normalizedIAUC60 measurements. The proposed approach provides repro-ducible and sensitive results and is robust to challengingexperimental conditions.Natural wound healing and bone regeneration after autogeneous
bone grafting have been extensively described in the literature. Boneregeneration results from a combination of different processes, orphases, which occur usually in a dynamic equilibrium (6). Although
NMR Biomed. 2010; 23: 48–55 Copyright � 2009 John Wiley &
our proposed paradigmuses a soft-tissue construct instead of a bonegraft, the same phases are required to ensure successful boneregeneration. In fact, the collagen-based scaffold may be moreeasily resorbed than traditional bone grafts to allow newbone formation. Also, the soft-tissue construct provides the idealthree-dimensional framework to guide desired angiogenesis (4),which is a major determinant to bone formation. The differentprocesses involved in bone formation are as follows. The earlyinflammatory phase is characterized by the different componentsof wound healing: inflammation, hemorrhage, hematoma, andblood clot formation. These combined phenomena stimulatemacrophages to release growth factors (such as VEGF), whichinduces angiogenesis (32). Vascularization is the second stage ingraft healing and is strongly associated with the previous phase.It starts shortly after graft implantation, and the mature vesselnetwork is established within 2 to 3 weeks following surgery. Thethird phase significantly overlaps with the vascularization phaseand may last up to 6 weeks. During this time span, the graft iscolonized by cells, nutrients, and other growth factors necessaryfor new bone formation via the newly established vasculature.The final phase, the remodeling phase, is initiated between thefourth and the sixth week post-surgery and continues for severalmonths. It involves remodeling and mineralization of theimmature randomly-oriented bone. The two latter phases arealso accompanied by the resorption of the graft material (6).In our study, periphery and center regions of the soft-tissue
construct exhibited different behaviors with regards to angio-genic activity, but in each case, the different phases observedwere consistent with expected angiogenic progression, asdescribed in the literature. In the periphery, the high IAUC60value observed 1 week after the surgery is consistent with thefirst two phases of inflammation and angiogenesis, since bothlead to high contrast agent uptake due to high vessel leakiness.Then, between the second and the sixth week after insertion,when both angiogenesis and the third phase are expected tooccur, the IAUC60 is lower and remains relatively constant. Thelower contrast agent uptake is consistent with the completion ofthe inflammatory phase. The plateau in IAUC60 needs to beinterpreted carefully, since different uptake curve dynamics (atweeks 3 and 6) suggest distinct vascular behavior that possiblyindicates a transition from phase 2 to 3. The IAUC60 contributioncomes mainly from inflammatory/angiogenic activity initially andlater from a mature vasculature that is functioning fully to supplythe graft with elements to the new bony tissue. Finally, the dropat 12 weeks is expected since the remodeling phase no longerrequires a large vascular supply, perhaps resulting in subsequentvessel pruning (33). In the center, the inflammation phase is notdistinguishable because of the distance from the actual surgerysite. As for the three other phases, they are clearly separated: theslow IAUC60 increase reflects the growing vessels during angio-genesis, the plateau corresponds to the new bone formationphase, and the decrease is the same as in the periphery.Nevertheless, it should be pointed out that the uptake curvepattern observed in the center may reflect primarily diffusion ofthe contrast agent from the construct periphery to the core and isnot a purely vascular-driven response. In fact, diffusion is a funda-mental means of transport in tissue regeneration, since someelements, like cells, move from the host tissue to the graft not viathe vasculature but through diffusion along the scaffold. Finally,the size of ROIs defined on the construct decreased significantlyfrom week 1, indicating resorption of the graft while new bonytissue is created as observed on the micro-CT results.
Sons, Ltd. www.interscience.wiley.com/journal/nbm
3

M. BEAUMONT ET AL.
54
In this work, the IAUC approach was preferred to more com-mon model-based approaches to analyze DCE-MRI data. Indeed,our experimental conditions (small animal brain imaging withclinical magnetic field, low temporal resolution) rendered thedetermination of the AIF very challenging and would havecompromised a model-based analysis (19). Although empiricalapproaches do not have clear physiological associations, ourresults show that our normalized IAUC60 metric is very sensitive tothe different stages that occur during graft healing and boneregeneration, and can monitor the regeneration process and itssuccess. Moreover, when quantitative model-based approachesare used, numerous factors (AIF errors, limited temporal resolu-tion, and choice of analysis model) may impair robustness andaccuracy (18). When using an IAUC metric, several approacheshave been taken. Walker-Samuel et al. (34) recommended the useof IAUC90 for in vivo studies, but they also mentioned that theintegration period does not matter if the interval is long enoughto ensure good signal-to-noise ratio. In another study, Morganet al. (24) showed there were no major changes by using IAUC60or IAUC180. Furthermore, they demonstrated that reproducibilitywas improved when IAUC was computed from the T1 valuesrather than from the MR signal intensities. Finally, Evelhoch et al.(21) proposed normalizing the data with an AIF for longitudinalstudies. Considering all these elements, we used normalizedIAUC60 values derived from the Gd concentration time curve toachieve accuracy. Although our normalization was performedusing the whole brain IAUC60 value rather than the AIF one, theautomatic selection of enhancing pixels implemented providedresults sensitive enough to minimize effects from inter-individualphysiological variation and contrast agent dose variability. Muscletissue was not chosen as a reference in this study because of lowsignal-to-noise ratio due to greater distance from the surface coil.The good sensitivity of the IAUC approach demonstrated in thisstudy warrants further investigation to achieve improveddistinction of uptake curve patterns.The presented normalized IAUC60 method also demonstrated
robustness and insensitivity to the anesthetic procedure (oneexception occurred at the last time point), whereas thenon-normalized IAUC60 values presented significant differences(results not shown). Indeed, the two anesthetics used in ourprotocol are well known to induce antagonistic physiologicaleffects, mainly on the vasculature (35). Those effects have beeninvestigated using MRI and they have been shown to influencethe MR signal (36). As demonstrated by Hendrich et al.(37), usingarterial spin labeling on rat, cerebral blood flow, as well as pO2
and mean arterial blood pressure, measured on animals under-going isoflurane anesthesia are higher than the ones of animalsanesthetized with pentobarbital. If the proposed approachsuccessfully homogenized the two groups without hiding therelevant changes in angiogenesis activity, a discrepancyappeared at 12 weeks after surgery. Several hypotheses maybe raised to explain this result. First, one can suggest that thesample size of the isoflurane group at week 12 (n¼ 2), is not largeenough to reflect an actual difference, and this result may bebiased by inter-animal variability. Another hypothesis, asmentioned above, is long-term remodeling of the newlyestablished vasculature, which normally leads to partial vesselpruning. The repeated isoflurane anesthesia could have ananti-pruning effect on the vasculature, resulting in a higher bloodvolume and, thus, a higher normalized IAUC60 value. Thisexplanation is likely, since isoflurane is known for havingpreconditioning properties, as shown in stroke (38). Finally, as
www.interscience.wiley.com/journal/nbm Copyright � 200
isoflurane and pentobarbital generate vasodilatation and vaso-constriction, respectively, the trend observed may be simply anemphasis of the natural trend, because vessels are more matureand more reactive to those chemical stimulations. A combinationof these three hypotheses may also explain the reporteddifference. Understanding this phenomenon requires furtherinvestigation.In conclusion, this study provides the first report of an in vivo
longitudinal DCE-MRI study in tissue-engineered calvarium bone.The soft-tissue construct acts as a resorbable support forpromoting angiogenesis and achieving complete bone regen-eration. The normalized IAUC60 approach used for the DCE-MRIanalysis was capable of characterizing angiogenesis anddiscriminating between the different phases of bone regener-ation, and was robust to challenging experimental conditions.
Acknowledgements
We thank Marvin Estrada for animal care support and TammyRayner, Ruth Weiss, and Garry Detzler for technical assistanceduring MR scanning.
REFERENCES
1. Giannoudis PV, Dinopoulos H, Tsiridis E. Bone substitutes: an update.Injury 2005; 36 (Suppl 3): S20–27.
2. Ebraheim NA, Elgafy H, Xu R. Bone-graft harvesting from iliac andfibular donor sites: techniques and complications. J. Am. Acad.Orthop. Surg. 2001; 9(3): 210–218.
3. Kneser U, Schaefer DJ, Polykandriotis E, Horch RE. Tissue engineeringof bone: the reconstructive surgeon’s point of view. J Cell Mol. Med.2006; 10(1): 7–19.
4. Kanczler JM, Oreffo RO. Osteogenesis and angiogenesis: the potentialfor engineering bone. Eur. Cell Mater. 2008; 15: 100–114.
5. Axhausen W. The osteogenetic phases of regeneration of bone; ahistorial and experimental study. J. Bone Joint Surg. Am. 1956; 38(3):593–600.
6. Goldberg VM, Stevenson S. Natural history of autografts and allo-grafts. Clin. Orthop. Relat. Res. 1987; 225: 7–16.
7. Watrin-Pinzano A, Ruaud JP, Cheli Y, Gonord P, Grossin L, Bettem-bourg-Brault I, Gillet P, Payan E, Guillot G, Netter P, Loeuille D.Evaluation of cartilage repair tissue after biomaterial implantationin rat patella by using T2 mapping. MAGMA 2004; 17(3–6): 219–228.
8. Trattnig S, Mamisch TC, Welsch GH, Glaser C, Szomolanyi P, Gebets-roither S, Stastny O, Horger W, Millington S, Marlovits S. QuantitativeT2 mapping of matrix-associated autologous chondrocyte transplan-tation at 3 Tesla: an in vivo cross-sectional study. Invest. Radiol. 2007;42(6): 442–448.
9. Moinnes JJ, Vidula N, Halim N, Othman SF. Ultrasound acceleratedbone tissue engineering monitored with magnetic resonance micro-scopy. Conf. Proc. IEEE Eng. Med. Biol. Soc. 2006; 1: 484–488.
10. Xu H, Othman SF, Hong L, Peptan IA, Magin RL. Magnetic resonancemicroscopy for monitoring osteogenesis in tissue-engineered con-struct in vitro. Phys. Med. Biol. 2006; 51(3): 719–732.
11. Cartwright L, Farhat WA, Sherman C, Chen J, Babyn P, Yeger H, ChengHL. Dynamic contrast-enhanced MRI to quantify VEGF-enhancedtissue-engineered bladder graft neovascularization: pilot study.J. Biomed. Mater. Res. A 2006; 77(2): 390–395.
12. Cheng HL, Chen J, Babyn PS, Farhat WA. Dynamic Gd-DTPA enhancedMRI as a surrogate marker of angiogenesis in tissue-engineeredbladder constructs: a feasibility study in rabbits. J. Magn. Reson.Imaging 2005; 21(4): 415–423.
13. Cheng HL, Wallis C, Shou Z, Farhat WA. Quantifying angiogenesis inVEGF-enhanced tissue-engineered bladder constructs by dynamiccontrast-enhanced MRI using contrast agents of different molecularweights. J. Magn. Reson. Imaging 2007; 25(1): 137–145.
14. Cheng HL. Dynamic contrast-enhanced MRI in oncology drug devel-opment. Curr. Clin. Pharmacol. 2007; 2(2): 111–122.
9 John Wiley & Sons, Ltd. NMR Biomed. 2010; 23: 48–55

DCE-MRI IN TISSUE-ENGINEERED CALVARIUM BONE
15. Helbich TH, Roberts TP, Rollins MD, Shames DM, Turetschek K, HopfHW, Muhler M, Hunt TK, Brasch RC. Noninvasive assessment ofwound-healing angiogenesis with contrast-enhanced MRI. Acad.Radiol. 2002; 9 (Suppl 1): S145–147.
16. Ehrhart N, Kraft S, Conover D, Rosier RN, Schwarz EM. Quantification ofmassive allograft healing with dynamic contrast enhanced-MRI andcone beam-CT: a pilot study. Clin. Orthop. Relat. Res. 2008; 466(8):1897–1904.
17. Tofts PS. Modeling tracer kinetics in dynamic Gd-DTPA MR imaging.J. Magn. Reson. Imaging 1997; 7(1): 91–101.
18. Cheng HL. Investigation and optimization of parameter accuracy indynamic contrast-enhancedMRI. J. Magn. Reson. Imaging 2008; 28(3):736–743.
19. Port RE, Knopp MV, Brix G. Dynamic contrast-enhanced MRI usingGd-DTPA: interindividual variability of the arterial input function andconsequences for the assessment of kinetics in tumors. Magn. Reson.Med. 2001; 45(6): 1030–1038.
20. Evelhoch JL. Key factors in the acquisition of contrast kinetic data foroncology. J. Magn. Reson. Imaging 1999; 10(3): 254–259.
21. Evelhoch JL, LoRusso PM, He Z, DelProposto Z, Polin L, Corbett TH,Langmuir P, Wheeler C, Stone A, Leadbetter J, Ryan AJ, Blakey DC,Waterton JC. Magnetic resonance imaging measurements of theresponse of murine and human tumors to the vascular-targetingagent ZD6126. Clin. Cancer Res. 2004; 10(11): 3650–3657.
22. Galbraith SM, Maxwell RJ, Lodge MA, Tozer GM, Wilson J, Taylor NJ,Stirling JJ, Sena L, Padhani AR, Rustin GJ. Combretastatin A4 phos-phate has tumor antivascular activity in rat and man as demonstratedby dynamic magnetic resonance imaging. J. Clin. Oncol. 2003; 21(15):2831–2842.
23. Galbraith SM, Lodge MA, Taylor NJ, Rustin GJ, Bentzen S, Stirling JJ,Padhani AR. Reproducibility of dynamic contrast-enhanced MRI inhuman muscle and tumours: comparison of quantitative and semi-quantitative analysis. NMR Biomed. 2002; 15(2): 132–142.
24. Morgan B, Utting JF, Higginson A, Thomas AL, Steward WP, HorsfieldMA. A simple, reproducible method for monitoring the treatment oftumours using dynamic contrast-enhanced MR imaging. Br. J. Cancer2006; 94(10): 1420–1427.
25. Roberts C, Issa B, Stone A, Jackson A, Waterton JC, Parker GJ.Comparative study into the robustness of compartmental modelingand model-free analysis in DCE-MRI studies. J. Magn. Reson. Imaging2006; 23(4): 554–563.
26. Fok TC, Jan A, Peel SA, Evans AW, Clokie CM, Sandor GK. Hyperbaricoxygen results in increased vascular endothelial growth factor (VEGF)
NMR Biomed. 2010; 23: 48–55 Copyright � 2009 John Wiley &
protein expression in rabbit calvarial critical-sized defects. Oral Surg.Oral Med. Oral Pathol. Oral Radiol. Endod 2008; 105(4): 417–422.
27. Jan AM, Sandor GK, Iera D, Mhawi A, Peel S, Evans AW, Clokie CM.Hyperbaric oxygen results in an increase in rabbit calvarial criticalsized defects. Oral Surg. Oral Med. Oral Pathol. Oral Radiol. Endod.2006; 101(2): 144–149.
28. Cheng HL, Wright GA. Rapid high-resolution T(1) mapping by variableflip angles: accurate and precise measurements in the presence ofradiofrequency field inhomogeneity. Magn. Reson. Med. 2006; 55(3):566–574.
29. Haase A. Snapshot FLASH MRI: applications to T1, T2, and chemical-shift imaging. Magn. Reson. Med. 1990; 13(1): 77–89.
30. Rohrer M, Bauer H, Mintorovitch J, Requardt M, Weinmann HJ.Comparison of magnetic properties of MRI contrast media solutionsat different magnetic field strengths. Invest. Radiol. 2005; 40(11):715–724.
31. Pitman EJG. Significance tests which may be applied to samples fromany populations. Suppl. J. R. Statist. Soc. 1937; 4(1): 119–130.
32. Marx RE, Ehler WJ, Peleg M. Mandibular and facial reconstruction:rehabilitation of the head and neck cancer patient. Bone 1996; 19 (1Suppl): 59S–82S.
33. Ghajar CM, George SC, Putnam AJ. Matrix metalloproteinase controlof capillary morphogenesis. Crit. Rev. Eukaryot. Gene Expr. 2008; 18(3):251–278.
34. Walker-Samuel S, Leach MO, Collins DJ. Evaluation of response totreatment using DCE-MRI: the relationship between initial area underthe gadolinium curve (IAUGC) and quantitative pharmacokineticanalysis. Phys. Med. Biol. 2006; 51(14): 3593–3602.
35. Todd MM, Wu B, Warner DS, Maktabi M. The dose-related effects ofnitric oxide synthase inhibition on cerebral blood flow during iso-flurane and pentobarbital anesthesia. Anesthesiology 1994; 80(5):1128–1136.
36. Baudelet C, Gallez B. Effect of anesthesia on the signal intensity intumors using BOLD-MRI: comparison with flow measurements byLaser Doppler flowmetry and oxygen measurements by luminescen-ce-based probes. Magn. Reson. Imaging 2004; 22(7): 905–912.
37. Hendrich KS, Kochanek PM,Melick JA, Schiding JK, Statler KD, WilliamsDS, Marion DW, Ho C. Cerebral perfusion during anesthesia withfentanyl, isoflurane, or pentobarbital in normal rats studied by arterialspin-labeled MRI. Magn. Reson. Med. 2001; 46(1): 202–206.
38. Kitano H, Kirsch JR, Hurn PD, Murphy SJ. Inhalational anesthetics asneuroprotectants or chemical preconditioning agents in ischemicbrain. J. Cereb. Blood Flow Metab. 2007; 27(6): 1108–1128.
Sons, Ltd. www.interscience.wiley.com/journal/nbm
55
Copyright © 2022 FDOKUMEN