Monitoring and prescription of GPS training load in elite ...
217
Monitoring and prescription of GPS training load in elite academy soccer athletes Will Abbott A thesis submitted in partial fulfillment of the requirement of University of Brighton for the degree of Doctor of Philosophy August 2018
-
Upload
khangminh22 -
Category
Documents
-
view
2 -
download
0
Transcript of Monitoring and prescription of GPS training load in elite ...

Monitoring and prescription of GPS
training load in elite academy soccer
athletes
Will Abbott
A thesis submitted in partial fulfillment of
the requirement of University of Brighton
for the degree of Doctor of Philosophy
August 2018

2
Abstract
Application of global positioning system (GPS) technology is poorly understood within
soccer, with limited consideration of the individual or population. The current thesis
investigated an individualised approach to monitoring and prescription of training load in
elite academy soccer. Study One, Study Two and Study Three focused upon individualising
the training load monitoring process. Study Four and Study Five progressed the focus to the
individual prescription of training load for soccer athletes.
Global speed thresholds have typically been utilised to classify high-speed locomotion,
masking important information regarding the relative intensity. Study One examined
discrepancies between global and individual thresholds when monitoring high-speed
locomotion. GPS data was collected for 19 Premier League academy soccer athletes, over a
six-week period. For each athlete and training session, high-speed running (HSR), very high-
speed running (VHSR), and sprinting (SPR) distances were calculated using both global and
individual thresholds. Athletes were sub-divided into high (HIMAS), medium (MEMAS), and
low (LOMAS) maximum aerobic speed groups. In LOMAS athletes, individual thresholds
produced higher HSR, VHSR and SPR distances compared to global. In HIMAS athletes,
individual analysis method produced 549m less HSR, and 341m less VHSR distance
compared to global. Global thresholds produced high-speed locomotion distances
significantly higher, or lower than individual thresholds for 47% of athletes, suggesting that
using field tests to individualise speeds thresholds will allow accurate quantification of
individual athlete intensity.
Study Two examined discrepancies between global and individual thresholds when
quantifying acceleration tasks. Thirty-one elite soccer athletes were studied over a four-week
period. For each athlete and training session: low-, moderate-, and high-intensity acceleration
distances were calculated using both global and individual thresholds. Athletes were sub-
divided into high (HIACC), medium (MEACC), and low (LOACC) maximum accelerative
capacity groups. For MEACC athletes, moderate- and high-intensity acceleration distances
were significantly higher utilising global thresholds compared to individual. For HIACC
athletes, significantly higher distances were produced utilising global thresholds, for low-,
moderate-, and high-intensity acceleration. Findings highlighted the discrepancies between

3
acceleration distances calculated utilising global and individual thresholds, and the variation
in discrepancies between athletes of differing physical capacities.
Quantifying the physical demands elicited upon playing positions during soccer competition
is vital for training prescription purposes. As a novel research question, Study Three
examined total distance, high-speed locomotion, maximum speed, and acceleration demands
of playing positions during competition. To provide further accuracy and insight, high-speed
locomotion and acceleration thresholds were individualised, and sub-divided by intensity.
GPS metrics were collected for 37 soccer athletes across 44 competitive matches. Athletes
were sub-divided into five playing positions, with GPS metrics analysed between playing
positions. Results demonstrated central defenders produced the lowest values for all GPS
metrics. Wide attackers and wide defenders produced significantly higher sprinting, and high-
intensity acceleration distances compared to all other positions. Central midfielders produced
significantly higher total and moderate-intensity acceleration distances compared to all other
playing positions. This study was the first to provide a holistic overview of the relative
demands placed upon playing positions, demonstrating the individual nature of soccer
competition.
Soccer training games are popular conditioning modalities, however research is yet to analyse
training game demands relative to positional demands of competition, or differentiate
between average and peak demands. Study Four investigated how different training game
interventions affected the average and peak demands elicited upon soccer playing positions
relative to their competitive demands. GPS and rating of perceived exertion (RPE) data was
collected for 46 soccer athletes over a season. Athletes were sub-divided into five playing
positions, with positional data collected for 22 matches and 39 training game sessions.
Average and peak GPS metrics, and RPE were compared between training games and
competition for each playing position. Findings demonstrated that although medium and
large training games elicited average total distances significantly higher than competition,
when comparing peak total distances, all game formats were significantly lower. This was
also evident with very high-speed running and sprinting intensities. Results highlight the
importance of analysing physical outputs of training games relative to peak demands of
competition. Findings provide coaches the ability to prescribe game formats to playing
positions specific to their positional requirements.

4
A novel alternative to age and weight categories for youth competition involves ‘bio-
banding’ athletes using maturation groups. Study Five investigated physical and technical
performance during bio-banded and chronological soccer competition intervention for
athletes of varying maturation status, yet to be examined by literature. Twenty-five male
soccer athletes, aged 11-15 years and 85-90% of predicted adult stature, were divided into
early, on-time, and late developing athletes. Athletes competed in both bio-banded and
chronological age group competition. Four physical performance metrics, and six technical
performance metrics were analysed to determine differences between maturation statuses,
competition format, and the interaction. For early developers, bio-banded produced
significantly more short passes, dribbles, and a higher RPE than chronological. For on-time
developers, bio-banded produced significantly more short passes, dribbles, and less long
passes than chronological. For late developers, bio-banded produced more tackles, and less
long passes than chronological. There were no significant differences identified for total,
sprinting, or acceleration distances between competition formats. Findings demonstrate bio-
banded competition increased the technical emphasis placed upon athletes of varying
maturation statuses, without reducing the physical demands. Consequently, competition
formats can be prescribed to athletes of differing maturity statuses, dependent upon their
developmental needs.
The current thesis makes numerous original contributions to individualising training load
monitoring and prescription. Findings provide significant implications for applied
practitioners aiming to develop the specificity of training for professional soccer athletes. The
thesis provides a strong rationale for individualising speed and acceleration thresholds to
monitor the relative demands placed upon individual athletes. Field based protocols were
used to determine individual thresholds, allowing applied practitioners cost and time effective
methods for implementation. The thesis was the first to identify the holistic positional
demands elicited by soccer competition, in addition to manipulating training game format to
examine average and peak demands elicited upon playing positions relative to competition.
Finally, the thesis was the first to demonstrate the impact of bio-banding on the physical and
technical demands of soccer.

5
Publications
Peer reviewed publications arising from this course of investigation
Abbott, W., Brickley, G., & Smeeton, N.J. (2018). An individual approach to monitoring
locomotive training load in English Premier League academy soccer players. International
Journal of Sports Science & Coaching, 13(3), 421-428.
Abbott, W., Brickley, G., Smeeton, N.J., & Mills, S. (2018). Individualizing acceleration in
English Premier League academy soccer players. The Journal of Strength and Conditioning
Research, 32(12), 3503-3510.
Abbott, W., Brickley, G., & Smeeton, N.J. (2018). Physical demands of playing position
within English Premier League academy soccer. Journal of Human Sport & Exercise, 13(2),
1-11.
Abbott, W., Brickley, G., & Smeeton, N.J. (2018). Positional differences in GPS outputs and
perceived exertion during soccer training games and competition. The Journal of Strength
and Conditioning Research, 32(11), 3222-3231.
Peer reviewed publications arising from research conducted alongside this course of
investigation
Abbott, W., Brownlee, T.E., Harper, L.D., Naughton, R.J. & Clifford, T. (2018). The
independent effects of match location, match result and the quality of opposition on
subjective wellbeing in under 23 soccer players: a case study. Research in Sports Medicine,
26(3), 262-275.
Clifford, T., Abbott, W., Kwiecien, S.Y., Howatson, G, & McHugh, M.P. (2018).
Cryotherapy re-invented: Application of phase change material for recovery in elite soccer.
International Journal of Sport Physiology and Performance, 13, 584-589.

6
McHugh, M.P., Clifford, T., Abbott, W., Kwiecien, S.Y., Kremenic, I.J., DeVita, J.J.,
Howatson, G. (2018). Countermovement jump recovery in professional soccer players using
an inertial sensor. International Journal of Sport Physiology and Performance, Publish
Ahead of Print.

7
List of Figures
Figure 2.1. Example report quantifying the intensity and direction of acceleration tasks. p.27
Figure 4.1 Mean (± SD) Distance travelled HSR, VHSR, and SPR when utilising global or
individual analysis methods, in LOMAS athletes. N.B. asterisk represents significant difference
of p < 0.01, d represents effect size. p.74
Figure 4.2 Mean (± SD) Distance travelled HSR, VHSR, and SPR when utilising global or
individual analysis methods, in MEMAS athletes. N.B. asterisk represents significance
difference of p < 0.01, d represents effect size. p.75
Figure 4.3 Mean (± SD) Distance travelled HSR, VHSR, and SPR when utilising global or
individual analysis methods, in HIMAS athletes. N.B. asterisk represents significance
difference of p < 0.01, d represents effect size. p.76
Figure 5.1. Distribution and mean distance travelled performing low-, moderate-, and high-
intensity acceleration when utilising global or individual thresholds, in LOACC athletes. N.B.
asterisk represents significant difference, d represents effect size. p.90
Figure 5.2. Distribution and mean distance travelled performing low-, moderate-, and high-
intensity acceleration when utilising global or individual thresholds, in MEACC athletes. N.B.
asterisk represents significant difference, d represents effect size. p.91
Figure 5.3. Distribution and mean distance travelled performing low-, moderate-, and high-
intensity acceleration when utilising arbitrary or individual thresholds, in HIACC athletes. N.B.
asterisk represents significant difference, d represents effect size. p.92
Figure 6.1 Differences in very high-speed running and sprinting distances produced by
soccer playing positions. N.B. level of statistical significance p < 0.05, d represents effect
size. p.106
8
Figure 6.2 Differences in moderate-intensity and high-intensity acceleration distances
produced by soccer playing positions. N.B. level of statistical significance p < 0.05, d
represents effect size. p.107
Figure 7.1 Average and peak total distance intensities produced by playing position during
training games and competition. N.B. asterisk represents significant difference of p < 0.05
compared to competition, d represents effect size. p.120
Figure 7.2 Average and peak very high-speed running and sprinting intensities produced by
playing position during training games and competition. N.B. asterisk represents significant
difference of p < 0.05 compared to competition, d represents effect size. p.122
Figure 7.3 Average and peak moderate-intensity acceleration distance intensities produced
by playing position during training games and competition. N.B. asterisk represents
significant difference of p < 0.05 compared to competition, d represents effect size. p.123
Figure 7.4 Average and peak high-intensity acceleration distance intensities produced by
playing position during training games and competition. N.B. asterisk represents significant
difference of p < 0.05 compared to competition, d represents effect size. p.125
Figure 7.5 Ratings of perceived exertion produced by playing position during training games
and competition. N.B. asterisk represents significant difference of p < 0.05 compared to
competition, d represents effect size. p.126
Figure 8.1. Rating of perceived exertion produced by early, on-time, late developing athletes
during bio-banded and chronological competition formats. N.B. asterisk represents
significant difference of p < 0.05, d represents effect size. p.141
Figure 8.2. Number of short passes produced by early, on-time, late developing athletes
during bio-banded and chronological competition formats. N.B. asterisk represents
significant difference of p < 0.05, d represents effect size. p.143

9
Figure 8.3. Number of long passes produced by early, on-time, late developing athletes
during bio-banded and chronological competition formats. N.B. asterisk represents
significant difference of p < 0.05, d represents effect size. p.144
Figure 8.4. Number of dribbles produced by early, on-time, late developing athletes during
bio-banded and chronological competition formats. N.B. asterisk represents significant
difference of p < 0.05, d represents effect size. p.145
Figure 8.5. Number of tackles produced by early, on-time, late developing athletes during
bio-banded and chronological competition formats. N.B. asterisk represents significant
difference of p < 0.05, d represents effect size. p.146

10
List of Tables
Table 3.1 Global high-speed locomotion thresholds utilised within Study One. p.53
Table 3.2 Individual high-speed locomotion thresholds utilised within Study One. p.53
Table 3.3 Global acceleration thresholds utilised within Study Two. p.54
Table 3.4 Individual acceleration thresholds utilised within Study Two. p.54
Table 3.5 GPS and subjective metrics utilised within Study Three, Study Four and Study
Five. p.55
Table 3.6 Technical performance metrics utilised within Study Five. p.56
Table 4.1 Speed thresholds for LOMAS, MEMAS, and HIMAS athlete groups using global and
individual analysis methods. p.73
Table 5.1. Acceleration thresholds for LOACC, MEACC, and HIACC athlete groups utilising
global and individual analysis methods. p.88
Table 6.1 Differences in total distance, and maximum speeds achieved by soccer playing
positions during competition. Level of statistical significance p < 0.05, d represents effect
size. p.105
Table 7.1 Descriptions of GPS metrics utilised. p.118
Table 8.1. Descriptions of physical performance metrics collected during competition
formats. p.139
Table 8.2. Descriptions of technical metrics collected during competition formats. p.139

11
Table 8.3. Total, very high-speed running and sprinting, and acceleration distances produced
by early, on-time, late developing athletes during bio-banded and chronological competition
formats. N.B. asterisk represents significant difference of p < 0.05. p.142
Table 8.4. Number of shots and crosses produced by early, on-time, late developing athletes
during bio-banded and chronological competition formats. N.B. asterisk represents
significant difference of p < 0.05. p.146
Table 9.1 Experimental hypotheses tested with the current thesis. p.155

12
Abbreviations and Explanations
The following abbreviations have been defined in the text in the first instance.
GPS -Global Positioning System
RPE -Rating of Perceived Exertion. Utilising the modified CR10 Borg scale
(Borg, 1982).
Global thresholds -Application of the same thresholds to all athletes. This can be to
quantify high-speed locomotion (Study One), or acceleration (Study
Two).
Individual thresholds -Application of individual specific thresholds to athletes. This is
determined by maximum aerobic speed and maximum sprint speed
performance (Study One), or maximum accelerative capacity (Study
Two).
MAS -Maximum aerobic speed.
MSS -Maximum sprint speed.
ASR -Anaerobic speed reserve.
vV̇O2max -Velocity at V̇O2max.
LOMAS -Low maximum aerobic speed (< 1 SD from group mean). This criteria
was used to sub-group athletes within Study One.
MEMAS -Medium maximum aerobic speed (± 1 SD from group mean). This
criteria was used to sub-group athletes within Study One.
HIMAS -High maximum aerobic speed (> 1 SD from group mean). This
criteria was used to sub-group athletes within Study One.
HSR -High-speed running.
VHSR -Very high-speed running.
SPR -Sprinting.
LOACC -Low maximum accelerative capacity (< 1 SD from group mean). This
criteria was used to sub-group athletes within Study Two.
MEACC -Medium maximum accelerative capacity (± 1 SD from group mean).
This criteria was used to sub-group athletes within Study Two.
HIACC -High maximum accelerative capacity (> 1 SD from group mean). This
criteria was used to sub-group athletes within Study Two.

13
LSG -Large training game, characterised as 10v10, 9v9, 8v8, or 7v7 plus
goalkeepers. Used to sub-divide training methodologies within Study
Four.
MSG -Medium training game, characterised as 6v6, 5v5, or 4v4 plus
goalkeepers. Used to sub-divide training methodologies within Study
Four.
SSG -Small training game, characterised as 3v3, 2v2, or 1v1 plus
goalkeepers. Used to sub-divide training methodologies within Study
Four.
Early developer -Maturity Z-score > 1. Used to sub-group athletes within Study Five.
On-time developer -Maturity Z-score -1 to +1. Used to sub-group athletes within Study
Five.
Late developer -Maturity Z-score < -1 Used to sub-group athletes within Study Five.
Bio-banded -Soccer competition with teams grouped by level of maturation.
Chronological -Soccer competition with teams grouped by age.

14
Acknowledgements
First and foremost, I would like to express my gratitude to my supervisors Dr. Gary Brickley
and Dr. Nicholas Smeeton for their help and guidance throughout the PhD. Both of you have
been invaluable throughout this process, and I have learnt a significant amount under your
tutelage.
I would also like to thank my family. John, Juliet, and Steph Abbott - without your continued
support I would not be in the position I currently am. This is as much a collective
achievement for us all as it is for me. Kathryn Newbon – thank you for your support, your
understanding, and your patience with this ongoing obsession!
Thank you to all the staff and players at Brighton and Hove Albion FC for your cooperation
and participation throughout data collection. Finally, thanks to the colleagues and friends
who inspired me to always challenge my beliefs and current practices, and who helped create
the desire to embark upon my research journey.

15
Contents
Abstract 2
Publications 5
Peer reviewed publications arising from this course of investigation 5
Peer reviewed publications arising from research conducted alongside this course of
investigation 5
List of figures 7
List of tables 10
Abbreviations and Explanations 12
Acknowledgements 14
1.0 Introduction 18
1.1 Introduction 19
1.2 Organisation of Thesis 23
2.0 Review of Literature 25
2.1 Training Load Monitoring Techniques 26
2.2 Background to GPS 26
2.3 GPS Validity and Reliability 28
2.4 High-speed Locomotion in Soccer 29
2.5 Acceleration Manoeuvres in Soccer 31
2.6 Individualising Athlete Training Load 32
2.7 Competitive Demands of Soccer 34
2.8 Physical Outputs and Match Outcome 36
2.9 Soccer Training to Develop Competitive Performance 36
2.10 Training For Peak Demands of Competition 38
2.11 Relative Age Effect in Soccer 39
2.12 The Effect of Maturation Upon Physical Performance 41
2.13 Bio-banding in Academy Soccer 43
2.14 Determining Significance and Effect Size of Experimental Results 46
3.0 General Methods 48
3.1 Participant Recruitment 49
3.2 Participant Exclusion Criteria 49
3.3 Data Collection Procedures 50

16
3.4 Participant Preparation and Warm Up Procedures 51
3.5 Physical and Technical Metrics Collected 52
3.6 Speed and Acceleration Thresholds 57
3.7 Physical Performance Testing Procedures 58
3.8 Athlete Groups 59
3.9 GPS Data Analysis 60
3.10 GPS Data Quality and Accuracy 61
3.11 Data Exclusion Criteria 61
3.12 Technical Data Analysis 62
3.13 Statistical Analysis 62
4.0 Study One - An individual approach to monitoring locomotive training load in
English Premier League academy soccer players 65
4.1 Introduction 67
4.2 Methodology 69
4.3 Results 73
4.4 Discussion 76
4.5 Conclusion 79
5.0 Study Two - Individualising acceleration in English Premier League academy soccer
players 80
5.1 Introduction 82
5.2 Methodology 85
5.3 Results 89
5.4 Discussion 92
5.5 Conclusion 96
6.0 Study Three - Physical demands of playing position within English Premier League
academy soccer 97
6.1 Introduction 99
6.2 Methodology 101
6.3 Results 104
6.4 Discussion 107
6.5 Conclusion 110
7.0 Study Four - Positional differences in GPS outputs and perceived exertion during
soccer training games and competition 111
7.1 Introduction 113
17
7.2 Methodology 115
7.3 Results 119
7.4 Discussion 126
7.5 Conclusion 130
8.0 Study Five - The effect of bio-banding upon physical and technical performance
during soccer competition 131
8.1 Introduction 133
8.2 Methodology 136
8.3 Results 140
8.4 Discussion 147
8.5 Conclusion 151
9.0 General Discussion 152
9.1 Introduction 153
9.2 Experimental Hypotheses Tested 154
9.3 Use of Field Tests to Individualise Speed and Acceleration Thresholds 156
9.4 Identifying Positional Demands and Prescribing Training Game Formats 159
9.5 Prescription of Bio-banded and Chronological Competition Formats 165
9.6 Limitations 168
9.7 Future Directions 170
9.8 Practical Recommendations 173
10.0 Reference List 177
11.0 Appendices 196
11.1 Appendix One – Participant Information Sheet and Consent Form – Study One
197
11.2 Appendix Two – Participant Information Sheet and Consent Form – Study Two
201
11.3 Appendix Three – Participant Information Sheet and Consent Form – Study
Three 205
11.4 Appendix Four – Participant Information Sheet and Consent Form – Study Four
209
11.5 Appendix Five – Participant Information Sheet and Consent Form – Study Five
213
11.6 Appendix Six – Club Permission For Data Collection 217

18
1.0 Introduction

19
1.1 Introduction
Due to the competitive nature of soccer, both on and off the pitch, teams are constantly
searching for tools to gain a competitive advantage. The significant financial incentives
associated with success result in organisations placing a large emphasis on identifying tools
to improve performance. Technological improvements, coupled with a continued search for
competitive advantage, have led to an increased use of technology within elite soccer
environments. Technology, such as global positioning system (GPS) devices, are now
common within most sporting organisations. GPS devices provide a wealth of information for
sport science practitioners and coaches, with the aim of improving training monitoring and
prescription processes, and gaining competitive advantages. With vast sums of data available,
and a number of potential methods to conduct analysis, it is vital data is collected and
analysed with accuracy and validity. To accurately and effectively monitor and prescribe
training load, and positively affect soccer training, the correct processes must be applied.
This is increasingly important given the shift towards an individual approach to training.
Emerging research acknowledges the individual nature of the training process, and
consequent requirement for an individual approach to training load monitoring and
prescription.
Distance travelled performing high-speed locomotion tasks (e.g. high-speed running, very
high-speed running, and sprinting) has received significant attention when investigating
training load (Bradley et al., 2009; Di Salvo et al., 2010). Faude et al. (2012) highlighted the
importance of high-speed locomotion by stating straight-line sprinting is the most dominant
action performed when scoring goals. Considering sprinting tasks are associated with
impaired muscle function, and increased perceived muscle soreness, the volume of sprinting
completed has implications upon recovery time and injury risk (Howatson & Milak, 2009). It
is therefore important that high-speed locomotion is quantified accurately (Carling, 2013).
Typically, global speed thresholds have been utilised to band high-speed locomotion in
applied environments. These thresholds are suggested to mask important information
regarding the relative intensity an individual is working (Hunter et al., 2015). Recently,
individual speed thresholds have been developed, however many are time consuming,
expensive, and require access to facilities and expertise to administer (Lovell & Abt, 2013).
This creates barriers for applied practitioners working with large squads of athletes. In
addition, researchers have utilised varying methodologies to test and individualise athlete’s
20
speed thresholds. Abt and Lovell (2009) utilised the second ventilatory threshold to
determine ‘high-intensity’ thresholds for individual athletes. Rationale was that the threshold
marked the transition from moderate to high-intensity exercise. Gabbett (2015) utilised field
tests to individualise speed thresholds, incorporating athlete’s maximum sprint speed. To
increase the specificity of speed thresholds, researchers have recently incorporated multiple
markers of athlete’s physical capacity to individualise the monitoring process. Hunter et al.
(2015) and Mendez-Villanueva et al. (2013) recently applied this to youth athletes, utilising
athlete’s functional limits of endurance and sprint locomotor capacities. Unsurprisingly,
differences in methodologies within previous research have led to varying conclusions,
requiring further investigation.
Despite having an important role in the monitoring process, soccer training load should not
focus solely upon high-speed locomotion. Doing so neglects metabolically demanding tasks
such as acceleration. An athlete’s ability to accelerate quickly is suggested to be vital for on
field performance, in addition to being important underlying factors for muscular fatigue
(Greig & Siegler, 2009; Lockie et al., 2011). Similar to high-speed locomotion, in the
majority of applied environments global acceleration thresholds are utilised to band and
quantify acceleration tasks. Considering the highly individual nature of the exercise
continuum, it is difficult to accurately assess the relative intensity of acceleration tasks
without accounting for an individual’s accelerative capacity. Recently, Sonderegger et al.
(2016) devised individual acceleration thresholds using individual’s maximum accelerative
capacity. This was the first study to devise individual acceleration thresholds, and focused
upon investigating acceleration values produced at various initial running speeds. The
protocol utilised was field based, meaning it could be replicated with large squads, and
minimal equipment. Research is yet to investigate discrepancies between global and
individual thresholds when quantifying acceleration tasks, requiring further investigation.
Extensive research has focused upon quantifying the physical demands of playing positions
during soccer competition (Bangsbo et al., 2006; Molinos, 2013). This is vital for training
prescription purposes, with training aiming to replicate or exceed competitive demands
(Hodgson et al., 2014). Research has demonstrated the physical demands elicited upon
playing positions differ significantly (Molinos, 2013). Central defenders and strikers are
suggested to produce the lowest total distances, with central midfielders producing the
highest (Dellal et al., 2012; Guadino et al., 2010). When investigating high-speed activities,

21
research demonstrated wide players produced the highest sprinting and high-intensity running
distances, with central players producing the lowest (Carling, 2013). Research has primarily
focused upon total, and high-speed distances, neglecting metabolically demanding actions
such as accelerating. Additionally, previous studies focusing upon high-speed locomotion
and acceleration tasks have utilised global thresholds, neglecting the relative intensity of
activities produced by athletes. Previous research has also failed to sub-divide acceleration
tasks dependent upon intensity. Consequently, there is rationale for thorough investigation to
determine the exact physical demands elicited upon soccer playing positions. This
information is vital for applied practitioners aiming to prescribe specific soccer training and
improve competitive performance.
Considering the differences in physical demands placed upon soccer playing positions, an
individualised approach to training must be adopted. Soccer training games are popular
amongst coaches, allowing for physical, technical and tactical aspects to be trained
simultaneously (Castellano & Casamichana, 2013; Davies et al., 2013). Training games can
be manipulated to alter the physical stimulus elicited upon athletes. One manipulation is
game size, with large, medium, or small training games suggested to alter the stimulus (Hill-
Haas et al., 2011). Despite investigating the physical outputs produced during different
training game formats, research is yet to relate findings to positional demands of competition.
Considering the varying demands elicited upon soccer playing positions, and the
consequential individual training requirements, it is vital training is assessed relative to
individual’s competitive demands. In addition, previous research investigating competitive
physical demands elicited upon playing positions has focused upon the average demands
(Domene, 2013). This has also been the case with research investigating the physical
demands of training games (Castellano et al., 2013; Owen et al., 2014). Focusing upon the
average demands of competition results in important information regarding the peak demands
of competition being overlooked. If athletes are trained to meet the average demands of
competition, they could be underprepared for the most demanding periods of play (Gabbett,
2016). Research suggests the most demanding periods of play often coincide with scoring or
conceding goals (Barnes et al., 2014; Faude et al., 2012). Consequently, it is vital the peaks
demands of competition and training are analysed in addition to the average demands.
In an attempt to individualise the prescription of competition, allow equal opportunity, and
reduce injury risk, a number of sports have introduced age categories (Figueiredo et al.,
22
2010). However, grouping soccer athletes by age has led to significant complexities related to
inter-individual variations, termed the relative age effect (Albuquerque et al., 2012; Del
Campo et al., 2010). The relative age effect relates to a high proportion of soccer athletes
being born earlier in the competitive year, and has been reported in both youth and
professional teams (Del Campo et al., 2010; Helsen et al., 2005; Meylan et al., 2010). The
increased strength, weight, and size of relatively older athletes increase the likelihood of
selection and retention within the sport (Delorme, 2014; Hirose, 2009). The relative age
effect has been viewed as discriminatory against younger athletes born later in the
competitive year, and is a concern for professional soccer (Edgar & O’Donoghue, 2005). An
alternative, novel solution to chronological age groups, are ‘bio-banded’ groups of athletes
with similar levels of growth or maturation (Delorme, 2014). To date, one piece of research
has focused upon the effect of bio-banded competition. Cumming et al. (2018) investigated
Premier League academy players’ experiences of participating in bio-banded soccer
competition, using qualitative data. Athletes perceived there was an increased emphasis upon
technique, tactics, and teamwork during bio-banded competition. In addition, early
developers perceived bio-banded competition as an increased physical stimulus. Currently,
there has been no quantitative evidence as to the effects of bio-banding upon physical and
technical performance during competition.
The overarching objective of this thesis was to examine an individualised approach to
monitoring and prescribing training loads in professional soccer. This was addressed in five
experimental chapters, which aimed to:
1.) Analyse the discrepancies between global and individual speed thresholds in monitoring
high-speed locomotion during soccer training and competition.
2.) Analyse the discrepancies between global and individual acceleration thresholds in
monitoring acceleration tasks performed during soccer training and competition.
3.) Quantify the physical demands placed upon soccer playing positions during competition.
4.) Examine the effect of training game format upon average and peak physical outputs
produced by soccer playing positions.

23
5.) Quantify the effects of bio-banded and chronological competition upon physical and
technical performance, for early, on-time and late developing athletes.
1.2 Organisation of Thesis
This thesis is presented in nine main chapters. The review of literature (Chapter Two)
examines all available studies focusing upon the following areas:
-Validity, reliability, and use of GPS within sport.
-Individualising speed and acceleration thresholds.
-The physical demands of soccer competition.
-Effect of match outcome upon competitive physical outputs.
-Manipulation of soccer training games as training modalities.
-Growth and maturation of youth athletes.
-Application of bio-banding within sport.
Throughout the literature review, special reference is provided to individualising training
load monitoring and prescription specific to individual athlete’s characteristics and
requirements.
The general methods (Chapter Three) provide details on the following procedures and
processes:
-Participant recruitment
-Participant exclusion criteria
-Data collection procedures
-Participant preparation and warm up procedures
-Physical and technical metrics collected
-Speed and acceleration thresholds
-Physical performance testing procedures
-Athlete groups
-GPS data analysis
-GPS data quality and accuracy
-Data exclusion criteria
-Technical data analysis
-Statistical analysis

24
Chapter Four (Study One) investigated the discrepancies between global and individual speed
thresholds when quantifying high-speed locomotion. The aim was to determine the extent of
the discrepancies between analysis methods, and whether discrepancies were uniform for
athletes of differing physical capacities.
Chapter Five (Study Two) identified the discrepancies in acceleration distances produced
using global and individual thresholds. The aim was to determine whether discrepancies
varied dependent upon acceleration intensity, and maximum accelerative capacity.
Chapter Six (Study Three) compared the physical demands of competition for different
soccer playing positions. The study also examined the effect of match outcome upon the
physical outputs of playing positions. The aim was to provide position specific
recommendations for training intensities.
Chapter Seven (Study Four) examined the effect of training game format upon physical
outputs produced by soccer playing positions. The study assessed both average and peak
physical demands of training games relative to positional demands during competition.
Chapter Eight (Study Five) investigated the effect of bio-banded competition upon physical
and technical performance. Differences in performance during bio-banded and chronological
competition was analysed for athletes of differing maturation status.
The general discussion (Chapter Nine) provides an overview of the thesis findings. The
findings relate to an individualised approach to monitoring and prescribing GPS training load
within elite academy soccer athletes.

25
2.0 Review of Literature

26
2.1 Training Load Monitoring Techniques
Training is a process of adaptation resulting from progressive and careful manipulation of
training load (Guadino et al., 2010). To be successful, accurate analysis of both squad and
individual training load is required (Casamichana et al., 2012; Gomez-Piriz et al., 2011). An
insufficient training stimulus could result in a reduction in cardiovascular fitness, whilst an
above optimum training stimulus could result in injury occurrence. Typically, methods such
as session ratings of perceived exertion (RPE) and heart rate monitoring have been used to
assess session intensity (Hill-Haas et al., 2011). RPE is a subjective measure of training
intensity that utilises the 1-10 Borg Scale (Scott et al., 2013). It is widely adopted in team
sports due to its ease to administer. RPE is inclusive of factors such as work completed,
illness, injury, and psychological conditions. Heart rate monitoring has traditionally been
used as a method to assess the physiological requirements of exercise. It is typically reported
as the time spent in relation to maximum heart rate (Dellal et al., 2012). Research has found
significant correlations between RPE and heart rate monitoring when assessing soccer session
intensity (Casamichana et al., 2012; Impellizzeri et al., 2004). More recently however,
questions have been raised regarding the sensitivity of heart rate in quantifying the
intermittent demands of sport (Castellano et al., 2013; Domene, 2013; Hodgson et al., 2014).
Scott et al. (2013) state that heart rate monitoring is a useful method for monitoring aerobic
energy production, however for training methods utilising anaerobic energy production,
demands are not accurately reflected. Considering soccer is a sport dominated by explosive
actions, it is vital for the training monitoring process that these actions are quantified. The
recent emergence of global positioning system (GPS) and accelerometer technology has
offered a highly practical way of monitoring the external training load of soccer
(Casamichana et al., 2012). GPS devices measure position, velocity and acceleration, of
which, a range of metrics are available to quantify external load. The ability to objectively
quantify external training load is suggested to be a vital aspect of athlete monitoring
(Cardinale & Varley, 2016). In contrast to heart rate and RPE, GPS devices allow for soccer
specific actions and movements to be quantified and recorded.
2.2 Background to GPS
Due to the competitive nature of soccer, organisations are constantly searching for tools to
gain a competitive advantage. A process that has recently gained momentum in sport science

27
is the use of technology to monitor training load. This is likely due to rapid advances in
technology, and increased availability (Cardinale & Varley, 2016). Consequently, athlete
tracking devices consisting of GPS and micro electrical mechanical systems are now
common within most sporting organisations (Malone et al., 2017). The basic components of
GPS technology provide information on total distance, speed, and acceleration, which can be
utilised to quantify external workload completed by athletes. This provides practitioners with
a wealth of options, including quantifying exertion and physical stress placed upon athletes,
assessing positional workloads during training or competition, or monitoring changes in
athlete’s physical capacities (Cummins et al., 2013). The integration of GPS with triaxial
accelerometers has allowed for measurement of accelerations in three axes, providing
information on the direction of acceleration tasks. Figure 2.1 provides an example of how the
direction and intensity of acceleration tasks can be quantified and presented using Catapult
Sprint (Catapult Sprint 5.1.5, Catapult Innovations, Melbourne, Australia) software. Further
analysis of speed data can be conducted by banding locomotion using activity bands. This
technology allows for detailed analysis into the specific physical demands and activity
profiles of competition and training (Aughey, 2011). As a consequence, specific training
programs can be developed to maximise improvements, and optimise competitive
performance (Cardinale & Varley, 2016). There are limitations associated with GPS
technology however. Hardware and software is expensive, analysis is time consuming, and
dedicated staff members are required to lead the analysis. In addition, GPS devices are unable
to quantify activities such as ball striking, wrestling and grappling.
Figure 2.1. Example report quantifying the intensity and direction of acceleration tasks.

28
Considering its widespread use within applied sporting environments, it is vital that
practitioners are aware of how GPS data is derived. This relates to how data is generated,
factors affecting validity and reliability, and the impact of changing hardware and software
(Malone et al., 2017). GPS is essentially a satellite navigation network, providing location
and time information for the tracking devices. These were initially developed for military
purposes, however are now commercially available. Satellites orbit the Earth, sending precise
time information via an atomic clock to the GPS receivers (Malone et al., 2017). The duration
of time taken for the radio signal to travel from the satellite to GPS receivers is used to
determine distance from the satellite. Using a minimum of four satellites connected to the
receiver, exact location of the receiver can be triangulated. Displacement can then be
calculated to determine speed of movement (Aughey, 2011).
2.3 GPS Validity and Reliability
Athlete tracking technology is continually being developed. Advancements in technology are
typically followed by validity and reliability investigations within the research. Validity of
the technology relates to the ability to accurately measure the intended variables (Scott et al.,
2015). In applied environments, the accurate quantification of exercise is vital to the
prescription and feedback process. Reliability of technology reflects the ability to reproduce
values on repeat occasions (Scott et al., 2015). This is important within applied environments
as it allows for comparison between sessions, and between athletes. Often, technology is
utilised within sport prior to the necessary validation and reliability information being
obtained. GPS devices are manufactured with various sampling rates, which relates to the
speed at which the unit gathers data. The majority of validity and reliability research has been
conducted on devices with 1-Hz, 5-Hz, and 10-Hz sampling rates. Previous research has
raised issues regarding the reliability of the 1-Hz and 5-Hz GPS units when measuring high-
intensity accelerations, decelerations, and changes of direction (Aguiar et al., 2013; Boyd et
al., 2013). In a recent review of the validity and reliability of GPS in team sport, Scott et al.
(2015) state that although all devices were able to accurately quantify distance, 1-Hz devices
had limitations with accurately quantifying short distance high-intensity sprinting (standard
estimate of error = 9.0 - 32.4%, moderate-poor validity). Although recent research suggests
5-Hz GPS devices have overcome said limitations with short distance high-intensity
sprinting, there are still issues associated with movements involving changes of direction
(standard estimate of error = 9.9 - 11.5%, moderate-poor validity) (Scott et al., 2015).

29
However, current advances in software and the availability of 10-Hz GPS and 100-Hz
accelerometer devices, have allowed for a greater accuracy and reliability when collecting
data (Akenhead et al., 2013; Cummins et al., 2013). Scott et al. (2015) conclude that 10-Hz
GPS devices have the ability to repeatedly report short distances at high speeds with good to
moderate intraunit reliability (mean coefficient of variation = 5.1%), therefore overcoming
the previous issues encountered with 1-Hz and 5-Hz units. Recent research conducted by
Delaney et al. (2017) provides further evidence, stating 10-Hz devices exhibit coefficient of
variation of 1.2 - 6.5% when assessing acceleration and deceleration. As a consequence, it is
suggested that the latest 10-Hz devices produce sufficient accuracy to quantify acceleration,
deceleration, and constant velocity movements within team sports (Scott et al., 2015; Varley
et al., 2012). Therefore, current literature has demonstrated the vast majority of activities and
tasks associated with soccer can be accurately quantified, and training load calculated. An
issue that remains however, is that of inter-unit reliability. Research has demonstrated that
intra-unit reliability of devices is higher than inter-unit reliability. Therefore, it is
recommended that athletes wear the same device when tracking over multiple sessions, to
reduce the associated error.
2.4 High-speed Locomotion in Soccer
During soccer competition, only 1 - 4% of locomotion distance is spent ‘sprinting’. The mean
distance of an individual sprint is 10 – 20 metres, with a mean duration of 2 – 3 seconds
(Spencer et al., 2005). Despite its infrequent nature, it typically occurs during the most
significant moments of competition (Barnes et al., 2014; Faude et al., 2012). For example,
scoring a goal, or preventing a shot on target (Guadino et al., 2010). To summarise athlete
locomotion, activities are banded using speed thresholds. These are typically attributed
subjective descriptions of movement and designated a specific speed band. Examples are
walking, jogging, running, high-speed running, very high-speed running, and sprinting
(Akenhead et al., 2013; Carling, 2013). Presently there are no consistent definitions for speed
bands, making comparisons between research difficult (Dwyer & Gabbett, 2012). In addition
to inconsistent speed thresholds used throughout research, another issue is the application of
global thresholds to athletes of varying ages and maturation. Global refers to the application
of the same speed thresholds systematically to all athletes. Although global speed thresholds
allow coaches to compare absolute workload completed by athletes, they are suggested to
mask important information relating to the relative intensity an individual is operating

30
(Hunter et al., 2015). Each individual’s internal response varies for the same external
demands, and result in differing degrees of adaptation. Individual variations are even more
pronounced when monitoring athletes of different ages and maturation levels (Gabbett,
2015). Due to inherent physiological, biomechanical, and metabolic differences during
exercise, speed thresholds based upon post-pubescent athletes may not be suitable for pre-
pubescent athletes (Cummins et al., 2013). For example, post-pubescent athletes are
demonstrated to have increased muscle mass when compared to pre-pubescent athletes,
resulting in greater levels of maximal strength, power output, and sprinting performance
(Meylan et al., 2010). The highly complex and athlete-specific factors influencing
locomotion mean that there is the potential for large error in training load calculation when
using global speed thresholds (Lacome et al., 2014). As a consequence, application of global
speed thresholds may result in an inadequate reflection of training load for the majority of
athletes within a squad (Abt & Lovell, 2009; Cummins et al., 2013).
Having identified the disadvantages associated with global speed thresholds, researchers
attempted to individualise thresholds using various physical performance markers (Abt &
Lovell, 2009; Hunter et al., 2015; Mendez-Villanueva et al., 2013). For example, previous
research has used gas ventilatory thresholds (Abt & Lovell, 2009; Hunter et al., 2015; Lovell
& Abt, 2013), or maximum sprint speed (Gabbett, 2015) as methods to individualise
locomotion for individual athletes. For applied practitioners, the identification of gas
ventilatory thresholds provides an issue. With access to facilities, equipment, and staff
necessary to accurately administer the tests, this proves expensive, time consuming, and
infeasible to many practitioners. Another limitation of previous research is that only single
performance markers were used to determine individual thresholds, reducing the accuracy of
thresholds. In contrast, Hunter et al. (2015) and Mendez-Villanueva et al. (2013) used
athlete’s aerobic and anaerobic locomotor capacities to individualise speed thresholds. Both
studies used field tests to determine maximum aerobic, and maximum sprint speeds,
providing applied alternatives to laboratory testing. Research by Mendez-Villanueva et al.
(2013) was conducted using youth soccer athletes however, limiting application of the
results. Direct application to elite adult soccer players may be limited due to biomechanical
and physiological differences caused by maturation. Hunter et al. (2015) presented research
as a case study, with limited participants. Therefore, results may not be applicable to large
squads of athletes demonstrating varying physical capacities. When critiquing the data
analysis, both studies focused solely upon competition, and did not include training within

31
their analyses. Given that the majority of training load is accumulated during training
scenarios, there is significant rationale for including training within the monitoring process.
Currently, no research has focused on the use of field tests to individualise training load in an
elite adult soccer population. As a consequence, there is rationale for further research into
high-speed locomotion training load. Due to the reported inaccuracies associated with global
speed thresholds, and the highly individual nature of athlete locomotion, an individualised
approach is often recommended to improve the training monitoring process for individual
athletes.
2.5 Acceleration Manoeuvres in Soccer
Despite having an important role, soccer training load should not focus solely upon
monitoring high-speed locomotion. Focusing upon high-speed locomotion neglects
metabolically demanding tasks occurring at low speed, for example acceleration (Akenhead
et al., 2013; Osgnach et al., 2010). To highlight the frequency and importance of acceleration,
research reported a three- to eight-fold greater number of accelerations compared to sprints
during competitive match-play (Varley & Aughey, 2013; Dalen et al., 2016). With the
average sprint during soccer lasting approximately two-seconds, an athlete’s ability to
accelerate and reach high speed quickly is suggested to be vital for on-field performance
(Lockie et al., 2011). In addition, Greig and Siegler (2009) suggest sprinting and acceleration
tasks are important underlying factors for muscular fatigue, given the high neuromuscular
demand associated. Epidemiological injury data suggests there is a higher occurrence of
muscular strain injuries towards the latter stages of competition, likely the result of fatigue.
Considering the neuromuscular demand associated with acceleration tasks, quantifying
acceleration within the training load monitoring process would have large consequences for
recovery.
As with high-speed locomotion, it is important to acknowledge individual capacities when
quantifying acceleration tasks. It has been demonstrated that acceleration demands elicited
upon playing positions during competition vary significantly (Dalen et al., 2016; Ingebrigsten
et al., 2015). Dalen et al. (2016) identified that wide defenders and wide attackers produced a
higher frequency of accelerations when compared to central midfielder and central defender
playing positions. Ingebrigtsen et al. (2015) provided similar conclusions, stating wide
players produced significantly more accelerations than central players. However, a limitation

32
associated with previous research investigating acceleration occurrence in soccer, is that
global thresholds have been utilised to band acceleration tasks. Within the current literature,
no consistent global acceleration thresholds exist for soccer. Aughey (2010) utilised a single
threshold of 2.78 m.s-2 to quantify acceleration occurrence. Akenhead et al. (2013) divided
thresholds by intensity, with acceleration rates of 1 - 2 m.s-2 for low-intensity acceleration, 2 -
3 m.s-2 for moderate-intensity, and > 3 m.s-2 for high-intensity. Bradley et al. (2010) also
divided accelerations by intensity, but utilised different thresholds, with moderate-intensity
defined as 2.5 - 4 m.s-2 and high-intensity defined as > 4 m.s-2. Although global acceleration
thresholds allow for comparisons in external workload completed by athletes, they fail to
acknowledge individual’s maximum accelerative capacities, and relative intensity of the
stimulus placed upon individual athletes. The dose-response relationship is highly individual,
with athletes’ internal responses to the same external stimulus varying, and resulting in
differing degrees of adaptation (Impellizzeri et al., 2005) Consequently, without an
individualised approach to monitoring acceleration, it is difficult to determine the intensity of
an individual’s acceleration.
Sonderegger et al. (2016) were the first to individualise acceleration thresholds, incorporating
individual’s maximum accelerative capacity. Results demonstrated a large range in maximum
accelerative capacities within highly trained junior soccer players, with values ranging from
4.5 - 7.1 m.s-2. Large variations in individual accelerative capacity provide further rationale
for an individualised approach to quantifying acceleration tasks. Akenhead and Nassis (2016)
recently investigated current training load practices and perceptions amongst applied
practitioners. Despite compelling physiological rationale, results demonstrated infrequent use
of individual thresholds within applied sport. Considering the advantages of an individual
approach to monitoring acceleration, and the vast literature currently utilising global
acceleration thresholds, rationale exists for investigation into the discrepancies between
global and individual acceleration thresholds.
2.6 Individualising Athlete Training Load
The importance of training load prescription and monitoring is frequently cited within the
literature (Gomez-Piriz et al., 2011; Jennings et al., 2010). From an injury prevention
perspective, Piggott et al. (2009) concluded that 40% of injuries could be linked with a
preceding spike in training load. When focusing upon performance enhancement, a large

33
emphasis is placed upon developing the physical performance of soccer athletes (Carling,
2013). Coaches aim to challenge the physical boundaries of athletes, without exceeding what
can be tolerated (Bowen et al., 2016). This increased focus upon physical performance is
likely the result of the increasing physicality of modern-day soccer (Barnes et al., 2014). To
develop the physical attributes of soccer athletes, training load must be carefully manipulated
(Hill-Haas et al., 2008). There is a fine balance between applying an appropriate training
stimulus to promote adaptation, and applying an above optimal training stimulus resulting in
an increased risk of injury. Recent research has focused heavily upon associations between
training load and injury occurrence. Gabbett (2016) utilised the acute:chronic workload ratio
as a tool to identify injury risk, citing a ‘sweet spot’ of optimal training load associated with a
reduced probability of injury. Training loads higher or lower than the prescribed ratio were
associated with an increased risk of injury. When utilising workload ratios to calculate injury
risk, it is of the upmost importance that valid representations of load elicited upon the athlete
are presented. Inaccuracies in the calculation of training load could lead to athlete
overtraining, an insufficient training stimulus, or injury occurrence. All of these eventualities
have a negative effect upon individual and team performance (Casamichana et al., 2012).
Considering the high energy cost required for high-speed locomotion (e.g high-speed
running, very high-speed running, and sprinting) and acceleration tasks, it is particularly
important that these activities are quantified accurately.
It is vital for practitioners to acknowledge how different training loads affect different
athletes. Training load is extremely individual in nature, with athletes responding differently
to training loads dependent upon a number of internal and external variables (Casamichana et
al., 2012; Scott et al., 2013). A major limitation of previous research focusing upon the
demands of soccer training and competition, is that the same training load thresholds have
been used for all athletes (Bradley et al., 2009; Di Salvo et al., 2010). This is despite athletes
having different physical capacities, and differing responses to physical stimuli. Similarly,
when coaches employ soccer training sessions, the majority of athletes are subject to the
same methods (Bloomfield et al., 2007; Di Salvo et al., 2007). This is despite the individual
roles of athletes varying significantly during competition. To be effective, training must
replicate situations that athletes encounter during competition. It is therefore essential to gain
a detailed understanding of the frequency, intensity, and direction of specific physical actions
and movements performed by individuals during competition (Bloomfield et al., 2007;
Russell et al., 2013). Once collated, this information can help attribute specific activity

34
profiles to playing positions or individuals (Di Salvo et al., 2007). A high occurrence of
specific actions and activities may overload certain muscle groups, and have implications for
how training load is monitored, and how individuals are conditioned. Furthermore,
individualised conditioning programs can be developed to replicate and overload positional
demands during competition (Bloomfield et al., 2007; Di Salvo et al., 2010).
2.7 Competitive Demands of Soccer
Soccer athletes typically cover 9 - 13 kilometres during competition (Domene, 2013). 60 -
70% of the total match duration is spent at low-intensity, either walking or jogging. However
there is typically a high-intensity burst of activity every 72-seconds (Bangsbo et al., 2006; Di
Salvo et al., 2007). High-intensity activity is suggested to constitute ~12% of total distance,
with a maximal sprint effort occurring every four-minutes (Di Salvo et al., 2010;
O’Donoghue et al., 2005). In addition, frequent changes of direction, alteration of activity,
technical actions, and unorthodox movements also occur (Bloomfield et al., 2007; Drust et
al., 2007). It is critical for the training analysis process that movement demands of
competition are recorded. This allows practitioners to assess the effectiveness of training
sessions relative to the demands of competition. To accurately prescribe training, it is vital
that research stays current, as the physical outputs produced during competition are
constantly evolving. Barnes et al. (2014) analysed English Premier League match data from
the 2006-07 season to the 2012-13 season. It was demonstrated that although total distance
covered remained relatively consistent, high-intensity running distance (21 - 24 km.h-1) and
sprinting distance (speed > 24.1 km-1) increased by ~35% throughout the same six-year
period. Maximal running speed also increased significantly during the time period,
demonstrating an increase in physical demands associated with high-level soccer competition
(Carling, 2013; Dellal et al., 2011a).
The majority of research investigating demands of soccer competition has focused upon
characterising total distance, and high-speed distances (Bradley et al., 2009; Di Salvo et al.,
2010). Despite previous research (Lovell & Abt, 2013) demonstrating the significant errors
associated with global speed thresholds in comparison to individualised, the majority of
research has used global speed thresholds when analysing competitive demands. Considering
the differing physical capacities of soccer athletes, results achieved using global speed
thresholds must be approached with caution. Despite the focus upon high-speed distances, it

35
has been suggested the demands of soccer cannot solely be described by speed parameters.
Focusing primarily upon speed parameters results in metabolically demanding activities,
performed at low absolute speeds being overlooked, and training load underestimated
(Akenhead et al., 2013; Scott et al., 2013). Research by Osgnach et al. (2010) demonstrates
acceleration and deceleration tasks are of a greater energy cost than moving at a constant
speed (Castellano & Casamichana, 2013; Hodgson et al., 2014). With the vast majority of
previous research focusing solely upon the high-speed demands of soccer, further research
investigating the holistic demands of soccer competition is warranted. Of the limited studies
including acceleration within their analyses, global speed thresholds were used to determine
acceleration intensity (Dalen et al., 2016; Ingebrigsten et al., 2015). A limitation of global
thresholds is that they fail to account for individual factors, and consequently cannot
acknowledge the intensity an individual athlete is operating (Hunter et al., 2015). Considering
the limitations surrounding the use of global speed and acceleration thresholds, rationale
exists for further investigation into the demands of soccer competition.
The physical demand placed upon athletes during soccer competition differs significantly
dependent upon playing position (Domene, 2013). Research by Dellal et al. (2012)
demonstrates significant differences in high-intensity running, number of sprints, headers,
tackles, and total distance between different positional roles. Carling (2013) provided further
evidence, stating that running at a range of speeds, as well as the number of changes in speed,
varied significantly dependent upon playing position. Significant differences have been
identified between playing position for total distance travelled (Dellal et al., 2012; Guadino et
al., 2010), high-speed distances (Bangsbo et al., 2006; Bradley et al., 2009), and the number
of accelerations and decelerations performed (Ingebrigtsen et al., 2015; Terje, et al., 2016).
Specifically, Guadino et al. (2010) found central defenders and strikers produced the lowest
total distance during competition, whilst central midfielders produced the highest total
distances. For high-speed activities, wide attacking and defending players produced the
highest distances, whilst central players produced the lowest (Carling, 2013). Research
investigating the occurrence of accelerations between different playing positions followed the
same pattern, with wide players producing higher acceleration values than central players
(Ingebrigtsen et al., 2015; Terje et al., 2016). Despite a number of studies analysing
positional differences in individual GPS metrics, research is yet to conduct a collaborative
study analysing the total distance, high-speed locomotion, maximum speed, and acceleration
demands of soccer playing positions during competition. Such research would aid coaches to

36
determine the content of their training sessions. With this information, coaches could design
training sessions specific to the demands of individual athletes, improving competitive
performance. Consequently, there is strong rationale for further, and more accurate,
investigation into the physical demands elicited upon soccer playing positions during
competition.
2.8 Physical Outputs and Match Outcome
In an attempt to positively influence the match results, a number of studies have examined
the relationship between physical outputs and match outcome (Carling, 2013; Castellano et
al., 2014). Research divided match outcome (i.e. won, drawn and lost), and compared the
physical outputs produced by outfield players during the match. Despite significant attention,
the relationship between match outcome and physical outputs produced still remains unclear.
Mohr et al. (2003) identified the ability to produce high physical outputs during competition
to be a differentiating factor between playing standard. Players of a higher competitive level
produced higher physical outputs during competition compared to moderate level players. A
review by Carling (2013) concluded that less successful teams in both England and Italy
produced higher overall and high-speed distances when compared to their more successful
counterparts. Castellano et al. (2014) suggest the relationship between physical output and
soccer success is complex. Concluding that producing lower physical outputs does not ensure
success, with success likely being linked to technical and tactical strategies. Past research
investigating the effect of physical outputs produced during different match outcomes has
failed to differentiate between playing positions. Differentiation between the physical outputs
produced by attacking and defending players in matches of differing outcome would provide
further insight into the discussion. In addition, previous research has conducted analysis upon
numerous teams within English and Italian leagues. No research has focused upon a single
team, and investigated the effects of positional physical outputs upon match outcome for a
competitive season. Further investigation into the relationship between positional physical
outputs and match outcome would provide valuable insight to applied practitioners.
2.9 Soccer Training to Develop Competitive Performance
To improve competitive performance, coaches employ team training sessions with the aim of
developing the technical, tactical, physical and psychological ability of athletes (Bloomfield

37
et al., 2007; Di Salvo et al., 2007). When focusing upon the physical ability, if the principle
of specificity is considered, effective training must replicate and overload the physical
demands an athlete encounters during competition. With significant variations in positional
requirements, it is important that training addresses each athlete’s individual needs (Dellal et
al., 2012). It is vital the same training techniques are not used for all athletes, in a ‘one size
fits all’ approach. Instead, different playing positions require an emphasis on distinct physical
components relative to their competitive requirements (Terje et al. 2016).
When investigating the different training methodologies used within soccer, training games,
also known as small-sided games, are frequently cited within the literature. Training games
are popular amongst coaches, as they allow the ability to improve technical, tactical and
physical aspects of soccer simultaneously (Castellano & Casamichana, 2013; Owen, Twist &
Ford, 2004). Advantages of this training modality are that training time, and therefore risk of
injury, are reduced, athlete motivation is high, and specificity of training is achieved
(Castellano et al., 2013). Research has demonstrated the intensity of certain training game
formats to be higher than competition, providing an overload stimulus relative to competitive
demands (Boyd et al., 2013; Hodgson et al. 2014). For example, Dellal et al. (2011a) stated
sprint activities ranged from 1.8 - 2.6% of total distance during competition, compared to
13.6 – 16.3% of total distance during small training games. During training games, coaches
have the ability to alter training game characteristics and manipulate the physical load placed
upon athletes (Casamichana et al., 2013; Dellal et al., 2012). Factors include the number of
players, individual playing area, number of touches, inclusion of goalkeepers, durations and
rest periods, and coach encouragement (Hill-Haas et al., 2011).
Of the factors affecting the physical load placed upon athletes, the number of players used
within training games is of particular interest to practitioners. Increasing the number of
players within the training game, whilst maintaining a constant pitch size decreases the
physical load (Halouani et al., 2014). In contrast, increasing pitch size whilst maintaining
player number increases the load (Da Silva et al., 2011). Considering an additional aim of
training games is to obtain tactical outcomes, it is important to maintain a relative playing
area consistent with competition in order to ensure ecological validity (Owen et al., 2014).
Whilst maintaining a constant relative playing area, research suggests different sized training
games elicit differing physical loads (Hill-Haas et al., 2011). There is evidence that large
training games (10v10, 9v9, 8v8, 7v7) result in higher total distances travelled, and high-

38
speed running distances when compared to medium (6v6, 5v5, 4v4) or small training games
(3v3, 2v2, 1v1) (Aguiar et al., 2013; Brandes et al. 2012; Dellal et al., 2012). It was
concluded that small training games are characterised by a higher frequency of change of
direction, acceleration and deceleration manoeuvres when compared to medium and large
training games (Davies et al., 2013; Koklu et al., 2012). Maximum speeds observed during
small training games were found to be significantly lower when compared to large training
games (Hill-Haas et al., 2009; Koklu et al., 2012).
Although the influence of training game size has been investigated previously, research has
failed to analyse the physical demands relative to demands of competition. In order to
effectively assess the training stimulus, it is necessary to analyse the demands of training
games relative to an athlete’s positional demands for competition. Previous research
investigating the effect of training game formats used global speed thresholds, with the
majority ignoring acceleration tasks and focusing upon total and high-speed distances.
Consequently, rationale exists for further investigation into the effects of manipulating
training game size for athletes of different playing positions, relative to their competitive
demands. This would provide coaches and conditioning staff with the ability to accurately
prescribe training game formats to playing positions in conjunction with their physical needs,
improving training specificity (Hill-Haas et al., 2010).
2.10 Training for Peak Demands of Competition
When planning and analysing physical outputs for soccer training, it is recommended for
practitioners to do so relative to physical outputs produced during competition. The rationale
for this is two-fold, firstly it provides context for the technical coaches, allowing for a greater
understanding of the data being reported. Secondly, it allows for the demands of training to
be assessed relative to the demands of competition. This allows coaches and sport science
practitioners to assess whether the physical aims of training have been achieved, and whether
training is preparing athletes for the demands of competition.
Previous research investigating the physical demands placed upon soccer playing positions
during competition has focused solely upon the average competitive demands (Domene,
2013). This is also a limitation of research investigating the demands of training games
relative to competition (Castellano et al., 2013; Owen et al., 2014). The disadvantages of
39
analysis focusing upon the average demands of competition are that vital information
regarding the peak demands of competition is masked. Additionally, if athletes are only ever
prepared for the average demands of competition, this could leave them underprepared, and
at a higher risk of injury, during the most demanding periods of play (Gabbett, 2016). The
most demanding periods of play often coincide with when goals are scored or conceded
(Barnes et al., 2014; Faude et al., 2012), so it is vital the peaks demands of competition are
acknowledged and prepared for during soccer training.
2.11 Relative Age Effect in Soccer
The majority of sports utilise age-related cutoff criterion to group young athletes for
competition (Albuquerque et al., 2015). The aim is to allow appropriate development, and
equal competition and opportunities for athletes participating. However, age-related cutoffs
can lead to complexities related to inter-individual variations, referred to as the relative age
effect (Albuquerque et al., 2012; Del Campo et al., 2010). Grouping athletes using age
cutoffs invariably result in significant cognitive, physical and emotional differences between
individuals (Helsen et al., 2005). For example, Albuquerque et al. (2015) demonstrated a
cutoff date of 1st January would result in an individual born on 1st January being grouped
with individuals born on 31st December of the same year. This provides the individual with a
12-month advantage, or 364 days of extra cognitive and physical development. 12-months
additional physical and cognitive maturation, and life experience, is a significant duration for
youth athletes (Edgar & O’Donoghue, 2005). Relative age effects are even more pronounced
when age categories comprise two consecutive years (Delorme et al., 2010). Due to the rapid
growth and development rates evident during adolescence, older individuals are typically
taller and heavier than those born later in the year (Meylan et al., 2010). The result is often a
manifestation of increased strength, speed and power, all of which are advantageous in most
sports, and attract the attention of coaches and scouts (Malina et al., 2007a; Till et al., 2010).
Malina et al. (2007b) suggest the consequence is an over representation of individuals born in
the first quarter of the selection year.
The relative age effect is prominent in both educational, and sport environments (Cobley et
al., 2009; Del Campo et al., 2010). In sport, it has been reported in baseball, ice-hockey,
netball, rugby, soccer and tennis (Mujika et al., 2009a). Conversely, in sports where physical
attributes are not as important (e.g dance, gymnastics), there is no relative age effect observed

40
(Delorme, 2014). In soccer, asymmetries in birth date distribution have been reported for
both youth and professional teams, with an increased incidence as the standard of play
increases (Del Campo et al., 2010; Helsen et al., 2005; Meylan et al., 2010). Musch and Hay
(1999) analysed birth dates of the highest professional soccer leagues in countries, reaching
the conclusion that the highest percentage of players were born in the first quarter of the year.
Additionally, when Australia moved the cut-off date for junior soccer competition from
January to August, there was an eventual corresponding shift in the distribution of birth dates
in senior professional players. This phenomenon has significant effects upon both the
immediate and long-term participation in soccer (Delorme, 2014).
The relative age effect is commonly viewed as discriminatory for younger players born late
in the competitive year, and is a large issue for professional soccer (Edgar & O’Donoghue,
2005). Relatively older players, possessing advantages such as increased size, weight, and
strength, are considered talented and of higher perceived potential to coaches and scouts. This
increases their likelihood of selection, and retention within the system (Delorme, 2014;
Hirose, 2009). In contrast, as a result of their less advanced physical maturity, relatively
younger players experience greater amounts of failure and interiority within their practice,
coupled with less playing opportunities (Delorme, 2014). The reduced playing time and low
perceived competence experienced by relatively younger players results significantly higher
dropout rates for these individuals (Delorme et al., 2010). Although the relative age effect
declines from childhood to the end of adolescence, with less variance in physical maturation,
this phenomenon still continues to have an influence (Albuquerque et al., 2012). By the end
of adolescence, relatively older players have already received greater exposure to competition
and training. As a result, relatively older players have had the opportunity to enhance
psychological, technical and tactical skills to a greater extent when compared to their younger
counterparts (Albuquerque et al., 2015). The volume of time participating in soccer specific
practice and play has been demonstrated as a differentiating factor between those progressing
to professional level at adulthood, and those who do not (Ford & Williams, 2012; Ford et al.,
2009). Separate from the short-term issues previously discussed, there are several long-term
issues associated with the relative age effect, and selecting individuals based upon their
superior physical characteristics. Following maturation, the physical advantages once
experienced by relatively older individuals are no longer present, with technical ability
becoming a larger determinant of success. Consequently, the majority of these early
developers will fail to progress at the same rate. Their later developing counterparts who have

41
persisted with the sport will catch up in size, speed, strength and power. This provides
rationale for a reduced relative age effect in some senior professional sports (Meylan et al.,
2010). However in the majority of cases, by this stage, large amounts of potential talent have
been lost from the sport (Helsen et al., 2005).
2.12 The Effect of Maturation Upon Physical Performance
The relative age effect is not the only discriminatory factor for talent identification within
youth sport, with the maturity status of individuals providing another difficulty (Albuquerque
et al., 2012; Cumming et al., 2018). Maturation refers to the structural and functional changes
occurring during the body’s progress towards maturity. Maturation is described as a process,
whilst maturity is the end state (Malina et al., 2015). The timing and tempo of maturation
varies significantly between individuals (Meylan et al., 2010). Timing refers to the
occurrence of specific maturational events (e.g age at peak height velocity), whilst tempo
refers to the rate at which maturation occurs (Malina et al., 2015; Meylan et al., 2010). The
progression of these processes is measured to provide an indication of advancement towards
maturity. Maturation status is typically assessed in terms of the level of maturation at the
current chronological age (Malina et al., 2015). The physical changes associated with
maturation are well documented, with previous research demonstrating that within a
chronological age group, early developing males performed better in strength, power, speed,
and repeated sprint tasks compared to late developers (Malina et al., 2004; Mujika et al.,
2009b). Maturation can also work in a contrasting manner to the relative age effect. Meylan
et al. (2010) explain that early developers born towards the end of the year can be more
physically mature than late developers born early in the year. As a consequence, it is vital
that an indicator of maturity status is provided in conjunction with talent identification
structures.
Soccer competition is characterised by explosive activities performed intermittently, for
example sprinting, jumping, tackling, and changing pace and direction (Meylan et al., 2010).
As a result, the physical characteristics essential for soccer success are suggested to be body
composition, aerobic and anaerobic capacity, speed, agility and power (Figueirdo et al.,
2009). The physical characteristics associated with superior soccer performance are
suggested to favour early developing males (Cumming et al., 2006; Spencer et al., 2011).
Increases in muscle mass associated with maturation are demonstrated to contribute towards

42
increased maximal strength, power output, and subsequent performance in field based tests
(Meylan et al., 2010). Cumming et al. (2006) demonstrate this, concluding that maturity
status had a positive influence on endurance, speed and power in adolescent male soccer
players aged 13 - 15 years. Similarly, Figueirdo et al. (2010) demonstrated that advanced
maturity contributed towards better power, speed and agility results in players aged 11 - 14
years. The effects of maturation create numerous physical advantages for early developers in
soccer, whilst simultaneously creating disadvantages for late developers (Malina et al., 2004).
Malina et al. (2004) suggest the differences in physical performance between males of
contrasting maturity status are most pronounced between 13 - 16 years. In certain
populations, the effects of maturation have resulted in correlations between playing positions.
In Portuguese players aged 13 - 15 years, Malina et al. (2004) found forwards were more
mature, taller, and heavier in comparison to other playing positions. This is likely the result
of the emphasis placed upon scoring goals within soccer.
Although early developers tend to be heavier and taller, the use of height and weight
measurements alone cannot provide an accurate representation of maturation status. Malina et
al. (2012) explains that two individuals of the same age can be the same height, but one
individual is closer to their final mature height than the other. Consequently, the individual
closer to their mature height is more advanced in maturity. Commonly used indicators of
maturation in males are skeletal age, and secondary sex characteristics (e.g pubic hair,
genitals, testicular volume) (Malina et al., 2007b). However, given the logistical issues
associated with x-rays, and the perceived invasiveness of identifying secondary sex
characteristics, there is interest in anthropometric estimates of maturity status (Malina et al.,
2015). Two alternative non-invasive indicators have been identified, resulting in less physical
and psychological risk for individuals (Malina et al., 2012). Current age, height, seated
height, and weight measurements can be used to estimate the time to or from peak height
velocity, and consequently age at peak height velocity. This method provides an indication of
timing. An alternative method is to calculate current height in relation to predicted mature
adult height using age, height, weight, and mid-parent height (Meylan et al., 2010). This is
termed the percentage of predicted adult height, and provides an estimate of maturity status.
Malina et al. (2007a) identified the 90% percentile error band as 5.3 centimetres between
actual and predicted mature height at 18 years of age. When using this method, it is important
to adjust self reported parental height with gender specific equations, as individuals have a
tendency to over estimate height (Meylan et al., 2010). Using mean and standard deviations

43
from large sample sizes as references, maturity status can be expressed as Z-scores and used
to classify maturity status (Meylan et al., 2010). Previous classifications have attributed Z-
scores of below -1 as late developers, between -1 and +1 as on-time, and above +1 as early
developers (Malina et al., 2007a; Meylan et al., 2010).
Large variations in maturity status within chronological age groups provide problems for
youth sport. Specifically, there are risk factors associated with maturity mismatches and
subsequent injuries for late developing players (Malina et al., 2007b). The associated
problems are not limited solely to late developers however. The physical advantages initially
experienced by early developers may be detrimental to their development in the long term
(Cumming et al., 2018). Whilst progressing through age groups and impressing through the
use of their physical strengths, the technical and tactical development of early developers is
commonly neglected. Cumming et al. (2018) state that adolescence provides a period of
increased neural refinement, whereby frequently used neural connections are strengthened,
and sparsely used connections are removed. This may result in early developers failing to
progress as expected once maturity associated differences are removed. For the future of the
sport, in addition to the potential economic, psychological, and health related implications of
late developers being released from the system prematurely, it is important to consider
variations in maturity status between athletes of the same chronological age (Albuquerque et
al., 2015; Delorme, 2014).
2.13 Bio-banding in Academy Soccer
Combat sports commonly group athletes using age and weight criteria in an attempt to create
equal opportunity and reduce injury risk (Figueirdo et al., 2010). When relating to soccer,
body size has a negligible impact upon performance, and grouping athletes using age and
weight would have limited practical value (Cumming et al., 2018). An alternative solution
involves bio-banding athletes into groups of similar levels of growth or biological maturation
(Delorme, 2014; Spencer et al., 2011). Simmons and Paull (2001) provide evidence from the
1930s and 1940s demonstrating biological maturation is more beneficial for competitive
grouping than chronological age groups. The aim of bio-banding is to reduce the variance in
physical attributes, resulting in competitive equity and a reduced risk of injury (Cumming et
al., 2018). By creating diverse challenges and learning environments, bio-banding can have a
positive effect upon both early and late developing athletes. For early developers, competing

44
against older and more physical athletes will result in a larger emphasis having to be placed
upon technical and tactical attributes. For late developers, a physically balanced environment
will result in the ability to develop both physical and technical attributes. Bio-banding could
potentially enhance the talent identification process, providing coaches and scouts the ability
to evaluate athletes with differences in physical maturity removed (Cumming et al., 2018).
The main beneficiaries would be developmental programs where technically skilled, late
developing players are frequently overlooked and released due to maturity related limitations
in physical performance (Malina et al., 2007a). Bio-banding aims to reduce the release of
later developing athletes, who would potentially reach the highest level, provided they
receive quality coaching and opportunities for competition. An additional aim of bio-banding
is to reduce the inclusion of early developing athletes approaching their final physical status,
who may not reach the highest level once their physical attributes are matched (Simmons &
Paull, 2001). There are implications of grouping older, late developing boys with a group of
younger boys however (Figueirdo et al., 2010). This may have potential social and
psychological repercussions, and therefore be acknowledged.
From a theoretical perspective, the positive effects of bio-banding can be understood using a
constraints-based framework (Newell, 1986). The framework states a player’s motor
performance results from the interactions of three constraints; task, individual and
environmental. Task constraints relate to the specific performance context and may be the
rules specifying behaviour, the goal of the task, or task-related implements. Individual
constraints refer to the individual’s characteristics, all of which can influence performance at
any moment in time. Examples of such include developmental and maturational factors.
Environmental constraints refer to the general factors influencing motor performance, such as
weather conditions, as well as socio-culture and economic factors. From the interaction of the
constraints, emergent behaviour is seen. Certain types of motor behaviour may only emerge
when particular constraints limiting performance are removed. There is an argument that
soccer athletes playing in chronologically grouped competition may result in the motor
performance of late developers being constrained by the presence of early developers. As a
consequence, if there is a change in the task constraint of athlete maturation as seen in bio-
banded matches, then a different motor performance will emerge. There is currently no
experimental evidence for the hypothesis predicted by the constraints model, however
qualitative accounts do exist (Cumming et al., 2018).

45
In a novel study, Cumming et al. (2018) analysed Premier League academy players’
experiences of participating in bio-banded soccer matches. Results indicated that early
developers felt bio-banded matches provided a superior physical challenge and learning
stimulus relative to their age group matches. Early developers also felt there was an increased
emphasis placed upon technique, tactics, and teamwork. Effectively, bio-banded games
exposed the early developers to the challenges typically encountered by late developers.
Conversely, late developers described bio-banded matches as less physically challenging
relative to their age group matches. Late developers found bio-banded matches provided
them with a greater opportunity to utilise their technical, physical, and psychological
attributes, and exert their influence upon the match. This study was the first to provide
feedback on the effect of bio-banded fixtures, focusing on the qualitative views of
participants. Research is yet to investigate the effects of bio-banding upon physical and
technical actions produced during matches however. In addition to the qualitative information
previously presented, physical and technical data is vital to determine the holistic effects of
bio-banding soccer matches.
Despite no research to date having investigated the effects of bio-banding upon physical
outputs produced during competition, previous studies have identified the effects of
maturation upon competitive physical outputs measured using GPS. In addition to performing
better in strength and power tests, early developing boys were found to cover greater high-
speed distances, achieved higher peak speeds, and produced more frequent high-intensity,
and repeated high-intensity actions (Buchheit & Mendez-Villaneuva, 2014; Meylan et al.,
2010). In a study examining the effects of age, maturity and body dimensions on match
running performance in U15 soccer players, results demonstrated older, more mature players
consistently outperformed their younger, less mature teammates during competition
(Buchheit & Mendez-Villaneuva, 2014). This compliments previous research suggesting age
and maturation positively impacted match-running performance (Buchheit et al., 2010).
Subsequently, Buchheit and Mendez-Villaneuva (2014) identified investigation into technical
and tactical outputs for players of differing maturation levels as an area for future research.
With the differences in physical outputs between players of different maturation levels clear,
there is rationale for subsequent investigation into the effects of bio-banding competition.
Research investigating the physical and technical differences between bio-banded and
chronologically aged competition would provide coaches with a holistic insight into the

46
effects of bio-banding. Additionally, further analysis into the differences for early, on-time,
and late developers would allow for the benefits of competition formats to be identified.
2.14 Determining Significance and Effect Size of Experimental Results
During experimental investigation, p values are used to determine the probability associated
with the experimental hypothesis being false. Typically, p < 0.05 is utilised as a measure of
statistical significance, indicating there is a 5% chance the observed difference is due to
chance (Wasserstein & Lazar, 2016). However, with a sufficiently large sample, a statistical
test may demonstrate a significant difference despite very small differences, often considered
trivial when applying the findings in practice (Sullivan & Feinn, 2012). Conversely,
measurements of effect size report the relative magnitude of differences (Thalheimer &
Cook, 2002). Researchers are encouraged to report effect sizes for numerous reasons
(Wilkinson, 1999). First, the magnitude of effect is presented in a standardised metric. This
allows for the practical significance of results to be demonstrated. Second, effect sizes allow
for meta-analytic conclusions to be made across studies. Finally, effect sizes from prior
research can be used to plan future research, specifically the sample size required to observe
statistical significance given a size of an effect observed (Lakens, 2013). Cohen’s d is a
commonly used method of determining effect size for t-tests (Cohen, 1988). This effect size
is described as the difference between two means, divided by the standard deviation of the
two conditions. The division by standard deviation enables comparison of effect sizes across
experiments. An advantage of Cohen’s d in comparison to other effect size measurements is
that first, it's popularity enables comparison of results to a large volume of published studies.
Second, Cohen’s d allow effect sizes to be interpreted against known benchmarks; small (d =
0.2), medium, (d = 0.5), or large (d = 0.8) (Lakens, 2013; Thalheimer & Cook, 2002). Partial
eta-squared (ηp2) is an effect size calculation used for more than two sets of observations,
typically within ANOVA analyses. Partial eta-squared measures the ratio of the variance
accounted for by an effect, and that effect plus its associated error variance (Levine &
Hullett, 2002). Partial eta-squared values range between 0 and 1, with ηp2 = .02 considered
small, ηp2 = .13 considered medium, and η2 = .26 considered a large effect size. An ηp
2 of .13
suggests that 13% of the total variance can be accounted for by the group (Lakens, 2013). In
summary, it is suggested that only reporting the p value is inadequate for readers to fully
understand the results. Instead, it is advised that both the statistical significance (p value), and

47
the effect size are reported within experimental investigations (Lakens, 2013; Sullivan &
Feinn, 2012; Wilkinson, 1999).

48
3.0 General Methods

49
3.1 Participant Recruitment
The participants recruited for studies within the current thesis were all contracted to Brighton
and Hove Albion FC. For Study One, Study Two, Study Three and Study Four, participants
were recruited from the club’s U23 and U18 squads. For Study Five, participants were
recruited from the club’s U16 - U12 squads. Prior to being recruited, participants were
briefed with a detailed explanation of the proposed study and the requirements. Participants
were informed of potential risks, and all provided written consent. For participants under the
age of 18, parental or guardian consent was provided. Participants were free to withdraw at
any time, without any repercussions from the football club, or otherwise.
The participants recruited for Study One, Study Two, Study Three and Study Four were all
well trained, and either professional soccer players (U23) or had a full time scholarship (U18)
with Brighton and Hove Albion FC. All participants had trained four to five times, and
played one to two competitive matches per week for a minimum of two years. Participants
recruited for Study Five were part-time soccer players contracted to Brighton and Hove
Albion FC. Study Five participants were aged 11 - 15 years, and between 85 - 90% of
predicted adult stature. Participants had trained two to three times, and played competitive
matches one to two times per week for a minimum of one year prior to the study.
All studies were conducted with protocols being fully approved by the ethical review board at
the University of Brighton prior to commencing. The study conformed to the requirements
stipulated by the Declaration of Helsinki, and all health and safety procedures were complied
with during the study.
3.2 Participant Exclusion Criteria
Participants were not considered for the studies if they were currently taking medication, or
had any previous history of renal, gastrointestinal or cardiovascular complications.
Participants were not considered for the studies if they had suffered from a musculoskeletal
injury within the past three months. Goalkeepers were excluded from all of the studies, as
they did not participate in the same training programmes. Participants were excluded from
Study Five if they were not between 85 - 90% of predicted adult stature.

50
3.3 Data Collection Procedures
During Study One, high-speed locomotion GPS data was collected for 19 full-time
professional soccer players over a six-week pre-season period. The six-week data collection
period consisted of 32 training sessions and two friendly matches. This programme was
designed by the head coach, and strength and conditioning coach. The programme consisted
of technical and tactical practices, small-sided games, replications of competition, and
physical conditioning work.
For Study Two, GPS derived acceleration data was collected for 31 full-time professional
soccer players over a four-week pre-season period. The data collection period was comprised
of 23 training sessions and four friendly matches. With a similar structure to Study One, the
pre-season programme was designed by head coach, and strength and conditioning coach,
consisting of a mixture of technical, tactical and physical practices.
During Study Three, GPS data was collected for 37 full-time professional soccer players
across 44 competitive matches. Data collection spanned two seasons, during which matches
were played once per week. Prior to both competitive seasons, participants had undergone
pre-season training and had appropriate conditioning levels. Fixtures used within the study
were U23 Premier League Two fixtures. Fixtures were in a competitive league format, with
emphasis placed upon results, ensuring motivation was high. Fixtures were consistently
played on a Monday evening, on natural grass. A 4-3-3 playing formation was adopted
throughout the data collection period.
During Study Four, GPS data from competition and training was collected for 46 full-time
professional soccer players across a competitive season. Data collection was comprised of 22
competitive matches, and 39 training game sessions. Prior to the commencement of data
collection, participants had undergone pre-season training, and had appropriate conditioning
levels. Fixtures used within the study were competitive U23 Premier League Two fixtures,
ensuring motivation was high. Fixtures were played on a Monday evening, on natural grass.
A 4-3-3 playing formation was utilised throughout the data collection period. Competition
and training game data was collected once per week. During training game sessions, one
game format was utilised (e.g large, medium or small), resulting in data collection for each
format every three weeks. The head technical coach allocated teams prior to each training

51
session, ensuring abilities were normally distributed, and participants played in their
designated playing positions. Training sessions occurred on a Thursday morning, with
Tuesday and Wednesday being designated rest days for the participants, reducing the effects
of fatigue. Large training games were characterised as 10v10, 9v9, 8v8, or 7v7 plus
goalkeepers. Medium training games were characterised as 6v6, 5v5, or 4v4 plus
goalkeepers. Small training games were characterised as 3v3, 2v2, or 1v1 plus goalkeepers
(Verheijen, 2014). Training games were played for four quarters of four-minutes each, with
three minutes rest between games (Hodgson et al., 2014). To maintain tactical validity,
relative player area for all formats was 120m2 per player, excluding goalkeepers (Hill-Haas et
al., 2011; Hodgson et al., 2014).
During Study Five, physical and technical performance data was collected for 25 male soccer
players across both bio-banded and chronological competition. Bio-banded competition was
against athletes grouped by the same maturation band, whilst chronological competition was
against athletes of the same chronological age. Both competition formats took place within
the competitive season, with participants having undertaken pre-season training. To ensure
comparability, competition formats were completed within two-weeks of each other. Bio-
banded fixtures were played in 11v11 format, with four 20-minute quarters. Games were
played on full-sized standard grass pitches (100 x 64m), with full-sized goals (8 x 2.4m).
Three substitutions were permitted in accordance with Football Association rules for youth
competition, and standard officiating was applied. Fixture format for the chronologically
aged competition was identical to the bio-banded fixtures. Fixtures were played in 11v11
format, four 20-minute quarters, on a 100 x 64m pitch and with standard Football Association
rules and officiating applied. The only exceptions were the U15 fixtures, which were divided
into two 40-minute halves to comply with league rules for the age group. All participants had
been members of the academy for at least one year prior to data collection, meaning they had
experience of competitive academy soccer.
3.4 Participant Preparation and Warm Up Procedures
Prior to the commencement of data collection for Study Three, Study Four, and Study Five,
participants completed a six-week pre-season consisting of physical and technical training
sessions, and friendly matches. The aim of the pre-season programme was to ensure the
participants had appropriate conditioning levels prior to the commencement of the

52
competitive season. Competitive matches within Study Three and Study Four were
comprised of official Premier League Two fixtures. Chronological matches during Study
Five were respective age group’s Premier League fixtures. Bio-banded matches during Study
Five were informal fixtures organised by the football clubs, as no formal competitive
programmes exists for bio-banded competition.
Prior to each fixture participants completed a 25-minute warm up consisting of physical
drills, passing, possessions, and finishing. This ensured adequate preparation for competition,
and was consistent throughout data collection periods for all studies within the thesis. Prior to
the commencement of training games, participants completed a 25-minute warm up
consisting of physical drills, passing, and possessions. All training games and matches were
played on natural grass. Participants used the same footwear throughout the individual
studies.
3.5 Physical and Technical Metrics Collected
Due to the varying analyses and aims of the studies within the current thesis, different
physical and technical performance metrics were collected. The sub-sections below detail the
metrics recorded and analysed, as well as their descriptions.
Study One
Within Study One, GPS derived high-speed locomotion data was collected. Two different
analysis methods and thresholds were applied; global and individual. Table 3.1 and 3.2 detail
the high-speed locomotion metrics and their descriptions.

53
Table 3.1 Global high-speed locomotion thresholds utilised within Study One. Global GPS Metric
Description
High-speed running distance
(m)
The distance travelled 4.2 - 5.5 m.s-1
(Abt & Lovell, 2009; Hunter et al., 2015; Lovell & Abt, 2013).
Very high-speed running
distance (m)
The distance travelled 5.5 – 7.0 m.s-1
(Abt & Lovell, 2009; Hunter et al., 2015; Lovell & Abt, 2013).
Sprinting distance (m) The distance travelled > 7.0 m.s-1
(Abt & Lovell, 2009; Hunter et al., 2015; Lovell & Abt, 2013).
Table 3.2 Individual high-speed locomotion thresholds utilised within Study One. Individual GPS Metric
Description
High-speed running distance
(m)
The distance travelled 80 – 99% of individual’s maximum aerobic
speed (Hunter et al., 2015; Mendez-Villanueva et al., 2013).
Very high-speed running
distance (m)
The distance travelled 100% maximum aerobic speed – 30% of
individual’s anaerobic speed reserve (Hunter et al., 2015;
Mendez-Villanueva et al., 2013).
Sprinting distance (m) The distance travelled >30% of individual’s anaerobic speed
reserve (Hunter et al., 2015; Mendez-Villanueva et al., 2013).
Study Two
Within Study Two, GPS derived acceleration data was collected. Two different analysis
methods and thresholds were applied; global and individual. Table 3.3 and 3.4 detail the
acceleration metrics and their descriptions.

54
Table 3.3 Global acceleration thresholds utilised within Study Two. Global GPS Metric Description
Low-intensity acceleration
distance (m)
The distance travelled accelerating 1 - 2 m.s-2
(Akenhead et al., 2013).
Moderate-intensity acceleration
distance (m)
The distance travelled accelerating 2 - 3 m.s-2
(Akenhead et al., 2013).
High-intensity acceleration
distance (m)
The distance travelled accelerating > 3 m.s-2
(Akenhead et al., 2013).
Table 3.4 Individual acceleration thresholds utilised within Study Two. Individual GPS Metric
Description
Low-intensity acceleration
distance (m)
The distance travelled accelerating between 25 - 50% of an
individual’s maximum accelerative capacity
(Sonderegger et al., 2016).
Moderate-intensity acceleration
distance (m)
The distance travelled accelerating between 50 - 75% of an
individual’s maximum accelerative capacity
(Sonderegger et al., 2016).
High-intensity acceleration
distance (m)
The distance travelled accelerating > 75% of an individual’s
maximum accelerative capacity
(Sonderegger et al., 2016).
Study Three
Within Study Three, GPS derived data including distance, speed, high-speed locomotion, and
acceleration was collected. Table 3.5 details the GPS metrics and their descriptions.

55
Table 3.5 GPS and subjective metrics utilised within Study Three, Study Four and Study
Five. GPS Metric
Description
Total distance (m) The total distance travelled.
Maximum speed (m.s-1) The maximum speed travelled by an individual during
competition.
Very high-speed running
distance (m)
The distance travelled between 100% maximum aerobic speed
and 30% anaerobic speed reserve. Calculated using modified
Montreal track test (Leger & Boucher, 1980). Protocol previously
utilised by Hunter et al. (2015) and Mendez-Villanueva et al.
(2013).
Sprinting distance (m)
The distance travelled above 30% anaerobic speed reserve.
Calculated using modified Montreal track test (Leger & Boucher,
1980). Protocol previously utilised by Hunter et al. (2015) and
Mendez-Villanueva et al. (2013).
Moderate-intensity acceleration
distance (m)
The distance travelled accelerating between 50 - 75% of an
individual’s maximum accelerative capacity (Sonderegger et al.,
2016).
High-intensity acceleration
distance (m)
The distance travelled accelerating > 75% of an individual’s
maximum accelerative capacity (Sonderegger et al., 2016).
Rating of perceived exertion Subjective rating of exertion using the modified CR10 Borg scale
(Borg, 1982).
Study Four
Within Study Four, GPS derived data including distance, high-speed locomotion, and
acceleration was collected. Subjective measures of training load in the form of ratings of
perceived exertion were also collected. Table 3.5 details the descriptions of the GPS and
subjective metrics.
Study Five
Within Study Five, physical and technical performance data was collected. Physical
performance data was in the form of GPS derived data and subjective measures of training

56
load. Table 3.5 details the descriptions of the GPS and subjective metrics. Technical
performance data was recorded and coded by trained academy analysts. Table 3.6 details the
descriptions of technical performance metrics.
Table 3.6 Technical performance metrics utilised within Study Five. Physical and Technical
Performance Metrics
Description
Shot A successful strike of the ball aimed at the opposing goal.
Short pass A strike of the ball (< 20m in distance) directed at a teammate,
and that was successfully controlled.
Long pass A strike of the ball (> 20m in distance) directed at a teammate,
and that was successfully controlled.
Cross A successful long pass from the widest quarter of the pitch
landing in the opposition penalty area.
Dribble Successfully running past an opponent with the ball.
Tackle A successful attempt to remove the ball from the opponent’s
possession through a physical challenge.
Ratings of Perceived Exertion
Individual’s ratings of perceived exertion (RPE) were collected during Study Four and Study
Five. The RPE scale used during both studies was the modified Borg CR10-scale. This scale
has previously been utilised as a method to monitor psychological and physiological load
within an elite soccer environment. RPE values were recorded 30-minutes following the
cessation of competition or training. During Study Four, when collecting RPE for training
games, participants were asked to provide an RPE value solely representative of the intensity
of training games. Following competition in Study Four and Study Five, participants were
asked to provide an RPE value solely representative of the intensity of competition.
Individual RPE was collected separately from each individual to ensure each participant’s
decision-making was not influenced. Participants had been familiarised with the RPE scale
prior to the data collection period.
57
3.6 Speed and Acceleration Thresholds
Global and individual speed thresholds were utilised within Study One, with differences in
high-speed locomotion distances produced by the thresholds investigated. The global speed
thresholds utilised within Study One were high-speed running as 4.2 – 5.5 m.s-1, very high-
speed running as 5.5 - 7.0 m.s-1, and sprinting as > 7.0 m.s-1. These thresholds were
frequently cited within soccer literature (Abt & Lovell, 2009; Hunter et al., 2015; Lovell &
Abt, 2013). The individual thresholds utilised were high-speed running as 80 - 99%
maximum aerobic speed, very high-speed running as 100% maximum aerobic speed to 30%
anaerobic speed reserve, and sprinting as > 30% of anaerobic speed reserve. These individual
thresholds had previously been utilised by Hunter et al. (2015) and Mendez-Villanueva et al.
(2013), to represent the functional limits of endurance and sprint locomotor capacities. As in
previous research, individual thresholds were determined using athlete’s maximum aerobic
speed, and maximum sprint speed values, calculated using validated field tests. The
methodology and processes used to calculate and apply individual speed thresholds in Study
One were also utilised within Study Three and Study Four to individualise high-speed
locomotion.
Within Study Two, global and individual acceleration thresholds were utilised to determine
differences in low-, moderate-, and high-intensity acceleration distances produced. The
global acceleration thresholds utilised were frequently cited thresholds within soccer
literature (Akenhead et al., 2013). Global thresholds were low-intensity acceleration as 1 - 2
m.s-2, moderate-intensity acceleration as 2 - 3 m.s-2, and high-intensity acceleration as > 3 m.s-
2. The individual acceleration thresholds had previously been utilised by Sonderegger et al.
(2016). Individual thresholds were low-intensity acceleration as 25 - 50% of maximum
accelerative capacity, moderate-intensity acceleration as 50 - 75%, and high-intensity
acceleration as > 75%. Individual’s maximum accelerative capacity was used to determine
individual acceleration thresholds. This protocol was field based and had previously been
used by Sonderegger et al. (2016) to individualise acceleration thresholds. The methodology
and processes used to calculate and apply individual acceleration thresholds in Study Two
were also utilised for Study Three, Study Four, and Study Five.

58
3.7 Physical Performance Testing Procedures
Field tests were used to determine athlete’s maximum sprint speed, maximum aerobic speed,
and maximum accelerative capacity. Maximum sprint speed and maximum aerobic speed
were used to determine peak speed and estimate vV̇O2max respectively. These values were
used to calculate individual speed thresholds for Study One, Study Three, Study Four, and
Study Five. In each study, maximum sprint speed and maximum aerobic speed protocols
were completed the day prior to data collection starting. The maximum sprint speed protocol
required each athlete to complete three maximal 40m linear sprints, with a minimum of three
minutes rest between repetitions. Maximum sprint speed was defined as the average speed
recorded over the quickest 10m sector, and measured using electronic light gates (Brower TC
Timing System) to the nearest 0.01s. The intraclass correlation coefficient for the maximum
sprint speed protocol has been cited as 0.94 - 0.99 (Mendez-Villanueva et al., 2013;
Winchester et al., 2008). The maximum sprint speed protocol was completed on an indoor
artificial grass surface with football boots.
The protocol used to identify maximum aerobic speed was a modified version of the
University of Montreal Track Test (Leger & Boucher, 1980). This protocol had previously
been used by Mendez-Villanueva et al. (2013) to estimate maximum aerobic speed. The
correlation coefficient for this protocol has been cited as 0.97 (Leger & Boucher, 1980). The
modified University of Montreal Track Test began with an initial running speed of 8 km.h-1,
with the speed increasing by 0.5 km.h-1 each minute. Athletes ran around a 200m athletics
track, marked with 20m intervals, in time with an audible cue, until either exhaustion or three
consecutive cones were missed. Maximum aerobic speed was estimated using the speed of
the final one-minute stage completed. The maximum aerobic speed protocol was completed
on the same grass surface and using the same footwear as data collection during the study.
Following the calculation of maximum sprint speed, and maximum aerobic speed scores,
each athlete’s theoretical anaerobic speed reserve was calculated. Anaerobic speed reserve
was defined as the difference between the maximum sprint and maximum aerobic speed
score. Both maximum sprint speed and maximum aerobic speed protocols had previously
been utilised by Mendez-Villanueva et al. (2013) and Hunter et al. (2015) to determine soccer
player’s maximum sprint and maximum aerobic speeds, and individualise speed thresholds.

59
Maximum accelerative capacity was used to individualise acceleration thresholds for Study
Two, Study Three, Study Four, and Study Five. Maximum accelerative capacity was
determined using a maximum acceleration protocol. In each study, the maximum acceleration
protocol was completed the day prior to data collection starting. The protocol required
athletes to complete three maximal 40m linear sprints, with a minimum of three minutes rest
between repetitions. The maximum rate of acceleration was calculated for each sprint
utilising 10-Hz portable GPS devices (OptimEye S5B, Version 7.18; Catapult Innovations,
Melbourne, Australia), with the highest acceleration values recorded for each athlete. The
protocol was completed on an indoor artificial grass surface, with football boots. This
protocol had previously been utilised to determine maximum sprint speed (Mendez-
Villanueva et al., 2013), with a similar protocol utilised by Sonderegger et al. (2016) to
determine maximum accelerative capacity and individualise acceleration thresholds.
3.8 Athlete Groups
Within Study One and Study Two, athletes were sub-divided dependent upon physical
performance testing scores. The purpose was to add further depth to the studies, examining
differences between global and individual analysis methods to be compared between athletes
of differing physical capacities. In Study One, athletes were sub-divided into three groups
based upon maximum aerobic speed testing scores. The athlete groups were characterised as
low maximum aerobic speed (LOMAS) (< 1 SD from mean), medium maximum aerobic speed
(MEMAS) (± 1 SD from mean), and high maximum aerobic speed (HIMAS) (> 1 SD from
mean). The athlete groups for Study Two were determined using maximum acceleration
scores. Athlete groups were characterised as low accelerative capacity (LOACC) (< 1 SD from
mean), medium accelerative capacity (MEACC) (±1 SD from mean), and high accelerative
capacity (HIACC) (> 1 SD from mean).
For Study Three and Study Four, participants were assigned an outfield playing position by
the head technical coach. Each participant only featured in one playing position. Playing
positions were central defender, wide defenders, central midfielders, wide attackers, and
strikers.
For Study Five, participants were sub-divided dependent upon maturation status. The three
sub-divisions of maturation status were early developers, on-time developers, and late

60
developers, derived using Maturity Z-scores. Early developers had a maturity Z-score of > 1,
on-time developers between 1 and -1, and late developers < -1. Maturity Z-scores were
calculated using participant’s percentage predicted adult height, and age and sex specific
reference values as previously utilised by Cumming et al. (2018) (Bayer & Bailey, 1959;
Malina et al., 2007a).
3.9 GPS Data Analysis
Following the recording of each set of data, GPS devices were downloaded to a computer and
analysed using Catapult Sprint software (Catapult Sprint 5.1.5, Catapult Innovations,
Melbourne, Australia). Using time and location data, distance, speed and acceleration could
be calculated. Speed was calculated using measurements of the Doppler shift of signals
received, distance was measured using positional differentiation (Malone et al., 2017).
Acceleration was calculated as the increasing rate of change in instantaneous speed over
time. Only the increasing rate of change in speed was measured, as a decreasing rate of
change in speed is classified as a deceleration (Hodgson et al., 2014). When analysing high-
speed locomotion tasks (e.g high-speed running, very high-speed running, sprinting,
sprinting), the minimum effort duration for was one-second (Hunter et al., 2015). When
analysing acceleration tasks (low-intensity, moderate-intensity, and high-intensity
acceleration distances) a minimum effort duration of 0.4 seconds was used. This was similar
to minimum effort durations cited in previous research (Dalen et al., 2016; Hodgson et al.,
2014; Ingebrigtsen et al., 2015).
When investigating physical demands during competition (Study Three), specific data
analysis processes were adhered to. To allow direct comparisons in data, only participants
completing 90-minutes were included within the analysis process. Once downloaded, each
data set was edited and split into two 45-minute halves. Extra time at the end of each half was
excluded to ensure comparison between matches. The same process was applied when
investigating training games within Study Four. Each training game data set was edited and
split into four quarters of four-minutes. Considering Study Four investigated both
competition and training game demands, GPS metrics were presented as per minute values to
allow comparability between competition and training games of different durations. Within
Study Four, peak and average values were calculated for GPS metrics. Peak values were
calculated by dividing each 90-minute match, or 16-minute training game, into one-minute

61
intervals, and recording the highest values achieved per minute for each GPS metric. Average
values were calculated by dividing total values for the 90-minute match, or 16-minute
training game, by the overall duration. For Study Five, competition data was edited and split
into four quarters of 20-minutes. Only participants completing the entire match were included
within the analysis process. As with previous research, extra time at the end of each quarter
was excluded to enable comparison between matches.
3.10 GPS Data Quality and Accuracy
10-Hz GPS devices (OptimEye S5B, Version 7.18; Catapult Innovations, Melbourne,
Australia) were used to record and collect data for all studies within the current thesis. It has
been demonstrated that 10-Hz GPS devices have an acceptable level of accuracy and
reliability when assessing the speed of movement within intermittent exercise (Aguiar et al.,
2013; Barbero-Alvarez et al., 2010; Varley et al., 2012). Devices sampling at 10-Hz provide
sufficient accuracy when quantifying acceleration, deceleration and constant speed
locomotion in team sports (Varley et al., 2012). When assessing reliability, Aughey (2011)
demonstrated coefficient of variations of 0.7 - 1.3% for 15m and 30m sprints, whilst Delaney
et al. (2017) demonstrated coefficient of variations of 3.6 - 5.9% for quantifying
instantaneous speed during acceleration.
In accordance with manufacturer’s instructions all GPS devices were switched on 15-minutes
prior to the beginning of each data collection session, and switched off immediately
following. Each GPS unit was worn in a designated tight-fitting vest located between the
scapulae to reduce unwanted movement. Athletes wore the same unit for each training
session to avoid inter-unit error.
3.11 Data Exclusion Criteria
Data exclusion criteria were applied to ensure the accuracy and validity of data was
maintained. For GPS data, the number of satellites, and horizontal dilution of position were
monitored for data quality purposes. If values ranged < 12 for number of satellites, or > 1 for
horizontal dilution of position, data was excluded.

62
During all of the studies, if participants did not complete the training session or match due to
injury, their data was excluded from the study. During Study Three, Study Four, and Study
Five, if the participants did not complete the entirety of the training game session (16-
minutes), or competition (80- or 90-minutes), their data was excluded.
3.12 Technical Data Analysis
Technical data during both bio-banded and chronological competition formats was recorded
using a camcorder (Sony HDR CX570). Fixtures were coded both live and retrospectively
using SportsCode (Version 10.3.36, Sportscode Elite Software), by trained academy
performance analysts. Video recordings and their respective coding were then downloaded to
a computer and synced. Technical performance metrics were produced using custom reports
on SportsCode software.
3.13 Statistical Analysis
Descriptive analyses were conducted on all data sets within the current thesis, with normality
values assessed using Kolmogorov-Smirnov and Shapiro-Wilk tests. Significance values of p
< 0.05 were used to analyse the distribution of data. Skewness and kurtosis values were
assessed, with standard error between -2 and +2 indicating the data was normally distributed.
Within Study One, analysis indicated data was non parametric. Consequently, Wilcoxon
signed rank tests were used to determine the within group (global, individual) differences in
high-speed running, very high-speed running, and sprinting values. This form of statistical
testing was used as the data was non-parametric. A Bonferroni adjustment was used in
conjunction with the Wilcoxon signed rank tests. Cohen’s d tests were used to determine the
effect sizes of the differences.
Within Study Two, descriptive analyses indicated data was parametric and normally
distributed. To determine differences in low-, moderate-, and high-intensity acceleration
distances produced by global and individual analysis methods, a two-way mixed design
ANOVA was used, where analysis method (global, individual) was the within-subjects
variable, and athlete group (LOACC, MEACC, HIACC) was the between subjects variable. Partial
eta-squared values were calculated to estimate the effect size for the ANOVA. Bonferroni

63
tests were used post-hoc to assess where differences occurred, with Cohen’s d tests used to
calculate effect sizes.
Within Study Three, descriptive analyses indicated that data was parametric, and normally
distributed. To investigate differences and interactions between match outcome and playing
position in the GPS metrics produced during competition, a two-way between subjects
ANOVA was used. Partial eta-squared values were calculated to estimate the effect size for
the ANOVA. Match outcome and playing position were the between-subjects variables.
Bonferroni tests were used post-hoc to assess where differences occurred, with Cohen’s d
tests used to calculate effect sizes.
Data within Study Four was parametric, and normally distributed. To investigate the
differences in eight GPS metrics and RPE produced by game formats for playing positions,
two-way between subjects ANOVAs were used, with playing position and game format being
the between-subjects variables. Partial eta-squared values were calculated to estimate the
effect size for the ANOVA. Bonferroni tests were used post-hoc to assess where differences
occurred, with Cohen’s d tests used to calculate effect sizes.
Descriptive analysis indicated Study Five data was parametric, and normally distributed. To
investigate differences in physical and technical performance between bio-banded and
chronologically aged fixtures for early, on-time, and late developers, two-way mixed design
ANOVAs were used where competition format (bio-banded, chronological) was the within-
subjects variable, and maturation status (early, on-time, late) was the between subjects
variable. Partial eta-squared values were calculated to estimate the effect size for the
ANOVA. Bonferroni tests were used post-hoc to assess where differences occurred, with
Cohen’s d tests used to calculate effect sizes.
The level of statistical significance for all tests within the studies was set at p < 0.05. For all
studies within the current thesis, Cohen’s d tests were used to calculate effect sizes. A
Cohen’s d effect size of d = 0.2 was considered a small effect size, d = 0.5 a medium effect
size, whilst d = 0.8 was considered a large effect size. For studies that used an ANOVA,
partial eta-squared values were calculated to estimate the effect size for the ANOVA. A
partial eta-squared effect size of ηp2 = .02 was considered a small effect size, an effect size of
ηp2 = .13 was considered a medium effect size, whilst ηp
2 = .26 was considered a large effect

64
size. All statistical analyses within the current thesis were performed using the software IBM
SPSS statistics (version 22; SPSS, Inc., Chicago, IL, USA).
.

65
4.0 Study One - An individual approach to monitoring locomotive
training load in English Premier League academy soccer players
Publication arising from this chapter: Abbott, W., Brickley, G., & Smeeton, N.J. (2018).
An individual approach to monitoring locomotive training load in English Premier League
academy soccer players. International Journal of Sports Science & Coaching, 13(3), 421-
428.
66
Abstract
To account for the individual intensity of locomotion tasks, individualised speed thresholds
have been proposed as an alternative to global speed thresholds. Methodologies to determine
individual speed thresholds have typically been laboratory based, time consuming, and
expensive, rendering them inappropriate for applied practitioners working with large squads.
The current study utilised easy to administer field tests to individualise speed thresholds. The
aim was to investigate differences between high-speed locomotion measured using global and
individual analysis methods. Nineteen, male, professional soccer players completed
maximum sprint and maximum aerobic speed protocols, and were divided into groups
dependent upon maximum aerobic speed performance (high – HIMAS, medium - MEMAS, and
low - LOMAS). Locomotion data was collected using portable GPS units, and analysed using
global and individual analysis methods to determine distances travelled performing high-
speed running (HSR), very high-speed running (VHSR), and sprinting (SPR). In LOMAS
athletes, the individual analysis method produced significantly higher HSR, VHSR and SPR
distances compared to global (mean differences 390m, 310m, and 88m respectively, p <
0.01). In MEMAS athletes, no significant differences were found between analysis methods for
HSR and VHSR. In HIMAS athletes, the individual analysis method produced significantly
lower HSR and VHSR distances compared to global (mean differences 549m and 341m, p <
0.01). Results concluded that the global analysis method produced high-speed locomotion
distances significantly higher, or lower than the individual analysis method for 47% of
athletes. The current study recommends the use of field tests to individualise speed
thresholds, allowing applied practitioners to accurately quantify individual athlete intensity.

67
4.1 Introduction
Determining associations between training load and injury occurrence in team sports is
important for optimising performance. A fine balance exists between applying the optimum
training stimulus to promote adaptation, and exceeding the optimum stimulus, which is
associated with a higher incidence of injury (Bowen et al., 2017; Casamichana et al., 2012).
Consequently, monitoring and understanding training load is vital to facilitate physical
performance, and reduce injury risk (Bowen et al., 2017; Hill-Haas et al., 2008). Distance
travelled performing high-speed locomotion tasks (e.g. high-speed running, very high-speed
running, and sprinting) has received significant attention when investigating training load
(Bradley et al., 2009; Di Salvo et al., 2010). Faude et al. (2012) highlighted the importance of
high-speed locomotion by stating that straight-line sprinting is the most dominant action
when scoring goals. Adding to the importance of sprinting, Barnes et al. (2014) demonstrated
distances travelled sprinting in the English Premier League have increased by ~35% between
2006 and 2013. Considering sprinting tasks are associated with impaired muscle function,
and increased perceived muscle soreness, the volume of sprinting completed has implications
upon recovery time and injury risk (Howatson & Milak, 2009). It is therefore important that
high-speed locomotion is quantified accurately (Carling, 2013).
High-speed locomotion tasks are typically banded using speed thresholds. Subjectively, these
have been equated to descriptions of movement and designated a specific speed band
(Carling, 2013; Akenhead et al., 2013). Despite growing interest in the area of global
positioning systems (GPS), there are no consistent definitions for speed thresholds, making
comparison between research difficult (Dwyer & Gabbett, 2012). Common speed thresholds
cited within soccer research are, high-speed running as 4.2 - 5.5 m.s-1 (Hunter et al., 2015;
Lovell & Abt, 2013), very high-speed running as 5.5 - 7.0 m.s-1 (Lovell & Abt, 2013; Abt &
Lovell, 2009), and sprinting as > 7.0 m.s-1 (Bradley et al., 2010; Hunter et al., 2009). In the
past, speed thresholds have been applied arbitrarily to all athletes. Global speed thresholds
allow for comparisons in absolute workload completed by athletes, but are suggested to mask
important information regarding the relative intensity an individual is working (Hunter et al.,
2015). Athlete’s internal responses to the same external demands vary, and result in differing
degrees of adaptation (Hunter et al., 2015). This is further emphasised when monitoring
athletes of different ages and maturation levels (Gabbett, 2015). Despite allowing for
comparisons between athletes, researchers have suggested the potential for large differences

68
in quantifying an individual’s high-intensity demands using global speed thresholds (Abt &
Lovell., 2009; Cummins et al., 2013).
Having identified the disadvantages associated with global speed thresholds, researchers have
attempted to individualise thresholds using physical performance markers (Abt & Lovell,
2009; Hunter et al., 2015; Mendez-Villanueva et al., 2013). The aim of individualising speed
thresholds is to account for the individual nature of the exercise-intensity continuum, and
accurately represent the relative intensity an athlete is working. In a recent case study, Abt
and Lovell (2009) individualised speed thresholds utilising athlete’s ventilatory thresholds.
The second ventilatory threshold represented the transition from moderate to high-intensity
exercise. Results found marked differences in high-intensity work performed between
athletes of the same playing position using the individualised speed thresholds, whilst
negligible results were demonstrated between the athletes using global thresholds.
Limitations of ventilatory thresholds to individualise high-speed locomotion are that it is time
consuming, expensive, and requires access to facilities and expertise to administer (Lovell &
Abt, 2013). This provides barriers for practitioners working with large squads of athletes. An
alternative method for increasing the specificity of speed thresholds, is using the athlete’s
functional limits of endurance and sprint locomotor capacities. Hunter et al. (2015) and
Mendez-Villanueva et al. (2013) recently applied this to youth athletes, using field tests to
assess athlete’s maximum aerobic, and maximum sprint speeds. Maximum aerobic speed is
strongly correlated with vV̇O2max, whilst maximum sprint speed allowed for the estimation of
an individual’s anaerobic speed reserve, and transition to sprinting (Hunter et al., 2015).
Currently, no research has utilised field tests to individualise speed thresholds in an elite adult
soccer population. Additionally, previous research has focused upon competition, excluding
training sessions from the analyses. Considering training scenarios may differ significantly
from competition, and a high volume of locomotive training load is accumulated whilst
training, further analysis is warranted.
To increase the accuracy of assessing athlete locomotion and improve the training monitoring
process, the aim of the current study was to determine the discrepancies between global and
individual methods for monitoring high-speed locomotion. Previous research has used youth
athletes, presented results in a case study format, and focused solely upon soccer competition
(Abt & Lovell, 2009; Hunter et al., 2015; Mendez-Villanueva et al., 2013). The current study
focused upon a squad of professional academy soccer athletes, with data collected over a six-

69
week pre season period consisting of training sessions and matches. Cost effective, easy to
administer, field tests were used to determine individual speed thresholds, and increased the
utility of the method for applied practitioners. Differences in high-speed locomotion,
determined using global and individual analysis methods, were assessed. The global method
used frequently cited speed thresholds for soccer (Bradley et al., 2010; Lovell & Abt, 2013)
whilst the individual method used thresholds derived from athlete’s physical testing results
(Hunter et al., 2015; Mendez-Villanueva et al., 2013). It was predicted that there would be
significant differences between the high-speed locomotion distances produced by global and
individual analysis methods. It was also predicted that the differences in high-speed
locomotion distances produced between analysis methods would vary dependent upon an
athlete’s physical capacity.
H1 – There will be a significant difference in high-speed locomotion distances produced by
global and individual analysis methods.
H01 - There will be no significant differences in high-speed locomotion distances produced by
global and individual analysis methods.
H2 – Differences in high-speed locomotion distances produced by global and individual
analysis methods will vary dependent upon an athlete’s physical capacity.
H02 - Differences in high-speed locomotion distances produced by global and individual
analysis methods will not vary dependent upon an athlete’s physical capacity.
4.2 Methodology
Design
Data collection for the study spanned a six-week pre-season period. Participants took part in
32 training sessions, and two friendly matches, resulting in a total of 645 data points. High-
speed locomotion was recorded and quantified for each athlete, using 10-Hz portable GPS
devices (OptimEye S5B, Firmware Version 7.18; Catapult Innovations, Melbourne,
Australia). GPS data for each athlete was analysed using two analysis methods, a global
analysis method, and an individual analysis method. Distances travelled performing high-
speed running (HSR), very high-speed running (VHSR), and sprinting (SPR) tasks were

70
recorded for each athlete’s training session. Values produced by global and individual
analysis methods were compared for each locomotion activity. The two analysis methods,
global and individual, were the independent variables within the study. The dependent
variables within the study were HSR, VHSR, and SPR distances.
Participants
Nineteen, male, full-time professional soccer athletes from an U23 Premier League academy
in the UK (18.2 ± 1.1 years, height 180.3 ± 7.1 cm, weight 75.6 ± 9 kg) participated in the
study. The participant’s mean involvement in soccer was 8.5 (± 1.5) years. Participants had
trained four to five times, and played one to two competitive matches per week for a
minimum of two years. Goalkeepers were excluded from the study, as they did not participate
in the same training sessions. All participants were briefed with a detailed explanation of the
proposed study and the requirements. They were informed of potential risks to them, and
provided written consent. For participants under the age of 18, parental or guardian consent
was provided. Participants were free to withdraw at any time, without any repercussions. The
study was conducted with the protocol being fully approved by the ethical review board at the
institution prior to commencing. The study conformed to the requirements stipulated by the
Declaration of Helsinki, and all health and safety procedures were complied with during the
study.
Procedures
The day prior to the start of pre-season training, each athlete completed maximum sprint
speed (MSS), and maximum aerobic speed (MAS) protocols to determine peak speed and
estimate vV̇O2max respectively. The MSS protocol required the athlete to complete three
maximal 40m linear sprints, with a minimum of three minutes rest between repetitions. MSS
was defined as the average speed recorded over the quickest 10m sector, and measured using
electronic light gates (Brower TC Timing System) to the nearest 0.01s. Intraclass correlation
coefficient for the MSS protocol has been cited as 0.94 - 0.99 (Mendez-Villanueva et al.,
2013). The MAS protocol was a modified version of the University of Montreal Track Test
(Leger & Boucher, 1980), previously used by Mendez-Villanueva et al. (2013). Correlation
coefficient for the MAS protocol has been demonstrated as 0.97 (Leger & Boucher, 1980).
The test began with an initial running speed of 8 km.h-1, with the speed increasing by 0.5
km.h-1 each minute. Athletes continued running around a 200m athletics track, marked with

71
20m intervals, in time with an audible cue, until either exhaustion or three consecutive cones
were missed. MAS was estimated as the speed of final one-minute stage completed by the
athlete. The MSS protocol was completed on an indoor artificial grass surface with football
boots. The MAS protocol was completed on the same grass surface and footwear used
throughout the study. Using MSS and MAS scores, each athlete’s theoretical anaerobic speed
reserve (ASR) was calculated. ASR was defined as the difference between the MSS and
MAS score, and reported in m.s-1. The MSS and MAS protocols were previously utilised by
Mendez-Villanueva et al. (2013) and Hunter et al. (2015) to determine soccer player’s
maximum sprint and maximum aerobic speeds.
During the six-week study, athletes followed the pre-season training plan constructed by the
head technical coach and the strength and conditioning coach. Training sessions (mean
duration 72 ± 9 minutes) were a mixture of technical practices, tactical practices, small-sided
games, replication of competition, and physical conditioning work. GPS units were switched
on 15-minutes prior to the beginning of each training session, in accordance with
manufacturer’s instructions, and switched off immediately following the session. Each GPS
unit was worn in a designated tight-fitting vest located between the scapulae to reduce
unwanted movement. Athletes wore the same unit for each training session to avoid inter-unit
error.
Data Analysis
10-Hz GPS devices were used to record data for each athlete’s training session. It has been
shown that 10-Hz GPS devices have an acceptable level of accuracy and reliability when
assessing the speed of movement within intermittent exercise (Aguiar et al., 2013; Barbero-
Alvarez et al., 2010; Varley et al., 2012). Specifically, Varley et al. (2012) state devices
sampling at 10-Hz provide sufficient accuracy when quantifying acceleration, deceleration
and constant speed locomotion in team sports. When assessing reliability, Aughey (2011)
demonstrated coefficient of variation of 0.7 - 1.3% for 15m and 30m sprints, whilst Delaney
et al. (2017) demonstrated coefficient of variation of 3.6 - 5.9% for quantifying instantaneous
speed during acceleration using 10-Hz GPS devices. The mean number of satellites during
data collection was 15 ± 1, and the mean horizontal dilution of position was 0.7 ± 0.1.
Following the recording of each training session, the individual GPS units were downloaded
to a computer and analysed using Catapult Sprint software (Catapult Sprint 5.1.5, Catapult

72
Innovations, Melbourne, Australia). Speed was calculated using measurements of the
Doppler shift of signals received, distance was measured using positional differentiation.
Distances travelled performing HSR, VHSR, and SPR tasks were recorded. The minimum
effort duration for high-speed locomotion tasks was one-second (Hunter et al., 2015). HSR,
VHSR and SPR variables were selected considering their use in previous literature
investigating individualised training load in soccer (Abt & Lovell, 2009; Hunter et al., 2015;
Lovell & Abt, 2013). This analysis process was repeated twice, once applying global speed
thresholds, and once applying individual speed thresholds. Data was presented as mean ±
standard deviation of distances travelled performing each locomotion task within the session.
Classification of Speed Thresholds
Distances travelled performing HSR, VHSR, and SPR tasks were calculated using global and
individual analysis methods. Forms of locomotion was designated a specific speed threshold,
which differed for global and individual analysis methods. Speed thresholds used for the
global analysis method were locomotion thresholds typically cited within soccer literature.
Global speed thresholds for HSR, VHSR, and SPR were 4.2 – 5.5 m.s-1, 5.5 - 7.0 m.s-1, and >
7.0 m.s-1 respectively (Abt & Lovell, 2009; Hunter et al., 2015; Lovell & Abt, 2013). The
speed thresholds utilised by the individual analysis method were athlete specific, and
determined by MSS and MAS performance. The individual analysis method was previously
utilised by Hunter et al. (2015) and Mendez-Villanueva et al. (2013), to represent the
functional limits of endurance and sprint locomotor capacities. Individual speed thresholds
for HSR, VHSR, and SPR were 80 - 99% MAS, 100% MAS - 30% ASR, and > 30% ASR
respectively.
Athlete Groups
Athletes were sub-divided into three groups based upon MAS testing scores. The purpose
was to add further depth to the study, allowing for differences in analysis methods to be
compared between athletes of differing physical capacities. The groups were characterised as
low MAS (LOMAS) (< 1 SD from mean), medium MAS (MEMAS) (± 1 SD from mean), and
high MAS (HIMAS) (> 1 SD from mean). Mean testing data for each athlete group, and mean
speed thresholds utilised for global and individual analysis methods, are shown in Table 4.1.

73
Table 4.1 Speed thresholds for LOMAS, MEMAS, and HIMAS athlete groups using global and
individual analysis methods.
Statistical Analysis
Descriptive analyses were conducted on the data set, with normality values assessed using
Kolmogorov-Smirnov and Shapiro-Wilk tests. Significance values of p < 0.05 indicate
uneven distribution of the data. Skewness and kurtosis values were assessed, with standard
error below -2 and above +2 indicating the data was not normally distributed. To determine
the within group differences in HSR, VHSR, and SPR values, Wilcoxon signed rank tests
were used. This form of statistical testing was used as the data was non-parametric. Wilcoxon
signed rank tests were used to determine the differences between HSR, VHSR, and SPR
values produced by global and individual analysis methods. A Bonferroni adjustment was
used in conjunction with the Wilcoxon signed rank tests. Cohen’s d tests were used to
calculate effect sizes of the differences. A Cohen’s d effect size of d = 0.2 was considered a
small effect size, d = 0.5 a medium effect size, whilst d = 0.8 was considered a large effect
size. The level of statistical significance was set at p < 0.05. All statistical analyses were
performed using the software IBM SPSS statistics (version 22; SPSS, Inc., Chicago, IL,
USA).
4.3 Results
Figure 4.1 shows the mean distances travelled performing HSR, VHSR, and SPR in LOMAS
athletes, calculated using global and individual analysis methods. Distance travelled
performing HSR, VHSR, and SPR were all significantly higher when calculated using the
individual analysis method compared to global (HSR Global Mdn = 1220m, Individual Mdn
= 1586m, Z = 11.175, p < 0.01, d = 0.94; VHSR Global Mdn = 418m, Individual Mdn =
Mean Running Speeds Global Analysis Method Individual Analysis Method
Athlete
Group
Data
Points
Mean
MAS
(m.s-1)
Mean
MSS
(m.s-1)
Mean
ASR
(m.s-1)
HSR
Threshold
(m.s-1)
VHSR
Threshold
(m.s-1)
SPR
Threshold
(m.s-1)
HSR
Threshold
(m.s-1)
VHSR
Thresho
ld (m.s-1)
SPR
Threshol
d (m.s-1)
LOMAS n = 166 4.7 ± 0.2 9.2 ± 0.4 4.6 ± 0.4 4.2 - 5.5 5.5 – 7.0 > 7.0 3.7 – 4.7 4.7 – 6.0 > 6.0
MEMAS n = 347 5.4 ± 0.2 9.2 ± 0.3 3.9 ± 0.4 4.2 - 5.5 5.5 – 7.0 > 7.0 4.3 – 5.4 5.4 – 6.6 > 6.6
HIMAS n = 132 6.0 ± 0.2 9.1 ± 0.2 3.1 ± 0.3 4.2 - 5.5 5.5 – 7.0 > 7.0 4.8 – 6.0 6.0 - 6.9 > 6.9
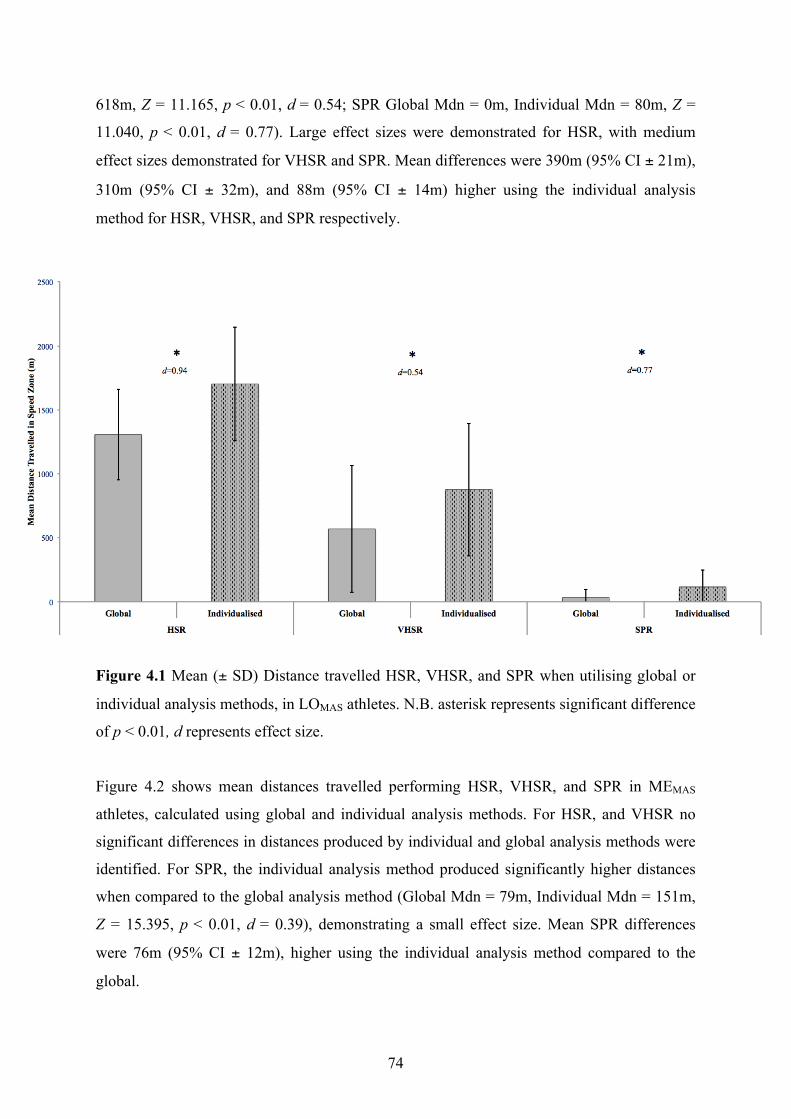
74
618m, Z = 11.165, p < 0.01, d = 0.54; SPR Global Mdn = 0m, Individual Mdn = 80m, Z =
11.040, p < 0.01, d = 0.77). Large effect sizes were demonstrated for HSR, with medium
effect sizes demonstrated for VHSR and SPR. Mean differences were 390m (95% CI ± 21m),
310m (95% CI ± 32m), and 88m (95% CI ± 14m) higher using the individual analysis
method for HSR, VHSR, and SPR respectively.
Figure 4.1 Mean (± SD) Distance travelled HSR, VHSR, and SPR when utilising global or
individual analysis methods, in LOMAS athletes. N.B. asterisk represents significant difference
of p < 0.01, d represents effect size.
Figure 4.2 shows mean distances travelled performing HSR, VHSR, and SPR in MEMAS
athletes, calculated using global and individual analysis methods. For HSR, and VHSR no
significant differences in distances produced by individual and global analysis methods were
identified. For SPR, the individual analysis method produced significantly higher distances
when compared to the global analysis method (Global Mdn = 79m, Individual Mdn = 151m,
Z = 15.395, p < 0.01, d = 0.39), demonstrating a small effect size. Mean SPR differences
were 76m (95% CI ± 12m), higher using the individual analysis method compared to the
global.

75
Figure 4.2 Mean (± SD) Distance travelled HSR, VHSR, and SPR when utilising global or
individual analysis methods, in MEMAS athletes. N.B. asterisk represents significance
difference of p < 0.01, d represents effect size.
Figure 4.3 shows mean distances travelled performing HSR, VHSR, and SPR in HIMAS
athletes, calculated using global and individual analysis methods. Results for the HIMAS
athlete group show the opposite trend to the LOMAS athlete group. The individual analysis
method produced significantly lower distances, when compared to the global analysis method
for both HSR (Global Mdn = 1893m, Individual Mdn = 1374m, Z = 3.956, p < 0.01, d =
1.73), and VHSR (Global Mdn = 1153m, Individual Mdn = 829m, Z = 3.274, p < 0.01, d =
0.72). A large effect size was demonstrated for HSR, with a medium effect size for VHSR.
Mean differences were 549m (95% CI ± 24m) and 341m (95% CI ± 30m) lower for HSR and
VHSR, when utilising the individual method compared to global. No differences were seen in
SPR distances between the two analysis methods.

76
Figure 4.3 Mean (± SD) Distance travelled HSR, VHSR, and SPR when utilising global or
individual analysis methods, in HIMAS athletes. N.B. asterisk represents significance
difference of p < 0.01, d represents effect size.
4.4 Discussion
The aim of the study was to analyse differences between global and individual methods for
monitoring high-speed locomotion. Individual speed thresholds for athletes were determined
using field based assessments of MSS and MAS, with athletes sub-divided into three groups
dependent upon MAS performance. This study was the first to individualise speed thresholds
using two field based performance tests, and to sub-divide athletes dependent upon physical
capacity.
The significant differences in HSR, VHSR, and SPR distances produced by global and
individual analysis methods were the result of the speed thresholds employed (Table 4.1).
Results for LOMAS athletes demonstrated mean HSR, VHSR, and SPR distances were
significantly higher using the individual analysis method compared to the global. This
resulted from lower speed thresholds used for the individual analysis method (≥ 3.7 ± 0.1
m.s-1, ≥ 4.7 ± 0.2 m.s-1, and ≥ 6.0 ± 0.2 m.s-1) in comparison to the global (≥ 4.2 m.s-1, ≥ 5.5

77
m.s-1, and ≥ 7.0 m.s-1). For MEMAS athletes, the only significant difference between analysis
methods were between mean SPR distances, with individual producing significantly higher
distances than global. This was the result of a lower SPR threshold for individual (≥ 6.6 ± 0.2
m.s-1) compared to the global analysis method (≥ 7.0 m.s-1). Similar speed thresholds were
employed for HSR and VHSR, resulting in no significant differences between analysis
methods. For HIMAS athletes, the individual analysis method produced significantly lower
mean HSR and VHSR distances compared to global. This was the result of higher speed
thresholds for individual (≥ 4.8 ± 0.1 m.s-1 and ≥ 6.0 ± 0.2 m.s-1) in comparison to global (≥
4.2 m.s-1 and ≥ 5.5 m.s-1). For SPR, thresholds employed were similar, resulting in no
significant differences. When considering current study predictions, the significant
differences in HSR, VHSR and SPR distances produced between analysis methods meant H1
was accepted, and H01 rejected. Considering the significant differences between HSR, VHSR,
and SPR distances varied between athlete groups, H2 was accepted, and H02 was rejected.
Current results demonstrated the individual analysis method produced significantly higher
HSR, VHSR, and SPR distances in LOMAS athletes, and significantly lower HSR and VHSR
distances in HI athletes, compared to the global analysis method. The findings compliment
research by Gabbett (2015) and Lovell and Abt (2013), despite differences in methodologies.
Gabbett (2015) recently compared global and individual analysis thresholds in youth Rugby
players, individualising speed thresholds using only maximum sprint speed. Gabbett (2015)
concluded that individualising speed thresholds increased the high-speed running attributed
to relatively slower athletes, and decreased the high-speed running attributed to faster
athletes. Lovell and Abt (2013) investigated the differences between high-intensity distances
produced by global and individual speed thresholds in elite soccer players. In contrast to the
current study, where speed thresholds were individualised using field based performance
tests, Lovell and Abt (2013) calculated ‘high-intensity’ as distance travelled above the second
ventilatory threshold. Results were similar to those demonstrated in LOMAS athletes within
the current study, with high-intensity distance significantly lower when using global
thresholds. Although results produced by Gabbett (2015) and Lovell and Abt (2013) are
similar for HIMAS and LOMAS athletes, the present study showed no significant differences in
HSR and VHSR distances produced between analysis methods for MEMAS athletes.
Differences in findings are likely the result of further analysis conducted within the current
study. Current results highlight the importance of sub-dividing athlete groups, providing

78
insight as to how differences between analysis methods vary within a squad of athletes.
Additionally, the current study utilised multiple performance markers to determine individual
thresholds. When individualising speed thresholds, Hunter et al. (2015) recommend multiple
performance markers to characterise the functional limits of endurance and sprint capacities.
Multiple performance measures allow for more representation of the relative locomotive
training load elicited upon athletes when compared to global speed thresholds. Considering
previous research used a single performance marker to individualise speed thresholds, this
may provide explanation for differing results within the current study.
Current findings have significant implications for applied practitioners aiming to accurately
monitor locomotive training load, and reduce injury risk. Recent research has focused upon
the association between training load and injury occurrence. Gabbett (2016) utilised the
acute:chronic workload ratio as a tool to identify injury risk, citing a ‘sweet spot’ of optimal
training load associated with a reduced probability of injury occurrence. When utilising
workload ratios to calculate injury risk, it is vital training load data included is a valid
representation of load elicited upon the athlete. Previous research suggests individual speed
thresholds produce more accurate representations of actual training load elicited, due to
individual’s physical performance capacities being accounted for (Hunter et al., 2015).
Integrating individual’s physical capacity within calculation of speed thresholds results in
increased validity of training load data. Without acknowledging an athlete’s physical
capacities, global speed thresholds may result in inaccurate representations of locomotive
training load. Inaccurate representation of training load increases the difficulty associated
with prescribing optimal training loads, increasing the probability of inappropriate training
load prescription and injury risk. Global speed thresholds allow practitioners to compare
performance between athletes, and assess an individual’s ability to tolerate locomotive
training load. However, if the aim is to accurately quantify the intensity of high-speed
locomotion, individual analysis methods distinguish between athletes of differing capacities
and maturation. The current study demonstrated individual speed thresholds could be
calculated using field based MAS and MSS tests. This provides practitioners operating with
large squads in applied settings an efficient and cost-effective method to individualise the
monitoring of high-speed locomotion.

79
4.5 Conclusion
Significant differences were demonstrated between high-speed locomotion distances
calculated using global and individual analysis methods. High-speed locomotion was similar
between analysis methods for MEMAS athletes, but global distances were significantly lower
for LOMAS athletes, and significantly higher for HIMAS athletes compared to individual
distances. With a large emphasis in modern day soccer placed upon physical development,
the need to accurately prescribe and monitor training load is paramount. Previous research
suggested individual analysis methods account for the relative intensity of locomotion tasks
by incorporating each athlete’s physical capacities, with global analysis methods unable to.
Comparatively, global speed thresholds allow practitioners to compare physical performance,
and determine an individual’s ability to tolerate a locomotive training load. If the objective is
to accurately quantify the intensity of high-speed locomotion for athletes of differing
capacities and maturation, it is recommended an individual analysis method be utilised. This
provides practitioners with the necessary tools to accurately monitor locomotive training
load, and ultimately optimise performance and reduce injury risk. The current study utilised
field tests to determine individual speed thresholds, a method that can be replicated
effectively for large squads. Although the study was conducted in soccer, similarities in
movement demands and intermittent speed profiles mean that findings are applicable to the
majority of team sports.

80
5.0 Study Two - Individualising acceleration in English Premier
League academy soccer players
Publication arising from this chapter: Abbott, W., Brickley, G., Smeeton, N.J., & Mills, S.
(2018). Individualizing acceleration in English Premier League academy soccer players. The
Journal of Strength and Conditioning Research, 32(12), 3503-3510.

81
Abstract
Global thresholds are typically utilised to band acceleration dependent upon intensity.
However, global thresholds do not account for variation in individual capacities, failing to
quantify true intensity of acceleration. Previous research has investigated discrepancies in
high-speed distances produced utilising global and individual speed thresholds, not yet
investigated for acceleration. The current aim was to investigate discrepancies between
global and individual thresholds when quantifying acceleration tasks. Acceleration data was
recorded for 31 professional soccer players, utilising 10-Hz GPS devices. Distances travelled
performing low-, moderate-, and high-intensity acceleration were calculated for athletes
utilising global and individual thresholds. Global acceleration thresholds for low-, moderate-,
and high-intensity acceleration were classified as 1 - 2 m.s-2, 2 - 3 m.s-2, and > 3 m.s-2
respectively, with individual thresholds classified as 25 - 50%, 50 - 75%, and > 75% of
maximum acceleration respectively. Athletes were grouped low (LOACC), medium (MEACC),
or high (HIACC) maximum accelerative capacity, determined utilising three maximal 40m
linear sprints. Two-way mixed design ANOVAs were used to analyse differences in
acceleration distances produced between analysis methods and athlete groups. No significant
differences were identified between analysis methods for LOACC. For MEACC, no significant
differences were demonstrated for low-intensity. Moderate- and high-intensity acceleration
distances were significantly higher for global compared to individual analysis method (p <
0.01). For HIACC, significantly higher acceleration distances were produced for all
acceleration intensities utilising global thresholds (p < 0.01). Significant differences
identified between analysis methods suggest practitioners must apply caution when utilising
global thresholds. Global thresholds do not account for individual capacities, and may
provide an inaccurate representation of relative intensity of acceleration tasks.
82
5.1 Introduction
Introduction of global positioning systems (GPS) to soccer has allowed an increased focus on
high-speed activities (Varley & Aughey, 2013). It is vital high-speed activities are quantified
accurately, considering their high-energy cost (Howatson & Milak, 2009), and link to goal
scoring opportunities (Faude et al., 2012; Little & Williams, 2005). Previously, global speed
thresholds have been utilised to quantify an individual’s high-speed activities (Bradley et al.,
2009). A limitation of global thresholds is the inability to acknowledge the relative intensity
of activity. The exercise intensity continuum is individual-dependent, resulting in reduced
accuracy when applying global thresholds to determine relative intensity for individuals (Abt
& Lovell, 2009). To increase the accuracy of quantifying individual training stimulus,
individual thresholds have been developed. Individual speed thresholds have previously been
calculated utilising maximum sprint speed (Gabbett, 2015; Reardon et al., 2015), maximum
aerobic speed (Mendez-Villanueva et al., 2013), gas ventilatory thresholds (Abt & Lovell,
2009; Clarke et al., 2015), or a combination of the aforementioned markers (Hunter et al.,
2015). Individual thresholds aim to quantify the relative intensity of high-speed locomotion,
providing accurate information on an individual’s training stimulus. Lovell and Abt (2013)
compared distances produced by global speed thresholds, and individual speed thresholds
determined utilising the second ventilatory threshold. Results demonstrated significant
differences in high-intensity work performed between athletes of the same positional role
utilising individual speed thresholds, whilst non-significant results were demonstrated
between the same athletes when utilising global thresholds. Recently, several researchers
have found discrepancies between values produced utilising global and individual speed
thresholds (Clarke et al., 2015; Gabbett, 2015; Reardon et al., 2015). These discrepancies
highlight the precision required to accurately monitor individual athlete training load.
Despite having an important role, soccer training load should not focus solely upon
monitoring high-speed activities. Focusing upon speed thresholds neglects metabolically
demanding tasks occurring at low speed, such as acceleration (Akenhead et al., 2013;
Osgnach et al., 2010). Research has reported a three- to eight-fold greater number of
accelerations than sprints when comparing their frequency during competition (Dalen et al.,
2016; Varley & Aughey, 2013). Lockie et al. (2011) state the mean duration of a sprint in
soccer is approximately two-seconds. Consequently, an athlete’s ability to accelerate and
reach high speed quickly is vital for on-field performance. Greig and Siegler (2009) suggest

83
sprinting and acceleration tasks are important underlying factors for muscular fatigue, given
the high neuromuscular demand associated. Considering the link between fatigue and the
occurrence of muscular strain injuries, as demonstrated by epidemiological injury data from
the latter stages of competition, quantifying acceleration within the training load monitoring
process would have large consequences for recovery.
As with high-speed activities, when quantifying acceleration tasks it is vital individual
capacities are acknowledged. Previous research demonstrated acceleration demands vary
significantly between playing positions during competition (Dalen et al., 2016; Ingebrigtsen
et al., 2015). Dalen et al. (2016) concluded wide defenders and wide attackers accelerated
with higher frequency than central midfielders and central defenders. Ingebrigtsen et al.
(2015) identified similar trends, with wide players producing significantly more acceleration
manoeuvres than central players. Authors explained central players typically operate in
congested areas of the pitch, limiting space to accelerate maximally and achieve high speeds.
A limitation of previous research investigating acceleration occurrence in soccer, is global
thresholds were utilised to band acceleration tasks. Currently, no consistent global
acceleration thresholds exist within the literature. Aughey (2010) utilised a single threshold
of 2.78 m.s-2 to quantify acceleration occurrence. Akenhead et al. (2013) further divided
thresholds of 1 - 2 m.s-2 for low-intensity acceleration, 2 - 3 m.s-2 for moderate-intensity, and
> 3 m.s-2 for high-intensity, whilst Bradley et al. (2010) defined moderate-intensity as 2.5 - 4
m.s-2 and high-intensity as > 4 m.s-2. Although global acceleration thresholds allow for
comparisons in external workload completed by athletes, they fail to acknowledge
individual’s maximum accelerative capacities, and relative intensity of the stimulus placed
upon individual athletes. The dose-response relationship is highly individual, with athletes’
internal responses to the same external stimulus varying, and resulting in differing degrees of
adaptation (Impellizzeri et al., 2005). Consequently, it is impossible to determine individual’s
acceleration intensity without an individualised approach to monitoring.
Considering the limitations of global acceleration thresholds, individual thresholds provide an
alternative method for monitoring acceleration intensity. Sonderegger et al. (2016) were the
first to attempt to individualise acceleration thresholds, incorporating individual’s maximum
accelerative capacity. This methodology was utilised to investigate acceleration values
produced at various initial running speeds. Results highlighted the variance in maximum
accelerative capacities in highly trained junior soccer players, with values ranging from 4.5 -

84
7.1 m.s-2. Despite a non-elite cohort, large variations in individual accelerative capacity
provide further rationale for an individualised approach to quantifying acceleration tasks.
Akenhead and Nassis (2016) recently investigated current training load practices and
perceptions amongst applied practitioners. Despite compelling physiological rationale, results
demonstrated infrequent use of individual thresholds within applied sport. This is likely due
to the time-cost associated with testing large squads, and the availability of expensive testing
equipment. These barriers could be overcome by utilising a field-based assessment with the
capability of testing squads of athletes simultaneously.
Considering the advantages of an individual approach to monitoring acceleration, and the
vast literature currently utilising global acceleration thresholds, rationale exists for study into
the discrepancies between global and individual acceleration thresholds. The current study
aimed to determine the discrepancies between global and individual thresholds when
quantifying acceleration tasks. Athletes were categorised dependent upon maximum
accelerative capacities to provide further insight into individualising thresholds for athletes of
varying physical capacities. Considering the high proportion of applied practitioners utilising
global acceleration thresholds for athletes, results will have significant implications for future
quantification of acceleration. It was predicted that significant differences would be evident
between acceleration distances produced by global and individual analysis methods.
Additionally, it was predicted the magnitude of differences between analysis methods would
vary dependent upon individual’s maximum accelerative capacities.
H3 – There will be significant differences in acceleration distances produced by global and
individual analysis methods.
H03 – There will be no significant differences in acceleration distances produced by global
and individual analysis methods.
H4 – Differences in acceleration distances produced by global and individual analysis
methods will vary dependent upon an athlete’s maximum accelerative capacity.
H04 – Differences in acceleration distances produced by global and individual analysis
methods will not vary dependent upon an athlete’s maximum accelerative capacity.

85
5.2 Methodology
Design
Participants were sub-divided into three groups utilising individual maximum acceleration
values (LOACC – low accelerative capacity, MEACC – medium accelerative capacity, HIACC –
high accelerative capacity). Participants took part in 23 training sessions, and four friendly
matches. Data collection spanned a four-week pre-season period. Acceleration data was
recorded and quantified for each athlete, utilising 10-Hz portable GPS devices (OptimEye
S5B, Version 7.18; Catapult Innovations, Melbourne, Australia). GPS-derived acceleration
data was analysed for individual athletes utilising two analysis methods; a global analysis
method, and individual analysis method. Distances travelled performing low-intensity,
moderate-intensity, and high-intensity acceleration was recorded for individual athlete’s
training sessions. Distances produced utilising global and individual analysis methods were
compared for low-, moderate-, and high-intensity acceleration.
Participants
Thirty-one, male, full-time professional soccer athletes from a Premier League academy in
the UK (19.4 ± 1.7 years, height 180.4 ± 9.2 cm, weight 76.9 ± 7.2 kg) participated in the
study. Participants took part in 23 training sessions, and four friendly matches during the
study (median 26 (IQR 26 – 27) data collections per participant). Participant’s mean
involvement in soccer was 7.1 (± 1.6) years. Participants had trained four to five times per
week, and played one to two competitive matches per week for a minimum of two years.
Goalkeepers were excluded from the study as they participated in separate training.
Participants were briefed with a detailed explanation of the proposed study and requirements.
Participants were informed of potential risks, and provided written consent. For participants
under the age of 18, parental or guardian consent was provided. Participants were free to
withdraw at any time, without any repercussions. The study was conducted with the protocol
fully approved by the ethical review board at the institution prior to commencing. The study
conformed to the requirements stipulated by the Declaration of Helsinki, and all health and
safety procedures were complied with.

86
Procedures
The day prior to commencement of pre-season training, athletes completed a maximum
acceleration protocol. The protocol required athletes to complete three maximal 40m linear
sprints, with at least three minutes rest between repetitions. The protocol was completed on
artificial grass, with football boots. This protocol has previously been utilised to determine
maximum sprint speed (Mendez-Villanueva et al., 2013), with a similar protocol utilised to
determine maximum accelerative capacity in previous research (Sonderegger et al., 2016).
The maximum rate of acceleration was calculated for each sprint utilising 10-Hz portable
GPS devices (OptimEye S5B, Version 7.18; Catapult Innovations, Melbourne, Australia),
with the highest acceleration values recorded for each athlete.
During the study, athletes followed the pre-season training plan constructed by the head
technical coach and strength and conditioning coach. Training sessions (mean duration 81 ±
10 minutes) were a mixture of technical practices, tactical practices, small-sided games,
replication of competition, and physical conditioning work. GPS units were switched on 15-
minutes prior to each training session, in accordance with manufacturer’s instructions, and
switched off immediately following the session. Each GPS unit was worn in a designated
tight-fitting vest located between the scapulae to reduce unwanted movement. Athletes wore
the same unit for each training session to avoid inter-unit error.
Data Analysis
10-Hz GPS devices were utilised to record data for individual athlete’s training sessions.
Akenhead et al. (2014) state 10-Hz GPS units can accurately assess acceleration in team-
sports, having been validated against 2000-Hz laser devices. The coefficient of variation for
quantifying instantaneous speed during acceleration tasks ranged from 3.6 - 5.9%, confirming
an acceptable level of validity (Akenhead et al., 2014; Delaney et al., 2017). The mean
number of satellites during data collection was 15 ± 1, and mean horizontal dilution of
position was 0.8 ± 0.1. Malone et al. (2017) suggest > 6 satellites for adequate data quality,
however following conversations with the manufacturer, data was excluded if number of
satellites decreased < 12. If horizontal dilution of position was > 1, data was excluded
(Malone et al., 2017). Following training sessions, individual GPS units were downloaded to
a computer and analysed utilising Catapult Sprint software (Catapult Sprint 5.1.5, Catapult
Innovations, Melbourne, Australia). Using time and location data, speed and acceleration
87
were calculated. Speed was calculated using measurements of the Doppler shift of signals
received, distance was measured using positional differentiation (Malone et al., 2017).
Acceleration was calculated as the increasing rate of change in instantaneous speed over
time. Only the increasing rate of change in speed was measured, as a decreasing rate of
change in speed is classified as a deceleration (Hodgson et al., 2014). Distances travelled
performing low-, moderate-, and high-intensity acceleration tasks were recorded. The
minimum effort duration for acceleration tasks was 0.4 seconds, similar to minimum effort
durations cited in previous research (Dalen et al., 2016; Hodgson et al., 2014; Ingebrigtsen et
al., 2015). The analysis process was repeated twice, first applying global acceleration
thresholds, and again applying individual acceleration thresholds.
Classification of Acceleration Thresholds
Acceleration thresholds utilised for the global analysis method were frequently cited
thresholds within soccer literature. Global acceleration thresholds for low-, moderate-, and
high-intensity acceleration was classified as 1 - 2 m.s-2, 2 - 3 m.s-2, and > 3 m.s-2 respectively
(Akenhead et al., 2013; Hodgson et al., 2014). The acceleration thresholds utilised by the
individual analysis method were athlete specific, and determined by maximum acceleration
values recorded during the testing protocol. The individual analysis method had previously
been utilised by Sonderegger et al. (2016) to quantify intensity of acceleration activities.
Sonderegger et al. (2016) banded low-, moderate-, and high-intensity acceleration as 25 -
50%, 50 - 75%, and > 75% of maximal acceleration respectively.
Athlete Groups
Athletes were sub-divided into three groups utilising maximum acceleration testing scores.
The purpose was to compare discrepancies between analysis methods for athletes of varying
accelerative capacities. Groups were characterised as low accelerative capacity (LOACC) (< 1
SD from mean), medium accelerative capacity (MEACC) (± 1 SD from mean), and high
accelerative capacity (HIACC) (> 1 SD from mean). Mean testing data for athlete groups, and
mean acceleration thresholds utilised for global and individual analysis methods are
presented in Table 5.1.

88
Table 5.1. Acceleration thresholds for LO, ME, and HI athlete groups utilising global and
individual analysis methods.
Statistical Analysis
Descriptive analyses were conducted on the data set, with normality values assessed using
Kolmogorov-Smirnov and Shapiro-Wilk tests. Significance values p > 0.05 indicated data
was normally distributed. Skewness and kurtosis values were assessed, with standard error
between -2 and +2 indicating the data was normally distributed. To investigate differences
low-, moderate-, and high-intensity acceleration distances produced by global and individual
thresholds for LOACC, MEACC, and HIACC athlete groups, two-way mixed design ANOVAs
were used where Analysis Method (Global, Individual) was the within-subjects variable, and
Athlete Group (LOACC, MEACC, HIACC) was the between subjects variable. Partial eta-squared
values were calculated to estimate the effect size for the ANOVA. A partial eta-squared
effect size of ηp2 = .02 was considered a small effect size, an effect size of ηp
2 = .13 was
considered a medium effect size, whilst ηp2 = .26 was considered a large effect size.
Bonferroni tests were used post-hoc to assess where differences occurred, with Cohen’s d
tests used to calculate effect sizes. An effect size of d = 0.2 was considered a small effect
size, an effect size of d = 0.5 was considered a medium effect size, whilst d = 0.8 was
considered a large effect size. All statistical analyses were performed using the software IBM
Athlete
Group
Number of
Athletes (n)
Data Points Maximum
Acceleration
(m.s-2)
Low-
Intensity
Acceleration
Threshold
(m.s-2)
Moderate-
Intensity
Acceleration
Threshold
(m.s-2)
High-
Intensity
Acceleration
Threshold
(m.s-2)
Global Analysis Method
LOACC 9 N = 238 5.7 ± 0.1 1.0 – 2.0 2.0 - 3.0 > 3.0
MEACC 14 N = 366 6.5 ± 0.2 1.0 – 2.0 2.0 - 3.0 > 3.0
HIACC 8 N = 211 7.2 ± 0.2 1.0 – 2.0 2.0 - 3.0 > 3.0
Individual Analysis Method
LOACC 9 N = 238 5.7 ± 0.1 1.4 – 2.8 2.8 – 4.3 > 4.3
MEACC 14 N = 366 6.5 ± 0.2 1.6 – 3.3 3.3 – 4.9 > 4.9
HIACC 8 N = 211 7.2 ± 0.2 1.8 – 3.6 3.6 – 5.4 > 5.4
LOACC = low accelerative capacity, MEACC = medium accelerative capacity, HIACC = high accelerative capacity.

89
SPSS statistics (version 22; SPSS, Inc., Chicago, IL, USA). The level of statistical
significance was set at p < 0.05.
5.3 Results
For low-intensity acceleration distance, significant differences and large effects were
identified for analysis method (F(1,812) = 2356.036; p < 0.01, ηp2 = .81), with a weak
interaction between analysis method and athlete group (F(2,812) = 27.766; p < 0.01, ηp2 = .09).
No significant differences were identified between athlete group (F(2,812) = 0.921; p = 0.40,
ηp2 = .01). Moderate-intensity acceleration distance also highlighted significant differences
between analysis method (F(1,812) = 2424.522; p < 0.01, ηp2 = .81), and interaction (F(2,812) =
48.897; p < 0.01, ηp2 = .15), demonstrating large and moderate effect sizes respectively. No
significant differences were identified for athlete group (F(2,812) = 0.257; p = 0.774, ηp2 = .01).
High-intensity followed a similar trend to moderate-intensity and low-intensity acceleration
distance, with significant differences identified for analysis method (F(1,812) = 3072.155; p <
0.01, ηp2 = .85), and interaction (F(2,812) = 23.312; p < 0.01, ηp
2 = .08), but no significant
differences identified for athlete group (F(2,812) = 3.206; p = 0.41, ηp2 = .01). A large effect
size was demonstrated for analysis method, whilst a small effect was demonstrated for the
interaction. When examining the direction of differences between analysis methods for low-,
moderate-, and high-intensity acceleration distances, the global analysis method produced
significantly higher distances than individual for all intensities (p < 0.05).
Figure 5.1 presents mean distance travelled performing low-intensity, moderate-intensity, and
high-intensity acceleration by LOACC athletes utilising global and individual thresholds.
Analysis demonstrated no significant differences in acceleration distances produced between
analysis methods for any acceleration intensity.

90
Figure 5.1. Distribution and mean distance travelled performing low-, moderate-, and high-
intensity acceleration when utilising global or individual thresholds, in LOACC athletes. N.B.
asterisk represents significant difference, d represents effect size.
Figure 5.2 presents mean distance travelled performing low-intensity, moderate-intensity, and
high-intensity acceleration by MEACC athletes utilising global and individual thresholds. Post-
hoc analysis demonstrated no significant difference in low-intensity acceleration distances
produced utilising global and individual analysis methods, however significant differences
were identified in moderate-intensity (t(365) = 34.060, p < 0.01, d = 1.06) and high-intensity
acceleration distances (t(365) = 39.140, p < 0.01, d = 2.24) between analysis methods. For both
moderate- and high-intensity, significant higher acceleration distances were produced
utilising the global analysis method. Mean moderate-intensity acceleration distances utilising
global thresholds were 43m (95% CI ± 2.5m) higher than individual thresholds, whilst mean
high-intensity acceleration distances were 62m (95% CI ± 3.1m) higher. These distances
equated to 74% (95% CI ± 4%) higher moderate-intensity, and 248% (95% CI ± 12%) higher
high-intensity acceleration distances when utilising the global analysis method.

91
Figure 5.2. Distribution and mean distance travelled performing low-, moderate-, and high-
intensity acceleration when utilising global or individual thresholds, in MEACC athletes. N.B.
asterisk represents significant difference, d represents effect size.
Figure 5.3 presents mean distance travelled performing low-intensity, moderate-intensity, and
high-intensity acceleration by HIACC athletes utilising global and individual thresholds. Post-
hoc analysis demonstrated significant differences between analysis methods for low-intensity
(t(210) = 26.397, p < 0.01, d = 0.70), moderate-intensity (t(210) = 25.512, p < 0.01, d = 1.38),
and high-intensity acceleration distances (t(210) = 28.173, p < 0.01, d = 2.59). For all
acceleration intensities, the global analysis method produced significantly higher distances
than the individual. When utilising the global analysis method, mean distances were 92m
(95% CI ± 6.9m), 61m (95% CI ± 4.7m), and 75m (95% CI ± 5.2m) higher for low-,
moderate-, and high-intensity acceleration respectively. Distances equated to 45% (95% CI ±
3%), 122% (95% CI ± 9%), and 441% (95% CI ± 30%) higher low-, moderate-, and high-
intensity acceleration distances respectively when utilising the global analysis method.

92
Figure 5.3. Distribution and mean distance travelled performing low-, moderate-, and high-
intensity acceleration when utilising arbitrary or individual thresholds, in HIACC athletes. N.B.
asterisk represents significant difference, d represents effect size.
5.4 Discussion
The current study examined discrepancies in low-, moderate-, and high-intensity acceleration
distances produced utilising global and individual methods of analysis. Athletes were
categorised dependent upon maximum accelerative capabilities, providing detailed insight
into the effects of individualising thresholds for athletes of varying physical capacities. Past
research investigated discrepancies between global and individual analysis methods for
quantifying high-speed activities, with the current study the first to examine discrepancies for
acceleration.
Acceleration distances produced utilising global and individual analysis methods varied
significantly between athlete groups. The LOACC athlete group demonstrated no significant
differences in low-, moderate-, or high-intensity acceleration distances produced utilising
global or individual analysis methods. In MEACC athletes, there were no significant
differences between low-intensity acceleration distances, but moderate- and high-intensity
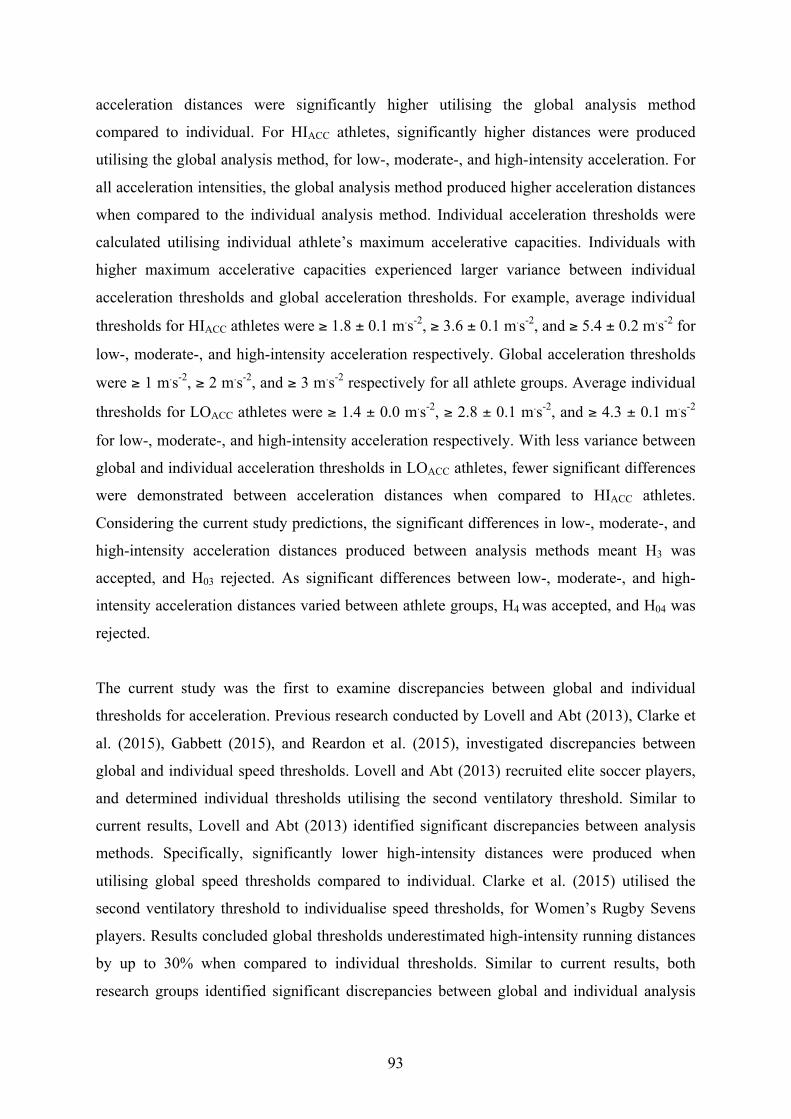
93
acceleration distances were significantly higher utilising the global analysis method
compared to individual. For HIACC athletes, significantly higher distances were produced
utilising the global analysis method, for low-, moderate-, and high-intensity acceleration. For
all acceleration intensities, the global analysis method produced higher acceleration distances
when compared to the individual analysis method. Individual acceleration thresholds were
calculated utilising individual athlete’s maximum accelerative capacities. Individuals with
higher maximum accelerative capacities experienced larger variance between individual
acceleration thresholds and global acceleration thresholds. For example, average individual
thresholds for HIACC athletes were ≥ 1.8 ± 0.1 m.s-2, ≥ 3.6 ± 0.1 m.s-2, and ≥ 5.4 ± 0.2 m.s-2 for
low-, moderate-, and high-intensity acceleration respectively. Global acceleration thresholds
were ≥ 1 m.s-2, ≥ 2 m.s-2, and ≥ 3 m.s-2 respectively for all athlete groups. Average individual
thresholds for LOACC athletes were ≥ 1.4 ± 0.0 m.s-2, ≥ 2.8 ± 0.1 m.s-2, and ≥ 4.3 ± 0.1 m.s-2
for low-, moderate-, and high-intensity acceleration respectively. With less variance between
global and individual acceleration thresholds in LOACC athletes, fewer significant differences
were demonstrated between acceleration distances when compared to HIACC athletes.
Considering the current study predictions, the significant differences in low-, moderate-, and
high-intensity acceleration distances produced between analysis methods meant H3 was
accepted, and H03 rejected. As significant differences between low-, moderate-, and high-
intensity acceleration distances varied between athlete groups, H4 was accepted, and H04 was
rejected.
The current study was the first to examine discrepancies between global and individual
thresholds for acceleration. Previous research conducted by Lovell and Abt (2013), Clarke et
al. (2015), Gabbett (2015), and Reardon et al. (2015), investigated discrepancies between
global and individual speed thresholds. Lovell and Abt (2013) recruited elite soccer players,
and determined individual thresholds utilising the second ventilatory threshold. Similar to
current results, Lovell and Abt (2013) identified significant discrepancies between analysis
methods. Specifically, significantly lower high-intensity distances were produced when
utilising global speed thresholds compared to individual. Clarke et al. (2015) utilised the
second ventilatory threshold to individualise speed thresholds, for Women’s Rugby Sevens
players. Results concluded global thresholds underestimated high-intensity running distances
by up to 30% when compared to individual thresholds. Similar to current results, both
research groups identified significant discrepancies between global and individual analysis

94
methods. Direction of discrepancies varied in comparison, with the global analysis method
overestimating acceleration distances produced by MEACC and HIACC athletes within the
current study. In contrast to current and previous research, Lovell and Abt (2013) and Clarke
et al. (2015) did not allow for discrepancies to be examined between athlete groups.
Gabbett (2015) calculated individual speed thresholds utilising maximum sprint speed in
youth Rugby League athletes. Results demonstrated that individual speed thresholds
increased high-speed running attributed to relatively slower athletes, and decreased high-
speed running attributed to relatively faster athletes. Reardon et al. (2015) identified similar
trends utilising maximum sprint speed to individualise thresholds in professional Rugby
Union. Results demonstrated a high-speed running underestimation of 22% for forwards, and
an overestimation of 18% for backs when utilising global speed thresholds. Results from
Gabbett (2015) and Reardon et al. (2015) compliment current results, with significant
differences identified between analysis methods, and varying differences identified between
athlete groups. Current results identified significant differences in low-, moderate-, and high-
intensity acceleration distances produced between analysis methods for HIACC athletes, but no
significant differences were identified for any acceleration intensity in LOACC athletes. In
addition, current results suggest discrepancies between analysis methods were more
pronounced at higher acceleration intensities. For low-intensity accelerations, differences of
45% were identified between analysis methods in HIACC athletes. Whilst for moderate-
intensity accelerations, differences of 74% and 122% were identified, and for high-intensity
accelerations, differences of 248% and 441% were identified for MEACC and HIACC athletes
respectively. Findings highlight the variance in physical capacity between athletes, providing
further rationale for an individual approach to monitoring acceleration.
Current findings have significant implications for quantifying the relative demands of
acceleration tasks. Previously, global acceleration thresholds have been utilised regardless of
individual physical capacity. Although global acceleration thresholds allow for comparisons
in external workloads between athletes, they do not represent the intensity an athlete is
operating (Hunter et al., 2015). This is vital when monitoring training loads of athletes with
different ages and physical capacities (Gabbett, 2015). Accounting for athletes maximum
capacity within acceleration thresholds provide practitioners a greater understanding of the
relative intensity of activity. The mean maximum acceleration within the current study was
6.4 ± 0.6 m.s-2 with the mean 50-percentile equating to 3.2 m.s-2. Application of the individual
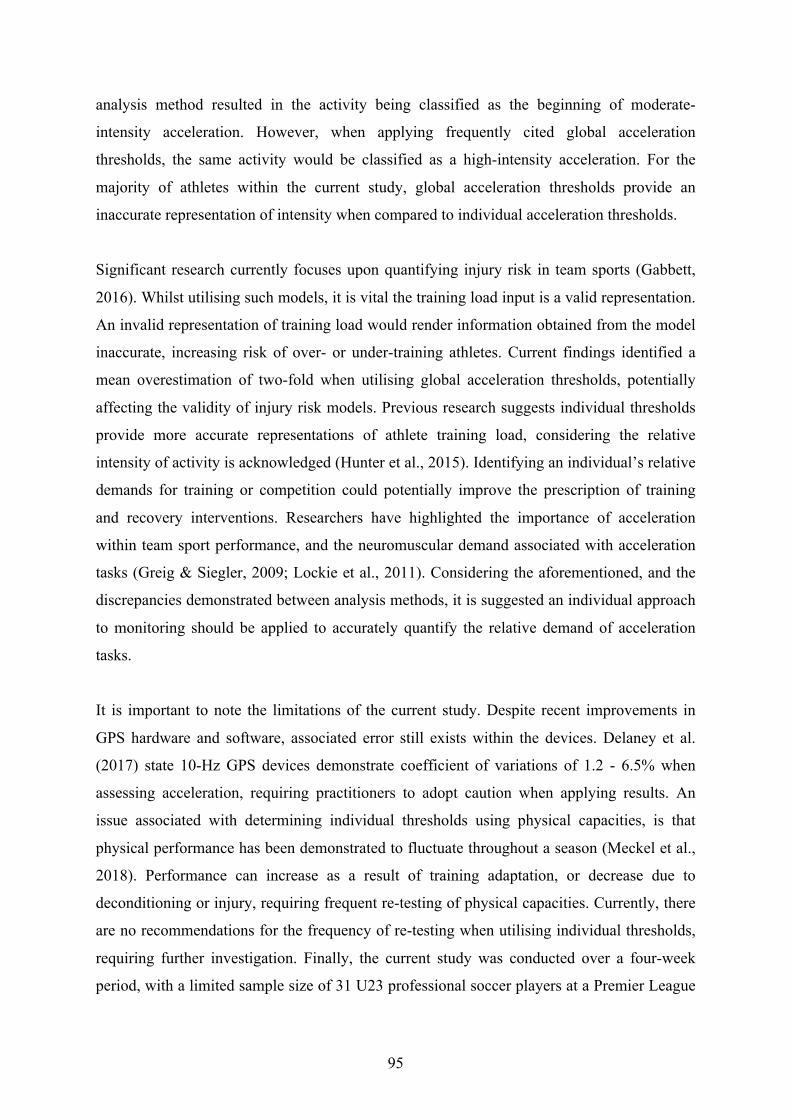
95
analysis method resulted in the activity being classified as the beginning of moderate-
intensity acceleration. However, when applying frequently cited global acceleration
thresholds, the same activity would be classified as a high-intensity acceleration. For the
majority of athletes within the current study, global acceleration thresholds provide an
inaccurate representation of intensity when compared to individual acceleration thresholds.
Significant research currently focuses upon quantifying injury risk in team sports (Gabbett,
2016). Whilst utilising such models, it is vital the training load input is a valid representation.
An invalid representation of training load would render information obtained from the model
inaccurate, increasing risk of over- or under-training athletes. Current findings identified a
mean overestimation of two-fold when utilising global acceleration thresholds, potentially
affecting the validity of injury risk models. Previous research suggests individual thresholds
provide more accurate representations of athlete training load, considering the relative
intensity of activity is acknowledged (Hunter et al., 2015). Identifying an individual’s relative
demands for training or competition could potentially improve the prescription of training
and recovery interventions. Researchers have highlighted the importance of acceleration
within team sport performance, and the neuromuscular demand associated with acceleration
tasks (Greig & Siegler, 2009; Lockie et al., 2011). Considering the aforementioned, and the
discrepancies demonstrated between analysis methods, it is suggested an individual approach
to monitoring should be applied to accurately quantify the relative demand of acceleration
tasks.
It is important to note the limitations of the current study. Despite recent improvements in
GPS hardware and software, associated error still exists within the devices. Delaney et al.
(2017) state 10-Hz GPS devices demonstrate coefficient of variations of 1.2 - 6.5% when
assessing acceleration, requiring practitioners to adopt caution when applying results. An
issue associated with determining individual thresholds using physical capacities, is that
physical performance has been demonstrated to fluctuate throughout a season (Meckel et al.,
2018). Performance can increase as a result of training adaptation, or decrease due to
deconditioning or injury, requiring frequent re-testing of physical capacities. Currently, there
are no recommendations for the frequency of re-testing when utilising individual thresholds,
requiring further investigation. Finally, the current study was conducted over a four-week
period, with a limited sample size of 31 U23 professional soccer players at a Premier League

96
academy. Consequently, findings are a representative of the athletes recruited, for the time
period of the study, and not directly applicable to all populations.
5.5 Conclusion
Current findings have significant implications for applied practitioners aiming to quantify the
relative demands of acceleration tasks for squads of athletes. Significant discrepancies were
demonstrated between acceleration distances calculated utilising global and individual
acceleration thresholds. Additionally, the discrepancies in distances produced by global and
individual acceleration thresholds varied dependent upon an athletes’ maximum accelerative
capacities. Considering the high neuromuscular demand of accelerating, and the frequent use
of modeling to predict injury risk, it is vital training load is accurately represented.
Advantages of global acceleration thresholds are the ability to compare physical performance
between athletes, and determine an individual’s ability to tolerate a given workload.
Conversely, individual acceleration thresholds allow the relative intensity of acceleration
tasks to be quantified, acknowledging athletes of different ages and physical capacities. If the
aim of monitoring training load is to accurately quantify the relative intensity an athlete is
operating, individual acceleration thresholds are recommended. Identification of the relative
demands placed upon an individual by training and competition can improve consequent
prescription training and recovery. The current protocol to determine maximum accelerative
capacity can be replicated with large squads, and minimal equipment. Although the current
study recruited soccer players, similarities in movement patterns mean findings are applicable
to the majority of team sports.

97
6.0 Study Three - Physical demands of playing position within
English Premier League academy soccer
Publication arising from this chapter: Abbott, W., Brickley, G., & Smeeton, N.J. (2018).
Physical demands of playing position within English Premier League academy soccer.
Journal of Human Sport & Exercise, 13(2), 1-11.

98
Abstract
Physical demands of soccer competition vary between playing positions. Previous research
investigated total, and high-speed distances, with limited research into acceleration demands
of competition. Research investigating speed and acceleration demands have utilised global
thresholds, overlooking the individual nature of athlete locomotion. The current study was
the first utilising individual speed and acceleration thresholds, investigating the relative
intensity of activities. Relationship between match outcome and physical outputs were also
investigated. GPS data from 44 professional matches was collected using 10-Hz GPS and
100-Hz accelerometer devices. 343 observations were divided by playing position, and match
result, with differences in GPS metrics analysed. Central midfielders produced the highest
total distances, and moderate-intensity acceleration distances (p < 0.01). Wide defenders and
attackers produced the highest very high-speed running, sprinting, and high-intensity
acceleration distances (p < 0.01). Central defenders produced the lowest values for all metrics
(p < 0.01). No significant differences were found between GPS metrics for differing match
outcomes (p > 0.05). In addition to differing tactical and technical roles, soccer playing
positions have specific physical demands associated. Current results allow coaches to
overload individual training intensities relative to competition. No relationships were evident
between GPS metrics and match outcome, suggesting soccer success is the result of superior
technical and tactical strategies.
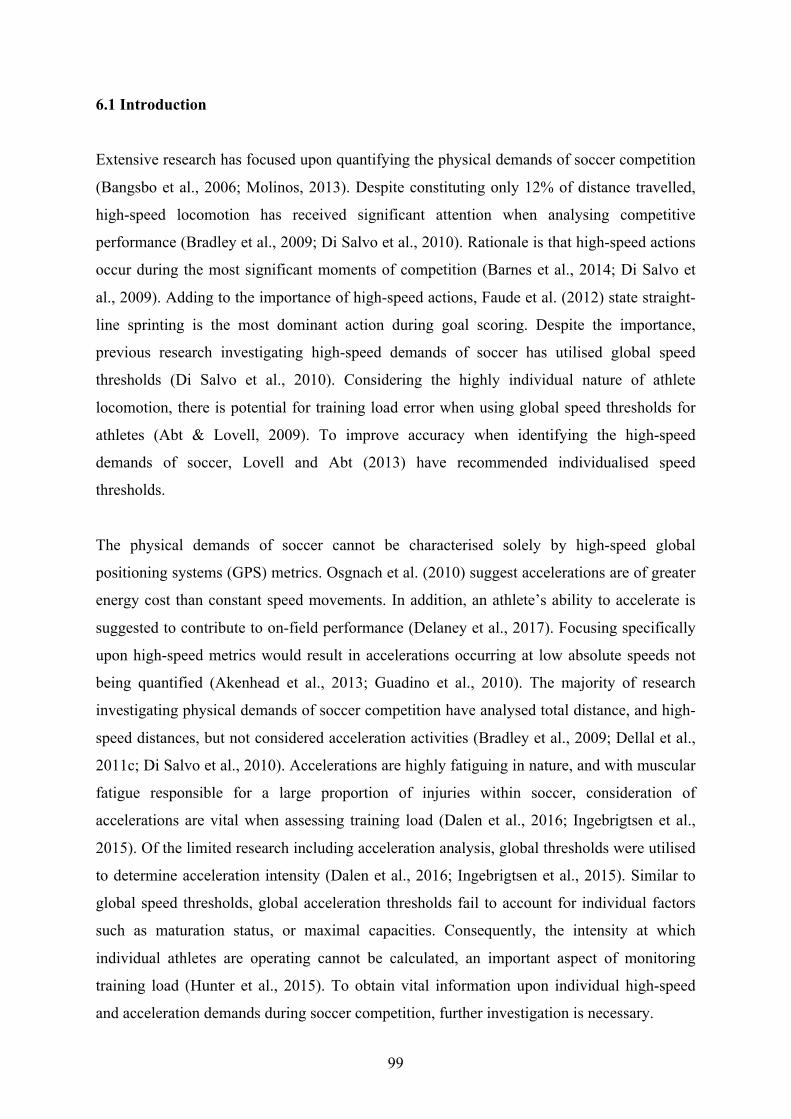
99
6.1 Introduction
Extensive research has focused upon quantifying the physical demands of soccer competition
(Bangsbo et al., 2006; Molinos, 2013). Despite constituting only 12% of distance travelled,
high-speed locomotion has received significant attention when analysing competitive
performance (Bradley et al., 2009; Di Salvo et al., 2010). Rationale is that high-speed actions
occur during the most significant moments of competition (Barnes et al., 2014; Di Salvo et
al., 2009). Adding to the importance of high-speed actions, Faude et al. (2012) state straight-
line sprinting is the most dominant action during goal scoring. Despite the importance,
previous research investigating high-speed demands of soccer has utilised global speed
thresholds (Di Salvo et al., 2010). Considering the highly individual nature of athlete
locomotion, there is potential for training load error when using global speed thresholds for
athletes (Abt & Lovell, 2009). To improve accuracy when identifying the high-speed
demands of soccer, Lovell and Abt (2013) have recommended individualised speed
thresholds.
The physical demands of soccer cannot be characterised solely by high-speed global
positioning systems (GPS) metrics. Osgnach et al. (2010) suggest accelerations are of greater
energy cost than constant speed movements. In addition, an athlete’s ability to accelerate is
suggested to contribute to on-field performance (Delaney et al., 2017). Focusing specifically
upon high-speed metrics would result in accelerations occurring at low absolute speeds not
being quantified (Akenhead et al., 2013; Guadino et al., 2010). The majority of research
investigating physical demands of soccer competition have analysed total distance, and high-
speed distances, but not considered acceleration activities (Bradley et al., 2009; Dellal et al.,
2011c; Di Salvo et al., 2010). Accelerations are highly fatiguing in nature, and with muscular
fatigue responsible for a large proportion of injuries within soccer, consideration of
accelerations are vital when assessing training load (Dalen et al., 2016; Ingebrigtsen et al.,
2015). Of the limited research including acceleration analysis, global thresholds were utilised
to determine acceleration intensity (Dalen et al., 2016; Ingebrigtsen et al., 2015). Similar to
global speed thresholds, global acceleration thresholds fail to account for individual factors
such as maturation status, or maximal capacities. Consequently, the intensity at which
individual athletes are operating cannot be calculated, an important aspect of monitoring
training load (Hunter et al., 2015). To obtain vital information upon individual high-speed
and acceleration demands during soccer competition, further investigation is necessary.

100
The physical demand elicited upon athletes during soccer competition differs significantly
dependent upon playing position (Molinos, 2013). For total distance, previous research
concluded central defenders and strikers produced the lowest distances, whilst central
midfield players produced the highest (Dellal et al., 2012; Guadino et al., 2010). For high-
speed activities, wide players (both attacking and defending) produced the highest distances
for sprinting and high-intensity running, whilst players operating in central areas produced
the lowest (Carling, 2013). Number of accelerations produced by playing positions followed
a similar pattern, with wide players accelerating significantly more than central players
(Dalen et al., 2016; Ingebrigtsen et al., 2015). Research is yet to combine these GPS metrics
into a collaborative study, determining the exact physical demands elicited upon soccer
playing positions in an elite population. Alongside the physical demands of soccer playing
positions, another area of interest to practitioners is the relationship between physical outputs
and match outcome. Previous research investigating this relationship has proved equivocal.
Mohr et al. (2003) found top class soccer players produce higher physical outputs when
compared to moderate professional players. More recently, researchers have concluded that
successful teams demonstrate lower physical outputs in comparison to unsuccessful teams
(Carling, 2013). Others cite no significant differences between teams of differing levels of
success (Castellano et al., 2014).
To increase the probability of success, a large emphasis of soccer training is focused upon
developing the physical attributes of athletes (Bowen et al., 2017). Training sessions are
guided by competition, and aim to replicate or exceed the physiological demands encountered
during matches. A high occurrence of specific activities may overload muscle groups, and
have implications for conditioning athletes (Bloomfield et al., 2007). Consequently, it is vital
for the training prescription process that competitive demands are accurately identified. The
aim of the study was to identify the physical demands placed upon soccer playing positions
using an individualised approach to monitoring. Previous research investigating the positional
demands of competition utilised global speed and acceleration thresholds, overlooking the
relative intensity of activities. The current study was the first to incorporate individual speed
and acceleration thresholds, providing an accurate representation of intensity for playing
positions. It was predicted that significant differences would be evident in the physical
outputs produced by soccer playing positions. The study also examined the effect of physical

101
outputs upon match outcome. It was predicted there would be significant differences in
physical outputs produced during matches of differing outcome.
H5 – There will be significant differences in the physical outputs produced by soccer playing
positions.
H05 - There will be no significant differences in the physical outputs produced by soccer
playing positions.
H6 – There will be significant differences in the physical outputs produced during matches of
differing match outcome.
H06 - There will be no significant differences in the physical outputs produced during
matches of differing match outcome.
6.2 Methodology
Design
Thirty-seven professional soccer players participated in 44 competitive matches spanning two
seasons. Physical data was recorded using 10-Hz GPS devices (OptimEye S5B, Version 7.18;
Catapult Innovations, Melbourne, Australia), resulting in 343 collections of data. GPS
metrics consisting of total distance, very-high speed running distance, sprinting distance,
maximal speed achieved, moderate-intensity acceleration distance, and high-intensity
acceleration distance were calculated. Data was divided by playing position, and match
result, with differences in GPS metrics analysed.
Participants
Thirty-seven, male, full-time professional soccer players from an U23 Premier League
academy (19.9 ± 1.4 years, height 180.3 ± 8.0 cm, weight 78.9 ± 8.4 kg) participated in the
study. Participants were assigned an outfield playing position by the head technical coach.
Playing positions were central defenders (n = 7) wide defenders (n = 7), central midfielders
(n = 8), wide attackers (n = 8), and strikers (n = 7). Each participant only featured in one
playing position. All participants were briefed with a detailed explanation of the aims and
requirements of the study, as well as potential risks. All participants provided written consent

102
for their involvement. For participants under the age of 18, parental or guardian consent was
provided. Participants were free to withdraw at any time, without any repercussions. The
study was conducted with full approval from the ethical review board at the institution prior
to commencing. The study conformed to the requirements stipulated by the Declaration of
Helsinki, and all health and safety procedures were complied with.
Procedures
GPS match data was collected for 44 competitive matches using 10-Hz GPS and 100-Hz
accelerometer devices (OptimEye S5B, Version 7.18; Catapult Innovations, Melbourne,
Australia). Data collection spanned two seasons, during which matches were played once per
week. Prior to the commencement of both competitive seasons, participants completed a six-
week pre-season consisting of physical and technical training sessions, and friendly matches.
Competitive matches within the study were comprised of Premier League Two fixtures. Prior
to competition, participants completed a standardised warm up, ensuring adequate
preparation for competition. For each match, participants wore a portable GPS device in a
designated tight-fitting vest located between the scapulae. GPS devices were switched on 15-
minutes prior to the warm up, in accordance with manufacturer’s instructions, and switched
off immediately following competition. Participants wore the same GPS device for each
match, avoiding inter-device error.
Prior to the data collection periods, participants completed maximum sprint speed (MSS),
and maximum aerobic speed (MAS) protocols previously utilised by Mendez-Villanueva et
al. (2013) and Hunter et al. (2015) to determine anaerobic and aerobic locomotor capacities
respectively. The MSS protocol required participants to complete three maximal 40m linear
sprints, with a minimum of three minutes rest between repetitions. MSS was defined as the
fastest speed recorded over any 10m sector, and measured using electronic light gates
(Brower TC Timing System) to the nearest 0.01s. The MAS protocol was a modified version
of the University of Montreal Track Test (Leger & Boucher, 1980), previously used by
Mendez-Villanueva et al. (2013). The test began with an initial running speed of 8 km.h-1,
with the speed increasing by 0.5 km.h-1 each minute. MAS was estimated as the speed of the
final stage completed by the participant. Using MSS and MAS values, each participant’s
anaerobic speed reserve (ASR) was calculated. ASR was defined as the difference between
the MSS and MAS score, and reported in m.s-1. MSS, MAS and ASR values were used to
determine each participant’s speed thresholds, and consequent values for very high-speed

103
running and sprinting GPS metrics. During the MSS protocol, the maximum rate of
acceleration was calculated for each sprint using 10-Hz portable GPS devices (OptimEye
S5B, Version 7.18; Catapult Innovations, Melbourne, Australia). The highest acceleration
value was recorded for each participant. Each participant’s maximal accelerative capacity
value was used to determine their individual acceleration thresholds. This method had
previously been utilised by Sonderegger et al. (2016) to assess maximal accelerative capacity
of athletes, and individualise acceleration thresholds.
Data Analysis
10-Hz GPS devices have demonstrated an acceptable level of accuracy and reliability when
assessing the speed of movement within intermittent exercise (Varley et al., 2012). Mean
number of satellites during data collection was 14.7 ± 1.8, and the mean horizontal dilution of
position was 0.8 ± 0.1. Following each match recording, GPS devices were downloaded to a
computer and analysed using Catapult Sprint software (Catapult Sprint 5.1.5, Catapult
Innovations, Melbourne, Australia). Speed was calculated using measurements of the
Doppler shift of signals received, distance was measured using positional differentiation. To
allow direct comparisons in data, only participants completing 90-minutes were included
within the analysis process. Once downloaded, each data set was edited and split into two 45-
minute halves. Extra time at the end of each half was excluded to ensure comparison between
matches. A total of 343 observations were collected from 44 matches, the mean number of
observations per participant was 8.7 ± 1.9 matches. Speed-related GPS metrics recorded were
maximal speed achieved, very high-speed running distance, and sprinting distance. Very-high
speed running, and sprinting distances were characterised as the distances travelled between
100% MAS – 30% ASR, and > 30% ASR respectively (Hunter et al., 2015; Mendez-
Villanueva et al., 2013). Acceleration-related GPS metrics recorded were moderate-intensity
acceleration, and high-intensity acceleration distances. These were characterised as distances
travelled accelerating between 50 - 75% and > 75% of an individual’s maximal accelerative
capacity respectively (Sonderegger et al., 2016). The total distance travelled during
competition was also recorded (Molinos, 2013; Guadino et al., 2010). Mean values for GPS
metrics were calculated for each playing position, and match outcome. Match outcome was
sub-divided into matches won (n = 14), drawn (n = 11), or lost (n = 19).
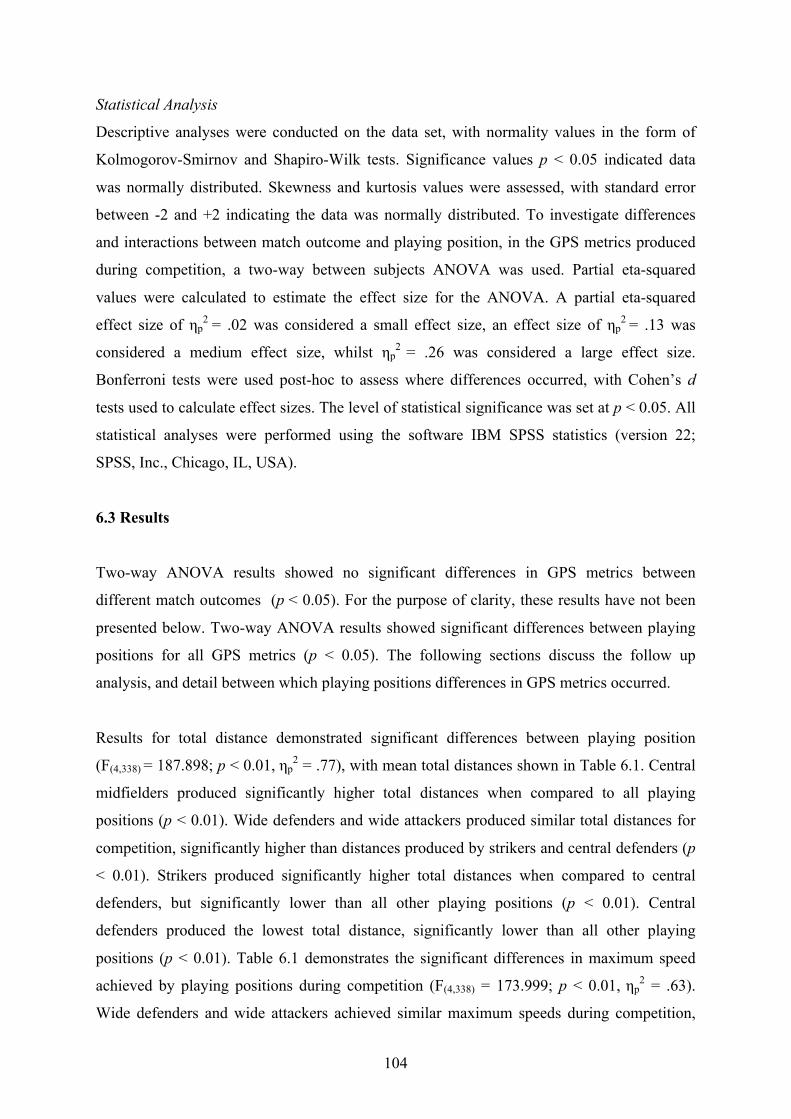
104
Statistical Analysis
Descriptive analyses were conducted on the data set, with normality values in the form of
Kolmogorov-Smirnov and Shapiro-Wilk tests. Significance values p < 0.05 indicated data
was normally distributed. Skewness and kurtosis values were assessed, with standard error
between -2 and +2 indicating the data was normally distributed. To investigate differences
and interactions between match outcome and playing position, in the GPS metrics produced
during competition, a two-way between subjects ANOVA was used. Partial eta-squared
values were calculated to estimate the effect size for the ANOVA. A partial eta-squared
effect size of ηp2 = .02 was considered a small effect size, an effect size of ηp
2 = .13 was
considered a medium effect size, whilst ηp2 = .26 was considered a large effect size.
Bonferroni tests were used post-hoc to assess where differences occurred, with Cohen’s d
tests used to calculate effect sizes. The level of statistical significance was set at p < 0.05. All
statistical analyses were performed using the software IBM SPSS statistics (version 22;
SPSS, Inc., Chicago, IL, USA).
6.3 Results
Two-way ANOVA results showed no significant differences in GPS metrics between
different match outcomes (p < 0.05). For the purpose of clarity, these results have not been
presented below. Two-way ANOVA results showed significant differences between playing
positions for all GPS metrics (p < 0.05). The following sections discuss the follow up
analysis, and detail between which playing positions differences in GPS metrics occurred.
Results for total distance demonstrated significant differences between playing position
(F(4,338) = 187.898; p < 0.01, ηp2 = .77), with mean total distances shown in Table 6.1. Central
midfielders produced significantly higher total distances when compared to all playing
positions (p < 0.01). Wide defenders and wide attackers produced similar total distances for
competition, significantly higher than distances produced by strikers and central defenders (p
< 0.01). Strikers produced significantly higher total distances when compared to central
defenders, but significantly lower than all other playing positions (p < 0.01). Central
defenders produced the lowest total distance, significantly lower than all other playing
positions (p < 0.01). Table 6.1 demonstrates the significant differences in maximum speed
achieved by playing positions during competition (F(4,338) = 173.999; p < 0.01, ηp2 = .63).
Wide defenders and wide attackers achieved similar maximum speeds during competition,

105
significantly higher than central defenders, central midfielders, and strikers (p < 0.01). There
were no significant differences in maximum speed when comparing wide defenders and wide
attackers, or comparing central defenders, central midfielders, and strikers.
Table 6.1 Differences in total distance, and maximum speeds achieved by soccer playing
positions during competition. N.B. level of statistical significance p < 0.05, d represents
effect size.
Figure 6.1 demonstrates the very high-speed running and sprinting distances produced by
soccer playing positions during competition. Significant differences were identified between
playing positions for both very-high speed running (F(4,338) = 684.486; p < 0.01, ηp2 = .89),
and sprinting distances (F(4,338) = 200.446; p < 0.01, ηp2 = .60). When focusing upon very
high-speed running distances, wide defenders and wide attackers produced the highest
distances, with central defenders, central midfielders, and strikers producing significantly
lower distances in comparison (p < 0.01). Strikers produced significantly higher very-high
speed running distances when compared to central defenders and central midfielders (p <
0.01). Central defenders produced significantly lower very-high speed running distances
when compared to all other playing positions (p < 0.01). The same significant differences
were seen between playing positions for sprinting distances, with one exception. There was
no significant difference in sprinting distances produced by central midfielders and strikers.
Playing Position
CD WD CM WA ST
Total distance (m) 9,830 ±428 10,747 ± 420 11,570 ± 469 10,918 ± 353 10,320 ± 420
Significant differences
present (p < 0.05)
Sig. less than:
WD (d = 2.1)
CM (d = 3.9)
WA (d = 2.8)
ST (d = 1.1)
Sig. more than:
CD (d = 2.1)
ST (d = 1.0)
Sig less than:
CM (d = 1.8)
Sig. more than
CD (d = 3.9)
WD (d = 1.8)
WA (d = 1.6)
ST (d = 2.8)
Sig more than
CD (d = 2.8)
ST (d = 1.5)
Sig less than:
CM (d = 1.6)
Sig more than:
CD (d = 1.1)
Sig less than:
WD (d = 1.0)
CM (d = 2.8)
WA (d = 1.5)
Maximum speed (m.s-1) 7.4 ± 0.3 8.4 ± 0.4 7.5 ± 0.3 8.6 ± 0.4 7.6 ± 0.5
Significant differences
present (p < 0.05)
Sig less than:
WD (d = 2.8)
WA (d = 3.4)
Sig more than:
CD (d = 2.8)
CM (d = 2.5)
ST (d = 1.8)
Sig less than:
WD (d = 2.5)
WA (d = 3.1)
Sig more than:
CD (d = 3.4)
CM (d = 3.1)
ST (d = 2.2)
Sig less than:
WD (d = 1.8)
WA (d = 2.2)
CD = Central Defenders, WD = Wide Defenders, CM = Central Midfielders, WA = Wide Attackers, ST = Strikers.

106
Figure 6.1 Differences in very high-speed running and sprinting distances produced by
soccer playing positions. N.B. level of statistical significance p < 0.05, d represents effect
size.
Figure 6.2 shows the moderate-intensity, and high-intensity acceleration distances produced
by soccer playing positions during competition. Significant differences in moderate-intensity
(F(4,338) = 91.475; p < 0.01, ηp2 = .56), and high-intensity acceleration distances (F(4,338) =
147.436; p < 0.01, ηp2 = .64) were demonstrated between playing positions. When focusing
on moderate-intensity acceleration distances, central midfielders produced significantly
higher distances than all other playing positions (p < 0.01). Wide defenders, wide attackers,
and strikers produced similar moderate-intensity acceleration distances, with no significant
differences between playing positions. Central defenders produced significantly lower
moderate-intensity acceleration distances compared to all other playing positions (p < 0.01).
Results for high-intensity acceleration distances differed to moderate-intensity acceleration
distances. Wide defenders and wide attackers produced significantly higher high-intensity
acceleration distances compared to central defenders, central midfielders, and strikers (p <
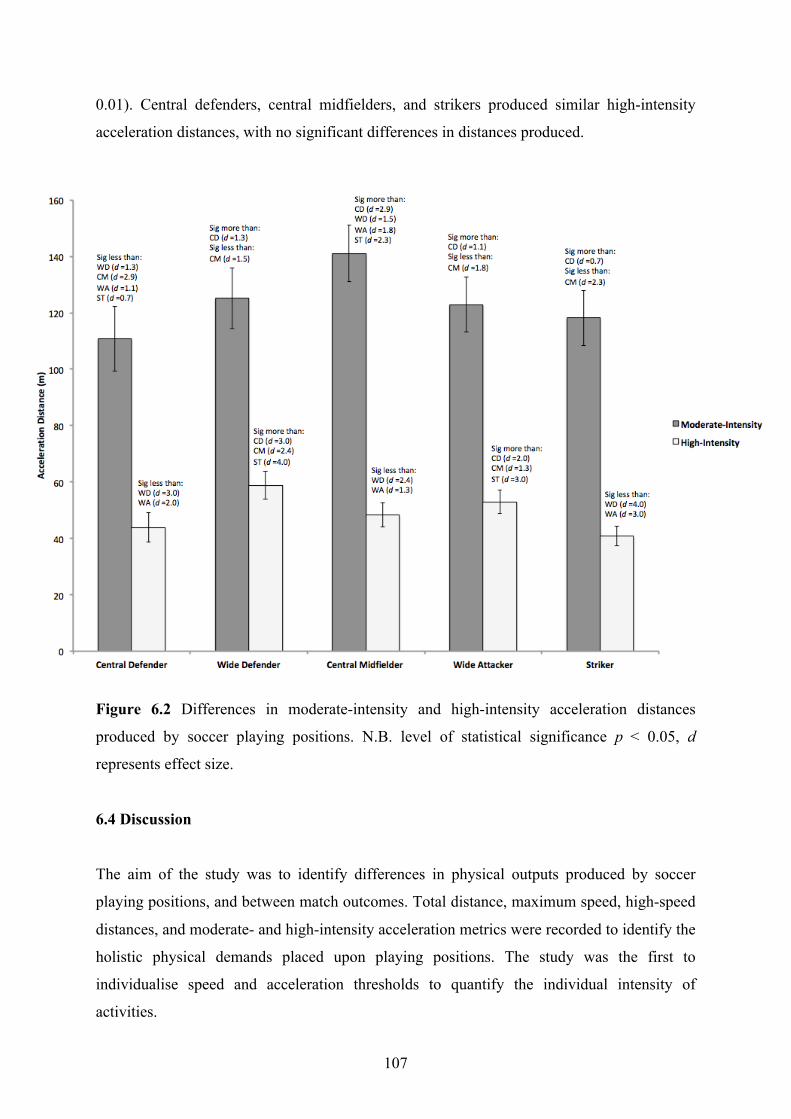
107
0.01). Central defenders, central midfielders, and strikers produced similar high-intensity
acceleration distances, with no significant differences in distances produced.
Figure 6.2 Differences in moderate-intensity and high-intensity acceleration distances
produced by soccer playing positions. N.B. level of statistical significance p < 0.05, d
represents effect size.
6.4 Discussion
The aim of the study was to identify differences in physical outputs produced by soccer
playing positions, and between match outcomes. Total distance, maximum speed, high-speed
distances, and moderate- and high-intensity acceleration metrics were recorded to identify the
holistic physical demands placed upon playing positions. The study was the first to
individualise speed and acceleration thresholds to quantify the individual intensity of
activities.

108
Current results demonstrated central defenders produced the lowest total, very high-speed
running, and sprinting distances, as previously reported by Dellal et al. (2011c) and Guadino
et al. (2010). Despite being the least physically demanding position, central defenders are
highlighted as an important position tactically, operating as the last line of defence (Bangsbo
et al., 2006). Central midfielders produced the highest total distances, complimenting
research by Bradley et al. (2009) and O’Donoghue et al. (2005). High total distances
produced by central midfielders are related to the positional role of linking defence and
attack, often requiring involvement in both phases of play. These results were in contrast to
research conducted by Carling (2013), finding that wide attackers produced the highest total
distances. Differences in results could be attributed to the varying tactical roles of wide
attackers between research studies.
When investigating positional differences in very high-speed running and sprinting distances,
current results emulated previous research, finding wide attackers produced the highest
distances for very high-speed running, and sprinting (Bradley et al., 2010; Ingebrigtsen et al.,
2015). Similar results were identified for maximum speeds achieved during competition, as
previously demonstrated by Bradley et al. (2009). High-speed running and sprinting distances
produced by wide defenders were similar to wide attackers, the result of operating on the
flanks of the pitch. Wide areas are less congested when compared to central areas, resulting
in increased opportunities to achieve high speeds unopposed. Significantly lower very high-
speed running, and sprinting distances produced by central defenders and central midfielders
owe to operating in congested, central areas of the pitch (Di Salvo et al., 2007).
When investigating positional differences in acceleration, Ingebrigtsen et al. (2015) reported
a higher frequency of accelerations in wide players compared to central. Current results
illustrate this for high-intensity acceleration distances, with wide attackers and wide
defenders producing the highest distances. Rationale is the frequent requirement of wide
positions to reach high-speeds, with rapid acceleration necessary to achieve this. For
moderate-intensity accelerations, the current study found central midfielders produced the
highest distances. This complimented research by Bloomfield et al. (2007), stating central
midfielders are involved in high volumes of moderate-intensity activity. Differences in high-
intensity and moderate-intensity acceleration distances produced by playing positions
emphasise the importance of sub-dividing these manoeuvres dependent upon intensity.

109
Strikers produced significantly lower total distances in comparison to wide defenders, wide
attackers and central midfielders, the result of limited involvement defensively, within the
current formation. Operating in central areas, strikers are required to produce stretched runs
behind opposition defenders, explaining moderate very high-speed running, sprinting, and
high-intensity acceleration distances. Considering significant differences between playing
positions were identified for all GPS metrics, H5 was accepted, and H05 was rejected. When
investigating the effects of physical outputs upon match outcome, no significant differences
were identified for any GPS metric. This was contrary to previous research (Carling, 2013;
Mohr et al., 2003), but complimented the suggestion by Castellano et al. (2014) that soccer
success is the result of superior technical and tactical strategies. Considering current study
predictions, the lack of significant differences between match outcomes meant H6 was
rejected, and H06 was accepted.
Considering the significant differences in physical demands placed upon playing positions,
uniform training methods would be impractical. Specific playing positions require emphasis
on distinct physical components relating to their competitive requirements (Dalen et al.,
2016). Central defenders have the least physical demand associated, allowing for a larger
volume of tactical and technical training, cited as important for the position (Bangsbo et al.,
2006). To overload competitive intensities, recommendations for total distance are > 109
m.min-1, with high-intensity acceleration distances > 0.5 m.min-1.
Wide defenders and wide attackers are characterised by large volumes of very high-speed
running, sprinting, and high-intensity accelerations. Specific training should incorporate
linear speed production, rapid acceleration to maximal speeds, and the ability to repeat these
actions. Overload intensities for very high-speed running, and sprinting are > 7.2 m.min-1,
and > 4.1 m.min-1 respectively for wide attackers, and > 7.0 m.min-1, and > 3.9 m.min-1
respectively for wide defenders. To overload competitive high-intensity acceleration
distances, intensities should exceed > 0.7 m.min-1 for wide attackers, and > 0.6 m.min-1 for
wide defenders.
Considering the physical demands elicited upon central midfielders during competition, the
training emphasis should differ from wide defenders and wide attackers. Specific training
should involve high total distances, with frequent moderate-intensity accelerations. To

110
overload competitive intensities for total distance, training intensity of > 129 m.min-1 is
required, with moderate-intensity acceleration intensity > 1.6 m.min-1. For strikers, demands
were multifaceted, with no dominant physical activity. To overload competitive intensities,
very-high speed running and sprinting intensities of > 5.0 m.min-1, and > 2.8 m.min-1 are
required. Training intensities of > 0.5 m.min-1 are required to overload high-intensity
accelerations. The current study’s training intensity recommendations are derived from mean
positional intensities for competition. Gabbett et al. (2016) warn that if the average demands
of competition are focused upon, athletes may be underprepared for the most demanding
passages of play. Consequently, further research is required to quantify the aforementioned
most demanding passages.
6.5 Conclusion
The current study demonstrates the significant differences in physical demands elicited upon
soccer playing positions during competition. In addition to differing tactical and technical
roles, each playing position has a specific physical demand associated. Findings provide
coaches with the information to accurately prescribe training intensities above those
encountered during competition. Further individualisation can be achieved by prescribing
training intensities to specific playing positions. Consequently, soccer training can be made
specific to the individual, and physical activities overloaded improve competitive
performance.

111
7.0 Study Four - Positional differences in GPS outputs and
perceived exertion during soccer training games and competition
Publication arising from this chapter: Abbott, W., Brickley, G., & Smeeton, N.J. (2017).
Positional differences in GPS outputs and perceived exertion during soccer training games
and competition. The Journal of Strength and Conditioning Research, 32(11), 3222-3231.

112
Abstract
Soccer training games are popular training modalities, allowing technical, tactical, and
physical aspects to be trained simultaneously. Small (SSGs), medium (MSGs) and large
training games (LSGs) elicit differing physical demands. To date, no research has
investigated physical and perceived demands of training games upon soccer playing positions
relative to competitive demands. Additionally, previous research has referenced average
competitive intensities, ignoring peak demands of competition. The current aim was to
investigate the effect of training game formats upon average and peak physical outputs
produced by soccer playing positions. Physical and perceptual data from 22 competitive
matches and 39 training game sessions was collected for 46 U23 professional players using
10-Hz GPS and 100-Hz accelerometer devices (MinimaxX version 4.0; Catapult Innovations,
Melbourne, Australia). Data analysed included GPS derived distance, speed, acceleration,
and RPE. Two-way between subjects ANOVAs were used to compare average and peak GPS
metrics, and RPE, between training games and competition for playing positions. Despite
eliciting significantly higher average total distances compared to competition (p < 0.01),
LSGs produced significantly lower peak total distance relative to competition (p < 0.01). For
very high-speed running and sprinting, LSGs elicited similar average intensities to
competition, however peak intensities were significantly lower than competition (p < 0.01).
MSGs and LSGs produced significantly higher average and peak moderate-intensity
acceleration distances than competition (p < 0.01). Results indicate the importance of
analysing relative to peak competitive demands, instead of focusing solely upon average
demands. The study demonstrates specific game formats can overload the competitive
demands of playing positions, and provide an individualised training stimulus.

113
7.1 Introduction
The aim of soccer conditioning training is to replicate, or overload, competitive demands to
develop performance during competition (Dellal et al., 2012). To prescribe an appropriate
overload stimulus, competitive demands need to be accurately identified and recorded.
Global Positioning Systems (GPS) has been integral in determining the frequency, intensity,
and duration of physical activity (Bloomfield et al., 2007). GPS technology provides an
indicator of external training load (e.g total distance, high-speed distances, and rates of
change in speed), however it is important to consider the internal load elicited upon athletes
(Owen et al., 2016). Rating of perceived exertion (RPE) is a valid indicator of internal
training load, correlating with V̇O2, heart rate, and blood lactate, and quantifying stress from
tasks unable to be recorded using GPS (e.g jumping, heading, tackling and grappling with
opponents) (Coutts et al., 2009; Hill-Haas et al., 2011). Integration of GPS and RPE allows
for physical and psychological demands of soccer competition to be comprehensively
recorded, and overloaded during training. Past research has focused on a solitary marker of
training load, failing to combine internal and external markers, and consequently overlooking
the holistic training response (Kelly & Drust, 2009; Owen et al., 2011).
The competitive demands of soccer differ between playing positions. Central defenders
produce the lowest total and high-speed distances during competition, whilst central
midfielders produce the highest total distances when compared to other positions (Bradley et
al., 2009; O’Donoghue et al., 2005). Wide attacking and wide defending positions are
characterised by high-speed activities, producing the highest sprint distance, and number of
high-intensity accelerations (Bradley et al., 2010, Ingebrigtsen et al., 2015). Considering the
variation in competitive demands elicited upon playing positions, a one-size-fits-all approach
to training must be avoided, instead focusing upon the specific requirements of athletes to
maximise training efficiency (Domene, 2013; Owen et al., 2016). When analysing
competitive demands, it is vital to consider the peak demands. Preparing for the average
demands of competition could leave athletes underprepared, and at a higher risk of injury,
during the most demanding periods of play (Gabbett et al., 2016).
Training games are a popular training modality in soccer, allowing for technical, tactical, and
physical aspects to be trained simultaneously (Abrantes et al., 2012; Owen et al., 2011).
Training games can elicit intensities higher than competition, with Dellal et al. (2011a)

114
demonstrating sprint activities ranging from 1.8 - 2.6% of total distance during competition,
compared to 13.6 – 16.3% of total distance during training games. Recent reviews suggest
training game intensity can be manipulated to control the stimuli applied to athletes (Aguiar
et al., 2012; Halouani et al., 2014). Increasing player number whilst maintaining a constant
pitch size decreases intensity (Halouani et al., 2014). However, increasing the pitch size using
a constant player number, increases intensity (Da Silva et al., 2011). Authors suggest
investigating the effects of player number and pitch size in isolation limits the ecological
validity of results. To maintain soccer specificity, and achieve tactical outcomes, it is
important the relative playing area is consistent with competition, or those prescribed by
technical coaches (Rampinini et al., 2007). Rationale exists for investigation of the effects of
training game format (e.g small, medium, and large) upon physical outputs produced with a
constant relative playing area. This would provide coaches the ability to manipulate physical
outcomes of training games, whilst maintaining tactical validity for competition.
When maintaining relative playing area, research has shown small training games (SSGs –
3v3) elicit higher ratings of perceived exertion (RPE) and heart rate responses, and lower
work:rest ratios in comparison to medium games (MSGs – 5v5), and large games (LSGs –
7v7) (Castellano et al., 2013). The same has been demonstrated for agility demands, and
changes in speed (Davies et al., 2013; Guadino et al., 2014). SSGs are unable to replicate the
sprint demands of competition however (Casamichana et al., 2012; Owen et al., 2014). LSGs
demonstrate higher total distances, high-speed running, and number of accelerations when
compared to their smaller equivalents (Brandes et al., 2012; Castellano et al., 2013). To date,
no research has used GPS and RPE analyses to investigate how different training game
formats overload playing positions relative to demands experienced during competition. Past
research has referenced average competitive intensities, ignoring the peak demands of
competition.
The aim of the current study was to investigate how training game format affects average and
peak physical outputs produced by soccer playing positions. Results aim to provide coaches
with vital information regarding the game formats most specific in stimulating competitive
demands of playing positions. It was predicted that there would be significant differences in
the average physical outputs produced by small, medium and large training games relative to
competition. It was also predicted that there would be significant differences in peak physical
outputs produced by different training game formats when compared to competition.

115
H7 – There will be significant differences in the average physical outputs produced by small,
medium and large training games relative to competition.
H07 - There will be no significant differences in the average physical outputs produced by
small, medium and large training games relative to competition.
H8 – There will be significant differences in the peak physical outputs produced by small,
medium and large training games relative to competition.
H08 - There will be no significant differences in the peak physical outputs produced by small,
medium and large training games relative to competition.
7.2 Methodology
Design
Competition and training data was collected for 46 U23 professional players during the
2016/17 soccer season. Players were divided into five playing positions (central defenders,
wide defenders, central midfielders, wide attackers, and strikers), with positional physical
data from 22 competitive matches, and 39 training game sessions (mean 12.3 ± 3.5 matches,
33.1 ± 2.2 training sessions) recorded using 10-Hz GPS and 100-Hz accelerometer devices
(MinimaxX version 4.0; Catapult Innovations, Melbourne, Australia). GPS metrics analysed
were distance, speed, and acceleration. Individual RPE data was collected following each
match and training game session. Average and peak GPS metrics, and RPE were compared
between training games and competition for each playing position.
Participants
Forty-six, male, full-time professional soccer players from an U23 Premier League academy
participated in the study (age 19.1 ± 1.2 years, range 17-21 years, height 180.1 ± 7.9 cm,
mass 79.8 ± 7.6 kg). Participants had been involved in soccer for a mean of 7.8 (± 1.6) years,
training four to five times a week for the past two years. Participants were assigned one
playing position by the head coach. Playing positions were; central defenders (n = 8) wide
defenders (n = 9), central midfielders (n = 12), wide attackers (n = 9), and strikers (n = 8).

116
Participants were briefed with the aims, requirements, and potential risks of the study.
Participants provided written consent for their involvement, parental or guardian consent was
provided for participants under the age of eighteen. Participants were free to withdraw at any
time, without any repercussions. Full approval was received from the ethical review board at
the institution the research was conducted. The study conformed to the requirements
stipulated by the Declaration of Helsinki, and all health and safety procedures were complied
with.
Procedures
Data collection spanned from August 2016 – May 2017, with competition and training games
occurring once per week. Prior to commencement of the competitive season, participants had
undergone pre-season training and had appropriate conditioning levels. Fixtures used within
the study were U23 Premier League Two fixtures. Fixtures were in a competitive league
format, with emphasis placed upon results, ensuring high motivation. Fixtures were played on
a Monday evening, on natural grass. Prior to competition, participants completed a 25-minute
warm up consisting of physical drills, passing, possessions, and finishing. This ensured
adequate preparation for competition, and was consistent throughout the data collection
period. A 4-3-3 playing formation was utilised throughout the data collection period. During
training game sessions, one game format was utilised (e.g large, medium or small), resulting
in data collection for each format every three weeks. The head technical coach allocated
teams prior to each training session, ensuring abilities were evenly distributed, and
participants played in their designated playing positions. Training sessions occurred on a
Thursday morning, with Tuesday and Wednesday being designated rest days for the
participants, reducing the effects of fatigue. LSGs were characterised as 10v10, 9v9, 8v8, or
7v7 plus goalkeepers. MSGs were characterised as 6v6, 5v5, or 4v4 plus goalkeepers. SSGs
were characterised as 3v3, 2v2, or 1v1 plus goalkeepers (Verheijen, 2014). Training games
were played for four quarters of four minutes each, with three minutes rest between games
(Hodgson et al., 2014). To maintain tactical validity, relative player area for all formats was
120m2 per player, excluding goalkeepers (Hill-Haas et al., 2011; Hodgson et al., 2014). Prior
to the commencement of training games, participants completed a 25-minute warm up
consisting of physical drills, passing, and possessions. As with competition, all training
games were played on natural grass. Participants used the same footwear throughout the
study.

117
For training games and competition, participants wore portable GPS devices (MinimaxX
version 4.0; Catapult Innovations, Melbourne, Australia). Participants wore the same GPS
devices throughout the data collection period to avoid inter-device error. Individual RPE was
recorded using the modified Borg CR10-scale. RPE values were recorded 30-minutes
following the cessation of competition or training. Following training, participants were
asked to provide an RPE value solely representative of the intensity of training games.
Participants had previously been familiarised with the RPE scale prior to the data collection
period.
Data Analysis
Following the collection of data, GPS devices were downloaded to a computer and analysed
using Catapult Sprint software (Catapult Sprint 5.1.5, Catapult Innovations, Melbourne,
Australia). Once downloaded, competition data was edited and split into two 45-minute
halves. Only participants completing the entire match or training session were included
within the analysis process. Training data was edited to include only the active duration of
training games. The mean number of satellites, and the horizontal dilution of position were
recorded during data collection. If values ranged < 12 for number of satellites, or > 1 for
horizontal dilution of position, data was excluded. A total of 156 data sets were collected
from 22 fixtures. Totals of 156 data sets for SSGs (1v1, n = 48, 2v2, n = 48, 3v3, n = 60), 199
for MSGs (4v4, n = 64, 5v5, n = 74, 6v6, n = 61), and 224 for LSGs (7v7, n = 42, 8v8, n =
48, 9v9, n = 54, 10v10, n = 80) were collected during the study. GPS metrics were derived
for each data set. To allow comparability between competition and training games of
different durations, GPS metrics were presented as per minute values. Descriptions of GPS
metrics are shown in Table 7.1.

118
Table 7.1 Descriptions of GPS metrics utilised.
For competition and training game data, peak and average values were calculated for GPS
metrics. Peak values were calculated by dividing each 90-minute match, or 16-minute
training game, into one-minute intervals, and recording the highest values achieved per
minute for each GPS metric. Average values were calculated by dividing total values for the
90-minute match, or 16-minute training game, by the overall duration. For data presentation
purposes, very high-speed running and sprinting distances were added and analysed as a
single value. These calculations are detailed in Table 7.1.
Statistical Analysis
Within the current study design, playing position and game format were independent
variables, and GPS metrics produced were dependent variables. Descriptive analyses were
conducted on all data sets. Normality values were assessed using Kolmogorov-Smirnov and
Shapiro-Wilk tests. Significance values of p > 0.05 indicated even distribution of the data.
GPS Metric
Description
Total distance (m.min-1)
The total distance travelled.
Very high-speed running
distance (m.min-1)
The distance travelled between 100% maximum aerobic speed and 30%
anaerobic speed reserve. Calculated using modified Montreal track test
(Leger & Boucher, 1980). Protocol previously utilised by Hunter et al.
(2015) and Mendez-Villanueva et al. (2013).
Sprinting distance (m.min-1)
The distance travelled above 30% anaerobic speed reserve. Calculated using
modified Montreal track test (Leger & Boucher, 1980). Protocol previously
utilised by Hunter et al. (2015) and Mendez-Villanueva et al. (2013).
Very high-speed running and
sprinting distance (m.min-1)
Very high-speed running and sprinting distance added together.
Moderate-intensity acceleration
distance (m)
The distance travelled accelerating between 50 - 75% of an individual’s
maximum accelerative capacity (Sonderegger et al., 2016).
High-intensity acceleration
distance (m)
The distance travelled accelerating > 75% of an individual’s maximum
accelerative capacity (Sonderegger et al., 2016).
Rating of perceived exertion Subjective rating of exertion using the modified CR10 Borg scale (Borg,
1982).
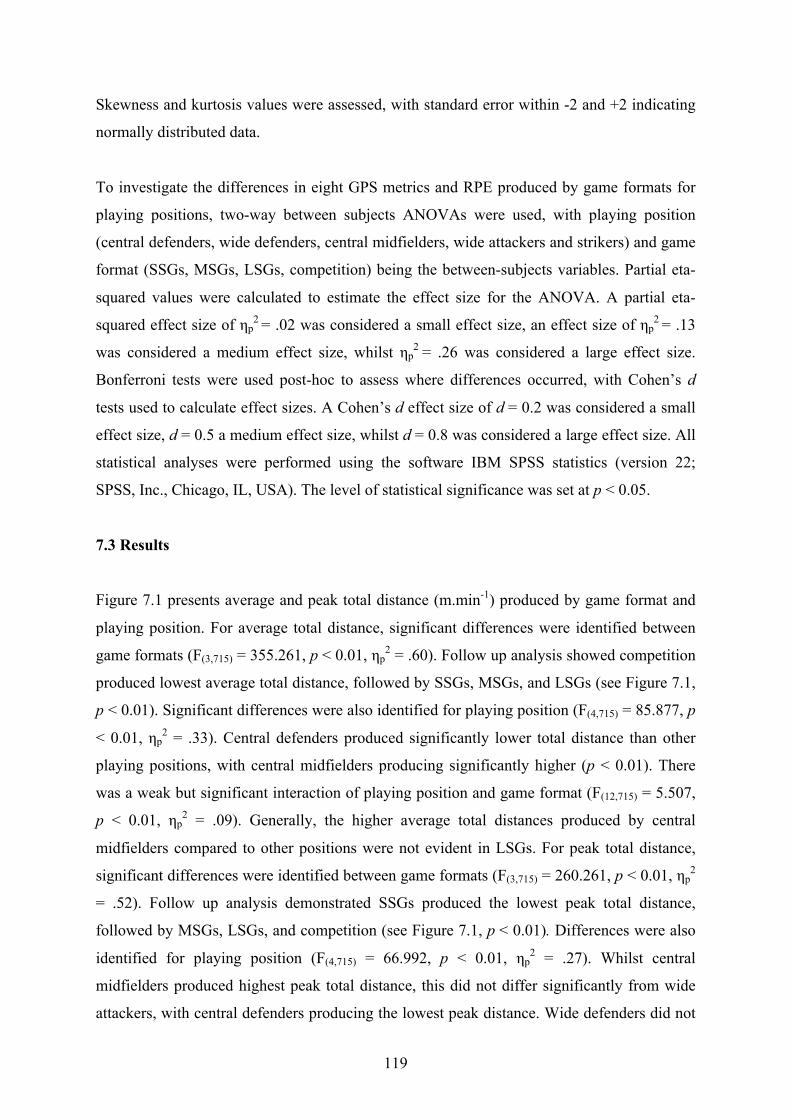
119
Skewness and kurtosis values were assessed, with standard error within -2 and +2 indicating
normally distributed data.
To investigate the differences in eight GPS metrics and RPE produced by game formats for
playing positions, two-way between subjects ANOVAs were used, with playing position
(central defenders, wide defenders, central midfielders, wide attackers and strikers) and game
format (SSGs, MSGs, LSGs, competition) being the between-subjects variables. Partial eta-
squared values were calculated to estimate the effect size for the ANOVA. A partial eta-
squared effect size of ηp2 = .02 was considered a small effect size, an effect size of ηp
2 = .13
was considered a medium effect size, whilst ηp2 = .26 was considered a large effect size.
Bonferroni tests were used post-hoc to assess where differences occurred, with Cohen’s d
tests used to calculate effect sizes. A Cohen’s d effect size of d = 0.2 was considered a small
effect size, d = 0.5 a medium effect size, whilst d = 0.8 was considered a large effect size. All
statistical analyses were performed using the software IBM SPSS statistics (version 22;
SPSS, Inc., Chicago, IL, USA). The level of statistical significance was set at p < 0.05.
7.3 Results
Figure 7.1 presents average and peak total distance (m.min-1) produced by game format and
playing position. For average total distance, significant differences were identified between
game formats (F(3,715) = 355.261, p < 0.01, ηp2 = .60). Follow up analysis showed competition
produced lowest average total distance, followed by SSGs, MSGs, and LSGs (see Figure 7.1,
p < 0.01). Significant differences were also identified for playing position (F(4,715) = 85.877, p
< 0.01, ηp2 = .33). Central defenders produced significantly lower total distance than other
playing positions, with central midfielders producing significantly higher (p < 0.01). There
was a weak but significant interaction of playing position and game format (F(12,715) = 5.507,
p < 0.01, ηp2 = .09). Generally, the higher average total distances produced by central
midfielders compared to other positions were not evident in LSGs. For peak total distance,
significant differences were identified between game formats (F(3,715) = 260.261, p < 0.01, ηp2
= .52). Follow up analysis demonstrated SSGs produced the lowest peak total distance,
followed by MSGs, LSGs, and competition (see Figure 7.1, p < 0.01). Differences were also
identified for playing position (F(4,715) = 66.992, p < 0.01, ηp2 = .27). Whilst central
midfielders produced highest peak total distance, this did not differ significantly from wide
attackers, with central defenders producing the lowest peak distance. Wide defenders did not
120
differ significantly from wide attackers or strikers (p < 0.01). There was a weak but
significant interaction of playing position and game format (F(12,715) = 4.278, p < 0.01, ηp2 =
.07). Whilst all peak total distance increased with game format, differences between central
defenders, wide defenders and strikers were not evident until LSGs and competition, with
significant differences between central defenders and wide defenders only evident during
competition.
Figure 7.1 Average and peak total distance intensities produced by playing position during
training games and competition. N.B. asterisk represents significant difference of p < 0.05
compared to competition, d represents effect size.
Figure 7.2 presents average and peak very high-speed running and sprinting distance (m.min-
1) produced by game format and playing position. For average very high-speed running and
sprinting distance, significant differences were identified between game formats (F(3,715) =
1642.181, p < 0.01, ηp2 = .87). Follow up analysis demonstrated SSGs produced the lowest
very high-speed running and sprinting distance, followed by MSGs, competition, and LSGs
(see Figure 7.2, p < 0.01). Differences were also identified for playing position (F(4,715) =

121
224.717, p < 0.01, ηp2 = .56). There were significant differences between all playing positions
for this measure (p < 0.05). There was a medium effect and significant interaction of playing
position and game format (F(12,715) = 61.863, p < 0.01, ηp2 = .51). For all positions excluding
wide defenders and wide attackers, typical differences between positions during competition
were not evident until game format increased to LSGs. Significant differences between wide
defenders and wide attackers were only evident in competition. For peak very high-speed
running and sprinting distance, significant differences were identified between game formats
(F(3,715) = 1125.315, p < 0.01, ηp2 = .83). Follow up analysis demonstrated SSGs produced the
lowest peak very high-speed running and sprinting distance, followed by MSGs, LSGs, and
competition (p < 0.01). Significant differences were also identified for playing position
(F(4,715) = 1551.192, p < 0.01, ηp2 = .35). Highest peak very high-speed running and sprinting
distance were observed in wide defenders and wide attackers, significantly different from all
positions excluding each other, followed by strikers, central midfielders, and central
defenders. There was a small effect and significant interaction of playing position and game
format (F(12,715) = 16.415, p < 0.01, ηp2 = .22). Peak very high-speed running and sprinting
distance increased with game format, however no significant differences were identified
between playing positions in SSGs, and typical differences seen between positions in
competition only emerged in LSGs.

122
Figure 7.2 Average and peak very high-speed running and sprinting intensities produced by
playing position during training games and competition. N.B. asterisk represents significant
difference of p < 0.05 compared to competition, d represents effect size.
Figure 7.3 presents average and peak moderate-intensity acceleration distance (m.min-1)
produced by game format and playing position. For average moderate-intensity acceleration
distance, significant differences were identified between game formats (F(3,715) = 464.523, p <
0.01, ηp2 = .76). Follow up analysis demonstrated SSGs produced highest average moderate-
intensity acceleration distance, followed by MSGs, LSGs and competition (see Figure 7.3, p
< 0.05). Differences were also identified for playing position (F(4,715) = 38.029, p < 0.01, ηp2 =
.21). Central defenders produced significantly lower moderate-intensity acceleration
distances than all other positions, with central midfielders producing significantly higher
moderate-intensity acceleration distance than all positions (p < 0.05). No significant
differences were identified between wide defenders, wide attackers and strikers. There was a
small effect and significant interaction of playing position and game format (F(12,715) = 4.563,
p < 0.01, ηp2 = .06). Differences in average moderate-intensity acceleration distance increased

123
with game format. For peak moderate-intensity acceleration distance, significant differences
were identified between game formats (F(3,715) = 195.359, p < 0.01, ηp2 = .38). Follow up
analysis demonstrated SSGs produced the highest peak moderate-intensity acceleration
distance, followed by MSGs. There were no significant differences between LSGs and
competition. Differences were also identified for playing position (F(4,715) = 43.329, p < 0.01,
ηp2 = .21). Central midfielders produced highest peak moderate-intensity acceleration
distance, with central defenders producing the lowest. No significant differences were
identified between wide defenders, wide attackers, and strikers. There was a small effect and
significant interaction of playing position and game format (F(12,715) = 2.465, p < 0.01, ηp2 =
.04). Whilst SSGs reflected the relative differences evident in competition, sizes of the
differences were smaller in SSGs.
Figure 7.3 Average and peak moderate-intensity acceleration distance intensities produced
by playing position during training games and competition. N.B. asterisk represents
significant difference of p<0.05 compared to competition, d represents effect size.

124
Figure 7.4 presents average and peak high-intensity acceleration distance (m.min-1) produced
by game format and playing position. For average high-intensity acceleration distance,
significant differences were identified between game formats (F(3,715) = 318.284, p < 0.01, ηp2
= .53). Follow up analysis demonstrated SSGs produced the lowest average high-intensity
acceleration distance, differing significantly from all other formats (p < 0.01). LSGs
produced the highest high-intensity acceleration distance, significantly different from all
formats. There were no significant differences between MSGs and competition (see Figure
7.4, p < 0.05). Significant differences were also identified for playing position (F(4,715) =
101.932, p < 0.01, ηp2 = .32). Central defenders and central midfielders produced the lowest
high-intensity acceleration distances, significantly different from all positions excluding each
other. Wide defenders and wide attackers produced the highest distances, significantly
different from all positions excluding each other (p < 0.05). There was a small effect and
significant interaction of playing position and game format (F(12,715) = 7.313, p < 0.01, ηp2 =
.12). MSGs most accurately reflected average competitive distance in wide defenders, wide
attackers and strikers, whereas relative differences between central defenders and central
midfielders during competition were only evident in LSGs, albeit at higher absolute
distances. For peak high-intensity acceleration distance, significant differences were
identified between game formats (F(3,715) = 269.531, p < 0.01, ηp2 = .44). Follow up analysis
demonstrated significant differences between all formats. SSGs produced lowest peak high-
intensity acceleration distance, followed by MSGs, competition, and LSGs. Significant
differences were also identified for playing position (F(4,715) = 26.352, p < 0.01, ηp2 = .17).
Wide defenders and wide attackers produced highest peak high-intensity acceleration
distances, significantly different to all positions, excluding each other. Central defenders and
central midfielders produced lowest peak high-intensity acceleration distances, with no
significant differences between each other, or between central midfielders and strikers (p <
0.05). There was a small effect and significant interaction of playing position and game
format (F(12,715) = 1.806, p < 0.05, ηp2 = .03). Generally, the relative differences between
playing positions identified during competition were evident in game formats. However,
strikers peak high-intensity acceleration distance was similar to central defenders and central
midfielders during SSGs and MSGs, but similar to wide defenders and wide attackers during
LSGs and competition.

125
Figure 7.4 Average and peak high-intensity acceleration distance intensities produced by
playing position during training games and competition. N.B. asterisk represents significant
difference of p < 0.05 compared to competition, d represents effect size.
Figure 7.5 presents RPE (Borg CR10-scale) produced by game format and playing position.
For average RPE, significant differences were identified between game formats (F(3,750) =
81.261, p < 0.01, ηp2 = .25). Follow up analysis demonstrated SSGs elicited the highest RPE
followed by MSGs, competition, and LSGs (see Figure 7.5, p < 0.01). No significant
differences were identified for playing position (F(4,750) = .855, p > 0.05, ηp2 = .01). There was
a small effect and a non-significant interaction of playing position and game format (F(12,715)
= 1.402, p > 0.05, ηp2 = .02).

126
Figure 7.5 Ratings of perceived exertion produced by playing position during training games
and competition. N.B. asterisk represents significant difference of p < 0.05 compared to
competition, d represents effect size.
7.4 Discussion
The current study examined the effect of training game format upon physical outputs and
perceived exertion within soccer playing positions. It was the first to combine GPS and RPE
measures to identify positional demands elicited by game formats, relative to competition.
Previous research had focused upon average demands, whilst the current study identified both
average and peak positional demands for training games and competition. Current findings
suggest no training game format develops overall soccer fitness, with each format eliciting a
unique physical load. It is possible to attribute specific training game formats to playing
positions, dependent upon the predominant activities performed during competition.
127
However, care must be taken to analyse training game outputs relative to the peak demands
of competition, as these differ to the average demands of competition.
Results demonstrated average total distance intensities were highest in LSGs, and lowest in
SSGs. Previous results investigating the effects of game format upon total distance have been
mixed. Aguiar et al. (2013) and Hill-Haas et al. (2009) suggested game format had no effect
upon distances travelled, whilst Castellano et al. (2013) and Guadino et al. (2014) found
distances travelled increased with game format. The current study found the latter, with a
larger absolute playing area, and increased ‘off the ball’ running associated with LSGs
providing rationale for findings. Alternative results produced by Aguiar et al. (2013) and
Hill-Haas et al. (2009) may result from only investigating SSGs and MSGs within their
analysis. Despite MSGs and LSGs producing significantly higher average intensities than
competition, peak total distance intensities results differed. For all positions excluding central
defenders, competition produced significantly higher peak total distances than training game
formats.
Very high-speed running and sprinting distances increased with game format, with LSGs
producing the highest intensities. Similar findings have been cited in previous research
(Castellano et al., 2013; Guadino et al., 2014). LSGs are characterised by larger absolute
playing areas, and allow athletes to reach high-speeds unopposed (Hill-Haas et al., 2009).
Comparing average very high-speed running and sprinting intensities to competition, only
LSGs were able to replicate competitive demands, with SSGs and MSGs significantly below
competitive values for all positions. For peak very high-speed running and sprinting
distances, all training game formats were significantly below competitive demands. This
suggests training games are an insufficient tool for replicating the peak demands of
competition.
Average moderate-intensity acceleration distances were highest in SSGs, and decreased as
game format increased. Current results contrast those reported by Castellano et al. (2013),
stating larger formats are associated with a higher frequency of accelerations. Castellano et
al. (2013) did not differentiate between moderate and high-intensity forms of acceleration,
making comparison in results difficult. Research by Davies et al. (2013) state the number of
agility manoeuvres produced during smaller formats were higher compared to larger formats,
agreeing with the current study. Guadino et al. (2014) also produced comparable results,

128
stating moderate acceleration increase as game format decreases. Smaller formats are
associated with increased ball involvement, and elicit more frequent changes of direction and
speed to evade opposition (Hill-Haas et al., 2009). When comparing average moderate-
intensity acceleration distances between game formats and competition, all game formats
were significantly higher, excluding LSGs for wide defender and striker positions. Peak
demands followed a similar trend, with SSGs and MSGs demonstrating significantly higher
peak moderate-intensity acceleration distances compared to competition. No significant
differences were identified between LSGs and competition for peak demands.
High-intensity acceleration distances were highest in LSGs, and decreased with game format.
Results compliment Guadino et al. (2014) and Owen et al. (2016), finding larger formats
produce more high-intensity accelerations compared to smaller formats. Rationale mirrors
very high-speed running and sprinting distances, with lower absolute playing areas resulting
in fewer opportunities to maximally accelerate unopposed. In smaller formats, distance
between players is less, reducing the distance covered to pressurise opponents (Owen et al.,
2016). When comparing average high-intensity acceleration distances to competition, LSGs
produced significantly higher intensities. MSGs produced average high-intensity acceleration
distances similar to competition, whilst SSGs produced significantly lower intensities.
Differences were replicated for peak high-intensity acceleration distances.
RPE was highest in SSGs, with lower ratings reported for MSGs, and the lowest for LSGs.
Aguiar et al. (2013) reported similar, with higher RPE for 2v2 and 3v3 formats in comparison
to 4v4 and 5v5. Abrantes et al. (2012) and Hill-Haas et al. (2009) also reported findings
complimenting the current study. Rationale for higher RPE produced during smaller formats
is an increased involvement with the football and opposition, and shorter recovery periods
between physical actions (Davies et al., 2013; Dellal et al., 2013). When comparing RPE
between game formats and competition, SSGs demonstrated significantly higher RPE, whilst
MSGs were similar to competition, for all positions. LSGs produced significantly lower RPE
values for central midfielders and wide attackers compared to competition. Considering
current study predictions, the significant differences in average and peak physical outputs
produced by SSGs, MSGs, and LSGs relative to competition meant H7 and H8 were accepted,
and H07 and H08 were rejected.
129
The current study demonstrates the importance of analysing peak competitive demands.
When comparing average total distance intensities of training games to competition, LSGs
and MSGs were significantly higher than competition. However, when comparing the peak
total distance intensities, all game formats were significantly lower than competition. This
was also evident with very high-speed running and sprinting intensities. Comparison of
average very high-speed running and sprinting intensities demonstrated no significant
differences between LSGs and competition. However, when comparing peak very high-speed
running and sprinting intensities, all game formats were significantly lower than competition.
This concludes that despite certain game formats replicating average demands of
competition, the peak demands of competition may not be replicated. From a performance
optimisation and injury prevention perspective, it is vital that coaches prepare the athletes for
peak intensities of competition. Focusing on average demands of competition will leave
athletes underprepared when faced with the most demanding periods of competition,
resulting in poor performance, or injury occurrence (Gabbett et al., 2016).
Results demonstrate specific training game formats replicate, and at times exceed, average
and peak demands of competition. Consequently, game formats can be prescribed to playing
positions based upon their positional demands. Central midfielders are associated with large
volumes of moderate-intensity manoeuvres (Bradley et al., 2009), highlighting SSGs as a
training modality. During SSGs, central midfielders produce significantly higher average and
peak moderate-intensity acceleration distances compared to competition. Wide defenders and
wide attackers are associated with high very high-speed running and sprinting, and high-
intensity acceleration distances during competition (Ingebrigtsen et al., 2015). Current results
highlight LSGs as a specific training stimulus for these positions. During LSGs, wide
defenders and wide attackers produce significantly higher average and peak high-intensity
acceleration distances compared to competition. Despite eliciting similar average very high-
speed running and sprinting distances for wide defenders and wide attackers, LSGs do not
replicate the peak demands of competition. For central defenders and strikers, competitive
demands are multifaceted, and therefore multiple game formats should be periodised
throughout a training block. For example, utilising SSGs to elicit a high frequency of
moderate-intensity accelerations, and utilising LSGs to elicit high total distance or very high-
speed running and sprinting activities. An issue highlighted by the current study is the
inability of training games to stimulate peak competitive very high-speed running and
sprinting intensities. Considering the importance of high-speed activities for all positions

130
within soccer (Faude et al., 2012), it is recommended supplementary sprinting training is
prescribed alongside training games to prepare athletes for peak competitive intensities.
It is important to note the limitations of the current study. Despite recent improvements in
GPS hardware and software, there is still error associated with devices. Delaney et al. (2017)
state 10-Hz devices exhibit coefficient of variations of 1.2 - 6.5% when assessing
acceleration and deceleration, and requires acknowledgment from practitioners when
applying results. Secondly, the current study was conducted using U23 professional soccer
players at a Premier League academy. Consequently, findings may not be directly applicable
to other levels or age groups. Finally, the study classified training games into ‘small’,
‘medium, and ‘large’ formats. Small games were comprised of 1v1, 2v2, and 3v3 training
games for example, of which the physical demands elicited by these variations may differ. As
a result, caution must be exercised when applying current findings to training programmes.
7.5 Conclusion
The current study provides important information to coaches and scientists regarding the
effect of training game formats upon physical outputs produced by soccer playing positions.
Results highlight the necessity to analyse physical outputs of training games relative to peak
demands of competition, and relative to individual playing position. Although certain game
formats replicated average competition demands, they were unable to replicate the peak
demands of competition. Prescribing training relative to average demands leads to under
preparation for the most demanding periods of competition, potentially resulting in poor
performance and an increased risk of injury. The current study demonstrates that specific
game formats can overload competitive demands, but careful consideration of playing
position and game format is required to provide an individualised training stimulus for
athletes. Training games were unable to adequately stimulate peak competitive very high-
speed running and sprinting intensities. Consequently, it is recommended that supplementary
sprinting training is prescribed to prepare athletes for these demands.

131
8.0 Study Five - The effect of bio-banding upon physical and
technical performance during soccer competition

132
Abstract
The aim of this study was to determine the effects of bio-banded competition on physical and
technical performance metrics in elite youth soccer athletes. Twenty-five male soccer athletes
(11 - 15 years) from an English Premier League Category One soccer academy participated
in bio-banded and chronological match-play competition. Athletes were between 85 - 90% of
predicted adult stature, and sub-divided into early, on-time and late developers. Physical and
technical performance data was collected for each athlete during both bio-banded and
chronological competition. For early developers, significantly more short passes, dribbles and
a higher RPE were evident during bio-banded competition compared to chronological
competition (p < 0.05). For on-time developers, significantly more short passes and dribbles,
and significantly less long passes were evident during bio-banded competition compared to
chronological (p < 0.05). For late developers, significantly more tackles, and significantly
less long passes were evident in bio-banded competition when compared to chronological (p
< 0.05). There were no significant differences identified for total, sprinting or acceleration
distances between competition formats. It was concluded that bio-banded competition
increased the opportunity for athletes of varying maturation status to develop technical skills
and performance, without reducing the physical demands.
133
8.1 Introduction
Most sports utilise age-related cutoff criterion to group young athletes for competition
(Albuquerque et al., 2015). The aim of this cutoff is to allow appropriate development, and
equal opportunity for those participating. In soccer, asymmetries of birth date distributions
have been reported for both youth and professional teams, with an increased incidence as the
standard of play increases (Del Campo et al., 2010; Helsen et al., 2005; Meylan et al., 2010).
This has resulted in a relative age effect, and bias in the distribution of birthdates towards
those that occur earlier in the age classification period, usually September to November born
athletes (Cobley et al., 2009; Musch & Hay, 1999). Although the relative age effect declines
from childhood to the end of adolescence, with less variance in physical maturation, relative
age effect still continues to have an influence (Albuquerque et al., 2012). By this time,
relatively older athletes have already received greater opportunities to develop through early
selection to high quality coaching and increased competitive levels. Consequently, they have
had the ability to enhance psychological, physical, technical and tactical aspects to a greater
extent when compared to their younger counterparts (Albuquerque et al., 2015).
In an attempt to allow equal opportunity and reduce injury risk, many combat sports have
grouped athletes by age and weight (Figueiredo et al., 2010). Body size has a negligible
impact upon soccer performance however, and grouping athletes in this manner would have
limited practical value due to large variations in positional requirements (Cumming et al.,
2018). An alternative solution involves bio-banding athletes into groups of similar levels of
growth or maturation (Delorme, 2014; Spencer et al., 2011). Bio-banding is thought to reduce
the variance in these physical attributes between teams, resulting in competitive equity and a
reduced risk of injury for those less physically mature (Cumming et al., 2018). Additionally,
bio-banding may help late developing athletes who could reach the highest level, but for the
greater physical maturity of their peers preventing them from receiving quality coaching and
opportunities for competition. Bio-banding is also suggested to reduce the selection bias
towards early developing athletes, who may not be as competent when their physical
attributes are controlled for (Simmons & Paull, 2001).
From a theoretical perspective, the positive effects of bio-banding can be understood using a
constraints-based framework (Newell, 1986). According to this framework, an athlete’s
motor performance results from the interactions of the task, individual and environmental

134
constraints. The task constraints relate to the specific performance context and may be the
rules specifying behaviour, the goal of the task, or task-related implements. The individual
constraints are made up of the individual’s characteristics, all of which can influence
performance at any given moment. Examples include developmental and maturational
factors. Finally, the environmental constraints specify the general factors influencing motor
performance and include weather conditions, as well as socio-culture and economic factors.
From the interaction of these constraints the emergent behaviour is seen. Certain types of
motor behaviour may only emerge when particular constraints limiting performance are
removed. Here we argue that soccer athletes playing in chronologically grouped competition
may lead to the motor performance of the late developers being constrained by the presence
of the early developers. Consequently, if there is a change in the task constraint of athlete
maturation as seen in bio-banded matches, then a different motor performance will emerge.
Despite the strong rationale for bio-banding, and its widespread adoption, there has been no
experimental investigation into the effects of bio-banding on physical and technical
performance within any sport. Buchheit and Mendez-Villaneuva (2014) investigated the
effects of age, maturity, and body dimensions on competitive running performance in U15
soccer athletes. They concluded that older, more mature athletes consistently outperformed
their younger, less mature teammates during chronologically aged competition. This
complimented previous research suggesting age and maturation positively impact running
performance (Buchheit et al., 2010). Subsequently, Buchheit and Mendez-Villaneuva (2014)
called for more data on technical and tactical performance of athletes of differing maturation
status. With differences in physical outputs between athletes of different maturation status
evident during chronological competition, there is rationale for subsequent investigation into
the physical effects of bio-banding competition.
Very little research has been published on bio-banding. Recently, Cumming et al. (2018)
investigated Premier League academy players’ experiences of participating in bio-banded
soccer competition. Results identified that early developers cited bio-banded competition as a
superior physical challenge and learning stimulus when compared to their chronological age
group competition. Early developers felt there was an increased emphasis upon technique,
tactics, and teamwork. Essentially, bio-banded competition exposed the early developers to
the challenges typically encountered by late developers. Late developers described bio-
banded competition as less physically challenging when compared to their chronological age

135
group competition. Late developers stated bio-banded competition provided them with a
greater opportunity to utilise their technical, physical, and psychological attributes, and exert
their influence upon competition. These findings can be interpreted using the constraints
based model of learning (Renshaw et al., 2010), whereby the constraint of maturation has an
effect upon the emergent behaviour, in this case the style of play and tactics adopted. The
novel study by Cumming et al. (2018) was the first providing feedback on the effect of bio-
banded fixtures, focusing upon the qualitative views of participants. Research is yet to
quantitatively investigate the effects of bio-banding upon physical and technical performance
during competition however.
The current aim was to determine differences in physical and technical performance during
bio-banded and chronological soccer competition. Physical and technical performance was
assessed between competition format for early, on-time, and late developing athletes.
Previously, researchers have demonstrated older, more mature athletes produced higher
physical outputs when compared to younger, less mature teammates during chronologically
aged competition (Buchheit & Mendez-Villaneuva, 2014). In this current study it was
predicted that bio-banded competition would increase the physical demands elicited upon
early developers, and reduce the demands elicited upon late developers when compared to
chronological competition. This effect would be reflected by higher rating of perceived
exertion (RPE) values reported for early developers and the effect reversed for the late
developers. Furthermore, it was predicted that bio-banding would change the maturation
constraint on technical performance, and as a result change the frequency that technical
performance indicators were observed. Short passes were predicted to increase in early
developers, and long passes decrease in late developers, when comparing bio-banded
competition to chronological competition.
H9 – There will be significant differences in physical performance metrics produced by bio-
banded and chronological competition formats.
H09 – There will be no significant differences in physical performance metrics produced by
bio-banded and chronological competition formats.
H10 – There will be no significant differences in technical performance metrics produced by
bio-banded and chronological competition formats.

136
H010 – There will be no significant differences in technical performance metrics produced by
bio-banded and chronological competition formats.
8.2 Methodology
Design
Physical and technical performance data was collected for 25 male soccer athletes. Athletes
were aged 11 - 15 years, and 85 - 90% of predicted adult stature. Athletes were sub-divided
into three maturation groups (early, on-time, and late developers) using Maturity Z-scores,
and competed in both bio-banded and chronological age group competition. Bio-banded
competition was against athletes grouped by the same maturation band, whilst chronological
competition was against athletes of the same chronological age. Four physical performance
metrics, and six technical performance metrics were analysed to determine differences
between maturation status, competition format, and the interaction. Physical data was
collected utilising 10-Hz global positioning system (GPS) and 100-Hz accelerometer devices
(OptimEye S5B, Version 7.18; Catapult Innovations, Melbourne, Australia). Technical data
was collected using video recordings (Sony HDR CX570) and coding (Version 10.3.36,
Sportscode Elite Software).
Participants
Twenty-five male soccer athletes (age 12.7 ± 1.0 years, height 155.9 ± 2.9 cm, weight 44.6 ±
5.5 kg, predicted adult height achieved 86.6 ± 1.3%) were recruited from a Premier League
Category One soccer academy to play in bio-banded, and chronologically aged fixtures.
Athletes were aged 11 - 15 years, and between 85 - 90% of predicted adult stature. Athletes
were grouped chronologically into under-12 (n = 8), under-13 (n = 9), under-14 (n = 4), and
under-15 (n = 4) age groups. Participants were sub-divided into three maturation groups,
early developers (Maturity Z-score > 1.0), on-time developers, (Maturity Z-score -1.0 –
+1.0), and late developers (Maturity Z-score < -1.0). Maturity Z-scores were calculated using
participant’s percentage predicted adult height, and age and sex specific reference values as
previously utilised by Cumming et al. (2018) (Bayer & Bailey, 1959; Malina et al., 2007a).
Mean age and Maturity Z-scores for the groups were: early developers = 11.5 ± 0.2 years,

137
Maturity Z-score = 1.7 ± 0.2. On-time developers = 12.3 ± 0.3 years, Maturity Z-score = 0.1
± 1.0. Late developers = 13.8 ± 0.6 years, Maturity Z-score = -3.0 ± 1.2.
Data collection occurred during the competitive season, with athletes having trained two to
three times and participated in competition once per week for a minimum of one season. All
participants had been members of the academy for at least one year prior to the study,
meaning they already had experience of competitive academy soccer. Prior to the
commencement of the study, participants and parents/guardians were provided details on the
nature of the study, and informed consent was collected. The study was conducted with the
protocol being fully approved by the ethical review board at the institution prior to
commencing. The study conformed to the requirements stipulated by the Declaration of
Helsinki, and all health and safety procedures were complied with during the study.
Procedures
The Khamis-Roche equation was used to predict adult height, and calculate the subsequent
percentage of predicted adult height for each participant. Following calculation, current
height has typically been reported as a percentage of predicted adult height to provide an
estimation of maturation status (Malina et al., 2015). This equation utilises current
chronological age, height, weight, and mid-parent height, of which information was measured
and recorded for each individual. Parental heights were self reported, and adjusted for over
estimation as previously cited by Cumming et al. (2018). Adjustments were based upon
measurements and self-reported heights of adults in the United States of America (Epstein et
al., 1995). The error between predicted and actual height at 18 years of age is reported to be
2.1% (Khamis & Roche, 1994), with the equation validated against skeletal age in Portuguese
soccer players (Malina et al., 2012). Trained academy staff measured participant’s heights
and weights within two weeks of competition. All staff were accredited with the International
Society for the Advancement of Kinanthropometry, and used standardised measurement
techniques.
Following calculations of predicted adult height, and percentage of predicted adult height
achieved for each participant, maturation bands were devised. The current study focused
upon 85 - 90% predicted adult height maturation band, of which all participants were ‘bio-
banded’ into. Participants then competed in a bio-banded fixture against athletes grouped by

138
the same maturation band. Bio-banded fixtures were played in 11v11 format, with four
quarters of 20-minutes. Matches were played on full-sized standard grass pitches (100 x
64m), with full-sized goals (8 x 2.4m). Three substitutions were permitted in accordance with
Football Association rules for youth competition, and standard officiating was applied. Prior
to competition, participants completed a standardised warm up, ensuring adequate
preparation for competition. This included physical, technical, and tactical preparation for the
upcoming competition. Bio-banded fixtures were played on three separate occasions, within
the same competitive season. Following the bio-banded fixtures, the participants reverted
back to their chronological age groups (U12, n = 8, U13, n = 9, U14, n = 4, U15, n = 4).
Within two weeks of the bio-banded fixture, participants played in a chronological fixture
against athletes grouped by the same chronological age. Fixture format for the
chronologically aged competition was identical to the bio-banded fixtures. Fixtures were
played in 11v11 format, four quarters of 20-minutes, on a 100 x 64m pitch and with standard
Football Association rules and officiating applied. The only exceptions were the U15
fixtures, which were divided into two halves of 40-minutes to comply with league rules for
the age group. Physical and technical data was recorded for each participant for both bio-
banded and chronologically grouped fixtures. Physical data was collected using a
combination of GPS and RPE measures. Technical data was derived from video recordings
(Sony HDR CX570) and coding (Version 10.3.36, Sportscode Elite Software) of the fixtures.
Data Analysis
Physical performance data was collected using portable 10-Hz GPS and 100-Hz
accelerometer devices (OptimEye S5B, Version 7.18; Catapult Innovations, Melbourne,
Australia). GPS devices were worn in a designated tight-fitting vest located between the
scapulae. GPS devices were switched on 15-minutes prior to the warm up, in accordance with
manufacturer’s instructions, and switched off immediately following competition.
Participants wore the same GPS device for competition, avoiding inter-device error.
Following the collection of data, GPS devices were downloaded to a computer and analysed
using Catapult Sprint software (Catapult Sprint 5.1.5, Catapult Innovations, Melbourne,
Australia). Once downloaded, competition data was edited and split into four quarters of 20-
minutes. Only participants completing the entire match were included within the analysis
process. The mean number of satellites, and the horizontal dilution of position were recorded
during data collection. If values ranged < 12 for number of satellites, or > 1 for horizontal
dilution of position, data was excluded. Sessional RPE was recorded using the modified Borg
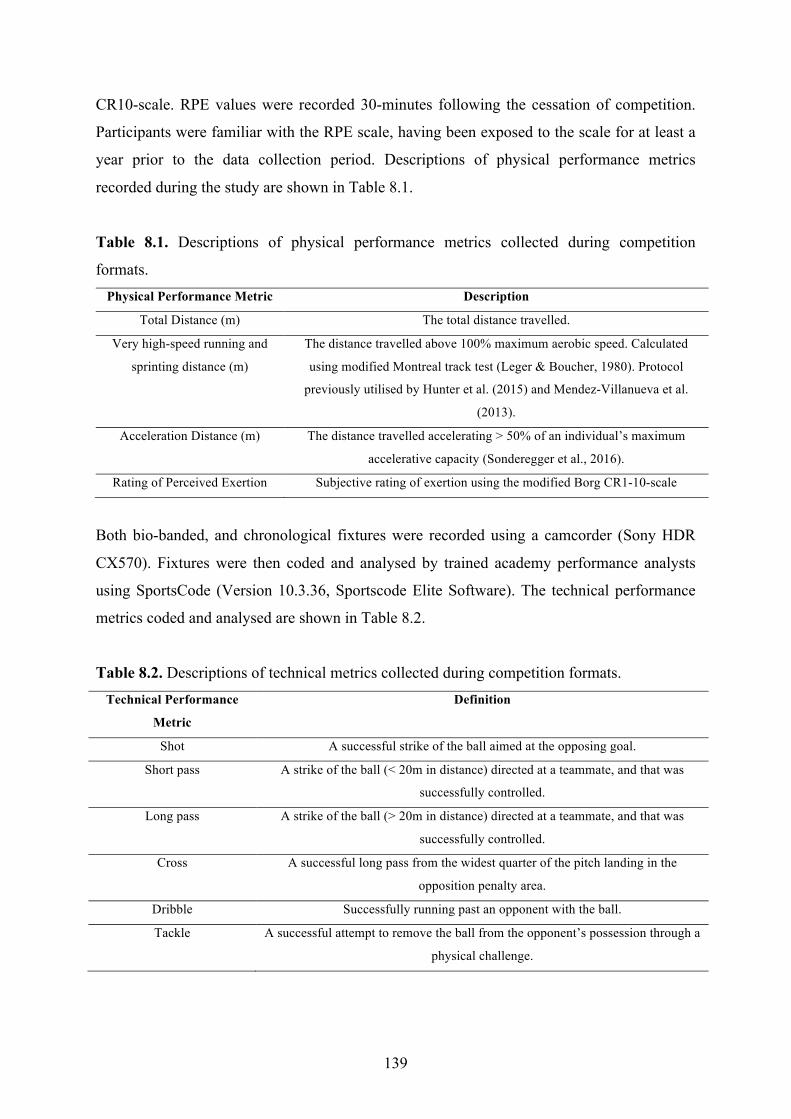
139
CR10-scale. RPE values were recorded 30-minutes following the cessation of competition.
Participants were familiar with the RPE scale, having been exposed to the scale for at least a
year prior to the data collection period. Descriptions of physical performance metrics
recorded during the study are shown in Table 8.1.
Table 8.1. Descriptions of physical performance metrics collected during competition
formats. Physical Performance Metric Description
Total Distance (m) The total distance travelled.
Very high-speed running and
sprinting distance (m)
The distance travelled above 100% maximum aerobic speed. Calculated
using modified Montreal track test (Leger & Boucher, 1980). Protocol
previously utilised by Hunter et al. (2015) and Mendez-Villanueva et al.
(2013).
Acceleration Distance (m) The distance travelled accelerating > 50% of an individual’s maximum
accelerative capacity (Sonderegger et al., 2016).
Rating of Perceived Exertion Subjective rating of exertion using the modified Borg CR1-10-scale
Both bio-banded, and chronological fixtures were recorded using a camcorder (Sony HDR
CX570). Fixtures were then coded and analysed by trained academy performance analysts
using SportsCode (Version 10.3.36, Sportscode Elite Software). The technical performance
metrics coded and analysed are shown in Table 8.2.
Table 8.2. Descriptions of technical metrics collected during competition formats. Technical Performance
Metric
Definition
Shot A successful strike of the ball aimed at the opposing goal.
Short pass A strike of the ball (< 20m in distance) directed at a teammate, and that was
successfully controlled.
Long pass A strike of the ball (> 20m in distance) directed at a teammate, and that was
successfully controlled.
Cross A successful long pass from the widest quarter of the pitch landing in the
opposition penalty area.
Dribble Successfully running past an opponent with the ball.
Tackle A successful attempt to remove the ball from the opponent’s possession through a
physical challenge.

140
Statistical Analysis
Descriptive analyses were conducted on the data set, with normality values in the form of
Kolmogorov-Smirnov and Shapiro-Wilk tests. Significance values p < 0.05 indicated data
was normally distributed. Skewness and kurtosis values were assessed, with standard error
between -2 and +2 indicating the data was normally distributed. To investigate differences in
physical and technical performance between bio-banded and chronologically aged fixtures
for early, on-time, and late developers, two-way mixed design ANOVAs were used where
Competition Format (Bio-banded, Chronological) was the within-subjects variable, and
Maturation Status (Early, On-Time, Late) was the between subjects variable. Partial eta-
squared values were calculated to estimate the effect size for the ANOVA. A partial eta-
squared effect size of ηp2 = .02 was considered a small effect size, an effect size of ηp
2 = .13
was considered a medium effect size, whilst ηp2 = .26 was considered a large effect size.
Bonferroni tests were used post-hoc to assess where differences occurred, with Cohen’s d
tests used to calculate effect sizes. An effect size of d = 0.2 was considered a small effect
size, an effect size of d = 0.5 was considered a medium effect size, whilst d = 0.8 was
considered a large effect size. All statistical analyses were performed using the software IBM
SPSS statistics (version 22; SPSS, Inc., Chicago, IL, USA). The level of statistical
significance was set at p < 0.05.
8.3 Results
Physical Analysis
Figure 8.1 presents mean RPE produced during competition formats, by different maturation
status. Significant differences were identified between maturation status (F(2,22) = 9.562; p <
0.05, ηp2 = .47). Follow up analysis demonstrated late developers produced significantly
higher RPE when compared to early developers (p < 0.05). Significant differences were also
identified in the interaction between competition format and maturation status (F(2,22) =
17.490; p < 0.01, ηp2 = .61). Results demonstrated that early developers produced
significantly higher RPE in the bio-banded format compared to chronological format (t =
9.295; p < 0.05, d = 1.2). There were no significant differences between RPE produced by
on-time developers, or late developers within the two competition formats.

141
Figure 8.1. Rating of perceived exertion produced by early, on-time, late developing athletes
during bio-banded and chronological competition formats. N.B. asterisk represents
significant difference of p < 0.05, d represents effect size.
Table 8.3 presents mean total distance, very high-speed running and sprinting distance, and
acceleration distance produced during competition formats for different maturation status.
For total distance, no significant differences were identified between competition format, or
the interaction between competition format and maturation status. Significant differences
were identified between maturation status (F(2,22) = 43.921; p < 0.01, ηp2 = .80) however.
Follow up analysis demonstrated late developers produced significantly higher total distances
when compared to early developers (p < 0.01). There were no significant differences between
late and on-time developers, or on-time and early developers. For very high-speed running
and sprinting distance, no significant differences were identified between competition format,
maturation status, or the interaction. For acceleration distance no significant differences were
identified between competition format, or the interaction between competition format and
maturation status. Significant differences were identified between maturation status (F(2,22) =
12.478; p < 0.01, ηp2 = .53), with late developers producing significantly higher acceleration
distances when compared to early and on-time developers (p < 0.05).
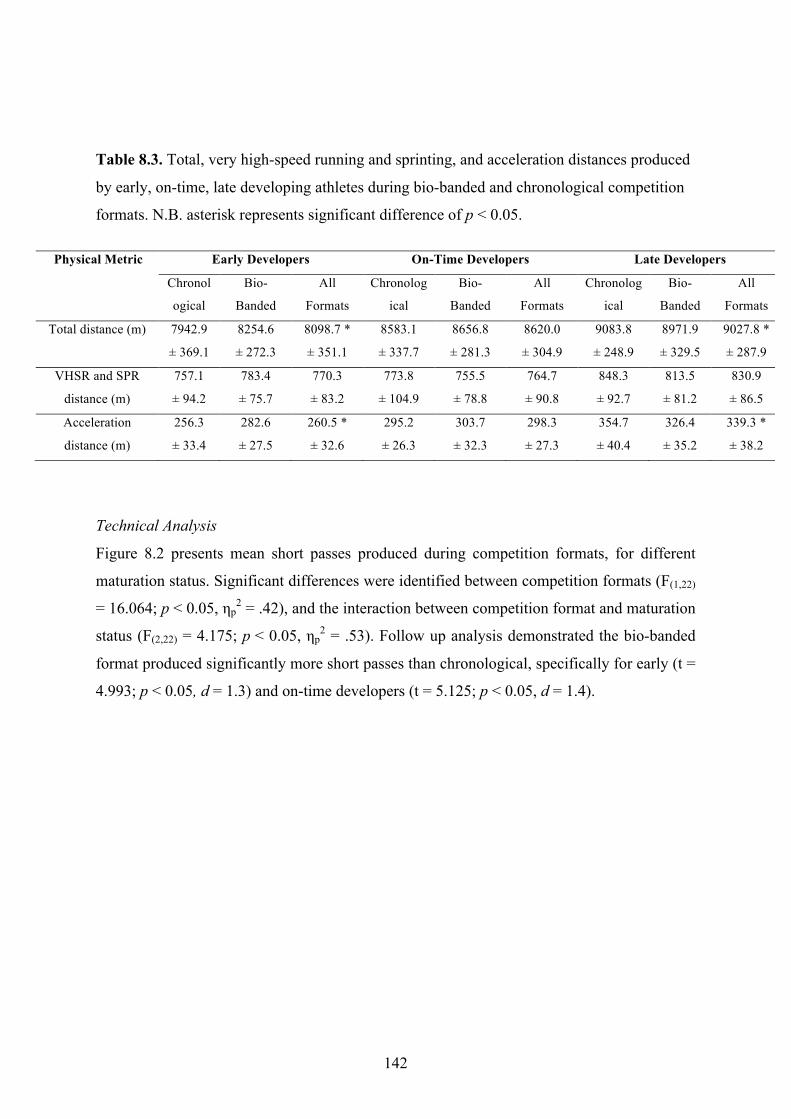
142
Table 8.3. Total, very high-speed running and sprinting, and acceleration distances produced
by early, on-time, late developing athletes during bio-banded and chronological competition
formats. N.B. asterisk represents significant difference of p < 0.05.
Technical Analysis
Figure 8.2 presents mean short passes produced during competition formats, for different
maturation status. Significant differences were identified between competition formats (F(1,22)
= 16.064; p < 0.05, ηp2 = .42), and the interaction between competition format and maturation
status (F(2,22) = 4.175; p < 0.05, ηp2 = .53). Follow up analysis demonstrated the bio-banded
format produced significantly more short passes than chronological, specifically for early (t =
4.993; p < 0.05, d = 1.3) and on-time developers (t = 5.125; p < 0.05, d = 1.4).
Physical Metric Early Developers On-Time Developers Late Developers
Chronol
ogical
Bio-
Banded
All
Formats
Chronolog
ical
Bio-
Banded
All
Formats
Chronolog
ical
Bio-
Banded
All
Formats
Total distance (m) 7942.9
± 369.1
8254.6
± 272.3
8098.7 *
± 351.1
8583.1
± 337.7
8656.8
± 281.3
8620.0
± 304.9
9083.8
± 248.9
8971.9
± 329.5
9027.8 *
± 287.9
VHSR and SPR
distance (m)
757.1
± 94.2
783.4
± 75.7
770.3
± 83.2
773.8
± 104.9
755.5
± 78.8
764.7
± 90.8
848.3
± 92.7
813.5
± 81.2
830.9
± 86.5
Acceleration
distance (m)
256.3
± 33.4
282.6
± 27.5
260.5 *
± 32.6
295.2
± 26.3
303.7
± 32.3
298.3
± 27.3
354.7
± 40.4
326.4
± 35.2
339.3 *
± 38.2

143
Figure 8.2. Number of short passes produced by early, on-time, late developing athletes
during bio-banded and chronological competition formats. N.B. asterisk represents
significant difference of p < 0.05, d represents effect size.
Figure 8.3 presents mean long passes produced during competition formats, for different
maturation status. As with short passes, significant differences were identified between
competition formats (F(1,22) = 19.284; p < 0.01, ηp2 = .47), and the interaction between
competition format and maturation status (F(2,22) = 3.091; p < 0.01, ηp2 = .22). Follow up
analysis demonstrated the chronological format produced significantly more long passes than
bio-banded, for on-time (t = 3.553; p < 0.01, d = 1.1) and late developers (t = 3.320; p < 0.05,
d = 1.0).

144
Figure 8.3. Number of long passes produced by early, on-time, late developing athletes
during bio-banded and chronological competition formats. N.B. asterisk represents
significant difference of p < 0.05, d represents effect size.
Figure 8.4 presents mean number of dribbles produced during competition formats, for
different maturation status. Significant differences were identified for the interaction between
competition formats and maturation status (F(2,22) = 8.693; p < 0.01, ηp2 = .44). Follow up
analysis demonstrated the bio-banded format produced significantly more dribbles than the
chronological competition format for early (t = 2.517; p < 0.05, d = 0.8), and on-time
developers (t = 7.236; p < 0.01, d = 0.7). There was no significant difference between the
number of dribbles produced by late developers during competition formats.

145
Figure 8.4. Number of dribbles produced by early, on-time, late developing athletes during
bio-banded and chronological competition formats. N.B. asterisk represents significant
difference of p < 0.05, d represents effect size.
Figure 8.5 presents mean number of tackles produced during competition formats, for
different maturation status. Significant differences were identified for the interaction between
competition formats and maturation status (F(2,22) = 6.195; p < 0.01, ηp2 = .36). Follow up
analysis demonstrated the bio-banded format produced significantly more tackles than the
chronological competition format for late developers (t = 3.571; p < 0.01, d = 1.0). No
significant differences were identified between competition formats for early or on-time
developers.

146
Figure 8.5. Number of tackles produced by early, on-time, late developing athletes during
bio-banded and chronological competition formats. N.B. asterisk represents significant
difference of p < 0.05, d represents effect size.
Table 8.4 presents mean number of shots, and crosses, produced during competition formats
for athletes of differing maturation status. For both technical metrics, no significant
differences were identified between competition formats, maturation status, or the interaction.
Table 8.4. Number of shots and crosses produced by early, on-time, late developing athletes
during bio-banded and chronological competition formats. N.B. asterisk represents
significant difference of p < 0.05.
Technical
Performance
Metric
Early Developers On-Time Developers Late Developers
Chronological Bio-Banded Chronological Bio-Banded Chronological Bio-Banded
Shots 1.9 ± 1.5 2.7 ± 1.6 2.5 ± 1.8 2.5 ± 2.0 2.4 ± 1.7 2.5 ± 1.6
Crosses 1.9 ± 1.9 2.0 ± 1.7 1.9 ± 2.1 1.6 ± 1.6 2.0 ± 1.9 0.8 ± 0.9

147
8.4 Discussion
The aim of the current study was to determine the differences in physical and technical
performance during bio-banded and chronological competition. This was the first study to
objectively assess the effect of bio-banding upon physical and technical performance. In line
with our predictions concerning physical performance, early developers produced
significantly higher RPE during bio-banded competition when compared to chronological.
However, no significant differences were identified in RPE produced between competition
formats, for on-time or late developers. Additionally, no significant differences were
identified in total, very high-speed running and sprinting, or acceleration distance produced
between competition formats for any maturation status. Considering the limited differences in
physical performance between bio-banded and chronological competition formats, H9 was
rejected and H09 accepted. In accordance with our predictions concerning technical
performance, there were significant differences between competition formats. There was an
increased number of short passes in early and on-time developers and a decrease in long
passes for on-time and late developers between bio-banded and chronological formats.
Dribbles decreased in early developers and increased in on-time developers. There were
increased tackles performed by late developers in bio-banded competition compared to
chronological. As a result of the significant differences in technical performance metrics
between competition formats, H10 was accepted and H010 rejected.
It was demonstrated that late developers produced significantly higher RPE when compared
to early developers overall. The higher RPE produced by late developers is likely the result of
a habitual exertion response to competing with and against athletes of a higher relative
physical development during usual chronological competition. When investigating
differences in RPE between competition formats, results demonstrated early developers
produced significantly higher RPE during bio-banded competition when compared to
chronological. But no differences between competition formats were found in other
maturation statuses. Higher RPE during bio-banded competition is likely the result of the
increased perceived physical demands when competing with and against other early
developers. Consistent with these results, significant differences were identified between the
physical outputs of the maturation statuses. Late developers produced significantly higher
total and acceleration distance when compared to early developers overall. From a
constraints-based framework (Renshaw et al., 2010), the learnt response towards higher total

148
and acceleration distances found late developers would emerge from the task constraints
imposed by the early developers in competition. In order for late developers to maintain their
competitiveness they would be required to produce higher total and acceleration distances,
whereas the early developers would not need to do so.
No significant differences were identified for total distance, very high-speed running and
sprinting distance and acceleration distance between competition formats for any maturation
status. When considering the prescription of bio-banded competition, current results
demonstrate that the bio-banded format does not significantly reduce the physical demands
elicited upon athletes of any maturation status when compared to chronological competition.
Although, there was a difference in the mean values for all physical performance metrics in
the predicted direction. Current results compliment research conducted by Cumming et al.
(2018) to some degree, investigating Premier League academy soccer players’ experiences
during bio-banded competition. Cumming et al. (2018) found that early developers described
bio-banded competition format as a superior physical challenge when compared to
chronological format. It was also found that late developers described bio-banded
competition as less physically challenging in comparison to chronological competition.
Although, these findings were derived from athletes’ perceptions.
When investigating short and long passes produced between competition formats, significant
differences were identified. The bio-banded format produced significantly higher number of
short passes for early, and on-time developers, when compared to the chronological format.
For long passes, bio-banded competition produced significantly less for on-time, and late
developers, when compared to chronological competition. When focusing on number of
dribbles and tackles produced during bio-banded and chronological competition formats,
significant differences were also identified. For the number of dribbles, bio-banded
competition produced significantly more dribbles compared to the chronological format, for
early and on-time developers. For number of tackles, bio-banded produced significantly more
tackles for late developers only. Referring to the constraints-based model, bio-banding
competition resulted in more tackles and less long passes performed by late developers
because of the reduced physical maturation of opponents compared to usual chronological
competition. Presumably, decreased relative strength of opponents enable tackling behaviour
to emerge. Likewise, the advantage of a long pass to a more physically mature teammate is
no longer an option. Consequently, this tactical option is no longer exploited. In the case of

149
early developers, the opportunity to dribble around less physically mature opponents is
reduced, and therefore this behaviour is less frequent. The necessity to produce more short
passes to move the ball towards the opponent’s goal is required, and emerges in this
competition format.
The finding of changes in frequency of certain technical skills can be seen as a potential
method of improving technical performance in soccer. Rampanini et al. (2009) identified
successful short passes, dribbles and tackles as important technical skill parameters for
success in top level professional soccer. Additionally, Bradley et al. (2013) identified a
superior technical proficiency in the Premier League when comparing to the lower English
leagues. This was characterised by significantly higher numbers of total passes in the Premier
League, in comparison to a more transient long ball tactic utilised at lower standards of
soccer (Barnes et al., 2014). Current results compliment research by Cumming et al. (2018),
suggesting the bio-banded formats place an increased emphasis upon technical ability. This is
reflected by an increased frequency of short passes, and dribbles for early and on-time
developers, supporting findings that bio-banded competition encouraged early developers to
emphasise technique over physicality (Cumming et al., 2018). Furthermore, an increased
technical emphasis was also apparent for late developers, with a decreased frequency of
longer passing in bio-banded competition formats. In addition, late developers produced
significantly more tackles in bio-banded formats, supporting previous findings that late
developers were allowed a great opportunity to exert and develop their physicality during
bio-banded formats (Cumming et al., 2018).
The trend for differences between bio-banded and chronological competition formats was not
apparent when investigating the number of shots and crosses performed. For number of shots,
there were no significant differences between competition formats, for early, on-time, or late
developers. This was the same for number of crosses, with no significant differences between
competition formats for any maturation status. The lack of significant differences identified
between competition formats for these two technical metrics is likely the result of the
specificity of actions to playing positions. Shooting is an action more commonly associated
with strikers and attacking playing positions, and infrequently seen in defenders. Crossing is
a technical action frequently exhibited in wide attacking and wide defending playing
positions, and rarely seen for central defenders. Due to the limited sample size, analysis was
not conducted for individual playing position, and therefore the large variations between
150
playing positions may have resulted in no significant differences being identified. This is a
topic requiring further investigation.
The current study provides applied practitioners with valuable insights regarding the physical
and technical differences between bio-banded and chronological competition formats for
athletes of differing maturation status. This study was the first to provide objective evidence
on the effect of bio-banding upon physical and technical performance. Results can be used to
individualise the prescription of competition format to different maturation statuses,
dependent upon their physical and technical development needs. For early developers, bio-
banded competition produced more short passes, more dribbles, and a higher RPE than
chronological competition. For on-time developers, bio-banded competition produced more
short passes, more dribbles, and less long passes than chronological competition. For late
developers, bio-banded competition produced more tackles, and less long passes than
chronological competition. For all maturation status, bio-banded competition increased the
occurrence of key technical performance metrics when compared to chronological
competition. Despite increases in technical demands, the physical demands placed upon
athletes during bio-banded competition were similar when compared to chronological
competition.
It is important to consider the limitations of the current study. Firstly, despite recent
improvements in GPS hardware and software, there is still associated error with the devices.
For example, Delaney et al. (2017) demonstrate that 10-Hz devices exhibit coefficient of
variations of 1.2 - 6.5% when assessing acceleration and deceleration, and must be
acknowledged when applying current results. The large effect sizes demonstrated within the
current study suggest the sizes of the differences were larger than the error associated with
measurement. Therefore, it can be stated with confidence that the effects are not the result of
chance. Secondly, the study was conducted using soccer athletes at a Premier League
academy, and consequently may not be directly applicable to other clubs or levels. Finally,
due to the nature of the study, a small sample size was recruited, and each athlete only
completed one bio-banded and chronological fixture. This prevented further study into the
effect of bio-banded and chronological competition formats for different playing positions
and maturation statuses. The current study found no significant differences in shooting and
crossing metrics between competition formats. Considering the specificity of these two

151
technical metrics to playing positions, conducting positional analysis may have resulted in
further findings.
8.5 Conclusion
The current study provides support for bio-banding as an intervention to alter the task
constraints of soccer match-play. The consequence of bio-banded competition was an
increase in performance indicators associated with technical skill. Significant differences
were identified between competition formats for several technical performance metrics,
which varied for athletes of differing maturation status. Current results can aid applied
practitioners in prescribing competition formats, dependent upon an athlete’s maturation
status and developmental needs. For all maturation status, bio-banded competition increased
the emphasis placed upon technical performance when compared to chronological
competition. The exact technical demands varied dependent upon maturation status.
Interestingly, early developers perceived bio-banded competition as more physically exerting
compared to chronological competition, as demonstrated by RPE. Despite increased technical
demands, and the increased perception of exertion, distances travelled during bio-banded
formats were similar when compared to chronological formats. Consequently, it can be
concluded that bio-banded competition format increases the technical emphasis placed upon
athletes of varying maturation status, without reducing the physical demands elicited.

152
9.0 General Discussion

153
9.1 Introduction
The focus area of the current thesis was the use of global positioning systems (GPS) as a
training load monitoring tool within professional soccer. The studies focused upon an
individualised approach to monitoring and prescribing training loads in elite academy soccer
players. Study One, Study Two, and Study Three examined the processes associated with the
individualised monitoring of training load. These processes involved the use of individual
speed and acceleration thresholds, and identifying the positional demands of soccer
competition. Study Four and Study Five focused upon how training games and competition
formats could be prescribed to athletes of different playing positions, and maturation status
respectively.
Specifically, Study One analysed the discrepancies between individual and global speed
analysis methods in monitoring high-speed locomotion for athletes of differing physical
capacities. Individual speed thresholds were determined utilising individual’s maximum
aerobic speed, and maximum sprint speed performance, assessed utilising field based tests.
Study Two analysed discrepancies between low-, moderate-, and high-intensity acceleration
distances produced using individual and global acceleration analysis methods for athletes of
varying maximal capacities. Individual acceleration thresholds were determined utilising a
field based test assessing individual’s maximum acceleration capacity.
Study Three quantified the physical demands elicited by soccer competition, and the
relationship between physical outputs and match outcome. The physical demands placed
upon soccer playing positions during competition were analysed and compared. The
association between the physical demands of individual playing positions and match outcome
was also investigated.
Study Four examined the effect of training game format upon physical outputs produced by
soccer playing positions. Physical outputs produced by playing positions during different
training game formats were analysed relative to the positional demands of competition. Both
average and peak demands of training games and competition were investigated.

154
Study Five quantified the effects of bio-banded competition upon physical and technical
performance in academy soccer players. Differences in physical and technical performance
metrics were compared between bio-banded and chronologically grouped competition.
Analysis was sub-divided for maturation status, with differences between competition format
investigated for early, on-time, and late developing athletes.
Findings of the current thesis demonstrate the importance of individualising the training load
monitoring process. In addition, findings highlight the need for specific prescription of
training and competition formats for athletes of different playing positions and maturation
statuses.
9.2 Experimental Hypotheses Tested
Table 9.1 presents the experimental hypotheses tested with the current thesis, and details
whether the individual hypothesis was accepted or rejected.

155
Table 9.1 Experimental hypotheses tested with the current thesis.
Hypothesis
Number
Description of Hypothesis Accepted
/ Rejected
H1 There will be a significant difference in high-speed locomotion
distances produced by global and individual analysis methods.
Accepted
H2
Differences in high-speed locomotion distances produced by
global and individual analysis methods will vary dependent
upon an athlete’s physical capacity.
Accepted
H3 There will be significant differences in acceleration distances
produced by global and individual analysis methods.
Accepted
H4
Differences in acceleration distances produced by global and
individual analysis methods will vary dependent upon an
athlete’s maximum accelerative capacity.
Accepted
H5 There will be significant differences in the physical outputs
produced by soccer playing positions.
Accepted
H6 There will be significant differences in the physical outputs
produced during matches of differing match outcome.
Rejected
H7
There will be significant differences in the average physical
outputs produced by small, medium and large training games
relative to competition.
Accepted
H8
There will be significant differences in the peak physical
outputs produced by small, medium and large training games
relative to competition.
Accepted
H9
There will be significant differences in physical performance
metrics produced by bio-banded and chronological
competition formats.
Rejected
H10
There will be no significant differences in technical
performance metrics produced by bio-banded and
chronological competition formats.
Accepted

156
9.3 Use of Field Tests to Individualise Speed and Acceleration Thresholds
When previously attempting to individualise speed and acceleration thresholds for athletes,
numerous methodologies have been utilised. Examples include ventilatory thresholds (Clarke
et al., 2015; Lovell & Abt, 2013), maximum aerobic speed (Hunter et al., 2015; Mendez-
Villanueva et al., 2013), maximum sprint speed (Gabbett, 2015; Reardon et al., 2015), and
maximum accelerative capacity (Sonderegger et al., 2016). For practitioners working in
applied sport, it is vital the methods utilised are cost-effective, time-efficient, and feasible.
Typically, practitioners are working with large squads of athletes, and have limited time and
budgets dedicated to physical testing procedures. Lovell and Abt (2013) utilised an
incremental treadmill test to determine individual athlete’s ventilatory thresholds. Although
making theoretical sense, with the second ventilatory threshold representing the transition
from moderate to high-intensity work, this procedure is infeasible to the majority of applied
practitioners. This methodology is time-intensive, expensive and requires access to facilities
and expertise to administer. Due to the aforementioned limitations, Study One and Study
Two utilised field tests to determine the physical capacities of athletes. The field tests utilised
had previously been administered in team sport environments, and conformed to current
testing procedures utilised by Premier League soccer academies.
Alongside being feasible to conduct, it is vital that tests are valid and reliable. Within Study
One, Study Three, Study Four, and Study Five, maximum sprint speed and maximum aerobic
speed testing protocols were used to determine peak speed and estimate vV̇O2max
respectively. The maximum sprint speed protocol involved each athlete completing three
maximal 40m linear sprints, with a minimum of three minutes rest between repetitions.
Maximum sprint speed was identified as the average speed recorded over the quickest 10m
sector, and measured using electronic light gates (Brower TC Timing System) to the nearest
0.01s. Mendez-Villanueva et al. (2013) demonstrated the intraclass correlation coefficient for
the maximum sprint speed protocol as 0.94 - 0.99. The protocol used to identify maximum
aerobic speed was a modified version of the University of Montreal Track Test (Leger &
Boucher, 1980). Mendez-Villanueva et al. (2013) had previously used this protocol to
estimate maximum aerobic speed. The correlation coefficient for the protocol has been
demonstrated as 0.97 (Leger & Boucher, 1980). The modified University of Montreal Track
Test begins with an initial running speed of 8 km.h-1, with the speed increasing by 0.5 km.h-1
each minute. Athletes run around a 200m athletics track, marked with 20m intervals, in time
157
with an audible cue, until either exhaustion or three consecutive cones are missed. Maximum
aerobic speed was estimated using the speed of the final one-minute stage completed. Both
maximum sprint speed and maximum aerobic speed protocols had previously been utilised by
Mendez-Villanueva et al. (2013) and Hunter et al. (2015) to determine soccer player’s
maximum sprint and maximum aerobic speeds, and individualise speed thresholds. Within
Study Two, Study Three, Study Four, and Study Five, maximum accelerative capacity was
determined using a maximum acceleration protocol. The protocol required athletes to
complete three maximal 40m linear sprints, with a minimum of three minutes rest between
repetitions. The maximum rate of acceleration was calculated utilising 10-Hz portable GPS
devices (OptimEye S5B, Version 7.18; Catapult Innovations, Melbourne, Australia), with the
highest acceleration values recorded for each athlete. This was identical to the protocol
utilised by Mendez-Villanueva et al. (2013) to determine maximum sprint speed, and a
similar protocol utilised by Sonderegger et al. (2016) to determine maximum accelerative
capacity and individualise acceleration thresholds. Delaney et al. (2017) reported coefficient
of variations of 1.2 - 6.5% when using 10-Hz GPS to assess acceleration, which must be
acknowledged by practitioners. Prior to each of the physical performance tests, athletes
completed a standardised warm up. The maximum sprint speed and maximum acceleration
protocols were completed on an indoor artificial grass surface with football boots. The
maximum aerobic speed protocol was completed on a grass surface with football boots. The
protocols utilised within the current thesis provided valid representations of physical
performance, and had previously been used within similar investigations. In addition, each of
the protocols demonstrated an acceptable level of reliability.
Study One was the first to individualise speed thresholds using field tests, and to sub-divide
athletes dependent upon physical capacity, whilst investigating discrepancies between
analysis methods. Results demonstrate the discrepancies between analysis methods vary
significantly for athletes of differing physical capacities. For athletes with low maximum
aerobic speed capacities, the individual analysis method produced significantly higher high-
speed running, very high-speed running, and sprinting distances when compared with the
global analysis method. For athletes with medium maximum aerobic speed capacities, the
differences were less marked. The only significant difference for medium maximum aerobic
speed athletes was the individual analysis method produced significantly higher sprinting
distances than the global method. When focusing upon athletes with high maximum aerobic
speed capacities, discrepancies followed the opposite trend to those demonstrated with low

158
maximum aerobic speed capacities. High-speed running and very high-speed running
distances produced by the individual analysis method were significantly lower when
compared to the global analysis method. Sub-dividing athletes by physical capacity provides
additional insight into the discrepancies between analysis methods. Varying discrepancies
between athletes of differing physical capacities (Gabbett, 2015) and playing positions
(Reardon et al., 2015) have previously been reported within literature, with comparable
results to the current study. Gabbett (2015) concluded individual thresholds increased high-
speed running attributed to relatively slower athletes, and decreased high-speed running
attributed to relatively faster athletes. Similarly, Reardon et al. (2015) demonstrated that
global speed thresholds underestimated the high-speed running performed by Rugby
forwards by 22%, and overestimated high-speed running performed by Rugby backs by 18%.
These results compliment the findings of Study One, highlighting the discrepancies in high-
speed locomotion distances produced by differing analysis methods for a squad athletes with
varying physical capacities.
To date, there is no research investigating the discrepancies between global and individual
analysis methods in quantifying acceleration. Study Two was the first to examine the
discrepancies between analysis methods, sub-dividing athletes dependent upon maximum
accelerative capacity. Findings demonstrated significant discrepancies between analysis
methods, with discrepancies varying between athletes of differing maximal accelerative
capacities. For athletes with low maximum accelerative capacities, no significant differences
were identified between analysis methods for any acceleration intensity. When focusing upon
athletes with medium maximum accelerative capacities, significantly higher moderate- and
high-intensity acceleration distances were produced utilising the global analysis method. For
athletes with high maximum accelerative capacities, significantly higher acceleration
distances were produced when utilising the global analysis method compared to the
individual, for all acceleration intensities. Considering Study Two was the first to investigate
discrepancies in acceleration distances produced by global and individual analysis methods,
current results cannot be compared to previous research. However, comparisons can be made
to previous research investigating discrepancies between global and individual speed
thresholds. Lovell and Abt (2013) reported significantly lower high-intensity distances
produced utilising global speed thresholds compared to individual. Whilst Clarke et al.
(2015) concluded that global thresholds underestimated high-intensity running distances by
up to 30% when compared to individual thresholds. Notably, the direction of the

159
discrepancies within both investigations differed in comparison to Study Two. However,
neither Lovell and Abt (2013) nor Clarke et al. (2015) sub-divided athlete groups within their
analyses. Current results are comparable to previous research sub-dividing athlete groups.
Gabbett (2015) demonstrated that individual speed thresholds decreased high-speed running
attributed to relatively faster athletes, whilst Reardon et al. (2015) concluded that global
speed thresholds overestimated the high-speed running performed by Rugby backs. Both
conclusions compliment current results, with significant differences identified between
analysis methods, and varying differences identified between athlete groups. Interestingly,
within the current study, discrepancies between analysis methods were more pronounced at
higher acceleration intensities, and the extent of the discrepancies were higher than those
reported by Reardon et al. (2015) in Rugby backs.
Findings from Study One and Study Two have significant implications for applied
practitioners aiming to monitor the relative demands of high-speed and accelerative tasks for
athletes. Global thresholds are frequently utilised in team sport environments due to their
feasibility, as they require no physical capacity testing (Akenhead & Nassis, 2016).
Considering the same thresholds are utilised for all athletes, global thresholds allow for
comparisons between external workloads completed by athletes. This is important for
coaches, given success within competition is determined by what an athlete can produce in
absolute terms. However, it is vital to note that global thresholds do not account for the
relative intensity an athlete is working. Therefore, if the aim is to quantify and monitor the
intensity of the activity being performed it is recommended individual thresholds are utilised.
Without acknowledging an athlete’s physical capacities, both current and previous results
(Gabbett, 2015; Lovell & Abt, 2013) demonstrate there are large errors associated with
estimating intensity using global thresholds.
9.4 Identifying Positional Demands and Prescribing Training Game Formats
The aim of soccer training sessions is to develop and improve competitive performance.
From a physical perspective, this requires the session to replicate or overload the demands an
athlete encounters during competition. Considering the physical demands placed upon
individual playing positions vary significantly, an individual’s training prescription should be
specific to their positional requirements. A high frequency of specific actions and activities
may overload certain muscle groups, and have implications for how individuals are

160
conditioned. In addition, training load is extremely individual in nature, with athletes
responding differently dependent upon numerous internal and external variables
(Casamichana et al., 2012; Scott et al., 2013). Therefore, to ensure training is efficient, and
that individual requirements are being met, it is vital that training techniques are specific to
individual athletes.
Study Three was the first to investigate the holistic physical demands placed upon soccer
playing positions utilising an individual approach to monitoring. Individual speed and
acceleration thresholds were administered, demonstrating significant variations in physical
demands elicited upon playing positions within the current subject group. When investigating
the physical demands placed upon the central defender, this playing position produced the
lowest total distances, high-speed distances, and moderate- and high-intensity acceleration
distances. This corresponds to results reported by Dellal et al. (2011c) and Guadino et al.
(2010), stating the central defender position is associated with the least physical demand.
Wide defender and wide attackers produced the highest high-speed distances, maximum
speed, and high-intensity acceleration distances during competition. This complimented
findings from Bradley et al. (2010) and Ingebrigtsen et al. (2015), and is suggested to be a
result of operating on the flanks of the pitch. Due to their varying competitive demands, the
training methodologies selected to train central defenders will differ significantly from those
selected to train wide attackers and defenders. Training for wide attackers and defenders
should focus upon developing high-speed locomotion and high-intensity acceleration
capacities, whilst training for central defenders should have a greater technical and tactical
focus, highlighted as important for the position (Bangsbo et al., 2006). Central midfielders
produced the highest total distances and moderate-intensity acceleration distances during
competition, as previously reported by Bradley et al. (2009) and O’Donoghue et al. (2005).
The demands elicited upon a central midfielder are specific to this playing position, and
consequently require different training methodologies compared to the playing positions
previously described. Based upon their competitive demands, specific training for central
midfielders would include a high volume of total distance, and frequent moderate-intensity
manoeuvers. Strikers produced significantly lower total distance travelled compared to all
playing positions, excluding central defenders. However strikers have a significant high-
speed demand placed upon the position, consequently requiring specific training
methodologies. Considering the significant differences in physical demands placed upon

161
soccer playing positions, uniform training methods would be impractical. There is therefore
rationale for specific training prescription for individuals within the same team.
Previous research had investigated the effect of training game format upon the average
demands elicited upon soccer players. However, Study Four was the first to investigate the
effect of training game size on average and peak physical demands elicited upon individual
playing positions relative to competition. Small training games produced the lowest average
and peak total distance intensities when compared to medium and large training games. The
average total distance intensities were not significantly different to competition, however
peak intensities were significantly below competitive intensities for all playing positions. The
trend was similar for average and peak very high-speed running and sprinting intensities.
Current findings compliment research conducted by Brandes et al. (2012) and Castellano et
al. (2013), demonstrating small training games produce lower total and high-speed distances
when compared to large training game formats. When comparing small training games to
competition, both average and peak intensities for very high-speed running and sprinting
were significantly below competitive intensities for all playing positions. For moderate-
intensity acceleration distances, small training games produced the highest average and peak
intensities when compared to all other game formats. Both average and peak intensities were
significantly higher than competition for all playing positions. Current results were in
contrast to those reported by Castellano et al. (2013), who concluded that large game formats
were associated with more frequent accelerations. However, Davies et al. (2013) reported
agility manoeuvres were more frequent during small formats when compared to large,
complimenting current findings. For high-intensity acceleration distances the trend was
reversed, with small training games producing the lowest average and peak intensities
compared to all other game formats. These findings mirrored Castellano et al. (2013),
suggesting the authors may only have recorded high-intensity accelerations during their
investigation. When comparing average high-intensity acceleration distance intensities to
competition, all playing positions excluding central defenders produced significantly lower
intensities relative to competition. For peak high-intensity acceleration distances, intensities
were significantly lower than competition for all playing positions. For RPE, small training
games produced the highest values when compared to all other training game formats,
mirroring findings from previous research (Aguiar et al., 2012; Hill-Haas et al., 2009). When
compared to competition, small training games produced significantly higher RPE values for
all playing positions. Considering the specific demands of small training games, this game

162
format would be a training modality best suited to overloading moderate-intensity
acceleration distances, and perceived exertions relative to competition.
The average and peak demands elicited upon playing positions by medium training games
differed significantly from those elicited by small training games. This has been
demonstrated in previous research for total distance travelled (Castellano et al., 2013), high-
speed running (Brandes et al., 2012), and agility manoeuvres (Davies et al., 2013). Average
total distance produced by medium training games was significantly higher than competition
for all playing positions. However, when analysing peak total distance, medium training
games produced an intensity significantly below those elicited during competition, for all
playing positions. For very high-speed running and sprinting distances, average and peak
intensities produced during medium training games were significantly below competitive
intensities, for all playing positions. When focusing upon moderate-intensity acceleration
distances, a different trend was identified. Medium training games produced significantly
higher average and peak intensities than competition, for all playing positions. For high-
intensity acceleration distances, there were no significant differences between average and
peak intensities produced during medium training games and competition, for any playing
position. When comparing RPE values produced during medium training games to
competition, there were no significant differences in values produced by any playing
position. When considering the specific demands of medium training games, this game
format would be a training modality best suited to overloading moderate-intensity
acceleration distances, and replicating high-intensity acceleration distances relative to
competition.
Large training games produced the highest average and peak total distance intensities when
compared to other training game formats. Average total distance was significantly higher
than competition for all playing positions. However, when analysing peak total distance,
large training games produced significantly lower intensities than competition for all playing
positions, excluding central defenders. For very high-speed running and sprinting distance,
large training games produced higher intensities than both small and medium training games,
complimenting previous research investigating average demands (Brandes et al., 2012;
Castellano et al. 2013). For average very high-speed running and sprinting distance
intensities, there was no significant difference between large training games and competition,
for all playing positions. However peak very high-speed running and sprinting distance

163
intensities followed the same trend as peak total distance, with significantly lower intensities
relative to competition, for all playing positions. When focusing upon moderate-intensity
acceleration distances, large training games produced the lowest intensities compared to other
training games. However, despite producing the lowest moderate-intensity acceleration
distances, average intensities were significantly higher than competition for central defender,
central midfielder and wide attacker positions. Additionally, there were no significant
differences between peak intensities produced during competition and large training games,
for any playing position. When focusing upon high-intensity acceleration distances, large
training games produced the highest intensities when compared to other training game
formats. Both average and peak intensities were significantly higher than competition for all
playing positions. The occurrence of high-intensity accelerations within the current study
corresponded with the suggestion of Castellano et al. (2013) that large training games
produce a higher acceleration demand when compared to smaller formats. This is despite
differences in methodology, with Castellano et al. (2013) not sub-dividing acceleration tasks
dependent upon intensity as in the current study. For RPE, as cited within previous research,
large training games produced the lowest values for all game formats (Aguiar et al., 2012;
Hill-Haas et al., 2009). When compared to competition, there were no significant differences
in RPE values produced between large training games and competition for central defender,
wide defender, and striker positions. However, RPE values produced by central midfielder
and wide attacker playing positions were significantly lower during large training games
compared to competition. When considering the specific demands of large training games,
this game format would be a training modality best suited to overloading high-intensity
acceleration distances, and replicating total distances, very high-speed running and sprinting
distances, and moderate-intensity acceleration distances. However, it must be noted that peak
total distance, and peak very high-speed running and sprinting distances were not replicated
by large training games, with only average intensities replicated.
The results of Study Four conclude that different training game formats elicit specific
physical stimuli upon athletes. Considering the results of Study Three, which demonstrate
each soccer playing position has differing physical demands elicited upon them during
competition, certain game formats can be used as specific training modalities to individual
playing positions. When assessing small training games, this game format overloaded
moderate-intensity acceleration distances, and perceived exertions relative to competition.
Considering the central midfielder position produces the highest frequency of moderate-

164
intensity accelerations during competition, small training games are a modality that provides
a specific stimulus to this playing position. In addition, small training games were the only
format that overloaded perceived exertion for the central midfielder position. When assessing
large training games, this game format overloaded high-intensity acceleration distances, and
average total distances, whilst replicating average very high-speed running and sprinting
distances. Wide defender and wide attacker playing positions are characterised by producing
high-speed distances, and high-intensity acceleration distances during competition.
Consequently, large training games produce a stimulus specific to the physical demands
elicited upon these positions during competition. When focusing upon medium training
games, this format overloaded moderate-intensity acceleration distances, and replicated high-
intensity acceleration distances relative to competition. The physical demands placed upon
the striker playing position are multifaceted, with the need to produce moderate- and high-
intensity acceleration manoeuvres during competition. Considering the aforementioned,
medium training games produce a specific stimulus for this playing position. In addition, this
game format overloads the average total distance intensities produced by the striker position
during competition.
Findings from Study Four and Study Five have significant implications for applied
practitioners. Results demonstrate the vast differences in physical demands placed upon
soccer playing positions during competition. Analysis of the demands of training game
formats provide vital information to practitioners regarding the specific physical stimuli
placed upon playing positions relative to their competitive demands. Having identified the
specific physical demands elicited by training games, current results allow practitioners to
prescribe game formats to playing positions dependent upon their specific training needs,
improving the specificity of soccer training. An issue highlighted by the current results is the
inability of all training game formats to replicate or overload peak very high-speed running
and sprinting distances produced during competition. This was evident for all playing
positions. Given the importance of high-speed activities for soccer performance, practitioners
are recommended to prescribe supplementary maximal speed training alongside their chosen
training games.

165
9.5 Prescription of Bio-banded and Chronological Competition Formats
Soccer is a sport characterised by intermittent explosive activities such as sprinting, jumping,
tackling, and change of pace and direction (Meylan et al., 2010). Increased muscle mass,
associated with maturation, contributes towards maximal strength, maximum power output,
and performance in field tests. With successful soccer performance determined by an
individual’s ability to perform the aforementioned tasks, advantages are therefore provided to
early developing males, whilst late developers are disadvantaged. Large variation in maturity
status within chronological age groups provides issues for youth soccer. Early developers,
possessing increased size, weight and strength are perceived as talented and of higher
potential to coaches and scouts. Consequently, early developers have an increased likelihood
of selection and retention within the system, whilst late developers experience higher levels
of failure, and reduced playing opportunities. This leads to high dropout rates for late
developers. Interestingly, the physical advantages initially experienced by early developers
may be detrimental to their long-term development. Progressing through the age groups using
their physical attributes results in decreased emphasis placed upon technical and tactical
development. Following maturation, the physical advantages once experienced are no longer
present, and technical ability becomes a larger determinant of success. The result is that early
developers no longer progress at the same rate, and are less effective (Meylan et al., 2010).
Bio-banding is suggested to have beneficial effects for both early and late developing
athletes. For early developers, being matched against more physical athletes results in a larger
emphasis being placed upon technical and tactical attributes. For late developers, being
exposed to a physically balanced environment results in the opportunity to have a greater
impact upon competition, and develop both physical and technical attributes. Using a
constraints-based framework, it is argued that playing in chronologically equivalent
competition may lead to the motor performance of the late developers being constrained by
the presence of the early developers. If there is a change in the task constraint of player
maturation, as seen in bio-banded matches, then a different motor performance will
potentially emerge. Bio-banded competition has the potential to improve the talent
identification process for scouts, providing the opportunity to evaluate athletes with the
effects of maturation removed. The desired result would be less late developers being
released prematurely, and less early developers being retained as a result of their superior
maturation status. Despite having significant implications for the development of youth

166
soccer athletes, there has been limited research focusing upon differences in physical and
technical performance between bio-banded and chronological competition. Cumming et al.
(2018) investigated the perceived experiences of athletes participating in bio-banded
competition, however only qualitative data was collected. Study Five was the first to compare
physical and technical performance during bio-banded and chronological competition, for
athletes of differing maturation status.
When focusing upon the effect of bio-banded competition upon physical performance, there
were limited differences in GPS metrics identified between competition formats for athletes
of all maturation statuses. No significant differences were identified between bio-banded and
chronological competition for total distance, sprinting distance, or acceleration distance, for
early, on-time, or late developers. When investigating differences in RPE between
competition formats however, significant differences were identified for early developers.
Early developers produced significantly higher RPE values during bio-banded competition
compared to chronological. This compliments research conducted by Cumming et al. (2018),
concluding early developers described bio-banded competition formats as a superior physical
challenge when compared to chronological formats. The higher RPE values produced by
early developers during bio-banded competition are likely the result of being matched with
other early developing athletes. This is in contrast to being matched against on-time or late
developers during chronological competition. The current study identified no significant
differences in RPE values between bio-banded and chronological competition for on-time, or
late developers. This is in contrast to findings by Cumming et al. (2018), who concluded late
developers described bio-banded competition as less physically challenging compared to
chronological.
The effect of bio-banded competition upon technical performance produced significant
differences for athletes of all maturation statuses. For short passes, bio-banded competition
produced significantly higher values than chronological competition for early, on-time, and
late developers. The opposite was true for long passes, with the chronological format
producing significantly higher values than bio-banded for on-time and late developers. For
the number of dribbles, significantly higher values were demonstrated during the bio-banded
format for early and on-time developers. For the number of tackles, bio-banded competition
produced significantly higher values than chronological competition for late developers.
Current results fall in line with research by Cumming et al. (2018), suggesting bio-banded

167
formats result in an increased emphasis placed upon technical ability. This is demonstrated
by a higher frequency of short passes, and dribbles for early and on-time developers, and a
lower frequency of longer passes for on-time and late developers. Late developers were also
demonstrated to produce more tackles during bio-banded competition, complimenting
suggestions from Cumming et al. (2018) that late developers were better able to exert their
physicality during bio-banded competition. Results for number of shots, and number of
crosses during the two competition formats did not follow the same trend, with no significant
differences being identified between competition format. This is likely the result of the
specificity of these actions to individual playing positions. Crossing is an action frequently
produced by wide attacking and wide defending positions, whilst shooting is an action most
frequently observed by strikers. Due to the nature of the study, a limited sample size was
available. This prevented further investigation into the effect of bio-banded and chronological
competition formats for different playing positions.
The findings from Study Five provide practitioners with valuable information regarding the
physical and technical effects of bio-band competition. Results indicate that the effects of
bio-banded competition differ dependent upon the individual athlete’s maturation status. For
early developers, bio-banded competition produced more short passes, more dribbles, and a
higher RPE compared to chronological. A higher RPE (Bio-banded Mean ± SD = 7.5 ± 0.9
RPE, Chronological Mean ± SD = 6.6 ± 0.5 RPE) would suggest the early developers found
bio-banded competition more physically demanding. The ease at which early developers can
exert their physicality has previously been a criticism of chronological competition. For on-
time developers, bio-banded competition produced more short passes, more dribbles, and less
long passes than chronological. For late developers, bio-banded competition produced more
tackles, and less long passes than chronological. The increases in tackles (Bio-banded Mean
± SD = 7.5 ± 3.4 tackles, Chronological Mean ± SD = 4.4 ± 2.7 tackles) suggest bio-banded
competition allows late developers to exert their physicality to a larger extent. The inability
for late developers to exert their physicality has previously been a criticism of chronological
competition. Results allow coaches to individually prescribe competition formats to athletes
of differing maturation statuses, dependent upon their physical and technical developmental
needs. These findings follow the theme identified by previous studies within the thesis,
providing rationale for an individual approach to the prescription of training load.

168
9.6 Limitations
The advantages of utilising individual thresholds to monitor both high-speed and accelerative
training load are clear. Accounting for individual athletes’ physical capacities allow for the
relative intensity of activities to be determined. An issue associated with determining
individual thresholds using physical capacities, is that physical capacities are demonstrated to
fluctuate throughout a season. For example, Meckel et al. (2018) demonstrated improvements
of 6 - 10% in a range of physical capacities throughout the course of a soccer season.
Physical capacities may increase as a result of a training emphasis, or decrease as a result of a
deconditioning or injury. As a consequence, it is important that physical capacity testing (e.g
maximum aerobic speed, maximum sprint speed, and maximum accelerative capacity) is
performed regularly, and individual thresholds are updated. Otherwise, the individual
thresholds utilised may provide an inaccurate representation of the load elicited upon an
individual. Currently, there are no recommendations for the frequency of re-testing when
utilising individual thresholds. During Study One and Study Two, physical performance tests
were conducted the day prior to the commencement of data collection to individualise
thresholds for the respective studies. From this point forward, individual thresholds utilised
during the respective studies were kept constant and not updated during the course of the
investigation, acting as a potential limitation.
The following points discuss the external validity of the approaches utilised within the thesis
studies. Participants within the current thesis were recruited from a professional soccer
academy. For Study One, Study Two, Study Three, and Study Four, participants were full-
time professional soccer players within a Premier League U23 squad. For Study Five, due to
the focus upon bio-banding and maturation, participants were part-time soccer players within
Premier League U16 - U12 squads. Previous research has demonstrated that the physical
outputs produced during competition vary dependent upon competitive level, and age
(Bradley et al., 2010; Mendez-Villanueva et al., 2013). As a consequence of the elite
participant level, and that the population studied were relatively homogenous, findings from
the current thesis may not be directly applicable to other genders, levels or across age groups.
In addition, the positional match data collected during Study Three and Study Four was
recorded for a 4-3-3 formation. Previous research has demonstrated the physical demands
elicited upon specific playing positions may vary dependent upon team formation (Bradley et
al., 2011). Bradley et al. (2011) identified that attackers produced ~30% more high-intensity

169
running within a 4-3-3 formation compared to a 4-4-2 or 4-5-1 formation. Different
formations place different tactical roles and responsibilities upon playing positions,
influencing the physical demands elicited.
The data collection periods for Study Three and Study Four spanned two and one seasons
respectively. Whilst producing large data sets, with a total of 343 match observations for
Study Three, and 735 match and training game observations for Study Four, long data
collection periods have issues associated. The issues relate to the maturational threat upon
internal validity. Despite large efforts to standardise data collection procedures, the nature of
research within applied environments result in the potential for external factors to affect data
collection. For example, the weather varied throughout the season, and consequently affected
the quality of the training and match pitches, in addition to athlete motivation. Although
effort was made to ensure athlete motivation was high (e.g coach encouragement, recorded
scores during training games), motivation may have varied throughout the season due to
personal or work related issues. Although these external factors may have affected the data
collected, the large data set ensured the effects were negligible.
The final limitation relates to the instrumentation threat upon internal validity. Within the
current thesis 10-Hz GPS devices were utilised. Advances in the hardware and software
associated with 10-Hz devices have allowed for greater accuracy and reliability when
compared to 1-Hz and 5-Hz devices. Caution was applied during data collection and analysis
processes to ensure procedures were standardised, and that accuracy was maintained.
Additionally, athletes consistently wore the same devices to reduce inter-unit error. As with
all technology however, there is associated error. 10-Hz devices are demonstrated to exhibit
coefficient of variations of 1.2 - 6.5% when assessing acceleration and deceleration.
Although this is suggested to provide sufficient accuracy to quantify acceleration and
deceleration within team sports, it requires acknowledgment from practitioners when
applying the current results. With GPS hardware and software constantly advancing, it is vital
future research validates new technology, ensuring practitioners are aware of the associated
error within results.
The aim of the thesis was to provide recommendations for training load monitoring and
prescription to both coaches and applied sport scientists. Therefore, it is vital that the studies
were conducted within an applied environment to ensure ecological validity. All of the

170
studies within the current thesis were conducted within a professional soccer club
environment, with professional soccer players. As a result of the high ecological validity, and
operating within a professional soccer club with specific daily objectives, at times the study
designs had to be compromised. An example is that randomised control trials utilising an
intervention and control group could not be administered within this environment. Within the
soccer academy, a large importance is placed upon providing equal opportunities for each of
the athletes. Progression to the next age group, or release from the soccer club at the end of
the season, has a significant effect upon the individual’s career and life. As a consequence, it
was deemed unethical to provide certain individuals access to specific training modalities and
opportunities, and not others. The result is that during Study Four, participants were exposed
to all training game formats, instead of being assigned a single modality. In addition, during
Study Five, participants played in both bio-banded and chronologically aged competition,
instead of being assigned a single competition format. Despite the current thesis being
conducted within an applied environment, a large emphasis was placed upon maintaining
scientific rigour, standardising testing procedures, and ensuring the data and conclusions
obtained were accurate. The ability to balance the internal and external validity of
investigations is a significant challenge within applied research. However, considering the
implications of the current thesis to applied environments, the balance was considered
achieved.
9.7 Future Directions
Considering physical performance has been demonstrated to fluctuate over the course of a
season, the individual thresholds used for monitoring high-speed locomotion and acceleration
should be reassessed regularly to reflect this. If physical performance testing, and
consequential update of individual thresholds, is not performed on a regular basis, an
inaccurate representation of training load may be provided. Currently however, there are no
recommendations for the frequency of re-testing. Considering the testing protocols utilised
within the current thesis were field tests, and often conducted within applied environments,
frequent re-testing would not be a significant inconvenience for applied practitioners. This is
an advantage of field tests when compared to laboratory tests, where frequent re-testing
would incur significant financial and time costs. To ensure that accurate information is
obtained, the frequency of re-testing should be investigated. Future research should aim to

171
identify the optimal frequency of re-testing for speed and acceleration thresholds, in order to
accurately reflect the relative load elicited upon individual athletes.
The participants recruited within the current thesis were all enrolled within a professional
soccer academy. There is a very small success rate within academy soccer, with as little as
0.5% of U9s graduating through to play for a first team (Wilson, 2015). With the physicality
of modern day soccer increasing, an increased emphasis has been placed upon developing the
physical attributes of athletes (Barnes et al., 2014; Carling, 2013). Further research is
required to identify which physical attributes (e.g. speed, strength, power, and endurance), if
any, correlate towards successfully graduating through the academy age groups into the first
team. This would be invaluable for talent identification, and benchmarking purposes. In
addition, practitioners and coaches could benefit from identification of the physical outputs
produced by first team playing positions. Identifying the physical attributes and physical
outputs required by first team soccer players will provide coaches and sport science
practitioners with a reference point, and the ability to benchmark current athletes against the
finished product.
Within the current thesis, Study Four investigated the effect of training game size upon the
average and peak demands elicited upon soccer playing positions. Results have significant
implications for applied practitioners looking to prescribe training games as conditioning
tools. Significant research has focused upon identifying the physical demands associated with
training games, and how they can be manipulated to affect the physical demands elicited.
Training games are only one of numerous training methodologies utilised by soccer coaches
however. Examples of other training methodologies include possessions, passing drills,
crossing and finishing, and phases of play. There has been limited research on the physical
demands elicited by other training methodologies, and how they can be utilised for soccer
playing positions. It is recommended future studies investigate the average and peak physical
demands elicited by these methodologies, and how they can potentially be manipulated.
Within both research and applied practice, there has been an increased use of models aiming
to identify the association between training load and injury occurrence. An example is
Gabbett (2016), and the use of the acute:chronic workload ratio. Gabbett (2016) cites a
‘sweet spot’ of optimal training load associated with a reduced injury risk. Training loads that
were higher or lower than the prescribed ratio were suggested to be associated with an

172
increased risk of injury. More recently, the acute:chronic workload ratio has been refined to
include exponentially weighted moving averages, suggested to provide greater sensitivity in
detecting injury likelihood (Murray et al., 2017; Williams et al., 2017). Research has raised
issues with the acute:chronic workload ratio, specifically regarding the integration of data
from different tracking systems, difficulties associated with monitoring athletes during
international or off-season periods, and which marker of training load should be utilised
(Buchheit, 2017). Previous research has incorporated a range of training load metrics when
utilising the aforementioned workload ratio. Examples include ratings of perceived exertion,
total distance, high-speed distance, number of exposures to maximum velocity, player load,
and the number of acceleration tasks (Bowen et al., 2017; Hulin et al., 2014; Malone et al.,
2017; Murray et al., 2017). When utilising workload ratios to calculate injury risk, it is vital
that valid representations of workload are incorporated within the models. If the training load
data input within the model is not a valid representation of load elicited upon an individual
athlete, then inaccurate data will be obtained from the model, and false assumptions
regarding the likelihood of injury will be made. Current research utilising the acute:chronic
workload ratio has used global thresholds to quantify high-speed and acceleration activities
(Bowen et al., 2017; Murray et al., 2017). A criticism highlighted by Buchheit (2017) is
given the large variations in physical capacity profiles between athletes within the same team,
the use of global speed thresholds may limit the sensitivity of the ratio to detect the individual
locomotion demand, and consequently, injury risk. The same is true when utilising global
acceleration thresholds to integrate acceleration training load data within the acute:chronic
workload ratio. Consequently, there is rationale for future research to investigate the
association between training load and injury occurrence whilst incorporating individual speed
and acceleration thresholds.
There has been an increased occurrence of practitioners utilising real-time GPS data (Malone
et al., 2017). This demonstrates the increasing influence of technology, and training load
monitoring and prescription processes within applied sport. Coaches and practitioners may
seek information on the current training load elicited upon an athlete, relative to pre-
determined prescriptions. This information can be used to inform decisions during training
sessions, as opposed to retrospectively following the training session occurring and data
being downloaded. Previous research identified discrepancies between real-time and post-
download data, and has suggested caution be applied when utilising real-time GPS (Aughey
& Falloon, 2010). Real-time GPS technology has since improved, however still requires

173
further research to establish accuracy (Malone et al., 2017). In addition, current real-time
technology only presents select training load metrics (e.g total distance travelled, high-speed
running and sprinting distance), and does not allow for real-time acute:chronic workload
ratios to be determined. Further improvements in technology, and incorporation of custom
training load variables and ratios, would allow the ability to accurately monitor training load
and influence training decisions in real-time. The consequence would be increased
opportunities to prescribe training loads specific for individual athletes.
9.8 Practical Recommendations
Findings from the current thesis provide applied practitioners with a number of
recommendations for monitoring and prescribing training load to elite soccer athletes.
Whilst monitoring the training load of individual athletes, it is important to account for
individual physical capacities. Accounting for an athlete’s relevant physical capacities will
allow training load to be expressed relative to the individual, and a true reflection of the
intensity obtained. Global thresholds allow for comparisons in external workload completed
between athletes, however must be utilised with caution. Results from the current thesis
demonstrate significant discrepancies between distances produced by global and individual
analysis methods for both high-speed locomotion and acceleration tasks. Global speed
thresholds produced significant differences in high-speed locomotion distances for 47% of
athletes when compared to individual speed thresholds. Similarly, global acceleration
thresholds produced significantly different acceleration distances for 57% of athletes when
compared to individual acceleration thresholds. Considering the increased use of workload
ratios to predict injury risk of athletes within applied environments, current findings will be
of significant interest to practitioners. Integrating physical capacities within speed and
acceleration thresholds increases the validity of training load data, and the consequential
assumptions derived from workload ratios. Within the current thesis, protocols used to
determine the individual athletes’ physical capacities were field-based tests, with the ability
to be conducted with large squads. Protocols required minimal equipment, and elicit minimal
financial and time-cost. Additionally, protocols typically exist as part of routine testing
batteries in professional team sport environments. Consequently, it is feasible for applied
practitioners to directly incorporate the current methodologies within their environment, and
administer an individualised approach to monitoring training load.

174
When prescribing training load, it is vital to quantify the physical demands elicited by
competition. This allows coaches and practitioners to design training sessions preparing the
athletes for, and developing, competitive performance. The holistic physical demands placed
upon individual playing positions vary significantly, as demonstrated by novel findings
within the current thesis. Central defenders have least physical demand placed upon them
during competition. Central midfielders travel the highest total distance, and produced the
most moderate-intensity accelerations. Wide defenders and attackers have a large high-speed
demand placed upon them during competition. The physical demands placed upon strikers
are multifaceted. Considering the significant variations in physical demands placed upon
soccer playing positions, it is vital that training prescription focuses upon the specific
requirements of athletes, instead of adopting a one-size-fits-all approach.
The current thesis demonstrates that training game format can be manipulated to alter the
physical demands elicited upon athletes. Small training games elicited the highest moderate-
intensity acceleration distances, and perceived exertions for all playing positions. Large
training games elicited the highest total, and high-speed distances, in addition to high-
intensity acceleration distances. Medium training games stimulated a number of physical
demands relative to competition. By highlighting the physical demands elicited upon playing
positions during both competition and training games, it is possible for the current thesis to
prescribe specific training game formats to playing positions based upon their physical
requirements. Considering central midfielders are associated with large volumes of moderate-
intensity accelerations, small training games are recommended. For wide defenders and
attackers, positions with a high sprinting and high-intensity acceleration demand, large
training games are recommended. For strikers, with a multitude of physical demands elicited
during competition, medium sized training games are recommended. It is important to note
however, that no specific training game format develops overall soccer fitness for all, or
individual, playing positions. Instead, each training game format elicits a unique physical
load. Caution must also be applied when prescribing training games relative to the average
demands of competition. The current thesis demonstrates that certain game formats replicated
the average demands of competition, however they were unable to replicate peak competitive
demands. This was true for high-speed running and sprinting intensities within all training
game formats. As a consequence, supplementary sprinting training is recommended to
prepare athletes for peak high-speed running and sprinting demands during competition.

175
Considering there had been no prior investigation into the peak demands elicited by training
game formats, these novel findings have significant implications upon training load
prescription for soccer playing positions.
When investigating the effect of bio-banded competition upon the physical and technical
performance of youth athletes, significant implications were identified for applied
practitioners. Findings indicated that the effect of bio-banded competition varied dependent
upon an athlete’s maturation status. For early developers, bio-banded competition produced
increases in numbers of short passes and dribbles, and a higher RPE when compared to
chronological competition. In the past, a criticism of chronological competition was the ease
at which early developers could exert their physicality. This reliance on physicality resulted
in a reduced emphasis on technique, hindering development. The increase in number of short
passes and dribbles indicates an increase in the technical emphasis placed upon early
developers. In addition, a higher RPE during bio-banded competition indicates early
developers found it more physically demanding. The increased technical emphasis
represented by higher numbers of passes and dribbles were also evident for on-time
developers. For late developers, bio-banded competition provided a different emphasis. More
tackles, and less long passes were demonstrated during bio-banded competition when
compared to chronological competition. The inability for late developers to exert their
physicality has previously been a criticism of chronological competition. However, increases
in number of tackles suggest bio-banded competition allows late developers to exert their
physicality to a larger extent. For all maturation statuses, there were no significant differences
in total distance, sprinting distance, or acceleration distance. This demonstrates that the
increased emphasis technical performance associated with bio-banded competition is not at
the detriment to physical performance. Considering there had been no previous investigation
into the physical and technical effects of bio-bandied competition, these novel findings have
significant implications for practitioners working with athletes of differing maturation
statuses and developmental levels. Findings allow coaches to individually prescribe
competition formats to athletes dependent upon their maturation status, and their individual
physical and technical developmental needs.
In summary, the current thesis provides significant contributions to the current body of
literature focusing upon monitoring and prescribing GPS training load. The overarching aim
of the thesis was to create an individualised approach to the methodologies employed within

176
elite academy soccer training and competition. Findings emphasised the importance of
individualising the training load monitoring process, and providing specific training and
competition formats to address the demands placed upon different playing positions and
maturation statuses. Whilst initially investigating the training load monitoring process,
findings demonstrated the significant discrepancies between global and individual analysis
methods when analysing both high-speed locomotion and acceleration. Findings also
demonstrated the extent to which the discrepancies varied between athletes of differing
physical capacities. Importantly, the current studies utilised field tests to determine individual
thresholds. Allowing applied practitioners the ability to incorporate an individualised
monitoring process without large time or financial costs. When progressing the focus from
training load monitoring to training load prescription, the current thesis demonstrated the
individual nature of soccer competition, and the specific demands placed upon playing
positions. Significant differences in positional demands provide rationale for specific training
methodologies for individuals. Current findings provide recommendations of specific training
modalities for soccer playing positions. Finally, the thesis focus shifted from training to
competition, investigating the effect of bio-banded competition upon physical and technical
demands placed upon different maturation statuses. Findings demonstrated that competition
formats could be prescribed to early, on-time, and late developing athletes dependent upon
their physical and technical developmental needs. In conclusion, thesis findings have
significant implications for applied sport scientists operating in elite soccer environments. By
incorporating current recommendations, applied practitioners can improve the accuracy of the
training monitoring process, and the specificity of training and competition prescription.

177
10.0 Reference List

178
Abrantes, C. I., Nunes, M. I, Macas, V. M, Leite, N. M., & Sampaio, J. E. (2012). Effects of
the number of players and game type constraints on heart rate, rating of perceived exertion,
and technical actions of small-sided soccer games. Journal of Strength & Conditioning
Research, 26(4), 976-981.
Abt, G., & Lovell, R. (2009). The use of individualized speed and intensity thresholds for
determining the distance run at high-intensity in professional soccer. Journal of Sports
Science, 27(9), 893-898.
Aguiar, M. V. D., Botelho, G. M. A., Goncalves, B. S. V., & Sampio, J. E. (2013).
Physiological responses and activity profiles of football small-sided games. Journal of
Strength & Conditioning Research, 27(5), 1287-1294.
Aguiar, M. A., Botelho, M. A., Lago, C., Macas, V., & Sampaio, J. (2012). A review on the
effects of soccer small-sided games. Journal of Human Kinetics, 33, 103-113.
Akenhead, R., French, D., Thompson, K. G., & Hayes, P. R. (2014). The acceleration
dependent validity and reliability of 10 Hz GPS. Journal of Science and Medicine in Sport,
17(5), 562-566.
Akenhead, R., Hayes, P. R., Thompson, K. G., & French, D. (2013). Diminuations of
acceleration and deceleration output during professional football match play. Journal of
Science and Medicine in Sport, 16(6), 556-561.
Akenhead, R., & Nassis, G. (2016). Training load and player monitoring in high-level
football: Current practice and perceptions. International Journal of Sports Physiology &
Performance, 11(5), 587-593.
Albuquerque, M. R., Franchini, E., Lage, G. M., Da Costa, V. T., Costa I. T., Malloy-Diniz,
L. F. (2015). The relative age effect in combat sports: an analysis of Olympic judo athletes,
1964-2012. Perceptual & Motor Skills, 121(1), 300-308.

179
Albuquerque, M. R., Lage, G. M., Da Costa, V. T., Ferreira, R. M., Penna E. M., Moraes, L.
C. C., & Malloy-Diniz, L. F. (2012). Relative age effect in Olympic taekwondo athletes.
Perceptual and Motor Skills, 114(2), 461-468.
Aughey, R. J. (2010). Australian football player work rate: evidence of fatigue and pacing?
International Journal of Sports Physiology & Performance, 5(3), 394-405.
Aughey, R. J. (2011). Applications of GPS technologies to field sports. International Journal
of Sports Physiology and Performance, 6(3), 295-3
Aughey, R. J., & Falloon, C. (2010). Real-time versus post-game GPS data in team sports.
Journal of Science and Medicine in Sport, 13(3), 348-349.
Baechle, T. R. & Earle, R W. (2008). Essentials of Strength and Conditioning Training
(Third Edition). USA: Human Kinetics.
Barbero-Alvarez, J. C., Coutts, A., Granda, J., Barbero-Alvarez, V., & Castagna, C. (2010).
The validity and reliability of a global positioning satellite system device to assess to speed
and repeated sprint ability (RSA) in athletes. Journal of Science and Medicine in Sport,
13(2), 232-235.
Bangsbo, J., Mohr, M., & Krustrup, P. (2006). Physical and metabolic demands of training
and match play in the elite football player. Journal of Sports Sciences, 24(7), 665-674.
Barnes, C., Archer, D. T., Hogg, B., Bush, M., & Bradley, P. S. (2014). The evolution of
physical and technical performance parameters in the English Premier League. International
Journal of Sports Medicine, 35(13), 1-6.
Bayer, L. M., & Bailey, N. (1959). Growth diagnosis: Selected methods for interpreting and
predicting development from one year. Chicago, IL: Chicago University Press.
Bloomfield, J., Polman, R., & O’Donoghue, P. (2007). Physical demands of different
positions in FA Premier League soccer. Journal of Sports Science and Medicine, 6(1), 63-70.

180
Bowen, L., Gross, A. S., Gimpel, M., & Li, F. (2017). Accumulated workloads and the
acute:chronic workload ratio relate to injury risk in elite youth football players. British
Journal of Sports Medicine, 51(5), 452-459.
Bradley, P. S., Carling, C., Archer, D., Roberts, J., Dodds, A., Di Mascio, M., Paul, D., Diaz,
A. G., Peart, D., & Krustrup, P. (2011). The effect of playing formation on high-intensity
running and technical profiles in English FA Premier League soccer matches. Journal of
Sport Sciences, 29(8), 821-830.
Bradley, P. S., Carling, C., Diaz, A.G., Hood, P., Barnes, C., Ade, J., Boddy, M., Krustrup,
P., & Mohr, M. (2013). Match performance and physical capacity of players in the top three
competitive standards of English professional soccer. Human Movement Science, 32(4), 808-
821.
Bradley, P. S., Di Mascio, M., Peart, D., Olsen, P., & Sheldon, B. (2010). High-intensity
activity profiles of elite soccer players at different performance levels. Journal of Strength &
Conditioning Research, 24(9), 2343-2351.
Bradley, P. S., Sheldon, W., Wooster, B., Olsen, P., Boanas, P., & Krustrup, P. (2009). High-
intensity running in English FA Premier League soccer matches. Journal of Sports Sciences,
27(2), 159-168.
Brandes, M., Heitman, A., & Muller, Lutz (2012). Physiological responses of different small-
sided game formats in elite youth soccer players. Journal of Strength & Conditioning
Research, 26(5), 1353-1360.
Borg, G. A. V. (1982). Psychophysical bases of perceived exertion. Medicine and Science in
Sports and Exercise, 14(5), 377-381.
Boyd, L. J., Ball, K., & Aughey, R. J. (2013). Quantifying external load in australian football
matches and training using accelerometers. International Journal of Sports Phyiology and
Performance, 8(1), 44-61.

181
Buchheit, M. (2017). Applying the acute:chronic workload ratio in elite football: worth the
effort? British Journal of Sports Medicine, 51(18), 1325-1327.
Buchheit, M., & Mendez-Villanueva, A. (2014). Effects of age, maturity and body
dimensions on match running performance in highly trained under-15 soccer players. Journal
of Sports Sciences, 32(13), 1271-1278.
Buchheit, M., Mendez-Villanueva, A., Simpson, B. M., & Bourdon, P. C. (2010). Match
running performance and fitness in youth soccer. International Journal of Sports Medicine,
31(11), 818-825.
Burgomaster, K. A. (2005). Six sessions of sprint interval training increases muscle oxidative
potential and cycle endurance capacity in humans. Journal of Applied Physiology, 98(6),
1985-1990.
Cardinale, M. & Varley, M. C. (2016). Wearable training monitoring technology:
Applications, challenges, and opportunities. International Journal of Sports Physiology and
Performance, 12(2), 255-262.
Carling C. (2013). Interpreting physical performance in professional soccer match-play:
Should we be more pragmatic in our approach? Journal of Sports Medicine, 43(8), 655-663.
Casamichana, D., & Castellano, J. (2010). Time-motion, heart rate, perceptual and motor
behavior demands in small-sides soccer games: effects of pitch size. Journal of Sport
Sciences, 28(14), 1615-1623.
Casamichana, D., Castellano, J., & Castagna, C. (2012). Comparing the physical demands of
friendly matches and small-sided games in semiprofessional soccer players. Journal of
Strength & Conditioning Research, 26(3), 837-843.
Casamichana, D., Castellano, J., & Dellal, A. (2013). Influence of different training regimes
on physical and physiological demands during small-sided soccer games: Continuous vs
intermittent format. Journal of Strength & Conditioning Research, 27(3), 690-697.

182
Castellano, J., Alvarez-Pastor, D., & Bradley, PS. (2014). Evaluation of research using
computerized tracking systems (Amisco and Prozone) to analyse physical performance in
elite soccer: A systematic review. Journal of Sports Medicine, 44(5), 701-712.
Castellano, J., & Casamichana, D. (2013). Differences in the number of accelerations
between small-sided games and friendly matches in soccer. Journal of Sport Sciences and
Medicine, 12(1), 209-210.
Castellano, J., Casamichana, D., & Dellal, A. (2013). Influence of game format and number
of players on heart rate responses and physical demands in small-sided soccer games. Journal
of Strength & Conditioning Research, 27(5), 1295-1303.
Clarke, A. C., Anson, J., & Pyne, D. (2015). Physiologically based GPS speed zones for
evaluating running demands in women’s rugby sevens. Journal of Sports Sciences, 33(11),
1101-1108.
Cobley, S., Baker, J., Wattie N., & McKenna, J. (2009). Annual age-grouping and athlete
development: A meta-analytical review of relative age effects in sport. Sports Medicine,
39(3), 235–256.
Cohen, J. (1988). Statistical power analysis for the behavioural sciences (2nd ed.). Hillsdale,
NJ: Lawrence Earlbaum Associates.
Coutts, A. J., Rampanini, E., Marcora, S. M., Castagna, C., & Impellizzeri, F. M. (2009).
Heart rate and blood correlates of perceived exertion during small-sided soccer games.
Journal of Science and Medicine in Sport, 12(1), 79-84.
Cumming, S. P., Battista, R. A., Standage, M., Ewing, M. E., & Malina, R. M. (2006).
Estimated maturity status and perceptions of adult autonomy support in youth soccer players.
Journal of Sports Sciences, 24(10), 1039-1046.
Cumming, S. P., Brown, D. J., Mitchell, S., Bunce, J., Hunt, D., Hedges, C., Crane, G.,
Gross, A., Scott, S., Franklin, E., Breakspear, D., Dennison, L., White, P., Cain, A.,
Eisenmann, J. C., & Malina, R. M. (2018). Premier league academy soccer players’

183
experiences of competing in a tournament bio-banded for biological maturation. Journal of
Sports Sciences, 36(7), 757-765.
Cummins, C., Orr, R., O’Connor, H. & West, C. (2013). Global positioning systems (GPS)
and microtechnology sensors in team sports: a systematic review. Journal of Sports
Medicine, 43(10), 1025-1043.
Da Silva, C. D., Impellizzeri, F. M., Natali, A. J., De Lima, J. R. P., Bara-Filho, M. G.,
Silami-Garcia, E., & Marins, J. C. B. (2011). Exercise intensity and technical demands of
small-sided games in young brazilian soccer players: effect of number of players, maturation
and reliability. Journal of Strength & Conditioning Research, 25(10), 2746-2751.
Dalen, T., Ingebrigtsen, J., Ettema, G., Hjelde, G. H., & Wisloff, U. (2016). Player load,
acceleration, and deceleration during 45 competitive matches of elite soccer. Journal of
Strength & Conditioning Research, 30(2), 351-359.
Davies, M. J., Young, W., Farrow, D., & Bahnert, A. (2013). Comparison of agility demands
of small-sided games in elite Australian football. International Journal of Sports Physiology
and Performance, 8(2), 139-147.
Del Campo, D. G. D., Vicedo, J. C. P., Villora, S. G., Jordan, O. R. C. (2010). The relative
age effect in youth soccer players from Spain. Journal of Sports Science and Medicine, 9(2),
190-198.
Delaney, J. A., Cummins, C. J., Thornton, H. R., & Duthie, G. M. (2017). Importance,
reliability and usefulness of acceleration measures in team sports. Journal of Strength &
Conditioning Research, Epub Ahead of Print.
Dellal, A., Drust, B., & Lago-Penas, C. (2013). Variation of activity demands in small-sided
soccer games. International Journal of Sports Medicine, 33(5), 370-375.
Dellal, A., Hill-Haas, S., Lago-Penas, C., & Chamari, K. (2011a). Small-sided games in
soccer: amateur vs professional players’ physiological responses, physical, and technical
activities. Journal of Strength and Conditioning Research, 25(9), 2371-2381.

184
Dellal, A., Lago-Penas, C., Wong, D. P., & Chamari, K. (2011b). Effect of the number of ball
contacts within bouts of 4 vs. 4 small-sided soccer games. International Journal of Sports
Physiology and Performance, 6(3), 322-333.
Dellal, A., Chamari, K., Wong, D. P., Ahamaidi, S., Keller, D., Barros, R., Bisciotti, G. N., &
Carling, C. (2011c). Comparison of physical and technical performance in european soccer
match-play: FA Premier League and La Liga. European Journal of Sport Science, 11(1), 51-
59.
Dellal, A., Owen, A., Wong, D., Krustrup, P., van Exsel, M., & Mallo, J. (2012). Technical
and physical demands of small vs. large sided games in relation to playing position in elite
soccer. Journal of Human Movement Science, 31(4), 957-969.
Delorme, N. (2014). Do weight categories prevent athletes from relative age effect? Journal
of Sports Sciences, 32(1), 16-21.
Delorme, N., Boiche, J., & Raspaud, M. (2010). Relative age and dropout in French male
soccer. Journal of Sports Sciences, 28(7), 717-722.
Di Salvo, V., Baron, R., Gonzalez-Haro, C., Gormasz, C., Pigozzi, F., & Bachl, N. (2010).
Sprinting analysis of elite soccer players during European Champions League and UEFA
Cup matches. Journal of Sports Sciences, 28(14), 1489-1494.
Di Salvo, V., Baron, R., Tschan, H., Calderon-Montero, F. J., Bachl, N., & Pigozzi, F.
(2007). Performance characteristics according to playing position in elite soccer.
International Journal of Sports Medicine, 28(14), 222-227.
Di Salvo, V., Gregson, W., Atkinson, G., Tordoff, P., & Drust, B. (2009). Analysis of high
intensity activity in premier league soccer. International Journal of Sports Medicine, 30(3),
205-212.

185
Domene, M. (2013). Evaluation of movement and physiological demands of full-back and
center-back soccer players using global positioning systems. Journal of Human, Sports and
Exercise, 8(4), 1015-1028.
Drust, B., Atkinson, G., & Reilly, T. (2007). Future perspectives in evaluation of the
physiology demands of soccer. Journal of Sports Medicine, 37(9), 783-805.
Dwyer, D. B., & Gabbett, T. J. (2012). Global positioning system data analysis, velocity
ranges, and a new definition of sprinting for field sport athletes. Journal of Strength and
Conditioning Research, 26(3), 818-824.
Edgar, S., & O’Donoghue, P. (2005). Season of birth distribution of elite tennis players.
Journal of Sports Sciences, 23(10) 1013-1020.
Epstein, L., Valoski, A. M. Kalarchian, M. A., & McCurley, J. (1995). Do children lose and
maintain weight easier than adults: A comparison of child and parent weight changes from
six months to ten years. Obesity Research, 3(5), 411-417.
Faude, O., Koch, T. & Meyer T. (2012). Straight sprinting is the most frequent action in goal
situations in professional football. Journal of Sport Sciences, 30(7), 625-631.
Figueiredo, A. J., Goncalves, C. E., Coelho, M. J., & Malina, R. M. (2009). Characteristics of
youth soccer players who drop out, persist or move up. Journal of Sport Sciences 27(9), 883-
891.
Figueiredo, A. J., Silva, M. J. C., Cumming, S. P., & Malina, R. M. (2010). Size and maturity
mismatch in youth soccer players 11- to 14-years-old. Pediatric Exercise Science, 22(4), 596-
612.
Ford, P. R., Ward, P., Hodges, N. J., & Williams, M. (2009). The role of deliberate practice
and play in career progression in sport: the early engagement hypothesis. High Ability
Studies, 20(1), 65-75.

186
Ford, P. R., & Williams, M. A. (2012). The developmental activities engaged in by elite
youth soccer players who progressed to professional status compared to those who did not.
Psychology of Sport and Exercise, 13, 349-352.
Gabbett, T. J. (2015). The use of relative speed zones increases the high-speed running
performed in team sport match-play. Journal of Strength and Conditioning Research, 29(12),
3353-3359.
Gabbett, T. J. (2016). The training-injury prevention paradox: should athletes be training
smarter and harder? British Journal of Sports Medicine, 50(5), 273-280.
Gabbett, T. J., Kennelly, S., Sheehaan, J., Hawkins, R., Milsom, J., King, E. Whitely, R., &
Ekstrand, J. (2016). If overuse injury is a ‘training load error’, should undertraining be
viewed the same way? British Journal of Sport Medicine,50(17), 1017-1018.
Gomez-Piriz, P. T., Jimenez-Reyes, P., & Ruiz-Ruiz, C. (2011). Relation between total body
load and session RPE in professional soccer players. Journal of Strength & Conditioning
Research, 25(8), 2100-2103.
Greig, M., & Siegler, J. C. (2009). Soccer-specific fatigue and eccentric hamstrings muscle
strength. Journal of Athletic Training, 44(2), 180-184.
Guadino, P., Alberti, G., & Iaia, M. F. (2014). Estimated metabolic and mechanical demands
during different small-sided games in elite soccer players. Human Movement Science, 36,
123-133.
Guadino, P., Iala, F. M., Alberti, G., Strudwick, A. J., Atkinson, G., & Gregson, W. (2010).
Monitoring training in elite soccer players: Systematic bias between running speed and
metabolic power data. International Journal of Sports Medicine, 34(11), 1-6.
Halouani, J., Chtourou, H., Gabbett, T., Chaouachi, A., & Chamari, K. (2014). Small-sided
games in team sports training: a brief review. Journal of Strength & Conditioning Research,
28(12), 3594-3618.

187
Harmer, A. R., McKenna, M. J., Sutton, J. R. & Snow, R. J. (2000). Skeletal muscle
metabolic and ionic adaptations during intense exercise following sprint training in humans.
Journal of Applied Physiology, 89(5), 1793-1803.
Helsen, W. F., van Winckel, J., & Williams, M.A. (2005). The relative age effect in youth
soccer across Europe. Journal of Sports Sciences, 23(6), 629-636.
Hill-Haas, S. V., Coutts, A. J., Dawson B. T. & Rowsell, G. J. (2010). Time-motion
characteristics and physiological responses of small-sided games in elite youth players: The
influence of player number and rule changes. Journal of Strength & Conditioning Research,
24(8), 2149-2156.
Hill-Haas, S. V., Coutts, A., Rowsell, G., & Dawson, B. (2008). Variability of acute
physiology responses and performance profiles of youth soccer players in small-sided games.
Journal of Science and Medicine in Sport, 11(5), 487-490.
Hill-Haas, S. V., Coutts, A. J., Rowsell, G. J., & Dawson, B. T. (2009). Generic versus small-
sided game training in soccer. International Journal of Sports Medicine, 30(9), 636-642.
Hill-Haas, S. V., Dawson, B., Impellizzeri, F. M., & Coutts, A. J. (2011). Physiology of
small-sided games training in football: A systematic review. Journal of Sports Medicine,
41(3), 199-220.
Hirose, N. (2009). Relationships among birth-month distribution, skeletal age and
anthropometric characteristics in adolescent elite soccer players. Journal of Sports Sciences,
27(11), 1159-1166.
Hodgson, C., Akenhead, R., & Thomas, K. (2014). Time-motion analysis of acceleration
demands of 4v4 small-sided soccer games player on different pitch sizes. Journal of Human
Movement Science, 33, 25-32.
Howatson, G., & Milak, A. (2009). Exercise-induced muscle damage following a bout of
sport specific repeated sprints. Journal of Strength & Conditioning Research, 23(8), 2419-
2424.

188
Hulin, B. T., Gabbett, T. J., Blanch, P., Chapman, P., Bailey, D., & Orchard, J. W. (2014).
Spikes in acute workload are associated with increased injury risk in elite cricket fast bowlers
British Journal of Sports Medicine, 48, 708-712.
Hulin, B. T., Gabbett, T. J., Lawson, D. W., Caputi, P., & Sampson, J. A. (2015). The acute:
chronic workload ratio predicts injury: High chronic workload may decrease injury risk in
elite rugby league players. British Journal of Sports Medicine, 0, 1-7.
Hunter, F., Bray, J., Towlson, C., Smith, M., Barrett, S., Madden, J., Abt, G., & Lovell, R.
(2015). Individualisation of time-motion analysis: a method comparison and case report
series. International Journal of Sports Medicine, 36(1), 41-48.
Impellizzeri, F. M., Rampinini, E., Coutts, A. J., Sassi, A., & Marcora, S. M. (2004). Use of
RPE based training load in soccer. Medicine and Science in Sport and Exercise, 36(6), 1042-
1047.
Impellizzeri, F. M., Rampinini, E., & Marcora, S. M. (2005). Physiological assessment of
aerobic training in soccer. Journal of Sports Sciences, 23(6), 583-592.
Ingebrigtsen, J., Dalen, T., Hjelde, G. H., Drust, B., & Wisloff, U. (2015). Acceleration and
sprint profiles of a professional football team in match play. European Journal of Sport
Science, 15(2), 101-110.
Jennings, D., Cormack, S., Coutts, A. J., Boyd, L., & Aughey, R. J. (2010). The validity and
reliability of GPS units for measuring distance in team sport specific running patterns.
International Journal of Sports Physiology and Performance, 5(3), 328-341.
Kelly, D. M., & Drust, B. (2009). The effect of pitch dimensions on heart rate responses and
technical demands of small-sided soccer games in elite players. Journal of Science and
Medicine Sport, 12(4), 475-479.

189
Khamis, H. J., & Roche, A. F. (1994). Predicting adult height without using skeletal age: The
Khamis-Roche method. Pediatrics, 94(4), 504-507.
Koklu, Y., Ersoz, G., Alemdaroglu, U., Asci, A., & Ozkan, A. (2012). Characteristics of a 4-
a-side small-sided game in young soccer players: the influence of different team formation
methods. Journal of Strength & Conditioning Research, 26(11), 3118-3123.
Krustrup, P., Mohr, M., Nybo, L., Majgaard, J., Jung, N., Bangsbo, J. (2006). The YoYo IR2
test: Physiological response, reliability, and application to elite soccer. Medicine & Science in
Sports & Exercise, 38(9), 1666-1673.
Lacome, M., Piscione, J., Hager, J. P., & Bourdin, M. (2014) A new approach to quantifying
physical demands in rugby union. Journal of Sports Science, 32(3), 290-300.
Lakens, D. (2013). Calculating and reporting effect sizes to facilitate cumulative science: a
practical primer for t-tests and ANOVAs. Frontiers in Psychology, 4, 1-12.
Leger, L., & Boucher, R. (1980). An indirect continuous running multistage field test: The
university of montreal track test. Canadian Journal of Applied Sport Science, 5(2), 77-84.
Levine, T. R., & Hullett, C. R. (2002). Eta squared, partial eta squared, and misreporting of
effect size in communication research. Human Communication Research, 28(4), 612-625.
Little, T., & Williams, A. G. (2005). Specificity of acceleration, maximum speed, and agility
in professional soccer players. Journal of Strength & Conditioning Research, 19(1), 76-78.
Lockie, R. G., Murphy, A. J., Knight, T. J., & De Jonge, X. A. K. (2011). Factors that
differentiate acceleration ability in field sport athletes. Journal of Strength & Conditioning
Research, 25(10), 2704-2714.
Lovell, R., & Abt, G. (2013) Individualization of time-motion analysis: a case-cohort
example. International Journal of Sports Physiology and Performance, 8(4), 456-458.
190
Malina, R. M., Dompier, T. P., Powell, J. W., Barron, M. J., & Moore, M. T. (2007a).
Validation of a noninvasive maturity estimate relative to skeletal age in youth football
players. Clinical Journal of Sports Medicine, 17(5), 362-368.
Malina, R. M., Eisenmann, J. C., Cumming, S. P., Ribeiro, B., & Aroso, J. (2004). Maturity-
associated variation in the growth and functional capacities of youth football (soccer) players
13-15 years. European Journal of Applied Physiology, 91(5), 555-562.
Malina, R. M., Ribeiro, B., Aroso, J., & Cumming, S. P. (2007b). Characteristics of youth
soccer players aged 13-15 years classified by skill level. British Journal of Sports Medicine,
41(5), 290-295.
Malina, R. M., Rogol, A. D., Cumming, S. P., Silva, M. J. C., & Figueiredo, A. J. (2015).
Biological maturation of youth athletes: assessment and implications. British Journal of
Sports Medicine, 49(13), 852-859.
Malina, R. M., Silva, M. J. C., Figueiredo, A. J., Carling, C., & Beunen, G. P. (2012).
Interrelationships among invasive and non-invasive indicators of biological maturation in
adolescent male soccer players. Journal of Sports Sciences, 30(15), 1705-1717.
Malone, J. J., Lovell, R., Varley, M. C., & Coutts, A. J. (2017). Unpacking the black box:
Applications and considerations for using GPS devices in sport. International Journal of
Sports Physiology & Performance, 12(2), 18-26.
Malone, S., Roe, M., Doran, D. A., Gabbett, T. J., & Collins, K. (2017). High chronic
training loads and exposure to bouts of maximal velocity running reduce injury risk in elite
Gaelic football. Journal of Science and Medicine in Sport, 20, 250-254.
Meckel, Y., Doron, O., Eliakim, E., & Eliakim, A. (2018). Seasonal variations in physical
fitness and performance indices of elite soccer players. Sports, 6(14), 1-10.
Mendez-Villanueva, A., Buchheit, M., Simpson, B., & Bourdon, P. C. (2013). Match play
intensity distribution in youth soccer. International Journal of Sports Medicine, 34(2), 101-
110.

191
Meylan, C., Cronin, J., Oliver, J., & Hughes, M. (2010). Talent identification in soccer: the
role of maturity status on physical, physiological and technical characteristics. International
Journal of Sports Science & Coaching, 5(4), 571-592.
Mohr, M., Krustrup, P., & Bangsbo, J. (2003). Match performance of high standard soccer
players with special reference to development of fatigue. Journal of Sport Sciences, 21(7),
519-528.
Molinos, A. (2013). Evaluation of movement and physiological demands of full-back and
center-back soccer players using global positioning systems. Journal of Human Sport and
Exercise, 8(4), 1015-1028.
Mujika, I., Vaeyens, R., Matthys, S. P. J., Santisteban, J., Goiriena, J., & Philippaerts, R.
(2009a). The relative age effect in a professional football club setting. Journal of Sports
Sciences, 27(11), 1153-1158.
Mujika, I., Spencer, M., Santisteban, J., Goiriena, J., & Bishop, D. (2009b). Age-related
differences in repeated-sprint ability in highly trained youth football players. Journal of
Sports Sciences, 27(14), 1581-1590.
Murray, N. B., Gabbett, T. J., Townshend, A. D., & Blanch, P. (2017). Calculating
acute:chronic workload ratios using exponentially weighted moving averages provides a
more sensitive indicator of injury likelihood than rolling averages. British Journal of Sports
Medicine, 51, 749-754.
Musch, J., & Hay, R. (1999). The relative age effect in soccer: Cross-cultural evidence for a
systematic distribution against children born late in the competition year. Sociology of Sport
Journal, 16(1), 54-64.
Newell, K. M. (1986). Constraints on the development of coordination, in M. G. Wade & H.
T. A. Whiting (Eds.), Motor Development in Children. Aspects of Coordination and Control.
Dordrecht, Netherlands: Martinus Nijhoff.

192
O’Donoghue, P., Rudkin, S., Bloomfield, J., Powell, S., Cairns, G., Dunkerly, A., Davey, P.,
Probert, G., & Bowater, J. (2005). Repeated work activity in English FA Premier League
soccer. International Journal of Performance Analysis in Sport, 5, 46-57.
Osgnach, C., Power, S., Bernardini, R., Rinaldo, R., & Prampero, P. (2010). Energy cost and
metabolic power in elite soccer: a new match analysis approach. Medicine and Science in
Sport and Exercise, 42(1), 170-178.
Owen, A. L., Dunlop, G., Rouissi, M., Haddad, M., Mendes, B., & Chamari, K. (2016).
Analysis of positional training loads (ratings of perceived exertion) during various-sided
games in European professional soccer players. International Journal of Sport Science &
Coaching, 11(3), 374-381.
Owen, A. L., Twist, C., & Ford, P. R. (2004). Small-sided games: the physiological and
technical effect of altering pitch size and player numbers. OR Insight, 7(2), 50-53.
Owen, A. L., Wong, D. P., McKenna, M., & Dellal, A. (2011). Heart rate responses and
technical comparison between small and large sided games in elite professional soccer.
Journal of Strength & Conditioning Research, 25(8), 2104-2110.
Owen, A. L., Wong, D. P., Paul, D., & Dellal, D. (2014). Physical and technical comparisons
between various-sided games within professional soccer. International Journal of Sports
Medicine, 35(4), 286-292.
Piggott, B., Newton, M., & McGuian, M. (2009). The relationship between training load and
incidence of injury and illness over a pre season at an Australian Football League club.
Journal of Australian Strength and Conditioning, 17, 4–17.
Rampinini, E., Impellizzeri, F. M., Castagna, C., Abt, G., Chamari, K., Sassi, A., & Marcora,
S. M. (2007). Factors influencing physiological responses to small sided soccer games.
Journal of Sports Science, 25(6), 659-666.

193
Rampinini, E., Impellizzeri, F. M., Castagna, C.M., Coutts, A.J. & Wisloff, U. (2009).
Technical performance during soccer matches of the Italian Serie A league: Effect of fatigue
and competitive level. Journal of Science and Medicine in Sport, 12(1), 227-233.
Rawstorn, J. C., Maddison, R., Ali, A., Foskett, A., & Gant, N. (2014). Rapid directional
change degrades GPS distance measurement validity during intermittent intensity running.
PLoS ONE, 9(4), 1-6.
Reardon, C., Tobin, D. P., & Delahunt, E. (2015). Application of individualized speed
thresholds to interpret position specific running demands in elite professional rugby union: a
GPS study. PLoS ONE, 10(7), 1-12.
Renshaw, I., Chow, J. I., Davids, K. & Hammond, J. (2010). A constraints-led perspective to
understanding skill acquisition and game play: A basis for integration of motor learning
theory and physical education praxis? Physical Education & Sport Pedagogy, 15(2), 117-
137.
Rodas, G., Ventura, J. L. Cadefau, J. A., Cusso, R. & Parra, J. (2000). A short training
programme for the rapid improvement of both aerobic and anaerobic metabolism. Journal of
Applied Physiology, 82(5), 480-486.
Russell, M., Rees, G., & Kingsley, M. I. C. (2013). Technical demands of soccer match play
in the English Championship. Journal of Strength & Conditioning Research, 27(10), 2869-
2873.
Scott, B. R., Lockie, R. G., Knight, T. J., Clark, A. C., & Xanna, A. K. (2013). A comparison
of methods to quantify in the in-season training load of professional soccer players.
International Journal of Sports Physiology and Performance, 8(2), 196-202.
Scott, M. T. U., Scott T. J., & Kelly, V. G. (2015). The validity and reliability of global
positioning systems in team sport: a brief review. Journal of Strength & Conditioning
Research, 30(5), 1470-1490.

194
Simmons, C., & Paull, G. C. (2001). Season-of-births bias in association football. Journal of
Sports Sciences, 19(9), 677-686.
Sonderegger, K., Tschopp, M., & Taube, W. (2016). The challenge of evaluating the intensity
of short actions in soccer: A new methodological approach using percentage acceleration.
PLoS ONE, 11(11), 1-10.
Spencer, M., Bishop, D., Dawson, B., & Goodman, C. (2005). Physiological and metabolic
responses of repeated-sprint activities: Specific to field-based team sports. Sports Medicine,
35(12), 1025-1044.
Spencer, M., Pyne, D., Santisteban, J., & Mujika, I. (2011). Fitness determinants of repeated-
sprint ability in highly trained youth football players. International Journal of Sports
Physiology and Performance, 6, 497-508.
Sullivan, G. M., & Feinn, R. (2012). Using effect size – or why the p value is not enough.
Journal of Graduate Medical Education, 4(3), 279-282.
Terje, D., Ingebrigtsen, J., Ettema, G., Hjelde, G. H., & Wisloff, U. (2016). Player load,
acceleration, and deceleration during 45 competitive matches of elite soccer. Journal of
Strength & Conditioning Research, 30(2), 351-359.
Thalheimer, W., & Cook, S. (2002, August). How to calculate effect sizes from published
research articles: A simplified methodology. Retrieved June 15, 2017 from http://work-
learning.com/effect_sizes.htm.
Till, K., Cobley, S., Wattie, N., O’Hara, J., Cooke, C., & Chapman, C. (2010). The
prevalence, influential factors and mechanisms of relative age effects in UK rugby league.
Scandinavian Journal of Medicine & Science in Sports, 20(2), 320-329.
Tonnessen, E., Shalfawi, S., Haugen, T., & Enoksen, E. (2011). The effect of 40-m repeated
sprint training on maximum sprinting speed, repeated sprint speed endurance, vertical jump,
and aerobic capacity in young elite male soccer players. Journal of Strength & Conditioning
Research, 25(9), 2364-2370.

195
Varley, M. C., & Aughey, R. J. (2013). Acceleration profiles in elite Australian soccer.
International Journal of Sports Medicine, 34(1), 34-39.
Varley, M. C., Fairweather, I. H., & Aughey, R. J. (2012). Validity and reliability of GPS for
measuring instantaneous velocity during acceleration, deceleration, and constant motion.
Journal of Sport Science, 30(2), 121-127.
Verheijen, R. (2014). The original guide to football periodization (Part 1). Amsterdam,
Netherlands: The World Football Academy.
Wasserstein, R. L., & Lazar, N. A. (2016). The ASA’s statement on p-values: Context,
process and purpose. The American Statistician, 70(2), 129-133.
Wilkinson, L. (1999). Statistical methods in psychology journals: Guidelines and
explanations. American Psychologist, 54(8), 594-604.
Williams, S., West, S., Cross, M. J., & Stokes, K. A. (2017). Better way to determine the
acute:chronic workload ratio? British Journal of Sports Medicine, 51(3), 209-210.
Wilson, B. (2015). Premier League uses data to nurture English football talent. BBC News,
27 March 2015. Available at http://www.bbc.co.uk/news/business-32064842
Winchester, J. B., Nelson, A. G., Landin, D., Young, M. A., & Schexnayder, I. C. (2008).
Static stretching impairs sprint performance in collegiate track field athletes. Journal of
Strength and Conditioning Research, 22(1), 13-19.

196
11.0 Appendices

197
11.1 Participant Information Sheet and Consent Form – Study One
Participant Information Sheet Date:
Study Leader: Will Abbott
Telephone: 07944103012
Email: [email protected]
Study Title: - An individual approach to monitoring locomotive training load in English
Premier League academy soccer players
You are requested to read this form carefully. If you are willing to participate in the study,
please sign the consent form. If you have any queries, or are unsure or uncertain about
anything, then you should not sign until your problem has been resolved and you are
completely happy to volunteer.
U23 male professional soccer athletes are required for an investigation of the efficacy of GPS
training load monitoring methods in quantifying high-speed locomotion within soccer
training and competition. As a volunteer you should be free from any injury or illness that
might interfere with the study. By taking part in this study, your performance shall in no way
be affected, only observed and analysed.
The aim of this study is to determine the discrepancies between high-speed distances
produced using two analysis methods; global or individual. You will complete your regular
pre-season training sessions and matches, with your GPS data being collected as normal, and
analysed using the two analysis methods. The high-speed distances produced by each method
will be analysed to determine the efficacy of global and individual speed thresholds in
quantifying high-speed locomotion for individual athletes.
A qualified first-aider will be in attendance during the training sessions and matches. You
may at any time withdraw from participating in the study. You do not have to give any

198
reason, and no one can attempt to dissuade you. If you ever require any further explanation,
please do not hesitate to ask.
Any information obtained during this study will remain confidential as to your identity,
although we will have access to the data for the study write-up. If data can be specifically
identified with you, your permission will be sought in writing before it is published. Other
material, which cannot be identified with you, may be published or presented at meetings
with the aim of benefiting others. All information will be stored in accordance with the
conditions required of the Data Protection Act 1998 and subsequent statutory instruments.
This study has received ethical and scientific approval to be undertaken, in accordance with
current University regulations.

199
Consent Form
Study Leader: Will Abbott
Telephone: 07944103012
Email: [email protected]
Study Title: - An individual approach to monitoring locomotive training load in English
Premier League academy soccer players
Please initial each box if content
1. I confirm that I have read and understood the attached information sheet. I
confirm that I have had the opportunity to consider the information, ask
questions and that these have been answered satisfactorily.
2. I confirm that I am well and free from injury and am capable of undertaking
the activities described in the information sheet
3. I understand that my participation is voluntary and that I am free to
withdraw at any time without giving any reason without my legal rights being
affected.
4. I allow for my training and match GPS data to be used in this study.

200
Name of Participant: Date: Signature:
Name of Parent (if U18) Date: Signature:
Name of Person taking Date: Signature:
Consent:

201
11.2 Participant Information Sheet and Consent Form – Study Two
Participant Information Sheet Date:
Study Leader: Will Abbott
Telephone: 07944103012
Email: [email protected]
Study Title: - Individualising acceleration in English Premier League academy soccer
players
You are requested to read this form carefully. If you are willing to participate in the study,
please sign the consent form. If you have any queries, or are unsure or uncertain about
anything, then you should not sign until your problem has been resolved and you are
completely happy to volunteer.
U23 male professional soccer athletes are required for investigation into the efficacy of GPS
training load monitoring methods in quantifying acceleration within soccer training and
competition. As a volunteer you should be free from any injury or illness that might interfere
with the study. By taking part in this study, your performance shall in no way be affected,
only observed and analysed.
The aim of this study is to determine the discrepancies between acceleration distances of
varying intensity produced using global or individual analysis methods. You will complete
your regular pre-season training sessions and matches, with your GPS data being collected as
normal, and analysed using two different analysis methods. The acceleration distances
produced by each method will be analysed to determine the efficacy of global and individual
thresholds in quantifying accelerations of varying intensities.
A qualified first-aider will be in attendance during the training sessions and matches. You
may at any time withdraw from participating in the study. You do not have to give any

202
reason, and no one can attempt to dissuade you. If you ever require any further explanation,
please do not hesitate to ask.
Any information obtained during this study will remain confidential as to your identity,
although we will have access to the data for the study write-up. If data can be specifically
identified with you, your permission will be sought in writing before it is published. Other
material, which cannot be identified with you, may be published or presented at meetings
with the aim of benefiting others. All information will be stored in accordance with the
conditions required of the Data Protection Act 1998 and subsequent statutory instruments.
This study has received ethical and scientific approval to be undertaken, in accordance with
current University regulations.

203
Consent Form
Study Leader: Will Abbott
Telephone: 07944103012
Email: [email protected]
Study Title: - Individualising acceleration in English Premier League academy soccer
players
Please initial each box if content
1. I confirm that I have read and understood the attached information sheet. I
confirm that I have had the opportunity to consider the information, ask
questions and that these have been answered satisfactorily.
2. I confirm that I am well and free from injury and am capable of
undertaking the activities described in the information sheet
3. I understand that my participation is voluntary and that I am free to
withdraw at any time without giving any reason without my legal rights being
affected.
4. I allow for my training and match GPS data to be used in this study.

204
Name of Participant: Date: Signature:
Name of Parent (if U18) Date: Signature:
Name of Person taking Date: Signature:
Consent:

205
11.3 Participant Information Sheet and Consent Form – Study Three
Participant Information Sheet Date:
Study Leader: Will Abbott
Telephone: 07944103012
Email: [email protected]
Study Title: - Physical demands of playing position within English Premier League academy
soccer
You are requested to read this form carefully. If you are willing to participate in the study,
please sign the consent form. If you have any queries, or are unsure or uncertain about
anything, then you should not sign until your problem has been resolved and you are
completely happy to volunteer.
U23 male professional soccer athletes are required for an investigation into the physical
demands placed upon soccer playing positions during competition. As a volunteer you should
be free from any injury or illness that might interfere with the study. By taking part in this
study, your performance shall in no way be affected, only observed and analysed.
The aim of this study is to determine the physical demands placed upon playing positions
during English Premier League academy soccer competition. You will complete your regular
competitive matches, with your GPS and RPE data being collected as normal. GPS metrics
produced during competition will be collected and analysed relative to other soccer playing
positions. This will determine the specific physical demands placed upon each playing
position, helping to identify specific training modalities for each individual.
A qualified first-aider will be in attendance during the training sessions and matches. You
may at any time withdraw from participating in the study. You do not have to give any
reason, and no one can attempt to dissuade you. If you ever require any further explanation,
please do not hesitate to ask.

206
Any information obtained during this study will remain confidential as to your identity,
although we will have access to the data for the study write-up. If data can be specifically
identified with you, your permission will be sought in writing before it is published. Other
material, which cannot be identified with you, may be published or presented at meetings
with the aim of benefiting others. All information will be stored in accordance with the
conditions required of the Data Protection Act 1998 and subsequent statutory instruments.
This study has received ethical and scientific approval to be undertaken, in accordance with
current University regulations.

207
Consent Form
Study Leader: Will Abbott
Telephone: 07944103012
Email: [email protected]
Study Title: - Physical demands of playing position within English Premier League academy soccer Please initial each box if content
1. I confirm that I have read and understood the attached information sheet. I
confirm that I have had the opportunity to consider the information, ask
questions and that these have been answered satisfactorily.
2. I confirm that I am well and free from injury and am capable of
undertaking the activities described in the information sheet.
3. I understand that my participation is voluntary and that I am free to
withdraw at any time without giving any reason without my legal rights being
affected.
4. I allow for my match GPS data to be used in this study.

208
Name of Participant: Date: Signature:
Name of Parent (if U18) Date: Signature:
Name of Person taking Date: Signature:
Consent:

209
11.4 Participant Information Sheet and Consent Form – Study Four
Participant Information Sheet Date:
Study Leader: Will Abbott
Telephone: 07944103012
Email: [email protected]
Study Title: - Positional differences in GPS outputs and perceived exertion during soccer
training games and competition
You are requested to read this form carefully. If you are willing to participate in the study,
please sign the consent form. If you have any queries, or are unsure or uncertain about
anything, then you should not sign until your problem has been resolved and you are
completely happy to volunteer.
U23 male professional soccer athletes are required for investigation into the effect of
different sized training games upon average and peak physical demands elicited upon soccer
playing positions. As a volunteer you should be free from any injury or illness that might
interfere with the study. By taking part in this study, your performance shall in no way be
affected, only observed and analysed.
The aim of this study is to determine the physical effect of different sized training games
upon the average and peak demands elicited upon soccer athletes relative to their positional
competitive demands. You will complete your regular training sessions and matches, with
your GPS and RPE data being collected as normal. GPS metrics produced during small,
medium, and large sized training games will be collected and analysed relative to competition
data. This will determine the effect of different training game formats in replicating the
average and peak demands of competition for soccer playing positions.
A qualified first-aider will be in attendance during the training sessions and matches. You
may at any time withdraw from participating in the study. You do not have to give any

210
reason, and no one can attempt to dissuade you. If you ever require any further explanation,
please do not hesitate to ask.
Any information obtained during this study will remain confidential as to your identity,
although we will have access to the data for the study write-up. If data can be specifically
identified with you, your permission will be sought in writing before it is published. Other
material, which cannot be identified with you, may be published or presented at meetings
with the aim of benefiting others. All information will be stored in accordance with the
conditions required of the Data Protection Act 1998 and subsequent statutory instruments.
This study has received ethical and scientific approval to be undertaken, in accordance with
current University regulations.

211
Consent Form
Study Leader: Will Abbott
Telephone: 07944103012
Email: [email protected]
Study Title: - Positional differences in GPS outputs and perceived exertion during soccer
training games and competition
Please initial each box if content
1. I confirm that I have read and understood the attached information sheet. I
confirm that I have had the opportunity to consider the information, ask
questions and that these have been answered satisfactorily.
2. I confirm that I am well and free from injury and am capable of
undertaking the activities described in the information sheet.
3. I understand that my participation is voluntary and that I am free to
withdraw at any time without giving any reason without my legal rights being
affected.
4. I allow for my training and match GPS data to be used in this study.

212
Name of Participant: Date: Signature:
Name of Parent (if U18) Date: Signature:
Name of Person taking Date: Signature:
Consent:

213
11.5 Participant Information Sheet and Consent Form – Study Five
Participant Information Sheet Date:
Study Leader: Will Abbott
Telephone: 07944103012
Email: [email protected]
Study Title: - The effect of bio-banding upon physical and technical performance during
soccer competition
You are requested to read this form carefully. If you are willing to participate in the study,
please sign the consent form. If you have any queries, or are unsure or uncertain about
anything, then you should not sign until your problem has been resolved and you are
completely happy to volunteer.
U16-U12 male soccer athletes, between 85 – 90% of predicted adult stature, are required for
an investigation the physical and technical effects of bio-banded competition. As a volunteer
you should be free from any injury or illness that might interfere with the study. By taking
part in this study, your performance shall in no way be affected, only observed and analysed.
The aim of this study is to determine the physical and technical effects of bio-banding soccer
competition relative to normal chronologically aged competition. You will take part in one
bio-banded match, where you will be matched with other athletes dependent upon your
maturation status. You will also take part in your regular competitive matches, with your
GPS and RPE data being collected as normal. Physical and technical metrics collected during
bio-banded and chronological competition will be analysed to determine the effect of bio-
banded competition upon physical and technical performance.
A qualified first-aider will be in attendance during the training sessions and matches. You
may at any time withdraw from participating in the study. You do not have to give any

214
reason, and no one can attempt to dissuade you. If you ever require any further explanation,
please do not hesitate to ask.
Any information obtained during this study will remain confidential as to your identity,
although we will have access to the data for the study write-up. If data can be specifically
identified with you, your permission will be sought in writing before it is published. Other
material, which cannot be identified with you, may be published or presented at meetings
with the aim of benefiting others. All information will be stored in accordance with the
conditions required of the Data Protection Act 1998 and subsequent statutory instruments.
This study has received ethical and scientific approval to be undertaken, in accordance with
current University regulations.

215
Consent Form
Study Leader: Will Abbott
Telephone: 07944103012
Email: [email protected]
Study Title: - The effect of bio-banding upon physical and technical performance during
soccer competition
Please initial each box if content
1. I confirm that I have read and understood the attached information sheet. I
confirm that I have had the opportunity to consider the information, ask
questions and that these have been answered satisfactorily.
2. I confirm that I am well and free from injury and am capable of
undertaking the activities described in the information sheet.
3. I understand that my participation is voluntary and that I am free to
withdraw at any time without giving any reason without my legal rights being
affected.
4. I allow for my physical and technical match data to be used in this study.

216
Name of Participant: Date: Signature:
Name of Parent (if U18) Date: Signature:
Name of Person taking Date: Signature:
Consent:

217
11.6 Appendix Six – Club Permission For Data Collection