Molecularly imprinted polymer-based solid-phase extraction combined with molecularly imprinted...
8
Journal of Chromatography A, 1198–1199 (2008) 59–66 Contents lists available at ScienceDirect Journal of Chromatography A journal homepage: www.elsevier.com/locate/chroma Molecularly imprinted polymer-based solid-phase microextraction fiber coupled with molecularly imprinted polymer-based sensor for ultratrace analysis of ascorbic acid Bhim Bali Prasad ∗ , Khushaboo Tiwari, Meenakshi Singh, Piyush Sindhu Sharma, Amit Kumar Patel, Shrinkhala Srivastava Analytical Division, Department of Chemistry, Faculty of Science, Banaras Hindu University, Varanasi 221005, India article info Article history: Received 31 March 2008 Received in revised form 19 May 2008 Accepted 22 May 2008 Available online 28 May 2008 Keywords: Molecularly imprinted solid-phase microextraction Molecularly imprinted polymer-sensor Ascorbic acid Differential pulse Cathodic stripping voltammetry Blood serum abstract Clinical manifestations owing to ascorbic acid deficiency demand an easy-to-use, rapid, robust and inex- pensive technique, which can measure serum ascorbic acid at ultratrace level to attend the problem of hypovitaminosis C and acute cases of scurvy. In the present work, a novel molecularly imprinted polymer (MIP)-coated solid-phase microextraction (SPME) fiber that could be coupled to a complementary MIP- sensor was prepared with ascorbic acid as a template molecule. The characteristics and applications of this fiber were investigated. The same MIP receptor for both SPME and the corresponding sensor was able to enhance the preconcentration of analyte substantially so as to attain the stringent level of sensitivity in highly diluted aqueous, blood serum and pharmaceutical samples. The extraction yield of ascorbic acid (AA) with the MIP-coated fiber was found to be quantitative (detection limit 0.0396 ng mL −1 , RSD = 2.3%, S/N = 3) in aqueous samples without any problem of non-specific false positive results and cross-reactivity. © 2008 Elsevier B.V. All rights reserved. 1. Introduction Our interest in l-ascorbic acid (AA) analysis is developed because of its major biological properties as anti-scorbutic vitamin and natural antioxidant. Low dietary AA intake has tremendous impact on drug metabolism and immune competence leading to the symptoms of scurvy. The diagnosis of scurvy is largely made on clinical grounds and may be supported by serum ascorbic acid level (SAAL) often, less than 11.4 mol L −1 [1]. The prevalence and risk factors owing to hypovitaminosis C consequent upon low SAAL cause clinical manifestations primarily of hemorrhagic syndrome, edema, stomatologic signs, arthritis, myalgia, anorexia, and depres- sion [2]. In an acute case of sudden infant death syndrome [3], hypovitaminosis C sometime turns to avitaminosis (zero SAAL). The SAAL deficiency is also observed in shaken baby syndrome [4]; and other diseases viz., hyperglycemia and atherosclerosis [5], where oral supplementation (1000 mg/day) is proved to be fast and effec- tive treatment. The larger dose of vitamin C may accelerate the ∗ Corresponding author. Tel.: +91 542 2307321x112. E-mail address: [email protected] (B.B. Prasad). lymphocyte blastomogenesis and can be linked with prognosis of cancer [6]. Numerous attempts have been reported for AA determination in different matrices and at different levels [7,8]. Sophisticated techniques like high performance liquid chromatography [9,10], biosensor [11], capillary electrophoresis [12,13], and solid-phase extraction [14] normally rendered inconclusive data without accounting for AA-oxidation during sample preparation and failed to detect AA as low as to diagnose hypovitaminosis C. Solid-phase microextraction (SPME), first introduced by Belardi and Pawaliszyn more than a decade ago [15], is a simultaneous sampling, precon- centration, matrix removal, and simple technique. Although SPME in combination with GC–MS has been used successfully for the determination of a wide variety of volatile and semi-volatile organic compounds, SPME with LC separation systems are limited owing to difficult methods for online coupling and subsequent operations [16]. Further, in view of costly commercial SPME fiber coatings (polydimethylsiloxane, polyacrylate, carbowax/divinyl benzene, polyimide, carbopack, polypyrrole) to be easily fouled in complex matrices, the applicability of head-space SPME is susceptible [17] especially for extraction of semi-volatile polar and alkaline organics from real samples [18]. The optical fibers (polymethyl methacrylic acid (PMMA) fibers used in illumination) are economically viable 0021-9673/$ – see front matter © 2008 Elsevier B.V. All rights reserved. doi:10.1016/j.chroma.2008.05.059
-
Upload
independent -
Category
Documents
-
view
0 -
download
0
Transcript of Molecularly imprinted polymer-based solid-phase extraction combined with molecularly imprinted...
Journal of Chromatography A, 1198–1199 (2008) 59–66
Contents lists available at ScienceDirect
Journal of Chromatography A
journa l homepage: www.e lsev ier .com/ locate /chroma
Molecularly imprinted polymer-based solid-phase microextraction
fiber coupled with molecularly imprinted polymer-based sensorfor ultratrace analysis of ascorbic acidBhim Bali Prasad ∗, Khushaboo Tiwari, Meenakshi Singh, Piyush Sindhu Sharma,Amit Kumar Patel, Shrinkhala Srivastava
sity, V
ing tcan mte ca
microasco
d. Thetratiobloodfibers wit
Analytical Division, Department of Chemistry, Faculty of Science, Banaras Hindu Univer
a r t i c l e i n f o
Article history:Received 31 March 2008Received in revised form 19 May 2008Accepted 22 May 2008Available online 28 May 2008
Keywords:Molecularly imprinted solid-phasemicroextractionMolecularly imprinted polymer-sensorAscorbic acidDifferential pulseCathodic stripping voltammetryBlood serum
a b s t r a c t
Clinical manifestations owpensive technique, whichhypovitaminosis C and acu(MIP)-coated solid-phasesensor was prepared withthis fiber were investigateto enhance the preconcenin highly diluted aqueous,(AA) with the MIP-coatedS/N = 3) in aqueous sample
1. Introduction
Our interest in l-ascorbic acid (AA) analysis is developedbecause of its major biological properties as anti-scorbutic vitaminand natural antioxidant. Low dietary AA intake has tremendousimpact on drug metabolism and immune competence leading tothe symptoms of scurvy. The diagnosis of scurvy is largely madeon clinical grounds and may be supported by serum ascorbic acidlevel (SAAL) often, less than 11.4 �mol L−1 [1]. The prevalence andrisk factors owing to hypovitaminosis C consequent upon low SAALcause clinical manifestations primarily of hemorrhagic syndrome,edema, stomatologic signs, arthritis, myalgia, anorexia, and depres-sion [2]. In an acute case of sudden infant death syndrome [3],hypovitaminosis C sometime turns to avitaminosis (zero SAAL). TheSAAL deficiency is also observed in shaken baby syndrome [4]; andother diseases viz., hyperglycemia and atherosclerosis [5], whereoral supplementation (1000 mg/day) is proved to be fast and effec-tive treatment. The larger dose of vitamin C may accelerate the
∗ Corresponding author. Tel.: +91 542 2307321x112.E-mail address: [email protected] (B.B. Prasad).
0021-9673/$ – see front matter © 2008 Elsevier B.V. All rights reserved.doi:10.1016/j.chroma.2008.05.059
aranasi 221005, India
o ascorbic acid deficiency demand an easy-to-use, rapid, robust and inex-easure serum ascorbic acid at ultratrace level to attend the problem of
ses of scurvy. In the present work, a novel molecularly imprinted polymerextraction (SPME) fiber that could be coupled to a complementary MIP-rbic acid as a template molecule. The characteristics and applications ofsame MIP receptor for both SPME and the corresponding sensor was able
n of analyte substantially so as to attain the stringent level of sensitivityserum and pharmaceutical samples. The extraction yield of ascorbic acid
was found to be quantitative (detection limit 0.0396 ng mL−1, RSD = 2.3%,hout any problem of non-specific false positive results and cross-reactivity.
© 2008 Elsevier B.V. All rights reserved.
lymphocyte blastomogenesis and can be linked with prognosis ofcancer [6].
Numerous attempts have been reported for AA determinationin different matrices and at different levels [7,8]. Sophisticatedtechniques like high performance liquid chromatography [9,10],biosensor [11], capillary electrophoresis [12,13], and solid-phaseextraction [14] normally rendered inconclusive data withoutaccounting for AA-oxidation during sample preparation and failedto detect AA as low as to diagnose hypovitaminosis C. Solid-phasemicroextraction (SPME), first introduced by Belardi and Pawaliszynmore than a decade ago [15], is a simultaneous sampling, precon-centration, matrix removal, and simple technique. Although SPMEin combination with GC–MS has been used successfully for thedetermination of a wide variety of volatile and semi-volatile organiccompounds, SPME with LC separation systems are limited owing todifficult methods for online coupling and subsequent operations[16]. Further, in view of costly commercial SPME fiber coatings(polydimethylsiloxane, polyacrylate, carbowax/divinyl benzene,polyimide, carbopack, polypyrrole) to be easily fouled in complexmatrices, the applicability of head-space SPME is susceptible [17]especially for extraction of semi-volatile polar and alkaline organicsfrom real samples [18]. The optical fibers (polymethyl methacrylicacid (PMMA) fibers used in illumination) are economically viable
togr.
60 B.B. Prasad et al. / J. Chromaand chemically resistant. Therefore, in the present investigation,PMMA fibers are most suitable for direct-immersion SPME for AAanalysis complying the concept that only freely dissolved com-pound (not total amount as in solvent extraction technique) isavailable for partitioning to the SPME fiber, where the equilib-rium between the fraction of compound bound to a matrix andthe fraction dissolved in an aqueous environment is not perturbed[19].
Despite the emerging trend of molecularly imprinted polymer(MIP) technology, the applications of MIP as SPME fiber coatingsfor selective and sensitive analysis are surprisingly very scarce[19–24]. Insofar as the combination of simplicity and flexibilityof SPME with selectivity of MIP is concerned, the AA analysiswas only feasible by applying GC, GC–MS, and HPLC detections;there is no such work, hitherto, reported using MIP-based SPMEfollowed by electrochemical detection. This is because of the prac-tical limitations of immobilization of tailor-made preparation ontofiber. Imprinted fibers, so far, are known to be prepared either bysilylation of silica fibers following MIP coating [21] or direct syn-thesis of MIP fibers (monoliths) using silica capillaries as molds,with silica being etched away after polymerization [24]. However,both types of fibers are fragile lacking porosity and thereby pooraccessibility of target analyte to binding sites. Therefore, stabilityand low capacity of such fibers need major improvements. In thepresent investigation, the stability problem because of the non-adherence of MIP molecules directly over fiber surface could beresolved simply by imbibing the sol–gel adhesion in between MIPfilm layer and fiber surface via strong chemical bondings resultingin organic–inorganic–organic interpenetrating network (IPN) [25].Such hybrid networks are expected to impart a high level of porosityand enhanced surface area of SPME fiber. Nevertheless, only usingSPME for the detection of AA at ultratrace level is still problematicin highly diluted samples. In such circumstances, there requires oneand more preconcentration steps to overcome insufficient sensitiv-ity of methodology employed. The present work deals, for the firsttime, with the ultratrace level analysis of AA using a combinationapproach of molecularly imprinted SPME and complementary MIP-sensor. The artificial receptor, poly(melamine-co-chloranil), firstsynthesized in our laboratory, is versatile and innovative to exertimprinting effect in the present study, playing in double role asmolecularly imprinted SPME material for AA preconcentration andas recognition receptor in the subsequent voltammetric sensing[26,27].
2. Experimental
2.1. Chemicals and reagents
Optical fibers (PMMA fibers) were obtained from a fiber opticUFO lamp (New Bright Decorative Co., Foshan-City/Nanhai, China).The reagent melamine (mel), chloranil (chl), AA, and other chem-icals were purchased from Loba chemie, India, Sarabhai Merck,India, and S.D. Fine, India. The sol–gel precursor, tetraethyl orthosil-icate (TEOS) was obtained from Sigma–Aldrich chemie, Germany.Commercially available vitamin C (AA) tablets (500 mg) were pur-chased from Glaxo Smith Kline+, India (Celin) and Nicholas Piramal,India (Limcee). All chemicals were of analytical grade. The sol-vent dimethylformamide (DMF) was of HPLC quantity. The stockstandard solutions of AA were freshly prepared daily by dissolv-ing 0.0125 g of AA in 25 mL demineralised triple distilled water(conductivity range (0.06–0.07) × 10−6 S cm−1). The working solu-tions of AA were prepared by appropriate dilutions and theirneutral conditions (pH 7.0) were maintained with the help of 0.01 MNaOH.
A 1198–1199 (2008) 59–66
2.2. Equipments
Differential-pulse, cathodic stripping voltammetry (DPCSV) wasperformed with a polarographic analyzer/stripping voltammeter(Model 264A EG & G Princeton Applied Research, USA) in conjunc-tion with a X-Y recorder (PAR Model RE 0089). In the three electrodecell of a 303A static mercury drop unit (EG & G Princeton AppliedResearch), a hanging mercury drop electrode (HMDE, surface area0.0092 cm2), a saturated Ag/AgCl electrode with porous Vycor frit,and a platinum electrode were used as working, reference andauxiliary electrodes, respectively. The morphological evaluations ofthe MIP-coated SPME fibers were performed by scanning electronmicroscope (model-XL 20 Phillips, Holland). The infrared absorp-tion spectra of coatings were obtained between 400 and 4000 cm−1
using a FTIR spectrophotometer (Jasco FT/IR 5300). Elemental anal-yses of MIP and NIP were performed using Heraeus Vario EL 111Carlo Erba 1108.
2.3. MIP-coated SPME fibers preparation
The PMMA fibers each of 4.0 cm in length and 100 �m in diame-ter were cleaned with ethanol and etched with 1 mol L−1 NaOH for1 h at room temperature. These fibers were washed with water andsoaked in 1 mol L−1 HCl for 30 min. Subsequently, the fibers werewashed with water again and dried preliminary with a stream ofnitrogen. Prior to coating with polymer, the fibers were essentiallysilylated for at least 30 min by immersing fibers into a 50% (v/v)TEOS solution in ethanol at room temperature and sol–gel synthe-sis was accelerated by one drop addition of a solution consistingof 0.1 M HCl and 0.5 mL water followed by a mechanical stirring(600 rpm) for 20 min. The imprinted polymer, poly[mel-co-chl],for AA and corresponding non-imprinted polymer were preparedand characterized (elemental analyses: found (%) C = 36.15, H = 4.10,N = 24.76; calculated (%) C = 36.57, H = 3.24, N = 24.88 for polymerwith (n + 1) DMF·H2O; n = 9) following conventional bulk poly-merization method reported earlier [28,29]. Normally in a singlebatch, the equimolar DMF solutions of mel (1.26 g/10.0 mL) and chl(2.46 g/10.0 mL) were mixed together and heated at ca 160 ◦C foran hour followed by the addition of an equimolar DMF solution ofthe template (AA) (1.76 g/10.0 mL) into the reaction mixture, andagain refluxing for 4 h. A brownish-black colored MIP–AA adductin the form of DMF slurry, was obtained after the complete evap-oration of DMF at 160 ◦C. The residual monomers, if any, werewashed off from the slurry with ethanol. Subsequently, the sily-
lated fibers were placed within this slurry, maintained at 80 ◦C, for1 h. When coating was accomplished, final product obtained wasa piece of exterior polymer film with the silylated fiber immobi-lized in it. The non-imprinted polymer (NIP)-coated fibers werealso prepared following the identical procedure but in the absenceof template. Both types of fibers, with MIP or NIP coating on thesurface, were obtained by pulling them cautiously out of polymerslurry (semi-solidified). Later these were allowed to pass one-by-one through a glass capillary (130 �m i.d.) for smoothening the MIPsurface immobilized on silylated fibers. A number of such modifiedfibers (including NIP fibers (10 fibers per batch)) were obtainedreproducibly, and the total average thickness all along each fiber ineach batch was measured as 130 ± 2 �m with the help of a verniercaliperse (Mitutoyo, Japan). This revealed a uniform monolayerimmobilization of sol–gel/MIP–AA adduct film of 30 ± 2 �m repro-ducible thickness. The complete removal of template from a coatedfiber was possible by soaking fibers for 30 min in 0.5 mL of 90% (v/v)methanol; no DPCSV peak corresponding to AA was detected afterthis treatment.The obtained coatings of the new MIP- or NIP-coated fibers had alittle difference in length (∼1.0 cm) and were accidented on the top.
togr. A
B.B. Prasad et al. / J. ChromaFig. 1. Schematic representation of the preparation of MIP-coated HMDE sensor.
In order to remove accidented coating and obtain a uniform lengthof 3.0 cm, the unwanted coatings were scrapped from the top usinga penknife. Finally, the uncoated end of fiber was spread with a lit-tle all-purpose adhesive and immediately inserted and fixed intoa 10 mm hole already drilled in the plunger of a syringe (Hindus-tan Syringes and Medical Devices, India). Further introducing fiberthrough the syringe needle, which may scrap the fiber coating ordamage its texture, is avoided in the present work.
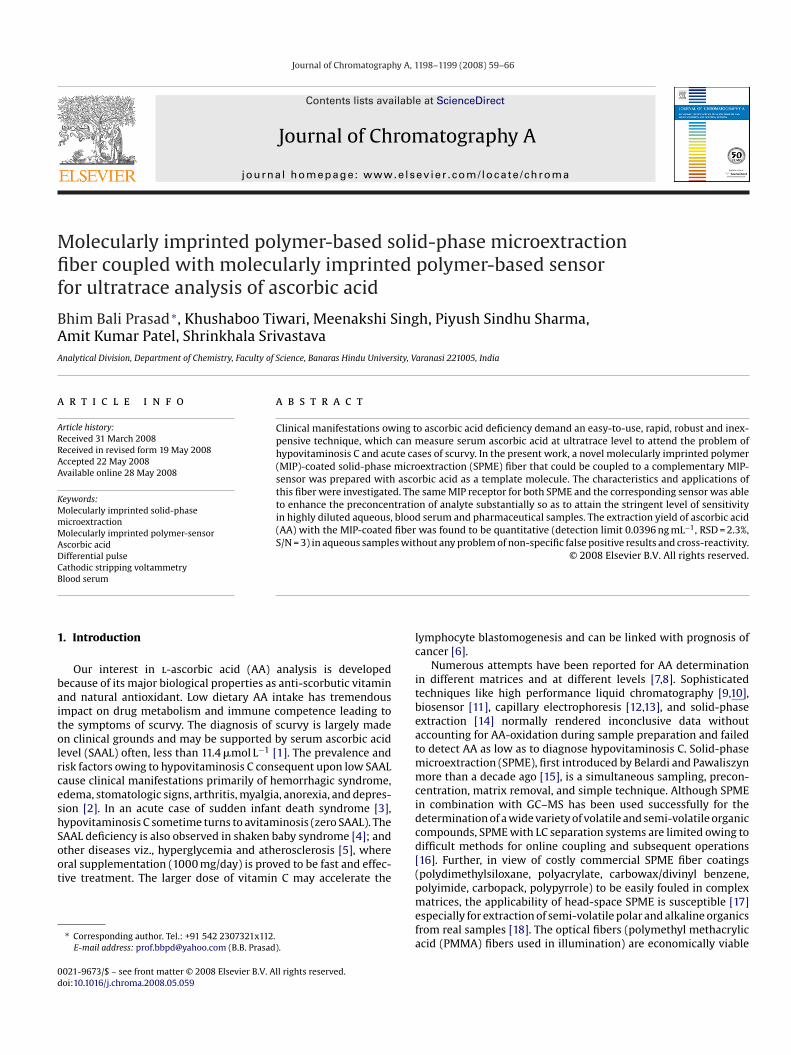
Fig. 2. Schematic representation of MIP
1198–1199 (2008) 59–66 61
2.4. SPME–DPCSV procedure
The homemade SPME system, optical fiber contained insidethe plunger of syringe, was vertically clamped on a stand. Allextractions (rebinding) were made from a 5.0-mL test sample (pHadjusted to 7.0 after requisite dilution) taken in a small cylin-
drical glass vial (5.5 mL capacity) by direct immersion of SPMEfiber in the sample for 30 min, with magnetic stirring (glass bar,size 10 mm × 0.3 mm) maintaining speed just enough to a vor-tex formation in the solution. Afterward, this fiber was initiallydipped in water (0.5 mL) for 2 min followed by multiple wash-ings with water (3× 0.5 mL) until the non-specific sorptions werecompletely removed. After water washings, the fiber was exposedto static desorption for 30 min in a desorption solvent [90% (v/v)methanol, 500 �L] taken in a 0.5 mL cone-shaped plastic vial.The entire 500 �L solution (desorbed) was immediately trans-ferred into a voltammetric cell containing 8.5 mL water (withno supporting electrolyte). The choice of HMDE, in lieu of solidelectrode, is appropriate one for the use. Because, each DPCSVrun could be accomplished with a fresh hanging mercury dropof reproducible size duly modified with same MIP to ensuredouble preconcentration; and moreover, HMDE is rather mass-sensitive and low-cost transducer in an electrochemical system.The immobilization of electron-rich MIP layer over small surfaceof preanodized mercury drop instantly assumed, after evapora-tion of DMF, in a fashion represented in Fig. 1 under columbicinteractions; MIP modification of HMDE and voltammetric-coated SPME fiber preparation.
togr.
62 B.B. Prasad et al. / J. Chromaprocedure were followed in same way as reported in detailelsewhere [28]. In all cases, DPCSV runs were recorded at the pre-anodized MIP-modified HMDE sensor using optimized operationalparameters: MIP concentration = 500 �g mL−1, deposition time(polymer) = 120 s, Eacc (accumulation potential of template) = +0.4 V(versus Ag/AgCl), tacc (accumulation time of template) = 120 s,pH = 7.0, scan rate = 10 mV s−1, pulse amplitude = 25 mV. The quan-tifications of the recorded DPCSV peaks were made using a methodof standard addition.
3. Results and discussion
3.1. Preparation and characterization of sol–gel immobilized MIPcoating
3.1.1. AA–MIP coating preparation through sol–gel techniqueAs shown in Fig. 2, the silylation of PMMA fibers involved the
formation of first microphase between hydrolyzed PMMA fiber(containing COOH groups) and sol–gel matrix via covalent bond-ing; and subsequently, anchoring a second interface between theterminal silanol of sol–gel and MIP–AA adduct. The second inter-face could readily be created presumably through SiO− attack at theelectron deficient site of chloranil terminal of MIP. The formation ofsuch IPN hybrid material in the present case apparently consistedof dual interfaces in which the molecular precursors for holdingorganic and inorganic networks are covalently linked to each other(telechelics) [25]. Further tethering of the polymer chains by oneend to interface through SiO− attack is still feasible. However, theMIP film thickness can be controlled to maintain monolayer coat-ing simply by optimizing the amount of polymer. In fact, the MIPcoating might involve entropic factors at the fiber surface that couldbe due to crowding of initial grafting chains and that prevents fur-ther insertion of polymer onto the surface. The total number oftethered polymer chains to the sol–gel interface onto fiber may notbe defined; however, thickness of coating layer was always consis-tent and reproducible in the present investigation. Under the samepreparation condition, MIP could not be coated when used witha non-silylated fiber. In order to acquire homogeneous, crack-free,and stable MIP coating, conditions for silylation of fibers [silylationtime: 30 min, sol–gel precursors composition: TEOS–ethanol (1:1,v/v) in presence of one drop 0.1 M HCl, sol–gel coating tempera-ture: 25 ◦C, MIP film coating temperature: 80 ◦C in DMF] should bestrictly followed. Due to strong interactions between the polymers
(PMMA, MIP) and the silane groups generated during the sol–gelprocess, a macrophase separation was avoided and the resultingmaterial, after template (AA) removal, had a high degree of homo-geneity and permeability. Furthermore, the proposed method offiber modification is advantageous in several respects as comparedto the reported procedures [20,21,24]. In the previous work, ana-lyte binding was drastically restricted owing to the diffusion barrieracross the MIP coating in the presence of highly cross-linked net-working, resulting in the low capacity of the fibers. It should be alsonoted that the sol–gel technique till date was widely exploited byencapsulating template or receptor in the sol–gel matrices givingrise to apparent limitations towards analyte diffusion. However, inthe present instance, the selectivity in sol–gel imprinted polymerwas relatively high with faster diffusion time as imprinting on thesurface of silica particle exposed microcavities of MIP outwardly fortemplate rebinding, without any steric hindrance (in the absenceof cross-linker), at the MIP film/solution interface.3.1.2. Morphological structure of AA–MIP coatingThe morphological structure of MIP coating can be assessed
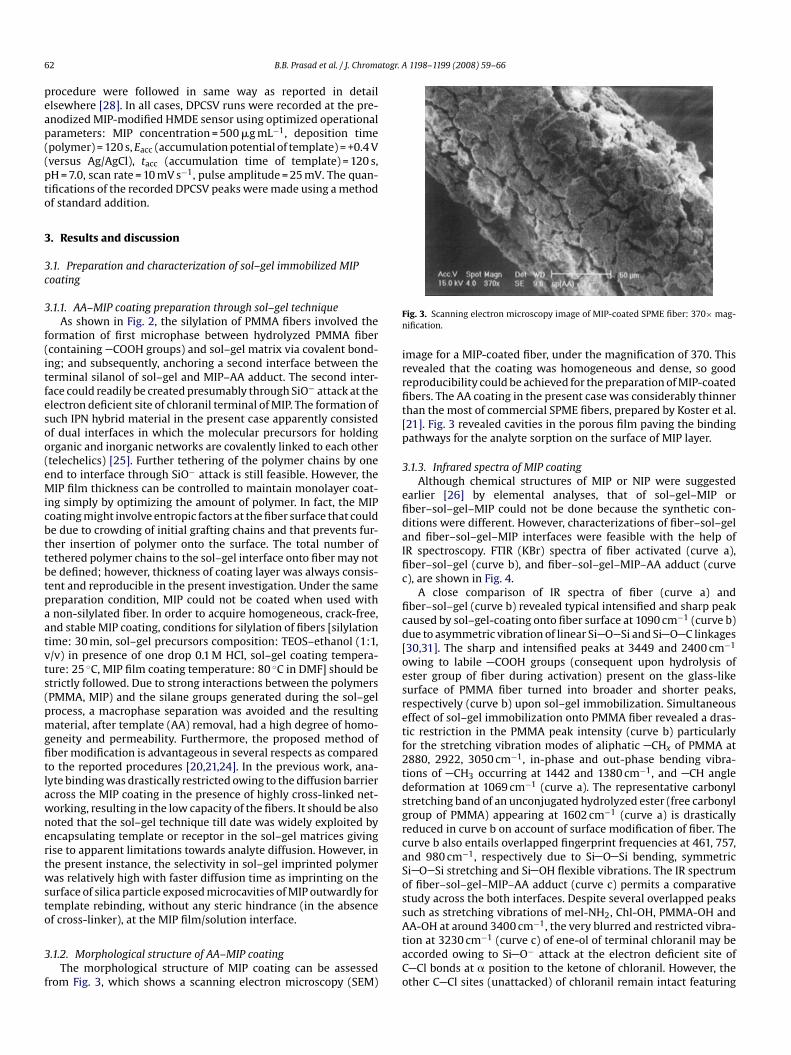
from Fig. 3, which shows a scanning electron microscopy (SEM)
A 1198–1199 (2008) 59–66
Fig. 3. Scanning electron microscopy image of MIP-coated SPME fiber: 370× mag-nification.
image for a MIP-coated fiber, under the magnification of 370. Thisrevealed that the coating was homogeneous and dense, so goodreproducibility could be achieved for the preparation of MIP-coatedfibers. The AA coating in the present case was considerably thinnerthan the most of commercial SPME fibers, prepared by Koster et al.[21]. Fig. 3 revealed cavities in the porous film paving the bindingpathways for the analyte sorption on the surface of MIP layer.
3.1.3. Infrared spectra of MIP coatingAlthough chemical structures of MIP or NIP were suggested
earlier [26] by elemental analyses, that of sol–gel–MIP orfiber–sol–gel–MIP could not be done because the synthetic con-ditions were different. However, characterizations of fiber–sol–geland fiber–sol–gel–MIP interfaces were feasible with the help ofIR spectroscopy. FTIR (KBr) spectra of fiber activated (curve a),fiber–sol–gel (curve b), and fiber–sol–gel–MIP–AA adduct (curvec), are shown in Fig. 4.
A close comparison of IR spectra of fiber (curve a) andfiber–sol–gel (curve b) revealed typical intensified and sharp peakcaused by sol–gel-coating onto fiber surface at 1090 cm−1 (curve b)due to asymmetric vibration of linear Si O Si and Si O C linkages[30,31]. The sharp and intensified peaks at 3449 and 2400 cm−1
owing to labile COOH groups (consequent upon hydrolysis ofester group of fiber during activation) present on the glass-likesurface of PMMA fiber turned into broader and shorter peaks,
respectively (curve b) upon sol–gel immobilization. Simultaneouseffect of sol–gel immobilization onto PMMA fiber revealed a dras-tic restriction in the PMMA peak intensity (curve b) particularlyfor the stretching vibration modes of aliphatic CHx of PMMA at2880, 2922, 3050 cm−1, in-phase and out-phase bending vibra-tions of CH3 occurring at 1442 and 1380 cm−1, and CH angledeformation at 1069 cm−1 (curve a). The representative carbonylstretching band of an unconjugated hydrolyzed ester (free carbonylgroup of PMMA) appearing at 1602 cm−1 (curve a) is drasticallyreduced in curve b on account of surface modification of fiber. Thecurve b also entails overlapped fingerprint frequencies at 461, 757,and 980 cm−1, respectively due to Si O Si bending, symmetricSi O Si stretching and Si OH flexible vibrations. The IR spectrumof fiber–sol–gel–MIP–AA adduct (curve c) permits a comparativestudy across the both interfaces. Despite several overlapped peakssuch as stretching vibrations of mel-NH2, Chl-OH, PMMA-OH andAA-OH at around 3400 cm−1, the very blurred and restricted vibra-tion at 3230 cm−1 (curve c) of ene-ol of terminal chloranil may beaccorded owing to Si O− attack at the electron deficient site ofC Cl bonds at � position to the ketone of chloranil. However, theother C Cl sites (unattacked) of chloranil remain intact featuring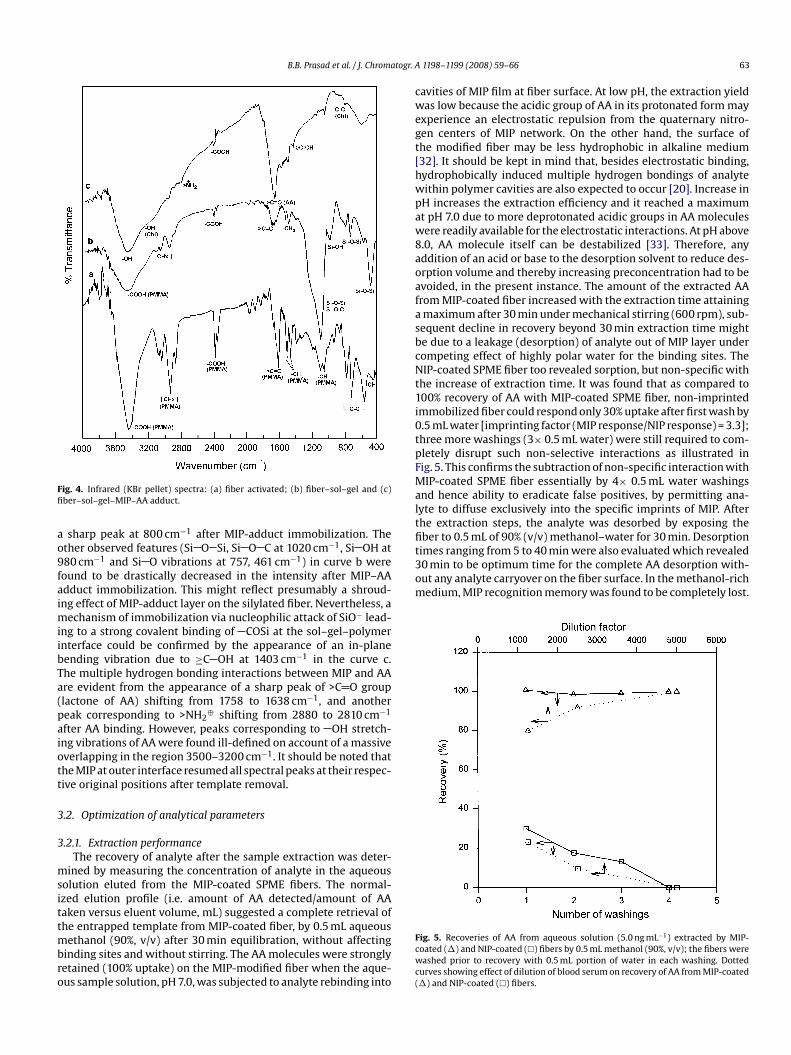
B.B. Prasad et al. / J. Chromatogr. A
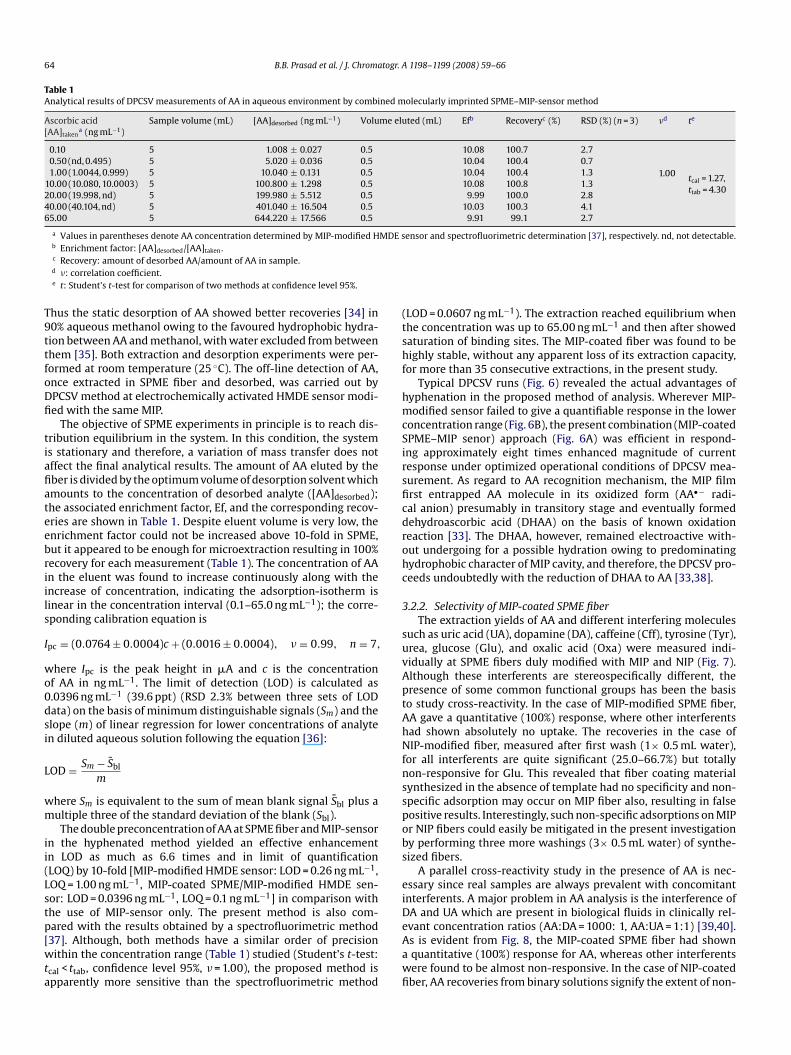
a maximum after 30 min under mechanical stirring (600 rpm), sub-sequent decline in recovery beyond 30 min extraction time mightbe due to a leakage (desorption) of analyte out of MIP layer undercompeting effect of highly polar water for the binding sites. TheNIP-coated SPME fiber too revealed sorption, but non-specific withthe increase of extraction time. It was found that as compared to100% recovery of AA with MIP-coated SPME fiber, non-imprintedimmobilized fiber could respond only 30% uptake after first wash by0.5 mL water [imprinting factor (MIP response/NIP response) = 3.3];three more washings (3× 0.5 mL water) were still required to com-pletely disrupt such non-selective interactions as illustrated inFig. 5. This confirms the subtraction of non-specific interaction withMIP-coated SPME fiber essentially by 4× 0.5 mL water washingsand hence ability to eradicate false positives, by permitting ana-lyte to diffuse exclusively into the specific imprints of MIP. Afterthe extraction steps, the analyte was desorbed by exposing thefiber to 0.5 mL of 90% (v/v) methanol–water for 30 min. Desorptiontimes ranging from 5 to 40 min were also evaluated which revealed30 min to be optimum time for the complete AA desorption with-out any analyte carryover on the fiber surface. In the methanol-richmedium, MIP recognition memory was found to be completely lost.
Fig. 4. Infrared (KBr pellet) spectra: (a) fiber activated; (b) fiber–sol–gel and (c)fiber–sol–gel–MIP–AA adduct.
a sharp peak at 800 cm−1 after MIP-adduct immobilization. Theother observed features (Si O Si, Si O C at 1020 cm−1, Si OH at980 cm−1 and Si O vibrations at 757, 461 cm−1) in curve b werefound to be drastically decreased in the intensity after MIP–AAadduct immobilization. This might reflect presumably a shroud-ing effect of MIP-adduct layer on the silylated fiber. Nevertheless, amechanism of immobilization via nucleophilic attack of SiO− lead-ing to a strong covalent binding of COSi at the sol–gel–polymerinterface could be confirmed by the appearance of an in-planebending vibration due to ≥C OH at 1403 cm−1 in the curve c.The multiple hydrogen bonding interactions between MIP and AAare evident from the appearance of a sharp peak of >C O group
(lactone of AA) shifting from 1758 to 1638 cm−1, and anotherpeak corresponding to >NH2⊕ shifting from 2880 to 2810 cm−1
after AA binding. However, peaks corresponding to OH stretch-ing vibrations of AA were found ill-defined on account of a massiveoverlapping in the region 3500–3200 cm−1. It should be noted thatthe MIP at outer interface resumed all spectral peaks at their respec-tive original positions after template removal.
3.2. Optimization of analytical parameters
3.2.1. Extraction performanceThe recovery of analyte after the sample extraction was deter-
mined by measuring the concentration of analyte in the aqueoussolution eluted from the MIP-coated SPME fibers. The normal-ized elution profile (i.e. amount of AA detected/amount of AAtaken versus eluent volume, mL) suggested a complete retrieval ofthe entrapped template from MIP-coated fiber, by 0.5 mL aqueousmethanol (90%, v/v) after 30 min equilibration, without affectingbinding sites and without stirring. The AA molecules were stronglyretained (100% uptake) on the MIP-modified fiber when the aque-ous sample solution, pH 7.0, was subjected to analyte rebinding into
1198–1199 (2008) 59–66 63
cavities of MIP film at fiber surface. At low pH, the extraction yieldwas low because the acidic group of AA in its protonated form mayexperience an electrostatic repulsion from the quaternary nitro-gen centers of MIP network. On the other hand, the surface ofthe modified fiber may be less hydrophobic in alkaline medium[32]. It should be kept in mind that, besides electrostatic binding,hydrophobically induced multiple hydrogen bondings of analytewithin polymer cavities are also expected to occur [20]. Increase inpH increases the extraction efficiency and it reached a maximumat pH 7.0 due to more deprotonated acidic groups in AA moleculeswere readily available for the electrostatic interactions. At pH above8.0, AA molecule itself can be destabilized [33]. Therefore, anyaddition of an acid or base to the desorption solvent to reduce des-orption volume and thereby increasing preconcentration had to beavoided, in the present instance. The amount of the extracted AAfrom MIP-coated fiber increased with the extraction time attaining
Fig. 5. Recoveries of AA from aqueous solution (5.0 ng mL−1) extracted by MIP-coated (�) and NIP-coated (�) fibers by 0.5 mL methanol (90%, v/v); the fibers werewashed prior to recovery with 0.5 mL portion of water in each washing. Dottedcurves showing effect of dilution of blood serum on recovery of AA from MIP-coated(�) and NIP-coated (�) fibers.
togr.
ned m
me elu
MDE s
64 B.B. Prasad et al. / J. Chroma
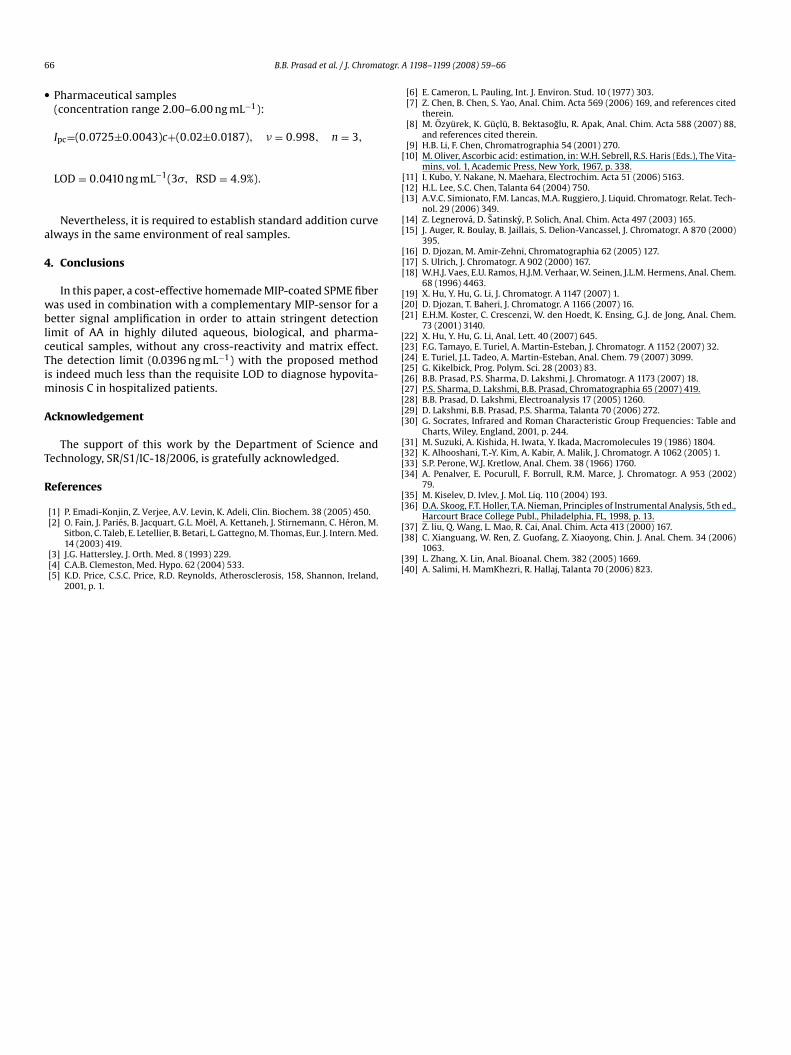
Table 1Analytical results of DPCSV measurements of AA in aqueous environment by combi
Ascorbic acid[AA]taken
a (ng mL−1)Sample volume (mL) [AA]desorbed (ng mL−1) Volu
0.10 5 1.008 ± 0.027 0.50.50 (nd, 0.495) 5 5.020 ± 0.036 0.51.00 (1.0044, 0.999) 5 10.040 ± 0.131 0.5
10.00 (10.080, 10.0003) 5 100.800 ± 1.298 0.520.00 (19.998, nd) 5 199.980 ± 5.512 0.540.00 (40.104, nd) 5 401.040 ± 16.504 0.565.00 5 644.220 ± 17.566 0.5
a Values in parentheses denote AA concentration determined by MIP-modified Hb Enrichment factor: [AA]desorbed/[AA]taken.c Recovery: amount of desorbed AA/amount of AA in sample.d �: correlation coefficient.e t: Student’s t-test for comparison of two methods at confidence level 95%.
Thus the static desorption of AA showed better recoveries [34] in90% aqueous methanol owing to the favoured hydrophobic hydra-tion between AA and methanol, with water excluded from betweenthem [35]. Both extraction and desorption experiments were per-formed at room temperature (25 ◦C). The off-line detection of AA,once extracted in SPME fiber and desorbed, was carried out byDPCSV method at electrochemically activated HMDE sensor modi-fied with the same MIP.
The objective of SPME experiments in principle is to reach dis-tribution equilibrium in the system. In this condition, the systemis stationary and therefore, a variation of mass transfer does notaffect the final analytical results. The amount of AA eluted by thefiber is divided by the optimum volume of desorption solvent whichamounts to the concentration of desorbed analyte ([AA]desorbed);the associated enrichment factor, Ef, and the corresponding recov-eries are shown in Table 1. Despite eluent volume is very low, theenrichment factor could not be increased above 10-fold in SPME,but it appeared to be enough for microextraction resulting in 100%recovery for each measurement (Table 1). The concentration of AAin the eluent was found to increase continuously along with theincrease of concentration, indicating the adsorption-isotherm islinear in the concentration interval (0.1–65.0 ng mL−1); the corre-sponding calibration equation is
Ipc = (0.0764 ± 0.0004)c + (0.0016 ± 0.0004), � = 0.99, n = 7,
where Ipc is the peak height in �A and c is the concentrationof AA in ng mL−1. The limit of detection (LOD) is calculated as
−1
0.0396 ng mL (39.6 ppt) (RSD 2.3% between three sets of LODdata) on the basis of minimum distinguishable signals (Sm) and theslope (m) of linear regression for lower concentrations of analytein diluted aqueous solution following the equation [36]:LOD = Sm − Sbl
m
where Sm is equivalent to the sum of mean blank signal Sbl plus amultiple three of the standard deviation of the blank (Sbl).
The double preconcentration of AA at SPME fiber and MIP-sensorin the hyphenated method yielded an effective enhancementin LOD as much as 6.6 times and in limit of quantification(LOQ) by 10-fold [MIP-modified HMDE sensor: LOD = 0.26 ng mL−1,LOQ = 1.00 ng mL−1, MIP-coated SPME/MIP-modified HMDE sen-sor: LOD = 0.0396 ng mL−1, LOQ = 0.1 ng mL−1] in comparison withthe use of MIP-sensor only. The present method is also com-pared with the results obtained by a spectrofluorimetric method[37]. Although, both methods have a similar order of precisionwithin the concentration range (Table 1) studied (Student’s t-test:tcal < ttab, confidence level 95%, � = 1.00), the proposed method isapparently more sensitive than the spectrofluorimetric method
A 1198–1199 (2008) 59–66
olecularly imprinted SPME–MIP-sensor method
ted (mL) Efb Recoveryc (%) RSD (%) (n = 3) �d te
10.08 100.7 2.7
tcal = 1.27,ttab = 4.30
10.04 100.4 0.71.0010.04 100.4 1.3
10.08 100.8 1.39.99 100.0 2.8
10.03 100.3 4.19.91 99.1 2.7
ensor and spectrofluorimetric determination [37], respectively. nd, not detectable.
(LOD = 0.0607 ng mL−1). The extraction reached equilibrium whenthe concentration was up to 65.00 ng mL−1 and then after showedsaturation of binding sites. The MIP-coated fiber was found to behighly stable, without any apparent loss of its extraction capacity,for more than 35 consecutive extractions, in the present study.
Typical DPCSV runs (Fig. 6) revealed the actual advantages ofhyphenation in the proposed method of analysis. Wherever MIP-modified sensor failed to give a quantifiable response in the lowerconcentration range (Fig. 6B), the present combination (MIP-coatedSPME–MIP senor) approach (Fig. 6A) was efficient in respond-ing approximately eight times enhanced magnitude of currentresponse under optimized operational conditions of DPCSV mea-surement. As regard to AA recognition mechanism, the MIP filmfirst entrapped AA molecule in its oxidized form (AA•− radi-cal anion) presumably in transitory stage and eventually formeddehydroascorbic acid (DHAA) on the basis of known oxidationreaction [33]. The DHAA, however, remained electroactive with-out undergoing for a possible hydration owing to predominatinghydrophobic character of MIP cavity, and therefore, the DPCSV pro-ceeds undoubtedly with the reduction of DHAA to AA [33,38].
3.2.2. Selectivity of MIP-coated SPME fiberThe extraction yields of AA and different interfering molecules
such as uric acid (UA), dopamine (DA), caffeine (Cff), tyrosine (Tyr),urea, glucose (Glu), and oxalic acid (Oxa) were measured indi-vidually at SPME fibers duly modified with MIP and NIP (Fig. 7).Although these interferents are stereospecifically different, thepresence of some common functional groups has been the basis
to study cross-reactivity. In the case of MIP-modified SPME fiber,AA gave a quantitative (100%) response, where other interferentshad shown absolutely no uptake. The recoveries in the case ofNIP-modified fiber, measured after first wash (1× 0.5 mL water),for all interferents are quite significant (25.0–66.7%) but totallynon-responsive for Glu. This revealed that fiber coating materialsynthesized in the absence of template had no specificity and non-specific adsorption may occur on MIP fiber also, resulting in falsepositive results. Interestingly, such non-specific adsorptions on MIPor NIP fibers could easily be mitigated in the present investigationby performing three more washings (3× 0.5 mL water) of synthe-sized fibers.A parallel cross-reactivity study in the presence of AA is nec-essary since real samples are always prevalent with concomitantinterferents. A major problem in AA analysis is the interference ofDA and UA which are present in biological fluids in clinically rel-evant concentration ratios (AA:DA = 1000: 1, AA:UA = 1:1) [39,40].As is evident from Fig. 8, the MIP-coated SPME fiber had showna quantitative (100%) response for AA, whereas other interferentswere found to be almost non-responsive. In the case of NIP-coatedfiber, AA recoveries from binary solutions signify the extent of non-

B.B. Prasad et al. / J. Chromatogr. A 1198–1199 (2008) 59–66 65
Fig. 6. DPCSV response of AA: (A) molecularly imprinted SPME–MIP-sensor, AA con-centration (ng mL−1): (a) 0.100, (b) 0.500, (c) 1.000; (B) MIP-modified HMDE sensor(without molecularly imprinted SPME), AA concentration (ng mL−1): (a) 0.100, (b)
0.500, (c) 1.000; (C) molecularly imprinted SPME–MIP-sensor, AA concentration inhuman blood serum: (a) 5.312 ng mL−1, (b) spiked to (a) by standard solution ofAA. Dotted runs after extraction from NIP-coated SPME fiber: (c) 5.312 ng mL−1, (d)spiked to (c) by standard solution of AA.specific sorption, varying within 12.5–33.9%, obtained after firstwater wash, which subsequently reduced to negligible after mul-tiple washings (3× 0.5 mL water). As regard to multiple mixtureanalysis where most of the interferents co-exist with AA in theirrespective clinically relevant concentration ratios [AA:UA = 1:1,AA:DA = 1000:1, AA:Cff = 1:10, AA:Tyr = 1000:1, AA:urea = 1:10,AA:Glu = 1:40, AA:Oxa = 1:10, and AA:mixture of all interfer-ents = 1:10 each], the MIP-coated SPME is capable of recognizing AAquantitatively without any contributions from non-specific bindingof test analyte and/or interferents. Tyrosine failed to rebind in MIPcavity through ion-exchange process despite being anionic at pH7.0 (Fig. 7). On the other hand, sensing mechanism in the presentcase exclusively includes an ion-exchange process of AA rebindingreleasing Cl− ions in aqueous medium. The small molecules likeurea, Glu, and Oxa might interact with the MIP or NIP coating by
Fig. 7. Extraction yields of AA, and interferents with MIP- and NIP-coated fibers at2.0 ng mL−1 level.
Fig. 8. Recoveries of AA from MIP-coated fibers in the presence of interferents inaqueous solutions: the concentrations (ng mL−1) of AA interferent in the binarymixtures are: (A) 2.0 AA + 2.0 UA, (B) 2.0 AA + 20.0 Cff, (C) 2.0 AA + 20.0 urea, (D)2.0 AA + 80.0 Glu, (E) 2.0 AA + 0.002 Tyr, (F) 2.0 AA + 20.0 Oxa, (G) 2.0 AA + 0.002 DA,(H) 2.0 AA + 20.0 (each) mixtures of interferents. Recoveries from NIP-coated fibersare shown after first wash (0.5 mL) and final wash (3× 0.5 mL) with water.
the hydrogen bonding but these were washed away as non-specificsorption by water from the fiber surface. Therefore, it can be con-cluded that the proposed method is ‘system specific’ with stoichio-metric non-covalent interactions of test analyte within MIP cavity.
3.2.3. Application to real samplesThe proposed method has been examined in human blood
serum (without sample pretreatment) and also in pharmaceu-tical formulations (500 mg Celin and Limcee) for the validationof the MIP-coated fiber selectivity. A typical analysis of humanblood serum demonstrated some assymmetricity in voltammet-ric peak (Fig. 6C, curve a) which was later improved after spikingwith known amount of authenticated AA sample (Fig. 6C, curveb). Insignificant DPCSV curves c and d (Fig. 6C) as obtained bythe use of NIP-coated fibers corroborate imprinting effect. As aremedial measure to culminate that non-specific sorption andMIP film fouling, particularly by the complex matrices of bloodsamples, serum samples must be diluted enough so that all inter-ferents and complex matrices could simultaneously be diluted to
become virtually ineffective. While measurement with molecularlyimprinted SPME–MIP-sensor in the present study rendered a quan-titative recovery (100%), the magnitude of non-specific sorptionsas revealed by a NIP-coated SPME fiber were found to be com-pletely vanished after 5 × 10³-fold dilution of blood sample (Fig. 5).The quantitative assay is only possible in the present instance atthe behest of facilitated rebinding of AA, by emerging electrostaticinteractions in addition to hydrogen bondings in aqueous environ-ment; and thereby, a relatively rapid mass-transfer in the restrictedaccess media of the IPN proposed across MIP-coated sol–gel-fiber[23]. In fact the diluted real samples were almost similar in behavioras diluted aqueous samples which is evident from their respec-tive calibration equations. The calibration equations obtained forblood serum and pharmaceutical samples, with their respectiveLOD values, were• Human blood serum (concentration range 0.11–65.3 ng mL−1):
Ipc=(0.0744±0.0006)c+(0.0011±0.0001), �=0.998, n=7,
LOD = 0.0403 ng mL−1(3�, RSD = 1.2%).
togr.
[
68 (1996) 4463.[19] X. Hu, Y. Hu, G. Li, J. Chromatogr. A 1147 (2007) 1.
66 B.B. Prasad et al. / J. Chroma
• Pharmaceutical samples(concentration range 2.00–6.00 ng mL−1):
Ipc=(0.0725±0.0043)c+(0.02±0.0187), � = 0.998, n = 3,
LOD = 0.0410 ng mL−1(3�, RSD = 4.9%).
Nevertheless, it is required to establish standard addition curvealways in the same environment of real samples.
4. Conclusions
In this paper, a cost-effective homemade MIP-coated SPME fiber
was used in combination with a complementary MIP-sensor for abetter signal amplification in order to attain stringent detectionlimit of AA in highly diluted aqueous, biological, and pharma-ceutical samples, without any cross-reactivity and matrix effect.The detection limit (0.0396 ng mL−1) with the proposed methodis indeed much less than the requisite LOD to diagnose hypovita-minosis C in hospitalized patients.Acknowledgement
The support of this work by the Department of Science andTechnology, SR/S1/IC-18/2006, is gratefully acknowledged.
References
[1] P. Emadi-Konjin, Z. Verjee, A.V. Levin, K. Adeli, Clin. Biochem. 38 (2005) 450.[2] O. Fain, J. Paries, B. Jacquart, G.L. Moel, A. Kettaneh, J. Stirnemann, C. Heron, M.
Sitbon, C. Taleb, E. Letellier, B. Betari, L. Gattegno, M. Thomas, Eur. J. Intern. Med.14 (2003) 419.
[3] J.G. Hattersley, J. Orth. Med. 8 (1993) 229.[4] C.A.B. Clemeston, Med. Hypo. 62 (2004) 533.[5] K.D. Price, C.S.C. Price, R.D. Reynolds, Atherosclerosis, 158, Shannon, Ireland,
2001, p. 1.
[[
[[[[[[[[[
[[[[
[[
[[
[[
A 1198–1199 (2008) 59–66
[6] E. Cameron, L. Pauling, Int. J. Environ. Stud. 10 (1977) 303.[7] Z. Chen, B. Chen, S. Yao, Anal. Chim. Acta 569 (2006) 169, and references cited
therein.[8] M. Ozyurek, K. Guclu, B. Bektasoglu, R. Apak, Anal. Chim. Acta 588 (2007) 88,
and references cited therein.[9] H.B. Li, F. Chen, Chromatrographia 54 (2001) 270.
[10] M. Oliver, Ascorbic acid: estimation, in: W.H. Sebrell, R.S. Haris (Eds.), The Vita-mins, vol. 1, Academic Press, New York, 1967, p. 338.
[11] I. Kubo, Y. Nakane, N. Maehara, Electrochim. Acta 51 (2006) 5163.12] H.L. Lee, S.C. Chen, Talanta 64 (2004) 750.
[13] A.V.C. Simionato, F.M. Lancas, M.A. Ruggiero, J. Liquid. Chromatogr. Relat. Tech-nol. 29 (2006) 349.
[14] Z. Legnerova, D. Satinsky, P. Solich, Anal. Chim. Acta 497 (2003) 165.[15] J. Auger, R. Boulay, B. Jaillais, S. Delion-Vancassel, J. Chromatogr. A 870 (2000)
395.[16] D. Djozan, M. Amir-Zehni, Chromatographia 62 (2005) 127.[17] S. Ulrich, J. Chromatogr. A 902 (2000) 167.[18] W.H.J. Vaes, E.U. Ramos, H.J.M. Verhaar, W. Seinen, J.L.M. Hermens, Anal. Chem.
20] D. Djozan, T. Baheri, J. Chromatogr. A 1166 (2007) 16.21] E.H.M. Koster, C. Crescenzi, W. den Hoedt, K. Ensing, G.J. de Jong, Anal. Chem.
73 (2001) 3140.22] X. Hu, Y. Hu, G. Li, Anal. Lett. 40 (2007) 645.23] F.G. Tamayo, E. Turiel, A. Martin-Esteban, J. Chromatogr. A 1152 (2007) 32.24] E. Turiel, J.L. Tadeo, A. Martin-Esteban, Anal. Chem. 79 (2007) 3099.25] G. Kikelbick, Prog. Polym. Sci. 28 (2003) 83.26] B.B. Prasad, P.S. Sharma, D. Lakshmi, J. Chromatogr. A 1173 (2007) 18.27] P.S. Sharma, D. Lakshmi, B.B. Prasad, Chromatographia 65 (2007) 419.28] B.B. Prasad, D. Lakshmi, Electroanalysis 17 (2005) 1260.29] D. Lakshmi, B.B. Prasad, P.S. Sharma, Talanta 70 (2006) 272.30] G. Socrates, Infrared and Roman Characteristic Group Frequencies: Table and
Charts, Wiley, England, 2001, p. 244.31] M. Suzuki, A. Kishida, H. Iwata, Y. Ikada, Macromolecules 19 (1986) 1804.32] K. Alhooshani, T.-Y. Kim, A. Kabir, A. Malik, J. Chromatogr. A 1062 (2005) 1.33] S.P. Perone, W.J. Kretlow, Anal. Chem. 38 (1966) 1760.34] A. Penalver, E. Pocurull, F. Borrull, R.M. Marce, J. Chromatogr. A 953 (2002)
79.35] M. Kiselev, D. Ivlev, J. Mol. Liq. 110 (2004) 193.36] D.A. Skoog, F.T. Holler, T.A. Nieman, Principles of Instrumental Analysis, 5th ed.,
Harcourt Brace College Publ., Philadelphia, FL, 1998, p. 13.37] Z. liu, Q. Wang, L. Mao, R. Cai, Anal. Chim. Acta 413 (2000) 167.38] C. Xianguang, W. Ren, Z. Guofang, Z. Xiaoyong, Chin. J. Anal. Chem. 34 (2006)
1063.39] L. Zhang, X. Lin, Anal. Bioanal. Chem. 382 (2005) 1669.40] A. Salimi, H. MamKhezri, R. Hallaj, Talanta 70 (2006) 823.