MOLECULAR TAXONOMICAL STUDIES ON SOUTH INDIAN ...
188
MOLECULAR TAXONOMICAL STUDIES ON SOUTH INDIAN SPECIES OF SELAGINELLA THESIS SUBMITTED TO MANONMANIAM SUNDARANAR UNIVERSITY IN PARTIAL FULFILLMENT OF THE REQUIREMENTS FOR THE AWARD OF THE DEGREE OF DOCTOR OF PHILOSOPHY IN BIOTECHNOLOGY By M. NARAYANI (Reg. No: 8414) CENTRE FOR PLANT BIOTECHNOLOGY PG and Research Department of Botany St. Xavier’s College (Autonomous) Palayamkottai – 627 002. MANONMANIAM SUNDARANAR UNIVERSITY Tirunelveli, Tamil Nadu, India. June 2014
-
Upload
khangminh22 -
Category
Documents
-
view
2 -
download
0
Transcript of MOLECULAR TAXONOMICAL STUDIES ON SOUTH INDIAN ...
MOLECULAR TAXONOMICAL STUDIES ON SOUTH
INDIAN SPECIES OF SELAGINELLA
THESIS SUBMITTED TO
MANONMANIAM SUNDARANAR UNIVERSITY
IN PARTIAL FULFILLMENT OF THE REQUIREMENTS
FOR THE AWARD OF THE DEGREE OF
DOCTOR OF PHILOSOPHY IN BIOTECHNOLOGY
By
M. NARAYANI
(Reg. No: 8414)
CENTRE FOR PLANT BIOTECHNOLOGY
PG and Research Department of Botany
St. Xavier’s College (Autonomous)
Palayamkottai – 627 002.
MANONMANIAM SUNDARANAR UNIVERSITY
Tirunelveli, Tamil Nadu, India.
June 2014

Dr. M. Johnson, M.Sc., Ph.D.,
Assistant Professor,
Department of Botany,
St. Xavier’s College (Autonomous),
Palayamkottai - 627 002.
CERTIFICATE
This thesis entitled “MOLECULAR TAXONOMICAL STUDIES ON
SOUTH INDIAN SPECIES OF SELAGINELLA” submitted by Mrs. M. NARAYANI
for the award of Degree of Doctor of Philosophy in Biotechnology of Manonmaniam
Sundaranar University is a record of bonafide research work done by her and it has not
been submitted for the award of any degree, diploma, associateship, fellowship of any
University / Institution.
Place: Palayamkottai Signature of the Guide
Date :

Mrs. M. NARAYANI (Reg. No. 8414),
Full Time Research Scholar,
Centre for Plant Biotechnology,
St. Xavier’s College (Autonomous),
Palayamkottai - 627 002.
DECLARATION
I hereby declare that the thesis entitled “MOLECULAR TAXONOMICAL
STUDIES ON SOUTH INDIAN SPECIES OF SELAGINELLA” submitted by me for
the Degree of Doctor of Philosophy in Biotechnology is the result of my orginal and
independent research work carried out under the guidance of Dr. M. Johnson, Assistant
Professor, Department of Botany, St. Xavier’s College (Autonomous), Palayamkottai and
it has not been submitted for the award of any degree, diploma, associateship, fellowship
of any University or Institution.
Place: Palayamkottai M. NARAYANI
Date:
ACKNOWLEDGEMENT
I express my grateful thanks to our Almighty who gave me a good knowledge
and health to finish my Ph. D successfully.
Foremost, I would like to express my sincere gratitude and thanks to my
Supervisor Dr. M. Johnson, M.Sc., Ph.D., Assistant Professor, Department of Botany,
St. Xavier’s College (Autonomous), Palayamkottai, for the continuous support of my
Ph. D study and for his patience, motivation, excellent guidance, enthusiasm and
immense knowledge. His guidance helped me in all the time of research and writing of
this thesis. I could not have imagined having a better mentor for my Ph. D study.
I am extremely thankful to Rev. Dr. V. Gilburt Camillus, S.J., Principal,
Rev. Dr. A. Joseph S.J., Rev. Dr. Alphonse Manickam, S.J., Former Principals and
Rev. Dr. L. John Peter Arulandam, S.J., Vice Principal, St. Xavier’s College
(Autonomous), Palayamkottai for having given me a chance to do this course.
I wish to place on record my deep sense of gratitude to Dr. L. Louis Jesudass,
M. Phil., Ph. D., Associate Professor and Head, Department of Botany, St. Xavier’s
College (Autonomous), Palayamkottai for his support and encouragement. I owe my
deepest gratitude to Dr. G. Sahaya Antony Xavier, M. Sc., Ph. D., Assistant Professor,
Department of Botany, St. Xavier’s College (Autonomous), Palayamkottai for his support
on writing this thesis.
I am thankful to all faculty members, Department of Botany for their support and
constant encouragement to complete this work successfully.

I express my sincere thanks to Dr. V. Irudayaraj, Assistant Professor, Dept. of
Botany, St. Xavier's College (Autonomous), Palayamkottai, Dr. Christopher Roy
Fraser Jenkins, Nepal and Dr. Hari Krishnan, Assistant Professor, Dept. of Botany,
T.D.M.N.S College, Kallikulam for their help in plant identification. I also convey my
thanks to Dr. Jeeva, Assistant Professor, Dept. of Botany, Scott Christian College,
Nagercoil for his help in plant collection during my research work.
I express my heart full thanks to Dr. A. Babu, Mrs. Syed Ali Fathima,
Dr. T. Renisheya Joy Jeba Malar, Mr. A. Sivaraman, Mrs. K. Chalini,
Mrs. V. Kalaiarasi, Mr. N. Janakiraman, Mrs. T. Renola Joy Jeba Ethal,
Ms. I. Revathy and Ms. T. Shibila, Research scholars, Centre for Plant Biotechnology,
for their kind help and encouragement throughout the research work.
I would also like to thank Mr. S. Ghanthi Kumar, Centre for Bio diversity and
Biotechnology (CBB) for his support in herbarium submission. I also express my thanks
to Mr. Shankar, Placement office, St. Xavier’s College (Autonomous), Palayamkottai
and Mr. Robert, Administrator of Robert Xerox for their moral support.
Last but not the least; I would like to thank my parents, Mr. M. Mony and
Mrs. M. Velammal for giving birth to me at the first place. I express my profound heart
full thanks to my Father-in-law and Mother-in-law Mr. Thomas Durai and
Mrs. J. Annapooranam for supporting me physically throughout my life. Finally, I
would like to thank my lovable husband, Mr. T. Titus Manuel and my kids T. N. Manoj
and T. N. Melvin Jose. They were always there cheering me up and stood by me through
the good times and bad.
!"#$%$&$#'"
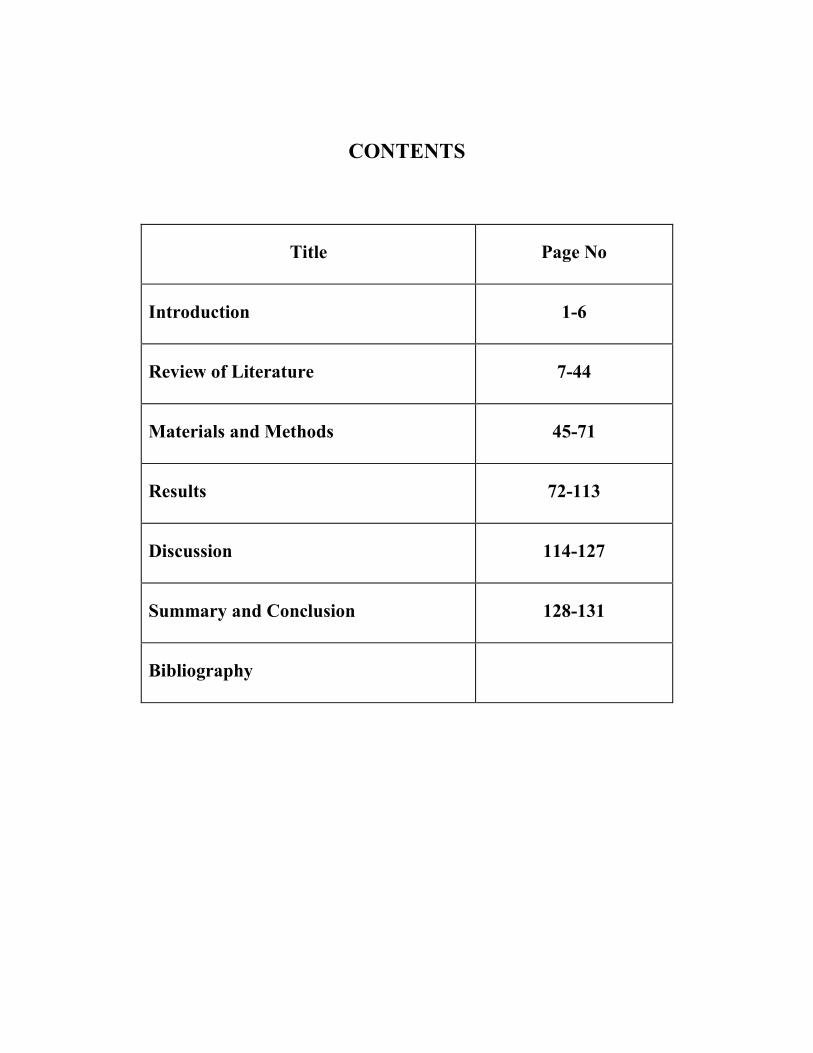
CONTENTS
Title Page No
Introduction 1-6
Review of Literature 7-44
Materials and Methods 45-71
Results 72-113
Discussion 114-127
Summary and Conclusion 128-131
Bibliography

ABBREVIATIONS
°C : Degree Celsius
(NH4)2SO4 : Ammonium Sulphate
µL : Micro Litre
2-DE : 2-Dimensional Electrophoresis
A : Adenine
AAT : Aspartate Amino Transferase
ABA : Abscissic acid
ACN : Acetonitrile
ACP : Acid Phosphatase
AFLP : Amplified Fragment Length Polymorphism
ALP : Alkaline Phosphatase
APS : Ammonium Per Sulphate
BLAST : Basic Local Alignment Search Tool
bp : basepairs
C
CBOL
:
:
Cytosine
Consortium for the Barcode Of Life
CLUSTAL W : CLUSTAL with a command line interface
cm : Centimetre
CO1 : Cytochrome c oxidase
Cp DNA : Chloroplast DNA
CTAB : Cetyl Trimethyl Ammonium Bromide
DNA : Deoxy ribo Nucleic Acid
dNTP : Deoxy Nucleotide Tri Phosphate
EDTA : Ethylene Diamine Tetra Acetic acid
EST : Esterase
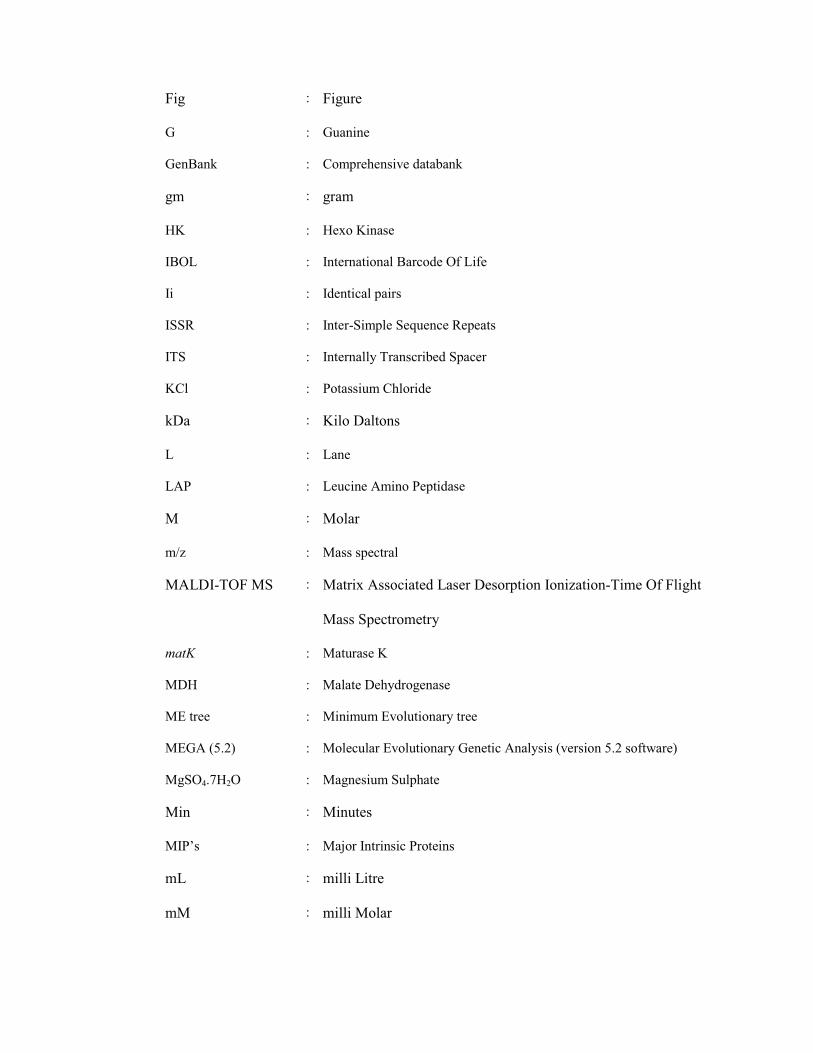
Fig : Figure
G : Guanine
GenBank : Comprehensive databank
gm : gram
HK : Hexo Kinase
IBOL : International Barcode Of Life
Ii
ISSR
:
:
Identical pairs
Inter-Simple Sequence Repeats
ITS : Internally Transcribed Spacer
KCl : Potassium Chloride
kDa : Kilo Daltons
L : Lane
LAP : Leucine Amino Peptidase
M : Molar
m/z : Mass spectral
MALDI-TOF MS : Matrix Associated Laser Desorption Ionization-Time Of Flight
Mass Spectrometry
matK : Maturase K
MDH : Malate Dehydrogenase
ME tree : Minimum Evolutionary tree
MEGA (5.2) : Molecular Evolutionary Genetic Analysis (version 5.2 software)
MgSO4.7H2O : Magnesium Sulphate
Min : Minutes
MIP’s : Major Intrinsic Proteins
mL : milli Litre
mM : milli Molar
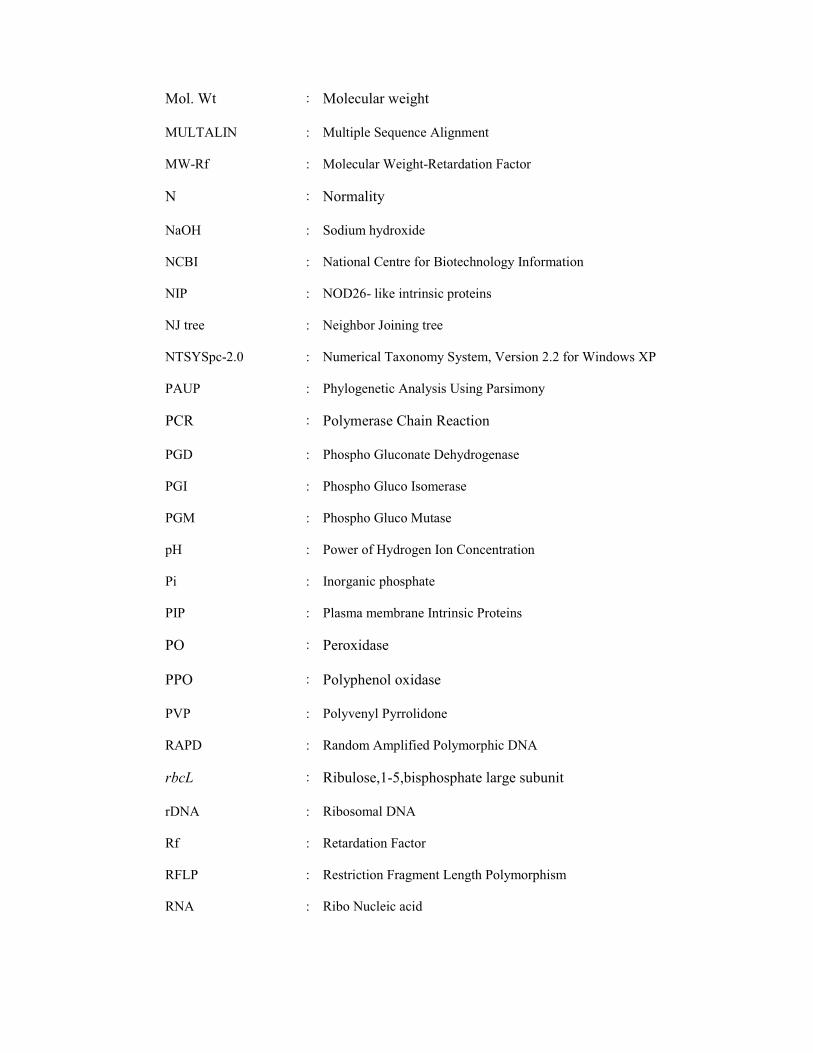
Mol. Wt : Molecular weight
MULTALIN : Multiple Sequence Alignment
MW-Rf : Molecular Weight-Retardation Factor
N : Normality
NaOH : Sodium hydroxide
NCBI : National Centre for Biotechnology Information
NIP : NOD26- like intrinsic proteins
NJ tree : Neighbor Joining tree
NTSYSpc-2.0 : Numerical Taxonomy System, Version 2.2 for Windows XP
PAUP : Phylogenetic Analysis Using Parsimony
PCR : Polymerase Chain Reaction
PGD : Phospho Gluconate Dehydrogenase
PGI : Phospho Gluco Isomerase
PGM : Phospho Gluco Mutase
pH : Power of Hydrogen Ion Concentration
Pi : Inorganic phosphate
PIP : Plasma membrane Intrinsic Proteins
PO : Peroxidase
PPO : Polyphenol oxidase
PVP : Polyvenyl Pyrrolidone
RAPD : Random Amplified Polymorphic DNA
rbcL : Ribulose,1-5,bisphosphate large subunit
rDNA : Ribosomal DNA
Rf : Retardation Factor
RFLP : Restriction Fragment Length Polymorphism
RNA : Ribo Nucleic acid
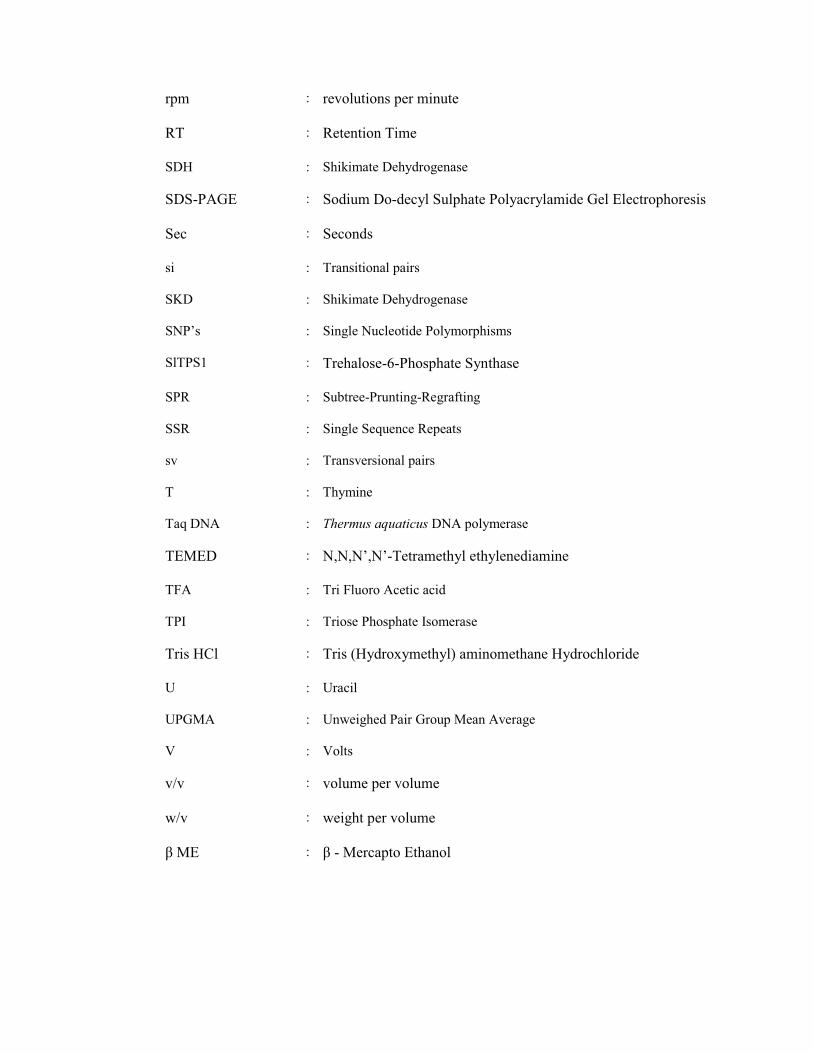
rpm : revolutions per minute
RT : Retention Time
SDH : Shikimate Dehydrogenase
SDS-PAGE : Sodium Do-decyl Sulphate Polyacrylamide Gel Electrophoresis
Sec : Seconds
si : Transitional pairs
SKD
SNP’s
:
:
Shikimate Dehydrogenase
Single Nucleotide Polymorphisms
SlTPS1 : Trehalose-6-Phosphate Synthase
SPR : Subtree-Prunting-Regrafting
SSR : Single Sequence Repeats
sv : Transversional pairs
T : Thymine
Taq DNA : Thermus aquaticus DNA polymerase
TEMED : N,N,N’,N’-Tetramethyl ethylenediamine
TFA : Tri Fluoro Acetic acid
TPI : Triose Phosphate Isomerase
Tris HCl : Tris (Hydroxymethyl) aminomethane Hydrochloride
U : Uracil
UPGMA : Unweighed Pair Group Mean Average
V : Volts
v/v : volume per volume
w/v : weight per volume
!"# : !- Mercapto Ethanol
1
Introduction
‘‘All the organic beings which have ever lived on this earth have descended from someone
primordial form’’
Charles Darwin
Each and every characteristic feature of a species on earth is an outcome of
evolutionary developments (Futuyma, 2005). Studies from the morphology to molecular level
in different genera of plants have shed light on the evolution of plants. This has led us to gain
an improved insight into evolution and the processes that drive evolution. The phylogenetic
relationships between different taxa have also been clarified due to these studies (Pryer et al.,
2004). The geneticist Theodosius Dobzhansky (1973) famously argued that ‘‘Nothing in
biology makes sense, except in the light of evolution’’. Evolution governs diversity on earth,
and plants are the most diverse organisms in the whole history of life. Biological diversity
refers to the variability of living organisms including their genetic variability of which they
are a part; it is indeed the biological capital and the basis for human survival and civilization.
The relevance of biodiversity lies encoded in the genes and the genetic diversity is the basis
of all bio-industrial developments (Mannion, 1995). The study and evolution of biodiversity
therefore, forms an important part of the ecosystem analysis, ecological economics and
developmental planning (Costanza, 1997).
India is one among eighteen megadiverse countries with significant biodiversity. The
major part of India lies within the Indo-Malaya and Palearctic ecozone. With 2.5 percent of
the world’s land area, India accounts for 7.8% of the recorded species of the world including
45,500 species of plants and more than 1200 species of vascular plants (MoEF, 2009;
Chandra et al., 2008). India hosts three biodiversity hotspots viz., the Himalayas, Western
Ghats and the Indo-Burma region. Among the three, the Western Ghats to a large extent
2
presides over the ecology of peninsular India. This rugged range of hills lie between
8°-20º40’N and 73°77’E covering a distance of about 1600 Km from Tapti valley in Gujarat
to Kanyakumari in Tamil Nadu is situated in the equatorial belt. The South Western Ghats
region falls within the states of Kerala and Tamil Nadu (Radhakrishna, 2001). The Western
Ghats harbor about 4,000 species of flowering plants and 320 species of ferns and fern allies
with more species diversity in the southern part (Sumesh et al., 2012).
Pteridophytes are non-flowering, vascular and spore-bearing plants which possess a
simple organization and are characterized by independent gametophytic and sporophytic
generations (Dixit, 1984). During the Jurassic period, pteridophytes formed the dominant part
of earth’s vegetation, but in present day flora, they have been largely replaced by the seed
bearing plants. The pteridophytes form a connecting link between the lower group of plants
(bryophytes) and the higher group of seed bearing plants (Dixit, 2000). Pteridophytes show
promise for their economic values and many of them had been used in various ways such as
folk remedies and medicine, plant protection, food and fodder, bio-fertilizer, environmental
monitoring, insect repellents and ornamentals (Kaur, 1989).
Genetic diversity in germplasm collections is fundamental to broadening the genetic
base of plant species. The data on agronomic, morphological and physiological plant traits
are generally used to estimate the magnitude of genetic diversity present in germplasm.
However, such data may not provide an accurate indication of genetic diversity because of
environmental influences upon the expression of observed traits (Shahid et al., 2000).
Considering these difficulties, several molecular and biochemical analysis has been applied to
establish germplasm differences at various taxonomic levels (Rabbani et al., 2010; Mumtaz et
al., 2010).
Molecular marker technology provides overall estimates of the genetic diversity of a
species and act as an important biological tool for the identification of raw materials of
3
medicinal plants (Sozen et al., 2010). Molecular genetic markers include biochemical
markers which detect variation at the gene product level (proteins and isozymes) and
molecular markers which detect variation at the nucleotide (DNA) level (Pervaiz et al.,
2010).
During the molecular era, a variety of tools have been developed for the analysis of
genetic diversity (Kumar and Kumari, 2009). One of the biochemical methods extensively
used in taxonomic and evaluation of genetic diversity studies is the electrophoretic analysis
(SDS-PAGE) that separates proteins according to their electrophoretic mobility (Syed et al.,
2011; Johnson et al., 2012; Warren et al., 2013; Sen et al., 2014). The mass spectrometric
(MS) techniques were developed for the ionization of proteins and peptides which include
matrix-associated laser desorption ionization (MALDI) combined with time of flight (TOF).
MS offers high sensitivity and accuracy for determining the molecular weight of proteins
according to the difference of m/z (mass/electric charge) ratio (Franc et al., 2013).
MALDI-TOF MS has advantages over other spectroscopic methods because of good
sensitivity and high tolerance towards contaminants (Hailat and Helleur, 2014).
Isozymes are good estimators for elucidating the possible mechanisms leading to the
formation of genetic variability in plant populations (Zeidler, 2000). It is widely used in the
studies of inter and intra-specific variation (Johnson and Raja, 2007; Johnson et al., 2010;
Nanthini et al., 2011; Johnson et al., 2012; Wang and Sheng, 2013). They also show lower
levels of polymorphism in a population where the expression of various isozymes differs both
temporally and spatially which can correctly identify several levels of taxa, accessions and
individuals since the assumption of homology can be more accurate than for same genomic
DNA markers (Smila et al., 2007).
In recent years there has been an explosion in the number of different types of genetic
markers and statistical tools are available for the analyses of molecular data. In most cases,

4
the new DNA based markers provide the same type of information as allozymes, but allow
for clear resolution of genetic differences (de Groot et al., 2012; Parveen, 2013; Wynns and
Asmussen, 2014). The study of relationships among major lineages of organisms,
phylogenetic analysis, has been closely associated with the classification and taxonomy in
which both are branches of the science of systematics (Mauro and Agorreta, 2010). In
particular, the use of molecular data and DNA sequences are appropriate for testing and
improving classifications, especially for highly diverse groups of flora such as pteridophytes
(Li et al., 2011).
Molecular methods used for detecting DNA sequence variation are generally based on
the use of Restriction Fragment Length Polymorphism (RFLP), Polymerase Chain Reaction
(PCR), Random Amplified Polymorphic DNAs (RAPD), Amplified Fragment Length
Polymorphisms (AFLPs), Inter-Simple Sequence Repeats (ISSRs), microsatellites and Single
Nucleotide Polymorphisms (SNPs) which proved especially important in diversity studies.
Newer and more powerful molecular techniques that detect variation at specific gene loci are
highly becoming available (Singh, 2013).
Barcoding has been equated with “DNA taxonomy” (Tautz et al., 2003) or
“Molecular taxonomy” (Blaxter, 2004). Molecular taxonomy supports the discovery of new
species with genetic measures using universal barcodes (Hebert et al., 2003). The non-coding
chloroplast (cp) DNA regions, as well as the nuclear ITS and the chloroplast protein-coding
sequences, have been commonly used as the barcoding markers for more species includes
plants (Wang et al., 2010; Ma et al., 2010; Mahadani et al., 2013). In case of pteridophytes,
rbcL would serve as a locus for species identification because it is the most characterized
plastid coding region in Genbank and provide a good baseline for comparison with other
plastid genes (Korall et al., 2007; Pryer et al., 2010; Li et al., 2011).
5
Selaginella Pal. Beauv., a perennial herbaceous plant (spike moss) is the only
surviving genus within the Selaginellaceae family. Selaginella is a unique terrestrial
heterosporous pteridophyte and is represented by about 700-750 species widely distributed
around the globe (Little et al., 2007). They grow in damp shady habitats; others are
xerophytic and grow on dry rocky cliffs. These xerophytic species are able to withstand
desiccation for months and expands when it is moistened. Such species are called resurrection
plants. Due to the drought-tolerance capacities, these species have different bioactive
chemical compounds which are medicinally important (Irudayaraj and Johnson, 2013).
Selaginella has been used as an alternative medicine to cure wound after childbirth, menstrual
disorder, skin disease, headache, fever, infection of exhalation channel and urethra, cirrhosis,
cancer, rheumatism, bone fracture etc (Setyawan and Darusman, 2008; Setyawan, 2009;
Setyawan, 2011).
Many methods have been carried out to characterize Selaginella species which
includes cytology (Manickam and Irudayaraj, 1988; Morbelli et al., 2001; Mukhopadhyay,
2002), histochemistry (Manickam and Irudayaraj, 1992), chemodiversity (Cheng et al., 2008;
Setyawan, 2011; Weng and Noel, 2013), phytochemistry and pharmacological studies
(Ma et al., 2002; Gayathri et al., 2005; Janaki et al., 2009; Duraiswamy et al., 2010;
Irudayaraj et al., 2010; Suganya et al., 2011; Sivaraman et al., 2013). Measurement of
morphological, anatomical and cytological traits alone may not serve as a useful criterion to
identify the fern ally Selaginella. Earlier work has revealed a great deal about concealed
genetic variability caused due to deleterious genes and cytological variations in Selaginella
(Manickam and Irudayaraj, 1988; Manickam and Irudayaraj, 1992; Morbelli et al., 2001;
Mukhopadhyay, 2002).
Globally, only very few reports are available on the molecular characterization and
systematic studies of Selaginella (Rodolfo et al., 1999; Korall and Kenrick, 2002; Korall and

6
Kenrick, 2004; Li et al., 2007; Banks et al., 2011; Hanna et al., 2012; Yobi et al., 2012; Das
et al., 2012; Harholt et al., 2012; Lydia et al., 2012; Weng and Noel, 2013; Gu et al., 2013).
But there is no report on the Indian Selaginella species. Hence, the present investigation is
aimed to determine the genetic similarities and variation of selected Selaginella species from
the Western Ghats of India using the biochemical and molecular analysis.
The specific objectives of the present investigation are as follows:
To reveal the protein profile of selected Selaginella species using SDS-PAGE.
To identify the protein similarities and variations among the Selaginella species by
applying MALDI-TOF MS analysis.
To determine the biochemical variation by means of isozymic profile.
To estimate the phylogenetical and evolutionary relationship among the selected
species of Selaginella using rbcL gene.
7
Review of Literature
Plants have always been the source of energy for survival and evolution of the animal
kingdom, thus forming the base for every ecological pyramid. Over the last few decades,
plant genomics has been studied extensively revolutionizing this area of research. During the
early period of research, classical strategies including comparative morphology, anatomy,
physiology and embryology were employed in genetic analysis to determine inter and
intra-species variability (Weising et al., 1995). In recent times, molecular markers have very
rapidly complemented the traditional strategies. Molecular taxonomy is an aspect of
molecular systematics, a broader term that includes the use of molecular data in
phylogenetics and biogeography (Schneider and Schuettpelz, 2006). The impact of molecular
data on the field of taxonomy can hardly be overstated. In combinations with explicit
methods for phylogenetic analysis, molecular data have reshaped concepts of relationships
and circumscriptions at all levels of the taxonomical hierarchy (Qui et al., 1999; Soltis et al.,
1999). As molecular phylogenetic studies have accumulated, it has become apparent that
different molecular tools are required for different questions because of varying rates of
sequence evolution among genomes, genes and gene regions. The choice of molecular tool is
very important to ensure that an appropriate level of variation is recovered to answer the
phylogenetic questions at hand. Nonetheless, the plant systematic community is using only a
small fraction of the available molecular tools (Small et al., 2004).
Every living organism contains DNA, RNA and proteins. In general, closely related
organisms which look morphologically similar have a high degree of agreement in the
molecular structure of these substances, while the molecules of distantly related organisms
usually show a pattern of dissimilarity. Conserved sequences are expected to accumulate
mutations over time and assuming a constant rate of mutation provides a molecular regulator

8
for dating divergence (Crawford, 2000). Such molecular composition can be studied by
genetic markers that represent genetic differences between individual organisms or species.
Such markers themselves do not affect the trait of interest because they are located only near
or linked to genes controlling the trait. Earlier, morphological markers were applied to
characterize phenotypic characters such as flower colour, seed shape, growth habits or
pigmentation (Sumarani et al., 2004). The main disadvantage of using morphological markers
is that they may be limited in number and are influenced by environmental factors or the
developmental stage of the plant and so measurement of morphological traits alone may not
serve as a useful criterion to evaluate plant germplasm (Winter and Kahl, 1995).
The theoretical frameworks for molecular systematic were laid in the 1960s. Early
attempts at molecular systematics or chemotaxonomy made use of proteins, enzymes,
carbohydrates and other molecules that were separated and characterized using biochemical
techniques such as chromatography and electrophoresis (Diaz et al., 2008). In addition,
biochemical techniques offered a powerful means of detecting introgression and
distinguishing it from other phenomena, such as joint retention of the ancestral condition and
convergence (Soltis, 1992). The sodium dodecyl sulfate polyacrylamide gel electrophoresis
(SDS-PAGE) technique is a powerful tool for estimating the molecular weights of proteins
(Weber et al., 1971). A major advantage of electrophoresis over morphological evaluation is
the speed with which a large number of test samples can be analyzed. It simultaneously
exploits differences in molecular size to resolve proteins differing by as little as 1% in their
electrophoretic mobility through the gel matrix (Scopes, 1994). Electrophoretic banding
pattern of polypeptides can be an efficient approach for assessment of different plant samples
(Felsentein, 2004).
Isozymes analysis has been used for over 60 years for various research purposes in
biology viz., to delineate phylogenetic relationships, to estimate genetic variability, to study

9
population genetics and developmental biology, to characterize the plant genetic resources
management and plant breeding. Isozymes originate through amino acid alterations which
cause changes in net charge or the spatial structure of the enzyme molecules and their
electrophoretic mobility (Soltis and Soltis, 1989). The strength of using isozymes is
simplicity; it does not require DNA extraction or the availability of sequence information,
primers or probes; they are quick and easy to use. Some plant species, however, can require
considerable optimization of techniques for certain enzymes. Isozymes have been applied in
many population genetic studies, including measurements of crossing rates, population
structure and population divergence (Freville et al., 2001). Isozymes are particularly useful at
the level of specific populations and closely related species and are therefore useful to study
diversity in crops and their relatives (Hamrick and Godt, 1997).
Isozymes are considered as molecular markers since they represent enzyme variants.
However, isozymes are in fact phenotypic markers since they may be affected by
environmental conditions (Krieger and Ross, 2002). They have been used often in concert
with other markers for fingerprinting purposes and diversity studies (Manjunatha et al.,
2003), to study inter-specific relationships (Garvin and Weeden, 1994), the mode of genetic
inheritance (Warnke et al., 1998), allelic frequencies in germplasm collections (Reedy et al.,
1995) and also to identify the parents of hybrids (Parani et al., 1997). The main disadvantage
of isozymes is their relatively low abundance and low level of polymorphism. Moreover,
proteins with identical electrophoretic mobility may not be homologous for distantly related
germplasm (Hudson et al., 1994).
With the advent of molecular era, a new generation of markers has been introduced
over the last two decades, which has revolutionized the entire scenario of biological sciences.
DNA-based molecular markers have acted as versatile tools and have found their own
position in various fields like taxonomy, physiology, embryology and genetic engineering.
10
They are no longer looked upon as simple DNA fingerprinting markers in variability studies
or as mere forensic tools. Ever since their development, they are constantly being modified to
enhance their utility and to bring about automation in the process of genome analysis (Miwa
et al., 2009). The discovery of PCR (Polymerase Chain Reaction) was a landmark in this
effort and proved to be an unique process that brought about a new class of DNA profiling
markers. This facilitated the development of marker-based gene tags, map-based cloning of
agronomically important genes, variability studies, phylogenetic analysis, synteny mapping
and marker-assisted selection of desirable genotypes. The DNA marker based approach gives
new dimensions to intensive efforts of breeding and marker-aided selection which can reduce
the time span of developing new and better varieties. These DNA markers offer several
advantages over traditional phenotypic markers, as they provide data that can be analyzed
objectively (Kumar et al., 2009). DNA markers may be broadly divided into three classes
based on the method of their detection viz., hybridization-based, PCR based and DNA
sequence based (Joshi et al., 2004).
DNA barcoding is an innovative molecular technique, which uses short and agreed
upon DNA sequences from either nuclear or cytoplasmic genome for rapid identification of
biological specimens at species level. Based on the study on 200 allied Lepidopteran species,
Hebert et al. (2003) were the first to propose the use of short DNA sequences as “Taxon
Barcodes” for species level identification. The DNA sequence which was found to be
applicable for barcoding animal species in their pioneering and subsequent studies was the
"Folmer region" at the 5' end of cytochrome c oxidase 1 (CO1), present in mitochondrial
genome (Hebert et al., 2003; 2004). Based on this initial success with animals, this was
projected as the locus that could provide recognition tags to all organisms including plants.
Realizing the importance of this technology, an international “Consortium for the Barcode of
Life” (CBOL) was established in 2004 (Lahaye et al., 2008). CBOL’s mission is to promote

11
the exploration and development of DNA barcoding as global standard for species
identification, through rapid compilation of high quality DNA barcodes in a public library of
DNA sequences. Another organization, International Barcode of Life (IBOL), based at
Guelph, Ontario in fact, is involved in barcoding of different group of plants and animals. It
aimed to generate DNA barcodes for 5 million specimens and 500,000 estimated species
existing on earth by 2015 (Muellner et al., 2011). DNA barcoding besides helping
taxonomists in rapid identification of new, cryptic, polymorphic species, is also a powerful
diagnostic tool in hands of enforcement agencies for checking illegal trade of endangered
species of both animals and plants especially bio-piracy (Jeanson et al., 2011). As opposed to
the current taxonomic methods which require whole plant preferably in flowering stage for its
authentic identification, DNA barcodes once standardized can identify the species even if a
minute amount of tissue/fragment is available (Yesson et al., 2011).
Diversity of pteridophytes
“Biodiversity is the degree of variety in nature and not nature itself”. The number of
species of plants, animals and microorganisms, the enormous diversity of genes in these
species; the different ecosystems on the planet such as deserts, rainforests and coral reefs are
all part of a biologically diverse earth (IIRS, 2002). India possess only 2% land mass of world
and harbors more than 7% of the global vascular plant species. Pteridophytes are primitive
vascular plants, which can adapt well in terrestrial habitat and form a conspicuous element of
the earth’s vegetation. Moreover they are important from evolutionary point of view and
reflect the emergence of seed habitat in the plants (Sumesh et al., 2012).
The global diversity of pteridophytes is yet not very clear; however the estimated
number of species in the world is about 9000-15000 (Haufler 1996; Smith et al., 2008). On
the other hand, according to Moran (2008) the exact number of pteridophytes is about 13,600
species. With reference to various enumerations, checklists and recent publications, the

12
number of Indian pteridophyte species is about 950-1000 species (Fraser-Jenkins, 2008;
Chandra and Fraser Jenkins, 2008; Chandra et al., 2008). Fraser-Jenkins (2009) enumerated
1050-1100 species of pteridophytes from India. Recently Kholia (2010) listed out 1200
species of pteridophytes. In India, the pteridophytes diversity is observed in the Himalayas,
Eastern and Western Ghats (Dixit, 2000) where as Western Ghats are a natural reservoir of
large number of important medicinal pteridophytes (Benjamin and Manickam, 2007).
After Beddome (1883) much work has not been done on Indian pteridophytes.
However an upswing was seen after 1950 in pteridological research and in almost all the
fields. Caius (1935) is supposed to be the first man who has described the medicinal uses of
some ferns of India. The most important studies on medicinal values of ferns and fern allies
were conducted by Nayar (1957), Hodge (1973), Dixit (1974), Dixit and Vohra (1984) and
Ghosh (1984). Jain and Sastry (1980) reported 17 rare and endangered species of
pteridophytes from India, followed by Dixit (1984) who included twenty five rare and
interesting pteridophytes from India. Bir (1987 and 1988) enumerated 156 rare and
endangered species of pteridophytes from various regions of India. Nayar and Sastry (1987;
1988; 1990) included 31 threatened pteridophytes in the volumes of the Botanical Survey of
India's Red Data Book of Indian Plants. Bharadwaja et al. (1987) enumerated 36 endangered
species belonging to 21 genera of ferns and fern-allies from Rajasthan. Pangtey and Samant
(1988) listed some rare and endangered pteridophytes of the Kumaun Himalaya, Uttarakhand.
Pande and Bir (1994); Pande and Pande (2003) identified 30 rare, threatened and endemic
taxa of the Kumaun Himalaya and later, Fraser-Jenkins et al. (2009) listed 123 rare and
endangered taxa of pteridophytes. Singh and Panigrahi (2005) reported 48 new and rare taxa
from Eastern Arunachal Pradesh and listed 16 endemics to North East India.
Manickam (1984) worked on the pteridophytes of Western Ghats in detail. Some of
the earlier prominent publications are ecological studies on the pteridophytes of Palni hills
13
(Manickam, 1984; Manickam, 1986), Cytology of the pteridophyte flora of Western Ghats,
South India (Manickam and Irudayaraj 1988; 1992). Madhusoodanan (1991) listed rare and
endangered ferns of the Western Ghats of Kerala, South India and later on, Manickam (1995)
reported 44 rare and endangered ferns and fern allies in the Western Ghats region of South
India. Benniamin et al. (2008) developed a key for identification of rare and endangered ferns
and fern allies of the Western Ghats.
Numerous works have been carried out in several pteridophytic species which
includes ethnobotanical (Rao et al., 2007; Sharief and Rao, 2007; Shil et al., 2009; Rout et
al., 2009; Sen and Ghose, 2011), taxonomical, phytochemical (Raja et al., 1995; Okwu,
2004; Shokeen et al., 2005; Hassan et al., 2007; Irudayaraj et al., 2010; Paulraj et al., 2011;
Britto et al., 2012; Mithraja et al., 2012; Johnson et al., 2013), cytological (Bir, 1962; 1965;
Ghatak, 1963; Bir and Vasudeva, 1979; Mahabale and Kamble, 1981; Manickam and
Irudayaraj, 1988; 1992; Irudayaraj et al., 1993; Irudayaraj and Bir, 1994; Bir et al., 1996),
pharmacognostical (Irudayaraj et al., 2005; Irudayaraj and Johnson, 2013), anti-bacterial
(Manickam et al., 2005; Khan et al., 2007; Maridass and Ghantikumar, 2008; Lai et al., 2010;
Panda et al., 2014), antifungal (Singh et al., 2008; Dolly et al., 2010), antidiabetic (Nair et
al., 2006), antioxidant (Beknal et al., 2010; Lai et al., 2010), anti-inflammatory (Zakaria et
al., 2006; Anuja et al., 2010), antihyperglycaemic activity (Ahmed et al., 2009; Sujith et al.,
2011; Paul et al., 2012), antidermatophytic activity (Nejad and Deokule, 2009) and other
pharmacological studies (Haripriya et al., 2010; Paul et al., 2012). In addition to the above
phytochemical and pharmacological examinations, the biochemical and molecular systematic
studies were also carried out by a number of pteridologists; Wolf et al., (1994); Pryer et al.,
(1995); Ebihara et al., (2002); Pinter et al., (2002); Hennequin et al., (2003); Skog et al.,
(2004); Zhang et al., (2005); Reid et al., (2006); Korall et al., (2007); Kirkpatrick (2007);
14
Johnson et al., (2007); Grusz et al., (2009); Johnson et al., (2010); Beck et al., (2011); de
Groot et al., (2012) and Johnson et al., (2012).
Molecular systematic studies on plants
The long-term survival and evolution of a species depends on the maintenance of
sufficient genetic variation within and among populations to adapt to new selection pressures
and those exerted by environmental changes (Barrett and Kohn, 1991). Genetic diversity
maintained in a plant species would be influenced by many processes, such as long-term
evolutionary history and characteristics of the species including genetic drift, gene flow and
mode of reproduction (Hamrick and Godt, 1990). Understanding the genetic variation within
and between populations is therefore required for the establishment of effective and efficient
conservation strategies for endemic and endangered plant species (Hamrick and Godt, 1996).
Characterization of genetic diversity in a plant species offers an opportunity to have a better
knowledge of the genetic affinity of germplasm (Syed et al., 2011).
The extent of genetic diversity in germplasm can be assessed through morphological
characterization and genetic markers. Morphometry could not provide solution of complex
taxonomic problems, modern biological techniques are now available that can resolve these
issues (Zubaida et al., 2006). Molecular marker technology provides a valuable tool to obtain
overall estimates of the genetic diversity of a species. In recent years, there has been
explosion in the availability of different types of molecular genetic markers which includes
proteins (Terry et al., 2007; Malik et al., 2009; Shah et al., 2011; Johnson et al., 2012),
isozymes (Smila et al., 2007; Johnson et al., 2010; Johnson et al., 2012), DNA hybridizations
(Chen et al., 2012), restriction enzymes (Tzfira et al., 2012), random PCR amplifications,
species-specific PCR primers (Periera, 2008; Bellstedt et al., 2010), RAPD (Pervaiz et al.,
2010; Elham et al., 2010), microsatellite markers (Rabbani et al., 2010), SNPs (Clarke et al.,
15
2013) and DNA sequence variation (Ren et al., 2010; Korall et al., 2010; Beck et al., 2011;
Alvarez et al., 2012; Pomponio et al., 2013).
Biochemical studies on plants
Proteomic analysis using biochemical techniques constructed a pathway to study the
genetic differentiation in plant populations. The word “proteome” was combined by the front-
half of protein and the back-half of genome (Wasinger et al., 1995) which indicates the
presence of all the proteins and their action modes in a cell, tissue or an organism. Analyses
of the variants occurring in plants concerning biochemical phenotype have been undertaken
to a lesser extent (Johnson and Manickam, 2003). Like other biological macromolecules such
as polysaccharides and nucleic acids, proteins are essential parts of organisms participate in
virtually every process within cells. Proteins have structural or mechanical functions and are
involved in biochemical reactions which are vital to metabolism (Omnia, 2010). Gene allele
codes for the production of amino acids that string together to form proteins. Thus,
differences in the nucleotide sequence of alleles result in the production of slightly different
strings of amino acids or variant forms of the proteins. These proteins code for the
development of the anatomical and physiological characteristic of the organism, which are
also responsible for determining aspects of the organism’s behavior (Bhat and Kudesia,
2011).
Proteins (SDS-PAGE) are simple to use in a variety of applications in plant
taxonomical research. The information on polymorphism using protein profiles in a set of
genotype is useful in tagging genes of interest and genetic mapping in extensive run to
facilitate marker assisted selection (Johnson et al., 2012) where as the banding positions and
regions of activity are variable based on the development of plants (Johnson and Patric Raja,
2007). Protein profiles are still powerful tools for determining genetic homology at the
molecular level and solving problems in systematic methodology (Johnson et al., 2012). The
16
methods available to isolate and distinguish proteins are electrophoresis, chromatography, gel
filtration, catalysis, immuno-techniques and sedimentation. Among these, electrophoresis is
often treated as the best investigative tool that has been applied successfully in many
botanical disciplines. It is especially employed for characterization and comparison of
germplasm as well as evaluation of protein expression at different developmental stages of
plants (Smila et al., 2007). Originating in the 1930s and till now electrophoresis technique
has been used as a tool for the study of heritable and developmental variations by geneticists,
systematists and population biologists because of their relative efficiency and cost
effectiveness (Siva and Krishnamurthy, 2005; Johnson, 2007; Smila et al., 2007; Johnson et
al., 2010).
Seigneurin-Berny et al. (1999) developed a novel approach based on the selective
extraction of hydrophobic proteins using organic solvents, followed by classical
polyacrylamide gel electrophoresis in the presence of sodium dodecyl sulfate (SDS-PAGE).
This procedure allowed the characterization of well known envelope membrane proteins that
displayed several transmembrane segments. Interestingly, most of these proteins were found
to be basic proteins which are detected by SDS-PAGE and shown to contain putative
transmembrane domains. SDS-PAGE also provided valid evidence for assessing
inter-specific relationships and intra-specific variation (Kamel et al., 2003; Javaid et al.,
2004; Celebi et al., 2009; Hameed et al., 2009). Many plant genotypes have been
characterized on the basis of electrophoresis profiles by SDS-PAGE (Zhan and Lin (1991);
Montalavan et al., (1995); Santhy et al., (1998); Habib et al., (2000); Sengupta and
Chattopadhayy (2000); Ghafoor et al., (2002); Asghar et al., (2004); Vivekananthan et al.,
(2005); Weber et al., (2005); Zubaida et al., (2006); Johnson et al., (2007); Babu et al.,
(2010); Malik et al., (2009); Muhammed et al., (2010); Joelri et al., (2011); Johnson et al.,
(2012); Johnson and Narayani (2013), Neilson et al., (2014). Revathy et al. (2011) studied
17
the protein variation of Adiantum raddianum, Arachniodes tripinnata, Dryopteris sparsa and
Odontosoria chinensis using SDS-PAGE. Sivaraman et al. (2011) determined the proteomic
expression of Tectaria paradoxa, Araiostegia hymenophylloides and Deparia petersonii
using electrophoresis.
MALDI-TOF MS analysis on plants
Knowledge of plant development and function can be obtained by determining the
distribution of proteins and metabolic processes within plant tissues. Development of
improved high-throughput proteomics techniques has shifted attention to ‘protein profiling’,
while attempts were made to identify all proteins that are present in a cell (Yates, 2004).
Analysis of a complete proteome remains a challenge, despite significant advances in mass
spectrometry technology and peptide fractionation tools. Such a challenge can best be tackled
by community effort of MALDI-TOF MS analysis because ionization method is generally
quite selective for different peptides. MALDI was first introduced in 1988 by Karas and
Hillenkamp as a revolutionary method for ionizing and mass-analyzing large biomolecules
where MALDI-TOF MS was first reported by Spengler (1994) and which has been applied to
visualize peptides and proteins by Caprioli (1997). MALDI-TOF MS analysis has the
potential to provide new insights into the molecular analysis of plants by providing high
spatial resolution information about proteins and potentially quantitative changes during plant
development or those induced by environmental variation (Grassl et al., 2011). Genome
annotation based on peptide identification in particular requires an open source platform to
collect and integrate MS data (Desire et al., 2007). The ionization principles will improve the
coverage of proteins and therefore MS data will increase the success of identification of
proteins in plants. Researchers have isolated and identified more than 200 protein complexes
using MALDI spectroscopic profile, providing clues as to how an entire proteome is
organized into functional units (Ohkmae, 2004).
18
Proteomic research using mass spectrometry is advanced in animals and yeast, plant
proteomics and its subcellular proteins are still at the initial phase (Zivy and de Vienne, 2000;
van Wijk, 2001; Kersten et al., 2002). Rice is the first crop genome to be decoded where the
rice proteome has been systematically analyzed using MS methods (Komatsu et al., 2003;
Rakwal and Agarwal, 2003). Cellular proteins are actively and passively transported across
cellular and organelle membranes during normal homeostasis and in response to stress and
external stimuli (Agarwal et al., 2005). Accurate identification and quantification of a sub-
cellular proteome is very useful and can provide insight into cellular/organelle function and
dynamics. In addition to the field of functional proteomics, sub-cellular proteomics can
provide insight into the molecular mechanisms of plant cell modulation of protein
accumulation in intracellular compartments in response to various perturbations and thus
provide refined knowledge about signal transduction in organelles (Hossain et al., 2012).
Some of the major sub-cellular organelles are plasma membranes, chloroplasts, mitochondria
and nucleus in which specific proteins from such organelles are studied by several
researchers (Rouquie et al., 1997; Peltier et al., 2000; Prime et al., 2000; Kruft et al., 2001;
Bae et al., 2003). By using proteomic tool of mass spectrometry analysis, over 400 proteins,
including 30 proteins from the tricarboxylic acid cycle, 78 proteins from the ETC and more
than 20 proteins from amino acid metabolism pathways have been identified in mitochondria
from the model plant Arabidopsis thaliana (Ito et al., 2007).
Peltier et al. (2000) investigated luminal and peripheral thylakoid proteins by a
combination of 2-DE and MALDI-TOF MS, and allowed a unique comparison of the two sub
proteomes in the plant chloroplast. The results estimated 200-230 different luminal and
peripheral proteins. Sixty-one proteins were identified, of which 33 are identified as a
functional domain, whereas 10 proteins had no annotated function. Peltier (2001) identified
350 kDa chloroplast protein protease complexes with 10 different subunits in the chloroplast

19
of Arabidopsis thaliana using MALDI-TOF MS analysis. A new chloroplast protein was thus
discovered that does not belong to any of the known chloroplast gene families. Yamaguchi
and Subramanian (2000) identified the proteins of 30S and 50S ribosomal subunits in spinach
chloroplasts by a combination of 2-DE, chromatography and mass spectrometry. The results
estimated that the Spinach plastid ribosome comprises 59 proteins, of which 53 are
Escherichia coli orthologues and six were non-ribosomal plastid specific proteins. Koller et
al. (2002) studied a systematic proteomic analysis of rice leaves, root and seed tissue using
independent technology of mass spectroscopic methods. The results allowed the
identification of 2,258 unique proteins. Among them, 189 proteins were detected in all of the
tissues which found to be involved in the central metabolic pathways, transcription control,
mRNA biosynthesis and protein biosynthesis.
Castillejo et al. (2008) analyzed the drought stress proteins in sunflower (Helianthus
annus) leaves by MALDI-TOF mass spectrometry. Out of the 23 identified proteins,
Helianthus annus matched 6 proteins followed by Arabidopsis thaliana (10), Nicotiana spp.
(3), Solanum tuberosum (1), Pisum sativum (1), Flaveria bidentis (1) and Selaginella
utahensis (1). Natarajan et al. (2009) elucidated a total of 107 low abundant proteins from
soybean seed using combined action of MALDI-TOF mass spectrometry and liquid
chromatography-mass spectrometry (LC-MS).
Kumar and Kumari (2009) described MALDI-TOF MS as an efficient method to
identify the variation of protein expression in in vitro and in vivo plants of Artemisia vulgaris.
The results showed that 59 µg of protein is present in in vitro leaf samples (50 µl), where as
in vivo plants have 58 µg of proteins in 50 µl of leaf sample. In addition proteins with
molecular weight 64, 48 and 37 kDa were significantly increased in in vivo where as 79, 53
and 28 kDa proteins were significantly increased in in vitro plant samples. Tian et al. (2009)
applied proteomic approaches of MALDI-TOF MS to identify genes and proteins involved in
20
antimicrobial defence, heavy metal uptake and translocation. A total of 74 proteins which
encodes metal binding and transport proteins, transcription factors, ABC transporters and
phenylpropanol biosynthetic enzymes were identified.
Kamal et al. (2010) identified the abiotic stress responsive proteins from wheat using
MALDI-TOF mass spectrometry. Of the total number of 575 identified proteins, 345 proteins
were recognized as abiotic stress responses unique proteins with isoforms. Of which 34% are
induced by heat, 27% are induced by drought, 15% by salt, 13% by cold and 11% by other
environmental stress.
Zhao et al. (2012) analyzed the differential expression of proteins in the rice leaves
and roots using MALDI-TOF MS. A total of 16 proteins were expressed in the rice leaves
and 25 proteins were expressed in the rice roots. The identified proteins were involved in
photosynthesis, carbohydrate metabolism, nitrogen metabolism, oxidative phosphorylation,
oxidative stress responses, signal transductions and cell division respectively. Hong et al.
(2012) used two-dimensional electrophoresis (2-DE), coupled with MALDI-TOF MS to
identify the mitochondrial protein expression between two plants Ananas comosus and
Kalanchoe pinnata. Peptide mass spectrometry permitted identification of 12 and 15 proteins
in mitochondrial 2-DE gels of A. cosmosus and K. pinnata respectively. Mitochondria-
specific proteins of A. cosmosus included three isoforms of ATP synthase sub unit beta, an
ATP synthase subunit alpha, phenylalanine ammonia-lyse 2, a mitochondrial ribosome
protein S3, a glucose-6-phosphate isomerase and a 14-3-3-like protein GF 14-F. Major
proteins specific to K. pinnata mitochondria included ADP-ATP carrier protein, an ATP
catalytic subunit A, a malate dehydrogenase and an outer mitochondrial membrane protein
(porin 2).
Datta et al. (2013) studied the changes in leaves proteome profile of Arabidopsis
thaliana in response to salicylic acid using MALDI-TOF MS analysis to identify

21
differentially expressed proteins. This proteomic profiling of salicylic acid treated leaves
versus control leaves demonstrated the changes of many defense related proteins like
pathogenesis related protein, disease-resistance protein, putative late blight-resistance protein,
WRKY4 and MYB4 along with gross increase in the rate of energy production. Lee et al.
(2013) characterized the sub-cellular organelle proteomes such as nuclei and mitochondria as
well as proteins distributed in plasma or microsomal membranes from various tissues in
Medicago truncatula by applying MALDI-TOF MS. The results enhanced the detection of
low abundance proteins and increased the overall detectable proportion of the sub-cellular
proteome.
Isozyme analysis on pteridophytes
Multiple forms of enzymes generally called as isozymes which catalyze the same
chemical reaction if their polypeptide constituents are coded by more than one gene locus and
allozymes coded by different alleles of the same locus (Hamrick and Gadt, 1997). The
existence of isozymes permits the fine-tuning of metabolism to meet the particular needs of a
given tissue or developmental state. Isozymes are useful as genetic and biochemical markers
and also as good estimators of genetic variability in plant populations. Isozymes were first
described by Hunter and Markert (1957). The expression of various isozymes differs both
temporally and spatially. Isozymes are usually the result of gene duplication, but can also
arise from nucleic acid hybridization. Isozyme markers can correctly identify several levels
of taxa, accessions and individuals since the assumption of homology can be more accurate
than for same genomic DNA markers (Karp et al., 1997).
Numerous enzymes were tested as markers for developmental processes in plants, but
there are few reports related to pteridophytes. The most interesting group of enzymes called
esterases (EST, E.C.3.1.1.6), which hydrolyze ester bonds, generally have a broad spectrum
of substrates and act on a wide variety of natural and xenobiotic compounds. 1-and 2-

22
naphthylacetate are often used for visualization of these enzymes in plant tissues (Peskan et
al., 2000). A few reports have been made on the presence of esterases in fungi, bacteria (Lee
et al., 1987; Oakeshott et al., 1993) and in plants (Krsnik-Rasol et al., 2001; Cummings and
Krafsur, 2005). Characterization of purified enzyme is critically important to elucidate
physiological functions and mechanisms of plant peroxidase. Peroxidase (PO, E.C.1.11.1.7)
is an enzyme found in all aerobic cells, which functions to decompose toxic hydrogen
peroxide (Petersen and Anderson, 2005). Knowledge of catabolic processes and the
properties of enzymes involved enables manipulation of peroxidase catabolism using
molecular approaches has been investigated by several researchers (Sebela et al., 2001; Yoda
et al., 2003; Cona et al., 2003).
Acid phosphatases (ACP, EC 3.1.3.2) are widely distributed in plants and animals
which catalytically break down a wide variety of phosphate esters and exhibit pH optima
below 6.0 (Vincent et al., 1992). Acid phosphatase is believed to be important for many
physiological processes, including regulation of phosphorus efficiency (Asaduzzaman et al.,
2011). Acid phosphatases have been purified and characterized from many of the plant
species (Ullah and Gibson, 1988; Panara et al., 1990; Staswick et al., 1994; Olczak et al.,
1997; Guo and Pesacreta, 1997; Kusudo et al., 2003; Kouadio, 2004; Gonnety et al., 2006).
The metalloenzyme known as alkaline phosphatase (ALP, EC 3.1.3.1) exists as several
tissue-specific isozymes encoded by separate genes. ALP is expressed in many species which
includes plants, animals and bacteria which catalyze the hydrolysis of phosphomonoesters
(Holtz and Kantrowitz, 1999). More than 80 years ago, the high level of ALP expression was
first noted in humans (Golub and Boesze-Battaglia, 2007).
Polyphenol oxidase (PPO, E.C.1.10.3.2) is a ubiquitous copper-containing protein
widely distributed in plant kingdom which uses molecular oxygen to oxidize common ortho-
diphenolic compounds such as caffeic acid and catechol to ortho-quinones. The o-quinones
23
are highly reactive substances that can react with aminoacids, peptides and proteins and thus
altering structural and functional properties of the cell (Zivkovic, 2009). PPO has been
characterized in a wide variety of plants (Mayer, 2006; Yoruk and Marshall, 2003). Recent
studies have indicated that phenol oxidizing enzymes may participate in response to various
abiotic stresses including drought (Zivkovic et al., 2009).
Isozymic studies on several fern taxa were carried out electrophoretically viz.,
Polypodium (Gastony, 1982; Bryan, 1987), Asplenium (Werth, 1985), Dryopteris (Werth,
1991), Bommeria (Haufler, 1985), Cystopteris (Haufler, 1987) and Pellaca (Gastony and
Gottlieb, 1985). Woodin et al. (1978) isolated two isozymic bands of chorismate mutase and
such bands are applied as diagnostic characters of Selaginella. Almost 30 years ago, isozyme
analyses of a small group of ferns in the genus Asplenium provided the first solid evidence
that a single polyploid species could have multiple, independent origins (Werth et al., 1985).
Haufler and Soltis (1986) elucidated the genetic constitution of the complex polypodiaceous
pattern in homosporous ferns by the expression of phosphoglucomutase and triose-phosphate
isomerase using isozymic analysis comparing with diploid angiosperms.
Phosphoglucomutase has a duplicated locus in Bommeria chrenbergiana, Asplenium
montanum and Polypodium virginianum where such locus is also observed in diploid
angiosperms. The complex banding patterns of triose-phosphate isomerase detected in
homosporous ferns and in diploid seed plants typically display two isozymes, one in the
chloroplast and the other in the cytosol.
Shigeo and Yasuyuki (1994) conducted an electrophoretic analysis of enzymes for the
Japanese fern Cratopteris thalictroides and confirmed the hybrid sterility between two
isozymic types of C. thalictroides. Korpelainen (1995) carried out enzyme genetic variation
in bracken fern Pteridium aquilinum by means of electrophoretic analysis. The mean value of
the differentiation among populations was high and the level of genetic divergence was

24
considerable. Hooper and Haufler (1997) explored the genetic diversity and breeding system
of six members of the epiphytic fern genus Pleopeltis, using electrophoretic analysis of
isozymes such as phosphogluco isomerase (PGI), triosephosphate isomerase (TPI), aspartate
aminotransferase (AAT), leucine aminopeptidase (LAP), hexokinase (HK), aldolase, malate
dehydrogenase (MDH), isocitrate dehydrogenase and shikimic dehydrogenase (SKDH). A
total of nine isozymes encoded by 11 putative gene loci were consistently resolved in all
Pleopeltis species and varieties showed that Pleopeltis species are diploid in nature.
Huang et al. (1997) determined the genetic diversity in Asmina triloba from nine
states using electro-focusing of a 24 enzyme system viz., acid phosphatase, alcohol
dehydrogenase, aconitate hydratase, adenylate kinase, formate dehydrogenase, fructose-
bisphosphate aldolase, fructose-bisphosphatase, fumarate hydratase, glucose-6-phosphate
dehydrogenase, glutamate dehydrogenase, glyceraldehyde-3-phosphate dehydrogenase,
isocitrate dehydrogenase, dihydrolipoamide dehydrogenase, malic enzyme, phosphogluco
isomerase, peroxidase, malate dehydrogenase, isocitrate dehydrogenase, mannose phosphate
isomerase, peroxidase, phosphoglucomutase, phosphogluconate dehydrogenase,
triosephosphate isomerase and shikimate dehydrogenase (SKD). Of the 24 enzyme systems
23 presumptive loci were observed and 49 alleles were detected across populations. The
results also explained mean number of alleles per locus (1.54), polymorphic loci (43.5%),
effective number of alleles per loci (1.209) and heterozygosity (0.172). Partitioning of genetic
diversity was observed as 88.2% within populations. Santiago (1999) studied the genetic
diversity in populations of Cryptogramma crispa (Pteridaceae) by means of isozymic
analysis. The percentage of polymorphic loci and the similarity levels obtained from the
isozyme analyses indicate a level of genetic variability of C. crispa are usually associated
with diploid fern species rather than polyploid species.
25
Herrero (2001) tested the isozyme variation and genetic relationships among diploid
and tetraploid taxa in the Asplenium obovatum group (Aspleniaceae) encoded by
electrophoretic analyses of eight enzyme system which includes triose phosphate isomerase
(TPI), phosphogluco isomerase (PGI), malate dehydrogenase (MDH), 6-phosphogluconate
dehydrogenase (6PGD), shikimate dehydrogenase (SDH), phosphoglucomutase (PGM),
aminotransferase (AAT) and leucine aminopeptidase (LAP). Gel stained with each enzyme
system showed two regions of band activity corresponding to both diploids and tetraploids in
homozygous and heterozygous pattern. Pajaron et al. (2005) evaluated seventeen populations
of Asplenium seelosii using isozyme electrophoresis. There was no genetic identity within
and between populations. It also clearly differentiated two groups viz., Asplenium
seelosii and Asplenium celtibericum and do not support the recognition of subspecies in this
complex. He et al. (2005) purified and characterized polyamine oxidase from the aquatic
nitrogen-fixing fern Azolla imbricata using electrophoretic analysis. SDS-PAGE gave a
single protein band corresponding to a molecular mass of 65.5 kDa. The overall purification
yield of polyamine oxidase was 7% of total activity which was purified by a factor of 82-fold
mg protein.
Various studies have been carried out on the isoperoxidase profiling on the south
Indian ferns and fern allies (Soltis and Soltis, 1993, 1999). Irudayaraj et al. (2009) illustrated
the isozymic evidence for the common origin of Diplazium species confined to South India
and Sri Lanka. A total of 30 bands in twenty five different positions with seven activity
regions were observed in the isoperoxidase enzyme system of Diplazium. Maximum degree
of diversity has been observed in D. travancoricum with the presence of fourteen bands,
followed by D. polypoides with nine bands, D. cognatum with four bands and D. dilatum
with two bands respectively. Johnson et al. (2010) identified the genetic distinction of three
filmy ferns viz., Trichomonas obscurum, Trichomonas proliferum and Trichomonas plicatum

26
using isoperoxidase analysis. A total of sixteen bands were obtained in Trichomonas enzyme
system. Bands were observed between zone four to nine and other zones were failed to
express in Trichomonas isoperoxidase enzyme system. Johnson et al. (2010) illustrated the
isoperoxidase banding profile for some selected species of Pteris from India. A total of thirty
eight bands were scored in thirty one different positions with eight active zones. The study
revealed the biochemical positions of the Pteris complex in which the similarity and variation
index between the five species of Pteris were reported with reference to isoperoxidase
profiles.
Johnson et al. (2010) studied the biochemical difference between the different
developmental stages of four rare and endangered ferns of Western Ghats of South India viz.,
Cheilanthes viridis, Phlebodium aureum and Pronephrium triphyllum and Sphaerostephanos
unitus using isozymic analysis. Four zones of activity were observed in C. viridis, multiple
zones of activity were obtained for P. aureum and P. triphyllum. Five zones of activity were
obtained in S. unitus. The isozyme profiles revealed the biochemical changes between the
different developmental stages of selected ferns. Johnson et al. (2010) studied the isozymic
variation of Tectaria coadunata, Tectaria wightii and Tectaria paradoxa using PAGE. A total
of seventeen bands with active regions were expressed in isoperoxidase enzyme system. The
study revealed hundred percentage genetic differentiations between the three Tectaria
species. Johnson et al. (2010) revealed inter-specific variation in the crude drugs of Maiden
hair ferns (Adiantum) from the Western Ghats, South India by means of isoperoxidase
analysis. Adiantum raddiannum and Adiantum lunulatum; Adiantum caudatum and Adiantum
zolingeri banding profile showed high percentage of similarity indices compared to other
species. The band PRX 13
and PRX 14, PRX 2
4, PRX 4
4and PRX 7
1showed their unique
presence in A. raddianum, PRX 51
for A. caudatum, PRX 64
and PRX 72
for A. zolingeri,
PRX 31, PRX 9
1, PRX 9
3and PRX 10
1for A. lunulatum, PRX 2
3and PRX 6
1for A.
27
hispidillum and PRX 43
for A. incisum. These unique bands can be used to distinguish and
characterize the species and differentiate the original crude drug from the adulterant.
Irudayaraj and Johnson (2011) identified the phylogenetic relationships among three
medicinally important species of Sphaerostephanos viz., S. arbuscula, S. unitus and S.
subtruncatus from South India using isozymic profile. A total of six different bands in five
different positions with different molecular weight were obtained. One band with MW/Rf
0.399 is common to S. arbuscula and S. unitus. Two bands (Rf 0.23 and 0.47) are present in S.
subtruncatus and one distinct band has been observed individually in S. arbuscula (Rf 0.507)
and S. unitus (Rf 0.56). Johnson et al. (2012) revealed inter-specific variation on three South
Indian species of tree fern Cyathea viz., C. gigantea, C. nilgirensis and C. crinita by applying
isoperoxidase analysis. A total of seven bands with three active regions were expressed in the
Cyathea spp. enzyme system. The banding pattern revealed hundred percentage genetic
differentiations between the three Cyathea species which belong to three different intra
generic taxonomical groups. Johnson et al. (2012) assessed the genetic variation between
different populations of Thelypteris ciliata collected from different localities on Tirunelveli
hills, using isoperoxidase profiling. A total of six bands in six different positions with five
active regions were observed in the isoperoxidase system of T. ciliata. The isoperoxidase
enzyme systems confirm the intra and inter population’s genetical difference of T. ciliata.
DNA barcoding on pteridophytes
DNA barcoding is an emerging global standard for recognition and identification of
eukaryotic species through comparison of sequences of a short DNA fragment called DNA
barcode from an unknown specimen to a library of reference sequences from known species
(Schori and Showalter, 2011). This allows identifying an organism at any stage of
development from a very small tissue sample, fresh or conserved many years ago. In
addition, to assigning specimens to known species, DNA barcoding will accelerate the ace of

28
species discovery by allowing taxonomists to rapidly sort specimens and by highlighting
divergent taxa that may represent new species. By augmenting their capabilities in these
ways, DNA barcoding offers taxonomists the opportunity to greatly expand and eventually
complete a global inventory of life’s diversity (Hebert and Gregory, 2005). An optimal DNA
barcode region is a small fragment present in all species of a major taxonomic group, having
invariable nucleotide sequence in all members of the same species, but with sufficient
variation to discriminate among the species. This fragment should be flanked by low-variable
regions for use of primers in PCR amplification and sequencing (Schneer, 2009).
A segment of the mitochondrial cytochrome c oxidase I gene is widely accepted as the
standard barcode region in animals (Hebert et al., 2003). In plants, however, no equivalently
accepted DNA barcode has been identified, despite the fact that many resolutions have been
proposed in the leading literature (Lahaye et al., 2008; Kress and Erickson, 2010; Asahina et
al., 2010; CBOL, 2010). Plastid genome (plastome) sequence information is of central
importance to trace the evolutionary history of plastids and their hosts. The small genome
size and high copy number per cell have made the plastid genomes sequencing much more
amenable than nuclear genomes. Currently, there are at least 190 completely sequenced
plastid genomes available, of them 163 are from various green plants, with land plants having
the best representation (Lai et al., 2010). Analysis of over 10,000 plastid genome (rbcL)
sequences from GenBank demonstrate that this locus could serve as the core region, with
sufficient variation to discriminate among species in approximately 85% of congeneric pair-
wise comparisions (Newmaster et al., 2006). Although efforts to identify a DNA barcode for
discriminating among recognized species are less successful in plants than animals, in recent
years, researchers have reported many efficient cases for plant DNA barcoding (Kress et al.,
2010; Li et al., 2011; de Groot et al., 2012).

29
Green (1971) isolated DNA from three genera of ferns (Angiopteris, Ophioglossum,
Ciboteum) and three genera of fern-allies (Psilotum, Equisetum, Selaginella). Pryer et al.
(1995) recorded a broad sampling of 50 existing Pteridophyte taxa, with representatives of all
major fern groups, and one seed plant (Cycas). Results from the morphological analysis are
compared with an independent analysis of rbcL data carried out for the same set of
pteridophyte taxa. Wolf et al. (1994) clarified the phylogenetic relationships among genera
and families of dennstaedtioid ferns by sequencing 1320 bp of the chloroplast gene rbcL from
45 species representing 13 families. Sequence divergence for rbcL averaged 0.9% among
species within genera, 10.3% among genera within families and 14.8% among families and
suggested that the data are appropriate for phylogenetic analysis at the generic and familial
levels in ferns. Maximum parsimony analysis resulted in four shortest trees of equal length.
Tree ferns form a single clade and Hymenophyllaceae appear as sister groups to the
dennstaedtioid ferns on all shortest trees. Polypodiaceae and adiantoid ferns groups
considered separate from the dennstaedtioid families emerged within the dennstaedtioid
clade.
Dubuisson et al. (2003) estimated the evolutionary relationships within the filmy fern
genus Trichomanas (Hymenophyllaceae) using rbcL nucleotide data from 46 species of
Trichomanas belonging to four subgenera: Achomanes, Didymoglossum, Pachychaetum and
Trichomanas. Out groups included four species of Hymenophyllum and the monotypic genus
Cardiomanes from New Zealand. The phylogenetic optimization includes two species
belonging to Morton’s Asiatic sections Callistopteris and Cephalomanes which are in
unresolved basal positions within Trichomanas and suggested that rbcL data alone are
inadequate for estimating the earliest cladogenetic events. Out of the four subgenera
Didymoglossum appears monophyletic. Lacostea is more closely related to Davalliopsis
(Pachychaetum) than to other members of subgenera Achomanes. Davalliopsis and Lacostea,

30
together with species of the morphologically different subgenera Achomanes, make up a
strongly supported Neotropical clade. Hemiepiphytes and strictly epiphytic or epipetric
species are grouped together in an ecologically definable clade that also includes Nesopteris.
Lacosteopsis (sensu Morton) is polyphyletic and comprises two distantly related clades: large
hemiepiphytic climbers and small strictly epiphytic/ epipetric taxa. Based on their work, each
of these associations is also supported by cytological, geographical, and ecological evidence
taxa.
Ranker et al. (2003) conducted a molecular phylogenetic analysis of the endemic
Hqwaiian fern genus Adenophorous (Grammitididaceae) by employing DNA sequence
variation from three cp DNA fragments viz., rbcL, atpB and the trnL-trnF intergenic spacer
(IGS). Phylogenetic analyses of individual DNA fragments resulted in single strong
supported phylogenetic hypothesis. The primary features of hypothesis are Adenophorus is
monophyletic, subgenus Oligadenus is paraphyletic, the endemic Hawaiin species Grammitis
tenella is strongly supported as the sister taxon to Adenophorous. Highly divided leaf blades
are evolutionary derived in the group and simple leaves are the ancestral and the common
ancestor of Adenophorus tenella clade remains unresolved.
Hauk et al. (2003) represented the phylogenetic studies of 36 species of
Ophioglossaceae using rbcL and trnL-trnF plastid DNA sequences. Individual and combined
analyses of the three data sets revealed two main clades of ophioglossoid and botrychioid
within the family. In the botrychioid clade, Helminthostachys was sister to a broadly defined
Botrychium and in some case Sceptridium was sister to Botrychium. Botrypus was
paraphyletic with Botrypus virginianus sister to Botrychium and Sceptridium. Botrypus
strictus was sister to all other botrychioid species except Helminthostachys. In the
ophioglossoid clade, Ophioglossum was sister to Cheiroglossa and Ophioderma but
relationships within Ophioglossum were not well supported.

31
Schneider et al. (2004) explored the phylogeny of the polygrammoid ferns using
nucleotide sequences derived from three plastid loci for each of 98 selected species. The
analyses recovered four major monophyletic lineages: the loxogrammoids, two clades and a
largely neotropical clade includes the pantropical Grammitidaceae. The loxogrammoid
lineage diverges first and is sister to a large clade comprising the three remaining species-rich
lineages. One paleotropical clade includes the drynarioid and selligueoid ferns whereas the
second paleotropical clade includes the platycerioids, lepisoroids, microsoroids and their
relatives. The grammitids nest within the neotropical clade in which epiphytic group remains
ambiguous. Microsorum and Polypodium were recovered as polyphyletic. In addition, the
analysis revealed that the rate of substitution in the grammitids is remarkably higher relative
to other polygrammoids.
Pryer et al. (2004) studied the phylogeny and evolution of ferns (monilophytes) with a
focus on the early leptosporangiate divergences. More than 5000 bp from the plastid (rbcL,
atpB, rps4) and the nuclear (18S rDNA) genomes were sequenced for 62 taxa. Phylogenetic
analyses confirmed that Osmundaceae are sister to the leptosporangiates, Dipteridaceae,
Matoniaceae, Gleicheniaceae, Hymenophyllaceae are monophyletic and schizaeoid ferns as
sister to a large clade of "core leptosporangiates" included heterosporous ferns, tree ferns and
polypods.
Korall et al. (2006) investigated phylogenetic relationships within tree ferns
Cyatheaceae, Plagiogyriaceae and Hymenophyllopsidaceae based on analyses of four protein-
coding, plastid loci (atpA, atpB, rbcL and rps4). The results revealed four well-supported
clades with genera of Dicksoniaceae interspersed among Loxomataceae, Culcita,
Plagiogyriaceae, Calochlaena, Dicksonia, Lophosoriaceae where Cibotium and Cyatheaceae
nested within Hymenophyllopsidaceae. These four groups are related to one another in which

32
Thyrsopteris and Metaxyaceae are weakly supported. In addition the results showed
Dicksoniaceae and Cyatheaceae are not monophyletic.
Schuettpelz and Pryer (2007) analyzed the most inclusive molecular dataset for
leptosporangiate ferns using three plastid genomes (rbcL, atpB and atpA). More than 4,000
bp, were sequenced for each of 400 leptosporangiate fern species and five outgroups.
Maximum likelihood analysis yielded strong phylogeny (80%) and the nodes were supported
!" #" $#%&$'$" (&)*(&+,,-" ,,./.0#1" 1*02*3.#4*" 5" 678" 9+*" #3#(!/&/" 10,:&-*-" #" 0*2,0d
approaching overall fern relationships, not only delivering additional support for the deepest
leptosporangiate divergences, but also uncovering the composition of more recently emerging
clades and their relationships to one another. Schuttpelz et al. (2007) presented a molecular
phylogeny of the fern family Pteridaceae by assessing overall relationships and the affinities
of previously unsampled genera. The analyses resulted in two newly assembled data sets
including 169 newly obtained sequences resolved five major clades within the Pteridaceae
viz., cryptogrammoids, ceratopteridoids, pteridoids, adiantoids and cheilonthoids. Of the
previously unsampled genera, Neurocallis and Ochropteris are nested within the genus
Pteris, Monogramma and Rheopteris are early diverging vittarioid ferns, Monogramma
resolved as polyphyletic and Adiantopsis occupied among cheilanthoids.
Korall et al. (2007) investigated the phylogenetic relationships of scaly tree ferns
based on DNA sequence data from five plastid regions (rbcL, rbcL-accD IGS, rbcL-atpB
IGS, trnG-trnR and trnL-trnF). The results resolved Sphaeropteris as sister to all other taxa
and scale features support two clades. Sphaeropteris has conformed scales, whereas all other
taxa have marginate scales. The marginate-scaled clade consists of three groups namely
Cyathea including Cnemidaria, Hymenophyllopsis, Trichipteris, Alsophila includes Alsophila
capensis and Gymnosphaera. Nagalingum et al. (2008) conducted a broad species level
relationship for Piluria and Salvinia using coding (atpB, rbcL and rpsA) and non coding
33
plastid regions (trnL, trnGR and rps4-trnS). Their analyses resolved that Marsileaceae,
Salviniaceae and all of the component genera as monophyletic. Salviniaceae incorporate
Salvinia and Azolla; in Marsileaceae, Marsilea is sister to the clade of Regnellidium and
Pilularia. Individual species level investigations for Pilularia and Salvinia provide
phylogenies within all genera of heterosporous ferns. Nitta (2008) explored the utility of three
plastid loci (rbcL, trnSGG and trnH-psbA) by sequencing the filmy ferns
(Hymenophyllaceae) known from Morea.
Grusz et al. (2009) studied the origin of apomictic polyploids in the Cheilanthes
yavapensis complex (Pteridaceae) by plastid and nuclear DNA sequencing. Plastid and
nuclear DNA sequencing revealed Cheilanthes lindheimeri is an autopolyploid derived from
a rare and undetected sexual diploid. The apomictic triploid Cheilanthes wootonii is an inter-
specific hybrid between Cheilanthes fendleri and Cheilenthes lindheimeri, whereas the
apomictic tetraploid Cheilanthes yavapansis comprised of two cryptic and geographically
distinct lineages. Their work suggested that deciphering species relationship and hybrid
origins in polyploidy agamic species complexes is difficult due to the cryptic nature of the
morphological characters that distinguish species but it is possible to use plastid phylogenies
to identify the maternal parents of hybrid ferns.
Ebihara et al. (2010) identified the pteridophytic flora of Japan (733 taxa including
subspecies and varieties) in molecular level to test the utility of two plastid DNA barcode
regions (rbcL and trnH-psbA) with the intention of developing an identification system for
native gametophytes. DNA sequences were obtained from each of 689 taxa for rbcL and 617
taxa for trnH-psbA. Mean inter-specific divergence values across all taxon pairs did not
reveal a significant difference in rate between trnH-psbA and rbcL but mean genetic distances
of each genus showed significant heterogeneity according to systematic position. Their
results suggested that DNA barcoding is expected to be an effective identification tool for
34
organisms with heteromorphic generations includes pteridophytes, which possess a
morphologically simple gametophyte generation.
Pryer et al. (2010) exposed DNA barcoding approaches to a case of mistaken identity
in the fern horticultural trade. Plastid rbcL, atpA and trnG-R sequence data demonstrated that
a fern marketed as Cheilanthes wrightii in the horticultural trade is infact Cheilanthes distans.
The results strongly advocated that the barcoding approach is a valuable technology to
correct plant identification errors in the international trade of horticulture industry. Labiak et
al. (2010) resolved molecular phylogeny, character evolution and biogeography of the
grammitid fern genus Lellingeria (Polypodiaceae) among 61 species and sequences were
obtained for two genes (atpB and rbcL) and four intergenic spacers (atpB-rbcL, rps4-trnS,
trnG-trnR and trnL-trnF). Lellingeria is composed of two main clades, L. myosuroides and
Lellingeria clades together are sister to Melpomene. Sister to all three of these is a clade with
two species of the polyphyletic genus Terpsichore. In L. myosuroides clade several dispersal
events occurred between the neotropics, Africa and Pacific Islands, whereas Lellingeria is
restricted to the neotropics, with about 60% of its diversity in the Andes.
Gao et al. (2010) sequenced the complete chloroplast genome of a scaly tree fern
Alsophila spinulosa (Cyatheaceae). The Alsophila cp genome is 156,661 base pairs (bp) in
size, and has a typical quadripartite structure with the large (LSC, 86, 308 bp) and small
single copy (SSC, 21, 623 bp) regions separated by two copies of an inverted repeats (IRs,
24,365 bp each). This genome contains 117 different genes encoding 85 proteins, 4 rRNAs
and 28 tRNAs. Pseudogenes of ycf66 and trnT-UGU are also detected in this genome. A
unique trnR-UCG gene (derived from trnR-CCG) is found between rbcL and accD. The
Alsophila cp genome shares some unusual characteristics with the previously sequenced cp
genome of the polypod fern Adiantum capillus-veneris, including the absence of 5 tRNA
genes that exist in most other cp genomes. The genome shows a high degree of synteny with

35
that of Adiantum, but differs considerably from two basal ferns (Angiopteris evecta and
Psilotum nudum).
Beck et al. (2011) estimated the ages of sexual and asexual diploids in the fern genus
Astrolepis using a well-supported plastid phylogeny trnGR. The 50 asexual polyploidy
samples were estimated to comprise 19 distinct lineages, including a variety of auto and
allopolyploid genomic combinations. The confounding association between asexuality and
polyploidy precludes regarding the effect of asexuality and suggested that asexuality limits
evolutionary potential in Astrolepis. Li et al. (2011) assessed the discriminatory power of the
core plant DNA barcode (rbcL and matK) as well as an alternative proposed fern barcodes
(trnH-psbA and trnL-F) among two fern groups viz., Deparia (Woodsiaceae) and the
Cheilanthes marginata group (Pteridaceae). With its high sequence variation, matK
complements rbcL provided a strong resolving power of the loci. With sequence variation
matK and trnL-F appears to be a suitable alternative barcode regions in ferns if universal
primer development of matK fails. trnH-psbA showed reduced sequence variation for the
majority of ferns. Their study suggested that DNA barcoding will revolutionized the
understanding of fern ecology and identification of the cryptic gametophyte phase of the
fern’s life history.
Wolf et al. (2011) described evolutionary patterns and processes in fern plastid
genomes (plastomes) and compared plastid organization and patterns of evolution in ferns to
those in seed plants. A large clade of ferns is characterized by a plastome reorganized with
respect to the ancestral gene order similar to seed plants and also observed high levels of
RNA in fern plastomes.
Hao et al. (2012) evaluated the chloroplast barcoding markers in more than 9100 plant
sequences by mean and smallest inter-specific distances. The results showed that the smallest
inter-specific distances decrease with the number of species sampled in 6 out of 10
36
chloroplast markers. The differences in the size of barcode gaps based on mean versus
smallest inter-specific distances have major implications for plant DNA barcoding.
Johnson et al. (2012) studied the phylogenetic relationships among 49 taxa (30 notholaenids
and 19 outgroup taxa) analyzed for three plastid loci atpA, trnG-R and rbcL. The
phylogenetic analysis of the plastid DNA set showed that outgroup taxa never displayed
gametophytic farina (with a single exception) and observed the unique expression of a
sporophytic character on the gametophytes of Notholaenid ferns (Pteridaceae).
Chen et al. (2013) performed the discriminating power of three barcodes (matK, rbcL
and trnL-F) on 16 vittarioid sporophytes. trnL-F showed highest primer universality and
discriminatory ability scores whereas PCR success rates were very low for matK and rbcL
regions (10.8% and 41.3%, respectively). BLAST analyses showed that all the sampled field
gametophytes could be successfully identified to species level. Blanca et al. (2013) made an
attempt to identify a cryptic fern (Pityrogramma trifoliata) distribution in the Western Andes
of Peru through DNA sequencing. They identified that the collected sporophytes pointed to
four different genera, two in Pteridaceae (Anogramma and Pityrogramma) and the others in
Aspleniaceae (Asplenium) and Cystopteridaceae (Cystopteris). The results resolved that
sequences of DNA (rbcL and trnG-R) pointed to Pityogramma trifoliata of Pteridaceae.
Studies on Selaginella
Selaginella, also known as spikemoss, is the only surviving genus within the
Selaginellaceae family. Selaginella includes more than 700 species widely distributed around
the world (Little et al., 2007). Selaginellaceae, together with the other two extant families
Lycopodiaceae (clubmosses) and Isotaceae (quillworts) within the division Lycopodiophyta
comprise the oldest lineage of vascular plants surviving on earth (Banks, 2009). Fossil
records suggest that lycopodiophytes often referred to as lycophytes diverged from all other
vascular plants including ferns and seed plants (euphyllophytes) more than 400 million year

37
ago (Pryer et al., 2004). As one of the few lycophyte genera that survived the Permian-
Triassic extinction event, Selaginella has been a long standing subject of investigation for
botanists and paleontologists.
Sah (2008) has explained the role and use of medicinal pteridophyte, particularly the
fern allies Selaginella even in the famous ancient literature ‘Ramayana’. Tulsidas, a famous
epic of Hindi poet described Selaginella as a wonder herb called as Sanjeevani booti (Life
giving herb), which according to the popular belief had given life to the dying Laxmana, the
younger brother of Lord Shree Rama. It is believed that medicines prepared from this herb
can even revive a dead person also.
Selaginella is traditionally used to cure several disease depending on species, such as
cancer or tumor, wound, after childbirth, menstrual disorder, female reproduction disease,
expulsion of the placenta, tonic (for after childbirth, increase body endurance, anti ageing,
etc), pneumonia, respiratory infection, exhalation channel infection, inflamed lung, cough,
tonsil inflammation, asthma, urethra infection, bladder infection, kidney stone, cirrhosis,
hepatitis, cystisis, bone fracture, rheumatism, headache, fever, skin diseases, eczema,
depurative, vertigo, toothache, backache, blood purify, blood coagulation, amenorrhea,
hemorrhage, diarrhea, stomach-ache, sedative, gastric ulcers, gastro-intestinal disorder,
rectocele, itches, ringworm, bacterial disease, bellyache, neutralize poison caused by
snakebite or sprained, bruise, paralysis, fatigue, dyspepsia, spleen disease (diabetic mellitus),
emmenagogue, diuretic, and to refuse black magic (Bouquet et al., 1971; Dixit and Bhatt,
1974; Lee and Lin, 1988; Ahmad and Raji, 1992; Bourdy and Walter, 1992; Nasution, 1993;
Lin et al., 1996; Caniago and Siebert, 1998; Sequiera, 1998; Dalimartha, 1999; Abu-Shamah
et al., 2000; Harada et al., 2002; Batugal et al., 2004; Mamedov, 2005; Khare, 2007;
Setyawan and Darusman, 2008; Haripriya et al., 2010; Irudayaraj et al., 2010; Suganya et
al., 2011; Sivaraman et al., 2013).
38
With the establishment of the genus Selaginella by Palisot de Beauvois (1805)
enormous research work has been done on this genus in various fields like morphology,
anatomy, cytology, palynology, taxonomy, floristics etc. (Mukhopadhyay, 2002). Alston
(1945) enumerated 58 species of Selaginella from India and Sri Lanka. Of these 45 species
were reported from India. Panigrahi and Dixit (1966) recorded twelve species of Selaginella
in Eastern India. According to Dixit (1984) 18 species are present in South India (Tamil Nadu
and Kerala). Twelve species have been reported from the Western Ghats, South India
(Manickam and Irudayaraj, 1992). Manickam and Irudayaraj (2003) recorded five species of
Selaginella from Nilgiris, Western Ghats, South India.
Morphological karyotype of Selaginella is firstly published by Manton (1950).
Chowdhury (1971) described the anatomy of two Indian xerophytic species viz., Selaginella
wightii and Selaginella bryopteris. The comparative studies on the anatomical and
morphological features of Selaginella apoda and Selaginella ludoviciana A. Br. have been
undertaken by Buck and Lucansky (1976). Imaichi and Kato (1989) have examined the
developmental anatomy of the shoot apex, rhizophore and root of Selaginella uncinata.
Morbelli et al. (2001) have observed the spore wall structure in Selaginella species from
Argentina. Mukhopadhyay (2002) has made morpho-anatomical observations on some Indian
members of Selaginella. Brighigna et al. (2002) have studied the structural and ultra
structural characterization of Selaginella lepidophylla, a desiccation-tolerant plant, during the
rehydration process. Seth and Kumar (2005) reported xylem-vessels in Selaginella adunca
and Selaginella chrysocaules. Sarvesh et al. (2010) described the ligule morphology in three
Indian Selaginella species viz., S. bryopteris, Selaginella repanda and Selaginella
panchghaniana from Matkuli and Apsravihar (Madya Pradesh). Schulz et al. (2010) studied
the life cycle of S. apoda using morphology and anatomy.
39
Chromosome number of several Selaginella species of India has been investigated by
various cytologists Kuriachan (1963); Loyal (1976; 1984); Ghatak (1977) and Vasudeva and
Bir (1983), Manickam and Irudayaraj (1988; 1992); Europe (Reese, 1951; Love and Love,
1961; Borgen, 1975), North America (Tryon, 1955, Love and Love, 1976), China (Wang et
al., 1984; Weng and Qiu, 1988), Taiwan (Tsai and Shieh, 1983; 1988), Japan (Takamiya,
1993) and other countries (Tchermak-Woes and Dolezal-Janish 1959; Zhukova and
Petrovsky, 1975). Jermy et al. (1967) made extensive investigation on chromosome numbers
of 76 species of Selaginella collected from the Malay Peninsula, Borneo, New Guinea,
Australia, Trinidad and Brazil.
Sharma et al. (1992) studied the behavior of chlorophylls, carotenoids and phenols in
drought resistance Selaginella from Rajasthan. Lin et al. (2000) have isolated four new
biflavonoids from Selaginella delicatula by phytochemical analysis. The activities of 10
enzymes involved in carbohydrate metabolism have been measured in both desiccated and
rehydrated fronds of the desiccation tolerant pteridophyte S. lepidophylla (Hook. & Grev.)
Spring (Harten & Eickmeier, 1986). Cheng et al. (2008) isolated and described the two new
unusual natural pigments, Selaginellin A and B from S. tamariscina. Lee et al. (2009) and
Juneyoung et al. (2009) isolated isocryptomerin from S. tamariscina applied in traditional
medicine. Paramanick et al. (2002) made comparative studies on amino acids in four species
of Selaginella. Setyawan (2011) have isolated thirteen compounds of flavonoids from
Selaginella viz., amentoflavone, 2',8''-biapigenin, delicaflavone, ginkgetin, heveaflavone,
hinokiflavone, isocryptomerin, kayaflavone, ochnaflavone, podocarpusflavone A,
robustaflavone, sumaflavone and taiwaniaflavone. Liu et al. (2008) evaluated the nature of
desiccation of tolerance in the resurrection plant Selaginella tamariscina by comparing the
composition of soluble sugars and saturation ratios of phospholipids between hydrated and
desiccated tissues of S. tamariscina.

40
Apart from morphology, anatomy and phytochemistry, different species of
Selaginella have also been subjected to pharmacological studies (Suganya et al., 2011) to
know the mechanism of action and to know the application of these drugs for the welfare of
human beings without any other side effects. Ma et al. (2003) reported two new antiviral
hormone glycosides, namely Unicoside A and Unicoside B from S. uncinata. Hu et al. (2004)
studied the hepatoprotective effects of Selaginella doederleinii Hieron from Taiwan. Gayathri
et al. (2005) evaluated the immunomodulatory and antioxidant properties of S. involvens, S.
delicatula and S. wightii. Janaki (2009) studied the pharmacological effect of an anticancer
spike-moss Selaginella inaequalifolia. Recently, antibacterial efficacy of S. inaequalifolia
and S. involvens against poultry pathogens and human pathogens has been studied by
Haripriya et al. (2010) and Irudayaraj et al. (2010). Chris Givens (2010) elucidated the
ethylene perception in S. apoda and S. moellendorffi. Sivaraman et al. (2013) evaluated the
antioxidant potential of Selaginella species viz., S. involvens, S. intermedia, S. inaequalifolia
and S. tenera by scavenging the DPPH+, ABTS
+, FRAP, metal chelating and
phosphomolybdenum assays. Research on diversity of Selaginella based on isozymic marker
for population dynamics is rarely conducted. Setyawan (2011) indicated that enzyme system
of esterase (EST), peroxidase (PRX), malate dehydrogenase (MDH), aspartate
aminotransferase (AAT) and acid phosphatase (ACP) can be used as diagnostic
characteristics for more than 20 species of Selaginella.
Molecular studies on Selaginella
Rodolfo et al. (1999) isolated cDNA, SlTPS1 encoding a 109-kD protein from the
resurrection plant Selaginella lepidophylla, which accumulates high levels of treholase
complemented with growth and stress tolerance defects in a yeast tps1 mutant. Protein
sequencing comparing showed that SlTPS1 shares high similarity to treholase-6-phosphate
synthase genes from prokaryotes and eukaryotes. SlTPS1 mRNA was constitutively

41
expressed in S. lepidophylla. The results also suggested that SlTPS1 protein is a functional
plant homolog capable of sustaining treholase biosynthesis that plays a major role in stress
tolerance in S. lepidophylla. Li et al. (2007) explored the genetic relationship among eight
medicinal species of Selaginella from China using RAPD. A total of 58 amplified bands and
RAPD map were obtained. Based on the RAPD map, a Jaccard’s genetic similarity matrix
and a dendrogram for 8 plants were established. The analyses revealed distinct inter-specific
and intra-specific variations among the studied species.
Banks et al. (2011) reported the genome sequence of the lycophyte Selaginella
moellendorffii. The transition from a gametophyte to a sporophyte dominated for fewer new
genes than the transition from a non seed vascular to a flowering plant whereas secondary
metabolic genes expanded extensively and in parallel to the lycophyte and angiosperm
lineages. Selaginella differs in post-transcriptional gene regulation, including small RNA
regulation of repetitive elements, an absence of the trans-acting small interfering RNA
pathway and extensive RNA editing of organellar genes. Hanna et al. (2012) identified and
analyzed the major intrinsic proteins (MIP’s) in the genome of spikemoss Selaginella
moellendorffii. In total 19 MIP’s were found in S. moellenderffi belonging to 6 of the 7 MIP
subfamilies that was previously identified in the moss Phycomitrella patens. Only three of the
MIP’s were classified as members of the conserved water specific plasma membrane intrinsic
protein (PIP) subfamily whereas half belong to the diverse NOD26-like intrinsic protein
(NIP).
Yobi et al. (2012) compared metabolic profiling between desiccation-sensitive species
Selaginella moellendorffii and desiccation-tolerant species Selaginella lepidophylla using
metabolomics profiling technology. A total of 301 metabolites including 170 named and 131
unnamed compounds across both species were observed. S. lepidophylla retained
significantly higher abundances of sucrose, mono and polysaccharides, and sugar alcohols
42
than S. moellendorffii. Aromatic amino acids, osmoprotectant betaine and flavonoids were
present abundantly in S. lepidophylla8";,.# (!<"(*:*(/",=">-glutamyl amino acid, linked with
glutathione metabolism in the detoxification of reactive oxygen species and with possible
nitrogen remobilization following rehydration were markedly higher in S. lepidophylla.
Markers for lipoxygenase activity were also greater in S. lepidophylla.
S. moellendorffii contained more than twice the number of unnamed compounds, with only a
slightly greater abundance than in S. lepidophylla. In contrast, S. lepidophylla contained 14
unnamed compounds of fivefold or greater abundance than in S. moellendorffii, suggesting
that these compounds might play critical roles in desiccation tolerant. Overall,
S. lepidophylla appears poised to tolerate desiccation in a constitutive manner using a wide
range of metabolites with some inducible components, whereas S. moellendorffii mounts only
limited metabolic responses to dehydration stress
Das et al. (2012) optimized a protocol for isolation of genomic DNA from leaves of
Selaginella species viz., Selaginella delicatula, Selaginella repanda, Selaginella bryopteris,
Selaginella plana and Selaginella monospora using RAPD analysis and studied their genetic
variation. The results observed that the Rogers and Benedich (1994) protocol yielded higher
quantities of DNA compared to the protocol of Murray and Thompson (1980). On the other
hand, the modified Rogers and Benedich (1994) protocol yielded better quantity (2-3 times
more) and quality genomic DNA than the original protocol of Rogers and Benedich (1994).
The isolation protocols of Dellaporta et al. (1983) and Doyle and Doyle (1987) did not yield
quantifiable amounts of genomic DNA. The modified DNA extraction protocol of Rogers
and Benedich (1994) proved to be most useful as both the quality and quantity of genomic
DNA significantly increased and yielded better results in RAPD-PCR analysis compared to
the original DNA extraction protocol of Rogers and Benedich (1994).
43
Lydia et al. (2012) explained the expression of MADS-domain proteins in Selaginella
moellendorffii by means of complete genome sequencing. S. moellendorffii revealed 19
putative MADS-box genes (13 Type I, 3 MIKC and 3 MIKC). The results showed that the
most recent common ancestor of vascular plants possessed MADS-domain proteins encoded
by Type I and Type II genes. Phylogeny tree represents the clades of floral organ identity
genes originated in a common ancestor of seed plants after the lineage that led to lycophytes
had branched off. The number of MIKC genes and the ratio of MIKC to MIKC genes is
lower in S. moellendorffii correlated with reduction of the gametophyte in vascular plants.
Drought is one of the most severe limitations to plant growth and productivity which
is observed in fern-allies. Resurrection plants have evolved a unique capability to tolerate
desiccation in vegetative tissues. Resurrection plants have been studied at structural,
physiological and molecular levels (Jiang et al., 2007). Proteomic analysis are an excellent
approach to study desiccation tolerance mechanisms because they show the actual protein
content that is performing enzymatic, regulatory and structural functions (Jiang et al., 2007).
Lina (2010) investigated the protein expression pattern between fully hydrated and desiccated
resurrection plant Selaginella lepidophylla from Columbia.
Wang et al. (2010) studied the desiccation tolerance in resurrection fern-ally
Selaginella tamariscina by physiological and proteomic analysis. The results showed that
endogenous abscissic acid (ABA) increased to regulate dehydration-responsive
genes/proteins. In addition the results showed 138 desiccation-responsive two-dimensional
electrophoresis (2-DE) spots, representing 103 unique proteins. Hierarchial clustering
analysis revealed that 83% of the proteins were down-regulated upon dehydration. They were
mainly involved in photosynthesis, carbohydrate and energy metabolism, stress and defense,
protein metabolism, signaling, membrane transport, cell structure and cell division. The
dynamic expression changes of desiccation-responsive proteins provide strong evidence that
44
cell structure modification, photosynthesis reduction, antioxidant system activation and
protein-transcriptional/translational modifications are essential to S. tamariscina in
responsive to dehydration.
Weng and Noel (2013) studied the chemo diversity in Selaginella and considered
their task as reference system for parallel and convergent metabolic evolution in terrestrial
plants. The functional analyses suggested that the specialized metabolites, generally accepted
to be restricted to seed plants have been identified in Selaginella which arose independently
that helps in conventional understanding of the evolution of metabolism.
Korall and Kenrick (2002) developed a phylogenetic framework for the clubmoss
family Selaginellaceae based on rbcL sequences. The analysis supports to distinguish the
monophyly of subgenera Selaginella and Tetragonostachys; Stachygyrandrum and
Heterostachys are polyphyletic. Korall and Kenrick (2004) evaluated the phylogenetic history
of Selaginellaceae based on DNA sequences from the plastid (rbcL) and nucleus (26S rDNA
gene) sequences. 26S rDNA and rbcL regions represent the main elements of species
diversity in Selaginellaceae family and analysed by means of maximum parsimony and
Bayesian inference. Substitution rates in the 26S rDNA were found to be high (26%
informative) but lower than rbcL (37% informative). Harholt et al. (2012) presented the
comparative genomic study of Selaginella moellendorffi which occupied an important
evolutionary position among land plants with Physcomitrella patens, the only non-vascular
terrestrial plant in which its genome has been sequenced. Gu et al. (2013) explored the utility
of ITS2 region for barcoding 103 medicinal plants including 34 species of the Selaginellaceae
family. The successful rate of PCR amplification and sequencing of the ITS2 region was
100%. There was significant divergence between the inter-specific and intra-specific genetic
distances of the ITS2 regions, while the barcoding gap was more obvious.
45
Materials and Methods
To fulfill the objectives of the present investigation, the following Selaginella species
viz., Selaginella intermedia (Bl.) Spring, Selaginella inaequalifolia (Hook. et Grev.) Spring,
Selaginella involvens (Sw.) Spring, Selaginella tenera (Hook & Grev.) Spring, Selaginella
wightii Hieron., Selaginella brachystachya (Hook. & Grev.) Spring, Selaginella repanda
(Desv.) Spring, Selaginella radicata (Hook. & Grev.) Spring, Selaginella bryopteris (L.) Bak,
Selaginella delicatula (Desv.) Alston with and without cones (Desv.) Alston were collected
from their natural habitats of South India. To know the molecular relationships among the
selected species of Selaginella following genetic analysis viz., protein separation by means of
SDS-PAGE, mass spectroscopic analysis using MALDI-TOF MS, isozymic profile with
PAGE and DNA sequencing using rbcL gene was carried out.
The detailed methodologies of the present investigation are as follows:
Collection of materials
The young leaves of selected ten Selaginella species viz., S. intermedia, S.
inaequalifolia, S. involvens, S. tenera, S. wightii, S. brachystachya, S. repanda, S. radicata, S.
bryopteris, S. delicatula with cones and S. delicatula without cones were collected from
Kaakachi hills (Tirunelveli, Tamil Nadu), Keeriparai and Marunthuvazh Malai
(Kanyakumari, Tamil Nadu), Shenbaganur and Eettipallum (Dindigul, Tamil Nadu),
Ponmudi (Idukki, Kerala), Nilgiris (Tamil Nadu) and Thenmalai (Kerala), and performed the
genetic polymorphism of the selected species (Table 1; Plate I).

46
Table 1: Geographical details of the selected species of Selaginella
Species name Locality Latitude and
Altitude
Species
code
Voucher No.
(XCH. No)
S. intermedia
(Plate II)
Kaakachi Hills,
Tamil Nadu.
8.7152836°
N
800-1800 mS1 25425
S. inaequalifolia
(Plate III)
Kaakachi Hills,
Tamil Nadu.
8.7152836°N
800-1800 mS2 25426
S. involvens
(Plate IV)
Kaakachi Hills,
Tamil Nadu.
8.7152836°
N
800-1800 mS3 25427
S. tenera
(Plate V)
Kaakachi Hills,
Tamil Nadu.
8.7152836°N
300-2000 mS4 25428
S. wightii
(Plate VI)
Marunthuvazh Malai,
Tamil Nadu.
8.1272411°N
350-1500 mS5 25429
S. brachystachya
(Plate VII)
Shenbaganur Hills,
Tamil Nadu.
10.2336828°N
1200-2000 mS6 25430
S. repanda
(Plate VIII)
Shenbaganur Hills,
Tamil Nadu.
10.2336828°N
1000-1200 mS7 25431
S. radicata
(Plate IX)
Ponmudi Hills,
Kerala.
8.7599422°N
110-1200 mS8 25432
S. bryopteris
(Plate X)
Ponmudi Hills,
Kerala.
8.7599422°N
110-1200 mS9 25433
S. delicatula
with cones
(Plate XI)
Ponmudi Hills,
Kerala.
8.7599422°N
0-1000 m
S10 25434
S. delicatula
without cones
(Plate XII)
Themalai Hills,
Kerala.
8.9632448°N
0-950 m
S11 25435
Botanical name: Selaginella intermedia (Bl.) Spring
Morphology of S. intermedia
Stem erect or sub erect, up to 2mm thick without leaves; rhizophores borne on the
basal one-third part of the main stem as stilt roots, entire plants about 30 x 15 cm, distal two-
47
third part of the main stem bears dichotomously branched lateral branches; leaves dimorphic
throughout, lateral leaves oblong-lanceolate, about 5 x 2 mm, base unequal, apex sub acute or
obtuse, margin ciliolate at the basal part, entire in the rest; median leaves ovate, 4 x 1.5 mm,
apex aristate, margin denticulate; cones about 1 x 0.3 cm, sporophylls uniform, ovate, 2 x 1
mm, acuminate, margin denticulate, microspores yellowish brown, 20 µm in diameter, exine
with prominent tubercles (Plate II).
Distribution: S. intermedia is confined to Tamil Nadu and Kerala in India. Common on
Kothayar hills, Kannikatty hills, Agasthiar hills, Kalakad hills and Sengaltheri hills (Plate II).
Occasional on Anamalais and Munnar hills. Terrestrial on forest floor along stream banks or
along shaded roadsides between 800-1800 m (Manickam and Irudayaraj, 1992).
Botanical name: Selaginella inaequalifolia (Hook. et Grev.) Spring
Morphology of S. inaequalifolia
Stem scandent, few feet long; main stem up to 4 mm thick, stramineous, glabrous or
with scattered leaves; rhizophores borne at the axis of primary branches, about 10 x 2 mm,
bearing roots at the basalmost part; primary branches alternate, about 5 cm apart, patent or
slightly ascending, lanceolate or oblanceolate, up to 25 x 7 cm, tripinnate; leaves scattered on
main stem, arranged in four rows on other branches, dark green; lateral leaves 5 x 2 mm,
ovate-lanceolate, slightly oblique, acute, entire; median leaves 1.5 x 1 mm, acuminate, cones
borne on ultimate branches, about 5 x 2 mm, quadrangular; sporophylls uniform, ovate, 2 x 1
mm, acuminate entire; megaspores 400 µm yellowish-brown, microspores 30 µm, exine of
both microspores and megaspores are with prominent, elongated outgrowths (Plate III).
Distribution: This is the largest species of Selaginella in South India. Occasional on
Agasthiar hills, Kothayar hills, Kannikatty hills and Ponmudi hills (Manickam and
Irudayaraj, 1992).

48
Botanical name: Selaginella involvens (Sw.) Spring
Morphology of S. involvens
Stem erect, rooting at the base only, up to 2 mm thick, terete, up to 2 cm long without
branches, stramineous; branched portion up to 28 x 12 cm, quadripinnate; lateral branches
about eight pairs, alternate up to 4 cm apart, ascending, lanceolate, about 8 x 2.5 cm, bearing
secondary and tertiary branches; leaves on main stem uniform, scattered, appressed, broadly
ovate, up to 3 x 2 mm, acute, entire; leaves on distalmost part of the main axis and on lateral
branches dimorphic; lateral leaves ovate-lanceolate; slightly oblique, 2 x 1 mm, acute, entire.
Leaves pale green to dark green; cones terminal on ultimate branches, up to 5 x 2 mm,
quadrangular; sporophylls uniform, ovate, 1 x 1 mm, acuminate, entire; microspores reddish
brown in mass, 30 µm in diameter (Plate IV).
Distribution: Common throughout India (Plate IV). Although it is a common species, fertile
plants are very rare (Manickam and Irudayaraj, 1992).
Botanical name: Selaginella tenera (Hook & Grev.) Spring
Morphology of S. tenera
Stem erect, rooting at the base only, up to 3 mm thick without leaves, up to 8 mm
wide with leaves, green to pink colour when fresh, stramineous to pink colour when dry,
entire plant up to 30 x 15 cm, with about five primary, alternate branches which bear several
times branched secondary branches. Leaves dimorphic throughout, contiguous on main stem
and on axis of primary branches, spreading and dense on the rest of the branches, lateral
leaves 3 x 1.5 mm, oblong-ovate, obtuse or subacute, denticulate on the acroscopic margin,
entire on the rest, base unequal; median leaves ovate, 1 x 0.5 mm, aristate, arista less than
half the length of the leaf, margin dentate, cones dorsiventral, about 1 x 0.25 cm; sporophylls
dimorphic, lateral sporophylls bear megasporangia, others with microsporangia; microspores
brick red in mass, 20 µm in diameter with thick wavy leasura; megaspores 150 µm (Plate V).

49
Distribution: S. tenera is confined to the mountains of the extreme South of India includes
Kothayar hills, Keeriparai hills, Ponmudi hills and Ooty hills (Plate V). But it is rare in Palni
hills. Terrestrial on the forest floor in shade. Rarely seen along shaded roadsides and
waysides from 300-2000 m (Manickam and Irudayaraj, 1992).
Botanical name: Selaginella wightii Hieron.
Morphology of S. wightii
Small plants, about 10 x 4 cm; stem terete, up to 1mm in diameter without leaves,
bearing roots occasionally all over the main stem which bears many main branches; main
branches branched again many times unequally and irregularly. Leaves dense, spirally
arranged, greenish-black, linear, up to 2 x 0.2 mm, apex long acuminate, margin with
membranaceous, ciliate border. Cones borne on ultimate branches, very slightly distinct from
sterile branches, more or less quadrangular, up to 1.5 x 0.5 mm; sporophylls uniform, spirally
arranged, ovate, apex acuminate, base cordate, margin denate, midvein distinct, two short
ligule present at the subbasal region; microsporangia and megasporangia borne on the same
spike, spherical, up to 1mm in diameter; microspore trilete, 50 x 40 µm, yellowish-brown
with prominent, branched ridges which converge to the centre, megaspores up to 250 µm,
dark brown (Plate VI).
Distribution: Very rare species. Occasional on Marunthuvazh Malai (Plate VI). Growing on
rock crevices in dry places along roadsides between 350-1500 m (Manickam and Irudayaraj,
1992).
Botanical name: Selaginella brachystachya (Hook. & Grev.) Spring
Morphology of S. brachystachya
Stem sub erect to prostrate, up to 2.5 mm thick, stramineous, branched from the base;
rhizophores borne occasionally all over the stem. Leaves dimorphic throughout, arranged in
four rows, sparse on main stem, dense on lateral branches; lateral leaves alternate up to 5 mm

50
apart on main stem, up to 6 x 1 mm aristate, arista more than half the length of the leaf,
margin entire, cones flattened, dorsiventral, 1 x 0.2 cm; sporophylls dimorphic, lateral
sporophyll spreading, oblanceolate, 2 x 0.5 mm, acute, entire; median sporophyll ovate, up to
2 x 0.75 mm, aristate, arista more than the length of the sporophyll; microspores yellowish-
brown, 25 µm in diameter, megaspores 300 µm, exine almost smooth (Plate VII) .
Distribution: S. brachystachya is confined to Sri Lanka, Maharashtra and South India. Rare
on Anamalais, Kalakad hills, Palni hills and Agasthiar hills (Plate VII). Terrestrial on forest
floor or at forest edges in shade between 1200-2000 m (Manickam and Irudayaraj, 1992).
Botanical name: Selaginella repanda (Desv.) Spring
Morphology of S. repanda
Stem erect, rooting at the base, occasionally near the distal part, stramineous, up to 1
mm thick without leaves, up to 4 mm wide with leaves, entire plant about 20 x 5 cm, primary
branches alternate, branched two to six times. Leaves dimorphic throughout lateral leaves
ovate-oblong, 3 x 1 mm, apex obtuse or subacute, margin ciliolate on the acroscopic base,
denticulate on the rest of the part; median leaves ovate, acute or acuminate, 1 x 0.75 mm,
margin sparsely denticulate. Cones about 5 x 2 mm, quadrangular; sporophylls uniform,
ovate, 1 x 0.5 mm, acute, margin denticulate; microspores reddish brown, 30 µm in diameter,
megaspores light green, 300 µm in diameter (Plate VIII).
Distribution: Occasional on Palni hills. Rare on Muzhiar-Kakki hills (Plate VIII). Terrestrial
on shady, moist soil cover between 1000-1200 m (Manickam and Irudayaraj, 1992).
Botanical name: Selaginella radicata (Hook. & Grev.) Spring
Morphology of S. radicata
S. radicata grows up to 18 x 9 cm; irregular in shape, stem prostrate, rooting
occasionally all over. Leaves at the base of main stem uniform, ovate, up to 2 x 1.5 mm,
acute, entire, leaves on the rest of the part of main stem and lateral branches dimorphic;
51
median leaves ascending, ovate, up to 1 x 1 mm, ciliolate; lateral leaves patent, narrowly
ovate, apex subacute, margin finely denticulate; leaves pale green, cones 6 x 2 mm, four-
sided, sporophylls uniform, 1.5 x 1 mm, broadly ovate, dentate, megasporangia borne at the
basal region, microsporangia borne towards the diatal part of the cone; microspores pale
brown, triangular with rounded corners, up to 35 µm in diameter, exine with thin densely
anastomosed thickenings; megaspore three per sporangium, pale green, up to 300 µm more or
less spherical, exine almost smooth (Plate IX).
Distribution: Rare species. S. radicata is confined to South India (Plate IX). Terrestrial on
moist earth banks along roadsides between 110-1200 m (Manickam and Irudayaraj, 1992).
Botanical name: Selaginella bryopteris (L.) Bak.
Morphology of S. bryopteris
Stems 5-25 cm, sub-erect to erect, simple in the basal lower third but profusely
branched above, branches flabellate. Rhizophores confined at the base. Leaves uniform on
the main stem, distant, ovate-lanceolate, denticulate, long-acuminate at tip; heteromorphic on
the branches, contiguous, ascending; lateral leaves ovate, oblique at base, acute to acuminate
at apex, midrib short, obscure, linear half-leaf dilated, thin, white-transluscent, imbriate,
denticulate, outer half-leaf thick, green; axillary leaves ± similar to the leaves; median leaves
small, ovate, oblique at base, acute to acuminate at a apex, entire to minutely denticulate.
Strobili rare due to prevalence of vegetative propagation, 3-5 x 1-2.5 mm, single at the apex
of the branchlets. Sporophylls uniform, ovate, entire to minutely denticulate, acuminate.
Megaspores 200-270 µm, dull-yellow, verrucoid. Microspores 15-25 µm, yellow, granulose
(Plate X).
Distribution: S. bryopteris distributed in India viz., Madhya Pradesh, Uttar Pradesh, Bihar,
Orissa, Tamil Nadu, Kerala and Maharashtra (Baishya and Rao, 1982).
52
Botanical name: Selaginella delicatula (Desv.) Alston
Morphology of S. delicatula
Stem erect or sub-erect, rooting at the base only, up to 4 mm thick without leaves,
stramineous; entire plant up to 45 x 15 cm, lateral branches many, alternate, tripinnate; leaves
scattered and oblique on main stem, arranged in four rows on lateral branches; lateral leaves
about 2.5 x 1.5 mm, ovate, obtuse, entire; median leaves ovate, 2 x 1 mm, aristate, entire,
arista less than half the length of the leaf. Spikes borne on ultimate branches, quadrangular,
up to 2 x 0.2 cm; sporophylls uniform, ovate, acuminate, entire, 2 x1 mm; microspores green,
30 µm in diameter, megaspores pale brown, 400 µm in diameter (Plate XI; Plate XII).
Distribution: Common on Kerala Ghats (Plate XI; Plate XII). Common on stone walls or
crevices of rocks along roadsides between 0-1000 m (Manickam and Irudayaraj, 1992).
Biochemical studies
Protein isolation
Fresh and young leaves of selected ten species of Selaginella viz., S. intermedia, S.
inaequalifolia, S. involvens, S. tenera, S. wightii, S. repanda, S. brachystachya, S. radicata, S.
bryopteris, S. delicatula with cones and S. delicatula without cones were collected from
various localities of South India. For protein analysis, the collected young leaves of selected
Selaginella species were washed once in deionized water and mashed in a pre-chilled mortar
using 500 µl of phosphate buffer (pH 7.0). The resultant slurry was centrifuged at 10,000 rpm
for 10 min at 4°C in an Eppendorf centrifuge and the supernatant was stored at 4
°C before
use.
Protein separation
SDS-PAGE (Anbalagan, 1999) was carried out at 25°C in the air conditioned room.
Separation of protein was carried out at 50V till the tracking dye reaches the separating gel
53
and at 100V thereafter for 3-5 hours or until the tracking dye had migrated to the bottom of
the gel. After electrophoresis, the gels were carefully removed from the mold and stained.
Gel mold
Two precisely cutted glass plates were clamped together with Vaseline coated 1.0 mm
spacers on each side and sealed on both sides and bottom.
Gel preparation
Reagents for gel preparation
Solution A - 29.2g Acrylamide and 0.8 g Bis acrylamide in 100 ml of distilled water.
Solution B - Tris HCl 1.5M, pH 8.8
Solution C - Tris HCl 0.5M, pH 6.8
Solution D - 10% (w/v) Ammonium per sulphate
10% (v/v) separation gel consisted of 3.3ml of sol. A, 2.5ml of sol. B, 100µl of sol. D,
4.1ml of distilled water and 10µl TEMED. The solution was mixed and poured in up to three-
fourth of the mold and allowed to polymerize. A thin layer of distilled H2O was dispersed on
top of the acrylamide solution to level the surface.
6% (v/v) stacking gel consisted of 0.6 ml of sol. A, 1.25 ml of sol. C, 50 µl of sol. D,
2.1 µl distilled H2O and 6 µl TEMED. The solution was mixed and added to the top of the
separating gel after the removal of water topped over the separating gel. The comb was
inserted into the top layer of the solution before it began to polymerize. The gel was allowed
to polymerize and the comb was removed immediately after polymerization. The molded gel
was clamped on to a vertical slab gel electrophoresis unit. The upper and lower reservoirs of
the electrophoresis unit were filled with required quantity of 1.5M Tris-glycine (pH 8.3) tank
buffer (Table 2 and 3).

54
Table 2: Chemical preparation for SDS-PAGE
Chemicals Preparation
Acrylamide stock 30% 29.2g Acrylamide + 0.8g Bis Acrylamide in 100
ml water
Lower Tris pH 8.8 for separating gel, 36.34g of Tris made up
to 200 ml with distilled water + 1% SDS
Upper Tris pH 6.8 for stacking gel, 12.1g Tris made up to 200
ml with distilled water + 1% SDS
Ammonium
persulphate0.05g in 0.5ml distilled water
Running Gel Buffer
(5X)
Tris 15.0g + 5% SDS + Glycine 72g in 1000 ml
distilled water. Dilute 300 ml 5X stock with 1200
ml Distilled water. Do not adjust the pH.
Sample Buffer 7.25ml distilled water + 1.25 ml stocking gel
buffer + 1ml of Glycerol + 1% SDS and
bromophenol blue.
Table 3: SDS-PAGE preparation
10% Separating Gel : Lower Tris
30% Acrylamide 10 ml
Lower Tris (8.8 pH) 7.5 ml
Distilled water 12.3 ml
APS 150 µl
TEMED 50 µl
6% Stacking Gel : Upper Tris
30% Acrylamide 2 ml
Upper Tris (6.8 pH) 3 ml
Distilled water 4.9 ml
APS 75 µl
TEMED 25 µl
Sample loading
50-60 µl of each sample was loaded directly into a well using a syringe. Care was
taken to avoid mixing of the sample with the reservoir buffer and also to avoid cross
55
contamination of samples. After electrophoresis the gels were stained using the method
described by Mortz et al. (2001) and Sorensen et al. (2002).
SILVER STAINING
Methodology for silver staining
After electrophoresis, the gel was removed from the cassette and placed into a tray
containing appropriate volume of fixing solution, and then the gel was soaked in
fixing solution for 2 h.
The fixative solution was discarded and the gel was washed in 20% ethanol for 20
min. The solution was changed three times to remove the remaining detergent ions as
well as fixation acid from the gel.
The ethanolic solution was discarded and enough volume of the sensitizing solution
was added and incubated for 2 min with gentle rotation.
The sensitizing solution was discarded and the gel was washed twice, 1 min each
time, in deionized water. Then the water was discarded.
The cold silver staining solution was added and shaked for 20 min to allow the silver
ions to bind with proteins.
After staining, the staining solution was poured off and the gel was rinsed with a large
volume of deionized water for 20-60 sec to remove the excess of unbound silver ions.
Repeat the washing once more.
Again the gel was shortly rinsed with the developing solution and then the solution
was discarded.
To stop the reduction reaction 50 ml of terminating solution was added directly to the
gel that is still immersed into developing solution. The gel was gently agitated for 10
mins. As soon as “boubling” of the solution is over, the development is stopped.

56
Moist gels was kept in 12% acetic acid at 4°C in sealed plastic bags or placed in the
drying solution for 2 h prior to vacuum drying.
After staining the gel was viewed using a Vilber Loubermat gel documentation
system and banding profiles of protein was determined by the migration from the
origin towards the anode. The chemicals needed for silver staining were prepared as
illustrated in Table 4.
To reveal the inter-specific relationship among the studied Selaginella species, the
SDS-PAGE protein profiles of the studied Selaginella species converted in to “1” and “0”
matrix, to indicate the presence or absence of bands, respectively. Genetic similarities (GS)
were estimated according to Nei and Li (1979) algorithm. To demonstrate the inter-specific
relationship, a cladogram was constructed by UPGMA using NTSYSpc- 2.0 software.
Table 4: Chemical preparation for silver staining
Reagents Preparation of chemicals
Fixation solution 50% ethanol + 12% glacial acetic acid + 0.05%
formalin + 100 ml distilled water
Washing solution 20% ethanol + 100 ml distilled water
Sensitizing solution 0.02% sodium thiosulphate + 100 ml distilled
water
Deionized water Washing
Staining 0.2% silver nitrate + 0.076% formalin + 100 ml
distilled water
Developing solution 6% sodium carbonate + 0.0004% sodium
thiosulphate + 0.05% formalin + 100 ml
distilled water
Terminating solution 12% acetic acid
Drying solution 20% ethanol

57
MALDI-TOF MS analysis
MALDI spectrum of Selaginella species were recorded using Applied Biosystems
MALDI-TOF Voyager De-Pro spectrometer. The MALDI sample was prepared by mixing
1µL of protein sample solution and sinapic acid matrix solution (5 mg/mL sinapic acid in
50% ACN/0.1% TFA). 0.75µL of the resulting mixture was spotted onto a freshly cleaned
stain less steel MALDI target plate. After air drying, the crystallized spots were processed
with a MALDI-TOF mass spectrometer (voyager DE PRO, Applied Biosystem). MS was
recorded in the positive and negative mode within a mass range from 500 to 1, 00, 000 kDa,
using a nitrogen laser (337 nm). The acceleration voltages applied for MS was 25 kV.
Isozymic variation
Five enzyme systems resolved in the selected Selaginella species were: peroxidase
(PO), esterase (EST), acid phosphatase (ACP), alkaline phosphatase (ALP) and polyphenol
oxidase (PPO).
Preparation of enzyme extract
To know the isozymic variation of the selected Selaginella species, the collected
young leaves were washed once in deionized water. For isozymic analysis, young 2-3 month
old plants from the natural habitat were collected in the wet paper and brought to the
laboratory. After wash in tap water, the leaves were dissected out and the crude enzyme
extracts were prepared by grinding in different buffers at varied pH based on enzymatic
system (Table 5) as described by Sadasivam and Manickam (1991). The slurry was
centrifuged at varied rpm at 4°C in a cooling centrifuge and the supernatant is stored at 4
°C
before use. The isolated enzymes then separated using PAGE.
Separation of isozyme
Polyacrylamide Gel Electrophoresis (PAGE) is carried out at 4°C using vertical gel
electrophoresis unit.
58
Separation of isozymes were carried out at 50V till the tracking dye reaches the
separating gel and at 100V thereafter for 3-5 hours or until the tracking dye had migrated to
the bottom of the gel.
Table 5: Isolation buffers based on enzyme system
Enzymes Buffer with varied pH rpm
Esterase 0.1M phosphate buffer (pH-7.0) 10,000 for 10 minutes
Peroxidase 1M sodium acetate buffer (pH-5.0) 10,000 for 10 minutes
Acid phosphatase 50 mM citrate buffer (pH-5.3) 10,000 for 10 minutes
Alkaline phosphatase 50 mM glycine buffer (pH-10.4) 10,000 for 10 minutes
Polyphenol oxidase0.01 M phosphate buffer (pH-7.0)
and 1% Tween 80
20,000 for 15 minutes
Gel mold
Two precisely cut glass plates are clamped together with Vaseline coated 1.0 mm
spacers on each side and sealed on both sides and bottom.
Gel preparation
Reagents for gel preparation
Solution A - 29.2 g Acrylamide and 0.8 g Bis acrylamide in 100 ml of distilled water.
Solution B - Tris HCl 1.5 M, pH 8.8
Solution C - Tris HCl 0.5 M, pH 6.8
Solution D - 10% (w/v) Ammonium per sulphate
10% (v/v) separation gel consisted of 3.9 ml of Sol. A, 3 ml of Sol. B, 4.9 ml of
distilled water, 60 µl of Sol. D and 47 µl of TEMED. The solution was mixed and poured in
up to three-fourth of the mold and allowed to polymerize. Disperse a thin layer of ethanol on
top of the acrylamide solution to level the surface.
6% (v/v) stacking gel consisted of 0.6 ml of Sol. A, 1 ml of Sol. C, 1.5 ml of distilled
water, 33 µl of Sol. D and 23 µl of TEMED. The solution was mixed and added to the top of
the separating gel after the removal of ethanol topped over the separating gel. The comb was

59
then inserted into the top layer of the solution before it began to polymerize. The gel was
allowed to polymerize and the comb was removed immediately after polymerization. The
molded gel was clamped on to a vertical slab gel electrophoresis unit. The upper and lower
reservoirs of the electrophoresis unit were filled with required quantity of 1.5 M Tris -
glycine tank buffer (Table 6 and 7).
Table 6: Chemical preparation for PAGE
Chemicals Preparation
Acrylamide stock 30% 29.2g Acrylamide + 0.8g Bis Acrylamide + 100ml
water
Lower Tris pH 8.8 for separating gel, 36.34g of Tris made up
to 200ml with distilled water
Upper Tris pH 6.8 for stacking gel, 12.1g Tris made up to
200ml with distilled water
Ammonium
persulphate
0.05g in 0.5ml distilled water
Running Gel
Buffer(5X)
Tris 15.0g + Glycine 72g in 1000 ml distilled
water. Dilute 300 ml 5 x stock with 1200 ml
Distilled water. Do not adjust the pH.
Sample Buffer 7.25ml distilled water +1.25ml stocking gel buffer
+ 1ml of Glycerol and bromophenol blue.

60
Table 7: PAGE preparation
10% Separating Gel : Lower Tris
30% Acrylamide 10 ml
Lower Tris (8.8 pH) 7.5 ml
Distilled water 12.3 ml
APS 150 µl
TEMED 50 µl
6% Stacking Gel : Upper Tris
30% Acrylamide 2 ml
Upper Tris (6.8 pH) 3 ml
Distilled water 4.9 ml
APS 75 µl
TEMED 25 µl
Sample loading
50-60 µl of each sample was loaded directly into a well using a micropipette. Care
was taken to avoid mixing of the sample with the tank buffer and also to avoid cross
contamination of samples. Staining procedures were varied depending upon the specific
assays.
Esterase assay
The enzymes separated in the gel are actively stained with the specific reaction
mixture for the isozyme esterase (Table 8).
Table 8: Staining reagents for esterase activity
Reagents Volume
1M phosphate buffer (pH-7.0) 10 ml
Fast blue B salt 100 mg
-napthyl acetate 80 mg
Distilled water 4 ml
Methanol 60 ml
61
The gel was incubated in the dark at 37°C for 20-30 minutes.
After incubation the gel was fixed in methanol: water: acetic acid: ethanol for 15
minutes.
Peroxidase assay
The enzymes separated in the gel are actively stained with the specific reaction
mixture for the isoperoxidase (Table 9).
Table 9: Staining reagents for peroxidase activity
Reagents Volume
0.1 M phosphate buffer (pH-7.0) 28 ml
O- dianizidine 100 mg
Distilled water 4 ml
H2O2 6 ml
Methanol 60 ml
The gel was incubated in the dark at 30°C for 30 minutes.
After incubation the gel was fixed in 7% acetic acid for 15 minutes.
Acid phosphatase assay
The enzymes separated in the gel are actively stained with the specific reaction
mixture for the isozyme acid phosphatase (Table 10).
Table 10: Staining reagents for acid phosphatase activity
Reagents Volume
50 mM Tris buffer (pH-5.3) 100 ml
Fast blue RR salt 100 mg
-napthyl phosphate 50 mg
Magnesium chloride 230 mg
The gel was incubated in the dark at 37°C for 3-4 hrs.

62
Alkaline phosphatase assay
The enzymes separated in the gel are actively stained with the specific reaction
mixture for the isozyme alkaline phosphatase (Table 11).
The gel was incubated in the dark at 37°C for 3-4 hrs.
Table 11: Staining reagents for alkaline phosphatase activity
Reagents Volume
0.1 N NaOH buffer (pH-10.5) 42 ml
Glycine 375 mg
p-nitrophenyl phosphate 165 mg
Magnesium chloride 10 g
Polyphenol oxidase assay
The enzymes separated in the gel are actively stained with the specific reaction
mixture for the isozyme polyphenol oxidase (Table 12).
Table 12: Staining reagents for polyphenol oxidase activity
Reagents Volume
0.1 M sodium phosphate buffer (pH-6.8) 100 ml
Catechol 15 mg
Sulphanilic acid 50 mg
The gel was incubated in the dark at 37°C for 5-10 minutes.
DNA BARCODING
For the present study, ten selected species of Selaginella were examined for DNA
polymorphism. DNA was extracted from (0.01-0.05 g) liquid nitrogen grounded leaves
!"#$%&' (!)*+' "'#,-).&-'/&01%'23)#&041%'5##,*)(#'63,#)-&' 7/2568' &903":0),*'#&04,-'
described by Murray and Thompson (1980); Doyle and Doyle (1987); Rogers and Benedich
(1994).
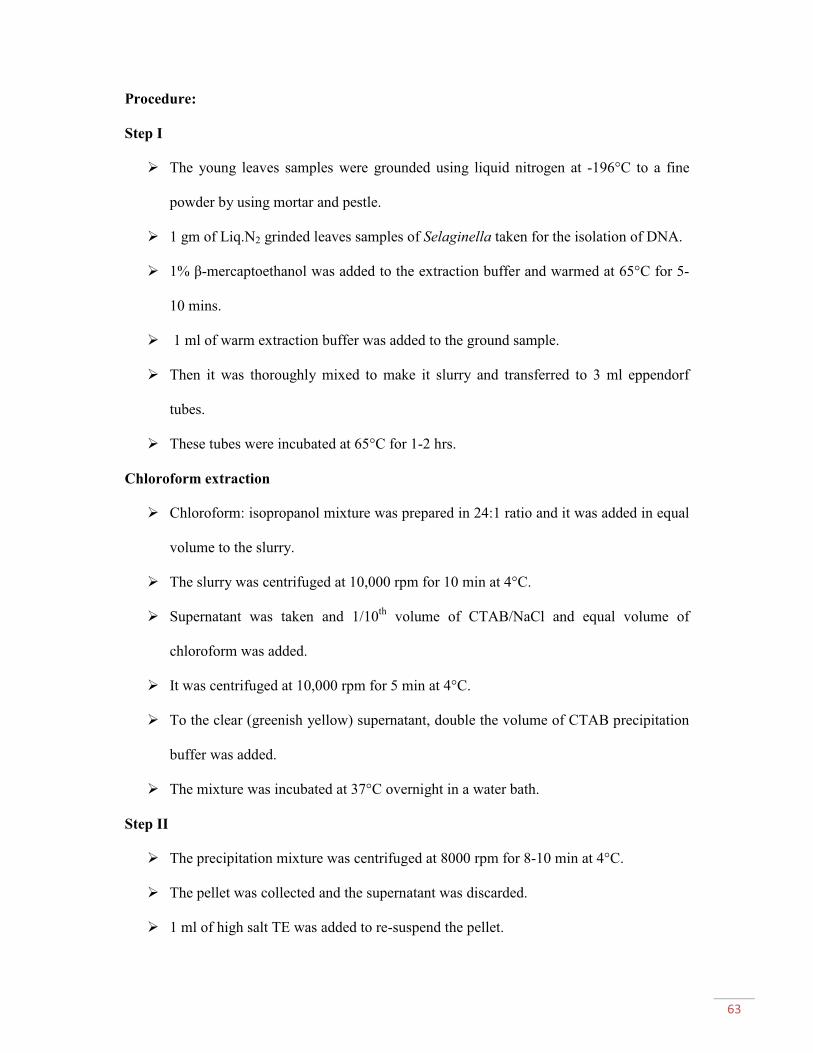
63
Procedure:
Step I
! The young leaves samples were grounded using liquid nitrogen at -196°C to a fine
powder by using mortar and pestle.
! 1 gm of Liq.N2 grinded leaves samples of Selaginella taken for the isolation of DNA.
! 1% ;-mercaptoethanol was added to the extraction buffer and warmed at 65°C for 5-
10 mins.
! 1 ml of warm extraction buffer was added to the ground sample.
! Then it was thoroughly mixed to make it slurry and transferred to 3 ml eppendorf
tubes.
! These tubes were incubated at 65°C for 1-2 hrs.
Chloroform extraction
! Chloroform: isopropanol mixture was prepared in 24:1 ratio and it was added in equal
volume to the slurry.
! The slurry was centrifuged at 10,000 rpm for 10 min at 4°C.
! Supernatant was taken and 1/10th
volume of CTAB/NaCl and equal volume of
chloroform was added.
! It was centrifuged at 10,000 rpm for 5 min at 4°C.
! To the clear (greenish yellow) supernatant, double the volume of CTAB precipitation
buffer was added.
! The mixture was incubated at 37°C overnight in a water bath.
Step II
! The precipitation mixture was centrifuged at 8000 rpm for 8-10 min at 4°C.
! The pellet was collected and the supernatant was discarded.
! 1 ml of high salt TE was added to re-suspend the pellet.

64
! The suspended pellets were transferred to glass tubes.
! 1.0 ml (0.6 volumes) of isopropanol was added and refrigerated at -20°C for 30 min to
get the pellets.
! After the precipitates were observed, the tubes were centrifuged at 8,000 rpm for 5
min at 4°C.
! The pellets were washed with 1ml of 80% ethanol by centrifuged at 10,000 rpm for 5
min at 4°C to remove the residual CTAB.
! The pellets were resuspended in 0.5 ml 1X TE.
! The suspended pellets were collected in micro-vials.
Step III
! The overnight incubated vials were spun at 12,000 rpm for 15 min at 4°C.
! The pellets were collected and washed with 0.5 ml of 70% ethanol.
! Centrifugation was done at 10,000 rpm for 5 min at 4°C.
! The pellets were re-suspended in 100 µl 1X TE.
! The re-suspended pellets were collected and stored at -20°C.
Verification of DNA levels in Agarose gel electrophoresis
" The sides of the gel tray were taped to hold the gel while setting and well forming
combs were placed with tray.
" 0.8% agarose gel was prepared by mixing 1.5 g agarose with 150 ml 1X TBE Buffer.
It was boiled in a microwave oven until the agarose dissolves (1-2 minutes).
" Cooled down by holding under a running cold tap; once cooled and 6 µl of ethidium
bromide was added (make sure to work in the fume hood) and swirlled to mix.
" Then the gel was poured into the tray and allowed to stand for at least 30 minutes
before loading the samples. The combs are removed and placed the gel into the
electrophoresis tank.
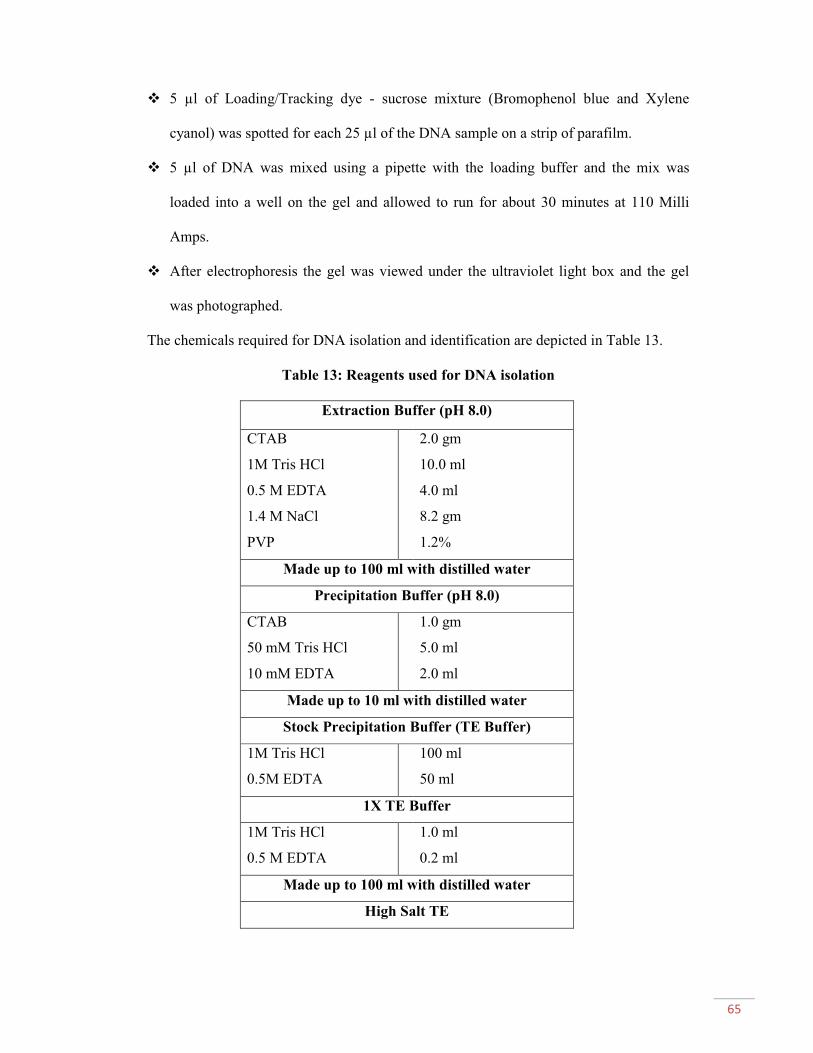
65
" 5 µl of Loading/Tracking dye - sucrose mixture (Bromophenol blue and Xylene
cyanol) was spotted for each 25 µl of the DNA sample on a strip of parafilm.
" 5 µl of DNA was mixed using a pipette with the loading buffer and the mix was
loaded into a well on the gel and allowed to run for about 30 minutes at 110 Milli
Amps.
" After electrophoresis the gel was viewed under the ultraviolet light box and the gel
was photographed.
The chemicals required for DNA isolation and identification are depicted in Table 13.
Table 13: Reagents used for DNA isolation
Extraction Buffer (pH 8.0)
CTAB
1M Tris HCl
0.5 M EDTA
1.4 M NaCl
PVP
2.0 gm
10.0 ml
4.0 ml
8.2 gm
1.2%
Made up to 100 ml with distilled water
Precipitation Buffer (pH 8.0)
CTAB
50 mM Tris HCl
10 mM EDTA
1.0 gm
5.0 ml
2.0 ml
Made up to 10 ml with distilled water
Stock Precipitation Buffer (TE Buffer)
1M Tris HCl
0.5M EDTA
100 ml
50 ml
1X TE Buffer
1M Tris HCl
0.5 M EDTA
1.0 ml
0.2 ml
Made up to 100 ml with distilled water
High Salt TE

66
1M NaCl
10mM Tris HCl (pH
8.0)
0.1mM EDTA (pH 8.0)
5.85 gm
1.0 ml
20µl
Made up to 100 ml with distilled water
10X TBE (pH 8.0)
Tris base
Boric acid
0.5 M EDTA (pH 8.0)
21.6 gm
11.0 gm
8.0 ml
Made up to 200 ml with distilled water and the
pH was adjusted with NaOH
CTAB/ NaCl (10 % CTAB/0.2M NaCl)
CTAB
NaCl
5.0 gm
2.04 gm
Made up to 50 ml with distilled water
PCRs were conducted in a total reaction volume of 30 µL containing 6 µL of autoclaved
ion-exchanged water, 5µL of dNTP mixture (stock of 10 mM of each dNTP), 13µL of 10x
Taq reaction buffer (200 mM Tris pH 8.8, 100 mM KCl, 100 mM (NH4)2SO4, 20mM
MgSO4.7H2O, 1% (v/v) Triton X-100, 50% (w/v) sucrose, 0.25% (w/v) cresol red), 2µL of
rbcL $3)#&3' 7<=>?' #@' .*"%' :,*:&*03"0),*8A' BCD' ,E' 2"F' GH5' $,%1#&3"!&' "*-' B' CD' ,E'
genomic DNA. The amplicon size of rbcL ranges from 654 bp; primers used (5’–3’) were
ATGTCACCACAAACAGAGACTAAAGC and GAAACGGTCTCTCCAACGCAT (Kress
and Erickson, 2007; Fazekas et al., 2008). PCR Samples were loaded after mixing with gel
loading dye along with 10µl of DNA Ladder (1000bp DNA Ladder viz., 100bp, 200bp,
300bp, 400bp, 500bp, 600bp, 700bp, 800bp, 900bp, 1000bp) (Table 14).
The PCR for rbcL was performed with an initial denaturation of 30 sec at 94°C followed
by 35 cycles under the following conditions: 94°C for 30 seconds, 58°C for 30 sec and 72°C
for 30 sec, terminated by an extension of 72°C for 5 min.
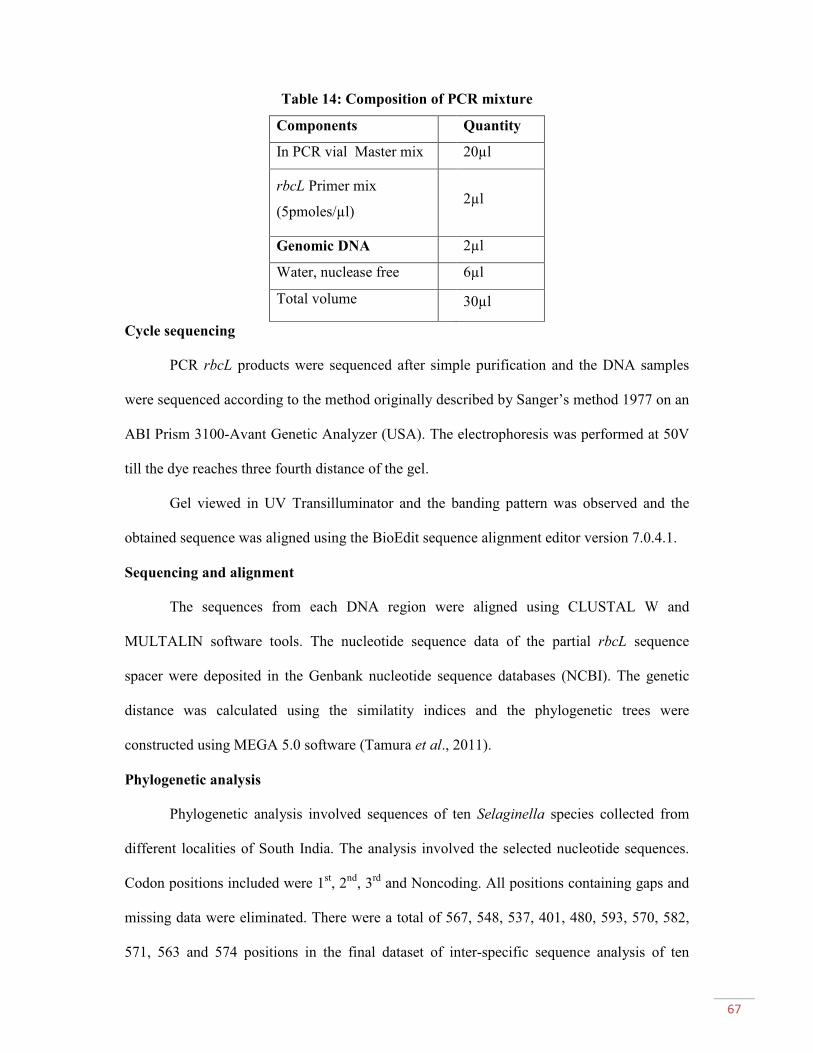
67
Table 14: Composition of PCR mixture
Components Quantity
In PCR vial Master mix 20µl
rbcL Primer mix
(5pmoles/µl)2µl
Genomic DNA 2µl
Water, nuclease free 6µl
Total volume 30µl
Cycle sequencing
PCR rbcL products were sequenced after simple purification and the DNA samples
were sequenced according to the method originally described by Sanger’s method 1977 on an
ABI Prism 3100-Avant Genetic Analyzer (USA). The electrophoresis was performed at 50V
till the dye reaches three fourth distance of the gel.
Gel viewed in UV Transilluminator and the banding pattern was observed and the
obtained sequence was aligned using the BioEdit sequence alignment editor version 7.0.4.1.
Sequencing and alignment
The sequences from each DNA region were aligned using CLUSTAL W and
MULTALIN software tools. The nucleotide sequence data of the partial rbcL sequence
spacer were deposited in the Genbank nucleotide sequence databases (NCBI). The genetic
distance was calculated using the similatity indices and the phylogenetic trees were
constructed using MEGA 5.0 software (Tamura et al., 2011).
Phylogenetic analysis
Phylogenetic analysis involved sequences of ten Selaginella species collected from
different localities of South India. The analysis involved the selected nucleotide sequences.
Codon positions included were 1st, 2
nd, 3
rdand Noncoding. All positions containing gaps and
missing data were eliminated. There were a total of 567, 548, 537, 401, 480, 593, 570, 582,
571, 563 and 574 positions in the final dataset of inter-specific sequence analysis of ten
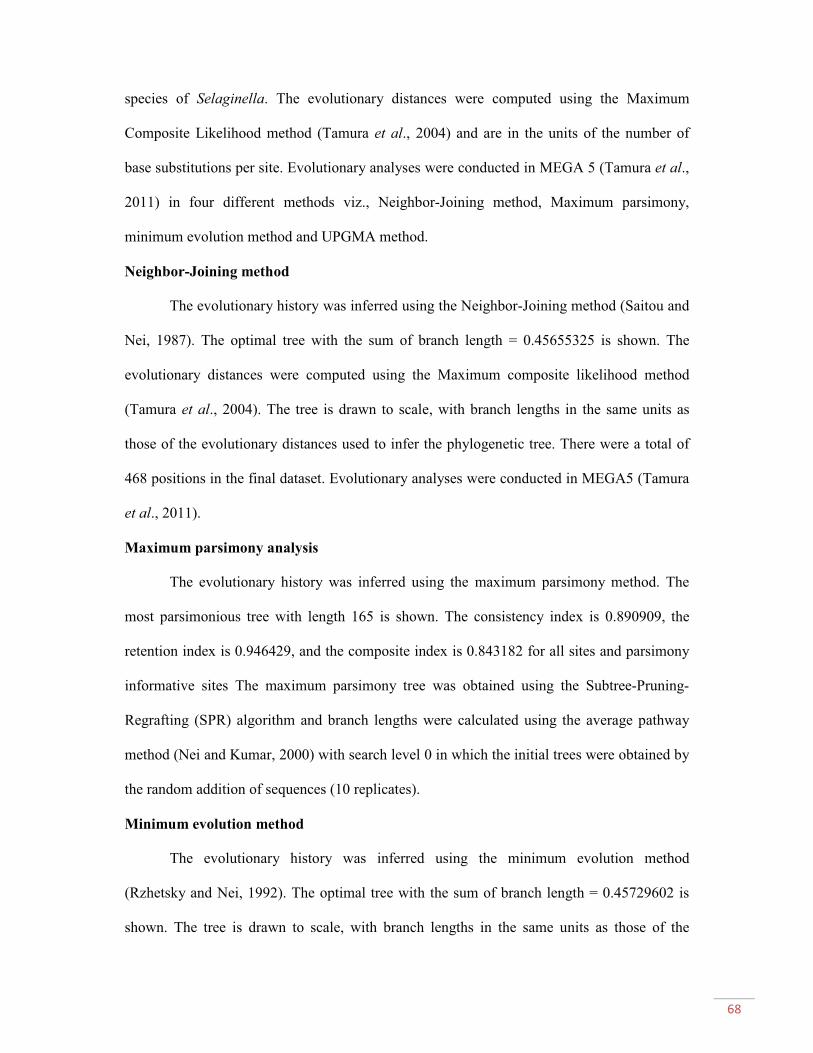
68
species of Selaginella. The evolutionary distances were computed using the Maximum
Composite Likelihood method (Tamura et al., 2004) and are in the units of the number of
base substitutions per site. Evolutionary analyses were conducted in MEGA 5 (Tamura et al.,
2011) in four different methods viz., Neighbor-Joining method, Maximum parsimony,
minimum evolution method and UPGMA method.
Neighbor-Joining method
The evolutionary history was inferred using the Neighbor-Joining method (Saitou and
Nei, 1987). The optimal tree with the sum of branch length = 0.45655325 is shown. The
evolutionary distances were computed using the Maximum composite likelihood method
(Tamura et al., 2004). The tree is drawn to scale, with branch lengths in the same units as
those of the evolutionary distances used to infer the phylogenetic tree. There were a total of
468 positions in the final dataset. Evolutionary analyses were conducted in MEGA5 (Tamura
et al., 2011).
Maximum parsimony analysis
The evolutionary history was inferred using the maximum parsimony method. The
most parsimonious tree with length 165 is shown. The consistency index is 0.890909, the
retention index is 0.946429, and the composite index is 0.843182 for all sites and parsimony
informative sites The maximum parsimony tree was obtained using the Subtree-Pruning-
Regrafting (SPR) algorithm and branch lengths were calculated using the average pathway
method (Nei and Kumar, 2000) with search level 0 in which the initial trees were obtained by
the random addition of sequences (10 replicates).
Minimum evolution method
The evolutionary history was inferred using the minimum evolution method
(Rzhetsky and Nei, 1992). The optimal tree with the sum of branch length = 0.45729602 is
shown. The tree is drawn to scale, with branch lengths in the same units as those of the
69
evolutionary distances used to infer the phylogenetic tree. The confidence probability
(multiplied by 100) that the interior branch length is greater than 0, as estimated using the
bootstrap test (500 replicates) is shown next to the branches (Dopazo, 1994; Rzhetsky, 1992).
The evolutionary distances were computed using the maximum composite likelihood method
(Tamura et al., 2004). The minimum evolution tree was searched using the Close-Neighbor-
Interchange (CNI) algorithm (Nei and Kumar, 2000) at a search level of 1. The Neighbor-
Joining algorithm (Saitou and Nei, 1987) was used to generate the initial tree.
UPGMA method
The evolutionary history was inferred using the UPGMA method (Sneath and Sokal,
1973). The optimal tree with the sum of branch length is 0.45504821. The tree is drawn to
scale, with branch lengths in the same units as those of the evolutionary distances used to
infer the phylogenetic tree. The evolutionary distances were computed using the maximum
composite likelihood method (Tamura et al., 2004).

70
Results
The biochemical and molecular analysis of the selected ten species of Selaginella
were done using the techniques of SDS-PAGE (protein separation), MALDI-TOF MS (mass
spectroscopic analysis), PAGE (isozymic profile) and DNA barcoding using rbcL gene to
identify the molecular relationship among them.
Protein profiling of Selaginella species
The relative positions of the protein bands of the studied Selaginella species viz., S.
intermedia, S. inaequalifolia, S. involvens, S. tenera, S. wightii, S. brachystachya, S. repanda,
S. radicata, S. bryopteris, S. delicatula with and without cones collected from various
localities of South India were revealed by SDS-PAGE. Multiple regions of activity were
observed in the protein electrophoretic system of Selaginella species. A total of 190 bands
with various Rf values and molecular weight were displayed in the SDS-PAGE gel system of
Selaginella (Table 15; Plate XIII) Among the ten species of Selaginella, S. repanda showed
maximum number of protein bands (25) followed by S. tenera (24), S. radicata (21), S.
intermedia (19), S. brachystachya (18), S. wightii (17). S. involvens and S. delicatula without
cones expressed equal number of bands (14). S. inaequalifolia and S. bryopteris depicted
equal number of protein bands (13). S. delicatula showed minimum number of bands (12).
The recorded data illustrated the role of protein in expressing the genetic similarity and/or
variation between the studied species of Selaginella. Each region expressed different proteins
which act as representative of the expression of a particular gene.
Based on the occurrence of proteins in the Selaginella gel system, the protein profiles
were classified into ten regions. Region 1 observed with seven positions and eighteen bands.
PP11
(Rf- 0.02; MW-281.8 kDa) showed its presence in S. intermedia, S. inaequalifolia, S.
involvens, S. tenera, S. wightii, S. radicata and S. bryopteris. PP12
(Rf-0.03; MW-272.6 kDa)

71
was shared by S. brachystachya and S. repanda. PP13
(Rf-0.04; MW-251.1 kDa), PP14
(Rf-
0.05; MW-223.8 kDa) and PP17
(Rf-0.09; 169.8 kDa) expressed its unique presence in S.
brachystachya, S. bryopteris and S. repanda respectively. PP15
(Rf-0.07; MW-199.5 kDa)
dispersed mutually by S. intermedia and S. wightii. PP16
(Rf-0.08; MW-177.8 kDa) displayed
its common occurrence in S. involvens, S. tenera, S. delicatula with and without cones.
Region 1 described the similarity among the studied species of Selaginella.
Region 2 displayed twenty two bands in nine positions. PP21
(Rf-0.10; MW-162.2
kDa) was shared by S. intermedia and S. bryopteris. Similarly, PP22
(Rf-0.11; MW-158.4
kDa) expressed its mutual presence in S. radicata and S. bryopteris. PP23
(Rf-0.12; MW-
154.8 kDa) represented its common occurrence in S. inaequalifolia, S. brachystachya and S.
repanda. PP24
(Rf-0.13; MW-141.2 kDa) was universal to S. intermedia and S. involvens.
PP25
(Rf-0.14; MW-135.8 kDa) illustrated its identical existence in S. inaequalifolia, S.
tenera and S. radicata. PP26
(Rf-0.16; MW-123 kDa) displayed its presence in S. intermedia,
S. wightii and S. bryopteris. PP27
(Rf-0.17; MW-111.3 kDa) observed mutually in S. tenera
and S. radicata. PP28
(Rf-0.18; MW-100 kDa) occupied its occurrence equally in S.
brachystachya and S. repanda. PP29
(Rf-0.19; MW-99.1 kDa) was evenly distributed in S.
involvens and S. tenera respectively. No unique band was found in region 2. Thus, region 2
clearly explained the biochemical similarity and phylogenetic relationships among the studied
Selaginella species.
Region 3 depicted twenty one bands in seven positions. PP31
(Rf-0.21; MW-98.7
kDa) expressed its common occurrence in S. brachystachya, S. repanda and S. radicata. PP32
(Rf-0.22; MW-96.2 kDa) was shared by S. delicatula with and without cones. PP33
(Rf-0.23;
MW-95.4 kDa) was unique to S. brachystachya. PP34
(Rf-0.25; MW-93.3 kDa) observed
commonly in S. tenera, S. wightii, S. radicata and S. bryopteris. PP35
(Rf-0.26; MW-92.5
kDa) represented its presence in S. intermedia, S. tenera and S. radicata. PP36
(Rf-0.27; 89.1

72
kDa) illustrated its common existence in S. wightii, S. brachystachya and S. repanda. PP37
(Rf-0.29; MW-87 kDa) was displayed by five species of Selaginella viz., S. intermedia, S.
involvens, S. tenera, S. brachystachya and S. radicata.
Region 4 represented seventeen bands with eight positions. PP41
(Rf-0.30; MW-81.2
kDa) was common to S. repanda and S. bryopteris. PP42
(Rf-0.32; MW-79.4 kDa) was
uniformly distributed in S. intermedia, S. tenera and S. radicata. PP43
(Rf-0.33; MW-70.7
kDa) was observed jointly in S. tenera and S. radicata. Similarly, PP44
(Rf-0.34; MW-63
kDa) explained its mutual presence in S. brachystachya and S. repanda. PP45
(Rf-0.35; MW-
61.6 kDa) expressed its unique existence in S. intermedia. S. wightii illustrated two distinct
bands with positions PP46
(Rf-0.36; MW-59 kDa) and PP48
(Rf-0.39; MW-55.9 kDa) which
explained its variation with the other studied species of Selaginella. PP47
(Rf-0.38; MW-57.5
kDa) displayed its occurrence in S. intermedia, S. tenera, S. brachystachya, S. repanda and S.
radicata. Region 5 depicted fifteen bands with five positions only. PP51
(Rf-0.40; MW-53.8
kDa) was distinct to S. repanda that explained its special occurrence in the region 5. PP52
(Rf-0.41; MW-52.1 kDa) was observed in S. tenera, S. repanda and S. bryopteris. PP53
(Rf-
0.43; MW-50.1 kDa) was common to S. brachystachya and S. repanda. PP54
(Rf-0.45; MW-
47.4 kDa) expressed commonly in S. involvens, S. tenera, S. wightii, S. repanda, and S.
delicatula. PP55
(Rf-0.47; MW-46.1 kDa) displayed its common existence in S. intermedia, S.
repanda, S. bryopteris and S. delicatula without cones.
Region 6 represented twenty three protein bands with six different positions. PP61
(Rf-0.50; MW-44.6 kDa) was distributed in S. wightii, S. brachystachya and S. repanda. PP62
(Rf-0.51; MW-43.2 kDa) was commonly expressed in S. intermedia, S. inaequalifolia, S.
involvens, S. radicata, S. delicatula with and without cones. PP63
(Rf-0.52; MW-41.9 kDa)
was displayed its unique presence in S. tenera. PP64
(Rf-0.54; MW-39.8 kDa) was observed
in S. wightii, S. repanda, S. bryopteris and S. delicatula. PP65
(Rf-0.57; MW-38 kDa) was

73
found common in S. intermedia, S. brachystachya and S. radicata. PP66
(Rf-0.58; MW-37.1
kDa) showed its presence uniformly in S. involvens, S. tenera, S. brachystachya, S. repanda,
S. delicatula with and without cones.
Region 7 expressed fourteen bands with five different positions. PP71
(Rf-0.60; MW-
35.6 kDa) was shared by S. inaequalifolia and S. wightii. PP72
(Rf-0.61; MW-33.1 kDa)
showed its exclusive presence in S. delicatula without cones which explained its variation
with other studied species of Selaginella. PP73
(Rf-0.63; 30.9 kDa) displayed uniformly in S.
tenera, S. brachystachya, S. repanda and S. radicata. PP74
(Rf-0.67; MW-29.1 kDa) showed
its common occurrence in S. involvens, S. tenera and S. wightii. PP75
(Rf-0.69; MW-28 kDa)
displayed its presence in S. intermedia, S. brachystachya, S. repanda and S. delicatula
without cones.
Region 8 occupied twenty one bands with eight positions. PP81
(Rf-0.70; MW-27.3
kDa) and PP84
(Rf-0.75; MW-22 kDa) showed its unique presence in S. inaequalifolia and S.
tenera respectively which explained its variation with other studied species of Selaginella.
PP82
(Rf-0.72; MW-25.1 kDa) showed its mutual existence in S. involvens and S. tenera.
PP83
(Rf-0.73; MW-24.8 kDa) elucidated its common occurrence in S. intermedia, S.
inaequalifolia, S. wightii, S. repanda, S. radicata, S. delicatula with and without cones. PP85
(Rf-0.76; MW-21.6 kDa) was shared by S. inaequalifolia and S. bryopteris. PP86
(Rf-0.77;
MW-17.7 kDa) represented its uniform presence in S. intermedia, S. involvens, S. wightii, S.
radicata, S. delicatula with and without cones. PP87
(Rf-0.78; MW-19 kDa) and PP88
(Rf-
0.79; MW-18.4 kDa) displayed its unique occurrence in S. brachystachya and S. tenera
respectively.
Region 9 displayed twenty four protein bands with seven different regions. PP91
(Rf-
0.8; MW-17.9 kDa) showed its common existence in S. repanda and S. radicata. Similarly,
PP92
(Rf-0.82; MW-16.5 kDa) displayed its expression equally in S. involvens, S. bryopteris
74
and S. delicatula. PP93
(Rf-0.83; MW-15.9 kDa) depicted its common occurence in S.
intermedia, S. inaequalifolia, S. tenera, S. repanda and S. radicata. PP94
(Rf-0.85; MW-14.1
kDa) depicted its presence jointly in S. wightii and S. bryopteris. PP95
(Rf-0.86; MW-13.8
kDa) displayed its occurrence in S. inaequalifolia, S. tenera, S. radicata, S. delicatula with
and without cones. PP96
(Rf-0.88; MW-12.5 kDa) dispersed uniformly in S. intermedia, S.
wightii and S. brachystachya. Similarly, PP97
(Rf-0.89; MW-11.9 kDa) showed it’s jointly
presence in S. inaequalifolia, S. involvens and S. repanda. Region 10 illustrated fifteen bands
with four positions. PP101
(Rf-0.91; MW-11.4 kDa) represented its joint distribution in S.
tenera, S. radicata and S. delicatula. PP102
(Rf-0.92; MW-11 kDa) exhibited its existence in
S. inaequalifolia, S. repanda and S. delicatula without cones. PP103
(Rf-0.95; MW-10.4 kDa)
was demonstrated its occurrence in S. intermedia, S. inaequalifolia, S. tenera, S. wightii, S.
radicata and S. delicatula. PP104
(Rf-0.97; MW-9.9 kDa) described its occurrence in S.
involvens, S. radicata and S. delicatula without cones. Regions 9 and 10 were failed to
express distinct bands in the studied Selaginella species.
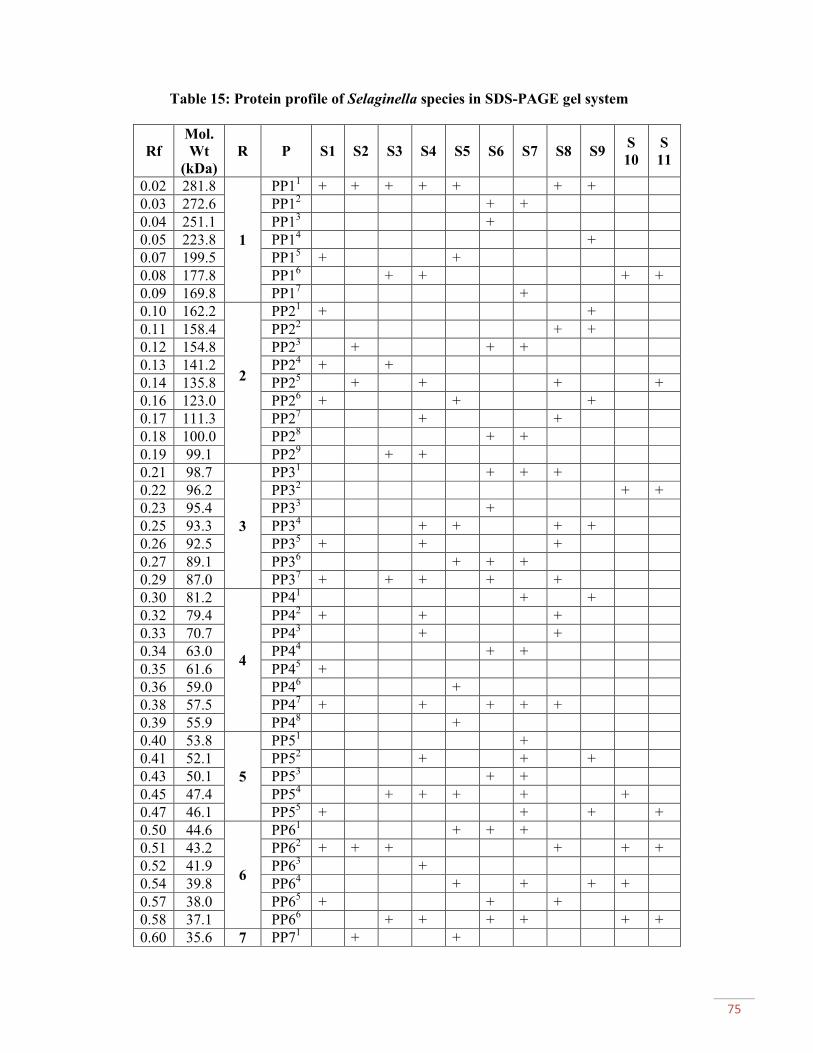
75
Table 15: Protein profile of Selaginella species in SDS-PAGE gel system
Rf
Mol.
Wt
(kDa)
R P S1 S2 S3 S4 S5 S6 S7 S8 S9S
10
S
11
0.02 281.8
1
PP11
+ + + + + + +
0.03 272.6 PP12
+ +
0.04 251.1 PP13
+
0.05 223.8 PP14
+
0.07 199.5 PP15
+ +
0.08 177.8 PP16
+ + + +
0.09 169.8 PP17
+
0.10 162.2
2
PP21
+ +
0.11 158.4 PP22
+ +
0.12 154.8 PP23
+ + +
0.13 141.2 PP24
+ +
0.14 135.8 PP25
+ + + +
0.16 123.0 PP26
+ + +
0.17 111.3 PP27
+ +
0.18 100.0 PP28
+ +
0.19 99.1 PP29
+ +
0.21 98.7
3
PP31
+ + +
0.22 96.2 PP32
+ +
0.23 95.4 PP33
+
0.25 93.3 PP34
+ + + +
0.26 92.5 PP35
+ + +
0.27 89.1 PP36
+ + +
0.29 87.0 PP37
+ + + + +
0.30 81.2
4
PP41
+ +
0.32 79.4 PP42
+ + +
0.33 70.7 PP43
+ +
0.34 63.0 PP44
+ +
0.35 61.6 PP45
+
0.36 59.0 PP46
+
0.38 57.5 PP47
+ + + + +
0.39 55.9 PP48
+
0.40 53.8
5
PP51
+
0.41 52.1 PP52
+ + +
0.43 50.1 PP53
+ +
0.45 47.4 PP54
+ + + + +
0.47 46.1 PP55
+ + + +
0.50 44.6
6
PP61
+ + +
0.51 43.2 PP62
+ + + + + +
0.52 41.9 PP63
+
0.54 39.8 PP64
+ + + +
0.57 38.0 PP65
+ + +
0.58 37.1 PP66
+ + + + + +
0.60 35.6 7 PP71
+ +
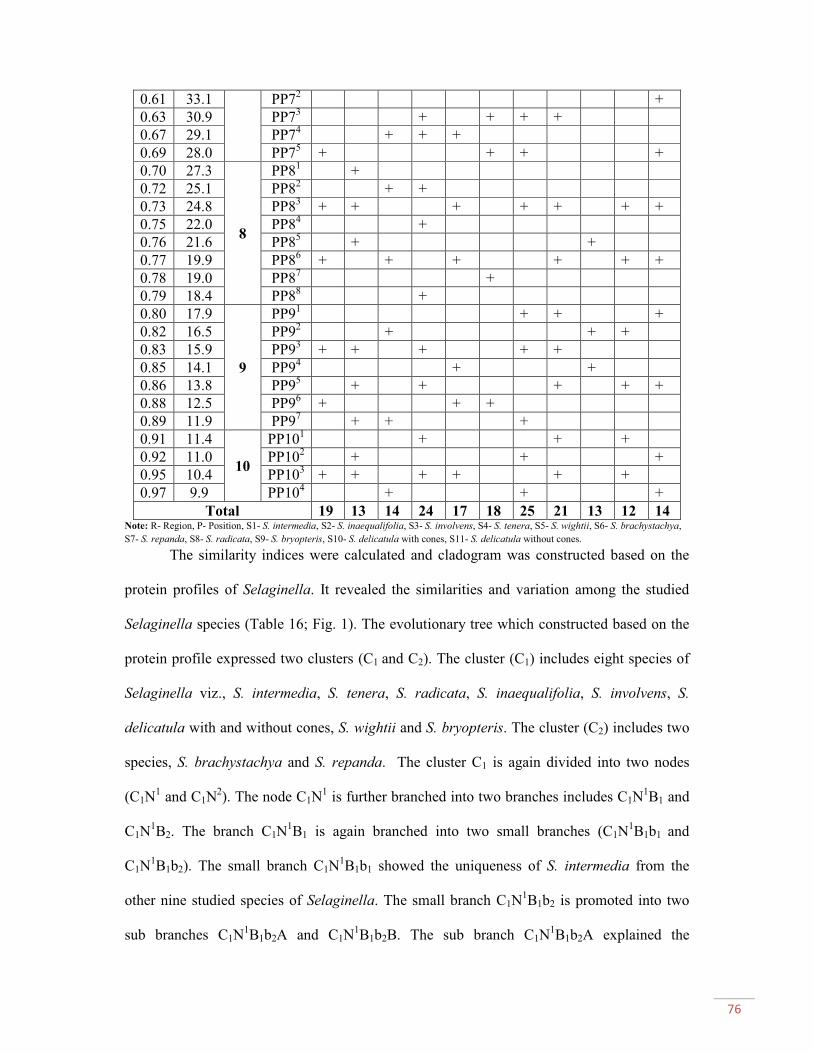
76
0.61 33.1 PP72
+
0.63 30.9 PP73
+ + + +
0.67 29.1 PP74
+ + +
0.69 28.0 PP75
+ + + +
0.70 27.3
8
PP81
+
0.72 25.1 PP82
+ +
0.73 24.8 PP83
+ + + + + + +
0.75 22.0 PP84
+
0.76 21.6 PP85
+ +
0.77 19.9 PP86
+ + + + + +
0.78 19.0 PP87
+
0.79 18.4 PP88
+
0.80 17.9
9
PP91
+ + +
0.82 16.5 PP92
+ + +
0.83 15.9 PP93
+ + + + +
0.85 14.1 PP94
+ +
0.86 13.8 PP95
+ + + + +
0.88 12.5 PP96
+ + +
0.89 11.9 PP97
+ + +
0.91 11.4
10
PP101
+ + +
0.92 11.0 PP102
+ + +
0.95 10.4 PP103
+ + + + + +
0.97 9.9 PP104
+ + +
Total 19 13 14 24 17 18 25 21 13 12 14Note: R- Region, P- Position, S1- S. intermedia, S2- S. inaequalifolia, S3- S. involvens, S4- S. tenera, S5- S. wightii, S6- S. brachystachya,
S7- S. repanda, S8- S. radicata, S9- S. bryopteris, S10- S. delicatula with cones, S11- S. delicatula without cones.
The similarity indices were calculated and cladogram was constructed based on the
protein profiles of Selaginella. It revealed the similarities and variation among the studied
Selaginella species (Table 16; Fig. 1). The evolutionary tree which constructed based on the
protein profile expressed two clusters (C1 and C2). The cluster (C1) includes eight species of
Selaginella viz., S. intermedia, S. tenera, S. radicata, S. inaequalifolia, S. involvens, S.
delicatula with and without cones, S. wightii and S. bryopteris. The cluster (C2) includes two
species, S. brachystachya and S. repanda. The cluster C1 is again divided into two nodes
(C1N1
and C1N2). The node C1N
1is further branched into two branches includes C1N
1B1 and
C1N1B2. The branch C1N
1B1 is again branched into two small branches (C1N
1B1b1 and
C1N1B1b2). The small branch C1N
1B1b1 showed the uniqueness of S. intermedia from the
other nine studied species of Selaginella. The small branch C1N1B1b2 is promoted into two
sub branches C1N1B1b2A and C1N
1B1b2B. The sub branch C1N
1B1b2A explained the

77
similarity and variation among S. tenera and S. radicata whereas the sub branch C1N1B1b2B
depicted the exclusive character of S. inaequalifolia from the other studied species of
Selaginella. The branch C1N1B2 is branched into two small branches C1N
1B2b1 which is
distinct from the other species of Selaginella. The small branch C1N1B2b2B represented the
closeness and divergence between S. delicatula with and without cones. The node C1N2
is
branched into two division C1N2B1 and C1N
2B2 that illustrated the similarity and variation
between S. wightii and S. bryopteris. The cluster (C2) is simply divided into two nodes C2N1
and C2N2
which showed the closeness and divergence between S. brachystachya and S.
repanda.
Table 16: Similarity indices of Selaginella species based on SDS-PAGE profile
Note: S1 - S. intermedia, S2 - S. inaequalifolia, S3 - S. involvens, S4 - S. tenera, S5 - S. wightii, S6 - S. brachystachya, S7 - S. repanda, S8 - S. radicata, S9 - S. bryopteris, S10 - S. delicatula with cones, S11 - S. delicatula without cones.
Fig. 1: Cladogram of studied Selaginella species based on SDS-PAGE profile
Taxon S1 S2 S3 S4 S5 S6 S7 S8 S9 S10 S11
S1 1.00
S2 0.15 1.00
S3 0.15 0.11 1.00
S4 0.16 0.13 0.21 1.00
S5 0.19 0.13 0.12 0.12 1.00
S6 0.13 0.03 0.06 0.09 0.08 1.00
S7 0.11 0.13 0.10 0.13 0.11 0.27 1.00
S8 0.27 0.20 0.11 0.28 0.13 0.10 0.10 1.00
S9 0.12 0.07 0.07 0.08 0.17 0.00 0.10 0.08 1.00
S10 0.12 0.16 0.23 0.16 0.17 0.00 0.10 0.18 0.08 1.00
S11 0.15 0.18 0.17 0.10 0.06 0.03 0.17 0.17 0.07 0.26 1.00

78
MALDI-TOF mass spectrum analysis
MALDI-TOF MS characterization of Selaginella species collected from various
localities of South India expressed different ion peaks ranged from 0 - 1, 00,000 kDa (Plate
XIV; XV). The results of MALDI- TOF MS analysis showed both positive and negative
peaks. For the present study, positive peaks were selected to identify the similarities and
variation among the studied Selaginella species. MALDI-TOF MS analysis of ten Selaginella
species showed totally 483 spectral peak values (m/z values) and they were represented in
Table 17. Among the spectral profile of ten Selaginella species, S. involvens displayed
maximum number (86) of spectral peaks ranged from 527 to 99215 m/z values. Next to that,
S. tenera represented 77 spectral peaks with m/z values 719 to 95316. S. inaequalifolia
showed 73 spectral peaks displayed from 501 to 96748 m/z values. S. delicatula with cones
expressed 69 spectral peaks (511 to 94366 m/z values) while S. delicatula without cones
depicted 45 spectral peaks ranged from 528 to 92003 m/z values. S. bryopteris established 54
spectral peaks with m/z values 594 to 95279. Subsequently, S. brachystachya exhibited 52
defined spectral peaks varied from 515 to 99633 m/z values. S. repanda demonstrated 50
spectral peaks with m/z values 536 to 99939. S. wightii recognized 42 spectral peaks differed
from 522 to 96955 m/z values. S. intermedia predicted 36 spectral peaks with m/z values 491
to 96955. S. radicata depicted minimum number (21) of spectral peaks varied from 694 to
91754 m/z values (Table 17). Among the 483 spectral peak values of the studied ten
Selaginella species, 71 spectral peaks were observed with unique presence, which
distinguished the genetic similarities and variation of studied Selaginella species.
Based on the MALDI-TOF mass spectral peaks of studied Selaginella species, the
similarity indices were calculated and the cladogram was constructed (Table 18; Fig. 2). The
cladogram displayed two clades C1 and C2. The clade C1 includes five species of Selaginella
viz., S. intermedia, S. inaequalifolia, S. wightii, S. involvens and S. tenera. Similarly, the

79
clade C2 includes five species of Selaginella viz., S. brachystachya, S. radicata, S. repanda,
S. bryopteris, S. delicatula with and without cones. The clade C1 is divided into two nodes,
C1N1
and C1N2. The node C1N
2showed the unique existence in S. tenera. The node C1N
1is
branched into C1N1B1 and C1N
1B2. The branch C1N
1B1 is further divided into two small
branches C1N1B1b1 and C1N
1B1b2, whereas the branch C1N
1B2 expressed the exclusive
character of S. involvens. The small branch C1N1B1b1 displayed the similarity between S.
intermedia and S. inaequalifolia. The small branch C1N1B1b2 depicted the distinct character
of S. wightii. The clade C2 is divided into two nodes C2N1
and C2N2. The C2N
1is branched
into C2N1B1 and C2N
1B2. The branch C2N
1B1 is again divided into two small branches
C2N1B1b1 and C2N
1B1b2. The branch C2N
1B2 illustrated the unique occurrence in S.
bryopteris. The small branch C2N1B1b1 explained the similarity between S. brachystachya
(C2N1B1b1A) and S. radicata (C2N
1B1b1B). The small branch C2N
1B1b2 displayed the
restricted distribution of S. repanda. The clade C2N2
is branched into C2N2B1 and C2N
2B2
that confirmed the similarity between S. delicatula with and without cones. The distingished
character of S. tenera, S. involvens, S. wightii, S. brachystachya and S. repanda is confirmed
in the cladogram by the presence of unique m/z values (Fig. 2). These specific m/z values can
be act as a biochemical marker to identify the specific Selaginella species in
chemosystematics and pharmaceutical industries.

80
Table 17: MALDI-TOF MS analysis of Selaginella species
S1 S2 S3 S4 S5 S6 S7 S8 S9 S10 S11
491 501 527 719 522 515 536 694 594 511 528
522 506 667 1020 594 536 555 11424 677 555 555
527 522 10045 10750 610 599 669 16000 694 599 574
636 625 10135 11061 667 694 694 16145 822 694 615
651 667 10190 11610 916 698 918 19545 11269 698 694
667 693 10335 13041 920 711 15937 20879 11487 876 698
688 833 10356 13549 921 798 16145 21460 11830 992 711
693 905 10574 13787 1165 3675 16238 21481 13280 2257 6103
729 10356 10615 14887 1170 5325 16382 23596 15512 2588 7068
895 10362 11460 20920 10149 10367 16725 24425 16145 9369 10284
916 11874 11466 21065 10252 15678 16995 27785 16694 10554 10367
920 12579 11874 21459 10278 16145 17710 31357 16974 10875 10554
10360 12616 12331 21832 10398 16766 17897 33637 16995 11258 10688
13200 13223 12336 22387 10424 17046 19898 37618 17202 11849 11070
20111 13435 12616 22809 10563 18602 20299 42933 17472 11923 11269
20112 14114 13435 23906 10589 21481 20610 43492 18405 12410 12130
21729 15794 13611 25648 10817 23596 23036 43533 18892 12783 13674
22062 19962 13871 26850 11025 31046 23596 47586 19473 14491 15077
22081 20112 14114 27928 11522 31357 25379 50257 21294 14566 15149
25815 20380 14316 28011 11652 31979 25628 51108 22393 15429 16145
25835 21251 14814 28364 11668 32870 25649 91754 22870 15771 16497
31189 21729 20112 29318 11895 34301 26582 23596 16145 17046
31232 22435 21749 29815 12435 37162 28116 24052 16818 17654
39193 23388 21792 30174 13829 38240 31357 24301 16995 19410
54052 23887 22062 30754 13887 40092 31439 24985 17046 20610
66271 23906 22435 31189 15794 41543 33824 27723 17181 20651
68469 24455 23906 31624 18469 43492 34239 28116 17482 33139
72579 25419 24611 32040 20380 44529 36561 29256 18405 39816
91294 25815 24776 32910 21045 45919 36955 29692 19048 50630
93699 26083 27182 32994 21066 48365 37972 30382 19136 52476
93741 27121 27888 34134 21251 49589 42933 31357 20610 53098
94052 27765 27928 34570 21832 61916 50133 32282 20651 57245
96374 28157 28054 36103 21895 71936 53637 32517 20879 59485
96685 29775 28115 36498 22062 72435 54031 34798 21066 60444
96748 29796 28281 38841 22081 72953 54301 38240 21771 62414
96955 31543 29796 39982 22413 73181 57773 40092 22268 63264
32579 29815 40796 22435 74322 58013 40506 23761 63860
33011 30071 41438 23802 77183 59941 42538 25649 63887
34537 32742 42247 25835 79775 61916 43471 26209 65213
40837 33233 45087 39193 81428 61979 46312 26707 65590
40859 34735 45835 39215 81801 64715 54301 29423 67307
41314 36103 48364 96955 84786 69485 62808 32062 71066
41688 36167 49234 86737 71066 66250 33326 86488
43057 37059 50339 89640 75886 69381 33575 88933
47080 37182 51002 91090 83709 70962 33637 92003
48260 37888 51272 91754 87110 72601 36561
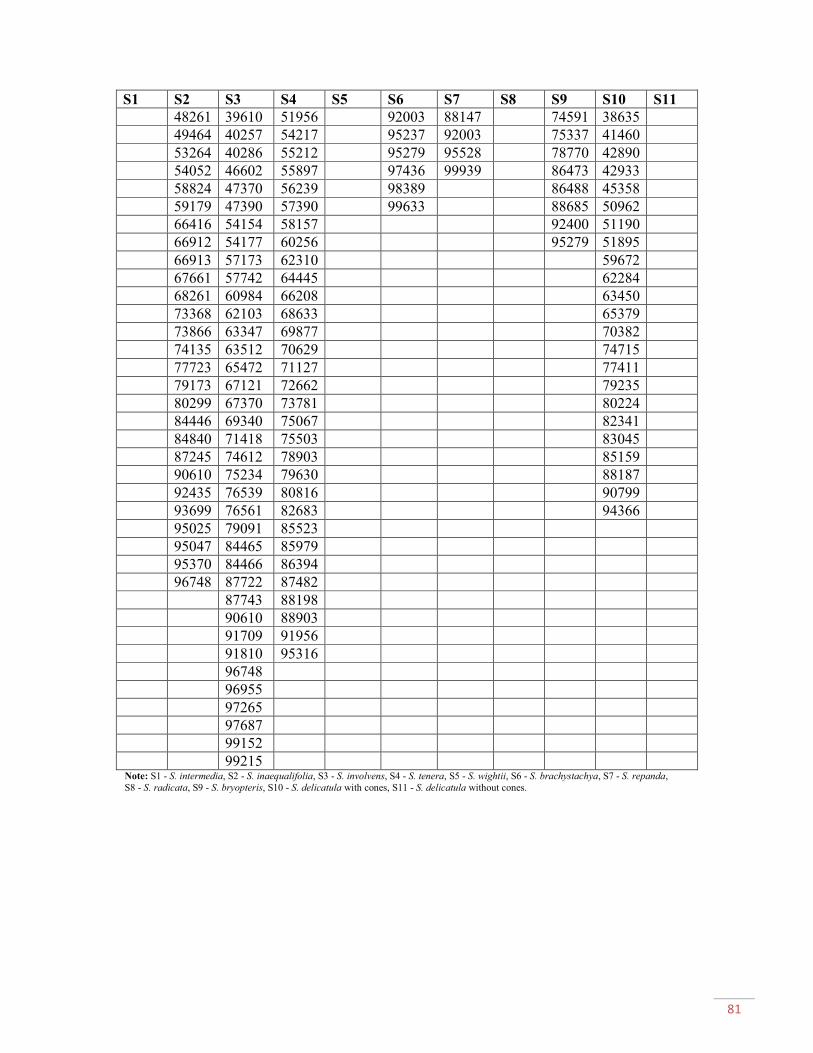
81
S1 S2 S3 S4 S5 S6 S7 S8 S9 S10 S11
48261 39610 51956 92003 88147 74591 38635
49464 40257 54217 95237 92003 75337 41460
53264 40286 55212 95279 95528 78770 42890
54052 46602 55897 97436 99939 86473 42933
58824 47370 56239 98389 86488 45358
59179 47390 57390 99633 88685 50962
66416 54154 58157 92400 51190
66912 54177 60256 95279 51895
66913 57173 62310 59672
67661 57742 64445 62284
68261 60984 66208 63450
73368 62103 68633 65379
73866 63347 69877 70382
74135 63512 70629 74715
77723 65472 71127 77411
79173 67121 72662 79235
80299 67370 73781 80224
84446 69340 75067 82341
84840 71418 75503 83045
87245 74612 78903 85159
90610 75234 79630 88187
92435 76539 80816 90799
93699 76561 82683 94366
95025 79091 85523
95047 84465 85979
95370 84466 86394
96748 87722 87482
87743 88198
90610 88903
91709 91956
91810 95316
96748
96955
97265
97687
99152
99215Note: S1 - S. intermedia, S2 - S. inaequalifolia, S3 - S. involvens, S4 - S. tenera, S5 - S. wightii, S6 - S. brachystachya, S7 - S. repanda,
S8 - S. radicata, S9 - S. bryopteris, S10 - S. delicatula with cones, S11 - S. delicatula without cones.

82
Table 18: Similarity indices of Selaginella species based on MALDI-TOF MS analysis
Note: S1 - S. intermedia, S2 - S. inaequalifolia, S3 - S. involvens, S4 - S. tenera, S5 - S. wightii, S6 - S. brachystachya, S7 - S. repanda,
S8 - S. radicata, S9 - S. bryopteris, S10 - S. delicatula with cones, S11 - S. delicatula without cones.
Fig. 2: Cladogram of Selaginella species based on MALDI-TOF MS analysis
Isozyme analysis
To know the isozymic variation among the selected ten Selaginella species from
South India, five enzyme systems were resolved viz., esterase (EST), peroxidase (PO), acid
phosphatase (ACP), alkaline phosphatase (ALP) and polyphenol oxidase (PPO).
Esterase
Multiple regions of activity with a total of thirty eight esterase bands were obtained in
the esterase system of studied Selaginella species (Table 19; Plate XVI). S. brachystachya
displayed maximum number (5) of esterase bands and S. inaequalifolia expressed minimum
number (2) of esterase bands. Esterase enzyme system of Selaginella showed eight active
Taxon S1 S2 S3 S4 S5 S6 S7 S8 S9 S10 S11
S1 1.00
S2 0.10 1.00
S3 0.05 0.09 1.00
S4 0.01 0.06 0.02 1.00
S5 0.10 0.05 0.02 0.02 1.00
S6 0.01 0.07 0.00 0.08 0.00 1.00
S7 0.03 0.02 0.01 0.08 0.02 0.07 1.00
S8 0.02 0.01 0.00 0.00 0.00 0.08 0.06 1.00
S9 0.01 0.07 0.07 0.00 0.01 0.06 0.04 0.05 1.00
S10 0.01 0.06 0.00 0.01 0.08 0.04 0.06 0.04 0.03 1.00
S11 0.02 0.02 0.00 0.00 0.01 0.07 0.05 0.02 0.03 0.06 1.00
83
regions (Table 19). Region 1 depicted four active bands. EST 11
(0.01) was common to S.
intermedia, S. involvens, S. repanda, S. radicata and S. bryopteris. EST 12
(0.03) showed its
presence jointly in S. tenera, S. brachystachya, S. delicatula with and without cones. EST 13
(0.05) depicted its common existence in S. involvens, S. wightii and S. repanda. EST 14
(0.09)
represented its occurrence in S. intermedia, S. bryopteris and S. delicatula without cones.
Region 2 displayed three active bands of esterase enzymes. EST 21
(0.10) was observed in S.
tenera, S. repanda and S. delicatula. EST 22
(0.14) established its mutual presence in S.
repanda and S. radicata. EST 23
(0.16) was shared by S. involvens and S. wightii. Region 3
illustrated with three active esterase enzymes. EST 31
(0.20) was common in S. repanda and
S. delicatula without cones. EST 32
(0.22), EST 33
(0.23) and EST 34
(0.25) were distinct to
S. inaequalifolia, S. intermedia and S. delicatula with cones. EST 35
(0.27) established its
mutual presence in S. tenera and S. radicata. Region 4 and 5 depicted with a single
enzymatic band, EST 41
with MW-Rf value (0.34) was universal to S. radicata and EST 51
(0.49) showed its common presence in S. involvens, S. repanda and S. bryopteris. Region 6
expressed three active enzymatic bands. EST 61
(0.50), EST 62
(0.54) and EST 63
(0.58)
exhibited its restricted character in S. brachystachya, S. involvens and S. repanda. Region 7
and 8 displayed with a single esterase band, EST 71
with MW-Rf (0.69) and EST 81
(0.76)
were distinct to S. intermedia and S. wightii respectively.

84
Table 19: Esterase enzymatic profile of Selaginella species
MW
RfR
Enzyme
positionS1 S2 S3 S4 S5 S6 S7 S8 S9 S10 S11
0.01
1
EST 11
+ + + + +
0.03 EST 12
+ + + +
0.05 EST 13
+ + +
0.09 EST 14
+ + +
0.10
2
EST 21
+ + +
0.14 EST 22
+ +
0.16 EST 23
+ +
0.20
3
EST 31
+ +
0.22 EST 32
+
0.23 EST 33
+
0.25 EST 34
+
0.27 EST 35
+ +
0.34 4 EST 41
+
0.49 5 EST 51
+ + +
0.50
6
EST 61
+
0.54 EST 62
+
0.58 EST 63
+
0.69 7 EST 71
+
0.76 8 EST81
+
Total 4 2 4 3 3 5 4 4 3 3 3Note:R- Region, S1- S. intermedia, S2- S. inaequalifolia, S3- S. involvens, S4- S. tenera, S5- S. wightii, S6- S. brachystachya, S7- S.
repanda, S8- S. radicata, S9- S. bryopteris, S10- S. delicatula with cones, S11- S. delicatula without cones.
Based on the esterase profile of the Selaginella species studied, the similarity indices
were calculated and the cladogram was constructed (Table 20; Fig. 3). The evolutionary tree
which was constructed based on the esterase profile expressed two clusters (C1 and C2). The
cluster (C1) includes eight species of Selaginella viz., S. intermedia, S. involvens, S. repanda,
S. bryopteris, S. radicata, S. tenera, S. brachystachya, S. delicatula with and without cones.
The cluster (C2) includes two Selaginella species, S. inaequalifolia and S. wightii. The
cluster C1 is again divided into two nodes (C1N1
and C1N2). The node C1N
1is branched into
C1N1B1 and C1N
1B2. The branch C1N
1B1 is again divided into two small branches (C1N
1B1b1
and C1N1B1b2). The small branch C1N
1B1b1 showed the unique presence of S. intermedia
from the other studied species of Selaginella. The small branch C1N1B1b2 is promoted into
two sub branches C1N1B1b2A and C1N
1B1b2B. The sub branch C1N
1B1b2A depicted the
exclusive character of S. involvens whereas the sub branch C1N1B1b2B explained the
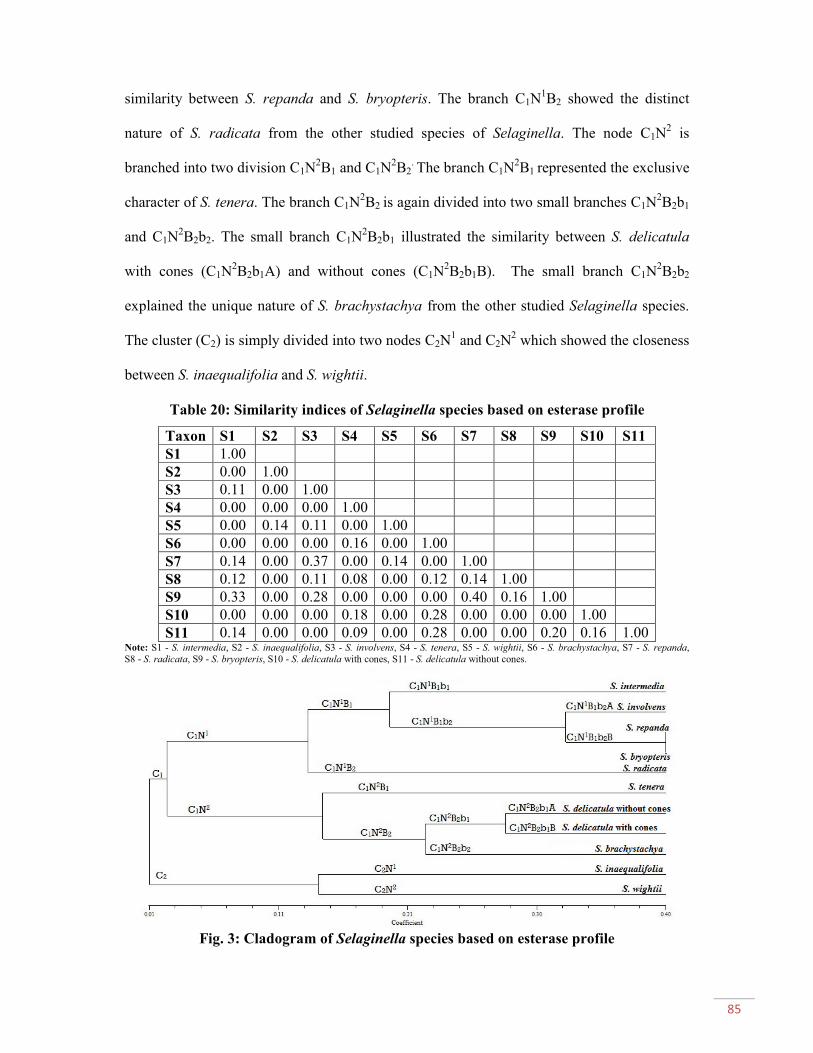
85
similarity between S. repanda and S. bryopteris. The branch C1N1B2 showed the distinct
nature of S. radicata from the other studied species of Selaginella. The node C1N2
is
branched into two division C1N2B1 and C1N
2B2
.The branch C1N
2B1 represented the exclusive
character of S. tenera. The branch C1N2B2 is again divided into two small branches C1N
2B2b1
and C1N2B2b2. The small branch C1N
2B2b1 illustrated the similarity between S. delicatula
with cones (C1N2B2b1A) and without cones (C1N
2B2b1B). The small branch C1N
2B2b2
explained the unique nature of S. brachystachya from the other studied Selaginella species.
The cluster (C2) is simply divided into two nodes C2N1
and C2N2
which showed the closeness
between S. inaequalifolia and S. wightii.
Table 20: Similarity indices of Selaginella species based on esterase profile
Taxon S1 S2 S3 S4 S5 S6 S7 S8 S9 S10 S11
S1 1.00
S2 0.00 1.00
S3 0.11 0.00 1.00
S4 0.00 0.00 0.00 1.00
S5 0.00 0.14 0.11 0.00 1.00
S6 0.00 0.00 0.00 0.16 0.00 1.00
S7 0.14 0.00 0.37 0.00 0.14 0.00 1.00
S8 0.12 0.00 0.11 0.08 0.00 0.12 0.14 1.00
S9 0.33 0.00 0.28 0.00 0.00 0.00 0.40 0.16 1.00
S10 0.00 0.00 0.00 0.18 0.00 0.28 0.00 0.00 0.00 1.00
S11 0.14 0.00 0.00 0.09 0.00 0.28 0.00 0.00 0.20 0.16 1.00Note: S1 - S. intermedia, S2 - S. inaequalifolia, S3 - S. involvens, S4 - S. tenera, S5 - S. wightii, S6 - S. brachystachya, S7 - S. repanda,
S8 - S. radicata, S9 - S. bryopteris, S10 - S. delicatula with cones, S11 - S. delicatula without cones.
Fig. 3: Cladogram of Selaginella species based on esterase profile

86
Peroxidase
Peroxidase enzyme system of Selaginella produced sixty six peroxidase bands with
ten active regions (Table 21). S. brachystachya displayed highest number (11) of peroxidase
bands and S. inaequalifolia expressed lowest number (2) of peroxidase bands (Table 21; Plate
XVI). Region 1 illustrated with six active bands. PRX 11
(0.01) was shared by S. wightii and
S. bryopteris. PRX 12
(0.02), PRX 13
(0.04) and PRX 14
(0.05) were distinct to S.
brachystachya, S. involvens and S. inaequalifolia respectively. PRX 15
(0.08) represented its
presence in S. delicatula with and without cones. PRX 16
(0.09) showed its common presence
in S. intermedia, S. brachystachya and S. radicata. Region 2 depicted six active enzymatic
bands. PRX 21
(0.11), PRX 24
(0.16) and PRX 26
(0.19) exhibited its restricted character in S.
repanda, S. involvens and S. radicata respectively. PRX 22
(0.12) was shared by S. bryopteris
and S. delicatula. PRX 23
(0.15) was showed its common existence in S. brachystachya and
S. delicatula without cones. PRX 25
(0.18) represented its mutual presence in S. repanda and
S. bryopteris. Region 3 illustrated with five active enzymatic bands. PRX 31
(0.21) and PRX
35
(0.28) exhibited its restricted character in S. tenera and S. brachystachya. PRX 32
(0.22)
was demonstrated its common occurence in S. intermedia, S. delicatula with and without
cones. PRX 33
(0.23) was showed it’s jointly presence in S. involvens, S. brachystachya and
S. bryopteris. PRX 34
(0.26) established its mutual presence in S. tenera and S. radicata.
Region 4 expressed four peroxidase bands. PRX 41, PRX 4
3and PRX 4
4with MW-Rf values
0.32, 0.36 and 0.38 were represented its unique existence in S. repanda, S. radicata and S.
tenera respectively. PRX 42
(0.35) showed its common presence in S. wightii, S.
brachystachya and S. bryopteris. Region 5 illustrated with three enzymatic bands. PRX 51
(0.42) and PRX 53
(0.47) were expressed their unique presence only in S. involvens. PRX 52
(0.46) established its mutual presence in S. tenera and S. wightii. Region 6 showed four
active peroxidase bands. PRX 61, PRX 6
2, PRX 6
3and PRX 6
4 with MW-Rf values 0.52,
87
0.53, 0.56 and 0.59 were displayed its unique presence in S. brachystachya, S. radicata, S.
wightii and S. involvens respectively. Similarly, region 7 displayed four peroxidase bands.
PRX 71
(0.60) and PRX 73
(0.66) exhibited its restricted expression in S. bryopteris and S.
wightii. PRX 72
(0.64) was observed in S. radicata, S. delicatula with and without cones.
PRX 74
(0.69) was shared by S. involvens and S. tenera. Similar to region 6 and 7, region 8
also observed with four enzymatic bands. PRX 81, PRX 8
3 and PRX 8
4 with MW-Rf values
0.70, 0.76 and 0.78 were depicted its unique character in S. brachystachya, S. intermedia and
S. repanda correspondingly. PRX 82
(0.74) was commonly shared by S. brachystachya and S.
radicata. Region 9 expressed with a single enzymatic band PRX 91
(0.88) was restricted to S.
delicatula without cones. Region 10 produced four active enzymatic bands. PRX 101
(0.91)
and PRX 103
(0.95) were distinct to S. tenera and S. radicata respectively. PRX 102
showed
it’s jointly distribution in S. brachystachya and S. bryopteris. PRX 104
(0.97) was dispersed
commonly in six species of Selaginella viz., S. inaequalifolia, S. involvens, S. wightii, S.
brachystachya, S. repanda and S. bryopteris.
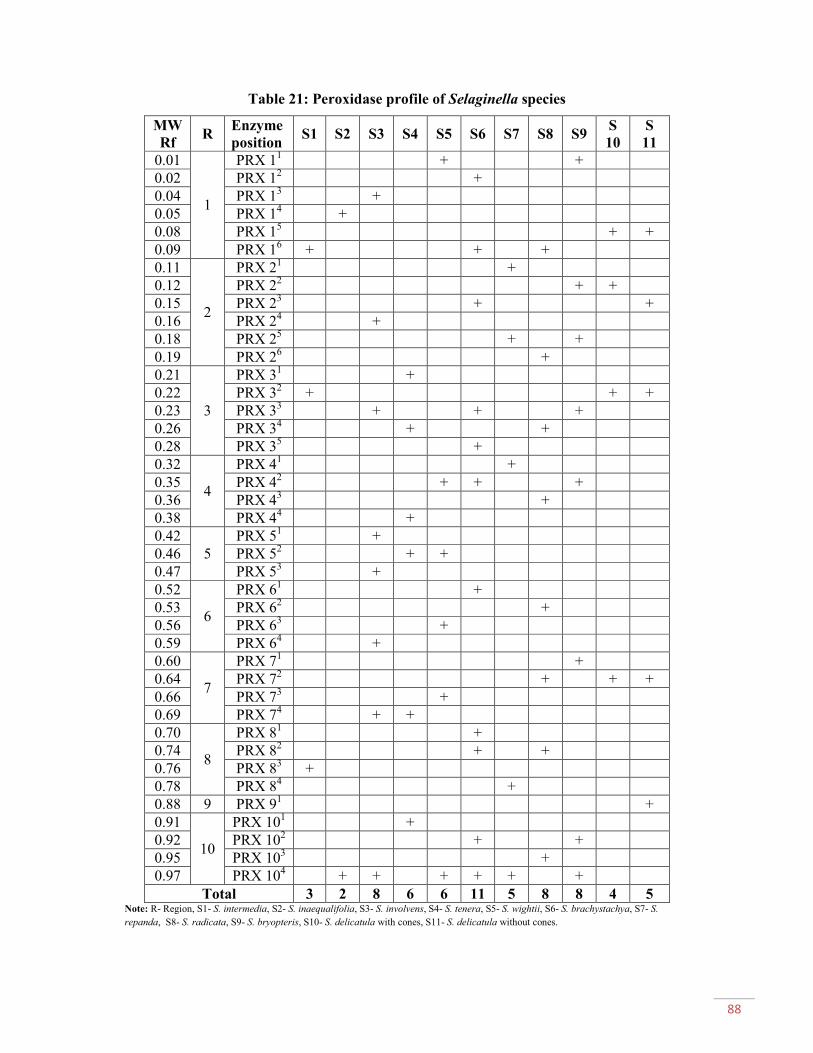
88
Table 21: Peroxidase profile of Selaginella species
MW
RfR
Enzyme
positionS1 S2 S3 S4 S5 S6 S7 S8 S9
S
10
S
11
0.01
1
PRX 11
+ +
0.02 PRX 12
+
0.04 PRX 13
+
0.05 PRX 14
+
0.08 PRX 15
+ +
0.09 PRX 16
+ + +
0.11
2
PRX 21
+
0.12 PRX 22
+ +
0.15 PRX 23
+ +
0.16 PRX 24
+
0.18 PRX 25
+ +
0.19 PRX 26
+
0.21
3
PRX 31
+
0.22 PRX 32
+ + +
0.23 PRX 33
+ + +
0.26 PRX 34
+ +
0.28 PRX 35
+
0.32
4
PRX 41
+
0.35 PRX 42
+ + +
0.36 PRX 43
+
0.38 PRX 44
+
0.42
5
PRX 51
+
0.46 PRX 52
+ +
0.47 PRX 53
+
0.52
6
PRX 61
+
0.53 PRX 62
+
0.56 PRX 63
+
0.59 PRX 64
+
0.60
7
PRX 71
+
0.64 PRX 72
+ + +
0.66 PRX 73
+
0.69 PRX 74
+ +
0.70
8
PRX 81
+
0.74 PRX 82
+ +
0.76 PRX 83
+
0.78 PRX 84
+
0.88 9 PRX 91
+
0.91
10
PRX 101
+
0.92 PRX 102
+ +
0.95 PRX 103
+
0.97 PRX 104
+ + + + + +
Total 3 2 8 6 6 11 5 8 8 4 5Note: R- Region, S1- S. intermedia, S2- S. inaequalifolia, S3- S. involvens, S4- S. tenera, S5- S. wightii, S6- S. brachystachya, S7- S.
repanda, S8- S. radicata, S9- S. bryopteris, S10- S. delicatula with cones, S11- S. delicatula without cones.
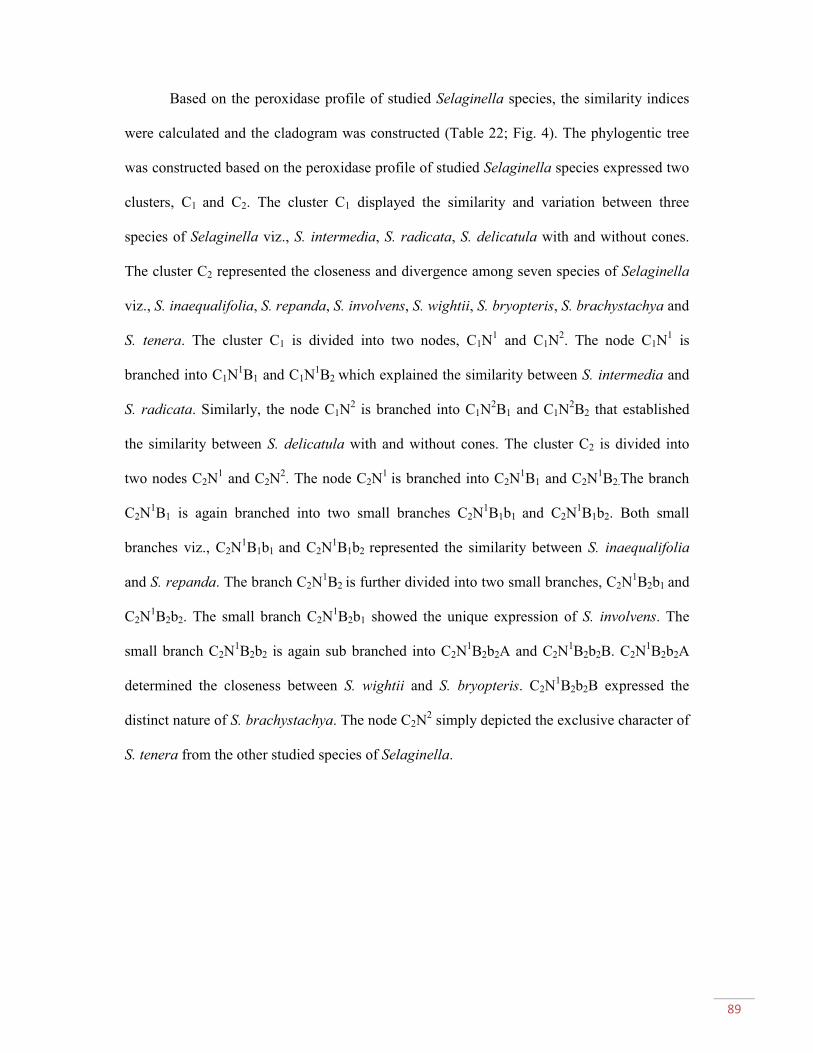
89
Based on the peroxidase profile of studied Selaginella species, the similarity indices
were calculated and the cladogram was constructed (Table 22; Fig. 4). The phylogentic tree
was constructed based on the peroxidase profile of studied Selaginella species expressed two
clusters, C1 and C2. The cluster C1 displayed the similarity and variation between three
species of Selaginella viz., S. intermedia, S. radicata, S. delicatula with and without cones.
The cluster C2 represented the closeness and divergence among seven species of Selaginella
viz., S. inaequalifolia, S. repanda, S. involvens, S. wightii, S. bryopteris, S. brachystachya and
S. tenera. The cluster C1 is divided into two nodes, C1N1
and C1N2. The node C1N
1is
branched into C1N1B1 and C1N
1B2 which explained the similarity between S. intermedia and
S. radicata. Similarly, the node C1N2
is branched into C1N2B1 and C1N
2B2 that established
the similarity between S. delicatula with and without cones. The cluster C2 is divided into
two nodes C2N1
and C2N2. The node C2N
1 is branched into C2N
1B1 and C2N
1B2.The branch
C2N1B1 is again branched into two small branches C2N
1B1b1 and C2N
1B1b2. Both small
branches viz., C2N1B1b1 and C2N
1B1b2 represented the similarity between S. inaequalifolia
and S. repanda. The branch C2N1B2 is further divided into two small branches, C2N
1B2b1 and
C2N1B2b2. The small branch C2N
1B2b1 showed the unique expression of S. involvens. The
small branch C2N1B2b2 is again sub branched into C2N
1B2b2A and C2N
1B2b2B. C2N
1B2b2A
determined the closeness between S. wightii and S. bryopteris. C2N1B2b2B expressed the
distinct nature of S. brachystachya. The node C2N2
simply depicted the exclusive character of
S. tenera from the other studied species of Selaginella.
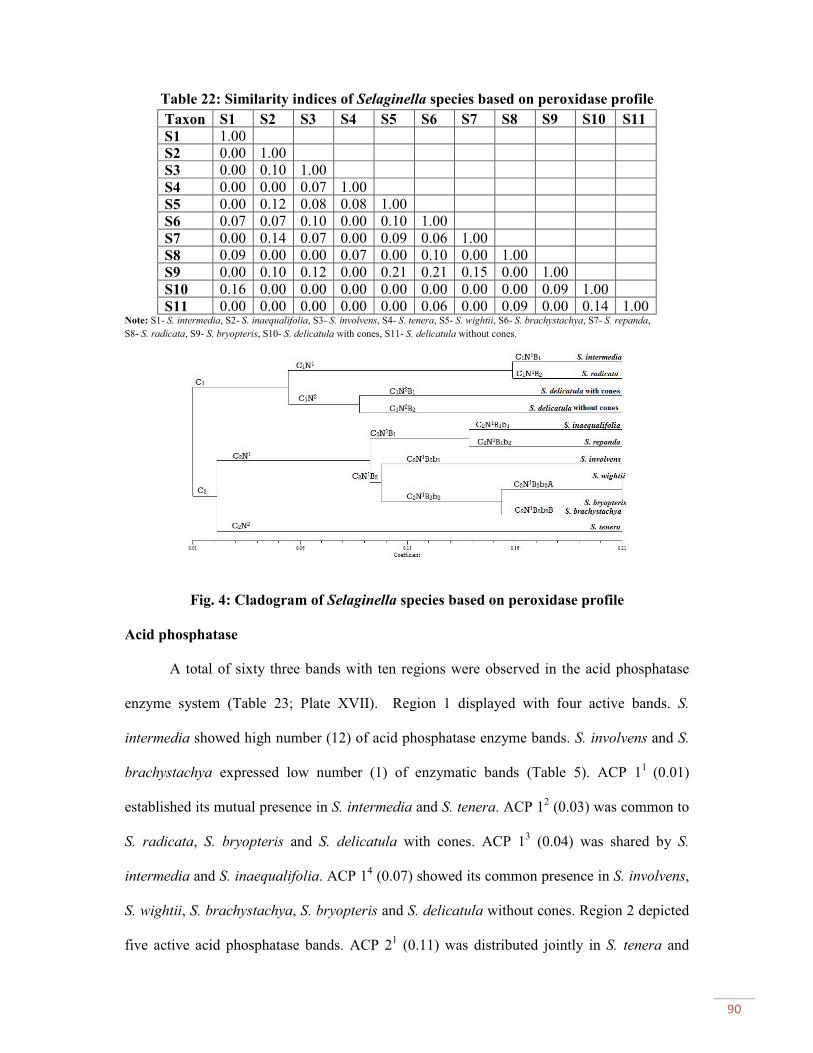
90
Table 22: Similarity indices of Selaginella species based on peroxidase profile
Taxon S1 S2 S3 S4 S5 S6 S7 S8 S9 S10 S11
S1 1.00
S2 0.00 1.00
S3 0.00 0.10 1.00
S4 0.00 0.00 0.07 1.00
S5 0.00 0.12 0.08 0.08 1.00
S6 0.07 0.07 0.10 0.00 0.10 1.00
S7 0.00 0.14 0.07 0.00 0.09 0.06 1.00
S8 0.09 0.00 0.00 0.07 0.00 0.10 0.00 1.00
S9 0.00 0.10 0.12 0.00 0.21 0.21 0.15 0.00 1.00
S10 0.16 0.00 0.00 0.00 0.00 0.00 0.00 0.00 0.09 1.00
S11 0.00 0.00 0.00 0.00 0.00 0.06 0.00 0.09 0.00 0.14 1.00Note: S1- S. intermedia, S2- S. inaequalifolia, S3- S. involvens, S4- S. tenera, S5- S. wightii, S6- S. brachystachya, S7- S. repanda,
S8- S. radicata, S9- S. bryopteris, S10- S. delicatula with cones, S11- S. delicatula without cones.
Fig. 4: Cladogram of Selaginella species based on peroxidase profile
Acid phosphatase
A total of sixty three bands with ten regions were observed in the acid phosphatase
enzyme system (Table 23; Plate XVII). Region 1 displayed with four active bands. S.
intermedia showed high number (12) of acid phosphatase enzyme bands. S. involvens and S.
brachystachya expressed low number (1) of enzymatic bands (Table 5). ACP 11
(0.01)
established its mutual presence in S. intermedia and S. tenera. ACP 12
(0.03) was common to
S. radicata, S. bryopteris and S. delicatula with cones. ACP 13
(0.04) was shared by S.
intermedia and S. inaequalifolia. ACP 14
(0.07) showed its common presence in S. involvens,
S. wightii, S. brachystachya, S. bryopteris and S. delicatula without cones. Region 2 depicted
five active acid phosphatase bands. ACP 21
(0.11) was distributed jointly in S. tenera and
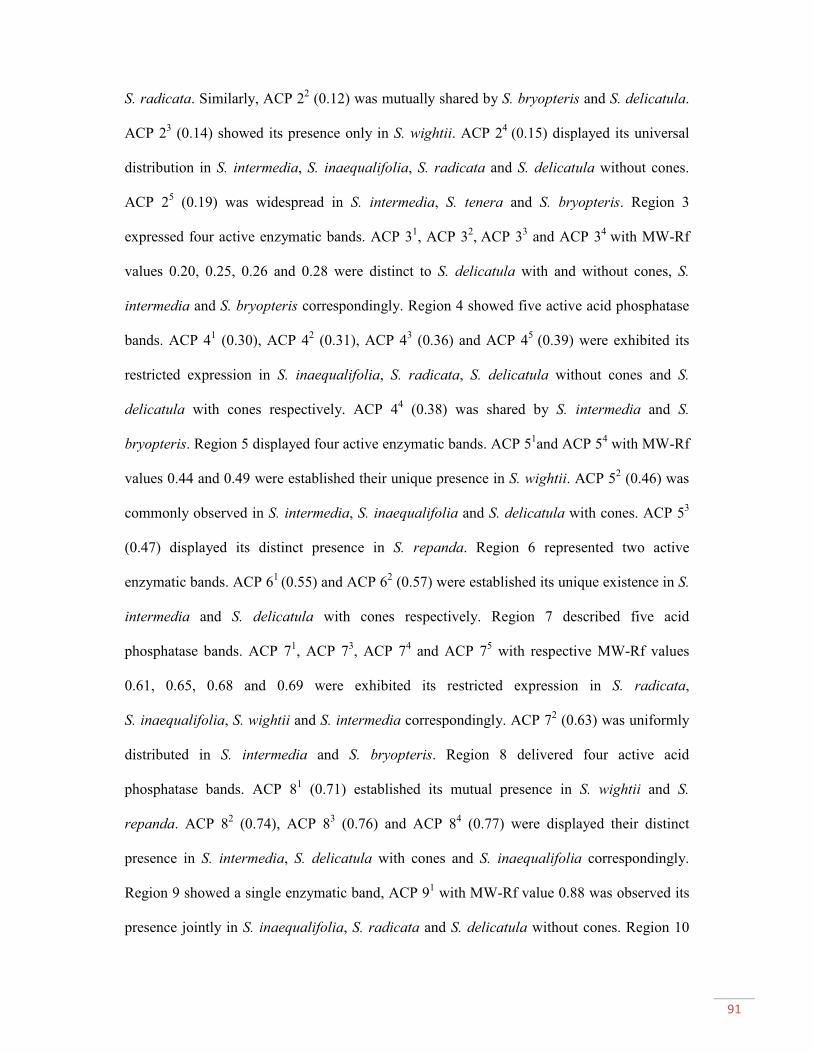
91
S. radicata. Similarly, ACP 22
(0.12) was mutually shared by S. bryopteris and S. delicatula.
ACP 23
(0.14) showed its presence only in S. wightii. ACP 24
(0.15) displayed its universal
distribution in S. intermedia, S. inaequalifolia, S. radicata and S. delicatula without cones.
ACP 25
(0.19) was widespread in S. intermedia, S. tenera and S. bryopteris. Region 3
expressed four active enzymatic bands. ACP 31, ACP 3
2, ACP 3
3and ACP 3
4 with MW-Rf
values 0.20, 0.25, 0.26 and 0.28 were distinct to S. delicatula with and without cones, S.
intermedia and S. bryopteris correspondingly. Region 4 showed five active acid phosphatase
bands. ACP 41
(0.30), ACP 42
(0.31), ACP 43
(0.36) and ACP 45
(0.39) were exhibited its
restricted expression in S. inaequalifolia, S. radicata, S. delicatula without cones and S.
delicatula with cones respectively. ACP 44
(0.38) was shared by S. intermedia and S.
bryopteris. Region 5 displayed four active enzymatic bands. ACP 51and ACP 5
4with MW-Rf
values 0.44 and 0.49 were established their unique presence in S. wightii. ACP 52
(0.46) was
commonly observed in S. intermedia, S. inaequalifolia and S. delicatula with cones. ACP 53
(0.47) displayed its distinct presence in S. repanda. Region 6 represented two active
enzymatic bands. ACP 61
(0.55) and ACP 62
(0.57) were established its unique existence in S.
intermedia and S. delicatula with cones respectively. Region 7 described five acid
phosphatase bands. ACP 71, ACP 7
3, ACP 7
4and ACP 7
5with respective MW-Rf values
0.61, 0.65, 0.68 and 0.69 were exhibited its restricted expression in S. radicata,
S. inaequalifolia, S. wightii and S. intermedia correspondingly. ACP 72
(0.63) was uniformly
distributed in S. intermedia and S. bryopteris. Region 8 delivered four active acid
phosphatase bands. ACP 81
(0.71) established its mutual presence in S. wightii and S.
repanda. ACP 82
(0.74), ACP 83
(0.76) and ACP 84
(0.77) were displayed their distinct
presence in S. intermedia, S. delicatula with cones and S. inaequalifolia correspondingly.
Region 9 showed a single enzymatic band, ACP 91
with MW-Rf value 0.88 was observed its
presence jointly in S. inaequalifolia, S. radicata and S. delicatula without cones. Region 10
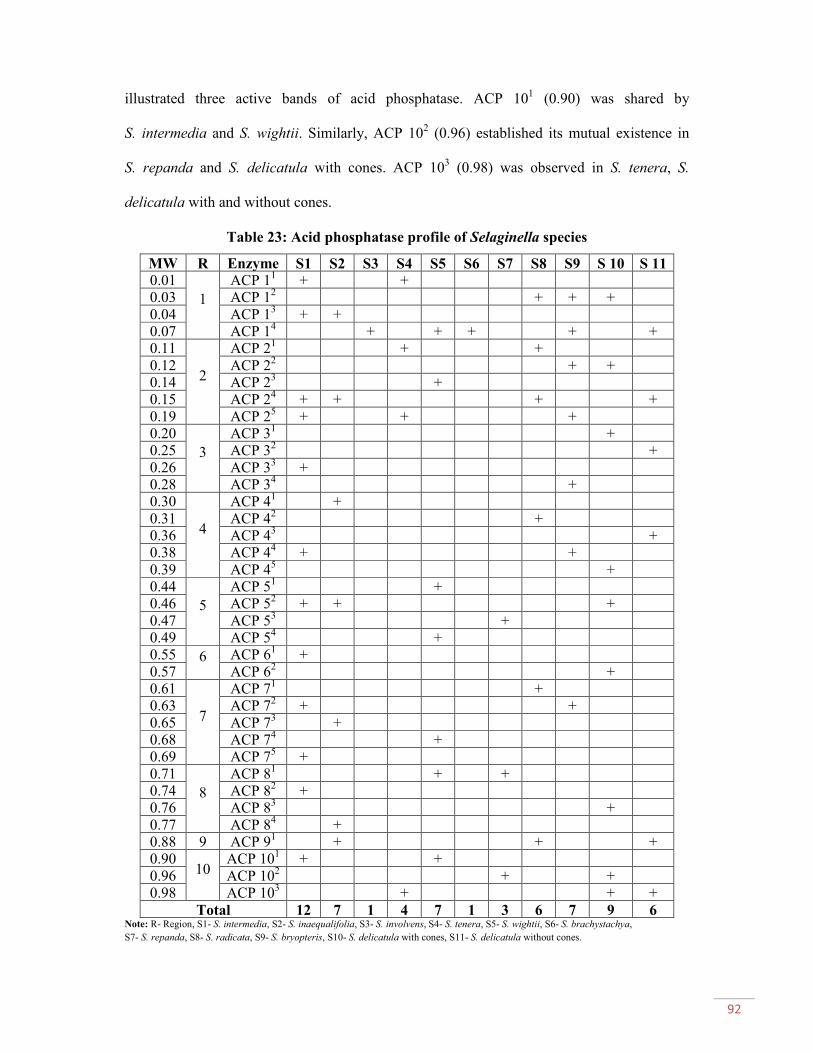
92
illustrated three active bands of acid phosphatase. ACP 101
(0.90) was shared by
S. intermedia and S. wightii. Similarly, ACP 102
(0.96) established its mutual existence in
S. repanda and S. delicatula with cones. ACP 103
(0.98) was observed in S. tenera, S.
delicatula with and without cones.
Table 23: Acid phosphatase profile of Selaginella species
MW R Enzyme S1 S2 S3 S4 S5 S6 S7 S8 S9 S 10 S 110.01
1
ACP 11
+ +0.03 ACP 1
2+ + +
0.04 ACP 13
+ +0.07 ACP 1
4+ + + + +
0.11
2
ACP 21
+ +
0.12 ACP 22
+ +0.14 ACP 2
3+
0.15 ACP 24
+ + + +
0.19 ACP 25
+ + +0.20
3
ACP 31
+0.25 ACP 3
2+
0.26 ACP 33
+0.28 ACP 3
4+
0.30
4
ACP 41
+
0.31 ACP 42
+0.36 ACP 4
3+
0.38 ACP 44
+ +
0.39 ACP 45
+0.44
5
ACP 51
+0.46 ACP 5
2+ + +
0.47 ACP 53
+0.49 ACP 5
4+
0.55 6 ACP 61
+
0.57 ACP 62
+0.61
7
ACP 71
+0.63 ACP 7
2+ +
0.65 ACP 73
+0.68 ACP 7
4+
0.69 ACP 75
+
0.71
8
ACP 81
+ +0.74 ACP 8
2+
0.76 ACP 83
+
0.77 ACP 84
+0.88 9 ACP 9
1+ + +
0.9010
ACP 101
+ +
0.96 ACP 102
+ +0.98 ACP 10
3+ + +
Total 12 7 1 4 7 1 3 6 7 9 6Note: R- Region, S1- S. intermedia, S2- S. inaequalifolia, S3- S. involvens, S4- S. tenera, S5- S. wightii, S6- S. brachystachya,
S7- S. repanda, S8- S. radicata, S9- S. bryopteris, S10- S. delicatula with cones, S11- S. delicatula without cones.

93
Based on the acid phosphatase profile of studied Selaginella species, the similarity
indices were calculated and the cladogram was constructed (Table 24; Fig. 5). The
evolutionary tree showed two clusters, C1 and C2. The cluster C1 displayed the similarity and
variation among five species of Selaginella viz., S. intermedia, S. inaequalifolia, S. radicata,
S. tenera, S. delicatula with and without cones. Similarly, the cluster C2 represented the
closeness and divergence among five species of Selaginella viz., S. involvens, S.
brachystachya, S. bryopteris, S. wightii and S. repanda. The cluster C1 is divided into two
nodes, C1N1
and C1N2. The node C1N
1is branched into C1N
1B1 and C1N
1B2. The node C1N
2
displayed the unique character of S. delicatula with cones. The branch C1N1B1 is further
divided into C1N1B1b1 and C1N
1B1b2. The branch C1N
1B2 represented the exclusive nature of
S. tenera. C1N1B1b1 presented the similarity between S. intermedia (C1N
1B1b1A) and S.
inaequalifolia (C1N1B1b1B). C1N
1B1b2 demonstrated the closeness between S. radicata
(C1N1B1b2A) and S. delicatula without cones (C1N
1B1b2B). The cluster C2 is divided into two
nodes, C2N1
and C2N2. The node C2N
1 is branched into C2N
1B1 and C2N
1B2.The branch
C2N1B1 explained the similarity between S. involvens and S. brachystachya. The branch
C2N1B2 exposed the distinct occurrence of S. bryopteris. The node C2N
2 is branched into
C2N2B1 and C2N
2B2 which depicted the similarity between S. wightii and S. repanda.
Table 24: Similarity indices of Selaginella species based on acid phosphatase profile
Taxon S1 S2 S3 S4 S5 S6 S7 S8 S9 S10 S11
S1 1.00
S2 0.15 1.00
S3 0.00 0.00 1.00
S4 0.12 0.00 0.00 1.00
S5 0.05 0.00 0.12 0.00 1.00
S6 0.00 0.00 0.50 0.00 0.12 1.00
S7 0.00 0.00 0.00 0.00 0.10 0.00 1.00
S8 0.05 0.15 0.00 0.10 0.00 0.00 0.00 1.00
S9 0.15 0.00 0.12 0.09 0.06 0.12 0.00 0.09 1.00
S10 0.04 0.06 0.00 0.07 0.00 0.00 0.08 0.06 0.11 1.00
S11 0.05 0.15 0.14 0.10 0.07 0.14 0.00 0.16 0.07 0.06 1.00Note: S1- S. intermedia, S2- S. inaequalifolia, S3- S. involvens, S4- S. tenera, S5- S. wightii, S6- S. brachystachya, S7- S. repanda,
S8- S. radicata, S9- S. bryopteris, S10- S. delicatula with cones, S11- S. delicatula without cones.
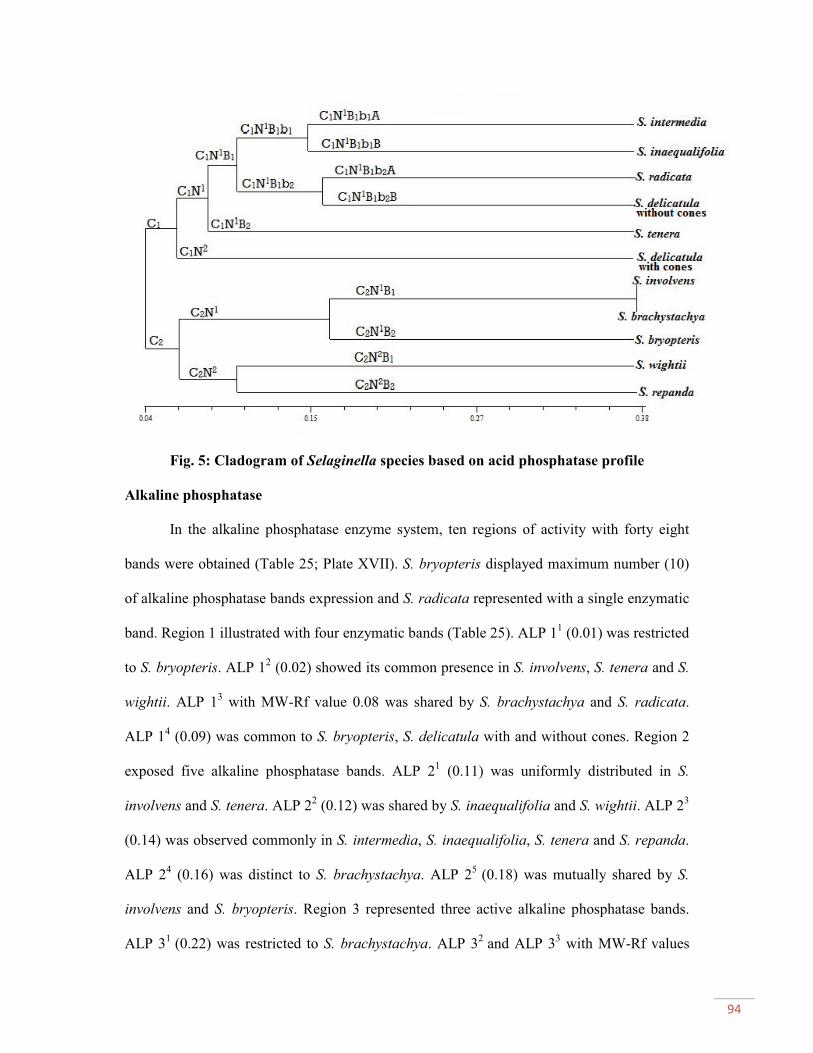
94
Fig. 5: Cladogram of Selaginella species based on acid phosphatase profile
Alkaline phosphatase
In the alkaline phosphatase enzyme system, ten regions of activity with forty eight
bands were obtained (Table 25; Plate XVII). S. bryopteris displayed maximum number (10)
of alkaline phosphatase bands expression and S. radicata represented with a single enzymatic
band. Region 1 illustrated with four enzymatic bands (Table 25). ALP 11
(0.01) was restricted
to S. bryopteris. ALP 12
(0.02) showed its common presence in S. involvens, S. tenera and S.
wightii. ALP 13
with MW-Rf value 0.08 was shared by S. brachystachya and S. radicata.
ALP 14
(0.09) was common to S. bryopteris, S. delicatula with and without cones. Region 2
exposed five alkaline phosphatase bands. ALP 21
(0.11) was uniformly distributed in S.
involvens and S. tenera. ALP 22
(0.12) was shared by S. inaequalifolia and S. wightii. ALP 23
(0.14) was observed commonly in S. intermedia, S. inaequalifolia, S. tenera and S. repanda.
ALP 24
(0.16) was distinct to S. brachystachya. ALP 25
(0.18) was mutually shared by S.
involvens and S. bryopteris. Region 3 represented three active alkaline phosphatase bands.
ALP 31
(0.22) was restricted to S. brachystachya. ALP 32
and ALP 33
with MW-Rf values

95
0.23 and 0.28 were expressed only in S. tenera. Region 4 displayed four active enzymatic
bands. ALP 41
(0.30) was shared by S. intermedia and S. tenera. ALP 42
(0.33), ALP 43
(0.37) and ALP 44
(0.38) were showed their unique presence in S. involvens, S. bryopteris
and S. tenera respectively. Region 5 displayed three enzymatic bands. ALP 51, ALP 5
2and
ALP 53
with MW-Rf values 0.46, 0.48 and 0.49 were restricted to S. involvens, S. bryopteris
and S. brachystachya correspondingly. Region 6 observed with a single enzymatic band, ALP
61
(0.58) was distinct to S. brachystachya. Region 7 illustrated with three alkaline
phosphatase bands. ALP 71
(0.60) and ALP 73
(0.64) were showed its unique existence in S.
delicatula and S. brachystachya respectively. ALP 72
(0.61) was uniformly distributed in S.
involvens and S. bryopteris. Region 8 depicted three alkaline phosphatase bands. ALP 81,
ALP 82
and ALP 83
with MW-Rf values 0.75, 0.77 and 0.79 were expressed its exclusive
character in S. bryopteris, S. wightii and S. involvens respectively. Region 9 delivered three
enzymatic bands. ALP 91
(0.81) and ALP 92
(0.83) were restricted to S. bryopteris and S.
delicatula with cones. ALP 93
(0.85) was shared by S. involvens and S. bryopteris. Region10
showed two alkaline phosphatase bands. ALP 101
(0.90) established its unique occurrence in
S. intermedia. ALP 102
(0.92) was observed in S. involvens, S. wightii, S. repanda, S.
bryopteris and S. delicatula without cones.

96
Table 25: Alkaline phosphatase profile of Selaginella species
MW
RfR
Enzyme
positionS1 S2 S3 S4 S5 S6 S7 S8 S9
S
10
S
11
0.01
1
ALP 11
+
0.02 ALP 12
+ + +
0.08 ALP 13
+ +
0.09 ALP 14
+ + +
0.11
2
ALP 21
+ +
0.12 ALP 22
+ +
0.14 ALP 23
+ + + +
0.16 ALP 24
+
0.18 ALP 25
+ +
0.22
3
ALP 31
+
0.23 ALP 32
+
0.28 ALP 34
+
0.30
4
ALP 41
+ +
0.33 ALP 42
+
0.37 ALP 43
+
0.38 ALP 44
+
0.46
5
ALP 51
+
0.48 ALP 52
+
0.49 ALP 53
+
0.58 6 ALP 61
+
0.60
7
ALP 71
+
0.61 ALP 72
+ +
0.64 ALP 73
+
0.75
8
ALP 81
+
0.77 ALP 82
+
0.79 ALP 83
+
0.81
9
ALP 91
+
0.83 ALP 92
+
0.85 ALP 93
+ +
0.9010
ALP 101
+
0.92 ALP 102
+ + + + +
Total 3 2 9 7 4 6 2 1 10 3 2Note: R- Region, S1- S. intermedia, S2- S. inaequalifolia, S3- S. involvens, S4- S. tenera, S5- S. wightii, S6- S. brachystachya, S7- S.
repanda, S8- S. radicata, S9- S. bryopteris, S10- S. delicatula with cones, S11- S. delicatula without cones.
Based on the alkaline phosphatase profile of studied Selaginella species, the similarity
indices were calculated and the cladogram was constructed (Table 26; Fig. 6). The
evolutionary tree displayed two clusters, C1 and C2. The cluster C1 is divided into two nodes,
C1N1
and C1N2. The node C1N
1is branched into C1N
1B1 and C1N
1B2. The branch C1N
1B1 is
further divided into C1N1B1b1 and C1N
1B1b2. C1N
1B1b1 represented the exclusive nature of S.
intermedia from the other studied species of Selaginella. C1N1B1b2 explained the similarity

97
between S. inaequalifolia and S. repanda. The branch C1N1B2 exposed the distinct
occurrence of S. tenera. The node C1N2
is branched into C1N2B1 and C1N
2B2. The branch
C1N2B1 is again branched into C1N
2B1b1 and C1N
2B1b2. C1N
2B1b1 presented the similarity
between S. involvens (C1N2B1b1A) and S. bryopteris (C1N
2B1b1B). The branch C1N
2B1b2
displayed the unique presence of S. wightii. The branch C1N2B2 demonstrated the closeness
between S. delicatula with cones (C1N2B2b1) and without cones (C1N
2B2b2B). The cluster C2
is divided into two nodes C2N1
and C2N2
which displayed the closeness between S.
brachystachya and S. radicata.
Table 26: Similarity indices of Selaginella species based on alkaline phosphatase profile
Taxon S1 S2 S3 S4 S5 S6 S7 S8 S9 S10 S11
S1 1.00
S2 0.20 1.00
S3 0.00 0.00 1.00
S4 0.20 0.11 0.12 1.00
S5 0.00 0.16 0.15 0.09 1.00
S6 0.00 0.00 0.00 0.00 0.00 1.00
S7 0.20 0.25 0.09 0.11 0.16 0.00 1.00
S8 0.00 0.00 0.00 0.00 0.00 0.14 0.00 1.00
S9 0.00 0.00 0.21 0.00 0.07 0.00 0.08 0.00 1.00
S10 0.00 0.00 0.00 0.00 0.00 0.00 0.00 0.00 0.00 1.00
S11 0.00 0.00 0.09 0.00 0.16 0.00 0.25 0.00 0.16 0.20 1.00Note: S1- S. intermedia, S2- S. inaequalifolia, S3- S. involvens, S4- S. tenera, S5- S. wightii, S6- S. brachystachya, S7- S. repanda,
S8- S. radicata, S9- S. bryopteris, S10- S. delicatula with cones, S11- S. delicatula without cones.
Fig. 6: Cladogram of Selaginella species based on alkaline phosphatase profile
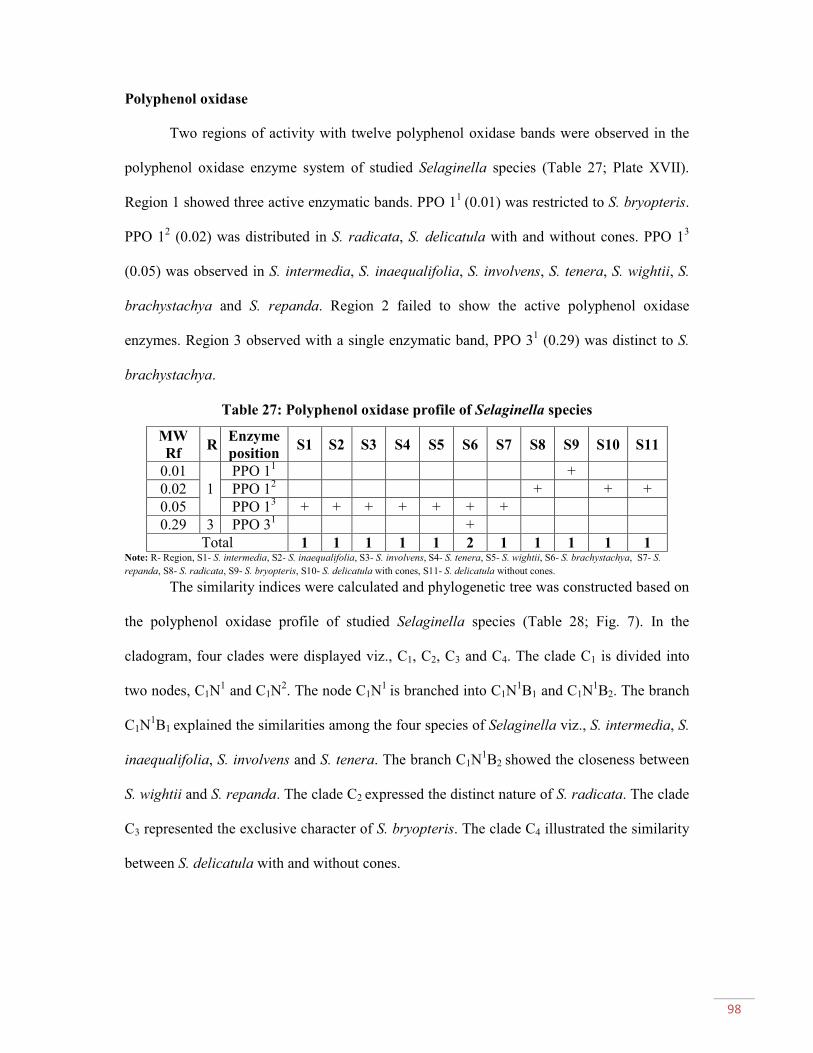
98
Polyphenol oxidase
Two regions of activity with twelve polyphenol oxidase bands were observed in the
polyphenol oxidase enzyme system of studied Selaginella species (Table 27; Plate XVII).
Region 1 showed three active enzymatic bands. PPO 11
(0.01) was restricted to S. bryopteris.
PPO 12
(0.02) was distributed in S. radicata, S. delicatula with and without cones. PPO 13
(0.05) was observed in S. intermedia, S. inaequalifolia, S. involvens, S. tenera, S. wightii, S.
brachystachya and S. repanda. Region 2 failed to show the active polyphenol oxidase
enzymes. Region 3 observed with a single enzymatic band, PPO 31
(0.29) was distinct to S.
brachystachya.
Table 27: Polyphenol oxidase profile of Selaginella species
MW
RfR
Enzyme
positionS1 S2 S3 S4 S5 S6 S7 S8 S9 S10 S11
0.01
1
PPO 11
+
0.02 PPO 12
+ + +
0.05 PPO 13
+ + + + + + +
0.29 3 PPO 31
+
Total 1 1 1 1 1 2 1 1 1 1 1Note: R- Region, S1- S. intermedia, S2- S. inaequalifolia, S3- S. involvens, S4- S. tenera, S5- S. wightii, S6- S. brachystachya, S7- S.
repanda, S8- S. radicata, S9- S. bryopteris, S10- S. delicatula with cones, S11- S. delicatula without cones.
The similarity indices were calculated and phylogenetic tree was constructed based on
the polyphenol oxidase profile of studied Selaginella species (Table 28; Fig. 7). In the
cladogram, four clades were displayed viz., C1, C2, C3 and C4. The clade C1 is divided into
two nodes, C1N1
and C1N2. The node C1N
1 is branched into C1N
1B1 and C1N
1B2. The branch
C1N1B1 explained the similarities among the four species of Selaginella viz., S. intermedia, S.
inaequalifolia, S. involvens and S. tenera. The branch C1N1B2 showed the closeness between
S. wightii and S. repanda. The clade C2 expressed the distinct nature of S. radicata. The clade
C3 represented the exclusive character of S. bryopteris. The clade C4 illustrated the similarity
between S. delicatula with and without cones.
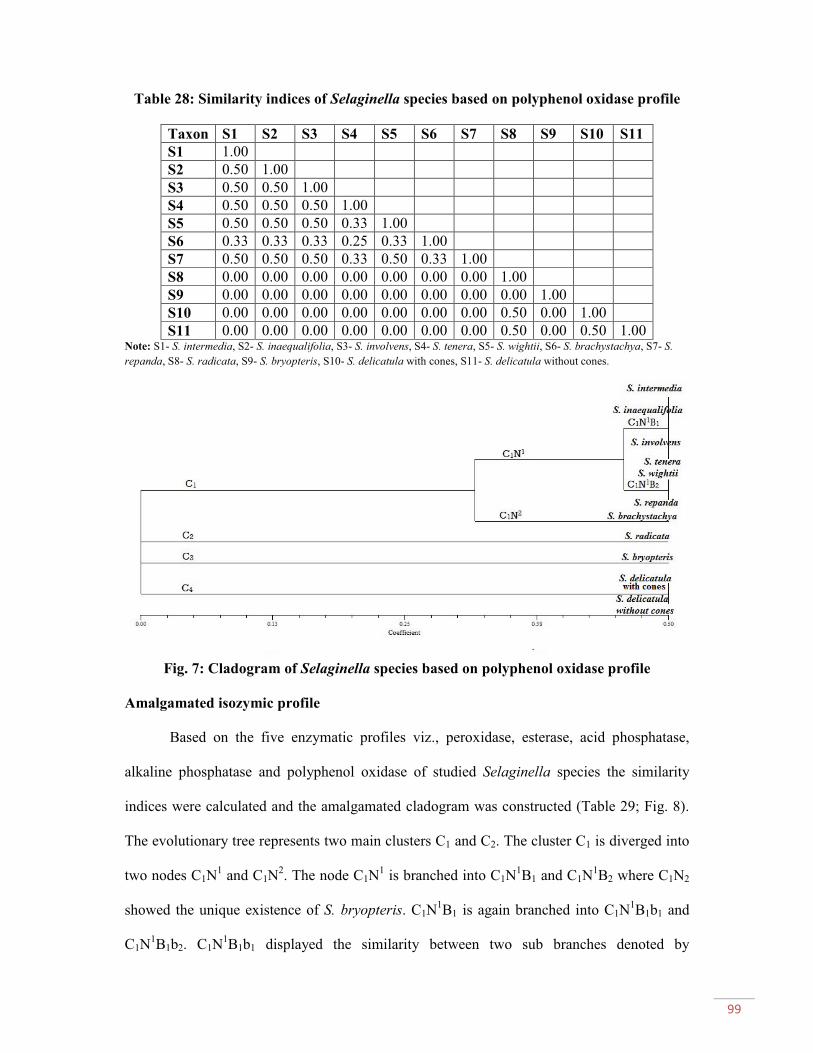
99
Table 28: Similarity indices of Selaginella species based on polyphenol oxidase profile
Taxon S1 S2 S3 S4 S5 S6 S7 S8 S9 S10 S11
S1 1.00
S2 0.50 1.00
S3 0.50 0.50 1.00
S4 0.50 0.50 0.50 1.00
S5 0.50 0.50 0.50 0.33 1.00
S6 0.33 0.33 0.33 0.25 0.33 1.00
S7 0.50 0.50 0.50 0.33 0.50 0.33 1.00
S8 0.00 0.00 0.00 0.00 0.00 0.00 0.00 1.00
S9 0.00 0.00 0.00 0.00 0.00 0.00 0.00 0.00 1.00
S10 0.00 0.00 0.00 0.00 0.00 0.00 0.00 0.50 0.00 1.00
S11 0.00 0.00 0.00 0.00 0.00 0.00 0.00 0.50 0.00 0.50 1.00Note: S1- S. intermedia, S2- S. inaequalifolia, S3- S. involvens, S4- S. tenera, S5- S. wightii, S6- S. brachystachya, S7- S.
repanda, S8- S. radicata, S9- S. bryopteris, S10- S. delicatula with cones, S11- S. delicatula without cones.
Fig. 7: Cladogram of Selaginella species based on polyphenol oxidase profile
Amalgamated isozymic profile
Based on the five enzymatic profiles viz., peroxidase, esterase, acid phosphatase,
alkaline phosphatase and polyphenol oxidase of studied Selaginella species the similarity
indices were calculated and the amalgamated cladogram was constructed (Table 29; Fig. 8).
The evolutionary tree represents two main clusters C1 and C2. The cluster C1 is diverged into
two nodes C1N1
and C1N2. The node C1N
1is branched into C1N
1B1 and C1N
1B2 where C1N2
showed the unique existence of S. bryopteris. C1N1B1 is again branched into C1N
1B1b1 and
C1N1B1b2. C1N
1B1b1 displayed the similarity between two sub branches denoted by
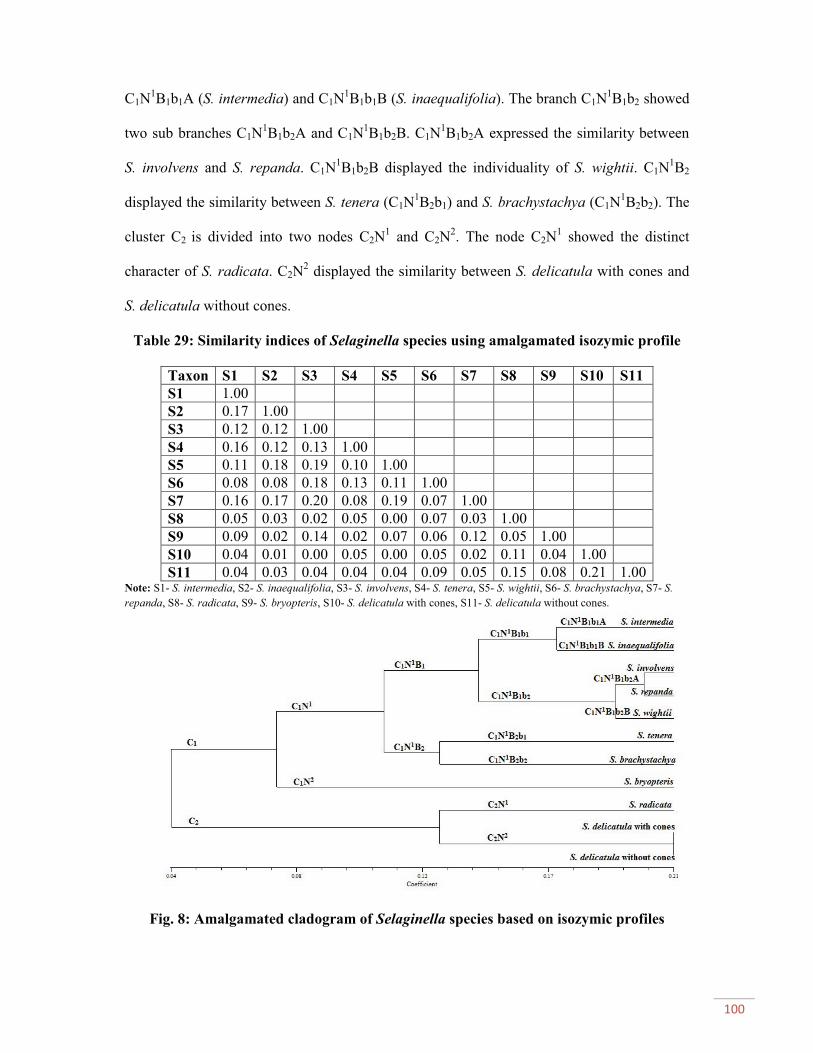
100
C1N1B1b1A (S. intermedia) and C1N
1B1b1B (S. inaequalifolia). The branch C1N
1B1b2 showed
two sub branches C1N1B1b2A and C1N
1B1b2B. C1N
1B1b2A expressed the similarity between
S. involvens and S. repanda. C1N1B1b2B displayed the individuality of S. wightii. C1N
1B2
displayed the similarity between S. tenera (C1N1B2b1) and S. brachystachya (C1N
1B2b2). The
cluster C2 is divided into two nodes C2N1
and C2N2. The node C2N
1showed the distinct
character of S. radicata. C2N2
displayed the similarity between S. delicatula with cones and
S. delicatula without cones.
Table 29: Similarity indices of Selaginella species using amalgamated isozymic profile
Taxon S1 S2 S3 S4 S5 S6 S7 S8 S9 S10 S11
S1 1.00
S2 0.17 1.00
S3 0.12 0.12 1.00
S4 0.16 0.12 0.13 1.00
S5 0.11 0.18 0.19 0.10 1.00
S6 0.08 0.08 0.18 0.13 0.11 1.00
S7 0.16 0.17 0.20 0.08 0.19 0.07 1.00
S8 0.05 0.03 0.02 0.05 0.00 0.07 0.03 1.00
S9 0.09 0.02 0.14 0.02 0.07 0.06 0.12 0.05 1.00
S10 0.04 0.01 0.00 0.05 0.00 0.05 0.02 0.11 0.04 1.00
S11 0.04 0.03 0.04 0.04 0.04 0.09 0.05 0.15 0.08 0.21 1.00Note: S1- S. intermedia, S2- S. inaequalifolia, S3- S. involvens, S4- S. tenera, S5- S. wightii, S6- S. brachystachya, S7- S.
repanda, S8- S. radicata, S9- S. bryopteris, S10- S. delicatula with cones, S11- S. delicatula without cones.
Fig. 8: Amalgamated cladogram of Selaginella species based on isozymic profiles

101
DNA isolation and PCR amplification
Among the three DNA isolation methods, the modified CTAB extraction method
described by Murray and Thompson (1980) yielded a good DNA isolation. The genomic
DNA of selected ten species of Selaginella collected from various localities of South India
was then amplified using rbcL primer. The results were illustrated in Plate XVIII. The PCR
amplification efficiency was good for the studied species and molecular weight ranges up to
500-600 base pairs and the amplicons were sequenced (Plate XIX-XXIV). The obtained
sequences were aligned, annotated and submitted in GenBank. The GenBank accession
numbers for the submitted Selaginella sequences with geographical details were tabulated in
Table 30.
Table 30: Geographical location and Genbank details of studied Selaginella species
Species name Locality Latitude and
Altitude
Species
code
Voucher
number
(XCH. No)
Genbank
Accession
number
S. intermediaKaakachi Hills,
Tamil Nadu.
8.7152836°
N
800-1800 mS1 25425 KF917189
S. inaequalifoliaKaakachi Hills,
Tamil Nadu.
8.7152836°
N
800-1800 mS2 25426 KF929424
S. involvensKaakachi Hills,
Tamil Nadu.
8.7152836°
N
800-1800 mS3 25427 KF917190
S. teneraKaakachi Hills,
Tamil Nadu.
8.7152836°
N
300-2000 mS4 25428 KF917191
S. wightiiMarunthuvazh
Malai, Tamil Nadu.
8.1272411°N
350-1500 mS5 25429 KF929423
S. brachystachyaShenbaganur Hills,
Tamil Nadu.
10.2336828°N
1200-2000 mS6 25430 KF929421
S. repandaShenbaganur Hills,
Tamil Nadu.
10.2336828°N
1000-1200 mS7 25431 KF917188
S. radicataPonmudi Hills,
Kerala.
8.7599422°N
110-1200 mS8 25432 KF917192
S. bryopterisPonmudi Hills,
Kerala.
8.7599422°N
110-1200 mS9 25433 KF929422
S.delicatula
with cones
Ponmudi Hills,
Kerala.
8.7599422°N
0-1000 mS10 25434 KF917193
S. delicatula
without cones
Themalai Hills,
Kerala.
8.9632448°N
0-950 mS11 25435 KF917194

102
Sequence Alignment
Multiple sequence alignment was performed for the studied ten species of Selaginella
using MULTALIN (version 5.4.1) and Clustal W tool and aligned sequences were illustrated
in Plate XXV. Phylogenetic tree was constructed based on the results of Clustal W (Fig. 9).
The goal of molecular systematics is to determine the phylogeny of a species or a
group of related species. Phylogeny is commonly represented in the form of cladogram.
Clade is a unit of common evolutionary descent which is classified into monophyletic,
paraphyletic and polyphyletic. A valid clade is monophyletic which consists of the ancestor
species and all its descendants. Paraphyletic group is one consisting of a common ancestor
but not all descendants of that common ancestor. Polyphyletic clade includes many species
that lack a common ancestor.
The cladogram constructed using Clustal W displayed two main clades C1 and C2.
The clade 1 & 2 included the monophyletic and paraphyletic expression (Fig. 8). The clade
C1 is divided into two nodes (C1N1
and C1N2). C1N
1expressed monophyletic taxon group
viz., S. repanda, S. radicata, S. involvens, S. delicatula with and without cones, S.
inaequalifolia and C1N2
includes paraphyletic taxon S. intermedia. The clade C2 expressed
the monophyletic taxon groups which comprised S. wightii, S. bryopteris, S. brachystachya
and C2N1
includes paraphyletic taxon S. tenera. C1N1
is branched into C1N1B1 and C1N
1B2.
The branch C1N1B1 is sub branched into C1N
1B1b1 and C1N
1B1b2. The sub branch C1N
1B1b1
explained the similarity between S. repanda and S. radicata where as C1N1B1b2 showed the
distinct character of S. involvens. C1N1B2 is also sub branched into C1N
1B2b1 and C1N
1B2b2.
The sub branch C1N1B2b1 showed the similarity between S. delicatula with and without cones
where, C1N1B2b2 explained the exclusive character of S. inaequalifolia. The clade C2 is
divided into two nodes (C2N1
and C2N2). The node C2N
2 showed the distinct occurrence of S.
tenera. The node C2N1
is branched into C2N1B1 and C2N
1B2. The branch C2N
1B1 includes S.
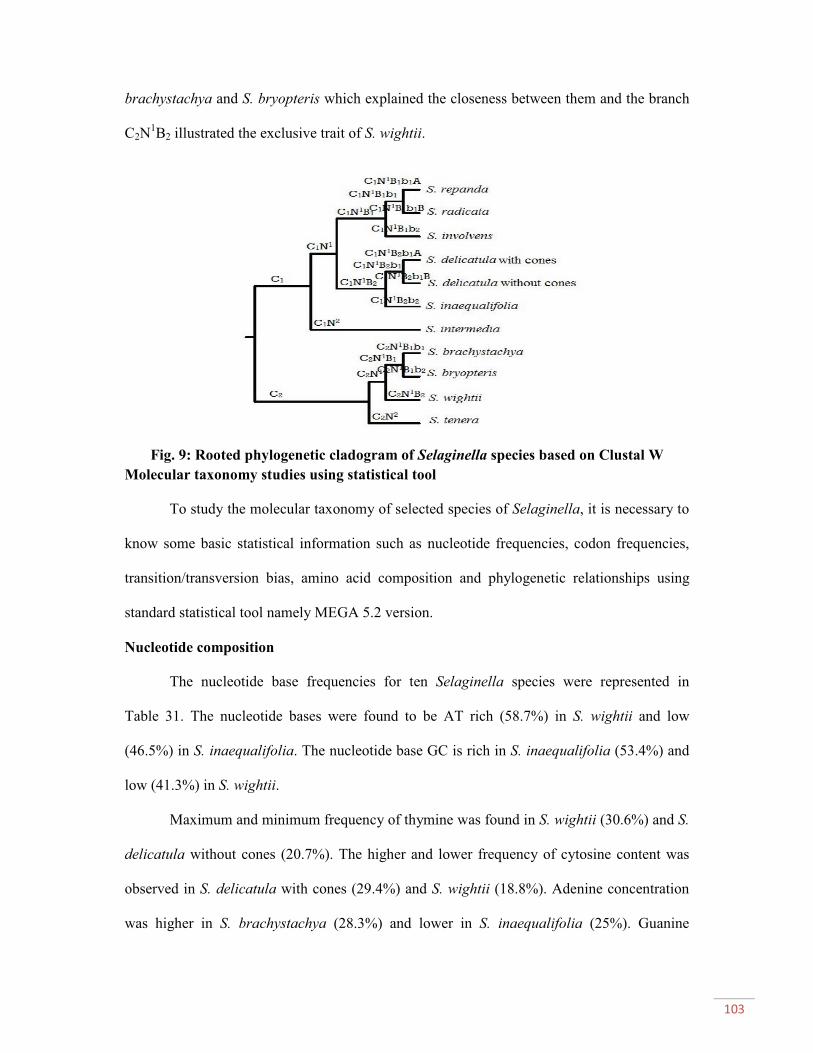
103
brachystachya and S. bryopteris which explained the closeness between them and the branch
C2N1B2 illustrated the exclusive trait of S. wightii.
Fig. 9: Rooted phylogenetic cladogram of Selaginella species based on Clustal W
Molecular taxonomy studies using statistical tool
To study the molecular taxonomy of selected species of Selaginella, it is necessary to
know some basic statistical information such as nucleotide frequencies, codon frequencies,
transition/transversion bias, amino acid composition and phylogenetic relationships using
standard statistical tool namely MEGA 5.2 version.
Nucleotide composition
The nucleotide base frequencies for ten Selaginella species were represented in
Table 31. The nucleotide bases were found to be AT rich (58.7%) in S. wightii and low
(46.5%) in S. inaequalifolia. The nucleotide base GC is rich in S. inaequalifolia (53.4%) and
low (41.3%) in S. wightii.
Maximum and minimum frequency of thymine was found in S. wightii (30.6%) and S.
delicatula without cones (20.7%). The higher and lower frequency of cytosine content was
observed in S. delicatula with cones (29.4%) and S. wightii (18.8%). Adenine concentration
was higher in S. brachystachya (28.3%) and lower in S. inaequalifolia (25%). Guanine
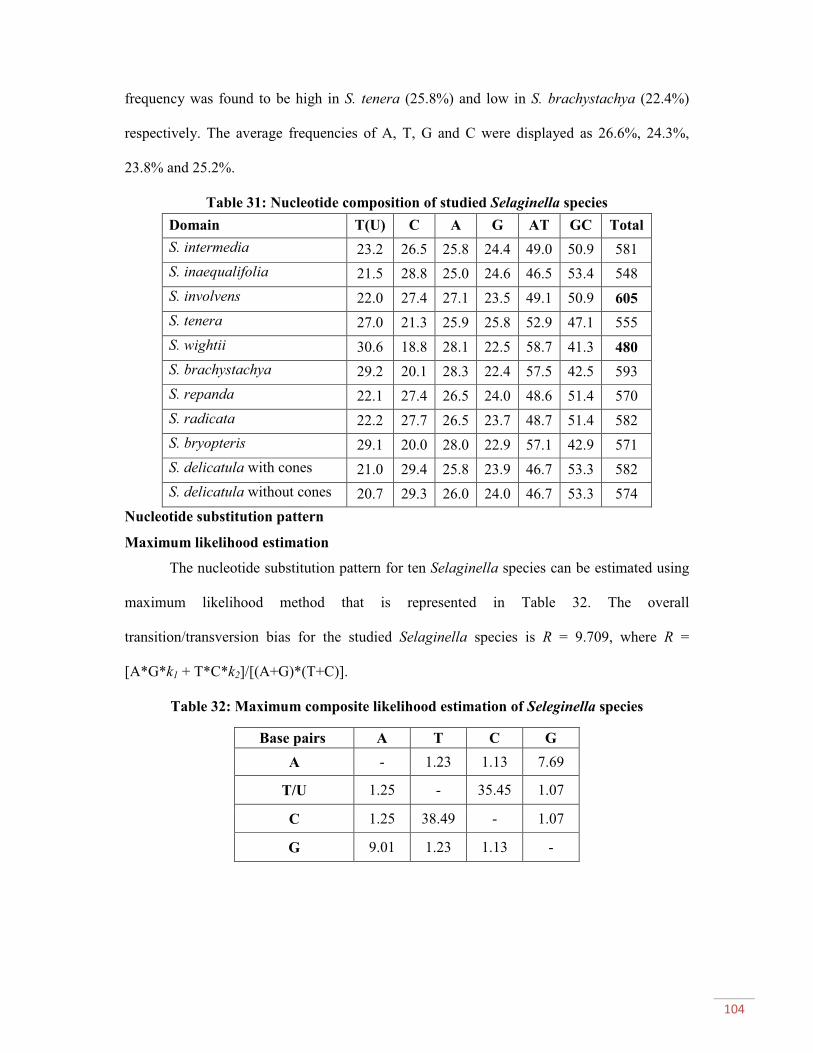
104
frequency was found to be high in S. tenera (25.8%) and low in S. brachystachya (22.4%)
respectively. The average frequencies of A, T, G and C were displayed as 26.6%, 24.3%,
23.8% and 25.2%.
Table 31: Nucleotide composition of studied Selaginella species
Domain T(U) C A G AT GC Total
S. intermedia 23.2 26.5 25.8 24.4 49.0 50.9 581
S. inaequalifolia 21.5 28.8 25.0 24.6 46.5 53.4 548
S. involvens 22.0 27.4 27.1 23.5 49.1 50.9 605
S. tenera 27.0 21.3 25.9 25.8 52.9 47.1 555
S. wightii 30.6 18.8 28.1 22.5 58.7 41.3 480
S. brachystachya 29.2 20.1 28.3 22.4 57.5 42.5 593
S. repanda 22.1 27.4 26.5 24.0 48.6 51.4 570
S. radicata 22.2 27.7 26.5 23.7 48.7 51.4 582
S. bryopteris 29.1 20.0 28.0 22.9 57.1 42.9 571
S. delicatula with cones 21.0 29.4 25.8 23.9 46.7 53.3 582
S. delicatula without cones 20.7 29.3 26.0 24.0 46.7 53.3 574
Nucleotide substitution pattern
Maximum likelihood estimation
The nucleotide substitution pattern for ten Selaginella species can be estimated using
maximum likelihood method that is represented in Table 32. The overall
transition/transversion bias for the studied Selaginella species is R = 9.709, where R =
[A*G*k1 + T*C*k2]/[(A+G)*(T+C)].
Table 32: Maximum composite likelihood estimation of Seleginella species
Base pairs A T C G
A - 1.23 1.13 7.69
T/U 1.25 - 35.45 1.07
C 1.25 38.49 - 1.07
G 9.01 1.23 1.13 -

105
Composite distance pattern
The composite distance pattern deals with the differences in base composition even
when the substitution patterns are homogeneous among lineages. In addition, the
compositional distance will correlate with the number of differences between 10 nucleotide
sequences. The composite difference among ten nucleotide sequences of Selaginella was
displayed in Table 33. Among the ten Selaginella species, the highest composite difference
(3.59) was observed among S. wightii and S. delicatula with cones, S. wightii and S.
delicatula without cones, S. bryopteris and S. delicatula with cones, S. bryopteris and S.
delicatula without cones. The lowest composite difference (0.00) was observed among S.
involvens and S. repanda, S. involvens and S. radicata, S. wightii and S. brachystachya, S.
repanda and S. radicata, S. wightii and S. bryopteris, S. brachystachya and S. bryopteris, S.
delicatula with and without cones.
Table 33: Estimation of composite distance of Selaginella species
Taxon S1 S2 S3 S4 S5 S6 S7 S8 S9 S10 S11
S1 1.00
S2 0.50 1.00
S3 0.26 0.08 1.00
S4 0.63 2.05 1.50 1.00
S5 1.34 3.29 2.48 0.19 1.00
S6 1.25 3.13 2.34 0.16 0.00 1.00
S7 0.23 0.07 0.00 1.44 2.43 2.29 1.00
S8 0.23 0.07 0.00 1.44 2.43 2.29 0.00 1.00
S9 1.34 3.29 2.48 0.19 0.00 0.00 2.43 2.43 1.00
S10 0.64 0.01 0.12 2.30 3.59 3.42 0.12 0.12 3.59 1.00
S11 0.64 0.01 0.12 2.30 3.59 3.42 0.12 0.12 3.59 0.00 1.00Note: S1- S. intermedia, S2- S. inaequalifolia, S3- S. involvens, S4- S. tenera, S5- S. wightii, S6- S. brachystachya, S7- S. repanda, S8- S.
radicata, S9- S. bryopteris, S10- S. delicatula with cones, S11- S. delicatula without cones.
Nucleotide pair frequencies for directional sequences
The evolutionary rate of the base substitutions present in nucleotide sequences can be
estimated using Kimura (1980) 2-parameter mode. The transition/transversion bias (R) for
directional sequences (16 pairs) of ten Selaginella species was estimated as 2.52. The
nucleotide pair frequencies were high in AA (133) followed by GG (118), CC (114) and TT
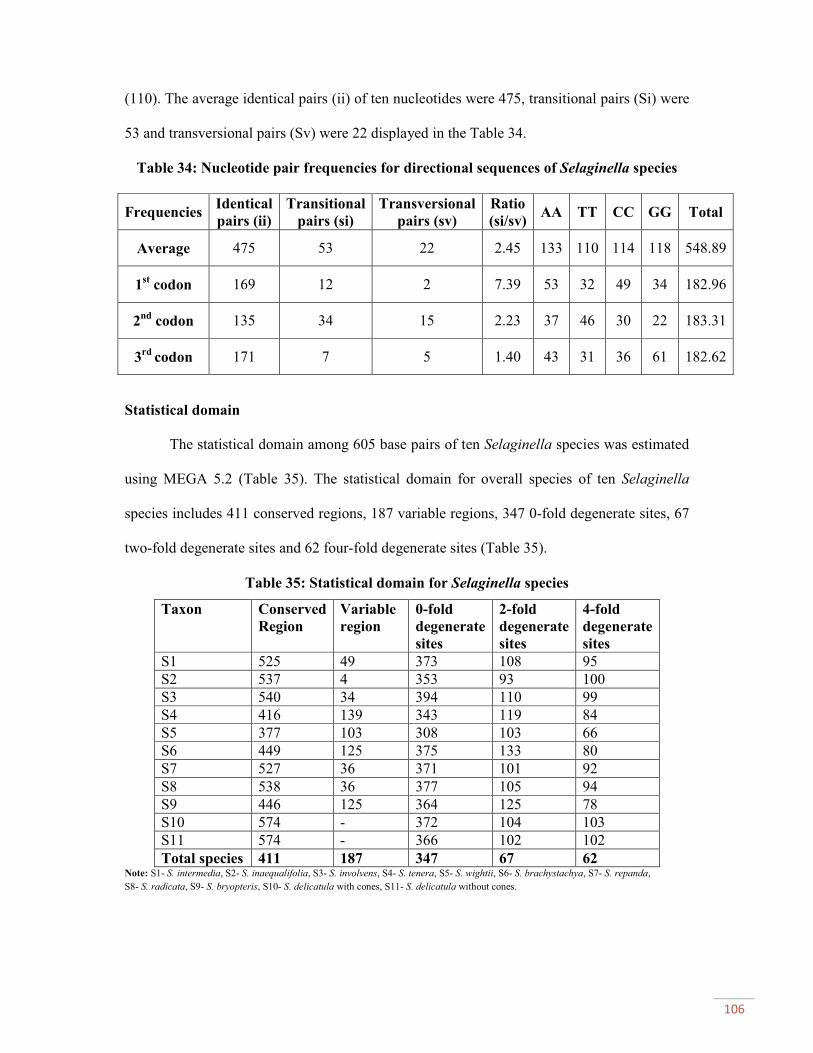
106
(110). The average identical pairs (ii) of ten nucleotides were 475, transitional pairs (Si) were
53 and transversional pairs (Sv) were 22 displayed in the Table 34.
Table 34: Nucleotide pair frequencies for directional sequences of Selaginella species
FrequenciesIdentical
pairs (ii)
Transitional
pairs (si)
Transversional
pairs (sv)
Ratio
(si/sv)AA TT CC GG Total
Average 475 53 22 2.45 133 110 114 118 548.89
1st
codon 169 12 2 7.39 53 32 49 34 182.96
2nd
codon 135 34 15 2.23 37 46 30 22 183.31
3rd
codon 171 7 5 1.40 43 31 36 61 182.62
Statistical domain
The statistical domain among 605 base pairs of ten Selaginella species was estimated
using MEGA 5.2 (Table 35). The statistical domain for overall species of ten Selaginella
species includes 411 conserved regions, 187 variable regions, 347 0-fold degenerate sites, 67
two-fold degenerate sites and 62 four-fold degenerate sites (Table 35).
Table 35: Statistical domain for Selaginella species
Taxon Conserved
Region
Variable
region
0-fold
degenerate
sites
2-fold
degenerate
sites
4-fold
degenerate
sites
S1 525 49 373 108 95
S2 537 4 353 93 100
S3 540 34 394 110 99
S4 416 139 343 119 84
S5 377 103 308 103 66
S6 449 125 375 133 80
S7 527 36 371 101 92
S8 538 36 377 105 94
S9 446 125 364 125 78
S10 574 - 372 104 103
S11 574 - 366 102 102
Total species 411 187 347 67 62Note: S1- S. intermedia, S2- S. inaequalifolia, S3- S. involvens, S4- S. tenera, S5- S. wightii, S6- S. brachystachya, S7- S. repanda,
S8- S. radicata, S9- S. bryopteris, S10- S. delicatula with cones, S11- S. delicatula without cones.
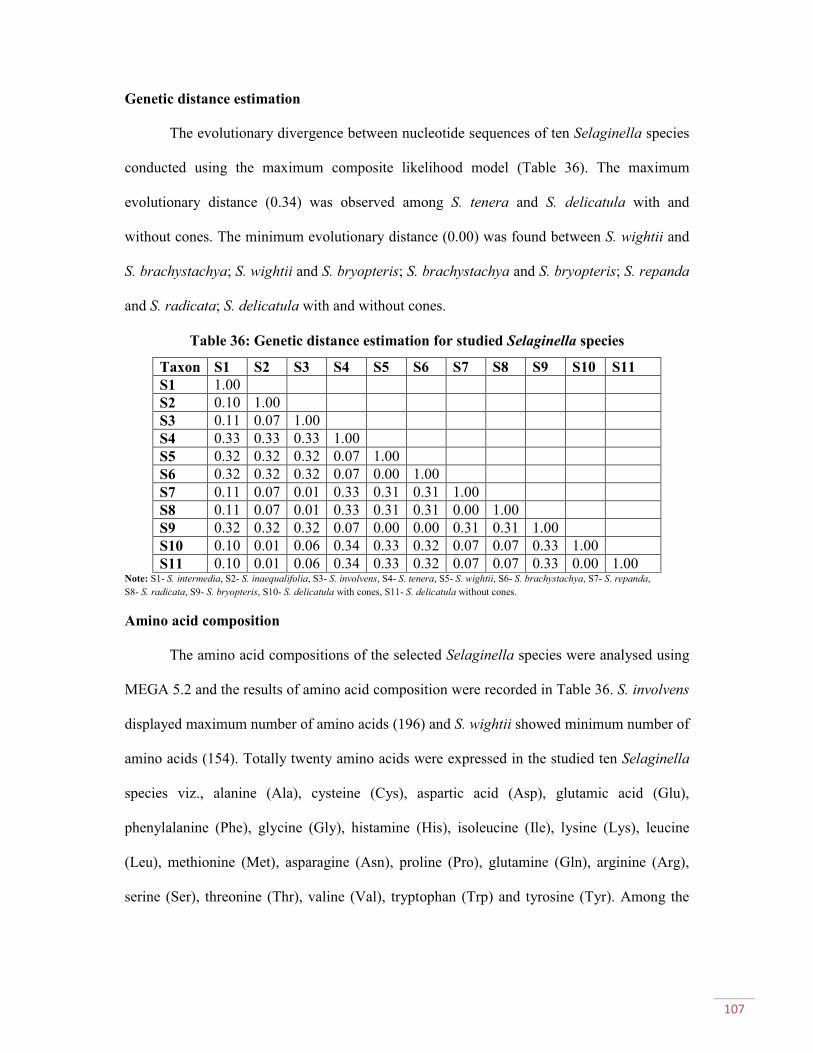
107
Genetic distance estimation
The evolutionary divergence between nucleotide sequences of ten Selaginella species
conducted using the maximum composite likelihood model (Table 36). The maximum
evolutionary distance (0.34) was observed among S. tenera and S. delicatula with and
without cones. The minimum evolutionary distance (0.00) was found between S. wightii and
S. brachystachya; S. wightii and S. bryopteris; S. brachystachya and S. bryopteris; S. repanda
and S. radicata; S. delicatula with and without cones.
Table 36: Genetic distance estimation for studied Selaginella species
Taxon S1 S2 S3 S4 S5 S6 S7 S8 S9 S10 S11
S1 1.00
S2 0.10 1.00
S3 0.11 0.07 1.00
S4 0.33 0.33 0.33 1.00
S5 0.32 0.32 0.32 0.07 1.00
S6 0.32 0.32 0.32 0.07 0.00 1.00
S7 0.11 0.07 0.01 0.33 0.31 0.31 1.00
S8 0.11 0.07 0.01 0.33 0.31 0.31 0.00 1.00
S9 0.32 0.32 0.32 0.07 0.00 0.00 0.31 0.31 1.00
S10 0.10 0.01 0.06 0.34 0.33 0.32 0.07 0.07 0.33 1.00
S11 0.10 0.01 0.06 0.34 0.33 0.32 0.07 0.07 0.33 0.00 1.00Note: S1- S. intermedia, S2- S. inaequalifolia, S3- S. involvens, S4- S. tenera, S5- S. wightii, S6- S. brachystachya, S7- S. repanda,
S8- S. radicata, S9- S. bryopteris, S10- S. delicatula with cones, S11- S. delicatula without cones.
Amino acid composition
The amino acid compositions of the selected Selaginella species were analysed using
MEGA 5.2 and the results of amino acid composition were recorded in Table 36. S. involvens
displayed maximum number of amino acids (196) and S. wightii showed minimum number of
amino acids (154). Totally twenty amino acids were expressed in the studied ten Selaginella
species viz., alanine (Ala), cysteine (Cys), aspartic acid (Asp), glutamic acid (Glu),
phenylalanine (Phe), glycine (Gly), histamine (His), isoleucine (Ile), lysine (Lys), leucine
(Leu), methionine (Met), asparagine (Asn), proline (Pro), glutamine (Gln), arginine (Arg),
serine (Ser), threonine (Thr), valine (Val), tryptophan (Trp) and tyrosine (Tyr). Among the
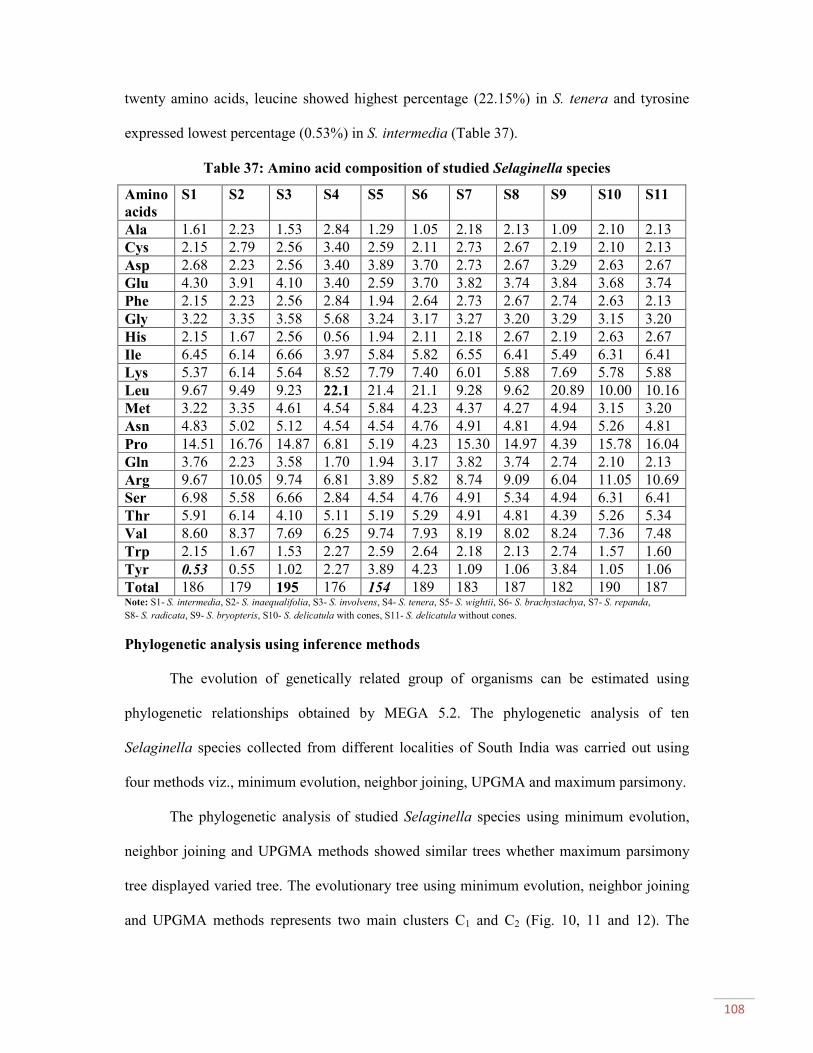
108
twenty amino acids, leucine showed highest percentage (22.15%) in S. tenera and tyrosine
expressed lowest percentage (0.53%) in S. intermedia (Table 37).
Table 37: Amino acid composition of studied Selaginella species
Amino
acids
S1 S2 S3 S4 S5 S6 S7 S8 S9 S10 S11
Ala 1.61 2.23 1.53 2.84 1.29 1.05 2.18 2.13 1.09 2.10 2.13
Cys 2.15 2.79 2.56 3.40 2.59 2.11 2.73 2.67 2.19 2.10 2.13
Asp 2.68 2.23 2.56 3.40 3.89 3.70 2.73 2.67 3.29 2.63 2.67
Glu 4.30 3.91 4.10 3.40 2.59 3.70 3.82 3.74 3.84 3.68 3.74
Phe 2.15 2.23 2.56 2.84 1.94 2.64 2.73 2.67 2.74 2.63 2.13
Gly 3.22 3.35 3.58 5.68 3.24 3.17 3.27 3.20 3.29 3.15 3.20
His 2.15 1.67 2.56 0.56 1.94 2.11 2.18 2.67 2.19 2.63 2.67
Ile 6.45 6.14 6.66 3.97 5.84 5.82 6.55 6.41 5.49 6.31 6.41
Lys 5.37 6.14 5.64 8.52 7.79 7.40 6.01 5.88 7.69 5.78 5.88
Leu 9.67 9.49 9.23 22.1 21.4 21.1 9.28 9.62 20.89 10.00 10.16
Met 3.22 3.35 4.61 4.54 5.84 4.23 4.37 4.27 4.94 3.15 3.20
Asn 4.83 5.02 5.12 4.54 4.54 4.76 4.91 4.81 4.94 5.26 4.81
Pro 14.51 16.76 14.87 6.81 5.19 4.23 15.30 14.97 4.39 15.78 16.04
Gln 3.76 2.23 3.58 1.70 1.94 3.17 3.82 3.74 2.74 2.10 2.13
Arg 9.67 10.05 9.74 6.81 3.89 5.82 8.74 9.09 6.04 11.05 10.69
Ser 6.98 5.58 6.66 2.84 4.54 4.76 4.91 5.34 4.94 6.31 6.41
Thr 5.91 6.14 4.10 5.11 5.19 5.29 4.91 4.81 4.39 5.26 5.34
Val 8.60 8.37 7.69 6.25 9.74 7.93 8.19 8.02 8.24 7.36 7.48
Trp 2.15 1.67 1.53 2.27 2.59 2.64 2.18 2.13 2.74 1.57 1.60
Tyr 0.53 0.55 1.02 2.27 3.89 4.23 1.09 1.06 3.84 1.05 1.06
Total 186 179 195 176 154 189 183 187 182 190 187Note: S1- S. intermedia, S2- S. inaequalifolia, S3- S. involvens, S4- S. tenera, S5- S. wightii, S6- S. brachystachya, S7- S. repanda,
S8- S. radicata, S9- S. bryopteris, S10- S. delicatula with cones, S11- S. delicatula without cones.
Phylogenetic analysis using inference methods
The evolution of genetically related group of organisms can be estimated using
phylogenetic relationships obtained by MEGA 5.2. The phylogenetic analysis of ten
Selaginella species collected from different localities of South India was carried out using
four methods viz., minimum evolution, neighbor joining, UPGMA and maximum parsimony.
The phylogenetic analysis of studied Selaginella species using minimum evolution,
neighbor joining and UPGMA methods showed similar trees whether maximum parsimony
tree displayed varied tree. The evolutionary tree using minimum evolution, neighbor joining
and UPGMA methods represents two main clusters C1 and C2 (Fig. 10, 11 and 12). The

109
cluster C1 is made of monophyletic taxon group viz., S. delicatula with and without cones, S.
inaequalifolia, S. involvens, S. repanda, S. radicata and a paraphyletic taxon S. intermedia
with the distance value 0.11. The cluster C2 consist of monophyletic taxon group viz., S.
brachystachya, S. wightii and S. bryopteris and a paraphyletic taxon S. tenera with highest
distance range 0.12. The cluster C1 is divided into two nodes C1N1
and C1N2. The node C1N
1
is branched into C1N1B1 and C1N
1B2 where C1N
2showed the unique character of S.
intermedia with the distance value 0.05. C1N1B1 is again branched into C1N
1B1b1 and
C1N1B1b2. C1N
1B1b1 displayed the similarity between C1N
1B1b1A (S. delicatula with cones)
and C1N1B1b1B (S. delicatula without cones). The branch C1N
1B1b2 expressed the
individuality of S. inaequalifolia with the distance value 0.002. C1N1B2 is then branched into
C1N1B2b1 and C1N
1B2b2. The branch C1N
1B2b1 displayed the diverged character of S.
involvens with the distance of 0.007. C1N1B2b2 represented 100% similarity between S.
repanda (C1N1B2b2A) and S. radicata (C1N
1B2b2B) with 0.00 distance value. The cluster C2
is divided into two nodes C2N1
and C2N2. The node C2N
1showed the distinct character of S.
tenera with distance range 0.04. The node C2N2
is branched into C2N2B1 and C2N
2B2. The
C2N2B1 expressed the individuality of S. brachystachya with lowest (0.00) distance value.
The branch C2N2B2 is again divided into two branches C2N
2B2b1 and C2N
2B2b2 which
displayed the closeness between S. wightii and S. bryopteris with least (0.00) distance range.
Fig. 10: Phylogenetic tree of Selaginella species based on minimum evolution method
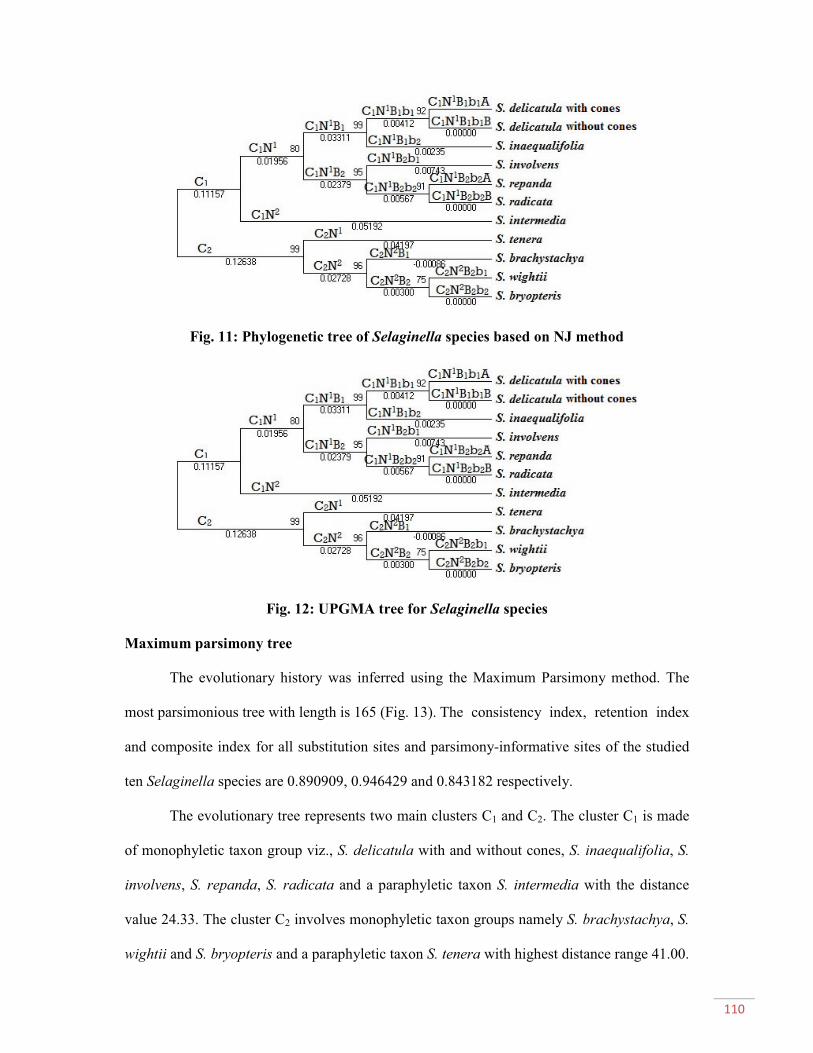
110
Fig. 11: Phylogenetic tree of Selaginella species based on NJ method
Fig. 12: UPGMA tree for Selaginella species
Maximum parsimony tree
The evolutionary history was inferred using the Maximum Parsimony method. The
most parsimonious tree with length is 165 (Fig. 13). The consistency index, retention index
and composite index for all substitution sites and parsimony-informative sites of the studied
ten Selaginella species are 0.890909, 0.946429 and 0.843182 respectively.
The evolutionary tree represents two main clusters C1 and C2. The cluster C1 is made
of monophyletic taxon group viz., S. delicatula with and without cones, S. inaequalifolia, S.
involvens, S. repanda, S. radicata and a paraphyletic taxon S. intermedia with the distance
value 24.33. The cluster C2 involves monophyletic taxon groups namely S. brachystachya, S.
wightii and S. bryopteris and a paraphyletic taxon S. tenera with highest distance range 41.00.

111
The cluster C1 is diverged into two nodes C1N1
and C1N2. The node C1N
1is branched into
C1N1B1 and C1N
1B2 where C1N2 showed the unique existence of S. intermedia with the
distance value 18.00. C1N1B1 is again branched into C1N
1B1b1 and C1N
1B1b2. C1N
1B1b1
displayed the similarity between two sub branches denoted by C1N1B1b1A (S. delicatula with
cones) and C1N1B1b1B (S. delicatula without cones) with least distance value 0.00 between
them. The branch C1N1B1b2 expressed the individuality of S. inaequalifolia compared with
other studied Selaginella species with distance 1.50. C1N1B2 is then branched into C1N
1B2b1
and C1N1B2b2. The branch C1N
1B2b1 displayed the diverged character of S. involvens with
distance range 2.50. C1N1B2b2 represented the similarity between S. repanda (C1N
1B2b2A)
and S. radicata (C1N1B2b2B) with 0.00 distance value. The cluster C2 is divided into two
nodes C2N1
and C2N2. The node C2N
1showed the distinct character of S. tenera with distance
range of 15.33. The node C2N2
is diverged into two branches C2N2B1 and C2N
2B2. The
C2N2B1 expressed the individuality of S. brachystachya with lowest distance value 0.00. The
branch C2N2B2 is again branched into C2N
2B2b1 and C2N
2B2b2 which displayed the similarity
between S. wightii and S. bryopteris with least distance range 0.00 respectively.
Fig. 13: Maximum parsimony tree of studied Selaginella species

112
Discussion
Systematics includes the classification of living organisms into hierarchical series of
groups emphasizing their phylogenetic relationships. It is the science of arranging species
which reflects their evolutionary relationships. Based on this concept, taxonomy would be
just a part of systematics but systematic includes both taxonomy and phylogeny (Wagele,
2005). Phylogenetics is the science of the reconstruction of phylogeny and phylogenetic
systematics is a method of classification based on the study of evolutionary relationships
between groups of organisms and the integration of proper species of groups into a
hierarchical system which reflects their phylogeny (Garcia et al., 2008).
The concept of “species” is perhaps the most debated subject in evolutionary biology
as demonstrated by the existence of more than twenty definitions based on different methods
and criteria (Hey, 2001). The morphological differences among the species are the result of
the extent of genetic divergence. Numerous taxonomic methods have been used to measure
these differences. Genetic information provided by morphological characters is often limited
and expression of quantitative trait is subjected to strong environmental influences. The
molecular approach for the identification of plant varieties or genotypes seems to be more
effective than the use of traditional morphological markers because it allows direct access to
the genetic material and makes it possible to understand the relationships between the
individuals (Karp et al., 1997). Thus molecular approaches have found a niche in taxonomy.
The molecular techniques now have become less time consuming and help us to establish the
genetic relationship between the members of different taxonomic categories (Singh, 2012).
The application of molecular data on the field of plant systematics can be used to infer
phylogeny. The molecular phylogenetic approach is most useful at different levels ranging
from kingdom to species. In the majority of cases, different molecular approaches tend to
confirm the taxonomic schemes established for plants (Wilson, 1995).
113
Assessment of genetic variability within and between species or populations for
purpose of conservation and to seek useful genotypes can be achieved by employing a variety
of techniques. Among these, use of molecular markers finds greater utility due to its ability to
reveal polymorphism at the genetic level. They have become increasingly popular in plant
research since they can potentially provide a much higher number of markers. Among the
different types of markers available, biochemical and molecular markers have become
exceedingly popular for estimation of genetic changes within and between the species
(Williams et al., 1990). With this knowledge, the present study aimed to reveal inter-specific
relationships among the selected species of Selaginella using biochemical (SDS-PAGE and
PAGE), spectroscopic (MALDI-TOF MS) and molecular analysis (DNA sequencing using
rbcL gene).
As molecular phylogenetic studies have accumulated, it has become evident that
different molecular tools are required for answering different questions because of varying
rates of sequence evolution among genomes, genes and gene regions. The choice of
molecular tools plays a vital role to ensure that an appropriate level of variation is recovered
to answer the phylogenetic problems. Most species display a complex of genetic variations
along their range of distribution. In the present study, molecular relationships among the ten
species of Selaginella viz., S. intermedia, S. inaequalifolia, S. involvens, S. tenera, S. wightii,
S. brachystachya, S. repanda, S. radicata, S. bryopteris, S. delicatula with cones and S.
delicatula without cones collected from various localities of South India which includes
Kaakachi hills (Tirunelveli, Tamil Nadu), Keeriparai and Maruthuvalmalai (Kanyakumari,
Tamil Nadu), Shenbaganur and Eettipallum (Dindigul, Tamil Nadu), Ponmudi (Idukki,
Kerala), Nilgiris (Tamil Nadu) and Thenmalai (Kerala) were examined.
Study of genetic variation is one such important and powerful procedure that often
been employed for taxonomic studies. Electrophoresis of proteins using SDS-PAGE has been

114
successfully used for the characterization of different taxonomic, evolutionary and genetic
relationship studies in plants (Johnson et al., 2009; Malik et al., 2009; Johnson et al., 2012).
SDS-PAGE technique is a powerful tool for estimating the molecular weights of proteins. It
simultaneously exploits differences in molecular size to resolve proteins differed by as little
as 1% in their electrophoretic mobility through the gel matrix (Smila et al., 2007).
Tateno et al. (2003) purified and characterized the expression of lectins (proteins)
which is approximately 15 kDa from rhizomes of the fern Phlebodium aureum by affinity
chromatography. Chang et al. (2005) analyzed various proteins of Arabidopsis thaliana by
use of high-speed centrifugation, sucrose gradient fractionation, one and two dimensional gel
electrophoresis, liquid chromatography purification and mass spectrometry. Lina (2010)
isolated and compared the protein expression between hydrated and desiccated Selaginella
lepidophylla tissues using two-dimensional difference polyacrylamide gel electrophoresis.
Wang et al. (2010) studied the desiccation tolerance in resurrection fern-ally Selaginella
tamariscina revealed by physiological and proteomic analysis. The results showed that
endogenous abscissic acid (ABA) increased to regulate dehydration-responsive
genes/proteins. In addition the results showed 138 desiccation-responsive two-dimensional
electrophoresis (2-DE) spots, representing 103 unique proteins. Banks et al. (2011) reported
the genome sequence of the lycophyte Selaginella moellendorffii. Lydia et al. (2012)
explained the expression of MADS-domain proteins in Selaginella moellendorffii by means
of complete genome sequencing. In the present study, SDS-PAGE proteins of Seleaginella
were isolated and separated, the protein profile was used to reveal inter-specific relationships
among the studied Selaginella species collected from various localities of South India.
Similar to the present study, the similarity and variation among the plant species using
SDS-PAGE have been carried out by many researchers (Smila et al., 2007; Johnson et al.,
2009; Babu et al., 2010; Nanthini et al., 2011; Johnson et al., 2012). The present study

115
explores the existing polymorphic proteins through SDS-PAGE to facilitate the
characterization of Selaginella species. SDS-PAGE revealed the inter-specific variability
among the selected Selaginella species in which, a total of 190 bands with various Rf values
and molecular weight were displayed in the SDS-PAGE gel system of Selaginella. Each
region expressed different proteins which act as representative of the expression of a
particular gene of the studied Selaginella species. Among the ten species of Selaginella, S.
repanda showed maximum number (25) of protein bands and S. delicatula with cones
showed minimum number (12) of protein bands. Unique banding patterns observed among
the ten Selaginella species acts as fingerprint of the selected Selaginella species. Such finger
printing is useful in differentiating the species and act as biochemical markers for such
species in plant systematic studies. These banding profiles will also facilitate the
identification of the medicinally important Selaginella species.
Singh et al. (2004) observed in Ocimum that, UPGMA cluster analysis of genetic
similarity indices helped to group all the accessions into two major clusters corresponding to
the botanical sections. Inter clustering within the two clusters precisely grouped one species
in one sub cluster as expected from their genetic background. Similar to Singh et al. (2004)
observation, in the present study the protein profile based cladogram exhibited two clusters in
which cluster C1 exhibited eight species of Selaginella which includes S. intermedia, S.
tenera, S. radicata, S. inaequalifolia, S. involvens, S. wightii and S. bryopteris, S. delicatula
with and without cones. The cluster C2 contains only two species that includes S.
brachystachya and S. repanda. The protein profile based cladogram explained the genetic
variability among the ten studied Selaginella species. The protein profiles presents an
interbreed depiction of the relationship among the ten species of Selaginella.
Matrix-assisted laser desorption/ionization (MALDI) time-of-flight mass
spectrometry (TOF MS) has been applied for the analysis of a wide range of biomolecules.

116
Initial applications were almost exclusively used for the qualitative analysis of biopolymers
because MALDI-TOF MS provided a fast and accurate approach to molecular mass and
purity information. Because of the speed of analysis, ease of use, relative low equipment cost,
ease of data interpretation and limited potential for cross-contamination between samples.
MALDI profiling offers exceptionally high-throughput and has therefore become an
attractive tool for the discovery and validation of biomarkers. In addition, the method must be
sufficiently precise to observe relative differences between distinct populations. Profiling has
now been applied in thousands of studies includes the quantification of amino acids, lipids,
natural products, drugs, polymers, herbicides, metabolites, toxins, oligonucleotides,
carbohydrates, peptides and proteins.
Analyzing proteins with MALDI–TOF MS has several advantages. MALDI–TOF MS
is fast; ionization, separation by size and detection of proteins takes milliseconds to complete.
By contrast, conventional electrophoretic methods for separating and detecting proteins can
take hours to complete. The results are absolute, being based on the intrinsic property of the
mass-to-charge ratio (m/z). This is inherently more accurate than electrophoresis-based or
hybridization array based methods, which are both susceptible to complications from
secondary-structure formation in proteins (Park, 2004). Furthermore, the absolute nature of
detection, combined with the detection of predominantly singly charged molecular ions,
makes the analysis of complex mixtures and great potential for high-throughput protein
analysis applications are now possible by MALDI-TOF MS (Nakumara and Oda, 2007).
Analysis by MALDI-TOF MS delivers fast determination, characterization and
measurement of accurate molecular weight of proteins. This systematic study allows the
analysis of proteomes or gene products in various tissues and physiological states of cells.
Protein characterization using MALDI TOF MS has become a major field of functional
genomics. MALDI-TOF MS analysis in proteomic research is advanced in animals, bacteria

117
and fungi (Kersten et al., 2002). In plants, MALDI-TOF MS was carried out to reveal the
protein profile of Arabidopsis thaliana (Peltier, 2001; Datta et al., 2013); spanich
(Yamaguchi and Subramanian, 2000); rice (Koller et al., 2002; Zhao et al., 2012); Helianthus
annus (Castillejo et al., 2008); Artemisia vulgaris (Kumar and Kumari, 2009); wheat (Kamal
et al., 2010); Ananas cosmos and Kalanchoe pinnata (Hong et al., 2012); Medicago
truncatula (Lee et al., 2013).
In the present study, MALDI-TOF MS analysis of ten Selaginella species collected
from different localities of South India expressed different ion peaks ranged from
0-1,00,000 Da. The results showed totally 483 spectral peak values (m/z values) and revealed
the biochemical similarity and variations among the selected species of Selaginella. Among
the spectral profile of ten Selaginella species, S. involvens displayed maximum number (86)
of spectral peaks ranged from 527 to 99215 m/z values. Next to that, S. tenera represented 77
spectral peaks with m/z values 719 to 95316. S. radicata depicted minimum number (21) of
spectral peaks varied from 694 to 91754 m/z values. Among the 483 spectral peak values of
the studied ten Selaginella species, 71 spectral peaks were observed with unique presence,
which distinguished the genetic similarities and variation of studied Selaginella species. The
resulting peak lists of individual samples were submitted to NTSYS software to produce a
taxonomic tree to reveal inter-specific variation. The morphologically distinguished character
of S. tenera, S. involvens, S. wightii, S. brachystachya and S. repanda is confirmed in the
cladogram by the presence of unique m/z values. Thus, the present m/z values of MALDI-
TOF MS analysis acted as a spectroscopic tool to recognize the inter-specific variation
among the selected Selaginella species.
Variations in isozyme expression of tissues reflect changes in metabolic activities
during growth, development and differentiation of plant by means of biochemical indices.
Changes in isozyme action during development of a tissue can be detected by pattern shifts
118
on PAGE profile. Isozyme markers have been useful in determining genetic relationships
among closely related species and cultivars. Isozyme electrophoresis is chosen for its relative
simplicity because it provides direct visualization of gene products and can provide an unique
fingerprint for each genetically distinct clone (Lebot et al., 1991). Isozyme polymorphism has
been successfully used for demonstrating inter and intra-specific variations in different
species and cultivars (Barta et al., 2003; Mukhlesur et al., 2004; Johnson et al., 2010;
Angelov and Ivanova, 2012).
Characterization of purified enzyme is important to reveal physiological functions and
action of particular enzymes. Investigation of enzyme catabolism using molecular approaches
is increased in recent trends (Rea et al., 2004). The functional characterization of plant
esterase has been explored (Sukor et al., 2006; Johnson and Raja, 2007; Hammad, 2009;
Nanthini et al., 2011). An increase in peroxidase activity has been reported as an early
response to different stresses and may provide cells with resistance against formation of H2O2
which is formed when plants are exposed to stress factors and so cause change in plant
metabolism (Castillo, 1992). Peroxidase is also involved in a large number of biochemical
and physiological processes and may change quantitatively and qualitatively during growth
and development (Zhi, 2003).
Phosphorus is one of the major elements found in plants. The available phosphate
concentration in many soils is rather low because it is commonly bound to many soil
constituents (Morales et al., 2012). As the sources of phosphorus run out, improvements in
the absorption and efficiency of phosphorus become necessary. Plants have developed several
mechanisms to overcome phosphorus deficiency by induction of extracellular and
intracellular phosphatases. The purified acid phosphatase was sensitive to ions at various
degrees depending on the ions nature and isoenzymes. The requirement of metallic ions for
acid phosphatase activity has also varied according to plant species, development stage and

119
isoenzymes heterogeneity. However, Mg2+
, Zn2+
and EDTA were inhibitors and K+, Cu
2+and
Ba2+
were activators for the specific enzyme. The acid phosphatase activity has been
previously reported in other plant species such as pea (Mizuta and Suda, 1980), spinach (Pan,
1985), tobacco (Pan et al., 1987; Chen, 1992), peanut seedlings (Gonnety et al., 2006) and
rice (Asaduzzaman, 2011). Alkaline phosphatases are enzymes that catalyze the hydrolysis of
phosphate ester bonds in extracellular organic molecules, permitting the cellular uptake of
inorganic phosphate (Pi) for metabolism. Their properties include low substrate specificity
and an alkaline pH optimum. The active site of most ALPs contains a single Mg and two Zn
atoms. Alkaline phosphatases in plants play a major role in the supply and metabolism of
inorganic phosphate for the maintenance of cellular metabolism (Coleman, 1992).
Polyphenol oxidase has been shown to exist in multiple and inter convertible forms
and is widely distributed in plant kingdom. It is well known that the enzyme plays an
important role in the browning reaction in fruits and vegetables. It has been suggested that the
polyphenol oxidase enzyme might be associated with many important physiological functions
such as growth and differentiation (Nitesh et al., 2010).
Isozymic analysis using electrophoresis has been carried out in both higher plants and
pteridophytes (Woodin et al. 1978; Gastony, 1982; Haufler and Soltis, 1986; Shigeo and
Yasuyuki, 1994; Hooper and Haufler, 1997; Santiago, 1999; Herrero, 2001; Pajaron et al.,
2005; Sukor et al., 2006; Hammad, 2009; Irudayaraj et al., 2009; Nandhini et al., 2011;
Johnson et al., 2012; Owk et al., 2013). Johnson et al. carried out few isozymic studies on
South Indian pteridophytes viz., Johnson et al. (2010) in Trichomonas; Johnson et al. (2010)
in Pteris; Johnson et al. (2010) in Cheilanthes viridis, Phlebodium aureum, Pronephrium
triphyllum and Sphaerostephanos unitus; Johnson et al. (2010) in Tectaria; Johnson et al.
(2010) in Adiantum.
120
Irudayaraj and Johnson (2011) identified the phylogenetic relationships among
Sphaerostephanos arbuscula, S. unitus and S. subtruncatus using isoperoxidase analysis. A
total of six different bands in five different positions with different molecular weight were
obtained. Johnson et al. (2012) exposed inter-specific variation on three species of tree fern
Cyathea by means of isoperoxidase analysis. A total of seven bands with three active regions
were expressed in the Cyathea spp. enzyme system. The banding pattern revealed hundred
percentage genetic differentiations between the three Cyathea species which belong to three
different intra generic taxonomical groups. Johnson et al. (2012) assessed the genetic
variation between different populations of Thelypteris ciliata collected from different
localities on Tirunelveli hills, using isoperoxidase profiling. A total of six bands in six
different positions with five active regions were observed in the isoperoxidase system of T.
ciliata. The isoperoxidase enzyme systems confirms inter and intra biochemical difference of
T. ciliata.
Similar to the previous observations in the present study also isozymic analysis viz.,
esterase, peroxidase, acid phosphatase, alkaline phosphatase and polyphenol oxidase were
carried out to know inter-specific relationship among the selected ten species of Selaginella.
The evolutionary tree of studied Selaginella species based on the esterase profile showed the
distinct nature of S. intermedia, S. involvens, S. radicata, S. tenera and S. brachystachya.
These will be an additional supportive evident to distinguish the morphologically unique
species of Selaginella viz., S. intermedia, S. involvens, S. radicata, S. tenera and S.
brachystachya. In peroxidase system of Selaginella, twenty five distinct bands were
observed. The phylogenetic tree based on the peroxidase profile of studied Selaginella
species explained the uniqueness of S. involvens, S. brachystachya and S. tenera. Isozymes
such as esterase and peroxidase have been utilized to assess the genetic similarity and
differences at the various taxonomic levels (Onus, 2000; Sabu et al., 2001; Manjunatha et al.,
121
2003). Similarly in the present study also, these isozymes are used as fingerprint for the
identification of Selaginella species. They revealed the variation at species level.
Acid phosphatase system of studied Selaginella species was observed with a total of
sixty three enzymatic bands with twenty one classified bands in the acid phosphatase profile.
The cladistic tree based on the acid phosphatase profile displayed the restricted character of
S. tenera, S. delicatula with cones and S. bryopteris. In addition, the acid phosphatase system
revealed the developmental stage variation in S. delicatula with and without cones. In
morphotaxonomy, the cones of fern allies play an important role to distinguish the fern allies
at species level. In the present study, the result of the acid phospahstase profiles provided an
alternative for the identification of S. delicatula without cones. In the alkaline phosphatase
enzyme system of studied Selaginella species, twenty exceptional bands were obtained. The
evolutionary tree displayed the distinctive character of S. intermedia, S. tenera and S. wightii.
Polyphenol oxidase enzyme system of studied Selaginella species was observed with twelve
active bands and showed only two distinct enzymatic bands. The phylogenetic tree of
Selaginella species displayed the uniqueness of S. brachystachya, S. radicata and S.
bryopteris based on polyphenol oxidase profile. The amalgamated cladogram of isozymic
profiles displayed the distinct character of S. wightii, S. bryopteris and S. radicata. Unique
banding profiles of esterase, peroxidase, acid phosphatase, alkaline phosphatase and
polyphenol oxidase were observed in the studied Selaginella species which were used to
distinguish the selected Selaginella species and these profiles will act as biochemical
fingerprint for the studied species in plant systematic studies.
Genetic markers represent genetic differences between individual organisms or
species. Such markers themselves do not affect the trait of interest because they are located
only near or linked to genes controlling the trait. All genetic markers occupy specific
genomic positions within chromosomes called loci. All methods for the identification of

122
species that rely on DNA or protein sequence analysis presuppose the neutral theory of
molecular evolution, in which different lineages diverge over evolutionary times by the
accumulation of molecular changes (Pereira, 2008). These methods are based on the
assumption that individuals from the same species carry specific protein or DNA sequences
that are different from those found in individuals from other species. However, the
distribution of a given molecular variant in time and in space will be influenced by the
reproductive success of individuals, migratory events and random genetic drift. Therefore, it
should be realized that a continuous genetic variability does exist among individuals of a
species.
Molecular markers have been looked upon as tools for a large number of applications
ranging from localization of a gene to improvement of plant varieties by marker assisted
selection. They have also become extremely popular markers for phylogenetic analysis
adding new dimensions to the evolutionary theories. Genome analysis based on molecular
markers has generated a vast amount of information and a number of databases are being
generated to preserve and popularize it. Among the various markers used to distinguish the
taxonomically varied species, DNA markers are more suitable and ubiquitous to most of the
living organisms.
Sayantani et al. (2012) developed the protocol for isolating genomic DNA from
leaves of Selaginella species viz., S. delicatula, S. repanda, S. bryopteris, S. plana and S.
monospora using a modified CTAB protocol of Rogers and Benedich (1994) and they
observed that the DNA samples were suitable for genetic diversity analysis with RAPD
markers. Similar to Sayantani et al. (2012) in the present study, the DNA of ten Selaginella
!"#$" %&' % "()*'#)"+%, $-.% '%/0+$1"+%2345%"()*'#)$0-%/")60+%+" #*$7"+%78%9,**'8% '-+%
Thompson (1980). The extracted DNA samples were suitable for rbcL gene amplification and
the amplified products were sequenced.
123
Many molecular markers with different advantage and disadvantage have been used
in the population genetic study. Previous markers for genetic diversity analysis include
RAPD, RFLP, AFLP, SSR, microsatellites, etc. Because of some disadvantages, in recent
days, the use of sequence data from the DNA of chloroplasts (cp DNA) or nuclear ribosomal
DNA (rDNA) and mitochondrial DNA have proven to be highly useful in elucidating both
lower and higher level relationships. In that, rbcL data has been most valuable for inferring
phylogenetic relationship between closely related species (Alvarez and Wendel, 2003).
Several studies have used DNA barcoding methods to identify pteridophytes (Ma et
al., 2010; Ebihara et al., 2010; Li et al., 2011). Some researchers evaluated the potential to
differentiate closely related sister species using DNA barcodes (Julian et al., 2009; Seberg
and Petersen, 2009; Federici et al., 2013). In the previous studies, the plastid barcoding loci
such as rbcL, matK, trnH-psbA, trnL-F, rpoB and rpoC1 were thought to be suitable as DNA
markers for species identification of medicinal pteridophytes. In the present study, the extent
of genetic variations among the ten species of Selaginella collected from various localities of
South India were assessed using rbcL gene. The results showed good universality with high
inter-specific divergence among the studied Selaginella species and the results also supports
for the precise identification of studied Selaginella species.
Azuma et al. (2000) performed phylogenetic analyses based on nucleotide sequences
of the chloroplast encoded rbcL gene to examine phylogenetic relationships of the genus
Salix together with other allied genera of the family Salicaceae. Phylogenetic analyses of
rbcL sequences strongly suggest the monophyly of three commonly recognized genera
(Chosenia, Salix and Toisusu). Two monophyletic groups are recognized within the larger
monophyletic group. In the present study, the highly developed DNA barcoding studies were
carried out in ten Selaginella species collected from various localities of South India using
rbcL gene to explore the inter-specific relationships among them. The evolution of species

124
diversity in the genus Selaginella has been studied and their phylogenetic relationships
obtained by MEGA 5.2 version. The phylogenetic tree of Selaginella species under study
displayed both monophyletic and paraphyletic groups. Monophyletic taxon group includes S.
delicatula with and without cones, S. inaequalifolia, S. involvens, S. repanda, S. radicata S.
tenera, S. brachystachya, S. wightii and S. bryopteris while paraphyletic group includes S.
intermedia.
Korall and Kenrick (2002) developed a phylogenetic framework for the club moss
family Selaginellaceae based on maximum parsimony analyses using PAUP* software
version 4.0. The chloroplast gene rbcL was sequenced for 62 species, which represent nearly
10% of living species diversity in the family. The analyses provide support for monophyly of
subgenera Selaginella and Tetragonostachys. Stachygynandrum and Heterostachys are
polyphyletic. Monophyly of Ericetorum is uncertain. Their results also indicate a large
number of new grouping which was not recognized on morphological grounds. Gu et al.
(2013) explored the use of DNA barcode ITS2 to identify medicinal plants of the
Selaginellaceae family. A total of 103 samples were collected from the main distribution
areas in China where those samples represented 34 species and contained almost all the
medicinal plants of Selaginellaceae. The ITS2 region of the genome was amplified from
those samples and sequenced using universal primers and reaction conditions. The success
rates of the PCR amplification and sequencing were 100%. There was significant divergence
between inter-specific and intra-specific genetic distances of the ITS2 regions, while the
presence of a barcoding gap was obvious. Using the BLAST1 and nearest distance methods,
their results proved that the ITS2 regions could successfully identify the species of all
Selaginellaceae samples in which they examined. The ITS2 barcode can effectively identify
medicinal plants of Selaginellaceae.
125
Similar to the previous findings, in the present study the genomic DNA of selected ten
species of Selaginella collected from various localities of South India, were isolated and
amplified using rbcL primer. The phylogenetic analysis of ten Selaginella species was carried
out using four methods viz., minimum evolution, neighbor joining, UPGMA and maximum
parsimony. The phylogenetic analysis of Selaginella species was studied using minimum
evolution, neighbor joining and UPGMA methods showed similar trees whereas maximum
parsimony tree displayed varied tree. The evolutionary tree using minimum evolution,
neighbor joining and UPGMA methods represents two main clusters C1 and C2. The cluster
C1 is made of monophyletic taxon group viz., S. delicatula with and without cones, S.
inaequalifolia, S. involvens, S. repanda, S. radicata and a paraphyletic taxon S. intermedia
with the distance value 0.11. The cluster C2 consist of monophyletic taxon group viz., S.
brachystachya, S. wightii and S. bryopteris and a paraphyletic taxon S. tenera with highest
distance range 0.12. The phylogenetic tree of maximum parsimony analysis represents two
main clusters C1 and C2. The cluster C1 is made of monophyletic taxon group viz., S.
delicatula with and without cones, S. inaequalifolia, S. involvens, S. repanda, S. radicata and
a paraphyletic taxon S. intermedia with the distance value 24.33. The cluster C2 involves
monophyletic taxon groups namely S. brachystachya, S. wightii and S. bryopteris and a
paraphyletic taxon S. tenera with highest distance range 41.00. The rbcL barcode can
effectively identify medicinal plants of Selaginellaceae. The results provide a scientific basis
for the particular identification of plants of the family Selaginellaceae. This study may
broaden the application of DNA barcoding in the medicinal plant field and benefit
phylogenetic investigations. In addition Selaginella species are often traded internationally
for their medical and ornamental importance, the present research provides a convenient tool
to validate the studied Selaginella species.
126
Summary and Conclusion
The present investigation was undertaken to identify the molecular taxonomical variation
among the ten Selaginella species viz., S. intermedia (Bl.) Spring, S. inaequalifolia (Hook. et
Grev.) Spring, S. involvens (Sw.) Spring, S. tenera (Hook & Grev.) Spring, S. wightii Hieron.,
S. brachystachya (Hook. & Grev.) Spring, S. repanda (Desv.) Spring, S. radicata (Hook. &
Grev.) Spring, S. bryopteris (L.) Bak, S. delicatula (Desv.) Alston with and without cones
(Desv.) Alston using biochemical and molecular analysis. To know the molecular
relationships among the selected species of Selaginella following biochemical viz., SDS-
PAGE for protein separation, MALDI-TOF MS analysis for protein identification, PAGE for
enzyme separation and molecular characterization includes DNA sequencing using rbcL gene
was carried out. To fulfill the objectives of the present study the Selaginella species were
collected from their natural habitats of South India. For protein analysis, the samples were
isolated and separated by the method described by Anbalagan (1999) and the gels were
stained using the method described by Mortz et al. (2001) and Sorensen et al. (2002).
MALDI-TOF MS analysis was carried out using Applied Biosystems MALDI-TOF Voyager
De-Pro spectrometer. For isozymic analysis, the enzymes isoperoxidase, isoesterase, acid
phosphatase, alkaline phosphatase and polyphenol oxidase were isolated, separated and
stained by the method explained by Sadasivam and Manickam (1991). For genomic analysis,
the DNA was isolated by the modified CTAB method described by Murray and Thomson
(1980).
To calculate the similarity indices the presence and absence of the MW-Rf values/
spectral peak values (m/z) were calculated as “1” and “0”. The results obtained through
biochemical and molecular analyses were documented and the similarity indices among the
studied species were calculated. The similarity indices values were plotted in NTSys software
127
and the cladograms were constructed using UPGMA. The cladograms were used to reveal
phylogenetic relationship among the studied Selaginella species.
SDS-PAGE protein profiling was carried out to know inter-specific relationship
among the studied Selaginella species collected from South India. SDS-PAGE demonstrated
the inter-specific variability among the studied Selaginella species in which, a total of 190
bands with different molecular weight were displayed in the SDS-PAGE gel system of
Selaginella. Each region expressed different proteins which act as representative of the
expression of a particular gene of the studied Selaginella species. The protein profile of S.
repanda showed high number (25) of protein bands and S. delicatula with cones showed low
number (12) of protein bands. Distinct protein bands were observed among the ten
Selaginella species which acts as biochemical markers of the studied Selaginella species. In
addition, these protein bands will make possible to identify the individual Selaginella species
and act as fingerprint in plant systematic studies.
MALDI-TOF MS analysis expressed different ion peaks ranged from 0 - 1, 00,000 Da
among ten Selaginella species collected from different localities of South India. The results
showed total of 483 spectral peak values. S. involvens displayed maximum number (86) of
spectral peaks ranged from 527 to 99215 m/z values. S. radicata depicted minimum number
(21) of spectral peaks varied from 694 to 91754 m/z values. There were 71 unique spectral
peaks are observed that explains the genetic similarities and variation of studied Selaginella
species. Evolutionary tree was constructed by submitting the spectral peak values of
individual Selaginella species to NTSYS software. The morphologically distinguished
character of S. tenera, S. involvens, S. wightii, S. brachystachya and S. repanda is confirmed
in the taxonomic tree by the occurrence of distinct spectral values. Thus, in the present study,
the occurred spectral peaks of MALDI-TOF MS analysis acted as a spectroscopic tool to
distinguish the studied Selaginella species.
128
In the present study, five kinds of enzyme systems viz., esterase, peroxidase, acid
phosphatase, alkaline phosphatase and polyphenol oxidase were characterized to identify
inter-specific relationship among the studied ten species of Selaginella. In the PAGE system
of studied Selaginella species, each enzyme was characterized with distinct enzymatic bands
which are representative of the appearance of a particular gene locus coding for that specific
isozyme. The cladogram of studied Selaginella species based on the esterase profile showed
the distinct nature of S. intermedia, S. involvens, S. radicata, S. tenera and S. brachystachya
which is a supplementary evident to distinguish the morphologically unique species. The
cladistic tree based on the peroxidase profile of studied Selaginella species explained the
uniqueness of S. involvens, S. brachystachya and S. tenera. The evolutionary tree based on
the acid phosphatase profile displayed the separated character of S. tenera, S. delicatula with
cones and S. bryopteris. Addition to that, the acid phosphatase system revealed the
developmental stages variation in S. delicatuala with and without cones. Thus, the result
supports to identify the medicinally important S. delicatula without cones.
The phylogenetic tree of alkaline phosphatase profile displayed the restricted
character of S. intermedia, S. tenera and S. wightii where the cladogram based on polyphenol
oxidase profile of Selaginella species displayed the uniqueness of S. brachystachya, S.
radicata and S. bryopteris. The present study shows that the ten Selaginella species were
easily separated isozymically and also revealed the similarities and variation among them. In
addition, the result obtained in the present study explained that the PAGE analysis can
provide an easy, low cost and quick way for the identification of Selaginella species and also
have a better knowledge of the genetic affinity of germplasm.
DNA barcoding is an advanced molecular tool applied for species identification and
to study the taxonomic variation among the closely related species. In the present study, DNA
barcoding using rbcL gene was applied to distinguish the inter-specific variation among the
129
selected Selaginella species viz., S. intermedia, S. inaequalifolia, S. involvens, S. tenera, S.
wightii, S. brachystachya, S. repanda, S. radicata, S. bryopteris, S. delicatula with and
without cones. Multiple sequence alignment was executed for the studied ten Selaginella
species using MULTALIN 5.4.1 version and Clustal W tool. The sequence alignment results
illustrated that the sequence of S. involvens, S. intermedia, S. inaequalifolia, S. wightii and S.
tenera were distinct from the other studied Selaginella species. Thus, the sequence alignment
results displayed inter-specific variation among the studied Selaginella species.
The phylogenetic relationship of studied Selaginella species was analyzed using
MEGA 5.2 version software. The cladistic tree explains the close relationship between S.
delicatula with and without cones. This proves that rbcL data is most valuable for inferring
phylogenetic relationship between closely related species. The phylogenetic tree of the ten
Selaginella species yielded two main groups such as monophyly and paraphyly.
Monophyletic taxon group includes S. delicatula with and without cones, S. inaequalifolia, S.
involvens, S. repanda, S. radicata, S. brachystachya, S. wightii and S. bryopteris.
Paraphyletic taxon group includes only S. intermedia and S. tenera. This mono and paraphyly
expression was a reflection of genetic as well as geographical variation. Thus the results of
phylogenetic analysis using MEGA 5.2 version software showed inter-specific similarity and
variation among the studied Selaginella species. DNA barcoding using rbcL gene in
particular may be applied to resolve the disputes of taxonomic identities, affairs and
authentication of the particular Selaginella species in plant systematics.
Finally, it can be concluded from the present research that the synergistic application
of biochemical and molecular markers can be used as a prominent tool to identify the
taxonomic relationship among the studied Selaginella species.
Bibliography
Abu-Shamah Z, Faridz ZF, Rizal MK, Fadhilah ZW, Abdullah I. Ethnobotanical study in
Kuala Nerang, Kedah. In: Chang YS, Mohtar M, Bramaniam V, Abu-Samah Z (eds)
Towards bridging science and herbal industry; Proceedings of the Seminar on
Medicinal and Aromatic Plants. Forest Research Institute Malaysia, Kepong, Kuala
Lumpur, 2000.
Agrawal GK, Yonekura M, Iwahashi Y, Iwahashi H, Rakwal R. System trends and
perspectives of proteomics in dicot plants PartII: proteomes of the complex
developmental stages. Journal of Chromatography B Analytical Technologies in
Biomedical and Life Science 2005; 815: 125-136.
Ahmad FB, Raji H. Medicinal plants of the Murut community in Sabah. In: Ghazzaly I, Siraj
O, Murtedza M (eds) Forest biology and conservation in Borneo. Centre for Borneo
Studies, Kota Kinabalu, 1992.
Ahmad R, Srivastava SP, Maurya R, Rajendran SM, Arya KR, Srivastava AK. Mild
antihyperglycaemic activity in Eclipta alba, Berberis aristata, Betula utilis, Cedrus
deodara, Myristica fragrans and Terminalia chebula. Indian Journal of Science and
Technology 2009; 1(5): 1-6.
Alston AHG. An enumeration of the Indian species of Selaginella. Proceedings National
Institute of Science, India, 1945; 11(B): 211-235.
Alvarez LD, López-Herranz ML, Betekhtin A, Catalan P. A DNA Barcoding method to
discriminate between the model plant Brachypodium distachyonand Its Close
Relatives B. stacei and B. hybridum (Poaceae). PLoS ONE 2012; 7(12): 1-20.
Alvarez, Wendel JF. Ribosomal ITS sequences and plant phylogenetic inference. Molecular
Phylogenetics and Evolution 2003; 29: 417-434.

Anbalagan K. An introduction to electrophoresis. Electrophoresis Institute, Yercaud, Tamil
Nadu, 1999.
Angelov GB, Ivanova TA. Isozyme variation and genetic affinities among four species of the
genus Festuca L. (Poaceae). Biodiversity Research and Conservation 2012; 28: 3-8.
Anuja GI, Latha PG, Suja SR, Shyamal S, Shine VJ, Sini S, et al. Anti-inflammatory and
analgesic properties of Drynaria quercifolia (L.) J. Smith. J. Ethnopharmacol 2010;
132(2): 456-460.
Asaduzzaman AKM, Rahman MH, Yeasmin T. Purification and characterization of acid
phosphatase from a Germinating black gram (Vigna mungo l.) Seedling. Archives of
Biological Sciences 2011; 63(3): 747-756.
Asahina H, Shinozaki J, Masuda K, Morimitsu Y, Satake M. Identification of medicinal
Dendrobium species by phylogenetic analyses using matK and rbcL sequences.
Journal of Natural Medicines 2010; 64: 133-138.
Asghar R, Siddique R, Afzal M, Akbar S. Inter and intra-specific variation in SDS-PAGE of
total seed protein in rice (Oryza sativa L.) germplasm. Pakistan Journal of Biological
Sciences 2004; 7(2): 139-143.
Azuma T, Kajita T, Yokoyama J, Ohashi H. Phylogenetic relationships of Salix (Saliaceae)
based on rbcL sequence data. American Journal of Botany 2000; 87(1): 67-75.
Babu A, Raja DP, Johnson M, Sivasankari G. Variability studies of selected taxa of
amaranthus. Journal of Basic and Applied Biology 2010; 4(1&2): 125-136.
Bae MS, Cho EJ, Choi EY, Park OK. Analysis of the Arabidopsis nuclear proteome and its
response to cold stress. Plant Journal 2003; 36: 652-663.
Baishya AK, Rao RR. Ferns and fern-allies of Meghalaya State, India. Scientific Publishers,
Maan Bhawan, Jodhpur, India, 1982; Pp: 1-153.
Banks JA, Nishiyama T, Hasebe M, Bowman JL, Michael G, Claude P, Albert VA, Naoki A,
Tsuyoshi A, Ambrose BA, et al. The Selaginella genome identifies genetic changes
associated with the evolution of vascular plants. Science 2011; 332: 960-963.
Banks JA. Selaginella and 400 million yearsofseparation. Annual Review of Plant Biology
2009; 60: 223-238.
Barett SCH, Kohn JR. Genetic and evolutionary consequences of small population size in
plants: implications for conservation. In-Genetics and Conservation if rare plants.
D.A. Falk and K.E. Holsinger (Ed), Oxford University Press, New York, 1991;
Pp: 3-30.
Barta J, Curn V, Divis J. Studies of biochemical variability of potato cultivars by soluble
protein, isoesterase and isoperoxidase electrophoretic patterns. Plant Soil
Environment 2003; 49(5): 230-236.
Batugal PA, Kanniah J, Young LS, Oliver JT. Medicinal plants research in Asia, Vol 1: The
framework and project workplans. International Plant Genetic Resources Institute-
Regional Office for Asia, the Pacific and Oceania (IPGRI-APO). Serdang, Selangor
DE, Malaysia, 2004.
Beck JB, Windham MD, Pryer KM. Do asexual polyploid lineages lead short evolutionary
lives? A case study from the fern genus Astrolepis. Evolution 2011; 65(11): 3217-
3229.
Beddome RH. A Hand book to the Ferns of British India, Ceylon and Malay Peninsula.
Thacker Spink and Co., Calcutta (Reprint ed. 1976). Today and Tomorrow's Printers
and Publishers, New Delhi, 1883.
Beknal AK, Korwar PG, Halkai MA, Kulkarni U, Patil BS, Soodam SR. Phytochemical
investigation and antioxidant activity study of Drynaria quercifolia Linn rhizome.
International Journal Current Pharmaceutical Research 2010; 2(4): 36-39.
Bellstedt DU, Pirie MD, Visser JC, de Villiers MJ and Gehrke B. A rapid and inexpensive
method for the direct PCR amplification of DNA from plants. American Journal of
Botany 2010; 65-68.
Benjamin A, Manickam VS. Medicinal pteridophytes from the Western Ghats. Indian
Journal of Traditional Knowledge 2007; 6(4): 611-618.
Benniamin A, Fraser-Jenkins CR, Irudayaraj V. Polystichum manickamianum
(Dryopteridaceae), a new species from South India, Novon, India, 2008.
Bharadwaja TN, Gema CN, Verma S. Status survey of pteridophytic flora of Rajasthan with
special reference to endangered ferns and fern allies. Indian fern Journal 1987;
4: 47-50.
Bhat TM, Kudesia R. Evaluation of genetic diversity in five different species of family
Solanaceae using cytological characters and protein profiling. Genetic Engineering
and Biotechnology Journal 2011; 20: 1-8.
Bir SS, Irudayaraj V, Manickam VS. Cytology of some ferns from the Nilgiris, South India
III. Fern Gazette 1996; 15: 141-150.
Bir SS, Vasudeva SM. Cytological studies on some ferns of Kodaikanal, South India. In:
Recent Research in Plant Sciences (Ed. S.S. Bir), Kalyani Publishers, New Delhi,
1979; 221-228.
Bir SS. Chromosome numbers in some ferns from Kodaikanal, South India. Caryologia
1965; 18: 107-115.
Bir SS. Cytological observations on some ferns from Simla (Western Himalayas). Current
Science 1962; 31: 248-250.
Bir SS. Evolutionary trends in the pteridophytic flora of India. Presidential address, Section
of Botany, Indian Science Congress Platinum Jubilee Session 1977, Proceedings
Indian Science Congress 1988; 75: 1-56.

Bir SS. Pteridophytic Flora of India: rare and endangered elements and their conservation.
Indian Fern Journal 1987; 4: 95-101.
Blanca L, Rothfels CJ, Arakaki M, Young KR, Pryer KM. Revealing a cryptic fern
distribution through DNA Sequencing: Pityrogramma trifoliata in the Western Andes
of Peru. American Fern Journal 2013; 103(1):40-48.
Borgen L. Chromosome numbers of vascular plants from Macaronesia. Norway Journal of
Botany 1975; 22: 71-76.
Bouquet A, Cave A, Paris R. Plantes medicinales du Congo-Brazzaville (III) plantes
medicinales et phytotherapie. Tome 1971; 5(2): 154-158.
Bourdy G, Walter A. Maternity and medicinal plants in Vanuatu I. The cycle of reproduction.
Journal of Ethnopharmacology 1992; 37: 179-196.
Brighigna L, Bennici A, Tani C, Tani G. Structural and ultra structural characterization of
Selaginella lepidophylla, a desiccation-tolerant plant, during the rehydration process.
Flora 2002; 197: 81-91.
Britto AJD, Gracelin DHS, Benjamin PJRK. Phytochemical studies on five medicinal ferns
collected from Southern Western Ghats, Tamilnadu. Asian Pacific Journal of Tropical
Biomedicine 2012; S: 536-538.
Bryan FA, Soltis DE. Electrophoretic evidence for allopolyploidy in the fern Polypodium
virginianum. Systematic Botany 1987; 12: 553-561.
Buck WR, Lucansky TW. An anatomical and morphological comparison of Selaginella
apoda and Selaginella ludoviciana. Bulletin of the Torrey Botanical Club 1976;
103(1): 9-16.
Caius JF. The medicinal and poisonous ferns of India. Journal of Bombay Natural History
Society 1935; 341- 361.

Caniago I, Siebert S. Medicinal plant ecology, knowledge and conservation in Kalimantan,
Indonesia. Economic Botany 1998; 52(3): 229-250.
Caprioli RM, Farmer TB, Gile J. Molecular imaging of biological samples: localization of
peptides and proteins using MALDI-TOF MS. Analytical Chemistry 1997; 69: 4751-
4760.
Castillejo MA, Maldonad AM, Samuel O, Jorrin JV. Proteomic analysis of responses to
drought stress in Sunflower (Helianthus annuus) leaves by 2DE gel electrophoresis
and mass spectrometry. The Open Proteomics Journal 2008; 1: 59-71.
Castillo FJ. Peroxidases and stress In: C Penel, Th Gaspar & H Greppin, eds, Plant
Peroxidases 1980, 1990. Topics and Detailed Literature on Molecular, Biochemical
and Physiological Aspects, University of Geneva. CRC Press, Inc. 1992; 187-203.
CBOL Plant Working Group. A DNA barcode for land plants. Proceedings of the National
Academy of Sciences 2010; 106: 12794-12797.
!"!#$% &'% &()*% +'% &,-.(% /0% 1$23,3-!4.-$(3% 3-56$!3% .4278% Ebenus L. species based on
morphological, RAPD-PCR and seed protein analyses in Turkey. Pakistan Journal of
Botany 2009; 41(5): 2477-2486.
Chandra S, Fraser-Jenkins CR, Kumari A, Srivastava A. A summary of the status of
threatened pteridophytes of India. Taiwania 2008; 53(2): 170-209.
Chandra S, Fraser-Jenkins CR. Threatened pteridophytes of India. In: S.C. Verma, S.P.
Khullar & H.K. Cheema (Eds.): Perspectives in Pteridophytes. Bishen Singh
Mahendra Pal Singh, Dehradun, India, 2008; Pp: 207-233.
Chang IF, Szick Miranda K, Pan S, Bailey-Sarres J. Proteomic characterization of
evolutionary conserved and variable proteins of Arabidopsis cystolic ribosomes. Plant
Physiology 2005; 137(3): 848-62.
Chen CW, Huang YM, Kuo LY, Nguyen QD, Luu HT, Callado JR, Farrar DR, Chiou WL.
trnL-F is a powerful marker for DNA identification of field vittarioid gametophytes
(Pteridaceae). Annals of Botany 2013; 111(4): 663-73.
Chen TY, Loan PTK, Hsu CL, Lee YH, Wang JTW, Wei KH, Lina CT, Li LJ. Label-free
detection of DNA hybridization using transistors based on CVD grown grapheme.
Biosensors and Bioelectronics 2012; 41: 103-109.
Chen WS, Huang YF, Chen YR. Localization of acid phosphatase in root cap of rice plant.
Botanical Bulletin Academia Sinica 1992; 33: 233-239.
Cheng XL, Ma SC, Yu JD, Yang SY, Xiao XY, Hu JH, Lu Y, Shaw PC, But PPH, Lin RC.
Selaginellin A and B, two novel natural pigments isolated from Selaginella
tamariscina. Chemical and Pharmaceutical Bulletin 2008; 56(7): 982-984.
Chowdhury NP. Researches on Living Pteridophytes in India, Burma and Ceylon. Asia
Publishing House, New York, 1971; Pp: 1-80.
Chris Givens S. A physiological and evolutionary study of the plant hormone ethylene.
Ditechronic Dissertation, Williamsburg, 2010.
Clarke WE, Parkin IA, Gajardo HA, Gerhardt DJ, Higgins E, Sidebottom C, Sharpe AG,
Snowdon RJ, Federico ML, Iniguez-Luy FL. Genomic DNA Enrichment Using
Sequence Capture Microarrays: a Novel Approach to Discover Sequence Nucleotide
Polymorphisms (SNP) in Brassica napus L. PLOS ONE 2013; 8(12): 1-14.
Coleman JE. Structure and mechanism of alkaline phosphatase. Annual Review of Biophysics
and Biomolecular Structure 1992; 21: 441-83.
Cona A, Cenci F, Cervelli M, Federico R, Mariottini P, Moreno S, Angelini R. Polyamine
oxidase, a hydrogen peroxide-producing enzyme, is up-regulated by light and down-
regulated by auxin in the outer tissues of the maize mesocoyl. Plant Physiology 2003;
131: 803-813.
Costanza R. The value of the world's ecosystem services and natural capital. Nature 1997;
387: 253-260.
Crawford DJ. Electrophoretic data and plant speciation. Systematic Botany 2000;
49: 479-501.
Cummings MA, Krafsur ES. Spatial diversity in mitochondrial cytochrome-C oxidase in
house flies. Medical and Veterinary Entomology 2005; 19: 53-59.
Dalimartha S. Ethnomedical information of some pteridophytes of Kerala sector of Western
Ghats. Mathew PJ, Mathew D, Unnithan CM, Pushpangadan P. In: Sasikumar B,
Krishnamurti B, Rema J, Ravindren, Atlas, Trubus Agriwidya, Yogyakarta,
Indonesia, 1999.
Das S, Maumita Bandyopadhya Y, Subir Bera. Optimization of protocol for isolation of
genomic DNA from leaves of Selaginella species suitable for RAPD analysis and
study of their genetic variation. American fern Journal 2012; Pp: 44-59.
Datta R, Sinha R, Chattopadhyay S. Changes in leaf proteome profile of Arabidopsis thaliana
in response to salicylic acid. Journal of Bio Science 2013; 38: 317-328.
de Groot GA, Verduyn B, Wubs ER, Erkens RH, During HJ. Inter and intra specific variation
in fern mating systems after long-distance colonization: the importance of selfing.
BMC Plant Biology 2012; 12: 3-6.
Dellaporta SL, Wood J, Hicks JB. A plant DNA mini-preparation: version II. Plant
Molecular Biology Reporter 1983; 1:19-21.
Desire F, Deutsch EW, Nesivizhskii AI. Integration with the human genome of peptide
sequences obtained by high throughput mass spectrometry. Genome Biology 2007;
6: 745-749.
Diaz S, Edna, Munoz A, Victor H. History, objectivity and the construction of molecular
phylogenies. Studies in History Philosophy of Biological and Biomedical Sciences
2008; 39(4): 451-468.
Dixit RD, Bhatt GK. Ferns: A much neglected group of medicinal plants II. Journal of
Research and Education in Indian Medicine 1974; 9: 59-68.
Dixit RD, Vohra JN. South Asia including India in general pteridophytes. 1984;
733: 810-840.
Dixit RD. A Census of the Indian Pteridophytes. Flora of India, Ser. 4, Botanical Survey of
India, Howrah (Calcutta). India, 1984; Pp: 1-177.
Dixit RD. Conspectus of pteridophytic diversity in India. Indian Fern Journal 2000;
17: 77-91.
Dolly R, Khare PB, Dantu PK. In vitro antibacterial and antifungal properties of aqueous and
non-aqueous frond extracts of Psilotum nudum, Nephrolepis biserrata and
Nephrolepis cordifolia. Indian Journal of Pharmaceutical Sciences 2010; 72(6):
818-822.
Dopazo J. Estimating errors and confidence intervals for branch lengths in phylogenetic trees
by a bootstrap approach. Journal of Molecular Evolution 1994; 38: 300-304.
Doyle JJ, Doyle JL. A rapid DNA isolation procedure for small quantities of fresh leaf tissue.
Phytochemistry Bulletin 1987; 19:11-15.
Dubuisson JY, Hennequin S, Douzery EJP, Cranfill RB, Smith AR, Pryer KM. rbcL
Phylogeny of the fern genus Trichomanes (hymenophyllaceae), with special reference
to neotropical taxa. International Journal of Plant Sciences 2003; 164(5):753-761.
Duraiswamy H, Nallaiyan S, Nelson J, Rathina Samy P, Johnson M, Irudayaraj V. The effect
of extracts of Selaginella involvens and Selaginella inaequalifolia leaves on poultry
pathogens. Asian Pacific Journal of Tropical Medicine 2010; 3(9): 678-681.
Ebihara A, Iwatsuki K, Kurita S, Ito M. Systematic position of Hymenophyllum rolandi-
principis Rosenst or a monotypic genus Rosenstockia Copel. (Hymenophyllaceae)
endemic to New Caledonia. Acta Phytotaxonomica et Geobotanica 2002; 53: 35-49.
Ebihara A, Nitta JH, Ito M. Molecular species identification with rich floristic sampling:
DNA barcoding the pteridophyte flora of Japan. PLoS ONE 2010; 5(2): 1-7.
Elham AA, Hady, Atef AA, Haiba, Nagwa R, Hamid A and Rizkalla AA. Phylogenetic
Diversity and Relationships of Some Tomato Varieties by Electrophoretic Protein and
RAPD analysis. Journal of American Science 2010; 6(11): 434- 441.
Federici S, Galimberti A, Bartolucci F, Bruni I, de Mattia F, Cortis P, Labra M. DNA
barcoding to analyse taxonomically complex groups in plants: the case of Thymus
(Lamiaceae). Botanical Journal of the Linnean Society 2013; 171: 687-699.
Felsenstein, J. Inferring phylogenies. Sinauer Associates, Sunderland, Mass. 2004; Pp: 663.
Franc V, Rehulka P, Medda R, Padiglia A, Floris G, Sebela M. Analysis of the glycosylation
pattern of plant copper amine oxidases by MALDI-TOF/TOF MS coupled to a
manual chromatographic separation of glycans and glycopeptides. Electrophoresis
2013; 34(16): 2357-67.
Fraser-Jenkins CR. A brief comparison of modern Pteridophyte classifications (Families and
genera in India). Indian Fern Journal 2009; 26: 107-127.
Fraser-Jenkins CR. Endemics and pseudo-endemics in relation to the distribution pattern of
Indian pteridophytes. Taiwania 2008; 53(3): 264-292.
Freville H, Justy F, Olivieri I. Comparative allozyme and microsatellite population structure
in a narrow endemic plant species Centaura corymbosa Pourret (Asteraceae).
Molecular ecology 2001; 10: 879-889.
Futuyma DJ. Evolutionary science, creationism and society. Evolution 2005; 22: 524-543.
Gao L, Yi X, Yang YX, Su YJ, Wang T. Complete chloroplast genome sequence of a tree
fern Alsophila spinulosa: insights into evolutionary changes in fern chloroplast
genomes. BMC Evolution Biology 2010; 11(9):130-134.
Garvin DF, NF Weeden. Isozyme evidence supporting a single geographic origin for
domesticated tepary bean. Crop Science 1994; 34:1390-1395.
Gastony GJ, Gottlieb LD. Genetic variation in the homosporous fern Pellaea
andromedifolia. American Journal of Botany 1985; 72: 257-267.
Gastony GJ, Gottlieb LD. Evidence for genetic heterozygosity in a homosporous fern Pellaea
andromedaefolia. American Journal of Botany 1982; 69: 634-637.
Gayathri V, Asha VV, Subramoniam A. Preliminary studies on the immunomodulatory and
antioxidant properties of Selaginella species. Indian Journal Pharmacology 2005; 37:
381-385.
Ghafoor A, Ahmad Z, Qureshi AS, Muhammad B. Genetic relationship in Vigna mungo (L.)
Hepper and V. radiata (L.) R. Wilczek based on morphological traits and SDS-PAGE.
Euphytica 2002; 123(3): 367-378.
Ghatak J. Biosystematic survey of pteridophytes from Shevaroy hills, South India. Nucleus
1977; 20: 105-108.
Ghatak J. Observations on the cytology and taxonomy of some ferns from India. Proceedings
in Indian Science Congress 1963; 50: 371-372.
Ghosh SR. New report of some ferns from Sikkim. Journal of Economic and Taxonomic
Botany 1984; 5(1): 245-246.
Golub EE, Battaglia KB. The role of alkaline phosphatase in mineralization. Current Opinion
in Orthopaedics 2007; 18:444-448.

Gonnety JT, Kouame LP. Purification and characterization of three low-molecular weight
acid phosphatase from peanut (Arachis hypogaea) seedlings. African Journal of
Botany 2006; 5(10): 035-044.
Gracia GJM, Espinosa F, Garcia GJC. Trends in Taxonomy today: an overview about the
main topics in Taxonomy. Zoologica Baetica 2008; 19: 15-49.
Grassl J, Nicolas LT, Millar AH. Matrix-assisted laser desorption/ionisation mass
spectrometry imaging and its development for plant protein imaging. Plant
Methods 2011; 7(21): 1-11.
Green BR. Isolation and base composition of DNA’s of primitive land plants, ferns and fern
allies. Biochem Biophys Acta 1971; 254(3): 402-406.
Grusz AL, Windham MD, Pryer KM. Deciphering the origins of apomictic polyploids in the
Cheilanthes yavapensis complex (Pteridaceae). American Journal of Botany 2009;
96(9): 1636-1645.
Gu W, Song J, Cao Y, Sun Q, Yao H, Wu Q, Chao J, Zhou J, Xue W, Duan W. Application
of the ITS2 Region for Barcoding Medicinal Plants of Selaginellaceae in
Pteridophyta. PLOS ONE 2013; 8(6): 1-8.
Guo J, Pesacreta JC. Purification and characterization of an acid phosphatase from the bulb of
allium cepa L. Journal Plant physiology 1997; 151: 520-527.
Habib M, Wani SA, Zargar GH, Habib M. Seed protein profile and isozyme polymorphism as
markers for identification of some important rice cultivars. Applied Biological
Research 2000; 2: 55-59.
Hailat I, Helleur R. Direct analysis of sterols by derivatization matrix assisted laser
desorption/ionization time-of-flight mass spectrometry and tandem mass
spectrometry. Wiley 2014; 28(2): 149-158.

Hameed A, Shah TM, Atta BM, Iqbal N, Haq MA, Ali H. Comparative seed storage protein
profiling of Kabuli chickpea genotypes. Pakistan Journal of Botany 2009; 41(2): 703-
710.
Hammad I. Genetic variation among Bougainvillea glabra cultivars (Nyctaginaceae) detected
by RAPD markers and isozymes patterns. Research Journal of Agriculture and
Biological Sciences 2009; 5(1): 63-71.
Hamrick JL, Godt MJ. Allozyme diversity in plant species. In: A. H. D. Brown, M. T. Clegg,
A. L. Kahler, B. S. Weir (eds.), Plant population genetics, breeding, and genetic
resources. Sinauer Associates, Inc, Sunderland, 1990; Pp: 43-63.
Hamrick JL, Godt MJW. Allozyme diversity in cultivated crops. Crop Science 1997; 37(1):
26-30.
Hamrick JL, Godt MJW. Conservation genetics of endemic plant species. In: Conservation
Genetics. (eds. Avise and J.L. Hamrick), Chapman and Hall, New York, 1996; Pp:
284-304.
Hanna IA, Kjellbom P, Urban J. Annotation of Selaginella moellendorffii: Major Intrinsic
Proteins and the Evolution of the Protein Family in Terrestrial Plants. Frontiers in
Plant Science 2012; 3: 33-40.
Hao DC, Xiao PG, Dong YPJ, Liu W. Evaluation of the chloroplast barcoding markers by
mean and smallest interspecific distances. Pakistan Journal of Botany 2012; 44(4):
1271-1274.
Harada K, Rahayu M, Muzakkir A. Medicinal plants of Gunung Halimun National Park,
West Java, Indonesia. Biodiversity Conservation Project JICA, PHPA & LIPI, Bogor,
2002.
Harholt J, Sorensen I, Fangel J, Roberts A, Willats WGT, Scheller HV, Petersen BL, Banks
JA, Ulvskov P. The glycosyltransferase repertoire of the spikemoss Selaginella
moellendorffii and a comparative study of its cell wall. PLoS ONE 2012; 7(5): 1-15.
Haripriya D, Selvan N, Jeyakumar N, Periasamy R, Johnson M, Irudayaraj V. The effect of
extracts of Selaginella involvens and Selaginella inaequalifolia leaves on poultry
pathogens. Asian Pacific Journal of Tropical Medicine 2010; 3(9): 678-681.
Harten JB, Eickmeier WG. Enzyme dynamics of the resurrection plant Selaginella
lepidophylla (Hook. & Grev.) Spring during rehydration. Plant Physiology 1986; 82:
61-64.
Hassan SW, Umar KA, Dubai YU, Ebbo AA, Faruk UZ. Antibacterial phytochemical and
toxicity studies of Pteridum aquilinum L. (Dennstaedtiaceae) in rabbits. Journal of
Pharmacology and Toxicology 2007; 2(2): 168-175.
Haufler C. Species concept and speciation in Pteridophytes. In: J. M. Camus, M. Gibby and
R. J. Johns (eds) Pteridology in perspective. Royal Botanic Gardens, Kew.1996. The
Plant Book- a portable dictionary of vascular plants. Cambridge University Press
Mabberley, 1997; Pp: 291-305.
Haufler CH, Soltis DE. Genetic evidence suggests that homosporous ferns with high
chromosome numbers are diploid. Genetics 1986; 83: 4389-4393.
Haufler CH. Electrophoresis is modifying our concepts of evolution in homosporous
pteridophytes. American Journal of Botany 1987; 74:953-966.
Haufler CH. Enzyme variability and modes of evolution in Bommeria (Pteridaceae).
Systematic Botany 1985; 10: 92-104.
Hauk WD, Parks CR, Chase MW. Phylogenetic studies of Ophioglossaceae: evidence from
rbcL and trnL-F plastid DNA sequences and morphology. Molecular Phylogenetic
Evolution 2003; 28(1): 131-51.
He ASG, Joyce BD, Wang AMZ. Characterization of polyamine oxidase from the aquatic
nitrogen-fixing fern Azolla imbricata. Plant Science 2005; 169: 185-190.
Hebert PDN, Cywinska A, Ball SL, de-Waard JR. Biological identifications through DNA
barcodes. Proceedings, Biological sciences 2003; 270(1512): 313-321.
Hebert PDN, Gregory TR. The promise of DNA barcoding for taxonomy. Systematic Biology
2005; 54: 852-859.
Hebert PDN, Penton EH, Burns JM, Janzen DH, Hallwachs W. Ten species in one: DNA
barcoding reveals cryptic species in neotropical skipper butterfly Astraptes fulgerator.
Proceeding of the National Academy of Sciences 2004; 101:14812-14817.
Hebert PDN, Ratnasingham S, de Waard JR. Barcoding animal life: cytochrome c oxidase
subunit 1 divergences among closely related species. Proceedings of Royal Society of
London. Series B Biological sciences 2003; 270(S): 96-99.
Hennequin S, Ebihara A, Ito M, Iwatsuki K, Dubuison JY. Molecular systematics of the fern
genus Hymenophyllum s.l. (Hymenophyllaceae) based on chloroplastic coding and
noncoding regions. Molecular Phylogenetic Evolution 2003; 27: 283-301.
Herrero A, Pajaro NS, Prada C. Isozyme variation and genetic relationships among taxa in
the Asplenium obovatum group (Aspleniaceae, Pteridophyta). American Journal of
Botany 2001; 88(11): 2040-2050.
Hey J. The mind of the species problem. Trends in Ecology and Evolution 2001; 16: 326-329.
Hodge WH. Fern food of Japan and the problem of toxicity. American Fern Journal 1973;
63: 77-80.
Holtz KM, Kantrowitz ER. The mechanism of the alkaline phosphatase reaction: insights
from NMR, crystallography and site-specific mutagenesis. FEBS Letters 1999; 462:
7-11.
Hong HTK, Akihiro N. Mitochondrial proteomic analysis of CAM plants, Ananas comosus
and Kalanchoe pinnata. Annals of Biological Research 2012; 3(1): 88-97.
Hooper EA, Haufler CH. Genetic diversity and breeding system in a group of neotropical
epiphytic ferns (Pleopeltis; polypodiaceae). American journal of botany 1997; 84(12):
1664-1674.
Hossain Z, Nouri MZ, Komatsu S. Plantcell organelle proteomics in response to abiotic
stress. Journal of Proteome Research 2012; 11: 37-48.
Hu MF, Yen MH, Liao JW, Liu KL. Hepatoprotective effects of the folk medicines of Yan-
Kan-Tang No.1 and Yan-Kan-Tang No.2 on Rats. Crop, Environment and
Bioinformatics 2004; 1: 229-238.
Huang H, Layne DR. Using isozyme polymorphisms for identifying and assessing genetic
variation in cultivated Pawpaw (Asimina triloba (L.) Dunal). Journal of American
Society Horticulture Science 1997; 122(4): 504-511.
Hudson RR, Bailey K, Skarecky D, Kwaitowski J, Ayala FJ. Evidence for positive selection
in the superoxide dismutase (SOD) region of Drosophila melanogaster. Genetics
1994; 136: 1329-1340.
Hunter RL, Markert CL. Science 1957; 125: 1294-1295.
IIRS. Biodiversity characterization at landscape level in Western Ghats, India, using Satellite
Remote Sensing and Geographic Information Systems. Indian Institute of Remote
Sensing. National Remote Sensing Agency, Department of Space, Government of
India. Dehra Dun, 2002.
Imaichi R, Kato M. Developmental anatomy of the shoot apical cell, rhizophore and root of
Selaginella uncinata. Journal of Plant Research 1989; 102(3): 369-380.
Irudayaraj V, Bir SS, Manickam VS. Cytology of some ferns from Nilgiris, South India. Fern
Gazette 1993; 14: 161-169.

Irudayaraj V, Bir SS. Cytology of some ferns from the Nilgiris, South India-II. Fern Gazette
1994; 14: 301-312.
Irudayaraj V, Janaky M, Johnson M, Selvan N. Preliminary phytochemical and antimicrobial
studies on a spike-moss Selaginella inaequalifolia (Hook. & Grev.) Spring. Asian
Pacific Journal of Tropical Medicine 2010; 957-960.
Irudayaraj V, Johnson M, Rajkumar SD. Isozymic evidence for the common origin of
Diplazium species confined to South India and Sri Lanka. Research and Reviews in
Biosciences 2009; 3(4).
Irudayaraj V, Johnson M. Morpho-anatomy, phytochemistry and pharmacology of anticancer
spike-mosses: A Review. Natural Products 2013; 2: 213-238.
Irudayaraj V, Johnson M. Studies on isozymic variation among the South Indian species of
Sphaerostephanos. Asian Pacific Journal of Tropical Biomedicine 2011; 1(5):
295-297
Irudayaraj V, Patric Raja D, Thirupurasundari G. Intra specific pharmacognostical
differences in a medicinal fern Blechnum orientale L. (Blechnaceae), In: Natarajan,
K., Xavier, S.A.G., Irudayaraj, V. (eds), National Seminar on Bioprospecting of
Bioresources; 2010.
Ito S, Nakamichi N, Nakamura Y, Niwa Y, Kato T, Murakami M, Kita M, Mizoguchi
T, Niinuma K, Yamashino T, Mizuno T. Genetic linkages between circadian clock-
associated components and phytochrome-dependent red light signal transduction in
Arabidopsis thaliana. Plant Cell Physiology 2007; 48(7): 971-983.
Jain SK, Sastry ARK. Threatened plants of India: A State-of-the-art Report. New Delhi,
India, 1980.

Janaki. Pharmacognostical studies on an anticancer spike-moss Selaginella inaequalifolia
(Hook. & Grev.) Spring (Pteridophyta: Selaginellaceae) M. Phil. Thesis submitted to
St. Xavier’s College (Autonomous), Palayamkottai, 2009.
Javaid A, Ghafoor A, Anwar R. Seed storage protein electrophoresis in groundnut for
evaluating genetic diversity. Pakistan Journal of Botany 2004; 30(1): 25-29.
Jeanson ML, Labat J-N, Little DP. DNA barcoding: a new tool for palm taxonomists? Annals
of Botany 2011; 1-7.
Jermy AC, Jones K, Colden C. Cytomorphological variation in Selaginella. Botany Journal
of Linneaen Society 1967; 60: 147-158.
Jiang GQ, Wang Z, Shang H, Yang WL, Hu ZA, Phillips J, Deng X. Proteome analysis of
leaves from the resurrection plant Boea hygrometrica in response to dehydration and
rehydration. Planta 2007; 225(6): 1405-1420.
Joelri MR, Britto SJ, Prabhu S, Senthilkumar SR. Phylogenetic relationships of Crotalaria
species based on seed protein polymorphism revealed by SDS-PAGE. International
Research Journal of Plant Science 2011; 2(5): 119-128.
Johnson AK, Rothfels CJ, Windham MD, Pryer KM. Unique expression of a sporophytic
character on the gametophytes of notholaenid ferns (Pteridaceae). American Journal
of Botany 2012; 99(6): 1118-1124.
Johnson M, Dominic Rajkumar S & Irudayaraj, V. Isozymic variation among three filmy
ferns belonging to different morphological forms growing in different ecological
niche. Biotechnology an Indian Journal 2010; 4(1).
Johnson M, Irudaya Raj V, Rajkumar SD. Isozymic variation studies on the selected species
of Tectaria from India. Journal of Chemical and Pharmaceutical Research 2010;
2(5): 334-338.
Johnson M, Irudayaraj V, Dominic Rajkumar S. Isoperoxidase analysis on Thelypteris ciliata
(Wall. ex Benth.) Holttum (Thelypteridaceae). Asian Pacific Journal of Tropical
Biomedicine 2012; S: 27-29.
Johnson M, Irudayaraj V, Rajkumar SD, Janakiraman N. Isozymic variation studies on the
selected species of Cyathea. International Journal of Biological Technology 2012;
355-361.
Johnson M, Irudayaraj V, Rajkumar SD, Manickam VS. Isozyme markers for the crude drugs
of Maiden Hair ferns from the Western Ghats, South India. Natural Products: An
Indian Journal 2012; 6(1).
Johnson M, Irudayaraj V, Rajkumar SD. Isozymic studies on selected species of Pteris from
India. Biochemistry 2010; 4(1).
Johnson M, Irudayaraj V, Rajkumar SD. Isozymic variation studies on the selected species of
Tectaria from India. Journal of Pharmaceutical Research 2010; 2(5): 334-338.
Johnson M, Janakiraman N, Chalini K, Narayani M, Kalaiarasi V. Studies on developmental
variation of isoperoxidase and protein profile of Zea mays L. Journal of Stress
Physiology & Biochemistry 2012; 8(1): 16-23.
Johnson M, Janakiraman N, Irudayaraj V. Isozyme analysis on different varieties of
sugarcane. Journal of Stress Physiology & Biochemistry 2012; 8(2): 22-31.
Johnson M, Manickam VS. In vitro multiplication of Baliospermum montanum (Willde)
Muell-Arg. - a threatened medicinal plant. Indian Journal of Experimental Biology
2003; 41: 1349-1351.
Johnson M, Manickam VS. Influence of plant growth regulators on in vitro raised
gametophytes of Cheilanthes viridis (Forssk.) Swartz. Journal of Basic and Applied
Biology 2010; 4(4): 18-23.
Johnson M, Narayani M. Somoclonal variation studies on Cassia occidentalis Linn using
SDS-PAGE. Journal of Harmonized Research in Applied Sciences 2013; 1(1): 37-41.
Johnson M, Patric Raja D. Role of isozymes in systematic study of Tephrosia purpurea,
Tephrosia villosa and Tephrosia spinosa. Biochemistry: An Indian Journal 2007;
1(4).
Johnson M, Renola Joy Jeba Ethal T, Babu A. Influence of salinity stress on proteomic
profiles of Cicer arietinum L. Journal of Stress Physiology & Biochemistry 2012;
8(3): 5-12.
Johnson M, Sonali D, Yasmin N, Babu A. Impacts of cytokinins and auxins on organogenesis
and somatic embryogenesis of Vitex negundo var. negundo L. and evaluation of
genetic fidelity. Biotechnology: An Indian Journal 2009; 3(4): 236-241.
Johnson M, Usha Raja AN, Malar TRJJ. Isozyme variations and genetic relationships among
three Plumbago species. Journal of Ecobiotechnology 2010; 2(5):54-59.
Johnson M, Wesely EG, Selvan N, Chalini K. Comparative phytochemical and isoperoxidase
studies on leaf and leaves derived callus of Solanum anguivi Lam. Journal of
Chemical and Pharmaceutical Research 2010; 2(4): 899-906.
Johnson M, Yasmin N, Sonali D, Rajasekara Pandian M. The role of cytokinin and auxin in
organogenesis of Passiflora mollussima and evaluation of biochemical changes using
isozyme and protein profiles. ETH Journal of Science and Technology 2007; 4(2):
27-36.
Johnson M. Differential expression of isoesterases in leaves and roots of Vigna unguiculata
L. in response to saline stress. Journal of Stress Physiology & Biochemistry 2012;
8(2): 59-68.
Johnson M. Somoclonal variation studies on Phyllanthus amarus Schum & Thonn. Iranian
Journal of Biotechnology 2007; 5(4): 240-245.
Johnson, M Janakiraman, N. Phytochemical and TLC studies on stem and leaves of the
orchid Dendrobium panduratum subsp. villosum Gopalan & A. N. Henry. Indian
Journal of Natural Products and Research 2013; 4(3): 250-254.
Joshi K, Chavan P, Warude D, Atwardhan B. Molecular markers in herbal drug technology.
Current Science 2004; 87: 159-165.
Julian RS, Robert FCN, Brianna NC. Plant DNA barcodes and species resolution in sedges
(Carex, Cyperaceae). Molecular Ecology Resources 2009; 9: 151-163.
Juneyoung L, Choi Y, Wou ER, Lee DG. Antibacterial and synergistic activity of
Isocryptomerin isolated from Selaginella tameriscina. Journal of Microbial
Biotechnology 2009; 19(2): 204-207.
Kamal AHMA, Kim AKH, Kwang-Hyun ShinA, Dong-Hoon ShinA, Hyung-Seok SeoA,
Dae-Seong ParkA, Sun-Hee Woo1 Moon-Soon LeeB, Keun-Yook Chung D.
Functional proteome analysis of wheat: systematic classification of abiotic stress
responsive Proteins. 19th World Congress of Soil Science, Soil Solutions for a
Changing World, Brisbane, Australia, 2010; 12-14.
Kamel EA, Hassan HZ, Ahmed SM. Electrophoretic characterization and the relationship
between some Egyptian Cruciferae. Online Journal of Biological Sciences 2003; 3(9):
834-842.
Karp A, Kresovich S, Bhat KV, Ayad WG, Hodgkin T. Molecular tools in plant genetic
resources conservation: A guide to the technologies, International Plant Genetic
Resources Institute Technical Bulletin 1997; 2: 1-47.
Kaur S. Economic exploitation and conservation: Emerging areas in the study of ferns and
fern allies. Indian Fern Journal 1989; 6: 23-29.
Kersten B, Burkle L, Kuhn EJ, Giavalisco P, Konthur Z, Lueking A, Walter G, Eickhoff H.
Schneider U. Large-scale plant proteomics. Plant Moleculat Biology 2002; 48:
133-141.
Khan A, Haque E, Mukhlesur Rahman M, Mosaddik A, Rahman M, Sultana N. Isolation of
antibacterial constituent from rhizome of Drynaria quercifolia and its sub-acute
toxicological studies. DARU Joournal of Pharmaceutical Sciences 2007; 15(4):
205-211.
Khare C. Indian medicinal plants - an illustrated dictionary. Springer. New York, 2007.
Setyawan AD, Darusman LK. Review: Biflavonoid compounds of Selaginella Pal.
Beauv. and its benefit. Biodiversitas 2008; 9(1): 64-81.
Kholia BS. Pteridophytic wealth of Sikkim Himalaya. Sikkim state Biodiversity Board and
Botanical survey of India, 2010; 43-64.
Kirkpatrick, REB. Investigating the monophyly of Pellaea (Pteridaceae) in the context of a
phylogenetic analysis of cheilanthoid ferns. Systematic Botany 2007; 32: 504-518.
Koller A, Washburn MP, Lange BM, Andon NL, Deciu C, Haynes PA, Hays L, Schieltz D,
Ulaszek R, Wei J, Wolters D, Yates JR. Proteomic survey of metabolic pathways in
rice. Proceedings of the National Academy of Sciences 2002; 99: 11969-11974.
Komatsu S, Konishi H, Shen S, Yang G. Rice proteomics: a step toward functional analysis
of the rice genome. Molecular Cell Proteomics 2003; 2: 2-10.
Korall P, Conant DS, Metzgar JS, Schneider H, Pryer KM. A molecular phylogeny of scaly
tree ferns (Cyatheaceae). American Journal of Botany 2007; 94(5): 873-886.
Korall P, Kenrick P. The phylogenetic history of Selaginellaceae based on DNA sequences
from the plastid and nucleus: extreme substitution rates and rate heterogeneity.
Molecular Phylogenetics and Evolution 2004; 31: 852-864.
Korall P, Kenrick P. Phylogenetic relationships in Selaginellaceae based on rbcL
sequences. American Journal of Botany 2002; 89(3): 506-517.
Korall P, Pryer KM, Metzgar JS, Schneider H, Conant DS. Tree ferns: monophyletic groups
and their relationships as revealed by four protein-coding plastid loci. Molecular
Phylogenic Evolution 2006; 39(3): 830-45.
Korall P, Schuettpelz E, Pryer KM. Abrupt deceleration of molecular evolution linked to the
origin of arborescence in ferns. Evolution 2010; 64(9): 2786-92.
Korpelainen H. Mating system and distribution of enzyme genetic variation in bracken
(Pteridium aquilinum). Canadian Journal of Botany 1995; 73:1611-1617.
Kouadio NEJP. Contribution a l’etude du tubercule de Taro Xanthosoma sp variete atoumbou
orono: evolution de quelques parameters biochimiques au cours de la conservation et
purification et caracterisation de deux phosphatases acides. These de doctorat 39me
cycle de I’UFR des sciences et technologie des aliments de I’ Universite d’Abobo-
Adjame. Cote d’Ivoire 2004; Pp: 1-10.
Kreiger M, Ross KG. Identification of a major gene regulating complex social behavior.
Science 2002; 295:328–332.
Kress WJ, Erickson DL, Swenson NG, Thompson J, Uriarte M, Zimmerman JK. Advances in
the use of DNA barcodes to build a community phylogeny for tropical trees in a
Puerto Rican forest dynamics plot. PLoS One 2010; 5(11): 15409-15411.
Krsnik-Rasol M, Balen B. Electrophoretic protein patterns and peroxidase activity related to
morphogenesis in Mammillaria gracillis tissue culture. Acta Botanica Croatica 2001;
2: 219-226.
Kruft V, Eubel H, Jansch L, Werhahn W, Braun HP. Proteomic approach to identify novel
mitochondrial proteins in Arabidopsis. Plant Physiology 2001; 127: 1694-1710.

Kumar A, Kushik P. Antibacterial effect of Adiantum capillus-veneris Linn. Indian Fern
Journal 1999; 16: 72-74.
Kumar P, Gupta VK, Misra AK, Modi DR, Pandey BK. Potential of molecular markers in
plant biotechnology. Plant Omics 2009; 2: 141-162.
Kumar PS, Kumari RBD. In vitro and In vivo identification of variation in protein expression
in Artemisia vulgaris L. Advances in Biological Research 2009; 3(5-6): 237-241.
Kuriachan PI. Cytology of the genus Selaginella. Cytologia 1963; 28: 376-380.
Kusudo T, Sakaki T, Inouye K. Purification and characterization of purple acid phosphatase
P1 from from dry power of sweet Potato. Bioscience, Biotechnology and Biochemistry
2003; 67: 1609-1611.
Labiak PH, Sundue M, Rouhan G. Molecular phylogeny, character evolution, and
biogeography of the grammitid fern genus Lellingeria (Polypodiaceae). American
Journal of Botany 2010; 97(8): 1354-64.
Lahaye R, van der Bank M, Bogarin D, Warner J, Pupulin F, Gigot G, Maurin O, Duthoit S,
Barraclough TG, Savolainen V. DNA barcoding the floras of biodiversity hotspots.
Proceedings of the National Academy of Sciences 2008; 105: 2923-2928.
Lai YH, Lim YY, Kim KH. Blechnum Orientale Linn-a fern with potential as antioxidant,
anticancer and antibacterial agent. BMC Complementary and Alternative Medicine
2010; 10: 15-19.
Lebot V, Aradhya MK, Manshardt RM. Geographic survey of genetic variation in kava
(Piper methysticum Forst. F. and P. wichmanii C. DC.). Pacific Science 1991; 45(2):
169-185.
Lee H, Lin JY. Antimutagenic activity of extracts from anticancer drugs in Chinese medicine.
Mutation Research 1988; 204(2): 229-234.
Lee H, To RJB, Latta RK. Some properties of extracellular acetyl xylan esterase produced by
the yeast Rhodotorula mucilaginosa. Applied and Environmental Microbiology 1987;
53: 2831-2834.
Lee J, Choi Y, Woo ER, Lee DG. Isocryptomerin, a novel membrane-active antifungal
compound from Selaginella tamariscina. Biochemical and Biophysical Research
Communication 2009; 379(3): 676-680.
Lee J, Zhentian Lei, Watson BS, Sumner LW. Sub-cellular proteomics of Medicago
truncatula. Frontiers in Plant Science 2013; 4(112): 1-6.
Li FW, Kuo LY, Rothfels CJ, Ebihara A, Chiou WL, Windham MD, Pryer KM. rbcL and
matK earn two thumbs up as the core DNA barcode for ferns. PLoS ONE 2011; 6(10):
1-7.
Li J, Wan DR, Chen KL. RAPD analysis of 8 medicinal species of Selaginella. Journal of
Chinese Medicinal Materials 2007; 30(4): 403-406.
Lin LC, Kuo YC, Chou CJ. Cytotoxic biflavonoids from Selaginella delicatula. Journal of
Natural Products 2000; 63(5): 627-630.
Lin R, Skaltsounis AL, Seguin E, Tillequin F, Koch M. Phenolic constituents of Selaginella
doederleinii. Planta Medica 1996; 60(2): 168-170.
Lina C. Proteomic expression study in resurrection plant, Selaginella lepidophylla. Report
submitted to University of Nevada, 2010; Pp: 1-4.
Little DP, Moran RC, Brenner ED, Stevenson DW. Nuclear genome size in Selaginella.
Genome 2007; 50: 351-356.
Liu MS, Chien CT, Lin TP. Constitutive components and induced gene expression are
involved in the desiccation tolerance of Selaginella tamariscina. Plant Cell
Physiology 2008; 49(4): 653-663.
Love A, Love D. IOPB chromosome number reports Lift. Taxon 1976; 25: 483-500.
Love A, Love D. Some chromosome numbers of Icelandic ferns and fern-allies. American
Fern Journal 1961; 51: 127-128.
Loyal DS, Kumar V. Cytotaxonomic observations on three Selaginella species from North-
Western Himalayas. Indian Fern Journal 1984; 1: 59-62.
Loyal DS. Chromosome counts in north-western Himalayan species of Selaginella.
Proceedings, Indian Science Congress Association 1976; 63: 127-128.
Lydia G, Elizabeth Barker, Christian Schulz, Barbara Ambrose, Neil Ashton, GünterTheißen,
Litt A. Selaginella genome analysis – entering the “homoplasy heaven” of the MADS
world. Frontiers in Plant Science 2012; 3(214): 1-14.
Ma LY, Wei F, Ma SC, Lin RC. Two new chromone glycosides from Selaginella uncinata.
Chinese Chem Letters 2002; 13(8): 748-51.
Ma XY, Xie CX, Liu C, Song JY, Yao H, Luo K, Zhu YJ, Gao T, Pang XH, Qian J, Chen
SL. Species identification of medicinal pteridophytes by a DNA barcode marker, the
chloroplast psbA-trnH intergenic region. Biological and Pharmaceutical Bulletin
2010; 33(11): 1919-1924.
Madhusoodanan PV. Rare and endangered ferns and fern-allies of Western Ghats of Kerala.
In: Karunakaran, C. K. (ed.), Proceedings of the Symposium on Rare, Endangered and
Endemic Plants of the Western Ghats. Thiruvananthapuram, India, 1991; Pp: 103-107.
Mahabale TS, Kamble SY. Cytology of ferns and other pteridophytes of Western India.
Proceedings Indian National Science Academy 1981; 47(2): 260-278.
Mahadani P, Sharma GD, Ghosh SK. Identification of ethnomedicinal plants
(Rauvolfioideae: Apocynaceae) through DNA barcoding from northeast India.
Pharmacognosy Magazine 2013; 9: 255-63.

Malik MFA, Afsari SQ, Muhammad A, Muhammad RK, Asif J. Evaluation of genetic
diversity in soybean (Glycine max) lines using seed protein electrophoresis.
Australian Journal of Crop Science 2009; 3(2):107-112.
Mamedov N. Adaptogenic, geriatric, stimulant and antidepressant plants of Russian Far East.
Journal Cell Molecular Biology 2005; 4: 71-75.
Manickam VS and Irudayaraj V. Pteridophyte Flora of the Western Ghats (South India). B. I.
Publications, New Delhi, 1992.
Manickam VS, Irudayaraj V. Cytology of the ferns of Western Ghats (South India). Today
and Tomorrow’s Printers and Publishers, New Delhi, 1988.
Manickam VS, Irudayaraj V. Pteridophyte flora of Nilgris, South India. Published by Dehra
Dun: Bishen Singh Mahendra Pal Singh, 2003; Pp: 192.
Manickam VS. Ecological studies on the fern flora of the Palni hills (South India). Today and
tomorrow’s Printers and Publishers, New Delhi, 1984.
Manickam VS. Fern flora of the Palni Hills (South India). Today and tomorrow’s Printers and
Publishers, New Delhi, 1986.
Manickam VS. Rare and endangered ferns of the Western Ghats of South India, Fern Gazette
1995; 15: 1-10.
Manikam VS, Benniamin A, Irudayaraj V. Antibacterial activity of leaf extracts of Christella
paracitica (L.) Lev. Indian Fern Journal 2005; 87-88.
Manjunatha BR, Virupakshi S, Naik GR. Peroxidase isozyme polymorphism in popular
sugarcane cultivars. Current Science 2003; 85: 1347-1349.
Mannion AM. Agriculture, environment and biotechnology. Agriculture, Ecosystems and
Environment 1995; 53: 31-45.
Manton I. Problems of cytology and evolution in the pteridophyte. Cambridge University
Press, Cambridge, 1950.
Maridass M, Ghantikumar S. Antibacterial activity of leaves of Blechnum orientale L.
Pharmacology online News Letter’s 2008; 3: 58-60.
Mauro SD, Agorreta A. Molecular systematics: a synthesis of the common methods and the
state of knowledge. Cellular & Molecular Biology Letters 2010; 15(2): 311–341.
Mayer AM. Polyphenol oxidases in plants and fungi: Going places? A review.
Phytochemistry 2006; 67: 2318-2331.
Ministry of Environment and Forests (MoEF). India’s Fourth National Report to the
Convention on Biological Diversity. 2009; Pp: 1-156.
Mithraja MJ, Irudayaraj V, Kiruba S and Jeeva S. Antibacterial efficacy of Drynaria
quercifolia (L.) J. Smith (Polypodiaceae) against clinically isolated urinary tract
pathogens. Asian Pacific Journal of Tropical Biomedicine 2012; 2(S1): 31-35.
Miwa H, Odrzykoski IJ, Matsui A, Hasegawa M, Akiyama H, Jia Y, Sabirov R, Takahashi H,
Boufford DE,Murakami N. Adaptive evolution of rbcL in Conocephalum (Hepaticae,
bryophytes). Gene 2009; 441: 169-175.
Mizuta S, Suda S. A comparative study multiple acid phosphatase in cellular fractions of
bean hypocotyls. Annals of Botany 1980; 45: 369-382.
Montalavan R, Ando A, Echeverrigaray S. Phenetic distance and geographical distribution of
Brazilian rice varieties using seed protein polymorphism. Breeding Science 1995; 4:
275-280.
Morales L, Gutierrez N, Maya V, Parra C, Martinez-Barajas M, Coello P. Purification and
characterization of an alkaline phosphatase induced by phosphorus starvation in
common Bean (Phaseolus vulgaris L.) Roots. Journal of the Mexican Chemical
Society 2012; 56(1), 80-84.

Moran RC. Diversity, biogeography and floristics. In: Biology and evolution of ferns and
lycopods. (Eds.)Tom Ranker and Christopher H. Haufler. Cambridge University
Press, 2008; Pp: 367-394.
Morbelli MA, Rowley JR, Claugher D. Spore wall structure in Selaginella (Lycophyta)
species growing in Argentina. Boletin de la Sociedad Argentina de Botanica 2001;
36: 315-368.
Mortz E, Krough TN, Vorum H, Gorg A. Improved silver staining protocols for high
sensitivity protein identification using matrix-assisted laser desorption/ionization-time
of flight analysis. Proteomics 2001; 1359-1363.
Muellner AN, Schaefer H, Lahaye R. Evaluation of candidate DNA barcoding loci for
economically important timber species of the mahogany family (Meliaceae).
Molecular Ecology Resource 2011; 11:450-460.
Muhammad IC, Abdul SM, Wang Y, Cheng Y, Tariq M, Muhammad A. Proteins as
biomarkers for taxonomic identification of traditional Chinese Medicines (TCMs)
from Subsection Rectae Genus Clematis from China. World Applied Sciences 2010; 8:
62-70.
Mukhlesur RM, Hirata Y, Alam SE. Genetic variation within Brassica rapa cultivars using
SDS-PAGE for seed and isozyme analysis. Journal of Biological Science 2004; 4(2):
239-242.
Mukhopadhyay R. Morpho-anatomical observations on some Indian members of Selaginella
P. Beauv. In: P. C. Trivedi (Ed.). Advances in Pteridology. Pointer Publishers, Jaipur,
India, 2002; Pp. 234-247.
Mumtaz AS, Naveed M, Shinwari ZK. Assessment of genetic diversity and germination
pattern in selected cotton genotypes of Pakistan. Pakistan Journal of Botany 2010;
42(6): 3949-3956.

Murray M, Thompson WF. Rapid isolation of molecular weight plant DNA. Nucleic Acids
1980; 8: 4321-4325.
Nagalingum NS, Nowak MD, Pryer KM. Assessing phylogenetic relationships in extant
heterosporous ferns (Salviniales), with a focus on Pilularia and Salvinia. Botanical
Journal of the Linnean Society 2008; 157: 673-685.
Nair SA, Shylesh BS, Gopakuar B, Subramoniam A. Anti-diabetes and hypoglycaemic
properties of Hemionitis arifolia (Burm.) Moore in rats. Journal of
Ethnopharmacology 2006; 106(2):192-197.
Nakamura T, Oda Y. Mass spectrometry-based quantitative Proteomics. Biotechnology and
Genetic Engineering Reviews 2007; 24: 147-164.
Nanthini AUR, Johnson M, Merlin Franco F. Renisheya Joy Jeba Malar T. Assessing the
genetic relationship between three selected species of Rauvolfia using isoenzyme
profiles and morphological characters. Journal of Phytology 2011; 3(9): 48-54.
Nasution RE. Proceeding of the 2nd National Seminary and Workshop on Ethnobotany. Book
1: Medicinal Plant. Yogyakarta. Puslitbang Biologi LIPI, Fakultas Biologi UGM &
Ikatan Pustakawan Indonesia (IPI), Jakarta, 1993; Pp: 24-25.
Natarajan SS, Krishnan HB, Lakshman S, Garrett WM. An efficient extraction method to
enhance analysis of low abundant proteins from soybean seed. Analytical
Biochemistry 2009; 394: 259-268.
Nayar BK. Medicinal ferns of India. Bulletin National Botanical Gardens 1957; 29: 1-36.
Nayar MP, Sastry ARK. Red Data Book of Indian Plants, eds. 1-3. Botanical Survey of India,
Howrah (Calcutta), India, eds 1987, 1988, 1990.
Nei M, Kumar S. Molecular Evolution and Phylogenetics. Oxford University Press, New
York, 2000.

Nei M, Li WH. Mathematical model for studying genetic variation in terms of restriction
endonucleases. Proceedings of the National I Academic Science 1979; 76: 5269-5273.
Neilson KA, George IS, Emery SJ, Sridevi M, Mehdi M, Haynes PA. Analysis of Rice
proteins using SDS-PAGE shotgun proteomics. Plant Proteomics 2014; 1072:
289-302.
Nejad BS, Deokule SS. Anti-dermatophytic activity of Drynaria quercifolia (L.) J. Smith.
Jundishapur. Journal of Microbiology 2009; 2(1): 25-30.
Newmaster SG, Fazekas AJ, Ragupathy S. DNA barcoding in land plants: evaluation of rbcL
in a multigene tiered approach. Canadian Journal of Botany 2006; 84: 335-341.
Nitesh L, Dilraj K, Patel NJ, Talati JG. Varietal identification of Chilli (Capsicum annuum
L.) by electrophoretic technique. Indian Journal of Agricultural Biochemistry 2010;
23(1):36-40.
Oakeshott JG, van Papenrecht EA, Boyce TM, Healy MJ, Russell RJ. Evolutionary genetics
of Drosophila esterases. Genetics 1993; 90: 239-268.
Ohkmae KP. Proteomic studies in plants. Journal of Biochemistry and Molecular Biology
2004; 37(1): 133-138.
Okwu DE. Phytochemicals and vitamin content of indigenous spices of South Eastern
Nigeria. Jourbal of Sustainable Agricculture and the Environment 2004; 6: 30-34.
Olczak M, Watorek W, Morawieka B. Purification and characterization of acid phosphatase
from yellow lupin (Lupinus luteus) seeds. Biochimica et Biophysica Acta 1997; 1341:
14-25.
Omnia BHA. Saliva proteins variations among human identical twins using SDS-PAGE.
Dissertation submitted for B.Sc (Honours). Department of Zoology, Faculty of
Sciences, University of Khartoum; 2010.
Onus AN, Pickergill B. A study of selected isozymes in Capsicum baccatum, Capsicum
eximium, Capsicum cardenasii, and two interspecific F1 hybrids in Capsicum species.
Turkish Journal of Botany 2000; 24: 311-318.
Owk AK, Tamminana R, Sape ST. Genetic Variation of Isozyme Polyphenol Oxidase (PPO).
Profiles in different varieties of Capsicum annuum L. Notulae Scientia Biologicae
2013; 5(4): 454-457.
Pajaron S, Quintanilla LG, Pangua E. Isozymic contribution to the systematics of
the Asplenium seelosii group. Systematic Botany 2005; 30(1): 52-59.
Palisot de Beauvois AM. Mag. Encyclopaedia, Paris, 1805; 9(5): 478.
Pan SM, Huang YF, Chen YR. Characterization and localization of acid phosphatase in
tobacco cell suspension culture. Taiwania 1987; 32: 1-12.
Pan SM. Phosphatase in Spinach Leaves subcellular localization and the stress effect. Bot.
Bull. Academia Sinica 1985; 26: 185-194.
Panara F, Pasqualini S, Antonielli M. Multiple forms of barley root acid phosphatase:
Purification and some characteristics of major cytoplasmic isoenzyme. Biochimica et
Biophysica Acta 1990; 1037: 73-80.
Panda SS, Sahoo K, Rana M, Rout NC, Dhal NK. Antimicrobial activities and phytochemical
investigation of some native pteridophytes. Asian journal of pharmaceutical and
clinical research 2014; 7(1):43-45.
Pande HC, Pande PC. An illustrated fern flora of the Kumaon Himalaya. Bishen Singh
Mahendra Pal Singh, Dehra Dun, India, 2003; 1: 5-9.
Pande PC, Bir SS. Present Assessment of rare and threatened vascular cryptogams
(Pteridophytes) of Kumaun Himalaya and their conservation strategies. Indian Fern
Journal 1994; 11: 31-48.

Pangtey YPS, Samant SS. Observations on the threatened rare and endangered flowering
plants and ferns in the flora of Kumaun Himalaya. In: Prakash, R. (ed.), Advances in
Forestry Research in India. International Book Distributors, Dehra Dun, India, 1988;
3: 65-73.
Panigrahi G, Dixit RD. Studies in the systematic of Indian Selaginella. Botanical survey of
India, Allahabad, 1966; 34: 192- 209.
Paramanik R, Mondal AK, Mondal S. Comparative study of the amino acid composition of
four species of Selaginella P. de Beauv. Phytomorphology 2002; 52: 337-345.
Parani M, Singh KN, Rangasamy S, Ramalingam RS. Identification of Sesamum alatum ×
Sesamum indicum hybrid using protein, isozyme and RAPD markers. Indian Journal
of Genetics and Plant Breeding 1997; 57: 381-388.
Park KO. Proteomics studies in plants. Journal of Biochemistry and Molecular Biology 2004;
37(1): 133-138.
Parveen I. DNA barcoding of Indian Orchids. Ph. D Thesis, University of Delhi, 2013.
Paul Raj K, Irudayaraj V, Johnson M, Patric Raja D. Phytochemical and anti-bacterial
activity of epidermal glands extract of Christella parasitica (L.) H. Lev. Asian Pacific
Journal of Tropical Biomedicine 2011; 1: 8-11.
Paul T, Das B, Apte KG, Banerjee S, Saxena RC. Evaluation of Anti-Hyperglycemic Activity
of Adiantum Philippense Linn, a Pteridophyte in Alloxan Induced Diabetic Rats.
Journal of Diabetes Metabolism 2012; 3(9): 2-8.
Peltier JB, Friso G, Kalume DE, Roepstorff P, Nilsson F, Adamska I, van Wijk KJ.
Proteomics of the chloroplast: systematic identification and targeting analysis of
lumenal and peripheral thylakoid proteins. Plant Cell 2000; 12: 319-342.

Peltier JB, Ytterberg J, Liberles DA, Roepstorff P, van Wijk KJ. Identification of a 350 kDa
ClpP protease complex with 10 different Clp isoforms in chloroplasts of Arabidopsis
thaliana. Journal of Biological Chemistry 2001; 276:16318-16327.
Pereira F, Carneiro J, Amorim A. Identification of species with DNA-based technology:
Current progress and challenges. Recent Patents on DNA & Gene Sequences 2008;
2(3): 187-200.
Pervaiz ZK, Rabbani MA, Shinwari ZK, Masood MS, Malik SA. Assessment of genetic
variability in Rice (Oryza sativa) germplasm from Pakistan using RAPD markers.
Pakistan Journal of Botany 2010; 42(5): 3369-3376.
Peskan T, Westermann M, Oelmuller R. Identification of low-density Triton X-100-insoluble
plasma membrane micro domains in higher plants. European Journal of
Biochemistry 2000; 267: 6989-6995.
Petersen CE, Anderson BJ. Investigations in the Biology 1151 Laboratory. Stipes Publishing
L.L.C. Champaign, IL, USA, 2005; 45.
Pinter I, Bakker F, Barrett J, Cox C, Gibby M, Henderson S, Morgan-Richards M, Rumsey F,
Russell S, Trewick S, Schneider H, Vogel J. Phylogenetic and biosystematic
relationships in four highly disjunct polyploid complexes in the subgenera Ceterach
and Phyllitis in Asplenium (Aspleniaceae). Organisms, Diversity, & Evolution 2002;
2: 299-311.
Pomponio MF, Torales S, Gallo L, Pastorino M, Marchelli P, Cervera MT, Poltri SM.
DNA sequence variation of drought-response candidate genes in Austrocedrus
chilensis. Electronic Journal of Biotechnology 2013; 16(2):1-7.
Prime T, Sherrier D, Mahon P, Packman L, Dupree P. A proteomic analysis of organelles
from Arabidopsis thaliana. Electrophoresis 2000; 21: 3488-3499.

Pryer KM, Schuettpelz E, Wolf PG, Schneider H, Smith AR, Cranfill R. Phylogeny and
evolution of ferns (monilophytes) with a focus on the early leptosporangiate
divergences. American Journal of Botany 2004; 91: 1582-1598.
Pryer KM, Smith AR, Skog JE. Phylogenetic relationships of extant ferns based on evidence
from morphology and rbcL sequences. American Fern Journal 1995; 85(4): 205-282.
Pryer KM, Schuettpelz E, Huiet L, Grusz AL, Rothfels CJ, Avent T, Schwartz D, Windham
MD. DNA barcoding exposes a case of mistaken identity in the fern horticultural
trade. Molecular Ecology Resources 2010; 10(6): 979-85.
Qiu-YL, Lee J, Bernasconi-Quadroni F, Soltis DE, Soltis PS, Zonis M, Zimmer EA, Chen Z,
Sauolainen V, Chase MW. The earliest angiosperms: evidence from mitochondrial,
plastid and nuclear genomes. Nature 1999; 402: 404-407.
Rabbani MA, Masood MS, Shinwari ZK, Shinozaki KY. Genetic analysis of basmati and
nonbasmati rice Pakistani rice (Oryza sativa L.) cultivars using microsatellite markers.
Pakistan Journal of Botany 2010; 42(4): 2551-2564.
Radhakrishna BP. The Western Ghats of the Indian peninsula. Memoir Geological Society of
India 2001; 47: 133-144.
Raja DP, Manickam VS, de Britto AJ, Gopalakrishnan S, Ushioda T, Satoh M, Tanimura A,
Fuchino H, Tanaka N. Chemical and chemotaxonomical studies on Dicranopteris
species. Chemisty and Pharmaceutical Bulletin, Tokyo, 1995; 43(10): 1800-3.
Rakwal R, Agrawal GK. Rice proteomics: current status and future perspectives.
Electrophoresis 2003; 24: 3378-3389.
Ranker TA, Geiger JM, Kennedy SC, Smith AR, Haufler CH, Parris BS. Molecular
phylogenetics and evolution of the endemic Hawaiian genus Adenophorus
(Grammitidaceae). Molecular Phylogenic Evolution 2003; 26(3): 337-47.
Rao TK, Reddy KN, Pattanaik C, Reddy CS. Ethnomedicinal importance of pteridophytes
used by chenchus of Nallamalais, Andhra Pradesh, India. Ethnobotanical Leaflets
2007; 11: 6-10.
Rea G, de Pinto MC, Tavazza R, Biondi S, Gobbi V, Ferrante P, De Gara L, Federico R,
Angelini R, Tavaladoraki P. Ectopic expression of maize polyamine oxidase and pea
copper amine oxidase in the cell wall of tobacco plants. Plant Physiology 2004; 134:
1414-1426.
Reese G. Erganzende mitteilungen uber die chromosome zahlen mitteleuroplischer
gefasspflanzen I. Berichte der Deutschen Botanischen Gesellschaft 1951; 64: 240-
255.
Reid JD, Plunkett GM, Peters GA. Phylogenetic relationships in the heterosporous fern genus
Azolla (Azollaceae) based on DNA sequence data from three noncoding regions.
International Journal of Plant Sciences 2006; 167: 529-538.
Ren BQ, Xiang XG, Chen ZD. Species identification of Alnus (Betulaceae) using rDNA and
cpDNA genetic markers. Molecular Ecology Resources 2010; 10: 594-605.
Revathy I, Johnson M, Babu A, Janakiraman N, Paralogaraj A, Irudayaraj V. In vivo
developmental ontogeny and protein expression studies on the selected ferns from the
Western Ghats, South India. Journal of Basic and Applied Biology 2011; 5(3-4): 194-
205.
Rodolfo Z, Gallardo JOM, Patrick VD, Folch-Mallol J, Beatrz B, Christophe VV, Roberto G,
Covarrubias AA, Sotelo JN, Thevelein JM, Iturriaga G. A Selaginella lepidophylla
Trehalose-6-phosphate synthase complements growth and stress-tolerance defects in a
yeast tps1 mutant. Plant physiology 1999; 119(4): 1473-1482.
Rogers SO, Benedich AJ. Extraction of total cellular DNA from plants, algae and fungi. In S.
B. Gelvin and R. A. Schilerpoort, eds. Plant Molecular Biology Manual. Kluwer
Academic, Dordrecht, The Netherlands, 1994; Pp: 1-8.
Rouquie D, Peltier JB, Marquis M, Tournaire C, Doumas P, Rossignol M. Construction of a
directory of tobacco plasma membrane proteins by combined two-dimensional gel
electrophoresis and protein sequencing. Electrophoresis 1997; 18: 654-660.
Rout SD, Panda T, Mishra N. Ethnomedicinal studies on some pteridophytes of similipal
biosphere reserve, Orissa, India. Intenational Journal of Medicine and Medical
Sciences 2009; 1(5): 192-197.
Rzhetsky A, Nei M. A simple method for estimating and testing minimum evolution trees.
Molecular Biology and Evolution 1992; 9: 945-967.
Sabu KK, Padmesh P, Seeni S. Estimation of active principle content and isozymes of
Andrographis paniculata Nees (Kalmegh): An important medicinal plant of India.
Journal of Medicinal and Aromatical Plant Sciences 2001; 23: 637-647.
Sadasivam S, Manickam A. Biochemical methods for Agricultural Science. Chapter 4.2
Wiley Eastern Ltd. and Tamil Nadu Agricultural University, Coimbatore, India, 1991.
Pp-139.
Sah P. Does the magical Himalayan herb “Sanjeevani Booti” really exist in nature? The
Journal of American Science 2008; 4(3): 65-67.
Saitou N, Nei M. The neighbor-joining method: A new method for reconstructing
phylogenetic trees. Molecular Biology and Evolution 1987; 4:406-425.
Santhy V, Niral V, Dadlani M. Biochemical markers for characterizing rice genotypes.
International Rice Research Notes 1998; 23: 10-15.
Santiago N, Emilia P, Lorena L. Sexual expression and genetic diversity in populations of
Cryptogramma crispa (pteridaceae). American Journal of Botany 1999; 86(7): 964-
973.
Sarvesh KS, Srivastava GK, Shukla PK. Comparative morphology of ligules of three Indian
species of Selaginella. American Fern Journal 2010; 100(2): 42-45.
Sayantani D, Maumita B, Subir B. Optimization of protocol for isolation of genomic DNA
from leaves of Selaginella species suitable for RAPD analysis and study of their
genetic variation. American Fern Journal 2012; 102(1): 47-54.
Schneer VS. DNA barcoding of animal and plant species as an approach for their molecular
identification and describing of diversity. Zhurnal Obshchei Biologii 2009; 70(4):
296-315.
Schneider H, Schuettpelz E. Identifying fern gametophytes using DNA sequences. Molecular
Ecology Notes 2006; 6: 989-991.
Schneider H, Smith AR, Cranfill R, Hildebrand TJ, Haufler CH, Ranker TA. Unraveling the
phylogeny of polygrammoid ferns (Polypodiaceae and Grammitidaceae): exploring
aspects of the diversification of epiphytic plants. Molecular Phylogenic
Evolution 2004; 31(3): 1041-63.
Schori M, Showalter AM. DNA barcoding as a means for identifying medicinal plants of
Pakistan. Pakistan Journal of Botany 2011; 43(SI): 1-4.
Schuettpelz E, Pryer KM. Fern phylogeny inferred from 400 leptosporangiate species and
three plastid genes. TAXON 2007; 56(4): 1037-1050.
Schuettpelz E, Schneider H, Huiet L, Windham MD, Pryer KM. A molecular phylogeny of
the fern family Pteridaceae: assessing overall relationships and the affinities of
previously unsampled genera. Molecular Phylogenetic Evolution 2007; 44(3): 1172-
1185.
Schulz C. Growth and care instructions of a new model species-the lysophyte Selaginella
apoda. American Fern Journal 2010; 100(3): 167-171.
Scopes RK. Protein Purification: Principles and Practice. 3rd eds, Springer Verlag, New
York, 1994.
Sebela M, Radova A, Angelini R, Tavladoraki P, Frebort I, Pec P. FAD-containing
polyamine oxidases: a timely challenge for researchers in biochemistry and
physiology of plants. Plant Science 2001; 160: 197-207.
Seberg O, Petersen G. How many loci does it take to DNA barcode a Crocus? PLoS ONE
2009; 4: 1-6.
Seigneurin-Berny D, Rolland N, Garin J, Joyard J. Differential extraction of hydrophobic
proteins from chloroplast envelope membranes: a subcellular-specific proteomic
approach to identify rare intrinsic membrane proteins. Plant Journal 1999; 19: 217-
228.
Sen A, Alikamanoglu S. Characterization of drought-tolerant sugar beet mutants induced
with gamma radiation using biochemical analysis and isozyme variations. Chemical
industry 2014; 94(2): 367-372.
Sen A, Ghose PD. A note on ethnobotanical studies of some pteridophytes in Assam. Indian
Journal of Traditional Knowledge 2011; 10(2): 292-295.
Sengupta S, Chattopadhyay NC. Rice varietal identification by SDS-PAGE. Seed Science and
Technology 2000; 28: 871-873.
Sequiera KM. Diversity, systematics, distribution and taxonomy of epiphytic pteridophytes of
Kerala part of Western Ghats, South India. Indian Fern Journal 1998; 15: 106-130.
Seth MK, Kumar S. Tracheary elements in pteridophytes of Bilaspur (Himachal Pradesh).
Part II: Length, breadth and length/breadth ratio of vessels. Indian Fern Journal 2005;
22: 137-145.

Setyawan AD, Darusman LK. Review: Biflavonoid compounds of Selaginella Pal. Beauv.
and its benefit. Biodiversitas 2008; 9(1): 64-81.
Setyawan AD. Traditionally utilization of Selaginella; field research and literature review.
Nusanthara Bioscience 2009; 1: 146-155.
Setyawan ADWI. Review: National products from Genus Selaginella (Selaginellaceae).
Bioscience 2011; 3(1): 44-58.
Shah I, James R, Barker J, Petroczi A, Naughton DP. Misleading measures in vitamin D
analysis: A novel LC-MS/MS assay to account for epimers and isobars. Nutrition
Journal 2011; 10:46.
Shahid MM, Kasutoshi O, Rashid A. Inter and Intra specific variation in SDS-PAGE
electrograms of total seed protein in Wheat, Barley and their wild species. Pakistan
Journal of Biological Sciences 2000; 3(12): 2223-2225.
Sharief MU, Rao RR. Ethnobotanical studies of Shompens-A critically endangered and
degenerating ethnic community in Great Nicobar Island. Current Science 2007; 93:
1623-1628.
Sharma S. Recent research in pteridophytes plant science, New Delhi, India, 1992; 34-39.
Shigeo M, Yasuyaki W. Hybrid sterility between two isozymic types of the fern Ceratopteris
thalictroides in Japan. Journal of Plant Research 1994; 107: 269-274.
Shil S, Dutta Choudhury M. Ethnomedicinal importance of pteridophytes used by Reang tribe
of Tripura, North East India. Ethnobotanical Leaflets 2009; 13: 634-643.
Shokeen P, Ray K, Bala M, Tandon V. Preliminary studies on activity of Ocimum sanctum,
Drynaria quercifolia and Annona squamosa against Neisseria gonorrhoeae. Sexually
Transmitted Diseases 2005; 32(2): 106-111.
Singh AK. Molecular taxonomy: use of modern methods in the identification of a species.
Indian Journal of Life Science 2012; 2(1): 143-147.

Singh AP, Samresh D, Bharti S, Archana S, Vandana S, Khanuja S PS. Phyogenetic
relationships as in Ocimum revealed by RAPD markers. Euphytica 2004; 136: 11-20.
Singh BN. Genetic polymorphism in Drosophila. Current Science 2013; 105(4): 461-469.
Singh M, Singh N, Khare PB, Rawat AKS. Antimicrobial activity of some important
Adiantum species used traditionally in indigenous systems of medicine. Journal of
Ethnopharmacology 2008; 115(2): 327-329.
Singh S, Panigrahi G. Ferns and fern-Allies of Arunachal Pradesh 1; 2. Bishen Singh
Mahendra Pal Singh, Dehra Dun, India, 2005; 881.
Siva R, Krishnamurthy KV. Isozyme diversity in Cassia auriculata L. African Journal of
Biotechnology 2005; 4(8): 772-775.
Sivaraman A, Johnson M, Babu A, Janakiraman N, Paralogaraj A, Renisheya Joy Jeba Malar
T, Narayani M. Morphogenetic development and protein expression studies on
selected ferns from Western Ghats, South India. Journal of Basic and Applied Biology
2011; 5(3-4): 206-219.
Sivaraman A, Johnson M, Parimelazhagan T, Irudayaraj V. Evaluation of antioxidant
potential of ethanolic extracts of selected species of Selaginella. Indian Journal of
Natural products and Resources 2013; l4(3): 238-244.
Skog JE, Mickel JT, Moran RC, Volovsek M, Zimmer EA. Molecular studies of
representative species in the fern genus Elaphoglossum (Dryopteridaceae) based on
cpDNA sequences rbcL, trnL-F and rps4-trnS. International Journal of Plant
Sciences 2004; 165: 1063-1075.
Small RL, Richard CC, Wendel JF. Use of nuclear genes for phylogeny reconstruction in
plants. Australian Systematic Botany 2004; 17: 145-170.

Smila H, Johnson M, Rajasekarapandian M. Studies on varietal difference, tissue specificity
and developmental variation of esterase and peroxidase isozymes in pearl millet
(Pennisetum glacum (L.) R. Br.). Indian Journal of Biotechnology 2007; 6: 91-99.
Smith AR, Pryer KM, Schuettpelz PK, Schneiler H, Wolf PJ. Fern classification. In: Biology
and evolution of ferns and lycopods. (Eds.)Tom A. Ranker and Christopher H.
Haufler. Cambridge University Press, 2008; Pp: 417- 467.
Sneath PHA, Sokal RR. Numerical Taxonomy. Freeman, San Francisco, 1973.
Soltis DE, Soltis PS. Molecular data and the dynamic nature of polyploidy. Critical Reviews
in Plant Sciences 1993; 1: 243-273.
Soltis DE, Soltis PS. Polyploidy, breeding systems, and genetic differentiation in
homosporous pteridophytes. In D. E. Soltis and P. S. Soltis [eds.], 1989. Isozymes in
plant biology, Dioscorides Press, Portland, Oregon, USA, 1998. Pp: 241-258.
Soltis DE, Soltis PS. Polyploidy: Recurrent formation and genome evolution. Trends in
Ecology & Evolution 1999; 14: 348-352.
Soltis PS, Soltis DE, Chase MW. Angiosperm phylogeny inferred from multiple genes as a
tool for comparative biology. Nature 1999; 402: 402-404.
Soltis PS, Soltis DE, Doyle JJ. Molecular systematics of plants. Chapman & Hall, New York,
1992.
Sorensen BK, Hojrup P, Ostergrad E, Jorgensen CS, Enghild J, Ryder LR, Houen G. Silver
staining of proteins on electro blotting membranes and intensification of silver
staining of proteins separated by polyacrylamide gel electrophoresis. Analytical
Biochemistry 2002; 304: 33-41.
Sozen E, Ozaydin B. A study of genetic variation in endemic plant Centaurea
wiedemanniana by using RAPD markers. Ekoloji 2010; 77: 1-8.
Spengler B, Hubert M, Kaufmann R. Proceedings of the 42nd Annual Conference on Mass
Spectrometry and Allied Topics. Chicago, Illinois; MALDI ion imaging and
biological ion imaging with a new scanning UV-laser microprobe; 1994; 1041.
Staswick PE, Papa C, Hung J, Rhee Y. Purification of major soybean leaf acid phosphatase
that is increased by seed-pod removal. Plant Physiology 1994; 104: 49-57.
Suganya S, Irudayaraj V, Johnson M. Pharmacognostical studies on an endemic Spike-Moss
Selaginella tenera (Hook. & Grev.) Spring from the Western Ghats, South India.
Journal of Chemical and Pharmaceutical Research 2011; 3(1): 721-731.
Sujith K, Darwin CR, Roosewelt C. Antidiabetic activity of methanolic extract of Butea
frondosa leaves with its possible mechanism of action. Asian Journal of
Pharmaceutical and Clinical Research 2011; 4: 93-98.
Sukor NA, Tee KC, John Keen C. Isozyme variation and relationships of selected Acacia
species. Pakistan Journal of Biological Science 2006; 9(6): 1047-1051.
Sumarani GO, Pillai SV, Harisankar P, Sundaresan S. Isozyme analysis of indigenous
Cassava germplasm for identification of duplicates. Genetic Resources and Crop
Evolution 2004; 51: 205-209.
Sumesh D, Subhash Chandran MD, Ramachandra TV. Pteridophytes of Western Ghats.
Biodiversity Documentation and Taxonomy 2012; 343-351.
Syed MAS, Rahman HU, Muhammad AF, Ashiq M, Rabbani, Ijaz AK, Zabta KS, Zahir S.
Inter specific variation of total seed protein in wild rice germplasm using SDS-PAGE.
Pakistan Journal of Botany 2011; 43(4): 2147-2152.
Takamiya M. Comparative karyomorphology and inter relationships of Selaginella in Japan.
Journal of Plant Research 1993; 106: 149-166.
Tamura K, Nei M, Kumar S. Prospects for inferring very large phylogenies by using the
neighbor-joining method. Proceedings of the National Academy of Sciences 2004;
101: 11030-11035.
Tamura K, Peterson D, Peterson N, Stecher G, Nei M, Kumar S. MEGA5: Molecular
evolutionary genetics analysis using maximum likelihood, evolutionary distance and
maximum parsimony methods. Molecular Biology and Evolution 2011; 28: 2731-
2739.
Tateno H, Harry C. Winter, Jerzy Petryniak and Irwin J. Goldstein. Purification,
characterization, molecular cloning and expression, of novel members of Jacalin-
related lectins from rhizomes of the true fern Phlebodium aureum (L) J. Smith
(Polypodiaceae). Journal of Biological Chemistry 2003; 1-37.
Tautz D, Arctander P, Minelli A, Thomas RH, Vogler AP. A plea for DNA taxonomy.
Trends in Ecology & Evolution 2003; 18: 70-74.
Tchermak-Woes E, Dolezal-Janish R. Uber die karyogische anatomie einiger Pteridophyten
sowie auffallende unterschiede im kernvolumen bei Cyrtomium falcatum. Osterr Bot
Zeit 1959; 116: 315-324.
Terry LJ, Shows EB, Wente SR. Crossing the nuclear envelope: hierarchical regulation of
nucleocytoplasmic transport. Science 2007; 318: 1412-1416.
Tian L, Gregory J Peel, Zhentian Lei, Naveed Aziz, Xinbin Dai, Ji He, Bonnie Watson, Zhao
Patrick XL, Sumner W, Richard A Dixon. Transcript and proteomic analysis of
developing white lupin (Lupinus albus L.) roots. BMC Plant Biology 2009, 9: 1-14.
Tryon RM. Selaginella rupestris and its allies. Ann Missouri Bot Gard. 1955; 42: 1-99.
Tsai JL, Shieh WC. A Cytotaxonomic survey of the Pteridophytes in Taiwan. Journal of
Science Engineering 1983; 20: 137-159.

Tsai JL, Shieh WC. Cytotaxonomic studies on the Selaginellaceae in Taiwan. Journal of
Science Engineering 1988; 25: 83-92.
Tzfira T, Weinthal D, Marton I, Zeevi V, Zuker A, Vainstein A. Genome modifications in
plant cells by custom-made rstr iction enzymes. Plant Biotechnology Journal 2012;
10(4): 373-389.
Ullah AH, Gibson DM. Purification and characterization of acid phosphatase from
cotyledons of germinating soybean seeds. Archives of Biochemistry and Biophysics
1988; 260: 514-520.
van Wijk KJ. Challenges and prospects of plant proteomics. Plant Physiology 2001; 126:
501-508.
Vasudeva SM, Bir SS. Chromosome numbers and evolutionary status of ferns and fern allies
of Pachmarhi Hills (Central India). In Bir SS (ed) Aspects of plant sciences. Vol. 6.
Today and Tomorrow's Printers & Publishers, New Delhi, 1983.
Vincent JB, Crowder MW, Averill BA. Hydrolysis of phosphate monoester: a biological
problem with multiple chemical solutions. Trends in Biochemical Sciences 1992; 17:
105-110.
Vivekananthan R, Sudhagar R, Ravi M, Ganapathy T, Thiyagarajan K, Rabindran R.
Evaluation of relative resistance of rice against sheath rot through combined screening
techniques. Acta Phytopathologica et Entomol Hungarica 2005; 40(3-4): 279-287.
Wagele JW. Foundations of Phylogenetic Systematics. Verlag Dr. Friedrich Pfeil. München,
Germany, 2005; Pp: 1-365.
Wang LJ, Sheng MY. The cytology, isozyme, HPLC fingerprint and inter-specific
hybridization studies of genus Epimedium (Berberidaceae). ISRN Pharmacology
2013; Pp: 1-7.

Wang X, Chen S, Zhang H, Shi L, Cao F, Guo L, Xie Y, Wang T, Yan X, Dai S. Desiccation
tolerance mechanism in resurrection fern-ally Selaginella tamariscina revealed by
physiological and proteomic analysis. Journal of Proteome Research 2010; 9(12):
6561-77.
Wang Z, Xia Q, Zhang Z. Cytological observations on twenty-five species of Chinese ferns.
Acta Botanica Science 1984; 26: 595-604.
Warnke SE, Douches DS, Branham BE. Isozyme analysis supports allotetrapoloid inheritance
in tetraploid creeping bluegrass (Agrostis palustris Huds.). Crop Science 1998; 38:
801-805.
Reedy ME, Knapp AD, Lamkey KR. Isozyme allelic frequency changes following
maize (Zea mays L.) germplasm regeneration. Maydica 1995; 40: 269-273.
Warren MMW, Paul JM, Malcolm FF. Analysis of an ethanol precipitate from ileal digesta:
evaluation of a method to determine mucin. Scientific Reports 2013; 3: 2045-2322.
Wasinger VC, Cordwell SJ, Cerpa-Polijak A, Yan JX, Gooley AA, Wilkims MR, Duncan
MW, Harris R, Williams KL, Humphery-Smith I. Progress with gene product
mapping the mollicutes: Mycoplasma genitalium. Electrophoresis 1995; 16: 1090-
1094.
Weber H, Borisjuk L, Wobus U. Molecular physiology of legume seed development. Annual
Review of Plant Biology 2005; 56: 253-279.
Weber K, Pringle JR, Osborn M. Measurement of molecular weights by electrophoresis on
SDS-acrylamide gel. Methods Enzymology 1972; 26: 3-27.
Weising K, Nybom H, Wolff K, Meyer W. DNA Fingerprinting in Plants and Fungi
(ed.Arbor, A.) CRC Press, Boca Raton, 1995, Pp: 1-3.
Weng JK, Noel JP. Chemodiversity in Selaginella: a reference system for parallel and
convergent metabolic evolution in terrestrial plants. Frontiers in plant science 2013;
4(119): 1-17.
Weng RF, Qiu SP. Chromosome counts of some ferns from Zhejiang. Investigatio et Studium
Naturae 1988; 8: 43-52.
Werth CR, Guttman SI, Eshbaugh WH. Electrophoretic evidence of reticulate evolution in
the Appalachian Asplenium complex. Systematic Botany 1985; 10: 184-192.
Werth CR. Isozyme studies on the Dryopteris ‘‘Spinulosa’’ complex. I. The origin of the log
fern Dryopteris celsa. Systematic Botany 1991; 16: 446-461.
Williams JGK, Kubelik AR, Livak KJ, Rafalski JA, Tingey SV. DNA polymorphisms
amplified by arbitrary primers are useful as genetic markers. Nucleic Acids Research
1990; 18: 6531-6535.
Wilson KH. Molecular biology as a tool for taxonomy. Clinical infectious Diseases 1995;
2(S): 117-121.
Winter P, Kahl G. Molecular marker technologies for plant improvement. World Journal of
Microbiology and Biotechnology 1995; 11: 438-448.
Wolf PG, Soltis PS, Soltis DE. Phylogenetic relationships of dennstaedtioid ferns: evidence
from rbcL sequences. Molecular Phylogenetic Evolution 1994; 3: 383-392.
Wolf PG, Der JP, Duffy AM, Davidson JB, Grusz AL, Pryer KM. The evolution of
chloroplast genes and genomes in ferns. Plant Molecular Biology 2011; 76(3-5):
251-261.
Woodin TS, Nishioka L, Hsu A. Comparison of chorismate mutase isozyme patterns in
selected plants. Plant Physiology 1978; 61: 949-952.
Wynns JT, Asmussen CBL. A comparison of 16 DNA regions for use as phylogenetic
markers in the pleurocarpous moss genus Plagiothecium (Hypnales). American
Journal of Botany 2014; 101: 652-669.
Yamaguchi K, Subramanian AR. The plastid ribosomal proteins, Identification of all the
proteins in the 50S subunit of an organelle ribosome (chloroplast). Journal of
Biological Chemistry 2000; 275: 28466-28482.
Yates III JR. Mass spectral analysis in proteomics. Annual Review of Biophysics and
Biomolecular Structure 2004; 33: 297-316.
Yesson C, Bárcenas RT, Hernández HM, de la Luz Riz-Maqueda M, Prado A, Rodríguez
VM, Hawkins JA. DNA barcodes for Mexican Cactaceae, plants under pressure from
wild collecting. Molecular Ecology Resources 2011; 11:775-783.
Yobi A, Bernard WM, Wone, Wenxin Xu, Alexander DC, Lining Guo, Ryals JA., Oliver MJ,
Cushman JC. Comparative metabolic profiling between desiccation-sensitive and
desiccation-tolerant species of Selaginella reveals insights into the resurrection trait.
The plant Journal 2012; 983-999.
Yoda H, Yamaguchi Y, Sano H. Induction of hypersensitive cell death by hydrogen peroxide
produced through polyamine degradation in tobacco plants. Plant Physiology 2003;
132: 1973-1981.
Yoruk R, Marshall MR. Physiochemical properties and function of plant polyphenol oxidase:
a review. Journal of Food Chemistry 2003; 27: 361-422.
Zakaria ZA, Abdul Ghani ZDF, Raden Mohd RNS, Hanan Kumar G, Sulaiman MR, Fatimah
CA. Antinociceptive and antiinflammatory activities of Dicranopteris linearis leaves
chloroform extract in experimental animals. Yakugaku Zasshi 2006; 126(11): 1197-
1203.
Zeidler M. Electrophoretic analysis of plant isozymes. Biologica 2000; 38: 7-15.
Zhan XY, Lin RH. SDS-PAGE analysis of seed glutelin in some cultivated and wild rice.
Chinese Journal of Rice Science 1991; 5(3): 109-113.
Zhang G, Zhang X, Chen Z. Phylogeny of cryptogrammoid ferns and related taxa based on
rbcL sequences. Nordic Journal of Botany 2005; 23: 485-493.
Zhao XF, Cheng qiang Ding. Comparative proteomic analysis of the effects nitric oxide on
alleviating Cd –induced toxicity in rice (Oryza sativa L.). Plant Omics Journal 2012;
5(6): 604-614.
Zhi Y, Xian LI, Ling LI, Xing H, and Tianli Y. Effects of temperature and several chemicals
on metabolic changes during dormancy release in NJ72 Nectaria. Agriculture Science
in China 2003; 2(5): 549-555.
Zhukova PG, Petrevsky VV. Chromosome numbers of some Western Chukotka plant species.
Botanicheskii Zhurnal 1975; 60: 395-401.
Zivkovic. Proteomic analysis of polyphenol oxidase in rustyback fern Ceterach officinarum
D.C. 18th Symposium of the Serbian Society for Plant Physiology, Book of Abstracts
Vrsac, Serbia, 2009; 109.
Zivy M, de Vienne D. Proteomics: a link between genomics, genetics and physiology. Plant
Molecular Biology 2000; 44: 575- 580.
Zubaida Y, Shahid M, Zabta KS, Mirajab K, Ashiq R. Evaluation of taxonomic status of
medicinal species of the genus Solanum and Capsicum based on poly acrylamide gel
electrophoresis. Pakistan Journal of Botany 2006; 38(1): 99-106.