Molecular phylogeny and Holarctic diversification of the subtribe Calathina (Coleoptera: Carabidae:...
15
This article appeared in a journal published by Elsevier. The attached copy is furnished to the author for internal non-commercial research and education use, including for instruction at the authors institution and sharing with colleagues. Other uses, including reproduction and distribution, or selling or licensing copies, or posting to personal, institutional or third party websites are prohibited. In most cases authors are permitted to post their version of the article (e.g. in Word or Tex form) to their personal website or institutional repository. Authors requiring further information regarding Elsevier’s archiving and manuscript policies are encouraged to visit: http://www.elsevier.com/copyright
Transcript of Molecular phylogeny and Holarctic diversification of the subtribe Calathina (Coleoptera: Carabidae:...

This article appeared in a journal published by Elsevier. The attachedcopy is furnished to the author for internal non-commercial researchand education use, including for instruction at the authors institution
and sharing with colleagues.
Other uses, including reproduction and distribution, or selling orlicensing copies, or posting to personal, institutional or third party
websites are prohibited.
In most cases authors are permitted to post their version of thearticle (e.g. in Word or Tex form) to their personal website orinstitutional repository. Authors requiring further information
regarding Elsevier’s archiving and manuscript policies areencouraged to visit:
http://www.elsevier.com/copyright
Author's personal copy
Molecular phylogeny and Holarctic diversification of the subtribe Calathina(Coleoptera: Carabidae: Sphodrini)
Carlos Ruiz a,*, Bjarte H. Jordal b, Brent C. Emerson c, Kipling W. Will d, José Serrano a
a Departamento de Zoología y Antropología Física, Facultad de Veterinaria, Universidad de Murcia, Campus de Espinardo, 30071 Murcia, Spainb Museum of Natural History, University of Bergen, Museplass 3, NO-5007 Bergen, Norwayc Centre for Ecology, Evolution and Conservation, School of Biological Sciences, University of East Anglia, Norwich NR4 7TJ, UKd ESPM Department, Organisms and Environment Division, University of California, 137 Mulford Hall, USA
a r t i c l e i n f o
Article history:Received 25 November 2008Revised 16 October 2009Accepted 19 October 2009Available online 10 November 2009
Keywords:CalathusCalathinaCarabidaeSphodriniPhylogenyHolarctic regionMacaronesian archipelagosNearctic regionSpeciationcox1-cox2Nuclear markers
a b s t r a c t
A molecular phylogeny of the subtribe Calathina was inferred from DNA sequence data from the mito-chondrial cox1-cox2 region and the nuclear genes 28S and EF-1a. All lineages within Calathina fromthe Holarctic region were represented except for the monotypic subgenus Tachalus. Maximum Parsimonyand Bayesian analyses of the combined data set showed that the subtribe is a monophyletic lineage thatincludes a single genus Calathus, where other taxa currently ranked as independent genera (Lindrothius,Synuchidius, Thermoscelis and Acalathus) are nested within this genus. Neocalathus and Lauricalathus, bothsubgenera of Calathus, were found to be polyphyletic and in need of taxonomic revision. The subtribeappears to have originated in the Mediterranean Basin and thereafter expanded into most parts of thePalearctic region, the Macaronesian archipelagos (at least five independent colonisation events), the Ethi-opian highlands and the Nearctic region (at least two independent events).
� 2009 Elsevier Inc. All rights reserved.
1. Introduction
According to the last Palearctic catalog (Hovorka and Sciaky,2003), the subtribe Calathina includes four genera, the HolarcticCalathus Bonelli 1810, the monotypic genera Thermoscelis (Cauca-sus) and Synuchidius (Balkan Peninsula), and the Caucasian genusLindrothius, (14 species). Calathus is the richest in species number(about 164), particularly in the Euromediterranean subregion.There are 19 species in the Nearctic region, 3 species in the Orientalregion and 17 in the Afrotropical region. Members of Calathus arecommon in most temperate areas. Some lineages are composedof forest-dwelling and often flightless species, with low dispersalpower and a restricted distribution. Other lineages include wingedspecies with high dispersal power that are broadly distributed andoften found in open and mesic to xeric habitats.
The systematics of the subtribe is based on morphological char-acters (Putzeys, 1873; Schatzmayr, 1937; Lindroth, 1956; Ball andNègre, 1972; Perrault, 1977). However, characters commonly usedto define species and to rank supraspecific taxa (pronotum shape,
elytral vestiture, etc.) are variable (e.g., Ball and Nègre, 1972, p.518) and thus less suitable for defining evolutionary lineages. Aprevious molecular study of the tribe Sphodrini (Ruiz et al.,2009) found Calathina to be a monophyletic clade on the basis ofmitochondrial and nuclear markers and estimated its origin to bebetween 10 and 26 Mya (million years ago), thus suggesting thatit is a relatively young and species rich group. In the present studywe aim to reconstruct the phylogenetic history of this subtribe, toinvestigate evolutionary relationships among species, diversifica-tion rates, geographical origins of main lineages, and the colonisa-tion of the Holarctic, with emphasis on the West-Palearctic region.Hypotheses to be investigated in this study are derived from taxo-nomical uncertainties. Acalathus is a genus that was treated as asubgenus of Calathus by Lindroth (1956) and Perrault (1977), as agenus closely related to Calathus (Casale, 1988), or more distantlyrelated and placed in the subtribe Dolochina (Hovorka and Sciaky,2003; Lorenz, 2005). Likewise Lindroth (1956) considered Dolichusas a species group within an inclusive genus Calathus, while otherauthors have placed this genus separate from Calathus in the sub-tribe Dolichina (Hovorka and Sciaky, 2003; Lorenz, 2005). The sta-tus and limits of certain taxa within Calathina is controversial andwe assess hypotheses related to the taxonomic status of proposed
1055-7903/$ - see front matter � 2009 Elsevier Inc. All rights reserved.doi:10.1016/j.ympev.2009.10.026
* Corresponding author. Fax: +34 968 364906.E-mail address: [email protected] (C. Ruiz).
Molecular Phylogenetics and Evolution 55 (2010) 358–371
Contents lists available at ScienceDirect
Molecular Phylogenetics and Evolution
journal homepage: www.elsevier .com/locate /ympev
Author's personal copy
genera that may be separate from Calathus (e.g., Thermoscelis, Lind-rothius) or well-delimited subgenera within this genus (Amphygi-nus, Bedelinus, Neocalathus, Lauricalathus).
Several lineages are particularly species rich on the Macarone-sian Islands west of the African coast. Previous studies on these lin-eages based solely on mitochondrial data have indicated thatmultiple colonisations have occurred on those islands (Emersonet al., 1999, 2000, see also Ruiz and Serrano, 2006). We further as-sess this hypothesis with a much broader selection of continentaltaxa. We have included representative species from nearly the en-tire geographical range of the subtribe Calathina, and analyzedtheir phylogenetic relationship using a mitochondrial fragmentcomprising cox1-tRNAleu-cox2 and fragments of the nuclear genes28S and EF-1a. Because rDNA and intron sequences frequently in-clude insertions and deletions in multiple alignments, we have ex-plored the effects of different alignment strategies on thereconstruction of the phylogenetic relationships. Finally, we haveexplored various factors potentially causing a lack of resolutionin species rich clades of late Mesozoic age.
2. Material and methods
2.1. Taxon sampling
Molecular sequence data were collected for 102 individuals of64 species. All genera and subgenera within the subtribe Calathinahave been sampled with the exception of the Mexican monotypicsubgenus Tachalus (Table 1). Related subtribes Dolichina, Synuchi-na and Pristosiina were used as outgroups based on previous phy-logenetic information (Ruiz et al., 2009). For a few species only drypinned material was available, resulting in a partial sequence ofthe mitochondrial cox1-cox2 fragment (950–1300 bp).
2.2. PCR and sequencing
DNA was extracted with the Qiagen DNeasy tissue kit (Qiagen,Hilden, Germany). We sequenced a fragment of the mitochondrialcytochrome oxidase I and II (cox1-cox2) genes (1630 bp), which in-cludes part of cox1 gene (865 bp), the complete tRNAleu (63 bp),and cox2 (702 bp). Within the ribosomal 28S rDNA we studied apartial sequence (D2–D4 region) of about 885 bp length. Theamplified protein-coding Elongation Factor 1a gene (EF-1a C0)had no introns and consisted of 773 bp. Primers and PCR conditionsused are described in Ruiz et al. (2009).
PCR products were purified with isopropanol and 5 M ammo-nium acetate, and sequencing was performed in both directionsusing the standard protocol for ABI BigDye Terminator v3.1 cyclesequencing kit (Applied Biosystems). Some polymorphic sites werefound in a few sequences of EF-1a C0, and nucleotide variationfrom these sites was named according to International Union ofPure and Applied Chemistry (IUPAC) symbols.
2.3. Sequence alignment
Sequences of cox1-cox2 and EF-1a were unambiguouslyaligned, with insertions of 3 bp at the 30 end of cox2 aligned aftertranslation to amino acids. To align the 28S rDNA sequences fivedifferent strategies were followed: (i) A computer-based alignmentwith Clustal W version 1.6 (Thompson et al., 1994) in MEGA ver-sion 4 (Tamura et al., 2007) for the entire sequence (named hereas CW). Transitions were weighted 0.5 related to transversions.Different weighting regimes of the gap opening (GOP) and gapextension penalties (GEP) were assayed, namely GOP/GEP: 1/0.25,1/0.5, 2/0.25, 2/0.5, 2/1, 4/0.5, 4/2, 8/1, 8/4, and the default 15/6.6 often cited in many papers, resulting in 10 different matrices
for each rDNA matrix. (ii) A manual alignment based on secondarystructure (Kjer, 1995) following the model of Gillespie et al. (2004)(abbreviated as SS). To characterize the expansion segments weused the Mfold software (http://frontend.bioinfo.rpi.edu/applications/mfold/cgi-bin/rna-form1.cgi) which folds RNA sequences basedon minimum free energy (Zuker, 2003). Secondary structure wasused to infer unambiguous or conserved regions (28Sc) and ambig-uous or variable regions (28Sv), and ambiguous regions werethereafter excluded from analyses. (iii) A combination of the firsttwo approaches (mixed approach or MX), in which the unambigu-ous and ambiguous regions were first defined based on secondarystructure and the ambiguous regions (28Sv) were subsequentlyaligned in Clustal W using the parameters listed above. (iv) TheClustalW alignment of the ambiguous regions was also performedby anchoring to an unambiguously aligned flank of 10–15 bp oneach side (named here as MXan). (v) A manual alignment usingClustalW as the starting point (abbreviated as MA).
Sensitivity analyses were carried out to evaluate different align-ment parameters and strategies. Congruence of 28S alignmentsusing different GOP/GEP and unambiguously aligned protein-cod-ing genes (cox1-cox2, EF-1a) was selected as the optimality crite-rion for further combined analyses. Congruence was measured asthe contribution of the gene partition to the Bremer Support (BS)(Bremer, 1994) of the combined analysis (Baker and DeSalle,1997). This contribution was calculated with BS and PartitionedBremer Support (PBS) in TreeRot v.3 (Sorenson and Franzosa,2007). PBS values were standardized for partitions of differentlength by dividing the PBS value by the minimum possible lengthof each branch (DeBry, 2001). The relative PBS support for eachnode of each gene partition was also measured and these measureswere related to the accumulated length from the root of the tree tothe actual node in the combined data topology.
2.4. Phylogenetic inference
Each data partition was analyzed separately and in combinationunder Maximum Parsimony (MP), as implemented in PAUP*
b4.0b10 (Swofford, 2002), and Bayesian analysis (BA) with Mr.Bayes v3.1. (Ronquist and Huelsenbeck, 2003). All data sets wereanalyzed with Modeltest (v.3.6) (Posada and Crandall, 1998) to findthe best-fit model of sequence evolution. The Akaike informationcriterion (AIC) (Akaike, 1973) was preferred over hLRTs to testthe various models as recommended by Posada and Buckley(2004). Parsimony analyses were conducted with 10,000 randomaddition replicates of heuristic searches and TBR branch swapping.Confidence in each node was assessed by bootstrapping 500 heu-ristic searches replicates with 20 random additions per replicate.Bayesian analyses were performed with 1,500,000 generationsfor separate analyses, and 3,000,000 generations for combinedanalyses, sampling trees every 100 generations. Likelihood valueswere observed with Tracer v1.4 (Rambaut and Drummond,2005), discarding all trees before stability in likelihood values asa burn-in (first 3000 trees in separate analyses and 6500 trees inthe combined ones). Stationarity was also reassessed using theconvergence diagnostic: the average standard deviation of split fre-quencies and the potential scale reduction factor (PSRF).
To explore long-branch attraction (LBA) artifacts a number ofstrategies indicated by Bergsten (2005) were followed: analysesof unlinked markers under various tree-reconstruction methodswith different sensitivity to LBA, different partition strategies un-der different models of molecular evolution, removal of a puta-tively wrongly placed taxon with a re-run of the analysis tocheck whether the remaining long branched taxa change position,and inclusion of all available sequences of main lineages of Calath-ina and Dolichina from GenBank.
C. Ruiz et al. / Molecular Phylogenetics and Evolution 55 (2010) 358–371 359

Author's personal copy
Table 1Accession numbers and locality for the taxa of the subtribe Calathina included in the study. AG: Algeria, BU: Bulgaria, CI: Canary Islands, ET: Ethiopia, GG: Georgia, IT: Italy, JA:Japan, MC: Macedonia, MEX: Mexico, MO: Morocco, MR: Madeira, NR: Norway, PL: Poland, PT: Portugal, SP: Spain, TR: Turkey, UK: United Kingdom, USA: United States ofAmerica.
Species Cod Locality cox1-cox2 28S Ef-1a C0
C. (Amphyginus) rotundicollis 132 Canalroya, Huesca (SP) GU254302 GU254392 GU254475C. (Amphyginus) rotundicollis 137 Soria (SP) AM410879 GU254394 ——————C. (Amphyginus) rotundicollis 153 Vinuesa (SP) —————— FJ173073 FJ173135C. (Amphyginus) rotundicollis 203 Monte Pollino, Calabria (IT) GU254317 GU254412 GU254485C. (Bedelinus) circumseptus 112 Albacete (SP) AM410880 GU254385 GU254470C. (Bedelinus) circumseptus 228 Córdoba (SP) FJ173207 FJ173086 FJ173144C. (Calathus) baeticus 143 Sierra de Baza, Granada (SP) AM410881 GU254397 GU254479C. (Calathus) brevis 19 Zamora (SP) GU254292 GU254349 GU254437C. (Calathus) fracassii 7 Gran Sasso (IT) AJ404989 GU254338 GU254427C. (Calathus) fuscipes 13 Gran Sasso (IT) AJ404994 GU254344 GU254433C. (Calathus) fuscipes 105 Sierra de Urbión, Soria (SP) AM410882 GU254382 GU254467C. (Calathus) fuscipes algiricus 126 Bab-Berret (MO) AM410883 FJ173072 FJ173134C. (Calathus) granatensis 9 Cádiz (SP) AJ404991 GU254340 GU254429C. (Calathus) granatensis 124 Igualeja, Málaga (SP) AM410885 GU254389 GU254473C. (Calathus) granatensis 133 Soria (SP) GU254303 GU254393 GU254476C. (Calathus) hispanicus 14 Sierra de Gredos, Ávila (SP) AJ404995 GU254345 GU254434C. (Calathus) hispanicus 15 Pto. de Guadarrama (SP) AJ404996 GU254346 ——————C. (Calathus) muchei 156 Samanli Daglari (TR) GU254306 GU254400 GU254481C. (Calathus) opacus 8 Moyen Atlas (MO) AJ404990 GU254339 GU254428C. (Calathus) opacus 150 Ifrane (MO) —————— GU254399 GU254480C. (Calathus) pirazzolii 6 Gran Sasso (IT) AJ404988 GU254337 GU254426C. (Iberocalathus) rotundatus estrelensis 116 Serra da Estrela (PT) AM410888 GU254388 ——————C. (Iberocalathus) rotundatus rotundatus 21 Braganza (PT) AM410886 GU254351 GU254439C. (Iberocalathus) rotundatus rotundatus 115 Cabezo de Manzaneda, Orense (SP) AM410887 GU254387 GU254472C. (Incertae sedis) aethiopicus 253 Mount. Wachacha.(ET) GU254329 —————— GU254495C. (Incertae sedis) colasianus 84 Chao de Ribiera Seixal (MR) AJ404998 GU254374 GU254461C. (Incertae sedis) complanatus 83 Rebecal (MR) AJ404999 GU254373 GU254460C. (Incertae sedis) vividus 86 Rebecal (MR) AJ405002 GU254375 GU254462C. (Lauricalathus) abaxoides 69 Tenerife (CI) AJ236975 GU254368 GU254456C. (Lauricalathus) angularis 44 Gran Canaria (CI) AJ236947 GU254359 GU254447C. (Lauricalathus) angustulus 95 Tenerife (CI) AJ404973 GU254380 ——————C. (Lauricalathus) appendiculatus 40 Gran Canaria (CI) AJ236956 GU254358 GU254446C. (Lauricalathus) ascendens 93 Tenerife (CI) AJ404980 GU254378 GU254464C. (Lauricalathus) auctus 97 Tenerife (CI) AJ404981 GU254381 GU254466C. (Lauricalathus) canariensis 48 Gran Canaria (CI) AJ236955 GU254360 GU254448C. (Lauricalathus) carinatus 87 Tenerife (CI) AJ404983 GU254376 ——————C. (Lauricalathus) cognatus 52 La Gomera (CI) AJ236966 GU254362 GU254450C. (Lauricalathus) depressus 89 Tenerife (CI) AJ404977 GU254377 GU254463C. (Lauricalathus) freyi 94 Tenerife (CI) AJ404978 GU254379 GU254465C. (Lauricalathus) gomerensis 55 La Gomera (CI) AJ236961 GU254363 GU254451C. (Lauricalathus) laureticola 49 La Gomera (CI) AJ236968 GU254361 GU254449C. (Lauricalathus) marcellae 61 La Gomera (CI) AJ236970 GU254366 GU254454C. (Lauricalathus) rectus 71 Tenerife (CI) AJ236959 GU254369 GU254457C. (Neocalathus) ambiguus 10 Gran Sasso (IT) AJ404992 GU254341 GU254430C. (Neocalathus) ambiguus ambiguus 28 Soria (SP) GU254296 GU254356 GU254444C. (Neocalathus) ambiguus rugicollis 172 Sakaltutan Pass (TR) GU254307 GU254401 ——————C. (Neocalathus) ambiguus rugicollis 175 Güven (TR) GU254308 GU254402 GU254482C. (Neocalathus) asturiensis 16 Galicia (SP) AJ236945 GU254347 GU254435C. (Neocalathus) asturiensis 127 Parque de Alvao (PT) GU254300 GU254390 GU254474C. (Neocalathus) aztec 220 La Marquesa (MEX) GU254320 GU254415 GU254488C. (Neocalathus) aztec 222 La Marquesa (MEX) GU254322 GU254417 GU254490C. (Neocalathus) aztec 267 La Marquesa (MEX) GU254333 GU254425 ——————C. (Neocalathus) bolivari 257 Tlamacas. Popo-Iztaccihuat (MEX) GU254330 GU254422 GU254496C. (Neocalathus) cinctus 17 Norfolk Brecklands (UK) AJ404997 GU254348 GU254436C. (Neocalathus) cinctus 31 Kizildag Pass (TR) GU254297 GU254357 GU254445C. (Neocalathus) cinctus 107 Sierra de Urbión, Soria (SP) AM410889 GU254383 GU254468C. (Neocalathus) cinctus 141 Aguelmam Afenourir Lake (MO) GU254304 GU254396 GU254478C. (Neocalathus) erratus 27 Rila Mountains (BU) AM410890 GU254355 GU254443C. (Neocalathus) erratus 113 Dzyanon village, Dolno (BU) GU254299 GU254386 GU254471C. (Neocalathus) gonzalezi 77 Lanzarote (CI) AJ404986 GU254372 GU254459C. (Neocalathus) gregarius 179 Pennsylvania (USA) GU254309 GU254403 GU254483C. (Neocalathus) leechi 221 La Marquesa (MEX) GU254321 GU254416 GU254489C. (Neocalathus) leechi 223 Nevado de Toluca (MEX) GU254323 GU254418 GU254491C. (Neocalathus) leechi 224 Nevado de Toluca (MEX) GU254324 GU254419 GU254492C. (Neocalathus) leechi 226 Tlamacas. Popo-Iztaccihuat (MEX) GU254325 GU254420 GU254493C. (Neocalathus) leechi 240 Nevado de Toluca (MEX) GU254327 GU254421 GU254494C. (Neocalathus) leechi 258 La Marquesa (MEX) GU254331 GU254423 GU254497C. (Neocalathus) marmoreus 218 Mineral del Chico (MEX) GU254318 GU254413 GU254486C. (Neocalathus) melanocephalus 11 Gran Sasso (IT) AJ236944 GU254342 GU254431C. (Neocalathus) melanocephalus 12 Norfolk Brecklands (UK) AJ404993 GU254343 GU254432C. (Neocalathus) melanocephalus 25 Rila Mountains (BU) GU254295 GU254353 GU254441C. (Neocalathus) melanocephalus 111 Formigal, Huesca (SP) GU254298 GU254384 GU254469C. (Neocalathus) metallicus 26 Pirin Mountains (BU) AM410893 GU254354 GU254442C. (Neocalathus) mexicanus 219 La Malinche (MEX) GU254319 GU254414 GU254487
360 C. Ruiz et al. / Molecular Phylogenetics and Evolution 55 (2010) 358–371

Author's personal copy
2.5. Testing for hard polytomies
In order to explore the lack of resolution at deeper phylogeneticnodes, we evaluated whether such polytomies were ’hard’, imply-ing rapid radiation. For all tests we used ultrametric trees recov-ered with the BEAST software (Drummond and Rambaut, 2007).Lineage through time (LTT) plots were used to visualize changesin diversification rates. Two statistical analyses were used to testfor significant departures from the constant speciation rate model(CR), the c-statistic (Pybus and Harvey, 2000) and the birth–deathlikelihood (BDL) test (Rabosky, 2006a). Both methods have provensuccessful in reconstructing diversification rates in various organ-isms (c-statistic: Barraclough and Vogler, 2002; Kadereit et al.,2004; Turgeon et al., 2005; Kozak et al., 2006; McKenna and Farrell,2006; Weir, 2006; Roelants et al., 2007; Hines, 2008; Janssenset al., 2009; birth–death models: Rabosky et al., 2007; Egan andCrandall, 2008; Rabosky and Lovette, 2008). As incomplete taxonsampling can result in a spurious decline in diversification ratesover time (Pybus and Harvey, 2000), we have explored the effectsof missing species on our analysis. We assumed that our sample
represents a fraction f (from 0.2 to 0.6) of the true number of lin-eages, and generated sets of 5000 trees under the null hypothesisof constant rate pure birth, in which taxa were randomly prunedfrom these trees.
C-statistic analyses were conducted with the Ape Library in R(Paradis, 1997). This analysis indicates whether the diversificationrate has increased (c > 0), decreased (c > 0) or remained constant(c = 0) over time. To take into account incomplete sampling simu-lations were carried out using different numbers of missing taxawith the MCCR test (Pybus and Harvey, 2000) in LASER (Rabosky,2006b). BDL analysis has been found to perform as well or betterthan the popular c-statistic that only identifies temporal decreasesin diversification (Rabosky, 2006a). BDL analyses were conductedusing LASER library in R (Rabosky, 2006b) to test the null hypoth-esis of rate-constancy against rate-variable models using AIC. Sig-nificance of the change in AIC scores was determined by creating adistribution of AIC scores. This was done by simulating 5000 treesusing yuleSim in LASER (Rabosky, 2006b), considering the samenumber of taxa and the same speciation rate as those estimatedunder the pure Birth model. Incomplete taxon sampling was con-
Table 1 (continued)
Species Cod Locality cox1-cox2 28S Ef-1a C0
C. (Neocalathus) micropterus 20 Poznan (PL) GU254293 GU254350 GU254438C. (Neocalathus) micropterus 146 Trondheim (NR) GU254305 GU254398 ——————C. (Neocalathus) mollis 22 Málaga (SP) GU254294 GU254352 GU254440C. (Neocalathus) mollis 120 La Cuenca, Soria (SP) FJ173193 FJ173071 FJ173133C. (Neocalathus) opaculus 190 Tallahasse, Florida (USA) GU254315 GU254410 ——————C. (Neocalathus) peropacus 188 Tumacacori, Arizona (USA) GU254313 —————— ——————C. (Neocalathus) ruficollis ruficollis 181 Marin Co., California (USA) GU254310 GU254404 ——————C. (Neocalathus) ruficollis ruficollis 182 Marin Co., California (USA) —————— GU254405 GU254484C. (Neocalathus) ruficollis ruficollis 183 Marin Co., California (USA) —————— GU254406 ——————C. (Neocalathus) ruficollis ruficollis 185 Marin Co., California (USA) GU254311 GU254407 ——————C. (Neocalathus) ruficollis ruficollis 189 Sta Barbara Co., California (USA) GU254314 GU254409 ——————C. (Neocalathus) ruficollis ruficollis 193 Sta Barbara Co., California (USA) GU254316 GU254411 ——————C. (Neocalathus) semisericeus 131 Rif Mountains (MO) GU254301 GU254391 ——————C. (Neocalathus) semisericeus 139 Rif Mountains (MO) AM410892 GU254395 GU254477C. (Neocalathus) simplicicollis 75 Fuerteventura (CI) AJ404985 GU254371 ——————C. (Neocalathus) solieri 272 Parc National Chréa (AG) GU254334 —————— ——————C. (Neocalathus) sp 262 Nevado de Toluca (MEX) GU254332 GU254424 GU254498C. (Neocalathus) subfuscus 72 Pico Ariens (MR) AJ405003 GU254370 GU254458C. (Trichocalathus) obliteratus 58 La Gomera (CI) AJ236971 GU254364 GU254452C. (Trichocalathus) pilosipennis 62 La Gomera (CI) AJ236964 GU254367 GU254455C. (Trichocalathus) refleximargo 60 La Gomera (CI) AJ236974 GU254365 GU254453Lindrothius caucasicus orbicollis 271 Martveli district, Lebarde (GG) FJ173220 FJ173100 FJ173157Lindrothius pseudopraestans 296 Mount Fish (GG) FJ173235 —————— FJ173171Lindrothius sp. 297 Aibja, Abkhazia (GG) FJ173236 FJ173115 FJ173172Thermoscelis insignis (Calathina) 304 Summelas, Trabzon (TR) GU254335 —————— ——————Synuchidius ganglbaueri (Calathina) 306 Pelister Mount. Veternica (MC) GU254336 —————— ——————Acalathus (Procalathus) advena (Dolichina) 186 San Bernardino Co., California (USA) GU254312 GU254408 ——————Acalathus (Procalathus) advena (Dolichina) 242 Great Basin N.P., Nevada (USA) GU254328 —————— ——————Anchomenidius astur (Dolichina) 277 León (SP) FJ173221 FJ173101 FJ173158Dolichus halensis (Dolichina) 282 Nishino, Noichi, Kochi (JA) FJ173226 FJ173105 FJ173162Laemostenus complanatus (Sphodrina) 256 Murcia (SP) FJ173217 FJ173097 FJ173154Pristosia aeneola (Pristosiina) 285 Chino, Nagano (JA) FJ173228 FJ173108 FJ173164Synuchus nitudus (Synuchina) 289 Jôza, Sakura, Chiba (JA) FJ173230 FJ173110 FJ173166
102 ind. 100 ind. 85 ind.
Table 2Data statistics for each data set. Ti/Tv, transition/transversion ratio; Pi, parsimony informative sites.
A C G Length Variable %Variable Conserved Pi Divergence (%) Ti/Tv
cox 1-cox 2 33.2 13.9 13.4 1630 720 44.2 908 583 7.3cox1 31.1 14.3 13.9 865 348 40.2 517 289 4.8 1.0tRNAleu 36.3 12.2 17.9 63 21 33.3 41 19 16.7 4.1cox2 35.5 13.6 12.4 702 351 50.0 350 275 11.8 1.0EF-1a 25.4 27.0 25.0 773 153 19.8 620 102 2.2 3.428S CW 15/6.6 26.1 18.0 25.1 885 198 22.4 682 127 2.6 1.4
C. Ruiz et al. / Molecular Phylogenetics and Evolution 55 (2010) 358–371 361
Author's personal copy
sidered by generating trees under a CR model with different levelsof incomplete sampling (f) in LASER (Rabosky, 2006b).
The possibility that polytomies were caused by insufficientdata (’soft’ polytomies) was also evaluated. Simulated data werebuilt with Mesquite v.2.01 (Maddison and Maddison, 2007) toexplore the predicted increase in node support associated withan increased number of nucleotides (Philippe et al., 2005). Sev-eral previous analyses have used simulations to estimate the
amount of data necessary to resolve difficult phylogenetic prob-lems (Berbee et al., 2000; Fishbein et al., 2001; de Queirozet al., 2002; Rokas et al., 2003; Zou et al., 2008; Spinks et al.,2009). Matrices of increasing size from 500 bp to 20 Kb wereconstructed taking into account the among-gene-tree variationfrequently found in real data sets (Spinks et al., 2009). Two pro-cedures were carried out: (i) simulated data were generated foreach partition with a length that was proportional to that of
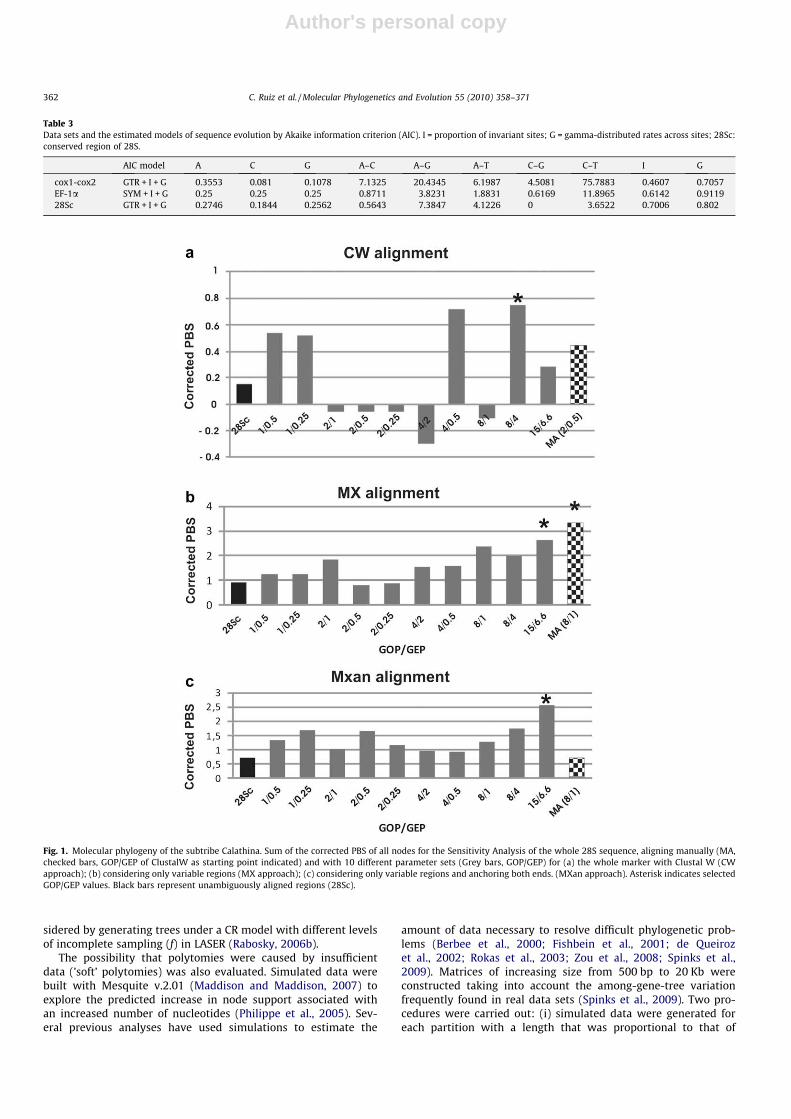
Fig. 1. Molecular phylogeny of the subtribe Calathina. Sum of the corrected PBS of all nodes for the Sensitivity Analysis of the whole 28S sequence, aligning manually (MA,checked bars, GOP/GEP of ClustalW as starting point indicated) and with 10 different parameter sets (Grey bars, GOP/GEP) for (a) the whole marker with Clustal W (CWapproach); (b) considering only variable regions (MX approach); (c) considering only variable regions and anchoring both ends. (MXan approach). Asterisk indicates selectedGOP/GEP values. Black bars represent unambiguously aligned regions (28Sc).
Table 3Data sets and the estimated models of sequence evolution by Akaike information criterion (AIC). I = proportion of invariant sites; G = gamma-distributed rates across sites; 28Sc:conserved region of 28S.
AIC model A C G A–C A–G A–T C–G C–T I G
cox1-cox2 GTR + I + G 0.3553 0.081 0.1078 7.1325 20.4345 6.1987 4.5081 75.7883 0.4607 0.7057EF-1a SYM + I + G 0.25 0.25 0.25 0.8711 3.8231 1.8831 0.6169 11.8965 0.6142 0.911928Sc GTR + I + G 0.2746 0.1844 0.2562 0.5643 7.3847 4.1226 0 3.6522 0.7006 0.802
362 C. Ruiz et al. / Molecular Phylogenetics and Evolution 55 (2010) 358–371

Author's personal copy
the original partitioned dataset. Each simulated partition wasgenerated using both the evolutionary model (Table 3) and thetree obtained from the original partition (Figs. 2–4). Polytomiesof the trees from each original partition were resolved arbitrarilyand the resulting new branches were assigned zero length withMesquite v.2.01 (Maddison and Maddison, 2007). The simulated
partitions were concatenated and then analyzed with MrBayes;(ii) a non-parametric bootstrap of the combined dataset was per-formed with Mesquite v.2.01 (Maddison and Maddison, 2007).Pseudoreplicates of variable size were obtained by re-samplingwith replacement from the original data and analyzed withMrBayes. Bayesian analyses were carried out for each simulated
Fig. 2. The 50% majority consensus tree resulting from the BA of the cox1-cox2 data partitioned by codon (1st, 2nd and 3rd). Number above node shows posterior probabilityP0.90. Bootstrap support values are shown below nodes. Circle numbers are discussed in the text. Name of taxa corresponds to those indicated in Table 1 (C. corresponds toCalathus). Capital letters in brackets denote the geographic region: WP, West-Palearctic; EB, Eurosiberian; EU, European; ME, Mediterranean; AF, North Africa; IB, Iberianpeninsula; IT, Italy; BK, Balkan peninsula; TR, Turkey; CA, Caucasus; LZ, Lanzarote Island; FV, Fuerteventura Island; TF, Tenerife; LG: La Gomera Island; GC, Gran Canaria; MR,Madeira; NA, North America; MX, Mexico; US, United States of America; ET, Ethiopia.
C. Ruiz et al. / Molecular Phylogenetics and Evolution 55 (2010) 358–371 363

Author's personal copy
matrix and the proportion of nodes with posterior probabilities>0.95 was measured.
3. Results
3.1. Sequence alignment
The secondary structure inferred for 28S had four variable-length regions, comprising 11% of the total length. The CW ap-proach resulted in generally longer alignments (885–933 basepairs) than the MX (886–910 base pairs) and MXan approaches(886–918 base pairs) (Fig. 1, Supplementary material). The unam-biguously aligned regions (28Sc) comprised 67 parsimony infor-mative sites across all taxa (8% of the conserved sites), while theremaining ambiguous regions of alignment (28Sv) exhibited49–60 additional informative characters (37–60% of the variableregions) depending on the alignment approach and parameters.
Different alignments were evaluated based on their relativecontribution (PBS) to the combined analysis of all data. The results
of changing alignment parameters are shown in Fig. 1. The Clustalalignment of full length sequences (CW) showed two peaks ofhigher PBS values under GOP/GEP values 4/0.5 and 8/4. The gappenalties 2/1–0.5–0.25, 4/2 and 8/1 were found to be most incon-gruent with the combined tree topology. For the MX alignment, thehighest PBS value was obtained with gap penalties set to 15/6.6 forthe ambiguous regions. When the flanking sides of variable regionswere anchored (MXan) the highest PBS value was also found withparameters set to 15/6.6, but the overall contribution using differ-ent GOP/GEP values was almost the same for each alignment(Fig. 1b and c). Manual correction for each of the alignment strat-egies showed different values of PBS (Fig. 1a–c).
After measuring the congruence between the variable regions of28S and unambiguously aligned regions (mitochondrial plus EF-1aand conserved 28S), we decided to exclude the variable regionsfrom the analysis because the different alignment strategies af-fected the resolution of the deepest nodes, even in the combinedanalysis (see below; e.g., relationships between clades 2 and 7 inFig. 5, and Figs. 3–5 of Supplementary material). This could bedue to alignment artefacts that become particularly relevant in cer-
Fig. 3. The 50% majority consensus tree resulting from the BA of EF-1a C0 partitioned by codon (1st, 2nd and 3rd). Number above node shows posterior probability P0.90.Bootstrap support values are shown below nodes. Circle numbers are discussed in the text. Name of taxa as in Fig. 2.
364 C. Ruiz et al. / Molecular Phylogenetics and Evolution 55 (2010) 358–371

Author's personal copy
tain clades defined by short internal branches (Kumar and Filipski,2007).
3.2. Phylogenetic inference
3.2.1. Separate analysesData statistics and models selected for the data partitions used
in this study are shown in Tables 2 and 3. The three independentmarkers resulted in similar topologies for the subtribe Calathina.The mtDNA fragment generated a tree with high support for themain clades (Fig. 2). However, relationships between these cladeswere poorly supported in most cases, but slightly increased wheneach codon position was modelled independently in MrBayes.
The subtribe Calathina includes seven clades (following thenotation by Ruiz and Serrano, 2006), which stand out as particu-larly stable and well supported:
– Clade 1 includes the endemic Iberian species Calathus (Iberocal-athus) rotundatus and the North American species Acalathus(Procalathus) advena; this last genus is currently classified in adifferent subtribe (Dolichina sensu Hovorka and Sciaky, 2003and Lorenz, 2005).
– Clade 2 is constituted by the Balkan Synuchidius ganglbaueri,three species of Calathus sometimes considered as members ofthe subgenus Neocalathus (C. granatensis, C. opacus, and C. metal-licus), and all species of the subgenus Calathus.
Fig. 4. The 50% majority consensus tree resulting from the BA of 28S aligned manually (MA). Number above node shows posterior probability P0.90. Bootstrap supportvalues are shown below nodes. Circle numbers are discussed in the text. Name of taxa as in Fig. 2.
C. Ruiz et al. / Molecular Phylogenetics and Evolution 55 (2010) 358–371 365

Author's personal copy
– Clade 3 comprises the West-Palearctic Calathus (Amphyginus)rotundicollis and the Tenerifean depressus group (subgenus Lau-ricalathus in part).
– Clade 4 includes Calathus circumseptus, a Circummediterraneanspecies of the monotypic subgenus Bedelinus.
– Clade 5 includes part of the subgenus Neocalathus (the Palearcticmelanocephalus group plus all the Nearctic species of the subge-nus), the North African C. semisericeus, and some taxa of uncer-tain affinity: the Madeiran vividus group and the Afrotropical C.aethiopicus.
– Clade 6 includes the remaining species of the subgenus Neocal-athus (the ambiguus group) together with species from the Can-ary Islands (the species of the subgenus Lauricalathus other thanthose of clade 3, plus all Trichocalathus).
– Clade 7 comprises the Caucasian genera Thermoscelis and Lind-rothius, which were considered independent genera in the lastPalearctic catalog (Hovorka and Sciaky, 2003).
Clade 1 is the sister group of a well-supported clade made up byall other Calathus plus the related genera Synuchidius, Thermoscelisand Lindrothius (Fig. 2). Clades 2 and 7 grouped together with max-imum support in the Bayesian analysis, and together with clade 6and the North African C. solieri made up a relatively well-supportedclade (pp: 0.95).
Nuclear EF-1a resulted in a topology that generally agreed withthe mtDNA results (Fig. 3). The same main clades were recoveredalthough the support for some of the deeper nodes was low. Cala-thus circumseptus (clade 4) was recovered with C. semisericeus with
Fig. 5. The 50% majority consensus tree resulting from the BA of the combined data without variable region (SS approach). Number above node shows posterior probabilityP0.90. Bootstrap support values are shown below nodes. Circle numbers are discussed in the text. Asterisk represents species belonging to subgenus Trichocalathus. Name oftaxa and acronyms of geographic regions as in Fig. 2.
366 C. Ruiz et al. / Molecular Phylogenetics and Evolution 55 (2010) 358–371
Author's personal copy
support (pp: 0.96). Clades 3 and 7 were recovered together but thisgroup received varying support depending upon the partitioningstrategy (with or without considering codon position, pp: 0.86–0.97).
Ribosomal 28S showed less resolution irrespective of the align-ment selected (Fig. 4 and Figs. 3–5 of Supplementary material).Only the monophyly of Calathus was supported, while all otherclade relationships were sensitive to alignment strategy.
3.2.2. Combined analysisCombined analyses showed very similar results to separate
analyses, in particular to the mtDNA analysis, but with increasednodal support. Clades 1–7 recovered by the mtDNA analyses werepresent in all combined analyses. Clade 1 formed the sister clade ofclades 2–7, that showed unstable relationships sensitive to the 28Salignment strategy and reconstruction method. When only unam-biguously aligned regions of 28S were used (28Sc), clades 2 and7 grouped together but only with moderate support (0.94/56)(Fig. 5). When variable regions (28Sv) were included and alignedmanually (MA), the same topology was recovered but with highersupport (clade 2 and 7, pp: 1.00/57, in Fig. 3, Supplementary mate-rial). The other lineages of Calathus (clades 3–6) received moderatesupport (pp: 0.96). When the CW or MX approaches were usedwithout manual correction, the position of clade 2 changed to be-come the sister group to a well-supported group of clades 3–7, irre-spective of selected alignment gap penalties. Among these clades,only the sister relationship between clade 3 and 7 was resolvedwith support, albeit low (>0.90) (Figs. 4 and 5, Supplementarymaterial).
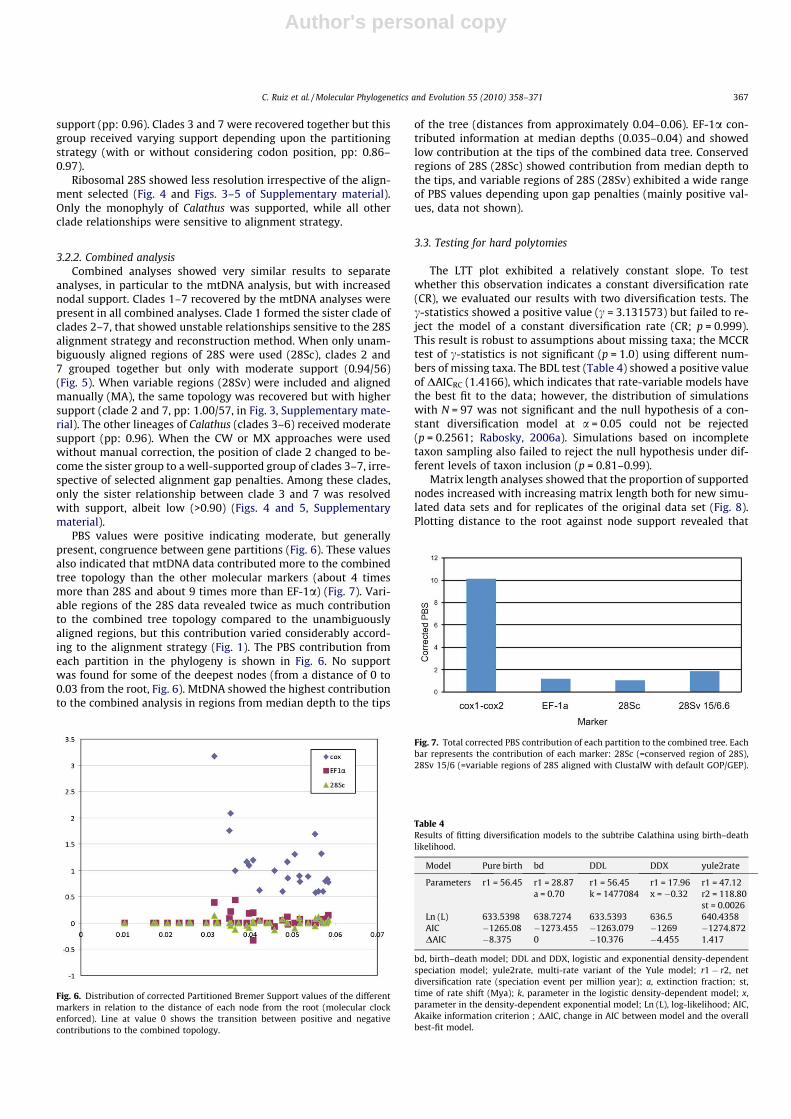
PBS values were positive indicating moderate, but generallypresent, congruence between gene partitions (Fig. 6). These valuesalso indicated that mtDNA data contributed more to the combinedtree topology than the other molecular markers (about 4 timesmore than 28S and about 9 times more than EF-1a) (Fig. 7). Vari-able regions of the 28S data revealed twice as much contributionto the combined tree topology compared to the unambiguouslyaligned regions, but this contribution varied considerably accord-ing to the alignment strategy (Fig. 1). The PBS contribution fromeach partition in the phylogeny is shown in Fig. 6. No supportwas found for some of the deepest nodes (from a distance of 0 to0.03 from the root, Fig. 6). MtDNA showed the highest contributionto the combined analysis in regions from median depth to the tips
of the tree (distances from approximately 0.04–0.06). EF-1a con-tributed information at median depths (0.035–0.04) and showedlow contribution at the tips of the combined data tree. Conservedregions of 28S (28Sc) showed contribution from median depth tothe tips, and variable regions of 28S (28Sv) exhibited a wide rangeof PBS values depending upon gap penalties (mainly positive val-ues, data not shown).
3.3. Testing for hard polytomies
The LTT plot exhibited a relatively constant slope. To testwhether this observation indicates a constant diversification rate(CR), we evaluated our results with two diversification tests. Thec-statistics showed a positive value (c = 3.131573) but failed to re-ject the model of a constant diversification rate (CR; p = 0.999).This result is robust to assumptions about missing taxa; the MCCRtest of c-statistics is not significant (p = 1.0) using different num-bers of missing taxa. The BDL test (Table 4) showed a positive valueof DAICRC (1.4166), which indicates that rate-variable models havethe best fit to the data; however, the distribution of simulationswith N = 97 was not significant and the null hypothesis of a con-stant diversification model at a = 0.05 could not be rejected(p = 0.2561; Rabosky, 2006a). Simulations based on incompletetaxon sampling also failed to reject the null hypothesis under dif-ferent levels of taxon inclusion (p = 0.81–0.99).
Matrix length analyses showed that the proportion of supportednodes increased with increasing matrix length both for new simu-lated data sets and for replicates of the original data set (Fig. 8).Plotting distance to the root against node support revealed that
Fig. 6. Distribution of corrected Partitioned Bremer Support values of the differentmarkers in relation to the distance of each node from the root (molecular clockenforced). Line at value 0 shows the transition between positive and negativecontributions to the combined topology.
Fig. 7. Total corrected PBS contribution of each partition to the combined tree. Eachbar represents the contribution of each marker: 28Sc (=conserved region of 28S),28Sv 15/6 (=variable regions of 28S aligned with ClustalW with default GOP/GEP).
Table 4Results of fitting diversification models to the subtribe Calathina using birth–deathlikelihood.
Model Pure birth bd DDL DDX yule2rate
Parameters r1 = 56.45 r1 = 28.87a = 0.70
r1 = 56.45k = 1477084
r1 = 17.96x = �0.32
r1 = 47.12r2 = 118.80st = 0.0026
Ln (L) 633.5398 638.7274 633.5393 636.5 640.4358AIC �1265.08 �1273.455 �1263.079 �1269 �1274.872DAIC �8.375 0 �10.376 �4.455 1.417
bd, birth–death model; DDL and DDX, logistic and exponential density-dependentspeciation model; yule2rate, multi-rate variant of the Yule model; r1 � r2, netdiversification rate (speciation event per million year); a, extinction fraction; st,time of rate shift (Mya); k, parameter in the logistic density-dependent model; x,parameter in the density-dependent exponential model; Ln (L), log-likelihood; AIC,Akaike information criterion ; DAIC, change in AIC between model and the overallbest-fit model.
C. Ruiz et al. / Molecular Phylogenetics and Evolution 55 (2010) 358–371 367

Author's personal copy
low support was randomly distributed within the tree, from deeperto shallower nodes (data not shown).
4. Discussion
4.1. Phylogenetic relationships within Calathina
Our analyses corroborated the monophyly of the subtribeCalathina and revealed seven well-supported clades that are in-ferred to represent main lineages within the subtribe. However,low support was obtained for some of the deepest nodes that wereassociated with short internal branches, and thus the relationshipsbetween these lineages could not be fully resolved. Lack of deepnodal resolution is frequently observed in molecular phylogenies(Whitfield and Lockhart, 2007) and may be due to a number of fac-tors such as (i) inappropriate molecular data; (ii) inappropriatephylogenetic methods or substitution models; (iii) insufficient data(Walsh et al., 1999; Whitfield and Lockhart, 2007); (iv) incongru-ence between data partitions (Baker and DeSalle, 1997; Cognatoand Vogler, 2001); or (v) rapid radiation (Rabosky and Lovette,2008; Whitfield and Kjer, 2008) resulting in ’hard’ polytomies(Maddison, 1989).
The first two factors are unlikely to explain our lack of basal res-olution because we have used 812 parsimony informative charac-ters from three independent markers that encompass a range ofsubstitution rates, implementing different substitution modelsfor each data partition together with phylogenetic methods thatdiffer in their analytical strengths. The PBS analyses (Fig. 6) re-vealed that the low support associated with the deepest nodeswas not due to incongruence, and a rapid radiation following theorigin of Calathina is unlikely because there were no significantdepartures from a constant speciation rate model in the c-statisticand the BDL tests. Although these tests lack power to detect in-creased diversification rates, they are more effective at detectinga decrease in diversification rates (Rabosky, 2006a), which is ex-pected after rapid radiation events (Rabosky and Lovette, 2008).With regard to insufficient data, both simulations and length-var-iable bootstrap re-sampling showed that the proportion of sup-ported nodes (pp > 0.95) increased with the size of the data
matrix (Fig. 8), which makes this hypothesis the most likely expla-nation for the low resolution of the deepest nodes. More data, pref-erably from other genes, are therefore needed to resolve therelationship between main clades in Calathina.
Regardless of the weakly resolved basal relationships withinCalathina, there was strong support for a paraphyletic Calathus thatincluded the current genera Synuchidius (clade 2), Thermoscelis andLindrothius (clade 7), and Acalathus (clade 1). This result agrees wellwith the ideas of Lindroth (1956) who divided Calathus into manydifferent species groups, including the aforementioned genera.Thus, molecular data support the existence of a subtribe Calathinathat includes a single inclusive genus Calathus, of which Synuchidi-us, Lindrothius, Thermoscelis and Acalathus should be ranked as sub-genera. The inclusion of Acalathus within the subtribe Calathinainstead of Dolichina has also been suggested by Ball and Nègre(1972), Perrault (1977) and Casale (1988).
The close relationship between the North American Acalathusadvena and the Iberian species Calathus (Iberocalathus) rotundatus(clade 1) was somewhat surprising because of the geographical dis-junction between these taxa. However, this relationship was sup-ported independently by mtDNA as well as 28S data. Also, therelatively short branch lengths observed for Calathus and Acalathusin the 28S data indicate that this relationship is not an artefact dueto long-branch attraction (Bergsten, 2005). The Bayesian analysesare particularly suited to handle erroneous relationships that canemerge as a consequence of elevated substitution rates, but noneof the implemented evolutionary models that were fitted to differentgenomic data and different codon positions revealed alternativehypotheses (Figs. 4, 6 and 7, and Fig. 2 of Supplementary material).Spurious inclusion of Acalathus in the ingroup was also tested bysampling a much wider range of Calathina (all genera) and Dolichina(4 out of 7 genera) outgroups, but did not result in topologicalchanges (data not shown). Long-branch attraction was also testedby removing each of these putatively wrongly placed taxa, one at atime, but none of them swapped position in the absence of the other.We are therefore confident that Acalathus belongs within the genusCalathus, a hypothesis that should be further tested by studying theextant species presently found in China. Molecular data also supportthe inclusion of the genus Dolichus within the subtribe Dolichina, asput forward by Casale (1988) and Ruiz et al. (2009).
Fig. 8. Relationship between sequence length of simulated datasets and proportion of supported nodes (posterior probability). Simulated data sets were built up using newdata sets (green line) or pseudoreplicates of the original data set (blue line). Red circle indicates proportion of supported nodes in the combined analysis of the original dataset.
368 C. Ruiz et al. / Molecular Phylogenetics and Evolution 55 (2010) 358–371

Author's personal copy
Clade 2 showed an unexpected relationship between the BalkanSynuchidius ganglbaueri, Calathus metallicus, the Iberian C. granaten-sis, the North African C. opacus and all species of the subgenus Cal-athus. Synuchidius ganglbaueri is usually regarded as a separategenus from Calathus on morphological grounds (Apfelbeck, 1930;Guéorguiev, 2007). Calathus metallicus shows external characterssimilar to the subgenus Neocalathus, and C. granatensis and C. opa-cus have been placed either in the subgenera Calathus or Neocala-thus because they show intermediate morphological charactersbetween these subgenera. Nevertheless, at least one morphologicalcharacter supports this clade by the presence of a tooth within theendophallus in all four taxa. A taxonomic reassessment is thereforerequired.
Clade 3 was made up by most but not all species of the subge-nus Lauricalathus inhabiting the island of Tenerife (the depressusgroup), with the European C. (Amphyginus) rotundicollis as sistergroup (Fig. 9). Nuclear data added in this study thus corroboratea relationship reported by Emerson et al. (2000) and Ruiz and Ser-rano (2006) based on mitochondrial data only. Two additional spe-cies from Tenerife (C. rectus and C. abaxoides) were on the otherhand related to taxa inhabiting other Canary Islands (Gran Canaria,La Gomera, El Hierro, clade 6), including the three La Gomeran spe-cies in the subgenus Trichocalathus. These Canarian taxa combinedmade up the sister group to a clade consisting primarily of westernPalearctic species of the ambiguus group in the subgenus Neocala-thus, including also one species from Madeira (Fig. 9). The nucleardata added in this study thus corroborate the lack of support for amonophyletic subgenus Trichocalathus (see also Emerson et al.,1999), as species in this subgenus from La Gomera are nested with-in the subgenus Lauricalathus on the same island. Generally shortbranches throughout the La Gomeran clade suggest that the ances-tor of these species underwent rapid morphological evolution giv-ing rise to the distinctive traits of Trichocalathus. A similar case offast morphological evolution associated with little moleculardivergence has been reported among carabids in the genus Carabus(see Osawa et al., 2004 and further references therein).
The lack of monophyly for species currently included in Neocal-athus (clades 5 and 6) corroborates the recently suggested poly-phyletic nature of this subgenus (Ruiz and Serrano, 2006). Onmorphological grounds Neocalathus is relatively uniform and doesnot currently pose any taxonomic controversies (e.g., Ball andNègre, 1972; Toribio, 2006), but no cladistic analysis has been car-ried out on the whole subgenus, and a thorough study to corrobo-rate the polyphyly of this subgenus is required. The Nearctic
Neocalathus (clade 5) formed a monophyletic group divided intoMexican and North American sister clades (or nearly so, dependingon the type of analysis), as proposed by Ball and Nègre (1972)based on morphological characters (Fig. 67, p. 519). We can there-fore infer a single colonisation of the Nearctic region by Neocala-thus, and only two independent colonizations when includingAcalathus. Further molecular studies on Mexican C. (Tachalus) ovi-pennis and Asian taxa of Procalathus and Acalathus are neverthelessneeded to achieve deeper insight into the evolutionary history ofNearctic Calathus.
4.2. Diversification of the subtribe Calathina in the MediterraneanBasin, Caucasus and Europe
The distribution of taxa within the subtribe is concentratedaround the Mediterranean Basin and the Caucasus. The mostextensive diversification in this area is found within the subgenusCalathus, with about 50 flightless species most of which are ende-mic to the mountain massifs on the northern side of the Mediter-ranean Basin. This suggests that isolation in mountains has beena significant factor in driving speciation within this lineage whereonly the wing dimorphic and eurytopic C. fuscipes has a wide Pale-arctic distribution. The more distantly related species of this clade,C. granatensis, C. opacus, C. metallicus and Synuchidius ganglbaueriseem to be peripheral isolates around the Mediterranean Basin,apparently relics of an ancestor that once had a wider distribution.The same explanation holds for the Caucasian taxa Lindrothius andThermoscelis (clade 7, Fig. 2). In contrast to the subgenus Calathus,the subgenera Bedelinus (C. circumseptus, clade 4, full winged) andAmphyginus (C. rotundicollis, clade 3, wing dimorphic) that havesimilar Mediterranean distributions are much less diverse lineages.Calathus rotundicollis has a discontinuous distribution that includesAtlantic Europe, Italy and Greece. The low sequence divergence be-tween Italian and Iberian individuals (p-distance cox1-cox2: 0.014)supports a recent origin for this disjunction, possibly during thePleistocene, as postulated for other organisms (e.g., Hewitt, 2001,2004).
Members of the melanocephalus (Fig. 5, clade 5) and the ambig-uus (Fig. 5, clade 6) groups in the subgenus Neocalathus show awider geographical distribution, in agreement with their higherdispersal power (they are either winged or wing dimorphic spe-cies) and lack of ecological specialisation (they are generalist taxa).These species are not limited to the Mediterranean Basin but occurin temperate and boreal Europe, and have colonised the Macarone-sian archipelagos and other areas out of the Palearctic region.
4.3. The colonisation of the Macaronesian subregion
The study of a large number of continental taxa and the use ofmultiple nuclear and mitochondrial markers allowed reconstruc-tion of colonisation events and subsequent radiations in Calathuson the Macaronesian archipelagos. New data have not only corrob-orated previous conclusions by Emerson et al. (1999, 2000) butadded interesting clues about the origin of multiple lineages ende-mic to these archipelagos. Based on these data, at least four or fiveindependent colonisation events of the Macaronesian archipelagoshave taken place (Fig. 9).
(i) The depressus group, which includes most Lauricalathus ofTenerife except for C. abaxoides and C. rectus, and the Euro-pean C. rotundicollis share a common ancestor, suggesting aWest-Palearctic origin of the Tenerifean clade. However,the genetic divergence between C. rotundicollis and the C.depressus group is relatively large (p-distance cox1-cox2:0.07), and thus extinction of a more closely related taxa fromanother geographical region is a possibility.
Fig. 9. Colonisation events of Macaronesia by subtribe Calathina. Roman numbersrefer to colonisation events detailed in the text.
C. Ruiz et al. / Molecular Phylogenetics and Evolution 55 (2010) 358–371 369

Author's personal copy
(ii) The European ambiguous group consisting of C. ambiguus, C.asturiensis, C. erratus and the Madeiran C. subfuscus formed asister group to a large clade of Canary island species (clade 6,the canariensis group). Although the sister relationship is notprima facie evidence for an ancestral European distribution,we note that most other distantly related species are also ofwestern Palearctic origin. It therefore seems likely that thecanariensis group diversified from a West-Palearctic ances-tor. Further diversification within this group possiblyoccurred in an east to west direction as indicated by thenested structure among Gran Canaria, Tenerife and LaGomera populations and higher taxa. The nested structureis consistent with a stepping-stone model of colonisationfrom the island closest to the mainland to the more distantislands in the west, as reported for other insect taxa in theCanary Islands (Juan et al., 2000). The most recent colonisa-tion event has possibly occurred between La Gomera and theyoungest island of El Hierro (1 Myr old), where the endemicC. spretus is closely related to the La Gomera species C.gomerensis (not included, see Emerson et al., 2000).
(iii) The eastern Canary Islands lineage (gonzalezi group), repre-sented by C. gonzalezi (Fuerteventura) and C. simplicicollis(Lanzarote), is paraphyletic with respect to the widespreadcontinental species C. mollis that is distributed along NorthAfrica and Europe. The paraphyletic distribution makesinference about their colonisation history equivocal. Thenested position of the continental species (C. mollis) mayindicate back colonisation from the eastern Canary Islandsto the mainland, a scenario documented in other Macarone-sian beetles (e.g., Jordal and Hewitt, 2004) and many othertaxa (Bellemain and Ricklefs, 2008), or it may indicate a dou-ble colonisation of the Canary Islands by the continentalancestor (Emerson, 2002).
(iv) The origin of the vividus group in Madeira (C. complanatus, C.colasianus, C. vividus) is uncertain given its sister relationshipwith a clade consisting of species from many different geo-graphical areas. The relatively deep genetic divergence ofthe vividus group points to a potentially ancient origin of thislineage.
(v) C. subfuscus from Madeira is closely related to the EuropeanC. ambiguus, which indicates an independent and recent col-onisation of this island.
From this minimum estimate of five independent colonisationsof the Macaronesian islands we note that a European mainland toMacaronesian island pattern is the most common pattern. Thismay appear at odds with the geographically closer location of theAfrican mainland. However, the general biogeography of the Mac-aronesian islands indicates that many (but not all) groups of in-sects and other organisms have indeed colonised these islandsfrom the mainland north of the Mediterranean Sea. These patternsare usually explained by way of prevailing winds and sea currentsfrom the Iberian Peninsula (Juan et al., 2000).The inferred colonisa-tion patterns in Calathus could also be an artefact caused by incom-plete sampling, although this seems unlikely as we have studiedmost North African species of Calathus (7 out of 9 species), repre-senting all extant lineages in that region (Antoine, 1957). It is how-ever possible that now extinct ancestors of the presentMacaronesian Calathus formerly inhabited North Africa, as hasbeen suggested more generally for the flora and fauna of the region(Emerson, 2002).
Acknowledgments
This work has been supported by projects 00595/PI/04 of theFundación Séneca (Murcia) and CGL2006-06706/BOS of the Span-
ish Ministerio de Educación y Ciencia. Carlos Ruiz was granted withFPU predoctoral grant of the Ministerio de Educación y Ciencia. Weheartily thank the many colleagues that helped us with collectingmaterial, particularly Carmelo Andújar, Jose Fermín Sánchez-Gea,Esteban Jiménez, José Luís Lencina and Javier Ibáñez (Universityof Murcia), Boby Gueorguiev (University of Sophia). Roy Danielssonhelped with loaned material (Museum of Zoology, University ofLund). Irene Muñoz and Lope Lorenzo helped with Fig. 9. GeorgeBall (University of Alberta) helped with the identification of Nearc-tic material. Ignacio Ribera (Museo Ciencias Naturales, Madrid)helped with valuable bibliography.
Appendix A. Supplementary data
Supplementary data associated with this article can be found, inthe online version, at doi:10.1016/j.ympev.2009.10.026.
References
Akaike, H., 1973. Information theory and an extension of the maximum likelihoodprinciple. In: Petrov, B.N., Caski, F. (Eds.), Proceedings of the SecondInternational Symposium on Information Theory. Akadémiai Kiadó, Budapest.,pp. 267–281.
Antoine, M., 1957. Coléoptères carabiques du Maroc (2éme partie). Mém. Soc. Sci.Nat. Phys. Maroc (Zool.) 3, 178–314.
Apfelbeck, V., 1930. Fauna insectorum balcanica VII. 2 teil. Neue Beiträge zurSystematischen Insektenkunde 4, 176.
Baker, R.H., DeSalle, R., 1997. Multiple sources of character information and thephylogeny of Hawaiian Drosophilids. Syst. Biol. 46, 654–673.
Ball, G.E., Nègre, J., 1972. The taxonomy of the Nearctic species of the genus CalathusBonelli (Coleoptera: Carabidae: Agonini). Trans. Am. Entom. Soc. 98, 412–533.
Barraclough, T.G., Vogler, A.P., 2002. Recent diversification rates in North Americantiger beetles estimated from a dated mtDNA phylogenetic tree. Mol. Biol. Evol.19, 1706–1716.
Bellemain, E., Ricklefs, R.E., 2008. Are islands the end of the colonization road?Trends Ecol. Evol. 23, 461–468.
Berbee, M.L., Carmean, D.A., Winka, K., 2000. Ribosomal DNA and resolution ofbranching order among the Ascomycota: how many nucleotides are enough?Mol. Phyl. Evol. 17, 337–344.
Bergsten, J., 2005. A review of long-branch attraction. Cladistics 21, 163–193.Bremer, K., 1994. Branch support and tree stability. Cladistics 10, 295–304.Casale, A., 1988. Revisione degli Sphodrina (Coleoptera, Carabidae, Sphodrini).
Monographie V. Museo Regionale di Scienze Naturali Torino, Torino.Cognato, A.I., Vogler, A.P., 2001. Exploring data interaction and nucleotide
alignment in a multiple gene analysis of Ips (Coleoptera: Scolytinae). Syst.Biol. 50, 758–780.
DeBry, R.W., 2001. Improving interpretation of the decay index for DNA sequencedata. Syst. Biol. 50, 742–752.
de Queiroz, A., Lawson, R., Lemos-Espinal, J.A., 2002. Phylogenetic relationships ofNorth American garter snakes (Thamnophis) based on four mitochondrial genes:how much DNA sequence is enough? Mol. Phyl. Evol. 22, 315–329.
Drummond, A., Rambaut, A., 2007. BEAST: Bayesian evolutionary analysis bysampling trees. BMC Evol. Biol. 7, 12–15.
Egan, A.N., Crandall, K.A., 2008. Divergence and diversification in North AmericanPsoraleeae (Fabaceae) due to climate change. BMC Biol. 6, 55.
Emerson, B.C., Oromí, P., Hewitt, G.M., 1999. MtDNA phylogeography and recentintra-island diversification among Canary Island Calathus beetles. Mol.Phylogenet. Evol. 13, 149–158.
Emerson, B.C., Oromi, P., Hewitt, G.M., 2000. Interpreting colonization of theCalathus (Coleoptera: Carabidae) on the Canary Islands and Madeira through theapplication of the parametric bootstrap. Evolution 54, 2081–2090.
Emerson, B.C., 2002. Evolution on oceanic islands: molecular phylogeneticapproaches to understanding pattern and process. Mol. Ecol. 11, 951–966.
Fishbein, M., Hibsch-Jetter, C., Soltis, D.E., Hufford, L., 2001. Phylogeny ofSaxifragales (Angiosperms, Eudicots): analysis of a rapid, ancient radiation.Syst. Biol. 50, 817–847.
Gillespie, J., Cannone, J., Gutell, R., Cognato, A., 2004. A secondary structural modelof the 28S rRNA expansion segments D2 and D3 from rootworms and relatedleaf beetles (Coleoptera: Chrysomelidae; Galerucinae). Insect Mol. Biol. 13, 495–518.
Guéorguiev, B.V., 2007. Annotated Catalogue of the Carabid Beetles of Albania(Coleoptera: Carabidae). Pensoft, Sofia.
Hines, H.M., 2008. Historical biogeography, divergence times, and diversificationpatterns of bumble bees (Hymenoptera: Apidae: Bombus). Syst. Biol. 57, 58–75.
Hewitt, G.M., 2001. Speciation, hybrid zones and phylogeography – or seeing genesin space and time. Mol. Ecol. 10, 537–549.
Hewitt, G.M., 2004. Genetic consequences of climatic oscillations in the Quaternary.Phil. Trans. R. Soc. B (Biol. Sci.) 359, 183–195.
Hovorka, O., Sciaky, R., 2003. Tribe Sphodrini. In: Löbl, I., Smetana, A. (Eds.),Catalogue of Palearctic Coleoptera. Apollo Books, Stenstrup, pp. 521–547.
370 C. Ruiz et al. / Molecular Phylogenetics and Evolution 55 (2010) 358–371
Author's personal copy
Janssens, S.B., Knox, E.B., Huysmans, S., Smets, E.F., Merckx, V.S.F.T., 2009. Rapidradiation of Impatiens (Balsaminaceae) during pliocene and pleistocene: resultof a global climate change. Mol. Phyl. Evol. 52, 806–824.
Jordal, B.H., Hewitt, G.M., 2004. The origin and radiation of Macaronesian beetlesbreeding in Euphorbia: The relative importance of multiple data partitions andpopulation sampling. Syst. Biol. 53, 711–734.
Juan, C., Emerson, B.C., Oromi, P., Hewitt, G.M., 2000. Colonization anddiversification: towards a phylogeographic synthesis for the Canary Islands.Trends Ecol. Evol. 15, 104–109.
Kadereit, J.W., Griebeler, E.M., Comes, H.P., 2004. Quaternary diversification inEuropean alpine plants: pattern and process. Phil. Trans. R. Soc. B (Biol. Sci.) 359,265–274.
Kjer, K.M., 1995. Use of ribosomal-RNA secondary structure in phylogenetic studiesto identify homologous positions – an example of alignment and datapresentation from the frogs. Mol. Phylogenet. Evol. 4, 314–330.
Kozak, K.H., Weisrock, D.W., Larson, A., 2006. Rapid lineage accumulation in a non-adaptive radiation: phylogenetic analysis of diversification rates in easternNorth American woodland salamanders (Plethodontidae: Plethodon). Proc. R.Soc. Lond. B. (Biol. Sci.) 273, 539–546.
Kumar, S., Filipski, A., 2007. Multiple sequence alignment: in pursuit of homologousDNA positions. Genome Res. 17, 127–135.
Lindroth, C.H., 1956. A revision of the genus Synuchus Gyllenhal (Coleoptera,Carabidae) in the widest sense, with notes on Pristosia and Calathus. Trans. R.Soc. Lond. 108, 485–585.
Lorenz, W., 2005. A Systematic List of Extant Ground Beetles of the World(Coleoptera ‘‘Geadephaga”: Trachypachidae and Carabidae incl. Paussinae,Cicindelinae, Rhysodinae). Tutzing, Germany, 530p.
Maddison, W.P., Maddison, D.R., 2007. Mesquite: a modular system for evolutionaryanalysis. Version 2.01. Available from: <http://mesquiteproject.org>.
Maddison, W.P., 1989. Reconstructing character evolution on polytomouscladograms. Cladistics 5, 365–377.
McKenna, D.D., Farrell, B.D., 2006. Tropical forests are both evolutionary cradles andmuseums of leaf beetle diversity. Proc. Natl. Acad. Sci. USA 103, 10947–10951.
Osawa, S., Su, Z.-H., Imura, Y., 2004. Molecular Phylogeny and Evolution of CarabidGround Beetles. Springer, Tokyo.
Paradis, E., 1997. Assessing temporal variations in diversification rates fromphylogenies: estimation and hypothesis testing. Proc. R. Soc. Lond. B. (Biol.Sci.) 264, 1141–1147.
Perrault, G.G., 1977. Le sous-genre Lindrothius (Kurnakov) en Asie mineure Col.Carabidae – genus Calathus (Bon.). Bull. Mens. Soc. Linn. Lyon 46, 220–224.
Philippe, H., Delsuc, F., Brinkmann, H., Lartillot, N., 2005. Phylogenomics. Ann. Rev.Ecol. Evol. Syst. 36, 541–562.
Posada, D., Crandall, K.A., 1998. MODEL TEST: testing the model of DNAsubstitution. Bioinformatics 14, 817–818.
Posada, D., Buckley, T., 2004. Model selection and model averaging inphylogenetics: advantages of Akaike information criterion and Bayesianapproaches over likelihood ratio tests. Syst. Biol. 53, 793–808.
Putzeys, J., 1873. Monographie des Calathides. Ann. Soc. Entomol. Belgique 16, 19–96.Pybus, O.G., Harvey, P.H., 2000. Testing macro-evolutionary models using
incomplete molecular phylogenies. Proc. R. Soc. Lond. B. (Biol. Sci.) 267,2267–2272.
Rabosky, D.L., 2006a. Likelihood methods for detecting temporal shifts indiversification rates. Evolution 60, 1152–1164.
Rabosky, D.L., 2006b. LASER: a maximum likelihood toolkit for detecting temporalshifts in diversification rates from molecular phylogenies. Evol. Bioinform
Online 2, 247–250. Available from: <http://www.pubmedcentral.nih.gov/articlerender.fcgi?artid=2674670>.
Rabosky, D.L., Donnellan, S.C., Talaba, A.L., Lovette, I.J., 2007. Exceptional among-lineage variation in diversification rates during the radiation of Australia’smost diverse vertebrate clade. Proc. R. Soc. Lond. B. (Biol. Sci.) 274, 2915–2923.
Rabosky, D.L., Lovette, I.J., 2008. Explosive evolutionary radiations: decreasingspeciation or increasing extinction through time? Evolution 62, 1866–1875.
Rambaut, A., Drummond, A., 2005. Tracer. MCMC Trace File Analyser. Version 1.3.University of Oxford, Oxford.
Roelants, K., Gower, D.J., Wilkinson, M., Loader, S.P., Biju, S.D., Guillaume, K., Moriau,L., Bossuyt, F., 2007. Global patterns of diversification in the history of modernamphibians. Proc. Natl. Acad. Sci. USA 104, 887–892.
Rokas, A., Williams, B.L., King, N., Carrol, S.B., 2003. Genome-scale approaches toresolving incongruence in molecular phylogenies. Nature 425, 798–804.
Ronquist, F., Huelsenbeck, J.P., 2003. MrBayes 3: Bayesian phylogenetic inferenceunder mixed models. Bioinformatics 19, 1572–1574.
Ruiz, C., Serrano, J., 2006. Molecular phylogeny and systematics of Calathus Bonelli(Coleoptera : Carabidae : Sphodrini) based on mitochondrial cox1-cox2sequences. Entomol. Fenn. 17, 214–220.
Ruiz, C., Jordal, B., Serrano, J., 2009. Molecular phylogeny of the tribe Sphodrini(Coleoptera: Carabidae) based on mitochondrial and nuclear markers. Mol.Phylogenet. Evol. 50, 44–58.
Schatzmayr, A., 1937. I Calathus d’Europa. Pubblicazioni del Museo Entomologico‘‘Pietro Rosi”. Duino 2, 1–49.
Spinks, P., Thomson, R., Lovely, G., Shaffer, H.B., 2009. Assessing what is needed toresolve a molecular phylogeny: simulations and empirical data from Emydidturtles. BMC Evol. Biol. 9, 56.
Sorenson, M.D., Franzosa, E.A., 2007. TreeRot, Version 3. Boston University, Boston.Swofford, D.L., 2002. PAUP*. Phylogenetic Analysis Using Parsimony (� and Other
Methods). Ver. 4. Sinauer, Sunderland.Tamura, K., Dudley, J., Nei, M., Kumar, S., 2007. MEGA4: molecular evolutionary
genetics analysis (MEGA) software version 4.0. Mol. Biol. Evol. 24, 1596–1599.Thompson, J.D., Higgins, D.G., Gibson, T.J., 1994. CLUSTAL W: improving the
sensitivity of progressive multiple sequence alignment through sequenceweighting, position-specific gap penalties and weight matrix choice. NucleicAcids Res. 22, 4673–4680.
Toribio, M., 2006. Notas sobre el género Calathus Bonelli, 1810, en la PenínsulaIbérica (Coleoptera, Carabidae). Bull. Soc. Ent. France 111, 51–57.
Turgeon, J., Stoks, R., Thum, R.A., Brown, J.M., Mcpeek, M.A., 2005. SimultaneousQuaternary radiations of three damselfly clades across the Holarctic. Am. Nat.165, E78–E107.
Walsh, H.E., Kidd, M.G., Moum, T., Friesen, V.L., 1999. Polytomies and the power ofphylogenetic inference. Evolution 53, 932–937.
Weir, J.T., 2006. Divergent timing and patterns of species accumulation in lowlandand highland neotropical birds. Evolution 60, 842–855.
Whitfield, J.B., Kjer, K.M., 2008. Ancient rapid radiations of insects: challenges forphylogenetic analysis. Ann. Rev. Ent. 53, 449–472.
Whitfield, J.B., Lockhart, P.J., 2007. Deciphering ancient rapid radiations. TrendsEcol. Evol. 22, 258–265.
Zou, X.H., Zhang, F.M., Zhang, J.G., Zang, L.L., Tang, L., Wang, J., Sang, T., Ge, S., 2008.Analysis of 142 genes resolves the rapid diversification of the rice genus.Genome Biol. 9 (3), R49.
Zuker, M., 2003. Mfold web server for nucleic acid folding and hybridizationprediction. Nucleic Acids Res. 31, 3406–3415.
C. Ruiz et al. / Molecular Phylogenetics and Evolution 55 (2010) 358–371 371