Molecular genetic investigations of renal cell carcinoma ...
361
0 Department of Medical Genetics Molecular genetic investigations of renal cell carcinoma predisposition Submitted for the degree of Doctor of Philosophy by Philip Simon Smith (USN: 303248033) Darwin College April 2019
-
Upload
khangminh22 -
Category
Documents
-
view
0 -
download
0
Transcript of Molecular genetic investigations of renal cell carcinoma ...

0
Department of Medical Genetics
Molecular genetic investigations of renal cell
carcinoma predisposition
Submitted for the degree of Doctor of Philosophy by
Philip Simon Smith (USN: 303248033)
Darwin College
April 2019

1
Declaration
This dissertation is the result of my own work and includes nothing which is the outcome of work
done in collaboration except as declared in the Preface and specified in the text. It is not substantially
the same as any that I have submitted, or, is being concurrently submitted for a degree or diploma
or other qualification at the University of Cambridge or any other University or similar institution
except as declared in the Preface and specified in the text. I further state that no substantial part of
my dissertation has already been submitted, or, is being concurrently submitted for any such degree,
diploma or other qualification at the University of Cambridge or any other University or similar
institution except as declared in the Preface and specified in the text. This thesis does not exceed
the prescribed word limit for the relevant Degree Committee to which it is being submitted.
2
Abstract
Name: Philip Simon Smith
Title: Molecular genetic investigations of renal cell carcinoma predisposition
Renal Cell Carcinomas (RCC) are a diverse group of histologically and genetically distinct renal
neoplasms accounting for 2.4% of all cancers worldwide. While a majority of RCC cases are sporadic
in nature, a proportion are due to genetic predisposition caused by syndromic and non-syndromic
conditions. Inherited renal cell carcinoma is associated with alterations in genes such as VHL, MET,
FH, and FLCN and identification of these genes has been critical to understanding the molecular
biology of both inherited and sporadic RCC, informing both clinical management and treatment.
Despite the large number of known genes which are linked to RCC predisposition, most individuals
with features of RCC predisposition do not harbour variants in known inherited RCC genes,
suggesting additional unknown causes of heritability have yet to be uncovered. This study has
utilised a range of genomic sequencing methodologies, scaling from single gene to whole genome
sequencing, on individuals with features of renal cell carcinoma predisposition in order to identify
novel causes of heritability associated with RCC. Multiple genomic sequencing approaches in these
individuals has uncovered a range of potential genetic features that could be associated with
predisposition to RCC, including genes not previously known to be associated with RCC, discovery
of new molecular mechanisms of genetic inheritance for known RCC predisposition syndromes, and
provided innovative methods for the identification and characterisation of molecular alterations in
specific inherited RCC subtypes.
3
Table of Contents
DECLARATION ................................................................................................................................................. 1
ABSTRACT ....................................................................................................................................................... 2
TABLE OF CONTENTS .................................................................................................................................... 3
ACKNOWLEDGEMENTS ................................................................................................................................. 9
1.0 INTRODUCTION ....................................................................................................................................... 10
1.0.1 TABLE OF CONTENTS .............................................................................................................................. 11
1.1 MEDICAL GENETICS: FROM MENDEL TO GENE THERAPY ................................................................................ 13
1.1.1 Discovery of genetics ..................................................................................................................... 13
1.1.2 Models of inheritance ..................................................................................................................... 13
1.1.3 De novo variants and mosaicism ................................................................................................... 14
1.1.4 Landscape of genetic alterations .................................................................................................... 15
1.1.5 Medical genetics in the present ...................................................................................................... 15
1.2 CANCER: A GENETIC DISEASE .................................................................................................................... 17
1.2.1 Genetic origin of cancer ................................................................................................................. 17
1.2.2 Hallmarks of cancer ........................................................................................................................ 20
1.2.3 Genetic inheritance of cancer ......................................................................................................... 22
1.3 RENAL CELL CARCINOMA ........................................................................................................................... 23
1.3.1 Incidence ........................................................................................................................................ 23
1.3.2 Major histological subtypes ............................................................................................................ 24
1.3.3 Tumour staging .............................................................................................................................. 27
1.3.4 Tumour grade ................................................................................................................................. 27
1.3.5 Survival .......................................................................................................................................... 29
1.3.6 Generalised treatment .................................................................................................................... 29
1.4 GENETICS OF RENAL CELL CARCINOMA ........................................................................................................ 32
1.4.1 Inherited renal cancer ..................................................................................................................... 32
1.4.2 Additional genetic risks factors in RCC predisposition ................................................................... 32
1.4.3 Von Hippel-Lindau disease ............................................................................................................ 34
1.4.4 Hereditary leiomyomatosis and renal cell carcinoma ..................................................................... 38
1.4.5 Birt-Hogg-Dubé syndrome .............................................................................................................. 41
1.4.6 Hereditary papillary renal cell carcinoma ........................................................................................ 43
1.4.7 Succinate dehydrogenase renal cell carcinoma ............................................................................. 44
1.4.8 Tubular sclerosis complex .............................................................................................................. 46
1.4.9 Cowden syndrome ......................................................................................................................... 48
1.4.10 CDC73-Related disorders ............................................................................................................ 50
1.4.11 Non-syndromic renal cell carcinoma ............................................................................................ 51
1.5 SOMATIC VARIATION IN RENAL CELL CARCINOMA ........................................................................................... 53
1.5.1 Clear cell renal cell carcinoma ....................................................................................................... 53
1.5.2 Papillary renal cell carcinoma ......................................................................................................... 55
1.5.3 Chromophobe renal cell carcinoma ................................................................................................ 56
1.5.4 Epigenetics of renal cell carcinomas .............................................................................................. 57
1.6 INHERITED AND SOMATIC VARIANTS IN RENAL CELL CARCINOMA ...................................................................... 59
4
1.7 SEQUENCING IN RARE DISEASES ................................................................................................................. 62
1.7.1 Sequencing technologies ............................................................................................................... 62
1.7.2 Sequencing technologies - The right tool for the job ...................................................................... 64
1.7.3 Variant detection in rare disease .................................................................................................... 66
1.8 SUMMARY ................................................................................................................................................ 68
1.9 AIMS ....................................................................................................................................................... 70
2.0 MATERIALS AND METHODS .................................................................................................................. 71
2.0.1 – TABLE OF CONTENTS ........................................................................................................................... 72
2.0.2 LABOUR CONTRIBUTIONS ........................................................................................................................ 73
2.1 SAMPLE PREPARATION .............................................................................................................................. 74
2.1.1 Sample retrieval and extraction ...................................................................................................... 74
2.1.2 Sample source and storage ........................................................................................................... 74
2.1.3 Patient cohort description ............................................................................................................... 75
2.2 SAMPLE QUALITY CONTROL AND METRICS .................................................................................................... 76
2.2.1 DNA quantification.......................................................................................................................... 76
2.2.2 Whole genome amplification of low quantity samples .................................................................... 76
2.3 POLYMERASE CHAIN REACTION (PCR) METHODS ......................................................................................... 77
2.3.1 Primer design ................................................................................................................................. 77
2.3.2 Short range PCR ............................................................................................................................ 77
2.3.3 Nested PCR ................................................................................................................................... 79
2.3.4 Long range PCR primer design ...................................................................................................... 79
2.3.5 Long range PCR............................................................................................................................. 79
2.3.6 Gel electrophoresis ........................................................................................................................ 81
2.4 SANGER SEQUENCING ............................................................................................................................... 82
2.4.1 PCR product clean-up .................................................................................................................... 82
2.4.2 Sanger sequencing termination reaction ........................................................................................ 82
2.4.3 Isopropanol clean-up and DNA precipitation .................................................................................. 84
2.4.4 Sequencing analysis ...................................................................................................................... 84
2.5 POOLED AMPLICON CLEAN-UP .................................................................................................................... 85
2.6 DNA SEQUENCING AND LIBRARY PREPARATION ............................................................................................ 87
2.6.1 Illumina Nextera XT Library preparation and sequencing ............................................................... 87
2.6.2 Illumina TruSight Cancer library preparation and sequencing ........................................................ 87
2.6.3 Illumina TruSeq rapid exome library preparation and sequencing ................................................. 87
2.6.4 Whole genome sequencing by Novogene ...................................................................................... 88
2.6.5 Library preparation labour contributions ......................................................................................... 88
2.7 GENERALISED SEQUENCING PIPELINE.......................................................................................................... 89
2.8 VARIANT FILTERING AND ANNOTATION ......................................................................................................... 90
2.9 OXFORD NANOPORE TECHNOLOGIES SEQUENCING ...................................................................................... 92
2.9.1 Sample preparation and long-range PCR amplicon ....................................................................... 92
2.9.2 Nanopore sequencing library preparation ...................................................................................... 92
2.9.3 Nanopore bioinformatics ................................................................................................................ 92
3.0 SEQUENCING OF CANDIDATE GENES BY SANGER AND TARGETED NEXT GENERATION
SEQUENCING APPROACHES ....................................................................................................................... 93
5
3.0.1 - TABLE OF CONTENTS ............................................................................................................................ 94
3.1 INTRODUCTION ......................................................................................................................................... 95
3.1.1 – Candidate gene - CDKN2B ......................................................................................................... 95
3.1.2 – Candidate gene - EPAS1 ............................................................................................................ 97
3.1.3 – Candidate genes - KMT2C and KMT2D ...................................................................................... 98
3.1.4 Aims ............................................................................................................................................. 100
3.2 MATERIALS AND METHODS ....................................................................................................................... 101
3.2.1 Samples ....................................................................................................................................... 101
3.2.2 Sanger sequencing primer design and co-ordinates .................................................................... 101
3.2.3 PCR reactions and Sanger sequencing ....................................................................................... 101
3.2.4 Long range PCR........................................................................................................................... 101
3.2.5 Illumina Nextera XT library preparation for amplicon sequencing ................................................ 102
3.2.6 Primary bioinformatics .................................................................................................................. 102
3.2.7 Variant filtering, annotation, and classification ............................................................................. 102
3.2.8 Sequence identity comparison ..................................................................................................... 102
3.2.9 Statistics ....................................................................................................................................... 102
3.3 RESULTS ............................................................................................................................................... 103
3.3.1 Targeted Sanger sequencing - PCR product generation .............................................................. 103
3.3.2 Targeted Sanger sequencing – Variant analysis .......................................................................... 106
3.3.3 KMT2C & KMT2D targeted sequencing – Long range PCR product generation .......................... 109
3.3.4 KMT2C & KMT2D targeted sequencing – Library preparation and quality control ....................... 112
3.3.5 KMT2C & KMT2D targeted sequencing – Variant analysis .......................................................... 116
3.3.6 KMT2C & KMT2D Targeted sequencing – Off-target regions and read mapping ........................ 118
3.3.7 KMT2C & KMT2D Targeted sequencing – BAGE2 gene sequence comparison ......................... 120
3.3.8 Validation of KMT2C nonsense variant ........................................................................................ 120
3.4 DISCUSSION ........................................................................................................................................... 122
3.5 CONCLUSION .......................................................................................................................................... 128
4.0 CANCER GENE SEQUENCING OF INDIVIDUALS WITH FEATURES OF INHERITED RCC .............. 129
4.0.1 TABLE OF CONTENTS ............................................................................................................................ 130
4.1 INTRODUCTION ....................................................................................................................................... 131
4.1.1 Aims ............................................................................................................................................. 133
4.2 METHODS .............................................................................................................................................. 134
4.2.1 Patients ........................................................................................................................................ 134
4.2.2 DNA extraction and quantification ................................................................................................ 134
4.2.3 Library preparations and sequencing ........................................................................................... 134
4.2.4 Sequencing bioinformatics ........................................................................................................... 134
4.2.5 Variant filtering and prioritisation .................................................................................................. 134
4.2.6 Statistical Analysis........................................................................................................................ 135
4.2.7 Sanger sequencing ...................................................................................................................... 135
4.3 RESULTS ............................................................................................................................................... 136
4.3.1 Clinical features ............................................................................................................................ 136
4.3.2 Quality control and variant filtering ............................................................................................... 138
4.3.3 Detection variants in Group A cancer predisposition genes ......................................................... 140
4.3.4 Detection of variants in Group B cancer predisposition genes ..................................................... 141
6
4.3.5 Detection of variants in Group C cancer predisposition genes ..................................................... 144
4.3.6 Analysis of variants of uncertain significance ............................................................................... 146
4.4 DISCUSSION ........................................................................................................................................... 151
4.5 CONCLUSION .......................................................................................................................................... 155
5.0 GERMLINE WHOLE EXOME SEQUENCING OF INDIVIDUALS WITH FEATURES OF INHERITED
RENAL CELL CARCINOMA ......................................................................................................................... 156
5.0.1 TABLE OF CONTENTS ............................................................................................................................ 157
5.1 INTRODUCTION ....................................................................................................................................... 158
5.1.1 Single nucleotide variant analysis ................................................................................................ 158
5.1.2 Copy number detection ................................................................................................................ 159
5.1.3 Gene burden analysis .................................................................................................................. 159
5.1.4 Additional detection methods ....................................................................................................... 161
5.1.5 Aims ............................................................................................................................................. 162
5.2 MATERIALS AND METHODS ....................................................................................................................... 163
5.2.1 Patients ........................................................................................................................................ 163
5.2.2 DNA extraction and quantification ................................................................................................ 163
5.2.3 Library preparations and sequencing ........................................................................................... 163
5.2.4 Sequencing bioinformatics ........................................................................................................... 163
5.2.5 Variant filtering and prioritisation .................................................................................................. 164
5.2.6 Copy number variation detection .................................................................................................. 164
5.2.7 Population stratification and sample concordance ....................................................................... 166
5.2.8 Burden analysis ............................................................................................................................ 167
5.2.9 Short tandem repeat detection ..................................................................................................... 170
5.2.10 Mobile element insertion detection ............................................................................................. 170
5.2.11 Statistical methods ..................................................................................................................... 170
5.3 RESULTS ............................................................................................................................................... 171
5.3.1 Clinical features ............................................................................................................................ 171
5.3.2 Quality control and variant filtering ............................................................................................... 174
5.3.3 Truncating and splice site-affecting variants across all genes ...................................................... 178
5.3.4 Detection of SNVs in sporadic renal cell carcinoma genes .......................................................... 181
5.3.5 Detection of SNVs in metabolic genes associated with Krebs cycle ............................................ 185
5.3.6 Copy number alterations - Calibration of copy number pipeline ................................................... 187
5.3.7 Copy number alterations calibration - Evaluation of call rate, type I, and type II errors ................ 187
5.3.8 Copy number alterations – RCC copy number analysis ............................................................... 189
5.3.9 Gene burden analysis .................................................................................................................. 194
5.3.10 Short tandem repeat expansion analysis ................................................................................... 199
5.3.11 Mobile element analysis ............................................................................................................. 201
5.4 DISCUSSION ........................................................................................................................................... 203
5.5 CONCLUSION .......................................................................................................................................... 208
6.0 CHARACTERISATION OF RCC-ASSOCIATED CONSTITUTIONAL CHROMOSOMAL
ABNORMALITIES BY WHOLE GENOME SEQUENCING ........................................................................... 209
6.0.1 TABLE OF CONTENTS ............................................................................................................................ 210
6.1 INTRODUCTION ....................................................................................................................................... 211
7
6.1.1 Constitutional translocations in RCC ............................................................................................ 211
6.1.2 Constitutional translocations in other cancers .............................................................................. 213
6.1.3 Methods for translocation characterisation ................................................................................... 213
6.1.4 Summary ...................................................................................................................................... 214
6.1.5 Aims ............................................................................................................................................. 215
6.2 MATERIALS AND METHODS ....................................................................................................................... 216
6.2.1 Literature review ........................................................................................................................... 216
6.2.2 Clinical studies ............................................................................................................................. 216
6.2.3 Sequence alignment and variant calling ....................................................................................... 216
6.2.4 WGS Analysis: Candidate gene analysis and Breakpoint identification ....................................... 217
6.2.5 Nanopore sequencing of translocation breakpoints ..................................................................... 217
6.2.6 Sanger sequencing ...................................................................................................................... 217
6.2.7 Statistical tests ............................................................................................................................. 217
6.3 RESULTS ............................................................................................................................................... 218
6.3.1 Literature review of previously reported cases ............................................................................. 218
6.3.2 Clinical features of previously unreported cases .......................................................................... 227
6.3.3 Whole genome sequencing and bioinformatics ............................................................................ 230
6.3.4 Characterisation of constitutional rearrangements in previously unreported cases ...................... 230
6.3.5 Characterisation of translocation breakpoints utilising Nanopore sequencing .............................. 233
6.3.6 Computational evaluation of breakpoint-related genes ................................................................ 236
6.4 DISCUSSION ........................................................................................................................................... 238
6.5 CONCLUSION .......................................................................................................................................... 243
7.0 DISCUSSION ........................................................................................................................................... 244
7.0.1 TABLE OF CONTENTS ............................................................................................................................ 245
7.1 RESULTS CHAPTERS: CONSEQUENCES, ASSOCIATIONS, AND LIMITATIONS ..................................................... 246
7.2 GENERAL LIMITATIONS IN NEXT GENERATION SEQUENCING PROJECTS ........................................................... 252
7.3 FUTURE DIRECTIONS FOR THE DETECTION OF HERITABILITY IN RCC ............................................................. 255
7.4 CONCLUSION .......................................................................................................................................... 258
8.0 BIBLIOGRAPHY ..................................................................................................................................... 259
9.0 APPENDIX............................................................................................................................................... 279
9.0.1 TABLE OF CONTENTS ............................................................................................................................ 280
9.0.2 NOTES ON APPENDIX DATA .................................................................................................................... 281
9.1 CHAPTER 2 MATERIALS AND METHODS ...................................................................................................... 282
9.1.1 Next generation sequencing pipeline – FASTQ to VCF ............................................................... 282
9.1.2 Next generation sequencing pipeline – VCF filtering and annotation ........................................... 285
9.1.3 ONT Nanopore sequencing pipeline ............................................................................................ 295
9.2 CHAPTER 3 TARGETED SANGER AND AMPLICON SEQUENCING ..................................................................... 308
9.2.1 Sanger sequencing and long range PCR primers ........................................................................ 308
9.2.2 Sequence identity comparisons ................................................................................................... 310
9.2.3 Sequence alignment and quality metrics – KMT2C/KMT2C sequencing ..................................... 311
9.2.4 BAGE-family genes table ............................................................................................................. 312
9.2.5 KMT2C/BAGE2 conservation ....................................................................................................... 313
9.3 CHAPTER 4 CANCER GENE PANEL SEQUENCING ......................................................................................... 314
8
9.3.1 Cancer gene panel target list ....................................................................................................... 314
9.3.2 Sanger sequencing primers – BRIP1 ........................................................................................... 316
9.4 CHAPTER 5 WHOLE EXOME SEQUENCING .................................................................................................. 317
9.4.1 WES gene lists ............................................................................................................................. 317
9.4.2 HapMap sample list ...................................................................................................................... 320
9.4.3a CNV pipeline - main ................................................................................................................... 321
9.4.3b CNV pipeline - Reference interval file generation ....................................................................... 331
9.4.4 Miscellaneous scripts ................................................................................................................... 335
9.4.5 Burden testing scripts ................................................................................................................... 338
9.4.6 Burden testing results ................................................................................................................... 347
9.5 CHAPTER 6 RCC-ASSOCIATED TRANSLOCATIONS ...................................................................................... 351
9.5.1 Copy number and structural variant calling scripts ....................................................................... 351
9.5.2 IGV visualisations of translocation break point ............................................................................. 353
9.5.3 Sanger sequencing of translocation break points ......................................................................... 358
9.5.4 Translocation Manta structural variant calls ................................................................................. 360

9
Acknowledgements
The writing of this thesis has undoubtedly been the greatest labour of love I have undertaken in my
scientific career and I have numerous people to thank who have supported, educated, guided, and
most of all tolerated me over the last four years. After four years of dedicated work on human
genetics, inherited cancer, and bioinformatics, I am elated to still feel the same passion and curiosity
at the end of this journey that I felt when I began.
First and foremost, I wish to thank Professor Eamonn Maher for his mentorship, guidance, and
patience, as well as graciously allowing me to pursue my PhD whilst maintaining my role as a
research assistant. Professor Maher’s support and discussions have vastly improved my approach
to science, my understanding of human genetics, as well as continually challenged me to push
myself and develop my knowledge in an area of biology I adore. Secondly, I am grateful to Dr Marc
Tischkowitz, who as my second supervisor, provided me with productive discussions, insightful
comments, critiques on my experimental plans and scientific thinking, and always provided a
consistent and ever-present support system if I needed it.
I am exceptionally grateful and owe more thanks than I can possibly bestow to my friends and
colleagues that I have had the privilege of working with over the last four years. The conversations,
discussions, and collaborations I have made with all my colleagues have been invaluable for my
development and growth as a scientist. There are several people who deserve special mention for
supporting me in my academic endeavours and as such I would like to personally thank Dr Ruth
Casey, Dr Graeme Clark, Dr France Docquier, Dr Eleanor Fewings, Dr Mae Goldgraben, Dr Benoit
Lan-Leung, Dr Alexey Larionov, Dr Eguzkine Ochoa, Dr Hannah West, and Dr James Whitworth.
Finally, I would like to thank my family who have consistently supported my ambition of working in
science and have been endlessly understanding of my absences at family engagements, putting up
with my long explanations of what I am doing, and keeping me motivated. Without their support and
guidance, I am certain that I would not have had the will, drive, or opportunity to submit this thesis.

10
1.0 Introduction
11
1.0.1 Table of contents
1.0.1 TABLE OF CONTENTS ......................................................................................................................... 11
1.1 MEDICAL GENETICS: FROM MENDEL TO GENE THERAPY ............................................................... 13
1.1.1 DISCOVERY OF GENETICS ....................................................................................................................... 13
1.1.2 MODELS OF INHERITANCE ....................................................................................................................... 13
1.1.3 DE NOVO VARIANTS AND MOSAICISM ........................................................................................................ 14
1.1.4 LANDSCAPE OF GENETIC ALTERATIONS ..................................................................................................... 15
1.1.5 MEDICAL GENETICS IN THE PRESENT ........................................................................................................ 15
1.2 CANCER: A GENETIC DISEASE ............................................................................................................. 17
1.2.1 GENETIC ORIGIN OF CANCER ................................................................................................................... 17
1.2.2 HALLMARKS OF CANCER ......................................................................................................................... 20
1.2.3 GENETIC INHERITANCE OF CANCER .......................................................................................................... 22
1.3 RENAL CELL CARCINOMA ..................................................................................................................... 23
1.3.1 INCIDENCE ............................................................................................................................................ 23
1.3.2 MAJOR HISTOLOGICAL SUBTYPES ............................................................................................................ 24
1.3.3 TUMOUR STAGING .................................................................................................................................. 27
1.3.4 TUMOUR GRADE .................................................................................................................................... 27
1.3.5 SURVIVAL ............................................................................................................................................. 29
1.3.6 GENERALISED TREATMENT...................................................................................................................... 29
1.4 GENETICS OF RENAL CELL CARCINOMA ............................................................................................ 32
1.4.1 INHERITED RENAL CANCER ...................................................................................................................... 32
1.4.2 ADDITIONAL GENETIC RISKS FACTORS IN RCC PREDISPOSITION .................................................................. 32
1.4.3 VON HIPPEL-LINDAU DISEASE ................................................................................................................. 34
1.4.4 HEREDITARY LEIOMYOMATOSIS AND RENAL CELL CARCINOMA ..................................................................... 38
1.4.5 BIRT-HOGG-DUBÉ SYNDROME ................................................................................................................ 41
1.4.6 HEREDITARY PAPILLARY RENAL CELL CARCINOMA ...................................................................................... 43
1.4.7 SUCCINATE DEHYDROGENASE RENAL CELL CARCINOMA ............................................................................. 44
1.4.8 TUBULAR SCLEROSIS COMPLEX ............................................................................................................... 46
1.4.9 COWDEN SYNDROME .............................................................................................................................. 48
1.4.10 CDC73-RELATED DISORDERS .............................................................................................................. 50
1.4.11 NON-SYNDROMIC RENAL CELL CARCINOMA ............................................................................................. 51
1.5 SOMATIC VARIATION IN RENAL CELL CARCINOMA .......................................................................... 53
1.5.1 CLEAR CELL RENAL CELL CARCINOMA ....................................................................................................... 53
1.5.2 PAPILLARY RENAL CELL CARCINOMA......................................................................................................... 55
1.5.3 CHROMOPHOBE RENAL CELL CARCINOMA ................................................................................................. 56
1.5.4 EPIGENETICS OF RENAL CELL CARCINOMAS .............................................................................................. 57
1.6 INHERITED AND SOMATIC VARIANTS IN RENAL CELL CARCINOMA ............................................... 59
1.7 SEQUENCING IN RARE DISEASES ........................................................................................................ 62
1.7.1 SEQUENCING TECHNOLOGIES .................................................................................................................. 62

12
1.7.2 SEQUENCING TECHNOLOGIES - THE RIGHT TOOL FOR THE JOB .................................................................... 64
1.7.3 VARIANT DETECTION IN RARE DISEASE ..................................................................................................... 66
1.8 SUMMARY ................................................................................................................................................ 68
1.9 AIMS .......................................................................................................................................................... 70
13
1.1 Medical genetics: From Mendel to gene therapy
1.1.1 Discovery of genetics
Mendelian inheritance, as first described by Gregor Mendel in 1865 in the Proceedings of the Natural
History Society of Brünn (1), was the beginning of our understanding of how genetic traits and
phenotypic features were passed from one generation to the next and is widely considered the birth
of the field of genetics. Rapid developments in the understanding, models, and theories regarding
genetics and genetic inheritance led to the identification of genetic alterations, which could confer
detrimental or beneficial survival advantages, as explored by scientists such as Charles Darwin and
Thomas Hunt Morgan, amongst many other 20th century geneticists. The application of genetic
inheritance to human disease traits in the mid to late 20th century transformed our understanding of
various diseases, demonstrating that diseases could be investigated as underlying inheritable traits
and their genetic aetiology understood.
1.1.2 Models of inheritance
Genetic diseases, defined as a condition that manifests due to a genetic abnormality, occur at
varying levels of pervasiveness within human populations and at varying clinical severities. While
many genetic disorders follow Mendelian inheritance, multiple models of inheritance have now been
defined and implicated in human disease, including but not limited to, X and Y-linked inheritance,
co-dominant inheritance, mitochondrial inheritance, and polygenic or complex traits. Further
complexity is added by way of incomplete or partial penetrance of phenotypes, as well as specific
genotype-phenotype correlations. Penetrance, for example, is the probable likelihood for any given
genotype to result in a phenotype, where a genotype is considered 100% penetrant when its
associated phenotype is always present. Genotype-phenotype correlations describe the
phenomenon of different alterations in one gene loci resulting in different phenotypic presentations,
for example a lower risk of phaeochromocytomas in Von Hippel-Lindau disease if resulting from a
truncating mutation in the tumour suppressor gene VHL compared to a missense substitution (2).
14
1.1.3 De novo variants and mosaicism
De novo genetic events, as a result of newly acquired alterations during zygote formation, can lead
to disease phenotypes without being inherited from the parental genomes. In fact, all genetically
inherited diseases will have stemmed from an initial de novo mutational event, with subsequent
generations inheriting that disease-causing allele. De novo events often lead to increased disease
prevalence within isolated human populations due to founder effects (e.g. Ellis–van Creveld
syndrome in Amish populations (3)) as a consequence of increased endogamy and consanguinity
or, in the case of autosomal recessive sickle cell disease, caused by variants in β-globin (HBB) gene,
due to the selective advantage conferred in the heterozygous state to malaria infection (4). De novo
events can also result in mosaic alterations, depending upon which cellular division in embryonic
development that the alteration occurred in, resulting in two cell populations with differing genotypes
within the same organism. Mosaicism is subdivided into somatic and germline mosaicism, based on
the subset of cells affected, with somatic cells unaffected in germline mosaicism. Mosaicism is a
prevalent mechanism for the occurrence of genetic disease and potential for unusual inheritance
patterns in the case of germline mosaic variants, as reviewed by Forsberg and Gisselsson (2017)(5).
15
1.1.4 Landscape of genetic alterations
Genetic aberrations are heterogeneous in nature but include alterations such as chromosomal
aneuploidy, chromosomal rearrangements (e.g. translocations and inversion), epigenetic and
imprinting defects, copy number alterations, and single or small nucleotide base errors (e.g.
nucleotide substitutions, insertions, and deletions). The human genome is highly variable with every
individual harbouring thousands of inherited alterations and tens of de novo alterations (6), many of
which confer no phenotype or no known effect. For non-neutral variants, the alterations vary greatly
in how they mechanistically lead to disease phenotypes but they broadly lead to altered or absent
protein products either via 1) haploinsufficiency, in which a single functional gene allele is insufficient
to generate sufficient protein to perform its biological function, 2) recessive variant or bi-allelic
inactivation of a gene leading to insufficient or inactive protein products, or 3) generation of a
dominant negative effect in which the affected gene product interferes with wildtype protein functions,
all of which cause aberrations in downstream molecular pathways resulting in abnormal phenotypic
presentations.
1.1.5 Medical genetics in the present
Understanding genetic alterations and their role in genetic diseases has developed and transformed
into the field of medical genetics. Medical genetics is now a broad, multi-disciplinary, scientific field
focused on identifying, classifying, and diagnosing genetic disorders and seeking to provide clinical
prognoses, counselling, and treatment options for affected individuals and related family members.
Prognosis of any genetic disorder varies widely based on the disease, ranging from only a minor
impact on quality of life to severe life-long medical intervention. Genetic disorders, in general,
intrinsically do not have any known cures (i.e. methods to correct the causative genetic alteration)
due to the causative alterations being ubiquitous to every cell, though some success has been seen
in the treatment of genetic autoimmune diseases in bone marrow utilising gene therapy and marrow
transplants (7).
16
Treatments for genetic disorders focus on methods to alleviate or remove disease symptoms, slow
the advances of disorders which become progressively worse with time, and provide counselling for
affected individuals and their families regarding screening and prophylactic options, transplantation
of the affected organ, as well as family planning in regard to fertility and likely transmission rates for
offspring. Currently, medical genetics is focused on the application of personalised medicine for
clinical management and the development of gene therapies, in order to provide a curative option
for patients afflicted with genetic diseases. Utilisation of genomic sequencing to inform
pharmacological contraindications and responses (8), potential tolerances and responses to
treatment plans are already being implemented and used in cancer genomics through analysis of
tumour sequencing, allowing for targeted use of tumour-specific therapeutics (9).
Gene therapies are a recent form of therapeutic measures for genetic disorders that aim to directly
alter the genetics of an affected individual. Gene therapy can be applied by two distinct approaches,
either somatic or germline, where somatic is by far the most common. Somatic applications could be
used to fix genetic alterations in specific tissues or organs, such as lung epithelial tissue in cystic
fibrosis (10), where the effect is not permanent and based on the ability of delivery methods to reach
the affected cells. Germline methods function identically but occur by altering the DNA of germline
cells, meaning that alterations are heritable. Most recently, the application of CRISPR-Cas9
nucleotide base editing has been seen as potential milestone in gene therapy with the ability to
permanently repair mutations in genes causing diseases, with the resulting change present in
subsequent cell divisions, but there are a number of ethical and practical concerns, particularly
regarding germline applications (11).
17
1.2 Cancer: A genetic disease
Cancer is multi-systemic group of diseases resulting from abnormal and uncontrolled cellular growth
in any organ within the human body leading to tumour formation. Cancers, in contrast to benign
tumours, have malignant properties and can invade and metastasise to other tissues, leading to
organ failure and ultimately death.
1.2.1 Genetic origin of cancer
Cancers are, at the most fundamental level, a genomic disease and the occurrence and
accumulation of genetic alterations or alterations in epigenetic regulation. These alterations lead to
a cellular environment in which uncontrolled replication can occur, which in turn leads to growth of
tumour cells in the affected organ. In all cells, mutations and damage to DNA are acquired over time
through both endogenous and exogenous mechanisms but they are generally either successfully
repaired (12), detected by cell cycle check points (13), or the alterations are functionally neutral or
result in no change to fitness (14).
Genetic alterations in genes leading to cancer development are defined by altering either one of two
core types of genes, tumour suppressor genes (TSGs) or oncogenes, which function in opposing
roles in the prevention and promotion of cellular proliferation and survival. TSGs are classically
associated with the transcription of proteins, which act to negatively regulate pathways involved in
cell cycle progression, replication, and positive regulation of pathways inducing apoptosis or cellular
senescence. Tumour suppressor genes are consistently inactivated by genetic alterations in cancer
cells, resulting in a loss of these functions. Conversely, proto-oncogenes (termed oncogenes after a
causal genetic alteration has occurred) serve to negatively regulate apoptotic pathways and are
positive drivers of cell cycle progression and division. Alterations in oncogenes, in contrast to TSGs,
are not inactivating and act to either increase the function of the transcribed protein, cause
constitutional protein activity, or elevate transcription rates, leading to further upregulation of their
target molecular pathways.
18
The identification of both TSGs and oncogenes led to the development of hypothesises on how an
acquired genetic alteration can specifically result in carcinogenic transformation. Knudson’s two-hit
hypothesis is regarded as one of the pivotal discoveries in cancer biology stating that loss or
inactivation of a single TSG allele is insufficient to result in cancer and a secondary ‘hit’ to inactivate
the remaining wild type allele is needed for cancer to develop (15). As with any rule there are
exceptions, such as TSGs expressing dominant negative effects or haploinsufficiency (16), but most
TSGs conform to this theory with secondary hits via additional inactivating variants or chromosomal
deletions (which result in loss of heterozygosity (LOH)) of the remaining wild type allele.
Proto-oncogenes typically do not follow the same two-hit hypothesis and most are dominant in
nature, with a single activating event sufficient to initiate oncogenic processes. In many cases, the
loss of TSGs and activation of proto-oncogenes act in concert to drive tumour initiation, which
consequently results in increased clonal expansion and genetic alterations to drive tumour
evolution through acquired driver mutations. The process of clonal expansion and tumour evolution
is not dissimilar to evolution that occurs at a species level, with acquired mutations conferring or
reducing survival advantages for sub-clones of the initiating tumour cell (17). These features of
tumour development resulted in the emergence of cancer cell traits termed the “hallmarks of
cancer”, a series of biological processes by which cancers can expand, survive, and resist
detection and death (18).
19
Lastly, temporal distribution over which the first initiating event and the progression towards
oncogenic potential occur, has been recently highlighted by the assessment of mutational profiles
in normal tissues. Evidence for the occurrence of cancer driver mutations found clonally in normal
tissues, such as skin and oesophageal, have demonstrated that driver mutations in both proto-
oncogenes and tumour suppressors have been found in a large proportion of normal cells,
increasing with age and exposure to exogenous mechanisms of DNA damage. These mutations
were observed to have occurred as early as infancy, indicating that initiating event occur and
persist over large temporal spans but cells harbouring these driver variants lacked additional
oncogenic features such as higher mutational burden and chromosomal instability seen in cancer
cells of the respective tissues (19–21). Furthermore, assessment of the timing of mutational events
seen in clear cell RCC in the TRACERx renal study demonstrated that initial clonal expansion
consists of only a few hundred cells harbouring a 3p loss initiating event, occurring upwards of 20
years prior to inactivation of VHL (considered to be the second hit). Following the inactivation of
VHL, diagnosis of clear cell RCC was not found until between 10-30 years after numerous
additional driver events had occurred (22). The importance of the temporal distribution of driver
events is that cancer cells, relative to cancer at a patient-level, have extremely low penetrance and
rarely result in a tumour.
20
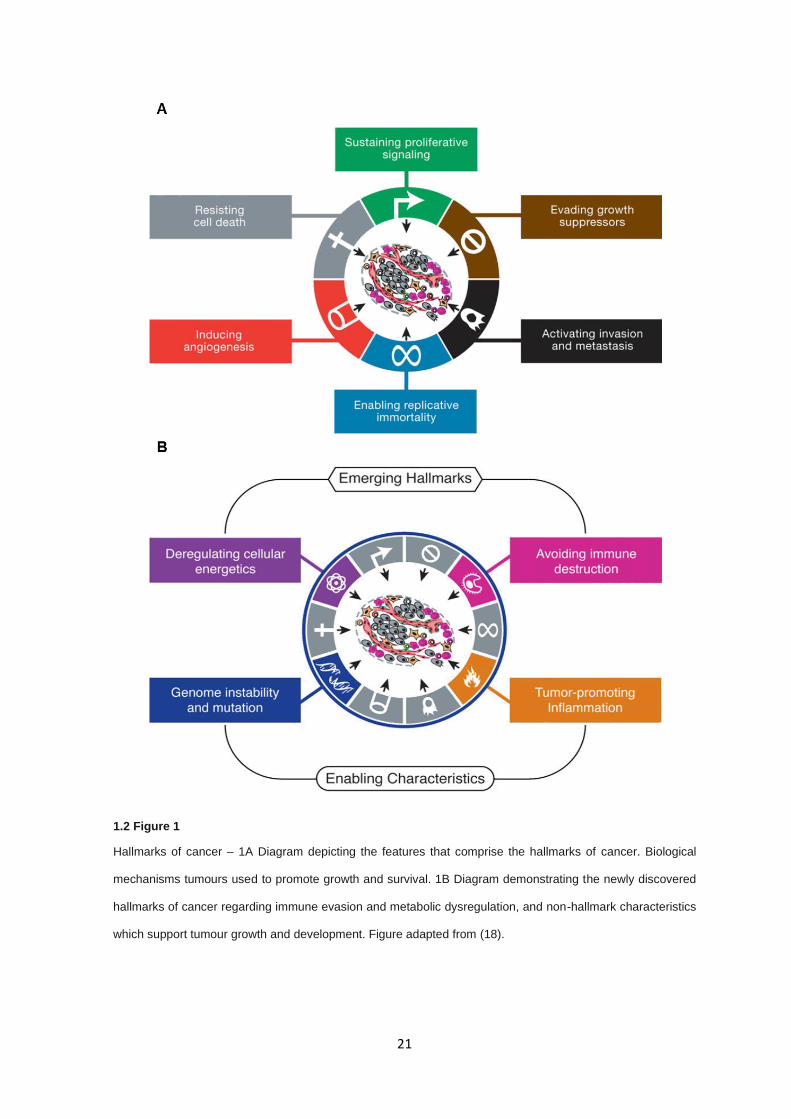
1.2.2 Hallmarks of cancer
The hallmarks of cancer, as reviewed by Hanahan & Weinberg (2011)(18), are a set of biological
features that are intrinsically linked to tumour initiation and development, acting to drive tumour
proliferation or hinder pathways and external mechanisms that would act moderate, attenuate, or
prevent tumour growth. Different cancers utilise different constituents of the hallmarks, manipulating
both intracellular pathways and the external surrounding tissues and making use of different
molecular networks and mechanisms to sustain cellular proliferation, the consequences of which
drive the diversity in both cancer types, histologies, and prognoses. The hallmarks of cancer are not
a definitive list of factors that drive cancer but a robust framework that acts to categorise the broadest
number of molecular features that can drive tumour progression (see 1.2 Figure 1).
Loss of control of biological processes such as proliferative signalling, induction of replicative
immortality by activation of telomerases, and the promotion metabolically favourable intracellular
conditions act to increase cellular growth and replication. In tandem, disruption of cellular
mechanisms functioning as growth suppressors through cell cycle checkpoints and negative
feedback loops, resisting cell death via inhibition or inactivation of apoptotic signalling pathways, and
the avoidance of immune destruction through dysregulation of cell surface markers and extracellular
signalling, act to reduce cancer cell death by either internal molecular routes or external immune
detection. Finally, tumours utilise the surrounding stromal tissue to establish a supportive
environment for growth and development by inducing angiogenesis via activation of angiogenic
pathways and prompting local inflammatory responses, which aid in tumour development, the
consequence of which leads to the formation of a tumour microenvironment in which cellular growth,
clonal expansion and evolution, and tissue invasion can flourish. The ability to be invasive and cause
metastases is a distinct property of cancers, making this hallmark potentially the most significant in
terms of disease mortality. While many benign tumours utilise the hallmarks of cancer sustain and
promote their growth, local and distal invasion through increased motility and large-scale changes
to underlying cellular subtype, as such the epithelial-mesenchymal transition (EMT), are properties
only exploited by cancers. These two traits are the greatest contributors to the lethality of cancers
with almost all cancers showing significant decreases in survival metrics once metastatic disease
has occurred (23).
21
1.2 Figure 1
Hallmarks of cancer – 1A Diagram depicting the features that comprise the hallmarks of cancer. Biological
mechanisms tumours used to promote growth and survival. 1B Diagram demonstrating the newly discovered
hallmarks of cancer regarding immune evasion and metabolic dysregulation, and non-hallmark characteristics
which support tumour growth and development. Figure adapted from (18).
22
1.2.3 Genetic inheritance of cancer
While cancers most frequently occur sporadically, with incidence rates increasing proportionally to
age in line with random acquisition of genetic variation and exposure to environmental factors,
familial inheritance of cancers and susceptibility to cancers is well documented. A predisposition to
cancer is most commonly identified by a strong family history of one or several cancer types within
a pedigree but is also signified by a reduction in the average age of onset in the presenting
individuals, or the presentation of multifocal or bilateral tumours. In many cases, these features
present concurrently, with family histories containing individuals presenting with earlier onset and
multiple tumours on presentation.
The mechanism for cancer development in an inherited disease is essentially identical to that of
sporadic cases in regard to the genetic mechanisms and subsequent biological changes which result
in oncogenesis, although the age of onset and cancer-specific presentations can differ, for example
inheritance of a null TP53 allele results in Li-Fraumeni syndrome (24), a syndrome characterised by
predisposition of a number of rare cancer types. Conversely, sporadic occurrences of TP53
mutations results in more common cancer types such as small cell lung, oesophageal, and ovarian
cancers (25). Inheritable cases of cancer arise due to the inheritance, or in some cases de novo
acquisition, of a constitutional variant in a TSG or proto-oncogene. The stable presence of a non-
wild type TSG allele in all cells has a significant impact on the probability of tumour development; for
TSGs, the barrier for complete allelic loss (as proposed in Knudson’s two-hit hypothesis) is halved
as only one somatic inactivating variant is required in the remaining wild type allele, rather than two
as required in sporadic cases (15). For proto-oncogenes the process is similar; constitutional variants
in proto-oncogenes overcome the requirements for somatic activation by already being
constitutionally active and only requiring the loss of additional TSGs or the correct cellular
environments to allow for tumour progression. Many syndromes associated with cancer risk
phenotypically display an array of non-cancer pathologies as a result of a non-wild type allele in
genes with multiple biological functions (26). Conversely, several cancer predisposition phenotypes
only manifest as a predisposition to cancer development, despite most associated genes having
functions outside of the remit of a TSG or oncogene, such as BRCA1 DNA repair associated and
BRCA2 DNA repair associated (BRCA1 and BRCA2) in Hereditary breast–ovarian cancer
syndrome (27).
23
1.3 Renal cell carcinoma
1.3.1 Incidence
Renal cell carcinoma (RCC) is the most frequent form of kidney cancer accounting for more than
90% of diagnosed cases, the remaining of which includes cancers of the renal medulla and
transitional cell carcinomas of the renal pelvis. Kidney cancers account for approximately 2% of new
cancer diagnoses and 1.5% of cancer deaths per year, globally (28). RCC occurs on average at 64
years of age (29), with age of onset being significantly lowered in individuals presenting with RCC
predisposition syndromes (30). Life time risk for individuals in the United Kingdom are estimated at
3% for males and 2% for females (31), with approximately 34% of cases being defined as
preventable (attributed to lifestyle and environmental factors) (32).
The primary lifestyle factors attributable to RCC risk are increased body mass index (BMI; kg/m2)
and tobacco usage. Increased BMI results in combined relative risk increases for both sexes of 28%
and 77% for overweight and obese individuals, respectively. BMI-linked RCC risk is biased towards
females with increased risk at 38% compared to 22% in overweight individuals and 95% compared
to 63% in obese individuals (33). Tobacco usage has also been showed to provide increased risk
for RCC development with a relative risk increase of 16-36% for tobacco users compared to never-
smokers (34). Other lifestyle and environmental factors for RCC risk include hypertension (35),
acquired cystic kidney disease (36), diabetes (37,38), non-prescription analgesic usage (39), poor
dietary choices (40,41), and exposure to specific chemical compounds (42,43).
Kidney cancer has seen the greatest increase in age-standardised incidence rate (ASIR) among all
cancers, having seen a 23% increase in incidence between 1990 and 2013. Furthermore, kidney
cancer occurs more readily in developed countries but has seen a similar increases of 34% and 36%
in incidence rates between both developing and developed countries, respectively (28). Increases in
ASIRs for kidney cancer may be attributable to increased rates of obesity (44), particularly in
developed countries, which is directly linked to poor dietary choices (45), as well as compounding
other risk factors such as hypertension (46) and diabetes (47). Moreover, kidney cancers have been
historically difficult to detect due to being relatively asymptomatic until late in tumour progression
(48), meaning technological advances such as use of abdominal ultrasound imaging, improved
screening, and increased life expectance may lead to a greater proportion of kidney cancers being
reported.
24
1.3.2 Major histological subtypes
Though RCC is broadly discussed as a singular disease, it is more accurately defined as collection
of renal neoplasms with distinct morphologies, molecular mechanisms, and genetic backgrounds.
According to the International Society of Urological Pathology (ISUP) more than 15 histological
subtypes of RCC can be defined but a majority of cases are categorised into three primary groups;
clear cell RCC, papillary RCC, and chromophobe RCC, which accounts for a vast majority of all RCC
cases (49) (1.3 Figure 2).
Clear cell RCC is the most commonly diagnosed histological subtype of RCC with an occurrence
rate of 63-83% of all RCC cases (50,51). Clear cell RCC occurs more predominantly in males than
females (1.5-3:1 male to female ratio) and has its highest incidence between 60 and 70 years of age.
Clear cell RCC is thought to originate from epithelial cells of proximal convoluted tubule and is
defined by large clear cytosolic cell body due to lipid accumulation (52,53). In term of gross
morphology, clear cell RCCs are solid, yellow tumours with a high degree of vascularisation (54).
Clear cell RCC has the worst clinical prognosis compared to both papillary RCC and chromophobe
RCC, with cancer-specific 5 years survival rates being 68.9%, 87.4%, and 86.7%, respectively (55).
The most frequent tumour stage at diagnosis in clear cell RCC is stage I but some studies reported
inconsistently, with stage III in two European studies (54,56) but stage I in a Japanese cohort (57).
Papillary RCC is the second most common histological subtype of RCC reported, split into two further
subtypes type 1 and type 2, accounting for 11-18.5% of all RCC (50,51). As discussed in relation to
clear cell RCC, type 1 papillary RCC have better prognoses and are clinically less aggressive (55),
where type 2 papillary RCC are similar in clinical presentation. In similarity to clear cell RCC, patients
most frequently report at stage I and at a median age of 65 (55). The two subtypes are designated
as basophilic (type 1), due to the presence of small hyperchromatic basophiles with minimal
cytoplasm, and eosinophilic (type 2) resulting from the presence of tumour cells with abundant
eosinophilic cytoplasm (58). Morphologically, papillary tumours are solid, well-demarcated with
minimal vascularity, particularly compared to clear cell RCC, and are slow growing (59). Differences
between type 1 and type 2 papillary RCC, while they present at similar frequencies, are that type 2
papillary RCC more frequently present at higher grades and has markedly worse survival outcomes
compared to type 1 (50).

25
Chromophobe RCC occurs in 5-6% of reported RCC tumours (50,51) and is considered the least
aggressive subtype of the three major subtypes (55), with 5-year survival rates as high as 94% (51),
and metastasis only seen in a small proportion of cases (58). Histologically, chromophobe RCC
consists of large cells with webbed cytoplasm and haloed nuclei. Conversely to clear cell and
papillary RCC, chromophobe RCC appears to occur more frequently or equally in females and
occurs most frequently at lower stages, rarely being diagnosed at stage III or IV (50,55).
Additional histological subtypes of RCC do occur but most are rare relative to the frequency of the
three primary types already discussed. These subtypes include, but are not limited to, clear cell
tubulopapillary RCC, a histological subtype with characteristics similar to that of both clear cell RCC
and papillary RCC (60). MiT-family translocation RCC, a subtype driven by recurrent somatic
translocations of Transcription Factor Binding To IGHM Enhancer 3 (TFE3) on Xp11.2 and
t(6;11)(p21;q12) translocations involving Transcription Factor EB (TFEB), as well as Melanocyte
Inducing Transcription Factor (MITF) and Transcription Factor EC (TFEC) (61). Mucinous tubular
and spindle cell carcinoma, subtype with strong similarities to papillary RCC but recently described
as a distinct histological subtype, reviewed by Zhao et al. (2015)(62). Lastly, succinate
dehydrogenase (SDH)-deficient RCC tumours, caused by loss of the SDH complex components, are
a recently classified histological subtype of RCC defined by distinctive eosinophilic inclusions
corresponding to giant mitochondria (49).
A histological feature that appears independently of histological subtype but has a substantial effect
on prognosis is presence or absence of sarcoma-like histology. Approximately 1-5% of RCC tumours
consist of a sarcoma-like or sarcomatoid histology which is strongly associated with a much poorer
prognosis compared to other histologies alone (63). While not consistently attributable to a single
primary histological subtype, sarcomatoid RCC is more frequent in chromophobe RCC histologies
though comprehensive data is limited (64,65). Sarcomatoid RCC is linked to a shift from an epithelial
to mesenchymal phenotype (EMT) (66) and EMT is linked with metastatic potential and increases in
mobility and invasiveness (67), explaining the increase in aggressiveness of RCC tumours with any
sarcomatoid histology present.
26
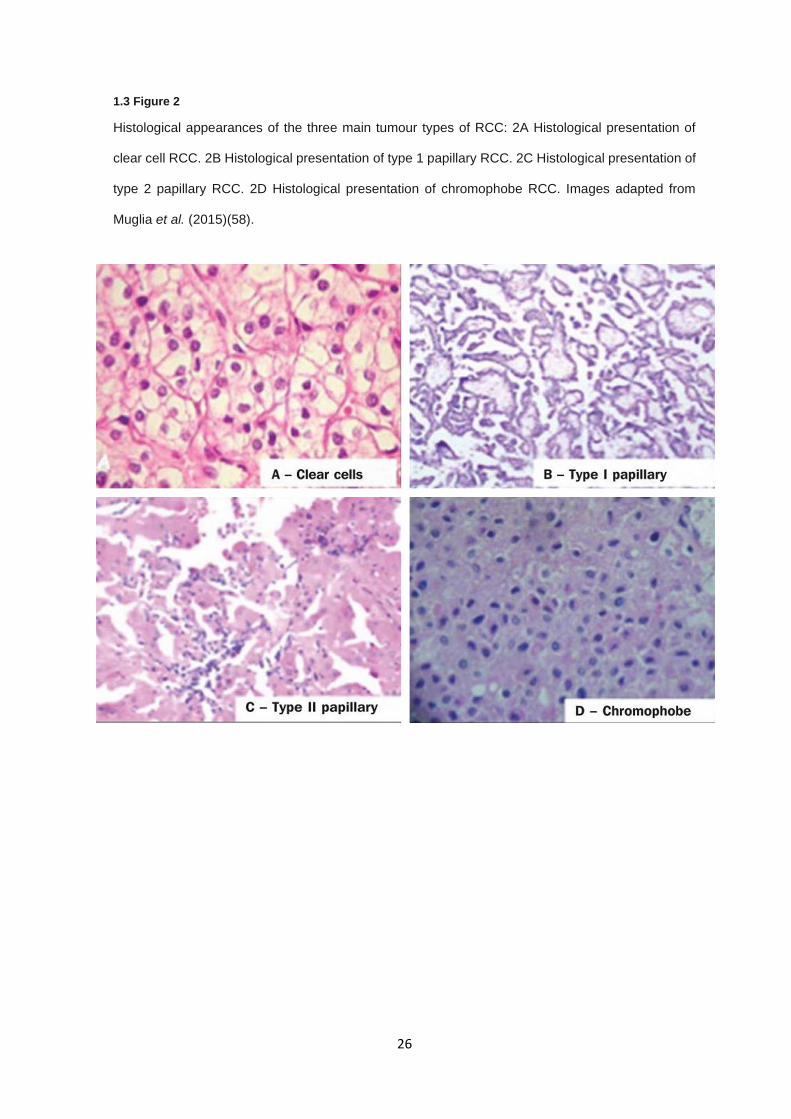
1.3 Figure 2
Histological appearances of the three main tumour types of RCC: 2A Histological presentation of
clear cell RCC. 2B Histological presentation of type 1 papillary RCC. 2C Histological presentation of
type 2 papillary RCC. 2D Histological presentation of chromophobe RCC. Images adapted from
Muglia et al. (2015)(58).
27
1.3.3 Tumour staging
Typically RCC is staged according to the degree of tumour spread throughout the body, where
tumour size and invasiveness are taken into account (68). RCC stage is characterised and
designated by classifications laid out by the American Joint Committee on Cancer as a combinatorial
function of tumour size (T0-4), lymph node metastasis (NX, N0, or N1), and distant metastasis (M0
or M1) (69). 1.3 Table 1 describes the TNM system and its associated staging.
1.3.4 Tumour grade
The prognostic value of RCC tumour grades has long been recognised and widely utilised as a metric
for outcome prediction and tumour progression rates (70). Tumour grading based on microscopic
cellular morphology and differentiation of tumours acts as a surrogate for numerous underlying
molecular and biochemical processes that influence the prior factors. Classically, RCC tumours have
been widely graded by the Fuhrman grading system (71) but more recent studies have demonstrated
that Fuhrman grading inadequately models tumour differentiation and that grading based on
individual histological subtype is more representative of predicted disease progression (49).
Current grading of RCC tumours was proposed jointly by the world health organisation (WHO) and
ISUP in 2012, with clear cell and papillary RCC being graded independently using nucleolar
prominence and tumour necrosis for clear cell and nucleolar prominence only for papillary (72). Due
to poor correlation with grading parameters (73) it was suggested that chromophobe grading should
not be performed (49). With all other histological subtypes, application of ISUP grading guidelines is
considered challenging due to lack of large enough cohorts to perform stratified analysis to inform
survival predictions.
28
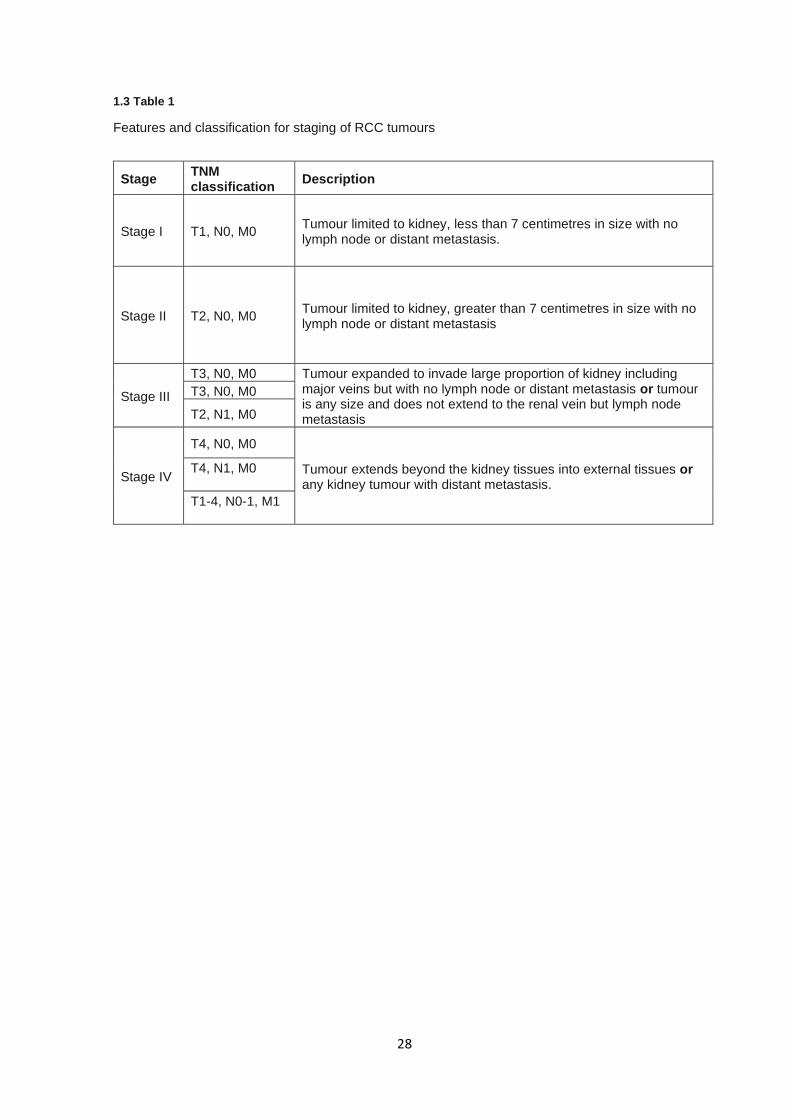
1.3 Table 1
Features and classification for staging of RCC tumours
Stage TNM classification
Description
Stage I T1, N0, M0 Tumour limited to kidney, less than 7 centimetres in size with no lymph node or distant metastasis.
Stage II T2, N0, M0 Tumour limited to kidney, greater than 7 centimetres in size with no lymph node or distant metastasis
Stage III
T3, N0, M0 Tumour expanded to invade large proportion of kidney including major veins but with no lymph node or distant metastasis or tumour is any size and does not extend to the renal vein but lymph node metastasis
T3, N0, M0
T2, N1, M0
Stage IV
T4, N0, M0
Tumour extends beyond the kidney tissues into external tissues or any kidney tumour with distant metastasis.
T4, N1, M0
T1-4, N0-1, M1
29
1.3.5 Survival
Overall survival rates for kidney cancer are approximately 72.4%, 56.2%, and 49.5% for 1-year, 5-
year, and 10-year survival, respectively. Survival rates for kidney cancers are strongly dependent on
tumour stage, grade, and histological subtype, as discussed previously. Survival declines sharply if
diagnosed at stage III or IV, with 5-year survival of 92.6% at stage I compared to 68.7% at stage III
and only 11.6% at stage IV (29). 5-year survival is also impacted by age of diagnosis where
individuals diagnosed before 45 years of age have a net survival rate of 87.8% compared to only
67.5% for those over 65 years of age (29).
1.3.6 Generalised treatment
While discussing all potential therapeutic routes and methods currently available for RCC is beyond
the scope of this thesis, this section covers the general patterns and principles guiding RCC
treatments as summarised from clinical guidelines (74).Treatment for RCC cases is generally
directed by tumour stage at presentation, with surgical intervention being the most effective current
treatment option. Surgical resection by partial, simple, or radical nephrectomy to remove tumour
tissue with increasing amount of the surrounding normal kidney based on tumour spread, is the first
line treatment for RCC where a lymphadenectomy is typically performed in stage III cases to remove
affected regional lymph node tissues (74). In stage IV tumours use of radical nephrectomy is still
widely used though is usually palliative due to tumour metastasis or tumour embolisms into the
circulatory system, and where resection of distance metastases is also performed where applicable
(74).
Across all stages, targeted therapeutic agents are deployed as both first- and second line treatments
for RCC. Anti-angiogenic agents, such as sunitinib and pazopanib, which target vascular endothelial
growth factor receptor (VEGFR), are commonly used in RCC due to known upregulations in
angiogenic pathways driven by VEGFR and other kinases in RCC tumours (75,76). Most targeted
therapeutic agents of this type are multi-kinase inhibitors and target VEGFR and its various isoforms,
as well as epidermal growth factor receptor (EGFR), Platelet-derived growth factor receptor
(PDGFR), mast/stem cell growth factor receptor (KIT), and hepatocyte growth factor receptor (MET)
tyrosine kinases (77–79).
30
Further targeted pharmaceutical agents, such as temsirolimus and everolimus, have been design to
target and inhibit mammalian target of rapamycin (mTOR) (80,81) due to its function in cell growth,
proliferation, and cell motility via the PI3K-AKT-mTOR pathway which includes proteins coded by
RCC-associated genes (82). Most recently, the development of Hypoxia inducible factor 2 alpha
(HIF2-α) antagonists has shown potential in down regulation of angiogenic pathways in metastatic
RCC with substantial pre-treatment with other agents (83). Phase I clinical trials utilising these
compounds have demonstrated their tolerability as well as some moderate evidence for disease
progression attenuation (84).
Immune therapy utilising monoclonal antibodies have been used as second line treatments for
individuals with RCC (74). Use of antibodies, such as ipilimumab and nivolumab show increased
overall survival and act to impair immune checkpoint mechanisms by inhibiting proteins Programmed
death-ligand 1 (PD-1) and cytotoxic T-lymphocyte-associated protein 4 (CTLA-4), resulting in
reduced cancer immune evasion (85,86). Additional treatments such as bevacizumab have also
been used to target VEGFR, therefore blocking angiogenic pathways in a manner similar to that of
sunitinib and pazopanib (87). Cytokine-based therapies have also been used for the treatment of
RCC to augment immune response to cancer cells. Cytokines such as interferon-α and interleukin-
2 have been widely given as conjunctive first line therapies with targeted therapeutic agents, though
overall efficacy is modest (74).
31
Though therapeutic routes for many RCC patients are relatively effective, particularly in early stage
diagnosis with high disease free and overall survival, therapeutic resistance is a well-documented
outcome in metastatic RCC treatment in both clear cell (88) and non-clear cell subtypes (89).
Resistance to tyrosine kinase inhibitors, such as sorafenib and sunitinib, which antagonise cell
surface receptors VEGFR and PDGFR to supress angiogenic response, occurs frequently in
metastatic RCC after 6-12 months (90), leading to disease progression despite continued treatment.
While the mechanism of resistance is not fully elucidated, there are several proposed routes by which
advanced RCC develop therapeutic resistance including drug resistance through reduced uptake or
lysosomal sequestration (91,92), activation of alternative angiogenic pathways (93), and
upregulation of pro-angiogenic cytokine Interleukin-8 (94). The effects of the tumour
microenvironment has also been implicated in resistance through external expression of VEGF via
pericytes supporting angiogenic growth in surviving endothelial cancer cells (95) and the recruitment
of pro-angiogenic inflammatory cells to the tumour site (96). More recently, EMT and its associated
transcriptional and morphological changes have been implicated as a mechanism of tyrosine kinase
inhibitor resistance, with suppression of EMT-related gene expression resulting in attenuated
therapeutic resistance in cell models (97).
32
1.4 Genetics of renal cell carcinoma
A number of Mendelian causes of RCC have been described and there is also evidence for the
involvement low penetrance susceptibility alleles in RCC predisposition. In this section I will first
describe Mendelian disorders associated with susceptibility to RCC and the results of GWAS studies
for susceptibility alleles.
1.4.1 Inherited renal cancer
Though a majority of RCC cases are sporadic in origin, an estimated 2-4% of RCC cases are due to
an inherited disorder (98). This minority of cases has been highly informative in sporadic cases for
the determination of involved molecular and genetic pathways that are affected in RCC (99), as well
as potential therapeutic targets for curative or palliative treatment (76,81,100). A summary of the
different syndromic and non-syndromic RCC predisposing conditions is provided in 1.4 Table 2 and
are discussed in further detail below.
1.4.2 Additional genetic risks factors in RCC predisposition
Family history of RCC is a significant risk factor with a relative risk of RCC incidence being at least
2.2 fold greater in individuals with a family history of kidney cancer (101). Regardless of familial
history, early presentation of RCC is a strong indication of predisposition, with early onset being
predictive of a positive detection of a pathogenic variant in a RCC predisposition gene (102). Lastly,
presentation of RCC with multiple foci or bilateral occurrence is also a common indication of genetic
predisposition of RCC with a significantly increased occurrence in comparison to sporadic cases
(103). In an assessment of heritability of RCC in Icelandic populations, 58% of RCC cases were
found in families with 2 or more affected family members, with increased relative risk for siblings and
parents, particularly if incidence was prior to 65 years of age (104). Nordic twin studies have also
validated the genetic component of RCC within families with a reported heritability of 38% (95% CI,
21%-55%), with no significant contribution from a shared environment (105).
33
In addition to the rare Mendelian causes of RCC predisposition described above, several studies
have attempted to identify risk loci through genome wide association studies (GWAS) of RCC
patients but, in contrast to the large number of susceptibility alleles identified for breast and colorectal
cancers, there have been a limited number of loci identified as predisposing to RCC. Two SNPs
(rs11894252 and rs7579899) found at 2p21 were shown to be associated with RCC risk and were
present within intron 1 of Endothelial PAS Domain Protein 1 (EPAS1; HIF2-α) with an odds ratio
(OR) = 1.18, a gene with inherent links to carcinogenic mechanisms in RCC (106,107), as well as
an additional locus at 11q13.3 (rs7105934) associated with reduced risk (108). Fine mapping of the
region surrounding 2p21 and detailed single nucleotide polymorphism (SNP) imputation, three
further SNPs (rs4953346, rs12617313 and rs9679290) which were not correlated with the SNPs
reported previously (108), were associated with RCC risk and suggest a complex haplotype
surrounding EPAS1 (109).
A follow-up study, which included meta-analysis of both studies (108,110), confirmed both previously
described loci as risk loci in RCC on 2p21 and 11q13.3, and suggested two additional SNPs in
linkage disequilibrium on 12p11.23 (rs718314 and rs1049380) located proximally to the gene Inositol
1,4,5-Trisphosphate Receptor Type 2 (ITPR2) (110). Analysis of clinical features of individuals
carrying rs7105934 on 11q13.3 and rs1049380 on 12p11.23 demonstrated increased and reduced
age of onset in RCC patients, respectively (111). A GWAS study in Icelandic participants further
elucidated risk loci for RCC, identifying a dinucleotide SNP (rs35252396) on 8q24.1, in the vicinity
of MYC proto-oncogene, BHLH transcription factor (MYC), conferring an OR = 1.27 which had
already been associated with other cancer types (112). Several additional studies then identified risk
loci on 2q22.3, associated with rs12105918 in intron 2 of Zinc Finger E-Box Binding Homeobox 2
(ZEB2), and on 1q24.1, associated with rs3845536 within intron 4 of Aldehyde Dehydrogenase 9
Family Member A1 (ALDH9A1) (113,114). Association studies have also identified that risk loci on
11q13.3 are able to modify the binding of HIF to the transcriptional enhancer of cyclin D1 (CCND1)
(115) and that SNPs rs1944129 and rs7177 found within CCND1 may contribute towards RCC
risk in Chinese populations (116). Most recently, association studied have demonstrated an
association between cumulative SNPs linked to increased leukocyte telomere lengths and risk of
RCC, implicating several additional loci with RCC risk (117).
34
The calculated population statistics and the limited risk conferred by common SNPs suggests that
2-4% of RCC cases linked to predisposition is likely an underestimate and there remains a relatively
large unexplained proportion of heritability. Underestimation of heritability is supported by recent
assessments of patients meeting genetic referral, where consensus referral criteria provided by the
American College of Medical Genetics (ACMG) across two independent RCC cohorts resulted in 24-
33.7% individuals in which their clinical features and histological findings would make them eligible
for genetic testing (118), suggesting that many individuals with heritability may not be referred for
genetic analysis in the first instance.
1.4.3 Von Hippel-Lindau disease
Von Hippel-Lindau disease (VHL; OMIM: 193300) is an inherited, autosomal dominant syndrome
associated with predisposition to multiple benign and malignant tumour types. Individuals with VHL
disease are subject to a range of clinical features including haemangioblastomas of the nervous
system and retina, renal cysts, clear cell RCC, phaeochromocytomas (PCCs), cystadenomas,
pancreatic neuroendocrine tumours, and endolymphatic sac tumours (119,120). VHL disease is a
rare condition, at a prevalence of 1:39,000-91,000 and a birth incidence of 1:22,000-42,987
(121,122). Though VHL disease predisposes to various clinical features and multiple tumour types,
clear cell RCC has a cumulative lifetime risk of ~70%, at a mean age of 44 years (123,124).
VHL disease was first described by Treacher Collins in 1894 who described two siblings with
retinal haemangioblastomas (125). Studies in 1904 by Eugen von Hippel and further
characterisation by Arvid Lindau in 1927 solidified the clinical features of VHL disease but the
genetic cause was not uncovered until a century after the initial description. Comparisons made
between the age of onsets in sporadic RCC cases and VHL disease cases suggested that the
genetic component responsible for VHL was a tumour suppressor following Knudson’s two-hit
hypothesis (30), and loss of 3p in RCC was suggestive that this region contained the causal gene
(126). Subsequent gene mapping, determination of the gene loci from collections of co-segregating
disease-specific loci, led to the discovery of the gene von Hippel-Lindau (VHL) on the short arm of
chromosome 3 at 3p25.3 (127). Investigations into mutational patterns in VHL disease patients and
sporadic RCC cases revealed frequent inactivation of VHL and LOH in tumours, confirming it as a
primary cause for RCC in both VHL disease and sporadic RCC cases (128,129).
35
A majority of individuals with VHL disease present with a family history of VHL with dominant
inheritance of the affected VHL allele, though de novo variants and mosaicism is estimated to
occur in 23% of cases (130,131). Interestingly, pathogenic alterations in VHL are also associated
with familial erythrocytosis type 2 (ECYT2; OMIM: 263400), an autosomal recessive condition
caused by homozygous or compound heterozygous specific missense variants in both VHL alleles
(132) with little to no overlap of the clinical features with those of VHL disease (133).
Pathogenic variants in VHL are remarkably penetrant at the patient-level (contrary to cellular
penetrance described earlier) with individuals developing at least one VHL-related cancer before 65
years of age in approximately 80-90% of cases (122,123). VHL disease is broadly categorised into
four subtypes, corresponding to differential phenotypic presentations concentrated on presence and
risk of RCC and phaeochromocytomas. The subtypes are defined as follows: Type 1 – RCC present
with no phaeochromocytomas, which is further subdivided into high and low RCC risk dependent on
the absence or occurrence of BRK1 deletions in concert with VHL deletions (134), designated as
Type 1A and 1B. Type 2A – Phaeochromocytomas with low RCC risk, Type 2B – both
Phaeochromocytomas and RCC, and Type 2C – Phaeochromocytomas with no RCC (135). Though
VHL is a well conserved gene, amino acids 1-53 show low evolutionary conservation and non-
truncating variants in these amino acids do not appear to cause VHL disease (136). Variant types
that lead to inactivation of VHL cover the full spectrum of molecular alterations including nonsense,
frameshifting insertions and deletions, missense, partial or complete loci deletions (136), and most
recently synonymous and intronic splice site affecting variants (137).
36
The VHL gene codes for the von Hippel-Lindau protein (pVHL) which functions in the regulation of
cellular response to hypoxia. Under normoxic conditions Egl-9 Family Hypoxia Inducible Factor 1, 2
and 3 (EGLN1, EGLN2 and EGLN3; prolyl hydroxylases; PHDs) act to hydroxylate specific proline
residues of HIF-α proteins, after which pVHL acts to bind hydroxylated HIF-α as a component of an
pVHL E3 ubiquitin ligase complex (VCB), resulting in ubiquitin-directed proteolysis (138). During
hypoxia, the oxygen-dependent hydroxylation of HIF-α proteins by PHDs does not occur, therefore
the VCB complex does not bind and ubiquitinate HIF-α proteins, leading to an accumulation of
hypoxia inducible factors (107,139). The translocation to the nucleus and cellular abundance of HIF-
α allow for hetero-dimer formation with HIF1-β subunits which then bind hypoxia response element
(HRE) motifs upstream of genes associated with hypoxic response (140). This leads to an
upregulation of transcription of genes associated with growth, angiogenesis, metabolism and stem
cell like phenotypes, reviewed by Keith et al. (2012)(141).
Loss of pVHL results in pseudo-hypoxic cellular environment, in which HIF1-α and HIF2-α substrates
are not targeted for degradation regardless of hydroxylation status, which leads to upregulation of
hypoxic response genes under normoxic conditions (141), consequentially driving tumour initiation.
It is worth noting that although both HIF1-α and HIF2-α function in response to hypoxia, they have
diverging functions and some reports suggest HIF1-α may act in opposition to HIF2-α as a tumour
suppressor gene (142,143) and loss of HIF1-α is rarely reported somatically (144).
While pVHL primarily functions in the regulation of hypoxia, pVHL also functions in the regulation of
cell cycle control, via p27 (145), microtubule organisation and spindle assembly (146), and regulation
of p53 (147). While these alternative functions are well defined and have functions related to
preventing tumourigenesis and progression, they are less rigorously studied, and the primary route
of pathogenesis is presumed to be loss of HIF regulation. Animal modelling of VHL loss have
provided some evidence to support the current theory regarding VHL-driven tumourigenesis.
37
Though homozygous VHL knockout mice models are embryonic lethal, heterozygous knockouts
develop haemangioblastoma-like liver growths and VHL disease-like renal cysts (148,149) but
studies were unable to show RCC development with VHL loss alone and suggest that tumour
development is not dependent on constitutional activation of HIF pathways (150). This in turn is
supported by the lack of cancer phenotype in bi-allelic inactivation of VHL seen in erythrocytosis type
2, where hypomorphic VHL alleles are present in every cell (133), the frequent loss of 3p as a second
hit somatically (151), and by mouse models which recapitulated human clear cell RCC development
in kidney-specific deletions of VHL and Polybromo 1 (PBRM1) together but not alone (152).
38
1.4.4 Hereditary leiomyomatosis and renal cell carcinoma
Hereditary leiomyomatosis and renal cell carcinoma (HLRCC; OMIM: 150800) is an autosomal
dominant disease resulting in a predisposition to tumours including RCC as well as cutaneous and
uterine leiomyomas (153,154). The population prevalence of HLRCC syndrome is currently
estimated to be 1 in 200,000 and relative risk for features of HLRCC have been estimated. HLRCC
is highly penetrant for non-RCC phenotypes with most affected individuals presenting with
leiomyomas, but risk for RCC appears to be reduced with occurrence between 15.6-31% (154,155).
Median age of presentation of RCC in HLRCC cases is 37 years of age (range 10-77) (156), which
matches to the age of onset described for other RCC predisposition syndromes and cases usually
present with a limited or single tumour, though multifocal cases have been reported. Most tumours
tend to be histologically classified as type 2 papillary RCC but also present with features of other
histological subtypes (157). HLRCC RCC tumours tend to be highly aggressive (grade III or IV) (155),
in contrast to most papillary RCC tumours which tend to be more latent (158).
HLRCC is associated with pathogenic variants in the Fumarate Hydratase (FH) gene (155,159,160).
Most of the reported pathogenic variants within FH are missense mutations (68.2%), the remaining
being small insertions or deletions, truncating mutations and splice altering variants (155,161).
Pathogenic FH variants are not found in between 10-15% of HLRCC, suggesting there may be an
unknown proportion of heritability that may be associated with undiscovered variants in FH (non-
coding variation or copy number alterations) or associated with alterations in genes other than FH
(155,160). As with VHL, FH is suggested to function as a tumour suppressor gene with bi-allelic loss
of FH resulting in complete ablation of FH enzyme function (154,159). The FH gene is located at
1q43 at chr1:241,497,557-241,519,785 and consists of 10 exons which encodes the protein
Fumarate hydratase, a core enzyme in the tricarboxylic acid (TCA) cycle (162).
39
FH catalyses the reversible hydration of fumarate to malate as part of the TCA cycle (163), driving
generation of substrates such as purine triphosphates (adenosine/guanine triphosphates; ATP/GTP)
and nicotinamide adenine dinucleotide (NADH) which are utilised by the electron transport chain for
oxidative phosphorylation. Loss of FH results in perturbation of the TCA cycle, leading to a loss of
oxidative phosphorylation and a metabolic switch to aerobic glycolysis to generate energy (164,165),
in line with the metabolic shift described by the Warburg effect (164) in tumours. PHD enzymes
function to hydroxylate proline residues of HIF2-α proteins, depending on cellular oxygen levels, and
regulate hypoxic response (see above). Under normoxic conditions these post-translational
modifications are added to HIF-α allowing pVHL complex binding and ubiquitination, leading to
proteolysis of HIF-α (107,138,166). In cells with bi-allelic inactivation of FH, cellular fumarate
accumulates and act as competitive inhibitors of PHDs which in turn results in the constitutive
activation of HIF-α, establishment of pseudo-hypoxia, and transcription of genes associated with
angiogenesis, cell growth, and metabolism (167–169).
Moreover, loss of FH can increase the number of reactive oxygen species (ROS) present which
again acts to stabilise HIF2-α via inactivation of PHD proteins by reducing the availability of non-
ROS oxygen molecules (170). Fumarate is able to post-translationally modify Kelch-like ECH
Associated Protein 1 (KEAP1), a protein associated with a E3 ubiquitin ligase complex which
regulates the stabilisation of nuclear factor erythroid 2-related factor 2 (NFE2L2) (171). NFE2L2
transcriptionally regulates genes associated with antioxidant response, upregulating genes which
encode proteins which function in antioxidant response element (ARE) controlled genes (172).
Specifically, ARE-controlled genes such as aldo-keto reductase family 1 member B10 (AKR1B10) is
suggested to be upregulated in both sporadic type 2 papillary RCC and HLRCC type 2 papillary
RCC, allowing for improved response to oxidative stress and confer a survival advantage, particularly
given the increased oxidative stress of a Warburg-like or glycolysis driven metabolism (172).
40
This is contrary to previous studies suggesting ROS actively inhibit PHD enzymes. It is likely that the
increase of intracellular ROS is a genuine consequence of FH loss, as loss of oxidative
phosphorylation leads to increase oxidative stress (173), but that fumarate both competitively inhibits
PHD enzymes and modifies KEAP1 directly while ROS themselves confer relatively little to the
stabilisation of HIF-α proteins. Lastly, accumulation of intracellular fumarate results in the inhibition
of α-ketoglutarate-dependent diooxygenases involved in histone and epigenetic demethylation, such
as ten-eleven translocation enzymes (TET) and lysine-specific demethylase (KDM) family enzymes
(174). Dysregulation of epigenetic modifications by the inhibition of these enzymes, particularly TET,
were then demonstrated to result in the indirect upregulation of HIF-α via loss of epigenetic inhibition
of HIF target transcripts (175).
In similarity to VHL, homozygous or compound heterozygous variants in FH result in a differential
autosomal recessive disease with limited phenotypic overlap. Bi-allelic inactivation of FH causes
Fumarase deficiency (FMRD; OMIM: 606812) which manifests as progressive neurological
dysfunctions including seizures, cerebral atrophy, and metabolic irregularities including lactic,
pyruvic, and fumaric aciduria (176,177). Phenotypic presentation appears to be variable in severity
but no FMRD case has presented with features associated with HLRCC, however parents of a FMRD
case did present with HLRCC (159). Currently, it is suggested that differences in phenotype
presentation between HLRCC and FMRD is due to gene dosage differences and that a majority of
FMRD cases have a high rate of mortality before an age at which HLRCC features typically develop.
41
1.4.5 Birt-Hogg-Dubé syndrome
Birt-Hogg-Dubé syndrome (BHD) is an autosomal dominant syndrome associated with
fibrofolliculomas, pulmonary cysts, pneumothorax, and renal cancers. BHD is driven by genetic
aberrations in the folliculin (FLCN) gene. BHD predisposes to renal neoplasms, with between 12-
27% of BHD patients developing renal cancer, often presenting as hybrid chromophobe RCC,
typically chromophobe/oncocytomas (178–180). In contrast to some other inherited RCC disorders,
renal cancers in BHD are histologically diverse; though one study reported a majority of BHD-related
tumours as hybrid chromophobe/oncocytoma or solely chromophobe (84%), with a minority of cases
being clear cell, oncocytoma, or papillary RCC (9%, 5%, and 2% respectively), other studies have
reported a majority of tumours were of clear cell subtypes (179). Additionally, there is some isolated
evidence that tumour histology in BHD cases is determined by the underlying driver variants within
early tumour clones, with tumours harbouring somatic mutations correlating to the presenting
histological subtype (i.e. oncocytoma with a secondary FLCN variants, oncocytic papillary RCC
carrying a MET Proto-Oncogene (MET) variant, and a clear cell RCC tumour harbouring a VHL
variant) (181).
Multifocal and bilateral occurrences in BHD-resultant renal cancers have a prevalence of 60% and
77%, respectively (182), with more recent studies reconfirming that a majority of individuals (83%)
present with either bilateral or multifocal RCC (183). While the primary clinical manifestation of BHD
syndrome is fibrofolliculomas, pulmonary cysts, pneumothorax, and RCC, BHD has also been shown
to be related to several other cancers. BHD has been linked to the development of thyroid tumours,
parotid tumours, adrenal carcinomas, melanoma, and the development of colorectal cancer (CRC)
and/or colorectal polyps which have also been suggested to be clinical features of BHD (184–188),
though further evidence to substantiate the associations is needed.
42
FLCN is a candidate tumour suppressor gene first identified by genome linkage analysis of BHD
families to 17p11.2 (189). Subsequently, genetic analysis mapped FLCN to chr17:17,206,924-
17,237,188 coding for a single full-length transcript of 14 exons, the first three of which are non-
coding. FLCN is a highly conserved gene with many pathogenic variants being truncating variants,
or variants within heavily conserved protein domains and these variants have been demonstrated to
generate unstable protein products and to be under purifying selection (190). Additionally, FLCN
contains a mutational “hotspot” at exon 11 due to the high frequency in which BHD patients present
with truncating variants within this loci (191,192), though frequent deletions of exons 1-3 and exons
9-14 have also been reported (193,194).
BHD patients harbouring a single inactivating variant in FLCN are frequently found to have acquired
a secondary somatic variant in, or LOH of, the wild-type allele of FLCN in RCC tumours (195).
Conversely, it has been suggested fibrofolliculomas do not appear to display LOH and the
pathogenesis of fibrofoliculomas seem to be driven by haploinsufficiency (196). Several animal
models have corroborated this hypothesis; Rat models harbouring a heterozygous germline variant
in the rat orthologue of FLCN were shown to present with renal tumours, of which 91% presented
with LOH of the wild type allele and the remaining LOH-negative tumour had deleterious frameshift
variant within the wild type allele.
The FLCN protein acts within several cellular pathways to regulate functions related to cellular
growth, metabolism, and apoptosis. Through interactions with Folliculin interacting protein 1 and 2
(FNIP1 and FNIP2), FLCN acts to regulate 5' AMP-activated protein kinase (AMPK), which functions
in the upregulation of hamartin and tuberin in the PI3K-AKT-mTOR pathway, resulting in attenuated
signalling (197–199). FLCN knockout models have also established increased mTOR activity where
loss of the wild type allele occurs, demonstrating a mechanism for tumour development in BHD
patients (200). Furthermore, FLCN and its complex proteins FNIP1 and FNIP2 have been shown to
inhibit the function of the MITF-TFE3-TFEB complex by reducing nuclear localisation (201), where
MITF has been shown to regulate both mTOR and HIFα.
43
1.4.6 Hereditary papillary renal cell carcinoma
Hereditary papillary renal cell carcinoma (HPRCC; OMIM: 605074) is an autosomal dominant
condition conferring a predisposition to the development of multifocal and bilateral papillary RCC
tumours (202). HPRCC is associated with type 1 papillary RCC, generally being low grade, well
differentiated, and is highly penetrant (156,203). The median age of onset for HPRCC tumour is 41
years of age and HPRCC cases are frequently bilateral or multi focal, but conversely to sporadic and
other germline causes of RCC, sex appears to be uniformly affected (156,204,205). HPRCC
tumours, in contrast to many other RCC syndromes, rarely co-occur with renal cysts but microscopic
lesions do occur proximally to the primary tumours (204,205) and much like sporadic type 1 papillary
RCC, HPRCC with type 1 papillary RCC are usually indolent in nature (206).
HPRCC is known to be caused by activating variants in MET and all activating variants have been
nonsynonymous changes with the MET tyrosine kinase domain (207,208). The MET gene is located
at 7q31.2 at chromosome co-ordinates chr7:116,672,390-116,798,386 and encodes a 21-exon
transcript for the C-MET tyrosine kinase receptor (MET). MET functions as a cell surface receptor
for hepatocyte growth factor (HGF) as it’s only known ligand (209). Binding of HGF to MET allows
for the transduction of a signal cascade through the PI3K-AKT-MTOR pathway and RAS-ERK
pathways, leading to upregulation of genes associated with cell survival, proliferation, and motility
(210), as well as increased HIF1-α and HIF2-α activity through mTOR activation (211).
Nonsynonymous variants in the tyrosine kinase domain of MET result in a protein with constitutive
MET auto-phosphorylation without the presence of HGF, resulting in a constant upregulation of the
pathways, such as PI3K-AKT-mTOR pathway, leading to tumour initiation (208).
44
1.4.7 Succinate dehydrogenase renal cell carcinoma
Succinate dehydrogenase renal cell carcinoma (SDH-RCC) is a subtype of RCC driven by loss of
function of the succinate dehydrogenase complex (SDH; electron transport chain complex II). Only
recently recognised as a distinct subtype of RCC (49), germline pathogenic variants in genes
encoding components of the succinate dehydrogenase complex leads to a predisposition to RCC in
an autosomal dominant manner. Inactivation of Succinate dehydrogenase complex, subunits A-D
via pathogenic variants in SDHA, SDHB, SDHC, and SDHD respectively, are frequently associated
with paragangliomas (PGLs), PCCs, and gastrointestinal stromal tumours (GISTs) (212).
Variants in these same genes can lead to RCC predisposition with the most common cause being
SDHB mutations (213–216), with SDHA mutations having only been demonstrated more recently
(217,218). SDH-deficient PCC and PGL have also been linked to variants in SDHAF2, which codes
for an SDH complex assembly factor but no germline variants have currently been described in
relation to RCC predisposition (219), and evidence for this association is limited. SDH-RCC cases
are rare compared to the other RCC predisposing syndromes with an incidence rate estimated at
0.05-0.2% of all RCC cases (220). In similarity to other RCC-predisposition syndromes, age of onset
is earlier than in sporadic RCC cases with a median of 40-43 years of age and moderately more
predominant in males compared to females (M:F=1.7-2.3:1) (220,221). Generally SDH-RCC
tumours are low grade but are frequently observed to be multifocal or bilateral in 26% and harbour
metastatic potential, with a reported 11-33% of cases developing metastatic disease (220,222).
While SDH-RCC usually occurs without other malignancies, studies suggest approximately 15% of
cases will additionally present with PGL and/or wild type GISTs (220). Histologically, SDH-deficient
tumours do not resemble the classical subtypes seen in other inherited conditions, having a strong
resemblance to oncocytomas, with cytoplasmic inclusions containing excessive numbers of
abnormal mitochondria, and features of other histological characteristics also seen (221). The
difficulties resulting from similarities to other tumour subtypes, particularly non-cancer tumours such
as renal oncocytomas, is that misdiagnosis of potentially malignant tumours as benign may impact
clinical treatment. Additionally, SDH-RCC tumours may appear to resemble hybrid
oncocytic/chromophobe RCC tumours seen in BHD as such confirmation of SDH gene or FLCN
inactivating variants is critical to inform diagnostics.
45
While estimates for disease penetrance is challenging when assessing SDH-RCC cases, SDHB
mutation carriers are more frequent than others and lifetime risk for RCC in SDHB variant carriers is
reported to be up to 14% at 70 years of age (215). However, recent studies employing Bayesian
estimates of penetrance of pathogenic variants in SDH genes compared to ExAC controls, as well
as case studies, have provided lower estimates for penetrance rates for SDH genes in PCC/PGL at
22% for SDHB, 8.3% for SDHC, and 1.7% for SDHA (SDHD was not assessed) (223) and an
additional study stating a penetrance of between 0.1%–4.9% for SDHA (224). Further assessment
of RCC risk has been investigated for SDHB and suggested lifetime risk for SDHB mutation carriers
to be 4.7% by 60 years (225), supporting the limited penetrance of variants in SDH genes, particularly
given the occurrence of Renal and Phaeochromocytoma/Paraganglioma Tumour Association
Syndrome (RAPTAS) cases and the strong correlation between PCC, PGL, and RCC (226).
Loss of any one of the components of the succinate dehydrogenase complex is enough to result in
destabilisation of the entire complex (227). In a similar manner to HLRCC and inactivation of FH,
loss of succinate oxidation by SDH into fumarate as part of both the TCA cycle and the electron
transport chain leads to an accumulation of intracellular succinate (168) as well as a reduction in
oxidative phosphorylation (228). The accumulated succinate acts identically to fumarate to act as a
competitive inhibitor of various biological processes related to RCC tumourigenesis. Succinate both
acts to inhibit the function of PHD proteins, which drive HIF-α destabilisation via pVHL and inhibits
α-ketoglutarate-dependent demethylases known to result in up-regulation of HIF proteins (175,229).
Though exceptionally rare, homozygous (or compound heterozygous) alterations to SDH complex
are profoundly detrimental, resulting in severe metabolic disorder, loss of cardiac function, and infant
mortality in one case report (230). This is supported by null knock out mouse models in which SDHB,
SDHC, and SDHD resulted in embryonic lethality (231).
46
1.4.8 Tubular sclerosis complex
Tubular sclerosis complex (TSC; OMIM: 191100) is an autosomal dominant multi-cancer
predisposition syndrome which can confer a risk to RCC caused by inactivating variants in TSC
Complex Subunit 1 (TSC1) or TSC Complex Subunit 2 (TSC2) (232). Patients diagnosed with TSC
classically present with neurodevelopmental delay and epilepsy (and intracranial hamartomas), with
cutaneous features such as angiofibromas, cardiac rhabdomyomas, and renal manifestations. The
most frequent renal manifestations are angiomyolipomas and renal cystics (233). Renal
angiomyolipomas as an entity are not classed as an RCC subtype as they are benign in nature, but
both renal cysts and angiomyolipomas are linked to (234,235) and difficult to distinguish from RCC
(233), respectively.
In comparison to other RCC-predisposing syndromes, RCC risk is lower in TSC with a prevalence
estimated at 2-3% in the general population (233). This rate is more significant given that the
incidence rate of TSC is much higher than many of the other RCC-predisposing syndromes at
1:6,760–1:13,520 (236), thus increasing the number of individuals going on to develop RCC of the
total diagnosed with TSC. While the incidence of RCC is low in TSC, an important aspect is the
molecular biology of the disease and its overlaps with other RCC-predisposing syndromes in genetic
causes and phenotypic presentation.
RCC presenting in TSC are observed at a mean age of between 30-42 years of age and, conversely
to other RCC syndromes, occurs at an inverse sex ratio (1:2.0-2.6: male to female ratio). In
approximately 47-55% cases present with either multifocal or bilateral RCC, with as many as 20
individual tumours reported in one case. Metastatic disease is rarely documented in TSC RCC cases
and prognosis is generally favourable, with most tumours occurring as oncocytic hybrid
chromophobe-like RCC or papillary-like RCC histologies (232,237).
47
As mentioned previously, TSC is known to be associated with loss of function variants in TSC1 and
TSC2 which encode the proteins hamartin and tuberin, respectively, mentioned previously in relation
to BHD. Mutational assessment of genotype-phenotype correlations suggest that pathogenic
variants in TSC2 result in more severe phenotypes and is also more frequently inactivated than
TSC1 (238). An estimated 15% of cases are not identified to carry either a coding single nucleotide
variant (SNV) or copy number variant (CNV) resulting in inactivation of either TSC1 and TSC2,
though a recent analysis suggested mosaic and intronic variants account for a large proportion of
the pathogenic variation in TSC (238,239).
Hamartin and tuberin form a protein-complex, which functions as a tumour suppressor. The
hamartin-tuberin heterodimer is regulated by RAC-alpha serine/threonine-protein kinase (AKT) (240)
and is an inhibitor of GTP-binding protein Rheb (RHEB) (241), as components of the PI3K-AKT-
mTOR pathway. RHEB functions upstream of mTOR and primarily acts to upregulate mTOR activity
through direct interaction or induction of a conformational change in the mTOR complex, leading to
an increase in mTOR phosphorylation (242). Increased activation of mTOR (and its associated
complex mTORC1) leads to the same increase in cellular proliferation, motility, survival, and
autophagy as described in HPRCC and BHD syndromes (82).
48
1.4.9 Cowden syndrome
Inactivating variants in the Phosphatase and tensin homolog (PTEN) gene are associated with
Cowden syndrome (CS; OMIM: 158350), an autosomal dominant condition causing some
neurodevelopmental disorders, as well as both benign and malignant tumours, including RCC.
Cowden syndrome has an occurrence is estimated at 1 in 200,000 with a significant risk of breast,
thyroid, endometrial cancers, and RCC. Life time risk of RCC for individuals with CS a reported 34%,
though estimates are variable given a limited number studies, ranging between 2-34% at age 70
years, with an elevated risk in women (243–245). A majority cases of CS with RCC exhibited papillary
RCC tumours, with the remaining presenting as chromophobe RCC, and a majority of the tumours
showed complete loss of PTEN protein expression under examination by immunohistochemistry
(246).
PTEN is a tumour suppressor gene located at chr10:87,863,113-87,971,930, codes for a 9-exon
protein Phosphatidylinositol 3,4,5-trisphosphate 3-phosphatase and dual-specificity protein
phosphatase (PTEN). PTEN functions in the regulation of the PI3K-AKT-mTOR pathway, via the
inhibition of Phosphatidylinositol 4,5-bisphosphate 3-kinase catalytic subunit alpha (PIK3CA). PTEN
acts to dephosphorylate phosphoinositide molecules, a lipid substrate utilised in Phosphatidylinositol
by PIK3CA, downstream of cell surface tyrosine kinase receptors like VEGFR. This antagonistic
response to Phosphatidylinositol signalling attenuates PI3K-AKT-mTOR signalling, reducing
expression of genes associated with cell growth, proliferation, and angiogenic processes (82).
Further forms of CS or CS-like syndromes, driven by epigenetic inactivation of Killin, P53 Regulated
DNA Replication Inhibitor (KLLN) and activating mutations in AKT and PI3KCA, have also been
associated with RCC development in PTEN negative cases (247,248). The KLLN gene is present at
the same loci as that of PTEN on 10q23.31, sharing the same transcription start site but transcribed
in the opposite orientation. Analysis of 123 CS and CS-like cases without germline PTEN variants
demonstrated hypermethylation of the shared promotor region, which did not impact PTEN
expression but reduced KLLN expression 250-fold. Individuals with KLLN hypermethylation
presented with RCC in twice as many cases as those with germline PTEN variants (247).
49
Further assessment of CS and CS-like individuals without PTEN or KLLN alterations by Orloff et al.
(2013) identified alterations in components of the PI3K-ATK-mTOR pathway in AKT and PI3KCA.
Of 91 cases sequenced, 11% harboured variants in either AKT or PI3KCA (2 and 8, respectively)
and two individuals, one carrying an AKT variant and the other a PI3KCA variant, presented with
RCC at 47 and 32, respectively (248).

50
1.4.10 CDC73-Related disorders
Inactivating variants in cell division cycle 73 (CDC73; also known as HRPT2) are known to cause a
series of autosomal dominant genetic disorders including Hyperparathyroidism jaw tumour
syndrome (HPT-JT; OMIM: 145001) which predisposes affected individuals to a range of renal
manifestations, including RCC. HPT-JT is characterised by synchronous or metachronous
presentation of hyperthyroidism, ossifying fibroma of the jaw bones, renal tumours, and uterine
tumours (249). Penetrance of HPT-JT is estimated to be 83% at age 70 years, with lower penetrance
in females (250). Approximately 20% of individuals diagnosed with HPT-JT display renal lesions of
some form, most frequently renal cysts or hamartomas with Wilms tumours, a form of paediatric
kidney cancer, also occurring in a subset of cases. Though RCC manifestations are rare in HPT-JT,
papillary RCC has been reported in conjunction with germline CDC73 variants and somatic LOH of
1q31.2 (251) and the known links between renal cysts and malignant renal phenotypes (234).
CDC73 on 1q31.2 is a tumour suppressor gene encoding a 17 exon, 531 amino acid protein
parafibromin, a component of the Polymerase-Associated Factor 1 (PAF1) complex, which has a
cellular role as RNA polymerase II complex, and has been shown to interact with histone-modifying
H3K4-methyltransferase proteins (252,253) and is known to function in the regulation of cell cycle
progression via regulation of cyclin D1 expression (254). Parafibromin has also been shown to act
to repress the transcription of myc proto-oncogene protein (MYC) via promotor suppression and
demonstrates a capacity to cause G1 phase cell cycle arrest (255,256), cementing CDC73 as a
tumour suppressor gene. CDC73 inactivation is also seen regularly in somatic renal tumours
(including clear cell, papillary, and chromophobe RCC) and inactivation is typically via LOH (257),
though some studies have demonstrated that hypermethylation and mutations within the 5’
untranslated region (UTR) also result in allelic loss (258).
51
1.4.11 Non-syndromic renal cell carcinoma
In recent years, investigations into the molecular basis of inherited RCC have elucidated some of
the molecular causes of non-syndromic inherited RCC. The earliest of these occurred prior to the
identification of VHL with the identification of a large Italian American family with a history of clear
cell RCC, a high incidence of bilateral presentation, and no age of onset greater than 60 years of
age (259). This family was found to harbour a t(3;8)(p14.2;q24.2) translocation resulting in disruption
of Fragile Histidine Triad (FHIT) and Ring Finger Protein 139 (RNF139) at the break point sites, and
formation of a fusion transcript (260). Further assessment and screening of individuals with RCC
presenting with features of heritability uncovered a number of other families and individuals carrying
constitutional translocations, most of which involved chromosome 3, and suggested specific
constitutional translocations could confer a risk to RCC development (261). In depth review and
analysis of RCC-associated translocation cases is performed in Chapter 6.
Several studies assessed germline RCC cohorts and families for the presence of genetic alterations
in significantly mutated genes in RCC tumours. Studies of patients with co-occurrence of RCC and
melanoma demonstrated a missense substitution in MITF are associated with higher risk of RCC
compared to controls (262). Screening of unrelated probands with features of predisposition revealed
that, although rare, germline variants in BRCA1 Associated Protein 1 (BAP1) segregated with RCC
phenotype and demonstrated LOH in several tumours as well as somatic VHL loss (263). In an
assessment of 35 individuals with unexplained family histories of clear cell RCC, one case was
shown to have a co-segregating frameshift variant in PBRM1 supporting predisposition to RCC
(264). It should also be noted that germline FLCN and SDHB mutations may also be detected in a
subset of patients with apparent non-syndromic inherited predisposition to RCC (214,265).
Lastly, exome sequencing and targeted resequencing of patients with features of familial RCC
uncovered candidate pathogenic missense variants in Cyclin Dependent Kinase Inhibitor 2B
(CDKN2B) (266). While the occurrence of variants in MITF, BAP1, PBRM1, and CDKN2B are
relatively rare, with only a small number of individuals per cohort being affected, they suggest the
remaining proportion of heritability is likely to be split across many genes at a low percentage,
rather than the discovery an unknown VHL-like gene, harbouring a large proportion of the
remaining risk.

1
.4 T
ab
le 2
Su
mm
ary
of m
ajo
r co
nd
itio
ns p
red
isp
osin
g to
RC
C in
clu
din
g r
ela
tive
incid
en
ce
ra
tes, R
CC
ris
k p
er
incid
ence
an
d o
the
r clin
ica
l fe
atu
res (
a -
Estim
ate
d p
reva
len
ce fro
m p
ed
igre
es,
no
t ca
lcu
late
d b
ase
d o
n p
op
ula
tio
n d
ata
) -
* cum
ula
tive
ris
k a
cro
ss a
ll gen
es.
Co
nd
itio
n
Heri
tan
ce
p
att
ern
G
en
e(s
) L
oc
us
Pre
va
len
ce
S
yn
dro
me
p
en
etr
an
ce
RC
C r
isk
(%
) M
ajo
r h
isto
log
y
Oth
er
fea
ture
s
Vo
n H
ippe
l-Lin
da
u
Au
tosom
al
do
min
an
t V
HL
3
p2
5.2
1
:39
,00
0
to
1:9
0,0
00
Hig
h
24
-45
Cle
ar
ce
ll
Ha
em
ang
iob
lasto
mas
Re
na
l cysts
P
ha
eoch
rom
ocyto
mas
Cysta
de
nom
as
Ne
uro
end
ocrin
e tu
mo
urs
A
ng
iom
ato
sis
E
nd
oly
mph
atic s
ac t
um
ou
rs
Here
ditary
le
iom
yo
mato
sis
an
d
ren
al ce
ll ca
rcin
om
a
Au
tosom
al
do
min
an
t F
H
1q
43
Unkn
ow
n
Hig
h
15
-30
Pa
pill
ary
(t
yp
e 2
) C
uta
ne
ou
s le
iom
yo
ma
s
Ute
rin
e le
iom
yo
ma
s
Bir
t-H
og
g-D
ub
é
synd
rom
e
Au
tosom
al
do
min
an
t F
LC
N
17
p1
1.2
1
:20
0,0
00
(a
) H
igh
12
-27
Hyb
rid
Ch
rom
op
ho
be
Fib
rofo
lliculo
ma
s
Pu
lmon
ary
cysts
P
ne
um
oth
ora
x
Here
ditary
pa
pill
ary
re
na
l ce
ll ca
rcin
om
a
Au
tosom
al
do
min
an
t M
ET
7
q3
1.2
U
nkn
ow
n
Hig
h
Incre
ased
Pa
pill
ary
(t
yp
e 1
) R
en
al cysts
Su
ccin
ate
d
eh
yd
roge
nase
RC
C
Au
tosom
al
do
min
an
t
SD
HB
S
DH
C
SD
HD
S
DH
A
1p
36
.13
1q
23
.3
11
q2
3.1
5
p1
5.3
3
Unkn
ow
n
Lo
w t
o
mo
de
rate
1
4 *
H
yb
rid
Pa
rag
ang
liom
as
Ph
ae
och
rom
ocyto
mas
Ga
str
oin
testina
l str
om
al
tum
ou
rs
Tu
be
rou
s s
cle
rosis
co
mp
lex
Au
tosom
al
do
min
an
t T
SC
1
TS
C2
9
q3
4
16
p1
3.3
1
:6,0
00
Va
ria
ble
2
-4
Hyb
rid
On
co
cytic
Fib
rom
as
Ne
uro
log
ica
l d
iso
rde
rs
Ne
uro
deve
lop
me
nta
l dis
ord
ers
R
ha
bd
om
yo
mas
Re
na
l an
gio
myo
lipom
as
Re
na
l cystic d
isea
se
Cow
de
n s
ynd
rom
e
Au
tosom
al
do
min
an
t P
TE
N
10
q2
3
1:2
00
,00
0
Hig
h
2-3
4
Pa
pill
ary
Ne
uro
deve
lop
me
nta
l dis
ord
ers
B
rea
st ca
nce
r T
hyro
id c
ance
r E
nd
om
etr
ial ca
nce
r
Chro
mosom
e 3
tr
an
slo
ca
tion
a
sso
cia
ted
Au
tosom
al
do
min
an
t C
ase
de
pe
nd
ent
Unkn
ow
n
Va
ria
ble
In
cre
ased
C
lea
r ce
ll N
on
e
53
1.5 Somatic variation in renal cell carcinoma
Large scale sequencing studies of RCC tumours have been performed to investigate and elucidate
the genetic causes of RCC and its histological subtypes. As discussed previously, in alignment with
their histological disparities, the major histological subtypes are genetically heterogeneous and
numerous genetic and molecular overlaps exist between somatic and germline alterations in RCC.
1.5.1 Clear cell renal cell carcinoma
Clear cell RCC, as the most common subtype of RCC, has been extensively characterised by tumour
profiling studies utilising multi-omic approaches. Copy number variations in clear cell RCC are large
scale losses or gains of entire chromosome arms, most frequently 3p which carries multiple inherited
RCC genes as previously discussed, and very few focal events. Loss of 3p occurred in more than
90% of tumours assessed, with gains of 5q and loss of 14q seen in 67% and 45% of tumours,
respectively. Whole exome sequencing of tumours revealed VHL, PBRM1, SET Domain Containing
2 (SETD2), Lysine Demethylase 5C (KDM5C), PTEN, BAP1, MTOR and Tumour Protein
P53 (TP53) as the most significantly mutated genes. Of note, approximately 20% of tumours
assessed had no alterations in any of the highly mutated genes, suggesting alternative drivers in
combination with chromosomal copy number alterations in 3p and 5q. Epigenetic inactivation of VHL
was demonstrated in 7% of tumours and was mutually exclusive with somatic VHL SNVs. Network
analysis showed dysregulation pathways for pVHL and its interacting components and chromatin
remodelling (including genes PBRM1 and AT-Rich Interaction Domain 1A (ARID1A))(267).
Systematic sequencing of clear cell RCC recapitulated the pivotal role of VHL and hypoxia in
sporadic clear cell RCC, with 55% of cases harbouring VHL mutations, 82% having upregulation of
hypoxia pathways, and 87% demonstrating loss of 3p. Further analysis resulted in the identification
of multiple somatic truncating mutations in histone modifying genes, containing SETD2 which was
frequently seen in other studies, including KDM5C, Lysine Demethylase 6A (KDM6A), and Lysine
Methyltransferase 2D (KMT2D) (268). Comprehensive integrative studies across more than 100
clear cell RCC tumours reiterated other findings but also identified driver mutations in Elongin C
(TCEB1), TET2, KEAP1, TP53, and MTOR. Of note, mutations in TCEB1 were mutually exclusive
with VHL variants, which is significant given they both function as part of the VCB complex (269).
54
More recent spatial and temporal sequencing approaches to understand the somatic variation of
clear cell RCC have uncovered the range and depth of differences because of tumour heterogeneity
both within and between tumours. Analysis of multi-site & multi-tumour data from the TRACERx renal
study uncovered that specific driver events or clusters of events are associated with different clonal
evolution trajectories, branching potentials, and intra-tumour heterogeneity, each of which have
different prognosis outcomes and responses to clinical treatments (270). These evolutionary
trajectories of specific sub-clones mirrors and explains the differences seen at the clonal driver
mutation resolution (such as PBRM1 loss tumours having poorer survival) and why other tumours
with different drivers respond differently in both progression and response to treatment.
55
1.5.2 Papillary renal cell carcinoma
Genetic characterisation of papillary tumours reiterated the distinctions found histologically and
implicates a different subset of genetic loci in tumour development (158). Type 1 papillary RCC,
harbour frequent copy number gains of chromosome 7 and 17 whereas Type 2 papillary RCC
tumours are characterised by significantly less copy number losses but two distinct clusters of cases
with or without a high degree of chromosomal instability and loss of 9p. Whole exome analysis
revealed that across all papillary RCC cases the most significantly affected genes included MET,
SETD2, Neurofibromin 2 (NF2), KDM6A, and SWI/SNF Related, Matrix Associated Actin Dependent
Regulator of Chromatin Subfamily B, Member 1 (SMARCB1). Additional restriction to genes already
implicated in cancer demonstrated BAP1, PBRM1, and TP53, among others were associated with
papillary RCC. Lastly, gene fusions of TFE3 and TFEB with various genes occurred in a proportion
of papillary RCC tumours (10.6%), including HIF1A.
In regards to specific papillary RCC subtypes, type 1 papillary RCC tumours more frequently
harboured variants in MET (18.6%), which clustered with known germline predisposition variants
found in HPRCC, and had increased levels of MET expression compared to type 2 papillary RCC.
Collectively, given the amplification of MET in cases with chromosome 7 gains, 83% of type 1
papillary RCC tumours carried MET alterations. In type 2 papillary tumours, Cyclin Dependent
Kinase Inhibitor 2A (CDKN2A) alterations were more frequent (25%) with focal losses of 9q21,
mutations, or hypermethylation as the cause. Additionally, SETD2, BAP1, and PBRM1 were
frequently altered, but in contrast to clear cell RCC, loss of 3p was infrequent. Additionally, CpG
island methylator phenotype (CIMP) associated tumours, were designated as a subset of type 2
papillary tumours driven by somatic mutations in FH. In tumours identified with hypermethylation
profiles, 55.6% carried alterations in FH as well as decreased mRNA expression of FH and increased
expression genes associated with glycolysis. This agrees with HLRCC caused by germline
inactivation of FH, where type 2 papillary RCC is most common (155) seen as well as the inhibition
of epigenetic factors by accumulated fumarate (174).
56
1.5.3 Chromophobe renal cell carcinoma
Characterisation of chromophobe RCC by Davis et al. (2014) demonstrated the unique genetic
features of this RCC subtype. Chromophobe RCC carries a distinctive copy number alteration
pattern with loss of chromosomes 1, 2, 6, 10, 13, and 17 in most cases (86%), with wide spread non-
focal loss of multiple other chromosomes, including chromosome 3 and was shown to have a low
mutational rate, even compared to other RCC subtypes (approximately 3-fold less than clear cell
RCC; 0.4 mutations per Mb). TP53 was reported as the most altered gene being mutated in 32% of
cases assessed, with variants also being present in PTEN (9%), MTOR (3%), and TSC1 or TSC2
(6%). In general, chromophobe RCC has fewer hypermethylation events in comparison to clear cell
RCC and demonstrated epigenetic silencing of CDKN2A in 6% of cases. In relation to gene
expression patterns, upregulation of genes associated with the TCA cycle and electron transport
chain were seen, counterintuitively to the shift away from oxidative phosphorylation that may be
expected due to the Warburg effect. In addition to metabolic expression changes, increased
expression of genes involved with cell cycle progression was also described. Lastly, analysis of
structural variation demonstrated a significant portion of chromophobe RCC cases have
chromosomal break points with the telomerase reverse transcriptase (TERT) promotor, associated
with telomeric end repair, and expression was shown to be elevated in these cases (271).
Further assessment of RCC tumours as a collective revealed additional focal losses and
amplifications of genes with associations to germline predisposition cases including loss of SDHD
and PTEN, as well as amplifications of PIK3CA and sequestosome 1 (SQSTM1) (272), of which
SQSTM1 is implicated as the driver gene in 5q amplifications (273). Complementary assessment of
data from the cancer genome atlas (TCGA) cancer study by Ricketts et al. (2018) recapitulated much
of the previous work with some additional findings. Both type 2 papillary RCC and its subset CIMP-
RCC have increased copy number loss of chromosome 22, which carries the loci for NF2 and
SMARCB1 and both chromophobe RCC and CIMP-RCC have loss of 13q, which harbours
retinoblastoma 1 (RB1) and BRCA2. Furthermore, collective assessment of RCC subtypes together
revealed that TP53 and PTEN were the only significantly mutated genes shared by all RCC tumour
types as well as deletion or hypermethylation of CDKN2A (274).
57
1.5.4 Epigenetics of renal cell carcinomas
Epigenetic inactivation is a well-established mechanism of cancer evolution and development (275)
and analysis of epigenetic alterations in RCC tumours has also been crucial to understanding the
molecular mechanisms driving tumourigenesis in RCC and its links to predisposition. Discoveries of
hypermethylation of several genes on 3p, including VHL and Ras association domain Family
Member 1 (RASSF1A) in sporadic RCC seen in 19% and 26% of cases, respectively (276,277),
demonstrated the potential for epigenetic alterations to define somatic tumour development.
Additional genes in the 3p region were demonstrated to be hypermethylated including family with
sequence similarity 107 member A (FAM107A) (278) and FHIT (279), with further candidate tumour
suppressors associated with RCC and other cancers also being identified, such as CDKN2A (280),
cadherin 1 (CDH1) (281), and Ras association domain family member 5 (RASSF5) (282). Various
further studies have implicated additional genes as downregulated in RCC through hypermethylation
such as KLLN which is associated with Cowden syndrome (283), secreted frizzled related protein 1
(SFRP1) a gene related to the downregulation of the Wingless/Integrated (WNT) signalling pathway
(284), and mutS homolog 2 (MSH2) which is related to DNA repair (285), as well as further genes
altered across multiple RCC subtypes are detailed in a review by Shenoy et al. (2015)(286).
Further comprehensive analysis of epigenetic inactivation in RCC tumours has identified a range of
different genes associated with hypermethylation in RCC, including the characterisation of CIMP
tumours described previously (287). Initial genome-wide approaches to discover frequently
hypermethylated promotor regions in RCC identified 9 genes. Of those genes identified, 6 displayed
reduction in functional expression and activity in in vitro experiments suggestive of cellular roles as
tumour suppressors (288) and follow-up methylation array studies identified more than 200
hypermethylated loci compared to normal tissues, including genes solute carrier family 34 member
2 (SLC34A2), ovo like transcriptional repressor 1 (OVOL1), and somatostatin (SST) in 64%, 40%,
and 31% of tumours respectively (289).
58
Hypermethylation, outside of promotor-specific methylation, has also been examined where RCC
samples were characterised by hypermethylation profiles preferentially occurring within coding
regions. The hypermethylation disproportionately affected both kidney-specific enhancer regions
associated with histone methylation as well as genes associated with hypoxia, likely as a
consequence of ongoing dysregulation of hypoxic pathways (290). Finally, use of methylation
alterations in RCC has been utilised as a biomarker, both diagnostically and predictively in the
development and progression of RCC tumours which can act to detect recurrent events or predict
prognostic features in assessed patient, reviewed by Lasseigne et al. (2018)(291).
59
1.6 Inherited and somatic variants in renal cell carcinoma
In general, somatic alterations in different RCC subtypes are characteristic of that specific histology
but clear overlaps at a chromosomal level (e.g. loss of 3p in clear cell RCC), but perhaps more
importantly, at a gene level occur in which a distinct but interconnected pattern of molecular
pathways is delineated. Genetic alterations in both germline and somatic analysis can be defined
broadly to being associated with one of three networks; VHL pathway, PI3K-AKT-mTOR pathway,
and histone modifying and chromatin remodelling network. In both sporadic and inherited cases of
RCC, the affected entities appear to map to one of these pathways with common proteins and
metabolic substrates linking them together.
HIF-α proteins are one of the primary endpoints of both the VHL-driven pathway and the PI3K-AKT-
mTOR pathway. VHL is found to be both inactivated in VHL disease and frequently lost in sporadic
RCC through inactivating mutations and loss of 3p in clear cell RCC, both acting to drive tumour
initiation and progression via HIF upregulation and a pseudo hypoxic gene response. Variants found
in FH in HLRCC and SDHA, SDHB, SDHC, and SDHD in SDH-RCC, while acting to disrupt cellular
metabolic processes also converge on the VHL pathway indirectly. Accumulation of both succinate
and fumarate results in pseudo-hypoxic conditions due to the inhibition of PHD proteins and loss of
HIF1-α and HIF2-α hydroxylation, consequently reducing HIF protein degradation via VHL (168).
The PI3K-AKT-mTOR pathway drives HIF upregulation as well as mTOR activity, and multiple
positive and negative regulators and components are implicated in RCC. Activating variants seen in
MET, as seen in HPRCC and amplification of chromosome 7 in sporadic papillary RCC result in
constitutional activation of the PI3K-AKT-mTOR pathway at its origin point on the cell surface,
causing continuous upregulation of all the downstream components, including HIF2-α and VEGFR
(292). Inactivation of PTEN which acts as an inhibitor of PI3K signal transduction are observed in
both Cowden syndrome and somatically in both clear cell and chromophobe RCC subtypes, resulting
in loss of regulated signal transduction through PI3K proteins.
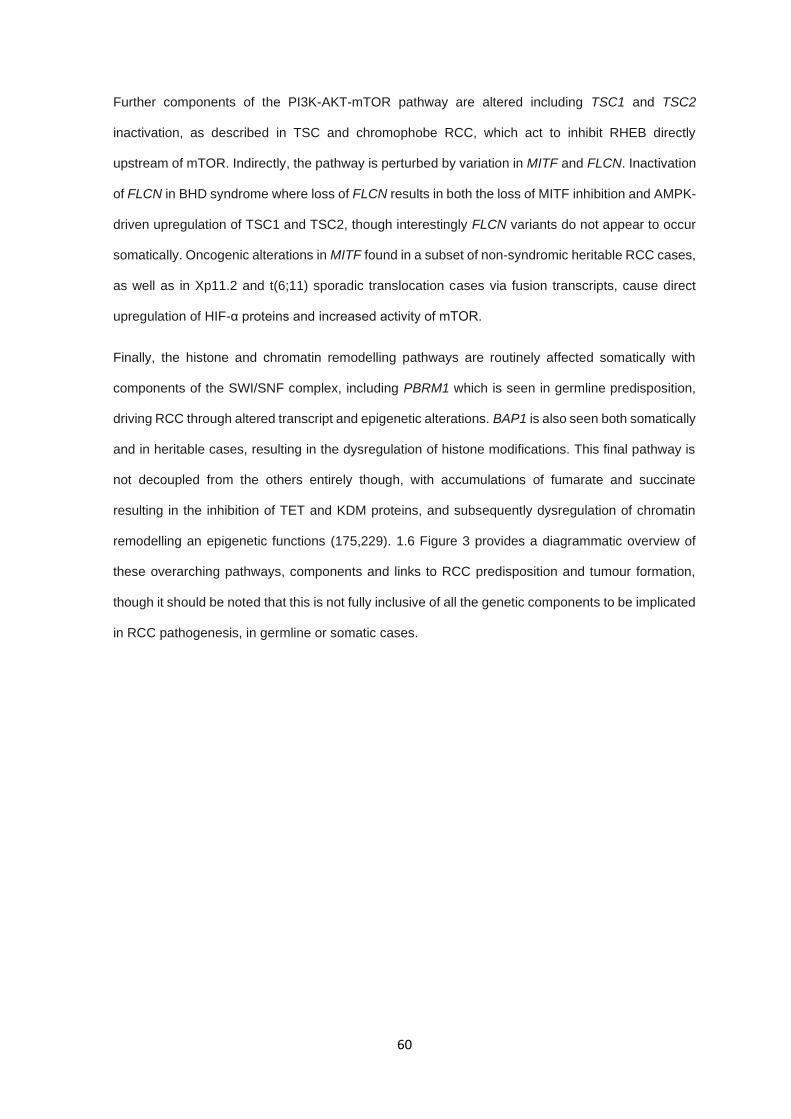
60
Further components of the PI3K-AKT-mTOR pathway are altered including TSC1 and TSC2
inactivation, as described in TSC and chromophobe RCC, which act to inhibit RHEB directly
upstream of mTOR. Indirectly, the pathway is perturbed by variation in MITF and FLCN. Inactivation
of FLCN in BHD syndrome where loss of FLCN results in both the loss of MITF inhibition and AMPK-
driven upregulation of TSC1 and TSC2, though interestingly FLCN variants do not appear to occur
somatically. Oncogenic alterations in MITF found in a subset of non-syndromic heritable RCC cases,
as well as in Xp11.2 and t(6;11) sporadic translocation cases via fusion transcripts, cause direct
upregulation of HIF-α proteins and increased activity of mTOR.
Finally, the histone and chromatin remodelling pathways are routinely affected somatically with
components of the SWI/SNF complex, including PBRM1 which is seen in germline predisposition,
driving RCC through altered transcript and epigenetic alterations. BAP1 is also seen both somatically
and in heritable cases, resulting in the dysregulation of histone modifications. This final pathway is
not decoupled from the others entirely though, with accumulations of fumarate and succinate
resulting in the inhibition of TET and KDM proteins, and subsequently dysregulation of chromatin
remodelling an epigenetic functions (175,229). 1.6 Figure 3 provides a diagrammatic overview of
these overarching pathways, components and links to RCC predisposition and tumour formation,
though it should be noted that this is not fully inclusive of all the genetic components to be implicated
in RCC pathogenesis, in germline or somatic cases.
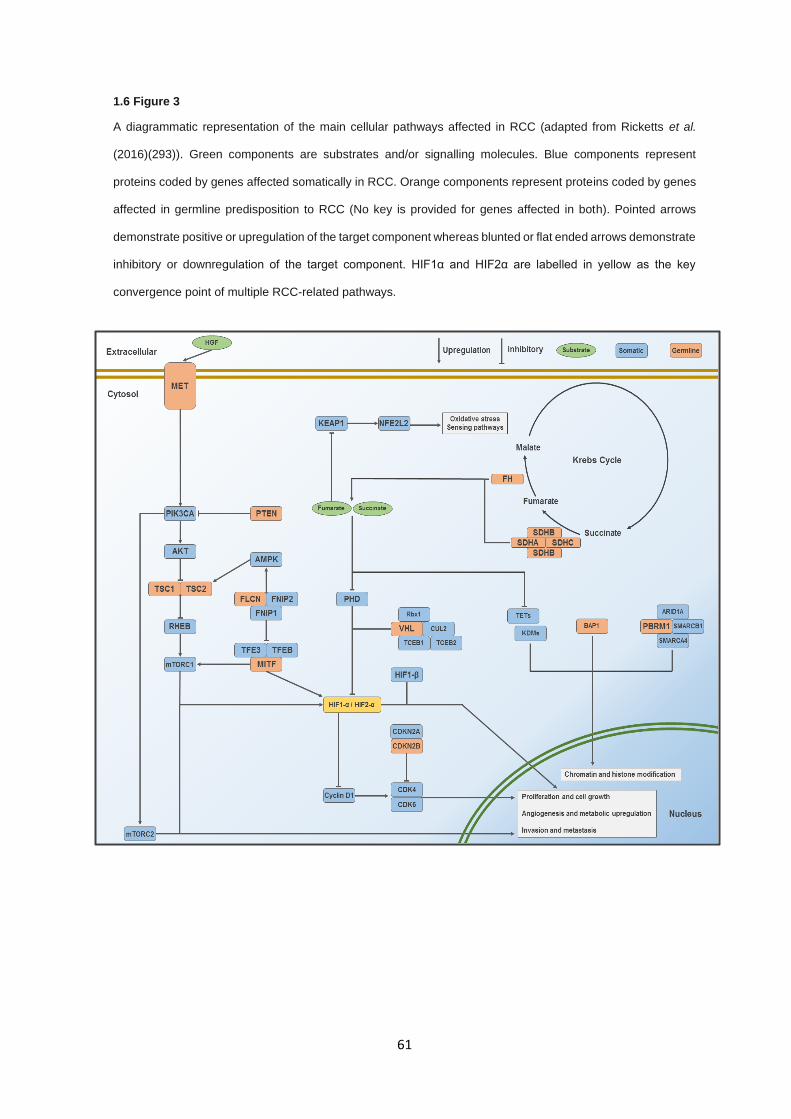
61
1.6 Figure 3
A diagrammatic representation of the main cellular pathways affected in RCC (adapted from Ricketts et al.
(2016)(293)). Green components are substrates and/or signalling molecules. Blue components represent
proteins coded by genes affected somatically in RCC. Orange components represent proteins coded by genes
affected in germline predisposition to RCC (No key is provided for genes affected in both). Pointed arrows
demonstrate positive or upregulation of the target component whereas blunted or flat ended arrows demonstrate
inhibitory or downregulation of the target component. HIF1α and HIF2α are labelled in yellow as the key
convergence point of multiple RCC-related pathways.
62
1.7 Sequencing in rare diseases
1.7.1 Sequencing technologies
The efficiency of identifying genetic alterations that result in disease phenotypes has progressed
rapidly over the last two decades, with ever decreasing costs and ever-increasing breadth and depth
of genetic information accurately interrogated by each technological iteration. A milestone in the
advancement of DNA sequencing was the development of Sanger sequencing (294) and its
application in automated capillary gel-electrophoresis (295), allowing for the sequencing of the
complete human genome in 2001 (296).
Following this breakthrough, rapid development of technologies with greater throughput and lower
economic and labour costs became the goal of genomic sequencing, culminating in the development
of high-throughput platforms utilising technologies such as sequencing by synthesis (Illumina, 454,
Ion Torrent) and sequencing by ligation (Complete Genomics, SOLiD). The widespread adoption of
2nd generation next generation sequencing (NGS) technologies, particularly Illumina-based
platforms, resulted in large scale sequencing of thousands of rare disease and oncology cases.
Additionally, development of sequencing adaptations such as RNA-seq (297), bisulphite sequencing
(298), ChIP-seq (299), and many others have allowed for the generation of sequencing data in
numerous “-omics”, leading to multi-dimensional analysis and providing greater biological insights.
The ability to limit sequencing in 2nd generation NGS technologies to specific target regions (e.g.
whole exome sequencing and targeted gene panels) has further improved efficacy, increasing the
biological relevance of the sequenced regions and reducing overall cost compared to whole genome
sequencing.
While 2nd generation NGS technologies have revolutionised genomic sequencing, 3rd generation
sequencing technologies (Pacific Biosciences SMRT sequencing (PacBio SMRT), 10X Genomics
and Oxford NanoPore Technologies (ONT)) are beginning to move into the spotlight, bringing with
them unique advantages and disadvantages. Perhaps the greatest disadvantage for 2nd generation
NGS technologies is the length of reads that are generated. The shorter read lengths limit coverage
over complex genomic regions, result in difficulties resolving repetitive genomic loci, have poor
resolution of structural variation, and an inability to perform accurate haplotype phasing.
63
The use of long read lengths overcomes many issues stemming from short reads. Use of long reads
in all 3rd generation technologies has improved alignment to complex genomic regions and highly
repetitive loci and has improved the calling and characterising of large structural variations.
Specifically PacBio SMRT sequencing and 10X Genomics have seen vast improvements in
haplotype phasing compared to short read sequencing (300,301). Furthermore, 3rd generation
methods such as PacBio SMRT and ONT have demonstrated the ability to perform innate nucleotide
base modification detection without the need for prior processing during library preparation
(302,303), though it is currently restricted to CpG island methylation detection.
A clear shortcoming of 3rd generation technologies is a large increase in cost for similar sequencing
throughput, particularly for ONT sequencing, but uptake by the scientific community will drive prices
down with sufficient demand. A disadvantage to even PacBio and 10X genomic long read
sequencing is the reliance of genomic centres with the financial and logistical means to provide
sequencing, each having high costs, maintenance and large machinery requirements to run
effectively. The development of ONT sequencing provided a reasonably high-throughput, portable
sequencing option and demonstrated its efficacy in sequencing genomes in infectious disease
outbreaks such as Ebola and Zika viruses (304,305). Furthermore, read lengths in ONT sequencing
are only limited on the length of DNA provided to the sequencer after library preparation and physical
constraints at the sequencing pore, allowing for exceptionally long reads of up to 2 Mb in length
(306). This advantage has been critical in the use of ONT sequencing for the characterisation of
structural variation larger than the read lengths of PacBio and 10X genomics (307), and where
specific loci are known to carry structural variants but the precise nature is not known, including large
deletions and tandem repeat expansions (308,309). Compared to both 2nd generation short read
technologies and other 3rd generation methods, ONT has some significant disadvantages, including
reduced throughput and increased per read error rates, particularly for repetitive regions, but far
lower cost and ease of use make it highly versatile given the right context.
64
1.7.2 Sequencing technologies - The right tool for the job
While technologies have rapidly developed and evolved to generate vast quantities of data, no
technology is without its niche, with Sanger sequencing still seeing ubiquitous use in both clinical
and research environments for targeted sequencing projects, validation of NGS findings, and clinical
diagnosis. In all, the selection of a specific sequencing technology relies upon the context in which
it is being applied. The generation of whole genome sequencing via Sanger sequencing is now an
absurd idea, resulting in substantially increased economic, labour, and time costs over newer 2nd
and 3rd generation methods. Conversely, using long read PacBio sequencing for the identification of
variants in a single exon of one gene is equally unreasoned, providing no practical benefits over
simple polymerase chain reaction (PCR) amplification and Sanger sequencing. Important selection
of the most appropriate sequencing method for the question being asked is vital to both maximise
the biologically relevant data whilst minimising economic, labour, and computational costs. In 1.7
Table 3, a comparison is made for which sequencing approach is most appropriate to the study
design being used if only utilising DNA sequencing.
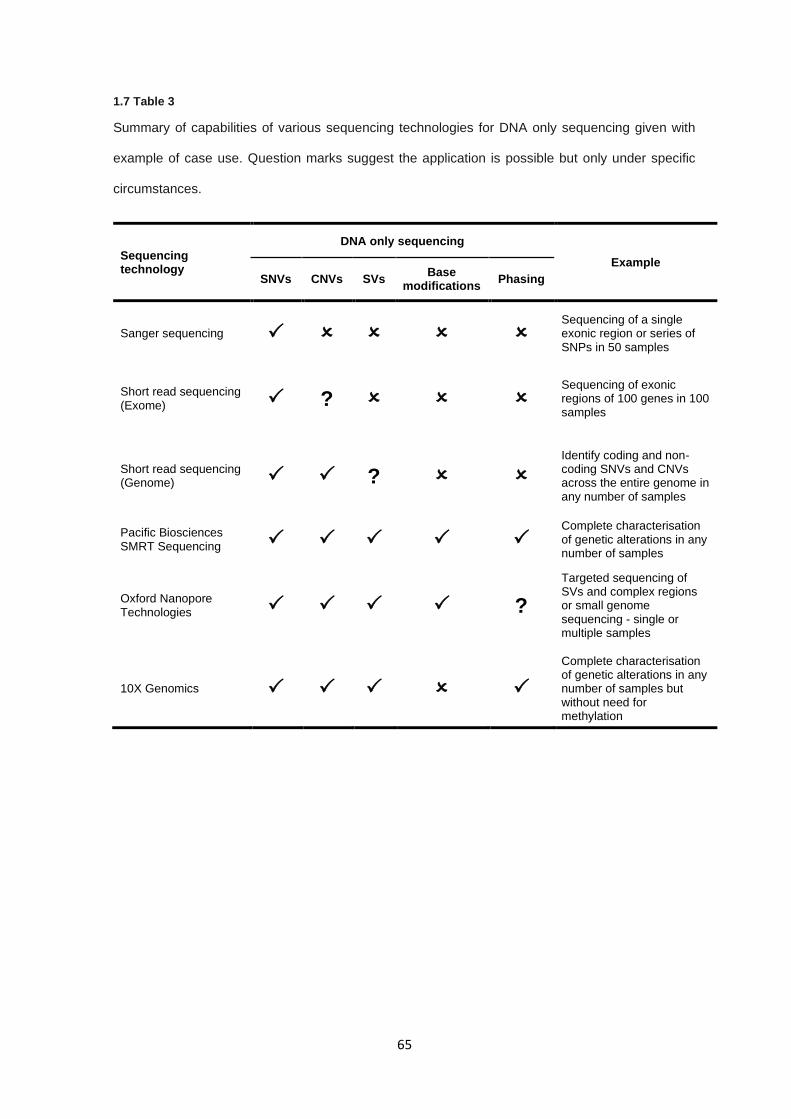
65
1.7 Table 3
Summary of capabilities of various sequencing technologies for DNA only sequencing given with
example of case use. Question marks suggest the application is possible but only under specific
circumstances.
Sequencing technology
DNA only sequencing
Example
SNVs CNVs SVs Base
modifications Phasing
Sanger sequencing Sequencing of a single exonic region or series of SNPs in 50 samples
Short read sequencing (Exome) ?
Sequencing of exonic regions of 100 genes in 100 samples
Short read sequencing (Genome) ?
Identify coding and non-coding SNVs and CNVs across the entire genome in any number of samples
Pacific Biosciences SMRT Sequencing
Complete characterisation of genetic alterations in any number of samples
Oxford Nanopore Technologies ?
Targeted sequencing of SVs and complex regions or small genome sequencing - single or multiple samples
10X Genomics
Complete characterisation of genetic alterations in any number of samples but without need for methylation
66
1.7.3 Variant detection in rare disease
The principal function of any sequencing technique is to identify the causal variant or variants
associated with the disease phenotype being investigated. Given the vast number of variants some
methods can uncover, filtering and identifying a causal variant can be a substantial challenge. In
hereditary disease, there are three primary methods for variant identification which are familial
segregation, trio analysis, and abundance in unrelated probands. Familial segregation is the effective
presentation of a phenotype within a family pedigree where affected individuals carry the candidate
genotype, where presentation is variable based on inheritance model and the penetrance of the
phenotype. For example, in a fully penetrant autosomal dominant pedigree, any given carrier has a
50% probability of passing the causal variant to their offspring and all carriers are affected.
A major drawback of segregation analysis is the need for well documented family histories, accurate
and meaningful phenotype data, as well as issues with identifying segregation in low penetrance or
complex traits where inheritance patterns may be obfuscated. Use of trio analysis, classically in the
form of mother-father-offspring trios, are a powerful method for variant detection and segregation.
Trio analysis can be especially effective when attempting to identify de novo variation in an affected
offspring, where both parents are unaffected, by removing the variants inherited from the paternal
and maternal alleles. Trio analysis (or any variation of comparing multiple related individuals) is still
viable for variants which aren’t de novo provided that phenotypic penetrance is strong enough, as
unaffected carriers will likely result in the filtering out of the causal variant.
Assessment of unrelated probands with the same disease can allow for the detection of single
variants or genes that are associated with the phenotype of interest. By applying statistical
methodology to allelic frequencies in cases compared to control sets, a calculation can be performed
as to whether or not a given feature is overrepresented in the case set. This can apply to single loci,
as is the case in genome-wide association studies (GWAS) studies or utilise more statistically
complex analyses over fixed genomic regions such as genes, via methods such as variant collapsing
or burden association tests (310).

67
Lastly, the assumption that any given cancer predisposition phenotype is likely to be autosomal
dominant, with potentially variable penetrance, is well founded with many cases following this
inheritance model. Conversely, there is increasing evidence for the role of complex or polygenic
traits in cancer predisposition, with multiple low risk variants conferring additive cancer risk. In this
instance, detection of low risk or polygenic traits is restricted to epidemiological studies with large
enough sample sizes to detect small effect sizes and for rare cancer predisposition, such as those
seen in RCC, the ability to detect these variants is juxtaposed to the sample size requirements.
68
1.8 Summary
RCC is complex set of renal neoplasm with distinct morphology, histology, and clinical courses and
is a prominent cancer in both developing and developed countries, seeing an increased incidence
globally. While clinical outcomes for stage I and low-grade tumours is favourable, tumours are often
detected at later stages and as such have a much lower survival rate. Additionally, RCC tumours are
treatment tolerant, with only moderate efficacies seen without targeted therapies and frequently
become treatment resistant. Both the early detection, screening frequency and targeted therapies
hinge on detection and understand the genetic components present both constitutionally and
somatically.
Each subtype of RCC are genetically distinct entities with differing somatic and germline mutation
patterns, as well clear genetic overlaps between causes of inherited RCC and somatic RCC driver
mutations. While characterisation of somatic mutations across the differing histological subtypes has
uncovered an array of genes involved in RCC tumourigenesis, understanding of RCC predisposition
genes has been vital to understanding molecular mechanisms, cellular environments, and genetic
circumstances which drive sporadic tumours.
While many genes associated with predisposition to RCC have been discovered, a large proportion
of the remaining genetic component is currently unknown, with many cases which meet genetic
screening criteria not carrying pathogenic variation in known RCC predisposition genes. By utilising
multiple sequencing methodologies on individuals with features of inherited RCC (early onset,
bilateral or multifocal tumours, and family history), potential candidate genes can be identified as
associated with RCC predisposition and as such inform investigations in molecular mechanism,
improve genetic testing and family screening, and provide potential targets for clinical management.
It is worth noting that while this is a potential source of heritability which is currently not assessed,
given the historical prior probability of an inherited cases of RCC (2-3%), the power to discover
additional inherited cases within a cohort with suspected features of predisposition (24-33.7%) has
low power without large sample numbers.

69
This posterior probability is a frequent challenge in the analysis of rare disease cohorts and
significantly impacts a studies ability to elucidate new genetic features which are associated with
RCC predisposition. In spite of this, rare disease studies do not have any robust alternative and a
failure to perform a given study due to low probability of identifying novel outcomes is not a
justification for ignoring the clinical and ethical needs of patients and families who present with rare
diseases, including inherited RCC.

70
1.9 Aims
To utilise multiple genomic targets and sequencing technologies to provide evidence to
support the association of inherited RCC with previously reported genes.
Use multiple genomic sequencing approaches and statistical case control analysis methods
to identify novel genes which are associated with a predisposition to RCC.

71
2.0 Materials and methods
72
2.0.1 – Table of contents
2.0.1 – TABLE OF CONTENTS ...................................................................................................................... 72
2.0.2 LABOUR CONTRIBUTIONS .................................................................................................................. 73
2.1 SAMPLE PREPARATION ......................................................................................................................... 74
2.1.1 SAMPLE RETRIEVAL AND EXTRACTION ...................................................................................................... 74
2.1.2 SAMPLE SOURCE AND STORAGE .............................................................................................................. 74
2.1.3 PATIENT COHORT DESCRIPTION ............................................................................................................... 75
2.2 SAMPLE QUALITY CONTROL AND METRICS ....................................................................................... 76
2.2.1 DNA QUANTIFICATION ............................................................................................................................ 76
2.2.2 WHOLE GENOME AMPLIFICATION OF LOW QUANTITY SAMPLES ..................................................................... 76
2.3 POLYMERASE CHAIN REACTION (PCR) METHODS ............................................................................ 77
2.3.1 PRIMER DESIGN ..................................................................................................................................... 77
2.3.2 SHORT RANGE PCR .............................................................................................................................. 77
2.3.3 NESTED PCR........................................................................................................................................ 79
2.3.4 LONG RANGE PCR PRIMER DESIGN ......................................................................................................... 79
2.3.5 LONG RANGE PCR ................................................................................................................................ 79
2.3.6 GEL ELECTROPHORESIS ......................................................................................................................... 81
2.4 SANGER SEQUENCING........................................................................................................................... 82
2.4.1 PCR PRODUCT CLEAN-UP....................................................................................................................... 82
2.4.2 SANGER SEQUENCING TERMINATION REACTION ......................................................................................... 82
2.4.3 ISOPROPANOL CLEAN-UP AND DNA PRECIPITATION ................................................................................... 84
2.4.4 SEQUENCING ANALYSIS .......................................................................................................................... 84
2.5 POOLED AMPLICON CLEAN-UP ............................................................................................................ 85
2.6 DNA SEQUENCING AND LIBRARY PREPARATION ............................................................................. 87
2.6.1 ILLUMINA NEXTERA XT LIBRARY PREPARATION AND SEQUENCING ............................................................... 87
2.6.2 ILLUMINA TRUSIGHT CANCER LIBRARY PREPARATION AND SEQUENCING ...................................................... 87
2.6.3 ILLUMINA TRUSEQ RAPID EXOME LIBRARY PREPARATION AND SEQUENCING .................................................. 87
2.6.4 WHOLE GENOME SEQUENCING BY NOVOGENE .......................................................................................... 88
2.6.5 LIBRARY PREPARATION LABOUR CONTRIBUTIONS ....................................................................................... 88
2.7 GENERALISED SEQUENCING PIPELINE ............................................................................................... 89
2.8 VARIANT FILTERING AND ANNOTATION .............................................................................................. 90
2.9 OXFORD NANOPORE TECHNOLOGIES SEQUENCING ....................................................................... 92
2.9.1 SAMPLE PREPARATION AND LONG-RANGE PCR AMPLICON ......................................................................... 92
2.9.2 NANOPORE SEQUENCING LIBRARY PREPARATION ...................................................................................... 92
2.9.3 NANOPORE BIOINFORMATICS .................................................................................................................. 92

73
2.0.2 Labour contributions
All methods described in this section were performed by the author with the exception of patient
recruitment (performed by Professor Eamonn Maher), sample retrieval and extraction (section 2.1),
and the contributions described in relation to DNA library preparations (section 2.6.5).
74
2.1 Sample preparation
2.1.1 Sample retrieval and extraction
Samples were received from various clinical genetic laboratories and DNA extraction methods will
vary per recruitment site. Most recruited participants had DNA processed and extracted via either
Cambridge University Hospital Addenbrookes East Anglian Medical Genetics Laboratory or
Birmingham Women's Hospital West Midlands Regional Genetics Laboratory. Further subsets of
samples were prepared at Melbourne, Exeter, Newcastle, King’s College London and sent to
Cambridge University Hospital Addenbrookes East Anglian Medical Genetics Laboratory for storage.
2.1.2 Sample source and storage
All but one sample used was blood serum-derived genomic DNA (one sample was buccal-derived
DNA and was not found to be detrimental to experimental findings). All stock DNA extractions were
stored in DNA Lo-bind microcentrifuge tubes (Eppendorf, Germany), sealed with Parafilm M (Bemis,
United States) or tethered screw cap microtubes with rubber sealed lids (STARLAB, United
Kingdom). Any samples received in containers not conforming to these storage requirements were
transferred into the appropriate storage containers. DNA sample dilutions were prepared using
Nuclease-free water (Qiagen, Germany) to required concentrations and quantified using either Qubit
Broad Range or Qubit High Sensitivity DNA assay (Invitrogen, United States), depending on
calculated target concentration (see section 2.2). All sample aliquots were stored at -20°C and
dilutions were used where possible to reduce freeze-thaw cycling of stock DNA samples.
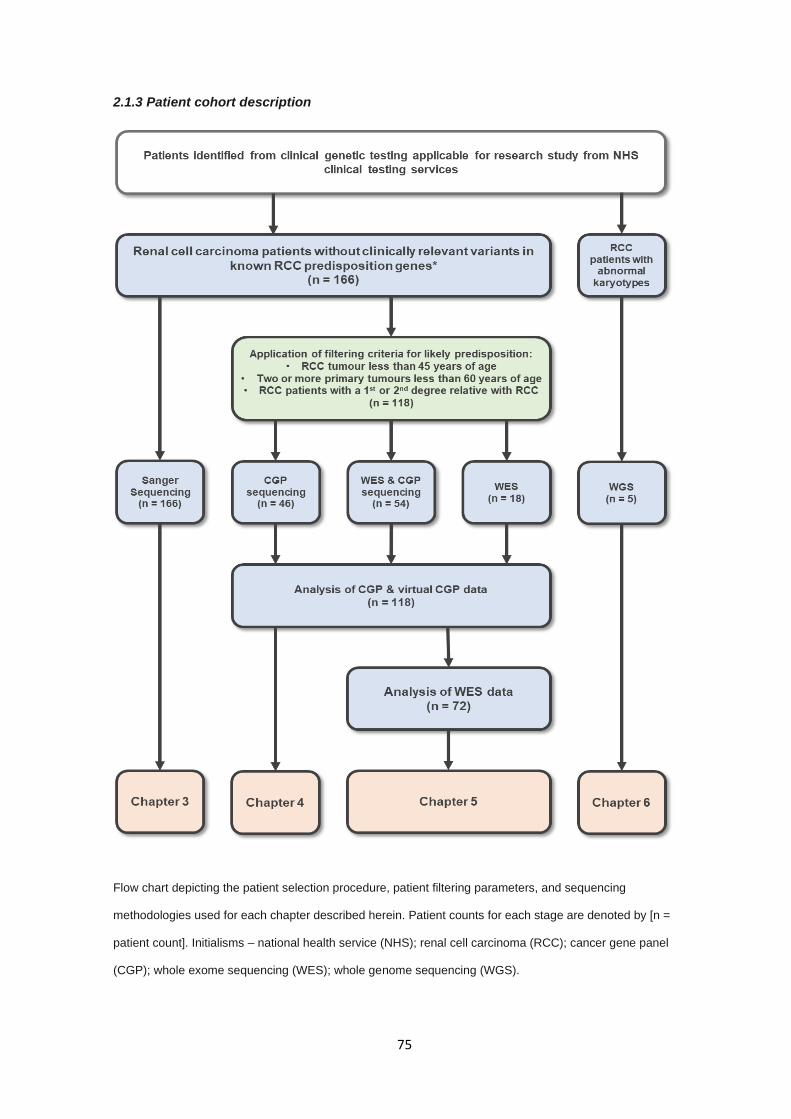
75
2.1.3 Patient cohort description
Flow chart depicting the patient selection procedure, patient filtering parameters, and sequencing
methodologies used for each chapter described herein. Patient counts for each stage are denoted by [n =
patient count]. Initialisms – national health service (NHS); renal cell carcinoma (RCC); cancer gene panel
(CGP); whole exome sequencing (WES); whole genome sequencing (WGS).
76
2.2 Sample quality control and metrics
2.2.1 DNA quantification
DNA quantification was performed with Qubit Broad Range DNA assay (Invitrogen, United States)
in most circumstances following the manufacturer’s protocol for 2 μl DNA input. In a limited number
of cases where DNA quantity was low/insufficient or DNA quality was questionable or low
concentration dilutions were required (e.g. DNA sequencing libraries) DNA aliquots were measured
by Qubit High Sensitivity DNA assay (Invitrogen, United States) to determine concentration (following
the manufacturer’s protocol for 2 μl DNA input) and NanoDrop 1000 Spectrophotometer
(Thermofisher, United States) using 1 μl DNA input to determine sample purity from 260/230 nm and
280/260 nm absorption ratio (311).
2.2.2 Whole genome amplification of low quantity samples
In certain instances, low DNA yield samples limited available DNA for downstream experiments. In
these cases, DNA was whole genome amplified using REPLI-g Mini kit (Qiagen, Germany) following
manufacturers’ instructions provided for initial input of 5 μl. Whole genome amplified product
concentrations were measured using the Invitrogen Qubit Broad Range DNA assay (see section
2.2.1). Whole genome amplified DNA was not used for high throughput sequencing methods due to
described base replication errors and region-specific amplification (312).
77
2.3 Polymerase chain reaction (PCR) methods
2.3.1 Primer design
Target sequences for designed primers were retrieved using University of California, Santa Cruz
(UCSC) Genome Browser (313) providing target co-ordinates from Human Genome build
GRCh38/Hg38 (314). Primers were designed using the Primer3 (315). Primer sets were evaluated
for non-specific binding and secondary structure formation using National Centre for Biotechnology
Information’s (NCBI) BLAST (Basic Local Alignment Search Tool) PrimerBLAST (316).
2.3.2 Short range PCR
PCR amplification was performed using AmpliTaq Gold DNA polymerase utilising GeneAmp10X
PCR Buffer II with MgCl2 (Applied Biosystems, United States). In most instances, PCR was
performed as per the manufacture’s protocol with a standard annealing temperature of 58°C and 30
cycles. In certain reactions, conditions required optimisation to produce a DNA product for
downstream steps. The annealing temperature was adjusted with a temperature gradient (53-63°C)
and the quantity of genomic DNA input required varied depending upon the quality of the DNA,
increasing incrementally from 10ng/reaction up to a maximum of 50ng/reaction. TaqMan Control
Genomic DNA (Applied Biosystems, United States) was used in place of patient genomic DNA,
where appropriate, for optimisations and negative control reactions. Standard PCR protocol is given
below in 2.3 Table 1.
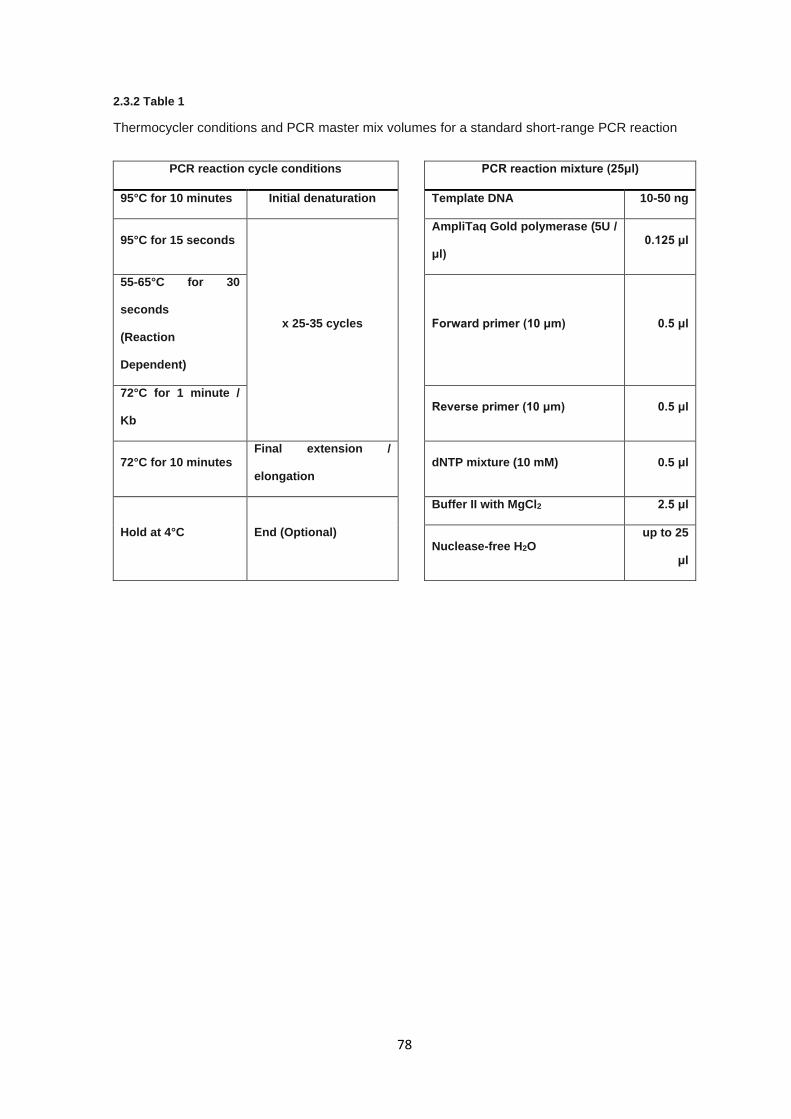
78
2.3.2 Table 1
Thermocycler conditions and PCR master mix volumes for a standard short-range PCR reaction
PCR reaction cycle conditions PCR reaction mixture (25μl)
95°C for 10 minutes Initial denaturation Template DNA 10-50 ng
95°C for 15 seconds
x 25-35 cycles
AmpliTaq Gold polymerase (5U /
μl) 0.125 μl
55-65°C for 30
seconds
(Reaction
Dependent)
Forward primer (10 μm) 0.5 μl
72°C for 1 minute /
Kb
Reverse primer (10 μm) 0.5 μl
72°C for 10 minutes Final extension /
elongation
dNTP mixture (10 mM) 0.5 μl
Hold at 4°C End (Optional)
Buffer II with MgCl2 2.5 μl
Nuclease-free H2O
up to 25
μl
79
2.3.3 Nested PCR
For a subset of reactions, initial amplification of PCR targets was complicated by local DNA
structures or sub-optimal primer designs. As such, expanded PCR amplicons were designed to span
the original target with additional flanking DNA sequence between 500-2000 bp 5’ and 3’ of the initial
PCR amplicon. Two PCR reactions as described in section 2.3.2 were performed, the first reaction
utilising the expanded amplicon primers and the second reaction using the original amplicon primers
but with the PCR product of former as the input DNA. For larger nested amplicons elongation times
in the PCR cycling conditions were adjusted as necessary.
2.3.4 Long range PCR primer design
Long range PCR primers were designed in accordance with the details of section 2.3.1 with the
alteration that primers should be purified via high performance liquid chromatography (HPLC) to
ensure the removal of truncated primer sequences and impurities to reduce possible off target
effects.
2.3.5 Long range PCR
Long range PCR amplicons were generated with the SequalPrep™ Long PCR Kit (Applied
Biosystems, United States). Stringent optimisation was completed to improve amplicon generation
via modification of the following conditions; Annealing temperature, concentration of enhancer,
DMSO concentration & number of PCR cycles. TaqMan® Control Genomic DNA (Applied
Biosystems, United States) was used for optimisation steps. Cycling conditions and reaction mixture
set up is given in the 2.3 Table 2 below.
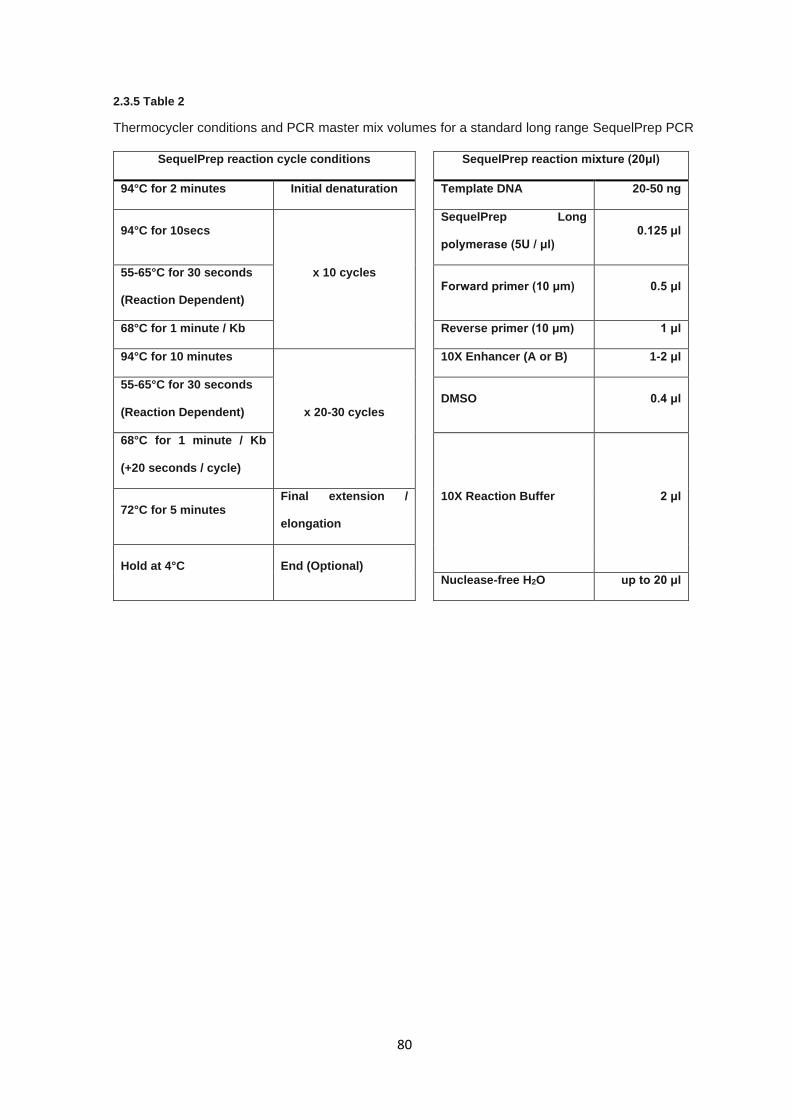
80
2.3.5 Table 2
Thermocycler conditions and PCR master mix volumes for a standard long range SequelPrep PCR
SequelPrep reaction cycle conditions SequelPrep reaction mixture (20μl)
94°C for 2 minutes Initial denaturation Template DNA 20-50 ng
94°C for 10secs
x 10 cycles
SequelPrep Long
polymerase (5U / μl) 0.125 μl
55-65°C for 30 seconds
(Reaction Dependent)
Forward primer (10 μm) 0.5 μl
68°C for 1 minute / Kb Reverse primer (10 μm) 1 μl
94°C for 10 minutes
x 20-30 cycles
10X Enhancer (A or B) 1-2 μl
55-65°C for 30 seconds
(Reaction Dependent)
DMSO 0.4 μl
68°C for 1 minute / Kb
(+20 seconds / cycle)
10X Reaction Buffer 2 μl 72°C for 5 minutes
Final extension /
elongation
Hold at 4°C End (Optional)
Nuclease-free H2O up to 20 μl
81
2.3.6 Gel electrophoresis
Gel electrophoresis was performed on a wide range of DNA products throughout the experiments
described in this thesis. This describes a generalised protocol used for all instances in which gel
concentrations, run times, and applied voltages differ between experiments. Prior to preparing a
agarose gel, 50X Tris Acetate-EDTA (TAE) stock solution was made by dissolving 242 g Tris-base
(Fisher Scientific, United States) in 500 ml of water (15 MΩ·cm), adding 37.2 g
Ethylenediaminetetraacetic acid disodium salt dehydrate (EDTA; Sigma Aldrich, United States), 57.2
ml glacial acetic acid (Sigma Aldrich, United States), and making total volume up to 1 L, after which
pH was adjusted to 8.5. This was diluted in 4.9 Litres of water (15 MΩ·cm) forming a 1X TAE buffer
(40mM Tris, 20 mM acetic acid, 2 mM EDTA). Agarose gel was prepared by adding TAE solution to
agarose (Sigma Aldrich, United States) to a final agarose gel mass concentration of between 5-30
mg/ml, depending on the weight of agarose and volume of 1X TAE.
Agarose gel solutions were cooled to approximately 10-15°C above solidifying temperature and 0.5X
SYBR Safe DNA Gel Stain (10,000X in DMSO; Invitrogen, United States) was evenly mixed into
solution. Gels were cast and left to set for 30 minutes, placed into a gel electrophoresis tank, and
submerged in 1X TAE. Typically, 5 μl DNA product was mixed with 1 μl DNA Gel Loading Dye 6X
(Thermo Scientific, United States) and loaded into each agarose gel well along with a ladder well
containing either 2.5 μl GeneRuler 100 Bp Plus, FastRuler Low Range (Thermofisher, United
States), or Quick-Load 1 kb DNA Ladder (New England Biolabs, United States) depending on
estimated amplicon size.
Agarose gels were run for 40-80 minutes at 6-8 V/cm, depending on estimated product size and
agarose concentration. Agarose gels were visualised using transient ultraviolet (UV) illumination on
the Gel Doc XR+ Gel Documentation System (BioRad, United States) and gel images were saved
as both BioRad proprietary 1SC format and standard JPEG format with minimal compression.
82
2.4 Sanger sequencing
2.4.1 PCR product clean-up
PCR products generated for Sanger sequencing were cleaned using ExoSAP to remove unwanted
single-strand sequences and residual dNTPs from the PCR reaction. ExoSAP was prepared by
mixing Exonuclease I (New England Biolabs, United States) and Shrimp Alkaline Phosphatase (SAP;
Sigma Aldrich, United States) enzymes at a ratio of 1:2, respectively. Each PCR product had 1 μl of
ExoSAP added directly to the PCR reaction mixture. ExoSAP-treated reaction mixtures were
incubated for 60 minutes at 37°C, followed immediately by an inactivating incubation of 80°C for 15
minutes.
2.4.2 Sanger sequencing termination reaction
Sanger sequencing was performed using BigDye Terminator v3.1 Cycle Sequencing Kit (Applied
Biosystems, United States). ExoSAP-purified PCR products were sequenced bi-directionally,
sequencing both the forward and reverse strands, to improve alignment and sequencing quality
where possible. Reaction mixtures consisted of 2 μl purified PCR product, 0.75 µl BigDye Terminator
v3.1 Ready Reaction Mix, 1 μl primer (10 pmol; forward or reverse strand), 2µl 5X BigDye
Sequencing buffer (Applied Biosystems, United States), and 4.25 µl nuclease-free water (Qiagen,
United States). The reaction cycling conditions are given in 2.4.2 table 3.
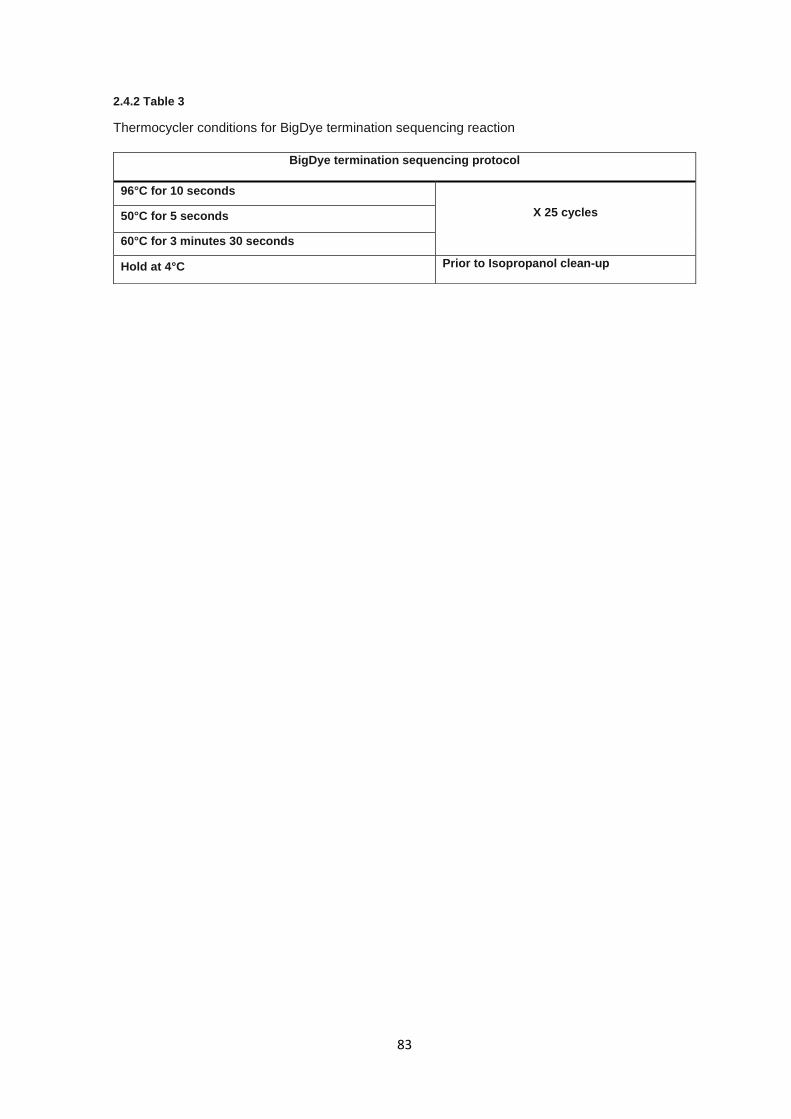
83
2.4.2 Table 3
Thermocycler conditions for BigDye termination sequencing reaction
BigDye termination sequencing protocol
96°C for 10 seconds
X 25 cycles 50°C for 5 seconds
60°C for 3 minutes 30 seconds
Hold at 4°C Prior to Isopropanol clean-up
84
2.4.3 Isopropanol clean-up and DNA precipitation
Isopropanol clean-up was used as a sequence precipitation and clean-up method for removing
unincorporated dyes and residual termination dNTPs left over from BigDye termination sequencing.
To each Sanger sequencing reaction, 40µl of freshly prepared 75% v/v isopropanol (Sigma Aldrich,
United States) was added and mixed gently by pipetting up and down twice. Reactions were then
incubated at room temperature for 30 minutes and the subsequently centrifuged at 2092 relative
centrifugal force (RCF) for 45 minutes. The reaction plate was then inverted onto absorbent paper
and tapped to discard isopropanol, centrifuged for 30 seconds at 33 RCF, and left to air dry for 10
minutes until all isopropanol has evaporated. DNA pellets were re-suspended in 20 µl of Hi-Di
Formamide (Applied Biosystems, United States).
2.4.4 Sequencing analysis
Sanger termination sequences were loaded onto either a 3730 DNA Analyzer or 3130xl DNA
Analyzer (Applied Biosystems, United States) where dye terminator sequences were separated by
capillary electrophoresis and dye florescence was recorded for analysis. Fluorescence
chromatograms were analysed using Sequencher v5.3 (Gene Codes Corporation, United States),
aligning sequences to a reference sequence of each targeted variant ±500 base pairs extracted from
UCSC, as described in section 2.3.1.
85
2.5 Pooled amplicon clean-up
As part of chapter 3, normalisation of pooled long-range PCR amplicons of variable lengths was
required prior to DNA library preparation for NGS sequencing. An efficient custom clean up method
was developed in-house to remove unwanted DNA fragments and contaminants whilst retaining
size-divergent pooled amplicons. Protocol is a hybridisation of the Agencourt AMPure XP PCR
Purification Beads (Beckman Coulter, United States) and clean up protocol provided in Illumina
TruSight Rapid Capture Sample Preparation Guide (Illumina, United States). Both systems
mentioned above use the AMPure XP magnetic beads for the separation of DNA products (named
“Sample Purification Beads” in the Illumina documentation).
A volume of each pooled sample amplicon was mixed well with a pipette and added to a deep-well
storage plate (minimum volume used was 10 µl as lower volumes resulted in issues with sample
manipulation whilst in contact with magnetic beads). Subsequently, 1.8 volumes of AMPure XP
magnetic beads (at room temperature and well mixed) were added to each pooled sample amplicon
well, sealed with an adhesive plate seal, shaken at 507 RCF for one minute, and left to incubate for
10 minutes at room temperature.
The deep-well storage plate was spun briefly to ensure no sample was lost and placed onto a
magnetic stand for 2 minutes. Whilst remaining on the magnetic stand, supernatant was carefully
removed without disturbing the pellet, to each well 200 μl of freshly prepared 80% v/v ethanol (Sigma
Aldrich, United States) was added and incubated at room temperature for 30 seconds after which
the supernatant was removed. This process was repeated twice for a total of two 80% v/v ethanol
washes.
Any remaining ethanol was aspirated off using a 20 μl pipette and air dried at room temperature for
a maximum of 5 minutes. The deep-well storage was removed from the magnetic stand and 40μl of
nuclease-free water added to each pool sample amplicon well. Elution-bead mix was then shaken
at 507 RCF for 1 minute. The deep-well storage plate was spun briefly to ensure no sample is lost
and placed onto a magnetic stand for 2-10 minutes, with the eluate being subsequently transferred
to a new labelled 96-well plate without disturbing the pellet.
86
Pooled sample concentrations were measured using the Invitrogen Qubit Broad Range DNA assay
both before and after clean up to measure levels of DNA loss during the clean-up process (see
section 2.2.1). Loss of DNA during clean-up is unavoidable using this method due to unbound DNA
fragments. This protocol had to accommodate a broad range of DNA amplicon sizes – the rate loss
that was seen typically 10-20% less than the original input (by total mass). Retention of all size
ranges was confirmed by gel electrophoresis (5 mg/ml agarose gel at 6 V/cm for 60 minutes – See
section 2.3.6).
87
2.6 DNA sequencing and library preparation
Full details of manufacturer’s protocols are omitted for brevity but are available online
(http://emea.support.illumina.com/array/protocols.html).
2.6.1 Illumina Nextera XT Library preparation and sequencing
Pooled amplicons underwent DNA library preparation using Illumina Nextera XT (Illumina, United
States) following the manufacturer’s protocol. All samples were diluted to 5ng/μl and processed
according to the manufacturer’s protocol. Pooled libraries were quantified by quantitative PCR and
loaded onto an Illumina MiSeq Sequencer using Illumina MiSeq Reagent v.2 – 300 cycle Kit – paired
end 150 bp (Illumina, United States).
2.6.2 Illumina TruSight Cancer library preparation and sequencing
Samples were prepared using the TruSight Cancer library prep kit (Illumina, United States) following
the manufacturer’s protocol. All samples were diluted to 5ng/μl and processed according to the
manufacturer’s protocol. Pooled libraries were quantified by quantitative PCR and loaded onto an
Illumina MiSeq Sequencer using Illumina MiSeq Reagent v.2 – paired end 150 bp (Illumina, United
States).
2.6.3 Illumina TruSeq rapid exome library preparation and sequencing
Samples were prepared using the TruSeq rapid exome library prep kit (Illumina, United States)
following the manufacturer’s protocol. All samples were diluted to 5ng/μl and processed according
to the manufacturer’s protocol. Pooled libraries were quantified by quantitative PCR and loaded onto
an Illumina HiSeq 2500 Sequencer using Illumina HiSeq Reagent v.2 – paired end 150 bp (Illumina,
United States).
88
2.6.4 Whole genome sequencing by Novogene
Whole genome sequencing (WGS) data was generated externally by a third-party company
Novogene (Beijing, China) from submitted blood-extract DNA. DNA was quantified and quality
checked as described in section 2.2 prior to submission to WGS. DNA underwent library preparation
using Illumina Nextera DNA library prep kit and sequenced on the Illumina HiSeq X platform.
Sequencing output was returned in trimmed and de-multiplexed FASTQ format on an external hard
drive and transferred to departmental hard drives after MD5 checksums.
2.6.5 Library preparation labour contributions
Library preparations of various results chapters discussed within this body of work were not solely
generated by the author and as such contributions are described as accurately as possible below.
Library preparation for section 2.6.1 were solely generated by the author and libraries were loaded
into sequencing flow cells and onto the Illumina MiSeq platform by the stratified medicine core
laboratory (SMCL) sequencing laboratory.
Library preparations for section 2.6.2 were performed by Dr Hannah West, Dr Andrea Luchetti, and
the author divided approximately 40%, 20%, 40% of the total libraries, respectively, and libraries
were loaded onto sequencing flow cells and onto both Illumina MiSeq and Illumina HiSeq 2500
platforms by the SMCL sequencing laboratory.
Library preparations for section 2.6.3, including the sequencing flow cell and Illumina HiSeq 2500 or
Illumina HiSeq 4000 loading were solely performed by the SMCL sequencing laboratory.
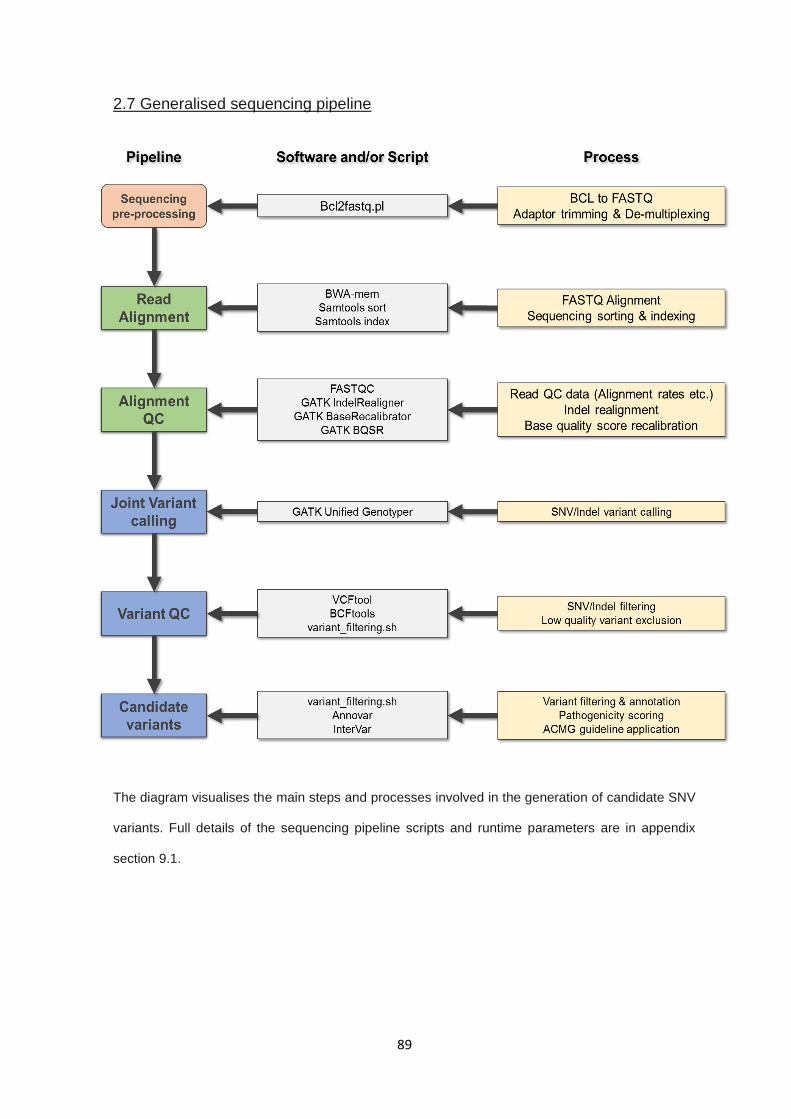
89
2.7 Generalised sequencing pipeline
The diagram visualises the main steps and processes involved in the generation of candidate SNV
variants. Full details of the sequencing pipeline scripts and runtime parameters are in appendix
section 9.1.
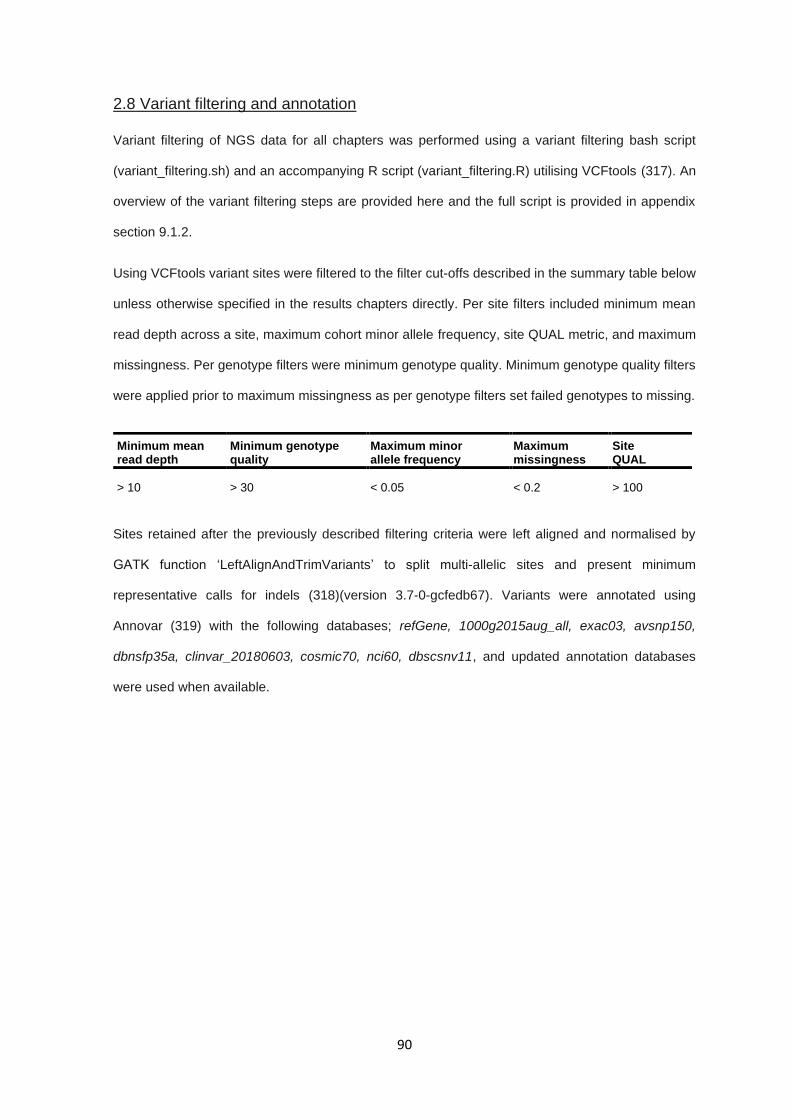
90
2.8 Variant filtering and annotation
Variant filtering of NGS data for all chapters was performed using a variant filtering bash script
(variant_filtering.sh) and an accompanying R script (variant_filtering.R) utilising VCFtools (317). An
overview of the variant filtering steps are provided here and the full script is provided in appendix
section 9.1.2.
Using VCFtools variant sites were filtered to the filter cut-offs described in the summary table below
unless otherwise specified in the results chapters directly. Per site filters included minimum mean
read depth across a site, maximum cohort minor allele frequency, site QUAL metric, and maximum
missingness. Per genotype filters were minimum genotype quality. Minimum genotype quality filters
were applied prior to maximum missingness as per genotype filters set failed genotypes to missing.
Sites retained after the previously described filtering criteria were left aligned and normalised by
GATK function ‘LeftAlignAndTrimVariants’ to split multi-allelic sites and present minimum
representative calls for indels (318)(version 3.7-0-gcfedb67). Variants were annotated using
Annovar (319) with the following databases; refGene, 1000g2015aug_all, exac03, avsnp150,
dbnsfp35a, clinvar_20180603, cosmic70, nci60, dbscsnv11, and updated annotation databases
were used when available.
Minimum mean read depth
Minimum genotype quality
Maximum minor allele frequency
Maximum missingness
Site QUAL
> 10 > 30 < 0.05 < 0.2 > 100
91
The annotated variants were parsed by the variant_filtering.R script and were then filtered by
genomic feature (restricted to “exonic”, “exonic;splicing”, or “splicing”) and removed variants
classified as “synonymous” or intergenic, specified by “unknown”. Variants were filtered by global
minor allele frequencies present in both the 1000 genomes project (320) and ExAC (321) cohorts.
Variants were retained if present at less than 1% (0.01 allelic frequency) using an ‘AND’ selection,
specifying variants should be present at less than 1% in both sets to pass filtering criteria. Variants
occurring with heterozygous call rates greater than 15% of the total cohort were removed as they
were considered to be either technical artefacts or undocumented common SNPs. Lastly, allelic
depth information was extracted for each genotype and alternative allelic depth ratios were
calculated. Sites in which no single non-reference genotype had an alternative allelic ratio (i.e.
percentage of supporting reads) great than 0.3 were removed.
In silico predictive metrics where mentioned in the text refer to the use of Sift (322), PolyPhen (323),
or CADD (324) applied either independently or collectively. Concordance for a variant being likely
pathogenic between the software predictions was defined by a prediction of ‘likely pathogenic’ by
Sift and PolyPhen and a CADD score greater than 25. Concordance for a variant being likely benign
between the software predictions was defined by a prediction of ‘tolerated’ or ‘benign’ by Sift and
PolyPhen and a CADD score lower than 10.
American College of Medical Genetics (ACMG) variant classification criteria (325) were automatically
applied utilising the default parameters of InterVar (version 2.0.2 20180827)(326) and Annovar (as
previously discussed). InterVar does not accept or output multi-sample VCF files so was provided a
pseudo single sample VCF containing all variants present in a given multi-sample VCF with all
genotypes set to heterozygous. Indels annotated by InterVar were right shifted so post-processing
was used to reapply left shift and normalisation in InterVar results files.
92
2.9 Oxford Nanopore Technologies sequencing
2.9.1 Sample preparation and long-range PCR amplicon
The sample used in Nanopore long read sequencing was prepared and quality controlled as
described in section 2.2. PCR products for the specific reactions described in the appropriate
chapters were performed as described in section 2.3.2 and in accordance with any additional
alterations specified in the chapter 6 materials and methods section referring to this portion of the
materials and methods chapter (section 6.2.5).
2.9.2 Nanopore sequencing library preparation
PCR amplicons were quantified to between 1-1.5 μg of total DNA, as described in section 2.2 and
libraries were generated using the manufacturer’s protocol (1D Amplicon by ligation SQK-LSK108),
with adaptation for reduced input fragment size, and loaded onto a FLO-MIN106 flow cell and
sequenced on a MinION sequencing platform utilising the MinION control software (version 18.12.9).
Sequencing was run for 1 hour and data was output in FAST5 format.
2.9.3 Nanopore bioinformatics
FAST5 read data from Nanopore sequencing was base called using the ONT Albacore Sequencing
Pipeline Software (version 2.3.3), generating both base called FAST5 output and FASTQ output
files. FAST5 and FASTQ data was indexed using Nanopolish (version 0.10.2) (327). Sequencing
quality was assessed by custom R script nano-qc.R, poretools (version 0.6.0) (328), and NanoStat
(329). Long read FASTQ data was aligned to GRCh38 using Minmap2 (version 2.10-r761) (330)
using ONT sequencing parameters. Full ONT Nanopore sequencing pipeline nano-pipe.sh is
included in appendix section 9.1.3.

93
3.0 Sequencing of candidate genes by Sanger and targeted next
generation sequencing approaches
94
3.0.1 - Table of contents
3.0.1 - TABLE OF CONTENTS ....................................................................................................................... 94
3.1 INTRODUCTION ....................................................................................................................................... 95
3.1.1 – CANDIDATE GENE - CDKN2B .............................................................................................................. 95
3.1.2 – CANDIDATE GENE - EPAS1 ................................................................................................................. 97
3.1.3 – CANDIDATE GENES - KMT2C AND KMT2D ........................................................................................... 98
3.1.4 AIMS .................................................................................................................................................. 100
3.2 MATERIALS AND METHODS ................................................................................................................ 101
3.2.1 SAMPLES ............................................................................................................................................ 101
3.2.2 SANGER SEQUENCING PRIMER DESIGN AND CO-ORDINATES ...................................................................... 101
3.2.3 PCR REACTIONS AND SANGER SEQUENCING .......................................................................................... 101
3.2.4 LONG RANGE PCR .............................................................................................................................. 101
3.2.5 ILLUMINA NEXTERA XT LIBRARY PREPARATION FOR AMPLICON SEQUENCING .............................................. 102
3.2.6 PRIMARY BIOINFORMATICS .................................................................................................................... 102
3.2.7 VARIANT FILTERING, ANNOTATION, AND CLASSIFICATION ........................................................................... 102
3.2.8 SEQUENCE IDENTITY COMPARISON ........................................................................................................ 102
3.2.9 STATISTICS ......................................................................................................................................... 102
3.3 RESULTS ................................................................................................................................................ 103
3.3.1 TARGETED SANGER SEQUENCING - PCR PRODUCT GENERATION .............................................................. 103
3.3.2 TARGETED SANGER SEQUENCING – VARIANT ANALYSIS ........................................................................... 106
3.3.3 KMT2C & KMT2D TARGETED SEQUENCING – LONG RANGE PCR PRODUCT GENERATION .......................... 109
3.3.4 KMT2C & KMT2D TARGETED SEQUENCING – LIBRARY PREPARATION AND QUALITY CONTROL .................... 112
3.3.5 KMT2C & KMT2D TARGETED SEQUENCING – VARIANT ANALYSIS ............................................................ 116
3.3.6 KMT2C & KMT2D TARGETED SEQUENCING – OFF-TARGET REGIONS AND READ MAPPING ......................... 118
3.3.7 KMT2C & KMT2D TARGETED SEQUENCING – BAGE2 GENE SEQUENCE COMPARISON.............................. 120
3.3.8 VALIDATION OF KMT2C NONSENSE VARIANT .......................................................................................... 120
3.4 DISCUSSION ........................................................................................................................................... 122
3.5 CONCLUSION ......................................................................................................................................... 128
95
3.1 Introduction
Current clinical practice utilises targeted sequencing, either using next generation sequencing (NGS)
panels such as cancer gene panels or ‘clinical’ exomes, or Sanger sequencing for specific genes
that have been associated with known diseases. The primary benefits of using Sanger sequencing
and genomic loci-limited NGS sequencing over more comprehensive NGS sequencing methods is
both a decrease in financial burden, a reduction in the labour required to perform data generation
and analysis, and an increase in the efficiency of accurate variant identification and assessment by
reducing the scope of data generated. Genes that are frequently somatically altered in sporadic RCC
tumours might be candidate targets for inherited disease. This is exemplified by the VHL TSG (99)
and most recently by PBRM1 and BAP1 which have been implicated in familial and sporadic RCC
(263,268,331). Assessment of these candidates allow for the selection of additional targets for
sequencing that are related to the pathways known to be altered in RCC (98). Here, a subset of
genes related to RCC predisposition or development were targeted by both Sanger and NGS
techniques in order to identify potential variants of interest in genes associated with RCC.
3.1.1 – Candidate gene - CDKN2B
Cyclin-dependent kinase inhibitor 2B (CDKN2B) is a two-exon gene which encodes the protein
p15INK4B (i.e. Cyclin-dependent kinase 4 inhibitor B) with both a canonical 138 amino acid transcript
(NM_004936) and a shorter 78 amino acid transcript (NM_078487). CDKN2B shares its genomic
positions with Cyclin-dependent kinase inhibitor 2B (CDKN2A), which have overlapping loci on
chromosome 9 (chr9:22002903-22009363 and chr9:21967752-21995301, respectively), along with
a third associated protein, p14ARF, which is encoded by CDKN2A utilising an alternative reading
frame.
96
As its namesake suggests, p15INK4B acts as an inhibitor of cyclin-dependent kinase 4 (CDK4), a
protein associated with cell cycle progression and regulation of proliferation in a protein complex with
cyclin-dependent kinase 6. CDK4 or CDK6 bind with Cyclin D1 (CD1) and function in the
phosphorylation of retinoblastoma (RB) proteins which results in the upregulation of gene
transcription via E2F proteins. Both p15INK4B and p16INK4A act to bind CDK4/CDK6-CD1 complexes
and inhibit the phosphorylation of RB proteins, which acts to decrease the activity of E2F transcription
factors (332,333). While the function of p15INK4B and p16INK4A have clear overlaps they are not
functionally redundant and p15INK4B has distinct functions as a tumour suppressor in the absence of
p16INK4A (334).
CDKN2A is reported to be frequently altered somatically across all RCC histological subtypes via
either promotor hypermethylation or deletion of 9p, correlated with poorer survival (274) and TCGA
data suggests copy number losses in RCC cases affect both CDKN2A and CDKN2B similarly (25).
Though inactivating variants in CDKN2B are rare somatically, with only a single inactivating variant
reported across all RCC samples in TCGA (25), hypermethylation of CDKN2B has been
demonstrated in RCC and other cancers, including acute myeloid and lymphoid leukaemia (335),
parathyroid adenomas (336), and colon cancer (337). Additionally, germline variants in CDKN2B
(amongst other cyclin-dependent kinase inhibitors) were associated with predisposition to multiple
endocrine neoplasia type 1 (MEN1), though the occurrence rate was low (338).
A previous study identified a truncating variant in an individual with familial clear cell RCC, and
subsequent sequencing of a cohort of individuals with features of inherited RCC, without pathogenic
variants in known RCC predisposition genes, resulted in candidate deleterious variants in CDKN2B
in up to 5% of assessed samples (95% CI, 0.21%–9.43%) with a significant enrichment compared
to dbSNP (0.2%) (266). Given the identification of CDKN2B as a candidate familial RCC cohort,
replication of these findings in an independent RCC cohort would support the hypothesis that
germline inactivation variants in CDKN2B is associated with RCC predisposition.
97
3.1.2 – Candidate gene - EPAS1
EPAS1 (also known as HIF2-α) is an enticing candidate gene for potential predisposition given its
role in the HIF-driven hypoxia response (141) and direct targeting by VHL-dependent ubiquitination
(107,138). EPAS1 is a 16 exon coding gene at 2p21 which encodes the protein endothelial PAS
domain-containing protein 1 (EPAS1). Under hypoxic conditions, EPAS1 together with HIF1A and
HIF1B act to upregulate angiogenic pathways and increase angiogenesis and cellular growth
through HRE-linked transcription (See 1.4.2 VHL disease).
Like many oncogenes, truncating or inactivating variants are not predicted to be pathogenic as they
do not result in constitutional protein activation or increased transcriptional expression. Publications
regarding EPAS1 have demonstrated that missense mutations in exons 9 and 12 in PCC/PGL
tumours are oncogenic (339,340), with EPAS1 variant carrying tumours having significantly higher
EPAS1 expression. In a subset of these cases, the variants were also shown to be present in the
germline indicating potential predisposition (339). These exons appear to be mutational hotspots,
co-localising to the hydroxylation site and reducing pVHL binding affinity, respectively, resulting in
constitutional activation of EPAS1 (341,342). GWAS studies in RCC have also demonstrated the
presence of a complex risk locus surrounding EPAS1, suggesting potential linkage to functional
variants in EPAS1 which may increase an individual’s risk for RCC (108,109).
Given the distinct genetic overlap between RCC and PCC/PGL through conditions such as VHL
disease, SDH-deficient tumours, and FH-related predisposition, an EPAS1 genotype association
with PCC/PGL suggested EPAS1 as a candidate for inherited RCC cases and as such exons 9 and
12 of EPAS1 were selected as candidate sequencing regions in this series of patients with features
of possible inherited RCC.
98
3.1.3 – Candidate genes - KMT2C and KMT2D
Somatic alterations frequently found in sporadic cases of RCC may indicate potential sources of
undiscovered heritability. Large scale sequencing projects such as TCGA (25), amongst others,
provide reliable data about which genes are frequently somatically altered in specific cancer types.
Lysine methyltransferase 2C and 2D (KMT2C and KMT2D), are genes that are altered in sporadic
RCC at frequencies of 5% and 3% respectively in TCGA renal cancer data set (25), with alteration
rates in chromophobe RCC up to 15%. Investigations into frequently altered somatic genes may
resolve the presence of germline alterations in those same genes, as is the case with genes such
as VHL, PBRM1, BAP1, PTEN, and MET.
Both KMT2C and KMT2D are large coding genes situated at 7q36.1 and 12q13.12, respectively.
KMT2C is a 59-exon gene encoding a 4,911 amino acid protein and KMT2D is a 54 exon gene
encoding a 5,537 amino acid protein. Both genes encode Histone lysine-specific N-
methyltransferase enzymes, which primarily act to catalyse the addition of methyl groups to lysine-
4 residues of histone H3, aptly named KMT2C and KMT2D (343). Both KMT2C and KMT2D are
frequently mutated in multiple cancers, demonstrating both an array of copy number gains, losses
and SNVs (25). Originally, they were termed MLL2/4 and MLL3 (corresponding to KMT2D and
KMT2C, correspondingly) due to being part of a family of proteins known as mixed-lineage leukaemia
(MLL) associated with multiple cancers, including leukaemia (343). KMT2C and KMT2D form protein
complexes with a series of common, and complex-specific proteins, including KDM6A, a lysine-
specific demethylase dysregulated in clear cell RCC (344,345) and function in histone regulation
through the addition of H3K4me1 groups to histones particularly in adipogenesis (346), though
exactly how this promotes tumourigenesis has not been well established. Several studies have
suggested H3K4me1 groups allow for open chromatin access to enhancer regions of oncogenic
transcripts, whereas alternative hypothesises suggest H3K4me1 modifications block DNA
methylation suggesting a loss of transcriptional repression via promotor methylation (347,348).
KMT2C and KMT2D also appear to have tumour suppressor functions through co-activation of p53
in DNA repair via the ASCOM protein complex (349).

99
Given that PBRM1 and BAP1 are histone modifying and chromatin remodelling genes (350,351)
frequently altered in somatic RCC (274) and have been recently associated with RCC predisposition
(263,331), assessing other histone modifying or chromatin remodelling genes such as KMT2C or
KMT2D may uncover new associations in individuals with predisposition to RCC. Finally,
unpublished data from whole exome sequencing data identified a nonsense variant in KMT2C
(NM170606.2: c.2263C>T: p.Gln755Ter: rs201234598) in a blood sample from a patent with familial
RCC in the absence of any other variants in RCC predisposing genes, raising the possibility that
germline variants in KMT2C or KMT2D might predispose to RCC.
Given these factors, sequencing of the full coding region of both KMT2C and KMT2D was performed
to assess for the presence of pathogenic variants that may confer predisposition. Given the total size
of the targeted regions standard Sanger sequencing was considered inappropriate and as such
amplicon-based next generation short read sequencing was utilised to achieve complete coverage
of the coding regions of both genes.
100
3.1.4 Aims
To validate findings of pathogenic CDKN2B variants being associated with RCC
predisposition in individuals with features of inherited RCC
Assess hotspot regions of EPAS1 to identify activating variants which may predispose
individuals to RCC in a manner similar to that seen in PCC/PGL
Evaluate the coding regions of KMT2C and KMT2D for pathogenic variants which may
predispose individuals to RCC utilising long range PCR and NGS sequencing methods
101
3.2 Materials and methods
3.2.1 Samples
Samples selected were individuals with RCC who had been referred to research as having features
of heritability, as described in section 2.1.3. A total of 166 individual germline whole blood DNA was
utilised for targeted sequencing of CDKN2B and EPAS1 exon 9 and exon 12. For NGS sequencing
of KMT2C and KMT2D, a subset of 96 individuals were selected for sequencing from the primary
cohort of 166 due to issues with sequencing relating to both capacity and economic constraints.
3.2.2 Sanger sequencing primer design and co-ordinates
Primers for both standard PCR reactions and long-range PCR reactions were designed as described
in the main materials and methods (sections 2.3.1). PCR primers for all experiments in this chapter
are reported in appendix section 9.2.1.
3.2.3 PCR reactions and Sanger sequencing
PCR reactions, bi-directional Sanger sequencing, and Sanger sequencing was performed as
described in main material and methods section 2.3.2, section 2.4. Failed reactions were repeated
with additional optimisation steps to improve PCR reaction parameters and sample DNA underwent
quality control to assess potential issues as described in main material and methods (section 2.2).
Reactions were repeated a maximum of 3 times.
3.2.4 Long range PCR
Long range PCR reactions were performed as described in section 2.3.5 of materials and methods
as input amplicons for next generation sequencing. Long range PCR primers were optimised
iteratively to a maximum of three iterations, after which regions were designated as poorly optimised
and not included in long range PCRs downstream. Failed reactions were re-optimised and repeated
an additional two times prior to being assigned ‘failed’ status.
102
3.2.5 Illumina Nextera XT library preparation for amplicon sequencing
DNA library preparation for KMT2C/KMT2D long range amplicons, including a custom developed
amplicon normalisation method, was performed as described in the main materials and methods
(section 2.5 and 2.6.1). Three individual libraries were prepared for 16 pooled samples for batch 1
and 2, and 21 samples for batch 3. Batches 1 and 2 were performed using a standard MiSeq flow
cell whereas batch 3 utilised a MiSeq Nano flow cell. Library loading on to the Illumina MiSeq was
performed by the SMCL sequencing service.
3.2.6 Primary bioinformatics
Primary bioinformatics from BCL to VCF was performed as described in the generalised pipeline in
the material and methods (sections 2.7) from FASTQ to VCF, BCF to FASTQ and sample de-
multiplexing was performed by the SMCL sequencing service.
3.2.7 Variant filtering, annotation, and classification
Variant quality filtering, feature annotation and classification was performed as described in the main
materials and methods (sections 2.8).
3.2.8 Sequence identity comparison
Sequence identity comparison was performed using Emboss Matcher pair-wise sequence alignment
algorithm to assess sequence similarities (352). FASTA sequences were downloads from NCBI
(https://www.ncbi.nlm.nih.gov/gene/) and sequence identity compared. Conserved regions were
generated using coordinate positions of matching sequence regions and converted to BED file format
prior to plotting. Command line details are provided within the pair-wise sequence alignment results
in appendix section 9.2.2.
3.2.9 Statistics
Fishers exact was performed using the fisher.test() function in stat package using R (version 3.5).
Binomial proportions and confidence intervals were calculated using bionom.test() in the stats
package using R (version 3.5).
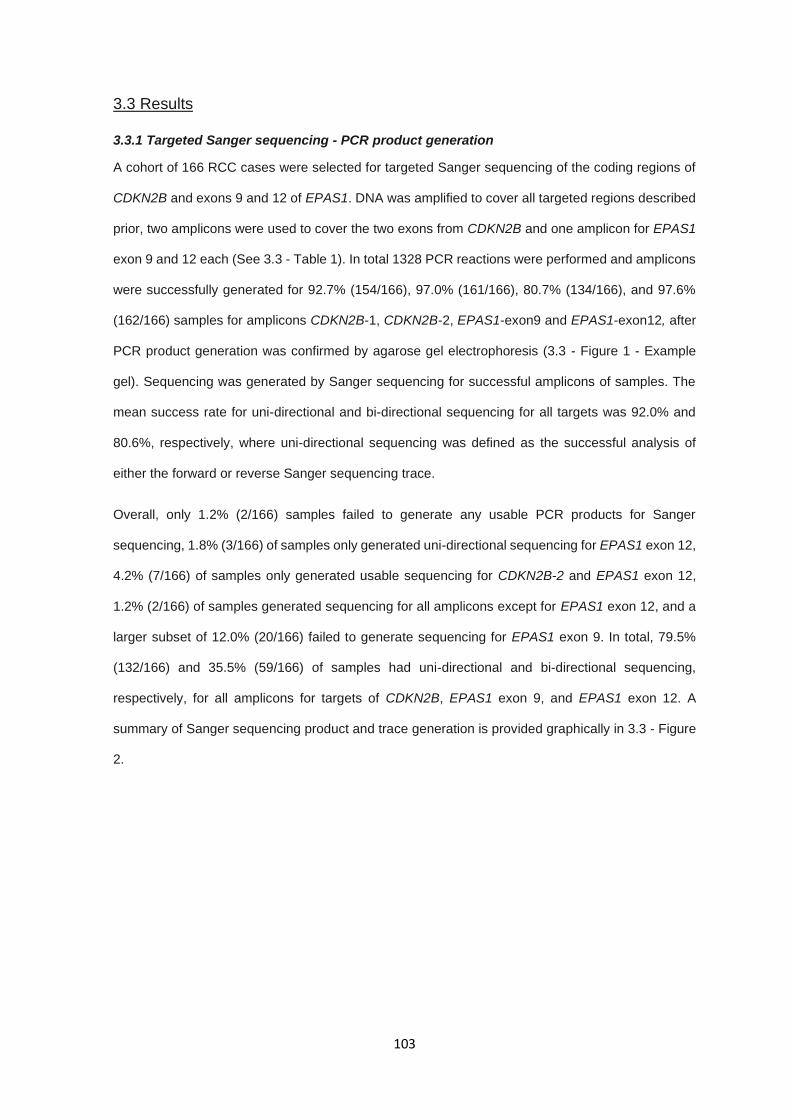
103
3.3 Results
3.3.1 Targeted Sanger sequencing - PCR product generation
A cohort of 166 RCC cases were selected for targeted Sanger sequencing of the coding regions of
CDKN2B and exons 9 and 12 of EPAS1. DNA was amplified to cover all targeted regions described
prior, two amplicons were used to cover the two exons from CDKN2B and one amplicon for EPAS1
exon 9 and 12 each (See 3.3 - Table 1). In total 1328 PCR reactions were performed and amplicons
were successfully generated for 92.7% (154/166), 97.0% (161/166), 80.7% (134/166), and 97.6%
(162/166) samples for amplicons CDKN2B-1, CDKN2B-2, EPAS1-exon9 and EPAS1-exon12, after
PCR product generation was confirmed by agarose gel electrophoresis (3.3 - Figure 1 - Example
gel). Sequencing was generated by Sanger sequencing for successful amplicons of samples. The
mean success rate for uni-directional and bi-directional sequencing for all targets was 92.0% and
80.6%, respectively, where uni-directional sequencing was defined as the successful analysis of
either the forward or reverse Sanger sequencing trace.
Overall, only 1.2% (2/166) samples failed to generate any usable PCR products for Sanger
sequencing, 1.8% (3/166) of samples only generated uni-directional sequencing for EPAS1 exon 12,
4.2% (7/166) of samples only generated usable sequencing for CDKN2B-2 and EPAS1 exon 12,
1.2% (2/166) of samples generated sequencing for all amplicons except for EPAS1 exon 12, and a
larger subset of 12.0% (20/166) failed to generate sequencing for EPAS1 exon 9. In total, 79.5%
(132/166) and 35.5% (59/166) of samples had uni-directional and bi-directional sequencing,
respectively, for all amplicons for targets of CDKN2B, EPAS1 exon 9, and EPAS1 exon 12. A
summary of Sanger sequencing product and trace generation is provided graphically in 3.3 - Figure
2.
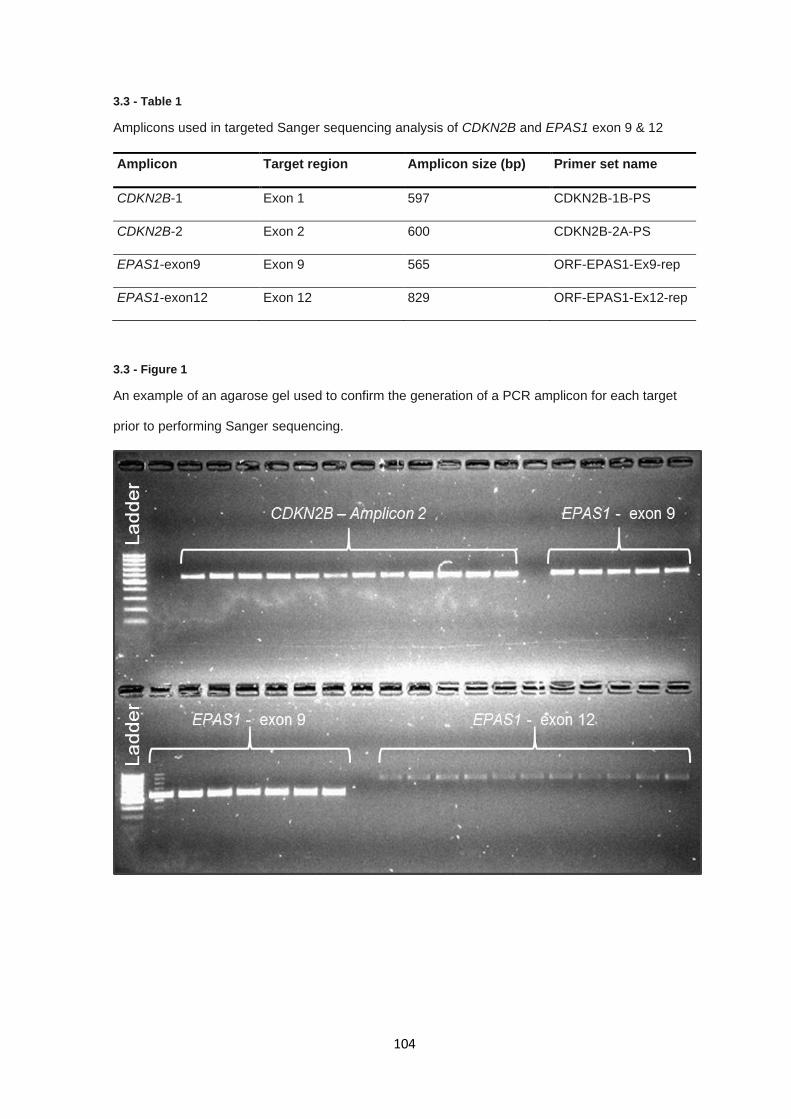
104
3.3 - Table 1
Amplicons used in targeted Sanger sequencing analysis of CDKN2B and EPAS1 exon 9 & 12
3.3 - Figure 1
An example of an agarose gel used to confirm the generation of a PCR amplicon for each target
prior to performing Sanger sequencing.
Amplicon Target region Amplicon size (bp) Primer set name
CDKN2B-1 Exon 1 597 CDKN2B-1B-PS
CDKN2B-2 Exon 2 600 CDKN2B-2A-PS
EPAS1-exon9 Exon 9 565 ORF-EPAS1-Ex9-rep
EPAS1-exon12 Exon 12 829 ORF-EPAS1-Ex12-rep
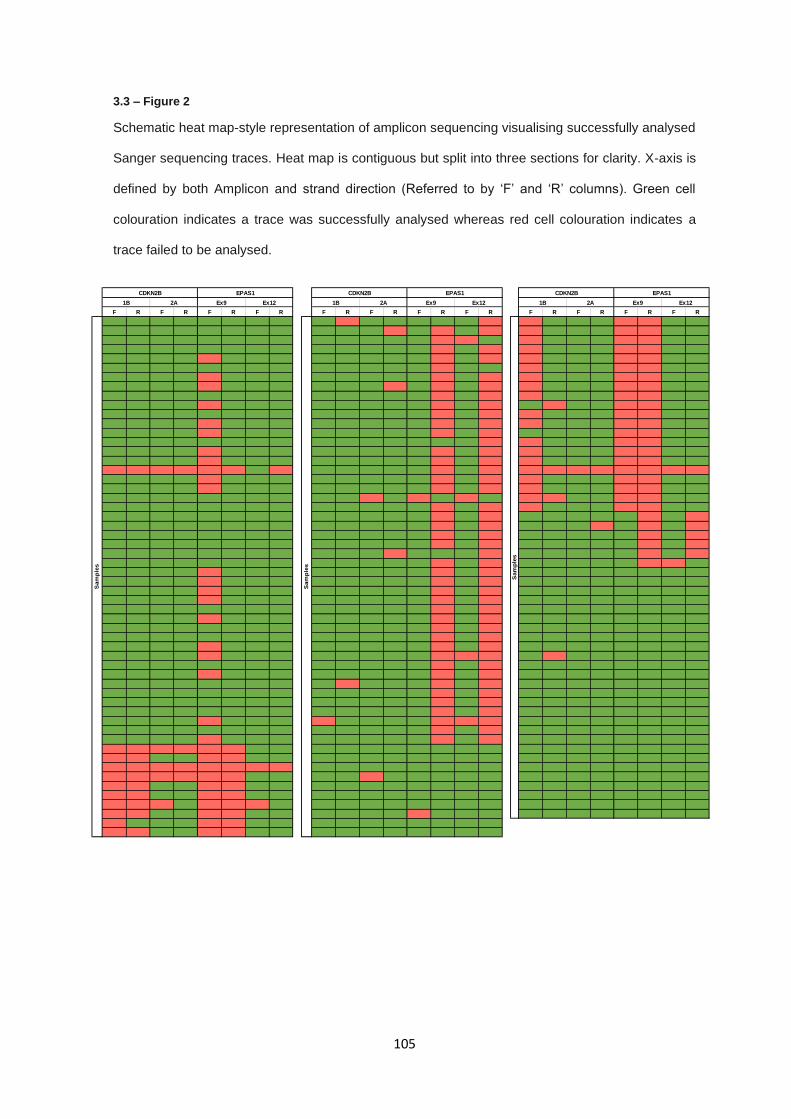
105
3.3 – Figure 2
Schematic heat map-style representation of amplicon sequencing visualising successfully analysed
Sanger sequencing traces. Heat map is contiguous but split into three sections for clarity. X-axis is
defined by both Amplicon and strand direction (Referred to by ‘F’ and ‘R’ columns). Green cell
colouration indicates a trace was successfully analysed whereas red cell colouration indicates a
trace failed to be analysed.
F R F R F R F R F R F R F R F R F R F R F R F R
Sam
ple
s
CDKN2B EPAS1
1B 2A Ex9 Ex12S
am
ple
s
Sam
ple
s
CDKN2B EPAS1
1B 2A Ex9 Ex121B 2A Ex9 Ex12
CDKN2B EPAS1

106
3.3.2 Targeted Sanger sequencing – Variant analysis
Sanger sequencing traces (bi-directional where available) were aligned to reference sequences for
the corresponding genomic regions. Across the 164 samples assessed with viable Sanger data,
variants were identified in 21 samples (12.7%), no sample carried more than a single variant, and
variants were distributed across the targeted regions with a majority of samples carrying variants in
EPAS1 exon 12 (CDKN2B = 2, EPAS1 exon 9 = 2, EPAS1 exon 12 = 17)(Sanger traces shown in
3.3 - Figure 3). Most variants occurred more than once across the sample set, with only 5 unique
sites altered, 1 in CDKN2B, 2 in EPAS1 exon 9, and 2 in EPAS1 exon 12 (See 3.3 - Table 2). Of the
identified variants, 2 were classified as common SNPs, occurring in gnomAD (353) at an allele
frequency of more than 1%. Remaining variants were assessed for pathogenicity based on manual
annotation of criteria including functional consequence, clinical reporting, and in silico predictive
metrics. Two individuals carried 1 variant in CDKN2B and two individuals carried variants in EPAS1
exon 9. Filtered variants, including informative annotation, are described in 3.3 - Table 3.
EPAS1 exon 9 variants were present in 1.49% (2/134) individuals with available sequence
information. The two variants present in EPAS1 exon 9 (NM_001430:c.1104G>A: p.Met368Ile and
NM_001430: c.1121T>A: p.Phe374Tyr) are flagged as likely benign according to ClinVar
submissions, VUS and likely benign by ACMG interpretation, and in-silico tools SIFT, PolyPhen and
CADD are in consensus that these missense alterations are unlikely to result in protein dysfunction.
The remaining variant identified in exon 2 of CDKN2B in two individuals (NM_004936: c.256G>A:
p.Asp86Asn) occurs at a minor allele frequency 1.22E-03 in the gnomAD dataset and falls within a
functional domain and in-silico predictive metrics used suggest the variant is detrimental. The
p.Asp86Asn variant is identical to that reported in the original report regarding RCC predisposition
related to CDKN2B variants (266) which occurred at a rate of 1.19% (1/84; 95% CI 0.03-6.46%).
Compared to this series, 1.24% (2/161; 95% CI 0.15-4.42%), the variant distributions are not
statistically different (fishers exact; p = 1.00).
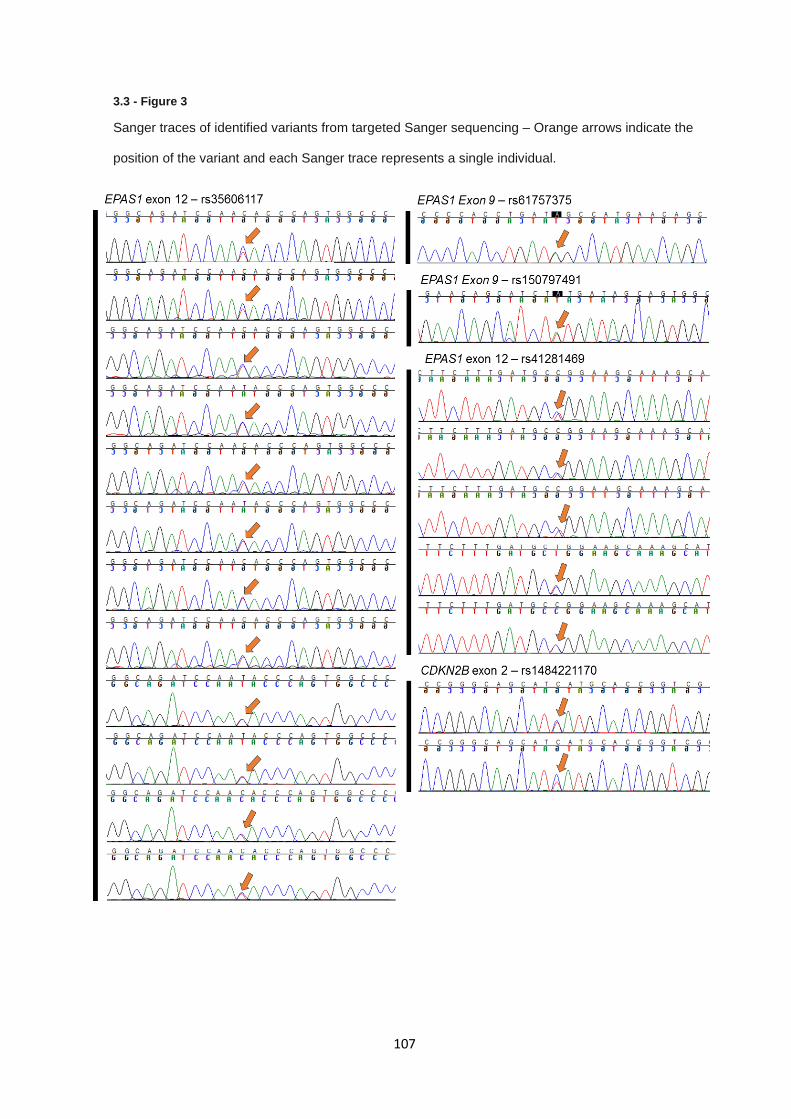
107
3.3 - Figure 3
Sanger traces of identified variants from targeted Sanger sequencing – Orange arrows indicate the
position of the variant and each Sanger trace represents a single individual.
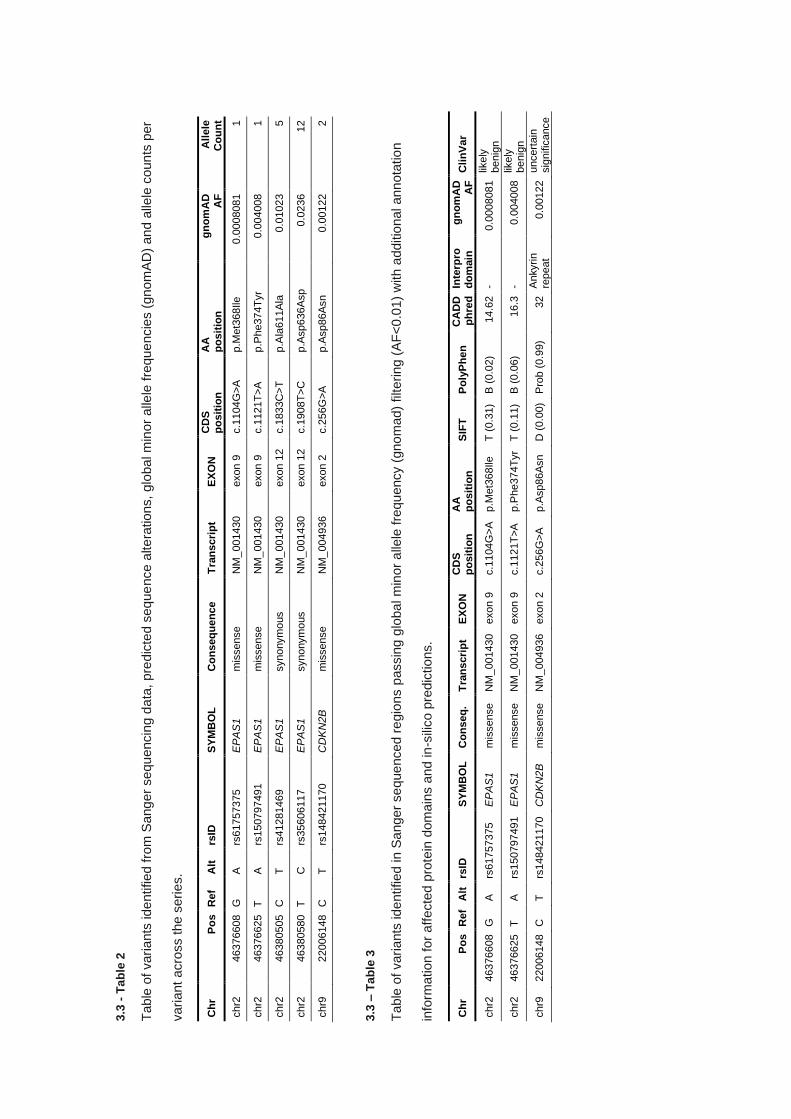
3.3
- T
ab
le 2
Table
of vari
ants
ide
ntified f
rom
Sang
er
sequ
encin
g d
ata
, pre
dic
ted s
eq
ue
nce a
lte
rations,
glo
ba
l m
inor
alle
le f
reque
ncie
s (
gn
om
AD
) an
d a
llele
coun
ts p
er
variant
acro
ss the s
eri
es.
3.3
– T
ab
le 3
Table
of vari
ants
ide
ntified in S
anger
se
que
nced r
egio
ns p
assin
g g
loba
l m
inor
alle
le f
requ
ency (
gno
mad)
filtering (
AF
<0.0
1)
with a
dditio
nal ann
ota
tio
n
info
rmation f
or
aff
ecte
d p
rote
in d
om
ain
s a
nd in
-sili
co p
redic
tions.
Ch
r P
os
Ref
Alt
rs
ID
SY
MB
OL
C
on
seq
ue
nce
Tra
ns
cri
pt
EX
ON
C
DS
p
os
itio
n
AA
p
os
itio
n
gn
om
AD
A
F
All
ele
C
ou
nt
chr2
46376608
G
A
rs
61757375
EP
AS
1
mis
sense
NM
_001430
exon 9
c.1
104G
>A
p.M
et3
68Ile
0.0
008081
1
chr2
46376625
T
A
rs
150797491
E
PA
S1
mis
sense
NM
_001430
exon 9
c.1
121T
>A
p.P
he374T
yr
0.0
04008
1
chr2
46380505
C
T
rs
41281469
EP
AS
1
synonym
ous
NM
_001430
exon 1
2
c.1
833C
>T
p.A
la611A
la
0.0
1023
5
chr2
46380580
T
C
rs
35606117
EP
AS
1
synonym
ous
NM
_001430
exon 1
2
c.1
908T
>C
p.A
sp636A
sp
0.0
236
12
chr9
22006148
C
T
rs
148421170
C
DK
N2B
m
issense
NM
_004936
exon 2
c.2
56G
>A
p.A
sp86A
sn
0.0
0122
2
Ch
r P
os
Ref
Alt
rs
ID
SY
MB
OL
C
on
seq
. T
ran
scri
pt
EX
ON
C
DS
p
os
itio
n
AA
p
os
itio
n
SIF
T
Po
lyP
he
n
CA
DD
p
hre
d
Inte
rpro
d
om
ain
g
no
mA
D
AF
C
lin
Var
chr2
46376608
G
A
rs
61757375
EP
AS
1
mis
sense
NM
_001430
exon 9
c.1
104G
>A
p.M
et3
68Ile
T (
0.3
1)
B (
0.0
2)
14.6
2
- 0.0
008081
likely
benig
n
chr2
46376625
T
A
rs
150797491
E
PA
S1
mis
sense
NM
_001430
exon 9
c.1
121T
>A
p.P
he374T
yr
T (
0.1
1)
B (
0.0
6)
16.3
-
0.0
04008
likely
benig
n
chr9
22006148
C
T
rs
148421170
C
DK
N2B
m
issense
NM
_004936
exon 2
c.2
56G
>A
p.A
sp86A
sn
D
(0.0
0)
Pro
b (
0.9
9)
32
Ankyrin
repeat
0.0
0122
uncert
ain
sig
nific
ance
109
3.3.3 KMT2C & KMT2D targeted sequencing – Long range PCR product generation
For the targeted sequencing of KMT2C and KMT2D, long range HPLC-purified primer pairs were
designed to cover the all exons and a proportion of intronic regions of both genes of both genes,
encompassing exons 1-58 of KMT2C and 1-54 of KMT2C for a total targeted sequencing region size
of 337 Kb. Amplicons were rejected if they failed to generate distinct or single amplicons and
application of this filtering criteria resulted in no available coverage of 16/112 exons (14.2%) (See
3.3 - Table 4). Agarose gel containing all optimised long-range PCR amplicons is shown in 3.3 -
Figure 4.
For the remaining optimised primer pairs, long range PCR amplification was carried out across 96
samples, totalling 1824 long range PCR reactions. After repeating long range PCRs, a total of 82.8%
of reactions successfully generated suitable PCR products for library preparation. The number of
successful amplicons was higher in KMT2D amplicons than KMT2C amplicons (87% compared to
81%), with the worst performing amplicon KMT2C exon 53-58 having 54.2% success rate and the
best performing amplicon KMT2D exon 12-14 successfully generating long range amplicons in
94.8% of samples (See 3.3 - Figure 5).
Samples with complete sets of amplicons were batched into libraries for sequencing utilising Illumina
NexteraXT kit as described in the methods (Section 3.2). Batch 1 and 2 consisted on amplicons for
both KMT2C and KMT2D whereas batch 3 only contained amplicons for KMT2D due to
complications discussed later in this chapter.
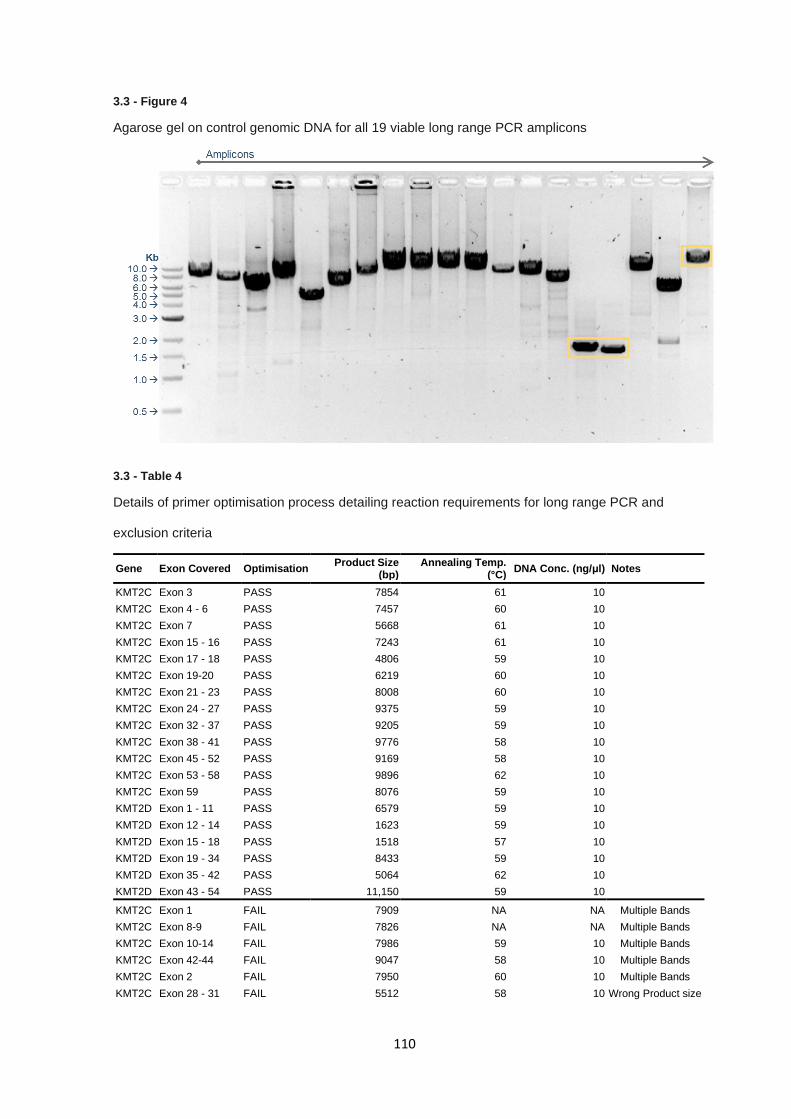
110
3.3 - Figure 4
Agarose gel on control genomic DNA for all 19 viable long range PCR amplicons
3.3 - Table 4
Details of primer optimisation process detailing reaction requirements for long range PCR and
exclusion criteria
Gene Exon Covered Optimisation Product Size
(bp) Annealing Temp.
(°C) DNA Conc. (ng/μl) Notes
KMT2C Exon 3 PASS 7854 61 10
KMT2C Exon 4 - 6 PASS 7457 60 10
KMT2C Exon 7 PASS 5668 61 10
KMT2C Exon 15 - 16 PASS 7243 61 10
KMT2C Exon 17 - 18 PASS 4806 59 10
KMT2C Exon 19-20 PASS 6219 60 10
KMT2C Exon 21 - 23 PASS 8008 60 10
KMT2C Exon 24 - 27 PASS 9375 59 10
KMT2C Exon 32 - 37 PASS 9205 59 10
KMT2C Exon 38 - 41 PASS 9776 58 10
KMT2C Exon 45 - 52 PASS 9169 58 10
KMT2C Exon 53 - 58 PASS 9896 62 10
KMT2C Exon 59 PASS 8076 59 10
KMT2D Exon 1 - 11 PASS 6579 59 10
KMT2D Exon 12 - 14 PASS 1623 59 10
KMT2D Exon 15 - 18 PASS 1518 57 10
KMT2D Exon 19 - 34 PASS 8433 59 10
KMT2D Exon 35 - 42 PASS 5064 62 10
KMT2D Exon 43 - 54 PASS 11,150 59 10
KMT2C Exon 1 FAIL 7909 NA NA Multiple Bands
KMT2C Exon 8-9 FAIL 7826 NA NA Multiple Bands
KMT2C Exon 10-14 FAIL 7986 59 10 Multiple Bands
KMT2C Exon 42-44 FAIL 9047 58 10 Multiple Bands
KMT2C Exon 2 FAIL 7950 60 10 Multiple Bands
KMT2C Exon 28 - 31 FAIL 5512 58 10 Wrong Product size
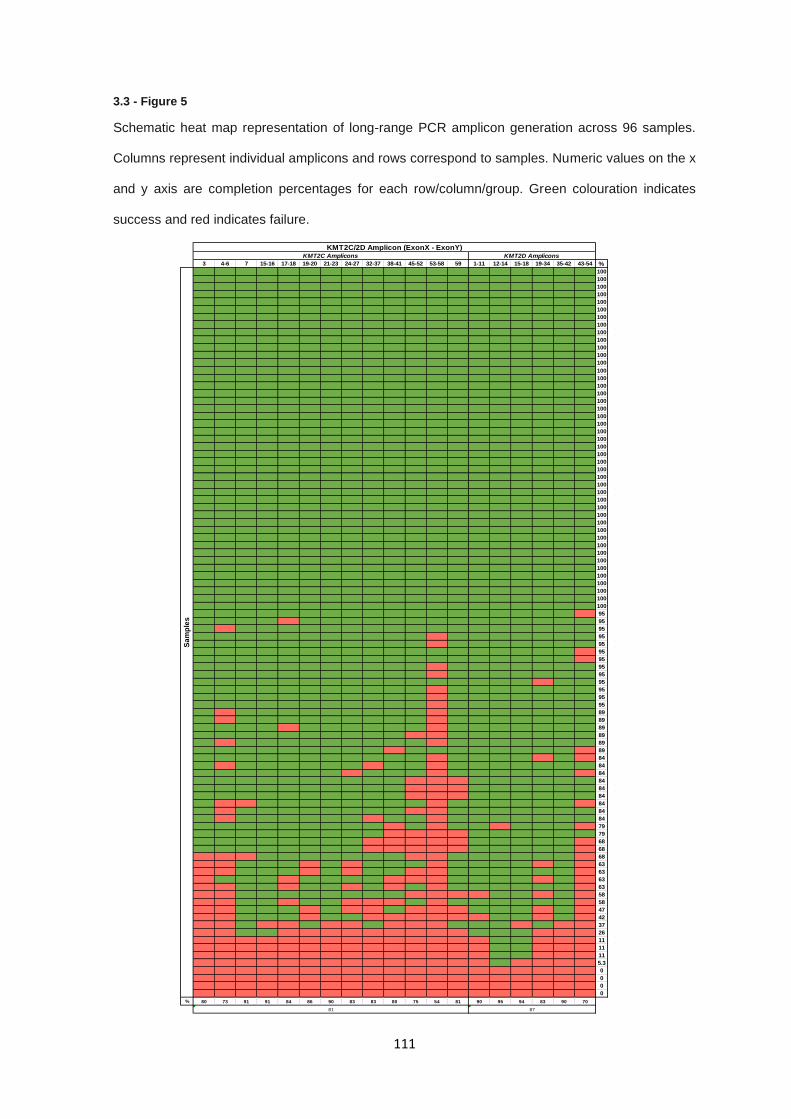
111
3.3 - Figure 5
Schematic heat map representation of long-range PCR amplicon generation across 96 samples.
Columns represent individual amplicons and rows correspond to samples. Numeric values on the x
and y axis are completion percentages for each row/column/group. Green colouration indicates
success and red indicates failure.
3 4-6 7 15-16 17-18 19-20 21-23 24-27 32-37 38-41 45-52 53-58 59 1-11 12-14 15-18 19-34 35-42 43-54 %
100
100
100
100
100
100
100
100
100
100
100
100
100
100
100
100
100
100
100
100
100
100
100
100
100
100
100
100
100
100
100
100
100
100
100
100
100
100
100
100
100
100
100
100
100
95
95
95
95
95
95
95
95
95
95
95
95
95
89
89
89
89
89
89
84
84
84
84
84
84
84
84
84
79
79
68
68
68
63
63
63
63
58
58
47
42
37
26
11
11
11
5.3
0
0
0
0
% 80 73 91 91 84 86 90 83 83 80 75 54 81 90 95 94 83 90 70
81 87
KMT2C Amplicons KMT2D Amplicons
KMT2C/2D Amplicon (ExonX - ExonY)
Sa
mp
les
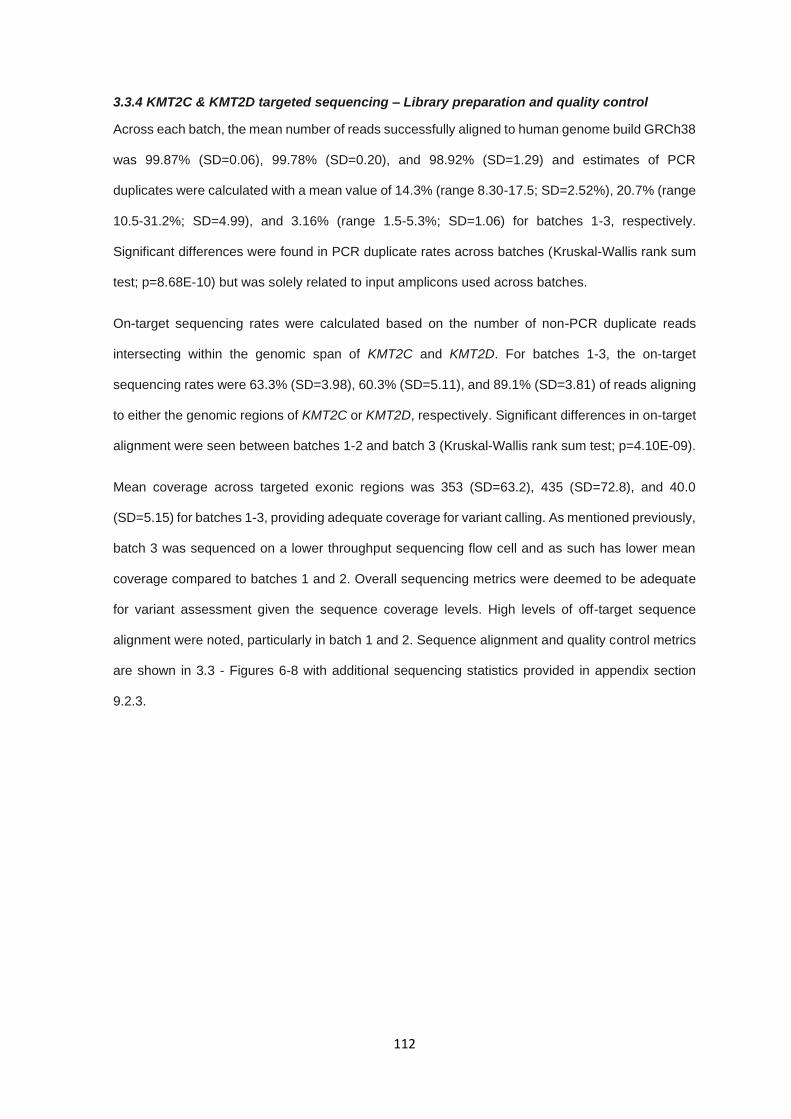
112
3.3.4 KMT2C & KMT2D targeted sequencing – Library preparation and quality control
Across each batch, the mean number of reads successfully aligned to human genome build GRCh38
was 99.87% (SD=0.06), 99.78% (SD=0.20), and 98.92% (SD=1.29) and estimates of PCR
duplicates were calculated with a mean value of 14.3% (range 8.30-17.5; SD=2.52%), 20.7% (range
10.5-31.2%; SD=4.99), and 3.16% (range 1.5-5.3%; SD=1.06) for batches 1-3, respectively.
Significant differences were found in PCR duplicate rates across batches (Kruskal-Wallis rank sum
test; p=8.68E-10) but was solely related to input amplicons used across batches.
On-target sequencing rates were calculated based on the number of non-PCR duplicate reads
intersecting within the genomic span of KMT2C and KMT2D. For batches 1-3, the on-target
sequencing rates were 63.3% (SD=3.98), 60.3% (SD=5.11), and 89.1% (SD=3.81) of reads aligning
to either the genomic regions of KMT2C or KMT2D, respectively. Significant differences in on-target
alignment were seen between batches 1-2 and batch 3 (Kruskal-Wallis rank sum test; p=4.10E-09).
Mean coverage across targeted exonic regions was 353 (SD=63.2), 435 (SD=72.8), and 40.0
(SD=5.15) for batches 1-3, providing adequate coverage for variant calling. As mentioned previously,
batch 3 was sequenced on a lower throughput sequencing flow cell and as such has lower mean
coverage compared to batches 1 and 2. Overall sequencing metrics were deemed to be adequate
for variant assessment given the sequence coverage levels. High levels of off-target sequence
alignment were noted, particularly in batch 1 and 2. Sequence alignment and quality control metrics
are shown in 3.3 - Figures 6-8 with additional sequencing statistics provided in appendix section
9.2.3.
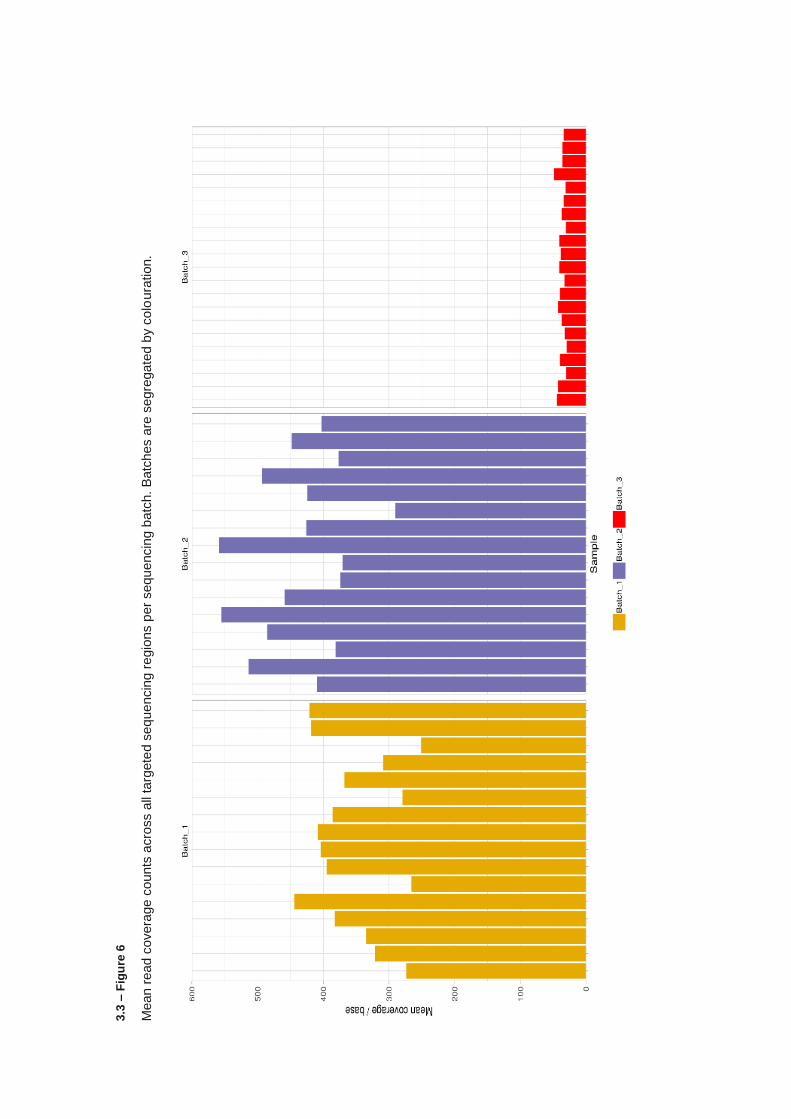
3.3
– F
igu
re 6
Mean
read
covera
ge
counts
acro
ss a
ll ta
rgete
d s
eq
ue
ncin
g r
egio
ns p
er
sequ
encin
g b
atc
h.
Batc
hes a
re s
egre
gate
d b
y c
olo
ura
tion.
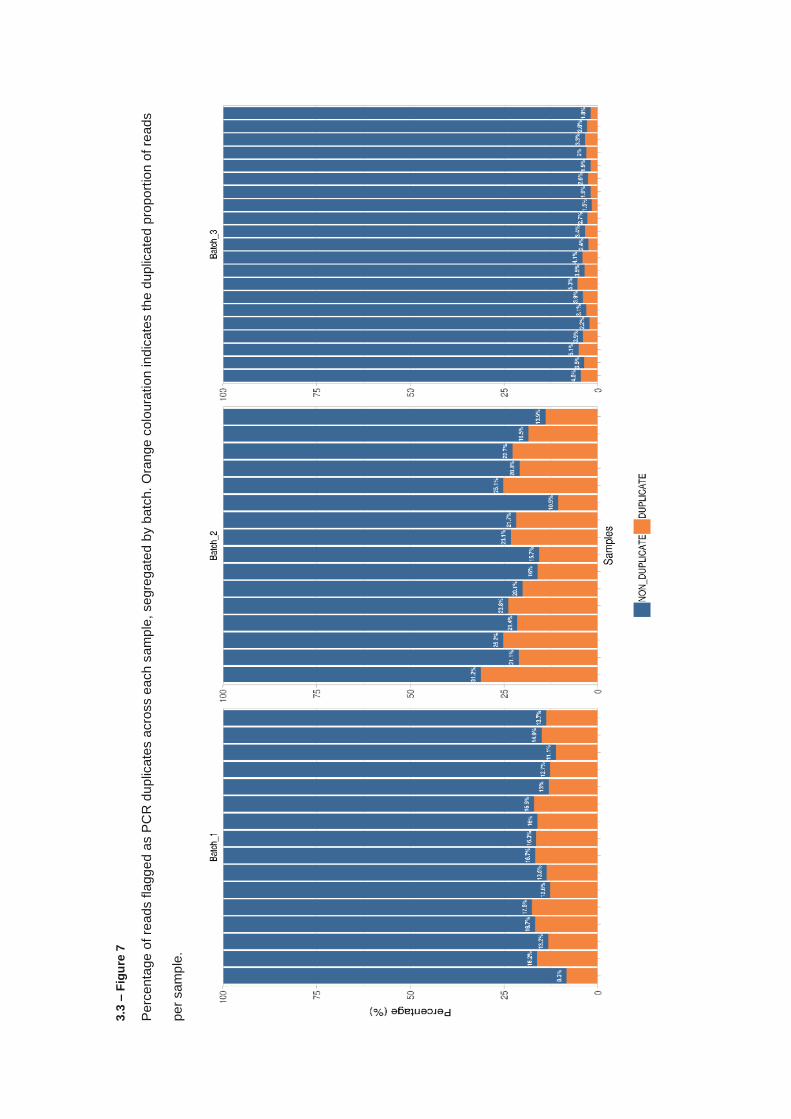
3.3
– F
igu
re 7
Perc
enta
ge o
f re
ads fla
gg
ed a
s P
CR
du
plic
ate
s a
cro
ss e
ach s
am
ple
, segre
gate
d b
y b
atc
h.
Ora
nge
colo
ura
tion ind
icate
s th
e d
up
licate
d p
roport
ion o
f re
ads
per
sam
ple
.
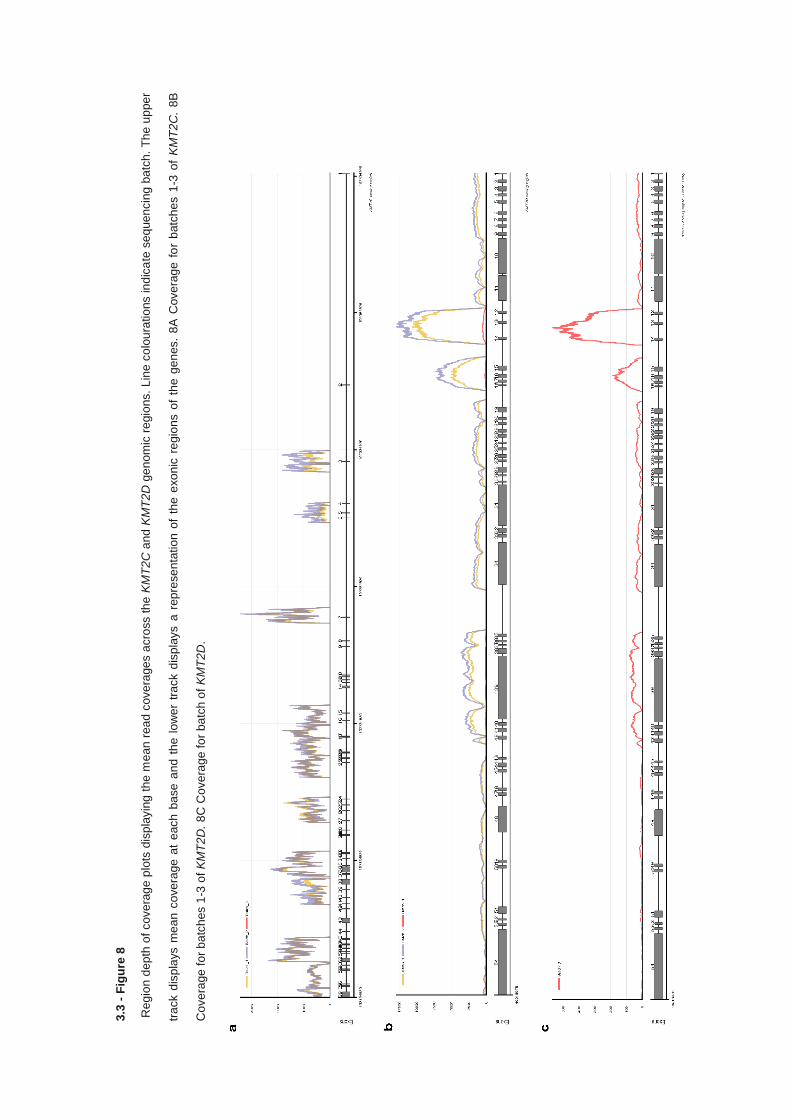
3.3
- F
igu
re 8
Reg
ion d
ep
th o
f cove
rag
e p
lots
dis
pla
yin
g t
he
me
an
rea
d c
ove
rage
s a
cro
ss t
he
KM
T2
C a
nd
KM
T2
D g
en
om
ic r
egio
ns.
Lin
e c
olo
ura
tio
ns in
dic
ate
se
quen
cin
g b
atc
h.
Th
e u
ppe
r
tra
ck d
isp
lays m
ea
n c
ove
rage a
t e
ach
ba
se
an
d t
he
lo
wer
tra
ck d
isp
lays a
rep
rese
nta
tio
n o
f th
e e
xo
nic
re
gio
ns o
f th
e g
en
es.
8A
Cove
rag
e f
or
batc
he
s 1
-3 o
f K
MT
2C
. 8B
Cove
rage
fo
r b
atc
hes 1
-3 o
f K
MT
2D
. 8
C C
ove
rag
e fo
r ba
tch
of
KM
T2
D.
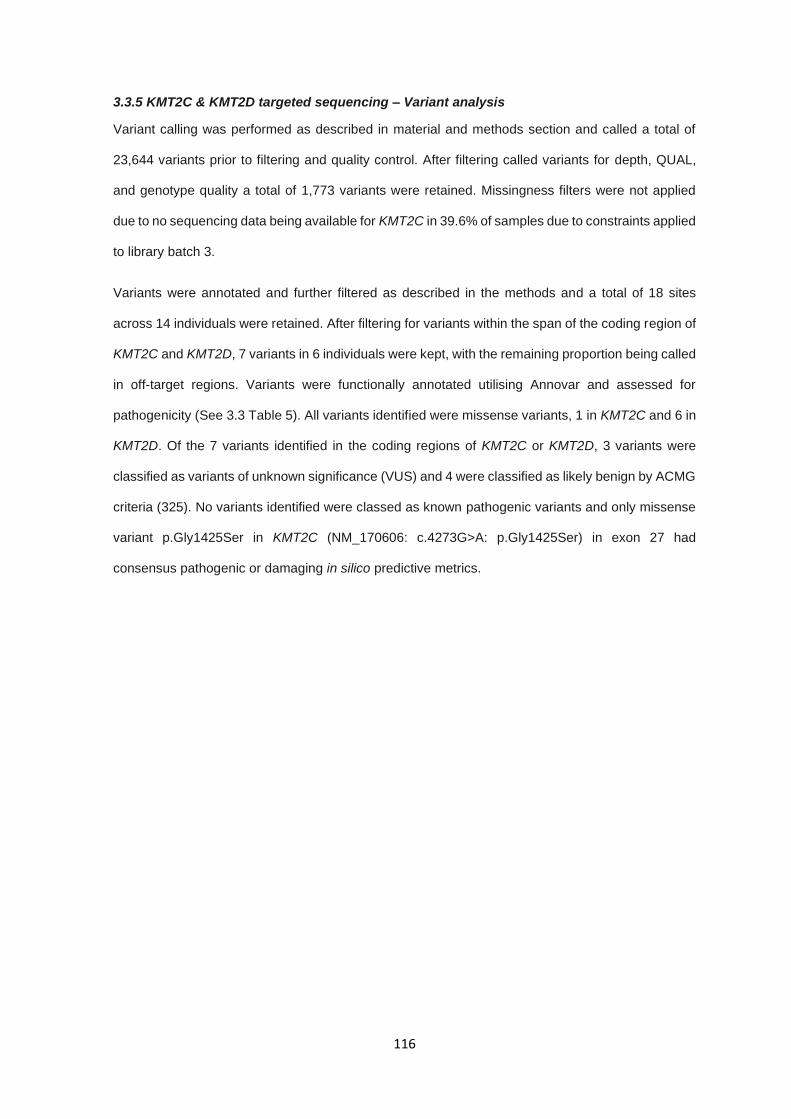
116
3.3.5 KMT2C & KMT2D targeted sequencing – Variant analysis
Variant calling was performed as described in material and methods section and called a total of
23,644 variants prior to filtering and quality control. After filtering called variants for depth, QUAL,
and genotype quality a total of 1,773 variants were retained. Missingness filters were not applied
due to no sequencing data being available for KMT2C in 39.6% of samples due to constraints applied
to library batch 3.
Variants were annotated and further filtered as described in the methods and a total of 18 sites
across 14 individuals were retained. After filtering for variants within the span of the coding region of
KMT2C and KMT2D, 7 variants in 6 individuals were kept, with the remaining proportion being called
in off-target regions. Variants were functionally annotated utilising Annovar and assessed for
pathogenicity (See 3.3 Table 5). All variants identified were missense variants, 1 in KMT2C and 6 in
KMT2D. Of the 7 variants identified in the coding regions of KMT2C or KMT2D, 3 variants were
classified as variants of unknown significance (VUS) and 4 were classified as likely benign by ACMG
criteria (325). No variants identified were classed as known pathogenic variants and only missense
variant p.Gly1425Ser in KMT2C (NM_170606: c.4273G>A: p.Gly1425Ser) in exon 27 had
consensus pathogenic or damaging in silico predictive metrics.
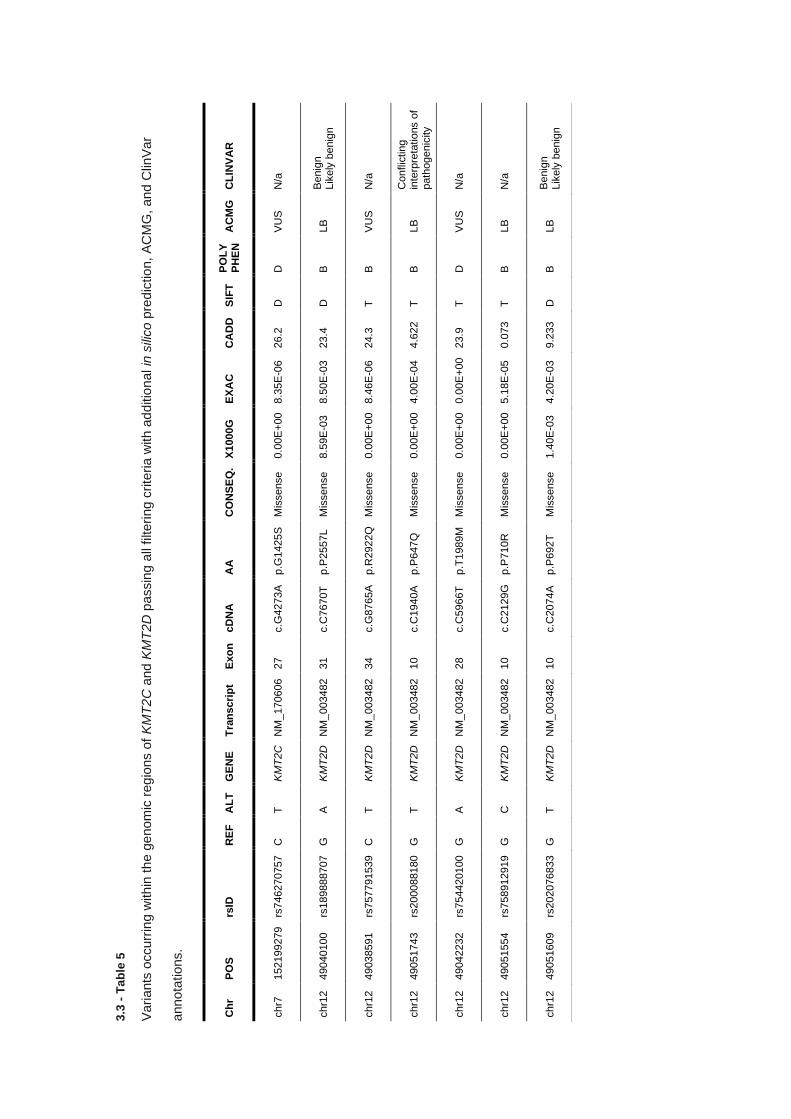
3.3
- T
ab
le 5
Vari
ants
occurr
ing w
ith
in t
he g
enom
ic r
eg
ions o
f K
MT
2C
and
KM
T2D
passin
g a
ll filteri
ng c
rite
ria w
ith a
dditio
nal in
sili
co
pre
dic
tio
n,
AC
MG
, and C
linV
ar
anno
tations.
Ch
r P
OS
rs
ID
RE
F
AL
T
GE
NE
T
ran
scri
pt
Exo
n
cD
NA
A
A
CO
NS
EQ
. X
1000G
E
XA
C
CA
DD
S
IFT
P
OL
Y
PH
EN
A
CM
G
CL
INV
AR
chr7
152199279
rs
746270757
C
T
K
MT
2C
N
M_
170606
27
c.G
4273A
p.G
1425S
M
issense
0.0
0E
+00
8.3
5E
-06
26.2
D
D
V
US
N
/a
chr1
2
49040100
rs
189888707
G
A
K
MT
2D
N
M_
003482
31
c.C
7670T
p.P
2557L
Mis
sense
8.5
9E
-03
8.5
0E
-03
23.4
D
B
LB
B
enig
n
Lik
ely
benig
n
chr1
2
49038591
rs
757791539
C
T
K
MT
2D
N
M_
003482
34
c.G
8765A
p.R
2922Q
M
issense
0.0
0E
+00
8.4
6E
-06
24.3
T
B
V
US
N
/a
chr1
2
49051743
rs
200088180
G
T
K
MT
2D
N
M_
003482
10
c.C
1940A
p.P
647Q
M
issense
0.0
0E
+00
4.0
0E
-04
4.6
22
T
B
LB
C
onflic
tin
g
inte
rpre
tatio
ns o
f path
ogenic
ity
chr1
2
49042232
rs
754420100
G
A
K
MT
2D
N
M_
003482
28
c.C
5966T
p.T
1989M
M
issense
0.0
0E
+00
0.0
0E
+00
23.9
T
D
V
US
N
/a
chr1
2
49051554
rs
758912919
G
C
K
MT
2D
N
M_
003482
10
c.C
2129G
p.P
710R
M
issense
0.0
0E
+00
5.1
8E
-05
0.0
73
T
B
LB
N
/a
chr1
2
49051609
rs
202076833
G
T
K
MT
2D
N
M_
003482
10
c.C
2074A
p.P
692T
M
issense
1.4
0E
-03
4.2
0E
-03
9.2
33
D
B
LB
B
enig
n
Lik
ely
benig
n
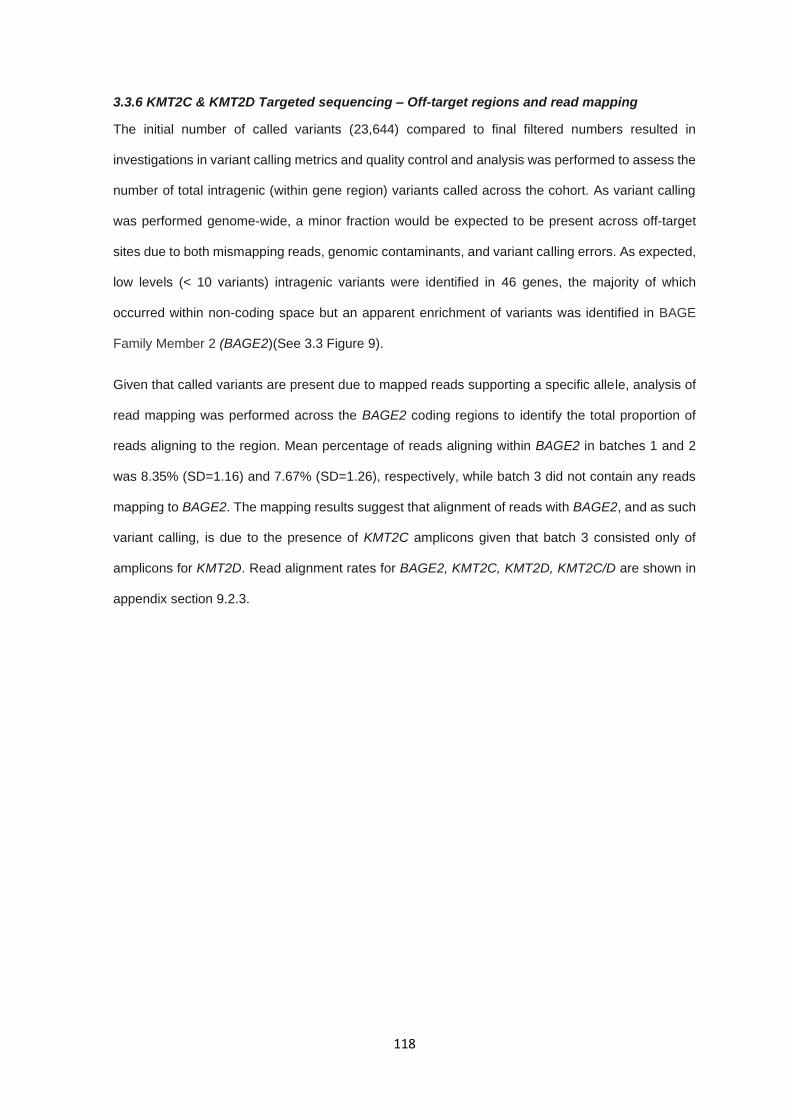
118
3.3.6 KMT2C & KMT2D Targeted sequencing – Off-target regions and read mapping
The initial number of called variants (23,644) compared to final filtered numbers resulted in
investigations in variant calling metrics and quality control and analysis was performed to assess the
number of total intragenic (within gene region) variants called across the cohort. As variant calling
was performed genome-wide, a minor fraction would be expected to be present across off-target
sites due to both mismapping reads, genomic contaminants, and variant calling errors. As expected,
low levels (< 10 variants) intragenic variants were identified in 46 genes, the majority of which
occurred within non-coding space but an apparent enrichment of variants was identified in BAGE
Family Member 2 (BAGE2)(See 3.3 Figure 9).
Given that called variants are present due to mapped reads supporting a specific allele, analysis of
read mapping was performed across the BAGE2 coding regions to identify the total proportion of
reads aligning to the region. Mean percentage of reads aligning within BAGE2 in batches 1 and 2
was 8.35% (SD=1.16) and 7.67% (SD=1.26), respectively, while batch 3 did not contain any reads
mapping to BAGE2. The mapping results suggest that alignment of reads with BAGE2, and as such
variant calling, is due to the presence of KMT2C amplicons given that batch 3 consisted only of
amplicons for KMT2D. Read alignment rates for BAGE2, KMT2C, KMT2D, KMT2C/D are shown in
appendix section 9.2.3.
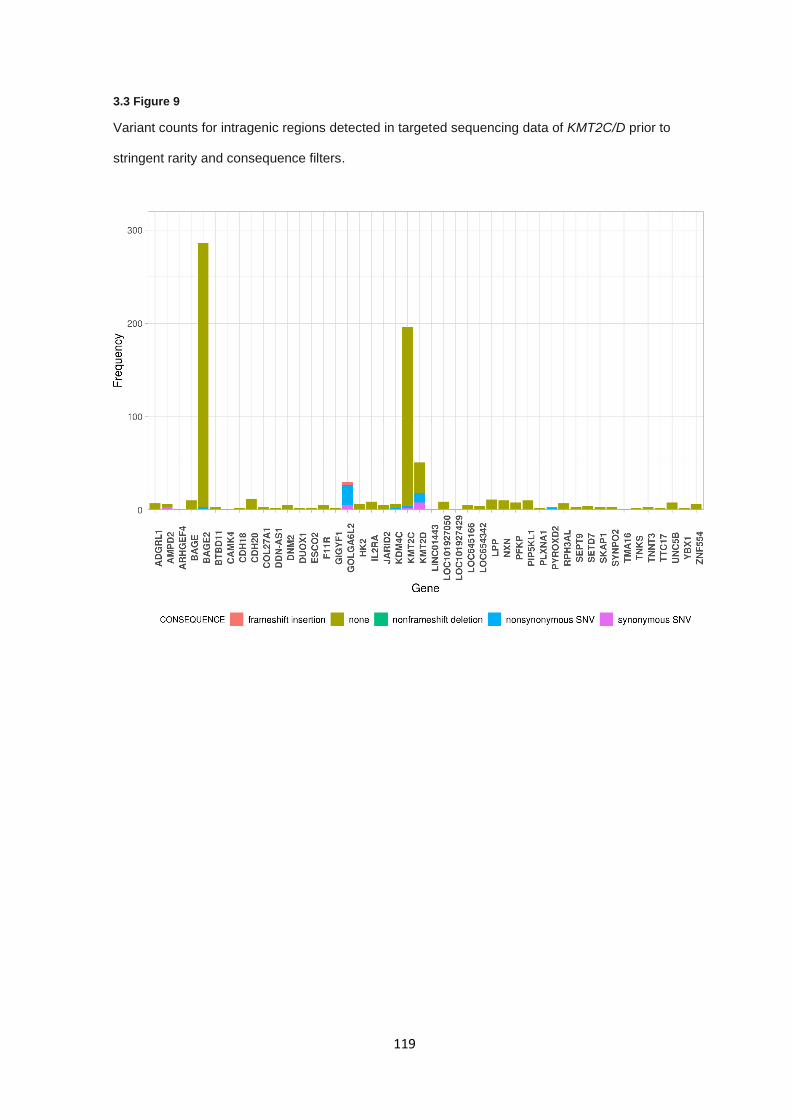
119
3.3 Figure 9
Variant counts for intragenic regions detected in targeted sequencing data of KMT2C/D prior to
stringent rarity and consequence filters.
120
3.3.7 KMT2C & KMT2D Targeted sequencing – BAGE2 gene sequence comparison
The BAGE family of genes consisting of members BAGE1-5, of which only BAGE2 and BAGE5 have
genomic positions designated in genome build GRCh38, where all others are unmapped and
designated in chr21p11.1, in proximity to BAGE2 (See Appendix 9.2.4). Since BAGE2 read
alignments only occur in samples containing KMT2C amplicons, it is likely sequence similarities exist
between regions of KMT2C and BAGE2, resulting in off-target alignment. Using Emboss matcher,
the coding sequences of KMT2C (ENSG00000055609) and BAGE2 (ENSG00000187172) resulted
in a pair-wise alignment sequence similarity of 86.6% and gap presence of 9%. Inverse pair-wise
alignments resulted in similar levels of sequence identity between KMT2C and BAGE2 (78.7%). Pair-
wise sequence of mRNA sequences for KMT2C (NM_170606) and BAGE2 (NM_182482) also
demonstrated significant sequence similarity (73%) but a much greater introduction of sequence
alignment gaps (25.4%), demonstrating lower identity within coding regions. Comparison of
conserved sequence regions in BAGE2 plotted across KMT2C demonstrated gene-wide
conservation (See Appendix 9.2 for sequence comparisons, read alignment rates, and conservation
plots).
3.3.8 Validation of KMT2C nonsense variant
Given the issues regarding KMT2C and multiple mapping of reads to BAGE2 and others, DNA for
the initial index case harbouring the KMT2C nonsense variant (NM170606.2: c.2263C>T:
p.Gln755Ter: rs201234598) was acquired and Sanger sequencing was used to amplify the region
containing the KMT2C variant. Sanger sequencing trace resolved a partial mosaic variant at the
affected site, with a reduced allelic depth estimated at 0.2-0.3 (See 3.3 Figure 10).
Additional variant data was extracted from ExAC and gnomAD aggregated datasets to assess
variant statistics related to the nonsense variant site. Both datasets employ a stringent series of filter
criteria on variants detected within the cohorts and though rs201234598 is reported, it failed random
forest filtering in both sets, suggesting the variant is artefactual. In addition to failing random forest
filtering metrics, the variant is present in a large proportion of genomes reported in gnomAD with
allele frequency reported in gnomAD greater than that in ExAC by an order of magnitude, 2.17E-03
compared to 4.1E-02.
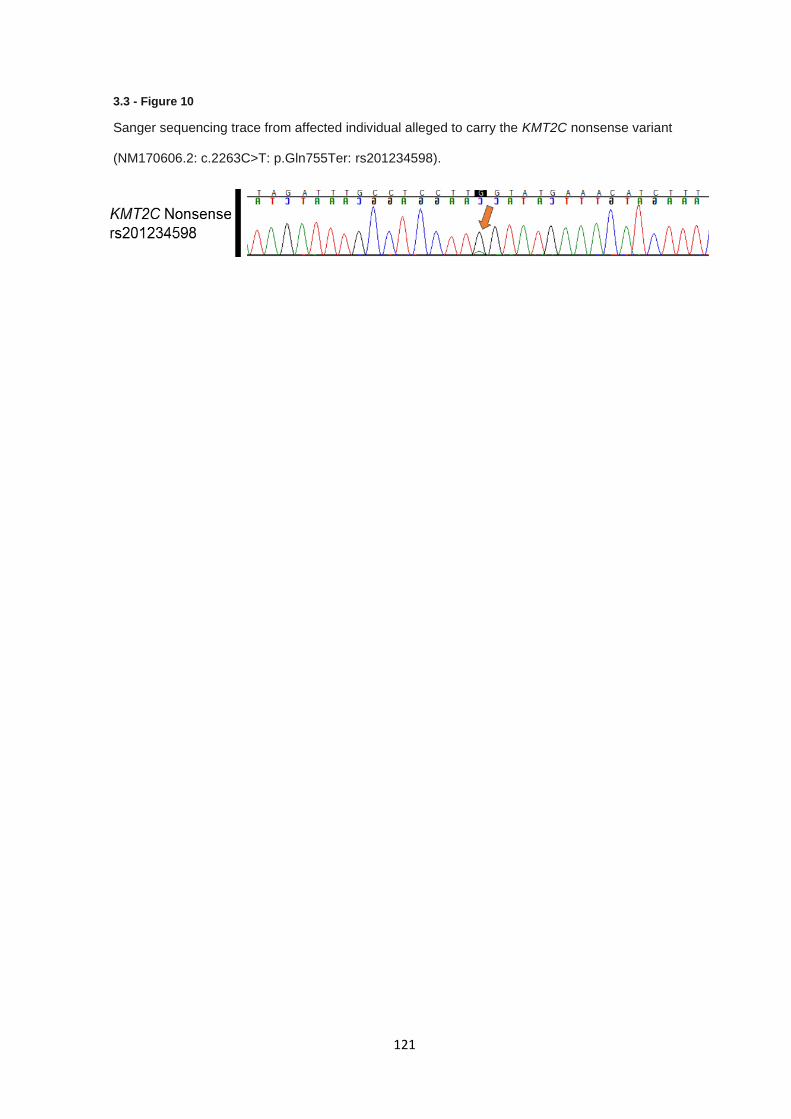
121
3.3 - Figure 10
Sanger sequencing trace from affected individual alleged to carry the KMT2C nonsense variant
(NM170606.2: c.2263C>T: p.Gln755Ter: rs201234598).
122
3.4 Discussion
Targeted Sanger sequencing of EPAS1 exon 9 and 12 and CDKN2B revealed several potential
variants of interest, though none were classified as pathogenic or likely pathogenic. Analysis of rare
variants in EPAS1 exon 9 and 12 identified two missense variants (NM_001430: c.1104G>A:
p.Met368Ile and NM_001430: c.1121T>A: p.Phe374Tyr) in exon 9 which have previously been
assessed in relation to polycythaemia and paragangliomas (342). While ClinVar and ACMG criteria
regard these variants as likely benign or VUS variants, functional studies have demonstrated that
EPAS1 p.Phe374Tyr results in a gain-of-function, demonstrating increased stability over wildtype
EPAS1, and protein interaction simulations suggested p.Phe374Tyr-EPAS1 protein disrupted pVHL
binding to its complex components (342). The second EPAS1 p.Met368Ile variant does not have
supporting functional data but occurs at a lower allele frequency in reference datasets and in close
proximity to the p.Phe374Tyr variant, suggesting that the p.Met368Ile variant may alter EPAS1 in a
similar manner, though functional confirmation would be required. Germline predisposing variants in
EPAS1 in RCC would be particularly interesting if proven to be a true association given recent clinical
trials of EPAS1 inhibitors as a treatment for RCC tumours (84), given the potential to attenuate
EPAS1 function somatically and improve clinical outcome.
The remaining variant identified in the targeted Sanger sequencing experiment was in exon 2 of
CDKN2B in two individuals (NM_004936: c.256G>A: p.Asp86Asn) and occurs at a minor allele
frequency 1.22E-03 and falls within a Ankyrin repeat domain. All in-silico predictive metrics used
suggest the variant is detrimental and previous publications determined that the variant resulted in
diminished function by disrupting the interaction between p15INK4B and CDK4 (354). The CDKN2B
p.Asp86Asn variant, as well as being seen in parathyroid adenomas (355), is identical to the variant
found in heritable RCC cases profiled previously (266) and supports the hypothesis that rare
functionally damaging variants in CDKN2B can confer a risk to RCC. However, given the allele
frequency in control non-cancer populations, high or complete penetrance is unlikely and variants in
CDKN2B may act similarly to variants in SDHB genes conferring only a low risk of RCC (221), though
further association data is required.
123
The issue regarding sequence identity between KMT2C and BAGE2 is the primary issue with the
outcome of the targeted sequencing of KMT2C and KMT2D. The first BAGE gene was originally
identified due to encoding an antigen present in melanoma (356), after which further BAGE genes,
including BAGE2, were identified mapping to both chromosome 9, 13, and 21 in juxtacentromeric
regions and have reported regions of sequence identity between 92-99% in similarity (357).
Evolutionary analysis of BAGE2 sequence origin revealed that BAGE2 and its related genes are
formed due to a reshuffling and duplication of regions of KMT2C on chromosome 7, followed by
further duplications across the chromosomes mentioned previously resulting in multiple BAGE
sequences across the genome (358). This, in part, demonstrates why many reads generated by
targeted sequencing of KMT2C produced off-target mapping to BAGE2.
The failure of amplicon generation of exons 1, 2, 8, 9, 10-14, 28-31, and 42-44 of KMT2C was
unexpected during primer optimisation, but no primers failed due to an absence of products. Given
the information regarding BAGE2 and that all primers failing optimisation did so due to either
incorrect or multiple primary products would suggest that long range primers are annealing to off
target sites in BAGE2 and its related genes despite rigorous primer design to minimise those factors.
It cannot be stated that all amplicon primer sets that failed are as a result of BAGE2 sequence
similarity though, since primers generating multiple products could also be producing PCR amplicons
outside of BAGE2. Loss of these amplicons resulted in a restriction in the available coding exons of
KMT2C available for analysis, which included exon 14 in which the nonsense variant (NM170606.2:
c.2263C>T: p.Gln755Ter: rs201234598) from the index case occurred.
For the amplicons that successfully passed optimisation, failure to generate products were either
due to multiple products (as discussed above) or due to an absence of PCR product. In this instance,
failure to generate products after iterative optimisation steps is likely due to DNA quality and degree
of fragmentation which are decreased and increased, respectively, during long-term storage and
freeze-thaw cycles. While a proportion of reads generated by NGS library preparation will map
incorrectly to BAGE2 due to sequence similarities, it is probable primer design resulted in the direct
amplification and sequencing of BAGE2 and KMT2C concurrently, with product sizes being
indistinguishable on standard gel electrophoresis. This is supported by the primer design process
which selected intronic regions for primer annealing, which are also highly conserved between the
two genes.
124
The presence of mismapped reads and resulting variant calls is an important consideration when
discussing variant calling due to the potential for false positive variant calls and is a documented
pitfall of short read sequencing (359). If reads are misaligned from KMT2C to BAGE2, logically it
suggests that reads are being conversely misaligned from BAGE2 to KMT2C. For identical regions,
this results in no detectable variation but if any read contained a sequence variation and aligned
incorrectly it would suggest an alternative allele at the misaligned loci. Repeated occurrence of this
process at the same site would provide enough supporting alternative reads to result in false positive
variant calling. Presence of false positive calls introduced by low mapping quality reads in simulated
data demonstrated that increase MAPQ filtering nullifies this concern generally (360) but MAPQ
filtering in this study was already greater than the suggested threshold to eliminate this issue.
In the case of exome data and the nonsense variant described previously, it is plausible a false
positive variant call occurred, given the difference in allelic frequencies between exome and genome
sequencing data sets and the reduced alternative allelic fraction seen in the Sanger sequencing.
Taken together, this provides informative data to suggest that the nonsense variant initially identified
results as a consequence of sequence conformity between KMT2C and BAGE2, where PCR
amplification from both regions results in the inclusion of sequence regions where differences in
sequence are limited to only a single base. The increased allelic frequency in gnomAD genomes
compared to exomes is likely due to the removal of biases introduced by exome target probe
hybridisation. Moreover, this introduces doubt over the reliability of all variant calling within the
KMT2C coding regions which share sequence identity with BAGE2, and as such caution should be
taken when assessing variants in this gene. A vast majority of current sequencing projects,
particularly somatic, utilise WES or capture-based sequencing to generate somatic variant calls.
Given that somatic calls are typically made at lower allelic fractions than germline calls, mismapping
in somatic cases could inadvertently result in an enrichment of false positive calls in genes identified
to be significantly mutated in tumour datasets.
125
While KMT2C sequencing harboured major issues regarding off-target effects and data
misalignment, KMT2D did not display these features and performed well by comparison, with no
amplicons failing to generate sequencing data and on-target sequencing rates above 80% in all
samples (See appendix section 9.2.3). One identified issue with sequencing of KMT2D was the
overrepresentation of amplicons KMT2D Exon 12 – 14 and Exon 15 – 18 which sequenced at far
greater depth than other targets (mean coverage > 20,000 for both) due to the size discrepancy
between other amplicons. Both KMT2D Exon 12 – 14 and Exon 15 – 18 are less than 2 Kb in length
(See 3.3 Figure 4 and Table 4), and as such pmol input of each amplicon, even after normalisation,
resulted in several fold increases in fragment retention prior to library preparation compared to larger
amplicons. Though this did not impact results generated in this study due to surplus sequence
coverage, replication in studies with narrower margins of error for targeted coverage may result in
disproportionate sequencing of these smaller amplicons, resulting in reduced or inadequate
coverage of other amplicons.
Targeted NGS of KMT2C and KMT2D identified several rare missense substitution variants in both
genes, but a majority occurred within KMT2D for the reasons specified previously. The single variant
in KMT2C (NM_170606: c.G4273A: p.G1425S) was predicted to be pathogenic by SIFT, PolyPhen
and CADD and reported with an allele frequency of 8.35E-06. The amino acid change glycine to
serine is non-conservative, therefore more likely to be damaging to protein structure but the variant
does not appear to affect any known regulatory or functional protein domain. Both variants KMT2D
p.P2557L (NM_003482: c.C7670T: p.P2557L) and KMT2D p.P692T (NM_003482: c.C2074A:
p.P692T) had no evidence to support pathogenicity and occurred at allele frequencies in ExAC at
marginally lower than 1%, suggesting they are unlikely to be disease-causing. One variant in KMT2D
(NM_003482: c.C1940A: p.P647Q) was predicted to be benign by in silico tools and had conflicting
interpretation in ClinVar but on review was reported as causal in an individual affected with Kabuki
syndrome but no case report was provided and multiple additional reports presented conflicting
evidence (361,362). The remaining KMT2D variants (NM_003482: c.G8765A: p.R2922Q,
NM_003482: c.C5966T p.T1989M, and NM_003482: c.C2129G: p.P710R) had contradictory or
unsupportive in silico metrics but occurred at allele frequencies consistent with the potential to be
disease causing, though none had any additional evidence to suggest pathogenicity.
126
KMT2C and KMT2D are associated with known autosomal dominant genetic disorders Kleefstra
syndrome 2 and Kabuki syndrome, respectively, and are associated with heterozygous loss-of-
function variants. Kleefstra syndrome 2 is a recently defined syndromic condition resulting in delayed
psychomotor development, and dysmorphic anatomical features associated with frameshift,
truncating and deletions of KMT2C (363). Kabuki syndrome is a well characterised syndrome
causing cognitive impairment, growth restriction, facial dysmorphisms and cardiac and renal
anomalies as a result of inactivating or truncating variants in KMT2D (364).
In this series no known pathogenic or loss of function variants were identified to substantiate the
hypothesis that pathogenic inactivating variants in in KMT2C or KMT2D might be associated with
RCC predisposition. For variants in KMT2C, presentation of kleefstra syndrome is typically seen with
sub-telomeric loss of 9q, including loss of EHMT1 or inactivation of KMT2C on chromosome 7 (365).
In tumours, inactivating mutations or deletions of KMT2C, alterations have been demonstrated to
downregulate DNA repair pathways (366), as well as mediate responses to oestrogen in breast
cancers (367). A potential genotype-phenotype could be hypothesised in which variants in KMT2C
under which loss of KMT2C can results in epigenetic reprogramming that corresponds with the
phenotype seen in kleefstra syndrome whilst in the context of cancer, impedance of DNA repair and
alternative epigenetic alterations could drive oncogenesis and cancer predisposition. While the exact
mechanism and correlation of such a genotype-phenotype correlation is not known it may currently
be the most likely hypothesis, particularly given functional links between KMT2C, SMARCB1, and
the SWI/SNF complex of which several genes are already associated with predisposition to RCC
(264) and the frequency at which KMT2C is altered somatically (25).
127
Moreover, KMT2D has conflicting evidence regarding its function as a tumour suppressor, being
shown to upregulate p53 and supress tumour development (349,368) but also functions in an
oncogenic capacity in maintaining tumour cell proliferation (369). Given that KMT2D has the potential
to act as either a TSG or an oncogene in a tumour-specific manner it could be hypothesised that
missense variants in KMT2D might predispose to renal cancer in the absence of Kabuki syndrome
(if the former were activating mutations and the latter resulted from inactivating mutations).
Additionally, single cell transcriptome and RNA sequencing data on patient-derived Kabuki
syndrome cell lines carrying a KMT2D nonsense variant displayed reduced cell cycle progression,
increased cell death, and most intriguingly demonstrated downregulated genes included an
overrepresentation of genes containing HRE motifs (370), most commonly activated by HIF complex
binding as discussed in relation to VHL regulation of hypoxia (138,140), proposing that activating
mutations in KMT2D could cause constitutional upregulation of HRE-containing genes in a manner
similar to HIF proteins. Only missense variants were identified in this series and no large deletions
are observed somatically in KMT2D but significant further analysis and functional assessment of
both the function of KMT2D in RCC and the identified variants are required before any conclusion
could be made regarding either the pathogenicity of the identified variants or the role of KMT2D in
RCC tumourigenesis.
However, an alternative hypothesis would be that missense variants with a partial loss of function
effect could cause an attenuated (and unrecognised) form of Kabuki syndrome and predispose to
renal cancer. Interestingly there are some case reports of tumour development in patients with
Kabuki syndrome, though there is no evidence of clear increased risk of neoplasia (371–373).
Furthermore, prostate tumour studies identified loss-of-function alterations in KMT2D in 60% of
assessed patients and demonstrated attenuation of cell proliferation, invasion and migration in
KMT2D knockout cell lines (374).
128
3.5 Conclusion
Targeted sequencing, both via Sanger sequencing and NGS techniques, can provide a robust and
relatively simple way to adequately genotype a small set of genomic regions but it is clear that issues
regarding pseudo-genes, DNA amplification rates, and DNA quality can give rise to difficulties in
experimental design and interpretation of sequencing data. Regardless of the pitfalls encountered
by the investigations present here, potential predisposition variants in both CDKN2B and EPAS1
could be of interest but cautious interpretation should be applied before drawing causal relationships
and a lack of an appropriate control group and technical issues regarding experimental design
confound drawing any firm conclusions. Clear weaknesses of sequencing a limited number of
genomic targets across a reduced a pre-screened cohort of samples is a reduction in power to detect
associations, but alternative methodologies are either more financially demanding or requires a more
complex analysis. Alterations in KMT2C and KMT2D, though occurring frequently in somatic RCC
cases are difficult to assess accurately, given the issues that were encountered in this study, but
several rare and potentially damaging variants were identified. No variants in KMT2C or KMT2D had
evidence to suggest pathogenicity but without additional genetic or molecular data further
conclusions cannot be made. In all cases, additional confirmation by co-segregation, validation
sequencing, or tumour sequencing to assess secondary mutations are required to support that
variants in KMT2D, CDKN2B or EPAS1 exon 9 are associated with germline predisposition to RCC.
129
4.0 Cancer gene sequencing of individuals with features of inherited
RCC
130
4.0.1 Table of contents
4.0.1 TABLE OF CONTENTS ....................................................................................................................... 130
4.1 INTRODUCTION ..................................................................................................................................... 131
4.1.1 AIMS .................................................................................................................................................. 133
4.2 METHODS ............................................................................................................................................... 134
4.2.1 PATIENTS ............................................................................................................................................ 134
4.2.2 DNA EXTRACTION AND QUANTIFICATION ................................................................................................. 134
4.2.3 LIBRARY PREPARATIONS AND SEQUENCING ............................................................................................. 134
4.2.4 SEQUENCING BIOINFORMATICS .............................................................................................................. 134
4.2.5 VARIANT FILTERING AND PRIORITISATION ................................................................................................ 134
4.2.6 STATISTICAL ANALYSIS ......................................................................................................................... 135
4.2.7 SANGER SEQUENCING .......................................................................................................................... 135
4.3 RESULTS ................................................................................................................................................ 136
4.3.1 CLINICAL FEATURES ............................................................................................................................. 136
4.3.2 QUALITY CONTROL AND VARIANT FILTERING ............................................................................................ 138
4.3.3 DETECTION VARIANTS IN GROUP A CANCER PREDISPOSITION GENES ......................................................... 140
4.3.4 DETECTION OF VARIANTS IN GROUP B CANCER PREDISPOSITION GENES .................................................... 141
4.3.5 DETECTION OF VARIANTS IN GROUP C CANCER PREDISPOSITION GENES .................................................... 144
4.3.6 ANALYSIS OF VARIANTS OF UNCERTAIN SIGNIFICANCE .............................................................................. 146
4.4 DISCUSSION ........................................................................................................................................... 151
4.5 CONCLUSION ......................................................................................................................................... 155
131
4.1 Introduction
Of all diagnosed RCC cases, approximately 3% are familial in nature (98). Molecular genetic studies
have identified multiple genetic causes for RCC predisposition. As discussed previously, the best
recognised cause of familial RCC is the dominantly inherited familial cancer syndrome von Hippel-
Lindau (VHL) disease caused by germline mutations in the VHL tumour suppressor gene (99,127).
Additionally, inactivating mutations in tumour suppressor genes (TSGs) BAP1, FH, FLCN, SDHB,
SDHD, SDHC, SDHA, PBRM1, and CDKN2B, as well as activating mutations in the MET proto-
oncogene have been implicated in predisposition to renal cancers (98). A majority of RCC with
suspected predisposition do not carry pathogenic variants in known RCC predisposition genes and
recent studies suggest between 24-33% of individuals presenting with RCC meet referral criteria for
genetic testing (118). Taken together, there is an unidentified genetic component to non-syndromic
RCC cases with features of predisposition.
As the previous chapter demonstrated, the rate of variant detection in single gene or exon
sequencing is low and as such high throughput sequencing of high priority targets would enable the
analyse of multiple genes of interest with reduced labour, at the expense of increased cost,
computational, and bioinformatic requirements. While initially cancer-associated genes were
described in relation to a single cancer phenotype, a greater number of genes are being associated
with several or even a spectrum of cancer predispositions, in both syndromic and non-syndromic
cases, such as BRCA1 in breast, ovarian, and prostate cancers (27,375). Recently, studies in a
number of human cancer types have identified pathogenic variants in a wide range of cancer
predisposition genes than have been traditionally associated with the cancer of interest, as
exemplified by Whitworth et al (2018) (376). A hypothesis can be proposed that adopting a wider
testing strategy to a cohort of patients with features that might indicate a cancer predisposition gene
mutation might improve knowledge of the molecular architecture of inherited RCC.

132
In order to identify new genetic components associated with renal cancer predisposition, 118
probands presenting with features of non-syndromic inherited RCC with no known pathogenic or
likely pathogenic variants in VHL, MET, FLCN, SDHB, CDKN2B and BAP1 were investigated and
targeted sequencing was performed using the Illumina TruSight cancer sequencing panel or virtual
TruSight cancer sequencing panel on available whole exome sequencing data. The sequencing
technology applied in each instance was only because of a shift from targeted panel sequencing to
whole exome sequencing as a laboratory standard operating procedure, not a specific experimental
design choice.

133
4.1.1 Aims
Confirm the lack of pathogenic or likely pathogenic variants in known RCC predisposition
genes.
Identify pathogenic or likely pathogenic variants in genes associated with RCC or other
cancers through targeted cancer gene and SNP sequencing.
134
4.2 Methods
4.2.1 Patients
Patients diagnosed with RCC were assessed for eligibility based on the presence of clinical features
associated with inherited RCC, as described in section 2.1.3. Patients were recruited if they matched
one of the following criteria 1) Patient had at least one first or second degree relative with RCC 2)
Presented with no family history but two or more separate primary RCC before age 60 years, or 3)
Presenting with RCC at age 45 years or less (age of diagnosis corresponding to less than 10% of
total cases as defined by SEER(377)). Patients with confirmed or likely mutations in BAP1, FH,
FLCN, MET, SDHB and VHL were excluded from the study.
4.2.2 DNA extraction and quantification
DNA extraction from whole blood lymphocytes, quantification and quality control was performed as
described in material and methods (section 2.1).
4.2.3 Library preparations and sequencing
Cancer gene panel library preparations were performed as described in materials and methods
(section 2.6.2). WES library preparations were performed as described in materials and methods
(section 2.6.3) performed by the SMCL sequencing service.
4.2.4 Sequencing bioinformatics
Primary bioinformatics (BCL to VCF) was performed as described in materials and methods (section
2.7) by the SMCL sequencing service. Variants from targeted sequencing panel and exome datasets
were called independently and a ‘virtual’ panel applied to the exome variants via VCFtools, restricting
the reported variants to the Cancer gene panel target bed intervals (with an additional 3bp padding)
4.2.5 Variant filtering and prioritisation
Variant filtering, annotation, and prioritisation was performed as described in the materials and
methods (section 2.8) including Intervar variant interpretation using ACMG guidelines (325). Targets
included in the cancer gene panel are given in appendix section 9.3.1 and were used to filter a virtual
variant panel in the WES sequencing samples.

135
4.2.6 Statistical Analysis
Proportion confidence intervals were calculated using R base function binom.test() at CI 95%, using
R (version 3.5). Two-tailed Fishers exact tests and odds ratios were calculated using the
‘oddsratio.fisher()’ function in epitools package (version 0.5-10), using R (version 3.5). Confidence
interval for odds ratio calculation was set to 95%.
4.2.7 Sanger sequencing
Primer design and PCR amplicon generation for Sanger sequencing was performed as described in
the main materials and methods (section 2.3). Sanger sequencing of variants was performed as
described in the main materials and methods (section 2.4). BRIP1 primer sequences are given in
the appendix (section 9.3.2).
136
4.3 Results
4.3.1 Clinical features
The 118 unrelated individuals with RCC eligible for inclusion were subdivided into three clinical
subsets: 44 cases with a positive family history and 74 sporadic cases comprising 30 cases with
multifocal or bilateral disease and 44 cases with early onset RCC only). Median age of onset across
all cases was 42 years (range 10-74) and 52 years (range 29-74) in the familial cases, 48 years
(range 31-72) in multifocal/bilateral cases and 33 years (range 10-46) in early onset cases).
Histological subtype was available for 70 of 118 cases (59.3 %) and comprised 68.6% clear cell
RCC, 27.1% papillary RCC, and 4.29% chromophobe RCC). Summary of the distribution of clinical
features are given in 4.3 Table 1.
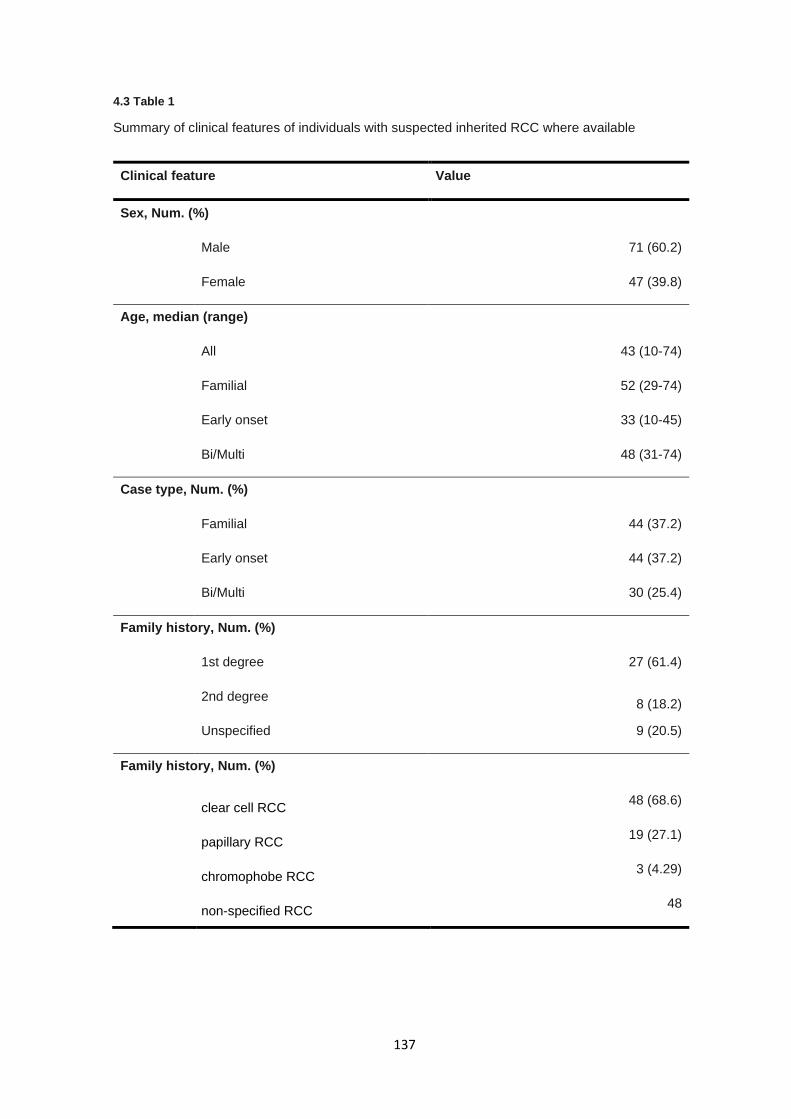
137
4.3 Table 1
Summary of clinical features of individuals with suspected inherited RCC where available
Clinical feature Value
Sex, Num. (%)
Male 71 (60.2)
Female 47 (39.8)
Age, median (range)
All 43 (10-74)
Familial 52 (29-74)
Early onset 33 (10-45)
Bi/Multi 48 (31-74)
Case type, Num. (%)
Familial 44 (37.2)
Early onset 44 (37.2)
Bi/Multi 30 (25.4)
Family history, Num. (%)
1st degree 27 (61.4)
2nd degree 8 (18.2)
Unspecified 9 (20.5)
Family history, Num. (%)
clear cell RCC
48 (68.6)
papillary RCC
19 (27.1)
chromophobe RCC
3 (4.29)
non-specified RCC
48
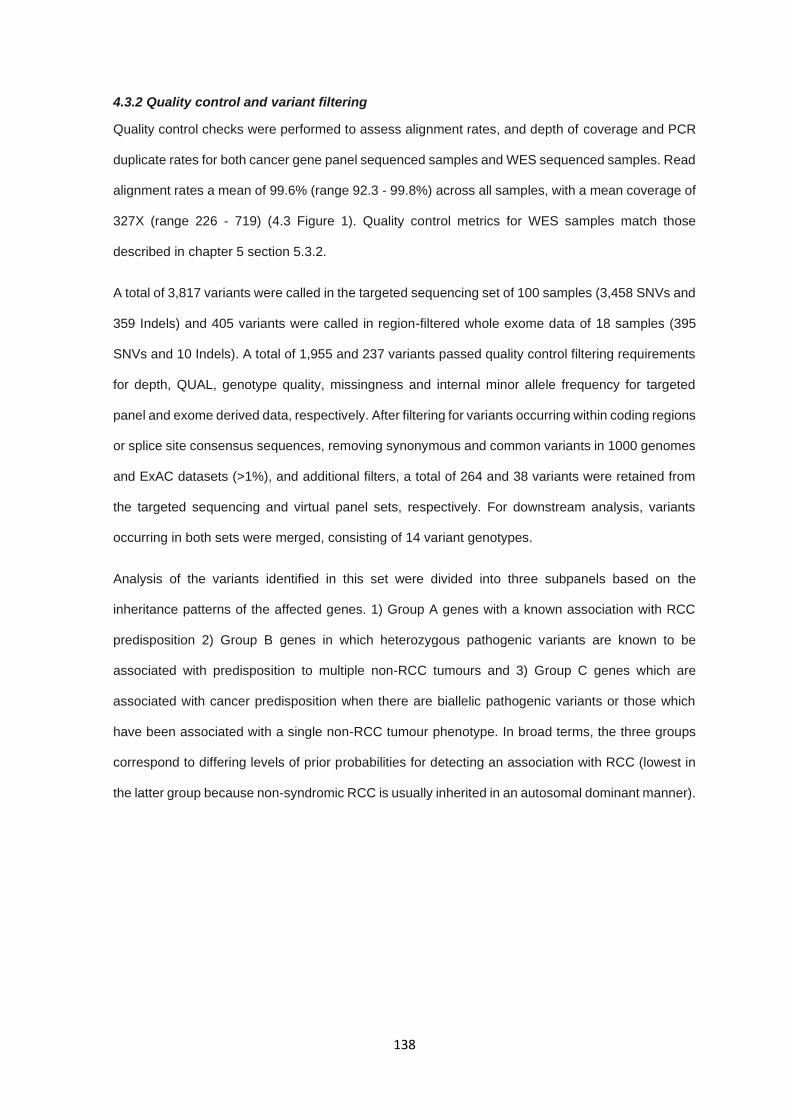
138
4.3.2 Quality control and variant filtering
Quality control checks were performed to assess alignment rates, and depth of coverage and PCR
duplicate rates for both cancer gene panel sequenced samples and WES sequenced samples. Read
alignment rates a mean of 99.6% (range 92.3 - 99.8%) across all samples, with a mean coverage of
327X (range 226 - 719) (4.3 Figure 1). Quality control metrics for WES samples match those
described in chapter 5 section 5.3.2.
A total of 3,817 variants were called in the targeted sequencing set of 100 samples (3,458 SNVs and
359 Indels) and 405 variants were called in region-filtered whole exome data of 18 samples (395
SNVs and 10 Indels). A total of 1,955 and 237 variants passed quality control filtering requirements
for depth, QUAL, genotype quality, missingness and internal minor allele frequency for targeted
panel and exome derived data, respectively. After filtering for variants occurring within coding regions
or splice site consensus sequences, removing synonymous and common variants in 1000 genomes
and ExAC datasets (>1%), and additional filters, a total of 264 and 38 variants were retained from
the targeted sequencing and virtual panel sets, respectively. For downstream analysis, variants
occurring in both sets were merged, consisting of 14 variant genotypes.
Analysis of the variants identified in this set were divided into three subpanels based on the
inheritance patterns of the affected genes. 1) Group A genes with a known association with RCC
predisposition 2) Group B genes in which heterozygous pathogenic variants are known to be
associated with predisposition to multiple non-RCC tumours and 3) Group C genes which are
associated with cancer predisposition when there are biallelic pathogenic variants or those which
have been associated with a single non-RCC tumour phenotype. In broad terms, the three groups
correspond to differing levels of prior probabilities for detecting an association with RCC (lowest in
the latter group because non-syndromic RCC is usually inherited in an autosomal dominant manner).
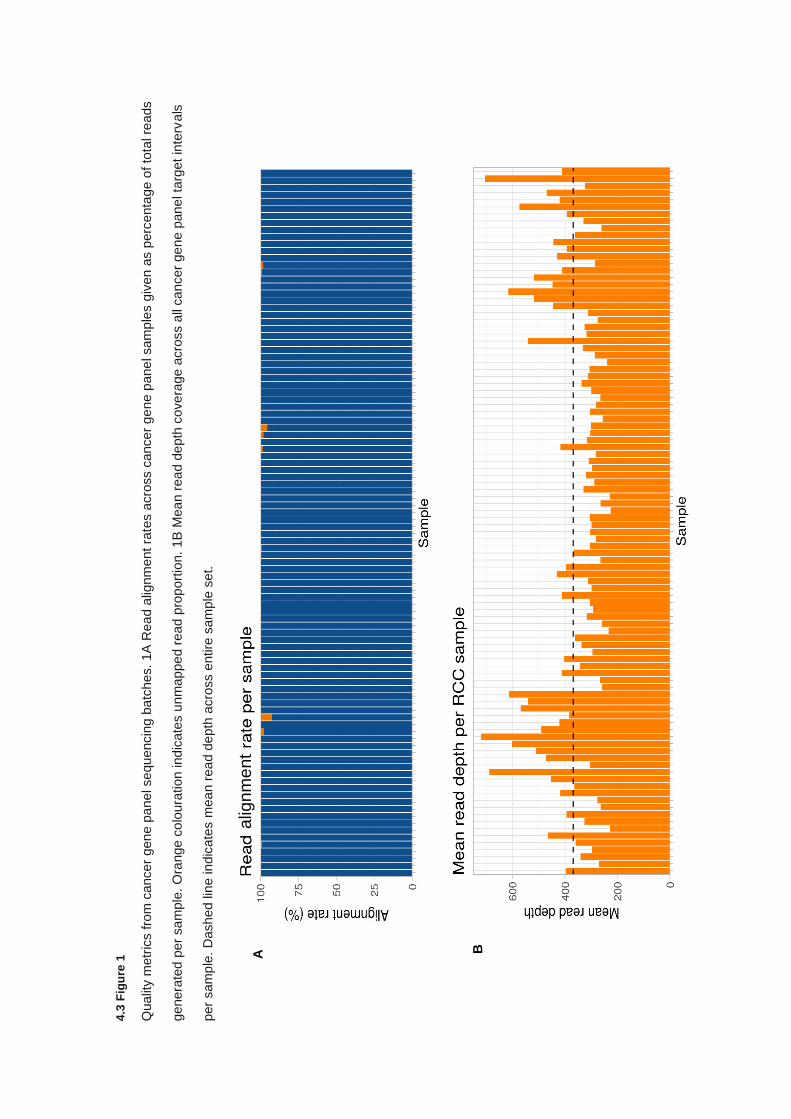
4.3
Fig
ure
1
Qualit
y m
etr
ics fro
m c
ancer
gen
e p
ane
l sequ
encin
g b
atc
hes. 1A
Rea
d a
lignm
ent ra
tes a
cro
ss c
ancer
ge
ne p
ane
l sam
ple
s g
iven
as p
erc
enta
ge o
f to
tal re
ads
genera
ted
per
sa
mple
. O
range c
olo
ura
tion ind
icate
s u
nm
ap
pe
d r
ead
pro
port
ion.
1B
Mea
n r
ea
d d
epth
covera
ge a
cro
ss a
ll ca
ncer
ge
ne p
ane
l ta
rget
inte
rvals
per
sam
ple
. D
ashe
d lin
e in
dic
ate
s m
ea
n r
ea
d d
epth
acro
ss e
ntire
sam
ple
set.
A B
alig
nm
ent
140
Variants passing filtering and meeting selection criteria were then assessed for pathogenicity using
the InterVar tool (326) for automatic generation of ACMG variant classifications. Of the 288 variants
assessed, a total of 19 were classified as pathogenic or likely pathogenic (P-LP) variants (5
pathogenic, 14 likely pathogenic), corresponding to 5 nonsense variants, 3 frameshift deletions, 2
frameshift insertions, 8 missense substitutions, and 1 splice site variant. The 19 variants were
observed in a total of 21 individuals, giving an identification rate 21/118 (17.8%; 95% CI: 11.4-25.9)
across all assessed cases. Pathogenic variants were equally distributed by count across the
inherited subtypes (8 variants in familial, 6 variants in early onset, and 7 variants in
bilateral/multifocal). All 19 pathogenic/likely pathogenic variants are described in 4.3 Table 2.
4.3.3 Detection variants in Group A cancer predisposition genes
As expected, no P/LP variants were detected in genes that had previously been analysed before
inclusion in this study (VHL, MET, FLCN, SDHB, CDKN2B or BAP1) and only a single gene identified
as harbouring a P/LP variant has been previously linked to RCC, either in germline or somatic
sequencing. A MITF missense variant in (NM_000248: c.952G>A: p.E318K) was identified in an
individual who presented with clear cell RCC at age 74 years and whose son was reported to have
presented with clear cell RCC at age 53 years. Sequencing in the individual’s unaffected brother did
not carry the variant and though this variant had been previously associated with predisposition to
RCC and melanoma (262), there was no family history of this tumour.
Three variants in MET (NM_000245: c.T2543C: p.V848A, NM_000245: c.G1406C: p.R469P, and
NM_000245: c.A1336G: p.I446V) were present at allelic frequencies lower than 8.5E-05, with in
silico predictions being variable, but none of the variants fall within the tyrosine kinase domain
associated with constitutional activation of c-MET (204,208), and none had been reported as somatic
events in sporadic RCC based on data from the catalogue of somatic mutations in cancer
(COSMIC)(378).
141
Six missense variants were identified in TSC2, associated with tuberous sclerosis complex (MIM:
613254) which predisposes individuals to renal angiomyolipomas and cysts, as well as hybrid or
oncocytic RCC in between 2-4% of cases (232,237). Histological information was not available for
these individuals to assess if they presented with histologies consistent with loss of TSC2. The
predicted pathogenicity of these missense variants, as well as the allele rarity, is variable but two
variants (NM_000548 c.G4657T: p.G1553C & NM_000548: c.G5117A: p.R1706H) occur within the
Rap GTPase activating protein domain implicated in RHEB inhibition (241) and one variant
(NM_000548: c.C2476A: p.L826M) arises in a Tuberin-type domain, though its direct function is not
known. None of the 6 variants identified in TSC2 had been reported as somatic events in sporadic
RCC in COSMIC.
4.3.4 Detection of variants in Group B cancer predisposition genes
A total of 6 P/LP variants were detected in the 3 genes in which heterozygous pathogenic variants
are known to be associated with predisposition to multiple non-RCC tumour types. Two Group B
genes, BRIP1 and CHEK2, harboured germline P/LP variants in more than one proband. Three
BRIP1 truncating variants (NM_032043: c.1161dupA: p.Gln388Thrfs*7, NM_032043: c.1871C>A:
p.Ser624*, and NM_032043: c.2392C>T: p.Arg798*) were identified across four individuals, two of
which carried a BRIP1 p.Ser624* nonsense variant. The four probands consisted of 2 familial cases
and 2 multifocal/bilateral cases. Age at diagnosis of RCC was 54, 64, 46, and 39 years and presented
with papillary, two non-specified, and clear cell RCC, respectively (see 4.3 Table 3). Affected family
members were available for one individual carrying the NM_032043: c.2698G>A: p.Arg798* and an
affected second degree relative (clear cell RCC at age 57 years) and also found to harbour the
NM_032043: c.2698G>A: p.Arg798* nonsense variant. In total, truncating variants in BRIP1 were
detected in 3.39% (4/118) of sequenced individuals. To compare frequencies to a comparable
control set the ICR1000UK control set was aligned identically and was analysed for number of
truncating variants. The ICR1000UK control cohort harboured truncating variants in 0.4% (4/999)
corresponding to an enrichment of truncating variants in our cases (p=5.92E-03, OR 8.70, 95% CI:
1.60 – 47.4).
142
Evaluation of rare truncating variants in BRIP1 compared to gnomAD revealed an estimated at
0.24% (123/51,300 (353); carriers were estimated using median allele number where alternative
alleles were presumed to be mutually exclusive) which results in a significant enrichment in the case
set (p=2.19E-04, OR 14.6, 95% CI: 3.85 – 39.35). Finally, statistical comparison to data published
by Easton et al (2016)(379) also demonstrated a statistical enrichment in this series (p=1.21E-04,
OR 18.2, 95% CI: 4.55 – 53.1) when compared to truncating variants in BRIP1 in breast cancer,
found at a rate of 0.19% (28/14,526). The BRIP1 truncating variants were confirmed by Sanger
sequencing (4.3 Figure 2).
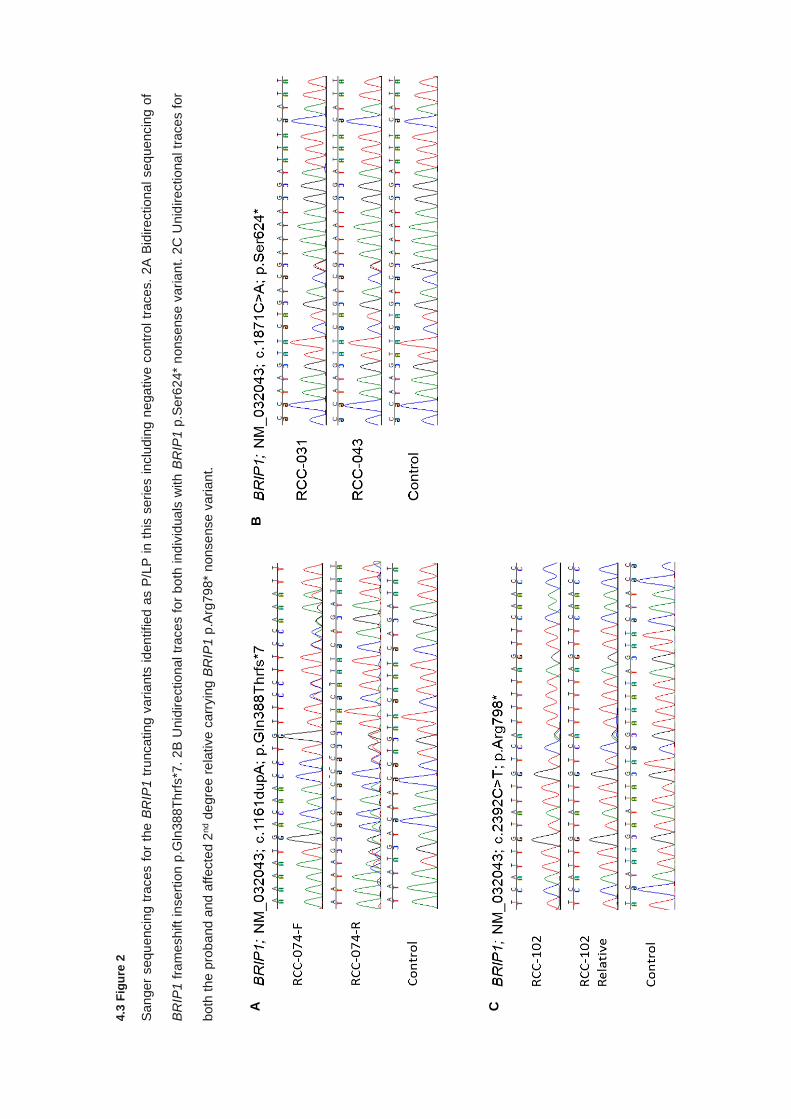
4.3
Fig
ure
2
San
ger
sequ
encin
g t
races f
or
the B
RIP
1 t
runcating v
ariants
iden
tified a
s P
/LP
in t
his
series inclu
din
g n
ega
tive c
ontr
ol tr
aces.
2A
Bid
ire
ctiona
l seq
uencin
g o
f
BR
IP1 f
ram
esh
ift
insert
ion p
.Gln
388T
hrf
s*7
. 2
B U
nid
irection
al tr
aces f
or
bo
th ind
ivid
ua
ls w
ith B
RIP
1 p
.Ser6
24*
nonsense v
ari
an
t. 2
C U
nid
irectiona
l tr
aces f
or
both
the p
rob
and a
nd
aff
ecte
d 2
nd d
egre
e r
ela
tive c
arr
yin
g B
RIP
1 p
.Arg
79
8*
nonse
nse v
aria
nt.
A
B
C
144
A frameshift deletion in CHEK2 (NM_007194: c.1263delT: p.Ser422Valfs*15) was identified in two
individuals, both of whom presented with multifocal RCC at age 56 years, though the histology was
not specified. The frameshift deletion is considered to be pathogenic and has previously been
detected in both germline sequencing of breast (380) and prostate cancer (381,382). An additional
CHEK2 missense variant (NM_007194: c.1427C>T: p.Thr476Met) was also identified in one
individual classified as likely pathogenic by InterVar (though there have been conflicting reports on
ClinVar (VUS=7, LP=10). The variant falls within the protein kinase domain of CHEK2 and in vitro
studies demonstrated a loss of kinase activity and loss of DNA repair function (383,384).
Finally, an individual carried a BRCA1 frameshift deletion in exon15 (NM_007300: c.4563delA:
p.Lys1521Asnfs*5) which was novel in ExAC and 1000 genomes, as well as not present in the non-
cancer gnomAD data set. The individual presented with early onset papillary RCC at age 40 years.
4.3.5 Detection of variants in Group C cancer predisposition genes
A PMS2 nonsense variant was identified in three individuals, purported to occur within the 4th amino
acid (PMS2: c.11C>G: p.Ser4*) but on review was found only to affect non-canonical isoform 14
(NM_001322015), resulting in an intronic substitution within the canonical isoforms of PMS2. A P-
LP missense variant in one individual was identified in PMS2, occurring within the canonical
transcript (NM_000535: c.2066C>T: p.Thr689Ile). The PMS2 missense substitution occurs within
exon 12 resulting in a Threonine to Isoleucine substitution in a c-terminal dimerization domain. The
variant occurs as a singleton in the gnomAD data set (353) and is considered to be highly deleterious
by multiple in silico predictive tools.
A patient presenting with early onset clear cell RCC at age 39 years harboured a nonsense variant
in FANCE (NM_021922: c.265C>T: p.Arg89*) within exon 2. The variant was seen only once in the
gnomAD data set and due to occurring early in the amino acid sequence presumably leads to loss
of the entire protein product but no further functional evidence was available.
145
Multiple P-LP variants were identified in genes associated with nucleotide excision repair pathways,
including ERCC2, XPA, and XPC. Three missense variants were identified in ERCC2 (NM_000400:
c.2084G>A: p.Arg695His, NM_000400: c.1802G>A: p.Arg601Gln, and NM_000400: c.772C>T:
p.Arg258Trp). Two of these missense variants were only present as singletons within the non-cancer
gnomAD data set (353) (NM_000400: c.2084G>A: p.Arg695His; AF = 4.22E-06 & NM_000400:
c.772C>T: p.Arg258Trp; AF = 4.23E-06), with the remaining variant ERCC2 (NM_000400:
c.1802G>A: p.Arg601Gln) occurring at minor allele frequency of 1.68E-04. All three variants are
within conserved functional protein domains, occurring within an ATP-dependent helicase C-terminal
domain, P-loop containing nucleoside triphosphate hydrolase & ATP-dependent helicase C-terminal
domain, and a DEAD2-type helicase ATP-binding domain, respectively. A nonsense variant in exon
4 of XPA (NM_000380: c.464delT: p.Leu155*) and a frameshift deletion in exon 2 of XPC
(NM_004628: c.219delG: p.Val75Trpfs*4) were also found. Both truncating variants occur early in
the reading frames of both genes and are novel variants not seen in the non-cancer Gnomad data
set (353).
Genetic overlaps have been demonstrated between RCC and Pheochromocytomas (PCC) and
paragangliomas (PGL), with variants in genes such as VHL, SDHB/C/D, and FH predisposing to
both tumour types (124,155,215,385). Therefore, analysis of genes associated with PCC/PGLs may
uncover new associations. One variant was present in SDHAF2 and two in RET which are associated
with predisposition to Phaeochromocytoma (386,387). The SDHAF2 variant (NM_017841: p.R18G)
is within exon 2, is present at a minor allele frequency of 2.8E-05 in gnomAD, and predictive in silico
tools suggested it occurred in a conserved amino acid and therefore likely damaging. Two RET
variants (NM_020975: c.C166A: p.L56M and NM_020975: c.G973A: p.A325T) occurred in one
individual each with the first being repeatedly flagged as benign by Clinvar. The latter has conflicting
interpretations of pathogenicity on Clinvar but SIFT, PolyPhen and CADD all suggest the variant is
not pathogenic in nature, particularly given that RET activating variants are typically clustered in the
tyrosine kinase domain (388).
146
4.3.6 Analysis of variants of uncertain significance
Of the 288 variants passing all quality control and filtering parameters, 134 variants were categorised
as variants of uncertain significance (VUS) by ACMG guidelines applied by InterVar. Of these
variants 96.3% (129/134) were missense variants, with 3 non-frameshift deletions, 1 nonsense
variant, and 1 splice site altering variant composing the remaining percentage. For genes harbouring
VUSs, 40.6% carried only a single variant (26/64 genes), with 25.0% (16/64 genes), 14.1% (9/64
genes), and 9.37% (6/64 genes) harbouring two, three and four variants across the sample set,
respectively. The remaining genes each carried five or more variants classified as VUS (CDKN2A =
13, ERCC5 = 10, ALK = 9, ATM = 9, TSC2 = 6, ERCC3 = 5 and ERCC4 = 5). VUS variants were
found at a rate of 1.40 per individual (range 0-4). VUS variants occurred less frequently in samples
harbouring P-LP variants at 1.05 compared to 1.48 variants per sample, though it did not reach
statistical significance (p=0.08; Student’s t-test). Comparisons of InterVar-assigned pathogenicity to
Clinvar status reported in the VUS variants identified 10 variants in which Clinvar indicates clear lack
of pathogenicity, marked as benign or likely benign. Conversely, no variants designated as VUS by
InterVar were classified as P-LP variant by Clinvar.
A single missense variant was found in SMARCB1, a gene encoding a component of the SWI/SNF
complex which contains PBRM1 (389), which is shown to be altered in papillary RCC (158). The
variant is located in the 4th exon (NM_001317946: c.C497G: p.T166S) and appears to be relatively
common compared to other VUSs in the set (AF=1.0E-03 nc-gnomAD) and is predicted to be
tolerated or benign by all in silico predictive tools.
Several missense VUS variants were present in genes significantly affected in somatic RCC
sequencing. The variants include two missense variants in EGFR which is amplified in somatic
papillary RCC as part of chromosome 7 duplications (274). Neither of the EGFR variants fall within
functional domains or have evidence to suggest they would result in constitutive activation of the
epidermal growth factor receptor. EGFR variant p.Pro20Arg (NM_005228: c.C59G: p.P20R) is
reported only once in gnomAD but is predicted to be tolerated or benign by in silico predictive tools
whereas the second variant (NM_005228: c.G2024A: p.R675Q) is reported more frequently (AF=
2.1E-04) but predicted to be deleterious by in silico predictive tools.
147
Two additional VUS variants were identified in TP53 and CDKN2A, both of which are described in
somatic sequencing. The variant in TP53 (NM_000546: c.G124A: p.D42N) is present as a singleton
in gnomAD and is located in the Cellular tumour antigen p53, transactivation domain 2 region but in
silico predictive tools suggest the amino acid change is tolerated. Lastly, a missense variant in
CDKN2A was present in 13 individuals (NM_000077: c.A221C: p.D74A). While passing all filtering
and quality control criteria, the inflated allele count for this variant is anomalous given the size of the
cohort sequenced and the expected rarity of causal variants. Review of data regarding this variant
suggested that it is present as a sequencing artefact and failed random forest filtering, as part of
ExAC (390) and as such this variant was not evaluated further.
Several samples carried non-missense VUS variants across multiple genes. An individual carried
both a BRCA2 non-frameshift deletion and a MSH6 splice site altering variant. The BRCA2 variant
(NM_000059:exon11: c.4142_4144del: p.1381_1382del) has multiple conflicting interpretations of
pathogenicity, reported as both likely benign and a VUS. The variant is reported at an allele
frequency which conforms with potential pathogenicity (AF=8.E-05) and functional studies have
demonstrated a loss of function of the BRCA2 protein (391) but additional Clinvar submissions report
co-occurrence with known pathogenic variants reported in breast cancer. The splice site affecting
deletion in MSH6 (NM_000179: c.4001+12_4001+15delACTA) is present in gnomAD at an allelic
frequency of 1.2E-03, which is relatively frequent for a pathogenic variant and expert panel review
in Clinvar regards it as a true VUS without further evidence to support pathogenic or benign
classification.
148
Two related genes, FANCL and FANCD2, were shown to be present in one individual each. A non-
frameshift deletion in FANCL (NM_001114636: c.1022_1024del: p.341_342del) was classified as a
VUS but functional studies have demonstrated the variant results in a null allele (392), and
subsequent incorporation of this data in ACMG shifts the classification for VUS to likely pathogenic.
The FANCD2 non-frameshift deletion (NM_033084: c.877_885del: p.293_295del) has no published
studies regarding its likely effect on protein function but it does result in the loss of 3 amino acids
within a region suggested to interact with FANCE and the variant is only present as a singleton in
gnomAD. Lastly, an individual carried a nonsense variant in CEBPA. CEBPA is an intronless gene
with a complex series of differential initiation codons, including both ATG and non-ATG start sites.
The variant CEBPA (NM_001287424: exon1: c.C16T: p.R6X), is only a stop gain in isoform C,
resulting in a 5’-UTR variant in other isoforms, making interpretation difficult (393).
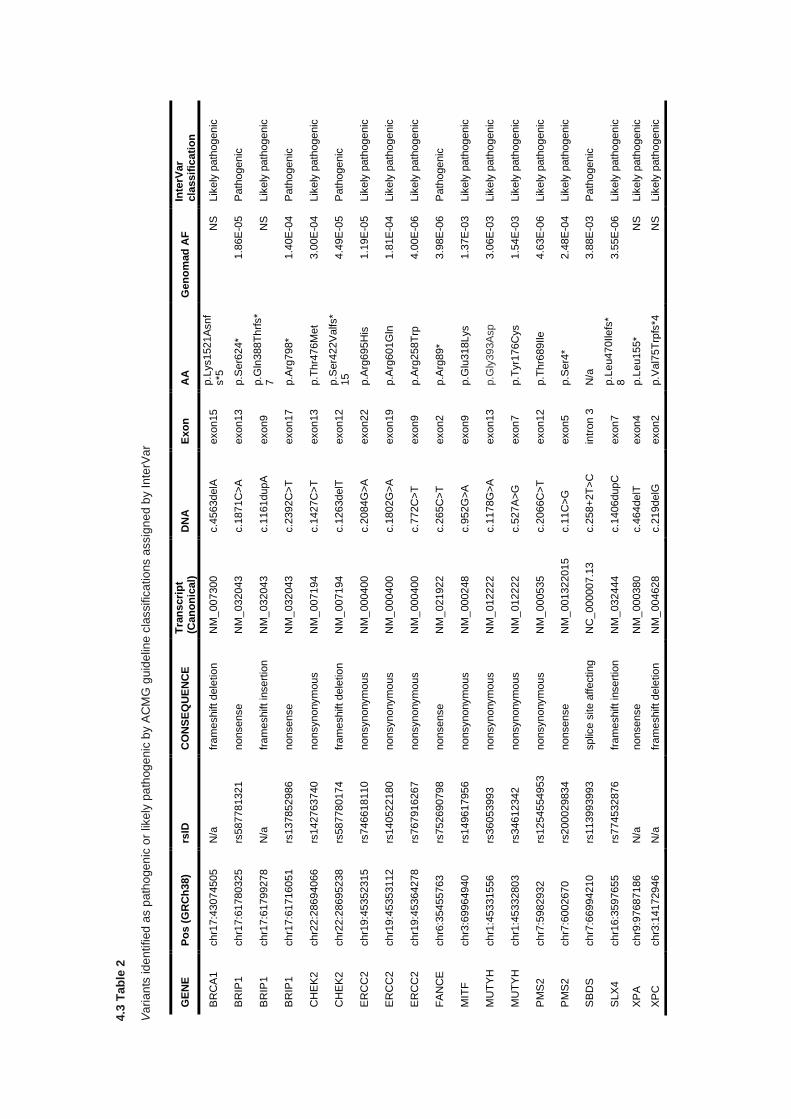
4.3
Tab
le 2
Va
ria
nts
id
en
tified
as p
ath
ogen
ic o
r lik
ely
pa
thog
enic
by A
CM
G g
uid
elin
e c
lassific
atio
ns a
ssig
ne
d b
y I
nte
rVa
r
GE
NE
P
os
(G
RC
h3
8)
rsID
C
ON
SE
QU
EN
CE
T
ran
scri
pt
(Can
on
ical)
D
NA
E
xo
n
AA
G
en
om
ad
AF
In
terV
ar
cla
ssif
icati
on
BR
CA
1
chr1
7:4
3074505
N
/a
fram
eshift dele
tio
n
NM
_007300
c.4
563delA
exon15
p.L
ys1521A
snf
s*5
N
S
Lik
ely
path
ogenic
BR
IP1
chr1
7:6
1780325
rs
587781321
nonsense
NM
_032043
c.1
871C
>A
exon13
p.S
er6
24*
1.8
6E
-05
Path
ogenic
BR
IP1
chr1
7:6
1799278
N
/a
fram
eshift in
sert
ion
NM
_032043
c.1
161dupA
exon9
p.G
ln388T
hrf
s*
7
NS
Lik
ely
path
ogenic
BR
IP1
chr1
7:6
1716051
rs137852986
nonsense
NM
_032043
c.2
392C
>T
exon17
p.A
rg798*
1.4
0E
-04
Path
ogenic
CH
EK
2
chr2
2:2
8694066
rs
142763740
nonsynonym
ous
NM
_007194
c.1
427C
>T
exon13
p.T
hr4
76M
et
3.0
0E
-04
Lik
ely
path
ogenic
CH
EK
2
chr2
2:2
8695238
rs
587780174
fr
am
eshift dele
tio
n
NM
_007194
c.1
263delT
exon12
p.S
er4
22V
alfs*
15
4.4
9E
-05
Path
ogenic
ER
CC
2
chr1
9:4
5352315
rs
746618110
nonsynonym
ous
NM
_000400
c.2
084G
>A
exon22
p.A
rg695H
is
1.1
9E
-05
Lik
ely
path
ogenic
ER
CC
2
chr1
9:4
5353112
rs
140522180
nonsynonym
ous
NM
_000400
c.1
802G
>A
exon19
p.A
rg601G
ln
1.8
1E
-04
Lik
ely
path
ogenic
ER
CC
2
chr1
9:4
5364278
rs
767916267
nonsynonym
ous
NM
_000400
c.7
72C
>T
exon9
p.A
rg258T
rp
4.0
0E
-06
Lik
ely
path
ogenic
FA
NC
E
chr6
:35455763
rs
752690798
nonsense
NM
_021922
c.2
65C
>T
exon2
p.A
rg89*
3.9
8E
-06
Path
ogenic
MIT
F
chr3
:69964940
rs149617956
nonsynonym
ous
NM
_000248
c.9
52G
>A
exon9
p.G
lu318Lys
1.3
7E
-03
Lik
ely
path
ogenic
MU
TY
H
chr1
:45331556
rs
36053993
nonsynonym
ous
NM
_012222
c.1
178G
>A
exon13
p.G
ly393A
sp
3.0
6E
-03
Lik
ely
path
ogenic
MU
TY
H
chr1
:45332803
rs
34612342
nonsynonym
ous
NM
_012222
c.5
27A
>G
exon7
p.T
yr1
76C
ys
1.5
4E
-03
Lik
ely
path
ogenic
PM
S2
chr7
:5982932
rs
1254554953
nonsynonym
ous
NM
_000535
c.2
066C
>T
exon12
p.T
hr6
89Ile
4.6
3E
-06
Lik
ely
path
ogenic
PM
S2
chr7
:6002670
rs
200029834
nonsense
NM
_001322015
c.1
1C
>G
exon5
p.S
er4
* 2.4
8E
-04
Lik
ely
path
ogenic
SB
DS
chr7
:66994210
rs
113993993
splic
e s
ite a
ffectin
g
NC
_000007.1
3
c.2
58+
2T
>C
in
tron 3
N
/a
3.8
8E
-03
Path
ogenic
SLX
4
chr1
6:3
597655
rs
774532876
fr
am
eshift in
sert
ion
NM
_032444
c.1
406dupC
exon7
p.L
eu470Ile
fs*
8
3.5
5E
-06
Lik
ely
path
ogen
ic
XP
A
chr9
:97687186
N
/a
nonsense
NM
_000380
c.4
64delT
exon4
p.L
eu155*
NS
Lik
ely
path
ogenic
XP
C
chr3
:14172946
N
/a
fram
eshift dele
tio
n
NM
_004628
c.2
19delG
exon2
p.V
al7
5T
rpfs
*4
NS
Lik
ely
path
ogenic
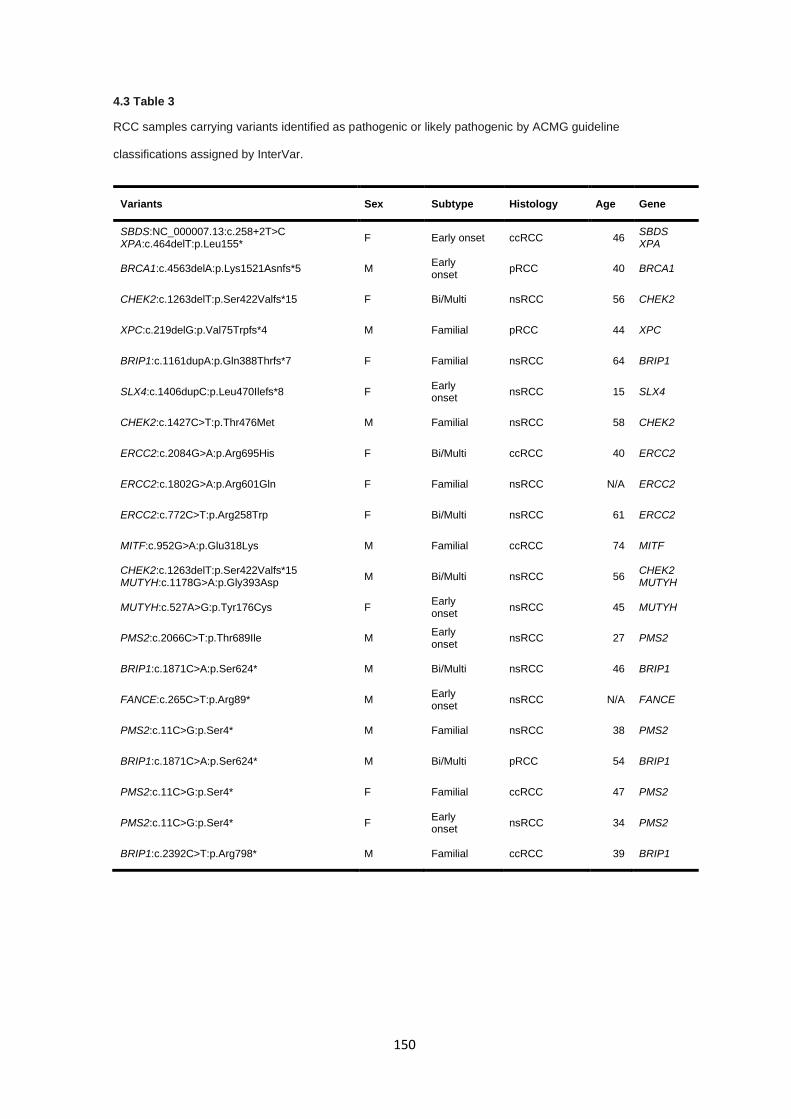
150
4.3 Table 3
RCC samples carrying variants identified as pathogenic or likely pathogenic by ACMG guideline
classifications assigned by InterVar.
Variants Sex Subtype Histology Age Gene
SBDS:NC_000007.13:c.258+2T>C XPA:c.464delT:p.Leu155*
F Early onset ccRCC 46 SBDS XPA
BRCA1:c.4563delA:p.Lys1521Asnfs*5 M Early onset
pRCC 40 BRCA1
CHEK2:c.1263delT:p.Ser422Valfs*15 F Bi/Multi nsRCC 56 CHEK2
XPC:c.219delG:p.Val75Trpfs*4 M Familial pRCC 44 XPC
BRIP1:c.1161dupA:p.Gln388Thrfs*7 F Familial nsRCC 64 BRIP1
SLX4:c.1406dupC:p.Leu470Ilefs*8 F Early onset
nsRCC 15 SLX4
CHEK2:c.1427C>T:p.Thr476Met M Familial nsRCC 58 CHEK2
ERCC2:c.2084G>A:p.Arg695His F Bi/Multi ccRCC 40 ERCC2
ERCC2:c.1802G>A:p.Arg601Gln F Familial nsRCC N/A ERCC2
ERCC2:c.772C>T:p.Arg258Trp F Bi/Multi nsRCC 61 ERCC2
MITF:c.952G>A:p.Glu318Lys M Familial ccRCC 74 MITF
CHEK2:c.1263delT:p.Ser422Valfs*15 MUTYH:c.1178G>A:p.Gly393Asp
M Bi/Multi nsRCC 56 CHEK2 MUTYH
MUTYH:c.527A>G:p.Tyr176Cys F Early onset
nsRCC 45 MUTYH
PMS2:c.2066C>T:p.Thr689Ile M Early onset
nsRCC 27 PMS2
BRIP1:c.1871C>A:p.Ser624* M Bi/Multi nsRCC 46 BRIP1
FANCE:c.265C>T:p.Arg89* M Early onset
nsRCC N/A FANCE
PMS2:c.11C>G:p.Ser4* M Familial nsRCC 38 PMS2
BRIP1:c.1871C>A:p.Ser624* M Bi/Multi pRCC 54 BRIP1
PMS2:c.11C>G:p.Ser4* F Familial ccRCC 47 PMS2
PMS2:c.11C>G:p.Ser4* F Early onset
nsRCC 34 PMS2
BRIP1:c.2392C>T:p.Arg798* M Familial ccRCC 39 BRIP1
151
4.4 Discussion
In many centres, individuals presenting with confirmed or indicative features of inherited RCC are
screened for pathogenic germline variants in a panel of RCC-predisposing syndrome genes that will
typically include VHL, MET, FLCN, FH, and SDHB and more recent studies have identified further
genes associate with RCC predisposition (SDHC, SDHA, BAP1, and PBRM1). Despite this, many
individuals undergoing screening harbour no causative variant in known predisposition genes
suggesting an undiscovered proportion of heritability for RCC.
Here, a targeted cancer gene sequencing panel, including 94 genes and 284 cancer-related SNPs,
was used to assess the presence of pathogenic or likely pathogenic variants in individuals with either
early onset, familial history, or multiple focal / bilateral presentation of RCC. At least one pathogenic
or likely pathogenic variant was identified in 21 of 118 patient (17.8%), as classified by InterVar using
the ACMG guidelines (325) including truncating variants in CHEK2, BRIP1, and BRCA1. The results
reported here conform with recent assessments of clinically relevant pathogenic variants in cancer
genes in multiple primary tumour cases which identified a comparable number of variants (15.2%),
in which 42% of those variants did not occur in genes which correlate with the presenting cancer
(376).
CHEK2 and BRCA1 variants have been reported in RCC cases previously but no known association
has been established between pathogenic variants in these genes and RCC predisposition. Single
cases have reported pathogenic BRCA1 variants (394) and recent results in a Chinese cohort of
early onset sporadic cases also identified pathogenic variants in BRCA1 (395). In difference to this
study, the rate of pathogenic variant detection was only 9.5% though this may be due to a reduced
scope, in terms of genes assessed, and inclusion of known RCC predisposing genes.
152
CHEK2 has been reported as being a multi-cancer susceptibility gene, with variants predisposing to
a number of different cancers, including RCC, (396,397) but most strongly associated with breast
cancer (398), though neither of the affected individuals carrying the CHEK2 variants had a family
history of breast cancer. Interpretation of either BRCA1 or CHEK2 variants is difficult and should be
assessed conservatively. The lack of demonstrable enrichment of CHEK2 and BRCA1 variants does
not support the involvement of these genes in RCC predisposition. In particular, the assessment of
BRCA1 and BRCA2 mutations in have been demonstrated to drive tumourigenesis in BRCA-
associated cancer lineages but biologically neutral in non-BRCA tumour lineages (399).
The occurrence of BRIP1 rare truncating variants in this series is an interesting finding given that
inactivating variants in BRIP1 are not currently associated with RCC but have been previously
implicated in predisposition to ovarian (400) and breast cancer (401), though more recent studies
have questioned the legitimacy of the association with breast cancer predisposition (379,402). The
data reported here suggests an association between rare BRIP1 truncating variants, being
statistically enriched compared to control and disease datasets, and segregating with affected family
members in one pedigree. Equally, this finding should be interpreted cautiously given the limited
statistical power and series size and further validation and follow-up in similarly screened
independent cohorts would be needed to confirm the association. Interestingly, recent publications
demonstrated no association between breast cancer and BRIP1 truncations (379) and in comparison
to the studies described in the aforementioned publication, BRIP1 truncations were statistically
enriched in our series, but again restrained interpretation is necessary.
153
As with previous studies, the assessment of VUS variants continues to be a challenging endeavour.
Population minor allele frequencies and in silico predictive tools may aid prediction of pathogenicity
but are not robust enough to reliably state whether a VUS is of consequence. For variants such as
the FANCL (NM_001114636: c.1022_1024del: p.341_342del) in-frame deletion identified,
pathogenicity may be ascertained from analysis of functional studies but this is unruly for all identified
variants and most do not have any additional supporting information to inform classification. Variants
in genes related to PCC (SDHAF2 and RET) and variants in TSC2 are potentially interesting
candidates for further assessment given the genotypic overlaps between PCC/PGLs and RCC and
the occurrence of RCC in Tubular sclerosis complex (232), caused by inactivating variants in TSC1
and TSC2 (403), but most are categorised as benign and functional studies would be needed to
confirm loss of function in those with unknown consequences. The nonsense variant in CEBPA
(NM_001287424: c.C16T: p.R6X) may also be an interesting candidate given its related function to
the SWI/SNF complex (404), multiple components of which are mutated somatically in RCC and
includes PBRM1 which is already associated with RCC predisposition (331).
Further limitations of the experimental design utilised in this chapter include the systematic
differences in sequencing sensitivity for the detection of variants, inclusion of individuals with non-
white British/Caucasian ethnographic backgrounds, and estimated tolerance to truncating variants
seen for BRIP1. Targeted panel sequencing had mean number of variants per sample of 38.2,
whereas variants generated from whole exome sequencing carried 22.5 variants per sample. For all
intents and purposes, sequencing methodology and bioinformatic processing for both targeted
sequencing and whole exome sequencing datasets are equivalent, utilising the same hybridisation
probes and whole exome data limited to genomic regions defined by targeted sequencing loci. As
such the primary differentiating factor is the read depth coverage for each methodology; Targeted
sequencing had a mean read depth across all samples of 327X coverage in comparison to 120X
coverage for exome samples and differing variant calling sensitivity may contribute to the difference
detection rates seen between targeted and exome sequencing datasets. This is particularly
important given the statistical comparison between the variants identified in this chapter to control
datasets generated from whole exome sequencing data.
154
A further limitation is ethnographic backgrounds in this chapter were not elucidated and statistical
comparisons of genotype rates between non-concordant ethnic groups can lead to confounding
results due to geography-specific genotypes and allele frequencies. In this instance, prior knowledge
from further analysis of exome data analysed in chapter 5 negate this limitation, as all of the identified
pathogenic variants occurred in individuals of European (non-Finnish) decent, but this is an important
caveat to consider had this study been performed in isolation.
Lastly, assessment of the likely impact of pathogenicity of truncating variants identified within BRIP1
is potentially a limitation on the conclusions that can be drawn from an enrichment of truncating
variants in BRIP1. Computational assessment of BRIP1 and its tolerance for truncating variants
(propensity to negatively select truncating variants) is that BRIP1 is highly tolerant of truncating
variants, suggesting that any given truncating variant in BRIP1 is unlikely to result in a phenotypic
change (pLI = 0) (321). Conversely, caution should be taken when assessing tolerance to inactivating
variants across an entire gene loci, as specific residues or features can carry greater or less
tolerance for alterations than the gene region as a whole, as exemplified by assessment of
constrained regions across the genome (405).
This assessment of pathogenic or likely pathogenic variants in inherited RCC also highlights the
current limitations of automated pipelines for the application of ACMG guidelines. With a number of
VUS variants being known benign variants through ClinVar consensus and misclassification of a
variant classified as VUS to likely pathogenic (FANCL: NM_001114636: c.1022_1024del:
p.341_342del) due to published functional studies (392). Discordance within ClinVar is already well
noted (406) and without proper integration of both in silico metrics, population minor allele frequency,
known functional studies, and consensus interpretations by other labs then annotation by automated
pipelines without robust downstream manual assessment will only compound the issue.
155
4.5 Conclusion
In conclusion, the targeted next generation sequencing of a series of cancer related genes and risk
SNPs using a pre-built cancer gene panel has uncovered a series of pathogenic and likely
pathogenic variants in a range of genes associated with both the monoallelic and biallelic
predisposition. Assessment of pathogenicity is challenging, particularly for VUS variants, without
functional follow up and additional evidence but familial segregation and statistical enrichment of
truncating variants in BRIP1 may suggest a new association between individuals with pathogenic
truncating variants in BRIP1 and RCC predisposition, though additional validation studies would be
beneficial to corroborate the evidence provided here. Designing of high-throughput functional
analyses of identified variants, such as effects on DNA repair function by variants in DNA repair-
related genes. Furthermore, large-scale population wide sequencing cohorts (such as Genomics
England 100K genomes) will greatly increase the ability to improve confidence in potentially
pathogenic variants by excluding pathogenicity based on population frequency.

156
5.0 Germline whole exome sequencing of individuals with features of
inherited renal cell carcinoma
157
5.0.1 Table of contents
5.0.1 TABLE OF CONTENTS ....................................................................................................................... 157
5.1 INTRODUCTION ..................................................................................................................................... 158
5.1.1 SINGLE NUCLEOTIDE VARIANT ANALYSIS ................................................................................................. 158
5.1.2 COPY NUMBER DETECTION .................................................................................................................... 159
5.1.3 GENE BURDEN ANALYSIS ...................................................................................................................... 159
5.1.4 ADDITIONAL DETECTION METHODS ......................................................................................................... 161
5.1.5 AIMS .................................................................................................................................................. 162
5.2 MATERIALS AND METHODS ................................................................................................................ 163
5.2.1 PATIENTS ............................................................................................................................................ 163
5.2.2 DNA EXTRACTION AND QUANTIFICATION ................................................................................................. 163
5.2.3 LIBRARY PREPARATIONS AND SEQUENCING ............................................................................................. 163
5.2.4 SEQUENCING BIOINFORMATICS .............................................................................................................. 163
5.2.5 VARIANT FILTERING AND PRIORITISATION ................................................................................................ 164
5.2.6 COPY NUMBER VARIATION DETECTION .................................................................................................... 164
5.2.7 POPULATION STRATIFICATION AND SAMPLE CONCORDANCE ...................................................................... 166
5.2.8 BURDEN ANALYSIS ............................................................................................................................... 167
5.2.9 SHORT TANDEM REPEAT DETECTION ...................................................................................................... 170
5.2.10 MOBILE ELEMENT INSERTION DETECTION .............................................................................................. 170
5.2.11 STATISTICAL METHODS ....................................................................................................................... 170
5.3 RESULTS ................................................................................................................................................ 171
5.3.1 CLINICAL FEATURES ............................................................................................................................. 171
5.3.2 QUALITY CONTROL AND VARIANT FILTERING ............................................................................................ 174
5.3.3 TRUNCATING AND SPLICE SITE-AFFECTING VARIANTS ACROSS ALL GENES .................................................. 178
5.3.4 DETECTION OF SNVS IN SPORADIC RENAL CELL CARCINOMA GENES .......................................................... 181
5.3.5 DETECTION OF SNVS IN METABOLIC GENES ASSOCIATED WITH KREBS CYCLE ............................................ 185
5.3.6 COPY NUMBER ALTERATIONS - CALIBRATION OF COPY NUMBER PIPELINE ................................................... 187
5.3.7 COPY NUMBER ALTERATIONS CALIBRATION - EVALUATION OF CALL RATE, TYPE I, AND TYPE II ERRORS .......... 187
5.3.8 COPY NUMBER ALTERATIONS – RCC COPY NUMBER ANALYSIS ................................................................. 189
5.3.9 GENE BURDEN ANALYSIS ...................................................................................................................... 194
5.3.10 SHORT TANDEM REPEAT EXPANSION ANALYSIS ...................................................................................... 199
5.3.11 MOBILE ELEMENT ANALYSIS ................................................................................................................ 201
5.4 DISCUSSION ........................................................................................................................................... 203
5.5 CONCLUSION ......................................................................................................................................... 208
158
5.1 Introduction
Investigations into the missing heritability seen in RCC have largely involved familial co-segregation
studies or targeted sequencing of known RCC associated genes and while whole exome sequencing
(WES) methods can be analytically more complex due to increased genomic coverage, that same
coverage can be leveraged to investigate the entire coding region and perform analyses which are
impractical in targeted sequencing panels. Utilising a subset of samples investigated in Chapter 4
(see section 2.1.3), WES was performed to investigate novel causes of RCC predisposition across
all coding regions and exploit multiple modes of analysis to discover unreported variants and
mechanisms associated inherited RCC.
5.1.1 Single nucleotide variant analysis
As performed with the cancer gene panel sequencing study (chapter 4), detection of rare pathogenic
variants across all individuals is a first route of investigation in uncovering new associations with
RCC predisposition. Analysis in this set will attempt to utilise multiple gene clusters to narrow down
and isolate potentially causal variants while effectively removing the vast number of non-pathogenic
variants carried in all individuals. Variant analysis will focus on 3 gene clusters; genes altered
somatically in RCC (after exclusion of known RCC predisposition genes), genes encoding complex
components of the tricarboxylic acid (TCA) cycle due to links with HLRCC and succinate
dehydrogenase deficient RCC (SDH-RCC), as well as phaeochromocytomas (PCC) and
paragangliomas (PGL) (155,212,214), and variant analysis of ultra-rare (AF < 0.001) truncating
variants (nonsense, frameshift deletions/insertions, or splice-site affecting) to determine if any novel
genes harbour variants which are most likely to be pathogenic compared to more frequent truncating
alterations. An allele frequency of 0.001 was selected as most individuals harbour, on average, 90-
100 truncating variants but most occur at non-pathogenic allele frequencies greater than 0.005 in
the general population (390). This methodology allows for a robust analysis of candidate variants in
relevant genes whilst maintaining a systematic and repeatable approach to variant detection.
159
5.1.2 Copy number detection
While a large proportion of genetic variation is attributable to single base variants, small or single
base insertions and deletions, there is an array of other genomic alterations that can result in a
disease phenotype. Cytogenetic or sub-microscopic insertions and deletions, chromosome
translocations and inversions, and copy number alterations all contribute to genetic variance within
a genome to varying degrees, some of which are pathogenic in nature. Typically, structural and copy
number alterations are detected and captured through means other than NGS-based sequencing
platforms, such as comparative genomic hybridisation arrays, due to NGS-based methods having
restrictive capture/target regions (i.e. whole exome sequencing or panel sequencing). Whilst many
of these alterations can be detected from whole genome sequencing with high specificity and
sensitivity, the prohibitive cost of whole genome sequencing and lower sequencing coverage in
comparison to targeted approaches makes this approach challenging. While whole exome
sequencing is restrictive in terms of genomic regions available to interrogate, many algorithms have
been designed to attempt to utilise and leverage the read depth and single nucleotide variant
information from this data to predict and make copy number variation (CNV) calls across targeted
regions. XHMM was chosen as the CNV detection tool of choice based on various metrics and data
availability, including portability, detection rates, and control requirements as reviewed by Tan et al
(2014) (407). Copy number alteration detection in this series may uncover unreported losses or gains
in both genes known to be associated with RCC predisposition or novel genes in which an
association with inherited RCC has yet to be established.
5.1.3 Gene burden analysis
With exome-wide sequencing, the amount of alleles genotyped allows for the opportunity to perform
relatively robust case-control analysis to identify loci which are statistically associated with cases (in
this instance individuals with features of inherited RCC) compared to a control set of healthy
individuals. In addition to inferring statistical associations, statistical testing provides an unbiased
framework for candidate variant detection without a need for gene lists and complex interpretation
of in silico predictive metrics and biological relevance.
160
Typically, association studies are performed on a genotype scale where individual variants are
compared by frequency between cases and controls, particularly in genome-wide association studies
(GWAS) which focus on common SNPs conferring a low risk for the case phenotype. For rare
disease, genotype-genotype comparisons are often not effective due to low sample numbers and, in
the case of WES, poor coverage of non-coding variant sites. More recent approaches to overcome
these limitations in rare disease is the development of collapsing or clustered statistical ‘burden’
testing, in which rare variants are assessed over specified genomic features or loci (e.g. genes,
pathways) to determine the presence of statistical enrichment (i.e. genetic burden) in comparison to
control sets, increasing the potential statistical power to detect an association.
Many bioinformatic tools and statistical models have been developed to perform these analyses such
as Combined Minor Allele test (CMAT) (408) and Combined Multivariate and Collapsing test (CMC)
(409) which collapse genotypes over a genomic loci into a single ‘score’, or more complex models
such as statistical kernel association test (SKAT) (310) which function to identify over-dispersion in
the calculated variance across a given genomic region. Lastly, statistical models have been
developed which combine the two approaches and include variant weighting (typically by minor allele
frequency) to improve modelling in assessing potential gene mutational burden, including tests such
as the optimal statistical kernel association test (SKAT-O) (410), as reviewed by Lee et al (2014)
(411).
Gene burden has been effectively used to identify increased occurrences of rare variants in specific
genes in both non-cancer syndromes (412,413) and germline cancer predisposition cases (414) and
may prove useful in the identification of novel genes in RCC predisposition which harbour a greater
mutational burden compared to healthy controls. In this study, the SKAT-O combined gene burden
and variance test was selected due to having greater statistical power when assessing variant sets
where causal direction of a given variant is unknown and a low proportion of variant are presumed
to be causal, though the SKAT-O test is less statistically powerful than either burden or variance-
based tests independently.
161
5.1.4 Additional detection methods
While not conventionally considered as causes of genetic disorders, particularly in cancer
predisposition syndromes, the role of mobile genetic elements (i.e. transposons) and short tandem
repeat expansions are rarely explored in germline sequencing for their potential involvement in the
disruption of genes associated with cancer predisposition.
Transposons are mobile DNA sequences which are capable of ‘jumping’ between different genetic
loci and form a substantial proportion of the human genome (415). Due to the mobile nature of
transposons, movement of a transposon into a coding region, exonic or intronic, can result in a
disease phenotype as seen in haemophilia A (416), retinitis pigmentosis (417), and cancer
predisposition (418) by disrupting the coding region, affecting exon splicing, or interfering with
promotor regions upstream of transcription start sites (419). Recent bioinformatics tools, such as
mobile element locator tool (MELT) (420), allow for the detection of common classes of transposons
in WES data based on reference positions and subsequent mismapping of reads to mobile elements
which have reinserted themselves into different genomic loci.
Short tandem repeats are present throughout the human genome (421) and expansion of these
repeat motifs has been associated with multiple genetic diseases such as myotonic dystrophy type
2 (422), myoclonic epilepsy (423), and Huntingdon’s disease (424). Only a small number of studies
have linked germline short tandem repeat expansions to cancer predisposition or gene regulation
(425), but disruption of intronic or exonic regions by motif expansion or contraction could lead to
altered gene function. Tools aimed at leveraging short read data have been developed to model and
estimate known short tandem repeats, such as gangSTR (426), and detect expansion or contractions
compared to reference repeat numbers.
162
5.1.5 Aims
Identify germline alterations in genes associated with somatic alterations in RCC, genes
associated with TCA cycle, and investigate rare truncating variants as a cause of RCC
predisposition.
Use a hypothesis-free statistical approach to identify potential associations in both genes
and pathways in order to determine potential causes of RCC predisposition.
Explore underutilised methods of WES data analysis to identify novel causes of RCC
predisposition caused by copy number alterations, mobile element insertions, and repeat
expansion changes.
163
5.2 Materials and methods
5.2.1 Patients
Samples included as part of this study were selected as a subset of the samples analysed in chapter
4 and as such were selected for the same clinical features as previously described; Patients were
recruited if they matched one of the following criteria 1) Patient had at least one first or second
degree relative with RCC 2) Presented with no family history but two or more separate primary RCC
before age 60 years, or 3) Presenting with RCC at age 45 years or less. Patients with confirmed or
likely mutations in BAP1, FH, FLCN, MET, SDHB and VHL were excluded from the study. The subset
of samples from the primary cohort is described in section 2.13, where patients with clinically relevant
variants from Chapter 4 were excluded.
5.2.2 DNA extraction and quantification
DNA extraction from whole blood lymphocytes, quantification and quality control was performed as
described in material and methods (section 2.1).
5.2.3 Library preparations and sequencing
WES library preparations were performed as described in materials and methods (section 2.6.3)
performed by the SMCL sequencing service.
5.2.4 Sequencing bioinformatics
Primary bioinformatics (BCL to VCF) was performed as described in materials and methods (section
2.7) by the SMCL sequencing service.
164
5.2.5 Variant filtering and prioritisation
Variant filtering, annotation, and prioritisation was performed as described in the materials and
methods (section 2.8) including Intervar variant interpretation using ACMG guidelines (325). Gene
lists were curated as follows; gene lists for TCA cycle genes were obtained from Reactome pathway
data (427). Genes frequently altered somatically in RCC tumours were selected from genes with
alterations occurring at a rate of 3% or greater within the TCGA provisional sample sets for clear cell
RCC, papillary RCC, and chromophobe RCC (25). The list was then assessed by NCG (version 6.0)
(428) and false positive genes, as flagged by Bailey et al (2018) (429), were removed as well as
known RCC predisposing genes retaining 41 genes (see appendix 9.4.1). Analysis of all known
coding genes was excluded as a SNV investigatory route due to a large proportion of uninformative
gene annotations for many genes.
5.2.6 Copy number variation detection
Copy number alterations were detected from BAM file read depth discrepancies identified utilising
XHMM (430) across WES aligned and sorted BAM files. Additional WES BAM files from other read
depth matched (mean depth within 1 Standard deviation) were jointly called to improve call rate and
identification of common CNVs. CNV calling utilising a modified version of the analysis pipeline was
also performed on all ICR birth control cohort cases to generate a reference set of commonly called
CNVs (Allele frequency > 0.05) to filter experimental data against. Default CNV calls were modified
to provide exon-level copy number calls and calls were filtered based on frequency (allele frequency
< 0.01) and Q_some quality (Q_some > 60), as described in the XHMM documentation (430).
CNV pipeline calibration was performed against a subset of samples sequenced as part of the
HapMap / 1000 genomes project with both comparative genomic hybridisation array-based copy
number calls and WES data (431) (Sample list provided in appendix section 9.4.2). The primary
script used to run CNV calling with XHMM, xhmm_CNV.sh, is provided in the appendix section
9.4.3a. Additional scripts, including pre-processing steps to generate reference files and parameter
files, annotation steps, and plotting is described in appendix section 9.4.3b. HapMap WES data was
downloaded in FASTQ format from EBI (ftp://ftp.1000genomes.ebi.ac.uk/vol1/ftp/) and aligned to
GRCh38 as described in materials and methods (section 2.7), after which the CNV pipeline
described herein was run across all HapMap WES BAM files.
165
Due to the data format of the HapMap calibration set additional pre-processing was required prior to
CNV analysis. HapMap CNV array data was downloaded from ftp://ftp.ncbi.nlm.nih.gov/hapmap and
remapped to GRCh38 from hg18 using NCBI remap service, discarding calls that failed to map to
GRCh38. HapMap CNV array genotypes were called bi-allelically and as such genotypes were
merged to match the mono-allelic calls provided by XHMM (e.g. -2 to 2 to -1 to 1). Genomic positions
were merged based on overlapping loci and unique intervals were retained. HapMap CNV data was
intersected with the genomic exome probe intervals as provided by Illumina to select only CNVs
overlapping with regions sequenced by WES by 5% or more. Intersected WES targets were then
filtered to remove regions with only reference or missing calls and the data was coerced into a
pseudo-XHMM output format for comparison.
166
5.2.7 Population stratification and sample concordance
Sample population structure and genetic background were calculated and assigned from
ADMIXTURE software (432) modelling, which allows for a higher resolution decomposition of genetic
ethnic background. Case variants were merged with high quality genotypes from the 1000 Genomes
data set which was used as the training set. Genotypes were pruned and separated by a minimum
of 2000 bp to reduced linkage effects, selecting only bi-allelic sites present in a minimum of 2
samples, and restricted to autosomal chromosomes. Further restrictions for minor allele frequency
(MAF > 0.05) and missingness per site (missingness < 5%) were subsequently applied.
ADMIXTURE algorithm was designated k = 5, corresponding to the number of population groups to
assign, which is equivalent to 1000 Genomes super population groups (320). Population structure
scripts, including plotting scripts are provided in the appendix (section 9.4.4). For samples in which
both WES and cancer gene sequencing had been performed, genotype concordance was performed
to assess if WES data adequately captured the same genotype information as the previously
sequenced cancer gene panel. The tool bcftools gtcheck (version 1.8) was used to compare
genotype calls across the pan-cancer gene panel targets (see chapter 4.2) to determine if
sequencing between WES and cancer gene panel sequencing were in concordance.
167
5.2.8 Burden analysis
Genomic region burden analysis was performed across all genes containing genetic variants utilising
sequence kernel association testing (SKAT) R package (version 1.3.2.1), as described by Wu et al
(310) utilising allele frequency as the weighting criteria after logistic weight conversion with the
“optimal” implementation. Principle components (PC) 1 and PC2 were generated using the same
variant pruning and filtering as discussed in 5.2.7 for ADMIXTURE analysis and were used as
covariates in the regression model. Cases in this series were joint called using GATK Unified
Genotyper (see materials and methods section 2.7) with control samples from the ICR UK 1000 birth
control cohort (433). Given that population structures in both sets should be of non-Finnish western
European origin PCA components PC1, PC2 and PC3 were used as sample exclusion criteria for
outliers falling outside of the primary PCA cluster (see section 5.3.9).
Joint called genotypes were filtered for variant consequence type, minor allele frequency (applied
independently to both cases, controls and both sets to reduce the interference of batch effects and
sequencing artefacts), minor allele frequency compared to the ExAC data set (390), genotype
quality, site QUAL, and missingness. Several iterative analyses were performed utilising differing
filtering and covariate combinations and burden testing results were assessed based on minimum
achievable p-value (MAP) adjusted Q-Q plot distributions to determine the best performing test,
where MAP values are generated during resampling of the burden input data as described by Lee
et al (2016) (434). Q-Q plots are frequently used as a metric of goodness of fit for association tests,
principally in GWAS studies (435), to determine if inflation of significance levels is presence between
the observed p values versus the theoretical p value quantiles and observe confounding features
such as population stratification. Filtering parameters and covariates for the optimised parameters
are described in 5.2 Table 1.
168
Results were corrected for multiple testing using false discovery rate adjustment (FDR) and genes
meeting significance thresholds, either p-value or corrected p-values where specified in the text,
were assessed for gene ontology and pathway enrichment using WebGestalt (436), Gene
Ontology/Panther analysis (Panther GO-slim biological process set; fishers exact method) (437),
and Reactome (427) in order to detect biological function or pathway enrichment in genes with
significant genetic burden compared to controls. Full burden testing script is provided in appendix
section 9.4.5. Additional comparisons were made to Network of Cancer Genes database set to
assess the proportion of genes identified as known or candidate cancer genes (428).
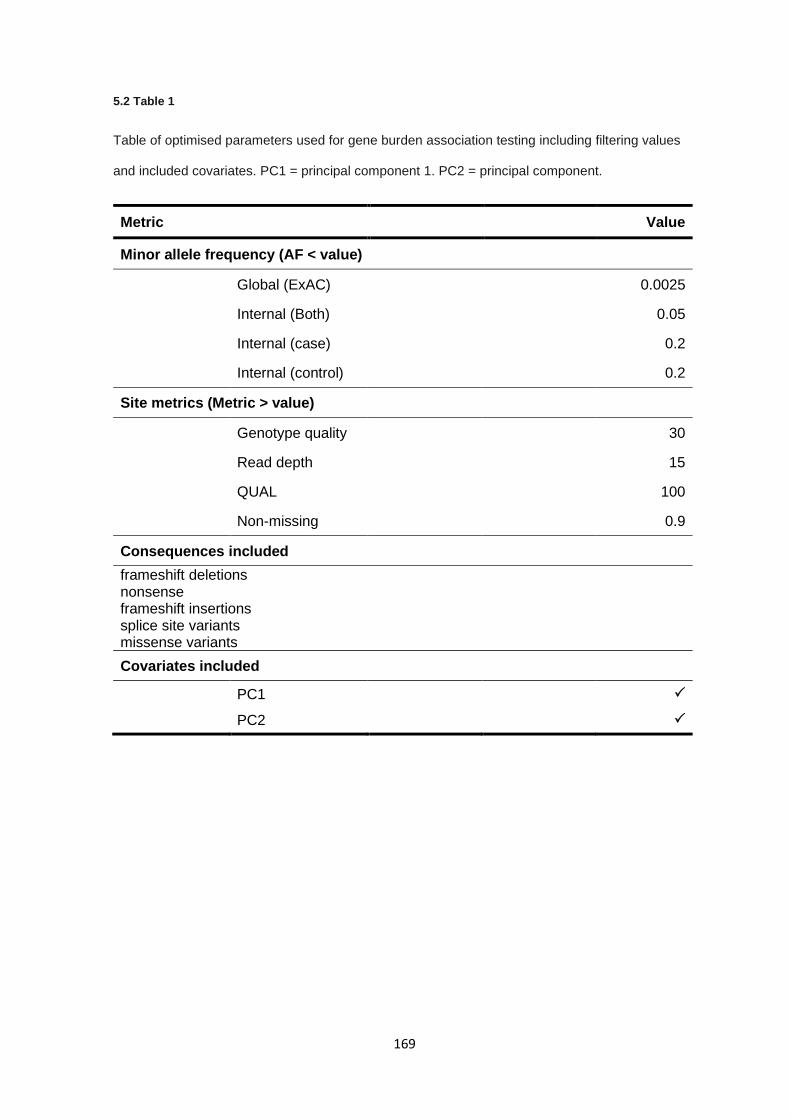
169
5.2 Table 1
Table of optimised parameters used for gene burden association testing including filtering values
and included covariates. PC1 = principal component 1. PC2 = principal component.
Metric Value
Minor allele frequency (AF < value)
Global (ExAC) 0.0025
Internal (Both) 0.05
Internal (case) 0.2
Internal (control) 0.2
Site metrics (Metric > value)
Genotype quality 30
Read depth 15
QUAL 100
Non-missing 0.9
Consequences included
frameshift deletions nonsense frameshift insertions splice site variants missense variants
Covariates included
PC1
PC2
170
5.2.9 Short tandem repeat detection
Detection of short tandem repeats was performed using the GRCh38 BAM files with GangSTR
(version 1.4) using the default parameters as described by Mousavi et al (2018)(426), with only
adjustments made for non-uniform coverage. Repeat expansion calls were filtered for read depth
(DP > 10) and Quality metric ‘Q’ (Q > 3). Calls were annotated by gene region and only calls falling
within known RCC predisposing genes and novel genes identified in this thesis were analysed (see
appendix 9.4.1).
5.2.10 Mobile element insertion detection
Mobile element insertions were detected using the mobile element locator tool (MELT; version 2.1.5)
across all BAM files to determine the presence of non-reference mobile element insertions into
coding regions. Analysis was performed against LINE1, ALU, HERVK, and SVA mobile element
reference sets for GRCh38. Variant calls were filtered by “PASS” status and split read support > 2.
Calls for mobile insertion types were merged into a single VCF file and filtered against known RCC
predisposing genes and novel genes identified in this thesis (see appendix 9.4.1).
5.2.11 Statistical methods
Q values (FDR corrected p values) after SKAT-O burden analysis were generated using p.adjust()
function with method “fdr” in base R (version 3.5). Fishers exact test was performed using the
fishers.test() function in base R (version 3.5). Chi-squared test was performed using function
chisq.test()in base R (version 3.5).
171
5.3 Results
5.3.1 Clinical features
A total of 72 unrelated individuals matching the selection criteria for RCC predisposition and were
grouped clinically as follows: 33 cases with a family history and 39 cases with either early onset or
bilateral/multifocal disease (23 and 16 cases, respectively). Median age of onset across all cases
was 41 years (range 23-74). Median age of onset in familial cases was 51 years (range 24-74), 48
years (range 31-60) in multifocal/bilateral cases and 34 years (range 23-46) in early onset cases
only cases.
Histological subtype was available for 36 of 72 cases (50%) and comprised 25 (69.4%) clear cell
RCC, 8 (22.2%) papillary RCC and 3 (8.3%) chromophobe RCC, approximately consistent with
previous assessments of histological frequencies. RCC presentation by sex was consistent with
sporadic and heritable cases across all individuals and subgroups (male to female ratio 1.5-2.2)
except for early onset which had significantly different distribution (male to female ratio 0.92; fishers
exact p=0.004). Summary of the distribution of clinical features are given in 5.3 Table 2.
Population structure analysis by admixture demonstrated that 66/72 individuals were of European
origin, with the remaining population being African (1/72), East Asian (1/72), and European-south
Asian (4/72) by admixture proportions (see 5.3 Figure 1).
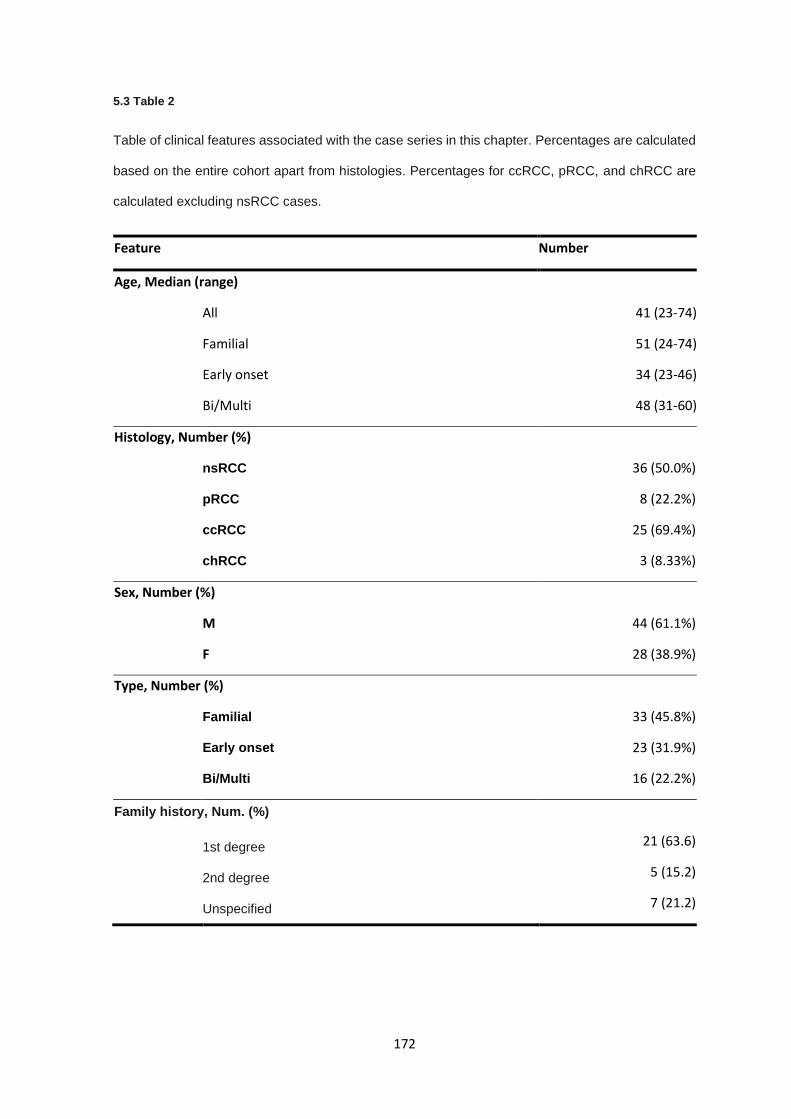
172
5.3 Table 2
Table of clinical features associated with the case series in this chapter. Percentages are calculated
based on the entire cohort apart from histologies. Percentages for ccRCC, pRCC, and chRCC are
calculated excluding nsRCC cases.
Feature Number
Age, Median (range)
All 41 (23-74)
Familial 51 (24-74)
Early onset 34 (23-46)
Bi/Multi 48 (31-60)
Histology, Number (%)
nsRCC 36 (50.0%)
pRCC 8 (22.2%)
ccRCC 25 (69.4%)
chRCC 3 (8.33%)
Sex, Number (%)
M 44 (61.1%)
F 28 (38.9%)
Type, Number (%)
Familial 33 (45.8%)
Early onset 23 (31.9%)
Bi/Multi 16 (22.2%)
Family history, Num. (%)
1st degree 21 (63.6)
2nd degree 5 (15.2)
Unspecified 7 (21.2)
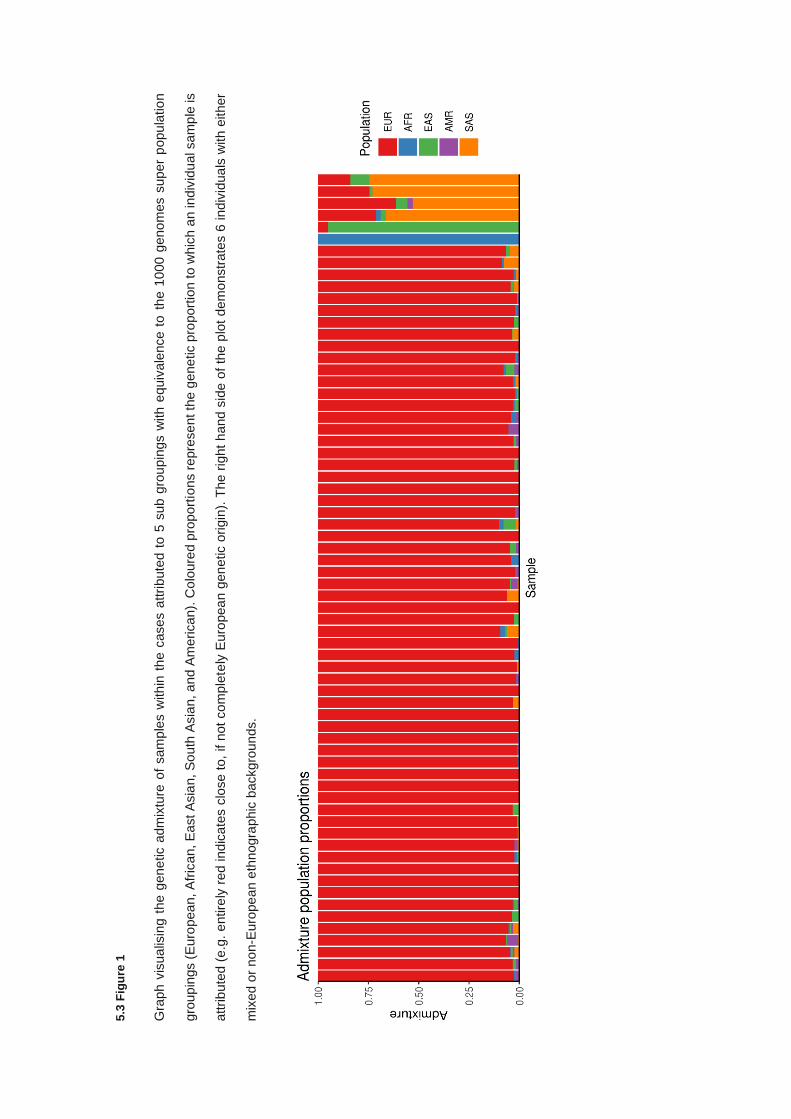
5.3
Fig
ure
1
Gra
ph v
isua
lisin
g t
he g
ene
tic a
dm
ixtu
re o
f sam
ple
s w
ith
in t
he c
ases a
ttri
bute
d t
o 5
sub g
rou
pin
gs w
ith e
quiv
ale
nce t
o t
he 1
000 g
eno
mes s
uper
popu
latio
n
gro
up
ings (
Euro
pea
n, A
fric
an, E
ast A
sia
n, S
outh
Asia
n, a
nd A
merican).
Co
loure
d p
roport
ions r
epre
se
nt th
e g
enetic p
roport
ion to w
hic
h a
n indiv
idu
al sam
ple
is
attrib
ute
d (
e.g
. e
ntire
ly r
ed indic
ate
s c
lose t
o,
if n
ot
co
mple
tely
Euro
pea
n g
en
etic o
rigin
). T
he r
ight
hand s
ide o
f th
e p
lot
dem
onstr
ate
s 6
indiv
idua
ls w
ith e
ither
mix
ed o
r no
n-E
uro
pe
an e
thnogra
phic
backgro
un
ds.
174
5.3.2 Quality control and variant filtering
Given the number of variants identified by whole exome sequencing, stringent and appropriate
variant filtering criteria are required, as well as appropriate quality control metrics for read alignment,
read depth, and variant calls. Read alignment rates a mean of 99.81% across all samples, with a
mean coverage of 120X. PCR duplicates across all samples were present at a mean rate of 13.7%
(range 7.2-30.2%) (5.3 Figure 2-3).
Comparisons for genotype discordance between samples sequenced on both the pan-cancer gene
sequencing panel and WES was available for 75.0% (54/72) of sequenced cases, of which no
samples demonstrated genotype discordance between the two sequencing data sets. The remaining
proportion had WES data but not pan-cancer sequencing panel data available.
Variant calling was performed and resulted in 337,021 variant calls (304,231 SNVs and 32,790
indels) including 12,704 multi-allelic sites with a resulting transition/transversion (Ts/Tv) ratio of 2.23.
After filtering for variant quality metrics (read depth, QUAL, genotype quality, missingness and minor
allele frequency), as described in the materials and methods section, and left alignment and
normalisation the number of variants retained was 194,367 (175,756 SNVs and 18,611 indels),
demonstrating an increased Ts/Tv ratio of 2.43. Indel size distributions, and variant substitution types
are shown in 5.3 Figure 4.
Variant filtering, as described in materials and methods (section 2.8) removed 113,663 variants
occurring in intergenic regions, intronic regions more than 2 bp from splice site consensus
sequences, and a further 34,445 variants which resulted in synonymous amino acid changes.
Variants were filtered for global minor allele frequency in both 1000 genomes and ExAC to exclude
sites present above 1%, resulting in 25,022 rare protein affecting variants being retained. Allelic
depth was assessed and variants with insufficient alternative allele depth (AD < 0.3) in at least one
sample per site were removed, reducing the final number of filtered sites to 22,384. Variants
identified as part of chapter 4 were excluded from reported variants but included in variant counts
and association testing.
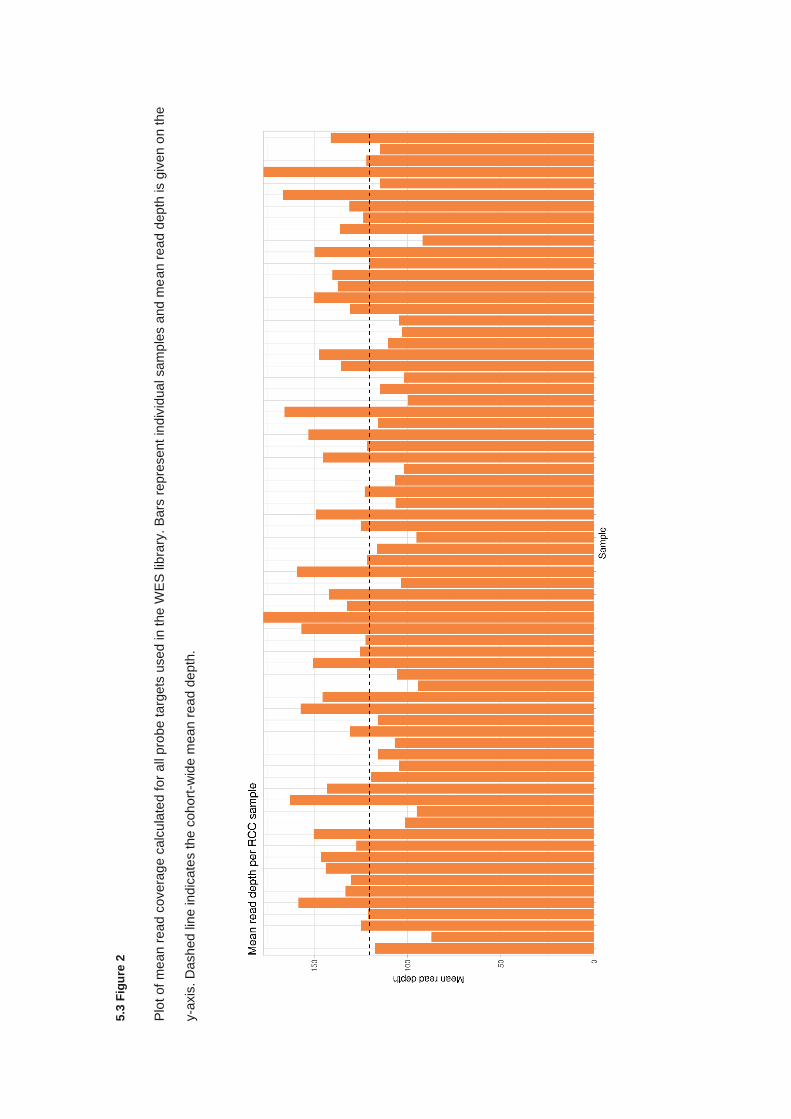
5.3
Fig
ure
2
Plo
t of
me
an r
ea
d c
overa
ge c
alc
ula
ted for
all
pro
be t
arg
ets
used in t
he W
ES
lib
rary
. B
ars
repre
sent
indiv
idua
l sam
ple
s a
nd m
ea
n r
ea
d d
epth
is g
iven o
n th
e
y-a
xis
. D
ashed lin
e ind
icate
s the c
oh
ort
-wid
e m
ean r
ea
d d
epth
.
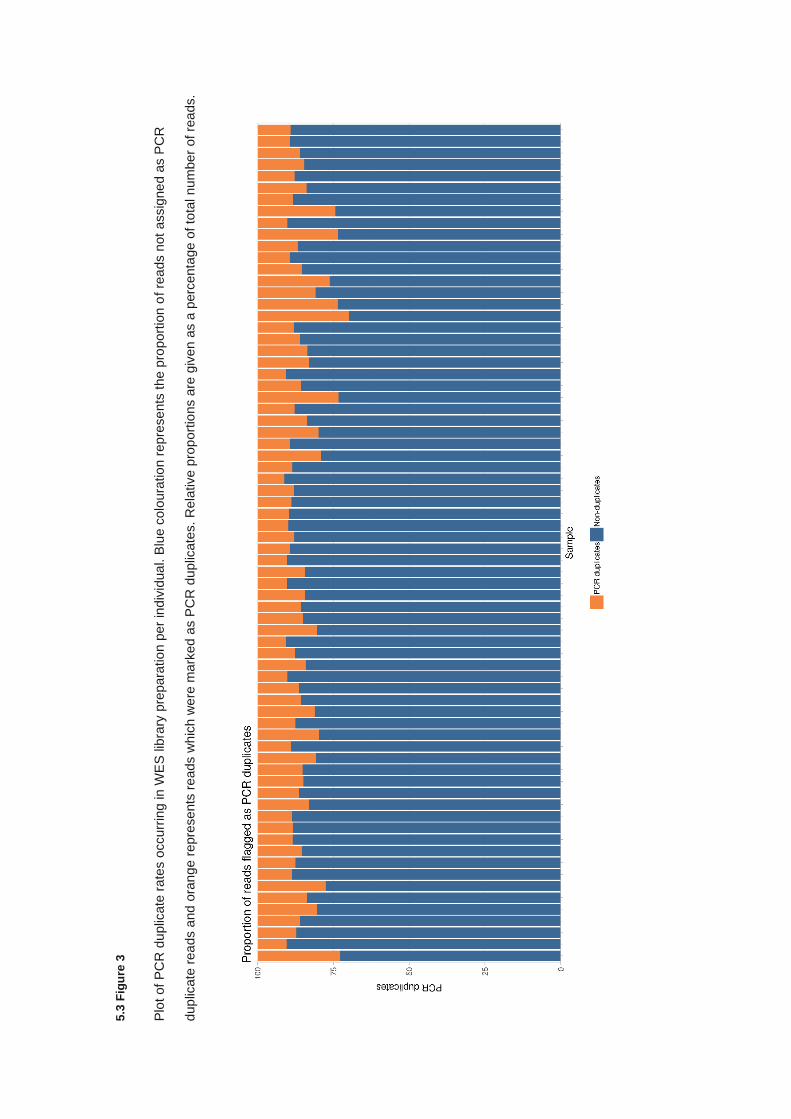
5.3
Fig
ure
3
Plo
t of
PC
R d
uplic
ate
ra
tes o
ccurr
ing in W
ES
lib
rary
pre
para
tio
n p
er
ind
ivid
ua
l. B
lue c
olo
ura
tio
n r
epre
se
nts
the p
roport
ion o
f re
ads n
ot
assig
ne
d a
s P
CR
dup
licate
rea
ds a
nd
ora
nge
repre
sents
re
ads w
hic
h w
ere
mark
ed a
s P
CR
du
plic
ate
s. R
ela
tive
pro
port
ions a
re g
iven
as a
perc
enta
ge o
f to
tal nu
mber
of re
ads.
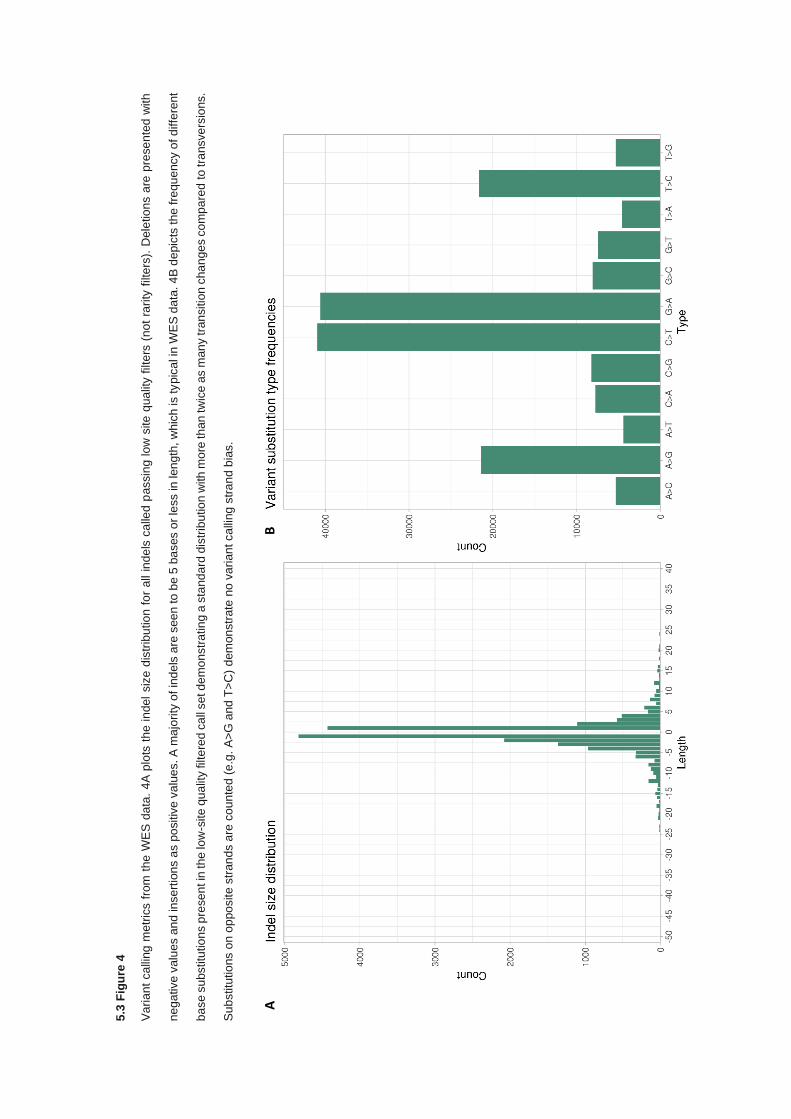
5.3
Fig
ure
4
Va
ria
nt
ca
lling
me
tric
s f
rom
the
WE
S d
ata
. 4
A p
lots
th
e in
del
siz
e d
istr
ibu
tio
n f
or
all
ind
els
ca
lled
passin
g lo
w s
ite
qua
lity f
ilte
rs (
no
t ra
rity
filt
ers
). D
ele
tio
ns a
re p
rese
nte
d w
ith
ne
ga
tive v
alu
es a
nd
in
se
rtio
ns a
s p
ositiv
e v
alu
es. A
ma
jority
of in
de
ls a
re s
ee
n to
be 5
ba
ses o
r le
ss in
len
gth
, w
hic
h is ty
pic
al in
WE
S d
ata
. 4
B d
epic
ts the
fre
qu
ency o
f d
iffe
rent
ba
se
su
bstitu
tio
ns p
rese
nt in
the
low
-site
qu
alit
y filt
ere
d c
all
set d
em
on
str
atin
g a
sta
nd
ard
dis
trib
utio
n w
ith
mo
re th
an
tw
ice
as m
an
y tra
nsitio
n c
ha
nge
s c
om
pa
red
to
tra
nsve
rsio
ns.
Su
bstitu
tio
ns o
n o
ppo
site
str
an
ds a
re c
ou
nte
d (
e.g
. A
>G
and
T>
C)
dem
on
str
ate
no
va
rian
t ca
lling
str
an
d b
ias.
A
B
178
Given the volume of genetic alterations called and meeting default filtering parameters, in-depth
analysis of all sites is an impractical methodology to determine potential candidate variants in RCC
predisposition. This is exemplified by applying ACMG classifications to the filtered call set which
categorises 84.4% (18,884/22,384) of the sites as variants of uncertain significance. As such, SNV
analysis was segregated into distinct analysis sets; Ultra rare truncating or splice site-affecting
variants, somatically altered genes in RCC, and genes related to the TCA cycle, as described in the
methods.
5.3.3 Truncating and splice site-affecting variants across all genes
Variants were filtered to retain only the most potentially damaging variant consequences (nonsense
variant, frameshift insertions or deletion, and splice site-affecting variants) in order to determine if
any rare or novel truncating variants disrupted genes which may function in predisposition to RCC.
After filtering a total of 1,134 variants were kept (5.1%), which consisted of 450 nonsense variants,
145 frameshift insertions, 310 frameshift deletions, and 229 splice site-affecting variants. Due to the
number of truncating variants identified, further filtering criteria were applied to reduce the candidate
number including removal of variants present in a non-reference homozygous state, variants
identified as known benign or likely benign alterations by ClinVar, and reducing the minor allele
frequency in ExAC to 0.001 which retained 758 variants. ACMG criteria (325) were applied to the
remaining variants utilising InterVar (326) as previously described and assigned 99 variants as
pathogenic or likely pathogenic (P/LP) and 608 variants as variants of uncertain significance. A
residual 51 variants failed to be parsed correctly by InterVar and as such were not assigned ACMG
classifications.
For sites designated as P/LP, genes were assessed by the Network of Cancer Genes platform (NCG)
(428) to determine if they have previously been related to cancer and in what capacity. The 99
variants contained 94 unique genes, of which 20 genes were suggested to be associated with cancer
as assigned by the NCG v6.0 analysis (428) (4 genes were flagged as potential false positives in
cancer and were excluded). This resulted in a final set of 21 sites with truncating alteration in
candidate cancer genes assigned as P/LP (5.3 Table 3).
179
All variants categorised as ultra-rare truncating variants were present in only a single individual and
occurred at allele frequencies in ExAC at 8.00E-04 or lower. Interpretation of these variants is highly
dependent upon gene function and established associations with other genetic disorders. Most In
silico predictions for these variants were not designated, except for CADD, which suggested all were
deleterious in nature. Interestingly, all the genes in which variants were identified in this subset were
altered somatically in RCC on average 1.83% (range 0.1-9%) of cases, though specific selection of
genes altered in RCC was not performed. Enrichment analysis biological processes associated with
the genes in this set using Panther gene ontologies did not identify any significantly enriched groups.
Several variants are worth noting, including the PKHD1 nonsense variant (NM_138694: c.C5323T:
p.R1775X) which is a known pathogenic variant associated with autosomal recessive polycystic
kidney disease. The variant is carried by an individual with early onset clear cell RCC. The variant
occurs midway through the protein coding sequence and is reported as loss of function intolerant by
gnomAD classifications (353). Lastly, PKHD1 is reported as a frequently altered (3%) across the
TCGA renal cancer set, though most are VUS missense variants. The truncating variant in DIAPH1
(NM_005219: c.C1261T: p.R421X) is associated with autosomal dominant deafness. DIAPH1 is
highly mutated somatically in RCC (9%) but is nearly exclusively amplified and only one truncating
variant is reported, occurring concurrently with an broad amplification (25). This would suggest that
truncating variants in DIAPH1 are unlikely to result in RCC predisposition despite the variant being
likely pathogenic.
RNF43 which harbours a frameshift deletion (NM_001305544: c.1410delC: p.P470fs) is also
reported frequently somatically (1.8%) but with a high degree of amplification though it has been
demonstrated to have tumour suppressor functions complicating variant interpretation in the context
of RCC predisposition. The splice site variant identified in NUP93 (NM_014669) affects the first base
of splice donor site after exon 2, potentially disrupting exon splicing. While no reports implicate
NUP93 in cancer, NUP93 inactivating variants are associated with autosomal recessive nephrotic
syndrome.
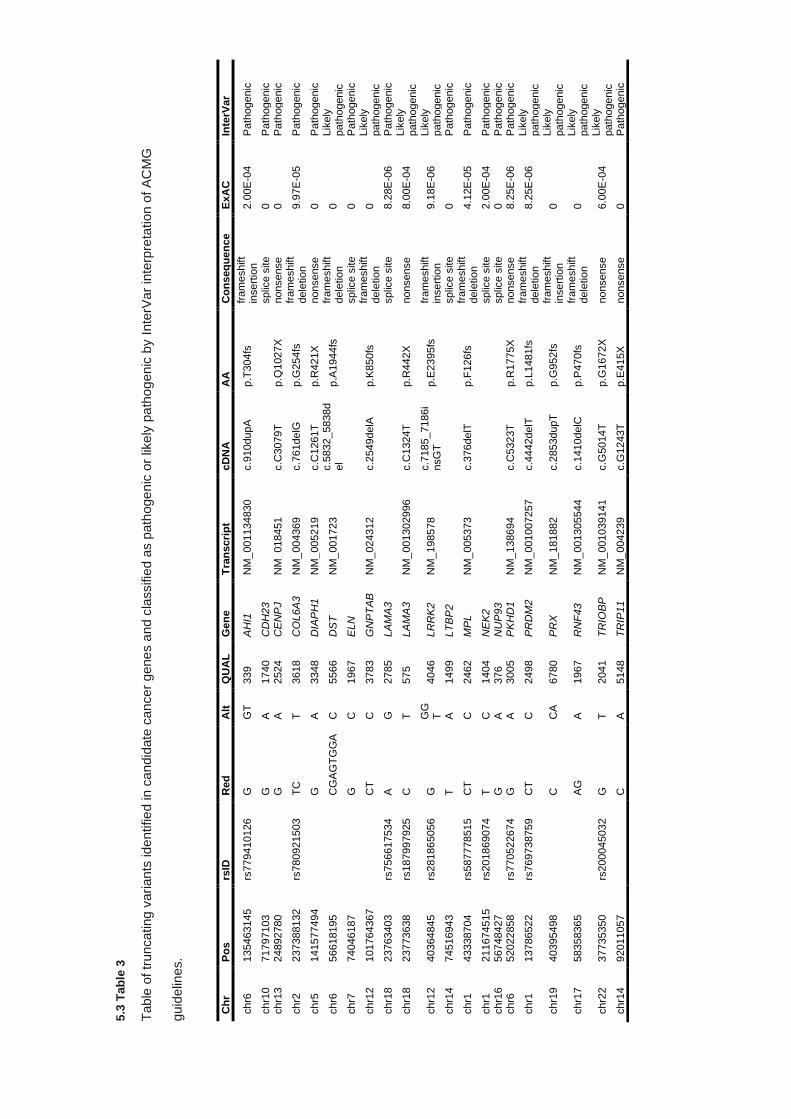
5.3
Tab
le 3
Table
of tr
uncating v
ari
an
ts ide
ntifie
d in c
an
did
ate
can
cer
genes a
nd c
lassifie
d a
s p
ath
oge
nic
or
like
ly p
ath
og
enic
by I
nte
rVar
inte
rpre
tation o
f A
CM
G
guid
elin
es.
Ch
r P
os
rsID
R
ed
A
lt
QU
AL
G
en
e
Tra
ns
cri
pt
cD
NA
A
A
Co
ns
eq
ue
nce
ExA
C
Inte
rVar
chr6
135463145
rs
779410126
G
G
T
339
AH
I1
NM
_001134830
c.9
10dupA
p.T
304fs
fr
am
eshift
insert
ion
2.0
0E
-04
Path
ogenic
chr1
0
71797103
G
A
1740
CD
H23
splic
e s
ite
0
Path
ogenic
chr1
3
24892780
G
A
2524
CE
NP
J
NM
_018451
c.C
3079T
p.Q
1027X
nonsense
0
Path
ogenic
chr2
237388132
rs
780921503
T
C
T
3618
CO
L6A
3
NM
_004369
c.7
61delG
p.G
254fs
fr
am
eshift
dele
tio
n
9.9
7E
-05
Path
ogenic
chr5
141577494
G
A
3348
DIA
PH
1
NM
_005219
c.C
1261T
p.R
421X
nonsense
0
Path
ogenic
chr6
56618195
CG
AG
TG
GA
C
5566
DS
T
NM
_001723
c.5
832_5838d
el
p.A
1944fs
fr
am
eshift
dele
tio
n
0
Lik
ely
path
ogenic
chr7
74046187
G
C
1967
ELN
splic
e s
ite
0
Path
ogenic
chr1
2
101764367
CT
C
3783
GN
PT
AB
N
M_
024312
c.2
549delA
p.K
850fs
fr
am
eshift
dele
tio
n
0
Lik
ely
path
ogenic
chr1
8
23763403
rs
756617534
A
G
2785
LA
MA
3
splic
e s
ite
8.2
8E
-06
Path
ogenic
chr1
8
23773638
rs
187997925
C
T
575
LA
MA
3
NM
_001302996
c.C
1324T
p.R
442X
nonsense
8.0
0E
-04
Lik
ely
path
ogenic
chr1
2
40364845
rs
281865056
G
G
GT
4046
LR
RK
2
NM
_198578
c.7
185_7186i
nsG
T
p.E
2395fs
fr
am
eshift
insert
ion
9.1
8E
-06
Lik
ely
path
ogenic
chr1
4
74516943
T
A
1499
LT
BP
2
splic
e s
ite
0
Path
ogenic
chr1
43338704
rs
587778515
C
T
C
2462
MP
L
NM
_005373
c.3
76delT
p.F
126fs
fr
am
eshift
dele
tio
n
4.1
2E
-05
Path
ogenic
chr1
211674515
rs
201869074
T
C
1404
NE
K2
splic
e s
ite
2.0
0E
-04
Path
ogenic
chr1
6
56748427
G
A
376
NU
P93
splic
e s
ite
0
Path
ogenic
chr6
52022858
rs
770522674
G
A
3005
PK
HD
1
NM
_138694
c.C
5323T
p.R
1775X
nonsense
8.2
5E
-06
Path
ogenic
chr1
13786522
rs
769738759
C
T
C
2498
PR
DM
2
NM
_001007257
c.4
442delT
p.L
1481fs
fr
am
eshift
dele
tio
n
8.2
5E
-06
Lik
ely
path
ogenic
chr1
9
40395498
C
CA
6780
PR
X
NM
_181882
c.2
853dupT
p.G
952fs
fr
am
eshift
insert
ion
0
Lik
ely
path
ogenic
chr1
7
58358365
AG
A
1967
RN
F4
3
NM
_001305544
c.1
410delC
p.P
470fs
fr
am
eshift
dele
tio
n
0
Lik
ely
path
ogenic
chr2
2
37735350
rs
200045032
G
T
2041
TR
IOB
P
NM
_001039141
c.G
5014T
p.G
1672X
nonsense
6.0
0E
-04
Lik
ely
path
ogenic
chr1
4
92011057
C
A
5148
TR
IP11
NM
_004239
c.G
1243T
p.E
415X
nonsense
0
Path
ogenic
181
5.3.4 Detection of SNVs in sporadic renal cell carcinoma genes
After variant filtering and quality control, variants were selected based on gene list incorporating
genes which are described as being frequently altered in sporadic RCC tumours, as described in the
materials and methods Assessment of variants passing filter identified 331 variants falling within the
coding regions of genes associated with sporadic RCC tumours (See appendix 9.4.1; excluding
known inherited RCC genes). Intervar was used to apply ACMG guidelines to all 331 variants and
found 3 pathogenic or likely pathogenic variants across 3 genes, all of which were previously
identified in the previous analysis (COL6A3: NM_004369: c.761delG: p.G254fs, DST: NM_001723:
c.5832_5838del: p.A1944fs, and PKHD1: NM_170724: c.C5323T: p.R1775X) and 227 VUS
variants. Variants were cross referenced with ClinVar data to remove conflicting reports and variants
presenting in a non-reference homozygous state were also removed, resulting in a final count of 202
variants.
Protein alterations incurred by the variants identified in this set consisted of 194 missense variants,
2 frameshift deletions, 2 frameshift insertions, 2 non-frameshifting deletions, 2 nonsense variants,
and 1 stop loss variant. Variants, excluding missense variants, are in 5.3 Table 4. Overall, few non-
nonsynonynmous variants were identified in genes which are frequently somatically altered in RCC
and of the 7 genes that were identified, 3 were recapitulations of variants identified without somatic
RCC-specific gene list filtering. The remaining 5 variants, 3 of which were truncating, only revealed
one variant of particular interest in SETD2 (NM_014159: c.579_587del: p.193_196del) which is one
of the most frequently somatically altered genes in RCC, though the pathogenicity of this variant is
uncertain given it does not result in a premature stop codon or frameshift. The deletion of 3 amino
acids (p193-196) may result in protein dysfunction but does not occur in any known critical functional
domain.
182
Analysis of VUS assigned missense variants is difficult, particularly given the number identified in
this instance (194 sites). Application of restraining in silico predictive metrics to filter variants further
still resulted in a large set of VUS missense variants being retained where selecting variants only
predicted to be likely pathogenic by SIFT and PolyPhen, as well as a CADD score greater than 25
was true for 132 variant sites. For the genes identified in 5.3 Table 4, AHNAK2, COL6A3, DST,
KIAA1109, PKHD1, SETD2, and XIRP2, also harboured rare VUS missense variants after in silico
filtering parameters were applied (AHNAK2 = 18, COL6A3 = 4, DST = 5, KIAA1109 = 1, PKHD1 =
1, SETD2 = 2, and XIRP2 = 7).
Further sub setting of VUS missense variants in the in silico filtered set uncovered missense variants
in biologically relevant somatic RCC-linked or cancer-associated genes such as ATM, KDM6A,
KMT2C, KMT2D, MTOR, NF2, and SMARCA4 in addition to SETD2 (See 5.3 Table 5).
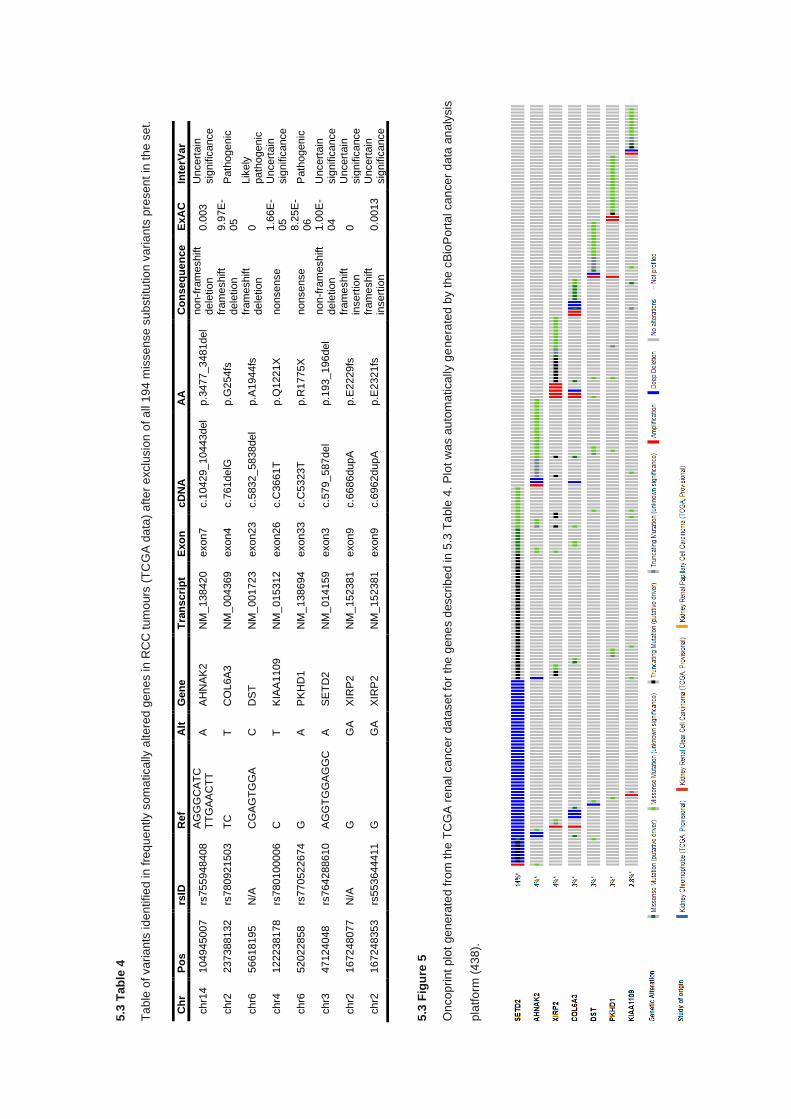
5.3
Tab
le 4
Ta
ble
of va
ria
nts
ide
ntifie
d in
fre
qu
ently s
om
atically
alte
red g
en
es in
RC
C t
um
ours
(T
CG
A d
ata
) aft
er
exclu
sio
n o
f a
ll 1
94
mis
se
nse
su
bstitu
tio
n v
aria
nts
pre
sen
t in
th
e s
et.
5.3
Fig
ure
5
On
co
prin
t plo
t ge
ne
rate
d f
rom
th
e T
CG
A r
ena
l ca
nce
r da
taset
for
the
gen
es d
escrib
ed in
5.3
Ta
ble
4. P
lot w
as a
uto
ma
tica
lly g
ene
rate
d b
y t
he
cB
ioP
ort
al ca
nce
r d
ata
an
aly
sis
pla
tfo
rm (
43
8).
Ch
r P
os
rsID
R
ef
Alt
G
en
e
Tra
ns
cri
pt
Exo
n
cD
NA
A
A
Co
ns
eq
ue
nce
ExA
C
Inte
rVar
chr1
4
104945007
rs
755948408
A
GG
GC
AT
C
TT
GA
AC
TT
A
A
HN
AK
2
NM
_138420
exon7
c.1
0429_10443del
p.3
477_3481del
non-f
ram
eshift
dele
tio
n
0.0
03
Uncert
ain
sig
nific
ance
chr2
237388132
rs
780921503
T
C
T
CO
L6A
3
NM
_004369
exon4
c.7
61delG
p.G
254fs
fr
am
eshift
dele
tio
n
9.9
7E
-05
Path
ogenic
chr6
56618195
N
/A
CG
AG
TG
GA
C
D
ST
N
M_
001723
exon23
c.5
832_5838del
p.A
1944fs
fr
am
eshift
dele
tio
n
0
Lik
ely
path
ogenic
chr4
122238178
rs
780100006
C
T
K
IAA
1109
NM
_015312
exon26
c.C
3661T
p.Q
1221X
nonsense
1.6
6E
-05
Uncert
ain
sig
nific
ance
chr6
52022858
rs
770522674
G
A
P
KH
D1
NM
_138694
exon33
c.C
5323T
p.R
1775X
nonsense
8.2
5E
-06
Path
ogenic
chr3
47124048
rs
764288610
A
GG
TG
GA
GG
C
A
SE
TD
2
NM
_014159
exon3
c.5
79_587del
p.1
93_196del
non-f
ram
eshift
dele
tio
n
1.0
0E
-04
Uncert
ain
sig
nific
ance
chr2
167248077
N
/A
G
GA
X
IRP
2
NM
_152381
exon9
c.6
686dupA
p.E
2229fs
fr
am
eshift
insert
ion
0
Uncert
ain
sig
nific
ance
chr2
167248353
rs
553644411
G
G
A
XIR
P2
NM
_152381
exon9
c.6
962dupA
p.E
2321fs
fr
am
eshift
insert
ion
0.0
013
Uncert
ain
sig
nific
ance
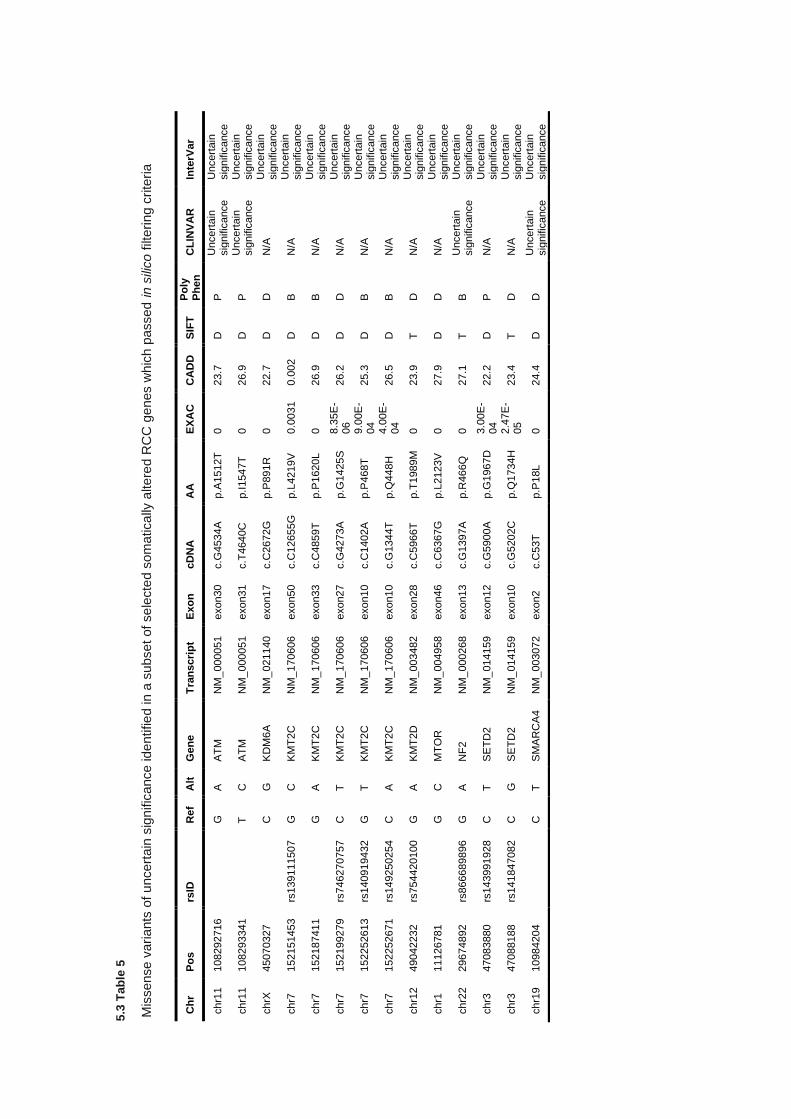
5.3
Tab
le 5
Mis
sense v
ari
ants
of u
ncert
ain
sig
nific
ance ide
ntifie
d in a
subse
t of se
lecte
d s
om
atica
lly a
ltere
d R
CC
ge
nes w
hic
h p
assed i
n s
ilico
filt
eri
ng c
rite
ria
Ch
r P
os
rsID
R
ef
Alt
G
en
e
Tra
ns
cri
pt
Exo
n
cD
NA
A
A
EX
AC
C
AD
D
SIF
T
Po
ly
Ph
en
C
LIN
VA
R
Inte
rVar
chr1
1
108292716
G
A
AT
M
NM
_000051
exon30
c.G
4534A
p.A
1512T
0
23.7
D
P
U
ncert
ain
sig
nific
ance
Uncert
ain
sig
nific
ance
chr1
1
108293341
T
C
AT
M
NM
_000051
exon31
c.T
4640C
p.I
1547T
0
26.9
D
P
U
ncert
ain
sig
nific
ance
Uncert
ain
sig
nific
ance
chrX
45070327
C
G
KD
M6
A
NM
_021140
exon17
c.C
2672G
p.P
891R
0
22.7
D
D
N
/A
Uncert
ain
sig
nific
ance
chr7
152151453
rs
139111507
G
C
K
MT
2C
N
M_
170606
exon50
c.C
12655G
p.L
4219V
0.0
031
0.0
02
D
B
N/A
U
ncert
ain
sig
nific
ance
chr7
152187411
G
A
KM
T2C
N
M_
170606
exon33
c.C
4859T
p.P
1620L
0
26.9
D
B
N
/A
Uncert
ain
sig
nific
ance
chr7
152199279
rs
746270757
C
T
K
MT
2C
N
M_
170606
exon27
c.G
4273A
p.G
1425S
8.3
5E
-06
26.2
D
D
N
/A
Uncert
ain
sig
nific
ance
chr7
152252613
rs
140919432
G
T
K
MT
2C
N
M_
170606
exon10
c.C
1402A
p.P
468T
9.0
0E
-04
25.3
D
B
N
/A
Uncert
ain
sig
nific
ance
chr7
152252671
rs
149250254
C
A
KM
T2C
N
M_
170606
exon10
c.G
1344T
p.Q
448H
4.0
0E
-04
26.5
D
B
N
/A
Uncert
ain
sig
nific
ance
chr1
2
49042232
rs
754420100
G
A
K
MT
2D
N
M_
003482
exon28
c.C
5966T
p.T
1989M
0
23.9
T
D
N
/A
Uncert
ain
sig
nific
ance
chr1
11126781
G
C
MT
OR
N
M_
004958
exon46
c.C
6367G
p.L
2123V
0
27.9
D
D
N
/A
Uncert
ain
sig
nific
ance
chr2
2
29674892
rs
866689896
G
A
N
F2
NM
_000268
exon13
c.G
1397A
p.R
466Q
0
27.1
T
B
U
ncert
ain
sig
nific
ance
Uncert
ain
sig
nific
ance
chr3
47083880
rs
143991928
C
T
S
ET
D2
NM
_014159
exon12
c.G
5900A
p.G
1967D
3.0
0E
-04
22.2
D
P
N
/A
Uncert
ain
sig
nific
ance
chr3
47088188
rs
141847082
C
G
S
ET
D2
NM
_014159
exon10
c.G
5202C
p.Q
1734H
2.4
7E
-05
23.4
T
D
N
/A
Uncert
ain
sig
nific
ance
chr1
9
10984204
C
T
SM
AR
CA
4
NM
_003072
exon2
c.C
53T
p.P
18L
0
24.4
D
D
U
ncert
ain
sig
nific
ance
Uncert
ain
sig
nific
ance
185
5.3.5 Detection of SNVs in metabolic genes associated with Krebs cycle
Variants from the filtered set were demarcated by genes associated with the TCA cycle (see
appendix 9.4.1) in order to identify novel or rare likely damaging variants in components the genes
encoding proteins involved in the TCA cycle and its supporting complexes. After gene list filtering
(22 genes) a total of 13 sites were retained. All sites identified within the genes present on the TCA
cycle gene list were nonsynonymous variants and InterVar interpretation of clinical significance
assigned 76.9% (10/13) as VUS variants, with the remaining categorised as likely benign.
Of the 13 variants identified, 10 sites occurred within known protein domains or functional sites,
though variants outside of protein domains did not correlate with variants assigned as likely benign.
Genes carrying variants included direct components of the TCA cycle complexes (ACO1, ACO2,
DLST, CS, IDH3A, MDH2,) and genes encoding proteins related to complex scaffolds or TCA
complex-like functions (SUCLG2, OGDHL, and DLD).
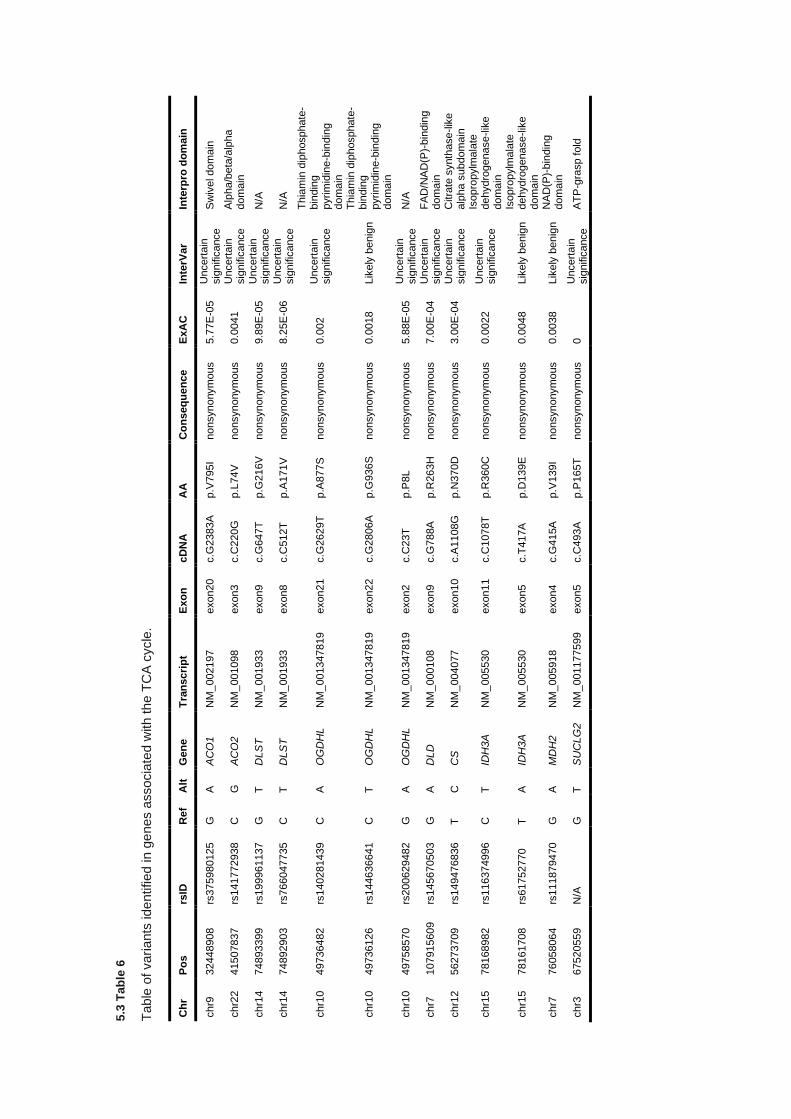
5.3
Tab
le 6
Table
of vari
ants
ide
ntified in g
enes a
ssocia
ted w
ith th
e T
CA
cycle
.
Ch
r P
os
rsID
R
ef
Alt
G
en
e
Tra
nscri
pt
Exo
n
cD
NA
A
A
Co
ns
eq
ue
nce
ExA
C
Inte
rVar
Inte
rpro
do
main
chr9
32448908
rs
375980125
G
A
A
CO
1
NM
_002197
exon20
c.G
2383A
p.V
795I
nonsynonym
ous
5.7
7E
-05
Uncert
ain
sig
nific
ance
Sw
ivel dom
ain
chr2
2
41507837
rs
141772938
C
G
A
CO
2
NM
_001098
exon3
c.C
220
G
p.L
74V
nonsynonym
ous
0.0
041
Uncert
ain
sig
nific
ance
Alp
ha/b
eta
/alp
ha
dom
ain
chr1
4
74893399
rs
199961137
G
T
D
LS
T
NM
_001933
exon9
c.G
647T
p.G
216V
nonsynonym
ous
9.8
9E
-05
Uncert
ain
sig
nific
ance
N/A
chr1
4
74892903
rs
766047735
C
T
D
LS
T
NM
_001933
exon8
c.C
512T
p.A
171V
nonsynonym
ous
8.2
5E
-06
Uncert
ain
sig
nific
ance
N/A
chr1
0
49736482
rs
140281439
C
A
O
GD
HL
NM
_001347819
exon21
c.G
2629T
p.A
877S
nonsynonym
ous
0.0
02
Uncert
ain
sig
nific
ance
Th
iam
in d
iphosphate
-bin
din
g
pyrim
idin
e-b
indin
g
dom
ain
chr1
0
49736126
rs
144636641
C
T
OG
DH
L
NM
_001347819
exon22
c.G
2806A
p.G
936S
nonsynonym
ous
0.0
018
Lik
ely
benig
n
Thia
min
dip
hosphate
-bin
din
g
pyrim
idin
e-b
indin
g
dom
ain
chr1
0
49758570
rs
200629482
G
A
O
GD
HL
NM
_001347819
exon2
c.C
23T
p.P
8L
nonsynonym
ous
5.8
8E
-05
Uncert
ain
sig
nific
ance
N/A
chr7
107915609
rs
145670503
G
A
D
LD
N
M_
000108
exon9
c.G
788A
p.R
263H
nonsynonym
ous
7.0
0E
-04
Uncert
ain
sig
nific
ance
FA
D/N
AD
(P)-
bin
din
g
dom
ain
chr1
2
56273709
rs
149476836
T
C
C
S
NM
_004077
exon10
c.A
1108G
p.N
370D
nonsynonym
ous
3.0
0E
-04
Uncert
ain
sig
nific
ance
Citra
te s
ynth
ase
-lik
e
alp
ha s
ubdom
ain
chr1
5
78168982
rs
116374996
C
T
ID
H3A
N
M_
005530
exon11
c.C
1078T
p.R
360C
nonsynonym
ous
0.0
022
Uncert
ain
sig
nific
ance
Isopro
pylm
ala
te
dehydro
genase
-lik
e
dom
ain
chr1
5
78161708
rs
61752770
T
A
IDH
3A
N
M_
005530
exon5
c.T
417A
p.D
139E
nonsynonym
ous
0.0
048
Lik
ely
benig
n
Isopro
pylm
ala
te
dehydro
genase
-lik
e
dom
ain
chr7
76058064
rs
111879470
G
A
M
DH
2
NM
_005918
exon4
c.G
415A
p.V
139I
nonsynonym
ous
0.0
038
Lik
ely
benig
n
NA
D(P
)-bin
din
g
dom
ain
chr3
67520559
N
/A
G
T
SU
CLG
2
NM
_001177599
exon5
c.C
493A
p.P
165T
nonsynonym
ous
0
Uncert
ain
sig
nific
ance
AT
P-g
rasp f
old
187
5.3.6 Copy number alterations - Calibration of copy number pipeline
In order to assess the necessary changes to default parameters provided by XHMM for the calling
of CNVs in unmatched whole exome data, calibration was performed on a subset of HapMap
samples with both whole exome sequencing and CNV calls from comparative genomic array data
(see materials and methods 5.2).
Comparisons in calling rate and genotype for overlapping targets in both whole exome and array
data were performed across 23 samples to assess the calling efficiency, genotyping accuracy, and
ability to replicate results found in CGH array data, considered the gold standard for high-throughput
detection of copy number alterations. Analysis was replicated 95 times utilising differential
parameters regarding target size, target read depth, sample read depth, read depth standard
deviation, and PCA variance normalisation. Of 95 replicates attempted, 73 successfully produced
CNV calls and used to generate summary and comparison data.
5.3.7 Copy number alterations calibration - Evaluation of call rate, type I, and type II errors
When comparing exome targets which intersected with genomic regions with available array data,
the true positive rate was 68.53 ± 2.89% when restricted to all experimental iterations for which
targets were called in both exome data and array data. False positives occurred at a mean rate of
5.69 ± 0.63% in which XHMM called an alteration in copy number but array data was discordant.
The remaining percentage was attributable to false negative calls, where XHMM failed to genotype
a non-neutral copy number alteration identified by the array data at a rate of 25.77 ± 3.30%.
Distributions across all samples are given in 5.3 Figure 6A.
A majority of algorithm parameters, independently, had little to no impact on call rates in the
calibration set with the exception of ‘minimum mean target read depth’, that is to say the threshold
below which exome targets are excluded on the basis of mean read depth across the analysed
samples (5.3 Figure 6B). No analysis was performed to assess call rate effects due to combinatorial
parameter modifications.
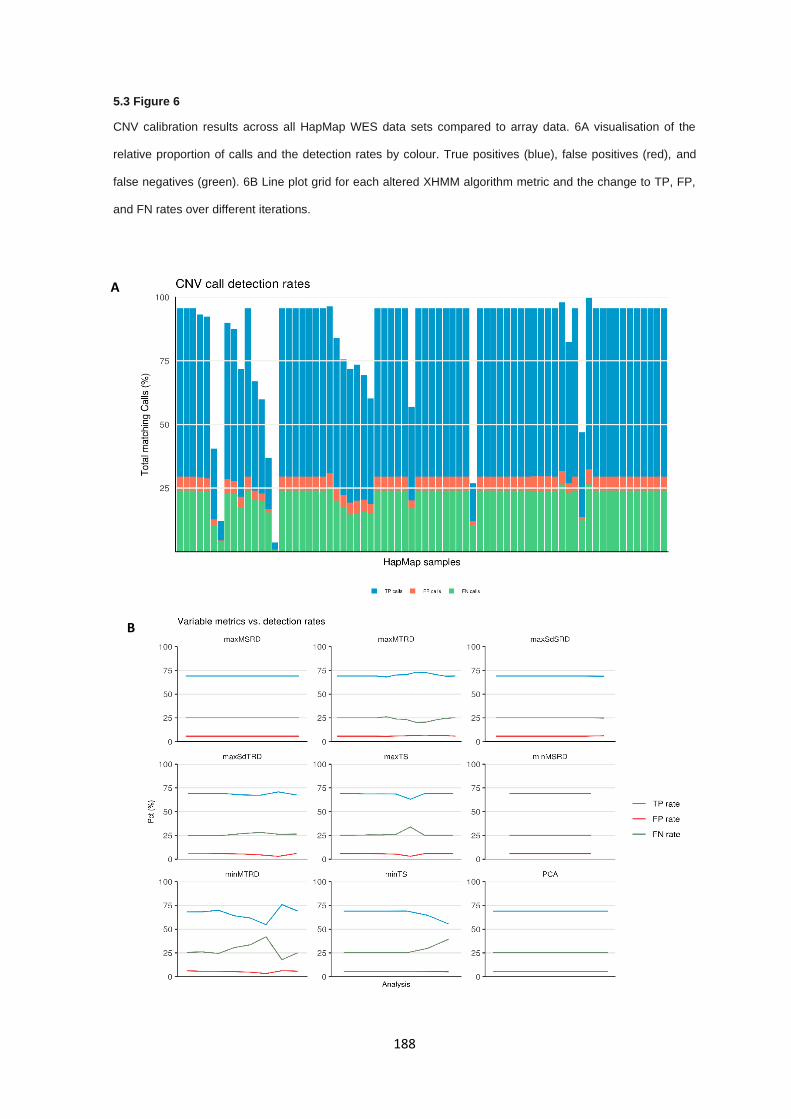
188
5.3 Figure 6
CNV calibration results across all HapMap WES data sets compared to array data. 6A visualisation of the
relative proportion of calls and the detection rates by colour. True positives (blue), false positives (red), and
false negatives (green). 6B Line plot grid for each altered XHMM algorithm metric and the change to TP, FP,
and FN rates over different iterations.
A
B
189
5.3.8 Copy number alterations – RCC copy number analysis
CNV calling utilising the CNV pipeline was performed on all 72 RCC WES cases with an additional
74 read depth-matched WES samples. The sample set was normalised on the second principle
component, removing variance up to the 70% threshold, as specified in the XHMM methodology
(430).
Initial calling by XHMM called 9,310 copy number altered regions across all samples. After
annotation and exon extraction, a total of 13,072 exons were called as having altered copy numbers
across 146 samples equating to 78,942 altered genotypes over all samples. These calls were split
evenly between deletions and duplications, with 39,378 duplications and 39,564 deletions (deletion
to duplication ratio = 1.004). The median number of duplication calls was 249 (range 53-780) per
sample and the mean number of deletions was 249 (range 116-1085). Stringent call filtering (see
materials and methods 5.2) filtered 7,418 sites and the removal of 27 samples in which no CNV calls
remained, resulting in the retention of 5,654 individual genotypes, 3,536 (62.5%) were duplications
and 2,118 (37.5%) were deletions. The mean duplication and deletion call rates across the retained
samples were 29.7 (range 0-591) and 17.8 (range 0-437), respectively.
Lastly, samples were subset to exclude the non-case samples used to improve calling. This caused
2,275 additional sites to be filtered causing a reduction in genotype calls to 3,379 (2,024 duplications
and 1,355 deletions). Median CNV calls per sample was 23 (range 1-441), with duplications having
a median of 15 (range 0-337) and deletions a median of 4 (range 0-437). Of the samples assessed,
5 individuals harboured call rates exceeding 1 standard deviation from the mean rate across all
samples, and 3 samples exceeded 2 standard deviations. These samples accounted for 46.6%
(1,576/3,379) of all CNV calls (See 5.3 Figure 7A).
190
Given that germline CNVs should occur at low rates, samples with an excessive number of CNVs
were excluded on the premise that the CNV calls were artefactual. Samples with CNV calls
exceeding one standard deviation greater than the cohort mean were removed. Exclusion of these
outlier samples resulted in attenuated call rates with a total of 5,654 sites called across 56 samples
for a total of 1,803 genotype calls (5.3 Figure 7B). Removal of the outlier samples resolved to
stabilise the CNV call rates across all samples with a median of 21 (range 1-127) CNV calls (1,179
duplications and 624 deletions). Median duplication and deletion rates in the final sample set were
12.5 (range 0-103) and 3 (range 0-123), respectively.
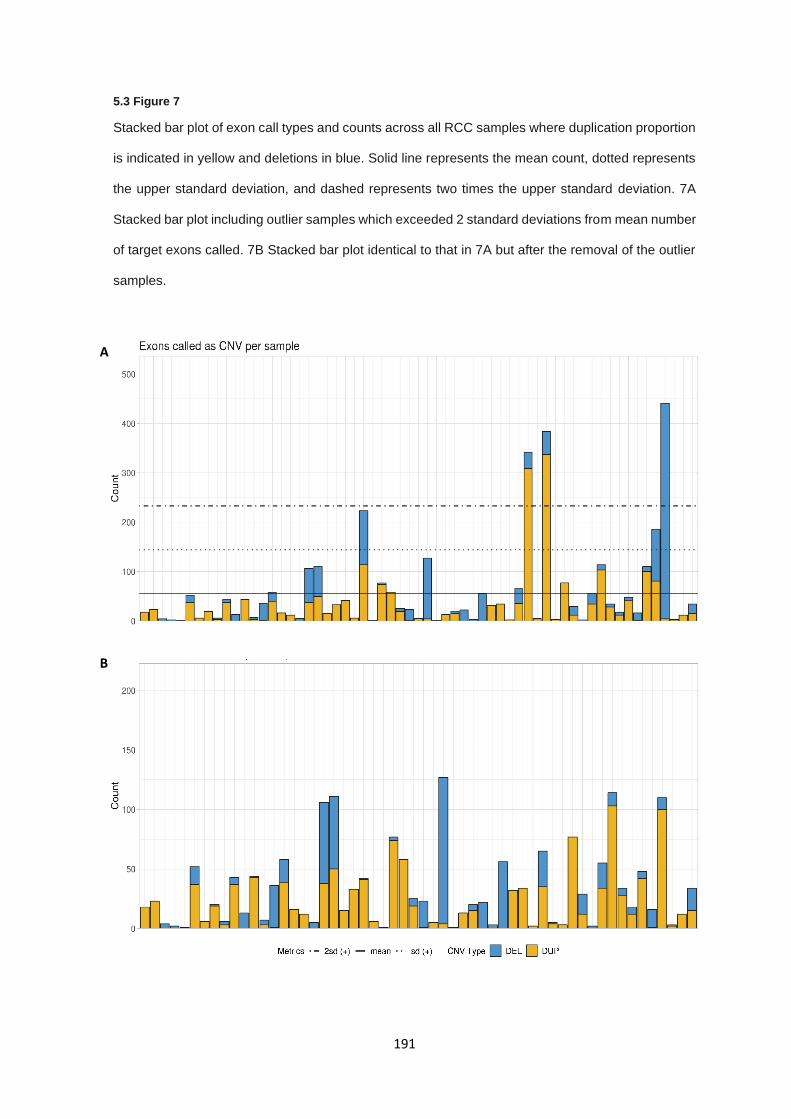
191
5.3 Figure 7
Stacked bar plot of exon call types and counts across all RCC samples where duplication proportion
is indicated in yellow and deletions in blue. Solid line represents the mean count, dotted represents
the upper standard deviation, and dashed represents two times the upper standard deviation. 7A
Stacked bar plot including outlier samples which exceeded 2 standard deviations from mean number
of target exons called. 7B Stacked bar plot identical to that in 7A but after the removal of the outlier
samples.
A
B

192
Analysis of affected genes was performed by first identifying CNV calls in protein coding genes and
subsequently the application of gene lists as utilised for SNV analysis. Analysis of CNV calls
discovered copy number duplications in 274 genes and copy number deletions in 137. A total of 18
genes had both copy gain and copy loss calls and were excluded on the basis that genes carrying
both duplications and deletions are unlikely to be associated with the same phenotypic presentation.
Filtering of CNV calls using a broad pan-cancer gene list (572 cancer-related genes curated from
the COSMIC cancer consensus gene lists (378) reduced the call set to 75 CNV calls which, when
exon overlapping calls were merged, collapsed to 10 distinct calls in 10 samples (5.3 Table 7). These
CNV calls were divided into 5 duplications and 5 deletions, 2 were full coding region alterations and
the remaining calls were partial. All calls occurred only once, detected in a single individual across
the entire unfiltered sample set. Many calls were partial duplications of known tumour suppressor
genes and therefore likely to be false positives or not assumed to have functional effects (TSC2,
CARD11, PMS2), as well as the full coding region of MUTYH. Deletions were broadly partial in
nature, resulting in copy number losses of a subset of exonic regions and only a single gene
demonstrated a copy loss of the entire coding region (EP300).
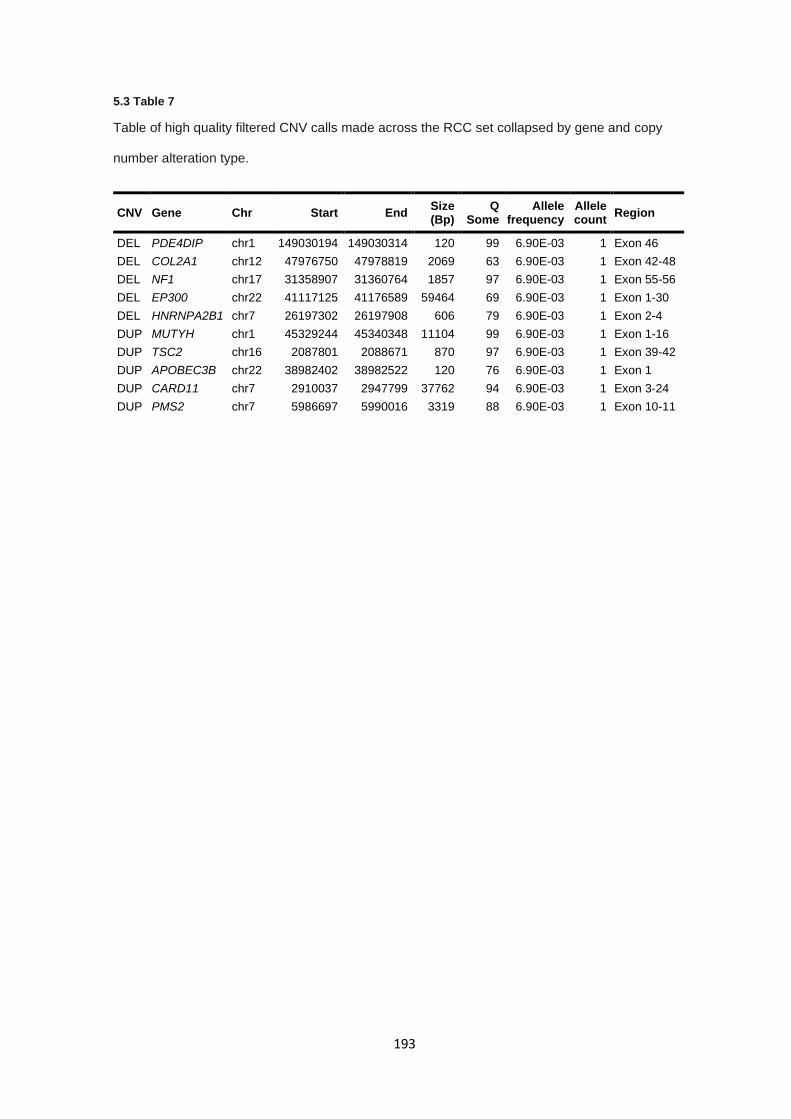
193
5.3 Table 7
Table of high quality filtered CNV calls made across the RCC set collapsed by gene and copy
number alteration type.
CNV Gene Chr Start End Size (Bp)
Q Some
Allele frequency
Allele count
Region
DEL PDE4DIP chr1 149030194 149030314 120 99 6.90E-03 1 Exon 46
DEL COL2A1 chr12 47976750 47978819 2069 63 6.90E-03 1 Exon 42-48
DEL NF1 chr17 31358907 31360764 1857 97 6.90E-03 1 Exon 55-56
DEL EP300 chr22 41117125 41176589 59464 69 6.90E-03 1 Exon 1-30
DEL HNRNPA2B1 chr7 26197302 26197908 606 79 6.90E-03 1 Exon 2-4
DUP MUTYH chr1 45329244 45340348 11104 99 6.90E-03 1 Exon 1-16
DUP TSC2 chr16 2087801 2088671 870 97 6.90E-03 1 Exon 39-42
DUP APOBEC3B chr22 38982402 38982522 120 76 6.90E-03 1 Exon 1
DUP CARD11 chr7 2910037 2947799 37762 94 6.90E-03 1 Exon 3-24
DUP PMS2 chr7 5986697 5990016 3319 88 6.90E-03 1 Exon 10-11
194
5.3.9 Gene burden analysis
Gene burden analysis was performed utilising 66 cases with features of RCC predisposition and 999
control samples from the ICR UK exome (433) (as described in materials and methods 5.2). As such,
patients identified as not having non-Finnish European admixtures were excluded from downstream
analysis. Burden analysis was restricted to truncating and nonsynonymous variants (excluding in-
frame deletions and insertions, non-coding, intronic, and synonymous alterations) and after filtering
resulted in 497,138 variants across 1,071 samples.
PCA was performed to assess for batch effects and determine appropriate covariates to include the
gene burden model (See 5.3 Figure 8). Further interrogation of the PCA plot and its variance profile
demonstrated a likely batch effect due to library and data preparation methods between control and
case samples, driven by variance in PC1 and intra-case variance from both P1 and PC2 collectively.
In PCA plots utilising principle components 3 or greater, samples broadly overlapped, suggesting no
variance between cases and controls, or intra-case variability.
The magnitude of any variance to a single principle component is an important factor when
determining the degree to which it will affect downstream analysis. A plot of cumulative variance was
generated for all computed principle components in order to quantify the contributed variance for
each principle component (see 5.3 Figure 9). Principle component 1 and 2 contributed 1.03% and
0.55% of total variance derived from the principle component analysis, respectively. All the remaining
variance was spread equally across all remaining principle components at percentages between 0 -
0.47% (mean = 0.09%). Formally, the contributed variance for each principle component broadly
correlated with the amount of variance contributed individually by each sample. Given the minimal
about of variance contributed by each principle component, downstream analysis was carried out
with both principle component 1 and 2 as covariates in the SKAT-O model with all remaining principle
components contributing an increasingly low amount of variance.
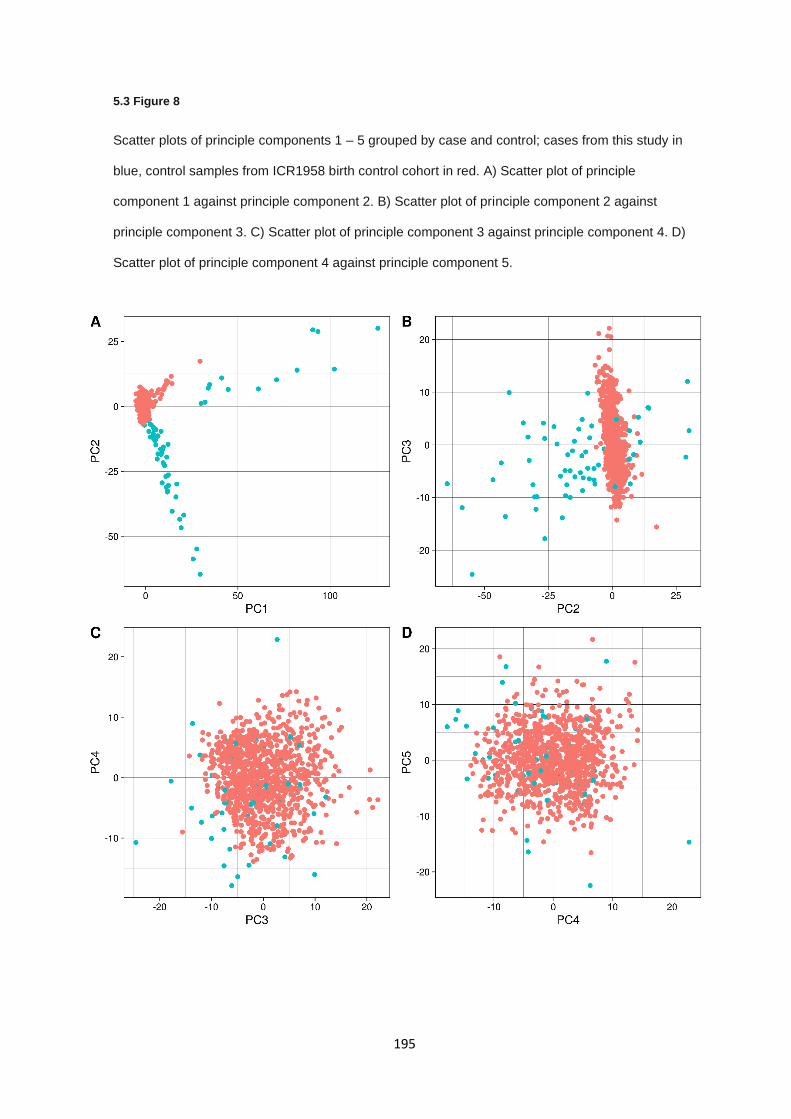
195
5.3 Figure 8
Scatter plots of principle components 1 – 5 grouped by case and control; cases from this study in
blue, control samples from ICR1958 birth control cohort in red. A) Scatter plot of principle
component 1 against principle component 2. B) Scatter plot of principle component 2 against
principle component 3. C) Scatter plot of principle component 3 against principle component 4. D)
Scatter plot of principle component 4 against principle component 5.
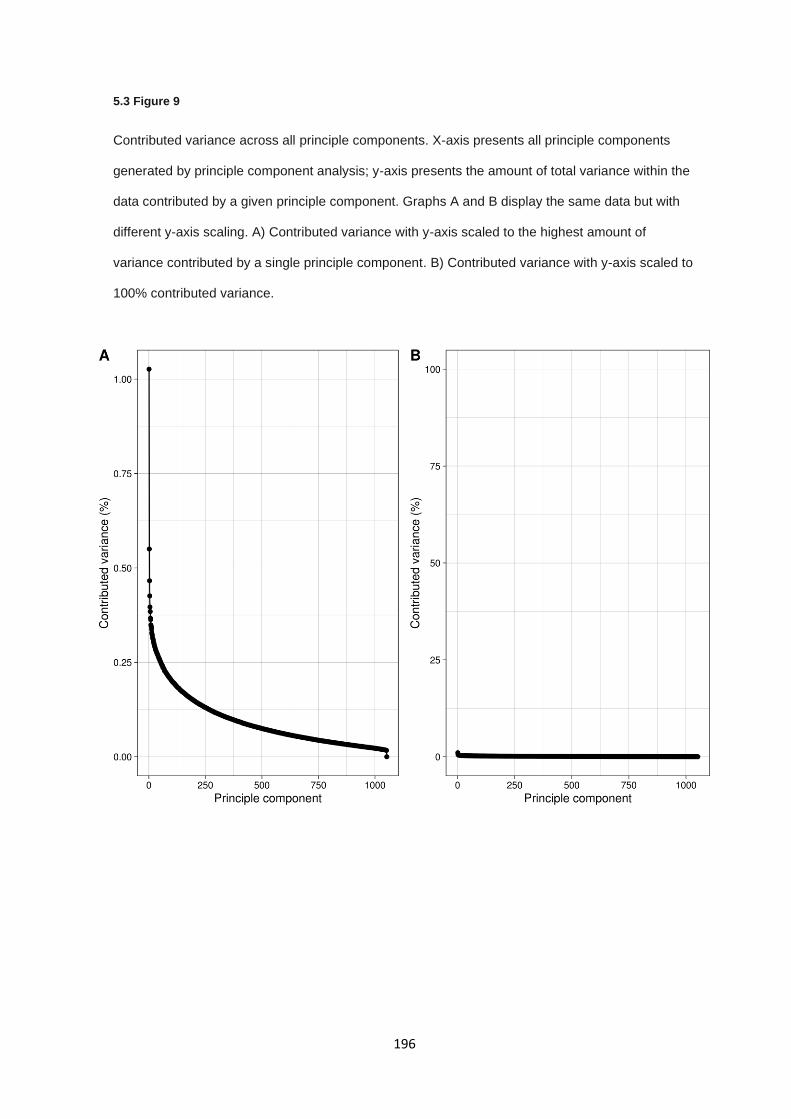
196
5.3 Figure 9
Contributed variance across all principle components. X-axis presents all principle components
generated by principle component analysis; y-axis presents the amount of total variance within the
data contributed by a given principle component. Graphs A and B display the same data but with
different y-axis scaling. A) Contributed variance with y-axis scaled to the highest amount of
variance contributed by a single principle component. B) Contributed variance with y-axis scaled to
100% contributed variance.
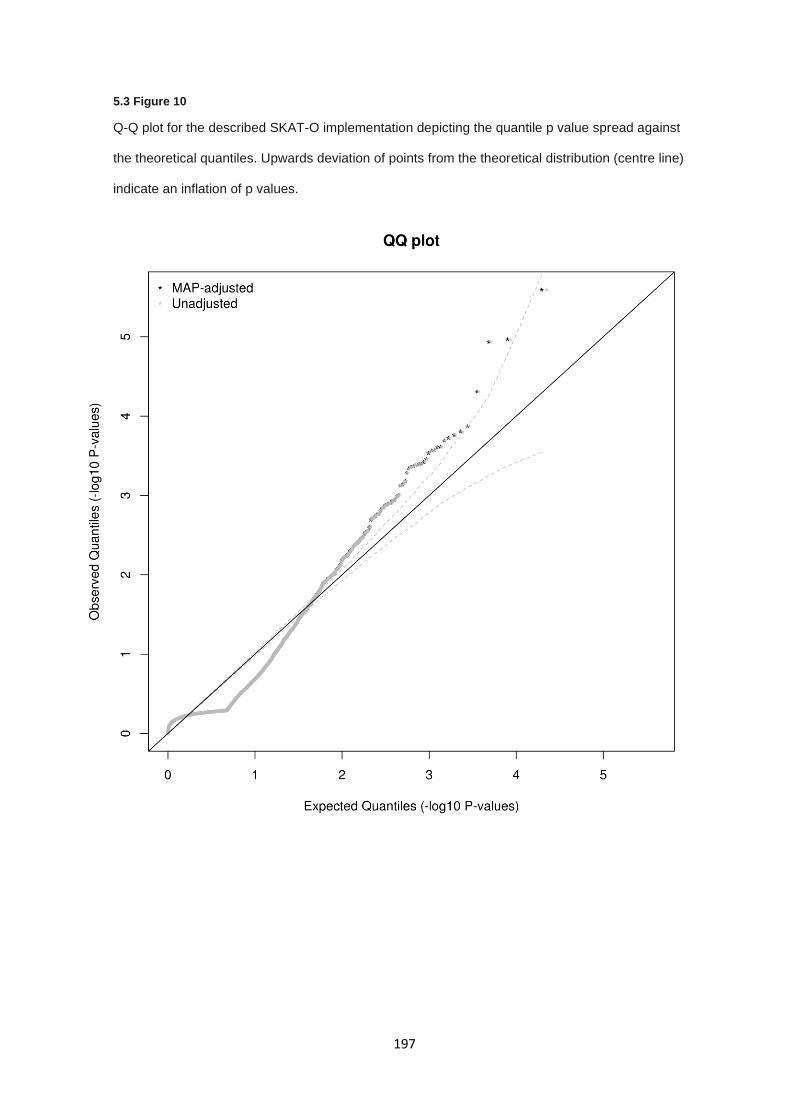
197
5.3 Figure 10
Q-Q plot for the described SKAT-O implementation depicting the quantile p value spread against
the theoretical quantiles. Upwards deviation of points from the theoretical distribution (centre line)
indicate an inflation of p values.
198
SKAT-O burden analysis was performed across all genes containing variants with the optimised
parameters with covariates (5.3 Figure 10 and 5.2 Table 1). Analysis of SKAT-O output revealed
532 genes with a significant mutational burden compared to controls at p < 0.05 and 180 genes at
significance p < 0.01 (See appendix section 9.4.6). A single gene was significant after multiple testing
correction by FDR (FBLIM1, q value = 0.035). The correction was applied across all assessed genes
(n = 13,959) and the false discovery rate was set to 5%, as such multiple testing correction was
statistically conservative for false positive associations. Genes occurring with p values < 0.01
included 12 known cancer associated genes as defined by network of cancer genes (v6.0) (428),
including HIF1A (p = 3.28E-04). Analysis of the genes associated with mutational burden (p < 0.01)
by the Network of Cancer Genes (NCG v6.0; (428)) identified a statistical enrichment of known or
candidate cancer genes in the burden-associated genes compared to global rates with 6.67%
(12/180) genes in the burden associated set being known or candidate cancer genes compared to
12.6% (2372/18833) across the genome (χ² test p = 0.040).
Gene enrichment analysis was performed on various gene set analysis platforms for genes with p
values < 0.01 in order to identify enriched biological processes, pathways, or regions. Analysis for
overrepresented gene ontologies (GOs) using WebGestalt detected no enriched GOs after FDR
correction. Gene enrichment performed by Reactome to detect statistically overrepresented
pathways did not detect any pathways in which genes (or their protein products) were enriched. It is
worth noting that Reactome failed to find matching gene identifiers for 70/180 (38.9%) genes despite
using multiple gene/protein identifiers (NCBI, Entrez gene, gene symbol, and Uniprot) which may
have impacted pathway enrichment analysis. Lastly, GO enrichment analysis using Panther and GO-
slim biological process ontology set also did not result in any FDR corrected biological processes
being enriched in genes with p values < 0.01.
199
5.3.10 Short tandem repeat expansion analysis
Short tandem repeat expansion (or contraction) (STRE) analysis was performed on BAM files for all
72 individuals in the case set to determine if known tandem repeat alterations could be detected in
germline sequencing from WES data, and if those alterations could impact genes known to result in
RCC predisposition. STREs were called at a mean rate of 34,925 calls per sample (median = 33,343;
range 20,776-69,571). STRE calls were filtered for both read depth and quality (Q) and restricted to
calls within known RCC predisposition genes (see appendix 9.4.1), as well as BRIP1, as identified
in chapter 4.
After filtering and genomic region restriction the mean number of STRE calls per sample was 1.78
(median = 1.5; range 1-5). Calls across all samples were collapsed into a single VCF resulting in a
total of 31 STRE calls passing filtering criteria. A further 24 sites were excluded for occurring at an
allele frequency greater than 5% (allele frequency > 0.05) and were therefore likely to be either false
positive calls or natural fluctuations in short tandem repeat lengths.
The remaining 7 sites (5.3 Table 11) occurred in 6 individual samples, with a single individual
harbouring both large STRE calls in SDHA and TSC1 (chr5:250296 A/(AGG)272 and chr9:132903602
C/(CAAAA)163). Of the 7 STRE calls made by gangSTR which passed all filtering criteria, 6 were
present within gene introns and none occurred in the disruption or in proximity to a spice site
consensus sequence. A single STRE call was present within exon 20 of BRIP1 (chr17:61684053
T/TTTGT), occurring at amino acid 998 within the BRCA1 binding domain in an individual with familial
RCC and no other known candidate variants from previous analysis.
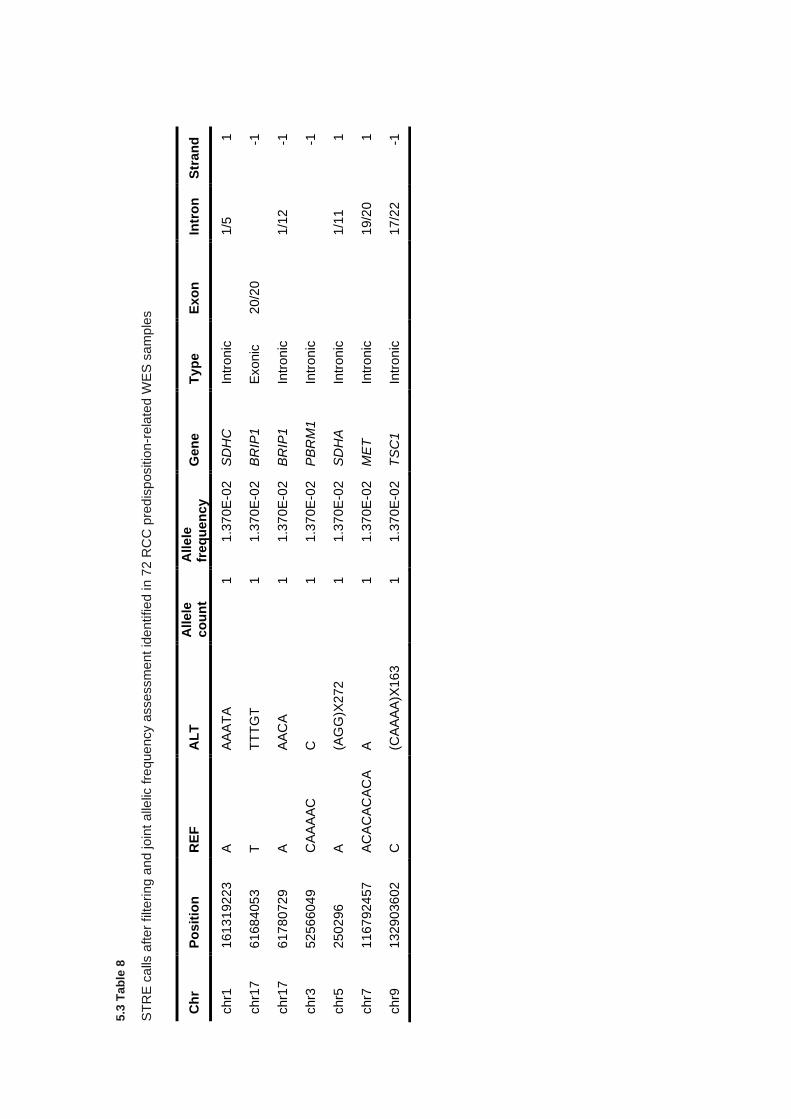
5.3
Tab
le 8
ST
RE
ca
lls a
fter
filteri
ng a
nd join
t alle
lic f
reque
ncy a
ssessm
ent
ide
ntifie
d in 7
2 R
CC
pre
dis
positio
n-r
ela
ted W
ES
sa
mp
les
Ch
r P
osit
ion
R
EF
A
LT
A
llele
co
un
t A
llele
fr
eq
uen
cy
G
en
e
Typ
e
Exo
n
Intr
on
S
tran
d
chr1
1613
192
23
A
A
AA
TA
1
1.3
70E
-02
S
DH
C
Intr
on
ic
1/5
1
chr1
7
6168
405
3
T
TT
TG
T
1
1.3
70E
-02
B
RIP
1
Exonic
20/2
0
-1
chr1
7
6178
072
9
A
AA
CA
1
1.3
70E
-02
B
RIP
1
Intr
on
ic
1/1
2
-1
chr3
5256
604
9
CA
AA
AC
C
1
1.3
70E
-02
P
BR
M1
In
tron
ic
-1
chr5
2502
96
A
(A
GG
)X272
1
1.3
70E
-02
S
DH
A
Intr
on
ic
1/1
1
1
chr7
1167
924
57
A
CA
CA
CA
CA
A
1
1.3
70E
-02
M
ET
In
tron
ic
19/2
0
1
chr9
1329
036
02
C
(C
AA
AA
)X16
3
1
1.3
70E
-02
T
SC
1
Intr
on
ic
17/2
2
-1
201
5.3.11 Mobile element analysis
Analysis of mobile element insertion was performed using MELT for all 72 samples present in the
WES data set. Initial calling of mobile element insertions (MEIs) was independently identified per
sample for each of the 4 transposable element types and jointly genotyped, describe in the materials
and methods section. Prior to site filtering MEIs the following number of MEIs were detected per
transposable element type; ALU = 1,645, HERVK = 1, LINE1 = 152, SVA = 73.
Filtering parameters for MELT calls were applied (PASS status and split read support > 2) to each
transposable element type resulting in the retention of 35 ALU sites, 0 HERVK sites, 5 LINE1 sites,
and 1 SVA sites. Transposon-specific VCF files were concatenated and region filtering of calls to
genes present in known RCC predisposition genes (and BRIP1), as described previously, did not
result in any sites being retained. Intersection of the sites present in the multi-transposon VCF file
with all known gene coding regions returned 41 sites with MEI calls. Removal of common (AF > 0.05)
MEI calls across the sample set retained 18 sites, only 1 of which was within a gene exon, ZNF763
(5.3 Table 9).
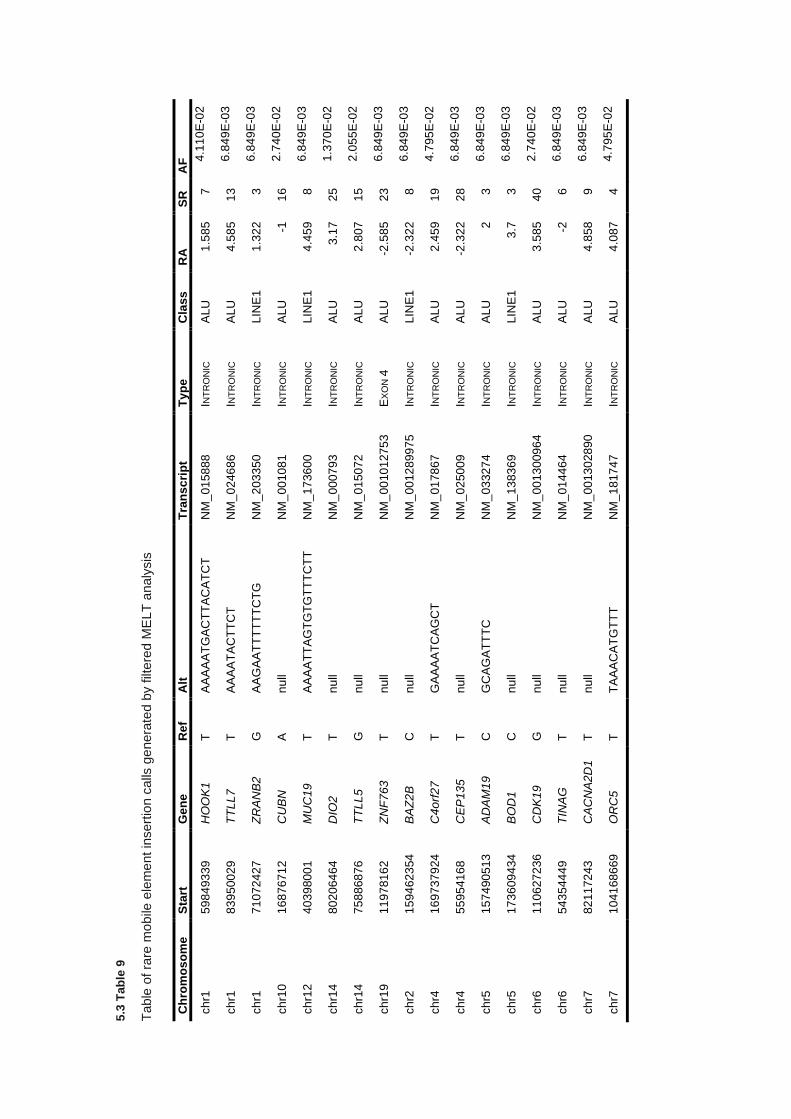
5.3
Tab
le 9
Table
of ra
re m
obile
ele
me
nt in
sert
ion c
alls
ge
nera
ted b
y filt
ere
d M
ELT
analy
sis
Ch
rom
os
om
e
Sta
rt
Ge
ne
R
ef
Alt
T
ran
sc
rip
t T
yp
e
Cla
ss
RA
S
R
AF
ch
r1
59
84
93
39
HO
OK
1
T
AA
AA
AT
GA
CT
TA
CA
TC
T
NM
_0
158
88
INT
RO
NIC
A
LU
1
.58
5
7
4.1
10
E-0
2
ch
r1
83
95
00
29
TT
LL
7
T
AA
AA
TA
CT
TC
T
NM
_0
246
86
INT
RO
NIC
A
LU
4
.58
5
13
6.8
49
E-0
3
ch
r1
71
07
24
27
ZR
AN
B2
G
A
AG
AA
TT
TT
TT
CT
G
NM
_2
033
50
INT
RO
NIC
L
INE
1
1.3
22
3
6.8
49
E-0
3
ch
r10
16
87
67
12
CU
BN
A
n
ull
NM
_0
010
81
INT
RO
NIC
A
LU
-1
1
6
2.7
40
E-0
2
ch
r12
40
39
80
01
MU
C1
9
T
AA
AA
TT
AG
TG
TG
TT
TC
TT
N
M_
17
36
00
INT
RO
NIC
L
INE
1
4.4
59
8
6.8
49
E-0
3
ch
r14
80
20
64
64
DIO
2
T
nu
ll N
M_
00
07
93
INT
RO
NIC
A
LU
3
.17
25
1.3
70
E-0
2
ch
r14
75
88
68
76
TT
LL
5
G
nu
ll N
M_
01
50
72
INT
RO
NIC
A
LU
2
.80
7
15
2.0
55
E-0
2
ch
r19
11
97
81
62
ZN
F7
63
T
nu
ll N
M_
00
10
127
53
EX
ON
4
AL
U
-2.5
85
23
6.8
49
E-0
3
ch
r2
15
94
62
354
BA
Z2
B
C
nu
ll N
M_
00
12
899
75
INT
RO
NIC
L
INE
1
-2.3
22
8
6.8
49
E-0
3
ch
r4
16
97
37
924
C4o
rf2
7
T
GA
AA
AT
CA
GC
T
NM
_0
178
67
INT
RO
NIC
A
LU
2
.45
9
19
4.7
95
E-0
2
ch
r4
55
95
41
68
CE
P13
5
T
nu
ll N
M_
02
50
09
INT
RO
NIC
A
LU
-2
.32
2
28
6.8
49
E-0
3
ch
r5
15
74
90
513
AD
AM
19
C
G
CA
GA
TT
TC
N
M_
03
32
74
INT
RO
NIC
A
LU
2
3
6
.84
9E
-03
ch
r5
17
36
09
434
BO
D1
C
n
ull
NM
_1
383
69
INT
RO
NIC
L
INE
1
3.7
3
6
.84
9E
-03
ch
r6
11
06
27
236
CD
K1
9
G
nu
ll N
M_
00
13
009
64
INT
RO
NIC
A
LU
3
.58
5
40
2.7
40
E-0
2
ch
r6
54
35
44
49
TIN
AG
T
n
ull
NM
_0
144
64
INT
RO
NIC
A
LU
-2
6
6
.84
9E
-03
ch
r7
82
11
72
43
CA
CN
A2D
1
T
nu
ll N
M_
00
13
028
90
INT
RO
NIC
A
LU
4
.85
8
9
6.8
49
E-0
3
ch
r7
10
41
68
669
OR
C5
T
T
AA
AC
AT
GT
TT
N
M_
18
17
47
INT
RO
NIC
A
LU
4
.08
7
4
4.7
95
E-0
2
203
5.4 Discussion
In this study the use of multiple analysis types has been utilised to identify potential candidate genes
which may be associated with RCC predisposition. Identification of genes with strong associations
with somatic RCC alterations in histone modifying and chromatin remodelling pathways such as
SMARCA4, SETD2, KDM6A, KMT2C, and KMT2D are potential candidate genes given the recent
association of PBRM1 and BAP1 with RCC predisposition (263,264) and in regard to the details
discussed in chapter 3 section 3.1.3. SMARCA4 encodes a component of the same complex as
PBRM1 and is frequently somatically altered in RCC and has been reported in predisposition to other
cancer (439).
Variants in SETD2, including a non-frameshift deletion, are interesting potential candidates given
the frequency of somatic alterations in SETD2 seen somatically, with 18% of clear cell RCC cases
having either copy loss or putative driver mutations (25) and has been demonstrated to act as tumour
suppressor via epigenetic regulation (440). Histopathological information was available for one of
the three individuals with SETD2 variants and had multifocal clear cell RCC at age 48 years, which
would correlate with SETD2 mutational status. Heterozygous loss of function SETD2 mutations have
been described as a cause of the intellectual disability disorder, Luscan-Lumish syndrome (MIM:
616831) which is characterised by developmental and speech delay, dysmorphic facial features,
macrocephaly and autistic features (441,442). Luscan-Lumish syndrome is a rare disorder and
predisposition to RCC has not been described and, to my knowledge, the individuals in our RCC
cohort with SETD2 variants did not have features of Luscan-Lumish syndrome. Variants in KMT2C
and KMT2D have been broadly discussed in previous chapters but they do occur frequently
somatically and should not be removed from consideration, particularly KMT2C given the sequencing
issues and potential false positives that may occur, as such further analysis would be necessary.
204
Lastly, KDM6A is a further gene coding a histone modifying protein, lysine demethylase 6A, and is
also altered somatically, though at a lower rate than the other genes mentioned (1.8%). KDM6A is
closely linked to KMT2D, both of which are associated with Kabuki syndrome 2 and 1, respectively
(MIM: 300867 and 147920) and therefore is open to the same points discussed in chapter 3 in regard
to the inheritance of a variant associated with an autosomal dominant condition. It is worth noting
that KDM6A is present on chromosome X and demonstrates X linked inheritance which complicates
variant interpretation. In this case the individual was a female presenting a chromophobe RCC at
age 27 years so adherence to a two-hit model is still feasible. Overall variants in these genes are
interesting candidates given the rate of somatic alterations, where 26% of RCC cases across all
histological subtypes carry at least one alteration in one of the genes discussed. While interesting
candidates, additional studies to confirm function implication of the variants identified and tumour
studies to demonstrate LOH which would support their role in RCC predisposition.
Variants were identified after analysis of genes associated with TCA cycle complex components and
supporting proteins. Interpretation of these variants in genes such as ACO1 and CS is difficult without
functional assessment of the variants and effect on the TCA cycle. Variants in these genes may act
similarly to FH in HLRCC or SDH genes by results in the intracellular accumulation of substrates of
the TCA cycle and intermediates such as 2-oxoglutarate which result in the disruption of alpha-
ketoglutarate-dependent dioxygenase enzymes such as TET and KDM proteins (229), as well as
potential inhibition of PHD proteins in a manner similar to that seen with fumarate and succinate
(175). Histopathology in these cases, where available, was 50% papillary RCC, which would be
consistent with HLRCC-like tumours if the mechanisms were similar (443). While protein function
experiments could be labour intensive, metabolic testing of tumours for accumulated metabolites
has been demonstrated for SDH-deficient and FH-deficient tumours (444) and, in combination with
immunohistochemistry for the affected TCA complexes, could rapidly confirm or refute the potential
detrimental nature of the variants in this set.
205
SNV analysis also identified several putative causal variants in genes linked to genetic renal
diseases known pathogenic variants associated with renal-related autosomal recessive conditions.
The nonsense variant in PKHD1 (NM_138694: c.C5323T: p.R1775X) which is a known pathogenic
variant associated with autosomal recessive polycystic kidney disease. While determining if this
variant is causal for the predisposition seen in this individual, it is interesting that an individual
harbouring a pathogenic allele for polycystic kidney disease would develop RCC given that cystic
disease is a risk factor for RCC (36) and a reported increased susceptibility in autosomal dominant
polycystic kidney disease (445), especially given the rate at which somatic alterations occur across
RCC tumours (3%). Conversely, whether the loss of the second wild type allele would induce RCC
or renal cysts only would require further investigation and that this may be an incidental finding of an
individual who is a carrier for autosomal recessive polycystic kidney disease. Assessed in the same
manner, the splice variant seen in NUP93 (NM_014669) could, in autosomal dominant inheritance
pattern, confer a risk to RCC but NUP93 inactivating variants have only been associated with
autosomal recessive nephrotic syndrome and though nephrotic syndrome has been associated with
increased cancer risk (446) in affected individuals, carriers have not been assessed for increased
cancer risk and are infrequently seen somatically. It is also important to note that acquired cystic
disease can develop in patients with renal failure and is associated with an increased risk of RCC
(447), as such drawing correlations between inherited renal cystic disease, RCC predisposition and
renal failure can be difficult.
206
Gene burden association testing demonstrated reasonably robust statistical metrics given the limited
sample size and case-control size discrepancy. Only a single gene reached statistical significance
after multiple test correction (FDR) and only a handful of genes were statistically significant prior to
FDR correction and known to be associated with cancer. Gene ontology analysis of genes with
significant burden, with or without multiple testing correction, failed to identify any relevant biological
processes that were enriched in the gene set. The clear limitation in the gene burden analysis is the
lack of association after multiple testing correction and the presence of an overabundance of genes
surpassing uncorrected significance level due to the observed p value inflation, seen in 5.3 Figure
9. Indications from both the gene burden outcomes and gene ontology enrichment suggest that
underlying issues with statistical power and clear issues regarding control of variance between the
cases and controls persist. Overall a limited number of conclusions can be drawn from the results
presented. Conversely, the gene burden analysis was performed on all coding sequence affecting
variants, utilising differing subsets of variant consequences, such as only missense variants may
yield different associations though refitting of the model is required. The statistical power of the
analysis performed here using SKAT-O could be greatly improved with increased sample size which
may allow for statistical associations to be detected and allow for absolute associations between
increased gene mutational burden and RCC predisposition.
Finally copy number, short tandem repeat expansion, and mobile element analyses collectively
identified very few candidate alterations which could be plausibly linked to RCC predisposition. CNV
analysis generated only 10 high quality calls, many of which were partial duplications that are unlikely
to result in an altered phenotype. Remaining calls such as the partial deletion of exons 55 and 56 of
NF1 are potentially interesting due to links with predisposition to PCC in neurofibromatosis 1 (MIM:
162200)(448) and the known phenotypic connections between those diseases and RCC (212,385).
Conversely, the deletion of those specific exons would result in the truncation of the 2nd and 3rd exons
from the final 57th exon which does not appear to harbour any functional domains, though there are
two modified phosphoserine residues on the C terminus which may have a function during mitosis
(449).
207
The full coding region deletion of EP300 due to it encoding the histone acetyltransferase enzyme
p300 which regulates chromatin structure and truncating mutations are seen relatively frequently in
somatic RCC (2.8%), although heterozygous inactivating variants in EP300 are associated with
Rubinstein–Taybi syndrome (450) and offsetting evidence is available for p300 and its function or
role in cancer. The WES-based CNV pipeline has clear limitations, particularly regarding false
negatives, which limits this study’s ability to detect CNVs. Additionally, the presence of a significant
false positive rate means any copy number alteration would need to be validated by conventional
methods (i.e. array-based of multiplex-ligation dependent probe amplification) and as such should
be interpreted with caution.
The exploratory investigations into the potential for short tandem repeat expansions or mobile
elements to be associated with RCC failed to reveal any substantial results and genetic diseases
caused by these mechanisms are rare. While these methods did not yield clear and obvious
associations, exploring all potential avenues to discover the heritability in RCC utilising rare and
under measured sources of genetic alterations may prove critical to identifying factors linked to
predisposition which fall outside of the typical paradigms assessed routinely.
208
5.5 Conclusion
WES analysis of individuals with features of RCC predisposition has uncovered a range of potentially
pathogenic or likely pathogenic variants outside of those discovered in chapter 4, as well as a series
of VUS variants in genes associated with somatic RCC, other renal-related diseases, and metabolic
pathways seen to be altered in both syndromic RCC and PCC. Conversely, case control mutational
burden analysis and exploration into copy number alterations and other genetic alteration types did
not reveal strong candidates for causes of inherited RCC. Limitations of reduced genomic coverage,
poor variant interpretation, and sample sizes have confounded the identification of any robust
associations. In particular, power to detect associations given the limited sample size and prior
probability of an individual having a monogenic disorder is the major limiting factor and it is likely that
only substantially increased sample sizes would be capable of identifying alleles that contribute to
RCC predisposition at moderate to low risk rates.
209
6.0 Characterisation of RCC-associated constitutional chromosomal
abnormalities by whole genome sequencing
210
6.0.1 Table of contents
6.0.1 TABLE OF CONTENTS ....................................................................................................................... 210
6.1 INTRODUCTION ..................................................................................................................................... 211
6.1.1 CONSTITUTIONAL TRANSLOCATIONS IN RCC........................................................................................... 211
6.1.2 CONSTITUTIONAL TRANSLOCATIONS IN OTHER CANCERS .......................................................................... 213
6.1.3 METHODS FOR TRANSLOCATION CHARACTERISATION ............................................................................... 213
6.1.4 SUMMARY ........................................................................................................................................... 214
6.1.5 AIMS .................................................................................................................................................. 215
6.2 MATERIALS AND METHODS ................................................................................................................ 216
6.2.1 LITERATURE REVIEW ............................................................................................................................ 216
6.2.2 CLINICAL STUDIES ................................................................................................................................ 216
6.2.3 SEQUENCE ALIGNMENT AND VARIANT CALLING ........................................................................................ 216
6.2.4 WGS ANALYSIS: CANDIDATE GENE ANALYSIS AND BREAKPOINT IDENTIFICATION ........................................ 217
6.2.5 NANOPORE SEQUENCING OF TRANSLOCATION BREAKPOINTS .................................................................... 217
6.2.6 SANGER SEQUENCING .......................................................................................................................... 217
6.2.7 STATISTICAL TESTS .............................................................................................................................. 217
6.3 RESULTS ................................................................................................................................................ 218
6.3.1 LITERATURE REVIEW OF PREVIOUSLY REPORTED CASES ........................................................................... 218
6.3.2 CLINICAL FEATURES OF PREVIOUSLY UNREPORTED CASES ....................................................................... 227
6.3.3 WHOLE GENOME SEQUENCING AND BIOINFORMATICS ............................................................................... 230
6.3.4 CHARACTERISATION OF CONSTITUTIONAL REARRANGEMENTS IN PREVIOUSLY UNREPORTED CASES............... 230
6.3.5 CHARACTERISATION OF TRANSLOCATION BREAKPOINTS UTILISING NANOPORE SEQUENCING ........................ 233
6.3.6 COMPUTATIONAL EVALUATION OF BREAKPOINT-RELATED GENES ............................................................... 236
6.4 DISCUSSION ........................................................................................................................................... 238
6.5 CONCLUSION ......................................................................................................................................... 243
211
6.1 Introduction
Constitutional translocations are detected prenatally at a rate of 1 in 109-238 births (0.42-0.92%)
(451–453), and large structural variants occur relatively frequently in the general population (454).
Chromosomal translocations are subdivided into 3 primary types; balanced, unbalanced, and
Robertsonian, each of which result in differential retention or loss of genomic information depending
upon the size and type of translocation. Though most translocations are not known to cause genetic
disorders, a subset of translocations, particularly those that are unbalanced, have been associated
with a number of different diseases including cancer, infertility, neuropsychiatric disorders, and
Intellectual/developmental disorders (455–458).
6.1.1 Constitutional translocations in RCC
Four decades ago, Cohen et al (1979) described a large kindred in which clear cell RCC segregated
with a constitutional translocation between the short arm of chromosome 3 and the long arm of
chromosome 8, t(3;8)(p14.2;q24.1) such that the risk of RCC in translocation carriers was estimated
to be 80% at age 60 years (259). Subsequently, somatic deletions of the short arm of chromosome
3 (3p) were found to be the most common cytogenetic abnormality in sporadic clear cell RCC
suggesting the presence of critical renal tumour suppressor genes on 3p (126). These developments
led to the suggestion that identification of individuals with suspected inherited forms of RCC should
be screened for constitutional translocations involving 3p and that the characterisation of RCC-
associated translocation breakpoints might lead to the identification of novel inherited RCC genes
(459). Subsequent research studies have confirmed that chromosome 3p does indeed harbour
several tumour suppressor genes (TSGs) that are frequently inactivated in sporadic RCC (e.g. VHL,
PBRM1, BAP1, RASSF1A) (25,128,277,389,460–463).
212
Unlike normal RCC syndromes, which conform to either a two hit hypothesis or constitutional
activation of an oncogene, constitutional translocations are suggested to cause RCC predisposition
via a three-hit model. The three-hit model of tumourigenesis in translocation-related renal cell
carcinomas is theorized as follows: I) presence of constitutional translocations lead to a genomic
instability, II) Loss of genomic stability results in the loss of the chromosome 3p region on the
derivative chromosome, III) Secondary loss of an allele from genes on the wildtype 3p region, usually
VHL, leads to complete loss of one or more tumour suppressor genes. Under this model, initial
genomic instability is insufficient to induce cancer development and two additional hits are still
required to induce neoplastic cell growth, frequently including the loss of tumour suppressors (i.e.
VHL), although the precise mechanism of the genomic instability is not known.
Translocations may also confer a generalised genomic instability, in which specific loss of 3p is not
required, and further inactivation of unknown genes are responsible for tumourigenesis.
Alternatively, translocations may result in positional-effect variegation, resulting in differential
expression patterns for coding regions under differential chromatin regulation (464). Generalising
the model to all translocations, particularly those outside of chromosome 3 has proven more
challenging. The lack of known tumour suppressors, intergenic break points, and no relation to
commonly lost regions in sporadic RCC cases suggests that other mechanisms are involved in
predisposition and tumour progression.
213
6.1.2 Constitutional translocations in other cancers
Constitutional translocations have been documented in leukaemia (465–468). Recently an overlap
between blood-derived cancers and RCC was described with a report of an individual with both RCC
and Hodgkin lymphoma concomitantly, in which germline testing identified a constitutional
t(6;11)(p21;q12) translocation (469), though the clinical significance is difficult to interpret.
Furthermore, translocations have also been linked with a predisposition to Wilm’s tumours (470–
472) and though translocations are not common in Wilm’s tumours, evidence for a non-stochastic
mechanism of tumourigenesis via constitutional translocations seems to be present for these cases,
implicating genes such as HACE1 and BBS9 as a susceptibility genes in Wilm’s tumour development
(470,472). Many additional studies have shown idiosyncratic presentations of constitutional
translocations in cases of oncogenesis, including but not limited to, testicular cancer (473), teratomas
(474), thymomas (475), appendiceal carcinomas (476), rhabdomyosarcomas (477), meningiomas
(478), retinoblastomas (479), and neuroblastomas (480–482).
6.1.3 Methods for translocation characterisation
Classically, translocations have been identified and characterised by performing an admixture of
techniques (including array painting, comparative genomic hybridisation arrays, flow cytogenetic
sorting, Fluorescent in-situ hybridisation, and YAC/BAC hybridisation), allowing for a steady increase
in genomic resolution to a juncture at which break points can be accurately mapped. These
techniques, whilst reliable, are laborious and have limited utility for further applications outside of
break point mapping.
Comparatively, newer techniques utilising next-generation sequencing at whole genome scale have
been used to identify and characterise constitutional translocations, utilising the increased genomic
coverage, paired read discordance, and local reassembly to characterise break points (470,483) but
have been widely underutilised. The significant drawback of these methods is the financial burden
of parallel sequencing, but further utility is provided in WGS approaches to allow for a greater breadth
and depth for data interrogation (e.g. single nucleotide variant, structural variation, and copy-number
aberrations). Clinical diagnostics may well benefit from a personalised but holistic approach to
genomic analysis by providing a greater volume of genetic information with which to interpret
disease, including but not limited to detection and analysis of structural rearrangements.
214
6.1.4 Summary
As discussed above and previously (Introduction section 1.4.10), constitutional translocations have
previously been associated with a predisposition to RCC having been identified in numerous families
and individuals harbouring translocations, most frequently chromosome 3 and other chromosome
partners. Though rare, these translocations have implications for understanding the molecular
mechanisms of RCC through characterisation of the chromosomal breakpoints, affected genomic
loci, and subsequent observations in RCC tumours. In this chapter, a review of all known RCC-
associated translocation cases to-date is performed, assessing the clinical and genetic features
across these cases and characterise the breakpoints and molecular genetics of novel RCC-
associated translocation cases. Lastly, the use of WGS and new bioinformatics approaches is
explored as a methodology for a robust and efficient method of breakpoint characterisation without
using techniques used previously in translocation characterisation studies.
215
6.1.5 Aims
Determine the clinical, genetic, and molecular features and characteristics of known RCC-
associated translocation cases
Perform molecular and clinical characterisation of 5 novel RCC-associated translocation
cases
Assess the viability of WGS-based and 3rd generation NGS methods for translocation
breakpoint characterisation
216
6.2 Materials and methods
6.2.1 Literature review
Reports of cases of RCC with a constitutional chromosome rearrangement were identified through
a search of PubMed using the search terms “renal cell carcinoma” or “renal cancer” or “kidney
cancer/tumour” and “rearrangement/inversion/translocation or chromosome” and by searching
previously published reports. When previous reports had suggested candidate genes that were
either close to or disrupted by the relevant chromosomal breakpoints, evidence to suggest that the
genes were implicated in human cancer was sought by reviewing curated data from the Network of
Cancer Genes data portal (NCG; http://ncg.kcl.ac.uk/ version 6) (428). Where genes were classified
as either ‘known cancer genes’, ‘candidate cancer genes’, or ‘non-cancer genes’. Genes flagged as
‘false positive cancer genes’ were designated as ‘non-cancer genes’.
6.2.2 Clinical studies
Individuals presenting with RCC and with constitutional rearrangements were ascertained through
Regional Clinical Genetics Units in the United Kingdom.
6.2.3 Sequence alignment and variant calling
DNA from four probands was sequenced at Novogene as described in materials and methods
section 2.6.4. WGS bioinformatics was performed as described in materials and methods section
2.7.
DNA from one proband underwent WGS as part of the NIHR BioResource Rare Diseases study with
sequencing and primary bioinformatics performed as previously described in Whitworth et al (2018)
(376). Data in this instance had been aligned to genome build GRCh37 and all subsequent analysis
was performed identically with appropriate adjustments for differences in genome build. All genomic
coordinates are reported in GRCh38 and GRCh37 coordinates were remapped using the NCBI
remap tool (https://www.ncbi.nlm.nih.gov/genome/tools/remap). Called SNVs were processed and
filtered for various quality control metrics and allelic frequency as described in materials and methods
section 2.8.
217
6.2.4 WGS Analysis: Candidate gene analysis and Breakpoint identification
The WGS results were analysed for evidence for rare, potentially pathogenic, SNVs and copy
number abnormalities in previously reported inherited RCC genes (VHL, MET, FH, SDHB, SDHD,
SDHC, BAP1, CDKN2B) (98,484). Copy number detection was performed using Canvas Copy
Number Variant Caller (version 1.39.0.1598) (485), copy number variants were filtered to include
calls only marked as “PASS” (See appendix section 9.51). Structural rearrangements and
breakpoints were identified using Manta Structural Variant Caller (version 1.3.1) (486). Manta
structural variants were filtered to include only calls marked as “PASS”, number of supporting
spanning/split reads > 5, QUAL > 100, and call frequency (See appendix section 9.5.1. Breakpoints
called on chromosomes matching cytogenetic reports were visually inspected using Integrative
Genomics Viewer (IGV - version 2.3.93) to confirm the presence of split and spanning reads (See
appendix section 9.5.2).
6.2.5 Nanopore sequencing of translocation breakpoints
Long read sequencing of translocation breakpoint PCR amplicons was performed as described in
the materials and methods section 2.9.
6.2.6 Sanger sequencing
Sanger sequencing was performed as described in materials and methods section 2.4 using
breakpoint spanning primer pairs (Appendix section 9.5.3). Primer pairs were constructed for each
chromosomal breakpoint to span the break point region by inversing the primer pairing (i.e. ChrA-
forward → ChrB-reverse & ChrB-forward → ChrA-reverse), in this instance only PCR products
specific to the translocation break point should be amplified. Sanger traces are provided in appendix
section 9.5.3.
6.2.7 Statistical tests
All statistical tests were performed using R project for statistical computing (version 3.5). Welch’s t-
test was performed using the package BSDA (version 1.2.0) with the function tsum.test(). Kruskal–
Wallis rank sum test was performed using the base R function kruskal.test(). Fisher’s exact test was
performed using the base R function fisher.test(). Statistical testing was undertaken on data from
confirmed translocation carriers only.
218
6.3 Results
6.3.1 Literature review of previously reported cases
A total of 17 previously published distinct constitutional chromosome rearrangements were identified
from searches of the biomedical literature (see 6.3 Table 1) (260,459,495–499,487–494). In 15
cases (88%) chromosome 3 was involved (all of which were reciprocal translocations) and there
were a variety of partner chromosomes in the 15 translocation cases (e.g. 3 with chromosome 6, 3
with chromosome 8 – see 6.3 Table 1 and 6.3 Figure 1). For the RCC-associated chromosome 3
translocation cases, the breakpoints were almost evenly distributed between the long arm (3q), n=8)
and short arm (3p; n=7) and were heterogeneous (see 6.3 Figure 2).
Review of the clinical and pathological data in the previously reported cases demonstrated 9
kindreds with at least 2 related individuals with RCC. In the 4 cases without a family history and
available clinical information, multiple RCC was described in 2 individuals. The mean age at
diagnosis of a renal tumour in those cases known to carry a constitutional chromosomal
rearrangement was 50 years (range 25-82 years). Histopathological details were available for 43
cases and clear cell RCC was reported in 42 cases (98%).
Previous studies have demonstrated that cases of sporadic and familial RCC differ by mean age of
diagnosis, with RCC presenting earlier in familial cases (30,129). Comparison of the mean age of
diagnosis of RCC in translocation cases to familial and sporadic RCC cases (as reported previously
by Maher et al. (30)) were 50.2 (SD=12.7), 48.2 (SD=12.3), and 61.8 (SD=10.8) years of age,
respectively. Translocation cases have a statistically lower age of diagnosis than those with sporadic
disease (Welch's t-test, p=9.84x10⁻⁷) but no significant difference between translocation and familial
cases was observed (Welch's t-test, p=0.522). Though age of diagnosis across all affected
translocation carriers is variable there was no significant difference in age when comparing between
familial (with 2 or more related individuals) translocation families (Kruskal–Wallis test, p=0.174).
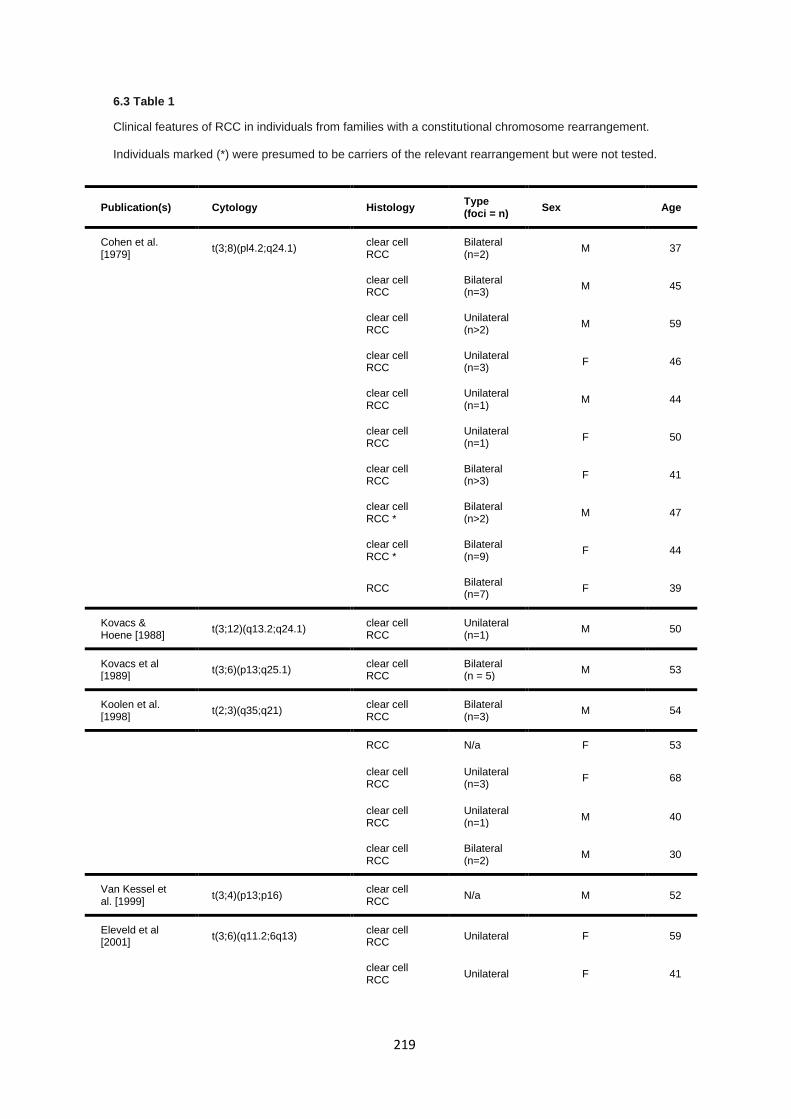
219
6.3 Table 1
Clinical features of RCC in individuals from families with a constitutional chromosome rearrangement.
Individuals marked (*) were presumed to be carriers of the relevant rearrangement but were not tested.
Publication(s) Cytology Histology Type (foci = n)
Sex Age
Cohen et al. [1979]
t(3;8)(pl4.2;q24.1) clear cell RCC
Bilateral (n=2)
M 37
clear cell RCC
Bilateral (n=3)
M 45
clear cell RCC
Unilateral (n>2)
M 59
clear cell RCC
Unilateral (n=3)
F 46
clear cell RCC
Unilateral (n=1)
M 44
clear cell RCC
Unilateral (n=1)
F 50
clear cell RCC
Bilateral (n>3)
F 41
clear cell RCC *
Bilateral (n>2)
M 47
clear cell RCC *
Bilateral (n=9)
F 44
RCC Bilateral (n=7)
F 39
Kovacs & Hoene [1988]
t(3;12)(q13.2;q24.1) clear cell RCC
Unilateral (n=1)
M 50
Kovacs et al [1989]
t(3;6)(p13;q25.1) clear cell RCC
Bilateral (n = 5)
M 53
Koolen et al. [1998]
t(2;3)(q35;q21) clear cell RCC
Bilateral (n=3)
M 54
RCC N/a F 53
clear cell RCC
Unilateral (n=3)
F 68
clear cell RCC
Unilateral (n=1)
M 40
clear cell RCC
Bilateral (n=2)
M 30
Van Kessel et al. [1999]
t(3;4)(p13;p16) clear cell RCC
N/a M 52
Eleveld et al [2001]
t(3;6)(q11.2;6q13) clear cell RCC
Unilateral F 59
clear cell RCC
Unilateral F 41
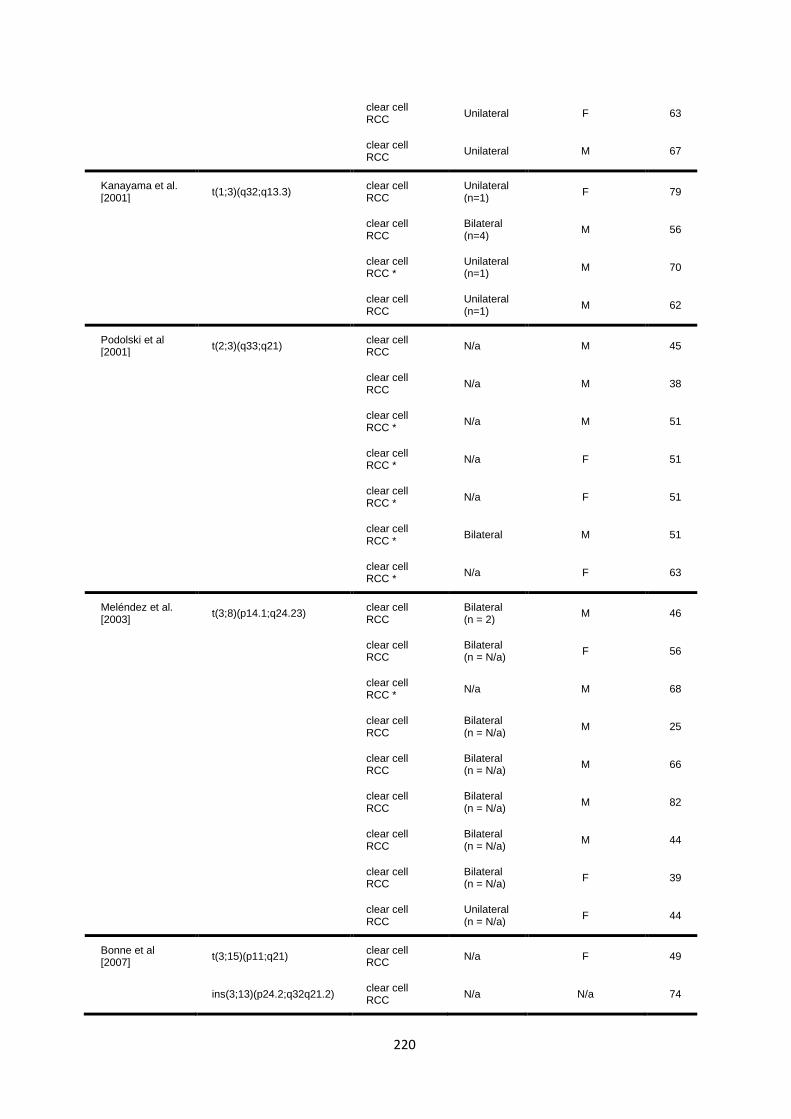
220
clear cell RCC
Unilateral F 63
clear cell RCC
Unilateral M 67
Kanayama et al. [2001]
t(1;3)(q32;q13.3) clear cell RCC
Unilateral (n=1)
F 79
clear cell RCC
Bilateral (n=4)
M 56
clear cell RCC *
Unilateral (n=1)
M 70
clear cell RCC
Unilateral (n=1)
M 62
Podolski et al [2001]
t(2;3)(q33;q21) clear cell RCC
N/a M 45
clear cell RCC
N/a M 38
clear cell RCC *
N/a M 51
clear cell RCC *
N/a F 51
clear cell RCC *
N/a F 51
clear cell RCC *
Bilateral M 51
clear cell RCC *
N/a F 63
Meléndez et al. [2003]
t(3;8)(p14.1;q24.23) clear cell RCC
Bilateral (n = 2)
M 46
clear cell RCC
Bilateral (n = N/a)
F 56
clear cell RCC *
N/a M 68
clear cell RCC
Bilateral (n = N/a)
M 25
clear cell RCC
Bilateral (n = N/a)
M 66
clear cell RCC
Bilateral (n = N/a)
M 82
clear cell RCC
Bilateral (n = N/a)
M 44
clear cell RCC
Bilateral (n = N/a)
F 39
clear cell RCC
Unilateral (n = N/a)
F 44
Bonne et al [2007]
t(3;15)(p11;q21) clear cell RCC
N/a F 49
ins(3;13)(p24.2;q32q21.2) clear cell RCC
N/a N/a 74
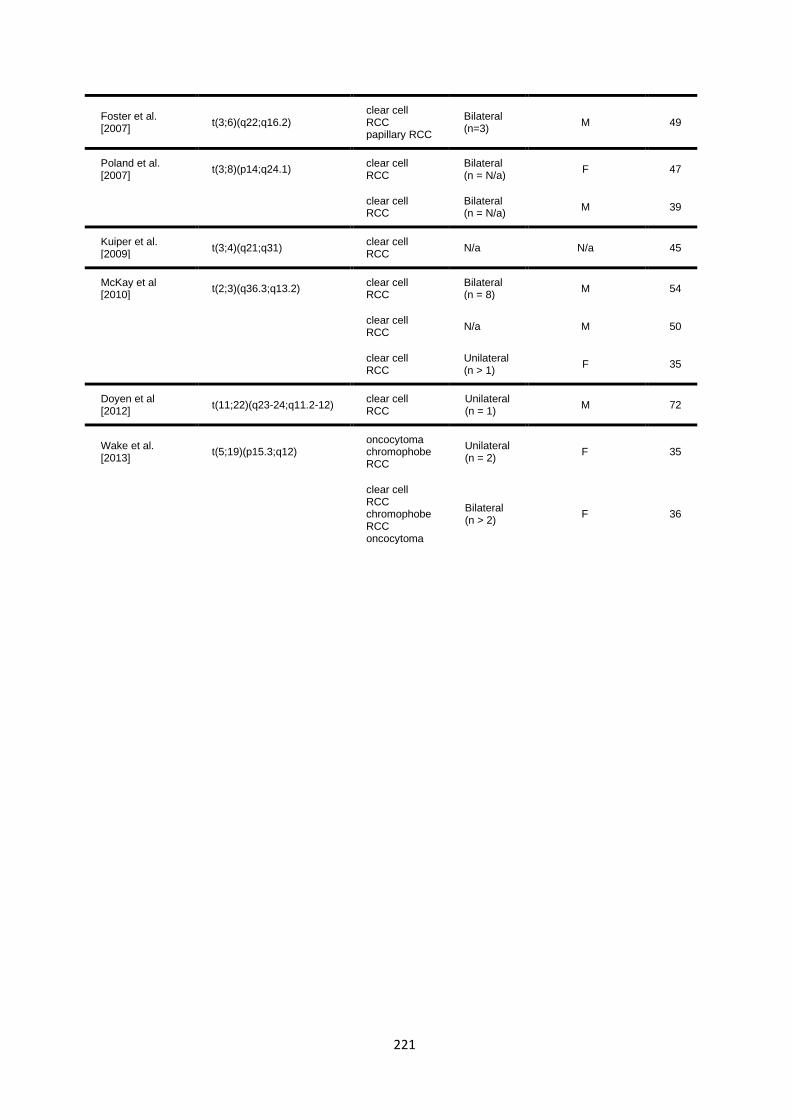
221
Foster et al. [2007]
t(3;6)(q22;q16.2) clear cell RCC papillary RCC
Bilateral (n=3)
M 49
Poland et al. [2007]
t(3;8)(p14;q24.1) clear cell RCC
Bilateral (n = N/a)
F 47
clear cell RCC
Bilateral (n = N/a)
M 39
Kuiper et al. [2009]
t(3;4)(q21;q31) clear cell RCC
N/a N/a 45
McKay et al [2010]
t(2;3)(q36.3;q13.2) clear cell RCC
Bilateral (n = 8)
M 54
clear cell RCC
N/a M 50
clear cell RCC
Unilateral (n > 1)
F 35
Doyen et al [2012]
t(11;22)(q23-24;q11.2-12) clear cell RCC
Unilateral (n = 1)
M 72
Wake et al. [2013]
t(5;19)(p15.3;q12) oncocytoma chromophobe RCC
Unilateral (n = 2)
F 35
clear cell RCC chromophobe RCC oncocytoma
Bilateral (n > 2)
F 36
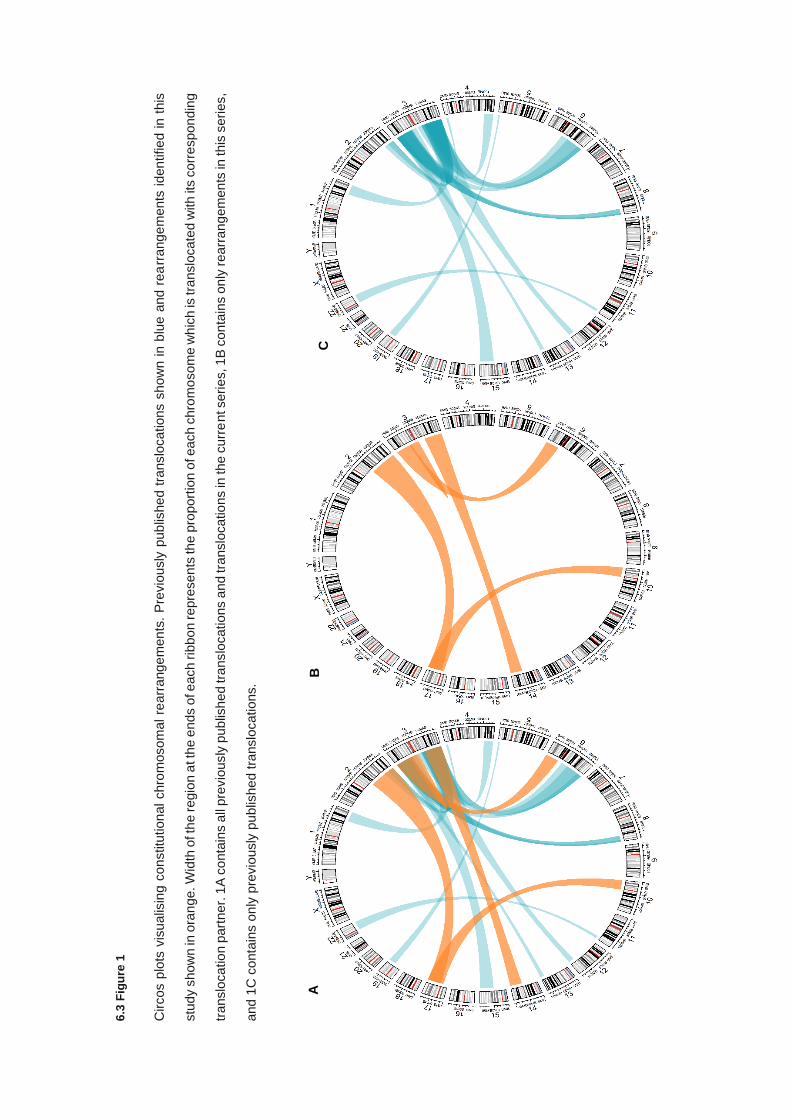
6.3
Fig
ure
1
Circos p
lots
vis
ualis
ing c
on
stitu
tion
al chro
mosom
al re
arr
ange
men
ts.
Pre
vio
usly
pub
lishe
d t
ranslo
cations s
how
n i
n b
lue a
nd r
ea
rrang
em
ents
iden
tifie
d in t
his
stu
dy s
how
n in
ora
nge. W
idth
of th
e regio
n a
t th
e e
nds o
f each rib
bo
n repre
sen
ts th
e p
roport
ion o
f each c
hro
mo
som
e w
hic
h is
tra
nslo
cate
d w
ith it
s c
orr
espond
ing
translo
catio
n p
art
ner.
1A
co
nta
ins a
ll pre
vio
usly
pub
lish
ed tra
nslo
cations a
nd tra
nslo
catio
ns in
the c
urr
ent seri
es, 1
B c
on
tain
s o
nly
rearr
an
gem
en
ts in
this
seri
es,
and 1
C c
onta
ins o
nly
pre
vio
usly
pu
blis
he
d tra
nslo
cations.
A
B
C
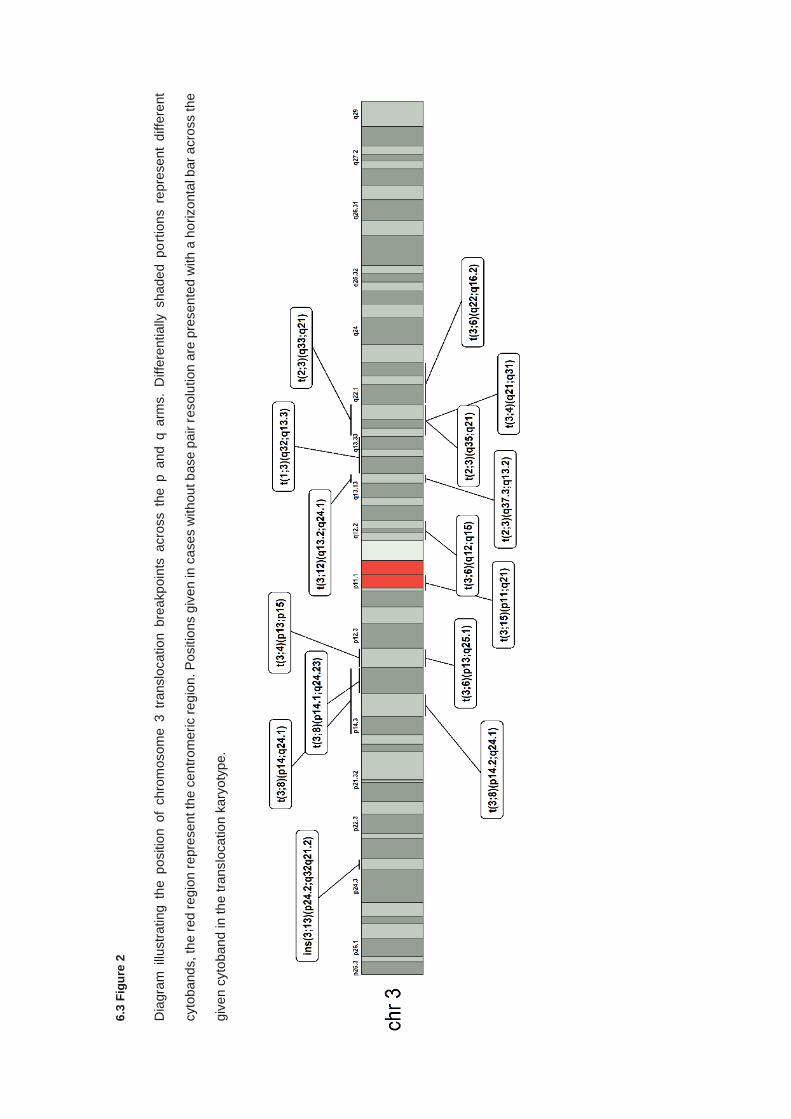
6.3
Fig
ure
2
Dia
gra
m i
llustr
ating t
he p
ositio
n o
f chro
mosom
e 3
tra
nslo
catio
n b
reakp
oin
ts acro
ss th
e p a
nd q a
rms.
Diffe
rentially
shade
d p
ort
ion
s r
epre
sent
diffe
rent
cyto
bands, th
e r
ed
reg
ion
repre
sent th
e c
en
trom
eri
c r
egio
n. P
ositio
ns g
iven in
cases w
ithou
t b
ase p
air
resolu
tion
are
pre
sen
ted
with a
ho
rizonta
l b
ar
acro
ss th
e
giv
en c
yto
ban
d in th
e tra
nslo
catio
n k
ary
oty
pe.
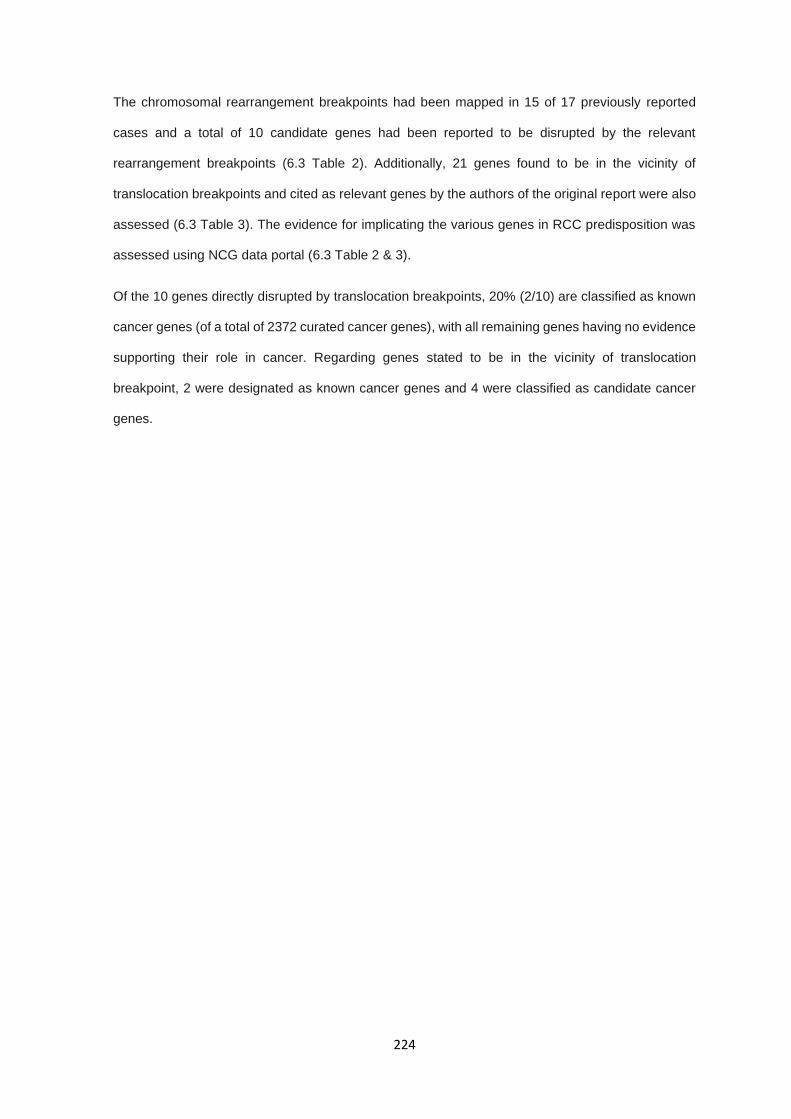
224
The chromosomal rearrangement breakpoints had been mapped in 15 of 17 previously reported
cases and a total of 10 candidate genes had been reported to be disrupted by the relevant
rearrangement breakpoints (6.3 Table 2). Additionally, 21 genes found to be in the vicinity of
translocation breakpoints and cited as relevant genes by the authors of the original report were also
assessed (6.3 Table 3). The evidence for implicating the various genes in RCC predisposition was
assessed using NCG data portal (6.3 Table 2 & 3).
Of the 10 genes directly disrupted by translocation breakpoints, 20% (2/10) are classified as known
cancer genes (of a total of 2372 curated cancer genes), with all remaining genes having no evidence
supporting their role in cancer. Regarding genes stated to be in the vicinity of translocation
breakpoint, 2 were designated as known cancer genes and 4 were classified as candidate cancer
genes.
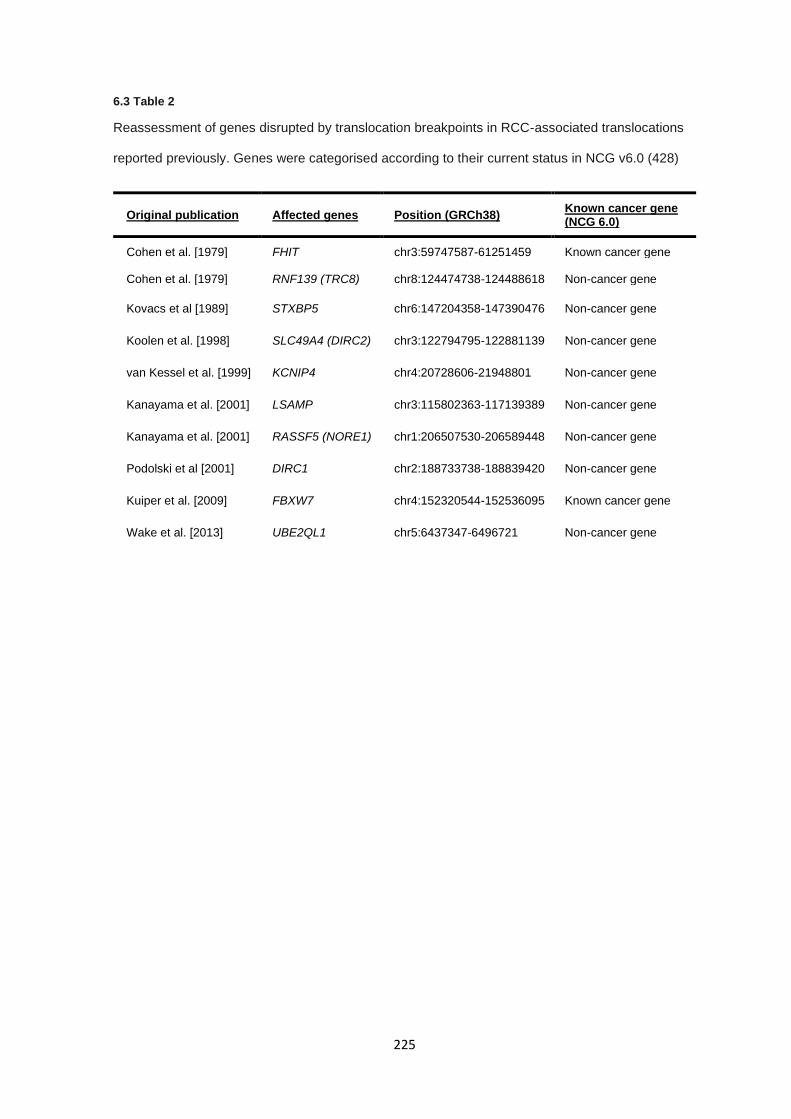
225
6.3 Table 2
Reassessment of genes disrupted by translocation breakpoints in RCC-associated translocations
reported previously. Genes were categorised according to their current status in NCG v6.0 (428)
Original publication Affected genes Position (GRCh38) Known cancer gene (NCG 6.0)
Cohen et al. [1979] FHIT chr3:59747587-61251459 Known cancer gene
Cohen et al. [1979] RNF139 (TRC8) chr8:124474738-124488618 Non-cancer gene
Kovacs et al [1989] STXBP5 chr6:147204358-147390476 Non-cancer gene
Koolen et al. [1998] SLC49A4 (DIRC2) chr3:122794795-122881139 Non-cancer gene
van Kessel et al. [1999] KCNIP4 chr4:20728606-21948801 Non-cancer gene
Kanayama et al. [2001] LSAMP chr3:115802363-117139389 Non-cancer gene
Kanayama et al. [2001] RASSF5 (NORE1) chr1:206507530-206589448 Non-cancer gene
Podolski et al [2001] DIRC1 chr2:188733738-188839420 Non-cancer gene
Kuiper et al. [2009] FBXW7 chr4:152320544-152536095 Known cancer gene
Wake et al. [2013] UBE2QL1 chr5:6437347-6496721 Non-cancer gene
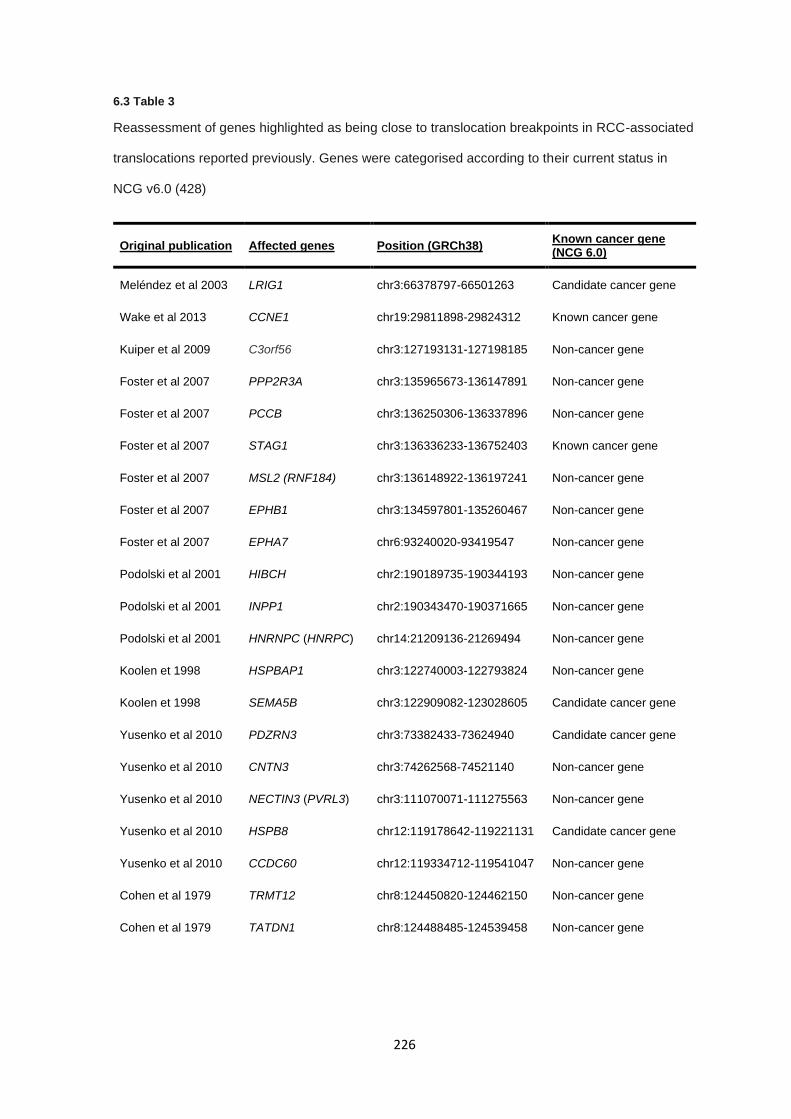
226
6.3 Table 3
Reassessment of genes highlighted as being close to translocation breakpoints in RCC-associated
translocations reported previously. Genes were categorised according to their current status in
NCG v6.0 (428)
Original publication Affected genes Position (GRCh38) Known cancer gene (NCG 6.0)
Meléndez et al 2003 LRIG1 chr3:66378797-66501263 Candidate cancer gene
Wake et al 2013 CCNE1 chr19:29811898-29824312 Known cancer gene
Kuiper et al 2009 C3orf56 chr3:127193131-127198185 Non-cancer gene
Foster et al 2007 PPP2R3A chr3:135965673-136147891 Non-cancer gene
Foster et al 2007 PCCB chr3:136250306-136337896 Non-cancer gene
Foster et al 2007 STAG1 chr3:136336233-136752403 Known cancer gene
Foster et al 2007 MSL2 (RNF184) chr3:136148922-136197241 Non-cancer gene
Foster et al 2007 EPHB1 chr3:134597801-135260467 Non-cancer gene
Foster et al 2007 EPHA7 chr6:93240020-93419547 Non-cancer gene
Podolski et al 2001 HIBCH chr2:190189735-190344193 Non-cancer gene
Podolski et al 2001 INPP1 chr2:190343470-190371665 Non-cancer gene
Podolski et al 2001 HNRNPC (HNRPC) chr14:21209136-21269494 Non-cancer gene
Koolen et 1998 HSPBAP1 chr3:122740003-122793824 Non-cancer gene
Koolen et 1998 SEMA5B chr3:122909082-123028605 Candidate cancer gene
Yusenko et al 2010 PDZRN3 chr3:73382433-73624940 Candidate cancer gene
Yusenko et al 2010 CNTN3 chr3:74262568-74521140 Non-cancer gene
Yusenko et al 2010 NECTIN3 (PVRL3) chr3:111070071-111275563 Non-cancer gene
Yusenko et al 2010 HSPB8 chr12:119178642-119221131 Candidate cancer gene
Yusenko et al 2010 CCDC60 chr12:119334712-119541047 Non-cancer gene
Cohen et al 1979 TRMT12 chr8:124450820-124462150 Non-cancer gene
Cohen et al 1979 TATDN1 chr8:124488485-124539458 Non-cancer gene
227
6.3.2 Clinical features of previously unreported cases
Five previously unreported constitutional chromosomal rearrangements ascertained through a
patient presenting with RCC were identified through UK genetics services. The cytogenetic, clinical
features and pathological features of the five probands and (when relevant) their affected relatives
are described in 6.3 Table 4. There were 4 translocations (involving chromosome 3 in two cases)
and a pericentric inversion of chromosome 3 (see 6.3 Table 4 and 6.3 Figure 1). Two or more
individuals developed RCC in 3 kindreds:
In the kindred with the t(3;14)(q13.3;q22) 5 individuals developed RCC (four of whom were confirmed
or obligate translocation carriers). The proband presented with bilateral RCC at age 75 years, his
daughter (an obligate carrier) died from RCC at age 36 years, his mother and two of his brothers
were reported to have developed RCC at ages 51, 41 and 79 years respectively. The proband’s
mother and brother with RCC at ages 51 and 79 years were also obligate t(3;14)(q13.3;q22) carriers
and the son of the latter developed RCC at age 67 years and was confirmed to have inherited the
t(3;14)(q13.3;q22).
In the kindred with the t(3;6)(p14.2;p12) rearrangement, the proband presented with RCC at age 72
years and four relatives were demonstrated to also harbour the translocation. Three had not
developed RCC (age at last follow up 47-52 years) but one (the proband’s brother) had developed
bilateral clear cell RCC age 55 years with unilateral recurrent disease and an adrenal metastasis
age 74 years and his son died from RCC at age 40 years without any record of his status for the
t(3;6)(p14.2;p12).
The index case carrying the inv(3)(p21.1q12) was unaffected but was ascertained following a report
that her cousin had developed clear cell RCC at age 39 and harboured the chromosome 3 inversion.
Other carriers of the inversion in the family who were reported to carry the inversion, but were
unaffected, included her paternal aunt and father, whilst her grandfather was also a carrier and died
of carcinomatosis at age 80 years. The proband’s brother was diagnosed with RCC at age 48 but
was not tested for the inversion.
228
The t(2q21.1; 17q11.2) was identified in a 37 year old man with a poorly differentiated clear cell RCC
who died from metastatic disease shortly thereafter. The translocation was maternally inherited and
was detected in three unaffected family members (mother and two siblings) aged between 30 and
58 years of age.
In the kindred with the t(10;17)(q11.21;p11.2) the proband and their sibling were found to have
features of suggestive Birt-Hogg-Dubé syndrome (BHD; OMIM: 135150) (pneumothoraces, and
fibrofolliculomas in the proband and multiple pulmonary cysts and fibrofolliculomas in his sister) after
the diagnosis of RCC in the proband and the detection of the translocation.
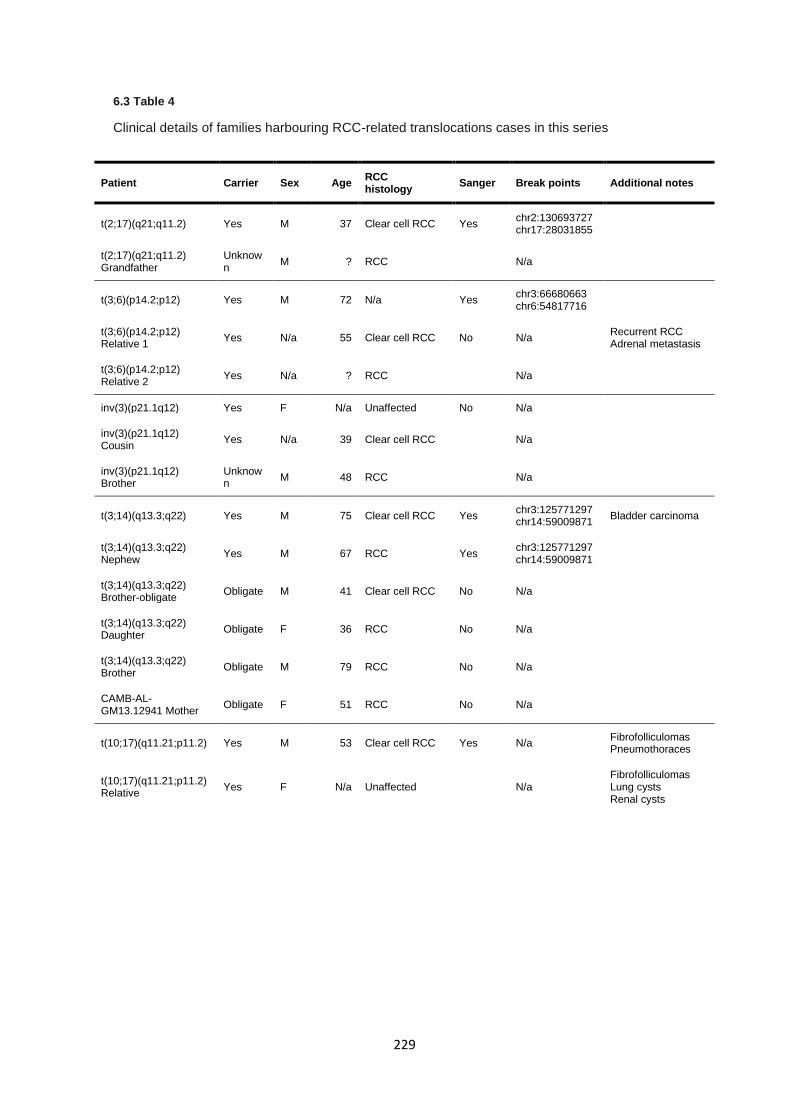
229
6.3 Table 4
Clinical details of families harbouring RCC-related translocations cases in this series
Patient Carrier Sex Age RCC histology
Sanger Break points Additional notes
t(2;17)(q21;q11.2) Yes M 37 Clear cell RCC Yes chr2:130693727 chr17:28031855
t(2;17)(q21;q11.2) Grandfather
Unknown
M ? RCC N/a
t(3;6)(p14.2;p12) Yes M 72 N/a Yes chr3:66680663 chr6:54817716
t(3;6)(p14.2;p12) Relative 1
Yes N/a 55 Clear cell RCC No N/a Recurrent RCC Adrenal metastasis
t(3;6)(p14.2;p12) Relative 2
Yes N/a ? RCC N/a
inv(3)(p21.1q12) Yes F N/a Unaffected No N/a
inv(3)(p21.1q12) Cousin
Yes N/a 39 Clear cell RCC N/a
inv(3)(p21.1q12) Brother
Unknown
M 48 RCC N/a
t(3;14)(q13.3;q22) Yes M 75 Clear cell RCC Yes chr3:125771297 chr14:59009871
Bladder carcinoma
t(3;14)(q13.3;q22) Nephew
Yes M 67 RCC Yes chr3:125771297 chr14:59009871
t(3;14)(q13.3;q22) Brother-obligate
Obligate M 41 Clear cell RCC No N/a
t(3;14)(q13.3;q22) Daughter
Obligate F 36 RCC No N/a
t(3;14)(q13.3;q22) Brother
Obligate M 79 RCC No N/a
CAMB-AL-GM13.12941 Mother
Obligate F 51 RCC No N/a
t(10;17)(q11.21;p11.2) Yes M 53 Clear cell RCC Yes N/a Fibrofolliculomas Pneumothoraces
t(10;17)(q11.21;p11.2) Relative
Yes F N/a Unaffected N/a Fibrofolliculomas Lung cysts Renal cysts
230
6.3.3 Whole genome sequencing and bioinformatics
Sequencing metrics were assessed to confirm data reliability and suitability for downstream SNV,
SV, and CNV analysis. Mean sequence alignment rates across all samples was 99.7%, indicating a
high-quality sequence mapping. WGS coverage analysis demonstrated a mean coverage of 28.9X
across all genomes, though the genome analysed as part of NIHR Rare diseases bioresource study
had mean coverage of 35X due to a different sequencing methodology. For variant calling, the
transition / transversion ratio (Ts/Tv) after minimal genotype filtering (depth > 10 and QUAL > 30)
was reported as 1.93, suggesting no variant calling bias across the genome.
6.3.4 Characterisation of constitutional rearrangements in previously unreported cases
WGS did not identify any plausible likely pathogenic or pathogenic SNVs or CNVs variants in
previously reported inherited RCC genes (VHL, SDHB, SDHC, SDHD, MET, FLCN, TSC1, TSC2,
FH, PTEN, PBRM1, BAP1, or CDKN2B) in the four probands who were affected by RCC. A novel
missense variant of uncertain significance by ACMG criteria (325) was identified in PBRM1
(NM_018313.4:c.2446A>T p.Asn816Tyr) in the t(3;6)(p14.2;p12) translocation case. DNA from an
affected individual was not available for sequencing in the family carrying the inv(3)(p21.1q12)
inversion, as such sequencing was performed solely to identify candidate breakpoints. Candidate
rearrangement breakpoints were identified from the WGS data by the Manta structural variation
detection algorithm in all five cases:
Breakpoints for translocation t(3;14)(q13.3;q22) were resolved to be present at the loci
chr3:125771297 and chr14:59009871. The candidate breakpoints were supported by 7 and 9
spanning and split reads, respectively (Appendix section 9.5.4). The candidate breakpoint locations
identified by WGS differed from those suggested previously by cytogenetic studies: the 3q breakpoint
at chr3:125771297 is within cytoband 3q21 and the WGS-identified 14q breakpoint at
chr14:59009871 maps to 14q23.1. Sanger sequencing confirmed the presence of the translocation
breakpoints. Sanger sequencing in a DNA sample from his affected nephew confirmed identical
breakpoints to the proband. The 3q breakpoint intersects with LOC105374312, an uncharacterised
non-coding RNA gene and the 14q breakpoint disrupts the last intron of LINC01500, a long intergenic
non-coding RNA gene, and is predicted to result in a truncated transcript lacking the final exon.
231
WGS in the second chromosome 3 associated translocation case t(3;6)(p14.2;p12) revealed
candidate breakpoints at chr3:66680663 and chr6:54817716 within an AT-rich repetitive region.
Breakpoint calls were supported by 4 and 7 spanning and split read calls, respectively (Appendix
section 9.5.4). Sanger sequencing confirmed the presence of the translocation breakpoints. The 3p
chromosomal breakpoint identified by WGS mapped within 3p14.1 and disrupted LOC105377142,
an uncharacterised non-coding RNA. The 6p breakpoint did not disrupt a predicted gene but was 29
kb upstream of FAM83B.
The candidate breakpoints in the inv(3)(p21.1q12) were identified by Manta with 11 spanning and
11 split reads supporting the presence of this inversion, though the number of reference spanning
reads was only 2 (Appendix section 9.5.4). The two candidate breakpoints mapped to chr3:59964935
at 3p14.2 (interrupting intron 7 of FHIT) and chr3:98667603 (3q12), 47 kb upstream of ST3GAL6-
AS1, a non-coding RNA gene. Though cytogenetics and Manta calls support the presence of the
inv(3)(p21.1q12), Sanger sequencing under multiple experimental conditions failed to generate any
PCR products and the candidate breakpoints could not be independently confirmed.
WGS in the first of the two non-chromosome 3 translocations (t(2;17)(q21.1;q11.2)) localised the
breakpoints to chr2:130693728 (2q21.1) and chr17:28030855 (17q11.2). The translocation
breakpoint was supported by 9 spanning and 10 split reads as called by Manta (Appendix section
9.5.4). Sanger sequencing confirmed the genomic coordinates and breakpoint as a single base
translocation without local rearrangement, insertions, or deletions. The breakpoint present on
chromosome 2 disrupted the coding region of two overlapping pseudogenes KLF2P3 and FAR2P3,
as well as interrupting a CpG island spanning chr2:130693485-130693839. The nearest coding
genes were POTEJ, AMER3, and GPR148 which were 35 kb upstream, 34 kb downstream and 62
kb downstream, respectively. The junction on chromosome 17 did not disrupt any known coding
region but was 1.7 kb upstream of a reported H3K27Ac element covering chr17:28,033,593-
28,035,092, and 9.9 kb upstream of the NLK gene.
232
The second non-chromosome 3 translocation t(10;17)(q11.22;p12) underwent sequencing as part
of the NIHR BioResource Rare Diseases BRIDGE project (see methods 6.2) and was analysed
previously as part of a multiple primary tumour cohort (34) with a history facial fibrofolliculomas,
recurrent pneumothoraces and RCC. At that time no abnormality was detected but subsequently
reanalysis identified candidate translocation breakpoints that were supported by two overlapping
Manta calls for the chromosome 10 and chromosome 17 breakpoints at chr17:17218211-17218214
(17p11.2) and chr10:43236047-43236050 (10q11.21) that were supported by 22 spanning and 10
split reads and a secondary call at chr17:17218216-17218217 and chr10:43236058-43236059 by
15 spanning and 18 split reads (Appendix section 9.5.4). Given the proximity of the assigned
breakpoint regions, a single translocation was presumed with an additional nested structural
variation resulting in divided calling. Sanger sequencing confirmed the presence of the translocation
breakpoint in the proband. The chromosome 17 breakpoint prediction disrupted the coding region of
FLCN, falling within intron 9 (ENST00000285071). The chromosome 10 breakpoint disrupted the
first intron of RASGEF1A (the first exon encodes 5’ untranslated region only proximal to the
translation initiation site (ENST00000395810). Sanger sequencing of DNA from the proband’s sibling
(who was known to carry the t(10;17)(q11.22;p12)) confirmed that translocation breakpoint and that
she had evidence of BHD syndrome (multiple lung and renal cysts and facial fibrofolliculomas).
233
6.3.5 Characterisation of translocation breakpoints utilising Nanopore sequencing
While Sanger sequencing of translocation breakpoints can effectively confirm the presence or
absence of a breakpoint, and in some instances provide characterisation of breakpoints, many
translocation break points are complex or involve additional genomic alterations such as deletions
and insertions of additional bases, particularly in repetitive regions. Herein demonstrates the utility
of Nanopore sequencing for the base-level characterisation of one of the newly reported
translocation cases, t(3;14)(q13.3;q22), which contained an ambiguous region at the break site by
multiple sequence alignment of breakpoint-spanning PCR products due to increased sequencing
read sizes.
Assessment of Nanopore sequencing metrics determined the sequencing run generated 46,431
reads across the translocation breakpoint with a median read length of 815 bp from 474 of 512 active
sequencing channels from breakpoint-spanning PCR products. Mean read qualities were most
frequent at 8-12, suggesting high quality sequencing was generated (6.3 Figure 3). Nanopore
sequencing was aligned to GRCh38 and generated 75,096 mapped reads. Discrepancy between
number of sequenced reads and the number of mapped reads is due to the presence of
supplementary read alignments, which are defined as reads with two distinct but split mapping
positions, as would be expected from a translocation breakpoint. Of those reads 71,927 (95.8%)
reads intersected the translocation breakpoints (chr3:125771297 and chr14:59009871) determined
by Manta.
Read alignments were visualised using IGV (6.3 Figure 4) which demonstrated the translocation
breakpoint succinctly, showing aligned reads split evenly between chromosome 3 and 14.
Comparisons between Nanopore alignments and Sanger sequencing alignments allowed for the
resolution of a 5 bp deletion on chromosome 14 (5’-ATGTGTGG) at the breakpoint site whereas
chromosome 3 did not appear to have any additional structural rearrangements.
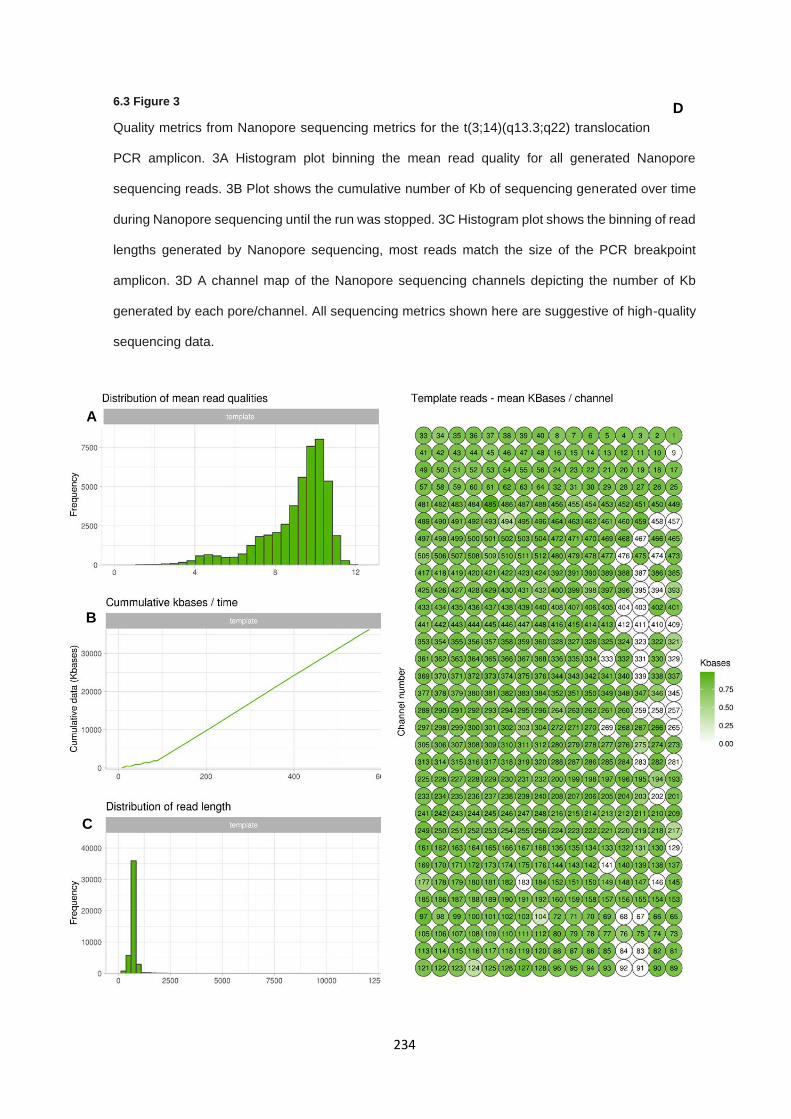
234
6.3 Figure 3
Quality metrics from Nanopore sequencing metrics for the t(3;14)(q13.3;q22) translocation
PCR amplicon. 3A Histogram plot binning the mean read quality for all generated Nanopore
sequencing reads. 3B Plot shows the cumulative number of Kb of sequencing generated over time
during Nanopore sequencing until the run was stopped. 3C Histogram plot shows the binning of read
lengths generated by Nanopore sequencing, most reads match the size of the PCR breakpoint
amplicon. 3D A channel map of the Nanopore sequencing channels depicting the number of Kb
generated by each pore/channel. All sequencing metrics shown here are suggestive of high-quality
sequencing data.
A
B
C
D
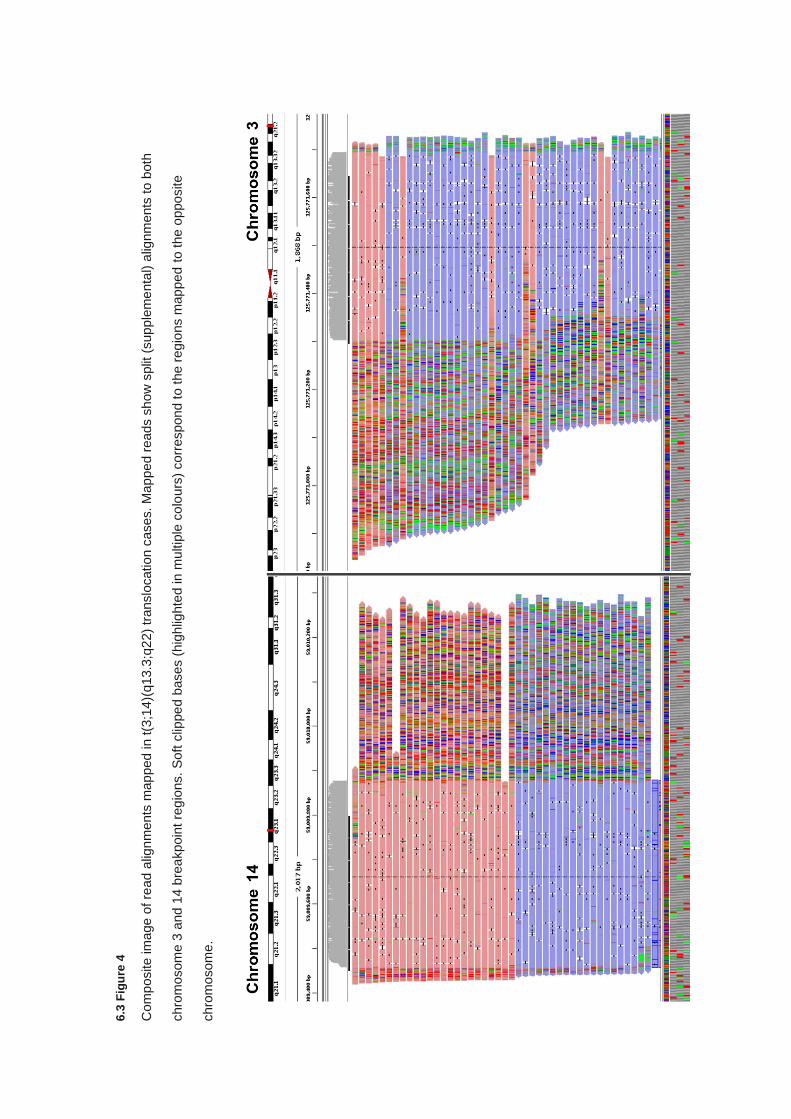
6.3
Fig
ure
4
Com
posite
im
age
of re
ad a
lign
ments
map
ped
in t(3
;14)(
q13.3
;q2
2)
translo
cation c
ases. M
ap
pe
d r
eads s
how
split
(sup
ple
me
nta
l) a
lignm
ents
to b
oth
chro
mosom
e 3
and
14 b
rea
kpoin
t re
gio
ns.
Soft
clip
pe
d b
ases (
hig
hlig
hte
d in m
ultip
le c
olo
urs
) corr
espond t
o t
he r
eg
ions m
ap
pe
d to t
he o
ppo
site
chro
mosom
e.
236
6.3.6 Computational evaluation of breakpoint-related genes
The five constitutional rearrangements were confirmed or postulated to disrupt three protein coding
genes (FHIT, FLCN and RASGEF1A) and to map within 50 kb of four more genes (FAM83B, POTEJ,
AMER3, NLK). Two of these genes, FHIT and FLCN have been previously implicated as renal
tumour suppressor genes (191,195) and potential evidence for a role of RASGEF1A, FAM83B,
POTEJ, AMER3 and NLK in hereditary cancer predisposition and/or somatic tumourigenesis was
sought from the NCG data portal (6.3 Table 5). On the NCG data portal both FHIT and FLCN were
classified as “known cancer genes”, RASGEF1A as a “candidate cancer gene” and the other genes
were categorised as “non-cancer genes”.
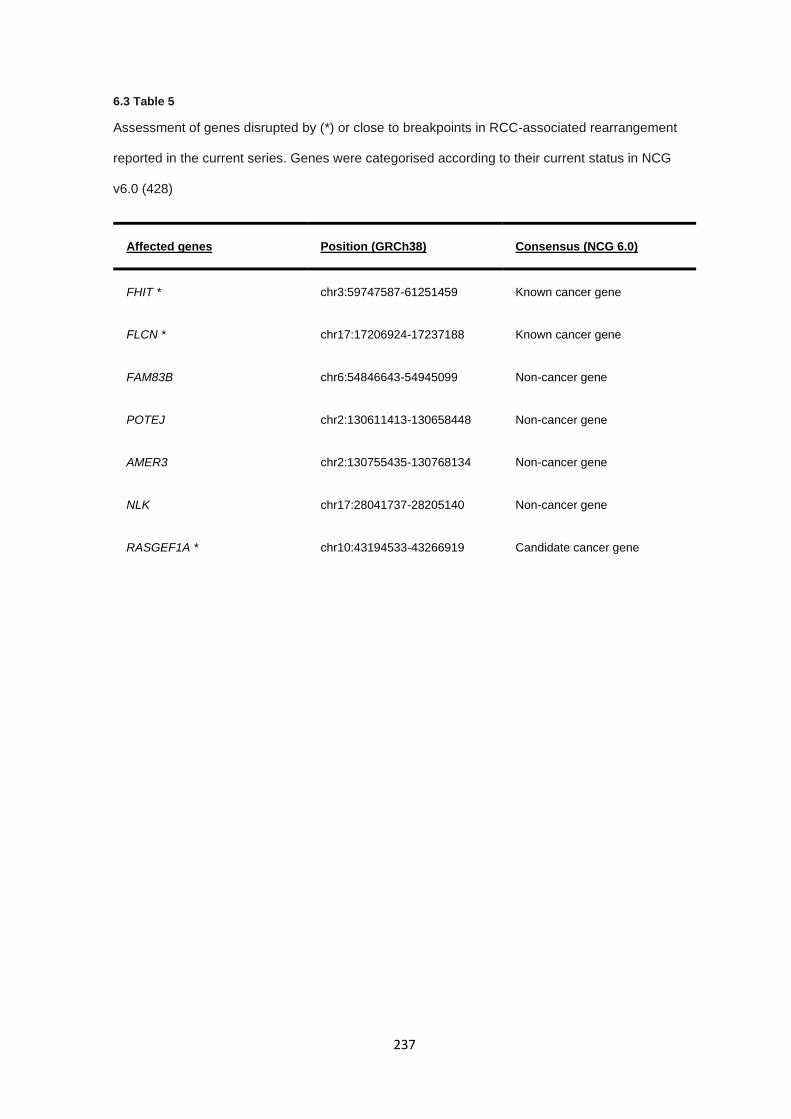
237
6.3 Table 5
Assessment of genes disrupted by (*) or close to breakpoints in RCC-associated rearrangement
reported in the current series. Genes were categorised according to their current status in NCG
v6.0 (428)
Affected genes Position (GRCh38) Consensus (NCG 6.0)
FHIT * chr3:59747587-61251459 Known cancer gene
FLCN * chr17:17206924-17237188 Known cancer gene
FAM83B chr6:54846643-54945099 Non-cancer gene
POTEJ chr2:130611413-130658448 Non-cancer gene
AMER3 chr2:130755435-130768134 Non-cancer gene
NLK chr17:28041737-28205140 Non-cancer gene
RASGEF1A * chr10:43194533-43266919 Candidate cancer gene
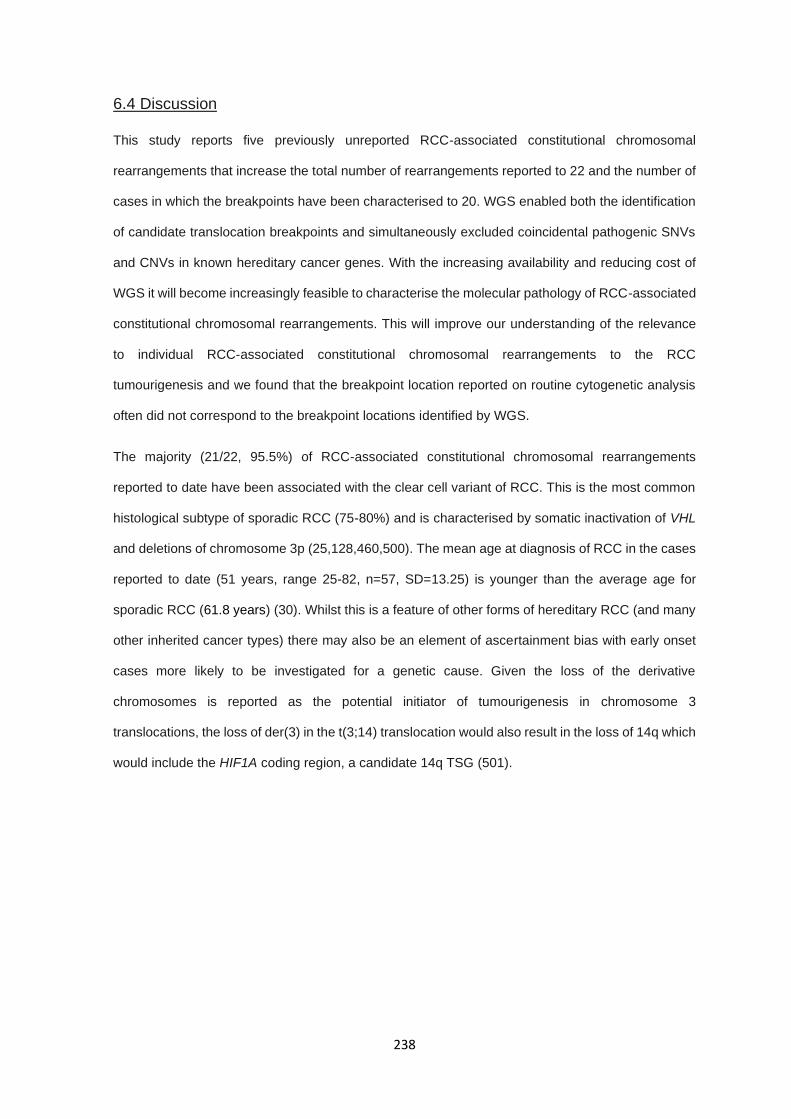
238
6.4 Discussion
This study reports five previously unreported RCC-associated constitutional chromosomal
rearrangements that increase the total number of rearrangements reported to 22 and the number of
cases in which the breakpoints have been characterised to 20. WGS enabled both the identification
of candidate translocation breakpoints and simultaneously excluded coincidental pathogenic SNVs
and CNVs in known hereditary cancer genes. With the increasing availability and reducing cost of
WGS it will become increasingly feasible to characterise the molecular pathology of RCC-associated
constitutional chromosomal rearrangements. This will improve our understanding of the relevance
to individual RCC-associated constitutional chromosomal rearrangements to the RCC
tumourigenesis and we found that the breakpoint location reported on routine cytogenetic analysis
often did not correspond to the breakpoint locations identified by WGS.
The majority (21/22, 95.5%) of RCC-associated constitutional chromosomal rearrangements
reported to date have been associated with the clear cell variant of RCC. This is the most common
histological subtype of sporadic RCC (75-80%) and is characterised by somatic inactivation of VHL
and deletions of chromosome 3p (25,128,460,500). The mean age at diagnosis of RCC in the cases
reported to date (51 years, range 25-82, n=57, SD=13.25) is younger than the average age for
sporadic RCC (61.8 years) (30). Whilst this is a feature of other forms of hereditary RCC (and many
other inherited cancer types) there may also be an element of ascertainment bias with early onset
cases more likely to be investigated for a genetic cause. Given the loss of the derivative
chromosomes is reported as the potential initiator of tumourigenesis in chromosome 3
translocations, the loss of der(3) in the t(3;14) translocation would also result in the loss of 14q which
would include the HIF1A coding region, a candidate 14q TSG (501).
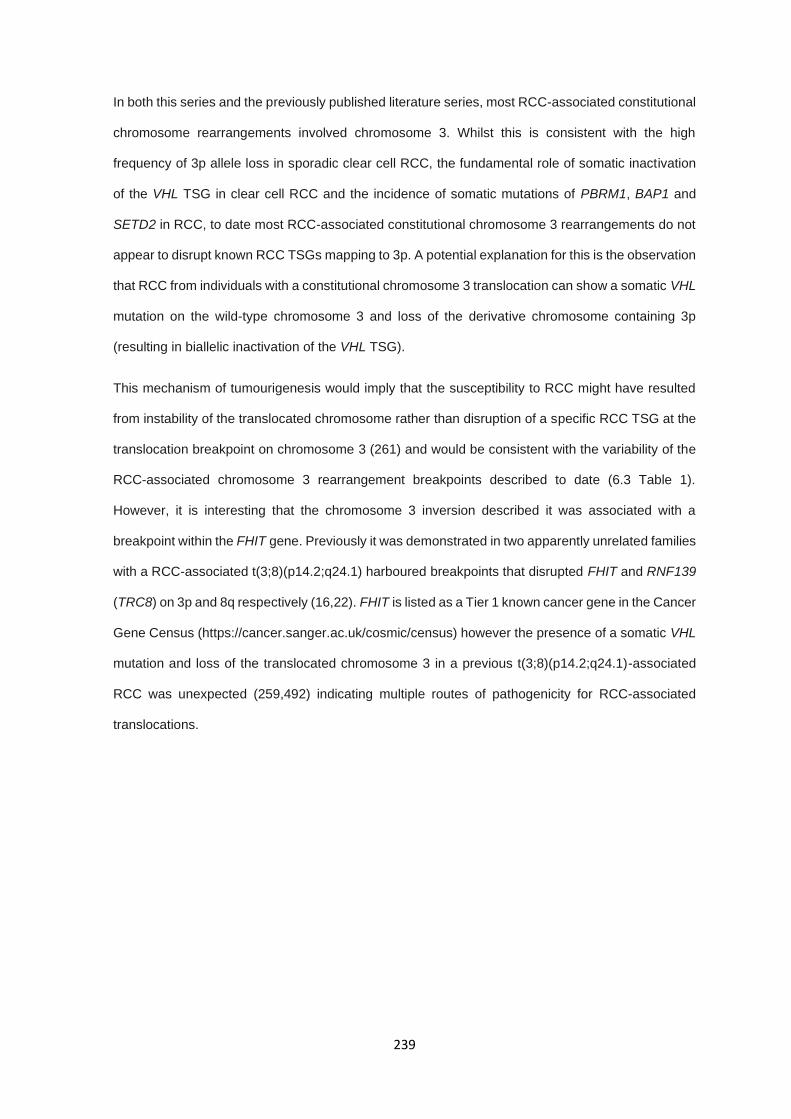
239
In both this series and the previously published literature series, most RCC-associated constitutional
chromosome rearrangements involved chromosome 3. Whilst this is consistent with the high
frequency of 3p allele loss in sporadic clear cell RCC, the fundamental role of somatic inactivation
of the VHL TSG in clear cell RCC and the incidence of somatic mutations of PBRM1, BAP1 and
SETD2 in RCC, to date most RCC-associated constitutional chromosome 3 rearrangements do not
appear to disrupt known RCC TSGs mapping to 3p. A potential explanation for this is the observation
that RCC from individuals with a constitutional chromosome 3 translocation can show a somatic VHL
mutation on the wild-type chromosome 3 and loss of the derivative chromosome containing 3p
(resulting in biallelic inactivation of the VHL TSG).
This mechanism of tumourigenesis would imply that the susceptibility to RCC might have resulted
from instability of the translocated chromosome rather than disruption of a specific RCC TSG at the
translocation breakpoint on chromosome 3 (261) and would be consistent with the variability of the
RCC-associated chromosome 3 rearrangement breakpoints described to date (6.3 Table 1).
However, it is interesting that the chromosome 3 inversion described it was associated with a
breakpoint within the FHIT gene. Previously it was demonstrated in two apparently unrelated families
with a RCC-associated t(3;8)(p14.2;q24.1) harboured breakpoints that disrupted FHIT and RNF139
(TRC8) on 3p and 8q respectively (16,22). FHIT is listed as a Tier 1 known cancer gene in the Cancer
Gene Census (https://cancer.sanger.ac.uk/cosmic/census) however the presence of a somatic VHL
mutation and loss of the translocated chromosome 3 in a previous t(3;8)(p14.2;q24.1)-associated
RCC was unexpected (259,492) indicating multiple routes of pathogenicity for RCC-associated
translocations.
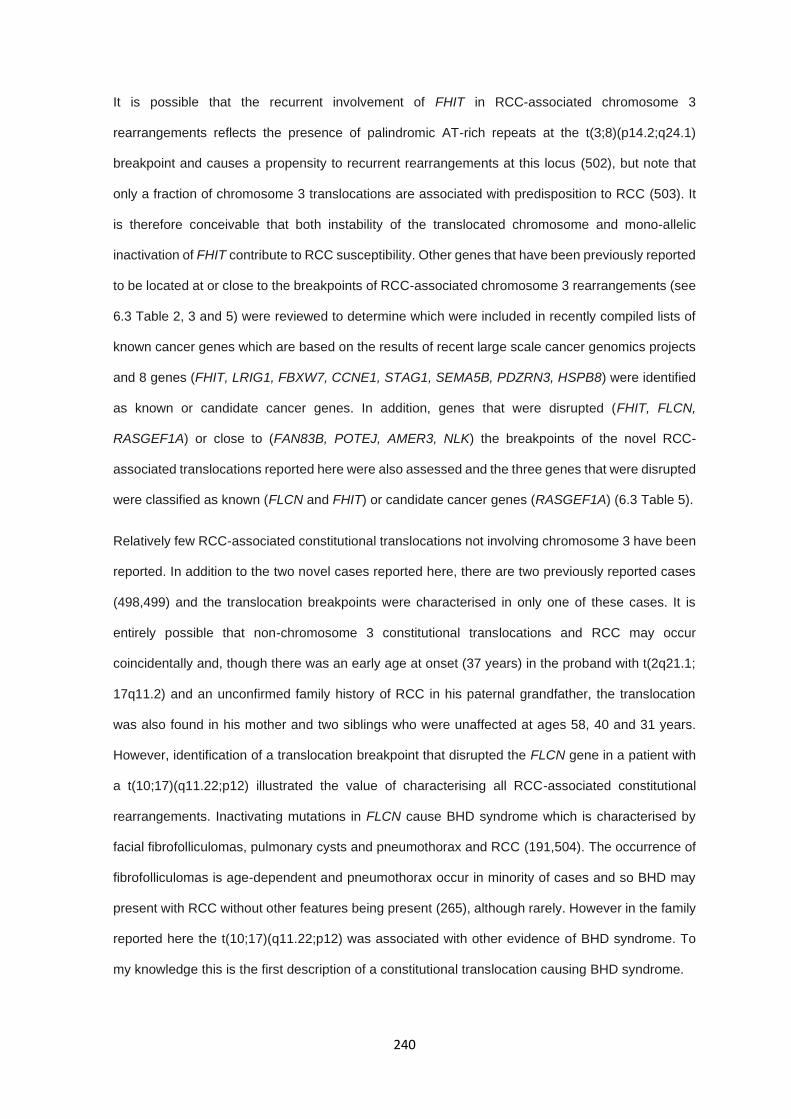
240
It is possible that the recurrent involvement of FHIT in RCC-associated chromosome 3
rearrangements reflects the presence of palindromic AT-rich repeats at the t(3;8)(p14.2;q24.1)
breakpoint and causes a propensity to recurrent rearrangements at this locus (502), but note that
only a fraction of chromosome 3 translocations are associated with predisposition to RCC (503). It
is therefore conceivable that both instability of the translocated chromosome and mono-allelic
inactivation of FHIT contribute to RCC susceptibility. Other genes that have been previously reported
to be located at or close to the breakpoints of RCC-associated chromosome 3 rearrangements (see
6.3 Table 2, 3 and 5) were reviewed to determine which were included in recently compiled lists of
known cancer genes which are based on the results of recent large scale cancer genomics projects
and 8 genes (FHIT, LRIG1, FBXW7, CCNE1, STAG1, SEMA5B, PDZRN3, HSPB8) were identified
as known or candidate cancer genes. In addition, genes that were disrupted (FHIT, FLCN,
RASGEF1A) or close to (FAN83B, POTEJ, AMER3, NLK) the breakpoints of the novel RCC-
associated translocations reported here were also assessed and the three genes that were disrupted
were classified as known (FLCN and FHIT) or candidate cancer genes (RASGEF1A) (6.3 Table 5).
Relatively few RCC-associated constitutional translocations not involving chromosome 3 have been
reported. In addition to the two novel cases reported here, there are two previously reported cases
(498,499) and the translocation breakpoints were characterised in only one of these cases. It is
entirely possible that non-chromosome 3 constitutional translocations and RCC may occur
coincidentally and, though there was an early age at onset (37 years) in the proband with t(2q21.1;
17q11.2) and an unconfirmed family history of RCC in his paternal grandfather, the translocation
was also found in his mother and two siblings who were unaffected at ages 58, 40 and 31 years.
However, identification of a translocation breakpoint that disrupted the FLCN gene in a patient with
a t(10;17)(q11.22;p12) illustrated the value of characterising all RCC-associated constitutional
rearrangements. Inactivating mutations in FLCN cause BHD syndrome which is characterised by
facial fibrofolliculomas, pulmonary cysts and pneumothorax and RCC (191,504). The occurrence of
fibrofolliculomas is age-dependent and pneumothorax occur in minority of cases and so BHD may
present with RCC without other features being present (265), although rarely. However in the family
reported here the t(10;17)(q11.22;p12) was associated with other evidence of BHD syndrome. To
my knowledge this is the first description of a constitutional translocation causing BHD syndrome.
241
The other novel translocation case did not disrupt a known cancer gene but occurred close to Nemo-
Like Kinase (NLK) a serine/threonine-protein kinase that has been associated with the non-canonical
WNT and MAPK signalling pathways. Whilst NLK is currently not designated as a known cancer
gene, evidence of tumour suppressor activity has been reported (505–507) and a role for NLK protein
in the stabilisation of p53 has been suggested (508). Interestingly, NLK appears to collaborate with
FBXW7 in the ubiquitination of c-Myb by enhancing ligation of additional ubiquitin molecules via NLK
phosphorylation, leading to downregulation of cellular proliferation (509) and previously a RCC-
associated constitutional translocation, t(3;4)(q21;q31), was demonstrated to interrupt FBXW7 (496).
Furthermore, FBXW7 is a designated tumour suppressor gene that is mutated in multiple types of
primary cancers (25) and encodes an F-box protein that is part of a SCF complex thought to target
cyclin E and mTOR for ubiquitin-mediated degradation (510,511). Additionally, it was demonstrated
FBXW7 interacts with Ubiquitin-conjugating enzyme E2Q-like protein 1 (UBE2QL1), the gene of
which is known to be disrupted in another previously reported RCC translocation case (499),
suggesting an interesting connection between multiple interacting gene products in translocation-
related RCC.
While studies demonstrated complete loss of der(3p) in tumours tested (259,496,512–515), partial
loss (489,516,517) or no loss of der(3p) in assessed tumours (493,495,518) has also been
documented. Furthermore, studies including assessment for loss of heterozygosity or inactivating
mutations in the remaining wildtype allele of VHL have also been conflicted with experimental data
demonstrating presence in all samples (489,495,496,515), some samples (516,517), and no
demonstrable loss (493,497,518).

242
The lack of known tumour suppressors, intergenic break points, and no relation to commonly lost
regions in sporadic RCC cases suggests that other mechanisms are involved in predisposition and
tumour progression. Translocations may confer a generalised genomic instability, in which specific
loss of 3p is not required, and further inactivation of unknown genes are responsible for
tumourigenesis. Alternatively, translocations may result in positional-effect variegation, resulting in
differential expression patterns for coding regions under differential chromatin regulation (464). It is
reasonable, given the atypical presentations and lack of familial history for non-chromosome 3
cases, that pathways responsible for oncogenesis in these individuals are case-specific and no
generalised model exists. Given the atypical presentations and lack of familial history for non-
chromosome 3 cases, that pathways responsible for oncogenesis in these individuals are case-
specific and no generalised model exists.
243
6.5 Conclusion
In conclusion, this study reports five new cases of RCC-associated constitutional chromosome
rearrangements characterised by WGS. These include the first example of a chromosome 3
inversion associated with RCC, the first case of a major inherited RCC gene disrupted by a
translocation and a third example of an RCC constitutional chromosome rearrangement that disrupts
FHIT. Review of the five novel cases reported here and previously reported cases demonstrates that
RCC-associated constitutional chromosome rearrangements: 1) mostly involve chromosome 3 but
rearrangements that solely involve other chromosomes may also be causally linked to RCC, 2) may
predispose to RCC by a variety of mechanisms including disruption of a tumour suppressor gene
(e.g. FLCN) and/or chromosomal instability (as with chromosome 3 translocations), 3) can be
efficiently characterised by WGS and 4) can identify candidate pathways for RCC tumourigenesis.
For chromosome 3 translocations it is unclear why most cases that are not ascertained because of
a personal or family history of RCC appear to be associated with a very low risk of RCC (493). In
those translocations that do predispose to RCC there may be a combination of factors involved
including instability of the translocated chromosome during cell division together with disruption of a
TSG (e.g. FHIT) and/or polygenic effects that increase RCC susceptibility.

244
7.0 Discussion

245
7.0.1 Table of contents
7.0.1 TABLE OF CONTENTS ....................................................................................................................... 245
7.1 RESULTS CHAPTERS: CONSEQUENCES, ASSOCIATIONS, AND LIMITATIONS ............................ 246
7.2 GENERAL LIMITATIONS IN NEXT GENERATION SEQUENCING PROJECTS .................................. 252
7.3 FUTURE DIRECTIONS FOR THE DETECTION OF HERITABILITY IN RCC ........................................ 255
7.4 CONCLUSION ......................................................................................................................................... 258
246
The set of studies presented in this thesis have focused on the heritability of RCC and the proportion
of undiscovered genetic inheritance which exists in families and individuals with features of
predisposition (early onset, family history, or multifocal or bilateral presentation), but in which no
genetic cause can be determined based on known RCC predisposition syndromes and genes. Each
chapter has concentrated on specific genetic sequencing technique, successively increasing in
scope and coverage; beginning with single gene and exon sequencing with Sanger sequencing and
ending with whole genome sequencing and 3rd generation sequencing methods, exploiting the
advantages of each method when used in the correct context.
7.1 Results chapters: Consequences, associations, and limitations
Chapter 3 utilised target Sanger sequencing and small scale amplicon-based WGS in order to
identify putative pathogenic variants in genes frequently altered in somatic RCC, genes in genetically
linked phenotypes, and replicate associations seen in more recent germline RCC studies (266). The
study effectively recapitulated previous findings for CDKN2B and its potential role in RCC
predisposition and findings of functionally detrimental variants in EPAS1 are strong candidates given
the role of EPAS1 in PCC and PGL and GWAS SNP associations in RCC, where a phenotypic
expansion of EPAS1 variants to include RCC would not be unexpected (111,339,342), but limited
inferences can be made in regard to the variants identified in KMT2C and KMT2D without additional
functional investigations and replication studies (and detailed clinical phenotyping). The most
demonstrable limitation of the targeted sequencing studies is the lack of a comparable control sets
to compare allele frequencies between RCC cases and the general population. Additionally,
selection criteria for patients recruited into this chapter were more broad than the selection criteria
for chapters 4, 5, and 6, which allows for individuals with lesser or minimal features of predisposition
to be present within the case cohort and reduce the detection of potentially pathogenic variants.
Further limitations include sequencing failures, stemming from methodical limitations or the intrinsic
nature of DNA sequencing. PCR amplification success rates are typically determined by various
factors, including primer design, reaction mixture constituents, cycling conditions and DNA template.
In this study, the limitations were derived from the latter in which the nature of the region assessed
(KMT2C) or the DNA integrity itself (CDKN2B and EPAS1) prevented optimal application of the
proposed methods.
247
It is important to note that the methods applied in this chapter are effective and reliable when used
in conjunction with high quality DNA, genomic regions without increased alignment complexity, such
as that seen with KMT2C and the BAGE genes (519), and an appropriate comparison to control
datasets. These methods reduce the necessity for large scale targeted or whole genome sequencing
which complicate bioinformatic and analytical approaches and make Sanger sequencing or small
scale amplicon-based NGS sequencing projects ideal for validation studies or clinical genetic testing
where reliability, replicability, and efficiency are critical.
Targeted sequencing of a panel of genes and SNPs associated with cancer used in Chapter 4
unveiled potentially the most intriguing result from the perspective of unreported heritability in RCC.
Through assessment of 118 individuals, the identification of an enrichment of pathogenic truncating
variants in BRIP1 indicate that BRIP1 may be a new RCC predisposition gene in subset of rare
inherited RCC cases. The statistical enrichment of BRIP1 truncation carriers compared to both
healthy control sets (ICR birth control cohort, gnomAD and ExAC non-tcga (321,433)) and disease
sets with known associations provide strong evidence for a legitimate genetic link between RCC
predisposition and BRIP1 which is strengthened further by the co-segregation of the truncating
variant in one of the assessed families (though extensive kindreds were not available). Though the
evidence is persuasive for the demonstrated association, caution should still be taken before
causally implicating heterozygous BRIP1 truncating variants in non-syndromic inherited RCC. As
BRIP1 functions in DNA double strand break repair (520), and as such acts as a tumour suppressor,
confirmation of LOH or inactivation of the remaining wildtype allele in tumours from the affected
carriers would add additional support and demonstration that the initial variants do in fact result in
protein ablation or functional loss, as not all truncating variant result in complete loss of protein
function. This especially relevant given that BRIP1 truncating variants were initially associated as
low penetrance risk alleles in breast cancer (401) but more recent epidemiological studies have cast
doubt on that affiliation, suggesting truncating BRIP1 variants do not confer any risk to breast cancer
(379).
248
The investigation into a subset of the same samples selected for matching criteria of features of RCC
predisposition utilising WES methods in chapter 5 provided an increased scope for the identification
of novel candidate variants and genes but also introduced additional complications. The study
identified potentially pathogenic truncating variants, as well as variants in both frequently somatically
altered genes and genes involved in the TCA cycle but the interpretation of these variants and
determining their impact in RCC predisposition is difficult without functional studies, segregation
within large families, or statistical enrichment in comparison to a control data set. Case-control
analysis performed well based on the model metrics assessed considering the prior assumptions
and innate limitations of the case data set. The case control testing over genomic regions failed to
identify any associations after multiple testing correction and genes genes demonstrated a trend
towards significance failed to demonstrate any enrichment in biological pathways. The major
limitation to this approach is that given the number of cases, the likely risk associated with variants,
and the requirement for conservative statistical association mean that the number of cases required
to have reasonable power to detect a causal variant greatly exceeds the number of cases that could
be reasonably ascertained from public genetic referral services. For example, given the incidence
rates of RCC in the general population, estimated occurrence of inherited RCC, and a variant effect
size (OR) of 2, the number of cases required to be powered at 80% is in excess of 1200 under liberal
false discovery correction.
Variants identified within genes associated with TCA cycle components are potentially the most
viable candidates for functional assessment given the recent use of metabolite concentrations as a
proxy for SDH complex function (444) and whether or not this could be applied to other TCA cycle
components is an intriguing and potential clinically useful application of this methodology as well as
uncovering pathogenicity of missense variants, particularly given most of these variants were not
classified as pathogenic or likely pathogenic.
249
Exploratory analysis of WES data utilising algorithms and bioinformatic tools for the identification of
copy number alterations, short tandem repeats, and mobile elements did not result in substantial
findings across the examined cohort which could be due to several factors. Detection of these genetic
alterations is limited by the bioinformatic tools, experimental design, and sequencing method used.
In particular, the copy number calling was limited by complications conferred by unmatched WES
data without the presence of internal controls to account for read depth variability and a high rate of
false negative calls, an issue which is compounded by limited genomic coverage in WES data. Copy
number detection in WGS is more reliable and replicable which was aptly demonstrated in the use
of WGS copy number analysis in chapter 6 (485). Additionally the tool used, XHMM, is widely utilised
for copy number calling including in large scale projects such as ExAC (321) but more recently
developed methods have since improved on calling rates and handling of sample and target
normalisation, including development of simulation pipelines and comparison benchmarks to
establish optimal calling parameters (521,522). The alternative hypothesis is that these types of
genetic alterations are rare causes of RCC predisposition, like that of chromosome 3 translocations,
and cases are likely to be infrequently detected in unrelated proband studies compared to specific
analysis of large pedigrees. Compared to copy number alterations, short tandem repeats and mobile
element insertions are very rarely causes of genetic disorders in general and identification of any
pathogenic alteration specifically in RCC predisposition was low, especially given the sample size.
More investigations have continued to sequence unrelated individuals with or without clinical features
of RCC predisposition utilising cancer gene panels or whole exome sequencing with variable
outcomes. Assessment of advanced RCC patients without selection for features of heritability
showed 16% carried germline variants in genes not otherwise associated with RCC predisposition,
such as CHEK2, APC, MUTYH, BRCA2, and RECQL4, amongst others. Additionally, it reiterated
previous investigations, identifying pathogenic variants in SDHA and BAP1, which currently have
limited support and require further validation (523). An investigation in a Chinese cohort of early
onset RCC cases documented 9.5% carried germline pathogenic variants, most of which (66%) were
in known RCC predisposition genes (VHL, TSC1, TSC2, FH, FLCN, BAP1, PBRM1), with the
remaining variants in BRCA2, BRCA1, and CDKN2A, though only BRCA1 demonstrated LOH in the
tumour (395).

250
These most recent investigations were recapitulated by the results of the cancer gene panel
sequencing and WES studies described in this thesis. The number of potential new candidates
identified appears to be limited, particularly when focused on SNVs, and variants identified as
potentially associated with RCC predisposition are occurring in genes with known associations to
other cancer predisposition (e.g. BRCA1, BRCA2, CHEK2 with breast cancer (27,383)) or genes
altered somatically at high frequency, supporting the results described by Whitworth et al (2018)(376)
in multiple primary malignant tumours which pathogenic variants found in individuals with unrelated
cancer type suggests a phenotypic expansion, which may be the case in inherited RCC as well.
Furthermore, while the identification of candidate genes has been limited this is the largest cohort of
pre-screened individuals with features of inherited RCC to be sequenced and interrogated for
putative genetic factors that are causal in RCC predisposition. Other sequencing projects have
utilised selection criteria (e.g. early onset, advanced disease, family history) (395,523) but none
previously implemented comprehensive pre-screening for known RCC predisposition genes. The
application and removal of individuals identified with pathogenic variants in known RCC genes is in
some respects a double-edged sword in that it potentially enriches novel genetic factors linked to
RCC predisposition but simultaneously reduces the number of available samples for analysis in an
already rare sample set.
251
Lastly, the study and review of RCC-associated translocation cases both previously published and
investigated in this thesis in chapter 6 reconfirmed and strengthened the link between specific
chromosomal alterations and RCC risk and determined the specific clinical characteristics of RCC-
associated translocation cases. While the identification and characterisation of constitutional
translocations in this study did not identify any likely novel candidate genes associated with RCC
predisposition, it did discover several novel occurrences not previously reported in other RCC
translocation studies. Firstly, a translocation interrupting FLCN was the most clinically relevant
finding which demonstrated BHD syndrome can be because of a translocation break point within the
FLCN coding region in an individual with classical features of BHD syndrome. This is the first
reported case of BHD syndrome caused by a translocation and may be important in assessing
additional individuals with features of BHD who do not demonstrate obvious pathogenic SNVs or
copy number alterations. Secondly, the identification of a chromosomal inversion, also involving
chromosome 3, is the first non-reciprocal balanced chromosomal alteration described in RCC-
associated chromosomal alteration cases. Finally, the study established a framework for the
identification and characterisation of translocation break points utilising WGS and 3rd generation
sequencing methodologies or Sanger sequencing to reduce the required workload to resolve
karyotyping reports to the base pair resolution, as well as providing genetic alterations to rule out
additional causes of inheritance such as pathogenic SNVs, CNVs, or other structural variants.
Utilising this analytical pipeline should reduce analysis cost and improve interrogation of further
samples identified as RCC-association chromosomal alteration cases.
252
7.2 General limitations in next generation sequencing projects
The results of this thesis are limited by a series of features which are common to all genetic
association studies, as well as limitations which are specific to targeted next generation sequencing
methodology. Primarily, the sample size in any given rare disease study is a limiting factor in the
ability to identify novel causes of genetic disorders, particularly in unrelated proband studies which
are unable to rely on familial segregation. By increasing sample sizes, statistical power and case
control analyses can be more effectively leveraged and identification of rarer idiosyncratic
presentations of predisposition can be detected.
This limitation is present across rare disease studies and germline cancer predisposition but is
particularly difficult in RCC. In comparison to the assessment of heritability of cancers such as
colorectal and breast cancers, which are relatively common, RCC is a rarer cancer subtype. Only an
estimated 12,500 new cases of RCC are diagnosed in the UK per year (31) which, when combined
with the low prevalence of heritability, currently estimated at 3% of cases (98), it limits the potential
UK wide cases to less than 400 individuals as a maximum sample size and that is without screening
for known RCC predisposition genes. Recent studies into the application of genetic referral criteria
suggest that the number of individuals eligible for genetic testing may be greater than previously
estimated which may improve the available samples for research study recruitment but closer
integration of clinical and research studies, as well as global collaboration efforts, are needed to
facilitate larger sample sizes to improve detection and discovery rates of the factors associated with
RCC predisposition. Additional benefits could be gained from clinical follow up and detailed
phenotyping of individuals with candidate variants and use familial segregation to determine if the
disease phenotype segregates with the putative variant in question.
253
One of the larger issues faced in large scale next generation sequencing projects such as the cancer
gene panel sequencing study and the whole exome sequencing study is the inability to resolve the
variant consequences of rare variants occurring across the genome and in candidate RCC
predisposition genes. This issue is exemplified by the WES study which, as stated in the study
results, identified more than 18,000 variants of uncertain significance, almost all of which were
missense variants. Use of ClinVar as a source of additional variant pathogenicity evidence can be
useful but availability is limited for most variants and many variants consist of conflicting or
uncorroborated reports (406,524). The development of the ACMG variant classification framework,
including its improved derivatives, have allowed for a more stringent and systematised approach for
variant interpretation (325,525). High-throughput tools such as InterVar have allowed for the rapid
application of those described classification (326), but the framework is limited and often inadequate
when not accompanied by additional evidence from functional molecular studies, incorporation of
reliable in silico predictive metrics, and integration of previously published data. Manual classification
of variants utilising these frameworks can be more effective but manual curation of publications and
functional studies for thousands of variants is unrealistic.
While thorough and detailed functional investigations into all known variants present in the human
genome would be the ultimate resource for variant interpretation, the scale and cost of even a fraction
of such an endeavour would be unobtainable. Integration of in silico predictive tools such as SIFT,
PolyPhen, and CADD amongst many others, could improve automated ACMG classifications but
their prediction accuracy has been shown to be unreliable in certain instances. Outside of variant
classification based on conservation and function consequence to the amino acid sequence, several
recently published features of genetic inheritance and mutational selection could prove useful for
future interpretation of variant pathogenicity and high-throughput functional experiments for subsets
of variants are being proposed.
254
Use of genomic features like genetic constraint, in which specific regions are under positive or
negative selection pressure, have been used across genes to predict intolerance or tolerance (353)
but constraint averages over an entire coding region may mask specific conserved domains or
regions with the coding space, including intronic regions. More recent developments and increased
whole genome sequencing datasets have enabled the calculation of base pair scale assessments
of mutational constraint (405) independent of gene loci, which may be a more representative proxy
for evolutionary purifying selection in regions that are presumably more critical to gene function. By
filtering variants in regions of low constraint (i.e. loci not under purifying selection) it may act to reduce
candidate variants to only those present in regions were constraint is high and identify variants more
likely to result in a functional alteration and assist in the interpretation of synonymous and intronic
variants in relation to disease.
Minor allele frequencies of variants in control populations are commonly used as a first pass filter for
the removal of SNPs and low-quality variants. This process is effective at removing many biologically
irrelevant variants but a vast majority of variants in any given individual are rarer than the standard
allele frequency cut-offs such as 5% and 1% and thus many rare non-pathogenic variants are
retained (526). Even assessment of ‘ultra-rare’ variants in chapter 5 at a minor allele frequency of
0.1% discovered many more variants than could be easily assessed for pathogenicity. Furthermore,
allele frequency filtering cut-offs are not disease specific, the likely allele frequency of a variant
causing a common disorder is likely different to that of one causing a rare disorder. Use of maximal
population allele frequencies, described by Whiffin et al (2017), which estimate the maximum
tolerated allele frequency at which a causal variant could occur in a control population and still be
disease causing may provide disease-specific allele frequency filtering thresholds (527), though the
model requires accurate estimates of population prevalence and likely genetic variability, allelic
variability, and likely penetrance which can be challenging to estimate in rare diseases.
Lastly, the development of systems such as CRISPR-Cas9 have enabled high capacity, high-
throughput screening libraries using gene specific RNA guides and cell line libraries. More recent
attempts are aimed at identifying therapeutic targets for specific cancer tumour types but an
extension of this system would be feasible and may help prioritise candidate genes more effectively
based on the effect of induced truncation in specific cell lines (528), allowing for the integration of in
vitro functional data into variant interpretation.
255
7.3 Future directions for the detection of heritability in RCC
In this series of studies, several interesting candidate variants, genes, and mechanisms were
discovered in association with RCC predisposition but only a small number of individuals carried
putative predisposition variants or presented with rare inherited subtypes (i.e. RCC-associated
translocation). The ability to identify candidate variants in individuals with features of RCC
predisposition echoes previous studies and results seen in clinical diagnostic labs in which
pathogenic variants are not identified in most tested individuals. While some of this missing
heritability could be due to the difficulties in variant interpretation, as described above, a proportion
may be missed due to not interrogating the genomic regions, variant consequences, or alterations
that are truly responsible for heritability in RCC and several other factors may help form future studies
which are able to effectively capture the heritable traits of RCC predisposition. Here I summarise a
non-exhaustive list of potential research directions and experimental study designs that could be
utilised to identify these genetic features which does not rely on solely increasing sample numbers,
which would be the most effective method of improving detection rates.
This thesis focused on the assessment of protein-affecting variant and excluded synonymous
variants and intronic variants which are becoming more established as disease causing even in
known RCC predisposition genes such as VHL (137). Variants in regulatory elements such as
promotor and enhancer regions, as well as intergenic regions could also be sources of heritability in
RCC and should be investigated. Use of WGS would allow for the discovery of variants in these
genomic areas but interpretation of pathogenicity is potentially more difficult than protein-affecting
variants. The advantage of WGS is that it would allow the exploration of structural and copy number
alterations with a much greater degree of accuracy and coverage than that provided by targeted
sequencing.
256
Combinatorial analysis of WES for SNV detection and low coverage WGS, which has been
demonstrated to be effective in the detection of copy number variants even at coverages as low as
1X to 5X (529), could provide significant computational and economic savings compared to full
coverage WGS. Conversely, a more comprehensive sequencing method, such as WGS long read
sequencing (e.g. PacBio SMRT sequencing), would allow for the examination of multiple DNA
alterations and remove many of the limitations of 2nd generation short read sequencing methods (see
Introduction chapter section 1.7) and allow for comprehensive SNV, structural, CNV, and phasing
data across the entire genome. Additionally, the assumption is that inheritance of RCC predisposition
is autosomal dominant and the likelihood that a proportion of inheritance is due to low penetrance or
polygenic traits is becoming relatively high. Investigations into these features, while complex, should
be performed to ascertain the proportion of heritability which can be attributed to complex polygenic
traits and risk loci which may help develop methods for assessing polygenic risk scores as utilised
in breast cancer (530).
An alternative to increased genomic coverage is the integration of different “–omics” and tumour
mutational, metabolic, and expression data to improve variant prioritisation and interpretation. Use
of epigenetic data, such as promotor methylation, may uncover germline methylation defects in
known or novel genes which are associated with RCC predisposition. Though inactivation of RCC
genes is frequently reported somatically (280,283,531), very few investigations have fully assessed
the methylation status of genes constitutionally. By identifying hypermethylation of promotor regions
or key regulatory elements which correlate with RCC heritability it may demonstrate new genetic
features involved in inherited RCC which would not be detected through DNA sequencing alone.
257
Inclusion of tumour SNV data would allow for the validation of candidate variant by assessing
features such as LOH, which provides support for two-hit hypothesis driven loss of tumour
suppressors, and tumour mutational signatures which may help identify if putative variants in genes
involved in DNA repair pathways, among others, result in the mutational signatures associated with
dysfunction in those pathways (532). The availability of fresh frozen tumour material collected
prospectively during study recruitment would also enable the use of immunohistochemistry and
metabolic investigations to determine and assess germline variant pathogenicity, improving
interpretation and reducing ambiguity when attempting to assess variants in genes with functions in
metabolism, such as those present in the TCA cycle. Integration of multiple “–omic” types could be
further expanded to the use of tumour RNA expression data which would enable the correlation of
transcript and allele-specific expression with the presence of putative pathogenic variants, where
pathogenicity could be refuted or supported based on whether that allele is expressed in tumours.
Counterintuitively, a proposal could be made for the reduction of study design from large scale
genomic sequencing of unrelated probands to family only studies. Studies focused detailed
phenotyping and genotyping of specific families may uncover pedigree-specific associations which
may then more readily be detected in unrelated individuals. By exploiting familial analysis and the
ability to co-segregate variants with disease status candidate variants can be more confidently
determined, after which unrelated proband cohorts can be screened for the genes identified. In fact,
several of the last genes associated with RCC predisposition, PBRM1 and BAP1 (263,331), were
discovered through unrelated proband screening but the variants were discovered in individuals with
strong family histories of RCC and retrospective analysis demonstrated co-segregation. By reversing
this approach and assessing individuals with particularly strong family histories, it may more
efficiently uncover associations which may be missed in unrelated proband studies.
258
7.4 Conclusion
This study has uncovered limited evidence for further associations with new genetic features and
RCC predisposition. Though cautious interpretation is needed, once confirmed these findings could
be utilised to inform clinical management through genetic counselling, increasing screening
procedures, or the development of targeted therapeutics. Furthermore, progressive molecular
sequencing methodologies were applied to improve detection and characterisation of causal events
in RCC predisposition which may act to increase the efficiency and analysis strategies of genomic
data in both research and clinical environments. While much of the genetic components related to
predisposition of RCC remains undiscovered, the results of this body of work may act as a foundation
for follow up studies which might lead to confirmation of the findings, or novel associations derived
from, those results described within this thesis.

259
8.0 Bibliography
260
1. Mendel, G. (1865) EXPERIMENTS IN PLANT HYBRIDIZATION (1865). EXPERIMENTS IN PLANT HYBRIDIZATION (1865); (1865) .
2. Maher, E. R., Webster, A. R., Richards, F. M., et al. (1996) Phenotypic expression in von Hippel-Lindau disease: correlations with germline VHL gene mutations. J. Med. Genet., 33, 328–32.
3. McKusick, V. A. (2000) Ellis-van Creveld syndrome and the Amish. Nat. Genet., 24, 203–204.
4. López, C., Saravia, C., Gomez, A., et al. (2010) Mechanisms of genetically-based resistance to malaria. Gene, 467, 1–12.
5. Forsberg, L. A., Gisselsson, D. and Dumanski, J. P. (2017) Mosaicism in health and disease — clones picking up speed. Nat. Rev. Genet., 18, 128–142.
6. Kong, A., Frigge, M. L., Masson, G., et al. (2012) Rate of de novo mutations and the importance of father’s age to disease risk. Nature, 488, 471–5.
7. Alderuccio, F., Chan, J., Scott, D. W., et al. (2009) Gene therapy and bone marrow stem-cell transfer to treat autoimmune disease. Trends Mol. Med., 15, 344–51.
8. Relling, M. V. and Evans, W. E. (2015) Pharmacogenomics in the clinic. Nature, 526, 343–350.
9. Huang, M., Shen, A., Ding, J., et al. (2014) Molecularly targeted cancer therapy: some lessons from the past decade. Trends Pharmacol. Sci., 35, 41–50.
10. Alton, E. W. F. W., Armstrong, D. K., Ashby, D., et al. (2015) Repeated nebulisation of non-viral CFTR gene therapy in patients with cystic fibrosis: a randomised, double-blind, placebo-controlled, phase 2b trial. Lancet Respir. Med., 3, 684–691.
11. Dai, W.-J., Zhu, L.-Y., Yan, Z.-Y., et al. (2016) CRISPR-Cas9 for in vivo Gene Therapy: Promise and Hurdles. Mol. Ther. Nucleic Acids, 5, e349.
12. Ciccia, A. and Elledge, S. J. (2010) The DNA damage response: making it safe to play with knives. Mol. Cell, 40, 179–204.
13. Shaltiel, I. A., Krenning, L., Bruinsma, W., et al. (2015) The same, only different - DNA damage checkpoints and their reversal throughout the cell cycle. J. Cell Sci., 128, 607–20.
14. Nei, M., Suzuki, Y. and Nozawa, M. (2010) The Neutral Theory of Molecular Evolution in the Genomic Era. Annu. Rev. Genomics Hum. Genet., 11, 265–289.
15. Knudson, A. (1971) Mutation and cancer: statistical study of retinoblastoma. Proc. Natl. Acad. Sci. U. S. A., 68, 820–3.
16. Willis, A., Jung, E. J., Wakefield, T., et al. (2004) Mutant p53 exerts a dominant negative effect by preventing wild-type p53 from binding to the promoter of its target genes. Oncogene, 23, 2330–2338.
17. Greaves, M. and Maley, C. C. (2012) Clonal evolution in cancer. Nature, 481, 306–313.
18. Hanahan, D. and Weinberg, R. A. (2011) Hallmarks of Cancer: The Next Generation. Cell, 144, 646–674.
19. Yokoyama, A., Kakiuchi, N., Yoshizato, T., et al. (2019) Age-related remodelling of oesophageal epithelia by mutated cancer drivers. Nature, 565, 312–317.
20. Martincorena, I., Fowler, J. C., Wabik, A., et al. (2018) Somatic mutant clones colonize the human esophagus with age. Science (80-. )., 362, 911–917.
21. Martincorena, I., Roshan, A., Gerstung, M., et al. (2015) High burden and pervasive positive selection of somatic mutations in normal human skin. Science (80-. )., 348, 880–886.
22. Mitchell, T. J., Turajlic, S., Rowan, A., et al. (2018) Timing the Landmark Events in the Evolution of Clear Cell Renal Cell Cancer: TRACERx Renal. Cell.
23. National Cancer Registration and Analysis Service (2014) Cancer Survivial in England by stage 2014. Cancer Survivial in England by stage 2014 http://www.ncin.org.uk/publications/survival_by_stage (accessed Mar 15, 2019).
24. Li, F. P. and Fraumeni, J. F. (1969) Soft-tissue sarcomas, breast cancer, and other neoplasms. A familial syndrome? Ann. Intern. Med., 71, 747–752.
25. Network, C. G. A. R., N., J., Weinstein, J. N., et al. (2013) The Cancer Genome Atlas Pan-Cancer analysis project. Nat. Genet., 45, 1113–20.
26. Rahman, N. (2014) Realizing the promise of cancer predisposition genes. Nature, 505, 302–8.
27. Petrucelli, N., Daly, M. B. and Pal, T. (1993) BRCA1- and BRCA2-Associated Hereditary Breast and Ovarian Cancer. BRCA1- and BRCA2-Associated Hereditary Breast and Ovarian Cancer; University of Washington, Seattle, (1993) .
28. Fitzmaurice, C., Dicker, D., Pain, A., et al. (2015) The Global Burden of Cancer 2013. JAMA Oncol., 1, 505.
29. Noone, A., Howlader, N., Krapcho, M., et al. (2017) SEER Cancer Statistics Review, 1975-2015. SEER Cancer Statistics Review, 1975-2015; Bethesda, (2017) .
30. Maher, E. R., Yates, J. R. and Ferguson-Smith, M. a (1990) Statistical analysis of the two stage mutation model in von Hippel-Lindau disease, and in sporadic cerebellar haemangioblastoma and renal cell carcinoma. J. Med. Genet., 27, 311–314.
31. Smittenaar, C. R., Petersen, K. A., Stewart, K., et al. (2016) Cancer incidence and mortality projections in the UK until 2035. Br. J. Cancer, 115, 1147–1155.
32. Brown, K. F., Rumgay, H., Dunlop, C., et al.
261
(2018) The fraction of cancer attributable to modifiable risk factors in England, Wales, Scotland, Northern Ireland, and the United Kingdom in 2015. Br. J. Cancer, 118, 1130–1141.
33. Wang, F. and Xu, Y. (2014) Body mass index and risk of renal cell cancer: A dose-response meta-analysis of published cohort studies. Int. J. Cancer, 135, 1673–1686.
34. Cumberbatch, M. G., Rota, M., Catto, J. W. F., et al. (2016) The Role of Tobacco Smoke in Bladder and Kidney Carcinogenesis: A Comparison of Exposures and Meta-analysis of Incidence and Mortality Risks. Eur. Urol., 70, 458–466.
35. Weikert, S., Boeing, H., Pischon, T., et al. (2008) Blood Pressure and Risk of Renal Cell Carcinoma in the European Prospective Investigation into Cancer and Nutrition. Am. J. Epidemiol., 167, 438–446.
36. Matson, M. A. and Cohen, E. P. (1990) Acquired cystic kidney disease: occurrence, prevalence, and renal cancers. Medicine (Baltimore)., 69, 217–26.
37. Tseng, C.-H. (2015) Type 2 Diabetes Mellitus and Kidney Cancer Risk: A Retrospective Cohort Analysis of the National Health Insurance. PLoS One, 10, e0142480.
38. Li, C., Balluz, L. S., Ford, E. S., et al. (2011) Association Between Diagnosed Diabetes and Self-Reported Cancer Among U.S. Adults: Findings from the 2009 Behavioral Risk Factor Surveillance System. Diabetes Care, 34, 1365–1368.
39. Cho, E., Curhan, G., Hankinson, S. E., et al. (2011) Prospective evaluation of analgesic use and risk of renal cell cancer. Arch. Intern. Med., 171, 1487–93.
40. Huang, T., Ding, P., Chen, J., et al. (2014) Dietary fiber intake and risk of renal cell carcinoma: evidence from a meta-analysis. Med. Oncol., 31, 125.
41. Zhao, J. and Zhao, L. (2013) Cruciferous Vegetables Intake Is Associated with Lower Risk of Renal Cell Carcinoma: Evidence from a Meta-Analysis of Observational Studies. PLoS One, 8, e75732.
42. Kelsh, M. A., Alexander, D. D., Mink, P. J., et al. (2010) Occupational Trichloroethylene Exposure and Kidney Cancer. Epidemiology, 21, 95–102.
43. Boffetta, P., Fontana, L., Stewart, P., et al. (2011) Occupational exposure to arsenic, cadmium, chromium, lead and nickel, and renal cell carcinoma: a case-control study from Central and Eastern Europe. Occup. Environ. Med., 68, 723–728.
44. NCD Risk Factor Collaboration (NCD-RisC), N. R. F. C. (2017) Worldwide trends in body-mass index, underweight, overweight, and obesity from 1975 to 2016: a pooled analysis of 2416 population-based measurement studies in 128·9 million children, adolescents, and adults. Lancet (London, England), 390, 2627–2642.
45. Swinburn, B. A., Caterson, I., Seidell, J. C., et al. (2004) Diet, nutrition and the prevention of excess weight gain and obesity. Public Health Nutr., 7, 123–46.
46. Kotchen, T. A. (2010) Obesity-Related Hypertension: Epidemiology, Pathophysiology, and Clinical Management. Am. J. Hypertens., 23, 1170–1178.
47. Hossain, P., Kawar, B. and El Nahas, M. (2007) Obesity and Diabetes in the Developing World — A Growing Challenge. N. Engl. J. Med., 356, 213–215.
48. Motzer, R. J., Bander, N. H. and Nanus, D. M. (1996) Renal-Cell Carcinoma. N. Engl. J. Med., 335, 865–875.
49. Srigley, J. R., Delahunt, B., Eble, J. N., et al. (2013) The International Society of Urological Pathology (ISUP) Vancouver Classification of Renal Neoplasia. Am. J. Surg. Pathol., 37, 1469–1489.
50. Moch, H., Gasser, T., Amin, M. B., et al. (2000) Prognostic utility of the recently recommended histologic classification and revised TNM staging system of renal cell carcinoma: a Swiss experience with 588 tumors. Cancer, 89, 604–14.
51. Amin, M. B., Amin, M. B., Tamboli, P., et al. (2002) Prognostic impact of histologic subtyping of adult renal epithelial neoplasms: an experience of 405 cases. Am. J. Surg. Pathol., 26, 281–91.
52. Ericsson, J. L., Seljelid, R. and Orrenius, S. (1966) Comparative light and electron microscopic observations of the cytoplasmic matrix in renal carcinomas. Virchows Arch. Pathol. Anat. Physiol. Klin. Med., 341, 204–23.
53. Du, W., Zhang, L., Brett-Morris, A., et al. (2017) HIF drives lipid deposition and cancer in ccRCC via repression of fatty acid metabolism. Nat. Commun., 8, 1769.
54. Andreiana, B. C., Stepan, A. E., Mărgăritescu, C., et al. (2018) Histopathological Prognostic Factors in Clear Cell Renal Cell Carcinoma. Curr. Heal. Sci. J., 44, 201–205.
55. Cheville, J. C., Lohse, C. M., Zincke, H., et al. (2003) Comparisons of outcome and prognostic features among histologic subtypes of renal cell carcinoma. Am. J. Surg. Pathol., 27, 612–24.
56. Ambrosetti, D., Dufies, M., Dadone, B., et al. (2018) The two glycolytic markers GLUT1 and MCT1 correlate with tumor grade and survival in clear-cell renal cell carcinoma. PLoS One, 13, e0193477.
57. Kim, H., Inomoto, C., Uchida, T., et al. (2018) Verification of the International Society of Urological Pathology recommendations in Japanese patients with clear cell renal cell carcinoma. Int. J. Oncol., 52, 1139–1148.
58. Muglia, V. F. and Prando, A. (2015) Renal cell carcinoma: histological classification and correlation with imaging findings. Radiol. Bras., 48, 166–74.
59. Lubensky, I. A., Schmidt, L., Zhuang, Z., et al.
262
(1999) Hereditary and Sporadic Papillary Renal Carcinomas with c-met Mutations Share a Distinct Morphological Phenotype. Am. J. Pathol., 155, 517–526.
60. Kuroda, N., Ohe, C., Kawakami, F., et al. (2014) Clear cell papillary renal cell carcinoma: a review. Int. J. Clin. Exp. Pathol., 7, 7312–8.
61. Zhong, M., De Angelo, P., Osborne, L., et al. (2012) Translocation Renal Cell Carcinomas in Adults. Am. J. Surg. Pathol., 36, 654–662.
62. Zhao, M., He, X. and Teng, X. (2015) Mucinous tubular and spindle cell renal cell carcinoma: a review of clinicopathologic aspects. Diagn. Pathol., 10, 168.
63. Adibi, M., Thomas, A. Z., Borregales, L. D., et al. (2015) Percentage of sarcomatoid component as a prognostic indicator for survival in renal cell carcinoma with sarcomatoid dedifferentiation. Urol. Oncol. Semin. Orig. Investig., 33, 427.e17-427.e23.
64. Akhtar, M., Tulbah, A., Kardar, A. H., et al. (1997) Sarcomatoid renal cell carcinoma: the chromophobe connection. Am. J. Surg. Pathol., 21, 1188–95.
65. Abrahams, N. A., Ayala, A. G. and Czerniak, B. (2003) Chromophobe renal cell carcinoma with sarcomatoid transformation. Ann. Diagn. Pathol., 7, 296–9.
66. Jones, T. D., Eble, J. N., Wang, M., et al. (2005) Clonal divergence and genetic heterogeneity in clear cell renal cell carcinomas with sarcomatoid transformation. Cancer, 104, 1195–1203.
67. Mittal, V. (2018) Epithelial Mesenchymal Transition in Tumor Metastasis. Annu. Rev. Pathol. Mech. Dis., 13, 395–412.
68. Sobin, L. H., Gospodarowicz, M. K. (Mary K. ., Wittekind, C. (Christian), et al. (2009) TNM classification of malignant tumours. TNM classification of malignant tumours; Wiley-Blackwell, (2009) .
69. Kim, S. P., Alt, A. L., Weight, C. J., et al. (2011) Independent validation of the 2010 American Joint Committee on Cancer TNM classification for renal cell carcinoma: results from a large, single institution cohort. J. Urol., 185, 2035–9.
70. Hand, J. R. and Broders, A. C. (1932) Carcinoma of the Kidney: The Degree of Malignancy in Relation to Factors Bearing on Prognosis. J. Urol., 28, 199–216.
71. Fuhrman, S. A., Lasky, L. C. and Limas, C. (1982) Prognostic significance of morphologic parameters in renal cell carcinoma. Am. J. Surg. Pathol., 6, 655–63.
72. Delahunt, B., McKenney, J. K., Lohse, C. M., et al. (2013) A Novel Grading System for Clear Cell Renal Cell Carcinoma Incorporating Tumor Necrosis. Am. J. Surg. Pathol., 37, 311–322.
73. Delahunt, B., Sika-Paotonu, D., Bethwaite, P. B., et al. (2007) Fuhrman Grading is not Appropriate for Chromophobe Renal Cell Carcinoma. Am. J. Surg. Pathol., 31, 957–960.
74. Ljungberg, B., Albiges, L., Abu-Ghanem, Y., et al. (2019) European Association of Urology Guidelines on Renal Cell Carcinoma: The 2019 Update. Eur. Urol.
75. Ferrara, N. (2004) Vascular endothelial growth factor as a target for anticancer therapy. Oncologist, 9 Suppl 1, 2–10.
76. Rini, B. I. and Small, E. J. (2005) Biology and clinical development of vascular endothelial growth factor-targeted therapy in renal cell carcinoma. J. Clin. Oncol., 23, 1028–43.
77. Mendel, D. B., Laird, A. D., Xin, X., et al. (2003) In vivo antitumor activity of SU11248, a novel tyrosine kinase inhibitor targeting vascular endothelial growth factor and platelet-derived growth factor receptors: determination of a pharmacokinetic/pharmacodynamic relationship. Clin. Cancer Res., 9, 327–37.
78. Abrams, T. J., Lee, L. B., Murray, L. J., et al. (2003) SU11248 inhibits KIT and platelet-derived growth factor receptor beta in preclinical models of human small cell lung cancer. Mol. Cancer Ther., 2, 471–8.
79. Sonpavde, G. and Hutson, T. E. (2007) Pazopanib: A novel multitargeted tyrosine kinase inhibitor. Curr. Oncol. Rep., 9, 115–119.
80. Podsypanina, K., Lee, R. T., Politis, C., et al. (2001) An inhibitor of mTOR reduces neoplasia and normalizes p70/S6 kinase activity in Pten+/- mice. Proc. Natl. Acad. Sci. U. S. A., 98, 10320–5.
81. Albert, S., Serova, M., Dreyer, C., et al. (2010) New inhibitors of the mammalian target of rapamycin signaling pathway for cancer. Expert Opin. Investig. Drugs, 19, 919–930.
82. Saxton, R. A. and Sabatini, D. M. (2017) mTOR Signaling in Growth, Metabolism, and Disease. Cell, 168, 960–976.
83. Wallace, E. M., Rizzi, J. P., Han, G., et al. (2016) A Small-Molecule Antagonist of HIF2α Is Efficacious in Preclinical Models of Renal Cell Carcinoma. Cancer Res., 76, 5491–5500.
84. Courtney, K. D., Infante, J. R., Lam, E. T., et al. (2018) Phase I Dose-Escalation Trial of PT2385, a First-in-Class Hypoxia-Inducible Factor-2α Antagonist in Patients With Previously Treated Advanced Clear Cell Renal Cell Carcinoma. J. Clin. Oncol., 36, 867–874.
85. Ribas, A. (2012) Tumor Immunotherapy Directed at PD-1. N. Engl. J. Med., 366, 2517–2519.
86. Camacho, L. H. (2015) CTLA-4 blockade with ipilimumab: biology, safety, efficacy, and future considerations. Cancer Med., 4, 661–672.
87. Ranieri, G., Patruno, R., Ruggieri, E., et al. (2006) Vascular endothelial growth factor (VEGF) as a target of bevacizumab in cancer: from the biology to the clinic. Curr. Med. Chem., 13, 1845–57.
88. Escudier, B., Eisen, T., Stadler, W. M., et al. (2007) Sorafenib in Advanced Clear-Cell Renal-Cell Carcinoma. N. Engl. J. Med., 356, 125–134.
263
89. Diamond, J. R., Salgia, R., Varella-Garcia, M., et al. (2013) Initial clinical sensitivity and acquired resistance to MET inhibition in MET-mutated papillary renal cell carcinoma. J. Clin. Oncol., 31, e254-8.
90. Rini, B. I. and Atkins, M. B. (2009) Resistance to targeted therapy in renal-cell carcinoma. Lancet Oncol., 10, 992–1000.
91. Gottesman, M. M., Fojo, T. and Bates, S. E. (2002) Multidrug resistance in cancer: role of ATP–dependent transporters. Nat. Rev. Cancer, 2, 48–58.
92. Gotink, K. J., Broxterman, H. J., Labots, M., et al. (2011) Lysosomal Sequestration of Sunitinib: A Novel Mechanism of Drug Resistance. Clin. Cancer Res., 17, 7337–7346.
93. Casanovas, O., Hicklin, D. J., Bergers, G., et al. (2005) Drug resistance by evasion of antiangiogenic targeting of VEGF signaling in late-stage pancreatic islet tumors. Cancer Cell, 8, 299–309.
94. Huang, D., Ding, Y., Zhou, M., et al. (2010) Interleukin-8 Mediates Resistance to Antiangiogenic Agent Sunitinib in Renal Cell Carcinoma. Cancer Res., 70, 1063–1071.
95. Hirschi, K. K. and D’Amore, P. A. (1997) Control of angiogenesis by the pericyte: molecular mechanisms and significance. EXS, 79, 419–28.
96. Finke, J., Ko, J., Rini, B., et al. (2011) MDSC as a mechanism of tumor escape from sunitinib mediated anti-angiogenic therapy. Int. Immunopharmacol., 11, 856–861.
97. Hwang, H. S., Go, H., Park, J.-M., et al. (2019) Epithelial-mesenchymal transition as a mechanism of resistance to tyrosine kinase inhibitors in clear cell renal cell carcinoma. Lab. Investig., 1.
98. Maher, E. R. (2013) Genomics and epigenomics of renal cell carcinoma. Semin. Cancer Biol., 23, 10–7.
99. Gossage, L., Eisen, T. and Maher, E. R. (2015) VHL, the story of a tumour suppressor gene. Nat. Rev. Cancer, 15, 55–64.
100. Gherardi, E., Birchmeier, W., Birchmeier, C., et al. (2012) Targeting MET in cancer: rationale and progress. Nat. Rev. Cancer, 12, 89–103.
101. Clague, J., Lin, J., Cassidy, A., et al. (2009) Family History and Risk of Renal Cell Carcinoma: Results from a Case-Control Study and Systematic Meta-Analysis. Cancer Epidemiol. Biomarkers Prev., 18, 801–807.
102. Nguyen, K. A., Syed, J. S., Espenschied, C. R., et al. (2017) Advances in the diagnosis of hereditary kidney cancer: Initial results of a multigene panel test. Cancer, 123, 4363–4371.
103. Klatte, T., Patard, J.-J., Wunderlich, H., et al. (2007) Metachronous Bilateral Renal Cell Carcinoma: Risk Assessment, Prognosis and Relevance of the Primary-Free Interval. J. Urol., 177, 2081–2087.
104. Gudbjartsson, T., Jónasdóttir, T. J.,
Thoroddsen, Á., et al. (2002) A population-based familial aggregation analysis indicates genetic contribution in a majority of renal cell carcinomas. Int. J. Cancer, 100, 476–479.
105. Mucci, L. A., Hjelmborg, J. B., Harris, J. R., et al. (2016) Familial Risk and Heritability of Cancer Among Twins in Nordic Countries. JAMA, 315, 68–76.
106. Bertout, J. A., Majmundar, A. J., Gordan, J. D., et al. (2009) HIF2alpha inhibition promotes p53 pathway activity, tumor cell death, and radiation responses. Proc. Natl. Acad. Sci. U. S. A., 106, 14391–6.
107. Ivan, M., Kondo, K., Yang, H., et al. (2001) HIFalpha targeted for VHL-mediated destruction by proline hydroxylation: implications for O2 sensing. Science, 292, 464–8.
108. Purdue, M. P., Johansson, M., Zelenika, D., et al. (2011) Genome-wide association study of renal cell carcinoma identifies two susceptibility loci on 2p21 and 11q13.3. Nat. Genet., 43, 60–5.
109. Han, S. S., Yeager, M., Moore, L. E., et al. (2012) The chromosome 2p21 region harbors a complex genetic architecture for association with risk for renal cell carcinoma. Hum. Mol. Genet., 21, 1190–1200.
110. Wu, X., Scelo, G., Purdue, M. P., et al. (2012) A genome-wide association study identifies a novel susceptibility locus for renal cell carcinoma on 12p11.23. Hum. Mol. Genet., 21, 456–62.
111. Audenet, F., Cancel-Tassin, G., Bigot, P., et al. (2014) Germline Genetic Variations at 11q13 and 12p11 Locus Modulate Age at Onset for Renal Cell Carcinoma. J. Urol., 191, 487–492.
112. Gudmundsson, J., Sulem, P., Gudbjartsson, D. F., et al. (2013) A common variant at 8q24.21 is associated with renal cell cancer. Nat. Commun., 4, 2776.
113. Henrion, M., Frampton, M., Scelo, G., et al. (2013) Common variation at 2q22.3 (ZEB2) influences the risk of renal cancer. Hum. Mol. Genet., 22, 825–31.
114. Henrion, M. Y. R., Purdue, M. P., Scelo, G., et al. (2015) Common variation at 1q24.1 (ALDH9A1) is a potential risk factor for renal cancer. PLoS One, 10, e0122589.
115. Schödel, J., Bardella, C., Sciesielski, L. K., et al. (2012) Common genetic variants at the 11q13.3 renal cancer susceptibility locus influence binding of HIF to an enhancer of cyclin D1 expression. Nat. Genet., 44, 420–5, S1-2.
116. Xue, J., Qin, Z., Li, X., et al. (2017) Genetic polymorphisms in cyclin D1 are associated with risk of renal cell cancer in the Chinese population. Oncotarget, 8, 80889.
117. Machiela, M. J., Hofmann, J. N., Carreras-Torres, R., et al. (2017) Genetic Variants Related to Longer Telomere Length are Associated with Increased Risk of Renal Cell Carcinoma. Eur. Urol., 72, 747–754.
264
118. Truong, H., Hegarty, S. E., Gomella, L. G., et al. (2017) Prevalence and Characteristics of Patients with Suspected Inherited Renal Cell Cancer: Application of the ACMG/NSGC Genetic Referral Guidelines to Patient Cohorts. J. Genet. Couns., 26, 548–555.
119. Glenn, G. M., Daniel, L. N., Choyke, P., et al. (1991) Von Hippel-Lindau (VHL) disease: distinct phenotypes suggest more than one mutant allele at the VHL locus. Hum. Genet., 87, 207–10.
120. Neumann, H. P. and Wiestler, O. D. (1991) Clustering of features of von Hippel-Lindau syndrome: evidence for a complex genetic locus. Lancet (London, England), 337, 1052–4.
121. Evans, D. G., Howard, E., Giblin, C., et al. (2010) Birth incidence and prevalence of tumor-prone syndromes: Estimates from a UK family genetic register service. Am. J. Med. Genet. Part A, 152A, 327–332.
122. Binderup, M. L. M., Galanakis, M., Budtz-Jørgensen, E., et al. (2017) Prevalence, birth incidence, and penetrance of von Hippel-Lindau disease (vHL) in Denmark. Eur. J. Hum. Genet., 25, 301–307.
123. Maher, E. R., Iselius, L., Yates, J. R., et al. (1991) Von Hippel-Lindau disease: a genetic study. J. Med. Genet., 28, 443.
124. Ong, K. R., Woodward, E. R., Killick, P., et al. (2007) Genotype-phenotype correlations in von Hippel-Lindau disease. Hum. Mutat., 28, 143–149.
125. Collins, T. (1894) Intra-ocular growths: Two cases, brother and sister, with peculiar vascular new growth, probably primarily retinal, affecting both eyes. Trans Ophthalmol.
126. Zbar, B., Brauch, H., Talmadge, C., et al. (1987) Loss of alleles of loci on the short arm of chromosome 3 in renal cell carcinoma. Nature, 327, 721–724.
127. Latif, F., Tory, K., Gnarra, J., et al. (1993) Identification of the von Hippel-Lindau disease tumor suppressor gene. Science (80-. )., 260, 1317–1320.
128. Foster, K., Prowse, A., van den Berg, A., et al. (1994) Somatic mutations of the von Hippel-Lindau disease tumour suppressor gene in non-familial clear cell renal carcinoma. Hum. Mol. Genet., 3, 2169–73.
129. Woodward, E. R., Clifford, S. C., Astuti, D., et al. (2000) Familial clear cell renal cell carcinoma (FCRC): clinical features and mutation analysis of the VHL, MET, and CUL2 candidate genes. J. Med. Genet., 37, 348–53.
130. Sgambati, M. T., Stolle, C., Choyke, P. L., et al. (2000) Mosaicism in von Hippel-Lindau disease: lessons from kindreds with germline mutations identified in offspring with mosaic parents. Am. J. Hum. Genet., 66, 84–91.
131. Coppin, L., Grutzmacher, C., Crépin, M., et al. (2014) VHL mosaicism can be detected by clinical next-generation sequencing and is not restricted to patients with a mild phenotype. Eur. J. Hum. Genet., 22, 1149–52.
132. Pastore, Y., Jedlickova, K., Guan, Y., et al. (2003) Mutations of von Hippel-Lindau Tumor-Suppressor Gene and Congenital Polycythemia. Am. J. Hum. Genet., 73, 412–419.
133. Gordeuk, V. R., Sergueeva, A. I., Miasnikova, G. Y., et al. (2004) Congenital disorder of oxygen sensing: association of the homozygous Chuvash polycythemia VHL mutation with thrombosis and vascular abnormalities but not tumors. Blood, 103, 3924–3932.
134. McNeill, A., Rattenberry, E., Barber, R., et al. (2009) Genotype-phenotype correlations in VHL exon deletions. Am. J. Med. Genet. Part A, 149A, 2147–2151.
135. Chen, F., Kishida, T., Yao, M., et al. (1995) Germline mutations in the von Hippel-Lindau disease tumor suppressor gene: Correlations with phenotype. Hum. Mutat., 5, 66–75.
136. Nordstrom-O’Brien, M., van der Luijt, R. B., van Rooijen, E., et al. (2010) Genetic analysis of von Hippel-Lindau disease. Hum. Mutat., 31, n/a-n/a.
137. Lenglet, M., Robriquet, F., Schwarz, K., et al. (2018) Identification of a new VHL exon and complex splicing alterations in familial erythrocytosis or von Hippel-Lindau disease. Blood, 132, 469–483.
138. Maxwell, P. H., Wiesener, M. S., Chang, G.-W., et al. (1999) The tumour suppressor protein VHL targets hypoxia-inducible factors for oxygen-dependent proteolysis. Nature, 399, 271–275.
139. Jaakkola, P., Mole, D. R., Tian, Y. M., et al. (2001) Targeting of HIF-alpha to the von Hippel-Lindau ubiquitylation complex by O2-regulated prolyl hydroxylation. Science, 292, 468–72.
140. Wenger, R. H., Stiehl, D. P. and Camenisch, G. (2005) Integration of Oxygen Signaling at the Consensus HRE. Sci. Signal., 2005, re12–re12.
141. Keith, B., Johnson, R. S. and Simon, M. C. (2012) HIF1α and HIF2α: sibling rivalry in hypoxic tumour growth and progression. Nat. Rev. Cancer, 12, 9–22.
142. Raval, R. R., Lau, K. W., Tran, M. G. B., et al. (2005) Contrasting properties of hypoxia-inducible factor 1 (HIF-1) and HIF-2 in von Hippel-Lindau-associated renal cell carcinoma. Mol. Cell. Biol., 25, 5675–86.
143. Shen, C., Beroukhim, R., Schumacher, S. E., et al. (2011) Genetic and functional studies implicate HIF1α as a 14q kidney cancer suppressor gene. Cancer Discov., 1, 222–35.
144. Morris, M. R., Hughes, D. J., Tian, Y.-M., et al. (2009) Mutation analysis of hypoxia-inducible factors HIF1A and HIF2A in renal cell carcinoma. Anticancer Res., 29, 4337–43.
145. Roe, J.-S., Kim, H.-R., Hwang, I.-Y., et al. (2011) von Hippel–Lindau protein promotes Skp2 destabilization on DNA damage. Oncogene, 30, 3127–3138.
265
146. Thoma, C. R., Toso, A., Gutbrodt, K. L., et al. (2009) VHL loss causes spindle misorientation and chromosome instability. Nat. Cell Biol., 11, 994–1001.
147. Roe, J.-S., Kim, H., Lee, S.-M., et al. (2006) p53 Stabilization and Transactivation by a von Hippel-Lindau Protein. Mol. Cell, 22, 395–405.
148. Haase, V. H., Glickman, J. N., Socolovsky, M., et al. (2001) Vascular tumors in livers with targeted inactivation of the von Hippel-Lindau tumor suppressor. Proc. Natl. Acad. Sci., 98, 1583–1588.
149. Kleymenova, E., Everitt, J. I., Pluta, L., et al. (2003) Susceptibility to vascular neoplasms but no increased susceptibility to renal carcinogenesis in Vhl knockout mice. Carcinogenesis, 25, 309–315.
150. Kapitsinou, P. P. and Haase, V. H. (2008) The VHL tumor suppressor and HIF: insights from genetic studies in mice. Cell Death Differ., 15, 650–9.
151. Velickovic, M., Delahunt, B. and Grebe, S. K. (1999) Loss of heterozygosity at 3p14.2 in clear cell renal cell carcinoma is an early event and is highly localized to the FHIT gene locus. Cancer Res., 59, 1323–6.
152. Nargund, A. M., Pham, C. G., Dong, Y., et al. (2017) The SWI/SNF Protein PBRM1 Restrains VHL-Loss-Driven Clear Cell Renal Cell Carcinoma. 18, 2893–2906.
153. Reed, W. B., Walker, R. and Horowitz, R. (1973) Cutaneous leiomyomata with uterine leiomyomata. Acta Derm. Venereol., 53, 409–16.
154. Launonen, V., Vierimaa, O., Kiuru, M., et al. (2001) Inherited susceptibility to uterine leiomyomas and renal cell cancer. Proc. Natl. Acad. Sci., 98, 3387–3392.
155. Toro, J. R., Nickerson, M. L., Wei, M.-H., et al. (2003) Mutations in the fumarate hydratase gene cause hereditary leiomyomatosis and renal cell cancer in families in North America. Am. J. Hum. Genet., 73, 95–106.
156. Shuch, B., Vourganti, S., Ricketts, C. J., et al. (2014) Defining early-onset kidney cancer: implications for germline and somatic mutation testing and clinical management. J. Clin. Oncol., 32, 431–7.
157. Grubb, R. L., Franks, M. E., Toro, J., et al. (2007) Hereditary Leiomyomatosis and Renal Cell Cancer: A Syndrome Associated With an Aggressive Form of Inherited Renal Cancer. J. Urol., 177, 2074–2080.
158. Linehan, W. M., Spellman, P. T., Ricketts, C. J., et al. (2015) Comprehensive Molecular Characterization of Papillary Renal-Cell Carcinoma. N. Engl. J. Med., 374, 135–45.
159. Tomlinson, I. P. M., Alam, N. A., Rowan, A. J., et al. (2002) Germline mutations in FH predispose to dominantly inherited uterine fibroids, skin leiomyomata and papillary renal cell cancer. Nat. Genet., 30, 406–410.
160. Alam, N. A., Rowan, A. J., Wortham, N. C., et
al. (2003) Genetic and functional analyses of FH mutations in multiple cutaneous and uterine leiomyomatosis, hereditary leiomyomatosis and renal cancer, and fumarate hydratase deficiency. Hum. Mol. Genet., 12, 1241–52.
161. Wei, M.-H., Toure, O., Glenn, G. M., et al. (2006) Novel mutations in FH and expansion of the spectrum of phenotypes expressed in families with hereditary leiomyomatosis and renal cell cancer. J. Med. Genet., 43, 18–27.
162. Alam, N. A., Bevan, S., Churchman, M., et al. (2001) Localization of a Gene (MCUL1) for Multiple Cutaneous Leiomyomata and Uterine Fibroids to Chromosome 1q42.3-q43. Am. J. Hum. Genet., 68, 1264–1269.
163. MASSEY, V. (1953) Studies on fumarase. 4. The effects of inhibitors on fumarase activity. Biochem. J., 55, 172–7.
164. Vander Heiden, M. G., Cantley, L. C. and Thompson, C. B. (2009) Understanding the Warburg effect: the metabolic requirements of cell proliferation. Science, 324, 1029–33.
165. Tong, W.-H., Sourbier, C., Kovtunovych, G., et al. (2011) The glycolytic shift in fumarate-hydratase-deficient kidney cancer lowers AMPK levels, increases anabolic propensities and lowers cellular iron levels. Cancer Cell, 20, 315–27.
166. D’Angelo, G., Duplan, E., Boyer, N., et al. (2003) Hypoxia Up-regulates Prolyl Hydroxylase Activity. J. Biol. Chem., 278, 38183–38187.
167. Isaacs, J. S., Jung, Y. J., Mole, D. R., et al. (2005) HIF overexpression correlates with biallelic loss of fumarate hydratase in renal cancer: Novel role of fumarate in regulation of HIF stability. Cancer Cell, 8, 143–153.
168. Pollard, P. J., Brière, J. J., Alam, N. A., et al. (2005) Accumulation of Krebs cycle intermediates and over-expression of HIF1α in tumours which result from germline FH and SDH mutations. Hum. Mol. Genet., 14, 2231–2239.
169. Pollard, P., Wortham, N., Barclay, E., et al. (2005) Evidence of increased microvessel density and activation of the hypoxia pathway in tumours from the hereditary leiomyomatosis and renal cell cancer syndrome. J. Pathol., 205, 41–49.
170. Sudarshan, S., Sourbier, C., Kong, H.-S., et al. (2009) Fumarate Hydratase Deficiency in Renal Cancer Induces Glycolytic Addiction and Hypoxia-Inducible Transcription Factor 1 Stabilization by Glucose-Dependent Generation of Reactive Oxygen Species. Mol. Cell. Biol., 29, 4080–4090.
171. Alderson, N. L., Wang, Y., Blatnik, M., et al. (2006) S-(2-Succinyl)cysteine: A novel chemical modification of tissue proteins by a Krebs cycle intermediate. Arch. Biochem. Biophys., 450, 1–8.
172. Ooi, A., Wong, J.-C., Petillo, D., et al. (2011) An Antioxidant Response Phenotype Shared between Hereditary and Sporadic Type 2 Papillary Renal Cell Carcinoma. Cancer Cell,
266
20, 511–523.
173. Lenaz, G. (1998) Role of mitochondria in oxidative stress and ageing. Biochim. Biophys. Acta - Bioenerg., 1366, 53–67.
174. Xiao, M., Yang, H., Xu, W., et al. (2012) Inhibition of -KG-dependent histone and DNA demethylases by fumarate and succinate that are accumulated in mutations of FH and SDH tumor suppressors. Genes Dev., 26, 1326–1338.
175. Laukka, T., Mariani, C. J., Ihantola, T., et al. (2016) Fumarate and Succinate Regulate Expression of Hypoxia-inducible Genes via TET Enzymes. J. Biol. Chem., 291, 4256–65.
176. Bourgeron, T., Chretien, D., Poggi-Bach, J., et al. (1994) Mutation of the fumarase gene in two siblings with progressive encephalopathy and fumarase deficiency. J. Clin. Invest., 93, 2514–8.
177. Coughlin, E. M., Christensen, E., Kunz, P. L., et al. (1998) Molecular Analysis and Prenatal Diagnosis of Human Fumarase Deficiency. Mol. Genet. Metab., 63, 254–262.
178. Benusiglio, P. R., Giraud, S., Deveaux, S., et al. (2014) Renal cell tumour characteristics in patients with the Birt-Hogg-Dubé cancer susceptibility syndrome: a retrospective, multicentre study. Orphanet J. Rare Dis., 9, 163.
179. Houweling, A. C., Gijezen, L. M., Jonker, M. A., et al. Renal cancer and pneumothorax risk in Birt–Hogg–Dubé syndrome; an analysis of 115 FLCN mutation carriers from 35 BHD families. Br. J. Cancer, 105, 1912–1919.
180. Toro, J. R., Wei, M.-H., Glenn, G. M., et al. (2007) BHD mutations, clinical and molecular genetic investigations of Birt-Hogg-Dubé syndrome: a new series of 50 families and a review of published reports. J. Med. Genet.
181. Gatalica, Z., Lilleberg, S. L., Vranic, S., et al. (2009) Novel intronic germline FLCN gene mutation in a patient with multiple ipsilateral renal neoplasms. Hum. Pathol., 40, 1813–1819.
182. Pavlovich, C. P., Walther, M. M., Eyler, R. A., et al. (2002) Renal tumors in the Birt-Hogg-Dubé syndrome. Am. J. Surg. Pathol., 26, 1542–52.
183. Kuroda, N., Furuya, M., Nagashima, Y., et al. (2014) Intratumoral peripheral small papillary tufts: a diagnostic clue of renal tumors associated with Birt-Hogg-Dubé syndrome. Ann. Diagn. Pathol., 18, 171–176.
184. Benusiglio, P., Gad, S., Massard, C., et al. (2014) Case Report: Expanding the tumour spectrum associated with the Birt-Hogg-Dubé cancer susceptibility syndrome. F1000Research, 3.
185. Dong, L., Gao, M., Hao, W., et al. (2016) Case Report of Birt–Hogg–Dubé Syndrome. Medicine (Baltimore)., 95, e3695.
186. Pradella, L. M., Lang, M., Kurelac, I., et al. (2013) Where Birt–Hogg–Dubé meets Cowden Syndrome: mirrored genetic defects in two
cases of syndromic oncocytic tumours. Eur. J. Hum. Genet., 21, 1169–1172.
187. Raymond, V. M., Long, J. M., Everett, J. N., et al. (2014) An oncocytic adrenal tumour in a patient with Birt-Hogg-Dubé syndrome. Clin. Endocrinol. (Oxf)., 80, 925–927.
188. Mota-Burgos, A., Acosta, E. H., Márquez, F. V., et al. (2013) Birt-Hogg-Dubé syndrome in a patient with melanoma and a novel mutation in the FCLN gene. Int. J. Dermatol., 52, 323–326.
189. Kean Khoo, S., Bradley, M., Wong, F. K., et al. (2001) Birt-Hogg-Dube syndrome: mapping of a novel hereditary neoplasia gene to chromosome 17p12-q11.2. Birt-Hogg-Dube syndrome: mapping of a novel hereditary neoplasia gene to chromosome 17p12-q11.2; (2001) .
190. Nahorski, M. S., Reiman, A., Lim, D. H. K., et al. (2011) Birt Hogg-Dubé syndrome-associated FLCN mutations disrupt protein stability. Hum. Mutat., 32, 921–929.
191. Nickerson, M. L., Warren, M. B., Toro, J. R., et al. (2002) Mutations in a novel gene lead to kidney tumors, lung wall defects, and benign tumors of the hair follicle in patients with the Birt-Hogg-Dubé syndrome. Cancer Cell, 2, 157–164.
192. Schmidt, L. S., Nickerson, M. L., Warren, M. B., et al. (2005) Germline BHD-Mutation Spectrum and Phenotype Analysis of a Large Cohort of Families with Birt-Hogg-Dubé Syndrome. Germline BHD-Mutation Spectrum and Phenotype Analysis of a Large Cohort of Families with Birt-Hogg-Dubé Syndrome; (2005) ; Vol. 76.
193. Ding, Y., Zhu, C., Zou, W., et al. (2015) FLCN intragenic deletions in Chinese familial primary spontaneous pneumothorax. Am. J. Med. Genet. Part A, 167, 1125–1133.
194. Okimoto, K., Sakurai, J., Kobayashi, T., et al. (2004) A germ-line insertion in the Birt-Hogg-Dubé (BHD) gene gives rise to the Nihon rat model of inherited renal cancer. Proc. Natl. Acad. Sci. U. S. A., 101, 2023–7.
195. Vocke, C. D., Yang, Y., Pavlovich, C. P., et al. (2005) High Frequency of Somatic Frameshift BHD Gene Mutations in Birt-Hogg-Dubé-Associated Renal Tumors. J. Natl. Cancer Inst., 97.
196. Van Steensel, M. A. M., Verstraeten, V. L. R. M., Frank, J., et al. (2007) Novel Mutations in the BHD Gene and Absence of Loss of Heterozygosity in Fibrofolliculomas of Birt-Hogg-Dubé Patients. J. Invest. Dermatol., 127, 588–593.
197. Baba, M., Hong, S.-B., Sharma, N., et al. (2006) Folliculin encoded by the BHD gene interacts with a binding protein, FNIP1, and AMPK, and is involved in AMPK and mTOR signaling. Proc. Natl. Acad. Sci. U. S. A., 103, 15552–7.
198. Hasumi, H., Baba, M., Hong, S.-B., et al. (2008) Identification and characterization of a novel folliculin-interacting protein FNIP2. Gene, 415, 60–7.
267
199. Shaw, R. J. (2009) LKB1 and AMP-activated protein kinase control of mTOR signalling and growth. Acta Physiol. (Oxf)., 196, 65–80.
200. Hasumi, Y., Baba, M., Ajima, R., et al. (2009) Homozygous loss of BHD causes early embryonic lethality and kidney tumor development with activation of mTORC1 and mTORC2. Proc. Natl. Acad. Sci., 106, 18722–18727.
201. Hong, S.-B., Oh, H., Valera, V. A., et al. (2010) Inactivation of the FLCN tumor suppressor gene induces TFE3 transcriptional activity by increasing its nuclear localization. PLoS One, 5, e15793.
202. Zbar, B., Tory, K., Merino, M., et al. (1994) Hereditary papillary renal cell carcinoma. J. Urol., 151, 561–6.
203. Schmidt, L., Junker, K., Weirich, G., et al. (1998) Two North American families with hereditary papillary renal carcinoma and identical novel mutations in the MET proto-oncogene. Cancer Res., 58, 1719–22.
204. Schmidt, L., Duh, F.-M., Chen, F., et al. (1997) Germline and somatic mutations in the tyrosine kinase domain of the MET proto-oncogene in papillary renal carcinomas. Nat. Genet., 16, 68–73.
205. Zbar, B., Glenn, G., Lubensky, I., et al. (1995) Hereditary papillary renal cell carcinoma: clinical studies in 10 families. J. Urol., 153, 907–12.
206. Ornstein, D. K., Lubensky, I. A., Venzon, D., et al. (2000) Prevalence of microscopic tumors in normal appearing renal parenchyma of patients with hereditary papillary renal cancer. J. Urol., 163, 431–3.
207. Schmidt, L., Junker, K., Nakaigawa, N., et al. (1999) Novel mutations of the MET proto-oncogene in papillary renal carcinomas. Oncogene, 18, 2343–2350.
208. Miller, M., Ginalski, K., Lesyng, B., et al. (2001) Structural basis of oncogenic activation caused by point mutations in the kinase domain of the MET proto-oncogene: modeling studies. Proteins, 44, 32–43.
209. Basilico, C., Arnesano, A., Galluzzo, M., et al. (2008) A High Affinity Hepatocyte Growth Factor-binding Site in the Immunoglobulin-like Region of Met. J. Biol. Chem., 283, 21267–21277.
210. Trusolino, L. and Comoglio, P. M. (2002) Scatter-factor and semaphorin receptors: cell signalling for invasive growth. Nat. Rev. Cancer, 2, 289–300.
211. MATSUMURA, A., KUBOTA, T., TAIYOH, H., et al. (2013) HGF regulates VEGF expression via the c-Met receptor downstream pathways, PI3K/Akt, MAPK and STAT3, in CT26 murine cells. Int. J. Oncol., 42, 535–542.
212. Bardella, C., Pollard, P. J. and Tomlinson, I. (2011) SDH mutations in cancer. Biochim. Biophys. Acta - Bioenerg., 1807, 1432–1443.
213. Vanharanta, S., Buchta, M., McWhinney, S. R.,
et al. (2004) Early-Onset Renal Cell Carcinoma as a Novel Extraparaganglial Component of SDHB-Associated Heritable Paraganglioma. Am. J. Hum. Genet., 74, 153–159.
214. Ricketts, C., Woodward, E. R., Killick, P., et al. (2008) Germline SDHB mutations and familial renal cell carcinoma. J. Natl. Cancer Inst., 100, 1260–1262.
215. Ricketts, C. J., Forman, J. R., Rattenberry, E., et al. (2010) Tumor risks and genotype-phenotype-proteotype analysis in 358 patients with germline mutations in SDHB and SDHD. Hum. Mutat., 31, 41–51.
216. Malinoc, A., Sullivan, M., Wiech, T., et al. (2012) Biallelic inactivation of the SDHC gene in renal carcinoma associated with paraganglioma syndrome type 3. Endocr. Relat. Cancer, 19, 283–290.
217. McEvoy, C. R., Koe, L., Choong, D. Y., et al. (2018) SDH-deficient renal cell carcinoma associated with biallelic mutation in succinate dehydrogenase A: comprehensive genetic profiling and its relation to therapy response. npj Precis. Oncol., 2, 9.
218. Nicolas, E., Demidova, E. V., Iqbal, W., et al. (2019) Interaction of germline variants in a family with a history of early-onset clear cell renal cell carcinoma. Mol. Genet. Genomic Med., e556.
219. Bayley, J.-P., Kunst, H. P., Cascon, A., et al. (2010) SDHAF2 mutations in familial and sporadic paraganglioma and phaeochromocytoma. Lancet Oncol., 11, 366–372.
220. Gill, A. J., Hes, O., Papathomas, T., et al. (2014) Succinate Dehydrogenase (SDH)-deficient Renal Carcinoma. Am. J. Surg. Pathol., 38, 1588–1602.
221. Williamson, S. R., Eble, J. N., Amin, M. B., et al. (2014) Succinate dehydrogenase-deficient renal cell carcinoma: detailed characterization of 11 tumors defining a unique subtype of renal cell carcinoma. Mod. Pathol., 28, 80–94.
222. Gill, A. J., Pachter, N. S., Chou, A., et al. (2011) Renal tumors associated with germline SDHB mutation show distinctive morphology. Am. J. Surg. Pathol., 35, 1578–85.
223. Benn, D. E., Zhu, Y., Andrews, K. A., et al. (2018) Bayesian approach to determining penetrance of pathogenic SDH variants. J. Med. Genet., 55, 729–734.
224. Maniam, P., Zhou, K., Lonergan, M., et al. (2018) Pathogenicity and Penetrance of Germline SDHA Variants in Pheochromocytoma and Paraganglioma (PPGL). J. Endocr. Soc., 2, 806–816.
225. Andrews, K. A., Ascher, D. B., Pires, D. E. V., et al. (2018) Tumour risks and genotype-phenotype correlations associated with germline variants in succinate dehydrogenase subunit genes SDHB, SDHC and SDHD. J. Med. Genet., 55, 384–394.
226. Casey, R. T., Warren, A. Y., Rodrigues, J. E., et al. (2017) Clinical and Molecular Features of
268
Renal and Phaeochromocytoma/Paraganglioma Tumour Association Syndrome (RAPTAS): Case Series and Literature Review. J. Clin. Endocrinol. Metab.
227. Douwes Dekker, P., Hogendoorn, P., Kuipers-Dijkshoorn, N., et al. (2003) SDHD mutations in head and neck paragangliomas result in destabilization of complex II in the mitochondrial respiratory chain with loss of enzymatic activity and abnormal mitochondrial morphology. J. Pathol., 201, 480–486.
228. Lussey-Lepoutre, C., Hollinshead, K. E. R., Ludwig, C., et al. (2015) Loss of succinate dehydrogenase activity results in dependency on pyruvate carboxylation for cellular anabolism. Nat. Commun., 6, 8784.
229. Xiao, M., Yang, H., Xu, W., et al. (2012) Inhibition of α-KG-dependent histone and DNA demethylases by fumarate and succinate that are accumulated in mutations of FH and SDH tumor suppressors. Genes Dev., 26, 1326–1338.
230. Van Coster, R., Seneca, S., Smet, J., et al. (2003) Homozygous Gly555Glu mutation in the nuclear-encoded 70 kDa flavoprotein gene causes instability of the respiratory chain complex II. Am. J. Med. Genet., 120A, 13–18.
231. Piruat, J. I. and Millán-Uclés, A. (2014) Genetically modeled mice with mutations in mitochondrial metabolic enzymes for the study of cancer. Front. Oncol., 4, 200.
232. Yang, P., Cornejo, K. M., Sadow, P. M., et al. (2014) Renal cell carcinoma in tuberous sclerosis complex. Am. J. Surg. Pathol., 38, 895–909.
233. Rakowski, S. K., Winterkorn, E. B., Paul, E., et al. (2006) Renal manifestations of tuberous sclerosis complex: Incidence, prognosis, and predictive factors. Kidney Int., 70, 1777–1782.
234. McGuire, B. B. and Fitzpatrick, J. M. (2010) The diagnosis and management of complex renal cysts. Curr. Opin. Urol., 20, 349–54.
235. Seyam, R. M., Alkhudair, W. K., Kattan, S. A., et al. (2017) The Risks of Renal Angiomyolipoma: Reviewing the Evidence. J. kidney cancer VHL, 4, 13–25.
236. Ebrahimi-Fakhari, D., Mann, L. L., Poryo, M., et al. (2018) Incidence of tuberous sclerosis and age at first diagnosis: new data and emerging trends from a national, prospective surveillance study. Orphanet J. Rare Dis., 13, 117.
237. Guo, J., Tretiakova, M. S., Troxell, M. L., et al. (2014) Tuberous sclerosis-associated renal cell carcinoma: a clinicopathologic study of 57 separate carcinomas in 18 patients. Am. J. Surg. Pathol., 38, 1457–67.
238. Dabora, S. L., Jozwiak, S., Franz, D. N., et al. (2001) Mutational analysis in a cohort of 224 tuberous sclerosis patients indicates increased severity of TSC2, compared with TSC1, disease in multiple organs. Am. J. Hum. Genet., 68, 64–80.
239. Tyburczy, M. E., Dies, K. A., Glass, J., et al.
(2015) Mosaic and Intronic Mutations in TSC1/TSC2 Explain the Majority of TSC Patients with No Mutation Identified by Conventional Testing. PLOS Genet., 11, e1005637.
240. Inoki, K., Li, Y., Zhu, T., et al. (2002) TSC2 is phosphorylated and inhibited by Akt and suppresses mTOR signalling. Nat. Cell Biol., 4, 648–657.
241. Zhang, Y., Gao, X., Saucedo, L. J., et al. (2003) Rheb is a direct target of the tuberous sclerosis tumour suppressor proteins. Nat. Cell Biol., 5, 578–581.
242. Long, X., Lin, Y., Ortiz-Vega, S., et al. (2005) Rheb Binds and Regulates the mTOR Kinase. Curr. Biol., 15, 702–713.
243. Tan, M.-H., Mester, J. L., Ngeow, J., et al. (2012) Lifetime Cancer Risks in Individuals with Germline PTEN Mutations. Clin. Cancer Res., 18, 400–407.
244. Bubien, V., Bonnet, F., Brouste, V., et al. (2013) High cumulative risks of cancer in patients with PTEN hamartoma tumour syndrome. J. Med. Genet., 50, 255–263.
245. Nieuwenhuis, M. H., Kets, C. M., Murphy-Ryan, M., et al. (2014) Cancer risk and genotype–phenotype correlations in PTEN hamartoma tumor syndrome. Fam. Cancer, 13, 57–63.
246. Mester, J. L., Zhou, M., Prescott, N., et al. (2012) Papillary Renal Cell Carcinoma Is Associated With PTEN Hamartoma Tumor Syndrome. Urology, 79, 1187.e1-1187.e7.
247. Bennett, K. L., Mester, J. and Eng, C. (2010) Germline Epigenetic Regulation of KILLIN in Cowden and Cowden-like Syndrome. JAMA, 304, 2724.
248. Orloff, M. S., He, X., Peterson, C., et al. (2013) Germline PIK3CA and AKT1 mutations in cowden and cowden-like syndromes. Am. J. Hum. Genet., 92, 76–80.
249. Shibata, Y., Yamazaki, M., Takei, M., et al. (2015) Early-onset, severe, and recurrent primary hyperparathyroidism associated with a novel <i>CDC73</i> mutation. Endocr. J., 62, 627–632.
250. van der Tuin, K., Tops, C. M. J., Adank, M. A., et al. (2017) CDC73-Related Disorders: Clinical Manifestations and Case Detection in Primary Hyperparathyroidism. J. Clin. Endocrinol. Metab., 102, 4534–4540.
251. Haven, C. J., Wong, F. K., van Dam, E. W. C. M., et al. (2000) A Genotypic and Histopathological Study of a Large Dutch Kindred with Hyperparathyroidism-Jaw Tumor Syndrome 1. J. Clin. Endocrinol. Metab., 85, 1449–1454.
252. Yart, A., Gstaiger, M., Wirbelauer, C., et al. (2005) The HRPT2 Tumor Suppressor Gene Product Parafibromin Associates with Human PAF1 and RNA Polymerase II. Mol. Cell. Biol., 25, 5052–5060.
253. Rozenblatt-Rosen, O., Hughes, C. M., Nannepaga, S. J., et al. (2005) The
269
Parafibromin Tumor Suppressor Protein Is Part of a Human Paf1 Complex. Mol. Cell. Biol., 25, 612–620.
254. Woodard, G. E., Lin, L., Zhang, J.-H., et al. (2005) Parafibromin, product of the hyperparathyroidism-jaw tumor syndrome gene HRPT2, regulates cyclin D1/PRAD1 expression. Oncogene, 24, 1272–1276.
255. Lin, L., Zhang, J.-H., Panicker, L. M., et al. (2008) The parafibromin tumor suppressor protein inhibits cell proliferation by repression of the c-myc proto-oncogene. Proc. Natl. Acad. Sci., 105, 17420–17425.
256. Zhang, C., Kong, D., Tan, M.-H., et al. (2006) Parafibromin inhibits cancer cell growth and causes G1 phase arrest. Biochem. Biophys. Res. Commun., 350, 17–24.
257. Zhao, J., Yart, A., Frigerio, S., et al. (2007) Sporadic human renal tumors display frequent allelic imbalances and novel mutations of the HRPT2 gene. Oncogene, 26, 3440–3449.
258. Hahn, M. A., Howell, V. M., Gill, A. J., et al. (2010) CDC73/HRPT2 CpG island hypermethylation and mutation of 5′-untranslated sequence are uncommon mechanisms of silencing parafibromin in parathyroid tumors. Endocr. Relat. Cancer, 17, 273–282.
259. Cohen, A. J., Li, F. P., Berg, S., et al. (1979) Hereditary renal-cell carcinoma associated with a chromosomal translocation. N. Engl. J. Med., 301, 592–595.
260. Gemmill, R. M., West, J. D., Boldog, F., et al. (1998) The hereditary renal cell carcinoma 3;8 translocation fuses FHIT to a patched-related gene, TRC8. Proc. Natl. Acad. Sci. U. S. A., 95, 9572–7.
261. Bodmer, D., Eleveld, M. J., Ligtenberg, M. J. L., et al. (1998) An Alternative Route for Multistep Tumorigenesis in a Novel Case of Hereditary Renal Cell Cancer and a t(2;3)(q35;q21) Chromosome Translocation. Am. J. Hum. Genet, 62, 1475–1483.
262. Bertolotto, C., Lesueur, F., Giuliano, S., et al. (2011) A SUMOylation-defective MITF germline mutation predisposes to melanoma and renal carcinoma. Nature, 480, 94–98.
263. Farley, M. N., Schmidt, L. S., Mester, J. L., et al. (2013) A novel germline mutation in BAP1 predisposes to familial clear-cell renal cell carcinoma. Mol. Cancer Res., 11, 1061–71.
264. Benusiglio, P. R., Couvé, S., Gilbert-Dussardier, B., et al. (2015) A germline mutation in PBRM1 predisposes to renal cell carcinoma. J. Med. Genet., 52, 426–430.
265. Woodward, E. R., Ricketts, C., Killick, P., et al. (2008) Familial Non-VHL Clear Cell (Conventional) Renal Cell Carcinoma: Clinical Features, Segregation Analysis, and Mutation Analysis of FLCN. Clin. Cancer Res., 14, 5925–5930.
266. Jafri, M., Wake, N. C., Ascher, D. B., et al. (2015) Germline Mutations in the CDKN2B Tumor Suppressor Gene Predispose to Renal
Cell Carcinoma. Cancer Discov., 5, 723–9.
267. Creighton, C. J., Morgan, M., Gunaratne, P. H., et al. (2013) Comprehensive molecular characterization of clear cell renal cell carcinoma. Nature, 499, 43–49.
268. Dalgliesh, G. L., Furge, K., Greenman, C., et al. (2010) Systematic sequencing of renal carcinoma reveals inactivation of histone modifying genes. Nature, 463, 360–3.
269. Sato, Y., Yoshizato, T., Shiraishi, Y., et al. (2013) Integrated molecular analysis of clear-cell renal cell carcinoma. Nat. Genet., 45, 860–7.
270. Turajlic, S., Xu, H., Litchfield, K., et al. (2018) Deterministic Evolutionary Trajectories Influence Primary Tumor Growth: TRACERx Renal. Cell.
271. Davis, C. F., Ricketts, C. J., Wang, M., et al. (2014) The somatic genomic landscape of chromophobe renal cell carcinoma. Cancer Cell, 26, 319–30.
272. Chen, F., Zhang, Y., Şenbabaoğlu, Y., et al. (2016) Multilevel Genomics-Based Taxonomy of Renal Cell Carcinoma. Cell Rep., 14, 2476–89.
273. Li, L., Shen, C., Nakamura, E., et al. (2013) SQSTM1 is a pathogenic target of 5q copy number gains in kidney cancer. Cancer Cell, 24, 738–50.
274. Ricketts, C. J., De Cubas, A. A., Fan, H., et al. (2018) The Cancer Genome Atlas Comprehensive Molecular Characterization of Renal Cell Carcinoma. Cell Rep., 23, 313-326.e5.
275. Tsai, H.-C. and Baylin, S. B. (2011) Cancer epigenetics: linking basic biology to clinical medicine. Cell Res., 21, 502–517.
276. Herman, J. G., Latif, F., Weng, Y., et al. (1994) Silencing of the VHL tumor-suppressor gene by DNA methylation in renal carcinoma. Proc. Natl. Acad. Sci. U. S. A., 91, 9700–4.
277. Morrissey, C., Martinez, A., Zatyka, M., et al. (2001) Epigenetic inactivation of the RASSF1A 3p21.3 tumor suppressor gene in both clear cell and papillary renal cell carcinoma. Cancer Res., 61, 7277–7281.
278. Awakura, Y., Nakamura, E., Ito, N., et al. (2008) Methylation-associated silencing of TU3A in human cancers. Int. J. Oncol., 33, 893–9.
279. Kvasha, S., Gordiyuk, V., Kondratov, A., et al. (2008) Hypermethylation of the 5′CpG island of the FHIT gene in clear cell renal carcinomas. Cancer Lett., 265, 250–257.
280. Dulaimi, E., Ibanez de Caceres, I., Uzzo, R. G., et al. (2004) Promoter hypermethylation profile of kidney cancer. Clin. Cancer Res., 10, 3972–9.
281. Costa, V. L., Henrique, R., Ribeiro, F. R., et al. (2007) Quantitative promoter methylation analysis of multiple cancer-related genes in renal cell tumors. BMC Cancer, 7, 133.
270
282. Morris, M. R., Hesson, L. B., Wagner, K. J., et al. (2003) Multigene methylation analysis of Wilms’ tumour and adult renal cell carcinoma. Oncogene, 22, 6794–6801.
283. Bennett, K. L., Campbell, R., Ganapathi, S., et al. (2011) Germline and somatic DNA methylation and epigenetic regulation of KILLIN in renal cell carcinoma. Genes, Chromosom. Cancer, 50, 654–661.
284. Gumz, M. L., Zou, H., Kreinest, P. A., et al. (2007) Secreted Frizzled-Related Protein 1 Loss Contributes to Tumor Phenotype of Clear Cell Renal Cell Carcinoma. Clin. Cancer Res., 13, 4740–4749.
285. Yoo, K. H., Park, Y.-K., Kim, H.-S., et al. (2010) Epigenetic inactivation of HOXA5 and MSH2 gene in clear cell renal cell carcinoma. Pathol. Int., 60, 661–666.
286. Shenoy, N., Vallumsetla, N., Zou, Y., et al. (2015) Role of DNA methylation in renal cell carcinoma. J. Hematol. Oncol., 8, 88.
287. McRonald, F. E., Morris, M. R., Gentle, D., et al. (2009) CpG methylation profiling in VHL related and VHL unrelated renal cell carcinoma. Mol. Cancer, 8, 31.
288. Morris, M. R., Ricketts, C. J., Gentle, D., et al. (2011) Genome-wide methylation analysis identifies epigenetically inactivated candidate tumour suppressor genes in renal cell carcinoma. Oncogene, 30, 1390–401.
289. Ricketts, C. J., Morris, M. R., Gentle, D., et al. (2012) Genome-wide CpG island methylation analysis implicates novel genes in the pathogenesis of renal cell carcinoma View supplementary material. Epigenetics, 7, 278–290.
290. Hu, C. Y., Mohtat, D., Yu, Y., et al. (2014) Kidney Cancer Is Characterized by Aberrant Methylation of Tissue-Specific Enhancers That Are Prognostic for Overall Survival. Clin. Cancer Res., 20, 4349–4360.
291. Lasseigne, B. N. and Brooks, J. D. (2018) The Role of DNA Methylation in Renal Cell Carcinoma. Mol. Diagn. Ther., 22, 431–442.
292. Dodd, K. M., Yang, J., Shen, M. H., et al. (2015) mTORC1 drives HIF-1α and VEGF-A signalling via multiple mechanisms involving 4E-BP1, S6K1 and STAT3. Oncogene, 34, 2239–2250.
293. Ricketts, C. J., Crooks, D. R., Sourbier, C., et al. (2016) SnapShot: Renal Cell Carcinoma. Cancer Cell, 29, 610-610.e1.
294. Sanger, F., Nicklen, S. and Coulson, A. R. (1977) DNA sequencing with chain-terminating inhibitors. Proc. Natl. Acad. Sci. U. S. A., 74, 5463–7.
295. Swerdlow, H., Wu, S. L., Harke, H., et al. (1990) Capillary gel electrophoresis for DNA sequencing. Laser-induced fluorescence detection with the sheath flow cuvette. J. Chromatogr., 516, 61–7.
296. Consortium, I. H. G. S. (2001) Initial sequencing and analysis of the human
genome. Nature, 409, 860–921.
297. Morin, R. D., Bainbridge, M., Fejes, A., et al. (2008) Profiling the HeLa S3 transcriptome using randomly primed cDNA and massively parallel short-read sequencing. Biotechniques, 45, 81–94.
298. Li, Y. and Tollefsbol, T. O. (2011) DNA methylation detection: bisulfite genomic sequencing analysis. Methods Mol. Biol., 791, 11–21.
299. Robertson, G., Hirst, M., Bainbridge, M., et al. (2007) Genome-wide profiles of STAT1 DNA association using chromatin immunoprecipitation and massively parallel sequencing. Nat. Methods, 4, 651–657.
300. Cretu Stancu, M., van Roosmalen, M. J., Renkens, I., et al. (2017) Mapping and phasing of structural variation in patient genomes using nanopore sequencing. Nat. Commun., 8, 1326.
301. Choi, Y., Chan, A. P., Kirkness, E., et al. (2018) Comparison of phasing strategies for whole human genomes. PLOS Genet., 14, e1007308.
302. Flusberg, B. A., Webster, D. R., Lee, J. H., et al. (2010) Direct detection of DNA methylation during single-molecule, real-time sequencing. Nat. Methods, 7, 461–5.
303. Simpson, J. T., Workman, R. E., Zuzarte, P. C., et al. (2017) Detecting DNA cytosine methylation using nanopore sequencing. Nat. Methods, 14, 407–410.
304. Hoenen, T., Groseth, A., Rosenke, K., et al. (2016) Nanopore Sequencing as a Rapidly Deployable Ebola Outbreak Tool. Emerg. Infect. Dis., 22, 331–4.
305. Quick, J., Grubaugh, N. D., Pullan, S. T., et al. (2017) Multiplex PCR method for MinION and Illumina sequencing of Zika and other virus genomes directly from clinical samples. Nat. Protoc., 12, 1261–1276.
306. Payne, A., Holmes, N., Rakyan, V., et al. (2018) BulkVis: a graphical viewer for Oxford nanopore bulk FAST5 files. Bioinformatics.
307. Coster, W. De, Roeck, A. De, Pooter, T. De, et al. (2018) Structural variants identified by Oxford Nanopore PromethION sequencing of the human genome. bioRxiv, 434118.
308. Kraft, F., Wesseler, K., Begemann, M., et al. (2019) Novel familial distal imprinting centre 1 (11p15.5) deletion provides further insights in imprinting regulation. Clin. Epigenetics, 11, 30.
309. Mitsuhashi, S., Frith, M. C., Mizuguchi, T., et al. (2018) Robust detection of tandem repeat expansions from long DNA reads. bioRxiv, 356931.
310. Wu, M. C., Lee, S., Cai, T., et al. (2011) Rare-variant association testing for sequencing data with the sequence kernel association test. Am. J. Hum. Genet., 89, 82–93.
311. Tataurov, A. V., You, Y. and Owczarzy, R. (2008) Predicting ultraviolet spectrum of single stranded and double stranded deoxyribonucleic acids. Biophys. Chem., 133, 66–70.
271
312. Borgström, E., Paterlini, M., Mold, J. E., et al. (2017) Comparison of whole genome amplification techniques for human single cell exome sequencing. PLoS One, 12, e0171566.
313. Kent, W. J., Sugnet, C. W., Furey, T. S., et al. (2002) The Human Genome Browser at UCSC. Genome Res., 12, 996–1006.
314. Lander, E. S., Linton, L. M., Birren, B., et al. (2001) Initial sequencing and analysis of the human genome. Nature, 409, 860–921.
315. Untergasser, A., Cutcutache, I., Koressaar, T., et al. (2012) Primer3--new capabilities and interfaces. Nucleic Acids Res., 40, e115.
316. Ye, J., Coulouris, G., Zaretskaya, I., et al. (2012) Primer-BLAST: a tool to design target-specific primers for polymerase chain reaction. BMC Bioinformatics, 13, 134.
317. Danecek, P., Auton, A., Abecasis, G., et al. (2011) The variant call format and VCFtools. Bioinformatics, 27, 2156–2158.
318. McKenna, A., Hanna, M., Banks, E., et al. (2010) The Genome Analysis Toolkit: a MapReduce framework for analyzing next-generation DNA sequencing data. Genome Res., 20, 1297–303.
319. Wang, K., Li, M. and Hakonarson, H. (2010) ANNOVAR: functional annotation of genetic variants from high-throughput sequencing data. Nucleic Acids Res., 38, e164–e164.
320. Auton, A., Abecasis, G. R., Altshuler, D. M., et al. (2015) A global reference for human genetic variation. Nature, 526, 68–74.
321. Ruderfer, D. M., Hamamsy, T., Lek, M., et al. (2016) Patterns of genic intolerance of rare copy number variation in 59,898 human exomes. Nat. Genet., 48, 1107–1111.
322. Kumar, P., Henikoff, S. and Ng, P. C. (2009) Predicting the effects of coding non-synonymous variants on protein function using the SIFT algorithm. Nat. Protoc., 4, 1073–1081.
323. Adzhubei, I., Jordan, D. M. and Sunyaev, S. R. (2013) Predicting Functional Effect of Human Missense Mutations Using PolyPhen-2. Current Protocols in Human Genetics, John Wiley & Sons, Inc., Hoboken, NJ, USA, Vol. Chapter 7, pp. 7.20.1-7.20.41.
324. Kircher, M., Witten, D. M., Jain, P., et al. (2014) A general framework for estimating the relative pathogenicity of human genetic variants. Nat. Genet., 46, 310–315.
325. Richards, S., Aziz, N., Bale, S., et al. (2015) Standards and guidelines for the interpretation of sequence variants: a joint consensus recommendation of the American College of Medical Genetics and Genomics and the Association for Molecular Pathology. Genet. Med., 17, 405–423.
326. Li, Q. and Wang, K. (2017) InterVar: Clinical Interpretation of Genetic Variants by the 2015 ACMG-AMP Guidelines. Am. J. Hum. Genet., 100, 267–280.
327. Loman, N. J., Quick, J. and Simpson, J. T.
(2015) A complete bacterial genome assembled de novo using only nanopore sequencing data. Nat. Methods, 12, 733–735.
328. Loman, N. J. and Quinlan, A. R. (2014) Poretools: a toolkit for analyzing nanopore sequence data. Bioinformatics, 30, 3399–3401.
329. De Coster, W., D’Hert, S., Schultz, D. T., et al. (2018) NanoPack: visualizing and processing long-read sequencing data. Bioinformatics, 34, 2666–2669.
330. Li, H. (2018) Minimap2: pairwise alignment for nucleotide sequences. Bioinformatics, 34, 3094–3100.
331. Benusiglio, P. R., Couvé, S., Gilbert-Dussardier, B., et al. (2015) A germline mutation in PBRM1 predisposes to renal cell carcinoma. J. Med. Genet., 52, 426–430.
332. Ortega, S., Malumbres, M. and Barbacid, M. (2002) Cyclin D-dependent kinases, INK4 inhibitors and cancer. Biochim. Biophys. Acta - Rev. Cancer, 1602, 73–87.
333. Roussel, M. F. (1999) The INK4 family of cell cycle inhibitors in cancer. Oncogene, 18, 5311–5317.
334. Krimpenfort, P., IJpenberg, A., Song, J.-Y., et al. (2007) p15Ink4b is a critical tumour suppressor in the absence of p16Ink4a. Nature, 448, 943–946.
335. Boultwood, J. and Wainscoat, J. S. (2007) Gene silencing by DNA methylation in haematological malignancies. Br. J. Haematol., 138, 3–11.
336. Arya, A. K., Bhadada, S. K., Singh, P., et al. (2017) Promoter hypermethylation inactivates CDKN2A, CDKN2B and RASSF1A genes in sporadic parathyroid adenomas. Sci. Rep., 7, 3123.
337. Spisák, S., Kalmár, A., Galamb, O., et al. (2012) Genome-Wide Screening of Genes Regulated by DNA Methylation in Colon Cancer Development. PLoS One, 7, e46215.
338. Agarwal, S. K., Mateo, C. M. and Marx, S. J. (2009) Rare Germline Mutations in Cyclin-Dependent Kinase Inhibitor Genes in Multiple Endocrine Neoplasia Type 1 and Related States. J. Clin. Endocrinol. Metab., 94, 1826–1834.
339. Welander, J., Andreasson, A., Brauckhoff, M., et al. (2014) Frequent EPAS1/HIF2α exons 9 and 12 mutations in non-familial pheochromocytoma. Endocr. Relat. Cancer, 21, 495–504.
340. Toledo, R. A., Qin, Y., Srikantan, S., et al. (2013) In vivo and in vitro oncogenic effects of HIF2A mutations in pheochromocytomas and paragangliomas. Endocr. Relat. Cancer, 20, 349–59.
341. Yang, C., Sun, M. G., Matro, J., et al. (2013) Novel HIF2A mutations disrupt oxygen sensing, leading to polycythemia, paragangliomas, and somatostatinomas. Blood, 121, 2563–2566.
342. Lorenzo, F. R., Yang, C., Ng Tang Fui, M., et
272
al. (2013) A novel EPAS1/HIF2A germline mutation in a congenital polycythemia with paraganglioma. J. Mol. Med. (Berl)., 91, 507–12.
343. Rao, R. C. and Dou, Y. (2015) Hijacked in cancer: the KMT2 (MLL) family of methyltransferases. Nat. Rev. Cancer, 15, 334–46.
344. Ibragimova, I., Maradeo, M. E., Dulaimi, E., et al. (2013) Aberrant promoter hypermethylation of PBRM1, BAP1, SETD2, KDM6A and other chromatin-modifying genes is absent or rare in clear cell RCC. Epigenetics, 8, 486–93.
345. Gossage, L., Murtaza, M., Slatter, A. F., et al. (2014) Clinical and pathological impact of VHL, PBRM1, BAP1, SETD2, KDM6A , and JARID1c in clear cell renal cell carcinoma. Genes, Chromosom. Cancer, 53, 38–51.
346. Lee, J.-E., Wang, C., Xu, S., et al. (2013) H3K4 mono- and di-methyltransferase MLL4 is required for enhancer activation during cell differentiation. Elife, 2, e01503.
347. Rada-Iglesias, A. (2018) Is H3K4me1 at enhancers correlative or causative? Nat. Genet., 50, 4–5.
348. Ooi, S. K. T., Qiu, C., Bernstein, E., et al. (2007) DNMT3L connects unmethylated lysine 4 of histone H3 to de novo methylation of DNA. Nature, 448, 714–717.
349. Lee, J., Kim, D.-H., Lee, S., et al. (2009) A tumor suppressive coactivator complex of p53 containing ASC-2 and histone H3-lysine-4 methyltransferase MLL3 or its paralogue MLL4. Proc. Natl. Acad. Sci. U. S. A., 106, 8513–8.
350. Buck, M. J., Raaijmakers, L. M., Ramakrishnan, S., et al. (2013) Alterations in chromatin accessibility and DNA methylation in clear cell renal cell carcinoma. Oncogene, 33, 4961–4965.
351. Nishikawa, H., Wu, W., Koike, A., et al. (2009) BRCA1-associated protein 1 interferes with BRCA1/BARD1 RING heterodimer activity. Cancer Res., 69, 111–119.
352. Waterman, M. S. and Eggert, M. (1987) A new algorithm for best subsequence alignments with application to tRNA-rRNA comparisons. J. Mol. Biol., 197, 723–8.
353. Karczewski, K. J., Francioli, L. C., Tiao, G., et al. (2019) Variation across 141,456 human exomes and genomes reveals the spectrum of loss-of-function intolerance across human protein-coding genes. bioRxiv, 531210.
354. Costa-Guda, J., Soong, C. P., Parekh, V. I., et al. (2013) Germline and Somatic Mutations in Cyclin-Dependent Kinase Inhibitor Genes CDKN1A, CDKN2B, and CDKN2C in Sporadic Parathyroid Adenomas. Horm. Cancer, 4, 301–307.
355. Lindberg, D., Åkerström, G. and Westin, G. (2007) Evaluation of CDKN2C/p18, CDKN1B/p27 and CDKN2B/p15 mRNA expression, and CpG methylation status in sporadic and MEN1-associated pancreatic endocrine tumours. Clin. Endocrinol. (Oxf)., 0,
070907134102003-???
356. Boël, P., Wildmann, C., Sensi, M. L., et al. (1995) BAGE: a new gene encoding an antigen recognized on human melanomas by cytolytic T lymphocytes. Immunity, 2, 167–75.
357. Ruault, M., van der Bruggen, P., Brun, M.-E., et al. (2002) New BAGE (B melanoma antigen) genes mapping to the juxtacentromeric regions of human chromosomes 13 and 21 have a cancer/testis expression profile. Eur. J. Hum. Genet., 10, 833–840.
358. Ruault, M., Ventura, M., Galtier, N., et al. (2003) BAGE genes generated by juxtacentromeric reshuffling in the Hominidae lineage are under selective pressure. Genomics, 81, 391–399.
359. Claes, K. B. M. and Leeneer, K. De (2014) Dealing with Pseudogenes in Molecular Diagnostics in the Next-Generation Sequencing Era. 303–315.
360. Ribeiro, A., Golicz, A., Hackett, C. A., et al. (2015) An investigation of causes of false positive single nucleotide polymorphisms using simulated reads from a small eukaryote genome. BMC Bioinformatics, 16, 382.
361. Li, Y., Bögershausen, N., Alanay, Y., et al. (2011) A mutation screen in patients with Kabuki syndrome. Hum. Genet., 130, 715–724.
362. Makrythanasis, P., van Bon, B., Steehouwer, M., et al. (2013) MLL2 mutation detection in 86 patients with Kabuki syndrome: a genotype-phenotype study. Clin. Genet., 84, 539–545.
363. Koemans, T. S., Kleefstra, T., Chubak, M. C., et al. (2017) Functional convergence of histone methyltransferases EHMT1 and KMT2C involved in intellectual disability and autism spectrum disorder. PLOS Genet., 13, e1006864.
364. Niikawa, N., Kuroki, Y., Kajii, T., et al. (1988) Kabuki make-up (Niikawa-Kuroki) syndrome: A study of 62 patients. Am. J. Med. Genet., 31, 565–589.
365. Kleefstra, T., Kramer, J. M., Neveling, K., et al. (2012) Disruption of an EHMT1-associated chromatin-modification module causes intellectual disability. Am. J. Hum. Genet., 91, 73–82.
366. Rampias, T., Karagiannis, D., Avgeris, M., et al. (2019) The lysine‐specific methyltransferase KMT 2C/ MLL 3 regulates DNA repair components in cancer . EMBO Rep., 20.
367. Gala, K., Li, Q., Sinha, A., et al. (2018) KMT2C mediates the estrogen dependence of breast cancer through regulation of ERα enhancer function. Oncogene, 37, 4692–4710.
368. Ortega-Molina, A., Boss, I. W., Canela, A., et al. (2015) The histone lysine methyltransferase KMT2D sustains a gene expression program that represses B cell lymphoma development. Nat. Med., 21, 1199–208.
369. Guo, C., Chen, L. H., Huang, Y., et al. (2013) KMT2D maintains neoplastic cell proliferation and global histone H3 lysine 4
273
monomethylation. Oncotarget, 4, 2144–53.
370. Carosso, G. A., Boukas, L., Augustin, J. J., et al. (2018) Transcriptional suppression from KMT2D loss disrupts cell cycle and hypoxic responses in neurodevelopmental models of Kabuki syndrome. bioRxiv, 484410.
371. de Billy, E., Strocchio, L., Cacchione, A., et al. (2019) Burkitt lymphoma in a patient with Kabuki syndrome carrying a novel KMT2D mutation. Am. J. Med. Genet. Part A, 179, 113–117.
372. Teranishi, H., Koga, Y., Nakashima, K., et al. (2018) Cancer Management in Kabuki Syndrome. J. Pediatr. Hematol. Oncol., 40, 1.
373. Karagianni, P., Lambropoulos, V., Stergidou, D., et al. (2016) Recurrent giant cell fibroblastoma: Malignancy predisposition in Kabuki syndrome revisited. Am. J. Med. Genet. A, 170A, 1333–8.
374. Lv, S., Ji, L., Chen, B., et al. (2018) Histone methyltransferase KMT2D sustains prostate carcinogenesis and metastasis via epigenetically activating LIFR and KLF4. Oncogene, 37, 1354–1368.
375. Beebe-Dimmer, J. L., Zuhlke, K. A., Johnson, A. M., et al. (2018) Rare germline mutations in African American men diagnosed with early-onset prostate cancer. Prostate, 78, 321–326.
376. Whitworth, J., Smith, P. S., Martin, J.-E., et al. (2018) Comprehensive Cancer-Predisposition Gene Testing in an Adult Multiple Primary Tumor Series Shows a Broad Range of Deleterious Variants and Atypical Tumor Phenotypes. Am. J. Hum. Genet., 103, 3–18.
377. Duggan, M. A., Anderson, W. F., Altekruse, S., et al. (2016) The surveillance, epidemiology, and end results (SEER) program and pathology: Toward strengthening the critical relationship. Am. J. Surg. Pathol., 40, e94–e102.
378. Forbes, S. A., Beare, D., Gunasekaran, P., et al. (2015) COSMIC: Exploring the world’s knowledge of somatic mutations in human cancer. Nucleic Acids Res., 43, D805–D811.
379. Easton, D. F., Lesueur, F., Decker, B., et al. (2016) No evidence that protein truncating variants in BRIP1 are associated with breast cancer risk: implications for gene panel testing. J. Med. Genet., 53, 298–309.
380. Byers, H., Wallis, Y., van Veen, E. M., et al. (2016) Sensitivity of BRCA1/2 testing in high-risk breast/ovarian/male breast cancer families: little contribution of comprehensive RNA/NGS panel testing. Eur. J. Hum. Genet., 24, 1591–1597.
381. Leongamornlert, D., Saunders, E., Dadaev, T., et al. (2014) Frequent germline deleterious mutations in DNA repair genes in familial prostate cancer cases are associated with advanced disease. Br. J. Cancer, 110, 1663–72.
382. Wu, Y., Yu, H., Zheng, S. L., et al. (2018) A comprehensive evaluation of CHEK2 germline mutations in men with prostate cancer.
Prostate, 78, 607–615.
383. Desrichard, A., Bidet, Y., Uhrhammer, N., et al. (2011) CHEK2 contribution to hereditary breast cancer in non-BRCA families. Breast Cancer Res., 13, R119.
384. Roeb, W., Higgins, J. and King, M.-C. (2012) Response to DNA damage of CHEK2 missense mutations in familial breast cancer. Hum. Mol. Genet., 21, 2738–44.
385. Clark, G. R., Sciacovelli, M., Gaude, E., et al. (2014) Germline FH mutations presenting with pheochromocytoma. J. Clin. Endocrinol. Metab., 99, E2046-50.
386. Hao, H.-X., Khalimonchuk, O., Schraders, M., et al. (2009) SDH5, a gene required for flavination of succinate dehydrogenase, is mutated in paraganglioma. Science, 325, 1139–42.
387. Bausch, B., Schiavi, F., Ni, Y., et al. (2017) Clinical Characterization of the Pheochromocytoma and Paraganglioma Susceptibility Genes SDHA, TMEM127, MAX, and SDHAF2 for Gene-Informed Prevention. JAMA Oncol., 3, 1204–1212.
388. Huang, K., Mashl, R. J., Wu, Y. Y., et al. (2018) Pathogenic Germline Variants in 10,389 Adult Cancers. Cell, 173, 355-370.e14.
389. Varela, I., Tarpey, P., Raine, K., et al. (2011) Exome sequencing identifies frequent mutation of the SWI/SNF complex gene PBRM1 in renal carcinoma. Nature, 469, 539–542.
390. The Exome Aggregation Consortium (ExAC) (2015) Analysis of protein-coding genetic variation in 60,706 humans. bioRxiv, 030338.
391. Wu, K., Hinson, S. R., Ohashi, A., et al. (2005) Functional evaluation and cancer risk assessment of BRCA2 unclassified variants. Cancer Res., 65, 417–26.
392. Ali, A. M., Kirby, M., Jansen, M., et al. (2009) Identification and characterization of mutations in FANCL gene: a second case of Fanconi anemia belonging to FA-L complementation group. Hum. Mutat., 30, E761-70.
393. Calkhoven, C. F., Müller, C. and Leutz, A. (2000) Translational control of C/EBPalpha and C/EBPbeta isoform expression. Genes Dev., 14, 1920–32.
394. Rashid, M. U., Gull, S., Faisal, S., et al. (2011) Identification of the deleterious 2080insA BRCA1 mutation in a male renal cell carcinoma patient from a family with multiple cancer diagnoses from Pakistan. Fam. Cancer, 10, 709–712.
395. Wu, J., Wang, H., Ricketts, C. J., et al. (2018) Germline mutations of renal cancer predisposition genes and clinical relevance in Chinese patients with sporadic, early‐onset disease. Cancer, cncr.31908.
396. Cybulski, C., Górski, B., Huzarski, T., et al. (2004) CHEK2 is a multiorgan cancer susceptibility gene. Am. J. Hum. Genet., 75, 1131–5.
274
397. Näslund-Koch, C., Nordestgaard, B. G. and Bojesen, S. E. (2016) Increased Risk for Other Cancers in Addition to Breast Cancer for CHEK2*1100delC Heterozygotes Estimated From the Copenhagen General Population Study. J. Clin. Oncol., 34, 1208–16.
398. Nevanlinna, H. and Bartek, J. (2006) The CHEK2 gene and inherited breast cancer susceptibility. Oncogene, 25, 5912–5919.
399. Jonsson, P., Bandlamudi, C., Cheng, M. L., et al. (2019) Tumour lineage shapes BRCA-mediated phenotypes. Nature, 571, 576–579.
400. Rafnar, T., Gudbjartsson, D. F., Sulem, P., et al. (2011) Mutations in BRIP1 confer high risk of ovarian cancer. Nat. Genet., 43, 1104–1107.
401. Seal, S., Thompson, D., Renwick, A., et al. (2006) Truncating mutations in the Fanconi anemia J gene BRIP1 are low-penetrance breast cancer susceptibility alleles. Nat. Genet., 38, 1239–1241.
402. Weber-Lassalle, N., Hauke, J., Ramser, J., et al. (2018) BRIP1 loss-of-function mutations confer high risk for familial ovarian cancer, but not familial breast cancer. Breast Cancer Res., 20, 7.
403. DiMario, F. J., Sahin, M. and Ebrahimi-Fakhari, D. (2015) Tuberous Sclerosis Complex. Pediatr. Clin. North Am., 62, 633–648.
404. Müller, C., Calkhoven, C. F., Sha, X., et al. (2004) The CCAAT enhancer-binding protein alpha (C/EBPalpha) requires a SWI/SNF complex for proliferation arrest. J. Biol. Chem., 279, 7353–8.
405. Havrilla, J. M., Pedersen, B. S., Layer, R. M., et al. (2019) A map of constrained coding regions in the human genome. Nat. Genet., 51, 88–95.
406. Shah, N., Hou, Y.-C. C., Yu, H.-C., et al. (2018) Identification of Misclassified ClinVar Variants via Disease Population Prevalence. Am. J. Hum. Genet., 102, 609–619.
407. Tan, R., Wang, Y., Kleinstein, S. E., et al. (2014) An evaluation of copy number variation detection tools from whole-exome sequencing data. Hum. Mutat., 35, 899–907.
408. Zawistowski, M., Gopalakrishnan, S., Ding, J., et al. (2010) Extending rare-variant testing strategies: analysis of noncoding sequence and imputed genotypes. Am. J. Hum. Genet., 87, 604–17.
409. Li, B. and Leal, S. M. (2008) Methods for Detecting Associations with Rare Variants for Common Diseases: Application to Analysis of Sequence Data. Am. J. Hum. Genet., 83, 311–321.
410. Lee, S., Emond, M. J., Bamshad, M. J., et al. (2012) Optimal unified approach for rare-variant association testing with application to small-sample case-control whole-exome sequencing studies. Am. J. Hum. Genet., 91, 224–37.
411. Lee, S., Abecasis, G. R., Boehnke, M., et al. (2014) Rare-variant association analysis: study designs and statistical tests. Am. J. Hum. Genet., 95, 5–23.
412. Shaw, K. A., Cutler, D. J., Okou, D., et al. (2019) Genetic variants and pathways implicated in a pediatric inflammatory bowel disease cohort. Genes Immun., 20, 131–142.
413. Klein, K., Tremmel, R., Winter, S., et al. (2019) A New Panel-Based Next-Generation Sequencing Method for ADME Genes Reveals Novel Associations of Common and Rare Variants With Expression in a Human Liver Cohort. Front. Genet., 10, 7.
414. Leongamornlert, D. A., Saunders, E. J., Wakerell, S., et al. (2019) Germline DNA Repair Gene Mutations in Young-onset Prostate Cancer Cases in the UK: Evidence for a More Extensive Genetic Panel. Eur. Urol.
415. Bourque, G., Burns, K. H., Gehring, M., et al. (2018) Ten things you should know about transposable elements. Genome Biol., 19, 199.
416. Ganguly, A., Dunbar, T., Chen, P., et al. (2003) Exon skipping caused by an intronic insertion of a young Alu Yb9 element leads to severe
hemophilia�A. Hum. Genet., 113, 348–352.
417. Schwahn, U., Lenzner, S., Dong, J., et al. (1998) Positional cloning of the gene for X-linked retinitis pigmentosa 2. Nat. Genet., 19, 327–332.
418. Teugels, E., De Brakeleer, S., Goelen, G., et al. (2005) De novo Alu element insertions targeted to a sequence common to the BRCA1 and BRCA2 genes. Hum. Mutat., 26, 284–284.
419. Lanikova, L., Kucerova, J., Indrak, K., et al. (2013) β-Thalassemia Due to Intronic LINE-1 Insertion in the β-Globin Gene (HBB): Molecular Mechanisms Underlying Reduced Transcript Levels of the β-GlobinL1 Allele. Hum. Mutat., 34, 1361.
420. Gardner, E. J., Lam, V. K., Harris, D. N., et al. (2017) The Mobile Element Locator Tool (MELT): population-scale mobile element discovery and biology. Genome Res., 27, 1916–1929.
421. Vergnaud, G. and Denoeud, F. (2000) Minisatellites: mutability and genome architecture. Genome Res., 10, 899–907.
422. Liquori, C. L., Ricker, K., Moseley, M. L., et al. (2001) Myotonic Dystrophy Type 2 Caused by a CCTG Expansion in Intron 1 of ZNF9. Science (80-. )., 293, 864–867.
423. Ishiura, H., Doi, K., Mitsui, J., et al. (2018) Expansions of intronic TTTCA and TTTTA repeats in benign adult familial myoclonic epilepsy. Nat. Genet., 50, 581–590.
424. Pringsheim, T., Wiltshire, K., Day, L., et al. (2012) The incidence and prevalence of Huntington’s disease: A systematic review and meta-analysis. Mov. Disord., 27, 1083–1091.
425. Grünewald, T. G. P., Bernard, V., Gilardi-Hebenstreit, P., et al. (2015) Chimeric EWSR1-FLI1 regulates the Ewing sarcoma susceptibility gene EGR2 via a GGAA microsatellite. Nat. Genet., 47, 1073–1078.
426. Mousavi, N., Shleizer-Burko, S., Yanicky, R., et al. (2019) Profiling the genome-wide landscape
275
of tandem repeat expansions. bioRxiv, 361162.
427. Sidiropoulos, K., Viteri, G., Sevilla, C., et al. (2017) Reactome enhanced pathway visualization. Bioinformatics, 33, 3461–3467.
428. Repana, D., Nulsen, J., Dressler, L., et al. (2019) The Network of Cancer Genes (NCG): a comprehensive catalogue of known and candidate cancer genes from cancer sequencing screens. Genome Biol., 20, 1.
429. Bailey, M. H., Tokheim, C., Porta-Pardo, E., et al. (2018) Comprehensive Characterization of Cancer Driver Genes and Mutations. Cell, 174, 1034–1035.
430. Fromer, M., Moran, J. L., Chambert, K., et al. (2012) Discovery and statistical genotyping of copy-number variation from whole-exome sequencing depth. Am. J. Hum. Genet., 91, 597–607.
431. (2003) The International HapMap Project. Nature, 426, 789–796.
432. Zhou, H., Alexander, D. and Lange, K. (2011) A quasi-Newton acceleration for high-dimensional optimization algorithms. Stat. Comput., 21, 261–273.
433. Ruark, E., Münz, M., Renwick, A., et al. (2015) The ICR1000 UK exome series: a resource of gene variation in an outbred population. F1000Research, 4, 883.
434. Lee, S., Fuchsberger, C., Kim, S., et al. (2016) An efficient resampling method for calibrating single and gene-based rare variant association analysis in case-control studies. Biostatistics, 17, 1–15.
435. Ehret, G. B. (2010) Genome-Wide Association Studies: Contribution of Genomics to Understanding Blood Pressure and Essential Hypertension. Curr. Hypertens. Rep., 12, 17.
436. Wang, J., Vasaikar, S., Shi, Z., et al. (2017) WebGestalt 2017: a more comprehensive, powerful, flexible and interactive gene set enrichment analysis toolkit. Nucleic Acids Res., 45, W130–W137.
437. Mi, H., Muruganujan, A., Ebert, D., et al. (2019) PANTHER version 14: more genomes, a new PANTHER GO-slim and improvements in enrichment analysis tools. Nucleic Acids Res., 47, D419–D426.
438. Gao, J., Aksoy, B. A., Dogrusoz, U., et al. (2013) Integrative Analysis of Complex Cancer Genomics and Clinical Profiles Using the cBioPortal. Sci. Signal., 6, pl1–pl1.
439. Hasselblatt, M., Nagel, I., Oyen, F., et al. (2014) SMARCA4-mutated atypical teratoid/rhabdoid tumors are associated with inherited germline alterations and poor prognosis. Acta Neuropathol., 128, 453–456.
440. Li, J., Duns, G., Westers, H., et al. (2016) SETD2: an epigenetic modifier with tumor suppressor functionality. Oncotarget, 7, 50719–50734.
441. Luscan, A., Laurendeau, I., Malan, V., et al. (2014) Mutations in SETD2 cause a novel
overgrowth condition. J. Med. Genet., 51, 512–517.
442. Lumish, H. S., Wynn, J., Devinsky, O., et al. (2015) Brief Report: SETD2 Mutation in a Child with Autism, Intellectual Disabilities and Epilepsy. J. Autism Dev. Disord., 45, 3764–3770.
443. Smit, D. L., Mensenkamp, A. R., Badeloe, S., et al. (2011) Hereditary leiomyomatosis and renal cell cancer in families referred for fumarate hydratase germline mutation analysis. Clin. Genet., 79, 49–59.
444. Casey, R. T., McLean, M. A., Madhu, B., et al. (2018) Translating In Vivo Metabolomic Analysis of Succinate Dehydrogenase–Deficient Tumors Into Clinical Utility. JCO Precis. Oncol., 1–12.
445. Cachat, F. and Renella, R. (2016) Risk of cancer in patients with polycystic kidney disease. Lancet. Oncol., 17, e474.
446. Christiansen, C. F., Onega, T., Sværke, C., et al. (2014) Risk and Prognosis of Cancer in Patients with Nephrotic Syndrome. Am. J. Med., 127, 871-877.e1.
447. Kondo, T., Sasa, N., Yamada, H., et al. (2018) Acquired cystic disease-associated renal cell carcinoma is the most common subtype in long-term dialyzed patients: Central pathology results according to the 2016 WHO classification in a multi-institutional study. Pathol. Int., 68, 543–549.
448. Ferner, R. E. (2007) Neurofibromatosis 1. Eur. J. Hum. Genet., 15, 131–138.
449. Olsen, J. V, Vermeulen, M., Santamaria, A., et al. (2010) Quantitative phosphoproteomics reveals widespread full phosphorylation site occupancy during mitosis. Sci. Signal., 3, ra3.
450. Hennekam, R. C. M. (2006) Rubinstein–Taybi syndrome. Eur. J. Hum. Genet., 14, 981–985.
451. Van Dyke, D. L., Weiss, L., Roberson, J. R., et al. (1983) The frequency and mutation rate of balanced autosomal rearrangements in man estimated from prenatal genetic studies for advanced maternal age. Am. J. Hum. Genet., 35, 301–8.
452. Vasilevska, M., Ivanovska, E., Kubelka Sabit, K., et al. (2013) The incidence and type of chromosomal translocations from prenatal diagnosis of 3800 patients in the republic of macedonia. Balkan J. Med. Genet., 16, 23–8.
453. Jacobs, P. A., Browne, C., Gregson, N., et al. (1992) Estimates of the frequency of chromosome abnormalities detectable in unselected newborns using moderate levels of banding. J. Med. Genet., 29, 103–8.
454. Collins, R. L., Brand, H., Karczewski, K. J., et al. (2019) An open resource of structural variation for medical and population genetics. bioRxiv, 578674.
455. Brand, H., Pillalamarri, V., Collins, R. L., et al. (2014) Cryptic and complex chromosomal aberrations in early-onset neuropsychiatric disorders. Am. J. Hum. Genet., 95, 454–61.
276
456. Mohamed, A. M., Kamel, A., Mahmoud, W., et al. (2015) Intellectual disability secondary to a 16p13 duplication in a 1;16 translocation. Extended phenotype in a four-generation family. Am. J. Med. Genet. Part A, 167, 128–136.
457. Minouk J, S., Michael E, J., Craig D, H., et al. (2018) Mortality and Cancer Incidence in Carriers of Balanced Robertsonian Translocations: a National Cohort Study. Am. J. Epidemiol.
458. Martin, R. H. (2008) Cytogenetic determinants of male fertility. Hum. Reprod. Update, 14, 379–390.
459. Boldog, F. L., Gemmillt, R. M., Wilkes, C. M., et al. (1993) Positional cloning of the hereditary renal carcinoma 3;8 chromosome translocation breakpoint (suppresor gene/fagile site/polycystic kidney diease/lung cancer/thyroid cancer). Genetics, 90, 8509–8513.
460. Gnarra, J. R., Tory, K., Weng, Y., et al. (1994) Mutations of the VHL tumour suppressor gene in renal carcinoma. Nat. Genet., 7, 85–90.
461. Young, A. C., Craven, R. A., Cohen, D., et al. (2009) Analysis of VHL Gene Alterations and their Relationship to Clinical Parameters in Sporadic Conventional Renal Cell Carcinoma. Clin. Cancer Res., 15, 7582–7592.
462. Peña-Llopis, S., Vega-Rubín-de-Celis, S., Liao, A., et al. (2012) BAP1 loss defines a new class of renal cell carcinoma. Nat. Genet., 44, 751–9.
463. Dreijerink, K., Braga, E., Kuzmin, I., et al. (2001) The candidate tumor suppressor gene, RASSF1A, from human chromosome 3p21.3 is involved in kidney tumorigenesis. Proc. Natl. Acad. Sci. U. S. A., 98, 7504–9.
464. Weiler, K. S. and Wakimoto, B. T. (1995) Heterochromatin and Gene Expression in Drosophila. Annu. Rev. Genet., 29, 577–605.
465. Panani, A. D., Pappa, V. and Raptis, S. A. (2004) Novel constitutional translocations t(3;5)(p25;q22) and t(1;14)(p31;q21) in patients with acute leukemia. Ann. Hematol., 83, 156–159.
466. Ganly, P., McDonald, M., Spearing, R., et al. (2004) Constitutional t(5;7)(q11;p15) rearranged to acquire monosomy7q and trisomy 1q in a patient with myelodysplastic syndrome transforming to acute myelocytic leukemia. Cancer Genet. Cytogenet., 149, 125–130.
467. Li, Y., Schwab, C., Ryan, S. L., et al. (2014) Constitutional and somatic rearrangement of chromosome 21 in acute lymphoblastic leukaemia. Nature, 508, 98–102.
468. Russel, J., Dutta, U., Wand, D., et al. (2009) The 9p24.3 Breakpoint of a Constitutional t(6;9)(p12;p24) in a Patient with Chronic Lymphocytic Leukemia Maps Close to the Putative Promoter Region of the DMRT2 Gene. Cytogenet. Genome Res., 125, 81–86.
469. Elsaid, M. Y., Gill, K. G., Gosain, A., et al. (2017) Synchronous Presentation of Renal Cell
Carcinoma and Hodgkin Lymphoma in an Adolescent. J. Pediatr. Hematol. Oncol., 39, e399–e402.
470. Slade, I., Stephens, P., Douglas, J., et al. (2010) Constitutional translocation breakpoint mapping by genome-wide paired-end sequencing identifies HACE1 as a putative Wilms tumour susceptibility gene. J. Med. Genet., 47, 342–347.
471. Hoban, P. R., Cowen, R. L., Mitchell, E. L., et al. (1997) Physical localisation of the breakpoints of a constitutional translocation t(5;6)(q21;q21) in a child with bilateral Wilms’ tumour. J. Med. Genet., 34, 343–5.
472. Vernon, E. G., Malik, K., Reynolds, P., et al. (2003) The parathyroid hormone-responsive B1 gene is interrupted by a t(1;7)(q42;p15) breakpoint associated with Wilms’ tumour. Oncogene, 22, 1371–1380.
473. Saikevych, I. A., Mayer, M., Brooks, V. P., et al. (1987) Cytogenetic study of a testicular tumor in a translocation (13;14) carrier. Cancer Genet. Cytogenet., 26, 299–307.
474. Veltman, I. M., Vreede, L. A., Cheng, J., et al. (2005) Fusion of the SUMO/Sentrin-specific protease 1 gene SENP1 and the embryonic polarity-related mesoderm development gene MESDC2 in a patient with an infantile teratoma and a constitutional t(12;15)(q13;q25). Hum. Mol. Genet., 14, 1955–1963.
475. Nicodème, F., Geffroy, S., Conti, M., et al. (2005) Familial occurrence of thymoma and autoimmune diseases with the constitutional translocation t(14;20)(q24.1;p12.3). Genes, Chromosom. Cancer, 44, 154–160.
476. Koorey, D., Basha, N. J., Tomaras, C., et al. (2000) Appendiceal carcinoma complicating adenomatous polyposis in a young woman with a de novo constitutional reciprocal translocation t(5;8)(q22;p23.1). J. Med. Genet., 37, 71–5.
477. Savaşan, S., Lorenzana, A., Williams, J. A., et al. (1998) Constitutional balanced translocations in alveolar rhabdomyosarcoma. Cancer Genet. Cytogenet., 105, 50–4.
478. Niazi, M., van Dijken, P. J. and al Moutaery, K. (1998) A patient with meningioma showing multiple cytogenetic abnormalities and a constitutional translocation (3;9)(q13.3;q22). Cancer Genet. Cytogenet., 105, 11–3.
479. Triviño, E., Guitart, M., Egozcue, J., et al. (1997) Characterization by FISH of a t(5;13) in a patient with bilateral retinoblastoma. Cancer Genet. Cytogenet., 96, 23–5.
480. Sossey-Alaoui, K., Su, G., Malaj, E., et al. (2002) WAVE3, an actin-polymerization gene, is truncated and inactivated as a result of a constitutional t(1;13)(q21;q12) chromosome translocation in a patient with ganglioneuroblastoma. Oncogene, 21, 5967–5974.
481. Vandepoele, K., Andries, V., Van Roy, N., et al. (2008) A Constitutional Translocation t(1;17)(p36.2;q11.2) in a Neuroblastoma Patient Disrupts the Human NBPF1 and ACCN1 Genes. PLoS One, 3, e2207.
277
482. Roberts, T., Chernova, O. and Cowell, J. K. (1998) NB4S, a member of the TBC1 domain family of genes, is truncated as a result of a constitutional t(1;10)(p22;q21) chromosome translocation in a patient with stage 4S neuroblastoma. Hum. Mol. Genet., 7, 1169–78.
483. Thibodeau, M. L., Steinraths, M., Brown, L., et al. (2017) Genomic and Cytogenetic Characterization of a Balanced Translocation Disrupting <b><i>NUP98</i></b> Cytogenet. Genome Res., 152, 117–121.
484. Shuch, B. and Zhang, J. (2018) Genetic Predisposition to Renal Cell Carcinoma: Implications for Counseling, Testing, Screening, and Management. J. Clin. Oncol., 36, 3560–3566.
485. Roller, E., Ivakhno, S., Lee, S., et al. (2016) Canvas: versatile and scalable detection of copy number variants. Bioinformatics, 32, 2375–2377.
486. Chen, X., Schulz-Trieglaff, O., Shaw, R., et al. (2016) Manta: rapid detection of structural variants and indels for germline and cancer sequencing applications. Bioinformatics, 32, 1220–1222.
487. Yusenko, M. V., Nagy, A. and Kovacs, G. (2010) Molecular analysis of germline t(3;6) and t(3;12) associated with conventional renal cell carcinomas indicates their rate-limiting role and supports the three-hit model of carcinogenesis. Cancer Genet. Cytogenet., 201, 15–23.
488. Chen, J., Lui, W.-O., Vos, M. D., et al. (2003) The t(1;3) breakpoint-spanning genes LSAMP and NORE1 are involved in clear cell renal cell carcinomas. Cancer Cell, 4, 405–413.
489. Eleveld, M. J., Bodmer, D., Merkx, G., et al. (2001) Molecular analysis of a familial case of renal cell cancer and a t(3;6)(q12;q15). Genes, Chromosom. Cancer, 31, 23–32.
490. Druck, T., Podolski, J., Byrski, T., et al. (2001) The DIRC1 gene at chromosome 2q33 spans a familial RCC-associated t(2;3)(q33;q21) chromosome translocation. 46, 583–589.
491. Bodmer, D., Eleveld, M., Kater-Baats, E., et al. (2002) Disruption of a novel MFS transporter gene, DIRC2, by a familial renal cell carcinoma-associated t(2;3)(q35;q21). Hum. Mol. Genet., 11, 641–9.
492. Meléndez, B., Rodríguez-Perales, S., Martínez-Delgado, B., et al. (2003) Molecular study of a new family with hereditary renal cell carcinoma and a translocation t(3;8)(p13;q24.1). Hum. Genet., 112, 178–85.
493. Poland, K. S., Azim, M., Folsom, M., et al. (2007) A constitutional balanced t(3;8)(p14;q24.1) translocation results in disruption of theTRC8 gene and predisposition to clear cell renal cell carcinoma. Genes, Chromosom. Cancer, 46, 805–812.
494. Foster, R. E., Abdulrahman, M., Morris, M. R., et al. (2007) Characterization of a 3;6 translocation associated with renal cell carcinoma. Genes. Chromosomes Cancer, 46,
311–7.
495. Bonne, A., Vreede, L., Kuiper, R. P., et al. (2007) Mapping of constitutional translocation breakpoints in renal cell cancer patients: identification of KCNIP4 as a candidate gene. Cancer Genet. Cytogenet., 179, 11–18.
496. Kuiper, R. P., Vreede, L., Venkatachalam, R., et al. (2009) The tumor suppressor gene FBXW7 is disrupted by a constitutional t(3;4)(q21;q31) in a patient with renal cell cancer. Cancer Genet. Cytogenet., 195, 105–11.
497. McKay, L., Frydenberg, M., Lipton, L., et al. (2011) Case report: renal cell carcinoma segregating with a t(2;3)(q37.3;q13.2) chromosomal translocation in an Ashkenazi Jewish family. Fam. Cancer, 10, 349–353.
498. Doyen, J., Carpentier, X., Haudebourg, J., et al. (2012) Renal cell carcinoma and a constitutional t(11;22)(q23;q11.2): case report and review of the potential link between the constitutional t(11;22) and cancer. Cancer Genet., 205, 603–607.
499. Wake, N. C., Ricketts, C. J., Morris, M. R., et al. (2013) UBE2QL1 is disrupted by a constitutional translocation associated with renal tumor predisposition and is a novel candidate renal tumor suppressor gene. Hum. Mutat., 34, 1650–61.
500. Banks, R. E., Tirukonda, P., Taylor, C., et al. (2006) Genetic and epigenetic analysis of von Hippel-Lindau (VHL) gene alterations and relationship with clinical variables in sporadic renal cancer. Cancer Res., 66, 2000–11.
501. Shen, C., Beroukhim, R., Schumacher, S. E., et al. (2011) Genetic and Functional Studies Implicate HIF1 as a 14q Kidney Cancer Suppressor Gene. Cancer Discov., 1, 222–235.
502. Kato, T., Franconi, C. P., Sheridan, M. B., et al. (2014) Analysis of the t(3;8) of hereditary renal cell carcinoma: a palindrome-mediated translocation. Cancer Genet., 207, 133–40.
503. Woodward, E. R., Skytte, A.-B., Cruger, D. G., et al. (2010) Population-based survey of cancer risks in chromosome 3 translocation carriers. Genes, Chromosom. Cancer, 49, 52–58.
504. Menko, F. H., van Steensel, M. A., Giraud, S., et al. (2009) Birt-Hogg-Dubé syndrome: diagnosis and management. Lancet Oncol., 10, 1199–1206.
505. Emami, K. H., Brown, L. G., Pitts, T. E. M., et al. (2009) Nemo-like kinase induces apoptosis and inhibits androgen receptor signaling in prostate cancer cells. Prostate, 69, 1481–1492.
506. Yasuda, J., Tsuchiya, A., Yamada, T., et al. (2003) Nemo-like kinase induces apoptosis in DLD-1 human colon cancer cells. Biochem. Biophys. Res. Commun., 308, 227–33.
507. Han, Y., Kuang, Y., Xue, X., et al. (2014) NLK, a novel target of miR-199a-3p, functions as a tumor suppressor in colorectal cancer. Biomed. Pharmacother., 68, 497–505.
508. Zhang, H.-H., Li, S.-Z., Zhang, Z.-Y., et al.
278
(2014) Nemo-like kinase is critical for p53 stabilization and function in response to DNA damage. Cell Death Differ., 21, 1656–63.
509. Kanei-Ishii, C., Nomura, T., Takagi, T., et al. (2008) Fbxw7 acts as an E3 ubiquitin ligase that targets c-Myb for nemo-like kinase (NLK)-induced degradation. J. Biol. Chem., 283, 30540–8.
510. Koepp, D. M., Schaefer, L. K., Ye, X., et al. (2001) Phosphorylation-Dependent Ubiquitination of Cyclin E by the SCFFbw7 Ubiquitin Ligase. Science (80-. )., 294, 173–177.
511. Mao, J.-H., Kim, I.-J., Wu, D., et al. (2008) FBXW7 targets mTOR for degradation and cooperates with PTEN in tumor suppression. Science, 321, 1499–502.
512. Kovacs, G. and Hoene, E. (1988) Loss of der(3) in renal carcinoma cells of a patient with constitutional t(3;12). Hum Genet, 78, 148–150.
513. Kovacs, G., Brusa, P. and De Riese, W. (1989) Tissue-specific expression of a constitutional 3;6 translocation: Development of multiple bilateral renal-cell carcinomas. Int. J. Cancer, 43, 422–427.
514. Podolski, J., Byrski, T., Zajaczek, S., et al. (2001) Characterization of a familial RCC-associated t(2;3)(q33;q21) chromosome translocation. J. Hum. Genet., 46, 685–693.
515. Kanayama, H., Lui, W. O., Takahashi, M., et al. (2001) Association of a novel constitutional translocation t(1q;3q) with familial renal cell carcinoma. J. Med. Genet., 38, 165–70.
516. Koolen, M. I., van der Meyden, A. P. M., Bodmer, D., et al. (1998) A familial case of renal cell carcinoma and a t(2;3) chromosome translocation. Kidney Int., 53, 273–275.
517. Valle, L., Cascón, A., Melchor, L., et al. (2005) About the origin and development of hereditary conventional renal cell carcinoma in a four-generation t(3;8)(p14.1;q24.23) family. Eur. J. Hum. Genet., 13, 570–578.
518. van Kessel, A. G., Wijnhoven, H., Bodmer, D., et al. (1999) Renal cell cancer: chromosome 3 translocations as risk factors. J. Natl. Cancer Inst., 91, 1159–60.
519. Ruault, M., Ventura, M., Galtier, N., et al. (2003) BAGE genes generated by juxtacentromeric reshuffling in the hominidae lineage are under selective pressure. Genomics, 81, 391–399.
520. Cantor, S. B., Bell, D. W., Ganesan, S., et al. (2001) BACH1, a novel helicase-like protein, interacts directly with BRCA1 and contributes to its DNA repair function. Cell, 105, 149–160.
521. Tolhuis, B. and Karten, H. (2018) Validation of an ultra-fast CNV calling tool for Next Generation Sequencing data using MLPA-verified copy number alterations. bioRxiv, 340505.
522. Sadedin, S. P., Ellis, J. A., Masters, S. L., et al. (2018) Ximmer: a system for improving accuracy and consistency of CNV calling from
exome data. Gigascience, 7.
523. Carlo, M. I., Mukherjee, S., Mandelker, D., et al. (2018) Prevalence of Germline Mutations in Cancer Susceptibility Genes in Patients With Advanced Renal Cell Carcinoma. JAMA Oncol., 4, 1228.
524. Landrum, M. J., Lee, J. M., Benson, M., et al. (2016) ClinVar: public archive of interpretations of clinically relevant variants. Nucleic Acids Res., 44, D862–D868.
525. Nykamp, K., Anderson, M., Powers, M., et al. (2017) Sherloc: a comprehensive refinement of the ACMG–AMP variant classification criteria. Genet. Med., 19, 1105–1117.
526. Bodian, D. L., McCutcheon, J. N., Kothiyal, P., et al. (2014) Germline variation in cancer-susceptibility genes in a healthy, ancestrally diverse cohort: implications for individual genome sequencing. PLoS One, 9, e94554.
527. Whiffin, N., Minikel, E., Walsh, R., et al. (2017) Using high-resolution variant frequencies to empower clinical genome interpretation. Genet. Med., 19, 1151–1158.
528. Behan, F. M., Iorio, F., Picco, G., et al. (2019) Prioritization of cancer therapeutic targets using CRISPR–Cas9 screens. Nature, 1.
529. Zhou, B., Ho, S. S., Zhang, X., et al. (2018) Whole-genome sequencing analysis of CNV using low-coverage and paired-end strategies is efficient and outperforms array-based CNV analysis. J. Med. Genet., 55, 735–743.
530. Mavaddat, N., Michailidou, K., Dennis, J., et al. (2019) Polygenic Risk Scores for Prediction of Breast Cancer and Breast Cancer Subtypes. Am. J. Hum. Genet., 104, 21–34.
531. Clifford, S. C., Prowse, A. H., Affara, N. A., et al. (1998) Inactivation of the von Hippel-Lindau (VHL) tumour suppressor gene and allelic losses at chromosome arm 3p in primary renal cell carcinoma: evidence for a VHL-independent pathway in clear cell renal tumourigenesis. Genes. Chromosomes Cancer, 22, 200–9.
532. Alexandrov, L. B., Kim, J., Haradhvala, N. J., et al. (2018) The Repertoire of Mutational Signatures in Human Cancer. bioRxiv, 322859.

279
9.0 Appendix
280
9.0.1 Table of contents
9.0.1 TABLE OF CONTENTS ....................................................................................................................... 280
9.0.2 NOTES ON APPENDIX DATA ............................................................................................................. 281
9.1 CHAPTER 2 MATERIALS AND METHODS ........................................................................................... 282
9.1.1 NEXT GENERATION SEQUENCING PIPELINE – FASTQ TO VCF .................................................................. 282
9.1.2 NEXT GENERATION SEQUENCING PIPELINE – VCF FILTERING AND ANNOTATION .......................................... 285
9.1.3 ONT NANOPORE SEQUENCING PIPELINE ................................................................................................ 295
9.2 CHAPTER 3 TARGETED SANGER AND AMPLICON SEQUENCING .................................................. 308
9.2.1 SANGER SEQUENCING AND LONG RANGE PCR PRIMERS .......................................................................... 308
9.2.2 SEQUENCE IDENTITY COMPARISONS ...................................................................................................... 310
9.2.3 SEQUENCE ALIGNMENT AND QUALITY METRICS – KMT2C/KMT2C SEQUENCING ........................................ 311
9.2.4 BAGE-FAMILY GENES TABLE ................................................................................................................ 312
9.2.5 KMT2C/BAGE2 CONSERVATION .......................................................................................................... 313
9.3 CHAPTER 4 CANCER GENE PANEL SEQUENCING ........................................................................... 314
9.3.1 CANCER GENE PANEL TARGET LIST ........................................................................................................ 314
9.3.2 SANGER SEQUENCING PRIMERS – BRIP1 ............................................................................................... 316
9.4 CHAPTER 5 WHOLE EXOME SEQUENCING .................................................................................... ...317
9.4.1 WES GENE LISTS ................................................................................................................................ 317
9.4.2 HAPMAP SAMPLE LIST .......................................................................................................................... 320
9.4.3A CNV PIPELINE - MAIN ......................................................................................................................... 321
9.4.3B CNV PIPELINE - REFERENCE INTERVAL FILE GENERATION ...................................................................... 331
9.4.4 MISCELLANEOUS SCRIPTS ..................................................................................................................... 335
9.4.5 BURDEN TESTING SCRIPTS .................................................................................................................... 338
9.4.6 BURDEN TESTING RESULTS ................................................................................................................... 347
9.5 CHAPTER 6 RCC-ASSOCIATED TRANSLOCATIONS ......................................................................... 351
9.5.1 COPY NUMBER AND STRUCTURAL VARIANT CALLING SCRIPTS .................................................................... 351
9.5.2 IGV VISUALISATIONS OF TRANSLOCATION BREAK POINT ........................................................................... 353
9.5.3 SANGER SEQUENCING OF TRANSLOCATION BREAK POINTS ........................................................................ 358
9.5.4 TRANSLOCATION MANTA STRUCTURAL VARIANT CALLS ............................................................................. 360

281
9.0.2 Notes on appendix data
The appendix figures, tables, lists, and data provided in this chapter are given in a context-free
format and are intended to be read as supplemental components to the other chapters in this
thesis. For scripts and code, script language is given in square brackets (e.g. [BASH]) and scripts
are provided in a minimally functional state and as such most code comments, user interface
components, software and server environment variables, and help utilities are removed for reduce
the number of pages generated by indiscriminate copying of scripts and pipelines into the
appendix.
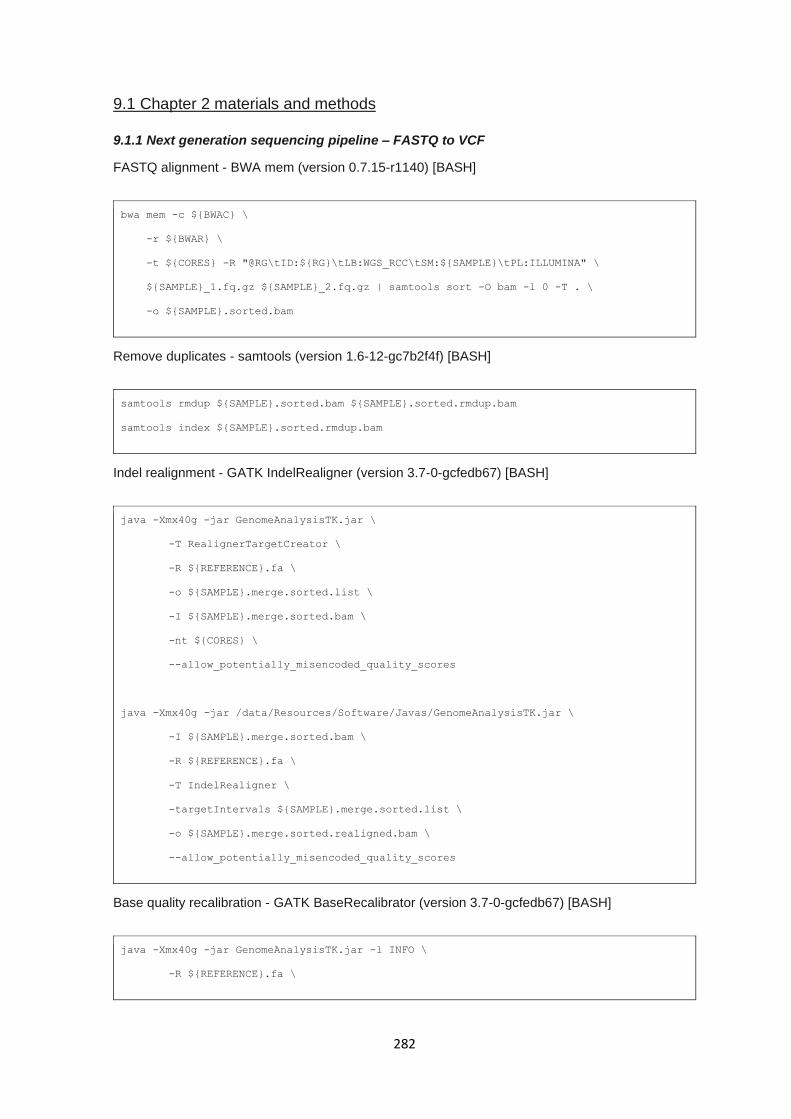
282
9.1 Chapter 2 materials and methods
9.1.1 Next generation sequencing pipeline – FASTQ to VCF
FASTQ alignment - BWA mem (version 0.7.15-r1140) [BASH]
bwa mem -c ${BWAC} \
-r ${BWAR} \
-t ${CORES} -R "@RG\tID:${RG}\tLB:WGS_RCC\tSM:${SAMPLE}\tPL:ILLUMINA" \
${SAMPLE}_1.fq.gz ${SAMPLE}_2.fq.gz | samtools sort -O bam -l 0 -T . \
-o ${SAMPLE}.sorted.bam
Remove duplicates - samtools (version 1.6-12-gc7b2f4f) [BASH]
samtools rmdup ${SAMPLE}.sorted.bam ${SAMPLE}.sorted.rmdup.bam
samtools index ${SAMPLE}.sorted.rmdup.bam
Indel realignment - GATK IndelRealigner (version 3.7-0-gcfedb67) [BASH]
java -Xmx40g -jar GenomeAnalysisTK.jar \
-T RealignerTargetCreator \
-R ${REFERENCE}.fa \
-o ${SAMPLE}.merge.sorted.list \
-I ${SAMPLE}.merge.sorted.bam \
-nt ${CORES} \
--allow_potentially_misencoded_quality_scores
java -Xmx40g -jar /data/Resources/Software/Javas/GenomeAnalysisTK.jar \
-I ${SAMPLE}.merge.sorted.bam \
-R ${REFERENCE}.fa \
-T IndelRealigner \
-targetIntervals ${SAMPLE}.merge.sorted.list \
-o ${SAMPLE}.merge.sorted.realigned.bam \
--allow_potentially_misencoded_quality_scores
Base quality recalibration - GATK BaseRecalibrator (version 3.7-0-gcfedb67) [BASH]
java -Xmx40g -jar GenomeAnalysisTK.jar -l INFO \
-R ${REFERENCE}.fa \
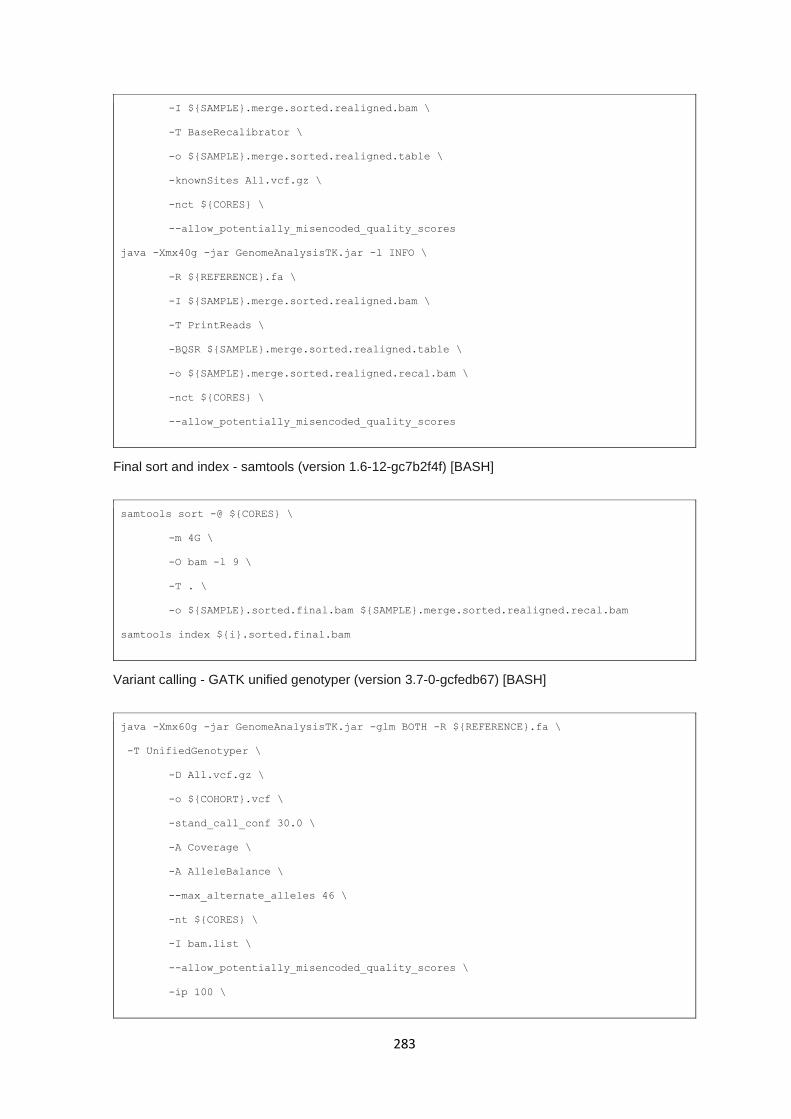
283
-I ${SAMPLE}.merge.sorted.realigned.bam \
-T BaseRecalibrator \
-o ${SAMPLE}.merge.sorted.realigned.table \
-knownSites All.vcf.gz \
-nct ${CORES} \
--allow_potentially_misencoded_quality_scores
java -Xmx40g -jar GenomeAnalysisTK.jar -l INFO \
-R ${REFERENCE}.fa \
-I ${SAMPLE}.merge.sorted.realigned.bam \
-T PrintReads \
-BQSR ${SAMPLE}.merge.sorted.realigned.table \
-o ${SAMPLE}.merge.sorted.realigned.recal.bam \
-nct ${CORES} \
--allow_potentially_misencoded_quality_scores
Final sort and index - samtools (version 1.6-12-gc7b2f4f) [BASH]
samtools sort -@ ${CORES} \
-m 4G \
-O bam -l 9 \
-T . \
-o ${SAMPLE}.sorted.final.bam ${SAMPLE}.merge.sorted.realigned.recal.bam
samtools index ${i}.sorted.final.bam
Variant calling - GATK unified genotyper (version 3.7-0-gcfedb67) [BASH]
java -Xmx60g -jar GenomeAnalysisTK.jar -glm BOTH -R ${REFERENCE}.fa \
-T UnifiedGenotyper \
-D All.vcf.gz \
-o ${COHORT}.vcf \
-stand_call_conf 30.0 \
-A Coverage \
-A AlleleBalance \
--max_alternate_alleles 46 \
-nt ${CORES} \
-I bam.list \
--allow_potentially_misencoded_quality_scores \
-ip 100 \

284
-dcov 1500 \
-rf MappingQuality \
--min_mapping_quality_score 30
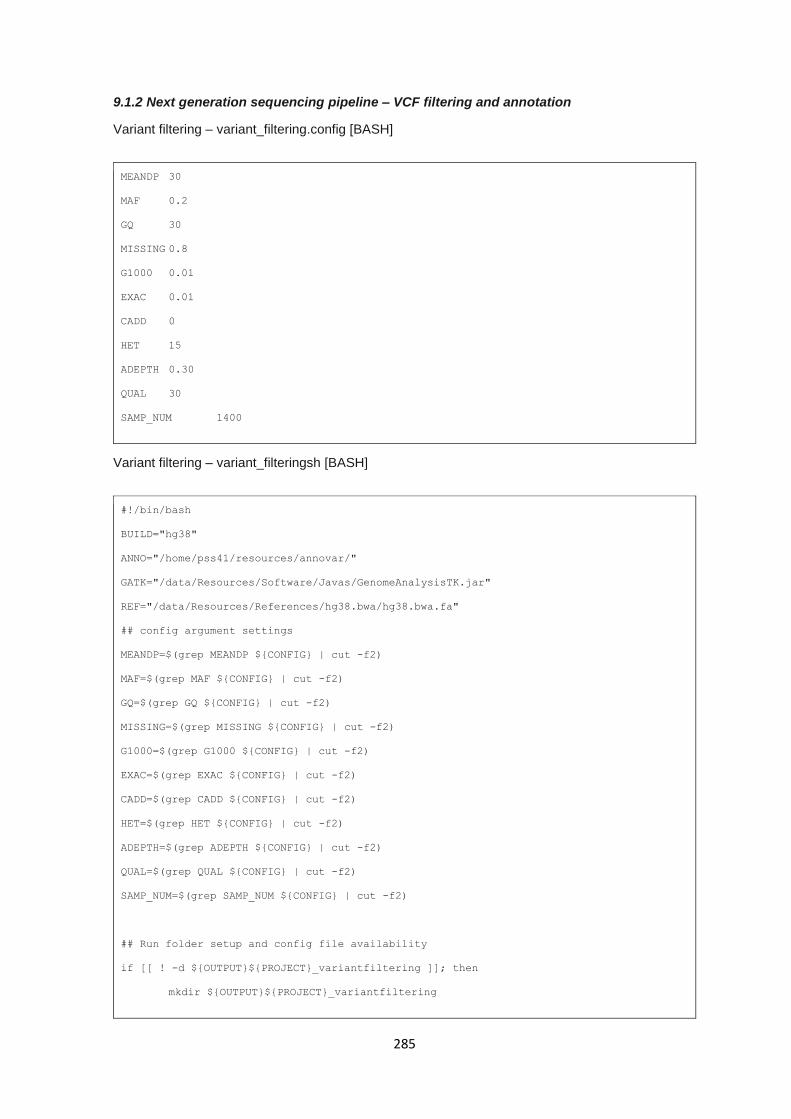
285
9.1.2 Next generation sequencing pipeline – VCF filtering and annotation
Variant filtering – variant_filtering.config [BASH]
MEANDP 30
MAF 0.2
GQ 30
MISSING 0.8
G1000 0.01
EXAC 0.01
CADD 0
HET 15
ADEPTH 0.30
QUAL 30
SAMP_NUM 1400
Variant filtering – variant_filteringsh [BASH]
#!/bin/bash
BUILD="hg38"
ANNO="/home/pss41/resources/annovar/"
GATK="/data/Resources/Software/Javas/GenomeAnalysisTK.jar"
REF="/data/Resources/References/hg38.bwa/hg38.bwa.fa"
## config argument settings
MEANDP=$(grep MEANDP ${CONFIG} | cut -f2)
MAF=$(grep MAF ${CONFIG} | cut -f2)
GQ=$(grep GQ ${CONFIG} | cut -f2)
MISSING=$(grep MISSING ${CONFIG} | cut -f2)
G1000=$(grep G1000 ${CONFIG} | cut -f2)
EXAC=$(grep EXAC ${CONFIG} | cut -f2)
CADD=$(grep CADD ${CONFIG} | cut -f2)
HET=$(grep HET ${CONFIG} | cut -f2)
ADEPTH=$(grep ADEPTH ${CONFIG} | cut -f2)
QUAL=$(grep QUAL ${CONFIG} | cut -f2)
SAMP_NUM=$(grep SAMP_NUM ${CONFIG} | cut -f2)
## Run folder setup and config file availability
if [[ ! -d ${OUTPUT}${PROJECT}_variantfiltering ]]; then
mkdir ${OUTPUT}${PROJECT}_variantfiltering
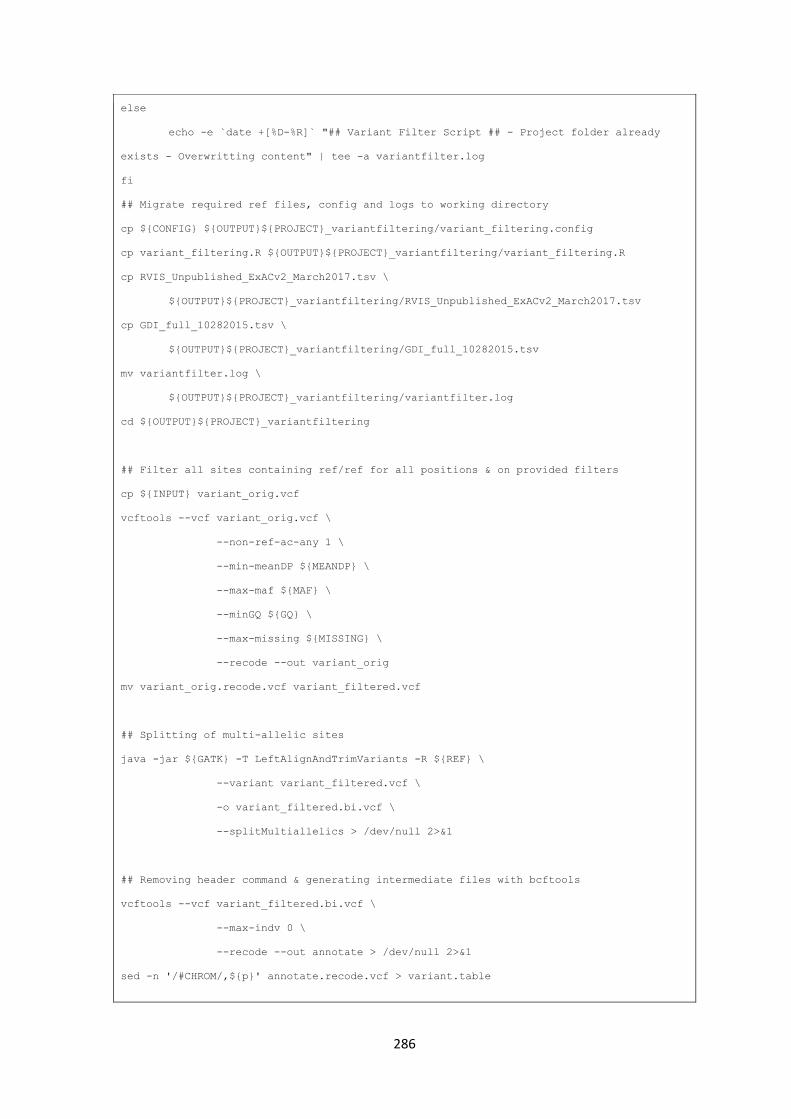
286
else
echo -e `date +[%D-%R]` "## Variant Filter Script ## - Project folder already
exists - Overwritting content" | tee -a variantfilter.log
fi
## Migrate required ref files, config and logs to working directory
cp ${CONFIG} ${OUTPUT}${PROJECT}_variantfiltering/variant_filtering.config
cp variant_filtering.R ${OUTPUT}${PROJECT}_variantfiltering/variant_filtering.R
cp RVIS_Unpublished_ExACv2_March2017.tsv \
${OUTPUT}${PROJECT}_variantfiltering/RVIS_Unpublished_ExACv2_March2017.tsv
cp GDI_full_10282015.tsv \
${OUTPUT}${PROJECT}_variantfiltering/GDI_full_10282015.tsv
mv variantfilter.log \
${OUTPUT}${PROJECT}_variantfiltering/variantfilter.log
cd ${OUTPUT}${PROJECT}_variantfiltering
## Filter all sites containing ref/ref for all positions & on provided filters
cp ${INPUT} variant_orig.vcf
vcftools --vcf variant_orig.vcf \
--non-ref-ac-any 1 \
--min-meanDP ${MEANDP} \
--max-maf ${MAF} \
--minGQ ${GQ} \
--max-missing ${MISSING} \
--recode --out variant_orig
mv variant_orig.recode.vcf variant_filtered.vcf
## Splitting of multi-allelic sites
java -jar ${GATK} -T LeftAlignAndTrimVariants -R ${REF} \
--variant variant_filtered.vcf \
-o variant_filtered.bi.vcf \
--splitMultiallelics > /dev/null 2>&1
## Removing header command & generating intermediate files with bcftools
vcftools --vcf variant_filtered.bi.vcf \
--max-indv 0 \
--recode --out annotate > /dev/null 2>&1
sed -n '/#CHROM/,${p}' annotate.recode.vcf > variant.table
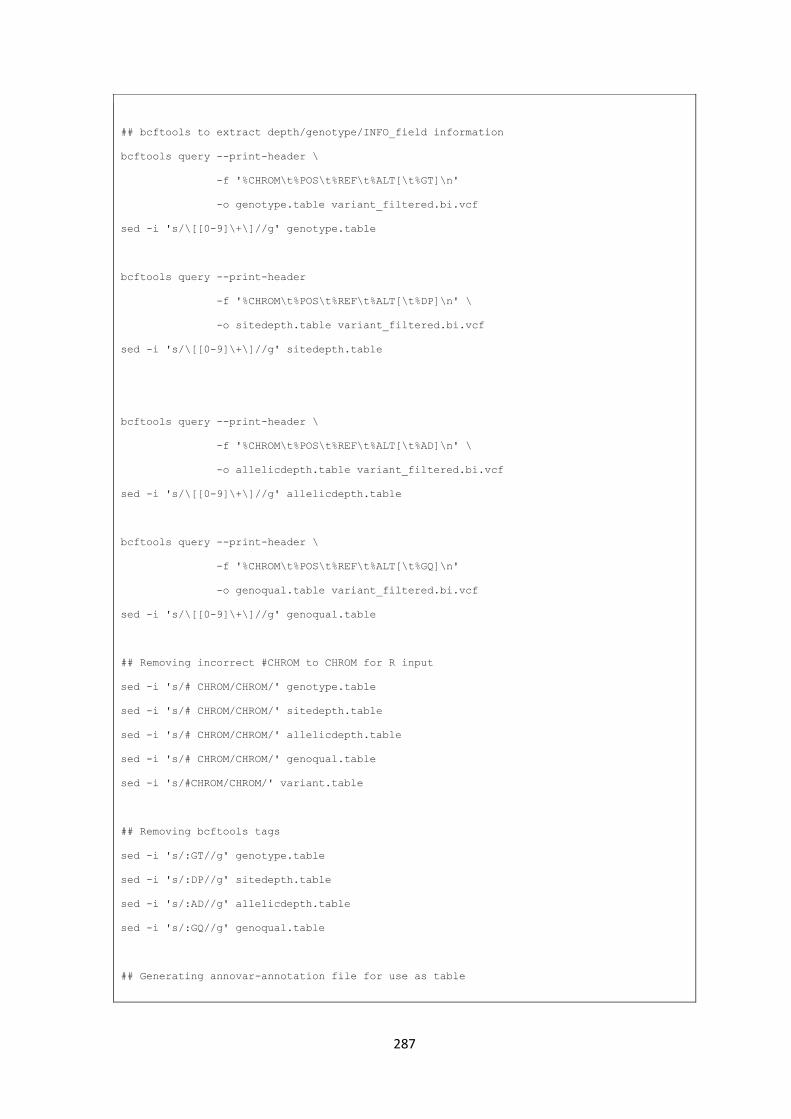
287
## bcftools to extract depth/genotype/INFO_field information
bcftools query --print-header \
-f '%CHROM\t%POS\t%REF\t%ALT[\t%GT]\n'
-o genotype.table variant_filtered.bi.vcf
sed -i 's/\[[0-9]\+\]//g' genotype.table
bcftools query --print-header
-f '%CHROM\t%POS\t%REF\t%ALT[\t%DP]\n' \
-o sitedepth.table variant_filtered.bi.vcf
sed -i 's/\[[0-9]\+\]//g' sitedepth.table
bcftools query --print-header \
-f '%CHROM\t%POS\t%REF\t%ALT[\t%AD]\n' \
-o allelicdepth.table variant_filtered.bi.vcf
sed -i 's/\[[0-9]\+\]//g' allelicdepth.table
bcftools query --print-header \
-f '%CHROM\t%POS\t%REF\t%ALT[\t%GQ]\n'
-o genoqual.table variant_filtered.bi.vcf
sed -i 's/\[[0-9]\+\]//g' genoqual.table
## Removing incorrect #CHROM to CHROM for R input
sed -i 's/# CHROM/CHROM/' genotype.table
sed -i 's/# CHROM/CHROM/' sitedepth.table
sed -i 's/# CHROM/CHROM/' allelicdepth.table
sed -i 's/# CHROM/CHROM/' genoqual.table
sed -i 's/#CHROM/CHROM/' variant.table
## Removing bcftools tags
sed -i 's/:GT//g' genotype.table
sed -i 's/:DP//g' sitedepth.table
sed -i 's/:AD//g' allelicdepth.table
sed -i 's/:GQ//g' genoqual.table
## Generating annovar-annotation file for use as table
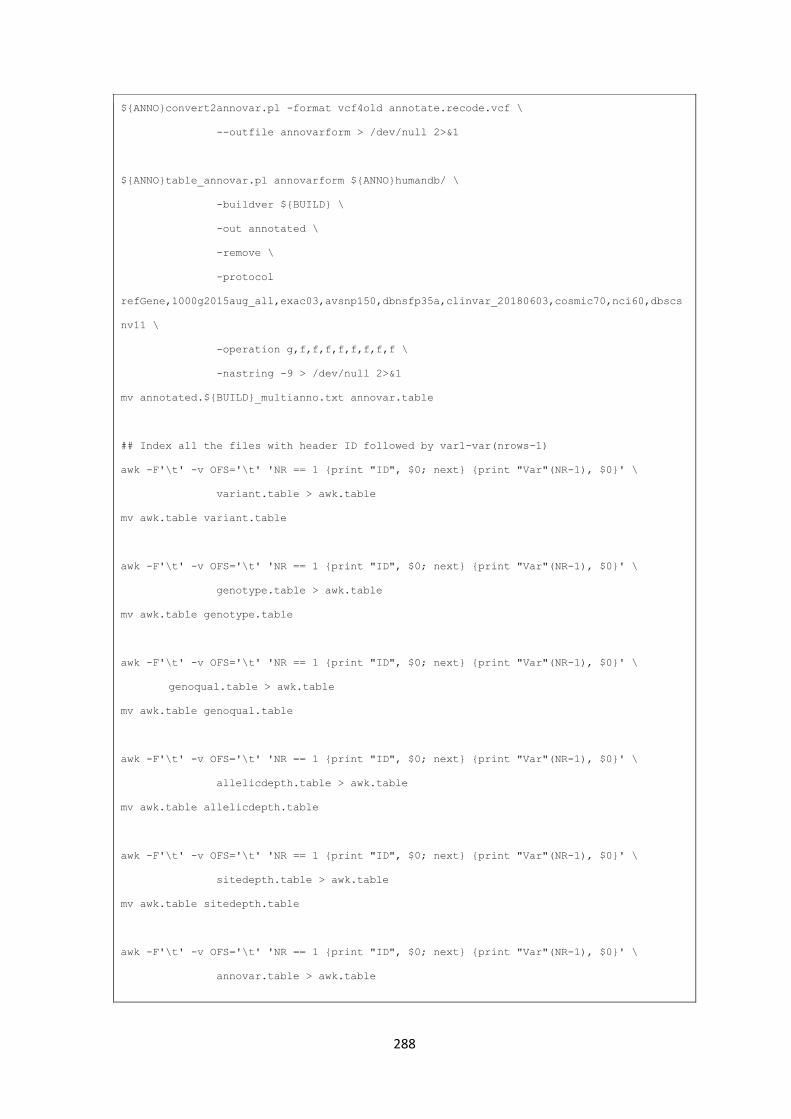
288
${ANNO}convert2annovar.pl -format vcf4old annotate.recode.vcf \
--outfile annovarform > /dev/null 2>&1
${ANNO}table_annovar.pl annovarform ${ANNO}humandb/ \
-buildver ${BUILD} \
-out annotated \
-remove \
-protocol
refGene,1000g2015aug_all,exac03,avsnp150,dbnsfp35a,clinvar_20180603,cosmic70,nci60,dbscs
nv11 \
-operation g,f,f,f,f,f,f,f,f \
-nastring -9 > /dev/null 2>&1
mv annotated.${BUILD}_multianno.txt annovar.table
## Index all the files with header ID followed by var1-var(nrows-1)
awk -F'\t' -v OFS='\t' 'NR == 1 {print "ID", $0; next} {print "Var"(NR-1), $0}' \
variant.table > awk.table
mv awk.table variant.table
awk -F'\t' -v OFS='\t' 'NR == 1 {print "ID", $0; next} {print "Var"(NR-1), $0}' \
genotype.table > awk.table
mv awk.table genotype.table
awk -F'\t' -v OFS='\t' 'NR == 1 {print "ID", $0; next} {print "Var"(NR-1), $0}' \
genoqual.table > awk.table
mv awk.table genoqual.table
awk -F'\t' -v OFS='\t' 'NR == 1 {print "ID", $0; next} {print "Var"(NR-1), $0}' \
allelicdepth.table > awk.table
mv awk.table allelicdepth.table
awk -F'\t' -v OFS='\t' 'NR == 1 {print "ID", $0; next} {print "Var"(NR-1), $0}' \
sitedepth.table > awk.table
mv awk.table sitedepth.table
awk -F'\t' -v OFS='\t' 'NR == 1 {print "ID", $0; next} {print "Var"(NR-1), $0}' \
annovar.table > awk.table
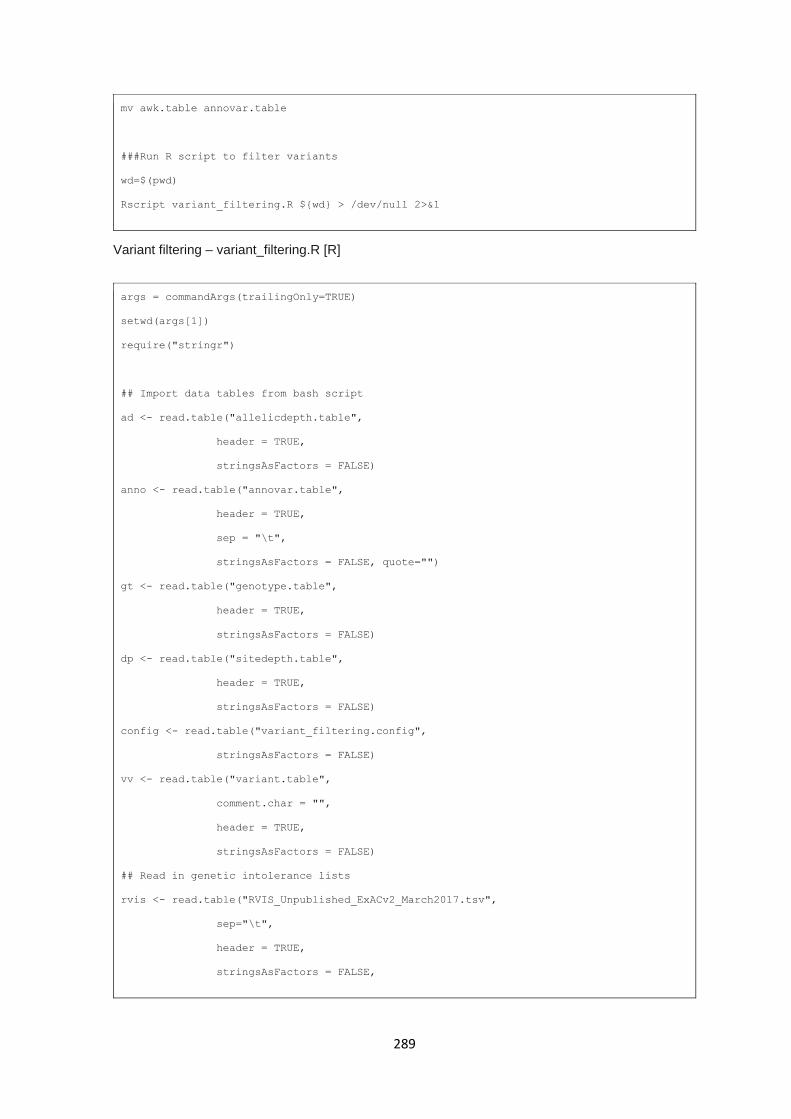
289
mv awk.table annovar.table
###Run R script to filter variants
wd=$(pwd)
Rscript variant_filtering.R ${wd} > /dev/null 2>&1
Variant filtering – variant_filtering.R [R]
args = commandArgs(trailingOnly=TRUE)
setwd(args[1])
require("stringr")
## Import data tables from bash script
ad <- read.table("allelicdepth.table",
header = TRUE,
stringsAsFactors = FALSE)
anno <- read.table("annovar.table",
header = TRUE,
sep = "\t",
stringsAsFactors = FALSE, quote="")
gt <- read.table("genotype.table",
header = TRUE,
stringsAsFactors = FALSE)
dp <- read.table("sitedepth.table",
header = TRUE,
stringsAsFactors = FALSE)
config <- read.table("variant_filtering.config",
stringsAsFactors = FALSE)
vv <- read.table("variant.table",
comment.char = "",
header = TRUE,
stringsAsFactors = FALSE)
## Read in genetic intolerance lists
rvis <- read.table("RVIS_Unpublished_ExACv2_March2017.tsv",
sep="\t",
header = TRUE,
stringsAsFactors = FALSE,
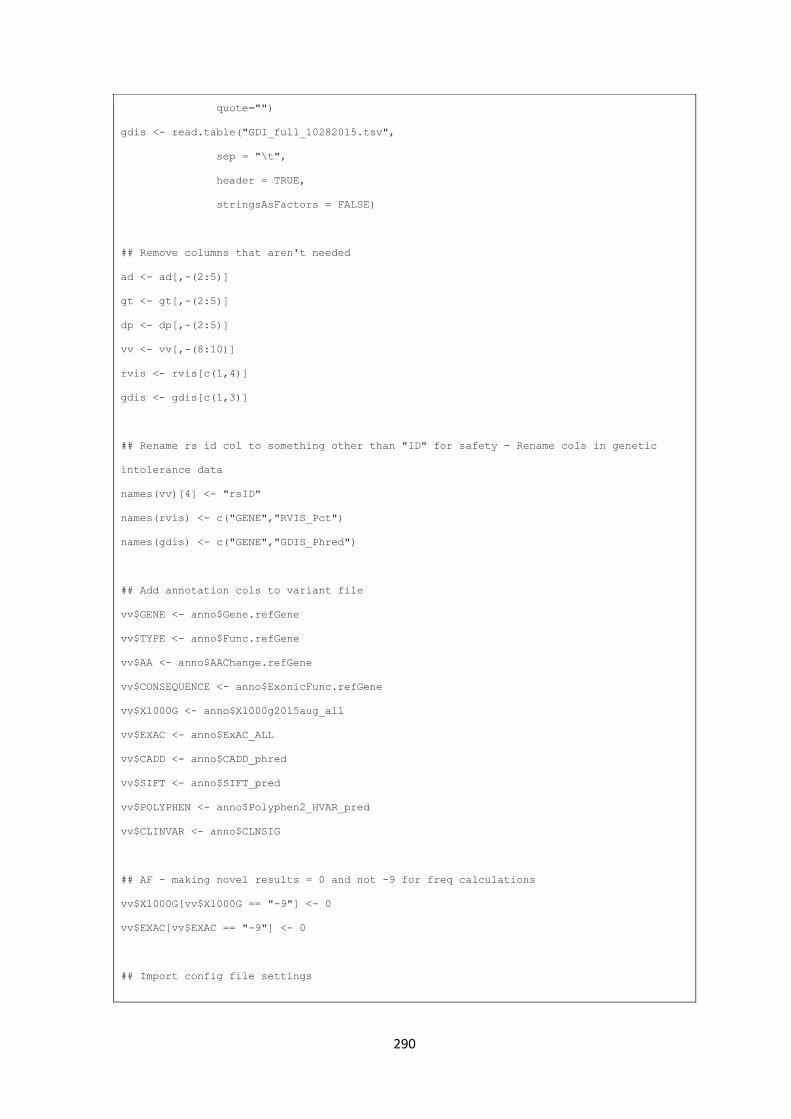
290
quote="")
gdis <- read.table("GDI_full_10282015.tsv",
sep = "\t",
header = TRUE,
stringsAsFactors = FALSE)
## Remove columns that aren't needed
ad <- ad[,-(2:5)]
gt <- gt[,-(2:5)]
dp <- dp[,-(2:5)]
vv <- vv[,-(8:10)]
rvis <- rvis[c(1,4)]
gdis <- gdis[c(1,3)]
## Rename rs id col to something other than "ID" for safety - Rename cols in genetic
intolerance data
names(vv)[4] <- "rsID"
names(rvis) <- c("GENE","RVIS_Pct")
names(gdis) <- c("GENE","GDIS_Phred")
## Add annotation cols to variant file
vv$GENE <- anno$Gene.refGene
vv$TYPE <- anno$Func.refGene
vv$AA <- anno$AAChange.refGene
vv$CONSEQUENCE <- anno$ExonicFunc.refGene
vv$X1000G <- anno$X1000g2015aug_all
vv$EXAC <- anno$ExAC_ALL
vv$CADD <- anno$CADD_phred
vv$SIFT <- anno$SIFT_pred
vv$POLYPHEN <- anno$Polyphen2_HVAR_pred
vv$CLINVAR <- anno$CLNSIG
## AF - making novel results = 0 and not -9 for freq calculations
vv$X1000G[vv$X1000G == "-9"] <- 0
vv$EXAC[vv$EXAC == "-9"] <- 0
## Import config file settings

291
X1000g <- config$V2[config$V1 == "G1000"]
exac <- config$V2[config$V1 == "EXAC"]
CADD <- config$V2[config$V1 == "CADD"]
HET <- config$V2[config$V1 == "HET"]
ADEPTH <- config$V2[config$V1 == "ADEPTH"]
QUAL <- config$V2[config$V1 == "QUAL"]
SAMP_NUM <- config$V2[config$V1 == "SAMP_NUM"]
## Filter variants to those occuring in exonic regions and splice sites
exonic.ft <- as.data.frame(anno$ID[grepl("^exonic$",anno$Func.refGene)
| grepl("^splicing$",anno$Func.refGene)
| grepl("^exonic;splicing$",anno$Func.refGene)])
## rename col to match other ID cols
names(exonic.ft)[1] <- "ID"
## filter by functional consequence
vv.ft <- vv[vv$ID %in% exonic.ft$ID,]
## filtering on functional consequnce - ExonicFunction.refGene
func.ft <- as.data.frame(vv.ft$ID[!grepl("^synonymous SNV$",vv.ft$CONSEQUENCE)
& !grepl("^unknown$",vv.ft$CONSEQUENCE)])
## rename col to match other ID cols
names(func.ft)[1] <- "ID"
## filter by functional consequence
vv.ft <- vv.ft[vv.ft$ID %in% func.ft$ID,]
## filter by qual
qual.ft <- as.data.frame(vv.ft$ID[vv.ft$QUAL > QUAL])
names(qual.ft)[1] <- "ID"
vv.ft <- vv.ft[vv.ft$ID %in% qual.ft$ID,]
## corce gt data.frame into a matrix and replace non-numeric format with numeric
genotypes
gt <- gt[gt$ID %in% vv.ft$ID,]
gtm <- as.matrix(gt)
gtm[gtm == "0/0"] <- 0
gtm[gtm == "0/1"] <- 1
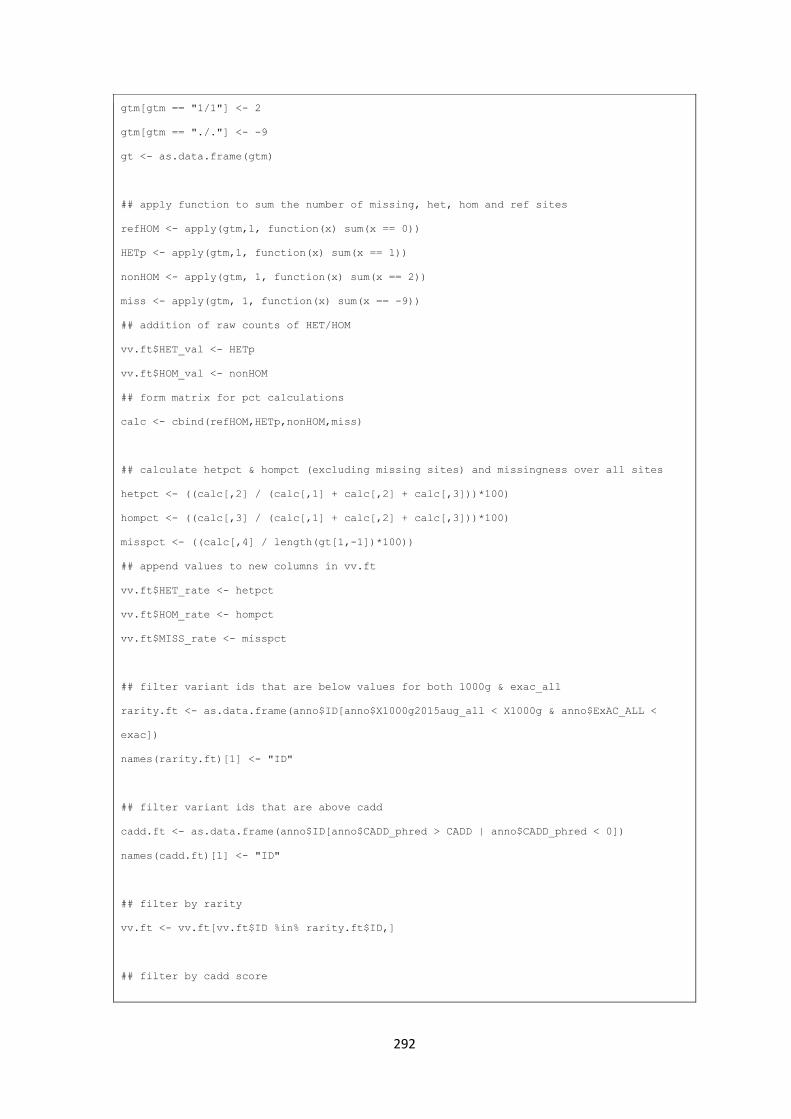
292
gtm[gtm == "1/1"] <- 2
gtm[gtm == "./."] <- -9
gt <- as.data.frame(gtm)
## apply function to sum the number of missing, het, hom and ref sites
refHOM <- apply(gtm,1, function(x) sum(x == 0))
HETp <- apply(gtm,1, function(x) sum(x == 1))
nonHOM <- apply(gtm, 1, function(x) sum(x == 2))
miss <- apply(gtm, 1, function(x) sum(x == -9))
## addition of raw counts of HET/HOM
vv.ft$HET_val <- HETp
vv.ft$HOM_val <- nonHOM
## form matrix for pct calculations
calc <- cbind(refHOM,HETp,nonHOM,miss)
## calculate hetpct & hompct (excluding missing sites) and missingness over all sites
hetpct <- ((calc[,2] / (calc[,1] + calc[,2] + calc[,3]))*100)
hompct <- ((calc[,3] / (calc[,1] + calc[,2] + calc[,3]))*100)
misspct <- ((calc[,4] / length(gt[1,-1])*100))
## append values to new columns in vv.ft
vv.ft$HET_rate <- hetpct
vv.ft$HOM_rate <- hompct
vv.ft$MISS_rate <- misspct
## filter variant ids that are below values for both 1000g & exac_all
rarity.ft <- as.data.frame(anno$ID[anno$X1000g2015aug_all < X1000g & anno$ExAC_ALL <
exac])
names(rarity.ft)[1] <- "ID"
## filter variant ids that are above cadd
cadd.ft <- as.data.frame(anno$ID[anno$CADD_phred > CADD | anno$CADD_phred < 0])
names(cadd.ft)[1] <- "ID"
## filter by rarity
vv.ft <- vv.ft[vv.ft$ID %in% rarity.ft$ID,]
## filter by cadd score
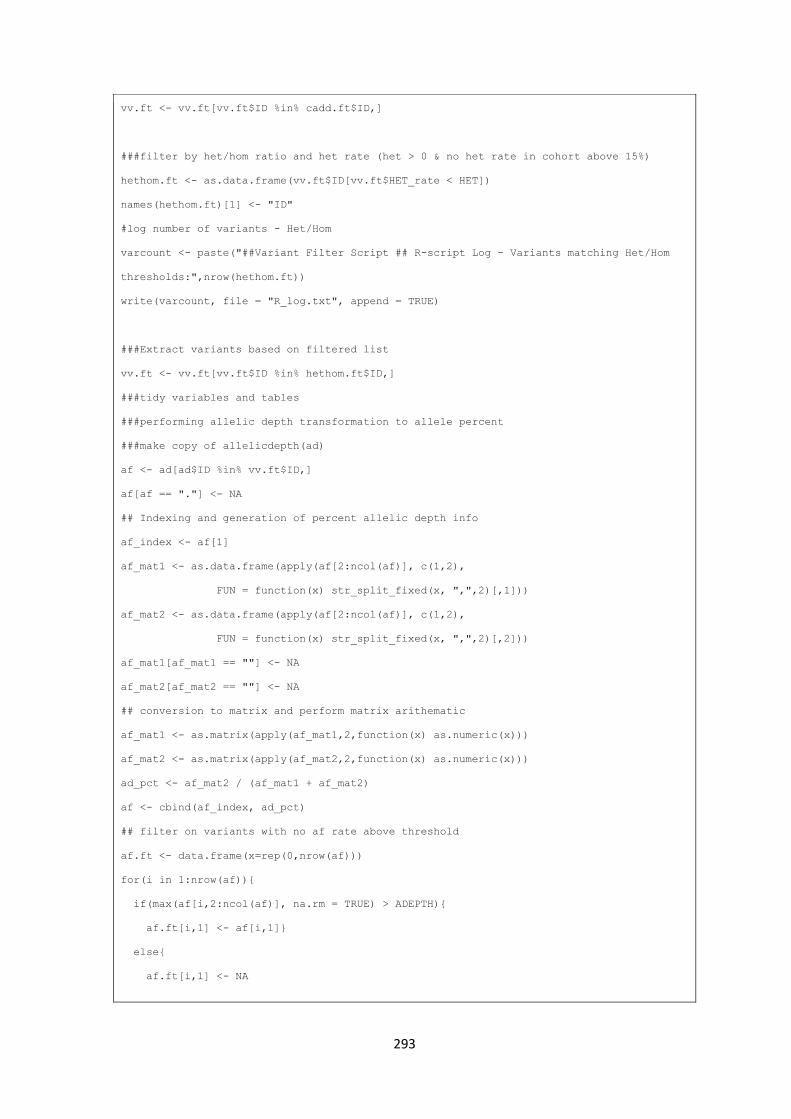
293
vv.ft <- vv.ft[vv.ft$ID %in% cadd.ft$ID,]
###filter by het/hom ratio and het rate (het > 0 & no het rate in cohort above 15%)
hethom.ft <- as.data.frame(vv.ft$ID[vv.ft$HET_rate < HET])
names(hethom.ft)[1] <- "ID"
#log number of variants - Het/Hom
varcount <- paste("##Variant Filter Script ## R-script Log - Variants matching Het/Hom
thresholds:",nrow(hethom.ft))
write(varcount, file = "R_log.txt", append = TRUE)
###Extract variants based on filtered list
vv.ft <- vv.ft[vv.ft$ID %in% hethom.ft$ID,]
###tidy variables and tables
###performing allelic depth transformation to allele percent
###make copy of allelicdepth(ad)
af <- ad[ad$ID %in% vv.ft$ID,]
af[af == "."] <- NA
## Indexing and generation of percent allelic depth info
af_index <- af[1]
af_mat1 <- as.data.frame(apply(af[2:ncol(af)], c(1,2),
FUN = function(x) str_split_fixed(x, ",",2)[,1]))
af_mat2 <- as.data.frame(apply(af[2:ncol(af)], c(1,2),
FUN = function(x) str_split_fixed(x, ",",2)[,2]))
af_mat1[af_mat1 == ""] <- NA
af_mat2[af_mat2 == ""] <- NA
## conversion to matrix and perform matrix arithematic
af_mat1 <- as.matrix(apply(af_mat1,2,function(x) as.numeric(x)))
af_mat2 <- as.matrix(apply(af_mat2,2,function(x) as.numeric(x)))
ad_pct <- af_mat2 / (af_mat1 + af_mat2)
af <- cbind(af_index, ad_pct)
## filter on variants with no af rate above threshold
af.ft <- data.frame(x=rep(0,nrow(af)))
for(i in 1:nrow(af)){
if(max(af[i,2:ncol(af)], na.rm = TRUE) > ADEPTH){
af.ft[i,1] <- af[i,1]}
else{
af.ft[i,1] <- NA
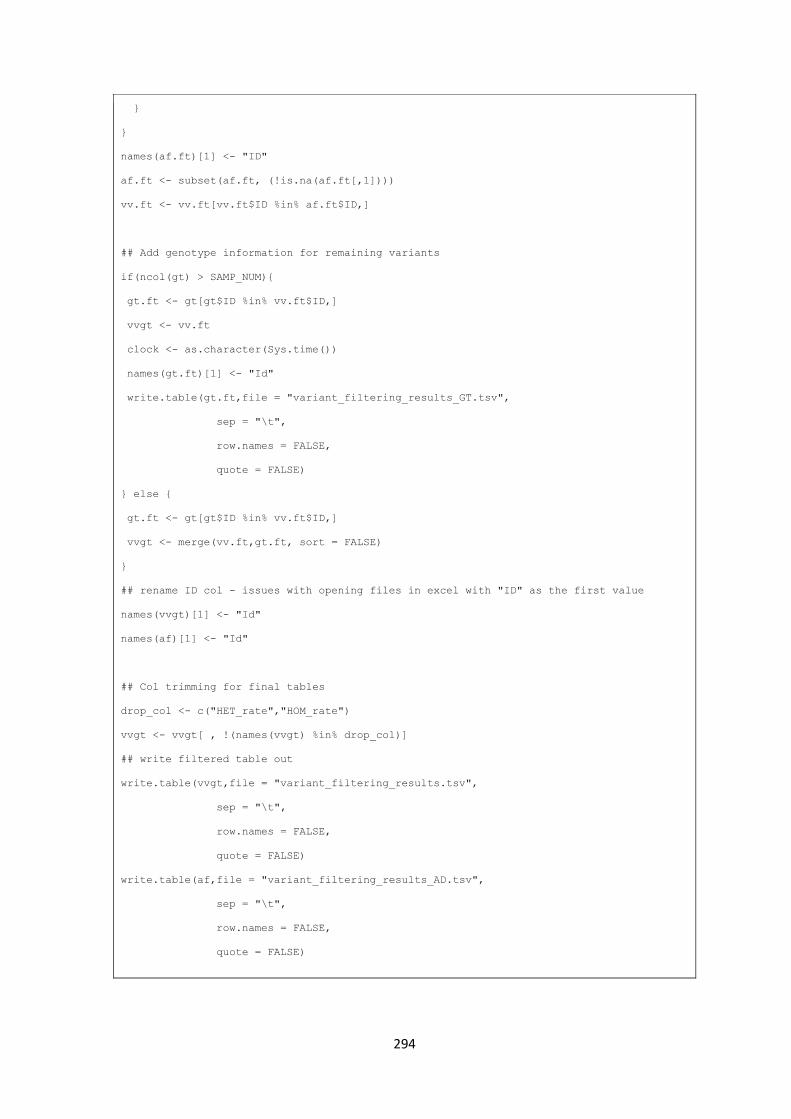
294
}
}
names(af.ft)[1] <- "ID"
af.ft <- subset(af.ft, (!is.na(af.ft[,1])))
vv.ft <- vv.ft[vv.ft$ID %in% af.ft$ID,]
## Add genotype information for remaining variants
if(ncol(gt) > SAMP_NUM){
gt.ft <- gt[gt$ID %in% vv.ft$ID,]
vvgt <- vv.ft
clock <- as.character(Sys.time())
names(gt.ft)[1] <- "Id"
write.table(gt.ft,file = "variant_filtering_results_GT.tsv",
sep = "\t",
row.names = FALSE,
quote = FALSE)
} else {
gt.ft <- gt[gt$ID %in% vv.ft$ID,]
vvgt <- merge(vv.ft,gt.ft, sort = FALSE)
}
## rename ID col - issues with opening files in excel with "ID" as the first value
names(vvgt)[1] <- "Id"
names(af)[1] <- "Id"
## Col trimming for final tables
drop_col <- c("HET_rate","HOM_rate")
vvgt <- vvgt[ , !(names(vvgt) %in% drop_col)]
## write filtered table out
write.table(vvgt,file = "variant_filtering_results.tsv",
sep = "\t",
row.names = FALSE,
quote = FALSE)
write.table(af,file = "variant_filtering_results_AD.tsv",
sep = "\t",
row.names = FALSE,
quote = FALSE)
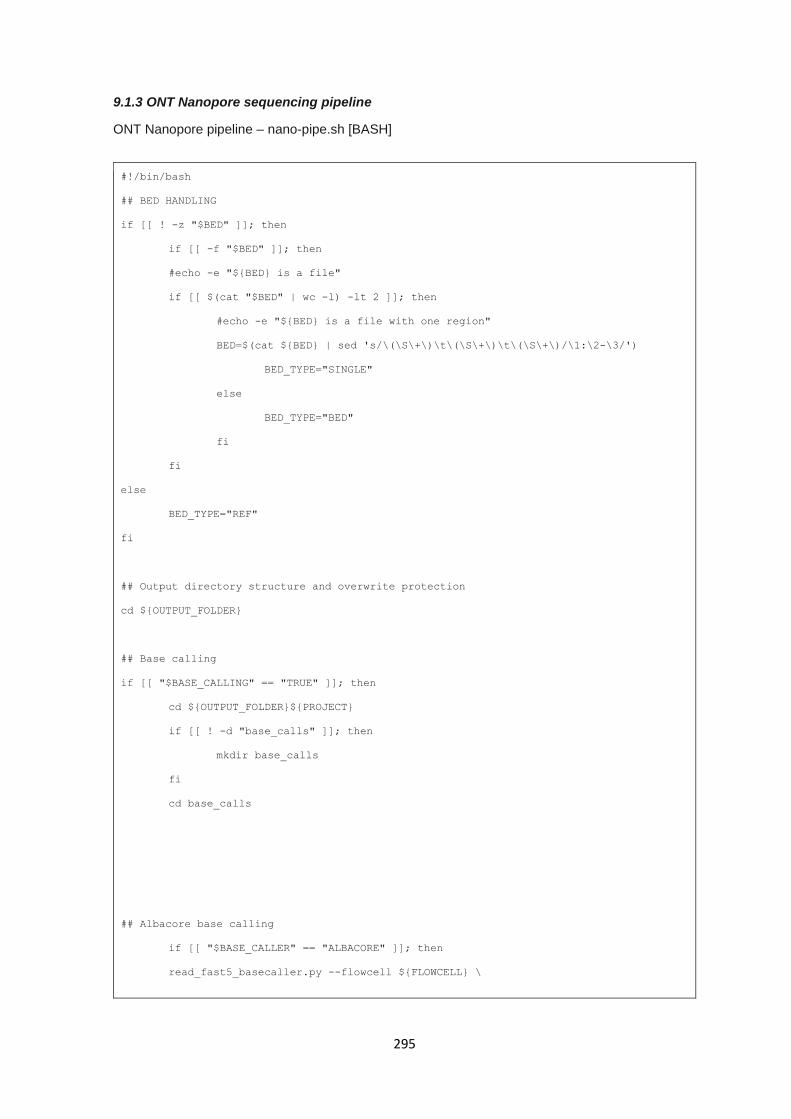
295
9.1.3 ONT Nanopore sequencing pipeline
ONT Nanopore pipeline – nano-pipe.sh [BASH]
#!/bin/bash
## BED HANDLING
if [[ ! -z "$BED" ]]; then
if [[ -f "$BED" ]]; then
#echo -e "${BED} is a file"
if [[ $(cat "$BED" | wc -l) -lt 2 ]]; then
#echo -e "${BED} is a file with one region"
BED=$(cat ${BED} | sed 's/\(\S\+\)\t\(\S\+\)\t\(\S\+\)/\1:\2-\3/')
BED_TYPE="SINGLE"
else
BED_TYPE="BED"
fi
fi
else
BED_TYPE="REF"
fi
## Output directory structure and overwrite protection
cd ${OUTPUT_FOLDER}
## Base calling
if [[ "$BASE_CALLING" == "TRUE" ]]; then
cd ${OUTPUT_FOLDER}${PROJECT}
if [[ ! -d "base_calls" ]]; then
mkdir base_calls
fi
cd base_calls
## Albacore base calling
if [[ "$BASE_CALLER" == "ALBACORE" ]]; then
read_fast5_basecaller.py --flowcell ${FLOWCELL} \
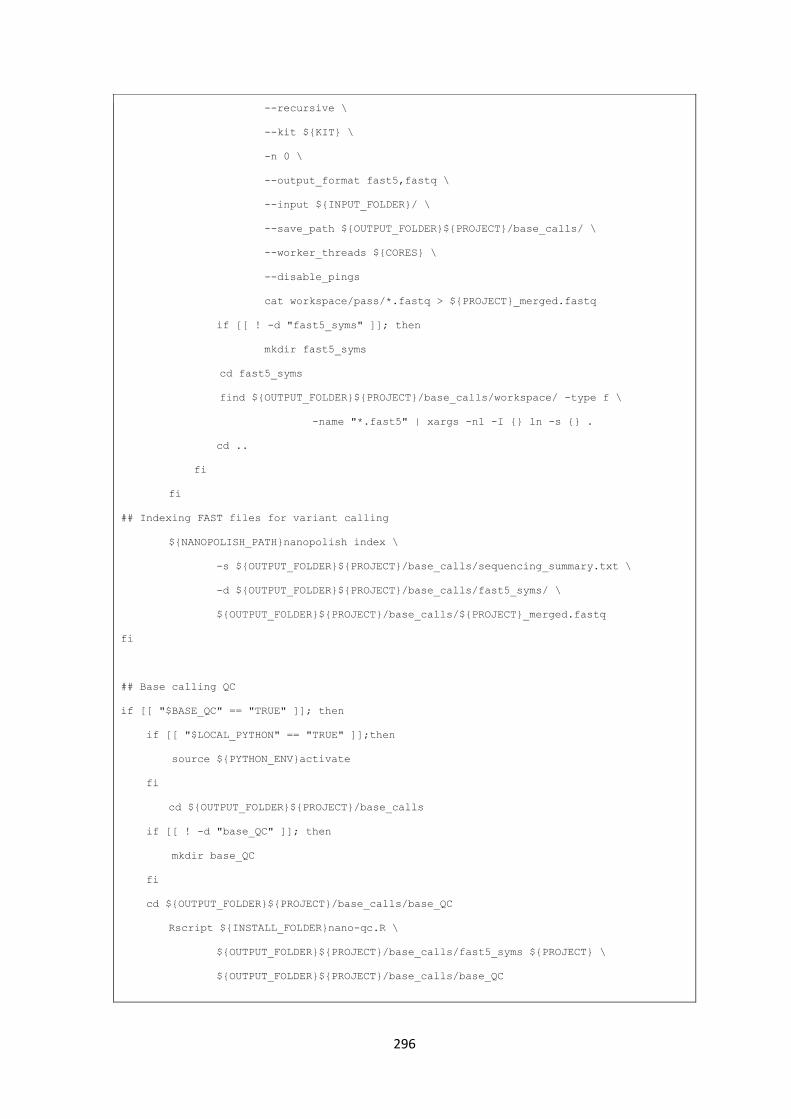
296
--recursive \
--kit ${KIT} \
-n 0 \
--output_format fast5,fastq \
--input ${INPUT_FOLDER}/ \
--save_path ${OUTPUT_FOLDER}${PROJECT}/base_calls/ \
--worker_threads ${CORES} \
--disable_pings
cat workspace/pass/*.fastq > ${PROJECT}_merged.fastq
if [[ ! -d "fast5_syms" ]]; then
mkdir fast5_syms
cd fast5_syms
find ${OUTPUT_FOLDER}${PROJECT}/base_calls/workspace/ -type f \
-name "*.fast5" | xargs -n1 -I {} ln -s {} .
cd ..
fi
fi
## Indexing FAST files for variant calling
${NANOPOLISH_PATH}nanopolish index \
-s ${OUTPUT_FOLDER}${PROJECT}/base_calls/sequencing_summary.txt \
-d ${OUTPUT_FOLDER}${PROJECT}/base_calls/fast5_syms/ \
${OUTPUT_FOLDER}${PROJECT}/base_calls/${PROJECT}_merged.fastq
fi
## Base calling QC
if [[ "$BASE_QC" == "TRUE" ]]; then
if [[ "$LOCAL_PYTHON" == "TRUE" ]];then
source ${PYTHON_ENV}activate
fi
cd ${OUTPUT_FOLDER}${PROJECT}/base_calls
if [[ ! -d "base_QC" ]]; then
mkdir base_QC
fi
cd ${OUTPUT_FOLDER}${PROJECT}/base_calls/base_QC
Rscript ${INSTALL_FOLDER}nano-qc.R \
${OUTPUT_FOLDER}${PROJECT}/base_calls/fast5_syms ${PROJECT} \
${OUTPUT_FOLDER}${PROJECT}/base_calls/base_QC
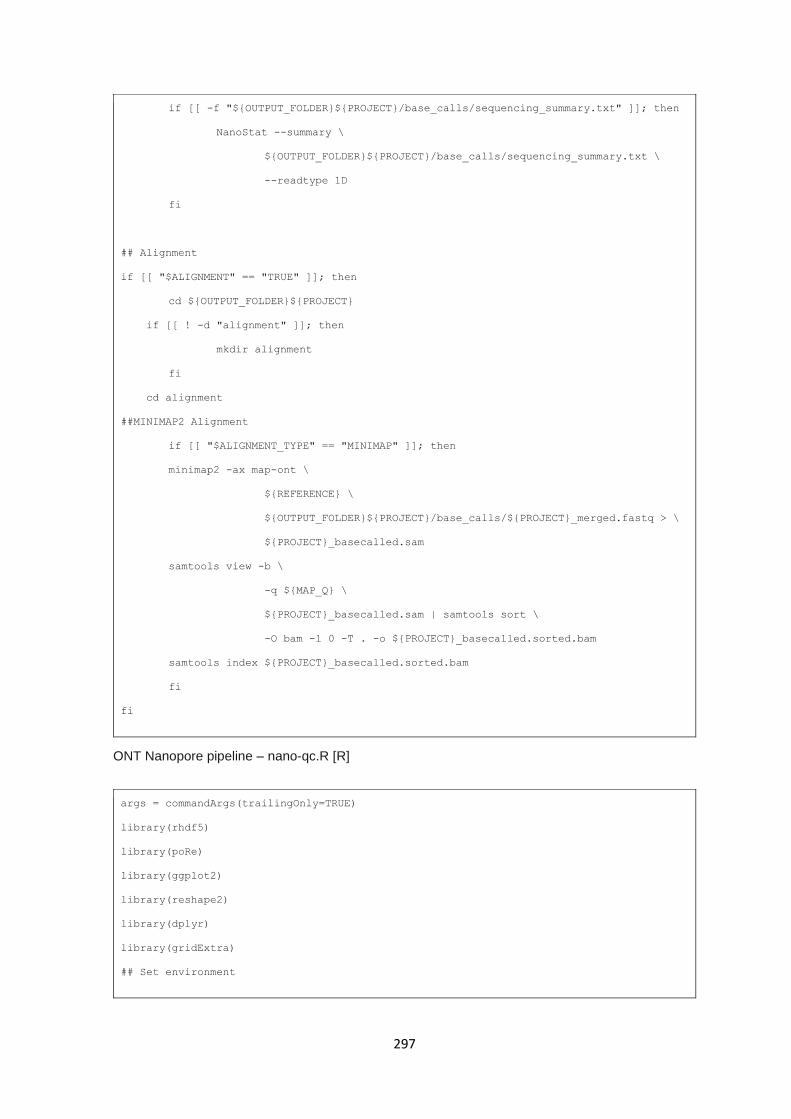
297
if [[ -f "${OUTPUT_FOLDER}${PROJECT}/base_calls/sequencing_summary.txt" ]]; then
NanoStat --summary \
${OUTPUT_FOLDER}${PROJECT}/base_calls/sequencing_summary.txt \
--readtype 1D
fi
## Alignment
if [[ "$ALIGNMENT" == "TRUE" ]]; then
cd ${OUTPUT_FOLDER}${PROJECT}
if [[ ! -d "alignment" ]]; then
mkdir alignment
fi
cd alignment
##MINIMAP2 Alignment
if [[ "$ALIGNMENT_TYPE" == "MINIMAP" ]]; then
minimap2 -ax map-ont \
${REFERENCE} \
${OUTPUT_FOLDER}${PROJECT}/base_calls/${PROJECT}_merged.fastq > \
${PROJECT}_basecalled.sam
samtools view -b \
-q ${MAP_Q} \
${PROJECT}_basecalled.sam | samtools sort \
-O bam -l 0 -T . -o ${PROJECT}_basecalled.sorted.bam
samtools index ${PROJECT}_basecalled.sorted.bam
fi
fi
ONT Nanopore pipeline – nano-qc.R [R]
args = commandArgs(trailingOnly=TRUE)
library(rhdf5)
library(poRe)
library(ggplot2)
library(reshape2)
library(dplyr)
library(gridExtra)
## Set environment
298
setwd(dir = args[3])
project <- args[2]
reads_info <- read.fast5.info(dir = args[1])
## Set Nanopore channel layout
layout <- function(){
p1 = data.frame(channel=33:64, row=rep(1:4, each=8), col=rep(1:8, 4))
p2 = data.frame(channel=481:512, row=rep(5:8, each=8), col=rep(1:8, 4))
p3 = data.frame(channel=417:448, row=rep(9:12, each=8), col=rep(1:8, 4))
p4 = data.frame(channel=353:384, row=rep(13:16, each=8), col=rep(1:8, 4))
p5 = data.frame(channel=289:320, row=rep(17:20, each=8), col=rep(1:8, 4))
p6 = data.frame(channel=225:256, row=rep(21:24, each=8), col=rep(1:8, 4))
p7 = data.frame(channel=161:192, row=rep(25:28, each=8), col=rep(1:8, 4))
p8 = data.frame(channel=97:128, row=rep(29:32, each=8), col=rep(1:8, 4))
q1 = data.frame(channel=1:32, row=rep(1:4, each=8), col=rep(16:9, 4))
q2 = data.frame(channel=449:480, row=rep(5:8, each=8), col=rep(16:9, 4))
q3 = data.frame(channel=385:416, row=rep(9:12, each=8), col=rep(16:9, 4))
q4 = data.frame(channel=321:352, row=rep(13:16, each=8), col=rep(16:9, 4))
q5 = data.frame(channel=257:288, row=rep(17:20, each=8), col=rep(16:9, 4))
q6 = data.frame(channel=193:224, row=rep(21:24, each=8), col=rep(16:9, 4))
q7 = data.frame(channel=129:160, row=rep(25:28, each=8), col=rep(16:9, 4))
q8 = data.frame(channel=65:96, row=rep(29:32, each=8), col=rep(16:9, 4))
map = rbind(p1, p2, p3, p4, p5, p6, p7, p8, q1, q2, q3, q4, q5, q6, q7, q8)
map.matrix = acast(map, row ~ col, value.var = "channel")
return(map.matrix)
}
channel.layout <- layout()
channel.layout <- melt(channel.layout)
## functions
## qual_plot fucntion
qual_plot <- function(input){
dat <- input[which(colnames(input) %in% c("tmq","cmq","mq2d"))]
#dat <- dat[!is.na(dat$tmq),]
qual_melt <- melt(as.matrix(dat))
qual_melt$Var2 <- as.character(qual_melt$Var2)
names(qual_melt) <- c("Var1","read type","mean quality")
299
qual_melt$`read type`[qual_melt$`read type` == "tmq"] <- "template"
qual_melt$`read type`[qual_melt$`read type` == "cmq"] <- "complement"
qual_melt$`read type`[qual_melt$`read type` == "mq2d"] <- "2d"
qual_melt$`read type` <- factor(qual_melt$`read type`,
levels = c("template","complement","2d"))
lim <-round(max(hist(qual_melt$`mean quality`[qual_melt$`mean quality` > 0])$counts),-
3)
ggplot(data = qual_melt,aes(x = `mean quality`,fill = `read type`)) +
geom_histogram(bins = 30,color = "grey25") +
facet_grid(. ~ `read type`) +
labs(title = "Distribution of mean read qualities",
fill = "Read type",
y = "Frequency",
x = "Mean quality") +
theme_light() +
scale_y_continuous(limits = c(0,lim),expand = c(0,0)) +
scale_fill_manual(values=c("#53B400", "#C49A00","#F8766D")) +
scale_x_continuous(limits = c(0,NA))
}
## length_plot fucntion
rlength_plot <- function(input){
dat <- input[which(colnames(input) %in% c("tlen","clen","len2d"))]
dat <- dat[!is.na(dat$tlen),]
rlength_melt <- melt(as.matrix(dat))
rlength_melt$Var2 <- as.character(rlength_melt$Var2)
#qual_melt <- qual_melt[qual_melt$value > 0,]
names(rlength_melt) <- c("Var1","read type","read length")
rlength_melt$`read type`[rlength_melt$`read type` == "tlen"] <- "template"
rlength_melt$`read type`[rlength_melt$`read type` == "clen"] <- "complement"
rlength_melt$`read type`[rlength_melt$`read type` == "len2d"] <- "2d"
300
rlength_melt$`read type` <- factor(rlength_melt$`read type`,
levels = c("template","complement","2d"))
lim <- round(max(hist(rlength_melt$`read length`[rlength_melt$`read length` >
0])$counts),-3)
ggplot(data = rlength_melt) +
geom_histogram(aes(x = `read length`,fill = `read type`),
bins = 50,color = "grey25") +
facet_grid(. ~ `read type`) +
labs(title = "Distribution of read length",
fill = "Read type",
y = "Frequency",
x = "Mean length") +
theme_light() +
scale_y_continuous(limits = c(0,lim),expand = c(0,0)) +
scale_fill_manual(values=c("#53B400","#C49A00","#F8766D")) +
scale_x_continuous(limits = c(0,NA))
}
##yield plot fucntion
yield_plot <- function(input){
dat <- input[!is.na(input$read_start_time),]
dat$TIME_SUM <- (as.numeric(dat$exp_start +
dat$read_start_time) –
min(as.numeric(dat$exp_start + dat$read_start_time)))
dat <- dat[order(dat$read_start_time),]
dat <- dat[which(colnames(dat) %in% c("tlen","clen","len2d","read_start_time"))]
dat$len2d <- cumsum(dat$len2d) / 1000
dat$tlen <- cumsum(dat$tlen) / 1000
dat$clen <- cumsum(dat$clen) / 1000
yield_melt <- melt(data = dat,id.vars = c("read_start_time"))
yield_melt$variable <- as.character(yield_melt$variable)
names(yield_melt) <- c("time","read type","cumulative kbs")
yield_melt$`read type`[yield_melt$`read type` == "tlen"] <- "template"

301
yield_melt$`read type`[yield_melt$`read type` == "clen"] <- "complement"
yield_melt$`read type`[yield_melt$`read type` == "len2d"] <- "2d"
yield_melt$`read type` <- factor(yield_melt$`read type`,
levels = c("template","complement","2d"))
ggplot(data = yield_melt) +
geom_line(aes(x = `time`,y = `cumulative kbs`,color = `read type`)) +
facet_grid(. ~ `read type`,scales = "free") +
labs(title = "Cummulative kbases / time",
x = "Time",
y = "Cumulative data (Kbases)",
color = "Read type") +
theme_light() +
scale_y_continuous(expand = c(0.01,0)) +
scale_color_manual(values=c("#53B400","#C49A00","#F8766D")) +
scale_x_continuous(limits = c(0,NA))
}
## channel kb function
channel_stats_plot_tkb <- function(input){
numeric_cols_sum <- c("len2d","tlen","clen","tcevents","channel")
dat_sum <- input[which(colnames(input) %in% numeric_cols_sum)]
dats <- dat_sum %>% group_by(channel) %>% summarise_all(sum)
merged_channel <- merge(channel.layout,dats,by.x = "value",by.y = "channel",all.x = T)
merged_channel$tlen <- merged_channel$tlen / 1000
merged_channel$len2d <- merged_channel$len2d / 1000
merged_channel$clen <- merged_channel$clen / 1000
names(merged_channel) <- c("channel","Var1","Var2","2d kbases (total)",
"template kbases (total)",
"complement kbases (total)",
"template events (total)")
merged_out <- melt(merged_channel,id.vars = c("channel","Var1","Var2"))
ggplot(merged_out[merged_out$variable=="template kbases (total)",],aes(x = Var2,y =
Var1)) +
geom_point(shape = 21,size = 9,
color = "grey25",stroke = 0.5,
aes(fill = value)) +
geom_text(aes(label=channel),size = 3) +
302
scale_y_reverse() +
scale_fill_continuous(low = "grey95", high = "#53B400",na.value = "white",
limits = c(0,
max(merged_out$value[which(merged_out$variable %in%
c("2d kbases (total)",
"template kbases (total)",
"complement kbases (total)"))])
)) +
labs(title = "Template reads - KBases / channel",y = "Channel number",
fill="Kbases") + theme_light() +
theme(panel.background = element_blank(),plot.background =
element_blank(),
panel.grid = element_blank(),axis.line = element_blank(),
axis.title.x = element_blank(),axis.ticks = element_blank(),
axis.text = element_blank(),panel.border = element_blank()
)
}
## channel events function
channel_stats_plot_tevn <- function(input){
numeric_cols_sum <- c("len2d","tlen","clen","tcevents","channel")
dat_sum <- input[which(colnames(input) %in% numeric_cols_sum)]
dats <- dat_sum %>% group_by(channel) %>% summarise_all(sum)
merged_channel <- merge(channel.layout,dats,by.x = "value",
by.y = "channel",
all.x = T)
merged_channel$tlen <- merged_channel$tlen
merged_channel$len2d <- merged_channel$len2d
merged_channel$clen <- merged_channel$clen
names(merged_channel) <- c("channel","Var1","Var2",
"2d kbases (total)",
"template kbases (total)",
"complement kbases (total)",
"template events (total)")
merged_out <- melt(merged_channel,id.vars = c("channel","Var1","Var2"))
ggplot(merged_out[merged_out$variable == "template events (total)",],
303
aes(x = Var2,y = Var1)) +
geom_point(shape = 21,
size = 9,
color = "grey25",
stroke = 0.5,
aes(fill = value)) +
geom_text(aes(label=channel),size = 3) +
scale_y_reverse() +
scale_fill_continuous(low = "grey95",high = "blue2",na.value = "white") +
labs(title = "Events / channel",y = "Channel number", fill="Events") +
theme_light() +
theme(panel.background = element_blank(),
plot.background = element_blank(),
panel.grid = element_blank(),
axis.line = element_blank(),
axis.title.x = element_blank(),
axis.ticks = element_blank(),
axis.text = element_blank(),
panel.border = element_blank()
)
}
## Chnanel mean kb function
channel_stats_plot_tmeankb <- function(input){
numeric_cols_mean <-c("len2d","tlen","clen","channel")
dat_mean <- input[which(colnames(input) %in% numeric_cols_mean)]
datm <- dat_mean %>% group_by(channel) %>% summarise_all(mean)
merged_channel <- merge(channel.layout,datm,by.x = "value",by.y = "channel",all.x = T)
merged_channel$tlen <- merged_channel$tlen / 1000
merged_channel$len2d <- merged_channel$len2d / 1000
merged_channel$clen <- merged_channel$clen / 1000
names(merged_channel) <- c("channel","Var1","Var2",
"2d kbases (mean)",
"template kbases (mean)",
"complement kbases (mean)")
304
merged_out <- melt(merged_channel,id.vars = c("channel","Var1","Var2"))
ggplot(merged_out[merged_out$variable == "template kbases (mean)",],aes(x = Var2,y =
Var1)) +
geom_point(shape = 21,size = 9,color = "grey25",stroke = 0.5, aes(fill = value)) +
geom_text(aes(label=channel),size = 3) +
scale_y_reverse() +
scale_fill_continuous(low = "white",high = "#53B400",na.value = "white",
limits = c(0,max(merged_out$value[which(merged_out$variable %in%
c("2d kbases (mean)",
"template kbases (mean)",
"complement kbases (mean)"))],na.rm = T))) +
labs(title = "Template reads - mean KBases / channel",
y = "Channel number",
fill="Kbases") +
theme_light() +
theme(panel.background = element_blank(),
plot.background = element_blank(),
panel.grid = element_blank(),
axis.line = element_blank(),
axis.title.x = element_blank(),
axis.ticks = element_blank(),
axis.text = element_blank(),
panel.border = element_blank()
)
}
## channel temp function
channel_stats_plot_temp <- function(input){
numeric_cols_mean <-c("channel","heatsink_temp")
dat_mean <- input[which(colnames(input) %in% numeric_cols_mean)]
datm <- dat_mean %>% group_by(channel) %>% summarise_all(mean)
merged_channel <- merge(channel.layout,datm,by.x = "value",
by.y = "channel",
305
all.x = T)
names(merged_channel) <- c("channel","Var1","Var2","temp (C)")
merged_out <- melt(merged_channel,id.vars = c("channel","Var1","Var2"))
ggplot(merged_out[merged_out$variable == "temp (C)",],aes(x = Var2,y = Var1)) +
geom_point(shape = 21,
size = 9,
color = "grey25",
stroke = 0.5,
aes(fill = value)) +
geom_text(aes(label=channel),size = 3) +
scale_y_reverse() +
scale_fill_continuous(low = "green",
high = "red",
na.value = "white",
limits = c(0,60)) +
labs(title = "Mean temperature / channel",
y = "Channel number",
fill="Temp (C)") +
theme_light() +
theme(panel.background = element_blank(),
plot.background = element_blank(),
panel.grid = element_blank(),
axis.line = element_blank(),
axis.title.x = element_blank(),
axis.ticks = element_blank(),
axis.text = element_blank(),
panel.border = element_blank()
)
}
## Channel quality function
channel_stats_plot_tmeanq <- function(input){
numeric_cols_mean <-c("tmq","cmq","mq2d","channel")
dat_mean <- input[which(colnames(input) %in% numeric_cols_mean)]
306
dat_mean[is.na(dat_mean)] <- 0
datm <- dat_mean %>% group_by(channel) %>% summarise_all(mean)
merged_channel <- merge(channel.layout,datm,by.x = "value",
by.y = "channel",
all.x = T)
names(merged_channel) <- c("channel","Var1","Var2",
"template quality (mean)",
"complement quality (mean)",
"2d quality (mean)")
merged_out <- melt(merged_channel,id.vars = c("channel","Var1","Var2"))
ggplot(merged_out[merged_out$variable == "template quality (mean)",],
aes(x = Var2,y = Var1)) +
geom_point(shape = 21,size = 9,color = "grey25",
stroke = 0.5, aes(fill = value)) +
geom_text(aes(label=channel),size = 3) +
scale_y_reverse() +
scale_fill_continuous(low = "grey95",high = "#53B400",na.value = "white",
limits = c(0,max(merged_out$value[which(merged_out$variable %in%
c("2d quality (mean)",
"template quality (mean)",
"complement quality (mean)"))],
na.rm = T))) +
labs(title = "Template reads - mean quality / channel",
y = "Channel number", fill="Quality") +
theme_light() +
theme(panel.background = element_blank(),
plot.background = element_blank(),
panel.grid = element_blank(),
axis.line = element_blank(),
axis.title.x = element_blank(),
axis.ticks = element_blank(),
axis.text = element_blank(),
panel.border = element_blank()
)
}
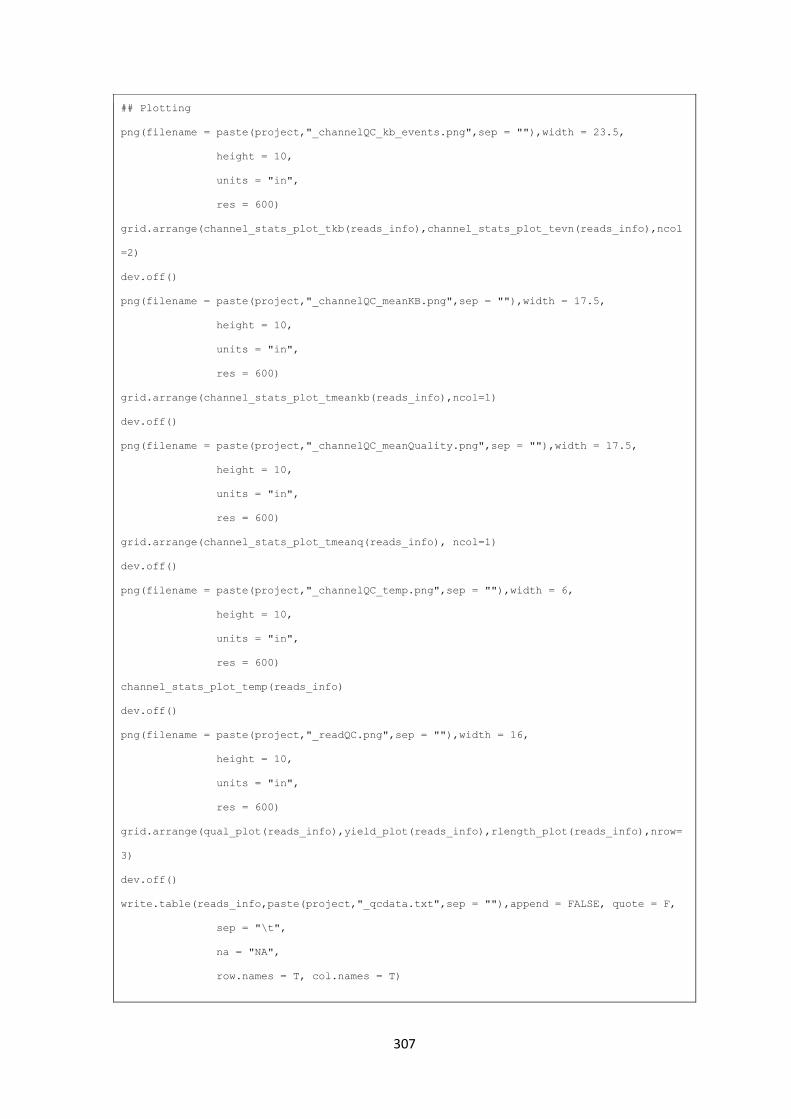
307
## Plotting
png(filename = paste(project,"_channelQC_kb_events.png",sep = ""),width = 23.5,
height = 10,
units = "in",
res = 600)
grid.arrange(channel_stats_plot_tkb(reads_info),channel_stats_plot_tevn(reads_info),ncol
=2)
dev.off()
png(filename = paste(project,"_channelQC_meanKB.png",sep = ""),width = 17.5,
height = 10,
units = "in",
res = 600)
grid.arrange(channel_stats_plot_tmeankb(reads_info),ncol=1)
dev.off()
png(filename = paste(project,"_channelQC_meanQuality.png",sep = ""),width = 17.5,
height = 10,
units = "in",
res = 600)
grid.arrange(channel_stats_plot_tmeanq(reads_info), ncol=1)
dev.off()
png(filename = paste(project,"_channelQC_temp.png",sep = ""),width = 6,
height = 10,
units = "in",
res = 600)
channel_stats_plot_temp(reads_info)
dev.off()
png(filename = paste(project,"_readQC.png",sep = ""),width = 16,
height = 10,
units = "in",
res = 600)
grid.arrange(qual_plot(reads_info),yield_plot(reads_info),rlength_plot(reads_info),nrow=
3)
dev.off()
write.table(reads_info,paste(project,"_qcdata.txt",sep = ""),append = FALSE, quote = F,
sep = "\t",
na = "NA",
row.names = T, col.names = T)
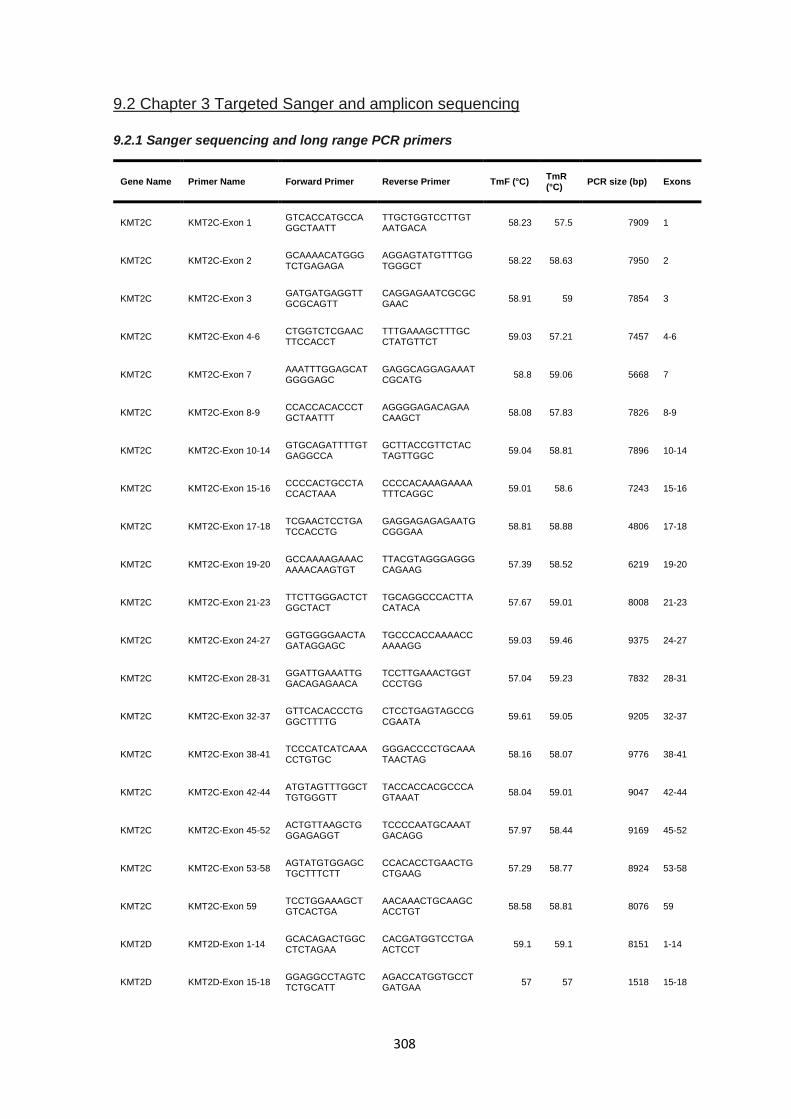
308
9.2 Chapter 3 Targeted Sanger and amplicon sequencing
9.2.1 Sanger sequencing and long range PCR primers
Gene Name Primer Name Forward Primer Reverse Primer TmF (°C) TmR (°C)
PCR size (bp) Exons
KMT2C KMT2C-Exon 1 GTCACCATGCCAGGCTAATT
TTGCTGGTCCTTGTAATGACA
58.23 57.5 7909 1
KMT2C KMT2C-Exon 2 GCAAAACATGGGTCTGAGAGA
AGGAGTATGTTTGGTGGGCT
58.22 58.63 7950 2
KMT2C KMT2C-Exon 3 GATGATGAGGTTGCGCAGTT
CAGGAGAATCGCGCGAAC
58.91 59 7854 3
KMT2C KMT2C-Exon 4-6 CTGGTCTCGAACTTCCACCT
TTTGAAAGCTTTGCCTATGTTCT
59.03 57.21 7457 4-6
KMT2C KMT2C-Exon 7 AAATTTGGAGCATGGGGAGC
GAGGCAGGAGAAATCGCATG
58.8 59.06 5668 7
KMT2C KMT2C-Exon 8-9 CCACCACACCCTGCTAATTT
AGGGGAGACAGAACAAGCT
58.08 57.83 7826 8-9
KMT2C KMT2C-Exon 10-14 GTGCAGATTTTGTGAGGCCA
GCTTACCGTTCTACTAGTTGGC
59.04 58.81 7896 10-14
KMT2C KMT2C-Exon 15-16 CCCCACTGCCTACCACTAAA
CCCCACAAAGAAAATTTCAGGC
59.01 58.6 7243 15-16
KMT2C KMT2C-Exon 17-18 TCGAACTCCTGATCCACCTG
GAGGAGAGAGAATGCGGGAA
58.81 58.88 4806 17-18
KMT2C KMT2C-Exon 19-20 GCCAAAAGAAACAAAACAAGTGT
TTACGTAGGGAGGGCAGAAG
57.39 58.52 6219 19-20
KMT2C KMT2C-Exon 21-23 TTCTTGGGACTCTGGCTACT
TGCAGGCCCACTTACATACA
57.67 59.01 8008 21-23
KMT2C KMT2C-Exon 24-27 GGTGGGGAACTAGATAGGAGC
TGCCCACCAAAACCAAAAGG
59.03 59.46 9375 24-27
KMT2C KMT2C-Exon 28-31 GGATTGAAATTGGACAGAGAACA
TCCTTGAAACTGGTCCCTGG
57.04 59.23 7832 28-31
KMT2C KMT2C-Exon 32-37 GTTCACACCCTGGGCTTTTG
CTCCTGAGTAGCCGCGAATA
59.61 59.05 9205 32-37
KMT2C KMT2C-Exon 38-41 TCCCATCATCAAACCTGTGC
GGGACCCCTGCAAATAACTAG
58.16 58.07 9776 38-41
KMT2C KMT2C-Exon 42-44 ATGTAGTTTGGCTTGTGGGTT
TACCACCACGCCCAGTAAAT
58.04 59.01 9047 42-44
KMT2C KMT2C-Exon 45-52 ACTGTTAAGCTGGGAGAGGT
TCCCCAATGCAAATGACAGG
57.97 58.44 9169 45-52
KMT2C KMT2C-Exon 53-58 AGTATGTGGAGCTGCTTTCTT
CCACACCTGAACTGCTGAAG
57.29 58.77 8924 53-58
KMT2C KMT2C-Exon 59 TCCTGGAAAGCTGTCACTGA
AACAAACTGCAAGCACCTGT
58.58 58.81 8076 59
KMT2D KMT2D-Exon 1-14 GCACAGACTGGCCTCTAGAA
CACGATGGTCCTGAACTCCT
59.1 59.1 8151 1-14
KMT2D KMT2D-Exon 15-18 GGAGGCCTAGTCTCTGCATT
AGACCATGGTGCCTGATGAA
57 57 1518 15-18
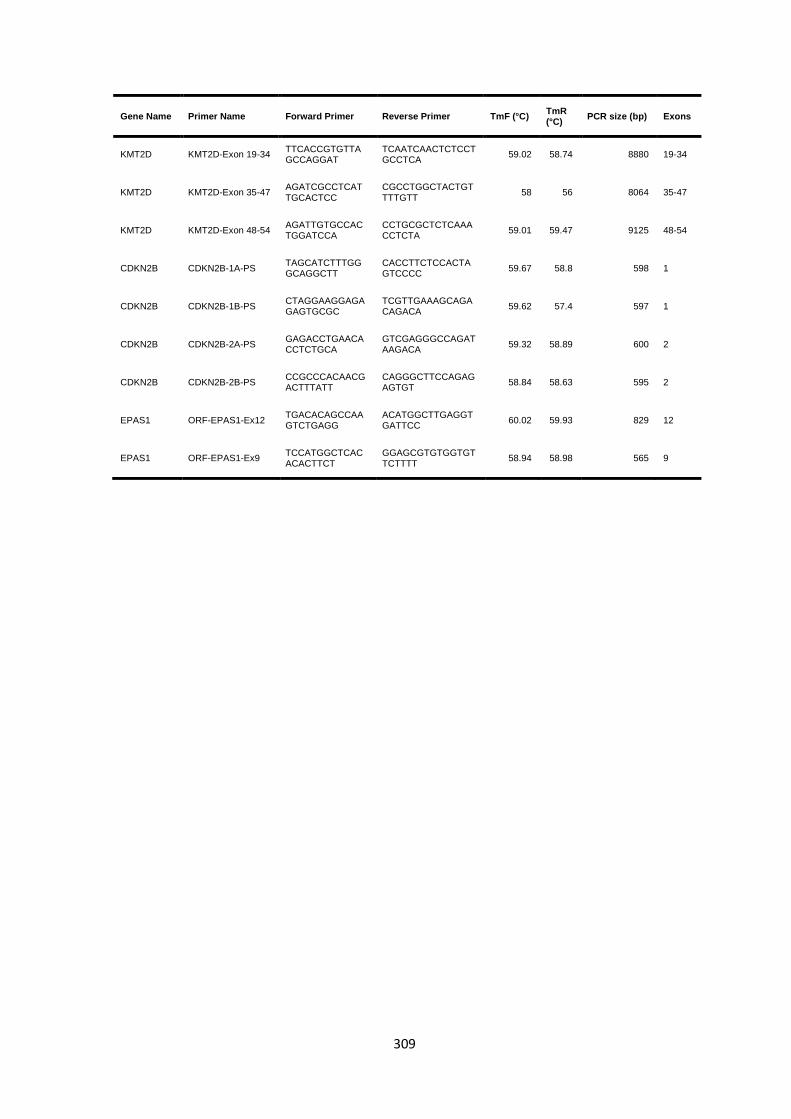
309
Gene Name Primer Name Forward Primer Reverse Primer TmF (°C) TmR (°C)
PCR size (bp) Exons
KMT2D KMT2D-Exon 19-34 TTCACCGTGTTAGCCAGGAT
TCAATCAACTCTCCTGCCTCA
59.02 58.74 8880 19-34
KMT2D KMT2D-Exon 35-47 AGATCGCCTCATTGCACTCC
CGCCTGGCTACTGTTTTGTT
58 56 8064 35-47
KMT2D KMT2D-Exon 48-54 AGATTGTGCCACTGGATCCA
CCTGCGCTCTCAAACCTCTA
59.01 59.47 9125 48-54
CDKN2B CDKN2B-1A-PS TAGCATCTTTGGGCAGGCTT
CACCTTCTCCACTAGTCCCC
59.67 58.8 598 1
CDKN2B CDKN2B-1B-PS CTAGGAAGGAGAGAGTGCGC
TCGTTGAAAGCAGACAGACA
59.62 57.4 597 1
CDKN2B CDKN2B-2A-PS GAGACCTGAACACCTCTGCA
GTCGAGGGCCAGATAAGACA
59.32 58.89 600 2
CDKN2B CDKN2B-2B-PS CCGCCCACAACGACTTTATT
CAGGGCTTCCAGAGAGTGT
58.84 58.63 595 2
EPAS1 ORF-EPAS1-Ex12 TGACACAGCCAAGTCTGAGG
ACATGGCTTGAGGTGATTCC
60.02 59.93 829 12
EPAS1 ORF-EPAS1-Ex9 TCCATGGCTCACACACTTCT
GGAGCGTGTGGTGTTCTTTT
58.94 58.98 565 9
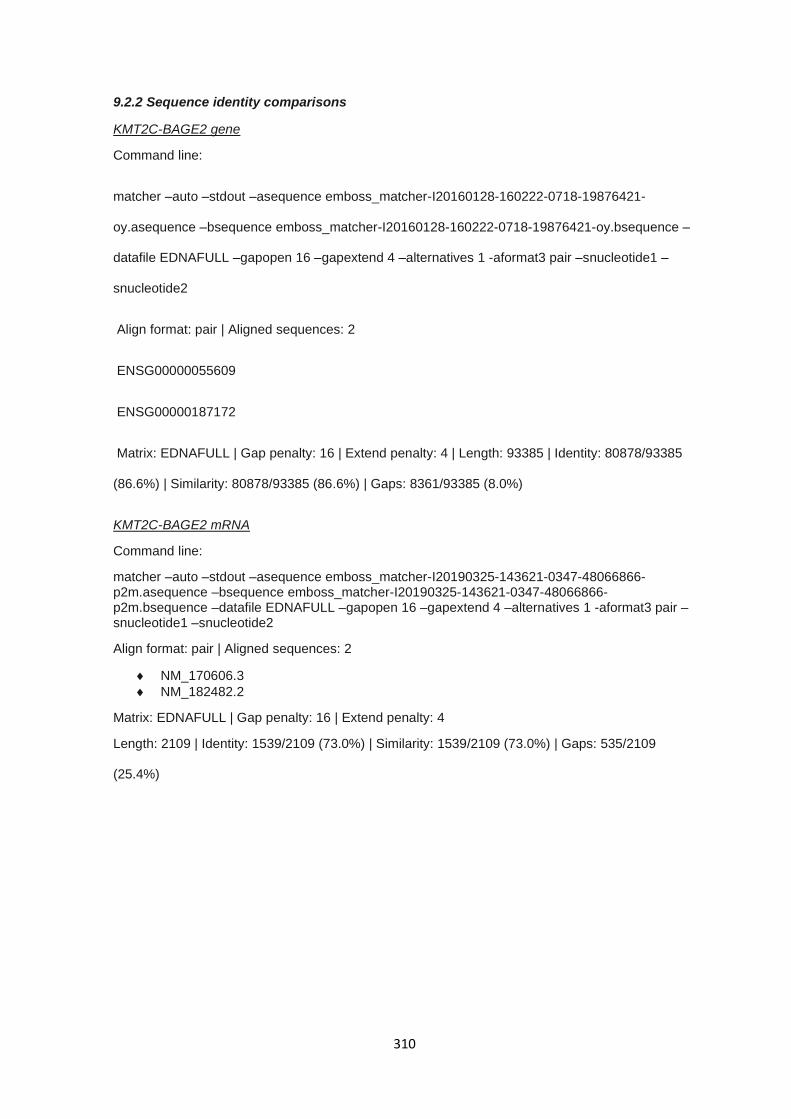
310
9.2.2 Sequence identity comparisons
KMT2C-BAGE2 gene
Command line:
matcher –auto –stdout –asequence emboss_matcher-I20160128-160222-0718-19876421-
oy.asequence –bsequence emboss_matcher-I20160128-160222-0718-19876421-oy.bsequence –
datafile EDNAFULL –gapopen 16 –gapextend 4 –alternatives 1 -aformat3 pair –snucleotide1 –
snucleotide2
Align format: pair | Aligned sequences: 2
ENSG00000055609
ENSG00000187172
Matrix: EDNAFULL | Gap penalty: 16 | Extend penalty: 4 | Length: 93385 | Identity: 80878/93385
(86.6%) | Similarity: 80878/93385 (86.6%) | Gaps: 8361/93385 (8.0%)
KMT2C-BAGE2 mRNA
Command line:
matcher –auto –stdout –asequence emboss_matcher-I20190325-143621-0347-48066866-p2m.asequence –bsequence emboss_matcher-I20190325-143621-0347-48066866-p2m.bsequence –datafile EDNAFULL –gapopen 16 –gapextend 4 –alternatives 1 -aformat3 pair –snucleotide1 –snucleotide2
Align format: pair | Aligned sequences: 2
NM_170606.3
NM_182482.2
Matrix: EDNAFULL | Gap penalty: 16 | Extend penalty: 4
Length: 2109 | Identity: 1539/2109 (73.0%) | Similarity: 1539/2109 (73.0%) | Gaps: 535/2109
(25.4%)
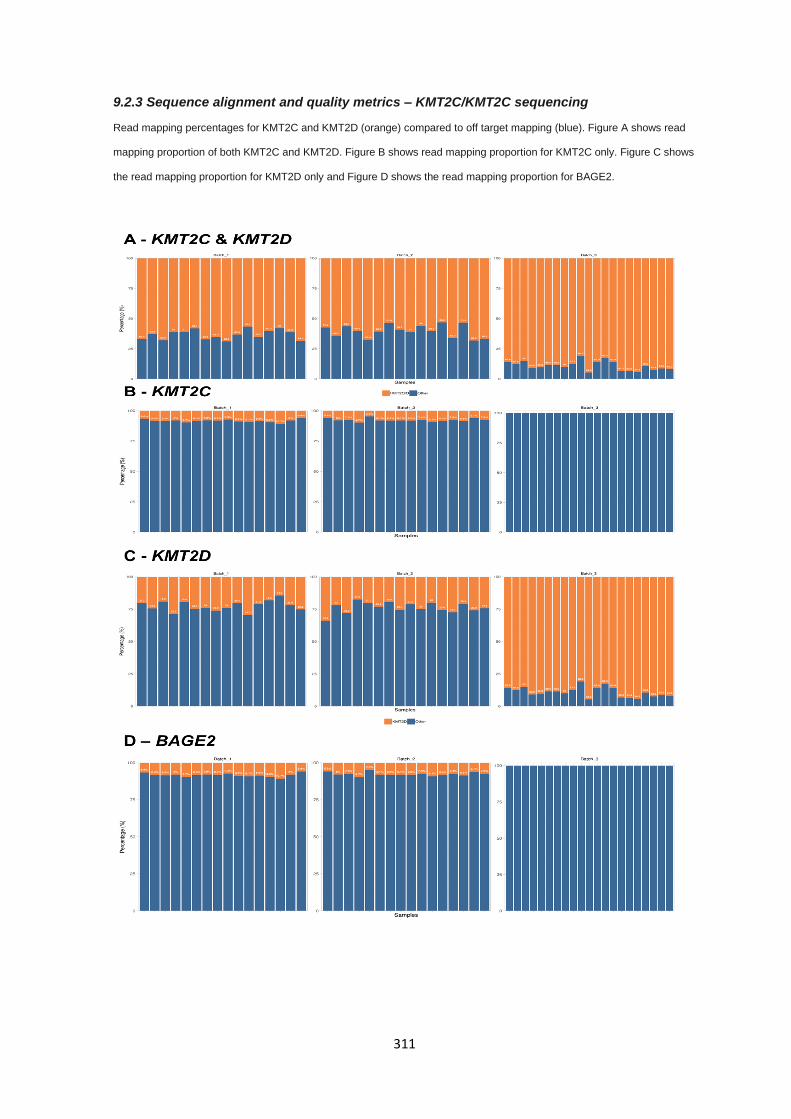
311
9.2.3 Sequence alignment and quality metrics – KMT2C/KMT2C sequencing
Read mapping percentages for KMT2C and KMT2D (orange) compared to off target mapping (blue). Figure A shows read
mapping proportion of both KMT2C and KMT2D. Figure B shows read mapping proportion for KMT2C only. Figure C shows
the read mapping proportion for KMT2D only and Figure D shows the read mapping proportion for BAGE2.
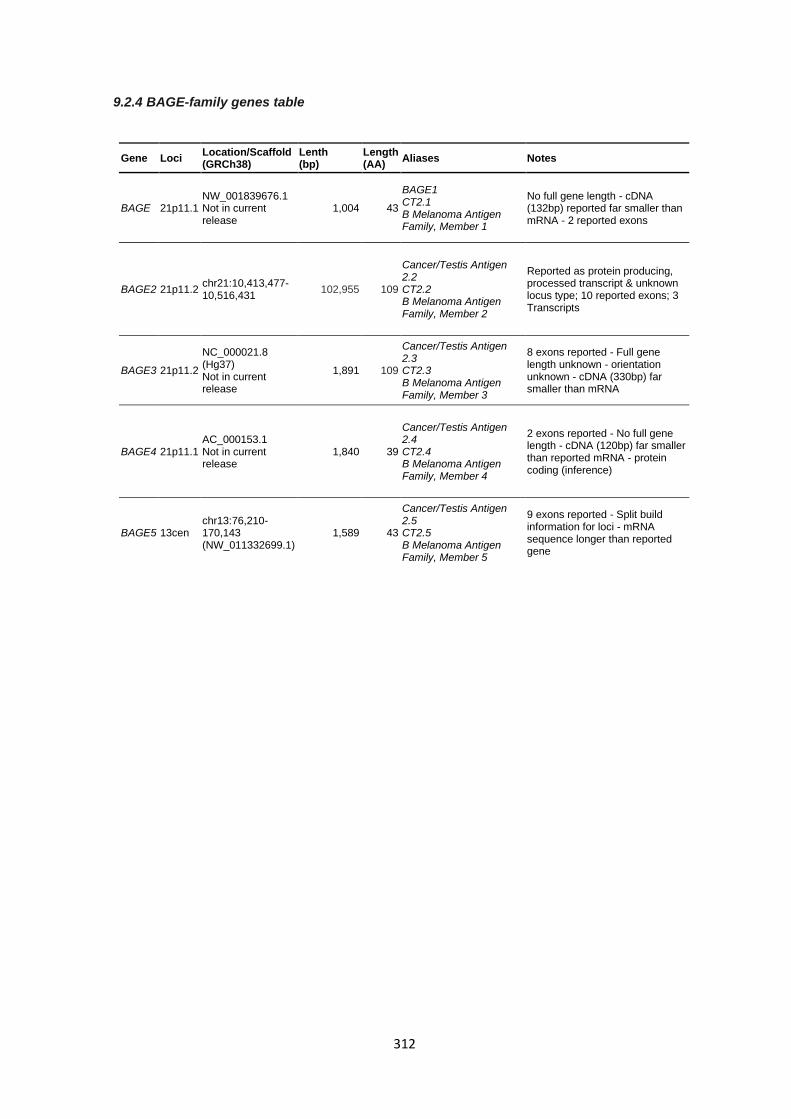
312
9.2.4 BAGE-family genes table
Gene Loci Location/Scaffold (GRCh38)
Lenth (bp)
Length (AA)
Aliases Notes
BAGE 21p11.1 NW_001839676.1 Not in current release
1,004 43
BAGE1 CT2.1 B Melanoma Antigen Family, Member 1
No full gene length - cDNA (132bp) reported far smaller than mRNA - 2 reported exons
BAGE2 21p11.2 chr21:10,413,477-10,516,431
102,955 109
Cancer/Testis Antigen 2.2 CT2.2 B Melanoma Antigen Family, Member 2
Reported as protein producing, processed transcript & unknown locus type; 10 reported exons; 3 Transcripts
BAGE3 21p11.2
NC_000021.8 (Hg37) Not in current release
1,891 109
Cancer/Testis Antigen 2.3 CT2.3 B Melanoma Antigen Family, Member 3
8 exons reported - Full gene length unknown - orientation unknown - cDNA (330bp) far smaller than mRNA
BAGE4 21p11.1 AC_000153.1 Not in current release
1,840 39
Cancer/Testis Antigen 2.4 CT2.4 B Melanoma Antigen Family, Member 4
2 exons reported - No full gene length - cDNA (120bp) far smaller than reported mRNA - protein coding (inference)
BAGE5 13cen chr13:76,210-170,143 (NW_011332699.1)
1,589 43
Cancer/Testis Antigen 2.5 CT2.5 B Melanoma Antigen Family, Member 5
9 exons reported - Split build information for loci - mRNA sequence longer than reported gene
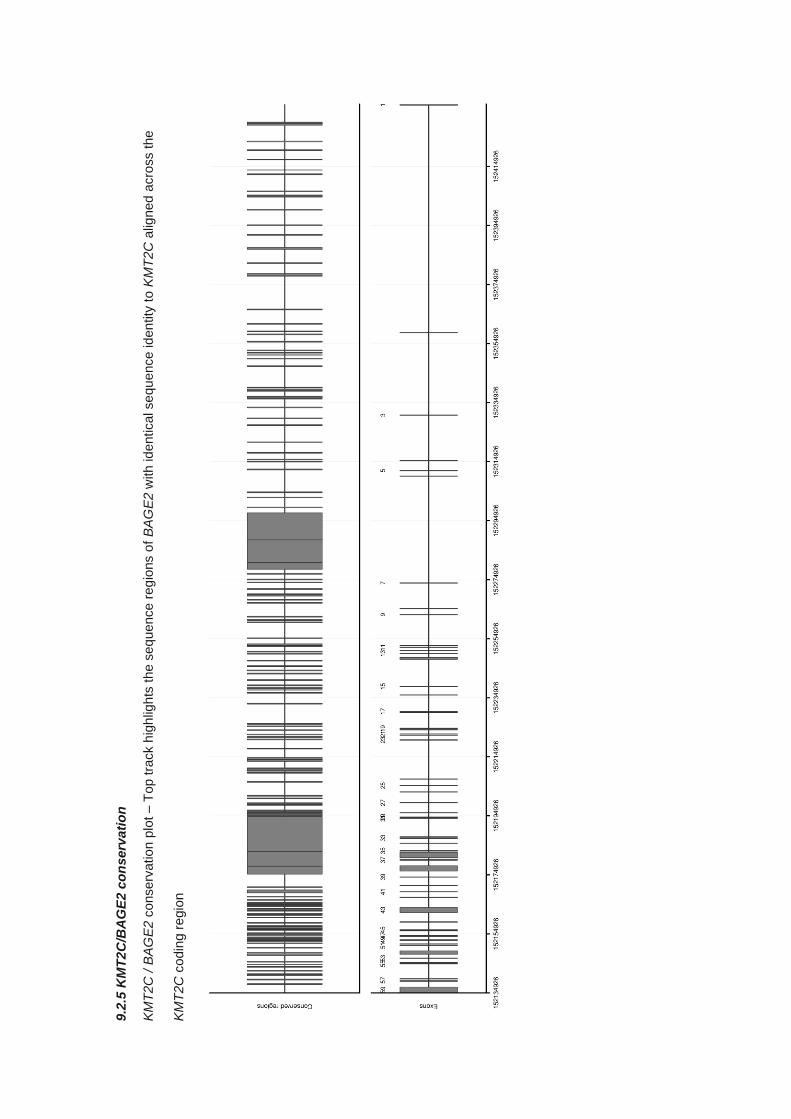
9.2
.5 K
MT
2C
/BA
GE
2 c
on
serv
ati
on
KM
T2C
/ B
AG
E2 c
onserv
ation p
lot
– T
op tra
ck h
igh
ligh
ts the s
eq
uence
reg
ions o
f B
AG
E2 w
ith id
entical se
qu
ence iden
tity
to K
MT
2C
alig
ned a
cro
ss the
KM
T2C
codin
g r
egio
n
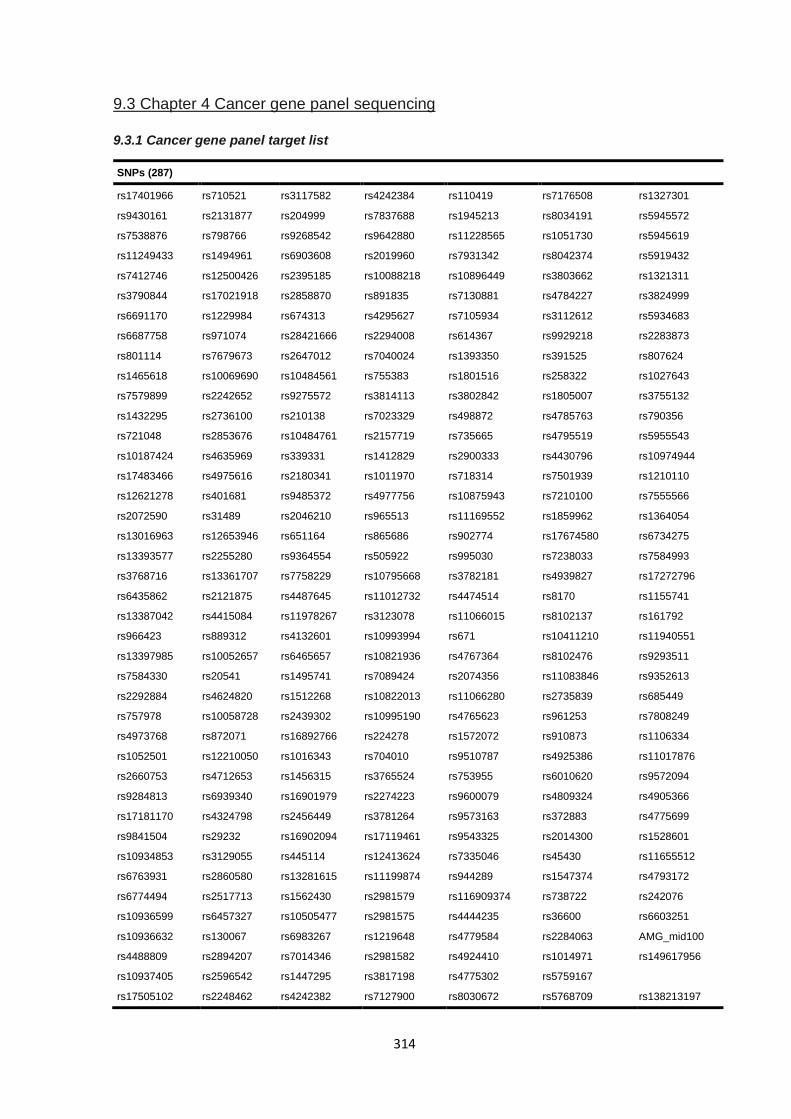
314
9.3 Chapter 4 Cancer gene panel sequencing
9.3.1 Cancer gene panel target list
SNPs (287)
rs17401966 rs710521 rs3117582 rs4242384 rs110419 rs7176508 rs1327301
rs9430161 rs2131877 rs204999 rs7837688 rs1945213 rs8034191 rs5945572
rs7538876 rs798766 rs9268542 rs9642880 rs11228565 rs1051730 rs5945619
rs11249433 rs1494961 rs6903608 rs2019960 rs7931342 rs8042374 rs5919432
rs7412746 rs12500426 rs2395185 rs10088218 rs10896449 rs3803662 rs1321311
rs3790844 rs17021918 rs2858870 rs891835 rs7130881 rs4784227 rs3824999
rs6691170 rs1229984 rs674313 rs4295627 rs7105934 rs3112612 rs5934683
rs6687758 rs971074 rs28421666 rs2294008 rs614367 rs9929218 rs2283873
rs801114 rs7679673 rs2647012 rs7040024 rs1393350 rs391525 rs807624
rs1465618 rs10069690 rs10484561 rs755383 rs1801516 rs258322 rs1027643
rs7579899 rs2242652 rs9275572 rs3814113 rs3802842 rs1805007 rs3755132
rs1432295 rs2736100 rs210138 rs7023329 rs498872 rs4785763 rs790356
rs721048 rs2853676 rs10484761 rs2157719 rs735665 rs4795519 rs5955543
rs10187424 rs4635969 rs339331 rs1412829 rs2900333 rs4430796 rs10974944
rs17483466 rs4975616 rs2180341 rs1011970 rs718314 rs7501939 rs1210110
rs12621278 rs401681 rs9485372 rs4977756 rs10875943 rs7210100 rs7555566
rs2072590 rs31489 rs2046210 rs965513 rs11169552 rs1859962 rs1364054
rs13016963 rs12653946 rs651164 rs865686 rs902774 rs17674580 rs6734275
rs13393577 rs2255280 rs9364554 rs505922 rs995030 rs7238033 rs7584993
rs3768716 rs13361707 rs7758229 rs10795668 rs3782181 rs4939827 rs17272796
rs6435862 rs2121875 rs4487645 rs11012732 rs4474514 rs8170 rs1155741
rs13387042 rs4415084 rs11978267 rs3123078 rs11066015 rs8102137 rs161792
rs966423 rs889312 rs4132601 rs10993994 rs671 rs10411210 rs11940551
rs13397985 rs10052657 rs6465657 rs10821936 rs4767364 rs8102476 rs9293511
rs7584330 rs20541 rs1495741 rs7089424 rs2074356 rs11083846 rs9352613
rs2292884 rs4624820 rs1512268 rs10822013 rs11066280 rs2735839 rs685449
rs757978 rs10058728 rs2439302 rs10995190 rs4765623 rs961253 rs7808249
rs4973768 rs872071 rs16892766 rs224278 rs1572072 rs910873 rs1106334
rs1052501 rs12210050 rs1016343 rs704010 rs9510787 rs4925386 rs11017876
rs2660753 rs4712653 rs1456315 rs3765524 rs753955 rs6010620 rs9572094
rs9284813 rs6939340 rs16901979 rs2274223 rs9600079 rs4809324 rs4905366
rs17181170 rs4324798 rs2456449 rs3781264 rs9573163 rs372883 rs4775699
rs9841504 rs29232 rs16902094 rs17119461 rs9543325 rs2014300 rs1528601
rs10934853 rs3129055 rs445114 rs12413624 rs7335046 rs45430 rs11655512
rs6763931 rs2860580 rs13281615 rs11199874 rs944289 rs1547374 rs4793172
rs6774494 rs2517713 rs1562430 rs2981579 rs116909374 rs738722 rs242076
rs10936599 rs6457327 rs10505477 rs2981575 rs4444235 rs36600 rs6603251
rs10936632 rs130067 rs6983267 rs1219648 rs4779584 rs2284063 AMG_mid100
rs4488809 rs2894207 rs7014346 rs2981582 rs4924410 rs1014971 rs149617956
rs10937405 rs2596542 rs1447295 rs3817198 rs4775302 rs5759167
rs17505102 rs2248462 rs4242382 rs7127900 rs8030672 rs5768709 rs138213197
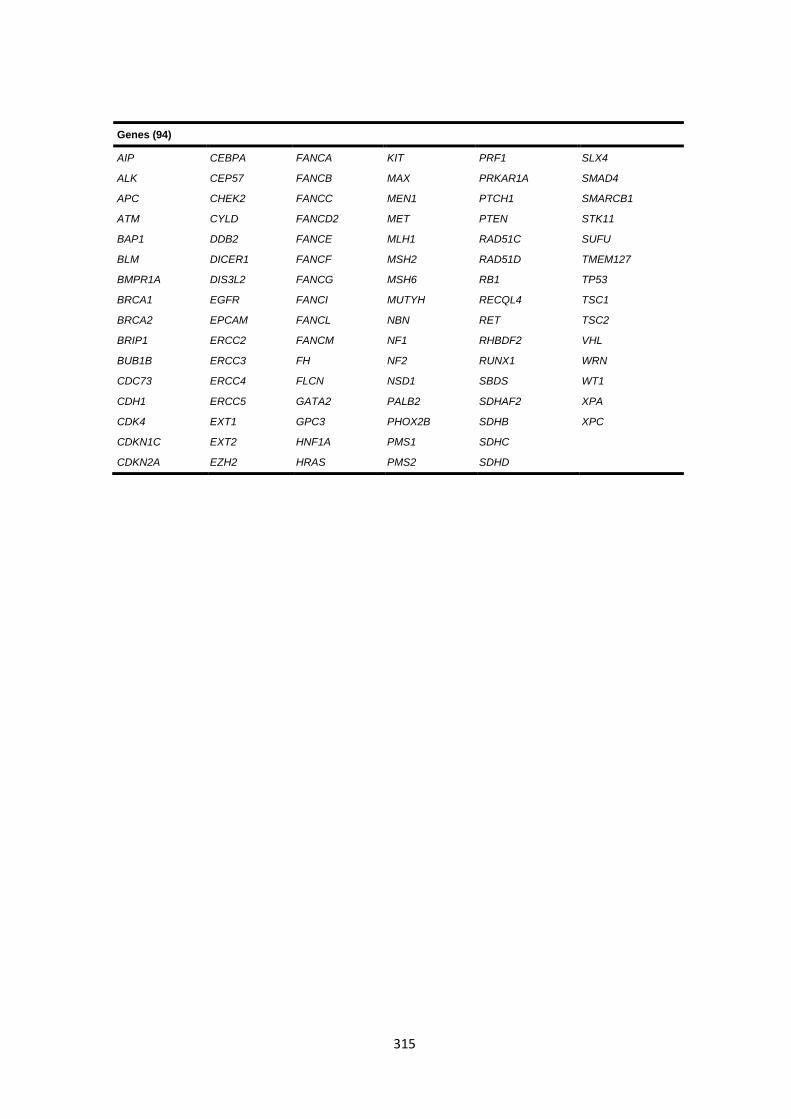
315
Genes (94)
AIP CEBPA FANCA KIT PRF1 SLX4
ALK CEP57 FANCB MAX PRKAR1A SMAD4
APC CHEK2 FANCC MEN1 PTCH1 SMARCB1
ATM CYLD FANCD2 MET PTEN STK11
BAP1 DDB2 FANCE MLH1 RAD51C SUFU
BLM DICER1 FANCF MSH2 RAD51D TMEM127
BMPR1A DIS3L2 FANCG MSH6 RB1 TP53
BRCA1 EGFR FANCI MUTYH RECQL4 TSC1
BRCA2 EPCAM FANCL NBN RET TSC2
BRIP1 ERCC2 FANCM NF1 RHBDF2 VHL
BUB1B ERCC3 FH NF2 RUNX1 WRN
CDC73 ERCC4 FLCN NSD1 SBDS WT1
CDH1 ERCC5 GATA2 PALB2 SDHAF2 XPA
CDK4 EXT1 GPC3 PHOX2B SDHB XPC
CDKN1C EXT2 HNF1A PMS1 SDHC
CDKN2A EZH2 HRAS PMS2 SDHD
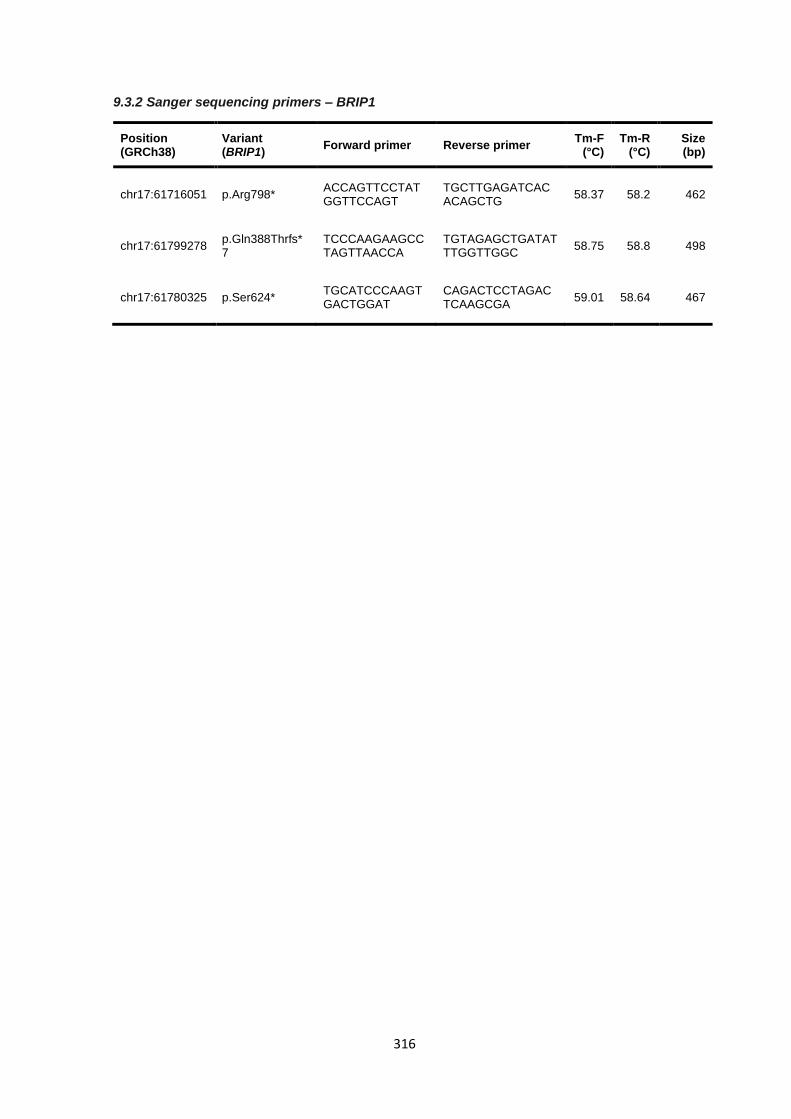
316
9.3.2 Sanger sequencing primers – BRIP1
Position (GRCh38)
Variant (BRIP1)
Forward primer Reverse primer Tm-F
(°C) Tm-R
(°C) Size (bp)
chr17:61716051 p.Arg798* ACCAGTTCCTATGGTTCCAGT
TGCTTGAGATCACACAGCTG
58.37 58.2 462
chr17:61799278 p.Gln388Thrfs*7
TCCCAAGAAGCCTAGTTAACCA
TGTAGAGCTGATATTTGGTTGGC
58.75 58.8 498
chr17:61780325 p.Ser624* TGCATCCCAAGTGACTGGAT
CAGACTCCTAGACTCAAGCGA
59.01 58.64 467
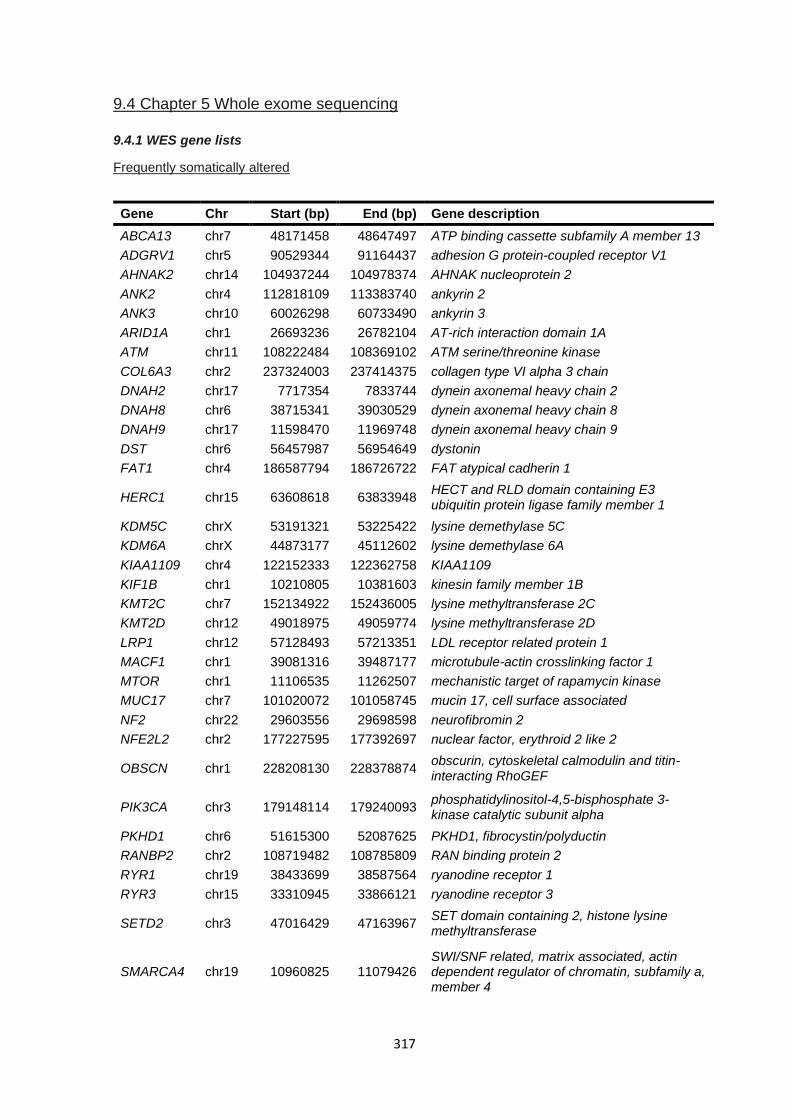
317
9.4 Chapter 5 Whole exome sequencing
9.4.1 WES gene lists
Frequently somatically altered
Gene Chr Start (bp) End (bp) Gene description
ABCA13 chr7 48171458 48647497 ATP binding cassette subfamily A member 13
ADGRV1 chr5 90529344 91164437 adhesion G protein-coupled receptor V1
AHNAK2 chr14 104937244 104978374 AHNAK nucleoprotein 2
ANK2 chr4 112818109 113383740 ankyrin 2
ANK3 chr10 60026298 60733490 ankyrin 3
ARID1A chr1 26693236 26782104 AT-rich interaction domain 1A
ATM chr11 108222484 108369102 ATM serine/threonine kinase
COL6A3 chr2 237324003 237414375 collagen type VI alpha 3 chain
DNAH2 chr17 7717354 7833744 dynein axonemal heavy chain 2
DNAH8 chr6 38715341 39030529 dynein axonemal heavy chain 8
DNAH9 chr17 11598470 11969748 dynein axonemal heavy chain 9
DST chr6 56457987 56954649 dystonin
FAT1 chr4 186587794 186726722 FAT atypical cadherin 1
HERC1 chr15 63608618 63833948 HECT and RLD domain containing E3 ubiquitin protein ligase family member 1
KDM5C chrX 53191321 53225422 lysine demethylase 5C
KDM6A chrX 44873177 45112602 lysine demethylase 6A
KIAA1109 chr4 122152333 122362758 KIAA1109
KIF1B chr1 10210805 10381603 kinesin family member 1B
KMT2C chr7 152134922 152436005 lysine methyltransferase 2C
KMT2D chr12 49018975 49059774 lysine methyltransferase 2D
LRP1 chr12 57128493 57213351 LDL receptor related protein 1
MACF1 chr1 39081316 39487177 microtubule-actin crosslinking factor 1
MTOR chr1 11106535 11262507 mechanistic target of rapamycin kinase
MUC17 chr7 101020072 101058745 mucin 17, cell surface associated
NF2 chr22 29603556 29698598 neurofibromin 2
NFE2L2 chr2 177227595 177392697 nuclear factor, erythroid 2 like 2
OBSCN chr1 228208130 228378874 obscurin, cytoskeletal calmodulin and titin-interacting RhoGEF
PIK3CA chr3 179148114 179240093 phosphatidylinositol-4,5-bisphosphate 3-kinase catalytic subunit alpha
PKHD1 chr6 51615300 52087625 PKHD1, fibrocystin/polyductin
RANBP2 chr2 108719482 108785809 RAN binding protein 2
RYR1 chr19 38433699 38587564 ryanodine receptor 1
RYR3 chr15 33310945 33866121 ryanodine receptor 3
SETD2 chr3 47016429 47163967 SET domain containing 2, histone lysine methyltransferase
SMARCA4 chr19 10960825 11079426 SWI/SNF related, matrix associated, actin dependent regulator of chromatin, subfamily a, member 4
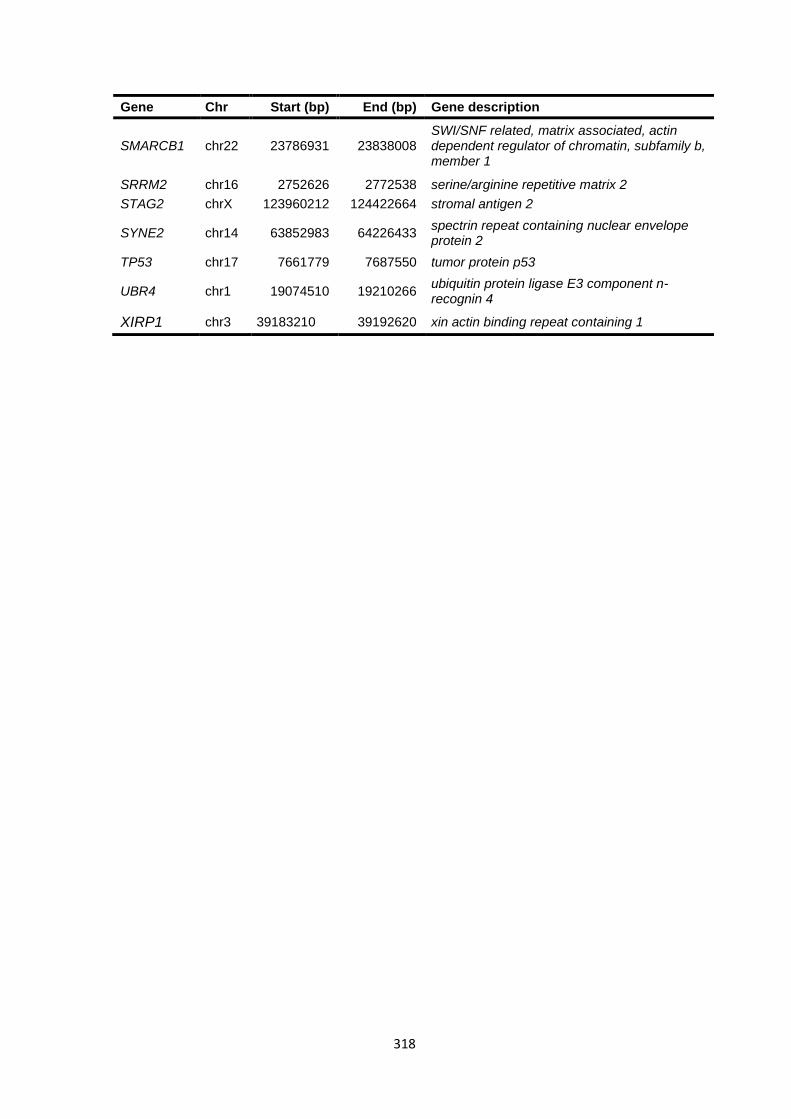
318
Gene Chr Start (bp) End (bp) Gene description
SMARCB1 chr22 23786931 23838008 SWI/SNF related, matrix associated, actin dependent regulator of chromatin, subfamily b, member 1
SRRM2 chr16 2752626 2772538 serine/arginine repetitive matrix 2
STAG2 chrX 123960212 124422664 stromal antigen 2
SYNE2 chr14 63852983 64226433 spectrin repeat containing nuclear envelope protein 2
TP53 chr17 7661779 7687550 tumor protein p53
UBR4 chr1 19074510 19210266 ubiquitin protein ligase E3 component n-recognin 4
XIRP1 chr3 39183210 39192620 xin actin binding repeat containing 1
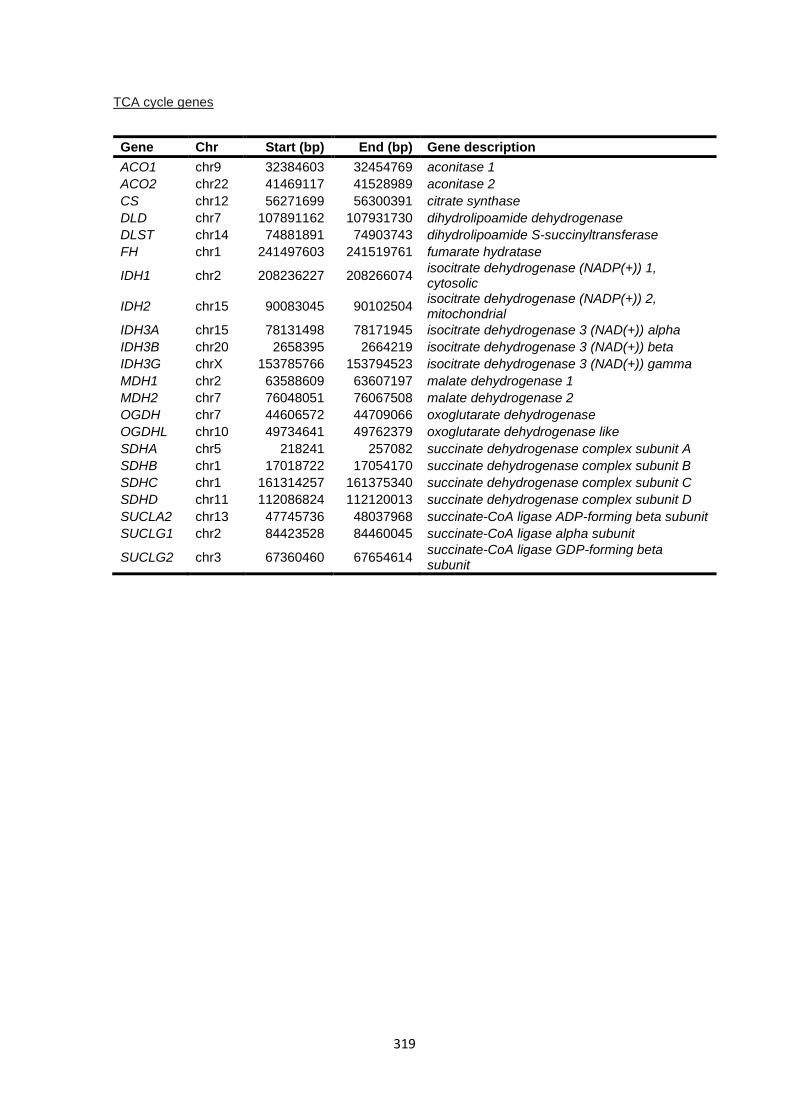
319
TCA cycle genes
Gene Chr Start (bp) End (bp) Gene description
ACO1 chr9 32384603 32454769 aconitase 1
ACO2 chr22 41469117 41528989 aconitase 2
CS chr12 56271699 56300391 citrate synthase
DLD chr7 107891162 107931730 dihydrolipoamide dehydrogenase
DLST chr14 74881891 74903743 dihydrolipoamide S-succinyltransferase
FH chr1 241497603 241519761 fumarate hydratase
IDH1 chr2 208236227 208266074 isocitrate dehydrogenase (NADP(+)) 1, cytosolic
IDH2 chr15 90083045 90102504 isocitrate dehydrogenase (NADP(+)) 2, mitochondrial
IDH3A chr15 78131498 78171945 isocitrate dehydrogenase 3 (NAD(+)) alpha
IDH3B chr20 2658395 2664219 isocitrate dehydrogenase 3 (NAD(+)) beta
IDH3G chrX 153785766 153794523 isocitrate dehydrogenase 3 (NAD(+)) gamma
MDH1 chr2 63588609 63607197 malate dehydrogenase 1
MDH2 chr7 76048051 76067508 malate dehydrogenase 2
OGDH chr7 44606572 44709066 oxoglutarate dehydrogenase
OGDHL chr10 49734641 49762379 oxoglutarate dehydrogenase like
SDHA chr5 218241 257082 succinate dehydrogenase complex subunit A
SDHB chr1 17018722 17054170 succinate dehydrogenase complex subunit B
SDHC chr1 161314257 161375340 succinate dehydrogenase complex subunit C
SDHD chr11 112086824 112120013 succinate dehydrogenase complex subunit D
SUCLA2 chr13 47745736 48037968 succinate-CoA ligase ADP-forming beta subunit
SUCLG1 chr2 84423528 84460045 succinate-CoA ligase alpha subunit
SUCLG2 chr3 67360460 67654614 succinate-CoA ligase GDP-forming beta subunit
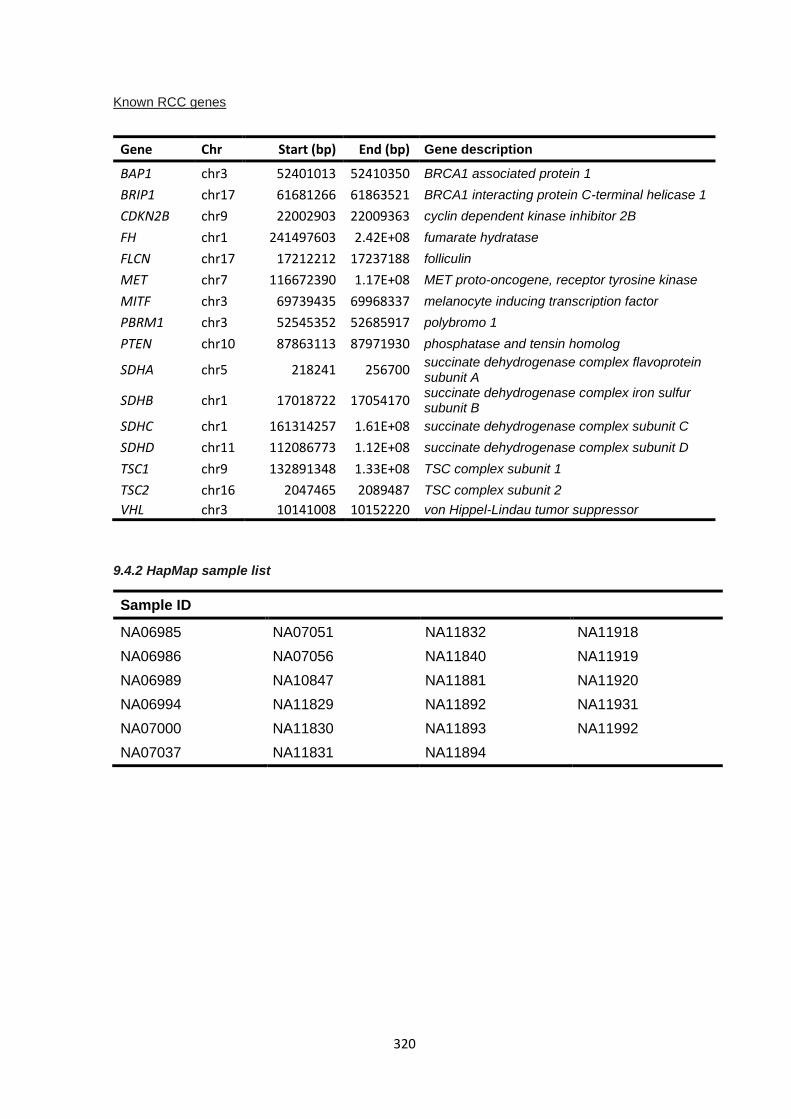
320
Known RCC genes
Gene Chr Start (bp) End (bp) Gene description
BAP1 chr3 52401013 52410350 BRCA1 associated protein 1
BRIP1 chr17 61681266 61863521 BRCA1 interacting protein C-terminal helicase 1
CDKN2B chr9 22002903 22009363 cyclin dependent kinase inhibitor 2B
FH chr1 241497603 2.42E+08 fumarate hydratase
FLCN chr17 17212212 17237188 folliculin
MET chr7 116672390 1.17E+08 MET proto-oncogene, receptor tyrosine kinase
MITF chr3 69739435 69968337 melanocyte inducing transcription factor
PBRM1 chr3 52545352 52685917 polybromo 1
PTEN chr10 87863113 87971930 phosphatase and tensin homolog
SDHA chr5 218241 256700 succinate dehydrogenase complex flavoprotein subunit A
SDHB chr1 17018722 17054170 succinate dehydrogenase complex iron sulfur subunit B
SDHC chr1 161314257 1.61E+08 succinate dehydrogenase complex subunit C
SDHD chr11 112086773 1.12E+08 succinate dehydrogenase complex subunit D
TSC1 chr9 132891348 1.33E+08 TSC complex subunit 1
TSC2 chr16 2047465 2089487 TSC complex subunit 2
VHL chr3 10141008 10152220 von Hippel-Lindau tumor suppressor
9.4.2 HapMap sample list
Sample ID
NA06985 NA07051 NA11832 NA11918
NA06986 NA07056 NA11840 NA11919
NA06989 NA10847 NA11881 NA11920
NA06994 NA11829 NA11892 NA11931
NA07000 NA11830 NA11893 NA11992
NA07037 NA11831 NA11894
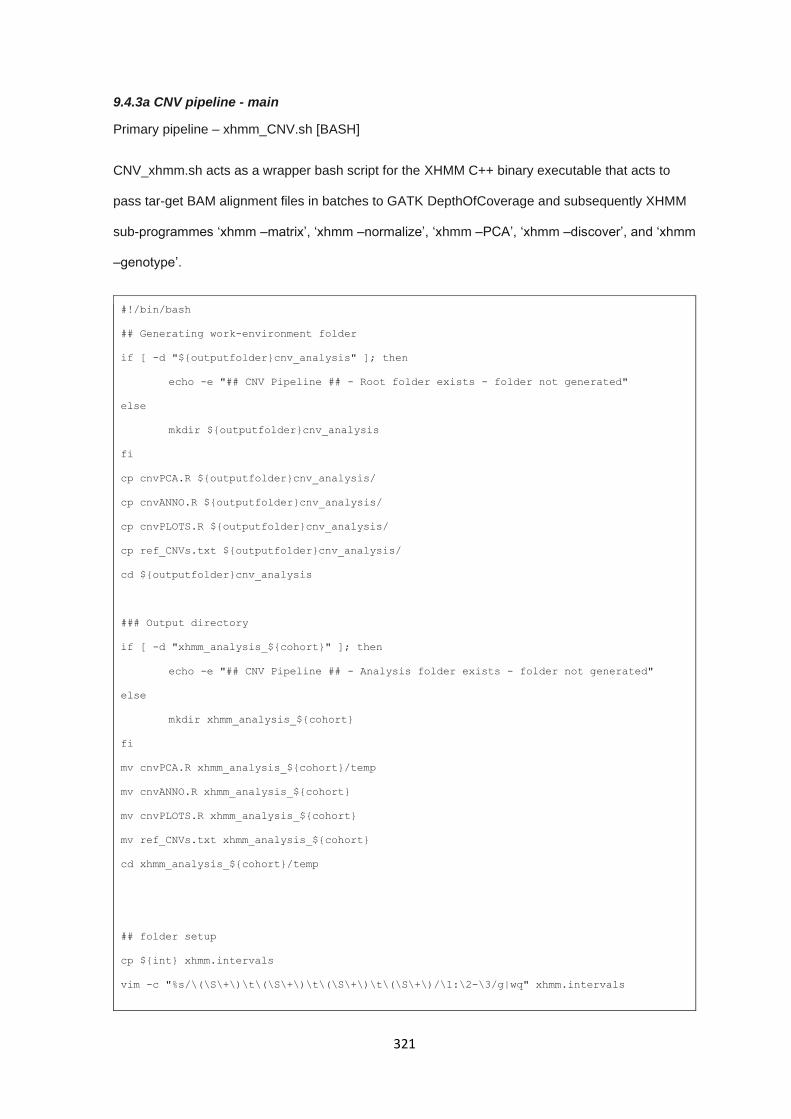
321
9.4.3a CNV pipeline - main
Primary pipeline – xhmm_CNV.sh [BASH]
CNV_xhmm.sh acts as a wrapper bash script for the XHMM C++ binary executable that acts to
pass tar-get BAM alignment files in batches to GATK DepthOfCoverage and subsequently XHMM
sub-programmes ‘xhmm –matrix’, ‘xhmm –normalize’, ‘xhmm –PCA’, ‘xhmm –discover’, and ‘xhmm
–genotype’.
#!/bin/bash
## Generating work-environment folder
if [ -d "${outputfolder}cnv_analysis" ]; then
echo -e "## CNV Pipeline ## - Root folder exists - folder not generated"
else
mkdir ${outputfolder}cnv_analysis
fi
cp cnvPCA.R ${outputfolder}cnv_analysis/
cp cnvANNO.R ${outputfolder}cnv_analysis/
cp cnvPLOTS.R ${outputfolder}cnv_analysis/
cp ref_CNVs.txt ${outputfolder}cnv_analysis/
cd ${outputfolder}cnv_analysis
### Output directory
if [ -d "xhmm_analysis_${cohort}" ]; then
echo -e "## CNV Pipeline ## - Analysis folder exists - folder not generated"
else
mkdir xhmm_analysis_${cohort}
fi
mv cnvPCA.R xhmm_analysis_${cohort}/temp
mv cnvANNO.R xhmm_analysis_${cohort}
mv cnvPLOTS.R xhmm_analysis_${cohort}
mv ref_CNVs.txt xhmm_analysis_${cohort}
cd xhmm_analysis_${cohort}/temp
## folder setup
cp ${int} xhmm.intervals
vim -c "%s/\(\S\+\)\t\(\S\+\)\t\(\S\+\)\t\(\S\+\)/\1:\2-\3/g|wq" xhmm.intervals
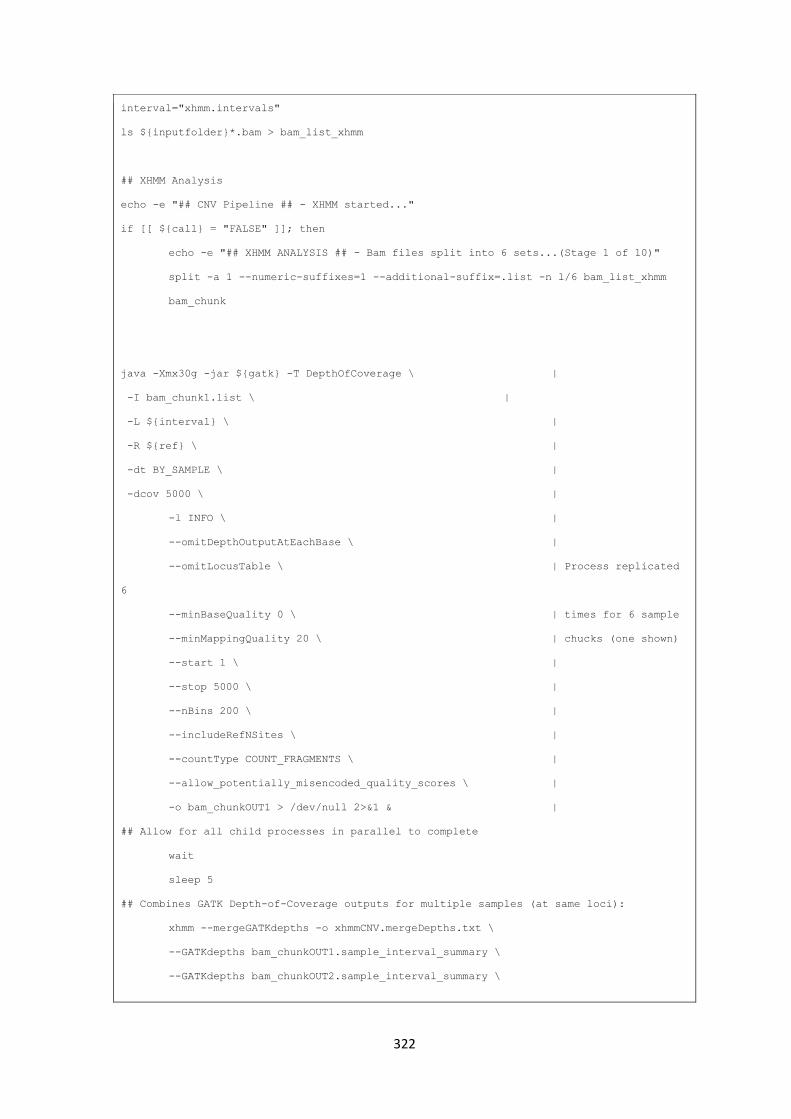
322
interval="xhmm.intervals"
ls ${inputfolder}*.bam > bam_list_xhmm
## XHMM Analysis
echo -e "## CNV Pipeline ## - XHMM started..."
if [[ ${call} = "FALSE" ]]; then
echo -e "## XHMM ANALYSIS ## - Bam files split into 6 sets...(Stage 1 of 10)"
split -a 1 --numeric-suffixes=1 --additional-suffix=.list -n l/6 bam_list_xhmm
bam_chunk
java -Xmx30g -jar ${gatk} -T DepthOfCoverage \ |
-I bam_chunk1.list \ |
-L ${interval} \ |
-R ${ref} \ |
-dt BY_SAMPLE \ |
-dcov 5000 \ |
-l INFO \ |
--omitDepthOutputAtEachBase \ |
--omitLocusTable \ | Process replicated
6
--minBaseQuality 0 \ | times for 6 sample
--minMappingQuality 20 \ | chucks (one shown)
--start 1 \ |
--stop 5000 \ |
--nBins 200 \ |
--includeRefNSites \ |
--countType COUNT_FRAGMENTS \ |
--allow_potentially_misencoded_quality_scores \ |
-o bam_chunkOUT1 > /dev/null 2>&1 & |
## Allow for all child processes in parallel to complete
wait
sleep 5
## Combines GATK Depth-of-Coverage outputs for multiple samples (at same loci):
xhmm --mergeGATKdepths -o xhmmCNV.mergeDepths.txt \
--GATKdepths bam_chunkOUT1.sample_interval_summary \
--GATKdepths bam_chunkOUT2.sample_interval_summary \
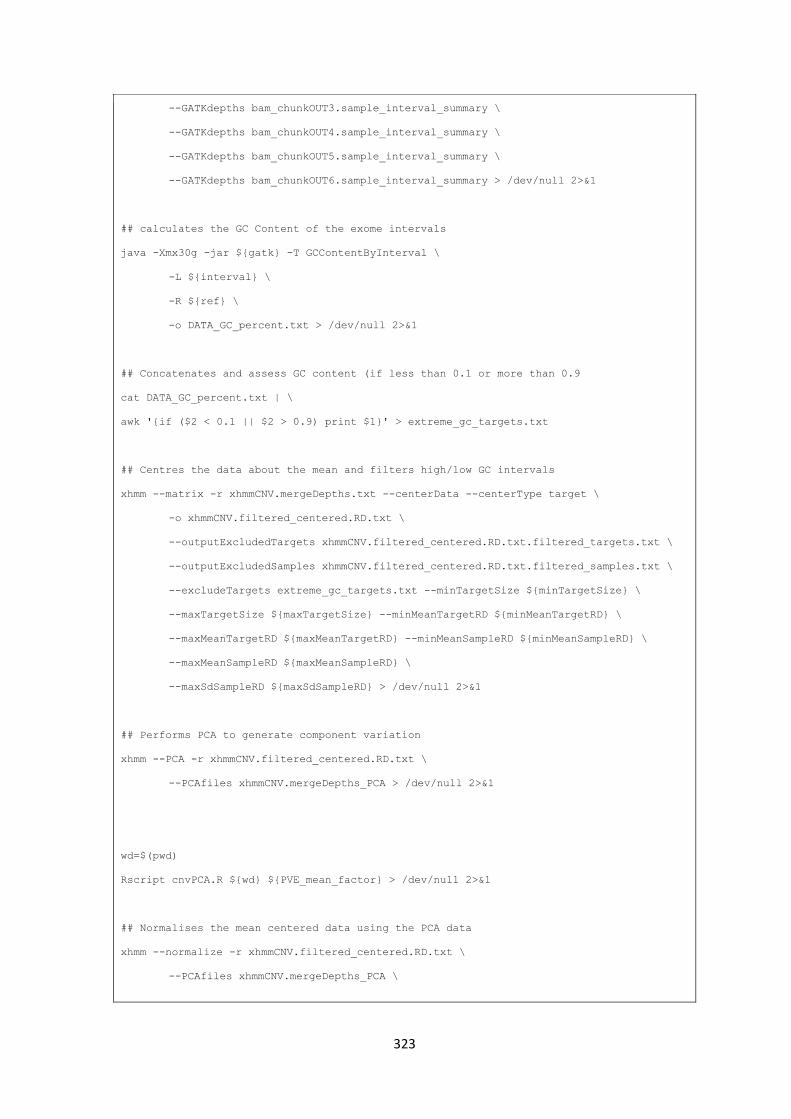
323
--GATKdepths bam_chunkOUT3.sample_interval_summary \
--GATKdepths bam_chunkOUT4.sample_interval_summary \
--GATKdepths bam_chunkOUT5.sample_interval_summary \
--GATKdepths bam_chunkOUT6.sample_interval_summary > /dev/null 2>&1
## calculates the GC Content of the exome intervals
java -Xmx30g -jar ${gatk} -T GCContentByInterval \
-L ${interval} \
-R ${ref} \
-o DATA_GC_percent.txt > /dev/null 2>&1
## Concatenates and assess GC content (if less than 0.1 or more than 0.9
cat DATA_GC_percent.txt | \
awk '{if ($2 < 0.1 || $2 > 0.9) print $1}' > extreme_gc_targets.txt
## Centres the data about the mean and filters high/low GC intervals
xhmm --matrix -r xhmmCNV.mergeDepths.txt --centerData --centerType target \
-o xhmmCNV.filtered_centered.RD.txt \
--outputExcludedTargets xhmmCNV.filtered_centered.RD.txt.filtered_targets.txt \
--outputExcludedSamples xhmmCNV.filtered_centered.RD.txt.filtered_samples.txt \
--excludeTargets extreme_gc_targets.txt --minTargetSize ${minTargetSize} \
--maxTargetSize ${maxTargetSize} --minMeanTargetRD ${minMeanTargetRD} \
--maxMeanTargetRD ${maxMeanTargetRD} --minMeanSampleRD ${minMeanSampleRD} \
--maxMeanSampleRD ${maxMeanSampleRD} \
--maxSdSampleRD ${maxSdSampleRD} > /dev/null 2>&1
## Performs PCA to generate component variation
xhmm --PCA -r xhmmCNV.filtered_centered.RD.txt \
--PCAfiles xhmmCNV.mergeDepths_PCA > /dev/null 2>&1
wd=$(pwd)
Rscript cnvPCA.R ${wd} ${PVE_mean_factor} > /dev/null 2>&1
## Normalises the mean centered data using the PCA data
xhmm --normalize -r xhmmCNV.filtered_centered.RD.txt \
--PCAfiles xhmmCNV.mergeDepths_PCA \
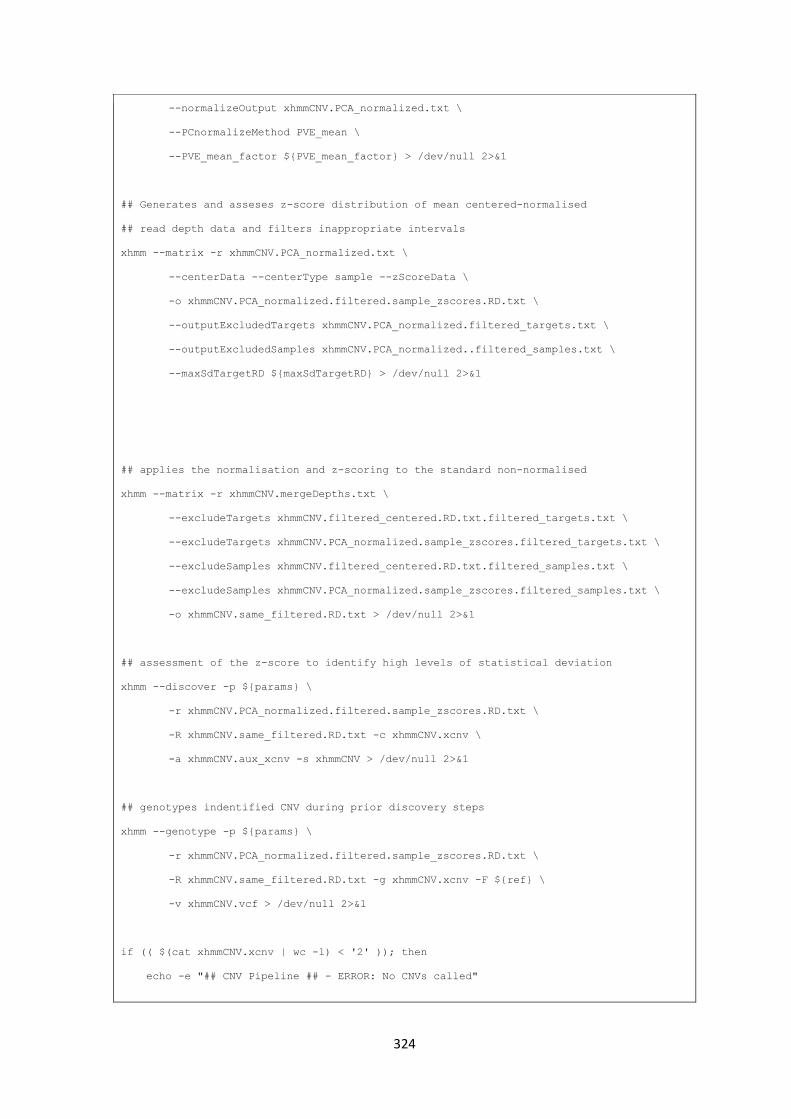
324
--normalizeOutput xhmmCNV.PCA_normalized.txt \
--PCnormalizeMethod PVE_mean \
--PVE_mean_factor ${PVE_mean_factor} > /dev/null 2>&1
## Generates and asseses z-score distribution of mean centered-normalised
## read depth data and filters inappropriate intervals
xhmm --matrix -r xhmmCNV.PCA_normalized.txt \
--centerData --centerType sample --zScoreData \
-o xhmmCNV.PCA_normalized.filtered.sample_zscores.RD.txt \
--outputExcludedTargets xhmmCNV.PCA_normalized.filtered_targets.txt \
--outputExcludedSamples xhmmCNV.PCA_normalized..filtered_samples.txt \
--maxSdTargetRD ${maxSdTargetRD} > /dev/null 2>&1
## applies the normalisation and z-scoring to the standard non-normalised
xhmm --matrix -r xhmmCNV.mergeDepths.txt \
--excludeTargets xhmmCNV.filtered_centered.RD.txt.filtered_targets.txt \
--excludeTargets xhmmCNV.PCA_normalized.sample_zscores.filtered_targets.txt \
--excludeSamples xhmmCNV.filtered_centered.RD.txt.filtered_samples.txt \
--excludeSamples xhmmCNV.PCA_normalized.sample_zscores.filtered_samples.txt \
-o xhmmCNV.same_filtered.RD.txt > /dev/null 2>&1
## assessment of the z-score to identify high levels of statistical deviation
xhmm --discover -p ${params} \
-r xhmmCNV.PCA_normalized.filtered.sample_zscores.RD.txt \
-R xhmmCNV.same_filtered.RD.txt -c xhmmCNV.xcnv \
-a xhmmCNV.aux_xcnv -s xhmmCNV > /dev/null 2>&1
## genotypes indentified CNV during prior discovery steps
xhmm --genotype -p ${params} \
-r xhmmCNV.PCA_normalized.filtered.sample_zscores.RD.txt \
-R xhmmCNV.same_filtered.RD.txt -g xhmmCNV.xcnv -F ${ref} \
-v xhmmCNV.vcf > /dev/null 2>&1
if (( $(cat xhmmCNV.xcnv | wc -l) < '2' )); then
echo -e "## CNV Pipeline ## - ERROR: No CNVs called"
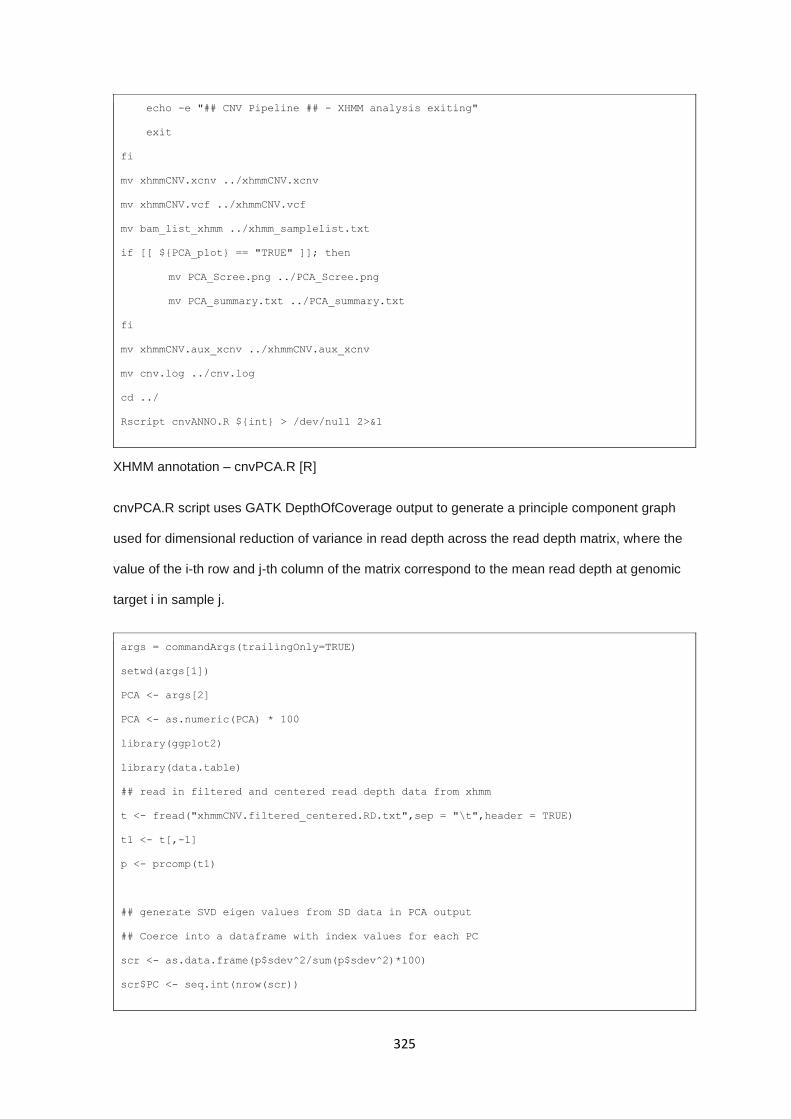
325
echo -e "## CNV Pipeline ## - XHMM analysis exiting"
exit
fi
mv xhmmCNV.xcnv ../xhmmCNV.xcnv
mv xhmmCNV.vcf ../xhmmCNV.vcf
mv bam_list_xhmm ../xhmm_samplelist.txt
if [[ ${PCA_plot} == "TRUE" ]]; then
mv PCA_Scree.png ../PCA_Scree.png
mv PCA_summary.txt ../PCA_summary.txt
fi
mv xhmmCNV.aux_xcnv ../xhmmCNV.aux_xcnv
mv cnv.log ../cnv.log
cd ../
Rscript cnvANNO.R ${int} > /dev/null 2>&1
XHMM annotation – cnvPCA.R [R]
cnvPCA.R script uses GATK DepthOfCoverage output to generate a principle component graph
used for dimensional reduction of variance in read depth across the read depth matrix, where the
value of the i-th row and j-th column of the matrix correspond to the mean read depth at genomic
target i in sample j.
args = commandArgs(trailingOnly=TRUE)
setwd(args[1])
PCA <- args[2]
PCA <- as.numeric(PCA) * 100
library(ggplot2)
library(data.table)
## read in filtered and centered read depth data from xhmm
t <- fread("xhmmCNV.filtered_centered.RD.txt",sep = "\t",header = TRUE)
t1 <- t[,-1]
p <- prcomp(t1)
## generate SVD eigen values from SD data in PCA output
## Coerce into a dataframe with index values for each PC
scr <- as.data.frame(p$sdev^2/sum(p$sdev^2)*100)
scr$PC <- seq.int(nrow(scr))
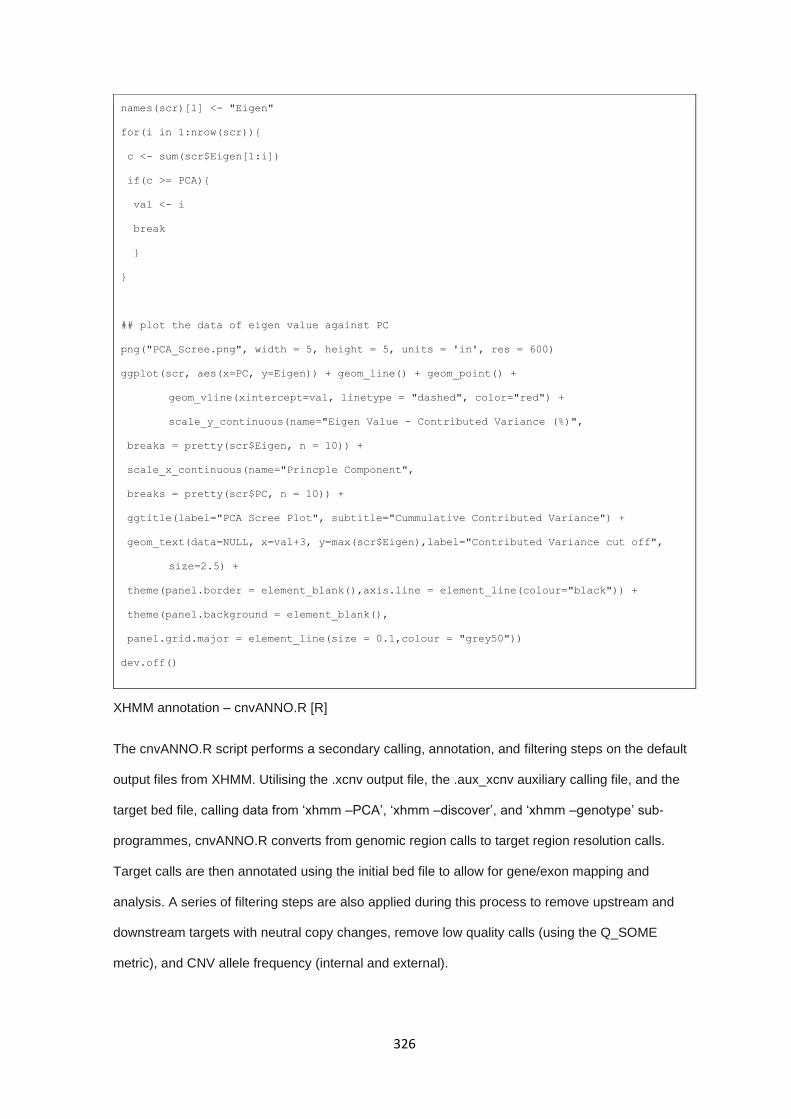
326
names(scr)[1] <- "Eigen"
for(i in 1:nrow(scr)){
c <- sum(scr$Eigen[1:i])
if(c >= PCA){
val <- i
break
}
}
## plot the data of eigen value against PC
png("PCA_Scree.png", width = 5, height = 5, units = 'in', res = 600)
ggplot(scr, aes(x=PC, y=Eigen)) + geom_line() + geom_point() +
geom_vline(xintercept=val, linetype = "dashed", color="red") +
scale_y_continuous(name="Eigen Value - Contributed Variance (%)",
breaks = pretty(scr$Eigen, n = 10)) +
scale_x_continuous(name="Princple Component",
breaks = pretty(scr$PC, n = 10)) +
ggtitle(label="PCA Scree Plot", subtitle="Cummulative Contributed Variance") +
geom_text(data=NULL, x=val+3, y=max(scr$Eigen),label="Contributed Variance cut off",
size=2.5) +
theme(panel.border = element_blank(),axis.line = element_line(colour="black")) +
theme(panel.background = element_blank(),
panel.grid.major = element_line(size = 0.1,colour = "grey50"))
dev.off()
XHMM annotation – cnvANNO.R [R]
The cnvANNO.R script performs a secondary calling, annotation, and filtering steps on the default
output files from XHMM. Utilising the .xcnv output file, the .aux_xcnv auxiliary calling file, and the
target bed file, calling data from ‘xhmm –PCA’, ‘xhmm –discover’, and ‘xhmm –genotype’ sub-
programmes, cnvANNO.R converts from genomic region calls to target region resolution calls.
Target calls are then annotated using the initial bed file to allow for gene/exon mapping and
analysis. A series of filtering steps are also applied during this process to remove upstream and
downstream targets with neutral copy changes, remove low quality calls (using the Q_SOME
metric), and CNV allele frequency (internal and external).
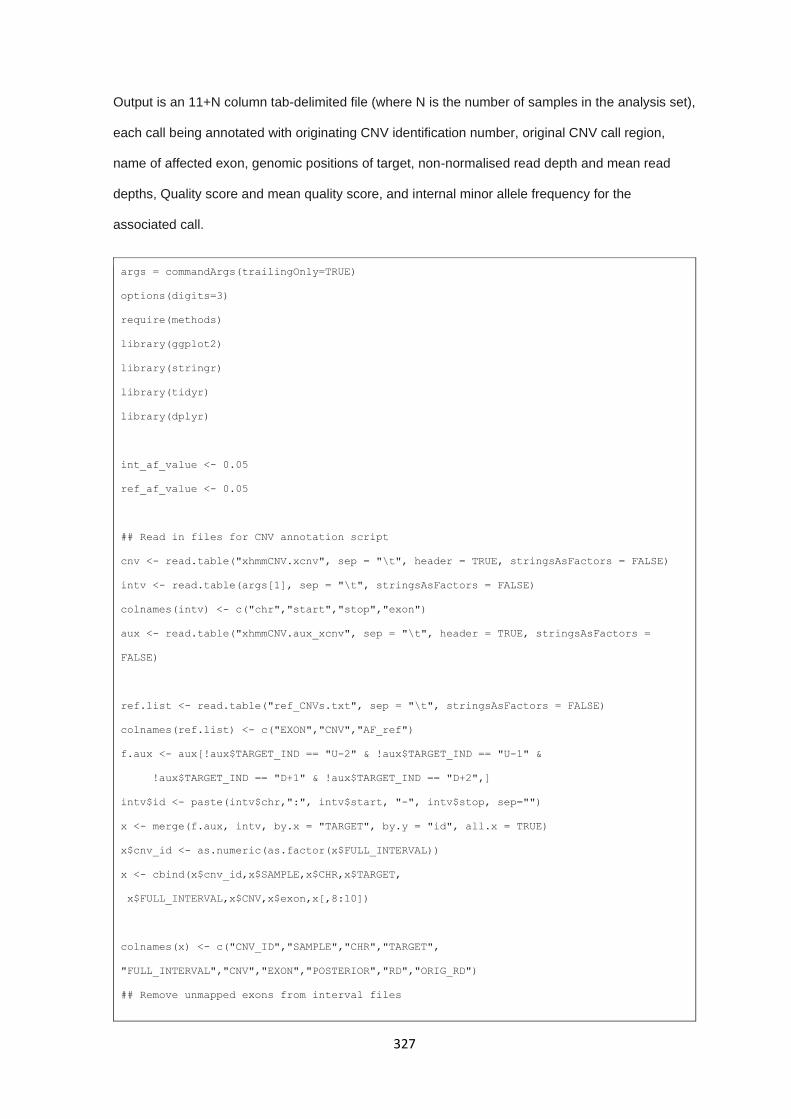
327
Output is an 11+N column tab-delimited file (where N is the number of samples in the analysis set),
each call being annotated with originating CNV identification number, original CNV call region,
name of affected exon, genomic positions of target, non-normalised read depth and mean read
depths, Quality score and mean quality score, and internal minor allele frequency for the
associated call.
args = commandArgs(trailingOnly=TRUE)
options(digits=3)
require(methods)
library(ggplot2)
library(stringr)
library(tidyr)
library(dplyr)
int_af_value <- 0.05
ref_af_value <- 0.05
## Read in files for CNV annotation script
cnv <- read.table("xhmmCNV.xcnv", sep = "\t", header = TRUE, stringsAsFactors = FALSE)
intv <- read.table(args[1], sep = "\t", stringsAsFactors = FALSE)
colnames(intv) <- c("chr","start","stop","exon")
aux <- read.table("xhmmCNV.aux_xcnv", sep = "\t", header = TRUE, stringsAsFactors =
FALSE)
ref.list <- read.table("ref_CNVs.txt", sep = "\t", stringsAsFactors = FALSE)
colnames(ref.list) <- c("EXON","CNV","AF_ref")
f.aux <- aux[!aux$TARGET_IND == "U-2" & !aux$TARGET_IND == "U-1" &
!aux$TARGET_IND == "D+1" & !aux$TARGET_IND == "D+2",]
intv$id <- paste(intv$chr,":", intv$start, "-", intv$stop, sep="")
x <- merge(f.aux, intv, by.x = "TARGET", by.y = "id", all.x = TRUE)
x$cnv_id <- as.numeric(as.factor(x$FULL_INTERVAL))
x <- cbind(x$cnv_id,x$SAMPLE,x$CHR,x$TARGET,
x$FULL_INTERVAL,x$CNV,x$exon,x[,8:10])
colnames(x) <- c("CNV_ID","SAMPLE","CHR","TARGET",
"FULL_INTERVAL","CNV","EXON","POSTERIOR","RD","ORIG_RD")
## Remove unmapped exons from interval files
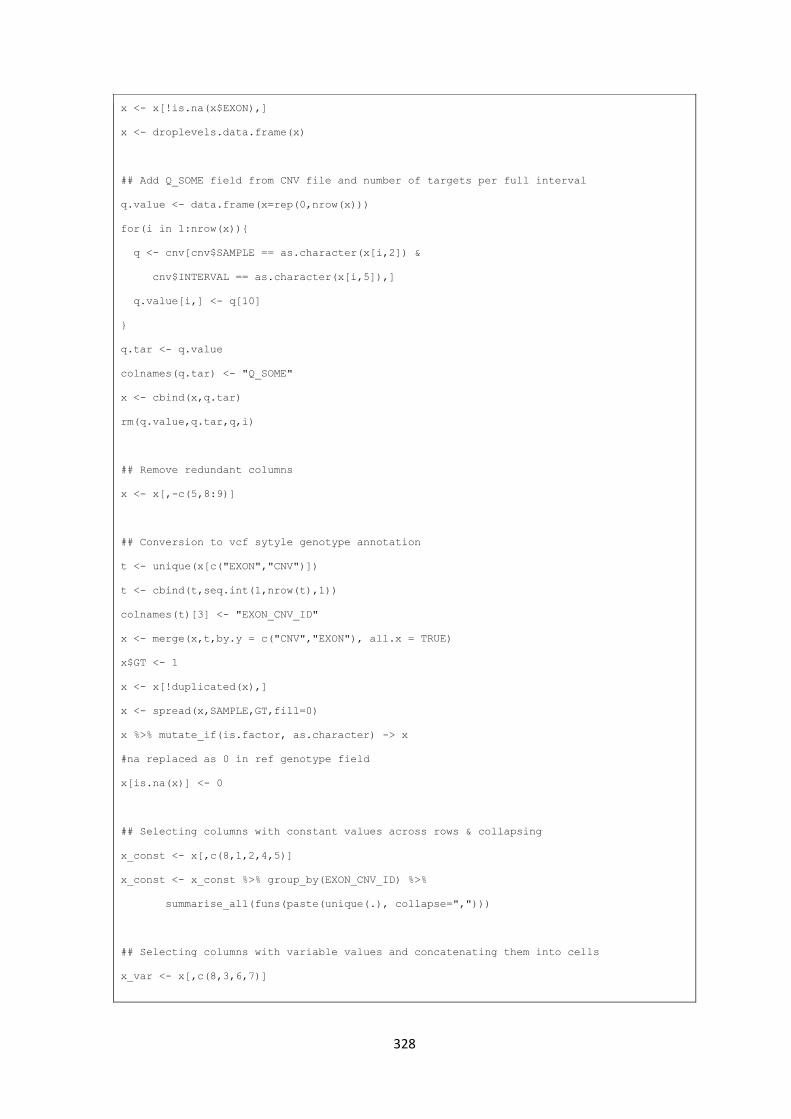
328
x <- x[!is.na(x$EXON),]
x <- droplevels.data.frame(x)
## Add Q_SOME field from CNV file and number of targets per full interval
q.value <- data.frame(x=rep(0,nrow(x)))
for(i in 1:nrow(x)){
q <- cnv[cnv$SAMPLE == as.character(x[i,2]) &
cnv$INTERVAL == as.character(x[i,5]),]
q.value[i,] <- q[10]
}
q.tar <- q.value
colnames(q.tar) <- "Q_SOME"
x <- cbind(x,q.tar)
rm(q.value,q.tar,q,i)
## Remove redundant columns
x <- x[,-c(5,8:9)]
## Conversion to vcf sytyle genotype annotation
t <- unique(x[c("EXON","CNV")])
t <- cbind(t,seq.int(1,nrow(t),1))
colnames(t)[3] <- "EXON_CNV_ID"
x <- merge(x,t,by.y = c("CNV","EXON"), all.x = TRUE)
x$GT <- 1
x <- x[!duplicated(x),]
x <- spread(x,SAMPLE,GT,fill=0)
x %>% mutate_if(is.factor, as.character) -> x
#na replaced as 0 in ref genotype field
x[is.na(x)] <- 0
## Selecting columns with constant values across rows & collapsing
x_const <- x[,c(8,1,2,4,5)]
x_const <- x_const %>% group_by(EXON_CNV_ID) %>%
summarise_all(funs(paste(unique(.), collapse=",")))
## Selecting columns with variable values and concatenating them into cells
x_var <- x[,c(8,3,6,7)]
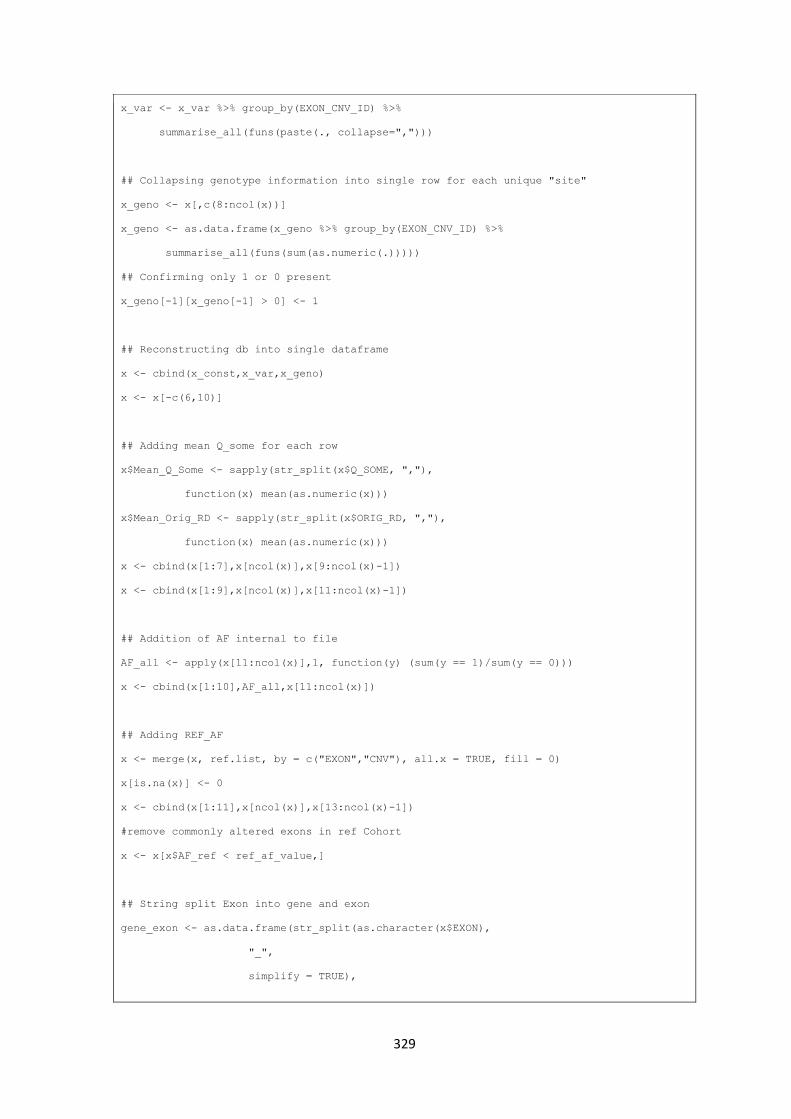
329
x_var <- x_var %>% group_by(EXON_CNV_ID) %>%
summarise_all(funs(paste(., collapse=",")))
## Collapsing genotype information into single row for each unique "site"
x_geno <- x[,c(8:ncol(x))]
x_geno <- as.data.frame(x_geno %>% group_by(EXON_CNV_ID) %>%
summarise_all(funs(sum(as.numeric(.)))))
## Confirming only 1 or 0 present
x_geno[-1][x_geno[-1] > 0] <- 1
## Reconstructing db into single dataframe
x <- cbind(x_const,x_var,x_geno)
x <- x[-c(6,10)]
## Adding mean Q_some for each row
x$Mean_Q_Some <- sapply(str_split(x$Q_SOME, ","),
function(x) mean(as.numeric(x)))
x$Mean_Orig_RD <- sapply(str_split(x$ORIG_RD, ","),
function(x) mean(as.numeric(x)))
x <- cbind(x[1:7],x[ncol(x)],x[9:ncol(x)-1])
x <- cbind(x[1:9],x[ncol(x)],x[11:ncol(x)-1])
## Addition of AF internal to file
AF_all <- apply(x[11:ncol(x)],1, function(y) (sum(y == 1)/sum(y == 0)))
x <- cbind(x[1:10],AF_all,x[11:ncol(x)])
## Adding REF_AF
x <- merge(x, ref.list, by = c("EXON","CNV"), all.x = TRUE, fill = 0)
x[is.na(x)] <- 0
x <- cbind(x[1:11],x[ncol(x)],x[13:ncol(x)-1])
#remove commonly altered exons in ref Cohort
x <- x[x$AF_ref < ref_af_value,]
## String split Exon into gene and exon
gene_exon <- as.data.frame(str_split(as.character(x$EXON),
"_",
simplify = TRUE),

330
stringsAsFactors = FALSE)
gene_exon <- gene_exon[-3]
colnames(gene_exon) <- c("GENE","EXON")
x <- x[-1]
x <- cbind(gene_exon,x[1:ncol(x)])
## Make sure chr positions are unified as numeric - not containing "chr"
x$CHR <- gsub("chr","",x$CHR)
x$TARGET <- gsub("chr","",x$TARGET)
## write output
write.table(x, file="cnv_xhmm_annotated.tsv", sep="\t",
quote = FALSE, row.names = FALSE, col.names = TRUE, na = "-9")
save.image(file="cnvANNO.RData")
331
9.4.3b CNV pipeline - Reference interval file generation
While implemented in its standard deployment, XHMM was limited in its ability to call CNVs at the
exon-level resolution and provided no reference files for exome target regions. Generation of an
accurate and curated target file is critical to calculating accurate CNV calls from therefore a series
of selection criteria were applied to all exome target regions.
Reference intervals
Exon bed file was downloaded from BioMart (1) in TSV format, returning unique entries for the
following fields:
"Chromosome/scaffold name"
"Exon region start (bp)"
"Exon region end (bp)"
"Gene name"
"Exon rank in transcript"
Exon intervals were reformatted to fit BED4 (chr, chromStart, chromEnd, Label) specifications.
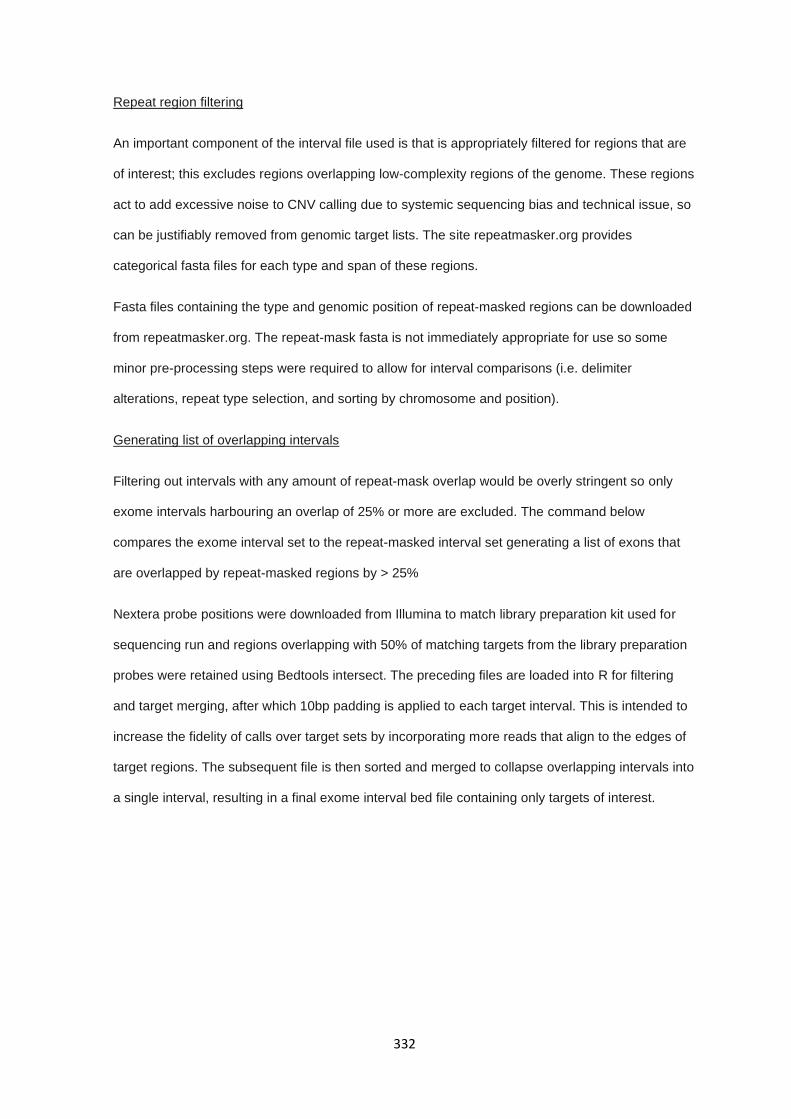
332
Repeat region filtering
An important component of the interval file used is that is appropriately filtered for regions that are
of interest; this excludes regions overlapping low-complexity regions of the genome. These regions
act to add excessive noise to CNV calling due to systemic sequencing bias and technical issue, so
can be justifiably removed from genomic target lists. The site repeatmasker.org provides
categorical fasta files for each type and span of these regions.
Fasta files containing the type and genomic position of repeat-masked regions can be downloaded
from repeatmasker.org. The repeat-mask fasta is not immediately appropriate for use so some
minor pre-processing steps were required to allow for interval comparisons (i.e. delimiter
alterations, repeat type selection, and sorting by chromosome and position).
Generating list of overlapping intervals
Filtering out intervals with any amount of repeat-mask overlap would be overly stringent so only
exome intervals harbouring an overlap of 25% or more are excluded. The command below
compares the exome interval set to the repeat-masked interval set generating a list of exons that
are overlapped by repeat-masked regions by > 25%
Nextera probe positions were downloaded from Illumina to match library preparation kit used for
sequencing run and regions overlapping with 50% of matching targets from the library preparation
probes were retained using Bedtools intersect. The preceding files are loaded into R for filtering
and target merging, after which 10bp padding is applied to each target interval. This is intended to
increase the fidelity of calls over target sets by incorporating more reads that align to the edges of
target regions. The subsequent file is then sorted and merged to collapse overlapping intervals into
a single interval, resulting in a final exome interval bed file containing only targets of interest.
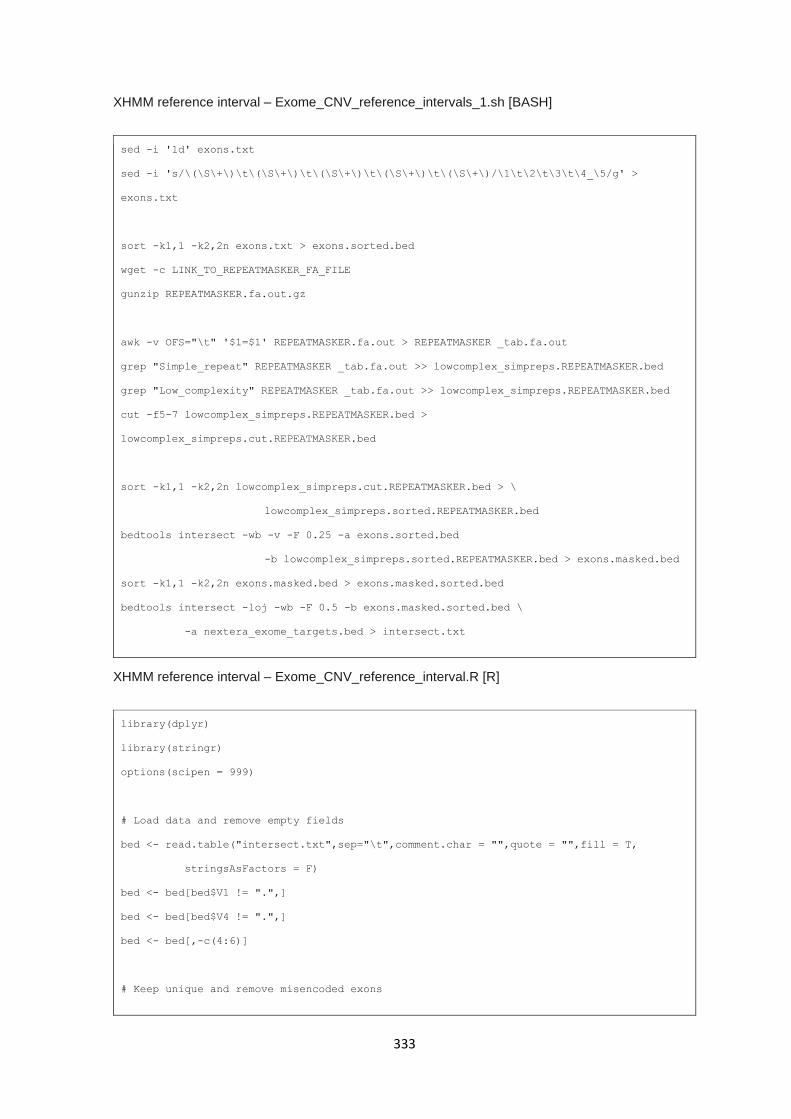
333
XHMM reference interval – Exome_CNV_reference_intervals_1.sh [BASH]
sed -i '1d' exons.txt
sed -i 's/\(\S\+\)\t\(\S\+\)\t\(\S\+\)\t\(\S\+\)\t\(\S\+\)/\1\t\2\t\3\t\4_\5/g' >
exons.txt
sort -k1,1 -k2,2n exons.txt > exons.sorted.bed
wget -c LINK_TO_REPEATMASKER_FA_FILE
gunzip REPEATMASKER.fa.out.gz
awk -v OFS="\t" '$1=$1' REPEATMASKER.fa.out > REPEATMASKER _tab.fa.out
grep "Simple_repeat" REPEATMASKER _tab.fa.out >> lowcomplex_simpreps.REPEATMASKER.bed
grep "Low_complexity" REPEATMASKER _tab.fa.out >> lowcomplex_simpreps.REPEATMASKER.bed
cut -f5-7 lowcomplex_simpreps.REPEATMASKER.bed >
lowcomplex_simpreps.cut.REPEATMASKER.bed
sort -k1,1 -k2,2n lowcomplex_simpreps.cut.REPEATMASKER.bed > \
lowcomplex_simpreps.sorted.REPEATMASKER.bed
bedtools intersect -wb -v -F 0.25 -a exons.sorted.bed
-b lowcomplex_simpreps.sorted.REPEATMASKER.bed > exons.masked.bed
sort -k1,1 -k2,2n exons.masked.bed > exons.masked.sorted.bed
bedtools intersect -loj -wb -F 0.5 -b exons.masked.sorted.bed \
-a nextera_exome_targets.bed > intersect.txt
XHMM reference interval – Exome_CNV_reference_interval.R [R]
library(dplyr)
library(stringr)
options(scipen = 999)
# Load data and remove empty fields
bed <- read.table("intersect.txt",sep="\t",comment.char = "",quote = "",fill = T,
stringsAsFactors = F)
bed <- bed[bed$V1 != ".",]
bed <- bed[bed$V4 != ".",]
bed <- bed[,-c(4:6)]
# Keep unique and remove misencoded exons

334
bed <- unique(bed)
bed <- bed[which(!grepl(bed$V7,perl = T,pattern = "\\S+_\\S+_\\S+")),]
# Collapse on genomic position
bed_col <- bed %>% group_by(V1,V2,V3) %>%
summarise_all(funs(paste(unique(.),collapse = ",")))
# Add padding
bed_col$V2 <- bed_col$V2 - 10
bed_col$V3 <- bed_col$V3 + 10
# Write output
write.table(bed_col, "cnv_targets_masked_pad_.bed",sep="\t",quote=FALSE,
row.names=FALSE,
col.names=FALSE)
XHMM reference interval – Exome_CNV_reference_intervals_2.sh [BASH]
sort -k1,1 -k2,2n cnv_targets_masked_pad.bed > cnv_targets_masked_pad_sort.bed
bedtools merge -i cnv_targets_masked_pad_sort.bed -c 4 \
-o collapse > COLLAPSE.cnv_targets_masked_pad_sort.bed
mv COLLAPSE.cnv_targets_masked_pad_sort.bed cnv_targets_masked_pad_sort.bed
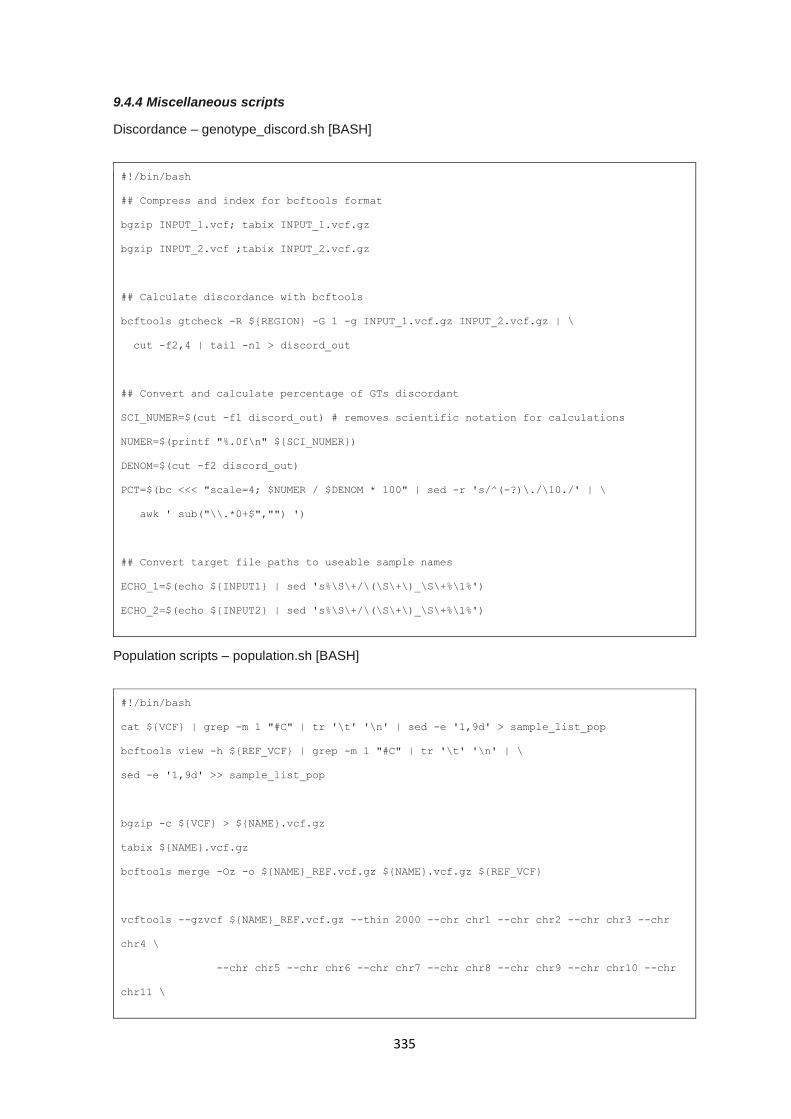
335
9.4.4 Miscellaneous scripts
Discordance – genotype_discord.sh [BASH]
#!/bin/bash
## Compress and index for bcftools format
bgzip INPUT_1.vcf; tabix INPUT_1.vcf.gz
bgzip INPUT_2.vcf ;tabix INPUT_2.vcf.gz
## Calculate discordance with bcftools
bcftools gtcheck -R ${REGION} -G 1 -g INPUT_1.vcf.gz INPUT_2.vcf.gz | \
cut -f2,4 | tail -n1 > discord_out
## Convert and calculate percentage of GTs discordant
SCI_NUMER=$(cut -f1 discord_out) # removes scientific notation for calculations
NUMER=$(printf "%.0f\n" ${SCI_NUMER})
DENOM=$(cut -f2 discord_out)
PCT=$(bc <<< "scale=4; $NUMER / $DENOM * 100" | sed -r 's/^(-?)\./\10./' | \
awk ' sub("\\.*0+$","") ')
## Convert target file paths to useable sample names
ECHO_1=$(echo ${INPUT1} | sed 's%\S\+/\(\S\+\)_\S\+%\1%')
ECHO_2=$(echo ${INPUT2} | sed 's%\S\+/\(\S\+\)_\S\+%\1%')
Population scripts – population.sh [BASH]
#!/bin/bash
cat ${VCF} | grep -m 1 "#C" | tr '\t' '\n' | sed -e '1,9d' > sample_list_pop
bcftools view -h ${REF_VCF} | grep -m 1 "#C" | tr '\t' '\n' | \
sed -e '1,9d' >> sample_list_pop
bgzip -c ${VCF} > ${NAME}.vcf.gz
tabix ${NAME}.vcf.gz
bcftools merge -Oz -o ${NAME}_REF.vcf.gz ${NAME}.vcf.gz ${REF_VCF}
vcftools --gzvcf ${NAME}_REF.vcf.gz --thin 2000 --chr chr1 --chr chr2 --chr chr3 --chr
chr4 \
--chr chr5 --chr chr6 --chr chr7 --chr chr8 --chr chr9 --chr chr10 --chr
chr11 \

336
--chr chr12 --chr chr13 --chr chr14 --chr chr15 --chr chr16 --chr chr17 \
--chr chr18 --chr chr19 --chr chr20 --chr chr21 --chr chr22 --chr chrX \
--min-alleles 2 --max-alleles 2 --non-ref-ac 2 --recode --out ${NAME}_REF
plink1.90 --vcf ${NAME}_REF.recode.vcf --out ${NAME}_REF.maf0.05 --make-bed --maf 0.05 \
--vcf-half-call 'm' --const-fid --biallelic-only --geno 0.05
${ADMIXTURE} ${NAME}_REF.maf0.05.bed 5
Rscript admixture_plotting.R ${NAME}_REF.maf0.05.5.Q
Population scripts – admixture_plot.R [R]
rm(list = ls())
## Enable cmd line args
args = commandArgs(trailingOnly=TRUE)
library(ggplot2)
library(reshape2)
library(plotly)
library(RColorBrewer)
q.table <- read.table(args[1])
colnames(q.table) <- c("SAS","EUR","EAS","AFR","AMR")
sample.table <- read.table("sample_list_pop")
colnames(sample.table) <- c("Sample")
pop.table <- read.table("1KG_samplePopulations.tsv",header = T)
plot.table <- cbind(sample.table,q.table)
merge.table <- merge(plot.table,pop.table[,c(2,4)],
by = "Sample",all.x = T,all.y = F,sort = F)
merge.table$pred <- apply(merge.table[2:6],1,function(x) names(which.max(x)))
lapply(sort(unique(merge.table$pred)),
function(x){print(table(merge.table$Super_population[merge.table$pred == x]))})
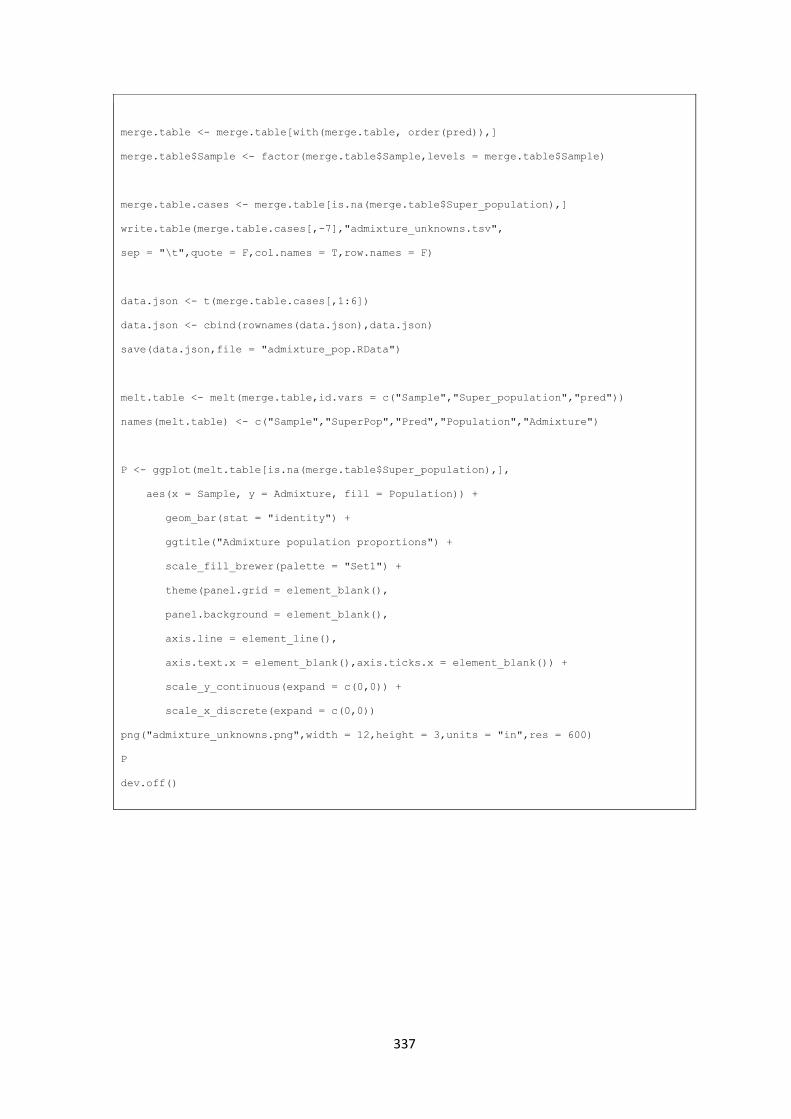
337
merge.table <- merge.table[with(merge.table, order(pred)),]
merge.table$Sample <- factor(merge.table$Sample,levels = merge.table$Sample)
merge.table.cases <- merge.table[is.na(merge.table$Super_population),]
write.table(merge.table.cases[,-7],"admixture_unknowns.tsv",
sep = "\t",quote = F,col.names = T,row.names = F)
data.json <- t(merge.table.cases[,1:6])
data.json <- cbind(rownames(data.json),data.json)
save(data.json,file = "admixture_pop.RData")
melt.table <- melt(merge.table,id.vars = c("Sample","Super_population","pred"))
names(melt.table) <- c("Sample","SuperPop","Pred","Population","Admixture")
P <- ggplot(melt.table[is.na(merge.table$Super_population),],
aes(x = Sample, y = Admixture, fill = Population)) +
geom_bar(stat = "identity") +
ggtitle("Admixture population proportions") +
scale_fill_brewer(palette = "Set1") +
theme(panel.grid = element_blank(),
panel.background = element_blank(),
axis.line = element_line(),
axis.text.x = element_blank(),axis.ticks.x = element_blank()) +
scale_y_continuous(expand = c(0,0)) +
scale_x_discrete(expand = c(0,0))
png("admixture_unknowns.png",width = 12,height = 3,units = "in",res = 600)
P
dev.off()
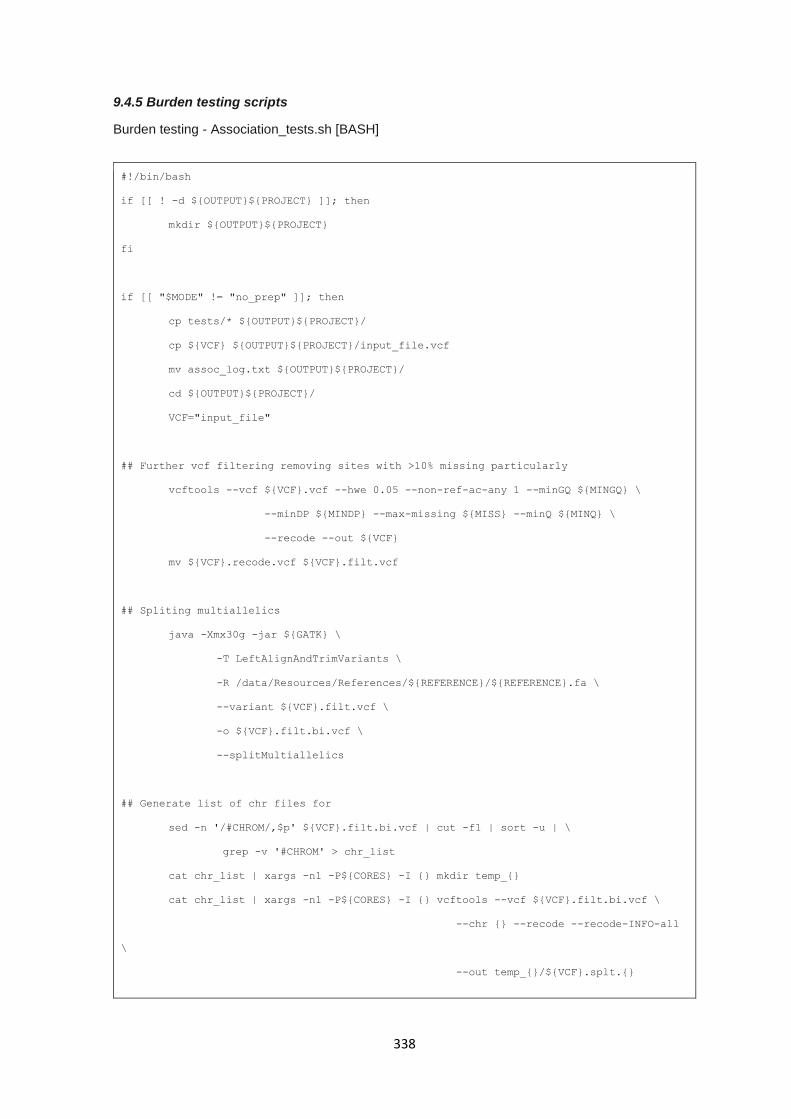
338
9.4.5 Burden testing scripts
Burden testing - Association_tests.sh [BASH]
#!/bin/bash
if [[ ! -d ${OUTPUT}${PROJECT} ]]; then
mkdir ${OUTPUT}${PROJECT}
fi
if [[ "$MODE" != "no_prep" ]]; then
cp tests/* ${OUTPUT}${PROJECT}/
cp ${VCF} ${OUTPUT}${PROJECT}/input_file.vcf
mv assoc_log.txt ${OUTPUT}${PROJECT}/
cd ${OUTPUT}${PROJECT}/
VCF="input_file"
## Further vcf filtering removing sites with >10% missing particularly
vcftools --vcf ${VCF}.vcf --hwe 0.05 --non-ref-ac-any 1 --minGQ ${MINGQ} \
--minDP ${MINDP} --max-missing ${MISS} --minQ ${MINQ} \
--recode --out ${VCF}
mv ${VCF}.recode.vcf ${VCF}.filt.vcf
## Spliting multiallelics
java -Xmx30g -jar ${GATK} \
-T LeftAlignAndTrimVariants \
-R /data/Resources/References/${REFERENCE}/${REFERENCE}.fa \
--variant ${VCF}.filt.vcf \
-o ${VCF}.filt.bi.vcf \
--splitMultiallelics
## Generate list of chr files for
sed -n '/#CHROM/,$p' ${VCF}.filt.bi.vcf | cut -f1 | sort -u | \
grep -v '#CHROM' > chr_list
cat chr_list | xargs -n1 -P${CORES} -I {} mkdir temp_{}
cat chr_list | xargs -n1 -P${CORES} -I {} vcftools --vcf ${VCF}.filt.bi.vcf \
--chr {} --recode --recode-INFO-all
\
--out temp_{}/${VCF}.splt.{}
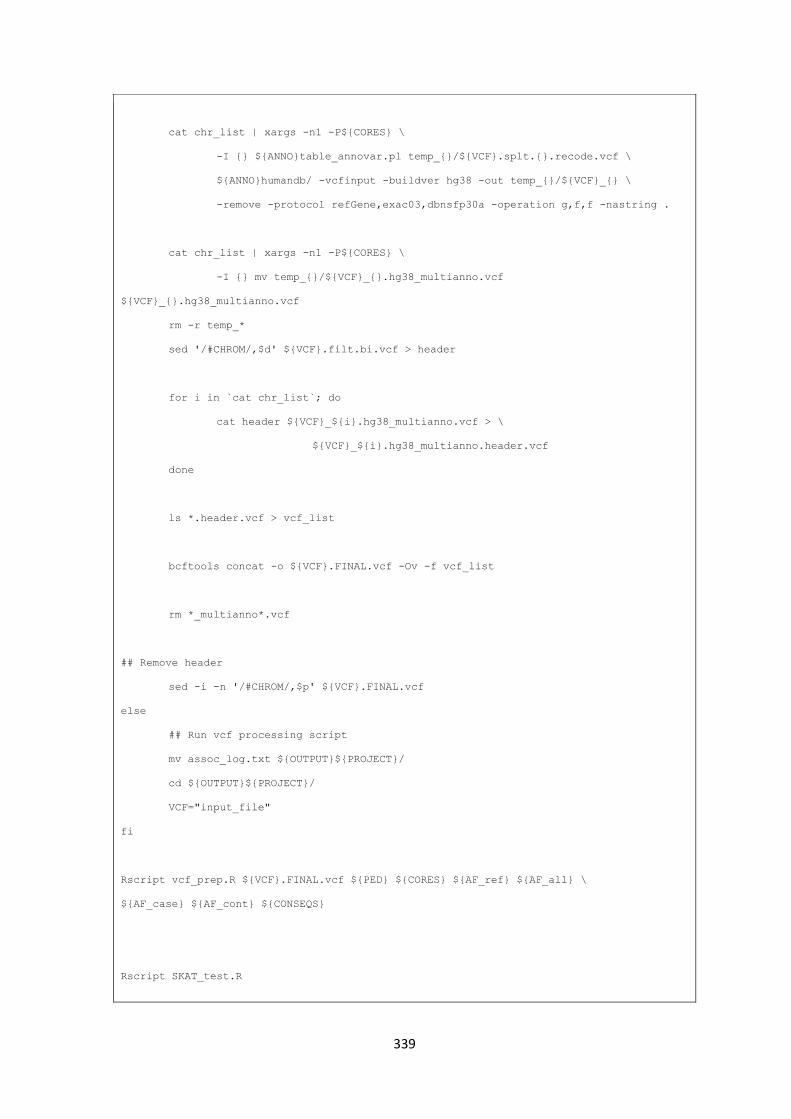
339
cat chr_list | xargs -n1 -P${CORES} \
-I {} ${ANNO}table_annovar.pl temp_{}/${VCF}.splt.{}.recode.vcf \
${ANNO}humandb/ -vcfinput -buildver hg38 -out temp_{}/${VCF}_{} \
-remove -protocol refGene,exac03,dbnsfp30a -operation g,f,f -nastring .
cat chr_list | xargs -n1 -P${CORES} \
-I {} mv temp_{}/${VCF}_{}.hg38_multianno.vcf
${VCF}_{}.hg38_multianno.vcf
rm -r temp_*
sed '/#CHROM/,$d' ${VCF}.filt.bi.vcf > header
for i in `cat chr_list`; do
cat header ${VCF}_${i}.hg38_multianno.vcf > \
${VCF}_${i}.hg38_multianno.header.vcf
done
ls *.header.vcf > vcf_list
bcftools concat -o ${VCF}.FINAL.vcf -Ov -f vcf_list
rm *_multianno*.vcf
## Remove header
sed -i -n '/#CHROM/,$p' ${VCF}.FINAL.vcf
else
## Run vcf processing script
mv assoc_log.txt ${OUTPUT}${PROJECT}/
cd ${OUTPUT}${PROJECT}/
VCF="input_file"
fi
Rscript vcf_prep.R ${VCF}.FINAL.vcf ${PED} ${CORES} ${AF_ref} ${AF_all} \
${AF_case} ${AF_cont} ${CONSEQS}
Rscript SKAT_test.R
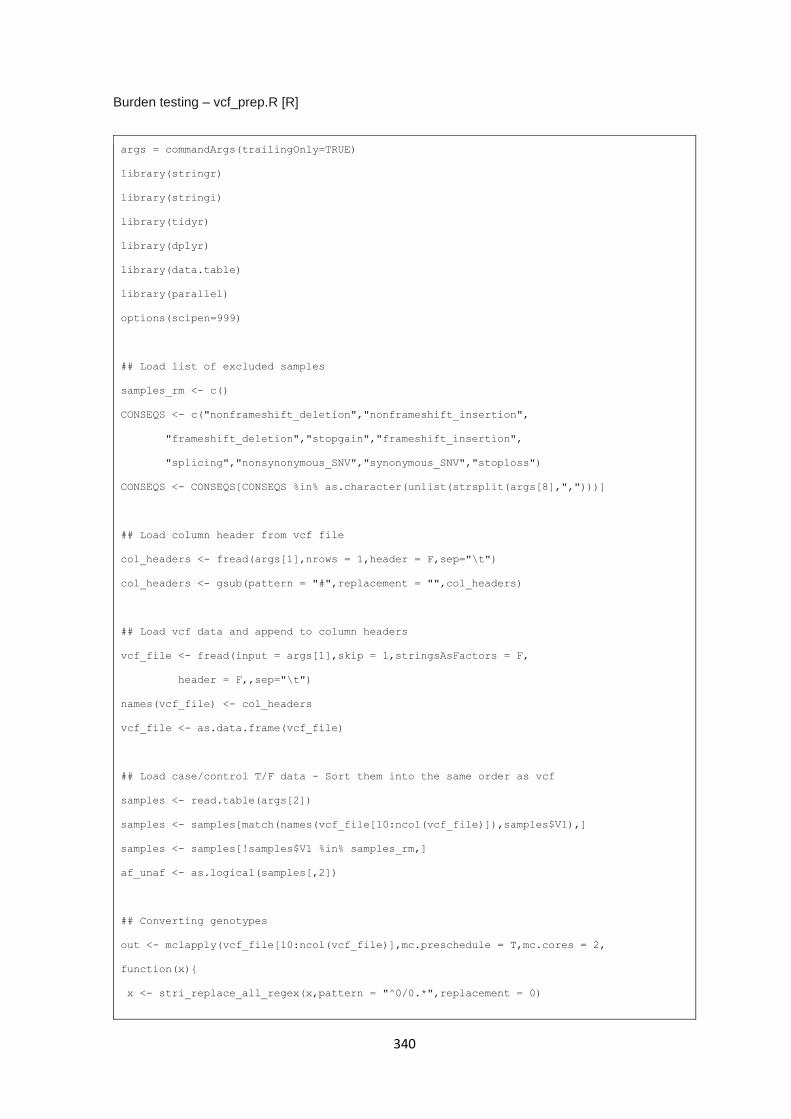
340
Burden testing – vcf_prep.R [R]
args = commandArgs(trailingOnly=TRUE)
library(stringr)
library(stringi)
library(tidyr)
library(dplyr)
library(data.table)
library(parallel)
options(scipen=999)
## Load list of excluded samples
samples_rm <- c()
CONSEQS <- c("nonframeshift_deletion","nonframeshift_insertion",
"frameshift_deletion","stopgain","frameshift_insertion",
"splicing","nonsynonymous_SNV","synonymous_SNV","stoploss")
CONSEQS <- CONSEQS[CONSEQS %in% as.character(unlist(strsplit(args[8],",")))]
## Load column header from vcf file
col_headers <- fread(args[1],nrows = 1,header = F,sep="\t")
col_headers <- gsub(pattern = "#",replacement = "",col_headers)
## Load vcf data and append to column headers
vcf_file <- fread(input = args[1],skip = 1,stringsAsFactors = F,
header = F,,sep="\t")
names(vcf_file) <- col_headers
vcf_file <- as.data.frame(vcf_file)
## Load case/control T/F data - Sort them into the same order as vcf
samples <- read.table(args[2])
samples <- samples[match(names(vcf_file[10:ncol(vcf_file)]),samples$V1),]
samples <- samples[!samples$V1 %in% samples_rm,]
af_unaf <- as.logical(samples[,2])
## Converting genotypes
out <- mclapply(vcf_file[10:ncol(vcf_file)],mc.preschedule = T,mc.cores = 2,
function(x){
x <- stri_replace_all_regex(x,pattern = "^0/0.*",replacement = 0)
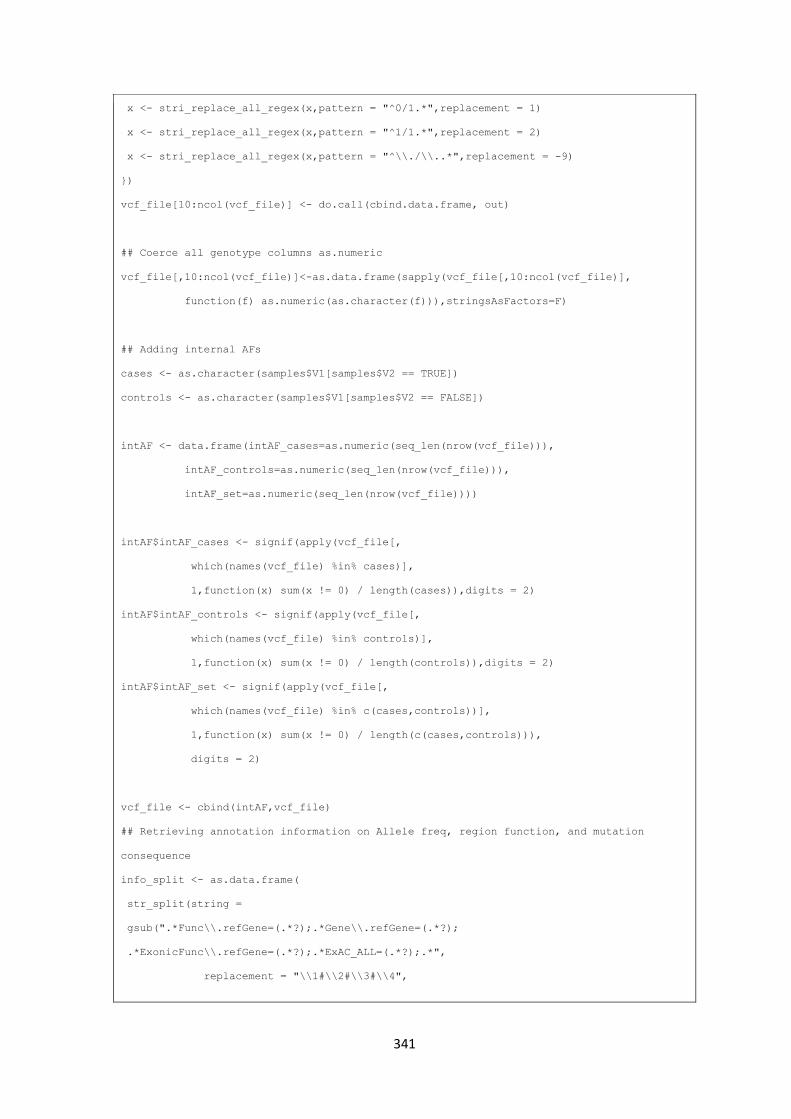
341
x <- stri_replace_all_regex(x,pattern = "^0/1.*",replacement = 1)
x <- stri_replace_all_regex(x,pattern = "^1/1.*",replacement = 2)
x <- stri_replace_all_regex(x,pattern = "^\\./\\..*",replacement = -9)
})
vcf_file[10:ncol(vcf_file)] <- do.call(cbind.data.frame, out)
## Coerce all genotype columns as.numeric
vcf_file[,10:ncol(vcf_file)]<-as.data.frame(sapply(vcf_file[,10:ncol(vcf_file)],
function(f) as.numeric(as.character(f))),stringsAsFactors=F)
## Adding internal AFs
cases <- as.character(samples$V1[samples$V2 == TRUE])
controls <- as.character(samples$V1[samples$V2 == FALSE])
intAF <- data.frame(intAF_cases=as.numeric(seq_len(nrow(vcf_file))),
intAF_controls=as.numeric(seq_len(nrow(vcf_file))),
intAF_set=as.numeric(seq_len(nrow(vcf_file))))
intAF$intAF_cases <- signif(apply(vcf_file[,
which(names(vcf_file) %in% cases)],
1,function(x) sum(x != 0) / length(cases)),digits = 2)
intAF$intAF_controls <- signif(apply(vcf_file[,
which(names(vcf_file) %in% controls)],
1,function(x) sum(x != 0) / length(controls)),digits = 2)
intAF$intAF_set <- signif(apply(vcf_file[,
which(names(vcf_file) %in% c(cases,controls))],
1,function(x) sum(x != 0) / length(c(cases,controls))),
digits = 2)
vcf_file <- cbind(intAF,vcf_file)
## Retrieving annotation information on Allele freq, region function, and mutation
consequence
info_split <- as.data.frame(
str_split(string =
gsub(".*Func\\.refGene=(.*?);.*Gene\\.refGene=(.*?);
.*ExonicFunc\\.refGene=(.*?);.*ExAC_ALL=(.*?);.*",
replacement = "\\1#\\2#\\3#\\4",
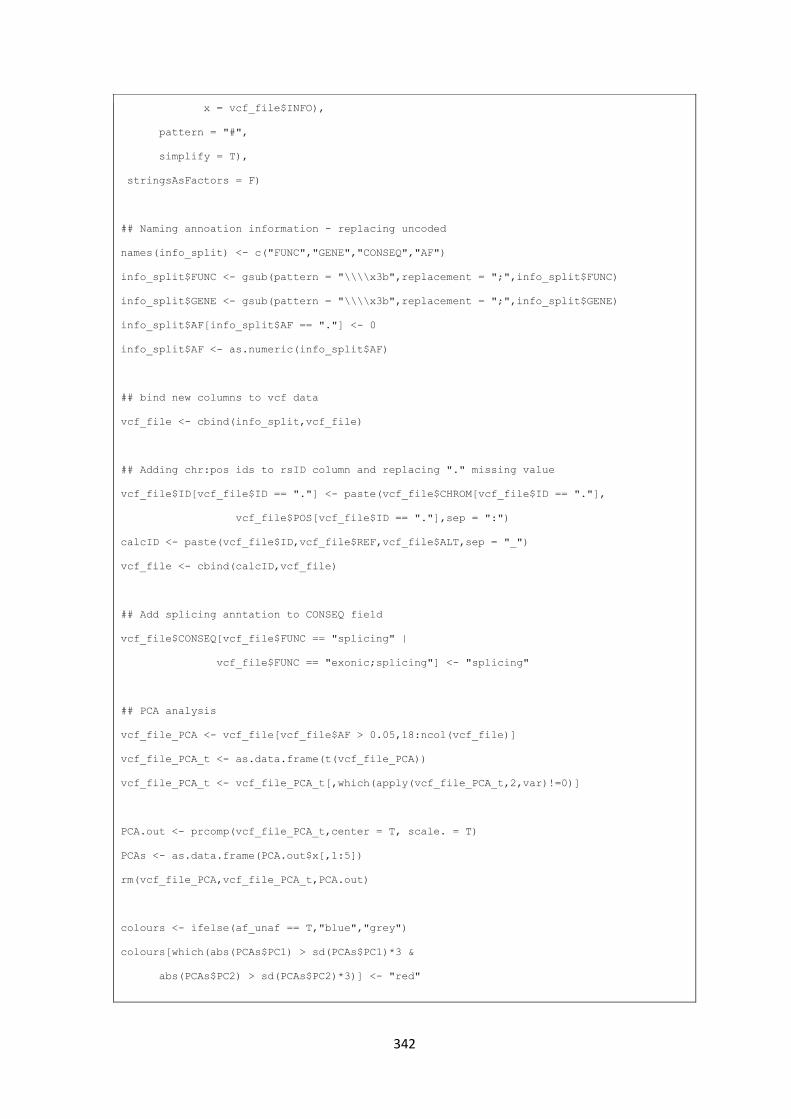
342
x = vcf_file$INFO),
pattern = "#",
simplify = T),
stringsAsFactors = F)
## Naming annoation information - replacing uncoded
names(info_split) <- c("FUNC","GENE","CONSEQ","AF")
info_split$FUNC <- gsub(pattern = "\\\\x3b",replacement = ";",info_split$FUNC)
info_split$GENE <- gsub(pattern = "\\\\x3b",replacement = ";",info_split$GENE)
info_split$AF[info_split$AF == "."] <- 0
info_split$AF <- as.numeric(info_split$AF)
## bind new columns to vcf data
vcf_file <- cbind(info_split,vcf_file)
## Adding chr:pos ids to rsID column and replacing "." missing value
vcf_file$ID[vcf_file$ID == "."] <- paste(vcf_file$CHROM[vcf_file$ID == "."],
vcf_file$POS[vcf_file$ID == "."],sep = ":")
calcID <- paste(vcf_file$ID,vcf_file$REF,vcf_file$ALT,sep = "_")
vcf_file <- cbind(calcID,vcf_file)
## Add splicing anntation to CONSEQ field
vcf_file$CONSEQ[vcf_file$FUNC == "splicing" |
vcf_file$FUNC == "exonic;splicing"] <- "splicing"
## PCA analysis
vcf_file_PCA <- vcf_file[vcf_file$AF > 0.05,18:ncol(vcf_file)]
vcf_file_PCA_t <- as.data.frame(t(vcf_file_PCA))
vcf_file_PCA_t <- vcf_file_PCA_t[,which(apply(vcf_file_PCA_t,2,var)!=0)]
PCA.out <- prcomp(vcf_file_PCA_t,center = T, scale. = T)
PCAs <- as.data.frame(PCA.out$x[,1:5])
rm(vcf_file_PCA,vcf_file_PCA_t,PCA.out)
colours <- ifelse(af_unaf == T,"blue","grey")
colours[which(abs(PCAs$PC1) > sd(PCAs$PC1)*3 &
abs(PCAs$PC2) > sd(PCAs$PC2)*3)] <- "red"
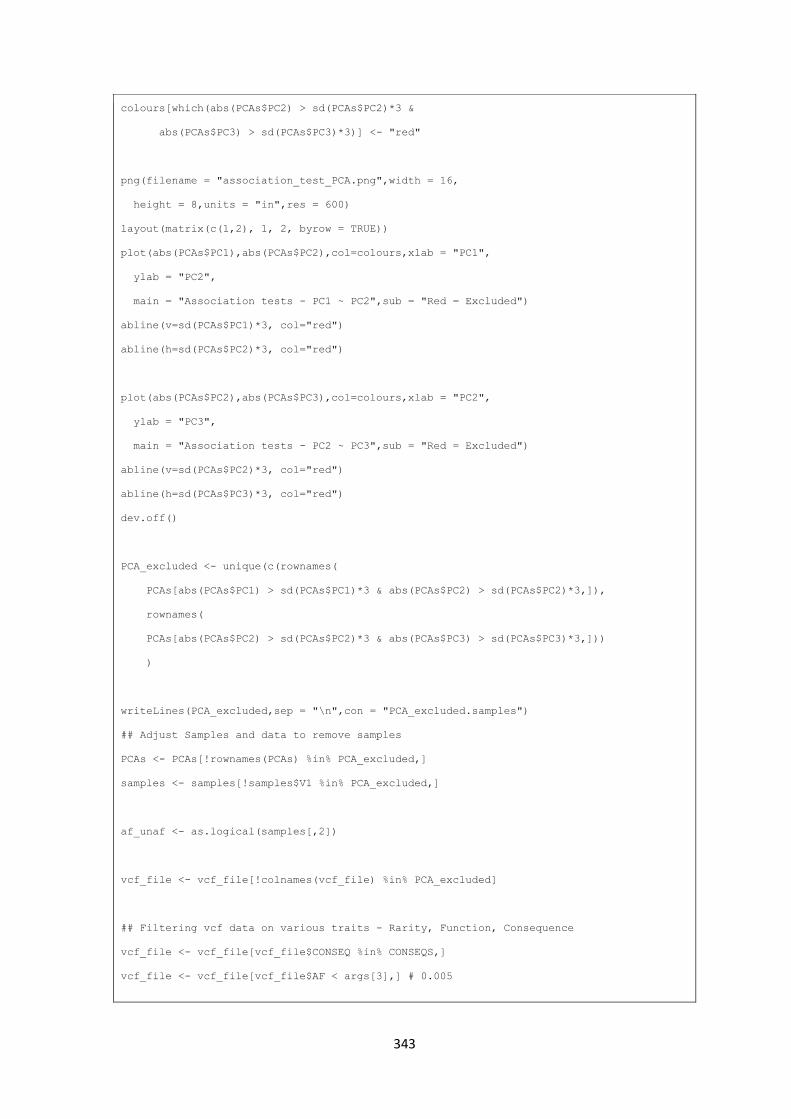
343
colours[which(abs(PCAs$PC2) > sd(PCAs$PC2)*3 &
abs(PCAs$PC3) > sd(PCAs$PC3)*3)] <- "red"
png(filename = "association_test_PCA.png",width = 16,
height = 8,units = "in",res = 600)
layout(matrix(c(1,2), 1, 2, byrow = TRUE))
plot(abs(PCAs$PC1),abs(PCAs$PC2),col=colours,xlab = "PC1",
ylab = "PC2",
main = "Association tests - PC1 ~ PC2",sub = "Red = Excluded")
abline(v=sd(PCAs$PC1)*3, col="red")
abline(h=sd(PCAs$PC2)*3, col="red")
plot(abs(PCAs$PC2),abs(PCAs$PC3),col=colours,xlab = "PC2",
ylab = "PC3",
main = "Association tests - PC2 ~ PC3",sub = "Red = Excluded")
abline(v=sd(PCAs$PC2)*3, col="red")
abline(h=sd(PCAs$PC3)*3, col="red")
dev.off()
PCA_excluded <- unique(c(rownames(
PCAs[abs(PCAs$PC1) > sd(PCAs$PC1)*3 & abs(PCAs$PC2) > sd(PCAs$PC2)*3,]),
rownames(
PCAs[abs(PCAs$PC2) > sd(PCAs$PC2)*3 & abs(PCAs$PC3) > sd(PCAs$PC3)*3,]))
)
writeLines(PCA_excluded,sep = "\n",con = "PCA_excluded.samples")
## Adjust Samples and data to remove samples
PCAs <- PCAs[!rownames(PCAs) %in% PCA_excluded,]
samples <- samples[!samples$V1 %in% PCA_excluded,]
af_unaf <- as.logical(samples[,2])
vcf_file <- vcf_file[!colnames(vcf_file) %in% PCA_excluded]
## Filtering vcf data on various traits - Rarity, Function, Consequence
vcf_file <- vcf_file[vcf_file$CONSEQ %in% CONSEQS,]
vcf_file <- vcf_file[vcf_file$AF < args[3],] # 0.005
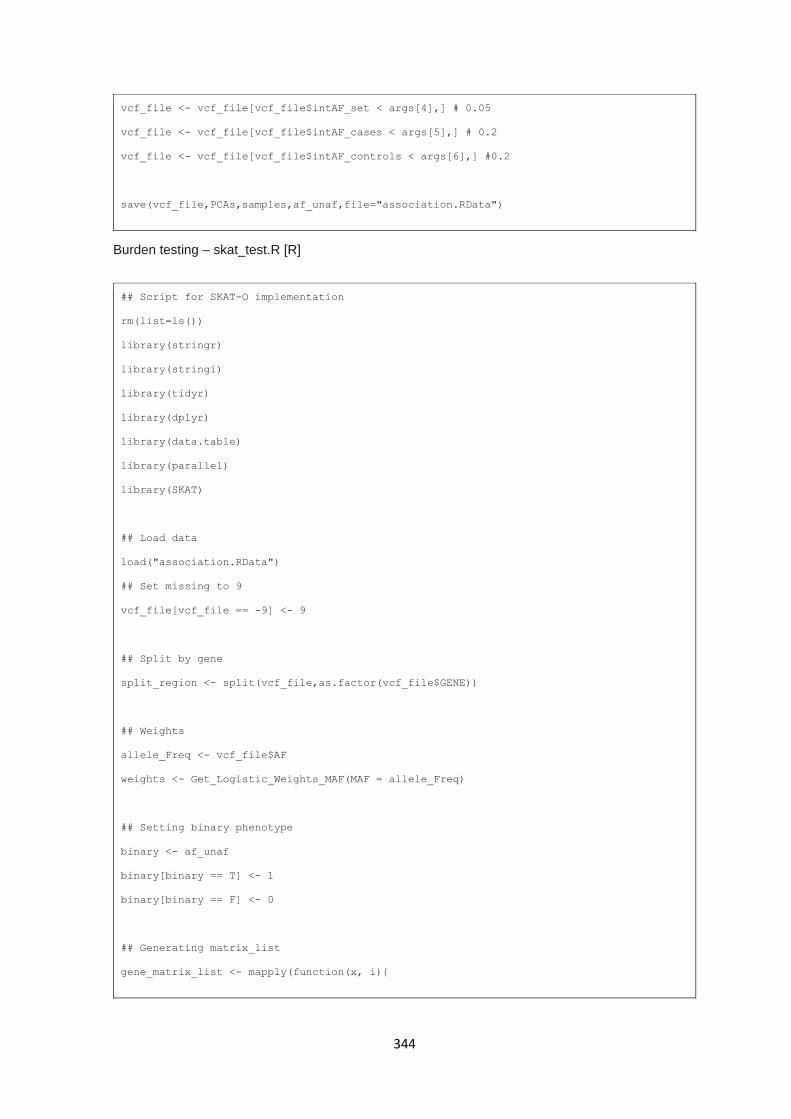
344
vcf_file <- vcf_file[vcf_file$intAF_set < args[4],] # 0.05
vcf_file <- vcf_file[vcf_file$intAF_cases < args[5],] # 0.2
vcf_file <- vcf_file[vcf_file$intAF_controls < args[6],] #0.2
save(vcf_file,PCAs,samples,af_unaf,file="association.RData")
Burden testing – skat_test.R [R]
## Script for SKAT-O implementation
rm(list=ls())
library(stringr)
library(stringi)
library(tidyr)
library(dplyr)
library(data.table)
library(parallel)
library(SKAT)
## Load data
load("association.RData")
## Set missing to 9
vcf_file[vcf_file == -9] <- 9
## Split by gene
split_region <- split(vcf_file,as.factor(vcf_file$GENE))
## Weights
allele_Freq <- vcf_file$AF
weights <- Get_Logistic_Weights_MAF(MAF = allele_Freq)
## Setting binary phenotype
binary <- af_unaf
binary[binary == T] <- 1
binary[binary == F] <- 0
## Generating matrix_list
gene_matrix_list <- mapply(function(x, i){
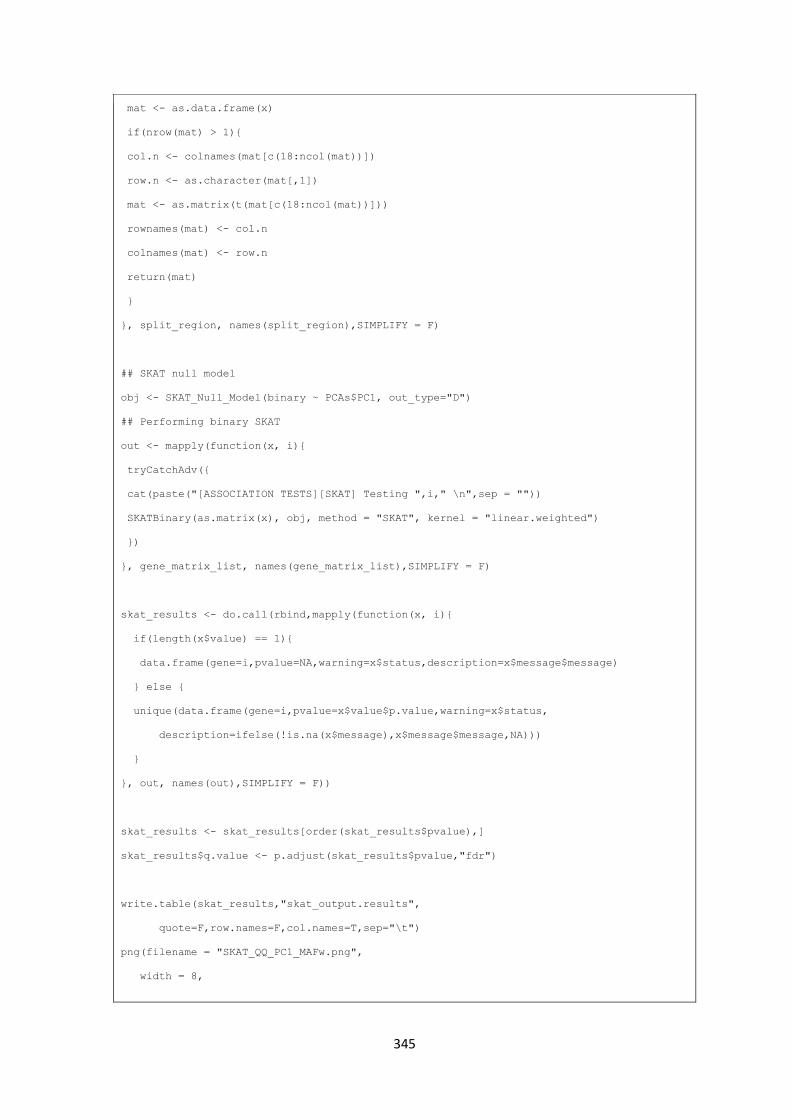
345
mat <- as.data.frame(x)
if(nrow(mat) > 1){
col.n <- colnames(mat[c(18:ncol(mat))])
row.n <- as.character(mat[,1])
mat <- as.matrix(t(mat[c(18:ncol(mat))]))
rownames(mat) <- col.n
colnames(mat) <- row.n
return(mat)
}
}, split_region, names(split_region),SIMPLIFY = F)
## SKAT null model
obj <- SKAT_Null_Model(binary ~ PCAs$PC1, out_type="D")
## Performing binary SKAT
out <- mapply(function(x, i){
tryCatchAdv({
cat(paste("[ASSOCIATION TESTS][SKAT] Testing ",i," \n",sep = ""))
SKATBinary(as.matrix(x), obj, method = "SKAT", kernel = "linear.weighted")
})
}, gene_matrix_list, names(gene_matrix_list),SIMPLIFY = F)
skat_results <- do.call(rbind,mapply(function(x, i){
if(length(x$value) == 1){
data.frame(gene=i,pvalue=NA,warning=x$status,description=x$message$message)
} else {
unique(data.frame(gene=i,pvalue=x$value$p.value,warning=x$status,
description=ifelse(!is.na(x$message),x$message$message,NA)))
}
}, out, names(out),SIMPLIFY = F))
skat_results <- skat_results[order(skat_results$pvalue),]
skat_results$q.value <- p.adjust(skat_results$pvalue,"fdr")
write.table(skat_results,"skat_output.results",
quote=F,row.names=F,col.names=T,sep="\t")
png(filename = "SKAT_QQ_PC1_MAFw.png",
width = 8,

346
height = 8,
units = "in",res = 600)
QQPlot_Adj(
Pval = as.numeric(unlist(
lapply(out,function(x) if(length(x$value) > 1 ){x$value$p.value}))),
MAP = as.numeric(unlist(
lapply(out,function(x) if(length(x$value) > 1 ){x$value$MAP}))))
dev.off()
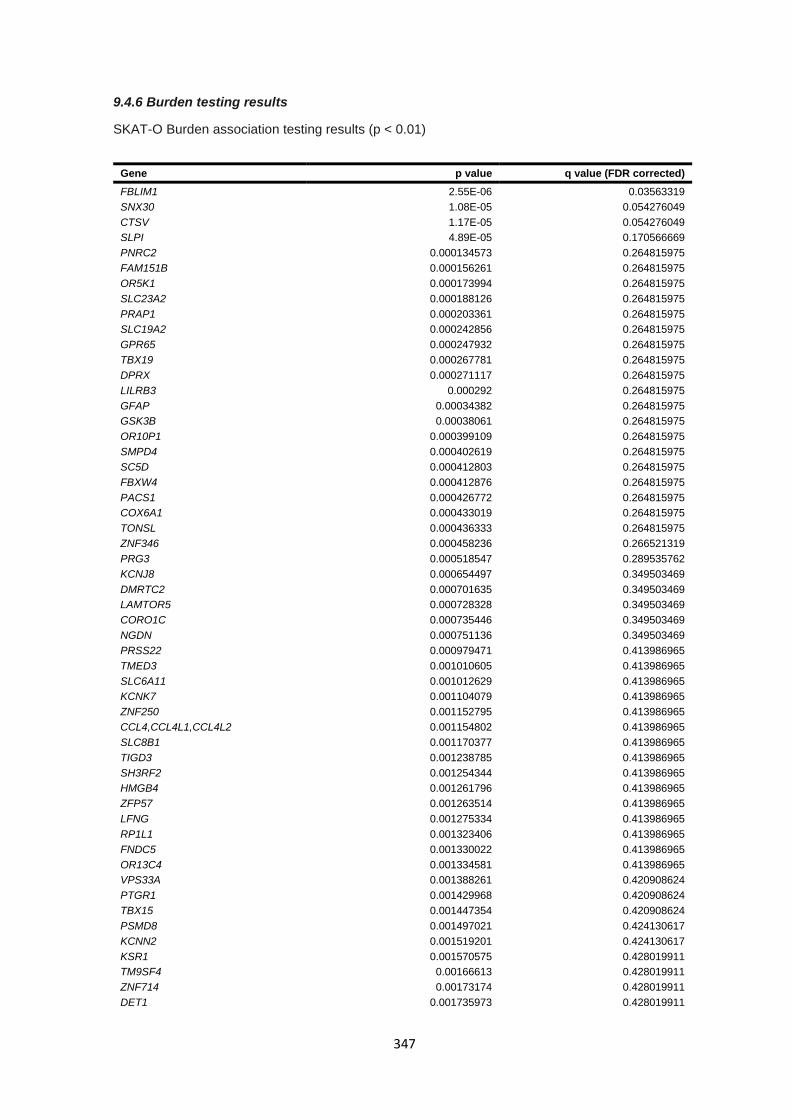
347
9.4.6 Burden testing results
SKAT-O Burden association testing results (p < 0.01)
Gene p value q value (FDR corrected)
FBLIM1 2.55E-06 0.03563319
SNX30 1.08E-05 0.054276049
CTSV 1.17E-05 0.054276049
SLPI 4.89E-05 0.170566669
PNRC2 0.000134573 0.264815975
FAM151B 0.000156261 0.264815975
OR5K1 0.000173994 0.264815975
SLC23A2 0.000188126 0.264815975
PRAP1 0.000203361 0.264815975
SLC19A2 0.000242856 0.264815975
GPR65 0.000247932 0.264815975
TBX19 0.000267781 0.264815975
DPRX 0.000271117 0.264815975
LILRB3 0.000292 0.264815975
GFAP 0.00034382 0.264815975
GSK3B 0.00038061 0.264815975
OR10P1 0.000399109 0.264815975
SMPD4 0.000402619 0.264815975
SC5D 0.000412803 0.264815975
FBXW4 0.000412876 0.264815975
PACS1 0.000426772 0.264815975
COX6A1 0.000433019 0.264815975
TONSL 0.000436333 0.264815975
ZNF346 0.000458236 0.266521319
PRG3 0.000518547 0.289535762
KCNJ8 0.000654497 0.349503469
DMRTC2 0.000701635 0.349503469
LAMTOR5 0.000728328 0.349503469
CORO1C 0.000735446 0.349503469
NGDN 0.000751136 0.349503469
PRSS22 0.000979471 0.413986965
TMED3 0.001010605 0.413986965
SLC6A11 0.001012629 0.413986965
KCNK7 0.001104079 0.413986965
ZNF250 0.001152795 0.413986965
CCL4,CCL4L1,CCL4L2 0.001154802 0.413986965
SLC8B1 0.001170377 0.413986965
TIGD3 0.001238785 0.413986965
SH3RF2 0.001254344 0.413986965
HMGB4 0.001261796 0.413986965
ZFP57 0.001263514 0.413986965
LFNG 0.001275334 0.413986965
RP1L1 0.001323406 0.413986965
FNDC5 0.001330022 0.413986965
OR13C4 0.001334581 0.413986965
VPS33A 0.001388261 0.420908624
PTGR1 0.001429968 0.420908624
TBX15 0.001447354 0.420908624
PSMD8 0.001497021 0.424130617
KCNN2 0.001519201 0.424130617
KSR1 0.001570575 0.428019911
TM9SF4 0.00166613 0.428019911
ZNF714 0.00173174 0.428019911
DET1 0.001735973 0.428019911
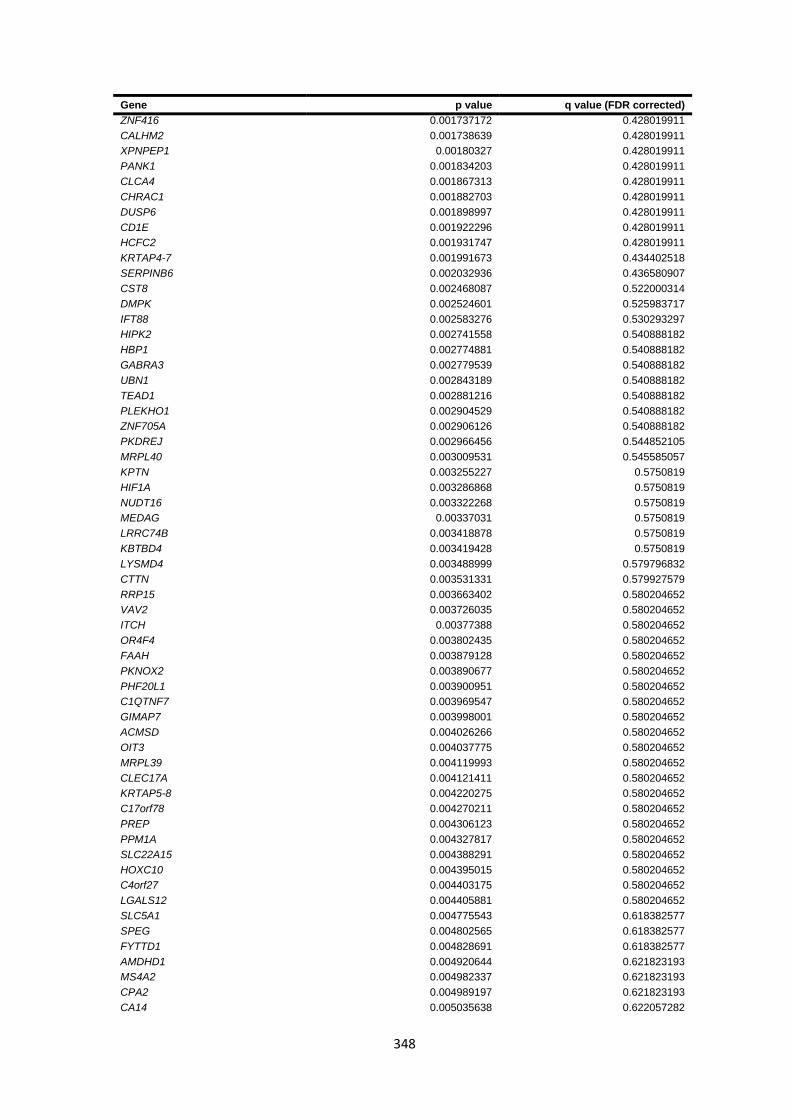
348
Gene p value q value (FDR corrected)
ZNF416 0.001737172 0.428019911
CALHM2 0.001738639 0.428019911
XPNPEP1 0.00180327 0.428019911
PANK1 0.001834203 0.428019911
CLCA4 0.001867313 0.428019911
CHRAC1 0.001882703 0.428019911
DUSP6 0.001898997 0.428019911
CD1E 0.001922296 0.428019911
HCFC2 0.001931747 0.428019911
KRTAP4-7 0.001991673 0.434402518
SERPINB6 0.002032936 0.436580907
CST8 0.002468087 0.522000314
DMPK 0.002524601 0.525983717
IFT88 0.002583276 0.530293297
HIPK2 0.002741558 0.540888182
HBP1 0.002774881 0.540888182
GABRA3 0.002779539 0.540888182
UBN1 0.002843189 0.540888182
TEAD1 0.002881216 0.540888182
PLEKHO1 0.002904529 0.540888182
ZNF705A 0.002906126 0.540888182
PKDREJ 0.002966456 0.544852105
MRPL40 0.003009531 0.545585057
KPTN 0.003255227 0.5750819
HIF1A 0.003286868 0.5750819
NUDT16 0.003322268 0.5750819
MEDAG 0.00337031 0.5750819
LRRC74B 0.003418878 0.5750819
KBTBD4 0.003419428 0.5750819
LYSMD4 0.003488999 0.579796832
CTTN 0.003531331 0.579927579
RRP15 0.003663402 0.580204652
VAV2 0.003726035 0.580204652
ITCH 0.00377388 0.580204652
OR4F4 0.003802435 0.580204652
FAAH 0.003879128 0.580204652
PKNOX2 0.003890677 0.580204652
PHF20L1 0.003900951 0.580204652
C1QTNF7 0.003969547 0.580204652
GIMAP7 0.003998001 0.580204652
ACMSD 0.004026266 0.580204652
OIT3 0.004037775 0.580204652
MRPL39 0.004119993 0.580204652
CLEC17A 0.004121411 0.580204652
KRTAP5-8 0.004220275 0.580204652
C17orf78 0.004270211 0.580204652
PREP 0.004306123 0.580204652
PPM1A 0.004327817 0.580204652
SLC22A15 0.004388291 0.580204652
HOXC10 0.004395015 0.580204652
C4orf27 0.004403175 0.580204652
LGALS12 0.004405881 0.580204652
SLC5A1 0.004775543 0.618382577
SPEG 0.004802565 0.618382577
FYTTD1 0.004828691 0.618382577
AMDHD1 0.004920644 0.621823193
MS4A2 0.004982337 0.621823193
CPA2 0.004989197 0.621823193
CA14 0.005035638 0.622057282
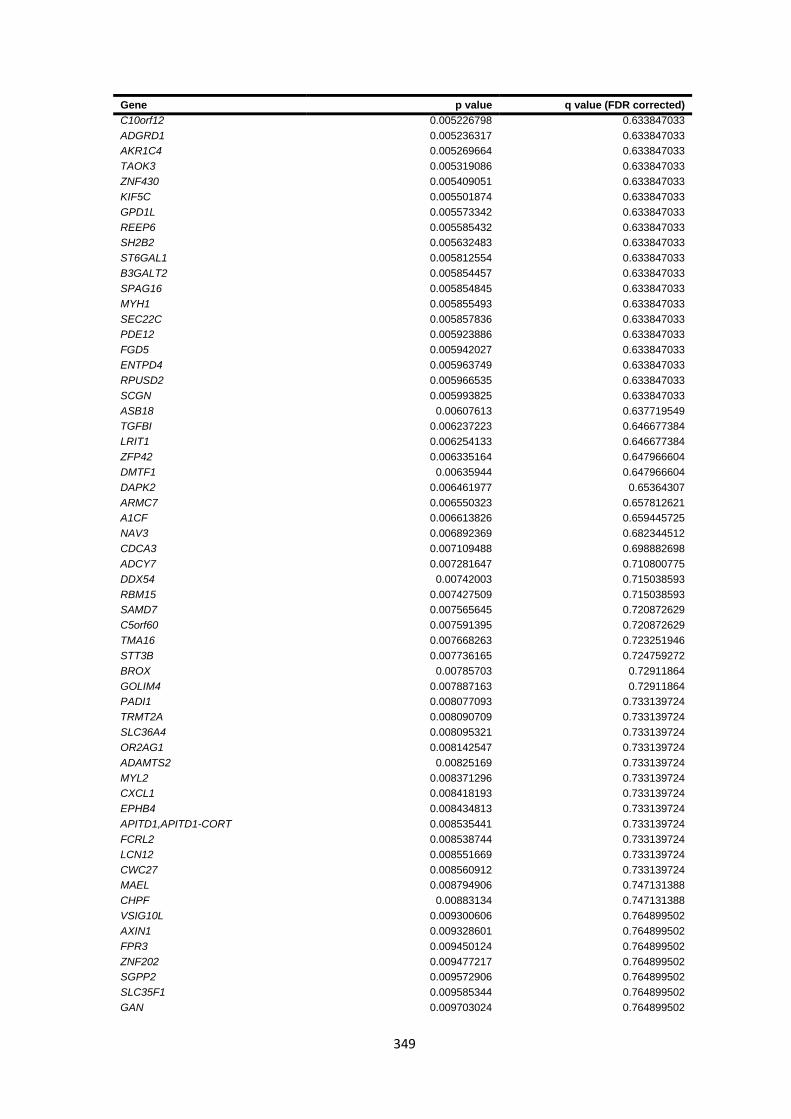
349
Gene p value q value (FDR corrected)
C10orf12 0.005226798 0.633847033
ADGRD1 0.005236317 0.633847033
AKR1C4 0.005269664 0.633847033
TAOK3 0.005319086 0.633847033
ZNF430 0.005409051 0.633847033
KIF5C 0.005501874 0.633847033
GPD1L 0.005573342 0.633847033
REEP6 0.005585432 0.633847033
SH2B2 0.005632483 0.633847033
ST6GAL1 0.005812554 0.633847033
B3GALT2 0.005854457 0.633847033
SPAG16 0.005854845 0.633847033
MYH1 0.005855493 0.633847033
SEC22C 0.005857836 0.633847033
PDE12 0.005923886 0.633847033
FGD5 0.005942027 0.633847033
ENTPD4 0.005963749 0.633847033
RPUSD2 0.005966535 0.633847033
SCGN 0.005993825 0.633847033
ASB18 0.00607613 0.637719549
TGFBI 0.006237223 0.646677384
LRIT1 0.006254133 0.646677384
ZFP42 0.006335164 0.647966604
DMTF1 0.00635944 0.647966604
DAPK2 0.006461977 0.65364307
ARMC7 0.006550323 0.657812621
A1CF 0.006613826 0.659445725
NAV3 0.006892369 0.682344512
CDCA3 0.007109488 0.698882698
ADCY7 0.007281647 0.710800775
DDX54 0.00742003 0.715038593
RBM15 0.007427509 0.715038593
SAMD7 0.007565645 0.720872629
C5orf60 0.007591395 0.720872629
TMA16 0.007668263 0.723251946
STT3B 0.007736165 0.724759272
BROX 0.00785703 0.72911864
GOLIM4 0.007887163 0.72911864
PADI1 0.008077093 0.733139724
TRMT2A 0.008090709 0.733139724
SLC36A4 0.008095321 0.733139724
OR2AG1 0.008142547 0.733139724
ADAMTS2 0.00825169 0.733139724
MYL2 0.008371296 0.733139724
CXCL1 0.008418193 0.733139724
EPHB4 0.008434813 0.733139724
APITD1,APITD1-CORT 0.008535441 0.733139724
FCRL2 0.008538744 0.733139724
LCN12 0.008551669 0.733139724
CWC27 0.008560912 0.733139724
MAEL 0.008794906 0.747131388
CHPF 0.00883134 0.747131388
VSIG10L 0.009300606 0.764899502
AXIN1 0.009328601 0.764899502
FPR3 0.009450124 0.764899502
ZNF202 0.009477217 0.764899502
SGPP2 0.009572906 0.764899502
SLC35F1 0.009585344 0.764899502
GAN 0.009703024 0.764899502

350
Gene p value q value (FDR corrected)
WLS 0.009774578 0.764899502
KCNB1 0.009842355 0.764899502
LIPF 0.009844052 0.764899502
PIGA 0.009867894 0.764899502
OR1S2 0.009888138 0.764899502
CHCHD2 0.009898729 0.764899502
CNN1 0.009907776 0.764899502
ENAH 0.009977957 0.764899502
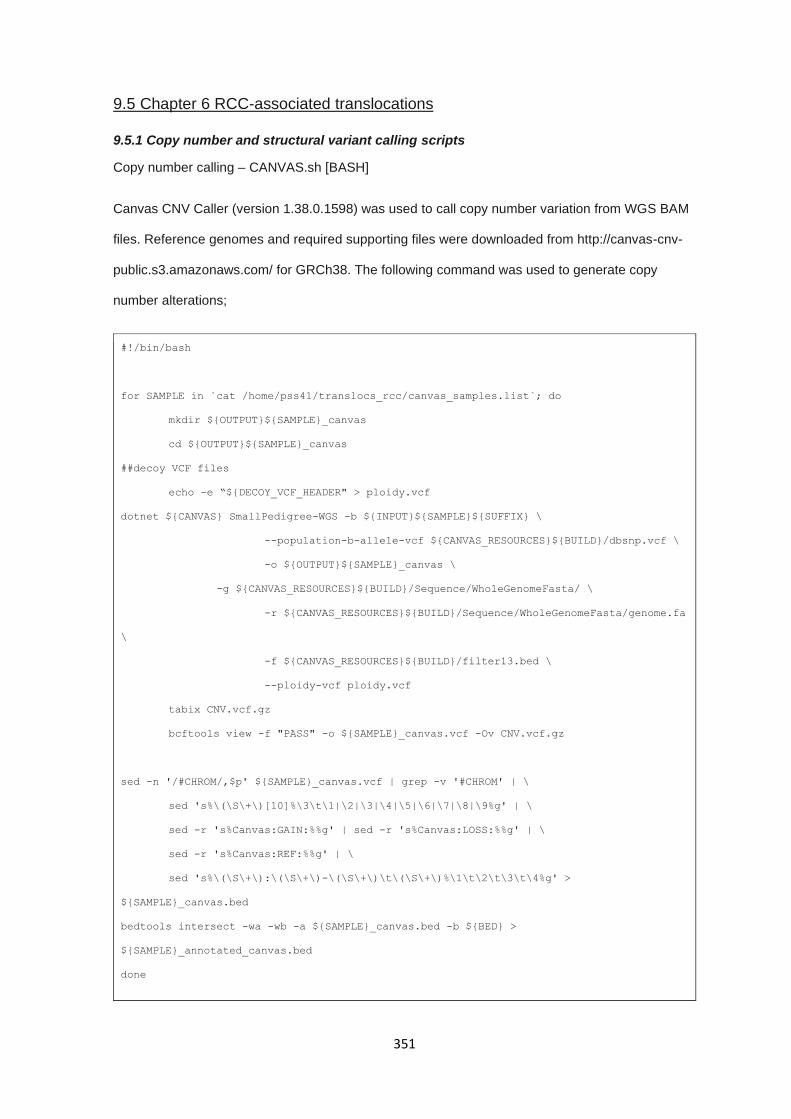
351
9.5 Chapter 6 RCC-associated translocations
9.5.1 Copy number and structural variant calling scripts
Copy number calling – CANVAS.sh [BASH]
Canvas CNV Caller (version 1.38.0.1598) was used to call copy number variation from WGS BAM
files. Reference genomes and required supporting files were downloaded from http://canvas-cnv-
public.s3.amazonaws.com/ for GRCh38. The following command was used to generate copy
number alterations;
#!/bin/bash
for SAMPLE in `cat /home/pss41/translocs_rcc/canvas_samples.list`; do
mkdir ${OUTPUT}${SAMPLE}_canvas
cd ${OUTPUT}${SAMPLE}_canvas
##decoy VCF files
echo –e “${DECOY_VCF_HEADER" > ploidy.vcf
dotnet ${CANVAS} SmallPedigree-WGS -b ${INPUT}${SAMPLE}${SUFFIX} \
--population-b-allele-vcf ${CANVAS_RESOURCES}${BUILD}/dbsnp.vcf \
-o ${OUTPUT}${SAMPLE}_canvas \
-g ${CANVAS_RESOURCES}${BUILD}/Sequence/WholeGenomeFasta/ \
-r ${CANVAS_RESOURCES}${BUILD}/Sequence/WholeGenomeFasta/genome.fa
\
-f ${CANVAS_RESOURCES}${BUILD}/filter13.bed \
--ploidy-vcf ploidy.vcf
tabix CNV.vcf.gz
bcftools view -f "PASS" -o ${SAMPLE}_canvas.vcf -Ov CNV.vcf.gz
sed -n '/#CHROM/,$p' ${SAMPLE}_canvas.vcf | grep -v '#CHROM' | \
sed 's%\(\S\+\)[10]%\3\t\1|\2|\3|\4|\5|\6|\7|\8|\9%g' | \
sed -r 's%Canvas:GAIN:%%g' | sed -r 's%Canvas:LOSS:%%g' | \
sed -r 's%Canvas:REF:%%g' | \
sed 's%\(\S\+\):\(\S\+\)-\(\S\+\)\t\(\S\+\)%\1\t\2\t\3\t\4%g' >
${SAMPLE}_canvas.bed
bedtools intersect -wa -wb -a ${SAMPLE}_canvas.bed -b ${BED} >
${SAMPLE}_annotated_canvas.bed
done
352
Structural variant calling – MANTA.sh [BASH]
Manta Structural variant caller (version 1.3.1) was used to identify candidate chromosomal break
points matching cytogenetic banding and assess if structural variants had impacted on known RCC
predisposition genes (VHL, MET, FH, SDHB, SDHD, SDHC, BAP1, CDKN2B). The following
command was used to generate SV calls using Manta;
#!/bin/bash
configManta.py --bam=${SAMPLE}.bam \
--referenceFasta=${REFERENCE}.fa \
--runDir=${OUTPUT_FOLDER}
${OUTPUT_FOLDER}/runWorkflow.py -m local -j 8
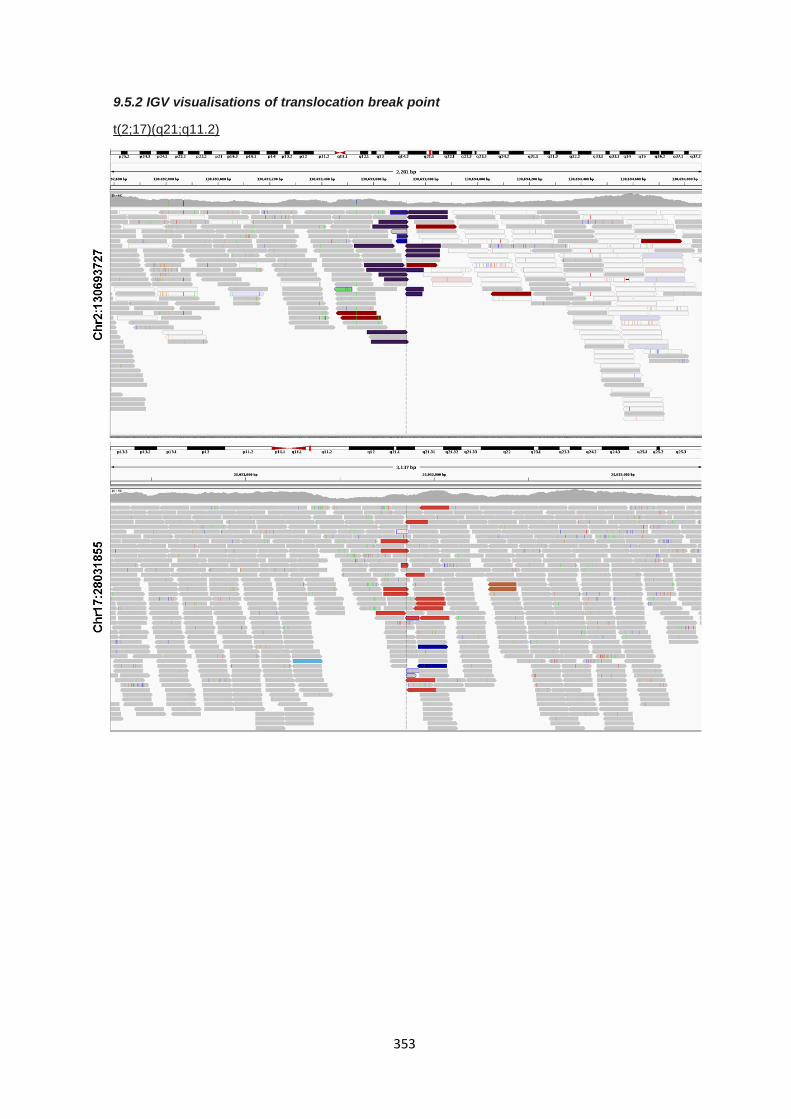
353
9.5.2 IGV visualisations of translocation break point
t(2;17)(q21;q11.2)
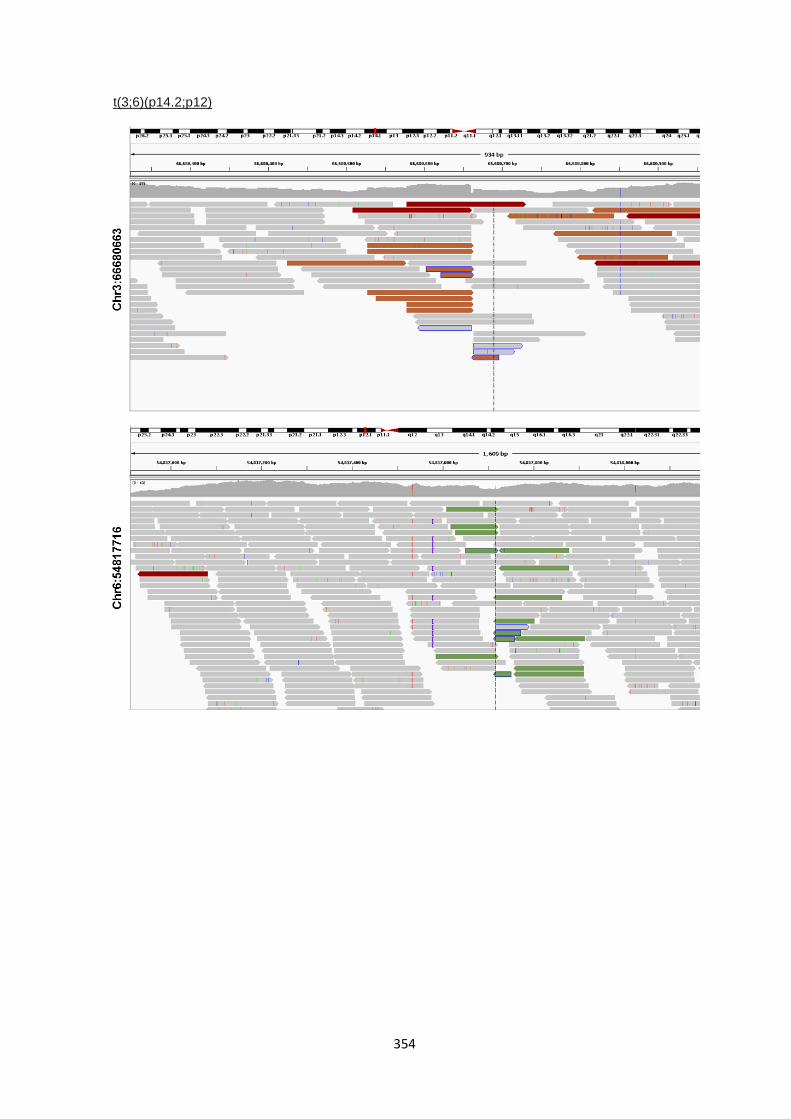
354
t(3;6)(p14.2;p12)
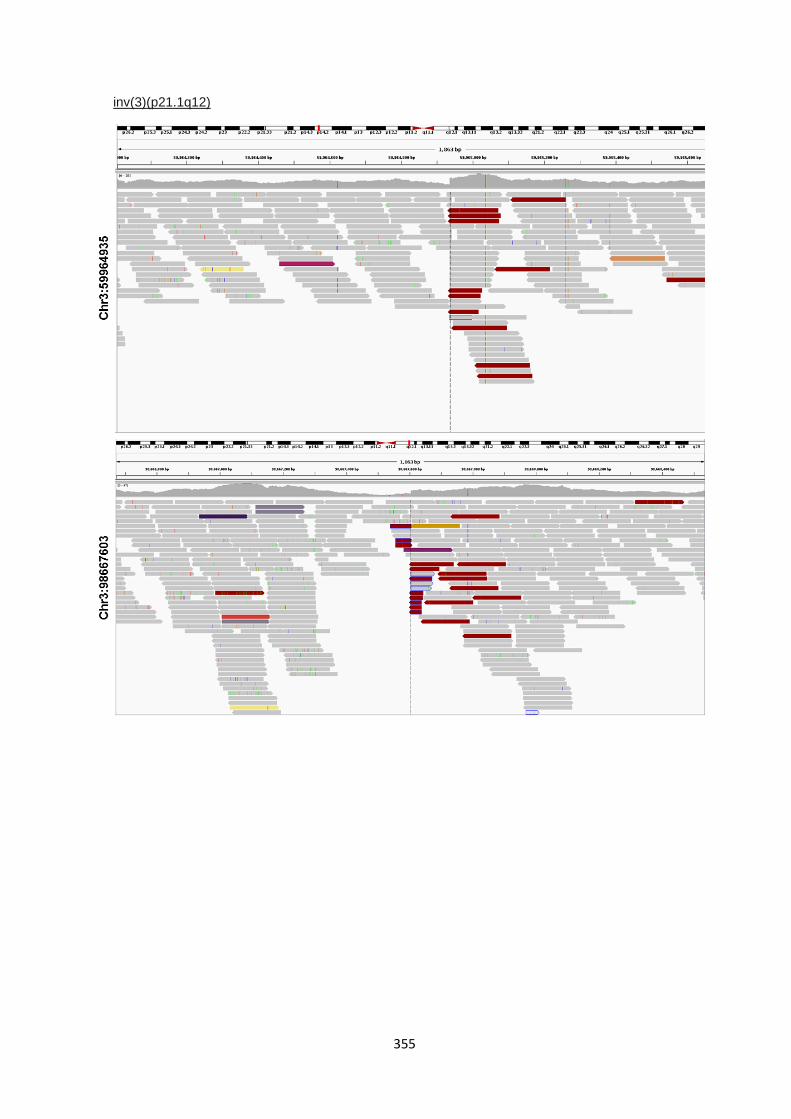
355
inv(3)(p21.1q12)
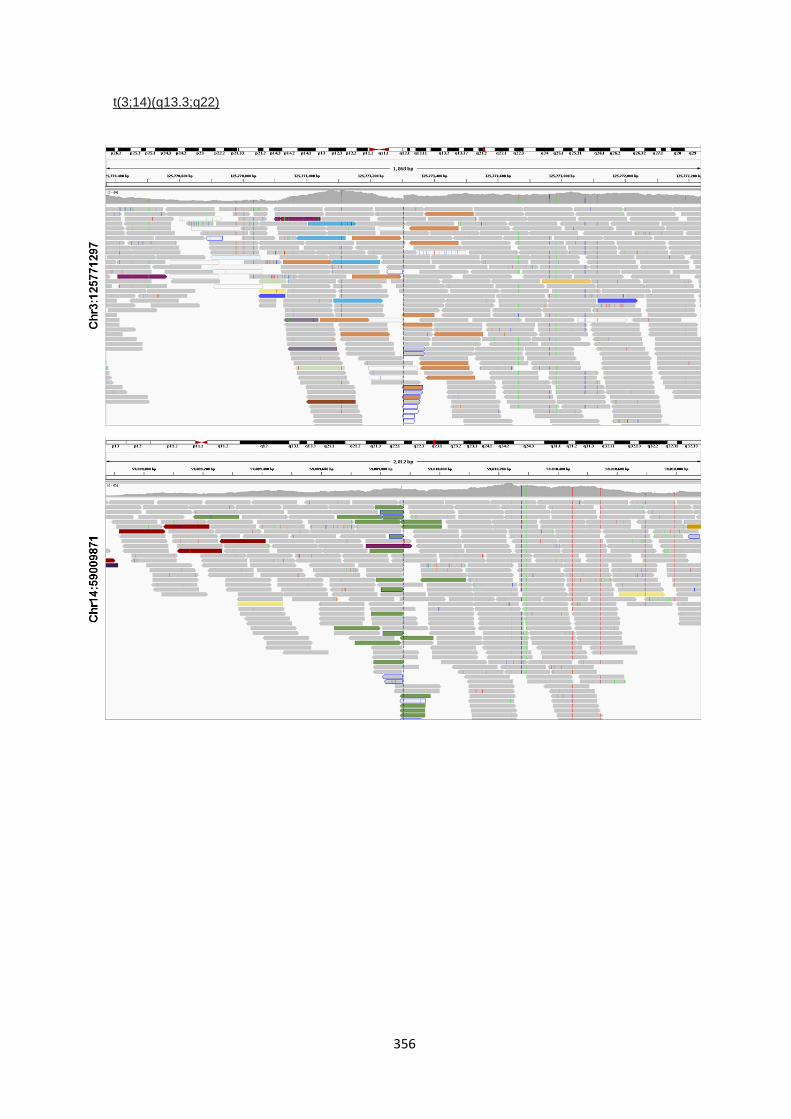
356
t(3;14)(q13.3;q22)

357
t(10;17)(q11.22;p12)
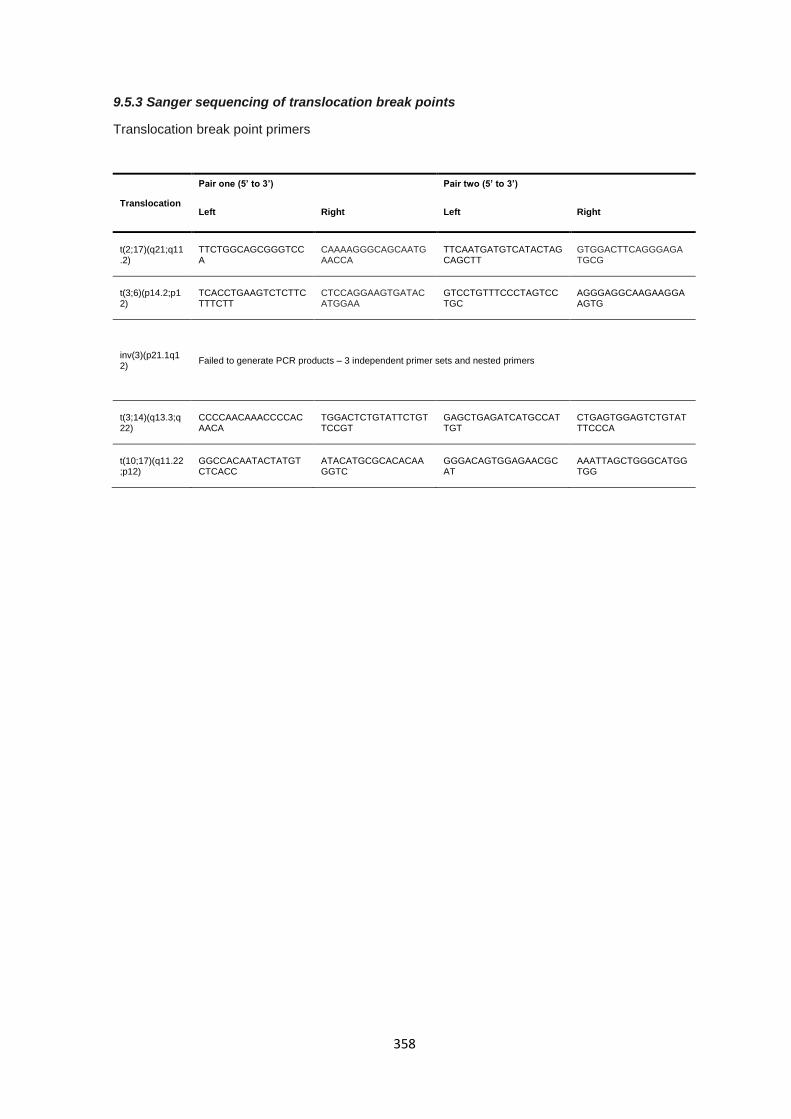
358
9.5.3 Sanger sequencing of translocation break points
Translocation break point primers
Translocation
Pair one (5’ to 3’) Pair two (5’ to 3’)
Left Right Left Right
t(2;17)(q21;q11.2)
TTCTGGCAGCGGGTCCA
CAAAAGGGCAGCAATGAACCA
TTCAATGATGTCATACTAGCAGCTT
GTGGACTTCAGGGAGATGCG
t(3;6)(p14.2;p12)
TCACCTGAAGTCTCTTCTTTCTT
CTCCAGGAAGTGATACATGGAA
GTCCTGTTTCCCTAGTCCTGC
AGGGAGGCAAGAAGGAAGTG
inv(3)(p21.1q12)
Failed to generate PCR products – 3 independent primer sets and nested primers
t(3;14)(q13.3;q22)
CCCCAACAAACCCCACAACA
TGGACTCTGTATTCTGTTCCGT
GAGCTGAGATCATGCCATTGT
CTGAGTGGAGTCTGTATTTCCCA
t(10;17)(q11.22;p12)
GGCCACAATACTATGTCTCACC
ATACATGCGCACACAAGGTC
GGGACAGTGGAGAACGCAT
AAATTAGCTGGGCATGGTGG
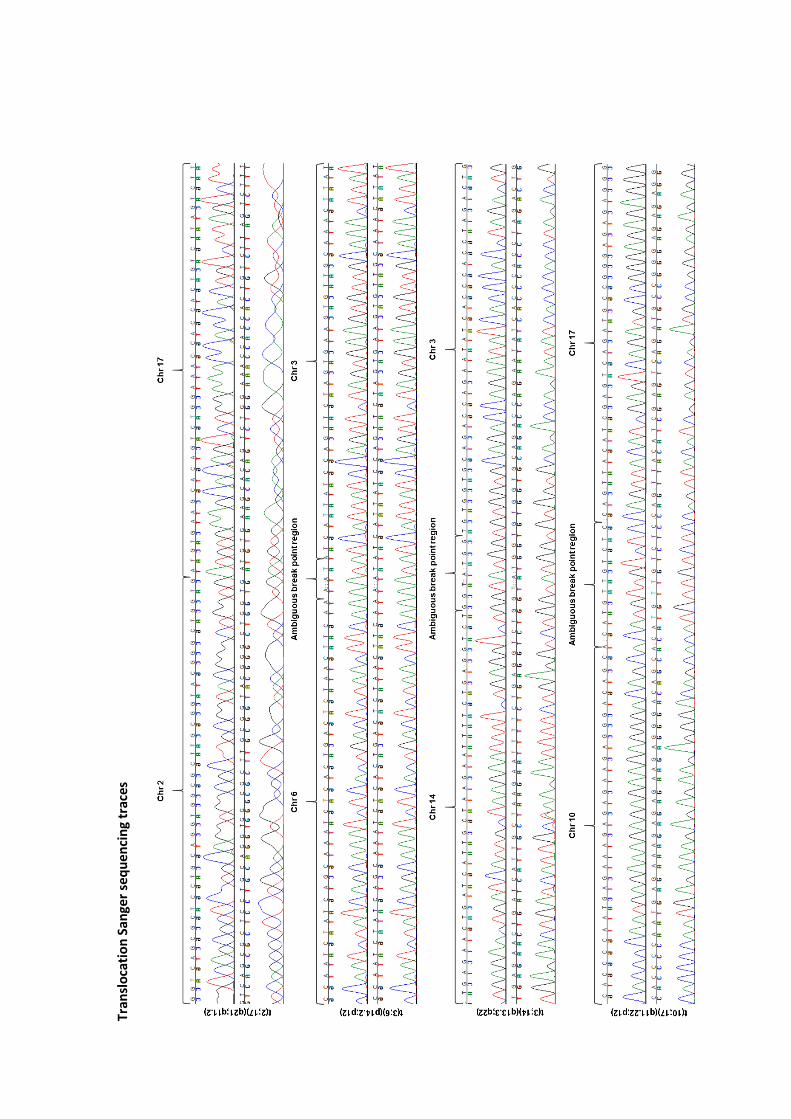
Tr
ansl
oca
tio
n S
ange
r se
qu
enci
ng
trac
es
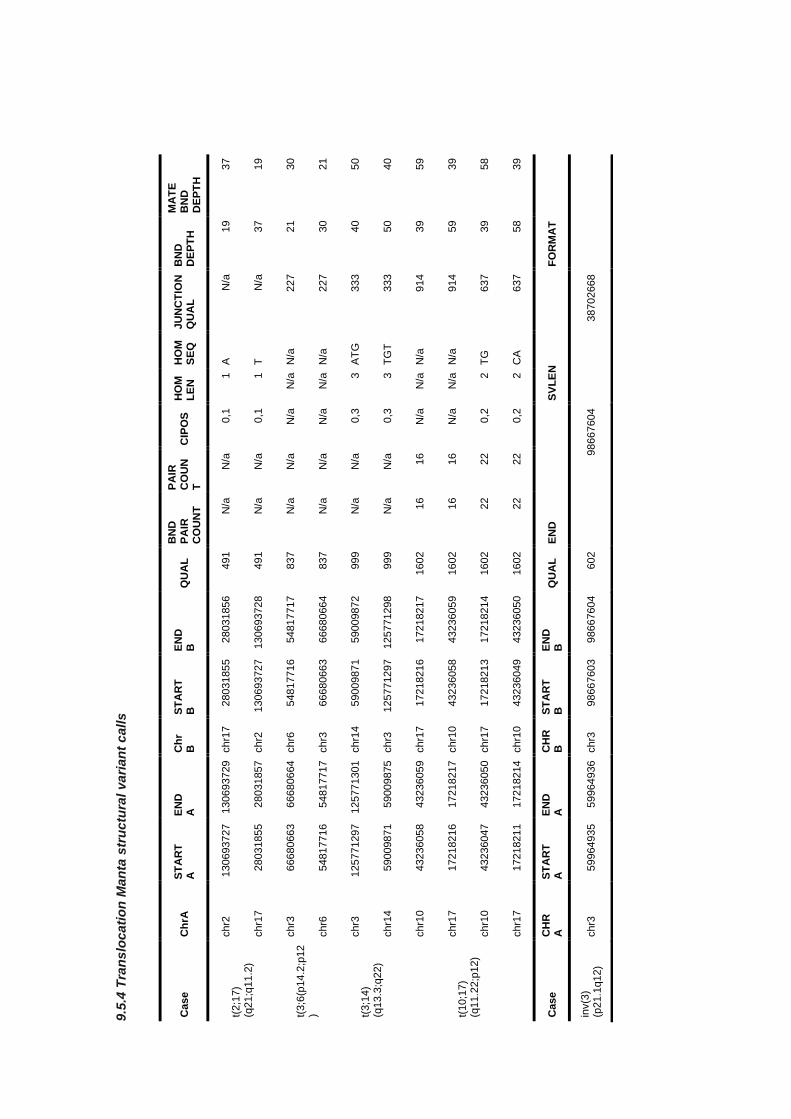
9.5
.4 T
ran
slo
cati
on
Man
ta s
tru
ctu
ral
va
rian
t c
all
s
Case
Ch
rA
ST
AR
T
A
EN
D
A
Ch
r B
S
TA
RT
B
E
ND
B
Q
UA
L
BN
D
PA
IR
CO
UN
T
PA
IR
CO
UN
T
CIP
OS
H
OM
L
EN
H
OM
S
EQ
JU
NC
TIO
N
QU
AL
B
ND
D
EP
TH
MA
TE
B
ND
D
EP
TH
t(2;1
7)
(q21;q
11.2
)
chr2
130693727
130693729
chr1
7
28031855
28031856
491
N/a
N
/a
0,1
1
A
N/a
19
37
chr1
7
28031855
28031857
chr2
130693727
130693728
491
N/a
N
/a
0,1
1
T
N/a
37
19
t(3;6
(p14.2
;p12
)
chr3
66680663
66680664
chr6
54817716
54817717
837
N/a
N
/a
N/a
N
/a
N/a
227
21
30
chr6
54817716
54817717
chr3
66680663
66680664
837
N/a
N
/a
N/a
N
/a
N/a
227
30
21
t(3;1
4)
(q13.3
;q22)
chr3
125771297
125771301
chr1
4
59009871
59009872
999
N/a
N
/a
0,3
3
AT
G
333
40
50
chr1
4
59009871
59009875
chr3
125771297
125771298
999
N/a
N
/a
0,3
3
TG
T
333
50
40
t(10;1
7)
(q11.2
2;p
12)
chr1
0
43236058
43236059
chr1
7
17218216
17218217
1602
16
16
N/a
N
/a
N/a
914
39
59
chr1
7
17218216
17218217
chr1
0
43236058
43236059
1602
16
16
N/a
N
/a
N/a
914
59
39
chr1
0
43236047
43236050
chr1
7
17218213
17218214
1602
22
22
0,2
2
TG
637
39
58
chr1
7
17218211
17218214
chr1
0
43236049
43236050
1602
22
22
0,2
2
CA
637
58
39
Case
C
HR
A
S
TA
RT
A
E
ND
A
C
HR
B
S
TA
RT
B
E
ND
B
Q
UA
L
EN
D
SV
LE
N
FO
RM
AT
inv(3
) (p
21.1
q12)
chr3
59964935
59964936
chr3
98667603
98667604
602
98667604
38702668