How Hydrogen Peroxide Is Metabolized by Oxidized Cytochrome c Oxidase

C A R B O N 5 0 ( 2 0 1 2 ) 7 4 8 – 7 6 0
.sc iencedi rect .com
Avai lab le at wwwjournal homepage: www.elsev ier .com/ locate /carbon
Molecular dynamics simulations of oxidized vapor-growncarbon nanofiber surface interactions with vinyl ester resinmonomers
Changwoon Jang a, Sasan Nouranian b,c, Thomas E. Lacy a,*, Steven R. Gwaltney d,Hossein Toghiani b, Charles U. Pittman Jr. d
a Department of Aerospace Engineering, Mississippi State University, Mississippi State, MS 39762, USAb The Dave C. Swalm School of Chemical Engineering, Mississippi State University, Mississippi State, MS 39762, USAc Center for Advanced Vehicular Systems (CAVS), Mississippi State, MS 39762-5405, USAd Department of Chemistry, Mississippi State University, Mississippi State, MS 39762, USA
A R T I C L E I N F O
Article history:
Received 23 July 2011
Accepted 5 September 2011
Available online 10 September 2011
0008-6223/$ - see front matter � 2011 Elsevidoi:10.1016/j.carbon.2011.09.013
* Corresponding author.E-mail address: [email protected] (T.E
1 Pyrograf products (an Affiliate of Appliefiber (date accessed: June 9, 2011).
A B S T R A C T
Surface oxidation effects on the liquid vinyl ester (VE) monomer distributions near two oxi-
dized vapor-grown carbon nanofiber (VGCNF) surfaces were studied using molecular dynam-
ics simulations. Two overlapping graphene sheets containing oxygenated functional groups
represented the oxidized VGCNF surfaces. Two liquid VE bisphenol-A dimethacrylates (des-
ignated VE1 and VE2, respectively) and styrene constituted the resin. Temporally and spa-
tially averaged relative monomer concentrations, calculated in a direction away from the
oxidized graphene surfaces, showed increased styrene and VE1 concentrations. Monomer
molar ratios found within a 10 A thick region adjacent to the oxidized graphene sheets were
substantially different from those in the bulk resin. Curing should result in the formation of a
very thin interphase region of different composition. The crosslink structure of such an inter-
phase will be distinct from that of an unoxidized VGCNF surface. The enhanced VE1 concen-
tration near this oxidized surface should give a higher crosslink density, leading to a stiffer
interphase than that adjacent to unoxidized VGCNF surfaces. VGCNF–matrix adhesion
may also be modified by the different interphase monomer molar ratios. These studies
may facilitate multiscale material design by providing insight into carbon nanofiber–matrix
interactions leading to improved macroscale composite properties.
� 2011 Elsevier Ltd. All rights reserved.
1. Introduction
Nanoreinforced polymer composites are increasingly being
used in structural and multifunctional applications [1]. Signif-
icant mechanical property improvements have been realized
by incorporating small amounts of low cost vapor-grown car-
bon nanofibers (VGCNFs) [2–10] due to their superb mechani-
er Ltd. All rights reserved
. Lacy).
d Sciences, Inc.) http://p
cal properties [11]. VGCNFs have diameters in the range of
70–200 nm and lengths of 50–200 lm.1 VGCNFs have been
used to reinforce different polymer matrices, but large-scale
nanofiber entanglements, dispersion difficulties, and poor
interfacial adhesion limit their effectiveness. Poor adhesion
decreases load transfer between the matrix and the nanofi-
ber. Hence, attempts have been made to oxidize or otherwise
.
yrografproducts.com/Merchant5/merchant.mvc?Screen=cp_nano-
C A R B O N 5 0 ( 2 0 1 2 ) 7 4 8 – 7 6 0 749
treat nanofiber surfaces to generate surface functional
groups, which enhance interfacial adhesion and aid VGCNF
de-agglomeration and dispersion in the matrix [12–14].
Oxidizing VGCNFs introduces hydroxyl, carbonyl, carbox-
ylic acid, anhydride and other surface functional groups
[12,15]. These entities interact with the resin constituents
through hydrogen bonding and dipole–dipole attractions.
This promotes better wetting and improves nanofiber–matrix
contact. Favorable interactions may result in selective adsorp-
tion of liquid resin monomers on the carbon nanofiber sur-
faces [16,17]. As a consequence, local monomer molar ratios
at the nanofiber surface may differ from those in the bulk li-
quid resin. Monomers crosslink during curing, so the final
composition of the crosslinked matrix in the immediate
vicinity of the nanofiber–matrix interface could differ from
that of the bulk matrix. This results in an ‘‘interphase’’ region
with distinct physical and mechanical properties [18–21]. The
existence of an interphase in polymer matrices reinforced
with nano-inclusions may have a profound impact on
effective composite properties given the high surface-area-
to-volume ratio associated with many nanoreinforcements
[19,22–25].
The authors recently studied the equilibrium distribution
of monomers in a liquid vinyl ester (VE) resin (Derakane
441-400, Ashland Co.) near a pristine (unoxidized) VGCNF sur-
face using molecular dynamics (MD) simulations [26]. The
pristine VGCNF surface was idealized using overlapping
graphene sheets in direct contact with a VE resin composed
of three monomer constituents: styrene and two VE dimeth-
acrylates with one and two bisphenol-A groups (n) in their
backbones, designated as VE1 (n = 1) and VE2 (n = 2), respec-
tively. A combination of high temperature (600, 1000 K) and
room temperature (300 K) simulations were used to establish
the initial and final equilibrium distributions of the three li-
quid resin monomers in a direction away from the graphene
sheets in the simulation cell. A styrene-rich layer was formed
in a �5 A thick region surrounding the graphene sheets [26].
This implied that a relatively compliant interphase region of
lower crosslink density may form in the resulting composite
upon resin curing.
In the current study, the interactions between the same VE
resin monomer composition and an oxidized VGCNF surface
were investigated using the methodology outlined in [26].
The interfacial interactions between oxidized VGCNFs and
the VE resin will influence both the formation and properties
of the interphase upon curing, as well as the matrix-to-nano-
fiber adhesion. Knowledge of the interphase and interfacial
properties is crucial for multiscale composite materials de-
sign and modeling, because the interphase volume fraction
may be quite significant and the monomer composition of
the resin in direct contact with the surface will dominate ma-
trix-reinforcement adhesion. Characterization of liquid resin
concentration profiles in the near surface regions and their
implications for interphase formation in reinforced thermo-
set composites have never been investigated using MD simu-
lations. This work in combination with the previous study [26]
represents the first attempts to do so. In principle, this meth-
odology could be applied to any liquid resin composed of two
or more monomers and any solid surface.
2. Molecular models
2.1. Models of vinyl ester resin monomers
Commercial Derakane 441-400 VE resin (Ashland Co.) with
33 wt.% styrene served as the model resin in this study [10,24].
It has an average of n = 1.62 bisphenol-A groups in the dimeth-
acrylate backbone and an average molecular weight of 690 g/
mol [28]. The general chemical formula of the VE dimethacry-
late monomer and the specific structures for the VE dimethac-
rylates, VE1 and VE2, are shown together with styrene in Fig. 1.
The Derakane 441-400 VE resin composition was a solution of
VE1, VE2 and styrene monomers at a VE1/VE2 mol ratio of 35/
61, which yielded the average value of n = 1.62.
2.2. Model of the oxidized VGCNF surface
VGCNFs are hollow structures composed of conical graphene
sheets arranged in stacked-cup morphology. This is shown in
Fig. 2a and c. For MD simulation purposes, the surface of a
VGCNF was idealized using two overlapping flat graphene
sheets tilted slightly to represent the edge region of the cone
in the known VGCNF stacked-cup microstructure (Fig. 2b and
c) [26]. Flat graphene sheets were used in the MD simulation
because the repeating unit cell size used was 6 · 5 · 6 nm3.
Thus, the 5 · 6 nm2 region shown on the curved, 70–200 nm
diameter nanofiber surface is very close to being planar
(Fig. 2c and d) [26]. Representative oxygen-containing func-
tional groups were manually introduced in a randomly dis-
tributed fashion on the basal plane of the graphene sheets
as shown in Fig. 2b. This is just one example of an oxidized
VGCNF surface. The ratio of the types of oxygenated surface
functional groups could change as the degree of surface oxi-
dation changes. In Fig. 2d, a low level of oxidation damage
to the graphene sheet’s basal plane is shown as circled open-
ings (holes) in the sheet. These occur when oxidation breaks
carbon–carbon bonds during the formation of carboxylic acid,
quinoid carbonyl or phenolic hydroxyl groups, and thereby
destroys the continuous hexagonal ring structure.
Representative oxidized functional groups were manually
introduced along both upper and lower basal planes (sur-
faces). Furthermore, the lateral planes (edges) of the graphene
sheets were similarly oxidized to represent the lateral plane
surface regions of experimentally functionalized VGCNFs.
The concentration of the functional groups generated along
the edges was far higher than in the basal planes, consistent
with the actual rate of oxidation at these locations [12]. The
functional groups introduced along the edges included phe-
nolic hydroxyl, lactone, quinone, hydroquinone, and anhy-
dride functions (Figs. 3 and 4) [12]. Hydroxyl, epoxide,
quinoid carbonyl, and carboxylic acid functional groups were
added to the basal plane of the graphene sheets as shown in
Fig. 5, where the highlighted rings represent surface holes
caused by oxidation damage to the graphene sheets. The
presence of these functional groups was previously confirmed
by Lakshminarayanan et al. [12] for nitric acid-oxidized
VGCNFs and by Gao et al. [29] for the surface of graphite oxide.
Both graphene basal surfaces (Fig. 2b) had oxygen functional
groups added because, as will be described later, the liquid

Fig. 1 – Vinyl ester resin based on bisphenol-A dimethacrylates: (a) general formula based on Derakane 441-400, (b) chemical
structure of VE1 (n = 1), (c) chemical structure of VE2 (n = 2), and (d) styrene.
750 C A R B O N 5 0 ( 2 0 1 2 ) 7 4 8 – 7 6 0
resin in the MD simulation cell was present on both sides of
the graphene sheets.
The contact surfaces between the two overlapping graph-
ene sheets (sheets 1 and 2 in Fig. 2b) were not functionalized,
since in real VGCNFs, the contact area between the stacked
nanocones remains unoxidized. This conclusion is drawn
from an experimental study [12] where VGCNFs were progres-
sively oxidized in refluxing concentrated nitric acid for peri-
ods exceeding 24 h without measurable weight loss.
Temporal X-ray Photoelectron Spectroscopy (XPS) studies
showed that after initial surface oxidation, no further oxida-
tion occurred for VGCNFs. This contrasts with polyacryloni-
trile (PAN)-based continuous fibers which lose weight
continuously as carbon is converted to CO2. If subsurface oxi-
dation could take place, one would expect VGCNFs to progres-
sively oxidize and lose weight. VGCNFs can give ether-type
functions below the surface layers at defects sites [30].
The surface density of the oxygen atoms on a basal plane is
defined as the number of oxygen atoms per unit surface area
of the sheet. The oxygen densities were 1.88 and 1.77/nm2
on sheets 1 and 2 (Fig. 2b), respectively. The average surface
oxygen density on the two surfaces was 1.83/nm2. The total
number of functional groups and the ratio of oxygen (O) to
carbon (C) on the graphene sheet basal planes are shown in
Table 1. The number of functional groups and ratios
O/C = 0.019–0.020 used in this study were chosen to corre-
spond to a low/modest level of basal plane surface oxidation.
For example, XPS data for surface-oxidized VGCNFs has
shown an O/C ratio of 0.16 after 24 h of oxidation in refluxing
2 Accelrys, Inc. http://accelrys.com/products/materials-studio/ (date
HNO3 [12]. This implies that the oxygen density selected for
this work represents a very mild oxidation treatment.
3. The MD simulation details
3.1. The simulation cell
MD simulations were performed using Accelrys� Materials
Studio� V5.0 software.2 A cell of size 60 · 50 · 60 A3 was cre-
ated and overlapping graphene sheets were positioned in
the middle of the simulation cell [26] with an inter-planar dis-
tance of 3.5 A as shown in Fig. 6. This distance is close to the
value of 3.4 A reported by Zhu et al. [31] for fishbone-type car-
bon nanofibers. The sheets were oriented at a small angle
(�9�) relative to the xz-plane of the unit cell (Fig. 6a). Three
dimensional (3D) periodic boundary conditions were em-
ployed. Initially, the oxidized graphene sheet structure was
relaxed in a geometry optimization step. This resulted in an
out-of-plane positioning of some graphene surface carbon
atoms with their attached functional groups (inset in
Fig. 6a) since oxidation converted some graphene carbons
from sp2 (planar) to sp3 (tetrahedral) hybridization. This oc-
curs during epoxide formation and subsequent ring-openings
to hydroxyl groups. Introducing carboxylic acid, quinoid
carbonyls or internal phenolic functional groups generates
‘‘holes’’ in the 2-D hexagonal graphene sheet basal planes
(Figs. 2d and 5). Next, the coordinates of the unoxidized
graphene carbon atoms (not the attached functional groups)
were fixed to prevent graphene sheet distortion and
accessed: June 9, 2011).
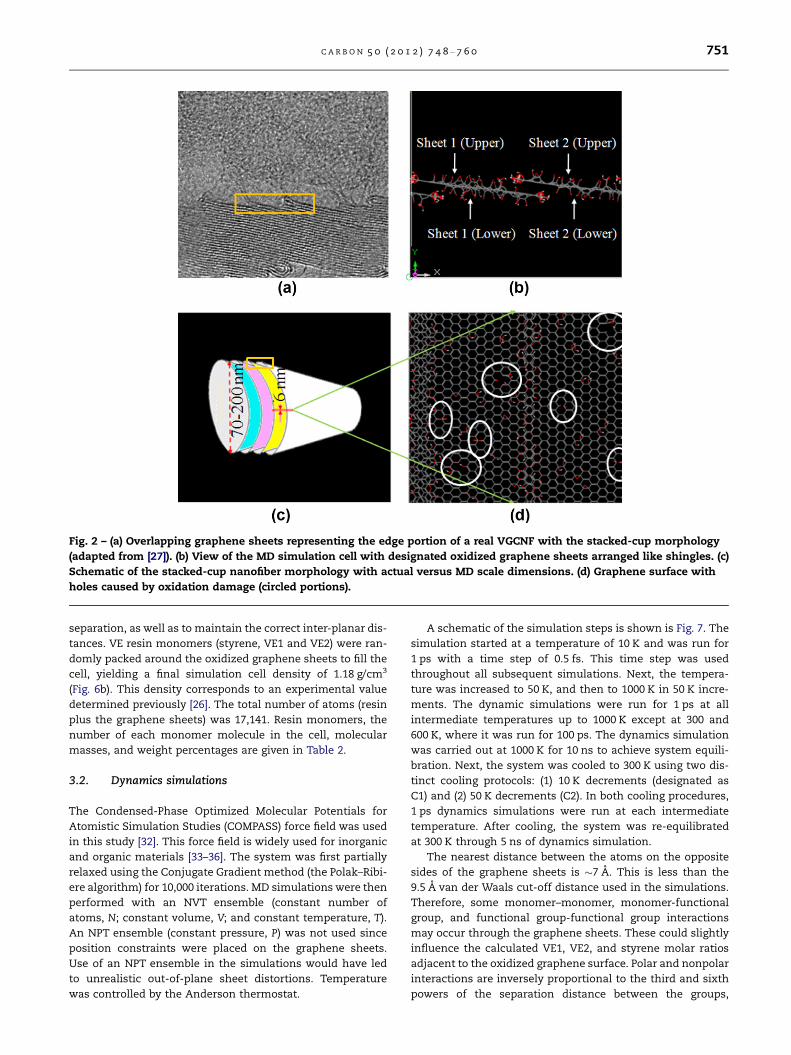
Fig. 2 – (a) Overlapping graphene sheets representing the edge portion of a real VGCNF with the stacked-cup morphology
(adapted from [27]). (b) View of the MD simulation cell with designated oxidized graphene sheets arranged like shingles. (c)
Schematic of the stacked-cup nanofiber morphology with actual versus MD scale dimensions. (d) Graphene surface with
holes caused by oxidation damage (circled portions).
C A R B O N 5 0 ( 2 0 1 2 ) 7 4 8 – 7 6 0 751
separation, as well as to maintain the correct inter-planar dis-
tances. VE resin monomers (styrene, VE1 and VE2) were ran-
domly packed around the oxidized graphene sheets to fill the
cell, yielding a final simulation cell density of 1.18 g/cm3
(Fig. 6b). This density corresponds to an experimental value
determined previously [26]. The total number of atoms (resin
plus the graphene sheets) was 17,141. Resin monomers, the
number of each monomer molecule in the cell, molecular
masses, and weight percentages are given in Table 2.
3.2. Dynamics simulations
The Condensed-Phase Optimized Molecular Potentials for
Atomistic Simulation Studies (COMPASS) force field was used
in this study [32]. This force field is widely used for inorganic
and organic materials [33–36]. The system was first partially
relaxed using the Conjugate Gradient method (the Polak–Ribi-
ere algorithm) for 10,000 iterations. MD simulations were then
performed with an NVT ensemble (constant number of
atoms, N; constant volume, V; and constant temperature, T).
An NPT ensemble (constant pressure, P) was not used since
position constraints were placed on the graphene sheets.
Use of an NPT ensemble in the simulations would have led
to unrealistic out-of-plane sheet distortions. Temperature
was controlled by the Anderson thermostat.
A schematic of the simulation steps is shown is Fig. 7. The
simulation started at a temperature of 10 K and was run for
1 ps with a time step of 0.5 fs. This time step was used
throughout all subsequent simulations. Next, the tempera-
ture was increased to 50 K, and then to 1000 K in 50 K incre-
ments. The dynamic simulations were run for 1 ps at all
intermediate temperatures up to 1000 K except at 300 and
600 K, where it was run for 100 ps. The dynamics simulation
was carried out at 1000 K for 10 ns to achieve system equili-
bration. Next, the system was cooled to 300 K using two dis-
tinct cooling protocols: (1) 10 K decrements (designated as
C1) and (2) 50 K decrements (C2). In both cooling procedures,
1 ps dynamics simulations were run at each intermediate
temperature. After cooling, the system was re-equilibrated
at 300 K through 5 ns of dynamics simulation.
The nearest distance between the atoms on the opposite
sides of the graphene sheets is �7 A. This is less than the
9.5 A van der Waals cut-off distance used in the simulations.
Therefore, some monomer–monomer, monomer-functional
group, and functional group-functional group interactions
may occur through the graphene sheets. These could slightly
influence the calculated VE1, VE2, and styrene molar ratios
adjacent to the oxidized graphene surface. Polar and nonpolar
interactions are inversely proportional to the third and sixth
powers of the separation distance between the groups,
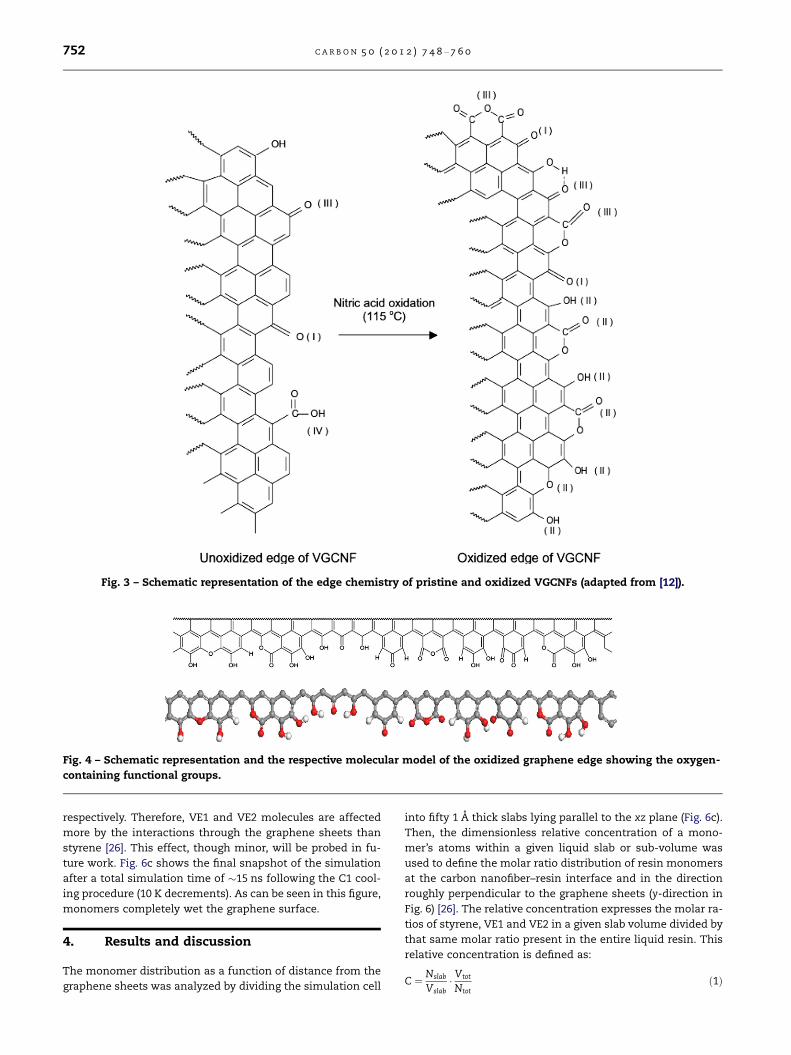
Fig. 3 – Schematic representation of the edge chemistry of pristine and oxidized VGCNFs (adapted from [12]).
Fig. 4 – Schematic representation and the respective molecular model of the oxidized graphene edge showing the oxygen-
containing functional groups.
752 C A R B O N 5 0 ( 2 0 1 2 ) 7 4 8 – 7 6 0
respectively. Therefore, VE1 and VE2 molecules are affected
more by the interactions through the graphene sheets than
styrene [26]. This effect, though minor, will be probed in fu-
ture work. Fig. 6c shows the final snapshot of the simulation
after a total simulation time of �15 ns following the C1 cool-
ing procedure (10 K decrements). As can be seen in this figure,
monomers completely wet the graphene surface.
4. Results and discussion
The monomer distribution as a function of distance from the
graphene sheets was analyzed by dividing the simulation cell
into fifty 1 A thick slabs lying parallel to the xz plane (Fig. 6c).
Then, the dimensionless relative concentration of a mono-
mer’s atoms within a given liquid slab or sub-volume was
used to define the molar ratio distribution of resin monomers
at the carbon nanofiber–resin interface and in the direction
roughly perpendicular to the graphene sheets (y-direction in
Fig. 6) [26]. The relative concentration expresses the molar ra-
tios of styrene, VE1 and VE2 in a given slab volume divided by
that same molar ratio present in the entire liquid resin. This
relative concentration is defined as:
C ¼ Nslab
Vslab� Vtot
Ntotð1Þ

Fig. 5 – Surface functional groups introduced on the overlapping graphene sheets represented for sections of the graphene
and holes caused by oxidation damage to the graphene sheets (bold regions).
Table 1 – The total number of functional groups on the graphene sheet basal planes and their oxygen (O) to carbon (C) ratios.
Number of functional groups O/C ratio Total O/C ratio
Epoxide Hydroxyl Aromatic ketone Carboxylic acid
Sheet 1 upper 2 11 3 1 0.020 0.020Sheet 1 lower 1 11 3 1 0.020Sheet 2 upper 2 10 3 1 0.019 0.019Sheet 2 lower 1 9 3 1 0.019
C A R B O N 5 0 ( 2 0 1 2 ) 7 4 8 – 7 6 0 753
where C is the relative concentration, Nslab is the number of
monomer atoms in the slab volume, Vslab is the slab volume,
Ntot is the total number of monomer atoms in the liquid resin,
and Vtot is the total liquid resin volume in the simulation cell.
Thus, a relative concentration of 1.0 within any slab means
that the ratio of the three monomers (styrene, VE1, and
VE2) in that slab is identical to the molar ratio of these three
monomers within the total liquid resin volume in the simula-
tion cell.
The monomer equilibrium distribution was reached dur-
ing successive MD simulations. The equilibration typically re-
quires long simulation times at lower temperatures.
Therefore, the temperature was increased to 1000 K to accel-
erate the equilibration process in this study (Fig. 7). The sim-
ulations at 1000 K were run for 10 ns and time-averaged
monomer concentration profiles at this temperature were
used to establish system equilibration. The relative monomer
concentrations were determined after each 50 ps of MD sim-
ulation and averaged over each successive 2 ns time interval
to eliminate the normal data fluctuations about the equilib-
rium relative concentrations [26]. Fig. 8a shows the time-aver-
aged styrene concentration profiles at 1000 K during the last
4 ns of the 10 ns simulation (Fig. 7), after the monomer distri-
butions had equilibrated. The relative monomer concentra-
tions go to zero in the domain 22 A < y < 25 A, where the
graphene sheets lie. The two time-averaged concentration

Fig. 6 – (a) View of stacked oxidized graphene sheets
idealizing the surface of an oxidized VGCNF. (b) The periodic
simulation cell randomly packed with liquid VE resin
monomers. (c) Final frame after �15 ns of dynamics
simulation showing a typical 1 A thick sub-volume used in
monomer concentration calculations.
Table 2 – Resin composition in the simulation cell.
Resina
monomerNumber ofmolecules
Molecularmass (au)
wt.%
VE1b 35 512.599 18.1VE2c 61 796.954 49.0Styrene 314 104.152 32.9
a This vinyl ester resin was based on Derakane 441-400 with n = 1.62
(n is the number of bisphenol-A groups in the dimethacrylate’s
backbone).b The dimethacrylate with n = 1.c The dimethacrylate with n = 2.
754 C A R B O N 5 0 ( 2 0 1 2 ) 7 4 8 – 7 6 0
profiles are essentially the same, showing the system has
reached equilibrium, since no appreciable change in the rela-
tive concentrations is evident apart from inherent MD fluctu-
ations [26]. Note that the styrene concentration profile is
nearly symmetric about the mid-plane of the simulation cell
(Fig. 8a). Since resin monomers only wet the outermost
graphene layer of a real carbon nanofiber, the relative styrene
concentration profiles were spatially averaged over both sides
of the idealized graphene sheets (Fig. 8b). Again, the two time-
averaged profiles closely matched, indicating the system had
equilibrated. Similar concentration profiles for VE1 and VE2
monomers were also generated in this fashion.
Once equilibration was reached at 1000 K, the system was
cooled to room temperature (300 K) using cooling procedures
C1 (10 K decrements) and C2 (50 K decrements) to investigate
the effect of cooling rate on the monomer concentration pro-
files and system re-equilibration at 300 K. The temporally and
spatially averaged monomer concentration profiles were
again used to establish the system equilibration. Fig. 9a shows
the styrene concentration profiles obtained over successive
2 ns time intervals during the last 4 ns of the 5 ns simulation
at 300 K following cooling procedure C1. The two concentra-
tion profiles closely matched, suggesting equilibrium was
reestablished at the lower temperature. In order to minimize
random fluctuations about the room temperature equilibrium
concentration profile, subsequent equilibrium concentration
profiles were based upon a temporal average over the entire
5 ns simulation at 300 K. The two cooling procedures only
had a minor impact on the equilibrium monomer concentra-
tions at 300 K. For example, Fig. 9b shows the time-averaged
styrene concentrations profiles obtained after following cool-
ing protocols C1 and C2. The essential character of the two
profiles was the same. Since the concentration profiles ob-
tained following the two cooling procedures represent two
equally valid characterizations of the system’s equilibrium
state, the two concentration profiles were averaged together.
Such an approach is consistent with the ergodic hypothesis.
All concentration profiles presented in the remainder of this
study were determined in this fashion.
Fig. 10a contains the equilibrium concentration profiles for
styrene, VE1, and VE2 monomers. At distances far from the
VGCNF surface, the relative concentrations for the three
monomers were consistent with that of the bulk resin. Near
the nanofiber surface, however, the relative concentrations
of all three monomers showed significant spatial variations
in a �5–10 A thick region surrounding the oxidized graphene
sheets (Fig. 10). For example, the styrene concentration was
about 1.2 times that of the bulk resin in the near surface re-
gion. This is in contrast to a value of 1.4 reported near the sur-
face of a pristine VGCNF [26]. The VE1 concentration was also
slightly greater than 1.2 times its bulk value at about 3 A from
the surface. If these ratios are mostly retained during the
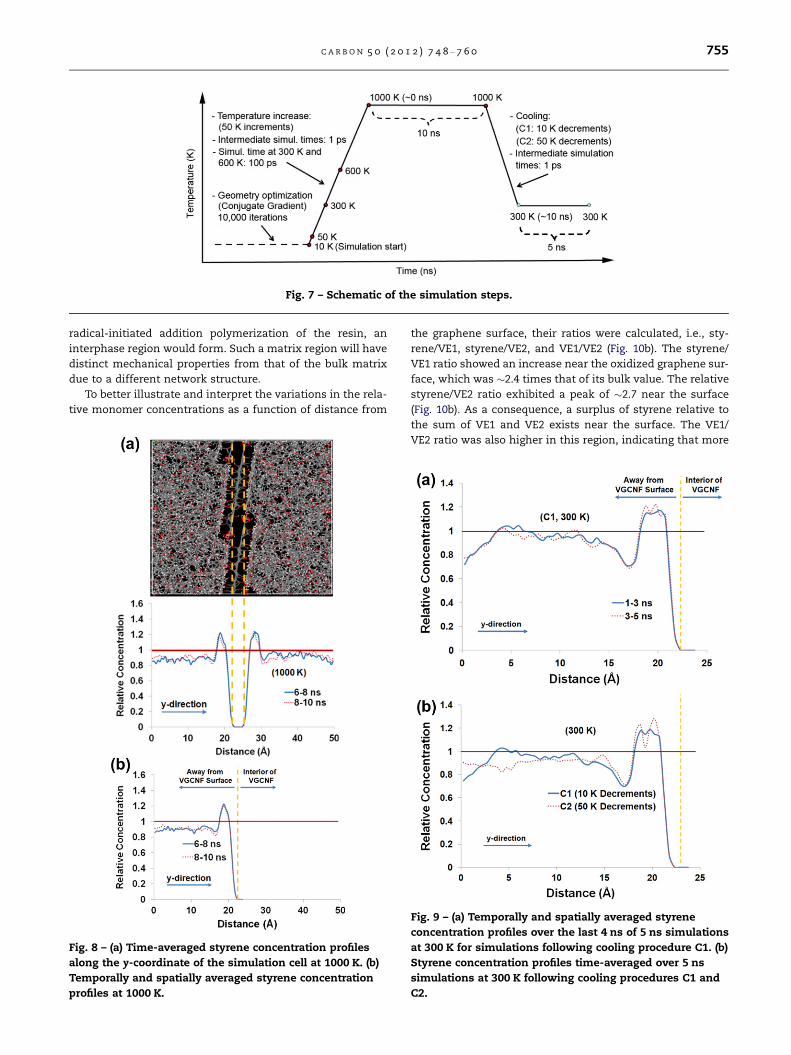
Fig. 7 – Schematic of the simulation steps.
C A R B O N 5 0 ( 2 0 1 2 ) 7 4 8 – 7 6 0 755
radical-initiated addition polymerization of the resin, an
interphase region would form. Such a matrix region will have
distinct mechanical properties from that of the bulk matrix
due to a different network structure.
To better illustrate and interpret the variations in the rela-
tive monomer concentrations as a function of distance from
Fig. 8 – (a) Time-averaged styrene concentration profiles
along the y-coordinate of the simulation cell at 1000 K. (b)
Temporally and spatially averaged styrene concentration
profiles at 1000 K.
the graphene surface, their ratios were calculated, i.e., sty-
rene/VE1, styrene/VE2, and VE1/VE2 (Fig. 10b). The styrene/
VE1 ratio showed an increase near the oxidized graphene sur-
face, which was �2.4 times that of its bulk value. The relative
styrene/VE2 ratio exhibited a peak of �2.7 near the surface
(Fig. 10b). As a consequence, a surplus of styrene relative to
the sum of VE1 and VE2 exists near the surface. The VE1/
VE2 ratio was also higher in this region, indicating that more
Fig. 9 – (a) Temporally and spatially averaged styrene
concentration profiles over the last 4 ns of 5 ns simulations
at 300 K for simulations following cooling procedure C1. (b)
Styrene concentration profiles time-averaged over 5 ns
simulations at 300 K following cooling procedures C1 and
C2.

Fig. 11 – Relative styrene/VE1 concentration ratios at 300 K
along the y-coordinate of the simulation cell for pristine [26]
versus oxidized graphene sheets.
Fig. 12 – Relative styrene/VE2 concentration ratios at 300 K
along the y-coordinate of the simulation cell for pristine [26]
versus oxidized graphene sheets.
Fig. 13 – Relative VE1/VE2 concentration ratios at 300 K
along the y-coordinate of the simulation cell for pristine [26]
versus oxidized graphene sheets.
Fig. 10 – (a) Temporally and spatially averaged monomer
concentration profiles at 300 K. These were averaged over
the two simulations that used cooling procedures C1 and
C2. (b) Relative monomer concentration ratios at 300 K based
on averaged relative concentrations in (a).
756 C A R B O N 5 0 ( 2 0 1 2 ) 7 4 8 – 7 6 0
VE1 accumulates near the graphene surface than VE2. Over-
all, both styrene and VE1 concentrations were enhanced near
the oxidized graphene surface. This could have repercussions
for interphase formation in the cured composite.
The relative monomer distributions (concentration pro-
files) near the oxidized surface were profoundly different
from those for a pristine (unoxidized) VGCNF [26]. To illustrate
these differences, the relative concentration ratios of styrene/
VE1, styrene/VE2, and VE1/VE2 were compared for both oxi-
dized and pristine VGCNF surfaces (Figs. 11–13). For example,
the styrene/VE1 ratio near the oxidized graphene surface is
substantially lower than that for a pristine surface (Fig. 11).
This indicates that less styrene (hydrophobic constituent)
and more VE1 (polar constituent) accumulate near the oxi-
dized nanofiber surface. In contrast, the styrene/VE2 ratio
near the nanofiber surface is slightly higher for the oxidized
case (Fig. 12). This shows that less VE2 accumulation occurs
near the oxidized surface than for a pristine graphene surface
since more of the highly polar VE1 molecules are present near
the oxidized graphene and compete for polar surface sites.
The VE1/VE2 ratio is larger near the oxidized graphene sur-
face than for a pristine surface (Fig. 13), suggesting again that
VE1 is enriched and VE2 is depleted in this region.

C A R B O N 5 0 ( 2 0 1 2 ) 7 4 8 – 7 6 0 757
Overall, both styrene and VE1 accumulate, in higher con-
centrations than their bulk value, near the oxidized graphene
surface (Fig. 10a). This relative styrene concentration (�1.2 in
Fig. 10a) is less than that near the pristine graphene surface
(�1.4 in [26]). The styrene accumulation at the oxidized
graphene occurs in the unoxidized regions of its basal planes.
The VE1 relative concentration is also higher near the oxi-
dized surface than the bulk value (Fig. 10a), in contrast to its
depletion near the pristine surface [26]. Clearly, using oxida-
tion to change the graphene surface chemistry plays a key
role in nanofiber–liquid monomer interfacial interactions,
leading to different monomer molar ratios and concentra-
tions in the region 5–10 A from these surfaces. This should
have consequences for the cured composites.
More VE1 (Fig. 13) in the cured network structure in the
interphase at the oxidized nanofiber surface would enhance
the crosslink density, which implies a stiffer matrix near
the VGCNF surface than that of the bulk. Hence, the inter-
phase adjacent to an oxidized graphene surface would be stif-
fer than that predicted at a pristine surface [26].
Strong polar interactions and hydrogen bonding between
the surface oxygen-containing functions and the oxygen
functions in VE1 and VE2 promote carbon nanofiber–matrix
interfacial adhesion and better interfacial shear strength.
Note that only a portion of the oxidized graphene surface dis-
plays oxygenated groups. Substantial portions of the surface
Fig. 14 – The final distributions of styrene (a and b) and VE1 (c a
graphene surfaces. Regions of high VE1 concentration near the
are non-polar graphene, which interact with styrene and to
a smaller degree with the aromatic rings in VE1 and VE2. This
mildly oxidized (O/C = 0.020) VGCNF surface has strongly per-
turbed the styrene/VE1/VE2 amounts adjacent to the surface.
If the degree of surface oxidation was increased, the near sur-
face monomers ratios would be further changed. One might
expect that substantially higher O/C VGCNF surfaces would
attract less styrene and perhaps more of both VE1 and VE2.
In the future, graphene (idealized VGCNF) surfaces with
various functional groups present at different surface concen-
trations will be studied in a crosslinked VE matrix using
graphene sheet pull-out simulations. These will give esti-
mates of the interfacial shear strength.
Fig. 14 shows the final distribution of styrene and VE1
monomers in the simulation cell for both oxidized and pris-
tine graphene surfaces. Styrene molecules align their phenyl
rings and vinyl group planes with the non-functionalized
regions of the oxidized graphene sheets (Figs. 14a and 15a).
This was also found for the pristine carbon nanofiber surfaces
[26] (Fig. 14b). The styrene phenyl rings were found stacked
both directly eclipsing graphene rings and in off-set (Fig. 15a)
configurations. The alignment of styrene parallel with the
graphene ring structure is due to favorable p–p stacking inter-
actions. These interactions could also exist between the phe-
nyl rings of both VE1 and VE2 bisphenol-A backbones and
graphene. However the –C(CH3)2– group between two phenyl
nd d) monomers for oxidized (left) versus pristine [26] (right)
oxidized graphene surface are marked in (c).
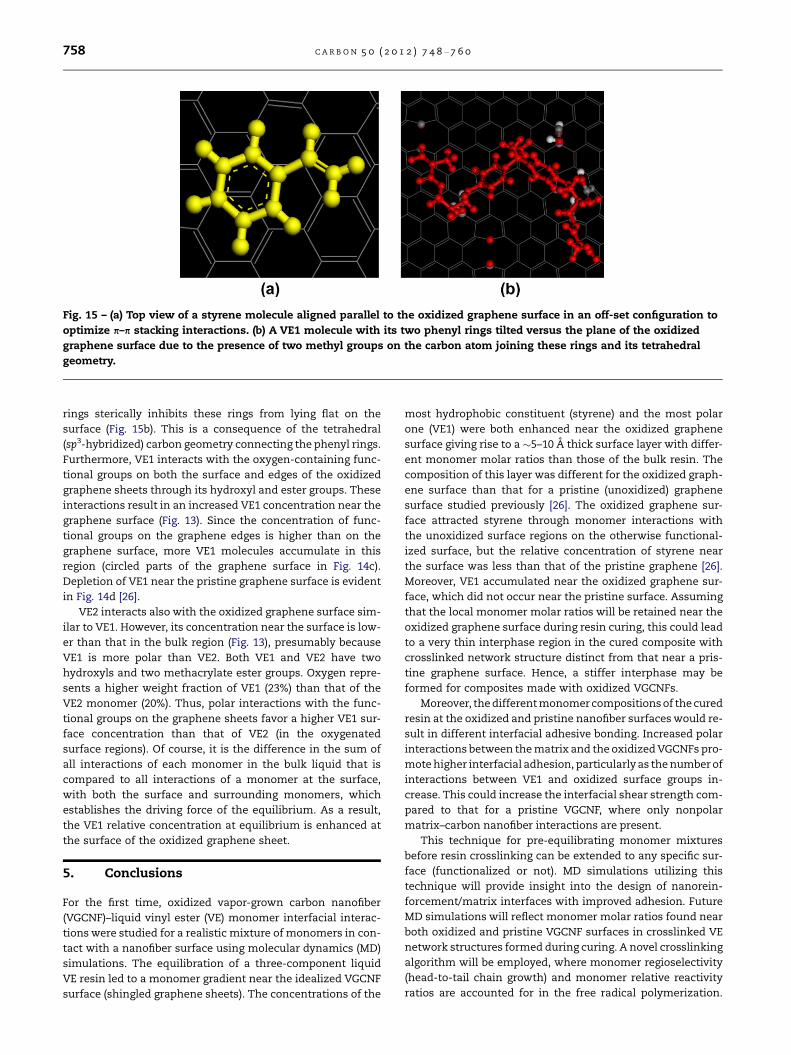
Fig. 15 – (a) Top view of a styrene molecule aligned parallel to the oxidized graphene surface in an off-set configuration to
optimize p–p stacking interactions. (b) A VE1 molecule with its two phenyl rings tilted versus the plane of the oxidized
graphene surface due to the presence of two methyl groups on the carbon atom joining these rings and its tetrahedral
geometry.
758 C A R B O N 5 0 ( 2 0 1 2 ) 7 4 8 – 7 6 0
rings sterically inhibits these rings from lying flat on the
surface (Fig. 15b). This is a consequence of the tetrahedral
(sp3-hybridized) carbon geometry connecting the phenyl rings.
Furthermore, VE1 interacts with the oxygen-containing func-
tional groups on both the surface and edges of the oxidized
graphene sheets through its hydroxyl and ester groups. These
interactions result in an increased VE1 concentration near the
graphene surface (Fig. 13). Since the concentration of func-
tional groups on the graphene edges is higher than on the
graphene surface, more VE1 molecules accumulate in this
region (circled parts of the graphene surface in Fig. 14c).
Depletion of VE1 near the pristine graphene surface is evident
in Fig. 14d [26].
VE2 interacts also with the oxidized graphene surface sim-
ilar to VE1. However, its concentration near the surface is low-
er than that in the bulk region (Fig. 13), presumably because
VE1 is more polar than VE2. Both VE1 and VE2 have two
hydroxyls and two methacrylate ester groups. Oxygen repre-
sents a higher weight fraction of VE1 (23%) than that of the
VE2 monomer (20%). Thus, polar interactions with the func-
tional groups on the graphene sheets favor a higher VE1 sur-
face concentration than that of VE2 (in the oxygenated
surface regions). Of course, it is the difference in the sum of
all interactions of each monomer in the bulk liquid that is
compared to all interactions of a monomer at the surface,
with both the surface and surrounding monomers, which
establishes the driving force of the equilibrium. As a result,
the VE1 relative concentration at equilibrium is enhanced at
the surface of the oxidized graphene sheet.
5. Conclusions
For the first time, oxidized vapor-grown carbon nanofiber
(VGCNF)–liquid vinyl ester (VE) monomer interfacial interac-
tions were studied for a realistic mixture of monomers in con-
tact with a nanofiber surface using molecular dynamics (MD)
simulations. The equilibration of a three-component liquid
VE resin led to a monomer gradient near the idealized VGCNF
surface (shingled graphene sheets). The concentrations of the
most hydrophobic constituent (styrene) and the most polar
one (VE1) were both enhanced near the oxidized graphene
surface giving rise to a �5–10 A thick surface layer with differ-
ent monomer molar ratios than those of the bulk resin. The
composition of this layer was different for the oxidized graph-
ene surface than that for a pristine (unoxidized) graphene
surface studied previously [26]. The oxidized graphene sur-
face attracted styrene through monomer interactions with
the unoxidized surface regions on the otherwise functional-
ized surface, but the relative concentration of styrene near
the surface was less than that of the pristine graphene [26].
Moreover, VE1 accumulated near the oxidized graphene sur-
face, which did not occur near the pristine surface. Assuming
that the local monomer molar ratios will be retained near the
oxidized graphene surface during resin curing, this could lead
to a very thin interphase region in the cured composite with
crosslinked network structure distinct from that near a pris-
tine graphene surface. Hence, a stiffer interphase may be
formed for composites made with oxidized VGCNFs.
Moreover, the different monomer compositions of the cured
resin at the oxidized and pristine nanofiber surfaces would re-
sult in different interfacial adhesive bonding. Increased polar
interactions between the matrix and the oxidized VGCNFs pro-
mote higher interfacial adhesion, particularly as the number of
interactions between VE1 and oxidized surface groups in-
crease. This could increase the interfacial shear strength com-
pared to that for a pristine VGCNF, where only nonpolar
matrix–carbon nanofiber interactions are present.
This technique for pre-equilibrating monomer mixtures
before resin crosslinking can be extended to any specific sur-
face (functionalized or not). MD simulations utilizing this
technique will provide insight into the design of nanorein-
forcement/matrix interfaces with improved adhesion. Future
MD simulations will reflect monomer molar ratios found near
both oxidized and pristine VGCNF surfaces in crosslinked VE
network structures formed during curing. A novel crosslinking
algorithm will be employed, where monomer regioselectivity
(head-to-tail chain growth) and monomer relative reactivity
ratios are accounted for in the free radical polymerization.

C A R B O N 5 0 ( 2 0 1 2 ) 7 4 8 – 7 6 0 759
Furthermore, interfacial shear strengths in VGCNF/VE nano-
composites will be calculated by VGCNF pull-out simulations
from crosslinked VE matrices containing interphases. These
studies may facilitate multiscale materials design by providing
insight into molecular level nanofiber–matrix interactions
leading to improved macroscale composite properties.
This work strengthens the important concept that liquid
structure is sensitive to an interface only in a region very
close to that interface. The liquid monomer structure in this
work reaches that of the bulk within very short distances
(�5–10 A) from the interface [37]. This generalization has re-
cently been proved for pure water at the air–water interface,
where water’s structure reaches that of the bulk within 3 A
of this interface. Thus, the water ‘‘memory effect’’ [38,39]
and the notion that long-range order can be induced in
water by an interface are now unacceptable [40,41]. For our
solution of nonpolar styrene and mildly polar VE1 and VE2,
changes in the monomer ratio and liquid structure also only
persist short distances (<10 A) from the two interfaces stud-
ied. This result is consistent with the prevalent view that
interphase formation is minimal in carbon fiber/thermoset
resin composites.
Acknowledgments
This work was sponsored by the US Department of Energy un-
der Contract DE-FC26-06NT42755. Special thanks go to William
Joost, Department of Energy’s technology area development
manager.
R E F E R E N C E S
[1] Hussain F, Hojjati M, Okamoto M, Gorga RE. Review article:polymer–matrix nanocomposites, processing,manufacturing, and application: an overview. J ComposMater 2006;40(17):1511–75.
[2] Carneiro OS, Covas JA, Bernardo CA, Caldeira G, van HattumFWJ, Ting J-M, et al. Production and assessment ofpolycarbonate composites reinforced with vapor growncarbon fibers. Compos Sci Technol 1998;58:401–7.
[3] Choi Y-K, Sugimoto K, Song S-M, Gotoh Y, Ohkoshi Y, Endo M.Mechanical and physical properties of epoxy compositesreinforced by vapor grown carbon nanofibers. Carbon2005;43:2199–208.
[4] Choi Y-K, Sugimoto K, Song S-M, Endo M. Production andcharacterization of polycarbonate composite sheetsreinforced with vapor grown carbon fiber. Compos Part A2006;37(11):1944–51.
[5] Zhou Y, Pervin F, Jeelani S. Effect of vapor grown carbonnanofiber on thermal and mechanical properties of epoxy. JMater Sci 2007;42:7544–53.
[6] Ren X, Wang XQ, Sui G, Zhong WH, Fuqua MA, Ulven CA.Effects of carbon nanofibers on crystalline structures andproperties of ultrahigh molecular weight polyethylene blendfabricated using twin-screw extrusion. J Appl Polym Sci2008;107:2837–45.
[7] Faraz MI, Bhowmik S, De Ruijter C, Laoutid F, Benedictus R,Dubois Ph, et al. Thermal, morphological, and mechanicalcharacterization of novel carbon nanofiber-filledbismaleimide composites. J Appl Polym Sci2010;117(4):2159–67.
[8] Lee S, Kim M-S, Ogale AA. Influence of carbon nanofiberstructure on properties of linear low density polyethylenecomposites. Polym Eng Sci 2010;50(1):93–9.
[9] Chavez-Medellın R, Sanchez de Almeida Prado LA, Schulte K.Polyamide-12/functionalized carbon nanofiber composites:evaluation of thermal and mechanical properties. MacromolMater Eng 2010;295(4):397–405.
[10] Nouranian S, Toghiani H, Lacy TE, Pittman Jr CU, Dubien J.Dynamic mechanical analysis and optimization of vapor-grown carbon nanofiber/vinyl ester nanocomposites usingdesign of experiments. J Compos Mater 2010. doi:10.1177/002199831038502.
[11] Tibbetts GG, Lake ML, Strong KL, Rice BP. A review of thefabrication and properties of vapor-grown carbon nanofiber/polymer composites. Compos Sci Technol 2007;67(7–8):1709–18.
[12] Lakshminarayanan PV, Toghiani H, Pittman CU. Nitric acidoxidation of vapor grown carbon nanofibers. Carbon2004;42:2422–33.
[13] Li J, Vergne MJ, Mowles ED, Zhong W-H, Hercules DM,Lukehart CM. Surface functionalization and characterizationof graphitic carbon nanofibers (GCNFs). Carbon2005;43(14):2883–93.
[14] Rasheed A, Dadmun MD, Britt PF. Polymer–nanofibercomposites: enhancing composite properties by nanofiberoxidation. J Polym Sci Part B 2006;44(21):3053–61.
[15] Klein KL, Melechko AV, McKnight TE, Retterer ST, Rack PD,Fowlkes JD, et al. Surface characterization andfunctionalization of carbon nanofibers. J Appl Phys2008;103(6):061301–26.
[16] Drzal LT. The interphase in epoxy composites. In: Dusek K,Drzal LT, editors. Epoxy resins and composites II. Berlin,Germany: Springer; 1986. p. 1–32.
[17] Palmese GR. Origin and influence of interphase materialproperty gradients in thermosetting composites. Newark DEUSA, University of Delaware, PhD dissertation; 1991.
[18] Vaia RA, Giannelis EP. Polymer nanocomposites: status andopportunities. Mater Res Soc Bull 2001:394–401.
[19] Jancar J. Review of the role of the interphase in the control ofcomposite performance on micro- and nano-length scales. JMater Sci 2008;43:6747–57.
[20] Jancar J. Interphase phenomena in polymer micro- andnanocomposites. In: Karger-Kocsis J, Fakirov S, editors. Nano-and micro-mechanics of polymer blends andcomposites. Cincinnati, OH: Hanser Publications; 2009. p.241–66.
[21] Schadler LS, Brinson LC, Sawyer WG. Polymernanocomposites: a small part of the story. JOM 2007:53–60.
[22] Ramanathan T, Liu H, Brinson LC. Functionalized SWNT/polymer nanocomposites for dramatic propertyimprovement. J Polym Sci Polym Phys 2005;43(17):2269–79.
[23] Saber-Samandari S, Afaghi Khatibi A. The effect ofinterphase on the elastic modulus of polymer basednanocomposites. Key Eng Mater 2006;312:199–204.
[24] Ciprari D, Jacob K, Tannenbaum R. Characterization ofpolymer nanocomposite interphase and its impact onmechanical properties. Macromolecules 2006;39(19):6565–73.
[25] Ramanathan T, Abdala AA, Stankovich S, Dikin DA, Hererra-Alonso M, Piner RD, et al. Functionalized graphene sheets forpolymer nanocomposites. Nat Nanotechnol 2008;3:327–31.
[26] Nouranian S, Jang C, Lacy TE, Gwaltney SR, Toghiani H,Pittman Jr CU. Molecular dynamics simulations of vinyl esterresin monomer interactions with vapor-grown carbonnanofiber and their implications for composite interphaseformation. Carbon 2011;49(10):3219–32.
[27] Endo M, Kim YA, Hayashi T, Yanagisawa T, Muramatsu H,Ezaka M, et al. Microstructural changes induced in ‘‘Stacked

760 C A R B O N 5 0 ( 2 0 1 2 ) 7 4 8 – 7 6 0
Cup’’ carbon nanofibers by heat treatment. Carbon 2003;41:1941–7.
[28] Li H. Synthesis, characterization, and properties of vinyl estermatrix resins. Blacksburg, VA, USA: Virginia PolytechnicInstitute and State University, PhD dissertation; 1998.
[29] Gao W, Alemany LB, Ci LJ, Ajayan PM. New insights into thestructure and reduction of graphite oxide. Nat Chem2009;1(5):403–8.
[30] Ros TG, van Dillen AJ, Geus JW, Koningsberger DC. Surfaceoxidation of carbon nanofibers. Chem Eur J 2002;8(5):1151–62.
[31] Zhu YA, Sui ZJ, Zhao TJ, Dai YC, Cheng ZM, Yuan WK.Modeling of fishbone-type carbon nanofibers: a theoreticalstudy. Carbon 2005;43:1694–9.
[32] Sun H. COMPASS: an ab initio force-field optimized forcondensed-phase applications: overview with details onalkane and benzene compounds. J Phys Chem B1998;102(38):7338–64.
[33] Rigby D, Sun H, Eichinger BE. Computer simulations ofpoly(ethylene oxide): force field, PVT diagram and cyclizationbehavior. Polym Int 1997;44:311–30.
[34] Bunte SW, Sun H. Molecular modeling of energetic materials:the parameterization and validation of nitrate esters in theCOMPASS force field. J Phys Chem B 2000;104:2477–89.
[35] McQuaid MJ, Sun H, Rigby D. Development and validation ofCOMPASS force field parameters for molecules with aliphaticazide chains. J Comput Chem 2004;25(1):61–71.
[36] Zhao L, Liu L, Sun H. Semi-ionic model for metal oxides andtheir interfaces with organic molecules. J Phys Chem C2007;111:10610–7.
[37] Stiopkin IV, Weeraman C, Pieniazek PA, Shalhout FY, SkinnerJL, Benderskii AV. Hydrogen bonding at the water surfacerevealed by isotopic dilution spectroscopy. Nature2011;474:192–5.
[38] Dayenas E, Beauvais F, Amara J, Oberbaum M, Robinzon B,Miadonna A, et al. Human basophil degranulation triggeredby very dilute antiserum against IgE. Nature 1988;333:816–8.
[39] Ball P. Here lies one whose name was writ in water. Nature2007. doi:10.1038/news070806-6.
[40] Jungwirth P. Physical chemistry: water’s wafer-thin surface.Nature 2011;474:168–9.
[41] Zheng JM, Chin W-C, Khijniak E, Khijniak Jr E, Pollack GH.Surfaces and interfacial water: evidence that hydrophilicsurfaces have long-range impact. Adv Colloid Interface Sci2006;127:19–27.
Copyright © 2022 FDOKUMEN