Molecular dynamics and structure of solids - US Government ...
592
mmiwmmR. m.
-
Upload
khangminh22 -
Category
Documents
-
view
1 -
download
0
Transcript of Molecular dynamics and structure of solids - US Government ...
mmiwmmR. m.


UNITED STATES DEPARTMENT OF COMMERCEMaurice H. Stans, Secretary
NATIONAL BUREAU OF STANDARDS • A. V. Astin, Director
and Structure of Solids
Edited by
R. S. Carter and J. J. Rush
Institute for Materials Research
National Bureau of Standards
Washington, D.C. 20234
Based on Invited and Contributed Papers
2nd Materials Research Symposium
held at the NBS, Gaithersburg, Maryland
October 16-19, 1967
National Bureau of Standards Special Publication 301
Nat. Bur Stand. (U.S.), Spec. Publ. 301, 571 pages, (June 1969)
Molecular Dynamics
CODEN : XNBSA
Issued June 1969
For sale by the Superintendent of Documents, U.S. Government Printing Office
Washington, D.C. 20402 - Price $4.00
"WVW. BlfflBUI OF STAMBftRDS
JUL < 3 19G9
144423
fv/o. 3D /
Foreword
The purpose of the annual symposia of the Institute for Materials
Research of the National Bureau of Standards is to provide a forum
for the presentation and exchange of information on the properties
of materials and the development and improvement of measurementtechniques.
"Molecular Dynamics and Structure of Solids," the second
annual symposium of the Institute for Materials Research was held
October 16-19, 1967 in the NBS laboratories at Gaithersburg, Mary-land, and was attended by 250 university, government and industrial
scientists from both the United States and abroad.
A major goal of the symposium was the encouragement of inter-
disciplinary cooperation in the study of the basic structural anddynamical properties of molecular solids. Such cooperation is essential
if we hope to achieve a proper understanding and utilization of these
materials. Topics and speakers were selected to demonstrate the
correlation of various experimental techniques and the information
they provide. This book, which documents the proceedings of the
symposium, includes the complete text of invited lectures as well as
summaries of the contributed papers and related discussions.
J. D. Hoffman, Director
Institute for Materials Research
National Bureau of Standards
C. O. MUEHLHAUSE,General Chairman of the Symposium
in

Preface
This book represents the formal report of the second materials
research symposium of the NBS Institute for Materials Research,
which was held at the National Bureau of Standards from October16-19, 1967. These symposia are intended to bring together author-
ities and workers in important areas of basic and applied materials
research to provide an opportunity for communication of results andexchange of ideas and to assess current progress and future goals
in such areas.
The subject of the symposium whose proceedings are presented
here was "Molecular Dynamics and Structure of Solids." In the
last decade there has been a virtual explosion of information on the
basic dynamical and structural properties of molecular materials,
which has been derived by a variety of spectroscopic and diffraction
techniques, both new and old. The purpose of this symposium wasto demonstrate and emphasize the correlation of the information
obtained by the various experimental methods, while providing a
review and discussion of important recent progress in the field of
molecular solids. In this way it was hoped to stimulate among the
participants, as well as readers of this book, a wider appreciation
of techniques outside their own specialties and through this to
encourage interdisciplinary cooperation.
The present volume contains the full text of the manuscripts
on which invited lectures were based as well as summaries of all
the contributed papers given at the symposium. The first part of
the book provides, through a series of invited papers, an extensive
introduction to the theory and practice of the major experimental
techniques applied to the study of the molecular dynamics and
structure of solids. These papers cover the fields of x-ray and neutron
diffraction, infrared and Raman spectroscopy, neutron inelastic
scattering and nuclear magnetic resonance spectroscopy. The rest
of the volume is comprised of invited and contributed papers which
discuss important recent work on lattice and molecular dynamics
and molecular crystal structure. The results presented cover a wide
range of molecular solids, including inorganic and organic crystals,
hydrogen-bonded systems and polymers.
We believe that this volume clearly demonstrates the great
advances which are being and can be made toward an understanding
of the basic properties and intermolecular forces of solids through a
complementary application of a variety of experimental methods.
v
PREFACE
The success of the symposium was made possible only because
of the cooperation and enthusiasm of many people in the Institute
for Materials Research and the National Bureau of Standards.
Special thanks are due to Dr. V. W. Myers, Assistant General Chair-
man; Mr. F. J. Shorten, Arrangements Chairman; and Mr. H. T.
Yolken, Social Chairman, for the symposium. The Program Commit-tee members are to be commended for creating an excellent programand also for their advice and assistance in preparing manuscripts for
publication in this book.
Although the entire staff of the NBS Office of Technical Informa-
tion and Publications were particularly helpful in organizing andconducting the symposium, much expert assistance and advice were
received from Messrs. W. R. Tilley, R. T. Cook, and G. T. Leighty.
Mr. J. E. Carpenter advised on publishing the proceedings.
Finally, the editors wish to thank the many people who assisted
in the various phases of the symposium and especially the preparation
of these proceedings. In this regard, special recognition is extended
to Mrs. Rosanne Dutrow who served as secretary, Miss Sandra
Beall and Mrs. C. S. Damron who typed the manuscripts, and
Mr. F. J. Shorten who coordinated the publication.
R. S. Carter
J. J. RushMay 15, 1968
VI
I
Abstract
This volume is based on material presented at the Second Materials Re-
search Symposium of the National Bureau of Standards, held October 16-19,
1967. It provides a review of the application of spectroscopic and diffraction
techniques to the study of the structure and dynamics of molecular solids. In-
vited papers on the theory and practice of the major experimental methods,
including neutron and x-ray diffraction, neutron inelastic scattering, infrared
and Raman spectroscopy and nuclear magnetic resonance, serve as a backgroundfor the more detailed presentation and discussion of results which follows. Thetopics covered in a series of invited and contributed papers include the lattice
dynamics of molecular crystals, the spectroscopy and crystal structure of organic
and inorganic solids and the dynamics of polymers.
Key Words: Molecular solid, crystal, polymer, molecular dynamics, lattice
dynamics, crystal structure, rotation, vibration, spectroscopy,
diffraction.
Library of Congress Catalog Card Number: 68-61721
vn

ContentsPage
Foreword 111
Preface v
INTRODUCTORY LECTURES
Theoretical Basis of Techniques for the Investigation of MolecularDynamics and Structure of Solids*
Elliott Montroll 3
The Contributions of Neutron and X-Ray Diffraction Techniques*
G. E. Bacon 57
Infrared and Raman Studies on Molecular Structure and Motion in Con-densed Phases*
G. R. Wilkinson 77
Neutron Inelastic Scattering Studies of Molecular Solids and Liquids*
P. A. Egelstaff 135
The Principles Involved in the Study of Molecular Motion in Solids byNuclear Magnetic Resonance*
R. E. Richards, F.R.S 157
STRUCTURE AND SPECTROSCOPY OF INORGANIC CRYSTALS
Spectroscopic and Diffraction Studies of Simple Hydrogen Bonds in Solids*
James A. Ibers 177
Structure and Dynamics in Molecular Crystals: Some Comparisons*Walter C. Hamilton 193
Dynamical Effects of Deuteron Intrabond Jumping in KD 2P0 4
V. Hugo Schmidt 219
The Detection of Atom Tunnelling in Solids
I. Pelah and Y. Imry 223
Proton Derealization in Inorganic Solids
J. J. Fripiat, P. G. Rouxhet, H. Jacobs, and A. Jelli 227
Structure Refinements, Thermal Motion and Madelung Constants of
Cdl2- and Cd(OH)2-Type Layer StructuresY. M. de Haan 233
The Aquated Hydrogen Ion: Single Crystal Diffraction Investigations of
Compounds Containing the (H 20-H-OH 2)+ Ion
Jack M. Williams 237
Infrared Investigation of Ordering and Structural Changes in AmmoniumHalides
C. W. Garland and N. E. Schumaker 241
*Invited papers.
IX
CONTENTS
Nuclear Magnetic Resonance and Neutron-Scattering Studies of Hindered Paee
Rotation in Phosphonium Iodide
T. C. Farrar and J. J. Rush 245
A Neutron Diffraction Study of Lithium Perchlorate TrihydrateA. Sequeira and Ivan Bernal 249
The Structure of Several Uranyl Nitrate Compounds as Determined byNeutron Diffraction
M. H. Mueller and N. Kent Dalley 253
Infrared Spectral Studies as a Tool for Sensing the Environment AboutWater Molecules in Hydrates
J. Schiffer and D. F. Hornig 257
Nuclear Magnetic Resonance Studies of Molecular Motion in ClathrateHydrates
C. A. McDowell and P. Raghunathan 261
Calculation and Analysis of Pulsed-NMR Line Shapes of Crystals
Marcel Kopp 265
The Vapor Pressure of CO/N2 Solid Solutions
J. A. Morrison, D. M. T. Newsham, and R. D. Weir 269
Structural Study of Ti509
L. K. Keys 273
Significance of Weighting Schemes in an Anisotropic Least Squares Re-finement of Ruby
J. W. McCauley and G. V. Gibbs 277
The Crystal Structure of C3Al2 .,B 51 (AlBio)
A. J. Perrotta, W. D. Townes, and J. A. Potenza 283
LATTICE DYNAMICS
Lattice Dynamics of Molecular Solids*
Gerald Dolling 289
Epithermal Neutron Inelastic Scattering from Metal HydridesS. S. Pan, M. L. Yeater, and W. E. Moore 315
Vibration Spectra of Hydrides Possessing the Cubic Perovskite Structure
by the Inelastic Scattering of Cold NeutronsArnulf J. Maeland 319
Absorption of Light by the Sound Waves of Orientationally DisorderedCrystals
E. Whalley 323
Lattice Vibrations in Some Simple Molecular Crystals
J. C. Laufer, J. E. Cahill, and G. E. Leroi 327
The Optical and Anharmonic Thermal Properties of a Diatomic Molecu-lar Solid
George E. Jelinek 331
Neutron Scattering Studies of Molecular Vibrations in Ice
H. Prask and H. Boutin 335
Invited paper,
x
CONTENTS
Infrared Absorption Studies of Intermolecular Vibrations in the Low Pa£e
Frequency RegionNeil T. McDevitt, R. E. Witkowski, and W. G. Fateley 339
Optical Phonons in Mixed Sodium Potassium Tantalates
T. G. Davis, N. E. Tornberg, C. H. Perry and N. Enable 343
On the Second Order Elastic Constants of Molecular Solids
M. L. Klein 349
STRUCTURE OF ORGANIC CRYSTALS
Diffraction Studies of Molecular Dynamics in Organic Crystals*
K. N. Trueblood 355
Information on Molecular Motion Derived From Anisotropic TemperatureFactor Coefficients
Carroll K. Johnson 381
Influence of Bonding Effects on Thermal Parameters as Determined byX-ray Diffraction
Philip Coppens 385
High Pressure Crystal Structure of Metal Free PhthalocyanineR. S. Kirk 389
X-Ray Diffraction and Radiofrequency Spectroscopic Investigation of
Dimethyltin Dichloride
Jack D. Graybeal and Domnic A. Berta 393
The Crystal and Molecular Structure of Tetraethylammonium Bis- (3) -1,2-
Dicarbollylcuprate (II)
Richard M. Wing 397
Nuclear Magnetic Resonance Studies of Single Crystals of Trichloroacetic
AcidDavid C. Haddix and Paul C. Lauterbur 403
Thermal and Composition Expansion of Clathrates in the Ethylene Oxide-Water System
J. A. McIntyre and D. R. Petersen 407
SPECTROSCOPY OF ORGANIC CRYSTALS
Nuclear Magnetic Resonance and Molecular Motion in Organic Crystals*
E. R. Andrew 413
Far Infrared Spectra and Space Group of Crystalline Hydrazine andHydrazine^
F. G. Baglin, S. F. Bush, and J. R. Durig 437
Molecular Rotation in Condensed Phases of Simple MoleculesM. Blumenfeld 441
Correlation of Infrared and Inelastic Neutron Scattering Spectra of Solid
MethaneAshok K. Agrawal and Sidney Yip 449
* Invited paper.
XI
CONTENTS
Theory of Phase Transitions in Solid MethanesTsunenobu Yamamoto, Yosuke Kataoka, and Hideo Yasuda 453
NMR Relaxation in Adamantane and Hexamethylenetetramine: Molec-ular Rotation and Diffusion
H. A. Resing 457
Thermodynamic Approach to Molecular Freedom, Especially in Plastically
Crystalline SubstancesElgar F. Westrum, Jr 459
Spectral Assignment in Inelastic Neutron Scattering Spectroscopy byAtomic Substitution Techniques
J. W. White 463
Anisotropic Lattice Dynamic Studies of Organo-Tin Compounds by Moss-bauer SpectroscopyHans A. Stockler and Hirotoshi Sano 469
DYNAMICS OF POLYMERS
Relaxation in Solid Polymers*David W. McCall 475
Low Frequency Vibrations in PolyethyleneW. R. Myers and P. H. Randolph 539
Neutron Scattering in Deuterated Polyethylene
L. A. Feldkamp and J. S. King 543
Epithermal Neutron Inelastic Scattering by Polyethylene
W. E. Moore, G. J. Kirouac, L. J. Esch, K. W. Seemann, andM. L. Yeater 547
The Vibrational Properties of PolyoxymethyleneS. F. Trevino and V. E. LaGarde 553
Vibration Spectra of PolyglycineV. D. Gupta, S. Trevino, and H. Boutin 559
Thermal Conductivity and Specific Heat of Amorphous Polymers Between0.4 and 4 °K
C. L. Choy, G. L. Salinger, and Y. C. Chiang 567
APPENDIX I—Symposium Committees 571
* Invited paper.
XII

INTRODUCTORY LECTURES

THEORETICAL BASIS OF TECHNIQUES FOR THEINVESTIGATION OF MOLECULAR DYNAMICS
AND STRUCTURE OF SOLIDS
ELLIOTT W. MONTROLL
University of Rochester, Rochester, New York 14627
The purpose of this introductory lecture is to review the basic
ideas behind several experimental techniques employed in the in-
vestigation of the structure and molecular dynamics of solids. In the
time allotted, I can hardly do more than drop a few names of topics
and of the individuals who have developed them.
Unfortunately, the only man who could have given a masterful
performance with such an assignment, Peter J. W. Debye, is no longer
with us. For almost sixty years, from his early youth until his dying
day, his imaginative, clearly presented investigations, as well as his
dynamic personal enthusiasm, made his contributions to the subject
of this conference greater than those of any other individual. Debye's
Ph.D. thesis was concerned with light scattering, as were his last
papers. This is not to imply that his career was spent rewriting his
doctor's thesis. While his fundamental papers on scattering of light,
x-rays, electrons and sound are all of great importance in the develop-
ment of our subject, his research on lattice dynamics, polar molecules,
electrolytes, magnetic cooling, transport processes, and properties of
polymers are of at least equal importance. His work and style havealways been an inspiration to me and I wish to dedicate this review
to his memory.
1. Thermodynamic Properties [1]1
1.1. Information Available and not Available in Heat CapacityMeasurements
While the variations of thermodynamic quantities with temperature,
pressure, density, external magnetic field, etc., reflect only the large
scale average behavior of a sample, they are important in indicating
drastic changes in the long range order of a system which occur during
phase transitions. When molecular interactions in a solid are described
through a small number of parameters, thermodynamic data yield
estimates of these parameters.
'Figures in brackets indicate the literature references at the end of this paper.
3
4 MOLECULAR DYNAMICS AND STRUCTURE OF SOLIDS
Theoretically, the thermodynamic properties of any substance are
derivable from its Hamiltonian H, which, of course, contains the
detailed laws of interaction between its various microscopic degrees
of freedom. The first step in the derivation of formulas for these
properties is to calculate the partition function
Z= trace exp(—0H) with (3=l/TkB (1)
kB being the Boltzmann constant. The internal energy and heat
capacity (with a quantity x held constant) follow from well knownstatistical mechanical formulas (x might be volume, pressure, external
magnetic field strength, etc.)
E=-dlogZ/d(3, Cx=(dE/dT) x (2)
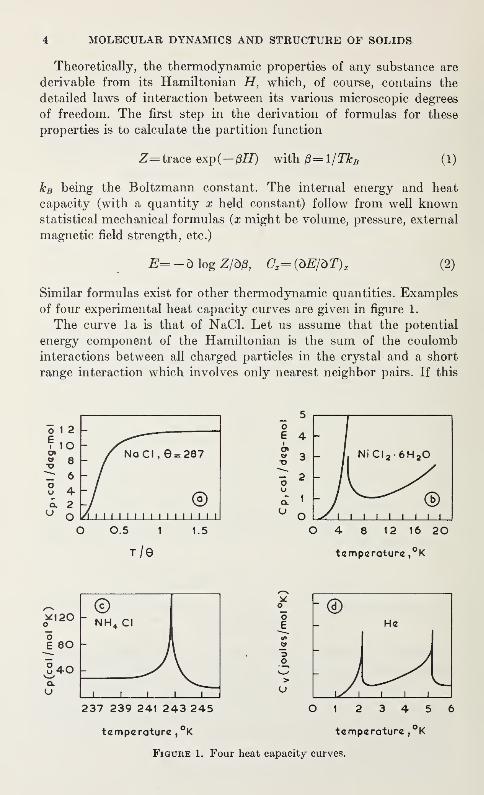
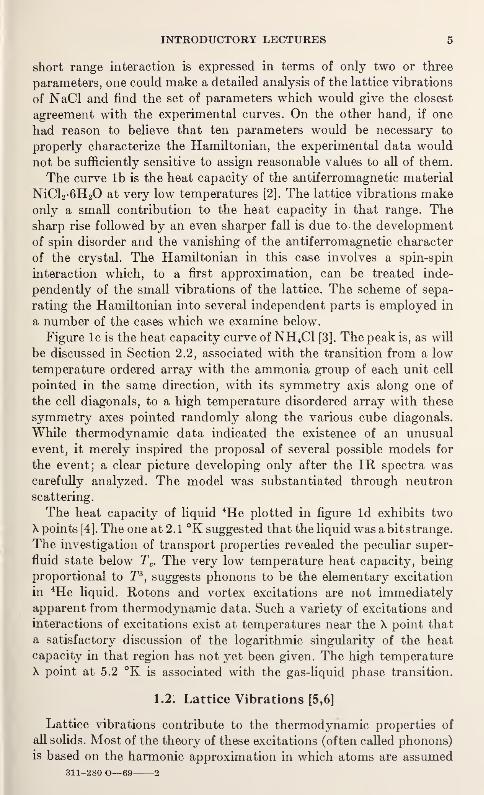
Similar formulas exist for other thermodynamic quantities. Examples
of four experimental heat capacity curves are given in figure 1.
The curve la is that of NaCl. Let us assume that the potential
energy component of the Hamiltonian is the sum of the coulomb
interactions between all charged particles in the crystal and a short
range interaction which involves only nearest neighbor pairs. If this
temperature ,°K temperature ,°K
Figure 1. Four heat capacity curves.
INTRODUCTORY LECTURES 5
short range interaction is expressed in terms of only two or three
parameters, one could make a detailed analysis of the lattice vibrations
of NaCl and find the set of parameters which would give the closest
agreement with the experimental curves. On the other hand, if one
had reason to believe that ten parameters would be necessary to
properly characterize the Hamiltonian, the experimental data would
not be sufficiently sensitive to assign reasonable values to all of them.
The curve lb is the heat capacity of the antiferromagnetic material
NiCl 2-6H 20 at very low temperatures [2]. The lattice vibrations makeonly a small contribution to the heat capacity in that range. Thesharp rise followed by an even sharper fall is due to the development
of spin disorder and the vanishing of the antiferromagnetic character
of the crystal. The Hamiltonian in this case involves a spin-spin
interaction which, to a first approximation, can be treated inde-
pendently of the small vibrations of the lattice. The scheme of sepa-
rating the Hamiltonian into several independent parts is employed in
a number of the cases which we examine below.
Figure lc is the heat capacity curve of NH4C1 [3]. The peak is, as will
be discussed in Section 2.2, associated with the transition from a low
temperature ordered array with the ammonia group of each unit cell
pointed in the same direction, with its symmetry axis along one of
the cell diagonals, to a high temperature disordered array with these
symmetry axes pointed randomly along the various cube diagonals.
While thermodynamic data indicated the existence of an unusual
event, it merely inspired the proposal of several possible models for
the event; a clear picture developing only after the IR spectra wascarefully analyzed. The model was substantiated through neutron
scattering.
The heat capacity of liquid 4He plotted in figure Id exhibits twoX points [4]. The one at 2. 1 °K suggested that the liquid was a bit strange.
The investigation of transport properties revealed the peculiar super-
fluid state below Tc . The very low temperature heat capacity, being
proportional to T3,suggests phonons to be the elementary excitation
in 4He liquid. Rotons and vortex excitations are not immediately
apparent from thermodynamic data. Such a variety of excitations andinteractions of excitations exist at temperatures near the X point that
a satisfactory discussion of the logarithmic singularity of the heat
capacity in that region has not yet been given. The high temperature
X point at 5.2 °K is associated with the gas-liquid phase transition.
1.2. Lattice Vibrations [5,6]
Lattice vibrations contribute to the thermodynamic properties of
all solids. Most of the theory of these excitations (often called phonons)
is based on the harmonic approximation in which atoms are assumed311-280 O—69 2
6 MOLECULAR DYNAMICS AND STRUCTURE OF SOLIDS
to suffer only small displacements from their equilibrium positions.
The potential energy is chosen to be a quadratic form in the displace-
ments of the various atoms from these equilibrium positions. Theindividual motions can be expressed as a linear combination of
independent normal modes of vibration. A frequency co is associated
with each of these normal modes so that in a crystal composed of Nunit cells with r atoms in each cell, there are 3rN frequencies. If
g(u>) doi is the fraction of these in the range between co and u-\-du, then
the contribution of the lattice vibrations to the heat capacity at
constant volume is
Cp=SrNkBj gf(w) (M) 2 csch2(foo0) du (3)
The determination of the frequency spectrum gf(co) follows from the
dynamical matrix of the crystal, a quantity which is derived from
the crystal Hamiltonian which is written as
h= (4)
T being the kinetic energy
r=|sm,«iG) (5)
and * the potential energy
*=*.+2 sm: ::kckc:>+o(«3). (6)
The quantities
represent respectively the displacement from equilibrium of the
particle (of mass m K) located at the /cth position in the lib. unit cell
(a running through the set of components x, y, and z) and the force
constant which couples the displacement in the a direction of the
/cth atom in the Zth cell with that in the a direction of the k atom in
the V cell. The quantity <£0 is the vibrational potential energy in the
equilibrium state with all atoms located at their equilibrium positions
and
$tt/J
[d^«Od^C')]o. ^^
The evaluation of these second derivatives is also to be made at the
equilibrium state.
INTRODUCTORY LECTURES 7
The equations of motion of the vibrating lattice can be found
from the Hamiltonian (4). In the small vibration harmonic approxi-
mation, the resulting equations are linear in the displacements u.
Since boundary effects are generally uninteresting, one usually
employs the Born-von Karman periodic boundary conditions in
lattice vibration discussions. The periodic nature of the crystal
implies that the ath component displacement of particle k in cell I
can be written as
ua (l
K)=m; ll2ua{k) exp i[<w (k)+2wk-r(/)]. (8)
When this is substituted into the equations of motion
«o=s&.(c>(:!) o)
one obtains a set of homogeneous equations whose solution exists
only if the determinant of the coefficients of the displacements
vanish. The matrix of the determinant is called the''dynamical
matrix." The normal mode frequencies w(k) associated with the wavevector k are solutions
det{DaP(K\ f)-c 2(k)8a^} =0 (10a)
where
^K^0^(w <m«0" 1/2S^«^^) exP[2^k - r^)] (10b)
The detailed dispersion relations
<o=co(k) (11)
which are the roots of the characteristic determinants (10a) as a
function of k are very sensitive to. the detailed choice of force constants
<£. Hence, experiments such as the scattering of slow neutrons bycrystals (see Section 2) which yield these dispersion curves can give
good agreement with results deduced from theoretical models only
if a good set of force constants have been used. Note that there are
a number of branches of dispersion relations. For example, in the
case of a monatomic cubic crystal, the dynamical matrix is 3x3 and
there are three branches.
Thermodynamic averages (cf. eq 3 for the heat capacity) over the
frequency spectrum or distribution function of the roots of (10a),
(11), are much less sensitive to the detailed choice of the force con-
stants and, therefore, do not produce as much information as experi-
ments involving driven disturbances. Generally, to interpret the
response of a crystal to coherent driving forces such as acoustic,
8 MOLECULAR DYNAMICS AND STRUCTURE OF SOLIDS
electromagnetic, or matter (for example, neutrons) waves, one needs
information about appropriate functions of the displacement vectors
(8) as well as the dispersion relations (11). Hence, a richer picture of
atomic and molecular motions must be available to interpret the
experimentally observed responses.
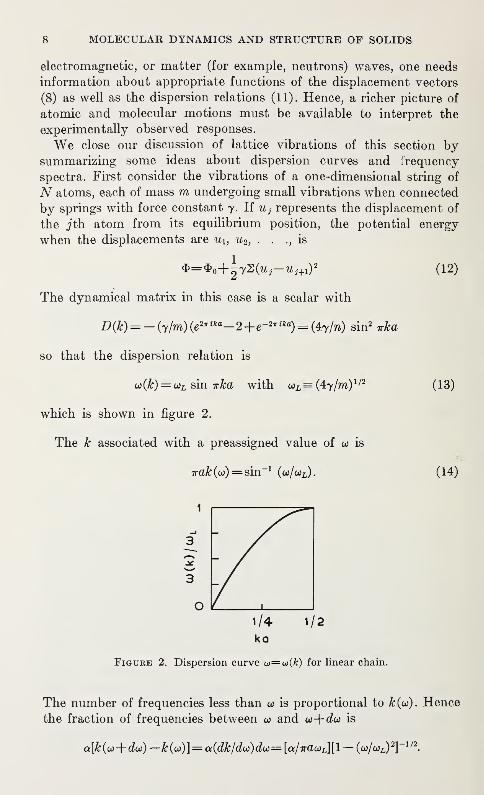
We close our discussion of lattice vibrations of this section bysummarizing some ideas about dispersion curves and frequency
spectra. First consider the vibrations of a one-dimensional string of
N atoms, each of mass m undergoing small vibrations when connected
by springs with force constant y. If Uj represents the displacement of
the jih atom from its equilibrium position, the potential energy
when the displacements are Ui, u2 , . . ., is
$=$0+|7S(u,-u,+1) 2(12)
The dynamical matrix in this case is a scalar with
D(k)= -(y/m)(e2" ika-2+e- 2* ika)= (4y/n) sin2
irka
so that the dispersion relation is
Q}(k)= ojL sin wka with o)L =(4y/m) 1/2(13)
which is shown in figure 2.
The k associated with a preassigned value of co is
7ra^(co)=sin_1
(co/coj. (14)
ka
Figure 2. Dispersion curve o)=a>(k) for linear chain.
The number of frequencies less than w is proportional to k(u). Hence
the fraction of frequencies between o and co+cfa is
a[k(u-\-dco) —k(co)]= a(dk/du)du>= [a/xacoJ[l— (o)/uL)21-1/2
INTRODUCTORY LECTURES 9
The normalization constant a is chosen to make the integral from
0 to o)L be equal to 1. Hence,
<*Lg(»)=- [l-(a>K) 2]- 1/2if 0 < co < <*L (15)
7T
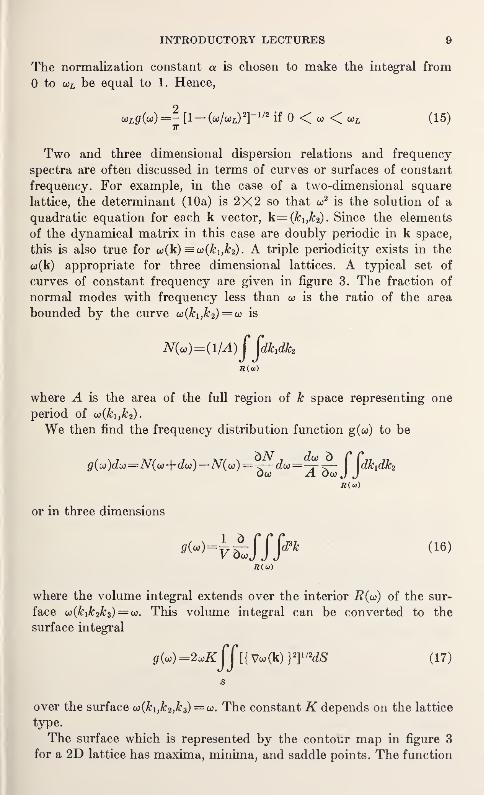
Two and three dimensional dispersion relations and frequency
spectra are often discussed in terms of curves or surfaces of constant
frequency. For example, in the case of a two-dimensional square
lattice, the determinant (10a) is 2X2 so that co2
is the solution of a
quadratic equation for each k vector, k=(ki,k2). Since the elements
of the dynamical matrix in this case are doubly periodic in k space,
this is also true for co(k) =to(&i,&2). A triple periodicity exists in the
co(k) appropriate for three dimensional lattices. A typical set of
curves of constant frequency are given in figure 3. The fraction of
normal modes with frequency less than co is the ratio of the area
bounded by the curve co(ki,k 2)= co is
N(u)=(l/A)fjdhdfa
iZ(w)
where A is the area of the full region of k space representing one
period of u(kifk 2).
We then find the frequency distribution function g(co) to be
g(u)du=N(w+dw)—N(u)=*^dw= (^^- f {dkxdk2Oco Ji Oco J J
or in three dimensions
where the volume integral extends over the interior E(co) of the sur-
face co(&i& 2& 3)= co. This volume integral can be converted to the
surface integral
0(co)=2^JJ[{ Vco(k) }T2dS (17)
s
over the surface u(ki,k 2,k 3)= a). The constant K depends on the lattice
type.
The surface which is represented by the contour map in figure 3
for a 2D lattice has maxima, minima, and saddle points. The function
10 MOLECULAR DYNAMICS AND STRUCTURE OF SOLIDS
O 1
k1a
Figure 3. Curves of constant frequenoy for 2D square lattice.
simple cubic
lattice model
1.0
b)/2K x1012
c.p.s.
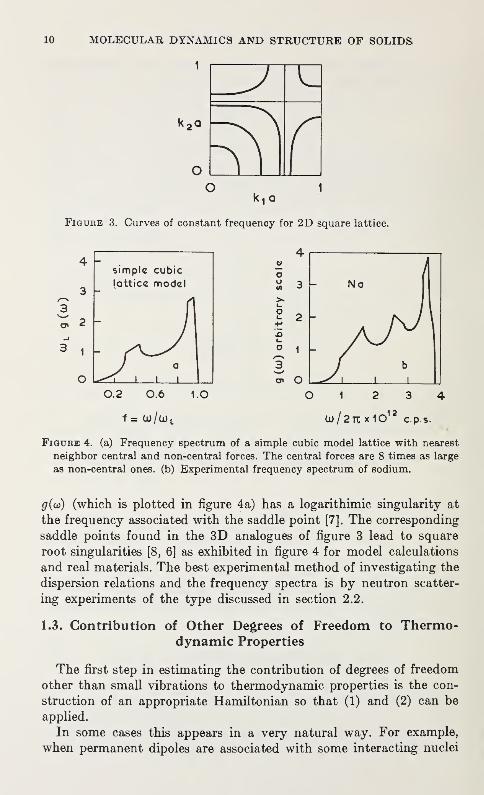
Figure 4. (a) Frequency spectrum of a simple cubic model lattice with nearest
neighbor central and non-central forces. The central forces are 8 times as large
as non-central ones, (b) Experimental frequency spectrum of sodium.
g(oi) (which is plotted in figure 4a) has a logarithimic singularity at
the frequency associated with the saddle point [7J. The corresponding
saddle points found in the 3D analogues of figure 3 lead to square
root singularities [8, 6] as exhibited in figure 4 for model calculations
and real materials. The best experimental method of investigating the
dispersion relations and the frequency spectra is by neutron scatter-
ing experiments of the type discussed in section 2.2.
1.3. Contribution of Other Degrees of Freedom to Thermo-dynamic Properties
The first step in estimating the contribution of degrees of freedom
other than small vibrations to thermodynamic properties is the con-
struction of an appropriate Hamiltonian so that (1) and (2) can be
applied.
In some cases this appears in a very natural way. For example,
when permanent dipoles are associated with some interacting nuclei
INTRODUCTORY LECTURES 11
or with interacting groups in the molecule in each unit cell, the dipole-
dipole Hamiltonian is just the sum of the potential energy of inter-
action of various dipole pairs (taken over all i^j)
2 ij \ rzu At j
Here is the distance of separation between the i and jth dipole
when the dipole moment vectors are and
In other cases a model Hamiltonian is constructed which summarizes
the main features of the interaction but involves some simplification
to make a theory possible. An important example is that used to
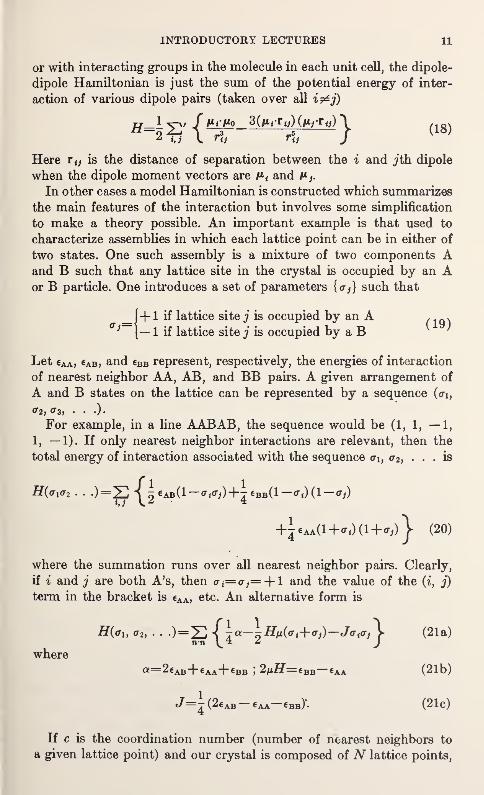
characterize assemblies in which each lattice point can be in either of
two states. One such assembly is a mixture of two components Aand B such that any lattice site in the crystal is occupied by an Aor B particle. One introduces a set of parameters {<r } } such that
[+1 if lattice site j is occupied by an A . .
\— 1 if lattice sitej is occupied by a B
Let €aa, €AB , and €bb represent, respectively, the energies of interaction
of nearest neighbor AA, AB, and BB pairs. A given arrangement of
A and B states on the lattice can be represented by a sequence (<ri,
02, ff3 , . . .).
For example, in a line AABAB, the sequence would be (1, 1, — 1,
1, —1). If only nearest neighbor interactions are relevant, then the
total energy of interaction associated with the sequence at, <t2 , • • • is
H(<ri<r2 • • *)=^C ^€Ab(1—^)+|€bb(1— 0"f)(l— (Tj)
+ieAA(l+0,)(l+0,)} (20)
where the summation runs over all nearest neighbor pairs. Clearly,
if i and j are both A's, then o-,= crJ= + l and the value of the {%, j)
term in the bracket is eAA , etc. An alternative form is
H(?u H • • 0=S ^la—Htiiai+^-Ja^y (21a)
wherea=2€AB+€AA+€BB ; 2nH=eBB— cAA (21b)
t/=i(2€AB -€AA-6BB)*. (21C)
If c is the coordination number (number of nearest neighbors to
a given lattice point) and our crystal is composed of N lattice points,
12 MOLECULAR DYNAMICS AND STRUCTURE OF SOLIDS
all energies can be measured relative to Nca/8 in which case we re-
write the Hamiltonian as
H(<r1} ^^^-/tHS^-JS^-. (22)j n-n
This is exactly the form of the Hamiltonian of the Ising model of a
ferromagnet if one identifies \xH. with the product of a spin momentn with an external magnetic field H and J with the spin-spin inter-
action between a pair of nearest neighbors.
In this model of ferromagnetism one lets
= f +1 if spin is "up"<T~ \ - 1 if spin is "down" (23)
and postulates the interaction energy between neighboring spins to be
g_ _ja(Jr—S ~J ^ nearest neighbor pair of spins is parallel
\ J if nearest neighbor pair of spins is antiparallel.
(24)
In a ferromagnetic crystal J>0 and in an antiferromagnetic one, <7<0.
If our binary alloy has a ground state in which A and B atoms alternate
on the lattice, then from (21c) J>0 and the alloy is analogous to an
antiferromagnetic crystal. It is analogous to a ferromagnetic one whenJ>0 in eq (21c) so that the alloy separates into two immiscible phases
at low temperatures, one being pure A and the other pure B.
A great deal is known about the thermodynamic and magnetic
properties of the Ising model [9-15]. This can be translated into
properties of our two component AB system and, indeed, into those
of any system which describes a cooperative phase which is the result
of each lattice point being able to appear in either of two possible states
in such a manner that the state at a given lattice point is correlated
with that of the neighboring lattice points.
1.4. Residual Entropy of Molecular Crystals
We close our discussion of thermodynamic properties with someremarks about the residual entropy problem. There are a number of
materials whose entropy, with the lowering of temperature, reaches a
a constant value which is much larger than the vibrational entropy
should be. Most of these substances are hydrogen bonded, although
there are some exceptions such as carbon dioxide and nitrous oxide.
Ice is probably the most studied example. Using measurements of
the heat capacity of ice from very low temperatures to the melting
point, Giauque and Stout [16] calculated an entropy 44.28 ±.05 cal/
INTRODUCTORY LECTURES 13
I * * I
#
• 1 • i— e(
— • — •i
• I I • I
• •— • I— •I
— • '— •I
—
• I I • I
I • •I
•
i• •
i
•
/"in 1
•1
•
•
•i
•T •• r
•T • L•
•i
• •_l•
• | • 1 9 .
1 • 1
•
r.L•
•
I*J.•
• • •—I • —I • —I • -—I •
• —1 • —I —I • —1 •• I I •
• J • •
n«—
> • —' •— • I
—
• • • i
.-i. j. •
• •
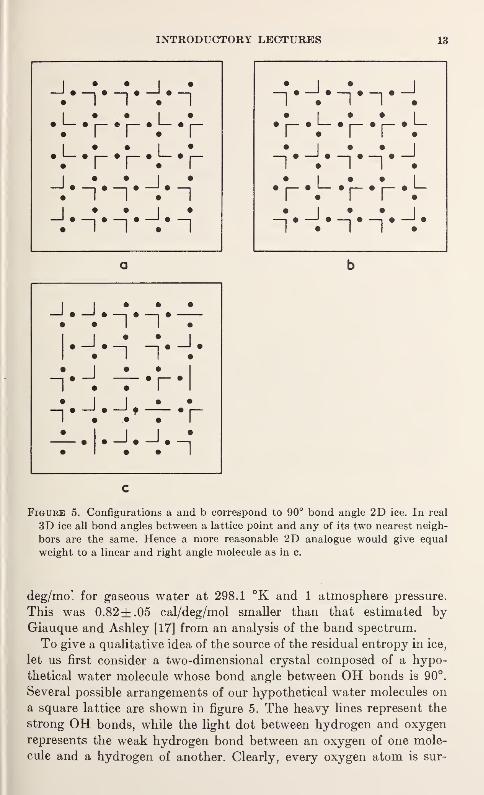
Figure 5. Configurations a and b correspond to 90° bond angle 2D ice. In real
3D ice all bond angles between a lattice point and any of its two nearest neigh-
bors are the same. Hence a more reasonable 2D analogue would give equal
weight to a linear and right angle molecule as in c.
deg/mo' for gaseous water at 298.1 °K and 1 atmosphere pressure.
This was 0.82 ±.05 cal/deg/mol smaller than that estimated byGiauque and Ashley [17] from an analysis of the band spectrum.
To give a qualitative idea of the source of the residual entropy in ice,
let us first consider a two-dimensional crystal composed of a hypo-
thetical water molecule whose bond angle between OH bonds is 90°.
Several possible arrangements of our hypothetical water molecules on
a square lattice are shown in figure 5. The heavy lines represent the
strong OH bonds, while the light dot between hydrogen and oxygen
represents the weak hydrogen bond between an oxygen of one mole-
cule and a hydrogen of another. Clearly, every oxygen atom is sur-
14 MOLECULAR DYNAMICS AND STRUCTURE OF SOLIDS
rounded by four nearest neighbor hydrogen atoms, two of which are
strongly bound and two weakly bound to the oxygen. The second
neighbors to a given oxygen are four other oxygens. Since the energy
of interaction between nearest and next-nearest neighbors, (and,
indeed, for even more distant neighbor pairs), is independent of the
detailed angular orientations, as long as one OH bond is in the hori-
zontal and the other in the vertical direction, many possible orienta-
tions lead to the same energy state of the lattice. Hence, a very large
entropy factor exists for that energy state.
In real ice, the bond angles are not 90°;however, each oxygen atom
still has four nearest neighbors, the lattice being a hexagonal wurtzite
structure (which is equivalent to distorted tetrahedral diamondlattice). The observed 0-0 distance is 2.76 A. Since the OH bond is
about 0.95 A, there are two possible positions for each hydrogen atom.
The "ice condition" which must be satisfied is that each oxvgen atommust be surrounded by two hydrogen atoms near it, 0.95 A, and twoon the far side, 1.81 A.
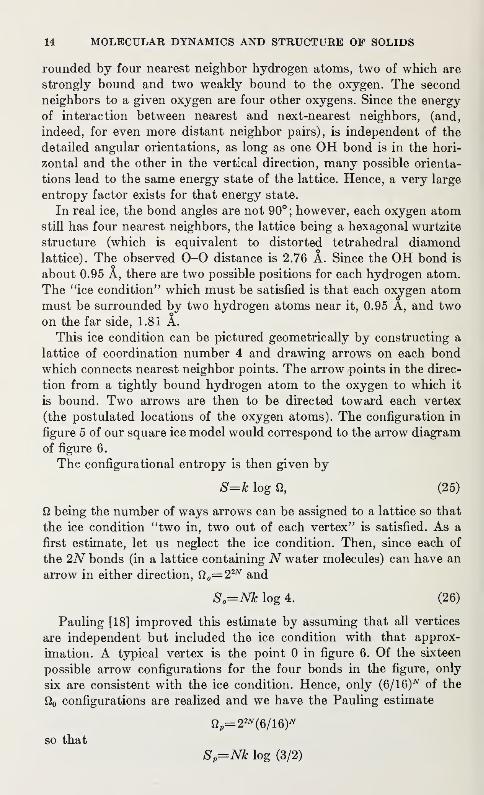
This ice condition can be pictured geometrically by constructing a
lattice of coordination number 4 and drawing arrows on each bondwhich connects nearest neighbor points. The arrow points in the direc-
tion from a tightly bound hydrogen atom to the oxygen to which it
is bound. Two arrows are then to be directed toward each vertex
(the postulated locations of the oxygen atoms). The configuration in
figure 5 of our square ice model would correspond to the arrow diagram
of figure 6.
The configuration al entropy is then given by
S=k log ft, (25)
ft being the number of ways arrows can be assigned to a lattice so that
the ice condition "two in, two out of each vertex" is satisfied. As a
first estimate, let us neglect the ice condition. Then, since each of
the 2N bonds (in a lattice containing N water molecules) can have an
arrow in either direction, Q 0=22N and
S0=Nk log 4. (26)
Pauling [18] improved this estimate by assuming that all vertices
are independent but included the ice condition with that approx-
imation. A typical vertex is the point 0 in figure 6. Of the sixteen
possible arrow configurations for the four bonds in the figure, only
six are consistent with the ice condition. Hence, only (6/16)^ of the
fi0 configurations are realized and we have the Pauling estimate
so that
Sp=Nk log (3/2)
NTRODUCTORY LECTURES 15
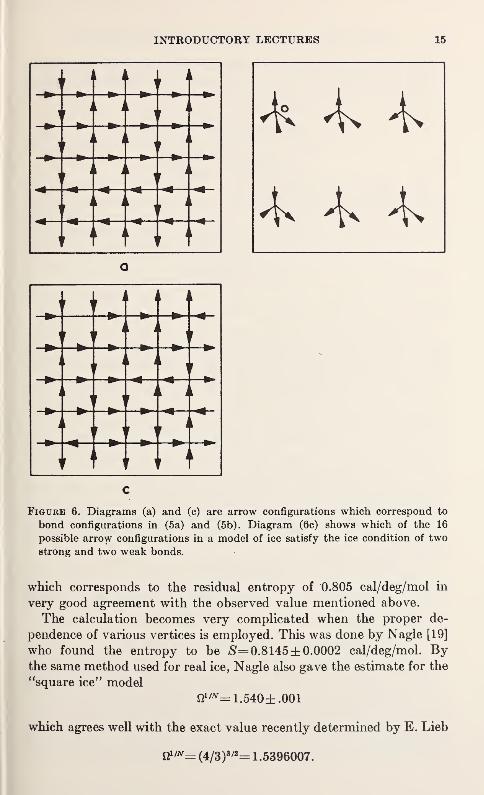
Figure 6. Diagrams (a) and (c) are arrow configurations which correspond to
bond configurations in (5a) and (5b). Diagram (6c) shows which of the 16
possible arrow configurations in a model of ice satisfy the ice condition of two
strong and two weak bonds.
which corresponds to the residual entropy of 0.805 cal/deg/mol in
very good agreement with the observed value mentioned above.
The calculation becomes very complicated when the proper de-
pendence of various vertices is employed. This was done by Nagle [19]
who found the entropy to be S=0.8145± 0.0002 cal/deg/mol. Bythe same method used for real ice, Nagle also gave the estimate for the1
'square ice" model
G1/iV=1.540±.001
which agrees well with the exact value recently determined by E. Lieb
tf/tf= (4/3)8/a=1 .5396007.
16 MOLECULAR DYNAMICS AND STRUCTURE OF SOLIDS
The Slater [20] model of hydrogen bonded ferroelectrics such as
KDP (potassium dihydrogen phosphate) has also been discussed byNagle and Lieb [21] by lattice statistics methods.
2. Scattering Techniques
2.1. Introductory Remarks
The theory of scattering was first developed by Rayleigh to give
an explanation of natural phenomenon such as the color of the sky
and the scattering of sound by obstacles. The use of the scattering
technique to probe the nature of materials was first motivated by the
theoretical investigations of Smoluchowski and Einstein on the
scattering of light by density fluctuations in fluids. Rutherford
scattering provided the present model of the structure of the atomand early researches of Laue, Bragg, and collaborators on the scat-
tering of x rays by crystals has exposed their detailed structures.
Appropriate probes for the investigation of motions of atoms and
molecules in a condensed phase are neutrons, x rays, and light. Thewave lengths of the first two are of the order of angstroms and the
latter of the order of thousands of angstroms.
An important difference between the first two is the average time
required by each to span a typical lattice spacing, this being about10~ 18 sec for a 10 kv x ray traveling with the speed of light and about
l0~ 13 sec for a 5 meV neutron with speed of 105 cm/sec. The x ray
travels so fast that it sees a frozen set of atomic positions in a crystal
while in the time required for a neutron to go one lattice spacing, the
atoms in the crystal may have changed their positions significantly.
Furthermore, the energy of a slow neutron might be less than or equal
to that of an atom with which it collides so that a considerable energy
exchange might occur. The energy of an x ray hardly changes as it is
scattered by a crystal.
The determination of crystal structures by x rays is based on the
interference between x rays reflected from successive layers of atoms
while a more productive analysis of neutron scattering data involves
inelastic effects.
2.2. Inelastic Neutron Scattering [22]
Let an incident beam of monoenergetic slow neutrons of wavelength X greater than twice the largest lattice spacing in the crystal
be scattered through an angle 0. Through its interaction with the
crystal during the scattering processes, its initial energy Ex and wavenumber kT is changed to the final values Ef and kf . This change in
energy and momentum is accomplished through the creation or
INTRODUCTORY LECTURES 17
annihilation of a phonon in the crystal. Since the energy of such a
phonon is E=ho),
EF-Ej= (kF-kj)h2/2m=E==ha (27)
and its momentum is hq (q being its wave vector),
h(kI-kF)=fi(2 7rT+q) (28)
where t is an arbitrary lattice vector. When q=0 this equation is just
the Bragg scattering formula.
Since the frequency associated with the wave vector q has the
property oo(q) =co(q+ 2?rr), (28) is equivalent to
w (q)=w (f4k7 -k,]), (29)
and (27) becomes
h(kF-k 2I)/2m=E=ho:(q) (30)
This expression is immediately applicable to the experimental deter-
mination of the dispersion curve o>=o>(q) =E/h. The energy of the
scattered neutron can be determined from a time of flight measure-
ment which yields the velocity which, in turn, yields \kF\=h~ 1(2mEI) 1/2
since £/=imv2. By scanning a large number of angles, a number of
(k7— kF) values and, hence, a number of q values are obtained with
the corresponding a>(q).
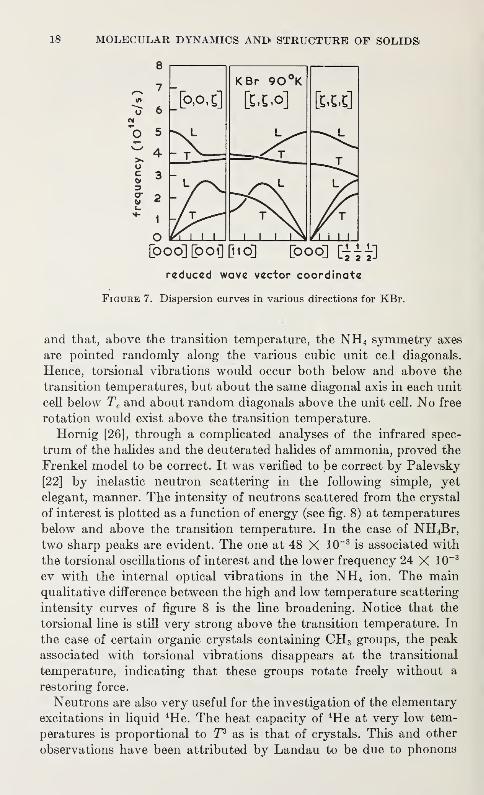
Many experimental dispersion curves have been obtained byBrockhouse and collaborators [23] with the Chalk River reactor, and
by Hughes and others with the Brookhaven reactor in the late 1950's
and early 1960's. This work has been developed further by others andprovides a great deal of our present knowledge of phonons in solids.
Several typical dispersion curves are shown in figure 7. Much of the
basic theory was done by van Hove [24, 25] and Placzek and, indeed,
while Placzek's papers are not numerous, he masterminded andinspired many early developments in the use of neutrons as a probe
for the investigation of lattice vibrations.
Neutrons are also useful in a search for rotational motions in
crystals. The basis of the anomolous heat capacity of the halides of
ammonia mentioned in Section 1 has been investigated by this method.Two competing theories were proposed when the anomoy was first
observed. Pauling suggested that, below the transition temperature,
the NH4 group undergoes torsional oscillations and that above the
transition temperature rotates freely. Frenkel proposed that, belowthe transition temperature, each NH 4 group is pointed in the samedirection with its symmetry axis along one of the same cell diagonal,
18 MOLECULAR DYNAMICS AND STRUCTURE OF SOLIDS
8
K Br 90°K
[ooo][ooi]Dio] [ooo] [i^]
reduced wave vector coordinate
Figure 7. Dispersion curves in various directions for KBr.
and that, above the transition temperature, the NH 4 symmetry axes
are pointed randomly along the various cubic unit ce.l diagonals.
Hence, torsional vibrations would occur both below and above the
transition temperatures, but about the same diagonal axis in each unit
cell below Tc and about random diagonals above the unit cell. No free
rotation would exist above the transition temperature.
Hornig [26], through a complicated analyses of the infrared spec-
trum of the halides and the deuterated halides of ammonia, proved the
Frenkel model to be correct. It was verified to be correct by Palevsky
[22] by inelastic neutron scattering in the following simple, yet
elegant, manner. The intensity of neutrons scattered from the crystal
of interest is plotted as a function of energy (see fig. 8) at temperatures
below and above the transition temperature. In the case of NH4Br,
two sharp peaks are evident. The one at 48 X 10~3is associated with
the torsional oscillations of interest and the lower frequency 24 X 10"3
ev with the internal optical vibrations in the NH4 ion. The mainqualitative difference between the high and low temperature scattering
intensity curves of figure 8 is the line broadening. Notice that the
torsional line is still very strong above the transition temperature. In
the case of certain organic crystals containing CH3 groups, the peak
associated with torsional vibrations disappears at the transitional
temperature, indicating that these groups rotate freely without a
restoring force.
Neutrons are also very useful for the investigation of the elementary
excitations in liquid 4He. The heat capacity of 4He at very low tem-
peratures is proportional to T3 as is that of crystals. This and other
observations have been attributed by Landau to be due to phonons
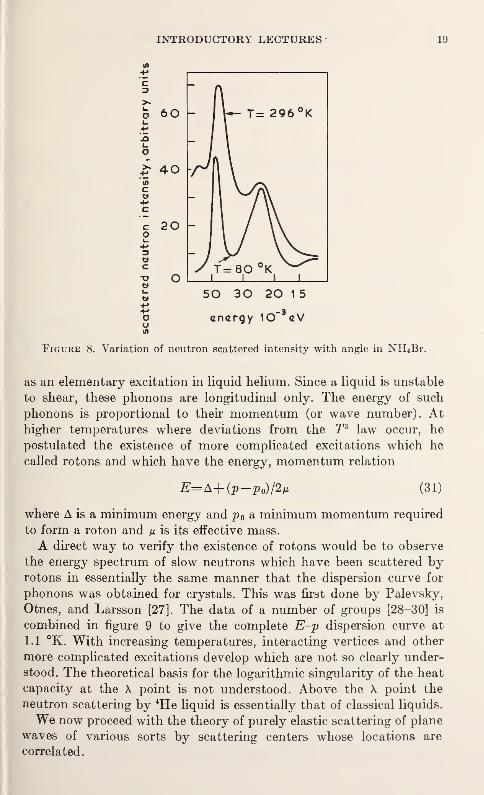
INTRODUCTORY LECTURES 19
as an elementary excitation in liquid helium. Since a liquid is unstable
to shear, these phonons are longitudinal only. The energy of such
phonons is proportional to their momentum (or wave number). Athigher temperatures where deviations from the T3 law occur, he
postulated the existence of more complicated excitations which he
called rotons and which have the energy, momentum relation
E=A+(p-Po)/2n (31)
where A is a minimum energy and p 0 a minimum momentum required
to form a roton and n is its effective mass.
A direct way to verify the existence of rotons would be to observe
the energy spectrum of slow neutrons which have been scattered byrotons in essentially the same manner that the dispersion curve for
phonons was obtained for crystals. This was first done by Palevsky,
Otnes, and Larsson [27]. The data of a number of groups [28-30] is
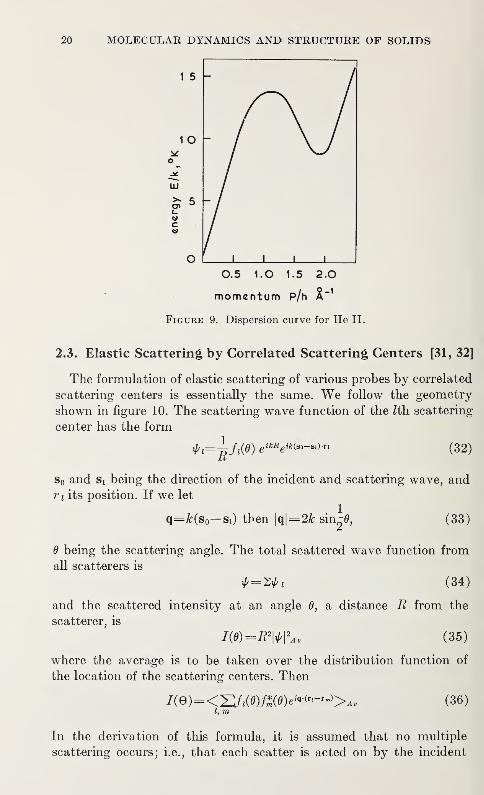
combined in figure 9 to give the complete E-p dispersion curve at
1.1 °K. With increasing temperatures, interacting vertices and other
more complicated excitations develop which are not so clearly under-
stood. The theoretical basis for the logarithmic singularity of the heat
capacity at the X point is not understood. Above the X point the
neutron scattering by 4He liquid is essentially that of classical liquids.
We now proceed with the theory of purely elastic scattering of plane
waves of various sorts by scattering centers whose locations are
correlated.
20 MOLECULAR DYNAMICS AND STRUCTURE OF SOLIDS'
0.5 1.0 1.5 2.0
momentum p/h X"1
Figure 9. Dispersion curve for He II.
2.3. Elastic Scattering by Correlated Scattering Centers [31, 32]
The formulation of elastic scattering of various probes by correlated
scattering centers is essentially the same. We follow the geometry
shown in figure 10. The scattering wave function of the Zth scattering
center has the form1
R /i(0) eikR
eik^°- Bl) -Tl (32)
s0 and Si being the direction of the incident and scattering wave, andr
x its position. If we let
q=&(s 0— Si) then |q|= 2fr sin-0, (33)
0 being the scattering angle. The total scattered wave function from
all scatterers is
t= 2*i (34)
and the scattered intensity at an angle 0, a distance R from the
scatterer, is
m=RWA, (35)
where the average is to be taken over the distribution function of
the location of the scattering centers. Then
/(e)=<zy,(»)£(9)«*<''-'->>. (36)I, m
In the derivation of this formula, it is assumed that no multiple
scattering occurs; i.e., that each scatter is acted on by the incident
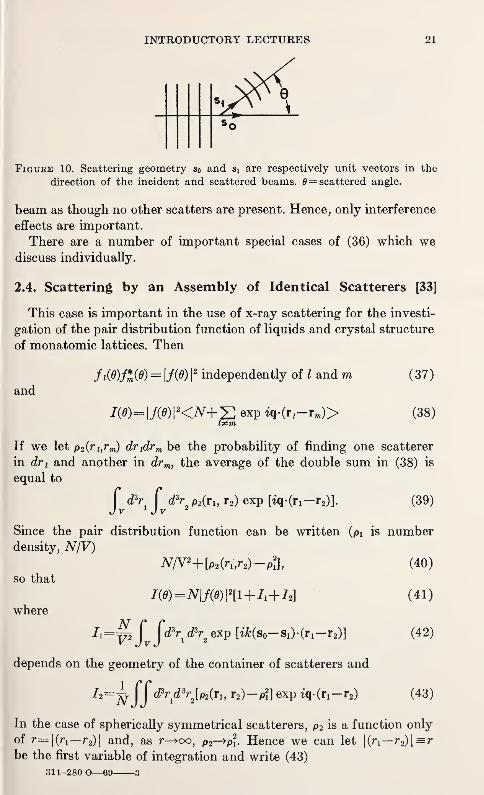
INTRODUCTORY LECTURES 21
Figure 10. Scattering geometry s0 and Si are respectively unit vectors in the
direction of the incident and scattered beams. 9— scattered angle.
beam as though no other scatters are present. Hence, only interference
effects are important.
There are a number of important special cases of (36) which wediscuss individually.
2.4. Scattering by an Assembly of Identical Scatterers [33]
This case is important in the use of x-ray scattering for the investi-
gation of the pair distribution function of liquids and crystal structure
of monatomic lattices. Then
andji(e)j*(0)= |
2 independently of I and m
/WH/WKAH-S exp iqir t-Tm)>
l^m
(37)
(38)
If we let p2(ri,rm) dr xdrm be the probability of finding one scatterer
in dti and another in drm , the average of the double sum in (38) is
equal to
jvd\ jvd\ P2(n, r2 ) exp [^-(Fx-^)]. (39)
Since the pair distribution function can be written (pi is numberdensity, N/V)
N/V2+[P2(ri}r2)-P*\, (40)
so that
l(e)=N\f(emi+l1+l2] (41)
where
^i=^jvJd^d^exp [^(So_ Sl ).(ri_ r2)] (42)
depends on the geometry of the container of scatterers and
/2=^ fjd\d\MTu r2)-p?] exp tq-(r!-r2) (43)
In the case of spherically symmetrical scatterers, p2 is a function only
of r=\(r1—
r
2)\ and, as r-»oo, p2-^p?. Hence we can let |(ri—
r
2)|=rbe the first variable of integration and write (43)
311-280 O—69 3
22 MOLECULAR DYNAMICS AND STRUCTURE OF SOLIDSi
h Tfv d3r2 flP2(r)-pl] e+*ffir (44)
where the integration over r extends over all space. The r2 integra-
tion yields the volume of the container so that
Uq)-=^j[ P2(r)-pl] e**(Pr
= PlJG(r)e*r<Pr (45)
where G(r) is the radial distribution function defined by
G(r) = -l+p-\P2 {r). (46)
The angle integration in (19) can be performed immediately since
G{r) depends only on r. Let y be the angle between (s0— Si) and r,
then
(s0— Si)-r=2r sin^0 cos y (47)
(since (s0— Si)= 2sin-0). Since d?r=±irr2 siny dy dr, the y integration
yields
/»(«)=4ta£g (r) rHr. (48)
If the scattering function ^(q) can be measured experimentally,
eq (47) can be inverted to yield the radial distribution function
G{r). This has been done for a number of monatomic liquids by the
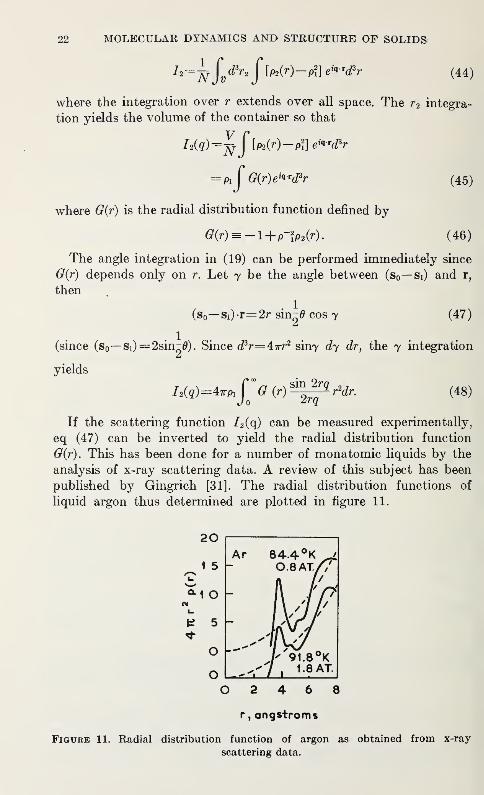
analysis of x-ray scattering data. A review of this subject has been
published by Gingrich [31]. The radial distribution functions of
liquid argon thus determined are plotted in figure 11.
20 1
1
r,angstroms
Figure 11. Radial distribution function of argon as obtained from x-ray
scattering data.
INTRODUCTORY LECTURES 23
While the pair distribution function can also be used in a discussion
of periodically distributed scatterers such as crystals, it is simpler to
return to (36) and (38). The lattice points at which scatterers are
located is
rz=/iai+Z2a2+Z3a3 (49)
where ai, a2 , and a3 are the primative vectors of a unit cell and lh l2 ,
and l3 run through the integers 1, 2, . . ., N. Then the sum 2^ in
(34) has the form
j=ih=\
n ^/c(S0~sl) -a/{ 1 -exp iNk(s0
-Sl ) Hj
}~/ii {l-exp^(s0-s 1).a,} (50)
so that
/(e)-ii>«l ffn^^^
|
(5i)
The averaging operation over positions in (35) is not included here
because it is assumed that the scattering points are fixed. In real
crystals there are small vibrations about the lattice points defined
by (49), each scatterer having a Gaussian distribution about the
lattice points, the dispersion being small at low temperatures and
large at high temperatures. However, we neglect this effect now.
As N^> oo we find that
T(A , sin2 f 1 HA=2wm m=0, ±1, ±2, . . .
M^)-N2 gin2 i/2A~\0 otherwise
(52)
Hence, in this limit the product of sine functions in (25) has the value
{1 if k(s— Si)-(ai, a2 ,
a3)= 27r(mi, m 2 ,m3)
0 otherwise (53)
Hence, 1(6) is proportional to N6if the three eq (27) are satisfied
and of lower order in N otherwise. Then if TV^IO 7, the intensity is
much greater at points at which (53) is satisfied. The lattice char-
acterized by (49) has a reciprocal lattice defined by the points
r* (mi, ra2 ,m3) =m 1
a*1+m2a*2+m3a.*3 mj=0, ±1, ±2, . . . (54)
where the a? satisfy
a?.a4=« iJfc j, £=1,2,3. (55)
24 MOLECULAR DYNAMICS AND STRUCTURE OF SOLIDS
It is clear that if a beam scattered from a periodic lattice impinges
on a photographic plate, the points which correspond to scattering
angles defined by
k(80— s1)/2ir=m 1at+m2a?+m3a? (56)
are identified by black spots on the positive made from the plate.
This array of spots is, of course, the well-known Laue pattern for
scattering by the periodic array. Note that k=2ir/\, X being the
wave length, and |.a*|= l/|aj where |a,-| is a typical spacing between
neighboring lattice points. Hence X must be of the order of \a } \if
integral values of the rrij can be found so that (56) is satisfied; in
order to obtain Laue spots, the wave length of the scattered radiation
must be of the same order of magnitude as the interatomic spacing
as is the case in the scattering of x rays by crystals.
Real crystals are not composed of static particles but are, as wasemphasized in section 1, constantly in thermal motion with each
particle vibrating around its equilibrium position. Hence, the position
of the Zth lattice point should not be expressed as (49) but rather, as
r(I)= Ziai
+
l2a2+h*3
+
u(0 (57)
where u(T) is a normally distributed random component with meanvalue zero and average square
<%2(Z)>=(^/6iVm)SMk)]- 1 coth [l/20h«,(*)] (58)
in the case of a monatomic lattice can be determined from the theory
of lattice vibrations. As usual &=l/TkB) and w/k) is the normal
mode frequency in branch j which corresponds to the wave vector k.
This causes the broadening of a Laue spot and reduces its intensity
by the Debye-Waller factor exp-2W where
W=Sit2<u2(l)>\- 2 sin2 6, (59)
X being the wave length of the incident x ray. A measurement of the
factor IF as a function of the temperature gives information on the
temperature variation of the mean square displacement of a lattice
point from its equilibrium position.
2.5. X-Ray Scattering by Molecular Crystal [33, 34]
The purpose of crystallographic studies today is to determine the
structure of complex molecules from the x-ray diffraction patterns
produced by them while they are in a crystalline state. With this in
mind, we shall generalize our formulae of section 3 to the case of more
than one particle per unit cell.
INTRODUCTORY LECTURES 25
Let each unit cell contain /-atoms and let r(n) be the vector which
connects the origin of our coordinate system to a local reference point
in the nth unit cell. We shall locate the local reference points at
equivalent points in the various unit cells and represent the positions
of the /-atoms in the nth unit cell by
rW+Pi 6=1, 2, . . . I)
If j j is the scattering factor of the jth atom in each cell, the total
scattered wave function of our crystals is
*«4S S/i exp [*s.(r(n)+p,)] (60a)it j=l n
=N*R- lF(s)L(s) (60b)
where
F(s)=y
E,.fjeikaH and L(s)=N-^e ikB ^n)
(61)j=l n
Since as N—>°° eq (55) implies
[Oif s/X^r* (62)|jL(s)|
-\lif s/X= r*,
r* being any lattice point on the reciprocal lattice, and that \\p\2 vanish
unless s=Xr*. If h is a given lattice point on the reciprocal lattice, the
scattered intensity associated with that point is proportional to
R2\t(\Y*)\
2=N&\F(h)\ 2(63)
where
^*)= S/>exp 2wi(hxl/\*\+h*xll\*\+h*xll\**\) (64);'=i
(x{, x32 ,
x£) being the coordinate of the jth particle in a given unit cell.
It is clear from (60-63) that the geometrical pattern of x-ray spots
or lines from a given crystal depends only on the manner in which
unit cells are stacked together, while the intensity of the various spots
or lines is determined by the detailed molecular structure in a typical
unit cell.
The x-ray scattering is due to the electrons in the crystal and the
scattering factor of a given atom depends on the electron density in
the atom. Hence, the function F(h) should be expressed in terms of
an electron density function p(r) rather than the point scattering
factors j^ The appropriate generalization of (64) is then
F(h)=vj\(a{) exp (2wih'£)<P{ (65)
26 MOLECULAR DYNAMICS AND STRUCTURE OF SOLIDS
where v is the volume of a unit cell and
t»=xJK\ M=l,2,3 (66)
and p(a£) is denned by
p(r) = P(aif!, a2r2 ,a3f 3) = p(a£) (67)
Then, if (65) is inverted
p(r)=v- l^,F(h)e-2^ (68)h
Generally the function F(h) is complex so that it can be expressed as
F(h)= \F(h)\expia(h) (69)
It is to be noted from (68) that since the density is real
F*(h)=F(-h) (70)
e-i«(W=eM-h) g0 that a(h)= -a(_h). (71)
and
Hence
p(r) =1 v- l^lF(h)e-2^+F(-h)e2*ih*]* h
=trlS| F(h)\ cos[27rh.f-a(h)]. (72)h
Unfortunately scattering intensity measurements as indicated byeq 63 yield only \F(h)
\but not the phases a(h) which are necessary in
(72) to yield the electron density function p(r) and, thus, the structure.
The problem is somewhat simplified in the case of centrosymmetric
molecules with
p(r)= P(-r)
for then employing (68)
P(r)=$p(r)+p(-r)]
=^- 1S F(h) cos (27rh.f
)
^i^SI^WIIcos a(h)+i sin a(h)] cos (2wh^) (73)h
If the cosine in (72) is expanded and the resulting p(r) is compared
with the above expression, one finds sina(h)= 0 so that <*(h)=0 or w
and coso:(h)=±l. Hence, the density function for centrosymmetric
structures is of the form
P(r)=v-^ ± \F(h}\ cos (2wh-S). (74)
INTRODUCTORY LECTURES 27
We can discuss the trials and tribulations of the x-ray crystallographer
through an examination of this formula.
Various combinations of the + and — signs must be picked, the
sums evaluated and densities plotted at a large number of points in
the unit cell. If an incorrect choice of signs is made, p(r) usually becomes
negative or a ridiculous structure appears. In the era before the inven-
tion of the high speed computer, it was very tedious to calculate each
three-dimensional Fourier series and it sometimes required months to
determine a structure. As with practicers of many professions in
which heartbreaking or backbreaking consequences result from poor
judgment or luck, a special spirit of companionship and rivalry
existed between crystallographers which was not always evident
among workers in other branches of physics.
Various technical tricks have been developed to speed up computa-
tions. These are discussed in crystallography books. Some are, how-
ever, of general interest.
The density auto-correlation function, (generally known in crystal-
lography as the Patterson function) [35]
P(6)=fv
P(r)p(T+6)d?r (75)
has the property that is becomes a maximum when the vector with
components (8i/ai,6i/<i2,8z/<h) corresponds to some vector between
atoms in the unit cell. Since as we shall see below it depends only on
^(h)! 2 or measured intensities, it can be computed directly without
any knowledge of phases.
Eq 68 yields
h, h' Jv
The r integral vanishes unless h + h'= 0 in which case it has the value
v, the volume of a unit cell. Hence, in view of (44)
P(6) =^- 1S|F(h)|
2exp(- 2wih • 6)
=tJ- 12|F(h)| 2cos(27rh.«) (76)
since the Patterson function P(d) is real.
Unfortunately the distribution of distances between atoms whichis found from P(6) does not always determine atomic positions.
However, when a heavy atom exists in each unit cell, the Patterson
function has very strong peaks at those values of 8 which represent
the vector separation between other atoms and the heavy atom. If
in (64) j=\ represents the fi>fi forjy 1 so that terms in P(d) whichare independent offx can be neglected and
PW-v-^UI+J^Jj cos 2*Mr1T r,) cos 2*h 6 } (77)
28 MOLECULAR DYNAMICS AND STRUCTURE OF SOLIDS
if 8 9* ± there is a strong cancellation that results in the sum-mation over h because the products of cosines can be expected to be
negative as often as they are positive. On the other hand, when 8= ±(ft— hj), the product of cosines is always positive so P(6) has peaks
for these values of 6 from which the positions of all atoms in the unit
cell relative to the heavy atom can be determined.
2.6. Scattering of Electromagnetic Waves by Spacial andTemporal Fluctuations in a Medium
Let us suppose that the wavelength of the radiation to be scattered
by a medium is much longer than the average distance between
particles making up the medium. Then the medium might be charac-
terized as a continuous one with local fluctuations in density, tempera-
ture, etc. It can then be divided into a large number of identical cells
of the volume 8V which are still small compared with the wavelength,
but contain a large number of particles. The quantity / z (0) in eq
(36) has the form
f l (0) = a lu(O) (78)
where the polarizability a zof the Zth cell depends on the deviation of
the local dielectric constant e(rj) from the mean value €0
a l=Ae(r l)8V/±T, Ae(r) = [e(r) -c0]/eQ (79)
and u(6) is the angular dependence of Rayleigh scattering with [36]
kW| 2=^4(l+cos2J) (80)
for unpolarized light, I0 being the incident intensity and somewhatdifferent factors appearing for other polarizations of the incident
beam.
Then, when the average (36) is converted to an integral by letting
dV->0
JW=^-Jf<A€ (r2)A€*(r1)> exp iq • (r2-r,)W3r2 . (81)
A variation in the dielectric constant can be expressed in terms of
variations in the density and temperature through
*K£Mf?>r-
(82)
INTRODUCTORY LECTURES 29
Since Ap and AT are statistically independent. [37]
am+(^,)
2
JJ<A7,
(r1)AT(r2)> exp iq • (r.-r,)*^**J-
• (83)
In the liquid state |de/dTK<|de/dp| so that only the density fluctua-
tion contribution to 1(0) is important. While our main interest here
is in molecular motions in solids some remarks will be made con-
cerning scattering from liquids especially at temperatures near phase
transitions where critical opalescence occurs. Similar formulae apply
to neutron scattering by magnetic materials near their curie tem-
perature [38].
If we let r 2— ri=r, the first integral in 1(6) can be written as
T^<AP(0)Ap(r)> exp iq-r d3r (84)
since the correlation between two points depends only on the distance
between them. The integration with respect to rx contributes the
volume of the container, V, when the correlation is short ranged.
The theory of density fluctuations in fluids which is usually used in
scattering calculations is that of Ornstein and Zernike. In their theory
one finds [39, 40]
<Ap(0)Ap(r)>-(^r/47rrfi
f1) exp[-r(^i)^] (85)
as r—» oo and
f kTplg0 if d^/dp^O
ckTv5/3g! if dp/dp=0 (86)
<[Ap(0)] 2>=j
where
0o=p-1dp/dp
and gi is related to a certain second derivative of the free energy
of the fluid, but for our application here it might be considered only
as a slowly varying function of the temperature which is to be deter-
mined experimentally. The quantity c is a dimensionless constant.
It can be shown that generally the required Fourier transform (84)
can be written as
Fj(Ap(0)Ap(r)> exp iq r^-g^ (87)
30 MOLECULAR DYNAMICS AND STRUCTURE OF SOLIDS
In the Ornstein-Zernike theory all terms of order higher than q2 are
neglected in the denominator. Hence to this approximation, in fluids
W=j«(|fY_^L (88)167T
2 \dpj go+giq2
The pressure derivative of the index of refraction is generally easier
to determine than the density derivative. Hence we write
and remember that
\q\= 2k sin y2B.
It should also be noted that g Q is related to the compressibility through
g Q= p-idp/dp=l/Kp* with k=—v^dv/dp (90)
where v is the specific volume, v=l/p.
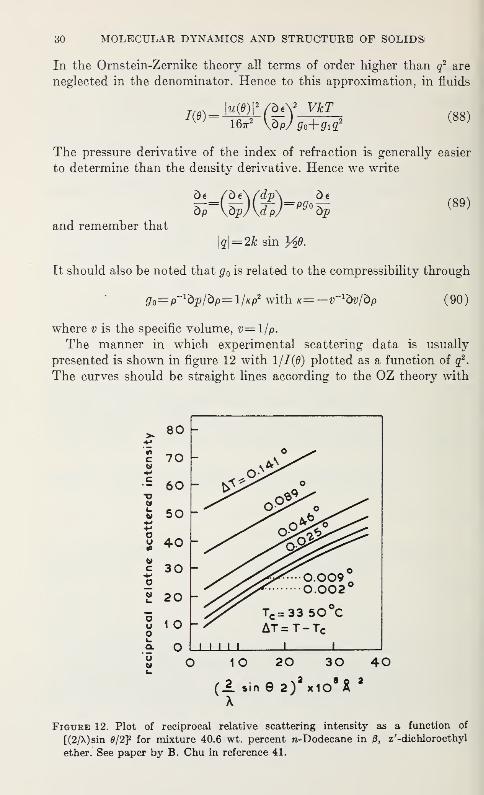
The manner in which experimental scattering data is usually
presented is shown in figure 12 with 1/1(6) plotted as a function of q2
.
The curves should be straight lines according to the OZ theory with
(i. sin 6 2)2x10
8X
2
x
Figure 12. Plot of reciprocal relative scattering intensity as a function of
[(2/\)sin 0/2F for mixture 40.6 wt. percent n-Dodecane in 0, z'-dichloroethyl
ether. See paper by B. Chu in reference 41.
INTRODUCTORY LECTURES 31
the intercept at the origin at the critical temperature. While there is
considerable interest in finding experimental deviations from straight
lines, one has to work very hard to do so in a controlled way. Ageneral discussion of these slight deviations by several authors is
given in reference [41].
With the availability of intense monochromatic laser sources, light
scattering experiments in both liquids and solids can be expected to
be of increasing importance. The spectrum as well as the intensity of
the scattered light can be observed. It is related to time dependent
correlations in condensed material. We now review the ideas behind
the relationship between time dependent correlations and the spectrum
of scattered light.
2.7. Time Dependent Correlations * and the Spectrum ofScattered Light [44-46]
While statistically there is an equilibrium number of fluctuations
of a given magnitude in a fluid, as has been discussed earlier, individual
fluctuations develope spontaneously and then die away or are propa-
gated away. For example, sound waves of various frequencies and
directions are generated at a given temperature T through thermal
excitations in fluids and crystals. A given one of these sound waves
yields spacially periodic density fluctuations. Light waves at the
proper Bragg angle related to the wave length and spacing between
planes of density fluctuations are reflected in the same manner that
x rays are reflected from crystal planes [42]. Also, a local entropy or
temperature fluctuation, when formed, disappears according to
Fourier's law or heat flow.
Time dependent fluctuations induce changes in the spectrum of the
scattered light. The reflecting planes which give rise to Bragg reflec-
tions move either toward or away from the observer. Hence the
scattered light suffers a Doppler shift in frequency and has two peaks
symmetrically placed on each side of the unseattered frequency.
This type of scattering is called Brillouin scattering after the predictor
of the effect. Landau and Placzek [43] pointed out that temperature
fluctuations are dispersed according to Fourier's law of heat flow and
give rise to the frequency broadening of the incident light.
The time dependent fluctuations in an electric field can be discussed
in terms of their autocorrelation function. The Rayleigh formula
for the scattered electric field at time t, at a point a distance R awayfrom the scattering medium and at an angle 0 relative to the direction
of the incident wave is
E(R, t) = ^ sine ja(r, t)e*'* d*r (91)
V
32 MOLECULAR DYNAMICS AND STRUCTURE OF SOLIDS
Since only the variations from the mean polarizability give rise to
scattering in direction 6^0,
E(R, t)= (yj^ sin0 e***-'^^ (2ic)™8e(k, t) (92)
smce8a(t)=SV8€(t)/4w with 5€=(€-€0)/60
we let de(k,t) be the Fourier transform of the variation in the dielectric
constant
5€(&, 0=(2^372J&*(r,
t)e*« d*r.
The auto correlation function in the field, neglecting the correlation
between different spacial fluctuations is obtained by averaging the
product
B*(R, t)E(R, H-T)=0?y 1^ sin20 e-*»>(bVY^ht*(k, t)8e(k, t+r)
(93)
In the remainder of this section we will not explicitly include the
dependence of e(k,t) on k but remember that we are always dealing
with the Arth Fourier component of the dielectric constant.
The spectral analysis of the light scattered can be discussed in
terms of that of E(t). However, the Fourier transform of E(t) taken
over an infinite time interval does not exist. The harmonic analysis of
E(t) is possible if averages are taken over long intervals of duration
T where one redefines E(t) so that
E(t)=
ro if
|*J>\t
scattered electric field if \t\< ^T. (94)
If the Fourier representation of E(t) is
E(t)-= r e- iutSTMdu> (95)J — CO
then its auto correlation function is (after employing (71) and inte-
grating over t)
i rT/2
£ r(r)=
^J T/E*(t)m+ r)dt
=f~Je-«*ST(a)S*T(u>')S
™T(i°'-<$2dada ' (96)
INTRODUCTORY LECTURES 33
Now let z=T(o)'— co) and employ a> and z as the variables of integra-
tion. Then
g r (r)=| e-^e^^SMSficc^zT- 1
) smzdzdu/z
As T —> oo the 2 integration yields
g T(r>- P lim ar^^Ao (97)J -co T->oo -Z
This result is consistent with the application of ParsevaFs Theoremto the determination of
<|£W>=i£j E (or*=arJ*_"_ do (98)
The quantity
GM=2w\un T-^StW (99)T->oo
is just the power spectrum of E(t). Furthermore, by inverting (97)
GM=hf~A T{T)eiT°dT
dr<E*(OE(*+T)>^™ (100)
The above formulae are, of course, the standard Wiener-Khinchine
formulae.
The power spectrum of the scattered light can then be expressed
in terms of the time dependent fluctuations in the dielectric constant
through eq (92) . Hence
eM=W^(y)4
§^/_" dT<6**(t)Ht+T)>e»» (101)
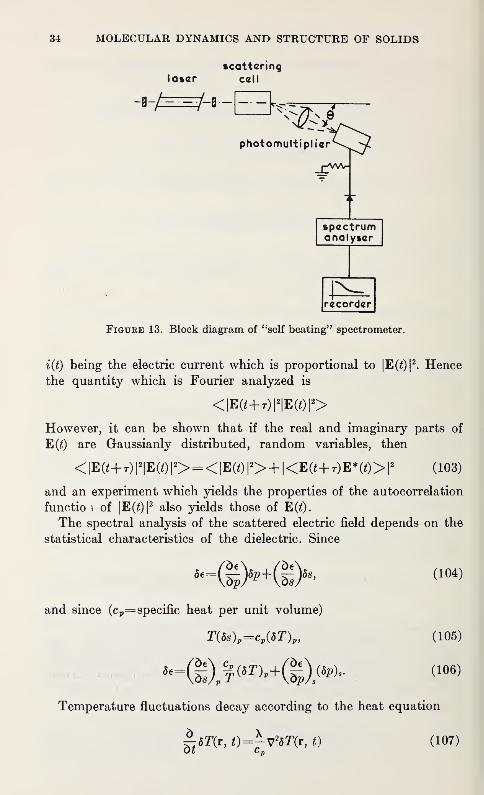
Actually, in various laser experiments, the spectral density function
G(co) is not obtained directly but it can be obtained from the experi-
mental arrangement sketched in figure 13. A signal which is the
photon current whose magnitude is |E(£)|2
is picked up on a photo-
tube. The resulting electric current is amplified and sent through a
spectrum analyzer which yields:
0(«)=4- f<t(0»«+r)> <«"-dr, (102)
34 MOLECULAR DYNAMICS AND STRUCTURE OF SOLIDS
scatteringlaser cell
photomultipli
spectrumanalyser
recorder
Figure 13. Block diagram of "self beating" spectrometer.
%{t) being the electric current which is proportional to |E(2)|2
. Hencethe quantity which is Fourier analyzed is
<|E(*+r)| 2|E(*)|
2>However, it can be shown that if the real and imaginary parts of
E(t) are Gaussianly distributed, random variables, then
<|E«+r)| 2|E«)| 2>= <!E(0| 2>+ |<E«+r)E*(0>|2(103)
and an experiment which yields the properties of the autocorrelation
functio \ of |E(Z)|2 also yields those of E(t).
The spectral analysis of the scattered electric field depends on the
statistical characteristics of the dielectric. Since
--(!MS>' (104)
and since (c p=specific heat per unit volume)
T(ds)p=c,(ST)p ,(105)
(106)
Temperature fluctuations decay according to the heat equation
(107)^-8T(t, t)=±v28T(r, t)
INTRODUCTORY LECTURES 35
where X is the thermal conductivity and c p is the heat capacity at
constant pressure. In &-space
so that
dT(k,t) = T0e-W T™ (108)
where the life time of a temperature fluctuation is
[r(k)]-1=c,/Xk2 . (109)
Following Brillouin, pressure fluctuations are associated with
thermally excited sound waves. These fluctuations modulate the
dielectric constant and give rise to Bragg-type scattering. They are
damped by viscosity in a fluid system and by thermal conduction in
both fluids and crystals. Generally one can express the k component
of the pressure fluctuation by
6p(k,t)=p 0 exp {±M(k)-\t\Tp(k)}. (110)
The ± corresponds to the two directions that the wave of frequency
ft(&) can propagate.
Since, in a linear theory, temperature and pressure fluctuations are
uncorrected, the contributions of (108) and (110) to (101) are additive.
Then from (110) the pressure fluctuation contribution to (101) is
proportional to
f--|r|r,(k) ir(«±o(k)). i r,(k) , u
)-Je rfr
-;[aJ ±«(k)]2+r|(k){lU)
The Lorentzian character of this quantity has been verified experi-
mentally to high precision by G. Benedik and his collaborators [44].
3. Relaxation and Resonance Techniques
3.1. Dielectric Relaxation [47, 48]
In 1913, after completing his work on specific heats and before
undertaking his long investigation of the effect of lattice vibrations onscattering of x-rays, Debye attempted to understand the anomalousdispersion of long wavelength radio waves by some liquids. Experi-
mental data had been collected by Drude and others, but no physical
basis had been given to the phenomenon.Debye attributed the anomalous dispersion to permanent dipole
moments of the molecules composing the material under investigation.
He argued that, while at low frequencies, the molecular dipoles could
36 MOLECULAR DYNAMICS AND STRUCTURE OF SOLIDS
change their orientation in phase with the periodic variation of the
driving field, at high frequencies, the "viscous" character of the fluid
prevents the molecules from keeping up with the field. Hence, if the
electric field has the periodic form
E=E 0 cos at (112)
then the polarization lags the driving field. Since the electric polariza-
tion, P, in the equation
D= E+4ttP (113)
lags the external field, the electric displacement has a componentwhich also lags it. One often assumes that
D=D 0 cos (cot—0)=Di cos cct-\-D2 sin cot (114)
where
Di=D 0 cos<f>
and D 2=D 0 sin<f>. (115)
It is generally observed that D 0 is proportional to E 0 . Then one can
write
Di=E 06i(w) and D 2=E 0e2 (w) (116)
where the first dielectric constant ei(co) is associated with the compo-
nent of the electric displacement which is in phase with the external
field and e2 (w) with that 90° out of phase with E. The quantity
tan 0=€2 (a))/ei(a>) (117)
is sometimes used to characterize a material.
The above formulae can be summarized in a compact notation byassuming that the electric field has the form
E=E 0e-i" t (118)
and
D=Do6 (- f" t-* )= €E (119)
where e is interpreted to be a complex dielectric constant. If one writes
it as
6= €l+i€2 (120)
then it is easy to verify that €i and e2 are to be identified with the two
dielectric constants. On this basis, e2 is often called the imaginary part
of the dielectric constant.
The quantity €2 (w) is also a measure of the energy absorbed by the
sample from the external driving field. It can be shown from a thermo-
dynamic discussion of dielectrics in an alternating electric field that
the energy absorbed per cycle is
INTRODUCTORY LECTURES 37
=coE§e2 (a;)/87r. (121)
Hence an experimental measurement of energy absorption is a
measurement of the imaginary component of the dielectric constant.
Since the polarization P in eq (109) is related to the electric
susceptibility \e by P=x eE,
Xe=(e-l)/4ir. (122)
The real and imaginary parts of the dielectric constant (and, indeed,
of the susceptibility) are not independent, but are related through
the Kronig-Kramers relation [49].
In order to employ the formal ideas above in the discussion of
molecular motions, one must make a model of these motions. This
was first attempted by Debye [47] through a theory of molecular
rotation analogous to the Einstein Theory of Brownian Motion.
In the case of a fluid, the torque on a given polar molecule (of dipole
moment n) to turn it in the direction of the field is
M=-M#sin0. (123)
The influence of collisions with other molecules gives rise to a
frictional torque which keeps the angular velocity to a constant
value with
M= {de/dt (124)
where f is the friction constant. According to Stokes law for the
rotation of a sphere of radius a in a fluid
f=87rr?a3, (125)
7f being the viscosity of the fluid. The mean square random angle
due to rotational Brownian motion is in time 5t
<d2>/m=kT/{. (126)
Debye then made a detailed analysis of the mean moment of a
dipole under the influence of a periodic electric field of field intensity
E=E 0 exp (-io)t) and found it to be, at time t
where the relaxation time r is
T=t/2kT (128)
311-280 O—,69 4
38 MOLECULAR DYNAMICS AND STRUCTURE OF SOLIDS
On this basis, the polarization P in equation (113) is proportional to
(1
—
iwr)' 1. The same mechanism implies that if a constant field EQ
is suddenly switched off at time t=0, then the mean moment after
time t would be
<m>=^E0 exp (-t/r). (129)
All of these ideas can be summarized through the introduction of
the transfer function a(t) which relates the electric displacement at
time t to the electric field at times earlier so that
V(t)=e^{t)+ fa{t')«{t-t')dt' (130)
where C. is the infinite frequency dielectric constant. Alternatively,
T){t)=*^{t)+p^(t-t'')a(t'')dt'' (131)
If the external field is periodic
D(0=Eo€„6-<ut+Eoe-<w^J^a(^
,
) exp (i<*t")dt" . (132)
When the memory function a{t) dies out in a finite time as it would
if it had the form
a(t)=a0 exv (-t/r) (133)
then the upper limit on (132) could be made infinite so that
D(t)=E0eiut {e oo+j\(t) exp (iut)di}. (134)
When a(t) has the decaying experimental form (133)
DW^Eoe-^^^-fraod-tW)- 1
} (135)
which is the form one would obtain from (112) and (127). Thestatic dielectric constant es would follow from the special choice
o>=0. Hence,
«o= (es— €oo)/r (136)
and from. (119), (120), and (135),
eiW-e^fe-O/d+ r2^) (137a)
€2 (W)= ra) (€s-€.)/(l-|-a>2T2) (137b)
and
tan ^=€2/€i=(cs— €e0)cor/(csH-€ 00 co
2T2). (138)
INTRODUCTORY LECTURES 39
The energy absorption is a maximum at the peak of the function
62 (co), i.e., at the frequency for which o>r=l. This then gives a measure-
ment of €2 which can then be expressed in terms of the molecular
parameters which characterize the relaxation process.
In many materials, all dipoles are not exposed to the same internal
electric fields. Hence there may be a number, or indeed a spectrum
of relaxation times. The experimental data would then not be con-
sistent with (137a) and (137b). Generally one can introduce a distri-
bution function for relaxation times such that
a(t)= e- t/ry(T)dT/r. (139)
When substituted into (134), the t integration can be performed to
yield
(140) is equivalent to (137) if
y(r)= (€-€„)5(T-r') (141)
and after integration, the prime is removed from the r'.
A number of detailed molecular models have been made and manymaterials investigated through the above ideas [50]. Dielectric re-
laxation methods have been especially helpful in studying molecular
mechanisms in polymers [51].
3.2. Nuclear Magnetic Resonance
While experiments of polar molecules were already fashionable in
the late 1920s and early 1930s, magnetic resonance techniques were
not developed until much later, mainly since paramagnetic suscepti-
bilities are a factor 103-104 smaller than electric susceptibilities. Thetheory was started in a paper by Waller [52] in 1932 and followed
up by Kronig, Casimer, Van Vleck, Du Pre, Broer, Debye and others
[53].
G. J. Gorter tried unsuccessfully to detect lattice heating resulting
from nuclear magnetic resonance absorption. His materials had too
long a relaxation time for nuclear spins to achieve equilibrium with
the lattice. However he contributed many ideas to the development
of the subject. Zavoisky [54] measured a barely resolved electron
magnetic resonance absorption in manganese and cupric ions in crys-
40 MOLECULAR DYNAMICS AND STRUCTURE OF SOLIDS
tals in 1945. Cummerow and Halliday [55] soon afterward observed a
well-resolved resonance in MnS04-4H 20. Proton resonances were found
by Purcell, Pound, and Torrey [56] and Bloch, Hansen and Pack-
ard [57]. The field quickly blossomed into one of the most active
branches of physics. A short survey of the entire field has recently
been published by G. Pake [58] and excellent textbooks have been
written by C. P. Slichter [59] and Abragam [60]. We will outline someof the main ideas behind the field and discuss their application to
the investigation of certain phase transitions in solids.
Resonance techniques are applied to particles such as electrons andnuclei which, in a given state, have a total magnetic moment fi and an
angular momentum J. These two vectors can be taken as parallel and
related by
H=yl, (142)
7 being the gyromagnetic ratio. J can be expressed in terms of a
dimensionless angular momentum I by
J=hl (143)
It is well known that if a particle with a magnetic moment is placed in
a magnetic field H, its energy levels are
E= —yhHm with m=I,I—l. . . (144)
The separation between successive levels is the constant yhH. Elec-
tromagnetic radiation of frequency
hw=yh TT=AE or u=yH (145)
would induce transitions in a sample composed of the particles de-
scribed above. A schematic experimental arrangement is sketched in
figure 13.
The sample is placed in a static magnetic field in the z direction,
HQ . Then an r-f magnetic field Hi of frequency co is applied perpendic-
ular to H0 . The r-f power absorbed by the sample can be deduced bymeasuring the Q of the coil. The power absorbed will be greatest
at the resonance frequency.
Since the formula for the resonance frequency does not depend on
h, one would expect to be able to make a classical analysis of the
situation. This, indeed, is very useful in the description of the relaxa-
tion processes which occur when the magnetic particle is not isolated
as, for example, through the spin lattice interaction when the particle
is imbedded in a crystal. The classical analysis of this situation was
first made by F. Bloch [61].
INTRODUCTORY LECTURES 41
The equation of motion for the magnetic moment under the in-
fluence of a torque provided by a magnetic field H is
<U/dt=pXK (146)
or from (142)
%=*XyH (147)
If H=H0 , a static field in the z direction, rotates at an angular
velocity Q=—ykH0 (k is the unit vector in the z direction). Theangular frequency
(o 0=Y# (148)
is the Larmor frequency and is identical with the resonance frequency
(145). A detailed discussion of the solution of (147) has been given in
reference [56] for the case when H0 has two parts consisting of a
static field H0 in the z direction and an alternating field normal to it
with
Hx=Hi cos at; Hy=Hi sin cot (149)
The bulk magnetization of a crystalline sample is M= 2/*i. Atthermal equilibrium in the absence of an external field, one wouldexpect M=0. However, in the presence of a static magnetic field H 0
in the z direction and a small r-f field normal to it, a non-vanishing
moment M develops. Its time variation is in many situations well
described by Bloch's phenomenological equations (with M 0=xoH0 ,
Xo being the static magnetic susceptibility)
rfM#=7(MXH),+ (M0-M2)/r1 (150a)
dMx/dt=y(MX H) X-Mx/T2 (1 50b)
dMv/dt=y(MXH) y-My/T2 (150c)
which involve two relaxation times. The time constant TY is the rate
at which an assembly of spins in a magnetic field come to equilibrium
with a reservoir of phonons as the magnetic moments take on their
Boltzmann distribution among their various Zeeman states (144). Apossible mechanism for T2 is somewhat analogous to the relaxation
phenomenon involving electric dipoles as discussed in Section 3.1.
Each spin is influenced by local fields due to neighboring spins at
slightly different locations so that if, initially, all spins are precessing
in the same manner, these fluctuations would soon take them out of
plane and eventually the system would be randomized. Generally,
T2 is less than Tt.
42 MOLECULAR DYNAMICS AND STRUCTURE OF SOLIDS
One would expect the Bloch model to yield resonance functions for
the magnetic susceptibility which are analogous to (137). When the
Bloch equations are solved relative to the driven magnetic fields
Hx(t)=HXQ exp (— io)t),
HZ=H0= constant (151)
in the regime Hx small, the magnetic susceptibility has the form
X=x'+ix" (152)
with
X , =ix0cooT2(coo-co)T2/[l+ (co-co0 )
227
2 ] (153a)
X' ' =\ XocooTVIl+ (co-co0)2T2 ]. (153b)
The Larmor frequency o) 0=H0 did not appear in the Debye theory
because in the polar molecule case there was no constant aligning field
and no Larmor precession about it. With the aid of (153b) experimental
data on x" could then yield information about molecular motions in
solids provided that one had models that cou.d be used for a calcula-
tion of x".The average power absorbed per cycle in a sample of magnetic
material in a periodic fieldHpert is the direct analogue of (121) using the
imaginary part of the magnetic susceptibility (122) instead of the
dielectric constant. In a sample of volume V, it is averaged over one
cycle,
<?>=\^xffHlQV. (154)
This quantity can be calculated directly by standard quantum me-chanical time dependent perturbation theory for a given model. Thebasic time independent Hamiltonian for an assembly of dipoles in a
solid can be taken as
H=^ zkH0+^Hjik (155)k j,k
where Hjjk is a sum of dipole-dipole interactions. When an r-f mag-
netic field in the x direction is switched on, a time dependent per-
turbing Hamiltonian must be added
Hpert=— ^,fjLXtkHXo cos o)t=—nxHXQ cos cct, (156)k
fix being the x component of the total moment. The power absorbed
in the sample depends on the number of transitions from a set of initial
states a of the Hamiltonian to final states b such that \Eb—Ea \
= ho3.
INTRODUCTORY LECTURES 43
From second order perturbation theory, the transition probability
is just the time average of the square of the matrix element of the
perturbation; i.e., it is proportional to [59,60]
m0 \(a\nx\b)\\
The power is also proportional to %u, the energy absorbed per tran-
sition. After one goes through the detailed energy balance calculation
and substitutes the results into (154) he finds
*"M=WW7 S«-"«l(«k|6)l,[«(£.--E,-s«)+«(£.-E»+M]
(157)
where Z is just the partition function
Z=S exp (-/3#„).a
The Boltzmann factor Z" 1 exp (
—
f$Ea) appears in (157) because it is
the probability that the state a is occupied initially. The delta function
insures that only those transitions are counted for which \Ea—Eb \=fiw.
Then
x"(co)=2^S^-^I(«Im,|6)| 2(158)
where the summation is to be taken over all states a and b such that
\Ea-Eb\=ha.
In order to calculate the susceptibility x"M from (158) we mustknow the energy levels of our system of interacting spins. This is, of
course, a very difficult problem to solve. However, as a first approxi-
mation, one might choose the Ea to be the Zeeman energy levels.
When they are examined in some detail, it is found that Ea/kT<i<C_l
under the conditions of the usual resonance experiments. Hence the
factor exp-(3Ea can be omitted from (157). On that basis, the line
shape is characterized by the function [59,60]
/(^)=JSI(«lMx|6)|2[6( a-^-M+5(^a
-^6+^)]. (159)
This quantity is still difficult to calculate, but van Vleck [62]
noticed that various moments of/(a>), Jo>
n/(a>) do), can be obtained with-
out too much trouble. First consider
+8(Ea-Eb+hu)]d<». (160)
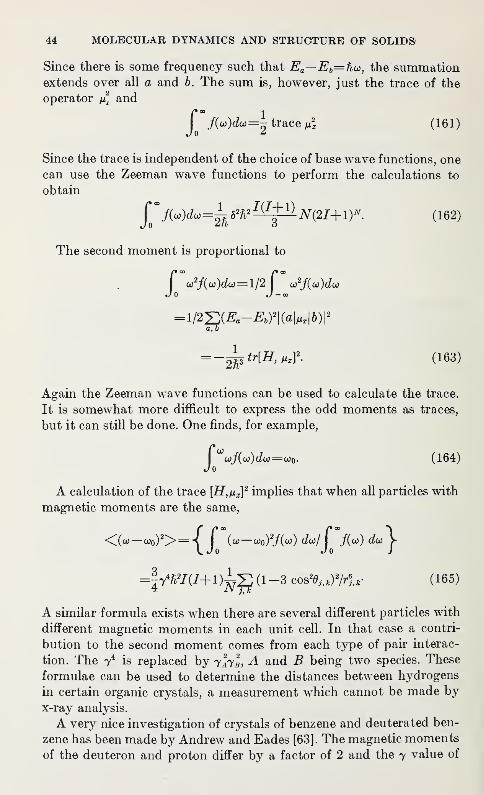
44 MOLECULAR DYNAMICS AND STRUCTURE OF SOLIDS
Since there is some frequency such that Ea—Eb=ficc, the summationextends over all a and b. The sum is, however, just the trace of the
operator £ and
Jo
trace £ (161)
Since the trace is independent of the choice of base wave functions, one
can use the Zeeman wave functions to perform the calculations to
obtain
f° f(u)d<*=±5wt^p±N(2I+l)». (162)
The second moment is proportional to
f co2jf(co )<&*>= 1/2 o>
2j(o>)du
J0 J -CD
a, b
=-^tr[HtftlY. (163)
Again the Zeeman wave functions can be used to calculate the trace.
It is somewhat more difficult to express the odd moments as traces,
but it can still be done. One finds, for example,
CO
co/(cu)(Zco=co0 . (164)
A calculation of the trace [H,nx]2 implies that when all particles with
magnetic moments are the same,
<(co-co0)2>={
j\u-u>o) 2JM dalf~JM
-=|yW(/+i)iS (1 -3 cos%, k)2/r«x (165)
4 J\l j,k
A similar formula exists when there are several different particles with
different magnetic moments in each unit cell. In that case a contri-
bution to the second moment comes from each type of pair interac-
tion. The y4
is replaced by y*yl, A and B being two species. These
formulae can be used to determine the distances between hydrogens
in certain organic crystals, a measurement which cannot be made by
x-ray analysis.
A very nice investigation of crystals of benzene and deuterated ben-
zene has been made by Andrew and Eades [63]. The magnetic momentsof the deuteron and proton differ by a factor of 2 and the 7 value of
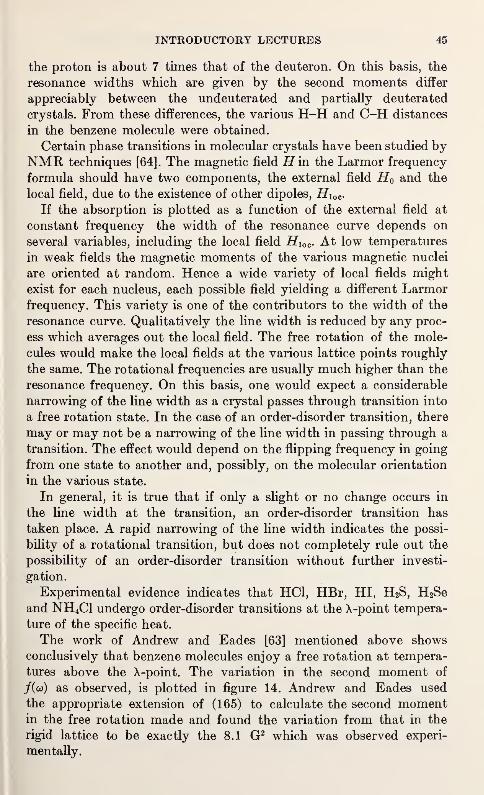
INTRODUCTORY LECTURES 45
the proton is about 7 times that of the deuteron. On this basis, the
resonance widths which are given by the second moments differ
appreciably between the undeuterated and partially deuterated
crystals. From these differences, the various H-H and C-H distances
in the benzene molecule were obtained.
Certain phase transitions in molecular crystals have been studied byNMR techniques [64]. The magnetic field J^in the Larmor frequency
formula should have two components, the external field H0 and the
local field, due to the existence of other dipoles, Hloc .
If the absorption is plotted as a function of the external field at
constant frequency the width of the resonance curve depends on
several variables, including the local field Hioc . At low temperatures
in weak fields the magnetic moments of the various magnetic nuclei
are oriented at random. Hence a wide variety of local fields might
exist for each nucleus, each possible field yielding a different Larmorfrequency. This variety is one of the contributors to the width of the
resonance curve. Qualitatively the line width is reduced by any proc-
ess which averages out the local field. The free rotation of the mole-
cules would make the local fields at the various lattice points roughly
the same. The rotational frequencies are usually much higher than the
resonance frequency. On this basis, one would expect a considerable
narrowing of the line width as a crystal passes through transition into
a free rotation state. In the case of an order-disorder transition, there
may or may not be a narrowing of the line width in passing through a
transition. The effect would depend on the flipping frequency in going
from one state to another and, possibly, on the molecular orientation
in the various state.
In general, it is true that if only a slight or no change occurs in
the line width at the transition, an order-disorder transition has
taken place. A rapid narrowing of the line width indicates the possi-
bility of a rotational transition, but does not completely rule out the
possibility of an order-disorder transition without further investi-
gation.
Experimental evidence indicates that HC1, HBr, HI, H2S, H2Se
and NH 4C1 undergo order-disorder transitions at the X-point tempera-
ture of the specific heat.
The work of Andrew and Eades [63] mentioned above shows
conclusively that benzene molecules enjoy a free rotation at tempera-
tures above the X-point. The variation in the second moment of
/(co) as observed, is plotted in figure 14. Andrew and Eades used
the appropriate extension of (165) to calculate the second momentin the free rotation made and found the variation from that in the
rigid lattice to be exactly the 8.1 G2 which was observed experi-
mentally.
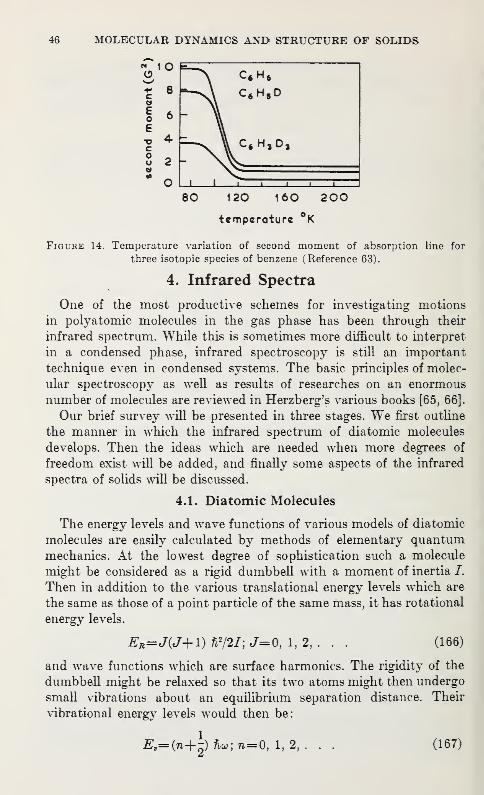
46 MOLECULAR DYNAMICS AND STRUCTURE OF SOLIDS
O L_l I i i i i i
80 120 160 200
temperature °K
Figure 14. Temperature variation of second moment of absorption line for
three isotopic species of benzene (Reference 63).
4. Infrared Spectra
One of the most productive schemes for investigating motions
in polyatomic molecules in the gas phase has been through their
infrared spectrum. While this is sometimes more difficult to interpret
in a condensed phase, infrared spectroscopy is still an important
technique even in condensed systems. The basic principles of molec-
ular spectroscopy as well as results of researches on an enormous
number of molecules are reviewed in Herzberg's various books [65, 66].
Our brief survey will be presented in three stages. We first outline
the manner in which the infrared spectrum of diatomic molecules
develops. Then the ideas which are needed when more degrees of
freedom exist will be added, and finally some aspects of the infrared
spectra of solids will be discussed.
4.1. Diatomic Molecules
The energy levels and wave functions of various models of diatomic
molecules are easily calculated by methods of elementary quantummechanics. At the lowest degree of sophistication such a molecule
might be considered as a rigid dumbbell with a moment of inertia /.
Then in addition to the various translational energy levels which are
the same as those of a point particle of the same mass, it has rotational
energy levels.
EB=J(J+1) h2/2l; J=0, 1, 2, . . . (166)
and wave functions which are surface harmonics. The rigidity of the
dumbbell might be relaxed so that its two atoms might then undergo
small vibrations about an equilibrium separation distance. Their
vibrational energy levels would then be:
#,= 0H-|) hu;n=0, 1, 2, (167)
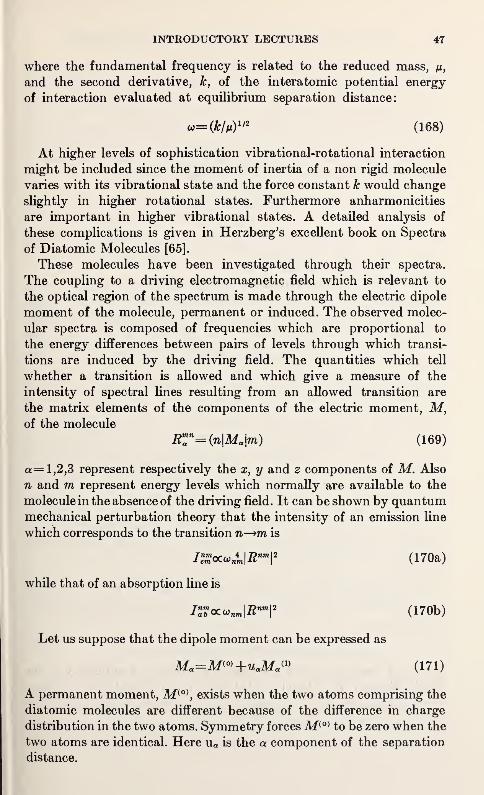
INTRODUCTORY LECTURES 47
where the fundamental frequency is related to the reduced mass, /x,
and the second derivative, k, of the interatomic potential energy
of interaction evaluated at equilibrium separation distance:
w=(Ar/M)i/2 (168)
At higher levels of sophistication vibrational-rotational interaction
might be included since the moment of inertia of a non rigid molecule
varies with its vibrational state and the force constant k would change
slightly in higher rotational states. Furthermore anharmonicities
are important in higher vibrational states. A detailed analysis of
these complications is given in Herzberg's excellent book on Spectra
of Diatomic Molecules [65].
These molecules have been investigated through their spectra.
The coupling to a driving electromagnetic field which is relevant to
the optical region of the spectrum is made through the electric dipole
moment of the molecule, permanent or induced. The observed molec-
ular spectra is composed of frequencies which are proportional to
the energy differences between pairs of levels through which transi-
tions are induced by the driving field. The quantities which tell
whether a transition is allowed and which give a measure of the
intensity of spectral lines resulting from an allowed transition are
the matrix elements of the components of the electric moment, M,of the molecule
RT=(n\Ma\m) (169)
a= 1,2,3 represent respectively the x, y and z components of M. Also
n and m represent energy levels which normally are available to the
molecule in the absence of the driving field. It can be shown by quantummechanical perturbation theory that the intensity of an emission line
which corresponds to the transition n—mi is
I™oca> nil\Rnm
\
2 (170a)
while that of an absorption line is
lWcco>nm\R™\2 (170b)
Let us suppose that the dipole moment can be expressed as
Ma=M™+uaMa{l)
(171)
A permanent moment, M(0), exists when the two atoms comprising the
diatomic molecules are different because of the difference in charge
distribution in the two atoms. Symmetry forcesM(0) to be zero when the
two atoms are identical. Here ua is the a component of the separation
distance.
48 MOLECULAR DYNAMICS AND STRUCTURE OF SOLIDS
In the rigid dumbbell modelM(1) =0 and the x, y, and z components of
M(0) are the magnitude of the permanent dipole moment multiplied bythe appropriate angle dependent function which takes the projection
of the dipole moment vector in the x, y, or z direction. When these
products are substituted into (169) and the n and m of (169) represent
rotational states J and J' the only nonvanishing matrix elements of
(169) are those with J—J'= ± 1. The difference between the energy in
the higher and next lower rotational states (J and J— 1) is
AE=h2(J+l)/I (172)
so that the rotational spectrum consists of a sequence of regularly
spaced lines with a separation of h2/I between neighbors. These are
generally in the far infrared region.
The selection rules for the vibrational spectrum are obtained bysubstituting (171) into (169) and interpreting n and m to be vibrational
states. The appropriate wave functions are the products of a Gaussian
factor and Hermite polynomials. From their orthogonality properties
a constant dipole moment, M(0), contributes nothing to R%n when
In a linear molecule there is only one displacement component in the
induced dipole moment (the second term in 171). We let x be
the deviation of the separation distance from its equilibrium
value. The only nonvanishing matrix elemets of x correspond to
n=m±l. Hence only vibrational transitions from a given level to its
closest neighboring levels are possible. Since vibrational levels are
equally spaced, AE is the same for all possible transitions which lead
to emission and for all transitions resulting from absorption. There-
fore there is a single line in the vibration spectrum for the simple
harmonic model with a linear electric moment function (171). It is
generally in the near infrared spectrum. There is an isotopic shift
which can be estimated by noting the change in reduced mass as given
by (168).
The vibrational model can be made more sophisticated in two ways.
First by adding cubic, quartic, etc., terms to the harmonic interaction
potential, and second by adding quadratic, cubic etc., terms to the
induced dipole moment contribution to (171). Both of these changes
make transitions \n—m|=2, 3, . . . possible as well as ^=m± 1. How-
ever, the intensity of the associated lines decreases rapidly with in-
creasing \n—m\.The rotation spectrum yields information about the moment of
inertia and internuclear distances. The vibration spectrum gives
force constants and other properties of the interaction potential.
INTRODUCTORY LECTURES 49
The Raman spectra is the change in the spectra of light scattered
by molecules. As was discussed in section 2, Rayleigh scattering de-
pends on the polarization of the scatterer, P=<*F, a being the polariza-
bility and F the electromagnetic field vector of the incident wave. In
the quantum theory of light scattering one must calculate the matrix
element of P(n\P\m)=J^oF^dr,
which, in the case of a periodic driving force F=F0cos w0t of frequency
«o can be written as
(7&|P|m)=F0 cos a>o*Jfnoal'm dr.
The time dependent factors in ^* and tf/m are respectively exp (iEnt/h)
and exp(—iEmt/h) so that (the ^>'s being spacial dependent part of wavefunctions)
(7>|P|m)=iF0{exp ^(«H^-SJA)+exp^(«0+[^m-^JA)}
If a is not a constant but depends on either angle or separation
distance, then the scattered light is composed of light of the incident
frequence w0 as well as the Raman frequencies.
<*o±{Em-En)lh (173)
for the {n, m) pairs which correspond to non-vanishing matrix elements.
For reasonable models of the polarizability function a it can be
shown that the selection rules for rotational Raman lines are AJ
=
±2, ±4, etc., with the intensity diminishing rapidly with increasing
|AJ|. The main vibrational Raman lines correspond to An=±l. It
should be emphasized that by the proper choice of co 0 , Raman lines
can be put in various regions of the spectrum.
4.2. Polyatomic Molecules [66, 69]
The rotational energy levels of molecules composed of more than
two atoms differ somewhat from those of diatomic molecules since
such molecules generally have three non-vanishing moments of
inertia rather than one. A simple formula exists for the energy levels
in the case of symmetrical "top" molecules; i.e., those such that IZ=IA ,
50 MOLECULAR DYNAMICS AND STRUCTURE OF SOLIDS
and Ix=Iy =Ib- It was shown many years ago by Reiche and Rada-macher [67] that
E=±h2[J(J+l)/IA +tf(l/IB+l/IA)]
£1=0, ±1, ±2, . . . and «7«=|0|,|0|+ 1, . . .
There is actually a very small IB in diatomic molecules because the
constituent atoms are not points but have an extended electron cloud
which is sufficient to give them a small IB . Then for a fixed ft the
AE's are the same as they would be in the absence of the ft2 term.
However, in a complete careful analysis of diatomic spectra, bands
which correspond to various values of ft can be picked out.
Molecules without symmetrical tops (i.e., the case IX±IV±IZ) do
not have a closed formula for the energy levels. Rather comprehensive
tables of energy levels and selection rules do exist however [68].
An extra property of sufficiently complicated polyatomic molecules
is that an internal free rotation might exist which could be infrared
active. There is a considerable literature on the nature of the angular
dependent internal potential barriers which must be overcome if someinternal part of the molecule is to rotate freely. The molecule CH 3OHhas an internal rotation as does C 2H 6 . The details of these rotations
have been deduced from band spectra.
As the pressure of a gas composed of polyatomic molecules is in-
creased the individual spectral lines of the infrared and Raman spectra
become broader and broader due to molecular collisions. In the liquid
state the molecules do not generally show a rotational fine structure,
H 2 being one of the rare exceptions. In dilute solutions one occasionally
does find a rotational fine structure.
In solids rotational degrees of freedom are generally repressed and
are replaced by librations or vibrations about preferred axes. Often
the best way to investigate the vibrational states of a polyatomic mole-
cule is through the spectra in its solid state at very low temperatures.
Since there is no rotation, any effect of rotations on vibrations in the
gaseous state has disappeared as well as effects of anharmonicity.
Hence the vibrational lines become much sharper.
If an internal free rotation develops at a phase transition it can be
observed by the appearance of rotational bands. The negative case of
the ammonium halides was mentioned earlier. The absence of the ro-
tational bands both below and above the phase transition is evidence
that the transition is an order-disorder one.
The vibrational spectra of a polyatomic molecule is deduced by
making a normal mode analysis of the small vibrations which the mole-
cule might undergo. A model for a given molecule is given in terms of a
INTRODUCTORY LECTURES 51
set of masses and force constants which then appear as elements in
the characteristic determinant whose roots yield the normal modefrequencies. There are two difficulties in this approach. First, when the
molecule becomes large the characteristic determinant becomes large
and unwieldy. When symmetries exist in the molecule, group theo-
retical methods are very useful in factoring the determinant into
several smaller ones. Second, one does not know the various force
constants a priori.
In simple symmetric molecules such as C2H2, S02 , or CH4 there are
not many force constants and the small vibration analysis can be done
easily with them as parameters. A pattern becomes clear so that with
only very rough estimates of the force constants a correspondence of
observed spectral lines with normal modes can be made. Then the
experimental data can be used to obtain precise values for the force
constants. Checks can be made or more information gained when re-
quired by observing shifts in the spectra when various isotopic sub-
stitutions are made. After a number of small molecules are well ana-
lyzed one can proceed to slightly more complicated ones, using someof the established force constants where similar interactions exist
in the complicated case. With these and other tricks quite a collection
of information on motions of rather complicated molecules has been
established.
The vibrations of diatomic and polyatomic molecules generally
change very little in going from the vapor to the liquid to the solid
state. When slight shifts occur they can sometimes be used to discuss
the interaction oetween molecules in the condensed phase. Mostchanges in fundamental frequencies are less than 5 percent and the
magnitude of the changes diminish with increasing temperature.
Certain qualitative differences may also appear. For example de-
generate modes which correspond to the same frequency may be split
due to crystal fields and transitions which were forbidden might beallowed through the intermolecular interaction.
Since most solids are not very transparent, experiments can only be
performed when very thin specimens can be made. There are a numberof complicated molecules of biological interest which can be prepared
only in minute quantities as a powder. Their absorption spectrum can
now be investigated by suspending them in a rather transparent ma-terial such as Nujol paste. Whatever the method used for sample
preparation of biological materials, great care must be taken. A dis-
cussion of techniques and precautions are given in reference [70].
Lists of frequencies of various bonds resulting from motions of
important fragments and groups in organic molecules have been as-
sembled [71]. Bonds in complicated molecules can then be identified
from such compilations even when detailed molecular structures are
52 MOLECULAR DYNAMICS AND STRUCTURE OF SOLIDS
not known or when the molecule is so complex that the mathematical
analysis of its vibrations become unwieldy.
Protein molecules sometimes exist in several states, one being bio-
logically active and the other not. Spectroscopic methods might beused as a tool to investigate the changes in structure or molecular
motions which are responsible for the difference in the activity. TheDNA molecule in solution changes from a double helix structure to a
random coil structure in which the hydrogen bonds which hold the
two strands of the helix together are broken. A critical temperature
range of a few degrees exists in which this transition occurs with the
double helix structure being the low temperature form and the randomcoil the high temperature form. The transition is generally followed byobserving the change in magnitude of an absorption peak at 2600 A.
The stacking of various base groups in the ordered double helix struc-
ture produces a depression in the absorption. With the breaking of
hydrogen bonds, the absorption at 2600 A increases to higher values
in the disordered denatured state [72].
4.3. More About Crystal Lattices [73-76]
The remarks made above for molecular crystals are not valid for
ionic crystals such as NaCl. In the cases discussed above the high
frequency internal vibrations are almost uncoupled from the low
frequency lattice vibrations. In the ionic crystals one effectively has a
giant molecule with all close neighbor interactions being of the sameorder of magnitude.
In optical experiments on these materials, one generally uses a very
thin slab of material and measures the intensities of the incident,
reflected and transmitted beams. Through energy conservation
h=IB+IT+IAIA being the absorbed intensity. In terms of the reflectivity R=IR/I0 ,
transmitivity T, and absortivity, A,
l=R+T+Aso that measurements in R and T yield information about A.
The optical properties of the sample are directly related to the
frequency dependent complex dielectric constant discussed in section
3.1. This quantity is in turn connected to atomic and molecular
motions in the material of interest. The various formal expressions of
section 3.1 are applicable to this problem.
The optical spectroscopy of crystals is concerned with driving
wavelengths much longer than the lattice spacings so that an external
driving field of the form
E=E0 exp i(2irk.r— w<) (174)
INTRODUCTORY LECTURES 53
is considered in the long wave length limit k=0 and no spacial dis-
persion is included in the theory. Hence the only part of the lattice
dispersion curves (see figure 7) which is relevant to this technique is
the k=0 asymptote of the optical branch of lattice vibrations.
In the simplest theory of the dielectric constant of an ionic crystal
one assumes that the lattice is composed of springs and point non-
polarizable masses. Then in an electric field the positive and negative
ions separate, the restoring force of each type of ion being propor-
tional to an effective mass of that type. The longitudinal and trans-
versal vibrations are assumed to be independent of each other for
waves traveling in symmetry directions in cubic crystals. One then
writes Newton's equation of motion for a typical positive ion (in a
two component lattice such as NaCl) in an effective electric field
which is the sum of the external driving field and the local field due to
all other ions. A similar equation is written for the negative ions and
the difference between the two accelerations are taken to obtain the
equations for the transverse optical vibrations
muT+my tuT+m<til'U>T=e*ETeif (175)
where uT=x+T— x_ T is the relative displacement of a nearest pair of
changes, m is the reduced mass m=m+m_/'(m++m_) ,mu2
0 the restor-
ing force constant, yT=^/TT , the damping constant, and ETett the
effective transverse electric field. The effective charges of the ions are
defined as ±e*. The transverse polarization of the medium is
PT=ne*(x+T—x_T)=ne*uT . (176)
The procedure . for choosing an appropriate form for the effective
field ETett was discussed many years ago by Lorentz [77]. When the
lateral dimensions of the medium are large compared with the wave-length and when the medium is cubic,
ETeff=EText+(4ir/S)PT ' (177)
the last term being the so-called Lorentz field and EText the external
electric field which drives the transverse vibration. Now, if we set
k=0 in (174) and call EText=E0 exp—iwt and furthermore write
/ \ (e*/m)E0 . (—_vuT(co)= 2
V
2 . >. (178)
coy— co2—KayT
then
/ \ (ne*2/m)E0
'
2 o
—
: =XT (a))rLo (179)o)t— co
— iyT oo
where
o>2
T=u0 -(4ir/S)ne*2/m (180)
311-280 O—69 —
5
54 MOLECULAR DYNAMICS AND STRUCTURE OF SOLIDS
and the transverse electric susceptibility Xr (co) is related to the trans-
verse dielectric constant through (122). The "plasma frequency" is
defined through the second term in (180)
<£= (47r/3)ne*2/m. (181)
The real and imaginary parts of the dielectric constant then have
forms essentially the same as those discussed in section 3.
(TAa)=M.-«T+yW (182b)
The damping constant yT vanishes in a purely harmonic theory.
However, if the original lattice vibration hamiltonian has anharmonic
forces or if the dipole moment term (171) has additional non-linear
terms in the displacements u, yT can be calculated form perturbation
theory in a manner analogous to the derivation of (158). It involves
so-called multiphonon processes. A similar discussion of the longi-
tudinal dielectric constant can be made.
When one relaxes the initial hypothesis that the atoms in the lattice
are point non-polarizable objects, then the atomic polarizabilities
must be included in the above discussion. This was first done bySzigeti [78].
All of the above mentioned elaborations as well as discussions of
experimental data and generalizations to systems with more compli-
cated unit cells than one finds in NaCl lattices can be found in recent
reviews by E. Burstein [74, 75] and collaborators and by D. H.
Martin [76].
5. Discussion
E. R. Lippincott: (University of Maryland) : My question is as-
sociated with the singularities that show up in the heat capacity
curves. Is it always true that these singularities show up when you have
cooperative motion? Is it necessary to have a cooperative phenomenonto have a singularity?
E. Montroll: I think all the sharp singularities come from some
kind of cooperative phenomena. I don't know of any exception.
INTRODUCTORY LECTURES 55
6. References
[1] W. Nernst and F. Lindemann, Zeit fur Elektrochemie und AngewandtePhysikalische Chemie 17, 817 (1911).
[2] W. K. Robinson and S. A. Friedberg, Phys. Rev. 117, 402 (1960).
[3] A. Lawson, Phys. Rev. 57, 417 (1940).
[4] M. R. Moldover and W. A. Little, Critical Phenomenon NBS Publication 273
(editors M. S. Green and J. V. Sengers) p. 79 (1966). See also M. J. Buck-ingham and W. M. Fairbank, Prog, in Low Temp. Phys. 3, 80 (1961).
[5] Dynamical Theory of Crystal Lattices, M. Born and K. Huang, Clarendon
Press, Oxford, (1954).
[6] Theory of Lattice Dynamics in the Harmonic Approximation, A. Maradudin,
E. Montroll and G. Weiss, Academic Press, New York, (1963).
[7] E. W. Montroll, J. Chem. Phys. 15, 575 (1947).
[8] L. van Hove, Phys. Rev. 89, 1189 (1953).
[9] L. Onsager, Phys. Rev. 65, 117 (1944); B. Kaufman and L. Onsager Phys.
Rev. 76, 1244 (1949).
[10] E. Montroll, R. Potts, and J. Ward, J. Math. Phys. 4, 308 (1963).
[11] G. F. Newell and E. W. Montroll, Rev. Mod. Phys. 25 % 353 (1953).
[12] C. Domb, Advances in Physics 9, 149 (1960).
[13] M. E. Fisher, Reports on Progress in Physics 30 (part 2), (1967).
[14] T. Schultz, D. Mattis, and E. Lieb, Rev. Mod. Phys. 36, 856 (1964).
[15] G. A. Baker Jr. Advances in Theoretical Physics 1, 1 (1965).
[16] W. F. Giauque and J. W. Stout, J. Am. Chem. Soc. 58, 1144 (1936).
[17] W. F. Giauque and M. Ashley, Phys. Rev. 43, 81 (1933).
[18] L. Pauling, J. Am. Chem. Soc. 57, 2680 (1935).
[19] J. F. Nagle, J. Math. Phys. 7, 1484 (1966); 7, 1492 (1966).
[20] J. Slater, J. Chem. Phys. 9, 16 (1941).
[21] E. Lieb, Phys. Rev. Letters 18, 692 (1967).
[22] H. Palevsky, Brookhaven Lecture Series number 66, (1967).
[23] cf. B. N. Brockhouse, Aarhus Summer School Lectures 1963, p. 211, (W. A.
Benjamin, Inc., N.Y.).
[24] G. Placzek and L. van Hove, Phys. Rev. 93, 1307 (1954).
[25] L. van Hove, Phys. Rev. 95, 249 (1954).
[26] E. L. Wagner and D. F. Hornig, J. Chem. Phys. 18, 296 (1950).
[27] Palevsky, Otnes, and Larson, Phys. Rev. 113, 11 (1958).
[28] Yarnell, Arnold, Bent, and Kerr, Phys. Rev. 113, 1358 (1959).
[29] D. G. Henshaw, Phys. Rev. Letters 1, 127 (1958).
[30] Henshaw, Woods, and Brockhouse, Bull. Am. Phys. Soc. 5, 12 (1960).
[31] N. S. Gingrich, Rev. Mod: Phys. 15, 90 (1943). For more recent review see
K. Furukawa, Reports on Prog, of Phys. 25, 396 (1962).
[32] W. L. Bragg, The Crystalline State I, G. Bell and Sons, London, (1933), andR. W. James, The Crystalline State II, G. Bell and Sons, London (1954).
[33] J. Bouman, Handbuch der Physik, 32, p. 96-237 (see especially p. 218-236),
1957.
[34] H. Lipson and W. Cochran, The Crystalline State III, G. Bell and Sons,
London, (1953).
[35] A. L. Patterson, Phys. Rev. 46, 373 (1934).
[36] Light Scattering by Small Particles, H. C. van de Hulst, Wiley, New York,
(1957).
[37] P. Debye, J. Appl. Phys. 15, 338 (1944).
[38] W. Marshall, Critical Phenomenon, NBS Publication 273, p. 135 (1966).
[39] L. S. Ornstein and F. Zernicke, Proc. Acad. Sci. Amsterdam 17, 793 (1914).
56 MOLECULAR DYNAMICS AND STRUCTURE OF SOLIDS
[40] Theoretical Physics in the Twentieth Century, p. 161, M. Fierz, Interscience,
New York, (1960).
[41] Phase transitions, NBS Publication 273 (Ed. M. S. Green and J. V. Sengers).
[42] L. Brillouin, Ann. Phys. 17, 88 (1922).
[43] L. Landau and G. Placzek, Physik. Z. Soviet Union 5, 172 (1934).
[44] N. C. Ford, Jr., and G. B. Benedek, Phys. Rev. Letters 15, 649 (1965).
Critical Phenomenon NBS Publ. 273, p. 150 (1966).
[45] G. B. Benedek and K. Fritsch, Phys. Rev. 149, 647 (1966).
[46] S. S. Alpert, Critical Phenomenon, NBS Publication 273, p. 157 (1966).
[47] Polar Molecules, P. Debye, Chemical Catalog Co., New York, (1929).
[48] Theory of Dielectrics, H. Frohlich, Clarendon Press, Oxford, (1958).
[49] R. Kronig, J. Am. Op. Soc. 12, 547 (1926) : H.A. Kramers, Atti del Congress
Internationale de Fisica Como (1927).
[50] W. Kauzmann, Rev. Mod. Phys., 14, 12 (1942).
[51] Viscoelastic Properties of Polymers, J. Ferry, Wiley, New York, (1961).
[52] I. Waller, Zeit, f. Physik 79, 370 (1932).
[53] Paramagnetic Resonance, C. J. Gorter, Elsevier, Amsterdam, (1947).
[54] E. J. Zavoisky, J. Phys. USSR 10, 197 (1946).
[55] R. L. Cummerow and D. Halliday, Phys. Rev. 70, 433 (1946).
[56] E. M. Purcell, H. C. Torrey, and R. V. Pound, Phys. Rev. 69, 37 (1946).
[57] F. Bloch, W. W. Hansen, and M. Packard, Phys, Rev. 70, 474 (1946).
[58] G. Pake, Proceedings of Conference on Magnetic Resonance, Cairo (1967).
[59] Principles of Magnetic Resonance, C. P. Slichter, Harper and Row, (1963).
[60] Principles of Nuclear Magnetism, A. Abragam, Clarendon Press, Oxford,
(1961).
[61] F. Bloch, Phys. Rev. 70, 460 (1946).
[62] J. H. van Vleck, Phys. Rev. 74, 1168 (1948).
[63] E. R. Andrew and R. G. Eades, Proc. Roy. Soc. A218, 537 (1953).
[64] N. L. Alpert, Phys. Rev. 75, 398 (1949).
[65] Molecular Spectra and Molecular Structure, I. Spectra of Diatomic Mole-
cules, G. Herzberg, van Nostrand, New York, (1950).
[66] Molecular Spectra and Molecular Structure, II. Infrared and Raman Spec-
troscopy, G. Herzberg, van Nostrand, New York, (1946).
[67] F. Reiche and H. Radamaker, Z. Phys. 39, 444 (1926).
[68] Cf. C. W. King, R. M. Haimer and P. C. Cross, J. Chem. Phys. 11, 27 (1943)
17, 826 (1949).
[69] D. F. Hornig, J. Chem. Phys. 16, 1063 (1948).
[70] J. Lecomte, Advances in Chem. Phys. 7, 408 (1964).
[71] R. N. Jones and C. Sandorfy, Chemical Applications of Spectroscopy (Vol
IX of Technique of Organic Chemistry, Ed. A. Weissberger, Interscience,
New York, (1956).
[72] P. Doty, J. Polymer Sci. 55, 1 (1961).
[73] Dynamical Theory of Crystal Lattices, M. Born and K. Huang, Clarendon
Press, Oxford, (1954).
[74] E. Burstein, Aarhus Summer School Lectures 1963, p. 276 (W. A. BenjaminInc. N.Y.).
[75] E. Burstein, S. Iwasa, and Y. Sawada, Redic. della Scuola Int. de Fisica
Enrico Fermi XXXIV Corso 421 (1966).
[76] D. H. Martin, Advances in Physics, 14, 39 (1965).
[77] Theory of Electrons, H. A. Lorentz, (Teubner 1909, Dover reprint 1953).
[78] B. Szigeti, Trans. Faraday Soc. 45, 155 (1949).
THE CONTRIBUTIONS OF NEUTRON AND X-RAYDIFFRACTION TECHNIQUES
G. E. BACON
The University, Sheffield 10, England
1. Introduction
The applications of neutrons and x rays in studying molecular
dynamics and the structure of solids depend particularly on four
factors.
1. The quantitative way in which individual atoms scatter a beamof neutrons or x rays.
2. The relation between neutron and x ray wavelengths and inter-
atomic and intramolecular distances.
3. The absorption coefficients, or, more important, the penetra-
bilities of these radiations for solids and liquids.
4. The energies of neutrons and x-ray photons in relation to the
energies of acoustic, vibrational and rotational quanta.
We can say at the outset, as indicated in figure 1, that neutrons of
thermal energy have not only the right wavelengths to determine
atomic positions by a study of the diffraction effects between neigh-
bouring atoms, but also the right energies to assess the dynamical
behaviour of solids—this being a consequence of the near equivalence
of the neutron energy and that of a quantum of energy for a lattice
vibration, a molecular vibration or a molecular rotation. On the
other hand x rays are favourable only from the first point of view andinfrared radiation is favourable only from the second.
Although neutrons and x rays, and indeed electrons, are employed
with the common aim of producing a view of both the static arrange-
ment and the dynamic motion of the atoms in a solid, yet the details
of the pictures which they yield are really totally different. This
happens because the different radiations see different things: x rays
measure electron density, electrons measure electric potential andneutrons measure nuclear density, often considerably modified be-
cause of resonance effects in neutron-nuclear scattering. We can
consider the magnitude of the scattering by an atom in terms of the
amplitude of the scattered wave for an incident wave of unit ampli-
tude. At distance r this is represented by —- where b is called the
57
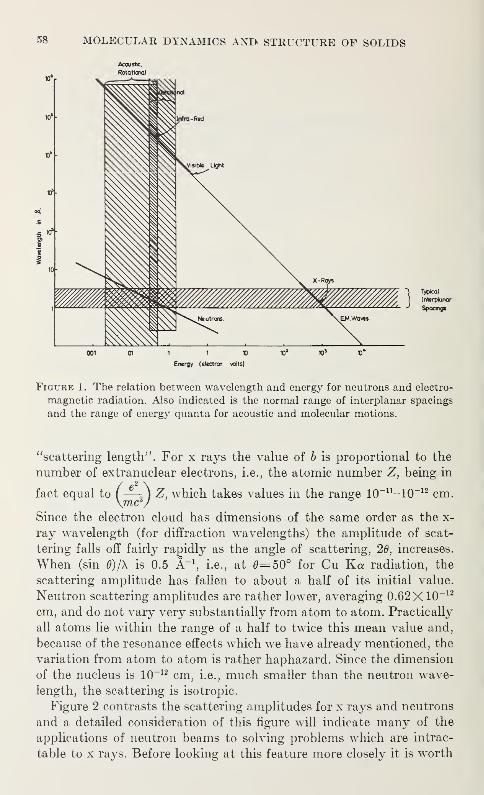
58 MOLECULAR DYNAMICS AND STRUCTURE OF SOLIDS
Acoustic.
001 01 1 1 V X? 10s U*
Energy (electron volts)
Figure 1. The relation between wavelength and energy for neutrons and electro-
magnetic radiation. Also indicated is the normal range of interplanar spacings
and the range of energy quanta for acoustic and molecular motions.
"scattering length". For x rays the value of b is proportional to the
number of extranuclear electrons, i.e., the atomic number Z, being in
fact equal to (^^) which takes values in the range 10_11-10~ 12 cm.
Since the electron cloud has dimensions of the same order as the x-
ray wavelength (for diffraction wavelengths) the amplitude of scat-
tering falls off fairly rapidly as the angle of scattering, 20, increases.
When (sin 0)/A is 0.5 A" 1
,i.e., at 0=50° for Cu Ka radiation, the
scattering amplitude has fallen to about a half of its initial value.
Neutron scattering amplitudes are rather lower, averaging 0.62X10" 12
cm, and do not vary very substantially from atom to atom. Practically
all atoms lie within the range of a half to twice this mean value and,
because of the resonance effects which we have already mentioned, the
variation from atom to atom is rather haphazard. Since the dimension
of the nucleus is 10-12 cm, i.e., much smaller than the neutron wave-
length, the scattering is isotropic.
Figure 2 contrasts the scattering amplitudes for x rays and neutrons
and a detailed consideration of this figure will indicate many of the
applications of neutron beams to solving problems which are intrac-
table to x rays. Before looking at this feature more closely it is worth
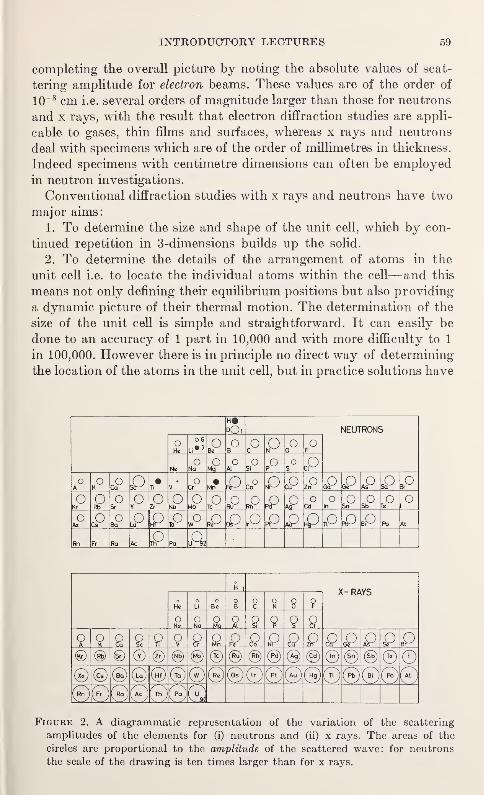
INTRODUCTORY LECTURES 50
completing the overall picture by noting the absolute values of scat-
tering amplitude for electron beams. These values are of the order of
10-8 cm i.e. several orders of magnitude larger than those for neutrons
and x rays, with the result that electron diffraction studies are appli-
cable to gases, thin films and surfaces, whereas x rays and neutrons
deal with specimens which are of the order of millimetres in thickness.
Indeed specimens with centimetre dimensions can often be employed
in neutron investigations.
Conventional diffraction studies with x rays and neutrons have two
major aims:
1. To determine the size and shape of the unit cell, which by con-
tinued repetition in 3-dimensions builds up the solid.
2. To determine the details of the arrangement of atoms in the
unit cell i.e. to locate the individual atoms within the cell—and this
means not only defining their equilibrium positions but also providing
a dynamic picture of their thermal motion. The determination of the
size of the unit cell is simple and straightforward. It can easily be
done to an accuracy of 1 part in 10,000 and with more difficulty to 1
in 100,000. However there is in principle no direct way of determining
the location of the atoms in the unit cell, but in practice solutions have
DOl NEUTRONS
oHe
06
sP oB P o
0 fo
Neo
Na M?o
Ato
Si
os cP
oA
OK cP £> •
Ti VO
Cr P Co° P cP zP oP £> £> sP BPo
KroRb
OSr
oY P o
Nbo
Mo LP & »° pP & oCd
oIn sP sP O
ko
OXe cP o
Ba P P w° LPP P pP aP P pp pp At
Rn Fr Ra Ac P Pa A
o
HeoLi
oBe
H1
oB
Oc
oN ? 9
X- RAYS
ONe
ONa Mq
OAl 9 o
p 9 9oA
oK
oCo.
OSc 9 o
V 9 P Q p P p P P P P P© ® © © © ® ® ® ® ® ® ® © ® ® ® ©© © © © ©©©©©©©©0©©©©©©© ©©C
p°)(0
Figure 2. A diagrammatic representation of the variation of the scattering
amplitudes of the elements for (i) neutrons and (ii) x rays. The areas of the
circles are proportional to the amplitude of the scattered wave: for neutrons
the scale of the drawing is ten times larger than for x rays.
60 MOLECULAR DYNAMICS AND STRUCTURE OF SOLIDS
been provided for many substances by incorporating suitable amounts
of labour, time and ingenuity, which increase in quantity as we pro-
gress from simple structures up to the few proteins which have been
analyzed in detail.
2. Crystal Structure Analysis
In all respects the crystal is the 3-dimensional analogue of the optical
diffraction grating so that the spectral positions, when the crystal is
illuminated with monochromatic radiation, are determined by the
grating spacing; i.e., the unit cell size, whereas the spectral intensities
are determined by the line shape and its transmission factor; i.e., the
content of the unit cell. Conversely, having made measurements with
x rays we can determine the electron density at any point in the unit
cell by making a three-dimensional summation of terms which are
proportional to the amplitudes of the 3-dimensional set of spectra.
In the same way, measurements of neutron spectra will give a calcula-
tion of the nuclear density in the material. In each case the drawback
to this procedure is that we require to know the spectral amplitudes
in both magnitude and phase, . . . and there is no direct way of meas-
uring phase. For centrosymmetrical structures the phase can be either
0° or 180° so that there are simply two alternatives for each term in the
summation but, even so, it is not a practical proposition, even with
computers, to calculate and choose between 2 n possible structural
arrangements when n may range from 1000 to 20,000. Even 230=10 9
and 10 9 seconds, assuming that we allow only one second for perusing
each result, is 35 years. With noncentrosymmetrical structures the
phase of each amplitude may take any value between 0° and 360°
and the problem is even more completely intractable.
The task of determining the structure therefore becomes that of
determining phases by a trial and error sequence in which calculations
are carried out for plausible model structures which have been sug-
gested by chemical information, reinforced by indirect methods which
may be very helpful in particular cases. Of such methods which have a
fairly general application the most useful is the Patterson synthesis
which is a summation of Fourier terms which involve intensities in-
stead of amplitudes. From such a synthesis it is possible to determine
interatomic vectors i.e., interatomic separations specified in both
magnitude and direction. The resulting pattern obtained in this way is
often confused, but significant information can be extracted fairly
readily when one of the atoms in a molecule is much heavier than the
others. Another method of fairly general application is that of iso-
morphous replacement, which can be applied, for example with the
alums, in the case of a series of isomorphous compounds which differ
in composition only in respect of one particular atom. By noting
INTRODUCTORY LECTURES 61
whether replacement by a heavier atom causes an increase or decrease
of intensity of individual reflections it is possible to draw conclusions
regarding their phases. It is of course necessary to assume that the
remainder of the structure is completely unchanged by these sub-
stitutions.
We can mention two other methods which may be applied to phase
determination.
2.1. Anomalous Scattering
If the wavelength of an incident beam of x rays lies in the neigh-
bourhood of an absorption edge for one of the scattering atoms then
the scattering amplitude of the latter becomes complex rather than real.
For CuKa radiation this occurs particularly for atoms of iron andcobalt. It can be shown that in such cases the usual equality of in-
tensity between reflections (h k I) and (h k I), known as FriedePs Law,will break down in structures which do not possess a centre of sym-metry. From the differences in intensity it is possible to calculate
phase angles. We shall discuss this behaviour later in relation to neu-
tron diffraction for which, for certain atoms, the effects are much moremarked.
2.2. Statistical Relations and Direct Methods
We have already said that the solution of most structures has
depended on using '
'trial and error" methods in which the diffraction
data have been reinforced by incorporating much subsidiary physical
and chemical information. It would be of enormous value if this in-
tuitive information could be put in at the outset of an analysis, rather
than at the end, and it is worthwhile asking whether it can be describe d
in any general terms. There are in fact two important principles which,
consciously or otherwise, are used as criteria in deciding whether anyartificially or mechanically determined structure could possibly be
correct. First, we know that the electron density can never be negative
anywhere in the unit-cell and, secondly, we know that structures are
built out of discrete atoms of fairly well-known size, shape and electron
content. These facts lead to certain statistical relationships and re-
strictions of the signs of the Fourier coefficients of related reflections.
For example Harker and Kasper [l]1 in 1958 gave the following in-
equalities which exist among the structure factors of a centrosymmet-
ric structure.
FH2 <^o(Fo+F2H) (1)
(Fh+Fh02 <(Fo+Fh+h')(Fo+Fh--h') (2)
(Fh-Fh02 <(Fo-Fh+h')(Fo-Fh-h') (3)
1 Figures in brackets indicate the literature references at the end of this paper.
62 MOLECULAR DYNAMICS AND STRUCTURE OF SOLIDS
where FH stands for ¥hkl ,FH+H ' stands for Fh+h >
t k+k >, i+v and F0 is
Fqoo in the forward direction and therefore equals N, the total numberof electrons in the unit-cell.
The first of these inequalities establishes a relation between F h]a
and F2h,2k,2i which may serve to determine the sign of the latter. Totake a simple example quoted by Ewald [2]: if |FH |
= 0.8N and|F2h|=: 0.45N then inequality (1) gives
0.64 N 2 <^N(N±0.45N).
This can only hold if we take the + sign, i.e., if the sign of F2H is
positive. For a full account of the development of this technique of
analysis and of its use in structure determination reference is made to
articles by Karle [3] and Woolfson [4].
2.3. Structural Refinement and Thermal Motion
By a combination of methods of the type we have discussed, and
with a degree of difficulty which may vary enormously for different
compounds, we can arrive at a structure which is largely correct and
in which the atomic coordinates are probably within 0.1 A of the
truth. There are various ways, such as by calculating the Reliability
Index or Discrepancy Factor, in which we can express the likely
accuracy of the structure at this stage. A process of structural refine-
ment then follows and this provides a convenient point in our survey to
introduce the topic of thermal motion. Because of an atom's thermal
energy it undergoes motion about its equilibrium position and in
order to specify this motion completely requires six parameters, in
addition to the three coordinates which define its equilibrium position.
The motion may be substantially different in different directions in a
manner which depends on the crystal symmetry and the type of
structure: for example, in a layer structure the displacements per-
pendicular to the layers will be much greater than those in their plane.
There now exists an accumulated volume of knowledge which permits,
at any temperature, a good estimate of the thermal motion of an
atom and a rough guess at its anisotropy. These preliminary values
of the thermal parameters and the initial values of the coordinates have
to be refined. In earlier days this was usually done by Fourier refine-
ment, involving cycles of recalculation of phases and production of
electron-density maps, but is is now more often done by least-squares
analysis, which is generally more adaptable to automatic computers.
The final outcome is a list of atomic coordinates, correct to 0.01 A or
often better, and a description of the ellipsoid of thermal motion for
each atom, specifying the magnitudes and orientations of its axes.
The overall accuraoy will depend very much on the particular com-
INTRODUCTORY LECTURES 63
pound and especially on the way in which this will decide the ratio
between the number of independent reflections which are measured
and the number of parameters which have to be determined. Thus, in
a neutron diffraction study of sucrose Brown and Levy [5] had 2800
independent measurements of spectral intensities from which to
determine about 400 parameters: in the analysis of myoglobin 17,000
reflections were measured but there were 21,500 parameters needed
to define the structure completely and 11,340 if the hydrogen atoms
were left out altogether, (Phillips, [6]).
The foregoing account of the principles of structural analysis is
applicable to either x-ray or neutron diffraction. It is an unfortunate
fact however that a suitable neutron source costs between 103 and
104 times as much as an x-ray set and that, even then, the number of
quanta in unit area of its incident beam is less by a similar order of
magnitude. It is of course these facts, leading to a scarcity of suitable
nuclear reactors, which limits the pace of advancement of neutron
beam work in investigating solids and liquids. It is therefore necessary
to ensure that, with any material or structure, all the progress which
can be achieved with x-rays is made first and that the neutron crystal-
lographer starts where his x-ray colleague leaves off. Our aim now,
therefore, is to see what the former can do which the latter cannot.
We return to an examination of figure 2.
3. The Contribution of Neutron Diffraction
The most important feature of figure 2 from the point of view of
molecular structure determination is that hydrogen is revealed as a
respectable scatterer of radiation. Its scattering length of —0.38 X 10~ 12
cm is rather below the average value of 0.62 X 10~ 12 cm, but not
unduly so. Moreover, deuterium has a scattering amplitude whichjust about equals the average, so that extremely good location of
hydrogen atoms can be achieved in those cases where deuterium
substitution can be effected. Moreover the fact that H, D havescattering lengths of opposite sign, so that hydrogen appears in
atomic projections as negative scattering density, means that the twoisotopes can be very readily distinguished in mixed systems. In
practice deuterium substitution is very valuable if studies have to be
confined to powdered materials but practically all single-crystal
studies have been achieved with ordinary hydrogen-containing
material.
3.1. Hydrogen Atoms and Thermal Motion
The importance of the accurate location of the hydrogen atoms is
not simply that it completes the picture of the molecule. Very often
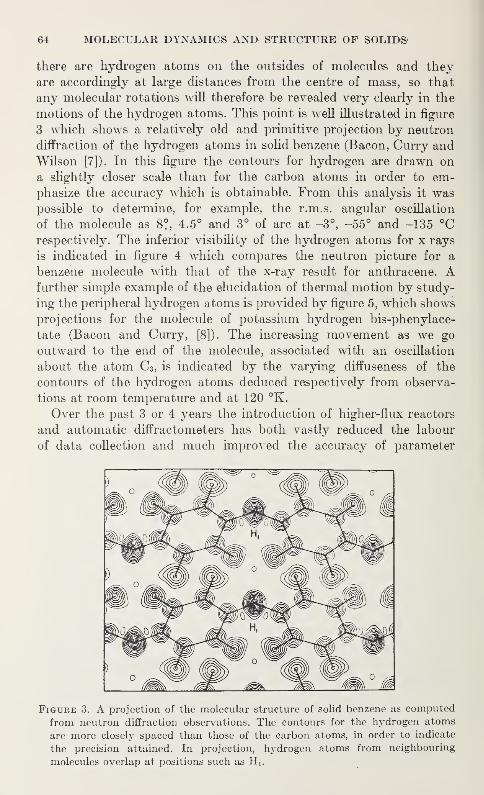
64 MOLECULAR DYNAMICS AND STRUCTURE OF SOLIDS
there are hydrogen atoms on the outsides of molecules and they
are accordingly at large distances from the centre of mass, so that
any molecular rotations will therefore be revealed very clearly in the
motions of the hydrogen atoms. This point is well illustrated in figure
3 which shows a relatively old and primitive projection by neutron
diffraction of the hydrogen atoms in solid benzene (Bacon, Curry andWilson [7]). In this figure the contours for hydrogen are drawn on
a slightly closer scale than for the carbon atoms in order to em-phasize the accuracy which is obtainable. From this analysis it waspossible to determine, for example, the r.m.s. angular oscillation
of the molecule as 8°, 4.5° and 3° of arc at -3°, -55° and -135 °Crespectively. The inferior visibility of the hydrogen atoms for x rays
is indicated in figure 4 which compares the neutron picture for a
benzene molecule with that of the x-ray result for anthracene. Afurther simple example of the elucidation of thermal motion by study-
ing the peripheral hydrogen atoms is provided by figure 5, which shows
projections for the molecule of potassium hydrogen bis-phenylace-
tate (Bacon and Curry, [8]). The increasing movement as we go
outward to the end of the molecule, associated with an oscillation
about the atom C3 , is indicated by the varying difTuseness of the
contours of the hydrogen atoms deduced respectively from observa-
tions at room temperature and at 120 °K.
Over the past 3 or 4 years the introduction of higher-flux reactors
and automatic diffractometers has both vastly reduced the labour
of data collection and much improved the accuracy of parameter
Figure 3. A projection of the molecular structure of solid benzene as computed
from neutron diffraction observations. The contours for the hydrogen atoms
are more closely spaced than those of the carbon atoms, in order to indicate
the precision attained. In projection, hydrogen atoms from neighbouring
molecules overlap at positions such as
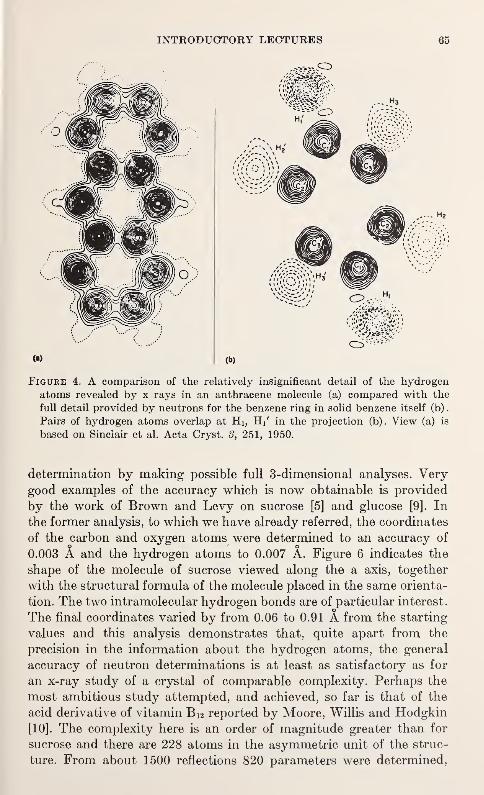
INTRODUCTORY LECTURES 65
Figure 4. A comparison of the relatively insignificant detail of the hydrogen
atoms revealed by x rays in an anthracene molecule (a) compared with the
full detail provided by neutrons for the benzene ring in solid benzene itself (b)
.
Pairs of hydrogen atoms overlap at Hi, H/ in the projection (b). View (a) is
based on Sinclair et al. Acta Cryst. 3, 251, 1950.
determination by making possible full 3-dimensional analyses. Verygood examples of the accuracy which is now obtainable is provided
by the work of Brown and Levy on sucrose [5] and glucose [9]. In
the former analysis, to which we have already referred, the coordinates
of the carbon and oxygen atoms were determined to an accuracy of
0.003 A and the hydrogen atoms to 0.007 A. Figure 6 indicates the
shape of the molecule of sucrose viewed along the a axis, together
with the structural formula of the molecule placed in the same orienta-
tion. The two intramolecular hydrogen bonds are of particular interest.
The final coordinates varied by from 0.06 to 0.91 A from the starting
values and this analysis demonstrates that, quite apart from the
precision in the information about the hydrogen atoms, the general
accuracy of neutron determinations is at least as satisfactory as for
an x-ray study of a crystal of comparable complexity. Perhaps the
most ambitious study attempted, and achieved, so far is that of the
acid derivative of vitamin B i2 reported by Moore, Willis and Hodgkin
[10]. The complexity here is an order of magnitude greater than for
sucrose and there are 228 atoms in the asymmetric unit of the struc-
ture. From about 1500 reflections 820 parameters were determined,
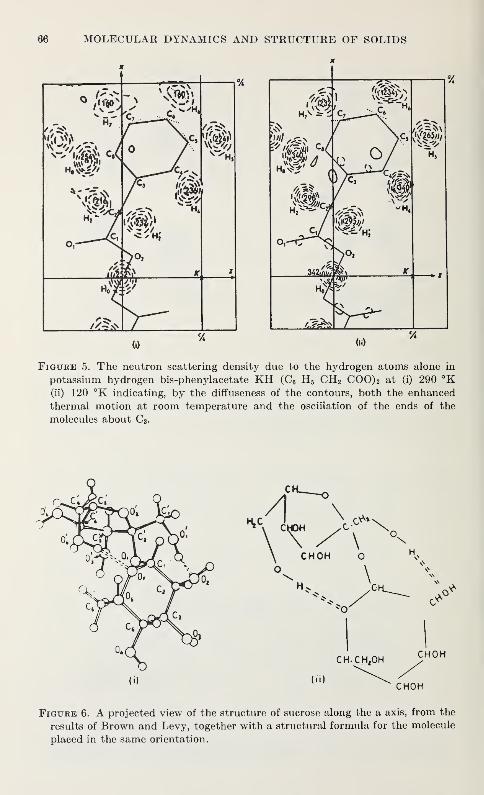
66 MOLECULAR DYNAMICS AND STRUCTURE OF SOLIDS
x
Figure 5. The neutron scattering density due to the hydrogen atoms alone in
potassium hydrogen bis-phenylacetate KH (C6 H 5 CH 2 COO) 2 at (i) 290 °K(ii) 120 °K indicating, by the diffuseness of the contours, both the enhanced
thermal motion at room temperature and the osculation of the ends of the
molecules about C3.
Figure 6. A projected view of the structure of sucrose along the a axis, from the
results of Brown and Levy, together with a structural formula for the molecule
placed in the same orientation.
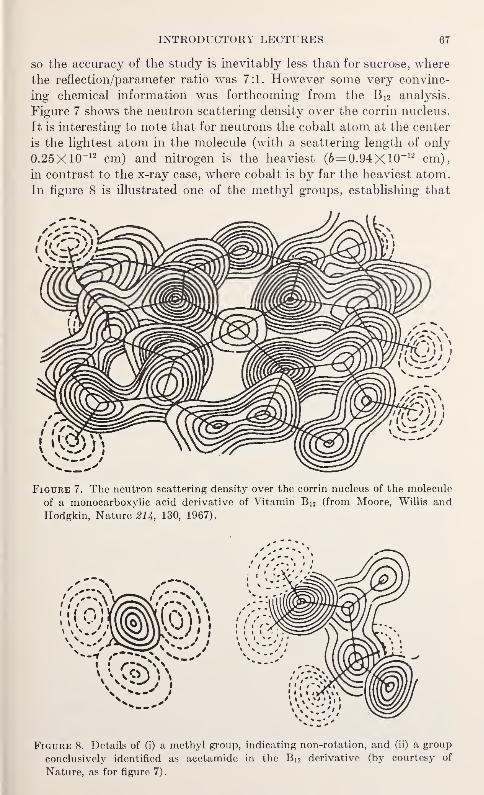
INTRODUCTORY LECTURES 67
so the accuracy of the study is inevitably less than for sucrose, where
the reflection/parameter ratio was 7:1. However some very convinc-
ing chemical information was forthcoming from the B l2 analysis.
Figure 7 shows the neutron scattering density over the corrin nucleus.
It is interesting to note that for neutrons the cobalt atom at the center
is the lightest atom in the molecule (with a scattering length of only
0.25X10⁻¹² cm) and nitrogen is the heaviest (6= 0.94 X10 -12 cm),
in contrast to the x-ray case, where cobalt is by far the heaviest atom.
In figure 8 is illustrated one of the methyl groups, establishing that
Figure 7. The neutron scattering density over the corrin nucleus of the molecule
of a monocarboxylic acid derivative of Vitamin Bi 2 (from Moore, Willis andHodgkin, Nature 214, 130, 1967).
Figure 8. Details of (i) a methyl group, indicating non-rotation, and (ii) a group
conclusively identified as acetamide in the B 12 derivative (by courtesy of
Nature, as for figure 7).
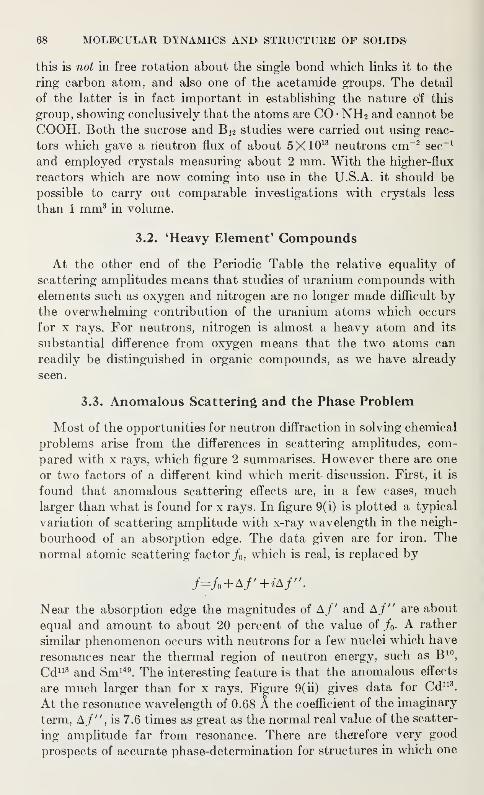
68 MOLECULAR DYNAMICS AND STRUCTURE OF SOLIDS
this is not in free rotation about the single bond which links it to the
ring carbon atom, and also one of the acetamide groups. The detail
of the latter is in fact important in establishing the nature o¥ this
group, showing conclusively that the atoms are CO • NH2 and cannot be
COOH. Both the sucrose and B 12 studies were carried out using reac-
tors which gave a neutron flux of about 5X10 13 neutrons cm-2sec
-1
and employed crystals measuring about 2 mm. With the higher-flux
reactors which are now coming into use in the U.S.A. it should be
possible to carry out comparable investigations with crystals less
than 1 mm3 in volume.
3.2. 'Heavy Element' Compounds
At the other end of the Periodic Table the relative equality of
scattering amplitudes means that studies of uranium compounds with
elements such as oxygen and nitrogen are no longer made difficult bythe overwhelming contribution of the uranium atoms which occurs
for x rays. For neutrons, nitrogen is almost a heavy atom and its
substantial difference from oxygen means that the two atoms can
readily be distinguished in organic compounds, as we have already
seen.
3.3. Anomalous Scattering and the Phase Problem
Most of the opportunities for neutron diffraction in solving chemical
problems arise from the differences in scattering amplitudes, com-
pared with x rays, which figure 2 summarises. However there are one
or two factors of a different kind which merit discussion. First, it is
found that anomalous scattering effects are, in a few cases, muchlarger than what is found for x rays. In figure 9(i) is plotted a typical
variation of scattering amplitude with x-ray wavelength in the neigh-
bourhood of an absorption edge. The data given are for iron. Thenormal atomic scattering factor f0 , which is real, is replaced by
/=/„+A/'+iA/".
Near the absorption edge the magnitudes of A/' and A/" are about
equal and amount to about 20 percent of the value of /0 . A rather
similar phenomenon occurs with neutrons for a few nuclei which have
resonances near the thermal region of neutron energy, such as B 10,
Cd113 and Sm 149. The interesting feature is that the anomalous effects
are much larger than for x rays. Figure 9(h) gives data for Cd113.
At the resonance wavelength of 0.68 A the coefficient of the imaginary
term, AJ" , is 7.6 times as great as the normal real value of the scatter-
ing amplitude far from resonance. There are therefore very good
prospects of accurate phase-determination for structures in which one
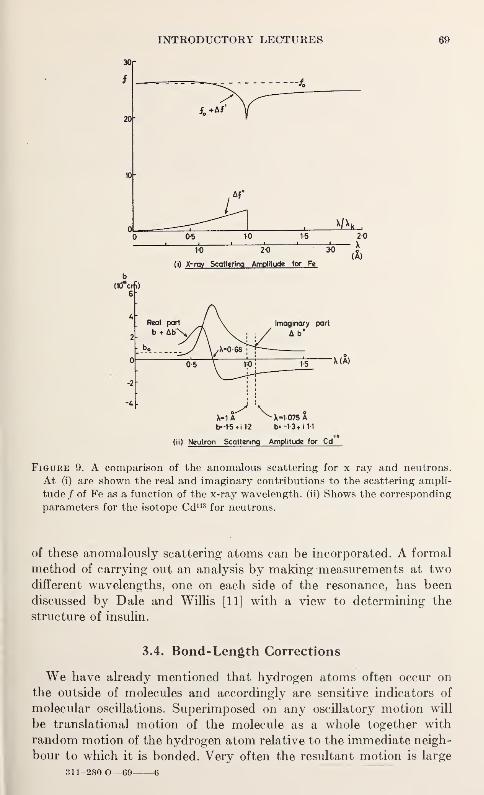
Figure 9. A comparison of the anomalous scattering for x ray and neutrons.
At (i) are shown the real and imaginary contributions to the scattering ampli-
tude / of Fe as a function of the x-ray wavelength, (ii) Shows the corresponding
parameters for the isotope Cd113 for neutrons.
of these anomalously scattering atoms can be incorporated. A formal
method of carrying out an analysis by making measurements at twodifferent wavelengths, one on each side of the resonance, has been
discussed by Dale and Willis [11] with a view to determining the
structure of insulin.
3.4. Bond-Length Corrections
We have already mentioned that hydrogen atoms often occur on
the outside of molecules and accordingly are sensitive indicators of
molecular oscillations. Superimposed on any oscillatory motion will
be translational motion of the molecule as a whole together with
random motion of the hydrogen atom relative to the immediate neigh-
bour to which it is bonded. Very often the resultant motion is large
311-280 O—69 6
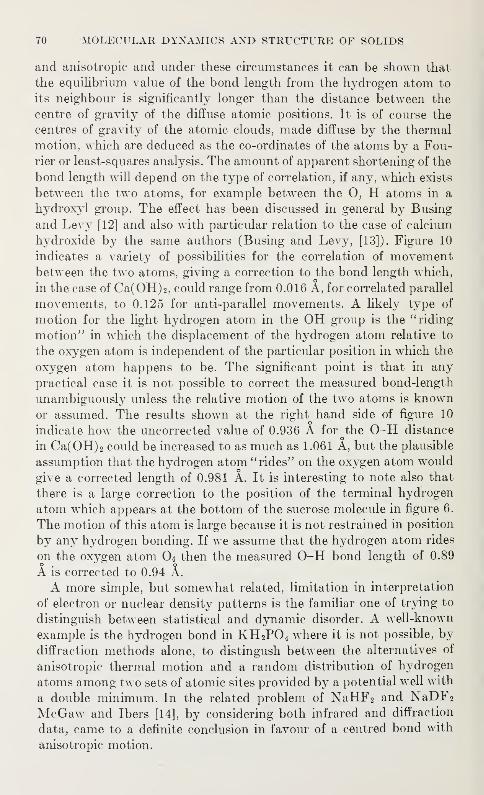
70 MOLECULAR DYNAMICS AND STRUCTURE OF SOLIDS
and anisotropic and under these circumstances it can be shown that
the equilibrium value of the bond length from the hydrogen atom to
its neighbour is significantly longer than the distance between the
centre of gravity of the diffuse atomic positions. It is of course the
centres of gravity of the atomic clouds, made diffuse by the thermal
motion, which are deduced as the co-ordinates of the atoms by a Fou-rier or least-squares analysis. The amount of apparent shortening of the
bond length will depend on the type of correlation, if any, which exists
between the two atoms, for example between the O, H atoms in a
hydroxyl group. The effect has been discussed in general by Busing
and Levy [12] and also with particular relation to the case of calcium
hydroxide by the same authors (Busing and Levy, [13]). Figure 10
indicates a variety of possibilities for the correlation of movementbetween the two atoms, giving a correction to the bond length which,
in the case of Ca(OH) 2 , could range from 0.016 A, for correlated parallel
movements, to 0.125 for anti-parallel movements. A likely type of
motion for the light hydrogen atom in the OH group is the " riding
motion" in which the displacement of the hydrogen atom relative to
the oxygen atom is independent of the particular position in which the
oxygen atom happens to be. The significant point is that in any
practical case it is not possible to correct the measured bond-length
unambiguously unless the relative motion of the two atoms is knownor assumed. The results shown at the right hand side of figure 10
indicate how the uncorrected value of 0.936 A for the O-H distance
in Ca(OH) 2 could be increased to as much as 1.061 A, but the plausible
assumption that the hydrogen atom "rides" on the oxygen atom would
give a corrected length of 0.981 A. It is interesting to note also that
there is a large correction to the position of the terminal hydrogen
atom which appears at the bottom of the sucrose molecule in figure 6.
The motion of this atom is large because it is not restrained in position
by any hydrogen bonding. If we assume that the hydrogen atom rides
on the oxygen atom O4 then the measured O-H bond length of 0.89
A is corrected to 0.94 A.
A more simple, but somewhat related, limitation in interpretation
of electron or nuclear density patterns is the familiar one of trying to
distinguish between statistical and dynamic disorder. A well-known
example is the hydrogen bond in KH 2P0 4 where it is not possible, by
diffraction methods alone, to distingush between the alternatives of
anisotropic thermal motion and a random distribution of hydrogen
atoms among two sets of atomic sites provided by a potential well with
a double minimum. In the related problem of NaHF 2 and NaDF 2
McGaw and Ibers [14], by considering both infrared and diffraction
data, came to a definite conclusion in favour of a centred bond with
anisotropic motion.
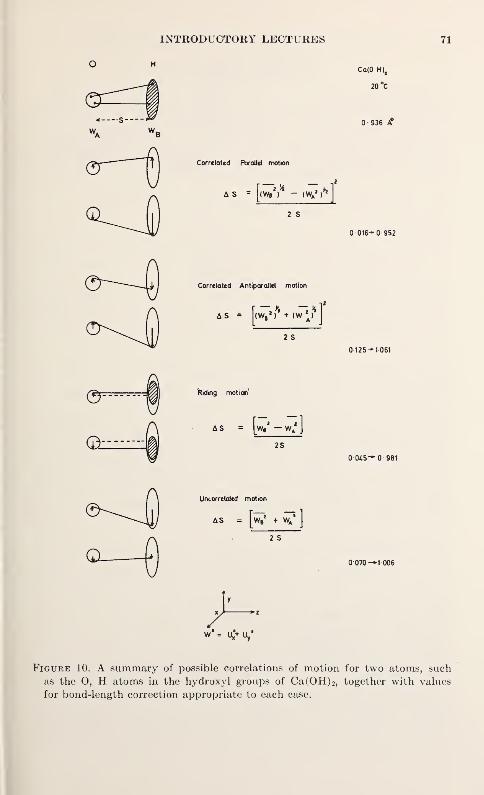
INTRODUCTORY LECTURES 71
Figure 10. A summary of possible correlations of motion for two atoms, such
as the O, H atoms in the hydroxyl groups of Ca(OH) 2 ,together with values
for bond-length correction appropriate to each case.
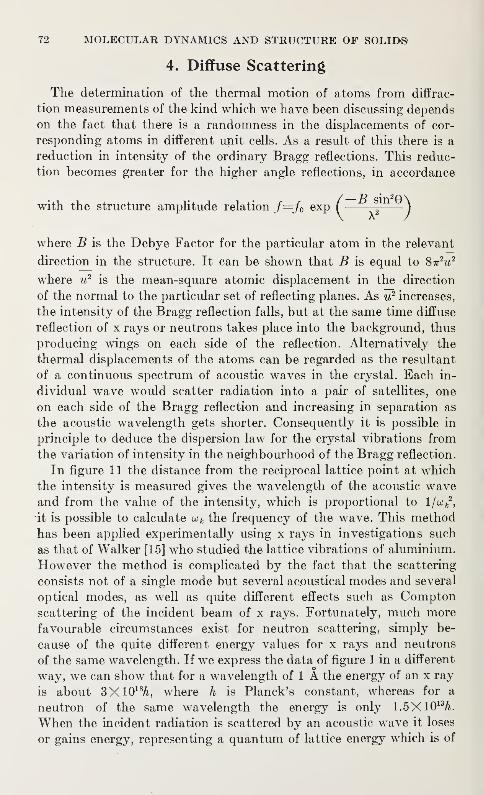
72 MOLECULAR DYNAMICS AND STRUCTURE OF SOLIDS
4. Diffuse Scattering
The determination of the thermal motion of atoms from diffrac-
tion measurements of the kind which we have been discussing depends
on the fact that there is a randomness in the displacements of cor-
responding atoms in different unit cells. As a result of this there is a
reduction in intensity of the ordinary Bragg reflections. This reduc-
tion becomes greater for the higher angle reflections, in accordance
where B is the Debye Factor for the particular atom in the relevant
direction in the structure. It can be shown that B is equal to StVwhere u2
is the mean-square atomic displacement in the direction
of the normal to the particular set of reflecting planes. As u2 increases,
the intensity of the Bragg reflection falls, but at the same time diffuse
reflection of x rays or neutrons takes place into the background, thus
producing wings on each side of the reflection. Alternatively the
thermal displacements of the atoms can be regarded as the resultant
of a continuous spectrum of acoustic waves in the crystal. Each in-
dividual wave would scatter radiation into a pair of satellites, one
on each side of the Bragg reflection and increasing in separation as
the acoustic wavelength gets shorter. Consequently it is possible in
principle to deduce the dispersion law for the crystal vibrations from
the variation of intensity in the neighbourhood of the Bragg reflection.
In figure 11 the distance from the reciprocal lattice point at which
the intensity is measured gives the wavelength of the acoustic waveand from the value of the intensity, which is proportional to l/o)
2,
it is possible to calculate u k the frequency of the wave. This method
has been applied experimentally using x rays in investigations such
as that of Walker [15] who studied the lattice vibrations of aluminium.
However the method is complicated by the fact that the scattering
consists not of a single mode but several acoustical modes and several
optical modes, as well as quite different effects such as Comptonscattering of the incident beam of x rays. Fortunately, much more
favourable circumstances exist for neutron scattering, simply be-
cause of the quite different energy values for x rays and neutrons
of the same wavelength. If we express the data of figure 1 in a different
way, we can show that for a wavelength of 1 A the energy of an x ray
is about 3X10¹⁸A, where h is Planck's constant, whereas for a
neutron of the same wavelength the energy is only 1.5X10¹³/*,.
When the incident radiation is scattered by an acoustic wave it loses
or gains energy, representing a quantum of lattice energy which is of
with the structure amplitude relation f=f0 exp
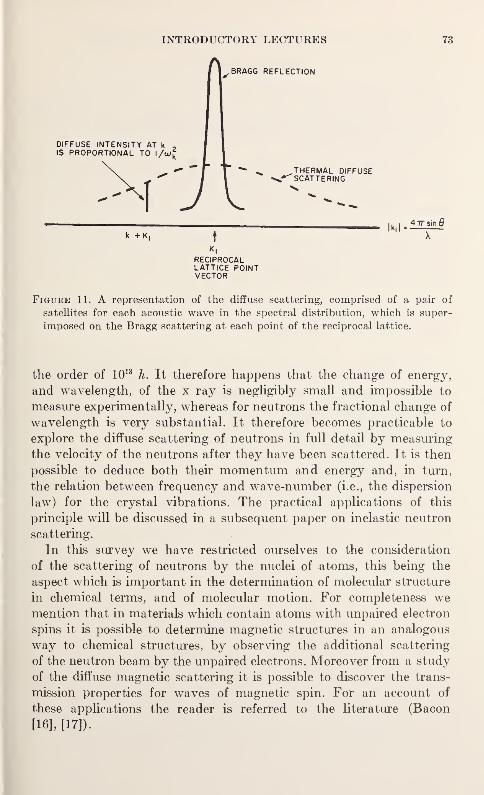
INTRODUCTORY LECTURES 73
DIFFUSE INTENSITY AT k
IS PROPORTIONAL TO l/w.
1^, BRAGG REFLECTION
THERMAL DIFFUSESCATTERING
k +K,t
Ik,| =47Tsinfl
X
RECIPROCALLATTICE POINTVECTOR
Figure 11. A representation of the diffuse scattering, comprised of a pair of
satellites for each acoustic wave in the spectral distribution, which is super-
imposed on the Bragg scattering at each point of the reciprocal lattice.
the order of 10 13h. It therefore happens that the change of energy,
and wavelength, of the x ray is negligibly small and impossible to
measure experimentally, whereas for neutrons the fractional change of
wavelength is very substantial. It therefore becomes practicable to
explore the diffuse scattering of neutrons in full detail by measuring
the velocity of the neutrons after they have been scattered. It is then
possible to deduce both their momentum and energy and, in turn,
the relation between frequency and wave-number (i.e., the dispersion
law) for the crystal vibrations. The practical applications of this
principle will be discussed in a subsequent paper on inelastic neutron
scattering.
In this survey we have restricted ourselves to the consideration
of the scattering of neutrons by the nuclei of atoms, this being the
aspect which is important in the determination of molecular structure
in chemical terms, and of molecular motion. For completeness wemention that in materials which contain atoms with unpaired electron
spins it is possible to determine magnetic structures in an analogous
way to chemical structures, by observing the additional scattering
of the neutron beam by the unpaired electrons. Moreover from a study
of the diffuse magnetic scattering it is possible to discover the trans-
mission properties for waves of magnetic spin. For an account of
these applications the reader is referred to the literature (Bacon
[16], [17])-
74 MOLECULAR DYNAMICS AND STRUCTURE OF SOLIDS
5. Discussion
H. A. Resing (Naval Research Laboratory) : How would the
difference between free rotation, hindered rotation, and activated
rotational jumps show up in these diffraction techniques?
G. E. Bacon: In the Fourier projections of scattering density
each atomic portrait is modified by whatever thermal motion the
atom undergoes, or by any disorder to which it is subject. Thus a
freely rotating group would have circular symmetry about the
rotation axis. In hindered rotation, the atom shapes would be smeared
out in the direction of motion. But it would not be possible to dis-
tinguish, say, rotational disorder from a static disorder which yielded
the same overall average distribution of atomic position.
J. J. Rush (Na tional Bureau of Standards) : Could you commenton the relative accuracies of electron and neutron diffraction in
determining hydrogen positions?
G. E. Bacon: It would be reasonable to take a factor of three
or four in favor of neutrons. Not only is the visibility of hydrogen
relative to other atoms higher for neutrons—say by a factor of two
or three in relation to a carbon atom—but also it is very much easier
to interpret accurately the measured spectral intensities in terms of
the structure amplitude factors of the unit cell.
D. T. Goldman (National Bureau of Standards) : Could you com-
ment on how light scattering might fit into this general picture of
determination of structure by scattering techniques?
G. E. Bacon: I would not expect any detail of the unit cell to be
revealed by optical wavelengths, but information on particle size
and texture could be forthcoming from samples of suitable trans-
mission or reflectivity.
6. References
[1] D. Harker and J. S. Kasper Acta Cryst. 1, 70-75 (1948).
[2] P. P. Ewald Fifty Years of X-ray Diffraction; Utrecht, Oosthoek p. 116
(1962).
[3] J. Karle Advances in Structure Research by Diffraction Methods 1 Ed.
R. Brill; Braunschweig, Vieweg: p. 55-89 (1964).
[4] M. M. Woolfson Chap. IX of The Determination of Crystal Structures
Third Edition, by H. Lipson and W. Cochran; Bell, London (1966).
[5] G. M. Brown and H. A. Levy Science 141, 921-3, (1964).
INTRODUCTORY LECTURES 75
[6] D. C. Phillips Advances in Structure Research by Diffraction Methods 2.
Ed. R. Brill and R. Mason, Braunschweig, Vieweg: p. 75-140 (1966).
[7] G. E. Bacon, N. A. Curry and S. A. Wilson Proc. Roy. Soc. A. 279, 98-110
(1964).
[8] G. E. Bacon and N. A. Curry Acta Cryst. 13, 717-21 (1960).
[9] G. M. Brown and H. A. Levy Science 147, 1038-9 (1965).
[10] F. M. Moore, B. T. M. Willis and D. C. Hodgkin Nature, London 214,
130-3 (1967).
[11] D. H. Dale and B. T. M. Willis A.E.R.E. -R 5195 (1966).
[12] W. R. Busing and H. A. Levy Acta Cryst. 17, 142-6 (1964).
[13] W. R. Busing and H. A. Levy J. Chem. Phys. 26, 563-8 (1957).
[14] B. L. McGaw and J. A. Ibers J. Chem. Phys. 39, 2677-84 (1963).
[15] C. B. Walker Phys. Rev. 103, 547-57 (1956).
[16] G. E. Bacon Neutron Diffraction 2nd Edition—Oxford, Clarendon Press
(1962).
[17] G. E. Bacon X-ray and Neutron Diffraction, Oxford, Pergamon Press (1966).

INFRARED AND RAMAN STUDIES ONMOLECULAR STRUCTURE AND MOTION
IN CONDENSED PHASES
G. R. WILKINSON
Department of Physics
King's College, Strand, London, England
1. Introduction
Although infrared and Raman spectroscopy [1, 2, 3, 4, 5]1 are very
mature fields of study, it is only recently with instrumental advances
in the far infrared region and with the use of lasers for Raman excita-
tion that complete vibrational spectra including polarization data can
be readily obtained.
The amount of data already collected on the vibrational spectra of'
'molecules in liquids" or "molecules in powdered solids" is immense,
as there is hardly a chemistry research department without at least
one infrared spectrometer. The stage of virtually automatic recording
was reached and widely applied over a decade ago and there are nowseveral thousand such instruments in daily use. The structure of manymolecules has been deduced by infrared and Raman spectroscopy.
However much of the day to day interpretation is of a semiempirical
nature and is usually directed towards the presence or absence of
vibrational frequencies which are characteristic of specific chemical
groups, e.g. CH 3 groups [4]. Often the spectra are only used to charac-
terize substances, i.e. as spectral fingerprints or to determine the
presence and purity of chemical materials. In comparison the numberof complete studies on crystalline solids treated from the point of view
of lattice dynamics [6, 7] is rather small.
Two questions will first be answered to try and clear up two fre-
quent misunderstandings about infrared and Raman spectroscopy.
First, "can infrared and Raman spectroscopy be used to determine
without ambiguity the structure of a solid?" The straight answer is
"no." In the gas phase the rotational energy of molecules is quantised,
and consequently if the rotational structure can be resolved and the
moments of inertia found, bond lengths and bond angles can be
deduced, provided sufficient isotopic species are available [5].
1 Figures in brackets indicate the literature references at end of this paper.
77
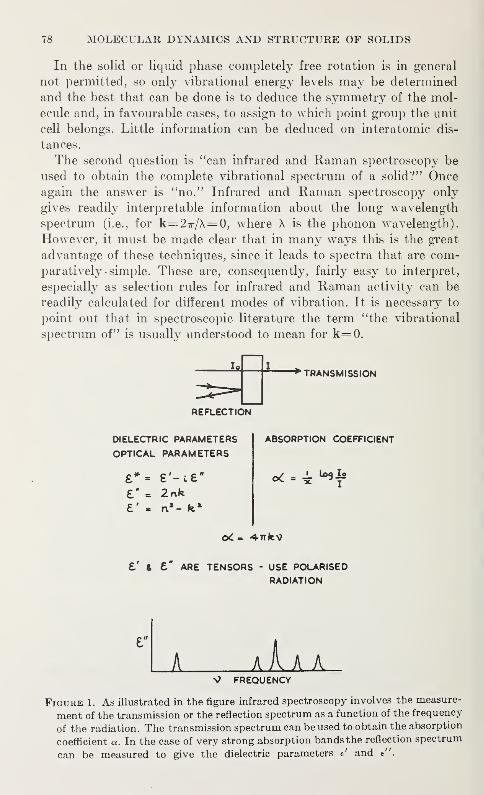
78 MOLECULAR DYNAMICS AND STRUCTURE OF SOLIDS
In the solid or liquid phase completely free rotation is in general
not permitted, so only vibrational energy levels may be determined
and the best that can be done is to deduce the symmetry of the mol-
ecule and, in favourable cases, to assign to which point group the unit
cell belongs. Little information can be deduced on interatomic dis-
tances.
The second question is "can infrared and Raman spectroscopy be
used to obtain the complete vibrational spectrum of a solid?" Onceagain the answer is "no." Infrared and Raman spectroscopy only
gives readily interpretable information about the long wavelength
spectrum (i.e., for k=27r/A= 0, where X is the phonon wavelength).
However, it must be made clear that in many ways this is the great
advantage of these techniques, since it leads to spectra that are com-
paratively-simple. These are, consequently, fairly easy to interpret,
especially as selection rules for infrared and Raman activity can be
readily calculated for different modes of vibration. It is necessary to
point out that in spectroscopic literature the term "the vibrational
spectrum of" is usually understood to mean for k=0.
I9TRANSMISSION
REFLECTION
DIELECTRIC PARAMETERS
OPTICAL PARAMETERS
£*= £'-c£"£* = 2rxfe
£' - a2 - fe*
£' & £" ARE TENSORS - USE POLARISED
RADIATION
ABSORPTION COEFFICIENT
, j_ Log Io
1 A A A A AV FREQUENCY
Figure 1. As illustrated in the figure infrared spectroscopy involves the measure-
ment of the transmission or the reflection spectrum as a function of the frequency
of the radiation. The transmission spectrum can be used to obtain the absorption
coefficient a. In the case of very strong absorption bands the reflection spectrum
can be measured to give the dielectric parameters e' and e".
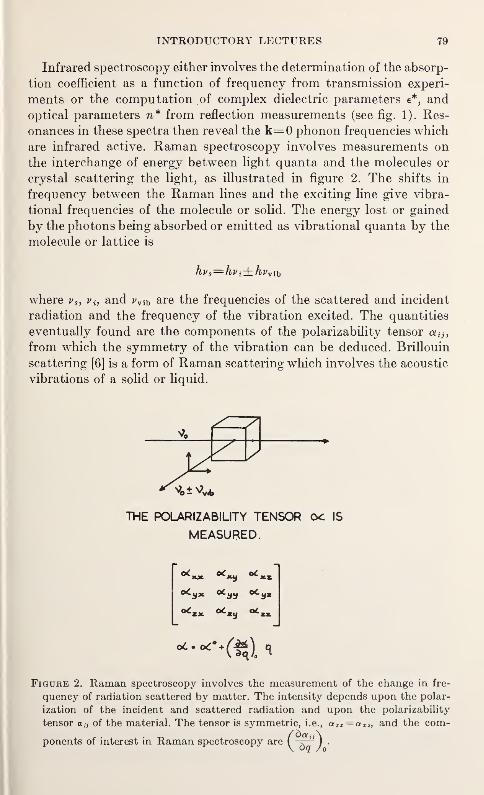
INTRODUCTORY LECTURES 79
Infrared spectroscopy either involves the determination of the absorp-
tion coefficient as a function of frequency from transmission experi-
ments or the computation of complex dielectric parameters e*, and
optical parameters n* from reflection measurements (see fig. 1). Res-
onances in these spectra then reveal the k=0 phonon frequencies which
are infrared active. Raman spectroscopy involves measurements on
the interchange of energy between light quanta and the molecules or
crystal scattering the light, as illustrated in figure 2. The shifts in
frequency between the Raman lines and the exciting line give vibra-
tional frequencies of the molecule or solid. The energy lost or gained
by the photons being absorbed or emitted as vibrational quanta by the
molecule or lattice is
where v s ,v { , and *>vlb are the frequencies of the scattered and incident
radiation and the frequency of the vibration excited. The quantities
eventually found are the components of the polarizability tensor a ij}
from which the symmetry of the vibration can be deduced. Brillouin
scattering [6] is a form of Raman scattering which involves the acoustic
vibrations of a solid or liquid.
Figure 2. Raman spectroscopy involves the measurement of the change in fre-
quency of radiation scattered by matter. The intensity depends upon the polar-
ization of the incident and scattered radiation and upon the polarizability
tensor a i} of the material. The tensor is symmetric, i.e., a zx= a xz , and the com-
THE POLARIZABILITY TENSOR OC IS
MEASURED.
ponents of interest in Raman spectroscopy are
80 MOLECULAR DYNAMICS AND STRUCTURE OF SOLIDS
In anisotropic crystals it is essential to use polarized radiation
to obtain the spacial dependence of the absorption coefficient a or the
dielectric parameters e* and to determine the components of the
polarizability tensor a tJ . mote the distinction between a and a tJ!)
Perhaps the greatest advantage in infrared and Raman spectros-
copy is the very wide range of materials whose vibrational spectra
may be explored. Crystals, amorphous solids including glasses, poly-
mers and liquids may be studied: metals however are completely
excluded. Only small quantities of substances are required. Goodspectra can frequently be obtained from milligrams of material if
microtechniques are employed. A further advantage is the precision
with which k = 0 frequencies may be measured. An accuracy of
= 0.2 cm-1or =0.2 millielectron volts is not difficult to achieve over
the whole, range of vibrational frequencies. Spectral resolutions of
0.25 cm-1for infrared and 1 cm -1
for Raman are routinely obtained
from commercially available spectrometers. As a consequence of
this precision, frequency shifts resulting from isotopic substitution
can be measured very accurately. This provides a very powerful methodof assigning resonances to particular modes of vibration.
The wide range of units used to measure phonon energies is a
constant source of frustration to lattice dynamicists. Frequencies or
phonon energies are often quoted in cycles sec. radians sec. wave-
numbers, millielectron volts or as Debye temperatures. Spectros-
copists have long used the wave number measured in cm _1 both
to denote photon and vibrational frequencies. Considerable advantages
would result from the adoption by spectroscopists of the electron
volt both for photon energies and for energy levels in matter.
(1 millielectron volt = 8.067 cm-1'). It is worthwhile recalling here
that kT at normal temperature -300° K is about 25 millielectron
volts or 200 cm _1. The ratio hv kT is of the greatest importance in
any consideration of the thermal population of vibrational energy
levels.
Fundamental vibrational frequencies of molecules or for one phonon
processes in crystals extend over the range 0 to 4500 cm-1, i.e.. 0-600
millielectron volts, the upper limit being the frequency of vibration
of the hydrogen molecule. Frequencies associated with stretching
vibrations [4] are -3600 cm" 1 for free O-H. —3000 cm" 1 for C-H.
-1100 cm" 1 for C-F. and -500 cm" 1 for C-I.
The whole of spectroscopy is dominated by the concept of sym-
metry, and the optical spectra of crystals is no exception. Without the
aid of group theory all but the spectra of the simplest systems would
be almost impossible to comprehend. In this article the symmetry of
modes of vibration are designated by the Schoenflies notation which
has been adopted by Mulliken and used by nearly all the workers in
the field of molecular vibrations.
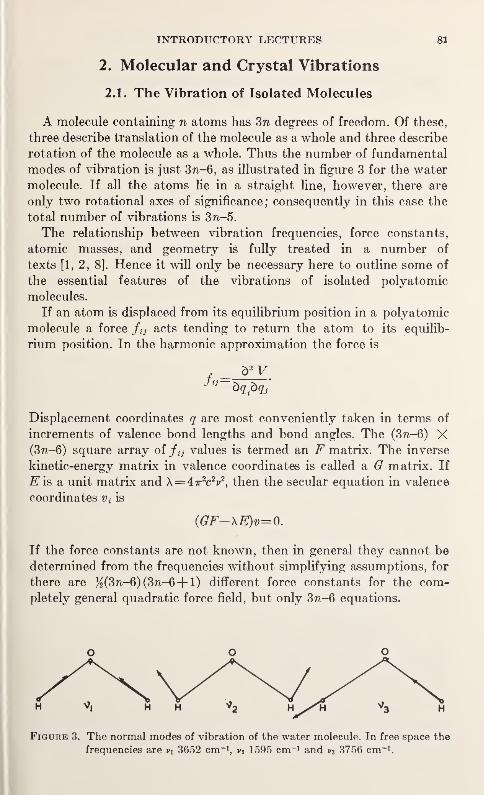
INTRODUCTORY LECTURES 81
2. Molecular and Crystal Vibrations
2.1. The Vibration of Isolated Molecules
A molecule containing n atoms has Sn degrees of freedom. Of these,
three describe translation of the molecule as a whole and three describe
rotation of the molecule as a whole. Thus the number of fundamental
modes of vibration is just 3n-6, as illustrated in figure 3 for the water
molecule. If all the atoms lie in a straight line, however, there are
only two rotational axes of significance; consequently in this case the
total number of vibrations is 3n-5.
The relationship between vibration frequencies, force constants,
atomic masses, and geometry is fully treated in a number of
texts [1,2, 8]. Hence it will only be necessary here to outline some of
the essential features of the vibrations of isolated polyatomic
molecules.
If an atom is displaced from its equilibrium position in a polyatomic
molecule a force ftj acts tending to return the atom to its equilib-
rium position. In the harmonic approximation the force is
Displacement coordinates q are most conveniently taken in terms of
increments of valence bond lengths and bond angles. The (3ti-6) X(3n-6) square array of /0 values is termed an F matrix. The inverse
kinetic-energy matrix in valence coordinates is called a G matrix. If
E'is a unit matrix and \ =4tzc2v2
, then the secular equation in valence
coordinates v { is
(GF-\E)v=-0.
If the force constants are not known, then in general they cannot be
determined from the frequencies without simplifying assumptions, for
there are %(Sn-6) (371-6+ 1) different force constants for the com-pletely general quadratic force field, but only 3n-6 equations.
Figure 3. The normal modes of vibration of the water molecule. In free space the
frequencies are v\ 3652 cm-1, vt 1595 cm-1 and v3 3756 cm-1
.
82 MOLECULAR DYNAMICS AND STRUCTURE OF SOLIDS
It is convenient to define an L matrix which is a collection of nor-
malized eigenvectors or solutions of the secular equation. The elements
of this L matrix are the normal coordinates
3«-6
3
Hence l tj is the charge of the valence coordinate v t per unit charge of
normal coordinate Qj.
Usually the force constants cannot be determined from experi-
mentally determined frequencies without further information or
without making approximations. This problem may be overcome byobtaining data from isotopically substituted molecules, using sym-metry operations to factor the secular equation, or by making ap-
proximations about the nature of the force field. The use of isotopically
substituted molecules coupled with symmetry factoring represents
the only way of obtaining nonapproximate force constants for larger
molecules.
The general quadratic force field can be approximated by setting
certain values of F which are expected to be small to be zero. In
the "central force" approximation all internal coordinates are defined
as distances between atoms, and consequently in simple molecules
the central force constants can be uniquely determined from the
observed frequencies. In practice this force field has not proved to
be very satisfactory. From a chemical point of view the 'Valence
force field" has attractions. In it the force constants are expressed
in terms of the valence internal coordinates which involve changes in
valence bond lengths and angles. This leads to an F matrix which is
now diagonal. Consequently the expansion and solution of the secular
equation is much simplified.
The Urey-Bradley force field neglects all off-diagonal elements in
the F matrix but includes central forces between closely adjacent
nonbonded atoms. It is essentially a combination of the "central
force" and "valence force" approximations. It has the advantage of
giving force constants that should be transferable among similar
molecules without introducing large error.
If a molecule possesses elements of symmetry, the description of
the vibrations can be greatly simplified by classifying them into
symmetry species. This is of the greatest importance in considering
the selection rules for whether a particular vibration of a molecule
will be detected in its infrared or Raman spectrum. Selection rules
for overtone and combination bands are easily deduced from formal
symmetry considerations [1]. All these applications of symmetry
considerations can conveniently be performed using group theoreti-
cal methods.
INTRODUCTORY LECTURES 83
The intensities of lines in the infrared absorption spectrum andand Raman spectrum are determined respectively by the matrix
elements
of the dipole moment fij and polarizability tensor a tj of the molecule.
There is an infrared absorption line at a fundamental frequency v 0
if the corresponding normal coordinate transforms in the same wayas one of the dipole moment components n x , ny ,
\i z . The Raman spec-
trum contains the fundamental line of frequency shift v 0 if q0 trans-
forms in the same way as one of the polarizability components a tj .
The polarizability may be expanded in terms of the normal coordinates
All modes of oscillation coming under the totally symmetric classes
are always Raman active.
If a centre of inversion is one of the elements in the group, all
modes which are antisymmetric with respect to it are Raman in-
active. All normal modes which are symmetric with respect to a centre
of inversion are infrared inactive.
The essential features of the vibrational spectrum of a solid are
best illustrated by a consideration [6, 9] of a diatomic lattice such
as diamond, NaCl or ZnS. For such a lattice the v versus k dispersion
curves consist of three optical branches and three acoustic branches
(see fig. 4). For crystals such as diamond, silicon or germanium,
the transverse optical branches are degenerate with the longitudinal
optical branches at k=0. In NaCl or ZnS-type crystals the trans-
verse optic and longitudinal optic branches are not degenerate at
k=0. In the optic modes the atoms vibrate against one another. If
the ions are oppositely charged, this type of motion may be excited
by an electromagnetic wave of the appropriate frequency. The modeof vibration which leads to the atoms moving together is referred to
as an acoustical mode. The group velocity of such a wave propa-
gating through the solid is vg=2-K^ and hence is directly related toOK
the slope of the dispersion curves. It may be noted that for k=0
and k=- the velocity of propagation of optical modes is zero, corre-
sponding to standing waves in the solid. The velocities of transverse
ao
2.2. The Vibrations of a Diatomic Lattice
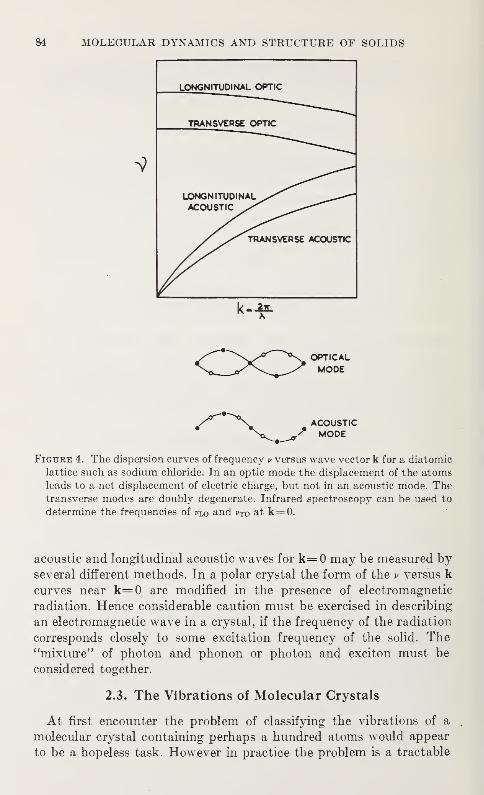
84 MOLECULAR DYNAMICS AND STRUCTURE OF SOLIDS
OPTICALMODE
ACOUSTICMODE
Figure 4. The dispersion curves of frequency v versus wave vector k for a diatomic
lattice such as sodium chloride. In an optic mode the displacement of the atomsleads to a net displacement of electric charge, but not in an acoustic mode. Thetransverse modes are doubly degenerate. Infrared spectroscopy can be used to
determine the frequencies of plo and pto at k= 0.
acoustic and longitudinal acoustic waves for k=0 may be measured byseveral different methods. In a polar crystal the form of the v versus k
curves near k=0 are modified in the presence of electromagnetic
radiation. Hence considerable caution must be exercised in describing
an electromagnetic wave in a crystal, if the frequency of the radiation
corresponds closely to some excitation frequency of the solid. The"mixture" of photon and phonon or photon and exciton must be
considered together.
2.3. The Vibrations of Molecular Crystals
At first encounter the problem of classifying the vibrations of a
molecular crystal containing perhaps a hundred atoms would appear
to be a hopeless task. However in practice the problem is a tractable
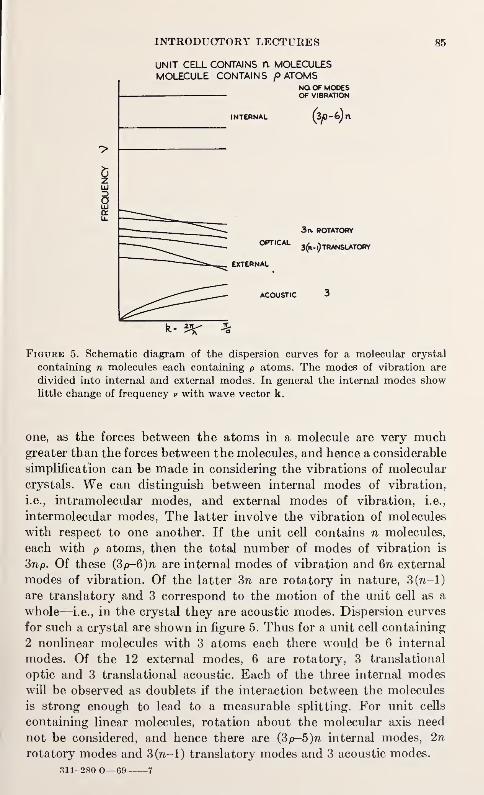
INTRODUCTORY LECTURES 85
UNIT CELL CONTAINS n MOLECULESMOLECULE CONTAINS p ATOMS
NQ OF MOOESOF VIBRATION
Figure 5. Schematic diagram of the dispersion curves for a molecular crystal
containing n molecules each containing p atoms. The modes of vibration are
divided into internal and external modes. In general the internal modes showlittle change of frequency v with wave vector k.
one, as the forces between the atoms in a molecule are very muchgreater than the forces between the molecules, and hence a considerable
simplification can be made in considering the vibrations of molecular
crystals. We can distinguish between internal modes of vibration,
i.e., intramolecular modes, and external modes of vibration, i.e.,
intermolecular modes, The latter involve the vibration of molecules
with respect to one another. If the unit cell contains n molecules,
each with p atoms, then the total number of modes of vibration is
Snp. Of these (3p-6)n are internal modes of vibration and 6n external
modes of vibration. Of the latter 3n are rotatory in nature, S(n-l)
are translatory and 3 correspond to the motion of the unit cell as a
whole—i.e., in the crystal they are acoustic modes. Dispersion curves
for such a crystal are shown in figure 5. Thus for a unit cell containing
2 nonlinear molecules with 3 atoms each there would be 6 internal
modes. Of the 12 external modes, 6 are rotatory, 3 translational
optic and 3 translational acoustic. Each of the three internal modeswill be observed as doublets if the interaction between the molecules
is strong enough to lead to a measurable splitting. For unit cells
containing linear molecules, rotation about the molecular axis need
not be considered, and hence there are (3p-5)n internal modes, 2n
rotatory modes and 3(n-l) translatory modes and 3 acoustic modes.
311-280 O—69 7
86 MOLECULAR DYNAMICS AND STRUCTURE OF SOLIDS
In order to classify the modes of vibration &=0 of a crystal, the
space group must be reduced from infinite order to finite order. Thetwo most frequently used ways of tackling the problem are those of
Bhagavantam and Venkatarayuda [10] and of Halford, [11, 12]. Theformer treat the crystal as large molecules in which primitive trans-
lations are equivalent to identity operations:
S = U X I
space factor Trans-
group group lations
They then consider the symmetry operations of the factor group
(which is defined as the symmetry group of the smallest unit from
which the crystal may be built up by primitive translations) taking
an atom as "invariant under a particular operation if it is carried into
an equivalent position, i.e., one that can be reached by a primitive
translation alone. Thus the set of unreducible representations which
are totally symmetric with respect to translation, according to one of
which each normal mode transforms, are given by
The alternative method, due to Halford, is to consider the site sym-
metry of particular molecular groups and use correlation tables for
the species of a group and its subgroups to determine the effect of
the lattice on the vibrations of the isolated molecules. Since all the
operations of the factor group can be obtained by taking all possible
products of the operations contained in the site groups, the two
methods give identical results and both have been used in the dis-
cussion of the spectra of various crystals.
The factor group defined above is situated at each lattice point
of the Bravais cell of the crystal under consideration, and hence it
is at the centre of the symmetric unit cell which is invariant under the
point group isomorphic with the space group of the crystal. The
corresponding reciprocal lattice in k space is also invariant under the
same point group operating about one of its lattice sites. This site
is at the centre of the Brillouin zone, where the group of the wave
vector is that of the entire group. Thus a classification of the modes
of the crystal are obtained by applying the above methods to the
factor group. Other special points in the zone have lower symmetries,
while general points have representations of the group of pure trans-
lations corresponding to the k=0 vector in question.
A brief review of Bhagavantam and Venkatarayuda's method will
now be given.
In the B and V method Nk , the number of times an irreducible
representation T is contained in another representation, is given by
INTRODUCTORY LECTURES 87
where
N is the order of the group.
hj is the number of group operations in the jth class.
Xj(R) and Xk(R) are the characters of the group operations T t and r*.
The normal modes are classified by a suitable choice of the representa-
tion T, and the selection rules for infrared and Raman are determined
by using the translation vector and symmetric tensor representation
respectively for r. If T Is defined by all SN cartesian coordinates
comprising all the degrees of freedom, the distribution of the normal
modes among the symmetry species can be found by substituting
the following expression for Xj into the formula above for Nk :
x;(w<)=wb(±1+cos <f>R).
Here a>R is the number of atoms invariant under the operation R,
and <I>R is the angle of rotation taking the signs for proper and— ve for improper rotations.
The modes of vibration can be further classified as follows:
Acoustic modes: In the acoustic modes the unit cell moves as one
unity, so in this case wR=l and
Xj=± 1+cos 2<f>R .
This also gives the selection rules for infrared absorption, since the
dipole moment transforms in the same way as for pure translations.
Translatory external modes: In this case we have
x(n = [«*(*) -1H± 1+cos 24>B]
where o)R (s) is the number of structural groups which remain invariant.
Rotatory external modes: These transform as the angular momentumP, i.e.,
x(R') = <*r{s-v)x(v)
x(p) = l±2 cos<t>R
where uR(s—p) is the number of polyatomic groups which remain
invariant. The monoatomic groups do not contribute since they have
no rotational degrees of freedom. In the case of linear molecules or
ions, there are only two degrees of freedom, and the character x(p)
for a rotation about the molecular axis is ±2 cos and that for
rotations perpendicular to it is zero.
88 MOLECULAR DYNAMICS AND STRUCTURE OF SOLIDS
Internal modes: Finally the number of internal modes may be found
by subtracting the sum of the acoustic, translatory and rotatory
external modes from the total number. Where there are more than two
structural groups, the number of internal modes due to each can be
found by ignoring first one then the other. As shown previously, if
there are n identical molecules in the unit cell then the total numberof internal modes is (3p— 6)n if the molecules are non linear, but
(3p— 5)n if they are linear.
The mean displacement of atoms in a particular vibrational state
is of interest in the interpretation of observations of lattice dynamics
by several different techniques [7], e.g. x-ray scattering. If the normal
modes of vibration for different frequencies have been completely
calculated using experimental data for the frequencies, then the mean-
square displacements of the different atoms involved in any normal
mode can be found. Thus the mean displacement of an atom in a
diamond-type lattice due to the excitation of the single optical
phonon of frequency v 0 is given by
where Mis the mass of the atom (e.g., C, Si, Ge, or Sn). Typical root-
mean-square displacements are of the order of 0.01 A to 0.1 A.
3. Spectroscopic Methods
3.1. Fundamentals of Infrared Spectroscopy—DielectricParameters
A normal mode of vibration in a crystal gives rise to infrared absorp-
tion if the displacement of the atoms leads to the generation of a dipole
moment. Usually it is the infrared absorption spectrum that is measured
by a spectrometer; however, as absorption coefficients in the infrared
are frequently very large, experimental difficulties arise in obtaining
thin enough samples. In such cases it is frequently necessary to
measure the reflection spectrum and then to calculate the dielectric
parameters for the solid as described below Dielectric parameters
are to be preferred to absorption coefficients or indices and to
refractive indices because e' and e" are much more readily compared
with theory. Absorption coefficients due to one-phonon processes vary
over as much a range as three orders of magnitude. Whereas a film only
a fraction of a micrometre thick is necessary for the study of the single
resonance in alkali halides, a crystal almost a millimetre thick is
necessary to study absorption due to intermolecular vibrations in
crystals containing nonpolar molecules.
INTRODUCTORY LECTURES 89
A discussion will first be given of the various parameters that may be
used to characterize the optical properties of solids and the relationship
between them (see fig. 1). The optical properties of a crystal may be
characterized by the complex refractive index
n*=n—ik
where n is the refractive index and k the absorption index. Alterna-
tively the complex dielectric parameter
may be used. From Maxwell's electromagnetic theory*
n*2=e*.
Hencee'=n2-k2
e"=2nk
The absorption coefficient a is defined by the equation
I=I0e-ax
where I0 is the electromagnetic energy incident on the sample of
thickness x, and / is the transmitted energy, a is related to the absorp-
tion index bya=4irkv
where v is the wave number of the radiation.
The conductivity of a dielectric can be shown to be
a=nkv=~^-'
The dielectric parameters are obtained from a study of the reflection
spectrum of a crystal.
The reflected amplitude at normal incidence r is given by
n—ik—lf— .
n—ik-\-\
If the phase change on reflection is 0 then
r=\r\ exp (id).
Since \r\— ^[Rfwhere R is the fraction of the energy reflected, this
equation can be used to give values of n and k.
90 MOLECULAR DYNAMICS AND STRUCTURE OF SOLIDS
l-R71=
l+R—2^fR cos 6
k= —2R sin 6
l+£-2V#cos0
A determination of the real part of the response of a system as a
function of frequency can give, via the Kramer-Kronig relations, the
imaginary part of the response of the system, and vice versa. Thereflectivity function R(v) and its associated phase 6(v) satisfy these
conditions [13]. Thus if R is known as a function of frequency betweenv=0 and v= °° , the value of 6(v) may be determined by an integral
transform. The transform linking 6 with R is
where vm is a given frequency at which the value of 6 is required.
In principle the reflection coefficient must be measured over an infinite
frequency range. However, various approximations can be made so
that usually only infrared measurements are required.
Classical dispersion theory provides the simplest approximation to
an understanding of the optical and dielectric parameters in terms
of the motion of the atoms in a crystal. Consider a set of particles
of mass m and charge e each bound to a fixed centre by a force, where
x is the particle displacement and co 0 the natural vibration frequency.
Suppose the effective electric field is F and y is a damping constant ;
then the equation of motion is
If N is the number of particles per unit volume, then the polarization
is Nex, and hence the dielectric parameter
mx+myx+mJ2
0x=eF.
The solution is of the form
eF 1x= m coo— co
2— iycc
4:7VP
3 Eas
F=E+^fp
also
INTRODUCTORY LECTURES 91
where Q' is the effective charge associated with the vibration
„ 4wNQ' 247r(e0+2)W
Hence ^—=e0—
e
ro=—-—^7
Let €0—
em =47rp
M?' 2
so
coo— co2— Iyco
'_„2_J.2_ f |
47Tp(cog— C02)C0^
"71 K ~ €a>_h
(^-co 2)2+7V
(^-co 2)2+7
2
The damping constant here has the dimensions of frequency, so that
a reduced damping constant is denned such that y0—-.
co
A quantum mechanical treatment of the vibrational frequencies of
simple lattices such as the alkali halides leads to basically similar
equations to those derived classically. Cowley [14] has shown that
" — (v20-i>
2)2+2v0[A-ir v ]
Hence
, , ,4(*i-*l)l(A-S)+2*£.]
e'~ t "+ [«-^) 2+2.oA,]
2+4^r;
„_ vl(€,
0—€
a} )2v0T v
€
"~lW-.2)2+2,0r,]
2+4^r 2
As mentioned above, Y v=~- and consequently, accord ng to classical
theory, the damping "constant" is actually proportional to the fre-
quency v. A„ represents a shift in frequency from the class cal frequency
v o due to anharmonicity.
The variation of r„ with frequency can be calculated from the
experimentally determined quantities in the equation:
1 v—
;
2[(e;-e'J2+e:'2
]
Expressions for I\ and A„ have been given by Cowley [14].
The real and imaginary parts of the dielectric parameter e' and e"
are related to one another. Thus if e„ is known for all frequencies then
92 MOLECULAR DYNAMICS AND STRUCTURE OF SOLIDS
ev can be calculated for any particular frequency using Kramer-Kronigequations
, ._ , 2 nve'Jdv€*~ e -~h
* Jo v'-vl
„_ 2tv0 r°° (€p0—ejdv
€"°~7T Jo V'-Vl
The first equation is especially valuable for calculating the zero fre-
quency dielectric parameter eo, which is usually referred to as the
dielectric constant.
If eel is taken as the dielectric parameter in the 7-ray region, whereit is experimentally found to be very close to unity, then the equation
can be written
4-1=1 JV<Z(log«>)
Hence if e" is measured throughout the electromagnetic spectrum andthen plotted against the logarithm of frequency, the area under the
curve is 7r/2(e0— 1) . From this curve the effects on the dielectric constant
e0 of various vibrational or electronic processes may be readily
appreciated.
The dielectric parameters are tensors and consequently it is essential
to use polarized radiation when recording the infrared absorption andreflection spectra of all but cubic crystals. Thus, with an orthorhombic
crystal the reflection has to be measured with the electric vector
parallel to the a, 6, and c axes. When obtaining the reflection spectra
from the be plane of a monoclinic crystal, it is necessary to rotate the
plane of polarization of the electric vector.
The longitudinal optic frequency vm can be found for k=0 by noting
that it is the frequency for which €'=0. It can be measured directly in
cubic crystals by a method due to Berriman [15]. A thin film is deposit-
ed on a metal surface, and then the reflection spectrum is measured
with an angle of incidence of about 30°, using infrared radiation plane-
polarized with a component perpendicular to the film surface. A marked
fall in the reflectivity occurs when e'=0 and gives the frequency of the
longitudinal optic mode at k=0.If the low and high frequency limits, e0 and ed, are known, then
vL0 may be calculated from a relationship first given by Lyddane,
Sachs, and Teller [16]
(0This equation may be generalized for cubic crystals having infrared
active vibrations as follows:
1/2
Vlo=[ — i VTq'
INTRODUCTORY LECTURES 93
A similar type of expression holds for the two principal dielectric
parameters of uniaxial crystals.
3.2. Fundamentals of Raman Spectroscopy of Crystals—thePolarizability Tensor
Raman spectroscopy of crystals involves the inelastic scattering
of photons. The energy lost or gained by the photons is used to create
an annihilate phonons in the crystal. Annihilation of phonons can
only occur if the phonon energy hv vib is not large compared with kT,
as the phonon population has a temperature dependence of the form
1
Anti-Stokes components of the Raman spectrum are rarely detectable
at normal temperatures for frequencies greater than about 800 cm"" 1
,
i.e., phonon energies larger than about 100 millielectron volts.
The essential features of Raman spectroscopy can be understood
using the following simplified argument [7]. Let a {j be the electronic
polarizability and q the displacement:
q=q0e2iriv* ibt
.
If monochromatic electromagnetic radiation of frequency v0 is applied:
E=E0e2 * iv° t
where E is the electric field. Then, since atJ may be expanded as a
power series as the polarizability changes with the vibrational motion
of the atoms
CL ij =OL0+ CLi<l+OL2q2+ •
where
~&a--<w).We then get an induced dipole moment M with a component:
M=alq0E0e2ri^v^\
which leads to Raman radiation at frequencies vo±v tib .
The terms a\ then give rise to one phonon processes; in order to
account for second-order Raman scattering, which involves the
creation or destruction of two phonons, a2 must be considered.
In general afj is a tensor with components that may be measuredusing polarized radiation
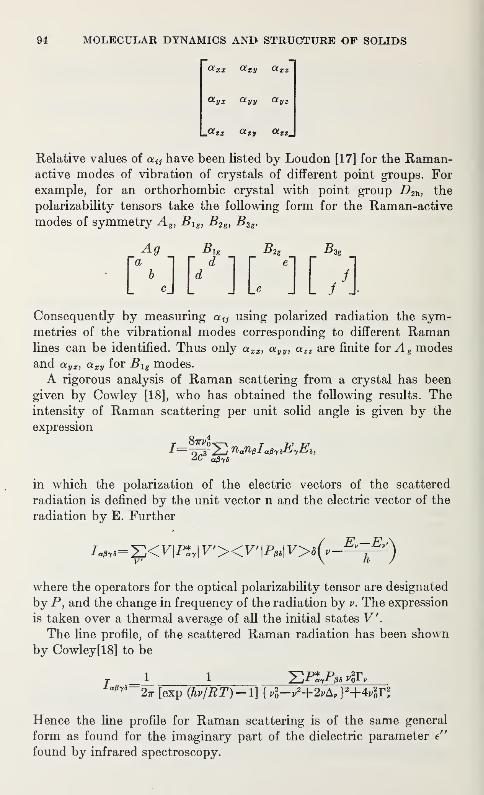
94 MOLECULAR DYNAMICS AND STRUCTURE OF SOLIDS
Relative values of an have been listed by Loudon [17] for the Raman-active modes of vibration of crystals of different point groups. For
example, for an orthorhombic crystal with point group D2h , the
polarizability tensors take the following form for the Raman-active
modes of symmetry A g ,Blg ,
B2g ,B3g .
Ag Big B2g B3g
umi it/]Consequently by measuring using polarized radiation the sym-metries of the vibrational modes corresponding to different Ramanlines can be identified. Thus only axx ,
a yy ,a zz are finite for A g modes
and ayx ,axy for Blg modes.
A rigorous analysis of Raman scattering from a crystal has been
given by Cowley [18], who has obtained the following results. Theintensity of Raman scattering per unit solid angle is given by the
expression
in which the polarization of the electric vectors of the scattered
radiation is defined by the unit vector n and the electric vector of the
radiation by E. Further
where the operators for the optical polarizability tensor are designated
by P, and the change in frequency of the radiation by v. The expression
is taken over a thermal average of all the initial states V'.
The line profile, of the scattered Raman radiation has been shown
by Cowley[18] to be
aW~27r [exp (hv/RT)— l] { vl-v2+2vA, }
2+4v20Tl
Hence the line profile for Raman scattering is of the same general
form as found for the imaginary part of the dielectric parameter e"
found by infrared spectroscopy.
INTRODUCTORY LECTURES 95
The term Brillouin scattering[6] is used to denote scattering in-
volving acoustic modes in solids or liquids. For the Stokes componentof the scattering the fractional shift in the frequency of the radiation is
Av 2nV . 6—= sinv c 2
where 0 is the angle between the direction of observation and the
original direction of propagation of light, n is the refractive index, Vis the velocity of propagation of the acoustic phonon, i.e., the sound
velocity, and c is the velocity of electromagnetic radiation. AsV/c is small
(^10~5), Brillouin shifts are only of order of 1 cm-1
, and hence a good
Fabry-Perot spectrometer is needed for the observation of the fre-
quency shift. In general for a solid there are three acoustic branches
for a single direction of propagation and consequently three Stokes
and three anti-Stokes components. However, in a liquid there is only
one velocity, as transverse waves cannot be propagated through
liquids, except perhaps for very short wavelengths. From a measure-
ment of the velocity of acoustic waves the elastic constants can be
deduced.
3.3. Selection Rules
The selection rules for infrared absorption and Raman scattering
in crystals can be derived by taking into consideration
(a) conservation of energy,
(b) conservation of momentum or wave vector, and
(c) the magnitude of the transition moments.
In infrared absorption (a) leads to the requirement that in a one-
phonon process the photon energy must equal the energy of the
phonon that is created. Since the wavelength of infrared radiation or
visible radiation used for Raman spectroscopy is very large comparedwith the dimensions of a unit cell, we can effectively set the wave-
vector of the electromagnetic radiation to zero. Consequently, in a
one phonon process in both infrared and Raman spectroscopy only
long-wavelength vibrations are excited, i.e., those for which k=0.In two phonon processes in both infrared and Raman spectroscopy
we must have
k 1+k2=0
where ki and k2 are the phonon wave vectors. Consequently the
transitions are not confined to k=0 but to any value of k, provided
that the equation above holds. Two-phonon processes then call for a
consideration of the combined density of vibrational states in which
96 MOLECULAR DYNAMICS AND STRUCTURE OF SOLIDS
the number of modes of vibration are computed taking the branches
of the dispersion curves in pairs for a common k value.
In a two phonon process which involves an internal mode of vibra-
tion for which the frequency v varies very little with wavevector,
the combined density of states approximates—at least in a cubic
crystal—to the density of vibrational states spectrum. This is important
for a discussion of the absorption that occurs on the high and low
frequency sides of many absorption lines due to internal modes.
From the above discussion it is clear that when dv/dk, or more rigor-
ously, when Vk v is either zero or has a slope discontinuity, there are
likely to be slope discontinuities in the combined density of states,
which may be reflected in infrared and Raman spectra involving two
phonon processes. Points in the Brillouin zone where each of the
components- of Vkv=0 are known as critical points.
The intensity of infrared absorption or Raman scattering depends
upon the matrix elements |MrF '| and \avJj'\. For infrared absorption
the transition moment is:
\Mvv '\ 2=j;
where
\l/ vM(q)\J/ v>di
M(q)=mQqo+S ™u<li<l&S m<M<M*-ij ijk
For Raman scattering we must consider the matrix elements
[aVi-']=
J*\l/vaij^v'dT=a
0ifjyl/v\f/v'dT
AsJ\f/
v\J/vdT is zero, the intensity of first-order Raman scattering
depends upon
As in the case of isolated molecules the activity—infrared or Raman
—
requires the evaluation ofJ\J/
vq\f/v>dT. In general, numerical solutions
are not possible; however, by using symmetry considerations and
group theoretical methods, the various modes can be assigned as
infrared or Raman active, although the intensities cannot be
calculated.
INTRODUCTORY LECTURES 97
3.4. Effect of Temperature and Pressure on Spectra
The infrared and Raman spectra of crystals are frequently strongly
temperature dependent. A reduction in temperature results in the
freezing out of thermal phonons and hence to the disappearance of
the two-phonon transitions which involve the annihilation of thermal
phonons. As a consequence of reduction by cooling of the number of
processes available for phonon-decay, damping factors r„ are de-
creased, and absorption lines are usually considerably sharper at low
temperatures. Lattice spacings usually decrease on cooling, and hence
force constants are increased and with them vibrational frequencies.
Similarly an increase in pressure invariably leads to the raising of
frequencies. Such temperature and pressure information is particularly
valuable in studies aimed at the understanding of intermolecular forces,
as the variation of frequencies with intermolecular distances may be
deduced.
Perhaps the most interesting type of changes in infrared and
Raman spectra are those which accompany changes of phase. Changes
in both infrared and Raman spectra can be followed with comparative
ease. As the structure changes so do selection rules; these can be
correlated with the two crystal structures involved. Small changes
in molecular or site symmetry or the onset of hindered rotation can
be detected.
Many materials have a low-frequency mode of vibration which is
strongly temperature-dependent, and the study of these is adding
much to our understanding of ferroelectric transitions [19, 20, 21].
A ferroelectric crystal is one which has a spontaneous electric dipole
moment. Usually the dielectric constant as measured at low fre-
quencies has a high value and a temperature dependence of the
following type:
In certain crystals the ferroelectricity results from a low-frequency
vibration becoming unstable as the temperature approaches the
ferroelectric transition temperature Tc . As shown above
ce0=T-Tc
Hence if one of the vibrational frequencies changes with temperature,
the value of e' 0 will alter if v for the mode approaches zero. It is usually
found that v2~(T—Tc).
98 MOLECULAR DYNAMICS AND STRUCTURE OF SOLIDS
3.5. Instrumentation
Infrared and Raman spectrometers have been available com-mercially for many years and have been developed to the stage where
the recording of spectra is virtually automatic. Most of the labour
now involved in obtaining spectra lies in sample preparation, e.g.,
in growing suitable crystals and determining the principal axes so as
to enable spectroscopic studies to be correlated with the structure.
Most infrared spectrometers [22] employ a blackbody source anduse a grating monochromator with filters to cut out overlapping orders.
Good detectors are available for whole infrared regions. Nonselective
types such as thermopiles and Golay detectors are usually incorporated
into commercial instruments. Performance can be improved by using
cooled photoconductive detectors, but these are frequency selective
and only function over comparatively narrow spectral ranges.
Nearly all commercial infrared spectrometers are of the double
beam type and produce a record on preprinted paper of the percentage
transmission as a function of frequency. A good general purpose
spectrometer will enable infrared spectra to be obtained between the
limits 200 cm-1to 4000 cm-1
, with a resolution better than 0.5 cm-1
and a signal to noise ratio exceeding 50/1. In such an instrument
grating and filter changes are automatic. Polarizers of the wire grid
type are now available to permit the recording of polarized spectra
throughout the infrared region. For the study of the absorption
spectra of small crystals or polymers, microilluminators have been
developed which enable infrared spectra to be obtained from areas as
small as 1 mm by 0.1 mm. The beam condensors that are used are
usually of the reflecting microscope type.
One of the most important developments in infrared spectroscopy
in recent years has been the opening up of the far infrared region (i.e.,
approximately from 5 cm-1to 200 cm-1
) for routine studies. This
frequency range is very important, as most intermolecular vibrational
frequencies occur within it. Spectroscopy in this region suffers from
the difficulty that there are as yet no readily tunable monochromatic
sources, and blackbody radiation in this range is weak. Hence, it is
essential that the form of spectrometer should have a high efficiency
interferometers of the Michelson type [23, 24] are now commercially
available for work in the far infrared region. In these interferometers,
radiation of all frequencies passed by a filter falls simultaneously on
the detector, instead of successively as in conventional monochro-
mators. On scanning the movable reflector, an interferogram I(x)
is produced from which it is possible to obtain the spectral intensity
G(v) by means of a Fourier transformation
INTRODUCTORY LECTURES 99
The actual computation is usually carried out using a digital computer.
If the distance moved by the scanning mirror is I, then the resolution
is given by Av~l/2l thus if 1=5 cm then Av~0.1 cm" 1. Even at liquid-
helium temperature very few intrinsic absorption bands in solids
are narrower than 1 cm-1; hence reliable measurements can now be
made on band contours throughout the infrared region.
The power of Raman spectroscopy has been radically improved
by the introduction of lasers as sources. These, combined with double
monochromators Avith very low scattered-light factors and extremely
sensitive photomultipliers, now make it routinely possible to obtain
good resolution Raman spectra with high signal-to-noise ratios from
comparatively small specimens, e.g., crystals weighing a few milli-
grams. This is largely due to the high radiation density which can
be produced in the specimen. In view of the fact that the beamis narrow and parallel, accurate polarization measurements are nowpossible. Further, the beam geometry is such that the recording of
Raman spectra at variable temperatures and pressure are muchfacilitated. Although ionised argon lasers (Green line 5145 A, 19,440
cm-1) are being used for Raman spectroscopy, most work so far done
has been with continuous He/Ne lasers with power outputs between
25 and 100 milliwatts. This type of laser provides a highly mono-chromatic source at 15,800 cm" 1 (6238 A). It is usual with manysamples to obtain Raman spectra as close as 30 cm-1
to the exciting
line. The red source enables many coloured samples to be examined,
as absorption by most coloured compounds is less for red light than
for blue or green. The output from these lasers is plane polarized,
and hence a quarter wave plate is necessary to rotate the plane of
polarization through 90°. A piece of polaroid is adequate as an analyser
;
however, in view of grating polarization, it is essential that a circular
polarizer should be placed in the path of the Raman radiation between
the analyser and the monochromator.
4. Experimental Studies on Specific Systems
The general principles just developed will now be applied to somespecific systems. No attempt will be made to give a complete review
of all studies that are worthy of notice. Here we discuss some examples
that illustrate the type of work that has been carried out on a very
wide range of materials. In some cases the studies give information
about the frequencies and types of vibration. In other cases the data
is used to reveal changes in molecular configuration.
4.1. Classification of Crystalline Solids
It would be very convenient for a discussion of the properties
of crystals if a satisfactory classification of different crystal types
100 MOLECULAR DYNAMICS AND STRUCTURE OF SOLIDS
existed which would bring together those with similar physical prop-
erties. The following frequently used classification distinguishes
between different types of crystals: molecular, covalent. ionic, andmetallic.
Unfortunately such a division is of limited value for classification
purposes, as in many crystals bonding of an intermediate character
is found, and in others different types of bonding operates betweendifferent constituent atoms. Thus the semiconductors silicon andgermanium are transitional cases between covalent solids and metals.
Silicon carbide is borderline between covalent and ionic. Calcite.
CaC0 3 has both molecular and ionic character.
However, the classification does have the advantage that the
prototypes do show quite distinct physical properties. From the point
of view of the infrared and Raman properties of these main divisions,
metals represent the only group whose vibrational spectra cannot be
studied. As the emphasis in this review is on molecular crystals, only
brief mention will be made to pure covalent crystals such as silicon.
Ionic crystals warrant much further discussion in view of the import-
ance of molecular ions in many inorganic systems.
A further classification is according to the space group of the
crystal, and as already seen, a knowledge of this together with the
number of atoms in the unit cell leads immediately by group theoretical
methods to a classification of the activity—infrared or Raman—of the
different modes of vibration. In the following discussion the representa-
tions to which the modes of vibration belong are fisted by T. (IR) and
(R) indicate infrared and Raman activity respectively; and (F) meansforbidden. The notation _L or means that the infrared transition is
perpendicular or parallel to the optic axis of the crystal. The acoustic-
modes are not included.
4.2. Elemental Covalent Crystals
The group TVb elements, carbon (diamond), silicon, and germaniumform covalent cystals with the diamond structure and as such may be
considered as giant molecules. The symmetry of the unit cell is such
that no one phonon absorption should be observed in the infrared,
and consequently thin slabs of the pure crystals are essentially trans-
parent over most of the infrared region. As the oscillator strength
IM^'I 2is effectively zero, the transverse optic and longitudinal optic
modes are degenerate at the zone centre. They are Raman active and
the Raman spectra of diamond, silicon, and germanium are known. As
pointed out previously, a knowledge of this frequency together with
the mass of the atom enables the root-mean-square amplitude of the
atoms in this mode of vibration to be calculated.
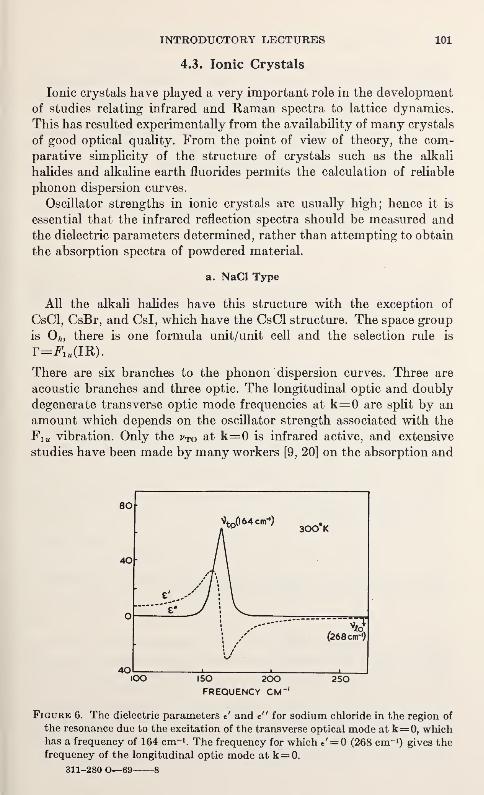
INTRODUCTORY LECTURES 101
4.3. Ionic Crystals
Ionic crystals have played a very important role in the development
of studies relating infrared and Raman spectra to lattice dynamics.
This has resulted experimentally from the availability of many crystals
of good optical quality. From the point of view of theory, the com-
parative simplicity of the structure of crystals such as the alkali
halides and alkaline earth fluorides permits the calculation of reliable
phonon dispersion curves.
Oscillator strengths in ionic crystals are usually high; hence it is
essential that the infrared reflection spectra should be measured and
the dielectric parameters determined, rather than attempting to obtain
the absorption spectra of powdered material.
a. NaCl Type
All the alkali halides have this structure with the exception of
CsCl, CsBr, and Csl, which have the CsCl structure. The space group
is Oh , there is one formula unit/unit cell and the selection rule is
T=Flu(m).
There are six branches to the phonon dispersion curves. Three are
acoustic branches and three optic. The longitudinal optic and doubly
degenerate transverse optic mode frequencies at k=0 are split by an
amount which depends on the oscillator strength associated with the
Fiu vibration. Only the vTO at k=0 is infrared active, and extensive
studies have been made by many workers [9, 20] on the absorption and
300.K
— e* J/ (268 cm-
1
)
1/1 1
—
lOO 150 200 250FREQUENCY CM"'
Figure 6. The dielectric parameters e' and e" for sodium chloride in the region of
the resonance due to the excitation of the transverse optical mode at k= 0, whichhas a frequency of 164 cm" 1
. The frequency for which €'= 0 (268 cm-1) gives the
frequency of the longitudinal optic mode at k= 0.
311-280 O—69 8
102 MOLECULAR DYNAMICS AND STRUCTURE OF SOLIDS
reflection spectra in order to obtain the dielectric parameters e' ande" and to connect these with the properties of the lattice. The dielectric
parameters for NaCl are illustrated in figure 6. Much current interest
now centres on the calculation of T v, the frequency and temperature-
dependent damping factor which is an inverse measure of the lifetime
of the phonon and which depends essentially upon the rate at which
the TO phonons are converted into two phonons.
The second-order Raman scattering involves two phonon processes
[7]. These, like the two phonon absorption in the infrared, extend
over a wide frequency range, as transitions may occur for any value
of the wavevector k provided that:
k!±k2=0.
Many other crystals with the NaCl structure besides the alkali
halides have been studied by infrared spectroscopy [9], e.g., AgCl,
AgBr, T1C1, TIBr, MgO, CaO, PbS, PbTe, NiO.
b. Zinc Blende Type
Many crystals have this structure. There is one formula unit/unit
cell having space group T d2 with r=F2u 0-R)- They differ from the
alkali halides in that each ion is surrounded by four not six near
neighbours. There is no centre of inversion, so that although the
phonon dispersion curves have generally the same form as those for
NaCl type lattices, the selection rules are now different. The k=0transverse optic mode is strongly infrared active and is also Ramanactive. As the crystal is piezoelectric the k=0 longitudinal optic modeis Raman active. Thus in gallium phosphide the most intense lines
in the Raman spectrum [25], which occur at 366.5 cm-1 and 403.8
cm-1,give the values of vTO and vLO respectively, at k=0. In the infra-
red absorption spectrum of thin films of GaP, Kleinman and Spitzer
[26] found a single peak at 366 cm-1,corresponding to the excitation
of the vTO mode. A review of results on many crystals with this struc-
ture has been given by Gielisse and Mitra [27].
c. Wurtzite Type
This is a hexagonal modification of the zinc-blende type with two
formula units/unit cell and space group C 64
. The selection rules are:
IW^IR, ||, R)+25,(F)+#i(IR, J_, R)+2#2(R).
The most important crystals with this structure are II-VI compoundssuch as ZnO, CdS, and CdSe [28]. The wurtzite structure is a slightly
distorted zinc blende structure in which the change in nearest and
next-nearest neighbour distances is small, and consequently the
INTRODUCTORY LECTURES 103
anisotropy is small. There are 12 phonon branches, of which three are
acoustic. Of the nine optical branches there is one A, and a doubly
degenerate E mode, which is both Raman and infrared active, two
doubly degenerate E 2 , which are Raman active only, and two in-
active Bi modes.
Dispersion curves for CdS have been calculated by Birman [29]
using a mixed valence-coulomb force field. At 77 °K CdS shows a
strong enhancement of the Raman spectrum [30] recorded with an
ionised argon laser, as the exciting line is close to the absorption
edge and consequently a Resonance Raman effect occurs.
d. Ginnibar (HgS)
This form of mercuric sulphide has three formula units in a hex-
agonal unit cell of symmetry D 34
. Hence there should be eighteen
branches to the phonon dispersion curves, and:
r=2A;(R)+3A'2
,
(IR, ||)+5#'(IR, ±, R)
The Raman active A\ modes occur at 43 cm-1 and 256 cm-1, whilst
the A2" modes that are infrared active are at 36, 102, and 336 cm-1
.
The E' type vibrations are found at 83, 82, 100, 280 and 343 cm" 1 in
the infrared and at 72, 88, 108, 282, and 343 cm -1in the Raman spec-
trum. There are also Raman peaks at 202, 290, and 351 cm-1.
As there is no centre of inversion in the unit cell, the longitudinal
optic modes would be expected to be Raman active. Presumably the
290 cm-1 and 351 cm-1peaks are LO modes. The measurement of
the polarizability tensor for the crystal is complicated by the fact
that cinnibar has a very high optical rotatory power. The Ramanspectrum is enhanced by resonance when using red He/Ne laser
excitation, as the exciting line frequency is very close to the absorption
edge of HgS.
e. Fluorite Type
The most commonly encountered members of this group are the
alkaline-earth fluorides. All have one formula unit in a unit cell of
space group Of with
r= JP1.(IR)+Faf(R).
There are nine branches to the phonon dispersion curves. LOi and TOiare split at k=o by an amount which depends on the oscillator strength
of the vTO vibration. L0 2 and T0 2 are degenerate at k=o. The infra-
red active mode involves the vibration of the metal ions against the
cage of surrounding anions. vTO is strongly infrared active and strong
reflection occurs in the far infrared between the TO and LO frequencies.
T0 2 and L0 2 are Raman active for k— o. Crystals of this type which
104 MOLECULAR DYNAMICS AND STRUCTURE OF SOLIDS
have been studied include CaF2 ,SrF2 ,
BaF2 ,CdF2 ,
PbF2 ,SrCl2 ,
and U02 [31].
f. Quartz
Si0 2 has 3 formula units/unit cell of space group D3 . Hence there
are 27 branches to the phonon dispersions, which have recently been
calculated by Elcombe [33]
r=4^L(R)+4£(IR, ||)+8#(IR, _L)
The infrared [32] and Raman spectra of quartz have been recorded
by several workers as a function of temperature. Recently a detailed
Raman study has been carried out as a function of temperature from
77 °K to 888 °K, and was directed towards elucidating the nature of
a—»/3 quartz transition which occurs at 846 °K. The a phase has
symmetry D 3 whilst the high temperature form (/3-quartz) has sym-
metry D 6 .
r=^ 1+3£2+242+251+4#1+4£,
2
4A l->A 1+3B2 ,4A 2->2A 2+2Bh 8E=4Ei+4E2
Shapiro [34] et al., have r,hown that the line at 147 cm-1increases in
intensity and decreases in frequency as the transition temperature is
approached. A logarithmic plot for this line shows that v2~{T— Tc)
1/2,
which is quite different from the form v2~(T—Tc) for ferroelectric
modes. A definitive identification of the 147 cm-1 band has not as
yet been made.
From a Raman spectroscopy [35] point of view, quartz is interesting
in that several longitudinal modes are strongly active and their
frequencies agree well with the positions for €'=0 determined from
an infrared analysis of the reflection spectra.
g. Rutile (Ti02)
This structure has two formula units/unit cell of space group T>4h .
In MgF2 , for example, the magnesium ions are located at sites with
D 2h symmetry and fluorine ions occupy sites having C2v symmetry.
r=A1,(R)+^(F)+^(2„(IR,||)
+ J5U(R)+52g(R) +2Blu(F) +#*(R)+3#tt(IR, ±).
Thus in the infrared three resonances occur with the electric vector
of the radiation perpendicular to the c axis and one with the electric
vector parallel to the c axis [36]. The Raman active modes have been
identified [37] and assigned to A lg ,Eg ,
Blg , and B2g by determining the
form of the polarizability tensor. Dispersion curves v versus k have
been calculated for MgF2 using a rigid ion model and adjusting force-
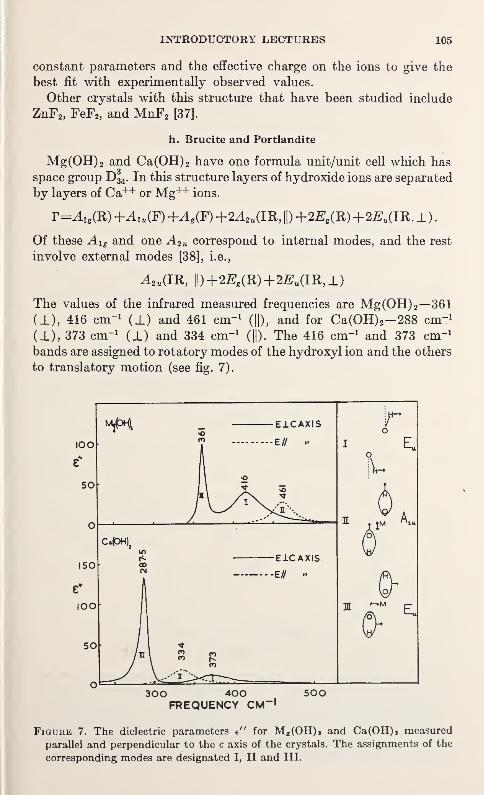
INTRODUCTORY LECTURES 105
constant parameters and the effective charge on the ions to give the
best fit with experimentally observed values.
Other crystals with this structure that have been studied include
ZnF2 ,FeF2 , and MnF2 [37].
h. Brucite and Portlandite
Mg(OH) 2 and Ca(OH) 2 have one formula unit/unit cell which has
space group D^. In this structure layers of hydroxide ions are separated
by layers of Ca++ or Mg++ ions.
T=Alg(R) +Alu(F)+Ag(F) +2,42u(IR, ||) +2Et(R) +2#U(IR, ±).
Of these A lg and one A2u correspond to internal modes, and the rest
involve external modes [38], i.e.,
A 2U(IR, ||)+2E,
f(R)+2B,(IB,±)
The values of the infrared measured frequencies are Mg(OH) 2— 361
(_L), 416 cm" 1
(J.) and 461 cm" 1
(||), and for Ca(OH) 2-288 cm" 1
(±), 373 cm" 1(jL) and 334 cm" 1
(||). The 416 cm" 1 and 373 cm" 1
bands are assigned to rotatory modes of the hydroxyl ion and the others
to translatory motion (see fig. 7).
300 400 500FREQUENCY CM"'
Figure 7. The dielectric parameters e" for M K(OH), and Ca(OH)i measured
parallel and perpendicular to the c axis of the crystals. The assignments of the
corresponding modes are designated I, II and III.
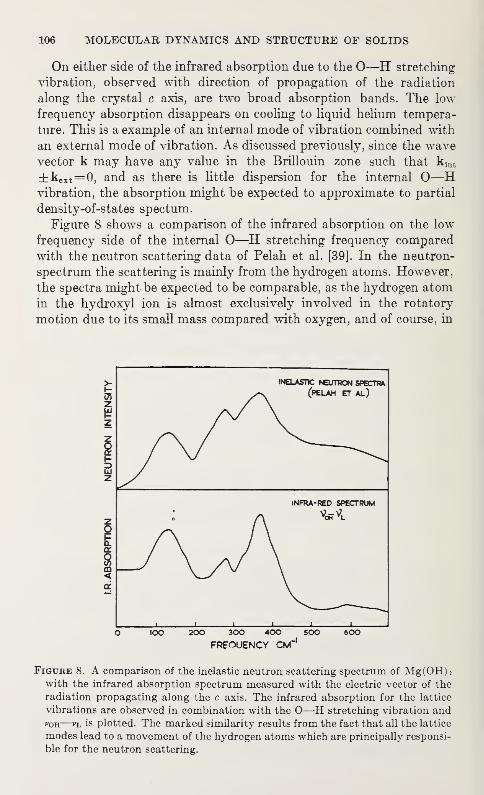
106 MOLECULAR DYNAMICS AND STRUCTURE OF SOLIDS
On either side of the infrared absorption due to the O—H stretching
vibration, observed with direction of propagation of the radiation
along the crystal c axis, are two broad absorption bands. The low
frequency absorption disappears on cooling to liquid helium tempera-
ture. This is a example of an internal mode of vibration combined with
an external mode of vibration. As discussed previously, since the wavevector k may have any value in the Brillouin zone such that k lnt
±kext=0, and as there is little dispersion for the internal O—
H
vibration, the absorption might be expected to approximate to partial
density-of-states spectum.
Figure 8 shows a comparison of the infrared absorption on the low
frequency side of the internal O—H stretching frequency compared
with the neutron scattering data of Pelah et al. [39]. In the neutron-
spectrum the scattering is mainly from the hydrogen atoms. However,
the spectra might be expected to be comparable, as the hydrogen atomin the hydroxyl ion is almost exclusively involved in the rotatory
motion due to its small mass compared with oxygen, and of course, in
i i i i i i
—
O IOO 200 300 400 500 6CO
FREQUENCY CM"'
Figure 8. A comparison of the inelastic neutron scattering spectrum of Mg(OH) 2
with the infrared absorption spectrum measured with the electric vector of the
radiation propagating along the c axis. The infrared absorption for the lattice
vibrations are observed in combination with the O—H stretching vibration and
voh—"l is plotted. The marked similarity results from the fact that all the lattice
modes lead to a movement of the hydrogen atoms which are principally responsi-
ble for the neutron scattering.
INTRODUCTORY LECTURES 107
translatory motions it has the same motion as that of the hydroxyl ion
as a whole.
Recently Oehler [40] has calculated the dispersion curves for
Ca(OH) 2 and Mg(OH) 2 ,using the frequencies of the external modes
given above and has compared his results with the combination bands
which occur in the 3600 cm-1region. The agreement is satisfactory,
and clearly shows that the assignment of the "wing" absorption is
essentially correct.
i. LaF3
There are six formula units in the unit cell of symmetry D^.
r=6Au(R) + 12E ,
tf(R)+6A 2ll (IR,||c) + ll^i ll(IR,±c).
Raman spectra [41] have been reported for LaF3 ,CeF 3 ,
PrF3 , and
NdF3 all of which have this structure.
j. LaCl3
Lanthanum chloride crystallizes in a hexagonal dipyramidal type
of unit cell of space group C6
2
h , with two formula units/unit cell.
The La3+ ions have site symmetry C 3h and Cl~ site symmetry C B .
r=2Ar(R)+2ft«(F)+6^f(R)+eSi tl(IR,±)
+2AJJB,, ±) +2BU(F) +2Elg(R)+Ef
2M(IR, ±) .
The infrared [42] and Raman [43] spectra have been measured for
LaCl 3 ,LaBr3 , and PrCl3 , which have the same structure.
k. KHF2
Potassium bifluoride has a tetragonal unit cell belonging to space
group T>\1 with two formula units/unit cell.
T=A lg(R) +2A 0(F)+Blg(R)+B2o(R)
+2Eg(R) +Ai.(P) +2^2U(IR, ||)+BtM +4#„(IR, ±).
The linear bifluoride ions lie in planes perpendicular to the c axis.
The external modes expected in the infrared are A2u and 2EU , both
of which are translatory modes and occur (fig. 9) at 146 cm-1 (A2u )
130 cm -1 (Eu) and 174 cm-1 (Eu). In the low-frequency Ramanspectrum one B lg mode of a rotatory nature is expected and two Eg
modes, one of which is rotatory and the other translatory. Mathieu
[44] has reported a Raman line at 100 cm-1, and as this has also been
observed by neutron scattering [45], it would appear to be a translatory
mode, as a rotatory mode would not involve an appreciable motionof the hydrogen atoms, which are the predominant scatterers in
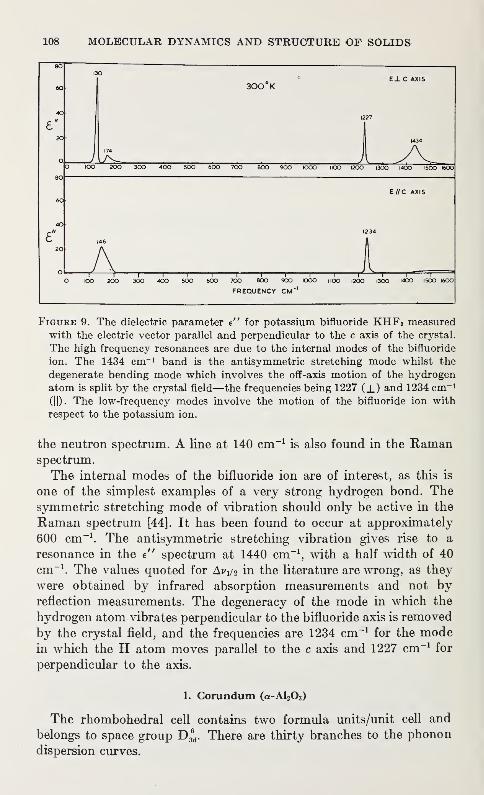
108 MOLECULAR DYNAMICS AND STRUCTURE OF SOLIDS
300 K
174
IOO 200 300 400 500 600 70O BOO 9O0 IOOO IIOO 1200 1300 1400 I5CO KbOO
146
A—r 1 1 1 1 1 1 1 1 1 r
KX) 200 300 400 SOO 600 700 BOO 900 IOOO IIOO 1200 1300 I4O0 ISOO I6OO
FREQUENCY CM"'
Figure 9. The dielectric parameter e" for potassium bifluoride KHF 2 measuredwith the electric vector parallel and perpendicular to the c axis of the crystal.
The high frequency resonances are due to the internal modes of the bifluoride
ion. The 1434 cm-1 band is the antisymmetric stretching mode whilst the
degenerate bending mode which involves the off-axis motion of the hydrogen
atom is split by the crystal field—the frequencies being 1227 ( JL) and 1234 cm-1
(||). The low-frequency modes involve the motion of the bifluoride ion with
respect to the potassium ion.
the neutron spectrum. A line at 140 cm-1is also found in the Raman
spectrum.
The internal modes of the bifluoride ion are of interest, as this is
one of the simplest examples of a very strong hydrogen bond. Thesymmetric stretching mode of vibration should only be active in the
Raman spectrum [44]. It has been found to occur at approximately
600 cm-1. The antisymmetric stretching vibration gives rise to a
resonance in the e" spectrum at 1440 cm-1, with a half width of 40
cm-1. The values quoted for Avi/ 2 in the literature are wrong, as they
were obtained by infrared absorption measurements and not byreflection measurements. The degeneracy of the mode in which the
hydrogen atom vibrates perpendicular to the bifluoride axis is removed
by the crystal field, and the frequencies are 1234 cm-1for the mode
in which the H atom moves parallel to the c axis and 1227 cm-1for
perpendicular to the axis.
1. Corundum (a-Al203)
The rhombohedral cell contains two formula units/unit cell and
belongs to space group D3
6
d . There are thirty branches to the phonon
dispersion curves.
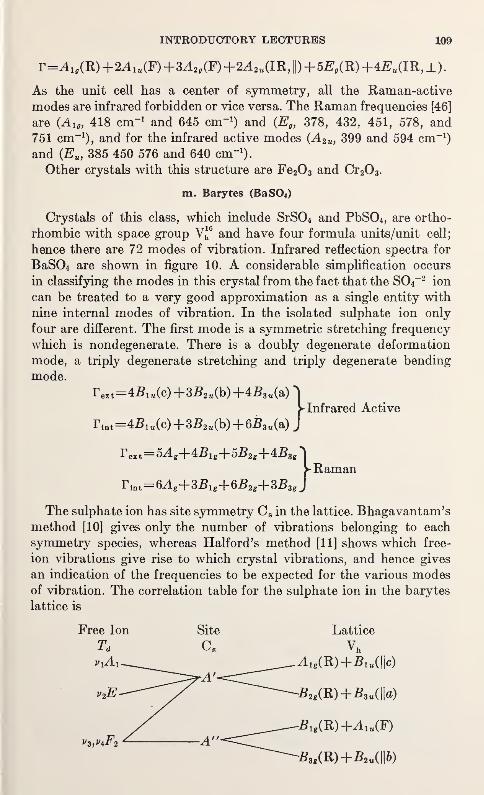
INTRODUCTORY LECTURES 109
T=AU(R) +2A lu(F) +SA2g (F) +2A2u(m, \\)+5E,(R) +4Eu(LB, i ±).
As the unit cell has a center of symmetry, all the Raman-active
modes are infrared forbidden or vice versa. The Raman frequencies [46]
are (A lg) 418 cm-1 and 645 cm" 1) and (Eg , 378, 432, 451, 578, and
751 cm" 1), and for the infrared active modes (A2u , 399 and 594 cm-1
)
and (Eu , 385 450 576 and 640 cm" 1).
Other crystals with this structure are Fe20 3 and Cr203 .
Crystals of this class, which include SrS04 and PbS04 , are ortho-
rhombic with space group Vj6and have four formula units/unit cell;
hence there are 72 modes of vibration. Infrared reflection spectra for
BaS04 are shown in figure 10. A considerable simplification occurs
in classifying the modes in this crystal from the fact that the SCU-2ion
can be treated to a very good approximation as a single entity with
nine internal modes of vibration. In the isolated sulphate ion only
four are different. The first mode is a symmetric stretching frequency
which is nondegenerate. There is a doubly degenerate deformation
mode, a triply degenerate stretching and triply degenerate bending
mode.
The sulphate ion has site symmetry C 8 in the lattice. Bhagavantarn'smethod [10] gives only the number of vibrations belonging to each
symmetry species, whereas Halford's method [11] shows which free-
ion vibrations give rise to which crystal vibrations, and hence gives
an indication of the frequencies to be expected for the various modesof vibration. The correlation table for the sulphate ion in the barytes
lattice is
Free Ion Site Lattice
m. Barytes (BaS04)
Infrared Active
Raman
ViA:
C.
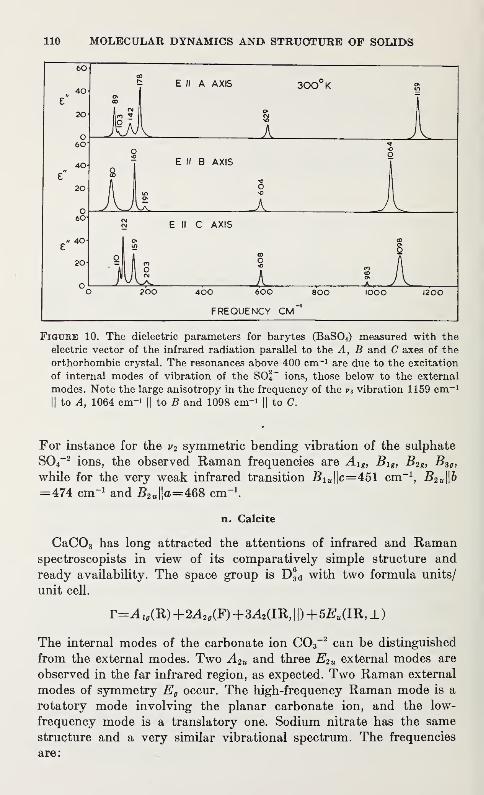
110 MOLECULAR DYNAMICS AND STRUCTURE OF SOLIDS
60
FREQUENCY CM
Figure 10. The dielectric parameters for barytes (BaS0 4 ) measured with the
electric vector of the infrared radiation parallel to the A, B and C axes of the
orthorhombic crystal. The resonances above 400 cm-1 are due to the excitation
of internal modes of vibration of the SOl~ ions, those below to the external
modes. Note the large anisotropy in the frequency of the v 3 vibration 1159 cm-1
H to A, 1064 cm- 1|| to B and 1098 cm"1
|| to C.
For instance for the v2 symmetric bending vibration of the sulphate
S04
~2 ions, the observed Raman frequencies are Aig,Blg ,
B2g ,B3o ,
while for the very weak infrared transition l?i M ||c=451 cm-1,B2u \\b
=474 cm" 1 and B2«||a=468 cm" 1.
n. Galcite
CaC03 has long attracted the attentions of infrared and Ramanspectroscopists in view of its comparatively simple structure and
ready availability. The space group is ~D6
3d with two formula units/
unit cell.
T=Aig(B,)+2A2g(F)+3^2(IR,| |) +5#„(IR, ±)
The internal modes of the carbonate ion C03
~2 can be distinguished
from the external modes. Two A2u and three E2u external modes are
observed in the far infrared region, as expected. Two Raman external
modes of symmetry E0 occur. The high-frequency Raman mode is a
rotatory mode involving the planar carbonate ion, and the low-
frequency mode is a translatory one. Sodium nitrate has the samestructure and a very similar vibrational spectrum. The frequencies
are:
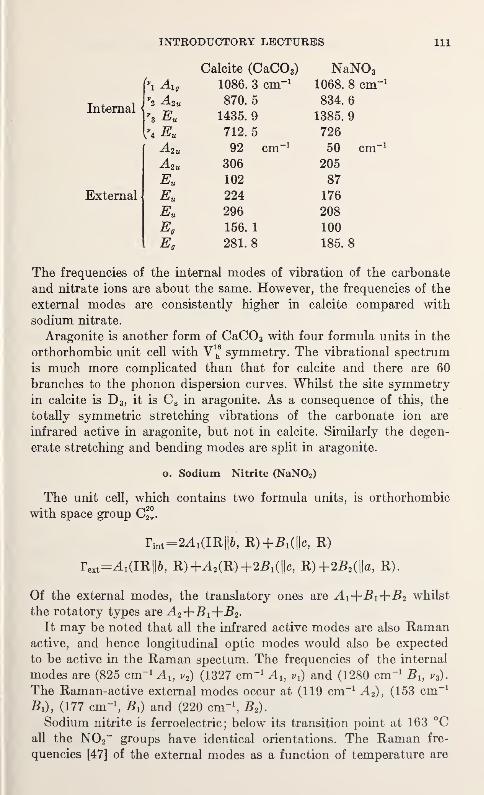
INTRODUCTORY LECTURES 111
Calcite (CaC03) NaN03
InternalV2 A2u
1086. 3 cm" 1
870. 5
1435. 9
712. 5
92 cm" 1
306
102
224
296
156. 1
281.8
1385. 9
726
1068. 8 cm834. 6
-i
50 cm
External
205
87
176
208
100
185.8
The frequencies of the internal modes of vibration of the carbonate
and nitrate ions are about the same. However, the frequencies of the
external modes are consistently higher in calcite compared with
sodium nitrate.
Aragonite is another form of CaC0 3 with four formula units in the
orthorhombic unit cell with V 1
^ symmetry. The vibrational spectrum
is much more complicated than that for calcite and there are 60
branches to the phonon dispersion curves. Whilst the site symmetryin calcite is D 3 , it is C 8 in aragonite. As a consequence of this, the
totally symmetric stretching vibrations of the carbonate ion are
infrared active in aragonite, but not in calcite. Similarly the degen-
erate stretching and bending modes are split in aragonite.
The unit cell, which contains two formula units, is orthorhombic
with space group C2
2
°
v .
Of the external modes, the translatory ones are J±i+B 1+B2 whilst
the rotatory types are A 2 -\-Bi~\-B2 .
It may be noted that all the infrared active modes are also Ramanactive, and hence longitudinal optic modes would also be expected
to be active in the Raman spectum. The frequencies of the internal
modes are (825 cm-1 A u v 2) (1327 cm" 1 Au v x) and (1280 cm-1 Bh v3).
The Raman-active external modes occur at (119 cm" 1 A 2), (153 cm-1
#0, (177 cm" 1
, and (220 cm" 1
,B2).
Sodium nitrite is ferroelectric; below its transition point at 163 °Call the N0 2
~ groups have identical orientations. The Raman fre-
quencies [47] of the external modes as a function of temperature are
o. Sodium Nitrite (NaN02 )
rlnt=2A 1 (IR||6, R)+5i(||c, R)
rext=^i(IR||6, R)+A 2(R)+-25 1 (||c, R)+2J5a (||a, R).
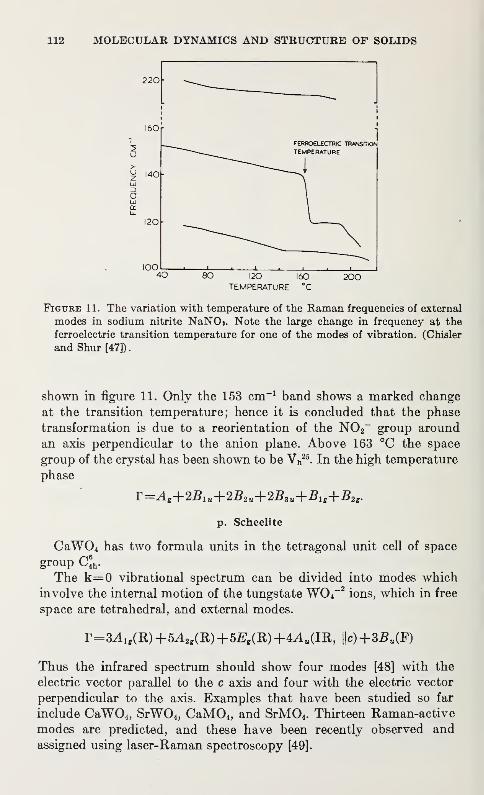
112 MOLECULAR DYNAMICS AND STRUCTURE OF SOLIDS
Figure 11. The variation with temperature of the Raman frequencies of external
modes in sodium nitrite NaNOj. Note the large change in frequency at the
ferroelectric transition temperature for one of the modes of vibration. (Chisler
and Shur [47]).
shown in figure 11. Only the 153 cm-1 band shows a marked change
at the transition temperature; hence it is concluded that the phase
transformation is due to a reorientation of the N0 2~ group around
an axis perpendicular to the anion plane. Above 163 °C the space
group of the crystal has been shown to be Vh25
. In the high temperature
phase
r=Ag+2Blit+2B2u+2B3u+Blg+B2g.
p. Scheelite
CaW04 has two formula units in the tetragonal unit cell of space
group c;h .
The k=0 vibrational spectrum can be divided into modes which
involve the internal motion of the tungstate W04
~2ions, which in free
space are tetrahedral, and external modes.
r=3A lf(R)+SA2g(R) +5#,(R) +4^„(IR, ||c) +3#„(F)
Thus the infrared spectrum should show four modes [48] with the
electric vector parallel to the c axis and four with the electric vector
perpendicular to the axis. Examples that have been studied so far
include CaW0 4 ,SrW04 ,
CaM04 , and SrM04 . Thirteen Raman-active
modes are predicted, and these have been recently observed and
assigned using laser-Raman spectroscopy [49].
INTRODUCTORY LECTURES 113
q. Zircon
ZrSi04 is tetragonal with two formula units/unit cell. The space
group is D\l and the site symmetry of the silicate ion is S4 .
r=2A lf(R)+Ag(F) +4Blg(R)+B2g(R) +5Eg(R)
+A lu(F)+3^ 2tt(IR, ||)+Blum+B2U(F)+4#U(IR, ±)
Thus in the infrared three resonances should be expected with the
electric vector of the radiation parallel to the c axis, and four with it
perpendicular to the c axis. The parallel frequencies are 338 cm-1,
608 cm-1, and 989 cm-1
, while the perpendicular frequencies are 288
cm-1, 389 cm-1
, 431 cm-1, and 885 cm" 1
. Of the frequencies of vibration
of the silicate ions Si04
~4, those at 885 cm"1 and 989 cm" 1 are due to
antisymmetric stretching vibrations which differ in frequency due to the
crystal field. The band at 608 cm-1is due to the antisymmetric
vibration v4 . All the expected Raman modes have been observed.
4.4. Molecular Crystals
Usually the forces between molecules in a crystal are weak comparedwith the atomic forces within the molecules themselves. Consequently
it is usually easy to distinguish between external and internal modes of
vibration. A good test to carry out when a suitable solvent is available
is to measure the infrared and Raman spectra in solution. If an
absorption line persists in solution, then the associated vibrational
mode must involve an internal motion of the atoms within the
molecule.
The infrared absorption due to intermolecular vibrations in crystals
is usually weak and is especially weak if the molecules are nonpolar
[50]. The infrared reflectivity is rarely sufficiently great to enable
measurements to be made of the dielectric parameters. Hence only the
absorption coefficient a is usually measured. In anisotropic crystals
polarized radiation must be used. Much of the interest in studying the
spectra involving internal modes of vibration is in determining
accurately the splitting in bands due to intermolecular interaction.
For such observations it is preferable to work at low termperatures
with a high resoution spectrometer.
a. Hydrogen
The infrared and Raman spectra of crystalline hydrogen has been
studied in great detail [51]. The spectra shown in figure 12 indicate
clearly that free rotation can exist in the solid state. Although the
internal mode is strongly Raman active [52], para hydrogen is notinfra-active until ortho hydrogen is added [53]. The spacing of the
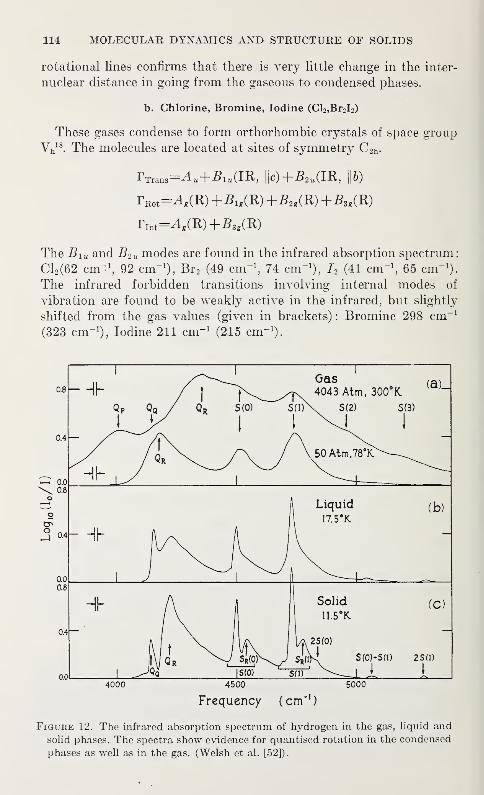
114 MOLECULAR DYNAMICS AND STRUCTURE OF SOLIDS
rotational lines confirms that there is very little change in the inter-
nuclear distance in going from the gaseous to condensed phases.
b. Chlorine, Bromine, Iodine (Cl2,Br2I 2)
These gases condense to form orthorhombic crystals of space group
Vh18
. The molecules are located at sites of symmetry C 2h -
rTrans=^+£l,(IR, ||<0 +52tt (IR, \\b)
rRot=4f(R) +Blg(K) +B2g(R) +B3g (Tl)
* Int— (R)+B3g(R)
The Bi u and B2u modes are found in the infrared absorption spectrum:
Cl 2 (62 cm" 1
, 92 cm" 1
), Br 2 (49 cm" 1
, 74 cm" 1
), h (41 cm" 1
, 65 cm" 1
).
The infrared forbidden transitions involving internal modes of
vibration are found to be weakly active in the infrared, but slightly
shifted from the gas values (given in brackets) : Bromine 298 cm-1
(323 cm" 1
), Iodine 211 cm" 1(215 cm- 1
).
11
ii /^^-^ Gas (a)Ih / J r\_^T\ 4043 Atm
'300
°K
Qp Qa/ Qr S(0) SnV\^S(2) S(3)
1 J
I Liquid
I7.5*K
+ A" ,
l|S(0)
Solid(C )
n.5°K.
L 2S(0)
Sr(VI s<o)*s(« 2sm
o
4000 4500 5000
Frequency (cm" 1
)
Figure 12. The infrared absorption spectrum of hydrogen in the gas, liquid and
solid phases. The spectra show evidence for quantised rotation in the condensed
phases as well as in the gas. (Welsh et al. [52]).
INTRODUCTORY LECTURES 115
c. Carbon Dioxide (C02)
Of particular interest are molecular crystals which contain simple
molecules which have been extensively studied in the gas phase, both
at low pressure so that the vibrational energy levels are known, and
at high pressures so that information on intermolecular forces in the
gas phase can be obtained. One such system is solid carbon dioxide.
Carbon dioxide condenses to form cubic crystals of space group
Th6 containing four linear molecules. The external modes are found
from
The Eg and 2Fg modes should be Raman active, whilst 2FU infrared-
active modes are to be expected. The observed values for the infrared-
active [54, 55] vibrations are 67 and 113 cm -1, and for Raman [57]
the frequencies 90.5 and 131 cm-1for the Fg modes and 73 cm-1
for
the Eg mode. Pople and Walmsley [56, 58] have used a Leonard-
Jones 6-12 potential of the form
together with an electric quadrupole interaction of the form 6/R5,
where 6 is the electric quadrupole moment of C02 . Reasonable agree-
ment with the observed frequencies is obtained.
In the region of the v2 and vz internal vibrational modes, summationbands of the type internal ± external occur [59], and as discussed
previously, these are density-of-states type spectra. Features in the
infrared spectrum involving combinations with the v3 internal anti-
symmetric stretching vibration and the v2 bending vibration differ by110 and 114 cm-1 from the internal mode frequencies. Similarly there
are features which differ in frequency by 78 cm-1 and 77 cm-1.
Extensive infrared and Raman studies have been made on the
hydrogen halides. Of these only HC1 will be discussed here. Solid
HC1 and DC1 undergo a phase transition at 98 °K and 105 °K re-
spectively. Their structures [60, 61] have recently been shown to be
isomorphous. The unit cell has four molecules and is orthorhombicwith space group C\ 2
V beloAv the transition temperature, and cubic
above. In the orthorhombic form the molecules are hydrogen bondedin planar zig-zag chains, all oriented the same way (i.e., to give a net
dipole moment) and arranged in layers parallel to the (001) plane.
In the cubic form the chlorine atoms form a face centred lattice;
however, the structure is disordered as the hydrogen bonds are
irregularly arranged. As there are four molecules in the unit cell in
T=A U (F) +EU (F)+EK(R) + 2F„(IR) + 2^(R).
d. Hydrogen Chloride (HC1 and DC1)
116 MOLECULAR DYNAMICS AND STRUCTURE OF SOLIDS
the low temperature phase, it is expected that there should be 9
translational modes, of which 6 should be both infrared and Ramanactive and 3 Raman active only. Eight rotatory modes should be
expected, of which six should be infrared and Raman active and twoonly Raman active. Four internal modes are predicted, all of whichshould be Raman active and three infrared active.
Experimentally only two translational modes are clearly apparent
at 86 cm-1 and 109 cm-1in the far infrared spectrum, while the number
of rotatory modes is at least four. There are three comparatively
strong infrared bands [62] due to internal motion at 2707,
2718, and 2758 cm-1 and four corresponding ones in the Ramanspectrum at 2705 cm-1
, 2720 cm-1, 2748 cm" 1
, and 2758 cm-1, all meas-
ured at 77 °K.
On passing through the transition to the cubic disordered hydrogen-
bonded phase, the infrared absorption bands due to the internal
vibration merge to give a single broad peak at 2780 cm" 1. The in-
crease in frequency is due to the 0.2 A increase in the hydrogen bondlength on going from the orthorhombic to cubic phase. Only a small
increase in frequency to 2787 cm-1 and an increase of from 44 cm-1
to 59 cm-1in half-width is found on melting. The gas-phase band
centre occurs at 2886 cm-1.
e. Mercurous Chloride (Hg2Cl2)
The tetragonal unit cell has one molecule in the unit cell which
has space group D\l
T=2A lg(R) +A 2u (IU, ||) +2#,(R) +tf„(IR, _L)
There are five internal modes of vibration in a linear molecule con-
taining 4 atoms. The Raman lines [64] at 167 cm-1 and 270 cm -1
are highly polarized and must correspond to Aig modes, leaving the
lines at 42 cm" 1 and 140 cm" 1 to be Eg modes. The low-frequency modeis clearly the rotatory mode, and the higher frequency mode involves
a bending vibration of the molecule. In the infrared a 33 cm" 1 peak is
assigned to the Eu bending mode and a 110 cm" 1 peak to the A 2u
stretching mode [65].
f. Naphthalene
This crystal has a monoclinic unit cell containing two molecules.
The space group is C2
5
A , to which many simple organic crystals belong.
T ext^3Ag(B,)+SBg(R)+2A u(m)+Blu(m).
The Ag and Bg modes which are Raman active are three pairs of
rotatory modes. The frequency difference between the A g and Bg
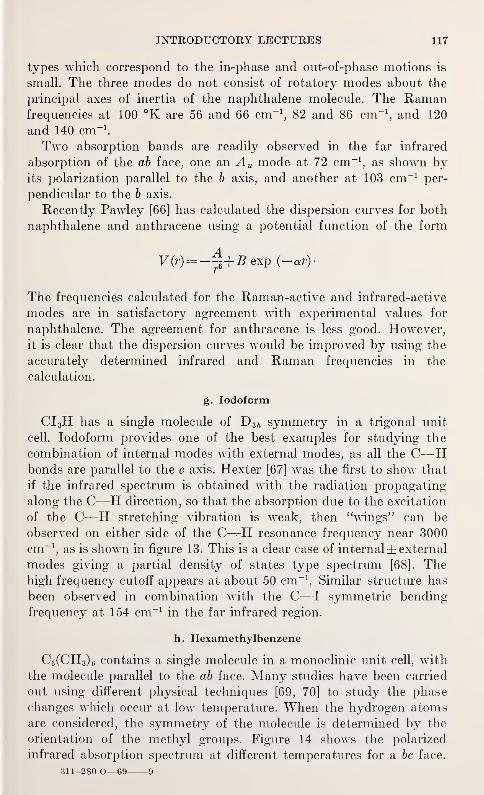
INTRODUCTORY LECTURES 117
types which correspond to the in-phase and out-of-phase motions is
small. The three modes do not consist of rotatory modes about the
principal axes of inertia of the naphthalene molecule. The Ramanfrequencies at 100 °K are 56 and 66 cm-1
, 82 and 86 cm-1, and 120
and 140 cm-1.
Two absorption bands are readily observed in the far infrared
absorption of the ab face, one an A u mode at 72 cm-1, as shown by
its polarization parallel to the b axis, and another at 103 cm-1per-
pendicular to the b axis.
Recently Pawley [66] has calculated the dispersion curves for both
naphthalene and anthracene using a potential function of the form
V(r)= -^+Bexp (-«r)-
The frequencies calculated for the Raman-active and infrared-active
modes are in satisfactory agreement with experimental values for
naphthalene. The agreement for anthracene is less good. However,
it is clear that the dispersion curves would be improved by using the
accurately determined infrared and Raman frequencies in the
calculation.
g. Iodoform
CI 3H has a single molecule of T) 3h symmetry in a trigonal unit
cell. Iodoform provides one of the best examples for studying the
combination of internal modes with external modes, as all the C—
H
bonds are parallel to the c axis. Hexter [67] was the first to show that
if the infrared spectrum is obtained with the radiation propagating
along the C—H direction, so that the absorption due to the excitation
of the C—H stretching vibration is weak, then "wings" can be
observed on either side of the C^H resonance frequency near 3000
cm-1, as is shown in figure 13. This is a clear case of internal± external
modes giving a partial density of states type spectrum [68]. Thehigh frequency cutoff appears at about 50 cm-1
. Similar structure has
been observed in combination with the C—I symmetric bending
frequency at 154 cm-1in the far infrared region.
h. Hexamethylbenzene
C 6(CH 3) 6 contains a single molecule in a monoclinic unit cell, with
the molecule parallel to the ab face. Many studies have been carried
out using different physical techniques [69, 70] to study the phase
changes which occur at low temperature. When the hydrogen atomsare considered, the symmetry of the molecule is determined by the
orientation of the methyl groups. Figure 14 shows the polarized
infrared absorption spectrum at different temperatures for a be face.
311-280 O—69 9
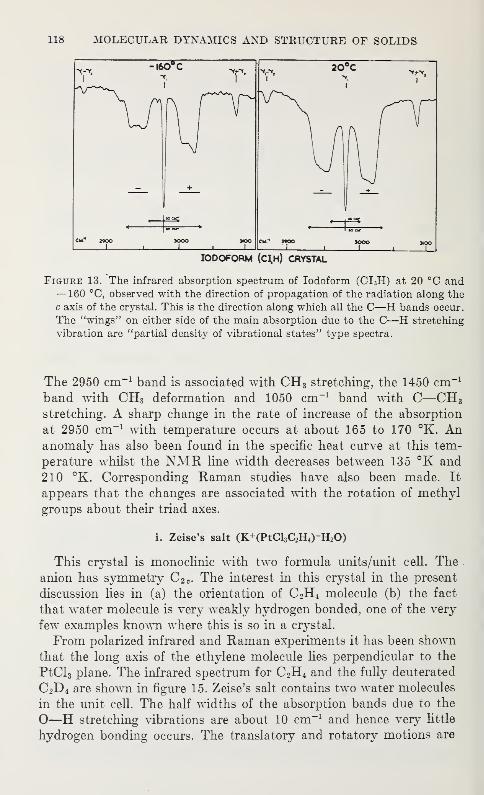
118 MOLECULAR DYNAMICS AND STRUCTURE OF SOLIDS
iodoform (c;h) CRYSTAL
Figure 13. The infrared absorption spectrum of Iodoform (CI 3H) at 20 °C and— 160 °C, observed with the direction of propagation of the radiation along the
c axis of the crystal. This is the direction along which all the C—H bands occur.
The "wings" on either side of the main absorption due to the C—H stretching
vibration are "partial density of vibrational states" type spectra.
The 2950 cm-1 band is associated with CH3 stretching, the 1450 cm-1
band with CH3 deformation and 1050 cm-1 band with C—CH 3
stretching. A sharp change in the rate of increase of the absorption
at 2950 cm-1 with temperature occurs at about 165 to 170 °K. Ananomaly has also been found in the specific heat curve at this tem-
perature whilst the NMK line width decreases between 135 °K and
210 °K. Corresponding Raman studies have also been made. It
appears that the changes are associated with the rotation of methyl
groups about their triad axes.
i. Zeise's salt (K+(PtCl3C2H4)-H20)
This crystal is monoclinic with two formula units/unit cell. The .
anion has symmetry C2p . The interest in this crystal in the present
discussion lies in (a) the orientation of C 2H4 molecule (b) the fact
that water molecule is very weakly hydrogen bonded, one of the very
fewT examples known where this is so in a crystal.
From polarized infrared and Raman experiments it has been shown
that the long axis of the ethylene molecule lies perpendicular to the
PtCl 3 plane. The infrared spectrum for C 2H4 and the fully deuterated
C 2D 4 are shown in figure 15. Zeise's salt contains two water molecules
in the unit cell. The half widths of the absorption bands due to the
O—H stretching vibrations are about 10 cm-1 and hence very little
hydrogen bonding occurs. The translatory and rotatory motions are
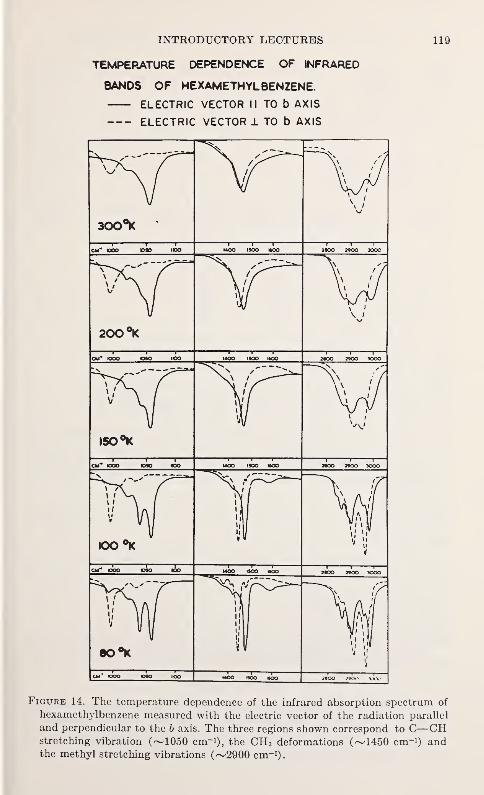
INTRODUCTORY LECTURES 119
TEMPERATURE DEPENDENCE OF INFRARED
BANDS OF HEXAMETHYLBENZENE.
ELECTRIC VECTOR II TO b AXIS
ELECTRIC VECTOR 1 TO b AXIS
Yi
/ —//<1/
300°K1 1 1
—
cm" koo ©jo icq—i
—
MOO ISOO MOO 2*00 2900 3OO0
"V s- y
\ /
V
X ^—/
a.200HC
ill
1 1 1
—
CM" IOOO ©SO ICO MOO ISOO i«oo1 1 1
2*X> 2900 XXX)——r\ , «»
\ /
Mi'II
/ \J\J i
ISO°K
v\j» /
i i i
CM" IOOO ©SO NOO MOO ISOO MOO 2«0O WOO 3000
uv\ OutOO K
1
Mill•
»
1 ' ' 1
CM" OOO OSO ICO MOO ISOO «oo Jtoo woo xxxj
1
1
1
,1
1
80°K i V
J ij
——r t 1 —CM OOO 0*0 IOO MOO ISOO l*CO 2800 J»00 «.X\>
Figure 14. The temperature dependence of the infrared absorption spectrum of
hexamethylbenzene measured with the electric vector of the radiation parallel
and perpendicular to the b axis. The three regions shown correspond to C—CHstretching vibration (~1050 cm-1
), the CH 3 deformations (~1450 cm" 1) and
the methyl stretching vibrations (~2900 cm-1).
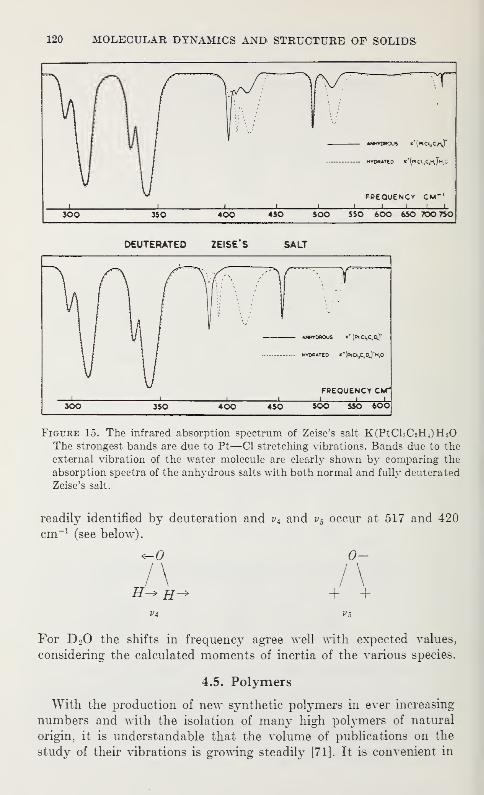
120 MOLECULAR DYNAMICS AND STRUCTURE OF SOLIDS
300 3SO 400 4SO SOO 5SO 600 6SO TOO 7SO
DEUTERATED ZEISE'S SALT
Figure 15. The infrared absorption spectrum of Zeise's salt K(PtCl3C 2H 4)H 20The strongest bands are due to Pt—CI stretching vibrations. Bands due to the
external vibration of the water molecule are clearly shown by comparing the
absorption spectra of the anhydrous salts with both normal and fully deuterated
Zeise's salt.
readily identified by deuteration and v± and v5 occur at 517 and 420
cm-1(see below).
<-0 0-
i\ i\
For D 20 the shifts in frequency agree well with expected values,
considering the calculated moments of inertia of the various species.
4.5. Polymers
With the production of new synthetic polymers in ever increasing
numbers and with the isolation of many high polymers of natural
origin, it is understandable that the volume of publications on the
study of their vibrations is growing steadily [71]. It is convenient in
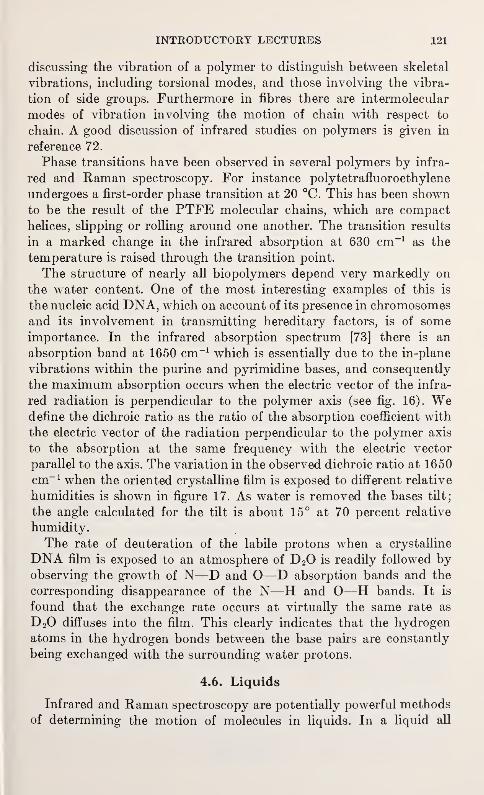
INTRODUCTORY LECTURES 121
discussing the vibration of a polymer to distinguish between skeletal
vibrations, including torsional modes, and those involving the vibra-
tion of side groups. Furthermore in fibres there are intermolecular
modes of vibration involving the motion of chain with respect to
chain. A good discussion of infrared studies on polymers is given in
reference 72.
Phase transitions have been observed in several polymers by infra-
red and Raman spectroscopy. For instance polytetrafluoroethylene
undergoes a first-order phase transition at 20 °C. This has been shownto be the result of the PTFE molecular chains, which are compact
helices, slipping or rolling around one another. The transition results
in a marked change in the infrared absorption at 630 cm-1as the
temperature is raised through the transition point.
The structure of nearly all biopolymers depend very markedly on
the water content. One of the most interesting examples of this is
the nucleic acid DNA, which on account of its presence in chromosomesand its involvement in transmitting hereditary factors, is of someimportance. In the infrared absorption spectrum [73] there is an
absorption band at 1650 cm-1 which is essentially due to the in-plane
vibrations within the purine and pyrimidine bases, and consequently
the maximum absorption occurs when the electric vector of the infra-
red radiation is perpendicular to the polymer axis (see fig. 16). Wedefine the dichroic ratio as the ratio of the absorption coefficient with
the electric vector of the radiation perpendicular to the polymer axis
to the absorption at the same frequency with the electric vector
parallel to the axis. The variation in the observed dichroic ratio at 1650
cm-1 when the oriented crystalline film is exposed to different relative
humidities is shown in figure 17. As water is removed the bases tilt;
the angle calculated for the tilt is about 15° at 70 percent relative
humidity.
The rate of deuteration of the labile protons when a crystalline
DNA film is exposed to an atmosphere of D 20 is readily followed byobserving the growth of N—D and O—D absorption bands and the
corresponding disappearance of the N—H and O—H bands. It is
found that the exchange rate occurs at virtually the same rate as
D 20 diffuses into the film. This clearly indicates that the hydrogen
atoms in the hydrogen bonds between the base pairs are constantly
being exchanged with the surrounding water protons.
4.6. Liquids
Infrared and Raman spectroscopy are potentially powerful methodsof determining the motion of molecules in liquids. In a liquid all
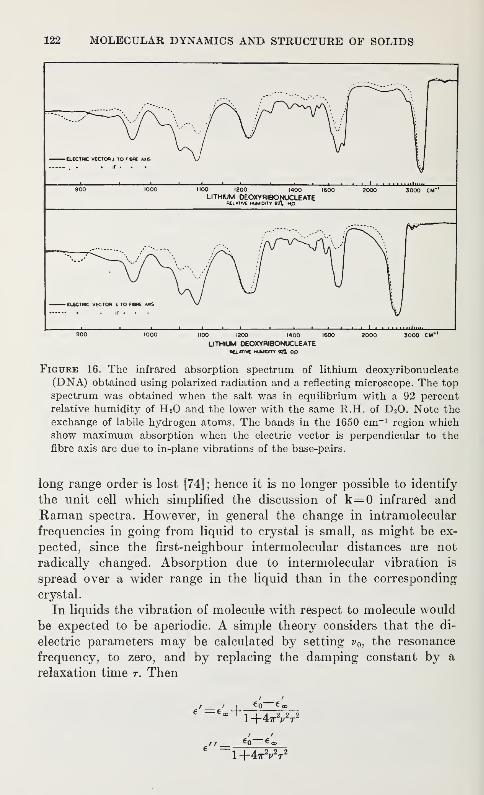
122 MOLECULAR DYNAMICS AND STRUCTURE OF SOLIDS
_i 1 1 1 1 1 1 1 1 i i
900 1000 1100 1200 1400 1600 2000 3000 CM" 1
LITHIUM DEOXYRIBONUCLEATEA£L»T(VE HUMIDITY 9it Hp
_l I I 1 1 1 1 1 1 1 1 1 1 1
900 1000 1100 1200 1400 1600 2000 3000 CM"'
LITHIUM DEOXYWBONUCLEATEMCLfflVE HUMOTV «2l op
Figure 16. The infrared absorption spectrum of lithium deoxyribonucleate
(DNA) obtained using polarized radiation and a reflecting microscope. The top
spectrum was obtained when the salt was in equilibrium with a 92 percent
relative humidity of H 20 and the lower with the same R.H. of D 20. Note the
exchange of labile hydrogen atoms. The bands in the 1650 cm-1 region whichshow maximum absorption when the electric vector is perpendicular to the
fibre axis are due to in-plane vibrations of the base-pairs.
long range order is lost [74] ; hence it is no longer possible to identify
the unit cell which simplified the discussion of k=0 infrared andRaman spectra. However, in general the change in intramolecular
frequencies in going from liquid to crystal is small, as might be ex-
pected, since the first-neighbour intermolecular distances are not
radically changed. Absorption due to intermolecular vibration is
spread over a wider range in the liquid than in the corresponding
crystal.
In liquids the vibration of molecule with respect to molecule would
be expected to be aperiodic. A simple theory considers that the di-
electric parameters may be calculated by setting v 0 , the resonance
frequency, to zero, and by replacing the damping constant by a
relaxation time r. Then
/ / IC 0 € co
6 1+4^2T2
/ /
/ /€0
jjjCD
6 "I-MttW
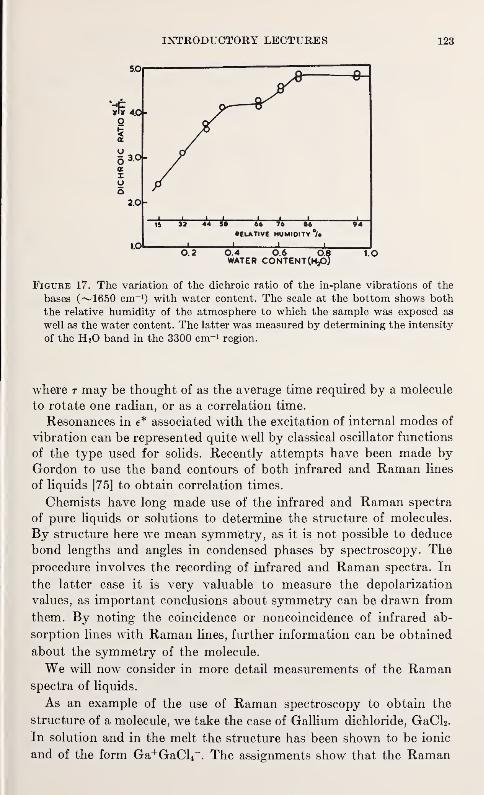
INTRODUCTORY LECTURES 123
Figure 17. The variation of the dichroic ratio of the in-plane vibrations of the
bases (~1650 cm-1) with water content. The scale at the bottom shows both
the relative humidity of the atmosphere to which the sample was exposed as
well as the water content. The latter was measured by determining the intensity
of the H 20 band in the 3300 cm-1 region.
where r may be thought of as the average time required by a molecule
to rotate one radian, or as a correlation time.
Resonances in e* associated with the excitation of internal modes of
vibration can be represented quite well by classical oscillator functions
of the type used for solids. Recently attempts have been made byGordon to use the band contours of both infrared and Raman lines
of liquids [75] to obtain correlation times.
Chemists have long made use of the infrared and Raman spectra
of pure liquids or solutions to determine the structure of molecules.
By structure here we mean symmetry, as it is not possible to deduce
bond lengths and angles in condensed phases by spectroscopy. The
procedure involves the recording of infrared and Raman spectra. In
the latter case it is very valuable to measure the depolarization
values, as important conclusions about symmetry can be drawn from
them. By noting the coincidence or noncoincidence of infrared ab-
sorption lines with Raman lines, further information can be obtained
about the symmetry of the molecule.
We will now consider in more detail measurements of the Ramanspectra of liquids.
As an example of the use of Raman spectroscopy to obtain the
structure of a molecule, we take the case of Gallium dichloride, GaCl2 .
In solution and in the melt the structure has been shown to be ionic
and of the form Ga+GaCl4~. The assignments show that the Raman
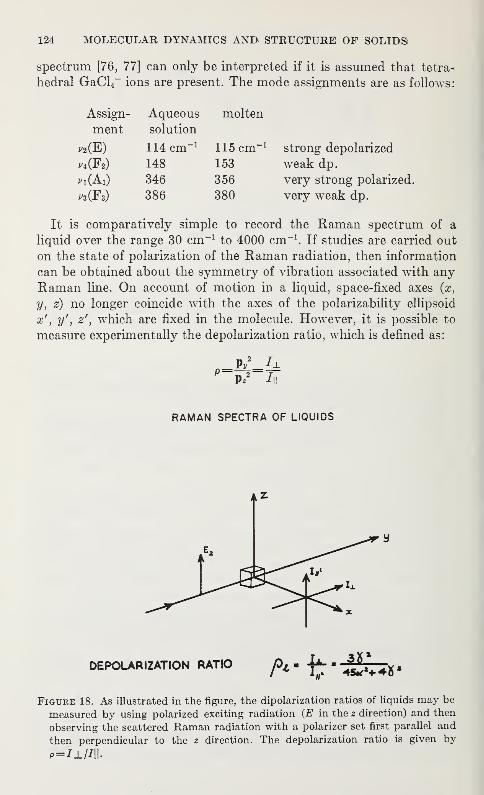
124 MOLECULAR DYNAMICS AND STRUCTURE OF SOLIDS
spectrum [76, 77] can only be interpreted if it is assumed that tetra-
hedral GaCl4" ions are present. The mode assignments are as follows:
Assign- Aqueous molten
ment solution
rtfJEl) 114 cm-1 115 cm" 1 strong depolarized
?4(F2) 148 153 weak dp.
*>i(Ai) 346 356 very strong polarized.
f3 (F3) 386 380 very weak dp.
It is comparatively simple to record the Raman spectrum of a
liquid over the range 30 cm-1to 4000 cm-1
. If studies are carried out
on the state of polarization of the Raman radiation, then information
can be obtained about the symmetry of vibration associated with any
Raman line. On account of motion in a liquid, space-fixed axes (x,
y, z) no longer coincide with the axes of the polarizability ellipsoid
x', y
f
,z
f
, which are fixed in the molecule. However, it is possible to
measure experimentally the depolarization ratio, which is defined as:
RAMAN SPECTRA OF LIQUIDS
Figure 18. As illustrated in the figure, the dipolarization ratios of liquids may be
measured by using polarized exciting radiation (E in the z direction) and then
observing the scattered Raman radiation with a polarizer set first parallel and
then perpendicular to the z direction. The depolarization ratio is given by
P= I±/I\l
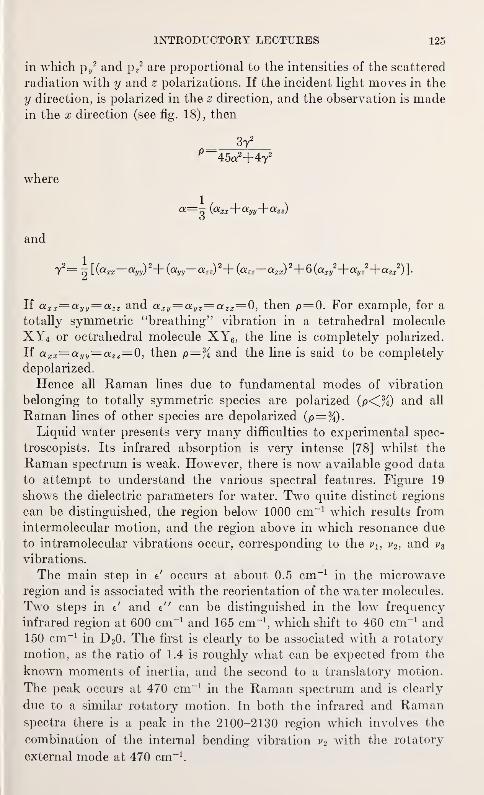
INTRODUCTORY LECTURES 125
in which p/ and p 22 are proportional to the intensities of the scattered
radiation with y and z polarizations. If the incident light moves in the
y direction, is polarized in the z direction, and the observation is madein the x direction (see fig. 18), then
372
P45a2+472
where
(axx+ayy+azz)
and
y2=
\\{olxx
—ayy)2+ {avv—azz)
2+ (azz—
a
xx)2+6(axy
2+ayz2+azx
2)].
If axx=a yy=a zz and axy=a yz=a zx=0, then p=0. For example, for a
totally symmetric "breathing" vibration in a tetrahedral molecule
XY4 or octrahedral molecule XY6 , the line is completely polarized.
If a xx=
a
yy=
a
zz=0, then p=% and the line is said to be completely
depolarized.
Hence all Raman lines due to fundamental modes of vibration
belonging to totally symmetric species are polarized (p<%) and all
Raman lines of other species are depolarized (p=%).Liquid water presents very many difficulties to experimental spec-
troscopists. Its infrared absorption is very intense [78] whilst the
Raman spectrum is weak. However, there is now available good data
to attempt to understand the various spectral features. Figure 19
shows the dielectric parameters for water. Two quite distinct regions
can be distinguished, the region below 1000 cm-1 which results from
intermolecular motion, and the region above in which resonance due
to intramolecular vibrations occur, corresponding to the vu v 2 , and v 3
vibrations.
The main step in e' occurs at about 0.5 cm-1in the microwave
region and is associated with the reorientation of the water molecules.
Two steps in e' and e" can be distinguished in the low frequency
infrared region at 600 cm-1 and 165 cm-1,which shift to 460 cm-1 and
150 cm-1in D 20. The first is clearly to be associated with a rotatory
motion, as the ratio of 1.4 is roughly what can be expected from the
known moments of inertia, and the second to a translatory motion.
The peak occurs at 470 cm -1in the Raman spectrum and is clearly
due to a similar rotatory motion. In both the infrared and Ramanspectra there is a peak in the 2100-2130 region which involves the
combination of the internal bending vibration v2 with the rotatory
external mode at 470 cm-1.
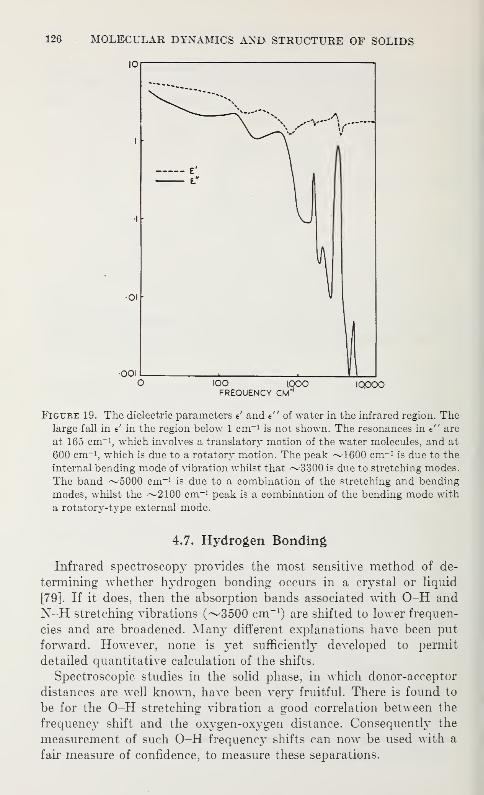
126 MOLECULAR DYNAMICS AND STRUCTURE OF SOLIDS
10
•OOil . ,1
1
O IOO 1000 IOOOOFREQUENCY CM^
Figure 19. The dielectric parameters e' and e" of water in the infrared region. Thelarge fall in e' in the region below 1 cm-1
is not shown. The resonances in e" are
at 165 cm-1, which involves a translator}7- motion of the water molecules, and at
600 cm-1, which is due to a rotatory motion. The peak ~1600 cm-1
is due to the
internal bending mode of vibration whilst that ~3300 is due to stretching modes.
The band ~5000 cm-1is due to a combination of the stretching and bending
modes, whilst the ~2100 cm-1 peak is a combination of the bending mode with
a rotatory-type external mode.
4.7. Hydrogen Bonding
Infrared spectroscopy provides the most sensitive method of de-
termining whether hydrogen bonding occurs in a crystal or liquid
[79]. If it does, then the absorption bands associated with 0-H and
N-H stretching vibrations (^3500 cm-1) are shifted to lower frequen-
cies and are broadened. Many different explanations have been put
forward. However, none is yet sufficiently developed to permit
detailed quantitative calculation of the shifts.
Spectroscopic studies in the solid phase, in which donor-acceptor
distances are well known, have been very fruitful. There is found to
be for the O-H stretching vibration a good correlation between the
frequency shift and the oxygen-oxygen distance. Consequently the
measurement of such O-H frequency shifts can now be used with a
fair measure of confidence, to measure these separations.
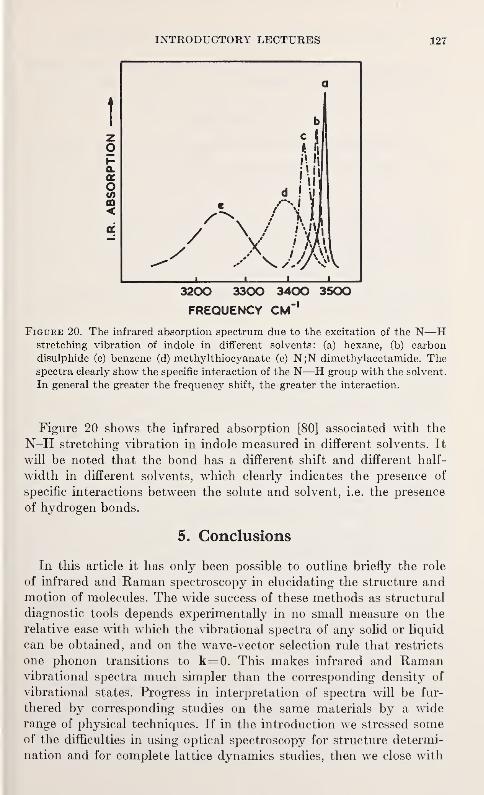
INTRODUCTORY LECTURES 127
I L I I I
3200 3300 3400 3500
FREQUENCY CM"'
Figure 20. The infrared absorption spectrum due to the excitation of the N—
H
stretching vibration of indole in different solvents: (a) hexane, (b) carbon
disulphide (c) benzene (d) methylthiocyanate (e) N;N dimethylacetamide. Thespectra clearly show the specific interaction of the N—H group with the solvent.
In general the greater the frequency shift, the greater the interaction.
Figure 20 shows the infrared absorption [80] associated with the
N-H stretching vibration in indole measured in different solvents. It
will be noted that the bond has a different shift and different half-
width in different solvents, which clearly indicates the presence of
specific interactions between the solute and solvent, i.e. the presence
of hydrogen bonds.
5. Conclusions
In this article it has only been possible to outline briefly the role
of infrared and Raman spectroscopy in elucidating the structure andmotion of molecules. The wide success of these methods as structural
diagnostic tools depends experimentally in no small measure on the
relative ease with which the vibrational spectra of any solid or liquid
can be obtained, and on the wave-vector selection rule that restricts
one phonon transitions to k= 0. This makes infrared and Ramanvibrational spectra much simpler than the corresponding density of
vibrational states. Progress in interpretation of spectra will be fur-
thered by corresponding studies on the same materials by a wide
range of physical techniques. If in the introduction we stressed someof the difficulties in using optical spectroscopy for structure determi-
nation and for complete lattice dynamics studies, then we close with
128 MOLECULAR DYNAMICS AND STRUCTURE OF SOLIDS
the claim that infrared and Raman spectroscopy are the most widely
applicable techniques for linking structure with dynamics.
6. Discussion
W. C. Hamilton (Brookhaven National Laboratory) : My colleagues
Drs. Klanderman and Spratley have completed a neutron diffraction
study of Zeise's salt. First of all they found, as Dr. Wilkinson has
suggested, that the hydrogen bond is weak. However, there are definite
O—H—CI hydrogen bonds—if one adopts a geometrical criterion.
A more interesting point of course is the effect of the coordination onthe geometry of the ethylene molecule. They found that the C=Cbond is lengthened by about 0.01 A over the value in free ethylene.
Furthermore, the hydrogen atoms are bent back away from the
platinum atom a small but significant amount. I would like to ask
Dr. Wilkinson to comment on the infrared evidence on these latter
two points.
G. R. Wilkinson: The infrared absorption spectrum of the water
molecule in Zeise's salt shows that the hydrogen bonding is very weakindeed. The criterion used being the shift in the v\ and v 3 stretching-
vibration frequencies and the halfwidth of the absorption bands.
The frequency shift for v 1} v2 , and v 3 from the gas phase values are
— 187 cm-1, +19 cm-1
, and —227 cm-1whilst the halfwidths AvH
for vi and vz are only 10 cm-1 and 15 cm-1in the salt. These line
widths are the narrowest that I have encountered for water molecules
in the condensed phase.
As far as the double bond length is concerned, infrared spectroscopy
is unable to give any information of the precise change of bond length.
However it does reveal that the force constant of the C=C bond is
reduced, and the frequency of the stretching vibration is reduced from
the value 1623 cm-1in ethylene gas to 1516 cm" 1 on coordination with
platinum.
R. Summitt (Department of Physics, Michigan State University)
:
Would you please comment on the effect of specimen size on the
infrared and Raman spectra of solid materials.
G. R. Wilkinson: Particle size has an appreciable effect on infrared
spectra, especially in the case of very strong absorption bands such
as occurs in ionic crystals. In fact it is frequently impossible to obtain
a true absorption spectrum with many inorganic powders—the
literature is full of spectra that are supposed to be infrared absorption
spectra but which are in fact reflection spectra or rather (1—R?)
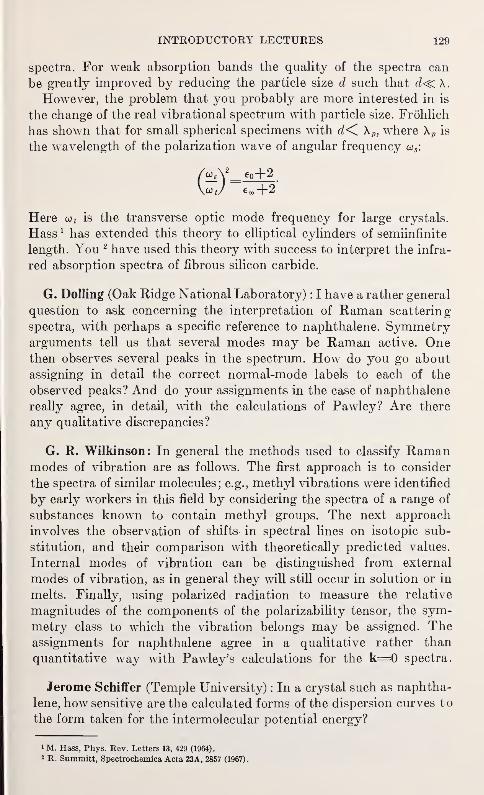
INTRODUCTORY LECTURES 129
spectra. For weak absorption bands the quality of the spectra can
be greatly improved by reducing the particle size d such that d<^ X
.
However, the problem that you probably are more interested in is
the change of the real vibrational spectrum with particle size. Frohlich
has shown that for small spherical specimens with d<C \ p , where X p is
the wavelength of the polarization wave of angular frequency co s :
Here u tis the transverse optic mode frequency for large crystals.
Hass 1 has extended this theory to elliptical cylinders of semiinfinite
length. You 2 have used this theory with success to interpret the infra-
red absorption spectra of fibrous silicon carbide.
G. Dolling (Oak Ridge National Laboratory) : I have a rather general
question to ask concerning the interpretation of Raman scattering
spectra, with perhaps a specific reference to naphthalene. Symmetryarguments tell us that several modes may be Raman active. Onethen observes several peaks in the spectrum. How do you go about
assigning in detail the correct normal-mode labels to each of the
observed peaks? And do your assignments in the case of naphthalene
really agree, in detail, with the calculations of Pawley? Are there
any qualitative discrepancies?
G. R. Wilkinson: In general the methods used to classify Ramanmodes of vibration are as follows. The first approach is to consider
the spectra of similar molecules; e.g., methyl vibrations were identified
by early workers in this field by considering the spectra of a range of
substances known to contain methyl groups. The next approach
involves the observation of shifts in spectral lines on isotopic sub-
stitution, and their comparison with theoretically predicted values.
Internal modes of vibration can be distinguished from external
modes of vibration, as in general they will still occur in solution or in
melts. Finally, using polarized radiation to measure the relative
magnitudes of the components of the polarizability tensor, the sym-
metry class to which the vibration belongs may be assigned. Theassignments for naphthalene agree in a qualitative rather than
quantitative way with Pawley's calculations for the k=0 spectra.
Jerome Schiffer (Temple University) : In a crystal such as naphtha-
lene, how sensitive are the calculated forms of the dispersion curves to
the form taken for the intermolecular potential energy?
€0+2
em +2
1 M. Hass, Phys. Rev. Letters 13, 429 (1964).
2 R. Summitt, Spectrochemica Acta 23A, 2857 (1967).
130 MOLECULAR DYNAMICS AND STRUCTURE OF SOLIDS
G. R. Wilkinson: As yet there is no experimental data on the com-plete dispersion curves for naphthalene, so it is not possible to answerthe question whether a potential of the form
V(r)=~+Bexp (-ar)
can be adjusted to fit the curves. However, prehminary calculations
suggest that it is not even possible to fit the k=0 frequencies exactly.
W. Fateley (Carnegie Mellon University) : Should we call the far
infrared absorptions in liquids "pseudo lattice" vibrations?
G. R. Wilkinson: I used the term "pseudo lattice" modes in liquids
to draw attention to the similarity between the infrared absorption
in liquids and the corresponding absorption in crystals of the samesubstance due to lattice modes. However, if you object then maybewe should refer to them as collective molecular motions with cor-
relation or relaxation times r.
J. J. Rush (National Bureau of Standards) : I was very interested in
the results you presented on hexamethylbenzene, which showed
changes in internal modes with temperature. A few years ago wemeasured neutron spectra for hexamethylbenzene, above and below
its X transition at 115 °K. We were able to directly observe the torsional
vibrations of the methyl groups. These showed a dramatic change
around the X point, indicating changes in the barrier to rotation.
These results, as well as some recent u.v. absorption spectra suggest
that the X transition is related to a distortion of the molecule. Are
the changes you have observed in the I.R. spectra consistent with
such a transition mechanism?
G. R. Wilkinson: The infrared absorption spectra show no evidence
that can be unambiguously interpreted as due to a marked distortion
of the hexamethylbenzene molecules. However, the possibility cannot
be completely ruled out. There is a very marked change in infrared
absorption associated with methyl vibrations which is interpreted
as being due to a reorientation of the methyl groups. The Ramanspectrum shows that if the hydrogen atoms are considered, then there
is more than one molecule in the unit cell—at least in the high
temperature phase.
E. R. Andrew (Nottingham University) : May 1 add to the discussion
on solid hexamethylbenzene? Allen and Cowking in our laboratory
have measured the nuclear magnetic resonance spin-lattice relaxation
time Ti which gives a measure of the rate of reorientation of the
INTRODUCTORY LECTURES 131
methyl groups. At the 116 °K transition there is a discontinuous
change of a factor of about three in 2V Below 116 °K the correlation
time of the reorientation is characterized by an activation energy of
1.9 kcal/mole, while above 116 °K it is 1.6 kcal/mole.
G. R. Wilkinson : I would be very interested to know what is the rate
of reorientation of the methyl groups. It is important to know howthis compares with the lifetime of the methyl vibrational states.
7. References
[1] A standard text on infrared and Raman spectroscopy is, Infrared and RamanSpectra of Polyatomic Molecules, G. Hertzberg (Van Nostrand, NewYork, 1945).
[2] A good text on the vibration of molecules, which makes extensive use of
symmetry considerations and gives a full discussion of the determination
of force constants is, Molecular Vibrations, E. B. Wilson, J. C. Decius andP. C. Cross (McGraw Hill Book Co., New York, N.Y., 1955).
[3] An extensive coverage of infrared and Raman spectroscopy can be found in
the volume, Infrared Spectroscopy and Molecular Structure, edited by
M. Davies (Elsevier, Amsterdam, 1963).
[4] A systematic approach to the classification of characteristic frequencies can
be found in, The Infrared Spectra of Complex Molecules, L. J. Bellamy
(Methuen, London, 1958).
[5] A very thorough discussion of vibration-rotation spectra in the gas phase can
be found in, Molecular Vibrators, H. C. Allen and P. C. Cross (John Wiley
& Sons, New York, N.Y., 1963).
[6] There are several sections devoted to the optical properties of lattice vibra-
tions in, Dynamical Theory of Lattice Vibrations, M. Born and K. Huang(Oxford University Press, London, 1954).
[7] A more recent edited volume on phonons is, Phonons in Perfect Lattices andin Lattices with Point Imperfections, R. W. H. Stevenson (Plenum
Press, New York, 1966).
[8] A concise outline of the theory of, vibrations of isolated molecules can be
found in, Chemical Infrared Spectroscopy, Vol. 1, ch. 8, W. J. Potts (John
Wiley & Sons, New York, N.Y., 1963).
[9] A full discussion of the infrared and Raman spectra of diatomic lattices
has been given by Burstein in, Lattice Dynamics, edited by R. F. Wallis
(Pergamon Press, London, 1964).
[10] S. Bhagavantam and T. Venkataryuda, Proc. Indian Acad. Sci. 9, 224 (1939)
.
[11] R. S. Halford, J. Chem. Phys. 14, 8 (1946).
[12] H. Winston and R. S. Halford, J. Chem. Phys. 17, 607 (1949).
[13] W. C. Price and T. S. Robinson, Proc. Phys. Soc. B66, 969 (1953).
[14] R. A. Cowley, Advances in Physics 13, 421 (1963).
[15] D. W. Berriman, Phys. Rev. 130, 2193 (1963).
[16] R. Lyddane, R. Sachs and E. Teller, Phys. Rev. 59, 673 (1941).
[17] R. Loudon, Advances in Physics 13, 423 (1964).
[18] R. A. Cowley, Proc. Phys. Soc. 84, 281 (1964).
[19] W. Cochran, Advances in Physics 9, 387 (1960).
[20] A. S. Barker and M. Tinkham, Phys. Rev. 125, 1527 (1962).
[21] C. H. Perry and T. F. McNeUy, Phys. Rev. 154, 456 (1967).
132 MOLECULAR DYNAMICS AND STRUCTURE OF SOLIDS
[22] For an account of the fundamentals of techniques see, Infrared Physics,
J. T. Houghton and S. D. Smith (Oxford University Press, Oxford, Eng-land, 1966).
[23] H. A. Gebbie and G. A. Vanasse, Nature 178, 432 (1956)
.
[24] Spectroscopic Techniques for Far Infrared and Millimetre Waves, edited
by D. H. Martin (North Holland, Amsterdam, 1937).
[25] M. V. Hobden and J. P. Russell, Physics Letters 13, 39 (1964).
[26] D. A. Kleinman and W. G. Spitzer, Phys. Rev. 119, 110 (1960).
[27] S. S. Mitra and P. J. Gielisse, Progress in Infrared Spectroscopy, Vol. 2,
edited by H. A. Szymanski (Plenum Press, New York, 1914).
[28] C. H. Perry, H. Geick, and S. S. Mitra, J. Appl. Phys. 37, 1994 (1966).
[29] M. A. Nusimovici and J. L. Birman, Phys. Rev. 156, 925 (1967).
[30] B. Tell, D. C. Damen and S. P. S. Porto, Phys. Rev. 144, 771 (1966).
[31] J. D. Axe and G. D. Pettit, Phys. Rev. 151, 676 (1966).
[32] W. G. Spitzer and W. Kleinman, Phys. Rev. 121, 1324 (1962).
[33] M. M. Elcombe, Proc. Phys. Soc. 91, 947 (1967).
[34] S. M. Shapiro, D. S. O'Shea and H. Z. Cummins, Phys. Rev. Letters 19,
361 (1967).
[35] J. F. Scott and S. P. S. Porto, Phys. Rev. 161, 903 (1967).
[36] A. S. Barker and M. Tinkham, Phys. Rev. 125, 1527 (1962).
[37] S. P. S. Porto, P. A. Fluery and T. C. Damen, Phys. Rev. 154, 522 (1967).
[38] S. S. Mitra, Solid State Physics 13 (Academic Press, New York, 1962).
[39] I. Pelah, K. Krebs and Y. Imry, J. Chem. Phys. 43, 1846 (1965).
[40] O. Oehler, Thesis for Doctor of Science Technische Hochschule Zurich (1967).
[41] R. P. Baumann and S. P. S. Porto, Phys. Rev. 161, 842 (1967).
[42] H. H. Caspers, J. Murphy and R. A. Buchanan, J. Chem. Phys. 40, 743 (1964)
.
[43] J. T. Hougen and S. Singh, Proc. Roy Soc. A277, 193 (1964).
[44] J. P. Mathieu and L. Coutoure, Compt. Rend. 228, 1054 (1950).
[45] H. Boutin, G. J. Safford and V. Brajovic, J. Chem. Phys. 39, 313 5 (1963).
[46] S. P. S. Porto and R. S. Krishnan, J. Chem. Phys. 47, 1009 (1967).
[47] E. V. Chisler and M. S. Shur, Phys. Stat. Solidi. 19, 163 (1966).
[48] A. S. Barker, Phys. Rev. 135, 742 (1964).
[49] S. P. S. Porto and J. F. Scott, Phys. Rev. 157, 716 (1967).
[50] O. Schnepp, J. Chem. Phys. 46, 3983 (1967).
[51] W. Vedder and D. F. Hornig, Infrared Spectra of Crystals, in Advances in
Spectroscopy, edited by H. W. Thompson (Interscience, New York, 1961).
[52] V. Soots, E. J. Allin and H. L. Welsh, Can. J. Phys., 1985 (1965).
[53] E. J. Allin, W. F. J. Hare and J. C. F. MacDonald, Phys. Rev. 98, 554 (1955)
.
[54] A. Ron, and O. Schnepp, J. Chem. Phys. 46, 3991 (1967).
[55] A. Anderson and S. H. Walmsley, Molecular Physics 7, 583 (1964).
[56] S. H. Walmsley and A. Anderson, Molecular Physics 7, 411 (1964).
[57] J. E. Cahill, J. C. Laufer and G. E. Leroi, J. Chem. Phys. 47, 3678 (1967).
[58] S. H. Walmsley and J. Pople, Molecular Physics 8, 345 (1964).
[59] D. A. Dows, Spectrochim. Acta 13, 308 (1959).
[60] E. Sandor and R. F. C. Farrow, Nature 213, 171 (1967).
[61] E. Sandor and R. F. C. Farrow, Nature 215, 1265 (1967).
[62] L. C. Brunei and H. Peyron, C. R. Acad. Sci. 264C, 821 (1961).
[63] A. Anderson, H. A. Gebbie and S. H. Walmsley, Molecular Physics 7, 401
(1964).
[64] I. R. Beattie, Chemistry in Britain 3, 347 (1967).
[65] A. Hadni and J. P. Mathieu, C. R. Acad. Sci. 252, 1585 (1961).
[66] G. S. Pawley, Phys. Stat. Solidi 20, 347 (1967).
[67] R. M. Hexter, J. Chem. Phys. 24, 1186 (1955).
INTRODUCTORY LECTURES 133
[68] W. C. Price and G. R. Wilkinson, J. Phys. Chem. Solids 18, 74 (1961).
[691 E. R. Andrew, J. Chem. Phys. 18, 607 (1950).
[70] J. J. Rush and T. I. Taylor, J. Chem. Phys. 44, 2749 (1966).
[71] H. Tasumi and S. Krimm, J. Chem. Phys. 46, 755 (1967).
[72] For a discussion of the theory and practice of infrared studies on polymers
see, Infrared Spectroscopy of High Polymers, R. Zbinden (Interscience,
New York, 1964).
[73] G. R. Wilkinson, W. C. Price and E. M. Bradbury, Spectrochim. Acta 14,
284 (1959).
[74] Introduction to the Liquid State, Edited by P. Egelstaff (Academic Press,
New York, 1967).
[75] R. G. Gordon, J. Chem. Phys. 43, 1307 (1965).
[761 L. Woodward, N. N. Greenwood, J. R. Hall and I. Worrall, J. Chem. Soc.
1505, 1958).
[77] J. Nixon and R. A. Plane, J. Am. Chem. Soc. 84, 4445 (1962).
[78] G. W. Chantry, H. A. Gebbie, B. Lassier and G. Wyllie, Nature 214, 163
(1967).
[79] The Hydrogen Bond, G. C. Pimentel and A. L. McClellan (Reinhold,
New York, 1960)
.
[80] W. C. Price, W. F. Sherman and G. R. Wilkinson, Proc. Roy. Soc. 255,
5 (1960).
311-280 O—^69 10

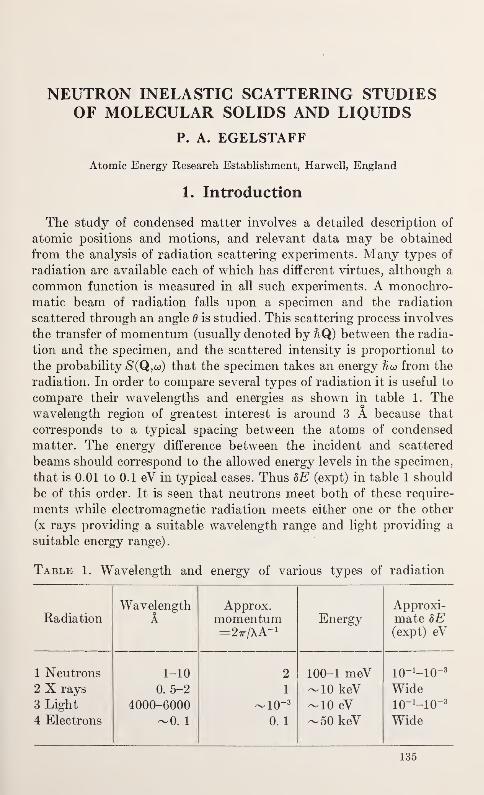
NEUTRON INELASTIC SCATTERING STUDIESOF MOLECULAR SOLIDS AND LIQUIDS
P. A. EGELSTAFF
Atomic Energy Research Establishment, Harwell, England
1. Introduction
The study of condensed matter involves a detailed description of
atomic positions and motions, and relevant data may be obtained
from the analysis of radiation scattering experiments. Many types of
radiation are available each of which has different virtues, although a
common function is measured in all such experiments. A monochro-
matic beam of radiation falls upon a specimen and the radiation
scattered through an angle 6 is studied. This scattering process involves
the transfer of momentum (usually denoted by hQ) between the radia-
tion and the specimen, and the scattered intensity is proportional to
the probability S(Q,o>) that the specimen takes an energy fiw from the
radiation. In order to compare several types of radiation it is useful to
compare their wavelengths and energies as shown in table 1. Thewavelength region of greatest interest is around 3 A because that
corresponds to a typical spacing between the atoms of condensed
matter. The energy difference between the incident and scattered
beams should correspond to the allowed energy levels in the specimen,
that is 0.01 to 0.1 eV in typical cases. Thus bE (expt) in table 1 should
be of this order. It is seen that neutrons meet both of these require-
ments while electromagnetic radiation meets either one or the other
(x rays providing a suitable wavelength range and light providing a
suitable energy range)
.
Table 1. Wavelength and energy of various types of radiation
RadiationWavelength
AApprox.
momentum= 27r/AA- 1
EnergyApproxi-mate bE(expt) eV
1 Neutrons 1-10 2 100-1 meV io-^io- 3
2 X rays 0. 5-2 1 -10 keV Wide3 Light 4000-6000 -10~ 3 -10 eV lO^-lO" 3
4 Electrons -0. 1 0. 1 -50 keV Wide
135
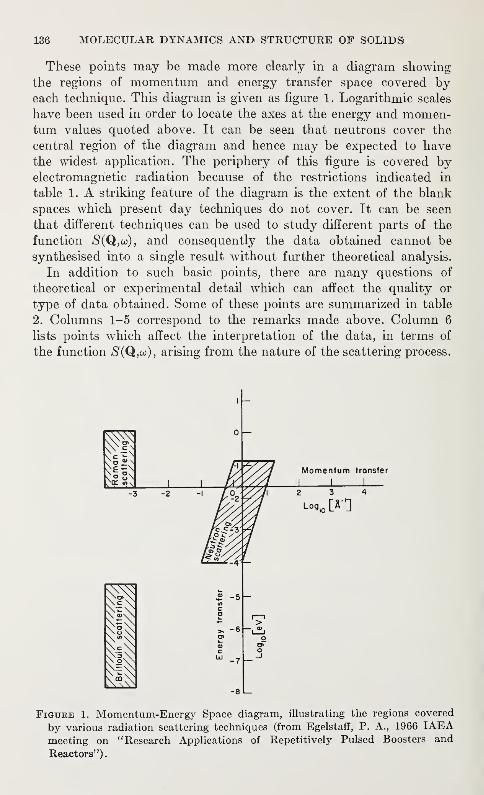
136 MOLECULAR DYNAMICS AND STRUCTURE OF SOLIDS
These points may be made more clearly in a diagram showing
the regions of momentum and energy transfer space covered byeach technique. This diagram is given as figure 1. Logarithmic scales
have been used in order to locate the axes at the energy and momen-tum values quoted above. It can be seen that neutrons cover the
central region of the diagram and hence may be expected to have
the widest application. The periphery of this figure is covered byelectromagnetic radiation because of the restrictions indicated in
table 1. A striking feature of the diagram is the extent of the blank
spaces which present day techniques do not cover. It can be seen
that different techniques can be used to study different parts of the
function $(Q,co), and consequently the data obtained cannot be
synthesised into a single result without further theoretical analysis.
In addition to such basic points, there are many questions of
theoretical or experimental detail which can affect the quality or
type of data obtained. Some of these points are summarized in table
2. Columns 1-5 correspond to the remarks made above. Column 6
lists points which affect the interpretation of the data, in terms of
the function S(Q,oo), arising from the nature of the scattering process.
i—
Figure 1. Momentum-Energy Space diagram, illustrating the regions covered
by various radiation scattering techniques (from Egelstaff, P. A., 1966 IAEAmeeting on "Research Applications of Repetitively Pulsed Boosters and
Reactors").
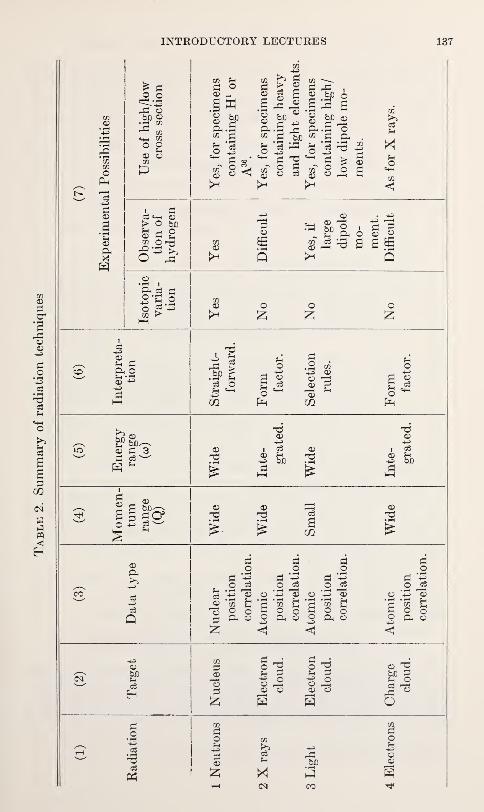
INTRODUCTORY LECTURES 137
COCO
oPh
S3
q o
bJO ©CO
03 <^-h ©> O bJD
fe c< 69 5 ^
O ^
5 .0
CO £h
c o
I M
'IIco g
CO
2 © S ® .Sip
8 S>°'8
gpft.5 "2 ft .5co g H CO
g% '3O +3
°~ 3 co* ^ 3 ^8 8 5l a 8 S » 8©
CO©
£ ©
CO
Fho
CO
S3O
s
©"
ft o8 * 3 a ag
O o o
(6)Interpreta-
tion
Straight-
forward.
Form
factor.
Selectionrules.
Form
factor.
(5)Energy
(«*)
Wideinte-
grated.
WideInte-
grated.
(4)Momen- tum range
(Q)Wide Wide
Small Wide
(3)
Data
type
Nuclear
position
correlation.
Atomic
position
correlation.
Atomic
position
correlation.
Atomic
position
correlation.
(2) TargetNucleus Electron
cloud.Electron
cloud.
Charge
cloud.
W
O
S3©
co
s?Fh
• i—
(
co
co
S3OFh
o©
138 MOLECULAR DYNAMICS AND STRUCTURE OF SOLIDS
Column 7 lists three experimental points. Variation of isotopic ratios
(e.g., H/D ratio) can be a powerful technique for isolating particular
modes of motion since the scattering law [#(Q,co)] can be altered
without altering the chemical nature of the sample. This possibility
is open to neutron scattering only because neutrons interact with
the nuclei, in contrast to the other cases listed where the interaction
is through the electrons or electric charge. For studies of many mo-lecular systems, the observation of hydrogen positions and motions
is important, and the difficulty of doing this is indicated briefly in
the table. Because the thermal neutron cross section of a proton is
approximately 10 times that of a typical nucleus, the observation
of protonic movements is relatively easy. As will be shown later,
it is necessary to deuterate a sample in order to measure "hydrogen"
positions in a -crystal structure; the deuterium cross section is similar
in magnitude to that for other nuclei. Motions involving hydrogen
atoms are also observed in light scattering if the electric dipole mo-ment is large enough to enhance the scattering due to a particular
protonic mode. For x-ray or electron scattering experiments hydro-
gen is almost invisible. Finally a useful technique is the relative
enhancement of the scattering from a particular group in a molecular
system. For neutrons scattering this can be done by deuterating those
parts of an organic molecule which it is desired not to observe. In
this case scattering from the remaining hydrogenous groups (e.g.,
CH3 — ) can be examined. As will be explained later this method is
useful for the study of molecular dynamics but not for structure work.
An analogous technique can be used in x-ray structural studies for
those cases where a heavy element can be placed at given points in a
molecule. Due to the relatively large scattered x-ray intensity from
heavy elements compared to light elements the location of such points
is obtained. Thus the uses of this technique with neutron or x radia-
tion are complementary, one providing dynamical and the other
structural information.
In the following section the theory of neutron scattering will be
outlined briefly, while later sections will be devoted to particular
cases of neutron inelastic scattering by molecular systems.
2. Nuclear Scattering of Neutrons [1]1
The cross section for the scattering of radiation by matter has been
described many times in the literature (e.g., Van Hove [2], Sjolander
[3]). The method followed is (essentially) the same for each kind of
radiation, differing only in detail, and in the following the principal
1 Figures in brackets indicate literature references at the end of this paper.
INTRODUCTORY LECTURES 139
steps in the theory of the scattering of thermal neutrons will be given.
These steps are as follows
:
(a) For low energy (thermal) neutrons only s-wave nuclear
scattering is important (because the neutron wavelength ^>
nuclear diameter)
.
(b) s-wave scattering cross sections (for an isolated stationary
nucleus) are spherically symmetric and independent of neutron
energy.
(c) The nuclear size is much smaller (^10~ 5) than the neutron
wavelength and the interatomic distances hence we may write
for the ith nuclear potential V(r) :
Vi(r) = constant 8 (r—
r
€)
where is the position of the ith nucleus.
(d) The overall perturbation is small (e.g., although the nuclear
potential is very strong within its range, the intensity scattered
by a single nucleus is very small) so that the Born approximation
is valid.
(e) The constant in (c) is determined by fitting the Born cross
section for epi-thermal neutrons to the measured "free atom"cross section. This constant is (conventionally) written:
—
m
where m is the neutron mass and b is a length (positive for hard-
sphere scattering) called the bound atom scattering length.
(A. V-j-pyj b 2 where A is
the ratio of nuclear to neutron masses.]
(f) Therefore, the scattering amplitude for a system of N atoms
is
—
a(e)-S^^r ,e
l'Q-r '5(r, -r
I)
The essential point which has been given in step (f) is that the
scattering amplitude in the Born approximation is expressed as
the Fourier transform of the scattering potential. Since the
scattering potential consists of a 5-function point for each atomwe get a Fourier transform of the atomic positions. However, so
far the atoms have been assumed to be fixed in space, and in
order to allow for atomic motions the following point is considered.
(g) If the atoms are moving about on a timescale comparable
with the value ofjj^ then the time dependence of the atomic
140 MOLECULAR DYNAMICS AND STRUCTURE OF SOLIDS
positions given in the formula in (f) above must be considered.
Essentially the neutron wave suffers a Doppler shift, which is
observed through the energy spectrum of the scattered neutrons.
The condition for the conservation of energy in the scattering
process may be represented as a Fourier transformation, so that
the required scattering amplitude involves a Fourier transforma-
tion between time and energy. Thus the scattering amplitude
involves both space and time Fourier transformations.
There is one final point to be considered, namely that an observ-
able cross section is given by the square modulus of the scattering
amplitude and for this reason it involves a product of two terms of the
kind given under (f) above. These two functions give a "pair correla-
tion function,'' and the cross section formula becomes finally the
Fourier transformation of the pair correlation given at eq. (1)
:
where rm (r) is the position of the rath atom at time r. A subscript 'V
'
will be used to denote the self term, that is the term for which
n=m in eq. (1).
The form of the correlation function shown here applies to a
classical system, eqs (1) and (2) are taken from Van Hove [2] to
whom this formalism is due.
The cross section is:
where b is the scattering length for a single bound atom and p is the
average density of the system.
It is possible to consider two types of correlation functions. Re-
ferring to eq (1) the first of these is the case for which the two atoms
n and ra are the same; this correlation describes the average motion
of a single atom and is therefore known as the self correlation function.
The second type of correlation function is that for which n and ra
may take on any values, so that all atoms in the system are considered.
This function is known as the coherent correlation function. The tech-
niques which are used in neutron scattering work to separate the Gfunction into these two parts depend upon the fact that different
isotopes of the same element may have different scattering lengths
and also that different spin states of the same isotope may have
different scattering lengths. Thus the separation depends upon
making measurements with the system in the same chemical state but
in different nuclear states.
a)
<P<r k Cb2-r- exp i(Q: r—q)t)[G(t, T)—p]drdr (2)
INTRODUCTORY LECTURES 141
An important case of this kind is that of hydrogen. Here the scat-
tering amplitude for the case of neutron and nuclear spins parallel is
almost equal in magnitude but of opposite phase to the case of neutron
and nuclear spins anti-parallel. Thus constructive interference of the
scattered wavelets cannot occur and the scattered wave from each
nucleus escapes from the specimen without being modified by inter-
ference effects. For this reason the neutron scattering by hydrogenous
systems is proportional to the transform of the self-correlation
function. That is it corresponds to the motions of single protons.
In addition since the scattering cross section for protons is (fortuitously)
about 20 times greater than that for carbon nuclei the neutron scattering
by an organic molecule can be related to the motion of its hydrogen
atoms only.
Another case is that for deuterium where the scattering lengths
for parallel and anti-parallel spins are different. Here some construc-
tive interference occurs and the coherent G function is observed.
The coherent cross section for deuterium is similar in magnitude to
that for carbon and many other elements so that interference between
the wavelets scattered by all the atoms of a molecular system has to
be considered. In this way the structure of a molecular system can be
studied. In addition deuterium has a small incoherent cross section
which gives a background to some experiments.
In summary, the cross section for hydrogen is large and incoherent
while that for deuterium is of normal size and coherent.
3. Neutron Spectrometers [4, 5]
During the past decade many different types of neutron spectrom-
eters have been developed. In each case, however, their success rests
upon the determination of either the neutron wavelength or velocity.
Either neutrons of a given wavelength are reflected from a single
crystal in the same manner as used for x rays, or neutrons of a given
velocity are selected by a system of shutters opening at pre-selected
times. The neutron energy is then determined from the relationships:
12
¥2mV =2^mv*=
2 (3)
where m is the neutron mass, v is its velocity and X is its wavelength
For inelastic scattering measurements the system is complicated bythe fact that two spectrometers are required. One is used to determine
the energy and direction of the neutron beam falling upon the sample
while the second is used to determine the energy and direction of
scattered neutrons. Two of the most widely used spectrometers will
be described briefly in the following.
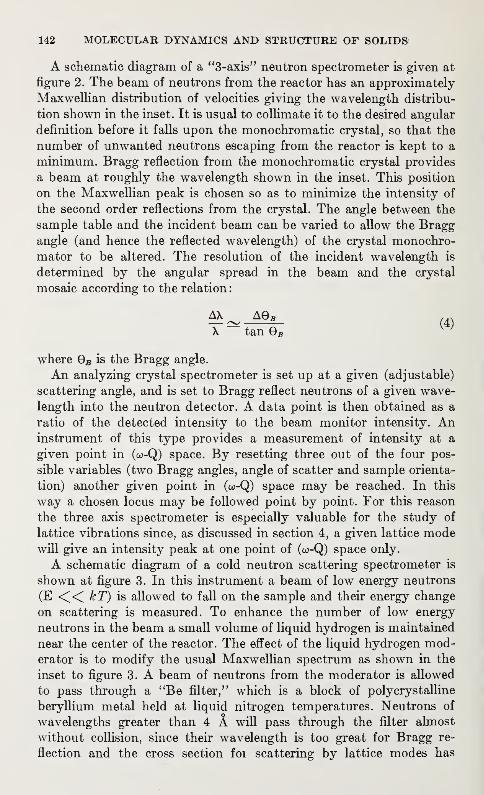
142 MOLECULAR DYNAMICS AND STRUCTURE OF SOLIDS
A schematic diagram of a "3-axis" neutron spectrometer is given at
figure 2. The beam of neutrons from the reactor has an approximately
Maxwellian distribution of velocities giving the wavelength distribu-
tion shown in the inset. It is usual to collimate it to the desired angular
definition before it falls upon the monochromatic crystal, so that the
number of unwanted neutrons escaping from the reactor is kept to a
minimum. Bragg reflection from the monochromatic crystal provides
a beam at roughly the wavelength shown in the inset. This position
on the Maxwellian peak is chosen so as to minimize the intensity of
the second order reflections from the crystal. The angle between the
sample table and the incident beam can be varied to allow the Braggangle (and hence the reflected wavelength) of the crystal monochro-
mator to be altered. The resolution of the incident wavelength is
determined by the angular spread in the beam and the crystal
mosaic according to the relation
:
^ (4)X
~~tan 0*
w
where 0B is the Bragg angle.
An analyzing crystal spectrometer is set up at a given (adjustable)
scattering angle, and is set to Bragg reflect neutrons of a given wave-
length into the neutron detector. A data point is then obtained as a
ratio of the detected intensity to the beam monitor intensity. Aninstrument of this type provides a measurement of intensity at a
given point in (co-Q) space. By resetting three out of the four pos-
sible variables (two Bragg angles, angle of scatter and sample orienta-
tion) another given point in (co-Q) space may be reached. In this
way a chosen locus may be followed point by point. For this reason
the three axis spectrometer is especially valuable for the study of
lattice vibrations since, as discussed in section 4, a given lattice modewill give an intensity peak at one point of (co-Q) space only.
A schematic diagram of a cold neutron scattering spectrometer is
shown at figure 3. In this instrument a beam of low energy neutrons
(E << kT) is allowed to fall on the sample and their energy change
on scattering is measured. To enhance the number of low energy
neutrons in the beam a small volume of liquid hydrogen is maintained
near the center of the reactor. The effect of the liquid hydrogen mod-erator is to modify the usual Maxwellian spectrum as shown in the
inset to figure 3. A beam of neutrons from the moderator is allowed
to pass through a "Be filter," which is a block of polycrystalline
beryllium metal held at liquid nitrogen temperatures. Neutrons of
wavelengths greater than 4 A will pass through the filter almost
without collision, since their wavelength is too great for Bragg re-
flection and the cross section foi scattering by lattice modes has
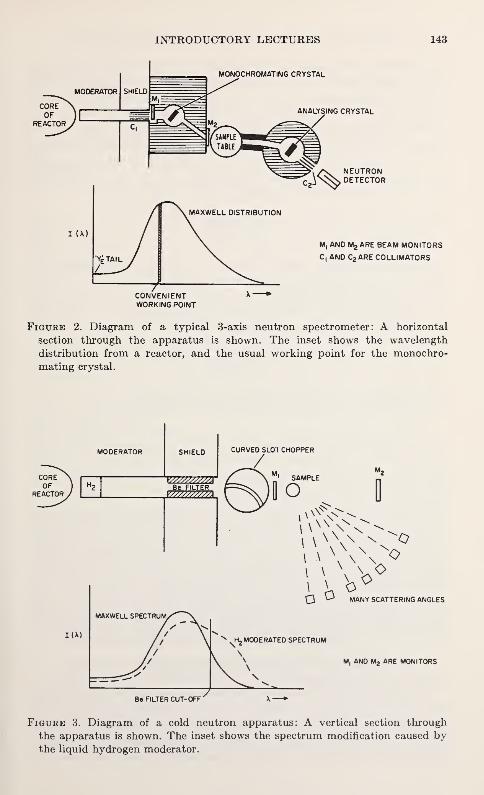
INTRODUCTORY LECTURES 143
M0N0CHR0MATING CRYSTAL
WORKING POINT
Figure 2. Diagram of a typical 3-axis neutron spectrometer: A horizontal
section through the apparatus is shown. The inset shows the wavelength
distribution from a reactor, and the usual working point for the monochro-
mating crystal.
Figure 3. Diagram of a cold neutron apparatus: A vertical section through
the apparatus is shown. The inset shows the spectrum modification caused bythe liquid hydrogen moderator.
144 MOLECULAR DYNAMICS AND STRUCTURE OF SOLIDS
been reduced by cooling the beryllium. However neutrons with
wavelengths less than 4 A can be Bragg reflected out of the beryllium
where they are captured in a neutron absorbing material. In this
way a nearly pure long wavelength beam is obtained.
This beam passes into a rotating disc (called a chopper) made of
neutron absorbing metal and through which a number of curved
slots have been cut. Depending upon the speed of rotation and the
slot parameters only neutrons in a given velocity (or wavelength)
band will pass through. The width of this velocity band is:
AV=^£ (5,
where d is the width and p the radius of curvature of the slot, R is
the radius of the chopper and co is the speed of rotation. It is usual
to choose the mean velocity transmitted (V=2wp) by choice of the
rotational speed, and in this case the relative resolution is independent
of velocity according to the relation:
AV Up .
Typical values for AVJV are 6 percent to 10 percent at 5 A.
Neutron detectors are set up at several angles with respect to the
incident beam. Because the neutrons fall upon the sample in bursts it
is possible to measure the time of flight of the scattered neutrons
between the sample and the detectors. This step is carried out byelectronic timing methods. The data is registered as scattered neutron
intensity (normalized by the beam intensity) as a function of neutron
time of flight. This type of spectrometer is useful when broad regions
of (co-Q) space have to be covered because complete neutron spectra
at many angles are obtained at one setting of the instrument. Moreoverapart from the neutron detector efficiency, the analyzing spectrometer
does not distort the shape of the scattered neutron spectrum. For these
reasons this type of spectrometer has been found to be useful in studies
of incoherent scattering by molecular systems and for scattering byliquids or gases where a broad scattered spectrum is generated.
4. Coherent Scattering by Molecular Crystals
The cross section for coherent inelastic scattering by single crystals
is usually divided into contributions from the interaction of the neu-
tron and the crystal involving one, two, etc., vibrational quanta
(phonons). The most useful information is obtained from the one
phonon cross section; namely the relationship between frequency and
INTRODUCTORY LECTURES 145
wave vector for the allowed vibrational modes of a given polarization.
For this reason that part of the interaction involving more than one
phonon is thought of as a background which must be kept small byappropriate choice of the experimental conditions. Usually this means,
not too high a temperature or magnitude of the scattering vector Q.
The one phonon cross section is proportional to (e.g. Lomer and
Low [1])
5(co±fc)5 (Q±q€-27rr) (7)
where j€ is the frequency of a phonon of polarization (e) and qe is its
wave vector. 2wr is a reciprocal lattice vector for the crystal. These
factors express the conservation of energy and "crystal momentum'
'
respectively, and restrict the scattered intensity to narrow regions of
(co— Q) space for which (7) is non-zero. Bragg scattering cross sections
involve similar factors from which / and q are omitted. Thus Bragg
scattering is distinguished from one phonon scattering by the fact
that it is an elastic rather than an inelastic process. On the other hand
multiphonon processes give rise to a factor 8 (Q±2q— 2ttt) and since
a range of energy transfers can meet this condition a broad energy
spectrum is observed. Thus if a neutron spectrometer has sufficient
energy and momentum resolution the one phonon scattering will be
seen as peaks of scattered intensity whose position is determined bysolving the equations:
k0-k=Q=27TT±q(a>) J (8)
The observed peak positions determine experimentally the locus q(co).
It is usual to adjust the direction of q by suitable choice of Q and t
so that it lies along one of the symmetry direction of the crystal.
Many such measurements have been made for metal crystals andionic crystals (e.g., Dolling and Woods [6]) . Work on molecular crystals
is in its infancy but many interesting new problems arise. For examplethe interaction between lattice modes and molecular modes is of
especial interest. A review of current work in this field will be given
by Dolling [7], and will not be discussed further here.
5. Incoherent Scattering by Hydrogenous Systems
As discussed in section 2 the incoherent scattering is related to the
Van Hove correlation function for single atoms (denoted by the sub-
script s). It has been found convenient to make incoherent measure-ments at low values of Q because structure in the spectrum of inelasti-
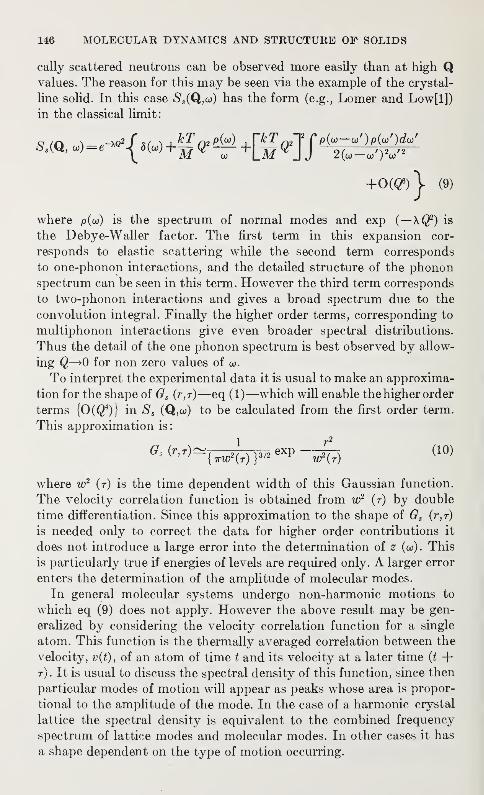
146 MOLECULAR DYNAMICS AND STRUCTURE OF SOLIDS
cally scattered neutrons can be observed more easily than at high Qvalues. The reason for this may be seen via the example of the crystal-
line solid. In this case Ss (Q,a>) has the form (e.g., Lomer and Low[l])
in the classical limit:
+0«?)\ (9)
where p(co) is the spectrum of normal modes and exp (—\Q2) is
the Debye-Waller factor. The first term in this expansion cor-
responds to elastic scattering while the second term corresponds
to one-phonon interactions, and the detailed structure of the phononspectrum can be seen in this term. However the third term corresponds
to two-phonon interactions and gives a broad spectrum due to the
convolution integral. Finally the higher order terms, corresponding to
multiphonon interactions give even broader spectral distributions.
Thus the detail of the one phonon spectrum is best observed by allow-
ing Q—>0 for non zero values of co.
To interpret the experimental data it is usual to make an approxima-
tion for the shape of Gs (r,r)—eq (1)—which will enable the higher order
terms (0(Q4)} in Ss (Q,co) to be calculated from the first order term.
This approximation is :
1 r2
Gs (r,r)^-( 2/ r
i 3/2 exp—^-r (10)
{ttW2(t) }
3/2 r1^(r)
where w2(r) is the time dependent width of this Gaussian function.
The velocity correlation function is obtained from w2(r) by double
time differentiation. Since this approximation to the shape of Gs (r,r)
is needed only to correct the data for higher order contributions it
does not introduce a large error into the determination of z (co). This
is particularly true if energies of levels are required only. A larger error
enters the determination of the amplitude of molecular modes.
In general molecular systems undergo non-harmonic motions to
which eq (9) does not apply. However the above result may be gen-
eralized by considering the velocity correlation function for a single
atom. This function is the thermally averaged correlation between the
velocity, v(i), of an atom of time t and its velocity at a later time (t +r) . It is usual to discuss the spectral density of this function, since then
particular modes of motion will appear as peaks whose area is propor-
tional to the amplitude of the mode. In the case of a harmonic crystal
lattice the spectral density is equivalent to the combined frequency
spectrum of lattice modes and molecular modes. In other cases it has
a shape dependent on the type of motion occurring.
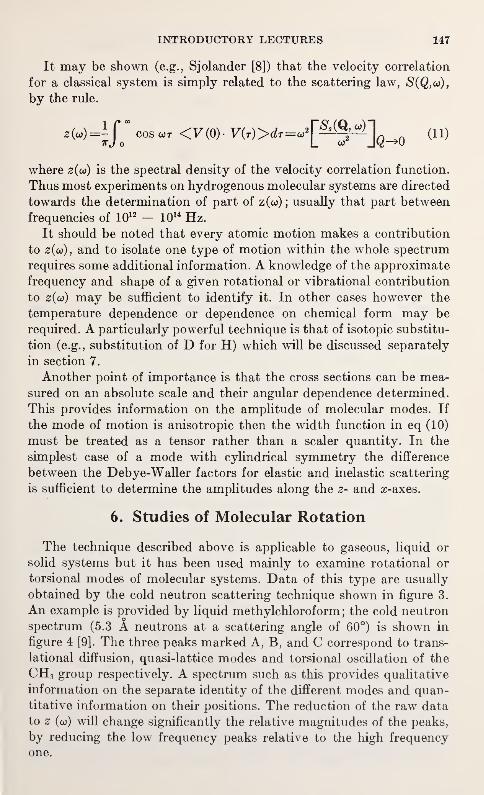
INTRODUCTORY LECTURES 147
It may be shown (e.g., Sjolander [8]) that the velocity correlation
for a classical system is simply related to the scattering law, $((2,co),
by the rule.
where z(u>) is the spectral density of the velocity correlation function.
Thus most experiments on hydrogenous molecular systems are directed
towards the determination of part of z(co);usually that part between
frequencies of 1012 — 1014 Hz.
It should be noted that every atomic motion makes a contribution
to z(u>)}and to isolate one type of motion within the whole spectrum
requires some additional information. A knowledge of the approximate
frequency and shape of a given rotational or vibrational contribution
to z(o)) may be sufficient to identify it. In other cases however the
temperature dependence or dependence on chemical form may be
required. A particularly powerful technique is that of isotopic substitu-
tion (e.g., substitution of D for H) which will be discussed separately
in section 7.
Another point of importance is that the cross sections can be mea-
sured on an absolute scale and their angular dependence determined.
This provides information on the amplitude of molecular modes. If
the mode of motion is anisotropic then the width function in eq (10)
must be treated as a tensor rather than a scaler quantity. In the
simplest case of a mode with cylindrical symmetry the difference
between the Debye-Waller factors for elastic and inelastic scattering
is sufficient to determine the amplitudes along the z- and z-axes.
6. Studies of Molecular Rotation
The technique described above is applicable to gaseous, liquid or
solid systems but it has been used mainly to examine rotational or
torsional modes of molecular systems. Data of this type are usually
obtained by the cold neutron scattering technique shown in figure 3.
An example is provided by liquid methylchloroform; the cold neutron
spectrum (5.3 A neutrons at a scattering angle of 60°) is shown in
figure 4 [9]. The three peaks marked A, B, and C correspond to trans-
lational diffusion, quasi-lattice modes and torsional oscillation of the
CH 3 group respectively. A spectrum such as this provides qualitative
information on the separate identity of the different modes and quan-titative information on their positions. The reduction of the raw data
to z (w) will change significantly the relative magnitudes of the peaks,
by reducing the low frequency peaks relative to the high frequency
one.
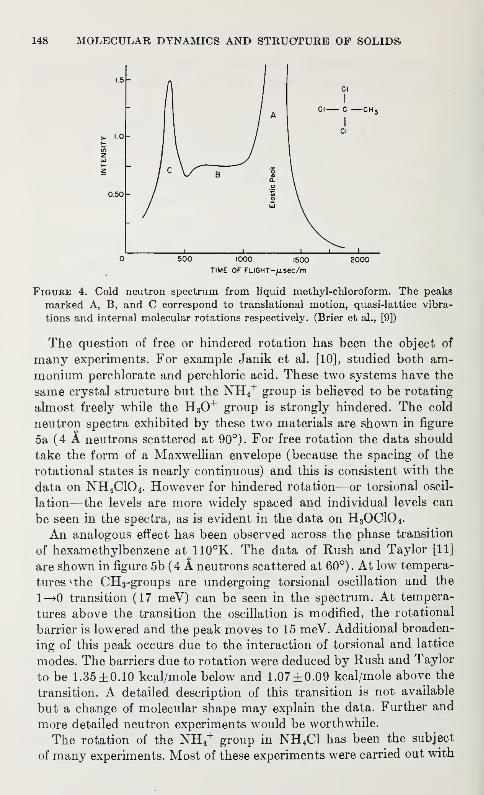
148 MOLECULAR DYNAMICS AND STRUCTURE OF SOLIDS
0 500 1000 1500 2000TIME OF FLIGHT-^.sec/m
Figure 4. Cold neutron spectrum from liquid methyl-chloroform. The peaks
marked A, B, and C correspond to translational motion, quasi-lattice vibra-
tions and internal molecular rotations respectively. (Brier et al., [9])
The question of free or hindered rotation has been the object of
many experiments. For example Janik et al. [10], studied both am-
monium perchlorate and perchloric acid. These two systems have the
same crystal structure but the NH 4+ group is believed to be rotating
almost freely while the H 30+ group is strongly hindered. The cold
neutron spectra exhibited by these two materials are shown in figure
5a (4 A neutrons scattered at 90°). For free rotation the data should
take the form of a MaxweUian envelope (because the spacing of the
rotational states is nearly continuous) and this is consistent with the
data on NH 4C10 4 . However for hindered rotation—or torsional oscil-
lation—the levels are more widely spaced and individual levels can
be seen in the spectra, as is evident in the data on H 3OC10 4 .
An analogous effect has been observed across th& phase transition
of hexamethylbenzene at 110°K. The data of Rush and Taylor [11]
are shown in figure 5b (4 A neutrons scattered at 60°). At low tempera-
tures Hhe CH 3-groups are undergoing torsional oscillation and the
1—>0 transition (17 meV) can be seen in the spectrum. At tempera-
tures above the transition the oscillation is modified, the rotational
barrier is lowered and the peak moves to 15 meV. Additional broaden-
ing of this peak occurs due to the interaction of torsional and lattice
modes. The barriers due to rotation were deduced by Rush and Taylor
to be 1.35±0.10 kcal/mole below and 1.07±0.09 kcal/mole above the
transition. A detailed description of this transition is not available
but a change of molecular shape may explain the data. Further and
more detailed neutron experiments would be worthwhile.
The rotation of the NH 4+ group in NH 4C1 has been the subject
of many experiments. Most of these experiments were carried out with
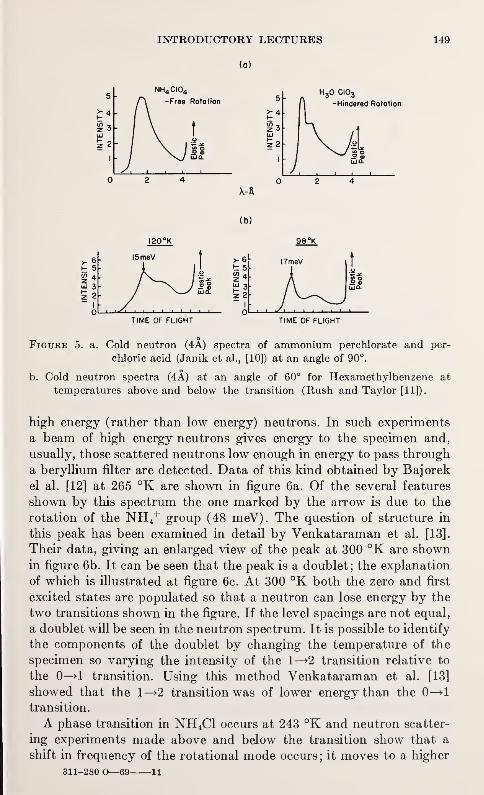
INTRODUCTORY LECTURES 149
(a)
TIME OF FLIGHT TIME OF FLIGHT
Figure 5. a. Cold neutron (4A) spectra of ammonium perchlorate and per-
chloric acid (Janik et al., [10]) at an angle of 90°.
b. Cold neutron spectra (4A) at an angle of 60° for Hexamethylbenzene at
temperatures above and below the transition (Rush and Taylor [11]).
high energy (rather than low energy) neutrons. In such experiments
a beam of high energy neutrons gives energy to the specimen and,
usually, those scattered neutrons low enough in energy to pass through
a beryllium filter are detected. Data of this kind obtained by Bajorek
el al. [12] at 265 °K are shown in figure 6a. Of the several features
shown by this spectrum the one marked by the arrow is due to the
rotation of the NH 4+ group (48 meV). The question of structure in
this peak has been examined in detail by Venkataraman et al. [13].
Their data, giving an enlarged view of the peak at 300 °K are shownin figure 6b. It can be seen that the peak is a doublet; the explanation
of which is illustrated at figure 6c. At 300 °K both the zero and first
excited states are populated so that a neutron can lose energy by the
two transitions shown in the figure. If the level spacings are not equal,
a doublet will be seen in the neutron spectrum. It is possible to identify
the components of the doublet by changing the temperature of the
specimen so varying the intensity of the 1—*2 transition relative to
the 0—>1 transition. Using this method Venkataraman et al. [13]
showed that the 1—*2 transition was of lower energy than the 0—>1transition.
A phase transition in NH 4C1 occurs at 243 °K and neutron scatter-
ing experiments made above and below the transition show that a
shift in frequency of the rotational mode occurs; it moves to a higher
311-280 0—69 11
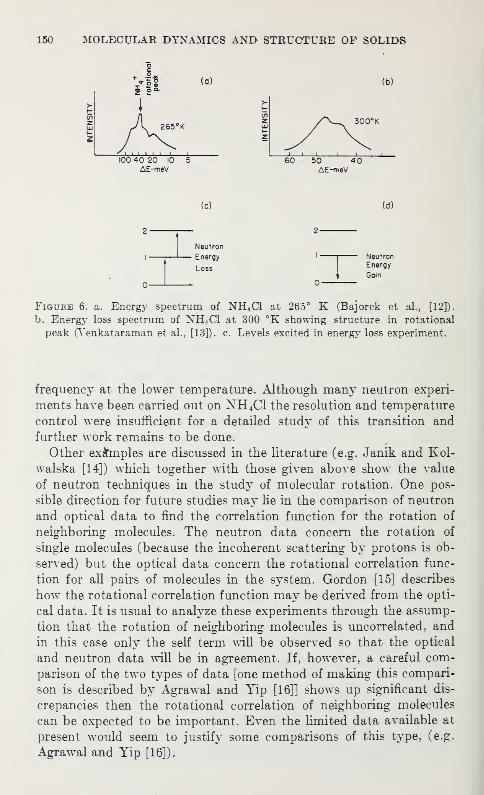
150 MOLECULAR DYNAMICS AND STRUCTURE OF SOLIDS
AE-meV
(c) (d)
Neutron
Energy
Loss
NeutronEnergy
Goin
Figure 6. a. Energy spectrum of NH4C1 at 265° K (Bajorek et al., [12]).
b. Energy loss spectrum of NH 4C1 at 300 °K showing structure in rotational
peak (Venkataraman et al., [13]). c. Levels excited in energy loss experiment.
frequency at the lower temperature. Although many neutron experi-
ments have been carried out on NH 4C1 the resolution and temperature
control were insufficient for a detailed study of this transition and
further work remains to be done.
Other examples are discussed in the literature (e.g. Janik and Kol-
walska [14]) which together with those given above show the value
of neutron techniques in the study of molecular rotation. One pos-
sible direction for future studies may He in the comparison of neutron
and optical data to find the correlation function for the rotation of
neighboring molecules. The neutron data concern the rotation of
single molecules (because the incoherent scattering by protons is ob-
served) but the optical data concern the rotational correlation func-
tion for all pairs of molecules in the system. Gordon [15] describes
how the rotational correlation function may be derived from the opti-
cal data. It is usual to analyze these experiments through the assump-
tion that the rotation of neighboring molecules is uncorrected, and
in this case only the self term will be observed so that the optical
and neutron data will be in agreement. If, however, a careful com-
parison of the two types of data [one method of making this compari-
son is described by Agrawal and Yip [16]] shows up significant dis-
crepancies then the rotational correlation of neighboring molecules
can be expected to be important, Even the limited data available at
present would seem to justify some comparisons of this type, (e.g.
Agrawal and Yip [16]).
INTRODUCTORY LECTURES 151
7. Special Methods
Because of the power of the neutron scattering method in the study
of hydrogenous systems, it can be applied in special situations. Three
examples are given below.
(a) Isotopic Substitution. Since neutrons are scattered by nuclei
it is possible to change the scattering properties of the system (by
changing the nuclei) without changing the chemical properties.
The principal example of this kind is the replacement of hydrogen
by deuterium in organic molecules. This technique is described
in the paper by White [17] in which neutron spectra from the three
molecules CH3OH, CD 3OH, and CH3OD are reported. In this
way the motion of the different parts of the molecule may be ob-
served as differences between the three spectra. More complex
examples of this kind are the study of rotation of side groups of
polymer chains, and the rotation of paraffin molecules by study-
ing specimens deuterated at the ends or centers of the molecule.
A similar method is to replace hydrogen by fluorine since
fluorine is relatively "invisible" to neutrons. However this often
results in a change in physical or chemical properties and so does
not have as wide an application as the former method.
(b) The Study of Molecular Series. The conventional technique of
observing the frequency of a rotational or torsional mode as a
function of molecular species may be used to advantage in neutron
work. This is especially so in cases where one or two members of
a series are symmetrical molecules which cannot be examined byoptical methods. An example is provided by the chloroethanes.
Allen et al. [18] studied the internal rotation of molecules from
C2H6 to C2C16 by optical and thermodynamic methods, but for
two members of the series the data were unsatisfactory. Recently
these workers have used neutron spectroscopy to remeasure the
frequencies of these two molecules with the results shown in
table 3 and figure 4.
The interpretation of these data rests upon the assumption
that the frequency of the torsional mode is independent of wavenumber. In this case neutron results are more reliable than the
other data for the molecules chosen, and when taken with the
other data for the lower and higher members of the series form
a reasonably consistent set.
(c) Motion of guest molecules (e.g., in xeolites). The high neutron
cross section of hydrogen makes it possible to observe the motion
of a guest molecule in a lattice of low cross section materials.
Examples are provided by natural or artificial xeolite—which
normally consist of low cross section nuclei—and by clathrates
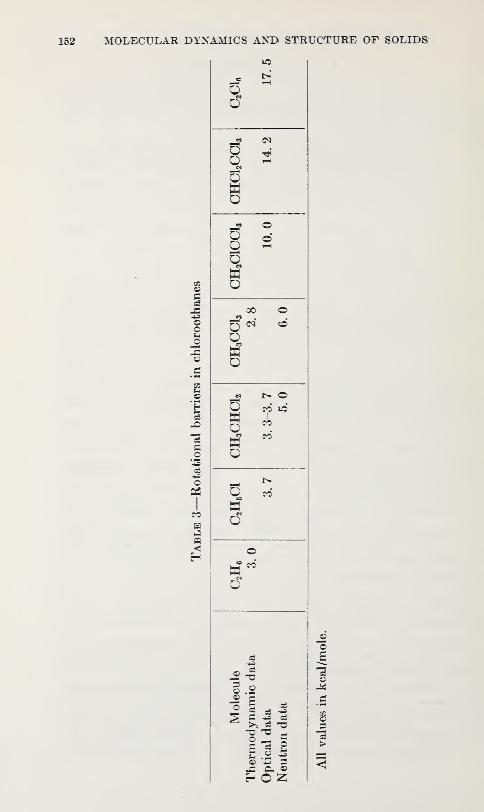
MOLECULAR DYNAMICS AND STRUCTURE OF SOLIDS
9£C
a
i
o
o
I
00
s
-<
1>
OO
8 3Owo
oo
wo
o
o
oQwO
i> o
I
CO
CO
q co
o
s41-2
I § J 1
S .2 -§
H O £
£
o
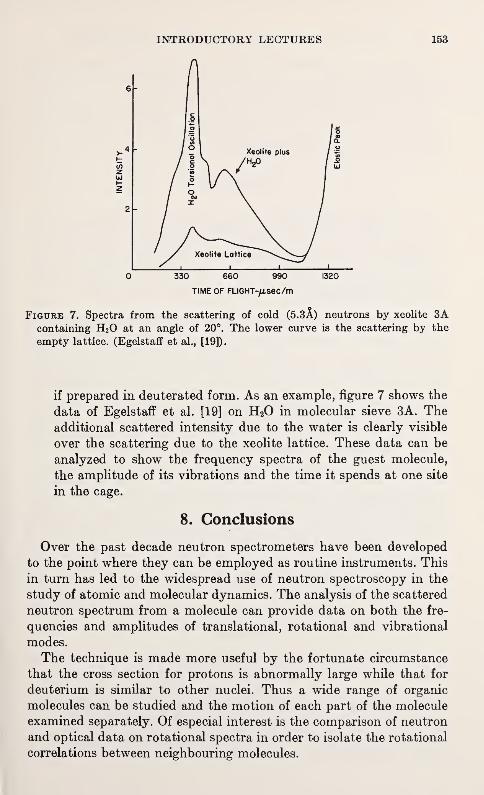
INTRODUCTORY LECTURES 153
TIME OF FLI6HT-/lsec/m
Figure 7. Spectra from the scattering of cold (5. 3A) neutrons by xeolite 3
A
containing H20 at an angle of 20°. The lower curve is the scattering by the
empty lattice. (Egelstaff et al., [19])
.
if prepared in deuterated form. As an example, figure 7 shows the
data of Egelstaff et al. [19] on H20 in molecular sieve 3A. Theadditional scattered intensity due to the water is clearly visible
over the scattering due to the xeolite lattice. These data can be
analyzed to show the frequency spectra of the guest molecule,
the amplitude of its vibrations and the time it spends at one site
in the cage.
8. Conclusions
Over the past decade neutron spectrometers have been developed
to the point where they can be employed as routine instruments. This
in turn has led to the widespread use of neutron spectroscopy in the
study of atomic and molecular dynamics. The analysis of the scattered
neutron spectrum from a molecule can provide data on both the fre-
quencies and amplitudes of translational, rotational and vibrational
modes.
The technique is made more useful by the fortunate circumstance
that the cross section for protons is abnormally large while that for
deuterium is similar to other nuclei. Thus a wide range of organic
molecules can be studied and the motion of each part of the molecule
examined separately. Of especial interest is the comparison of neutron
and optical data on rotational spectra in order to isolate the rotational
correlations between neighbouring molecules.
154 MOLECULAR DYNAMICS ANI> STRUCTURE OF SOLIDS
In the case of molecular crystals the frequency—wave numberrelationship for lattice, rotational and vibrational modes can be
measured. However little work is complete as yet.
This method is as yet in its infancy, but it may be expected to be
applied more widely in the coming decade and help to provide a newinsight into many molecular problems.
9. Discussion
D. W. McCall (Bell Telephone Laboratories) : You mentioned that
the broadening of low energy neutron lines is a reflection of self
diffusion of the scattering molecules. Earl}' results for self diffusion
coefficients were not in agreement with tracer or NMR results. Canyou summarize the present situation concerning the comparison of
the neutron-derived diffusion coefficients and tracer results?
P. A. Egelstaff: There are several reasons for this discrepancy. Oneis that neutron measurements are made at high values of the momen-tum transfer where you observe the time for a diffusive step rather
than the diffusion constant. This effect gives an observed width for
the quasi-elastic peak which is less than that forecast by Ficks law.
Another reason is that the spectral density of the velocity correlation
function for protons in large organic molecules often has intense
components at low frequencies. In contrast with the above effect this
causes the width to be larger than predicted by Ficks law.
In general, the values of the momentum transfer used in neutron
work are not small enough to be sure that the diffusion constant is
measured properly, but as indicated above, other interesting informa-
tion may be obtained from the data. For those cases (e.g., liquid
sodium or liquid hydrogen) where one has reason to believe that Qis small enough, reasonable agreement with tracer or NMR work is
found. However, even in these cases, the diffusion constant can be
measured to a higher accuracy by the other methods, so that one
should not look to the neutron method for good diffusion constant
data. Rather one should exploit the new information made available
by a tool which can probe at high Q values.
V. H. Schmidt (Montana State University): How fast a hindered
rotation can be distinguished from a free rotation?
P. A. Egelstaff: The practical answer depends upon whether other
modes of motion overlap or couple to the rotation being sought.
However, if a molecule resides in a given orientation for 10-12 sec or
longer the hindering is easily visible but if it resides for less than
INTRODUCTORY LECTURES 155
10" 13 sec it will appear as virtually free. This answer applies to a
typical existing spectrometer, but if (see answer to Dr. Moore's
question) a new phased chopper spectrometer is used, one might hope
to push one limit to 10-11 sec and the other to 10" 14sec.
M. J. Moore (Rensselaer Polytechnique Institute) : Could you com-
ment on the resolution one could expect in these scattering experi-
ments, in view of the various experimental parameters, e.g., chopper
width, flight path, etc.?
P. A. Egelstaff: If we assume that the collimation angles are in the
region of 2 ° and the incident wavelength is about 5 A, then the aver-
age performance of existing spectrometers corresponds to resolutions
ranging from 0.5 meV for elastic scattering to 10 meV for an energy
transfer of 100 meV. However, there may be as much as a factor 10
difference in resolution between a filter-chopper apparatus mountedon a low flux reactor and a phased chopper apparatus mounted on a
high flux reactor (e.g., the new cold neutron apparatus at the NBSreactor). A spectrometer of the latter type can have a resolution of
0.05 meV for elastic scattering and 0.5 meV for inelastic transition
of 30 meV.
P. Coppens (Brookhaven National Laboratory) : What are the
prospects for observing overtones of molecular librations? Has in-
formation on anharmonicity of the librations been obtained?
P. A. Egelstaff: The cases of (lattice) modes in NH4C1 and PH4I
have been studies already, but only a limited number of cases in which
the level energy is < 0.05 eV can be examined using present techniques.
Future development, towards studying unharmonicity of internal
modes of molecules, will become possible when strong neutron sources
of about 0.25 eV are available (e.g., the linac pulsed neutron source).
Some experiments of this kind have been conducted on metal hydrides
by Yeater and co-workers at R.P.I, and by Whittemore and co-
workers at G.A.
10. References
[1] Lomer, W. M. and Low, G. C, Ch. 1, Thermal Neutron Scattering, Ed.P. A. Egelstaff, Academic Press (London), (1965).
[2] Van Hove, L., Phys. Review 95, 249, (1954).
[3] Sjolander, A., 72, Phonons and Phonon Interactions, Ed. T. A. Bak (NewYork: Benjamin), (1964).
[4] Brugger, R. M., Ch. 12, Thermal Neutron Scattering, Ed. P. A. Egelstaff,
Academic Press (London), (1965).
156 MOLECULAR DYNAMICS AND STRUCTURE OF SOLIDS
[5] Iyengar, P. K., Ch. 3, Thermal Neutron Scattering, Ed. P. A. Egelstaff,
Academic Press (London), (1965).
[6] Dolling, G. and Woods, D. B., Ch. 5, Thermal Neutron Scattering, Ed.
P. A. Egelstaff, Academic Press (London), (1965).
[7] Dolling, G., These proceedings.
[8] Sjolander, A., Ch. 7, Thermal Neutron Scattering, Ed. P. A. Egelstaff,
Academic Press (London), (1965).
[9] Brier, P. N. et al., To be published.
[10] Janik, J. A., Janik, J. M., Mellor, J. and Palevsky, H., J. Phys. Chem.Solids 25, 1091, (1964).
[11] Rush, J. J. and Taylor, T. I. (1966), J. Chem. Phys. 44, 2749, (1966).
[12] Bajorek et al., In Inelastic Scattering of Neutrons, Vol. II, 355, published
by IAEA, Vienna, (1965).
[13] Venkataraman, G. et al., Report No. AEET 258, (1965).
[14] Janik, J. A. and Kowalska, A., Ch. 10, Thermal Neutron Scattering, Ed.
P. A. Egelstaff, Academic Press (London), (1965).
[15] Gordon, R. B., J. Chem. Physics 43, 1307, (1965).
[16] Agrawal, A. K. and Yip, S., These proceedings.
[17] White, J. W., These proeedings.
[18] Allen, G., Brier, P. N. and Lane, G. Trans Faraday Society 63, 824, (1967).
[19] Egelstaff, P. A., Downes, J. and White, J., Proc. Soc. Chem. Ind., 306, (1968).
/
THE PRINCIPLES INVOLVED IN THE STUDY OFMOLECULAR MOTION IN SOLIDS BY NUCLEAR
MAGNETIC RESONANCE
R. E. RICHARDS, F.R.S.
Physical Chemistry Laboratory, University of Oxford, Oxford, England
1. Introduction
Nuclear resonance lines in solids are often broadened either bymagnetic dipole-dipole interactions with other spins in the crystal or
by quadrupole coupling between the electric quadrupole moment of
the nucleus and electric field gradients in the crystal; in special cases
other mechanisms may also contribute to the line width. If molecular
motion occurs in the solid with sufficient frequency, these interactions
may be partially or completely averaged to zero; from the change
of line shape and width it is often possible to characterize the axis
or axes and the amplitudes of the molecular motion responsible for
the changes of line width. The mechanisms of the various interactions
which may cause line broadening in n.m.r. spectra are outlined
briefly below and the conditions for line narrowing by molecular
motion considered.
The magnetic dipole-dipole and electric quadrupole interactions
also provide the most important process by which Zeeman energy
can be transferred among the nuclei themselves, by so-called spin-
spin relaxation, and by which energy may be exchanged between the
nuclear spin system and the thermal motion of the molecules in the
lattice, by spin lattice relaxation. These two processes are usually
characterized by the spin-spin relaxation time, T2} and the spin
lattice relaxation time, TVThe nuclear spin lattice transitions are not stimulated by time
independent effects, but only by interactions which are modulated
at appropriate frequencies. In solids the transitions are induced bythe magnetic dipole-dipole couplings or by the electric quadrupole
couplings, which are modulated by molecular motion. By studying
the variation of Tx and T2 with temperature, the frequency of the
molecular motion and its temperature dependence can be found.
The principles of these studies, and some of the complications which
can occur, are discussed in the second part of the article.
157
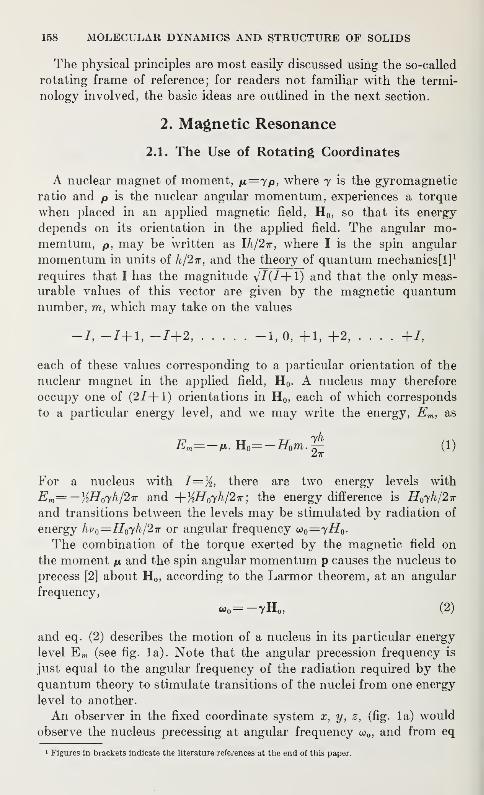
158 MOLECULAR DYNAMICS AND STRUCTURE OF SOLIDS
The physical principles are most easily discussed using the so-called
rotating frame of reference; for readers not familiar with the termi-
nology involved, the basic ideas are outlined in the next section.
2. Magnetic Resonance
2.1. The Use of Rotating Coordinates
A nuclear magnet of moment, n=yp, where 7 is the gyromagnetic
ratio and p is the nuclear angular momentum, experiences a torque
when placed in an applied magnetic field, H 0 , so that its energy
depends on its orientation in the applied field. The angular mo-memturn, p, may be written as Ih/2ir, where I is the spin angular
momentum in units of h/2ir, and the theory of quantum mechanics]!] 1
requires that I has the magnitude and that the only meas-urable values of this vector are given by the magnetic quantumnumber, m, which may take on the values
-/, -7+1, -1+2, -1,0, +1, +2, . . . . +/,
each of these values corresponding to a particular orientation of the
nuclear magnet in the applied field, H0 . A nucleus may therefore
occupy one of (27+1) orientations in H 0 , each of which corresponds
to a particular energy level, and we may write the energy, Em , as
#m=-M.Ho=-#0m.g (1)
For a nucleus with I=%, there are two energy levels with
Em= — Y2H0yh/2T and + %£Z 07^/2 *'; the energy difference is HQyh/2T
and transitions between the levels may be stimulated by radiation of
energy hv 0=H0yh/2ir or angular frequency oi 0=yH0 .
The combination of the torque exerted by the magnetic field on
the moment p, and the spin angular momentum p causes the nucleus to
precess [2] about HG ,according to the Larmor theorem, at an angular
frequency,
«0=-7H0) (2)
and eq. (2) describes the motion of a nucleus in its particular energy
level Em (see fig. la). Note that the angular precession frequency is
just equal to the angular frequency of the radiation required by the
quantum theory to stimulate transitions of the nuclei from one energy
level to another.
An observer in the fixed coordinate system x, y, z, (fig. la) would
observe the nucleus precessing at angular frequency o)Q , and from eq
1 Figures in brackets indicate the literature references at the end of this paper.
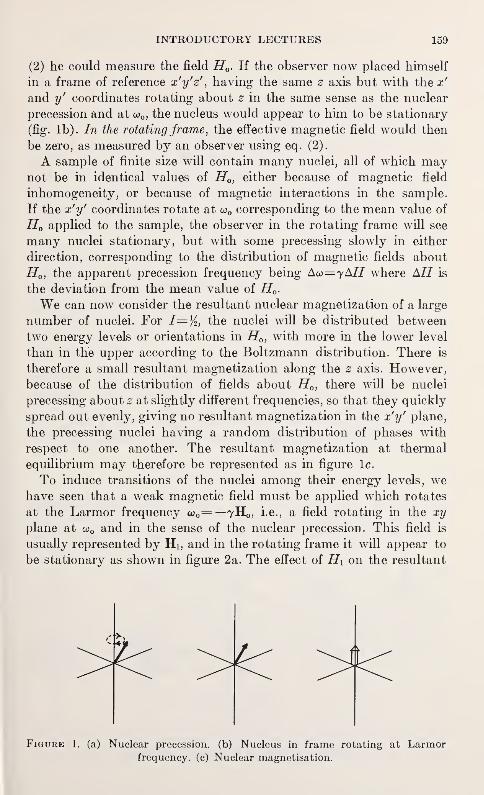
INTRODUCTORY LECTURES 159
(2) he could measure the field H0 . If the observer now placed himself
in a frame of reference x'y'z',having the same z axis but with the x'
and y' coordinates rotating about z in the same sense as the nuclear
precession and at co0 , the nucleus would appear to him to be stationary
(fig. lb). In the rotating frame, the effective magnetic field would then
be zero, as measured by an observer using eq. (2).
A sample of finite size will contain many nuclei, all of which maynot be in identical values of H0 , either because of magnetic field
inhomogeneity, or because of magnetic interactions in the sample.
If the x'y' coordinates rotate at cu0 corresponding to the mean value of
HQ applied to the sample, the observer in the rotating frame will see
many nuclei stationary, but with some precessing slowly in either
direction, corresponding to the distribution of magnetic fields about
H0 , the apparent precession frequency being Aco—yAH where AH is
the deviation from the mean value of H0 .
We can now consider the resultant nuclear magnetization of a large
number of nuclei. For I=Y2 , the nuclei will be distributed between
two energy levels or orientations in HQ , with more in the lower level
than in the upper according to the Boltzmann distribution. There is
therefore a small resultant magnetization along the z axis. However,
because of the distribution of fields about H0 , there will be nuclei
precessing about z at slightly different frequencies, so that they quickly
spread out evenly, giving no resultant magnetization in the x'y' plane,
the precessing nuclei having a random distribution of phases with
respect to one another. The resultant magnetization at thermal
equilibrium may therefore be represented as in figure lc.
To induce transitions of the nuclei among their energy levels, wehave seen that a weak magnetic field must be applied which rotates
at the Larmor frequency wG= -7H0, i.e., a field rotating in the xy
plane at co0 and in the sense of the nuclear precession. This field is
usually represented by Hi, and in the rotating frame it will appear to
be stationary as shown in figure 2a. The effect of Hx on the resultant
Figure 1. (a) Nuclear precession, (b) Nucleus in frame rotating at Larmorfrequency, (c) Nuclear magnetisation.
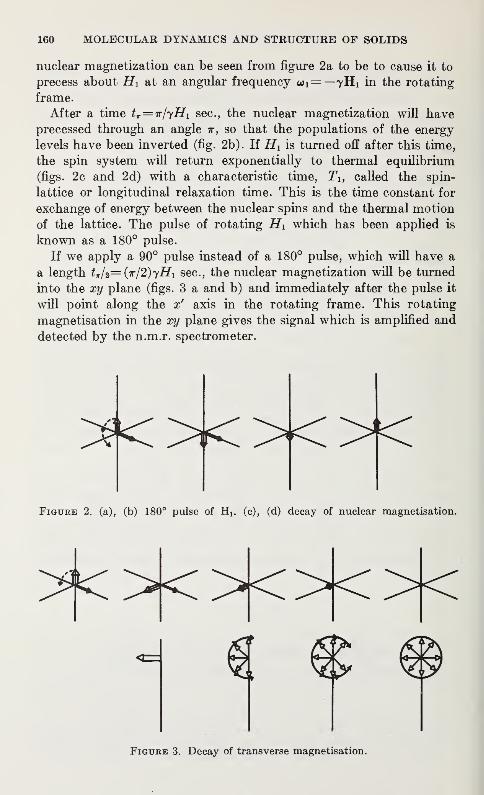
160 MOLECULAR DYNAMICS AND STRUCTURE OF SOLIDS
nuclear magnetization can be seen from figure 2a to be to cause it to
precess about Hi at an angular frequency 7H1 in the rotating
frame.
After a time tT=ir/yHi sec, the nuclear magnetization will haveprecessed through an angle ir, so that the populations of the energy-
levels have been inverted (fig. 2b). If Hi is turned off after this time,
the spin system will return exponentially to thermal equilibrium
(figs. 2c and 2d) with a characteristic time, T1} called the spin-
lattice or longitudinal relaxation time. This is the time constant for
exchange of energy between the nuclear spins and the thermal motion
of the lattice. The pulse of rotating Hi which has been applied is
known as a 180° pulse.
If we apply a 90° pulse instead of a 180° pulse, which will have a
a length t,/i=(r/2)yHi sec, the nuclear magnetization will be turned
into the xy plane (figs. 3 a and b) and immediately after the pulse it
will point along the x' axis in the rotating frame. This rotating
magnetisation in the xy plane gives the signal which is amplified and
detected by the n.m.r. spectrometer.
Figure 2. (a), (b) 180° pulse of (c), (d) decay of nuclear magnetisation.
>k>k:d<:4<><
Figure 3. Decay of transverse magnetisation.
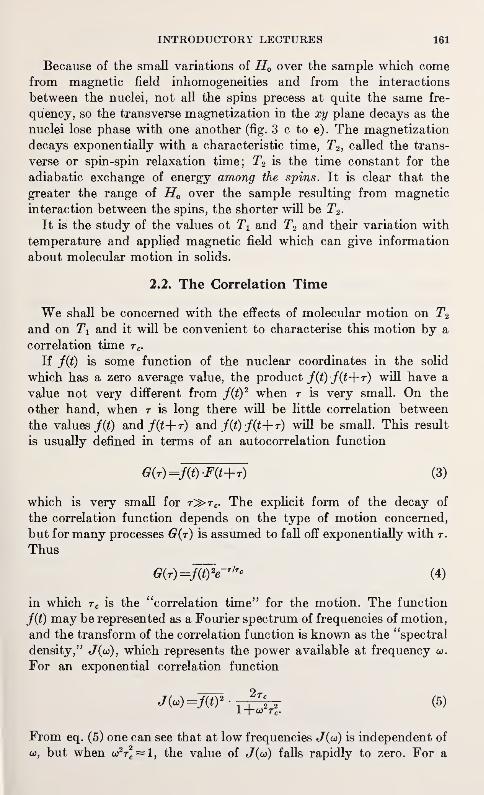
INTRODUCTORY LECTURES 161
Because of the small variations of H0 over the sample which comefrom magnetic field inhomogeneities and from the interactions
between the nuclei, not all the spins precess at quite the same fre-
quency, so the transverse magnetization in the xy plane decays as the
nuclei lose phase with one another (fig. 3 c to e). The magnetization
decays exponentially with a characteristic time, T2 , called the trans-
verse or spin-spin relaxation time; T2 is the time constant for the
adiabatic exchange of energy among the spins. It is clear that the
greater the range of H0 over the sample resulting from magnetic
interaction between the spins, the shorter will be T2 .
It is the study of the values ot Tx and T2 and their variation with
temperature and applied magnetic field which can give information
about molecular motion in solids.
2.2. The Correlation Time
We shall be concerned with the effects of molecular motion on T2
and on Tx and it will be convenient to characterise this motion by a
correlation time rc .
If j{t) is some function of the nuclear coordinates in the solid
which has a zero average value, the product f(t) J(t-\-r) will have a
value not very different from jit)2 when r is very small. On the
other hand, when r is long there will be little correlation between
the values/© and/(£+r) and f(t)m
f(t-\-r) will be small. This result
is usually defined in terms of an autocorrelation function
6(r)=f(t)F(t+r) (3)
which is very small for r^>rc . The explicit form of the decay of
the correlation function depends on the type of motion concerned,
but for many processes G(t) is assumed to fall off exponentially with r.
Thus
G(r)=M 2e-T/Tc
(4)
in which r c is the "correlation time" for the motion. The function
j(t) may be represented as a Fourier spectrum of frequencies of motion,
and the transform of the correlation function is known as the "spectral
density," «7(w), which represents the power available at frequency w.
For an exponential correlation function
J(")=W2'^W (5)
From eq. (5) one can see that at low frequencies «7(w) is independent of
co, but when co2r*~l, the value of J(to) falls rapidly to zero. For a
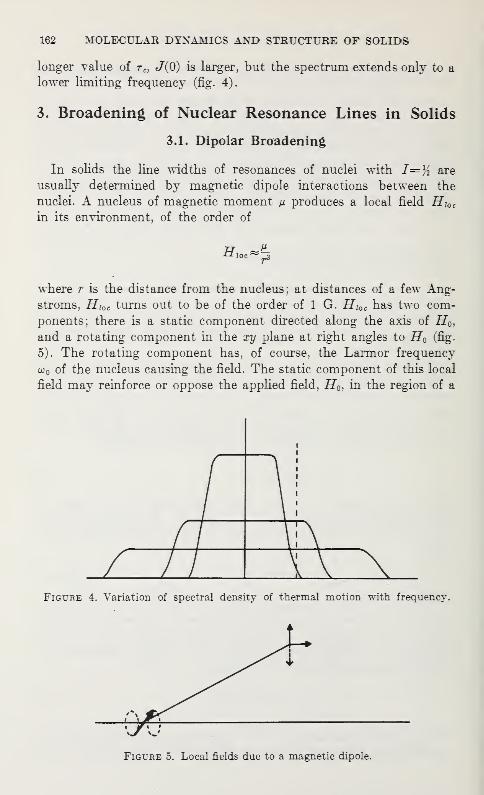
162 MOLECULAR DYNAMICS AND STRUCTURE OF SOLIDS
longer value of r c , «7(0) is larger, but the spectrum extends only to a
lower limiting frequency (fig. 4).
3. Broadening of Nuclear Resonance Lines in Solids
3.1. Dipolar Broadening
In solids the line widths of resonances of nuclei with I=% are
usually determined by magnetic dipole interactions between the
nuclei. A nucleus of magnetic moment p produces a local field H]GC
in its environment, of the order of
where r is the distance from the nucleus; at distances of a few Ang-
stroms, Hioc turns out to be of the order of 1 G. Hioc has two com-
ponents; there is a static component directed along the axis of H0 ,
and a rotating component in the xy plane at right angles to H0 (fig.
5). The rotating component has, of course, the Larmor frequency
o> 0 of the nucleus causing the field. The static component of this local
field may reinforce or oppose the applied field, H0 , in the region of a
Figure 4. Variation of spectral density of thermal motion with frequency.
Figure 5. Local fields due to a magnetic dipole.
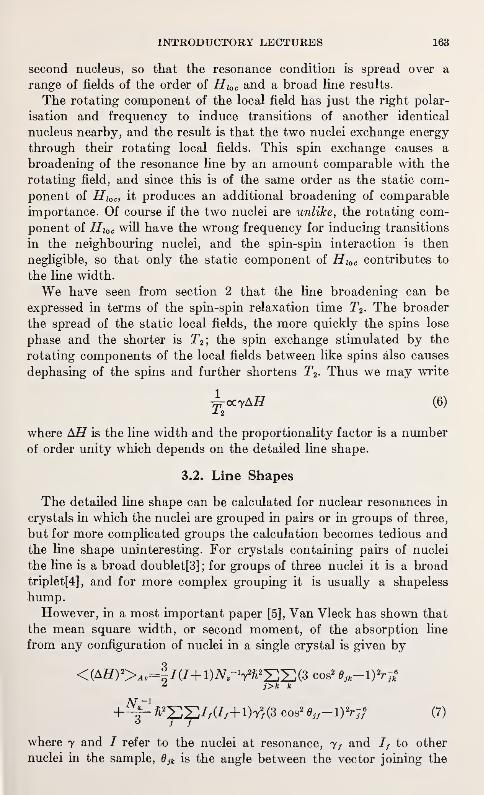
INTRODUCTORY LECTURES 163
second nucleus, so that the resonance condition is spread over a
range of fields of the order of Hioc and a broad line results.
The rotating component of the local field has just the right polar-
isation and frequency to induce transitions of another identical
nucleus nearby, and the result is that the two nuclei exchange energy
through their rotating local fields. This spin exchange causes a
broadening of the resonance line by an amount comparable with the
rotating field, and since this is of the same order as the static com-
ponent of Hioc, it produces an additional broadening of comparable
importance. Of course if the two nuclei are unlike, the rotating com-
ponent of Hioc will have the wrong frequency for inducing transitions
in the neighbouring nuclei, and the spin-spin interaction is then
negligible, so that only the static component of Hioc contributes to
the line width.
We have seen from section 2 that the line broadening can be
expressed in terms of the spin-spin relaxation time T2 . The broader
the spread of the static local fields, the more quickly the spins lose
phase and the shorter is T2 ; the spin exchange stimulated by the
rotating components of the local fields between like spins also causes
dephasing of the spins and further shortens T2 . Thus we may write
jrocyAH (6)
where AH is the line width and the proportionality factor is a numberof order unity which depends on the detailed line shape.
3.2. Line Shapes
The detailed line shape can be calculated for nuclear resonances in
crystals in which the nuclei are grouped in pairs or in groups of three,
but for more complicated groups the calculation becomes tedious andthe line shape uninteresting. For crystals containing pairs of nuclei
the line is a broad doublet[3] ; for groups of three nuclei it is a broad
triplet[4], and for more complex grouping it is usually a shapeless
hump.However, in a most important paper [5], Van Vleck has shown that
the mean square width, or second moment, of the absorption line
from any configuration of nuclei in a single crystal is given by
<(AH) 2>Ap=|/(/+i)ivs-v^2]2:(3 cos2 ejk-\yr-^* j>k k
-h^P ft22S//tf
r
/+i)72/(3 cos2
eJf-iyr 7? (7)
where y and / refer to the nuclei at resonance, yf and to other
nuclei in the sample, 6jk is the angle between the vector joining the
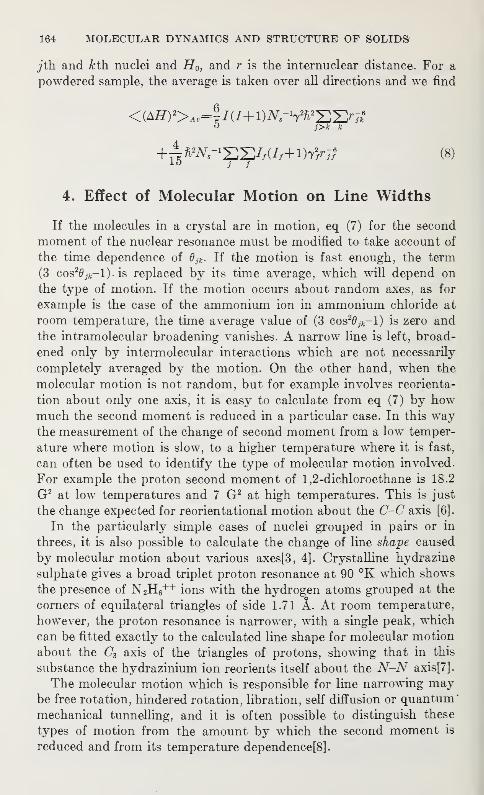
164 MOLECULAR DYNAMICS AND STRUCTURE OF SOLIDS/
jth and kth nuclei and HQ) and r is the internuclear distance. For a
powdered sample, the average is taken over all directions and we find
<(AHy>A,=lni+i)Ns-vvT,i:>-]*e
O j>k k
+A^Ws
- 1SS//(//+l)T2/rJ/
6(8)
103 1
4. Effect of Molecular Motion on Line Widths
If the molecules in a crystal are in motion, eq (7) for the second
moment of the nuclear resonance must be modified to take account of
the time dependence of 6jk . If the motion is fast enough, the term
(3 cos20 jfc-l)> is replaced by its time average, which will depend on
the type of motion. If the motion occurs about random axes, as for
example is the case of the ammonium ion in ammonium chloride at
room temperature, the time average value of (3 cos2djk-l) is zero and
the intramolecular broadening vanishes. A narrow line is left, broad-
ened only by intermolecular interactions which are not necessarily
completely averaged by the motion. On the other hand, when the
molecular motion is not random, but for example involves reorienta-
tion about only one axis, it is easy to calculate from eq (7) by howmuch the second moment is reduced in a particular case. In this waythe measurement of the change of second moment from a low temper-
ature where motion is slow, to a higher temperature where it is fast,
can often be used to identify the type of molecular motion involved.
For example the proton second moment of 1 ,2-dichloroethane is 18.2
G2 at low temperatures and 7 G2 at high temperatures. This is just
the change expected for reorientational motion about the C-C axis [6].
In the particularly simple cases of nuclei grouped in pairs or in
threes, it is also possible to calculate the change of line shape caused
by molecular motion about various axes[3, 4]. Crystalline hydrazine
sulphate gives a broad triplet proton resonance at 90 °K which shows
the presence of N 2H6++ ions with the hydrogen atoms grouped at the
corners of equilateral triangles of side 1.71 A. At room temperature,
however, the proton resonance is narrower, with a single peak, which
can be fitted exactly to the calculated line shape for molecular motion
about the C3 axis of the triangles of protons, showing that in this
substance the hydrazinium ion reorients itself about the N-N axis[7].
The molecular motion which is responsible for line narrowing maybe free rotation, hindered rotation, libration, self diffusion or quantum'
mechanical tunnelling, and it is often possible to distinguish these
types of motion from the amount by which the second moment is
reduced and from its temperature dependence[8].
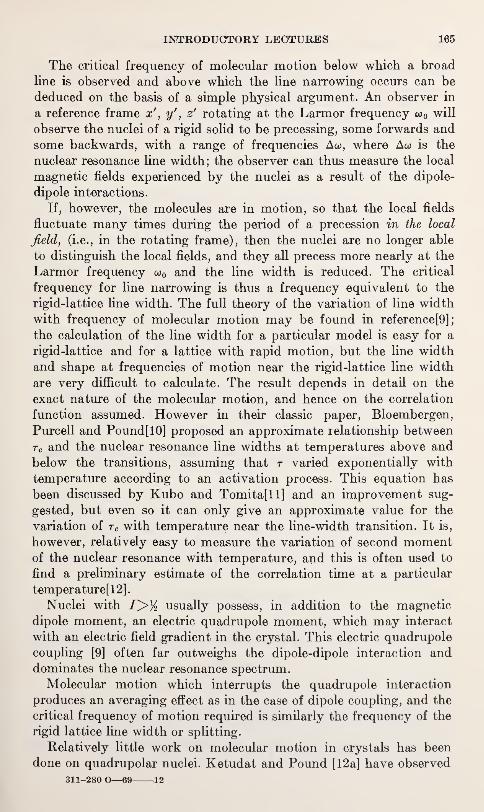
INTRODUCTORY LECTURES 165
The critical frequency of molecular motion below which a broad
line is observed and above which the line narrowing occurs can be
deduced on the basis of a simple physical argument. An observer in
a reference frame x', y' , z' rotating at the Larmor frequency w 0 will
observe the nuclei of a rigid solid to be precessing, some forwards and
some backwards, with a range of frequencies Aco, where Aco is the
nuclear resonance line width; the observer can thus measure the local
magnetic fields experienced by the nuclei as a result of the dipole-
dipole interactions.
If, however, the molecules are in motion, so that the local fields
fluctuate many times during the period of a precession in the local
field, (i.e., in the rotating frame), then the nuclei are no longer able
to distinguish the local fields, and they all precess more nearly at the
Larmor frequency co 0 and the line width is reduced. The critical
frequency for line narrowing is thus a frequency equivalent to the
rigid-lattice line width. The full theory of the variation of line width
with frequency of molecular motion may be found in reference [9]
;
the calculation of the line width for a particular model is easy for a
rigid-lattice and for a lattice with rapid motion, but the line width
and shape at frequencies of motion near the rigid-lattice line width
are very difficult to calculate. The result depends in detail on the
exact nature of the molecular motion, and hence on the correlation
function assumed. However in their classic paper, Bloembergen,
Purcell and Pound [10] proposed an approximate relationship between
tc and the nuclear resonance line widths at temperatures above and
below the transitions, assuming that r varied exponentially with
temperature according to an activation process. This equation has
been discussed by Kubo and Tomita[ll] and an improvement sug-
gested, but even so it can only give an approximate value for the
variation of rc with temperature near the line-width transition. It is,
however, relatively easy to measure the variation of second momentof the nuclear resonance with temperature, and this is often used to
find a preliminary estimate of the correlation time at a particular
temperature[ 12].
Nuclei with usually possess, in addition to the magnetic
dipole moment, an electric quadrupole moment, which may interact
with an electric field gradient in the crystal. This electric quadrupole
coupling [9] often far outweighs the dipole-dipole interaction and
dominates the nuclear resonance spectrum.
Molecular motion which interrupts the quadrupole interaction
produces an averaging effect as in the case of dipole coupling, and the
critical frequency of motion required is similarly the frequency of the
rigid lattice line width or splitting.
Relatively little work on molecular motion in crystals has been
done on quadrupolar nuclei. Ketudat and Pound [12a] have observed
311-280 O—69 12
166 MOLECULAR DYNAMICS AND STRUCTURE OF SOLIDS
the deuterium resonance in LiS04 D20 and conclude that the D20molecules reorient themselves about their twofold axes.
Chiba [12b] by the same method has been able to make a detailed
study of the motion of the water molecules in BaCl2 D 20 and in a
number of strongly hydrogen bonded crystals.
5. Effect of Molecular Motion on Relaxation Times
We have already seen (3.1) that the spin-spin or transverse relaxa-
tion time, T2f is related to the resonance line width. The static com-ponents of local magnetic fields cause a range of nuclear precession
frequencies, so that the nuclei lose phase; the rotating components of
the local fields induce spin exchange and shorten T2 still further. Thevalue of T2 therefore depends on local fields along the z direction
which have frequency components near zero (static) and also on
local fields in the xy plane which fluctuate at frequencies close to the
Larmor frequency.
The spin-lattice, or longitudinal relaxation time, Ti, is concerned
with changes of magnetisation along the z direction, and these changes
can only be stimulated by local fields which fluctuate in the xy plane
In order to analyze the effects of molecular motion on Ti and T2 wemust therefore consider the spectral distribution of the fluctuations
of the local nuclear magnetic fields caused by the motion.
5.1. Modulation of Dipole-Dipole Interactions by Molecular
Motion
The modulation of dipole interactions by molecular motion, and its
effect on the nuclear relaxation times was first set out by Bloembergen,
Purcell and Pound [10]; the theory has since been extended and gen-
eralised and recent reviews may be found in references 9 and 13.
The classical dipolar energy of interaction, E, between two magnetic
moments fii and p2 is
where r is the radius vector from m to /*2- Treating mi and ix2 as operators
(2.1).
E= Mi-/*2 3(/ii-r) (ft2 -r)
r3 r5(9)
M2=72^12
The general dipolar Hamiltonian for N spins then becomes
2 j k L r% r)k J(10)
INTRODUCTORY LECTURES 167
Using spherical polar coordinates and the raising and lowering opera-
tors I+ and I~}the Hamiltonian may be -written in the form
9£*^r [A+B+C+D+E+F]
where (H)
A=IXJ22(l-3 cos20)
B=-\ [ItI;+IrI}](lS cos2 0)
<7=-| [Ithn+IiJ}] sin 0 cos Oe'**
D=-\ [IrLz+IiJZ] sin 0 cos Be**
E=-jI+I? sin2 Be-2i+
4
F=~Irl2 sm2 6e 2i*
When the molecules in the solid are in motion, the coordinates r,
B and <j> vary randomly with time, and it is convenient to choose as
space functions the terms
2^= (1-3 cos2 0)r"3
Fx=r-Z sin B cos de***
F2=r~* sin2 Be±2i* (12)
When these functions vary randomly with time, the correspond-
ing spectral densities are
Jo(o>)=F0 (t)2-j(a>)
J.(«)=#i(fl*.j(«). (13)
If we assume an exponential correlation function (section 2.2) the
normalised spectral density j(<a) becomes
(14)
The functions in eq (13) thus describe the intensity of the fre-
quency components at co of the fluctuating dipolar fields in the solid
arising from the molecular motion characterised by the correlation
tine rc .
168 MOLECULAR DYNAMICS AND STRUCTURE OF SOLIDS
5.2. Effect of Motion on Tx
Spin-lattice relaxation involves transitions of nuclei which are
stimulated by fluctuating fields in the xy plane, and which involve
exchange of energy between the spins and the thermal molecular
motion. The terms C, D, E and F of the Hamiltonian (eq 11) can
induce spin-lattice relaxation, as can be seen from the spin operators
involved. We are therefore concerned with Fi(t) and F2 (t) of eq (12).
Terms C and D involve a single spin flip, requiring a frequency co0 ,
but terms E and F represent double spin flips, requiring a frequency
2co0 , where co0 is the nuclear Larmor frequency.
Terms C and D involve the function Fi(t) and terms E and Fthe function F2 (t) (eq 12). Spin lattice relaxation is therefore stimu-
lated by spectral components Ji(<a0) and J2 (2co0), i.e.,
^i(02-2r c F2 (ty.2r c
l+co§r? l+4a>§r?"
The functions Fx and F2 are measure of the local fields in the xy
plane, and contain the internuclear distances. For example, for spin-
lattice relaxation of a spin / interacting with several identical nuclei,
provided their motions are not correlated, it turns out that [9],
^=| 7W(/+l)SW,^W+J2> ;,,(2cOo)]. (15)1 1 * k
For rotational motion
t/l(^o)=TT -—[ % 2> e^2(2cOo) r^TT'~~6
_ '
1 T A 2 215 rfh 1+ woTe 15 rjk H-4w0Te
so
For a group of identical nuclei this value is
H <(^)2>^H^+H&] (16)
where <C(^) 2^ Av is the second moment of the absorption line in
angular frequency units.
When co02Tc<<1 (eq 16) reduces to
1 2<(Aco2)>^-5t c
and Tx is inversely proportional to rc. On the other hand, when motion
is slow and col T? is large,
INTRODUCTORY LECTURES 169
hr= \ <(Aco2)>a*—4~±\ 3 «/t c
and Ti is directly proportional to rc. Furthermore, the plot of Tiagainst r c passes through a minimum value of T1 when wor c =0.6,
so that,
Thus by following the variations of Ti in a solid one can follow
the variation of tc. For example, if r c is the correlation time for
hindered reorientation in a solid, it is likely to vary exponentially
with the temperature according to an equation of the form
In this case a plot of In Tx against 1/T will have two linear portions
with a minimum given by eq (17). From the slopes of the linear
parts, the value of the potential barrier, V, can be derived, and from
the temperature of the minimum where o)0t c~ 0.6, the value of r0
can be obtained.
The formation of a minimum in the plot of Ti against rc can be
seen qualitatively from figure 4, if we remember that spin lattice
relaxation is stimulated by thermal fluctuations near a>0 and 2co0 .
When t c is small, at high temperatures, the correlation spectrum,
e/(o>), is very extended and the intensity near coQ is small, and Tx is
long. As tc increases, the intensities of the components near coQ in-
crease and T1 becomes shorter.
When co02rc
2 = l, the intensities of the thermal fluctuations are at
a maximum near co0 (fig. 4b) and Tl reaches a minimum. As rc gets
longer still, the correlation spectrum shrinks further back to fre-
quencies below co0 , and Tx increases as the thermal fluctuations at the
Larmor frequency die away again.
Many studies of molecular motions have been made, using Tx
measurements. For example, Andrew and Eades [14] have studied
the change of second moment and of relaxation time with temperature
for solid benzene. The change of second moment is consistent with
reorientation of the benzene ring about its hexad axis. The value of
Ti passes through a minimum at about 170 °K and from the slopes
of the plots of In Tx against 1/T at high and low temperatures, an
activation energy for the motion of 3.95 kcal/mole was found.
Further measurements have been made by Anderson [15] on solid
solutions of C6H6 in C6D6 from which it was possible to extrapolate
the value of (Tx ) min from pure benzene to a crystal having C 6H6 in
C6D6 at infinite dilution. The value of (2\)mln obtained corresponds
(17)
y/RT
170 MOLECULAR DYNAMICS AND STRUCTURE OF SOLIDS
to a relatively isolated benzene molecule, and was found to be 196
± S msec at 50 Mc/s. The value of (T^^ can also be calculated
from eq (17). using the known interproton distance in benzene, and
is found to be 199 msec, in excellent agreement with the experimental
result.
Such measurements of correlation times for molecular motion can
be made not only as a function of temperature but also as a function
of pressure; Anderson and Slichter [16] have measured the effect of
pressure on molecular motion in camphor, benzene, hexamethyl-
benzene, ammonium chloride, and some n-alkanes, and have tabulated
volumes of activation.
A considerable amount of work has been done on molecular motion
in polymers. Connor, Blears and Allen [17] have studied proton
spin-lattice relaxation in polypropylene oxides over a range of tem-
peratures. Two Ti minima were observed, one corresponding with
motion of the chain backbone and the other with methyl group
rotation. The measurements correlate well with dielectric and me-chanical measurements of the chain backbone motion for which an
activation energy of 10.5 kcal/mole was found.
Relaxation times in polymers are often complicated by "spin
diffusion" at low temperatures. If the methyl groups at the end of a
hydrocarbon chain are free to rotate, they may act as an energy
"sink" for the whole spin system. Spin-spin relaxation, which in
solids is much faster than spin-lattice relaxation, may conduct energy
very efficiently from the methylene protons to the methyl groups,
which by virtue of their rotation may be more strongly coupled to
the thermal modes of the lattice.
This mechanism has been carefully studied [IS, 19], and if it domi-
nates spin-lattice relaxation in a hydrocarbon, one expects that
(a) the Ti minimum will occur at the same temperature for all mem-bers of a homologous series, (b) the value of (Ti) min will be inversely
proportional to the fraction of methyl protons, and (c) the activation
energies for members of a homologous series would all be about the
same and equal to that for the reorientation of the methyl groups.
The equations given above refer only to solids in which nuclear
relaxation occurs by rotational motion among like nuclei. For other
forms of motion, such as diffusion, similar arguments may be used,
but different correlation functions may be involved.
Holcomb and Xorberg [20] have studied the temperature depend-
ence of relaxation times of lithium, sodium, and rubidium in the
alkali metals and have determined the magnitude and temperature
dependence of the self diffusion coefficients. Hultsch and Barnes
[21] then determined the effects of pressure on these diffusion co-
efficients in lithium and sodium.
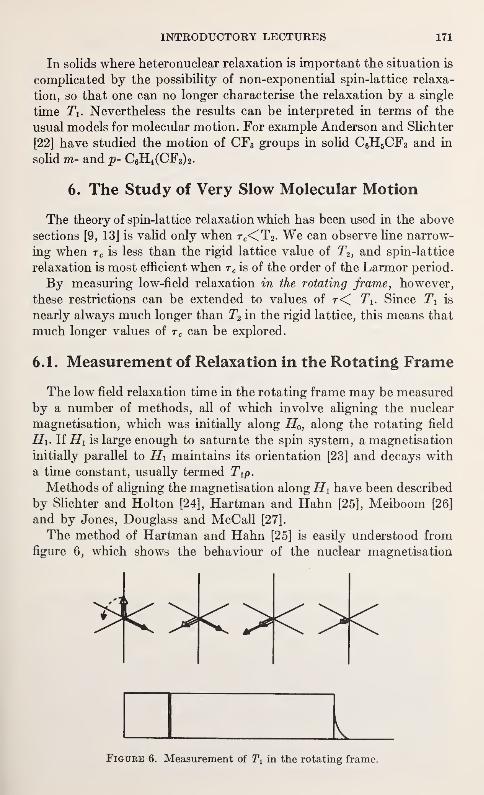
INTRODUCTORY LECTURES 171
In solids where heteronuclear relaxation is important the situation is
complicated by the possibility of non-exponential spin-lattice relaxa-
tion, so that one can no longer characterise the relaxation by a single
time Ti. Nevertheless the results can be interpreted in terms of the
usual models for molecular motion. For example Anderson and Slichter
[22] have studied the motion of CF3 groups in solid C6H5CF3 and in
solid m- and p- C6H4(CF3)2.
6. The Study of Very Slow Molecular Motion
The theory of spin-lattice relaxation which has been used in the above
sections [9, 13J is valid only when rc<T2 . We can observe line narrow-
ing when r c is less than the rigid lattice value of T2 , and spin-lattice
relaxation is most efficient when r c is of the order of the Larmor period.
By measuring low-field relaxation in the rotating frame, however,
these restrictions can be extended to values of r< TV Since Tl is
nearly always much longer than T2 in the rigid lattice, this means that
much longer values of r c can be explored.
6.1. Measurement of Relaxation in the Rotating Frame
The low field relaxation time in the rotating frame may be measured
by a number of methods, all of which involve aligning the nuclear
magnetisation, which was initially along H0 ,along the rotating field
Hi. If Hi is large enough to saturate the spin system, a magnetisation
initially parallel to Hi maintains its orientation [23] and decays with
a time constant, usually termed Tip.
Methods of aligning the magnetisation along Hi have been described
by Slichter and Holton [24], Hartman and Hahn [25], Meiboom [26]
and by Jones, Douglass and McCall [27].
The method of Hartman and Hahn [25] is easily understood from
figure 6, which shows the behaviour of the nuclear magnetisation
I I ^_Figure 6. Measurement of Tx in the rotating frame.
172 MOLECULAR DYNAMICS AND STRUCTURE OF SOLIDS
in the rotating frame. The field Hi is applied at (a) for a time equivalent
to a 90° pulse (section 2.1) until (b). When the nuclear magnetisation
lies along the xfaxis, Hi having been applied along y
f
, Hi is not turned
off but shifted in phase by 90°. (b) and (c) thus follow almost in-
stantaneously.
The nuclear magnetisation is now aligned along Hi ; it is allowed to
relax in Hi for a time, t, and then Hi is turned off at (d) . When Hi is
turned off, a free induction decay may be observed from the rotating
magnetisation in the xy plane; its height measures the remaining
magnetisation after time, t. By varying the time constant, Tip,
for the decay of magnetisation in the rotating frame may be measured.
6.2. Effects of Molecular Motion on 1 ip
The theoretical interpretation of these measurements is complicated
by the fact that Hi is comparable with the dipole-dipole interaction
energy, which cannot therefore be treated as a perturbation on the
Zeeman energy.
However, if the correlation time for molecular motion is small
compared with T2 for the rigid lattice, the effect of dipolar coupling
is greatly diminished and the Redfield theory [13] described in section
5 can still be applied. Calculation of Tip is then similar to that for
the laboratory frame Ti, except that the Hamiltonian for the rotating
frame only contains terms of the type E and F of eq (11). The fre-
quency components of the correlation spectrum which cause relaxa-
tion are therefore only those at 2o>i.
If we define the "local dipolar field", HXoc as
Hio2c=!<(Atf) 2>AV
then it turns out [28] that
1 _372T c(l-g)ffio
2c
TiP 1+4w!t;
where (1— q) is the fraction of the Dipolar Hamiltonian which is time
dependent. This factor depends, of course, on the type of motion and
the model concerned.
If the molecular motion is slow, so that r c> T2 (rigid lattice), a
quite different treatment must be used which has been given in detail
by Slichter and Ailion [29, 30, 31]. This theory is based on the concept
of spin temperature which is valid when t c^>T2 and Hi~H\Q ^, and its
physical basis is very clearly set out on page 1100 of [30]. The result
is that
1 _2{\-<p)HilTip T c(H*-\-H&)
INTRODUCTORY LECTURES 173
where (l—p) is a factor similar to, but not necessarily identical with
(1— q) of the fast motion condition.
The intermediate case, when Hi~Hl0C and t~T2 is not properly-
described by either theory, so there is some ambiguity in the inter-
pretation of a Tip minimum.Ailion and Slichter [31] have studied TXp over a wide range of tem-
peratures, and determined rc for self diffusion in lithium metal. Theyapplied the BPP [10] and Redfield [13] theories to the high-tempera-
ture region where r c is short and the spin temperature theory to the
low temperature region. In this way they were able to follow the
variation of rc with temperature almost continuously from r c=10-9
sec. to t c=1 sec.
The technique has been applied to a variety of systems, from an
exhaustive study of molecular motion in crystalline H 2S by Look,
Lowe and Northby [32] to a study of methyl-group rotation and spin
diffusion in normal alkanes [28].
The correlation time for self diffusion in d-l and d camphor has
been measured [27] in the temperature range 10 to 95 °C and found
to vary from 70 /usee to 30 msec, corresponding to an activation
energy of 15.4 Kcal/mole. The motion of the water molecules in gyp-sum has been further studied using these methods by Look and Lowe[33].
7. Discussion
W. C. Hamilton (Brookhaven National Laboratory) : In the inter-
pretation of relaxation-time measurements, a classical activated
process is usually assumed in order to derive a potential barrier.
Would you care to comment on the validity of this approximation,
particularly in the case of low-barrier motions? I wonder whether
one would obtain different barriers if one considered in detail the
small and limited number of energy levels for a realistic potential
function?
R. E. Richards: I suppose the justification for using the activated
type of barrier is that it's the simplest thing to do, and that whenyou do it you frequently find that you get the expected temperature
dependence of the relaxation time. But I must emphasize that whatyou are measuring in these experiments is just the intensity of the
fluctuations at some particular frequencies, and that the barriers
you get and the frequency factors do depend on the model you assume.
In principal one could, of course, explore the whole of the correlation
spectrum by changing the value of the magnetic field in a series of
experiments. Then you might find that you couldn't describe the
spectrum in terms of a single correlation time, and you might find
that it varied in a complicated way with temperature, but you would
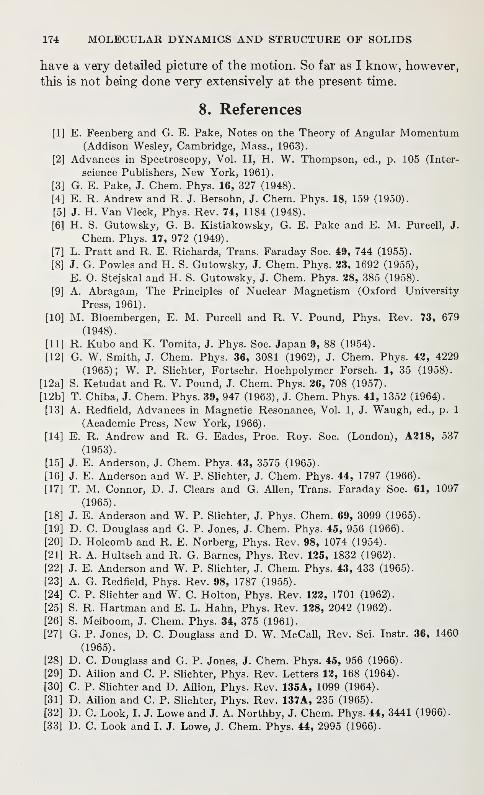
174 MOLECULAR DYNAMICS AND STRUCTURE OF SOLIDS
have a very detailed picture of the motion. So far as I know, however,
this is not being done very extensively at the present time.
8. References
[1] E. Feenberg and G. E. Pake, Notes on the Theory of Angular Momentum(Addison Wesley, Cambridge, Mass., 1963).
[2] Advances in Spectroscopy, Vol. II, H. W. Thompson, ed., p. 105 (Inter-
science Publishers, New York, 1961).
[3] G. E. Pake, J. Chem. Phys. 16, 327 (1948).
[4] E. R. Andrew and R. J. Bersohn, J. Chem. Phys. 18, 159 (1950).
[5] J. H. Van Vleck, Phys. Rev. 74, 1184 (1948).
[6] H. S. Gutowsky, G. B. Kistiakowsky, G. E. Pake and E. M. Purcell, J.
Chem. Phys. 17, 972 (1949).
[7] L. Pratt and R. E. Richards, Trans. Faraday Soc. 49, 744 (1955).
[8] J. G. Powles and H. S. Gutowsky, J. Chem. Phys. 23, 1692 (1955),
E. O. Stejskal and H. S. Gutowsky, J. Chem. Phys. 28, 385 (1958).
[9] A. Abragam, The Principles of Nuclear Magnetism (Oxford University
Press, 1961).
[10] M. Bloembergen, E. M. Purcell and R. V. Pound, Phys. Rev. 73, 679
(1948).
[11] R. Kubo and K. Tomita, J. Phys. Soc. Japan 9, 88 (1954).
[12] G. W. Smith, J. Chem. Phys. 36, 3081 (1962), J. Chem. Phys. 42, 4229
(1965); W. P. Slichter, Fortschr. Hochpolymer Forsch. 1, 35 (1958).
[12a] S. Ketudat and R. V. Pound, J. Chem. Phys. 26, 708 (1957).
[12b] T. Chiba, J. Chem. Phys. 39, 947 (1963), J. Chem. Phys. 41, 1352 (1964).
[13] A. Redfield, Advances in Magnetic Resonance, Vol. 1, J. Waugh, ed., p. 1
(Academic Press, New York, 1966).
[14] E. R. Andrew and R. G. Eades, Proc. Roy. Soc. (London), A218, 537
(1953).
[15] J. E. Anderson, J. Chem. Phys. 43, 3575 (1965).
[16] J. E. Anderson and W. P. Slichter, J. Chem. Phys. 44, 1797 (1966).
[17] T. M. Connor, D. J. Clears and G. Allen, Trans. Faraday Soc. 61, 1097
(1965).
[18] J. E. Anderson and W. P. Slichter, J. Phys. Chem. 69, 3099 (1965).
[19] D. C. Douglass and G. P. Jones, J. Chem. Phys. 45, 956 (1966).
[20] D. Holcomb and R. E. Norberg, Phys. Rev. 98, 1074 (1954).
[21] R. A. Hultsch and R. G. Barnes, Phys. Rev. 125, 1832 (1962).
[22] J. E. Anderson and W. P. Slichter, J. Chem. Phys. 43, 433 (1965).
[23] A. G. Redfield, Phys. Rev. 98, 1787 (1955).
[24] C. P. Slichter and W. C. Holton, Phys. Rev. 122, 1701 (1962).
[25] S. R. Hartman and E. L. Hahn, Phys. Rev. 128, 2042 (1962).
[26] S. Meiboom, J. Chem. Phys. 34, 375 (1961).
[27] G. P. Jones, D. C. Douglass and D. W. McCall, Rev. Sci. Instr. 36, 1460
(1965).
[28] D. C. Douglass and G. P. Jones, J. Chem. Phys. 45, 956 (1966).
[29] D. Ailion and C. P. Slichter, Phys. Rev. Letters 12, 168 (1964).
[30] C. P. Slichter and D. Ailion, Phys. Rev. 135A, 1099 (1964).
[31] D. Ailion and C. P. Slichter, Phys. Rev. 137A, 235 (1965).
[32] D. C. Look, I. J. Lowe and J. A. Northby, J. Chem. Phys. 44, 3441 (1966).
[33] D. C. Look and I. J. Lowe, J. Chem. Phys. 44, 2995 (1966).
STRUCTURE AND SPECTROSCOPY OF INORGANICCRYSTALS

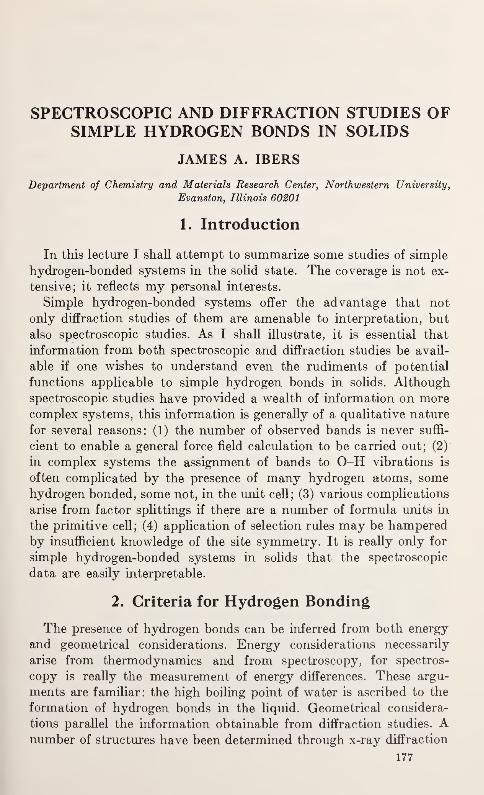
SPECTROSCOPIC AND DIFFRACTION STUDIES OFSIMPLE HYDROGEN BONDS IN SOLIDS
JAMES A. IBERS
Department of Chemistry and Materials Research Center, Northwestern University,
Evanston, Illinois 60201
1. Introduction
In this lecture I shall attempt to summarize some studies of simple
hydrogen-bonded systems in the solid state. The coverage is not ex-
tensive; it reflects my personal interests.
Simple hydrogen-bonded systems offer the advantage that not
only diffraction studies of them are amenable to interpretation, but
also spectroscopic studies. As I shall illustrate, it is essential that
information from both spectroscopic and diffraction studies be avail-
able if one wishes to understand even the rudiments of potential
functions applicable to simple hydrogen bonds in solids. Although
spectroscopic studies have provided a wealth of information on morecomplex systems, this information is generally of a qualitative nature
for several reasons: (1) the number of observed bands is never suffi-
cient to enable a general force field calculation to be carried out; (2)
in complex systems the assignment of bands to O-H vibrations is
often complicated by the presence of many hydrogen atoms, somehydrogen bonded, some not, in the unit cell; (3) various complications
arise from factor splittings if there are a number of formula units in
the primitive cell; (4) application of selection rules may be hamperedby insufficient knowledge of the site symmetry. It is really only for
simple hydrogen-bonded systems in solids that the spectroscopic
data are easily interpretable.
2. Criteria for Hydrogen Bonding
The presence of hydrogen bonds can be inferred from both energy
and geometrical considerations. Energy considerations necessarily
arise from thermodynamics and from spectroscopy, for spectros-
copy is really the measurement of energy differences. These argu-
ments are familiar: the high boiling point of water is ascribed to the
formation of hydrogen bonds in the liquid. Geometrical considera-
tions parallel the information obtainable from diffraction studies. Anumber of structures have been determined through x-ray diffraction
177
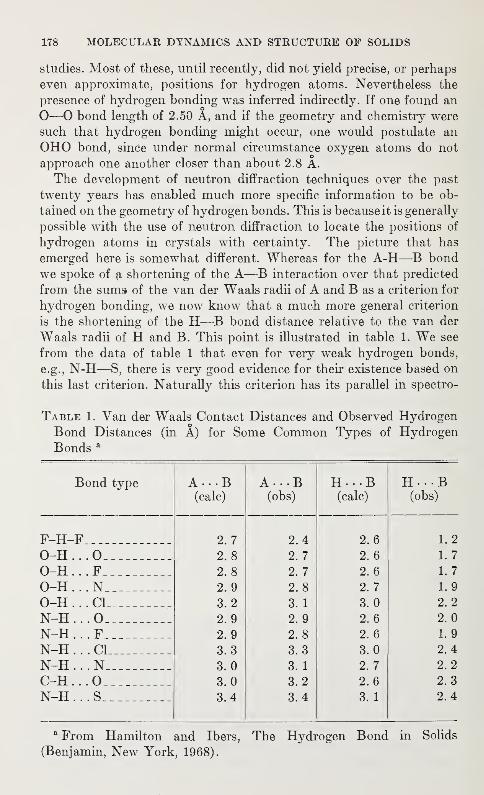
178 MOLECULAR DYNAMICS AND STRUCTURE OF SOLIDS
studies. Most of these, until recently, did not yield precise, or perhaps
even approximate, positions for hydrogen atoms. Nevertheless the
presence of hydrogen bonding was inferred indirectly. If one found an
O—O bond length of 2.50 A, and if the geometry and chemistry were
such that hydrogen bonding might occur, one would postulate an
OHO bond, sinCe under normal circumstance oxygen atoms do not
approach one another closer than about 2.8 A.
The development of neutron diffraction techniques over the past
twenty years has enabled much more specific information to be ob-
tained on the geometry of hydrogen bonds. This is because it is generally
possible with the use of neutron diffraction to locate the positions of
hydrogen atoms in crystals with certainty. The picture that has
emerged here is somewhat different. Whereas for the A-H—B bondwe spoke of a shortening of the A—B interaction over that predicted
from the sums of the van der Waals radii of A and B as a criterion for
hydrogen bonding, we now know that a much more general criterion
is the shortening of the H—B bond distance relative to the van der
Waals radii of H and B. This point is illustrated in table 1. We see
from the data of table 1 that even for very weak hydrogen bonds,
e.g., N-H—S, there is very good evidence for their existence based on
this last criterion. Naturally this criterion has its parallel in spectro-
Table 1. Van der Waals Contact Distances and Observed HydrogenBond Distances (in A) for Some Common Types of HydrogenBonds a
Bond type A • • • B A • • • B H • • B H-.-B(calc) (obs) (calc) (obs)
F-H-F 2. 7 2.4 2. 6 1. 2
O-H . ..0 2. 8 2.7 2. 6 1. 7
O-H . ..F 2. 8 2. 7 2. 6 1. 7
O-H ...N 2. 9 2. 8 2. 7 1. 9
O-H . . . CI 3. 2 3. 1 3.0 2. 2
N-H . ..0 2. 9 2. 9 2. 6 2. 0
N-H . . .F 2. 9 2. 8 2. 6 1. 9
N-H . . . CI 3.3 3.3 3. 0 2.4
N-H . . . N 3. 0 3. 1 2. 7 2.2
C-H . . .0 3. 0 3.2 2. 6 2. 3
N-H . ..s 3.4 3.4 3. 1 2.4
a From Hamilton and Ibers, The Hydrogen Bond in Solids
(Benjamin, New York, 1968).
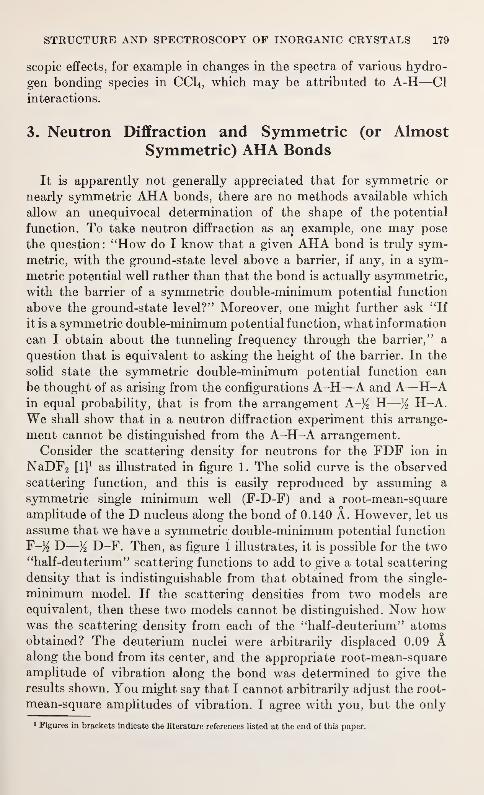
STRUCTURE AND SPECTROSCOPY OF INORGANIC CRYSTALS 179
scopic effects, for example in changes in the spectra of various hydro-
gen bonding species in CC14 , which may be attributed to A-H—CI
interactions.
3. Neutron Diffraction and Symmetric (or AlmostSymmetric) AHA Bonds
It is apparently not generally appreciated that for symmetric or
nearly symmetric AHA bonds, there are no methods available which
allow an unequivocal determination of the shape of the potential
function. To take neutron diffraction as an example, one may pose
the question: "How do I know that a given AHA bond is truly sym-
metric, with the ground-state level above a barrier, if any, in a sym-
metric potential well rather than that the bond is actually asymmetric,
with the barrier of a symmetric double-minimum potential function
above the ground-state level?" Moreover, one might further ask "If
it is a symmetric double-minimum potential function, what information
can I obtain about the tunneling frequency through the barrier," a
question that is equivalent to asking the height of the barrier. In the
solid state the symmetric double-minimum potential function can
be thought of as arising from the configurations A-H—A and A—H-Ain equal probability, that is from the arrangement A-% H—% H-A.We shall show that in a neutron diffraction experiment this arrange-
ment cannot be distinguished from the A-H-A arrangement.
Consider the scattering density for neutrons for the FDF ion in
NaDF2 [l]1 as illustrated in figure 1. The solid curve is the observed
scattering function, and this is easily reproduced by assuming a
symmetric single minimum well (F-D-F) and a root-mean-square
amplitude of the D nucleus along the bond of 0.140 A. However, let us
assume that we have a symmetric double-minimum potential function
F-% D
—
y2 D-F. Then, as figure 1 illustrates, it is possible for the two"half-deuterium" scattering functions to add to give a total scattering
density that is indistinguishable from that obtained from the single-
minimum model. If the scattering densities from two models are
equivalent, then these two models cannot be distinguished. Now howwas the scattering density from each of the "half-deuterium" atomsobtained? The deuterium nuclei were arbitrarily displaced 0.09 Aalong the bond from its center, and the appropriate root-mean-square
amplitude of vibration along the bond was determined to give the
results shown. You might say that I cannot arbitrarily adjust the root-
mean-square amplitudes of vibration. I agree with you, but the only
1 Figures in brackets indicate the literature references listed at the end of this paper.
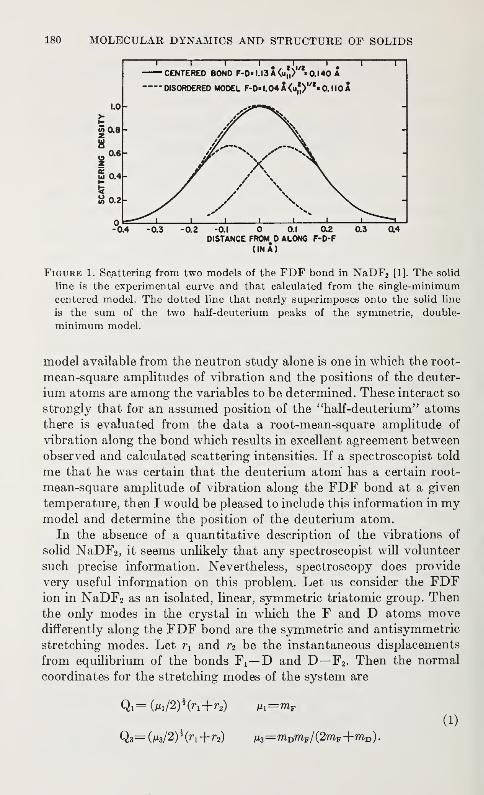
180 MOLECULAR DYNAMICS AND STRUCTURE OF SOLIDS
DISTANCE FROM0 ALONG F-D-F
(IN A)
Figure 1. Scattering from two models of the FDF bond in NaDF2 [1]. The solid
line is the experimental curve and that calculated from the single-minimum
centered model. The dotted line that nearly superimposes onto the solid line
is the sum of the two half-deuterium peaks of the symmetric, double-
minimum model.
model available from the neutron study alone is one in which the root-
mean-square amplitudes of vibration and the positions of the deuter-
ium atoms are among the variables to be determined. These interact so
strongly that for an assumed position of the "half-deuterium" atoms
there is evaluated from the data a root-mean-square amplitude of
vibration along the bond which results in excellent agreement between
observed and calculated scattering intensities. If a spectroscopist told
me that he was certain that the deuterium atom has a certain root-
mean-square amplitude of vibration along the FDF bond at a given
temperature, then I would be pleased to include this information in mymodel and determine the position of the deuterium atom.
In the absence of a quantitative description of the vibrations of
solid NaDF2 , it seems unlikely that any spectroscopist will volunteer
such precise information. Nevertheless, spectroscopy does provide
very useful information on this problem. Let us consider the FDFion in NaDF2 as an isolated, linear, symmetric triatomic group. Thenthe only modes in the crystal in which the F and D atoms movedifferently along the FDF bond are the symmetric and antisymmetric
stretching modes. Let rx and r2 be the instantaneous displacements
from equilibrium of the bonds Fx—D and D—
F
2 . Then the normal
coordinates for the stretching modes of the system are
Qi= W2)*(r1+r2) Mi=raF(1)
Q3= W2)*(r!+r2) ju3=mDmF/ (2mF+mD ).
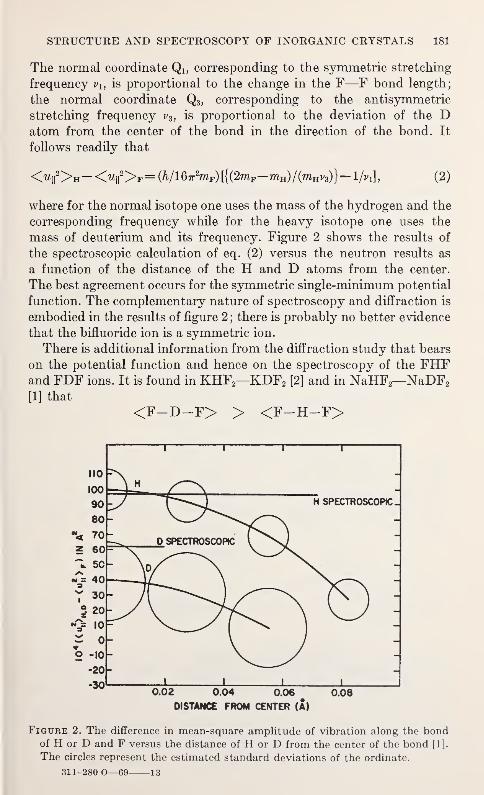
STRUCTURE AND SPECTROSCOPY OF INORGANIC CRYSTALS 181
The normal coordinate Q 1; corresponding to the symmetric stretching
frequency vu is proportional to the change in the F—F bond length;
the normal coordinate Q3 ,corresponding to the antisymmetric
stretching frequency v3 , is proportional to the deviation of the Datom from the center of the bond in the direction of the bond. It
follows readily that
<^[I2>h-On2>F= (Vl6T2mF)[{(2mF-mH)/(mH^)}- l/vil (2)
where for the normal isotope one uses the mass of the hydrogen and the
corresponding frequency while for the heavy isotope one uses the
mass of deuterium and its frequency. Figure 2 shows the results of
the spectroscopic calculation of eq. (2) versus the neutron results as
a function of the distance of the H and D atoms from the center.
The best agreement occurs for the symmetric single-minimum potential
function. The complementary nature of spectroscopy and diffraction is
embodied in the results of figure 2; there is probably no better evidence
that the bifluoride ion is a symmetric ion.
There is additional information from the diffraction study that bears
on the potential function and hence on the spectroscopy of the FHFand FDF ions. It is found in KHF2—KDF2 [2] and in NaHF2—NaDF2
[1] that
<F-D-F> > <F-H-F>
i 1 1 r
—I I I L_0.02 0.04 0.06 0.08
DISTANCE FROM CENTER (A)
Figure 2. The difference in mean-square amplitude of vibration along the bondof H or D and F versus the distance of H or D from the center of the bond [1].
The circles represent the estimated standard deviations of the ordinate.
311-280 O—69 13
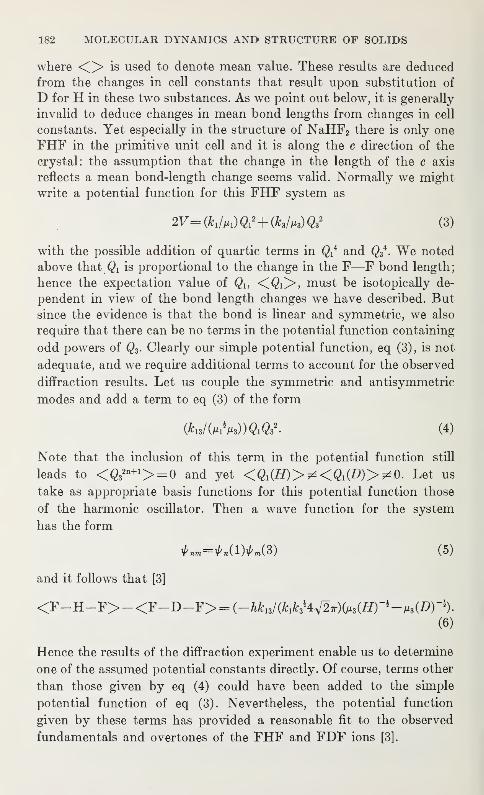
182 MOLECULAR DYNAMICS AND STRUCTURE OF SOLIDS
where <> is used to denote mean value. These results are deduced
from the changes in cell constants that result upon substitution of
D for H in these two substances. As we point out below, it is generally
invalid to deduce changes in mean bond lengths from changes in cell
constants. Yet especially in the structure of NaHF2 there is only one
FHF in the primitive unit cell and it is along the c direction of the
crystal: the assumption that the change in the length of the c axis
reflects a mean bond-length change seems valid. Normally we might
write a potential function for this FHF system as
2V=(k 1/» 1)Q 1
2+ (k3/»3)Q32
(3)
with the possible addition of quartic terms in Qi and Q3 . We noted
above that Qi is proportional to the change in the F—F bond length;
hence the expectation value of Qi, <CQC>, must be isotopically de-
pendent in view of the bond length changes we have described. Butsince the evidence is that the bond is linear and symmetric, we also
require that there can be no terms in the potential function containing
odd powers of Q3 . Clearly our simple potential function, eq (3), is not
adequate, and we require additional terms to account for the observed
diffraction results. Let us couple the symmetric and antisymmetric
modes and add a term to eq (3) of the form
(W(MiW)<2i«32. (4)
Note that the inclusion of this term in the potential function still
leads to <Q32n+1>= 0 and yet ^ <Qi(D)> ^0. Let us
take as appropriate basis functions for this potential function those
of the harmonic oscillator. Then a wave function for the system
has the form
lK«=*»(l)lM3) (5)
and it follows that [3]
<F-H-F>-<F-D-F> = (-^ 1,/(ifcA*4V2T)&l.(fl)"*-/|.(Z>)",).
(6)
Hence the results of the diffraction experiment enable us to determine
one of the assumed potential constants directly. Of course, terms other
than those given by eq (4) could have been added to the simple
potential function of eq (3). Nevertheless, the potential function
given by these terms has provided a reasonable fit to the observed
fundamentals and overtones of the FHF and FDF ions [3].
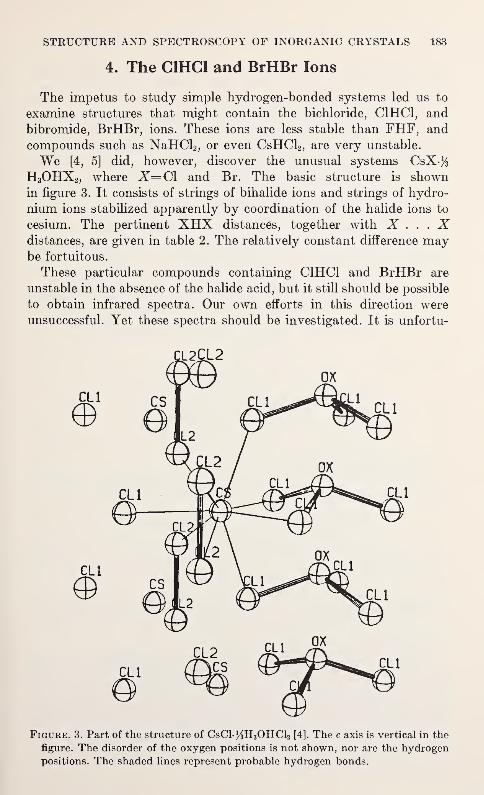
STRUCTURE AND SPECTROSCOPY OF INORGANIC CRYSTALS 183
4. The C1HC1 and BrHBr Ions
The impetus to study simple hydrogen-bonded systems led us to
examine structures that might contain the bichloride, C1HC1, and
bibromide, BrHBr, ions. These ions are less stable than FHF, and
compounds such as NaHCl2 , or even CsHCl2 , are very unstable.
We [4, 5] did, however, discover the unusual systems CsX-%H3OHX2 , where X=Cl and Br. The basic structure is shownin figure 3. It consists of strings of bihalide ions and strings of hydro-
nium ions stabilized apparently by coordination of the halide ions to
cesium. The pertinent XHX distances, together with X . . . Xdistances, are given in table 2. The relatively constant difference maybe fortuitous.
These particular compounds containing C1HC1 and BrHBr are
unstable in the absence of the halide acid, but it still should be possible
to obtain infrared spectra. Our own efforts in this direction were
unsuccessful. Yet these spectra should be investigated. It is unfortu-
Figure. 3. Part of the structure of CsCl ^H 3OHCl2 [4]. The c axis is vertical in the
figure. The disorder of the oxygen positions is not shown, nor are the hydrogenpositions. The shaded lines represent probable hydrogen bonds.
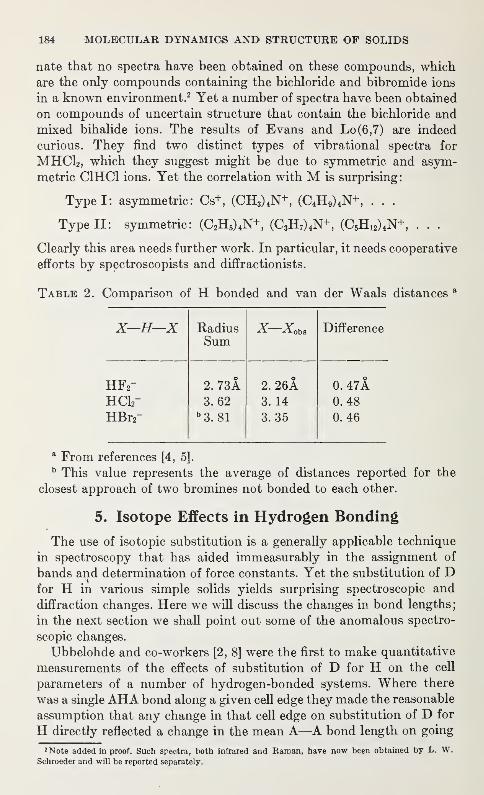
184 MOLECULAR DYNAMICS AND STRUCTURE OF SOLIDS
nate that no spectra have been obtained on these compounds, which
are the only compounds containing the bichloride and bibromide ions
in a known environment.2 Yet a number of spectra have been obtained
on compounds of uncertain structure that contain the bichloride andmixed bihalide ions. The results of Evans and Lo(6,7) are indeed
curious. They find two distinct types of vibrational spectra for
MHC12 , which they suggest might be due to symmetric and asym-
metric C1HC1 ions. Yet the correlation with M is surprising:
Type I: asymmetric: Cs+, (CH3) 4N+, (C4H 9) 4N+ . . .
Type II: symmetric: (C2H5) 4N+, (C3H7) 4N+, (C5H12) 4N+, . . .
Clearly this area needs further work. In particular, it needs cooperative
efforts by spectroscopists and diffractionists.
Table 2. Comparison of H bonded and van der Waals distances a
X—H—X RadiusSum
X—Xoba Difference
HF2"
2. 73A 2. 26A 0. 47AHCI2- 3. 62 3. 14 0. 48
HBr2" b
3. 81 3. 35 0. 46
a From references [4, 5].
b This value represents the average of distances reported for the
closest approach of two bromines not bonded to each other.
5. Isotope Effects in Hydrogen Bonding
The use of isotopic substitution is a generally applicable technique
in spectroscopy that has aided immeasurably in the assignment of
bands and determination of force constants. Yet the substitution of Dfor H in various simple solids yields surprising spectroscopic and
diffraction changes. Here we will discuss the changes in bond lengths;
in the next section we shall point out some of the anomalous spectro-
scopic changes.
Ubbelohde and co-workers [2, 8] were the first to make quantitative
measurements of the effects of substitution of D for H on the cell
parameters of a number of hydrogen-bonded systems. Where there
was a single AHA bond along a given cell edge they made the reasonable
assumption that any change in that cell edge on substitution of D for
H directly reflected a change in the mean A—A bond length on going
2 Note added in proof. Such spectra, both infrared and Raman, have now been obtained by L. W.Schroeder and will be reported separately.
STRUCTURE AND SPECTROSCOPY OF INORGANIC CRYSTALS 185
from AHA to ADA. More often, however, there were several inde-
pendent AHA bonds that could contribute to the change in the cell
edge, and so the interpretation of the results became more arbitrary.
Maximum cell changes are about 0.06 A on substitution of D for H,and since A—A distances could not be determined with an estimated
error of less than perhaps 0.03 A in those days, it was clearly necessary
to use the changes in cell constants to deduce indirectly the changes in
bond lengths. Direct determinations of these AHA and ADA bondlengths would not have yielded precise enough answers to enable one
to detect significant changes in bond lengths on deuteration.
The situation has now changed, and in reasonably simple systems
containing first row elements, such as C or O, along with H, it is pos-
sible to determine O—O bond lengths to an apparent precision of
around 0.002 A, and so to attach significance to differences in ODOand OHO distances of the order of 0.01 A. We have carried out a
complete single-crystal study of both normal and deuterated oxalic
acid dihydrate [9]. We chose oxalic acid dihydrate because Robertson
and Ubbelohde [10] had found the isotope effect to be very large for
this substance; when they assumed that the effect was only in the
strongest of the three independent OHO bonds, they concluded that
this bond was lengthened by about 0.041 A on deuteration.
A sketch of the structure and of our results is shown in figure 4. Notethat all three OHO bonds lengthen on deuteration, and that the
strongest bond does not lengthen as much as one of the very weakbonds. It is clear that the effects of isotopic substitution are indeed
long range, and are not localized in the particular strong hydrogen
bond. We conclude that most of the results in the literature on the
changes in bond lengths with deuteration are unreliable, since these
are obtained from measurements of changes in cell constants in cases
where there is more than one independent bond along the cell edge. It
would seem that there is a severe paucity of reliable information on
the effects of isotopic substitution on bond lengths in the solid state
and that much experimental and theoretical work needs to be done.
6. The Systems HCr02/DCr02 and HC0O2/DC0O2
Let us turn finally to the chromous and cobaltous acid systems that
have provided various spectroscopic and diffraction puzzles over the
past several years. The structure of HCr02 , which is typical of all
members of this series, is shown in figure 5. The structure is very
simple indeed, with only one HM02 unit in the primitive cell. The site
symmetry around M is D3d , at least to a first approximation. The only
positional variables in a crystallographic sense are the position of the
O atom along the threefold axis and the position of the H atom. In a
desire to understand the nature of the potential well in this OHO
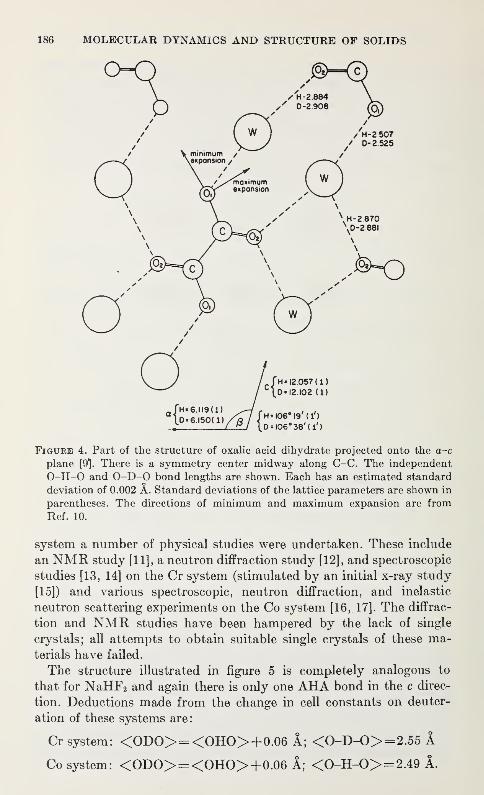
186 MOLECULAR DYNAMICS AND STRUCTURE OF SOLIDS
Figure 4. Part of the structure of oxalic acid dihydrate projected onto the a-c
plane [9]. There is a symmetry center midway along C-C. The independent
O-H-0 and O-D-0 bond lengths are shown. Each has an estimated standard
deviation of 0.002 A. Standard deviations of the lattice parameters are shown in
parentheses. The directions of minimum and maximum expansion are from
Ref. 10.
system a number of physical studies were undertaken. These include
an NMR study [11], a neutron diffraction study [12], and spectroscopic
studies [13, 14] on the Cr system (stimulated by an initial x-ray study
[15]) and various spectroscopic, neutron diffraction, and inelastic
neutron scattering experiments on the Co system [16, 17]. The diffrac-
tion and NMR studies have been hampered by the lack of single
crystals; all attempts to obtain suitable single crystals of these ma-terials have failed.
The structure illustrated in figure 5 is completely analogous to
that for NaHF2 and again there is only one AHA bond in the c direc-
tion. Deductions made from the change in cell constants on deuter-
ation of these systems are:
Cr system: <ODO>= <OHO>+0.06 A; <0-D-0>=2.55 A
Co system: <ODO>= <OHO>+0.06 A; <0-H-0>= 2.49 A.
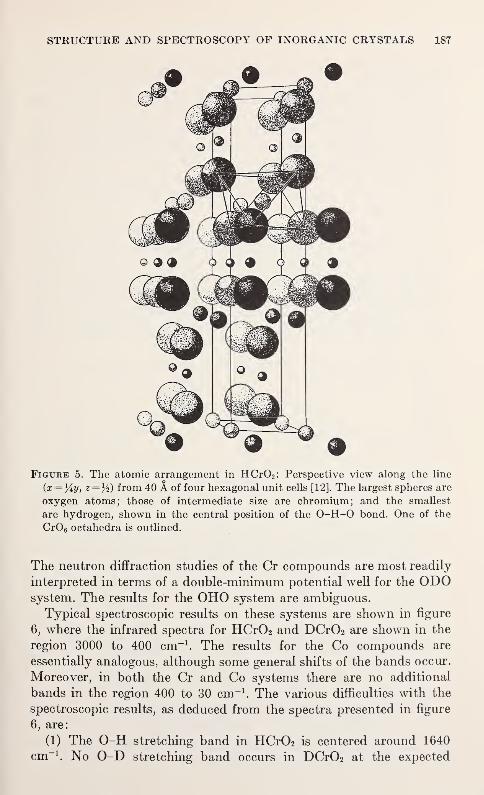
STRUCTURE AND SPECTROSCOPY OF INORGANIC CRYSTALS 187
Figure 5. The atomic arrangement in HCr02 : Perspective view along the line
(x=}iy, z= K) from 40 A of four hexagonal unit cells [12]. The largest spheres are
oxygen atoms; those of intermediate size are chromium; and the smallest
are hydrogen, shown in the central position of the O-H-0 bond. One of the
Cr06 octahedra is outlined.
The neutron diffraction studies of the Gr compounds are most readily
interpreted in terms of a double-minimum potential well for the ODOsystem. The results for the OHO system are ambiguous.
Typical spectroscopic results on these systems are shown in figure
6, where the infrared spectra for HCr02 and DCr02 are shown in the
region 3000 to 400 cm-1. The results for the Co compounds are
essentially analogous, although some general shifts of the bands occur.
Moreover, in both the Cr and Co systems there are no additional
bands in the region 400 to 30 cm -1. The various difficulties with the
spectroscopic results, as deduced from the spectra presented in figure
6, are:
(1) The O-H stretching band in HCr02 is centered around 1640
cm-1. No O-D stretching band occurs in DCr02 at the expected
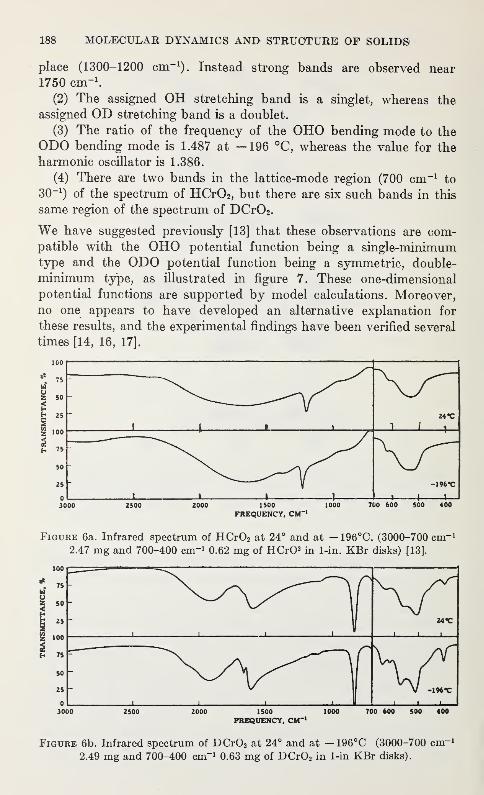
188 MOLECULAR DYNAMICS AND STRUCTURE OF SOLIDS
place (1300-1200 cm-1). Instead strong bands are observed near
1750 cm" 1.
(2) The assigned OH stretching band is a singlet, whereas the
assigned OD stretching band is a doublet.
(3) The ratio of the frequency of the OHO bending mode to the
ODO bending mode is 1.487 at —196 °C, whereas the value for the
harmonic oscillator is 1.386.
(4) There are two bands in the lattice-mode region (700 cm-1to
30-1) of the spectrum of HCr02 , but there are six such bands in this
same region of the spectrum of DCr02 .
We have suggested previously [13] that these observations are com-patible with the OHO potential function being a single-minimum
type and the ODO potential function being a symmetric, double-
minimum type, as illustrated in figure 7. These one-dimensional
potential functions are supported by model calculations. Moreover,no one appears to have developed an alternative explanation for
these results, and the experimental findings have been verified several
times [14, 16, 17].
1500
FREQUENCY. CM'
Figure 6a. Infrared spectrum of HCr02 at 24° and at — 196°C. (3000-700 cm" 1
2.47 mg and 700-400 cm" 1 0.62 mg of HCrO2 in 1-in. KBr disks) [13].
100
I:g 100
I n
1 1 1 1
24«C
r
1 1 1 1 1
1S00
FREQUENCY, CM*700 600 500 400
Figure 6b. Infrared spectrum of DCr02 at 24° and at -196°C (3000-700 cm" 1
2.49 mg and 700-400 cm-10.63 mg of DCr02 in 1-in KBr disks).
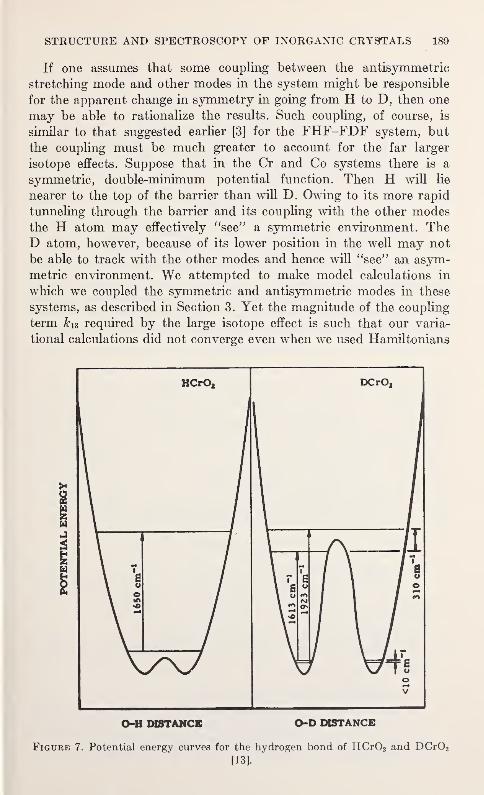
STRUCTURE AND SPECTROSCOPY OF INORGANIC CRYSTALS 189
If one assumes that some coupling between the antisymmetric
stretching mode and other modes in the system might be responsible
for the apparent change in symmetry in going from H to D, then one
may be able to rationalize the results. Such coupling, of course, is
similar to that suggested earlier [3] for the FHF-FDF system, but
the coupling must be much greater to account for the far larger
isotope effects. Suppose that in the Cr and Co systems there is a
symmetric, double-minimum potential function. Then H will lie
nearer to the top of the barrier than will D. Owing to its more rapid
tunneling through the barrier and its coupling with the other modesthe H atom may effectively "see" a symmetric environment. TheD atom, however, because of its lower position in the well may not
be able to track with the other modes and hence will "see" an asym-metric environment. We attempted to make model calculations in
which we coupled the symmetric and antisymmetric modes in these
systems, as described in Section 3. Yet the magnitude of the coupling
term kn required by the large isotope effect is such that our varia-
tional calculations did not converge even when we used Hamiltonians
HCrOa DCrO,
\\ °
f \ I "»
/ \ 1 •
\ 6cm" / \ / 811 / o
\ tf* \°
\ ***
m 11 I•**
\ *°
\ *°
cr-—«
10
cm
1
V
w
O-H DISTANCE O-D DISTANCE
Figure 7. Potential energy curves for the hydrogen bond of HCr02 and DCr02
[13].
190 MOLECULAR DYNAMICS AND STRUCTURE OF SOLIDS
of as high an order as is compatible with our computer. We havetherefore studied what happens to the various levels as we gradually
increase the kn term. It would appear that the idea of coupling of
the antisymmetric stretching mode with other modes of the system
may have some merit in explaining the puzzle of the very large
spectroscopic changes on deuteration in the HOO2 and HC0O2systems. Yet clearly there is great need for new and inventive theo-
retical work on these systems.
7. Summary
In this lecture I have tried to touch on a few topics that I hope will
be of interest to both the diffractionist and the spectroscopist. Let meagain emphasize that the study of simple hydrogen bonds in solids is
one route to an understanding of hydrogen bonding in general, and
that such systems offer the advantage that the spectroscopic and
diffraction results are complementary and lead, when combined, to a
more thorough understanding than would have been obtained from
the individual results of either method.
It is not feasible here to acknowledge individually all of the manycollaborators who have shared with me in the fun of some of the
studies I have described. For the most part their names will be found
in the references. I should like to indicate, however, that the workdescribed here was carried out not only at Northwestern University,
but also at Brookhaven National Laboratory and at Shell Develop-
ment Company. The work at Northwestern University was supported
by the Advanced Research Projects Agency of the Defense Depart-
ment through the Northwestern Materials Research Center.
8. Discussion
W. J. Potts (Dow Chemical Company): I have two comments:
1. Mulls in fluorocarbons usually don't result in chemical reac-
tions. The chemical reaction is likely to occur between the ionic
substance and the ionic NaCl or KBr plates.
2. A possible explanation of the anomalous behavior between Hand D chromous acid in their infrared spectra is a strong Fermi
resonance interaction in the D case, little or none in the H case.
J. A. Ibers: In response to your comments:1. The CsX-% (H30 HX2) compounds are apparently unstable
in the absence of HX. Our initial efforts to obtain reliable spectra
were not successful. We encourage others more experienced in
obtaining spectra of reactive materials to look at these substances.
STRUCTURE AND SPECTROSCOPY OF INORGANIC CRYSTALS 191
2. Although I can't eliminate the possibility of Fermi resonance,
I don't believe it affords an explanation of the dramatic differences
in spectra in the lattice-mode regions of these two substances.
K. Harmon (Harvey Mudd College) : We have repeated the spec-
troscopic work of Evans and Lo on H CI2 with H Bt~2 cations and
find a steady progression in the spectra from tetramethylammoniumto tetrabutylammonium compounds. Has any spectroscopic workshown evidence for type I and type II vibration spectra with the
HF2 ions? All of the reports I have seen are with small cations, where
a type I spectrum would be expected.
J. A. Ibers: I'm aware of no spectral or diffraction work on salts
containing both the HF2 ion and large cations.
J. Schiffer (Temple University) : I noted in your bifluoride-ion
calculation, you considered only a stretch-stretch term in your ex-
pression for potential energy. I know this is partly a matter of curve
fitting, but still might be real. Did you consider stretch-bend inter-
actions as influencing the isotope effect?
J. A. Ibers: We could probably have achieved a similar fit using
coupling with the bending, rather than with the antisymmetric
stretching frequency. Since we were also interested in fitting the
overtones of the antisymmetric stretching frequency, we restricted
our potential to terms related to the symmetric and antisymmetric
stretching modes.
9. References
[1] B. L. McGaw and J. A. Ibers, J. Chem. Phys. 39, 2677 (1963).
[2] A. R. Ubbelohde, Proc. Roy. Soc. (London) A173, 417 (1939).
[3] J. A. Ibers, J. Chem. Phys. 41, 25 (1964); R. G. Delaplane and J. A. Ibers,
J. Chem. Phys. 48, 539 (1968).
[4] L. W. Schroeder and J. A. Ibers, J. Am. Chem. Soc. 88, 2601 (1966).
[5] L. W. Schroeder and J. A. Ibers, Inorg. Chem. 7, 5944 (1968).
[6] J. C. Evans and G. Y. -S. Lo, J. Phys. Chem. 70, 11 (1966).
[7] J. C. Evans and G. Y. -S. Lo, J. Phys. Chem. 70, 20 (1966).
[8] For a bibliography on measured isotope effects see J. A. Ibers, Ann.Rev. Phys. Chem. 16, 375 (1965).
[9] R. G. Delaplane and J. A. Ibers, J. Chem. Phys. 45, 3451 (1966).
[10] J. M. Robertson and A. R. Ubbelohde, Proc. Roy. Soc. (London) A170,
222 (1939).
[11] J. A. Ibers, C. H. Holm, and C. R. Adams, Phys. Rev. 121, 1620 (1961).
[12] W. C. Hamilton and J. A. Ibers, Acta Cryst. 16, 1209 (1963).
[13] R. G. Snyder and J. A. Ibers, J. Chem. Phys. 36, 1356 (1962).
[14] J. J. Rush and J. R. Ferraro, J. Chem. Phys. 44, 2496 (1966).
[15] R. M. Douglass, Acta Cryst. 10, 423 (1957).
[16] A. Benoit, Spectrochim. Acta 19, 2011 (1963).
[17] R. G. Delaplane, J. A. Ibers, J. R. Ferraro, and J. J. Rush, J. Chem.Phys., in press.

STRUCTURE AND DYNAMICS IN MOLECULARCRYSTALS; SOME COMPARISONS 1
WALTER C. HAMILTON
Chemistry Department
Brookhaven National Laboratory, Upton, New York 11973
1. Chemists and Molecules
In a recent conversation with a colleague, I learned that he wasassociated with the School of Molecular Science in a new university.
The explanation that he was really a member of the chemistry depart-
ment should have been expected, for the best definition of the chemist
is that he is a molecular scientist.2 He is concerned with the structure of
molecules, the dynamics of molecules, and the synthesis of molecules.
These three areas have as a matter of fact been suggested by the
Westheimer Committee [l]3 as the proper divisions of chemistry, as
opposed to the traditional physical, organic, and inorganic chemistries.
We are concerned in these colloquia with two of these broad areas
of chemistry—the structure and dynamics of molecules. We must be
careful not to define the latter area too narrowly, for the chemist is
interested not only in the dynamics of individual molecules, the thermal
motions in pure crystals or liquids for example, but in the dynamics
involved in chemical change—for in a narrower sense it is chemical
change that is what chemistry is really all about. The chemical
industry is based on an extension of the alchemist's attempts to
generate valuable materials from worthless ones. Thus some of mycolleagues consider that the study of chemical kinetics—how molecules
react—is the heart of all chemistry.
It thus behooves us, as molecular scientists actively engaged in the
study of the detailed structure and dynamics of pure substances, to
consider how our techniques can be of value to the chemist who is
actually doing chemistry.
The configurational and metrical aspects of molecular structure
determination—so well exemplified by x-ray crystallography—have
been and will continue to be of great importance to the chemist in
1 Research performed under the auspices of the U.S. Atomic Energy Commission.2 The current breed of physicist in this country always seems a bit uncomfortable when faced with mole-
cules, but perhaps this is because he—in contrast to his chemical friends—knows that molecules are rather
easily understood and does not care to bother with them.3 Figures in brackets indicate literature references at the end of this paper.
193
194 MOLECULAR DYNAMICS AND STRUCTURE OF SOLIDS
obvious ways. Reaction mechanisms and chemical syntheses can only
be understood if one has some feeling for the relative positions of the
atoms in the molecules. This area of structural chemistry has been of
growing importance in recent years, perhaps reaching its pinnacle in
the attempt to relate geometrical configuration to activity in protein
enzymes. It is also clear that inorganic chemistry has received a
tremendous shot in the arm from the fact that small molecular struc-
tures can be determined in a quite routine fashion nowadays.In this paper, however, I would like to address myself more to the
question of molecular dynamics and leave the questions of geometrical
structure somewhat to one side. The practical chemist is interested in
the energy of his reacting system as a function of the geometrical
parameters of the system. If he has in his hands an accurate descrip-
tion of this reaction surface, he is in a better position to predict the
mechanism and rate of a reaction: Which configuration of reacting
species is involved in the transition state? From our present point of
view, we would like to ask whether such information can be obtained
from structural studies of the type we are discussing here. Can studies
of molecular motion in pure compounds give some insight into the
way in which these molecules will react with other molecules? Can wedetermine the details of the force field surrounding a molecule? I will
try in the following pages to give some perspective to the problems of
determining interesting things about potential functions from neutron
and x-ray diffraction and neutron inelastic scattering studies. I will
emphasize the desirability of the use of complementary techniques; I
will discuss the importance of models; I will give some report of the
present status of these techniques; and I will finally indulge in some
speculation regarding the future of neutron inelastic scattering as
applied to chemical problems. Most of these problems will be discussed
in some detail by other contributors to this symposium, so I will feel
free to leave out a great deal of detail while apologizing in advance for
any substantial overlap.
2. Molecules and Models
The two classical methods of studying molecular structure are
diffraction and spectroscopy. The first gives information on position
(and information on the change in position averaged over time) ; the
second gives information on energy levels. From both, we would like
to determine potential functions. In many practical cases when weare examining a particular mode of molecular motion we are measur-
ing a system which is initially in its lowest energy level with respect
to this motion. At best, we are dealing with a Boltzmann population
of the lowest few energy levels. It is clear that it is impossible to con-
STRUCTURE AND SPECTROSCOPY OF INORGANIC CRYSTALS 195
struct a complete potential surface from such measurements. 4 Nor-
mally a model for the potential is chosen—a simple harmonic potential
for example—and parameters of the model are fit to the data. These
parameters only have meaning if the assumed model is correct. Bycomparing various measurement techniques, which are affected bythe model in different ways, we hope that we can define the model and
test its correctness far better than we could by using one technique
alone. Furthermore, it is often important that numerical calculations
be used to establish the qualitative features of a model, while the
experiment is used to determine precisely the quantitative parameters
to be associated with this model if it is indeed correct.
The importance of models can best be understood by examination
of some simple one-dimensional problems. In diffraction methods, wemeasure an amplitude of motion. In spectroscopy we measure an
energy level difference. The model of the harmonic oscillator is usually
chosen as the best approximation for molecular motions. An extreme
model for a vibrational mode is that of a particle in a one-dimensional
box (square-well with infinitely high potential walls). By formulas
which are developed in every elementary quantum mechanics book,
we can show that the following relationships exist between the meansquare amplitude of vibration in the ground state <r2> and the
vibrational frequency co between the ground and first excited states:
For the harmonic oscillator in its ground state 5-6
<^> = _*_ = !M (DSirmcoc raw
For the particle in the box in its ground state
^ ' rao>c8.[_12 2**J rawK )
The constants 16.8 and 16.3 are valid for <r2> expressed in A2, ra in
a.m.u. and u in cm-1.
For a particle with a mass of 1.5 atomic mass units and a frequency
of 275 cm-1, we find root mean square (rms) amplitudes <r2>*=
0.202 and 0.199 A for the two cases (see fig. 1). Thus the relationship
between the vibrational amplitude and the first vibrational level
* One of the great bugaboos of spectroscopy has been that although in principle we know that a completeknowledge of the energy levels of a system will allow us to calculate all thermodynamic functions—andhence all chemistry—we first of all do not have all the energy levels, and secondly do not have adequatemodels from which to infer all the energy levels from the few that we have measured. This situation is
especially valid for molecules of any interesting complexity. Given that we have measured the energylevels of a system, what have we learned about chemistry?
« The notation <r2> means the average value of over the probability density function for the motion.6 An actual measurement of the amplitude by diffraction would measure the average over all populated
levels. We ignore this difference for the purposes of this illustration.
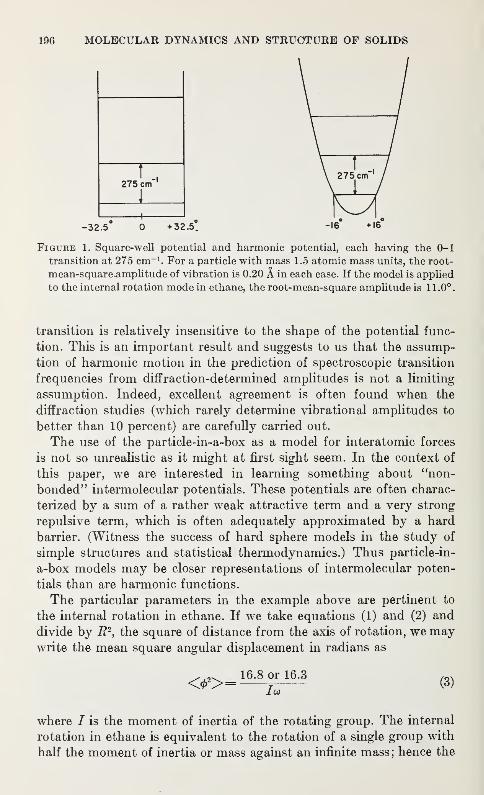
196 MOLECULAR DYNAMICS AND STRUCTURE OF SOLIDS
Figure 1. Square-well potential and harmonic potential, each having the 0-1
transition at 275 cm-1. For a particle with mass 1.5 atomic mass units, the root-
mean-square-amplitude of vibration is 0.20 A in each case. If the model is applied
to the internal rotation mode in ethane, the root-mean-square amplitude is 11.0°.
transition is relatively insensitive to the shape of the potential func-
tion. This is an important result and suggests to us that the assump-
tion of harmonic motion in the prediction of spectroscopic transition
frequencies from diffraction-determined amplitudes is not a limiting
assumption. Indeed, excellent agreement is often found when the
diffraction studies (which rarely determine vibrational amplitudes to
better than 10 percent) are carefully carried out.
The use of the particle-in-a-box as a model for interatomic forces
is not so unrealistic as it might at first sight seem. In the context of
this paper, we are interested in learning something about 1
'non-
bonded" intermolecular potentials. These potentials are often charac-
terized by a sum of a rather weak attractive term and a very strong
repulsive term, which is often adequately approximated by a hard
barrier. (Witness the success of hard sphere models in the study of
simple structures and statistical thermodynamics.) Thus particle-in-
a-box models may be closer representations of intermolecular poten-
tials than are harmonic functions.
The particular parameters in the example above are pertinent to
the internal rotation in ethane. If we take equations (1) and (2) and
divide by R2, the square of distance from the axis of rotation, we may
write the mean square angular displacement in radians as
= 16.8 or 16.3(3)
where / is the moment of inertia of the rotating group. The internal
rotation in ethane is equivalent to the rotation of a single group with
half the moment of inertia or mass against an infinite mass ; hence the
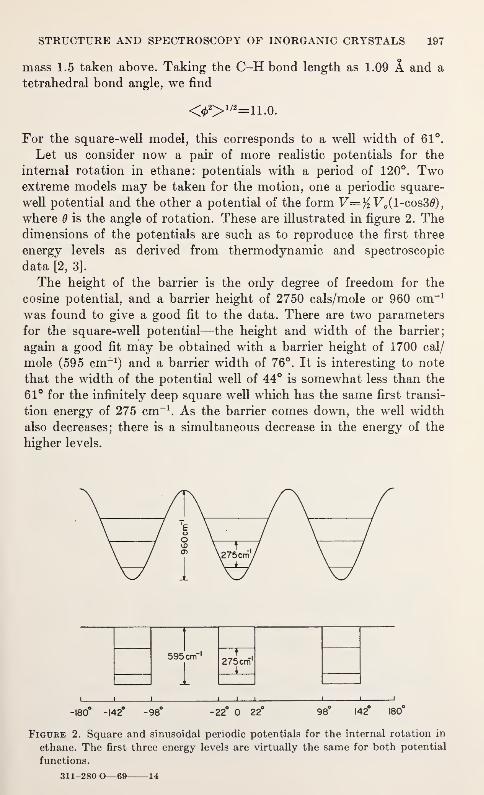
STRUCTURE AND SPECTROSCOPY OF INORGANIC CRYSTALS 197
mass 1.5 taken above. Taking the C-H bond length as 1.09 A and a
tetrahedral bond angle, we find
<02>1/2=11 .o.
For the square-well model, this corresponds to a well width of 61°.
Let us consider now a pair of more realistic potentials for the
internal rotation in ethane: potentials with a period of 120°. Twoextreme models may be taken for the motion, one a periodic square-
well potential and the other a potential of the form Vo(l-cos30),
where 6 is the angle of rotation. These are illustrated in figure 2. Thedimensions of the potentials are such as to reproduce the first three
energy levels as derived from thermodynamic and spectroscopic
data [2, 3].
The height of the barrier is the only degree of freedom for the
cosine potential, and a barrier height of 2750 cals/mole or 960 cm-1
was found to give a good fit to the data. There are two parameters
for the square-well potential—the height and width of the barrier;
again a good fit may be obtained with a barrier height of 1700 cal/
mole (595 cm-1) and a barrier width of 76°. It is interesting to note
that the width of the potential well of 44° is somewhat less than the
61° for the infinitely deep square well which has the same first transi-
tion energy of 275 cm-1. As the barrier comes down, the well width
also decreases; there is a simultaneous decrease in the energy of the
higher levels.
i i i i i—i 1 1 1
-180° -142° -98° -22° 0 22° 98° 142° 180°
Figure 2. Square and sinusoidal periodic potentials for the internal rotation in
ethane. The first three energy levels are virtually the same for both potential
functions.
311-280 O—69 14
198 MOLECULAR DYNAMICS AND STRUCTURE OF SOLIDS
The really important point of this example is that the derived
barrier height is sensitively related to the shape of the barrier andmay have little relationship to the actual height if the functional form
chosen is incorrect. As noted above, potential functions for rotations
of groups in crystals may more nearly approximate square well type
potentials than the cosine potentials commonly assumed in interpreta-
tion of spectroscopic and diffraction data. This point will be further
illustrated in some of the examples discussed later in the paper.
In this case again, we expect the amplitude of vibration to be very
nearly equal for the two cases and to be simply related to the vibra-
tional frequency, so that the comparison between spectroscopic and
diffraction data will again be valid, independent of the shape of the
barrier.
3. Models and Techniques
3.1. Diffraction and Vibration Amplitudes
In some of the examples below, we will discuss the results of neutron
diffraction studies in which vibration amplitudes have been derived
from the diffraction data. Other participants in this conference have
discussed in considerable detail how this is done and what types of
information can be obtained. I would like to make three points in this
section: one, that neutron diffraction may provide better measure-
ments for these vibration amplitudes in many cases of interest than
does x-ray diffraction; second, that the particular model assumed for
the refinement of the diffraction data is of some significance although
it may often be ignored; and finally that there is a wealth of informa-
tion available in the detailed analyses of thermal motions by methods
which have been pioneered by Cruickshank [4] and further refined
by Schomaker and Trueblood [5]. Furthermore, a modification of the
usual least squares refinement of thermal motion is proposed.
a. Neutron Diffraction
The scattering of neutrons from atoms in crystals is from a region
of nuclear dimensions—10-13 cm. From the point of view of 1 Aneutrons, the nucleus is a point source and therefore an isotropic
scatterer. There is no decreasing form factor characteristic of the
electron distribution as there is for x-ray diffraction. This has two
important results. First, the shapes of the atoms seen in the inversion
of the diffraction data are due entirely to thermal motion (and disorder
in the crystal), and no assumptions as to electron distribution are
necessary in deriving the parameters describing the thermal motion. 7
7 The combination of neutron and x-ray diffraction on the same crystals has been used in an elegant way
by Coppens [6] to obtain accurate electron density distributions in crystals. This work has been discussed
in another paper at this conference.
STRUCTURE AND SPECTROSCOPY OF INORGANIC CRYSTALS 199
The second important result of the lack of form-factor dependence
is that the scattering extends with appreciable intensity to muchhigher scattering angles, and thus more accurate data may be obtained.
For many of the problems in which I have been interested, neutron
diffraction has been essential for another reason. Namely, hydrogen
atoms do not scatter x-rays with enough intensity for it to be possible
to obtain accurate parameters for their thermal motion. Neutron
diffraction offers a considerable improvement, for the ratio of the
scattering cross section of hydrogen to that for carbon is about 0.4,
while it is 0.03 for x rays. The practical effect is that we can determine
bond lengths involving hydrogen atoms to better than 0.01 A and
the thermal motion parameters of these hydrogen atoms to a few
percent. Most of the work I will discuss later on is devoted to studies
of the hydrogen bond, but I will also assert that most interesting
molecules have hydrogen around their periphery, so that if we are
to study the forces between interacting, interesting molecules we are
forced to study the dynamics of hydrogen atoms with great accuracy.
The second point I would like to make in this section concerns the
validity of models used in the refinement of diffraction data, the
amount of information we can obtain from diffraction data and
whether we can still obtain interesting information even if our models
are wrong. The most direct method of understanding a diffraction
experiment is to look at the representation of the scattered density
as revealed in a Fourier inversion of the diffraction data. This maygive a qualitative feeling for the nature of the thermal motion. For
a quantitative measure, however, diffraction data is almost always
analyzed by carrying out a least squares refinement of the parameters
of a model. This model is almost always a model which describes
the motion of each atom as that of an independent three-dimensional
harmonic oscillator. Even in the refinements where rigid body and
other constraints are placed on the model, the model is still confined
to harmonic motion. Thus the motion of each atom is described bya three-dimensional Gaussian function
where r is a vector describing the atomic position and A is a matrix
whose inverse A-1is the matrix of mean-square displacements.
Now any distribution function p(r) is completely specified byspecifying all of its moments:
b. Validity of the Usual Models
p(r)= Po (r) exp {-%r'Ar} (4)
200 MOLECULAR DYNAMICS AND STRUCTURE OF SOLIDS
The matrix A-1 defined in eq (4) contains the second moments m002,
m020,
ra200,m011
,ra
110, m101
. The assumption of the particular form
(eq (4)) implies certain relations between these moments and higher
moments of the distribution. In particular, all the odd momentsare zero and the higher moments are given by expressions of the type
m (0 >2n > 0)= (2^_ 1 )m (0.2n-2,0)m (0,2,0) (6)
Thus the average value of x* is
m04.0=<a.4>= 3<a;2> 2( 7)
If we assume that the scattering density function is approximately
Gaussian, we may wish to add as further parameters in the refinement
the departures of the higher moments from their ideal values. Such
a procedure does of course add extra parameters to the refinement,
and it is only natural that the agreement between the observed and
calculated data improve. The most desirable approach is one that
first uses a theoretical model to ascertain which of the many possible
additional parameters are likely to be of any importance, then refines
these parameters by a least squares procedure, and finally assesses
the improvement in the agreement by a valid statistical test [7].
Experience and theory tell us that the harmonic approximation is
probably valid to a high degree of accuracy for most of the internal
modes of motion of a molecule. It is not so likely to be valid for the
very low frequency modes involved in intermolecular interactions
and in internal rotations in molecules and crystals. Convincing
evidence for departures from the harmonic approximation has been
given by Willis [8] and Dawson [9] for the ionic crystals CaF2 and U0 2 .
Pawley [10] has suggested directly refining the rigid group vibration
parameters of molecules rather than the vibrational parameters of
individual atoms, from which the group vibrational parameters maybe derived with the Schomaker-Trueblood [5] formalism. This has the
desirable effect of greatly reducing the number of parameters to be
determined in a crystal structure refinement.
I would like to propose the following scheme to put a few parameters
back in. Since one of the main interests in determining vibrational
parameters is in the study of intermolecular forces, a sensible approach
might be as follows:
(1) Use vibrational parameters for the internal modes obtained
from spectroscopic measurement on the same or related molecules.
(2) Refine parameters describing the rigid body motions as well
as parameters describing internal rotations.
(3) Include in the parameters refined in (2) more sophisticated
models of thermal motion than the harmonic. Thus include refine-
STRUCTURE AND SPECTROSCOPY OF INORGANIC CRYSTALS 201
ment of higher moments of the rigid groups—not of individual
atoms. It is just in the low-frequency motions of whole molecules
and groups within molecules that the anharmonic terms are likely
to be of most importance. Introducing them in this way will still
lead to fewer parameters than the usual complete harmonic refine-
ment for individual atoms and may well lead to much better descrip-
tions of thermal motion in molecular crystals than we have had
up to now. Some efforts in this direction are being made in our
laboratory.
Complete, general descriptions of the rigid body motions should teach
us much about the forces between molecules. We have a unique
situation in the crystal in that we can easily measure the directional
properties of intermolecular forces.
3.2. Neutron Inelastic Scattering
Neutron inelastic scattering promises to be the most important of
the techniques for the study of the dynamics of motion in molecular
crystals. Here again, a useful first approximation for a crystal model
is that of harmonic motion. But again, for the more interesting
motions involving weak intermolecular forces, it is the departures
from harmonic motion that may be of the most interest.
In the ideal inelastic scattering experiment, we can control the
following parameters:
(1) The energy E0 of the incident neutrons.
(2) The energy Es of the detected scattered neutrons.
(3) The scattering angle. This may be expressed in the change in
vector momentum AP=P 0—
P
s of the neutron, or usually as the
change in the wave vector k= k0—
k
s with k=P/ft.
(4) The orientation of the crystal lattice with respect to the
scattering vector k.
(5) The temperature of the crystal and, hence, the population
in various energy levels.
In any real experiment, we may average over one or more of these
quantities. In some cases, this may lead to simpler theoretical ex-
pressions for the scattered intensity. In others, it may lead to nasty
problems in resolution.
The change in energy AE=E0—ES of the neutron must of course be
equal to the change in energy in the scattering system; thus it mustrepresent a transition between stationary states of the scattering
system. By studying the scattered intensity as a function of energy
change, we obtain a spectrum which is characteristic of the energy
level scheme of the crystal. By varying the crystal orientation weare able to obtain information concerning the polarization character-
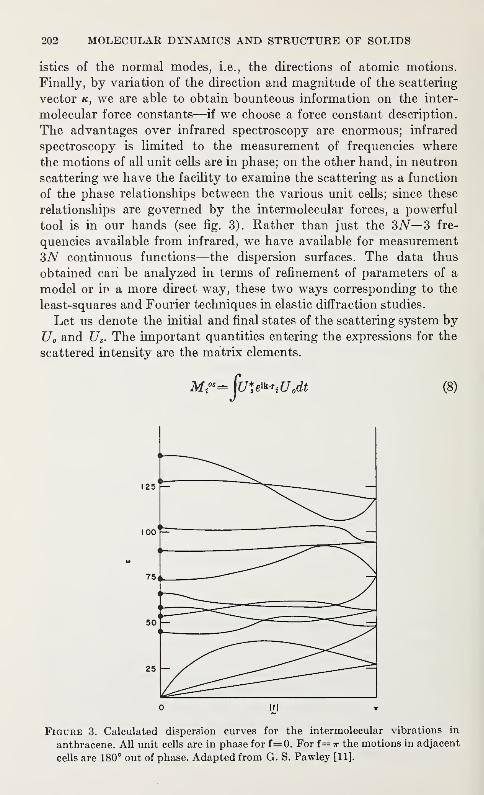
202 MOLECULAR DYNAMICS AND STRUCTURE OF SOLIDS:
istics of the normal modes, i.e., the directions of atomic motions.
Finally, by variation of the direction and magnitude of the scattering
vector k, we are able to obtain bounteous information on the inter-
molecular force constants—if we choose a force constant description.
The advantages over infrared spectroscopy are enormous; infrared
spectroscopy is limited to the measurement of frequencies where
the motions of all unit cells are in phase; on the other hand, in neutron
scattering we have the facility to examine the scattering as a function
of the phase relationships between the various unit cells; since these
relationships are governed by the intermolecular forces, a powerful
tool is in our hands (see fig. 3). Rather than just the 3iV— 3 fre-
quencies available from infrared, we have available for measurement
3iV continuous functions—the dispersion surfaces. The data thus
obtained can be analyzed in terms of refinement of parameters of a
model or in a more direct way, these two ways corresponding to the
least-squares and Fourier techniques in elastic diffraction studies.
Let us denote the initial and final states of the scattering system by
U0 and Us . The important quantities entering the expressions for the
scattered intensity are the matrix elements.
o |f|
Figure 3. Calculated dispersion curves for the intermolecular vibrations in
anthracene. All unit cells are in phase for f=0. For f== ir the motions in adjacent
cells are 180° out of phase. Adapted from G. S. Pawley [11].
STRUCTURE AND SPECTROSCOPY OF INORGANIC CRYSTALS 203
defined for each atom i in the crystal. The scattered intensity for
given values of k and AE may be expressed as
I(k,AE) oc S S atajMW, (9)#o 1=1 j=l
where a* and a, are the scattering lengths for the nuclei and the
summations are over all atoms in the crystal. If there is random occu-
pancy of a given unit cell site in the crystal, it becomes theoretically
advantageous to separate the expression for the total scattering into
a coherent part and an incoherent part. Defining 8
ar=[<al>-<a i>T2(10)
andaf*=<at>, (11)
we may obtain expressions for the incoherent and coherent scattering
as
/,n cOC(MUSWnCM,| 2(12)
i
and
/cohoc {kjk0) S2 afaf^WMr (IS)i=i j=i
The latter expression may of course be written as
Jcoh__^sJc0
T,ar"M, (14)
The sum is still over the whole crystal but eq (14) suggests that the
coherent scattering may be written as the square of a structure factor.
If this is true, it seems clear that the Fourier transformation of this
measured structure factor may then be used to directly obtain a mapwhich is related to the momentum distribution in the crystal.
If a model of harmonic motion is assumed, we can obtain the
following results
:
Let the displacement Ar, of an atom % in one unit cell be expressed
in terms of the normal coordinate q, the polarization vector C t , the
atomic mass m, and the number of unit cells N in the crystal by
Ari=Q
iq{Nm ir 112(15)
The intensity of the incoherent scattering may now be written
/oc^S^lnc2^^^# (16)K 0 cell Mi 2co
8 <> denotes average value over all atoms in the same crystallographic site.
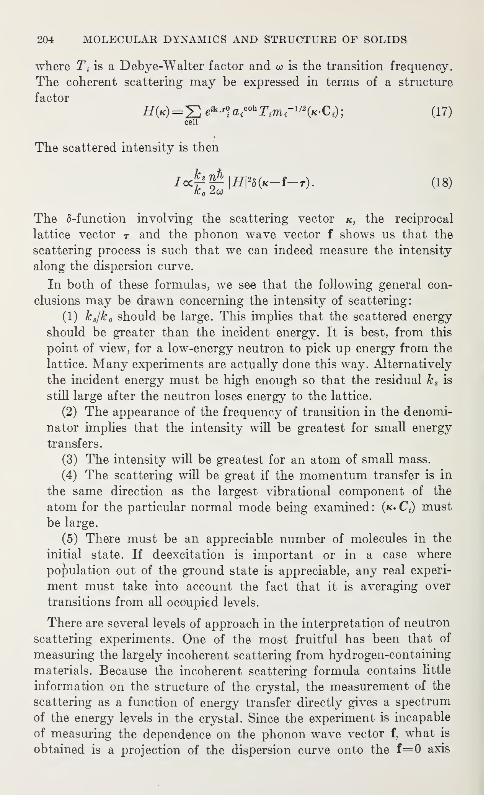
204 MOLECULAR DYNAMICS AND STRUCTURE OF SOLIDS
where Tt is a Debye-Walter factor and oo is the transition frequency.
The coherent scattering may be expressed in terms of a structure
factor
H(K)= J}e*-<°i arhTtm t
- 1/2(K'Ci); (17)
cell
The scattered intensity is then
J«£§£lflP»(«-f-«). (18)
The 5-function involving the scattering vector k, the reciprocal
lattice vector t and the phonon wave vector f shows us that the
scattering process is such that we can indeed measure the intensity
along the dispersion curve.
In both of these formulas, we see that the following general con-
clusions may be drawn concerning the intensity of scattering:
(1) k s/k 0 should be large. This implies that the scattered energy
should be greater than the incident energy. It is best, from this
point of view, for a low-energy neutron to pick up energy from the
lattice. Many experiments are actually done this way. Alternatively
the incident energy must be high enough so that the residual k s is
still large after the neutron loses energy to the lattice.
(2) The appearance of the frequency of transition in the denomi-
nator implies that the intensity will be greatest for small energy
transfers.
(3) The intensity will be greatest for an atom of small mass.
(4) The scattering will be great if the momentum transfer is in
the same direction as the largest vibrational component of the
atom for the particular normal mode being examined: (k»C<) must
be large.
(5) There must be an appreciable number of molecules in the
initial state. If deexcitation is important or in a case where
population out of the ground state is appreciable, any real experi-
ment must take into account the fact that it is averaging over
transitions from all occupied levels.
There are several levels of approach in the interpretation of neutron
scattering experiments. One of the most fruitful has been that of
measuring the largely incoherent scattering from hydrogen-containing
materials. Because the incoherent scattering formula contains little
information on the structure of the crystal, the measurement of the
scattering as a function of energy transfer directly gives a spectrum
of the energy levels in the crystal. Since the experiment is incapable
of measuring the dependence on the phonon wave vector f, what is
obtained is a projection of the dispersion curve onto the f=0 axis
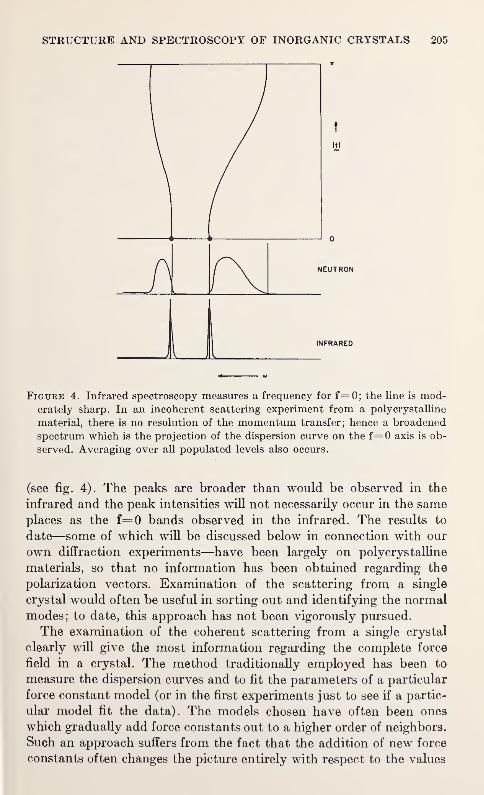
STRUCTURE AND SPECTROSCOPY OF INORGANIC CRYSTALS 205
Figure 4. Infrared spectroscopy measures a frequency for 1 = 0; the line is mod-erately sharp. In an incoherent scattering experiment from a polycrystalline
material, there is no resolution of the momentum transfer; hence a broadened
spectrum which is the projection of the dispersion curve on the f= 0 axis is ob-
served. Averaging over all populated levels also occurs.
(see fig. 4). The peaks are broader than would be observed in the
infrared and the peak intensities will not necessarily occur in the sameplaces as the f=0 bands observed in the infrared. The results to
date—some of which will be discussed below in connection with our
own diffraction experiments—have been largely on polycrystalline
materials, so that no information has been obtained regarding the
polarization vectors. Examination of the scattering from a single
crystal would often be useful in sorting out and identifying the normal
modes; to date, this approach has not been vigorously pursued.
The examination of the coherent scattering from a single crystal
clearly will give the most information regarding the complete force
field in a crystal. The method traditionally employed has been to
measure the dispersion curves and to fit the parameters of a particular
force constant model (or in the first experiments just to see if a partic-
ular model fit the data). The models chosen have often been ones
which gradually add force constants out to a higher order of neighbors.
Such an approach suffers from the fact that the addition of new force
constants often changes the picture entirely with respect to the values
206 MOLECULAR DYNAMICS AND STRUCTURE OF SOLIDS
of the lower force constants. The new part of the solution is not
orthogonal to the old. The situation is analogous to that of fitting a
function by expansion into a power series. If the coefficients of powers
of the argument are used, convergence is difficult because of the ex-
tremely non-orthogonal character of powers of x; on the other handexpansion into a superposition of polynomials orthogonal over the
interval of the fit is usually a stable procedure. Thus, in the description
of the force field surrounding a molecule, a fit to parameters of a set
of orthogonal functions would appear to offer the most satisfactory
approach. 9
Another approach is to go directly to a Fourier inversion of the
intensity data as measured along a dispersion surface. Such an in-
version would produce structural as well as dynamical information.
Peaks will appear near atomic positions which will contain informa-
tion on the atomic motion for the particular normal mode in question.
This is opposed to the ordinary Fourier map from diffraction data
where the sum totals of the motions are observed. Intensity data
from coherent scattering experiments have not often been used in
this way, for the experimental problem of measuring intensity is ex-
tremely difficult because of resolution problems. I nevertheless look
forward to the day when this will prove to be the most sophisticated
use of scattering data.
We should ultimately be in a position to analyze this wealth of
information in terms of anharmonic models, particularly in terms of
directional effects in forces between molecules—getting away from
the spherical potentials usually associated with van der Waals or
Lennard-Jones potential functions where the intermolecular potentials
are expressed simply as the sum of individual atomic potentials.
Both rigid-group refinement of diffraction data and detailed ex-
amination of the frequencies and intensities of inelastic scattering maybe expected to provide us in the coming years with information con-
cerning forces which is of real use to the chemist. We now turn to
some systems which have been studied by the simpler techniques.
4. Techniques and Results: Some Examples FromHydrogen-Bonded Systems
4.1. Phosphonium Iodide
Phosphonium iodide (fig. 5) has been studied by Rush [12] by the
method of neutron inelastic scattering. He has found a peak frequency
of 327±11 cm-1, which he has assigned to the frequency of torsional
9We should expect that we can obtain better convergence properties in the study of intermolecular forces
than has often been achieved with forces in ionic or metallic crystals because of the shorter range forces
usually involved; thus for molecular crystals the force constant expansion may prove to be good enough.
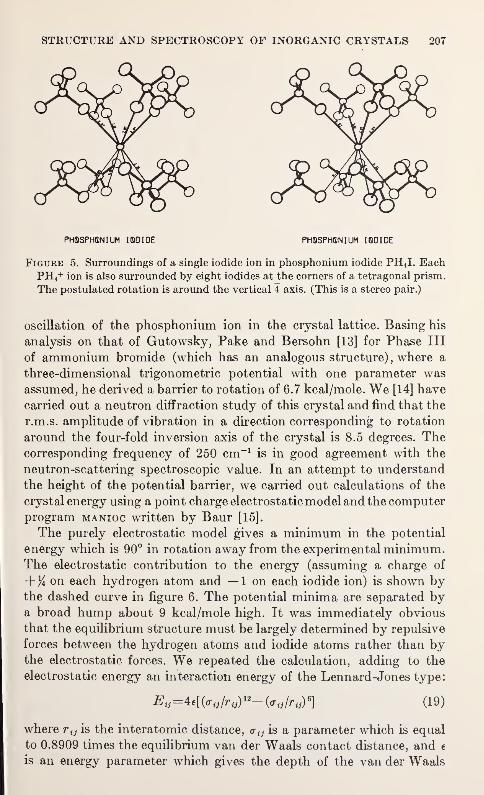
STRUCTURE AND SPECTROSCOPY OF INORGANIC CRYSTALS 207
PH0SPH8NIUM I SO IDE PH8SPHQN I UM IODIDE
Figure 5. Surroundings of a single iodide ion in phosphonium iodide PH 4I. EachPH 4
+ ion is also surrounded by eight iodides at the corners of a tetragonal prism.
The postulated rotation is around the vertical 4 axis. (This is a stereo pair.)
oscillation of the phosphonium ion in the crystal lattice. Basing his
analysis on that of Gutowsky, Pake and Bersohn [13] for Phase III
of ammonium bromide (which has an analogous structure) , where a
three-dimensional trigonometric potential with one parameter wasassumed, he derived a barrier to rotation of 6.7 kcal/mole. We [14] have
carried out a neutron diffraction study of this crystal and find that the
r.m.s. amplitude of vibration in a direction corresponding to rotation
around the four-fold inversion axis of the crystal is 8.5 degrees. Thecorresponding frequency of 250 cm-1
is in good agreement with the
neutron-scattering spectroscopic value. In an attempt to understand
the height of the potential barrier, we carried out calculations of the
crystal energy using a point charge electrostaticmodel and the computerprogram manioc written by Baur [15].
The purely electrostatic model gives a minimum in the potential
energy which is 90° in rotation away from the experimental minimum.The electrostatic contribution to the energy (assuming a charge of
+ V\ on each hydrogen atom and — 1 on each iodide ion) is shown bythe dashed curve in figure 6. The potential minima are separated bya broad hump about 9 kcal/mole high. It was immediately obvious
that the equilibrium structure must be largely determined by repulsive
forces between the hydrogen atoms and iodide atoms rather than bythe electrostatic forces. We repeated the calculation, adding to the
electrostatic energy an interaction energy of the Lennard-Jones type:
^«=4f[(^v)n-(^)l (19)
where r i} is the interatomic distance, atj is a parameter which is equal
to 0.8909 times the equilibrium van der Waals contact distance, and e
is an energy parameter which gives the depth of the van der Waals
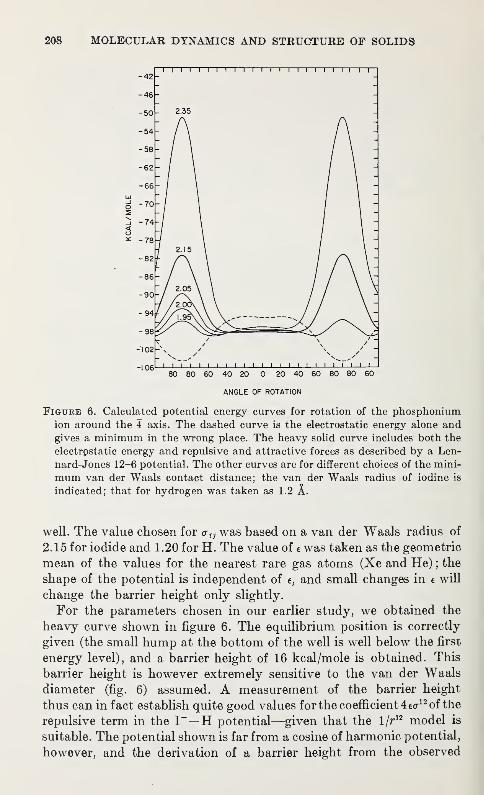
208 MOLECULAR DYNAMICS AND STRUCTURE OF SOLIDS
I I I ! I I
80 80 60 40 20 0 20 40 60 80 80 60
ANGLE OF ROTATION
Figure 6. Calculated potential energy curves for rotation of the phosphoniumion around the 4 axis. The dashed curve is the electrostatic energy alone andgives a minimum in the wrong place. The heavy solid curve includes both the
electrpstatic energy and repulsive and attractive forces as described by a Len-
nard-Jones 12-6 potential. The other curves are for different choices of the mini-
mum van der Waals contact distance; the van der Waals radius of iodine is
indicated; that for hydrogen was taken as 1.2 A.
well. The value chosen for was based on a van der Waals radius of
2.15 for iodide and 1.20 for H. The value of t was taken as the geometric
mean of the values for the nearest rare gas atoms (Xe and He) ; the
shape of the potential is independent of e, and small changes in e will
change the barrier height only slightly.
For the parameters chosen in our earlier study, we obtained the
heavy curve shown in figure 6. The equilibrium position is correctly
given (the small hump at the bottom of the well is well below the first
energy level), and a barrier height of 16 kcal/mole is obtained. This
barrier height is however extremely sensitive to the van der Waals
diameter (fig. 6) assumed. A measurement of the barrier height
thus can in fact establish quite good values for the coefficient 4 eo-12 of the
repulsive term in the I~—H potential—given that the 1/r12 model is
suitable. The potential shown is far from a cosine of harmonic potential,
however, and the derivation of a barrier height from the observed
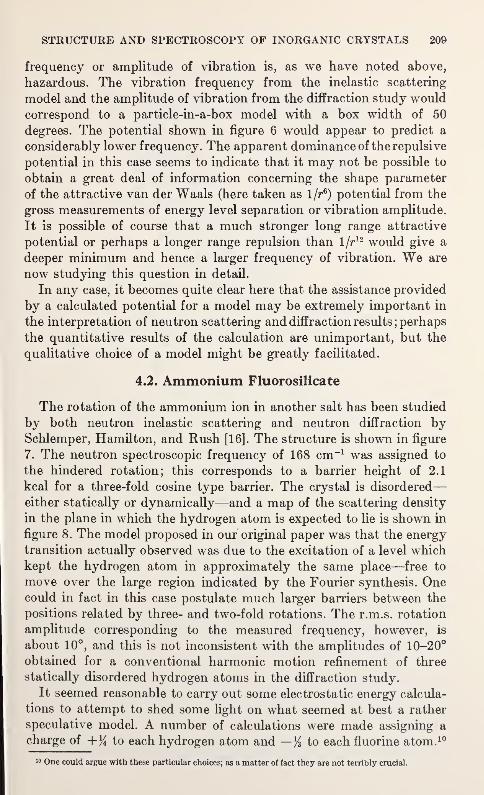
STRUCTURE AND SPECTROSCOPY OF INORGANIC CRYSTALS 209
frequency or amplitude of vibration is, as we have noted above,
hazardous. The vibration frequency from the inelastic scattering
model and the amplitude of vibration from the diffraction study would
correspond to a particle-in-a-box model with a box width of 50
degrees. The potential shown in figure 6 would appear to predict a
considerably lower frequency. The apparent dominance of the repulsive
potential in this case seems to indicate that it may not be possible to
obtain a great deal of information concerning the shape parameter
of the attractive van der Waals (here taken as 1/r6) potential from the
gross measurements of energy level separation or vibration amplitude.
It is possible of course that a much stronger long range attractive
potential or perhaps a longer range repulsion than 1/r12 would give a
deeper minimum and hence a larger frequency of vibration. We are
now studying this question in detail.
In any case, it becomes quite clear here that the assistance provided
by a calculated potential for a model may be extremely important in
the interpretation of neutron scattering and diffraction results; perhaps
the quantitative results of the calculation are unimportant, but the
qualitative choice of a model might be greatly facilitated.
4.2. Ammonium Fluorosilicate
The rotation of the ammonium ion in another salt has been studied
by both neutron inelastic scattering and neutron diffraction bySchlemper, Hamilton, and Rush [16]. The structure is shown in figure
7. The neutron spectroscopic frequency of 168 cm-1 was assigned to
the hindered rotation; this corresponds to a barrier height of 2.1
kcal for a three-fold cosine type barrier. The crystal is disordered
—
either statically or dynamically—and a map of the scattering density
in the plane in which the hydrogen atom is expected to lie is shown in
figure 8. The model proposed in our original paper was that the energy
transition actually observed was due to the excitation of a level whichkept the hydrogen atom in approximately the same place—free to
move over the large region indicated by the Fourier synthesis. Onecould in fact in this case postulate much larger barriers between the
positions related by three- and two-fold rotations. The r.m.s. rotation
amplitude corresponding to the measured frequency, however, is
about 10°, and this is not inconsistent with the amplitudes of 10-20°
obtained for a conventional harmonic motion refinement of three
statically disordered hydrogen atoms in the diffraction study.
It seemed reasonable to carry out some electrostatic energy calcula-
tions to attempt to shed some light on what seemed at best a rather
speculative model. A number of calculations were made assigning a
charge of to each hydrogen atom and — % to each fluorine atom. 10
One could argue with these particular choices; as a matter of fact they are not terribly crucial.
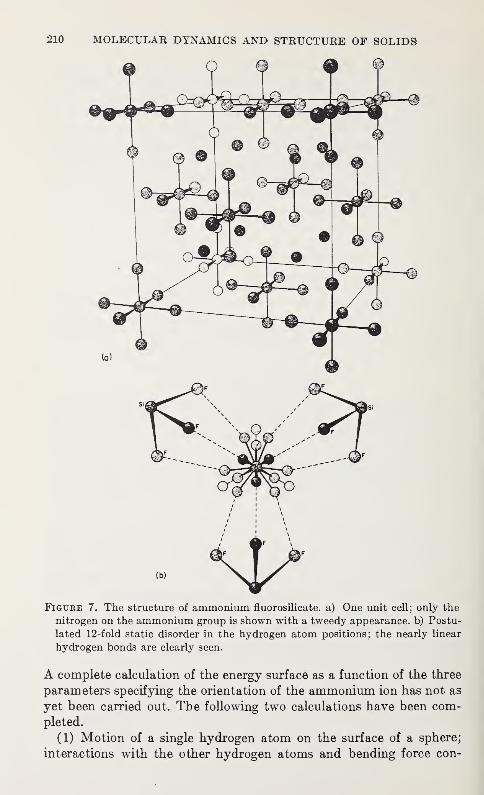
210 MOLECULAR DYNAMICS AND STRUCTURE OF SOLIDS
Figure 7. The structure of ammonium fluorosilicate. a) One unit cell; only the
nitrogen on the ammonium group is shown with a tweedy appearance, b) Postu-
lated 12-fold static disorder in the hydrogen atom positions; the nearly linear
hydrogen bonds are clearly seen.
A complete calculation of the energy surface as a function of the three
parameters specifying the orientation of the ammonium ion has not as
yet been carried out. The following two calculations have been com-
pleted.
(1) Motion of a single hydrogen atom on the surface of a sphere;
interactions with the other hydrogen atoms and bending force con-
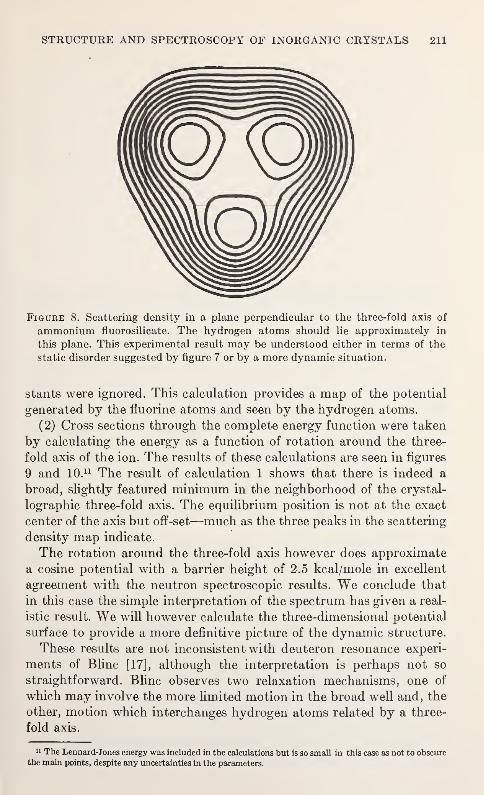
STRUCTURE AND SPECTROSCOPY OF INORGANIC CRYSTALS 211
Figure 8. Scattering density in a plane perpendicular to the three-fold axis of
ammonium fluorosilicate. The hydrogen atoms should lie approximately in
this plane. This experimental result may be understood either in terms of the
static disorder suggested by figure 7 or by a more dynamic situation.
stants were ignored. This calculation provides a map of the potential
generated by the fluorine atoms and seen by the hydrogen atoms.
(2) Cross sections through the complete energy function were taken
by calculating the energy as a function of rotation around the three-
fold axis of the ion. The results of these calculations are seen in figures
9 and 10. 11 The result of calculation 1 shows that there is indeed a
broad, slightly featured minimum in the neighborhood of the crystal-
lographic three-fold axis. The equilibrium position is not at the exact
center of the axis but off-set—much as the three peaks in the scattering
density map indicate.
The rotation around the three-fold axis however does approximate
a cosine potential with a barrier height of 2.5 kcal/mole in excellent
agreement with the neutron spectroscopic results. We conclude that
in this case the simple interpretation of the spectrum has given a real-
istic result. We will however calculate the three-dimensional potential
surface to provide a more definitive picture of the dynamic structure.
These results are not inconsistent with deuteron resonance experi-
ments of Blinc [17], although the interpretation is perhaps not so
straightforward. Blinc observes two relaxation mechanisms, one of
which may involve the more limited motion in the broad well and, the
other, motion which interchanges hydrogen atoms related by a three-
fold axis.
» The Lennard-Jones energy was included in the calculations but is so small in this case as not to obscure
the main points, despite any uncertainties in the parameters.
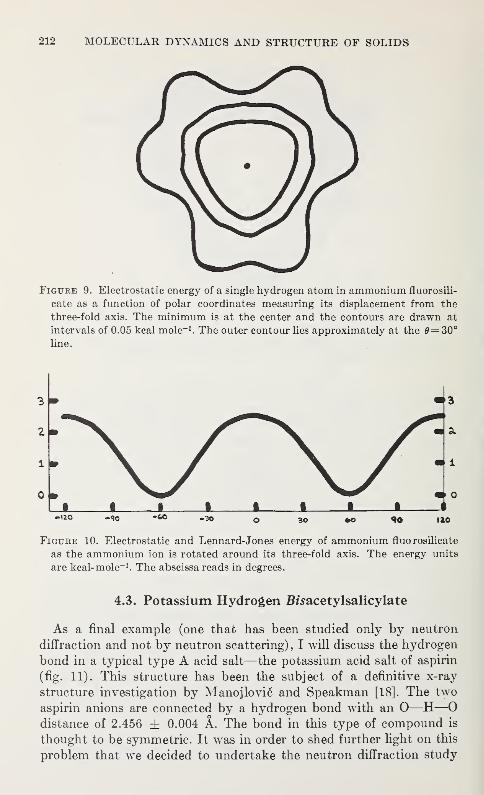
212 MOLECULAR DYNAMICS AND STRUCTURE OF SOLIDS
Figure 9. Electrostatic energy of a single hydrogen atom in ammonium fluorosili-
cate as a function of polar coordinates measuring its displacement from the
three-fold axis. The minimum is at the center and the contours are drawn at
intervals of 0.05 kcal mole-1 . The outer contour lies approximately at the 6=30°line.
4.3. Potassium Hydrogen Bxsacetylsalicylate
As a final example (one that has been studied only by neutron
diffraction and not by neutron scattering), I will discuss the hydrogen
bond in a typical type A acid salt—the potassium acid salt of aspirin
(fig. 11). This structure has been the subject of a definitive x-ray
structure investigation by Manojlovic and Speakman [18]. The two
aspirin anions are connected by a hydrogen bond with an O—H—
O
distance of 2.456 ± 0.004 A. The bond in this type of compound is
thought to be symmetric. It was in order to shed further light on this
problem that we decided to undertake the neutron diffraction study
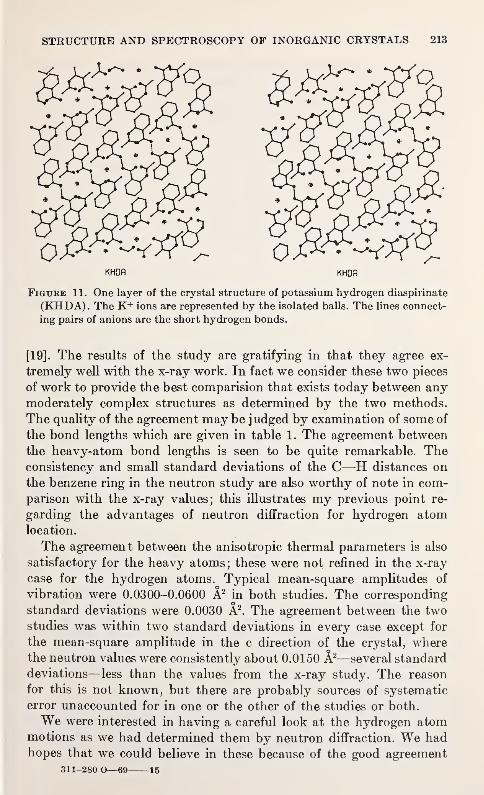
STRUCTURE AND SPECTROSCOPY OF INORGANIC CRYSTALS 213
KHDfl KHDR
Figure 11. One layer of the crystal structure of potassium hydrogen diaspirinate
(KHDA). The K+ ions are represented by the isolated balls. The lines connect-
ing pairs of anions are the short hydrogen bonds.
[19]. The results of the study are gratifying in that they agree ex-
tremely well with the x-ray work. In fact we consider these two pieces
of work to provide the best comparision that exists today between anymoderately complex structures as determined by the two methods.
The quality of the agreement may be judged by examination of some of
the bond lengths which are given in table 1. The agreement between
the heavy-atom bond lengths is seen to be quite remarkable. Theconsistency and small standard deviations of the C—H distances onthe benzene ring in the neutron study are also worthy of note in com-parison with the x-ray values; this illustrates my previous point re-
garding the advantages of neutron diffraction for hydrogen atomlocation.
The agreement between the anisotropic thermal parameters is also
satisfactory for the heavy atoms; these were not refined in the x-ray
case for the hydrogen atoms. Typical mean-square amplitudes of
vibration were 0.0300-0.0600 A2in both studies. The corresponding
standard deviations were 0.0030 A2. The agreement between the two
studies was within two standard deviations in every case except for
the mean-square amplitude in the c direction of the crystal, wherethe neutron values were consistently about 0.0150 A2—several standard
deviations—less than the values from the x-ray study. The reason
for this is not known, but there are probably sources of systematic
error unaccounted for in one or the other of the studies or both.
We were interested in having a careful look at the hydrogen atommotions as we had determined them by neutron diffraction. We hadhopes that we could believe in these because of the good agreement
311-280 O—69 15
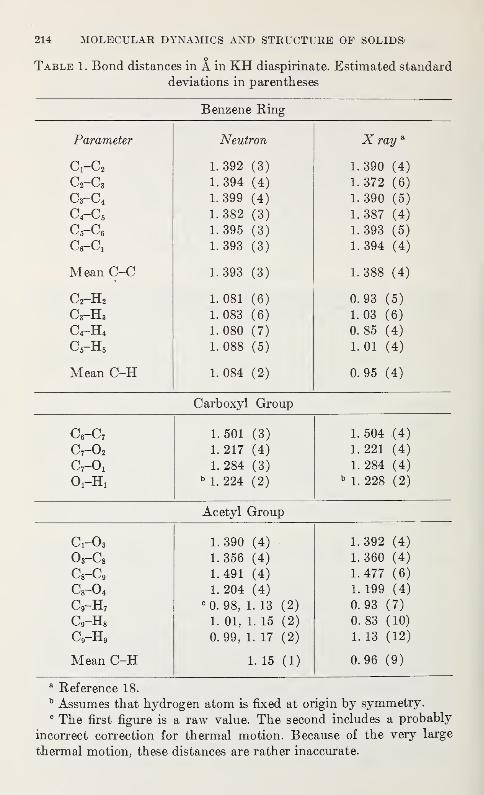
214 MOLECULAR DYNAMICS AND STRUCTURE OF SOLIDS
Table 1. Bond distances in A in KH diaspirinate. Estimated standard
deviations in parentheses
Benzene Ring
Parameter Neutron A ray
L^i—L/2 1. 392 (3) 1. oyu (4;
O2—O3 1. 394 (4) 1. 372 (6)
O3—O4 1.399 (4) 1. 390 (5)
C4—O5 1. 382 (3) 1.387 (4)
C5—
C
6 1. 395 (3) 1.393 (5)
1. 393 (3) 1.394 (4)
iviean vj—0 1. 393 (3) 1 Qfifi ( A.\1. 000 y<±)
C2"~H2 1. 081 (6) 0.93 (5)
C3—H3 1. 083 (6) 1.03 (6)
C4—H4 1.080 (7) 0.85 (4)
C 5-H5 1. 088 (5) 1.01 (4)
Mean C-H 1. 084 (2) 0.95 (4)
Carboxyl Group
C6~C7 1. 501 (3) 1.504 (4)
Cr-02 1.217 (4) 1.221 (4)
0,-0, 1.284 (3) 1. 284 (4)
0,-H, b1. 224 (2)
b1. 228 (2)
Acetyl Group
(VO3 1.390 (4) 1.392 (4)
o3-c8 1.356 (4) 1.360 (4)
1.491 (4) 1.477 (6)
c8-o4 1.204 (4) 1. 199 (4)
C9-H7 c0. 98, 1. 13 (2) 0.93 (7)
C9—
H
8 1. 01, 1. 15 (2) 0.83 (10)
C9—
H
9 0.99, 1. 17 (2) 1. 13 (12)
Mean C-H 1.15 (1) 0.96 (9)
a Reference 18.b Assumes that hydrogen atom is fixed at origin by symmetry.c The first figure is a raw value. The second includes a probably
incorrect correction for thermal motion. Because of the very large
thermal motion, these distances are rather inaccurate.
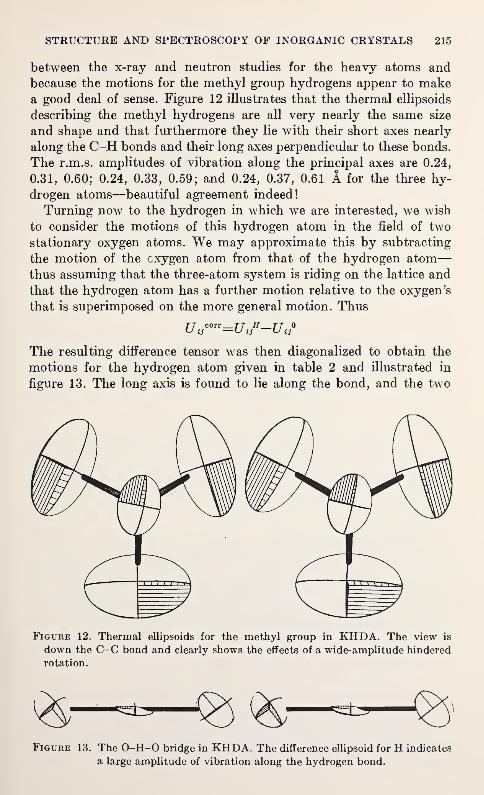
STRUCTURE AND SPECTROSCOPY OF INORGANIC CRYSTALS 215
between the x-ray and neutron studies for the heavy atoms andbecause the motions for the methyl group hydrogens appear to makea good deal of sense. Figure 12 illustrates that the thermal ellipsoids
describing the methyl hydrogens are all very nearly the same size
and shape and that furthermore they lie with their short axes nearly
along the C-H bonds and their long axes perpendicular to these bonds.
The r.m.s. amplitudes of vibration along the principal axes are 0.24,
0.31, 0.60; 0.24, 0.33, 0.59; and 0.24, 0.37, 0.61 A for the three hy-
drogen atoms—beautiful agreement indeed!
Turning now to the hydrogen in which we are interested, we wish
to consider the motions of this hydrogen atom in the field of two
stationary oxygen atoms. We may approximate this by subtracting
the motion of the oxygen atom from that of the hydrogen atom
—
thus assuming that the three-atom system is riding on the lattice and
that the hydrogen atom has a further motion relative to the oxygen's
that is superimposed on the more general motion. Thus
The resulting difference tensor was then diagonalized to obtain the
motions for the hydrogen atom given in table 2 and illustrated in
figure 13. The long axis is found to lie along the bond, and the two
Figure 12. Thermal ellipsoids for the methyl group in KHDA. The view is
down the C-C bond and clearly shows the effects of a wide-amplitude hindered
rotation.
^—^—§3 — —Q>$>
Figure 13. The O-H-0 bridge in KHDA. The difference ellipsoid for H indicates
a large amplitude of vibration along the hydrogen bond.
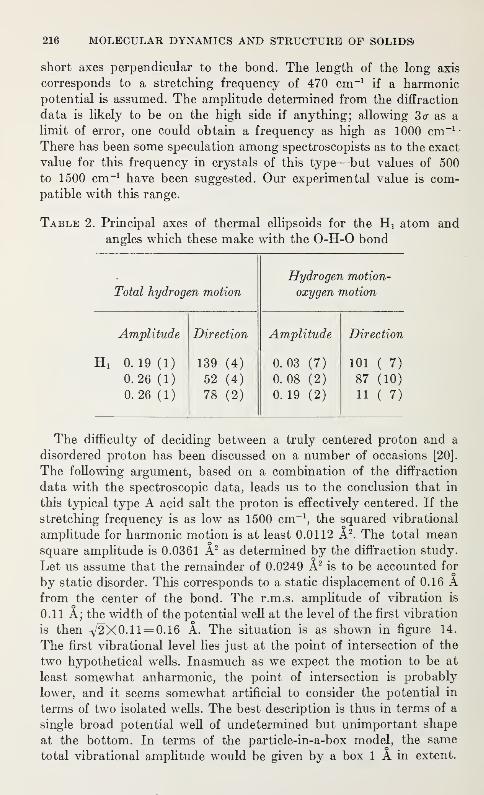
216 MOLECULAR DYNAMICS AND STRUCTURE OF SOLIDS)
short axes perpendicular to the bond. The length of the long axis
corresponds to a stretching frequency of 470 cm-1if a harmonic
potential is assumed. The amplitude determined from the diffraction
data is likely to be on the high side if anything; allowing 3<r as a
limit of error, one could obtain a frequency as high as 1000 cm -1•
There has been some speculation among spectroscopists as to the exact
value for this frequency in crystals of this type—but values of 500
to 1500 cm-1 have been suggested. Our experimental value is com-patible with this range.
Table 2. Principal axes of thermal ellipsoids for the Hi atom and
angles which these make with the O-H-0 bond
Hydrogen motion-
Total hydrogen motion oxygen motion
Amplitude Direction Amplitude Direction
Hx 0.19(1) 139 (4) 0.03 (7) 101 ( 7)
0.26 (1) 52 (4) 0.08 (2) 87 (10)
0. 26 (1) 78 (2) 0. 19 (2) 11 ( 7)
The difficulty of deciding between a truly centered proton and a
disordered proton has been discussed on a number of occasions [20].
The following argument, based on a combination of the diffraction
data with the spectroscopic data, leads us to the conclusion that in
this typical type A acid salt the proton is effectively centered. If the
stretching frequency is as low as 1500 cm-1, the squared vibrational
amplitude for harmonic motion is at least 0.0112 A2. The total mean
square amplitude is 0.0361 A2 as determined by the diffraction study.
Let us assume that the remainder of 0.0249 A2is to be accounted for
by static disorder. This corresponds to a static displacement of 0.16 Afrom the center of the bond. The r.m.s. amplitude of vibration is
0.11 A; the width of the potential well at the level of the first vibration
is then 72X0.11= 0.16 A. The situation is as shown in figure 14.
The first vibrational level lies just at the point of intersection of the
two hypothetical wells. Inasmuch as we expect the motion to be at
least somewhat anharmonic, the point of intersection is probably
lower, and it seems somewhat artificial to consider the potential in
terms of two isolated wells. The best description is thus in terms of a
single broad potential well of undetermined but unimportant shape
at the bottom. In terms of the particle-in-a-box model, the same
total vibrational amplitude would be given by a box 1 A in extent.
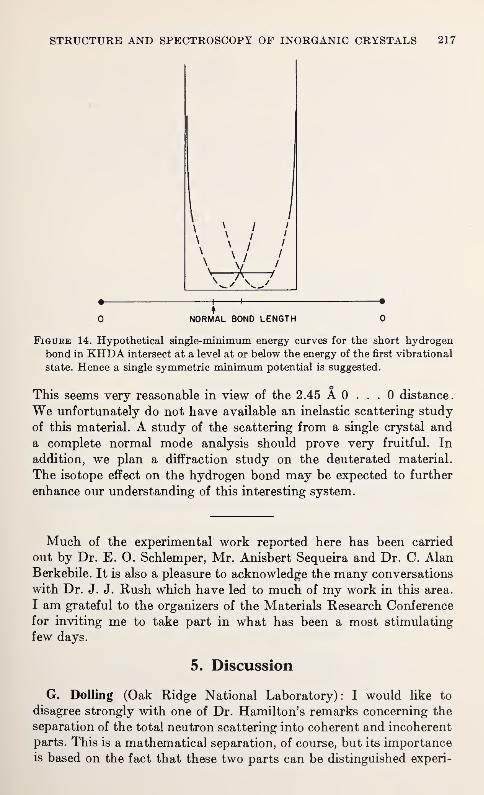
STRUCTURE AND SPECTROSCOPY OF INORGANIC CRYSTALS 217
\
\/
0 NORMAL BOND LENGTH 0
Figure 14. Hypothetical single-minimum energy curves for the short hydrogen
bond in KHDA intersect at a level at or below the energy of the first vibrational
state. Hence a single symmetric minimum potential is suggested.
This seems very reasonable in view of the 2.45 A 0 ... 0 distance.
We unfortunately do not have available an inelastic scattering study
of this material. A study of the scattering from a single crystal and
a complete normal mode analysis should prove very fruitful. In
addition, we plan a diffraction study on the deuterated material.
The isotope effect on the hydrogen bond may be expected to further
enhance our understanding of this interesting system.
Much of the experimental work reported here has been carried
out by Dr. E. O. Schlemper, Mr. Anisbert Sequeira and Dr. C. Alan
Berkebile. It is also a pleasure to acknowledge the many conversations
with Dr. J. J. Rush which have led to much of my work in this area.
I am grateful to the organizers of the Materials Research Conference
for inviting me to take part in what has been a most stimulating
few days.
G. Dolling (Oak Ridge National Laboratory): I would like to
disagree strongly with one of Dr. Hamilton's remarks concerning the
separation of the total neutron scattering into coherent and incoherent
parts. This is a mathematical separation, of course, but its importanceis based on the fact that these two parts can be distinguished experi-
5. Discussion
218 MOLECULAR DYNAMICS AND STRUCTURE OF SOLIDS
mentally, in contradiction to Dr. Hamilton's statement. The dis-
tinguishing feature of the coherent scattering is the delta function in
momentum space which does not appear in the cross-section for
incoherent scattering.
W. C. Hamilton: But we have no way of knowing whether a given
neutron reaching the counter has been scattered incoherently or
coherently. A measurement at a given point in energy-momentumspace leads to no information on coherence or incoherence. We mustuse a theoretical model to perform the separation. This was the
context of my remark.
6. References
[1] Committee for the Survey of Chemistry, Chemistry: Opportunities andNeeds, National Academy of Sciences-National Research Council, Wash-ington, D.C., 1965.
[2] G. B. Kistiakowsky, J. R. Lacher, and F. Stitt, J. Chem. Phys. 7, 289 (1939).
[3] A. Charlesby, Proc. Phys. Soc. 54, 471 (1942).
[4] D. W. J. Cruickshank, Acta Cryst. 9, 754 (1956).
[5] V. Schomaker and K. N. Trueblood, Acta Cryst. B23, 63 (1968).
[6] P. Coppens, Science, 158, 1577 (1967).
[7] W. C. Hamilton, Acta Cryst. 18, 502 (1965).
[8] B. T. M. Willis, Acta Cryst. 18, 75 (1965).
[9] B. Dawson, Acta Cryst. 21, A5 (1965).
[10] G. S. Pawley, Acta Cryst. 17, 457 (1964).
[11] G. S. Pawley, Phys. Stat. Sol. 20, 347 (1967).
[12] J. J. Rush, J. Chem. Phys. 44, 1722 (1966); also T. C. Farrar and J. J. Rush,
these proceedings.
[13] H. S. Gutowsky, G. E. Pake, and R. Bersohn, J. Chem. Phys. 22, 643 (1954)"
[14] A. Sequeira and W. C. Hamilton, J. Chem. Phys. 47, 1818 (1967).
[15] W. Baur, Acta Cryst. 19, 209 (1965).
[16] E. O. Schlemper, W. C. Hamilton, and J. J. Rush, J. Chem. Phys. 44, 2499
(1966).
[17] R. Blinc, private communication.
[18] L. Manojlovic and J. C. Speakman, J. Chem. Soc, 971 (1967).
[19] A. Sequeira, C. A. Berkebile, and W. C. Hamilton, J. Mol. Str. 1, 283 (1967).
[20] W. C. Hamilton and J. A. Ibers, Hydrogen Bonding in Solids, W. A.
Benjamin, New York, 1967, pp. 108-113.
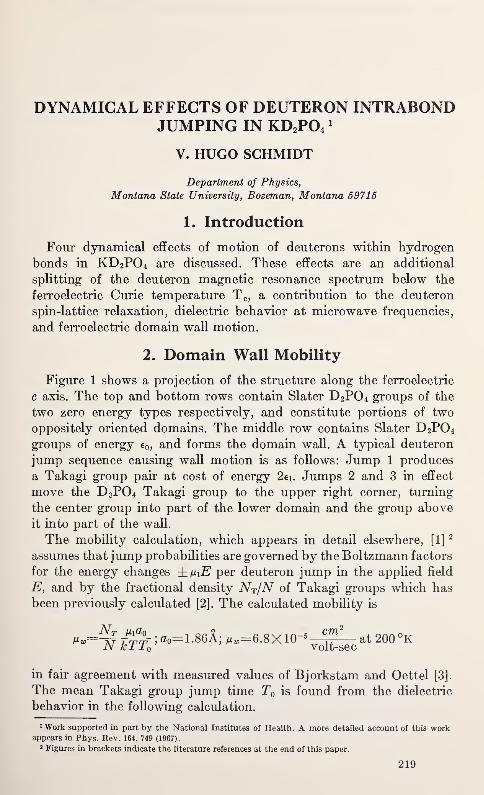
DYNAMICAL EFFECTS OF DEUTERON INTRABONDJUMPING IN KD2P(V
V. HUGO SCHMIDT
Department of Physics,
Montana State University, Bozeman, Montana 59715
1. Introduction
Four dynamical effects of motion of deuterons within hydrogen
bonds in KD2PO4 are discussed. These effects are an additional
splitting of the deuteron magnetic resonance spectrum below the
ferroelectric Curie temperature T c , a contribution to the deuteron
spin-lattice relaxation, dielectric behavior at microwave frequencies,
and ferroelectric domain wall motion.
2. Domain Wall Mobility
Figure 1 shows a projection of the structure along the ferroelectric
c axis. The top and bottom rows contain Slater D2PO4 groups of the
two zero energy types respectively, and constitute portions of two
oppositely oriented domains. The middle row contains Slater D 2P04
groups of energy e0 , and forms the domain wall. A typical deuteron
jump sequence causing wall motion is as follows: Jump 1 produces
a Takagi group pair at cost of energy 2ei. Jumps 2 and 3 in effect
move the D 3P04 Takagi group to the upper right corner, turning
the center group into part of the lower domain and the group above
it into part of the wall.
The mobility calculation, which appears in detail elsewhere, [1]2
assumes that jump probabilities are governed by the Boltzmann factors
for the energy changes ±tnE per deuteron jump in the applied field
E, and by the fractional density NT/N of Takagi groups which has
been previously calculated [2]. The calculated mobility is
Pw=^£ rSSr ;ao=1.86A; /z„=6.8Xl(T5Clf at 200 °K
JM kl 1q volt-sec
in fair agreement with measured values of Bjorkstam and Oettel [3].
The mean Takagi group jump time T0 is found from the dielectric
behavior in the following calculation.
1 Work supported in part by the National Institutes of Health. A more detailed account of this workappears in Phys. Rev. 164. 749 (1967).
2 Figures in brackets indicate the literature references at the end of this paper.
219
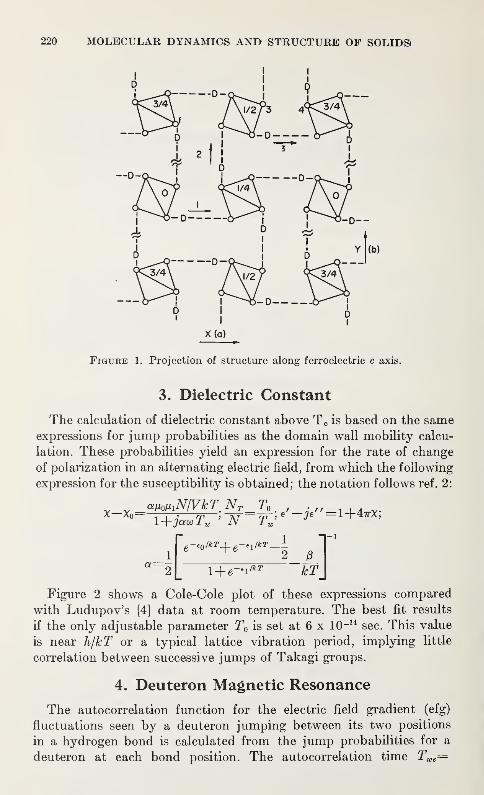
220 MOLECULAR DYNAMICS AND STRUCTURE OF SOLIDS
3. Dielectric Constant
The calculation of dielectric constant above T c is based on the sameexpressions for jump probabilities as the domain wall mobility calcu-
lation. These probabilities yield an expression for the rate of change
of polarization in an alternating electric field, from which the following
expression for the susceptibility is obtained; the notation follows ref. 2:
atwN/VkT Nr To , •„_,,,_.X_Xo~ 1+jauT. 'W-Ta 'e ~]t - X+45rX
'
t0/kT\ - tl /kT_I
_ 2 g
Figure 2 shows a Cole-Cole plot of these expressions compared
with Ludupov's [4] data at room temperature. The best fit results
if the only adjustable parameter T0 is set at 6 x 10~14sec. This value
is near h/kT or a typical lattice vibration period, implying little
correlation between successive jumps of Takagi groups.
4. Deuteron Magnetic Resonance
The autocorrelation function for the electric field gradient (efg)
fluctuations seen by a deuteron jumping between its two positions
in a hydrogen bond is calculated from the jump probabilities for a
deuteron at each bond position. The autocorrelation time T„ e=
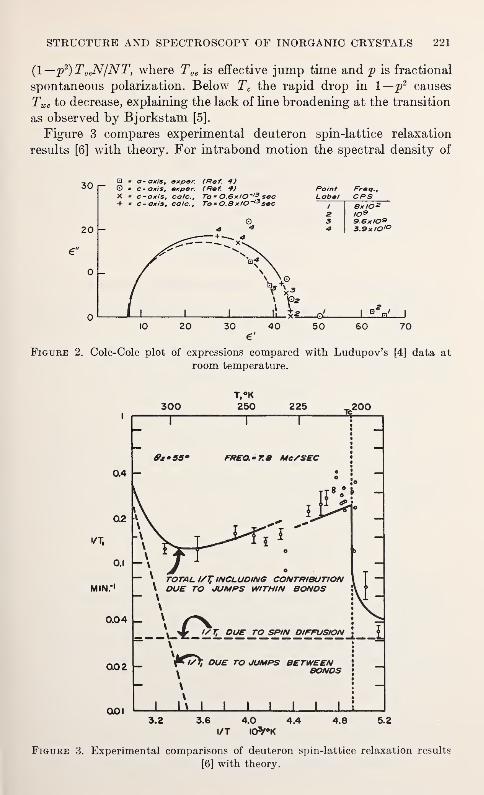
STRUCTURE AND SPECTROSCOPY OF INORGANIC CRYSTALS 221
(l—p2)ToeN/NT}where Toe is effective jump time and p is fractional
spontaneous polarization. Below Tc the rapid drop in 1—p2 causes
Twe to decrease, explaining the lack of line broadening at the transition
as observed by Bjorkstam [5].
Figure 3 compares experimental deuteron spin-lattice relaxation
results [6] with theory. For intrabond motion the spectral density of
Q m a- axis, axper (Ref. 4)© - c-oxis, exper. (Ref. 4) Point Preq.,X * c-axis, ca/c. To » 0.6x/0~'3 sec Label CPS
10 20 30 40 50 60€'
Figure 2. Cole-Cole plot of expressions compared with Ludupov's [4] data at
room temperature.
T °K
300 250 225Te200
~1I I :
0**55* FREQ.-7.3 Me/SEC
\
J LA_J I I I I I L
3.2 3.6 4.0 4.4 4.8 5.2
l/T I0^°K
Figure 3. Experimental comparisons of deuteron spin-lattice relaxation results
[6] with theory.

222 MOLECULAR DYNAMICS AND STRUCTURE OF SOLIDS
the efg fluctuations is given by
J(«)=i {l-p>)Tj{l+JT?)~\ (l-p*)Twe .
The rapid drop in 1/Ti below Tc results from the decrease of both1—p2 and Twe . The gap in the curve is due to the onset of interbond
jumping. The Takagi group activation energy e1 of 0.078 eV is found
from the temperature dependence of intrabond relaxation above Tc .
Because the efg's at the two bond positions are known [5], there is
only one adjustable parameter, Toe ,having a best fit value of 8 x 10~ 14
sec, somewhat larger than TQ as expected.
5. References
[1] V. H. Schmidt, Proc. Interoat. Meeting on Ferroelectricity, Prague, 2, 97
(1966).
[2] H. B. Silsbee, E. A. Uehling, and V. H. Schmidt, Phys. Rev. 133, A165
(1966).
[3] J. L. Bjorkstam, private communication.
[4] Ts.-Zh. Ludupov, Soviet Phys., Crystallography 11, 416 (1966).
[5] J. L. Bjorkstam, Phys. Rev. 153, 599 (1967).
[6] V. H. Schmidt and E. A. Uehling, Phys. Rev. 126, 447 (1962).
THE DETECTION OF ATOM TUNNELING INSOLIDS
I. PELAH 1 and Y. IMRY 2
Israel Atomic Energy Commission
Soreq Nuclear Research Centre, Yavne, Israel
1. Introduction
The tunneling of atoms between two or more potential minima is
an interesting phenomenon. It is essential for understanding ferro-
electricity in KH2P0 4 (KDP)[1] 3 and probably in other crystals.
Tunneling occurs also for many cases of impurities in solids.
In this paper we discuss direct measurements of tunneling, employ-
ing the interaction of the tunneling atom with external radiation.
This includes experiments like IR absorption, neutron scattering
and Mossbauer effect. We shall describe how effects peculiar of tun-
neling are directly detectable. Existing IR and neutron studies of
KDP will be reviewed and some new experiments suggested.
The behavior of radiation emitted, absorbed or scattered by two
distinct sources is well known. Our basic problem is that of one source
tunneling between two positions[2]. Interesting interference effects
can be obtained. In the following we shall discuss a mathematically
simple two mimimum model which illustrates the above points and
is, in fact, a good approximation for the protons in KDP.
2. A Simple Model
Consider a particle of mass m in the following potential[3]. Twojointed parabolic wells centered at ± x 0 , the oscillator frequency in
each well is co, the bottom of the left well is lower by B than that of
the right one. We assume that co is large enough so that we can neglect
the influence of the higher oscillator levels on the ground level.
For B=0, the degenerate ground state will split into two levels,
|l> and |2>, with symmetric and antisymmetric wave functions,
respectively. The splitting is given by E2—E=2Q,
2fi= (7)i/2 2 exP (_ 2
2)
1 Present address: Argonne National Laboratories, Solid State Physics Div., Argonne, Illinois
2 Present address: Dept. of Engineering Physics, Cornell University, Ithaca, New York3 Figures in brackets indicate the literature references at the end of this paper.
223
224 MOLECULAR DYNAMICS AND STRUCTURE OF SOLIDS)
with q= Xoih/mu)- 1 /2= ft is the "tunneling matrix element."a
For the asymmetric case, 0<i?<cftco, the splitting increases:
E2—Ei=2(Q,2+B2l4:)\ |l> is more concentrated in the deeper well
and |2> in the higher well. The concentration is complete for 2?^>ft.
If we denote the relative weights of the wave function |l> in the
two wells by a and (3, with a2+/3
2=l, we can characterize the degree
of localization by the parameter a(3 ranging from % for B=0 to 0
for£»ft.
We shall need the following matrix elements
:
< 11
exp (ikx)11>= exp (— &V ) [a
2exp (
—
ikx0)+ /32exp (ikx 0) ]
< 21
exp (ikx)|2>= exp(—k2a2
) [a2exp (ikx0)+0
2exp (
—
ikx0) ]
<l|exp(fc)|2>= 2io!jSexp(— k2a2) sin kx0 .
Using these matrix elements, we can find the cross sections for the
processes of interest.
a. Infrared Absorption—The transition dipole is
M=2 Qx 0a(3
where Q is the effective charge of the tunneling particle. We note
that Qx0 is much larger than a—typical transition moment for a
single well. The absorption will, however, decrease sharply with
asymmetry (due to the factor 2a(3) because of decreasing overlap
between the wavefunctions.
The isotope effect is interesting. A substitution of higher mass
will greatly reduce ft. In a symmetric well the transition energy will
thus decrease, but the intensity will be unaffected. In a strongly
asymmetric well (j5^>ft), the transition energy, roughly equal to
B, will change only slightly, while the intensity will drop sharply.
These effects will be complicated by the fact that in KDP, for ex-
ample, the asymmetry, which is determined by interactions between
the protons, will also change with deuteration [1].
b. Neutron Scattering—We are interested in incoherent scattering
from a system of protons each moving in its own potential. This is
meaningful for KDP when it is understood that the asymmetry for
each proton is determined [1] by interactions with its neighbours.
Because of the high incoherent cross section of H, it will contribute
most of the cross section for KDP.We denote the component of the momentum transfer K parallel
to the tunneling direction by k and obtain for the elastic part
I
= exp(-2&V) (a4+ j84+2«2
/32 cos 2kx0) .
el
STRUCTURE AND SPECTROSCOPY OF INORGANIC CRYSTALS 225
Note the periodic dependence on K,x0 due to the interference
between the two wells. In the inelastic part this interference is even
more important. For "one phonon (E2—Ei) energy loss processes
we get
(^T~) « ±<x2P* exP (-2&V) sin2 kx0
The inelastic cross section, and the K,x0 dependent part of the
elastic cross section, decrease sharply with the asymmetry.
c. Recoilless Emission by Tunneling Impurities[2].HeTe one has
to take into account the following result, due to Lipkin.[4] We as-
sume the impurity to move in some effective potential, with energy
levels En and recoilless emission matrix elements /„. The usual ex-
pression
/.(T)=Z>»I/,.I2
n
for the Mossbauer fraction, where wn is the thermal weight of the
nth. level, is correct only when the relaxation time, TR, of the "oscil-
lator" levels is much longer than the lifetime, TN , of the nuclear level.
If TR <^:TN (as is almost always the case, since TV^IO" 8 sec, TR~10-11 sec) we have for the Mossbauer fraction:
/2cn=i2W„i 2
n
i.e., a coherent averaging.
For the case where the impurity potential is harmonic, the ratio
betweenjx and/2 is a Bessel function factor. For our tunneling model
we obtain
:
ji(T)= exp (-2P<r2)(a4+^4+2o2
/32 cos kx0)
j2{T)= exp (-2&V)[cos2 kx0+ tan h2(^^{o?-^) sin2 kx0~j-
The difference between jx and j2 can be extremely large, and the
"interference pattern" is temperature dependent. This type of effect
will occur also for three dimensional models. In the case B^>tt,
kx0~Tr/4:, the temperature dependence of/2 is very sharp. This might
be the explanation for the experimental results for Kr in hydro-
quinone clathrates [5]. Another case where a Mossbauer source prob-
ably performs tunneling is Fe in AgCl.
3. Review of the Experiments in KDP
A hydrogen mode around 400 cm-1 was found by Pelah, Lef-
kovitz, Kley and Tunkello [6] for KDP, using inelastic, energy gain,
neutron scattering. This was assumed to be the splitting E.— F.,
226 MOLECULAR DYNAMICS AND STRUCTURE OF SOLIDS)
in a double minimum well. Further IE. neutron measurements [1]
have substantiated this result.
It is believed that in the ordered, ferroelectric state the protons
are effectively localized in their single wells by the interactions,
which provide large static asymmetry for each double minimum well.
In the nonordered state, the asymmetries are changing slowly with
time; the average situation is symmetric, but <|J5|>^0. The dis-
appearance of tunneling below the Curie point is demonstrated bythe changes in the IR spectrum. The absorption around 400 cm-1
,
which is connected with tunneling, drops sharply upon the transition
(at 123 °K) [1]. The same experiment is planned using neutrons and an
energy loss method.
It turned out that a simple experiment which would again support
this picture was possible [7]. The hydrogen bonds in KDP, along
which the protons tunnel, are directed along the lattice x and y axes.
Therefore, the total scattering cross sections for neutron beamsparallel, az , and perpendicular, <rx , to the z axis should differ. In fact
it is easy to see that ax should be higher than a2 . Both ux and az were
measured [7] as a function of neutron energy and of temperature
(with special attention to the vicinity of the Curie point).
The results are in a good agreement with calculations based on a
model in which the protons tunnel along the H-bonds and makeharmonic vibrations (with the experimental frequencies) perpendic-
ular, to the H-bonds. Interesting changes were found in the vicinity
of the Curie point.
Further experiments for the measurements of the dependence of
the cross section on K,x0 are planned. Preliminary results confirm
that the inelastic cross section rises with K,x0 . Quantitative results
will give an independent determination of afi and x 0 . It would be
interesting if high energy neutrons could be used to see the periodic
variation with K,x0 . Finally, the collective proton modes, with
which we have not dealt here, seem to be a most interesting problem.
4. References
[1] Y. Imry, I. Pelah and E. Wiener, J. Chem. Phys. 43, 4332 (1965).
[2] Y. Imry, Lecture delivered at the Nato Advanced Study Inst, on Tunneling,
Riso, 1967, (to be published).
[3] R. Blinc and D. Hadzi, Molec. Phys. 1, 398 (1958).
[4] H. J. Lipkin, Ann. Phys. (N.Y.) 26, 115 (1964).
[5] Y. Hazony, P. Hillman, M. Pasternak and S. Ruby, Phys. Letters 2, 337
(1962).
[6] I. Pelah, I. Lefkovitz, W. Kley and E. Tunkello, Phys. Rev. Letters 2, 94
(1959).
[7] Y. Imry, I. Pelah, E. Wiener and C. Zafrir, Solid State Comm. 5, 41 (1967).
PROTON DELOCALIZATION IN INORGANICSOLIDS
J. J. FRIPIAT, P. G. ROUXHET, H. JACOBS, and A. JELLI
Laboratoire de Physico-Chimie Minirale
Institut des Sciences de la Terre
42, de Croylaan, Heverlee-Louvain {Belgium)
This paper aims to show that in the special case of solids containing
hydroxyl groups, infrared spectroscopy may contribute to the study
of lattice defects arising from proton derealization. In these solids,
heated progressively to elevated temperatures, a decrease of the
integrated intensities of the stretching as well as of the deformation
and torsion OH bands is observed, the initial intensity being fully
restored on cooling the sample.
These, effects seem to occur in several kinds of inorganic solids
including micas [l],1 boehmite, [2] and decationed zeolites [3].
1. Perturbation Due To Sample Emission
Recording infrared spectra at high temperature requires careful
protection for sample emission, even if discrete emission bands are not
detectable [4].
In the used double beam IR spectrograph, this is achieved bystopping the second chopper between the sample and the optics in a
position where 50 percent of the intensities of the two beams are
collected and by using larger slits. In an earlier work [1] the effect of
the continuous emission was unfortunately neglected. Subsequent
data were always obtained with only the first chopper between the
source and the sample in operation.
2. Decrease in Intensity of the OH Vibration Bands
Several hypotheses may be proposed to explain the decrease in
intensity of the OH vibration absorption band of inorganic solids
heated at high temperatures.
(1) In an monocristalline solid a change in the orientation of the
OH transition moment could be invoked. Careful measurements madeon mica monocrystals ruled out very clearly this possibility [1, 5].
1 Figures in brackets indicate the literature references at the end of this paper.
227
228 MOLECULAR DYNAMICS AND STRUCTURE OF SOLIDS)
(2) The temperature increase could effect the electron distribution
in the OH bond, producing a change in the magnitude of the transition
dipole. This explanation cannot be accepted because the decrease in
intensity of the stretching, deformation and torsion OH bands are
almost identical in boehmite [2].
(3) A more probable explanation could be supported by consid-
ering the well known intensity decrease of OH stretching bands
caused by the release of hydrogen bonding. This explanation, how-
ever, is again ruled out by the observation that for the various ma-terials already studied, no correlation was found between the fre-
quency shift of the OH stretching band and the decrease in intensity.
Moreover, calculations founded on the perturbation of the vibra-
tional energy levels by the weakening of the H bonds fails to reproduce
the right order of magnitude of the intensity loss [2]
.
(4) In view of the impossibility of explaining the intensity loss of
OH vibrations by any of the effects listed above, it has been proposed
that it may be accounted for by assuming that the protons are, to
some extent, delocalized at increasing temperatures.
3. Interpretation of the OH Band Intensity Loss in
Boehmite [2]
Among aluminum hydrates, boehmite presents the unique feature
of a distribution of hydrogen bonded hydroxyls along a zig-zag chain.
Table 1 gives the loss of relative intensity obtained for the stretching
modes of untreated and deuterated bohemite. A similar evolution is
observed for the other vibrational modes. The activation energies
obtained by plotting the integrated intensities against T~ l (°K-1)
averages 2 kcal.
It is assumed that any vibrational transition starting from a level
approximately located 2 kcal above the fundamental level does not
contribute to the discrete absorption of radiant energy. Therefore,
increasing the sample temperature shifts the populations of the vibra-
tional levels in such a way that an increasing number of OH oscilla-
tors does not contribute furthermore to the band intensity.
The condition of inefficiency of these optical transitions would
originate from the broadening of the upper vibrational levels where
the tunneling probability becomes noticeable with respect to the
vibration period. At this level, the probability for a proton to escape
from its initial potential well during the vibration period is such that
it may be considered as delocalized. This phenomenon might involve
two adjacent potential wells of the zig-zag chain or, several potential
wells by nipping, for instance, a complete row of OH bonds. Approxi-
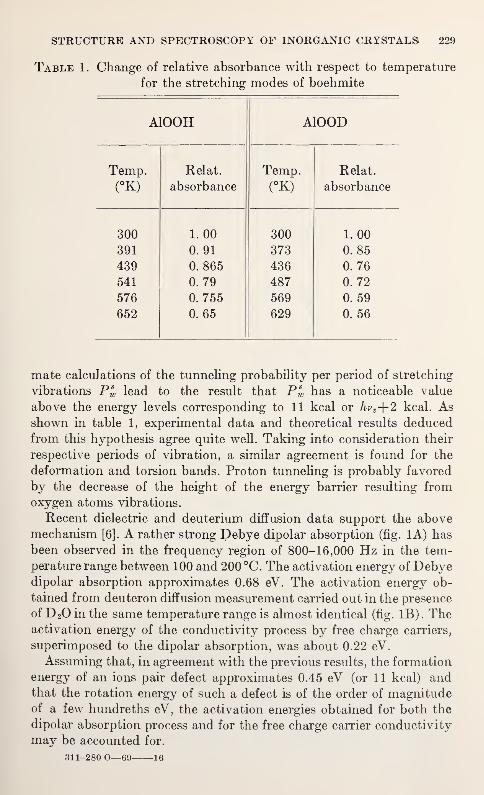
STRUCTURE AND SPECTROSCOPY OF INORGANIC CRYSTALS 229
Table 1. Change of relative absorbance with respect to temperature
for the stretching modes of boehmite
AlOOH AlOOD
Temp. Relat. Temp. Relat.
(°K) absorbance (°K) absorbance
300 1. 00 300 1. 00
391 0. 91 373 0. 85
439 0. 865 436 0. 76
541 0. 79 487 0. 72
576 0. 755 569 0. 59
652 0. 65 629 0. 56
mate calculations of the tunneling probability per period of stretching
vibrations P s
w lead to the result that P s
w has a noticeable value
above the energy levels corresponding to 11 kcal or hv v-\-2 kcal. As
shown in table 1, experimental data and theoretical results deduced
from this hypothesis agree quite well. Taking into consideration their
respective periods of vibration, a similar agreement is found for the
deformation and torsion bands. Proton tunneling is probably favored
by the decrease of the height of the energy barrier resulting fromoxygen atoms vibrations.
Recent dielectric and deuterium diffusion data support the abovemechanism [6]. A rather strong Debye dipolar absorption (fig. 1A) has
been observed in the frequency region of 800-16,000 Hz in the tem-
perature range between 100 and 200 °C. The activation energy of Debyedipolar absorption approximates 0.68 eV. The activation energy ob-
tained from deuteron diffusion measurement carried out in the presence
of D 20 in the same temperature range is almost identical (fig. IB) . Theactivation energy of the conductivity process by free charge carriers,
superimposed to the dipolar absorption, was about 0.22 eV.
Assuming that, in agreement with the previous results, the formation
energy of an ions pair defect approximates 0.45 eV (or 11 kcal) andthat the rotation energy of such a defect is of the order of magnitudeof a few hundreths eV, the activation energies obtained for both the
dipolar absorption process and for the free charge carrier conductivity
may be accounted for.
311-280 O—69 16
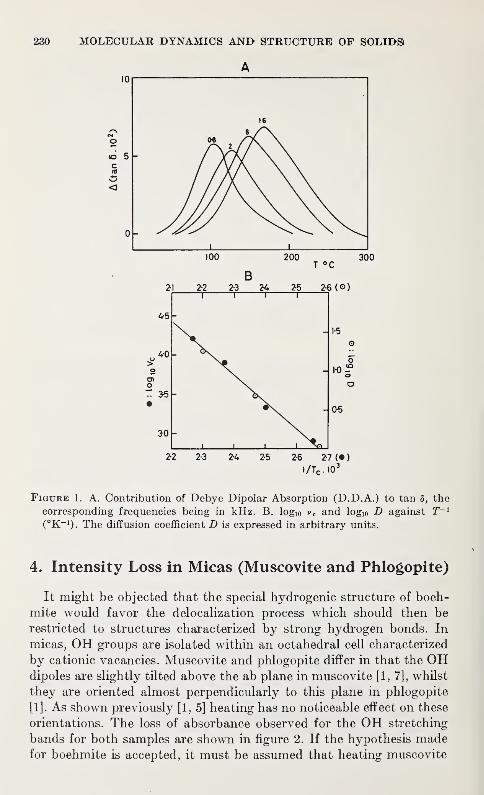
230 MOLECULAR DYNAMICS AND STRUCTURE OF SOLIDS*
A
300
1/TC .10*
Figure 1. A. Contribution of Debye Dipolar AbsorptioD (D.D.A.) to tan 8, the
corresponding frequencies being in kHz. B. logio v c and logio D against T~ l
(°K_1). The diffusion coefficient D is expressed in arbitrary units.
4. Intensity Loss in Micas (Muscovite and Phlogopite)
It might be objected that the special hydrogenic structure of boeh-
mite would favor the derealization process which should then be
restricted to structures characterized by strong hydrogen bonds. In
micas, OH groups are isolated within an octahedral cell characterized
by cationic vacancies. Muscovite and phlogopite differ in that the OHdipoles are slightly tilted above the ab plane in muscovite [1, 7], whilst
they are oriented almost perpendicularly to this plane in phlogopite
[1]. As shown previously [1, 5] heating has no noticeable effect on these
orientations. The loss of absorbance observed for the OH stretching
bands for both samples are shown in figure 2. If the hypothesis madefor boehmite is accepted, it must be assumed that heating muscovite
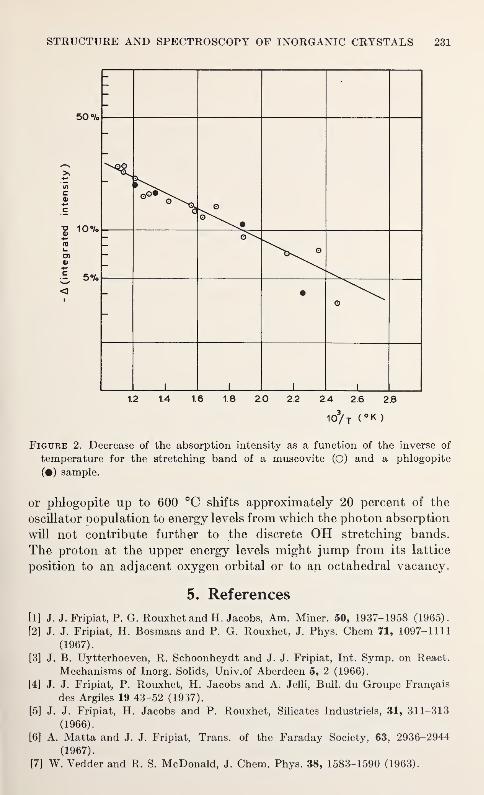
STRUCTURE AND SPECTROSCOPY OF INORGANIC CRYSTALS 231
50%
10°/.
IIII
o
|irrr
•o
1 1 1
1.2 1.4 1.6 1.8 2.0 2.2 2.4 2.6 2.8
103
/ T (°K )
Figure 2. Decrease of the absorption intensity as a function of the inverse of
temperature for the stretching band of a muscovite (O) and a phlogopite
(#) sample.
or phlogopite up to 600 °C shifts approximately 20 percent of the
oscillator population to energy levels from which the photon absorption
will not contribute further to the discrete OH stretching bands.
The proton at the upper energy levels might jump from its lattice
position to an adjacent oxygen orbital or to an octahedral vacancy.
5. References
[1] J. J. Fripiat, P. G. Rouxhet and H. Jacobs, Am. Miner. 50, 1937-1958 (1965).
[2] J. J. Fripiat, H. Bosmans and P. G. Rouxhet, J. Phys. Chem 71, 1097-1111
(1967).
[3] J. B. UytterhoeveD, R. Schoonheydt and J. J. Fripiat, Int. Symp. on React.
Mechanisms of Inorg. Solids, Univ. of Aberdeen 5, 2 (1966).
[4] J. J. Fripiat, P. Rouxhet, H. Jacobs and A. Jelli, Bull, du Groupe Frangais
des Argiles 19 43-52 (1937).
[5] J. J. Fripiat, H. Jacobs and P. Rouxhet, Silicates Industriels, 31, 311-313
(1966) .
[6] A. Matta and J. J. Fripiat, Trans, of the Faraday Society, 63, 2936-2944
(1967) .
[7] W. Vedder and R. S. McDonald, J. Chem. Phys. 38, 1583-1590 (1963).

STRUCTURE REFINEMENTS, THERMAL MOTIONAND MADELUNG CONSTANTS OF Cdl2—AND
Cd(OH) 2—TYPE LAYER STRUCTURES
Y. M. DE HAAN
Laboratorium voor Technische Natuurkunde
Technische Hogeschool, Delft, The Netherlands
1. Geometric Aspects—Thermal Motion
Many halides and hydroxydes of bivalent metals have structures
which can be crudely described as close-packed arrangements of
anions in which the cation-occupied octahedra join up to form layers
perpendicular to the trigonal axis. The layers have a net charge zero
and may be regarded as giant molecules held together by weak forces.
We will assume the intralayer bonding to be essentially ionic.
In the hydroxydes, each proton is located in the tetrahedral hole
formed by the O atom, to which it is covalently linked, and three
O atoms of the adjacent layer. The indications are that there is no
hydrogen bonding [l].1
The close-packing may be
hexagonal (C6-or Cd(OH) 2 structure),
cubic (Cl9-or CdCl 2 structure), or
mixed (C27-or Cd(OH)Cl structure and many structures
with longer stacking periods, or with stacking faults)
.
In all these structures the layers (sandwiches) are of essentially the
same type.
A different classification can be made on the basis of the ratio of
the ionic radii : p=RM++/Rx— Although the critical value for octahedral
coordination is 0.414, many Cdl2-type halides (particularly iodides)
have much lower p-values. Mgl 2 (p=0.33) is a particularly good
example of such a "rattling structure".
On the other hand, many hydroxydes and chlorides have high
p-values; in this case we will speak of expanded structures. A typical
example is Ca(OH) 2 :p=0.71.
Whereas the octahedra in rattling and "nicely fitting" structures
are expected to be fairly regular (see table 1) , the expanded structures
(with relatively large cations) may have their octahedra considerably
distorted, from cubic to trigonal symmetry. The radius ratio deter-
Figures in brackets indicate the literature references at the end of this paper.
233
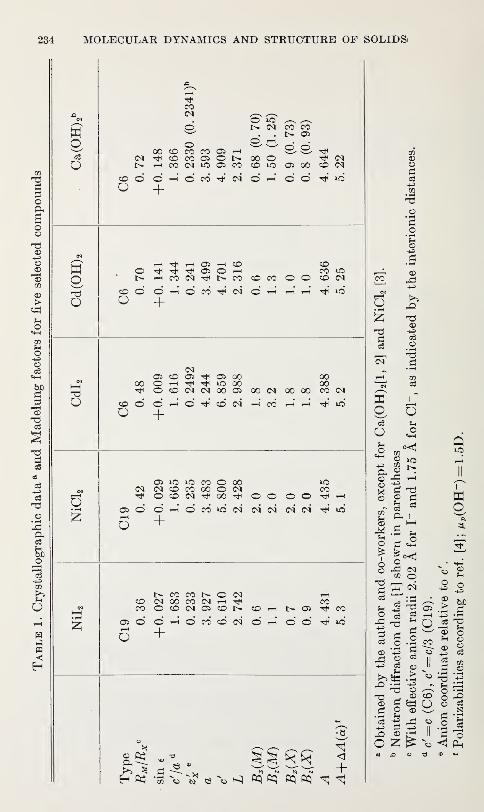
234 MOLECULAR DYNAMICS AND STRUCTURE OF SOLIDS
wo
o
COtM
00 © CO CO Oi HCO CO ffi O N
rH CO CM *0 Oi CO
O. rH
00 OCO *o
CO COo>
© oOi 00
"tf CMCO CM
CO
OO © rH © CO CM Ot-h OO lO
ho
r-I Tf t—I Oi rH COO ^ -hh Tfl Oi O y—i
rt CO (M ^ N CO
COCO lO
CO CO O O CO CM
o
COO O h O CO ^ (N O h rH rH ic
Oi CO Oi Oi O000 O rH TtH TfH *C 00hh O CO (N IN 00 Oi 00 CM
0000
00 00 CO CM
CO
oO rH © -tf CO (N H CO rHrH LQ
Oi iO iO CO O 00CM N CO CO 00 O (NO CO CM 00 tJH O O CO© © rH
OirH
oO rH O CO >0 N CM CM (N W lO
N CO CO N O M<N 00 CO <M rHO CO N Oi CO N
OiO © rH © cO CO CM
5 +O rH
I>- Oi
© ©
COTjH CO
HH lO
CO
cq Bq rJ pq+
CO
o• i-H
o3
wooo
P,CDOXCP
CD
rP.
r>5
CD
^3
OO
«4H
!
i2
CD
r^
CD
i-P rH
g d
P< !
P~• i-l pH
O rP CM
03' :P •
Q ^Po3
CD
rP
^sS .6;_D -3
CD
P*c3
O
CD CO
p © cr>
II
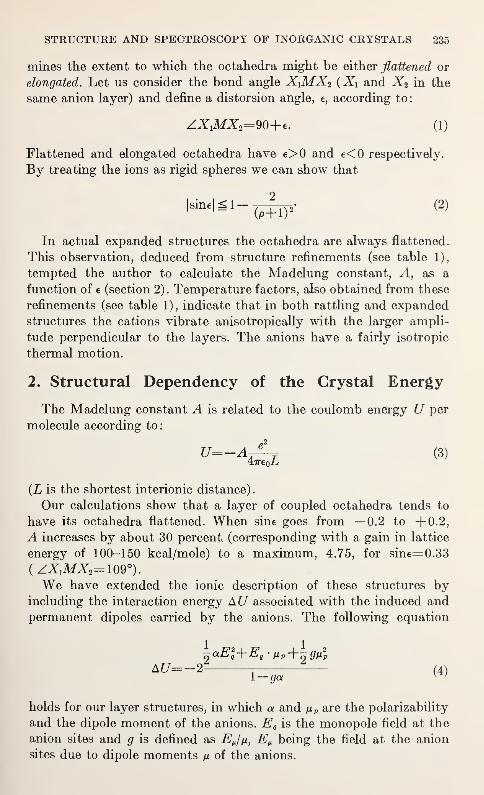
STRUCTURE AND SPECTROSCOPY OF INORGANIC CRYSTALS' 235
mines the extent to which the octahedra might be either flattened or
elongated. Let us consider the bond angle XYMX2 (Xi and X2 in the
same anion layer) and define a distorsion angle, e, according to
:
ZXlMX2=90-\-e. (1)
Flattened and elongated octahedra have e>0 and e<0 respectively.
By treating the ions as rigid spheres we can show that
isintig, (2)
In actual expanded structures the octahedra are always flattened.
This observation, deduced from structure refinements (see table 1),
tempted the author to calculate the Madelung constant, A, as a
function of e (section 2). Temperature factors, also obtained from these
refinements (see table 1), indicate that in both rattling and expanded
structures the cations vibrate anisotropically with the larger ampli-
tude perpendicular to the layers. The anions have a fairly isotropic
thermal motion.
2. Structural Dependency of the Crystal Energy
The Madelung constant A is related to the coulomb energy U per
molecule according to:
(L is the shortest interionic distance)
.
Our calculations show that a layer of coupled octahedra tends to
have its octahedra flattened. When sine goes from —0.2 to +0.2,
A increases by about 30 percent (corresponding with a gain in lattice
energy of 100-150 kcal/mole) to a maximum, 4.75, for sine=0.33
(ZXlMX2= 109°).
We have extended the ionic description of these structures byincluding the interaction energy AU associated with the induced and
permanent dipoles carried by the anions. The following equation
\aE2
q+E
q -n P +~gn2
p
AU=-2* 2—(4)
1— ga v '
holds for our layer structures, in which a and fi p are the polarizability
and the dipole moment of the anions. Eq is the monopole field at the
anion sites and g is defined as EJ/i, E„ being the field at the anion
sites due to dipole moments \i of the anions.
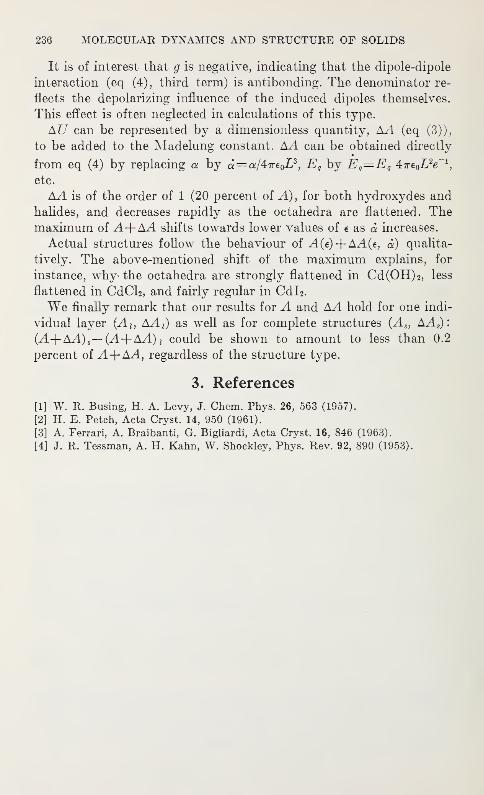
236 MOLECULAR DYNAMICS AND STRUCTURE OF SOLIDS
It is of interest that g is negative, indicating that the dipole-dipole
interaction (eq (4), third term) is antibonding. The denominator re-
flects the depolarizing influence of the induced dipoles themselves.
This effect is often neglected in calculations of this type.
AU can be represented by a dimensionless quantity, AA (eq (3)),
to be added to the Madelung constant. AA can be obtained directly
from eq (4) by replacing a by a=a/47re 0£3,Eq by E Q
=Eq47re0i2
e-1
,
etc.
AA is of the order of 1 (20 percent of A), for both hydroxydes and
halides, and decreases rapidly as the octahedra are flattened. Themaximum of A+A^L shifts towards lower values of e as a increases.
Actual structures follow the behaviour of A(e) + AA(e, a) qualita-
tively. The above-mentioned shift of the maximum explains, for
instance, why- the octahedra are strongly flattened in Cd(OH)2, less
flattened in CdCh, and fairly regular in CdL.We finally remark that our results for A and AA hold for one indi-
vidual layer (Ai, AAi) as well as for complete structures (A s ,AA S) :
(A+AA) S— {A+AA)icould be shown to amount to less than 0.2
percent of A-\-AA, regardless of the structure type.
3. References
[1] W. R. Busing, H. A. Levy, J. Chem. Phys. 26, 563 (1957).
[2] H. E. Petch, Acta Cryst. 14, 950 (1961).
[3] A. Ferrari, A. Braibanti, G. Bigliardi, Acta Cryst. 16, 846 (1963).
[4] J. R. Tessman, A. H. Kahn, W. Shockley, Phys. Rev. 92, 890 (1953).
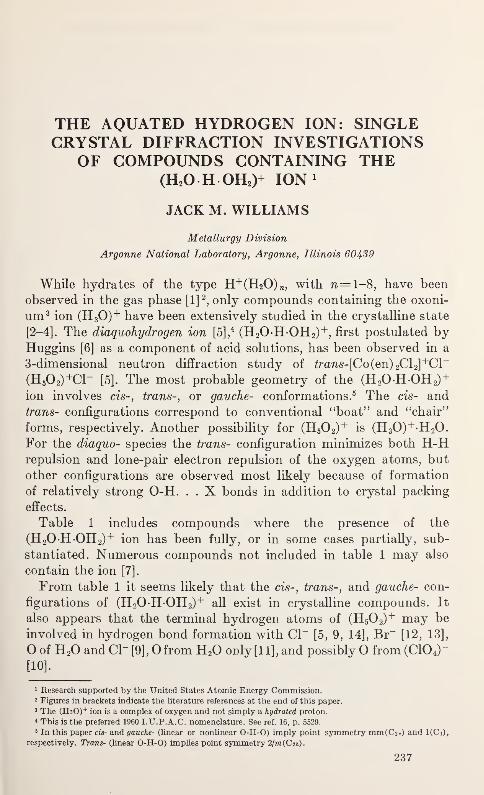
THE AQUATED HYDROGEN ION: SINGLECRYSTAL DIFFRACTION INVESTIGATIONS
OF COMPOUNDS CONTAINING THE(H20 H OH 2)+ ION 1
JACK M. WILLIAMS
Metallurgy Division
Argonne National Laboratory, Argonne, Illinois 60439
While hydrates of the type H+(H20)„, with 71= 1-8, have been
observed in the gas phase [l]2
,only compounds containing the oxoni-
um 3 ion (H 30) + have been extensively studied in the crystalline state
[2-4]. The diaquohydrogen ion [5],4 (H 2OHOH 2)
+, first postulated by
Huggins [6] as a component of acid solutions, has been observed in a
3-dimensional neutron diffraction study of trans-[Co (en) 2C1 2]+C1~
(H 50 2)+C1- [5]. The most probable geometry of the (H 2OHOH 2)+
ion involves cis-, trans-, or gauche- conformations.5 The cis- andtrans- configurations correspond to conventional "boat" and "chair"
forms, respectively. Another possibility for (H50 2)+ is (H 30)
+ H 20.
For the diaquo- species the trans- configuration minimizes both H-Hrepulsion and lone-pair electron repulsion of the oxygen atoms, but
other configurations are observed most likely because of formation
of relatively strong O-H. . . X bonds in addition to crystal packing
effects.
Table 1 includes compounds where the presence of the
(H 2OHOH 2)+ ion has been fully, or in some cases partially, sub-
stantiated. Numerous compounds not included in table 1 may also
contain the ion [7].
From table 1 it seems likely that the cis-, trans-, and gauche- con-
figurations of (H 2OHOH 2)+ all exist in crystalline compounds. It
also appears that the terminal hydrogen atoms of (H50 2)+ may be
involved in hydrogen bond formation with Cl~ [5, 9, 14], Br-
[12, 13],
O of H 20 and Cl~ [9] , O from H 20 ooly [1 1], and possibly O from (C10 4)
"
[10].
1 Research supported by the "United States Atomic Energy Commission.2 Figures in brackets indicate the literature references at the end of this paper.3 The (H30) + ion is a complex of oxygen and not simply a hydrated proton.4 This is the preferred 1960 I.U.P.A.C. nomenclature. See ref. 16, p. 5529.
5 In this paper cis- and gauche- (linear or nonlinear O-H-O) imply point symmetry mm(C2») and l(Ci),
respectively. Trans- (linear O-H-O) implies point symmetry 2lm(Cn).
237
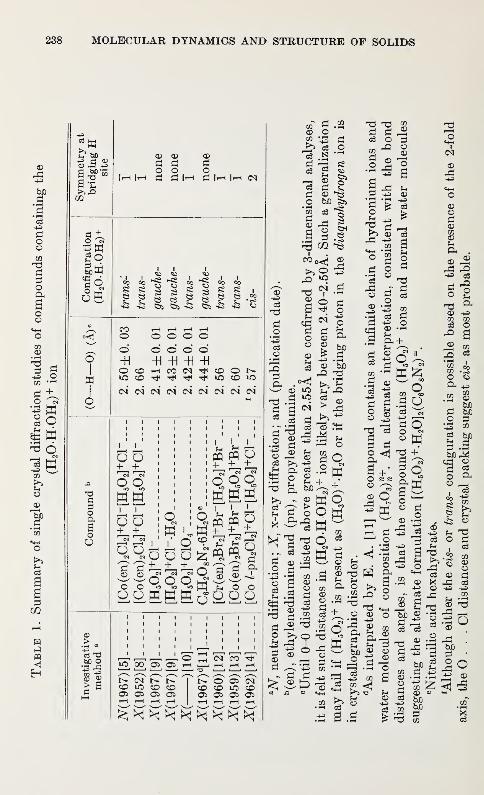
238 MOLECULAR DYNAMICS AND STRUCTURE OF SOLIDS
.2 3S o
oI
w
T3S3
OOh
aoo
c3 T3bO O
> B
0)0 CD
Art do o o
I I
2 2 « oI
*
1100 CO
COo o o o o© o © ©-H -H HH -H
o-HO CO H CO (N*0 CO rfi tJH t^i tJH
CO ©iO CD iO
I
oCM
oH
i
o
+ +"o o qwww
73 -=! ""3 _^
d
oo
o(N
+ , + , +,0-3-3 3,
>T5 iC l±J S_i O O
O rt (N CO ^iO00O)O5h,_LhhhN (N N NCO iO CO CO0)0)05 0)
© O) cNCO CO IO CO0)0)05 0)
GO* dCD O
.2 ^ ^ £
o3
d
-ad
"co
dCD
I
do
•1—1
03 ON
srCDtJD
0d
c=h
Sa-
oS
do
'+3
o3
d
dooSH
Ph
d'Sot3
^ h
^ g CD
d^CD
?h dPh j2
' o3
?Ho
2 W
^Z? CO
P w
d03
CD
d• 1—1
B03
• i-h
T3CD
dCDd
ois
CD
dCD
CDW
dc3
CO
do
Bd
• 1—
1
dorH
d
CD
II
rd -e
d
np
•5 03
CD • ih
?hP< +SH s
CD ^d 1/5
CDw
d •
CD JhCO ©CD
fa ^Oh OCO .3
' N • 1—
I
rd
too
I—I ^3-H c3
03 COH b
'd c3 od od d
d§+" §O ee X,
sq 1« w 0r-p s—
' CD
1—1 o
03 rj
Ph
o ^
8 s §Ph^CD O pc o
2o«+H
I
CM
CD
CDCD
d©COCD
Ph .
CD ^pd ^^ o3
§ 2
CDCO COc3
03 on
O NO
Ph^00
CO
« i
CD M+3 CD03 rj
dS ^CD "H
CD-3 03
a §
o3 SS
"-1 ^
0 PiCD ^
1
03
5 ^5
h -do d,
«.2 00g CDV
CDCD p,d o3
CD
rd
CD
rd !
d •
SOCD
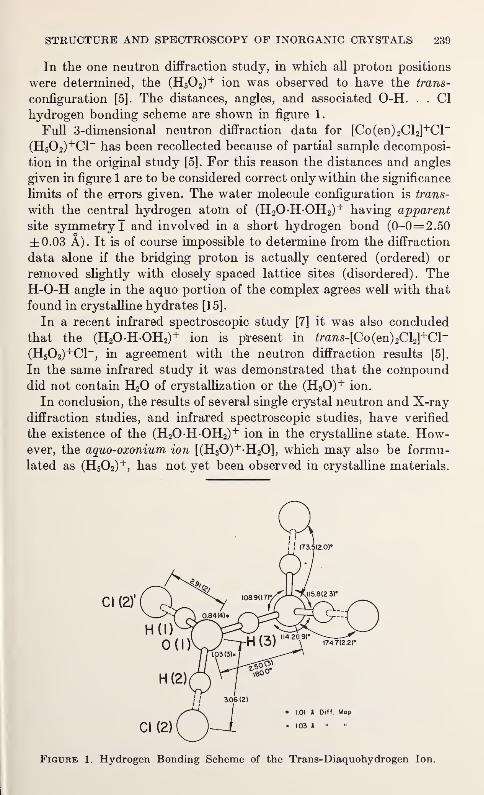
STRUCTURE AND SPECTROSCOPY OF INORGANIC CRYSTALS 239
In the one neutron diffraction study, in which all proton positions
were determined, the (H50 2)+ ion was observed to have the trans-
configuration [5]. The distances, angles, and associated O-H. . . CI
hydrogen bonding scheme are shown in figure 1.
Full 3-dimensional neutron diffraction data for [Co(eD) 2Cl 2]+Cl~
(H50 2 )+C1~ has been recollected because of partial sample decomposi-
tion in the original study [5]. For this reason the distances and angles
given in figure 1 are to be considered correct only within the significance
limits of the errors given. The water molecule configuration is trans-
with the central hydrogen atom of (H 2OHOH 2)+ having apparent
site symmetry! and involved in a short hydrogen bond (0-0=2.50
±0.03 A). It is of course impossible to determine from the diffraction
data alone if the bridging proton is actually centered (ordered) or
removed slightly with closely spaced lattice sites (disordered). TheH-O-H angle in the aquo portion of the complex agrees well with that
found in crystalline hydrates [15].
In a recent infrared spectroscopic study [7] it was also concluded
that the (H2OHOH2)+ ion is present in Zrans-[Co(en) 2Cl2]
+Cl-
(H502)+C1~, in agreement with the neutron diffraction results [5].
In the same infrared study it was demonstrated that the compounddid not contain H20 of crystallization or the (H30)+ ion.
In conclusion, the results of several single crystal neutron and X-raydiffraction studies, and infrared spectroscopic studies, have verified
the existence of the (H20-HOH2)+ ion in the crystalline state. How-
ever, the aquo-oxonium ion [(H30)+-H20], which may also be formu-
lated as (H502)+
, has not yet been observed in crystalline materials.
Figure 1. Hydrogen Bonding Scheme of the Trans-Diaquohydrogen Ion.
240 MOLECULAR DYNAMICS AND STRUCTURE OF SOLIDS
The author wishes to thank Dr. I. Olovsson for preprints of his
work prior to publication.
References
[1] P. Kebarle and A. M. Hogg, J. Chem. Phys. 42, 798 (1965).
[2] R. E. Richards and J. A. S. Smith, Trans. Faraday Soc. 47, 1261 (1951)
.
[3] Y. K. Yoon and G. B. Carpenter, Acta Cryst. 12, 17 (1959).
[4] C. C. Ferriso and D. F. Hornig, J. Chem. Phys. 23, 1464 (1955).
[5] J. M. Williams, Inorg. Nucl. Chem. Lett. 3, 297 (1967).
[6] M. L. Huggins, J. Phys. Chem. 40, 723 (1936).
[7] R^. D. Gillard and G. Wilkinson, J. Chem. Soc. 1640 (1964).
[8] A. Nakahara, Y. Saito and H. Kuroya, Bull. Chem. Soc. Japan 25, 331
23, 966 (1967); 23, 971(1967). (1952).
[9] J-O. Lundgren and I. Olovsson, Acta Cryst. 23, 966 (1967); 23, 971 (1967).
[10] I. Olovsson, private communication.
[11] E. Andersen, Acta Cryst. 22, 204 (1967).
[12] S. Ooi, Y. Komiyama and H, Kuroya, Bull. Chem. Soc. Japan 33, 354
(1960).
[13] S. Ooi ,Y. Komiyama, Y. Saito and H. Kuroya, Bull. Chem. Soc. Japan 32,
263 (1959).
[14] Y. Saito and H. Iwasaki, Bull. Chem. Soc. Japan 35, 1131 (1962).
[15] W. H. Baur, Acta Cryst. 19, 909 (1965).
[16] A. Silverman, J. Am. Chem. Soc. 82, 5529 (1960).
INFRARED INVESTIGATION OF ORDERINGAND STRUCTURAL CHANGES IN
AMMONIUM HALIDES
C. W. GARLAND and N. E. SGHUMAKERDepartment of Chemistry
Massachusetts Institute of Technology, Cambridge, Massachusetts 02139
1. Introduction
Ammonium chloride and ammonium bromide undergo transitions
involving the relative orientations of the ammonium ions. At low
temperatures, both salts have a CsCl-type cubic structure with all the
ammonium ions oriented'
'parallel' ' to each other. NH4C1 exhibits an
order-disorder transition of the lambda type at 242 °K (249 °K in
ND4C1). Above the lambda point, the crystal is randomly disordered
with respect to the two equivalent orientations of the tetrahedral
NH4+ ion in the cubic unit cell. The situation is more complex in the
bromide because of the existence of an ordered tetragonal phase in
which chains of "parallel" NH4+ ions are surrounded by nearest-
neighbor chains with the opposite orientation. NH4Br exhibits a
complicated order-order transition between the cubic and tetragonal
structures at ~108 °K (~ 167 °K in ND4Br) and a lambda-typetransition between ordered tetragonal and disordered cubic structures
at 235 °K (214 °K in ND4Br).
Previous infrared investigations [l]1 have contributed greatly to
establishing the order-disorder nature of the lambda transitions in
ammonium halides. The present investigation of normal and deuterated
ammonium chloride and bormide extends the earlier work in two im-
portant ways: (a) spectra have been recorded for crystalline samples
(^lOOju thick) as well as sublimed films (~3/i thick);
(c) spectra
have been recorded as a detailed function of temperature between21 °K and 300 °K. This report cannot present the complete results but
will summarize two features of special interest. In section 2 we shall
deal with the librational motion of NH4+ ions and the potential barrier
to rotation. In section 3, the degree of order in the crystal will be
discussed in terms of an anomalous component of the allowed j>4 band.
1 Figures in brackets indicate the literature references at the end of this paper.
241
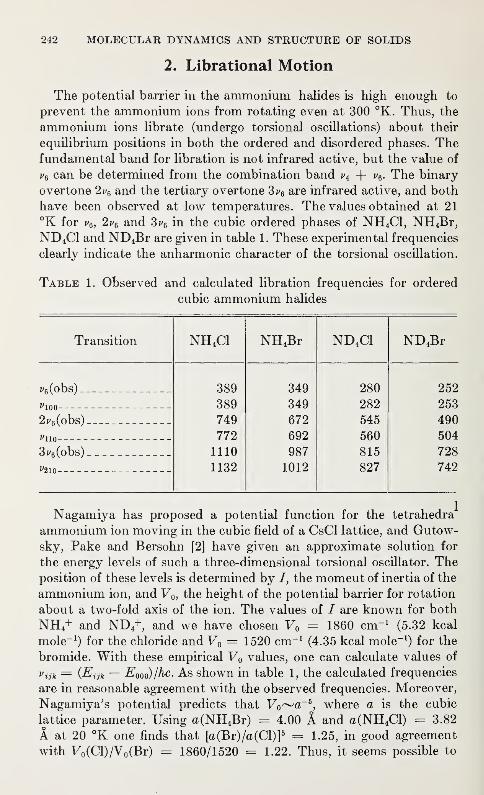
242 MOLECULAR DYNAMICS AND STRUCTURE OF SOLIDS
2. Librational Motion
The potential barrier in the ammonium halides is high enough to
prevent the ammonium ions from rotating even at 300 °K. Thus, the
ammonium ions librate (undergo torsional oscillations) about their
equilibrium positions in both the ordered and disordered phases. Thefundamental band for libration is not infrared active, but the value of
vq can be determined from the combination band *>4 + ^e- The binary-
overtone 2^6 and the tertiary overtone 3i>6 are infrared active, and both
have been observed at low temperatures. The values obtained at 21
°K for *>6 ,2vq and Sv& in the cubic ordered phases of NH4C1, NH4Br,
ND4C1 and ND 4Br are given in table 1. These experimental frequencies
clearly indicate the anharmonic character of the torsional oscillation.
Table 1. Observed and calculated libration frequencies for ordered
cubic ammonium halides
Transition NH4C1 NH4Br ND 4C1 ND 4Br
f6(obs)_ 389 349 280 252
i^ioo 389 349 282 253
2v6 (obs) 749 672 545 490
772 692 560 504
3i>6 (obs) 1110 987 815 728
^210 1132 1012 827 742
Nagamiya has proposed a potential function for the tetrahedra
ammonium ion moving in the cubic field of a CsCl lattice, and Gutow-sky, Pake and Bersohn [2] have given an approximate solution for
the energy levels of such a three-dimensional torsional oscillator. Theposition of these levels is determined by /, the momeut of inertia of the
ammonium ion, and V0 , the height of the potential barrier for rotation
about a two-fold axis of the ion. The values of / are known for both
NH4+ and ND 4+, and we have chosen V0 = I860 cm" 1
(5.32 kcal
mole-1) for the chloride and V0 — 1520 cm-1
(4.35 kcal mole-1) for the
bromide. With these empirical V0 values, one can calculate values of
vm — (Em — E000)/hc. As shown in table 1, the calculated frequencies
are in reasonable agreement with the observed frequencies. Moreover,
Nagamiya's potential predicts that V0~a~ 5, where a is the cubic
lattice parameter. Using a(NH4Br) = 4.00 A and <z(NH4Cl) = 3.82
A at 20 °K one finds that [a(Br) /a (CI)] 5 = 1.25, in good agreement
with F0(Cl)/V 0(Br) = 1860/1520 = 1.22. Thus, it seems possible to
STRUCTURE AND SPECTROSCOPY OF INORGANIC CRYSTALS 243
establish appropriate values for V0 in spite of the fact that the
calculated anharmonicity is less than that observed.
3. Effects of Disorder
Although the spectra contain several indications of changes due to
ordering, we shall limit this discussion to the behavior near the infrared
active, triply-degenerate bending vibration (*>4) of the NH4+ ion. The
behavior of the deuterated salts is qualitatively in agreement with
that described below.
NH4CIfilms. At 21 °K, the v4 bending vibration gives rise to a single
strong band at 1403 cm-1. However, at temperatures above~120 °K
an anomalous component (denoted by v4') is observed at 1444 cm-1.
Iv/, the intensity of this component, has been measured as a function
of temperature and can be shown to be quite simply related to the
orientational disorder [3].
NH^Br films. The situation here is more complex because v4 is split
by a tetragonal crystal field, and one observes a second componentnear the strong 1400 cm-1
v4 band in the ordered tetragonal phase at
110 °K. The behavior of Iv± near the lambda point at 235 °K thus
reflects changes in both the tetragonal distortion of the lattice and the
disorder of the NH4+ orientations. The most surprising feature is the
large variation of Iv± observed in the cubic phase between 20 and 110
°K. Thermal measurements [4] show a sluggish first-order transition
at 108 °K and strongly indicate that the cubic NH4Br at 100 °K is as
completely ordered as is NH4C1 at that temperature. In fact, the
spectra demonstrate that a considerable amount of equilibrium "dis-
order" exists in the cubic phase and the transition is by no means a
simple first-order change.
4. References
[1] E. L. Wagner and D. F. Hornig, J. Chem. Phys. 18, 296, 305 (1950).
[2] H. S. Gutowsky, G. E. Pake and R. Bersohn, J. Chem. Phys. 22, 643 (1954).
[3] C. W. Garland and N. E. Schumaker, J. Phys. Chem. Solids 28, 799 (1967).
[4] M. Sorai, H. Suga and S. Seki, Bull. Chem. Soc. Japan 38, 1125 (1965).

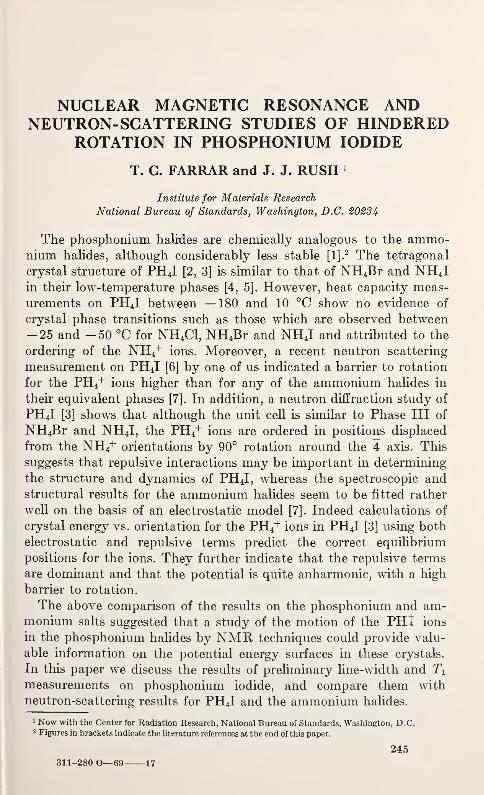
NUCLEAR MAGNETIC RESONANCE ANDNEUTRON-SCATTERING STUDIES OF HINDERED
ROTATION IN PHOSPHONIUM IODIDE
T. C. FARRAR and J. J. RUSH 1
Institute for Materials Research
National Bureau of Standards, Washington, D.C. 20234
The phosphonium halides are chemically analogous to the ammo-nium halides, although considerably less stable [l].
2 The tetragonal
crystal structure of PH4I [2, 3] is similar to that of NH4Br and NH4 I
in their low-temperature phases [4, 5]. However, heat capacity meas-
urements on PH4I between —180 and 10 °C show no evidence of
crystal phase transitions such as those which are observed between-25 and -50 °C for NH4C1, NH4Br and NH4I and attributed to the
ordering of the NH4+ ions. Moreover, a recent neutron scattering
measurement on PH4I [6] by one of us indicated a barrier to rotation
for the PH4+ ions higher than for any of the ammonium halides in
their equivalent phases [7]. In addition, a neutron diffraction study of
PH4I [3] shows that although the unit cell is similar to Phase III of
NH4Br and NH4I, the PH4+ ions are ordered in positions displaced
from the NH4+ orientations by 90° rotation around the 4 axis. This
suggests that repulsive interactions may be important in determining
the structure and dynamics of PH4I, whereas the spectroscopic andstructural results for the ammonium halides seem to be fitted rather
well on the basis of an electrostatic model [7]. Indeed calculations of
crystal energy vs. orientation for the PH4+ ions in PH4I [3] using both
electrostatic and repulsive terms predict the correct equilibrium
positions for the ions. They further indicate that the repulsive terms
are dominant and that the potential is quite anharmonic, with a high
barrier to rotation.
The above comparison of the results on the phosphonium and am-monium salts suggested that a study of the motion of the PHl ions
in the phosphonium halides by NMR techniques could provide valu-
able information on the potential energy surfaces in these crystals.
In this paper we discuss the results of preliminary line-width and 7\
measurements on phosphonium iodide, and compare them with
neutron-scattering results for PH4I and the ammonium halides.
1 Now with the Center for Radiation Research, National Bureau of Standards, Washington, D.C.2 Figures in brackets indicate the literature references at the end of this paper.
245311-280 O—69 17
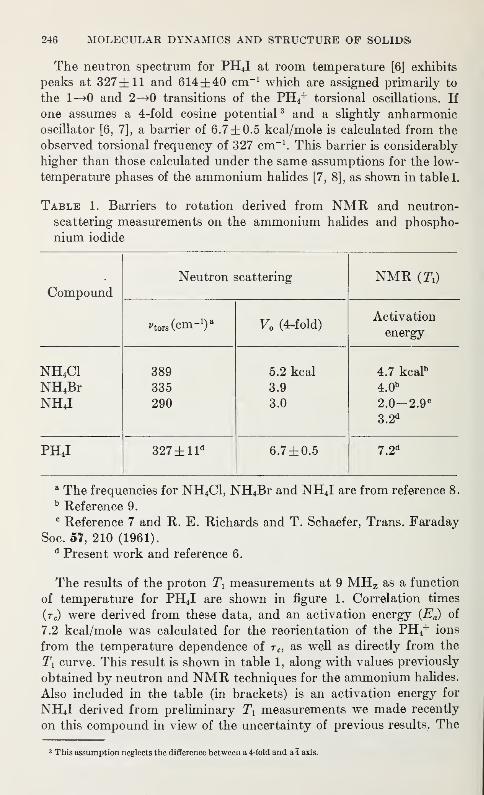
246 MOLECULAR DYNAMICS AND STRUCTURE OF SOLIDS
The neutron spectrum for PH4I at room temperature [6] exhibits
peaks at 327 ±11 and 6 14 ±40 cm-1 which are assigned primarily to
the 1—>0 and 2—»0 transitions of the PH4+ torsional oscillations. If
one assumes a 4-fold cosine potential 3 and a slightly anharmonic
oscillator [6, 7], a barrier of 6.7± 0.5 kcal/mole is calculated from the
observed torsional frequency of 327 cm-1. This barrier is considerably
higher than those calculated under the same assumptions for the low-
temperature phases of the ammonium halides [7, 8], as shown in table 1.
Table 1. Barriers to rotation derived from NMR and neutron-
scattering measurements on the ammonium halides and phospho-
nium iodide
CompoundNeutron scattering NMR (fi)
vt0TS (cm-l
)a V0 (4-fold)
Activation
energy
NH4C1
NH4Br
NHJ
389
335
290
5.2 kcal
3.9
3.0
4.7 kcaP
4.0b
2.0-2.9 c
3.2d
PH4I 327±lld 6.7±0.5 7.2d
a The frequencies for NH4C1, NH4Br and NHJ are from reference 8.
b Reference 9.
c Reference 7 and R. E. Richards and T. Schaefer, Trans. Faraday
Soc. 57, 210 (1961).d Present work and reference 6.
The results of the proton Tx measurements at 9 MHZ as a function
of temperature for PH4I are shown in figure 1. Correlation times
(r c) were derived from these data, and an activation energy (Ea) of
7.2 kcal/mole was calculated for the reorientation of the PH4+ ions
from the temperature dependence of rc, as well as directly from the
Ti curve. This result is shown in table 1, along with values previously
obtained by neutron and NMR techniques for the ammonium halides.
Also included in the table (in brackets) is an activation energy for
NH4I derived from preliminary Txmeasurements we made recently
on this compound in view of the uncertainty of previous results. The
3 This assumption neglects the difference between a 4-fold and a i axis.
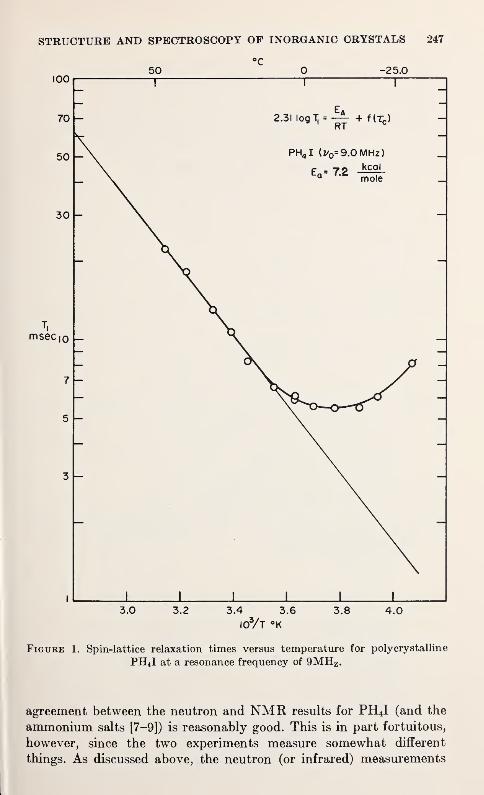
STRUCTURE AND SPECTROSCOPY OF INORGANIC CRYSTALS 247
°C50
100
70 -
msec io —
•25.0
2.31 logTi = -^p +HTC )
PH4 I (l/0=9.0MHz)
3.0 3.2 3.4 3.6 3.8
I03A °K
4.0
Figure 1. Spin-lattice relaxation times versus temperature for polycrystalline
PH4I at a resonance frequency of 9MHZ .
agreement between the neutron and NMR results for PHJ (and the
ammonium salts [7-9]) is reasonably good. This is in part fortuitous,
however, since the two experiments measure somewhat different
things. As discussed above, the neutron (or infrared) measurements
248 MOLECULAR DYNAMICS AND STRUCTURE OF SOLIDS)
provide information about the torsional energy levels below the
barrier to rotation which, on the assumption of a four-fold cosine
potential, can be used to calculate the total barrier height. The NMRmethod [7], on the other hand, makes no such assumption about the
barrier height. Rather it assumes that a classical activated reorienta-
tion of the PH4+ ions determines the temperature behavior of the
spin-lattice relaxation time. The energy parameter which is derived
is roughly a measure of the average energy difference between the
lower torsional levels and the rotational levels above the barrier.
However, the agreement between the two derived "barriers" for
PH4I does indicate that the actual barrier height is in the region of
7 kcal/mole, and that the potential is closer to harmonic than recent
calculations [3] would suggest. Further the difference in orientation
between the PH4+ ions in PHJ [3] and the NH4
+ ions in NH4Br [5]
suggests that a study of the structure and dynamics of all the phos-
phonium halides could be quite useful for obtaining a better under-
standing of the balance of electrostatic and repulsive forces in such
crystals. Such studies are in progress. We will report the results along
with a more detailed discussion of our results on PH4I at a later date.
References
[1] J. R. Van Wazer, Phosphorus and Its Compounds, Interscience Publishers,
Inc., New York, 1, 207-211 (1961).
[2] R. G. Dickinson, J. Am. Chem. Soc. 44, 1489 (1922).
[3] A. Sequeira and W. C. Hamilton, J. Chem. Phys. 47, 1818 (1967); also W.C. Hamilton, these proceedings.
[4] J. A. Ketelaar, Nature 134, 250 (1934).
[5] H. A. Levy and S. W. Peterson, J. Am. Chem. Soc. 75, 1536 (1953).
[6] J. J. Rush, J. Chem. Phys. 44, 1722 (1966).
[7] H. S. Gutowsky, G. E. Pake and R. Bersohn, J. Chem. Phys. 23, 643 (1954).
[8] G. VeDkataraman, et al., J. Phys. Chem. Solids 27, 1103 (1966).
[9] D. E. Woessner and B. S. Snowden, Jr., J. Phys. Chem. 71, 952 (1967); J.
Chem. Phys. 47, 378 (1967).
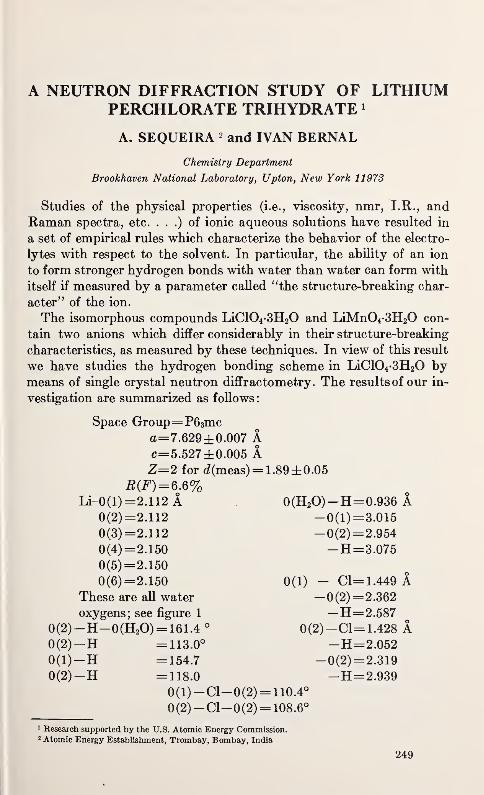
A NEUTRON DIFFRACTION STUDY OF LITHIUMPERCHLORATE TRIHYDRATE 1
Studies of the physical properties (i.e., viscosity, nmr, I.R., andRaman spectra, etc. . . .) of ionic aqueous solutions have resulted in
a set of empirical rules which characterize the behavior of the electro-
lytes with respect to the solvent. In particular, the ability of an ion
to form stronger hydrogen bonds with water than water can form with
itself if measured by a parameter called "the structure-breaking char-
acter" of the ion.
The isomorphous compounds LiC104-3H20 and LiMn04-3H20 con-
tain two anions which differ considerably in their structure-breaking
characteristics, as measured by these techniques. In view of this result
we have studies the hydrogen bonding scheme in LiC104-3H20 bymeans of single crystal neutron diffractometry. The results of our in-
vestigation are summarized as follows
:
A. SEQUEIRA 2 and IVAN BERNAL
Chemistry Department
Brookhaven National Laboratory, Upton, New York 11973
Space Group=P63mca=7.629± 0.007 Ac=5.527±0.005 AZ=2 for d(meas)= 1.89±0.05
£(F)=6.6%Li-0(1) =2.112 A 0(H2O)-H
0(2)=2.112 -0(1)
0(3)=2.112 -0(2):
0(4)=2.150 —
H
0(5) =2.150
0(6)=2.150 0(1) - CI
These are all water —0(2):
oxygens; see figure 1 —IT
0(2)-H-0(H2O)= 161.4 ° 0(2)-Cl0(2)-H =113.0° —
H
0(1)-H =154.7 -0(2)0(2)-H =118.0 —
H
0(1) -Cl-0(2) = 110.4°
0(2) -Cl-0(2)= 108.6°
2.362
2.587
3.015
2.954
3.075
0.936 A
2.052
2.319
2.939
1.449 A
1.428 A
o
o
1 Research supported by the U.S. Atomic Energy Commission.2 Atomic Energy Establishment, Trombay, Bombay, India
249
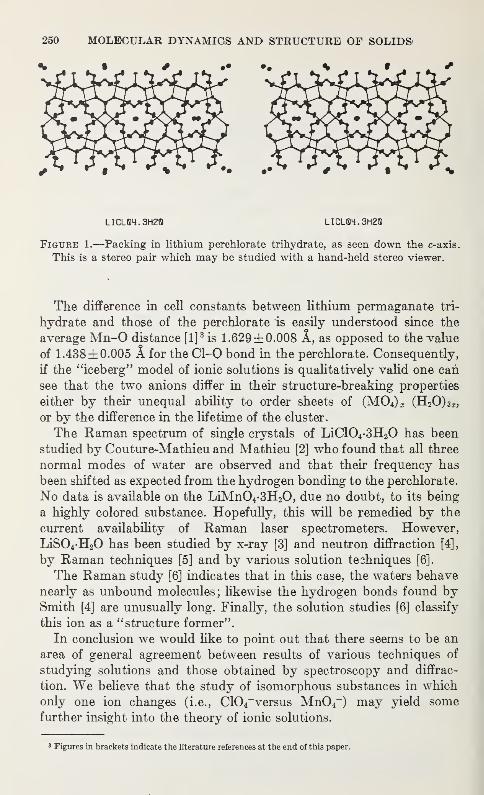
250 MOLECULAR DYNAMICS AND STRUCTURE OF SOLID&
LICL84.3H2Q LICLQ4. 3H2Q
Figure 1.—Packing in lithium perchlorate trihydrate, as seen down the c-axis.
This is a stereo pair which may be studied with a hand-held stereo viewer.
The difference in cell constants between lithium permaganate tri-
hydrate and those of the perchlorate is easily understood since the
average Mn-0 distance [l]3is 1.629±0.008 A, as opposed to the value
of 1.438 ±0.005 A for the Cl-0 bond in the perchlorate. Consequently,
if the "iceberg" model of ionic solutions is qualitatively valid one can
see that the two anions differ in their structure-breaking properties
either by their unequal ability to order sheets of (M04)j (H20) 3a; ,
or by the difference in the lifetime of the cluster.
The Raman spectrum of single crystals of LiC104-3H20 has been
studied by Couture-Mathieu and Mathieu [2] who found that all three
normal modes of water are observed and that their frequency has
been shifted as expected from the hydrogen bonding to the perchlorate.
No data is available on the LiMn04-3H20, due no doubt, to its being
a highly colored substance. Hopefully, this will be remedied by the
current availability of Raman laser spectrometers. However,
LiS04-H20 has been studied by x-ray [3] and neutron diffraction [4],
by Raman techniques [5] and by various solution techniques [6].
The Raman study [6] indicates that in this case, the waters behave
nearly as unbound molecules; likewise the hydrogen bonds found bySmith [4] are unusually long. Finally, the solution studies [6] classify
this ion as a "structure former".
In conclusion we would like to point out that there seems to be an
area of general agreement between results of various techniques of
studying solutions and those obtained by spectroscopy and diffrac-
tion. We believe that the study of isomorphous substances in which
only one ion changes (i.e., C104~versus Mn04") may yield somefurther insight into the theory of ionic solutions.
3 Figures in brackets indicate the literature references at the end of this paper.

STRUCTURE AND SPECTROSCOPY OF INORGANIC CRYSTALS 251
References
[1] G. Palenik, Inorg. Chem. 6, 503 (1967).
[2] L. Couture-Mathieu and J. P. Mathieu, Acta Cryst. 5, 571 (1952).
[3] A. C. Larson, Acta Cryst. 18, 717 (1965).
[4] A. Smith, Acta Cryst. 18, 717 (1965), private communication to A. C. Larson.
[5] C. Bassas-Dubuisson, /. Chim. Phys. 50, C98 (1953).
[6] See E. R. Hightingale, Jr., in Chemical Physics of Ionic Solution, B. E.
Conway and R. G. Barradas, Eds., John Wiley and Sons, New York,
pp. 87-100 (1966).

THE STRUCTURE OF SEVERAL URANYL NI-
TRATE COMPOUNDS AS DETERMINED BYNEUTRON DIFFRACTION 1
M. H. MUELLER and N. KENT DALLEY 2
Argonne National Laboratory, Argonne, Illinois 60439
The use of neutron diffraction in the crystal structure determina-
tions of [U02(H20) 2(N03) 2] [l]3
,[U02(H20) 2(N03) 2]4H20 [2] and
[U02(H20){CO(NH2) 2 } 4](N03)2 [3], hereafter referred to as I, II and
III respectively, made it possible to obtain more accurate positions
for light atoms and to make a more complete study of the hydrogen
bonding present in each compound than would have been possible
using x-rays. This is a result of the more favorable atomic scattering
factor ratios and a smaller absorption problem in neutron diffraction.
It was found that the uranium coordination in all three compoundssupports the conclusions of Evans [4] which he set forth in a review of
uranyl compounds, and the U-0 distances are in accord with those
predicted by Zachariasen and Plettinger [5]. The uranyl ion is linear
within experimental error in all three compounds though only in I is
this required by the space group symmetry. All three compounds have
a nearly planar (within 0.2 A) arrangement of oxygen atoms perpen-
dicular to the uranyl ion; in I and II the coordination consists of six
oxygens, two from two water ligands and four from two bidentate
nitrato groups; and in III it consists of five oxygens, one water oxygen
and four carbonyl oxygens from the four urea groups. The pentagon of
III is more regular than the hexagons of I and II; the unpuckered
hexagon of I and II being possible only because of the presence of the
highly polarizing N03" group which allows the 0-0 approach of the
oxygens to be less than is normally encountered.
Previous investigators had attempted to determine the structure
of these compounds by other methods. In an infrared study of I [6]
the nitrate group showed C2v rather than the higher T>3h symmetry,hence it was concluded that the nitrate groups were covalently boundto the uranium as bidentate ligands. It was also shown [7] that there
were no loosely bound water molecules outside the coordination sphere.
These results were substantiated by the present neutron study. An
1 This work was sponsored by the U.S. Atomic Energy Commission.2 Student Research Associate from University of Texas, Austin, Texas.3 Figures in brackets indicate the literature references at the end of this paper.
253
254 MOLECULAR DYNAMICS AND STRUCTURE OP SOLIDS'
earlier x-ray study of I [8] had reported the same type of configuration
but because of erroneous bond lengths and lattice parameters it mustbe considered of doubtful value.
In a previous attempt to determine the structure of II, Gatehouse
and Comyns [9] suggested the structure to be [U02(H20) 6]-2N03
from infrared studies but shortly thereafter Allpress and Hambly [10]
showed that the infrared spectra of II was only slightly different from
that of I and they indicated that there were covalent nitrates in both
compounds. This was also shown in an infrared study by Ferraro and
Walker [6]. Two previous diffraction experiments [11, 12] had not
settled the question, however the findings of this neutron study con-
firmed the presence of bidentate nitrato ligands in II and also agreed
with both the infrared study of Ferraro and Walker and an inelastic
neutron scattering study [13] on II which indicated several different
water environments.
The infrared work on III left many questions unanswered. A Russian
study [14] showed that in such a compound the urea ligands would
replace the nitrato groups in the primary coordination sphere, which
suggested a fivefold coordination of the uranyl ion. However other
investigators [15, 16] suggested a coordination of six about the ion
with the possibility of a monodentate nitrato ligand or a tetramer.
The neutron results showed it was indeed a case of fivefold coordination.
The hydrogen bonding in I is a rather simple chain type linkage.
Only the water hydrogens of one of the two nonequivalent kinds of
molecules are involved in hydrogen bonding; one hydrogen bondlinking to the uncoordinated nitrato oxygen of the other kind of mole-
cule and the second hydrogen bond terminating at the uranyl oxygen of
the same kind of molecule. In II the hydrogen bonding is much more
complicated with the basic structural units joined together by a net-
work of water sheets. These sheets consist of the four water molecules
outside the primary coordination sphere of the uranium atom. There
are fairly strong hydrogen bonds from the coordinated water molecules
to the water sheets and then weaker bonds from the waters of the
sheet to the uncoordinated nitrato oxygens. The water molecules of
the sheets are also joined together by hydrogen bonds (see fig. 1).
In III most of hydrogen bonds involve the oxygens of the nitrato
groups. Thus the nitrate groups perform an important cohesive
function in the crystal.
The thermal motion in these compounds has, as would be expected,
the larger components of motion perpendicular to the bond direction.
In III there is large thermal motion in which the isotropic temperature
factors for some of the oxygens of the nitrate groups are nearly eight.
However there is no indication of any disorder.
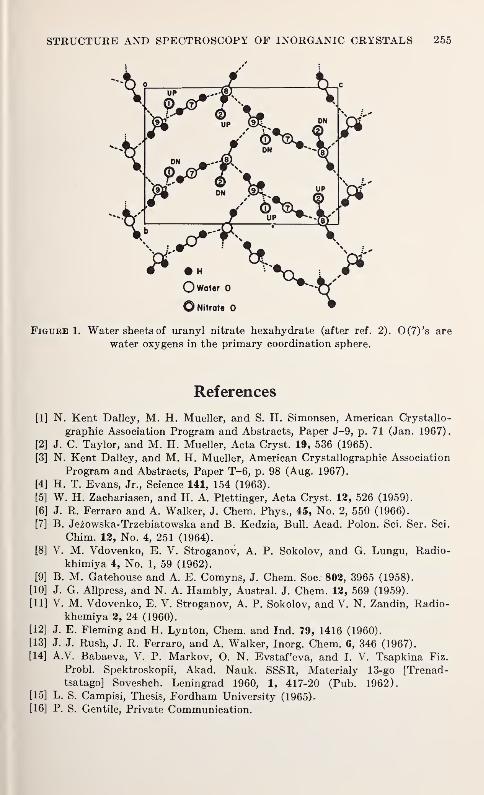
STRUCTURE AND SPECTROSCOPY OF INORGANIC CRYSTALS 255
Figure 1, Water sheets of uranyl nitrate hexahydrate (after ref. 2). 0(7)'s are
water oxygens in the primary coordination sphere.
References
[1] N. Kent Dalley, M. H. Mueller, and S. H. Simonsen, American Crystallo-
graphic Association Program and Abstracts, Paper J-9, p. 71 (Jan. 1967)
.
[2] J. C. Taylor, and M. H. Mueller, Acta Cryst. 19, 536 (1965).
[3] N. Kent Dalley, and M. H. Mueller, American Crystallographic Association
Program and Abstracts, Paper T-6, p. 98 (Aug. 1967).
[4] H. T. Evans, Jr., Science 141, 154 (1963).
[5] W. H. Zachariasen, and H. A. Plettinger, Acta Cryst. 12, 526 (1959).
[6] J. R. Ferraro and A. Walker, J. Chem. Phys., 45, No. 2, 550 (1966).
[7] B. Jezowska-Trzebiatowska and B. Kedzia, Bull. Acad. Polon. Sci. Ser. Sci.
Chim. 12, No. 4, 251 (1964).
[8] V. M. Vdovenko, E. V. Stroganov, A. P. Sokolov, and G. Lungu, Radio-
khimiya 4, No. 1, 59 (1962).
[9] B. M. Gatehouse and A. E. Comyns, J. Chem. Soc. 803, 3965 (1958).
[10] J. G. Allpress, and N. A. Hambly, Austral. J. Chem. 12, 569 (1959).
[11] V. M. Vdovenko, E. V. Stroganov, A. P. Sokolov, and V. N. Zandin, Radio-khemiya 2, 24 (1960).
[12] J. E. Fleming and H. Lynton, Chem. and Ind. 79, 1416 (1960).
[13] J. J. Rush, J. R. Ferraro, and A. Walker, Inorg. Chem. 6, 346 (1967).
[14] A.V. Babaeva, V. P. Markov, O. N. Evstaf'eva, and I. V. Tsapkina Fiz.
Probl. Spektroskopii, Akad. Nauk. SSSR, Materialy 13-go [Trenad-
tsatago] Soveshch. Leningrad 1960, 1, 417-20 (Pub. 1962).
[15] L. S. Campisi, Thesis, Fordham University (1965).
[16] P. S. Gentile, Private Communication.

INFRARED SPECTRAL STUDIES AS A TOOL FORSENSING THE ENVIRONMENT ABOUT WATER
MOLECULES IN HYDRATES
J. SCHIFFER
Department of Chemistry
Temple University, Philadelphia, Pa. 19122
and
D. F. HORNIG
Office of Science and Technology
The White House, Washington, D.C. 20500
The isotope dilution technique has proven very useful for sensing
the environment about water molecules in hydrates [1], In principle,
it involves recording vibrational spectra of hydrates, containing
varying admixtures of H20, HOD and D20.
The utility of this technique is based on the following considera-
tions: A hydrate prepared from a salt solution, containing a small
percentage of D20 relative to H20, has as its next major componentto H20, the isotopic species HOD. The OD motions of these HOD'swill be both intra and intermolecularly uncoupled from their environ-
ments, since they are far removed in frequency from vibrations of
molecules surrounding them. The same applies to OH motions of
HOD in highly deuterated hydrates. Absorptions due to these un-
coupled modes will henceforth be designated p0h and vOT) bands.
The number of these bands directly reflects the number of physically
different OH and OD bonds in a hydrate, their frequencies reflect
the extent to which each bond is hydrogen-bound in the solid, andtheir frequency shifts from vapor values, in conjunction with fre-
quency shift—OH—X correlations [2, 3] give reasonable estimates
of the geometric environment about each bond of a water molecule
in a hydrate. We may also obtain estimates of OH bond distances
from a frequency shift—
r
OH correlation [4].
As the percentage of D20 is increased in a hydrate, the probability
increases for having HOD molecules adjacent to one another andfor having two deuteriums on the same water molecule. These lead
to the appearance of additional bands in the OD stretching region
due to (1) vi and i>3 motions of uncoupled D20 molecules and (2)
intermolecular coupling components of adjacent OD oscillators. A257
258 MOLECULAR DYNAMICS AND STRUCTURE OF SOLIDS
parallel pattern is expected in the OH stretching region as the con-
centration of H20 is increased stepwise in a deuterated sample. Theseadditional features are useful for associating pairs of uncoupledvOH (and vOTt) bands with particular water molecules [1]. Criteria
needed for these assignments are (1) intra and intermolecular coupling
components split about their corresponding uncoupled bands, and (2)
splitting is greater for OD than OH motion if coupling is intra-
molecular, with the reverse applying for intermolecular coupling [1].
Using these criteria, we can associate particular vOH 's with particular
water molecules and so obtain the complete environment about
each type of water molecule in a hydrate. In addition, the magnitudes
of observed splittings can and have been used for obtaining valuable
information about intra and intermolecular forces in hydrates [1].
Let us now illustrate the above points with specific examples
drawn from infrared spectra of NaCl-2H20, NaBr-2H20, CaS04-
2H20 [5], BaCl2-2H20 [5], and their deutero-analogues.
The infrared spectrum of NaCl-2D20 (containing H20)
contains four bands in its OH stretching region at —195 °C [1]. These
appear at 3530, 3434, 3426 and 3416 cm-1. Three of these merge
into one at —78 °C. This reflects temperature broadening rather
than a phase transition, as shown by additional spectral studies.
The appearance of four bands indicates there are four different OHenvironments in this hydrate. Although no x-ray work has been
performed on it, by analogy with the isomorphous NaBr-2H20, weexpect two types of water molecules to exist in NaCl-2H20 with four
physically different OH groups. The four uncoupled j>0h bands
confirm this and further indicate that of the two types of water
molecules present, one is considerably distorted by its potential en-
vironment while the other is nearly undistorted. This is reasoned
from one vOH band being considerably removed from the remaining
three.
A study of coupling between vOH 's has revealed that the 3530 and
3416 cm-1bands correspond to one molecule, (I), while the remaining
two belong to the nearly undistorted one, (II) [1]. If we now assume
only OH—CI bonds, we predict O—CI distances at —195° C to be
[3]: Molecule (I), 3.26 and 3.35 A (or less if bifurcated bonding):
Molecule (II), 3.267 and 3.271 A. Confirmation of these predictions
must await a diffraction study of this hydrate.
The second example is that of NaBr 2H20. An x-ray determination
of this reveals there are three different O—Br distances, two of
length 3.36 A and one of 3.38 A [6]. The infrared spectrum of V/a
percent deuterated NaBr 2H20 indicates there are four vOT) bands
appearing at 2608, 2544, 2532, and 2522 cm" 1 at —195 °C. Again, as
in the chloride hydrate, we predict two types of water molecules, one
STRUCTURE AND SPECTROSCOPY OF INORGANIC CRYSTALS 259
distorted and one nearly undistorted. The predicted O—Br distances
are: Molecule (I), 3.40 and 3.49 A (or less if bifurcated); Molecule
(II), 3.41 and 3.42 A. These agree reasonably well with Carpenter's
values and suggest further analysis of the x-ray data to identify the
environment about the weakly hydrogen-bonded OH group.
In our next example, gypsum, we see a clear illustration of the ex-
treme sensitivity of this method relative to that of diffraction methods.
A neutron diffraction analysis by Atoji and Rundle [7] indicates the
single type of water molecule in gypsum forms linear OH—O bonds of
length 2.816 ±0.014 A and 2.824 ±0.015 A. The small difference in
bond lengths suggests the uncoupled vou (and vOT) ) bands should fall
very near one another in frequency. This is not realized experimentally.
The i>oh bands are found at 3411 and 3494 cm" 1 at — 195 °C (3405 and
3501 cm-1at 33 °C) while vOT> bands are observed at 2517 and 2574
cm" 1 (-195 °C), and at 2516 and 2583 cm" 1(33 °C). The frequency
separations are quite large, indicating the extreme sensitivity of the
vibrations to small changes in environment. The small collapse in
frequency on deuteration reveals the vqb. bands do not originate in
splittings due to the presence of a double minimum potential for proton
motion.
As our final example, we consider the hydrate, BaCl2-2H 20. Thespectrum of a 5 percent deuterated sample of this, at —195 °C, shows
four vOT> bands appearing at 2440, 2447, 2465, and 2521 cm-1; we
obtain the same pattern as in NaBr • 2H20, only with stronger hydrogen
bonding evident : three OH's should be in similar environments with a
fourth less strongly bound. This is in excellent agreement with neutron
diffraction predictions on BaCl2 -2H20 [8], made after the private
communication of our infrared results. The three similar OH en-
vironments correspond to OH—CI distances 3.130, 3.179, and 3.182 A,
all slightly nonlinear. The weaker bond is bifurcated, being highly
nonlinear, with O—CI distances, 3.302 and 3.238 A.
References
[1] J. Schiffer, Ph. D. Thesis, Princeton University, 1963.
[2] K. Nakamoto, M. Margoshes and R. E. Rundle, J. Am. Chem. Soc. 77, 6480
(1955).
[3] O. Glemser and E. Hartert, Naturwiss. 43, 534 (1955).
[4] G. C. Pimentel and A. L. McClellan, The Hydrogen Bond, W. H. Freeman andCo., San Francisco, Calif., p. 90 (1960).
[5] Work performed by R. Kling, Temple University, 1967.
[6] W. R. Haaf and G. B. Carpenter, Acta Cryst. 17, 730 (1964).
[7] M. Atoji and R. E. Rundle, J. Chem. Phys. 29, 1306 (1958).
[8] W. R. Busing, private communication, 1962.

NUCLEAR MAGNETIC RESONANCE STUDIES OFMOLECULAR MOTION IN CLATHRATE
HYDRATESC. A. MCDOWELL and P. RAGHUNATHAN
Department of Chemistry,
University of British Columbia, Vancouver, British Columbia, Canada
Although the overall crystal structures of the clathrate hydrates
are now well-known [l],1 studies of the nature and extent of molecular
motion undergone by the "guest" molecules inside their clathrate
structures have been comparatively few [2-6]. A study of the nuclear
magnetic resonance absorption of the guest species should be of par-
ticular advantage, since the hydrate frameworks provide selective
isolation of the guest molecule. The use of magnetic resonance tech-
niques for the study of motional processes in analogous structures has
been demonstrated by Gilson and McDowell [7] and by Meyer et
al. [8, 9]. A problem which often arises in the application of the NMRtechnique to most clathrate hydrates is that the guest molecule andthe lattice alike contain proton spins, and computations of dipole-
dipole interactions in such structures become complex. Isotopic sub-
stitution of the lattice protons using D 20 reduces these interactions
considerably. Alternately, choosing a fluorocarbon molecule as
"guest" in the hydrate host-structure simplifies the problem greatly
since for such a case the F19 resonance may be studied.
In this report we shall summarize our results pertaining to the
temperance-dependence of NMR line shapes and spin-lattice relaxa-
tion times for a variety of molecules enclathrated in hydrate structures.
The results were obtained with a crossed-coil, wide line NMR spec-
trometer operated at 30MHz. The resonance line shapes were rational-
ized on the basis of precise calculations of theoretical second momentsfor various dynamical models of the guest molecules. These calcula-
tions consisted of "intra-guest" second moment contributions from a
single host-lattice cavity as well as "interguest" contributions for all
occupied cavities in the neighbourhood.
For convenience we shall divide the clathrates studied into four
categories. In the first category may be placed the hydrates of CF A
and SF 6 . From F 19 magnetic resonance line shapes we conclude that
the guest molecules in these clathrates experience but little restric-
tion from the walls of the host cavities, and freely reorient about a
chosen axis of symmetry at low temperatures. Random motion sets
in only at higher temperatures. Below 250 °K, spherically symmetric
1 Figures in brackets indicate the literature references at the end of this paper.
261
311-280 0—69 18
262 MOLECULAR DYNAMICS AND STRUCTURE OF SOLIDS)
force fields are indicated inside the cavities of these crystal lattices.
The guest molecules spend all their time reorienting in these cavities
and translational motion appears to be quite hindered. For example,
we have demonstrated by means of a rigorous second moment anal-
ysis that, at temperatures above 150 °K, SF6 undergoes a very limited
isotropic translational motion up to a distance of 0.5 A from the centre
of the clathration volume. In the limit of fully quantized reorienta-
tion, the dominant mechanism of relaxation of the fluorine spins would
be expected to be a spin-rotation interaction [10, 11].
The hydrate of propane appears to belong to a category of clathrates
in which the temperature-induced translational motion of guests is a
maximum. Proton resonance of propane has been studied in two speci-
mens of the deuterated hydrate, one of which was richer in guest
content than the other. From the temperature-dependence of the line
shapes of these specimens it has been suggested that, below 160 °K,
propane assumes a staggered C 2-configuration inside the clathrate
cavity. Reorientations about the molecular C 2-symmetry axis super-
imposed on methyl reorientations are thought to occur, and an ac-
tivation energy barrier of 1.70 ±0.08 kcal.mole-1 has been computed
for the above composite motion from the proton spin-lattice relaxa-
tion times in the temperature range of 77-110 °K. Both adiabatic fast
passage and progressive signal saturation methods were used for
measuring the relaxation times, and the results obtained by the two
techniques were in excellent agreement. Closer to the melting point
of the clathrate, diffusion of propane through the host lattice is indi-
cated. Diffusional activation energies of 1.40 ±0.02 kcal.mole-1 and
0.75 ±0.05 kcal/mole have been obtained for the guest-rich and
guest-deficient clathrates, respectively.
Somewhat different results were observed for the three monohalo-
methane hydrates, CH3X (X=Cl,Br,I). For these clathrates, which
make up the third category, our low-temperature proton resonance
studies indicate that there are definite constraints to the reorienta-
tional and translational motion of the guest molecules. Experimental
second moment data obtained at 77 °K for the monochloro- and
monoiodomethane clathrates show evidence for only low-amplitude
oscillatory motions of the CH3 groups. For the monobromomethaneclathrate, a triplet line shape has been observed at 77 °K which
indicates some alignment of the guest molecules. At higher tempera-
ture it is presumed that the hydrate lattice expands to permit free
reorientations about the C3 axis of the CH3 groups of the three guest
molecules. From the associated lineAvidth transitions, values of
2.48±0.32, 9.30±0.25, and 6.80±0.50 kcal/mole" 1 have been calcu-
lated for the activation energy barrier hindering methyl reorientation
in the CH3C1-, CH3Br- and CH3I hydrates, respectively. The motional
model proposed for the higher temperature range is adequately
STRUCTURE AND SPECTROSCOPY OF INORGANIC CRYSTALS 263
supported by measurements of the proton spin-lattice relaxation
times.
The clathrate hydrates of the two dihalomethanes, CH2C12 and
CH2F2 ,may be placed in the fourth and last category, where all
motional effects which could affect the absorption line shape were
virtually absent below 90 °K. For the dichloromethane clathrate
hydrate, a clearly resolved doublet characteristic of rigidly aligned
proton pairs has been obtained at 77 °K. This doublet has been
analyzed by means of an IBM 7040 computer program to yield an
H-H distance of 1.73 ±0.04 A for the "guest" dichloromethane
molecule. The F 19 resonance line of the CH2F2-clathrate was very
broad but possessed no structure, presumably owing to a strong
broadening by IT-F19 intramolecular dipolar interaction. Analysis of
this line shape gave a value of 2. 14 ±0.04 A for the F-F distance in a
CH2F2 "guest" molecule
The general trend of our results indicates that, at least in specific
cases, refinements to the currently existent approximations of
"spherically-symmetric" host cages are necessary. Indeed, in extreme
cases of tight-fitting guest molecules, it is even possible to envision
the heretofore neglected "exchange interactions" arising from the
overlap of the electronic wave functions of the guest molecules with
peripheral orbitals of host-lattice oxygens. Alternately, a low-tempera-
ture contraction of host lattices of such clathrates in the direction of
non-cubic symmetry is another distinct possibility, and low-tempera-
ture x-ray crystal structure studies of such hydrates should be of
interest. One might recall in this context that earlier work on quinol
clathrates of large molecules (e.g., S02 ,CH3CN) has led to the proposal
of distorted host-lattice cavities. [12]
We thank the National Research Council of Canada for their
generous support of this work.
References
[1] G. A. Jeffrey, Dechema-Monographien 47, 849 (1962).
[2] G. J. Wilson and D. W. Davidson, Can. J. Chem. 41, 264 (1963).
[3] V. McKoy and O. Sinanoglu, J. Chem. Phys. 38, 2846 (1963).
[4] D. W. Davidson, M. M. Davies and K. Williams, J. Chem. Phys. 40, 3449
(1964).
[5] K. B. Harvey, F. R. McCourt and H. F. Shurvell, Can. J. Chem. 42, 960
(1964).
[6] S. Brownstein, D. W. Davidson and D. Fiat, J. Chem. Phys. 46, 1454 (1967).
[7] D. F. R. Gilson and C. A. McDowell, Mol. Phys. 4, 125 (1961).
[8] H. Meyer and T. A. Scott, J. Phys. Chem. Solids 11, 215 (1959).
[9] S. Foner, H. Meyer and W. H. Kleiner, J. Phys. Chem. Solids 18, 273 (1961).
[10] W. R. Hacklemann and P. S. Hubbard, J. Chem. Phys. 39, 2688 (1963).
[11] P. S. Hubbard, Phys. Rev., 131, 1155 (1963).
[12] L. A. K. Staveley in Non-stoichiometric Compounds, Ch. 50, Ed. L.
Mandelcorn (Academic Press, Inc., 1964).

CALCULATION AND ANALYSIS OF PULSED-NMRLINE SHAPES OF CRYSTALS 1
MARCEL KOPP 2
One may calculate the absorption spectrum of a spin system bydiagorializing its Hamiltonian; but for a crystal of spins % (strictly
dipolar broadening) the large number of spins to be considered makesthe matrices untractable. One can, however, calculate the Fourier-
transform of the spectrum, the decay of the free precession signal,
which is the response of the system to a powerful pulse of resonant
frequency. The method [1, 2]3 was successful for reproducing the
shapes of fluorite (CaF 2), a simple-cubic lattice of spins where drastic
simplifications are permitted [1]. We have applied the formulae of
Lowe and Norberg [1] (LN) and of Evans and Powles [2] (EP) to
lattices containing up to 81 spins where no symmetry is required, but
the computation time is accordingly increased. The early decays co-
incide for both formulations; however, the later behavior diverges for
LN (without additional farther-neighbor attenuation) but converges
for EP. In the latter case, a Fourier transformation to the absorption
shape is successful.
Deductions about the molecular shape are often drawn from the
second moment of the absorption line and from its doublet splitting if
it occurs. Information may also be derived from their Fourier trans-
forms, the second derivative of the precession decay at its time origin,
and the first zero of the oscillating decay, respectively. However, it is
difficult to extract detailed structural information from spectral
moments. Even peak-to-peak splittings are not relevant, but rather
the center-of-gravity splitting, or first moment of the shape [3].
Similarly, the first zero t'0F of the decay shape F(t) is not relevant and
one must deduce the zero t'ou of the first term U(t) of the LN-series
or EP-Dyson expansion. The difference t'0P—
t'0U= At'0 can be com-
puted from lattice parameters using either expansion (since only the
early decay is involved), and variations of the parameters has but
little effect on At'0 . The relevant splitting is then
Sj*=l/t'ouOC (1-3 cos2^)/rV
1 Work performed while the author was a visitor with the Department of Physics, University of Pitts-
burgh (1965-1966), where hospitality is gratefully acknowledged. The computation costs, at the Centers
of the University and of Mellon Institute, were covered by the National Science Foundation.2 Present Address: Mellon Institute, Pittsburgh, Pennsylvania 15213.3 Figures in brackets indicate the literature references at the end of this paper.
265
266 MOLECULAR DYNAMICS AND STRUCTURE OF SOLIDS*
Knowing the angle 6jk , between the spin-spin vector and the field B 0 ,
one can extract the spin-spin distance rjk , or vice-versa.
The precision of broad-line absorption spectroscopy is impaired bythe necessarily large field modulation, and often by a slow spin-lattice
relaxation. Pulse spectroscopy is free from these handicaps, but the
observed trace decay V(t) must be corrected to the decay shape
Fit) because of delays characteristic of the receiver circuit andcoherent detector [4]. The correction is simple, but still the early
decay shape (where all spectral moments are contained) is obscured
by an instrumental blocking time. The available corrected decay
shape must therefore be extrapolated to time origin. A convolu-
tion analysis (decomposing the decay as a product of simple func-
tions) was suggested by Abragam [5], and applied to some well-
behaved shapes in order to deduce second moments [6]. But, in
general, the fit of an even polymonial of high degree (e.g., 20th) to the
available decay up to about the second zero is more appropriate andsuccessful. Once the decay shape is completed to time origin, it can
be Fourier-transformed into the absorption shape. We have thus
analyzed numerically the experimental decay shapes of Barnaal [7]
for fluorite and ice.
The particular line shape for B 0 ||c-axis in ice is of special interest
because all six intramolecular doublets then merge into one. Thefirst zero is found at T'oF= 11.4 ±0.3 jusec. The difference M'
0= \.b
/xsec. is measured on the computed shapes. (Averages taken over the
6 non-equivalent molecular orientations and the 18 configurations of
the molecule and its six nearest protons, surrounded by 45 other protons
in randomly-chosen but hydrogen-bonding arrangements.) The effects
of molecular vibrations and librations on the first-neighbor splittings
are discussed to nearly cancel each other to —1.5 percent on Sjk ,but
to appreciably reduce the second-neighbor splittings. The zero of u(t)
can thus be located at t'oU= 12.3 ±0.3 /xsec or less. This fields for
the intramolecular HH distance the value (1.635 =F0.015) A or less,
which is somewhat smaller than the distance 1.65 A expected from a
tetrahedral HOH angle (with OH=1.01 A as determined by neutron
diffraction at D20[8]).
The aim of the present study was to determine what structural
information can be derived about the intra- and inter-molecular
configurations in ice from its n.m.r. line shapes. The methods were
tested on fluorite, a simple-cubic spin lattice, and on gypsum and
hydrogen sulphide, simple hydrates, and may be applied to other
suitable hydrates or molecular crystals.
STRUCTURE AND SPECTROSCOPY OF INORGANIC CRYSTALS 267
References
[1] I. J. Lowe and R. E. Norberg, Phys. Rev., 107, 46 (1957).
S. Clough and I. R. McDonald, Proc. Phys. Soc, 86, 833 (1965).
S. Gade and I. J. Lowe, Phys. Rev., 148, 382 (1966).
[2] W. A. B. Evans and J. G. Powles, Phys. Letters 24A, 218 (1967).
[3] B. Pedersen and D. F. Holcomb, J. Chem. Phys., 38, 61 (1963).
[4] D. E. Barnaal and I. J. Lowe, Rev. Sci. Instr., 37, 428 (1966).
See also, J. G. Powles and J. H. Strange, Proc. Phys. Soc. 82, 6 (1963)
;
J. Jeener and P. Broekaest, Phys. Rev. 157, 232 (1967).
[5] A. Abragam, The Principles of Nuclear Magnetism (Clarendon, 1961), p. 120.
[6] D. C. Look, I. J. Lowe, and J. A. Northby, J. Chem. Phys., 44, 3441 (1966)
D. E. Barnaal and I. J. Lowe, Phys. Rev., 148, 328 (1966), J. Chem. Phys.,
46, 4800 (1967).
[7] D. E. Barnaal, Thesis, Univ. of Minnesota (1965), Univ. Microfilm #65-7867,
and Ref. 6.
[8] S. W. Peterson and H. A. Levy, Acta Cryst., 10, 70, 344 (1957). R. Chidam-baram, Acta Cryst., 14, 467 (1961)

THE VAPOR PRESSURE OF CO/N2
SOLID SOLUTIONS
J. A. MORRISON, D. M. T. NEWSHAM,' AND R. D. WEIR 1
Division of Pure Chemistry
National Research Council of Canada, Ottawa, Canada
1. Introductory Remarks
This investigation continues previous work [1]2 in which some
thermodynamic properties of condensed CO (accidentally containing
about 2.6 percent N2) were measured. Deviations from the properties
of pure CO were used to make some deductions about the behavior
of the solution of N2 in CO in the region of the X-type transition that
occurs in the pure substances and in the solutions [2]. Because of the
close similarity of N2 to CO with respect to mass, molecular properties
[3] and crystal structure, substitution of N2 into the CO lattice does
not perturb the solid too severely. By contrast, for some other
molecular crystals, it has been found that drastic changes in the shape
of the X-transitions are produced by diluting the crystal lattice with
molecules of similar volume but different mass. For example, the
well-known X-transition that occurs in solid CH4 at about 20.4 °Kdisappears when Kr in excess of 16 mole percent is added [4].
In this brief report, we are concerned only with vapor pressures of
the solutions; no other thermodynamic properties have been measured.
Two different measuring techniques have been used with the sameapparatus. The second technique was developed to circumvent
difficulties encountered in the attainment of equilibrium in the solu-
tions in the region T<0.9T (melting point).
2. Experimental Method
The vapor pressure cell and cryostat were constructed in the formof a simplified adiabatic calorimeter assembly of the type widely used
to measure the thermodynamic properties of condensible substances
at low temperatures. The cell was a thick-walled copper cylinder
(2.5 cm dia. x 7.5 cm long) with an internal volume of 2.5 cm3. It
carried a heater wound on the outer surface and a capsule-type plati-
num resistance thermometer set into a re-entrant well with Wood's
1 National Research Council of Canada postdoctoral fellow.2 Figures in brackets indicate the literature references at the end of this paper.
269
270 MOLECULAR DYNAMICS AND STRUCTURE OF SOLIDS
metal. A German silver tube (1 mm. outer dia., 0.1 mm wall-thickness)
that carried a close-wound heater over its entire length in the cryostat
connected the cell with a gas-handling system on the outside. The cell
and surrounding adiabatic shield were hung in a vacuum space andconnected by difference thermocouples in the usual way.
Pressures were determined to a precision of ± 0.005 mm with a fused
quartz Bourdon gage (Model 140, Texas Instruments Inc.). Themanufacturer's calibration was checked by comparing the gage with
a mercury manometer; some significant deviations were found. Thezero point of the gage showed no detectable shift with continuous
use over the pressure range 0 to 250 mm.The CO and N2 used in the experiments were of so-called spectro-
scopic purity. The main impurities were found in the CO: up to
680 p.p.m. C02 and 268 p.p.m. He. An attempt was made to reduce
the latter by a crude distillation before the CO specimen was put in
the vapor pressure cell.
3. Experimental Results
The vapor pressure measurements on pure CO condensed in the
cell were straightforward and reproducible at all temperatures to
within the precision of the pressure gage. Moreover, the triple point
and transition point temperatures and pressures agreed with those
in the literature [5, 6] within their assigned accuracies. From a plot
of log P against ~ for the a and |8 solid phases, the enthalpy change
of the transition was estimated to be 162 ±11 cal/mole, in reasonable
agreement with calorimetric results [1, 5].
The behavior of the solutions was different. Long equilibrium times
were observed and, as a consequence, the vapor pressures were not
reproducible at the lower temperatures, within the precision of the
measuring gage. It was found possible to achieve equilibrium in the
/3-phase just below the melting point in about five hours. If it is
assumed that equihbrium is achieved by diffusion and that the acti-
vation energy is of the magnitude of the heat of sublimation, then the
estimated equihbrium time at 50 °K would be about a month—
a
clearly impracticable time interval.
As a result of these findings with a bulk solid phase (~2 cm3 of
solid solution), a second technique for measuring the vapor pressures
was tried and found to be successful. It was a variation of a dew-point
method in which vapor in the cell was compressed by decreasing the
external volume until a very small amount (~10~4 cm3) of solid formed.
The pressure corresponding to an infinitesimal amount of solid, in
equilibrium with its vapor, was obtained from the point at which
the rate of change of pressure with volume altered abruptly. Vapor
STRUCTURE AND SPECTROSCOPY OF INORGANIC CRYSTALS 271
pressures of the solutions were determined in this way with a repro-
ducibility better than ±0.05 mm for pressures exceeding 10 mm.Preliminary analyses of the latter data indicate that solutions of
N2 in CO at concentrations of 20 percent or less behave nearly ideally.
For example, if the data are plotted on a reduced scale (log(P/Px )
versus T\/T), the curves for the solutions and pure CO are nearly
coincident. Earlier conclusions that gross departures from a regular
solution model occurred in the a-phase [7] appear now to have been
due to the fact that equilibrium was not achieved with a bulk specimen.
A more detailed account of the work has since been published [8].
4. Conclusions
The main conclusion to be drawn is that the thermodynamicproperties of solid solutions can only be measured practically in the
region T<0.9T (melting point) if an infinitesimal amount of solid is
present. This essentially rules out calorimetric measurements that
require gross specimens.
The vapor pressure data obtained in this work should provide a
rigorous test for discussing the various theories of solutions that are
available. This is not the case for liquids because the detailed micro-
scopic structure of the solution is not known. It is perhaps surprising
that so much experimental emphasis has been placed on liquid
solutions.
One conclusion that can be drawn from the present work is that the
transitions in CO and N2 occur for the same physical reason since
the solutions show almost the same thermodynamic behavior as the
pure components when they are considered on a reduced basis.
5. References
[1] E. K. Gill and J. A. Morrison, J. Chem. Phys. 45, 1585 (1966).
[2] M. J. Angwin and J. Wasserman, J. Chem. Phys. 44, 417 (1966).
[3] L. A. K. Staveley, J. Phys. Chem. Solids 18, 46 (1961).
[4] A. Eucken and H. Veith, Z. Physik Chem. 38B, 393 (1938).
[5] J. O. Clayton and W. F, Giauque, J. Amer. Chem. Soc. 54, 2610 (1932).
[6] A. G. Duncan and L. A. K. Staveley, Trans. Farad. Soc. 62, 548 (1966).
[7] See figure 5 of reference [1].
[8] J. A. Morrison, D. M. J. Newsham, and R. D. Weir, Trans. Farad. Soc. 64,
1461 (1968).

STRUCTURAL STUDY OF TisO,
L. K. KEYS 1
Materials Research Laboratory Pennsylvania State University, University Park,
Pennsylvania 16802
The crystal structure of Ti509 has been characterized by x-ray
diffraction studies by Anderson [l].2 It was found that the structure
can be described as being built up of rutile-type elements, with a
complicated arrangement of the metal atoms in the interstitial posi-
tions of the lattice formed by the packing of the anions. More explicitly
the crystal structure of Ti509 is triclinic, with a space group Pi and
unit cell constants given as: a= 5.569 A, 6=7.120 A, c=8.865 A,
o:=97.55°, j8=112.34°, and 7=108.50°. There are 2 Ti509 per unit
cell [1]. The structure is believed to to be formed from Ti06-octahedra
which are arranged in slabs of rutile structure (sharing edges and
corners) of finite height of five such octahedra. The height of the
rutile slabs is limited (or bounded) by the formation of shear chains or
stacking faults. Across the faults these slabs share octahedral faces,
and this results in a close metal-metal distance (2.81 A) between ca-
tions occupying these face-sharing octahedra. This close distance has
led to the postulation of a metal-metal bond forming between the
cations occupying these octahedra [2, 3]. Such effects have also been
described in other metal oxides [4].
The five-octahedral width slab can be considered to have a cation
arrangement of the form Ti3+-Ti4+-Ti4+-Ti4+— Ti3+ [3]. The bondwould then form between the Ti3+ cations in the face-sharing octahedra
at the boundaries of the slab. Magnetic susceptibility studies should be
able to confirm this structure as some evidence should appear for the
cation-cation interactions [5].
The magnetic susceptibility study of Ti509 has actually shown it to
resemble antiferromagnetic behavior [6] as indicated by figure 1. Themagnetic susceptibility shows a complex dependence on the inverse
of the temperature above the indicated Neel temperature. The ap-
parent Neel temperature observed for this phase occurs at about
130 °K. This can be interpreted as confirming a moderate exchange
interaction occurring between the face-sharing Ti06— octahedra.
1 Present Address: Nuclear Systems Programs, General Electric Company, Cincinnati, Ohio 45215.
2 Figures in brackets indicate the literature references at the end of this paper.
273
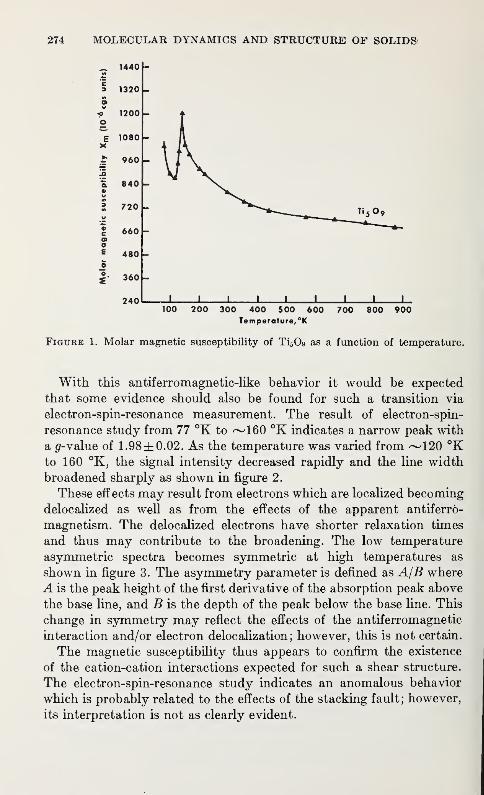
274 MOLECULAR DYNAMICS AND STRUCTURE OF SOLIDS)
With this antiferromagnetic-like behavior it would be expected
that some evidence should also be found for such a transition via
electron-spin-resonance measurement. The result of electron-spin-
resonance study from 77 °K to ^160 °K indicates a narrow peak with
a #-value of 1.98 ±0.02. As the temperature was varied from ~120 °Kto 160 °K, the signal intensity decreased rapidly and the line width
broadened sharply as shown in figure 2.
These eff ects may result from electrons which are localized becoming
delocalized as well as from the effects of the apparent antiferro-
magnetism. The delocalized electrons have shorter relaxation times
and thus may contribute to the broadening. The low temperature
asymmetric spectra becomes symmetric at high temperatures as
shown in figure 3. The asymmetry parameter is defined as AjB where
A is the peak height of the first derivative of the absorption peak above
the base line, and B is the depth of the peak below the base line. This
change in symmetry may reflect the effects of the antiferromagnetic
interaction and/or electron derealization;however, this is not certain.
The magnetic susceptibility thus appears to confirm the existence
of the cation-cation interactions expected for such a shear structure.
The electron-spin-resonance study indicates an anomalous behavior
which is probably related to the effects of the stacking fault; however,
its interpretation is not as clearly evident.
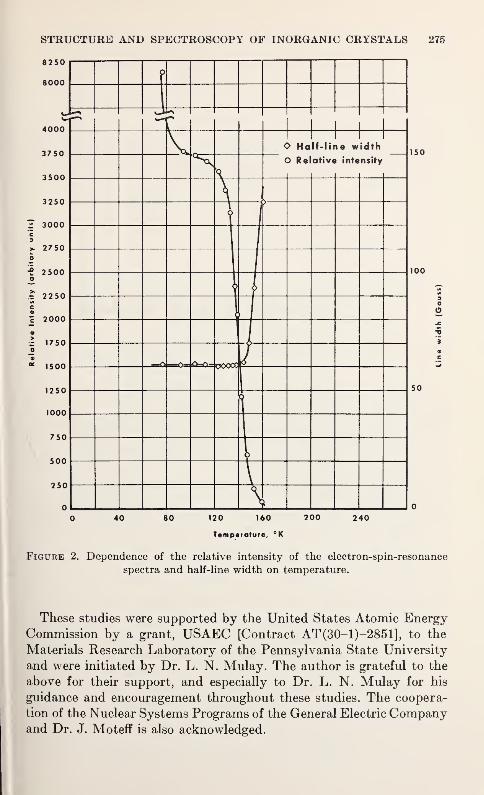
STRUCTURE AND SPECTROSCOPY OF INORGANIC CRYSTALS 275
8250
120 160
Temperature, °K
Figure 2. Dependence of the relative intensity of the electron-spin-resonance
spectra and half-line width on temperature.
These studies were supported by the United States Atomic EnergyCommission by a grant, USAEC [Contract AT(30-1)-2851], to the
Materials Research Laboratory of the Pennsylvania State University
and were initiated by Dr. L. N. Mulay. The author is grateful to the
above for their support, and especially to Dr. L. N. Mulay for his
guidance and encouragement throughout these studies. The coopera-
tion of the Nuclear Systems Programs of the General Electric Companyand Dr. J. Moteff is also acknowledged.
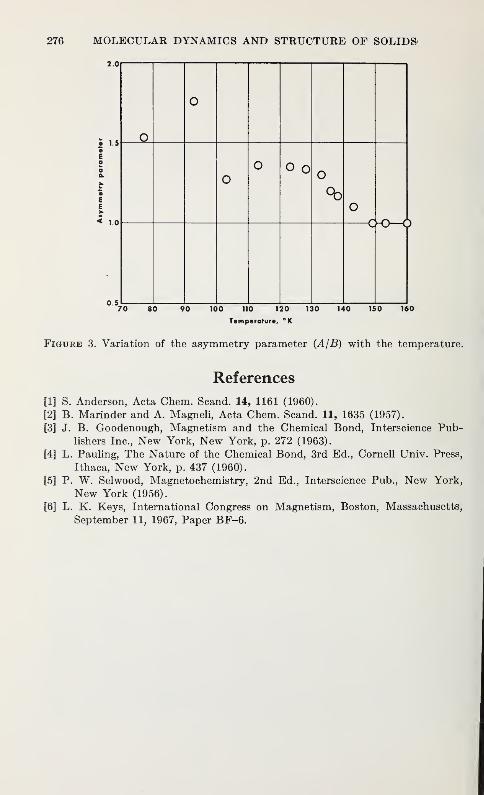
276 MOLECULAR DYNAMICS AND STRUCTURE OF SOLIDS
2.0|
E
0 3
o o
co—
6
70 80 90 100 110 120 130 140 150 160
Temperature, °K
Figure 3. Variation of the asymmetry parameter (A/B) with the temperature.
References
[1] S. Anderson, Acta Chem. Scand. 14, 1161 (1960).
[2] B. Marinder and A. Magneli, Acta Chem. Scand. 11, 1635 (1957).
[3] J. B. Goodenough, Magnetism and the Chemical Bond, Interscience Pub-lishers Inc., New York, New York, p. 272 (1963).
[4] L. Pauling, The Nature of the Chemical Bond, 3rd Ed., Cornell Univ. Press,
Ithaca, New York, p. 437 (1960).
[5] P. W. Selwood, Magnetochemistry, 2nd Ed., Interscience Pub., New York,
New York (1956).
[6] L. K. Keys, International Congress on Magnetism, Boston, Massachusetts,
September 11, 1967, Paper BF-6.
SIGNIFICANCE OF WEIGHTING SCHEMES IN ANANISOTROPIC LEAST SQUARES REFINEMENT
OF RUBY
J. W. McCAULEY 1 and G. V. GIBBS 2
Materials Research Laboratory
Pennsylvania State University, University Park, Pennsylvania 16802
The structural and vibrational parameters of a ruby synthesized
by Barks, [1]3 containing 5.2 mole percent Cr20 3 (a=4.770(l),
c= 13.020(5) A) were refined by least-squares and Fourier methods
employing 3D counter diffractometer intensity data. A study of the
crystal's diffraction symmetry and intensity data reveal that R3c and
R3 are the most probable alternate space groups. Two anisotropic
least-squares refinements, one using 197 non-equivalent intensities in
R3 and the other using 66 symmetry combined intensities in R3c,
resulted in a weighted R-factor ( Cruickshank's weighting scheme [4])
of 6.7 percent for R3c and 11.2 percent for R3. These results suggest
that the crystal possesses space group symmetry R3c which necessi-
tates that the Cr and the Al atoms be randomly distributed in the
cation sites.
The effect of various absolute and relative weighting schemes on
the final parameters was subsequently examined in several least-
squares refinements using the 66 intensities consistent with R3csymmetry. Absolute weights corresponding to systematic and aniso-
tropic errors inherent in the intensity measurement [2] were estimated
in two ways: (1) from the standard deviation of averaged symmetryequivalent reflections and (2) from the range estimate [3]. Relative
weights were estimated from empirical expressions suggested byCruickshank [4] and by Hanson [5] and from the least-squares deriva-
tion of standard deviations from the assumed linear relationship
between the calculated standard deviations and the observed absolute
amplitudes. Unitary weights were also utilized in a refinement.
The final positional and vibrational parameters calculated in the
refinements using the above weighting schemes are listed in table 1.
All the positional parameters are statistically identical and do not
significantly differ from those obtained for corundum by Newnham1 Now at the Army Materials and Mechanics Research Center, Watertown, Mass.2Now at the Department of Geological Sciences, Virginia Polytechnic Institute, Blacksburg, Virginia.
3 Figures in brackets indicated the literature references at the end of this paper.
277
311-280 O—69 19
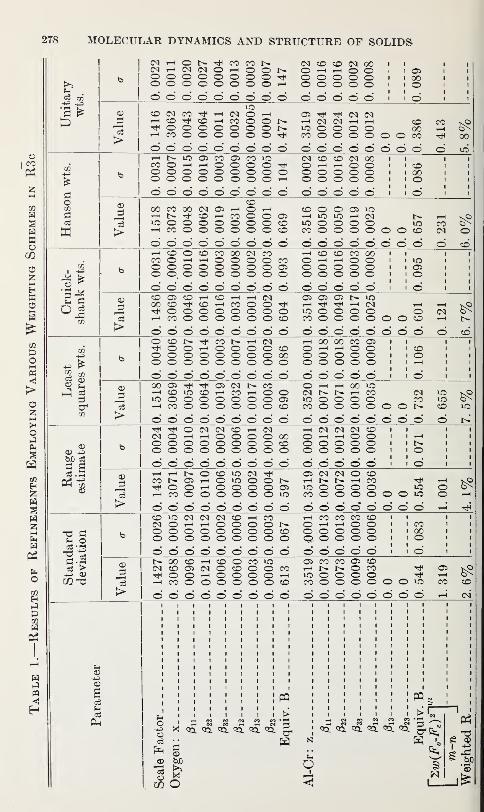
278 MOLECULAR DYNAMICS AND STRUCTURE OF SOLIDS
N H O N i< M MI CM i-H CM CM O i-H OO O O O O O O O I>
_ O©©©©©©©rHM O CO N 00O i—i t—i © oo o o o oo o o o oooooooooo ooooo
CD
la
I ©CNCOT*rHCM©rHI T-ICOT^Or-HCOOOt^I rtHOOOOOOOb-I rHCOOOOOOO^ooooooooo oooooooo
os tjh Tin cm cmi—
l CM CM h rH CD COO O O O 00 rHCOOOOOOOCO Tt* 00
doCO
w
O rHo oo o
OS 00 ®rH O Oo o oo o o
co to© © rHO O OO O i-H
N CD CO IM 00O i-H rH O Oooooooooooooooooooo ooooo
>I toI H
CDCO 00 (M OS i—i O i—I cDOOOStOt^^CDr-ICOOOOS H lO >0 H M |>.OOOOOOOCD lOOOOO iOCOOOOOOOCO COOOOOOOCO
ooooooooo ooooooooCO
I -+-3
^ fe:
o ^
Ph dO *
co
cd
CD OO rHo oo o
CD CO 00rH O Oo o oo o o
CM COO O COO O OSo o o
i—I CD CD CO 00O t—I i—i o oooooooooooooooooooo oooooCDOSCOt—ICOt—It—l(N Ol Ol © N lOOOCOrJHCDT-iCOOOTti H ^ t|< H M i—
i
OOOOOOOOO tooooo oi-HCOOOOOOOcD COOOOOOOOo' oooooooo oooooooo
+3 p-
03 CD
CD
>
O CDTfH Oo oo o
N ^ fO NO rH O Oo o o oo o o o
rH CMO O COO O 00o o o
rH 00 00 CO OSO rH rH O Oooooooooooooooooooo oooooOOOIHHOCNNCO OrHrHOOlOrHCDLOCOrHCOrHOO IN N N H CO CMlOOOOOOOOOS U0OOOO COrHCOOOOOOOcO COOOOOOOOooooooooo o o ©*©"©'©'© o
CDCD +3bQ 03
d d03.
S
CD
CD
IS
CM ©© ©© ©
© CM
© ©© ©
CM ©© ©© ©© ©
rH CM© © 00© © ©© © ©
rH CM CM CM COO rH rH O ©© © © © ©© © © © ©©©©©©©©©© © O O O o I ©HHNOCOiOM^ OS CM CM © ©CONOJHOiOOON H N N H COt^oohoooooj io o o o o inHCOOOOOOOiO C0©©©©©©*0©"©*©"©©*©©©"© © © © ©*©*©©' ©
t2 d03 'rH
03 >+=> CD
G0^
CD
r3
© IOCM ©© ©© © © ©© ©
CM ©© ©© ©© ©
rH CO© ©© © ©© © ©
rH CO CO CO ©O rH rH © ©© © © © ©©.©©©©©©©©©©©©© ©©© © ©
co00O
r^oo©rHco©co*o oscocoos©CM©OCM©©©©CO H N N O CO^OOhOOOOh iO © © © © t*hHCOOOOOOOCO CO©©©©©©iO©©"©'©©©©©© ©'©©'©©© ©' ©*
03rH03
PhfHO+^o03
to dCD
to
pq
i-i e» eo _»h _•-( _e» rHCQ. CQ. CQ. CQ. CQ. CQ. ^
SH
oPC
co O
rrj
flS CDD
"33
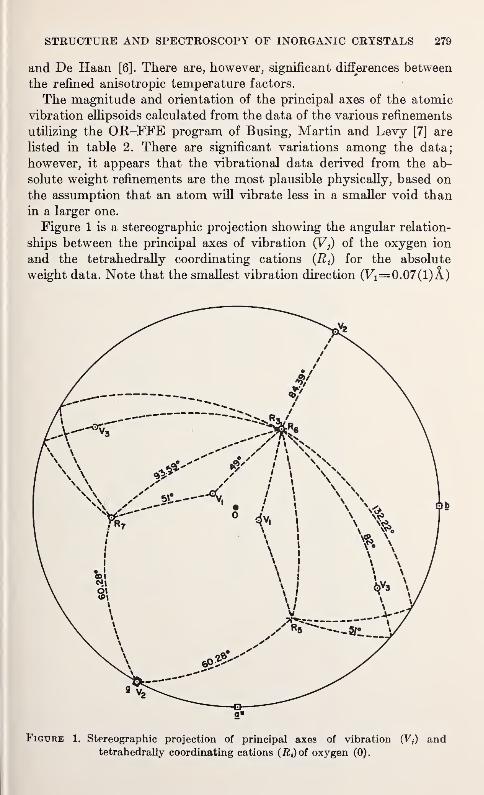
STRUCTURE AND SPECTROSCOPY OF INORGANIC CRYSTALS 279
and De Haan [6]. There are, however, significant differences between
the refined anisotropic temperature factors.
The magnitude and orientation of the principal axes of the atomic
vibration ellipsoids calculated from the data of the various refinements
utilizing the OR-FFE program of Busing, Martin and Levy [7] are
listed in table 2. There are significant variations among the data;
however, it appears that the vibrational data derived from the ab-
solute weight refinements are the most plausible physically, based on
the assumption that an atom will vibrate less in a smaller void than
in a larger one.
Figure 1 is a stereographic projection showing the angular relation-
ships between the principal axes of vibration (Vj) of the oxygen ion
and the tetrahedrally coordinating cations (Ri) for the absolute
weight data. Note that the smallest vibration direction (Vi=0.07(l)A)
2"
Figure 1. Stereographic projection of principal axes of vibration (F,) andtetrahedrally coordinating cations (Ri) of oxygen (0).
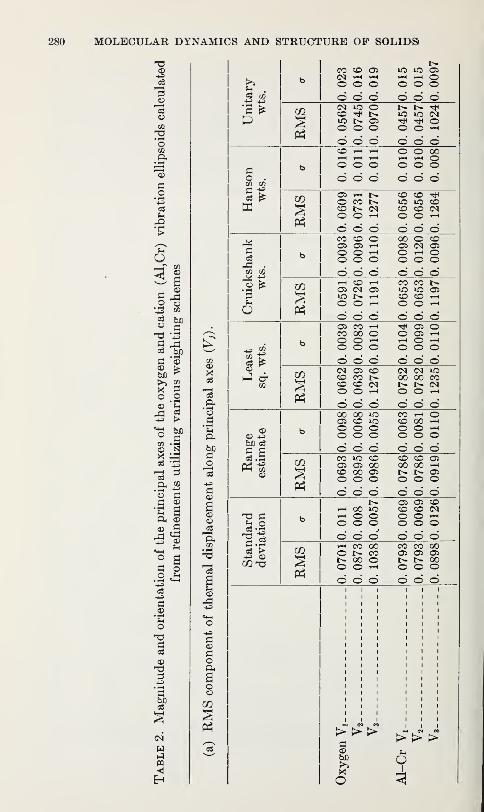
280 MOLECULAR DYNAMICS AND STRUCTURE OF SOLIDS
CP
2o"5oCO
IS"oCO
.2
rH^2
O
Si9 ^5 ©
CO
o3©
§
o©h3
$ 'IX! r^o3 g
© fl
ft3
0} rH
j§ *h3 ©*TH
^
a o• rH *+H
o3+3
rHo
©
+^• rH
I
m
Eh
o3
Ir£3
+3
©
oOh
aoo
Unitary wts.
b
0.
0230.016 0.019 0.015
0.
015
0.
0097
RMS
0.
0562
0.
0745
0.
0970
0.
0457
0.
0457
0.
1024
Hanson wts.
b0.
016
0.
011
0.011 0.010
0.
010
0.
008
RMS
0.
0609
0.
0731
0.
1277
0.
0656
0.
0656
0.
1264
Cruickshank wts.
b
0.
0093
0.
0096
0.
0110
0.
0098
0.
0120
0.
0096
RMS
0.
0591
0.
0726
0.
1191
0.
0653
0.
0653
0.
1197
Least
sq.
wts.
b
0.
0039
0.
0083
0.
0101
0.
0104
0.
0099
0.0110
RMS
0.
0662
0.
0639
0.
1276
0.
0782
0.
0782
0.
1235
Rangeestimate
b
0.
0098
0.
0068
0.
0055
0.
0063
0.
0081
0.
0110
RMS
0.
0693
0.
0895
0.
0986
0.
0786
0.
0786
0.
0919
Standard deviation
b0.011
0.
0080,0057
0.
0069
0.
0069
0.
0126
RMS
0.
0701
0.
0873
0.
1038
0.
0793
0.
0793
0.
0898
iii iiiiii iiiiii iiiiii iiiiii iii
iii iiiiii iiiiii iiiiii iiiiii iiiiii iiiiii iii
>>> >>>
o 3
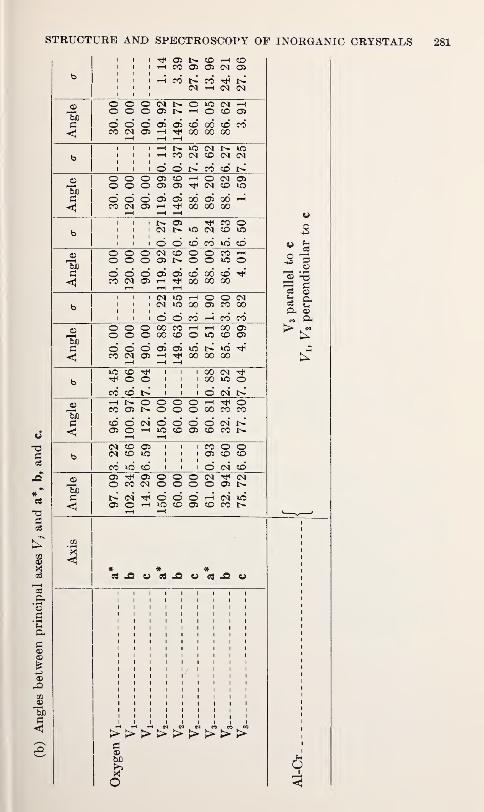
STRUCTURE AND SPECTROSCOPY OF INORGANIC CRYSTALS 281
*
f©
©
GO©
©
S3
<1
<!
©
P
5C
Oi l>- CO t—i CDh W © 05 (N Oh CO N CO r)< |>
(N h (N N000<Nt^O*OCNJT-H00005NH0003OOO05 05 O00OMCOINOIH^OOOOOO
h N iO (N N iOh CO M O M M© © t>» CO CO l>-
OOOCiCOrH©CNCT>OOOOiOir^CNcOiOOOOOiOSOOOiOOi-HCOMOJH^CXIOOOO
t> OS rfH CO O(M N lO W O iO
O O CO CO iO COOOOCMCOOOCOrHOOOOSt^OO^OO0000)05000©^COINOJH^COOOOO
N «3 h O O NCN iC GO OS CO 00
O O CO i-H CO COOOO00C0t-It-i0005OOOGOCOOiOCOOS©©©OSOSiOr^iO^CONOH^OOOOOO>o Oo oCO CD N
00 <M00 *0 OO <N l>
T-lt^OOOOr-lT^OMO5NOOO00MMCOOtMOOOOCNt^050HU5C003COCON<M CO<N CO
CO »0 CO
CO O OOi CO CO
O <N COCiTfOJOOOlN^NOCO<NOOOOC3it^!>(MTfOOOrHCNlO050H10C0050CON
*
f-l l—. <—i ^ (.^ tTJ W W>>>>>>>>>
©
o
o
© 73
a &Ph ©
oI
3
282 MOLECULAR DYNAMICS AND STRUCTURE OF SOLIDS;
almost bisects the angles Rt-0-R3 and R6-0-R5 , both at 93.59(3)°;
the intermediate vibration direction (V2=0.087(8)A) bisects the
angles Rr-0-R 5 at 120.5(1)° and R3-0-R 6 at 84.4(1)°, the meanbeing 102.47°; and the maximum vibration direction (V3=0.104(6)A)bisects approximately the angles R5-0-R3 and Rt-0-R 6 , both at
132.22(5)°.
In sum, then, the absolute weight data suggest that the vibrational
anisotropy of the oxygen ion is controlled by the coordinating cations
and, furthermore, that the cation (Al-Cr) is vibrationally isotropic
and not anisotropic as indicated by the data from the relative weight
refinements. This latter conclusion indicates that if cation-cation
orbital overlap is exhibited by apparent cation anisotropic vibration
then there seems to be no overlap present in this structure.
It is apparent from the preceding analysis that weighting schemes
must not be used indiscriminately in least-squares refinements if
physicially meaningful information regarding anisotropic vibrational
states of atoms is desired. Any relative scheme which weights the data
according to an empirical function of the magnitude of the Fovalues, regardless of which Fo is the most precise, must in fact erro-
neously bias the temperature factor calculation.
We would like to thank Dr. R. E. Newnham and Dr. E. P. Meagherfor many helpful suggestions. This work was supported by ARPAgrants SD-132 and DA-49-083 OSA-3140.
References
[1] R. E. Barks, Flux growth of single crystal R203 oxides with the corundumstructure: Ph. D. thesis in Geochemistry, The Pennsylvania State Uni-
versity (1966).
[2] S. C. Abrahams, Acta Cryst., 17, 1327-1328 (1964).
[3] J. A. Ibers, Acta Cryst., 9, 652-654 (1956).
[4] D. W. J. Cruickshank, "Computing Methods in Crystallography," edited by
J. S. Rollet, pages 112-116 Pergamon Press, New York, (1965).
[5] A. W. Hanson, Acta Cryst., 19, 19-26 (1965).
[6] R. E. Newnham and Y. De Haan, Zeit. Krist., 117, 235-237 (1962).
[7] W. R. Busing, K. O. Martin, and H. A. Levy, OR-FLS, A fortran crystallo-
graphic least-squares program: ORNL-TN-305, Oak Ridge, Tennessee
(1962). W. R. Busing, K. O. Martin, and H. A. Levy, OR-FFE, A fortran
crystallographic function and error program: ORNL, Oak Ridge, Tennessee
(1964).
THE CRYSTAL STRUCTURE OF CSA12 ,B51(A1B 10)
A. J. PERROTTA, W. D. TOWNES, and J. A. POTENZA
Institute for Exploratory Research
U.S. Army Electronics Command, Fort Monmouth, New Jersey 07703
Of the higher aluminum borides, only the structure of AlBi 0 has
been reported. Three stoichiometries, AlBi 0 (Z=5.2) [1, 2],1 C4A1B24
(Z=2) [3] and C4A1B26 (Z=2) [4] have been proposed, the major
uncertainties being the presence of carbon and the role it plays in the
structure. In addition, questions regarding the orientation of B i2
icosahedra [2, 3] and the nature of intericosahedral atoms [2, 4] have
emerged. The present study gives the first detailed structure report
of this interesting boride.
Cell parameters [1] are C2/m2/c21/m; 0=5.69O±O.OO1, 6=8.810±0.001, c=9.100±0.002A; p=2.537± 0.003 g/cm3
. A total of 762
observed reflections were collected for hkl, 0</&<ll, to sin0/X
< 1.21 using Mota radiation and a G.E. XRD-6 semi-automatic
diffractometer. Preliminary structure factor calculations showed that
one proposed structure [2] was unsatisfactory, the correct icosahedral
orientation being that determined by Matkovich [3]. Final site assign-
ments (table 1) as Al, B or C were made by comparing discrepancy
indices for a number of models and by requiring that all nearest
neighbor contacts be as close to the sum of the covalent atomic radii
as possible to minimize charge transfer [4]. The presence of C wasverified by electron microprobe analysis. The stoichiometry was de-
termined by analysing peak heights from the final (1^=0.050) Fourier
based on an average B peak height of 5e"/A3. This procedure, neces-
sitated by partial site occupancy, led to a calculated density of 2.53
g/cm3, and the formula C 8Al2.5B5i, which is close to C 8A12B52 , an ideal
ternary compound proposed by Hoard [4].
Two interesting comparisons emerge from the arrangement of Band C atoms. First, the hexagonal close packing of icosahedra (fig. 1)
is similar to that for a proposed polymorph of boron [5]. Each three-
center bond in the proposed structure is replaced by a C atom in the
present structure. Carbon then completes six-fold coordination about
Yi of the icosahedral B atoms; remaining icosahedral contacts in bothstructures are B—B. Second, all C atoms are in tetrahedral environ-
Figures in brackets indicate the literature references at the end of this paper.
283
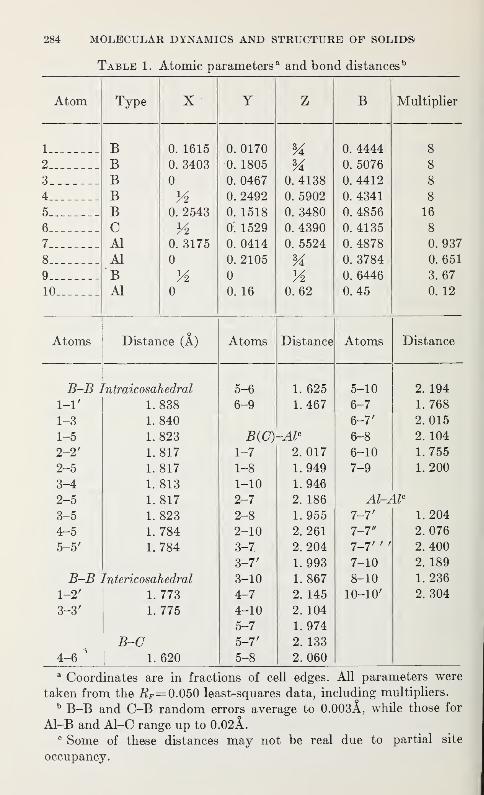
284 MOLECULAR DYNAMICS AND STRUCTURE OF SOLIDS
Table 1. Atomic parameters a and bond distances 1"
Atom Type X Y Z B Multiplier
1 B 0. 1615 0. 0170 K 0. 4444 8
2 B 0. 3403 0. 1805 % 0. 5076 8
3 B 0 0. 0467 0.4138 0. 4412 8
4 B 0. 2492 0. 5902 0. 4341 8
5 B 0. 2543 0. 1518 0. 3480 0. 4856 16
6 C 0: 1529 0. 4390 0. 4135 8
7 Al 0. 3175 0. 0414 0. 5524 0. 4878 0. 937
8 Al 0 0. 2105 % 0. 3784 0. 651
9 B 0 V2 0. 6446 3. 67
10 Al 0 0. 16 0. 62 0. 45 0. 12
Atoms Distance (A) Atoms Distance Atoms Distance
B-B jIntraicosahedral 5-6 1. 625 5-10 2. 194
1-1' 1. 838 6-9 1. 467 6-7 1. 768
1-3 1. 840 6-7' 2. 015
1-5 1. 823 B(C)-Alc 6-8 2. 104
2-2' 1. 817 1-7 2. 017 6-10 1. 755
2-5 1. 817 1-8 1. 949 7-9 1. 200
3-4 1. 813 1-10 1. 946
2-5 1. 817 2-7 2. 186 Al-Alc
3-5 1. 823 2-8 1. 955 7-7' 1. 204
4-5 1. 784 2-10 2. 261 7-7" 2. 076
5-5' 1. 784 3-7 2. 204 7-7' ''
2. 4003-7' 1. 993 7-10 2. 189
B-B Intericosahedral 3-10 1. 867 8-10 1. 236
1-2' 1. 773 4-7 2. 145 10-10' 2. 304
3-3' 1. 775 4-10 2. 104
5-7 1. 974
B-C 5-7' 2. 133
4-6i
1.620 5-8 2. 060
a Coordinates are in fractions of cell edges. All parameters were
taken from the RF= 0.050 least-squares data, including multipliers.
b B-B and C-B random errors average to 0.003A, while those for
Al-B and Al-C range up to 0.02A.c Some of these distances may not be real due to partial site
occupancy.
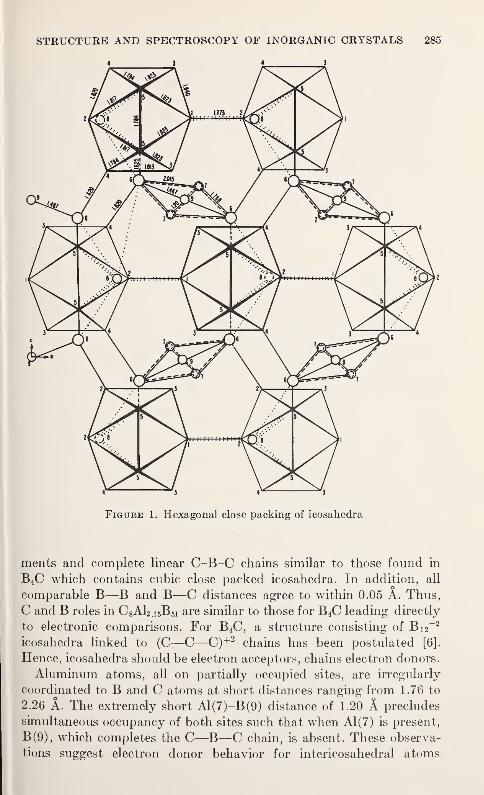
STRUCTURE AND SPECTROSCOPY OF INORGANIC CRYSTALS 285
Figure 1. Hexagonal close packing of icosahedra
ments and complete linear C-B-C chains similar to those found in
B4C which contains cubic close packed icosahedra. In addition, all
comparable B—B and B—C distances agree to within 0.05 A. Thus,
C and B roles in C 8Al2 .i 5B 51 are similar to those for B4C leading directly
to electronic comparisons. For B4C, a structure consisting of Bi 2
~2
icosahedra linked to (C—C—C)+ 2 chains has been postulated [6].
Hence, icosahedra should be electron acceptors, chains electron donors.
Aluminum atoms, all on partially occupied sites, are irregularly
coordinated to B and C atoms at short distances ranging from 1.76 to
2.26 A. The extremely short Al(7)-B(9) distance of 1.20 A precludes
simultaneous occupancy of both sites such that when Al(7) is present,
B(9), which completes the C—B—C chain, is absent. These observa-
tions suggest electron donor behavior for intericosahedral atoms
286 MOLECULAR DYNAMICS AND STRUCTURE OF SOLIDS
which contributes to the electronic stability of the structure. Thus,
partial occupancy of intericosahedral sites may be due to a balance
between the electronic acceptor requirement of B !2 groups and the
space available for donor atoms once the rigid icosahedral framework
is formed. Finally, the topotatic transition [7] ofaC4AlB24
" to the B4Cstructure can be understood on the basis of similar bonding in both
structures, suggesting that C 8Al2 .i5B 51 is a crystalline solution of B4Cstabilized by aluminum. B4C may then have an undiscovered hexag-
onal close packed polymorph, a modification already suggested for
elemental boron [5].
References
[1] J. A. Kohn, G. Katz and A. A. Giardini, Z. Kristallogr. Ill, 53 (1958).
[2] G. Will, J. Amer. Chem. Soc. 85, 2335 (1963); Nature 212, 175 (1966).
[3] V. I. Matkovich, J. Economy and R. F. Giese, J. Amer. Chem. Soc. 86, 2337
(1964).
[4] J. L. Hoard, The Chemistry of Boron and its Compounds, Chap. Two. E.Muetterties, Editor (John Wiley & Sons, Ltd.; 1966),
[5] W. N. Lipscomb and D. Britton, J. Chem. Phys. 33, 275 (1960).
[6] H. C. Longuet-Higgins and M. de V. Roberts, Proc. Roy. Soc. (London)
230A, 110 (1955).
[7] R. F. Giese, J. Economy and V. I. Matkovich, Acta. Cryst. 20, 697 (1966).
LATTICE DYNAMICS

LATTICE DYNAMICS OF MOLECULAR SOLIDS 1
GERALD DOLLING 2
Solid State Division, Oak Ridge National Laboratory
Oak Ridge, Tennessee 37830
1. Introduction
The development of new experimental techniques for the study of
the solid state, of which neutron inelastic scattering is perhaps the
most valuable, has been accompanied by a renewed interest in the
dynamical theory of crystal lattices. The problems which this theory
has to deal with fall into two main classes : (i) what is the nature and
magnitude of the forces between the atoms and molecules in a crystal
and (ii) how may the various measurable properties of a crystal be
calculated if the forces are known? The classic paper by Born and von
Karman [1]3 provided a framework within which the latter problems
might be solved, and there is now a considerable literature on the sub-
ject of calculations of the frequencies of normal modes of vibration of
crystals and related properties. The standard text-book is that of
Born and Huang [2], and there are several more recent reviews both
of the theory and its application to particular solids [3-5]. The poten-
tial energy V of the crystal is expanded in powers of the displacements
of the atoms from their equilibrium positions. The coefficients of the
displacements in the quadratic term V2 of this expansion are the har-
monic force constants which couple the atom (Ik) to that at (l'kf
),
where the labels I and k denote the particular unit cell and atom type,
respectively. If the cubic and all higher order terms in the expansion
are neglected, then the equations of motion for the atoms lead to a
temperature-independent dispersion relation, i>=vj(q), between the
frequencies, v, and wave vectors, q, of the normal modes of vibration
(j is a polarization index). Anharmonic effects may be calculated bytaking into account appropriate higher order terms [6, 7, 8]. Relatively
little progress has been made, however, toward quantitative a priori
calculations of the basic interatomic and intermolecular forces in
solids; these are customarily represented by arbitrary parameters, i.e.,
the coefficients of the various terms in the potential energy expansion,
whose values are adjusted to give agreement with selected physical
1 Research sponsored by the U.S. Atomic Energy Commission under contract with the Union Carbide
Corporation.2 On leave from Chalk River Nuclear Laboratories, Chalk River, Ontario; now returned.3 Figures in brackets indicate literature references at end of this paper.
289
290 MOLECULAR DYNAMICS AND STRUCTURE OF SOLIDS
properties. The numerical values thus obtained can then be used to
compute other properties of the solid.
The purpose of this paper is firstly to show how the dynamical
theory for a relatively simple solid has been treated, along the lines
suggested above, secondly to indicate the difficulties which arise in
the study of crystals of more complicated structure, and thirdly, to
discuss various methods which have been developed to avoid or over-
come those difficulties. The interactions (aside perhaps from the
coulomb forces between charged ions which can be calculated exactly)
will be represented by disposable parameters or force constants,
whose values will be obtained by comparison with appropriate
physical properties. In section 2, we briefly outline the Born-von
Karman theory and certain extensions which have been made in order
to describe the lattice dynamics of a simple alkali halide. Experimental
results and theoretical calculations for lithium fluoride (LiF) [9] are
presented as a typical example. In section 3, the somewhat morecomplicated cases of sodium nitrite (NaN02) [10] and hexamethyl-
enetetramine (HMT) [11, 12, 13] are considered, in which the practical
limitations of the straightforward Born-von Karman model becomeapparent, but where it is still feasible to represent the interionic and/or
intermolecular force constants by arbitrary disposable parameters.
For more complicated crystals still, such as naphthalene and anthra-
cene, the number of such parameters becomes so large that alternative
approaches must be found. In section 4 are described the ideas of
Kitaigorodskii and co-workers [14, 15], and the lattice dynamical
calculations of Pawley [16], in which one such alternative approach
is explored.
2. Dynamical Theory for a Simple Solid
We shall assume without discussion that the well-known adiabatic
approximation and cyclic boundary conditions [2] may be applied.
We write the quadratic term in the expansion of the crystal potential
energy in the usual way [2, 3]
where <j>xy (lk,l'k') = [d2V/dx(lk)dy(l'k')], ux {lk) is the displacement in
the z-direction of the kth. atom in the Zth unit cell, and the derivatives
are to be taken at the equilibrium positions of the atoms. (Strictly
speaking, this statement applies at 0 °K and in the absence of an-
harmonic effects, but in practice it is often convenient [7] to make use
of a "pseudo-harmonic" approximation in which the second derivatives
are evaluated at the equilibrium positions of the atoms at the tern-
a)
LATTICE DYNAMICS 291
perature of interest. The force constants then implicitly involve
certain anharmonic terms and are temperature-dependent.) Theequation of motion for the (Ik) atom can then be treated by means of a
traveling wave solution
ux (lk)=Ux (kq) exp i[q • r(lk)—2m>(q)t] (2)
where r(lk=T(r)-\-r(k) specifies the equilibrium coordinates of the kth.
atom within the Ith unit cell. The resulting equations of motion, only
Sn in number (there are n atoms in the unit cell), may be concisely
expressed in matrix notation
4Trv2mV=MV (3)
where m is a diagonal matrix whose elements are the ionic masses mk)
and M is a square matrix of order Sn x 3n
:
Mxy (kk' , q)= J24>xv (lk, I'V) exp iq • [r(Z'&')-r(Z&)]. (4)
The sum over all atoms V includes the atom (Ik) itself, and the
so-called "self term"<f>xy (lk, Ik) is defined as the negative of the sum of
the forces acting on the (Ik) atom due to all its neighbors. This ensures
that the condition of translational invariance is satisfied. For each value
of the wave vector q, eq (3) has Sn solutions Vj(q)(j=l .... Sn),
each with its associated eigenvector Vj(q), describing the 3n normal
modes of vibration of the crystal for that wave vector. The wavevector is arbitrary to the extent of the addition of any reciprocal
lattice vector r of the crystal,
^(q)=^(q+2Tr) (5)
and it is customary to reduce all normal-mode wave vectors into the
first Brillouin zone by subtracting suitable reciprocal lattice vectors.
The application of this (pseudo-harmonic) theory to the dynamicsof a given crystal is now straightforward. The interaction between anypair of atoms (Ik) and (Vk f
) is represented by a (3x3) matrix of force
constants <j>xv (lk,l'kf)', in general, there will be very many of these
parameters, but it is customary to limit the number, (a) by restricting
the range of interaction so as to include only a few near-neighbor
pairs, (b) by applying the symmetry of the crystal (see below for
examples of this procedure) and (c) by specifying the interaction to be
of some special type (e.g. central forces). For sufficiently simple
crystals, having highly symmetric structures, only a few distinct atomtypes, and relatively short range forces, it is easily possible to set upthe matrix elements of eq (4) without an excessive number of dis-
292 MOLECULAR DYNAMICS AND STRUCTURE OF SOLIDS
posable parameters <f>xy(lk,l'k'). The diagonalization of the matrix is
not a difficult machine computation, at least for small values of n,
and so calculation of the normal mode frequencies can be performed,
together with many other physical properties which depend on those
frequencies. It should be borne in mind, however, that this discussion
has not touched upon one of the basic problems of lattice dynamics,
namely the evaluation of the force constants themselves from somemore fundamental theory. Attempts to treat this problem have been
made for alkali halides [17,18] and for so-called "simple" metals
[19-22], but a discussion of these topics is outside the scope of the
present paper.
We now describe the application of the above theory to a relatively
simple solid, in order to facilitate the discussion of more complicated
solids in the subsequent sections. Since one of the latter is at least
partly ionic (NaN"02 ), it is convenient to introduce the subject of
coulomb forces by choosing an alkali halide, LiF, as our example. Thelattice dynamics of alkali halides has a long history, and several im-
portant contributions to the subject have been made in recent years
(see reference 5 for a review). Indeed, efforts are still being made [23]
to improve upon the successful "shell model" of Dick and Overhauser
[24], as developed by Cochran and co-workers. For the present pur-
pose, however, it is appropriate to consider only the coulomb forces
between the monopole charges on the ions; the added refinements of a
shell model for molecular crystals in which the ionic and molecular
polarizabilities are taken into account, will no doubt become necessary
as the study of such crystals intensifies. If the charge on the kth. ion
(assumed to be rigid) is Zk , then the contribution to the crystal poten-
tial arising from coulomb forces is
V<=\ S ZkZk,/\r(l'k')-T(lk)\ (6)^ Ik, l'k'
This term may be expanded in powers of the ionic displacements, in
the same way as the potential arising from all other sources. Thedynamical matrix Mean be written as a sum of two parts.
Mxy{W, q)=Rxv (kkf
,q)+ZkZk,Cxy (kk',q) (7)
where R involves arbitrary force constants representing (purely
phenomenologically) all the non-coulomb interactions, and Cis a matrix
whose elements may be computed explicitly for any given crystal
structure.
The classic paper in this field is that of Kellerman [26], to which the
reader is referred for full details of this calculation in the case of NaCl.
LATTICE DYNAMICS 293
Thus, in the case of LiF, if we know the charge Z, the coulomb contri-
bution to the dynamical matrix involves no disposable parameters.
We have only to consider the form of R, that is to say, to decide the
number of independent parameters<f>xv (lk,l'k') required by symmetry
to specify the non-coulomb interactions. In the most general case, the
force constants defined by eq (1) can be expressed as a (3X3) array
011 012 013\
021 022 023 r (8)
k03l 032 033/
The number of independent 4>i3 is, however, severely restricted by the
high degree of crystal symmetry in LiF. If we represent an allowed
symmetry operation by a transformation matrix S, then clearly
S$(lk,l'k')'s=$(l''k'', I" 'k" ') (9)
since the lattice remains unchanged by this operation. Certain types
of symmetry operation, which we call class A (following the notation
of Cochran and Pawley [11]), leave both the origin atom (Ik) and the
neighbor (l'k') in their original positions (1=1" > l'=l" '). In this case
clearly the transformed matrix $(l"k", I" 'k" ') and the original
$(lk, l'k') must be identical. Other types of symmetry operation, class
B, involve a translation of the (l'k') atom from r(l'k') to —r(l'k'), i.e.
l'=—l" '.In this case it is easily seen from the definition (1) that
$>(lk}l'k')=l(lk,l'k') (10)
As an example of a class A symmetry operation in LiF, consider the
mirror plane perpendicular to the z axis, with the (Ik) and (l'k') atoms
taken to be at (0,0,0) and (a/2,0,0) respectively. This operation is
represented by the transformation matrix
£=[0 1 0 • (11)
\0 0 -1/
Substitution of this into eq (9) leads at once to the result 0i 3=03 i=
023=032=0; application of the remaining allowed symmetry operations
in the same way finally reduces the matrix to the simple form
0 0 \
022 0 ) (12)
0 022 /
specifying the interactions between nearest neighbor ions in LiF. Theanalogous result for the second nearest neighbor interactions is readily
311-280 0—69 20
294 MOLECULAR DYNAMICS AND STRUCTURE OF SOLIDS
obtained in the same way. We can now construct a simple model for
the lattice dynamics of LiF, in which the following forces are taken into
account
:
(i) Long range coulomb forces between the monopole charges (±Ze) onthe ions.
(ii) Short range 1
'overlap" type forces between nearest neighbor ions,
represented by the phenomenological force constants <f>n , <f>22 of eq
(12).
(iii) Short range forces between second nearest neighbor P~ ions,
represented by force constants <£'ii(=tf>'22 ), 4>'m and ^/
i2(=0 ,
2i).
The analogous Li+— Li+ forces are neglected in view of the small size of
that ion. A further simplification, that the forces are axially symmetric,
[27] is often made to eliminate one of these 3 second neighbor force
constants, which in this case reduces to the assumption that 4/12=
4>'u— <f>'z3>
The contribution of the short range forces to the elements of the
dynamical matrix are obtained from eq (4), and the electrostatic
contributions calculated as in reference 26. If the 5 parameters<f>n ,
022, 4>'u> 0r
33 and Z are given, the normal mode frequencies Vj(q) can
be calculated for all q from the eigenvalues of the dynamical matrix,
eq (3). Alternatively, if a reasonable number of frequencies have been
experimentally measured, then a set of 5 parameter values can be
obtained, by the method of least-squares, which gives the best fit to
the measurements. In view of the difficulty of calculating the param-
eter values from first principles, mentioned in the introduction, it is
the latter procedure which is most commonly employed. The fre-
quencies of normal modes of a large number of different wave vectors
in Li7F have recently been measured [9] at 298 °K by standard tech-
niques of inelastic scattering of slow neutrons. The results for modespropagating along two directions of high crystal symmetry, A and A(the cube edge and body diagonal respectively), are shown in figure 1.
We shall not discuss here the group theoretical methods [28-30] used
to label the various branches of the spectrum according to the charac-
ters of their irreducible representations. Since there are two ions in
the primitive unit cell (k=l,2), there are, in general, 6 distinct normal
modes for any arbitrary q value. In these two directions, however, the
symmetry is such that the transversely polarized modes (A5 ,A3) occur
in doubly degenerate pairs. Another useful consequence of the high
symmetry is that the polarization of the modes can be determined
rather easily in inelastic neutron scattering experiments, simply byinspection of the intensities of the coherent one-phonon peaks. In
more complex crystals, this problem of identification of the modes
becomes very much more serious, as we shall see.
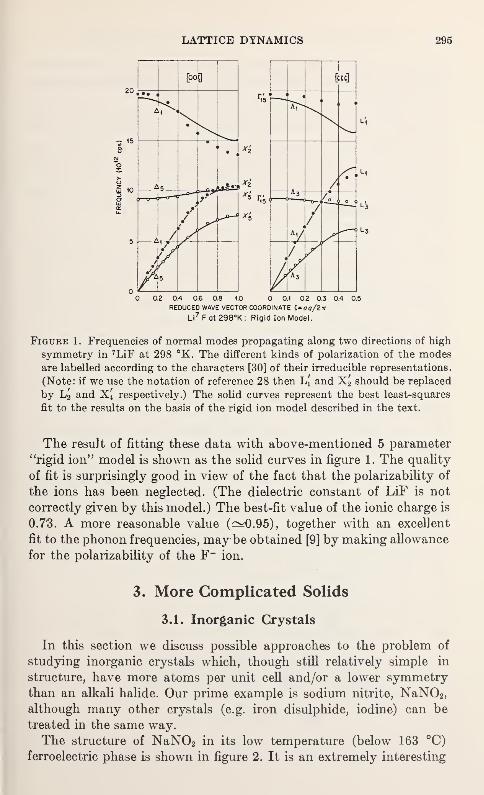
LATTICE DYNAMICS 295
Figure 1. Frequencies of normal modes propagating along two directions of high
symmetry in 7LiF at 298 °K. The different kinds of polarization of the modesare labelled according to the characters [30] of their irreducible representations.
(Note: if we use the notation of reference 28 then 1>[ and X2 should be replaced
by L2 and X4 respectively.) The solid curves represent the best least-squares
fit to the results on the basis of the rigid ion model described in the text.
The result of fitting these data with above-mentioned 5 parameter
''rigid ion" model is shown as the solid curves in figure 1. The quality
of fit is surprisingly good in view of the fact that the polarizability of
the ions has been neglected. (The dielectric constant of LiF is not
correctly given by this model.) The best-fit value of the ionic charge is
0.73. A more reasonable value (^0.95), together with an excellent
fit to the phonon frequencies, may be obtained [9] by making allowance
for the polarizability of the F~ ion.
3. More Complicated Solids
3.1. Inorganic Crystals
In this section we discuss possible approaches to the problem of
studying inorganic crystals which, though still relatively simple in
structure, have more atoms per unit cell and/or a lower symmetrythan an alkali halide. Our prime example is sodium nitrite, NaN02 ,
although many other crystals (e.g. iron disulphide, iodine) can be
treated in the same way.
The structure of NaN02 in its low temperature (below 163 °C)
ferroelectric phase is shown in figure 2. It is an extremely interesting
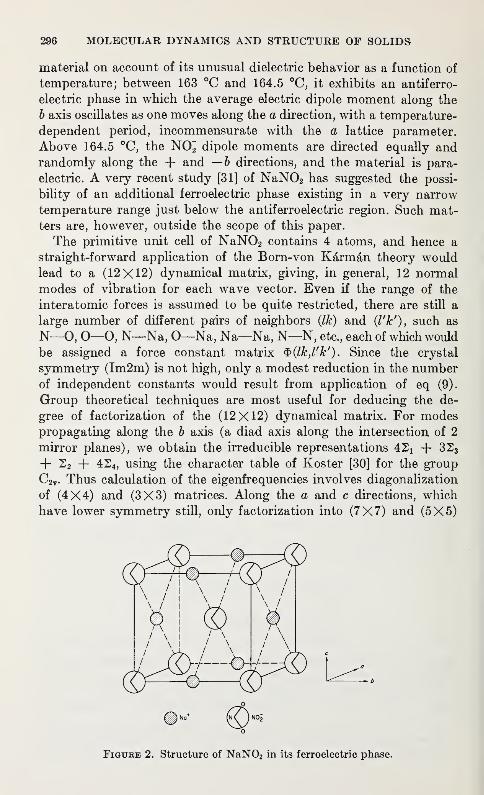
296 MOLECULAR DYNAMICS AND STRUCTURE OF SOLIDS
material on account of its unusual dielectric behavior as a function of
temperature; between 163 °C and 164.5 °C, it exhibits an antiferro-
electric phase in which the average electric dipole moment along the
b axis oscillates as one moves along the a direction, with a temperature-
dependent period, incommensurate with the a lattice parameter.
Above 164.5 °C, the NO2 dipole moments are directed equally andrandomly along the + and — b directions, and the material is para-
electric. A very recent study [31] of NaN02 has suggested the possi-
bility of an additional ferroelectric phase existing in a very narrow
temperature range just below the antiferroelectric region. Such mat-ters are, however, outside the scope of this paper.
The primitive unit cell of NaN02 contains 4 atoms, and hence a
straight-forward application of the Born-von Karman theory wouldlead to a (12X12) dynamical matrix, giving, in general, 12 normal
modes of vibration for each wave vector. Even if the range of the
interatomic forces is assumed to be quite restricted, there are still a
large number of different pairs of neighbors (Ik) and (l'kf
), such as
N—O, O—O, N—Na, O—Na, Na—Na, N—N, etc., each of which would
be assigned a force constant matrix $(lk,l'kf
). Since the crystal
symmetry (Im2m) is not high, only a modest reduction in the numberof independent constants would result from application of eq (9).
Group theoretical techniques are most useful for deducing the de-
gree of factorization of the (12X12) dynamical matrix. For modespropagating along the b axis (a diad axis along the intersection of 2
mirror planes), we obtain the irreducible representations 4Xi + 3S3
+ 22 + 4S4 ,using the character table of Koster [30] for the group
C2v . Thus calculation of the eigenfrequencies involves diagonalization
of (4X4) and (3X3) matrices. Along the a and c directions, which
have lower symmetry still, only factorization into (7X7) and (5X5)
Figure 2. Structure of NaN02 in its ferroelectric phase.
LATTICE DYNAMICS 297
matrices is possible. It is clear, therefore, that this approach to the
lattice dynamics of NaN02 is quite difficult, perhaps prohibitively
so. In any event, it is known from Raman scattering experiments
that 3 of the 12 normal modes have very much higher frequencies
than the other 9, in the range 25 to 40X10 12 Hz. These are the in-
ternal modes of vibration of the tightly bound NO2 ion, which are
more or less decoupled from the low frequency 'lattice' ' modes. It
would seem more profitable, therefore, to think of NaN02 as a di-
atomic crystal, like LiF, except that one of the''atoms" has an electric
dipole moment in addition to a charge, and librational as well as
translational degrees of freedom. This approach has been successful
in the study of the dynamics of organic molecular solids, [11, 12, 13,
16] which will be discussed later. To avoid confusion in the subse-
quent discussion of particular atoms within molecules or groups of
atoms like NO2, we shall often refer to such multi-atomic groupings
as "molecules".
We begin as before by postulating force constants<f>xv (lk,l'k*)
representing the force in the x direction on the (Ik) molecule whenthe (l'k') molecule is displaced a unit amount in the y direction. In
addition, we postulate sets of<f>xp(lk,l'k') and
<f>a& (lk,l'kr) which relate
the forces and couples exerted on the (Ik) molecule when (l'k') is
rotated about the 0 axis by a unit amount. The (x,y,z) and (a,P,y)
axis systems need not be coincident; it is often convenient to choose
crystallographic axes for expressing the displacements u x (lk) and
principal axes of the molecule for expressing the rotations Ba (lk). In
NaN02 ,however, these two sets of axes coincide with the ortho-
rhombic axes a, b and c. The quadratic term in the crystal potential
energy, eq (1), is extended to include products of rotational andtranslational displacements, and the new force constants are just the
second derivatives of the potential with respect to these displacements.
Equations of motion of the form (mass X acceleration= force constant
X displacement) are supplemented by equations of the form (momentof inertia X angular acceleration= torque X angular displacement):
mA(tt)=-S*r(tt, I'k'^i'k^-yzt^ik, rk')et(i'k') (13)Vk'y fFh
hJa (lk)= -yZ<l>ay(lk, l'k')uv(l'k')-^<f>a(3 (lk, (14)VFy Vk'p
m k is the mass of the kih molecule and Ika is the moment of inertia
about the a axis. If a particular atom within a molecule is denoted
by the index p, then the displacement of that atom is given by
u (Ikp)=u (Ik)+0 (Ik) X r (p) (15)
where r(p) is the position of an atom relative to the center of massof the molecule (Ik)
.
298 MOLECULAR DYNAMICS AND STRUCTURE OF SOLIDS
Eqs (13) and (14) can be reduced by substitution of traveling wavesolutions in the usual manner, and the normal mode frequencies are
obtained as before from a matrix eq (3) . The diagonal matrix m now
has two types of elements, m k and Ika , and the eigenvectors U haveboth translational and rotational (or librational) components. If
there are n molecular units and n' individual atoms (which are not
in molecular units) in the primitive unit cell, then the matrix m is of
order (3n'+6n). For NaN02 ,n=n'=l
fand so m is a (9x9) matrix.
Each eigenvector U has 9 components, 3 translational coordinates
for the Na+ ion, 3 for the N02~ ion, and 3 librational coordinates for
the N02~ ion.
We must now consider what simplifications can be achieved byappropriate symmetry arguments both in the number of independent
force constants and in the order of the dynamical matrix. The high-
temperature paraelectric phase of NaN02 has, in effect, a rather
higher symmetry. Furthermore, no large differences have been ob-
served [10] between the two phases in most of the normal modefrequencies. The following remarks, while strictly applicable only to
the paraelectric phase, may be regarded as a useful first approximation
to the less symmetric ferroelectric phase.
First we discuss the application of group theory to the dynamics
of NaN02 when we regard a unit cell as containing a NO J ion at the
origin and a Na+ ion at (b/2, 0, 0), the former having librational
degrees of freedom. If we assume Immm symmetry, each of the 3
crystallographic axes, a, b, c, is on the same footing, and the (9x9)
dynamical matrix factorizes in the same way for all 3 propagation
directions. The group of the wave vector for any of these directions is
C2v , which contains elements E (the identity "operation) , C2 (parallel
to [0^0], say) and two mirror planes av ,ay intersecting along [OfO].
We use the translational displacements of the Na+ and NO J ions
along the a, b, and c directions, and the librational displacements of
the NOo ion about those 3 axes, as a basis set for reducing the rep-
resentation of the group. Remembering that a librational displace-
ment is an axial vector, which transforms differently from a polar
vector under the operation of mirror planes, we find the characters 9,
— 3, 1 and 1 corresponding to the 4 symmetry operations listed above.
With the help of the character table [30] for C2v , we then obtain the
irreducible representations for waves propagating along [OfO]:
22 1+ S2+3S3+3S4 (16)
S 2 refers to two longitudinally polarized modes (LO+LA), S2 to a
pure librational mode about the b axis, while 23 and S 4 are each
mixtures of 2 transversely polarized translational modes and a libra-
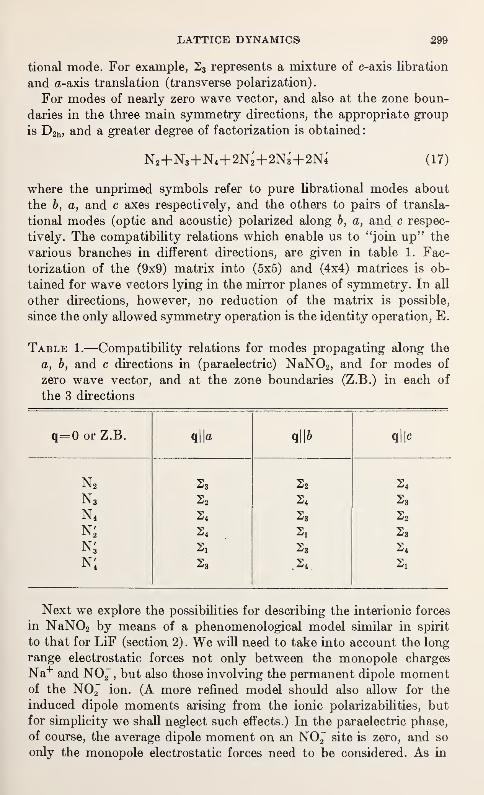
LATTICE DYNAMICS 299
tional mode. For example, 23 represents a mixture of c-axis libration
and a-axis translation (transverse polarization).
For modes of nearly zero wave vector, and also at the zone boun-
daries in the three main symmetry directions, the appropriate group
is D2h , and a greater degree of factorization is obtained:
N2+N3+N4+2N2+2N3+2N4 (17)
where the unprimed symbols refer to pure librational modes about
the b, a, and c axes respectively, and the others to pairs of transla-
tional modes (optic and acoustic) polarized along b, a, anol c respec-
tively. The compatibility relations which enable us to "join up" the
various branches in different directions, are given in table 1. Fac-
torization of the (9x9) matrix into (5x5) and (4x4) matrices is ob-
tained for wave vectors lying in the mirror planes of symmetry. In all
other directions, however, no reduction of the matrix is possible,
since the only allowed symmetry operation is the identity operation, E.
Table 1.—Compatibility relations for modes propagating along the
a, 6, and c directions in (paraelectric) NaN02 , and for modes of
zero wave vector, and at the zone boundaries (Z.B.) in each of
the 3 directions
q=0 or Z.B. q||d q||* q||c
N2 s3 S2 s4
N3 s2 s4 s3
N 4 s4 s3 s2
NJ s4 Si s3
N3 Si s3 s4
N4 s3 .s4 Si
Next we explore the possibilities for describing the interionic forces
in NaN02 by means of a phenomenological model similar in spirit
to that for LiF (section 2) . We will need to take into account the long
range electrostatic forces not only between the monopole charges
Na+ and N02~
, but also those involving the permanent dipole momentof the NO^~ ion. (A more refined model should also allow for the
induced dipole moments arising from the ionic polarizabilities, butfor simplicity we shall neglect such effects.) In the paraelectric phase,
of course, the average dipole moment on an NO^ site is zero, and so
only the monopole electrostatic forces need to be considered. As in
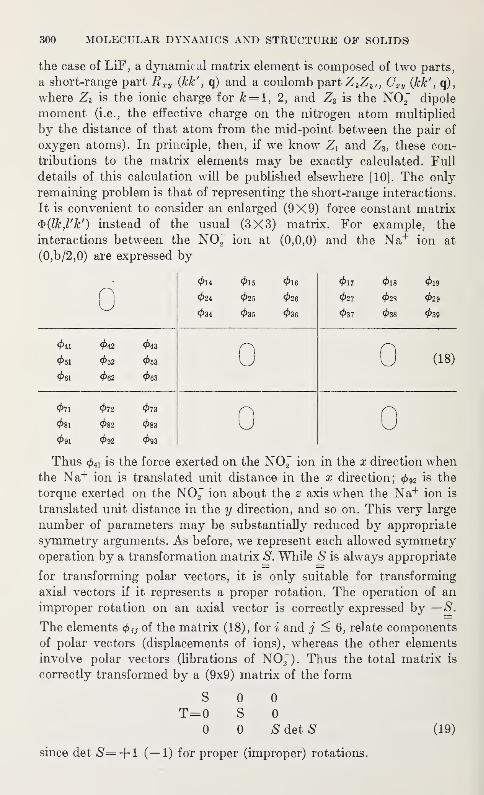
300 MOLECULAR DYNAMICS AND STRUCTURE OF SOLIDS
the case of LiF, a dynamical matrix element is composed of two parts,
a short-range part R xy (kk', q) and a coulomb part Z kZk ,, Cxv Qck' q),
where Zk is the ionic charge for k= l, 2, and Z3 is the NO" dipole
moment (i.e., the effective charge on the nitrogen atom multiplied
by the distance of that atom from the mid-point between the pair of
oxygen atoms). In principle, then, if we know Zx and Z3 , these con-
tributions to the matrix elements may be exactly calculated. Full
details of this calculation will be published elsewhere [10]. The only
remaining problem is that of representing the short-range interactions.
It is convenient to consider an enlarged (9X9) force constant matrix
${lk,Vk') instead of the usual (3X3) matrix. For example, the
interactions between the NO^ ion at (0,0,0) and the Na+ ion at
(0,b/2,0) are expressed by
o014
024
034
015
025
035
016
026
036
017
027
037
018
023
038
019
029
041 042 043
051 052 053
061 062 063
071 072 073
081 082 083
091 092 093
0 (18)
nu nu
Thus 041 is the force exerted on the N02~ ion in the x direction when
the Na+ ion is translated unit distance in the x direction; 0 92 is the
torque exerted on the N02~ ion about the z axis when the Na+ ion is
translated unit distance in the y direction, and so on. This very large
number of parameters may be substantially reduced by appropriate
symmetry arguments. As before, we represent each allowed symmetryoperation by a transformation matrix S. While S is always appropriate
for transforming polar vectors, it is only suitable for transforming
axial vectors if it represents a proper rotation. The operation of an
improper rotation on an axial vector is correctly expressed by — S.
The elements<f> tj of the matrix (18), for i and j < 6, relate components
of polar vectors (displacements of ions), whereas the other elements
involve polar vectors (librations of N02~). Thus the total matrix is
correctly transformed by a (9x9) matrix of the form
S 0 0
T=0 S 0
0 0 SdetS (19)
since det £— + 1 (—1) for proper (improper) rotations.
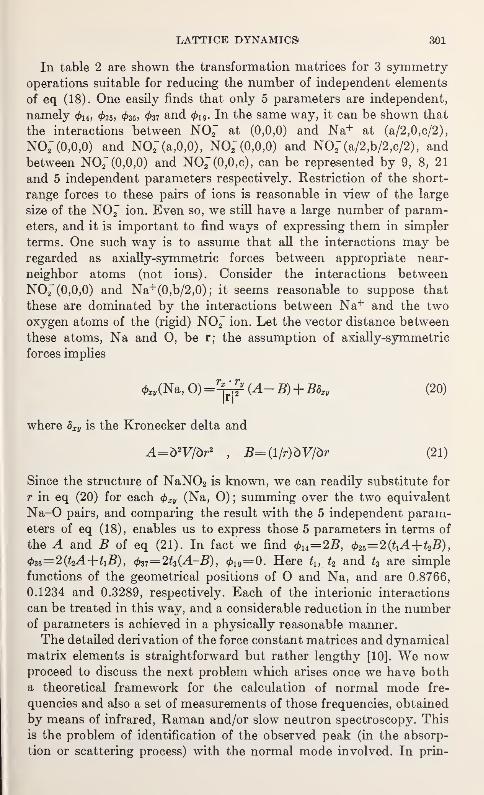
LATTICE DYNAMICS 301
In table 2 are shown the transformation matrices for 3 symmetryoperations suitable for reducing the number of independent elements
of eq (18). One easily finds that only 5 parameters are independent,
namely 4>u , 025, 036, 037 and 0i 9 . In the same way, it can be shown that
the interactions between N02~ at (0,0,0) and Na+ at (a/2,0,c/2),
N02" (0,0,0) and NO2~(a,0,0), N02
" (0,0,0) and N02"(a/2,b/2,c/2), and
between N02" (0,0,0) and NO2~(0,0,c), can be represented by 9, 8, 21
and 5 independent parameters respectively. Restriction of the short-
range forces to these pairs of ions is reasonable in view of the large
size of the N02" ion. Even so, we still have a large number of param-
eters, and it is important to find ways of expressing them in simpler
terms. One such way is to assume that all the interactions may be
regarded as axially-symmetric forces between appropriate near-
neighbor atoms (not ions). Consider the interactions between
N02~ (0,0,0) and Na+ (0,b/2,0) ; it seems reasonable to suppose that
these are dominated by the interactions between Na+ and the two
oxygen atoms of the (rigid) N02~ ion. Let the vector distance between
these atoms, Na and O, be r; the assumption of axially-symmetric
forces implies
MNa, O)Jtt (A-B) + B8xy (20)
where Sxy is the Kronecker delta and
A=&V/to*,
B=(l/r)dV/dr (21)
Since the structure of NaN02 is known, we can readily substitute for
r in eq (20) for each<f>xy (Na, O)
;summing over the two equivalent
Na-0 pairs, and comparing the result with the 5 independent param-eters of eq (18), enables us to express those 5 parameters in terms of
the A and B of eq (21). In fact we find <f>u=2B, 025=2(£^i-H2£),
036=
2
(kA+tiB), <f>37=2t3(A-B) , 0i9=O. Here U, U and tz are simple
functions of the geometrical positions of O and Na, and are 0.8766,
0.1234 and 0.3289, respectively. Each of the interionic interactions
can be treated in this way, and a considerable reduction in the numberof parameters is achieved in a physically reasonable manner.The detailed derivation of the force constant matrices and dynamical
matrix elements is straightforward but rather lengthy [10]. We nowproceed to discuss the next problem which arises once we have botha theoretical framework for the calculation of normal mode fre-
quencies and also a set of measurements of those frequencies, obtained
by means of infrared, Raman and/or slow neutron spectroscopy. This
is the problem of identification of the observed peak (in the absorp-
tion or scattering process) with the normal mode involved. In prin-
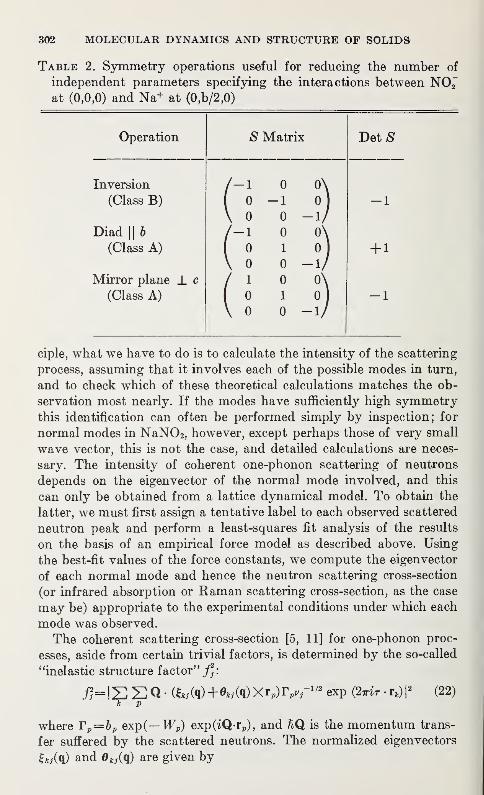
302 MOLECULAR DYNAMICS AND STRUCTURE OF SOLIDS
Table 2. Symmetry operations useful for reducing the number of
independent parameters specifying the interactions between NO^~
at (0,0,0) and Na+ at (0,b/2,0)
Operation
Inversion
(Class B)
Diad||
b
(Class A)
Mirror plane _L c
(Class A)
DetS
-1
+ 1
-1
ciple, what we have to do is to calculate the intensity of the scattering
process, assuming that it involves each of the possible modes in turn,
and to check which of these theoretical calculations matches the ob-
servation most nearly. If the modes have sufficiently high symmetrythis identification can often be performed simply by inspection; for
normal modes in NaN02 ,however, except perhaps those of very small
wave vector, this is not the case, and detailed calculations are neces-
sary. The intensity of coherent one-phonon scattering of neutrons
depends on the eigenvector of the normal mode involved, and this
can only be obtained from a lattice dynamical model. To obtain the
latter, we must first assign a tentative label to each observed scattered
neutron peak and perform a least-squares fit analysis of the results
on the basis of an empirical force model as described above. Using
the best-fit values of the force constants, we compute the eigenvector
of each normal mode and hence the neutron scattering cross-section
(or infrared absorption or Raman scattering cross-section, as the case
may be) appropriate to the experimental conditions under which each
mode was observed.
The coherent scattering cross-section [5, 11] for one-phonon proc-
esses, aside from certain trivial factors, is determined by the so-called
"inelastic structure factor"/*:
j}=ESQ' (^(q)+^(q)Xr,)r^- 1/2 exp (27m-. r*)!2
(22)k V
where Tp=bp exp(—Wp) exp(iQ-rp), and fiQ is the momentum trans-
fer suffered by the scattered neutrons. The normalized eigenvectors
£kj(q) and 6 kj (q) are given by
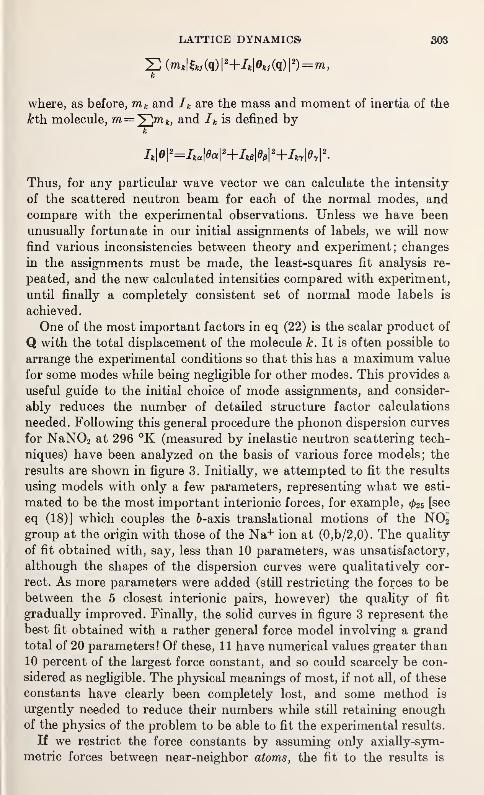
LATTICE DYNAMICS 303
S (mk\^(q)\2+Ik \ekj (q)\
2)==m,k
where, as before, m k and Ik are the mass and moment of inertia of the
kth molecule, m=y^,m k , and Ik is defined byk
Thus, for any particular wave vector we can calculate the intensity
of the scattered neutron beam for each of the normal modes, andcompare with the experimental observations. Unless we have been
unusually fortunate in our initial assignments of labels, we will nowfind various inconsistencies between theory and experiment; changes
in the assignments must be made, the least-squares fit analysis re-
peated, and the new calculated intensities compared with experiment,
until finally a completely consistent set of normal mode labels is
achieved.
One of the most important factors in eq (22) is the scalar product of
Q with the total displacement of the molecule k. It is often possible to
arrange the experimental conditions so that this has a maximum value
for some modes while being negligible for other modes. This provides a
useful guide to the initial choice of mode assignments, and consider-
ably reduces the number of detailed structure factor calculations
needed. Following this general procedure the phonon dispersion curves
for NaN02 at 296 °K (measured by inelastic neutron scattering tech-
niques) have been analyzed on the basis of various force models; the
results are shown in figure 3. Initially, we attempted to fit the results
using models with only a few parameters, representing what we esti-
mated to be the most important interionic forces, for example,<f>25 [see
eq (18)] which couples the 6-axis translational motions of the NO2group at the origin with those of the Na+ ion at (0,b/2,0). The quality
of fit obtained with, say, less than 10 parameters, was unsatisfactory,
although the shapes of the dispersion curves were qualitatively cor-
rect. As more parameters were added (still restricting the forces to be
between the 5 closest interionic pairs, however) the quality of fit
gradually improved. Finally, the solid curves in figure 3 represent the
best fit obtained with a rather general force model involving a grand
total of 20 parameters! Of these, 11 have numerical values greater than
10 percent of the largest force constant, and so could scarcely be con-
sidered as negligible. The physical meanings of most, if not all, of these
constants have clearly been completely lost, and some method is
urgently needed to reduce their numbers while still retaining enoughof the physics of the problem to be able to fit the experimental results.
If we restrict the force constants by assuming only axially-sym-
metric forces between near-neighbor atoms, the fit to the results is
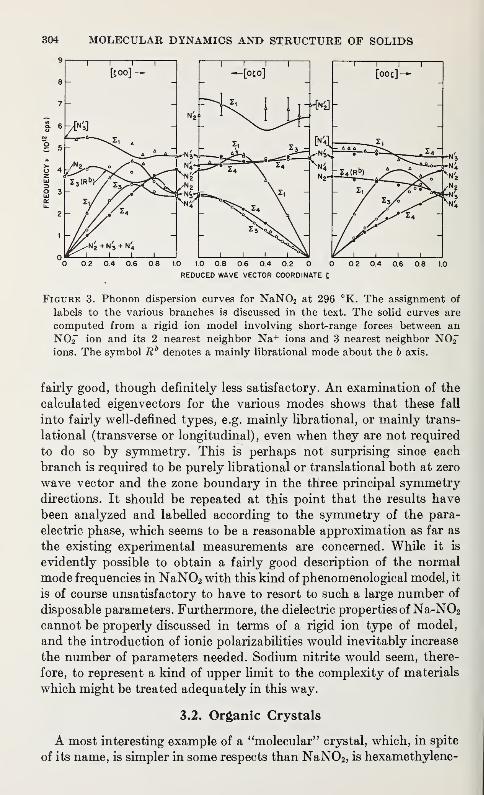
304 MOLECULAR DYNAMICS AND STRUCTURE OF SOLIDS/
i 1 r
[ooc]—
0.2 0.4 0.6 0.8 1.0
REDUCED WAVE VECTOR COORDINATE C
Figure 3. Phonon dispersion curves for NaN02 at 296 °K. The assignment of
labels to the various branches is discussed in the text. The solid curves are
computed from a rigid ion model involving short-range forces between an
NO^" ion and its 2 nearest neighbor Na+ ions and 3 nearest neighbor NO^"
ions. The symbol R b denotes a mainly librational mode about the b axis.
fairly good, though definitely less satisfactory. An examination of the
calculated eigenvectors for the various modes shows that these fall
into fairly weJI-defined types, e.g. mainly librational, or mainly trans-
lational (transverse or longitudinal) , even when they are not required
to do so by symmetry. This is perhaps not surprising since each
branch is required to be purely librational or translational both at zero
wave vector and the zone boundary in the three principal symmetrydirections. It should be repeated at this point that the results have
been analyzed and labelled according to the symmetry of the para-
electric phase, which seems to be a reasonable approximation as far as
the existing experimental measurements are concerned. While it is
evidently possible to obtain a fairly good description of the normal
mode frequencies in NaN02 with this kind of phenomenological model, it
is of course unsatisfactory to have to resort to such a large number of
disposable parameters. Furthermore, the dielectric properties ofNa-N02
cannot be properly discussed in terms of a rigid ion type of model,
and the introduction of ionic polarizabilities would inevitably increase
the number of parameters needed. Sodium nitrite would seem, there-
fore, to represent a kind of upper limit to the complexity of materials
which might be treated adequately in this way.
3.2. Organic Crystals
A most interesting example of a "molecular" crystal, which, in spite
of its name, is simpler in some respects than NaN02 , is hexamethylene-
LATTICE DYNAMICS 305
tetracaine (HMT). This is a highly symmetrical molecule and the
crystal structure is body-centered cubic, with only one molecule in the
primitive unit cell. Each molecule contains 22 atoms [(CH2) 6N4], and
so a straightforward treatment of the crystal dynamics (i.e., a Born-
von Karman interatomic force model) would lead to a (66x66)
dynamical matrix whose elments would contain an enormous numberof force constant parameters. However, almost all of the normal modesare internal modes of vibration of the molecular unit; most of these are
of rather high frequency and so are virtually unchanged from the analo-
gous modes in the free molecule. We would not expect them to display
very much dispersion, and so an adequate knowledge of these modes is
obtained by optical studies of their limiting behavior at very small
wave vector. The low frequency modes of the system, those in which the
molecules behave as more or less rigid units, are of greater interest
from the crystal dynamics point of view; these would be expected to
show significant dispersion effects, which could be studied in detail byappropriate inelastic neutron scattering experiments. HMT is indeed
the first molecular crystal for which comprehensive lattice dynamical
calculations [11,13] have been carried out on the basis of a physically
reasonable intermolecular force model, which we shall now briefly
describe. For full details of these calculations, the reader is referred
to the excellent paper by Cochran and Pawley [11]. A much simplified
model for HMT has been discussed by Becka and Cruickshank [32].
As in the case of NaN0 2 described above, we wish to establish a
dynamical model for HMT which will take into account the transla-
tional and librational motions of the molecular units, while neglecting
their internal modes of vibration. Force constants, representing the
forces and couples exerted on a molecule by its near neighbors, are
postulated, and the appropriate equations of motion, eq (14), are
written down. Maximum use is made of the high symmetry of this
crystal to reduce the number of disposable parameters. It turns out
that only 6 independent parameters are required to specify the inter-
actions for the first nearest neighbors, and 6 also for the second nearest
neighbor interactions. Cochran and Pawley make the further assump-tions that the molecule is centro-symmetric (in order to eliminate
2 of these 12 parameters), and that the molecules are rigid (i.e.,
unpolarizable) . Thus coulomb interactions do not enter into the
calculations. Since there is only one molecule (and no separate
"atoms") per cell, the dynamical matrix is of order (6x6). Roughlyspeaking, for any wave vector, we find 3 translational acoustic type
modes and 3 librational (optic) type modes. The usual kinds of
simplifications arise for modes propagating along high symmetrydirections. For q along A, or (100), for example, the matrix factorizes
into 2 linear equations (longitudinal acoustic and pure librational)
306 MOLECULAR DYNAMICS AND STRUCTURE OF SOLIDS'
and 2 (2x2) matrices giving modes of mixed character. At q=0, all
three librational modes become degenerate; the frequency of this
mode has been measured by Raman spectroscopy. Force constant
values were chosen [11] to fit both this frequency and the measuredelastic constants. These data are insufficient to specify all the param-eters individually, and so various plausible sets of values weretried to see how much the calculated dispersion curves depended oneach force constant. The result of one of these calculations is repro-
duced in figure 4.
As yet, there are no published measurements of the phonon fre-
quencies in HMT, although neutron scattering experiments on a
single crystal of fully deuterated HMT are in progress at ChalkRiver [33]. It is necessary to use deuterated specimens in these co-
herent scattering experiments, since the scattering cross-section of
hydrogen is almost completely incoherent. Indeed, incoherent in-
elastic neutron scattering experiments on many hydrogenous materials
can readily be performed [34]. Such experiments can often give
valuable, though qualitative, information about the frequency dis-
tribution function of the normal modes in a crystal; coherent scattering
experiments are needed to obtain the normal mode frequencies them-
selves. It will certainly be of great interest to see whether the theory
of Cochran and Pawley gives an adequate fit to the experimental
results when these become available, or whether some more compli-
cated model is needed. Another excellent candidate for such a com-
parison between theory and experiment is adamantane [13]. Incoherent
neutron scattering experiments on this highly symmetric molecular
crystal have been performed by Stockmeyer and Stiller [35]. Pre-
sumably it would be possible to produce single crystals of the deu-
terated material, so that some extremely interesting coherent scatter-
ing experiments could be made.
4. Even More Complicated Solids
In the previous sections we discussed some examples of crystals
which were either highly symmetric (but comprising many different
atom types) or composed of only a few different atoms (but having
rather low symmetry). A very large number of crystals, however, fall
into neither of these categories, and yet are perhaps not so complex
as to prohibit all useful discussion of their dynamical properties at
this time. Examples of such crystals are organic hydrocarbons, such
as benzene, naphthalene and anthracene. The essential characteristic
of such crystals from our viewpoint is that it should be a good ap-
proximation to divide their normal modes into two more or less
distinct groups (i) the lattice modes, translations and librations of
(almost) rigid molecules and (ii) the intramolecular modes. Since the
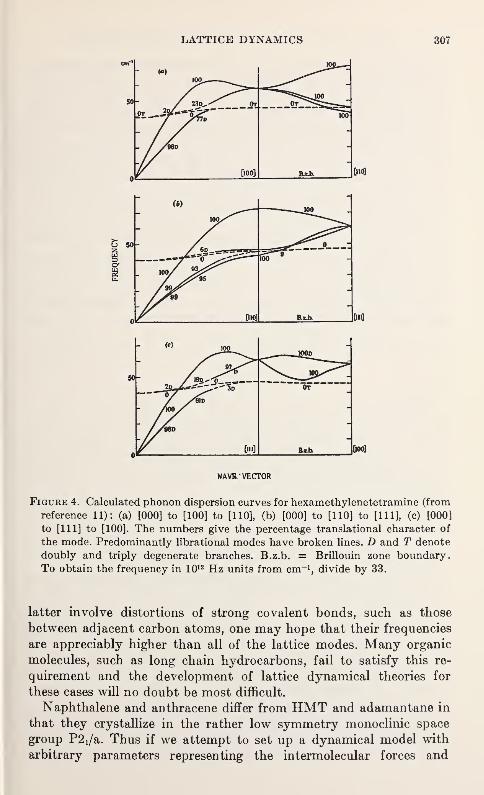
WAVE VECTOR
Figure 4. Calculated phonon dispersion curves for hexamethylenetetramine (from
reference 11): (a) [000] to [100] to [110], (b) [000] to [110] to [111], (c) [000]
to [111] to [100]. The numbers give the percentage translational character of
the mode. Predominantly librational modes have broken lines. D and T denote
doubly and triply degenerate branches. B.z.b. = Brillouin zone boundary.
To obtain the frequency in 1012 Hz units from cm-1, divide by 33.
latter involve distortions of strong covalent bonds, such as those
between adjacent carbon atoms, one may hope that their frequencies
are appreciably higher than all of the lattice modes. Many organic
molecules, such as long chain hydrocarbons, fail to satisfy this re-
quirement and the development of lattice dynamical theories for
these cases will no doubt be most difficult.
Naphthalene and anthracene differ from HMT and adamantane in
that they crystallize in the rather low symmetry monoclinic space
group P2i/a. Thus if we attempt to set up a dynamical model with
arbitrary parameters representing the intermolecular forces and
308 MOLECULAR DYNAMICS AND STRUCTURE OF SOLIDS
couples, then the symmetry is of very little help in reducing the num-ber of independent parameters, and even if only nearest neighbor
interactions are considered, this number is prohibitively large. Con-sequently, as Pawley [16] points out, a model based on fewer param-eters is called for. A very attractive solution to this problem is to
postulate some kind of empirical potential function (it seems to be
out of the question at present to actually calculate such a function
from first principles) describing the interactions between an individual
atom within a molecule and all other atoms on neighboring molecules.
We assume that each atom is rigidly bound within its own molecule,
so that intramolecular potentials need not be considered. In certain
cases, however, this restriction might advantageously be lifted, but
for the moment we ignore this possibility. Naphthalene and anthracene
are essentially planar molecules, consisting respectively of two andthree benzene rings attached together in the manner indicated in
figure 5. The only interatomic potentials needed are for C—C, C—
H
and H—H bonds. A very popular type of potential which has been
invoked for several different purposes [36, 37, 38, 39, 14] consists of
an attractiveVan der Waals term balanced by an exponential repulsion:
V(r)= -A/r*+B exp (-otr) . (23)
Values for the parameters A, B and a for each of the 3 types of
atom pairs have been given by Kitaigorodskii [14]. These were ob-
tained by comparing the heats of sublimation of a few simple hydro-
carbons with their lattice energies computed by summing eq. (23)
over all pairs of atoms in distinct molecules. Other analytic expressions
such as the well-known 6-12 potential, could also be used. One possible
objection to all such simple potentials is that they are functions only
of interatomic distance r, independent of direction. At present, how-
ever, there would seem to be little point in introducing more com-
plicated functions, at least until it has been found that the use of
eq (23) fails to provide a satisfactory fit to experimental data.
In order to make use of these potential functions to calculate the
"lattice mode'' frequencies in naphthalene, for example, we first set
up a phenomenological force model similar to those discussed in section
3. As usual, maximum use is made of the limited symmetry to reduce
the number of<f>xy(lk,l'k') which must be calculated. In addition to the
two classes of operators, A and B, mentioned previously in connection
with symmorphic space groups, there is a third class appropriate to
non-symmorphic groups such as P2i/a, which relates the appropriate
force-constant matrix and the inverse of its transpose. The operation
of the screw diad, an example of this class, is described in detail by
Pawley [16]. After all possible symmetry arguments have been made,
a large number of interaction coefficients remain to be evaluated. For
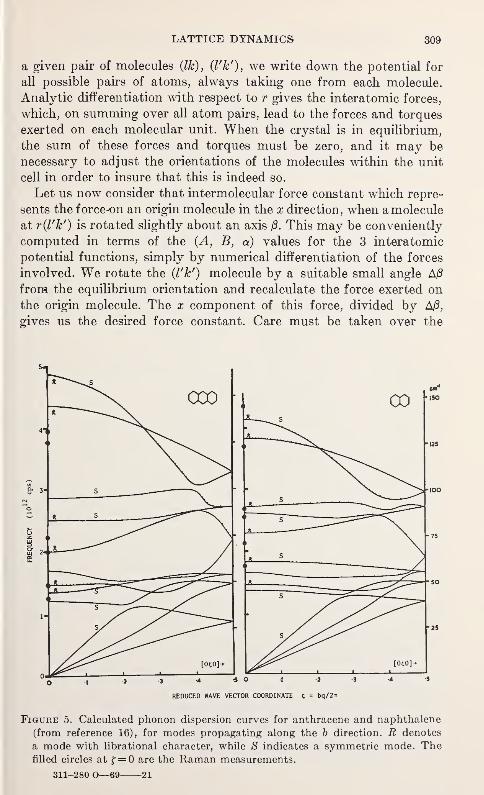
LATTICE DYNAMICS 309
a given pair of molecules {Ik), (l'k'), we write down the potential for
all possible pairs of atoms, always taking one from each molecule.
Analytic differentiation with respect to r gives the interatomic forces,
which, on summing over all atom pairs, lead to the forces and torques
exerted on each molecular unit. When the crystal is in equilibrium,
the sum of these forces and torques must be zero, and it may be
necessary to adjust the orientations of the molecules within the unit
cell in order to insure that this is indeed so.
Let us now consider that intermolecular force constant which repre-
sents the force-on an origin molecule in the x direction, when a molecule
at r{l'k') is rotated slightly about an axis 0. This may be conveniently
computed in terms of the {A, B, a) values for the 3 interatomic
potential functions, simply by numerical differentiation of the forces
involved. We rotate the (l'k') molecule by a suitable small angle A/3
from the equilibrium orientation and recalculate the force exerted on
the origin molecule. The x component of this force, divided by A/3,
gives us the desired force constant. Care must be taken over the
5-|
REDUCED WAVE VECTOR COORDINATE C = bq/2ir
Figure 5. Calculated phonon dispersion curves for anthracene and naphthalene
(from reference 16), for modes propagating along the b direction. R denotes
a mode with librational character, while S indicates a symmetric mode. Thefilled circles at £=0 are the Raman measurements.
311-280 0—69 21
310 MOLECULAR DYNAMICS AND STRUCTURE OF SOLIDS
choice of increments in displacement and angle used in this numerical
differentiation. Pawley [16] found that 10~4 A and 3X10⁻⁴ radians
were most suitable. Once all the force constants have been computedin this way, it is relatively straightforward to set up the dynamical
matrix [(12X12) since there are two molecules per unit cell] anddiagonalize it to obtain the 12 normal mode frequencies for anydesired wave vector. The only "high symmetry direction" in this
monoclinic structure is along the b axis; here the 12 lattice modesreduce to a set of 6 symmetric modes which preserve the space group
symmetry and 6 antisymmetric modes which do not. The lattice-mode
dispersion curves calculated by Pawley [16] for naphthalene and
anthracene are shown in figure 5. Also shown here are the results of
Raman scattering measurements of certain zero wave vector modes.
The agreement with the calculations is fairly good, particularly for
the lower frequencies. The higher frequency modes would be expected
to fit less satisfactorily, since the lowest frequency internal modes of
molecular vibration are probably not too far removed from these, and
some interaction between them is to be expected.
As in the case of hexamethylenetetramine, single crystals of fully
deuterated naphthalene and anthracene are necessary for coherent
inelastic neutron scattering experiments on these materials. Such
experiments are either in progress or planned for the near future for
both anthracene (at Oak Ridge) and naphthalene[40] (at Harwell),
and so much more detailed tests of Kitaigorodskii's potential functions
and Pawley's normal-mode calculations will soon be possible.
The technique of obtaining intermolecular force constants by sum-
ming over the derivatives of interatomic potentials can, of course, be
applied to simpler materials, provided there are only one or two atomic
species present. Thus the hydrocarbon adamantane [(CH2)6(CH) 4]
could be treated in this way, using the same interatomic potential
functions as for naphthalene. Hexamethylenetetramine [(CH2)6NJ
would be rather more clumsily dealt with in this way, however, since
6 distinct potentials would need to be specified. Inorganic materials
of a molecular character, such as iodine, may also be discussed along
these lines. A first stage would be to postulate an iodine-iodine poten-
tial Vi(r) between atoms belonging to different, rigid I2 molecules.
The intermolecular force constants may then be computed exactly as
in the case of naphthalene, and the lattice dynamics of this orthorhom-
bic material expressed in terms of only 3 parameters. Such a model
neglects the internal modes of vibration of the h molecules. This mayor may not turn out to be a reasonable approximation for the lattice
modes; if not, then this restriction might be removed by postulating
a second, stronger, iodine-iodine potential, V2 (f), to act only between
atoms within a given molecule. The parameters describing Vj(r) and
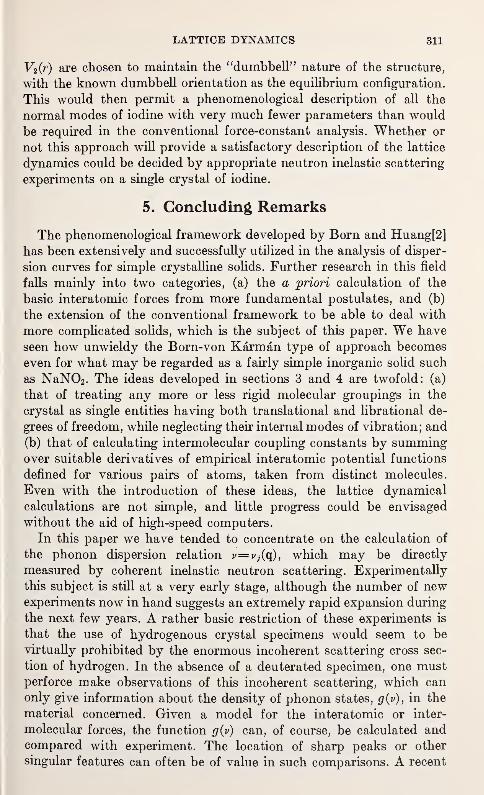
LATTICE DYNAMICS 311
V2 (r) are chosen to maintain the "dumbbell" nature of the structure,
with the known dumbbell orientation as the equilibrium configuration.
This would then permit a phenomenological description of all the
normal modes of iodine with very much fewer parameters than would
be required in the conventional force-constant analysis. Whether or
not this approach will provide a satisfactory description of the lattice
dynamics could be decided by appropriate neutron inelastic scattering
experiments on a single crystal of iodine.
5. Concluding Remarks
The phenomenological framework developed by Born and Huang[2]
has been extensively and successfully utilized in the analysis of disper-
sion curves for simple crystalline solids. Further research in this field
falls mainly into two categories, (a) the a priori calculation of the
basic interatomic forces from more fundamental postulates, and (b)
the extension of the conventional framework to be able to deal with
more complicated solids, which is the subject of this paper. We have
seen how unwieldy the Born-von Karman type of approach becomes
even for what may be regarded as a fairly simple inorganic solid such
as NaN02 . The ideas developed in sections 3 and 4 are twofold: (a)
that of treating any more or less rigid molecular groupings in the
crystal as single entities having both translational and librational de-
grees of freedom, while neglecting their internal modes of vibration; and
(b) that of calculating intermolecular coupling constants by summingover suitable derivatives of empirical interatomic potential functions
defined for various pairs of atoms, taken from distinct molecules.
Even with the introduction of these ideas, the lattice dynamical
calculations are not simple, and little progress could be envisaged
without the aid of high-speed computers.
In this paper we have tended to concentrate on the calculation of
the phonon dispersion relation v=vj(q), which may be directly
measured by coherent inelastic neutron scattering. Experimentally
this subject is still at a very early stage, although the number of newexperiments now in hand suggests an extremely rapid expansion during
the next few years. A rather basic restriction of these experiments is
that the use of hydrogenous crystal specimens would seem to be
virtually prohibited by the enormous incoherent scattering cross sec-
tion of hydrogen. In the absence of a deuterated specimen, one mustperforce make observations of this incoherent scattering, which can
only give information about the density of phonon states, g(v), in the
material concerned. Given a model for the interatomic or inter-
molecular forces, the function g(v) can, of course, be calculated andcompared with experiment. The location of sharp peaks or other
singular features can often be of value in such comparisons. A recent
312 MOLECULAR DYNAMICS AND STRUCTURE OF SOLIDS
review of this subject has been given by Boutin[34]. As the crystals
being studied become more complex, it is clear that every possible
technique, coherent and incoherent neutron scattering, Raman scat-
tering, infrared spectroscopy, elastic constant measurements, and so
on, will be needed to achieve a complete picture of their lattice
dynamics.
The author is indebted to his many colleagues both at Chalk River
and Oak Ridge for stimulating discussions on molecular dynamics in
general, to Dr. G. S. Pawley for valuable correspondence concerning
naphthalene and anthracene, and to Dr. C. B. Clark for discussions
of possible force models' for iodine.
6. Discussion
H. Resing (Naval Research Laboratory) : Has any use been madeof the fact that Smith has shown the barrier to rotation in HMT is
18 kcal/mol by means of NMR measurements?
G. Dolling: No use has been made of this information in setting upthe HMT force model. The derivatives of the crystal potential (e.g.
the force constants) are not directly related to the barrier height for
molecular rotation.
H. Resing: The heat capacity can be calculated from the derived
vibration frequencies. Is agreement between such a theoretical heat
capacity and the experimental heat capacity a good argument for the
validity of the theory?
G. Dolling: As far as I know, the heat capacity of HMT has not
been computed from the calculated phonon frequencies, although this
could readily be done in the harmonic approximation. One might
expect to obtain agreement with the experimental heat capacity to
within several percent. To this extent, such a comparison between
theory and experiment is quite useful, although anharmonic effects
will make it very dim cult to deduce from it any more quantitative
information about the harmonic model. At this stage, therefore, since
we do not have accurate calculations of the anharmonic contribution,
the heat capacity is not a particularly sensitive test of a (pseudo-
harmonic) force model.
M. Blumenfeld (University of Toronto) : I would like to suggest that
an ethylene crystal would be interesting to study by the neutron
scattering technique. It's a simple molecule in a relatively simple
crystal, and one might obtain a more easily interpreted dispersion
curve than with some of the more complicated molecules you've been
discussing.
LATTICE DYNAMICS 313
G. Dolling: So long as the ethylene molecule satisfies the require-
ment that the internal vibrations are well separated from the lattice
modes, it would be an appropriate case.
M. Blumenfeld : The lattice modes, on the basis of Raman spectra,
are in the region of 100 cm.-1 The internal modes are in the range
from 1000 to 3000 cm." 1
J. J. Rush (National Bureau of Standards) : Preparation of a large
enough crystal at low temperatures might be difficult.
7. References
[1] M. Born and T. von Karman, Phys. Zeit. 13, 297 (1912).
[2] M. Born and K. Huang, Dynamical Theory of Crystal Lattices, ClarendonPress, Oxford (1955).
[3] W. Cochran, Reports in Progress in Physics 26, 1 (1963).
[4] A. A. Maradudin, E. W. Montroll and G. H. Weiss, Lattice Dynamics in the
Harmonic Approximation, Solid State Physics, Suppl. 3, editors F. Seitz
and D. Turnbull, Academic Press, New York (1963).
[5] G. Dolling and A. D. B. Woods, in Thermal Neutron Scattering, editor P. A.
Egelstaff, Academic Press, New York (1965).
[6] G. Leibfried and W. Ludwig, in Solid State Physics, editors F. Seitz and D.Turnbull, Vol. 12, Academic Press, New York (1963).
[7] R. A. Cowley, Advance 3 in Phys. 12, 421 (1963).
[8] V. N. Kashcheev and M. A. Krivoglaz, Sov. Phys. Solid State 3, 1107 (1961)
;
translation from Fiz. Tverdogo Tela 3, 1528 (1961).
[9] G. Dolling, H. G. Smith, R. M. Nicklow, P. R. Vijayaraghavan and M. K.
Wilkinson, Phys. Rev. 168, 970 (1988)
[10] J. Sakurai, R. A. Cowley and G. Dolling, Bull. Am. Phys. Soc. 12, 282 (1967),
and to be published.
[11] W. Cochran and G. S. Pawley, Proc. Roy. Roy. Soc. (London) A280, 1 (1964).
[12] H. Hahn and W. Biem, Phys. Stat. Sol. 3, 1911 (1963).
[13] W. Biem, Phys. Stat. Sol. 3, 1927 (1963).
[14] A. I. Kitaigorodskii, J. Chim. Phys. 63, 6 (1966).
[15] A. I. Kitaigorodskii, B. D. Koreshkov and A. G. Kulkin, Sov. Phys. Solid
State 7, 511 (1965) ; translation from Fiz. Tverdogo Tela 7, 643 (1965).
[16] G. S. Pawley, Phys. Stat. Sol. 20, 347 (1967).
[17] P. O. Lowdin, A Theoretical Investigation into Some Properties of Ionic
Crystals, Almquist and Wiksells, Uppsala (1948).
[18] S. O. Lundquist, Ark. Fys. 9, 435 1955); 12, 263 1957).
[19] T. Toya, J. Res. Inst. Catalysis, Hokkaido Univ. 6, 183 (1958).
[20] L. J. Sham, Proc. Roy. Soc. (London) A283, 33 (1965).
[21] W. A. Harrison, Pseudo Potentials in the Theory of Metals, W. A. Benjamin,
New York (1966).
[22] A. E. O. Animalu, Technical Report No. 3, Solid State Theory Group,
Cavendish Laboratory, Cambridge (1965).
[23] U. Schroder, Solid State Commun. 4, 347 (1966). Also V. Nusslein and U.Schroder, Phys. Stat. Sol. 21, 309 (1967).
[24] B. G. Dick and A. W. Overhauser, Phys. Rev. 112, 90 (1958).
[25] W. Cochran, Phys. Rev. Letters 2, 495 (1959).
[26] E. W. Kellermann, Phil. Trans. A238, 513 (1940).
[27] T. Wolfram, G. W. Lehman and R. E. DeWames, Phys. Rev. 129, 2483 (1963)
314 MOLECULAR DYNAMICS AND STRUCTURE OF SOLIDS!
[28] L. P. Bouckaert, R. Smoluchowski and E. Wigner, Phys. Rev. 50, 58 (1936).
[29] These methods are thoroughly described in papers by S. H. Vosko and A. A.
Maradudin, and by J. L. Warren, Rev. Mod. Phys. 40, 1 (1988) and 40,
38, (1968).
[30] G. F. Koster, in Solid State Physics, editors F. Seitz and D. Turnbull, Vol.
V, Academic Press, New York (1957).
[31] S. Hoshino and H. Motegi, Jap. Appl. Phys. 6, 708 (1967); see also Y.
Takagi and K. Gesi, J. Phys. Soc. Japan 22, 979 (1967), for additional
references.
[32] L. N. Becka and D. W. J. Cruickshank, Proc. Roy. Soc. (London), A273,435 and 455 (1963).
[33] B. M. Powell, private communication.
[34] H. Boutin, in Proceedings of the Symposium on Thermal Neutron Scattering
Applied to Chemical and Solid State Physics, American Crystallographic
Association, 3, 30 (1967).
[35] R. Stockmeyer and H. H. Stiller, Phys. Stat. Sol. 19, 781 (1967).
[36] C. A. Coulson and C. W. Haigh, Tetrahedron 19, 527 (1963).
[37] B. De Santis, E. Giglio, A. M. Liquori and A. Ripamonti, Nature 206, 456
(1965).
[38] A. I. Kitaigorodskii, Tetrahedron 14, 230 (1961).
[39] D. P. Craig, R. Mason, P. Pauling and D. P. Santry, Proc. Roy. Soc. (London)
A286, 98 (1965).
[40] G. S. Pawley, private communication.
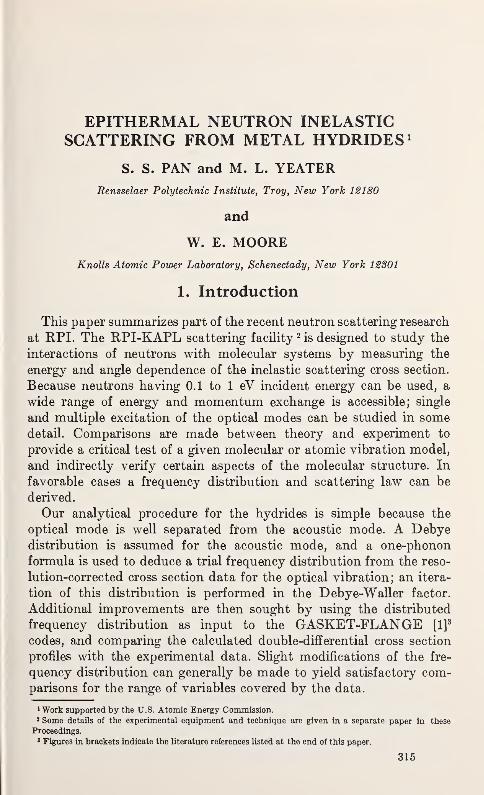
EPITHERMAL NEUTRON INELASTICSCATTERING FROM METAL HYDRIDES 1
S. S. PAN and M. L. YEATERRensselaer Polytechnic Institute, Troy, New York 12180
and
W. E. MOOREKnolls Atomic Power Laboratory, Schenectady, New York 12301
1. Introduction
This paper summarizes part of the recent neutron scattering research
at RPI. The RPI-KAPL scattering facility 2 is designed to study the
interactions of neutrons with molecular systems by measuring the
energy and angle dependence of the inelastic scattering cross section.
Because neutrons having 0.1 to 1 eV incident energy can be used, a
wide range of energy and momentum exchange is accessible; single
and multiple excitation of the optical modes can be studied in somedetail. Comparisons are made between theory and experiment to
provide a critical test of a given molecular or atomic vibration model,
and indirectly verify certain aspects of the molecular structure. In
favorable cases a frequency distribution and scattering law can be
derived.
Our analytical procedure for the hydrides is simple because the
optical mode is well separated from the acoustic mode. A Debyedistribution is assumed for the acoustic mode, and a one-phonon
formula is used to deduce a trial frequency distribution from the reso-
lution-corrected cross section data for the optical vibration; an itera-
tion of this distribution is performed in the Debye-Waller factor.
Additional improvements are then sought by using the distributed
frequency distribution as input to the GASKET-FLANGE [l]3
codes, and comparing the calculated double-differential cross section
profiles with the experimental data. Slight modifications of the fre-
quency distribution can generally be made to yield satisfactory com-parisons for the range of variables covered by the data.
1 Work supported by the U.S. Atomic Energy Commission.2 Some details of the experimental equipment and technique are given in a separate paper in these
Proceedings.3 Figures in brackets indicate the literature references listed at the end of this paper.
315
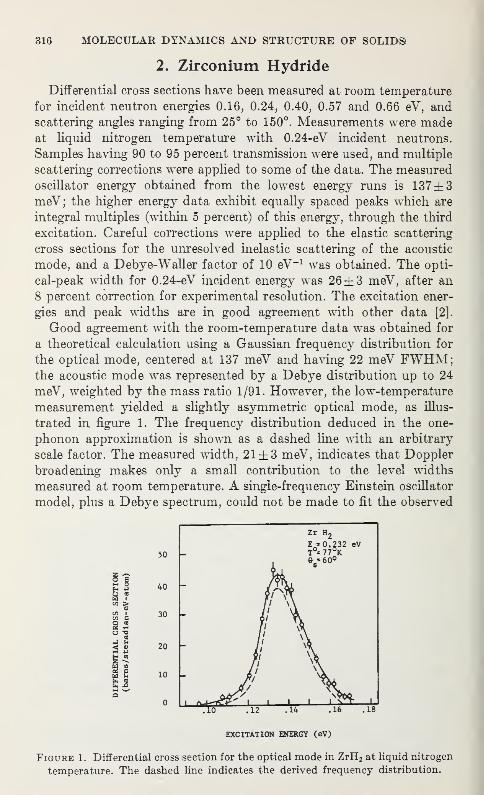
316 MOLECULAR DYNAMICS AND STRUCTURE OF SOLIDS
2. Zirconium Hydride
Differential cross sections have been measured at room temperature
for incident neutron energies 0.16, 0.24, 0.40, 0.57 and 0.66 eV, and
scattering angles ranging from 25° to 150°. Measurements were madeat liquid nitrogen temperature with 0.24-eV incident neutrons.
Samples having 90 to 95 percent transmission were used, and multiple
scattering corrections were applied to some of the data. The measured
oscillator energy obtained from the lowest energy runs is 137 ±3meV; the higher energy data exhibit equally spaced peaks which are
integral multiples (within 5 percent) of this energy, through the third
excitation. Careful corrections were applied to the elastic scattering
cross sections for the unresolved inelastic scattering of the acoustic
mode, and a Debye-Waller factor of 10 eV-1 was obtained. The opti-
cal-peak width for 0.24-eV incident energy was 26±3 meV, after an
8 percent correction for experimental resolution. The excitation ener-
gies and peak widths are in good agreement with other data [2].
Good agreement with the room-temperature data was obtained for
a theoretical calculation using a Gaussian frequency distribution for
the optical mode, centered at 137 meV and having 22 meV FWHM;the acoustic mode was represented by a Debye distribution up to 24
meV, weighted by the mass ratio 1/91. However, the low-temperature
measurement yielded a slightly asymmetric optical mode, as illus-
trated in figure 1. The frequency distribution deduced in the one-
phonon approximation is shown as a dashed line with an arbitrary
scale factor. The measured width, 21 ±3 meV, indicates that Doppler
broadening makes only a small contribution to the level widths
measured at room temperature. A single-frequency Einstein oscillator
model, plus a Debye spectrum, could not be made to fit the observed
Zr H.
EXCITATION ENERGY (eV)
Figure 1. Differential cross section for the optical mode in ZrH2 at liquid nitrogen
temperature. The dashed line indicates the derived frequency distribution.
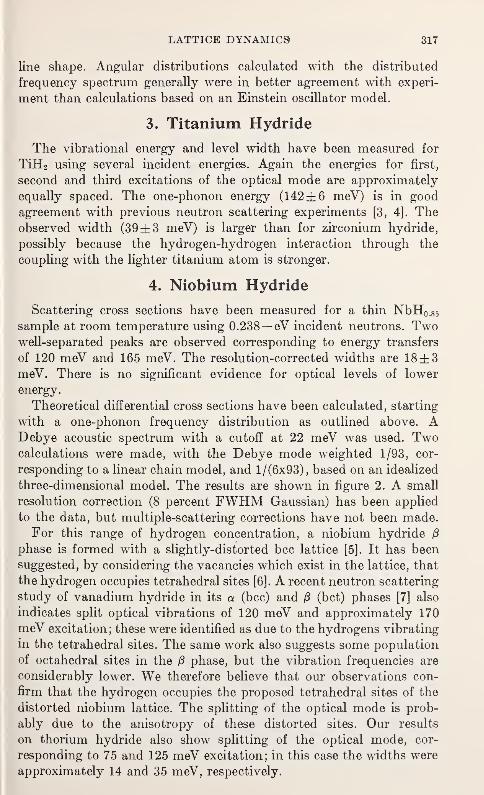
LATTICE DYNAMICS 317
line shape. Angular distributions calculated with the distributed
frequency spectrum generally were in better agreement with experi-
ment than calculations based on an Einstein oscillator model.
3. Titanium Hydride
The vibrational energy and level width have been measured for
TiH2 using several incident energies. Again the energies for first,
second and third excitations of the optical mode are approximately
equally spaced. The one-phonon energy (142±6 meV) is in good
agreement with previous neutron scattering experiments [3, 4]. Theobserved width (39±3 meV) is larger than for zirconium hydride,
possibly because the hydrogen-hydrogen interaction through the
coupling with the lighter titanium atom is stronger.
4. Niobium Hydride
Scattering cross sections have been measured for a thin NbH0 .8 5
sample at room temperature using 0.238— eV incident neutrons. Twowell-separated peaks are observed corresponding to energy transfers
of 120 meV and 165 meV. The resolution-corrected widths are 18±3meV. There is no significant evidence for optical levels of lower
energy.
Theoretical differential cross sections have been calculated, starting
with a one-phonon frequency distribution as outlined above. ADebye acoustic spectrum with a cutoff at 22 meV was used. Twocalculations were made, with the Debye mode weighted 1/93, cor-
responding to a linear chain model, and 1/(6x93), based on an idealized
three-dimensional model. The results are shown in figure 2. A small
resolution correction (8 percent FWHM Gaussian) has been applied
to the data, but multiple-scattering corrections have not been made.For this range of hydrogen concentration, a niobium hydride /S
phase is formed with a slightly-distorted bcc lattice [5]. It has been
suggested, by considering the vacancies which exist in the lattice, that
the hydrogen occupies tetrahedral sites [6]. A recent neutron scattering
study of vanadium hydride in its a (bcc) and /3 (bet) phases [7] also
indicates split optical vibrations of 120 meV and approximately 170
meV excitation; these were identified as due to the hydrogens vibrating
in the tetrahedral sites. The same work also suggests some population
of octahedral sites in the £ phase, but the vibration frequencies are
considerably lower. We therefore believe that our observations con-
firm that the hydrogen occupies the proposed tetrahedral sites of the
distorted niobium lattice. The splitting of the optical mode is prob-
ably due to the anisotropy of these distorted sites. Our results
on thorium hydride also show splitting of the optical mode, cor-
responding to 75 and 125 meV excitation; in this case the widths were
approximately 14 and 35 meV, respectively.
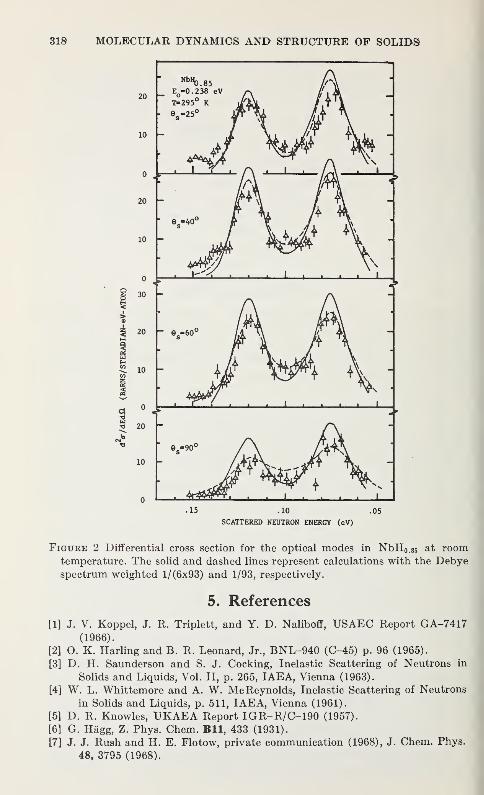
318 MOLECULAR DYNAMICS AND STRUCTURE OF SOLIDS
SCATTERED NEUTRON ENERGY (eV)
Figuee 2 Differential cross section for the optical modes in NbH 0 .g5 at roomtemperature. The solid and dashed lines represent calculations with the Debyespectrum weighted 1/(6x93) and 1/93, respectively.
5. References
[1] J. V. Koppel, J. R. Triplett, and Y. D. Naliboff, USAEC Report GA-7417(1966).
[2] O. K. Harling and B. R. Leonard, Jr., BNL-940 (C-45) p. 96 (1965).
[3] D. H. Saunderson and S. J. Cocking, Inelastic Scattering of Neutrons in
Solids and Liquids, Vol. II, p. 265, IAEA, Vienna (1963).
[4] W. L. Whittemore and A. W. Mc Reynolds, Inelastic Scattering of Neutrons
in Solids and Liquids, p. 511, IAEA, Vienna (1961).
[5] D. R. Knowles, UKAEA Report IGR-R/C-190 (1957).
[6] G. Hagg, Z. Phys. Chem. Bll, 433 (1931).
[7] J. J. Rush and H. E. Flotow, private communication (1968), J. Chem. Phys.
48, 3795 (1968).
VIBRATION SPECTRA OF HYDRIDES POSSESSINGTHE CUBIC PEROVSKITE STRUCTURE BY THEINELASTIC SCATTERING OF COLD NEUTRONS
ARNULF J. MAELANDAMMRC, Watertown, Mass. 02172
1. Introduction
Messer and coworkers have, on the basis of x-ray powder patterns
and by analogy with BaLiF3 ,reported BaLiH3 ,
SrLiH3 [1]1 and
EuLiII3 [2] to have inverse perovskite structures. A recent neutron
diffraction study of BaLiH3 and BaLiD3 has confirmed the perovskite
structure [3]. In the present experiments, we have obtained the
vibration spectra of BaLiH3 and SrLiH3 by the energy-gain scattering
of cold neutrons. Infrared transmission spectra have also been obtained
to supplement the neutron data and assist in the identification of the
vibration frequencies.
2. Experimental Procedure
The neutron measurements were made at the AMMRC reactor
using a cold beryllium filter spectrometer. The incident neutrons have
a mean energy of about 3.5 meV. In the incoherent inelastic scattering
process lattice vibrational quanta (phonons) are transferred to the
incident neutrons. Energy analysis of the scattered neutrons are
obtained by the conventional time-of-flight method. The energy
resolution is about 4 percent at low energy transfer and becomesprogressively worse at large energy transfers. The infrared transmission
spectra were recorded on a Perkin-Elmer 621 spectrometer. Thesamples were dispersed in nujol and placed between KBr disks.
3. Results
The time-of-flight spectrum of neutrons scattered by SrLiH3 is
shown in figure 1. The spectrum for BaLiH3 is quite similar. Eachspectrum shows 4 distinct inelastic scattering bands corresponding to
four optic modes. The elastic neutron peak begins around channel 156
in both spectra. The neutron scattering cross section is in general not
expressable in terms of the frequency distribution function. However,
1 Figures in brackets indicate the literature references at the end of this paper.
319
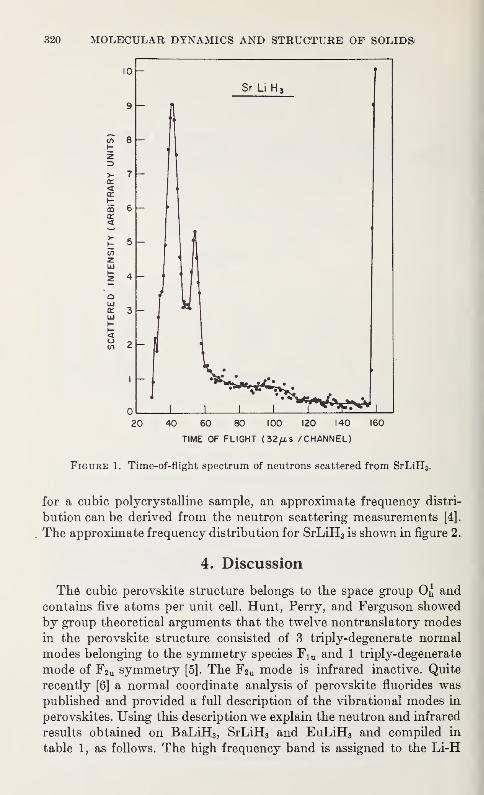
320 MOLECULAR DYNAMICS AND STRUCTURE OF SOLIDS
10
Sr Li H 3
9 _ i
co 8 -
Z3
(ARBITRARY
CD
-g
£ 5COzLU
g 4 -
QLUa: 3
b
SCATT
E
—
ro -
O 1
1 1 1 1 ^-T«^ w1
20 40 60 80 100 120 140 160
TIME OF FLIGHT (32/i.s /CHANNEL)
Figure 1. Time-of-flight spectrum of neutrons scattered from SrLiH3 .
for a cubic polycrystalline sample, an approximate frequency distri-
bution can be derived from the neutron scattering measurements [4].
The approximate frequency distribution for SrLiH3 is shown in figure 2.
4. Discussion
The cubic perovskite structure belongs to the space group 0^ and
contains five atoms per unit cell. Hunt, Perry, and Ferguson showed
by group theoretical arguments that the twelve nontranslatory modesin the perovskite structure consisted of 3 triply-degenerate normal
modes belonging to the symmetry species Fiu and 1 triply-degenerate
mode of F2u symmetry [5]. The F2u mode is infrared inactive. Quite
recently [6] a normal coordinate analysis of perovskite fluorides was
published and provided a full description of the vibrational modes in
perovskites. Using this description we explain the neutron and infrared
results obtained on BaLiH3 ,SrLiH3 and EuLiH3 and compiled in
table 1, as follows. The high frequency band is assigned to the Li-H
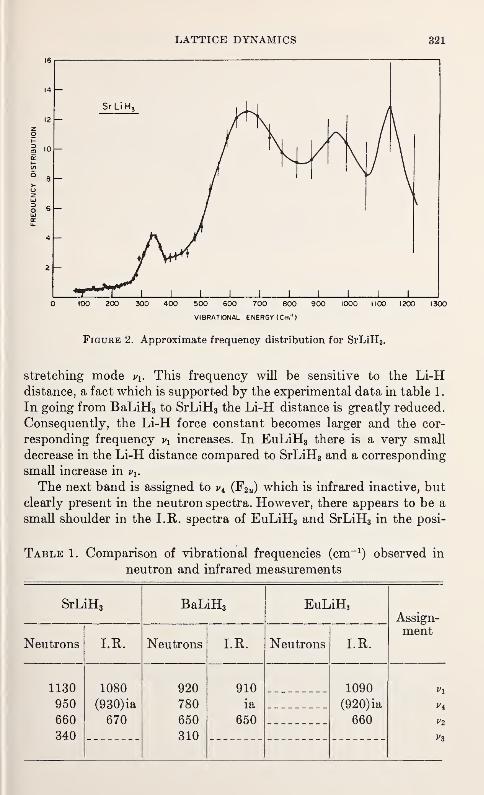
stretching mode vv This frequency will be sensitive to the Li-Hdistance, a fact which is supported by the experimental data in table 1.
In going from BaLiH3 to SrLiH3 the Li-H distance is greatly reduced.
Consequently, the Li-H force constant becomes larger and the cor-
responding frequency v Y increases. In EuLiH3 there is a very small
decrease in the Li-H distance compared to SrLiH3 and a corresponding
small increase in v\.
The next band is assigned to i>4 (F2u) which is infrared inactive, but
clearly present in the neutron spectra. However, there appears to be a
small shoulder in the I.R. spectra of EuLiH3 and SrLiH3 in the posi-
Table 1. Comparison of vibrational frequencies (cm-1) observed in
neutron and infrared measurements
SrLiH3 BaLiH3 EuLiH,Assign-ment
Neutrons I.R. Neutrons I.R. Neutrons I.R.
1130 1080 920 910 1090 V\
950 (930)ia 780 ia (920) ia Vl
660 670 650 650 660 V2
340 310
322 MOLECULAR DYNAMICS AND STRUCTURE OF SOLIDS
tion where v± is expected. This is probably due to relaxation of the
selection rules as a result of defects in the perovskite lattice. The third
frequency is assigned to the Li-H bending mode, in which the
H" ions displace perpendicularly to the H-Li-H line. This mode is
observed in the infrared as well as in the neutron spectrum. The lowest
band, v3 , is associated with the M+2 lattice mode; in this mode the
LiH3 group oscillates as an entity against the lattice of the heavy metal
atoms. It is an external mode and is expected to occur at much lower
frequencies than the other modes which are internal. This follows
from the assumption that forces between groups are much weaker than
those among atoms within a group. The lowest frequency mode, v3, wasnot observed in the infrared because of the KBr cut-off.
This work was supported by Picatinny Arsenal, Dover, New Jersey,
through a NAS-NRC Postdoctoral Fellowship.
5. References
[1] C. E. Messer, J. C. Eastman, R. G. Mers, and A. J. Maeland, Inorg. Chem. 3,
776 (1964).
[2] C. E. Messer and K. Hardcastle, Inorg. Chem. 3, 1327 (1964).
[3] A. J. Maeland and A. F. Andresen, Paper presented at the 7th International
Congress of the International Union of Crystallography in Moscow,
U.S.S.R., 12-19 July, 1966.
[4] L. S. Kothari and K. S. Singwi, Solid State Phys. 8, 109 (1959).
[5] G. R. Hunt, C. H. Perry, and J. Ferguson, Phys. Rev. 134, A688 (1964).
[6] I. Nakagawa, A. Tsuchida, and T. Shimanouchi, J. Chem. Phys. 47, 982
(1967).
ABSORPTION OF LIGHT BY THE SOUND WAVESOF ORIENTATIONALLY DISORDERED CRYSTALS
E. WHALLEYDivision of Applied Chemistry,
National Research Council, Ottawa, Canada
1. Introduction
The translational symmetry of a perfect crystal requires that light
is absorbed by the nuclear vibrations in a fundamental transition
only if the wave vector of the lattice vibration k and of the light in
the crystal K are equal. Any departure from exact translational sym-metry relaxes this selection rule and may make all normal vibrations
of the crystal active.
The purpose of this paper is to discuss the absorption of light byorientationally disordered crystals in the acoustic branches where the
Debye density of states holds. We are interested then in the absorption
of light by sound waves.
It has been shown recently [1]1 that all the translational lattice
vibrations of an orientationally disordered crystal are active in the
infrared and Raman spectra. A detailed study of the far-infrared
spectrum of ice [2], particularly of cubic ice (ice Ic), which is orienta-
tionally disordered, revealed features that could be identified with
features in the density of vibrational states such as the TO, LO, LA,and TA maxima, the minimum between the LO and LA branches,
and so on. It is assumed that the potential energy V can be written
as the sum of square terms of the internal coordinates
where s(l, k) is the /cth internal coordinate associated with unit cell
I and is the corresponding force constant. The change A/j, of the
dipole moment of the crystal for the change of the internal
coordinates is
2. Summary of General Theory
2F=X>(k)s2(Z, k)
l,K(1)
(2)
Figures in brackets indicate the literature references listed at the end of this paper.
323
324 MOLECULAR DYNAMICS AND STRUCTURE OF SOLIDS
where M(Z, k) is the dipole moment derivative with respect to co-
ordinate s(l, k). In an ordered crystal M(Z, k) is independent of I, but in
a disordered crystal, it is different for different I because of the disorder.
M(l, k) can be divided into a regular part M'(k) that has the diffrac-
tion symmetry of the crystal. It is independent of I, and is equal to
the average value of M(Z, k) over all unit cells,
M'«=^SM(Z,k), (3)
where N is the number of unit cells. The difference M"(7, k) between
M(l, K) and M'(/c),
M"(Z, k)=M(1, «)-M'(*), (4)
describes the electrical irregularity of the crystal. A non-zero value of
M'OO causes the usual activity of low-wave-vector vibrations, whereas
a non-zero value of M"(Z, k) causes all vibrations to be active.
If only one coordinate s(k) contributes to the potential energy andif M" 2
(l, k) has only one value M" 2(k), then the integrated reduced
absorptivity A(k, j) of a normal vibration of wave vector k in branchy
A{k,j)= V§K{v)dv, (5)
whereV is the molar volume, K(y) the absorptivity due to the vibration
k, j, and v the vacuum wave number of the light, is
A(Kj)=§ ij!^R('<W(k,j). (6)
In this equation
B(«)=Af"»W/*(«), (7)
a>2(k,j) is the circular frequency of vibration k, j, and the refractive
index n allows for the effects of the material on the field. Eq. (6) is
also obtained if several coordinates contribute appreciably to the
potential energy and the dipole moment, providing that R(k) is the
same for each one.
By summing over all vibrations, assuming that each normal vibra-
tion has a band width small compared to the frequency interval over
which the absorptivity changes appreciably, it can be shown that the
absorptivity K(u>) at frequency co is given by
' K^=We^ E^ (8)
where c is the velocity of light and g(<a) is the density of vibrational
states at frequency co.
LATTICE DYNAMICS 325
3. Debye Distribution
If the frequency is low enough that the Debye distribution holds,
then
<7(w)=9iV-4> (9)CO£)
where o>D is the Debye frequency and N is Avogadro's number.
The quantity R can be obtained in various ways. One is from the
contribution of the translational band to the static dielectric constant.
According to a theory as yet unpublished [3], the difference between
the limiting low-frequency (€0) and high-frequency (€«>) dielectric
constants is
€0—€oo=-p^—3 3
—
R- (10)
Hence, from eqs (8-10), in terms of the vacuum wave number v of
the light absorbed
K{v)=Mj{e-*„)vDQ^ (11)
where
€o+2 1
€«+2 6(
1/2
arises from the effects of the internal field. The absorptivity is pro-
portional to the fourth power of the wave number.
4. Application to Ice
For ice, e0=3.1[4], e0— 6«= 1.1[3], and ^=157 cm-1
[5]. Consequently,
from eq (11)
i^W=4.6X10³(v/vDY cm-1
.
The theoretical absorptivity is compared with experiment in the
range 50 to 16 cm-1in figure 1, which is a plot of log K{v) against log
v at 100 °K. At the higher frequencies the absorptivity is proportional
to the fourth power of the frequency and is nearly independent of
temperature, and the value is within a factor of 3 of that predicted byeq (11). In view of the approximations in the theory, particularly the
neglect of long-range interactions [6] and of the short-range correla-
tion of orientations, the agreement is satisfactory. There is no doubtthat the sound waves are absorbing light as fundamentals.
At frequencies below those shown in figure 1, the absorptivity de-
parts from a fourth power dependence on the wave number. This no
doubt is caused by difference bands, whose intensity is expected to be
approximately proportional to the square of the frequency [7J.
311-280 O—69 22
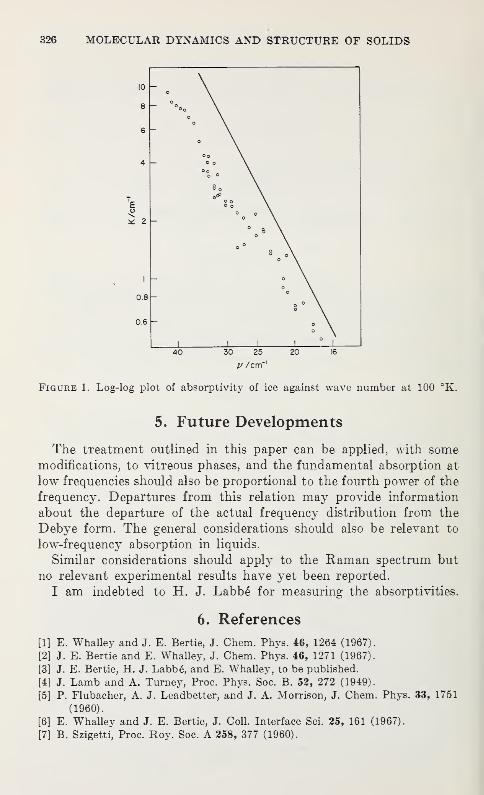
326 MOLECULAR DYNAMICS AND STRUCTURE OF SOLIDS
30 25 20 16
V /cm"'
Figure 1. Log-log plot of absorptivity of ice against wave number at 100 °K.
5. Future Developments
The treatment outlined in this paper can be applied, with somemodifications, to vitreous phases, and the fundamental absorption at
low frequencies should also be proportional to the fourth power of the
frequency. Departures from this relation may provide information
about the departure of the actual frequency distribution from the
Debye form. The general considerations should also be relevant to
low-frequency absorption in liquids.
Similar considerations should apply to the Raman spectrum but
no relevant experimental results have yet been reported.
I am indebted to H. J. Labbe for measuring the absorptivities.
6. References
[1] E. Whalley and J. E. Bertie, J. Chem. Phys. 46, 1264 (1967).
[2] J. E. Bertie and E. Whalley, J. Chem. Phys. 46, 1271 (1967).
[3] J. E. Bertie, H. J. LabbS, and E. Whalley, to be published.
[4] J. Lamb and A. Turney, Proc. Phys. Soc. B. 52, 272 (1949).
[5] P. Flubacher, A. J. Leadbetter, and J. A. Morrison, J. Chem. Phys. 33, 1751
(1960).
[6] E. Whalley and J. E. Bertie, J. Coll. Interface Sci. 25, 161 (1967).
[7] B. Szigetti, Proc. Roy. Soc. A 258, 377 (1960).
LATTICE VIBRATIONS IN SOME SIMPLEMOLECULAR CRYSTALS
J. C. LAUFER, J. E. CAHILL, and G. E. LEROI 1
Frick Chemical Laboratory
Princeton University, Princeton, New Jersey 08540
Raman spectra of polycrystalline samples of C02 ,N20, a-N2 and
a-CO have been obtained on a laser instrument built in this labora-
tory [l].2 Several librational lattice modes have been observed and
experimental frequencies are compared to theoretical calculations us-
ing a pairwise intermolecular potential consisting of a Lennard-Jones
(6,12) term and multipole-multipole interactions [2].
The crystal structures of C02 [3-5], N20[6], N2 [7] and CO[8] are
very similar, all forming face-centered cubic lattices with four mole-
cules per unit cell oriented along the body diagonals. Carbon dioxide
has a Th space group with the molecules on S 6 sites. In the other
crystals, there is no inversion center; thus the site group is reduced to
C3 and the space group to T4. In N2 the molecules are displaced slightly
(0.17 A) along the body diagonals, thus destroying the inversion center.
For CO and N20, the molecules themselves lack an inversion center.
There is some disorder in the CO[9] and N2O[10] crystals in that the
sense of the molecules is random.
For C02 there are three librational frequencies (Eg+2Tg) and four
translational (A u-\-Eu+2Tu). The three librations are Raman active
and the two Tu translations infrared active. Mixing between librations
and translations is strictly forbidden. For N2 , CO and N20 there are
also three librations (E+2T) and four translations (A+E+ 2 T) . All
modes are Raman active and the T modes are infrared active. Mixing
between librations and translations is no longer forbidden.
The observed frequencies are given in the table. The spectrum of
C02 is as predicted, showing three bands which do not correspond with
the observed far-infrared results [11]. The N20 results are similar,
giving three bands which are assigned as librations because of their
strong intensity. The fact that there is no coincidence with the far-
infrared spectrum [11] strengthens this assignment and shows that
appreciable mixing between librations and translations does not occur.
Two strong bands were observed in N2 . Because of their intensity, and
1 Present address: Department of Chemistry, Michigan State University, East Lansing, Michigan 48823.
2 Figures in brackets indicate the literature references listed at the end of this paper.
327
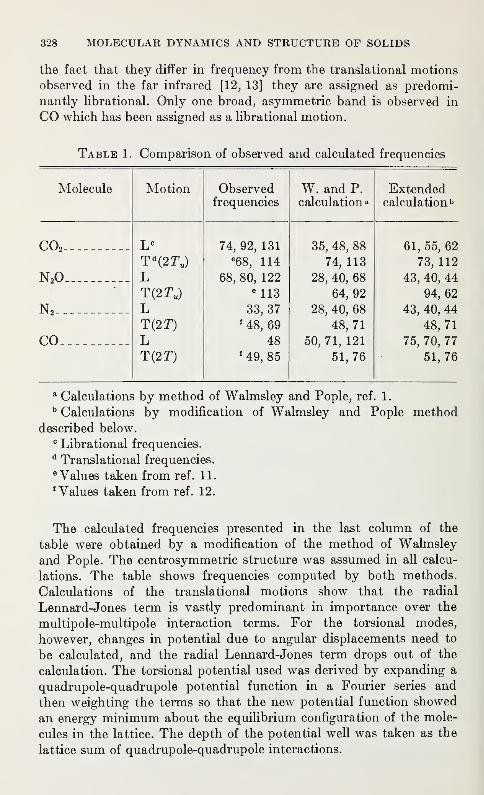
328 MOLECULAR DYNAMICS AND STRUCTURE OF SOLIDS
the fact that they differ in frequency from the translational motions
observed in the far infrared [12, 13] they are assigned as predomi-
nantly librational. Only one broad, asymmetric band is observed in
CO which has been assigned as a librational motion.
Table 1. Comparison of observed and calculated frequencies
Molecule Motion Observed W. and P. Extendedfrequencies calculation a calculation 11
C02 L c74, 92, 131 35, 48, 88 61, 55, 62
T d(2Ttt)e68, 114 74, 113 73, 112
N20 L 68, 80, 122 28, 40, 68 43, 40, 44
T(2TU)e 113 64, 92 94, 62
N2 L 33, 37 28, 40, 68 43, 40, 44
T(2T) f48, 69 48, 71 48,71
CO L 48 50, 71, 121 75, 70, 77
T(2T) 149, 85 51,76 51, 76
a Calculations by method of Walmsley and Pople, ref. 1.
b Calculations by modification of Walmsley and Pople methoddescribed below.
c Librational frequencies.d Translational frequencies.e Values taken from ref. 11.
1 Values taken from ref. 12.
The calculated frequencies presented in the last column of the
table were obtained by a modification of the method of Walmsley
and Pople. The centrosymmetric structure was assumed in all calcu-
lations. The table shows frequencies computed by both methods.
Calculations of the translational motions show that the radial
Lennard-Jones term is vastly predominant in importance over the
multipole-multipole interaction terms. For the torsional modes,
however, changes in potential due to angular displacements need to
be calculated, and the radial Lennard-Jones term drops out of the
calculation. The torsional potential used was derived by expanding a
quadrupole-quadrupole potential function in a Fourier series and
then weighting the terms so that the new potential function showed
an energy minimum about the equilibrium configuration of the mole-
cules in the lattice. The depth of the potential well was taken as the
lattice sum of quadrupole-quadrupole interactions.
LATTICE DYNAMICS 329
The calculations of translational lattice modes give good agreement
with experimental values. The model used for librational modes pre-
dicts these frequencies to be clustered about one small spectral region.
The data on N2 showed this to be the case, with relatively good agree-
ment as to observed and predicted frequencies. The fact that COshows only one broad asymmetric band in the Raman suggests that
several lattice modes lie close to one another and cannot be resolved.
The model fails for C02 and N20, probably because these are rodlike
molecules and cannot be forced to fit a point quadrupole model. It
should be noted though that between N20 and C02 and between N 2
and CO, the member of the pair with the higher quadrupole momenthas the higher librational lattice frequencies. This relationship is
evidence that even for molecules that cannot be approximated by a
point, the concept of a point quadrupole may be useful in understanding
lattice modes.
References
[1] R. E. Miller, D. L. Rousseau, and G. E. Leroi, Technical Report No. 22,
ONR Contract 1858 (27), May 1967.
[2] S. H. Walmsley and J. A. Pople, Mol. Phys. 8, 345 (1964).
[3] J. de Smedt and W. H. Keesom, Proc. Acad. Sci. Amst. 27, 839 (1924);
Z. Krist. 62, 312 (1926).
[4] H. Mark and C. Pohland, Z. Krist. 61, 293 (1925); 64, 113 (1926).
[5] J. C. McLennan and J. O. Wilhelm, Trans. Roy. Soc. Can. 19, Sec. Ill (3)
,
51 (1925).
[6] J. de Smedt and W. H. Keesom, Proc. Acad. Sci. Amst. 27, 839 (1924);
Verslag. Akad. Wetenshap. Amst. 33, 888 (1924).
[7] T. H. Jordan, H. W. Smith, W. E. Streib and W. N. Lipscomb, J. Chem.Phys. 41, 756 (1964).
[8] L. Vegard, Z. Physik 61, 185 (1930); 88, 235 (1934).
[9] J. O. Clayton and W. F. Giauque, J. Am. Chem. Soc. 54, 2610 (1932).
[10] R. W. Blue and W. F. Giauque, J. Am. Chem. Soc. 57, 991 (1935).
[11] A. Anderson and S. H. Walmsley, Mol. Phys. 7, 583 (1964).
[12] A. Anderson and G. E. Leroi, J. Chem. Phys. 45, 4359 (1966).
[13] A. Ron and O. Schnepp, J. Chem. Phys. 46, 3991 (1967).

THE OPTICAL AND ANHARMONIC THERMALPROPERTIES OF A DIATOMIC
MOLECULAR SOLID 1
GEORGE E. JELINEK
Lawrence Radiation Laboratory
University of California, Livermore, California 94550
1. Introduction
Between 23.9 and 43.6 °K neutron [1]2 and electron diffraction [2]
data indicate that 0 oxygen has a primitive monomolecular rhombo-hedral structure with the axis of the molecule oriented parallel to
the three-fold axis. The structure of the low-temperature a form of
oxygen is monoclinic [3]. The low-temperature a form of fluorine is
not known but the diffraction patterns are similar to those of /?
oxygen [4]. Nitrogen below 35.6 °K has a cubic structure with three
non-bonded neighbors at 3.42 A and six at 3.55 A [5]. Thus it seems
possible that a primitive rhombohedral equilibrium structure with
large vibrational excursions from the equilibrium configuration might
constitute a reasonable model for the description of the lattice vibra-
tions of oxygen, nitrogen, and fluorine at low temperatures.
2. Potential Model
The assumed structure involves cubic close-packing of cylinders andthe effects of the harmonic, cubic, and quartic potential are con-
sidered. The force constants have been obtained from the two-bodypotential between nonbonded atoms. The potentials considered are
the modified Buckingham (6-exp) and the Lennard-Jones (6, 12)
potential. The parameters of the potential have been evaluated fromthe observed cohesive energies and the nearest-neighbors distances of
oxygen, nitrogen, carbon monoxide, fluorine, chlorine, bromine, andiodine.
3. Anharmonic Thermal Properties
The Born and Huang approach to the problem of the anharmoniccontribution to the thermodynamic properties consists in treating the
1 This work was performed under the auspices of the U.S. Atomic Energy Commission.2 Figures in brackets indicate the literature references listed at the end of this paper.
331
332 MOLECULAR DYNAMICS AND STRUCTURE OF SOLIDS
anharmonic terms in potential energy expansion as small perturba-
tions [6]. The normal-mode solutions for the harmonic potential,
being good zeroth order approximations to the Hamiltonian, serve as
the basis set for the calculation of the anharmonic properties. Thepotential energy is expanded first in terms of the parameters of a
homogeneous deformation, then in terms of the nuclear displacements
from their equilibrium position in the homogeneously deformed
structure.
For both the a and 0 phases of oxygen the calculated Cp is in very
good agreement with the experimental results. For a nitrogen and a
fluorine, stable below 35.6 and 45.5 °K, respectively, the calculated
Cp is also in good agreement with the experimental results. The calcu-
lated thermodynamic properties are less satisfactory for carbon
monoxide and poor for chlorine, bromine, and iodine.
4. Discussion of the Infrared Spectra
The 0-oxygen structure contains one molecule in the unit cell
oriented parallel to the trigonal axis, occupying a site of D3d sym-
metry. For a one-phonon absorption in the infrared the conservation
of energy, wlight=cophonon and conservation of momentum, klight=
kphonon require that essentially k=0. There are six polarization
vectors for each wave vector. For k=0 the normal modes may be
classified according to their symmetry.
In the zero wave vector approximation a combination will be
allowed in the infrared spectrum if the character of the combination
has the same symmetry as translation (component of x, y, or z in the
character table). The character of a combination is determined bytaking the direct product of the characters of the two modes. Thedirect product of Alg with A2u yields A2u and is infrared active. Thedirect product of Alg with E w is E u which is also active. For the dis-
persion curves of oxygen the transverse acoustic mode, in the zero
wave vector limit, has symmetry Eu . The longitudinal acoustic modehas symmetry A2w . Though allowed by factor group analysis, both
modes have zero frequency at k=0 and thus neither will appear in
the spectrum in combination with Au (the fundamental vibration) in
the infinite wave length limit. The torsional optic mode has symmetry
Eg for k=0 and is not infrared active in combination with Alg .
When considering combinations in the infrared spectrum, one is no
longer concerned merely with k=0. A combination is a two phonon
process and we can get combinations with all wave vectors of the dis-
persion curves for which energy and momentum are conserved.
^light= w l+ a'2
kiight= ki-f-k2.
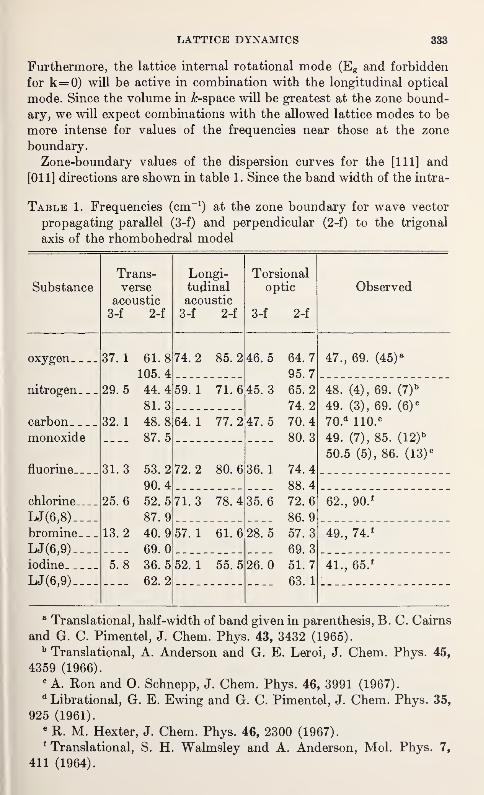
LATTICE DYNAMICS 333
Furthermore, the lattice internal rotational mode (Eg and forbidden
for k=0) will be active in combination with the longitudinal optical
mode. Since the volume in &-space will be greatest at the zone bound-
ary, we will expect combinations with the allowed lattice modes to be
more intense for values of the frequencies near those at the zone
boundary.
Zone-boundary values of the dispersion curves for the [111] and
[Oil] directions are shown in table 1. Since the band width of the intra-
Table 1. Frequencies (cm-1) at the zone boundary for wave vector
propagating parallel (3-f) and perpendicular (2-f) to the trigonal
axis of the rhombohedral model
SubstanceTrans-verse
3-f 2-f
Longi-tudinalflpmmtip.
3-f 2-f
Torsionaloptic
3-f 2-f
Observed
oxygen
nitrogen
carbon
monoxide
fluorine
chlorine
LJ(6,8)
bromine
LJ(6,9)
37. 1 61. 8
105.4
29. 5 44. 4
81. 3
32. 1 48. 8
87. 5
31.3 53.2
90.4
25. 6 52. 5
87. 9
13. 2 40. 9
69.0
74. 2 85. 2 46. 5 64. 7
95. 7
45. 3 65. 2
74.2
47. 5 70. 4
80. 3
47., 69. (45)a
59. 1 71. 6 48. (4), 69. (7)b
49. (3), 69. (6)c
70.d 110. e
49. (7), 85. (12)b
50.5 (5), 86. (13)c
64. 1 77. 2
72. 2 80. 6 36. 1 74. 4
88.4
71.3 78.4 35. 6 72. 6
86.9
62., 90.1
57. 1 61. 6 28. 5 57. 3
69. 3
49., 74. f
iodine 5. 8 36. 5
62.2
52. 1 55. 5 26. 0 51. 7
63. 1
41., 65.f
LJ(6,9)
a Translational, half-width of band given in parenthesis, B. C. Cairns
and G. C. Pimentel, J. Chem. Phys. 43, 3432 (1965).b Translational, A. Anderson and G. E. Leroi, J. Chem. Phys. 45,
4359 (1966).c A. Ron and O. Schnepp, J. Chem. Phys. 46, 3991 (1967).d Librational, G. E. Ewing and G. C. Pimentel, J. Chem. Phys. 35,
925 (1961).e R. M. Hexter, J. Chem. Phys. 46, 2300 (1967).1 Translational, S. H. Walmsley and A. Anderson, Mol. Phys. 7,
411 (1964).
334 MOLECULAR DYNAMICS AND STRUCTURE OF SOLIDS
molecular mode of the model is only about 2 cm-1, the predicted
combination spectrum of the model may be obtained from the critical
points of the frequency distribution spectrum, g(co), with the character
of the modes contributing to the critical points determined from the
eigenvectors of the various dispersion-curve branches.
Cairns and Pimentel observe that the lattice combination band of
oxygen has two broad features, one centered 47 cm-1 and the other
centered 69 cm-1 above the center of the 02 fundamental at 1549 cm-1.
On the basis of the selection rules for the D3d structure they conclude
that the lattice bands involve combinations with the translational
lattice modes. The frequency distribution function for oxygen for the
Lennard-Jones (6,12) potential contains distinct peaks at 56, 71, and87 cm-1
. In view of the large half-width of the combination absorption
band (45 cm" 1) it is difficult to classify the two peaks observed since
the band encompasses nearly the entire range of zone-boundary
frequencies for both the translational and rotational lattice modes.
It seems apparent, though, that the lattice combination centered at
69 cm-1is a vibration-translation combination of the type longitudinal
optic+longitudinal acoustic, as concluded by Cairns and Pimentel.
A possible assignment to the broad band centered at 47 cm-1is a
vibration-libration of the type longitudinal optic+ transverse rotation.
For the other substances as shown in table 1, while there is reason-
able agreement between calculated and observed spectra, the model
indicates that the combination spectra contain a manifold of transla-
tional and librational modes, with the observed spectra containing
modes of both translational and librational character.
5. References
[1] Alikanov, Soviet Physics-JETP 45, 812 (1963).
[2] E. M. Horl, Act Cryst. 15, 845 (1962).
[3] C. S. Barrett, L. Meyer, and J. Wasserman, J. Chem. Phys. 47, 592 (1967).
[4] T. H. Jordan, W. E. Streib, and W. N. Lipscomb, J. Chem. Phys. 41, 760
(1964).
[5] W. E. Streib, T. H. Jordan, and W. N. Lipscomb, J. Chem. Phys. 37, 2962
(1962).
[6] M. Born and K. Huang, The Dynamical Theory of Crystal Lattices (Oxford
University Press, New York, 1954).
NEUTRON SCATTERING STUDIES OFMOLECULAR VIBRATIONS IN ICE
H. PRASK 1 and H. BOUTIN 1 2
Picatinny Arsenal, Dover, New Jersey 07801
and
S. YIP
Massachusetts Institute of Technology, Cambridge, Massachusetts 02138
It is well known that the phonon frequency distribution function
of a monatomic, cubic crystal can be determined from a measurementof the one-phonon incoherent neutron scattering cross-section [l].
3
The exact determination of the frequency distribution of molecular
solids, on the other hand, generally involves a formidable computa-tional problem. In this work an extension of the one-phonon inco-
herent neutron scattering theory for monatomic crystals has been
investigated for incoherent scattering molecular solids with particular
application to ice.
If one assumes that molecular translations and rotations are sepa-
rable, a frequency distribution can be associated with each such that
g(<a)=gT((ji>) +<7ij(co), where subscripts T and R denote translation androtation respectively and g(u>) is the distribution function for the
system. If translational motions are treated as small-displacement
oscillations and rotations as small angle torsions, a Gaussian expres-
sion is obtained for the intermediate scattering function [2]
:
x(K,t)=e-2WeKl/2MT(t). (1)
r^=X ^[coth2^T COSC0 ^_ * sin ^J^M+^^mJ' ®
where e~2W is the Debye-Waller factor associated with translations,
M is the molecular mass and MR is an effective rotational mass.
When eq (1) is applied in the one-phonon approximation, the cross
section becomes proportional to an effective frequency distribution,
<7etf(w)= <77.(a>) +(MIMR)gR{u), which allows determination of g{oi) if
1 Quests at the Array Materials and Mechanics Research Center, Watertown, Mass.2 Present Address: Research Laboratories Division, Bendix Corporation, Southfield, Michigan.3 Figures in brackets indicate the literature references at the end of this paper.
335
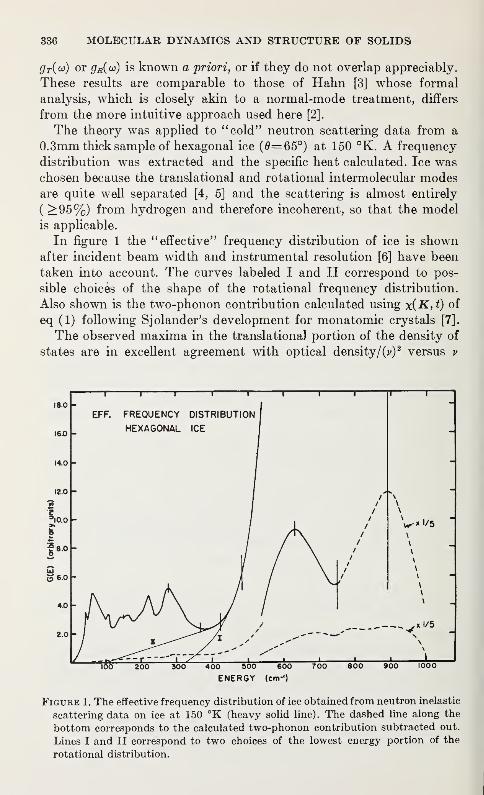
336 MOLECULAR DYNAMICS AND STRUCTURE OF SOLIDS
gT(o>) or gR(u>) is known a priori, or if they do not overlap appreciably.
These results are comparable to those of Hahn [3] whose formal
analysis, which is closely akin to a normal-mode treatment, differs
from the more intuitive approach used here [2].
The theory was applied to "cold" neutron scattering data from a
0.3mm thick sample of hexagonal ice (0=65°) at 150 °K. A frequency
distribution was extracted and the specific heat calculated. Ice waschosen because the translational and rotational intermolecular modesare quite well separated [4, 5] and the scattering is almost entirely
( >95%) from hydrogen and therefore incoherent, so that the model
is applicable.
In figure 1 the "effective" frequency distribution of ice is shownafter incident beam width and instrumental resolution [6] have been
taken into account. The curves labeled I and II correspond to pos-
sible choices of the shape of the rotational frequency distribution.
Also shown is the two-phonon contribution calculated using x(K, t) of
eq (1) following Sjolander's development for monatomic crystals [7].
The observed maxima in the translational portion of the density of
states are in excellent agreement with optical density/M 2 versus v
t i1 1 1 1 1 1 1 r
ENERGY (cm-')
Figure 1. The effective frequency distribution of ice obtained from neutron inelastic
scattering data on ice at 150 °K (heavy solid line). The dashed line along the
bottom corresponds to the calculated two-phonon contribution subtracted out.
Lines I and II correspond to two choices of the lowest energy portion of the
rotational distribution.
LATTICE DYNAMICS 337
obtained from recent infrared measurements [8, 9], which for a dis-
ordered crystal should show features of the density of states [10].
Calculation of C„(T) in the harmonic approximation was made using
both separations I and II indicated in figure 1. The "true" or thermo-
dynamic g(o)) is determinable ifMR is known. Alternatively, normaliza-
tion of the observed rotational and translational distributions to equal
total degrees of freedom fixesMR , which in the case of the ice distribu-
tion of figure 1 yields Mr^I.O. The large statistical errors at high
energy transfers make this value somewhat uncertain.
Specific heat calculated from separation II is in excellent absolute
agreement with measured values [11, 12] from 0 to 100 °K and deviates
by less than 10 percent from Cw corrected for anharmonicity [5], over
the entire range 0—273 °K. The moments of translational distribu-
tion II are also in excellent agreement with moments inferred by Lead-
better [5] from a detailed analysis of the measured specific heat.
Separation I, which a priori seems more reasonable, gives poorer
agreement with measured C t.(T) values and the inferred moments. It
should be pointed out that multiple scattering has not been corrected
for, and could alter these results. The shape of the lowest energy por-
tion of the frequency distribution (0-40 cm-1) is in agreement with
that obtained by Leadbetter from analysis of the specific heat.
In conclusion, the theory outlined in this paper provides a model bywhich an approximate frequency distribution can be obtained for somemolecular crystals. The application of the theory to ice, although not
conclusive, does give a frequency distribution that gives specific heats
in agreement with measurement, frequencies close to optical results,
and distribution moments in agreement with inferred values.
References
[1] G. Placzek and L. van Hove, Phys. Rev. 93, 1207 (1954).
[2] H. Prask, H. Boutin, and S. Yip, J, Chem. Phys. 48, 3367 (1968).
[3] H. Hahn in Inelastic Scattering of Neutrons. International Atomic EnergyAgency, Vienna, II, 279 (1965).
[4] Reviewed by N. Ockman, Adv. Phys. 7, 199 (1958).
[5] A. J. Leadbetter, Proc. Roy. Soc. 287A, 403 (1965).
[6] K. E. Larsson, U. Dahlborg, S. Holmryd, K. Otnes, and R. Stedman, Ark. f.
Fys. 16, 199 (1959).
[7] A. Sjolander, Ark. Fys. 14, 315 (1958).
[8] J. E. Bertie and E. Whalley, J. Chem. Phys. 46, 1271 (1967).
[9] W. Bagdade, Far Infrared Absorption in Ice Ih and Liquid Water, Mid-American Symp. on Spect., Chicago, May, 1967.
[10] E. Whalley and J. E. Bertie, J. Chem. Phys. 46, 1264 (1967).
[11] W. F. Giaque and J. W. Stout, J. Am. Chem. Soc. 58, 1144 (1936).
[12] P. Flubacher, A. J. Leadbetter, and J. A. Morrison, J. Chem. Phys. 33, 1751
(1960).

INFRARED ABSORPTION STUDIES OF INTER-MOLECULAR VIBRATIONS IN THE LOW
FREQUENCY REGION
NEIL T. McDEVITT
AFML (MAYA)
Wright-Patterson Air Force Base, Ohio 1^5^33
and
R. E. WITKOWSKI and W. G. FATELEY
Mellon Institute
Pittsburgh, Pennsylvania 15213
The solid state is characterized by high cohesion and rigidity, yet
the type of force existing between the particles and the relationship
between the structure and physical-chemical properties of the crystal
still presents a considerable challenge to the researcher.
Infrared spectroscopy is playing its role in the development of the
science of materials through the study of crystalline solids. Theenergy levels of a solid are, of course, essentially a property of the
whole system. In our infrared study of solids we are interested in the
type of bonding that contributes greatly to the lattice energy of the
system. We, therefore, are interested in studying the vibrational modesof a system that are associated with intermolecular forces. As a matter
of convenience we have classified intermolecular forces as to the fol-
lowing types : ionic, van der Waals and hydrogen bonding. As examples
of materials that we have studied in which these forces are predomi-
nant we cite some metal oxides, polynuclear aromatics, and phenols.
Since atoms in the solid state may be held together by forces that
can be classified as ionic, covalent or a combination of types, it is
necessary to have infrared methods that may help to distinguish be-
tween these forces. Three methods have been used in our infrared
studies of lattice vibrations: (1) lattice parameter, (2) high pressure
diamond cell and (3) low and high temperature studies.
The first method takes into consideration the predominant ionic
characteristics of a large number of inorganic materials. Infrared
spectra were measured in the region 1000 to 50 cm-1. In general the
size and coordination number of the ions determine the tetrahedral
and octahedral grouping in most oxides. These groups, in turn, build
339
340 MOLECULAR DYNAMICS AND STRUCTURE OF SOLIDS
the unit cell and determine to a large extent the lattice parameters of
the crystal. This particular method worked very well in the study of
rare earth oxides and garnets. From this study we are able to showhow the lattice parameter, and not the reduced mass of the metals,
played its role in determining the frequency position of the M—
O
stretching mode.
Recent high pressure diamond cell studies by Brasch and Jakobsen
in the mid-infrared and Ferraro and Mitra in the far-infrared have
indicated that useful data can be obtained from this technique. This
method was utilized in our study to determine if pressure on a material
would affect lattice vibrations in a specific way. The diamond cell
studies were performed on a Michelson far-infrared interferometer.
The first material studied under pressure was sodium chloride.
Pressure had a dramatic effect on this compound and its lattice fre-
quency shifted from 165 to 218 cm-1. Points were obtained in between
these frequencies by cycling the pressure through the maximum range
(50 kb) several times and then leaving the sample under a particular
pressure for approximately fifteen minutes. The first recording was at
one atmosphere and the next at maximum pressure of the particular
study. Several more recordings would then be made as the pressure
was lowered and the last obtained at one atmosphere again.
The following series of compounds have been studied by both
pressure and low-temperature methods. Cuprous oxide has only two
optically active modes in the infrared. One in the mid-infrared at
625 cm-1 and one in the low frequency region at 147 cm-1. The appli-
cation of 100 kilobars of pressure to this compound shifts the 625 cm-1
band to 690 cm-1 while the low frequency band remains the same.
At 150 °K under normal pressure the 625 band shifts to 635 and the
147 band to 150 cm-1. This seems to indicate that the metal-to-oxygen
stretching mode in this body centered cubic lattice is greatly affected
by pressure while the bending mode is not even slightly perturbed.
Zr02 and Hf02 have a series of three bands occurring between 280
and 230 cm" 1. For Zr02 we found bands at 272, 262 and 233 cm" 1
while Hf02 has bands at 270, 260 and 237 cm-1. Although the mass of
hafnia is almost twice that of zirconia, we can see that the first two
frequencies in Zr02 are only slightly higher than for Hf02 . However,
the low frequency band at 237 cm-1for Hf02 is slightly higher than
the corresponding frequency in Zr02 . Pressure increases this bandfrequency slightly in Zr02 , while it has more of an effect on Hf02 .
Low temperature studies show both bands shifting approximately the
same degree; however, this shift is larger than the pressure shift.
We chose anthracene as an example of an organic compound exhibit-
ing van der Waals' forces in the crystalline state. Anthracene has
bands at 232, 164, 114, and 60 cm-1. The two high frequency bands
LATTICE DYNAMICS' 341
have been assigned to molecular vibrations while the band at 114 cm-1
is assigned to a lattice mode. At 10 kb the molecular vibrations shift
slightly while the lattice mode shifts to 140 cm-1. It appears from this
study that van der Waals' bonding is quite sensitive to pressure.
There is approximately a ten cm-1shift in this frequency when the
temperature is lowered to 100 °K.
Phenol is an interesting compound exhibiting hydrogen bonding
characteristics. This material has an O—H O stretching absorp-
tion band in the low-frequency region. When pressure is applied to
this compound two different phases may be obtained. Phase II was an
O—H O absorption at 133 cm-1 while Phase I has a band at
175 cm-1. Both bands shift approximately 25 cm-1 with applied
pressure.
Conclusion
The three methods studied in this paper are helpful in studying
intermolecular vibrations in the low frequency infrared region. How-ever, not all lattice modes shift with pressure, and there is some indi-
cation that the type of motion the atoms undergo in a specific modemay determine its sensitivity to pressure. There also seems to be a
definite distinction between sensitivity to pressure and a sensitivity
to temperature.
311-280 0—69—23

OPTICAL PHONONS IN MIXED SODIUMPOTASSIUM TANTALATES
T. G. DAVIS, N. E. TORNBERG, and C. H. PERRY
Spectroscopy Laboratory 1
Materials Center for Science and Engineering 2
and Research Laboratory of Electronics 3
Massachusetts Institute of Technology, Cambridge, Massachusetts 02139
and
N. KNABLEN.A.S.A., Electronics Research Center
Cambridge, Massachusetts 02138
1. Introduction
The dielectric properties of KTa03 have been investigated byWemple [1] and indicate Curie-Weiss law behavior with an extrapo-
lated Curie temperature (Tc ) of 1-3 °K. Davis [2] has obtained dielec-
tric data of the mixed crystal system NaTa03-KTa03 as a function of
temperature. Tc rises to a maximum of 65 °K for a sample containing
48 percent NaTa03 , falls with higher NaTa03 concentrations, and
becomes negative at approximately 72 percent NaTa03 . For materials
in the range 35-50 percent NaTa03 , an anomalous "plateau" in the
dielectric behavior is observed [2]. This could arise (e.g., in
(Na0.4:Ko.6)Ta03) from a second-order ferroelectric transition at
^55 °K and a transition from cubic to a structurally different phase
(e.g. tetragonal) at 37 °K. X-ray data by Davis [2] shows that samples
with concentrations to ~70 percent NaTa03 are cubic at roomtemperature.
Above 70 percent the structure initially becomes tetragonal, finally
shearing to pseudo-monoclinic as the concentration approaches pure
NaTa03 . The (Na:c :Ki_ 2.)Ta03 crystals investigated here by infrared
and Raman spectroscopy as a function of temperature had x=0.0,
0.12, 0.40 and 0.85.
1 The work of this laboratory is supported in part by the National Science Foundation Grant No. GP-4923.
2 The work of this laboratory is supported in part by A.R.P.A., S.D.-90.
3 The work of this laboratory is supported in part by the Joint Services Electronics Program (Contract
DA28-043-AMC02536 (E)).
343
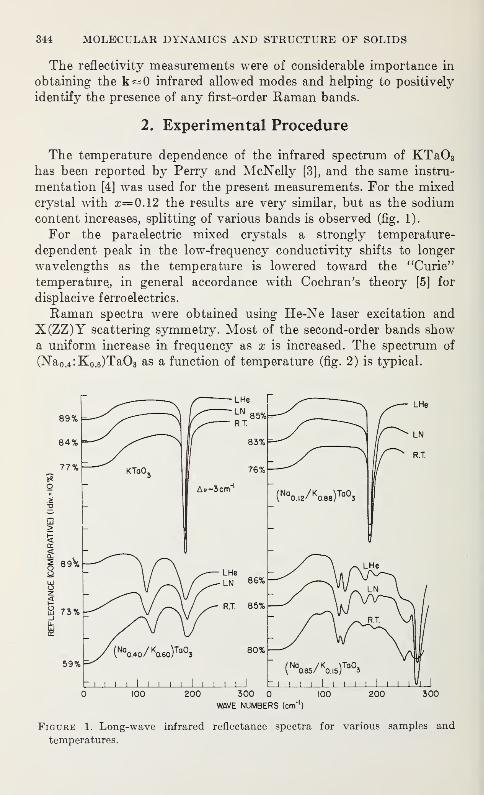
344 MOLECULAR DYNAMICS AND STRUCTURE OF SOLIDS
The reflectivity measurements were of considerable importance in
obtaining the k^O infrared allowed modes and helping to positively
identify the presence of any first-order Raman bands.
2. Experimental Procedure
The temperature dependence of the infrared spectrum of KTa03
has been reported by Perry and McNelly [3], and the same instru-
mentation [4] was used for the present measurements. For the mixed
crystal with 2=0.12 the results are very similar, but as the sodium
content increases, splitting of various bands is observed (fig. 1).
For the paraelectric mixed crystals a strongly temperature-
dependent peak in the low-frequency conductivity shifts to longer
wavelengths as the temperature is lowered toward the "Curie"
temperature, in general accordance with Cochran's theory [5] for
displacive ferro electrics.
Raman spectra were obtained using He-Ne laser excitation and
X(ZZ)Y scattering symmetry. Most of the second-order bands showa uniform increase in frequency as x is increased. The spectrum of
(Na 0.4:K 0.6)TaO3 as a function of temperature (fig. 2) is typical.
WAVE NUMBERS (cm*1
)
Figure 1. Long-wave infrared reflectance spectra for various samples and
temperatures.
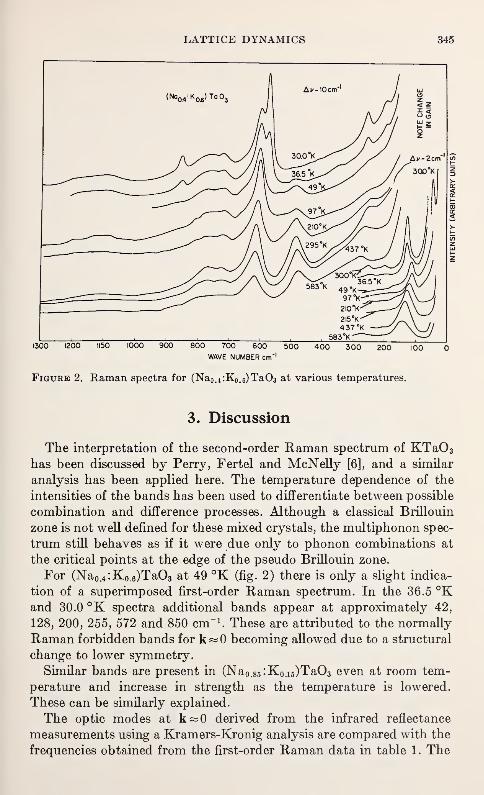
LATTICE DYNAMICS 345
| | i i i i i | |iJOJ r\
, , ,
—1300 1200 1150 1000 900 800 700 600 500 400 300 200 100
WAVE NUMBER cm" 1
Figure 2. Raman spectra for (Na0 . 4 :K0.6)TaO3 at various temperatures.
3. Discussion
The interpretation of the second-order Raman spectrum of KTa0 3
has been discussed by Perry, Fertel and McNelly [6], and a similar
analysis has been applied here. The temperature dependence of the
intensities of the bands has been used to differentiate between possible
combination and difference processes. Although a classical Brillouin
zone is not well defined for these mixed crystals, the multiphonon spec-
trum still behaves as if it were due only to phonon combinations at
the critical points at the edge of the pseudo Brillouin zone.
For (Na 0.4:Ko.6)Ta03 at 49 °K (fig. 2) there is only a slight indica-
tion of a superimposed first-order Raman spectrum. In the 36.5 °Kand 30.0 °K spectra additional bands appear at approximately 42,
128, 200, 255, 572 and 850 cm" 1. These are attributed to the normally
Raman forbidden bands for k«0 becoming allowed due to a structural
change to lower symmetry.
Similar bands are present in (Na 0 .85'Ko.i5)Ta03 even at room tem-
perature and increase in strength as the temperature is lowered.
These can be similarly explained.
The optic modes at k~0 derived from the infrared reflectance
measurements using a Kramers-Kronig analysis are compared with the
frequencies obtained from the first-order Raman data in table 1. The
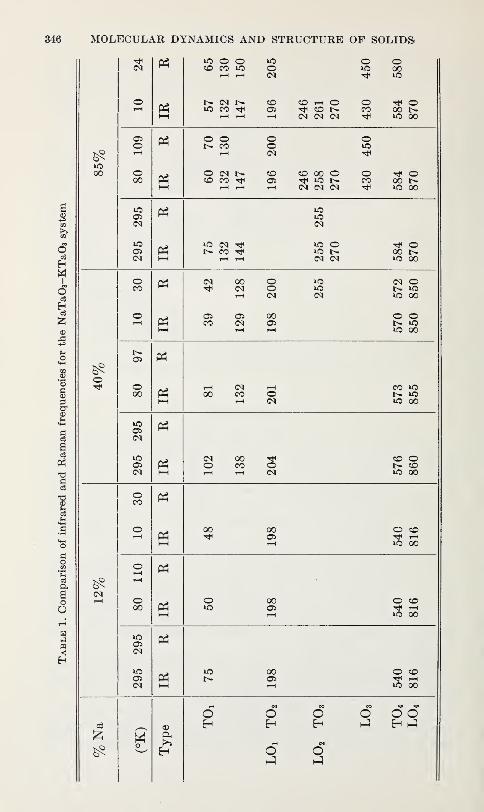
346 MOLECULAR DYNAMICS AND STRUCTURE OF SOLIDS
to o oco co to
N (N NiO M CO T—I O^ CO N
CM <M CM
rt^ O00tO 00
tO00
OSo o oCO
O (M NCO CO
CO 00 o^ iC NCM CM <N
TtH O00tO 00
HW
i
d
CM
P3lO tN ^N M r)f
tO O TtH O00 t*-iO 00
00CM
OSCM
to 00
lO 00
65o
I—
(
H CM00 CO
CMO
O
00CO
CO toI> to»0 00
CO oCO
tO 00
O COTJH r"-t
to X
O CO
lO 00
PS
to O CO
lO 00
03 CD
O O
O
o
O
o o o
LATTICE DYNAMICS 347
general agreement of the frequencies helps confirm the supposition
that for all sodium concentrations in the paraelectric phase, the
Raman spectrum is essentially a combined density of states curve
and indicates the phase transitions present.
The band at ~130 cm -1in 40 percent NaTa03 is interpreted as a
TOi normal mode which separates from the ferroelectric mode due to
the lowering of the crystal symmetry to tetragonal at the second
phase transition.
The normally orthohombic 85 percent NaTa03 crystal has a dielec-
tric constant with a considerably reduced temperature dependence.
This may explain the behavior of the lowest frequency mode and the
two additional bands at ~130 cm-1 and 147 cm-1, which show very
little temperature dependence in both the infrared and the Ramanspectra. The band or bands around 255 cm -1
in the two crystals with
highest sodium content could be due to the "F2u" mode, which is
normally inactive in the cubic crystals, becoming both infrared and
Raman active in the tetragonal phase. It should be noted that further
work is in progress in the region of the phase transitions on various
intermediate concentrations of NaTa03 .
Electric-field induced Raman spectra in the paraelectric phase is
presently being investigated by T. G. Davis at M.I.T. and N.A.S.A.
(E.R.C.). The temperature dependence of the "soft" mode and the
other first-order forbidden modes in these crystals with z<0.70 has
been observed. However, discussion of these results is beyond the
scope of this summary and will be published elsewhere.
4. References
[1] S. H. Wemple, Phys. Rev. 137A, 1575 (1965).
[2] T. G. Davis, S. M. Thesis, Department of Electrical Engineering, M.I.T.
(1965) (unpublished).
[3] C. H. Perry and T. F. McNelly, Phys. Rev. 154, 456 (1967).
[4] C. H. Perry, R. Geick and E. F. Young, Appl. Opt. 5, 1171 (1966).
[5] W. Cochran, Advances in Physics 9, 387 (1960).
[6] C. H. Perry, J. H. Fertel and T. F. McNelly, J. Chem. Phys. 47, 1619 (1967).

ON THE SECOND ORDER ELASTIC CONSTANTSOF MOLECULAR SOLIDS
M. L. KLEIN*
School of Chemistry
University of Bristol, Bristol, England
In this paper we are concerned with the possible importance of
anharmonic effect in the interpretation of the thermoelastic properties
of molecular solids. In particular, we shall be concerned with the rela-
tionship between elastic constants determined by(a) Isothermal thermodynamic measurement
(b) Velocity of ultrasound (adiabatic)
(c) Slopes of phonon dispersion curves as measured by the in-
elastic scattering of neutrons.
For a strictly harmonic solid these three measurements are equi-
valent and simply related to the harmonic force constants. However,
in an anharmonic crystal (i.e., real crystal) these three quantities, in
principle at least, show a different temperature dependence. Later weshall use solid Kr to illustrate the posible magnitude of these differ-
ences. Solid Kr is chosen because it is a crystal in which anharmonic
effects are important, but not dominant, and this situation is likely
to be common to many other molecular solids.
1. Isothermal Elastic Constants
Here it is convenient to define isothermal elastic constants as the
coefficients in the Taylor series expansion of (F/V), the Helmoltz free
energy density, in powers of the homogeneous strain parameters {uap}.
(F-F) /V=SafiU afi+^ SJffrUa^r
Thus VSJr«r=& 2F/bu aflduOT) T
Since the Helmholtz energy is temperature dependent, so too are
the isothermal elastic constants. In particular the lowest order explicit
temperature dependence is given by
(1/V) St/Wr*—yaprYcTTcv]
Qj
*ICI Fellow.
349
350 MOLECULAR DYNAMICS AND STRUCTURE OF SOLIDS
where
7a^"COW
and e and c r are the contribution to the internal energy and specific
heat of the mode a. The parameters fia&irT and ya& , which describe the
strain dependence of the normal modes, can be related to the usual
anharmonic force constants by perturbation theory.
For a cubic crystal under an isotropic stress Sap= —p&a$ the bulk
modulus BT is given by
::::
2. Adiabatic Elastic Constants
The adiabatic constants (^E/bUa^u^slV which determine the
velocity of ultrasonic waves can be related to the isothermal constants
by thermodynamics. For a cubic crystal one finds.
where y=(V/CT)(dS/dV) T is the usual thermodynamic Griineisen
parameter.
3. Inelastic Neutron Scattering
The inelastic scattering of neutrons can be used to measure the fre-
quency 9. and wave vector Q of phonons. The limiting slope of phonon
dispersion curves can be used to derive wave velocities and hence
effective elastic constants.
The explicit temperature-dependent contribution to these constants
has the following form [l]1
17
Here /(Q)=[(7(Q) 2/(0(Q)
2-KQ) 2)]
where v(Q) is the velocity of the probe in the direction Q and C(Q) is
the derivative with respect to wave vector of the mode o along the
direction Q of the probe. At finite temperatures these constants maynot have the same symmetry properties as the macroscopic elastic
constants. We note that if /(Q)=l we recover the isothermal result
whereas if /(Q)= 0 the neutron measurement yields the quaDtity
(d2E/du aS du„)nlV, where n is the mean number of phonons in the mode03. Thus, in general, the slopes of phonon dispersion curves give neither
the adiabatic nor isothermal constants at finite temperatures. Quan-
1 Figures in brackets indicate the literature references listed at the end of this paper.
LATTICE DYNAMICS 351
titative prediction without recourse to a specific model is difficult, but
it is clear that for cubic crystals, for example,
0?<1OO) >fff (100).
4. Model Calculations and Experimental Results for
Solid Kr
Adiabatic and isothermal elastic constants have been calculated for
solid Kr using a Mie Lennard-Jones (13-6) central two-body potential
with parameters fitted to the latent heat and molar volume at 0 °K [2].
At 77.3 °K the isothermal bulk modulus for this model is calculated
to be 20.0 kbars. This value is to be compared with the experimental
value 20.8 ± 0.7 kbars [3].
At 77.3 °K the adiabatic longditudinal wave velocity for the (110)
direction is calculated to be 1280 m/sec which is to be compared with
the recently measured experimental value [4].
^d(220)= 1370±80 m/sec.
Phonon dispersion curves for the (100), (110), and (111) directions
in fee Kr were recently reported [5]. The measurements were carried
out at 79 °K on a crystal with lattice parameter 5.725 A (approximately
0.3 kbars pressure). Typical values of the slopes of the dispersion
curves derived from these measurements are
»7(100)= 910± 90 m/sec (760)
0?(1OO)=115O±12O m/sec (1200)
»?(110) = 1310±120 m/sec (1280).
The values in parentheses are adiabatic velocities calculated for the
(13-6) potential. If these values are taken at all seriously then they
confirm the prediction that for finite temperatures
^(100)X(100); anddflf (100)/dT<dv»? (100)/dT.
With some improvement in the present experimental accuracy this
difference will probably be detectable.
5. References
[1] R. A. Cowley, Proc. Phys. Soc. 90, 1127 (1967).
[2] C. Feldman and M. L. Klein, to be published.
[3] V. O. Urvas, D. L. Losee and R. O. Simmons, unpublished work.
[4] E. Liicher, et al., unpublished work.
[5] W. B. Daniels, G. Shirane, D. C. Frazer, H. Umebayashi and A. Leake, Phys.
Rev. Letters 18, 538 (1937).


STRUCTURE OF ORGANIC CRYSTALS

DIFFRACTION STUDIES OF MOLECULARDYNAMICS IN ORGANIC CRYSTALS*
K. N. TRUEBLOOD
Department of Chemistry
University of California
Los Angeles, California 90024
1. Introduction
The chief focus in this brief account is on some recent work on two
topics relevant to the theme of the symposium : the description of the
motion of individual molecules and parts of molecules in crystals and
the mechanisms of some reactions in the solid state. Little is said here
about a number of important and relevant topics, including the recent
contributions of Cochran and Pawley [1-4] 1 on the lattice dynamics of
organic molecular crystals, the sorts of information available from
studies of diffuse x-ray scattering [5] and from neutron inelastic
scattering, and the application of data from precise structure analyses
to the testing and improvement of the parameters of inter- and intra-
molecular potential functions [6-9]. All of these are germane to a dis-
cussion of molecular dynamics in crystals, but some of them are being
considered by others and limitations of time preclude any adequate
discussion of them here.
The introduction of high-speed computing techniques in the early
1950's had a profound influence on the course of structure analyses bydiffraction methods in several different ways. It made possible for
the first time detailed structural studies of large molecules—first with
hundreds, now with thousands of atoms—and made practicable the
use of direct analytical methods for structure determination without
any chemical assumptions. These direct methods have in the past few
years become almost routine in many laboratories, at first only for
centrosymmetric structures but now increasingly for non-centrosym-
metric ones as well. Computers also made possible the development of
techniques for fully automatic data collection.
However, our concern here is chiefly with another aspect of the
impact of the computer—the development and application of rapid
and precise multiparameter refinement techniques. Why is refinement
* University of California Contribution 2175.1 Figures in brackets indicate the literature references at the end of this paper.
355
356 MOLECULAR DYNAMICS AND STRUCTURE OF SOLIDS
needed at all? The answer to this question is closely related to the
central problem of structure analysis by diffraction methods, the
"phase problem". The pattern of scattered radiation from an object is
the Fourier transform of the distribution of scattering matter in the
object—if the radiation can easily be focussed, one can recombine it
with appropriate lenses and get an image of the scattering matter.
With x-rays and neutrons however, no such physical recombination is
possible, so one must resort to analytical methods and perform a
Fourier inversion. In order to do that, however, one needs to know not
only the intensity of scattered radiation at each point (and thus its
amplitude) but also its phase. The amplitudes may readily be deter-
mined experimentally, but the phases seldom can be. The process of
structure determination consists in finding an approximate set of phases,
which then may be used with the observed amplitudes in the recon-
struction of an approximate image of the scattering matter by Fourier
synthesis. Refinement consists in systematically altering appropriate
parameters of the trial structure until it fits the observed data in an
optimum way, i.e., until the scattering amplitudes calculated for the
derived structure agree with those observed as closely as is meaningful
when one considers the experimental precision and accuracy.
When a structure involves only a few parameters—as do the simple
and often highly symmetrical structures studied during the first two
decades of x-ray crystallography—multiparameter refinement tech-
niques are not needed. However, they became essential by the early
1940's as the complexity of structures under investigation increased,
and Hughes in 1941 [10] first applied the least-squares method. This is
still by far the most widely used refinement technique; because the
observational equations are non-linear, least squares must be applied
in an iterative way, and many cycles are often needed for convergence.
Hughes' first application of least squares was in a two-dimensional
study, and very few organic structures were studied three-dimension-
ally before the late 1940's because the processing of three-dimensional
data was just too tedious. Months of labor were needed for a single
Fourier synthesis or diagonal least-squares cycle, and to calculate a
"full-matrix least squares"—i.e., to take into account the mutual
interactions of the different parameters during refinement—was out
of the question. Thus there simply was no opportunity for study of the
fine details of even the simplest organic structures and consequently
there was no need to measure with high precision the intensities of the
diffraction maxima—it is these intensities which reflect the fine details
of the arrangement of scattering matter in the unit cell. The moderate
precision of photographic methods and eye estimation was quite
adequate.
This situation changed markedly when high-speed computers be-
came available to crystallographers, and there was a period when
STRUCTURE OF ORGANIC CRYSTALS 357
numerous structures were refined beyond the point warranted by the
precision and accuracy of the experimental data used. However, this
sort of injudicious refinement is now uncommon, in part because
appropriate statistical tests are often applied. Furthermore, one nowhas as a standard the demonstrated consistency and physical plausi-
bility of results obtained in independent studies of many related
substances. A reemphasis during the last decade on techniques for
precise measurement of the diffracted intensities, including corrections
for the various sorts of errors that can occur—chiefly absorption and
secondary extinction—has helped significantly in improving the
precision of the derived parameters.
Even though approximate structures can often be determined with
no chemical assumptions, other than the plausible one that the struc-
ture contains approximately spherical atoms, the process of structure
refinement necessarily involves a model of the scattering matter, since
refinement consists in adjusting appropriate parameters of a model to
get the best fit with the experimental intensity data. The choice of
parameters to be refined is in some ways obvious and in some wayssubtle. Clearly the total number of adjustable parameters must be far
smaller than the number of independent intensity estimates.
One set of these parameters is the positions of atoms not fixed bysymmetry—three per atom in the general case, although in complex
structures containing reasonably rigid groups of moderately predict-
able geometry (e.g., phenyl groups), the internal geometry of the group
is sometimes assumed and only its center of mass and orientation
refined [11]. However, whether one assumes individual atoms or
definite groups of atoms, there still remain questions about their
atomic numbers, their shapes, and their modes of vibration.
We consider atomic and molecular motions in the next section; with
regard to atomic shapes and numbers, the most common assumption
currently is that each atom is spherical and of known atomic number(known from some clues about the chemical nature of the compoundunder study). When there is ambiguity about atomic identity, the
atomic number can be a parameter to be determined, and with goodx-ray intensity data it can be ascertained with reasonable assurance if
there are not many atoms present of much higher atomic number. This
topic is considered briefly below.
The assumption that atoms are spherical has until recently seemedadequate for essentially all x-ray studies, but attention is now being
directed both experimentally and theoretically to the detection of
bonded density and the effects of neglect of aspherical components of
charge distributions in the usual treatments [12-14]. These effects are
very difficult to detect experimentally since they are manifested
primarily in the inner region of the diffraction pattern because of the
311-280 0—69 24
358 MOLECULAR DYNAMICS AND STRUCTURE OF SOLIDS
reciprocal relation between this pattern and the distribution of scatter-
ing matter that gives rise to it, and the intensities in this inner region
are the most difficult to measure precisely because of extinction andother experimental difficulties. However the effects do seem experi-
mentally detectable, even though small. Dawson's formalism for
treating such effects [14] includes also provision for handling anhar-
monic components of atomic vibration amplitudes.
2. Atomic Vibration Parameters or ''TemperatureFactors"
Within a year after the discovery of x-ray diffraction, Debyeintroduced what has come to be known as the "Debye-Waller factor"
or simply the "temperature factor" to allow for atomic vibrations in
crystals. This factor is a coefficient in an exponential term which
reduces the intensity of the diffracted radiation with increasing
scattering angle:
1=10 e-2B(Bln2
6) /X*
I0 is the intensity expected for an atom at rest; the coefficient B is an
"isotropic temperature factor", the same for all scattering directions.
Inasmuch as the intensity is proportional to the square of the structure
factor amplitude |F|, an equivalent form is
\F\= \F0 \e-B{sin2(>) * 2
(2.1)
In deriving this relation, Debye analyzed the effects of displace-
ments of atoms from their equilibrium sites.. He assumed for simplicity
that these displacements were independent and (on the average)
isotropic, and that the potential function governing them was the
same for every atom. In essence this amounts to assuming a simple
cubic structure with one atom at every lattice point. Hence there is
only a single isotropic vibration parameter for the whole structure
—
the diminution in intensity arising from this cause depends only on
the angle between the incident and diffracted beams and not on the
direction from which the incident beam impinges on the crystal. This
approximation is a considerable oversimplification for most structures,
since the potential functions governing atomic motions often vary
widely for different atoms except in the simplest structures, and are
isotropic only when symmetry demands that they be. However,
until the 1950's, it was seldom possible to take either the anisotropy
or the variation from atom to atom into account in calculations.
The first improvement was to allow for individual isotropic "tem-
perature factors" (this name persists even though it was clear from the
start that there would be vibrations even at 0 °K and that a static
STRUCTURE OF ORGANIC CRYSTALS 359
disorder would normally be indistinguishable from the dynamic one
implied by this name if studies were made only at a single tempera-
ture) . As it became possible to handle larger numbers of parameters, it
became common to assume that each individual atom was vibrating
harmonically in an anisotropic field, so that its general motion could
be described by a symmetric tensor with six independent components
(corresponding physically to the magnitudes of the three principal
axes of an ellipsoid of vibration and the three angles specifying the
orientation of this ellipsoid relative to the crystal axes) . This descrip-
tion of atomic vibrational motion in terms of individual ellipsoidal
''temperature factors" is still by far the most common and is used in
most precise refinements because it is easy to handle and a fair ap-
proximation in many situations. The most common formulation of it
is expressed in terms of the familiar Miller indices of the Bragg'
'reflecting plane", which are also the indices of the corresponding
diffraction maximum in reciprocal crystal space. In this formulation
the exponential term analogous to that in eq (2.1) is
exp[-(bnh2+b22k*+bMl 2+b l2hk+b2zkl+bM] (2.2)
or
e-2* 2S T.UijSiSj (2.3)i j
where s is the reciprocal vector with components s t and magnitude
2 sin 0/A,
with a*, b*, and c* the reciprocal axes of the crystal. C7tJ is a componentof a symmetric tensor U such that the mean square amplitude of
vibration in the direction of a unit vector m { with respect to the
reciprocal axes is
u2=T, ^Uijniimj. (2.4)i j
Although the use of individual atomic isotropic and anisotropic
vibration parameters has been regarded at times as unjustified andmerely a device to improve the agreement of calculated with observed
structure amplitudes by introducing additional adjustable parameters,
the benefits have in fact far outweighed and outnumbered the abuses.
These "vibration parameters" may indeed mask other effects and mayeven be in part artifacts arising from absorption by the crystal, whichsimulates a negative temperature factor and may introduce false
anisotropy because of irregularities of crystal shape. However, bysuitable choice of radiation and crystal size and shape, this effect can
be minimized, and if it is significant it can be (and usually now is)
corrected for in careful work.
360 MOLECULAR DYNAMICS AND STRUCTURE OF SOLIDS
Careful scrutiny of even isotropic temperature factors during least-
squares refinement of a structure is one of the most effective ways of
discovering spurious "atoms" introduced into a trial structure. If an
assumed atom is spurious, its vibration parameter will increase very
rapidly—physically this corresponds to a spreading of the scattering
matter of this supposed atom over a very large volume, an indication
that the assumed position is incorrect. When the position is correct,
but the identification of the atom is not—i.e., in x-ray determinations,
when its atomic number is wrong—this mis-identification can often
be discovered by comparison of the vibration parameters of the as-
sumed atom and its immediate neighbors. If it seems to be vibrating
far less than one might have expected, it probably has been assigned
too low a scattering factor, so that to compensate the electrons appear
more concentrated than they really are. Conversely, if its vibration
seems too great, it may have been assigned too high an atomic number,
or it may be disordered in any of a variety of ways. These sorts of
considerations have been used many times, e.g. to distinguish the
oxygen and nitrogen atoms in the amide group of aureomycin [15], and
to distinguish supposed oxygen atoms from what was in reality a
half-chlorine atom (i.e., chlorine in two-fold disorder) in an iron
porphine [16].
Similar examination of anisotropic "temperature factors" can be
even more helpful. For example, in the aforementioned iron-porphine
[16] and also in a closely related molecule [17], the vibration parameters
of the metal atoms were unusually high parallel to c but were normal
in other directions. This anomaly, together with certain other unusual
structural features, suggested that in fact the molecules involved were
disordered parallel to c. A much improved fit to the data, together
with more normal vibration parameters, was found with this model.
Even in the absence of disorder, scrutiny of the behavior of aniso-
tropic vibration parameters during refinement can aid in differentiating
similar atoms or reveal unsuspected errors. For example, it helped in
differentiating nitrosyl and carbonyl groups in MnNO(CO) 2P(C 6H 5)3
[18] and brought to light an inadvertent error in the sign of the
y-parameter of one oxygen atom of the phosphate group of calcium
thymidylate [19]. Because of the latter error, the assumed position of
this atom was 0.55 A from the correct position along b; when refine-
ment was started, the "temperature factor" parallel to the y-axis
increased very rapidly, but those in other directions remained normal.
At the same time, the refinement process gradually shifted the
^/-parameter, and as it approached its correct value, the corresponding
temperature factor decreased again to a reasonable magnitude.
Some attempts have been made in the past to use more exact de-
scriptions of the scattering from atoms or groups of atoms undergoing
STRUCTURE OF ORGANIC CRYSTALS 361
librational motion, particularly torsional motion in hindered rotation,
but they are unwieldy and have in fact been applied only rarely.
However, they are attracting renewed interest [20,21] and more treat-
ments of this sort are to be expected with the better data now avail-
able, which warrant more exact analyses.
3. Rigid-Body and Related Treatments
3.1. Rigid-Body Motion
Cruickshank first showed in 1956 [22] how to determine the compo-
nents of the rigid-body motion of a molecule in a crystal by a least-
squares analysis of the individual atomic anisotropic vibration parame-
ters. His treatment involves a description of the molecular motion in
terms of two symmetric tensors, one for translation (T) and one for
libration (which he termed «). It has been widely adopted and used
in many studies of molecular crystal structures.
However, in recent years it has been recognized by several people
that Cruickshank's treatment is inadequate when there is no pre-
ordained center of libration (e.g., a center of symmetry, which was in
fact present in the molecules that he first treated) and attempts have
been made to determine and refine the position of an assumed center
of libration [23,24]. Actually, Schomaker first recognized in 1963 that
an additional tensor was needed to account for correlations of libration
and translation, and a complete analysis has now been published [25].
In addition to the translation (T) and libration (L) tensors, which
are symmetric as before and thus involve six parameters each, the
screw correlation tensor (S) must be included. For a molecule at a
sufficiently unsymmetrical site, S has eight independent components,
one of its diagonal elements being arbitrary, and the contributions to
the anisotropic displacement tensors by the rigid-body part of the
enormously complicated actual motions can be described in terms of
six uncorrelated simple motions: three principal mean-square trans-
lations plus three screw (helical) motions about and along three
mutually perpendicular non-intersecting axes.
The problem of fitting the observed atomic vibrational displacement
tensors (the U of eq (2.4)) in terms of rigid-body translation and screw
motion involves in the general case a least-squares fit of twenty
independent parameters. If the molecule is at a symmetrical site, someor all of the components of S are subject to special restrictions; for
example, if the molecule is at a centrosymmetric site, S vanishes
completely and the treatment is identical to Cruickshank's. In anyevent the fit is always independent of the origin assumed in the descrip-
tion of the motion and can be found by a straightforward linear least-
squares process.
362 MOLECULAR DYNAMICS AND STRUCTURE OF SOLIDS
3.2. Librational Corrections to Distances
Cruikshank [26, 27] was also the first to treat an important conse-
quence of librational motion, namely that intramolecular distances
will appear foreshortened. The corrections for this effect depend only
on the libration tensor L when rigid-body motion is all that is in-
volved. In more complicated situations, it is only possible to make a
meaningful correction by making assumptions about the joint dis-
tribution of the motions of the atoms involved [28]. An assumption
commonly made is that one atom "rides" on another (essentially
that it participates in all of the motion of the atom on which it rides
plus some additional motion of its own). This assumption often seems
justified, particularly when a light atom is attached terminally to a
heavier one (e.g., as in a —OH group).
Becka and Cruickshank have shown convincingly [29] how the
correction for rigid-body librational motion removes an apparent
small temperature dependence of the C-N bond distance in hexa-
methylenetetramine. The uncorrected distance decreases by more than
0.010 A as the temperature is raised from 34 to 298 °K; the r.m.s.
librational amplitude increases at the same time from 2.4° to 6.6°
[30]. When this latter increase is taken into account, the difference
in the foreshortening correction at the different temperatures is
found to account almost exactly for the apparent change in bondlength.
3.3. Pawley's Rigid-Body Method
Pawley [23, 24] has used an approach to the determination of the
rigid-body parameters different from that of Cruickshank or Scho-
maker and Trueblood. He makes the rigid-body assumption at an
early stage in the refinement of the parameters of the structure, so
that instead of determining individual atomic anisotropic vibration
parameters, he determines only the components of the overall libra-
tional and translational tensors L and T and the coordinates of a
presumed origin of libration. 2
This approach has the advantage that it reduces the number of
parameters and gives appreciably more rapid convergence; it also
usually gives somewhat smaller standard deviations for the rigid-
body tensors than are obtained by the analysis of refined individual
atomic vibration parameters. It is of course suitable only for rather
rigid molecules, since the individual atomic anisotropic temperature
factors are constrained to fit the parameters of the rigid-body motion.
Most of the molecules studied by Pawley [24] were indeed quite
rigid boron compounds, but one had —CH2Br groups which might
2 In a private communication just received, Pawley reports that he has modified his parameter-refine-
ment program to include S instead of the presumed origin of libration and that the least-squares process
no longer converges but rather exhibits all the symptoms If ill-conditioning.
STRUCTURE OF ORGANIC CRYSTALS 363
have been expected to be moderately flexible. Surprisingly, whenthe constraints on the individual temperature factors were removed
at the end of the refinement, there was no significant improvement
in the agreement of observed and calculated structure amplitudes.
3.4. Internal Vibrations
Any rigid-body treatment involves either assuming that the in-
ternal vibrations are negligible with respect to the rigid-body motion,
explicitly correcting for the internal vibrations if they are known
[31, 32], or modifying the analysis to include them when they do not
increase too greatly the number of parameters to be determined. Byfar the most common assumption in practice has been to ignore the
internal vibrations. This approximation is generally justified as far as
bond-stretching vibrations are concerned (except when hydrogen vi-
brational parameters have been determined and are being used to
determine rigid-body motion—this is possible with neutron diffraction
although not with x-rays). The approximation is less good for bending
modes, but is still acceptable for many molecules; it is much morequestionable when there are appreciable torsional modes (e.g., about
single bonds).
It has become common practice to make an analysis of possible
rigid-body motion at the conclusion of the determination of the
structure of a molecular crystal. By comparing the results with and
without certain suspect atoms or groups of atoms, and in particular
the fit of the vibrational parameters of these atoms to the rigid-
body model, the validity of the model can be plausibly tested. For
example, the appreciable vibrations of the cyano groups in manycyano-olefins are readily apparent when this sort of comparison is
made [33], and the large out-of-plane bending characteristic of car-
bonyl oxygens and other terminal atoms has been noted many times
[34]. A recent survey [35] indicates that the rigid-body postulate
may be more widely applicable to molecular crystals than might at
first be thought; detailed atom-by-atom comparisons were made, andsince Cruickshank's method was used although some of the molecules
were not centrosymmetric, the fits were not in fact as good as they
would be with the more exact treatment, which has always given a
better fit, even when the increased number of parameters is taken
into account [25].
In several of the most careful organic structural studies to
date, including hexamethylenetetramine [30], S-endo-p\ienj\-2-endo~
norbornanol [36], and benzene [37,38], the rigid-body motion has been
treated separately from at least the most prominent internal vibra-
tions. The results shown in table 1 for the libration of the benzene
molecule about its six-fold axis at various temperatures [37,38] are
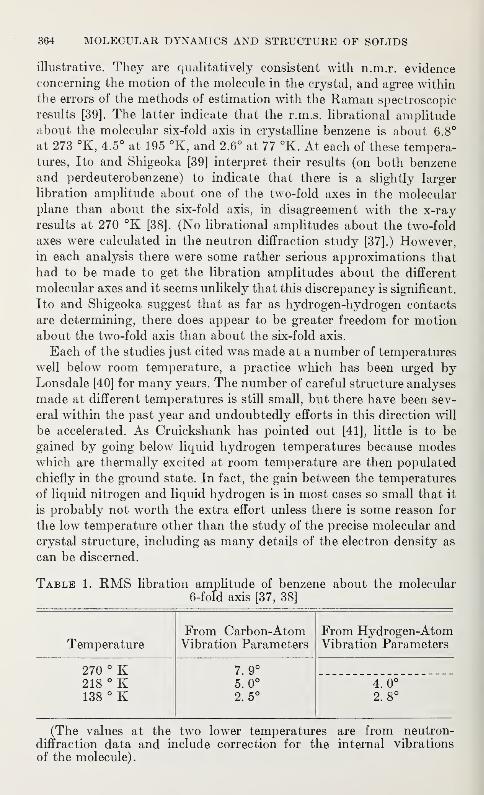
364 MOLECULAR DYNAMICS AND STRUCTURE OF SOLIDS
illustrative. They are qualitatively consistent with n.m.r. evidence
concerning the motion of the molecule in the crystal, and agree within
the errors of the methods of estimation with the Raman spectroscopic
results [39]. The latter indicate that the r.m.s. librational amplitudeabout the molecular six-fold axis in crystalline benzene is about 6.8°
at 273 °K, 4.5° at 195 °K, and 2.6° at 77 °K. At each of these tempera-
tures, Ito and Shigeoka [39] interpret their results (on both benzeneand perdeuterobenzene) to indicate that there is a slightly larger
libration amplitude about one of the two-fold axes in the molecular
plane than about the six-fold axis, in disagreement with the x-ray
results at 270 °K [38]. (No librational amplitudes about the two-fold
axes were calculated in the neutron diffraction study [37].) However,in each analysis there were some rather serious approximations that
had to be made to get the libration amplitudes about the different
molecular axes and it seems unlikely that this discrepancy is significant.
Ito and Shigeoka suggest that as far as hydrogen-hydrogen contacts
are determining, there does appear to be greater freedom for motionabout the two-fold axis than about the six-fold axis.
Each of the studies just cited was made at a number of temperatures
well below room temperature, a practice which has been urged byLonsdale [40] for many years. The number of careful structure analyses
made at different temperatures is still small, but there have been sev-
eral within the past year and undoubtedly efforts in this direction will
be accelerated. As Cruickshank has pointed out [41], little is to be
gained by going below liquid hydrogen temperatures because modeswhich are thermally excited at room temperature are then populated
chiefly in the ground state. In fact, the gain between the temperatures
of liquid nitrogen and liquid hydrogen is in most cases so small that it
is probably not worth the extra effort unless there is some reason for
the low temperature other than the study of the precise molecular and
crystal structure, including as many details of the electron density as
can be discerned.
Table 1. RMS libration amplitude of benzene about the molecular6-fold axis [37, 38]
TemperatureFrom Carbon-AtomVibration Parameters
From Hydrogen-AtomVibration Parameters
270 ° K 7. 9°
218 ° K 5. 0° 4. 0°
138 ° K 2. 5° 2. 8°
(The values at the two lower temperatures are from neutron-diffraction data and include correction for the internal vibrations
of the molecule).
STRUCTURE OF ORGANIC CRYSTALS 365
It is clearly important in attempting to deduce information about
internal modes that the data used be of the best possible accuracy. Avery ambitious attempt has been made [42] to determine the internal
bending modes of di-p-xylylene ([2.2]paracyclophane);however, the
molecule has high symmetry so there is little redundancy in the
vibrational parameters that can be used and hence any errors in
them will be important. An extensive further study of this molecule
using both diffractometer and film data [43] indicates that the vibra-
tion parameters found earlier were sufficiently in error that the con-
clusions from that analysis concerning the details of the various bending
modes of the molecule (which depended chiefly on differences in the
parameters for the three unique atoms) are not well founded.
A striking demonstration of the physical plausibility of vibration
parameters derived by careful analysis of accurate data has recently
been given by Johnson in his neutron-diffraction study of 3-endo-
phenyl-2-encfo-norbornanol [36]. In one approach, he treated the entire
skeleton of non-hydrogen atoms as a rigid body, and then used the
motional parameters so derived to calculate the rigid-body contribu-
tions to the hydrogen vibrational parameters, assuming them to "ride"
on the heavy-atom skeleton. The differences between the actual hydro-
gen vibrations and those so calculated presumably represent the dis-
placements due to internal vibrations of the hydrogen atoms.
The general pattern so found was physically very plausible: the
smallest displacements were along the bond directions, the out-of-plane
displacements for the phenyl-hydrogens were greater than the in-plane
tangential ones, and the largest displacements for the methylene
hydrogens were in the H-C-H plane and nearly perpendicular to the
C-H bonds. A far better fit of the heavy-atom parameters was obtained
by treating the phenyl group and the norbornanol cage as two separate
rigid bodies, and the three plausible patterns of hydrogen-atom move-ment noted above were then even more apparent. Furthermore the
differential hydrogen displacements so derived agree reasonably well
with the displacements expected from the usual force constants andfrequency assignments.
3.5. Segmented or Coupled Rigid-Bodies
Johnson [44] has recently extended the rigid-body approach to whathe terms "segmented rigid bodies", that is a group of individually rigid
segments riding on each other and joined by axes of torsional oscilla-
tion. He has applied this model with notable success to citric acid,
which he treated as consisting of six segments joined by five torsional
axes.
A general approach to the problem of coupled rigid bodies has been
suggested by Schomaker [45]. It involves no assumptions of riding
366 MOLECULAR DYNAMICS AND STRUCTURE OF SOLIDS
motion and is just a generalization of the analysis of a single rigid
body [25]. For example, if there are two rigid bodies joined at a single
point, there wil1 be one overall translational tensor and two librational
and screw tensors, a total of 34 parameters; with two rigid bodies
joined together at two points, the additional constraint reduces the
number of parameters to 26. Since in a large molecule of the sort whichis likely to be of interest for this type of analysis there are manyatoms, with six vibrational parameters per atom, there should normally
be more than sufficient data for determining these additional rigid-
body parameters. It remains to be seen, of course, whether they will be
physically plausible, but presumably they should be as consistent as
those for individually rigid molecules. That these are often extremely
plausible physically is shown in the next section.
4. Some Experimental Results Concerning Motionof Molecules and Portions of Molecules
A few examples have been selected from some recent precise struc-
ture analyses to illustrate the sorts of patterns of molecular motion
that can be discerned from diffraction data. Almost all of the results
quoted have been determined by application of the rigid body model,
including S when needed, to the individual atomic temperature factors
after the latter have been determined by least-squares refinement.
The only exceptions are for the nitro groups, for which calculations
were made as described below, and for naphthalene and anthracene,
to which Pawley applied his refinement method [24].
Despite the fact that the individual atomic mean-square displace-
ments are usually precise only to about 5 percent in the best analyses,
there are normally sufficient atoms in the rigid body so that its param-
eters can be determined with fair precision. The r.m.s. discrepancies
of the observed and calculated components of the displacement
tensors (taking into account the number of independent parameters
being determined) were evaluated in every example quoted and the
fit was usually well within the estimated precision of the experimentally
determined displacements.
Cruickshank's results for anthracene [46, 47] and naphthalene [48]
were the first ones obtained with the rigid-body model and demon-
strated at once its general plausibility. The principal axes of the
translational and librational tensors for each molecule coincided with
the molecular axes within experimental error, and the findings were
consistent with both thermodynamic and spectroscopic data [49].
Pawley's elegant recent development of a model for the lattice dynam-ics of each of these crystals [4] gives good agreement of the tensors
derived from the diffraction data with those calculated from the knownstructures using an assumed "6-exp" interatomic potential function.
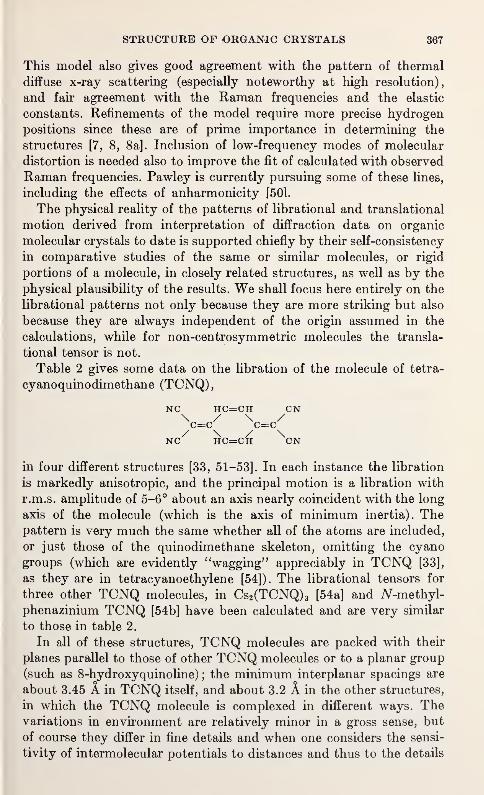
STRUCTURE OF ORGANIC CRYSTALS 367
This model also gives good agreement with the pattern of thermal
diffuse x-ray scattering (especially noteworthy at high resolution),
and fair agreement with the Raman frequencies and the elastic
constants. Refinements of the model require more precise hydrogen
positions since these are of prime importance in determining the
structures [7, 8, 8a]. Inclusion of low-frequency modes of molecular
distortion is needed also to improve the fit of calculated with observed
Raman frequencies. Pawley is currently pursuing some of these lines,
including the effects of anharmonicity f50l.
The physical reality of the patterns of librational and translational
motion derived from interpretation of diffraction data on organic
molecular crystals to date is supported chiefly by their self-consistency
in comparative studies of the same or similar molecules, or rigid
portions of a molecule, in closely related structures, as well as by the
physical plausibility of the results. We shall focus here entirely on the
librational patterns not only because they are more striking but also
because they are always independent of the origin assumed in the
calculations, while for non-centrosymmetric molecules the transla-
tional tensor is not.
Table 2 gives some data on the libration of the molecule of tetra-
cyanoquinodimethane (TCNQ),
NC HC=CH CN\c=c/ \=c/
NC HC=CH CN
in four different structures [33, 51-53]. In each instance the libration
is markedly anisotropic, and the principal motion is a libration with
r.m.s. amplitude of 5-6° about an axis nearly coincident with the long
axis of the molecule (which is the axis of minimum inertia). Thepattern is very much the same whether all of the atoms are included,
or just those of the quinodimethane skeleton, omitting the cyano
groups (which are evidently "wagging' 9 appreciably in TCNQ [33],
as they are in tetracyanoethylene [54]). The librational tensors for
three other TCNQ molecules, in Cs2(TCNQ) 3 [54a] and iV-methyl-
phenazinium TCNQ [54b] have been calculated and are very similar
to those in table 2.
In all of these structures, TCNQ molecules are packed with their
planes parallel to those of other TCNQ molecules or to a planar group
(such as 8-hydroxyquinoline) ; the minimum interplanar spacings are
about 3.45 A in TCNQ itself, and about 3.2 A in the other structures,
in which the TCNQ molecule is complexed in different ways. Thevariations in environment are relatively minor in a gross sense, but
of course they differ in fine details and when one considers the sensi-
tivity of intermolecular potentials to distances and thus to the details
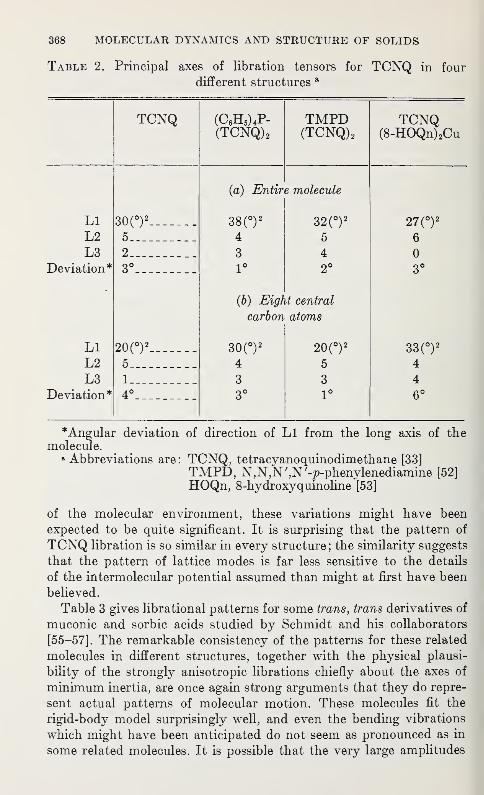
368 MOLECULAR DYNAMICS AND STRUCTURE OF SOLIDS
Table 2. Principal axes of libration tensors for TCNQ in four
different structures a
TCNQ (C6H5) 4P-(TCNQ) 2
TMPD(TCNQ),
TCNQ(8-HOQn) 2Cu
(a) Entire molecule
LIL2L3
Deviation*
30(°) 2
5___
2___
3°__
38(0)2
4
3
1°
32(0)2
5
42°
27(°) :
6
03°
(b) Eight central
carbon atoms
LIL2L3
Deviation *
20(°) 2
5___
4°__
30(°) 2
4
3
3°
20(°) 2
5
31°
33(°) :
4
46°
*Angular deviation of direction of Ll from the long axis of themolecule.
a Abbreviations are: TCNQ, tetracyanoquinodimethane [33]
TMPD, N,N,^N'-p-phenylenediamine [52]
HOQn, 8-hydroxyquinoline [53]
of the molecular environment, these variations might have been
expected to be quite significant. It is surprising that the pattern of
TCNQ libration is so similar in every structure; the similarity suggests
that the pattern of lattice modes is far less sensitive to the details
of the intermolecular potential assumed than might at first have been
believed.
Table 3 gives libration al patterns for some trans, trans derivatives of
muconic and sorbic acids studied by Schmidt and his collaborators
[55-57]. The remarkable consistency of the patterns for these related
molecules in different structures, together with the physical plausi-
bility of the strongly anisotropic librations chiefly about the axes of
minimum inertia, are once again strong arguments that they do repre-
sent actual patterns of molecular motion. These molecules fit the
rigid-body model surprisingly well, and even the bending vibrations
which might have been anticipated do not seem as pronounced as in
some related molecules. It is possible that the very large amplitudes
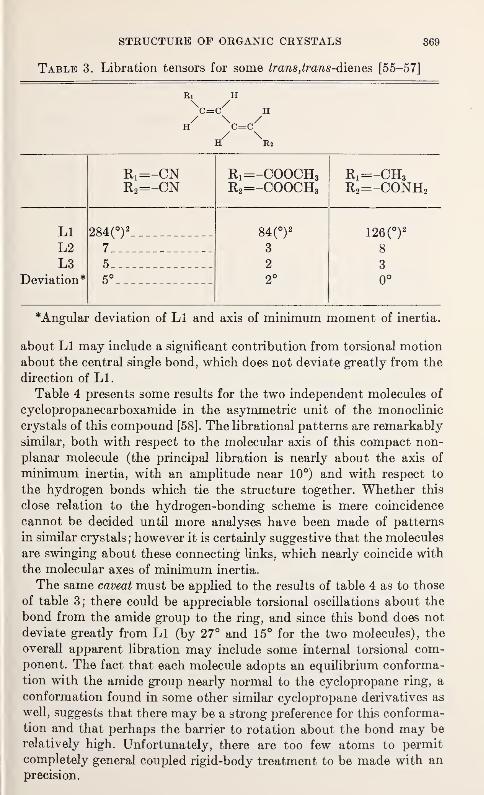
STRUCTURE OF ORGANIC CRYSTALS 369
Table 3. Libration tensors for some trans,trans-dieues [55-57]
Ri HW H
^ )C=C
(H R 2
R 1=-CN R1=-COOCH3 Ri=—CH3
R,2=-CN R2=-COOCH3 R2=-CONH2
LI 284(°) 2 84(°) 2 126(°) 2
L2 7 3 8
L3 5 2 3
Deviation* 5° 2° 0°
*Angular deviation of Ll and axis of minimum moment of inertia.
about Ll may include a significant contribution from torsional motion
about the central single bond, which does not deviate greatly from the
direction of Ll.
Table 4 presents some results for the two independent molecules of
cyclopropanecarboxamide in the asymmetric unit of the monoclinic
crystals of this compound [58]. The librational patterns are remarkably
similar, both with respect to the molecular axis of this compact non-
planar molecule (the principal libration is nearly about the axis of
minimum inertia, with an amplitude near 10°) and with respect to
the hydrogen bonds which tie the structure together. Whether this
close relation to the hydrogen-bonding scheme is mere coincidence
cannot be decided until more analyses have been made of patterns
in similar crystals; however it is certainly suggestive that the molecules
are swinging about these connecting links, which nearly coincide with
the molecular axes of minimum inertia.
The same caveat must be applied to the results of table 4 as to those
of table 3; there could be appreciable torsional oscillations about the
bond from the amide group to the ring, and since this bond does not
deviate greatly from Ll (by 27° and 15° for the two molecules), the
overall apparent libration may include some internal torsional com-ponent. The fact that each molecule adopts an equilibrium conforma-
tion with the amide group nearly normal to the cyclopropane ring, a
conformation found in some other similar cyclopropane derivatives as
well, suggests that there may be a strong preference for this conforma-tion and that perhaps the barrier to rotation about the bond may be
relatively high. Unfortunately, there are too few atoms to permit
completely general coupled rigid-body treatment to be made with anprecision.
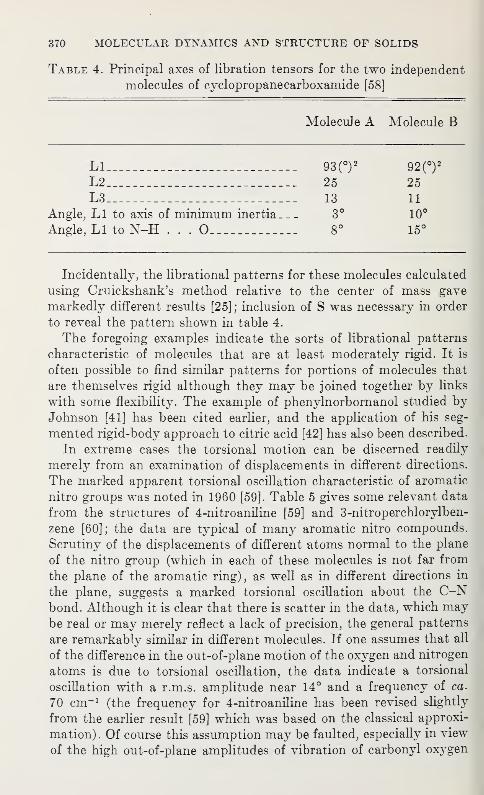
370 MOLECULAR DYNAMICS AND STRUCTURE OF SOLIDS
Table 4. Principal axes of libration tensors for the two independent
molecules of cyclopropanecarboxamide [58]
Molecule A Molecule B
Ll 93(0)2
92(0)
2
L2 25 25
L3 13 11
Angle, Ll to axis of minimum inertia 3° 10°
Angle, Ll to N-H . . . O 8° 15°
Incidentally, the librational patterns for these molecules calculated
using Cruickshank's method relative to the center of mass gave
markedly different results [25]; inclusion of S was necessary in order
to reveal the pattern shown in table 4.
The foregoing examples indicate the sorts of librational patterns
characteristic of molecules that are at least moderately rigid. It is
often possible to find similar patterns for portions of molecules that
are themselves rigid although they may be joined together by links
with some flexibility. The example of phenylnorbornanol studied byJohnson [41] has been cited earlier, and the application of his seg-
mented rigid-body approach to citric acid [42] has also been described.
In extreme cases the torsional motion can be discerned readily
merely from an examination of displacements in different directions.
The marked apparent torsional oscillation characteristic of aromatic
nitro groups was noted in 1960 [59]. Table 5 gives some relevant data
from the structures of 4-nitroaniline [59] and 3-nitroperchlorylben-
zene [60]; the data are typical of many aromatic nitro compounds.
Scrutiny of the displacements of different atoms normal to the plane
of the nitro group (which in each of these molecules is not far from
the plane of the aromatic ring), as well as in different directions in
the plane, suggests a marked torsional oscillation about the C-Nbond. Although it is clear that there is scatter in the data, which maybe real or may merely reflect a lack of precision, the general patterns
are remarkably similar in different molecules. If one assumes that all
of the difference in the out-of-plane motion of the oxygen and nitrogen
atoms is due to torsional oscillation, the data indicate a torsional
oscillation with a r.m.s. amplitude near 14° and a frequency of ca.
70 cm-1(the frequency for 4-nitroaniline has been revised slightly
from the earlier result [59] which was based on the classical approxi-
mation). Of course this assumption may be faulted, especially in view
of the high out-of-plane amplitudes of vibration of carbonyl oxygen
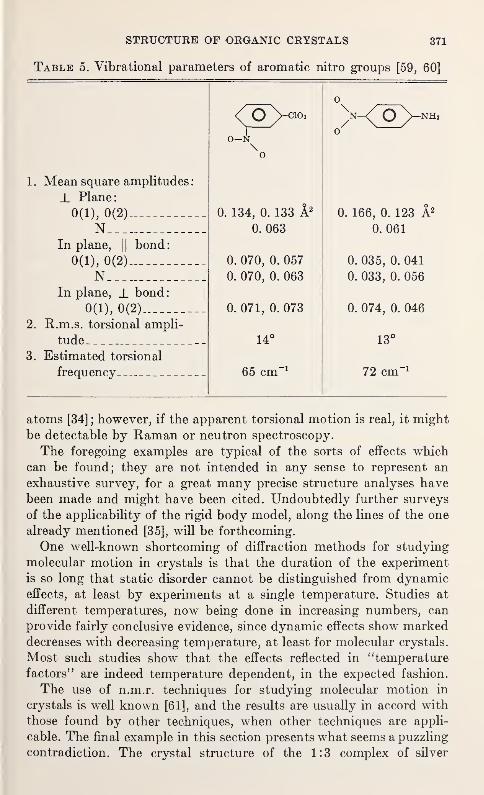
STRUCTURE OF ORGANIC CRYSTALS 371
Table 5. Vibrational parameters of aromatic nitro groups [59, 60]
1 . Mean square amplitudes
:
_L Plane:
0(1), 0(2)
NIn plane,
1
1 bond
:
0(1), 0(2)
NIn plane, J_ bond:
0(1), 0(2)
2. R.m.s. torsional ampli-
tude
3. Estimated torsional
frequency
atoms [34] ;however, if the apparent torsional motion is real, it might
be detectable by Raman or neutron spectroscopy.
The foregoing examples are typical of the sorts of effects which
can be found; they are not intended in any sense to represent an
exhaustive survey, for a great many precise structure analyses have
been made and might have been cited. Undoubtedly further surveys
of the applicability of the rigid body model, along the lines of the one
already mentioned [35], will be forthcoming.
One well-known shortcoming of diffraction methods for studying
molecular motion in crystals is that the duration of the experiment
is so long that static disorder cannot be distinguished from dynamiceffects, at least by experiments at a single temperature. Studies at
different temperatures, now being done in increasing numbers, can
provide fairly conclusive evidence, since dynamic effects show markeddecreases with decreasing temperature, at least for molecular crystals.
Most such studies show that the effects reflected in "temperature
factors" are indeed temperature dependent, in the expected fashion.
The use of n.m.r. techniques for studying molecular motion in
crystals is well known [61], and the results are usually in accord with
those found by other techniques, when other techniques are appli-
cable. The final example in this section presents what seems a puzzling
contradiction. The crystal structure of the 1:3 complex of silver
ClOs
O—
N
\
0. 134, 0. 133 A2
0. 063
0. 070, 0. 057
0. 070, 0. 063
0. 071, 0. 073
14°
65 cm-1
n-<; O Vnhj
0. 166, 0. 123 A2
0. 061
0. 035, 0. 041
0. 033, 0. 056
0. 074, 0. 046
13°
72 cm" 1
372 MOLECULAR DYNAMICS AND STRUCTURE OF SOLIDS
perchlorate with dioxane has been determined at room temperature
(about 22 °C)[62]. Since the silver atom (at the origin) determines
essentially all of the signs in this structure, there is little ambiguityabout the Fourier synthesis which corresponds to the electron density;
it shows quite clearly that at room temperature the dioxane molecules
are rotating axially about a line between the oxygen atoms. Detailed
structure factor calculations and examination of the anisotropy of the
thermal parameters of the oxygen atoms of the dioxane molecule sup-
port this model. There is no indication that the dioxane molecules
reorient themselves spherically, although the percholate ion does
appear to do so.
Kecently however' Kawamori and Sakiyama [63] have mademeasurements of the proton magnetic resonance spectrum of crystals
of this complex between —66 and +25 °C. They find two phase
transitions (at 14 and 17 °C). By studies of line width, and comparison
with calculated second moments, they conclude that axial rotation is
present at about 14 °C and that there is spherical reorientation of
the dioxane molecules above 17 °C. They imply that the latter result
is in accord with the x-ray findings. In fact, it seems to contradict
them, but the temperatures involved are not greatly different, and it
is not clear whether the apparently contradictory observations were
really made on the same phase.
5. Chemical Reactions in Organic Crystals
There has recently been increasing attention to studies of solid
state reactions of various sorts, which certainly faU properly within
the scope of any consideration of molecular dynamics. Morawetz [64]
has reviewed much of the work involving organic crystals; one sub-
sequent stud}T is that of Lonsdale, Nave, and Stephens [65] who madea very detailed investigation of the changes occurring during the
photochemical and thermal conversion of a single crystal of anthracene
photo-oxide to a single crystal of a mixture of anthraquinone and
anthrone. They discuss the observed changes in terms of the details
of the molecular structures, thermal vibrations, and packing in the
crystals.
The most comprehensive current studies of solid state organic
chemistry by a combination of diffraction and other techniques are
those of Schmidt and his collaborators at the Weizmann Institute
[66, 67]; much of their work has appeared in the Journal of TheChemical Society, chiefly in mid-1964 and early 1967. Their most
extensive published studies concern the photochemistry of crj'stals of
trans and cis cinnamic acid derivatives, various _p-benzoquinones, and
a number of trans, /rans-dienes (principally derivatives of muconic
and sorbic acids) , and the photochromy, thermochromy, and lumines-
cence of anils of o-hydroxy aromatic aldelrydes.^
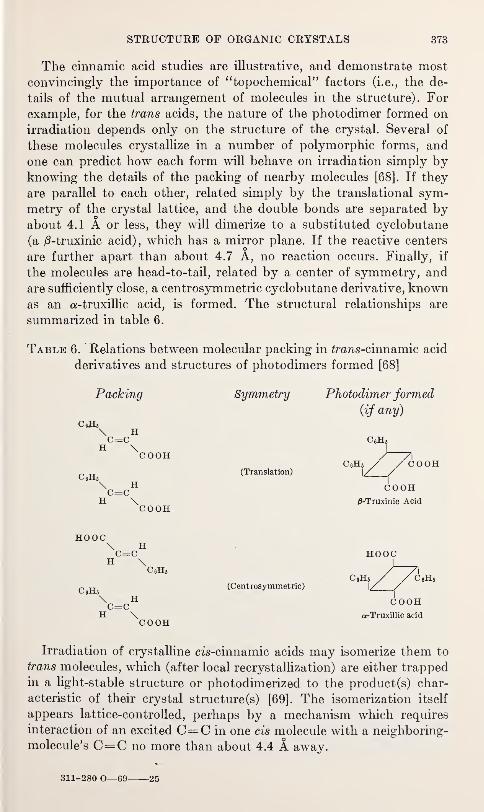
STRUCTURE OF ORGANIC CRYSTALS 373
The cinnamic acid studies are illustrative, and demonstrate most
convincingly the importance of "topochemicar' factors (i.e., the de-
tails of the mutual arrangement of molecules in the structure). For
example, for the trans acids, the nature of the photodimer formed on
irradiation depends only on the structure of the crystal. Several of
these molecules crystallize in a number of polymorphic forms, and
one can predict how each form will behave on irradiation simply byknowing the details of the packing of nearby molecules [68]. If they
are parallel to each other, related simply by the translational sym-
metry of the crystal lattice, and the double bonds are separated byabout 4.1 A or less, they will dimerize to a substituted cyclobutane
(a /3-truxinic acid), which has a mirror plane. If the reactive centers
are further apart than about 4.7 A, no reaction occurs. Finally, if
the molecules are head-to-tail, related by a center of symmetry, and
are sufficiently close, a centrosymmetric cyclobutane derivative, knownas an a-truxillic acid, is formed. The structural relationships are
summarized in table 6.
Table 6. Relations between molecular packing in frwis-cinnamic acid
derivatives and structures of photodimers formed [68]
Packing Symmetry Photodimer formed
(if any)Cells
C 6H 5
c=c
COOH(Translation)
C=CH
COOH
C 6H 5
C 6H 5 OH
CO<>OH
0-Truxinic Acid
HOOC
H \C 6H 5
C 6H5
(Centrosymmetric)
HC=C
H \COOH
HOOC
CbH
a-Truxillic acid
Irradiation of crystalline cis-cinnamic acids may isomerize them to
trans molecules, which (after local recrystallization) are either trapped
in a light-stable structure or photodimerized to the product (s) char-
acteristic of their crystal structure(s) [69]. The isomerization itself
appears lattice-controlled, perhaps by a mechanism which requires
interaction of an excited C=C in one cis molecule with a neighboring-
molecule's C=C no more than about 4.4 A away.
311-280 0—69 25
374 MOLECULAR DYNAMICS AND STRUCTURE OF SOLIDS
Topochemical control is certainly demonstrated for these reactions,
in accord with the postulate [66] that they occur with a minimumamount of atomic or molecular movement. Topochemical factors are
expected not to be dominant when reactions involve long-distance
migrations of electrons or excitation energy, or in systems of high
symmetry (such as many inorganic crystals).
In the studies of ^-benzoquinones [70] and muconic acid deriva-
tives [71], the results were with very few exceptions also in accord
with the postulates of topochemical control. In some of the quinone
crystals, the occurrence of close non-parallel double-bond contacts
appeared to be correlated with the formation of polymeric (rather
than dimeric) products. Presumably the interaction of these reactive
centers leads to open-chain dimer diradicals which cannot terminate
by ring closure and may therefore instead initiate polymerization.
Much of the work on the photochromy, thermochromy, and lumi-
nescence of N-salicylideneanilines and related anils has been summa-rized in the latest paper by Cohen and Flavian [72]. Extensive
spectroscopic studies of crystals and solutions, together with studies
of crystal structure, have provided evidence that the thermochromic
behavior arises as a consequence of a tautomeric proton shift (from
oxygen to nitrogen) and that the same ground and excited states are
involved in the thermochromic absorption as in the luminescence.
One by-product of these studies of anils was a detailed analysis of
the structure of crystalline N-5-chlorosalicylideneaniline at both roomtemperature and at 90 °K [73]. The structures are very similar at the
two temperatures. All atoms of the molecule are very nearly coplanar
and in fact the molecule behaves as a moderately rigid body at each
temperature; the axis of principal librational motion is in the plane
of the molecule and close to the axis of minimum inertia. At roomtemperature this motion corresponds to a r.m.s. amplitude of about
5°; at 90 °K it is about half as great. Possibly the application of a
coupled rigid-body analysis to this molecule would give an improved
fit and permit separating a torsional component from this apparent
overall librational pattern, but the fit is already quite satisfactory.
Once again we see evidence that the rigid-body model has wider
applicability than might be supposed.
It is a pleasure to acknowledge my indebtedness to those whosent me published and unpublished information and suggestions,
including N. Baenziger, D. W. J. Cruickshank, B. Dawson, A. W.Hanson, C. K. Johnson, E. Maslen, G. S. Pawley, J. Rush, G. M. J.
Schmidt, and V. Schomaker. I am also most grateful to Bonnie Warnfor her help with many of the calculations reported here.
STRUCTURE OF ORGANIC CRYSTALS 375
6. Discussion
J. J. Rush (National Bureau of Standards) : Shimanouchi has
recently published a very detailed far infrared study on lattice
vibrations in solid benzene, and we've also recently published some
less well resolved low-energy neutron spectra of benzene. I was
wondering if you know of any attempt that has been made to compare
the mean-square amplitudes that one would get out of these data
with the mean-square amplitudes you showed for benzene.
K. N. Trueblood : I don't. George, do you know if this has been done?
G. E. Bacon (University of Sheffield) : Not to my knowledge.
K. N. Trueblood: I'll look into that. Thank you.
E. Prince (Naval Research Laboratory) : How good must the data
be to yield valid dynamic information? How does one know if the
data are good enough?
K. N. Trueblood: These are excellent questions and not easy to
answer at all precisely. With regard to the second one, the only wayone can know that the dynamic information one has derived is mean-
ingful is to compare it with data obtained in other ways and to try to
see if it is physically plausible. As for the first question, the answer is
that it certainly ought to be the very best you can get, and the best
you can get now is very good. There's no doubt that people have
overrefined poor data in the past. It's also clear now, as Coppens will
show in just a moment, that if you're trying to get the most precise
vibrational parameters, you should take into account anisotropy of
form factors, as well as minimizing the usual systematic errors. In
the examples that I've cited here, the motion has been quite significant,
with fairly large r.m.s. amplitudes, say 5 degrees or more. Under those
conditions I would guess that most of the relatively precise x-ray
studies now being done would be adequate. But, of course, in manymolecules the motions are smaller than that, and if you want to do
something of the sort that Carroll Johnson illustrated with the
norbornanol derivative, it would be very hard to do it with ordinary
x-ray data and get really meaningful results. On the other hand, with
the best automatic diffractometer data, I suspect it is possible, but
only under the most careful circumstances. Of course with data which
is carefully taken but of less than the best obtainable quality one can
often find consistent and plausible patterns such as those cited earlier,
but one must regard them with some skepticism. I fear this isn't a
376 MOLECULAR DYNAMICS AND STRUCTURE OF SOLIDS
very satisfactory answer—no doubt the best assurance comes fromfinding similar information by independent techniques.
Perhaps Dr. Johnson can comment.
C. K. Johnson (Oak Ridge National Laboratory) : Systematic
errors in the neutron-diffraction Bragg-reflection intensities of 3-
e?ic?o-phenyl-2-e7icfo-norbornanol [36] would have much less effect on the
accuracy of the mean-square amplitudes of the phenyl hydrogen
atoms relative to the mean-square amplitudes of the phenyl carbon
atoms than these errors would have on the absolute mean-square
amplitudes determined for the atoms of the phenyl group. Systematic
errors in intensities would, in general, affect the carbon and hydrogen
anisotropic temperature factor coefficients in the same manner andthis would cancel out in the analysis of mean-square amplitudes of
hydrogen atoms relative to carbon atoms because of the similar
geometry of hydrogen and carbon atoms on the phenyl group.
G. E. Bacon: Have you considered, or do you think it would be
possible to consider, the formulation of some factor which would
express—in a rough way at least—the extent to which the thermal
data is compatible with rigid-body motion? I am struck by the
contrast between some of the molecules which you have described
and cases, like potassium hydrogen bisphenylacetate, where weconcluded that the molecule moved as a whole, but not rigidly.
K. N. Trueblood: I have not thought about that, but it certainly
might be helpful qualitatively to have some such measure, and it
ought to be considered further. {Added later: Some function of the
ratio of the r.m.s. &Ui}1 corrected for the number of parameters
being determined, to the average e.s.d. of an individual UiJ} could
measure how well any particular model fit. One would have to specify
what that model was—e.g., a completely rigid molecule, or one
composed of several coupled rigid segments. For more than this one
needs to examine the fit of the tensors of the individual atoms as
Burns et al. have done [35]).
R. D. Gilardi (Naval Research Laboratory) : I was wondering
about the question of separability of the internal vibrational motion
from rigid-body translations and librations with the unit cell. I
should think that a symmetrical molecule, such as CO2, would appear
the same whether it was vibrating in a symmetric bend or librating
within the crystal lattice. Do you think this inseparability is confined
to special symmetrical cases or whether it might, to some extent,
affect all such diffraction analyses of dynamics?
STRUCTURE OF ORGANIC CRYSTALS 377
K. N. Trueblood: I'm sure you're right about C02 . The question
of distinguishing the symmetrical bending of CO2 from a possible
libration about an axis normal to the plane of the bending vibration
is analogous to the difficulty of distinguishing torsional motionabout a bond from libration of the whole molecule about the bond.
Diffraction data, involving both time- and lattice-averaging, cannot
separate the two, at least if the molecule is symmetrical about the
bond. (If it is not, the individual parts may have significantly dif-
ferent torsional amplitudes, and some resolution of the motions wouldbe possible.) However, for general internal modes of larger and less
symmetrical molecules, I don't believe this sort of inseparability wouldnormally be a major problem; furthermore, of course, the amplitudes
of most stretching and many bending vibrations are appreciably less
than those consistent with common patterns of libration of molecules.
In the work of Duax and Baenziger [74] on CS2 , the problem did not
arise because they used spectroscopic data to get the librational
amplitudes rather than attempting to derive them from the diffrac-
tion data. (This answer is amplified from that given at the time.)
W. C. Hamilton (Brookhaven National Laboratory) : In the light
of Professor Trueblood's talk, I would like to restate the method I
proposed for the refinement of molecular motions from diffraction
data. Let us express the total thermal motion MT of a molecule in
a crystalline solid in the following way:
MT=MX+M&+M&where
Mi= internal molecular modes
M2B=harmonic rigid body motion (the T, L, and S of Pro-
fessor Trueblood's paper)
MRB=anharmonic contributions to the rigid body motions.
Pawley's approach was to refine MBB ,assuming that the other
two terms were zero. I propose using spectroscopic values for Mjand refining both M"B and MBB . Of course this approach is rigorous
only if there is no serious coupling of the internal modes, that is if
the dispersion curves for these modes are flat. This will be one very
interesting question for the neutron lattice dynamics people to answer,
"How flat are the dispersion curves for the internal optical modesin molecular crystals?"
378 MOLECULAR DYNAMICS AND STRUCTURE OF SOLIDS
7. References
[1] W. Cochran, Reports on Progress in Physics 26, 1 (1963).
[2] W. Cochran and G. S. Pawley, Proc. Roy. Soc. A280, 1 (1964).
[3] W. G. Cochran, in Phonons and Phonon Interactions (T. Bak, editor),
p. 102, W. A. Benjamin, New York (1964).
[4] G. S. Pawley, Phys. stat, sol. 20, 347 (1967).
[5] W. A. Wooster, Diffuse X-ray Reflections from Crystals, Oxford University
Press, Oxford (1962).
[6] A. I. Kitajgorodskij, J. chim. Phys. 63, 9 (1966).
[7] D. P. Craig, R. Mason, P. Pauling, and D. P. Santry, Proc. Roy. Soc.
A268, 98 (1965).
[8] D. E. Williams, J. Chem. Phys. 45, 3770 (1966).
[8a] D. E. Williams, Abstracts of the American Crystallographic Association,
p. 54, Atlanta, Georgia (1967).
[9] P. K. Gantzel and K. N. Trueblood, Acta Cryst. 18, 958 (1965).
[10] E. W. Hughes, J. Amer. Chem. Soc. 63, 1737 (1941).
[11] S. J. LaPlaca and J. A. Ibers, Acta Cryst. 18, 511 (1965).
[12] A. M. O'Connell, A. I. M. Rae, and E. N. Maslen, Acta Cryst. 21, 208
(1966) .
[13] G. C. Verschoor, Nature 202, 1206 (1964) and Thesis, Groningen.
[13a] R. F. Stewart, Abstracts of the American Crystallographic Association,
p. 51, Atlanta, Georgia (1967).
[13b] P. Coppens, This Symposium, paper Fl (1967).
[13c] P. Coppens and A. L. Bednowitz, Abstracts of the American Crystallo-
graphic Association, p. 52, Atlanta, Georgia (1967).
[14] B. Dawson, Proc. Roy. Soc. A298, 255, 264 (1967).
[15] J. Donohue, J. D. Dunitz, K. N. Trueblood, and M. S. Webster, J. Amer.Chem. Soc. 85, 851 (1963).
[16] J. L. Hoard, G. H. Cohen, and M. D. Glick, J. Amer. Chem. Soc. 89, 1992
(1967) .
[17] M. D. Glick, G. H. Cohen, and J. L. Hoard, J. Amer. Chem. Soc. 89, 1996
(1967).
[18] J. H. Enemark and J. A. Ibers, Inorg. Chem. 6, 1575 (1967).
[19] K. N. Trueblood, P. Horn, and V. Luzzati, Acta Cryst. 14, 965 (1961).
[20] G. M. Brown and R. Chidambaram, Abstracts of the American Crystallo-
graphic Association, p. 21, Atlanta, Georgia (1967).
[21] E. N. Maslen, Acta. Cryst. A24, 434 (1968).
[22] D. W. J. Cruickshank, Acta Cryst. 9, 754 (1956).
[23] G. S. Pawley, Acta Cryst. 17, 457 (1964).
[24] G. S. Pawley, Acta Cryst. 20, 631 (1966).
[25] V. Schomaker and K. N. Trueblood, Acta Cryst. B24, 63 (1968).
[26] D. W. J. Cruickshank, Acta Cryst. 9, 757 (1956).
[27] D. W. J. Cruickshank, Acta Cryst. 14, 896 (1961).
[28] W. R. Busing and H. A. Levy, Acta Cryst. 17, 142 (1964).
[29] L. N. Becka and D. W. J. Cruickshank, Proc. Roy. Soc. A273, 435
(1963).
[30] L. N. Becka and D. W. J. Cruickshank, Proc. Roy. Soc. A273, 455
(1963).
[31] P. W. Higgs, Acta Cryst. 8, 99 (1955).
[32] S. J. Cyvin, Spectrochim. Acta 15, 828 (1959).
[33] R. E. Long, R. A. Sparks, and K. N. Trueblood, Acta Cryst. 18, 932 (1965).
[34] K. Lonsdale, D. Walley, and K. El Sayed, Acta Cryst. 20, 13 (1966).
STRUCTURE OF ORGANIC CRYSTALS 379
[35] D. M. Burns, W. G. Ferrier, and J. T. McMullan, Acta Cryst. 22, 623
(1967) .
[36] C. K. Johnson, This Symposium, paper C5 (1967).
[37] G. E. Bacon, N. A. Curry, and S. A. Wilson, Proc. Roy. Soc. A 279, 98
(1964).
[38] E. G. Cox, D. W. J. Cruickshank, and J. A. S. Smith, Proc. Roy. Soc. A247, 1 (1958).
[39] M. Ito and T. Shigeoka, Spectrochim. Acta 22, 1029 (1966).
[40] R. E. Gilbert and K. Lonsdale, Acta Cryst. 9, 697 (1956).
[41] D. W. J. Cruickshank, Acta Cryst. 9, 1005 (1956).
[42] K. Lonsdale, H. J. Milledge, and K. V. K. Rao, Proc. Roy. Soc. A 255, 82
(1960).
[43] D. A. Bekoe, H. S. Maddox, and K. N. Trueblood, unpublished.
[44] C. K. Johnson, Abstracts of the Amer. Cryst. Assoc., p. 82, Minneapolis,
Minnesota (1967).
[45] V. Schomaker, private communication (1967).
[46] D. W. J. Cruickshank, Acta Cryst. 9, 915 (1956).
[47] D. W. J. Cruickshank, Acta Cryst. 10, 470 (1957).
[48] D. W. J. Cruickshank, Acta Cryst. 10, 504 (1957).
[49] D. W. J. Cruickshank, Rev. Mod. Phys. 30, 163 (1958).
[50] G. S. Pawley, private communication (1967).
[51] P. Goldstein, K. Seff, and K. N. Trueblood, Acta Cryst. B24, 778 (1968).
[52] A. W. Hanson, Acta Cryst. B24, 768 (1968).
[53] R. M. Williams and S. C. Wallwork, Acta Cryst. 23, 448 (1967).
[54] D. A. Bekoe and K. N. Trueblood, Z. Kristallogr. 113, 1 (1960).
[54a] C. J. Fritchie and P. J. Arthur, Jr., Acta Crystallographica 21, 139 (1966).
[54b] C. J. Fritchie, Acta Crystallographica 20, 892 (1966).
[55] S. E. Filippakis, L. Leiserowitz, and G. M. J. Schmidt, J. Chem. Soc. B,
290 (1967).
[56] S. E. Filippakis, L. Leiserowitz, and G. M. J. Schmidt, J. Chem. Soc. B,
297 (1967).
[57] S. E. Filippakis, L. Leiserowitz, and G. M. J. Schmidt, J. Chem. Soc. B,
305 (1967).
[58] R. E. Long, H. S. Maddox, and K. N. Trueblood, submitted to Acta. Cryst.
[59] K. N. Trueblood, E. Goldish, and J. Donohue, Acta Cryst. 14, 1009 (1961).
[60] G. J. Palenik, J. Donohue, and K. N. Trueblood, Acta Cryst. 24, in press
(1968) .
[61] E. R. Andrew, J. Phys. Chem. Solids 18, 9 (1960).
[62] R. J. Prosen and K. N. Trueblood, Acta Cryst. 9, 741 (1956).
[63] A. Kawamori and M. Sakiyama, J. Phys. Soc. Japan 18, 1218 (1963).
[64] H. Morawetz, Science 152, 705 (1966).
[65] K. Lonsdale, E. Nave, and J. F. Stephens, Phil Trans. A 261, 1 (1966).
[66] M. D. Cohen and G. M. J. Schmidt, J. Chem. Soc. 1996 (1964).
[67] F. L. Hirshfeld and G. M. J. Schmidt, J. Polymer Sci. A 2, 2181 (1964).
[68] G. M. J. Schmidt, J. Chem. Soc, 2014 (1964).
[69] J. Bregman, K. Osaki, G. M. J. Schmidt, and F. I. Sonntag, J. Chem. Soc,
2021 (1964).
[70] D. Rabinovich and G. M. J. Schmidt, J. Chem. Soc. B, 144 (1967).
[71] M. Lahav and G. M. J. Schmidt, J. Chem. Soc B, 312 (1967).
[72] M. Cohen and S. Flavian, J. Chem. Soc. B, 334 (1967).
[73] J. Bregman, L. Leiserowitz, and G. M. J. Schmidt, J. Chem. Soc, 2068
(1964).
[74] N. C. Baenziger and W. L. Duax, J. Chem. Phys. 48, 2974 (1968).

INFORMATION ON MOLECULAR MOTIONDERIVED FROM ANISOTROPIC TEMPERATURE
FACTOR COEFFICIENTS 1
CARROLL K. JOHNSON
Chemistry Division
Oak Ridge National Laboratory
Oak Ridge, Tennessee 87880
1. Rigid-Body Model
The anisotropic temperature factor (ATF) coefficients derived
through a crystal-structure analysis describe the time-averaged mean-square displacement in 3-space for each crystallographically distinct
atom in the crystal. Correlations between the displacements of differ-
ent atoms are not experimentally obtainable from x-ray or neutron
Bragg reflection data. Consequently, it is necessary to adopt a modelwhich fixes the interatom correlations of motion in order to formulate a
description of overall molecular motion from the ATF coefficients.
The simplest possible model for molecular motion is the rigid-body
model in which all intramolecular interatomic distances are held con-
stant. A recent detailed analysis of the mathematics for rigid-body
motion of a molecule in a crystal is given by Schomaker and True-
blood [l].2If the time-averaged mean-square amplitudes of displace-
ment due to internal molecular vibration in the same molecule or a
similar molecule are known, the effect of these displacements can be
subtracted from the observed ATF coefficients before fitting the rigid-
body model.
2. Internal Molecular Vibrations
A normal coordinate treatment of spectroscopic data from the gas
and liquid phases can be used to obtain time-averaged mean-square
amplitudes of displacement due to internal molecular vibration. Three-
by-three symmetric matrices defining the mean-square amplitude in 3-
space for each of the N atoms in the molecule are present along the
block diagonal of the complete 3iV-by-3iV symmetric "cartesian mean-square amplitude matrix." The cartesian mean-square amplitude
1 Research sponsored by the U.S. Atomic Energy Commission under contract with Union Carbide
Corporation.2 Figures in brackets indicate the literature references at the end of this paper.
381
382 MOLECULAR DYNAMICS AND STRUCTURE OF SOLIDS
matrix can be calculated with a computer program written by J. H.Schachtschneider [2]. The results of two such calculations using
Schachtschneider's program and the published internal coordinates andforce constants for benzene [3] and cyclobutane [4] are shown pictori-
ally [5] in figure 1
.
3. Mean- Square Displacements of Phenyl HydrogenAtoms
The crystal structures [6] of 3-endo-phenyl-2-e7i(2o-norbornanol-5-
exo-7-anti-d2 and the nondeuterated isomorph were determined byneutron diffraction. There are two molecules in the asymmetric unit
and two different isomorphous crystals; consequently, we obtain four
independently determined sets of ATF coefficients for the molecule.
A description of rigid-body motion for the carbon atoms in the
phenyl groups was calculated from the derived ATF coefficients after
correcting for the displacements due to internal vibration as obtained
from the spectroscopic study of benzene. The ATF coefficients of the
hydrogen atoms were entered into the calculation in such a way that
the hydrogen atoms were allowed to "ride" on the carbon ring with
additional radial, in-plane, and out-of-plane mean-square displace-
ments. The average resulting rms displacements of a hydrogen atomare 0.08±0.02 A along the bond, 0.13±0.01 A in the plane and 0.20±
0.01 A out of the plane. These values are to be compared with the
corresponding values of 0.077, 0.116 and 0.150 A obtained from the
spectroscopic study of benzene. The out-of-plane displacement value
is significantly different from that of benzene, but the other values are
essentially in agreement. Further work is underway to investigate the
cause of the discrepancy.
4. Segmented-Body Model
Many molecules have large-amplitude modes of internal vibration,
such as torsional oscillation about a single covalent bond. In such cases
a "segmented-body" model can often be used to allow for this internal
motion. The segmented-body model [7] is a network of coupled rigid-
bodies. The freedom of motion between any two coupled segments of
the model can be constrained to approximate a specific internal molec-
ular motion such as torsional oscillation.
The type of segmented-body model most easily treated mathe-
matically is the ' 'riding model" [8], in which a segment B is assumed to
"ride" on another segmental. Segment B has all the mean-square dis-
placement caused by the motion of segment A as well as the additional
mean-square displacement arising from the freedom of motion of the
coupling joint connecting segment B to segment A. The additional
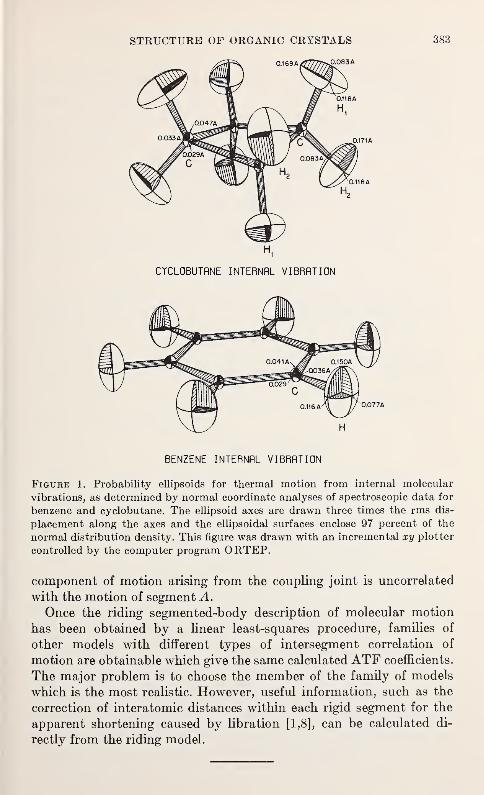
STRUCTURE OF ORGANIC CRYSTALS 383
H,
CTCLOBUTRNE INTERNAL VIBRATION
BENZENE INTERNAL VIBRATION
Figuee 1. Probability ellipsoids for thermal motion from internal molecular
vibrations, as determined by normal coordinate analyses of spectroscopic data for
benzene and cyclobutane. The ellipsoid axes are drawn three times the rms dis-
placement along the axes and the ellipsoidal surfaces enclose 97 percent of the
normal distribution density. This figure was drawn with an incremental xy plotter
controlled by the computer program ORTEP.
component of motion arising from the coupling joint is uncorrected
with the motion of segmentAOnce the riding segmented-body description of molecular motion
has been obtained by a linear least-squares procedure, families of
other models with different types of intersegment correlation of
motion are obtainable which give the same calculated ATF coefficients.
The major problem is to choose the member of the family of models
which is the most realistic. However, useful information, such as the
correction of interatomic distances within each rigid segment for the
apparent shortening caused by libration [1,8], can be calculated di-
rectly from the riding model.
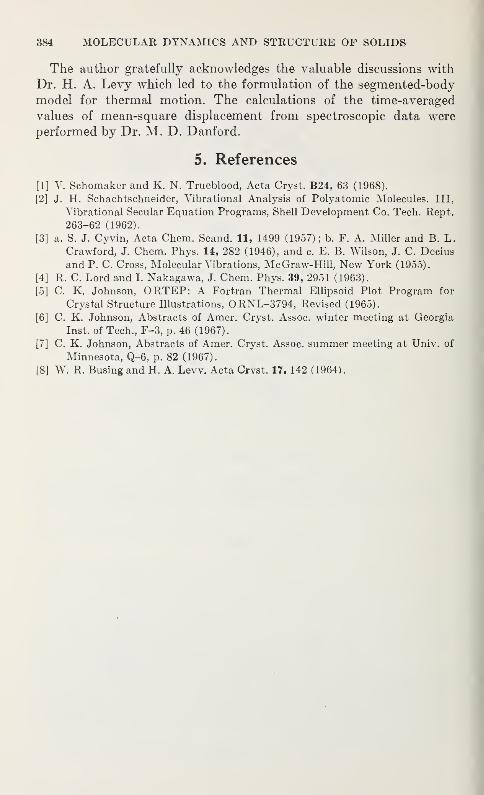
384 MOLECULAR DYNAMICS AND STRUCTURE OF SOLIDS
The author gratefully acknowledges the valuable discussions with
Dr. H. A. Levy which led to the formulation of the segmented-body
model for thermal motion. The calculations of the time-averaged
values of mean-square displacement from spectroscopic data were
performed by Dr. M. D. Danford.
5. References
[1] V. Schomaker and K. N. Trueblood, Acta Cryst. B24, 63 (1968).
[2] J. H. Schachtschneider, Vibrational Analysis of Polyatomic Molecules. Ill,
Vibrational Secular Equation Programs, Shell Development Co. Tech. Rept.
263-62 (1962).
[3] a. S. J. Cyvin, Acta Chem. Scand. 11, 1499 (1957); b. F. A. Miller and B. L.
Crawford, J. Chem. Phys. 14, 282 (1946), and c. E. B. Wilson, J. C. Decius
and P. C. Cross, Molecular Vibrations, McGraw-Hill, New York (1955).
[4] R. C. Lord and I. Nakagawa, J. Chem. Phys. 39, 2951 (1963).
[5] C. K. Johnson, ORTEP: A Fortran Thermal Ellipsoid Plot Program for
Crystal Structure Illustrations, ORNL-3794, Revised (1965).
[6] C. K. Johnson, Abstracts of Amer. Cryst. Assoc. winter meeting at Georgia
Inst, of Tech., F-3, p. 46 (1967).
[7] C. K. Johnson, Abstracts of Amer. Cryst. Assoc. summer meeting at Univ. of
Minnesota, Q-6, p. 82 (1967).
[8] W. R. Busing and H. A. Lew. Acta Crvst. 17. 142 (1964).
INFLUENCE OF BONDING EFFECTS ONTHERMAL PARAMETERS AS DETERMINED BY
X-RAY DIFFRACTION 1
PHILIP COPPENS
Chemistry Department
Brookhaven National Laboratory, Upton, New York 11973
1. Introduction
X-ray temperature parameters obtained in conventional least-
squares refinement using a free-atom model will generally contain
contributions resulting from asymmetry of the valence electrons due
to bonding. An experimental measure of the effect is obtained bycomparative x-ray and neutron diffraction analyses. The few analyses
of sufficient accuracy which have been undertaken indicate that the
effect is appreciable at least for first row atoms. X-ray temperature
factors for first row atoms are therefore of limited usefulness in the
study of molecular dynamics.
2. Analysis of the Effect
We want to list three perturbations causing atomic asymmetry:
(1) Bond Density. A wave function describing a covalent bond ABcontains a cross term between the atomic wave functions ^(A) and
^(B). This cross term represents the bond density or "overlap density."
Its presence indicates that a certain amount of valence electronic
charge has migrated from the atom into the bond region.
(2) Lone-Pair Electrons. When all atomic orbitals are either half-
filled or doubly-filled the charge cloud is spherically symmetric. In the
prepared state or valence state part of the orbitals may be doubly
filled. The extra electrons in these "lone pair orbitals" cause an
appreciable atomic asymmetry.
(3) Tonicity. Polarity of a bond will bring additional charge to
specific atomic orbitals. An electronegative atom in a conjugated
system will, for example, have extra charge in its p r orbital.
These effects have been discussed from the standpoint of the
diffractionist by, among others, McWeeny [1]2
, Dawson [2] and Cop-
pens and Coulson [3]. The asymmetry results in a measurable shift in
1 Research performed under the auspices of the U.S. Atomic Energy Commission.2 Figures in brackets indicate the literature references at the end of this paper.
385
386 MOLECULAR DYNAMICS AND STRUCTURE OF SOLIDS
the centroid of the charge density of first row atoms, for which the
valence electrons form a considerable fraction of the total electron
cloud. Similarly the temperature factors will be affected.
Bonding density may be simulated, for example, by an increase in
the temperature parameters. Both Allmann [4] and Stewart [5] have
calculated the variation in shape of a Fourier maximum with variation
of the isotropic temperature parameter B. From their results it can be
derived that for a carbon atom with B in the range 2.5-5.0 A2 andfor Cu-Ka cut-off of reflections, an increase of 1 A2 in B corresponds to
a migration of 0.22 electrons of the Is2 shell into the region about 0.7 Afrom the nucleus, which is the midpoint of a typical bond. The cor-
responding number for the 2sp3 shell is only 0.05. Thus, the free-atom
model in x-ray structure analysis compensates for the diffuseness of
the valence electrons by a smearing out of the core electrons of the
Is shell.
Dawson's treatment of the diamond structure gave an experimental
value of 0.108 electrons/atom/bond for the overlap density [6]. This
indicates that a trigonal first-row atom may have a total overlap
density of about 0.33 electrons, and its temperature parameter maytherefore increase by as much as 1.5 A2
, a relative error of 40 percent!
An increase in B shifts the bonding density equally in all directions,
while the arrangement of the bonds is obviously not spherically sym-
metric. However, more sophisticated models for thermal motion can
absorb bonding asymmetry with greater ease. Thus, the routinely used
anisotropic harmonic approximation will produce results which are
especially erroneous when the deviations from spherical symmetry are
centrosymmetric, while a model incorporating anharmonic motion
can allow for any bonding asymmetry.
3. Experimental Evidence
Separate refinement of high-order x-ray data can provide an estimate
of true atomic motion, as the valence electrons contribute relatively
little to high-order reflections. Such a refinement by Hall and Maslen
[7] on orthanilic acid has produced temperature factors which are
generally 5-10 percent lower than those obtained from all data. Thedrawbacks of this procedure are, first, that the amount of data is
considerably reduced by exclusive use of high-order reflections and,
second, that even the high-order reflections contain some contribution
from the valence electrons [8, 5]. Comparison of x-ray and neutron
parameters do, however, yield the requested information without any
of these drawbacks. Data of sufficient accuracy are available on a
few compounds, they include: a-oxalic acid [9, 10], a-deutero oxalic
acid [9, 11], s-triazine [12] and hydroxyapatite [13]. In the last com-
pound the diagonal elements (3U of the thermal vibration tensor as
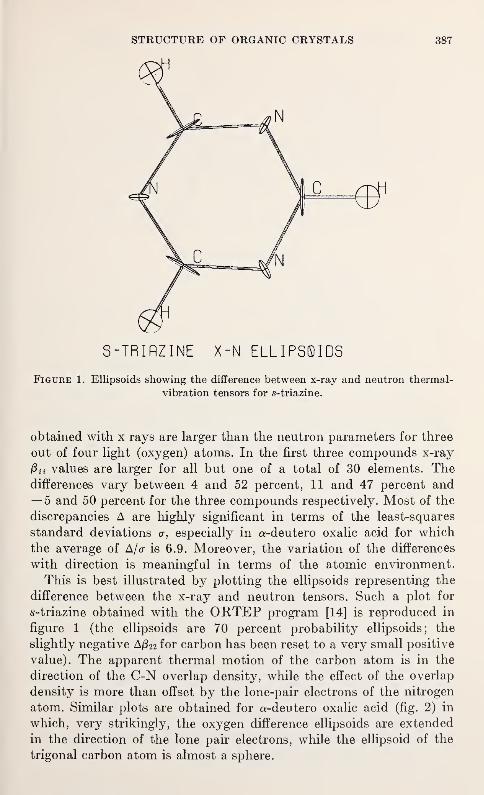
STRUCTURE OF ORGANIC CRYSTALS 387
S-TRIflZINE X-N ELLIPSQIDS
Figure 1. Ellipsoids showing the difference between x-ray and neutron thermal-
vibration tensors for s-triazine.
obtained with x rays are larger than the neutron parameters for three
out of four light (oxygen) atoms. In the first three compounds x-ray
$n values are larger for all but one of a total of 30 elements. Thedifferences vary between 4 and 52 percent, 11 and 47 percent and— 5 and 50 percent for the three compounds respectively. Most of the
discrepancies A are highly significant in terms of the least-squares
standard deviations cr, especially in a-deutero oxalic acid for which
the average of A/a is 6.9. Moreover, the variation of the differences
with direction is meaningful in terms of the atomic environment.
This is best illustrated by plotting the ellipsoids representing the
difference between the x-ray and neutron tensors. Such a plot for
s-triazine obtained with the ORTEP program [14] is reproduced in
figure 1 (the ellipsoids are 70 percent probability ellipsoids; the
slightly negative A/322 for carbon has been reset to a very small positive
value). The apparent thermal motion of the carbon atom is in the
direction of the C-N overlap density, while the effect of the overlap
density is more than offset by the lone-pair electrons of the nitrogen
atom. Similar plots are obtained for a-deutero oxalic acid (fig. 2) in
which, very strikingly, the oxygen difference ellipsoids are extended
in the direction of the lone pair electrons, while the ellipsoid of the
trigonal carbon atom is almost a sphere.
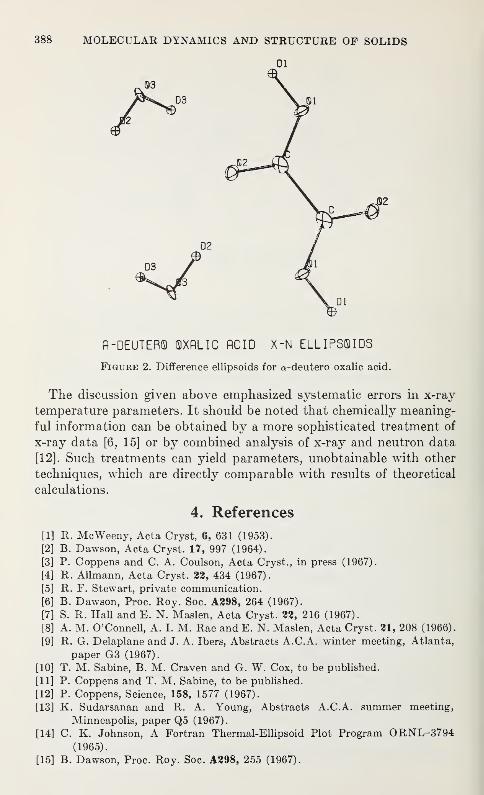
388 MOLECULAR DYNAMICS ANJ> STRUCTURE OF SOLIDS
Dl
fl-DEUTERQ QXRLIC ACID X-N ELLIPSSIDS
Figure 2. Difference ellipsoids for a-deutero oxalic acid.
The discussion given above emphasized systematic errors in x-ray
temperature parameters. It should be noted that chemically meaning-
ful information can be obtained by a more sophisticated treatment of
x-ray data [6, 15] or by combined analysis of x-ray and neutron data
[12]. Such treatments can yield parameters, unobtainable with other
techniques, which are directly comparable with results of theoretical
calculations.
4. References
[1] R. McWeeny, Acta Cryst, 6, 631 (1953).
[2] B. Dawson, Acta Cryst. 17, 997 (1964).
[3] P. Coppens and C. A. Coulson, Acta Cryst., in press (1967).
[4] R. Allmann, Acta Cryst. 23, 434 (1967).
[5] R. F. Stewart, private communication.
[6] B. Dawson, Proc. Roy. Soc. A298, 264 (1967).
[7] S. R. Hall and E. N. Maslen, Acta Cryst. 22, 216 (1967).
[8] A. M. O'Connell, A. I. M. Rae and E. N. Maslen, Acta Cryst. 21, 208 (1966).
[9] R. G. Delaplane and J. A. Ibers, Abstracts A.C.A. winter meeting, Atlanta,
paper G3 (1967).
[10] T. M. Sabine, B. M. Craven and G. W. Cox, to be published.
[11] P. Coppens and T. M. Sabine, to be published.
[12] P. Coppens, Science, 158, 1577 (1967).
[13] K. Sudarsanan and R. A. Young, Abstracts A.C.A. summer meeting,
Minneapolis, paper Q5 (1967).
[14] C. K. Johnson, A Fortran Thermal-Ellipsoid Plot Program ORNL-3794(1965).
[15] B. Dawson, Proc. Roy. Soc. A298, 255 (1967).
HIGH PRESSURE CRYSTAL STRUCTURE OFMETAL FREE PHTHALOCYANINE
R. S. Kirk
General Electric Research and Development Center
Schenectady, New York 12301
1. Introduction
The known crystal structures of the phthalocyanines have been
rapidly multiplying in the past few years. For each new chemical
variation there seems to be a new crystal form. Although any particular
phthalocyanine shows only one or another structure for sizable
single crystals, there are indications that in their metastable forms
such phthalocyanins can occur in all the known structures. Thedifficulty of obtaining good single crystals has hindered efforts to
prove this fact.
It has been found that under high pressures macroscopic single
crystals of the phthalocyanine can be transformed to new crystal
structures. The quality of the new crystals has indicated the possi-
bility of accurate structural determination. Unfortunately, it is not
possible to quench to one atmosphere pressure, the new crystal form.
Furthermore, single-crystal x-ray studies at high pressures require a
considerable amount of effort. However, it has been found that byfollowing the changes in the morphology of the single crystals as they
transform from the known to the unknown crystal forms, probable
new lattices may be constructed for the high pressure forms. Although
similar transformations occur in a wide variety of compounds, this
report will deal exclusively with the behavior of metal-free phthal-
ocyanine, (H 2P C).
2. Equipment
High pressure experiments with H2P C single crystals were performed
in a high pressure cell consisting of diamond anvils compressing a
liquid-filled gasket (see fig. 1) [1] .* A gasket of Inconel, 0.015 cmthick with a 0.025 cm hole, was filled with heptane and a crystal of
sample. The diamonds contain the pressure and still allow the sample
to be examined optically. The combination of liquid and metal gasket
1 Figures in brackets indicate the literature references at the end of this paper.
311-280 0—69 26
389
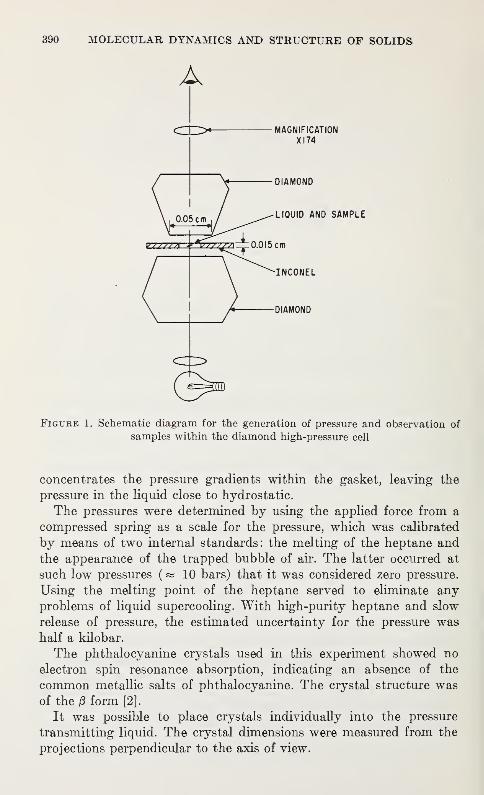
390 MOLECULAR DYNAMICS AND STRUCTURE OF SOLIDS
Figure 1. Schematic diagram for the generation of pressure and observation of
samples within the diamond high-pressure cell
concentrates the pressure gradients within the gasket, leaving the
pressure in the liquid close to hydrostatic.
The pressures were determined by using the applied force from a
compressed spring as a scale for the pressure, which was calibrated
by means of two internal standards: the melting of the heptane and
the appearance of the trapped bubble of air. The latter occurred at
such low pressures (« 10 bars) that it was considered zero pressure.
Using the melting point of the heptane served to eliminate anyproblems of liquid supercooling. With high-purity heptane and slow
release of pressure, the estimated uncertainty for the pressure washalf a kilobar.
The phthalocyanine crystals used in this experiment showed no
electron spin resonance absorption, indicating an absence of the
common metallic salts of phthalocyanine. The crystal structure wasof the £ form [2].
It was possible to place crystals individually into the pressure
transmitting liquid. The crystal dimensions were measured from the
projections perpendicular to the axis of view.
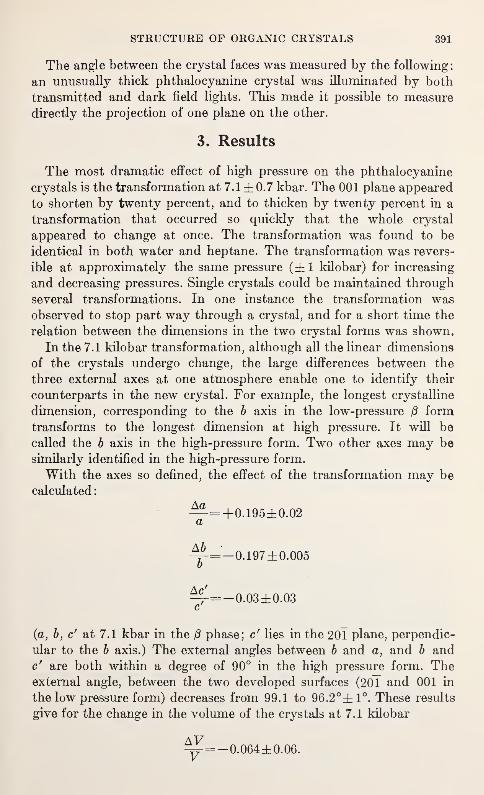
STRUCTURE OF ORGANIC CRYSTALS 391
The angle between the crystal faces was measured by the following:
an unusually thick phthalocyanine crystal was illuminated by both
transmitted and dark field lights. This made it possible to measure
directly the projection of one plane on the other.
3. Results
The most dramatic effect of high pressure on the phthalocyanine
crystals is the transformation at 7.1 ±0.7 kbar. The 001 plane appeared
to shorten by twenty percent, and to thicken by twenty percent in a
transformation that occurred so quickly that the whole crystal
appeared to change at once. The transformation was found to be
identical in both water and heptane. The transformation was revers-
ible at approximately the same pressure (±1 kilobar) for increasing
and decreasing pressures. Single crystals could be maintained through
several transformations. In one instance the transformation wasobserved to stop part way through a crystal, and for a short time the
relation between the dimensions in the two crystal forms was shown.
In the 7.1 kilobar transformation, although all the linear dimensions
of the crystals undergo change, the large differences between the
three external axes at one atmosphere enable one to identify their
counterparts in the new crystal. For example, the longest crystalline
dimension, corresponding to the b axis in the low-pressure 0 form
transforms to the longest dimension at high pressure. It will be
called the b axis in the high-pressure form. Two other axes may be
similarly identified in the high-pressure form.
With the axes so defined, the effect of the transformation may be
calculated
:
—=+0.195±0.02a
^-=-0.197±0.005o
^=-0.03±0.03c
(a, b, c' at 7.1 kbar in the jS phase; c' lies in the 201 plane, perpendic-
ular to the b axis.) The external angles between b and a, and b andc' are both within a degree of 90° in the high pressure form. Theexternal angle, between the two developed surfaces (201 and 001 in
the low pressure form) decreases from 99.1 to 96.2°± 1°. These results
give for the change in the volume of the crystals at 7.1 kilobar
^r= -0.064±0.06.
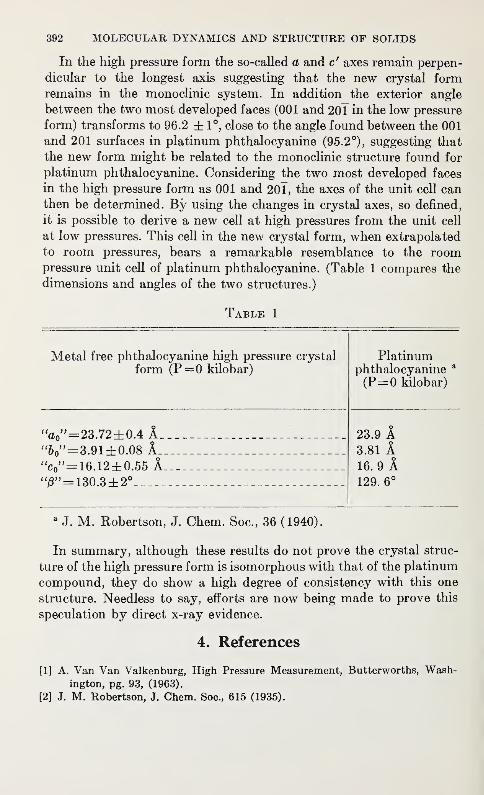
392 MOLECULAR DYNAMICS AND STRUCTURE OF SOLIDS
In the high pressure form the so-called a and c' axes remain perpen-
dicular to the longest axis suggesting that the new crystal formremains in the monoclinic system. In addition the exterior angle
between the two most developed faces (001 and 201 in the low pressure
form) transforms to 96.2 ±1°, close to the angle found between the 001
and 201 surfaces in platinum phthalocyanine (95.2°), suggesting that
the new form might be related to the monoclinic structure found for
platinum phthalocyanine. Considering the two most developed faces
in the high pressure form as 001 and 20l, the axes of the unit cell canthen be determined. By using the changes in crystal axes, so defined,
it is possible to derive a new cell at high pressures from the unit cell
at low pressures. This cell in the new crystal form, when extrapolated
to room pressures, bears a remarkable resemblance to the roompressure unit cell of platinum phthalocyanine. (Table 1 compares the
dimensions and angles of the two structures.)
aJ. M. Robertson, J. Chem. Soc, 36 (1940).
In summary, although these results do not prove the crystal struc-
ture of the high pressure form is isomorphous with that of the platinum
compound, they do show a high degree of consistency with this one
structure. Needless to say, efforts are now being made to prove this
speculation by direct x-ray evidence.
Table 1
Metal free phthalocyanine high pressure crystal
form (P = 0 kilobar)
Platinumphthalocyanine a
(P=0 kilobar)
'V=23.72±0.4 A_"6
0"=3.91±0.08 A_
"c0"=16.12±0.55 A"j8"=130.3±2°
23.9 A3.81 A16.9 A129. 6°
4. References
[1] A. Van Van Valkenburg, High Pressure Measurement, Butterworths, Wash-
ington, pg. 93, (1963).
[2] J. M. Robertson, J. Chem. Soc, 615 (1935).
X-RAY DIFFRACTION AND RADIO-FREQUENCYSPECTROSCOPIC INVESTIGATION OF
DIMETHYLTIN DICHLORIDE*
JACK D. GRAYBEAL 1 and DOMNIC A. BERTA 2
Department of Chemistry, West Virginia University, Morgantown, West Virginia
26506
1. Introduction
Previous nuclear quadrupole resonance (NQR) investigations [1, 2]3
have shown that there is a much larger change of the observed NQRfrequency of 35C1 in going from SnCl 4 to organotin chlorides than for
comparable substitutions on other group IVA tetrahalides. This
phenomenon, along with observed positive temperature coefficients
for several dichlorides, indicates that there is either a large change
of 7r-bonding or ionic character with substitution of organic groups.
An NQR Zeeman study was instigated in order to determine the
magnitude and direction of the principal electric-field gradient (EFG)tensor components and hence provide additional bonding information.
A knowledge of the crystal structure is necessary to specify the
EFG axis directions. The combined study has provided an excellent
sample of how the results of an NQR Zeeman experiment can aid in
an x-ray crystal structure determination.
2. Experimental Work
Crystals of dimethyltin dichloride, (CH 3) 2SnCl 2 , suitable for x-ray
studies were prepared by the slow evaporation, in a dry box, of a
saturated solution of (CH3) 2SnCl2 in CC1 4 . A large (2 cm3) crystal
for the Zeeman study was obtained by growing from a melt in a
Bridgman furnace. The density of (CH 3) 2SnCl2 was found to be 2.30
±0.09 g cm-3using a standard pycnometric method with trimethyl-
amine and NjN'-bisCl-ethyl-S-methylpenty^diethylenetriamine as
immersing liquids.
The x-ray crystal structure determination was done using a pris-
matic crystal 0.5mm X 0.7mm X 0.7mm at 25 °C. Initially the cell
parameter c was determined from a rotation photograph, and upon
* Supported by a grant from the National Science Foundation.1 Present address: Department of Chemistry, V.P.I., Blacksburg, Va. 24061.
2 Present address- Allegheny Ballistics Laboratory, Cumberland, Md. 21502.
3 Figures in brackets indicate the literature references at the end of this paper.
393
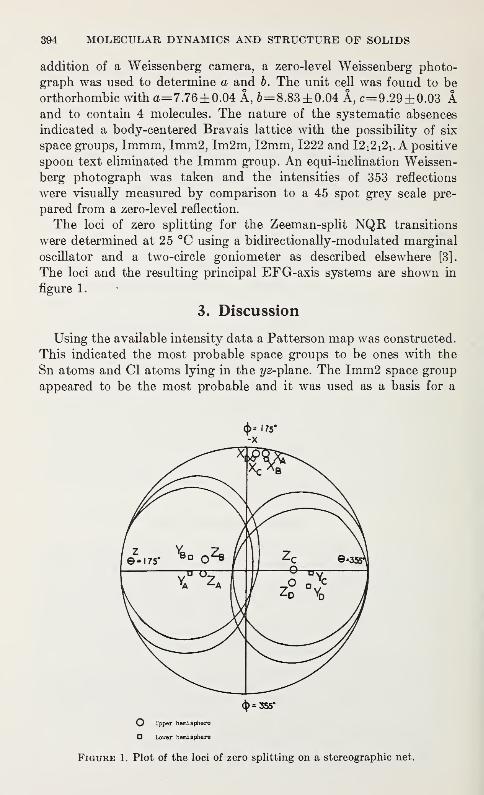
394 MOLECULAR DYNAMICS AND STRUCTURE OF SOLIDS
addition of a Weissenberg camera, a zero-level Weissenberg photo-
graph was used to determine a and b. The unit cell was found to be
orthorhombic witha=7.76±0.04 A, 6=8.83±0.04 A, c=9.29±0.03 Aand to contain 4 molecules. The nature of the systematic absences
indicated a body-centered Bravais lattice with the possibility of six
space groups, Immm, Imm2, Im2m, I2mm, 1222 and I2i2i2i. A positive
spoon text eliminated the Immm group. An equi-inclination Weissen-
berg photograph was taken and the intensities of 353 reflections
were visually measured by comparison to a 45 spot grey scale pre-
pared from a zero-level reflection.
The loci of zero splitting for the Zeeman-split NQR, transitions
were determined at 25 °C using a bidirectionally-modulated marginal
oscillator and a two-circle goniometer as described elsewhere [3].
The loci and the resulting principal EFG-axis systems are shown in
figure 1.
3. Discussion
Using the available intensity data a Patterson map was constructed.
This indicated the most probable space groups to be ones with the
Sn atoms and CI atoms lying in the 1/2-plane. The Imm2 space group
appeared to be the most probable and it was used as a basis for a
4>= 175-
<J>=355*
O "ppor hemisphere
Lower hemisphere
Figure 1. Plot of the loci of zero splitting on a stereographic net.
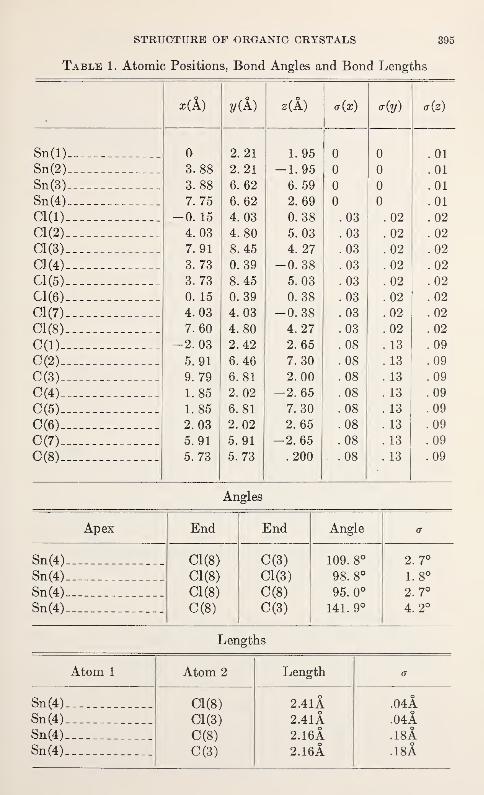
STRUCTURE OF ORGANIC CRYSTALS 395
Table 1. Atomic Positions, Bond Angles and Bond Lengths
2/(A) 2(A) <r(x) (7fe)
Sn(l) 0 2 21 1. 95 0 0 . 01
Sn(2) 3. 88 2 21 -1.95 0 0 .01
Sn(3) 3. 88 6. 62 6. 59 0 0 . 01
Sn(4) 7. 75 6. 62 2. 69 0 0 .01
Cl(l) -0. 15 4 03 0. 38 . 03 . 02 . 02
Cl(2) 4. 03 4 80 5. 03 .03 . 02 . 02
Cl(3) 7.91 8. 45 4. 27 .03 . 02 . 02
C](4) 3. 73 0. 39 -0. 38 .03 . 02 . 02
Gl(5) 3. 73 8. 45 5. 03 . 03 . 02 . 02
Cl(6) 0. 15 0. 39 0. 38 .03 .02 . 02
Cl(7) 4. 03 4. 03 -0. 38 .03 .02 .02
Cl(8) 7. 60 4. 80 4. 27 .03 .02 .02
C(l) -2. 03 2. 42 2. 65 .08 . 13 . 09
C(2) 5.91 6. 46 7. 30 . 08 . 13 . 09
C(3) 9. 79 6. 81 2. 00 .08 . 13 . 09
C(4) 1.85 2. 02 -2. 65 . 08 13 .09
C(5) 1.85 6. 81 7. 30 .08 . 13 .09
C(6) 2. 03 2. 02 2. 65 .08 13 .09
0(7) 5.91 5. 91 -2. 65 .08 13 .09
0(8) 5. 73 5. 73 .200 .08 13 .09
Angles
Apex End End Angle O"
Sn(4) Cl(8) 0(3) 109. 8° 2. 7°
Sn(4) Cl(8) 01(3) 98. 8° 1.8°
Sn(4) 01(8) 0(8) 95. 0° 2. 7°
Sn(4) 0(8) 0(3) 141. 9° 4.2°
Lengths
Atom 1 Atom 2 Length a
Sn(4) 01(8) 2.41A .04A
Sn(4) Cl(3) 2.4lA .041
Sn(4) C(8) 2.16A .18A
Sn(4) C(3) 2.16A .18A
396 MOLECULAR DYNAMICS AND STRUCTURE OF SOLIDS
least squares refinement. Using the usual Lorentz polarization cor-
rections, an isotropic temperature factor of 2.5, and no absorption
correction, a structure was determined with an R of 27. Even though
the large prismatic crystal used limited the use of any absorption
correction, it was believed that a lower R factor should be obtained.
At this point in the investigation the zero splitting loci had been
obtained, and reference to figure 1 shows that rather than having
two loci with their principal EFG Z-axes separated by the ClSnCl
bond angle, there are two pairs. The individual members of each
pair have principal EFG Z-axes separated by only 10 ±2°. This
indicates that the plane of the ClSnCl skeleton is tilted out of the
2/2-plane by 5 ±2°.
This twisting of the ClSnCl skeleton would change the space
group to I2i2i2i. Four possible modes of twisting the molecule within
the unit cell* were considered and a full matrix least-square refine-
ment in the I2i2i2i space group was attempted for each. The best
agreement, an R of 21, was obtained with the atom positions and
bond parameters given in table 1. The ClSnCl skeleton is twisted out
of the 2/2-plane by 3 ±2°.
The zero splitting loci were used to obtain the directions of the EFGprincipal axes and the EFG asymmetry parameter. The latter wasfound to be t]= 0.34 ±0.06. Using this value of r?; the observed NQRfrequency, 15.712 ±0.003 MHz; the known nuclear quadrupole mo-ment for 35C1, Q=— 0.0789X10 _24cm3
; and allowing for the contribu-
tion to the EFG of partial ionic charges on the atoms in neighboring
molecules, the 7r-bond character of the Sn-Cl bond is calculated to
be 7r=7rx+x 2/=0.207±.002 with wy—
w
x=— .0.095± 0.02.
4. References
[1] E. D. Swiger and J. D. Graybeal, J. Am. Chem. Soc. 87, 1464 (1965).
[2] P. J. Green and J. D. Graybeal, J. Am. Chem. Soc. 89, 4305 (1967).
[3] G. L. McKown and J. D. Graybeal, J. Chem. Phys. 44, 610 (1966).
THE CRYSTAL AND MOLECULAR STRUCTUREOF TETRAETHYLAMMONIUM BIS-(3)-l,2-
DICARBOLLYLCUPRATE (II)
RICHARD M. WING
Department of Chemistry
University of California, Riverside, California 92502
1. The Descriptive Chemistry of Dicarbollylmetalloids
1.1. The Dicarbollyl Group
The dicarbollyl dianion C2B 9Hn-2
is the fragment remaining when(BH) 2+
is "formally" extruded from an icosahedral C2B 10Hl2 group.
Of interest to the present discussion is that species in which the five-
atom open face produced above has carbons as near neighbors.
The electronic structure of the fragment bears a strong resemblance
to the cyclopentadienyl ion C5H5~, in that the five-atom face with six
electrons in delocalized orbitals directed roughly at the position va-
cated by (BH) 2+is comparable to the delocalized t electrons of
C5H5".
1.2. Dicarbollyl Analogs of Sandwich 7r-Cyclopentadienides
M. F. Hawthorne and coworkers have synthesized a number of
transition-metal derivatives of the dicarbollyl dianion, which seem to
to be directly analogous to the corresponding metal cyclopenta-
dienides [l].1
X-ray crystal structure studies by Zalkin [2, 3] et al., for the iron
(III) and rhenium (I) derivatives and electron spin resonance workby Maki [4] on the iron (III) derivatives convincingly illustrate the
analogy.
The organometallic chemistry of copper has no representatives in tt
sandwich chemistry, however, so when Hawthorne and Warren [5]
isolated a blue crystalline compound of copper from an aqueous,
strongly basic solution of cupric chloride and (3)~l,2-dicarbollide
dianion we were anxious to study this unusual compound.
1.3. Physical Criteria for a Sensible Descriptive Chemistry
It is this author's opinion that atom positions, while certainly neces-
sary, do not generally supply information sufficient to describe a
Figures in brackets indicate the literature references at the end of this paper.
397
398 MOLECULAR DYNAMICS AND STRUCTURE OF SOLIDS
molecular structure. Indeed in some instances the accuracy of bondlengths scales the difference of two chemistries, e.g., the double versus
the triple bond.
Thus it becomes important to add the information to be found in
other measurements such as electronic and vibrational spectroscopy
and magnetic resonance, which in turn become better experiments if
they can be done on single crystals.
In this study single-crystal visible and electron spin resonance
spectroscopy have been used in conjunction with a crystal structure
determination in an effort to formulate a molecular description of the
bis-dicarbollylcuprate (II) ion.
2. X-Ray Structure [6]
2.1. Crystal Data
The blue crystals are triclinic; a0= 12.98 A, b0=9.09 A, c0=8.73 A,
o:=93. 5°, /3=90.1°, 7=117.1°. There is one formula unit per cell.
2.2. Molecular Framework Structure
With only one heavy atom per unit cell, the structure was assumed
to be centrosymmetric, and a Fourier was computed assuming all
structure factors to be positive. The images of the 21 unique non-
hydrogen atoms were clearly visible at this point.
This structure was refined by full matrix least-squares variation of
all positional and temperature factors. Following six cycles of such
refinement during which all cage atoms were assumed to be borons,
the residual R was 0.14, and all eleven cage hydrogens were visible
in a difference Fourier.
2.3. Choosing the Cage Carbons
Two factors made the choice of the cage carbons clear. First the
temperature factors of two of the (cage) atoms were ca. 30 percent
smaller than the other nine. Second the intra-cage atom-atom dis-
tances clearly factored into three classes, containing respectively,
1 short, 6 medium, and 18 long bonds. These facts considered sepa-
rately lead to identical choices for the two carbon atoms, CB2 and
CB3 in figure 1.
The two atoms referred to above were treated as carbons, cage
hydrogens were added but not refined, and all thermal motion was
treated anisotropically, with the result that after 8 additional cycles
of refinement the residual was 0.09.
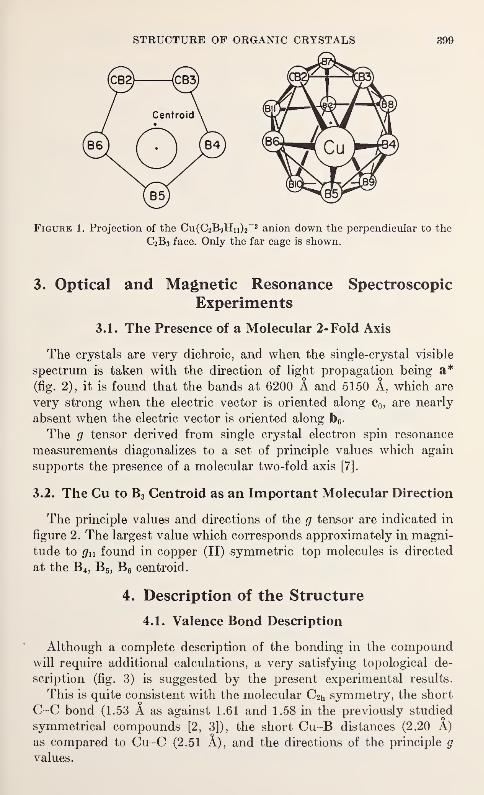
STRUCTURE OF ORGANIC CRYSTALS 399
Figure 1. Projection of the Cu(C2B9Hn) 22 anion down the perpendicular to the
C2B3 face. Only the far cage is shown.
3. Optical and Magnetic Resonance Spectroscopic
Experiments
3.1. The Presence of a Molecular 2- Fold Axis
The crystals are very dichroic, and when the single-crystal visible
spectrum is taken with the direction of light propagation being a*
(fig. 2), it is found that the bands at 6200 A and 5150 A, which are
very strong when the electric vector is oriented along c0 , are nearly
absent when the electric vector is oriented along b0 .
The g tensor derived from single crystal electron spin resonance
measurements diagonalizes to a set of principle values which again
supports the presence of a molecular two-fold axis [7].
3.2. The Gu to B3 Gentroid as an Important Molecular Direction
The principle values and directions of the g tensor are indicated in
figure 2. The largest value which corresponds approximately in magni-
tude to <7n found in copper (II) symmetric top molecules is directed
at the B4 ,B5 ,
B 6 centroid.
4. Description of the Structure
4.1. Valence Bond Description
Although a complete description of the bonding in the compoundwill require additional calculations, a very satisfying topological de-
scription (fig. 3) is suggested by the present experimental results.
This is quite consistent with the molecular C2h symmetry, the short
C-C bond (1.53 A as against 1.61 and 1.58 in the previously studied
symmetrical compounds [2, 3]), the short Cu-B distances (2.20 A)
as compared to Cu-C (2.51 A), and the directions of the principle g
values.
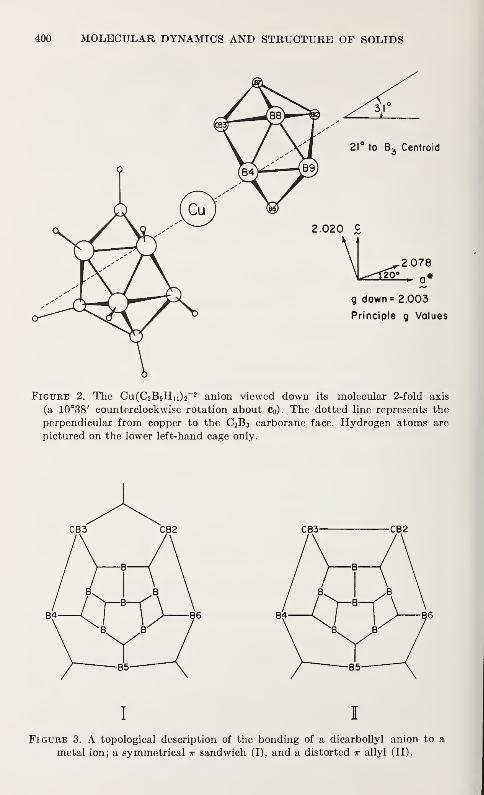
400 MOLECULAR DYNAMICS AND STRUCTURE OF SOLIDS
Figure 2. The Cu(C2BgHii) 2-2 anion viewed down its molecular 2-fold axis
(a 10°38 / counterclockwise rotation about Co). The dotted line represents the
perpendicular from copper to the C2B 3 carborane face. Hydrogen atoms arc
pictured on the lower left-hand cage only.
I I
Figure 3. A topological description of the bonding of a dicarbollyl anion to a
metal ion; a symmetrical ir sandwich (I), and a distorted ir allyl (II).
STRUCTURE OF ORGANIC CRYSTALS 401
The proposed description closely relates this compound to the bis-
allyl nickel (II) molecule.
4.2. Electron-Rich Metalloaromatics
Theoretical work on this molecule and related "sandwich" com-
pounds indicate that a combination of two factors are needed to cause
the observed slip distortion.
(1) The system must be electron rich.
(2) The aromatic ring must be heterocyclic, or unsymmetrical
in some other way (e.g. bridged naphthalene).
For heterocyclic rings, the direction of distortion can be predicted
from simple electronegativity considerations.
4.3. Organometallic?
One must be especially careful in descriptive areas in the choice of
words.
Thus this author hesitates to classify this molecule as an organo-
metallic since the copper and carbon atoms interact minimally if at all
in this system.
5. References
[1] L. F. Warren, Jr., and M. F. Hawthorne, J. Am. Chem. Soc. 89, 470 (1967) and
references therein.
[2] A. Zalkin, D. H. Templeton and T. E. Hopkins, J. Am. Chem. Soc. 87, 3988
(1965).
[3] A. Zalkin, T. E. Hopkins and D. H. Templeton, Inorg. Chem. 5, 1189 (1966).
[4] A. H. Maki and T. E. Berry, J. Am. Chem. Soc. 87, 4437 (1965).
[5] M. F. Hawthorne and L. F. Warren, private communication. A full account
of the chemistry of these compounds is in press, M. F. Hawthorne, et. al.,
J. Am. Chem. Soc.
[6] Richard M. Wing, J. Am. Chem. Soc. 89, 5599 (1967), for a full report on the
structure.
[7] August H. Maki and D. D. Scott, private communication.

NUCLEAR MAGNETIC RESONANCE STUDIES OFSINGLE CRYSTALS OF TRICHLOROACETIC ACID 1
DAVID C. HADDIX 2 and PAUL C. LAUTERBUR 3
Department of Chemistry,
State University of New York at Stony Brook,
Stony Brook, New York 11790
1. Introduction
Although the magnetic shielding of a nucleus is in general a tensor
quantity, only the average shielding (equal to one-third the trace) is
observable in isotropic fluids. Some information on shielding anisot-
ropics can be obtained from the NMR spectra of small molecules in
nematic solvents [1]4 and studies of solids, either polycrystalline or
single crystals [2] can allow determination of the complete tensor in
favorable cases. The small differences in average nuclear magnetic
shieldings (chemical shifts) found for protons can usually be expected
to be obscured by large dipolar Couplings among the protons. At a
frequency of 100 MHz, for example, a typical proton chemical shift
of 10 ppm corresponds to 1 kHz, very much smaller than a typical
line width in the solid of 20 G, or about 85 kHz. If proton shielding
tensors in solids could be studied, however, they would provide infor-
mation on the nature of the bonding and on the effects responsible for
the shifts. We have therefore searched for opportunities to make such
measurements.
In the example reported here, trichloroacetic acid, success is attribu-
table to two circumstances. First, there are relatively few protons per
unit volume in the crystal lattice, and these are in chemically identi-
cal, but differently oriented molecules. The individual peaks in the
spectrum can become as narrow as 1.2 kHz. This would still not per-
mit resolution of the peaks from the differently oriented molecules,
except for the happy circumstance that the nuclei are closely
coupled in pairs. Since the strengths of the couplings depend uponthe orientation of the crystal in the magnetic field, the pair of other-
wise overlapping lines can be split into a pair of well-separated
doublets. One such spectrum is shown in figure 1. The sharp line is
1 This work was supported in part by the Research Foundation of State University of New York andby the National Science Foundation.
2 Deceased.
3 Alfred P. Sloan Fellow.4 Figures in brackets indicate the literature references at the end of this paper.
403
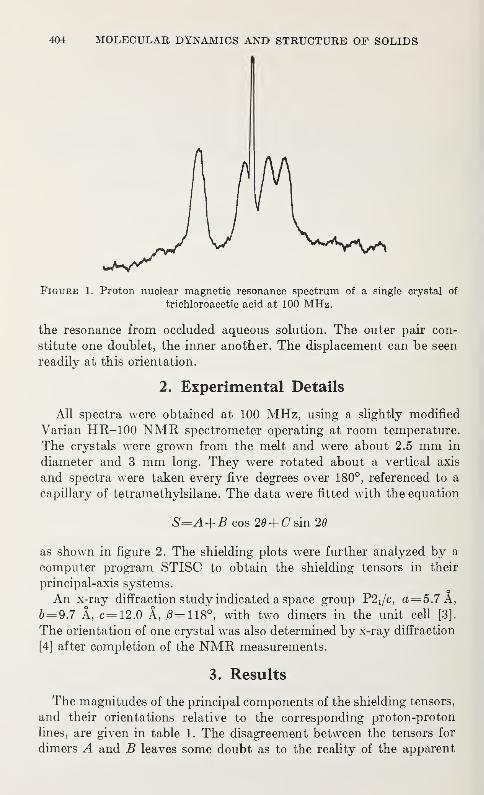
404 MOLECULAR DYNAMICS AND STRUCTURE OF SOLIDS
n
Figure 1. Proton nuclear magnetic resonance spectrum of a single crystal of
trichloroacetic acid at 100 MHz.
the resonance from occluded aqueous solution. The outer pair con-
stitute one doublet, the inner another. The displacement can be seen
readily at this orientation.
2. Experimental Details
All spectra were obtained at 100 MHz, using a slightly modified
Varian HR-100 NMR spectrometer operating at room temperature.
The crystals were grown from the melt and were about 2.5 mm in
diameter and 3 mm long. They were rotated about a vertical axis
and spectra were taken every five degrees over 180°, referenced to a
capillary of tetramethylsilane. The data were fitted with the equation
S=A+B cos 20+ (7 sin 26
as shown in figure 2. The shielding plots were further analyzed by a
computer program STISC to obtain the shielding tensors in their
principal-axis systems.
An x-ray diffraction study indicated a space group P2i/c, a=5.7A,b= 9.7 A, c=12.0 A, 0=118°, with two dimers in the unit cell [3].
The orientation of one crystal was also determined by x-ray diffraction
[4] after completion of the NMR measurements.
3. Results
The magnitudes of the principal components of the shielding tensors,
and their orientations relative to the corresponding proton-proton
lines, are given in table 1. The disagreement between the tensors for
dimers A and B leaves some doubt as to the reality of the apparent
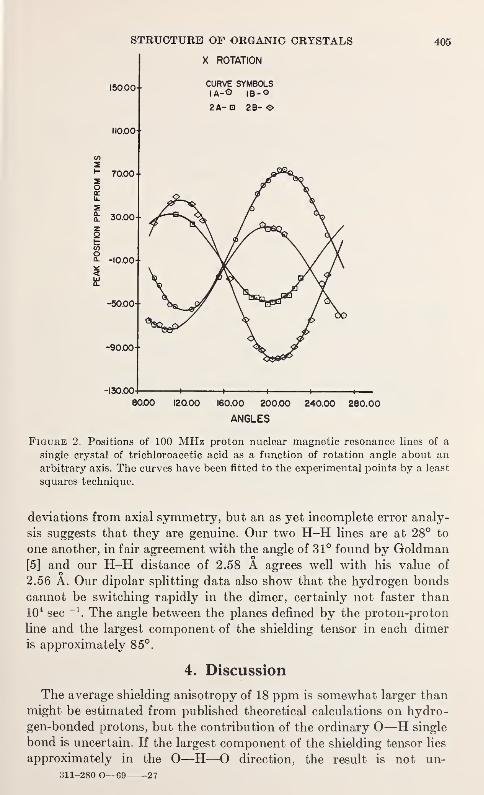
STRUCTURE OF ORGANIC CRYSTALS 405
X ROTATION
150.00CURVE SYMBOLSlA-O ib-O
2A- 2B- <S>
110.00
-130.00-1 1 1 1 —i 1
80.00 12000 160.00 200.00 240.00 280.00
ANGLES
Figure 2. Positions of 100 MHz proton nuclear magnetic resonance lines of a
single crystal of trichloroacetic acid as a function of rotation angle about an
arbitrary axis. The curves have been fitted to the experimental points by a least
squares technique.
deviations from axial symmetry, but an as yet incomplete error analy-
sis suggests that they are genuine. Our two H-H lines are at 28° to
one another, in fair agreement with the angle of 31° found by Goldman[5] and our H-H distance of 2.58 A agrees well with his value of
2.56 A. Our dipolar splitting data also show that the hydrogen bonds
cannot be switching rapidly in the dimer, certainly not faster than
10 4 sec_1
. The angle between the planes defined by the proton-proton
line and the largest component of the shielding tensor in each dimer
is approximately 85°.
4. Discussion
The average shielding anisotropy of 18 ppm is somewhat larger than
might be estimated from published theoretical calculations on hydro-
gen-bonded protons, but the contribution of the ordinary O—H single
bond is uncertain. If the largest component of the shielding tensor lies
approximately in the O—H—O direction, the result is not un-
311-280 O—69 27
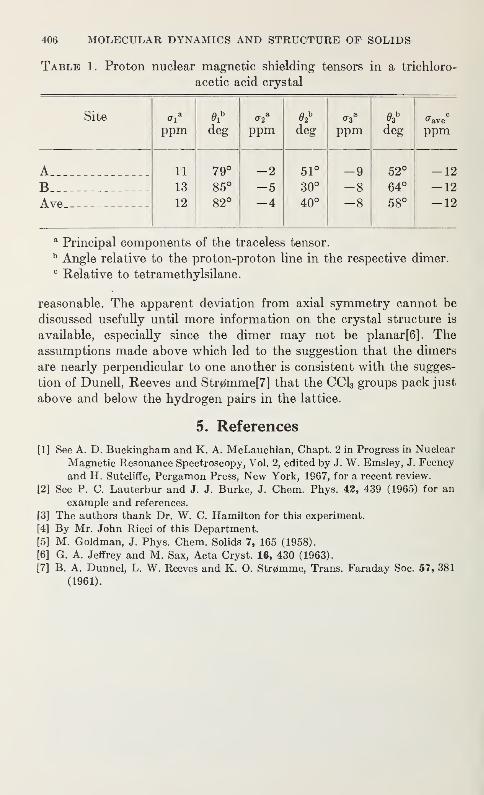
406 MOLECULAR DYNAMICS AND STRUCTURE OF SOLIDS
Table 1. Proton nuclear magnetic shielding tensors in a trichloro-
acetic acid crystal
Site 0ib
<r2a 02* *3
a03
b°"ave
C
ppm deg ppm deg ppm deg ppm
A 11 79° -2 51° -9 52° -12B 13 85° -5 30° -8 64° -12Ave 12 82° -4 40° -8 58° -12
a Principal components of the traceless tensor.b Angle relative to the proton-proton line in the respective dimer.c Relative to tetramethylsilane.
reasonable. The apparent deviation from axial symmetry cannot be
discussed usefully until more information on the crystal structure is
available, especially since the dimer may not be planar[6]. Theassumptions made above which led to the suggestion that the dimers
are nearly perpendicular to one another is consistent with the sugges-
tion of Dunell, Reeves and Str0mme[7] that the CC13 groups pack just
above and below the hydrogen pairs in the lattice.
5. References
[1] See A. D. Buckingham and K. A. McLauchlan, Chapt. 2 in Progress in Nuclear
Magnetic Resonance Spectroscopy, Vol. 2, edited by J. W. Emsley, J. Feeney
and H. Sutcliffe, Pergamon Press, New York, 1967, for a recent review.
[2] See P. C. Lauterbur and J. J. Burke, J. Chem. Phys. 43, 439 (1965) for an
example and references.
[3] The authors thank Dr. W. C. Hamilton for this experiment.
[4] By Mr. John Ricci of this Department.
[5] M. Goldman, J. Phys. Chem. Solids 7, 165 (1958).
[6] G. A. Jeffrey and M. Sax, Acta Cryst. 16, 430 (1963).
[7] B. A. Dunnel, L. W. Reeves and K. O. Str0mme, Trans. Faraday Soc. 57, 381
(1961).
THERMAL AND COMPOSITION EXPANSION OFCLATHRATES IN THE ETHYLENE OXIDE-
WATER SYSTEM
J. A. McINTYRE and D. R. PETERSEN
Chemical Physics Research Laboratory
The Dow Chemical Company, Midland, Michigan 4864-0
Water and certain small, relatively non-reactive molecules can be
crystallized together to form clathrate structures in which H20molecules are hydrogen-bonded into an array of contiguous polyhedral
cages which enclose guest molecules. In the Type I clathrate structure
(fig. 1), the cubic unit cell consists of two pentagonal dodecahedra
and six somewhat larger tetrakaidecahedra. The unit cell formula,
assuming that all eight of the cages are filled, is 8M46H20, where Mis the guest molecule. An important result of a theoretical treatment
of the clathrate hydrates, however, is the prediction that such com-
pounds should be nonstoichiometric and of variable composition!!]. 1
The nonstoichiometric nature of the ethylene oxide-water clathrate
was verified by McMullan and Jeffrey[2] by means of a single-crystal
x-ray structure analysis.
In their study, they found the cubic cell parameter to be 12.03 ±0.01 A at —25 °C for the compound crystallizing from a melt con-
taining 8 mole percent ethylene oxide. Using this cell edge, Glew and
Rath[3] were able to demonstrate the variable composition of this
compound by comparison with their observed density values. However,
a more positive demonstration of this property requires that the unit
cell parameter as a function of temperature be known for a variety of
compositions. This report contains the results of such a study[4].
Through x-ray diffraction experiments, thermal expansion relations
were established for several specific compositions over the tempera-
ture range from — 140 to —20 °C. Figure 2 shows a plot of the clathrate
unit-cell parameter versus temperature for the samples containing
2.3, 4.8, 9.3, and 12.8 mole percent ethlyene oxide.
The values derived from the few cell-parameter measurements madeon the sample containing 2.3 mole percent ethylene oxide could be
fitted by the 4.8 mole percent ethylene oxide curve within the error of
measurement. The curves shown were drawn from the quadratic
1 Figures in brackets indicate the literature references listed at the end of this paper.
407
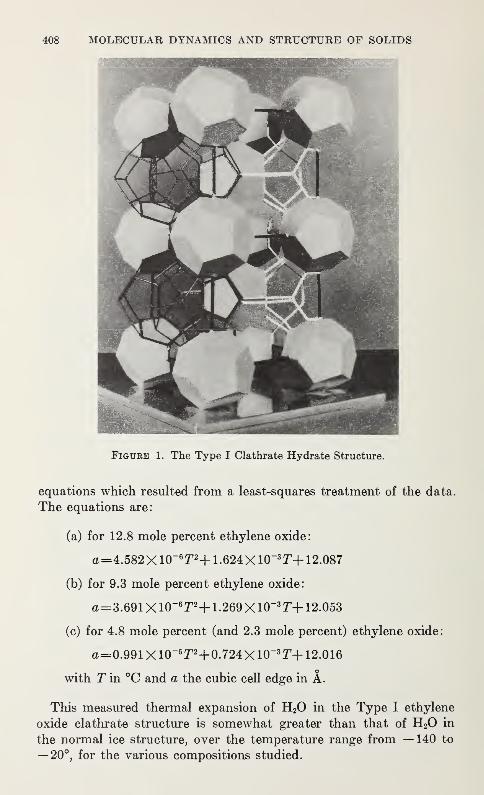
408 MOLECULAR DYNAMICS AND STRUCTURE OF SOLIDS
Figure 1. The Type I Clathrate Hydrate Structure.
equations which resulted from a least-squares treatment of the data.
The equations are:
(a) for 12.8 mole percent ethylene oxide:
a=4.582X 10_6T2+ 1.624X 10"3r+ 12.087
(b) for 9.3 mole percent ethylene oxide:
a=3.691 X 1(T6T2+ 1.269X 10⁻³T+ 12.053
(c) for 4.8 mole percent (and 2.3 mole percent) ethylene oxide:
a=0.991X10⁻⁶r2+0.724X10_3T+ 12.016
with T in °C and a the cubic cell edge in A.
This measured thermal expansion of H20 in the Type I ethylene
oxide clathrate structure is somewhat greater than that of H20 in
the normal ice structure, over the temperature range from —140 to
— 20°, for the various compositions studied.
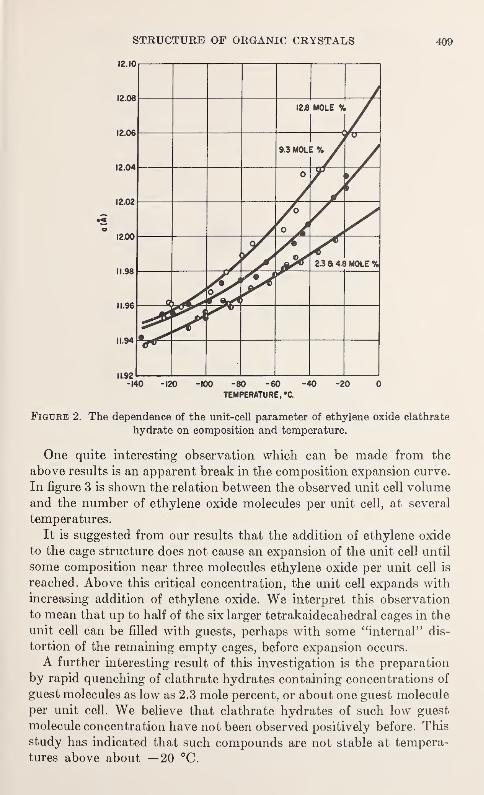
1 1.92 1 1 1 1 1 1 1 1
-140 -120 -100 -80 -60 -40 -20 0TEMPERATURE, *C
Figure 2. The dependence of the unit-cell parameter of ethylene oxide clathrate
hydrate on composition and temperature.
One quite interesting observation which can be made from the
above results is an apparent break in the composition expansion curve.
In figure 3 is shown the relation between the observed unit cell volumeand the number of ethylene oxide molecules per unit cell, at several
temperatures.
It is suggested from our results that the addition of ethylene oxide
to the cage structure does not cause an expansion of the unit cell until
some composition near three molecules ethylene oxide per unit cell is
reached. Above this critical concentration, the unit cell expands with
increasing addition of ethylene oxide. We interpret this observation
to mean that up to half of the six larger tetrakaidecahedral cages in the
unit cell can be filled with guests, perhaps with some "internal" dis-
tortion of the remaining empty cages, before expansion occurs.
A further interesting result of this investigation is the preparation
by rapid quenching of clathrate hydrates containing concentrations of
guest molecules as low as 2.3 mole percent, or about one guest molecule
per unit cell. We believe that clathrate hydrates of such low guest
molecule concentration have not been observed positively before. This
study has indicated that such compounds are not stable at tempera-
tures above about —20 °C.
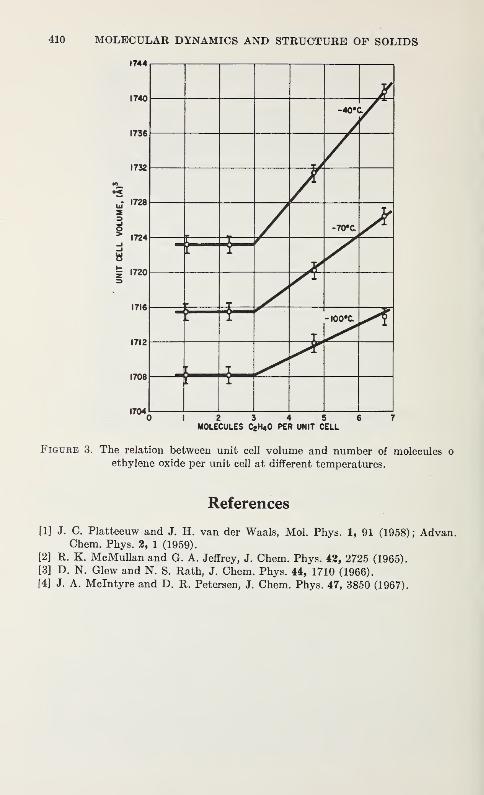
410 MOLECULAR DYNAMICS AND STRUCTURE OF SOLIDS
1744
1740
1736
1732
1728
1724
3£ I72C
1716
1712
1708
1704
-40*<
-70*C.
5
L
-1 1
i
—
_
g- I00-C.
f
—
0 1 2 3 4 5 6 7MOLECULES C2H40 PER UNIT CELL
Figure 3. The relation between unit cell volume and number of molecules o
ethylene oxide per unit cell at different temperatures.
References
[1] J. C. Platteeuw and J. H. van der Waals, Mol. Phys. 1, 91 (1958); Advan.Chem. Phys. 2, 1 (1959).
[2] R. K. McMuUan and G. A. Jeffrey, J. Chem. Phys. 42, 2725 (1965).
[3] D. N. Glew and N. S. Rath, J. Chem. Phys. 44, 1710 (1966).
[4] J. A. Mclntyre and D. R. Petersen, J. Chem. Phys. 47, 3850 (1967).

SPECTROSCOPY OF ORGANIC CRYSTALS

NUCLEAR MAGNETIC RESONANCE ANDMOLECULAR MOTION IN ORGANIC CRYSTALS
E. R. ANDREW
Department of Physics
University of Nottingham
Nottingham, England
1. Introduction
In this article I shall first discuss a representative group of related
organic solids in which molecular reorientation about one preferred
axis had been examined by the nuclear magnetic resonance (n.m.r.)
method. I shall then draw attention to experiments in which narrowing
of n.m.r. spectra of solids is achieved by rapidly spinning the speci-
mens, since this gives insight into the narrowing mechanism and lends
support to the underlying ideas. I shall then go on to consider a group of
organic solids in which not only is the molecule as a whole capable of
rotational motion, but in which there is also rotational motion of
groups within the molecule. Next I shall discuss solids in which as the
temperature is raised progressively more general motions of the mole-
cules are excited. This leads to a discussion of the diffusion of molecules
in solids. Finally, I shall mention the way in which quadrupole effects
can provide information about molecular motion in solids.
2. Molecular Motion About One Preferred Axis
The proton magnetic resonance spectrum of polycrystalline organic
materials usually consists of one broad resonance line which sometimes
exhibits partially resolved structural features. The spectral breadth
is caused predominantly by the magnetic dipolar interaction betweenthe protons; in simple physical terms the protons in the material
experience a variety of local magnetic fields generated by their
neighbours. Only in simple examples can the spectral profile be cal-
culated in detail, but in all cases one important parameter of the
spectral line, namely the mean square width or second moment, can
be calculated in terms of the crystal structure [l].1 If the molecules
are not fixed in the crystal but undergo reorientation, the magnetic
dipolar interaction between the protons becomes time-dependent, and
Figures in brackets indicate the literature references at the end of this paper.
413
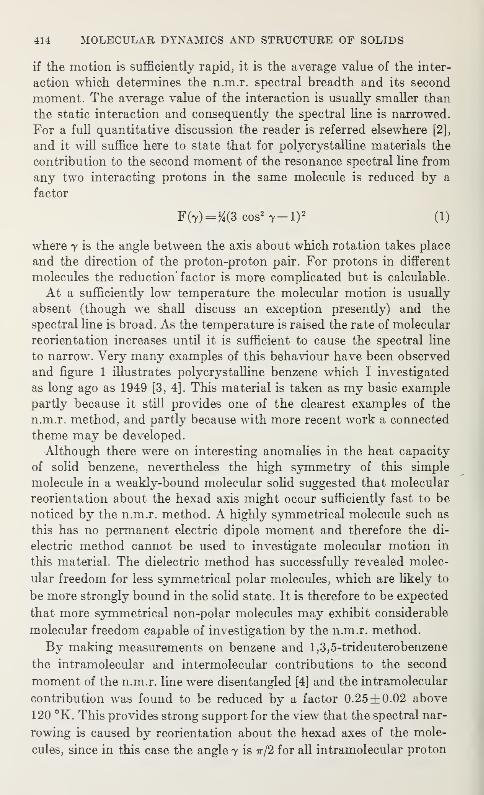
414 MOLECULAR DYNAMICS AND STRUCTURE OF SOLIDS
if the motion is sufficiently rapid, it is the average value of the inter-
action which determines the n.m.r. spectral breadth and its second
moment. The average value of the interaction is usually smaller than
the static interaction and consequently the spectral line is narrowed.
For a full quantitative discussion the reader is referred elsewhere [2],
and it will suffice here to state that for polycrystalline materials the
contribution to the second moment of the resonance spectral line from
any two interacting protons in the same molecule is reduced by a
factor
F(7)= M(3cos27-l) 2
(1)
where y is the angle between the axis about which rotation takes place
and the direction of the proton-proton pair. For protons in different
molecules the reduction' factor is more complicated but is calculable.
At a sufficiently low temperature the molecular motion is usually
absent (though we shall discuss an exception presently) and the
spectral line is broad. As the temperature is raised the rate of molecular
reorientation increases until it is sufficient to cause the spectral line
to narrow. Very many examples of this behaviour have been observed
and figure 1 illustrates polycrystalline benzene which I investigated
as long ago as 1949 [3, 4]. This material is taken as my basic example
partly because it still provides one of the clearest examples of the
n.m.r. method, and partly because with more recent work a connected
theme may be developed.
Although there were on interesting anomalies in the heat capacity
of solid benzene, nevertheless the high symmetry of this simple
molecule in a weakly-bound molecular solid suggested that molecular
reorientation about the hexad axis might occur sufficiently fast to be
noticed by the n.m.r. method. A highly symmetrical molecule such as
this has no permanent electric dipole moment and therefore the di-
electric method cannot be used to investigate molecular motion in
this material. The dielectric method has successfully revealed molec-
ular freedom for less symmetrical polar molecules, which are likely to
be more strongly bound in the solid state. It is therefore to be expected
that more symmetrical non-polar molecules may exhibit considerable
molecular freedom capable of investigation by the n.m.r. method.
By making measurements on benzene and 1,3,5-trideuterobenzene
the intramolecular and intermolecular contributions to the second
moment of the n.m.r. line were disentangled [4] and the intramolecular
contribution was found to be reduced by a factor 0.25 ±0.02 above
120 °K. This provides strong support for the view that the spectral nar-
rowing is caused by reorientation about the hexad axes of the mole-
cules, since in this case the angle y is ir/2 for all intramolecular proton
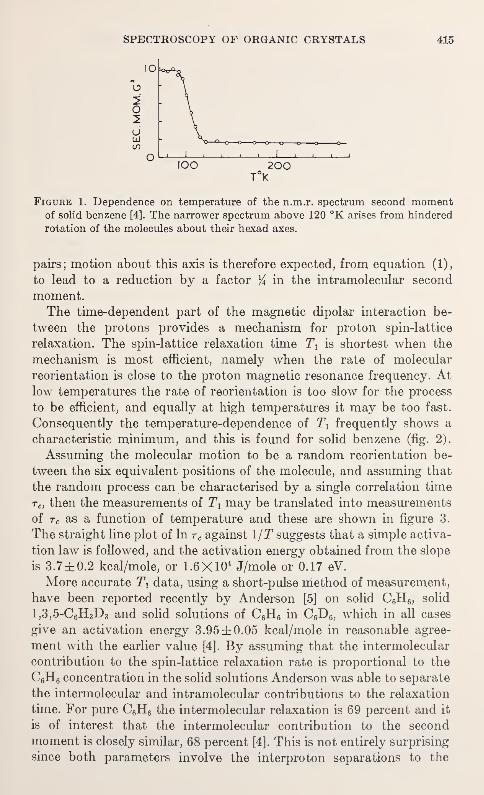
SPECTROSCOPY OF ORGANIC CRYSTALS 415
Figure 1. Dependence on temperature of the n.m.r. spectrum second momentof solid benzene [4]. The narrower spectrum above 120 °K arises from hindered
rotation of the molecules about their hexad axes.
pairs; motion about this axis is therefore expected, from equation (1),
to lead to a reduction by a factor % in the intramolecular second
moment.The time-dependent part of the magnetic dipolar interaction be-
tween the protons provides a mechanism for proton spin-lattice
relaxation. The spin-lattice relaxation time TY is shortest when the
mechanism is most efficient, namely when the rate of molecular
reorientation is close to the proton magnetic resonance frequency. Atlow temperatures the rate of reorientation is too slow for the process
to be efficient, and equally at high temperatures it may be too fast.
Consequently the temperature-dependence of Tx frequently shows a
characteristic minimum, and this is found for solid benzene (fig. 2).
Assuming the molecular motion to be a random reorientation be-
tween the six equivalent positions of the molecule, and assuming that
the random process can be characterised by a single correlation time
rc , then the measurements of Tx may be translated into measurements
of tc as a function of temperature and these are shown in figure 3.
The straight line plot of In r c against 1/T suggests that a simple activa-
tion law is followed, and the activation energy obtained from the slope
is 3.7 ±0.2 kcal/mole, or 1.6X10* J/mole or 0.17 eV.
More accurate TY data, using a short-pulse method of measurement,
have been reported recently by Anderson [5] on solid C6H6 , solid
1,3,5-C 6H3D 3 and solid solutions of C6H6 in C6D 6 , which in all cases
give an activation energy 3.95 ±0.05 kcal/mole in reasonable agree-
ment with the earlier value [4]. By assuming that the intermolecular
contribution to the spin-lattice relaxation rate is proportional to the
C 6H6 concentration in the solid solutions Anderson was able to separate
the intermolecular and intramolecular contributions to the relaxation
time. For pure C6H 6 the intermolecular relaxation is 69 percent and it
is of interest that the intermolecular contribution to the second
moment is closely similar, 68 percent [4]. This is not entirely surprising
since both parameters involve the interproton separations to the
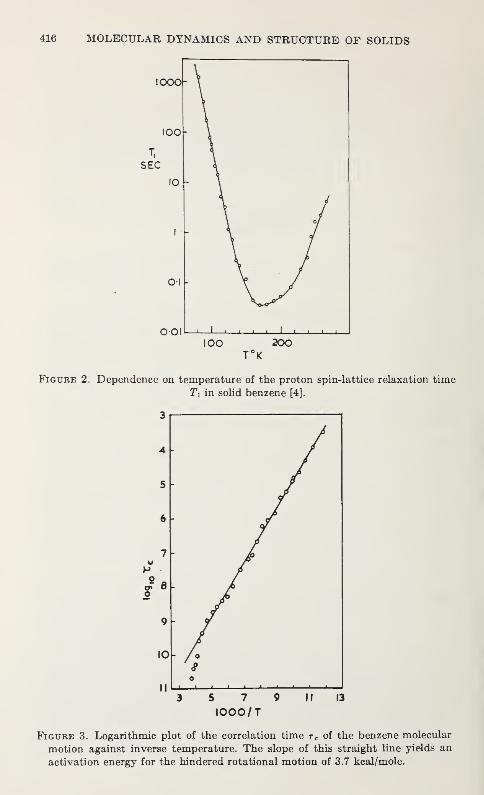
416 MOLECULAR DYNAMICS AND STRUCTURE OF SOLIDS
Figure 3. Logarithmic plot of the correlation time t c of the benzene molecular
motion against inverse temperature. The slope of this straight line yields an
activation energy for the hindered rotational motion of 3.7 kcal/mole.
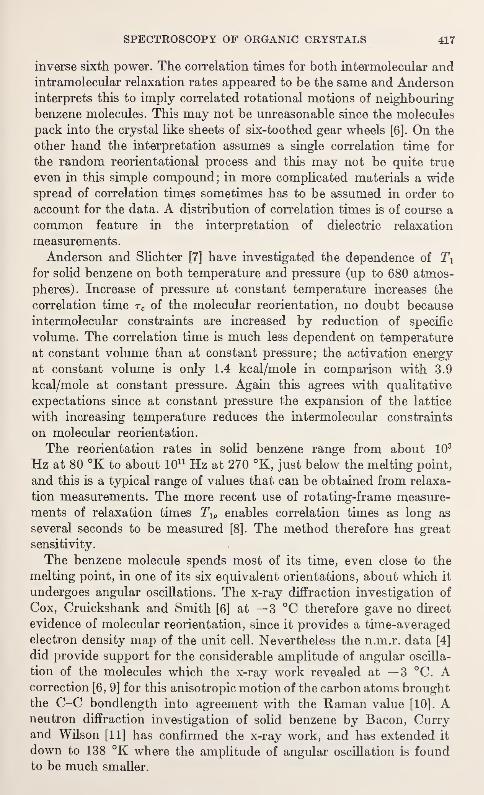
SPECTROSCOPY OF ORGANIC CRYSTALS 417
inverse sixth power. The correlation times for both intermolecular andintramolecular relaxation rates appeared to be the same and Andersoninterprets this to imply correlated rotational motions of neighbouring
benzene molecules. This may not be unreasonable since the molecules
pack into the crystal like sheets of six-toothed gear wheels [6]. On the
other hand the interpretation assumes a single correlation time for
the random reorientational process and this may not be quite true
even in this simple compound; in more complicated materials a widespread of correlation times sometimes has to be assumed in order to
account for the data. A distribution of correlation times is of course a
common feature in the interpretation of dielectric relaxation
measurements.
Anderson and Slichter [7] have investigated the dependence of T1
for solid benzene on both temperature and pressure (up to 680 atmos-
pheres). Increase of pressure at constant temperature increases the
correlation time rc of the molecular reorientation, no doubt because
intermolecular constraints are increased by reduction of specific
volume. The correlation time is much less dependent on temperature
at constant volume than at constant pressure; the activation energy
at constant volume is only 1.4 kcal/mole in comparison with 3.9
kcal/mole at constant pressure. Again this agrees with qualitative
expectations since at constant pressure the expansion of the lattice
with increasing temperature reduces the intermolecular constraints
on molecular reorientation.
The reorientation rates in solid benzene range from about 103
Hz at 80 °K to about 1011 Hz at 270 °K, just below the melting point,
and this is a typical range of values that can be obtained from relaxa-
tion measurements. The more recent use of rotating-frame measure-
ments of relaxation times Tlp enables correlation times as long as
several seconds to be measured [8]. The method therefore has great
sensitivity.
The benzene molecule spends most of its time, even close to the
melting point, in one of its six equivalent orientations, about which it
undergoes angular oscillations. The x-ray diffraction investigation of
Cox, Cruickshank and Smith [6] at —3 °C therefore gave no direct
evidence of molecular reorientation, since it provides a time-averaged
electron density map of the unit cell. Nevertheless the n.m.r. data [4]
did provide support for the considerable amplitude of angular oscilla-
tion of the molecules which the x-ray work revealed at —3 °C. Acorrection [6, 9] for this anisotropic motion of the carbon atoms broughtthe C-C bondlength into agreement with the Raman value [10]. Aneutron diffraction investigation of solid benzene by Bacon, Curryand Wilson [11] has confirmed the x-ray work, and has extended it
down to 138 °K where the amplitude of angular oscillation is foundto be much smaller.
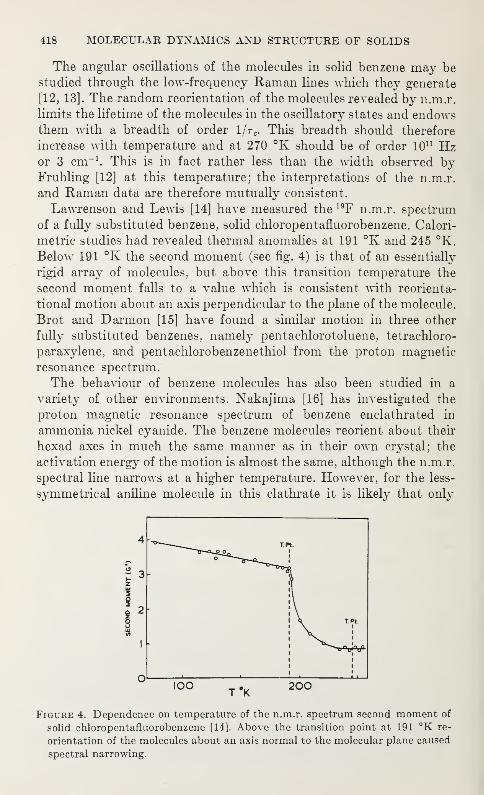
418 MOLECULAR DYNAMICS AND STRUCTURE OF SOLIDS
The angular oscillations of the molecules in solid benzene may bestudied through the low-frequency Raman lines which they generate
[12, 13]. The random reorientation of the molecules revealed by n.m.r.
limits the lifetime of the molecules in the oscillatory states and endowsthem with a breadth of order l/rc. This breadth should therefore
increase with temperature and at 270 °K should be of order 10 11 Hzor 3 cm-1
. This is in fact rather less than the width observed byFruhling [12] at this temperature; the interpretations of the n.m.r.
and Raman data are therefore mutually consistent.
Lawrenson and Lewis [14] have measured the 19F n.m.r. spectrum
of a fully substituted benzene, solid chloropentafluorobenzene. Calori-
metric studies had revealed thermal anomalies at 191 °K and 245 °K.
Below 191 °K the second moment (see fig. 4) is that of an essentially
rigid array of molecules, but above this transition temperature the
second moment falls to a value which is consistent with reorienta-
tional motion about an axis perpendicular to the plane of the molecule.
Brot and Darmon [15] have found a similar motion in three other
fully substituted benzenes, namely pentachlorotoluene, tetrachloro-
paraxylene, and pentachlorobenzenethiol from the proton magnetic
resonance spectrum.
The behaviour of benzene molecules has also been studied in a
variety of other environments. Nakajima [16] has investigated the
proton magnetic resonance spectrum of benzene enclathrated in
ammonia nickel cyanide. The benzene molecules reorient about their
hexad axes in much the same manner as in their own crystal; the
activation energy of the motion is almost the same, although the n.m.r.
spectral line narrows at a higher temperature. However, for the less-
symmetrical aniline molecule in this clathrate it is likely that only
Figure 4. Dependence on temperature of the n.m.r. spectrum second moment of
solid chloropentafluorobenzene [14]. Above the transition point at 191 °K re-
orientation of the molecules about an axis normal to the molecular plane caused
spectral narrowing.
SPECTROSCOPY OF ORGANIC CRYSTALS 419
the amino group has rotational freedom, while the pyridine molecule
shows little rotational freedom at all. Hindered rotation about their
hexad axes has also been established for benzene molecules in a numberof other clathrates [17]. The relative isolation of the benzene molecules
in clathrates leads to longer proton spin-lattice relaxation times [17].
Benzene molecules have also been found by n.m.r. to show freedom
of reorientation about their hexad axes in certain solid complexes.
One example [18] is dibenzene chromium, Cr(C 6H 6) 2 , in which the
chromium atoms are sandwiched between pairs of benzene molecules
which have a common hexad axis. Another example is provided by the
less-symmetrical benzene-silver-chlorate complex [19]. In ferrocene,
ruthenocene and titanocene dichloride the metal atom is sandwiched
between two cyclopentadienyl (C5H5) rings, forming a molecular ar-
rangement similar to the dibenzene chromium complex, and in similar
fashion there is found to be ring-reorientation about the pentad
axes [18, 20, 21, 22].
Another environment in which benzene molecules have been studied
is when adsorbed on solid surfaces. Both on charcoal surface [23] andon silica gel [24], proton magnetic resonance studies demonstrate that
the molecules are reorienting about their hexad axes down to liquid
nitrogen temperatures. In fact the rotational freedom is greater than
in solid benzene [4], which is in turn greater than in the dicyano-
ammine-nickel clathrate [16]. Benzene has also been studied when dis-
solved in nematic liquid crystals [25]. The high mobility of the mole-
cules ensures the averaging out of intermolecular contributions to the
proton magnetic resonance spectrum, but their environment amonglong host molecules aligned with the magnetic field causes them to
be partly oriented, with the result that intramolecular dipolar inter-
actions are not fully eliminated. As a consequence the spectrum
examined under high-resolution conditions displays a wealth of fine
lines which supply the signs of the J coupling constants [26]. Hexa-fluorobenzene, C 6F6 , has been similarly studied [27].
3. Macroscopic Motion About One Axis
In the previous section a number of examples have been given in
which rapid molecular motion about one preferred axis within the
solid is believed to be responsible for the narrowing of the n.m.r.
spectra. I shall now describe experiments in which we have demon-strated in a direct manner that rotation does indeed cause spectral
narrowing [28-35]. If a solid specimen is rapidly rotated in the ap-
plied magnetic field, the coherent rotational motion is impressed
upon every internuclear vector in the specimen, and the average
magnetic dipolar linewidth should as a consequence be reduced by a
factor %(3 cos2a— 1), and the second moment by the square of this,
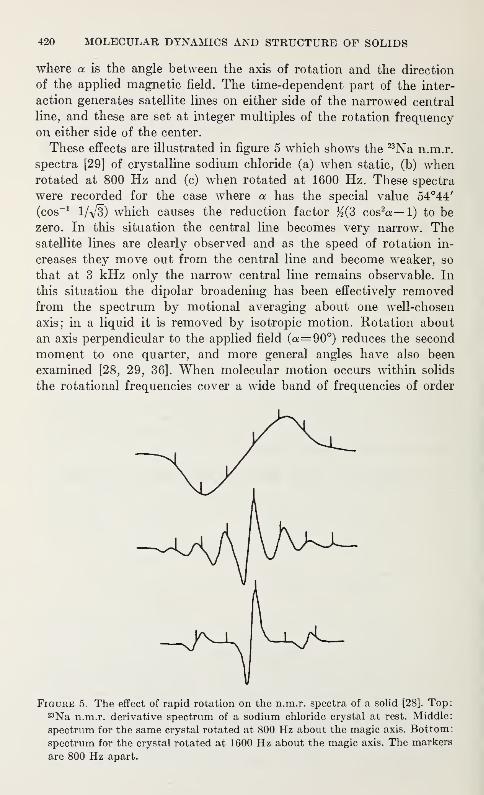
420 MOLECULAR DYNAMICS AND STRUCTURE OF SOLIDS
where a is the angle between the axis of rotation and the direction
of the applied magnetic field. The time-dependent part of the inter-
action generates satellite lines on either side of the narrowed central
line, and these are set at integer multiples of the rotation frequency
on either side of the center.
These effects are illustrated in figure 5 which shows the 23Na n.m.r.
spectra [29] of crystalline sodium chloride (a) when static, (b) whenrotated at 800 Hz and (c) when rotated at 1600 Hz. These spectra
were recorded for the case where a has the special value 54°44'
(cos-1
1/V3) which causes the reduction factor %(3 cos2a— 1) to be
zero. In this situation the central line becomes very narrow. Thesatellite lines are clearly observed and as the speed of rotation in-
creases they move out from the central line and become weaker, so
that at 3 kHz only the narrow central line remains observable. In
this situation the dipolar broadening has been effectively removedfrom the spectrum by motional averaging about one well-chosen
axis; in a liquid it is removed by isotropic motion. Rotation about
an axis perpendicular to the applied field (a=90°) reduces the second
moment to one quarter, and more general angles have also been
examined [28, 29, 36]. When molecular motion occurs within solids
the rotational frequencies cover a wide band of frequencies of order
Figure 5. The effect of rapid rotation on the n.m.r. spectra of a solid [28]. Top:23Na n.m.r. derivative spectrum of a sodium chloride crystal at rest. Middle:
spectrum for the same crystal rotated at 800 Hz about the magic axis. Bottom:
spectrum for the crystal rotated at 1600 Hz about the magic axis. The markers
are 800 Hz apart.
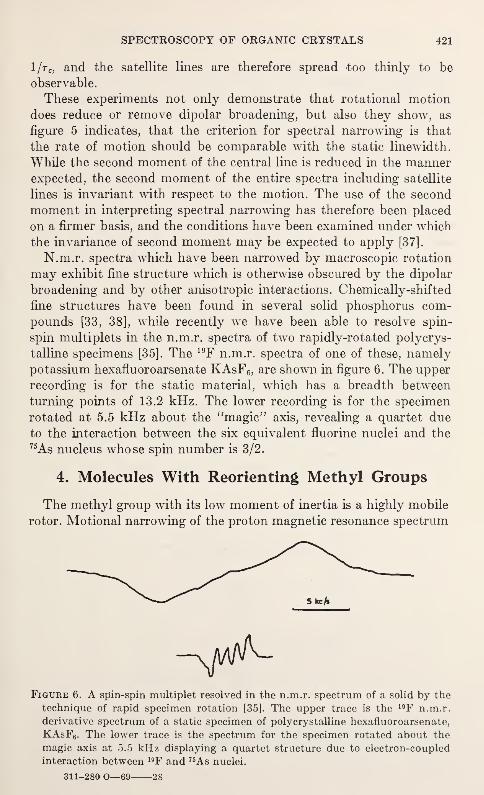
SPECTROSCOPY OF ORGANIC CRYSTALS 421
1/t c , and the satellite lines are therefore spread too thinly to be
observable.
These experiments not only demonstrate that rotational motion
does reduce or remove dipolar broadening, but also they show, as
figure 5 indicates, that the criterion for spectral narrowing is that
the rate of motion should be comparable with the static linewidth.
While the second moment of the central line is reduced in the mannerexpected, the second moment of the entire spectra including satellite
lines is invariant with respect to the motion. The use of the second
moment in interpreting spectral narrowing has therefore been placed
on a firmer basis, and the conditions have been examined under which
the invariance of second moment may be expected to apply [37].
N.m.r. spectra which have been narrowed by macroscopic rotation
may exhibit fine structure which is otherwise obscured by the dipolar
broadening and by other anisotropic interactions. Chemically-shifted
fine structures have been found in several solid phosphorus com-
pounds [33, 38], while recently we have been able to resolve spin-
spin multiplets in the n.m.r. spectra of two rapidly-rotated polycrys-
talline specimens [35]. The 19F n.m.r. spectra of one of these, namelypotassium hexafluoroarsenate KAsF 6 , are shown in figure 6. The upper
recording is for the static material, which has a breadth between
turning points of 13.2 kHz. The lower recording is for the specimen
rotated at 5.5 kHz about the "magic" axis, revealing a quartet due
to the interaction between the six equivalent fluorine nuclei and the75As nucleus whose spin number is 3/2.
4. Molecules With Reorienting Methyl Groups
The methyl group with its low moment of inertia is a highly mobile
rotor. Motional narrowing of the proton magnetic resonance spectrum
Figure 6. A spin-spin multiplet resolved in the n.m.r. spectrum of a solid by the
technique of rapid specimen rotation [35]. The upper trace is the 19F n.m.r.
derivative spectrum of a static specimen of polycrystalline hexafluoroarsenate,
KAsF6 . The lower trace is the spectrum for the specimen rotated about the
magic axis at 5.5 kHz displaying a quartet structure due to electron-coupled
interaction between 19F and 75As nuclei.
311-280 O—69- -28
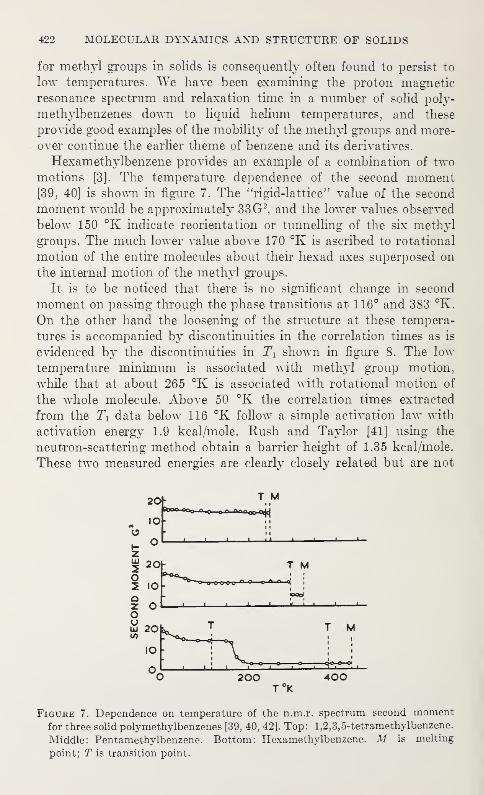
422 MOLECULAR DYNAMICS AND STRUCTURE OF SOLIDS
for methyl groups in solids is consequently often found to persist to
low temperatures. We have been examining the proton magnetic
resonance spectrum and relaxation time in a number of solid poly-
methylbenzenes down to liquid helium temperatures, and these
provide good examples of the mobility of the methyl groups and more-
over continue the earlier theme of benzene and its derivatives.
Hexamethylbenzene provides an example of a combination of twomotions [3]. The temperature dependence of the second moment[39, 40] is shown in figure 7. The "rigid-lattice" value of the second
moment would be approximately 33G 2, and the lower values observed
below 150 °K indicate reorientation or tunnelling of the six methyl
groups. The much lower value above 170 °K is ascribed to rotational
motion of the entire molecules about their hexad axes superposed on
the internal motion of the methyl groups.
It is to be noticed that there is no significant change in second
moment on passing through the phase transitions at 116° and 383 °K.
On the other hand the loosening of the structure at these tempera-
tures is accompanied by discontinuities in the correlation times as is
evidenced by the discontinuities in Tl shown in figure 8. The low
temperature minimum is associated with methyl group motion,
while that at about 265 °K is associated with rotational motion of
the whole molecule. Above 50 °K the correlation times extracted
from the Tx data below 116 °K follow a simple activation law with
activation energy 1.9 kcal/mole. Rush and Taylor [41] using the
neutron-scattering method obtain a barrier height of 1.35 kcal/mole.
These two measured energies are clearly closely related but are not
2<*
m IO
| 2OHO2 IO
oz oOui 20id
IO
T M4i
T M
2O0 400
Figure 7. Dependence on temperature of the n.m.r. spectrum second momentfor three solid polymethylbenzenes [39, 40, 42]. Top: 1,2,3,5-tetramethylbenzene.
Middle: Pentamethylbenzene. Bottom: Hexamethylbenzene. M is melting
point; T is transition point.
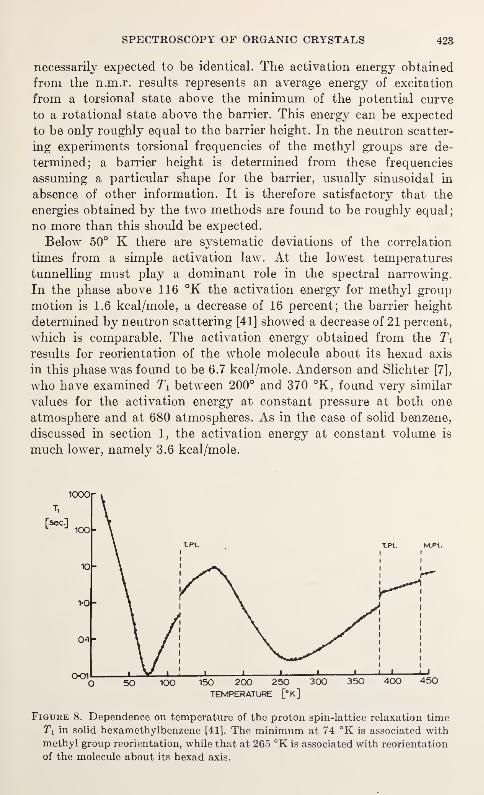
SPECTROSCOPY OF ORGANIC CRYSTALS 423
necessarily expected to be identical. The activation energy obtained
from the n.m.r. results represents an average energy of excitation
from a torsional state above the minimum of the potential curve
to a rotational state above the barrier. This energy can be expected
to be only roughly equal to the barrier height. In the neutron scatter-
ing experiments torsional frequencies of the methyl groups are de-
termined; a barrier height is determined from these frequencies
assuming a particular shape for the barrier, usually sinusoidal in
absence of other information. It is therefore satisfactory that the
energies obtained by the two methods are found to be roughly equal;
no more than this should be expected.
Below 50° K there are systematic deviations of the correlation
times from a simple activation law. At the lowest temperatures
tunnelling must play a dominant role in the spectral narrowing.
In the phase above 116 °K the activation energy for methyl group
motion is 1.6 kcal/mole, a decrease of 16 percent; the barrier height
determined by neutron scattering [41] showed a decrease of 21 percent,
which is comparable. The activation energy obtained from the T\
results for reorientation of the whole molecule about its hexad axis
in this phase was found to be 6.7 kcal/mole. Anderson and Slichter [7],
who have examined T\ between 200° and 370 °K, found very similar
values for the activation energy at constant pressure at both one
atmosphere and at 680 atmospheres. As in the case of solid benzene,
discussed in section 1, the activation energy at constant volume is
much lower, namely 3.6 kcal/mole.
TEMPERATURE [°k]
Figure 8. Dependence on temperature of the proton spin-lattice relaxation timeT
x in solid hexamethylbenzene [41]. The minimum at 74 °K is associated with
methyl group reorientation, while that at 265 °K is associated with reorientation
of the molecule about its hexad axis.
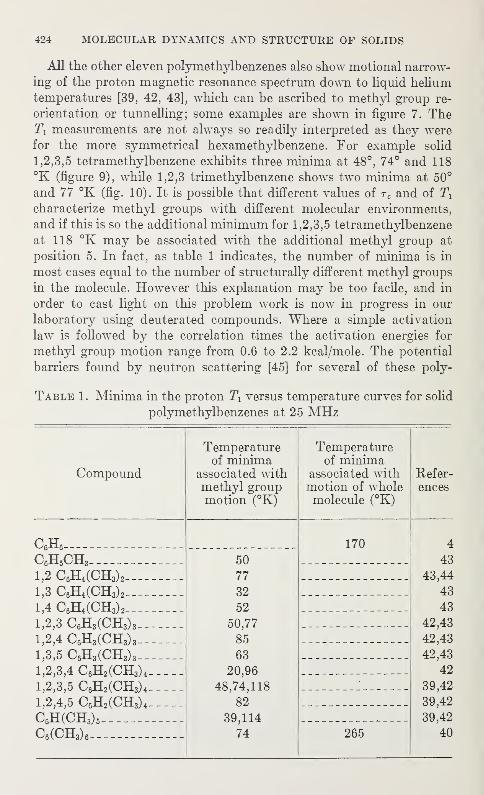
424 MOLECULAR DYNAMICS AND STRUCTURE OF SOLIDS
All the other eleven polymethylbenzenes also show motional narrow-
ing of the proton magnetic resonance spectrum down to liquid helium
temperatures [39, 42, 43], which can be ascribed to methyl group re-
orientation or tunnelling; some examples are shown in figure 7. TheTi measurements are not always so readily interpreted as they werefor the more symmetrical hexamethylbenzene. For example solid
1,2,3,5 tetramethylbenzene exhibits three minima at 48°, 74° and 118
°K (figure 9), while 1,2,3 trimethylbenzene shows two minima at 50°
and 77 °K (fig. 10). It is possible that different values of r c and of 2\
characterize methyl groups with different molecular environments,
and if this is so the additional minimum for 1,2,3,5 tetramethylbenzene
at 118 °K may be associated with the additional methyl group at
position 5. In fact, as table 1 indicates, the number of minima is in
most cases equal to the number of structurally different methyl groups
in the molecule. However this explanation may be too facile, and in
order to cast light on this problem work is now in progress in our
laboratory using deuterated compounds. Where a simple activation
law is followed by the correlation times the activation energies for
methyl group motion range from 0.6 to 2.2 kcal/mole. The potential
barriers found by neutron scattering [45] for several of these poly-
Table 1. Minima in the proton Tl versus temperature curves for solid
polymethylbenzenes at 25 MHz
Compound
Temperatureof minima
associated withmethyl groupmotion (°K)
Temperatureof minima
associated withmotion of wholemolecule (°K)
Refer-ences
C6H6
C6H5CH3
1.2 C6H4(CH3) 2
1.3 C6H4(CH3) 2
1.4 C 6H4(CH3) 2.___
1.2.3 C6H3(CH3) 3 __
1.2.4 C 6H3(CH3) 3__
1.3.5 CeH3(CH3) 3..
1.2.3.4 C6H2(CH3) 4 .
1.2.3.5 C 6H2(CH3) 4 .
1,2,4,5 C6H2(CH3) 4 .
C 6H(CH3) 5
C6(CH3) 6
50
77
32
52
50,77
85
63
20,96
48,74,118
82
39,114
74
170
265
4
43
43,44
43
43
42,43
42,43
42,43
42
39,42
39,42
39,42
40
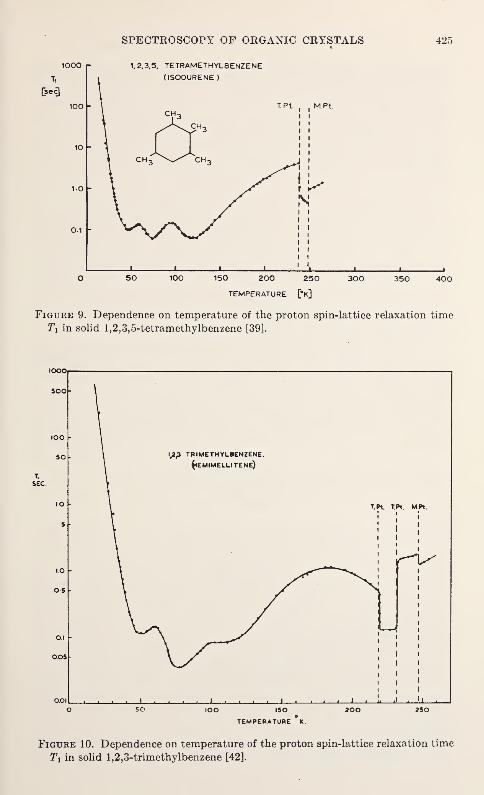
SPECTROSCOPY OF ORGANIC CRYSTALS 425
1000 1,2.3,5, TETRAMETHYLBENZENE
Tsecl
100 T.Pt., ,
M.Pt.CH 3
10 o ! !
CH 3 CH 3
"it-1-0 -
is
0-1
I i i i LJj -L_ i i
O 50 100 150 200 250 300 350 400
TEMPERATURE [°k]
Figure 9. Dependence on temperature of the proton spin-lattice relaxation time
Ti in solid 1,2,3,5-tetramethylbenzene [39].
1000
o.oil , , , , i , , , , i , , , , i , , , , \ , b J , UO SO IOO 150 200 250
TEMPERATURE K.
Figure 10. Dependence on temperature of the proton spin-lattice relaxation time
Ti in solid 1,2,3-trimethylbenzene [42].
426 MOLECULAR DYNAMICS AND STRUCTURE OF SOLIDS
niethylbenzenes range from 1.0 to 2.2 kcal/mole. Second moment and
Tip measurements indicate more general motion of the molecules,
probably about an axis normal to the molecule, in several of these
compounds at temperatures approaching their melting points.
The series of solid compounds X(CH3) 4 , where X is C, Si, Ge, Snand Pb provides another good example of rapid methyl group rotation
superposed on a general reorientation of the molecule [46, 47, 48].
5. General Molecular Motion and Diffusion
There are now a number of examples of solids whose n.m.r. spectrum
narrows in several distinct steps as the temperature is raised. The rate of
each process increases with temperature, though usually governed byquite different activation energies, and as each rate becomes compar-
able with the spectral width, the line narrows further. The different
processes and their rates are usually mirrored in the temperature
dependence of spin-lattice relaxation time behaviour, as we saw with
hexamethylbenzene in the previous section.
An early example in this category which we studied some years ago
is solid cyclohexane [49]. The second moment falls from 26.0 G2 at
100 °K to 6.4 G2 at 186 °K where there is a first order phase transition.
This can be quantitatively accounted for by reorientation of the mole-
cules about their triad axes with an activation energy of about 11
kcal/mole. In the new phase above 186 °K the second moment has the
smaller value of 1.4 G2 which can be accounted for by the assumption
of a general motion of the molecules about their center of mass. The
motion need not be isotropic but must be sufficiently near-isotropic to
cause the intramolecular contribution to the second moment to be
removed. The entropy of transition is much larger than the entropy of
melting, and there is a change of about 8 percent in specific volume.
This implies a much looser molecular arrangement in the upper phase
which gives the molecules much greater freedom of rotational motion.
Above 220 °K the spectrum narrows again to a sharp width character-
istic of a liquid. Even the intermolecular contribution to the dipolar
broadening has now disappeared and this implies diffusion of the
molecules through the crystal lattice at a rate in excess of 104 Hz. This
diffusional motion, postulated [49] to explain the n.m.r. results of solid
cyclohexane has been confirmed by the radiotracer technique by Hoodand Sherwood [50,51], who used l4C labelled cyclohexane, and obtained
an activation energy of 16.3 kcal/mole for the process. Recent measure-
ments [52] of T lp have revealed a minimum in its temperature
dependence, and yield an activation energy of 10 kcal/mole which is
significantly lower.
The behaviour of solid cyclohexane is typical of many so-called
"plastic crystals", which are characterized by at least one phase trans-
SPECTROSCOPY OF ORGANIC CRYSTALS 427
formation accompanied by a large heat of transition, usually larger
than the heat of fusion. Such transitions are sometimes referred to as
"pre-melting". The molecules are globular in shape and in the upper
temperature phase exhibit considerable molecular freedom. Besides
cyclohexane some examples of the large number of such solids which
have been examined by the n.m.r. method are cyclobutane [53],
cyclopentane [54], neopentane [47,48,55], perfluorocyclohexane [56],
cyclohexanol [57,58], hexamethyldisilane [59], 2,2- and 2,3-di-
methylbutane [60,61], succinonitrile [62], camphor [63], triethylene-
diamine [64], quinuclidine [65]. In all these solids the molecules show a
general quasi-isotropic reorientation, and with the exception of
quinuclidine there is also evidence of molecular diffusion. Most of
these materials have, like cyclohexane, a heat of transition greater than
the heat of melting, often much greater. In the case of camphor, whose
molecules have a permanent electric dipole moment, there is dielectric
evidence of molecular motion consistent with the n.m.r. results.
Solid cyclohexanol [58] is an interesting case in that the molecular
tumbling and diffusion narrow the n.m.r. spectral line sufficiently to
enable a high-resolution spectrum to be observed consisting of three
chemically-shifted proton lines with intensity ratios 1:1:10. These
lines clearly arise from the resonance of the OH group, the H on the
same carbon atom, and the remaining ten ring protons. The spectrum
has in fact the characteristics of the high-resolution n.m.r. spectrum
of a liquid, and indeed on melting there was no discernible change in
the spectrum.
6. Evidence of Molecular Motion From QuadrupoleEffects
Evidence for molecular motion in solids which has been discussed
in the preceding sections has been, derived from the magnetic-resonance
spectra, and relaxation behaviour of nuclei of spin % such as the pro-
ton and 19F. However the examination of nuclei with spin numbergreater than %, and therefore possessing an electric quadrupole moment,
can often give additional information. Molecular motion modulates
the nuclear electric quadrupolar interaction, enabling the motion to
be studied through its effect on the electric quadrupolar coupling ten-
sor, its principal axes and principal values, and on the nuclear spin-
lattice relaxation time. The first work of this kind was that of Ketudat
and Pound [66], who examined the deuteron resonance in monocrys-
talline Li2S04-D 20 and showed that at room temperature the water
molecule reorients about the DOD bisector between its two equivalent
positions 180° apart, while at 148 °K the spectrum corresponded to
that of stationary water molecules. The same type of behaviour has
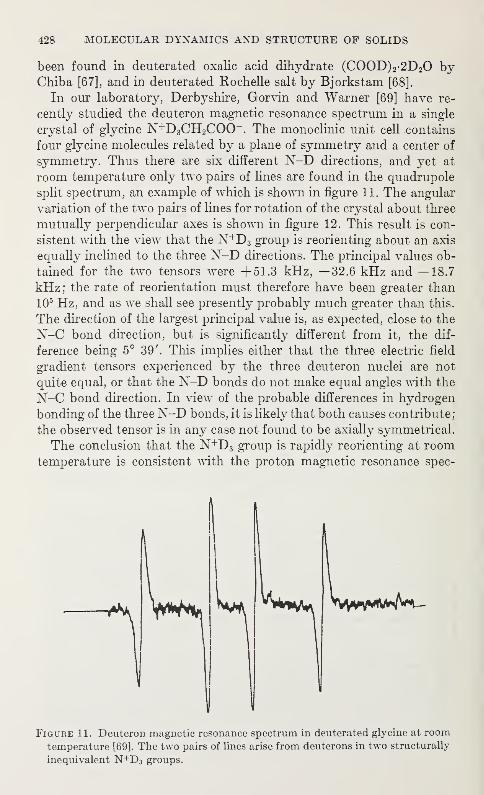
428 MOLECULAR DYNAMICS AND STRUCTURE OF SOLIDS
been found in deuterated oxalic acid dihydrate (COOD) 2-2D20 byChiba [67], and in deuterated Rochelle salt by Bjorkstam [68].
In our laboratory, Derbyshire, Gorvin and Warner [69] have re-
cently studied the deuteron magnetic resonance spectrum in a single
crystal of glycine N+D 3CH2COO~. The monoclinic unit cell contains
four glycine molecules related by a plane of symmetry and a center of
symmetry. Thus there are six different N-D directions, and yet at
room temperature only two pairs of lines are found in the quadrupole
split spectrum, an example of which is shown in figure 1 1 . The angular
variation of the two pairs of lines for rotation of the crystal about three
mutually perpendicular axes is shown in figure 12. This result is con-
sistent with the view that the N+D3 group is reorienting about an axis
equally inclined to the three N-D directions. The principal values ob-
tained for the two tensors were +51.3 kHz, —32.6 kHz and —18.7
kHz ; the rate of reorientation must therefore have been greater than
10 5 Hz, and as we shall see presently probably much greater than this.
The direction of the largest principal value is, as expected, close to the
N-C bond direction, but is significantly different from it, the dif-
ference being 5° 39'. This implies either that the three electric field
gradient tensors experienced by the three deuteron nuclei are not
quite equal, or that the N-D bonds do not make equal angles with the
N-C bond direction. In view of the probable differences in hydrogen
bonding of the three N-D bonds, it is likely that both causes contribute;
the observed tensor is in any case not found to be axially symmetrical.
The conclusion that the N+D 3 group is rapidly reorienting at roomtemperature is consistent with the proton magnetic resonance spec-
Figure 11. Deuteron magnetic resonance spectrum in deuterated glycine at room
temperature [69]. The two pairs of lines arise from deuterons in two structurally
inequivalent N+D 3 groups.
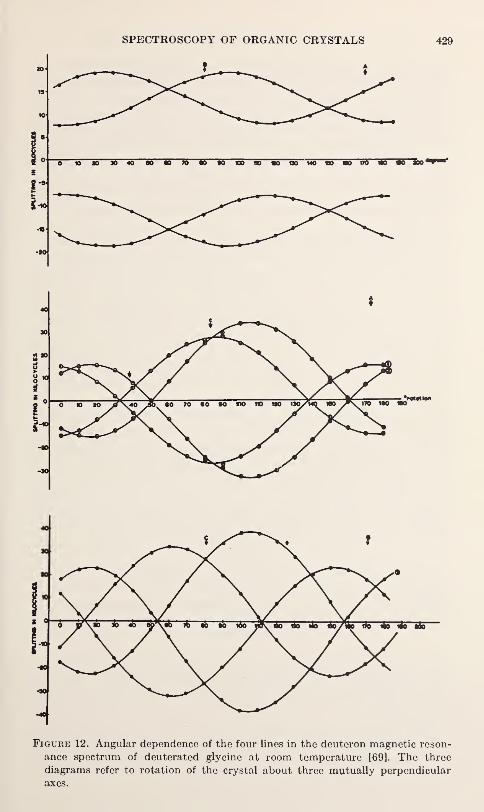
SPECTROSCOPY OF ORGANIC CRYSTALS 429
Figure 12. Angular dependence of the four lines in the deuteron magnetic reson-
ance spectrum of deuterated glycine at room temperature [69]. The three
diagrams refer to rotation of the crystal about three mutually perpendicular
axes.
430 MOLECULAR DYNAMICS AND STRUCTURE OF SOLIDS
trum of a single crystal of ordinary glycine investigated by Webb andMoulton [70]. Below 150 °K the spectrum is much broader [70, 71]
corresponding to essentially static N+H3 groups, implying that the
rate of reorientation at these temperatures is less than 105 Hz in ordi-
nary glycine. On the other hand Derbyshire et al. [72] find at 90 °Kthat the deuteron magnetic resonance still consists of only four lines,
implying that the rate of reorientation at this temperature is greater
than 105c/s in the deuterated glycine. This greater mobility in the
deuterated species presumably reflects the weaker nature of deuterated
hydrogen bonds compared with protonated hydrogen bonds.
A single crystal of deuterated alanine N+D3 C(CH3)HCOO_has
been studied also [72] and like glycine shows that there is rapid re-
orientation of the N+D3 group. Here the principal values of the aver-
aged tensor are +49.2 kHz, —29.0 kHz and —20.2 kHz. The direction
of the largest principal value in this case is 3° 40' away from the N-Cbond direction. Rotational motion of the N+D3 group has also been
studied in deuterated triglycine sulphate by Bjorkstam [73] and
Blinc, Pintar and Zupancic [74],
An interesting result was obtained [72] with deuterated malonic
acid CH2(COOD) 2 . The triclinic unit cell contains two molecules
related by a center of symmetry. Thus one would anticipate finding
two pairs of lines corresponding to two different O-D directions; in
fact four pairs were found at room temperature. This implies that
for each O-D bond there are two possible bond directions. This is
not of course disclosed by the x-ray investigation of the crystal struc-
ture, which did not locate the hydrogen atoms.
A number of representative examples have been given in this
paper of different kinds of molecular motion which the nuclear
magnetic resonance method has been able to illuminate. Other ex-
amples will be found in earlier review articles [75, 76, 77].
I wish to thank Dr. P. S. Allen, Dr. W. Derbyshire, Dr. D. C.
Douglass, Dr. R. G. Eades and Dr. I. J. Lawrenson for information
on their work in advance of publication.
7. Discussion
D. W. McCall (Bell Telephone Laboratories): In KAsF6 you
were able to resolve the As-F spin coupling by a 6 kHz rotation. As
the resonance Avidth is —'13 kHz this seems surprising. Can you tell
us about this?
E. R. Andrew: Experimentally one finds that you don't have
to rotate at quite the rate equal to the linewidth of the static specimen
SPECTROSCOPY OF ORGANIC CRYSTALS 431
defined between derivative turning points. Usually one finds that the
spectrum is already beginning to show the effect of rotation when the
specimen is rotated at about a quarter of the derivative width. This
is in reasonable agreement with the theory of Clough and Gray that
the spectrum should narrow substantially when the rate of rotation is
comparable with the r.m.s. width, which in the case of KAsF6 is
4.5 kHz.
R. S. Kirk (General Electric) : Does the activation energy of
the relaxation time show a change when tunnelling becomes important?
E. R. Andrew: At lower temperatures where tunnelling assumes
greater importance, the correlation time deduced from the spin-lattice
relaxation time measurements for the solid polymethylbenzenes
deviates from "a simple activation law.
G. W. Smith (General Motors Research) : Various data show
that both hexamethylethane and neopentane are 'plastic crystals' and
display self-diffusion. However in the analogous compounds hexa-
methyldisilane and tetramethylsilane, only hexamethyldisilane has a
plastic phase. Would you care to comment on this?
E. R. Andrew: I do not think we have a quantitative under-
standing of the phase transitions in molecular solids. However one can
see empirically a progression of behaviour as silicon replaces carbon
in the compounds mentioned. Replacing carbon with silicon in hexa-
methylethane decreases the melting point by 86° from 374 to 288 °K.
Replacing carbon with silicon in tetramethylcarbon (neopentane)
decreases the melting point by 80° from 254 to 174 °K. The replace-
ment has approximately the same effect on the melting point. Replac-
ing carbon by silicon in hexamethylethane has the effect of increasing
the transition temperature by 69° from 153 to 222 °K. If the replace-
ment of carbon by silicon in tetramethylcarbon were to have the sarhe
result on the transition temperature, the transition temperature for
tetramethylsilane would occur at about 209 °K. However the melting-
point of this compound is low, 174 °K, and consequently the plastic
phase does not exist.
C. S. Johnson (University of North Carolina) : I wonder if exactly
the same activation energies are obtained from linewidths as from
second moments.
E. R. Andrew: All the activation energies that I have quoted
are based on spin-lattice relaxation data and not at all from spectral
432 MOLECULAR DYNAMICS AND STRUCTURE OF SOLIDS
narrowing. Consequently they are based on a much wider range of
temperature, since the spectrum usually narrows over a small tem-perature interval. However if Ti measurements are lacking, estimates
of activation energy can be obtained from spectral narrowing. Strictly
one should work with the linewidth here and not with the second
moment, since the latter is not uniquely obtainable in the region of
narrowing.
C. S. Johnson: If you can compare the activation energies fromrelaxation measurements and from linewidths will they come out the
same?
E. R. Andrew: Yes, you can very often give a reasonable account
of the line-narrowing process using the activation data from the T\
measurements.
D. F. R. Gilson (McGill University) : The linewidth versus tempera-
ture plot obtained by Hoch and Rushworth for cyclobutane indicated
two linewidths at the same temperature. Similar results were obtained
by G. W. Smith for triethylenediamine and by us for some other
compounds. Would you care to comment on this?
E. R. Andrew: I do not recall the details of the work mentioned
sufficiently clearly. However both compounds contain pairs of protons
which would generate a line structure and in the region where the
spectrum is narrowed by hindered rotation the intermolecular broad-
ening may be reduced sufficiently to allow the intramolecular structure
to be resolved.
C. Brot (Centre National de la Recherche Scientifique) : Do you
have any comment on the possible differences between the activation
enthalpy (which is most often measured), the activation energy, and
the intermolecular potential barrier.
E. R. Andrew: This is an interesting point, since measurements
have been made of T\ by Anderson and Slichter on a number of
solids as a function of pressure and temperature. For the more com-
pressible molecular solids they found a significant difference be-
twe3n the activation energy at constant pressure (activation enthalpy)
and the activation energy at constant volume. At constant volume
one supposes that the potential barriers restraining molecular rotation
are held constant and that as the temperature rises more molecules
are excited over the potential barriers. On the other hand at constant
pressure the lattice expands as the temperature rises and one expects
SPECTROSCOPY OF ORGANIC CRYSTALS 433
that the potential barriers are progressively reduced while at the
same time more molecules are being excited over them. In this case
there should therefore be a more rapid variation of molecular reorien-
tation rate with temperature, and hence the activation enthalpyshould be greater than the activation energy measured at constant
volume, and this is what was found.
J. J. Rush (National Bureau of Standards): I have a commentrather than a question. Professor Andrew and I have already discussed
some of this in private, but I think considering the nature of the
conference that some comments about correlation between the neutronscattering data and the nmr data might be apropos. By a happy co-
incidence, as Professor Andrew pointed out, a whole sequence of poly-
methylbenzenes were studied in the same temperature region and the
same phases, by neutron scattering at Argonne, and by Professor
Andrew and his collaborators in England. The correlation betweenthese data is quite impressive, particularly in cases such as o-xylene
and durene where you do have some hope for the potential to ap-
proximate a three-fold cosine potential. The activation energies
extracted by Professor Andrew and his collaborators are in quite
good agreement with the barriers to rotation we calculated from the
measured 1-0 transitions. In addition, all of these data are consistent
with the activation energies for the gas phase derived from thermo-
dynamic data, also assuming a cosine potential. This, I think, demon-
strates that similar types of measurements in parallel directions bythese techniques can, in the future, contribute more information about
individual motions and potential barriers and changes with state
of aggregation than one technique alone.
8. References
[I] J. H. Van Vleck, Phys. Rev. 74, 1168 (1948).
[2] See for example E. R. Andrew, Nuclear Magnetic Resonance, CambridgeUniversity Press (1955) ; A. Abragam, The Principles of Nuclear Magnet-
ism, Clarendon Press, Oxford (1961); C. P. Slichter, Principles of Mag-netic Resonance, Harper and Row (1963).
[3] E. R. Andrew, J. Chem. Phys. 18, 607 (1950).
[4] E. R. Andrew and R. G. Eades, Proc. Roy. Soc. A218, 537 (1953).
[5] J. E. Anderson, J. Chem. Phys. 43, 3575 (1965).
[6] E. G. Cox, D. W. J. Cruickshank and J. A. S. Smith, Proc. Roy. Soc. A247,
1 (1958).
[7] J. E. Anderson and W. P. Slichter, J. Chem. Phys. 44, 1797 (1966).
[8] D. C. Ailion and C. P. Slichter, Phys. Rev. 137, A235 (1965).
[9] E. G. Cox, Rev. Mod. Phys. 30, 159 (1958).
[10] B. Stoicheff, J. Chem. Phys. 21, 1410 (1953).
[II] G. E. Bacon, N. A. Curry and S. A. Wilson, Proc. Roy. Soc. A379, 98
(1964).
[12] A. Fruhling, Anu. Phys. Paris 6, 401 (1951).
434 MOLECULAR DYNAMICS AND STRUCTURE OF SOLIDS
[13] I. Ichishuma and S. Mizushima, J. Chem. Phys. 18, 1686 (1950); also M.Ito and T. Shigeoka, Spectrochim. Acta 22, 1029 (1966).
[14] I. J. Lawrenson and C. Lewis, Proc. Phys. Soc. 89, 923 (1966).
[15] C. Brot and I. Darmon, J. Chim. Phys. 63, 100 (1966).
[16] H. Nakajima, J. Phys. Soc. Japan 20, 555 (1965).
[17] T. Miyamoto, T. Iwamoto, Y. Sasaki and S. Fujiwara, J. Chem. Phys. 45,
752 (1966).
[18] L. N. Mulay, E. G. Rochow and E. O. Fischer, J. Inorg. Nuel. Chem. 4,
231 (1957).
[19] D. F. R. Gilson and C. A. McDowell, J. Chem. Phys. 39, 1825 (1963); the
same authors have reported a study of molecular motion in other organic
complexes in Can. J. Chem. 44, 945 (1966).
[20] C. H. Holm and J. A. Ibers, J. Chem. Phys. 30, 885 (1959).
[21] L. N. Mulay and M. E. Fox, Naturwissenschaften 49, 446 (1962)
.
[22] L. N. Mulay and A. Attalla, J. Amer. Chem. Soc. 85, 702 (1963).
[23] J. K. Thompson, J. J. Krebs and H. A. Resing, J. Chem. Phys. 43, 3853
(1965).
[24] D. E. Woessner, J. Phys. Chem. 70, 1217 (1966).
[25] A. Saupe and G. Englert, Phys. Rev. Letters 11, 462 (1963).
[26] L. C. Snyder and E. W. Anderson, J. Amer. Chem. Soc. 86, 5023 (1964).
[27] L. C. Snyder and E. W. Anderson, J. Chem. Phys. 42, 3336 (1965).
[28] E. R. Andrew, A. Bradbury and R. G. Eades, Nature 182, 1659 (1958).
[29] E. R. Andrew, A. Bradbury and R. G. Eades, Nature 183, 1802 (1959).
[30] E. R. Andrew, A. Bradbury, R. G. Eades and G. J. Jenks, Nature 188, 1103
(1960).
[31] E. R. Andrew and R, G. Eades, Disc. Faraday Soc. 34, 38 (1962).
[32] E. R. Andrew, A. Bradbury, R. G. Eades and V. T. Wynn, Physics Letters
4, 99 (1963).
[33] E. R. Andrew and V. T. Wynn, Proc. Roy. Soc. A291, 257 (1966).
[34] E. R. Andrew, S. Clough, L. F. Farnell, T. D. Gledhill and I. Roberts, Physics
Letters 21, 505 (1966).
[35] E. R. Andrew, L. F. Farnell and T. D. Gledhill, Phys. Rev. Letters 19, 6
(1967).
]36] I. J. Lowe, Phys. Rev. Letters 2, 285 (1959).
[37] E. R. Andrew and G. J. Jenks, Proc. Phys. Soc. 80, 663 (1962).
[38] H. Kessemeier and R. E. Norberg, Phys. Rev. 155, 321 (1967).
[39] P. S. Allen, E. R. Andrew and A. Cowking, Proc. XIV Colloque Ampere,
Ljubljana 1078 (1966).
[40] P. S. Allen and A. Cowking, J. Chem. Phys. 47, 4286 (1967.)
[41] J. J. Rush and T. I. Taylor, J. Chem. Phys. 44, 274 (1966).
[42] A. Cowking, Ph.D. thesis, University of Nottingham (1967).
[43] G. P. Jones, R. G. Eades, K. W. Terry and J. P. LleweUyn, (to be published).
[44] J. Haupt and W. Muller-Warmuth, CR XIII Colloque Ampere, Louvain 247
(1964).
[45] J. J. Rush, J. Chem. Phys. 47, 3936 (1967).
[46] G. W. Smith, J. Chem. Phys. 42, 4229 (1965).
[47] J. G. Powles and H. S. Gutowsky, J. Chem. Phys. 21, 1695 (1955).
[48] E. O. Stejskal, D. E. Woessner, T. C. Farrar and H. S. Gutowsky, J. Chem.
Phys. 31, 55 (1959).
[49] E. R. Andrew and R. G. Eades, Proc. Roy. Soc. A216, 398 (1953).
[50] G. M. Hood and J. N. Sherwood, Molecular Crystals 1, 97 (1966).
[51] G. M. Hood and J. N. Sherwood, J. Chim. Phys. 63, 121 (1966).
[52] D. C. Douglass (private communication).
SPECTROSCOPY OF ORGANIC CRYSTALS 435
[53] M. J. R. Hoch and F. A. Rushworth, Proc. Phys. Soc. 83, 949 (1964).
[54] F. A. Rushworth, Proc. Roy. Soc. A222, 526 (1954).
[55] H. S. Gutowsky and G. E. Pake, J. Chem. Phys. 18, 162 (1950).
[56] A. Fratiello and D. C. Douglass, J. Chem. Phys. 41, 974 (1964).
[57] P. Averbuch, C.R. Acad. Sci. Paris 244, 3147 (1963).
[58] H. Suga, M. Sugisaki and S. Seki, Molecular Crystals 1, 377 (1966).
[59] T. Yukitoshi, H. Suga, S. Seki and J. Itoh, J. Phys. Soc. Japan 13, 506 (1957)
.
[60] R. G. Eades, G. P. Jones, J. P. Llewellyn and K. W. Terry, Proc. Phys. Soc.
91, 124 (1967).
[61] G. P. Jones, Physics Letters 22, 390 (1966).
[62] L. Petrakis and A. Rao, J. Chem. Phys. 39, 1633 (1963).
[63] J. E. Anderson and W. P. Slichter, J. Chem. Phys. 41, 1922 (1964).
[64] G. W. Smith, J. Chem. Phys. 43, 4325 (1965).
[65] I. Darmon and C. Brot, Molecular Crystals 1, 417 (1966).
[66] S. Ketudat and R. V. Pound, J. Chem. Phys. 26, 708 (1957).
[67] T. Chiba, J. Chem. Phys. 41, 1352 (1964).
[68] J. L. Bjorkstam, Bull. Am. Phys. Soc. 9, 142 (1964).
[69] W. Derbyshire, T. Gorvin and D. Warner, Molecular Physics 12, 299 (1967).
[70] W. E. Webb and W. G. Moulton, J. Chem. Phys. 36, 1911 (1962).
[71] R. A. Kromhout and W. G. Moulton, J. Chem. Phys. 23, 1673 (1955).
[72] W. Derbyshire, T. Gorvin and D. Warner, (private communication).
[73] J. L. Bjorkstam, Phys. Rev. 153, 599 (1967).
[74] R. Blinc, M. Pintar and I. Zupancic, J. Phys. Chem. Solids 28, 405 (1967) .
[75] E. R. Andrew, J. Phys. Chem. Solids 18, 9 (1961).
[76] J. G. Powles, J. Phys. Chem. Solids 18, 17 (1961).
[77] E. R. Andrew and P. S. Allen, J. Chem. Phys. 63, 85 (1966).

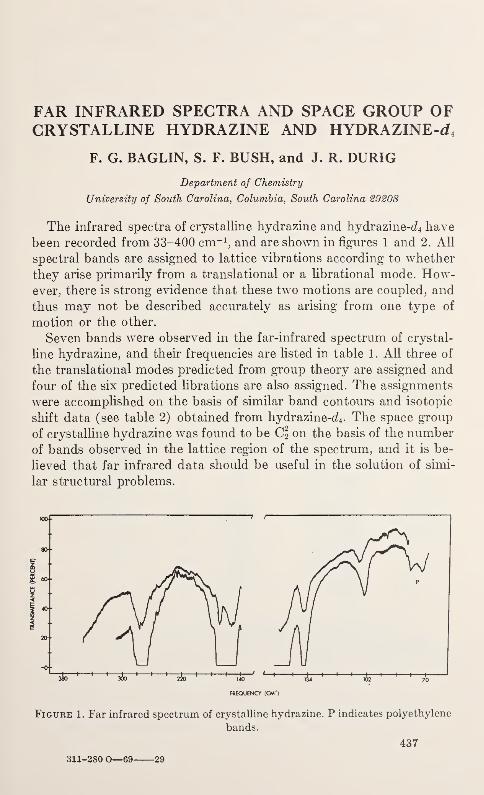
FAR INFRARED SPECTRA AND SPACE GROUP OFCRYSTALLINE HYDRAZINE AND HYDRAZINE-^
F. G. BAGLIN, S. F. BUSH, and J. R. DURIG
Department of Chemistry
University of South Carolina, Columbia, South Carolina 29208
The infrared spectra of crystalline hydrazine and hydrazine-^ have
been recorded from 33-400 cm-1, and are shown in figures 1 and 2. All
spectral bands are assigned to lattice vibrations according to whether
they arise primarily from a translational or a librational mode. How-ever, there is strong evidence that these two motions are coupled, and
thus may not be described accurately as arising from one type of
motion or the other.
Seven bands were observed in the far-infrared spectrum of crystal-
line hydrazine, and their frequencies are listed in table 1 . All three of
the translational modes predicted from group theory are assigned and
four of the six predicted librations are also assigned. The assignments
were accomplished on the basis of similar band contours and isotopic
shift data (see table 2) obtained from hydrazine-^. The space group
of crystalline hydrazine was found to be C\ <>n the basis of the number
of bands observed in the lattice region of the spectrum, and it is be-
lieved that far infrared data should be useful in the solution of simi-
lar structural problems.
FREQUENCY (CM1
)
Figure 1. Far infrared spectrum of crystalline hydrazine. P indicates polyethylene
bands.
437
311-280 O—69 29
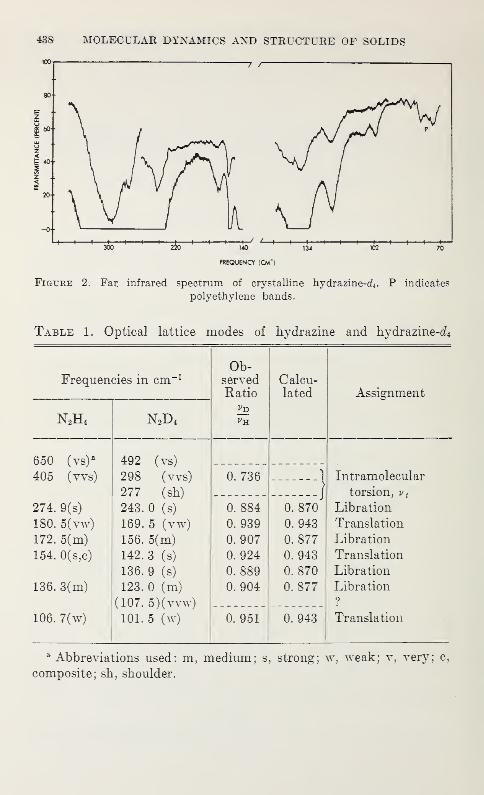
43S MOLECULAR DYNAMICS AND STRUCTURE OF SOLIDS
'' 300 ' ' ' 220 ' ' * i^O^
^' ' I3i ' ' * 102 ' ' ' 70
FREQUENCY (CMJ
)
Figure 2. Far infrared spectrum of crystalline hydrazine-d4 . P indicates
polyethylene bands.
Table 1. Optical lattice modes of hydrazine and hydrazine-^
Frequencies in cm-1Ob-
servedRatio
Calcu-lated Assignment
N2H4 N2D4
650 (vs) a
405 (vvs)
492 (vs)
298 (vvs)
277 (sh)
243. 0 (s)
169. 5 (vw)
156. 5(m)
142. 3 (s)
136. 9 (s)
123. 0 (m)
(107. 5)(vvw)
101. 5 (w)
0. 736 Intramolecular
:::::::) torsion, v t
274. 9(s)
180. 5(vw)
172. 5(m)
154. 0(s,c)
136. 3(m)
0. 884
0. 939
0. 907
0. 924
0. 889
0. 904
0. 870
0. 943
0. 877
0. 943
0. 870
0. 877
Libration
Translation
Libration
Translation
Libration
Libration?
106. 7(w) 0. 951 0. 943 Translation
a Abbreviations used: m, medium; s, strong; w, weak; v, very; c,
composite; sh, shoulder.
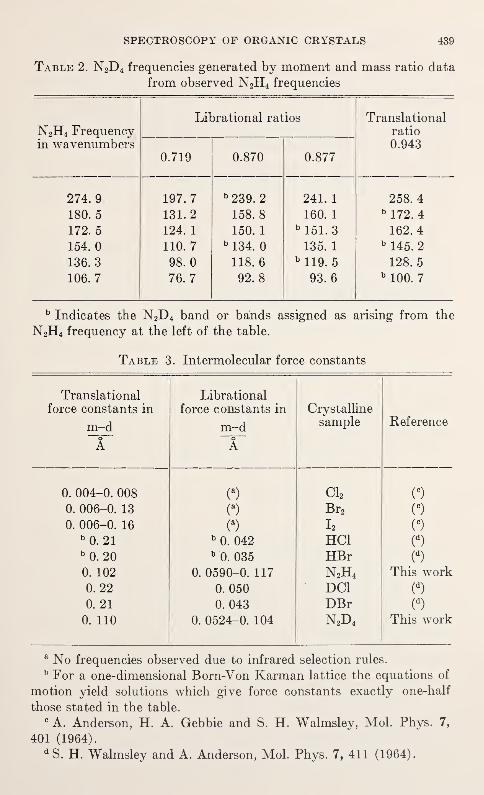
SPECTROSCOPY OF ORGANIC CRYSTALS 439
Table 2. N2D 4 frequencies generated by moment and mass ratio data
from observed N2H4 frequencies
Librational ratios TranslationalN2H4 Frequency ratio
in wavenumbers U.9430.719 0.870 0.877
274.9 197.7 b 239. 2 241. 1 258.4
180. 5 131.2 158. 8 160. 1b 172. 4
172. 5 124. 1 150. 1 M51.3 162.4
154. 0 110. 7 b 134. 0 135. 1b 145. 2
136.3 98. 0 118. 6 b 119. 5 128. 5
106.7 76.7 92. 8 93.6 b 100. 7
b Indicates the N2D 4 band or bands assigned as arising from the
N2H4 frequency at the left of the table.
Table 3. Intermolecular force constants
Translationalforce constants in
m-d"X
Librational
force constants in
m-d
A
Crystalline
sample Reference
0. 004-0. 008 (a) Cl2 co
0. 006-0. 13 (a) Br2 (°)
0. 006-0. 16 (a) I2 o
b0. 21 b
0. 042 HC1 (")
b0. 20 b
0. 035 HBr (d)
0. 102 0. 0590-0. 117 N2H4 This work0. 22 0. 050 DC1 C)
0. 21 0. 043 DBr C)
0. 110 0. 0524-0. 104 N2D4 This work
a No frequencies observed due to infrared selection rules.
b For a one-dimensional Born-Von Karman lattice the equations of
motion yield solutions which give force constants exactly one-half
those stated in the table.c A. Anderson, H. A. Gebbie and S. H. Walmsley, Mol. Phys. 7,
401 (1964).d S. H. Walmsley and A. Anderson, Mol. Phys. 7, 411 (1964).
440 MOLECULAR DYNAMICS AND STRUCTURE OF SOLIDS
The force constant calculations were carried out using a modified
Born-Von Karman model. Two dumbbell-shaped bodies were used to
represent the two hydrazine molecules per unit cell. The NH2 groups
were assumed to be connected by a rigid Aveightless bar, and the dumb-bells, in turn, connected by a weightless spring. The masses at the end
of the dumbbells were nearly isobaric with the NH2 group, i.e., an
oxygen atom. Thus, a one dimensional "ribbon lattice" was con-
structed.This model closely matches the configuration of the molecules
in the crystal lattice. The results of this calculation are given in table 3.
One of us (FGB) wishes to thank the National Cancer Institute for a
postdoctoral fellowship, number 6-F2-CA-35,825-0lAl. We also wish
to thank the National Aeronautics and Space Administration for their
sponsorship of this research through grant NGR-41-002.003.
MOLECULAR ROTATION IN CONDENSED PHASESOF SIMPLE MOLECULES
M. BLUMENFELD
Department of Physics,
University of Toronto, Toronto, Ontario
1. Introduction
The problem of molecular rotation in condensed phases has re-
ceived considerable attention since the early investigations of Craw-ford, Welsh and Harrold [1]
1 into the Raman spectra of liquid oxygen,
nitrogen, and methane, and solid methane. From the shape and
extent of the rotational wings they concluded that these molecules
rotated freely in their condensed phases.
In a series of articles, Gordon [2] has demonstrated a new methodof extracting information regarding molecular rotation from the
spectra of molecules in their condensed states. Briefly, the spectrum
is analysed in terms of the moments of its intensity distribution,
I{v), where the nth. moment of a Raman band is given by
where v s is some suitably chosen band origin.
The lower-order moments yield quantities depending on low order
distribution functions. In particular, from the second and fourth
moments the magnitude of the intermolecular torque (the angular
derivative of the intermolecular potential) hindering the rotational
motion can be obtained. This analysis requires that the intensity
be accurately known, particularly in the tail ends of the spectral
bands. A reinvestigation of the Raman spectra of liquid oxygen
and methane, and of sol d methane was undertaken to obtain suitable
data for such an analysis.
1.2. Rotational Correlation Function Analysis
Gordon [3] has also shown how to recover dynamical information
about the molecular rotation from the shapes of the depolarized
1.1. Moment Analysis of Spectral Bands
1 Figures in brackets indicate the literature references listed at the end of this paper.
441
442 MOLECULAR DYNAMICS AND STRUCTURE OF SOLIDS
spectral bands. The normalized intensity distribution, I(v), is the
Fourier transform of C(t), a normalized correlation function of the
anisotropy of the vibrational polarizability, /3° given by
-J
/loo —2-Klvt
X4/M=2^J < Tr/3"(0) •/?•«)>« « dt
-2wivt
> c dt
For a linear diatomic molecule such as 02 the correlation function
can be expressed as
C(<)=<P2(u(0)-u(f))>
in the classical limit, where u is the unit vector along the symmetryaxis, and Pi(x) is the second Legendre polynomial.
The same relation holds for a spherical top molecule such as meth-
ane, except that the unit vector now points along a twofold axis.
The correlation function can be thought of as representing the decay
of our knowledge about the rotational motion of the molecule.
2. Experimental Procedure
The cryostat and the method by which the samples were obtained
and retained are described elsewhere [4]. The solid samples were
clear and flawless throughout, reducing the background due to para-
sitic light scattered by cracks, bubbles, or crystal boundaries into
the spectrograph optics. Excitation was by a Toronto Hg arc; the
spectra were recorded on a modified Bausch and Lomb Dual-Grating
Spectrograph, using slit widths of about 250 and 500 microns. In
the second order at 4625 A the reciprocal linear dispersion is 8 cm_1/mm.
3. Results and Discussion
3.1. Moment Analysis
a. Liquid Oxygen
The band profile of the aniso tropically scattered Raman spectrum
of liquid oxygen, shown in figure 1, was obtained by subtracting the
properly normalized profile of the Rayleigh line from the total Ramanband profile, under the assumption that the isotropic Q branch was
the image of the Rayleigh line broadened by the slit. The first four
moments about the Q branch peak position, 1551.9 cm-1, were calcu-
lated and the mean-squared torque, ^r2^, obtained from the ratio
M(4) kT he ,
wm~ 32'hcB+
kfB<T>
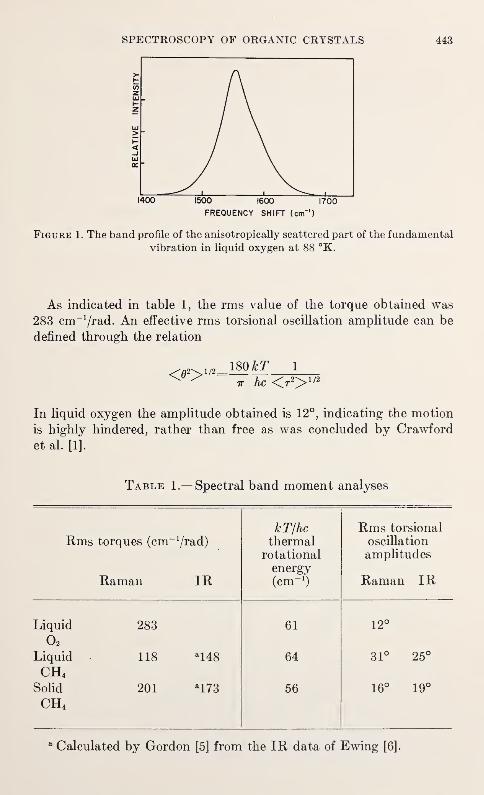
SPECTROSCOPY OF ORGANIC CRYSTALS 443
I —=l 1 i _^— i
1400 1500 1600 1700
FREQUENCY SHIFT (cm-')
Figure 1. The band profile of the anisotropically scattered part of the fundamental
vibration in liquid oxygen at 88 °K.
As indicated in table 1, the rms value of the torque obtained was
283 cm-1/rad. An effective rms torsional oscillation amplitude can be
defined through the relation
<02> 1/2;180 kT 1
he <r2> 1 '2
In liquid oxygen the amplitude obtained is 12°, indicating the motion
is highly hindered, rather than free as was concluded by Crawford
et al. [1].
Table 1.— Spectral band moment analyses
Rms torques (cm"
Raman
Vrad)
IR
kT/hcthermal
rotational
energy(cm" 1
)
Rms torsional
oscillation
amplitudes
Raman IR
Liquid 283 61 12°
o2
Liquid 118 a148 64 31° 25°
CH4
Solid 201 a173 56 16° 19°
CH4
a Calculated by Gordon [5] from the IR data of Ewing [6].
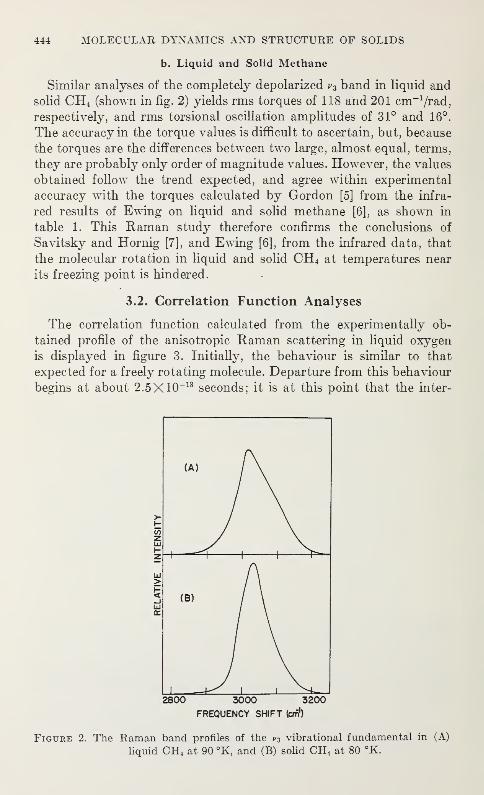
444 MOLECULAR DYNAMICS AND STRUCTURE OF SOLIDS
b. Liquid and Solid Methane
Similar analyses of the completely depolarized v 3 band in liquid and
solid CH4 (shown in fig. 2) yields rms torques of 118 and 201 cm-1/ra(i,
respectively, and rms torsional oscillation amplitudes of 31° and 16°.
The accuracy in the torque values is difficult to ascertain, but, because
the torques are the differences between two large, almost equal, terms,
they are probably only order of magnitude values. However, the values
obtained follow the trend expected, and agree within experimental
accuracy with the torques calculated by Gordon [5] from the infra-
red results of Ewing on liquid and solid methane [6], as shown in
table 1. This Raman study therefore confirms the conclusions of
Savitsky and Hornig [7], and Ewing [6], from the infrared data, that
the molecular rotation in liquid and solid CH4 at temperatures near
its freezing point is hindered.
3.2. Correlation Function Analyses
The correlation function calculated from the experimentally ob-
tained profile of the anisotropic Raman scattering in liquid oxygen
is displayed in figure 3. Initially, the behaviour is similar to that
expected for a freely rotating molecule. Departure from this behaviour
begins at about 2.5X10⁻¹³ seconds; it is at this point that the inter-
Figure 2. The Raman band profiles of the p 3 vibrational fundamental in (A)
liquid CH 4 at 90 °K, and (B) solid CH4 at 80 °K.
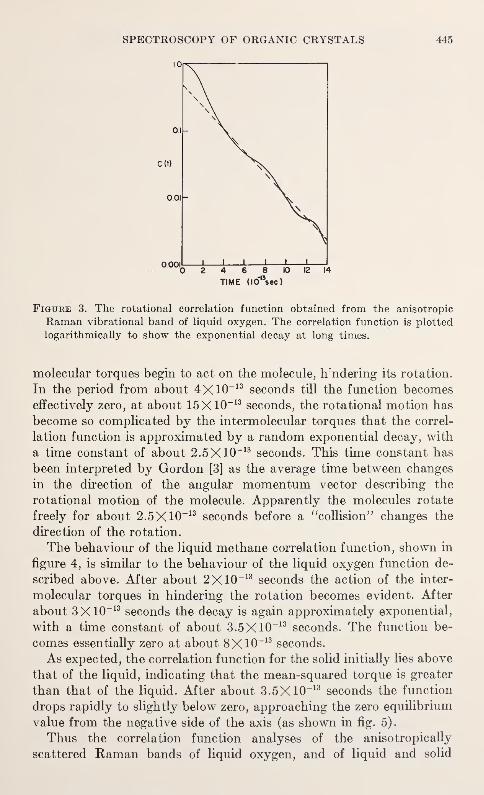
SPECTROSCOPY OF ORGANIC CRYSTALS 445
c(t)
0.01
0.001.
Figure 3. The rotational correlation function obtained from the anisotropic
Raman vibrational band of liquid oxygen. The correlation function is plotted
logarithmically to show the exponential decay at long times.
molecular torques begin to act on the molecule, tendering its rotation.
In the period from about 4X10-13 seconds till the function becomeseffectively zero, at about 15X10-13 seconds, the rotational motion has
become so complicated by the intermolecular torques that the corre-
lation function is approximated by a random exponential decay, with
a time constant of about 2.5X10⁻¹³ seconds. This time constant has
been interpreted by Gordon [3] as the average time between changes
in the direction of the angular momentum vector describing the
rotational motion of the molecule. Apparently the molecules rotate
freely for about 2.5 X10~ 13 seconds before a "collision" changes the
direction of the rotation.
The behaviour of the liquid methane correlation function, shown in
figure 4, is similar to the behaviour of the liquid oxygen function de-
scribed above. After about 2X10" 13 seconds the action of the inter-
molecular torques in hindering the rotation becomes evident. After
about 3X10-13 seconds the decay is again approximately exponential,
with a time constant of about 3.5X10" 13 seconds. The function be-
comes essentially zero at about 8X10-13 seconds.
As expected, the correlation function for the solid initially lies above
that of the liquid, indicating that the mean-squared torque is greater
than that of the liquid. After about 3.5X10⁻¹³ seconds the function
drops rapidly to slightly below zero, approaching the zero equilibrium
value from the negative side of the axis (as shown in fig. 5)
.
Thus the correlation function analyses of the aniso tropically
scattered Raman bands of liquid oxygen, and of liquid and solid
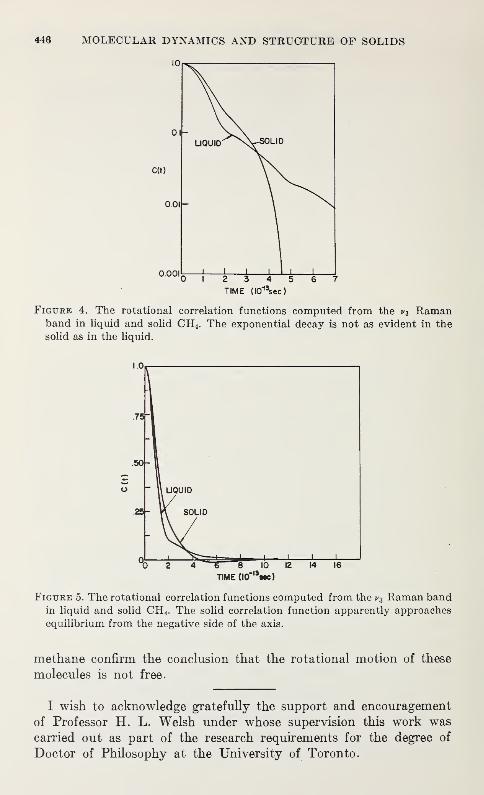
446 MOLECULAR DYNAMICS AND STRUCTURE OF SOLIDS
10
C(t)
0.01-
0.001 12 3 4 5
TIME (lO^ec)
Figure 4. The rotational correlation functions computed from the v% Ramanband in liquid and solid CH 4 . The exponential decay is not as evident in the
solid as in the liquid.
8 10
TIME (I0""tic)
Figure 5. The rotational correlation functions computed from the v% Raman bandin liquid and solid CH 4 . The solid correlation function apparently approaches
equilibrium from the negative side of the axis.
methane confirm the conclusion that the rotational motion of these
molecules is not free.
I wish to acknowledge gratefully the support and encouragement
of Professor H. L. Welsh under whose supervision this work was
carried out as part of the research requirements for the degree of
Doctor of Philosophy at the University of Toronto.

SPECTROSCOPY OF ORGANIC CRYSTALS 447
4. References
[1] M. F. Crawford, H. L. Welsh, and J. H. Harrold, Can. J. Phys. 30, 81 (1952)
[2] R. G. Gordon, J. Chem. Phys. 39, 2788 (1963); ibid. 40, 1973 (1964); ibid.
41, 1819 (1964).
[3] R. G. Gordon, J. Chem. Phys. 43, 3658 (1965); ibid. 43, 1307 (1965); ibid.
44, 1830 (1966).
[4] M. Blumenfeld and H. L. Welsh, to be published.
[5] R. G. Gordon, private communication (1966).
[6] G. E. Ewing, J. Chem. Phys. 40, 179 (1964).
[7] G. B. Savitsky and D. F. Hornig, J. Chem. Phys. 36, 2634 (1962).

CORRELATION OF INFRARED AND INELASTICNEUTRON SCATTERING SPECTRA OF
SOLID METHANE
ASHOK K. AGRAWAL and SIDNEY YIP
Department of Nuclear Engineering, Massachusetts Institute of Technology,
Cambridge, Mass. 02139
It is well known that spectra of infrared absorption, Raman scatter-
ing and inelastic neutron scattering all provide information about
rotational motions in molecular systems. Recently attempts have
been made to correlate these spectra by using time relaxation func-
tions [l],1 which are obtained from optical band shapes, directly in the
analysis of incoherent neutron scattering measurements. The studies
thus far have been directed at liquid methane for which optical and
neutron data are both available [2, 3]. In this paper we consider similar
corelations of infrared and neutron spectra of solid methane near its
X-point. We have obtained an effective frequency spectrum which can
be used in cross-section calculations and which is in qualitative agree-
ment with that inferred from the neutron data. We have also deduced
an approximate thermodynamic frequency distribution function which
leads to a reasonable estimate of the heat capacity.
In the Gaussian approximation the double differential neutron
incoherent scattering cross section o-(Eo,E,0) is completely determined
by the mean-square displacement function W(t). For slow neutrons
W(t) has contributions from center-of-mass translations and molecular
rotations. The rotational contribution can be expressed in terms of
the relaxation function F(t), which is the Fourier transform of a
normalized infrared absorption band l(co) [3]. Using measurements at
28 °K[4] we have determined F(t), and the results are shown in
figure 1 along with the relaxation function for a free spherical rotor.
Curves A and B correspond to slightly different ways of smoothing
the experimental ±(co) within the fluctuations in the data. It can be
seen that for times less than £o~0.2X10~ 12 sec, there is little differ-
ence between F(t) (curve A) and the free rotation result. The dimen-
sionless time t*=(kB T/iy/2
to is about 0.55, which is essentially the
same as that for liquid methane at 98 °K[1]. Deviation of F(t) fromfree-rotation behavior beyond t 0 indicates the onset of intermolecular
torque effects. At long times F(t) appears to approach an exponential
1 Figures in brackets indicate the literature references listed at the end of this paper.
449
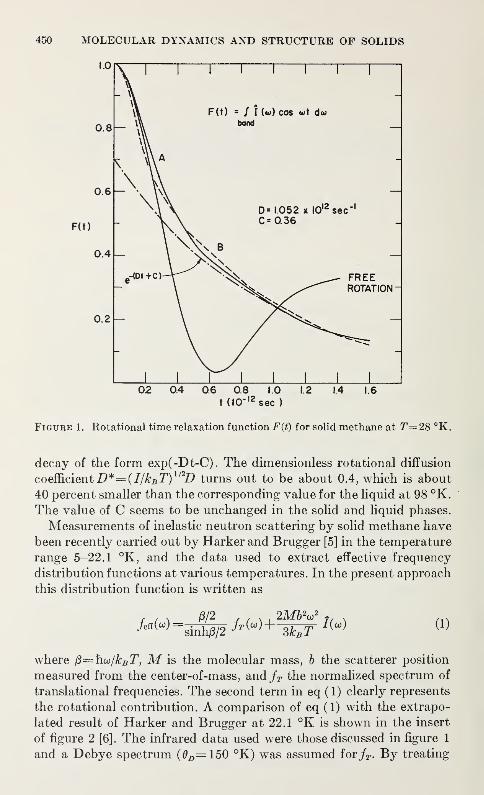
450 MOLECULAR DYNAMICS AND STRUCTURE OF SOLIDS
02 0.4 0.6 0.8 1.0 1.2 1.4 1.6
t (I0"l2 sec )
Figure 1. Rotational time relaxation function Fit) for solid methane at T=28 °K.
decay of the form exp(-Dt-C). The dimensionless rotational diffusion
coefficient D*=(I/kB T)1/2D turns out to be about 0.4, which is about
40 percent smaller than the corresponding value for the liquid at 98 °K.
The value of C seems to be unchanged in the solid and liquid phases.
Measurements of inelastic neutron scattering by solid methane have
been recently carried out by Harker and Brugger [5] in the temperature
range 5-22.1 °K, and the data used to extract effective frequency
distribution functions at various temperatures. In the present approach
this distribution function is written as
fl/2 ,'
. 2MbVf/eff(")=
sInh0/2MC0)+Wr J(W) (1)
where t3=h.u/kB T, M is the molecular mass, b the scatterer position
measured from the center-of-mass, and/r the normalized spectrum of
translational frequencies. The second term in eq (1) clearly represents
the rotational contribution. A comparison of eq (1) with the extrapo-
lated result of Harker and Brugger at 22.1 °K is shown in the insert
of figure 2 [6]. The infrared data used were those discussed in figure 1
and a Debye spectrum (0D=15O °K) was assumed for/r .By treating
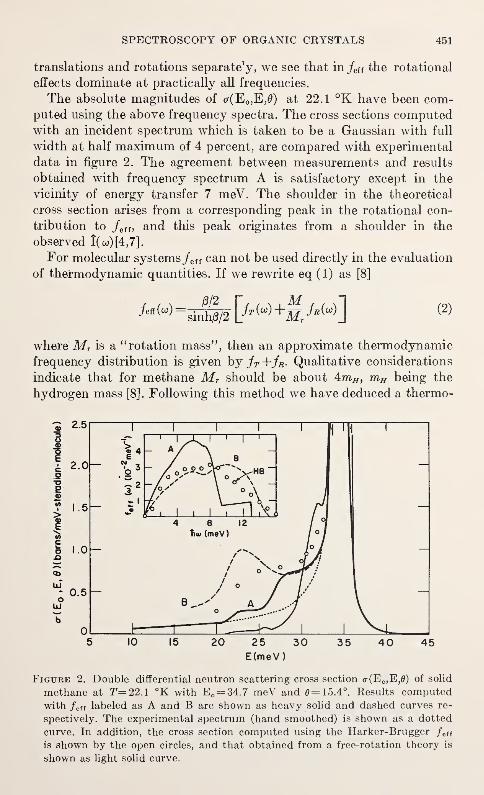
SPECTROSCOPY OF ORGANIC CRYSTALS 451
translations and rotations separate'y* we see that in /eff the rotational
effects dominate at practically all frequencies.
The absolute magnitudes of o-(Eo,E,0) at 22.1 °K have been com-puted using the above frequency spectra. The cross sections computedwith an incident spectrum which is taken to be a Gaussian with full
width at half maximum of 4 percent, are compared with experimental
data in figure 2. The agreement between measurements and results
obtained with frequency spectrum A is satisfactory except in the
vicinity of energy transfer 7 meV. The shoulder in the theoretical
cross section arises from a corresponding peak in the rotational con-
tribution to Jetf , and this peak originates from a shoulder in the
observed I(w)[4,7J.
For molecular systems
/
eff can not be used directly in the evaluation
of thermodynamic quantities. If we rewrite eq (1) as [8]
where'Mr is a "rotation mass", then an approximate thermodynamic
frequency distribution is given by jT +fB .Qualitative considerations
indicate that for methane MT should be about 4m#, mH being the
hydrogen mass [8]. Following this method we have deduced a thermo-
5 10 15 20 25 30 35 40E(meV)
Figure 2. Double differential neutron scattering cross section <r(E o,E,0) of solid
methane at T=22.\ °K with E0= 34.7 meV and 0=15.4°. Results computed
with /e ff labeled as A and B are shown as heavy solid and dashed curves re-
spectively. The experimental spectrum (hand smoothed) is shown as a dotted
curve. In addition, the cross section computed using the Harker-Brugger /eff
is shown by the open circles, and that obtained from a free-rotation theory is
shown as light solid curve.
452 MOLECULAR DYNAMICS AND STRUCTURE OF SOLIDS
dynamic frequency distribution from spectrum A given in figure 2.
The value of MT deduced from this spectrum is 5mH . At 28 °K the
value of the specific heat c v computed with this distribution and
assuming a harmonic solid is within the quoted experimental uncer-
tainty [9].
We wish to thank G. E. Ewing and R. M. Brugger for makingavailable large plots of their experimental data. Also we thank H.
Prask for the use of a computer program to compute specific heat.
This work was supported by Army Research Office—Durham under
contract DAHC04-67-O-001 1
.
References
[1] R. G. Gordon, J. Chem. Phys. 43, 1307 (1965).
[2] V. F. Sears, Can. J. Phys. 45, 237 (1967).
[3] A. K. Agrawal and S. Kip, J. Chem. Phys. 46, 1999 (1967).
[4] G. E. Ewing, J. Chem. Phys. 40, 179 (1964).
[5] Y. D. Harker and R. M. Brugger, J. Chem. Phys. 46, 2201 (1967).
[6] For this comparison we have normalized fe f { to have the same area of 0.32
as the Harker-Brugger curve. This normalization is not used in subsequent
cross-section calculations.
[7] This shoulder is even more pronounced in the data of G. B. Savitsky and
D. F. Hornig, J. Chem. Phys. 36, 2634 (1962).
[8] S. Yip, H. Prask and H. Boutin, to be published.
[9] J. H. Colwell, E. K. Gill and J. A. Morrison, J. Chem. Phys. 39, 635 (1963).
THEORY OF PHASE TRANSITIONS IN SOLIDMETHANES
TSUNENOBU YAMAMOTO, YOSUKE KATAOKA and HIDEOYASUDA
Department of Chemistry, Faculty of Science
Kyoto University, Kyoto, Japan
In the present report we would like to present briefly a quantummechanical study of the James-Keenan model [l]
1 with special em-
phasis on application to solid light methane.
In 1959 James and Keenan published an elaborate theoretical work
on phase transitions in solid heavy methane [1]. It was based on the
assumption that the intermolecular interaction which is responsible
for the transitions under consideration is essentially the electrostatic
octopole-octopole interaction between neighboring molecules. They
have succeeded in revealing the main characteristics of three solid
phases, I, II, and III, through laborious consideration of the stability
of various possible phases, and have reproduced quantitatively the
thermodynamical features of the observed double transitions in
CD 4 [2].
We have tried to make a quantum mechanical continuation of James
and Keenan's classical theory. At first each of three nuclear spin
species A, E, and T were treated separately under the assumption of
no interspecies conversion. Then two kinds of mixture of nuclear
spin species, normal and equilibrium, were treated with and without
the said assumption, respectively. All the calculations were carried
out in the framework of the molecular-field approximation method.
Figure 1 shows the upper transition lines of both CH4 and CD 4 .
2
We have made the calculations in the subspace with J ^9, J being
the rotational quantum number, which is sufficient so long as we are
concerned with phenomena below about 30 °K. The value of the cou-
pling parameter at zero pressure can be determined such that the equi-
librium mixture of CH4 has its transition at 20.4 °K, the observed
upper transition temperature [3]. Then one sees that solid CH 4
exhibits remarkable spin-statistics effects, whereas solid CD 4 does not.
From this one infers that the molecules in solid CH4 are undergoing a
sort of hindered rotation under the influence from neighboring molecules
1 Figures in brackets indicate the literature references listed at the end of this paper.
2 The curves for the normal mixtures have already been given by M. J. Freiser, thesis, Purdue University,
1956.
453
311-280 0—69 30
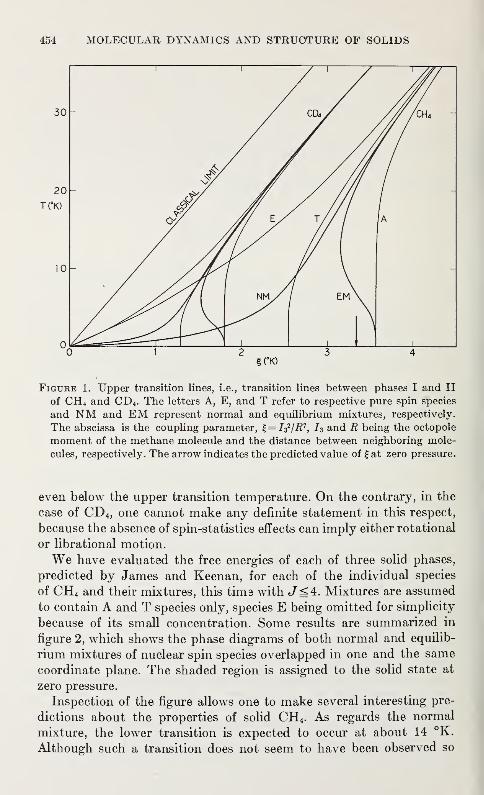
454 MOLECULAR DYNAMICS AND STRUCTURE OF SOLIDS
30 CD4
20
TOO
10
NM EM
§00
Figure 1. Upper transition lines, i.e., transition lines between phases I and II
of CH 4 and CD 4 . The letters A, E, and T refer to respective pure spin species
and NM and EM represent normal and equilibrium mixtures, respectively.
The abscissa is the coupling parameter, %=I32/R7
,73 and R being the octopole
moment of the methane molecule and the distance between neighboring mole-
cules, respectively. The arrow indicates the predicted value of £at zero pressure.
even below the upper transition temperature. On the contrary, in the
case of CD 4 , one cannot make any definite statement in this respect,
because the absence of spin-statistics effects can imply either rotational
or librational motion.
We have evaluated the free energies of each of three solid phases,
predicted by James and Keenan, for each of the individual species
of CH4 and their mixtures, this time with J^4. Mixtures are assumed
to contain A and T species only, species E being omitted for simplicity
because of its small concentration. Some results are summarized in
figure 2, which shows the phase diagrams of both normal and equilib-
rium mixtures of nuclear spin species overlapped in one and the same
coordinate plane. The shaded region is assigned to the solid state at
zero pressure.
Inspection of the figure allows one to make several interesting pre-
dictions about the properties of solid CH4 . As regards the normal
mixture, the lower transition is expected to occur at about 14 °K.
Although such a transition does not seem to have been observed so
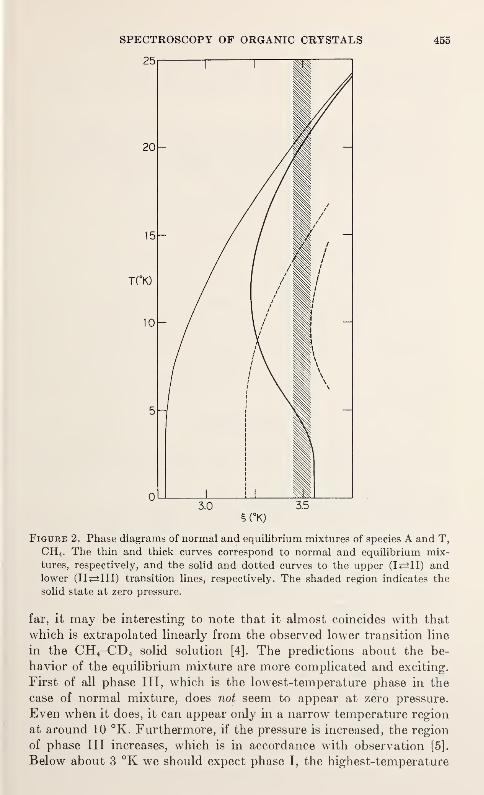
SPECTROSCOPY OF ORGANIC CRYSTALS 455
§(°K)
Figure 2. Phase diagrams of normal and equilibrium mixtures of species A and T,
CH 4 . The thin and thick curves correspond to normal and equilibrium mix-
tures, respectively, and the solid and dotted curves to the upper (I^11) andlower (II<=±III) transition lines, respectively. The shaded region indicates the
solid state at zero pressure.
far, it may be interesting to note that it almost coincides with that
which is extrapolated linearly from the observed lower transition line
in the CH 4-CD 4 solid solution [4]. The predictions about the be-
havior of the equilibrium mixture are more complicated and exciting.
First of all phase III, which is the lowest-temperature phase in the
case of normal mixture, does not seem to appear at zero pressure.
Even when it does, it can appear only in a narrow temperature region
at around 10 °K. Furthermore, if the pressure is increased, the region
of phase III increases, which is in accordance with observation [5].
Below about 3 °K we should expect phase I, the highest-temperature
456 MOLECULAR DYNAMICS AND STRUCTURE OF SOLIDS
disordered phase, to appear again down to 0 °K. This comes from the
fact that, as the temperature is lowered, more and more molecules
convert to species A, until all the molecules turn to this species at
0 °K.
As is well known, Morrison et al. [7] have found a rather broad
anomaly in the specific heat of solid CH4 at about 8 °K, and proposed
to interpret it as indication of the occurence of a lower transition
which had been overlooked until then. Now, Pitzer et al. [6] have
recently reported that NMR intensity in solid CH4 increases with
time when the sample is kept at some temperature below 10 °K, if it
is contaminated by a small amount of oxygen molecules, and that no
appreciable change occurs if the sample is pure. This apparently meansthat the interspecies conversion is prohibited in the lowest temperature
region in pure CH4 , but that it is catalyzed by the presence of oxygen
molecules. Then one may assign our normal mixture to pure methaneand our equilibrium mixture to methane with oxygen. At present it
is not easy for us to decide which of the two mixtures corresponds
better to the experimental situation of Morrison et al. Thus it is
highly desirable that further experimental studies be carried out,
particularly calorimetric and infrared-absorption experiments on
samples with controlled oxygen content, for the purpose of testing
our predictions.
References
[1] H. M. James and T. A. Keenan, J. Chem. Phys. 31, 12 (1959).
[2] K. Clusius and L. Popp, Z. physik. chem. (Leipzig) B46, 63 (1940); J. H.
Colwell, E. K. Gill, and J. A. Morrison, J. Chem. Phys. 39, 635 (1963); 42,
3144 (1965).
[3] K. Clusius, Z. physik. Chem. (Leipzig) B3, 41 (1929).
[4] E. Bartholome, G. Drikos, and A. Eucken, ibid. B39, 371 (1938).
[5] J. S. Rosenshein and W. M. Whitney, Low Temperature Physics, J. G. Dauntet al., Eds., Plenum Press, Inc., New York, p. 1114. (1965).
[6] H. P. Hopkins, Jr., P. L. Donoho, and K. S. Pitzer, J. Chem. Phys. 47, 864
(1967). See also R. P. Wolf and W. M. Whitney, Low Temperature Physics,
J. G. Daunt et al., Eds., Plenum Press, Inc., New York, p. 1118 (1965).
[7] J. H. Colwell, E. K. Gill, and J. A. Morrison, J. Chem. Phys. 36, 2223 (1962).
NMR RELAXATION IN ADAMANTANE AND HEXA-METHYLENETETRAMINE: MOLECULAR
ROTATION AND DIFFUSION
H. A. RESING
U.S. Naval Research Laboratory, Washington, D.C. 20390
The molecular structure of hexamethylenetetramine (HMT) differs
from that of adamantane, Ci0H16 ,only in the replacement of four
bridgehead carbon atoms by nitrogen. Both solids melt at about
270 °C. Despite these similarities the crystal structure of HMT is bcc,
while that of adamantane is fee above —65 °C and tetragonal below.
A very significant difference is that adamantane is a "plastic crystal"
(easily undergoes plastic deformation) while HMT is not. The under-
lying thesis here is that the difference in plastic behavior is due to a
difference in diffusion coefficients, and it is the purpose of this workto measure this latter difference using those NMR methods (relaxation
in the local field [l])1 which are most sensitive to diffusional motion.
We have measured the NMR relaxation times (both in the labora-
tory and rotating reference frames) and have interpreted the data in
terms of molecular rotation and diffusion. The barriers to rotational
motion are 19 kcal/mole for HMT, 3.1 kcal/mole for fee adamantane,
and 6.1 kcal/mole for tetragonal adamantane. The barrier to self
diffusion for adamantane is 34 kcal/mole; this extremely large value
shows that the repulsive part of the intermolecular potential must be
quite steep, i.e., adamantane is indeed a hard sphere. While the
adamantane diffusional jump time could be followed over nearly seven
powers of ten, that for HMT is so long at all temperatures that it
has no observable effect on NMR relaxation. At 270 °C therefore,
the adamantane diffusion coefficient must be at least five orders of
magnitude greater than that for HMT. The adamantane data are
shown in figure 1.
Of particular interest in the context of this meeting is the rotation
in the high-temperature adamantane phase and in HMT. From figure 1
it can be shown that at the melting point the time between rotational
jumps in adamantane is about 2 x 10~ 12sec, which is roughly the same
as a librational period. Thus the harmonic approximation in lattice
dynamics [2] (i.e., small displacements from the equilibrium position)
is clearly not valid for adamantane. This conclusion is in accord with
1 Figures in brackets indicate the literature references listed at the end of this paper.
457
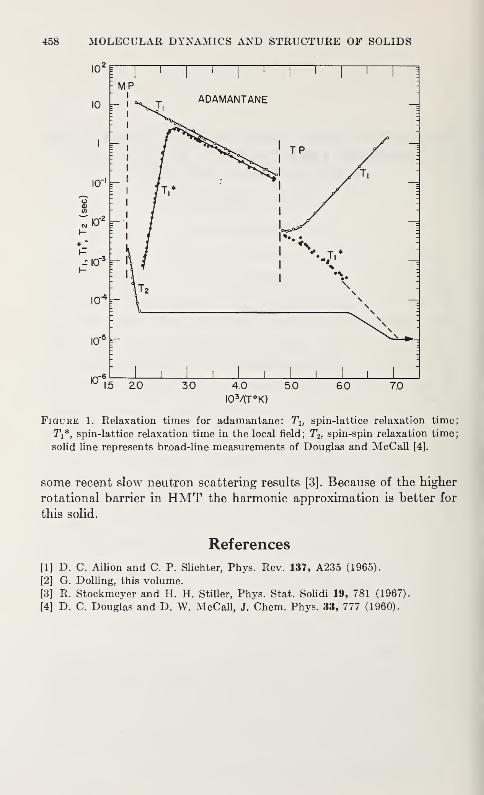
458 MOLECULAR DYNAMICS AND STRUCTURE OF SOLIDS
ioMt°k)
Figure 1. Relaxation times for adamantane: Th spin-lattice relaxation time;
T{*, spin-lattice relaxation time in the local field; T2 ,spin-spin relaxation time;
solid line represents br.oad-line measurements of Douglas and McCall [4].
some recent slow neutron scattering results [3]. Because of the higher
rotational barrier in HMT the harmonic approximation is better for
this solid.
References
[1] D. C. Ailion and C. P. Slichter, Phys. Rev. 137, A235 (1965).
[2] G. Dolling, this volume.
[3] R. Stockmeyer and H. H. Stiller, Phys. Stat. Solidi 19, 781 (1967).
[4] D. C. Douglas and D. W. McCall, J. Chem. Phys. 33, 777 (1960).
THERMODYNAMIC APPROACH TO MOLECULARFREEDOM, ESPECIALLY IN PLASTICALLY
CRYSTALLINE SUBSTANCES
EDGAR F. WESTRUM, JR.
Department of Chemistry
University of Michigan, Ann Arbor, Michigan 48104
Transformations involving abrupt changes of molecular freedom in
solids are among the most fascinating and probably least understood
of solid state physical problems. Such transformations are often ac-
companied by dramatic changes in the physical characteristics seem-
ingly disproportionate to the subtle structural metamorphoses which
occur at the molecular level. As we have seen already exemplified in
this symposium, a transition is rather like the elephant in the fable of
the nine blind men in that its apparent manifestation is dependent
upon the technique by which it is approached.
Although many experimental techniques have been shown to pro-
vide penetrating insight into the nature and mechanism of molecular
freedom in crystalline substances, the solid state researcher is so often
occasioned to acknowledge the extraordinary yield of information ob-
tainable from cryogenic thermal capacity determinations that he is
tempted to attribute a more fundamental significance to such measure-
ments than to any single method of investigation. Certainly determi-
nations of heat capacity and related thermal phenomena have already
contributed much to the interpretation of molecular dynamics as a
sensitive parameter of the energetics spectrum of substances and the
Gibbs energies and entropies of phases and their transitions. In addi-
tion, calorimetric data are particularly relevant for treatment of order-
disorder phenomena even at elevated temperatures. An example of
such an approach to transitions in which the entropy may be evaluated
by AS=R In Q is that of succinonitrile [l],1 [NC(CH2 ) 2CN], which,
although obviously not very globular in its molecular shape, none-
theless evidences a plastically crystalline phase. X-ray diffraction
analysis indicates Crystal II to be completely-ordered monoclinic
(consisting only of gauche molecular forms), whereas infrared data
show Crystal I to be a highly-disordered, body-centered cubic phase
(composed of a temperature-dependent, equilibrium mixture of
gauche and trans geometrical isomers).
1 Figures in brackets indicate the literature references at the end of this paper.
459
460 MOLECULAR DYNAMICS AND STRUCTURE OF SOLIDS
In solid-solid transitions in which order-disorder effects predomi-
nate, the entropy change may be approximated by ASt=R In Q, in
which Q is the ratio of the number of orientation al states statistically
occupied in the two phases. In the case of succinonitrile, the disorder-
ing at the 223.3 °K. transition arises from four terms: (i) alignment
of the principle axis of the molecule with the cube diagonals (R In
4=2.755 e.u.), (ii) rigid rotation of the molecule about this axis
(R In 2=1.377), (Hi) entropy of mixing gauche and trans isomers
(-R[X tIn X t
+Xg In Xg-XgIn 2]= 2.08), (iv) volume change of
the lattice on transition (R In \V2fVi]'f "free" volume=0.18). The sumof these four calculated contributions, A#£=6.39±0.09 e.u., is in
excellent accord with the experimental value, 6.35 ±0.03 e.u.
The low entropy of melting, 2.68 e.u., at Tm=331.3 °K. indicates
that the Crystal I phase of succinonitrile is indeed plastically crys-
talline. The agreement obtained between the third-law entropy of the
gas, 79.04 ±0.10 e.u. at 298.15 °K., and the corresponding value ob-
tained from the spectroscopic data, 79.09 ±0.10 e.u., is ample indica-
cation of the absence of residual disorder in the structure in Crystal II
and justifies the assumptions implicit in calculating the contributions
to the entropy.
A similar approach has been used to elucidate the mechanism of
transition in the symmetrical-top molecules of table 1 [2]. These bicy-
clo-hydrocarbon molecules provide interesting symmetry-sensitive
regularities.
Guthrie and McCullough [3] treated ASt for simple tetrahedral
molecules stochastically and concluded that a minimum of about ten
distinguishable molecular orientations exists at each lattice site for
substances normally considered to be plastic crystals. In this light,
rotation can be more adequately described in terms of orientational
disorder, with the molecules "flipping" rapidly into discrete, dis-
tinguishable positions in the crystal lattice. The treatment of such
changes in structure must be applied cautiously, however, until it is
more adequately tested by careful crystallographic studies, for there
is considerable uncertainty in the magnitude of the vibrational con-
tribution. To minimize this uncertainty, the approach of Guthrie and
McCullough may need to be modified by making heat capacity meas-
urements on the high temperature form undercooled to near 0 °K.
We are presently endeavoring to do this, and if successful and un-
hindered by complicating transitions involving metastable phases, we
should be able to evaluate ASt (0 ok ) and thereby perhaps make an
even more convincing interpretation for adamantane [4].
Although the great success of thermodynamics in the determinations
of molecular structures has been evident for nearly two decades, this
work has been done largely on gaseous molecules. In determining
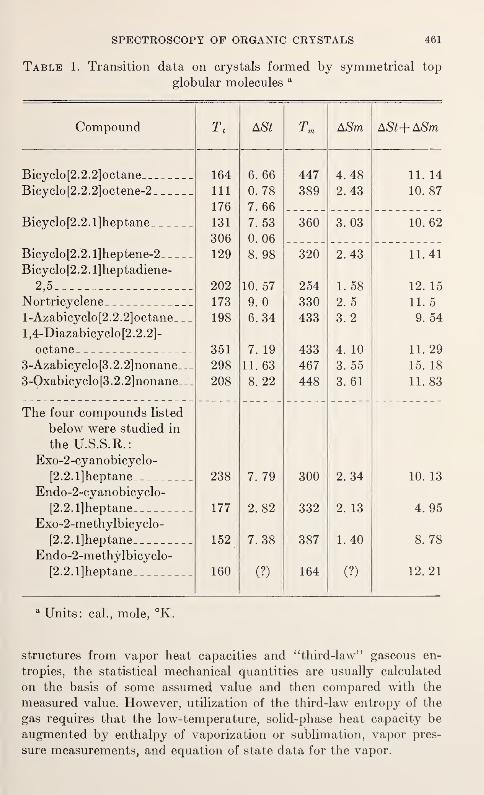
SPECTROSCOPY OF ORGANIC CRYSTALS 461
Table 1. Transition data on crystals formed by symmetrical top
globular molecules a
Compound ASt Tm771 ASm ASt+ASm
Bicyclo[2.2.2]octane 164 6. 66 447 4. 48 11. 14
Bicyclo [2.2.2]octene-2 111 0. 78 389 2. 43 10. 87
176 7. 66
Bicyclo [2. 2. 1]heptane 131 7. 53 360 3. 03 10. 62
306 0. 06
Bicyclo [2.2. l]heptene-2 129 8. 98 320 2. 43 11. 41
Bicyclo[2.2.1]heptadiene-
2,5 202 10. 57 254 1. 58 12. 15
Nortricyclene 1 io11
6
y. u 660 Z. 0 11 c11. 5
1-Azabicyclo [2.2.2]octane 198 6. 34 433 3. 2 9. 54
l,4-Diazabicyclo[2.2.2]-
octane 351 7. 19 433 4. 10 11. 29
3-Azabicyclo[3.2.2]nonane___J L J 298 11. 63 467 3. 55 15. 18
3-Oxabicyclo [3.2.2]nonane 208 8. 22 448 3. 61 11. 83
The four compounds listed
below were studied in
the U.S.S.R.:
Exo-2-cyanobicyclo-
[2.2.1]heptane 238 7. 79 300 2. 34 10. 13
Endo-2-cyanobicyclo-
[2.2.1]heptane 177 2. 82 332 2. 13 4. 95
Exo-2-methylbicyclo-
[2.2.1]heptane 152 7.38 387 1.40 8. 78
Endo-2-methylbicyclo-
[2.2.1]heptane 160 (?) 164 (?) 12. 21
a Units: cal., mole, °K.
structures from vapor heat capacities and "third-law" gaseous en-
tropies, the statistical mechanical quantities are usually calculated
on the basis of some assumed value and then compared with the
measured value. However, utilization of the third-law entropy of the
gas requires that the low-temperature, solid-phase heat capacity be
augmented by enthalpy of vaporization or sublimation, vapor pres-
sure measurements, and equation of state data for the vapor.
462 MOLECULAR DYNAMICS AND STRUCTURE OF SOLIDS
The advantages of determining barrier heights exclusively from
crystalline phase heat capacities have recently been demonstrated byWulff [5]. His method involves the evaluation of the heat capacity
contributions of a crystal from (i) the intermolecular (lattice) vibra-
tions, (ii) the intramolecular vibrations (calculated within the har-
monic oscillator approximation by combination of Einstein functions
based upon the observed spectra), (Hi) Cp—Cv (resulting from the
expansion of the lattice as occasioned by the anharmonicities of the
vibrations), and (iv) the internal rotational freedom. Although bar-
riers in the crystalline state potentially involve intermolecular forces
which are absent from the gaseous phase, excellent accord between
barrier values for gases and crystals has been obtained.
A similar ASt approach has been used on ionic crystals, and in the
absence of disordering transitions, the resolution of the heat capacity
contribution has provided an elucidation of the dynamics of sym-
metrical ions.
References
[1] C. A. Wulff and E. F. Westrum, Jr., J. Phys. Chem. 67, 2376 (1963).
[2] Based largely on unpublished studies from the author's research group at
Ann Arbor.
[3] G. B. Guthrie, Jr. and J. P. McCullough, J. Phys. Chem. Solids 18, 53 (1961).
[4] S. S. Chang and E. F. Westrum, Jr., J. Phys. Chem. 64, 1547 (1960).
[5] C. A. Wulff, J. Chem. Phys. 39, 1227 (1963).
SPECTRAL ASSIGNMENT IN INELASTIC NEUTRONSCATTERING SPECTROSCOPY BY ATOMIC
SUBSTITUTION TECHNIQUES
J. W. WHITE
Physical Chemistry Laboratory, Oxford, England
1. Introduction
When a beam of monoenergetic slow neutrons falls on a sample
containing hydrogen (which may be a molecular crystalline solid) , the
neutrons are scattered incoherently. If the energies of the outgoing
neutrons are analysed it is found that some are scattered without anychange in energy, whilst others gain or lose energy by their interaction
with the molecular modes in the lattice. Measurements of the amountof energy gained by these inelasticly scattered neutrons, when very
cold incident neutrons are used, lead directly to the energies of the
molecular states responsible for the scattering. The technique resembles
closely the Raman scattering of light, which has traditionally been a
source of molecular motional constants.
There are two particular virtues of the neutron scattering methodwhich shall concern us in this paper. Firstly, transitions between molec-
ular and crystal states which cannot be seen by optical spectroscopy
because they are forbidden by optical selection rules, are observable by
neutron scattering. This comes about because the neutron interacts
with the molecular vibrations etc., through the neutron-nucleus inter-
action rather than indirectly through the electron cloud as is the case
with light. Secondly the intensities of scattering in largely incoherent
systems, such as those containing hydrogen, can be directly related
through their angular dependence to the amplitudes of motion asso-
ciated with particular vibrational frequencies. Under these circum-
stances it is highly desirable to be able to separate out the neutron
inelastic scattering spectrum into contributions from different parts
of the molecule, so that the frequencies and the amplitudes for these
parts can be determined separately.
In the experiments reported here molecules with two hydrogenous
scattering centres, such as CH 3OH, have been studied with cold
neutron inelastic scattering. So long as the scattering from each
463
464 MOLECULAR DYNAMICS AND STRUCTURE OF SOLIDS
centre in a molecule is largely incoherent, the differential scattering
cross section of a molecule with two scattering centres can be written
{ «&(Q,«)+B&(Q,«) } (l)
where is the differential scattering cross section with respect to
fractional angle of scattering 512 and fractional energy transfer dw(in frequency units). It is equal to the intensity of the scattering
spectrum if the incident neutrons are well defined in coUimation andenergy, k and k 0 are the scattered and incident wavevectors of the
neutron respectively, Q = k-ko is the momentum transferred in the
collision, co is the energy transferred in the collision (in radians sec-1
)
and Sj(Q,co) is the scattering law for thejth different molecular group
and is defined by
Sj(Q,<»)=JJ
exP {*(Q •*-«<) }Gj(r,t)drdt (2)
This is the double fourier transform of the space-time correlation
function Gj(r,t) which describes fully the motion of the scattering
centre j [1, 2].1
It is because of the very explicit connection between the equation of
motion of the scattering centre and the neutron scattering spectrum
described in the above equation, that there are no selection rules for
the spectrum and that there is the possibility of determining the
amplitudes of motion from the intensities. In addition the additivity
of the spectra contained in eq (1) for incoherent scattering makes the
atomic substitution techniques described in this paper possible.
The experiments described were carried out using the cold-neutron
time of flight spectrometer on the DIDO reactor at A.E.R.E. Harwell.
This has been described by Harris et al. [3]. The incident wavelength
was 5.3A and the energy resolution was approximately 7 percent.
Samples of the methanols and acetic acids were especially dried and
had purities above 99 percent. There was little change in the spectrum
on freezing except in the quasielastic region. All samples were kept
as thin as possible to make sure that the scattering at no time exceeded
15 percent and was generally less than 10 percent.
2. Frequency Assignment
Figure 1 shows the elastic and inelastic components of the neutron
scattering spectrum from liquid CH3OH. In the inelastic region the
large broad band at a time of flight of about 500 microsec/metre
extends from energy transfers of about 20 cm" 1 to about 300 cm-1.
1 Figures in brackets indicate the literature references at the end of this paper.
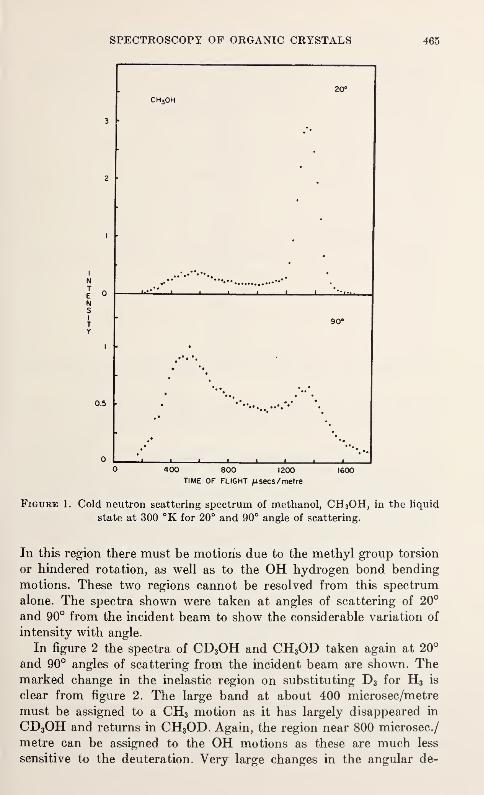
SPECTROSCOPY OF ORGANIC CRYSTALS 465
400 800 1200
time OF flight /isecs/ metre
Figure 1. Cold neutron scattering spectrum of methanol, CH 3OH, in the liquid
state at 300 °K for 20° and 90° angle of scattering.
In this region there must be motions due to the methyl group torsion
or hindered rotation, as well as to the OH hydrogen bond bending
motions. These two regions cannot be resolved from this spectrum
alone. The spectra shown were taken at angles of scattering of 20°
and 90° from the incident beam to show the considerable variation of
intensity with angle.
In figure 2 the spectra of CD3OH and CH3OD taken again at 20°
and 90° angles of scattering from the incident beam are shown. Themarked change in the inelastic region on substituting D3 for H3 is
clear from figure 2. The large band at about 400 microsec/metre
must be assigned to a CH3 motion as it has largely disappeared in
CD3OH and returns in CH3OD. Again, the region near 800 microsec./
metre can be assigned to the OH motions as these are much less
sensitive to the deuteration. Very large changes in the angular de-
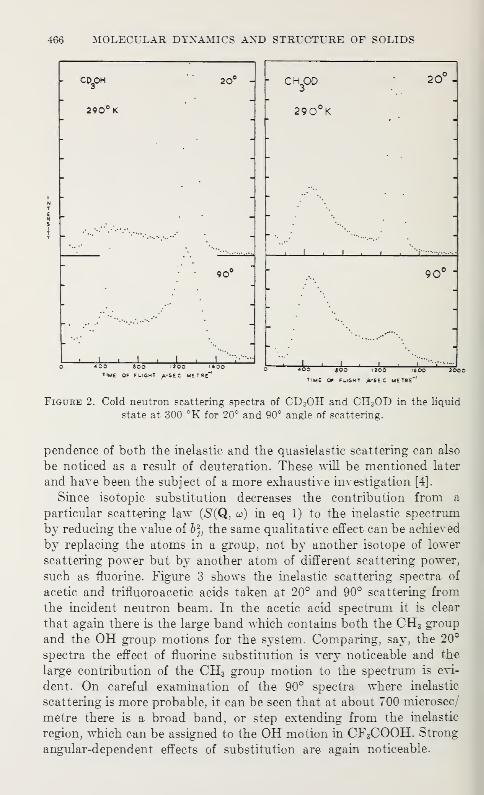
466 MOLECULAR DYNAMICS AND STRUCTURE OF SOLIDS
CD OH
290 K
20°
90^
1 I L100 800 I2O0 I
TIME OF FLIGHT ^.-SEC METRE-
CKpD
290°K
20*
90 l
>o too ice too
time of flight ^».-se c metre"'
Figure 2. Cold neutron scattering spectra of CD 3OH and CH sOD in the liquid
state at 300 °K for 20° and 90° angle of scattering.
pendence of both the inelastic and the quasielastie scattering can also
be noticed as a result of deuteration. These will be mentioned later
and have been the subject of a more exhaustive investigation [4].
Since iso topic substitution decreases the contribution from a
particular scattering law (S(Q, to) in eq 1) to the inelastic spectrum
by reducing the value of b 2j}the same qualitative effect can be achieved
by replacing the atoms in a group, not by another isotope of lower
scattering power but by another atom of different scattering power,
such as fluorine. Figure 3 shows the inelastic scattering spectra of
acetic and trifluoroacetic acids taken at 20° and 90° scattering from
the incident neutron beam. In the acetic acid spectrum it is clear
that again there is the large band which contains both the CH3 group
and the OH group motions for the system. Comparing, say, the 20°
spectra the effect of fluorine substitution is very noticeable and the
large contribution of the CH3 group motion to the spectrum is evi-
dent. On careful examination of the 90° spectra where inelastic
scattering is more probable, it can be seen that at about 700 microsec/
metre there is a broad band, or step extending from the inelastic
region, which can be assigned to the OH motion in CF3COOH. Strong
angular-dependent effects of substitution are again noticeable.
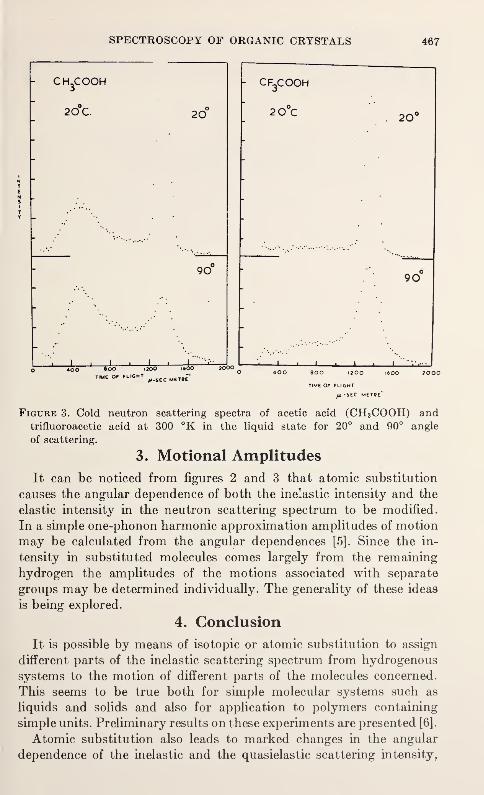
SPECTROSCOPY OF ORGANIC CRYSTALS 467
CH^COOH
20°C 20
90
Too"
CF3COOH
2 0°C 20°
90
eoo 1200
TIME OF flight
-SEC MET8E
Figure 3. Cold neutron scattering spectra of acetic acid (CH3COOH) andtrifluoroacetic acid at 300 °K in the liquid state for 20° and 90° angle
of scattering.
3. Motional Amplitudes
It can be noticed from figures 2 and 3 that atomic substitution
causes the angular dependence of both the inelastic intensity and the
elastic intensity in the neutron scattering spectrum to be modified.
In a simple one-phonon harmonic approximation amplitudes of motion
may be calculated from the angular dependences [5]. Since the in-
tensity in substituted molecules comes largely from the remaining
hydrogen the amplitudes of the motions associated with separate
groups may be determined individually. The generality of these ideas
is being explored.
4. Conclusion
It is possible by means of isotopic or atomic substitution to assign
different parts of the inelastic scattering spectrum from hydrogenous
systems to the motion of different parts of the molecules concerned.
This seems to be true both for simple molecular systems such as
liquids and solids and also for application to polymers containing
simple units. Preliminary results on these experiments are presented [6].
Atomic substitution also leads to marked changes in the angular
dependence of the inelastic and the quasielastic scattering intensity,
468 MOLECULAR DYNAMICS AND STRUCTURE OF SOLIDS
and this seems to allow the amplitudes of motion of different groups
to be determined separately.
5. References
[1] L. Van Hove, Phys. Rev. 95, 249 (1954).
[2] K. E. Larson Inelastic Scattering of Neutrons, IAEA, Vienna, 2, p. 3, (1965).
[3] D. H. C. Harris, S. J. Cocking, P. A. Egelstaff and F. J. Webb, Inelastic
Scattering of Neutrons, IAEA, Vienna, 1, 107 (1963).
[4] B. K. Aldred, R. Eden and J. W. White, Disc. Farad. Soc. 43, 169 (1967).
[5] J. S. Downes, P. A. Egelstaff and J. W. White, Chemistry and Industry
(1967). (Special number on Molecular Sieves and Zeolites).
[6] For application to polymers, see G. F. Lowgster and J. W. White, J. Chem.Phys. 48, 5271 (1968).
ANISOTROPIC LATTICE DYNAMIC STUDIESOF ORGANO-TIN COMPOUNDS BYMOSSBAUER SPECTROSCOPY
HANS A. STOGKLER
Department of Chemical Physics
National Lead Co., Hightstown, New Jersey 08520
and
HIROTOSHI SANO
Department of Chemistry
Ochanomizu University, Tokyo, Japan
The area, A t, under the ^th absorption line of a normalized Moss-
bauer-effect energy spectrum is [l].1
where o~i{E, 0, <p) is the energy-dependent gamma ray absorption
cross-section for the ^th nuclear transition, when the principal axis
of the perturbing field is oriented at spherical angles 6 and *p relative
to the incident (or emitted) photon beam. fs is the source recoilless
fraction and/a (0, <p) is the angular dependent probability of recoilless
7-ray absorption in the target material. fa is related to k, the wavevector of the 7-radiation, and to u T , the ensemble average of the in-
stantaneous displacement of the rth absorbing nucleus from its meanposition.
In the harmonic approximation [2],
Eq 2 is analogous to the Debye-Waller factor for x-ray scattering
It has been shown that the instantaneous mean-square vibrational
amplitude, <i^>, is significantly smaller in organometallic tin
compounds where the Mossbauer 119Sn atom is directly bonded in a
three-dimensional polymeric network lattice [5]. Similarly, <j^> for119Sn in linear-chain polymers, e.g., [(CH ) 3SnF]„, is considerably
smaller compared to a typical monomeric molecular unit such as
1 Figures in brackets indicate the literature references at the end of this paper.
l-exp (-M6, <p)W<r,(E, 6, <p))]dE (1)
/„=exp[-<(ku r)2>] (2)
[3,4].
469
311-280 O—69 31
470 MOLECULAR DYNAMICS AND STRUCTURE OF SOLIDS
(CH3) 4Sn, especially at higher temperatures. It was also found that
these randomly oriented one-dimensional polycrystalline polymers
displayed temperature-dependent asymmetric quadrupole doublet
line intensities due to the anisotropic recoilless fraction associated
with each nuclear spin state (±3/2, 3/2+ and ±1/2, 3/2+), i.e., the
Karyagin effect [6, 7, 8, 9].
The present investigation includes the analysis of a typical organotin
layer structure, viz, [(CH3) 2SnO]„. The tin in dimethyltinoxide is penta-
coordinated with three nearest-neighbor oxygen atoms to form a two-
dimensional polymeric Cdl2-type layer lattice [10] with a well-
ordered intermolecular arrangement [11]. The present isomer shift
and quadrupole splitting data support the earlier [11] conclusion that
the tin-oxygen bond is relatively ionic with perhaps a minimum of
dative bond character which presumably gives rise to a pseudo-ionic
lattice structure. [(CH3) 2SnO] reis being compared here with a typical
monomeric trigonal bipyramidal covalent compound (CH3) 3SnCl-pyr-
idine[12].
The isomer shifts, with respect to Sn02 , for [(CH3) 2SnO] tt and
(CH3) 3SnCl-pyridine are 0.93±0.09 mm/sec and 1.33±0.09 mm/sec,
respectively. This means that the s-electron density, 2^/(0), at the
tin nucleus is less in [(CH3) 2SnO] rethan in (CH3) 3SnCl-pyridine. The
quadrupole splitting for [(CH3) 2SnO] n is 2.07 + 0.09 mm/sec, while it
is 3.44 ±0.09 mm/sec for (CH3) 3SnCl-pyridine.
Figure 1 shows <w 2
>, in (angstroms) 2 versus temperature, hi de-
grees Kelvin, for (CH3) 3SnCl-pyridine (curve 1) and [(CH3) 2SnO]„
(curve 2.) The lattice-dynamic behavior can be interpreted by con-
sidering the anisotropic mean-square displacement tensor [13, 14], U r.
We have
<u 2r>= S t7&IA+5X«*>« (3)
1,3=1
where <w 2> d corresponds to non-rigid-body distortional vibrations
[15]. The contribution of internal modes (e.g., high frequency infrared
active modes) to <w2> is probably much less significant than that of
lattice modes. Using the analysis suggested in reference 14, we have
U(j=Tij+GijkiLki-\-HijkiSk i (4
)
where T is the translation tensor, L is the libration tensor, and S is
the tensor that correlates translation and libration. U r represents a
vibrational ellipsoid in <^>— space with components <u2
r> x ,
<^> y , and <i£2
r> 2 . It is expected that the components of U r will
be smaller for a polymeric layer structure at almost all temperatures.
Thus, «> for [(CH3) 2SnO]„ and (CH3) 3SnCl- pyridine is 0.0053
A
2
and 0.0107A2 at 70 °K, while at 170 °K it is 0.0151A2 and 0.0285A2,
respectively.
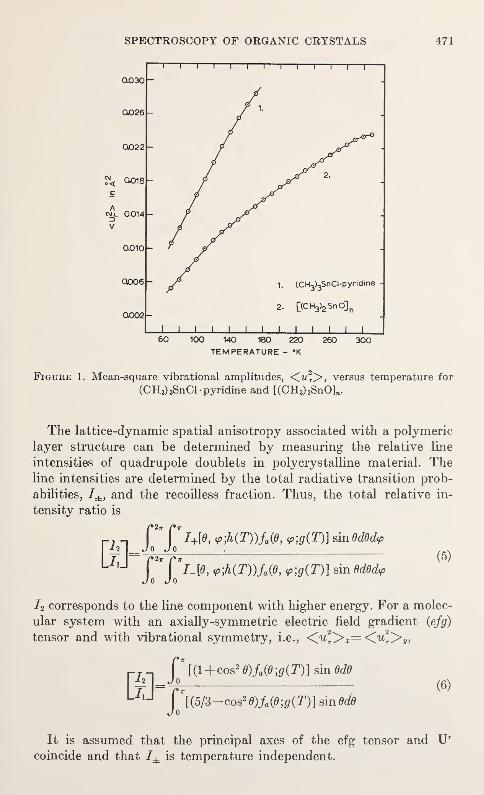
SPECTROSCOPY OF ORGANIC CRYSTALS 471
0.030
1 1 1
—
O026 - f 1.
Q022
?< 0O18
c
c^. 0.014
Vf
aoio r
00061. (CH3)3
SnCI-pyridine -
0002
I I I
2. [(CH3)2 SnO]n
I I I I I I I I I I
60 100 140 180 220 260 300TEMPERATURE - °K
Figure 1. Mean-square vibrational amplitudes, <« 2r>, versus temperature for
(CH 3) 3SnCl- pyridine and [(CH 3) 2SnOL.
The lattice-dynamic spatial anisotropy associated with a polymeric
layer structure can be determined by measuring the relative line
intensities of quadrupole doublets in polycrystalline material. Theline intensities are determined by the total radiative transition prob-
abilities, 7± , and the recoilless fraction. Thus, the total relative in-
tensity ratio is
(
2T
('1+1$, <pMT))M°, <p;g(T)] sindddd?±2 JO JO
r-J n I I-L +lv } //jav, V
j
£2 Jo Jp,
Jo Jog(T)] sin Bd0d<p
(5)
I2 corresponds to the line component with higher energy. For a molec-
ular system with an axially-symmetric electric field gradient (efg)
tensor and with vibrational symmetry, i.e., <iu2
ry> x= <iu r^> Vi
[(1+cos20)ja(6;g(T)} sin Odd
ITTT^ " (6)
JoK5/3-cos2 0)/„(0;0(T)]sin0<ft
It is assumed that the principal axes of the efg tensor and U r
coincide and that I± is temperature independent.
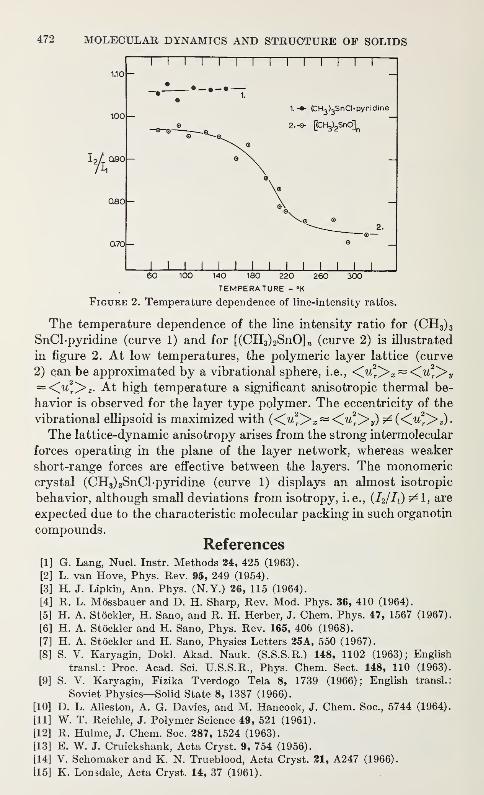
472 MOLECULAR DYNAMICS AND STRUCTURE OF SOLIDS
140 180 220 260 300
TEMPERATURE - °K
Figure 2. Temperature dependence of line-intensity ratios.
The temperature dependence of the line intensity ratio for (CH3) 3
SnCl-pyridine (curve 1) and for [(CH3) 2SnO] ra(curve 2) is illustrated
in figure 2. At low temperatures, the polymeric layer lattice (curve
2) can be approximated by a vibrational sphere, i.e., <Cu2
r^> x ~ <Cu2
r^> y
~<^u2
r^> z . At high temperature a significant anisotropic thermal be-
havior is observed for the layer type polymer. The eccentricity of the
vibrational ellipsoid is maximized with «^> x«<u*> y) 5z£« /?4>z)-
The lattice-dynamic anisotropy arises from the strong intermolecular
forces operating in the plane of the layer network, whereas weaker
short-range forces are effective between the layers. The monomericcrystal (CH3) 3SnCl-pyridine (curve 1) displays an almost isotropic
behavior, although small deviations from isotropy, i. e., (I2/I1) 9^1, are
expected due to the characteristic molecular packing in such organotin
compounds.
References[1] G. Lang, Nucl. Instr. Methods 34, 425 (1963).
[2] L. van Hove, Phys. Rev. 95, 249 (1954).
[3] H. J. Lipkin, Ann. Phys. (N.Y.) 26, 115 (1964).
[4] R. L. Mossbauer and D. H. Sharp, Rev. Mod. Phys. 36, 410 (1964).
[5] H. A. Stockier, H. Sano, and R. H. Herber, J. Chem. Phys. 47, 1567 (1967).
[6] H. A. Stockier and H. Sano, Phys. Rev. 165, 406 (1968).
[7] H. A. Stockier and H. Sano, Physics Letters 25A, 550 (1967).
[8] S. V. Karyagin, Dokl. Akad. Nauk. (S.S.S.R.) 148, 1102 (1963); English
transl.: Proc. Acad. Sci. U.S.S.R., Phys. Chem. Sect. 148, 110 (1963).
[9] S. V. Karyagin, Fizika Tverdogo Tela 8, 1739 (1966); English transl.:
Soviet Physics—Solid State 8, 1387 (1966).
[10] D. L. Alleston, A. G. Davies, and M. Hancock, J. Chem. Soc, 5744 (1964).
[11] W. T. Reichle, J. Polymer Science 49, 521 (1961).
[12] R. Hulme, J. Chem. Soc. 387, 1524 (1963).
[13] E. W. J. Cruickshank, Acta Cryst. 9, 754 (1956).
[14] V. Schomaker and K. N. Trueblood, Acta Cryst. 21, A247 (1966).
[15] K. Lonsdale, Acta Cryst. 14, 37 (1961).

DYNAMICS OF POLYMERS

RELAXATION IN SOLID POLYMERS [1]1
David W. McCall
Bell Telephone Laboratories
Murray Hill, New Jersey 07971
1. Introduction
In this paper we make an attempt to summarize the present
state of knowledge relating to molecular motions in solid polymers
[2]. The discussion is concerned only with organic materials of high
molecular weight, in the glassy, crystalline and rubbery states.
Oriented materials will not be discussed. Even with these restrictions
the existing literature on the subject, both experimental and theoret-
ical, is very large. The aim is doubtless presumptuous and the attempt
can only be partially fulfilled.
A survey of available experimental data has been conducted and
the results are presented in the form of "transition maps." Dielectric,
dynamic mechanical, nuclear magnetic resonance and some dynamic
birefringence results are included. These transition maps locate
the relaxation processes with respect to frequency and temperature.
The fact that the various techniques yield points tending to lie on
the same loci is taken as empirical evidence that common molecular
motions are responsible for the various experimental observations.
That is to say, the different experimental methods are sensitive at
the same relaxation frequencies, and these frequencies can often
be identified with motions of specific molecular groups.
Transition maps say rather little about relaxation strengths or
intensities. Very often the intensities for corresponding relaxation
mechanisms differ markedly. For example, a very weak dielectric
loss may lie on the same transition map locus as a very strong me-
chanical loss. Further, in a material showing two transition loci,
one transition may be stronger in the dynamic mechanical sense while
the other is stronger in the dielectric sense. To understand this
feature it is necessary to look into the manner in which the experiment
couples to the molecular motion. This is a difficult problem even in
the most favorable circumstances.
In NMR and dielectric relaxation experiments the experimenter
imposes a force field that is nearly uniform throughout the specimen.
Figures in brackets indicate the literature references at end of this paper.
475
476 MOLECULAR DYNAMICS AND STRUCTURE OF SOLIDS
The interaction between the field and the specimen can be written
down in molecular terms with some considerable confidence. For
example, there is no doubt that dielectric relaxation in many systems
can be properly described in terms of the time dependence of the
orientation of permanent electric dipoles. The energy of interaction
with an applied field F is simply E = — /*F. Similarly, NMR can
be analyzed in terms of molecular reorientation and diffusion.
In dynamic mechanical experiments it is less certain that the
forces applied to the surfaces of the specimen will be transmitted
uniformly throughout the volume of the specimen. Many polymers
exhibit a complex crystalline-amorphous morphology and the me-
chanical properties of the amorphous parts may differ by orders of
magnitude from the mechanical properties of the crystalline parts
even though the dielectric properties differ only slightly. This matter
complicates the dynamic mechanical problem enormously, and muchremains to be done on both experimental and theoretical aspects
of the problem. Progress in this line could greatly enhance the use-
fulness of dynamic mechanical measurements.
Inasmuch as we shall refer frequently to relaxation frequencies,
correlation times and relaxation times it is in order to discuss these
parameters briefly. By relaxation time we mean the characteristic
time associated with macroscopic experimental effects. Generally
it is taken to be the reciprocal of a frequency of maximum loss. Acorrelation time is a time associated with events on a molecular scale.
As it turns out the distinction is numerically unimportant for me-
chanical and dielectric experiments, because the macroscopic and
molecular times are nearly equal, and is well understood for NMRexperiments. This result is by no means obvious but it is a reliable
theoretical conclusion. The relaxation frequency as used in this paper
is defined in terms of experimental variables which differ from one
method to another.
For the present purposes dielectric loss, e", was plotted against log
(frequency) at constant temperature and the frequency of maximumloss was taken to be v c at that temperature. In some cases results were
reported as tan 8 (= e"/€')j and in these cases we simply used tan 8
plots instead of e" plots. Mechanical loss G", E", J" or tan 8 (= G"/G',
E"IE' , or J"IJ') were handled in the same way. In most mechanical-
loss studies the frequency range covered was insufficient to allow this
type of treatment. Although it is less desirable, plots of loss versus
temperature at constant frequency were used in such cases. v c was
taken as the measurement frequency at the temperature of maximumloss.
NMR relaxation results come n three varieties, spin-lattice re-
laxation (Ti), spin-spin relaxation (T2 or line width) and "rotating
DYNAMICS OF POLYMERS 477
frame" relaxation (Tip). NMR results were almost always analyzed
with relaxation time-temperature plots. v c was taken to be the res-
onance frequency at the temperature of a Tx minimum. A change in
T2 (or resonance width, 8H) with temperature marks the onset of
motion of frequency ~\I2tt(T2)lt (or ^y5HLT/2ir) where ULT" implies
the low temperature or rigid lattice condition. u c was taken as this
frequency at the middle of the transition temperature range. This
point is usually difficult to pick out with accuracy. As most resonances
are of the order of 10 G wide at low temperatures, v c from T2 is always
of the order of 104 to 105 Hz. NMR experiments in the "rotating
frame" have recently come into use and serve to extend the range of
v c to lower frequencies. u c= yHi/2w at the temperature of a Tip mini-
mum (Hi is the strength of the rf magnetic field). As Hi is typically of
the order of one to 10 G, v c for a Tlp minimum corresponds to the
same frequency range as that probed by T2 studies. At lower temper-
atures, when conditions are favorable, v c becomes ~ l/2irTiP .
In defining the u c's in these ways we hava neglected various factors
of order unity that may properly be applied. The attempt is to keep
as close as possible to measured quantities. In any case, for our pur-
poses the corrections are insignificant.
The use of the term correlation frequency often leads to the mistaken
notion that the molecules are undergoing a periodic reorientation. In
fact, the correlation frequency is v c=1/2ttt c where r c is some sort of
average time between motional events. The event might be the re-
orientation from one postion to another or it might be a diffusive jump.
Of course, the frequencies encountered in resonance spectra, e.g.
microwave spectra of gases, do correspond to frequencies of molecular
motion in the classical sense. The transition from resonance to relaxa-
tion behavior is an important matter of current interest owing to very
far infrared and sub-millimeter microwave methods now being
employed.
The magnitudes of v c of interest here vary over a wide range. In
mobile liquids u c~1010 to 10 11 Hz, whereas in glassy or crystalline
solids v c is very small, perhaps zero. Polymeric materials range widely
between these extremes and measured results are available from 10~4
to 10 9 Hz. Even these bounds are primarily an indication of experi-
mental limitations and in no way imply limits characteristic of the
spectrum of polymer motions. One should keep in mind that manypolymer systems have two or more motional mechanisms active under
the same conditions. For example, in PMMA 2 at 250 °K there are
processes with identifiable u c's of 10 7, 105 and 10
-2 Hz. The presence of
simultaneous resolvable relaxations in itself provides clues concerning
the molecular processes involved.
2 See Appendix 1 for a translation of the abbreviations used in designating the polymers discussed in this
paper.
478 MOLECULAR DYNAMICS AND STRUCTURE OF SOLIDS
Molecular motions in polymers [3] can be loosely classified underthe following headings
:
1. Primary main chain motion in crystals.
2. Primary main chain motions in amorphous materials.
3. Secondary main chain motion in crystals.
4. Secondary main chain processes in amorphous materials.
5. Side group motions.
6. Impurity motions.
Primary main chain motion in crystals is a hindered rotation about
the main chain axis. All of the chains in the crystalline regions maybe involved. The motion could occur via a defect mechanism. Ac-
tivation energies tend to be high, greater than 30 kcal/mole. In PTFEthis motion sets in at a first-order polymorphic transition. In poly-
ethylene it is probable that the "a-transition" involves the onset of
such motions. In this case it sets in gradually. The presence of mobile
imperfections or kinks has been suggested. Translation along the
chain axis may also occur.
The primary main-chain motions in amorphous regions begin at
the glass transition. The glass transition marks the onset of large-
scale main chain motions, both rotational and translational. Therigid glass becomes a viscous liquid as the temperature is raised.
Arrhenius plots, i.e. plots of log v c versus 1/T, are often curved and
the resulting variable activation energies are very large; 100 kcal/mole
is not unusual. The temperature dependence is usually analyzed in
terms of an alternate expression due to Williams, Landel and Ferry
[4]. PIB and PMMA are good examples of amorphous materials,
that exhibit glass transitions. The amorphous regions in semicrystalline
polymers also undergo similar changes in their state of motion;
e.g. the ' '^-transition' ' in polyethylene is probably of this nature.
Secondary main-chain processes are thought to be more localized
than the primary motions just described. The secondary processes
are characteristic of linear polymers which tend to be semicrystalline.
Activation energies in the neighborhood of 10 to 15 kcal/mole are
normally encountered. It may be that only a fraction of the chains
are involved. For example, in crystalline regions it may be that only
those chain segments which lie near a row vacancy (possibly as-
sociated with a chain end) are free to move. In a glassy structure
composed of linear chains there are probably chain lengths of limited
size with enough free volume to permit some motion. Loose folds at
crystal surfaces may also have some freedom of motion. We emphasize
that these mechanisms are particularly speculative. The "7-transition"
in polyethylene is an example of this type of process.
Side-group motions are quite common and tend to occur well
below the glass transition temperature. Activation energies may be
DYNAMICS OF POLYMERS 479
above 20 kcal/mole for large or highly polar side groups but can be
as low as 2 kcal/mole for methyl-group rotations. As only a few atoms
are included in the moving unit, it is possible to establish these
mechanisms with some certainty. PMMA exhibits three transitions
of this type, rotation of the ester side group (the transition"),
rotation of the main chain methyl group and rotation of the ester
methyl group.
Low molecular weight impurities can dominate relaxation at very
low temperatures. In such cases the motions of the polymer are frozen
out and the small impurity molecules provide the only relaxation
mechanism. The very low temperature process in polystyrene could
be an impurity effect.
In all relaxation phenomena the key physical process is the dis-
sipation of energy. This is simply the conversion of work into heat.
A sinusoidal stress produces a sinusoidal strain, where the stress
may be a mechanical pressure and the strain a volume change, or
the stress could be an electrical voltage and the strain an electrical
charge. If the stress and strain always remain in phase, that is, if
the response of the specimen is much faster than the change in stress,
the work done on the specimen during half a cycle is stored and
returned to the stress-making device during the other half cycle.
This is a reversible system, no net work is done (per cycle) and no
heat is generated. The electronic polarization is a good example of
such a mechanism. On the other hand, if there is some sluggish factor
in the response of the specimen, the stress and strain get out of phase,
net work is done (per cycle) and heat must be generated.
In simple mathematical terms, consider the mechanical problem.
The work done in an interval dt is
dW=jdl
where j is the force and dl is the displacement in dt. For a sinusoidal
stress, ignoring transient terms,
j=f0 sin oit
and1=1 o sin (ut-\-<p)
where <p is the phase difference.
dl=l 0o) cos (wt+<p)dt.
The work done is
W=f0l 0 cos <p|*(sin tat) (cos tat) codt—f0 l 0 sin <pj(sin2wfycadt.
or
W=—ttIJ0 sin <p per cycle.
480 MOLECULAR DYNAMICS AND STRUCTURE OF SOLIDS
The first integral is the elastic part which integrates to zero over
an integral number of cycles.
On a molecular scale one is confronted with the problem of ex-
plaining dissipative phenomena by means of statistical mechanics,
based on conservative force laws. It seems probable that this can be
done, but it is difficult to obtain an intuitive grasp of the mechanics
of dissipation. An explicit model calculation would be helpful but weknow of no satisfactory example. Most theoretical work does not
address itself to this problem. Recent activity has centered upon the
description of macroscopic properties in terms of statistical averages
of the time dependence of various molecular quantities, i.e., the correla-
tion functions [65, 66]. A calculation of the correlation functions from
first principles would clarify the situation, but this has not been
produced.
In order to describe the relaxation process explicity we must state a
mechanism, i.e., designate a part of the system which participates byconverting the coherent excitation supplied by the experiment into
excitation of the phonon bath of the specimen. The phonon bath can
be regarded as a collection of oscillators characterized by a distribu-
tion function. Mechanical excitation can be regarded as creation of
coherent phonons (i.e., in phase with one another) of the experimental
frequency. These phonons interact with the designated part of the
system and leave it in some excited state. The excitation can sub-
sequently decay by emitting phonons coherent with the excitation,
in which case no dissipation occurs, or the excitation can decay byproducing one or more phonons of different phase or frequency, i.e.,
dissipate energy into the heat bath. The transition probabilities which
describe these competing processes are very complicated in extremely
simple systems, and it is unrealistic to hope for a detailed calculation
for polymeric media. For this reason the phonon bath is not introduced
explicitly but its presence is felt whenever a temperature appears in
the analysis.
2. Some Theories of Relaxation
Theoretical treatments of relaxation processes are numerous and
it is not our intent to review all the theories or any one exhaustively.
Rather, we will attempt to describe some of the physical ideas under-
lying these theories and assess their success and rationality as applied
to polymers.
2.1. Transition State Theory
The transition state theory [5] of time-dependent processes is one
of the oldest and most successful theories available. Eyring has been
the principal spokesman for this point of view, but others have
DYNAMICS OF POLYMERS 481
contributed significantly, and the ideas have been known for a long
time. The theory is limited in some respects, but it is extremely useful.
Eyring has been successful in applying the ideas to a wide variety of
phenomena. The basic step is to set the characteristic frequency of
any process equal to a fundamental vibration frequency, (kT/h),
multiplied by an exponential activation energy term, exp(—AGXRT),
vc=(kT/h) exp (-AQt/RT). (1)
This leads to an activation energy (actually an enthalpy)
,
AH*=-R(blnvMllT)) p (2)
and an activation volume,
AV t=—R T(dlnuc/dp) T . (3)
It is easily shown that the activation energy at constant volume,
Ev=—R@[nve/d(l/T)) v is given by
Ev=AH*-pAV* (4)
where
Pt=T(dp/dT) v . (5)
The model can be visualized as follows. A molecule oscillates subject
to forces specified by two potential wells separated by a barrier. If
kT is very small compared with the barrier height the molecule tends
to stay in one well, making transitions to the other well only occasion-
ally. This is the situation for processes of interest here. Crudely speak-
ing, (kT/h) is the frequency with which the molecule approaches the
barrier, and the exponential term is the probability that it will have
the necessary energy to surmount the barrier. Relaxation experiments
couple to the molecules with energies weak compared with kT andAH*. Thus, the experiments cause only small changes in the thermal
motions.
When polymers are under consideration the unit whose motion is
to be described is usually not the entire molecule but some muchsmaller portion such as a side group or a limited length of chain. This
is not very different from the case of low molecular weight considera-
tions except that the potential may be of intramolecular as well as
intermolecular origin. The oscillation considered may be either trans-
lational or rotational in nature.
Interpretation of the parameters derived on analysis of the experi-
ments must be undertaken with great care. The great generality andwide applicability are the results of a nonexplicit basis. The graphs in
section 4 attest to the constancy of AH\ and this parameter is ex-
482 MOLECULAR DYNAMICS AND STRUCTURE OF SOLIDS
tremely useful in keeping track of data. (The glass transition does
not usually yield a constant AHt, as will be discussed.) Small activa-
tion energies can often be associated with specific motions of small
groups, but large activation energies can refer to less definite rearrange-
ments.
When a rigid linear molecule, n segments in length, is considered
to rotate about its long axis, it is reasonable to write [3]
AW=AHlDi+nAHle (6)
andASt=ASld+n-ASie . (7)
As we have noted, many relaxation studies consist of temperature
dependencies at constant frequency, so it is desirable to solve the rate
expression, eq. (1), for the temperature of maximum loss, Tmax . Withthe rigid-rod assumptions this becomes
T^=To(j^) (8)
where T0^AHtjASle ,a^AHlJAHl. and b=(ASind-R ln(hv/kT))/
ASleg . We recall that v as used here is the experimental frequency.
When chain twisting is introduced [3, 6, 7]
AW=AHtDd+j(n).AHtee (9)
and AS1is assumed to be a similar function of n.f(n) must be equal to
n at small n (rigid behavior) and reach a limiting value for large n.
! That is, the activation energy should become independent of chain
length when twisting occurs to such an extent that only a small
fraction of the chain is near the rotational barrier at any given time.
For realistic potentials it is found that twisting does not occur at all
until the molecule becomes fairly long (e.g., this n may be greater
than 100 for paraffin chains). Thus the rigid-rod behavior may be
widely applicable.
This result is not obvious but a simple physical model can makethe basis clear. The chain-twisting potential and a sinusoidal barrier
potential are given as,
w-^(t)Vf^ <»>
where z is the distance along the chain, v? the angle of rotation, a the
segment length and A and B are constants governing the twist energy
(^4) and the rotation energy (B). It is desired to find the minimumenergy that will be sufficient to make the molecule pass over the
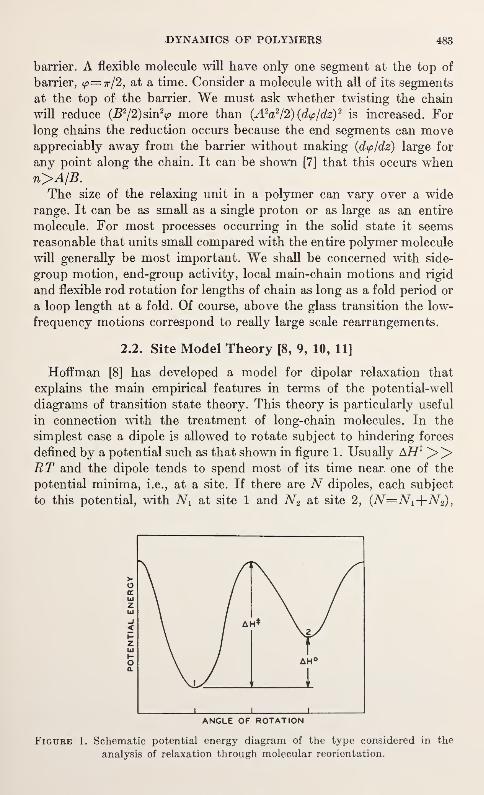
DYNAMICS OF POLYMERS 483
barrier. A flexible molecule will have only one segment at the top of
barrier, (p=w/2, at a time. Consider a molecule with all of its segments
at the top of the barrier. We must ask whether twisting the chain
will reduce (B2/2)sm2<p more than (A2a2
/2)(d(p/dz)2
is increased. For
long chains the reduction occurs because the end segments can moveappreciably away from the barrier without making (d<p/dz) large for
any point along the chain. It can be shown [7] that this occurs whenn>A/B.The size of the relaxing unit in a polymer can vary over a wide
range. It can be as small as a single proton or as large as an entire
molecule. For most processes occurring in the solid state it seems
reasonable that units small compared with the entire polymer molecule
will generally be most important. We shall be concerned with side-
group motion, end-group activity, local main-chain motions and rigid
and flexible rod rotation for lengths of chain as long as a fold period or
a loop length at a fold. Of course, above the glass transition the low-
frequency motions correspond to really large scale rearrangements.
2.2. Site Model Theory [8, 9, 10, 11]
Hoffman [8] has developed a model for dipolar relaxation that
explains the main empirical features in terms of the potential-well
diagrams of transition state theory. This theory is particularly useful
in connection with the treatment of long-chain molecules. In the
simplest case a dipole is allowed to rotate subject to hindering forces
defined by a potential such as that shown in figure 1. Usually AH* >>RT and the dipole tends to spend most of its time near one of the
potential minima, i.e., at a site. If there are N dipoles, each subject
to this potential, with Ni at site 1 and N2 at site 2, (N=Ni+N2),
I i i i 1
ANGLE OF ROTATION
Figure 1. Schematic potential energy diagram of the type considered in the
analysis of relaxation through molecular reorientation.
484 MOLECULAR DYNAMICS AND STRUCTURE OF SOLIDS
then the dipole moment of the system is Ni/ii-\-N2 /i2- The dielectric
constant is proportional to the component of this polarization along
the measuring field, F. Hoffman solves the coupled equations for
Ni andN2 ,
at
^=2kN1-2k ,N2 (11)at
where 2k is the transition probability for a jump from site 1 to site 2
and 2krrefers to the reverse jump.
k and k' are simply the characteristic frequencies of the transition-
state theory,
k=A exp [-(AHt+AH°)/BT] (13)
and
k'=A' exp (-AHyBT). (14)
The differences between A and A' reflect entropy of activation factors
The shape of the potential wells is not a critical factor.
After the field F is switched on suddenly, the system approaches
its equilibrium polarization exponentially in time. The correlation
frequency is given by 2(k-\-kf
). The transition probabilities place the
center of the loss legion on a frequency scale, and the magnitude of
the polarization is directly related to the intensity of the dielectric
loss. The parameter AHXis the activation energy for the shift of
frequency with temperature. The parameter AH0 can be deduced
from the temperature dependence of the loss intensity. The intensity
is low at both low and high temperatures and passes through a maxi-
mum when AH0 and RT are of the same magnitude. In addition to
the factor involv ng AH° and temperature, the loss intensity is pro-
portional to Njj.2
, where m2
is the square of the component of the
molecular dipole moment perpendicular to the axis of rotation.
A more complex model using three sites reveals the existence of
two relaxation rates and thus gives the possibility of explaining dis-
tributions of relaxation times. In general, more sites tend to give morerelaxation rates and the lower rates tend to correspond to the larger
polarizations. Of course, there may be other or'gins of relaxation-time
distributions within the framework of the site model, e.g. a distribu-
tion of AHX arising from a distribution of dipole motion potentials.
The site-model theory gives a satisf^ung description of dipole re-
laxation and has been notably successful where it has been applied
with care. The parameters of the theory can also be analyzed in terms
DYNAMICS OF POLYMERS 485
of molecular properties and intermolecular interactions. This has beendone for long-chain dipolar compounds in clathrate complexes andthe results are impressive [12].
Hoffman, Williams and Passaglia [3] have recently presented a dis-
cussion of relaxation in solid polymers based on the site model. In
this ambitious project the authors considered many mechanisms of
motion, made proposals concerning the complex transition behavior
observed with linear polymers and carried through a calculation of
the dynamic mechanical loss based on the site model. We shall take
up their specific applications in section 4.
2.3. Free Volume Theories [4, 13]
Free volume has been invoked widely in approximate theoretical
studies of liquids. The free volume has been denned in a variety of
ways, and it would take us too far afield to try to do justice to this
area of activity. However, the mechanism of the glass transition has
often been discussed in terms of free volume, and it is relevant to
give a brief summary of the kinetic aspects of the arguments here.
The free volume is a measure o c the looseness of the structure of
the solid or liquid, and it is plausible to associate looseness with mo-lecular mobility. Of course, the average free volume as measured bymacroscopic parameters is not necessarily a clear-cut indication of
the local free volume, as it may vary from point to point in the sub-
stance. Moreover, the manner in which free volume fluctuates in
time is important. For these, and other reasons it can be argued that
the results of free volume theory will be rather insensitive to the
details of the definition of the free volume.
Let the free volume and the total volume be denoted Vf and V.
Let the free volume fraction be defined hyf=Vf/V. It is assumed that
a unit of N segments can move when the local free volume fraction
exceeds some critical value jc . v c is set equal to the product of the
probability that the local free-volume exceeds fc , and a frequency
factor, A, so that
vc=a r*<j)dj as)
where $>(/) is a distribution function for local free volume. Bueche
[14] has used this technique for the description of glass-forming sub-
stances. He evaluated <£(/) by means of a free-energy expansion andshowed, with some approximations, that,
vc=vg exp { -NMd/f)
-
(1//,)] } (16)
311-380 O—69 32
486 MOLECULAR DYNAMICS AND STRUCTURE OF SOLIDS
where / is the average free-volume fraction and the subscript g refers
to values at the glass temperature. Using
f=fg+a(T-Tg), (17)
it is easily shown that,
ln(«A)= {NJJtt (T- Tt)l(T- Tg+f„/a) (l»
which is a form of the WLF (Williams, Landel, Ferry) equation.
The WLF equation is usually deduced [4] from the Doolittle viscosity
relation,
V=A' exp (BV/Vf), (19)
where the constant B is of order unity. Equation (16) is seen to be
analogous to the Doolittle relation.
The free volume depends only upon intermolecular potential
energies, and computations of Vf for relatively simple liquids are
well known [13]. The application of these methods to polymers is
more complex, however, owing to uncertainty concerning the size
and composition of the unit engaged in motion. Usually Vf is taken
as the difference between the melt volume and an " occupied" volume.
^=0.025 for most polymers.
2.4. Statistical Mechanical Theory [15, 16]
Gibbs and DiMarzio [15] have argued that the glass transition in
polymers is a kinetic manifestation of a thermodynamic transition
which lies typically 50° C below Tg . At this transition the system
ceases rearrangements (v—»0) owing to the fact that there are no
configurations available into which the system may rearrange. Atleast, the number of configurations has become sufficiently small that
other configurations are not accessible. The configurational entropy
becomes zero at the transition temperature, T2 . Beginning from this
point of view Adam and Gibbs [16] have discussed polymer relaxation
in the glass-transition region. Only the most general statistical
mechanical principles are required.
The transition probability is written as a product of a frequency
factor and the probability that the system is in a state for which
rearrangements are possible.
vc=A exp (
—
2*Afj./k T) (20)
where z* is the smallest number of segments that can compose a unit
capable of rearrangement. A/* is the free-energy difference that
determines the concentration of states permitting rearrangement.
DYNAMICS OF POLYMERS 487
It is then argued that z* is proportional to 1/SC) where Sc is the con-
figurational entropy of the specimen.
also ve=Aexp(—C/SeT), (21)
where C=AfjLS*/k (22)
and s c* is the configurational entropy of a unit of size z*. This is a
key step because Gibbs and DiMarzio [15] had based their earlier
analysis on the assumption that Sc=0 at the thermodynamic transi-
tion temperature T2 . Thus Sc at any other temperature is given by,
Se(T)=ACMT/T2) (23)
where ACP is the difference in heat capacity between the equilibrium
melt and the glass at Tg . ACP is assumed to be independent of
temperature.
The foregoing considerations lead directly to an equation of the
form of the WLF equation,
ln(vc/vg) =a 1(T-Tg)/(a2+ T- Tg) (24)
wheredi=G/AOpTgln(Tg/T2) (25)
and
a2=Tg ln(TgIT2)IW } (26)
which is slightly temperature dependent. T0 as used here need not be
the glass temperature but could be some other reference temperature.
The key step mentioned above, leading to the proportionality
between z* and S'1
, comes about simply. The configurational entropy
of a unit composed of z* segments is s*. If Sc refers to one mole of
segments, then
Se=(NA/z*)s* (27)
because NA /z* is the number of units composed of z* segments
(NA is Avogadro's number). Thus,
z*=(s*Na/Sc) (28)
and equation (21) follows if A/i is expressed in molar terms. Thephysical content of this development is that, as the system becomesmore disordered, units consisting of fewer segments become able to
rearrange. Whereas this is a plausible result, it is less obvious that
all of the temperature dependence is contained in TSC . We are
accustomed to regarding An as temperature independent in transition-
state theory. However, s* is the configurational entropy of a section
of chain, i.e., a rearrangeable unit, whose length varies with tempera-
488 MOLECULAR DYNAMICS AND STRUCTURE OF SOLIDS
ture, and we have no definite notion concerning its temperature
behavior. We would welcome a theoretical development of this
quantity [21].
The success of this theory and the free volume theories is reckoned
in terms of the qualitative "reasonableness" of the parameters
derived by fitting the theoretical equations to experimental data.
In view of the enormously complicated systems described, the results
are gratifying.
2.5. Chain Dynamics Theories
Each of the preceding theories expresses the correlation frequency
as a product of a frequency factor and a conditional probability for
the motional transition. In this section we mention an entirely
different theoretical approach that has been developed by Bueche
[17], Rouse [18], Zimm [19] and others [20, 4]. A single polymer
molecule is considered in a fluid solvent. The molecule is considered
to be composed of sub-molecules (of, say, 30 segments) and a differ-
ential equation for the position of each sub-molecule is the starting
point. This equation is just a balance of the forces on the sub-molecule,
and the set of equations is coupled owing to the fact that the sub-
molecules are connected to one another. The forces include a Brownianmotion term and a frictional force that involves an empirical "friction
factor per segment". A normal coordinate transformation serves to
uncouple the system of equations, and the solution consists of
eigenfunctions that are linear combinations of the positions of the
sub-molecules. Each eigenfunction describes a configuration that
decays with a time constant given by an associated eigenvalue.
This type of theory is attractive because it deals directly with the
long-chain character of polymers. A distribution of relaxation fre-
quencies arises naturally in terms of the normal modes, and it is
perhaps worth considering the physical picture to be associated
with these modes. Consider a large number of polymer molecules
each with its segments numbered from 1 to N. The positions of the
segments of a molecule relative to the center of gravity of that mole-
cule specify the molecule's configuration. If the system is unoriented,
the average position of segment 1 taken over the entire ensemble is
zero. The same statement is true for any given segment. An eigen-
function specifies a displacement for each (ensemble average) segment
position. Now if the ensemble has an initial average set of displace-
ments given by an eigenfunction, the theory shows that the dis-
placements will decay to zero with an exponential time dependence.
The time constant for the decay will be given by the corresponding
eigenvalue. In general eigenfunctions that specify nearly equal
displacements for neighboring segments decay slowly. Figure 2
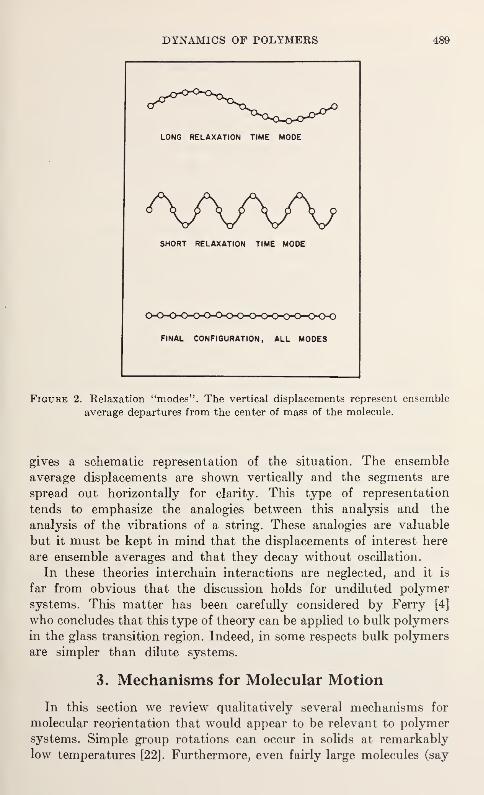
DYNAMICS OF POLYMERS 489
LONG RELAXATION TIME MODE
AA/WSHORT RELAXATION TIME MODE
FINAL CONFIGURATION, ALL MODES
Figure 2. Relaxation "modes". The vertical displacements represent ensemble
average departures from the center of mass of the molecule.
gives a schematic representation of the situation. The ensemble
average displacements are shown vertically and the segments are
spread out horizontally for clarity. This type of representation
tends to emphasize the analogies between this analysis and the
analysis of the vibrations of a string. These analogies are valuable
but it must be kept in mind that the displacements of interest here
are ensemble averages and that they decay without oscillation.
In these theories interchain interactions are neglected, and it is
far from obvious that the discussion holds for undiluted polymer
systems. This matter has been carefully considered by Ferry [4]
who concludes that this type of theory can be applied to bulk polymers
in the glass transition region. Indeed, in some respects bulk polymers
are simpler than dilute systems.
3. Mechanisms for Molecular Motion
In this section we review qualitatively several mechanisms for
molecular reorientation that would appear to be relevant to polymer
systems. Simple group rotations can occur in solids at remarkably
low temperatures [22]. Furthermore, even fairly large molecules (say
490 MOLECULAR DYNAMICS AND STRUCTURE OF SOLIDS
MW>100) can undergo overall reorientation. For example, in
hexamethylbenzene the reorientation frequency for methyl rotation
is greater than 103 Hz at 1 °K and the reorientation frequency for
the entire molecule is greater than 103 Hz at 200 °K. Many examples
can be cited. Many long-chain paraffins are known to undergo re-
orientation about their long-chain axes in the crystalline state, andthese materials have similar freedom when enclosed in urea clathrate
cages [23]. Long-chain ketones also exhibit this type of molecular
activity [24]. Thus well-defined molecular motions have been identified
in relatively simple solids, and we expect the same sorts of motions
in solids polymers.
Although the vast and complex field of polymer morphologycannot be summarized here, a few remarks are in order because
morphological concepts and terminology must enter into the assign-
ment of relaxation mechanisms [25]. In amorphous systems, such as
atactic polystyrene, we expect the structures to be disordered in
the same sense that lower molecular weight liquids are disordered.
Long-range order is absent, but the tendency for chain molecules to
arrange themselves with their axes parallel probably extends over
considerable distances. This tendency to parallel arrangement could
help make chain axis rotations easy. Crystalline polymers always
exhibit a parallel chain structure. In recent years the chain-folded
morphology has been shown to be very common in bulk polymers.
As the crystal thickness is of the same order of magnitude as the
length of chain required for chain twisting, the chains may or maynot behave as rigid rods. The tightness of the fold structures would
seem to be a crucial factor. If the folds contain only three or four
segments, any chain rotations that occur must be coupled closely to
fold or defect motions. If the folds are loose, containing ten or more
segments, it is possible that the folds and interior crystal chains
may reorient at quite different frequencies. In a loose fold structure
a substantial fraction of the total number of segments in the specimen
occurs in the folds. Extended-chain crystals have also been identified,
but the extent to which they occur is still unknown. The amorphous
regions of semi-crystalline polymers are largely uncharacterized.
They include partially-fractionated, low-molecular weight material,
large disordered regions, and disordered or partially disordered sur-
face layers on crystals. The level of crystallinity is important. Whenthe specimen is less than 30 percent crystalline it seems likely that
the structure of the amorphous regions is similar to the structure of
a completely glassy or rubbery polymer. However, when the specimen
is greater than 80 percent crystalline, crystal surfaces and internal
defects probably play an important role. In general we do not know
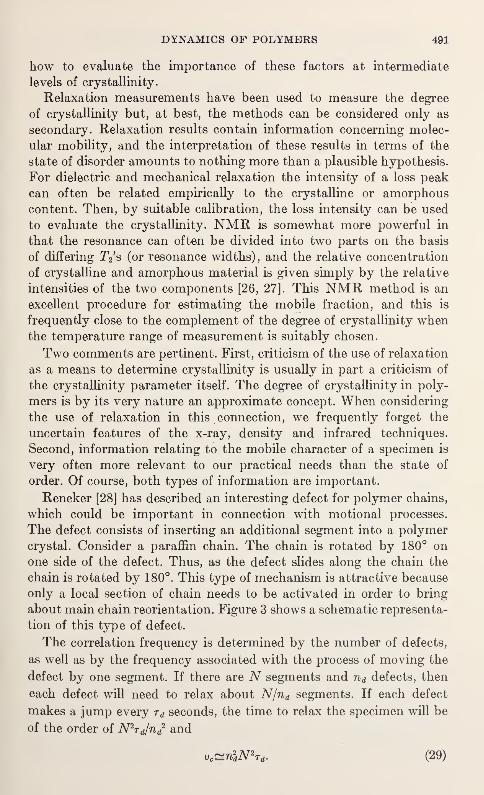
DYNAMICS OF POLYMERS 491
how to evaluate the importance of these factors at intermediate
levels of crystallinity.
Relaxation measurements have been used to measure the degree
of crystallinity but, at best, the methods can be considered only as
secondary. Relaxation results contain information concerning molec-
ular mobility, and the interpretation of these results in terms of the
state of disorder amounts to nothing more than a plausible hypothesis.
For dielectric and mechanical relaxation the intensity of a loss peak
can often be related empirically to the crystalline or amorphouscontent. Then, by suitable calibration, the loss intensity can be used
to evaluate the crystallinity. NMR is somewhat more powerful in
that the resonance can often be divided into two parts on the basis
of differing TVs (or resonance widths), and the relative concentration
of crystalline and amorphous material is given simply by the relative
intensities of the two components [26, 27]. This NMR method is an
excellent procedure for estimating the mobile fraction, and this is
frequently close to the complement of the degree of crystallinity whenthe temperature range of measurement is suitably chosen.
Two comments are pertinent. First, criticism of the use of relaxation
as a means to determine crystallinity is usually in part a criticism of
the crystallinity parameter itself. The degree of crystallinity in poly-
mers is by its very nature an approximate concept. When considering
the use of relaxation in this connection, we frequently forget the
uncertain features of the x-ray, density and infrared techniques.
Second, information relating to the mobile character of a specimen is
very often more relevant to our practical needs than the state of
order. Of course, both types of information are important.
Reneker [28] has described an interesting defect for polymer chains,
which could be important in connection with motional processes.
The defect consists of inserting an additional segment into a polymer
crystal. Consider a paraffin chain. The chain is rotated by 180° on
one side of the defect. Thus, as the defect slides along the chain the
chain is rotated by 180°. This type of mechanism is attractive because
only a local section of chain needs to be activated in order to bring
about main chain reorientation. Figure 3 shows a schematic representa-
tion of this type of defect.
The correlation frequency is determined by the number of defects,
as well as by the frequency associated with the process of moving the
defect by one segment. If there are N segments and nd defects, then
each defect will need to relax about N/nd segments. If each defect
makes a jump every r d seconds, the time to relax the specimen will be
of the order of N2Td/nd
2 and
vc^ndN\d . (29)
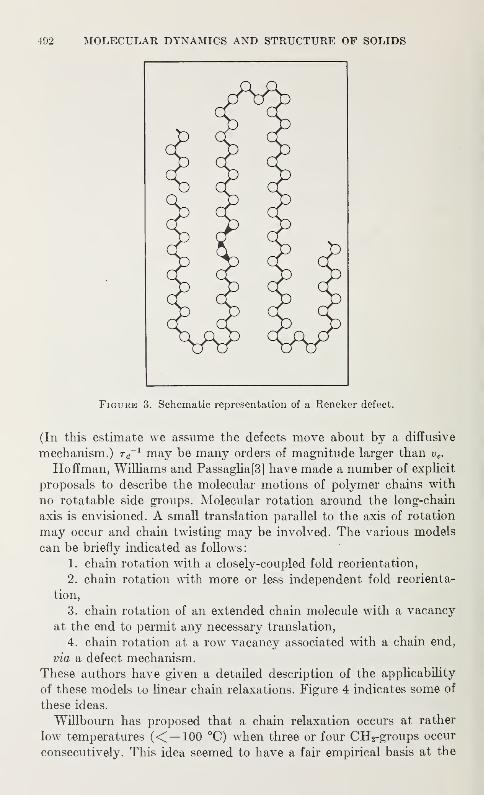
492 MOLECULAR DYNAMICS AND STRUCTURE OF SOLIDS
Figure 3. Schematic representation of a Reneker defect.
(In this estimate we assume the defects move about by a diffusive
mechanism.) r d_1 may be many orders of magnitude larger than vc .
Hoffman, Williams and Passaglia[3] have made a number of explicit
proposals to describe the molecular motions of polymer chains with
no rotatable side groups. Molecular rotation around the long-chain
axis is envisioned. A small translation parallel to the axis of rotation
may occur and chain twisting may be involved. The various models
can be briefly indicated as follows:
1. chain rotation with a closely-coupled fold reorientation,
2. chain rotation with more or less independent fold reorienta-
tion,
3. chain rotation of an extended chain molecule with a vacancy
at the end to permit any necessary translation,
4. chain rotation at a row vacancy associated with a chain end,
via a defect mechanism.
These authors have given a detailed description of the applicability
of these models to linear chain relaxations. Figure 4 indicates some of
these ideas.
Willbourn has proposed that a chain relaxation occurs at rather
low temperatures (<— 100 °C) when three or four CH 2-groups occur
consecutively. This idea seemed to have a fair empirical basis at the
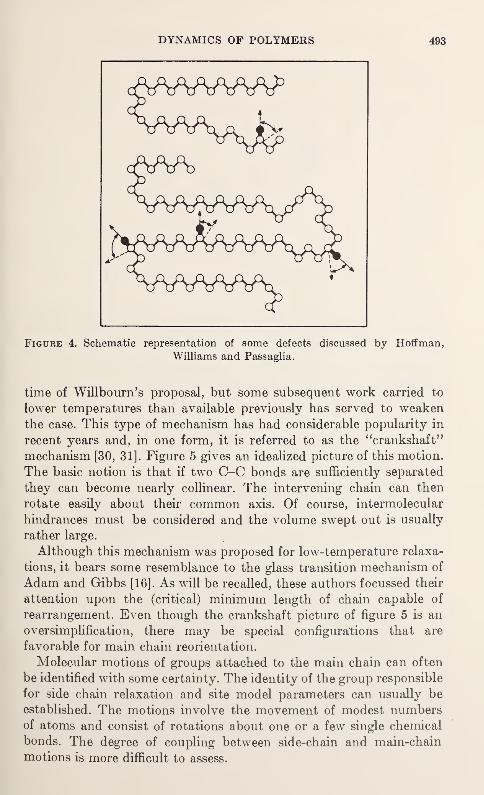
DYNAMICS OF POLYMERS 493
Figure 4. Schematic representation of some defects discussed by Hoffman,
Williams and Passaglia.
time of Willbourn's proposal, but some subsequent work carried to
lower temperatures than available previously has served to weakenthe case. This type of mechanism has had considerable popularity in
recent years and, in one form, it is referred to as the "crankshaft"
mechanism [30, 31]. Figure 5 gives an idealized picture of this motion.
The basic notion is that if two C-C bonds are sufficiently separated
they can become nearly collinear. The intervening chain can then
rotate easily about their common axis. Of course, intermolecular
hindrances must be considered and the volume swept out is usually
rather large.
Although this mechanism was proposed for low-temperature relaxa-
tions, it bears some resemblance to the glass transition mechanism of
Adam and Gibbs [16]. As will be recalled, these authors focussed their
attention upon the (critical) minimum length of chain capable of
rearrangement. Even though the crankshaft picture of figure 5 is an
oversimplification, there may be special configurations that are
favorable for main chain reorientation.
Molecular motions of groups attached to the main chain can often
be identified with some certainty. The identity of the group responsible
for side chain relaxation and site model parameters can usually be
established. The motions involve the movement of modest numbersof atoms and consist of rotations about one or a few single chemical
bonds. The degree of coupling between side-chain and main-chain
motions is more difficult to assess.
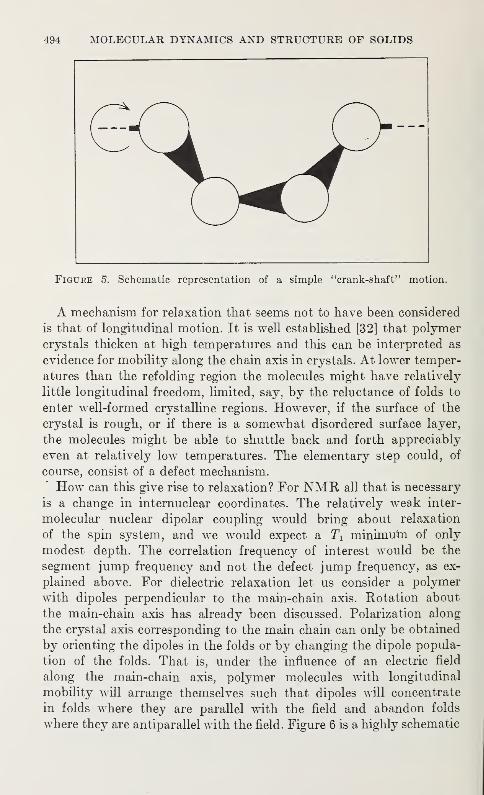
494 MOLECULAR DYNAMICS AND STRUCTURE OF SOLIDS
Figure 5. Schematic representation of a simple "crank-shaft" motion.
A mechanism for relaxation that seems not to have been considered
is that of longitudinal motion. It is well established [32] that polymer
crystals thicken at high temperatures and this can be interpreted as
evidence for mobility along the chain axis in crystals. At lower temper-
atures than the refolding region the molecules might have relatively
little longitudinal freedom, limited, say, by the reluctance of folds to
enter well-formed crystalline regions. However, if the surface of the
crystal is rough, or if there is a somewhat disordered surface layer,
the molecules might be able to shuttle back and forth appreciably
even at relatively low temperatures. The elementary step could, of
course, consist of a defect mechanism.
How can this give rise to relaxation? For NMR all that is necessary
is a change in internuclear coordinates. The relatively weak inter-
molecular nuclear dipolar coupling would bring about relaxation
of the spin system, and we would expect a Ti minimum of only
modest depth. The correlation frequency of interest would be the
segment jump frequency and not the defect jump frequency, as ex-
plained above. For dielectric relaxation let us consider a polymer
with dipoles perpendicular to the main-chain axis. Rotation about
the main-chain axis has already been discussed. Polarization along
the crystal axis corresponding to the main chain can only be obtained
by orienting the dipoles in the folds or by changing the dipole popula-
tion of the folds. That is, under the influence of an electric field
along the main-chain axis, polymer molecules with longitudinal
mobility will arrange themselves such that dipoles will concentrate
in folds where they are parallel with the field and abandon folds
where they are antiparallel with the field. Figure 6 is a highly schematic
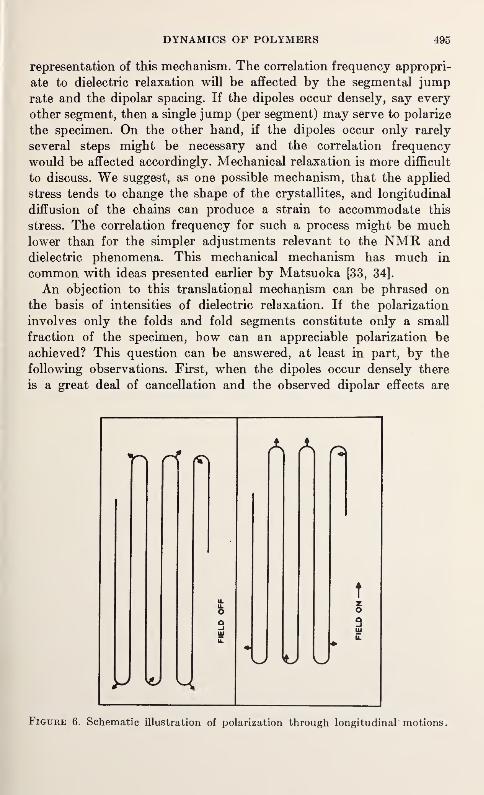
DYNAMICS OF POLYMERS 495
representation of this mechanism. The correlation frequency appropri-
ate to dielectric relaxation will be affected by the segmental jumprate and the dipolar spacing. If the dipoles occur densely, say every
other segment, then a single jump (per segment) may serve to polarize
the specimen. On the other hand, if the dipoles occur only rarely
several steps might be necessary and the correlation frequency
would be affected accordingly. Mechanical relaxation is more difficult
to discuss. We suggest, as one possible mechanism, that the applied
stress tends to change the shape of the crystallites, and longitudinal
diffusion of the chains can produce a strain to accommodate this
stress. The correlation frequency for such a process might be muchlower than for the simpler adjustments relevant to the NMR and
dielectric phenomena. This mechanical mechanism has much in
common with ideas presented earlier by Matsuoka [33, 34].
An objection to this translational mechanism can be phrased on
the basis of intensities of dielectric relaxation. If the polarization
involves only the folds and fold segments constitute only a small
fraction of the specimen, bow can an appreciable polarization be
achieved? This question can be answered, at least in part, by the
following observations. First, when the dipoles occur densely there
is a great deal of cancellation and the observed dipolar effects are
Figure 6. Schematic illustration of polarization through longitudinal motions.
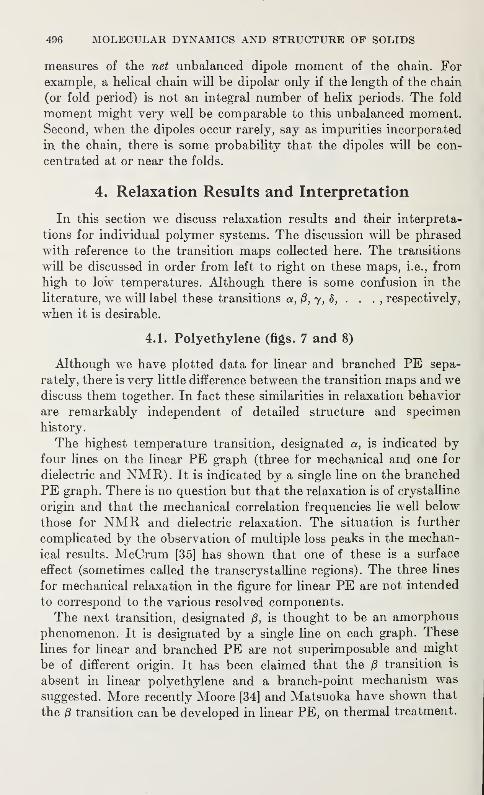
496 MOLECULAR DYNAMICS AND STRUCTURE OF SOLIDS
measures of the net unbalanced dipole moment of the chain. For
example, a helical chain will be dipolar only if the length of the chain
(or fold period) is not an integral number of helix periods. The fold
moment might very well be comparable to this unbalanced moment.Second, when the dipoles occur rarely, say as impurities incorporated
in the chain, there is some probability that the dipoles will be con-
centrated at or near the folds.
4. Relaxation Results and Interpretation
In this section we discuss relaxation results and their interpreta-
tions for individual polymer systems. The discussion will be phrased
with reference to the transition maps collected here. The transitions
will be discussed in order from left to right on these maps, i.e., from
high to low temperatures. Although there is some confusion in the
literature, we will label these transitions a, j8, 7, 8, . . .,respectively,
when it is desirable.
4.1. Polyethylene (figs. 7 and 8)
Although we have plotted data for linear and branched PE sepa-
rately, there is very little difference between the transition maps and wediscuss them together. In fact these similarities in relaxation behavior
are remarkably independent of detailed structure and specimen
history.
The highest temperature transition, designated a, is indicated byfour lines on the linear PE graph (three for mechanical and one for
dielectric and NMR). It is indicated by a single line on the branched
PE graph. There is no question but that the relaxation is of crystalline
origin and that the mechanical correlation frequencies lie well below
those for NMR and dielectric relaxation. The situation is further
complicated by the observation of multiple loss peaks in the mechan-
ical results. McCrum [35] has shown that one of these is a surface
effect (sometimes called the transcrystalline regions). The three lines
for mechanical relaxation in the figure for linear PE are not intended
to correspond to the various resolved components.
The next transition, designated 0, is thought to be an amorphous
phenomenon. It is designated by a single line on each graph. These
lines for linear and branched PE are not superimposable and might
be of different origin. It has been claimed that the 0 transition is
absent in linear polyethylene and a branch-point mechanism was
suggested. More recently Moore [34] and Matsuoka have shown that
the 0 transition can be developed in linear PE, on thermal treatment.
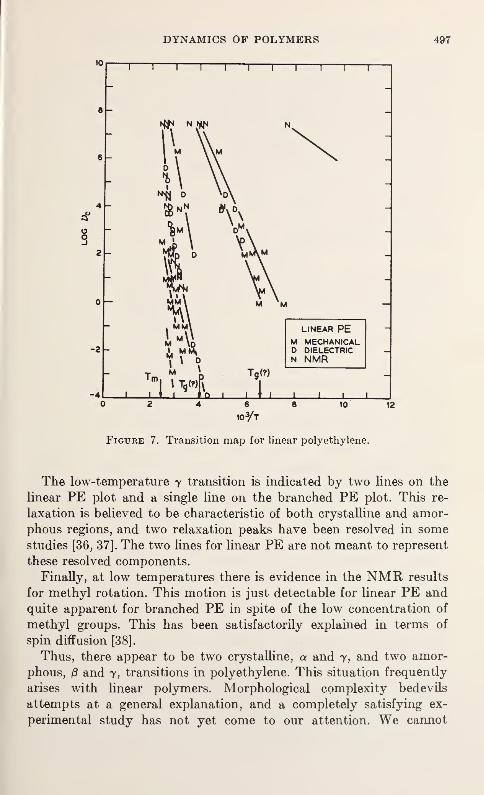
10i r
DYNAMICS OF POLYMERS
i i i i
1 1 1—i—
r
497
M MECHANICALD DIELECTRICN NMR
12
Figure 7. Transition map for linear polyethylene.
The low-temperature y transition is indicated by two lines on the
linear PE plot and a single line on the branched PE plot. This re-
laxation is believed to be characteristic of both crystalline and amor-
phous regions, and two relaxation peaks have been resolved in somestudies [36, 37]. The two lines for linear PE are not meant to represent
these resolved components.
Finally, at low temperatures there is evidence in the NMR results
for methyl rotation. This motion is just detectable for linear PE andquite apparent for branched PE in spite of the low concentration of
methyl groups. This has been satisfactorily explained in terms of
spin diffusion [38].
Thus, there appear to be two crystalline, a and y, and two amor-
phous, /3 and y, transitions in polyethylene. This situation frequently
arises with linear polymers. Morphological complexity bedevils
attempts at a general explanation, and a completely satisfying ex-
perimental study has not yet come to our attention. We cannot
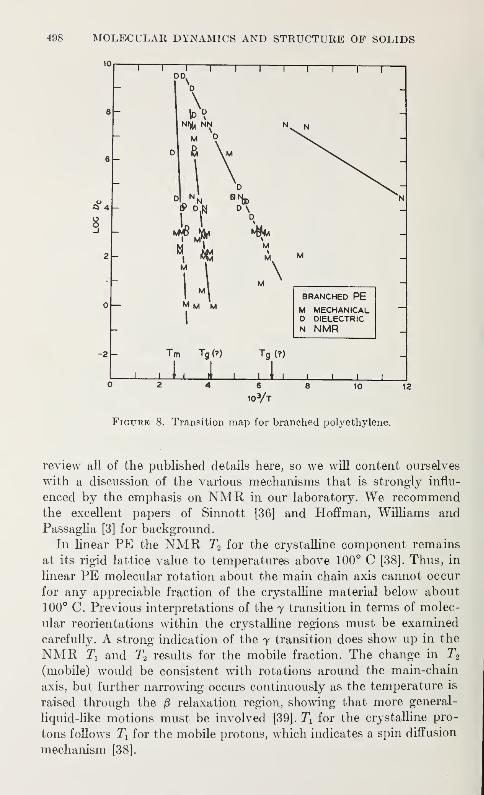
498 MOLECULAR DYNAMICS AND STRUCTURE OF SOLIDS
10
a 4
8
-2
"i i i i
1 1—i—i
1 1 rDO.
0
"Ha nn
M D
a N
Ml
M M M
MM M
\BRANCHED PEM MECHANICALD DIELECTRICN NMR
J L
Tm Tg(?)
L I
Tg(?)
1J 1—I I Ii i i
6
103/T10 12
Figure 8. Transition map for branched polyethylene.
review all of the published details here, so we will content ourselves
with a discussion of the various mechanisms that is strongly influ-
enced by the emphasis on NMR in our laboratory. We recommendthe excellent papers of Sinnott [36] and Hoffman, Williams and
Passaglia [3] for background.
In linear PE the NMR T2 for the crystalline component remains
at its rigid lattice value to temperatures above 100° C [38]. Thus, in
linear PE molecular rotation about the main chain axis cannot occur
for any appreciable fraction of the crystalline material below about100° C. Previous interpretations of the y transition in terms of molec-
ular reorientations within the crystalline regions must be examined
carefully. A strong indication of the y transition does show up in the
NMR Tx and T2 results for the mobile fraction. The change in T2
(mobile) would be consistent with rotations around the main-chain
axis, but further narrowing occurs continuously as the temperature is
raised through the 0 relaxation region, showing that more general-
liquid-like motions must be involved [39]. TY for the crystalline pro-
tons follows Tx for the mobile protons, which indicates a spin diffusion
mechanism [38].
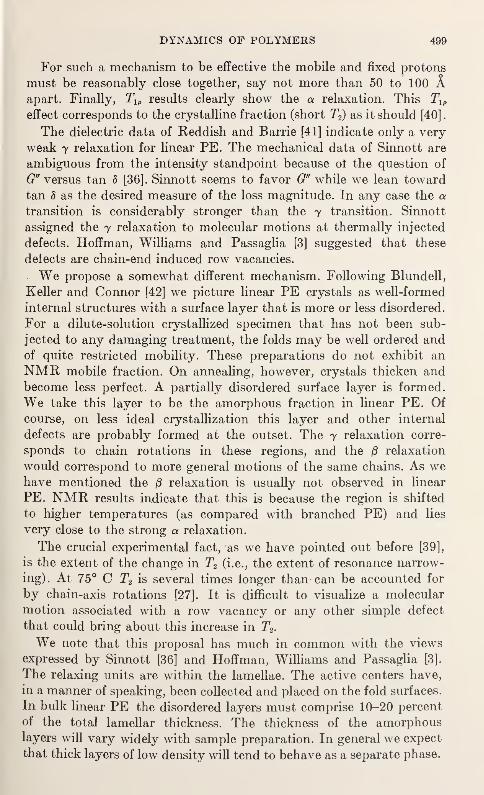
DYNAMICS OF POLYMERS 499
For such a mechanism to be effective the mobile and fixed protons
must be reasonably close together, say not more than 50 to 100 Aapart. Finally, Tlp results clearly show the a relaxation. This Tlp
effect corresponds to the crystalline fraction (short T2) as it should [40]
.
The dielectric data of Reddish and Barrie [41] indicate only a very
weak 7 relaxation for linear PE. The mechanical data of Sinnott are
ambiguous from the intensity standpoint because ol the question of
G" versus tan 5 [36]. Sinnott seems to favor G" while we lean toward
tan 5 as the desired measure of the loss magnitude. In any case the a
transition is considerably stronger than the y transition. Sinnott
assigned the y relaxation to molecular motions at thermally injected
defects. Hoffman, Williams and Passaglia [3] suggested that these
detects are chain-end induced row vacancies.
We propose a somewhat different mechanism. Following Blundell,
Keller and Connor [42] we picture linear PE crystals as well-formed
internal structures with a surface layer that is more or less disordered.
For a dilute-solution crystallized specimen that has not been sub-
jected to any damaging treatment, the folds may be well ordered andof quite restricted mobility. These preparations do not exhibit anNMR mobile fraction. On annealing, however, crystals thicken andbecome less perfect. A partially disordered surface layer is formed.
We take this layer to be the amorphous fraction in linear PE. Ofcourse, on less ideal crystallization this layer and other internal
defects are probably formed at the outset. The y relaxation corre-
sponds to chain rotations in these regions, and the & relaxation
would correspond to more general motions of the same chains. As wehave mentioned the 0 relaxation is usually not observed in linear
PE. NMR results indicate that this is because the region is shifted
to higher temperatures (as compared with branched PE) and lies
very close to the strong a relaxation.
The crucial experimental fact, as we have pointed out before [39],
is the extent of the change in T2 (i.e., the extent of resonance narrow-
ing). At 75° C T2 is several times longer than can be accounted for
by chain-axis rotations [27]. It is difficult to visualize a molecular
motion associated with a row vacancy or any other simple defect
that could bring about this increase in T2 .
We note that this proposal has much in common with the views
expressed by Sinnott [36] and Hoffman, Williams and Passaglia [3].
The relaxing units are within the lamellae. The active centers have,
in a manner of speaking, been collected and placed on the fold surfaces.
In bulk linear PE the disordered layers must comprise 10-20 percent
of the total lamellar thickness. The thickness of the amorphouslayers will vary widely with sample preparation. In general we expect
that thick layers of low density will tend to behave as a separate phase.
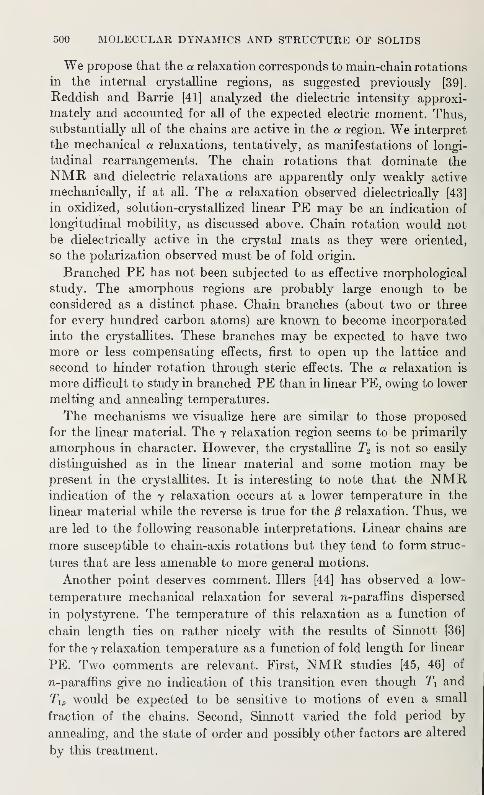
500 MOLECULAR DYNAMICS AND STRUCTURE OF SOLIDS
We propose that the a relaxation corresponds to main-chain rotations
in the internal crystalline regions, as suggested previously [39].
Reddish and Barrie [41] analyzed the dielectric intensity approxi-
mately and accounted for all of the expected electric moment. Thus,substantially all of the chains are active in the a region. We interpret
the mechanical a relaxations, tentatively, as manifestations of longi-
tudinal rearrangements. The chain rotations that dominate the
NMR and dielectric relaxations are apparently only weakly active
mechanically, if at all. The a relaxation observed dielectrically [43]
in oxidized, solution-crystallized linear PE may be an indication of
longitudinal mobility, as discussed above. Chain rotation would not
be dielectrically active in the crystal mats as they were oriented,
so the polarization observed must be of fold origin.
Branched PE has not been subjected to as effective morphological
study. The amorphous regions are probably large enough to be
considered as a distinct phase. Chain branches (about two or three
for every hundred carbon atoms) are known to become incorporated
into the crystallites. These branches may be expected to have two
more or less compensating effects, first to open up the lattice andsecond to hinder rotation through steric effects. The a relaxation is
more difficult to study in branched PE than in linear PE, owing to lower
melting and annealing temperatures.
The mechanisms we visualize here are similar to those proposed
for the linear material. The 7 relaxation region seems to be primarily
amorphous in character. However, the crystalline T2 is not so easily
distinguished as in the linear material and some motion may be
present in the crystallites. It is interesting to note that the NMRindication of the 7 relaxation occurs at a lower temperature in the
linear material while the reverse is true for the 0 relaxation. Thus, we
are led to the following reasonable interpretations. Linear chains are
more susceptible to chain-axis rotations but they tend to form struc-
tures that are less amenable to more general motions.
Another point deserves comment, filers [44] has observed a low-
temperature mechanical relaxation for several n-paraffins dispersed
in polystyrene. The temperature of this relaxation as a function of
chain length ties on rather nicely with the results of Sinnott [36]
for the 7 relaxation temperature as a function of fold length for linear
PE. Two comments are relevant. First, NMR studies [45, 46] of
n-paraffins give no indication of this transition even though Tx and
Tlp would be expected to be sensitive to motions of even a small
fraction of the chains. Second, Sinnott varied the fold period by
annealing, and the state of order and possibly other factors are altered
by this treatment.
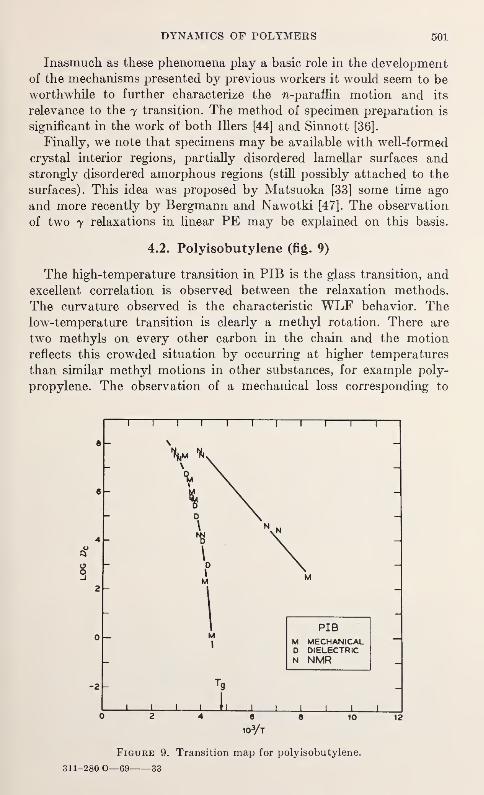
DYNAMICS OF POLYMERS 501
Inasmuch as these phenomena play a basic role in the development
of the mechanisms presented by previous workers it would seem to beworthwhile to further characterize the w-paraffin motion and its
relevance to the y transition. The method of specimen preparation is
significant in the work of both Illers [44] and Sinnott [36].
Finally, we note that specimens may be available with well-formed
crystal interior regions, partially disordered lamellar surfaces andstrongly disordered amorphous regions (still possibly attached to the
surfaces). This idea was proposed by Matsuoka [33] some time ago
and more recently by Bergmann and Nawotki [47]. The observation
of two 7 relaxations in linear PE may be explained on this basis.
The high-temperature transition in PIB is the glass transition, and
excellent correlation is observed between the relaxation methods.
The curvature observed is the characteristic WLF behavior. Thelow-temperature transition is clearly a methyl rotation. There are
two methyls on every other carbon in the chain and the motion
reflects this crowded situation by occurring at higher temperatures
than similar methyl motions in other substances, for example poly-
propylene. The observation of a mechanical loss corresponding to
4.2. Polyisobutylene (fig. 9)
6
2
IM
PIBo M MECHANICAL
D DIELECTRICN NMR
-2 -
0 2 4 6 8 10 12
103/T
Figure 9. Transition map for polyisobutylene.
311-280 0—69 33
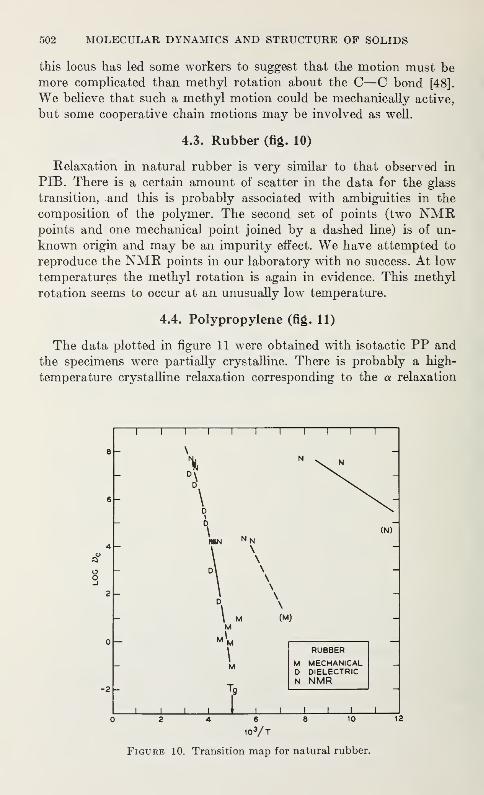
502 MOLECULAR DYNAMICS AND STRUCTURE OF SOLIDS
this locus has led some workers to suggest that the motion must bemore complicated than methyl rotation about the C—C bond [48].
We believe that such a methyl motion could be mechanically active,
but some cooperative chain motions may be involved as well.
4.3. Rubber (fig. 10)
Relaxation in natural rubber is very similar to that observed in
PIB. There is a certain amount of scatter in the data for the glass
transition, and this is probably associated with ambiguities in the
composition of the polymer. The second set of points (two NMRpoints and one mechanical point joined by a dashed line) is of un-
known origin and may be an impurity effect. We have attempted to
reproduce the NMR points in our laboratory with no success. At low
temperatures the methyl rotation is again in evidence. This methyl
rotation seems to occur at an unusually low temperature.
4.4. Polypropylene (fig. 11)
The data plotted in figure 11 were obtained with isotactic PP and
the specimens were partially crystalline. There is probably a high-
temperature crystalline relaxation corresponding to the a relaxation
i 1 1 r i r i i r
2 -
0 -
-2 -
(N)
RUBBER
M MECHANICALD DIELECTRICN NMR
J I I L J I I I I L6
103A10
Figure 10. Transition map for natural rubber.
12
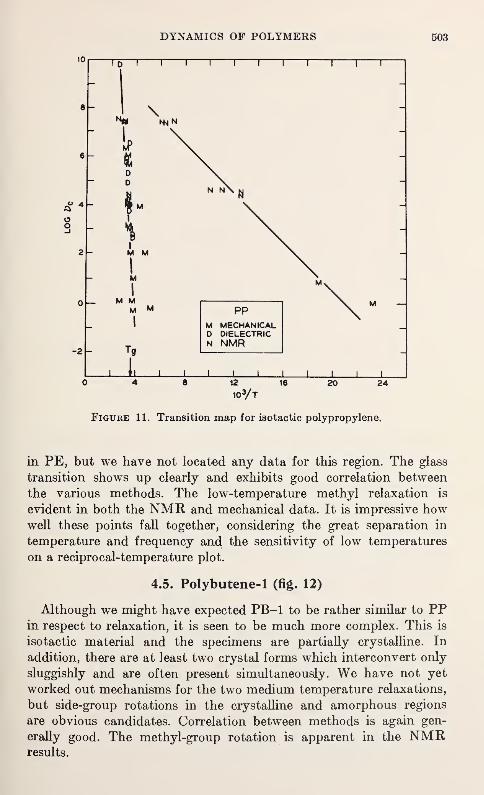
in PE, but we have not located any data for this region. The glass
transition shows up clearly and exhibits good correlation between
the various methods. The low-temperature methyl relaxation is
evident in both the NMR and mechanical data. It is impressive howwell these points fall together, considering the great separation in
temperature and frequency and the sensitivity of low temperatures
on a reciprocal-temperature plot.
4.5. Polybutene-1 (fig. 12)
Although we might have expected PB-1 to be rather similar to PPin respect to relaxation, it is seen to be much more complex. This is
isotactic material and the specimens are partially crystalline. In
addition, there are at least two crystal forms which interconvert only
sluggishly and are often present simultaneously. We have not yet
worked out mechanisms for the two medium temperature relaxations,
but side-group rotations in the crystalline and amorphous regions
are obvious candidates. Correlation between methods is again gen-
erally good. The methyl-group rotation is apparent in the NMRresults.
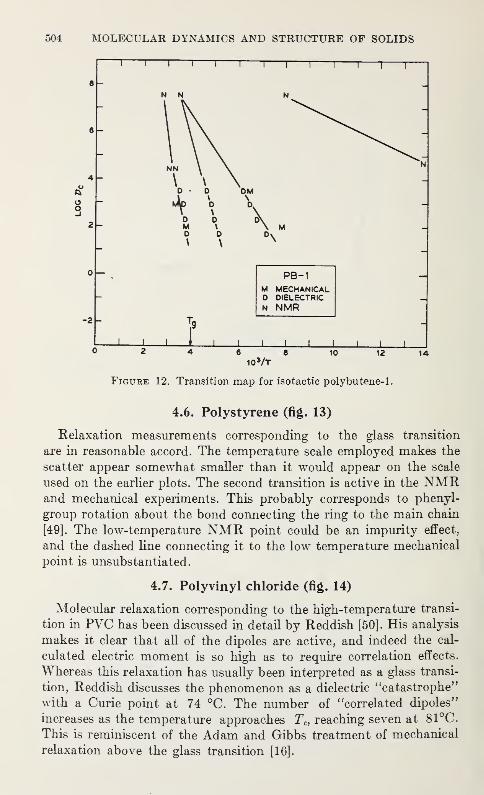
504 MOLECULAR DYNAMICS AND STRUCTURE OF SOLIDS
"I 1 1
-2
i r i i
1 1 1 r
PB-1M MECHANICALD DIELECTRICN NMR
6 8ioVt
10 12 14
Figure 12. Transition map for isotactic polybutene-1.
4.6. Polystyrene (fig. 13)
Relaxation measurements corresponding to the glass transition
are in reasonable accord. The temperature scale employed makes the
scatter appear somewhat smaller than it would appear on the scale
used on the earlier plots. The second transition is active in the NMRand mechanical experiments. This probably corresponds to phenyl-
group rotation about the bond connecting the ring to the main chain
[49]. The low-temperature NMR point could be an impurity effect,
and the dashed line connecting it to the low temperature mechanical
point is unsubstantiated.
4.7. Polyvinyl chloride (fig. 14)
Molecular relaxation corresponding to the high-temperature transi-
tion in PVC has been discussed in detail by Reddish [50]. His analysis
makes it clear that all of the dipoles are active, and indeed the cal-
culated electric moment is so high as to require correlation effects.
Whereas this relaxation has usually been interpreted as a glass transi-
tion, Reddish discusses the phenomenon as a dielectric "catastrophe"
with a Curie point at 74 °C. The number of "correlated dipoles"
increases as the temperature approaches Tc ,reaching seven at 81°C.
This is reminiscent of the Adam and Gibbs treatment of mechanical
relaxation above the glass transition [16].
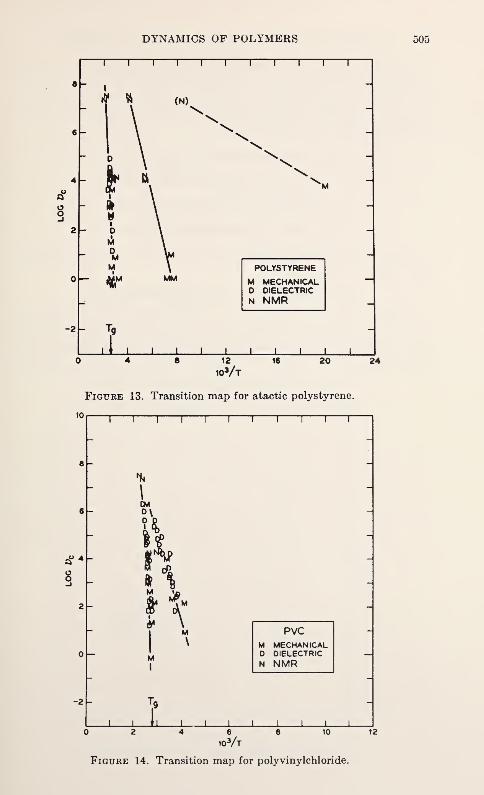
DYNAMICS OF POLYMERS 505
-2 -
I i i i i i i i i i r
hl
ft
i
D
M0MMMM
(N)
POLYSTYRENE
M MECHANICALD DIELECTRICN NMR
Li I I I I I Ii i i i
12
ioVt20 24
Figure 13. Transition map for atactic polystyrene.
101—i—i—n1—i—i—i
1—i—i—
r
-2
2 -
0 -
CM
U
M «A
i i 1 1 i i i
PVCM MECHANICALD DIELECTRIC
N NMR
J I I L6
ioVt10 t2
Figure 14. Transition map for polyvinylchloride.
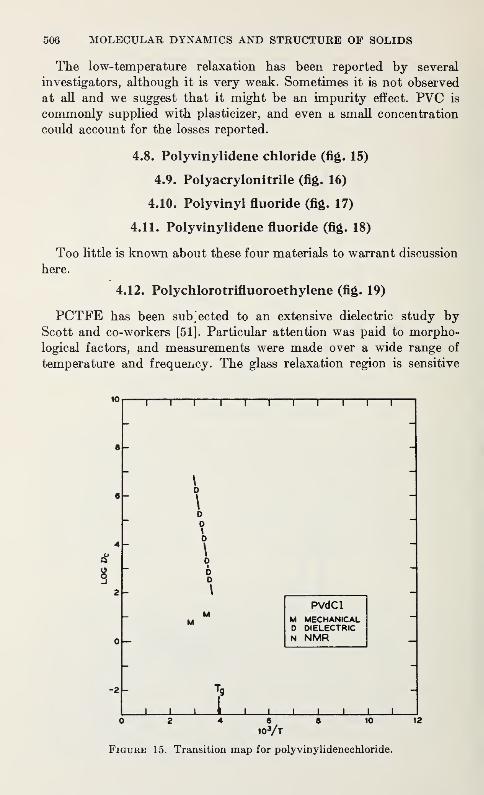
506 MOLECULAR DYNAMICS AND STRUCTURE OF SOLIDS
The low-temperature relaxation has been reported by several
investigators, although it is very weak. Sometimes it is not observed
at all and we suggest that it might be an impurity effect. PVC is
commonly supplied with plasticizer, and even a small concentration
could account for the losses reported.
4.8. Polyvinylidene chloride (fig. 15)
4.9. Polyacrylonitrile (fig. 16)
4.10. Polyvinyl fluoride (fig. 17)
4.11. Polyvinylidene fluoride (fig. 18)
Too little is known about these four materials to warrant discussion
here.
4.12. Polychlorotrifluoroethylene (fig. 19)
PCTFE has been subjected to an extensive dielectric study byScott and co-workers [51]. Particular attention was paid to morpho-
logical factors, and measurements were made over a wide range of
temperature and frequency. The glass relaxation region is sensitive
Figure 15. Transition map for polyvinylidenechloride.
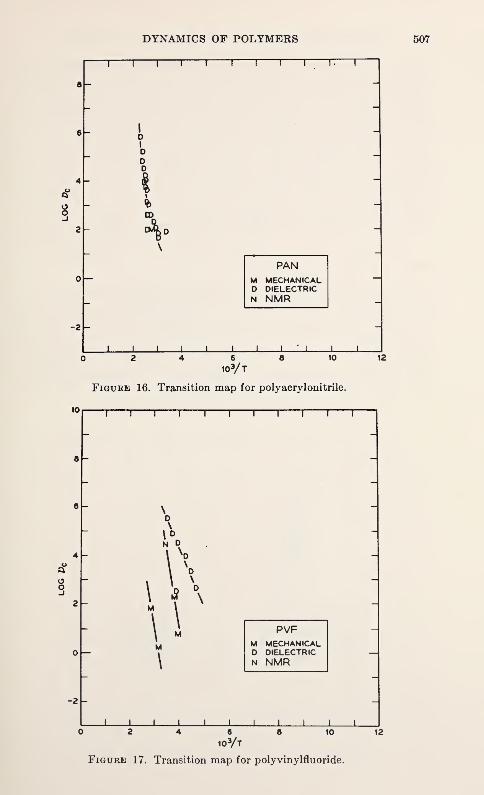
DYNAMICS OF POLYMERS 507
-2
i 1 1 1 r t 1 r—
r
0 —PAN
M MECHANICAL0 DIELECTRICN NMR
ioVtto
10
Figure 16. Transition map for polyacrylonitrile.
—I
—
_ 1 T i r
N P
2 -
0 —
> f
UM
\
\v°
PVFM MECHANICAL0 DIELECTRICN NMR
I I I I J I I II I
6
103/T10 12
Figure 17. Transition map for polyvinylfluoride.
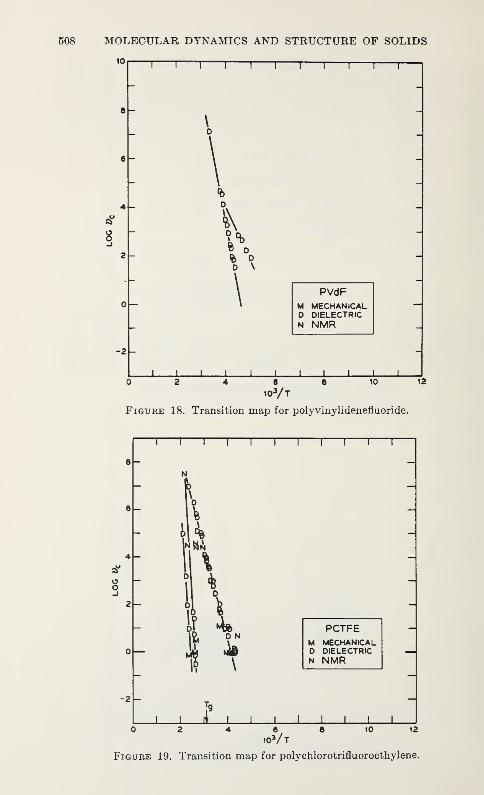
MOLECULAR DYNAMICS AND STRUCTURE OF SOLIDS
10i r i—
r
8 -
i 1 1 r
PVdFM MECHANICALD DIELECTRICN NMR
0 2 4 6 8 10
103/T
Figure 18. Transition map for polyvinylidenefluoride.
12
i I i I I I I i i i r
8 -
6 -
-2
2 -
"HA
ft3*
I? \
PCTFEM MECHANICALD DIELECTRICN NMR
J i ii i i i I I i i l120 2 4 6 8 10
103/T
Figure 19. Transition map for polychlorotrifluoroethylene
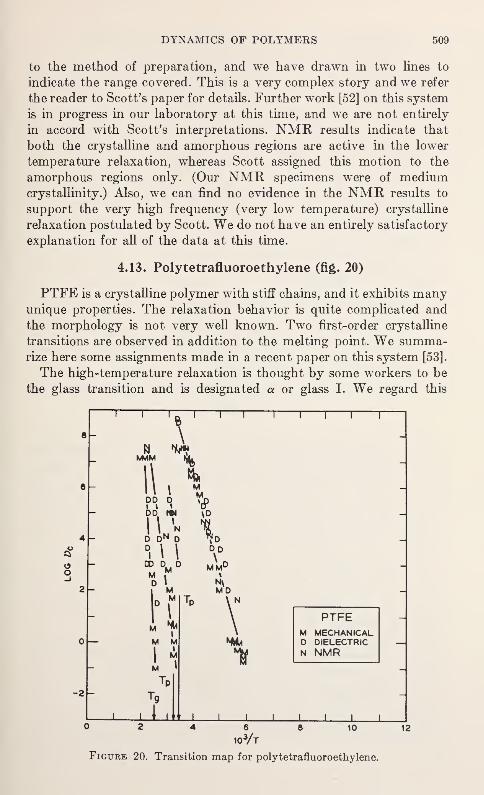
DYNAMICS OF POLYMERS 509
to the method of preparation, and we have drawn in two lines to
indicate the range covered. This is a very complex story and we refer
the reader to Scott's paper for details. Further work [52] on this system
is in progress in our laboratory at this time, and we are not entirely
in accord with Scott's interpretations. NMR results indicate that
both the crystalline and amorphous regions are active in the lower
temperature relaxation, whereas Scott assigned this motion to the
amorphous regions only. (Our NMR specimens were of mediumcrystallinity.) Also, we can find no evidence in the NMR results to
support the very high frequency (very low temperature) crystalline
relaxation postulated by Scott. We do not have an entirely satisfactory
explanation for all of the data at this time.
4.13. Polytetrafluoroethylene (fig. 20)
PTFE is a crystalline polymer with stiff chains, and it exhibits manyunique properties. The relaxation behavior is quite complicated and
the morphology is not very well known. Two first-order crystalline
transitions are observed in addition to the melting point. We summa-rize here some assignments made in a recent paper on this system [53].
The high-temperature relaxation is thought by some workers to be
the glass transition and is designated a or glass I. We regard this
1 1 1 1 1
1
PTFEM MECHANICALD DIELECTRICN NMR
J I II I I
0 2 4 6 8 10 12
103A
Figure 20. Transition map for polytetrafluoroethylene.
510 MOLECULAR DYNAMICS AND STRUCTURE OF SOLIDS
assignment as tentative and insecure. The dielectric data could
better be interpreted in terms of a crystalline relaxation. No corre-
sponding NMR relaxation is observed (see below).
The second transition, labelled 0, is a crystalline phenomenon. Weinterpret this as a region of extensive longitudinal freedom which
extends down to the first-order transition just above room temperature.
Clarke [54] has x-ray evidence that may support this suggestion.
The molecules within the crystalline regions obtain rotational free-
dom abruptly just below room temperature. Here again the x-ray
and NMR evidence lead to the same conclusion [55, 56]. The rate of
relaxation just above the transition corresponds to u c^10 8 Hz. Cor-
responding relaxations are observed in the intermediate phase.
The low-temperature transition, designated y or glass II, is an
amorphous phenomenon. The chains gradually attain rotational
mobility arid longitudinal translational mobility in more or less the
same temperature range, as indicated by the continuous increase of
the amorphous T2a . It is of interest that T2a becomes independent of
temperature above about 180 °C. This is just the region where T2a
would be expected to increase sharply if the a transition corresponds
to a glass transition in the usual sense.
4.14. Polyhexafluoropropylene-tetrafluoroethylene Copolymer(fig. 21)
This material can be regarded as a somewhat branched PTFE.The branches consist of CF3 groups and molecular models reveal that
they fit compactly into the fluorocarbon chain [57]. One of the most
dramatic effects of the branches is the lowering of the first-order
transition that occurs near 20 °C in linear PTFE. A copolymer con-
taining about 10 percent hexafluoropropylene shows this transition
at about —50 °C and the transition seems to have lost some of its
sharpness. This specimen is 30-40 percent crystalline.
The high-temperature relaxation behaves as a glass transition.
NMR results indicate two distinct T2 s, and T2a increases rapidly in
this region [52]. Quite general motions are visualized. Note that this
is entirely different than our interpretation of the corresponding (a)
relaxation in PTFE.Just below this high-temperature relaxation there is a change in the
NMR T2 which we take to signal the onset of longitudinal translations
in both the crystalline and amorphous regions. The NMR point with
parentheses is taken from a small discontinuity in the Tlp curve and
is probably the remnant feature of the first-order transition that
heralds the 0 relaxation in PTFE. Its temperature, 15 °C, is reason-
able in this view. Its position on a frequency scale :s not significant
[52].
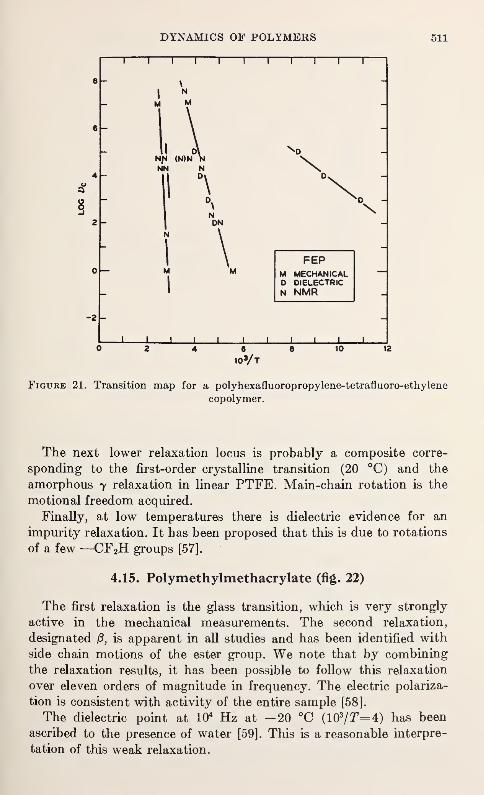
DYNAMICS OF POLYMERS
i 1 1—i—i
1 1—i—i
1 r
0 —
-2 -
511
\
I
N
M M
Nfi (N)N
NN NDi
NON
i \ FEPM MECHANICALD DIELECTRICN NMR
J I I I L
ioVt10 12
Figure 21. Transition map for a polyhexafluoropropylene-tetrafluoro-ethylene
copolymer.
The next lower relaxation locus is probably a composite corre-
sponding to the first-order crystalline transition (20 °C) and the
amorphous y relaxation in linear PTFE. Main-chain rotation is the
motional freedom acquired.
Finally, at low temperatures there is dielectric evidence for an
impurity relaxation. It has been proposed that this is due to rotations
of a few —CF2H groups [57].
4.15. Polymethylmethacrylate (fig. 22)
The first relaxation is the glass transition, which is very strongly
active in the mechanical measurements. The second relaxation,
designated 0, is apparent in all studies and has been identified with
side chain motions of the ester group. We note that by combining
the relaxation results, it has been possible to follow this relaxation
over eleven orders of magnitude in frequency. The electric polariza-
tion is consistent with activity of the entire sample [58].
The dielectric point at 104 Hz at —20 °C (103/T=4) has been
ascribed to the presence of water [59]. This is a reasonable interpre-
tation of this weak relaxation.
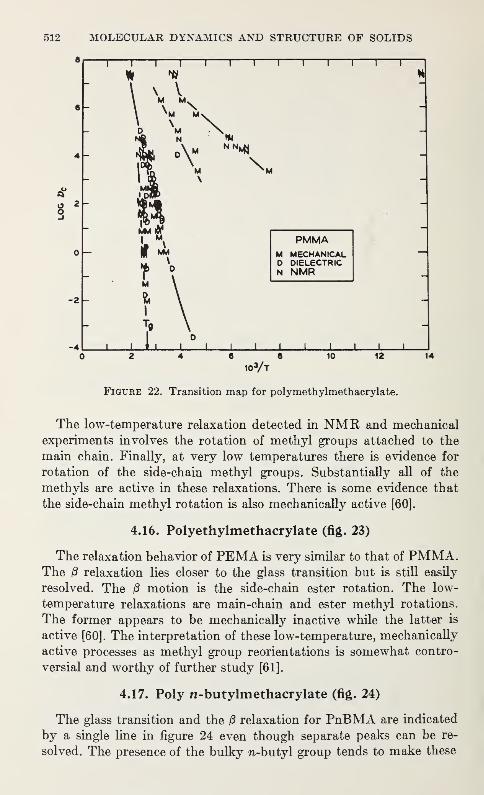
512 MOLECULAR DYNAMICS AND STRUCTURE OF SOLIDS
i1 1 1 1 1 1 r
82
-2
-4
PMMAM MECHANICALD DIELECTRICN NMR
J I I L6 6
ioVt10 12
Figure 22. Transition map for polymethylmethacrylate.
The low-temperature relaxation detected in NMR and mechanical
experiments involves the rotation of methyl groups attached to the
main chain. Finally, at very low temperatures there is evidence for
rotation of the side-chain methyl groups. Substantially all of the
methyls are active in these relaxations. There is some evidence that
the side-chain methyl rotation is also mechanically active [60].
4.16. Polyethylmethacrylate (fig. 23)
The relaxation behavior of PEMA is very similar to that of PMMA.The |8 relaxation lies closer to the glass transition but is still easily
resolved. The 13 motion is the side-chain ester rotation. The low-
temperature relaxations are main-chain and ester methyl rotations.
The former appears to be mechanically inactive while the latter is
active [60]. The interpretation of these low-temperature, mechanically
active processes as methyl group reorientations is somewhat contro-
versial and worthy of further study [61].
4.17. Poly n-butylmethacrylate (fig. 24)
The glass transition and the /3 relaxation for PnBMA are indicated
by a single line in figure 24 even though separate peaks can be re-
solved. The presence of the bulky n-butyl group tends to make these
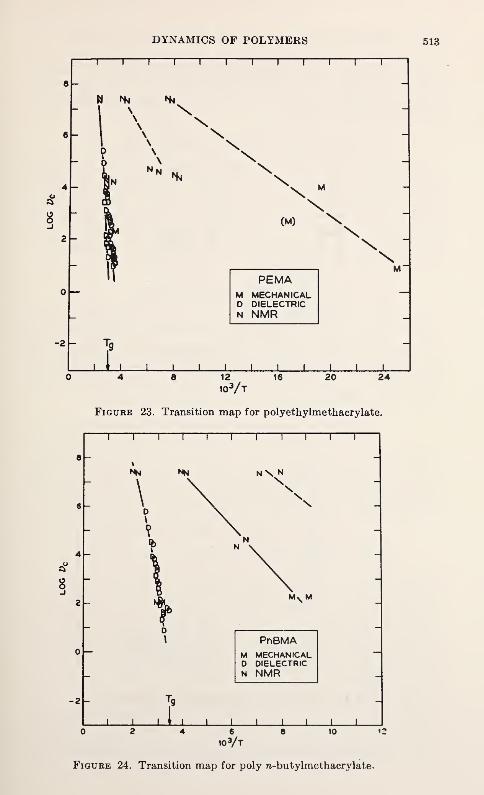
DYNAMICS OF POLYMERS 513
i i i i i i i i i i i r
N Hi Hi
I \ \N
INHi
(M) \
PEMAM MECHANICALD DIELECTRICN NMR
-2
J12 16
ioVt20 24
-2 -
Figure 23. Transition map for polyethylmethacrylate.
I I I I I1 i i i r
nn nn
\
2 -
0 —
>PnBMA
M MECHANICALD DIELECTRICN NMR
J I i i i J I I I l L6
io3/t10
Figure 24. Transition map for poly w-butylmethacrylate.
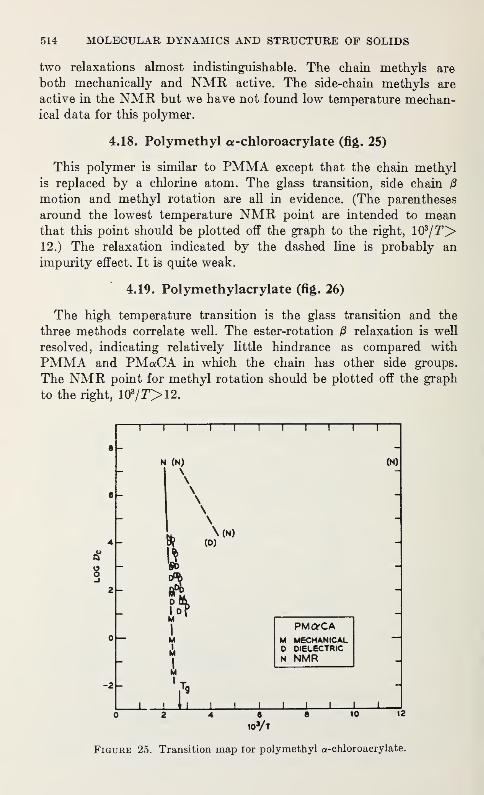
514 MOLECULAR DYNAMICS AND STRUCTURE OF SOLIDS
two relaxations almost indistinguishable. The chain methyls are
both mechanically and NMR active. The side-chain methyls are
active in the NMR but we have not found low temperature mechan-ical data for this polymer.
4.18. Polymethyl a-chloroacrylate (fig. 25)
This polymer is similar to PMMA except that the chain methyl
is replaced by a chlorine atom. The glass transition, side chain &
motion and methyl rotation are all in evidence. (The parentheses
around the lowest temperature NMR point are intended to meanthat this point should be plotted off the graph to the right, 103/T>12.) The relaxation indicated by the dashed line is probably an
impurity effect. It is quite weak.
4.19. Polymethylacrylate (fig. 26)
The high temperature transition is the glass transition and the
three methods correlate well. The ester-rotation 0 relaxation is well
resolved, indicating relatively little hindrance as compared with
PMMA and PMaCA in which the chain has other side groups.
The NMR point for methyl rotation should be plotted off the graph
to the right, 103/r>12.
6 -
4 -
-2 -
i—i—i—i—i
1—i—r—i—i—
r
N (N)
\(N)
MI
M
M
iI
\\(N)
(D)
J I
PMorCAM MECHANICALD DIELECTRICN NMR
I I I I I
6
103A10 12
Figure 25. Transition map tor polymethyl a-chloroacrylate.
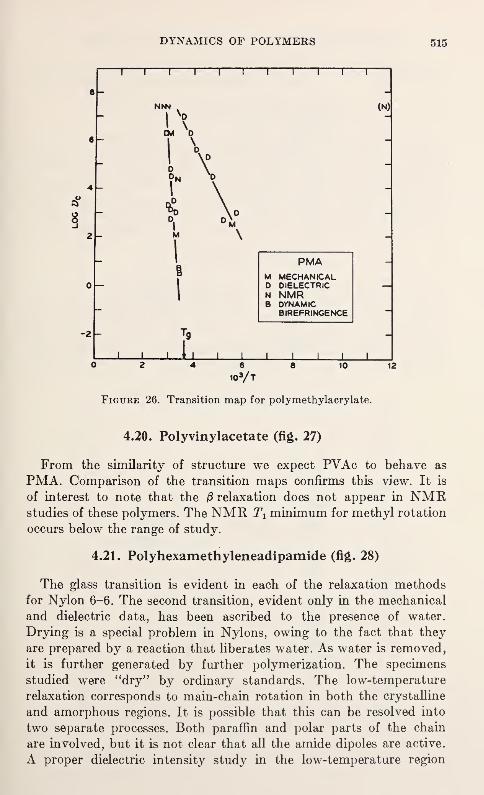
DYNAMICS OF POLYMERS 515
Figure 26. Transition map for polymethylacrylate.
4.20. Polyvinylacetate (fig. 27)
From the similarity of structure we expect PVAc to behave as
PMA. Comparison of the transition maps confirms this view. It is
of interest to note that the relaxation does not appear in NMRstudies of these polymers. The NMR Tx minimum for methyl rotation
occurs below the range of study.
4.21. Polyhexamethyleneadipamide (fig. 28)
The glass transition is evident in each of the relaxation methodsfor Nylon 6-6. The second transition, evident only in the mechanical
and dielectric data, has been ascribed to the presence of water.
Drying is a special problem in Nylons, owing to the fact that they
are prepared by a reaction that liberates water. As water is removed,
it is further generated by further polymerization. The specimens
studied were "dry" by ordinary standards. The low-temperature
relaxation corresponds to main-chain rotation in both the crystalline
and amorphous regions. It is possible that this can be resolved into
two separate processes. Both paraffin and polar parts of the chain
are involved, but it is not clear that all the amide dipoles are active.
A proper dielectric intensity study in the low-temperature region
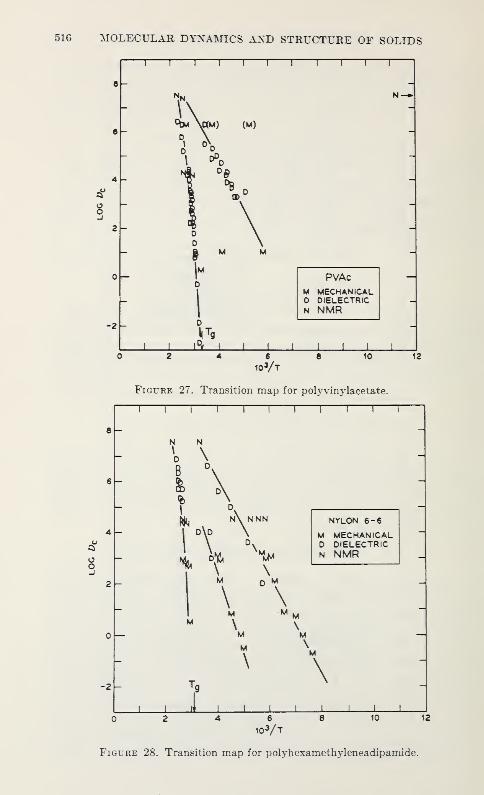
516 MOLECULAR DYNAMICS AND STRUCTURE OF SOLIDS
—11 1 1 1 1 1 1 1 1
1
2 -
-2 -
PVAcM MECHANICALD DIELECTRICN NMR
1 11 1
1
6 6 10
103/T12
Figure 27. Transition map for polyvinylacetate.
-2
0 —
T I i 1 1 r
N N
B0
\n\ n
M
NN
'Mm
NYLON 6-6
M MECHANICALD DIELECTRICN NMR
M
VI
\J I u I I I 1
6
io3/t10 12
Figure 28. Transition map for polyhexamethyleneadipamide.
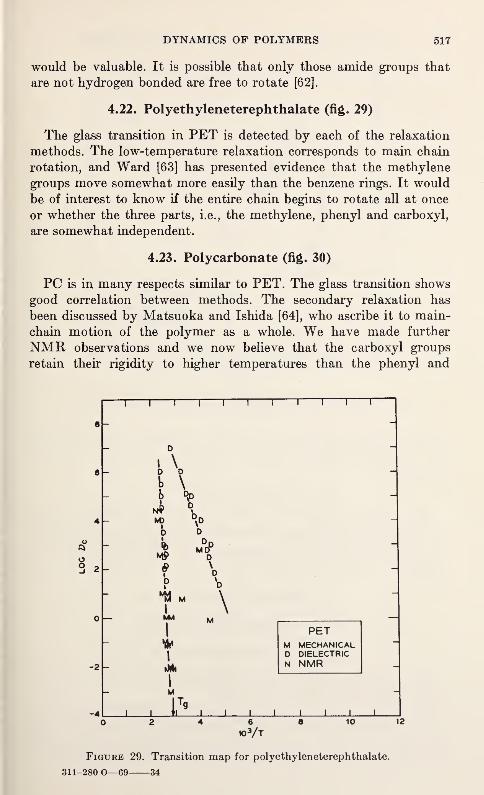
DYNAMICS OF POLYMERS 517
would be valuable. It is possible that only those amide groups that
are not hydrogen bonded are free to rotate [62].
4.22. Polyethyleneterephthalate (fig. 29)
The glass transition in PET is detected by each of the relaxation
methods. The low-temperature relaxation corresponds to main chain
rotation, and Ward [63] has presented evidence that the methylene
groups move somewhat more easily than the benzene rings. It would
be of interest to know if the entire chain begins to rotate all at once
or whether the three parts, i.e., the methylene, phenyl and carboxyl,
are somewhat independent.
4.23. Polycarbonate (fig. 30)
PC is in many respects similar to PET. The glass transition shows
good correlation between methods. The secondary relaxation has
been discussed by Matsuoka and Ishida [64], who ascribe it to main-
chain motion of the polymer as a whole. We have made further
NMR observations and we now believe that the carboxyl groups
retain their rigidity to higher temperatures than the phenyl and
Figure 29. Transition map for polyethyleneterephthalate.
311-280 O—69 34
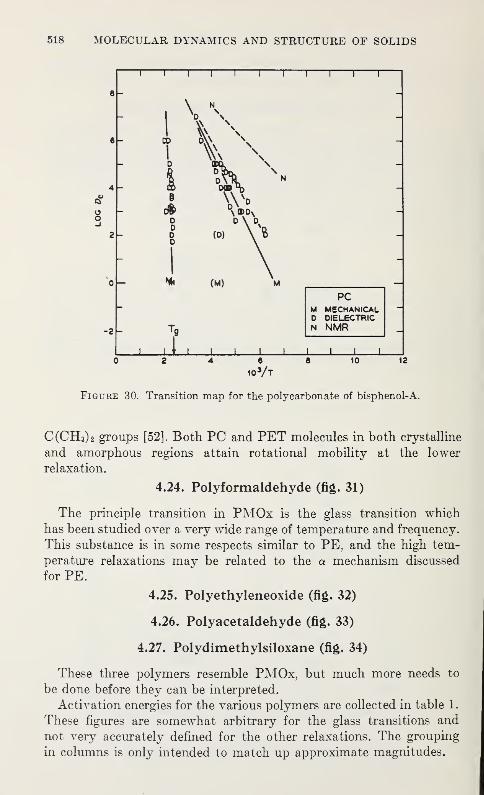
518 MOLECULAR DYNAMICS AND STRUCTURE OF SOLIDS
-2
i 1 1 1 1 1 1 1 1 1 r
0 —PC
M MECHANICALD DIELECTRICN NMR
J I i l l I I I I I I L2 4 6 0 10
10 3A12
Figure 30. Transition map for the polycarbonate of bisphenol-A.
C(CH 3) 2 groups [52]. Both PC and PET molecules in both crystalline
and amorphous regions attain rotational mobility at the lower
relaxation.
4.24. Polyformaldehyde (fig. 31)
The principle transition in PMOx is the glass transition which
has been studied over a very wide range of temperature and frequency.
This substance is in some respects similar to PE, and the high tem-
perature relaxations may be related to the a mechanism discussed
for PE.
4.25. Polyethyleneoxide (fig. 32)
4.26. Polyacetaldehyde (fig. 33)
4.27. Polydimethylsiloxane (fig. 34)
These three polymers resemble PMOx, but much more needs to
be done before they can be interpreted.
Activation energies for the various polymers are collected in table 1.
These figures are somewhat arbitrary for the glass transitions and
not very accurately defined for the other relaxations. The grouping
in columns is only intended to match up approximate magnitudes.
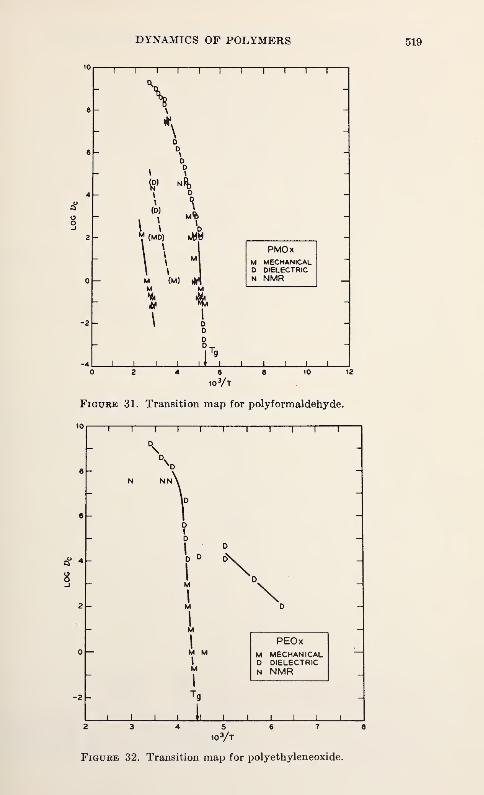
DYNAMICS OF POLYMERS 519
i—i
1—i
r i i i i r
V\
\
(D)
|\
M (MO)
I
\
DD\
0 —
-2
, \ 0
J(MO) M^H
\"JM (M) MM
MMi
PMOxM MECHANICALD DIELECTRICN NMR
"Ifc
I
J L J L
ioVt
Figure 31. Transition map for polyformaldehyde.
10
£ 4
8
-2
! I I I I I I I I I I
PEOxM MECHANICALD DIELECTRICN NMR
J I I I fcl I I I I I L5
103/T
Figure 32. Transition map for polyethyleneoxide.
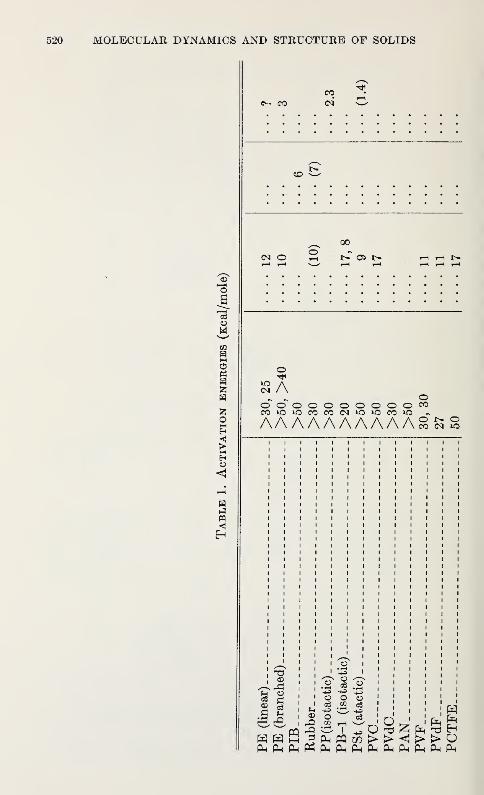
MOLECULAR DYNAMICS AND STRUCTURE OF SOLIDS
©
©
mSs
H
fcOEH
iS
©<1
H
pq
CO
CO
(NO 200
N 05 N H H N
OA
oooooooooo^oAAAAAAAAAAmnr>- o
^5©
| §
.2"-+3
3" §© ocs 22+3oGO I
PQPhPh Ph
> >Ph Ph Ph
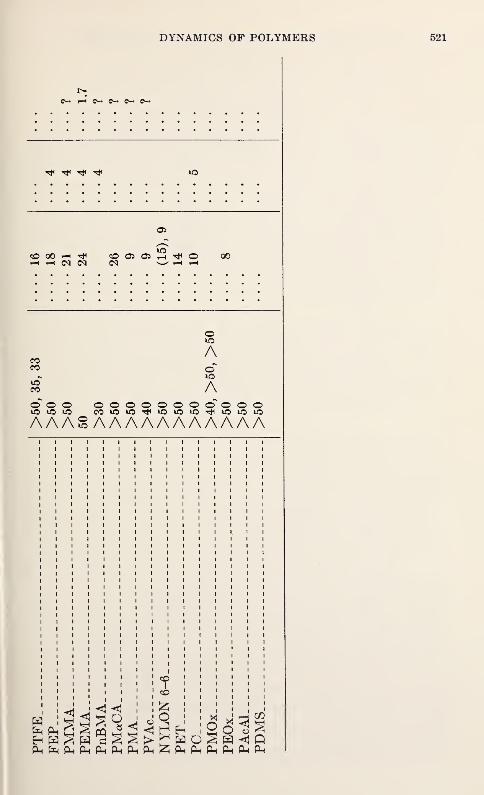
DYNAMICS OF POLYMERS 521
O— rH O— O—
^ Tf ^
CO 00 H ^H H N IMCO CT> O 00
CO
oAoA
ooo oooooooooooAAASAAAAAAAAAAA
PLH SH « SPh fs4 Ph fin Ph Ph Ph
I
CO
^ d h 1 2 o o sPh^PhPlhPhPhPhP-i
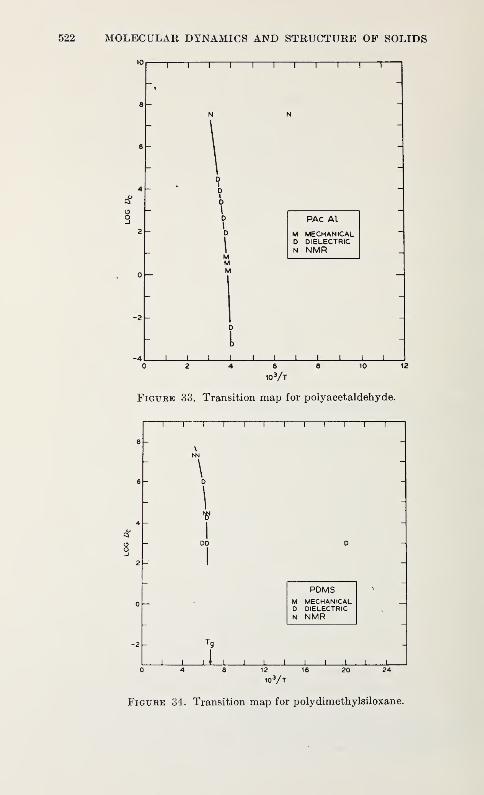
522 MOLECULAR DYNAMICS AND STRUCTURE OF SOLIDS
10, 1 .
—
i r i 1 1 r
PAC Al
M MECHANICALD DIELECTRICN NMR
41 I I I L0 2 4 6 8 10 12
io3/t
Figure 33. Transition map for polyacetaldehyde.
-i—i—i—i—i—i—i—i—i—i—i—
r
PDMSM MECHANICALD DIELECTRICN NMR
J I Li I I I I I I I I L12 16
io3A
20 24
Figure 34. Transition map for polydimethylsiloxane.
DYNAMICS OF POLYMERS 523
5. Conclusions
Although the problems associated with understanding relaxation
behavior in solid polymers are difficult, progress has been made.
Correlations between the various methods are good. It is remarkable
just how far our discussion of relaxation in solid polymers can be
carried with almost no reference to morphological matters. Also, it
is remarkable that the correlations work out as well as they do, con-
sidering that materials are being compared that have appreciably
different origins .and histories. It appears that relaxation frequencies
are not very sensitive to morphological detail. However, it seems
likely that for further experimental characterization of the intensities,
it will be necessary to pay close attention to morphology and other
structural features.
Assignments of molecular mechanisms for a polymer can usually be
made intuitively and checked by comparisons with related polymers
and estimates of the magnitudes of relaxation parameters. These
assignments are entirely reasonable for many polymers, and we have
confidence in most that we have discussed in this paper. This intuitive
procedure is less formal, but basically similar to the assignment of
resonance spectra, i.e., optical, infrared, etc.
Once a molecular mechanism has been distinguished, the relaxation
can usually be described by a very limited number of parameters.
Consequently only a limited number of theoretical parameters can be
extracted and correspondingly simple models should be chosen. For
example, we regard it as unlikely that more than a two-position cal-
culation will be necessary for the description of polymer data. Thetheories of Bueche and Adam and Gibbs should be useful in under-
standing glass-transition phenomena. However, it is not obvious that
the site model cannot be made to cover this situation as well.
It seems to us that the abundance of relaxation work carried out over
the last decade has served its purpose. Future work should follow a
different pattern. There is sufficient experimental and theoretical
background available that we should begin to emphasize more practi-
cal aspects. Oriented and composite materials are obvious candidates.
The relevance of basic relaxation studies to engineering matters mustbe examined and developed.
Finally, the basic work of the future should proceed as a close
collaboration between theorists and experimentalists. This is a trend
that is already beginning to take shape. The theoreticians are not
burdened by an investment in a piece of equipment and thus are morelikely to be willing to consider a wide range of experimental sources.
524 MOLECULAR DYNAMICS AND STRUCTURE OF SOLIDS
The experimentalists must learn to take a broader view. Practitioners
of dielectric relaxation, mechanical relaxation and NMR attend the
same meetings, but inter-group communication is usually condescend-
ing and lacking in depth. A general theoretical model, not restricted
to a single experiment, could provide a medium for broader under-
standing. With new relaxation tools (e.g. dynamic birefringence) be-
coming available, the need is urgent.
It is a pleasure to acknowledge a great debt to many friends and
colleagues for assistance and encouragement in the preparation of this
material. Several sections of this paper were developed in close col-
laboration with D. C. Douglass, and it would be difficult to over-
emphasize his contributions. W. P. Slichter and S. Matsuoka con-
tributed frequeDtly and generously in many ways. D. R. Falcone
provided much of the original data. W. Reddish, J. D. Hoffman,
J. G. Powles, J. Strange, Y. Ishida, T. M. Connor, K. M. Sinnott andE. S. Clark provided material in advance of publication. Professor
Powles and the University of Kent kindly provided a haven in which
some of this material was prepared. Valuable discussions were provided
by G. Willams, B. Read, N. G. McCrum, and I. M. Ward, as well as
those individuals mentioned above.
6. Discussion
H. Resing (Naval Research Laboratory): Are the relaxations in
the " Ailion-Slichter'' experiment always exponential? If they are, howdoes this fit in with the notion of a distribution of correlation times,
e.g. jump times? After all, how can two nuclei with different relaxa-
tion environments communicate their spin temperature to one another?
Is spin diffusion involved?
D. W. McCall: Dr. Resing has raised an important point. The" Slichter-Ailion" theory predicts that under certain conditions
t c=T1p . A distribution in r c may or may not be reflected in a distribu-
tion in Tlp ,e.g. non-exponential rotating frame relaxation curves. If
the distribution of rc is a sort of macroscopic distribution, e.g. arising
from a specimen made up of domains, each with a given r c ,where
r c varies from one domain to another, a distribution of TVs can
result. We believe this situation occurs in semicrystalline polymers
because distinct Tlp curves appear for the crystalline and amorphous
regions. On the other hand, if the various parts of the distribution
are coupled strongly to one another, we interpret the Slichter-Ailion
model to obtain a single exponential decay in the rotating frame and
the resulting Tlp should be approximately equal to some average r c .
DYNAMICS OF POLYMERS 525
7. References
[1] Part of the material included in this paper was presented at the PolymerResearch Group Conference, Moretonhampstead, England, April, 1964.
[2] The subject of this paper was considered by a symposium which met at the
American Chemical Society meeting at Atlantic City, September, 1965.
The papers from this symposium have been published: Transitions andRelaxations in Polymers, edited by Raymond F. Boyer, Interscience Pub-lishers, New York, 1966. This monograph is often listed as: J. PolymerSci. C14, (1966).
[3] Many of the ideas expressed throughout this paper have been drawn from or
influenced by: J. D. Hoffman, G. Williams and E. Passaglia, J. Polymer
Sci. C14, 173 (1966).
[4] J. D. Ferry, Viscoelastic Properties of Polymers, John Wiley & Sons, NewYork, 1961.
[5] S. Glasstone, K. J. Laidler and H. Eyring, Theory of Rate Processes,
McGraw-Hill Book Co., New York, 1941.
[6] H. Frohlich, Proc. Phys. Soc. (London) 54, 422 (1942).
[7] G. Williams, J. I. Lauritzen and J. D. Hoffman, private communication, to
be published.
[8] J. D. Hoffman and H. G. Pfeiffer, J. Chem. Phys. 22, 132 (1954).
[9] H. Frohlich, Theory of Dielectrics, Oxford Press, 1958, 2nd Ed., Chapter
III.
[10] A. H. White, J. Chem. Phys. 7, 58 (1939).
[11] P. Debye, Chem. Rev. 19, 171 (1936).
[12] J. I. Lauritzen, J. Chem. Phys. 28, 118 (1958).
[13] H. Eyring, D. Henderson, B. J. Stover and E. M. Eyring, Statistical Me-chanics and Dynamics, John Wiley, New York, 1964, p. 369.
[14] F. Bueche, J. Chem. Phys. 21, 1850 (1953).
[15] J. H. Gibbs and E. A. DiMarzio, J. Chem. Phys. 28, 373, 807 (1958).
[16] G. Adam and J. H. Gibbs, J. Chem. Phys. 43, 139 (1965).
[17] F. Bueche, J. Chem. Phys. 22, 603 (1954).
[18] P. E. Rouse, J. Chem. Phys. 21, 1272 (1953).
[19] B. H. Zimm, J. Chem. Phys. 24, 269 (1956).
[20] R. E. Dewames, W. F. Hall and M. C. Shen, J. Chem. Phys. 46, 2782 (1967)
.
[21] M. C. Shen and A. Eisenberg, Prog. Solid State Chem. 3, 407 (1966).
[22] E. R. Andrew and P. S. Allen, J. chim. phys. 85 (1966).
[23] D. F. R. Gilson and C. A. McDowell, Nature 183, 1183 (1959).
[24] R. J. Meakins, Trans. Faraday Soc. 51, 953 (1955).
[25] A discussion of morphology with specific reference to relaxation is given in
ref. 3.
[26] W. P. Slichter and D. W. McCall, J. Polymer Sci. 25, 230 (1957).
[27] D. W. McCall and E. W. Anderson, J. Polymer Sci. 1A, 1175 (1963).
[28] D. H. Reneker, J. Polymer Sci. 59, 539 (1962).
[29] A. H. Willbourn, Trans. Faraday Soc. 54, 717 (1958).
[30] R. F. Boyer, J. Polymer Sci. C14, 3 (1966).
[31] T. F. Schatzki, J. Polymer Sci. C14, 139 (1966).
[32] W. O. Statton and P. H. Geil, J. Appl. Polymer Sci. 3, 357 (1960).
526 MOLECULAR DYNAMICS AND STRUCTURE OF SOLIDS
[33] S. Matsuoka, discussion at the symposium mentioned in ref. 2.
[34] R. S. Moore and S. Matsuoka, J. Polymer Sci. C5, 163 (1964).
[35]_N. G. McCrum and E. L. Morris, Proc. Royal Soc. A202, 506 (1966).
[36] K. M. Sinnott, J. Polymer Sci. C14 (1966).
[37] S. Matsuoka, private communication.
[38] D. W. McCall and D. C. Douglass, Polymer 4, 433 (1963).
[39] D. W. McCall and W. P. Slichter, J. Polymer Sci. 26, 171 (1957).
[40] D. W. McCall and D. C. Douglass, Appl. Phys. Letters 7, 12 (1965).
[41] W. Reddish and I. T. Barrie, I.U.P.A.C. Symp. Wiesbaden, Kurzmitteilen
IA3, 1958.
[42] D. J. Blundell, A. Keller and T. Connor, private communication, to be
published.
[43] Y. Ishida and K. Yamafuji, Kolloid-Z. 202, 26 (1965).
[44] K. H. Illers, Rheol. Acta, 3, 194 (1964).
[45] D. C. Douglass and G. P. Jones, J. Chem. Phys. 45, 956 (1966).
[46] J. E. Anderson and W. P. Slichter, J. Phys. Chem. 69, 3099 (1965).
[47] K. Bergmann and K. Nawotki, presented at Mainz, April 1966.
[48] A. E. Woodward, personal conversation.
[49] K. H. Illers, Z. f. Elektrochem. 65, 679 (1961).
[50] W. Reddish, J. Polymer Sci. C14, 123 (1966).
[51] A. H. Scott, D. J. Scheiber, A. J. Curtis, J. I. Lauritzen, and J. D. Hoffman,
J. Res. N. B. S. 66 A, 269 (1962).
[52] D. W. McCall, D. C. Douglass and D. R. Falcone, to be published.
[53] D. W. McCall, D. C. Douglass and D. R. Falcone, J. Phys. Chem. 71,
998 (1967).
[54] E. S. Clark, unpublished studies, presented at a NASA conference, Case
Institute, April, 1967.
[55] E. S. Clark and L. T. Muus, Z. Krist 117, 119 (1962).
[56] D. Hyndman and G. F. Origlio, J. Appl. Phys. 31, 1849 (1960).
[57] R. K. Eby and F. C. Wilson, J. Appl. Phys. 33, 2951 (1962).
[58] D. W. McCall, J. Phys. Chem. 70, 949 (1966).
[59] D. J. Scheiber and D. J. Mead, J. Chem. Phys. 37, 326 (1957).
[60] K. M. Sinnott, J. Polymer Sci. 35, 273 (1959).
[61] A. E. Woodward, J. Polymer Sci. C14, 89 (1966).
[62] D. W. McCall and E. W. Anderson, J. Chem. Phys. 32, 237 (1962).
[63] I. M. Ward, Trans. Faraday Soc. 56, 648 (1960).
[64] S. Matsuoka and Y. Ishida, J. Polymer Sci. C14, 247 (1966).
[65] R. Zwanzig, Annual Reviews of Physical Chemistry, 17 (1966).
[66] Y. H. Pao, private communication.
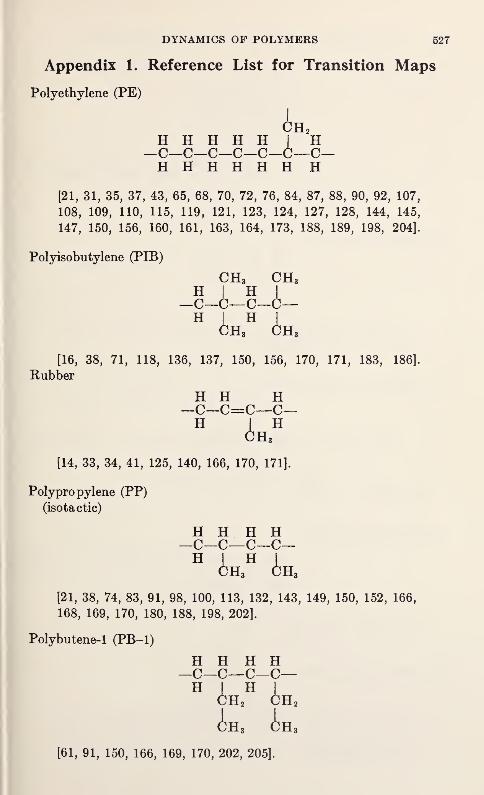
DYNAMICS OF POLYMERS 527
Appendix 1. Reference List for Transition Maps
Polyethylene (PE)
^H 2
H H H H H | H—C—C—C—C—C—C—C—H H H H H H H
[21, 31, 35, 37, 43, 65, 68, 70, 72, 76, 84, 87, 88, 90, 92, 107,
108, 109, 110, 115, 119, 121, 123, 124, 127, 128, 144, 145,
147, 150, 156, 160, 161, 163, 164, 173, 188, 189, 198, 204].
Polyisobutylene (PIB)
CH3 CH3
—c—c—c—h—H
iH3
Hd
[16, 38, 71, 118, 136, 137, 150, 156, 170, 171, 183, 186].
Rubber
H H H—C—C=C—C—H I H
CH3
[14, 33, 34, 41, 125, 140, 166, 170, 171].
Polypropylene (PP)
(isotactic)
H H H HC—C—C—
C
H^h3
HhH3
[21, 38, 74, 83, 91, 98, 100, 113, 132, 143, 149, 150, 152, 166,
168, 169, 170, 180, 188, 198, 202].
Polybutene-1 (PB-1)
H H H H—C—C—C—C—
d)H 3 d>H 3
[61, 91, 150, 166, 169, 170, 202, 205].
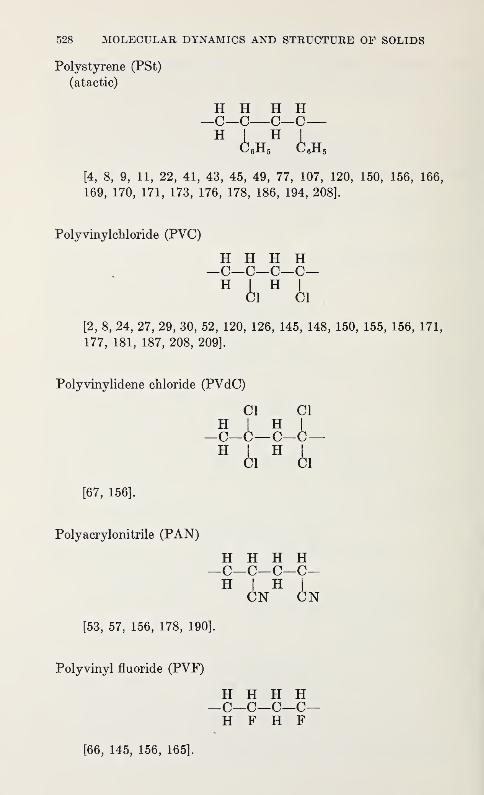
528 MOLECULAR DYNAMICS AND STRUCTURE OF SOLIDS
Polystyrene (PSt)
(atactic)
H H H HC—C—C—
C
H
[4, 8, 9, 11, 22, 41, 43, 45, 49, 77, 107, 120, 150, 156, 166,
169, 170, 171, 173, 176, 178, 186, 194, 208].
Polyvinylchloride (PVC)
H H H HC—C—C—C-
H ^ E :
1 CI
[2, 8, 24, 27, 29, 30, 52, 120, 126, 145, 148, 150, 155, 156, 171,
177, 181, 187, 208, 209].
Polyvinylidene chloride (PVdC)
CI CI
—c—i—c—i—H
A,H
A,
[67, 156].
Polyacrylonitrile (PAN)
H H H H—C—C—C—C—H I H I
CN CN
[53, 57, 156, 178, 190].
Polyvinyl fluoride (PVF)
H H H H—C—C—C—C—H F H F
[66, 145, 156, 165].
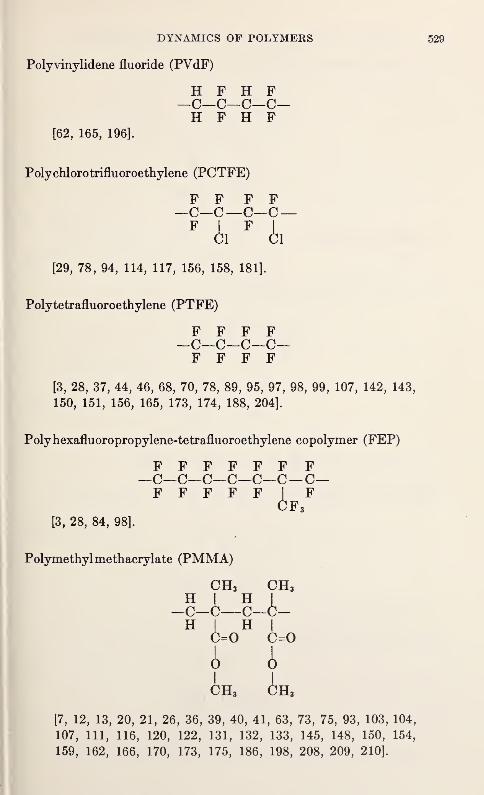
DYNAMICS OF POLYMERS
Polyvinylidene fluoride (PVdF)
H F H F—C—C—C—C—H F H F
[62, 165, 196].
Polychlorotrifluoroethylene (PCTFE)
F F F F—C—C—C—C—r
AiF
ii
[29, 78, 94, 114, 117, 156, 158, 181].
Polytetrafluoroethylene (PTFE)
F F F F—C—C—C—C—F F F F
[3, 28, 37, 44, 46, 68, 70, 78, 89, 95, 97, 98, 99, 107, 142, 143,
150, 151, 156, 165, 173, 174, 188, 204].
Polyhexafluoropropylene-tetrafluoroethylene copolymer (FEP)
F F F F F F F—C—C—C—C—C—C—C—F F F F F I F
CF 3
[3, 28, 84, 98].
Polymethylmethacrylate (PMMA)
CH3 CH3
—c—c—c—i—
0 A1 I
CH 3 CH 3
[7, 12, 13, 20, 21, 26, 36, 39, 40, 41, 63, 73, 75, 93, 103, 104,
107, 111, 116, 120, 122, 131, 132, 133, 145, 148, 150, 154,
159, 162, 166, 170, 173, 175, 186, 198, 208, 209, 210].
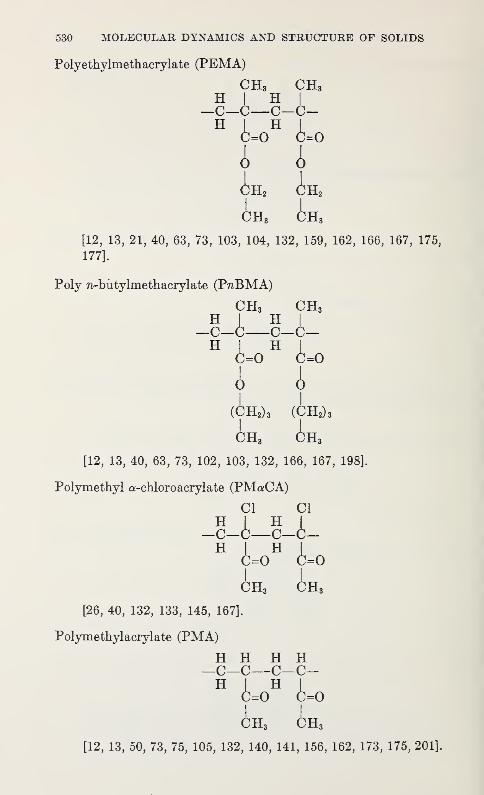
530 MOLECULAR DYNAMICS AND STRUCTURE OF SOLIDS
Polyethylmethacrylate (PEMA)
CH3 CH 3
—c—c—c—c-
i i
(vH2 CH2
[12, 13, 21, 40, 63, 73, 103, 104, 132, 159, 162, 166, 167, 175,
177].
Poly n-biitylmethacrylate (PnBMA)
CH3 CH3
—C—h C—C—
A A
(CH2) 3 (CH2)3
[12, 13, 40, 63, 73, 102, 103, 132, 166, 167, 198].
Polymethyl a-chloroacrylate (PMaCA)
CI CI
—c—c—c—i-
CH3 (^H3
[26, 40, 132, 133, 145, 167].
Polymethylacrylate (PMA)
H H H H—C—C—C—C-H
i=oH
i=o
(^H3 (^H 3
[12, 13, 50, 73, 75, 105, 132, 140, 141, 156, 162, 173, 175, 201].
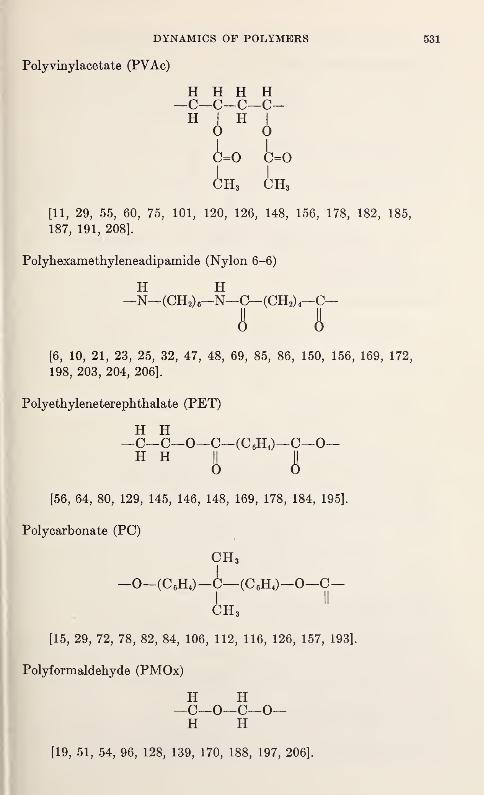
DYNAMICS OF POLYMERS
Polyvinylacetate (PVAc)
H H HC—C—
C
H I H
HC-
[11, 29, 55, 60, 75, 101, 120, 126, 148, 156, 178, 182, 185,
187, 191, 208].
Polyhexamethyleneadipamide (Nylon 6-6)
[6, 10, 21, 23, 25, 32, 47, 48, 69, 85, 86, 150, 156, 169, 172,
198, 203, 204, 206].
Polyethyleneterephthalate (PET)
H H—C—C—O—C—(C 6H4)—C—O—H H
& A
[56, 64, 80, 129, 145, 146, 148, 169, 178, 184, 195].
Polycarbonate (PC)
[15, 29, 72, 78, 82, 84, 106, 112, 116, 126, 157, 193].
Polyformaldehyde (PMOx)
H H—N—(CH2) 6—N—C—(CH2) 4—C—
-0-(C 6H4)-<
H H—C—O—C—O—H H
[19, 51, 54, 96, 128, 139, 170, 188, 197, 206].
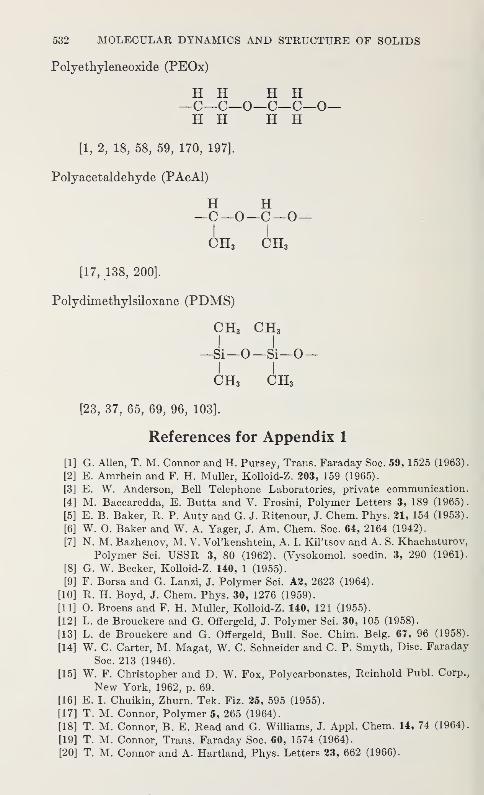
532 MOLECULAR DYNAMICS AND STRUCTURE OF SOLIDS
Polyethyleneoxide (PEOx)
H H H H—C—C—O—C—C—O—H H H H
[1, 2, 18, 58, 59, 170, 197].
Polyacetaldehyde (PAcAl)
H H—c—o—c—o
—
I I
CH 3 CH3
[17, 138, 200].
Polydimethylsiloxane (PDMS)
CH3 CH 3
—Si—O—Si—O—
(|}H3 CH3
[23, 37, 65, 69, 96, 103].
References for Appendix 1
[1] G. AUen, T. M. Connor and H. Pursey, Trans. Faraday Soc. 59, 1525 (1963).
[2] E. Amrhein and F. H. Muller, Kolloid-Z. 203, 159 (1965).
[3] E. W. Anderson, Bell Telephone Laboratories, private communication.
[4] M. Baccaredda, E. Butta and V. Frosini, Polymer Letters 3, 189 (1965)
.
[5] E. B. Baker, R. P. Auty and G. J. Ritenour, J. Chem. Phys. 21, 154 (1953).
[6] W. O. Baker and W. A. Yager, J. Am. Chem. Soc. 64, 2164 (1942).
[7] N. M. Bazhenov, M. V. Vol'kenshtein, A. I. Kil'tsov and A. S. Khachaturov,
Polymer Sci. USSR 3, 80 (1962). (Vysokomol. soedin. 3, 290 (1961).
[8] G. W. Becker, Kolloid-Z. 140, 1 (1955).
[9] F. Borsa and G. Lanzi, J. Polymer Sci. A2, 2623 (1964).
[10] R. H. Boyd, J. Chem. Phys. 30, 1276 (1959).
[11] O. Broens and F. H. Muller, Kolloid-Z. 140, 121 (1955).
[12] L. de Brouckere and G. Offergeld, J. Polymer Sci. 30, 105 (1958).
[13] L. de Brouckere and G. Offergeld, Bull. Soc. Chim. Belg. 67, 96 (1958).
[14] W. C. Carter, M. Magat, W. C. Schneider and C. P. Smyth, Disc. Faraday
Soc. 213 (1946).
[15] W. F. Christopher and D. W. Fox, Polycarbonates, Reinhold Publ. Corp.,
New York, 1962, p. 69.
[16] E. I. Chuikin, Zhurn. Tek. Fiz. 25, 595 (1955).
[17] T. M. Connor, Polymer 5, 265 (1964).
[18] T. M. Connor, B. E. Read and G. Williams, J. Appl. Chem. 14, 74 (1964).
[19] T. M. Connor, Trans. Faraday Soc. 60, 1574 (1964).
[20] T. M. Connor and A. Hartland, Phys. Letters 23, 662 (1966).
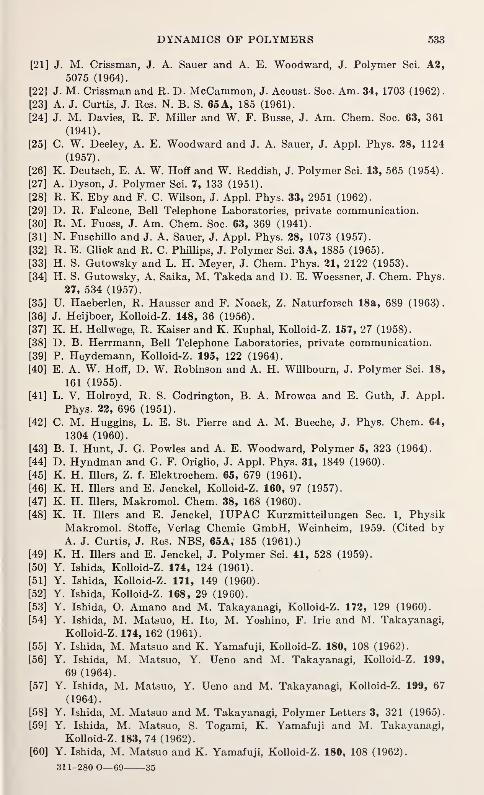
DYNAMICS OF POLYMERS 533
[21] J. M. Crissman, J. A. Sauer and A. E. Woodward, J. Polymer Sci. A3,
5075 (1964).
[22] J. M. Crissman and R. D. McCammon, J. Acoust. Soc. Am. 34, 1703 (1962).
[23] A. J. Curtis, J. Res. N. B. S. 65 A, 185 (1961).
[24] J. M. Davies, R. F. Miller and W. F. Busse, J. Am. Chem. Soc. 63, 361
(1941).
[25] C. W. Deeley, A. E. Woodward and J. A. Sauer, J. Appl. Phys. 28, 1124
(1957).
[26] K. Deutsch, E. A. W. Hoff and W. Reddish, J. Polymer Sci. 13, 565 (1954).
[27] A. Dyson, J. Polymer Sci. 7, 133 (1951).
[28] R. K. Eby and F. C. Wilson, J. Appl. Phys. 33, 2951 (1962).
[29] D. R. Falcone, Bell Telephone Laboratories, private communication.
[30] R. M. Fuoss, J. Am. Chem. Soc. 63, 369 (1941).
[31] N. Fuschillo and J. A. Sauer, J. Appl. Phys. 28, 1073 (1957).
[32] R. E. Glick and R. C. Phillips, J. Polymer Sci. 3A, 1885 (1965).
[33] H. S. Gutowsky and L. H. Meyer, J. Chem. Phys. 21, 2122 (1953).
[34] H. S. Gutowsky, A. Saika, M. Takeda and D. E. Woessner, J. Chem. Phys.
27, 534 (1957).
[35] U. Haeberlen, R. Hausser and F. Noack, Z. Naturforsch 18a, 689 (1963)
.
[36] J. Heijboer, Kolloid-Z. 148, 36 (1956).
[37] K. H. Hellwege, R. Kaiser and K. Kuphal, Kolloid-Z. 157, 27 (1958).
[38] D. B. Herrmann, Bell Telephone Laboratories, private communication.
[39] P. Heydemann, Kolloid-Z. 195, 122 (1964).
[40] E. A. W. Hoff, D. W. Robinson and A. H. Willbourn, J. Polymer Sci. 18,
161 (1955).
[41] L. V. Holroyd, R. S. Codrington, B. A. Mrowca and E. Guth, J. Appl.
Phys. 22, 696 (1951).
[42] C. M. Huggins, L. E. St. Pierre and A. M. Bueche, J. Phys. Chem. 64,
1304 (1960).
[43] B. I. Hunt, J. G. Powles and A. E. Woodward, Polymer 5, 323 (1964).
[44] D. Hyndman and G. F. Origlio, J. Appl. Phys. 31, 1849 (1960).
[45] K. H. Illers, Z. f. Elektrochem. 65, 679 (1961).
[46] K. H. Illers and E. Jenckel, Kolloid-Z. 160, 97 (1957).
[47] K. H. Illers, Makromol. Chem. 38, 168 (1960).
[48] K. H. Illers and E. Jenckel, IUPAC Kurzmitteilungen Sec. 1, Physik
Makromol. Stoffe, Verlag Chemie GmbH, Weinheim, 1959. (Cited byA. J. Curtis, J. Res. NBS, 65A, 185 (1961).)
[49] K. H. Illers and E. Jenckel, J. Polymer Sci. 41, 528 (1959).
[50] Y. Ishida, Kolloid-Z. 174, 124 (1961).
[51] Y. Ishida, Kolloid-Z. 171, 149 (1960).
[52] Y. Ishida, Kolloid-Z. 168, 29 (1960).
[53] Y. Ishida, O. Amano and M. Takayanagi, Kolloid-Z. 172, 129 (1960).
[54] Y. Ishida, M. Matsuo, H. Ito, M. Yoshino, F. Irie and M. Takayanagi,
Kolloid-Z. 174, 162 (1961).
[55] Y. Ishida, M. Matsuo and K. Yamafuji, Kolloid-Z. 180, 108 (1962).
[56] Y. Ishida, M. Matsuo, Y. Ueno and M. Takayanagi, Kolloid-Z. 199,
69 (1964).
[57] Y. Ishida, M. Matsuo, Y. Ueno and M. Takayanagi, Kolloid-Z. 199, 67
(1964).
[58] Y. Ishida, M. Matsuo and M. Takayanagi, Polymer Letters 3, 321 (1965).
[59] Y. Ishida, M. Matsuo, S. Togami, K. Yamafuji and M. Takayanagi,
Kolloid-Z. 183, 74 (1962).
[60] Y. Ishida, M. Matsuo and K. Yamafuji, Kolloid-Z. 180, 108 (1962).
311-280 0—69 35
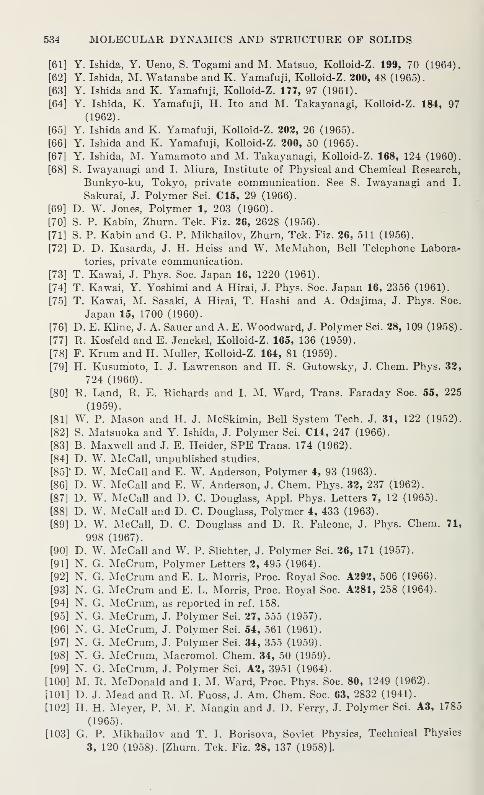
534 MOLECULAR DYNAMICS AND STRUCTURE OF SOLIDS
[61] Y. Ishida, Y. Ueno, S. Togami and M. Matsuo, Kolloid-Z. 199, 70 (1964).
[62] Y. Ishida, M. Watanabe and K. Yamafuji, KoUoid-Z. 200, 48 (1965).
[63] Y. Ishida and K. Yamafuji, KoUoid-Z. 177, 97 (1961).
[64] Y. Ishida, K. Yamafuji, H. Ito and M. Takayanagi, Kolloid-Z. 184, 97
(1962).
[65] Y. Ishida and K. Yamafuji, Kolloid-Z. 202, 26 (1965).
[66] Y. Ishida and K. Yamafuji, Kolloid-Z. 200, 50 (1965).
[67] Y. Ishida, M. Yamamoto and M. Takayanagi, Kolloid-Z. 168, 124 (1960).
[68] S. Iwayanagi and I. Miura, Institute of Physical and Chemical Research,
Bunkyo-ku, Tokyo, private communication. See S. Iwayanagi and I.
Sakurai, J. Polymer Sci. C15, 29 (1966).
[69] D. W. Jones, Polymer 1, 203 (1960).
[70] S. P. Kabin, Zhurn. Tek. Fiz. 26, 2628 (1956).
[71] S. P. Kabin and G. P. Mikhailov, Zhurn, Tek. Fiz. 26, 511 (1956).
[72] D. D. Kasarda, J. H. Heiss and W. McMahon, Bell Telephone Labora-
tories, private communication.
[73] T. Kawai, J. Phys. Soc. Japan 16, 1220 (1961).
[74] T. Kawai, Y. Yoshimi and A Hirai, J. Phys. Soc. Japan 16, 2356 (1961).
[75] T. Kawai, M. Sasaki, A Hirai, T. Hashi and A. Odajima, J. Phys. Soc.
Japan 15, 1700 (1960).
[76] D. E. Kline, J. A. Sauer and A. E. Woodward, J. Polymer Sci. 28, 109 (1958)
.
[77] R. Kosfeld and E. Jenckel, Kolloid-Z. 165, 136 (1959).
[78] F. Krum and H. Muller, Kolloid-Z. 164, 81 (1959).
[79] H. Kusumoto, I. J. Lawrenson and H. S. Gutowsky, J. Chem. Phys. 32,
724 (1960).
[80] R. Land, R. E. Richards and I. M. Ward, Trans. Faraday Soc. 55, 225
(1959).
[81] W. P. Mason and H. J. McSkimin, Bell System Tech. J. 31, 122 (1952).
[82] S. Matsuoka and Y. Ishida, J. Polymer Sci. C14, 247 (1966).
[83] B. Maxwell and J. E. Heider, SPE Trans. 174 (1962).
[84] D. W. McCall, unpublished studies.
[85]' D. W. McCall and E. W. Anderson, Polymer 4, 93 (1963).
[86] D. W. McCall and E. W. Anderson, J. Chem. Phys. 32, 237 (1962).
[87] D. W. McCall and D. C. Douglass, Appl. Phys. Letters 7, 12 (1965).
[88] D. W. McCall and D. C. Douglass, Polymer 4, 433 (1963).
[89] D. W. McCall, D. C. Douglass and D. R. Falcone, J. Phys. Chem. 71,
998 (1967).
[90] D. W. McCall and W. P. Slichter, J. Polymer Sci. 26, 171 (1957).
[91] N. G. McCrum, Polymer Letters 2, 495 (1964).
[92] N. G. McCrum and E. L. Morris, Proc. Royal Soc. A292, 506 (1966).
[93] N. G. McCrum and E. L. Morris, Proc. Royal Soc. A281, 258 (1964).
[94] N. G. McCrum, as reported in ref. 158.
[95] N. G. McCrum, J. Polymer Sci. 27, 555 (1957).
[96] N. G. McCrum, J. Polymer Sci. 54, 561 (1961).
[97] N. G. McCrum, J. Polymer Sci. 34, 355 (1959).
[98] N. G. McCrum, Macromol. Chem. 34, 50 (1959).
[99] N. G. McCrum, J. Polymer Sci. A2, 3951 (1964).
[100] M. R. McDonald and I. M. Ward, Proc. Phys. Soc. 80, 1249 (1962).
[101] D. J. Mead and R. M. Fuoss, J. Am. Chem. Soc. 63, 2832 (1941).
[102] H. H. Meyer, P. M. F. Mangin and J. D. Ferry, J. Polymer Sci. A3, 1785
(1965).
[103] G. P. Mikhailov and T. I. Borisova, Soviet Physics, Technical Physics
3, 120 (1958). [Zhurn. Tek. Fiz. 28, 137 (1958)].
DYNAMICS OF POLYMERS 535
[104] G. P. Mikhailov, J. Polymer Sci. 30, 605 (1958).
[105] G. P. Mikhailov, Zhurn. Tek. Fiz. 21, 1395 (1951).
[106] G. P. Mikhailov and M. P. Eidelnant, Vysokomolek. soed. 2, 287 (1960).
[107] G. P. Mikhailov and A. M. Lobanov, Soviet Physics, Technical Physics
3, 249 (1958). [Zhurn. Tek. Fiz. 28, 267 (1958)].
[108] G. P. Mikhailov, S. P. Kabin and T. A. Krylova, Soviet Physics, Technical
Physics 2, 1899 (1957). [Zhurn. Tek. Fiz. 27, 2050 (1957)].
[109] G. P. Mikhailov, S. P. Kabin and B. I. Sazhin, Zhurn. Tek. Fiz. SSSR 25,
590 (1955).
[110] R. S. Moore and S. Matsuoka, J. Polymer Sci. C5, 163 (1964).
[Ill] E. L. Morris and N. G. McCrum, Polymer Letters 1, 393 (1963).
[112] F. K. Muller and K. Huff, Kolloid-Z. 164, 34 (1959).
[113] L. T. Muus, N. G. McCrum and F. C. McGrew, Soc. Plastics Enginrs. J. 15,
368 (1959).
[114] T. Nakajima and S. Saito, J. Polymer Sci. 31, 423 (1958).
[115] H. Nakayasu, H. Markowitz and D. J. Plazek, Trans. Soc. Rheology 5,
261 (1961).
[116] L. E. Nielsen, Mechanical Properties of Polymers, Reinhold, New York,
1962.
[117] A. Nishioka, J. Polymer Sci. 37, 163 (1959).
[118] A. W. Nolle and J. J. Billings, J. Chem. Phys. 30, 84 (1959).
[119] W. G. Oakes and D. W. Robinson, J. Polymer Sci. 14, 505 (1954).
[120] A. Odajima, J. Sohma and K. Koike, J. Phys. Soc. Japan 12, 272 (1957).
[121] A. Odajima, J. A. Sauer and A. E. Woodward, J. Phys. Chem. 66, 718 (1962)
.
[122] A. Odajima, A. E. Woodward and J. A. Sauer, J. Polymer Sci. 55, 181
(1961).
[123] H. G. Olf and A. Peterlin, Kolloid-Z. 215, 97 (1967).
[124] N. Oskin and B. Maxwell, cited in private communication from W. Reddish,
Imperial Chemical Industries.
[125] A. R. Payne and J. R. Scott, Engineering Design with Rubber, McLaren,London, 1960, p. 30.
[126] W. F. Peck, Bell Telephone Laboratories, private communication.
[127] A. Peterlin and H. G. Olf, Polymer Letters 2, 409 (1964).
[128] A. Peterlin and H. G. Olf, Polymer Letters 2, 769 (1964).
[129] P. R. Pinnock and I. M. Ward, Polymer 7, 255 (1966).
[130] D. J. Plazek, W. Dannhauser and J. D. Ferry, J. Colloid Sci. 16, 101 (1961).
[131] J. G. Powles and P. Mansfield, Polymer 3, 336 (1962).
[132] J. G. Powles, B. I. Hunt and D. J. H. Sandiford, University of Kent,
Canterbury, private communication.
[133] J. G. Powles, J. Polymer Sci. 22, 79 (1956).
[134] J. G. Powles and P. Mansfield, Polymer 3, 340 (1962).
[135] J. G. Powles and A. Hartland, Nat re 186, 26 (1960).
[136] J. G. Powles and K. Luszczynski, Physica 25, 455 (1959).
[137] J. G. Powles, Proc. Phys. Soc. (London) 69, 281 (1956).
[138] B. E. Read, J. Polymer Sci. C5, 87 (1964).
[139] B. E. Read and G. Williams, Polymer 2, 239 (1961).
[140] B. E. Read, in Techniques of Polymer Science, Soc. Chem. Ind. (London)
monograph #17, 198 (1963).
[141] B. E. Read, J. Polymer Sci. C5, 87 (1964).
[142] W. Reddish, J. G. Powles and B. I. Hunt, Polymer Letters 3, 671 (1965).
[143] W. Reddish, Imperial Chemical Industries, private communication.
[144] W. Reddish and J. T. Barrie, IUPAC Symposium, Wiesbaden, Kurzmit-
teilen IA3, 1959.
536 MOLECULAR DYNAMICS AND STRUCTURE OF SOLIDS
[145] W. Reddish, Pure and Applied Chem. 5, 723 (1962).
[146] W. Reddish, Trans. Faraday Soc. 46, 459 (1950).
[147] R. C. Rempel, H. E. Weaver, R. H. Sands and R. L. Miller, J. Appl. Phys.
28, 1082 (1957).
[148] S. Saito, Kolloid-Z. 189, 116 (1963).
[149] J. A. Sauer, R. A. Wall, N. Fuschillo and A. E. Woodward, J. Appl. Phys.
29, 1385 (1958).
[150] J. A. Sauer and A. E. Woodward, Rev. Modern Phys. 32, 88 (1960).
[151] J. A. Sauer and D. E. Kline, IX International Congress Appl. Mech.,
Univ. Brussels 5, 368 (1957).
[152] J. A. Sauer, A. E. Woodward and N. Fuschillo, J. Appl. Phys. 30, 1488
(1959).
[153] B. I. Sazhin, V. S. Skurikhina and Y. I. Illin, Vysokomolekul. Soed. 1,
1383 (1959).
[154] D. J. Scheiber and D. J. Mead, J. Chem. Phys. 27, 326 (1957).
[155] K. Schmieder and K. Wolfe, Kolloid-Z. 127, 65 (1952).
[156] K. Schmieder and K. Wolfe, Kolloid-Z. 134, 149 (1953).
[157] H. Schnell, Ang. Chemie 68, 633 (1956).
[158] A. H. Scott, D. J. Scheiber, A. J. Curtis, J. I. Lauritzen, and J. D. Hoffman,
J. Res. NBS 66A, 269 (1962).
[159] K. M. Sinnott, J. Polymer Sci. 35, 273 (1959).
[160] K. M. Sinnott, Grace Chemical, private communication.
[161] K. M. Sinnott, Polymer Letters 3, 945 (1965).
[162] K. M. Sinnott, J. Polymer Sci. 42, 3 (1960).
[163] W. P. Slichter, J. Appl. Phys. 31, 1865 (1960).
[164] W. P. Slichter, J. Appl. Phys. 32, 2339 (1961).
[165] W. P. Slichter, J. Polymer Sci. 24, 173 (1957).
[166] W. P. Slichter, Ann. N. Y. Acad. Sci. 83, 60 (1959).
[167] W. P. Slichter and E. M. Mandell, J. Appl. Phys. 30, 1473 (1959).
[168] W. P. Slichter and E. M. Mandell, J. Appl. Phys. 29, 1438 (1958).
[169] W. P. Slichter, Soc. Plastics Enginrs. J. 15, 303 (1959).
[170] W. P. Slichter, Makromol. Chem. 34, 67 (1959).
[171] W. P. Slichter, Bell Telephone Laboratories, private communication.
[172] W. P. Slichter, J. Appl. Phys. 26, 1099 (1955).
[173] G. C. Smith and F. H. Muller, Kolloid-Z. 206, 137 (1965).
[174] J. A. S. Smith, Disc. Faraday Soc. 19, 207 (1955).
[175] N. S. Steck, Soc. Plastics Enginrs. Trans. 4, 34 (1964).
[176] J. M. Stevels, Glass Ind. 35, 657 (1954).
[177] S. Strella and S. N. Chinai, J. Polymer Sci. 31, 45 (1958).
[178] H. A. Stuart, Physik der Hoch Polymeren, Bd. IV, Springer Verlag, Berlin,
1956, pp. 549, 563.
[179] M. Takayanagi, H. Harima and Y. Iwata, Mem. Fac. Enginr. Kyushu
Univ. 23, 1 (1963).
[180] M. Takayanagi, Mem. Fac. Enginr. Kyushu Univ. 23, 41 (1963).
[181] T. Tanaka and Y. Ishida, Prog. Theor. Phys. Sup. 10, 121 (1959).
[182] K. Tanaka, K. Yamagata and S. Kittaka, Bull. Chem. Soc. Japan 29, 843
(1956).
[183] D. A. Thomas and D. W. Robinson, British J. Appl. Phys. 6, 41 (1955).
[184] A. B. Thompson and D. W. Woods, Trans. Faraday Soc. 52, 1383 (1956).
[185] H. Thurn and K. Wolf, Kolloid-Z. 148, 16 (1956).
[186] H. Thurn, discussion of paper by R. Kosfeld, Kolloid-Z. 165, 136 (1959).
See also, H. Hendus, G. Schnell, H. Thurn and K. Wolf, Ergebn. exakt.
Naturwiss. 31, 220 (1959).
DYNAMICS OF POLYMERS 537
[187] H. Thurn and F. Wurstlin, Kolloid-Z. 156, 21 (1958).
[188] N. J. Trappeniers, C. J. Gerritsma and P. H. Oosting, Physica 30, 997
(1964).
[189] C. A. F. Tuijman, Polymer 4, 259 (1963).
[190] L. K. H. Van Beek, J. Appl. Polymer Sci. 9, 553 (1965).
[191] P. F. Veselovski and A. I. Slusker, Zhurn. Tek. Fiz. 25, 939, 1204 (1955).
[192] J. Volger, Indust. chim. Beige 20, spec. #128 (1955).
[193] G. Voskotter and R. Kosfeld, Kolloid-Z. 216, 85 (1967).
[194] R. A. Wall, J. A. Sauer and A. E. Woodward, J. Polymer Sci. 35, 281 (1959)
.
[195] I. M. Ward, Trans. Faraday Soc. 56, 648 (1960).
[196] T. Wentink, J. Appl. Phys. 32, 1063 (1961).
[197] R. E. Wetton and G. Allen, Polymer 7, 331 (1966).
[198] A. H. Willbourn, Trans. Faraday Soc. 54, 717 (1958).
[199] G. Williams, Polymer 4, 27 (1963).
[200] G. Williams, Trans. Faraday Soc. 59, 1397 (1963).
[201] G. Williams, Trans. Faraday Soc. 60, 1556 (1964).
[202] A. E. Woodward, A. Odajima and J. A. Sauer, J. Phys. Chem. 65, 1384
(1961).
[203] A. E. Woodward, J. M. Crissman and J. A. Sauer, J. Polymer Sci. 44, 23
(1960).
[204] A. E. Woodward and J. A. Sauer, private communication.
[205] A. E. Woodward, J. A. Sauer and R. A. Wall, J. Chem. Phys. 30, 854 (1959)
.
[206] A. E. Woodward, J. A. Sauer, C. E. Deeley and D. E. Kline, J. Colloid Sci.
12, 363 (1957).
[207] A. E. Woodward and J. A. Sauer, J. Polymer Sci. 35, 281 (1959).
[208] W. A. Yager, Trans. Electrochem. Soc. 74, 113 (1938).
[209] A. Zosel, Kolloid-Z. 199, 113 (1964).
[210] K. Yamamoto and Y. Wada, J. Phys. Soc. Japan 12, 374 (1957).

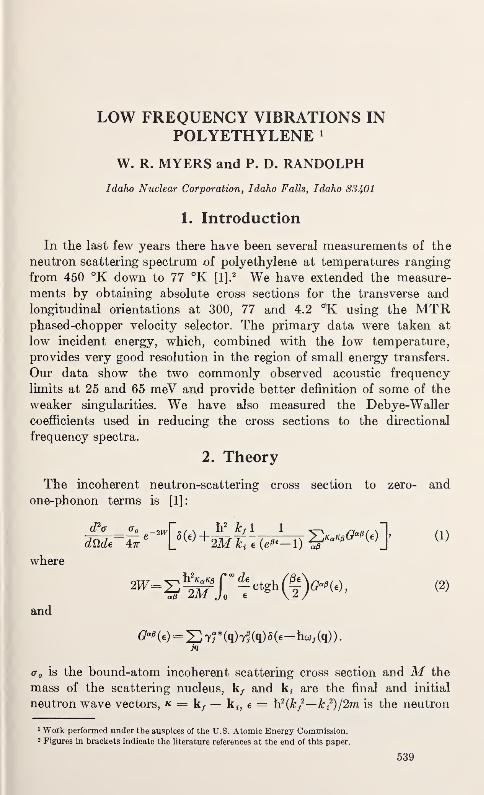
LOW FREQUENCY VIBRATIONS INPOLYETHYLENE 1
W. R. MYERS and P. D. RANDOLPH
Idaho Nuclear Corporation, Idaho Falls, Idaho 83401
1. Introduction
In the last few years there have been several measurements of the
neutron scattering spectrum of polyethylene at temperatures ranging
from 450 °K down to 77 °K [l].2 We have extended the measure-
ments by obtaining absolute cross sections for the transverse andlongitudinal orientations at 300, 77 and 4.2
0)K using the MTRphased-chopper velocity selector. The primary data were taken at
low incident energy, which, combined with the low temperature,
provides very good resolution in the region of small energy transfers.
Our data show the two commonly observed acoustic frequency
limits at 25 and 65 meV and provide better definition of some of the
weaker singularities. We have also measured the Debye-Waller
coefficients used in reducing the cross sections to the directional
frequency spectra.
2. Theory
The incoherent neutron-scattering cross section to zero- and
one-phonon terms is [1]:
where
and
^(e)=S7r(<j)7?(q)«(e-Wq))-
<r 0 is the bound-atom incoherent scattering cross section and M the
mass of the scattering nucleus, k, and are the final and initial
neutron wave vectors, * = kf— k*, e = h2(kf
2—ki)/2m is the neutron
1 Work performed under the auspices of the U.S. Atomic Energy Commission.2 Figures in brackets indicate the literature references at the end of this paper.
539
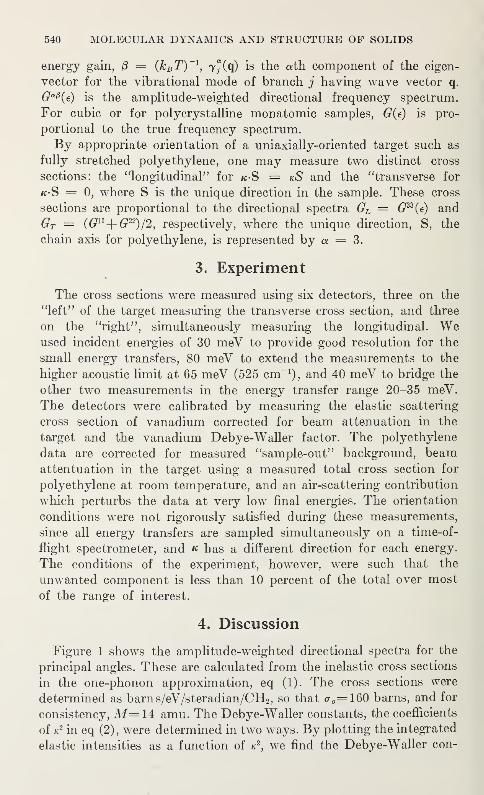
540 MOLECULAR DYNAMICS AND STRUCTURE OF SOLIDS
energy gain, 0 = {kB T)~l
,?"(q) is the ath component of the eigen-
vector for the vibrational mode of branch j having wave vector q.
Ga0(e) is the amplitude-weighted directional frequency spectrum.
For cubic or for polycrystalline monatomic samples, G(e) is pro-
portional to the true frequency spectrum.
By appropriate orientation of a uniaxially-oriented target such as
fully stretched polyethylene, one may measure two distinct cross
sections: the "longitudinal" for k S = kS and the "transverse for
k-S = 0, where S is the unique direction in the sample. These cross
sections are proportional to the directional spectra GL = 6r33
(c) and
GT = (Gn+G22)/2, respectively, where the unique direction, S, the
chain axis for polyethylene, is represented by a = 3.
3. Experiment
The cross sections were measured using six detectors, three on the
"left" of the target measuring the transverse cross section, and three
on the "right", simultaneously measuring the longitudinal. Weused incident energies of 30 meV to provide good resolution for the
small energy transfers, 80 meV to extend the measurements to the
higher acoustic limit at 65 meV (525 cm-1), and 40 meV to bridge the
other two measurements in the energy transfer range 20-35 meV.The detectors were calibrated by measuring the elastic scattering
cross section of vanadium corrected for beam attenuation in the
target and the vanadium Debye-Waller factor. The polyethylene
data are corrected for measured "sample-out" background, beamattentuation in the target using a measured total cross section for
polyethylene at room temperature, and an air-scattering contribution
which perturbs the data at very low final energies. The orientation
conditions were not rigorously satisfied during these measurements,
since all energy transfers are sampled simultaneously on a time-of-
flight spectrometer, and « has a different direction for each energy.
The conditions of the experiment, however, were such that the
unwanted component is less than 10 percent of the total over most
of the range of interest.
4. Discussion
Figure 1 shows the amplitude-weighted directional spectra for the
principal angles. These are calculated from the inelastic cross sections
in the one-phonon approximation, eq (1). The cross sections were
determined as barns/eV/steradian/CH2 , so that o- o=160 barns, and for
consistency, M= 14 amu. The Debye-Waller constants, the coefficients
of k2 in eq (2), were determined in two ways. By plotting the integrated
elastic intensities as a function of k2, we find the Debye-Waller con-
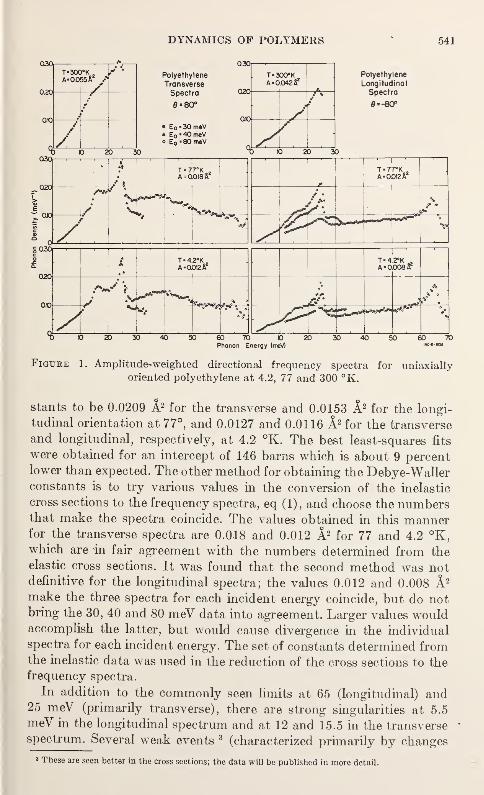
DYNAMICS OF POLYMERS 541
T-300°K.A-0.055& /*
Z
Polyethylene
Transverse
Spectra
0*80°
• E0 '30meV* E0 '40meVo E0 '80meV
T-3A«0
00°K.042 A
f
7-
Polyethylene
Longitudinal
Spectra
0=-8O°
Figure 1. Amplitude-weighted directional frequency spectra for uniaxially
oriented polyethylene at 4.2, 77 and 300 °K.
stants to be 0.0209 A2 for the transverse and 0.0153 A2 for the longi-
tudinal orientation at 77°, and 0.0127 and 0.0116 A2 for the transverse
and longitudinal, respectively, at 4.2 °K. The best least-squares fits
were obtained for an intercept of 146 barns which is about 9 percentlower than expected. The other method for obtaining the Debye-Wallerconstants is to try various values in the conversion of the inelastic
cross sections to the frequency spectra, eq (1), and choose the numbersthat make the spectra coincide. The values obtained in this mannerfor the transverse spectra are 0.018 and 0.012 A 2 for 77 and 4.2 °K,which are in fair agreement with the numbers determined from theelastic cross sections. It was found that the second method was notdefinitive for the longitudinal spectra; the values 0.012 and 0.008 A2
make the three spectra for each incident energy coincide, but do notbring the 30, 40 and 80 meV data into agreement. Larger values wouldaccomplish the latter, but would cause divergence in the individual
spectra for each incident energy. The set of constants determined fromthe inelastic data was used in the reduction of the cross sections to thefrequency spectra.
In addition to the commonly seen limits at 65 (longitudinal) and25 meV (primarily transverse), there are strong singularities at 5.5
meV in the longitudinal spectrum and at 12 and 15.5 in the transversespectrum. Several weak events 3 (characterized primarily by changes
3 These are seen better in the cross sections; the data will be published in more detail.
542 MOLECULAR DYNAMICS AND STRUCTURE OF SOLIDS
in slope) are indicated at about 9.5, 15.5 and 23 meV in the longitudinal
and at 4, 6.5 and 18 meV in the transverse spectrum. With the excep-
tion of the singularities at 65 and 12 meV which have little temperature
dependence, most of the frequencies seem to increase by 0.5 to 1.5 meVin going from 300 to 4.2 °K. An interesting feature of the data is that
weak modes which are calculated to be transverse show up, generally,
more strongly in the longitudinal spectrum. In particular, the limit at
23 meV is probably the transverse limit, va5(0), of the "longitudinal
branch", v-0 , which though very weakly indicated in the longitudinal
spectra, is not at all evident in the transverse. The event at 9.5 meVhas been shown by IB, experiments to be a transverse mode, however,
and it too shows up better in the longitudinal spectrum.
The orientation requirements are very well satisfied for these energy
transfers, so that modes near these limits definitely have longitudinal
components. They may show up better in the longitudinal spectrum
simply because it is less dense; the only limits that are calculated [2]
to be longitudinal in the acoustic region are at 65 and at about 7 meV(the latter is not seen in either spectrum). It is quite likely that the
strong 5.5 meV limit in the longitudinal spectrum is the missing vb
Q (0).
Although the amplitude-weighted frequency spectrum is not the
appropriate function for the calculation of specific heat, these spectra,
normalized to one hydrogen atom, fit the measured specific heat of
polyethylene fairly well up to about 50 °K. Above 50° the calculated
CV(T) diverges due to the multiphonon components in the spectra.
The two-phonon components have been calculated [3] to becomeimportant at about 12 meV, in agreement with this observation.
We see very little credible structure in the range from 25 to 65 meV;while the amplitude in this region is probably due to multiphonon con-
tributions, better calculations and measurements at small k are needed
to demonstrate this. The helium-temperature measurements give
much better resolution at the lowest energies, but the two-phonon
contribution is not substantially reduced compared to nitrogen tem-
perature measurements at larger energy transfers.
5. References
[1] See for example, W. Myers, G. C. Summerfield, and J. S. King, J. Chem.
Phys. 44, 184 (1966).
[2] See for example, M. Tasumi and S. Krimm, J. Chem. Phys. 46, 755 (1966).
[3] J. E. Lynch (private communication).
NEUTRON SCATTERING IN DEUTERATEDPOLYETHYLENE 1
L. A. FELDKAMP 2 and J. S. KING
The University of Michigan, Ann Arbor, Michigan 4-8104
1. Introduction
The study of neutron scattering from deuterated polyethylene was
undertaken to observe the shift in vibrational frequencies due to the
deuterium mass, and thereby clarify features of earlier data on normal
polyethylene, and to attempt direct observation of the dispersion
relations in the predominantly coherent target.
2. Experimental Method
2.1. Spectrometer
The scattering measurements were made on a triple-axis crystal
spectrometer in which the analyzing system was set to observe down-scattering to a final energy of about .030 ev. The sample was main-
tained at 78 °K to reduce multiphonon events.
2.2. Target Preparation
Several thin disks, formed by pressing (CD2) W granules at 160 °Cand 1000 psi, comprised the unoriented target, which had a total
thickness of .144 in. Strips cut from the disks were later stretched
500 percent under infra-red heat to induce an approximately uniaxial
orientation. The distribution of c-axis orientations was found from
neutron diffraction to have a FWHM of 8°.
3. Discussion of the Data
3.1. Comparison with Normal Polyethylene
The data, for purposes of comparison, have been converted to
frequency spectra using the incoherent approximation. The poly-
crystalline spectrum is compared with earlier data [1]3 on normal
polyethylene in figure 1. The expected shift in vibrational frequencies
1 Work supported by the National Science Foundation.2 National Science Foundation Predoctoral Fellow.3 Figures in brackets indicate the literature references at the end of this paper.
543
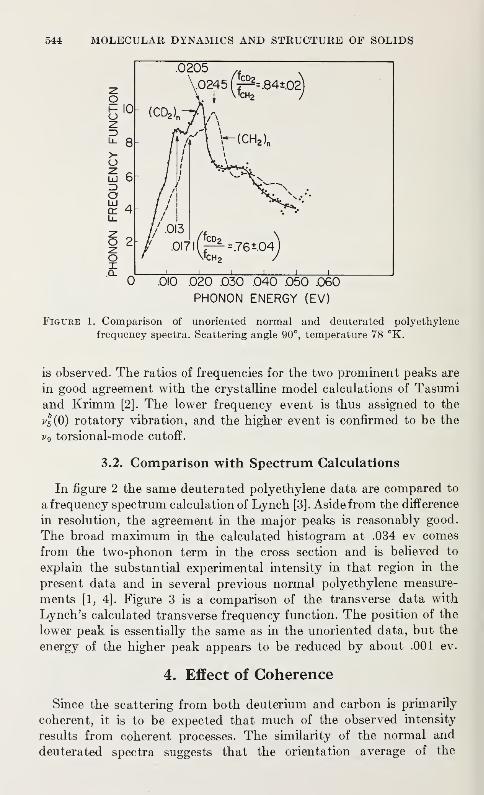
544 MOLECULAR DYNAMICS AND STRUCTURE OF SOLIDS
"°"0 .010 .020 .030 .040 .050 .060
PHONON ENERGY (EV)
Figure 1. Comparison of unoriented normal and deuterated polyethylene
frequency spectra. Scattering angle 90°, temperature 78 °K.
is observed. The ratios of frequencies for the two prominent peaks are
in good agreement with the crystalline model calculations of Tasumiand Krimm [2]. The lower frequency event is thus assigned to the
^(0) rotatory vibration, and the higher event is confirmed to be the
v9 torsional-mode cutoff.
3.2. Comparison with Spectrum Calculations
In figure 2 the same deuterated polyethylene data are compared to
a frequency spectrum calculation of Lynch [3]. Aside from the difference
in resolution, the agreement in the major peaks is reasonably good.
The broad maximum in the calculated histogram at .034 ev comes
from the two-phonon term in the cross section and is believed to
explain the substantial experimental intensity in that region in the
present data and in several previous normal polyethylene measure-
ments [1, 4]. Figure 3 is a comparison of the transverse data with
Lynch's calculated transverse frequency function. The position of the
lower peak is essentially the same as in the unoriented data, but the
energy of the higher peak appears to be reduced by about .001 ev.
4. Effect of Coherence
Since the scattering from both deuterium and carbon is primarily
coherent, it is to be expected that much of the observed intensity
results from coherent processes. The similarity of the normal and
deuterated spectra suggests that the orientation average of the
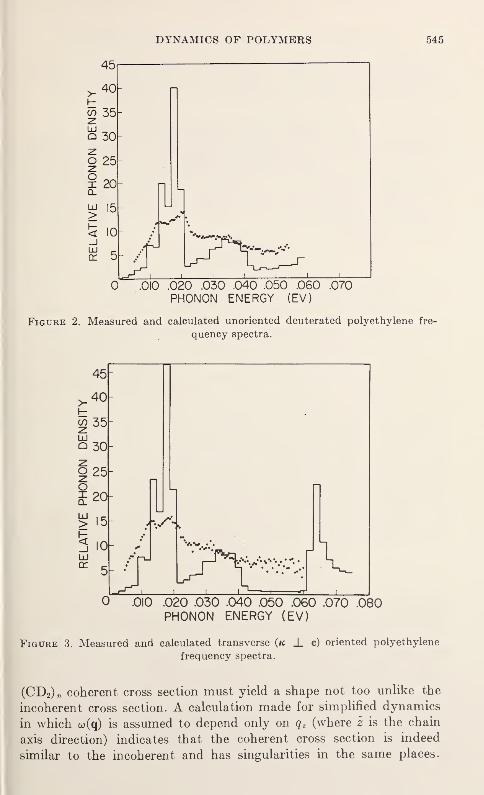
DYNAMICS OF POLYMERS 545
.010 .020 .030 .040 .050 .060 .070
PHONON ENERGY (EV)
Figure 2. Measured and calculated unoriented deuterated polyethylene fre-
quency spectra.
.010 .020 .030 .040 .050 .060 .070 .080PHONON ENERGY (EV)
Figure 3. Measured and calculated transverse (k _L c) oriented polyethylene
frequency spectra.
(CD2) recoherent cross section must yield a shape not too unlike the
incoherent cross section. A calculation made for simplified dynamics
in which w(q) is assumed to depend only on q z (where £ is the chain
axis direction) indicates that the coherent cross section is indeed
similar to the incoherent and has singularities in the same places.
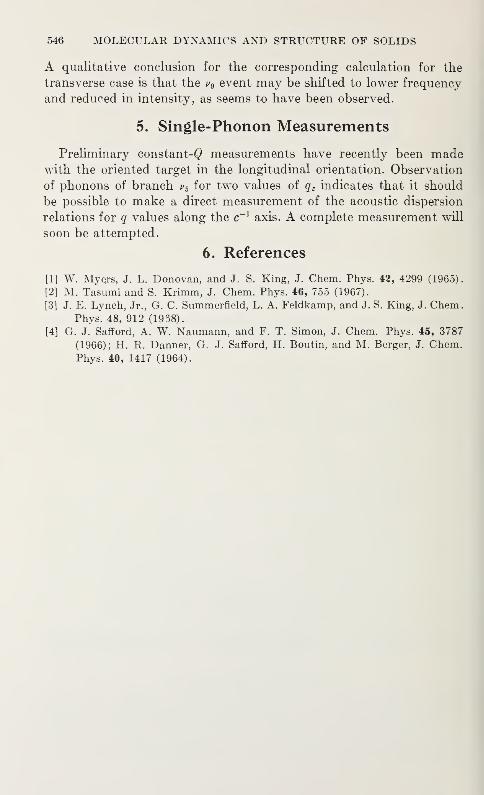
546 MOLECULAR DYNAMICS AND STRUCTURE OF SOLIDS
A qualitative conclusion for the corresponding calculation for the
transverse case is that the v 9 event may be shifted to lower frequency
and reduced in intensity, as seems to have been observed.
5. Single-Phonon Measurements
Preliminary constant-Q measurements have recently been madewith the oriented target in the longitudinal orientation. Observation
of phonons of branch v5 for two values of q z indicates that it should
be possible to make a direct measurement of the acoustic dispersion
relations for q values along the c~laxis. A complete measurement will
soon be attempted.
6. References
[1] W. Myers, J. L. Donovan, and J. S. King, J. Chem. Phys. 42, 4299 (1965).
[2] M. Tasumi and S. Krimm, J. Chem. Phys. 46, 755 (1967).
[3] J. E. Lynch, Jr., G. C. Summerfield, L. A. Feldkamp, and J. S. King, J. Chem.Phys. 48, 912 (1958).
[4] G. J. Safford, A. W. Naumann, and F. T. Simon, J. Chem. Phys. 45, 3787
(1966); H. R. Danner, G. J. Safford, H. Boutin, and M. Berger, J. Chem.Phys. 40, 1417 (1964).
EPITHERMAL NEUTRON INELASTIC SCATTERINGBY POLYETHYLENE 1
W. E. MOORE, G. J. KIROUAC, L. J. ESGH, K. W. SEEMANN
Knolls Atomic Power Laboratory, Schenectady, New York 12301
and
M. L. YEATER
Rensselaer Polytechnic Institute, Troy, New York 12180
1. Introduction
The RPI-KAPL neutron scattering system utilizes an electron
linear accelerator and phased chopper to produce short neutron
bursts of a desired energy; scattered-neutron energies are measured bytime-of-flight. Incident energies can be chosen over a range of 0.1 to
1 eV, making possible the study of high energy-transfer modes of
molecular systems. Data are compared with calculations based upontheoretical models, thus providing a means of verifying the frequency
distribution for the normal modes of vibration. Data can also be
reduced to the scattering law, which is extended by these measure-
ments to higher energy and momentum transfers than are usually
accessible. In the present work, double-differential cross sections were
measured for polyethylene using five incident energies and five
scattering angles. The experimental system will be described briefly
and examples of the data will be shown.
2. Experimental Method
A diagram of our experimental setup is shown in figure 1. Intense
bursts of fast neutrons produced in the tantalum target are partially
thermalized in a thin moderator placed nearby. A nearly monochro-
matic neutron burst is selected by a chopper placed 6m from this
source. The Linac is synchronized with the neutron chopper and the
phase between the two determines the neutron velocity selected. Thechopped beam passes through a thin sample under study and scattered
neutrons are detected in banks of ten-atm. 3He-filled counters. Flight
times of detected neutrons are recorded by an on-line computer;
1 Work supported by the U.S. Atomic Energy Commission under contract No. W-31-109-Eng.-52 andAT(30-3)-328.
547
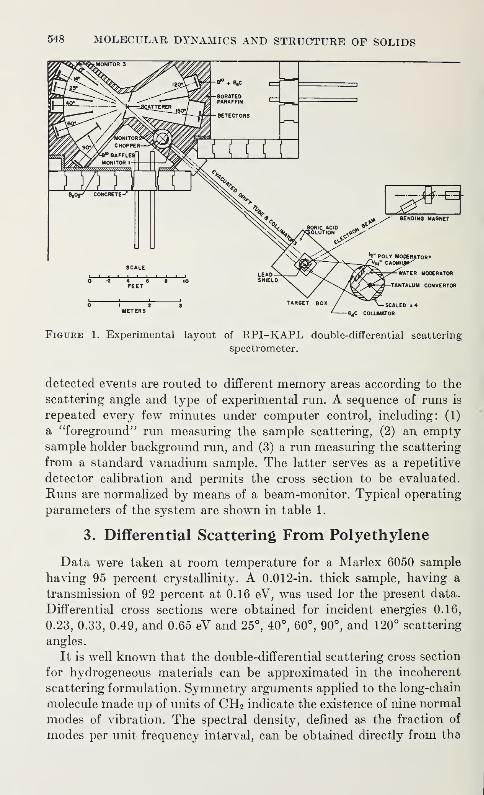
548 MOLECULAR DYNAMICS AND STRUCTURE OF SOLIDS
Figure 1. Experimental layout of RPI-KAPL double-differential scattering
spectrometer.
detected events are routed to different memory areas according to the
scattering angle and type of experimental run. A sequence of runs is
repeated every few minutes under computer control, including: (1)
a "foreground" run measuring the sample scattering, (2) an emptysample holder background run, and (3) a run measuring the scattering
from a standard vanadium sample. The latter serves as a repetitive
detector calibration and permits the cross section to be evaluated.
Runs are normalized by means of a beam-monitor. Typical operating
parameters of the system are shown in table 1.
3. Differential Scattering From Polyethylene
Data were taken at room temperature for a Marlex 6050 sample
having 95 percent crystallinity. A 0.012-in. thick sample, having a
transmission of 92 percent at 0.16 eV, was used for the present data.
Differential cross sections were obtained for incident energies 0.16,
0.23, 0.33, 0.49, and 0.65 eV and 25°, 40°, 60°, 90°, and 120° scattering
angles.
It is well known that the double-differential scattering cross section
for hydrogeneous materials can be approximated in the incoherent
scattering formulation. Symmetry arguments applied to the long-chain
molecule made up of units of CH2 indicate the existence of nine normal
modes of vibration. The spectral density, defined as the fraction of
modes per unit frequency interval, can be obtained directly from the
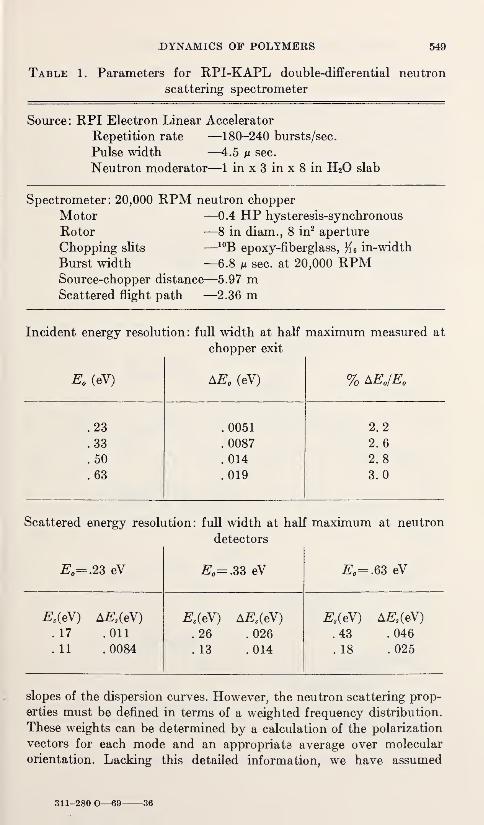
DYNAMICS OF POLYMERS 549
Table 1. Parameters for RPI-KAPL double-differential neutron
scattering spectrometer
Source: RPI Electron Linear Accelerator
Repetition rate —180-240 bursts/sec.
Pulse width —4.5 m sec.
Neutron moderator—1 in x 3 in x 8 in H20 slab
Spectrometer: 20,000 RPM neutron chopper
Motor —0.4 HP hysteresis-synchronous
Rotor —8 in diam., 8 in2 aperture
Chopping slits —10B epoxy-fiberglass, # 6 in-width
Burst width —6.8 m sec. at 20,000 RPMSource-chopper distance—5.97 mScattered flight path —2.36 m
Incident energy resolution: full width at half maximum measured at
chopper exit
E0 (eV) AE0 (eV) % AE0/E0
.23 . 0051 2.2
.33 .0087 2.6
. 50 . 014 2.8
. 63 . 019 3.0
Scattered energy resolution: full width at half maximum at neutron
detectors
E0=.2S eV E0=.33 eV #0=.63 eV
Es(eV) AEs(eV) Es(eV) AEs (eV) Es(eV) AEs(eV)
.17 .011 . 26 . 026 . 43 . 046
.11 .0084 .13 .014 . 18 . 025
slopes of the dispersion curves. However, the neutron scattering prop-
erties must be defined in terms of a weighted frequency distribution.
These weights can be determined by a calculation of the polarization
vectors for each mode and an appropriate average over molecular
orientation. Lacking this detailed information, we have assumed
311-280 O—69 36
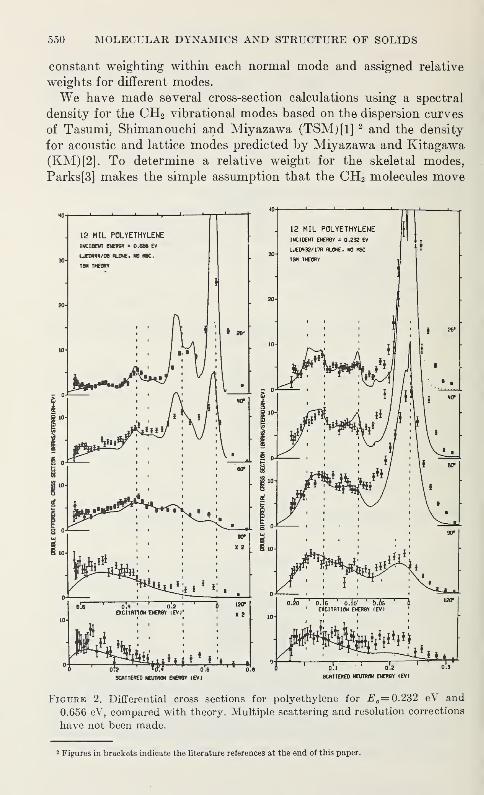
550 MOLECULAR DYNAMICS AND STRUCTURE OF SOLIDS
constant weighting within each normal mode and assigned relative
weights for different modes.
We have made several cross-section calculations using a spectral
density for the CH2 vibrational modes based on the dispersion curves
of Tasumi, Shimanouchi and Miyazawa (TSM)[1] 2 and the density
for acoustic and lattice modes predicted by Miyazawa and Kitagawa
(KM) [2]. To determine a relative weight for the skeletal modes,
Parks[3] makes the simple assumption that the CH2 molecules move
SCATTERED NEUTRON ENERGY (EVI
Figure 2. Differential cross sections for polyethylene for E 0= 0.232 eV and
0.656 eV, compared with theory. Multiple scattering and resolution corrections
have not been made.
2 Figures in brackets indicate the literature references at the end of this paper.
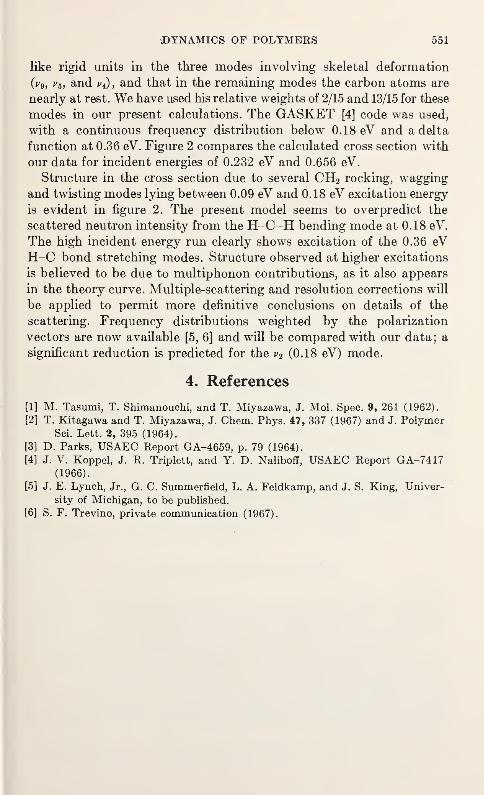
DYNAMICS OF POLYMERS 551
like rigid units in the three modes involving skeletal deformation
(*>9 ,v5 , and j>4), and that in the remaining modes the carbon atoms are
nearly at rest. We have used his relative weights of 2/15 and 13/15 for these
modes in our present calculations. The GASKET [4] code was used,
with a continuous frequency distribution below 0.18 eV and a delta
function at 0.36 eV. Figure 2 compares the calculated cross section with
our data for incident energies of 0.232 eV and 0.656 eV.
Structure in the cross section due to several CH2 rocking, wagging
and twisting modes lying between 0.09 eV and 0.18 eV excitation energy
is evident in figure 2. The present model seems to overpredict the
scattered neutron intensity from the H-C-H bending mode at 0.18 eV.
The high incident energy run clearly shows excitation of the 0.36 eVH-C bond stretching modes. Structure observed at higher excitations
is believed to be due to multiphonon contributions, as it also appears
in the theory curve. Multiple-scattering and resolution corrections will
be applied to permit more definitive conclusions on details of the
scattering. Frequency distributions weighted by the polarization
vectors are now available [5, 6] and will be compared with our data; a
significant reduction is predicted for the v2 (0.18 eV) mode.
4. References
[1] M. Tasumi, T. Shimanouchi, and T. Miyazawa, J. Mol. Spec. 9, 261 (1962).
[2] T. Kitagawa and T. Miyazawa, J. Chem. Phys. 47, 337 (1967) and J. PolymerSci. Lett. 2, 395 (1964).
[3] D. Parks, USAEC Report GA-4659, p. 79 (1964).
[4] J. V. Koppel, J. R. Triplett, and Y. D. Naliboff, USAEC Report GA-7417(1966).
[5] J. E. Lynch, Jr., G. C. Summerfield, L. A. Feldkamp, and J. S. King, Univer-
sity of Michigan, to be published.
[6] S. F. Trevino, private communication (1967).

THE VIBRATIONAL PROPERTIES OFPOLYOXYMETHYLENE
S. F. Trevino
Picatinny Arsenal, Dover, N.J. 07801
and
V. E. LaGarde
Boston College, Newton, Mass. 02740
1. Introduction
Polyoxymethylene POM is a polymer with chemical repeat unit
(CH20). The chain backbone, consisting of carbon and oxygen atoms,
defines a helix of nine chemical units and five turns in the identity
period. The unit cell of the crystal is hexagonal and contains one
chain [l].1 The vibrational properties of the polymer have been previ-
ously investigated by infrared absorption and Raman scattering
studies of Todokoro et al. [2], and reasonably good agreement wasobtained between the observed optically-active vibrations and a cal-
culation based on an isolated chain model. These studies were con-
cerned predominantly with high-energy vibrations, and as yet there
is very little information on the very low energy modes. The purpose of
the present work is an attempt to obtain more extensive information
about these low frequency modes which consist of skeletal torsions and
deformations.
2. Experimental Procedure
The data obtained consist of measurements of the double differential
cross section for inelastic scattering of cold neutrons. The measure-
ments were made using the cold beryllium filter spectrometer located
at the AMMRC reactor (2 megawatts, light water moderated).
The polymer scattering sample was oriented by stretching and roll-
ing. The direction of the chains was determined by x-ray measure-
ments to lie along the stretch direction with distribution characterized
by an angular width of 13° at half maximum [3]. Two measurementswere made on this sample which consisted of alternately placing the
Figures in brackets indicate the literature references at the end of this paper.
553
554 MOLECULAR DYNAMICS AND STRUCTURE OF SOLIDS
chain axis parallel and perpendicular to the direction of momentumtransfer. The measured time of flight spectra were corrected for back-
ground and instrumental sensitivity. An effective frequency distribu-
tion was obtained which reproduced the measured spectrum in the
one-phonon approximation. An iterative procedure was used to take
into account the instrumental resolution and incident line shape
in this fit.
3. Theoretical
The normal coordinate calculation of the vibrations of the polymer
has been performed using the Wilson GF matrix method [4] as modified
by Higgs [5]. The model used is that of an isolated helix. The frequen-
cies of the twelve normal modes are calculated as a function of 5 which
is defined as
8=2irkc (1)
k being the phonon momentum and c the distance between adjacent
chemical units along the chain axis. The density-of-states function
g{y) is calculated graphically from the one-dimensional definition
9(v
where the sum is over the branches j.
Two functions gL (v) and gT {v) have also been calculated. These
are-defined as
!fcM=S(C5(a)) 2(JA (3)
gAv)=lZ [(CK5))2+(CJW) 2
] (§) W
Here C*(5), Cj(5) and CJ(5) are respectively the polarization vec-
tors of the hydrogen atoms for branch j along the a, b, and c axes. Thec axis is taken as the chain axis and the a and b axes form an orthog-
onal coordinate system with it. In the one-phonon approximation,
these two functions are proportional to the effective frequency distri-
butions described in section 2.
The force field used in the model is of the Urey-Bradley type [6], and
consists of describing the potential energy as a series of harmonic forces
preventing bond stretching, valence-angle bending and torsions about
valence bonds.
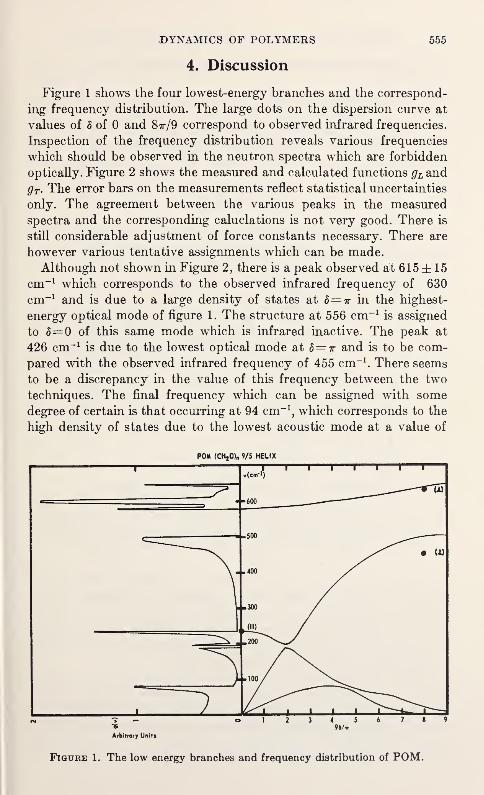
DYNAMICS OF POLYMERS 555
4. Discussion
Figure 1 shows the four lowest-energy branches and the correspond-
ing frequency distribution. The large dots on the dispersion curve at
values of 5 of 0 and 8tt/9 correspond to observed infrared frequencies.
Inspection of the frequency distribution reveals various frequencies
which should be observed in the neutron spectra which are forbidden
optically. Figure 2 shows the measured and calculated functions ^andgT . The error bars on the measurements reflect statistical uncertainties
only. The agreement between the various peaks in the measured
spectra and the corresponding caluclations is not very good. There is
still considerable adjustment of force constants necessary. There are
however various tentative assignments which can be made.
Although not shown in Figure 2, there is a peak observed at 615 ± 15
cm-1 which corresponds to the observed infrared frequency of 630
cm-1 and is due to a large density of states at 8=tt in the highest-
energy optical mode of figure 1. The structure at 556 cm-1is assigned
to 5=0 of this same mode which is infrared inactive. The peak at
426 cm-1is due to the lowest optical mode at 8=t and is to be com-
pared with the observed infrared frequency of 455 cm-1. There seems
to be a discrepancy in the value of this frequency between the two
techniques. The final frequency which can be assigned with somedegree of certain is that occurring at 94 cm-1
, which corresponds to the
high density of states due to the lowest acoustic mode at a value of
POM (CHjO),, 9/5 HELIX
Arbitrary Units
Figure 1. The low energy branches and frequency distribution of POM.
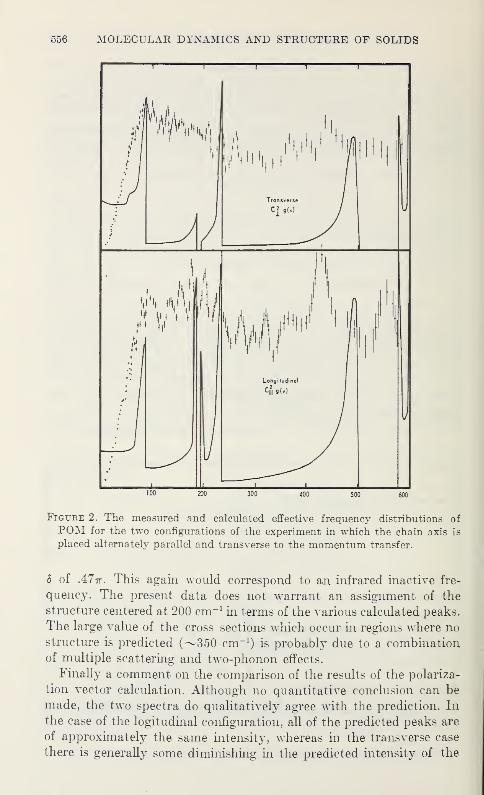
556 MOLECULAR DYNAMICS AND STRUCTURE OF SOLIDS
t 1 i r
-J Lu I i i LJ100 200 300 400 500 600
Figure 2. The measured and calculated effective frequency distributions of
POM for the two configurations of the experiment in which the chain axis is
placed alternately parallel and transverse to the momentum transfer.
5 of A7tt. This again would correspond to an infrared inactive fre-
quency. The present data does not warrant an assignment of the
structure centered at 200 cm-1in terms of the various calculated peaks.
The large value of the cross sections which occur in regions where nostructure is predicted (^350 cm-1
) is probably due to a combination
of multiple scattering and two-phonon effects.
Finally a comment on the comparison of the results of the polariza-
tion vector calculation. Although no quantitative conclusion can be
made, the two spectra do qualitatively agree with the prediction. In
the case of the logitudinal configuration, all of the predicted peaks are
of approximately the same intensity, whereas in the transverse case
there is generally some diminishing in the predicted intensity of the
DYNAMICS OF POLYMERS 557
higher-energy modes. This general trend is reflected in the measure-
ments.
In conclusion, two frequencies not observable in infrared have been
identified in addition to two which have previously been seen. There
is a reasonable possibility of identifying more modes in the region of
200 cm-1 when the measurements are repeated with an instrument of
better resolution. The force constants will be adjusted as soon as this
better data is available.
5. References
[1] H. Todokoro, T. Yasumoto, S. Murahashi, and I. Nitta, J. Polymer Sci. 44,
266 (1960).
[2] H. Todokoro, M. Kobayashi, Y. Kawaguchi, A. Kobayashi, and S. Murahashi,
J. Chem. Phy. 38, 703 (1963).
[3] The sample was provided by Dr. H. Starkweather of E. I. du Pont de Nemours& Co.
[4] E. B. Wilson, J. C. Decius and P. C. Cross, Molecular Vibrations, McGraw-Hill (1955).
[5] P. W. Higgs, Proc. Roy. Soc, London A220, 472 (1953).
[6] T. Shimanouchi, J. Chem. Phys. 17, 245 (1949).

VIBRATION SPECTRA OF POLYGLYCINE
V. D. GUPTA, 1 2 S. TREVINO, 2 and H. BOUTIN 2 3
Explosives Laboratory, Picatiny Arsenal, Dover, N.J. 07801
1. Introduction
Polyglycine (—CH2—CO—NH—
)
n is the simplest of all synthetic
polyamino acids, and a study of its normal modes and their dispersion
is fundamental to an understanding of more complex polypeptides andproteins. It exists in two forms which differ in chain conformation.
Polyglycine I contains fully extended linear zig-zag chains with a two-
fold screw axis which are packed in an anti-parallel arrangement. Poly-
glycine II chains exist in helical form with a three-fold screw axis.
They are mostly parallel and are packed in a hexagonal lattice. In both
forms the neighboring chains are hydrogen bonded via N—H...O=Cbonds. In polyglycine II, Padden and Keith [1]
4 from morphological
studies and Krimm [2] from infrared studies have shown the simul-
taneous presence of both direct and inverted chains. Ramachandranet al. [3] have shown that, as in collagen, hydrogen bonds of the type
C— H...0 can be formed in polyglycine II. It is found that only one-
third the possible number of such bonds can be formed. These obser-
vations are in accordance with the infrared studies of Krimm et al. [4].
Fukushima, Ideguchi and Miyazawa [5] have made a normal-mode
calculation limited to the in-plane vibrations of polyglycine I and have
studied the amide band frequencies. Since the low-frequency vibrations
are expected to depend sensitively on the chain conformation, we have
recalculated the normal modes for both the in-plane and out-of-plane
vibrations and studied their dispersion.
2. Theory
Calculations are carried out according to Wilson's GF matrix methodas modified by Higgs [6]. The secular determinant to be solved is:
\G(6)F(f»-I\(e)\=0 (1)
where / is the identity matrix and 0 is the phase difference between
1 Visiting Scientist on leave from Physics Department, Indian Institute of Technology, Kanpur, India.
2 Guests of Army Materials and Mechanics Research Center, Watertown, Mass. 02712.
3 Present Address—Bendix Corporation, Southfield, Michigan.
* Figures in brackets indicate the literature references at the end of this paper.
559
560 MOLECULAR DYNAMICS AND STRUCTURE OF SOLIDS
successive units. It is related to the phonon momentum K and the
distance (a) between adjacent chemical units by 0=27rKa. TheThe frequencies are given by the relation
X(0)=4irV(0) (2)
A plot of vibrational frequency v as a function of 0(O<0<7r) gives
the dispersion of the mode. A Urey-Bradley force field was used.
Assuming that a single phonon is involved in the scattering process,
the incoherent neutron scattering cross section can be written as:
c{^=iMm x^^p^_[) ^' ^aie-'W/M (3)
where a tis the incoherent scattering length of the Zth nucleus in the
unit cell, Ef and Et are the final and incident neutron energies, Mis the neutron mass,
<f>is the scattering angle, e~2Wl is the Debye-Waller
factor for the Zth particle, ho)=Ef—Ei^>0 is the energy of the phononfrom which the neutron is scattered and
g;'(«)={MiM,)vi{2vys §d*e\K.cm\2K<*-<*M) (4)
where Mi is the mass of the Ith. particle and v is the volume of the unit
cell. For the case of a monoatomic polycrystalline sample the sum over I
reduces to
S afr-^ig'i' (co) =a2le-
2W(M/Ml) g(o>) (5)
where g{u>) is the density of states. Since a knowledge of the polarisa-
tion vectors Cj-(0) is necessary to obtain frequency distributions from
the inelastic neutron scattering cross section, our frequency distribu-
tion reported here is an approximate one.
3. Results and Discussion
The dispersion curves calculated for polyglycine I are shown in
figure 1 and the calculated and observed infrared frequencies with
their assignments are given in table 1. The inelastic neutron spectra
of polyglycine I and II was obtained using theAMMRC slow chopper.
The frequency distributions obtained are shown in figures 2 and 3.
The torsional motion around the amide C-N bond (amide VII)
which involves the large displacement of the alpha carbon atom should
be sensitive to conformational changes. This band appears as a strong
band at 210 cm-1in the neutron spectra and at 215 cm-1
in infrared
absorption. The corresponding band in P.G.II appears at 365 cm-1.
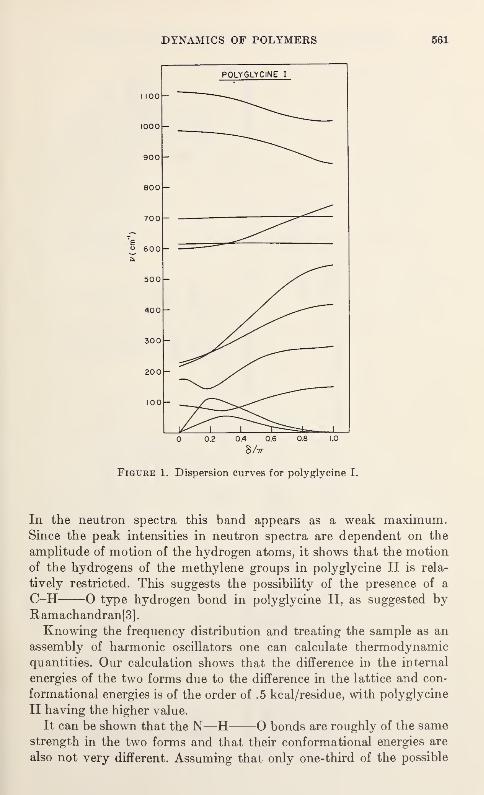
DYNAMICS OF POLYMERS 561
I 100
1000
900
800
700
» 600
500
400
300
20 0
100
0 0.2 0.4 0.6 0.8 1.0
S/7T
Figure 1. Dispersion curves for polyglycine I.
In the neutron spectra this band appears as a weak maximum.Since the peak intensities in neutron spectra are dependent on the
amplitude of motion of the hydrogen atoms, it shows that the motion
of the hydrogens of the methylene groups in polyglycine II is rela-
tively restricted. This suggests the possibility of the presence of a
C-H O type hydrogen bond in polyglycine II, as suggested byRamachandran[3]
.
Knowing the frequency distribution and treating the sample as an
assembly of harmonic oscillators one can calculate thermodynamicquantities. Our calculation shows that the difference in the internal
energies of the two forms due to the difference in the lattice and con-
formational energies is of the order of .5 kcal/residue, with polyglycine
II having the higher value.
It can be shown that the N—H O bonds are roughly of the samestrength in the two forms and that their conformational energies are
also not very different. Assuming that only one-third of the possible
POLYGLYCINE I
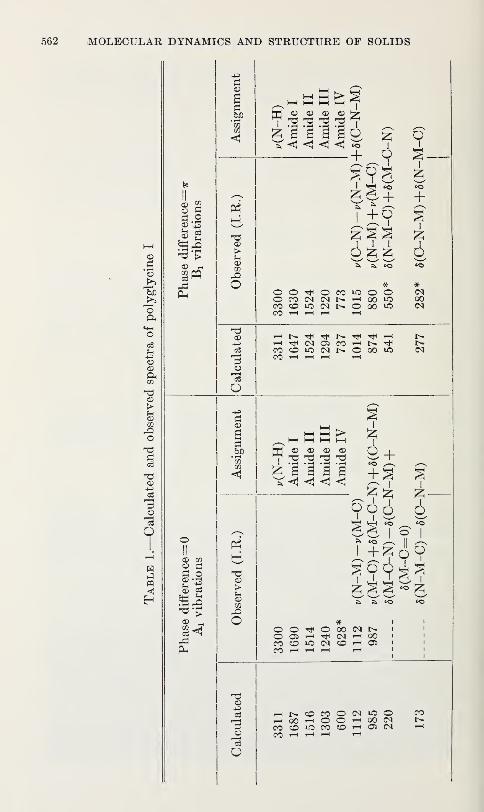
MOLECULAR DYNAMICS AND STRUCTURE OF SOLIDS
<D co
os=?
o
& g"~!
-d >© -
Ph
h3
CO
o
hH a > aH H H ,
wI
© © © ©id 'd ^
i
£ a a a a oA ^ *<J <1 *o
+ o
as>a
oi
a-i
+ +
O O Tt< O CO lOO CO N N N HCO O iO M N OCO i~i t—I rH r-
I
o o00 *000 »o
I
O
00CM
-d©
o
o
HtJINOSCOHN^ l>CO^iOMNOOOiO CMCO r—I r-I i—( r-
1
© co
Eh O
© ?3
03 -<
c• i—
i
COCO
<1
-d©>
CO
o
©*d
© © ©'d ""d
w1 :y* a a a aX«1 <j <t1 ^
i
s +to ^+ 2
966as
2;
6
^9azi a a «
O O O 00 (N NO Oi 1—I <N rH 00
CO CO lO N tD H 05CO 1—I -i—(
1—I i-H
-d©
"do
O
,—iI>.COCOO<M*0©T-HOO'-iOO'-iOOcNCOCOiOCOCOHOINCO T—
I»—
II
1—1
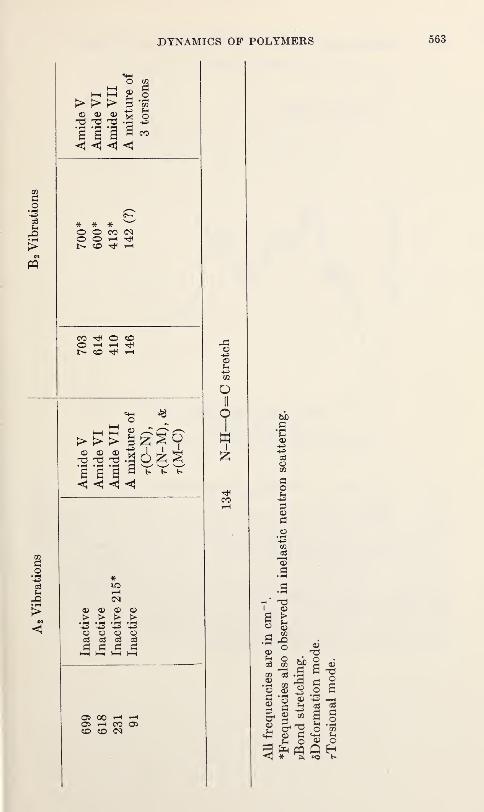
DYNAMICS OF POLYMERS
HHgS>>> p -a
^ ^ •§ ^
a.2
u * * * wO O CO <NO O T}4
t>- CO t}H t-H
CO O CDO H H ^1N CD ^ h
> > >CD © CD
nd
a J
CD —T '—
^
PO
c3
42
*
rH<N
CD CD CD
'-+2 '43 *,J3
o o oo3 o3 o3
p P P
pP
CD
oII
Tw
I
Oi 00 *—I'—
i
Oi i—I CO OiCD CO CN
gS3crCD
P i3CD wg.?
CD
§ •
ll
O co
CD O
to K
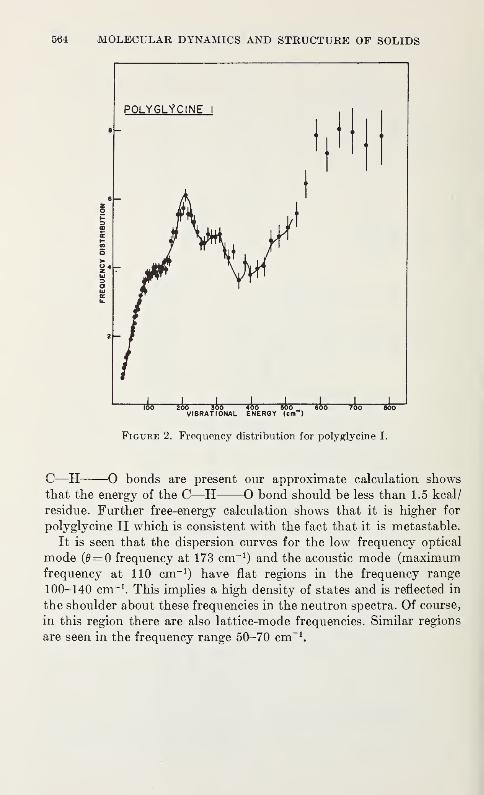
564 MOLECULAR DYNAMICS AND STRUCTURE OF SOLIDS
Figure 2. Frequency distribution for polyglycine I.
C—H O bonds are present our approximate calculation shows
that the energy of the C—H O bond should be less than 1.5 kcal/
residue. Further free-energy calculation shows that it is higher for
polyglycine II which is consistent with the fact that it is metastable.
It is seen that the dispersion curves for the low frequency optical
mode (0= 0 frequency at 173 cm-1) and the acoustic mode (maximum
frequency at 110 cm-1) have flat regions in the frequency range
100-140 cm-1. This implies a high density of states and is reflected in
the shoulder about these frequencies in the neutron spectra. Of course,
in this region there are also lattice-mode frequencies. Similar regions
are seen in the frequency range 50-70 cm-1.
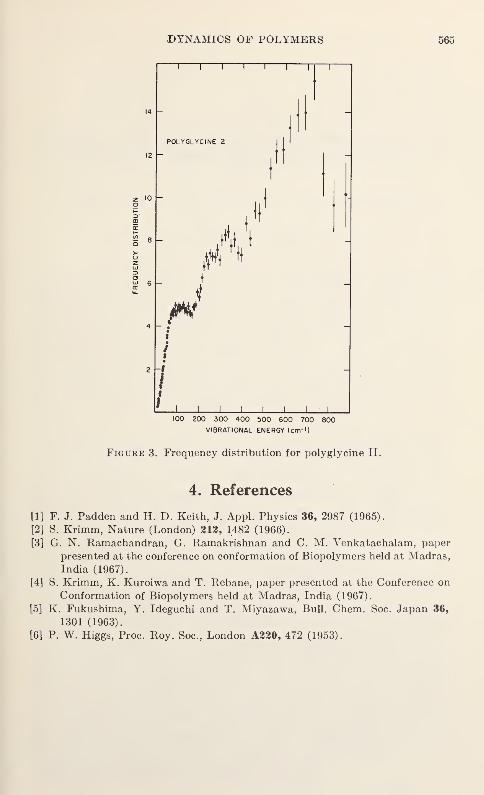
/DYNAMICS OF POLYMERS 565
100 200 300 400 500 600 700 800
VIBRATIONAL ENERGY (cm" 1
)
Figure 3. Frequency distribution for polyglycine II.
4. References
[1] F. J. Padden and H. D. Keith, J. Appl. Physics 36, 2987 (1965).
[2] S. Krimm, Nature (London) 212, 1482 (1966).
[3] G. N. Ramachandran, G. Ramakrishnan and C. M. Venkatachalam, paper
presented at the conference on conformation of Biopolymers held at Madras,
India (1967).
[4] S. Krimm, K. Kuroiwa and T. Rebane, paper presented at the Conference on
Conformation of Biopolymers held at Madras, India (1967).
[5] K. Fukushima, Y. Ideguchi and T. Miyazawa, Bull. Chem. Soc. Japan 36,
1301 (1963).
[6] P. W. Higgs, Proc. Roy. Soc, London A220, 472 (1953).

THERMAL CONDUCTIVITY AND SPECIFIC HEATOF AMORPHOUS POLYMERS BETWEEN
0.4 AND 4 °K 1
C. L. CHOY, G. L. SALINGER, and Y. C. CHIANG
Department of Physics and Astronomy
Rensselaer Polytechnic Institute, Troy, New York 12180
The thermal properties of crystals are reasonably well understood
theoretically because of the periodic nature of the lattice. The thermal
properties of amorphous solids, however, are badly understood. Attemperatures low enough that the wavelength of the dominant thermal
vibrations is long compared to the microscopic disorder, the theory
applicable to crystals should also be applicable to amorphous solids.
Thus the thermal conductivity, K, and the specific heat, C, have
been measured in amorphous polymethyl methacrylate (PMMA),polystyrene (PSTY) and polyvinyl acetate (PVAc) between 0.4 and
4 °K.
The thermal conductivity, shown in figure 1 , is qualitatively similar
for all three polymers. It is nearly temperature independent near
4 °K and decreases with an ever increasing power of the temperature
as the temperature is lowered. Near 0.4 °K, KccT1
5
. This does not
agree with the linear temperature dependence of the thermal con-
ductivity predicted by Klemens[l] 2 for inorganic glasses. Attempts
to fit the data by adding internal boundary scattering to the Klemenstheory resulted in temperature-independent mean free paths of
about 50 ii. This is too long to be physically meaningful.
The Klemens theory may not be applicable since the end-to-end
chain length of the polymer chains is the same as the dominant wave-
length of the vibrations of the upper part of the temperature range.
The thermal conductivity was measured for three different samples
of PMMA. The data shown are for a specially prepared pure PMMA(lucite) having a weight average molecular weight of 430,000. For a
sample having an average molecular weight of 79,000, the thermal
conductivity was 6 percent less over the temperature range. A sample
cut from a ){ inch Rohm and Haas sheet, known to have many short
chains, displayed a thermal conductivity about 10 percent less than
that shown here. Measurements at lower temperatures may be
necessary to make a meaningful comparison with the theory.
1 Figures in brackets indicate the literature refererences at end of this paper.2 Work supported by the National Aeronautics and Space Administration.
567
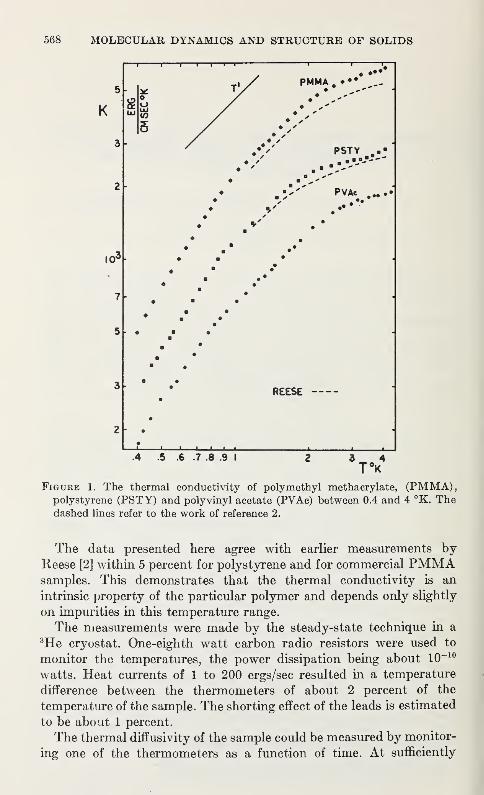
568 MOLECULAR DYNAMICS AND STRUCTURE OF SOLIDS
.5 .6 .7 .8 .9 I Vk4
Figure 1. The thermal conductivity of polymethyl methacrylate, (PMMA),polystyrene (PSTY) and polyvinyl acetate (PVAc) between 0.4 and 4 °K. Thedashed lines refer to the work of reference 2.
The data presented here agree with earlier measurements byReese [2] within 5 percent for polystyrene and for commercial PMMAsamples. This demonstrates that the thermal conductivity is an
intrinsic property of the particular polymer and depends only slightly
on impurities in this temperature range.
The measurements were made by the steady-state technique in a3He cryostat. One-eighth watt carbon radio resistors were used to
monitor the temperatures, the power dissipation being about 10~10
watts. Heat currents of 1 to 200 ergs/sec resulted in a temperature
difference between the thermometers of about 2 percent of the
temperature of the sample. The shorting effect of the leads is estimated
to be about 1 percent.
The thermal diffusivity of the sample could be measured by monitor-
ing one of the thermometers as a function of time. At sufficiently
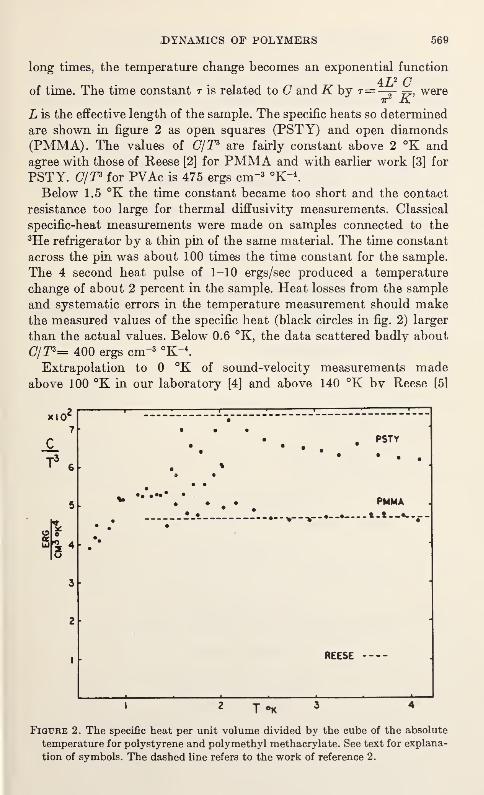
DYNAMICS OF POLYMERS 569
long times, the temperature change becomes an exponential function4JT2 Q
of time. The time constant r is related to C andK by r= —— ==, were
L is the effective length of the sample. The specific heats so determined
are shown in figure 2 as open squares (PSTY) and open diamonds(PMMA). The values of C/T* are fairly constant above 2 °K andagree with those of Reese [2] for PMMA and with earlier work [3] for
PSTY. C/T* for PVAc is 475 ergs cm"3 °K~4.
Below 1.5 °K the time constant became too short and the contact
resistance too large for thermal diffusivity measurements. Classical
specific-heat measurements were made on samples connected to the3He refrigerator by a thin pin of the same material. The time constant
across the pin was about 100 times the time constant for the sample.
The 4 second heat pulse of 1-10 ergs/sec produced a temperature
change of about 2 percent in the sample. Heat losses from the sample
and systematic errors in the temperature measurement should makethe measured values of the specific heat (black circles in fig. 2) larger
than the actual values. Below 0.6 °K, the data scattered badly about
0/J3= 400 ergs cm"3 °K"4.
Extrapolation to 0 °K of sound-velocity measurements madeabove 100 °K in our laboratory [4] and above 140 °K bv Reese [51
xiOc
7
c_
T3 s
s| 4
. PSTY
PMMAt-!__*-.
REESE
I 2 J°K 4
Figure 2. The specific heat per unit volume divided by the cube of the absolute
temperature for polystyrene and polymethyl methacrylate. See text for explana-
tion of symbols. The dashed line refers to the work of reference 2.
570 MOLECULAR DYNAMICS AND STRUCTURE OF SOLIDS
result in (7/T3=420±40 ergs cm-3 °K~4 for polystyrene. This value
is considerably lower than the measured C/T3 except at the lowest
temperatures. This anomalous specific heat is ascribed to the existence
of low frequency non-acoustic modes [5]. The data are consistent
with the addition of a 10 °K Einstein mode to the Debye spectrum.
We believe that some of the side groups are only loosely coupled to
the lattice and contribute to this mode. Recent measurements[6]
on irradiation-produced cross-linked polystyrene, which showed no
change in the thermal conductivity and a 25 percent reduction in
the specific heat between 1.2 and 4 °K, are consistent with this
explanation.
References
[1] G. P. Klemens, Proc. Roy. Soc. (London) A208, 108 (1951).
[2] W. Reese, J. Appl. Phys. 37, 864 (1966).
[3] R. J. Noer, C. W. Dempsey and J. E. Low, Bull. Am. Phys. Soc. 4, 108 (1959).
[4] J. I. Treu (unpublished).
[5] W. Reese, J. Appl. Phys. 37, 3959 (1966).
[6] W. Reese, private communication.
Appendix I
Molecular Dynamics and Structure of Solids
Symposium Committees
Carl 0. Muehlhause, General Chairman Reactor Radiation Division
Vernon W. Myers, Deputy General Chairman Reactor Radiation Division
Program Committee
Robert S. Carter, Chairman, Reactor Radiation Division
Norman P. Bekkedahl Polymers Division
Thomas C. Farrar Inorganic Materials Division
David T. Goldman Reactor Radiation Division
William G. Hodgson Research Associate to
The Institute for Materials
Research, American
Cyanamid CompanyJohn D. Hoffman Polymers Division
David R. Lide Atomic Physics Division
Edward Prince Reactor Branch, Nuclear
Physics Division, NavalResearch Laboratory
Curt W. Reimann Inorganic Materials Division
John J. Rush Reactor Radiation Division
Jon J. Spijkerman Analytical Chemistry Division
Arrangements Committee
Frederick J. Shorten, Chairman, Reactor Radiation Division
Social Committee
Howard T. Yolken, Chairman, Institute for Materials Research
Tours Committee
Frederick J. Shorten, Chairman, Reactor Radiation Division
Ladies Program
Mrs. Edward L. Brady, Chairman
Finance Committee
Ronald B. Johnson, Chairman, Institute for Materials Research
571
U.S. GOVERNMENT PRINTING OFFICE : 1969 O—311-280