Module 9: Principles of Power System Operation - Western ...
150
9|Principles of System Operation W E S T E R N E L E C T R I C I T Y C O O R D I N A T I N G C O U N C I L 1
-
Upload
khangminh22 -
Category
Documents
-
view
4 -
download
0
Transcript of Module 9: Principles of Power System Operation - Western ...

9|Principles of System Operation
W E S T E R N E L E C T R I C I T Y C O O R D I N A T I N G C O U N C I L
1

Course Outline
1. Introduction to WECC 2. Fundamentals of Electricity 3. Power System Overview 4. Principles of Generation 5. Substation Overview 6. Transformers 7. Power Transmission 8. System Protection 9. Principles of System Operation

Overview
• The Principles of Power System Operation module presents the following topics: – Balancing Authorities
– AGC and Energy Balance
– Interconnected Operations
– Automatic Generation Control
– Operating Limits
– Power System Stability
– Computer System Functions
– And a few more topics of interest

Balancing Authority Overview
• Definition
• Basic Responsibilities
• WECC Balancing Authorities
• Industry Restructuring
4
W E S T E R N E L E C T R I C I T Y C O O R D I N A T I N G C O U N C I L

Balancing Authority Overview Definition
What Is A Balancing Authority (BA)?
• A Balancing Authority is defined by a set of resources and interchange meters.
• Traditional Balancing Authorities have dispatchable generation, load, and interchange.

Balancing Authority
A
Balancing Authority
B
Balancing Authority
D Balancing Authority
C Balancing Authority
E
M
M
M
M
M
M
M
M
M
= meter
Balancing Authorities
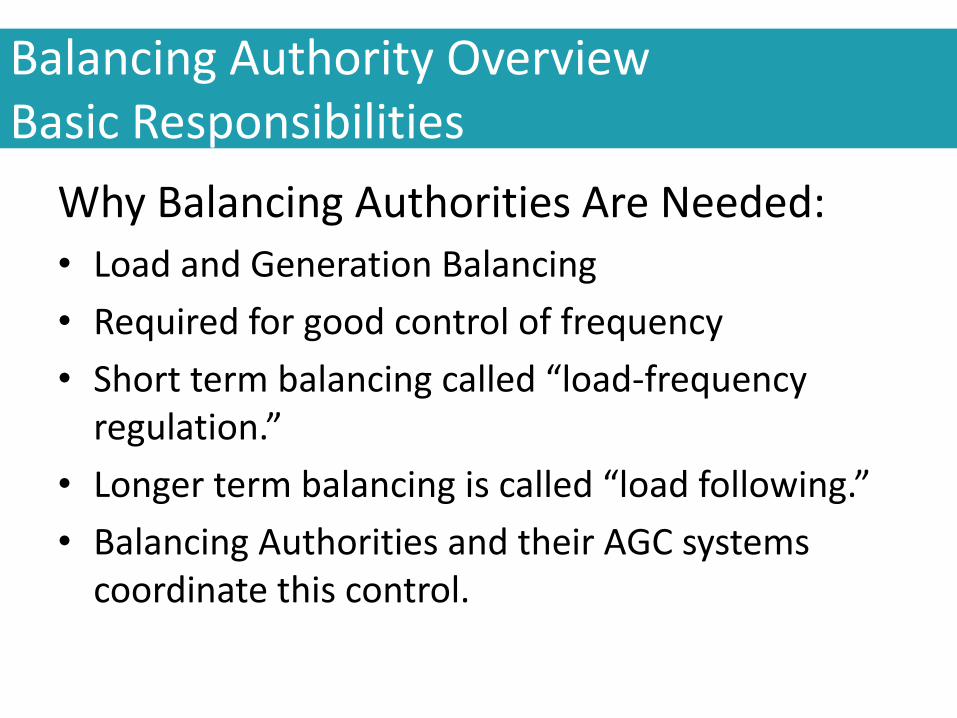
Balancing Authority Overview Basic Responsibilities
Why Balancing Authorities Are Needed: • Load and Generation Balancing
• Required for good control of frequency
• Short term balancing called “load-frequency regulation.”
• Longer term balancing is called “load following.”
• Balancing Authorities and their AGC systems coordinate this control.

Balancing Authority Overview Basic Responsibilities
• Balance Load, Generation, and Net Interchange.
• Control Frequency and Time Error.
• Implement Interchange Transactions.

Balancing Authority Overview WECC Balancing Authorities

Balancing Authority Overview Industry Restructuring
• Balancing Authorities
• Reliability Coordinators
• Interchange Coordinators
• Transmission Operators
• Independent System Operators (ISO)
• Regional Transmission Organizations (RTO)

Check Your Knowledge: Balancing Authority Overview
1. How many Balancing Authorities are in the Western Interconnection?
2. What do BAs balance?
3. How does a generation-only BA balance load and generation?
W E S T E R N E L E C T R I C I T Y C O O R D I N A T I N G C O U N C I L

Automatic Generation Control (AGC) Basics
• Scheduled and Actual Interchange
• Turbine Governor Controls
• Area Control Error
• Sample Automatic Generator Control Response
• NERC / WECC Control Criteria
• Time Error

Automatic Generation Control (AGC) Basics Scheduled Interchange
How Do We Do Interchange?
How do we get 100 MW of power to flow from Balancing Authority A to B?
Scenario:
A generates 100 MW more than its load.
B generates 100 MW less than its load.
Excess MW from A serves the deficiency in B.

Automatic Generation Control (AGC) Basics Scheduled Interchange
What is Scheduled Interchange?
• An agreement to exchange a specified amount of power for an agreed upon period of time.
• Balancing Authorities implement the schedule in a coordinated manner.

Automatic Generation Control (AGC) Basics Actual Interchange
What is Actual Interchange? • Measured MW flow between balancing
authorities.
• Uses interchange meters on lines establishing the balancing authority boundaries.
• Flows are not always intentional

BA Load = (Generation) – (Net Interchange)
Balancing Authority
M
M
M
M
M
Generation
Interchange
Automatic Generation Control (AGC) Basics Actual Interchange
Computing BA Area Load

Automatic Generation Control (AGC) Basics
A Matter of Balance
60
Load Generation
Frequency

Turbine
R
L Motor
R L
f
Increasing speed decreases turbine input
Steam
Speed Changer
Generator
Moveable collar
A generator will increase output when it sees low frequency A generator will decrease output when it sees high frequency Governor action takes place without control center instruction.
Automatic Generation Control (AGC) Basics Turbine Governor Controls
Generating Unit Controls


• Measures whether Balancing Authority is properly generating its MW requirements.
• Factors in required actions to help control interconnection frequency.
Automatic Generation Control (AGC) Basics Area Control Error (ACE)

AGC Control Modes
• Tie line bias control is the normal mode used. It uses both frequency and tie-line power flow to calculate ACE.
• A more descriptive term for this control mode is constant net interchange with frequency bias. It recognizes the following:
• If frequency decreases and the power leaving the system increases (or power entering the system decreases), then the need for power is outside the Balancing Authority.
• If frequency decreases and the power leaving the system decreases (or power entering the system increases), then the need for power is inside the Balancing Authority.

• Flat frequency control responds only to frequency changes. It does not respond to power flow changes on tie lines. This mode is used only on an isolated system, since it could lead to overloading tie lines while correcting frequency in an interconnected system.
• Flat tie line control responds only to changes in power flow on tie lines. It does not respond to changes in frequency. To prevent large frequency deviations, it is used only for brief periods when a frequency measurement is not available.
AGC Control Modes

ACE = (NIA - NIS) –(10B x (FA - FS))
• Negative ACE = under-generation
• Positive ACE = over-generation
Tie-line error factor
Frequency error factor
Automatic Generation Control (AGC) Basics ACE Equation

M
Telemetry
A’s control action due to:
Tie Line Error
Frequency Error
Schedule = 1000 MW
Actual = 1000 MW
Frequency OK
Tie Line Error? NO
Balancing Authority
A
Load = 4000 MW
Load = 3000 MW
B’s control action due to:
Tie Line Error
Frequency Error
1 Initial Conditions
NONE
NONE
NONE
NONE
Gen = 5000 MW
Gen = 2000 MW
Balancing Authority
B

M
Telemetry
A’s control action due to:
Tie Line Error
Frequency Error
Schedule = 1000 MW
Actual = 925 MW
Frequency Low Tie Line Error? Yes
Load = 4300 MW
Load = 3000 MW
B’s control action due to:
Tie Line Error
Frequency Error
2 Load Jumps 300MW in Balancing Area A
=increase generation =decrease generation
Gen = 5225 MW
Gen = 5000 MW Gen = 2000 MW
Gen = 2075 MW
Balancing Authority
A Balancing Authority
B

M
Telemetry
A’s control action due to:
Tie Line Error
Frequency Error
Schedule = 1000 MW
Actual = 980 MW
Frequency Low Tie Line Error? Yes
Gen = 5280 MW
Load = 4300 MW
Gen = 2020 MW
Load = 3000 MW
B’s control action due to:
Tie Line Error
Frequency Error
3 Nearing new steady state
=increase generation =decrease generation
Balancing Authority
A Balancing Authority
B

M
Telemetry
A’s control action due to:
Tie Line Error
Frequency Error
Schedule = 1000 MW
Actual = 1000 MW
Frequency OK Tie Line Error? NO
Gen = 5300 MW
Load = 4300 MW
Gen = 2000 MW
Load = 3000 MW
B’s control action due to:
Tie Line Error
Frequency Error
4 New steady state
=increase generation =decrease generation
NONE
NONE
NONE
NONE
Balancing Authority
A Balancing Authority
B

Automatic Generation Control (AGC) Basics Sample Automatic Generator Control Response
Frequency Disturbance Sequence Somewhere in the system, a generator trips. Stored energy (inertia) from all rotating mass in
system replaces lost generation. Increased MW output without increased mechanical
input slows the interconnected system (frequency drops).
All generator governors act to stop frequency decline.
AGC of deficient system eventually reacts to restore frequency.


• Measures a Balancing Authority’s control performance over time
Non-compliance can result in monetary penalties
Two Control Performance Standards serve as measures
CPS1
CPS2
Automatic Generation Control (AGC) Basics NERC / WECC Control Criteria

Automatic Generation Control (AGC) Basics NERC / WECC Control Criteria
CPS1 – Helping or hurting frequency? Control errors of moderate magnitude are acceptable
Control errors helping frequency are good.
(over-generating when frequency is low, under-generating when frequency is high)
Control errors hurting the frequency are bad. (over-generating when frequency is high, under-generating when frequency is low)
32
W E S T E R N E L E C T R I C I T Y C O O R D I N A T I N G C O U N C I L

CPS1 – Help the Frequency!
Starting with a nominal value of 200%, your score goes up when you help the frequency, and your score goes down when you hurt the frequency.
• At 200% your frequency is on schedule and your ACE is zero.
• 100% is the minimum acceptable control average.
Automatic Generation Control (AGC) Basics NERC / WECC Control Criteria

Automatic Generation Control (AGC) Basics NERC / WECC Control Criteria
CPS2 – Magnitude of ACE over time
Over a 10-minute period, the average ACE may not exceed a threshold value called L10.
– L10 values are unique to each Balancing authority

Note: Assume Frequency is LOW during entire period.
-50
-40
-30
-20
-10
0
10
20
30
40
50
Time
Note: Assume Frequency is LOW during entire period
Good Control CPS1, CPS2 OK
CPS1 OK CPS2 Violations
CPS1 Violations CPS2 Violations
L 10
L 10
Control Performance Example

Automatic Generation Control (AGC) Basics Time Error
• Operation at other than 60Hz results in time error
–Low frequency-time is “slow”
–High frequency-time is “fast”
Large time error accumulations are a sign of poor Interconnection control performance.

Scheduled frequency altered
60.02 Hz to correct “slow” time
59.98 Hz to correct “fast” time
Automatic time error (ATEC)
Added component to ACE equation
Automatic Generation Control (AGC) Basics Time Error

Check Your Knowledge: AGC Basics
1. What does AGC stand for?
2. How does the system know you plugged your vacuum in?
3. How do different types of generation respond to AGC?
W E S T E R N E L E C T R I C I T Y C O O R D I N A T I N G C O U N C I L

Operating Reserves
• Purpose and type of operating reserves
• Standards
• Current issues
• Reserve Sharing Groups

Operating Reserves Purpose and Types
• Electricity production is an “real-time” process.
• Extra generating capacity needs to be readily available.
• Operating reserves are needed to replace lost generation and supply load increases.
• All in the name of good frequency control

Regulating reserve
–Needed for moment to moment load balancing
–Used to meet CPS1 and CPS2
Standard
Must be spinning
Responsive to AGC
Have enough to meet CPS1 and CPS2
Operating Reserves Purpose and Types

5000
5500
6000
6500
7000
7500
7:00 7:06 7:12 7:18 7:24 7:30 7:36 7:42 7:48 7:54 8:00
Time
0
500
1000
1500
2000
2500
Scheduled imports
Generation
Load
Regulating Reserves For Moment To Moment Load Regulation

• Contingency Reserve –Used to replace lost generation
–Used to meet the Disturbance Control Standard (DCS)
–Systems can meet requirements collectively • Create Reserve Sharing Groups
Operating Reserves Purpose and Types

Purpose and Types Operating Reserves
• Contingencies
–e.g. generation failures
– load forecast errors
• Regulation
– Frequency
–ACE

OLD - TOTAL OPERATING RESERVE
Regulating Reserve Spinning - Meet NERC Criteria
On Demand Obligations
Plus
OR
2) 5% Load Responsibility on Hydro PLUS 7% of Load
Responsibility on Thermal
1) Greatest Single Contingency
Contingency Reserve = Greater of: 50%
Spinning
Additional for Interruptible Imports
Plus

New Standard-How much?
Greater of:
• MW loss from single most severe contingency.
-or- • 3% of hourly integrated load
plus 3% of hourly integrated generation
Operating Reserves Purpose and Types

Operating Reserves Standards
New BAL-002-WECC-2 Standard R1. Each Balancing Authority and each Reserve Sharing Group shall maintain a minimum amount of Contingency Reserve, except within the first sixty minutes following an event requiring the activation of Contingency Reserve, that is: [Violation Risk Factor: High] [Time Horizon: Real-time operations] 1.1 The greater of either: The amount of Contingency Reserve equal to the loss of the most severe single contingency; The amount of Contingency Reserve equal to the sum of three percent of hourly integrated Load plus three percent of hourly integrated generation.

Operating Reserves Standards
New BAL-002-WECC-2 Standard
1.2 Comprised of any combination of the reserve types specified below:
Operating Reserve – Spinning
Operating Reserve - Supplemental
Interchange Transactions designated by the Source Balancing Authority as
Operating Reserve – Supplemental
Reserve held by other entities by agreement that is deliverable on Firm
Transmission Service
A resource, other than generation or load, that can provide energy or
reduce energy consumption
Load, including demand response resources, Demand-Side Management
resources, Direct Control Load Management, Interruptible Load or
Interruptible Demand, or any other Load made available for curtailment by
the Balancing Authority or the Reserve Sharing Group via contract or
agreement.
All other load, not identified above, once the Reliability Coordinator has
declared an energy emergency alert signifying that firm load interruption is
imminent or in progress.

Operating Reserves Standards
Disturbance Control Standard (DCS) • The ACE must return either to zero or to its pre-
disturbance level within fifteen minutes following the start of the disturbance.
• Disturbance control standard compliance – Each BA or reserve sharing group shall meet the
Disturbance Control Standard (DCS) 100% of the time for reportable disturbances.
• Reportable disturbance reporting threshold – events that cause ACE to change by 35% of Most
Severe Single Contingency.

• Self supply • Market structure
– California ISO
• Reserve sharing groups – Northwest Power Pool – Desert Southwest Reserve Sharing Group – Rocky Mountain Reserve Group
Operating Reserves Providing Reserves

Check Your Knowledge: Operating Reserves
1. What is the purpose of Operating Reserves?
2. What are 3 types of Operating Reserves?
W E S T E R N E L E C T R I C I T Y C O O R D I N A T I N G C O U N C I L

Operating Limits
• Electric current flowing from the generators to the loads follows all available paths.
• Most current flows over paths that offer the least impedance through conductors, transformers, and other power system components.
• On well-designed power systems, natural load flows are such that no lines are overloaded under normal circumstances.
• In some cases, phase-shifting transformers may be required to alter the natural current flows on the transmission system.

• If a transmission line is opened for any reason, such as a fault, current flows almost instantaneously redistribute over the remaining transmission system.
• Power systems are generally designed to handle contingencies, such as a line tripping, without overloading any facility.
• However, this is not always possible, particularly when other lines are already out of service. Therefore, system operators may be required to implement emergency switching actions or arm special remedial action schemes during certain contingencies to prevent equipment loadings from exceeding emergency ratings.
Operating Limits

Thermal Limits
• To avoid excessive heating, utilities assign thermal limits or ratings to devices.
• These limits should not be exceeded.
• The ratings are based on the amount of heat the device can carry and dissipate. Ratings are expressed in amps, MW, or MVA.
• Ratings vary with season and the amount of time the device is exposed to the high current.

• Each energized device (a circuit breaker, the bus work, transformer, conductor, etc.) has an individual rating. When multiple devices in series (e.g., a transmission line and a series capacitor) have different thermal limits, the most restrictive rating applies to the combination of facilities.
• Conductor and transformer ratings are typically the most restrictive factors.
Thermal Limits

Annealing
• The reduction of conductor strength due to annealing over the life of the conductor (annealing is the process of heating and cooling the conductor)
• The increase in conductor sag due to thermal expansion at high temperatures (minimum conductor-to-ground clearances must be maintained at all times)
• There are usually several ratings, tailored to local loading and weather conditions that apply to a given line.

Normal, Peak & Emergency Ratings
• Normal rating is the maximum current that can flow on a continuous basis.
• Peak rating is the current that can be tolerated for a limited time period, usually four hours. In general, the peak rating is higher than the normal rating.
• Emergency rating is the highest rating of the line. This rating is the maximum current that is permissible for a short period of time, usually one hour or less. Utilities may operate at the emergency rating during abnormal power system conditions.

• Voltage limits provide upper and lower voltage boundaries for operating the equipment and overall power system. The purpose of voltage limits is to maintain voltage levels on both transmission and customer connections. – Exceeding the high-voltage limit may lead to
overheating and over-excitation of the equipment.
– Operating the equipment below the low-voltage limit may cause motor loads to stall and may lead to voltage collapse.
Voltage Limits

Stability
• Stability is a power system property that enables the synchronous machines of the system to respond to a disturbance so as to return to a steady-state condition. It is determined by the power system's ability to adjust its generators so that they remain synchronized following a power system load change or disturbance, such as the loss of a major transmission line, generator, or load.

Synchronism
• You may recall from previous modules that synchronism occurs when connected AC systems, machines, or a combination of the two operate at the same frequency and the voltage phase angle differences between systems or machines are stable at less than 90○.
• In an unstable system, load changes or disturbances cause generators to speed up or slow down and consequently, to fall out of synchronism with the rest of the system. When a generator loses synchronism, it has to be tripped and re-synchronized, which places additional burden on the remaining generators.

Stability Problems
• Changes in the mechanical forces that drive generators occur much more slowly than power system electrical changes resulting from disturbances. When a disturbance occurs, the generating station's mechanical components have to play "catch up" to make the required adjustments.
• We know that the power delivered to the system by a generator depends on the relative phase angle between the generator voltage and the system voltage.

Where: Vs =
sending-end
voltage Vr =
receiving-end
voltage Φ= phase
angle between
the Vs and Vr
X = reactance of the line
Stability Problems

Stability Problems
• If the phase angle increases slightly, the power flow increases.
• Decreasing the phase angle causes the electrical power flow to decrease.
• However, under fault conditions, even though the phase angle may increase, power transfer may decrease on the line. This is due to an increase in reactance and a decrease in voltage.
• When the relative phase angle reaches 90○, the electrical output of a generator starts to decrease as the angle increases. This is a key point in understanding the process of generator stability.

Power Transfer
0
400
800
1200
1600
2000
2400
0 30 60 90 120
150
180
Power Angle
Po
we
r T
ran
sfe
r (M
W)
Power
Angle
Pe
Pm
Capability with
two lines in service
A
V
700 MW
490 MW
R V S
P VSVR
X Sine =
Page 9-19

Power Transfer
0
400
800
1200
1600
2000
2400
0 30 60 90 120
150
180
Power Angle
Po
we
r T
ran
sfe
r (M
W)
Power Transfer
0
400
800
1200
1600
2000
2400
0 30 60 90 120
150
180
Power Angle
Po
we
r T
ran
sfe
r (M
W)
Power
Angle
Pe
Pm
A1
A2
B
Capability with
one line
C
D
Maximum Power
Swing
A
V R V S

Stability Limit
• The maximum amount of power that can be transferred across a system is called the stability limit.
• If the power transfer is below the stability limit, the system is stable.
• If the power transfer is above the stability limit, the system is unstable.

Stability Conditions
• Three stability conditions exist: – steady-state
– transient
– dynamic
• It is beyond the scope of this class to cover each of the stability conditions in detail. Instead we provide general definitions of each. These classes are covered in detail in the WECC System Operator Training EOPS/System Restoration class.

• Steady-state stability is a power system's ability to maintain synchronism between parts of the system during normal load changes. It also refers to the power system's ability to damp out any oscillations caused by such changes.
• Transient stability is a power system's ability to maintain synchronism between system parts when subjected to a fault of specified severity.
• Dynamic stability is a power system's ability to maintain synchronism between system parts after the initial swing (during the transient stability period) until the system settles down to a new, steady-state condition.
Stability Conditions

Suggested Operating Guidelines
• Adhere to actual line loading limits and path scheduling limitations (i.e., the maximum scheduled interchange is not greater than the transfer capability).
• Use series compensation methods, as appropriate.
• Monitor system conditions, including line loadings, generation changes, and line conditions.
• Carefully analyze the effect of planned equipment outages and adjust system operations accordingly.

• Keep remedial action schemes and protection schemes in-service as much as possible.
• Keep power system stabilizers in-service.
• Follow established operating procedures.
• Be prepared to shed load, as necessary.
• Exchange operating information with adjacent systems.
Suggested Operating Guidelines

• The Series Capacitors capacitance may interact (resonate) with the transmission line's inductance and produce electrical oscillations with frequencies between 10 and 50 Hz.
• These oscillations are called subsynchronous since they are less than the normal 60 Hz frequency of the rotating machine. When these electrical resonances occur on the system, currents at the subsynchronous frequency flow into the stators of the generators. These currents produce torsional stresses in the generating unit shafts.
Subsynchronous Resonance

• If the damping from the electrical resistance in the system and steam in the turbines is insufficient, or if the electrical system is heavily stressed, the subsynchronous oscillations build up. This is called subsynchronous resonance. Shearing of the turbine-generator shaft can occur as a result of subsynchronous resonance.
Subsynchronous Resonance

Subsynchronous Resonance
Page 9-22

• Utilities use several methods to prevent and/or control subsynchronous resonances, including: minimizing the use of series capacitors by implementing other methods of improving power system stability implementing operating procedures that bypass series capacitors when the power system is in a contingency condition
• Installing special relays or filtering devices that block low frequency currents from entering a generator
• Installing a NGH Damping scheme at the series capacitor installation site
Subsynchronous Resonance

Computer System Function
• SCADA • AGC • Economic Dispatch • Interchange Transaction Scheduling • Hydroelectric Coordination • Hydrothermal Coordination • Power System Analysis • Information Storage and retrieval
• AND ALL OF THIS INFO IS BROUGHT INTO THE SYSTEM
OPERATORS DESK & the S.O. must monitor and determine what actions need to be taken….

Computer System Function

Computer System Function- the “Good Old Days”

Interchange Scheduling Introduction
• Scheduling Fundamentals
• Scheduling Day

Power Markets
Decentralized Market Used to be most common
Individual sellers deal with individual buyers
Marketers & Brokers facilitate deals
Analogous to a Real Estate Market

Centralized Market Becoming more common. Sellers & Buyers converge in a
“marketplace.” Marketplace designs vary. May include ancillary services. Analogous to a Stock Market.
Power Markets

Generation Market (producers)
Assesses Market Conditions
Submits an “asking price” (bid)
Looks for a buyer
Consumer Market (loads)
Assesses Market Conditions
Assesses needs
Submits a “willing to purchase price”
Looks for a seller
Day in the Life of a Market

(PSE) Generation Market
Consumer Market
Transmission Market (Getting the goods to market)
Supply & Demand
Marketer
1
Marketing / Operations Interface

Transmission Service
FERC Orders 888/889
Requires functional separation of merchant & transmission functions.
Transmission service equally available to all market players.
Transmission marketed via an OASIS (Open Access Same-time Information System).

Ancillary Service
Scheduling & Dispatch. Reactive supply & voltage
control. Load regulation & frequency
control. Energy imbalance. Operating Reserves. Energy loss compensation.

Marketing / Operations Interface
Generation Market
Consumer Market
Transmission Market (Getting the goods to market)
Reliability
Rule Appliers…
Supply & Demand
BAs
TOPs
RCs
TSPs
1
3
(PSE)
Marketer

BAs
TOPs
RCs
TSPs
MARKETING / OPERATIONS INTERFACE
Generation Market
Consumer Market
Transmission Market (Getting the goods to market)
Reliability
Rule Appliers…
Supply & Demand
1
3
(PSE)
Marketer
Market Rule Applier…

Firm Highest level of delivery priority Backed-up by system-wide
resources
Contingent Delivery contingent on availability
of certain resources Cut before any firm deliveries
Common Power Types in the Market

Non-firm / Interruptible
Lowest level of priority
Highest likelihood of being cut
Common Power Types in the Market

Hour 1 2 3 4 21 22 23 24
Import A 50 50 25 35 75 45 25 0
Export B 35 42 55 80 62 75 30 25
Power transactions are implemented by use of hourly schedules
Power Scheduling

Hour 1 2 3 4 21 22 23 24
Import A 50 50 25 35 75 45 25 0
Export B 35 42 55 80 62 75 30 25
Hour 2 is understood as the 60 minute period ending at 2:00 AM (Hour Ending 0200)
Power Scheduling

Hour 1 2 3 4 21 22 23 24
Import A 50 50 25 35 75 45 25 0
Export B 35 42 55 80 62 75 30 25
Values shown are the MWh hours to be delivered or received for the hour
Power Scheduling

Hour 1 2 3 4 21 22 23 24
Import A 50 50 25 35 75 45 25 25
Export B 35 42 55 80 62 75 30 0
Imports are netted against exports to determine a net schedule
Net 15 8 30 45 13 30 5 25 in out out in in out out in
Power Scheduling

Schedulers exchange schedules (the preschedule) with transaction partners & balancing authorities each day for the next day’s operation
Operators make real-time schedule adjustments, as needed
Power Scheduling

In real-time, hourly schedule changes are ramped to smooth out abrupt changes
Hour 08 Hour 10 Hour 09
as scheduled
as implemented
Power Scheduling

When actual interchange differs from scheduled interchange we get inadvertent flow
Causes Schedule errors Poor unit control Frequency control Ramp skew Metering error
Inadvertent Interchange

The number of power transactions has grown tremendously
Electronic Tagging (E-tag)
Allows each transaction to be uniquely identified
Identifies all parties & transmission arrangements
Facilitates timely schedule cuts if problems arise
Transaction Tagging

What is Unscheduled flow?
Why is it a problem?
Managing USF
WECC USF Procedures
Unscheduled Flow

Inherent in interconnected system operation
Power flows in all parallel paths
Scheduled path will not carry all the power
USF creates problems for others...
Unscheduled Flow

A
C D
B Scheduled Flow
USF
Contract Path
Schedule from A to D
USF
USF
Scheduled & Unscheduled Flow

A
C D
B
USF
Scheduled Flow
Contract Path
Schedule from A to D
Scheduled Flow
Scheduled Flow
Scheduled & Unscheduled Flow

A
C D
B Unscheduled Flow
Scheduled Flow
Contract Path
Receiver reduces import schedule Increases generation
Affected Path
Sender reduces export schedule Decreases generation
More generation
Less generation
How Schedule Cuts Relieve USF
Affected Path from A to D
Scheduled Flow
Scheduled Flow

Use phase shifters, DC line, series capacitors in the path
Accommodate some USF
Coordinate phase shifters WECC-wide
Curtail schedules causing USF
Managing Unscheduled Flow

After-the-Fact Accounting
Actual operation differs from the original plan
Accounting and billing actual deliveries
Every day, energy accounting personnel unravel the myriad changes from the prescheduled operation
Check Your Knowledge: Interchange Scheduling Introduction
1. What is the relation between scheduling power and actual power?
2. What is the primary contributor to unscheduled flows?
3. Is it better to generate close to load or far away?
104
W E S T E R N E L E C T R I C I T Y C O O R D I N A T I N G C O U N C I L

Off-Nominal Frequency Plan
• Load/Generation Balance
• Generator Under-frequency Protection
• Why Coordinate Load-Shedding?
• Plan Overview

Off-Nominal Frequency Plan Load/Generation Balance
Frequency Control
Frequency is stable when load and generation match
Frequency drops when load is higher than generation
Frequency rises when generation is higher than load

Off-Nominal Frequency Plan Load/Generation Balance
Frequency Control
Many types of utility and customer equipment will be damaged if operated at abnormal frequencies
Generators will trip

Under-Frequency Limit (Hz)
Over-Frequency Limit (Hz)
Time Delay Before Tripping
60.0-59.5 60.0-60.5 NA (normal)
59.4-58.5 60.6-61.5 3 minutes
58.4-57.9 61.6-61.7 30 seconds
57.8-57.4 7.5 seconds
57.3-56.9 45 cycles
56.8-56.5 7.2 cycles
<56.4 >61.7 Instant. trip
Off-Nominal Frequency Plan Generator Under-Frequency Protection
Generator Frequency Trip Settings

Off-Nominal Frequency Plan Generator Under-Frequency Protection
Controlling Frequency AGC Operator action
Routine generation changes Interruptible load curtailments Manual load shedding

Off-Nominal Frequency Plan Generator Under-Frequency Protection
Controlling Frequency Automatic relay action
Under-frequency load shedding Over-frequency load restoration

Off-Nominal Frequency Plan Generator Under-Frequency Protection
Under-frequency Load Shedding Block of load is set to trip if frequency dips
below a pre-set point.
Multiple blocks are used.
Settings are coordinated throughout WECC.

LOAD SHED
BLOCK
% of LOAD TO
DROP
RELAY
TRIP FREQUENCY
1 5.3 59.1 Hz
2 5.9 58.9 Hz
3 6.5 58.7 Hz
4 6.7 58.5 Hz
5 6.7 58.3 Hz
Off-Nominal Frequency Plan Generator Under-Frequency Protection
Under-Frequency Load Shedding

XYZ Interconnection
A Exporting
power
B Importing
power
C Exporting
power
D Importing
power
Off-Nominal Frequency Plan Why Coordinate Load Shedding?

A Exporting
power
B Importing
power
Exporting power
Importing power
Disturbance occurs in this area, causing
separation
Why Coordinate Load Shedding? Off-Nominal Frequency Plan Why Coordinate Load Shedding?

A Exporting
power
B
Importing power
C Exporting
power
D
Importing power
High frequency
Low frequency
Off-Nominal Frequency Plan Why Coordinate Load Shedding?

B Importing
power
C Exporting
power
D Importing
power
Low frequency
Load shedding in area D is set to trip at higher
frequencies than area B.
Island sheds load-all in area D
Off-Nominal Frequency Plan Why Coordinate Load Shedding?

B Importing
power
C Exporting
power
D Importing
power Low frequency
A further separation
occurs
High frequency
Off-Nominal Frequency Plan Why Coordinate Load Shedding?

C Exporting
power
D Importing
power
Way too much generation, units
trip on high frequency.
Then, frequency goes low again & more load trips
Off-Nominal Frequency Plan Why Coordinate Load Shedding?

C Exporting
power
D Importing
power
If all areas had same UF trip
points, this island would have been
much less affected by the initial disturbance
Off-Nominal Frequency Plan Why Coordinate Load Shedding?

Coordinates: • Trip levels for UF load shedding-
normal and stall. • Generation UF/OF tripping levels-
trip load first. • Automatic load restoration levels-
limits frequency overshoot.
WECC Off-Nominal Frequency Load Shedding & Restoration Plan

Also Specifies: • Relay types and response times. • Tie-line tripping guidelines. • Loads unacceptable for UF
tripping.
WECC Off-Nominal Frequency Load Shedding & Restoration Plan

Check Your Knowledge: Off-Nominal Frequency Plan
1. How does the power system protect itself when the frequency is moving too far away from the target?
2. What frequency is used at your house? In your state? In the interconnection?
122
W E S T E R N E L E C T R I C I T Y C O O R D I N A T I N G C O U N C I L

System Restoration
• Major Disturbances
• Operator Challenges
• Building from the Black
• 2003 Eastern Blackout
• 2011 Pacific Southwest Blackout

• Islanding
• Load shedding
• Trip of generation
• Full or partial blackout
Major System Events

Storms
Earthquakes
Equipment malfunction
Operating errors
Sabotage (intentional or not)
Causes of Major System Events
Communication
Many alarms & phone calls
Non-routine conversations
Many demands for information
Battery power limited
Operator Challenges In Restoration

Full extent of problem often unknown.
Availability and training of field personnel.
Mobilization difficulties.
Un-staffed facilities.
Operator Challenges In Restoration

Blackstart units
Few units can blackstart
Testing/training important
Building From Black

Initial system very fragile
Frequency control critical
High voltage a problem
Cold load pickup
Building From Black

Before After

1. Poor Vegetation Management
2. Poorly Trained Operators
3. Poor Operator Tools
4. Need Mandatory Rules
Key Findings of 2003 Blackout Report

Before Trimming After Trimming
Improved Vegetation Management
132

September 2011 Pacific Southwest
Disturbance

September 8, 2011
• A disturbance occurred on the afternoon of September 8, 2011 which led to cascading outages and loss of load.
• SDG&E, IID & CFE had complete system outages.
• APS and WALC lost some load.

September 8, 2011
• This disturbance occurred on a heavily loaded summer day.
• Load interrupted:
–SDG&E 4293 MW
–CFE 2150 MW
–IID 929 MW
–APS 389 MW
–WALC 74 MW

September 8, 2011
• FERC / NERC Report findings: System was not being operated in a secure state for an N-1 outage due to:
– Lack of information sharing between entities.
– Lack of adequate studies.
– Sub 100 kV facilities not adequately considered in next-day studies.
• Initiating event: Loss of APS Hassayampa-North Gila 500 kV Line due to an operating error.
• All load was restored in approximately 12 hours.

Some NERC Standards Violated
• COM-002-2, R2 – Issue directives in a clear & concise manner – Three-part communication
• EOP-001-2.1b – Developing, maintaining & implementing emergency plans
• EOP-003-2 – Shed load rather than risking uncontrolled failure or cascade
• EOP-005-2 – Returning system to normal following a disturbance
• EOP-006-2 – Coordination with Reliability Coordinator
• TOP-004-2 – Operate so that instability, uncontrolled separation, or cascading
outages will not occur as a result of the most severe single contingency


139

Sequence of Events – 1
• At 1527, APS Hassayampa-North Gila 500 kV line relayed due to switchmen error.
• Loss of 500 kV line caused overload on area’s lower voltage system as power sought alternate route into San Diego area.
• IID’s 92 kV system started to collapse within 40 seconds of initial 500 kV line trip.

Sequence of Events – 2
• IID lost 230/92 kV transformers at Cochella Valley and Ramon.
• CFE lost generation in Mexico.
• IID experienced a voltage collapse in its service area and lost 50% of load when UVLS operated.


Sequence of Events - 3
• As IID, WAPA and APS lower voltage system collapsed the 230 kV system on the coast loaded heavier and heavier.
• A protection scheme associated with path 44 operated separating the San Diego, IID, and CFE systems.
• Load was much greater than generation so system collapsed.
• UFLS operated but too little too late.
• Entire event took only 11 minutes.


Questions?

REVIEW
• Collect Pre-test &
Simulator Modules
• Complete course
evaluation
• Take final exam
Things left to do????

TEST TIME…
Closed Book!

Please turn in your Class evaluations and plastic badge holders.
You Endured to the End!

Thank you!