Module 4: - Measures of Central Tendency - Mathematics
28
CO_Q4_Mathematics 7_Module 4 Mathematics Quarter 4 – Module 4: Measures of Central Tendency 7
-
Upload
khangminh22 -
Category
Documents
-
view
5 -
download
0
Transcript of Module 4: - Measures of Central Tendency - Mathematics
CO_Q4_Mathematics 7_Module 4
Mathematics
Quarter 4 – Module 4:
Measures of Central Tendency
7
Mathematics– Grade 7 Alternative Delivery Mode Quarter 4 – Module 4: Measures of Central Tendency First Edition, 2020 Republic Act 8293, section 176 states that: No copyright shall subsist in any work of the Government of the Philippines. However, prior approval of the government agency or office wherein the work is created shall be necessary for exploitation of such work for profit. Such agency or office may, among other things, impose as a condition the payment of royalties. Borrowed materials (i.e., songs, stories, poems, pictures, photos, brand names, trademarks, etc.) included in this module are owned by their respective copyright holders. Every effort has been exerted to locate and seek permission to use these materials from their respective copyright owners. The publisher and authors do not represent nor claim ownership over them. Published by the Department of Education Secretary: Leonor Magtolis Briones Undersecretary: Diosdado M. San Antonio
Printed in the Philippines by___________________________ Department of Education – SOCCSKSARGEN - Region XII Office Address: Regional Center, Brgy. Carpenter Hill, City of Koronadal
Telefax: (083) 2288825/ (083)2281893
E-mail Address: [email protected]
Development Team of the Module
Writers: Regilyn M. Magana, Hazel C. Frias
Editors: Grace Joy A. Canseco, Cecile S. Dela Rosa
Reviewers: Evelyn C. Frusa, Noemi E. Parcon, Rolex H. Lotilla, and Arvin Tejada
Layout Artists: Den R. Fernandez, Erwin J. Etoc
Management Team: Allan G. Farnazo,
Gilbert B. Barrera
Arturo D. Tingson Jr.
Peter Van C. Ang-ug
Prima Roullo
Evelyn C. Frusa
Bernardita M. Villano
7
Mathematics Quarter 4 – Module 4:
Measures of Central Tendency
Introductory Message
This Self-Learning Module (SLM) is prepared so that you, our dear learners,
can continue your studies and learn while at home. Activities, questions,
directions, exercises, and discussions are carefully stated for you to understand
each lesson.
Each SLM is composed of different parts. Each part shall guide you step-by-
step as you discover and understand the lesson prepared for you.
Pre-tests are provided to measure your prior knowledge on lessons in each
SLM. This will tell you if you need to proceed on completing this module or if you
need to ask your facilitator or your teacher’s assistance for better understanding of
the lesson. At the end of each module, you need to answer the post-test to self-
check your learning. Answer keys are provided for each activity and test. We trust
that you will be honest in using these.
In addition to the material in the main text, Notes to the Teacher are also
provided to our facilitators and parents for strategies and reminders on how they
can best help you on your home-based learning.
Please use this module with care. Do not put unnecessary marks on any
part of this SLM. Use a separate sheet of paper in answering the exercises and
tests. And read the instructions carefully before performing each task.
If you have any questions in using this SLM or any difficulty in answering
the tasks in this module, do not hesitate to consult your teacher or facilitator.
Thank you.
1 CO_Q4_Mathematics 7_Module 4
What I Need to Know
This module was designed and written with you in mind. It is here to help you
learn about the measures of central tendency of grouped and ungrouped data. This
module is designed to be self-sufficient for the current learning situation. The
language used recognizes your vocabulary level. The lessons are arranged to follow
the standard sequence of the course in the curriculum guide. However, the order in
which you read them can be changed to correspond with the textbook you are now
using.
The module is divided into two lessons, namely:
Lesson 1 – Measures of Central Tendency of Ungrouped Data
Lesson 2 – Measure of Central Tendency of Grouped Data
After going through this module, you are expected to:
1. illustrate the measures of central tendency (mean, median and mode) of
statistical data; and
2. calculate the measures of central tendency of the ungrouped and grouped
2 CO_Q4_Mathematics 7_Module 4
250
What I Know
Choose the letter of the best answer. Write the chosen letter on a separate sheet
of paper.
1. Which of the following statements is TRUE? A. An angle is formed by two non collinear rays. B. Two points determine an angle. C. An angle divides a plane into two distinct parts. D. Two distinct angles cannot share an interior point.
2. What is the sum of the measures of supplementary angles?
A. 450 B. 500 C. 900 D. 1800
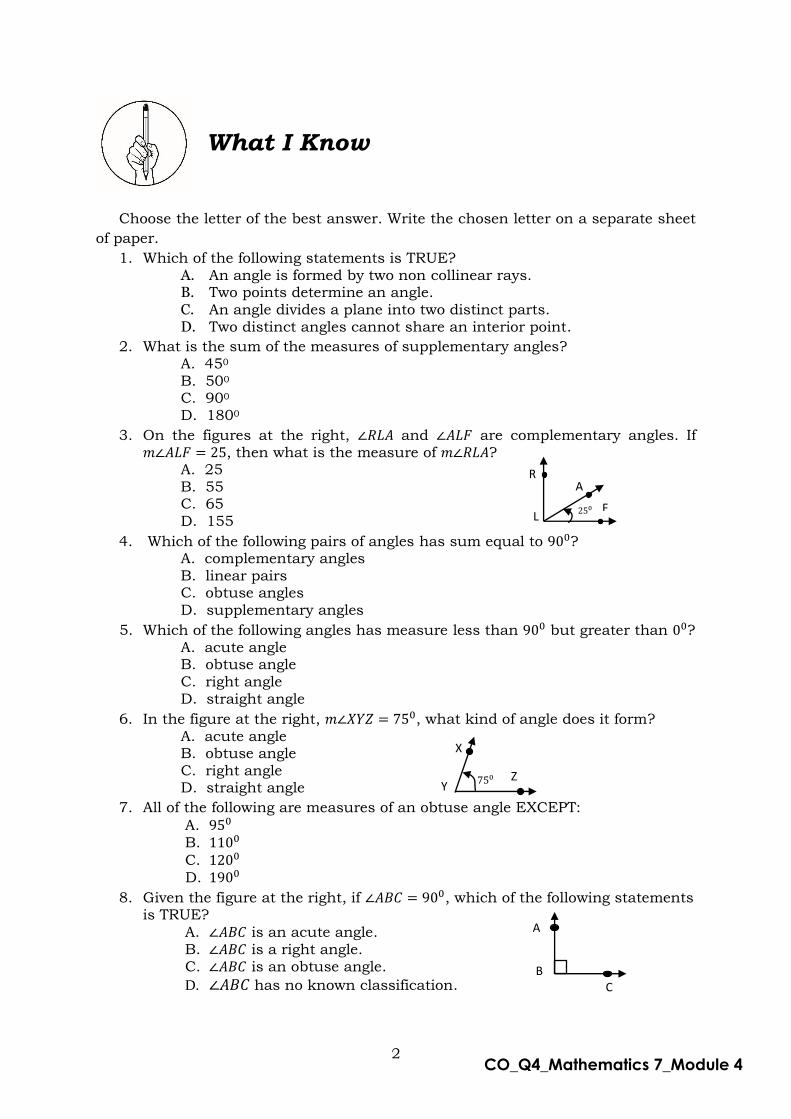
3. On the figures at the right, ∠𝑅𝐿𝐴 and ∠𝐴𝐿𝐹 are complementary angles. If 𝑚∠𝐴𝐿𝐹 = 25, then what is the measure of 𝑚∠𝑅𝐿𝐴?
A. 25 B. 55 C. 65 D. 155
4. Which of the following pairs of angles has sum equal to 900? A. complementary angles B. linear pairs C. obtuse angles D. supplementary angles
5. Which of the following angles has measure less than 900 but greater than 00? A. acute angle B. obtuse angle C. right angle D. straight angle
6. In the figure at the right, 𝑚∠𝑋𝑌𝑍 = 750, what kind of angle does it form?
A. acute angle B. obtuse angle C. right angle D. straight angle
7. All of the following are measures of an obtuse angle EXCEPT:
A. 950
B. 1100
C. 1200
D. 1900
8. Given the figure at the right, if ∠𝐴𝐵𝐶 = 900, which of the following statements is TRUE?
A. ∠𝐴𝐵𝐶 is an acute angle. B. ∠𝐴𝐵𝐶 is a right angle. C. ∠𝐴𝐵𝐶 is an obtuse angle.
D. ∠𝐴𝐵𝐶 has no known classification.
R A
L F
X
Y Z 750
A
B C

3 CO_Q4_Mathematics 7_Module 4
1 2 3
4
9. Which of the following is a measure of an acute angle?
A. 1700
B. 1500
C. 900
D. 800
10. If 𝑚∠𝑀𝐴𝑇 = 1350 and 𝑚∠𝐻𝐴𝐸 = 450, then which of the following could describe the two angles?
A. complementary angles B. vertical angles C. supplementary angles
D. forms a right angle
11. Given the figures at the right, what can you conclude about the two angles? A. linear pairs B. congruent angles C. vertical angles D. perpendicular to each other
12. Which of the following is true about parallel lines? A. coplanar lines that do not intersect no matter how far they are
extended B. two lines with a common point C. three or more lines that have a common point D. straight lines that do not intersect and are not on the same plane
For items No. 13 – 14, consider the figure below:
13. Which of the following are vertical angles?
A. ∠1 and ∠2 B. ∠1 and ∠4 C. ∠2 and ∠4
D. ∠2 and ∠3
14. Which of the following form a linear pair?
A. ∠1 and ∠2
B. ∠1 and ∠3 C. ∠2 and ∠4 D. None of these.
15. Which of the following describes the perpendicular lines? A. lines that intersect to form a right angle B. lines that meet at a common point C. lines that do not meet D. lines that meet to form complementary angles
A
B C D
E F
350
350
4 CO_Q4_Mathematics 7_Module 4
Lesson
1 Measures of Central
Tendency of Ungrouped Data
Let us begin with the exploratory activities that will introduce you to the
basic concepts of measures of tendency and how these concepts are applied in real-
life. Good luck dear!
After going through this module, you are expected to:
1. illustrate the measures of central tendency (mean, median and mode) of
ungrouped data; and
2. calculate the measures of central tendency of the ungrouped data.
What’s In
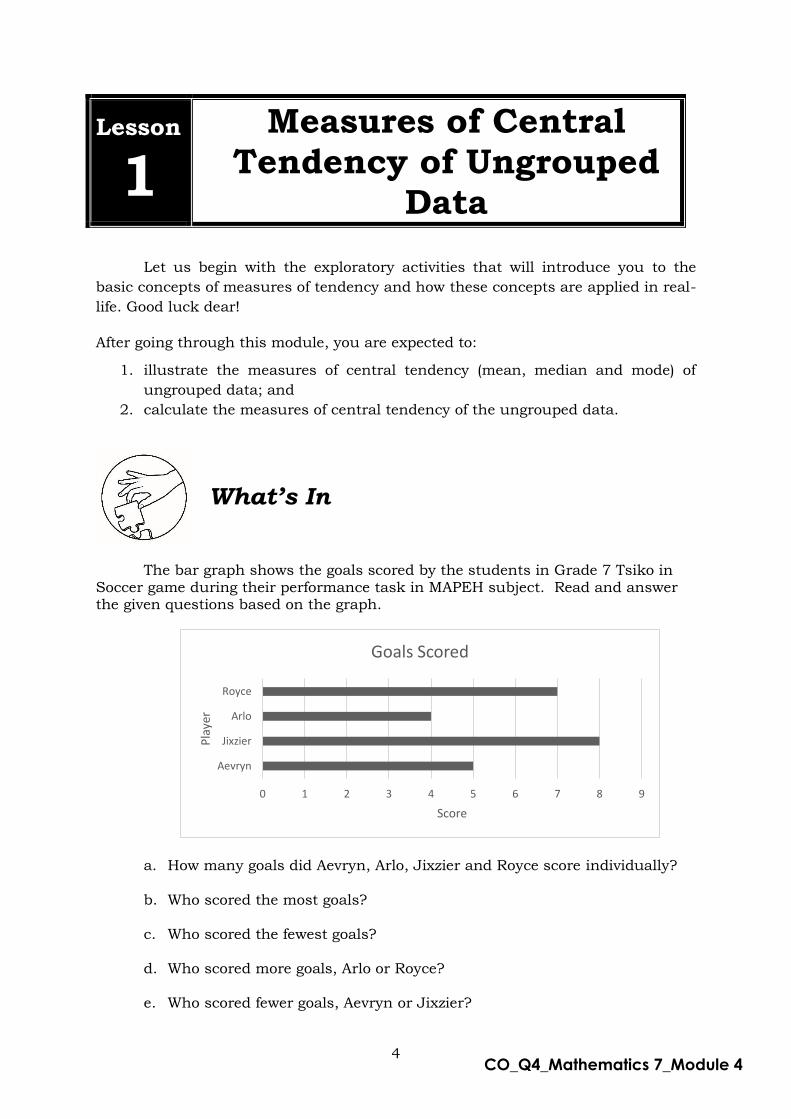
The bar graph shows the goals scored by the students in Grade 7 Tsiko in
Soccer game during their performance task in MAPEH subject. Read and answer the given questions based on the graph.
a. How many goals did Aevryn, Arlo, Jixzier and Royce score individually?
b. Who scored the most goals?
c. Who scored the fewest goals?
d. Who scored more goals, Arlo or Royce?
e. Who scored fewer goals, Aevryn or Jixzier?
0 1 2 3 4 5 6 7 8 9
Aevryn
Jixzier
Arlo
Royce
Score
Pla
yer
Goals Scored
5 CO_Q4_Mathematics 7_Module 4
f. How many more goals did Jixzier score than Royce?
g. How many more goals did Aevryn score than Arlo?
The activity that you just accomplished provided you situations where the basic concepts of statistics are applied. In this module, you will do activities that will help you in answering the question “How can I make use of the representations and descriptions of a given set of data?”.
What’s New
Perform the following activities to check your understanding about
averages. After doing the activities in this section, it is expected that you will be
able to answer the question, “What is the best way to measure a given set of data?”.
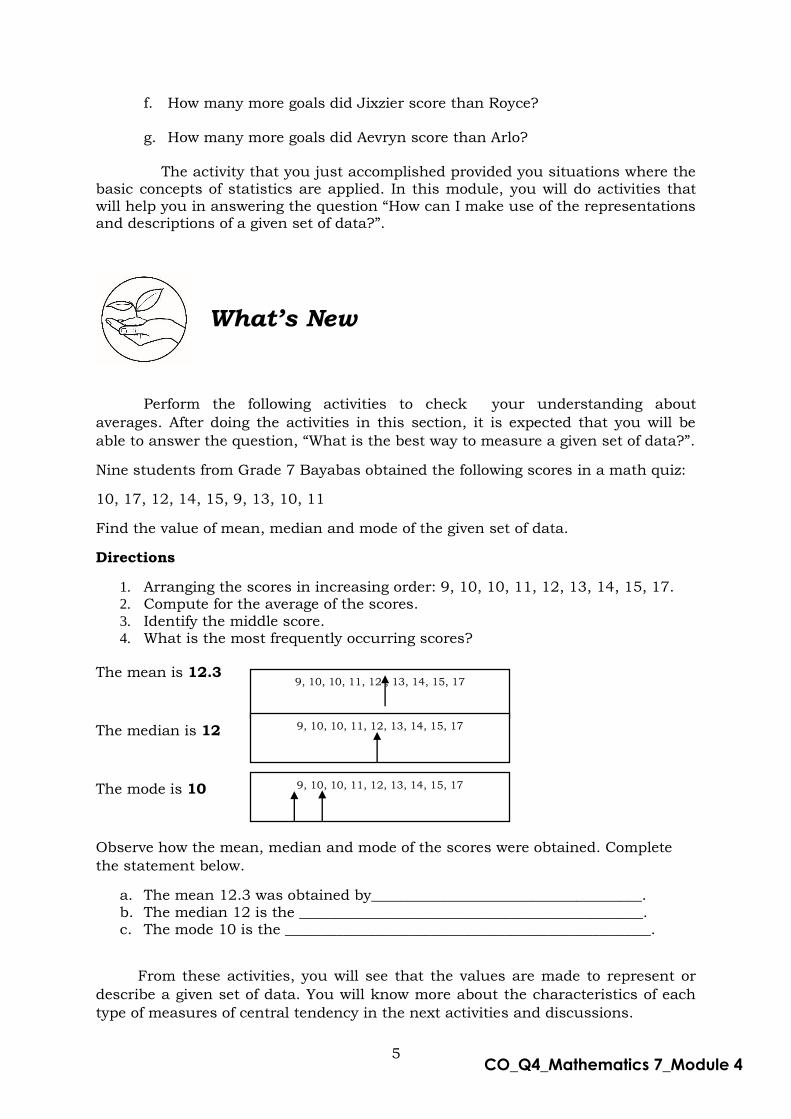
Nine students from Grade 7 Bayabas obtained the following scores in a math quiz:
10, 17, 12, 14, 15, 9, 13, 10, 11
Find the value of mean, median and mode of the given set of data.
Directions
1. Arranging the scores in increasing order: 9, 10, 10, 11, 12, 13, 14, 15, 17. 2. Compute for the average of the scores. 3. Identify the middle score. 4. What is the most frequently occurring scores?
The mean is 12.3
The median is 12
The mode is 10
Observe how the mean, median and mode of the scores were obtained. Complete
the statement below.
a. The mean 12.3 was obtained by_____________________________________. b. The median 12 is the _______________________________________________. c. The mode 10 is the __________________________________________________.
From these activities, you will see that the values are made to represent or
describe a given set of data. You will know more about the characteristics of each
type of measures of central tendency in the next activities and discussions.
9, 10, 10, 11, 12 , 13, 14, 15, 17
9, 10, 10, 11, 12, 13, 14, 15, 17
9, 10, 10, 11, 12, 13, 14, 15, 17
6 CO_Q4_Mathematics 7_Module 4
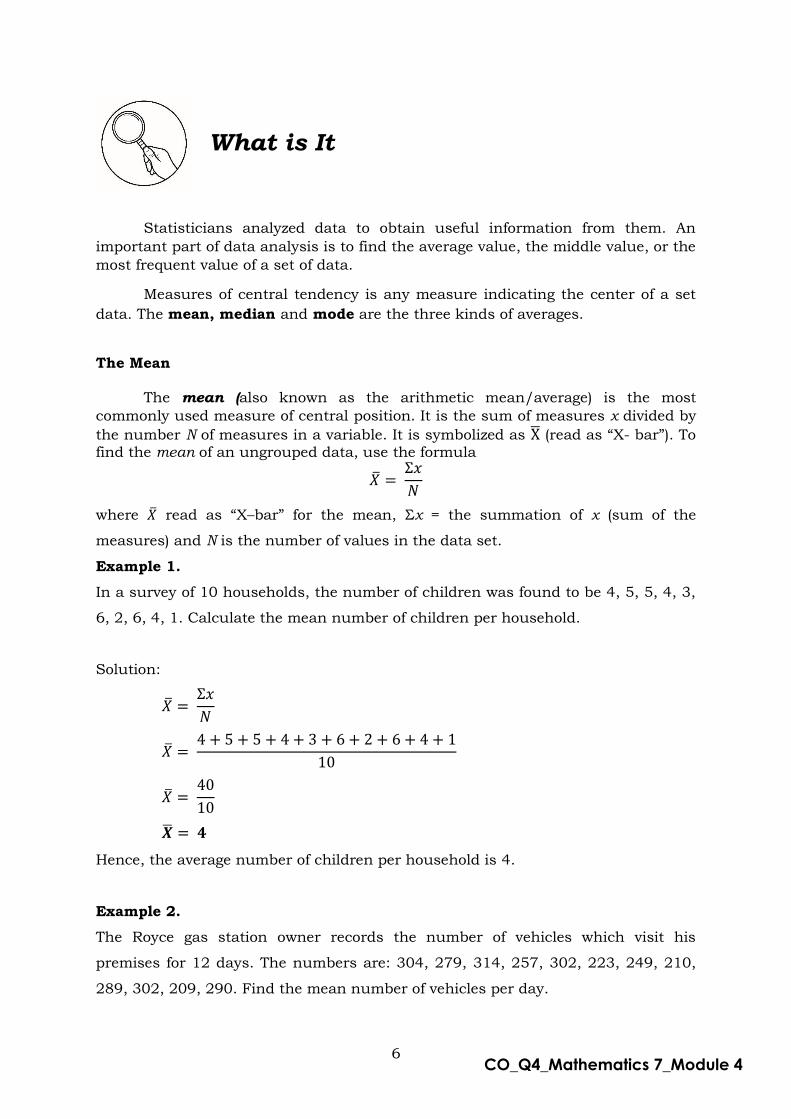
What is It
Statisticians analyzed data to obtain useful information from them. An
important part of data analysis is to find the average value, the middle value, or the
most frequent value of a set of data.
Measures of central tendency is any measure indicating the center of a set
data. The mean, median and mode are the three kinds of averages.
The Mean
The mean (also known as the arithmetic mean/average) is the most
commonly used measure of central position. It is the sum of measures x divided by
the number N of measures in a variable. It is symbolized as X̅ (read as “X- bar”). To
find the mean of an ungrouped data, use the formula
�̅� = Σ𝑥
𝑁
where �̅� read as “X–bar” for the mean, Σx = the summation of x (sum of the
measures) and N is the number of values in the data set.
Example 1.
In a survey of 10 households, the number of children was found to be 4, 5, 5, 4, 3,
6, 2, 6, 4, 1. Calculate the mean number of children per household.
Solution:
�̅� = Σ𝑥
𝑁
�̅� = 4 + 5 + 5 + 4 + 3 + 6 + 2 + 6 + 4 + 1
10
�̅� = 40
10
�̅� = 𝟒
Hence, the average number of children per household is 4.
Example 2.
The Royce gas station owner records the number of vehicles which visit his
premises for 12 days. The numbers are: 304, 279, 314, 257, 302, 223, 249, 210,
289, 302, 209, 290. Find the mean number of vehicles per day.

7 CO_Q4_Mathematics 7_Module 4
Solution:
�̅� = Σ𝑥
𝑁
�̅� = 304 + 279 + 314 + 257 + 302 + 223 + 249 + 210 + 289 + 302 + 209 + 290
12
�̅� = 3228
12
�̅� = 𝟐𝟔𝟗
Hence, the average number of vehicles per day is 269.
Example 3.
A group of students in section Calathea obtained the following scores in math quiz:
2,4,6,5,10,8,9,7,8. What is the mean score of the students?
Solution:
�̅� = Σ𝑥
𝑁
�̅� =2 + 4 + 6 + 5 + 10 + 8 + 9 + 7 + 8
9
�̅� = 59
9
�̅� = 𝟔. 𝟓𝟔
Hence, the average score of students in math quiz is 6.56.
The Median
The median is the middle value in a set of data. It is symbolized as (�̃� ) (read as “X – tilde”). To
find a median, arranged the scores either in increasing or decreasing order and
then find the middle score.
Example 1:
Find the median of the following set of numbers.
8, 14, 8, 45, 1, 31, 16, 40, 12, 30, 42, 30, 24

8 CO_Q4_Mathematics 7_Module 4
Solution:
Arrange the numbers from least to greatest or greatest to least. In case of an odd
number of terms, find the middle term.
1 8 8 12 14 16 24 30 30 31 40 42 45
N = 13
We can see from the arranged numbers that the middle value is 24.
Since the middle value is the median, then the median is 24.
Example 2.
In a basketball game between ABC High School and XYZ High School, the ABC
players’ individual points were 3, 13, 7, 5, 21, 23, 14, 11, 23 and 8. Calculate the
median of the following scores.
Solution:
Arrange the numbers from least to greatest or greatest to least.
3 5 7 8 11 13 14 21 23 23
In case of an even number of terms the average of the middle values is the median.
N = 10
Since the number of measures is even, then the median is the average of the two
middle scores.
�̃�= 𝑥1+𝑥2
2
�̃�= 11+13
2
�̃�= 24
2
�̃�= 12
Hence, the median score is 12.
Example 3.
The following are the ages of students in a vocational class: 32, 43, 39, 28, 42, 31.
Find the median age of the students.
Solution:
Arrange the numbers from least to greatest or greatest to least.
28 31 32 39 42 43
9 CO_Q4_Mathematics 7_Module 4
N = 6. In case of an even number of terms the average of the middle values is the
median.
�̃�= 𝑥1+𝑥2
2
�̃�= 32+39
2
�̃�= 71
2
�̃�= 35.5
Hence, the median age of the students is 35.5.
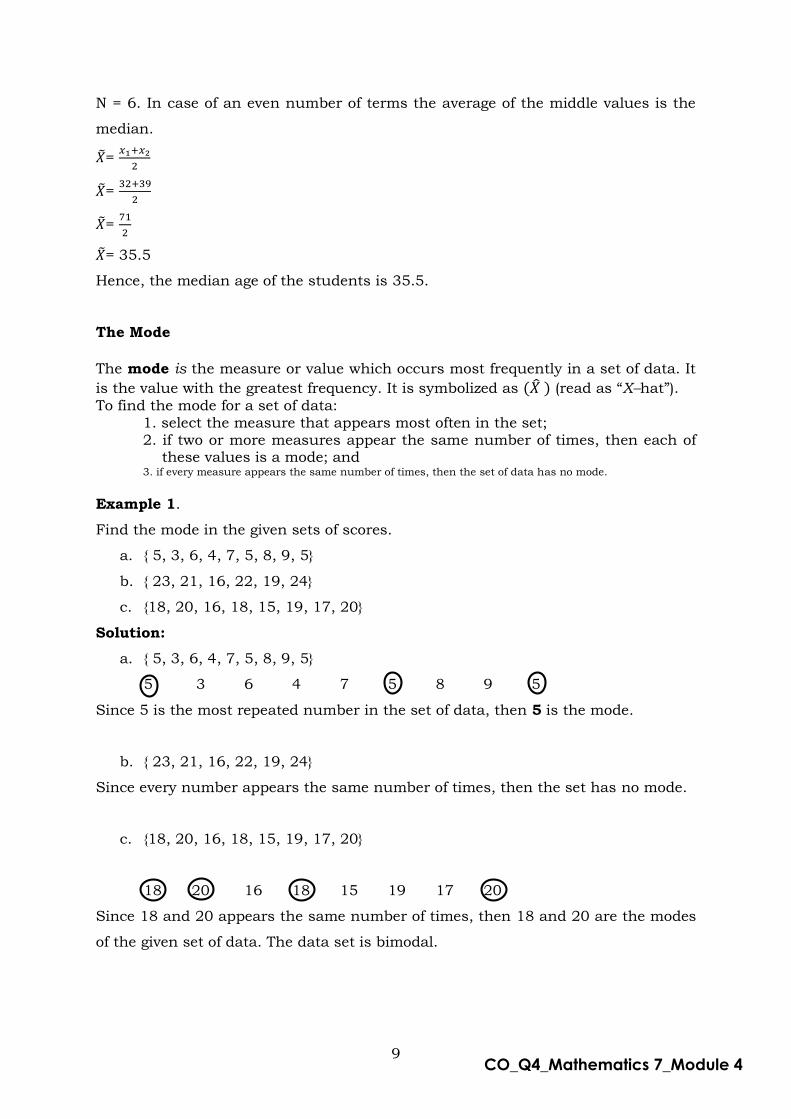
The Mode
The mode is the measure or value which occurs most frequently in a set of data. It
is the value with the greatest frequency. It is symbolized as (�̂� ) (read as “X–hat”).
To find the mode for a set of data: 1. select the measure that appears most often in the set; 2. if two or more measures appear the same number of times, then each of
these values is a mode; and 3. if every measure appears the same number of times, then the set of data has no mode.
Example 1.
Find the mode in the given sets of scores.
a. { 5, 3, 6, 4, 7, 5, 8, 9, 5}
b. { 23, 21, 16, 22, 19, 24}
c. {18, 20, 16, 18, 15, 19, 17, 20}
Solution:
a. { 5, 3, 6, 4, 7, 5, 8, 9, 5}
5 3 6 4 7 5 8 9 5
Since 5 is the most repeated number in the set of data, then 5 is the mode.
b. { 23, 21, 16, 22, 19, 24}
Since every number appears the same number of times, then the set has no mode.
c. {18, 20, 16, 18, 15, 19, 17, 20}
18 20 16 18 15 19 17 20
Since 18 and 20 appears the same number of times, then 18 and 20 are the modes
of the given set of data. The data set is bimodal.
10 CO_Q4_Mathematics 7_Module 4
Median Measures of Central Tendency Mode Mean
What’s More
1. Find the mean, median and mode/modes of each of the following sets of
data.
a. 35, 54, 58, 61, 97
b. 40, 38, 29, 34, 37, 22, 15, 38
c. 26, 32, 12, 18, 11, 18, 21, 12, 27
d. 3, 3, 4, 7, 5, 7, 6, 7, 8, 8, 8, 9, 8, 10, 12, 9, 15, 15
What I Have Learned
To sum it up, read each statements carefully and identify which
word/words is being described. Choose your answer from the box hat best below.
Write your answer on a separate answer sheet.
_____________1. I am the most commonly used measure of central tendency.
_____________2. I appear the most number of times in a given set.
_____________3. I am typical and I am in three forms.
_____________4. I am also referred to as an average.
_____________5. I am the middle value in a set of data arranged in numerical
(ascending or decreasing) order.
11 CO_Q4_Mathematics 7_Module 4
What I Can Do
Here is another activity that lets you apply what you learned about the
measures of central tendency by doing the following activities.
Solve the following problem.
1. Charlie got the following scores during their fourth quarter summative
quizzes: 23, 26, 19, 25, 16, 23 and 21. What is the mean, median and
mode of the given scores?
2. A slipper store was able to sell 15 pairs of slippers in one day with sizes,
6, 7, 7, 6, 5, 5, 6, 4, 4, 5, 6, 7, 8, 9, and 6. Which slipper size is saleable?
How many of this size were sold for the day?
3. Suppose your grades on three Science exams are 80, 93, and 91. What
grade do you need on your next exam to have an average of 90 on the four
exams?
Great work! You did a good job in applying what you have learned!
12 CO_Q4_Mathematics 7_Module 4
Congratulations on making this far! This module will provide you with
exciting activities on Measures of Central Tendency of grouped data. Good luck!
After using this module, you are expected to:
1. illustrate the measures of central tendency (mean, median and mode) of
grouped data; and
2. calculate the measures of central tendency of grouped data.
What’s In
Micah’s Math test scores were 79, 51, 83, 76, 99, 75, 73, 84 and 77.
What is Micah’s average test scores? If her teacher drops the lowest score,
what will Micah’s average be?
What’s New
The ages of 20 guests at a party are 22, 23, 24, 32, 27, 28, 29, 27, 7,
20, 22, 81, 33, 27, 26, 24, 19, 20, 21, and 33. What is the average age of
guests in the party?
What is It
Grouped Data
The data in a real-world situation can be overwhelming. However, by
appropriately organizing data, it is often possible to make a rather
complicated set of data easier to understand.
Although the basic ideas of grouping use common sense, there are
associated terminologies. To understand the terms, we consider the following:
Lesson
2 Measures of Central
Tendency of Grouped Data
13 CO_Q4_Mathematics 7_Module 4
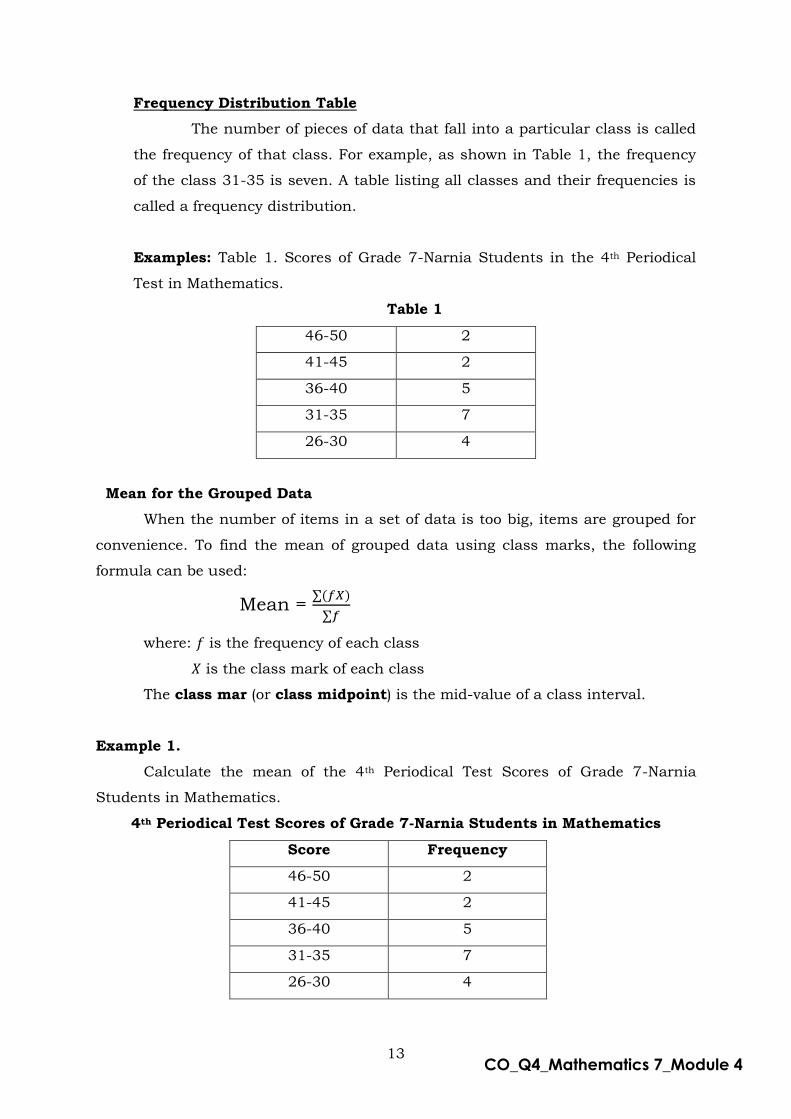
Frequency Distribution Table
The number of pieces of data that fall into a particular class is called
the frequency of that class. For example, as shown in Table 1, the frequency
of the class 31-35 is seven. A table listing all classes and their frequencies is
called a frequency distribution.
Examples: Table 1. Scores of Grade 7-Narnia Students in the 4th Periodical
Test in Mathematics.
Table 1
46-50 2
41-45 2
36-40 5
31-35 7
26-30 4
Mean for the Grouped Data
When the number of items in a set of data is too big, items are grouped for
convenience. To find the mean of grouped data using class marks, the following
formula can be used:
Mean = ∑(𝑓𝑋)
∑𝑓
where: 𝑓 is the frequency of each class
𝑋 is the class mark of each class
The class mar (or class midpoint) is the mid-value of a class interval.
Example 1.
Calculate the mean of the 4th Periodical Test Scores of Grade 7-Narnia
Students in Mathematics.
4th Periodical Test Scores of Grade 7-Narnia Students in Mathematics
Score Frequency
46-50 2
41-45 2
36-40 5
31-35 7
26-30 4
14 CO_Q4_Mathematics 7_Module 4
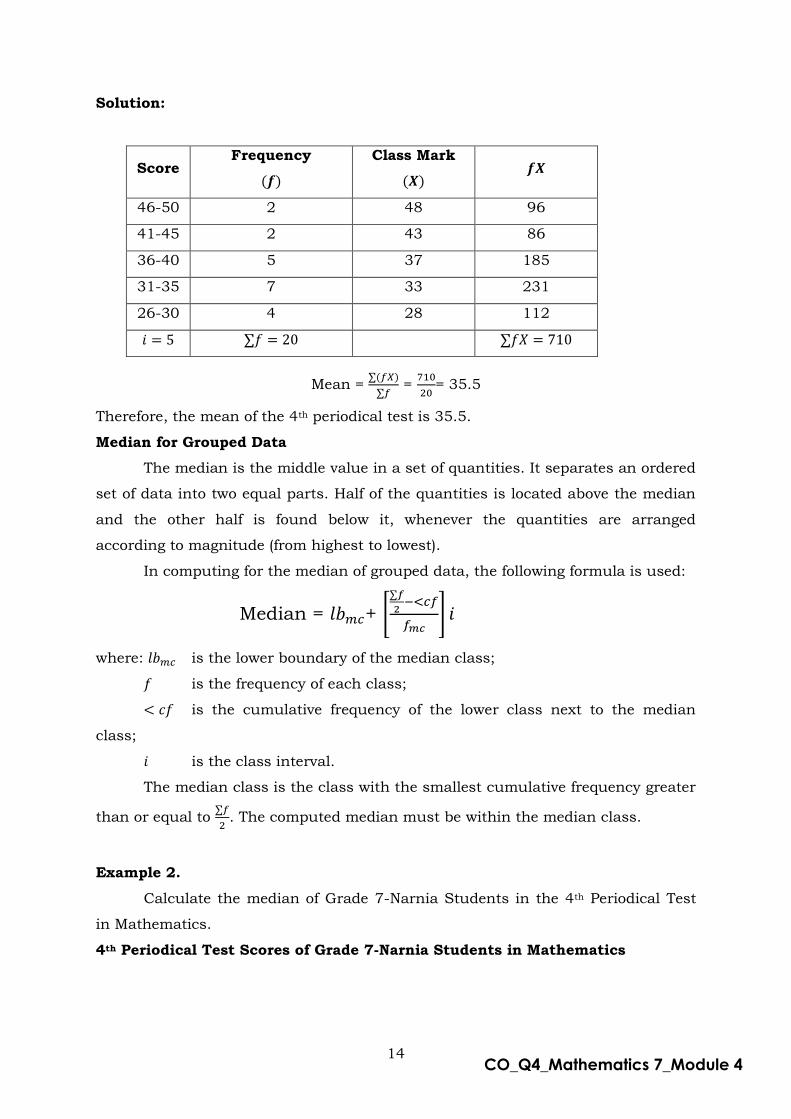
Solution:
Score Frequency
(𝒇)
Class Mark
(𝑿) 𝒇𝑿
46-50 2 48 96
41-45 2 43 86
36-40 5 37 185
31-35 7 33 231
26-30 4 28 112
𝑖 = 5 ∑𝑓 = 20 ∑𝑓𝑋 = 710
Mean = ∑(𝑓𝑋)
∑𝑓 =
710
20= 35.5
Therefore, the mean of the 4th periodical test is 35.5.
Median for Grouped Data
The median is the middle value in a set of quantities. It separates an ordered
set of data into two equal parts. Half of the quantities is located above the median
and the other half is found below it, whenever the quantities are arranged
according to magnitude (from highest to lowest).
In computing for the median of grouped data, the following formula is used:
Median = 𝑙𝑏𝑚𝑐+ [∑𝑓
2−<𝑐𝑓
𝑓𝑚𝑐] 𝑖
where: 𝑙𝑏𝑚𝑐 is the lower boundary of the median class;
𝑓 is the frequency of each class;
< 𝑐𝑓 is the cumulative frequency of the lower class next to the median
class;
𝑖 is the class interval.
The median class is the class with the smallest cumulative frequency greater
than or equal to ∑𝑓
2. The computed median must be within the median class.
Example 2.
Calculate the median of Grade 7-Narnia Students in the 4th Periodical Test
in Mathematics.
4th Periodical Test Scores of Grade 7-Narnia Students in Mathematics
15 CO_Q4_Mathematics 7_Module 4
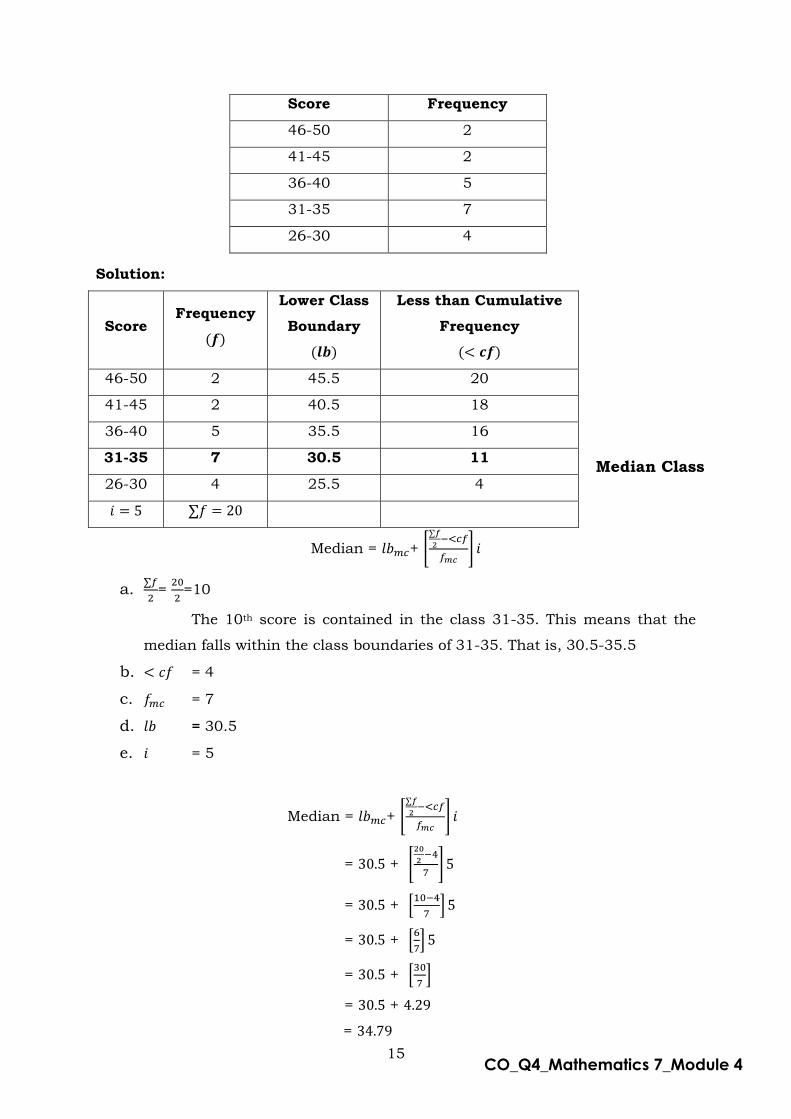
Score Frequency
46-50 2
41-45 2
36-40 5
31-35 7
26-30 4
Solution:
Score Frequency
(𝒇)
Lower Class
Boundary
(𝒍𝒃)
Less than Cumulative
Frequency
(< 𝒄𝒇)
46-50 2 45.5 20
41-45 2 40.5 18
36-40 5 35.5 16
31-35 7 30.5 11
26-30 4 25.5 4
𝑖 = 5 ∑𝑓 = 20
Median = 𝑙𝑏𝑚𝑐+ [∑𝑓
2−<𝑐𝑓
𝑓𝑚𝑐] 𝑖
a. ∑𝑓
2=
20
2=10
The 10th score is contained in the class 31-35. This means that the
median falls within the class boundaries of 31-35. That is, 30.5-35.5
b. < 𝑐𝑓 = 4
c. 𝑓𝑚𝑐 = 7
d. 𝑙𝑏 = 30.5
e. 𝑖 = 5
Median = 𝑙𝑏𝑚𝑐+ [∑𝑓
2−<𝑐𝑓
𝑓𝑚𝑐] 𝑖
= 30.5 + [20
2−4
7] 5
= 30.5 + [10−4
7] 5
= 30.5 + [6
7] 5
= 30.5 + [30
7]
= 30.5 + 4.29
= 34.79
Median Class
16 CO_Q4_Mathematics 7_Module 4
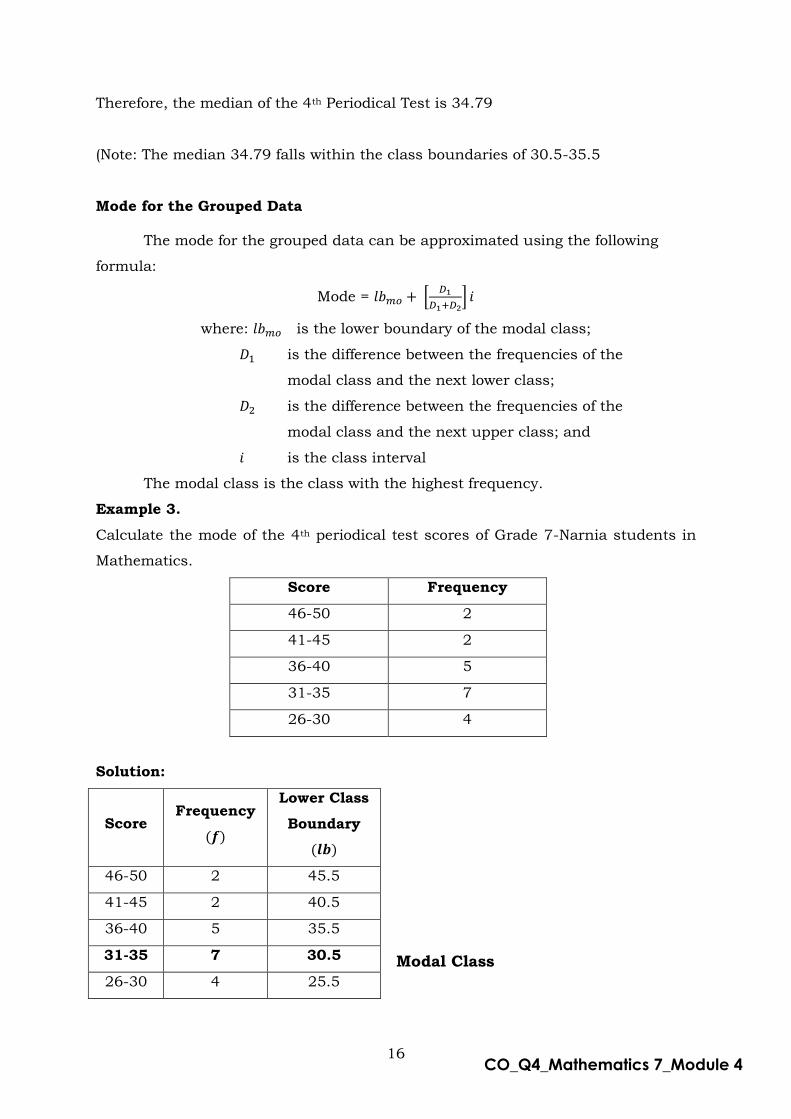
Therefore, the median of the 4th Periodical Test is 34.79
(Note: The median 34.79 falls within the class boundaries of 30.5-35.5
Mode for the Grouped Data
The mode for the grouped data can be approximated using the following
formula:
Mode = 𝑙𝑏𝑚𝑜 + [𝐷1
𝐷1+𝐷2] 𝑖
where: 𝑙𝑏𝑚𝑜 is the lower boundary of the modal class;
𝐷1 is the difference between the frequencies of the
modal class and the next lower class;
𝐷2 is the difference between the frequencies of the
modal class and the next upper class; and
𝑖 is the class interval
The modal class is the class with the highest frequency.
Example 3.
Calculate the mode of the 4th periodical test scores of Grade 7-Narnia students in
Mathematics.
Score Frequency
46-50 2
41-45 2
36-40 5
31-35 7
26-30 4
Solution:
Score Frequency
(𝒇)
Lower Class
Boundary
(𝒍𝒃)
46-50 2 45.5
41-45 2 40.5
36-40 5 35.5
31-35 7 30.5
26-30 4 25.5
Modal Class

17 CO_Q4_Mathematics 7_Module 4
Since class 31-35 has the highest frequency, therefore the modal class is 31-35.
𝑙𝑏𝑚𝑜 = 30.5
𝐷1 = 7 - 4 = 3
𝐷2 = 7 – 5 = 2
𝑖 = 5
Mode = 𝑙𝑏𝑚𝑜 + [𝐷1
𝐷1+𝐷2] 𝑖
= 30.5 + [3
3+2] 5
= 30.5 + [3
5] 5
= 30.5 + [15
5]
= 30.5 + 3
= 33.5
Therefore, the mode of the 4th periodical test scores is 33.5.
What’s More
A. Find the mean, median, and mode of the following data set.
Scores of Grade 7 Students in 30-point Math Quiz Scores f
28-29 1
26-27 3
24-25 3
22-23 3
20-21 6
18-19 6
16-17 8
14-15 6
12-13 10
10-11 14
18 CO_Q4_Mathematics 7_Module 4
mean median mode cumulative frequency
modal class median class frequency lower class boundary
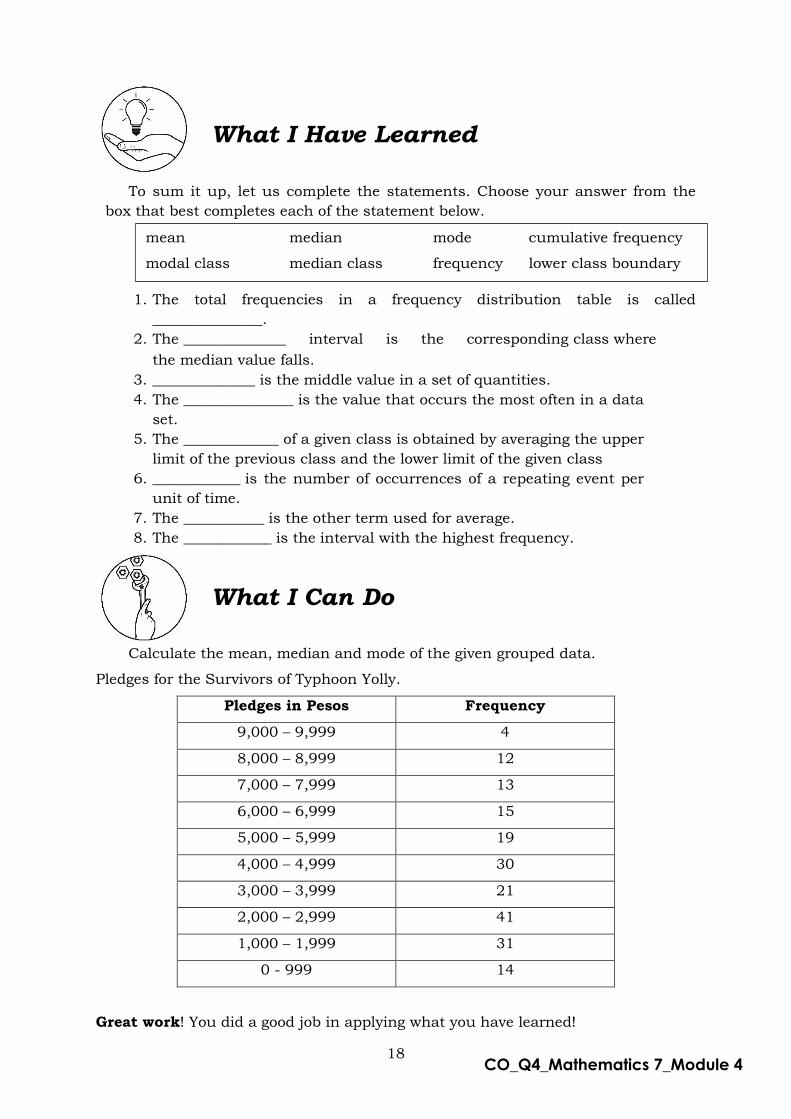
What I Have Learned
To sum it up, let us complete the statements. Choose your answer from the
box that best completes each of the statement below.
1. The total frequencies in a frequency distribution table is called
_______________.
2. The ______________ interval is the corresponding class where
the median value falls.
3. ______________ is the middle value in a set of quantities.
4. The _______________ is the value that occurs the most often in a data
set.
5. The _____________ of a given class is obtained by averaging the upper
limit of the previous class and the lower limit of the given class
6. ____________ is the number of occurrences of a repeating event per
unit of time.
7. The ___________ is the other term used for average.
8. The ____________ is the interval with the highest frequency.
What I Can Do
Calculate the mean, median and mode of the given grouped data.
Pledges for the Survivors of Typhoon Yolly.
Pledges in Pesos Frequency
9,000 – 9,999 4
8,000 – 8,999 12
7,000 – 7,999 13
6,000 – 6,999 15
5,000 – 5,999 19
4,000 – 4,999 30
3,000 – 3,999 21
2,000 – 2,999 41
1,000 – 1,999 31
0 - 999 14
Great work! You did a good job in applying what you have learned!
19 CO_Q4_Mathematics 7_Module 4
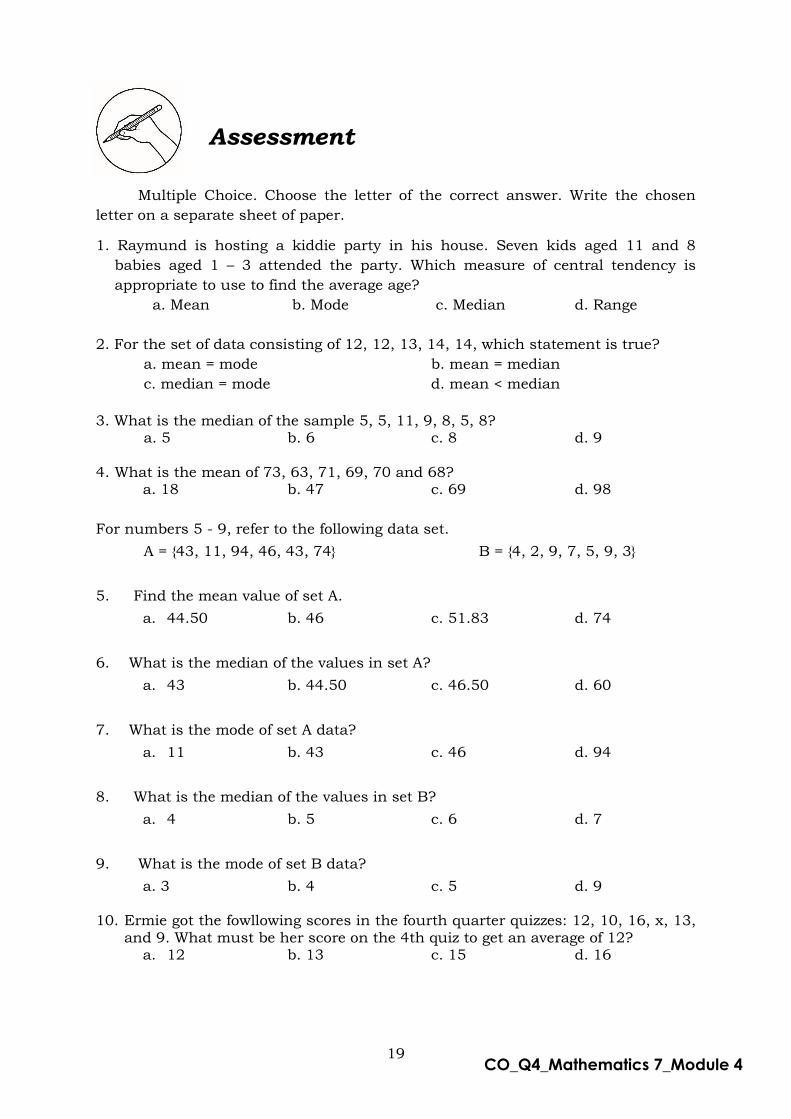
Assessment
Multiple Choice. Choose the letter of the correct answer. Write the chosen
letter on a separate sheet of paper.
1. Raymund is hosting a kiddie party in his house. Seven kids aged 11 and 8
babies aged 1 – 3 attended the party. Which measure of central tendency is
appropriate to use to find the average age?
a. Mean b. Mode c. Median d. Range
2. For the set of data consisting of 12, 12, 13, 14, 14, which statement is true?
a. mean = mode b. mean = median
c. median = mode d. mean < median
3. What is the median of the sample 5, 5, 11, 9, 8, 5, 8? a. 5 b. 6 c. 8 d. 9 4. What is the mean of 73, 63, 71, 69, 70 and 68?
a. 18 b. 47 c. 69 d. 98
For numbers 5 - 9, refer to the following data set.
A = {43, 11, 94, 46, 43, 74} B = {4, 2, 9, 7, 5, 9, 3}
5. Find the mean value of set A.
a. 44.50 b. 46 c. 51.83 d. 74
6. What is the median of the values in set A?
a. 43 b. 44.50 c. 46.50 d. 60
7. What is the mode of set A data?
a. 11 b. 43 c. 46 d. 94
8. What is the median of the values in set B?
a. 4 b. 5 c. 6 d. 7
9. What is the mode of set B data?
a. 3 b. 4 c. 5 d. 9 10. Ermie got the fowllowing scores in the fourth quarter quizzes: 12, 10, 16, x, 13,
and 9. What must be her score on the 4th quiz to get an average of 12? a. 12 b. 13 c. 15 d. 16
20 CO_Q4_Mathematics 7_Module 4
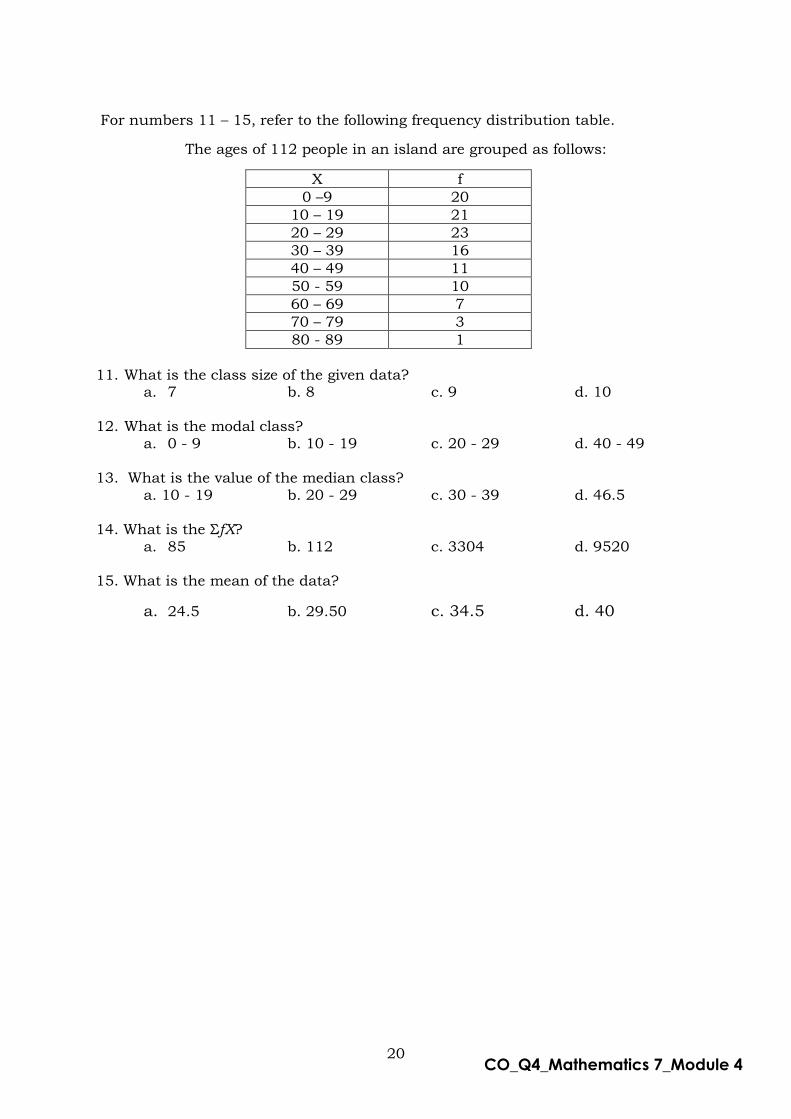
For numbers 11 – 15, refer to the following frequency distribution table.
The ages of 112 people in an island are grouped as follows:
X f
0 –9 20
10 – 19 21
20 – 29 23
30 – 39 16
40 – 49 11
50 - 59 10
60 – 69 7
70 – 79 3
80 - 89 1
11. What is the class size of the given data?
a. 7 b. 8 c. 9 d. 10
12. What is the modal class? a. 0 - 9 b. 10 - 19 c. 20 - 29 d. 40 - 49
13. What is the value of the median class?
a. 10 - 19 b. 20 - 29 c. 30 - 39 d. 46.5
14. What is the ΣfX? a. 85 b. 112 c. 3304 d. 9520
15. What is the mean of the data?
a. 24.5 b. 29.50 c. 34.5 d. 40
21 CO_Q4_Mathematics 7_Module 4
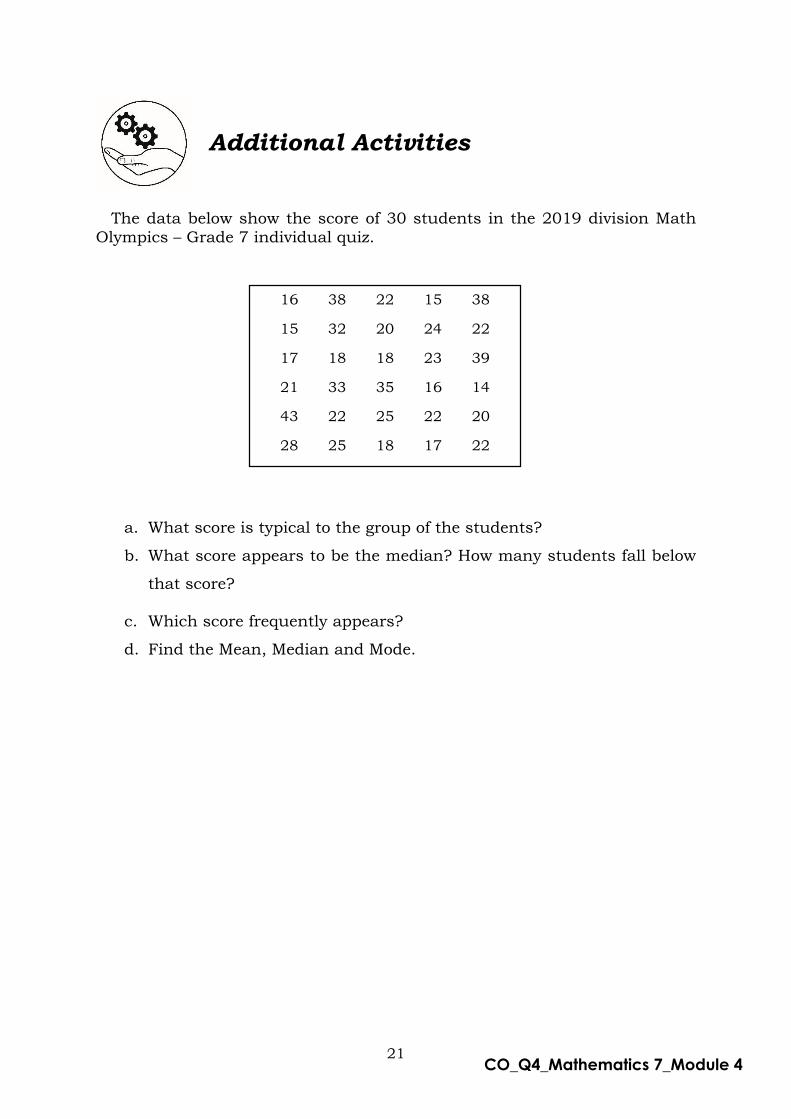
Additional Activities
The data below show the score of 30 students in the 2019 division Math
Olympics – Grade 7 individual quiz.
a. What score is typical to the group of the students?
b. What score appears to be the median? How many students fall below
that score?
c. Which score frequently appears?
d. Find the Mean, Median and Mode.
16 38 22 15 38
15 32 20 24 22
17 18 18 23 39
21 33 35 16 14
43 22 25 22 20
28 25 18 17 22

22 CO_Q4_Mathematics 7_Module 4
Answer Key
Lesson 1 What's New
1.Add all the scores divided by the total number of set in a data.
2.Middle Value
when arranged in descending or ascending order
3.The most appeared data
What I Know
1.C 11. C 2.A 12. B 3.B 13. D 4.A 14. D 5.B 15.C
6.D 7.C 8.D 9.D 10.C
Lesson 1 What's More A
a.Mean = 61 Median = 58 Mode =no mode
b.Mean = 31.63 Median = 35.5 Mode =38
c.Mean = 19.67 Median = 18 Mode =12and 18
d.Mean = 8 Median = 8 Mode =8
Lesson 1 What’s In
a.Aevryn 5 Arlo 4
Jixzier 8 Royce 7
b.Jixzier c.Arlo d.Royce e.Aevryn
f.1
g.1
Lesson 1
What I Have
Learned
1.Mean 2.Mode 3.Measures of
cental tendency
4.Mean 5.Median
Additional Activities
a.23.93 b.22 and 12 c.22 d.Mean = 23.93 e.Median = 22 f.Mode = 22
Assessment
1.B 9. D 2.B 10. A 3.C 11. D 4.C 12. C 5.C 13. B 6.C 14. C 7.B 15. B 8.B 9.d
Lesson 2 What’s In
77.44 and 80.75
What’s New
27
What’s More
Mean=16.23
Median = 15.5
Mode = 11.06
Lesson 2 What I have learned
1.cumulative
frequency
2. median class
3. median
4. mode
5.lowerclass
boundary
6. frequency
7. mean
8. modal class
Lesson 1 What I Can Do
1.Mean = 21.86 Median = 23
Mode = 23
2.Size 6 is the
saleable size There are 15 shoes sold for the day.
3.96
Lesson 2
What I Can Do
Mean = 41,019.5
Median = 3,665.5
Mode = 2,332. 83
23 CO_Q4_Mathematics 7_Module 4
References
E-Math – Grade 7 Learner’s Material Revised Edition, 2015, ISBN: 978-971-23-
6941-4,pp 598 - 613
Mathematics Learner’s Module for Grade 8, 2015, ISBN: 971-07-2168-2, pp 485 -
539, JTW Corporation

For inquiries or feedback, please write or call: Department of Education - Bureau of Learning Resources (DepEd-BLR)
Ground Floor, Bonifacio Bldg., DepEd Complex Meralco Avenue, Pasig City, Philippines 1600
Telefax: (632) 8634-1072; 8634-1054; 8631-4985
Email Address: [email protected] * [email protected]