Prevalence of Lifestyle Factors and Lifestyle Diseases among ...
Upload
khangminh22Category
view
2download
0
Modifiable Lifestyle Behaviors and CKD Progression:A Narrative ReviewSarah J. Schrauben ,1 Benjamin J. Apple ,2 and Alex R. Chang 3
AbstractLiving a healthy lifestyle is one of the safest and most cost-effective ways to improve one’s quality of life andprevent and/or manage chronic disease. As such, current CKDmanagement guidelines recommend thatpatients adhere to a healthy diet, perform$150 minutes per week of physical activity, manage their bodyweight, abstain from tobacco use, and limit alcohol. However, there are limited studies that investigate therelationship between these lifestyle factors and the progression of CKD among people with establishedCKD. In this narrative review, we examine the reported frequencies of health lifestyle behavior engagementamong individuals with non–dialysis-dependent CKD and the existing literature that examines the influencesof diet, physical activity, weight management, alcohol consumption, and tobacco use on the progression ofCKD, as measured by decline in GFR, incident ESKD, or elevated proteinuria or albuminuria in individualswith CKD. Many of the available studies are limited by length of follow-up and small sample sizes, andmeta-analyses were limited because the studies were sparse and had heterogeneous classifications ofbehaviors and/or referent groups and of CKD progression. Further research should be done to determineoptimal methods to assess behaviors to better understand the levels at which healthy lifestyle behaviors areneeded to slow CKD progression, to investigate the effect of combining multiple lifestyle behaviors onimportant clinical outcomes in CKD, and to develop effective techniques for behavior change. Despite thelack of evidence of efficacy from large trials on the ability of lifestyle behaviors to slow CKD progression,maintaining a healthy lifestyle remains a cornerstone of CKDmanagement given the undisputed benefits ofhealthy lifestyle behaviors on cardiovascular health, BP control, and survival.
KIDNEY360 3: 752–778, 2022. doi: https://doi.org/10.34067/KID.0003122021
IntroductionCKD is an epidemic, affecting more than one in tenAmerican adults (1). Patients with CKD have a highburden of risk factors for cardiovascular disease(CVD) and experience high rates of CVD events.Maintaining a healthy lifestyle offers a crosscuttingapproach to reduce the risk of CVD. Lifestyle behav-iors are similarly recommended across relevant guide-lines, including the Kidney Disease Improving GlobalOutcomes (KDIGO) 2012 Clinical Practice Guidelinefor the Evaluation and Management of CKD, theKDIGO 2020 Guidelines for Diabetes Management inCKD, and the American College of Cardiology/Amer-ican Heart Association guidelines on the primary pre-vention of CVD (Table 1) (2,3). In the CKD population,lifestyle behaviors, such as diet, physical activity,weight management, alcohol consumption, andtobacco use, have mainly been studied in relation toreducing CVD events and mortality risk (4–6), andless is known about limiting CKD progression. Thepurpose of this narrative review is to describe the cur-rent evidence of how select lifestyle behaviors relateto CKD progression, defined as progressive decline inGFR, development of ESKD, or increase in proteinuria
or albuminuria among people with established CKDwithout kidney failure requiring transplant or dialy-sis. Using PubMed, we selected observational studies,randomized controlled trials (RCTs), systematicreviews, and meta-analyses that focused on the rela-tionship of lifestyle behaviors and CKD progression.The search terms included the following: CKD pro-gression, end-stage renal disease, ESRD, end-stagekidney disease, ESKD, glomerular filtration rate decline,GFR decline, lifestyle factors, diet, dietary pattern,dietary acid load, potential renal acid load, sodium,potassium, protein, phosphorous, smoking, smokingcessation, marijuana, alcohol, physical activity, exer-cise, obesity, body mass index, and BMI. We did notinclude studies that investigated the effect of multiplelifestyle behaviors and, therefore, this review does notcover how lifestyle behaviors in combination relateto CKD progression. As a narrative review, we werenot inclusive of all published studies assessing therelationship between lifestyle behaviors and CKDprogression, which limits our ability to assess allpublished results, but we have focused on includinghigh-quality studies and limiting inclusion of studiesthat reported very similar results.
1Renal, Electrolyte-Hypertension Division, Department of Biostatistics, Epidemiology, and Informatics, Center for Clinical Epidemiologyand Biostatistics, Perelman School of Medicine, University of Pennsylvania, Philadelphia, Pennsylvania2Geisinger Commonwealth School of Medicine, Scranton, Pennsylvania3Kidney Health Research Institute, Department of Population Health Sciences, Geisinger Health, Danville, Pennsylvania
Correspondence: Dr. Alex R. Chang, Kidney Health Research Institute, Department of Population Health Sciences, Geisinger Health,100 N. Academy Ave., Danville, PA 17822. Email: [email protected]
752 Copyright # 2022 by the American Society of Nephrology www.kidney360.org Vol 3 April, 2022
Review Article
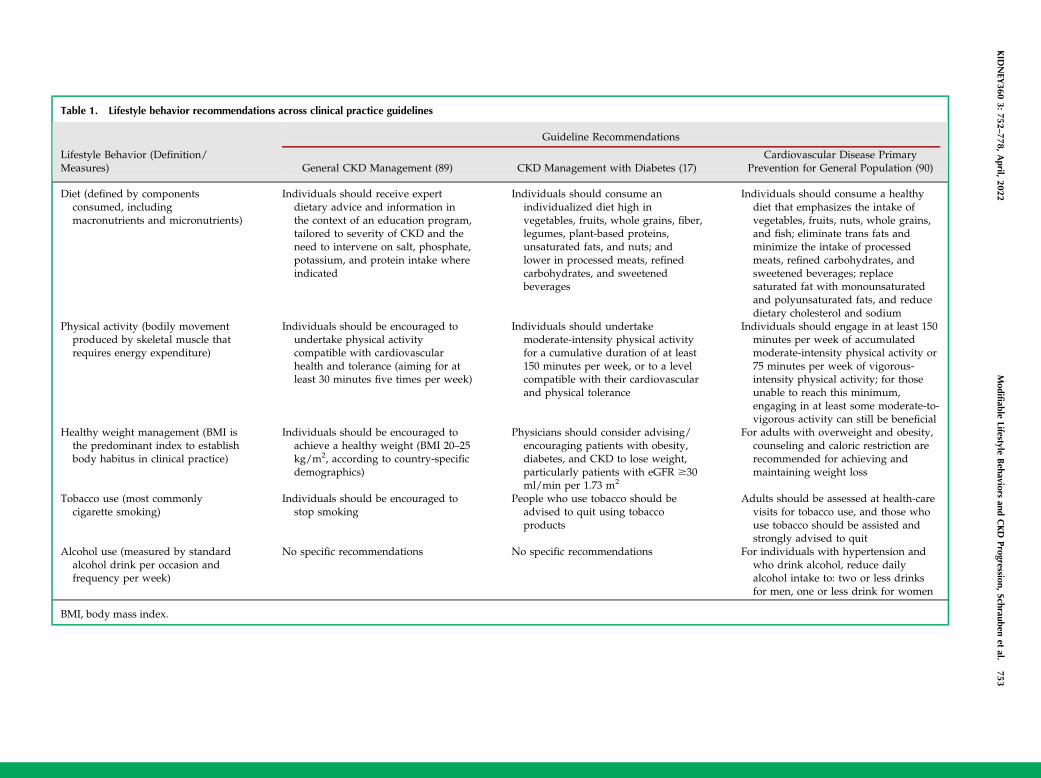
Table 1. Lifestyle behavior recommendations across clinical practice guidelines
Lifestyle Behavior (Definition/Measures)
Guideline Recommendations
General CKD Management (89) CKD Management with Diabetes (17)Cardiovascular Disease Primary
Prevention for General Population (90)
Diet (defined by componentsconsumed, includingmacronutrients and micronutrients)
Individuals should receive expertdietary advice and information inthe context of an education program,tailored to severity of CKD and theneed to intervene on salt, phosphate,potassium, and protein intake whereindicated
Individuals should consume anindividualized diet high invegetables, fruits, whole grains, fiber,legumes, plant-based proteins,unsaturated fats, and nuts; andlower in processed meats, refinedcarbohydrates, and sweetenedbeverages
Individuals should consume a healthydiet that emphasizes the intake ofvegetables, fruits, nuts, whole grains,and fish; eliminate trans fats andminimize the intake of processedmeats, refined carbohydrates, andsweetened beverages; replacesaturated fat with monounsaturatedand polyunsaturated fats, and reducedietary cholesterol and sodium
Physical activity (bodily movementproduced by skeletal muscle thatrequires energy expenditure)
Individuals should be encouraged toundertake physical activitycompatible with cardiovascularhealth and tolerance (aiming for atleast 30 minutes five times per week)
Individuals should undertakemoderate-intensity physical activityfor a cumulative duration of at least150 minutes per week, or to a levelcompatible with their cardiovascularand physical tolerance
Individuals should engage in at least 150minutes per week of accumulatedmoderate-intensity physical activity or75 minutes per week of vigorous-intensity physical activity; for thoseunable to reach this minimum,engaging in at least some moderate-to-vigorous activity can still be beneficial
Healthy weight management (BMI isthe predominant index to establishbody habitus in clinical practice)
Individuals should be encouraged toachieve a healthy weight (BMI 20–25kg/m2, according to country-specificdemographics)
Physicians should consider advising/encouraging patients with obesity,diabetes, and CKD to lose weight,particularly patients with eGFR $30ml/min per 1.73 m2
For adults with overweight and obesity,counseling and caloric restriction arerecommended for achieving andmaintaining weight loss
Tobacco use (most commonlycigarette smoking)
Individuals should be encouraged tostop smoking
People who use tobacco should beadvised to quit using tobaccoproducts
Adults should be assessed at health-carevisits for tobacco use, and those whouse tobacco should be assisted andstrongly advised to quit
Alcohol use (measured by standardalcohol drink per occasion andfrequency per week)
No specific recommendations No specific recommendations For individuals with hypertension andwho drink alcohol, reduce dailyalcohol intake to: two or less drinksfor men, one or less drink for women
BMI, body mass index.
KID
NEY
3603:
752–778,
April,
2022Modifiable
LifestyleBehaviors
andCKD
Progression,Schrauben
etal.
753
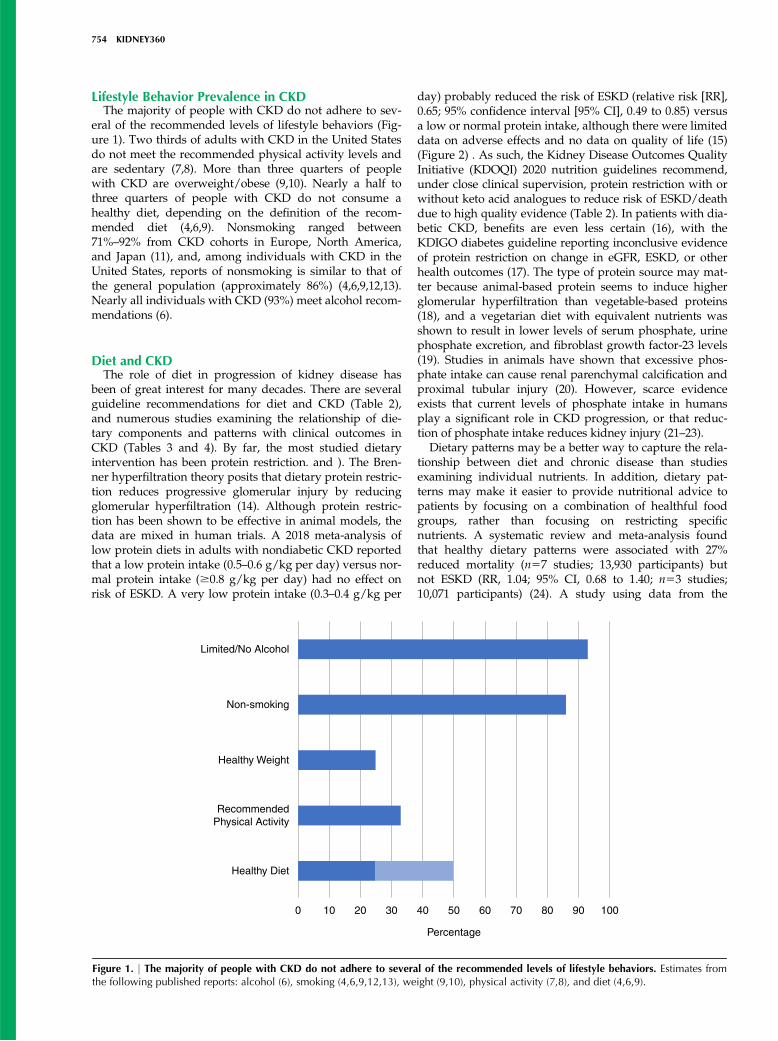
Lifestyle Behavior Prevalence in CKDThe majority of people with CKD do not adhere to sev-
eral of the recommended levels of lifestyle behaviors (Fig-ure 1). Two thirds of adults with CKD in the United Statesdo not meet the recommended physical activity levels andare sedentary (7,8). More than three quarters of peoplewith CKD are overweight/obese (9,10). Nearly a half tothree quarters of people with CKD do not consume ahealthy diet, depending on the definition of the recom-mended diet (4,6,9). Nonsmoking ranged between71%–92% from CKD cohorts in Europe, North America,and Japan (11), and, among individuals with CKD in theUnited States, reports of nonsmoking is similar to that ofthe general population (approximately 86%) (4,6,9,12,13).Nearly all individuals with CKD (93%) meet alcohol recom-mendations (6).
Diet and CKDThe role of diet in progression of kidney disease has
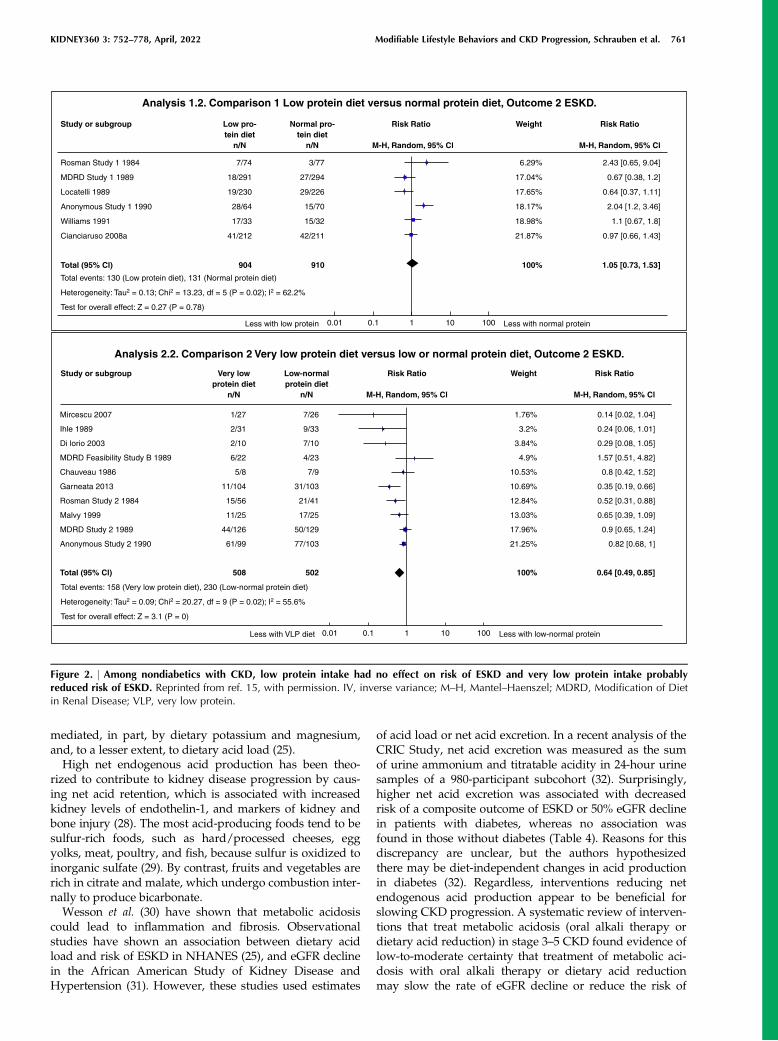
been of great interest for many decades. There are severalguideline recommendations for diet and CKD (Table 2),and numerous studies examining the relationship of die-tary components and patterns with clinical outcomes inCKD (Tables 3 and 4). By far, the most studied dietaryintervention has been protein restriction. and ). The Bren-ner hyperfiltration theory posits that dietary protein restric-tion reduces progressive glomerular injury by reducingglomerular hyperfiltration (14). Although protein restric-tion has been shown to be effective in animal models, thedata are mixed in human trials. A 2018 meta-analysis oflow protein diets in adults with nondiabetic CKD reportedthat a low protein intake (0.5–0.6 g/kg per day) versus nor-mal protein intake ($0.8 g/kg per day) had no effect onrisk of ESKD. A very low protein intake (0.3–0.4 g/kg per
day) probably reduced the risk of ESKD (relative risk [RR],0.65; 95% confidence interval [95% CI], 0.49 to 0.85) versusa low or normal protein intake, although there were limiteddata on adverse effects and no data on quality of life (15)(Figure 2) . As such, the Kidney Disease Outcomes QualityInitiative (KDOQI) 2020 nutrition guidelines recommend,under close clinical supervision, protein restriction with orwithout keto acid analogues to reduce risk of ESKD/deathdue to high quality evidence (Table 2). In patients with dia-betic CKD, benefits are even less certain (16), with theKDIGO diabetes guideline reporting inconclusive evidenceof protein restriction on change in eGFR, ESKD, or otherhealth outcomes (17). The type of protein source may mat-ter because animal-based protein seems to induce higherglomerular hyperfiltration than vegetable-based proteins(18), and a vegetarian diet with equivalent nutrients wasshown to result in lower levels of serum phosphate, urinephosphate excretion, and fibroblast growth factor-23 levels(19). Studies in animals have shown that excessive phos-phate intake can cause renal parenchymal calcification andproximal tubular injury (20). However, scarce evidenceexists that current levels of phosphate intake in humansplay a significant role in CKD progression, or that reduc-tion of phosphate intake reduces kidney injury (21–23).
Dietary patterns may be a better way to capture the rela-tionship between diet and chronic disease than studiesexamining individual nutrients. In addition, dietary pat-terns may make it easier to provide nutritional advice topatients by focusing on a combination of healthful foodgroups, rather than focusing on restricting specificnutrients. A systematic review and meta-analysis foundthat healthy dietary patterns were associated with 27%reduced mortality (n57 studies; 13,930 participants) butnot ESKD (RR, 1.04; 95% CI, 0.68 to 1.40; n53 studies;10,071 participants) (24). A study using data from the
Limited/No Alcohol
Non-smoking
Healthy Weight
Recommended Physical Activity
Healthy Diet
0 10 20 30 40 50
Percentage
60 70 80 90 100
Figure 1. | The majority of people with CKD do not adhere to several of the recommended levels of lifestyle behaviors. Estimates fromthe following published reports: alcohol (6), smoking (4,6,9,12,13), weight (9,10), physical activity (7,8), and diet (4,6,9).
754 KIDNEY360

National Health and Nutrition Examination Survey(NHANES; 1988–1994) found that a low DietaryApproaches to Stop Hypertension (DASH) dietary scorewas associated with ESKD (quintile 1 relative hazard, 1.7;95% CI, 1.1 to 2.7; quintile 2 relative hazard, 2.2; 95% CI, 1.1to 4.1) (25). Hu et al. (26) examined the relationshipbetween dietary intake and risk of CKD progression in theChronic Renal Insufficiency Cohort (CRIC) Study. Com-pared with participants with the lowest tertile of adher-ence, the participants in the most adherent tertile of theAlternative Healthy Eating Index-2010 (AHEI-2010), alter-nate Mediterranean diet (aMed), and DASH diet wereassociated with lower risk of CKD progression (17% forAHEI-2010, 25% for aMed, 17% for DASH).
Observational studies examining associations betweenspecific foods and risk of ESKD have often found conflict-ing findings and can be challenging to interpret given thedifferent methods of estimating intake and differingapproaches to adjustment. In the Singapore Chinese HealthStudy, red meat intake was associated with ESKD (highestquartile versus lowest quartile, hazard ratio, 1.40; 95% CI,1.15 to 1.71), whereas the consumption of poultry, fish,eggs, or dairy products was not associated with ESKD (27).In the CRIC Study, the benefits observed with the aMedstudy were largely driven by vegetable and nut intake,whereas no association was seen with red/processed meatintake (26). In the NHANES study, the association betweenDASH dietary score and risk of ESKD appeared to be
Table 2. Diet recommendations for individuals with CKD
Dietary Component Recommendation Source
Dietary pattern Adults with CKD 1–5 not on dialysis or post-transplantation, with or without dyslipidemia: suggestprescribing a Mediterranean diet may improve lipidprofiles (2C)
KDOQI Nutrition 2020 (87)
Protein intake Adults with CKD 3–5 who are metabolically stable:recommend, under close clinical supervision, proteinrestriction with or without ketoacid analogues, to reducerisk for ESKD/death (1A) and improve quality of life (2C)
KDOQI Nutrition 2020 (87)
Adults with CKD 1–5D (1B) or those post-transplantation(OPINION): there is insufficient evidence to recommend aparticular protein type (plant versus animal) in terms ofthe effects on nutritional status, calcium or phosphatelevels, or the blood lipid profile
Patients with diabetes with CKD 1–5: suggest maintaining aprotein intake of 0.8 g protein/kg (weight) per day (2C)
KDIGO Diabetes 2020 (17)
Dietary acid load Adults with CKD 1–4: suggest reducing NEAP throughincreased dietary intake of fruits and vegetables (2C) toreduce the rate of decline of residual kidney function
KDOQI Nutrition 2020 (87)
Sodium intake Adults with CKD 3–5: recommend limiting sodium intake to,2.3 g/d to reduce BP and improve volume control (1B)
KDOQI Nutrition 2020 (87)
Adults with CKD 3–5: suggest limiting sodium intake to,2.3 g/d to reduce proteinuria synergistically withavailable pharmacologic interventions (2A)
Patients with diabetes with CKD: suggest limiting sodiumintake to ,2 g/d in patients with diabetes and CKD (2C)
KDIGO Diabetes 2020 (17)
Patients with high BP and CKD: suggest targeting a sodiumintake ,2 g/d in patients with high BP and CKD (2C)
KDIGO Blood pressure 2020 (86)
Potassium intake Adults with CKD 3–5: reasonable to adjust dietarypotassium intake to maintain serum potassium within thenormal range (OPINION)
KDOQI Nutrition 2020 (87)
Calcium intake Adults with CKD 3–4 not taking active vitamin Danalogues: suggest total elemental calcium intake of800–1000 mg/d (including dietary calcium, calciumsupplementation, and calcium-based phosphate binders)to maintain a neutral calcium balance (2B)
KDOQI Nutrition 2020 (87)
Phosphorus intake Adults with CKD 3–5: recommend adjusting dietaryphosphate intake to maintain serum phosphate levels inthe normal range (1B)
KDOQI Nutrition 2020 (87)
Adults with CKD 1–5: reasonable when making decisionsabout phosphate restriction treatment to consider thebioavailability of phosphate sources (e.g., animal,vegetable, additives) (OPINION)
The strength of each recommendation is indicated as Level 1 ("recommended") or Level 2 ("suggested"), and the quality of thesupporting evidence is shown as A, B, C, or D: high, moderate, low, and very low, respectively. Opinion is expert opinion withoutstrong evidence in CKD population. KDOQI, Kidney Disease Outcomes Quality Initiative; KDIGO, Kidney Disease ImprovingGlobal Outcomes; NEAP, net endogenous acid production.
KIDNEY360 3: 752–778, April, 2022 Modifiable Lifestyle Behaviors and CKD Progression, Schrauben et al. 755
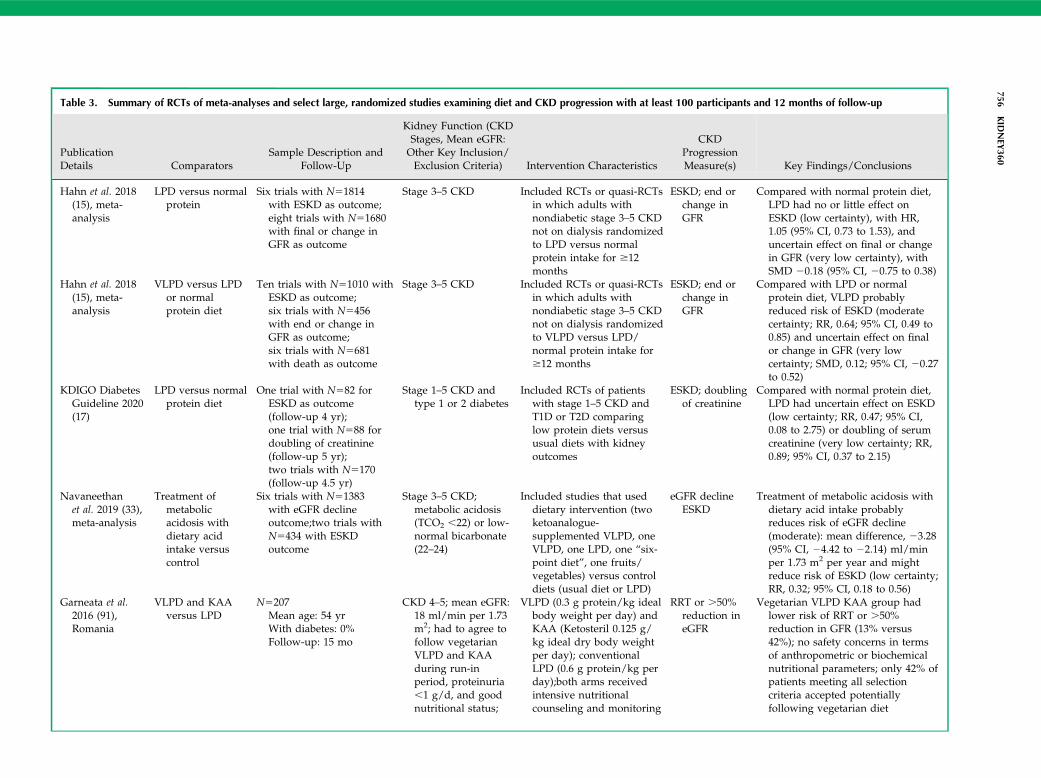
Table 3. Summary of RCTs of meta-analyses and select large, randomized studies examining diet and CKD progression with at least 100 participants and 12 months of follow-up
PublicationDetails Comparators
Sample Description andFollow-Up
Kidney Function (CKDStages, Mean eGFR:Other Key Inclusion/Exclusion Criteria) Intervention Characteristics
CKDProgressionMeasure(s) Key Findings/Conclusions
Hahn et al. 2018(15), meta-analysis
LPD versus normalprotein
Six trials with N51814with ESKD as outcome;eight trials with N51680with final or change inGFR as outcome
Stage 3–5 CKD Included RCTs or quasi-RCTsin which adults withnondiabetic stage 3–5 CKDnot on dialysis randomizedto LPD versus normalprotein intake for $12months
ESKD; end orchange inGFR
Compared with normal protein diet,LPD had no or little effect onESKD (low certainty), with HR,1.05 (95% CI, 0.73 to 1.53), anduncertain effect on final or changein GFR (very low certainty), withSMD 20.18 (95% CI, 20.75 to 0.38)
Hahn et al. 2018(15), meta-analysis
VLPD versus LPDor normalprotein diet
Ten trials with N51010 withESKD as outcome;six trials with N5456with end or change inGFR as outcome;six trials with N5681with death as outcome
Stage 3–5 CKD Included RCTs or quasi-RCTsin which adults withnondiabetic stage 3–5 CKDnot on dialysis randomizedto VLPD versus LPD/normal protein intake for$12 months
ESKD; end orchange inGFR
Compared with LPD or normalprotein diet, VLPD probablyreduced risk of ESKD (moderatecertainty; RR, 0.64; 95% CI, 0.49 to0.85) and uncertain effect on finalor change in GFR (very lowcertainty; SMD, 0.12; 95% CI, 20.27to 0.52)
KDIGO DiabetesGuideline 2020(17)
LPD versus normalprotein diet
One trial with N582 forESKD as outcome(follow-up 4 yr);one trial with N588 fordoubling of creatinine(follow-up 5 yr);two trials with N5170(follow-up 4.5 yr)
Stage 1–5 CKD andtype 1 or 2 diabetes
Included RCTs of patientswith stage 1–5 CKD andT1D or T2D comparinglow protein diets versususual diets with kidneyoutcomes
ESKD; doublingof creatinine
Compared with normal protein diet,LPD had uncertain effect on ESKD(low certainty; RR, 0.47; 95% CI,0.08 to 2.75) or doubling of serumcreatinine (very low certainty; RR,0.89; 95% CI, 0.37 to 2.15)
Navaneethanet al. 2019 (33),meta-analysis
Treatment ofmetabolicacidosis withdietary acidintake versuscontrol
Six trials with N51383with eGFR declineoutcome;two trials withN5434 with ESKDoutcome
Stage 3–5 CKD;metabolic acidosis(TCO2 ,22) or low-normal bicarbonate(22–24)
Included studies that useddietary intervention (twoketoanalogue-supplemented VLPD, oneVLPD, one LPD, one “six-point diet”, one fruits/vegetables) versus controldiets (usual diet or LPD)
eGFR declineESKD
Treatment of metabolic acidosis withdietary acid intake probablyreduces risk of eGFR decline(moderate): mean difference, 23.28(95% CI, 24.42 to 22.14) ml/minper 1.73 m2 per year and mightreduce risk of ESKD (low certainty;RR, 0.32; 95% CI, 0.18 to 0.56)
Garneata et al.2016 (91),Romania
VLPD and KAAversus LPD
N5207Mean age: 54 yrWith diabetes: 0%Follow-up: 15 mo
CKD 4–5; mean eGFR:18 ml/min per 1.73m2; had to agree tofollow vegetarianVLPD and KAAduring run-inperiod, proteinuria,1 g/d, and goodnutritional status;
VLPD (0.3 g protein/kg idealbody weight per day) andKAA (Ketosteril 0.125 g/kg ideal dry body weightper day); conventionalLPD (0.6 g protein/kg perday);both arms receivedintensive nutritionalcounseling and monitoring
RRT or .50%reduction ineGFR
Vegetarian VLPD KAA group hadlower risk of RRT or .50%reduction in GFR (13% versus42%); no safety concerns in termsof anthropometric or biochemicalnutritional parameters; only 42% ofpatients meeting all selectioncriteria accepted potentiallyfollowing vegetarian diet
756KID
NEY
360
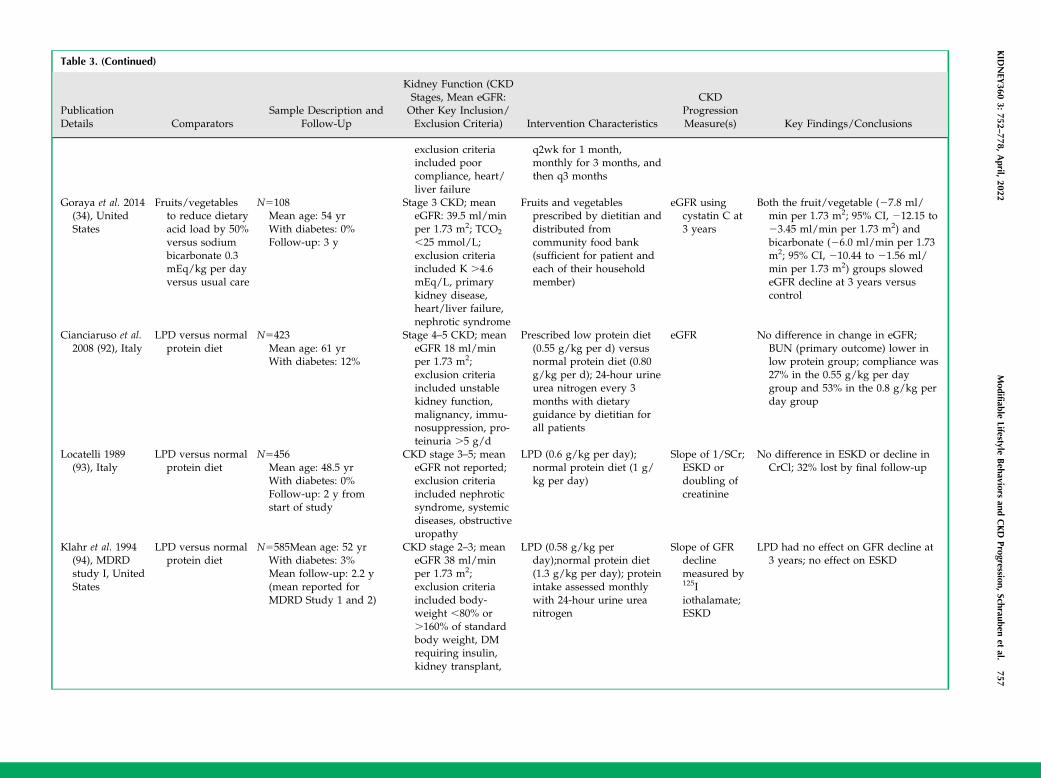
Table 3. (Continued)
PublicationDetails Comparators
Sample Description andFollow-Up
Kidney Function (CKDStages, Mean eGFR:Other Key Inclusion/Exclusion Criteria) Intervention Characteristics
CKDProgressionMeasure(s) Key Findings/Conclusions
exclusion criteriaincluded poorcompliance, heart/liver failure
q2wk for 1 month,monthly for 3 months, andthen q3 months
Goraya et al. 2014(34), UnitedStates
Fruits/vegetablesto reduce dietaryacid load by 50%versus sodiumbicarbonate 0.3mEq/kg per dayversus usual care
N5108Mean age: 54 yrWith diabetes: 0%Follow-up: 3 y
Stage 3 CKD; meaneGFR: 39.5 ml/minper 1.73 m2; TCO2
,25 mmol/L;exclusion criteriaincluded K .4.6mEq/L, primarykidney disease,heart/liver failure,nephrotic syndrome
Fruits and vegetablesprescribed by dietitian anddistributed fromcommunity food bank(sufficient for patient andeach of their householdmember)
eGFR usingcystatin C at3 years
Both the fruit/vegetable (27.8 ml/min per 1.73 m2; 95% CI, 212.15 to23.45 ml/min per 1.73 m2) andbicarbonate (26.0 ml/min per 1.73m2; 95% CI, 210.44 to 21.56 ml/min per 1.73 m2) groups slowedeGFR decline at 3 years versuscontrol
Cianciaruso et al.2008 (92), Italy
LPD versus normalprotein diet
N5423Mean age: 61 yrWith diabetes: 12%
Stage 4–5 CKD; meaneGFR 18 ml/minper 1.73 m2;exclusion criteriaincluded unstablekidney function,malignancy, immu-nosuppression, pro-teinuria .5 g/d
Prescribed low protein diet(0.55 g/kg per d) versusnormal protein diet (0.80g/kg per d); 24-hour urineurea nitrogen every 3months with dietaryguidance by dietitian forall patients
eGFR No difference in change in eGFR;BUN (primary outcome) lower inlow protein group; compliance was27% in the 0.55 g/kg per daygroup and 53% in the 0.8 g/kg perday group
Locatelli 1989(93), Italy
LPD versus normalprotein diet
N5456Mean age: 48.5 yrWith diabetes: 0%Follow-up: 2 y fromstart of study
CKD stage 3–5; meaneGFR not reported;exclusion criteriaincluded nephroticsyndrome, systemicdiseases, obstructiveuropathy
LPD (0.6 g/kg per day);normal protein diet (1 g/kg per day)
Slope of 1/SCr;ESKD ordoubling ofcreatinine
No difference in ESKD or decline inCrCl; 32% lost by final follow-up
Klahr et al. 1994(94), MDRDstudy I, UnitedStates
LPD versus normalprotein diet
N5585Mean age: 52 yrWith diabetes: 3%Mean follow-up: 2.2 y(mean reported forMDRD Study 1 and 2)
CKD stage 2–3; meaneGFR 38 ml/minper 1.73 m2;exclusion criteriaincluded body-weight ,80% or.160% of standardbody weight, DMrequiring insulin,kidney transplant,
LPD (0.58 g/kg perday);normal protein diet(1.3 g/kg per day); proteinintake assessed monthlywith 24-hour urine ureanitrogen
Slope of GFRdeclinemeasured by125Iiothalamate;ESKD
LPD had no effect on GFR decline at3 years; no effect on ESKD
KID
NEY
3603:
752–778,
April,
2022Modifiable
LifestyleBehaviors
andCKD
Progression,Schrauben
etal.
757
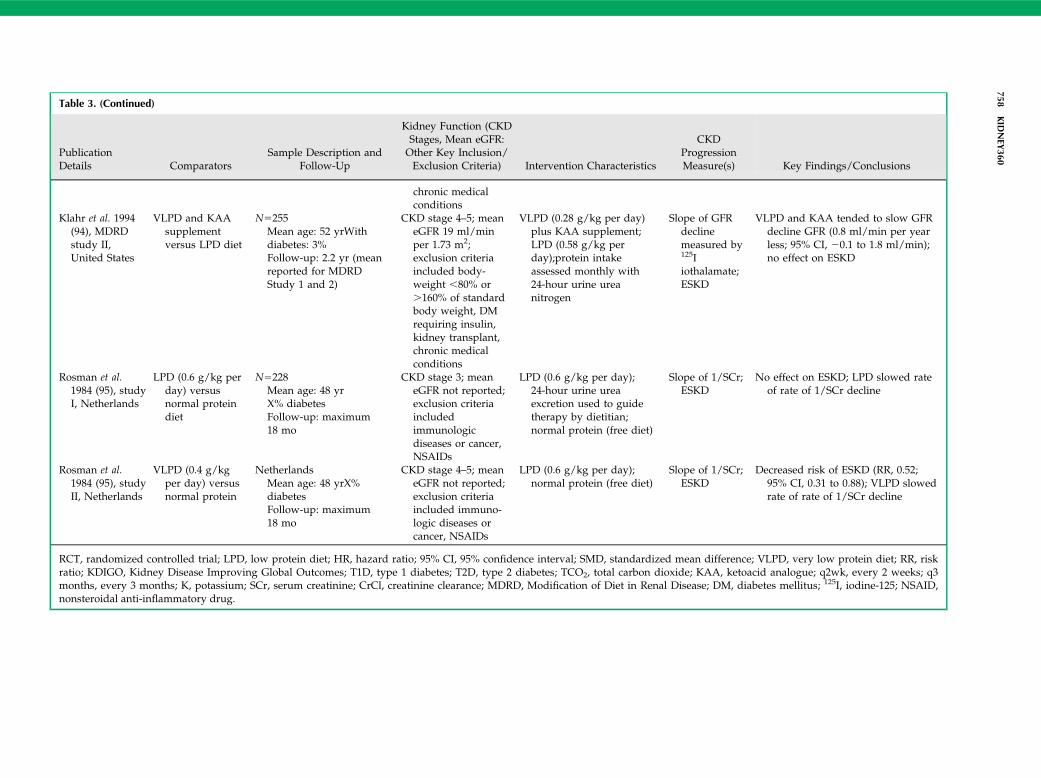
Table 3. (Continued)
PublicationDetails Comparators
Sample Description andFollow-Up
Kidney Function (CKDStages, Mean eGFR:Other Key Inclusion/Exclusion Criteria) Intervention Characteristics
CKDProgressionMeasure(s) Key Findings/Conclusions
chronic medicalconditions
Klahr et al. 1994(94), MDRDstudy II,United States
VLPD and KAAsupplementversus LPD diet
N5255Mean age: 52 yrWithdiabetes: 3%Follow-up: 2.2 yr (meanreported for MDRDStudy 1 and 2)
CKD stage 4–5; meaneGFR 19 ml/minper 1.73 m2;exclusion criteriaincluded body-weight ,80% or.160% of standardbody weight, DMrequiring insulin,kidney transplant,chronic medicalconditions
VLPD (0.28 g/kg per day)plus KAA supplement;LPD (0.58 g/kg perday);protein intakeassessed monthly with24-hour urine ureanitrogen
Slope of GFRdeclinemeasured by125Iiothalamate;ESKD
VLPD and KAA tended to slow GFRdecline GFR (0.8 ml/min per yearless; 95% CI, 20.1 to 1.8 ml/min);no effect on ESKD
Rosman et al.1984 (95), studyI, Netherlands
LPD (0.6 g/kg perday) versusnormal proteindiet
N5228Mean age: 48 yrX% diabetesFollow-up: maximum18 mo
CKD stage 3; meaneGFR not reported;exclusion criteriaincludedimmunologicdiseases or cancer,NSAIDs
LPD (0.6 g/kg per day);24-hour urine ureaexcretion used to guidetherapy by dietitian;normal protein (free diet)
Slope of 1/SCr;ESKD
No effect on ESKD; LPD slowed rateof rate of 1/SCr decline
Rosman et al.1984 (95), studyII, Netherlands
VLPD (0.4 g/kgper day) versusnormal protein
NetherlandsMean age: 48 yrX%diabetesFollow-up: maximum18 mo
CKD stage 4–5; meaneGFR not reported;exclusion criteriaincluded immuno-logic diseases orcancer, NSAIDs
LPD (0.6 g/kg per day);normal protein (free diet)
Slope of 1/SCr;ESKD
Decreased risk of ESKD (RR, 0.52;95% CI, 0.31 to 0.88); VLPD slowedrate of rate of 1/SCr decline
RCT, randomized controlled trial; LPD, low protein diet; HR, hazard ratio; 95% CI, 95% confidence interval; SMD, standardized mean difference; VLPD, very low protein diet; RR, riskratio; KDIGO, Kidney Disease Improving Global Outcomes; T1D, type 1 diabetes; T2D, type 2 diabetes; TCO2, total carbon dioxide; KAA, ketoacid analogue; q2wk, every 2 weeks; q3months, every 3 months; K, potassium; SCr, serum creatinine; CrCl, creatinine clearance; MDRD, Modification of Diet in Renal Disease; DM, diabetes mellitus; 125I, iodine-125; NSAID,nonsteroidal anti-inflammatory drug.
758KID
NEY
360
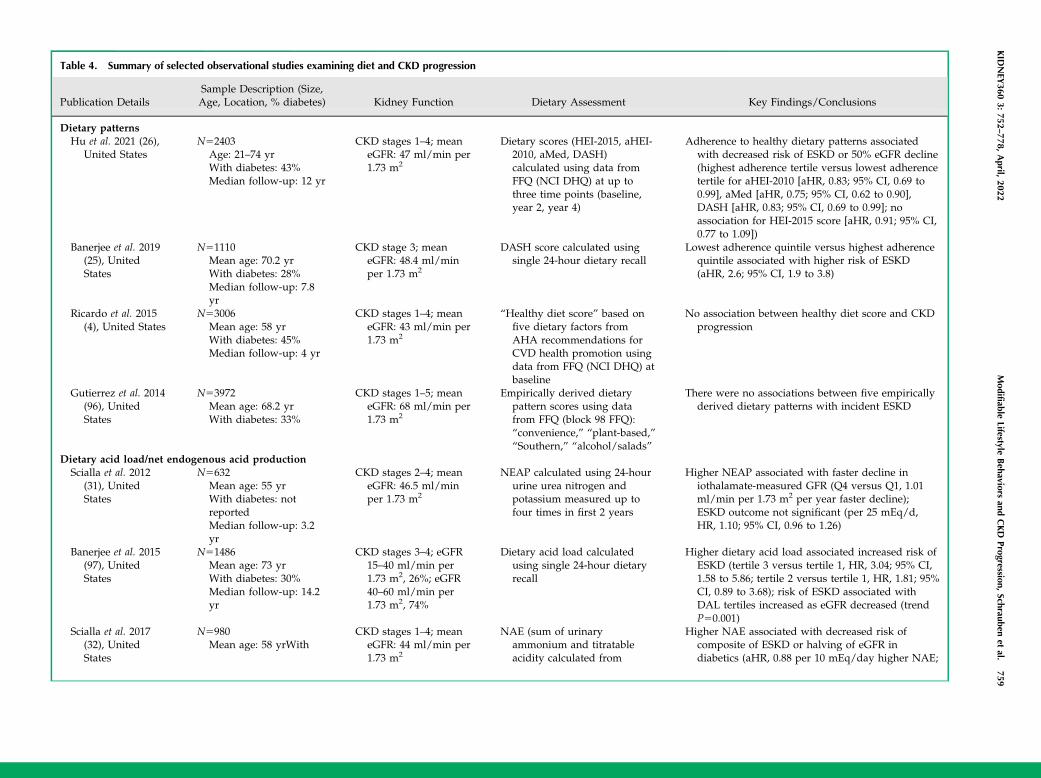
Table 4. Summary of selected observational studies examining diet and CKD progression
Publication DetailsSample Description (Size,Age, Location, % diabetes) Kidney Function Dietary Assessment Key Findings/Conclusions
Dietary patternsHu et al. 2021 (26),
United StatesN52403
Age: 21–74 yrWith diabetes: 43%Median follow-up: 12 yr
CKD stages 1–4; meaneGFR: 47 ml/min per1.73 m2
Dietary scores (HEI-2015, aHEI-2010, aMed, DASH)calculated using data fromFFQ (NCI DHQ) at up tothree time points (baseline,year 2, year 4)
Adherence to healthy dietary patterns associatedwith decreased risk of ESKD or 50% eGFR decline(highest adherence tertile versus lowest adherencetertile for aHEI-2010 [aHR, 0.83; 95% CI, 0.69 to0.99], aMed [aHR, 0.75; 95% CI, 0.62 to 0.90],DASH [aHR, 0.83; 95% CI, 0.69 to 0.99]; noassociation for HEI-2015 score [aHR, 0.91; 95% CI,0.77 to 1.09])
Banerjee et al. 2019(25), UnitedStates
N51110Mean age: 70.2 yrWith diabetes: 28%Median follow-up: 7.8yr
CKD stage 3; meaneGFR: 48.4 ml/minper 1.73 m2
DASH score calculated usingsingle 24-hour dietary recall
Lowest adherence quintile versus highest adherencequintile associated with higher risk of ESKD(aHR, 2.6; 95% CI, 1.9 to 3.8)
Ricardo et al. 2015(4), United States
N53006Mean age: 58 yrWith diabetes: 45%Median follow-up: 4 yr
CKD stages 1–4; meaneGFR: 43 ml/min per1.73 m2
“Healthy diet score” based onfive dietary factors fromAHA recommendations forCVD health promotion usingdata from FFQ (NCI DHQ) atbaseline
No association between healthy diet score and CKDprogression
Gutierrez et al. 2014(96), UnitedStates
N53972Mean age: 68.2 yrWith diabetes: 33%
CKD stages 1–5; meaneGFR: 68 ml/min per1.73 m2
Empirically derived dietarypattern scores using datafrom FFQ (block 98 FFQ):“convenience,” “plant-based,”“Southern,” “alcohol/salads”
There were no associations between five empiricallyderived dietary patterns with incident ESKD
Dietary acid load/net endogenous acid productionScialla et al. 2012
(31), UnitedStates
N5632Mean age: 55 yrWith diabetes: notreportedMedian follow-up: 3.2yr
CKD stages 2–4; meaneGFR: 46.5 ml/minper 1.73 m2
NEAP calculated using 24-hoururine urea nitrogen andpotassium measured up tofour times in first 2 years
Higher NEAP associated with faster decline iniothalamate-measured GFR (Q4 versus Q1, 1.01ml/min per 1.73 m2 per year faster decline);ESKD outcome not significant (per 25 mEq/d,HR, 1.10; 95% CI, 0.96 to 1.26)
Banerjee et al. 2015(97), UnitedStates
N51486Mean age: 73 yrWith diabetes: 30%Median follow-up: 14.2yr
CKD stages 3–4; eGFR15–40 ml/min per1.73 m2, 26%; eGFR40–60 ml/min per1.73 m2, 74%
Dietary acid load calculatedusing single 24-hour dietaryrecall
Higher dietary acid load associated increased risk ofESKD (tertile 3 versus tertile 1, HR, 3.04; 95% CI,1.58 to 5.86; tertile 2 versus tertile 1, HR, 1.81; 95%CI, 0.89 to 3.68); risk of ESKD associated withDAL tertiles increased as eGFR decreased (trendP50.001)
Scialla et al. 2017(32), UnitedStates
N5980Mean age: 58 yrWith
CKD stages 1–4; meaneGFR: 44 ml/min per1.73 m2
NAE (sum of urinaryammonium and titratableacidity calculated from
Higher NAE associated with decreased risk ofcomposite of ESKD or halving of eGFR indiabetics (aHR, 0.88 per 10 mEq/day higher NAE;
KID
NEY
3603:
752–778,
April,
2022Modifiable
LifestyleBehaviors
andCKD
Progression,Schrauben
etal.
759
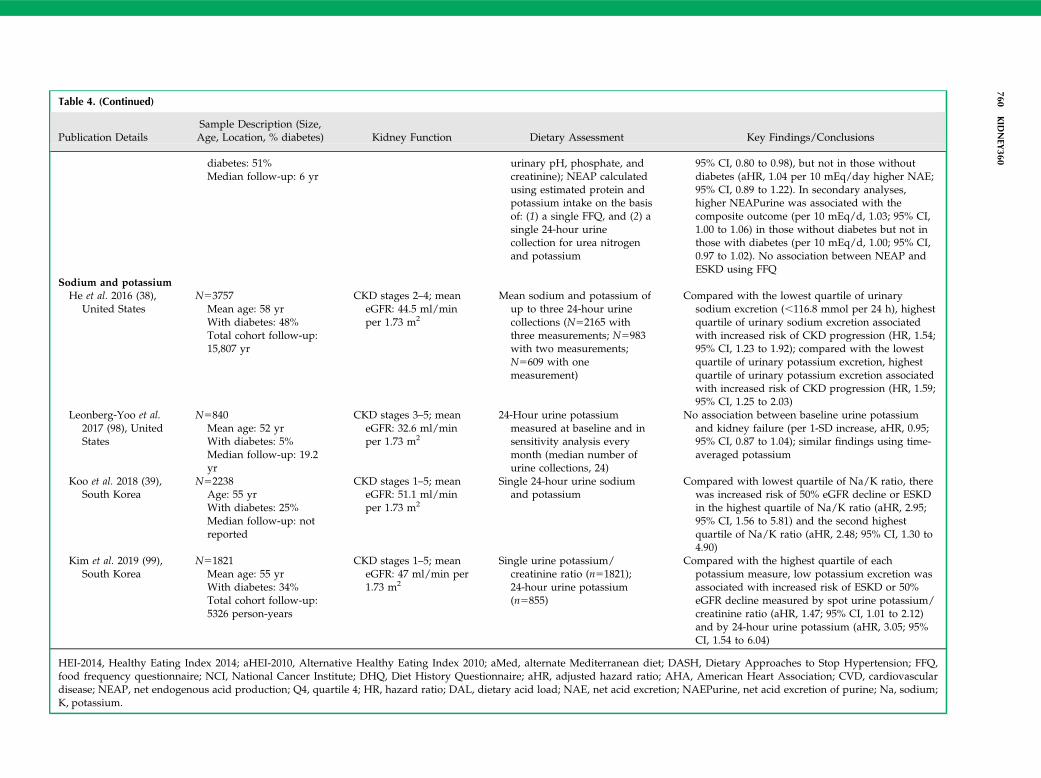
Table 4. (Continued)
Publication DetailsSample Description (Size,Age, Location, % diabetes) Kidney Function Dietary Assessment Key Findings/Conclusions
diabetes: 51%Median follow-up: 6 yr
urinary pH, phosphate, andcreatinine); NEAP calculatedusing estimated protein andpotassium intake on the basisof: (1) a single FFQ, and (2) asingle 24-hour urinecollection for urea nitrogenand potassium
95% CI, 0.80 to 0.98), but not in those withoutdiabetes (aHR, 1.04 per 10 mEq/day higher NAE;95% CI, 0.89 to 1.22). In secondary analyses,higher NEAPurine was associated with thecomposite outcome (per 10 mEq/d, 1.03; 95% CI,1.00 to 1.06) in those without diabetes but not inthose with diabetes (per 10 mEq/d, 1.00; 95% CI,0.97 to 1.02). No association between NEAP andESKD using FFQ
Sodium and potassiumHe et al. 2016 (38),
United StatesN53757
Mean age: 58 yrWith diabetes: 48%Total cohort follow-up:15,807 yr
CKD stages 2–4; meaneGFR: 44.5 ml/minper 1.73 m2
Mean sodium and potassium ofup to three 24-hour urinecollections (N52165 withthree measurements; N5983with two measurements;N5609 with onemeasurement)
Compared with the lowest quartile of urinarysodium excretion (,116.8 mmol per 24 h), highestquartile of urinary sodium excretion associatedwith increased risk of CKD progression (HR, 1.54;95% CI, 1.23 to 1.92); compared with the lowestquartile of urinary potassium excretion, highestquartile of urinary potassium excretion associatedwith increased risk of CKD progression (HR, 1.59;95% CI, 1.25 to 2.03)
Leonberg-Yoo et al.2017 (98), UnitedStates
N5840Mean age: 52 yrWith diabetes: 5%Median follow-up: 19.2yr
CKD stages 3–5; meaneGFR: 32.6 ml/minper 1.73 m2
24-Hour urine potassiummeasured at baseline and insensitivity analysis everymonth (median number ofurine collections, 24)
No association between baseline urine potassiumand kidney failure (per 1-SD increase, aHR, 0.95;95% CI, 0.87 to 1.04); similar findings using time-averaged potassium
Koo et al. 2018 (39),South Korea
N52238Age: 55 yrWith diabetes: 25%Median follow-up: notreported
CKD stages 1–5; meaneGFR: 51.1 ml/minper 1.73 m2
Single 24-hour urine sodiumand potassium
Compared with lowest quartile of Na/K ratio, therewas increased risk of 50% eGFR decline or ESKDin the highest quartile of Na/K ratio (aHR, 2.95;95% CI, 1.56 to 5.81) and the second highestquartile of Na/K ratio (aHR, 2.48; 95% CI, 1.30 to4.90)
Kim et al. 2019 (99),South Korea
N51821Mean age: 55 yrWith diabetes: 34%Total cohort follow-up:5326 person-years
CKD stages 1–5; meaneGFR: 47 ml/min per1.73 m2
Single urine potassium/creatinine ratio (n51821);24-hour urine potassium(n5855)
Compared with the highest quartile of eachpotassium measure, low potassium excretion wasassociated with increased risk of ESKD or 50%eGFR decline measured by spot urine potassium/creatinine ratio (aHR, 1.47; 95% CI, 1.01 to 2.12)and by 24-hour urine potassium (aHR, 3.05; 95%CI, 1.54 to 6.04)
HEI-2014, Healthy Eating Index 2014; aHEI-2010, Alternative Healthy Eating Index 2010; aMed, alternate Mediterranean diet; DASH, Dietary Approaches to Stop Hypertension; FFQ,food frequency questionnaire; NCI, National Cancer Institute; DHQ, Diet History Questionnaire; aHR, adjusted hazard ratio; AHA, American Heart Association; CVD, cardiovasculardisease; NEAP, net endogenous acid production; Q4, quartile 4; HR, hazard ratio; DAL, dietary acid load; NAE, net acid excretion; NAEPurine, net acid excretion of purine; Na, sodium;K, potassium.
760KID
NEY
360
mediated, in part, by dietary potassium and magnesium,and, to a lesser extent, to dietary acid load (25).High net endogenous acid production has been theo-
rized to contribute to kidney disease progression by caus-ing net acid retention, which is associated with increasedkidney levels of endothelin-1, and markers of kidney andbone injury (28). The most acid-producing foods tend to besulfur-rich foods, such as hard/processed cheeses, eggyolks, meat, poultry, and fish, because sulfur is oxidized toinorganic sulfate (29). By contrast, fruits and vegetables arerich in citrate and malate, which undergo combustion inter-nally to produce bicarbonate.Wesson et al. (30) have shown that metabolic acidosis
could lead to inflammation and fibrosis. Observationalstudies have shown an association between dietary acidload and risk of ESKD in NHANES (25), and eGFR declinein the African American Study of Kidney Disease andHypertension (31). However, these studies used estimates
of acid load or net acid excretion. In a recent analysis of theCRIC Study, net acid excretion was measured as the sumof urine ammonium and titratable acidity in 24-hour urinesamples of a 980-participant subcohort (32). Surprisingly,higher net acid excretion was associated with decreasedrisk of a composite outcome of ESKD or 50% eGFR declinein patients with diabetes, whereas no association wasfound in those without diabetes (Table 4). Reasons for thisdiscrepancy are unclear, but the authors hypothesizedthere may be diet-independent changes in acid productionin diabetes (32). Regardless, interventions reducing netendogenous acid production appear to be beneficial forslowing CKD progression. A systematic review of interven-tions that treat metabolic acidosis (oral alkali therapy ordietary acid reduction) in stage 3–5 CKD found evidence oflow-to-moderate certainty that treatment of metabolic aci-dosis with oral alkali therapy or dietary acid reductionmay slow the rate of eGFR decline or reduce the risk of
Analysis 1.2. Comparison 1 Low protein diet versus normal protein diet, Outcome 2 ESKD.
Analysis 2.2. Comparison 2 Very low protein diet versus low or normal protein diet, Outcome 2 ESKD.
Study or subgroup
Total events: 130 (Low protein diet), 131 (Normal protein diet)
Heterogeneity: Tau2 = 0.13; Chi2 = 13.23, df = 5 (P = 0.02); I2 = 62.2%
Test for overall effect: Z = 0.27 (P = 0.78)
Total events: 158 (Very low protein diet), 230 (Low-normal protein diet)
Heterogeneity: Tau2 = 0.09; Chi2 = 20.27, df = 9 (P = 0.02); I2 = 55.6%
Test for overall effect: Z = 3.1 (P = 0)
Less with low protein 0.01 0.1 1 10 100 Less with normal protein
Less with VLP diet 0.01 0.1 1 10 100 Less with low-normal protein
Rosman Study 1 1984
MDRD Study 1 1989
Locatelli 1989
Anonymous Study 1 1990
Williams 1991
Cianciaruso 2008a
Total (95% Cl)
Mircescu 2007
Ihle 1989
Di lorio 2003
MDRD Feasibility Study B 1989
Chauveau 1986
Garneata 2013
Rosman Study 2 1984
Malvy 1999
MDRD Study 2 1989
Anonymous Study 2 1990
Total (95% Cl)
7/74
18/291
19/230
28/64
17/33
41/212
904
1/27
2/31
2/10
6/22
5/8
11/104
15/56
11/25
44/126
61/99
508
7/26
9/33
7/10
4/23
7/9
31/103
21/41
17/25
50/129
77/103
502
1.76%
3.2%
3.84%
4.9%
10.53%
10.69%
12.84%
13.03%
17.96%
21.25%
100%
0.14 [0.02, 1.04]
0.24 [0.06, 1.01]
0.29 [0.08, 1.05]
1.57 [0.51, 4.82]
0.8 [0.42, 1.52]
0.35 [0.19, 0.66]
0.52 [0.31, 0.88]
0.65 [0.39, 1.09]
0.9 [0.65, 1.24]
0.82 [0.68, 1]
0.64 [0.49, 0.85]
3/77
27/294
29/226
15/70
15/32
42/211
910
6.29%
17.04%
17.65%
18.17%
18.98%
21.87%
100%
2.43 [0.65, 9.04]
0.67 [0.38, 1.2]
0.64 [0.37, 1.11]
2.04 [1.2, 3.46]
1.1 [0.67, 1.8]
0.97 [0.66, 1.43]
1.05 [0.73, 1.53]
Low pro-tein diet
n/N
Normal pro-tein diet
n/N
Risk Ratio
M-H, Random, 95% Cl M-H, Random, 95% Cl
Weight Risk Ratio
Study or subgroup Very lowprotein diet
n/N
Low-normalprotein diet
n/N
Risk Ratio
M-H, Random, 95% Cl M-H, Random, 95% Cl
Weight Risk Ratio
Figure 2. | Among nondiabetics with CKD, low protein intake had no effect on risk of ESKD and very low protein intake probablyreduced risk of ESKD. Reprinted from ref. 15, with permission. IV, inverse variance; M–H, Mantel–Haenszel; MDRD, Modification of Dietin Renal Disease; VLP, very low protein.
KIDNEY360 3: 752–778, April, 2022 Modifiable Lifestyle Behaviors and CKD Progression, Schrauben et al. 761
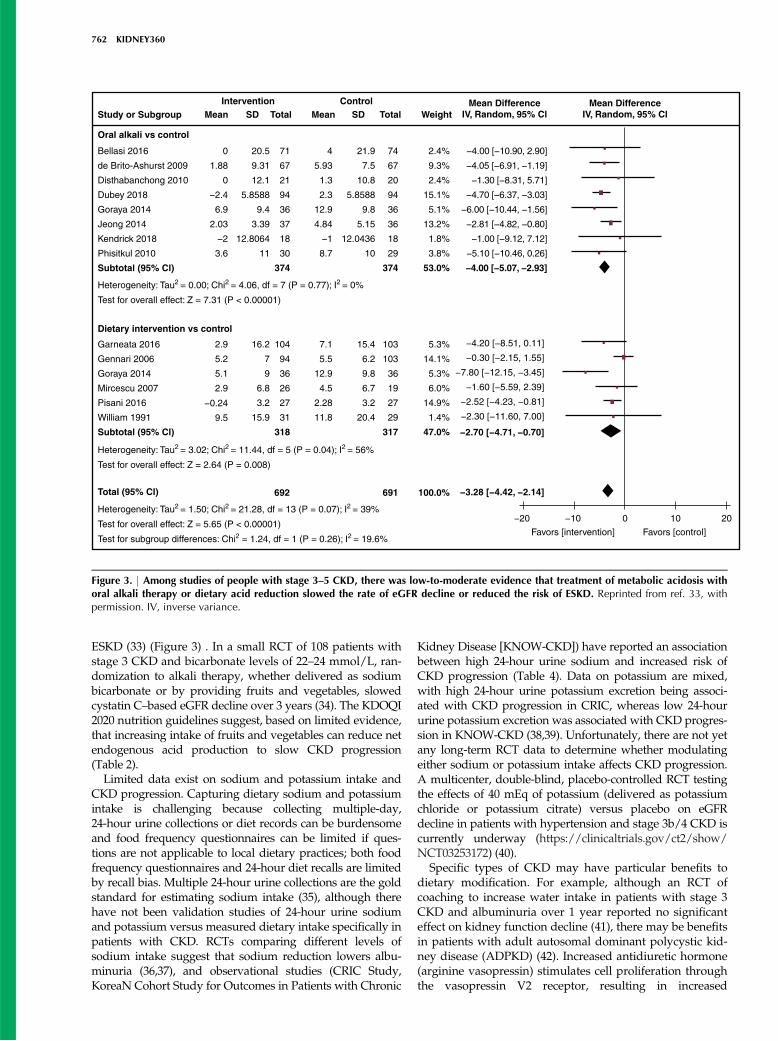
ESKD (33) (Figure 3) . In a small RCT of 108 patients withstage 3 CKD and bicarbonate levels of 22–24 mmol/L, ran-domization to alkali therapy, whether delivered as sodiumbicarbonate or by providing fruits and vegetables, slowedcystatin C–based eGFR decline over 3 years (34). The KDOQI2020 nutrition guidelines suggest, based on limited evidence,that increasing intake of fruits and vegetables can reduce netendogenous acid production to slow CKD progression(Table 2).Limited data exist on sodium and potassium intake and
CKD progression. Capturing dietary sodium and potassiumintake is challenging because collecting multiple-day,24-hour urine collections or diet records can be burdensomeand food frequency questionnaires can be limited if ques-tions are not applicable to local dietary practices; both foodfrequency questionnaires and 24-hour diet recalls are limitedby recall bias. Multiple 24-hour urine collections are the goldstandard for estimating sodium intake (35), although therehave not been validation studies of 24-hour urine sodiumand potassium versus measured dietary intake specifically inpatients with CKD. RCTs comparing different levels ofsodium intake suggest that sodium reduction lowers albu-minuria (36,37), and observational studies (CRIC Study,KoreaN Cohort Study for Outcomes in Patients with Chronic
Kidney Disease [KNOW-CKD]) have reported an associationbetween high 24-hour urine sodium and increased risk ofCKD progression (Table 4). Data on potassium are mixed,with high 24-hour urine potassium excretion being associ-ated with CKD progression in CRIC, whereas low 24-hoururine potassium excretion was associated with CKD progres-sion in KNOW-CKD (38,39). Unfortunately, there are not yetany long-term RCT data to determine whether modulatingeither sodium or potassium intake affects CKD progression.A multicenter, double-blind, placebo-controlled RCT testingthe effects of 40 mEq of potassium (delivered as potassiumchloride or potassium citrate) versus placebo on eGFRdecline in patients with hypertension and stage 3b/4 CKD iscurrently underway (https://clinicaltrials.gov/ct2/show/NCT03253172) (40).
Specific types of CKD may have particular benefits todietary modification. For example, although an RCT ofcoaching to increase water intake in patients with stage 3CKD and albuminuria over 1 year reported no significanteffect on kidney function decline (41), there may be benefitsin patients with adult autosomal dominant polycystic kid-ney disease (ADPKD) (42). Increased antidiuretic hormone(arginine vasopressin) stimulates cell proliferation throughthe vasopressin V2 receptor, resulting in increased
Intervention Control Mean DifferenceIV, Random, 95% ClWeightTotalMean SDTotalSDMeanStudy or Subgroup
Oral alkali vs control
Dietary intervention vs control
Bellasi 2016
de Brito-Ashurst 2009
Disthabanchong 2010
Dubey 2018
Goraya 2014
Jeong 2014
Kendrick 2018
Phisitkul 2010
Subtotal (95% Cl)
Garneata 2016
Gennari 2006
Goraya 2014
Mircescu 2007
Pisani 2016
William 1991
Subtotal (95% Cl)
0
1.88
0
−2.4
6.9
2.03
−2
3.6
20.5
9.31
12.1
5.8588
9.4
3.39
12.8064
11
71
67
21
94
36
37
18
30
374
4
5.93
1.3
2.3
12.9
4.84
−1
8.7
74
67
20
94
36
36
18
29
374
2.4%
9.3%
2.4%
15.1%
5.1%
13.2%
1.8%
3.8%
53.0%
5.3%
14.1%
5.3%
6.0%
14.9%
1.4%
47.0%
103
103
36
19
27
29
317
21.9
7.5
10.8
5.8588
9.8
5.15
12.0436
10
15.4
6.2
9.8
6.7
3.2
20.4
7.1
5.5
12.9
4.5
2.28
11.8
104
94
36
26
27
31
318
16.2
7
9
6.8
3.2
15.9
2.9
5.2
5.1
2.9
−0.24
9.5
−4.00 [−10.90, 2.90]
−4.05 [−6.91, −1.19]
−1.30 [−8.31, 5.71]
−4.70 [−6.37, −3.03]
−6.00 [−10.44, −1.56]
−2.81 [−4.82, −0.80]
−1.00 [−9.12, 7.12]
−5.10 [−10.46, 0.26]
−4.00 [−5.07, −2.93]
−4.20 [−8.51, 0.11]
−0.30 [−2.15, 1.55]
−7.80 [−12.15, −3.45]
−1.60 [−5.59, 2.39]
−2.52 [−4.23, −0.81]
−2.30 [−11.60, 7.00]
−2.70 [−4.71, −0.70]
−3.28 [−4.42, −2.14]
−20 −10
Favors [intervention] Favors [control]
0 10 20
Mean DifferenceIV, Random, 95% Cl
Heterogeneity: Tau2 = 0.00; Chi2 = 4.06, df = 7 (P = 0.77); I2 = 0%
Test for overall effect: Z = 7.31 (P < 0.00001)
Heterogeneity: Tau2 = 3.02; Chi2 = 11.44, df = 5 (P = 0.04); I2 = 56%
Test for overall effect: Z = 2.64 (P = 0.008)
Total (95% Cl) 692 691 100.0%
Heterogeneity: Tau2 = 1.50; Chi2 = 21.28, df = 13 (P = 0.07); I2 = 39%
Test for overall effect: Z = 5.65 (P < 0.00001)
Test for subgroup differences: Chi2 = 1.24, df = 1 (P = 0.26); I2 = 19.6%
Figure 3. | Among studies of people with stage 3–5 CKD, there was low-to-moderate evidence that treatment of metabolic acidosis withoral alkali therapy or dietary acid reduction slowed the rate of eGFR decline or reduced the risk of ESKD. Reprinted from ref. 33, withpermission. IV, inverse variance.
762 KIDNEY360
intracellular cAMP. Interestingly, high water intakedecreases urinary vasopressin, whereas high sodium intakestimulates urinary vasopressin (43). A recent study foundthat every 1 g/d of sodium was associated with increasedeGFR decline (20.11 ml/min per 1.73 m2 per gram of salt),whereas protein intake was not associated with CKD pro-gression in patients with ADPKD. The association betweensodium intake and CKD progression was substantiallymediated by plasma copeptin, supporting the possible roleof sodium increasing vasopressin and resulting in CKDprogression (42). Further randomized trials are needed todetermine whether sodium restriction or increased fluidintake can slow progression in ADPKD.
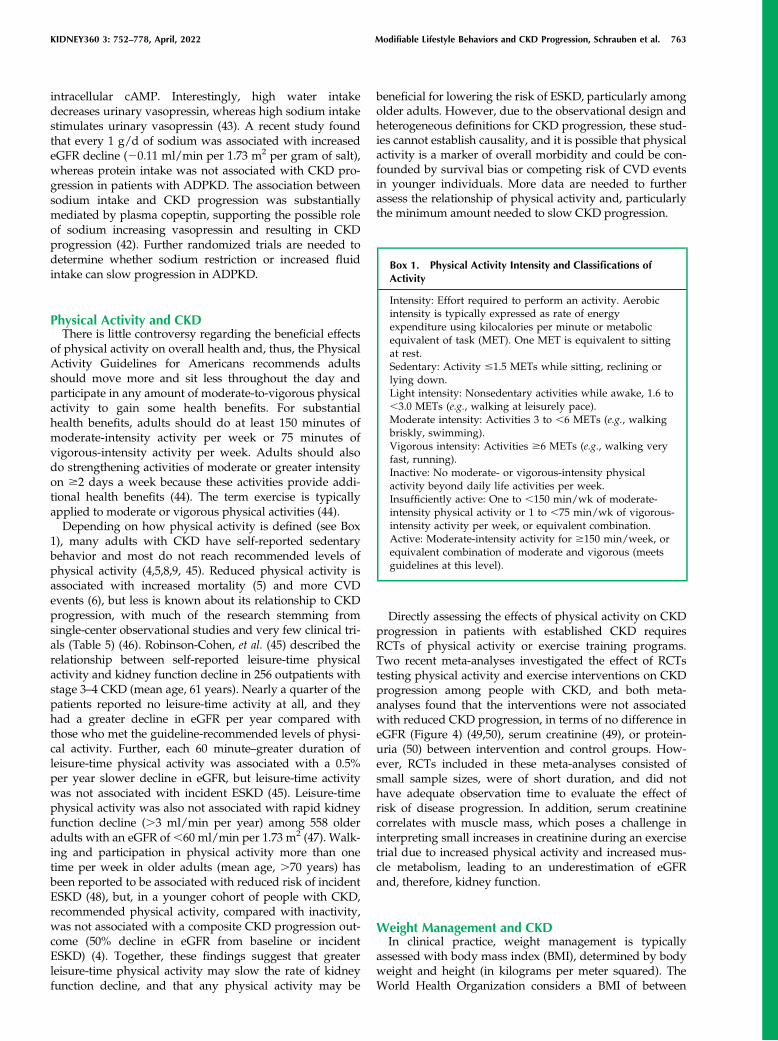
Physical Activity and CKDThere is little controversy regarding the beneficial effects
of physical activity on overall health and, thus, the PhysicalActivity Guidelines for Americans recommends adultsshould move more and sit less throughout the day andparticipate in any amount of moderate-to-vigorous physicalactivity to gain some health benefits. For substantialhealth benefits, adults should do at least 150 minutes ofmoderate-intensity activity per week or 75 minutes ofvigorous-intensity activity per week. Adults should alsodo strengthening activities of moderate or greater intensityon $2 days a week because these activities provide addi-tional health benefits (44). The term exercise is typicallyapplied to moderate or vigorous physical activities (44).Depending on how physical activity is defined (see Box
1), many adults with CKD have self-reported sedentarybehavior and most do not reach recommended levels ofphysical activity (4,5,8,9, 45). Reduced physical activity isassociated with increased mortality (5) and more CVDevents (6), but less is known about its relationship to CKDprogression, with much of the research stemming fromsingle-center observational studies and very few clinical tri-als (Table 5) (46). Robinson-Cohen, et al. (45) described therelationship between self-reported leisure-time physicalactivity and kidney function decline in 256 outpatients withstage 3–4 CKD (mean age, 61 years). Nearly a quarter of thepatients reported no leisure-time activity at all, and theyhad a greater decline in eGFR per year compared withthose who met the guideline-recommended levels of physi-cal activity. Further, each 60 minute–greater duration ofleisure-time physical activity was associated with a 0.5%per year slower decline in eGFR, but leisure-time activitywas not associated with incident ESKD (45). Leisure-timephysical activity was also not associated with rapid kidneyfunction decline (.3 ml/min per year) among 558 olderadults with an eGFR of,60 ml/min per 1.73 m2 (47). Walk-ing and participation in physical activity more than onetime per week in older adults (mean age, .70 years) hasbeen reported to be associated with reduced risk of incidentESKD (48), but, in a younger cohort of people with CKD,recommended physical activity, compared with inactivity,was not associated with a composite CKD progression out-come (50% decline in eGFR from baseline or incidentESKD) (4). Together, these findings suggest that greaterleisure-time physical activity may slow the rate of kidneyfunction decline, and that any physical activity may be
beneficial for lowering the risk of ESKD, particularly amongolder adults. However, due to the observational design andheterogeneous definitions for CKD progression, these stud-ies cannot establish causality, and it is possible that physicalactivity is a marker of overall morbidity and could be con-founded by survival bias or competing risk of CVD eventsin younger individuals. More data are needed to furtherassess the relationship of physical activity and, particularlythe minimum amount needed to slow CKD progression.
Directly assessing the effects of physical activity on CKDprogression in patients with established CKD requiresRCTs of physical activity or exercise training programs.Two recent meta-analyses investigated the effect of RCTstesting physical activity and exercise interventions on CKDprogression among people with CKD, and both meta-analyses found that the interventions were not associatedwith reduced CKD progression, in terms of no difference ineGFR (Figure 4) (49,50), serum creatinine (49), or protein-uria (50) between intervention and control groups. How-ever, RCTs included in these meta-analyses consisted ofsmall sample sizes, were of short duration, and did nothave adequate observation time to evaluate the effect ofrisk of disease progression. In addition, serum creatininecorrelates with muscle mass, which poses a challenge ininterpreting small increases in creatinine during an exercisetrial due to increased physical activity and increased mus-cle metabolism, leading to an underestimation of eGFRand, therefore, kidney function.
Weight Management and CKDIn clinical practice, weight management is typically
assessed with body mass index (BMI), determined by bodyweight and height (in kilograms per meter squared). TheWorld Health Organization considers a BMI of between
Box 1. Physical Activity Intensity and Classifications ofActivity
Intensity: Effort required to perform an activity. Aerobicintensity is typically expressed as rate of energyexpenditure using kilocalories per minute or metabolicequivalent of task (MET). One MET is equivalent to sittingat rest.Sedentary: Activity #1.5 METs while sitting, reclining orlying down.Light intensity: Nonsedentary activities while awake, 1.6 to,3.0 METs (e.g., walking at leisurely pace).Moderate intensity: Activities 3 to ,6 METs (e.g., walkingbriskly, swimming).Vigorous intensity: Activities $6 METs (e.g., walking veryfast, running).Inactive: No moderate- or vigorous-intensity physicalactivity beyond daily life activities per week.Insufficiently active: One to ,150 min/wk of moderate-intensity physical activity or 1 to ,75 min/wk of vigorous-intensity activity per week, or equivalent combination.Active: Moderate-intensity activity for $150 min/week, orequivalent combination of moderate and vigorous (meetsguidelines at this level).
KIDNEY360 3: 752–778, April, 2022 Modifiable Lifestyle Behaviors and CKD Progression, Schrauben et al. 763
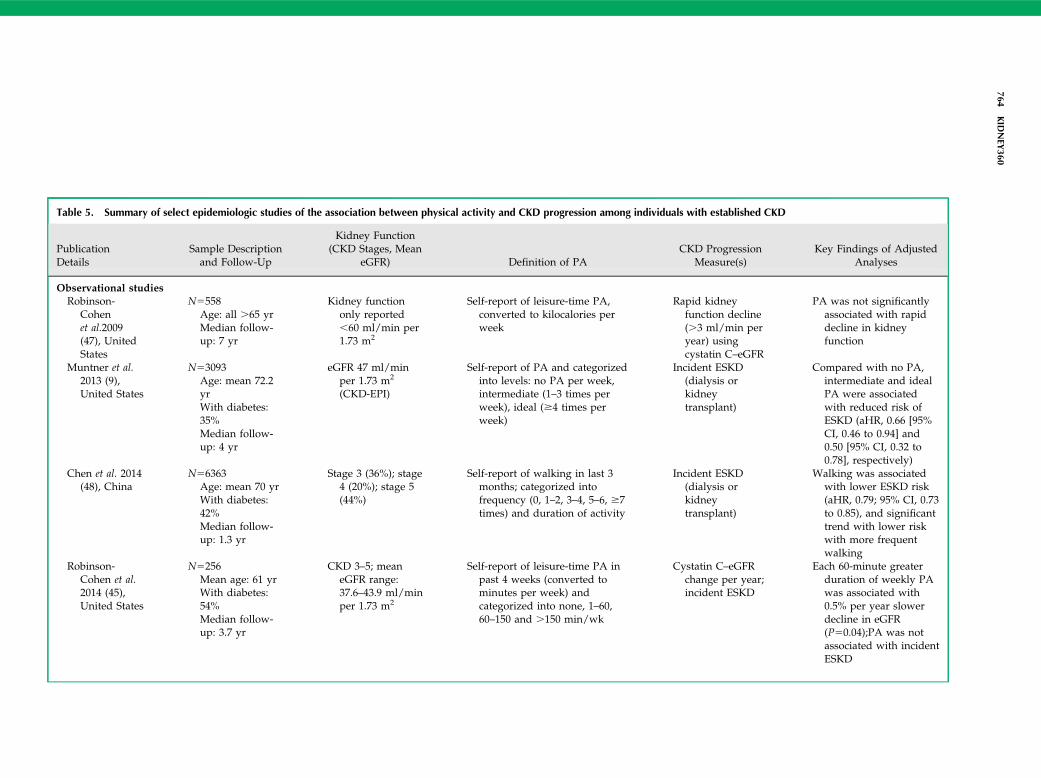
Table 5. Summary of select epidemiologic studies of the association between physical activity and CKD progression among individuals with established CKD
PublicationDetails
Sample Descriptionand Follow-Up
Kidney Function(CKD Stages, Mean
eGFR) Definition of PACKD Progression
Measure(s)Key Findings of Adjusted
Analyses
Observational studiesRobinson-
Cohenet al.2009(47), UnitedStates
N5558Age: all .65 yrMedian follow-up: 7 yr
Kidney functiononly reported,60 ml/min per1.73 m2
Self-report of leisure-time PA,converted to kilocalories perweek
Rapid kidneyfunction decline(.3 ml/min peryear) usingcystatin C–eGFR
PA was not significantlyassociated with rapiddecline in kidneyfunction
Muntner et al.2013 (9),United States
N53093Age: mean 72.2yrWith diabetes:35%Median follow-up: 4 yr
eGFR 47 ml/minper 1.73 m2
(CKD-EPI)
Self-report of PA and categorizedinto levels: no PA per week,intermediate (1–3 times perweek), ideal ($4 times perweek)
Incident ESKD(dialysis orkidneytransplant)
Compared with no PA,intermediate and idealPA were associatedwith reduced risk ofESKD (aHR, 0.66 [95%CI, 0.46 to 0.94] and0.50 [95% CI, 0.32 to0.78], respectively)
Chen et al. 2014(48), China
N56363Age: mean 70 yrWith diabetes:42%Median follow-up: 1.3 yr
Stage 3 (36%); stage4 (20%); stage 5(44%)
Self-report of walking in last 3months; categorized intofrequency (0, 1–2, 3–4, 5–6, $7times) and duration of activity
Incident ESKD(dialysis orkidneytransplant)
Walking was associatedwith lower ESKD risk(aHR, 0.79; 95% CI, 0.73to 0.85), and significanttrend with lower riskwith more frequentwalking
Robinson-Cohen et al.2014 (45),United States
N5256Mean age: 61 yrWith diabetes:54%Median follow-up: 3.7 yr
CKD 3–5; meaneGFR range:37.6–43.9 ml/minper 1.73 m2
Self-report of leisure-time PA inpast 4 weeks (converted tominutes per week) andcategorized into none, 1–60,60–150 and .150 min/wk
Cystatin C–eGFRchange per year;incident ESKD
Each 60-minute greaterduration of weekly PAwas associated with0.5% per year slowerdecline in eGFR(P50.04);PA was notassociated with incidentESKD
764KID
NEY
360
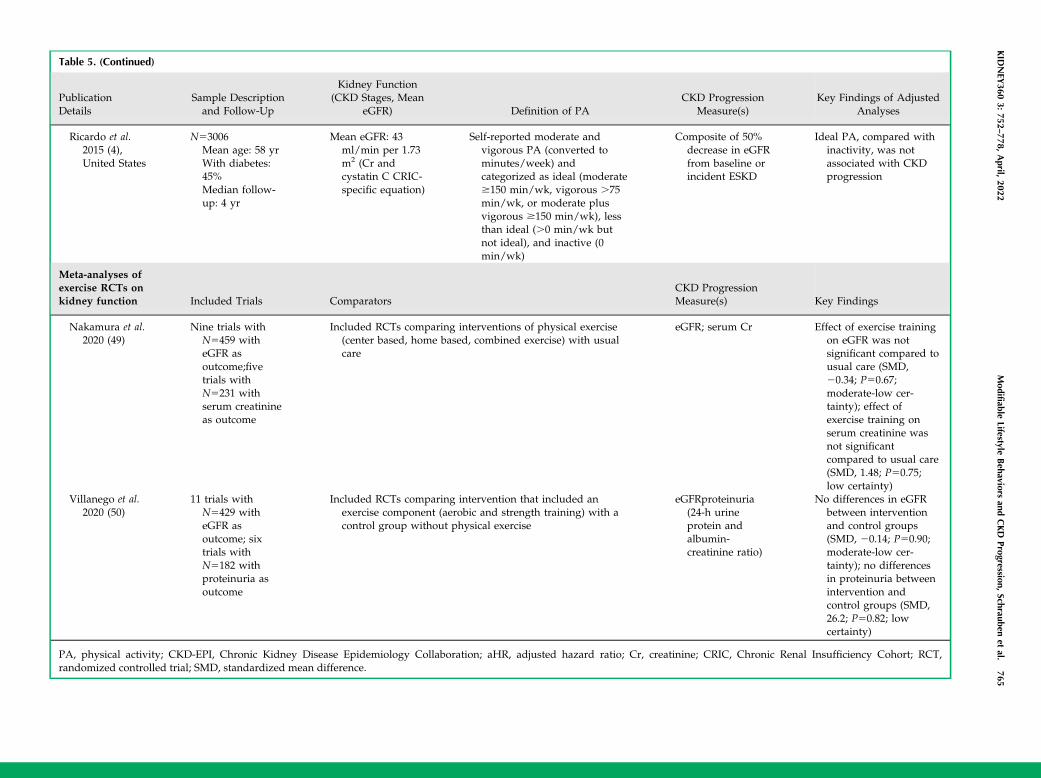
Table 5. (Continued)
PublicationDetails
Sample Descriptionand Follow-Up
Kidney Function(CKD Stages, Mean
eGFR) Definition of PACKD Progression
Measure(s)Key Findings of Adjusted
Analyses
Ricardo et al.2015 (4),United States
N53006Mean age: 58 yrWith diabetes:45%Median follow-up: 4 yr
Mean eGFR: 43ml/min per 1.73m2 (Cr andcystatin C CRIC-specific equation)
Self-reported moderate andvigorous PA (converted tominutes/week) andcategorized as ideal (moderate$150 min/wk, vigorous .75min/wk, or moderate plusvigorous $150 min/wk), lessthan ideal (.0 min/wk butnot ideal), and inactive (0min/wk)
Composite of 50%decrease in eGFRfrom baseline orincident ESKD
Ideal PA, compared withinactivity, was notassociated with CKDprogression
Meta-analyses ofexercise RCTs onkidney function Included Trials Comparators
CKD ProgressionMeasure(s) Key Findings
Nakamura et al.2020 (49)
Nine trials withN5459 witheGFR asoutcome;fivetrials withN5231 withserum creatinineas outcome
Included RCTs comparing interventions of physical exercise(center based, home based, combined exercise) with usualcare
eGFR; serum Cr Effect of exercise trainingon eGFR was notsignificant compared tousual care (SMD,20.34; P50.67;moderate-low cer-tainty); effect ofexercise training onserum creatinine wasnot significantcompared to usual care(SMD, 1.48; P50.75;low certainty)
Villanego et al.2020 (50)
11 trials withN5429 witheGFR asoutcome; sixtrials withN5182 withproteinuria asoutcome
Included RCTs comparing intervention that included anexercise component (aerobic and strength training) with acontrol group without physical exercise
eGFRproteinuria(24-h urineprotein andalbumin-creatinine ratio)
No differences in eGFRbetween interventionand control groups(SMD, 20.14; P50.90;moderate-low cer-tainty); no differencesin proteinuria betweenintervention andcontrol groups (SMD,26.2; P50.82; lowcertainty)
PA, physical activity; CKD-EPI, Chronic Kidney Disease Epidemiology Collaboration; aHR, adjusted hazard ratio; Cr, creatinine; CRIC, Chronic Renal Insufficiency Cohort; RCT,randomized controlled trial; SMD, standardized mean difference.
KID
NEY
3603:
752–778,
April,
2022Modifiable
LifestyleBehaviors
andCKD
Progression,Schrauben
etal.
765

18.5 and 25 kg/m2 as normal weight, a BMI between 25and 30 kg/m2 as overweight, and a BMI of .30 kg/m2 asobese. The prevalence of obesity continues to increaseworldwide, and a consistent, graded relationship betweenobesity and incident CKD has been demonstrated(11,51,52). A recent UK Biobank study using Mendelianrandomization suggests that the obesity-CKD relationship iscausal and mostly mediated by diabetes and elevated BP (53).However, the relationship between obesity and CKD progres-sion is less clear in patientswith establishedCKD (Table 6).In a large cohort of 453,946 US veterans with an eGFR of
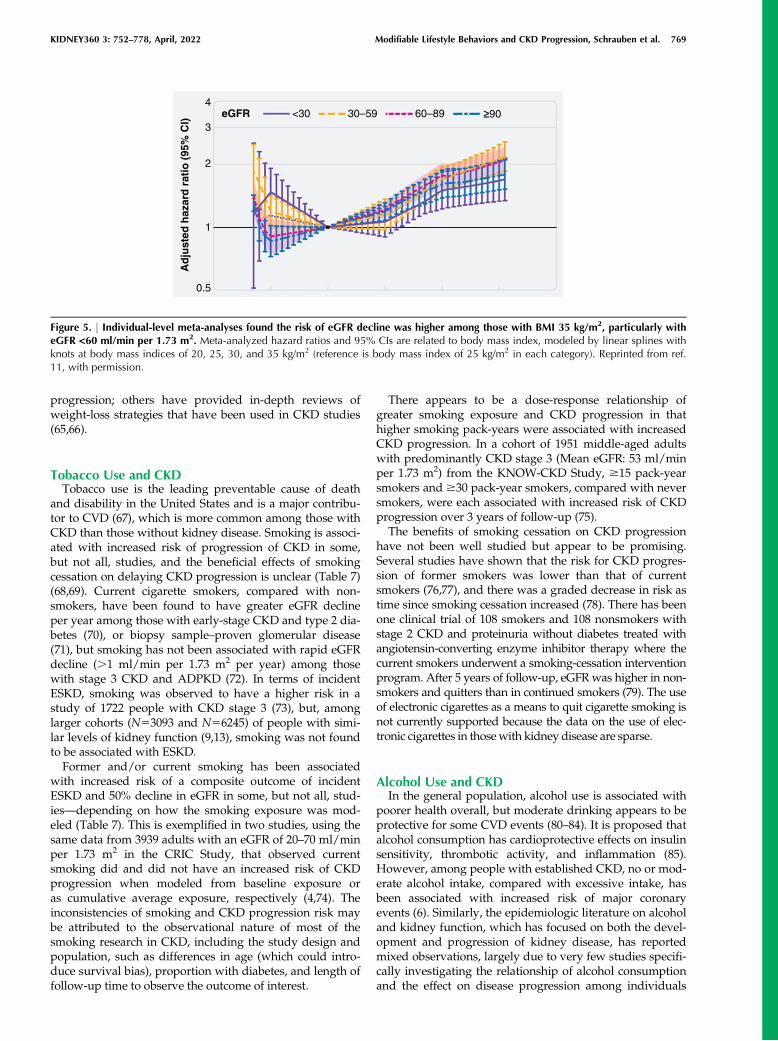
,60 ml/min per 1.73 m2, a BMI corresponding to over-weight/mild obesity (25–35 kg/m2) had the lowest risk forCKD progression, and a BMI ,25 kg/m2 was consistentlyassociated with worsening of kidney function (10). How-ever, the generalizability of this study’s findings may be lim-ited because the cohort was older (.70 years), and mostparticipants were men. Individual-level meta-analyses wereconducted by the CKD Prognosis Consortium in 5.5 millionadults in 39 general population cohorts and 91,607 adults in18 CKD cohorts (11). In models stratified by baseline eGFR,hazard ratios for risk of eGFR decline for a BMI of 35 kg/m2
versus a reference BMI of 25 kg/m2 were 1.88 (95% CI, 1.69to 2.08) for those with an eGFR of 30–59 ml/min per 1.73 m2
were 1.78 (95% CI, 1.36 to 2.34) and 1.88 (95% CI, 1.61 to2.18) for those with an eGFR of ,30 ml/min per 1.73 m2
(Figure 5). Adjustment for potential mediators (e.g., hyper-tension, diabetes, albuminuria) attenuated results. Meta-analysis of participants in the CKD cohorts found smallereffect sizes, with sensitivity analysis excluding the first3 years of follow-up suggesting some role of reverse causa-tion (Figure 5, Table 6). Risks associated with obesity may
vary by type of kidney disease. An elevated BMI amongindividuals with IgA nephropathy and ADPKD has beennoted as a risk factor for CKD progression (54,55), whereasno association between elevated BMI and risk of CKD pro-gression was noted in a cohort of patients with biopsysample–proven glomerulonephritides (56).
CKD management guidelines recommend weight reduc-tion for adults with CKD and obesity. However, intentionalweight loss among these individuals has shown mixedresults, and largely depends on the type of weight-lossintervention (e.g., diet, exercise, surgery, medications). Thecurrent evidence of the effects of weight loss on the pro-gression of CKD is mainly on the basis of observationalreports and a few small randomized trials of low-to-moder-ate quality. Bariatric surgery has most consistently sug-gested a beneficial effect of weight loss on kidney function(57), with a recent RCT of patients with type 2 diabetes andalbuminuria demonstrating greater resolution of albumin-uria in those undergoing Roux-en-Y gastric bypass versusbest medical treatment (82% versus 48% remission) (58). Atthis time, there are no convincing data to support a specificdiet for weight loss to slow CKD progression (59). Addi-tionally, some controversy exists in more advanced CKD(i.e., eGFR of ,30 ml/min per 1.73 m2) because malnutri-tion and muscle wasting are potential concerns and obser-vational studies have found an association between weightloss and risk of death in patients with ESKD (60–62). How-ever, much of this weight loss is unintentional, and recentstudies have found that bariatric surgery is associated withreduced risk of death in patients with CKD and ESKD(63,64). It is beyond the scope of this review to describe indetail each of the weight-loss strategies and CKD
Exercise Control Mean DifferenceYearWeightTotalMeanTotal SDSDMeanStudy or Subgroup
1.2.2 Home-based exercise
1.2.3 Combined exercise
Total (95% Cl)
Heterogeneity: Tau2 = 0.00; Chi2 = 5.71, df = 9 (P = 0.77); I2 = 0%Test for overall effect: Z = 0.43 (P = 0.67)Test for subgroup differences: Chi2 = 0.69, df = 2 (P = 0.71); I2 = 0%
Van Craenenbroeck 2015Greenwood 2015Leehey 2016Beetham 2018Subtotal (95% Cl)Heterogeneity: Tau2 = 0.00; Chi2 = 0.89, df = 3 (P = 0.83); I2 = 0%Test for overall effect: Z = 0.21 (P = 0.84)
Hiraki 2017Aoike 2018Subtotal (95% Cl)Heterogeneity: Tau2 = 30.69; Chi2 = 1.96, df = 1 (P = 0.16); I2 = 49%Test for overall effect: Z = 0.04 (P = 0.97)
Headley 2012Aoike 2018Barcellos 2018Kirkman 2019Subtotal (95% Cl)Heterogeneity: Tau2 = 0.00; Chi2 = 2.17, df = 3 (P = 0.54); I2 = 0%Test for overall effect: Z = 0.89 (P = 0.37)
127.7–1.9
44
5.8211
12.45
1013581697
524.1–2.6
46
10.3313
12.546
118
491583
4.9%2:1%
10.9%19.8%37.7%
3.0%1.5%4.5%
35.1
0.7440.339.6–0.8
5.5 19 –0.3341.735.8–0.2
4.4 21101868
117
25.4%0.8%1.3%
30.3%57.8%
18.220.2
8.4
81474
115
18.719.98.9
30.911.4
1514 39.5
24.112.9
1314
721
1226
1.2.1 Center-based exercise
Mean DifferenceIV, Random, 95% Cl
1.07 [ 2.04, 4.18]–1.40 [–18.58, 15.78]3.80 [–10.19, 17.79]–0.60 [– 3.45, 2.25]
0.22 [–1.84, 2.28]
100.0%221238 –0.34 [–1.91, 1.22]
–20 –10 0 10 20
Favours [control] Favours [exercise]
0.23 [–10.58, 11.04]6.80 [–6.04, 19.64] 2018
–4.40 [–13.42, 4.62]
–1.16 [–3.72, 1.39]–2.00 [–5.52, 1.52]
0.70 [–4.04, 5.44]3.60 [–7.21, 14.41]
–4.00 [–11.09, 3.09]
2018201620152015
2017
2019201820182012
IV, Random, 95% Cl
Figure 4. | A meta-analysis of physical activity and exercise interventions tested in randomized controlled trials among people with CKDfound there was no difference in eGFR among intervention and control groups. Reprinted from ref. 49, with permission.
766 KIDNEY360

Table 6. Summary of select epidemiologic studies of the association of BMI and CKD progression among individuals with established CKD
PublicationDetails Sample Description and Follow-Up Kidney Function Obesity Measure
CKD ProgressionMeasure(s) Key Findings
Hsu et al. 2006(52), UnitedStates
N5unclear; source population320,252 with and without CKD;unclear how many with eGFR,60 ml/min per 1.73 m2Age:31–43 yr (across categories ofweight)With diabetes: 13%–21%(across categories ofweight)Follow-up: from 1964 to1985 until 2000
Individuals witheGFR ,60 ml/min per 1.73 m2
(MDRD) or withpresence ofproteinuria orhematuria onurinalysis
BMI categories:underweight (,18.5kg/m2), normalweight (18.5–24.9 kg/m2), overweight(25–29.9 kg/m2), class1 obesity (30–34.9 kg/m2), class 2 obesity(35–39.9 kg/m2), andextreme obesity ($40kg/m2)
Incidence of ESKD(dialysis ortransplant)
Compared with normal weight, overweight/obesityassociated with increased risk of ESKD in modelsadjusted for demographics, smoking, myocardialinfarction, cholesterol, creatinine, proteinuria,hematuria: BMI 25–29.9 kg/m2 (RR, 1.5; 95% CI,1.2 to 2.0), BMI 30–34.9 kg/m2 (RR, 2.7; 95% CI,2.0 to 3.6), BMI 35–39.9 kg/m2 (RR, 4.7; 95% CI,3.3 to 6.8), BMI $40 kg/m2 (RR, 3.1; 95% CI, 1.8 to5.3)
Babayev et al.2013 (100),United States
N512,534 participants of NationalKidney Foundation Kidney EarlyEvaluation ProgramMean age:66.8 yrWith diabetes: 42%Follow-up: 8 yr
CKD stages3–4;mean eGFR:48 ml/min per1.73 m2 (CKD-EPI)
BMI categories: ,30 kg/m2, 30–34.9 kg/m2,$35 kg/m2
Incident ESKD Compared with BMI ,30 kg/m2, obesity notassociated with ESKD in models adjusted fordemographics, hypertension, diabetes, eGFR, andalbuminuria: BMI 30–34.9 kg/m2 (HR, 0.90; 95%CI, 0.65 to 1.25); BMI $35 kg/m2 (HR, 1.09; 95%CI, 0.78 to 1.52)
Lu et al. 2014 (10),United States
N5453,946 US veterans with eGFR,60 ml/min per 1.73 m2Age:73.9 yrWith diabetes: 41%Follow-up: from 2004 to 2006 until 2012
Mean eGFR: 47.9ml/min per 1.73m2 (CKD-EPI)
BMI categories: ,20, 20to ,25, 25 to ,30, 30to ,35, 35 to ,40, 40to ,45, 45 to ,50, and$50 kg/m2
Incident ESKD;doubling ofserum creatinine;slopes of eGFR
BMI between 25–35 kg/m2, corresponding tooverweight/mild obesity, had lowest risk of CKDprogression. In models adjusted for demographics,comorbidities (except for hypertension, diabetes),medications, BMI $35 kg/m2 associated withworse outcomes in patients with stage 3 CKD, butnot in stage 4–5 CKD; additional adjustment forhypertension and diabetes attenuated associations
Yun et al. 2018(101), SouthKorea
N51940 participants of KNOW-CKDAge: 53.5 yrWith diabetes:34%Median follow-up: 3.1 yr
CKD 1–5; meaneGFR: 54.1 ml/min per 1.73 m2
(CKD-EPI)
Obesity defined as BMI$25 kg/m2
Composite of 50%decline in eGFRfrom baseline oronset of ESKD(dialysis orkidneytransplant)
Compared with nonobesity, obesity was associatedwith increased risk of CKD progression. In modeladjusted for demographics, smoking, laboratorymeasures, left ventricular mass index, eGFR,proteinuria: obesity was associated with HR of1.41 (95% CI, 1.08 of 1.83)
Chang et al. 2019(11),individual-levelmeta-analysis
39 general population cohortstudies (N55,459,014)Meanfollow-up: 6 yr
Individuals witheGFR ,60 ml/min per 1.73 m2
Continuous BMI withlinear splines
GFR declinedetermined byestimated eGFRdecline $40%,initiation of RRTor eGFR ,10ml/min per 1.73m2
Among patients with eGFR ,60 ml/min per 1.73 m2
in general population cohorts, J-shaped associationbetween BMI and risk for GFR decline withsignificant heterogeneity across cohorts; in modelsadjusted for demographics and smoking,compared with a BMI of 25 kg/m2, HRs at 35 kg/m2: eGFR 30–59 ml/min per 1.73 m2 (HR, 1.78;95% CI, 1.36 to 2.34); eGFR ,30 ml/min per 1.73m2 (HR, 1.88; 95% CI, 1.61 to 2.18);adjustment for
KID
NEY
3603:
752–778,
April,
2022Modifiable
LifestyleBehaviors
andCKD
Progression,Schrauben
etal.
767
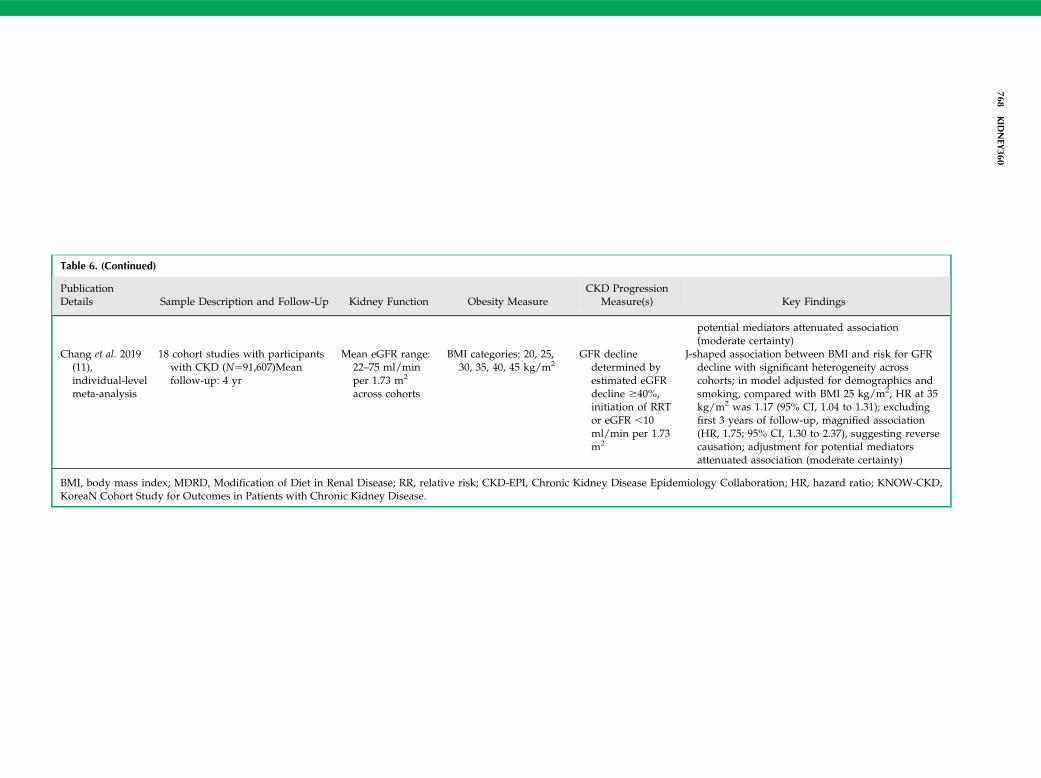
Table 6. (Continued)
PublicationDetails Sample Description and Follow-Up Kidney Function Obesity Measure
CKD ProgressionMeasure(s) Key Findings
potential mediators attenuated association(moderate certainty)
Chang et al. 2019(11),individual-levelmeta-analysis
18 cohort studies with participantswith CKD (N591,607)Meanfollow-up: 4 yr
Mean eGFR range:22–75 ml/minper 1.73 m2
across cohorts
BMI categories: 20, 25,30, 35, 40, 45 kg/m2
GFR declinedetermined byestimated eGFRdecline $40%,initiation of RRTor eGFR ,10ml/min per 1.73m2
J-shaped association between BMI and risk for GFRdecline with significant heterogeneity acrosscohorts; in model adjusted for demographics andsmoking, compared with BMI 25 kg/m2, HR at 35kg/m2 was 1.17 (95% CI, 1.04 to 1.31); excludingfirst 3 years of follow-up, magnified association(HR, 1.75; 95% CI, 1.30 to 2.37), suggesting reversecausation; adjustment for potential mediatorsattenuated association (moderate certainty)
BMI, body mass index; MDRD, Modification of Diet in Renal Disease; RR, relative risk; CKD-EPI, Chronic Kidney Disease Epidemiology Collaboration; HR, hazard ratio; KNOW-CKD,KoreaN Cohort Study for Outcomes in Patients with Chronic Kidney Disease.
768KID
NEY
360
progression; others have provided in-depth reviews ofweight-loss strategies that have been used in CKD studies(65,66).
Tobacco Use and CKDTobacco use is the leading preventable cause of death
and disability in the United States and is a major contribu-tor to CVD (67), which is more common among those withCKD than those without kidney disease. Smoking is associ-ated with increased risk of progression of CKD in some,but not all, studies, and the beneficial effects of smokingcessation on delaying CKD progression is unclear (Table 7)(68,69). Current cigarette smokers, compared with non-smokers, have been found to have greater eGFR declineper year among those with early-stage CKD and type 2 dia-betes (70), or biopsy sample–proven glomerular disease(71), but smoking has not been associated with rapid eGFRdecline (.1 ml/min per 1.73 m2 per year) among thosewith stage 3 CKD and ADPKD (72). In terms of incidentESKD, smoking was observed to have a higher risk in astudy of 1722 people with CKD stage 3 (73), but, amonglarger cohorts (N53093 and N56245) of people with simi-lar levels of kidney function (9,13), smoking was not foundto be associated with ESKD.Former and/or current smoking has been associated
with increased risk of a composite outcome of incidentESKD and 50% decline in eGFR in some, but not all, stud-ies—depending on how the smoking exposure was mod-eled (Table 7). This is exemplified in two studies, using thesame data from 3939 adults with an eGFR of 20–70 ml/minper 1.73 m2 in the CRIC Study, that observed currentsmoking did and did not have an increased risk of CKDprogression when modeled from baseline exposure oras cumulative average exposure, respectively (4,74). Theinconsistencies of smoking and CKD progression risk maybe attributed to the observational nature of most of thesmoking research in CKD, including the study design andpopulation, such as differences in age (which could intro-duce survival bias), proportion with diabetes, and length offollow-up time to observe the outcome of interest.
There appears to be a dose-response relationship ofgreater smoking exposure and CKD progression in thathigher smoking pack-years were associated with increasedCKD progression. In a cohort of 1951 middle-aged adultswith predominantly CKD stage 3 (Mean eGFR: 53 ml/minper 1.73 m2) from the KNOW-CKD Study, $15 pack-yearsmokers and $30 pack-year smokers, compared with neversmokers, were each associated with increased risk of CKDprogression over 3 years of follow-up (75).The benefits of smoking cessation on CKD progression
have not been well studied but appear to be promising.Several studies have shown that the risk for CKD progres-sion of former smokers was lower than that of currentsmokers (76,77), and there was a graded decrease in risk astime since smoking cessation increased (78). There has beenone clinical trial of 108 smokers and 108 nonsmokers withstage 2 CKD and proteinuria without diabetes treated withangiotensin-converting enzyme inhibitor therapy where thecurrent smokers underwent a smoking-cessation interventionprogram. After 5 years of follow-up, eGFRwas higher in non-smokers and quitters than in continued smokers (79). The useof electronic cigarettes as a means to quit cigarette smoking isnot currently supported because the data on the use of elec-tronic cigarettes in thosewith kidney disease are sparse.
Alcohol Use and CKDIn the general population, alcohol use is associated with
poorer health overall, but moderate drinking appears to beprotective for some CVD events (80–84). It is proposed thatalcohol consumption has cardioprotective effects on insulinsensitivity, thrombotic activity, and inflammation (85).However, among people with established CKD, no or mod-erate alcohol intake, compared with excessive intake, hasbeen associated with increased risk of major coronaryevents (6). Similarly, the epidemiologic literature on alcoholand kidney function, which has focused on both the devel-opment and progression of kidney disease, has reportedmixed observations, largely due to very few studies specifi-cally investigating the relationship of alcohol consumptionand the effect on disease progression among individuals
eGFR <30 30–59 60–89 ≥90
Ad
just
ed h
azar
d r
atio
(95
% C
l)
0.5
1
3
2
4
Figure 5. | Individual-level meta-analyses found the risk of eGFR decline was higher among those with BMI 35 kg/m2, particularly witheGFR <60 ml/min per 1.73 m2. Meta-analyzed hazard ratios and 95% CIs are related to body mass index, modeled by linear splines withknots at body mass indices of 20, 25, 30, and 35 kg/m2 (reference is body mass index of 25 kg/m2 in each category). Reprinted from ref.11, with permission.
KIDNEY360 3: 752–778, April, 2022 Modifiable Lifestyle Behaviors and CKD Progression, Schrauben et al. 769
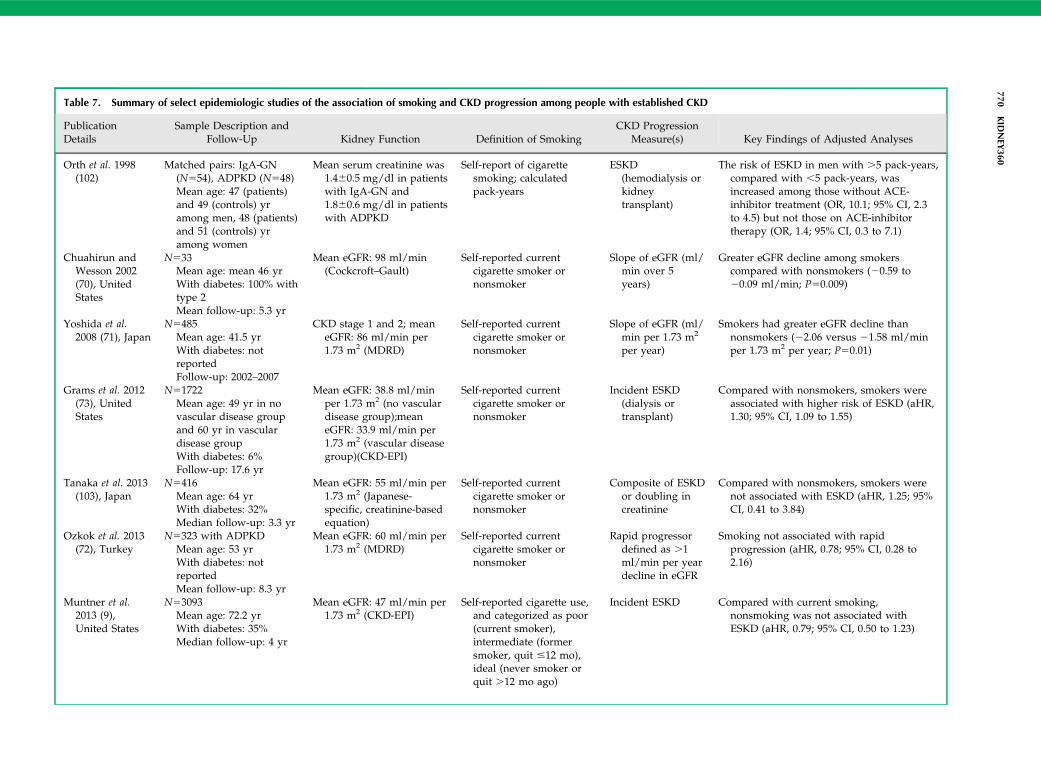
Table 7. Summary of select epidemiologic studies of the association of smoking and CKD progression among people with established CKD
PublicationDetails
Sample Description andFollow-Up Kidney Function Definition of Smoking
CKD ProgressionMeasure(s) Key Findings of Adjusted Analyses
Orth et al. 1998(102)
Matched pairs: IgA-GN(N554), ADPKD (N548)Mean age: 47 (patients)and 49 (controls) yramong men, 48 (patients)and 51 (controls) yramong women
Mean serum creatinine was1.460.5 mg/dl in patientswith IgA-GN and1.860.6 mg/dl in patientswith ADPKD
Self-report of cigarettesmoking; calculatedpack-years
ESKD(hemodialysis orkidneytransplant)
The risk of ESKD in men with .5 pack-years,compared with ,5 pack-years, wasincreased among those without ACE-inhibitor treatment (OR, 10.1; 95% CI, 2.3to 4.5) but not those on ACE-inhibitortherapy (OR, 1.4; 95% CI, 0.3 to 7.1)
Chuahirun andWesson 2002(70), UnitedStates
N533Mean age: mean 46 yrWith diabetes: 100% withtype 2Mean follow-up: 5.3 yr
Mean eGFR: 98 ml/min(Cockcroft–Gault)
Self-reported currentcigarette smoker ornonsmoker
Slope of eGFR (ml/min over 5years)
Greater eGFR decline among smokerscompared with nonsmokers (20.59 to20.09 ml/min; P50.009)
Yoshida et al.2008 (71), Japan
N5485Mean age: 41.5 yrWith diabetes: notreportedFollow-up: 2002–2007
CKD stage 1 and 2; meaneGFR: 86 ml/min per1.73 m2 (MDRD)
Self-reported currentcigarette smoker ornonsmoker
Slope of eGFR (ml/min per 1.73 m2
per year)
Smokers had greater eGFR decline thannonsmokers (22.06 versus 21.58 ml/minper 1.73 m2 per year; P50.01)
Grams et al. 2012(73), UnitedStates
N51722Mean age: 49 yr in novascular disease groupand 60 yr in vasculardisease groupWith diabetes: 6%Follow-up: 17.6 yr
Mean eGFR: 38.8 ml/minper 1.73 m2 (no vasculardisease group);meaneGFR: 33.9 ml/min per1.73 m2 (vascular diseasegroup)(CKD-EPI)
Self-reported currentcigarette smoker ornonsmoker
Incident ESKD(dialysis ortransplant)
Compared with nonsmokers, smokers wereassociated with higher risk of ESKD (aHR,1.30; 95% CI, 1.09 to 1.55)
Tanaka et al. 2013(103), Japan
N5416Mean age: 64 yrWith diabetes: 32%Median follow-up: 3.3 yr
Mean eGFR: 55 ml/min per1.73 m2 (Japanese-specific, creatinine-basedequation)
Self-reported currentcigarette smoker ornonsmoker
Composite of ESKDor doubling increatinine
Compared with nonsmokers, smokers werenot associated with ESKD (aHR, 1.25; 95%CI, 0.41 to 3.84)
Ozkok et al. 2013(72), Turkey
N5323 with ADPKDMean age: 53 yrWith diabetes: notreportedMean follow-up: 8.3 yr
Mean eGFR: 60 ml/min per1.73 m2 (MDRD)
Self-reported currentcigarette smoker ornonsmoker
Rapid progressordefined as .1ml/min per yeardecline in eGFR
Smoking not associated with rapidprogression (aHR, 0.78; 95% CI, 0.28 to2.16)
Muntner et al.2013 (9),United States
N53093Mean age: 72.2 yrWith diabetes: 35%Median follow-up: 4 yr
Mean eGFR: 47 ml/min per1.73 m2 (CKD-EPI)
Self-reported cigarette use,and categorized as poor(current smoker),intermediate (formersmoker, quit #12 mo),ideal (never smoker orquit .12 mo ago)
Incident ESKD Compared with current smoking,nonsmoking was not associated withESKD (aHR, 0.79; 95% CI, 0.50 to 1.23)
770KID
NEY
360
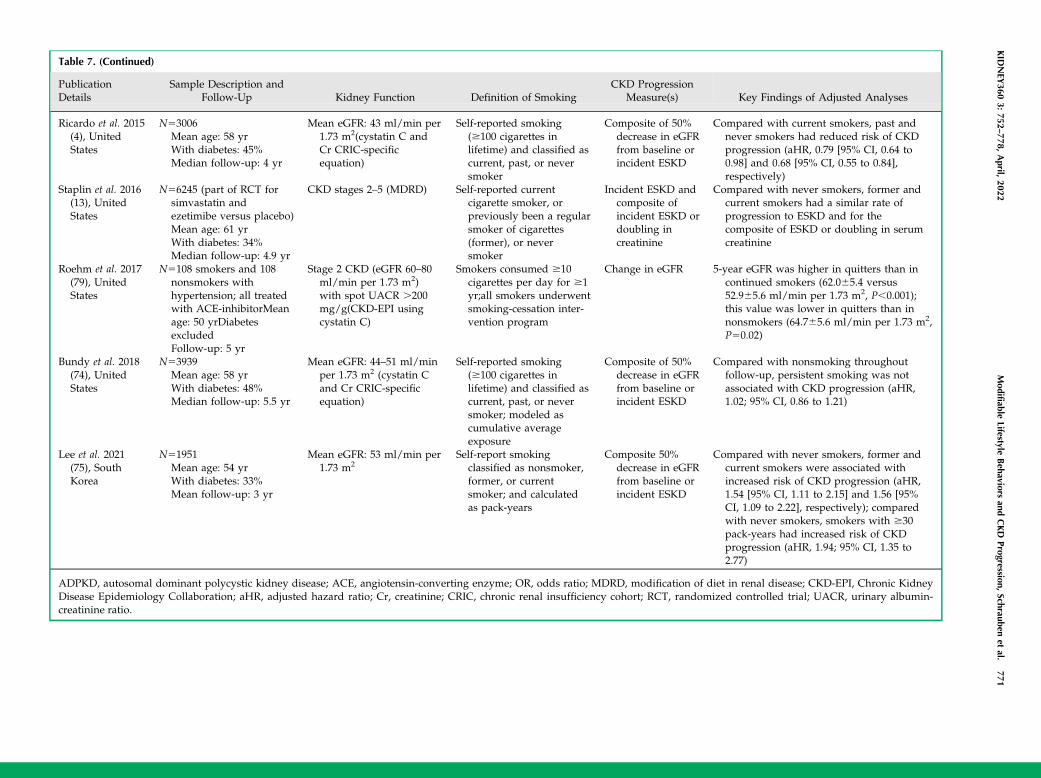
Table 7. (Continued)
PublicationDetails
Sample Description andFollow-Up Kidney Function Definition of Smoking
CKD ProgressionMeasure(s) Key Findings of Adjusted Analyses
Ricardo et al. 2015(4), UnitedStates
N53006Mean age: 58 yrWith diabetes: 45%Median follow-up: 4 yr
Mean eGFR: 43 ml/min per1.73 m2(cystatin C andCr CRIC-specificequation)
Self-reported smoking($100 cigarettes inlifetime) and classified ascurrent, past, or neversmoker
Composite of 50%decrease in eGFRfrom baseline orincident ESKD
Compared with current smokers, past andnever smokers had reduced risk of CKDprogression (aHR, 0.79 [95% CI, 0.64 to0.98] and 0.68 [95% CI, 0.55 to 0.84],respectively)
Staplin et al. 2016(13), UnitedStates
N56245 (part of RCT forsimvastatin andezetimibe versus placebo)Mean age: 61 yrWith diabetes: 34%Median follow-up: 4.9 yr
CKD stages 2–5 (MDRD) Self-reported currentcigarette smoker, orpreviously been a regularsmoker of cigarettes(former), or neversmoker
Incident ESKD andcomposite ofincident ESKD ordoubling increatinine
Compared with never smokers, former andcurrent smokers had a similar rate ofprogression to ESKD and for thecomposite of ESKD or doubling in serumcreatinine
Roehm et al. 2017(79), UnitedStates
N5108 smokers and 108nonsmokers withhypertension; all treatedwith ACE-inhibitorMeanage: 50 yrDiabetesexcludedFollow-up: 5 yr
Stage 2 CKD (eGFR 60–80ml/min per 1.73 m2)with spot UACR .200mg/g(CKD-EPI usingcystatin C)
Smokers consumed $10cigarettes per day for $1yr;all smokers underwentsmoking-cessation inter-vention program
Change in eGFR 5-year eGFR was higher in quitters than incontinued smokers (62.065.4 versus52.965.6 ml/min per 1.73 m2, P,0.001);this value was lower in quitters than innonsmokers (64.765.6 ml/min per 1.73 m2,P50.02)
Bundy et al. 2018(74), UnitedStates
N53939Mean age: 58 yrWith diabetes: 48%Median follow-up: 5.5 yr
Mean eGFR: 44–51 ml/minper 1.73 m2 (cystatin Cand Cr CRIC-specificequation)
Self-reported smoking($100 cigarettes inlifetime) and classified ascurrent, past, or neversmoker; modeled ascumulative averageexposure
Composite of 50%decrease in eGFRfrom baseline orincident ESKD
Compared with nonsmoking throughoutfollow-up, persistent smoking was notassociated with CKD progression (aHR,1.02; 95% CI, 0.86 to 1.21)
Lee et al. 2021(75), SouthKorea
N51951Mean age: 54 yrWith diabetes: 33%Mean follow-up: 3 yr
Mean eGFR: 53 ml/min per1.73 m2
Self-report smokingclassified as nonsmoker,former, or currentsmoker; and calculatedas pack-years
Composite 50%decrease in eGFRfrom baseline orincident ESKD
Compared with never smokers, former andcurrent smokers were associated withincreased risk of CKD progression (aHR,1.54 [95% CI, 1.11 to 2.15] and 1.56 [95%CI, 1.09 to 2.22], respectively); comparedwith never smokers, smokers with $30pack-years had increased risk of CKDprogression (aHR, 1.94; 95% CI, 1.35 to2.77)
ADPKD, autosomal dominant polycystic kidney disease; ACE, angiotensin-converting enzyme; OR, odds ratio; MDRD, modification of diet in renal disease; CKD-EPI, Chronic KidneyDisease Epidemiology Collaboration; aHR, adjusted hazard ratio; Cr, creatinine; CRIC, chronic renal insufficiency cohort; RCT, randomized controlled trial; UACR, urinary albumin-creatinine ratio.
KID
NEY
3603:
752–778,
April,
2022Modifiable
LifestyleBehaviors
andCKD
Progression,Schrauben
etal.
771
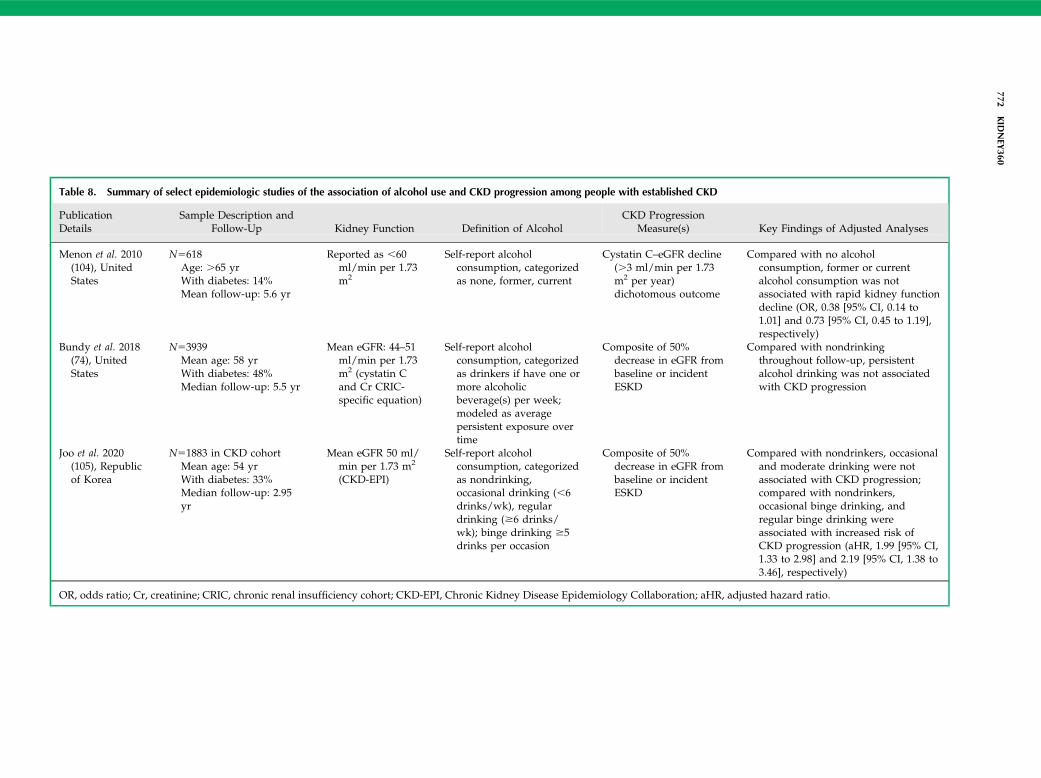
Table 8. Summary of select epidemiologic studies of the association of alcohol use and CKD progression among people with established CKD
PublicationDetails
Sample Description andFollow-Up Kidney Function Definition of Alcohol
CKD ProgressionMeasure(s) Key Findings of Adjusted Analyses
Menon et al. 2010(104), UnitedStates
N5618Age: .65 yrWith diabetes: 14%Mean follow-up: 5.6 yr
Reported as ,60ml/min per 1.73m2
Self-report alcoholconsumption, categorizedas none, former, current
Cystatin C–eGFR decline(.3 ml/min per 1.73m2 per year)dichotomous outcome
Compared with no alcoholconsumption, former or currentalcohol consumption was notassociated with rapid kidney functiondecline (OR, 0.38 [95% CI, 0.14 to1.01] and 0.73 [95% CI, 0.45 to 1.19],respectively)
Bundy et al. 2018(74), UnitedStates
N53939Mean age: 58 yrWith diabetes: 48%Median follow-up: 5.5 yr
Mean eGFR: 44–51ml/min per 1.73m2 (cystatin Cand Cr CRIC-specific equation)
Self-report alcoholconsumption, categorizedas drinkers if have one ormore alcoholicbeverage(s) per week;modeled as averagepersistent exposure overtime
Composite of 50%decrease in eGFR frombaseline or incidentESKD
Compared with nondrinkingthroughout follow-up, persistentalcohol drinking was not associatedwith CKD progression
Joo et al. 2020(105), Republicof Korea
N51883 in CKD cohortMean age: 54 yrWith diabetes: 33%Median follow-up: 2.95yr
Mean eGFR 50 ml/min per 1.73 m2
(CKD-EPI)
Self-report alcoholconsumption, categorizedas nondrinking,occasional drinking (,6drinks/wk), regulardrinking ($6 drinks/wk); binge drinking $5drinks per occasion
Composite of 50%decrease in eGFR frombaseline or incidentESKD
Compared with nondrinkers, occasionaland moderate drinking were notassociated with CKD progression;compared with nondrinkers,occasional binge drinking, andregular binge drinking wereassociated with increased risk ofCKD progression (aHR, 1.99 [95% CI,1.33 to 2.98] and 2.19 [95% CI, 1.38 to3.46], respectively)
OR, odds ratio; Cr, creatinine; CRIC, chronic renal insufficiency cohort; CKD-EPI, Chronic Kidney Disease Epidemiology Collaboration; aHR, adjusted hazard ratio.
772KID
NEY
360
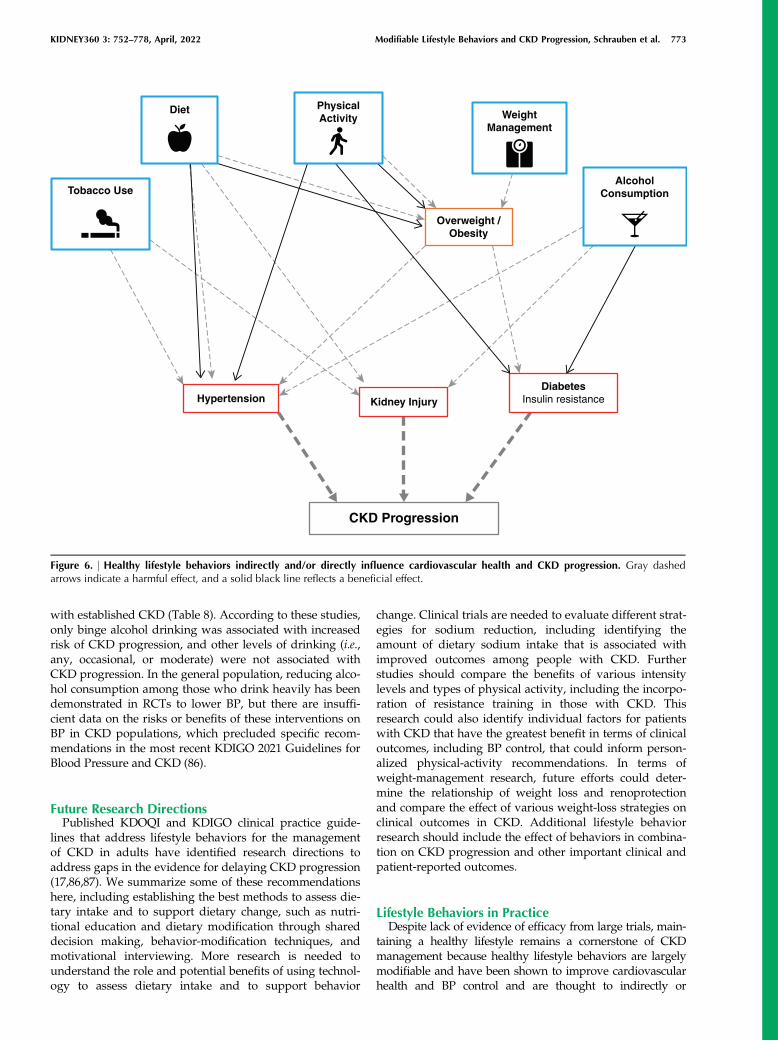
with established CKD (Table 8). According to these studies,only binge alcohol drinking was associated with increasedrisk of CKD progression, and other levels of drinking (i.e.,any, occasional, or moderate) were not associated withCKD progression. In the general population, reducing alco-hol consumption among those who drink heavily has beendemonstrated in RCTs to lower BP, but there are insuffi-cient data on the risks or benefits of these interventions onBP in CKD populations, which precluded specific recom-mendations in the most recent KDIGO 2021 Guidelines forBlood Pressure and CKD (86).
Future Research DirectionsPublished KDOQI and KDIGO clinical practice guide-
lines that address lifestyle behaviors for the managementof CKD in adults have identified research directions toaddress gaps in the evidence for delaying CKD progression(17,86,87). We summarize some of these recommendationshere, including establishing the best methods to assess die-tary intake and to support dietary change, such as nutri-tional education and dietary modification through shareddecision making, behavior-modification techniques, andmotivational interviewing. More research is needed tounderstand the role and potential benefits of using technol-ogy to assess dietary intake and to support behavior
change. Clinical trials are needed to evaluate different strat-egies for sodium reduction, including identifying theamount of dietary sodium intake that is associated withimproved outcomes among people with CKD. Furtherstudies should compare the benefits of various intensitylevels and types of physical activity, including the incorpo-ration of resistance training in those with CKD. Thisresearch could also identify individual factors for patientswith CKD that have the greatest benefit in terms of clinicaloutcomes, including BP control, that could inform person-alized physical-activity recommendations. In terms ofweight-management research, future efforts could deter-mine the relationship of weight loss and renoprotectionand compare the effect of various weight-loss strategies onclinical outcomes in CKD. Additional lifestyle behaviorresearch should include the effect of behaviors in combina-tion on CKD progression and other important clinical andpatient-reported outcomes.
Lifestyle Behaviors in PracticeDespite lack of evidence of efficacy from large trials, main-
taining a healthy lifestyle remains a cornerstone of CKDmanagement because healthy lifestyle behaviors are largelymodifiable and have been shown to improve cardiovascularhealth and BP control and are thought to indirectly or
Tobacco Use
Diet PhysicalActivity Weight
Management
AlcoholConsumption
Overweight /Obesity
Kidney Injury
CKD Progression
HypertensionDiabetes
Insulin resistance
Figure 6. | Healthy lifestyle behaviors indirectly and/or directly influence cardiovascular health and CKD progression. Gray dashedarrows indicate a harmful effect, and a solid black line reflects a beneficial effect.
KIDNEY360 3: 752–778, April, 2022 Modifiable Lifestyle Behaviors and CKD Progression, Schrauben et al. 773
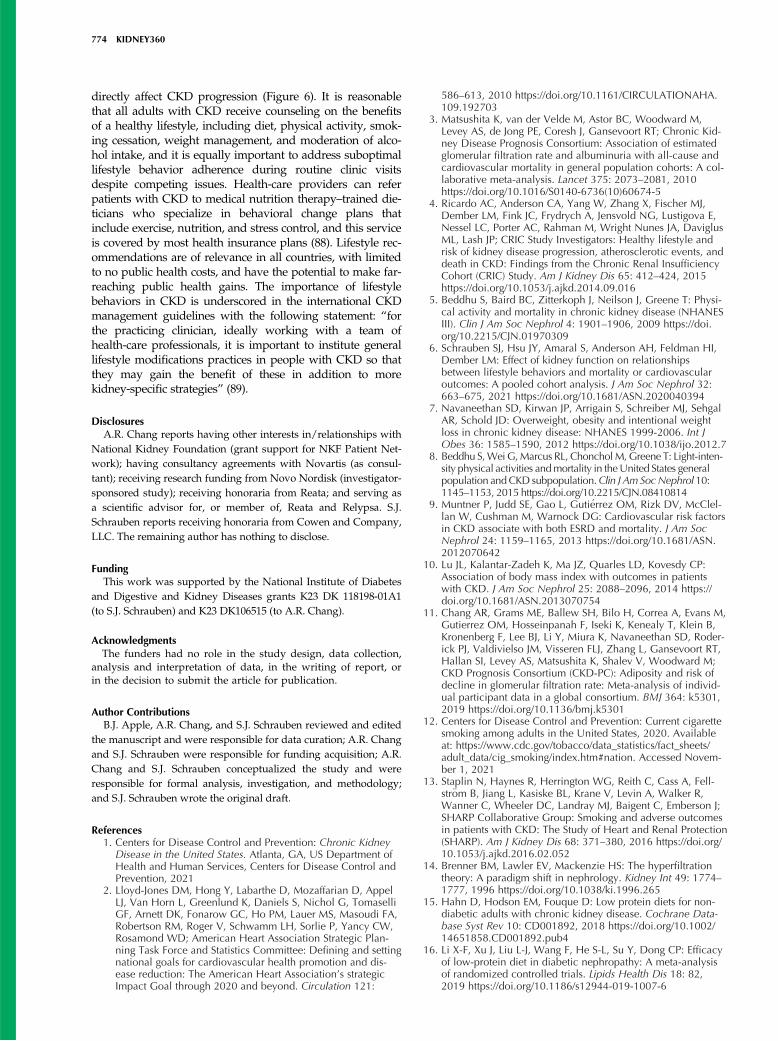
directly affect CKD progression (Figure 6). It is reasonablethat all adults with CKD receive counseling on the benefitsof a healthy lifestyle, including diet, physical activity, smok-ing cessation, weight management, and moderation of alco-hol intake, and it is equally important to address suboptimallifestyle behavior adherence during routine clinic visitsdespite competing issues. Health-care providers can referpatients with CKD to medical nutrition therapy–trained die-ticians who specialize in behavioral change plans thatinclude exercise, nutrition, and stress control, and this serviceis covered by most health insurance plans (88). Lifestyle rec-ommendations are of relevance in all countries, with limitedto no public health costs, and have the potential to make far-reaching public health gains. The importance of lifestylebehaviors in CKD is underscored in the international CKDmanagement guidelines with the following statement: “forthe practicing clinician, ideally working with a team ofhealth-care professionals, it is important to institute generallifestyle modifications practices in people with CKD so thatthey may gain the benefit of these in addition to morekidney-specific strategies” (89).
DisclosuresA.R. Chang reports having other interests in/relationships with
National Kidney Foundation (grant support for NKF Patient Net-work); having consultancy agreements with Novartis (as consul-tant); receiving research funding from Novo Nordisk (investigator-sponsored study); receiving honoraria from Reata; and serving asa scientific advisor for, or member of, Reata and Relypsa. S.J.Schrauben reports receiving honoraria from Cowen and Company,LLC. The remaining author has nothing to disclose.
FundingThis work was supported by the National Institute of Diabetes
and Digestive and Kidney Diseases grants K23 DK 118198-01A1(to S.J. Schrauben) and K23 DK106515 (to A.R. Chang).
AcknowledgmentsThe funders had no role in the study design, data collection,
analysis and interpretation of data, in the writing of report, orin the decision to submit the article for publication.
Author ContributionsB.J. Apple, A.R. Chang, and S.J. Schrauben reviewed and edited
the manuscript and were responsible for data curation; A.R. Changand S.J. Schrauben were responsible for funding acquisition; A.R.Chang and S.J. Schrauben conceptualized the study and wereresponsible for formal analysis, investigation, and methodology;and S.J. Schrauben wrote the original draft.
References1. Centers for Disease Control and Prevention: Chronic Kidney
Disease in the United States. Atlanta, GA, US Department ofHealth and Human Services, Centers for Disease Control andPrevention, 2021
2. Lloyd-Jones DM, Hong Y, Labarthe D, Mozaffarian D, AppelLJ, Van Horn L, Greenlund K, Daniels S, Nichol G, TomaselliGF, Arnett DK, Fonarow GC, Ho PM, Lauer MS, Masoudi FA,Robertson RM, Roger V, Schwamm LH, Sorlie P, Yancy CW,Rosamond WD; American Heart Association Strategic Plan-ning Task Force and Statistics Committee: Defining and settingnational goals for cardiovascular health promotion and dis-ease reduction: The American Heart Association’s strategicImpact Goal through 2020 and beyond. Circulation 121:
586–613, 2010 https://doi.org/10.1161/CIRCULATIONAHA.109.192703
3. Matsushita K, van der Velde M, Astor BC, Woodward M,Levey AS, de Jong PE, Coresh J, Gansevoort RT; Chronic Kid-ney Disease Prognosis Consortium: Association of estimatedglomerular filtration rate and albuminuria with all-cause andcardiovascular mortality in general population cohorts: A col-laborative meta-analysis. Lancet 375: 2073–2081, 2010https://doi.org/10.1016/S0140-6736(10)60674-5
4. Ricardo AC, Anderson CA, Yang W, Zhang X, Fischer MJ,Dember LM, Fink JC, Frydrych A, Jensvold NG, Lustigova E,Nessel LC, Porter AC, Rahman M, Wright Nunes JA, DaviglusML, Lash JP; CRIC Study Investigators: Healthy lifestyle andrisk of kidney disease progression, atherosclerotic events, anddeath in CKD: Findings from the Chronic Renal InsufficiencyCohort (CRIC) Study. Am J Kidney Dis 65: 412–424, 2015https://doi.org/10.1053/j.ajkd.2014.09.016
5. Beddhu S, Baird BC, Zitterkoph J, Neilson J, Greene T: Physi-cal activity and mortality in chronic kidney disease (NHANESIII). Clin J Am Soc Nephrol 4: 1901–1906, 2009 https://doi.org/10.2215/CJN.01970309
6. Schrauben SJ, Hsu JY, Amaral S, Anderson AH, Feldman HI,Dember LM: Effect of kidney function on relationshipsbetween lifestyle behaviors and mortality or cardiovascularoutcomes: A pooled cohort analysis. J Am Soc Nephrol 32:663–675, 2021 https://doi.org/10.1681/ASN.2020040394
7. Navaneethan SD, Kirwan JP, Arrigain S, Schreiber MJ, SehgalAR, Schold JD: Overweight, obesity and intentional weightloss in chronic kidney disease: NHANES 1999-2006. Int JObes 36: 1585–1590, 2012 https://doi.org/10.1038/ijo.2012.7
8. Beddhu S,WeiG,Marcus RL, ChoncholM,Greene T: Light-inten-sity physical activities andmortality in theUnited States generalpopulation andCKD subpopulation.Clin J Am SocNephrol 10:1145–1153, 2015 https://doi.org/10.2215/CJN.08410814
9. Muntner P, Judd SE, Gao L, Guti�errez OM, Rizk DV, McClel-lan W, Cushman M, Warnock DG: Cardiovascular risk factorsin CKD associate with both ESRD and mortality. J Am SocNephrol 24: 1159–1165, 2013 https://doi.org/10.1681/ASN.2012070642
10. Lu JL, Kalantar-Zadeh K, Ma JZ, Quarles LD, Kovesdy CP:Association of body mass index with outcomes in patientswith CKD. J Am Soc Nephrol 25: 2088–2096, 2014 https://doi.org/10.1681/ASN.2013070754
11. Chang AR, Grams ME, Ballew SH, Bilo H, Correa A, Evans M,Gutierrez OM, Hosseinpanah F, Iseki K, Kenealy T, Klein B,Kronenberg F, Lee BJ, Li Y, Miura K, Navaneethan SD, Roder-ick PJ, Valdivielso JM, Visseren FLJ, Zhang L, Gansevoort RT,Hallan SI, Levey AS, Matsushita K, Shalev V, Woodward M;CKD Prognosis Consortium (CKD-PC): Adiposity and risk ofdecline in glomerular filtration rate: Meta-analysis of individ-ual participant data in a global consortium. BMJ 364: k5301,2019 https://doi.org/10.1136/bmj.k5301
12. Centers for Disease Control and Prevention: Current cigarettesmoking among adults in the United States, 2020. Availableat: https://www.cdc.gov/tobacco/data_statistics/fact_sheets/adult_data/cig_smoking/index.htm#nation. Accessed Novem-ber 1, 2021
13. Staplin N, Haynes R, Herrington WG, Reith C, Cass A, Fell-str€om B, Jiang L, Kasiske BL, Krane V, Levin A, Walker R,Wanner C, Wheeler DC, Landray MJ, Baigent C, Emberson J;SHARP Collaborative Group: Smoking and adverse outcomesin patients with CKD: The Study of Heart and Renal Protection(SHARP). Am J Kidney Dis 68: 371–380, 2016 https://doi.org/10.1053/j.ajkd.2016.02.052
14. Brenner BM, Lawler EV, Mackenzie HS: The hyperfiltrationtheory: A paradigm shift in nephrology. Kidney Int 49: 1774–1777, 1996 https://doi.org/10.1038/ki.1996.265
15. Hahn D, Hodson EM, Fouque D: Low protein diets for non-diabetic adults with chronic kidney disease. Cochrane Data-base Syst Rev 10: CD001892, 2018 https://doi.org/10.1002/14651858.CD001892.pub4
16. Li X-F, Xu J, Liu L-J, Wang F, He S-L, Su Y, Dong CP: Efficacyof low-protein diet in diabetic nephropathy: A meta-analysisof randomized controlled trials. Lipids Health Dis 18: 82,2019 https://doi.org/10.1186/s12944-019-1007-6
774 KIDNEY360
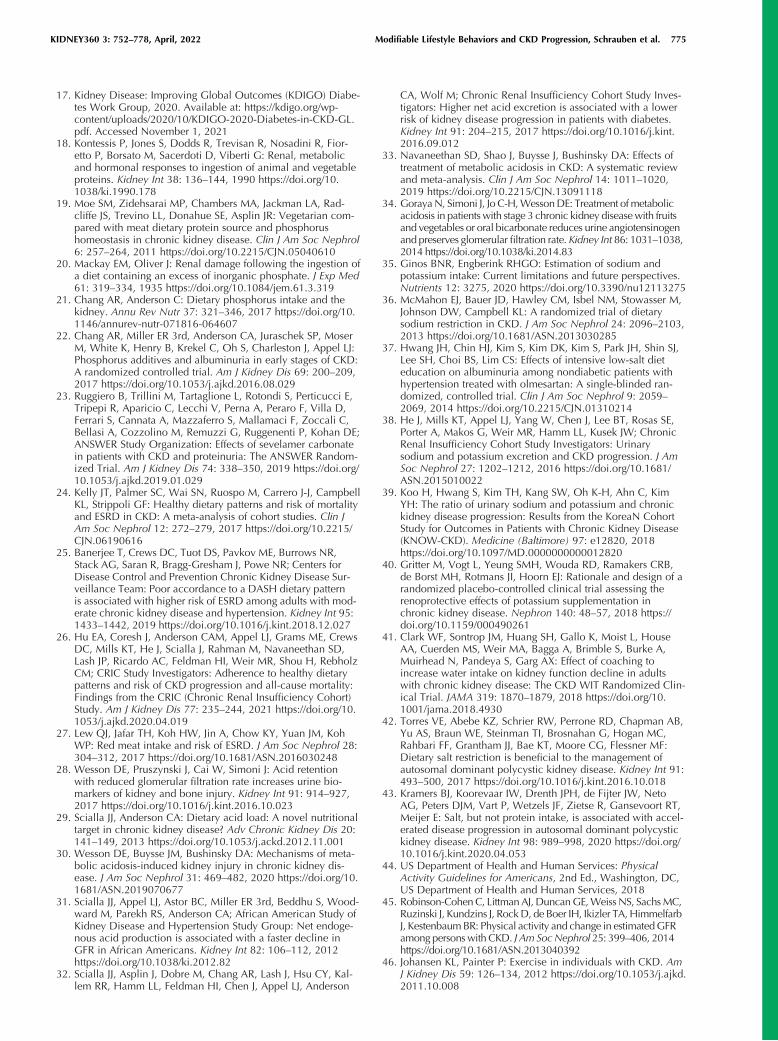
17. Kidney Disease: Improving Global Outcomes (KDIGO) Diabe-tes Work Group, 2020. Available at: https://kdigo.org/wp-content/uploads/2020/10/KDIGO-2020-Diabetes-in-CKD-GL.pdf. Accessed November 1, 2021
18. Kontessis P, Jones S, Dodds R, Trevisan R, Nosadini R, Fior-etto P, Borsato M, Sacerdoti D, Viberti G: Renal, metabolicand hormonal responses to ingestion of animal and vegetableproteins. Kidney Int 38: 136–144, 1990 https://doi.org/10.1038/ki.1990.178
19. Moe SM, Zidehsarai MP, Chambers MA, Jackman LA, Rad-cliffe JS, Trevino LL, Donahue SE, Asplin JR: Vegetarian com-pared with meat dietary protein source and phosphorushomeostasis in chronic kidney disease. Clin J Am Soc Nephrol6: 257–264, 2011 https://doi.org/10.2215/CJN.05040610
20. Mackay EM, Oliver J: Renal damage following the ingestion ofa diet containing an excess of inorganic phosphate. J Exp Med61: 319–334, 1935 https://doi.org/10.1084/jem.61.3.319
21. Chang AR, Anderson C: Dietary phosphorus intake and thekidney. Annu Rev Nutr 37: 321–346, 2017 https://doi.org/10.1146/annurev-nutr-071816-064607
22. Chang AR, Miller ER 3rd, Anderson CA, Juraschek SP, MoserM, White K, Henry B, Krekel C, Oh S, Charleston J, Appel LJ:Phosphorus additives and albuminuria in early stages of CKD:A randomized controlled trial. Am J Kidney Dis 69: 200–209,2017 https://doi.org/10.1053/j.ajkd.2016.08.029
23. Ruggiero B, Trillini M, Tartaglione L, Rotondi S, Perticucci E,Tripepi R, Aparicio C, Lecchi V, Perna A, Peraro F, Villa D,Ferrari S, Cannata A, Mazzaferro S, Mallamaci F, Zoccali C,Bellasi A, Cozzolino M, Remuzzi G, Ruggenenti P, Kohan DE;ANSWER Study Organization: Effects of sevelamer carbonatein patients with CKD and proteinuria: The ANSWER Random-ized Trial. Am J Kidney Dis 74: 338–350, 2019 https://doi.org/10.1053/j.ajkd.2019.01.029
24. Kelly JT, Palmer SC, Wai SN, Ruospo M, Carrero J-J, CampbellKL, Strippoli GF: Healthy dietary patterns and risk of mortalityand ESRD in CKD: A meta-analysis of cohort studies. Clin JAm Soc Nephrol 12: 272–279, 2017 https://doi.org/10.2215/CJN.06190616
25. Banerjee T, Crews DC, Tuot DS, Pavkov ME, Burrows NR,Stack AG, Saran R, Bragg-Gresham J, Powe NR; Centers forDisease Control and Prevention Chronic Kidney Disease Sur-veillance Team: Poor accordance to a DASH dietary patternis associated with higher risk of ESRD among adults with mod-erate chronic kidney disease and hypertension. Kidney Int 95:1433–1442, 2019 https://doi.org/10.1016/j.kint.2018.12.027
26. Hu EA, Coresh J, Anderson CAM, Appel LJ, Grams ME, CrewsDC, Mills KT, He J, Scialla J, Rahman M, Navaneethan SD,Lash JP, Ricardo AC, Feldman HI, Weir MR, Shou H, RebholzCM; CRIC Study Investigators: Adherence to healthy dietarypatterns and risk of CKD progression and all-cause mortality:Findings from the CRIC (Chronic Renal Insufficiency Cohort)Study. Am J Kidney Dis 77: 235–244, 2021 https://doi.org/10.1053/j.ajkd.2020.04.019
27. Lew QJ, Jafar TH, Koh HW, Jin A, Chow KY, Yuan JM, KohWP: Red meat intake and risk of ESRD. J Am Soc Nephrol 28:304–312, 2017 https://doi.org/10.1681/ASN.2016030248
28. Wesson DE, Pruszynski J, Cai W, Simoni J: Acid retentionwith reduced glomerular filtration rate increases urine bio-markers of kidney and bone injury. Kidney Int 91: 914–927,2017 https://doi.org/10.1016/j.kint.2016.10.023
29. Scialla JJ, Anderson CA: Dietary acid load: A novel nutritionaltarget in chronic kidney disease? Adv Chronic Kidney Dis 20:141–149, 2013 https://doi.org/10.1053/j.ackd.2012.11.001
30. Wesson DE, Buysse JM, Bushinsky DA: Mechanisms of meta-bolic acidosis-induced kidney injury in chronic kidney dis-ease. J Am Soc Nephrol 31: 469–482, 2020 https://doi.org/10.1681/ASN.2019070677
31. Scialla JJ, Appel LJ, Astor BC, Miller ER 3rd, Beddhu S, Wood-ward M, Parekh RS, Anderson CA; African American Study ofKidney Disease and Hypertension Study Group: Net endoge-nous acid production is associated with a faster decline inGFR in African Americans. Kidney Int 82: 106–112, 2012https://doi.org/10.1038/ki.2012.82
32. Scialla JJ, Asplin J, Dobre M, Chang AR, Lash J, Hsu CY, Kal-lem RR, Hamm LL, Feldman HI, Chen J, Appel LJ, Anderson
CA, Wolf M; Chronic Renal Insufficiency Cohort Study Inves-tigators: Higher net acid excretion is associated with a lowerrisk of kidney disease progression in patients with diabetes.Kidney Int 91: 204–215, 2017 https://doi.org/10.1016/j.kint.2016.09.012
33. Navaneethan SD, Shao J, Buysse J, Bushinsky DA: Effects oftreatment of metabolic acidosis in CKD: A systematic reviewand meta-analysis. Clin J Am Soc Nephrol 14: 1011–1020,2019 https://doi.org/10.2215/CJN.13091118
34. GorayaN, Simoni J, Jo C-H,WessonDE: Treatment ofmetabolicacidosis in patientswith stage 3 chronic kidney diseasewith fruitsand vegetables or oral bicarbonate reduces urine angiotensinogenand preserves glomerular filtration rate.Kidney Int 86: 1031–1038,2014 https://doi.org/10.1038/ki.2014.83
35. Ginos BNR, Engberink RHGO: Estimation of sodium andpotassium intake: Current limitations and future perspectives.Nutrients 12: 3275, 2020 https://doi.org/10.3390/nu12113275
36. McMahon EJ, Bauer JD, Hawley CM, Isbel NM, Stowasser M,Johnson DW, Campbell KL: A randomized trial of dietarysodium restriction in CKD. J Am Soc Nephrol 24: 2096–2103,2013 https://doi.org/10.1681/ASN.2013030285
37. Hwang JH, Chin HJ, Kim S, Kim DK, Kim S, Park JH, Shin SJ,Lee SH, Choi BS, Lim CS: Effects of intensive low-salt dieteducation on albuminuria among nondiabetic patients withhypertension treated with olmesartan: A single-blinded ran-domized, controlled trial. Clin J Am Soc Nephrol 9: 2059–2069, 2014 https://doi.org/10.2215/CJN.01310214
38. He J, Mills KT, Appel LJ, Yang W, Chen J, Lee BT, Rosas SE,Porter A, Makos G, Weir MR, Hamm LL, Kusek JW; ChronicRenal Insufficiency Cohort Study Investigators: Urinarysodium and potassium excretion and CKD progression. J AmSoc Nephrol 27: 1202–1212, 2016 https://doi.org/10.1681/ASN.2015010022
39. Koo H, Hwang S, Kim TH, Kang SW, Oh K-H, Ahn C, KimYH: The ratio of urinary sodium and potassium and chronickidney disease progression: Results from the KoreaN CohortStudy for Outcomes in Patients with Chronic Kidney Disease(KNOW-CKD). Medicine (Baltimore) 97: e12820, 2018https://doi.org/10.1097/MD.0000000000012820
40. Gritter M, Vogt L, Yeung SMH, Wouda RD, Ramakers CRB,de Borst MH, Rotmans JI, Hoorn EJ: Rationale and design of arandomized placebo-controlled clinical trial assessing therenoprotective effects of potassium supplementation inchronic kidney disease. Nephron 140: 48–57, 2018 https://doi.org/10.1159/000490261
41. Clark WF, Sontrop JM, Huang SH, Gallo K, Moist L, HouseAA, Cuerden MS, Weir MA, Bagga A, Brimble S, Burke A,Muirhead N, Pandeya S, Garg AX: Effect of coaching toincrease water intake on kidney function decline in adultswith chronic kidney disease: The CKD WIT Randomized Clin-ical Trial. JAMA 319: 1870–1879, 2018 https://doi.org/10.1001/jama.2018.4930
42. Torres VE, Abebe KZ, Schrier RW, Perrone RD, Chapman AB,Yu AS, Braun WE, Steinman TI, Brosnahan G, Hogan MC,Rahbari FF, Grantham JJ, Bae KT, Moore CG, Flessner MF:Dietary salt restriction is beneficial to the management ofautosomal dominant polycystic kidney disease. Kidney Int 91:493–500, 2017 https://doi.org/10.1016/j.kint.2016.10.018
43. Kramers BJ, Koorevaar IW, Drenth JPH, de Fijter JW, NetoAG, Peters DJM, Vart P, Wetzels JF, Zietse R, Gansevoort RT,Meijer E: Salt, but not protein intake, is associated with accel-erated disease progression in autosomal dominant polycystickidney disease. Kidney Int 98: 989–998, 2020 https://doi.org/10.1016/j.kint.2020.04.053
44. US Department of Health and Human Services: PhysicalActivity Guidelines for Americans, 2nd Ed., Washington, DC,US Department of Health and Human Services, 2018
45. Robinson-CohenC, LittmanAJ, DuncanGE,WeissNS, SachsMC,Ruzinski J, Kundzins J, RockD, de Boer IH, Ikizler TA,HimmelfarbJ, KestenbaumBR: Physical activity and change in estimatedGFRamong personswith CKD. J Am SocNephrol 25: 399–406, 2014https://doi.org/10.1681/ASN.2013040392
46. Johansen KL, Painter P: Exercise in individuals with CKD. AmJ Kidney Dis 59: 126–134, 2012 https://doi.org/10.1053/j.ajkd.2011.10.008
KIDNEY360 3: 752–778, April, 2022 Modifiable Lifestyle Behaviors and CKD Progression, Schrauben et al. 775

47. Robinson-Cohen C, Katz R, Mozaffarian D, Dalrymple LS, deBoer I, Sarnak M, Shlipak M, Siscovick D, Kestenbaum B:Physical activity and rapid decline in kidney function amongolder adults. Arch Intern Med 169: 2116–2123, 2009 https://doi.org/10.1001/archinternmed.2009.438
48. Chen I-R, Wang S-M, Liang CC, Kuo H-L, Chang C-T, Liu J-H,Lin HH, Wang IK, Yang YF, Chou CY, Huang CC: Associationof walking with survival and RRT among patients with CKDstages 3-5. Clin J Am Soc Nephrol 9: 1183–1189, 2014https://doi.org/10.2215/CJN.09810913
49. Nakamura K, Sasaki T, Yamamoto S, Hayashi H, Ako S,Tanaka Y: Effects of exercise on kidney and physical functionin patients with non-dialysis chronic kidney disease: A sys-tematic review and meta-analysis. Sci Rep 10: 18195, 2020https://doi.org/10.1038/s41598-020-75405-x
50. Villanego F, Naranjo J, Vigara LA, Cazorla JM, Montero ME,Garc�ıa T, Torrado J, Mazuecos A: Impact of physical exercisein patients with chronic kidney disease: Sistematic review andmeta-analysis. Nefrologia (Engl Ed) 40: 237–252, 2020 https://doi.org/10.1016/j.nefroe.2020.06.012
51. Vivante A, Golan E, Tzur D, Leiba A, Tirosh A, Skorecki K,Calderon-Margalit R: Body mass index in 1.2 million adoles-cents and risk for end-stage renal disease. Arch Intern Med172: 1644–1650, 2012 https://doi.org/10.1001/2013.jamainternmed.85
52. Hsu CY, McCulloch CE, Iribarren C, Darbinian J, Go AS:Body mass index and risk for end-stage renal disease. AnnIntern Med 144: 21–28, 2006 https://doi.org/10.7326/0003-4819-144-1-200601030-00006
53. Zhu P, Herrington WG, Haynes R, Emberson J, Landray MJ,Sudlow CLM, Woodward M, Baigent C, Lewington S, StaplinN: Conventional and genetic evidence on the associationbetween adiposity and CKD. J Am Soc Nephrol 32: 127–137,2021 https://doi.org/10.1681/ASN.2020050679
54. Berthoux F, Mariat C, Maillard N: Overweight/obesity revis-ited as a predictive risk factor in primary IgA nephropathy.Nephrol Dial Transplant 28[Suppl 4]: iv160–iv166, 2013https://doi.org/10.1093/ndt/gft286
55. Nowak KL, You Z, Gitomer B, Brosnahan G, Torres VE, Chap-man AB, Perrone RD, Steinman TI, Abebe KZ, Rahbari-OskouiFF, Yu ASL, Harris PC, Bae KT, Hogan M, Miskulin D, Chon-chol M: Overweight and obesity are preditors of progressionin early autosomal dominant polycystic kidney disease. J AmSoc Nephrol 29: 571–578, 2018 https://doi.org/10.1681/ASN.2017070819
56. Elyan BMP, Lees JS, Gillis KA, Mackinnon B, Fox JG, GeddesCC, McQuarrie EP: Obesity is not associated with progressionto end stage renal disease in patients with biopsy-proven glo-merular diseases. BMC Nephrol 20: 237, 2019 https://doi.org/10.1186/s12882-019-1434-7
57. Bolignano D, Zoccali C: Effects of weight loss on renal functionin obese CKD patients: A systematic review. Nephrol Dial Trans-plant 28: iv82–iv98, 2013 https://doi.org/10.1093/ndt/gft302
58. Cohen RV, Pereira TV, Aboud CM, Petry TBZ, Lopes CorreaJL, Schiavon CA, Pomp�ılio CE, Pechy FNQ, da Costa SilvaACC, de Melo FLG, Cunha da Silveira LP, de Paris CaravattoPP, Halpern H, Monteiro FLJ, da Costa Martins B, Kuga R, Pal-umbo TMS, Docherty NG, le Roux CW: Effect of gastricbypass vs best medical treatment on early-stage chronic kid-ney disease in patients with type 2 diabetes and obesity: Arandomized clinical trial. JAMA Surg 155: e200420, 2020https://doi.org/10.1001/jamasurg.2020.0420
59. Lambert K, Beer J, Dumont R, Hewitt K, Manley K, Meade A,Salamon K, Campbell K: Weight management strategies forthose with chronic kidney disease: A consensus report fromthe Asia Pacific Society of Nephrology and Australia and NewZealand Society of Nephrology 2016 renal dietitians meeting.Nephrology (Carlton) 23: 912–920, 2018 https://doi.org/10.1111/nep.13118
60. Molnar MZ, Streja E, Kovesdy CP, Bunnapradist S, SampaioMS, Jing J, Krishnan M, Nissenson AR, Danovitch GM, Kalan-tar-Zadeh K: Associations of body mass index and weight losswith mortality in transplant-waitlisted maintenance hemodial-ysis patients. Am J Transplant 11: 725–736, 2011 https://doi.org/10.1111/j.1600-6143.2011.03468.x
61. Harhay MN, Chen X, Chu NM, Norman SP, Segev DL, McA-dams-DeMarco M: Pre-kidney transplant unintentional weightloss leads to worse post-kidney transplant outcomes. NephrolDial Transplant 36: 1927–1936, 2021 https://doi.org/10.1093/ndt/gfab164
62. Ku E, Kopple JD, Johansen KL, McCulloch CE, Go AS, Xie D,Lin F, Hamm LL, He J, Kusek JW, Navaneethan SD, RicardoAC, Rincon-Choles H, Smogorzewski M, Hsu CY; CRIC StudyInvestigators: Longitudinal weight change during CKD pro-gression and its association with subsequent mortality. Am JKidney Dis 71: 657–665, 2018 https://doi.org/10.1053/j.ajkd.2017.09.015
63. Sheetz KH, Woodside KJ, Shahinian VB, Dimick JB, Mont-gomery JR, Waits SA: Trends in bariatric surgery proceduresamong patients with ESKD in the United States. Clin J Am SocNephrol 14: 1193–1199, 2019 https://doi.org/10.2215/CJN.01480219
64. Coleman KJ, Shu YH, Fischer H, Johnson E, Yoon TK, TaylorB, Imam T, DeRose S, Haneuse S, Herrinton LJ, Fisher D, LiRA, Theis MK, Liu L, Courcoulas AP, Smith DH, ArterburnDE, Friedman AN: Bariatric surgery and risk of death in per-sons with chronic kidney disease [published online ahead ofprint March 3, 2021]. Ann Surg https://doi.org/10.1097/SLA.0000000000004851
65. Chintam K, Chang AR: Strategies to treat obesity in patientswith CKD. Am J Kidney Dis 77: 427–439, 2021 https://doi.org/10.1053/j.ajkd.2020.08.016
66. Friedman AN, Kaplan LM, le Roux CW, Schauer PR: Manage-ment of obesity in adults with CKD. J Am Soc Nephrol 32:777–790, 2021 https://doi.org/10.1681/ASN.2020101472
67. U.S. Department of Health and Human Services: The HealthConsequences of Smoking—50 Years of Progress: A Report ofthe Surgeon General, Atlanta, GA, US Department of Healthand Human Services, Centers for Disease Control andPrevention, National Center for Chronic Disease Preventionand Health Promotion, Office on Smoking and Health,2014
68. Halimi JM, Giraudeau B, Vol S, Cac�es E, Nivet H, LebranchuY, Tichet J: Effects of current smoking and smoking discontin-uation on renal function and proteinuria in the general popu-lation. Kidney Int 58: 1285–1292, 2000 https://doi.org/10.1046/j.1523-1755.2000.00284.x
69. Sawicki PT, M€uhlhauser I, Bender R, Pethke W, HeinemannL, Berger M: Effects of smoking on blood pressure and protein-uria in patients with diabetic nephropathy. J Intern Med 239:345–352, 1996 https://doi.org/10.1046/j.1365-2796.1996.468809000.x
70. Chuahirun T, Wesson DE: Cigarette smoking predicts fasterprogression of type 2 established diabetic nephropathy despiteACE inhibition. Am J Kidney Dis 39: 376–382, 2002 https://doi.org/10.1053/ajkd.2002.30559
71. Yoshida T, Takei T, Shirota S, Tsukada M, Sugiura H, ItabashiM, Ogawa T, Uchida K, Tsuchiya K, Nitta K: Risk factors forprogression in patients with early-stage chronic kidney diseasein the Japanese population. Intern Med 47: 1859–1864, 2008https://doi.org/10.2169/internalmedicine.47.1171
72. Ozkok A, Akpinar TS, Tufan F, Kanitez NA, Uysal M, GuzelM, Caliskan Y, Alisir S, Yazici H, Ecder T: Clinical characteris-tics and predictors of progression of chronic kidney disease inautosomal dominant polycystic kidney disease: A single cen-ter experience. Clin Exp Nephrol 17: 345–351, 2013 https://doi.org/10.1007/s10157-012-0706-3
73. Grams ME, Coresh J, Segev DL, Kucirka LM, Tighiouart H,Sarnak MJ: Vascular disease, ESRD, and death: Interpretingcompeting risk analyses. Clin J Am Soc Nephrol 7: 1606–1614, 2012 https://doi.org/10.2215/CJN.03460412
74. Bundy JD, Bazzano LA, Xie D, Cohan J, Dolata J, Fink JC, HsuCY, Jamerson K, Lash J, Makos G, Steigerwalt S, Wang X,Mills KT, Chen J, He J; CRIC Study Investigators: Self-reportedtobacco, alcohol, and illicit drug use and progression ofchronic kidney disease. Clin J Am Soc Nephrol 13: 993–1001,2018 https://doi.org/10.2215/CJN.11121017
75. Lee S, Kang S, Joo YS, Lee C, Nam KH, Yun H-R, Park JT,Chang TI, Yoo TH, Kim SW, Oh KH, Kim YH, Park SK, KangSW, Choi KH, Ahn C, Han SH: Smoking, smoking cessation,
776 KIDNEY360
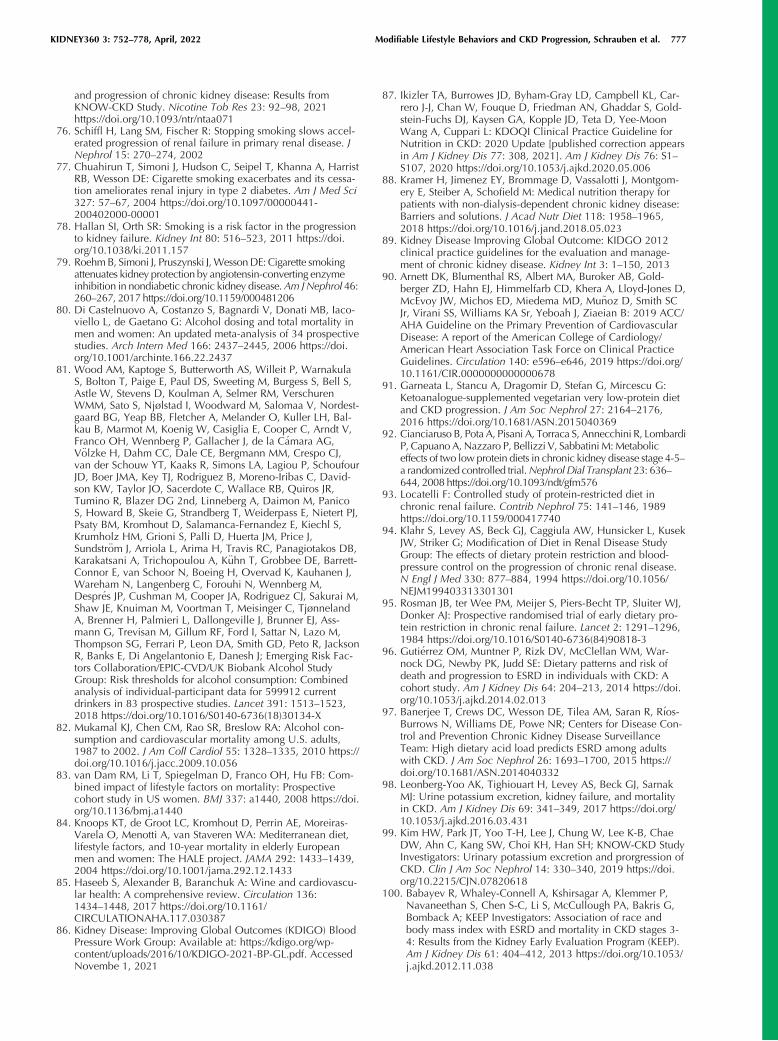
and progression of chronic kidney disease: Results fromKNOW-CKD Study. Nicotine Tob Res 23: 92–98, 2021https://doi.org/10.1093/ntr/ntaa071
76. Schiffl H, Lang SM, Fischer R: Stopping smoking slows accel-erated progression of renal failure in primary renal disease. JNephrol 15: 270–274, 2002
77. Chuahirun T, Simoni J, Hudson C, Seipel T, Khanna A, HarristRB, Wesson DE: Cigarette smoking exacerbates and its cessa-tion ameliorates renal injury in type 2 diabetes. Am J Med Sci327: 57–67, 2004 https://doi.org/10.1097/00000441-200402000-00001
78. Hallan SI, Orth SR: Smoking is a risk factor in the progressionto kidney failure. Kidney Int 80: 516–523, 2011 https://doi.org/10.1038/ki.2011.157
79. RoehmB, Simoni J, Pruszynski J,WessonDE: Cigarette smokingattenuates kidney protection by angiotensin-converting enzymeinhibition in nondiabetic chronic kidney disease.Am JNephrol 46:260–267, 2017 https://doi.org/10.1159/000481206
80. Di Castelnuovo A, Costanzo S, Bagnardi V, Donati MB, Iaco-viello L, de Gaetano G: Alcohol dosing and total mortality inmen and women: An updated meta-analysis of 34 prospectivestudies. Arch Intern Med 166: 2437–2445, 2006 https://doi.org/10.1001/archinte.166.22.2437
81. Wood AM, Kaptoge S, Butterworth AS, Willeit P, WarnakulaS, Bolton T, Paige E, Paul DS, Sweeting M, Burgess S, Bell S,Astle W, Stevens D, Koulman A, Selmer RM, VerschurenWMM, Sato S, Njølstad I, Woodward M, Salomaa V, Nordest-gaard BG, Yeap BB, Fletcher A, Melander O, Kuller LH, Bal-kau B, Marmot M, Koenig W, Casiglia E, Cooper C, Arndt V,Franco OH, Wennberg P, Gallacher J, de la C�amara AG,V€olzke H, Dahm CC, Dale CE, Bergmann MM, Crespo CJ,van der Schouw YT, Kaaks R, Simons LA, Lagiou P, SchoufourJD, Boer JMA, Key TJ, Rodriguez B, Moreno-Iribas C, David-son KW, Taylor JO, Sacerdote C, Wallace RB, Quiros JR,Tumino R, Blazer DG 2nd, Linneberg A, Daimon M, PanicoS, Howard B, Skeie G, Strandberg T, Weiderpass E, Nietert PJ,Psaty BM, Kromhout D, Salamanca-Fernandez E, Kiechl S,Krumholz HM, Grioni S, Palli D, Huerta JM, Price J,Sundstr€om J, Arriola L, Arima H, Travis RC, Panagiotakos DB,Karakatsani A, Trichopoulou A, K€uhn T, Grobbee DE, Barrett-Connor E, van Schoor N, Boeing H, Overvad K, Kauhanen J,Wareham N, Langenberg C, Forouhi N, Wennberg M,Despr�es JP, Cushman M, Cooper JA, Rodriguez CJ, Sakurai M,Shaw JE, Knuiman M, Voortman T, Meisinger C, TjønnelandA, Brenner H, Palmieri L, Dallongeville J, Brunner EJ, Ass-mann G, Trevisan M, Gillum RF, Ford I, Sattar N, Lazo M,Thompson SG, Ferrari P, Leon DA, Smith GD, Peto R, JacksonR, Banks E, Di Angelantonio E, Danesh J; Emerging Risk Fac-tors Collaboration/EPIC-CVD/UK Biobank Alcohol StudyGroup: Risk thresholds for alcohol consumption: Combinedanalysis of individual-participant data for 599912 currentdrinkers in 83 prospective studies. Lancet 391: 1513–1523,2018 https://doi.org/10.1016/S0140-6736(18)30134-X
82. Mukamal KJ, Chen CM, Rao SR, Breslow RA: Alcohol con-sumption and cardiovascular mortality among U.S. adults,1987 to 2002. J Am Coll Cardiol 55: 1328–1335, 2010 https://doi.org/10.1016/j.jacc.2009.10.056
83. van Dam RM, Li T, Spiegelman D, Franco OH, Hu FB: Com-bined impact of lifestyle factors on mortality: Prospectivecohort study in US women. BMJ 337: a1440, 2008 https://doi.org/10.1136/bmj.a1440
84. Knoops KT, de Groot LC, Kromhout D, Perrin AE, Moreiras-Varela O, Menotti A, van Staveren WA: Mediterranean diet,lifestyle factors, and 10-year mortality in elderly Europeanmen and women: The HALE project. JAMA 292: 1433–1439,2004 https://doi.org/10.1001/jama.292.12.1433
85. Haseeb S, Alexander B, Baranchuk A: Wine and cardiovascu-lar health: A comprehensive review. Circulation 136:1434–1448, 2017 https://doi.org/10.1161/CIRCULATIONAHA.117.030387
86. Kidney Disease: Improving Global Outcomes (KDIGO) BloodPressure Work Group: Available at: https://kdigo.org/wp-content/uploads/2016/10/KDIGO-2021-BP-GL.pdf. AccessedNovembe 1, 2021
87. Ikizler TA, Burrowes JD, Byham-Gray LD, Campbell KL, Car-rero J-J, Chan W, Fouque D, Friedman AN, Ghaddar S, Gold-stein-Fuchs DJ, Kaysen GA, Kopple JD, Teta D, Yee-MoonWang A, Cuppari L: KDOQI Clinical Practice Guideline forNutrition in CKD: 2020 Update [published correction appearsin Am J Kidney Dis 77: 308, 2021]. Am J Kidney Dis 76: S1–S107, 2020 https://doi.org/10.1053/j.ajkd.2020.05.006
88. Kramer H, Jimenez EY, Brommage D, Vassalotti J, Montgom-ery E, Steiber A, Schofield M: Medical nutrition therapy forpatients with non-dialysis-dependent chronic kidney disease:Barriers and solutions. J Acad Nutr Diet 118: 1958–1965,2018 https://doi.org/10.1016/j.jand.2018.05.023
89. Kidney Disease Improving Global Outcome: KIDGO 2012clinical practice guidelines for the evaluation and manage-ment of chronic kidney disease. Kidney Int 3: 1–150, 2013
90. Arnett DK, Blumenthal RS, Albert MA, Buroker AB, Gold-berger ZD, Hahn EJ, Himmelfarb CD, Khera A, Lloyd-Jones D,McEvoy JW, Michos ED, Miedema MD, Mu~noz D, Smith SCJr, Virani SS, Williams KA Sr, Yeboah J, Ziaeian B: 2019 ACC/AHA Guideline on the Primary Prevention of CardiovascularDisease: A report of the American College of Cardiology/American Heart Association Task Force on Clinical PracticeGuidelines. Circulation 140: e596–e646, 2019 https://doi.org/10.1161/CIR.0000000000000678
91. Garneata L, Stancu A, Dragomir D, Stefan G, Mircescu G:Ketoanalogue-supplemented vegetarian very low-protein dietand CKD progression. J Am Soc Nephrol 27: 2164–2176,2016 https://doi.org/10.1681/ASN.2015040369
92. Cianciaruso B, Pota A, Pisani A, Torraca S, Annecchini R, LombardiP, CapuanoA,Nazzaro P, Bellizzi V, SabbatiniM:Metaboliceffects of two lowprotein diets in chronic kidney disease stage 4-5–a randomized controlled trial.Nephrol Dial Transplant 23: 636–644, 2008 https://doi.org/10.1093/ndt/gfm576
93. Locatelli F: Controlled study of protein-restricted diet inchronic renal failure. Contrib Nephrol 75: 141–146, 1989https://doi.org/10.1159/000417740
94. Klahr S, Levey AS, Beck GJ, Caggiula AW, Hunsicker L, KusekJW, Striker G; Modification of Diet in Renal Disease StudyGroup: The effects of dietary protein restriction and blood-pressure control on the progression of chronic renal disease.N Engl J Med 330: 877–884, 1994 https://doi.org/10.1056/NEJM199403313301301
95. Rosman JB, ter Wee PM, Meijer S, Piers-Becht TP, Sluiter WJ,Donker AJ: Prospective randomised trial of early dietary pro-tein restriction in chronic renal failure. Lancet 2: 1291–1296,1984 https://doi.org/10.1016/S0140-6736(84)90818-3
96. Guti�errez OM, Muntner P, Rizk DV, McClellan WM, War-nock DG, Newby PK, Judd SE: Dietary patterns and risk ofdeath and progression to ESRD in individuals with CKD: Acohort study. Am J Kidney Dis 64: 204–213, 2014 https://doi.org/10.1053/j.ajkd.2014.02.013
97. Banerjee T, Crews DC, Wesson DE, Tilea AM, Saran R, R�ıos-Burrows N, Williams DE, Powe NR; Centers for Disease Con-trol and Prevention Chronic Kidney Disease SurveillanceTeam: High dietary acid load predicts ESRD among adultswith CKD. J Am Soc Nephrol 26: 1693–1700, 2015 https://doi.org/10.1681/ASN.2014040332
98. Leonberg-Yoo AK, Tighiouart H, Levey AS, Beck GJ, SarnakMJ: Urine potassium excretion, kidney failure, and mortalityin CKD. Am J Kidney Dis 69: 341–349, 2017 https://doi.org/10.1053/j.ajkd.2016.03.431
99. Kim HW, Park JT, Yoo T-H, Lee J, Chung W, Lee K-B, ChaeDW, Ahn C, Kang SW, Choi KH, Han SH; KNOW-CKD StudyInvestigators: Urinary potassium excretion and prorgression ofCKD. Clin J Am Soc Nephrol 14: 330–340, 2019 https://doi.org/10.2215/CJN.07820618
100. Babayev R, Whaley-Connell A, Kshirsagar A, Klemmer P,Navaneethan S, Chen S-C, Li S, McCullough PA, Bakris G,Bomback A; KEEP Investigators: Association of race andbody mass index with ESRD and mortality in CKD stages 3-4: Results from the Kidney Early Evaluation Program (KEEP).Am J Kidney Dis 61: 404–412, 2013 https://doi.org/10.1053/j.ajkd.2012.11.038
KIDNEY360 3: 752–778, April, 2022 Modifiable Lifestyle Behaviors and CKD Progression, Schrauben et al. 777
101. Yun H-R, Kim H, Park JT, Chang TI, Yoo TH, Kang SW, ChoiKH, Sung S, Kim SW, Lee J, Oh KH, Ahn C, Han SH; KoreanCohort Study for Outcomes in Patients With Chronic KidneyDisease (KNOW-CKD) Investigators: Obesity, metabolicabnormality, and progression of CKD. Am J KidneyDis 72: 400–410, 2018 https://doi.org/10.1053/j.ajkd.2018.02.362
102. Orth SR, St€ockmann A, Conradt C, Ritz E, Ferro M, KreusserW, Piccoli G, Rambausek M, Roccatello D, Sch€afer K, Sie-berth HG, Wanner C, Watschinger B, Zucchelli P: Smokingas a risk factor for end-stage renal failure in men with pri-mary renal disease. Kidney Int 54: 926–931, 1998 https://doi.org/10.1046/j.1523-1755.1998.00067.x
103. Tanaka K, Nakayama M, Kanno M, Kimura H, Watanabe K,Tani Y, Kusano Y, Suzuki H, Hayashi Y, Asahi K, Sato K,Miyata T, Watanabe T: Skin autofluorescence isassociated with the progression of chronic kidney disease: A
prospective observational study. PLoS One 8: e83799, 2013https://doi.org/10.1371/journal.pone.0083799
104. Menon V, Katz R, Mukamal K, Kestenbaum B, de Boer IH,Siscovick DS, Sarnak MJ, Shlipak MG: Alcohol consumptionand kidney function decline in the elderly: Alcohol and kid-ney disease. Nephrol Dial Transplant 25: 3301–3307, 2010https://doi.org/10.1093/ndt/gfq188
105. Joo YS, Koh H, Nam KH, Lee S, Kim J, Lee C, Yun HR, ParkJT, Kang EW, Chang TI, Yoo TH, Oh KH, Chae DW, Lee KB,Kim SW, Lee J, Kang SW, Choi KH, Ahn C, Han SH: Alcoholconsumption and progression of chronic kidney disease:Results from the Korean Cohort Study for Outcome in Patientswith Chronic Kidney Disease. Mayo Clin Proc 95: 293–305,2020 https://doi.org/10.1016/j.mayocp.2019.06.014
Received: May 7, 2021 Accepted: January 7, 2022
778 KIDNEY360
Copyright © 2022 FDOKUMEN