UNDERSTANDING LIFESTYLE IN PATIENTS ON ...
440
UNDERSTANDING LIFESTYLE IN PATIENTS ON HAEMODIALYSIS: A MULTICULTURAL PERSPECTIVE Thesis submitted for the degree of Doctor of Philosophy at the University of Leicester Yan Song Department of Infection, Immunity and Inflammation University of Leicester August 2018
-
Upload
khangminh22 -
Category
Documents
-
view
0 -
download
0
Transcript of UNDERSTANDING LIFESTYLE IN PATIENTS ON ...

UNDERSTANDING LIFESTYLE IN
PATIENTS ON HAEMODIALYSIS:
A MULTICULTURAL PERSPECTIVE
Thesis submitted for the degree of
Doctor of Philosophy at the
University of Leicester
Yan Song
Department of Infection, Immunity and Inflammation
University of Leicester
August 2018

i
Abstract Understanding Lifestyle in Patients on Haemodialysis:
A Multicultural Perspective
Yan Song
Supervised by:
Prof. Alice Smith, Dr. James Burton, Prof. Xiaolan Chen and Dr.Yujie Guo
Background: Healthy lifestyle plays a crucial role in improving comorbidities and
decreasing mortality in haemodialysis (HD) patients. However, there is no
comprehensive study to address the status of lifestyle especially cross culture
comparison. This thesis aimed to understand the difference of HD patients’ lifestyle
between the UK and China in aspects of nutritional and physical status.
Methods: Dietary intake was assessed by 24-hour diet recall interviews in 40 UK and
43 Chinese HD patients. Physical function and activity were examined by a
combination of questionnaires (1156 UK and 542Chinese HD patients) and objective
measures (30 UK and 40 Chinese HD patients, with additional evaluation of Quality
of Life [QoL], symptoms and body composition). In addition, 10 UK and 44 Chinese
healthy controls were evaluated for objective measures.
Results: A high prevalence of dietary insufficiency in general was revealed, but UK
HD patients had a better management of micronutrients (such as iron) than Chinese
HD patients. Both UK and Chinese HD patients had impaired physical function and
activity that were worse in UK patients than Chinese patients. Factors influencing
physical function and activity include demographic (age, gender, muscle and fat
mass), clinical (nutrition, inflammation and bone derangement) and psychological
factors (perceived benefits and barriers to exercise), QoL and symptoms. UK HD
patients’ lower protein status and bone metabolism, higher fat mass and symptom
burden, and fewer perceived exercise benefits may contribute to the lower physical
function and activity than in Chinese HD patients.
Conclusion: Malnutrition and low physical function and activity existed in both UK
and Chinese HD patients, with a better management of micronutrients in UK and
higher physical function and activity in China. Healthy lifestyle behaviors should be
improved in both cultures. Promoting communication of lifestyle between UK and
China is required.

ii
Acknowledgments
Throughout my PhD there have been so many people to whom I would like to express
my gratitude to. It has been a wonderful, unique but challenging journey for me and
I believe I will never forget it for the rest of my whole life.
Firstly, I would like to thank my supervisors Prof. Alice Smith, Dr. James Burton,
Prof. Xiaolan Chen and Dr.Yujie Guo. Alice and James thank you for supervising and
supporting me with great patience. What I have learned from you reminds me to have
a rigorous attitude towards research now and in the future. Xiaolan and Yujie thank
you for the selfless help you gave me when I conducted my study in China.
To my Progress Review Panel (PRP) members, I would like to thank Sally, who
always encouraged me to have confidence with my PhD. Bin thank you so much for
your unconditional trust and encouragement to relieve my worry and anxiety.
To my Dad, thank you for keeping your liver cancer stable in these four years, so that
I wouldn’t have any concerns about your health, and for allowing me to chase my
dream. Mum, my husband, my daughter and my whole family, thanks for your love
to support me walking along this lonely road. To my friends in the UK, US and China,
I know you are always there for me when I need. To Barry, thank you for constantly
proofreading my thesis.
To my participants, I could not do anything without your cooperation. Thank you for
believing me that I can do something for you.
Finally, I would like to express a special thanks to my colleagues in the Kidney
Lifestyle team. Darren, Dan, Heather, Hannah, Amy, Patrick, Barbara, Soteris, Doug,
Tom, Daniel and Annabel. I feel so lucky and full of gratitude to meet all of you in
the UK. Darren and Dan your help and support made me stronger. I could not have
completed my thesis without your support. Heather, Hannah and Amy, I will always
remember the moments when I felt frustrated, you gave me numerous hugs and told
me that everything would be fine. Thank you, I believe it.

iii
Publications
Conference poster presentations
Song Y, Highton P, Clarke AL, Burton JO, Smith AC. Functional capacity and
physical activity behaviour and perceptions in patients on unit-based haemodialysis.
Poster presentation, UK Kidney Week, Birmingham, June 2016.
Song Y, Highton P, Clarke AL, Wang X, Liang W, Chen X, Guo Y, Burton JO, Smith
AC. Exercise behaviour in unit-based maintenance haemodialysis patients in the UK
and China. Poster presentation, British Renal Society Conference, Nottingham April
2017
Song Y, Highton P, Clarke AL, Wang X, Liang W, Chen X, Guo Y, Burton JO, Smith
AC. Self-perceived benefits and barriers of exercise in unit-based maintenance
haemodialysis patients in the UK and China. Poster Presentation, Renal Association
UK Kidney Week Conference, Liverpool June 2017
Song Y; Highton PJ; Vogt BP; Biruete A; Wilund KR; Smith AC; Burton JO.
Narrowing the phosphate divide: a comparison between UK and Chinese
haemodialysis patients. Poster Presentation, American Society of Nephrology
Conference, New Orleans November 2017
Song Y; Highton PJ; Clarke AL; Burton JO, Smith AC. Exploring Walking Pace,
Physical Activity and Readiness to Change in End Stage Renal Disease. Poster
Presentation, American Society of Nephrology Conference, New Orleans November
2017

iv
Table of Contents
Abstract ....................................................................................................................... i
Acknowledgments ..................................................................................................... ii
Publications ..............................................................................................................iii
Table of Contents ..................................................................................................... iv
List of Tables ............................................................................................................ xi
List of Figures ........................................................................................................ xvii
List of Key Abbreviations ...................................................................................... xx
Chapter 1 Introduction ............................................................................................ 1
1.1 Overview of Chronic kidney disease ........................................................ 2
1.1.1 Incidence and prevalence ...................................................................... 3
1.1.2 Causes and risk factors ......................................................................... 4
1.1.3 Overview of End Stage Renal Disease ................................................. 5
1.2 Physical activity and exercise .................................................................... 7
1.2.1 Effects of physical activity and exercise in haemodialysis ................... 8
1.2.2 Current situation of exercise or physical activity in haemodialysis
patients between the UK and China .................................................................... 9
1.2.3 Assessment of physical function in haemodialysis patients ............... 10
1.2.4 Physical activity measurement for haemodialysis patients ................. 12
1.3 Nutritional status in haemodialysis ........................................................ 15
1.3.1 Prevalence causes and potential comorbidities of malnutrition in
haemodialysis patients ....................................................................................... 15
1.3.2 Nutritional blood parameters in haemodialysis patients ..................... 16
1.3.3 Nutritional status in haemodialysis between the UK and China ........ 22
1.3.4 Assessment of nutritional status in haemodialysis patients ................ 23
1.3.5 Influence of provision of food during haemodialysis treatment on
haemodialysis patient ........................................................................................ 28
1.4 Body composition of haemodialysis patients ......................................... 29
1.5 The underlying impact of culture on lifestyle between UK and Chinese
haemodialysis patients ........................................................................................ 31
1.6 Aims ........................................................................................................... 32

v
Chapter 2 Methods ................................................................................................. 34
2.1 Introduction .............................................................................................. 35
2.2 Research design ........................................................................................ 36
2.2.1 The DISH study .................................................................................. 36
2.2.2 The QCKD study ................................................................................ 42
2.2.3 The COCO study ................................................................................ 45
2.3 Outcome measures ................................................................................... 52
2.3.1 Outcome measures in the DISH study ................................................ 52
2.3.2 Outcome measures in the QCKD study .............................................. 53
2.3.3 Outcome measures in the COCO study .............................................. 56
2.4 Statistical analysis .................................................................................... 62
Chapter 3 Demographics and Clinical Information of Participants in the DISH,
QCKD and COCO Studies..................................................................................... 64
3.1 Abstract ..................................................................................................... 65
3.2 Introduction .............................................................................................. 65
3.3 Methods ..................................................................................................... 66
3.4 Results ....................................................................................................... 67
3.4.1 Demographics and nutritional blood parameters of haemodialysis
patients in the DISH study ................................................................................. 67
3.4.2 Demographics and clinical information of haemodialysis patients in
the QCKD study ................................................................................................ 74
3.4.3 Demographics of haemodialysis patients and healthy controls in the
COCO study ...................................................................................................... 80
3.5 Discussion .................................................................................................. 92
3.6 Conclusion ................................................................................................. 94
Chapter 4 Comparison of dietary Intake between UK and Chinese
Haemodialysis Patients ........................................................................................... 95
4.1 Abstract ..................................................................................................... 96
4.2 Background ............................................................................................... 96
4.3 Methods ..................................................................................................... 98
4.4 Results ....................................................................................................... 98
4.4.1 Energy and protein intake ................................................................... 98
4.4.2 Dietary intake of trace elements, minerals and vitamins .................. 102

vi
4.5 Discussion ................................................................................................ 121
4.5.1 Dietary insufficiency in UK and Chinese haemodialysis patients .... 121
4.5.2 Provision of food during haemodialysis ........................................... 122
4.5.3 Iron intake and serum iron in the UK and Chinese haemodialysis
patients 122
4.5.4 Calcium intake and serum calcium in the UK and Chinese
haemodialysis patients ..................................................................................... 124
4.5.5 Phosphate intake and serum phosphate in the UK and Chinese
haemodialysis patients ..................................................................................... 125
4.5.6 Potassium intake and serum potassium in the UK and Chinese
haemodialysis patients ..................................................................................... 125
4.5.7 Sodium intake and serum sodium in the UK and Chinese
haemodialysis patients ..................................................................................... 126
4.5.8 Vitamin C in the UK and Chinese haemodialysis patients ............... 127
4.5.9 Vitamin D in the UK and Chinese haemodialysis patients ............... 127
4.5.10 Limitations ........................................................................................ 128
4.6 Conclusion ............................................................................................... 129
Chapter 5 Validity of the Duke Activity Status Index (DASI) and General
Practice Physical Activity Questionnaire and (GPPAQ)Walking Pace Question
................................................................................................................................ 130
5.1 Abstract ................................................................................................... 131
5.2 Background ............................................................................................. 131
5.3 Methods ................................................................................................... 133
5.4 Results ..................................................................................................... 134
5.4.1 Demographics of haemodialysis patients ......................................... 134
5.4.2 Validity of the DASI against the Shuttle Walking test in the UK and
Chinese haemodialysis patients ....................................................................... 134
5.4.3 Validity of the GPPAQ walking pace question against the gait speed
objectively measured by the SPPB .................................................................. 137
5.5 Discussion ................................................................................................ 138
5.6 Conclusion ............................................................................................... 141
Chapter 6 Physical Function of Haemodialysis Patients in the UK and China
................................................................................................................................ 142
6.1 Abstract ................................................................................................... 143

vii
6.2 Background ............................................................................................. 143
6.3 Methods ................................................................................................... 144
6.4 Results ..................................................................................................... 145
6.4.1 Physical function measured by questionnaires in the UK
haemodialysis patients ..................................................................................... 145
6.4.2 Physical function measured by physical performance tests in the UK
haemodialysis patients and healthy controls ................................................... 148
6.4.3 Physical function measured by questionnaires in Chinese
haemodialysis patients ..................................................................................... 151
6.4.4 Physical function measured by physical performance tests in Chinese
haemodialysis patients and healthy controls ................................................... 153
6.4.5 Comparison of physical function measured by questionnaires between
the UK and Chinese haemodialysis patients ................................................... 155
6.4.6 Comparison of physical function measured by physical performance
tests between UK and Chinese haemodialysis patients ................................... 159
6.5 Discussion ................................................................................................ 162
6.5.1 Physical function in the UK haemodialysis patients ........................ 162
6.5.2 Physical function in Chinese haemodialysis patients ....................... 165
6.5.3 Comparison of physical function between UK and Chinese
haemodialysis patients ..................................................................................... 166
6.5.4 Strengths and limitations .................................................................. 167
6.6 Conclusion ............................................................................................... 168
Chapter 7 Physical Activity Levels in Haemodialysis Patients in the UK and
China ...................................................................................................................... 169
7.1 Abstract ................................................................................................... 170
7.2 Background ............................................................................................. 170
7.3 Methods ................................................................................................... 172
7.4 Results ..................................................................................................... 172
7.4.1 Physical activity level measured by questionnaires in the UK
haemodialysis patients ..................................................................................... 172
7.4.2 Physical activity level measured by tri-axial accelerometry of the
haemodialysis patients and healthy controls in the UK ................................... 177
7.4.3 Physical activity level measured by questionnaires in Chinese
haemodialysis patients ..................................................................................... 178

viii
7.4.4 Physical activity level measured by Sensewear Armband (SWA) of
the haemodialysis patients and healthy controls in China ............................... 182
7.4.5 Comparison of physical activity level measured by questionnaires
between UK and Chinese haemodialysis patients ........................................... 185
7.4.6 Comparison of PA level measured by Sensewear Armband (SWA)
between UK and Chinese haemodialysis patients ........................................... 189
7.5 Discussion ................................................................................................ 191
7.5.1 PA level in the UK haemodialysis patients ...................................... 191
7.5.2 PA level in Chinese haemodialysis patients ..................................... 192
7.5.3 Comparison of PA level between UK and Chinese haemodialysis
patients 193
7.5.4 Strengths and limitations .................................................................. 194
7.6 Conclusion ............................................................................................... 195
Chapter 8 Self-perceived Benefits and Barriers to Exercise in the UK and
Chinese Haemodialysis patients .......................................................................... 196
8.1 Abstract ................................................................................................... 197
8.2 Background ............................................................................................. 197
8.3 Methods ................................................................................................... 198
8.4 Results ..................................................................................................... 199
8.4.1 Self-perceived benefits and barriers to exercise in the UK
haemodialysis patients ..................................................................................... 199
8.4.2 Self-perceived benefits and barriers to exercise in Chinese
haemodialysis patients ..................................................................................... 201
8.4.3 Comparison of self-perceived benefits and barriers to exercise
between UK and Chinese haemodialysis patients ........................................... 204
8.5 Discussion ................................................................................................ 206
8.6 Conclusion ............................................................................................... 209
Chapter 9 Relationship between Physical Function, Activity and Quality of
Life, Symptoms and Body Composition in UK and Chinese haemodialysis
Patients ................................................................................................................... 210
9.1 Abstract ................................................................................................... 211
9.2 Background ............................................................................................. 211
9.3 Methods ................................................................................................... 213
9.4 Results ..................................................................................................... 214

ix
9.4.1 QoL, symptom burdens and body composition in the UK
haemodialysis patients ..................................................................................... 214
9.4.2 QoL, symptom burdens and body composition in Chinese
haemodialysis patients ..................................................................................... 218
9.4.3 omparison of QoL, symptom burdens and body composition between
UK and Chinese haemodialysis patients ......................................................... 222
9.5 Discussion ................................................................................................ 227
9.6 Conclusion ............................................................................................... 231
Chapter 10 General Discussion ........................................................................... 232
10.1 Practical Implications ............................................................................ 238
10.2 Future research ...................................................................................... 239
10.2.1 Nutrition ............................................................................................ 239
10.2.2 Activity ............................................................................................. 239
10.3 Conclusion ............................................................................................... 242
Appendices ............................................................................................................. 243
Appendix A Ethics approval letter ...................................................................... 244
A.1 The DISH study .......................................................................................... 245
A.2 The QCKD study ........................................................................................ 246
A.3 The COCO study ........................................................................................ 249
A.4 Ethics approval letterin Chinese study..................................................... 253
Appendix B Patients information sheet (PIS) and Consent form .................... 254
B.1 The DISH study .......................................................................................... 255
B.1.1 PIS in the UK study ............................................................................... 255
B.1.2 PIS in Chinese study .............................................................................. 263
B.1.3 Consent form in the UK study ............................................................... 268
B.1.4 Consent form in Chinese study .............................................................. 269
B.2 The QCKD study ........................................................................................ 270
B.2.1 PIS in the UK study ............................................................................... 270
B.2.2 PIS in Chinese study .............................................................................. 275
B.2.3 Consent form in the UK study ............................................................... 279
B.2.4 Consent form in Chinese study .............................................................. 280
B.3 The COCO study ........................................................................................ 281

x
B.3.1 PIS in the UK study ............................................................................... 281
B.3.2 PIS in Chinese study .............................................................................. 306
B.3.3 Consent form in the UK study ............................................................... 327
B.3.4 Consent form in Chinese study .............................................................. 329
Appendix C. Interview record and questionnaires using in this thesis............ 331
C.1 The DISH study .......................................................................................... 332
C.1.1 UK HD patients ..................................................................................... 332
C.1.2 Chinese HD patients .............................................................................. 336
C.2 The QCKD study ........................................................................................ 337
C.2.1 UK HD patients ..................................................................................... 337
C.2.2 Chinese HD patients .............................................................................. 345
C.3 The COCO study ........................................................................................ 352
C.3.1 UK HD patients and healthy controls .................................................... 352
C.3.2 Chinese HD patients and healthy controls ............................................. 356

xi
List of Tables
Table1- 1Stage of chronic kidney disease by GFR and albuminuria categories......... 3
Table1- 2Risk factors for Chronic Kidney disease ..................................................... 5
Table2- 1Exclusion criteria for UK and Chinese HD patients in the DISH study .... 40
Table2- 2Outcome measures in the COCO study ..................................................... 46
Table2- 3Exclusion criteria for HD patients in the COCO study ............................. 48
Table2- 4Exclusion criteria for healthy controls in the COCO study ....................... 48
Table2- 5Calculation of the four-level Physical Activity Index (PAI) ...................... 54
Table3- 1Demographic characteristics of the UK HD patients in the DISH study .. 68
Table3- 2Nutritional blood parameters of the UK HD patients in the DISH study .. 69
Table3- 3Chinese HD patients’ demographic characteristics in the DISH study ..... 71
Table3- 4 Nutritional blood parameters of Chinese HD patients in the DISH study 72
Table3- 5 Comparison of demographic characteristics of HD patients between the UK
and China in the DISH study .................................................................................... 73
Table3- 6Comparison of nutritional blood parameters of HD patients between the UK
and China in the DISH study .................................................................................... 74
Table3- 7Demographics characteristics in the UK HD patients in the QCKD study75
Table3- 8Clinical information in the UK HD patients in the QCKD study .............. 76
Table3- 9Demographics characteristics in Chinese HD patients in the QCKD study
.................................................................................................................................. 77
Table3- 10Characteristics of clinical information in Chinese HD patients in the
QCKD study ............................................................................................................. 78
Table3- 11Comparison of demographics in the HD patients between the UK and
China in the QCKD study ......................................................................................... 79
Table3- 12Comparison of clinical information between the UK and Chinese HD
patients in the QCKD study ...................................................................................... 80
Table3- 13Demographic characteristics in the UK HD patients in the COCO study
.................................................................................................................................. 81

xii
Table3- 14Demographics characteristics in UK healthy controls in the COCO study
.................................................................................................................................. 83
Table3- 15Comparison of demographics between HD patients and healthy controls in
the UK in the COCO study ....................................................................................... 85
Table3- 16Demographic characteristics in Chinese HD patients in the COCO study
.................................................................................................................................. 87
Table3- 17Demographics characteristics in Chinese healthy controls in the COCO
study .......................................................................................................................... 88
Table3- 18 Comparison of demographics between the HD patients and Healthy
controls in China in the COCO study ....................................................................... 90
Table3- 19Comparison of demographics in HD patients between UK and China in the
COCO study .............................................................................................................. 92
Table4- 1HD patients’ energy and protein intake in the UK and China ................... 99
Table4- 2HD patients’ iron intake in the UK and China ......................................... 102
Table4- 3HD patients’ calcium intake in the UK and China .................................. 105
Table4- 4HD patients’ phosphate intake in the UK and China ............................... 108
Table4- 5HD patients’ potassium intake in the UK and China ............................... 111
Table4- 6HD patients’ sodium intake in the UK and China ................................... 114
Table4- 7HD patients’ vitamin C intake in the UK and China ............................... 117
Table4- 8HD patients’ vitamin C intake in the UK and China ............................... 119
Table5- 1Validation of the GPPAQ walking pace against gait speed obtained from the
SPPB in the UK HD patients .................................................................................. 137
Table5- 2Validation of the GPPAQ walking pace against gait speed obtained from the
SPPB in Chinese HD patients ................................................................................. 138
Table6- 1Correlations between the DASI score and continuous variables of
demographics and clinical information ................................................................... 146
Table6- 2 Distribution of walking pace in the UK HD patients ............................. 147
Table6- 3Correlation between walking speed and continuous variables of
demographics and clinical information ................................................................... 148

xiii
Table6- 4Comparison of physical function tests between HD patients and healthy
controls in the UK ................................................................................................... 149
Table6- 5Multiariable linear regression analysis for the comparison of the ISWT
between HD patients and healthy controls in the UK after controlling for age ...... 150
Table6- 6Multiariable linear regression analysis for the comparison of the ESWT
between HD patients and healthy controls in the UK after controlling for age ...... 150
Table6- 7Multiariable linear Regression analysis for the comparison of the STS60
between HD patients and healthy controls in the UK after controlling for age ...... 150
Table6- 8Correlations between the DASI score and continuous variables of
demographics and clinical information ................................................................... 152
Table6- 9the distribution of walking pace in Chinese HD patients ........................ 152
Table6- 10Correlation between walking speed and continuous variables of
demographics and clinical information ................................................................... 153
Table6- 11Comparison of physical performance tests between HD patients and
healthy controls in China ........................................................................................ 154
Table6- 12Multivariable linear regression analysis for the comparison of the DASI
between UK and Chinese HD patients after adjusting for age and gender ............. 156
Table6- 13 Multi-nominal logistic regression analysis for the comparison of walking
pace between the UK and Chinese HD patients adjusting for age and gender ....... 158
Table6- 14Comparison in physical performance tests between the UK and Chinese
HD patients ............................................................................................................. 159
Table6- 15Multiariable linear regression analysis for the ISWT between UK and
Chinese HD patients after adjusting for age and gender ........................................ 160
Table6- 16Multiariable linear regression analysis for the STS60 between UK and
Chinese HD patients after adjusting for age and gender ........................................ 160
Table6- 17Multiariable linear regression analysis for the SPPB between UK and
Chinese HD patients after adjusting for age and gender ........................................ 161
Table6- 18Multiariable linear regression analysis for the HGS between UK and
Chinese HD patients after adjusting for age and gender ........................................ 161

xiv
Table7- 1Distribution of Physical Activity Index in the UK HD patients .............. 172
Table7- 2The distribution of PAI in genders, ethnicities and smoking status in the UK
HD patients ............................................................................................................. 173
Table7- 3 Correlation between PAI category and continuous variables in the UK HD
patients .................................................................................................................... 174
Table7- 4LTEQ, HCS and percentage of patients that complete exercise ‘long enough
to work up a sweat’ in a typical week in UK HD patients ...................................... 175
Table7- 5Types of exercise completed by patients: number of patients reported and
percentages .............................................................................................................. 175
Table7- 6 Spearman’s rank correlation between LTEQ score and continuous variables
................................................................................................................................ 176
Table7- 7Comparison of PA level on between HD day and non-HD day in the UK HD
patients .................................................................................................................... 177
Table7- 8Multiariable linear regression analysis for the comparison of weekly MVPA
between HD patients and healthy controls after adjusting for age ......................... 178
Table7- 9the distribution of PAI in Chinese HD patients ....................................... 179
Table7- 10The distribution of PAI in genders and smoking status in Chinese HD
patients .................................................................................................................... 179
Table7- 11Spearman’s rank correlation between PAI category and continuous
variables .................................................................................................................. 180
Table7- 12The LTEQ, HCS categories and percentage of patients that complete
exercise ‘long enough to work up a sweat’ in a typical week in Chinese HD patients
................................................................................................................................ 181
Table7- 13Types of exercise completed by patients: number of patients reported and
percentages .............................................................................................................. 181
Table7- 14Spearman’s rank correlation between LTEQ score, demographics and
clinical information ................................................................................................. 182
Table7- 15Comparison of PA level on between HD day and non-HD day in Chinese
HD patients ............................................................................................................. 183

xv
Table7- 16Multi-nominal logistic regression Analysis for the comparison of the
GPPAQ .................................................................................................................... 187
Table7- 17Comparison of the total LTEQ score and HCS categories between UK and
Chinese HD patients ............................................................................................... 188
Table7- 18Multiariable linear regression Analysis for the comparison of the total
LTEQ score between UK and Chinese HD patients after adjusting for age and gender
................................................................................................................................ 189
Table7- 19Comparison of PA level between UK and Chinese HD patients ........... 190
Table8- 1Correlation between benefits and barriers scores, the DASI and LTEQ . 201
Table8- 2Correlation between benefits and barriers scores, the DASI and LTEQ . 204
Table8- 3Multivariable linear regression analysis for the comparison of perceived
benefits of exercise between UK and Chinese HD patients after adjusting for age and
gender ...................................................................................................................... 206
Table9- 1Impact scores for each of the renal symptoms in UK HD patients ......... 216
Table9- 2Correlational relationship between QoL (EQ5D-5L index value), physical
function (SWT, STS60, SPPB, and HGS) and PA level (Weekly MVPA) in UK HD
patients .................................................................................................................... 216
Table9- 3Correlational relationship between impact of renal symptoms, physical
function (SWT) and PA level (Weekly MVPA) in the UK HD patients ................. 217
Table9- 4Correlational relationship between body composition (LTI, FTI), physical
function (SWT, STS60, SPPB, HGS) and PA level (Weekly MVPA) in UK HD
patients .................................................................................................................... 218
Table9- 5Impact scores for each of the renal symptoms in Chinese HD patients .. 220
Table9- 6Correlational relationship between QoL (EQ5D-5L index value), physical
function (SWT, STS60, SPPB, HGS) and PA level (Weekly MVPA) in Chinese HD
patients .................................................................................................................... 220
Table9- 7Correlational relationship between impact of symptoms, physical function
(SWT) and physical activity level (Weekly MVPA) in Chinese HD patients ........ 221
Table9- 8Correlational relationship between body composition (LTI, FTI) and

xvi
physical function (SWT, STS60, SPPB, HGS) and physical activity level (Weekly
MVPA) in Chinese HD patients .............................................................................. 222
Table9- 9Multiariable linear regression analysis for the QoL between UK and Chinese
HD patients after adjusting for age and gender ...................................................... 223
Table9- 10Unadjusted and adjusted symptoms related to renal disease between UK
and Chinese HD patients ......................................................................................... 224
Table9- 11Comparison of percentage of low LTI and high FTI between the UK and
Chinese HD patients ............................................................................................... 225
Table9- 12Multiariable linear regression analysis for the FTI between UK and
Chinese HD patients after adjusting for age and gender ........................................ 226

xvii
List of Figures
Figure2- 1Flow diagram of the DISH study ............................................................. 37
Figure2- 2 Nutrient analysis of a 60g boiled egg in the Nutritics ............................. 39
Figure2- 3Nutrient analysis of a 60g boiled egg in the Nutrition calculator ............ 40
Figure2- 4Flowchart of recruitment process and included patients in the UK ......... 42
Figure2- 5Flowchart of recruitment process and included patients in China ........... 42
Figure2- 6Flow diagram of the QCKD study ........................................................... 45
Figure2- 7Flow diagram of the COCO study ........................................................... 47
Figure2- 8Flowchart of recruitment process and included HD patients in the UK .. 50
Figure2- 9Flowchart of recruitment process and included healthy controls in the UK
.................................................................................................................................. 50
Figure2- 10Flowchart of recruitment process and included HD patients in China .. 51
Figure2- 11Flowchart of recruitment process and included healthy controls in China
.................................................................................................................................. 52
Figure4- 1Comparison of energy intake on dialysis, non-dialysis and average day in
HD patients between the UK and China ................................................................. 100
Figure4- 2Comparison of protein intake on dialysis, non-dialysis and average day in
HD patients between the UK and China ................................................................. 101
Figure4- 3Comparison of iron intake on dialysis, non-dialysis and average day in
male HD patients between the UK and China ........................................................ 103
Figure4- 4Comparison of iron intake on dialysis, non-dialysis and average day in
female HD patients between the UK and China ..................................................... 104
Figure4- 5Comparison of calcium intake on dialysis, non-dialysis and average day in
HD patients between the UK and China ................................................................. 106
Figure4- 6Comparison of serum calcium concentration in HD patient from UK and
China ....................................................................................................................... 107
Figure4- 7Comparison of phosphorus intake on dialysis, non-dialysis and average day
in HD patients between the UK and China ............................................................. 109

xviii
Figure4- 8Comparison of serum phosphorus concentration in HD patient between the
UK and China ......................................................................................................... 110
Figure4- 9Comparison of potassium intake on dialysis, non-dialysis and average day
in HD patients between the UK and China ............................................................. 112
Figure4- 10Comparison of serum potassium concentration in HD patient from the UK
and China ................................................................................................................ 113
Figure4- 11Comparison of sodium intake on dialysis, non-dialysis and average day
in HD patients between the UK and China ............................................................. 115
Figure4- 12Comparison of serum sodium concentration in HD patient from the UK
and China ................................................................................................................ 116
Figure4- 13Comparison of vitamin C intake on dialysis, non-dialysis and average day
in HD patients between the UK and China ............................................................. 118
Figure4- 14Comparison of vitamin D intake on dialysis, non-dialysis and average day
in HD patients between the UK and China ............................................................. 120
Figure5- 1Linear regression showing DASI against the ISWT in UK HD patients
................................................................................................................................ 135
Figure5- 2Linear regression showing DASI against the ISWT in Chinese HD patients
................................................................................................................................ 135
Figure5- 3Linear regression showing DASI against the Endurance Shuttle Walking
Test (ESWT) in the UK HD patients ...................................................................... 136
Figure5- 4Linear regression showing DASI against the ESWT in Chinese HD patients
................................................................................................................................ 136
Figure6- 1Histogram of the frequency of the DASI scores .................................... 145
Figure6- 2Histogram of the frequency of DASI scores in Chinese HD patients .... 151
Figure6- 3Comparison in DASI score between UK and Chinese HD patients ...... 155
Figure6- 4Comparison of walking pace categories between the UK and Chinese HD
patients .................................................................................................................... 157
Figure7- 1Comparison of daily steps between HD patients and healthy controls in
China ....................................................................................................................... 184

xix
Figure7- 2Comparison of weekly MVPA between HD patients and healthy controls
in China ................................................................................................................... 185
Figure7- 3Comparison of the PAI categories between UK and Chinese HD patients
................................................................................................................................ 186
Figure8- 1The major benefits of exercise held by UK HD patients reported with
DPPEBBS ............................................................................................................... 200
Figure8- 2The major barriers to exercise held by UK HD patients reported with
DPPEBBS ............................................................................................................... 200
Figure8- 3The major benefits of exercise held by Chinese HD patients reported with
DPPEBBS ............................................................................................................... 202
Figure8- 4The major barriers to exercise held by Chinese HD patients reported with
DPPEBBS ............................................................................................................... 203
Figure8- 5Comparison in benefits score between UK and Chinese HD patients ... 205
Figure8- 6Comparison in barriers score between UK and Chinese HD patients ... 205
Figure9- 1Renal symptoms reported in a usual week by UK HD patients ............. 215
Figure9- 2Renal symptoms reported in a usual week by Chinese HD patients ...... 219
Figure9- 3Comparison of QoL (index value) between UK and Chinse HD patients
................................................................................................................................ 223
Figure9- 4Comparison of LTI between UK and Chinese HD patients ................... 225
Figure9- 5Comparison of FTI between UK and Chinese HD patients ................... 226
Figure10- 1schematic representation of the order of the studies presented in this thesis
................................................................................................................................ 235

xx
List of Key Abbreviations 6MWT 6 Minute Walk Test
ABI Ankle Brachial pressure Index
ACEI Angiotensin-Converting Enzyme Inhibitors
ADLs (ADL) Activities of Daily Living
ALP Alkaline Phosphatase
ARBs Angiotensin Receptor Blockers
AV arteriovenous
baPWV brachial-ankle Pulse Wave Velocity
BCM Body Composition Monitor
BFR Body Fat Rate
BIA Bioelectrical Impedance Analysis
BMI Body Mass Index
BNP B-type Natriuretic Peptide
CA-IMT Carotid Artery Intima-Media Thickness
CAVI Cardio-Ankle Vascular Index
CDC Centres for Disease Control and Prevention
CKD Chronic Kidney Disease
CMO Chief Medical Office
CNRDS Chinese National Renal Data System
CoFID Composition of Foods Integrated Dataset
COI Cardiac Output Index
COPD Chronic Obstructive Pulmonary Disease
CRF Chronic Renal Failure
CRP C-Reactive Protein
CSBP Chinese Society of Blood Purification
CVD Cardiovascular Disease
DASI Duke Activity Status Index
DMMS Dialysis Morbidity and Mortality Wave II Study
DOPPS Dialysis Outcomes and Practice Pattern Study
DPI Dietary Protein Intake
DPPEBBS Dialysis Patient-Perceived Exercise Benefits and
Barriers Scale

xxi
DXA Dual Energy X-Ray Absorptiometry
eGFR estimated Glomerular Filtration Rate (eGFR)
EBPG European Best Practice Guidelines
EE Energy Expenditure
EF Ejection Fraction
EQ-5D-5L The Euro QOL-5 Dimensions-5 Level
EQ-VAS EQ-Visual Analogue Scale
ESA Erythropoiesis Stimulating Agents
ESRD End Stage Renal Disease
ESWT Endurance Shuttle Walking Test
FFM Fat-Free Mass (FFM)
FM Fat Mass
FNIH Foundation for the National Institutes of Health
FTI Fat Tissue Index
GFR Glomerular Filtration Rate
GPPAQ GP physical activity questionnaire
HCS Health Contribution Score
HD Haemodialysis
HDL-C high-density-lipoprotein Cholesterol
Hgb Haemoglobin
HGS Handgrip Strength
HR Heart Rate
HRMs Heart Rate Monitors
HRQoL Health-Related Quality of Life
IDWG Interdialytic Weight Gain
IL-6 Interleukin 6
IQR Interquartile Range
ISWT Incremental Shuttle Walking Test
KDIGO Kidney Disease Improving Global Outcomes
KDQOL-SF Kidney Disease Quality of Life Short Form
KDQOL kidney disease quality of life questionnaire
LM Lean Mass
LTEQ Leisure Time Exercise Questionnaire
LTI Lean Tissue Index

xxii
LVM Left Ventricular Mass
MAC Mid-Arm Circumference
MAMC Mid-Arm-Muscle-Circumference
MEMS Microelectromechanical systems
METs Metabolic Equivalent of Task
MICS Malnutrition–Inflammation Complex Syndrome
MIS Malnutrition-Inflammation Score
MQSGA Modified Quantitative Subjective Global Assessment
MSSs Multi-Sensor Systems
MVPA Moderate to Vigorous Physical Activity
NHS National Health Service
NICE National Institute of Clinical Excellence
NKF National Kidney Foundation
nPCR normalised Protein Catabolic Rate
nPNA normalised Protein Nitrogen Appearance
NS Nutritional Status
NSI Nutrition Screening Initiative
OR Odds Ratios
PA Physical Activity
PAI Physical Activity Index
PCS Physical Component Scale
PD Peritoneal Dialysis
PEW Protein-Energy Wasting
POS-S Palliative Care Outcome Scale–Symptoms Renal
PRT Progressive Resistance Training
PTH Parathyroid Hormone
QOF Quality and Outcomes Framework
QoL Quality of Life
RCT Randomized Controlled Trial
RRT Renal Replacement Therapy
RS-ONS Renal-Specific Oral Nutrition Supplement
SD Standard Deviation
SE Standard Error
SFT Skin Fold Thickness

xxiii
SGA Subjective Global Assessment
SMM Skeletal Muscle Mass
SPPB Short Physical Performance Battery
SPSS Statistical Package of Social Sciences
STS Sit-to-Stand
STS5 Sit-to-Stand 5
STS60 Sit-to-Stand 60
SVI Stroke Volume Index
SWA Sensewear Armband
SWT Shuttle Walking Test
TAS Total Activity Score
TBF Total Body Fat
TCM Traditional Chinese Medicine
TIA Transient Ischemic Attack
TMA Thigh Muscle Mass
TSF Triceps Skinfold
TTM Transtheoretical Model
URR Urea Reduction Ratio
USRDS US Renal Data System
VPA Vigorous Physical Activity
VO2peak Peak Oxygen Consumption
VO2max Maximal Oxygen Uptake
WBLM Whole Body Lean Mass
WHO World Health Organization

1
Chapter 1
Introduction

2
1.1 Overview of Chronic kidney disease
The kidney is a critical organ with multiple functions which are imperative to life. It
mainly regulates water and electrolyte balance, eliminates metabolic waste products and
potentially harmful foreign substances, controls acid-base balance, maintains key
homeostasis components and releases hormones. Playing such a crucial role in
maintenance of our health and lives, any impairments of renal function can result in a
wide variety of complex and serious physical and psychological consequences.
Chronic Kidney Disease (CKD) is the term for a group of heterogeneous disorders
resulting in the progressive and irreversible decline in renal function, which is defined by
“kidney damage for ≥3 months based on findings of abnormal structure or function or
Glomerular Filtration Rate (GFR) <60ml/min/1.73m2 for >3 months with or without
evidence of kidney damage (Drawz, Rahman 2015)”. Kidney damage includes either
structural or functional abnormalities of the kidneys, such as albuminuria or proteinuria,
or urinary sediment abnormalities. Irrespective of various possible causes, the severity of
CKD can be classified into 5 stages depending on GFR and/or the presence of
albuminuria (National Kidney Foundation 2002, Levin, Stevens et al. 2013).
Stage 1 and 2 are regarded as mild CKD and require confirmation with evidence of kidney
damage. Stage 3 is further divided into 3a and 3b. The rationale of classification is that
3b is associated with multiple adverse outcomes including cardiovascular outcomes.
Patients with stage 1 to 3a (mild-to-moderate CKD) have no physical findings specific to
the decrease of kidney function and therefore they are commonly asymptomatic. A
diagnosis of CKD 3-5 can be diagnosed on GFR alone. Various symptoms, such as edema,
itchy skin, insomnia, muscle cramps, fatigue and so on frequently manifest in these stages
of CKD, which become apparent and prominent with progressively decreased kidney
function. Besides common symptoms, CKD was proved to be an independent risk factor
for Cardiovascular Disease (CVD), cognitive dysfunction and hospitalization. Metabolic
abnormalities, including anaemia, secondary hyperparathyroidism, and electrolyte
disturbances are complications of CKD as well (Drawz, Rahman 2015).

3
Table1- 1Stage of chronic kidney disease by GFR and albuminuria categories
Persistent Albuminuria Categories,
Description and Range
Normal to
mildly increased
Moderately
increased
Severely
increased
<30 mg/g
(<3mg/mmol)
30-300 mg/g
(3-30mg/mmol)
>300mg/g
(>30mg/mmol)
GF
R C
ate
go
ries
(mL
/min
/1.7
3 m
2)
Sta
ge,
Des
crip
tio
n,
an
d R
an
ge
1 Normal or high ≥90 1 if CKD 1 2
2 Mildly
decreased 60-89 1 if CKD 1 2
3a
Mildly to
moderately
decreased
45-59 1 2 3
3b
Moderately to
severely
decreased
30-44 2 3 3
4 Severely
decreased 15-29 3 3 4+
5 Kidney failure <15 4+ 4+ 4+
GFR and albuminuria categories inform the risk for progression. Green indicates low risk, yellow indicates
moderately increased risk, orange indicates high risk, and red indicated very high risk. The numbers in each
box are recommendations for the frequency of monitoring/year. (Levin, Stevens et al. 2013).
1.1.1 Incidence and prevalence
CKD is now recognized as a major and common public health problem worldwide. The
rise in the number of patients is threatening the healthcare system all over the world and
may reach epidemic proportions over the next decade (Bolignano, Lacquaniti et al. 2009).
According to the published investigation of Public Health England in 2014, the
prevalence of CKD in England was 6.1% with more than 2.62 million aged over 16
(Public Health England 2015). Up to September 2010, a cross-sectional survey of a
nationally representative sample of Chinese adults showed that the prevalence of CKD
in China was 10.8% with 119.5 million adults aged 18 years or older (Zhang, Wang et al.
2012). Although the prevalence of CKD in China estimated from the survey was similar
to that in developed countries such as the USA (13.0%) and Norway (10.2%) (Hallan,
Coresh et al. 2006, Coresh, Selvin et al. 2007), the prevalence of stage 3 and 4 of CKD
was lower compared to those of developed countries. Similarly, in contrast with the 1.6%
in prevalence of stage 3 CKD in China (Zhang, Wang et al. 2012), the 5.4% prevalence
in the UK stage 3 patients was relatively higher. Despite the fact that diabetes and

4
hypertension have increased remarkably in the past 15-20 years in China (Zhang, Wang
2009), the impact of these diseases on CKD might not be felt for another 10 years(Zhang,
Wang 2009). The consequence resulting from this phenomenon may lead to a
dramatically high rate of prevalence of CKD in China in the foreseeable future.
1.1.2 Causes and risk factors
Although the cause of CKD depends on patient’s demographics, such as race, age and
geographical area, in summary, the most common causes of CKD are diabetes and
hypertension all over the world. It was revealed that CKD patients entering End Stage
Renal Disease (ESRD) due to diabetes demonstrated a progressive increase over the past
decade. However, glomerulonephritis, cystic kidney disease and hypertension as causes
of ESRD remained relatively steady (Atkins 2005). The US Renal Data System (USRDS)
demonstrated that 44% of all incidence ESRD patients suffered from diabetes mellitus
(United States Renal Data System, (USRDS) 2008), which was similar to the situation
that existed in the UK (Gilg, Rao et al. 2013). Following diabetes, essential hypertension
and atherosclerotic renal vascular disease contribute to the most frequent causes of CKD
in the UK (Kumar, Bitla et al. 2012). In China, analysis of renal biopsy data showed that
the primary cause of CKD was glomerulonephritis, which was followed by diabetic
nephropathy and hypertension nephrosclerosis (Xie, Chen 2008). Besides the causes
associated with the incidence of CKD, it is crucial to identify risk factors which contribute
to the initiation and progression of CKD. These risk factors can be classified into
modifiable and non-modifiable categories, which cover susceptibility, initiation and
progression factors (EI Kossi, Bello et al. 2007). Improving lifestyle behaviours
involving living an active life, healthy diet, ceasing smoking, and avoiding drug abuse,
benefit a significant body of initiation and progression factors, so that it can prevent CKD
and alleviate the deterioration of kidney function impairment.

5
Table1- 2Risk factors for Chronic Kidney disease
Non-modifiable Modifiable
Old age (S) Systemic hypertension (I, P)
Male sex (S) Diabetes mellitus (I, P)
Race/ethnicity(S) Proteinuria (P)
Genetic disposition (S) Dyslipidaemia (I, P)
Family history(S) Smoking (I, P)
Low birth weight(S) Obesity (I, P)
Infections/infestations (I)
Drugs and herbs/analgesic abuse (I)
Autoimmune disease/obstructive uropathy/stones(I)
Low socio-economic status (S)
S, Susceptibility factor; I, Initiation factor; P, Progression factors
1.1.3 Overview of End Stage Renal Disease
When a patient’s GFR is less than 15ml/min/1.73m2, the patient develops ESRD, which
is serious, long-term chronic irreversible renal failure and requires Renal Replacement
Therapy (RRT) in the form of dialysis (haemodialysis [HD] and peritoneal dialysis [PD])
or a transplant to maintain life. Kidney transplantation is an important choice for ESRD
patients. It is associated with a lower risk of mortality, cardiovascular events and
improved Quality of Life (QoL) compared with dialysis (Tonelli, Wiebe et al. 2011).
However, the declining rate of organ donation combined with the increasing number of
ESRD cases have led to a significant challenge for patients and healthcare professionals
(Wolfe, Roys et al. 2010, USRDS 2008). Therefore, dialysis treatment is regarded as an
essential alternative to artificially fulfil the job of the kidneys. Research found that HD is
the most widely available form of dialysis with 65% of ESRD patients compared with
10% receiving PD, and the rest receive a transplant (Hall, Chertow 2007, Painter 2005).
Haemodialysis and Peritoneal dialysis
HD, the most common form in dialysis, usually involves thrice weekly treatments of
approximately four hours. Blood is circulated through a disposable dialyser, which
contains hollow fibres surrounded by a semi-permeable membrane. As blood moves
through these fibres it comes into contact with purified water with added electrolytes
(dialysate), which is circulated around the outside of the hollow tubes. Basically,
materials are exchanged between the blood and the dialysate and this occurs across the
semi-permeable membrane of the dialyzer. As a result, waste products and electrolytes
in the blood move from the blood side of the membrane into the dialysate solution,
resulting in adequate control of biochemistry, fluid overload, acidosis and uremic

6
symptoms in most patients. In PD, fluid is instilled into the peritoneal space, where it
remains for a period of time, to allow waste products to diffuse from the blood into the
fluid through the peritoneum as the dialysis membrane.
Nowadays, dialysis is estimated to be undertaken by more than 2 million people
worldwide (Magnard, Deschamps et al. 2013b), and it is predicated that the need for
dialysis will increase dramatically over the next 10 years due to a growing epidemic of
obesity and diabetes (Rao A, Casula A, Castledine C 2014). In 2014, the reported
incidence of ESRD in the UK and China were 115 (UK Renal Registry 2015) and 47 Per
Million of Population (PMP)(Chinese National Renal Data System 2015),
respectively. To date, current data indicates that there are 36,000 dialysis patients in the
UK, of which 27,000 receive HD(UK Renal Registry 2015). According to the survey
conducted by the Chinese Society of Blood Purification (CSBP) and the Chinese National
Renal Data System (CNRDS), there were 385, 000 HD cases by December 31, 2015 with
prevalence at 280 PMP, compared with 65,074 HD or PD patients at the end of 2007
(Zuo, Wang et al. 2010). These findings confirm the high prevalence of HD and predict
that taking care of HD patients will become an increasing burden on both families and
society in the UK and China.
Symptoms and Complications
Despite significant improvement in dialysis techniques and the progress in treatment of
co-morbidities, patients with ESRD still suffer from a wide variety of symptoms and
complications. Dialysis patients described that the symptoms they were struggling with
were up to an average of nine symptoms in one study (Yong, Kwok et al. 2009a). Also,
ESRD patients with severely damaged kidney function are associated with various
complications. Among them, atherosclerotic complications were certified to be the
leading cause of mortality in ESRD patients (Wanner, Krane et al. 2005, Amann, Buzello
et al. 2000, Burton, Jefferies et al. 2009, Levey, Beto et al. 1998). It has been reported
that over 50% all deaths on HD are due to problems related to CVD (Parfrey 2000,
Zoccali, Tripepi et al. 2005). The USRDS annual data reported the prevalence of cancer
and Chronic Obstructive Pulmonary Disease (COPD) in HD patients showed a notable
increment from 2004 to 2007(CollinsAJ 2012). A review in regard with the aging dialysis
populations revealed cognitive impairment is an occult burden for ESRD, as evidenced
by the fact that up to 70% of the cohort have moderate or severe cognitive impairment

7
(Murray 2008). Additionally, muscle wasting (Cigarrán, Pousa et al. 2013), anaemia
(Locatelli, Pisoni et al. 2004), systemic inflammation (Avesani, Carrero et al. 2006), poor
mental health (Palmer, Vecchio et al. 2013, Bautovich, Katz et al. 2014), and reduced
QoL (Dobsak, Homolka et al. 2012)all contribute to the numerous complications among
HD patients. In order to alleviate these symptoms or complications, some require daily
medication but many have to be managed rather than treated. Some symptoms can be
ameliorated by encouraging patients to increase regular physical activity (PA), such as
fatigue, dyspnea and sleep disturbance (Douglas, Murtagh et al. 2009, Cohen, Moss et al.
2006, Murtagh, Murphy et al. 2006, Murtagh, Addington-Hall et al. 2006, Critchley,
Plach et al. 2001). Similarly, some complications can be improved through careful dietary
control, fluid restriction and nutrition support (Almeras, Argiles 2009). Actually,
increasing studies showed that a sedentary lifestyle and an altered nutritional status (NS)
have been identified as major risk factors for adverse outcomes, which lead to a high risk
of morbidity and mortality in HD population(O'Hare, Tawney et al. 2003a, Lopes, Bragg-
Gresham et al. 2010). Therefore, improving a healthier lifestyle in HD patients, including
promoting NS, increasing PA/exercise level and physical functioning are important
integral parts of ESRD management.
1.2 Physical activity and exercise
PA and exercise have long been known to be a significant way of improving people’s
physiological and psychosocial health. C J Caspersen et al. defined PA as “any bodily
movement produced by the skeletal muscles that result in energy expenditure”, e.g.
walking upstairs and gardening. Exercise is a subtype of PA. It is characterized with more
specific and explicit plans and structures so as to obtain the improvement or maintenance
of health and fitness (Caspersen, Powell et al. 1985), such as jogging or cycling. Aerobic
and resistance exercise are two integral parts in an exercise program due to their different
physiological effect. Aerobic exercise refers to activities stimulating and strengthening
the heart and lungs, resulting in moving oxygen-rich blood throughout the body, and
keeping internal vital organs working efficiently (Sigal, Kenny 2010), such as walking or
jogging with continuous, repetitive movement of large muscle groups for at least 10
minutes at a time. Whereas resistance exercise refers to activities strengthening bones
and muscles, resulting in improving posture and providing the strength and endurance of

8
daily living activities (Sigal, Kenny 2010), such as weight lifting or work against a
resistance load.
1.2.1 Effects of physical activity and exercise in haemodialysis
A systematic analysis revealed that aerobic combined with resistance exercise were the
best way of advocating wellness for patients with CKD (Heiwe, Jacobson 2011).
Numerous studies have shown that exercise improves Peak Oxygen Consumption
(VO2peak) as well as Ejection Fraction(EF), left ventricular mass(LVM), Stroke Volume
Index(SVI) and Cardiac Output Index(COI) in HD patients (Johansen 2007, Deligiannis,
Kouidi et al. 1999, Toussaint, Polkinghorne et al. 2008a).
Muscle wasting has been confirmed as one of the most powerful independent indicators
of mortality in ESRD (Rhee, Kalantar-Zadeh 2014). The occurrence rate of skeletal
muscle wasting will increase with CKD progresses (Kovesdy, Kopple et al. 2013). An
exercise training rehabilitation programme(Kouidi, Iacovides et al. 1997)or both
moderate and vigorous PA (Morishita, Kubo et al. 2014), have both shown to markedly
improve skeletal muscle mass. One study of 16 weeks of resistance training significantly
increased neuromuscular function and muscle force development (Molsted, Andersen et
al. 2013).
It was estimated that around 25% of ESRD population suffer from depression(Ver, Cukor
et al. 2012). The symptoms of longstanding depression has a negative impact on sleep
quality, concentrating ability and activity level(Finkelstein, Wuerth et al. 2008), leading
to increased hospitalizations and mortality in HD (Hedayati, Bosworth et al. 2008).
Several studies of exercise in HD patients have suggested that participating in aerobic
exercise training may be beneficial in relieving levels of depressed mood and have a
positive impact upon other psychological problems such as anxiety (Mi Rye Suh, R N,
Hyuk Jung et al. 2002, Painter, Carlson et al. 2000b, Tentori, Elder et al. 2010).
Although the aetiology of systemic inflammation is too complex to be fully elucidated
(Cheema 2008), a growing number of studies revealed that it was inversely associated
with muscle mass and physical fitness (Church, Barlow et al. 2002, Rahimi, Secknus et
al. 2005, Albert, Glynn et al. 2004, Kaizu, Ohkawa et al. 2003a). Higher PA levels were
correlated with reduced amount of Interleukin 6 (IL-6), C-Reactive Protein (CRP) and
other pro-inflammatory markers(Baumgartner, Koehler et al. 1996, Bruunsgaard 2005),

9
all of which in circulating concentrations indicate the severity of systemic inflammation
(Kalantar-Zadeh 2007, Bruunsgaard 2005).
Obviously, the combined physiological and psychological effects of exercise have a
positive impact on QoL in HD population. Furthermore, studies assessed with a variety
of QoL questionnaires have been directly demonstrated that increased PA improved HD
patients’ QoL (Tentori, Elder et al. 2010, Mi Rye Suh, R N, Hyuk Jung et al. 2002). Mi
Rye Suh et al. reported that HD patients improved QoL secondary to 12 week of an
exercise program composed of bicycle ergometer, the treadmill or upper limb ergometer
(Mi Rye Suh, R N, Hyuk Jung et al. 2002).
A series of Goldberg’s studies have found the metabolic effects of exercise training
(Goldberg, Hagberg et al. 1980a, Goldberg, Geltman et al. 1983, Goldberg, Hagberg et
al. 1980b). Exercise can decrease triglycerides and increase high-density-lipoprotein
Cholesterol (HDL-C), which improve atherosclerotic heart disease. Additionally,
improvement of sleep quality, reduction in antihypertensive medications, and even
attenuated socio-economic indicators have also been demonstrated in several studies
elucidating the effect of exercise in HD patients (Tentori, Elder et al. 2010, Miller, Cress
et al. 2002, Yang, Xu et al. 2015).
1.2.2 Current situation of exercise or physical activity in haemodialysis patients
between the UK and China
Whilst the importance of motivating HD patients to exercise has attracted increased
attention from healthcare providers in developed countries worldwide, it is still unclear
how to incorporate exercises into their daily lives. Numerous studies have shown that
exercise levels among HD patients were lower than healthy (Sterky, Stegmayr 2005) or
even healthy sedentary controls (Johansen, Chertow et al. 2000a, Johansen, Sakkas et al.
2003). Activity levels continued to decline by up to 3.4% each month after initiation of
dialysis(Johansen, Kaysen et al. 2003). A study conducted in America showed that 59%
of HD patients reported no additional PA except for Activities of Daily Living (ADLs)
in a baseline investigation (Painter, Carlson et al. 2000c). Another survey regarding the
relationship between exercise and limitations in PA levels among HD patients
demonstrated that 56% of patients exercised less than once a week, 75% reported severe

10
limitations in vigorous activities, and 42% had severe limitations in moderate PA (Stack,
Murthy 2008b).
In the UK, although exercise was first introduced to HD patients decades ago, physical
inactivity is still a serious and highly prevalent issue. A study conducted with a total
activity score (TAS) highlighted the lack of PA in patients with kidney disease (Hayhurst,
Ahmed 2015). In particular, the study identified the HD patients as the most physically
inactive group compared with the other groups of CKD patients and healthy control.
There are few studies with regard to investigation about PA level in HD patients in China.
A cross-sectional survey using convenience sampling in North China found that 26.7%
HD participants were inactive and only 2.7% among them were active (Li, Li et al. 2010a).
Furthermore, their dominant types of PA were only transport-related walking and
household work. Despite that, studies regarding exercise intervention conducted with HD
patients remain inadequate. Apart from outpatient-based renal rehabilitation programs,
which were implemented only in a couple of kidney disease units, intra-dialytic exercise
is the most widely used exercise form on HD patients in the UK. Whilst recent efforts
have been offered on the quality and quantity of exercise interventions in HD patients,
clinical trials involving these interventions have limitations, such as small sample size,
no blinded controls, and lack of the understanding of participants’ exercise or PA level
(Macdonald, Marcora et al. 2005, Torkington, MacRae et al. 2006, Greenwood, Naish et
al. 2014b, Kirkman, Mullins et al. 2014). In China, only two studies in Hong Kong (Lo,
Lo et al. 1998) and Taiwan (Liu, Chung et al. 2015) evaluated the effectiveness of two
types of exercise for HD patients. There is only one study in Mainland China which
implemented individualized exercise during HD session, and results revealed that
exercise had improve the exercise capacity and QoL (Wu, He et al. 2014a).
1.2.3 Assessment of physical function in haemodialysis patients
Physical function refers to an individual’s ability to perform activities required in their
daily lives. It includes multiple determinants, such as exercise capacity (cardiorespiratory
fitness), strength, sensory function, clinical status, and environmental and behavioural
factors (Painter, Stewart et al. 1999, Stewart, Painter 1997). Obviously, it is considerably
difficult to cover all areas when assessing physical function. Therefore, the measurement
can be tailored according to specific population and the topics of specific interest. It can
be seen that the assessment of physical function mainly involves laboratory test, physical

11
performance tests and self-reported physical functioning questionnaires (Hlatky, Boineau
et al. 1989a).
Laboratory test
Physical function can be measured using laboratory tests of oxygen uptake during a
maximal exercise performed on incremental treadmill or cycle ergometer protocols
(Maximal Oxygen Uptake [VO2max]). However, with severe chronic disease, some
patients are unable to meet the criteria of VO2max. In such cases, the most commonly
used marker of physical function is VO2peak or symptom-limited VO2peak. The specific
test involves a gradually increasing velocity until the patient reaches physical exhaustion.
VO2peak is recorded when the highest VO2 is obtained during the last stage. Koufaki P
et al. confirmed that physical function measured by the VO2 was feasible and can be
safely performed with HD patients when considering specific cautions (Koufaki, Mercer
2006). However, this cardiopulmonary fitness test is not extensively implemented in HD
patients due to the costs of instruments and personnel.
Physical performance tests
Physical function is more frequently evaluated by effective but simple measures based
on physical performance. These objective measures cover different areas depending on
various specific characteristics of interest. Walking tests are for determining mobility,
including Shuttle Walking Test (SWT), 6 Minute Walk Test (6MWT) and gait speed tests.
Handgrip Strength (HGS) and Sit-to-Stand test (STS) are used to evaluate muscle power
or endurance of leg muscle, such as STS5, 10-STS and so on. A significant body of
studies assessed physical function by using various physical performance tests to evaluate
the effect of exercise interventions among HD patients (Painter, Carlson et al. 2000d,
Nonoyama, Brooks et al. 2010, Parsons, Toffelmire et al. 2006). Additionally, physical
performance tests play a crucial role in exploring the associated factors of physical
function as well, such as anaemia (Penninx, Pahor et al. 2004), L-carnitine (Wächter,
Vogt et al. 2002)and anabolic steroid (Johansen, Painter et al. 2006b).
Self-reported physical function questionnaires
Apart from objective measures, self-report questionnaires are the other optimum option
for assessing physical function with HD patients. The Kidney Disease Quality of Life
12
Questionnaire (KDQOL) was extensively used to obtain as much information as possible
on physical function in dialysis patients (Hays, Kallich et al. 1994). This questionnaire
comprises an eight-point scale, which includes 10 items of questions assessing abilities
to deal with the physical requirements of life, ranging from bathing or dressing to
vigorous activities (Ron D. Hays et al. 1997). There were evidence to support that the
low physical function level based on the poor Kidney Disease Quality of Life Short Form
(KDQOL-SF ™) scores was an independent and powerful predictor of adverse clinical
outcomes and high risk of mortality in HD patients (Mapes, Lopes et al. 2003).
Additionally, The Duke Activity Status Index (DASI) was widely utilized in renal disease
and regarded as a reliable measure of physical function in CKD patients, especially the
reliability is higher in estimated Glomerular Filtration Rate (eGFR) less than 35 ml/min
per 1.73m2 than eGFR≥35 ml/min per 1.73 m2 (Ravani, Kilb et al. 2012).
1.2.4 Physical activity measurement for haemodialysis patients
Increasing PA level have been documented as a behaviour strongly associated with
optimizing health and reducing morbidity and mortality in HD patients, which is
consistent with recommendations made by the NICE (The national institute of clinical
excellence, (NICE) 2015) and the Kidney Disease Improving Global Outcomes (KDIGO)
(Levin, Stevens et al. 2013)for HD patient. A comprehensive and explicit assessment of
PA is of fundamental importance in promoting HD patients to have an active lifestyle.
The assessment of PA’s dimensions (frequency, duration and intensity) over the past
week or month and domains (occupational, leisure time, domestic and transport) are the
main topics of interests of researchers when assessing PA. Generally, the measure tools
for assessing PA includes self-reported and direct measures, of those, questionnaires are
most frequently used in cross-sectional studies (Ainsworth, Cahalin et al. 2015), and
Multi-Sensor Systems (MSSs)were widely conducted in HD patients (Carvalho,
Reboredo et al. 2014b, Avesani, Trolonge et al. 2011b).
Self-report questionnaires
A number of questionnaires were used for assessing PA level in various health status
range (Armstrong, Bull 2006, Scarmeas, Luchsinger et al. 2009, Johansen, Painter et al.
2001). However, low test-retest reliability and validity and confining to the performance
of heavy intensity PA in questionnaires were usually documented in the previous

13
literatures (Jacobs, Ainsworth et al. 1993, Shephard 2003). The GP physical activity
questionnaire (GPPAQ) was usually chosen over other recognised PA questionnaires (G.
Godin, R J Shephard 1985) due to its applicability over a wide age and brevity. It was
developed for the routine check of cardiovascular health (NHS Health Check Program
Standards 2014) and 2013/14 Hypertension Quality and Outcomes Framework (QOF)
performance in the UK (Let’s Get Moving: Commissioning Guidance 2012).
The Leisure Time Exercise Questionnaire (LTEQ) was used for assessing the amount of
exercise undertaken with respondents who participate in exercise and identifying
preferred activities. Validity for the LTEQ was confirmed by the correlation with
VO2max(Godin, Shephard 1985). Meanwhile, the significant association of the LTEQ
with lengthier and more detailed exercise questionnaires also evidenced the validity of
the LTEQ (Goodman, Ballou 2004a).
Objective measures
Although there is no single gold-standard objective measure to assess PA, researchers
have a wide range of options according to their specific interests.
Pedometer
Pedometer is a hip-worn mechanical sensor identifying steps based on the force generated
from a typical heel-strike during ambulation. With the introduction of computer
techniques, accuracy of pedometer has enhanced by the Microelectromechanical systems
(MEMS). Apart from that, pedometer can also provide a valid estimation of PA intensity.
However, it is understood that the ankle is the most accurate placement for tracing steps
(Karabulut, Crouter et al. 2005). Hence, most pedometers with hip-worn fail to provide
accurate assessment for steps. In particular, the accuracy of pedometer would be lower
when participants’ steps were at slow gait speed (<2mhp) (Melanson, Knoll et al. 2004,
Crouter, Schneider et al. 2003). Apparently, the compromised accuracy may restrict
pedometer’s utilization in HD patients with relatively slower walking speed than general
population.

14
Accelerometer
Accelerometer is a small wearable monitor recording acceleration on planes at sampling
rates >1time/second. Captured accelerations are then processed and calibrated to a
known standard PA measure, such as doubly-labelled water (DLW), relying on a
unitless intensity metric or ‘‘counts’’. The doubly labelled water method is viewed as
gold standard for the assessment of total energy expenditure (TEE) (Butler, Green et al.
2004). It uses stable isotopes of hydrogen and oxygen to trace the flow of water and
carbon dioxide production through the body during the interval between first and last
body water samples (Ainslie, Reilly et al.2003). A single estimate of the rate of oxygen
consumption can be derived from these data. When combined with a measure of resting
metabolic rate, The DLW can calculate activity-related energy expenditure.
Accelerometer provides Metabolic Equivalent of Task(METs) thresholds to summarize
data to output the duration and frequency of PA into sedentary, light, moderate and
strenuous intensities (Ainsworth, Cahalin et al. 2015). Apparently, accelerometer is
capable of monitoring the dimension of PA, involving the frequency, duration, intensity
of activities. Furthermore, the appeal of accelerometer is that it can measure PA with a
detailed and relatively precise manner. Nowadays, triaxial accelerometer measuring
acceleration on three planes provides more sensitive and precise PA due to a more
comprehensive assessment of body movement than uniaxial devices. Additionally,
triaxial accelerometer is capable of quantifying movement patterns during walking
because it includes vertical and anterior-posterior accelerations for measuring step
frequency and mediolateral accelerations for detecting specific gait-related movement
(Kavanagh, Menz 2008). However, accelerometer is unable to detect non-ambulatory
activities, such as weight-lifting and cycling. The reason is the limited accuracy of EE
measurements with accelerometers (Matthew 2005). It only measures a single modality
of PA and attempt to correct it with EE. Whereas, non-ambulatory activities do not
involve a single modality. Additionally, lack of sensitivity for detecting sedentary and
light intensity activities is a drawback of accelerometer as well (Butte, Ekelund et al.
2012).
Multi-sensor systems
Multi-sensor systems (MSSs) are a combination of physiological measure and
mechanical sensor. It can provide precise and accurate assessment of PA level. Different

15
MSSs include different parameters, involving accelerometer, galvanic skin response, HR,
respiration and skin or core temperature. MSSs have potential precision in measuring
non-ambulatory activities because the results may come from triangulating EE estimates
derived from multiple sensors (Ainsworth, Cahalin et al. 2015). While they are valid in
healthy population (Rowlands, Thomas et al. 2004) and chronic diseases (Van Remoortel,
Raste et al. 2012, Van Remoortel, Giavedoni et al. 2012), MSSs also have been widely
adopted in the studies with kidney transplant recipients (Carvalho, Reboredo et al. 2014a)
and HD patients (Carvalho, Reboredo et al. 2014a, Avesani, Trolonge et al. 2011a,
Gomes, Reboredo et al. 2015). MSSs presented the results by measuring numbers of steps,
time spent on difference activities (lying, sitting, standing and walking), and activities
intensity. Compared to questionnaires, pedometers and other monitors that measure PA
through arbitrary units or estimated EE, MSSs showed higher accuracy and less
variability (Van Remoortel, Raste et al. 2012).
1.3 Nutritional status in haemodialysis
1.3.1 Prevalence causes and potential comorbidities of malnutrition in
haemodialysis patients
Malnutrition is a common problem involving 40-50% of ESRD patients (Basaleem,
Alwan et al. 2004), with the estimated prevalence of 18-75% in HD patients (Leinig,
Moraes et al. 2011). 37% of 122 HD patients in Spain had evidence of malnutrition at
baseline assessment, 40.5% at 12 months and 41.4% at 24 months (Gracia-Iguacel,
González-Parra et al. 2013). An NS investigation in Yemen with 50 HD patients showed
that 70% of patients were moderately malnourished and severe malnutrition accounted
for 20% (Basaleem, Alwan et al. 2004).
The causes of malnutrition are various, including inadequate dietary intake due to loss of
appetite, gastrointestinal disturbances and anorexia, dialysis treatment, defective food
assimilation and utilization occurring as a result of hypercatabolism, concomitant
diseases namely systemic inflammation(Locatelli, Fouque et al. 2002a), sepsis, and CVD
(Laville, Fouque 2000).
Malnutrition leads to systemic inflammation (Stenvinkel, Heimbürger et al. 2000),
muscle wasting (Basaleem, Alwan et al. 2004), highly prevalence for hospitalization
(Steiber, Handu et al. 2003), poor QoL and fatigue (Laws, Tapsell et al. 2000b), and

16
eventually causes increased mortality risk in HD patients. Nutritional parameters,
including body mass index (BMI), Subjective Global Assessment (SGA) and serum
albumin levels were assessed with 167 HD patients at the dialysis initiation. It was shown
that reduced serum albumin (P=0.01) and malnutrition scores (P=0.02) independently
predicted mortality after a ten-year of follow-up (Chan, Kelly et al. 2012). Radojica V.
Stolic et al. examined BMI, treatment outcomes and biochemical parameters over a 4-
year period to evaluate HD patients’ metabolic syndrome and NS. The results revealed
that more than two thirds of the malnourished patients who accounted for 26.7% of the
examined participants died, which indicated that there was an inverse association
between malnutrition and survival rate (Stolic, Trajkovic et al. 2010).
1.3.2 Nutritional blood parameters in haemodialysis patients
Haemoglobin and serum ferritin
Anaemia is a common symptom in CKD patients with a high risk of adverse outcomes
associated with increased morbidity and mortality. The primary aetiology of anaemia is
the inadequate erythropoietin to support erythropoiesis due to kidney function
impairment. Apart from diminished erythropoietin, the other multifactorial contributors
are iron, folate and vitamin B12 deficiency, decreased red blood cell lifespan,
hyperparathyroidism, inflammation, hypothyroidism and ‘uremic environment’ (US
Recombinant Human Erythropoietin Predialysis Study Group 1991, Hsu, McCulloch et
al. 2002, Eschbach, Adamson 1985, Kaze, Kengne et al. 2015). These factors contributed
in part to the consequence that the prevalence of anaemia increased as CKD patients’
GFR declined. A number of prior studies revealed that the prevalence of anaemia in
ESRD or HD patients could up to almost 100% (Afshar, Sanavi et al. 2010, Suega, Bakta
et al. 2005, Astor, Muntner et al. 2002, McClellan, Aronoff et al. 2004).
Based on the latest renal data report, 20% of the UK HD patients had Hgb ≥ 12g/dl, while
59% had Hgb from 10 to 12 g/dl (UK Renal Registry 2016). The mean Hgb was 11.0g/dl
in the UK HD patients. Improvement in prevention and management of anaemia has been
observed in developed countries (Kaze, Kengne et al. 2015). However, the prohibitive
cost of Erythropoiesis Stimulating Agents (ESA), which are administered by 19~40%
patients with CKD (Covic, Nistor et al. 2014) to treat anaemia, may interfere patients
from developing countries with limited healthcare resource to afford them (Afshar,

17
Sanavi et al. 2010, Suega, Bakta et al. 2005). Although 19.7% of Chinese HD patients
had Hgb ≥ 12g/dl, only 35.8% had Hgb from 10 to 12g/dl, which was much lower than
the proportionate in UK patients. Furthermore, the mean Hgb of Chinese HD patients was
only 10.1 g/dl(Chinese National Renal Data System 2015).
Serum ferritin concentration is a critical and most commonly used marker playing a role
in predicting iron status in HD patients (Kalantar-Zadeh, Rodriguez et al. 2004). In
accordance with anaemia guidelines, intravenous iron is necessary to administer regularly
to HD patients in order to maintain ferritin between 100 to 800ng/ml (National Kidney
Foundation anemia working group 2001). Following the USRDS report in May 2016
(United States Renal Data System, USRDS 2017), 31.6% and 21.9% of American HD
patients had serum ferritin of 801~1200 ng/ml and >1200ng/ml, respectively. The
percentages with serum ferritin of ≥100μg/l (equals to ng/ml) and ≥800μg/l in UK HD
patients were demonstrated by centres based on the UK Renal Registry 19th Annual
Report in 2015 (UK Renal Registry 2016). It showed that 94% of the overall UK HD
patients had serum ferritin ≥100μg/l, with the median of 415μg/l. It is understood that the
CNRDS did not cover the investigation or collection of serum ferritin with Chinese HD
patients. According to the finding of a study exploring the associated factors of
cardiovascular morbidity in Chinese HD patients, the median of the serum ferritin in 1775
patients only approached 284.1 ng/ml, which was much lower than 415μg/l in the UK
HD patients (Hou, Jiang et al. 2012).
Serum calcium and phosphate
As predictors of the mineral metabolism disorders, serum calcium and phosphate
management are playing an important role in decreasing vascular calcification risk,
comorbidities and mortality in HD patients (Massry, Coburn et al. 2003, Block, Klassen
et al. 2004, Young, Albert et al. 2005, An, Kim et al. 2009). 560 HD patients were
followed up for 9 years to evaluate survival rates and predictors of mortality. The adjusted
time-dependent model revealed that hypocalcaemia, hypercalcemia and
hyperphosphatemia were all significantly associated with death (Ossareh, Farrokhi et al.
2016). A study involving 119,010 American HD patients confirmed that uncorrected
serum calcium <8.5 and ≥10.2mg/dl were associated with excess mortality in HD patients
(Rivara, Ravel et al. 2015). The recommended target range of serum calcium is 2.2-
2.5mmol/l (8.8-10.2mg/dl) for HD patients by the NICE (Steddon, Sharples 2011). 79.3%

18
of the UK HD patients were within the normal range and only 10.6% of patients had
calcium levels less than 2.2mmol/l according to the UK Renal Registry 19th Annual report
(UK Renal Registry 2016). However, 49.8% of Chinese HD patients in 2014 had calcium
with 2.2-2.5mmol/l. The proportion of hypocalcaemia patients in the Chinese HD patients
was up to 36.0% (Chinese National Renal Data System 2015).
Except for being an influencing factor of mineral bone disease, serum phosphate predicts
the NS of HD patients as well due to the strong correlation with protein intake (Block,
Klassen et al. 2004). Hyperphosphatemia is a common biochemical abnormality in HD
population and leads to higher cardiovascular morbidity and mortality (Alfrey 2004,
Kendrick, Chonchol 2011). It is due to the decline of kidney function, the reduced
clearance of phosphate during dialysis (Al-Hejaili, Kortas et al. 2003, Kooienga 2007,
Gutzwiller, Schneditz et al. 2003), poor compliance with dietary instructions (Kalantar-
Zadeh 2007, Uribarri 2007, Pollock, Jaffery 2007, Poduval, Wolgemuth et al. 2003), and
lack of knowledge about foods rich in phosphate(Sherman 2009, Tentori 2008, Wald
2008).The study with 119,010 U.S. HD patients revealed that patients with serum
phosphate ≥6.4mg/dl had the increased mortality risk (Rivara, Ravel et al. 2015). On the
basis of 2017 USRDS annual report (United States Renal Data System, USRDS 2017),
65.9% HD patients had serum phosphate levels greater than 4.5mg/dl (1.5mmol/l). It is
not comparable in serum phosphate between the U.S. and UK HD patients, since these
two renal data system adopt different audit standard for phosphate with 0.8~1.5mmol/l
(United States Renal Data System, USRDS 2017) and1.1~1.7mmol/l(UK Renal Registry
2016), respectively. However, UK HD patients seemed to appear lower proportionate of
HD patients who were beyond the Renal Association (RA) audit standard (≥1.7mmol/l)
with 35.9% than U.S. HD cohorts. Additionally, Chinese HD patients had worse control
of serum phosphate than their UK counterparts. 54.5% of Chinese HD patients had a
serum phosphate above the standard (≥1.7mmol/l) based on the CNRDS report (Chinese
National Renal Data System 2015).
Serum potassium
Controlling hyperkalaemia is an ever-present challenge in ESRD patients (Lin, Tu et al.
2013). The causes of hyperkalaemia are associated with poor compliance with low
potassium diet, the use of Angiotensin-Converting Enzyme Inhibitors (ACEI),
Angiotensin Receptor Blockers (ARBs), spironolactone and the unavailability

19
fludrocortisone and potassium binders (Sanghavi, Whiting et al. 2013). Hyperkalaemia
can result in weak and paralyzed skeletal muscles, reduced conduction velocity and
accelerated repolarization (Ahmed, Weisberg 2001), which may lead to the reduced
physical function, disability and fatigue in dialysis patients. Importantly, all-cause
mortality is also associated with hyperkalaemia. The normal range of serum potassium is
3.5-5.5mEq/L. A 3-year study with 81,013 HD patients showed that serum potassium
between 4.6 and 5.3mEq/L indicated the greatest survival, whereas <4.0 or ≥5.6mEq/L
was associated with the higher mortality risk (Kovesdy, Regidor et al. 2007). The
distribution of serum potassium concentration in overall HD patients of each country was
not showed in the USRDS, UKRR or CNRDS reports. The UKRR in 2015 hoped to
obtain complete potassium data for analysis in the next report. In the Dialysis Outcomes
and Practice Pattern Study (DOPPS), HD nutritional indicators were evaluated across
France, Germany, Italy, Spain and the UK. Overall, the percentage of HD patients with
hyperkalaemia of ≥ 6.0mmol/l was almost 20%. 10% of UK HD patients suffered from
hyperkalaemia, which had the lowest proportionate among these five countries (Hecking,
Bragg-Gresham et al. 2004). It is understood that there was few studies pertaining to the
investigation of serum potassium concentration in Chinese HD population except for82
urgent-start HD patients showing their mean serum potassium with 4.3±0.8 mmol/L (Jin,
Fang et al. 2016).
Serum sodium
Net sodium balance for HD patients dependents on the concentration gradient between
the serum and dialysate sodium (Lambie, Taal et al. 2005). Although a higher dialysate
sodium concentration was widely used in the U.S. for reducing intra-dialytic hypotension
and dialysis-related complications, the consensus regarding the optimal dialysate sodium
concentration has not been reached (Flanigan 2000). Therefore, ample studies have being
focused on exploring the relationship between dialysate sodium and pre-dialysis serum
sodium concentration, and giving insight into the importance of understanding pre-
dialysis serum sodium concentration (Hecking, Karaboyas et al. 2012, Mc Causland,
Brunelli et al. 2011, Jung, Lee et al. 2013). In the DOPPS involving 11,555 HD patients
from 12 countries, mean serum sodium level of the overall patients was 138.5 ± 2.8
mEq/L. Mean serum sodium concentration was 138.5 ± 2.8mEq/L in the UK, which
happened to be in line with the average level in the 12 countries(Hecking, Karaboyas et

20
al. 2012). A study was conducted to compare the left ventricular hypertrophy between
HD and PD in Chinese patients. The result showed that the mean serum sodium
concentration was 137.1± 1.6mEq/L.
The DOPPS (Hecking, Karaboyas et al. 2012) and Hemodialysis (HEMO) (Waikar,
Brunelli 2011) showed an unexpected finding that the lower mortality risk was observed
in HD patients with higher serum sodium concentrations. The DOPPS even extended the
finding to a larger and international data set. More interestingly, the lowest mortality was
associated with HD patients, when their serum sodium concentration was more than
142mEq/L. The risk with higher serum sodium did not start until the concentration was
more than 145mEq/L. Hyponatremia itself in the HD patients with the unique physiology
may be a predictor of mortality. Additionally, sodium and caloric intake are highly
correlated (Alderman, Cohen et al. 1998). The finding above was not beyond the normal
serum sodium range of 135-145mEq/L. Given all the USRDS, UKRR or CNRDS did not
report the distribution of serum sodium concentration in overall HD patients of the
corresponding countries, the relationship of serum sodium level and survival in HD
patients needs to be further explored in future study. Virtually, a significant body of
studies showed that dietary sodium intake was associated with Interdialytic Weight Gain
(IDWG), the pathogenesis of hypertension and hypervolemia, and left ventricular
hypertrophy (Kayikcioglu, Tumuklu et al. 2008, Ozkahya, Ok et al. 2006, Maduell,
Navarro 2001). A large scale and prospective trial with detailed dietary assessments
unrevealed that higher dietary sodium intake was independently correlated with greater
risk of mortality (Mc, Waikar et al. 2012).
Serum vitamin C
The low levels of vitamin C in HD patients were associated with anaemia due to the
negative influence on iron and red cell, bone and mineral metabolism causing from the
inverse correlation with both PTH and Alkaline Phosphatase (ALP) levels, inflammation
and oxidative stress (Fumeron, Nguyen-Khoa et al. 2005a, Locatelli, Canaud et al. 2003).
These comorbidities corroborated the evidence that patients with lower plasma vitamin
C levels in HD patients suffered from shorter survival time. Vitamin C deficiency in HD
patients was highly prevalent. A study found that 66% of U.S. HD participants suffered
from vitamin C deficiency and 15% with severe vitamin C deficiency (Richter, Kuhlmann

21
et al. 2008a). As to Chinese HD patients, the proportionate of severe vitamin C deficiency
was up to 35.9% (Zhang, Dong et al. 2012).
Vitamin C deficiency arise from a range of potential causes (Raimann, Levin et al. 2013).
Inadequate dietary Intake and increased need of vitamin C for optimal health due to
dialytic vitamin C removal are some of HD specific issues. Apart from nausea, poor
appetite impacting on inadequate vitamin C intake, restriction of potassium-fortified food,
such as vegetable and fruits, are the main reason of hindering vitamin C intake in HD
patients. Virtually, it is still controversial with the vitamin C intake recommendation for
HD patients. The concern raises due to the potential oxalate toxicity causing from high
doses of vitamin C. The KDOQI guidelines declared that there was no substantial
evidence to support the use of vitamin C in prevention of anaemia in CKD patients
(KDOQI, National Kidney Foundation. 2006). No more than 100 mg/day is the
recommendation for HD patients (Brenner 2008). However, in light of the aetiology of
diet restriction and loss of vitamin C through dialysis, a consensus has been reached that
supplementary vitamin C is requires. The EBPG guideline (Fouque, Vennegoor et al.
2007b) on nutrition developed a more precise recommendation that a daily allowance of
75-90mg is required for HD patients.
Serum vitamin D
Vitamin D is an important fat-soluble vitamin playing critical role in regulating serum
calcium and phosphate concentration, bone mineralization and suppressing PTH (DeLuca
2004). Generally, the stage of serum vitamin D status can be classified into deficiency,
insufficiency, hypovitaminosis, adequacy, and toxicity (Zittermann 2006). Among these
categories, deficiency and insufficiency were defined as 25(OH) D concentrations with
0-25nmol/l and 25-50nmol/l, respectively. Limited sun exposure, increased age,
premature birth, obesity and insufficient dietary intake are some of causes that lead to
deficiency and insufficiency of vitamin D (Sadlier, Magee 2007, Zittermann 2003).
Vitamin D deficiency is highly prevalent in HD patients (Fiedler, Dorligjav et al. 2011).
In a cross-sectional study with large HD cohort conducted in the U.S., up to 96.6%
patients was found to have vitamin D insufficiency and deficiency (Krassilnikova,
Ostrow et al. 2014). High prevalence with deficiency and insufficiency of vitamin D also
occurred in the UK HD patients. Even though a clinical guideline for cholecalciferol
supplementation was implemented with patients in the UK, only 5% of patients had

22
optimal levels of vitamin D. 65% and 30% of patients were found to suffer from deficient
and insufficient serum vitamin D (Huish, Fletcher et al. 2016). In a study exploring the
serum 25 (OH) D level and its influencing factors with Chinese HD patients, the
prevalence of vitamin D deficiency and insufficiency was 88.9% (Zhang, Shen et al.
2012). A significant body of studies identified the association between low vitamin D
level and CVD, coronary artery calcification and bone fractures in HD patients
(Souberbielle, Body et al. 2010, Goodman, Goldin et al. 2000, Drechsler, Pilz et al. 2010,
Wolf, Shah et al. 2007), which negatively influenced patients’ health and survival rate
(Nigwekar, Bhan et al. 2012). Reduced sunlight exposure (Clayton, Singer 2009, Korkor,
Bretzmann et al. 2009), nutritional intake (Korkor, Bretzmann et al. 2009)and synthesis
of cholecalciferol in the skin (Michaud, Naud et al. 2010) might be popular explanations
of vitamin D deficiency and insufficiency specific to HD patients. It is lack of evidence
discriminating the vitamin D source from between diet and sun exposure. However, a
study conducted in Brisbane found that even in a sunny climate, vitamin D deficiency
was still a common outcome in the majority of HD patients. A study showed that there
was a strong association between dietary intake and serum vitamin D [25(OH) D] in HD
patients (Sadlier, Magee 2007).
1.3.3 Nutritional status in haemodialysis between the UK and China
A high prevalence of malnutrition was found in the HD patients who were assessed by
clinical, anthropometric and biochemical parameters relevant to NS in the UK(Huidobro,
Velasco et al. 2001). No nutritional improvements occurred as dialysis was ongoing or
there was no difference in nutritional markers between patients with less and more than
12 months in dialysis (Huidobro, Velasco et al. 2001).Albumin was reported with the
lowest level in the UK among five European countries in the Dialysis Outcomes and
Practice Patterns Study (DOPPS). Some other parameters suggested as crucial measures
of NS by the Clinical Practice Guidelines for Nutrition in Chronic Renal Failure (CRF),
such as serum creatinine and normalised Protein Catabolic Rate (nPCR), also did not
show significant higher levels than those in the other countries. Even the highest
frequency of severe malnutrition was observed in the UK among these five countries
(Combe, McCullough et al. 2004a).
In China, 7.4% of the global HD population (Chen, Peng et al. 2013a) has around 10%
mortality rate (Cheng, Nayyar et al. 2013), which was partly attributed to high

23
malnutrition. A cross-sectional study with 75 HD patients from South China was
conducted to evaluate the NS of patients. The findings showed that 68% of patients were
reported as malnourished and 8% had severe malnutrition, based on the Malnutrition-
Inflammation Score (MIS) (Chen, Peng et al. 2013b). It may imply that malnutrition was
prevalent in HD patients in South China. South China is one of the wealthiest districts in
China. It can be presumed that the NS in the other areas of China is similar to South
China, or even worse.
1.3.4 Assessment of nutritional status in haemodialysis patients
Effective assessment of NS for HD patients is required to thoroughly understand NS.
Combining the EBPG (Fouque, Vennegoor et al. 2007b) with the KDIGO
recommendations (Levin, Stevens et al. 2013), the assessment of NS in HD patients
mainly includes a panel of anthropometrics and biochemical measures.
Serum albumin
Serum albumin is recommended to be performed monthly in all HD patients as a crucial
measurement of NS (Fouque, Vennegoor et al. 2007a). Although serum albumin levels
are inversely influenced by acute-phase proteins, such as acute or chronic inflammation
and infection, it is still viewed as an inexpensive, easy to perform and widely available
measurement showing the robust correlation with NS, and high prediction in mortality
risk. The outcome goal of serum albumin equals to or greater than 4.0g/dl (measured with
the bromcresol green method). Serum albumin concentrations below 4.0g/dl predicated
an increased risk of death (Lowrie, Lew 1990). A study showed that in keeping with
serum albumin levels of 3.5 to 3.9 g/dl, the odd rates rise to 1.48, with levels of 3.0 to
3.4g/dl, the odd rate was 3.13(Biancari, Kantonen et al. 2002).
Serum cholesterol
Serum cholesterol concentration of <1.5g/l predicted increased mortality risk, which
appears in conflict with the conventional notion that hypercholesterolemia is a risk factor
for cardiovascular mortality. However, studies showed that hypocholesterolaemia is
highly associated with Malnutrition–Inflammation Complex Syndrome (MICS), which
is viewed as the main cause of cardiovascular atherosclerotic disease, hypo-
responsiveness and increased mortality risk in HD patients (Kalantar-Zadeh, Kilpatrick

24
et al. 2005). Increased cholesterol concentration appeared to be protective and
paradoxically associated with a better outcome (Axelsson, Rashid Qureshi et al.
2004).The paradox is likely due to the cholesterol lowering effect of systemic
inflammation and malnutrition. Therefore, evaluating serum cholesterol level is
considered as a valid measurement of protein-energy NS in HD patients by guidelines
(Fouque, Vennegoor et al. 2007a, Levin, Stevens et al. 2013). Actually, extended
literature documented that the relationship between serum cholesterol and cardiovascular
mortality demonstrated as ‘U-shaped curve phenomenon’ in HD patients (Iseki,
Yamazato et al. 2002, Liu, Coresh et al. 2004c, Moradi, Streja et al. 2014), which was
described that the risk for mortality increases as serum cholesterol falls below
approximately 1.5g/l or rises about 2-3g/l (Fouque, Vennegoor et al. 2007b). In a
Japanese study, the lower serum cholesterol concentration indicated the higher mortality
in patients with low serum albumin, another marker of inflammation and malnutrition as
described above. However, the higher cholesterol level was associated with higher
mortality when serum albumin levels beyond 4.5 g/dl(Iseki, Yamazato et al. 2002).
Similar results were found out in another study, a positive association was demonstrated
between serum cholesterol concentration with overall and CVD mortality in the absence
of inflammation/malnutrition (Liu, Coresh et al. 2004c).
Body composition measurements: anthropometric parameters, Bioelectrical
Impedance Analysis (BIA) and Dual Energy X-Ray Absorptiometry (DXA)
Four-site skin fold thickness (SFT), mid-arm circumference (MAC), Mid-Arm-Muscle-
Circumference (MAMC) and BMI, are anthropometric screening methods, which are cost
effective and reliable to NS assessment for HD patients. SFT, including triceps, biceps,
sub-scapular and ileac crest, is used to estimate body fat. MAC and MAMC provided an
assessment of muscle mass. These parameters are recommended to be measured when
patients star undergoing HD (Fouque, Vennegoor et al. 2007b). Accumulating evidence
(Oe, Oe et al. 1998, Torun, Micozkadioglu et al. 2007) suggested that skinfold thickness
measurement was still very useful for assessing body fat on HD therapy, although some
other technical tools were reported to be more sensitive than it (Oe, Oe et al. 1998).A
study with 90 HD patients indicated that the mean body fat obtained by skinfold
thickness (13.5±6.2kg) and BIA (13.7±6.7kg)were similar, and the strongest interclass
correlation was found between these two measurement tools (r=0.87) (Kamimura, Dos

25
Santos, Nelma Scheyla José et al. 2003). Additionally, Su CT found the significant
association between declines in MAC with all-cause mortality and cardiac outcomes
through the HEMO study with 1846 HD patients (Su, Yabes et al. 2013).
BMI is a simple, quick and convenient measure of evaluating body composition and
malnutrition for HD patients, which is powerful to predict poor clinical outcomes. Low
BMI in HD patients is associated with the high risk of co-morbidity and poor prognosis.
Inversely, high BMI is regarded as protective as documented in some studies (Johansen,
Young et al. 2004a, Kalantar-Zadeh, Abbott et al. 2005). However, the drawback of BMI
is that it is impossible to differentiate between FM and Lean Mass (LM). Thus,
researchers are confronted with challenge of distinguishing which components of body
composition plays the role in the improvement of survival rate. little consensus has been
reached on the relationship between specific BMI thresholds and obesity in a variety of
studies (Abbott, Glanton et al. 2004, Xue, Dahl et al. 2003, Rodrigues, Santin et al. 2015).
Juliana R. tested the specificity and sensitivity of BMI thresholds using skinfold thickness
and waist circumference as reference (Rodrigues, Santin et al. 2015). The findings
showed that BMI thresholds used for diagnosing adiposity by World Health Organization
(WHO) and Nutrition Screening Initiative (NSI) were not suitable for elderly on HD,
which may lead to the misclassification of BMI in this population (Rodrigues, Santin et
al. 2015). The USRDS Dialysis Morbidity and Mortality Wave II Study (DMMS) (Abbott,
Glanton et al. 2004)reported the relationship between 4 quartiles of BMI and 5-year
survival with 1675 HD patients. The results showed that HD patients in the <21.9 quartile
of BMI appeared to the worst survival. Conversely, patients with BMI≥30 decreased all-
cause mortality. In another American study representing the association of initial HD
access type with mortality, there was a decreased all-cause mortality when BMI was more
than 25(Xue, Dahl et al. 2003). In light of the prevailing uncertainty about the target BMI
for HD patients, EBPG proposed that HD patients should maintain a BMI>23.0 to keep
a good nutrition (Fouque, Vennegoor et al. 2007a). BMI was specifically recommended
to sustain in a range of 20 to 25 in KDIGO(Levin, Stevens et al. 2013).
Body composition reflecting NS can be measured by BIA and DXA as well. BIA is a
convenient, safe and non-invasive method measuring body composition of muscle and
FM (Schoeller, Alon et al. 2012, Bartok, Schoeller 2004, Albert, Hail et al. 2004). The
principle of BIA is to use a change in reactance and resistance of the current passing
through the various body tissues to measure body components (Chertow, Lowrie et al.

26
1995). Essentially, the current can more easily pass through muscle tissue (which
contains a large amount of fluid) than fat tissue. It has been documented that BIA as a
method for measuring fat and fat free mass (Lukaski, Bolonchuk et al. 1986) predicted
body compartment changes in various clinical situations (Yanovski, Hubbard et al. 1996)
and provided accurate estimates of muscle mass in pre-dialysis CKD patients (Macdonald,
Marcora et al. 2006). However, the BIA is a two–compartment model. It assumes that
water and mineral content are in the same proportion. Therefore, the body composition
measured by the BIA in HD patients with the abnormalities of hydration status and
potential renal osteodystrophy may be shown with inaccurate and unreliable results
(Woodrow, Oldroyd et al. 1996c, Kamimura, Avesani et al. 2003).
In order to conduct a precise assessment for body composition with HD patients, DXA is
recommended as the most accurate and reliable method commonly used in clinics for
routine assessment of FM and Fat-Free Mass (FFM) (Jeong, Wu et al. 2015, Nielsen,
Ladefoged et al. 1994).It is a straightforward and painless measure involving a small
amount of x-ray radiation but the level of dose is quite safe for patients. In HD patients,
DXA is the gold standard for estimating three principal components including FM, fat
free mass and bone mineral content (Locatelli, Fouque et al. 2002b, van den Ham, E C,
Kooman et al. 1999). As early as 1995, Stenver DI et al. proposed that DXA was a
powerful tool for estimating the magnitude of body compartments in ESRD patients,
supported by the positive correlation between fluid loss during dialysis and reduction in
fat-free mass observed from DXA (Stenver, Gotfredsern et al. 1995). DXA has been
extensively validated because its reproducibility for both the total body composition and
regional measurements are more accurate comparing to other techniques (Heimbürger,
Qureshi et al. 2000, Svendsen, Haarbo et al. 1991). However, the cost of DXA is
expensive and it is not widely available, especially at some poverty areas in the
developing countries. Therefore, the routine use of DXA is not recommended (Fouque,
Vennegoor et al. 2007a).
Dietary interviews
There is no any alternatives but dietary interviews or diary can detect in time the change
of food intake before other objective malnutrition parameters start changing (Fouque,
Vennegoor et al. 2007a). HD patients are subject to food restrictions requiring them to
limit dietary sodium, phosphate, potassium and fluid intake. Although controversy

27
regarding food restriction and healthy dietary pattern is present among various studies
(Khoueiry, Waked et al. 2011, Kalantar-Zadeh, Kamyar, MD, MPH, PhD, Ikizler 2013,
Kalantar‐Zadeh, Tortorici et al. 2015), keeping minerals or water under control still
benefits from diet restriction. However, undoubtedly, improved NS is attributed to
adequate dietary protein and energy intake (Slomowitz, Monteon et al. 1989, Bergström,
Fürst et al. 1993). Therefore, whilst maintaining optimal compliance of food restriction,
balancing food restriction and maintaining adequate nutritional constituent intake
requires a thorough understanding of dietary intake for HD patients. Routine evaluation
of food intake is recommended to perform every 6 months after the evaluation at the first
month of dialysis to predict NS.
A 3-day dietary recording and 24-hour diet recall interview were recommended in both
KDIGO (Levin, Stevens et al. 2013) and EBPG guidelines (Fouque, Vennegoor et al.
2007a), as well as numerous studies investigating dietary intake (Bazanelli, Kamimura et
al. 2010, Kloppenburg, de Jong et al. 2002, Huang, Sjögren et al. 2014). The 24-hour
dietary recall is an easy administered tool that has been validated in HD patients to assess
the macro and micronutrient intake. In dietary interviews, relatively comprehensive and
precise details of subject’s food and drink intake during the previous 24 hours were
recalled and collected. The advantage of 24 hour recall are less time consuming, the fact
that the subjects do not need to provide or prepare records of diaries (Wiggins 2002,
Griffiths, Russell et al. 1999), and more likely to result in successful collection of data
compare with the other diet assessments (Griffiths, Russell et al. 1999).
There are no significantly difference between 24 hour diet recall and 3-day diet diary in
determining dietary protein and energy intake (Griffiths, Russell et al. 1999).A 3-day
diary involving a dialysis, non-dialysis and weekend day was recommended for HD
patients to assess dietary intake (Eknoyan, Levin 2000). Although record length of ≥ 3
day were viewed as appropriate for usual diet representation (American Dietetic
Association 2011), with the difference of dietary patterns due to the influence of dialysis
process, diet intake confined to a single dialysis or non-dialysis day in 3-day diet diary
may not represent a typical food intake reflecting diet variations. Additionally, subjects
need to be taught to record the time of meals, methods of food preparations, and describe
the food and drinks consumed, including the amount and composition consumed at home,
in restaurants, and even processed foods. Whilst efficacy of the 3-day food diary is worthy

28
to be taken into account, patients are also confronted to the challenge of describing and
recording their dietary diary.
Subjective Global Assessment (SGA)
The SGA (Steiber, Kalantar-Zadeh et al. 2004)is a valid and clinically useful measure
tool that includes a 7-point Likert-type scale of four items (weight loss, anorexia,
subcutaneous fat, and muscle mass). Subjective weightings were assigned to each of the
four items to produce a global assessment. Score of 1 to 2 represented severe malnutrition;
3 to 5, moderate to mild malnutrition; and 6 to 7, normal nutrition. It has been widely
used to assess NS in surgical, elderly patients (Christensson, Unossons et al. 2003), and
patients with cancer (Bauer, Capra et al. 2002) or liver transplants (Stephenson, Moretti
et al. 2001). In 2000, the National Kidney Foundation (NKF) KDOQI recommended that
SGA can be used in nutritional assessment with the adult dialysis population (Kopple
2001a). Lower SGA score showed the higher mortality risk in dialysis patients (Chung,
Lindholm et al. 2003). In a prospective, longitudinal and multi-centre study in incident
HD patients, moderate and severe Protein-Energy Wasting (PEW) identified by SGA
were associated with an increased mortality in 7 years of follow-up comparing to a normal
NS at baseline(Krediet, Boeschoten et al. 2009).
1.3.5 Influence of provision of food during haemodialysis treatment on
haemodialysis patient
Provision of meals during HD sessions is still a controversial issue practiced by different
countries, regions and clinics. Generally, food was provided to patients during their HD
treatments in most European and Asian countries. Conversely, intradialytic food
consumption is banned in most American cities (Wizemann 2000, Kalantar-Zadeh,
Ikizler 2013). In a survey conducted in 73 clinics from 6 continents, 85% and 65% of
clinics allowed and encouraged patients to have food during treatment, respectively.
However, 9 units from North American implemented ‘eating-prohibitory’ regulations
(Kistler, Benner et al. 2014) .
The common concerns about eating during HD sessions involved postprandial
hypotension, risk of chocking or aspiration, reduced kt/v (dialysis adequacy) and
infection control (Shibagaki, Takaichi 1998). Whereas, on the basis of an investigation
about the most frequently reported reasons to restrict food during treatment, the vast

29
majority of clinicians expressed that these adverse clinical outcomes rarely occurred
(Kistler, Benner et al. 2014). Lara B Pupim et al. found that intradialytic oral
supplementation played an important role in reversing HD associated net negative whole
body and skeletal muscle protein catabolism, consequently, improved the deranged NS
that commonly exists in HD patients (Pupim, Majchrzak et al. 2006a). Daily protein
intake (DPI) in most HD patients was less than 1.0g/kg based on the observation of
mounting studies (Burrowes, Larive et al. 2003b, Kopple 1998), which was markedly
lower than dietary protein requirement with 1.2g/kg/day(Kopple 2001b). The additional
0.2 to 0.4 g/kg/d of protein can be provided by foods during HD treatment session.
Additionally to the effect of reversing protein catabolism caused by HD treatment and
improving NS, eating during HD sessions motivates patients to enhance compliance and
satisfaction of attending HD treatment.
1.4 Body composition of haemodialysis patients
Muscle wasting may contribute to the abnormalities in cardiac function in HD patients
(Stenvinkel, Heimburger et al. 2004, Stenvinkel, Pecoits-Filho et al. 2003). A study
pertaining to the relationship between body composition and arteriosclerosis revealed that
decreased Thigh Muscle Mass (TMA) and accumulated abdominal visceral fat were
correlated with Carotid Artery Intima-Media Thickness (CA-IMT) (Kato, Ishida et al.
2011). Meanwhile, TMA was inversely correlated with brachial-ankle Pulse Wave
Velocity (baPWV), Cardio-Ankle Vascular Index (CAVI) and Ankle Brachial pressure
Index (ABI).
Sarcopenia is a progressive and generalised loss of Skeletal Muscle Mass (SMM) quality
and strength, which consequently leads to physical disability, poor QoL and even death
(Delmonico, Harris et al. 2007, Goodpaster, Park et al. 2006). It is a predominant sign
significantly marked and highly prevalent in HD patients (Domañski, Ciechanowski 2012,
Foley, Wang et al. 2007). A cross-sectional study with 95 ESRD patients aged over 50
years showed one third of HD patients were affected by sarcopenia (Kim, Choi et al.
2013). In another study, 549 HD patients were evaluated the prevalence of muscle
wasting using different guideline definitions of sarcopenia (Tangvoraphonkchai, Hung et
al. 2018). Despite the results due to the variation in guideline cut-off, high prevalence
with 84.5% using the European Working Group on Sarcopenia in Older People
(EWGSOP), 73.2% with North American Foundation for the National Institutes of Health

30
(FNIH)Sarcopenia Project, 75.2% and 56.6% using North American and the UK
normative data, respectively, were shown in the study. Muscle gain with weight loss
predicted a higher survival than muscle loss while weight gain (Kalantar-Zadeh, Streja et
al. 2010). Compromised muscle strength was significantly correlated with physical
inactivity, inflammation and mortality, even stronger than low muscle mass (Isoyama,
Qureshi et al. 2014). Indeed, as evidenced by a number of studies, reduced muscle mass
and impaired muscle strength were important predictors of adverse outcome and
mortality in HD patients, which make joint effort to show the relationship between
sarcopenia and prognosis of ESRD (Thomas 2007, Isoyama, Qureshi et al. 2014, Kim,
Choi et al. 2013).
Protein energy wasting (PEW) is a significant symptom characterized with decreased
body stores of protein and energy fuels (Fouque, Kalantar-Zadeh et al. 2008a). It is
reported that 18%-75% of CKD patients suffered from PEW (Carrero, Chmielewski et al.
2008, Kalantar-Zadeh, Ikizler et al. 2003). The prevalence is higher in HD patients than
other CKD patients (Carrero, Stenvinkel et al. 2013). Mounting studies have shown the
robust association between PEW, comorbidity and mortality (Fouque, Kalantar-Zadeh et
al. 2008b, Owen Jr, Lew et al. 1993, de Mutsert, Grootendorst et al. 2008, Fleischmann,
Teal et al. 1999).
PEW is strongly associated with malnutrition (de Mutsert, Grootendorst et al. 2008) as
well as loss of lean tissue mass (Carrero, Chmielewski et al. 2008). Muscle wasting is
viewed as one of the most valid markers of PEW in HD patients. As mentioned before,
while muscle wasting appears progressively deterioration with worsen kidney function
in CKD patients (Foley, Wang et al. 2007), it is accelerated by factors commonly present
in HD patients, such as acidosis, comorbidities, HD treatment and sedentary lifestyle
(Fouque, Kalantar-Zadeh et al. 2008b, Du, Hu et al. 2005, Ikizler, Pupim et al. 2002).HD
patients body composition is of fundamental importance for the understanding of PEW
in HD patients.
Evidence documented that despite its modality exercise is beneficial to improve body
composition in HD patient. Resistance exercise influenced LM and FM, while aerobic
exercise impacted FM (Drenowatz, Hand et al. 2015). One study involving Progressive
Resistance Training (PRT) with HD patients significantly increased SMM and decreased
Body Fat Rate (BFR) (Song, Sohng 2012). Another aerobic exercise training programme

31
for 12 weeks with HD patients showed the potentials of preventing a decline in body
composition and knee joint muscle function resulting from inactivity in CKD patients
(Young, Hudson et al. 2015). Therefore, assessment of body composition can evaluate
the effect of different modalities of exercise with various intensities on HD patients.
1.5 The underlying impact of culture on lifestyle between UK and Chinese
haemodialysis patients
Hwu Y. et al. found that people with chronic diseases had their own evaluation system to
tell which activities were good for their health because of the long medical course (Hwu,
Coates et al. 2001). Furthermore, choosing some activities or not is closely associated
with their culture (Kim, Bramlett et al. 1998, Kleinman 1978). A study involving 17
population samples’ nutrient intake including in the UK and China indicated that different
lifestyle between western and East Asian population had protective and adverse impact
on CVD (Zhou, Stamler et al. 2003). It has been reported that the intake of total fat,
saturated fat and cholesterol in traditional Western diets were higher than East Asian diets.
However, calcium and potassium intake of Asian diets were lower than those in Western
diets (Zhou, Stamler et al. 2003). The findings corroborated the fact that culture plays a
critical role in determining food selection (Blundell, Gibbons et al. 2015). The
‘Transtheoretical Model’ (TTM) is a theory of therapy used for assessing individuals’
readiness to change to a new healthier behaviour and providing strategies to guide the
individuals, which is beneficial to predict future stage of change for exercise and guide
practical exercise intervention (Callaghan, Khalil et al. 2010). It was revealed that culture
might influence the relationships between stages of readiness to exercise and self‐efficacy
(Marcus, Owen 1992).
Different cultures between the UK and China may result in the disparity of the diet habits
and perception of exercise. Additionally, unique traditional Chinese cultural health belief
derived from the Traditional Chinese Medicine (TCM) also potentially affect Chinese
HD patients’ lifestyle. The traditional Chinese culture believes that renal disease is the
consequence of tiredness caused by overwork (Qu, Liang, & Chen, 2001), which impairs
kidney function. There is also a strong cultural belief in China that people with chronic
diseases need more rest to restore the balance of Yin and Yang (Wu, He et al. 2014b) ,
and increase vitality and energy (Zhang, Liu et al. 2015). To some extent, overwork may
equal vigorous exercise. Therefore, exercise and rest may be contradictory in Chinese

32
cultural health beliefs. Meanwhile, Chinese people believe that there is a strong
correlation between diet and disease, so the illness may follow the principles of Yin and
Yang in the choice of special food or Chinese herbs and to refuse some toxic food defined
by Chinese medicine.
1.6 Aims
Malnutrition and physical inactivity are highly prevalent in HD patients, which result in
high risks of morbidity and mortality. It has been known that perceptions, attitudes and
habits relating to lifestyle may be influenced by culture or ethnicity. Therefore, the
objective of the thesis was to gain a thorough understanding of nutritional and physical
status in HD patients between the UK and China. Furthermore, the thesis was aiming to
explore the disparity of the influencing factors of lifestyle between UK and Chinese HD
patients. The specific aims of each chapter are shown as follows:
(1) To understand and compare diet intake on dialysis and non-dialysis day between
UK and Chinese HD patients;
To explore the underlying associated factors that lead to the discrepancy of
nutritional blood parameters between UK and Chinese HD patients.
In order to achieve the aims above, protein and energy intake, dietary intake of trace
elements, minerals and vitamins and nutritional blood parameters were analysed and
contrasted in HD patients between the UK and China. The results and discussion are
shown in Chapter 4.
(2) To explore the validity of the DASI and GPPAQ walking pace question with
UK and Chinese HD patients
The DASI and GPPAQ walking pace question were concurrently administered with the
Shuttle Walking Test (SWT) and gait speed test with the same HD cohorts in the UK and
China, respectively. Validity of the DASI and GPPAQ walking pace were analysed in
Chapter 5.
(3) To characterise and compare physical function between UK and Chinese HD
patients;
To explore the correlation between physical function, demographics and clinical
information with HD patients in the UK and China.

33
Both the DASI and GPPAQ walking pace question were conducted with a large sample
of UK and Chinese HD patients. Physical performance tests were carried out with HD
patients and healthy controls in the UK and China. Physical function obtained by self-
report questionnaires and objective measures were analysed and shown in chapter 6.
(4) To characterise and compare PA level between UK and Chinese HD patients;
To explore the correlation between PA level, demographics and clinical information
with HD patients in the UK and China.
The GPPAQ and LTEQ were administered with large UK and Chinese HD cohorts. The
Multi-sensor systems (MSSs) were used to assess habitual PA level with HD patients and
healthy controls in the UK and China. The PA level achieved by questionnaires and MSSs
were shown in chapter 7.
(5) To characterise and compare self-perceived benefits and barriers to exercise
between UK and Chinese HD patients;
To explore the correlation between self-perceived benefits and barriers to exercise,
physical function and PA level.
The Dialysis Patient-Perceived Exercise Benefits and Barriers Scale (DPPEBBS) was
conducted with the UK and Chinese HD patients. The results of questionnaires and its
correlation with physical function and PA level were shown in chapter 8.
(6) To understand relationship between physical function, activity and QoL,
symptoms and body composition in UK and Chinese HD patients.
The Euro QOL-5 Dimensions-5 Level (EQ-5D-5L) and Palliative Care Outcome Scale–
Symptoms Renal (POS-S) were administered with UK and Chinese HD patients to assess
QoL and symptoms relating to renal disease. The Body Composition Monitor (BCM) was
conducted to obtain patients’ body composition. The relationship between physical
function, activity and QoL, symptoms and body composition in UK and Chinese HD
patients were shown in Chapter 9.

34
Chapter 2
Methods

35
2.1 Introduction
This chapter described all methods employed in Chapters 4 to 8. Essentially, the data in
these chapters were extracted from 3 separate studies.
(1) The DISH study (Dietary Intake and Nutritional Status of Haemodialysis patients
from the UK and China) was carried out to gain initial information on dietary intake
on dialysis and non-dialysis days with HD patients in the UK and China, giving
insight into HD patients’ nutritional status (NS) and the correlation between dietary
intake and nutritional parameters. The data of the UK HD patients were collected by
a researcher from the Leicester Kidney lifestyle Team, two PhD students from São
Paulo State University and University of Illinois and the researcher. The Chinese
data were collected by the researcher.(2) The QCKD study (Increasing Physical
Activity in Chronic Kidney Disease: The Patient Perspective) was carried out to gain
a thorough understanding of physical function, physical activity (PA) levels and self-
perceived benefits and barriers to exercise, which were all measured by
questionnaires given to HD patients in the UK and China. The researcher collected
the data of the patients in Leicestershire, and the rest UK data were obtained by
researchers from the other regions in the UK. The study conducted in China were
carried out by two Master students at Nantong University and the researcher.
(3) The COCO study (Physical Condition and Associated Factors in Haemodialysis
Patients) explored the relationship of HD patients’ physical function, activity level
and Quality of Life (QoL), symptoms relating to renal disease and body composition
in the UK and China. The data of the UK healthy controls were collected by two
researchers from the Leicester Kidney Lifestyle team. The data of the UK HD
patients and all Chinese participants were collected by the researcher.
All the studies focussed on the English National Health Service (NHS) and Chinese
patients who were recruited from HD units in the UK and China. Each study followed
a specific protocol and participant’s characteristics were used to explore UK and
Chinese HD patients’ diet intake with a 24-hour diet recall interview, levels of
physical function, and PA level using questionnaires and objective measures.
Considering both the QCKD and COCO studies involving HD patients’ physical
status, the results of these two studies were synthesized and provided a complete
presentation of physical function (Chapter 6) and PA level (Chapter 7) in UK and
Chinese HD patients.

36
2.2 Research design
2.2.1 The DISH study
DISH was an observational study which involved HD patients from single centres in the
UK and China, respectively. The study was designed to explore HD patients’ diet intake
on dialysis and non-dialysis days in the UK and China and comprehensively understand
their NS and the correlation between dietary intake and nutritional parameters. All the
aspects of the study documentation including the UK and Chinese patients were approved
by the NHS Research Ethics Committee (Ref. UHL 11329) and the Ethics Committee of
the Affiliated Hospital of Nantong University (Ref.2015-12), respectively.
The study collected the UK and Chinese HD patients’ dietary intake by using the 24-hour
diet recall interviews. The diet recall record included food and fluid items, amount or
portion, food location of purchase, cooking method and brand. Nutritional blood
parameters were obtained from the blood results of patients’ medical records. Blood
nutritional parameters were taken from a single sample of blood obtained on the date
closest to the dietary interview. Only results obtained within 3 months of the dietary
assessment were utilised.
In order to account for the impact of the HD process on dietary intake, HD patients’ diet
intake on dialysis and non-dialysis day were assessed by the researcher, respectively. The
24-hour diet recall interviews were undertaken on two normal dialysis sessions in two
consecutive weeks where the patients were asked to recall their food and fluid intake on
non-dialysis days for the previous 24 hours. Additionally, two more diet recall interviews
on two dialysis sessions following the ones where the last interviews took place were
arranged for HD patients to recall the diet intake on the dialysis days when the non-
dialysis day’s dietary recall were obtained. Flow diagram of the DISH study is shown
Figure2- 1.

37
Figure2- 1Flow diagram of the DISH study
First, the patients were asked to list all food and fluid consumed in the previous 24-hours
without any interruption during the 24-hour dietary recall interviews. The researcher then
went through the list to ensure that nothing had been forgotten, especially snacks,
condiments or supplements. Then the patients were asked to recall the details of the
portion size, location of food purchased, brand of food and cooking method. The
researcher then checked the list and gathered the time and location of the food and fluid
consumed. Finally, the patients and researcher reviewed the list one more time to ensure
accuracy.
Patients’ dietary intake on dialysis and non-dialysis days were obtained by averaging the
results collected from two dialysis days and non-dialysis days, respectively. Additionally,

38
a weekly diet intake was computed by summing up the diet intake on dialysis days and
non-dialysis days, as shown in the following formula: the weekly diet intake = the average
dialysis day’s diet intake ×3+ the average non-dialysis day’s diet intake ×4. For some HD
patients who have dialysis twice a week, the formula was the weekly diet intake = the
average dialysis day’s diet intake ×2+ the average non-dialysis day’s diet intake ×5. A
usual daily dietary intake was obtained through the weekly diet intake divided by 7 days.
Food and fluid consumed by patients was inputted into the Nutritics and Nutrition
calculator, which are based on the 2015 Composition of Foods Integrated Dataset (CoFID)
including McCance and Widdowson (7th edition) and China Food Composition (2nd
version) nutritional databases for the UK and Chinese patients, respectively. Take a boiled
egg with 60 grams for example, the “boiled egg” and the portion size of 60g was typed
in the Nutritics. The software then provided a nutrient analysis for the boiled egg, such
as energy at 86 kcal, protein with 8.5g and so on. Similarly, the “boiled egg” was typed
or chosen in the dish list and the amount of 60g was inputted in the Nutrition calculator.
The detailed nutrients of the boiled egg, such as energy at 86 kcal and protein as 8g, were
presented. The nutrient analysis of a 60g boiled egg in the Nutritics and Nutrition
calculator are shown in Figure2- 2 and Figure2- 3, respectively.

39
Figure2- 2 Nutrient analysis of a 60g boiled egg in the Nutritics
Eggs, chicken, whole, boiled (60 g) EXPORT TO

40
Figure2- 3Nutrient analysis of a 60g boiled egg in the Nutrition calculator
Participants
Inclusion criteria
HD patients aged ≥ 18 years who were willing and able to take part in the study.
Participants from the UK were recruited from two HD centres in the Leicester Renal
Network, and participants from China were recruited from the Affiliated Hospital of
Nantong University.
Exclusion criteria
Table2- 1Exclusion criteria for UK and Chinese HD patients in the DISH study
Exclusion criteria
Age <18 years
Patients with special medical condition which may influence dietary intake or assimilation E.g. Total
Parenteral Nutrition (TPN), unusual dietary restrictions and short bowel syndrome
Clinically overt infection in the last 6 weeks
Pregnancy
Insufficient command of English, Mandarin or Nantong Dialects to understand the patient
information sheet and give consent, or unable to understand the patient information sheet and give
consent for any other reason

41
Recruitment
Before the research was started, the managers and matrons of each HD units identified
potentially eligible patients in their units. The eligible patients were approached by the
researcher. The study was explained and the patient information sheets were given to
potential participants. The patients were allowed at least 48 hours to decide whether to
participate. Written consent was obtained from all participants prior to entering the study.
The GP of the UK HD patients and the consultant nephrologist of the Chinese HD patients
were then informed of their participation in the research. Two copies of written consent
were given to the patients and recorded in each of the patient’s medical notes, along with
a copy of the Patient Information Sheet.
54 UK HD patients were approached and given a detailed explanation of the study by the
researcher, out of these 54 patients, 14 refused to participate in the study. Finally, 40
patients agreed to allow their medical records to be accessed and completed all the
interviews. 61 Chinese HD patients were approached and given patient information
sheets. After being allowed 48 hours as consideration time, 17 patients refused to take
part. Ultimately, 44 patients agreed to have their medical records accessed and completed
the study. The consort diagram depicting the UK and Chinese HD patients flow through
the study are showed in Figure2- 4and Figure2- 5.

42
Figure2- 4Flowchart of recruitment process and included patients in the UK
Figure2- 5Flowchart of recruitment process and included patients in China
2.2.2 The QCKD study
The QCKD study was a cross-sectional multicentre study which involved HD patients in
the UK and China. The study was designed to gain a thorough understanding of exercise

43
behaviour in HD patients in the UK and China in terms of physical function, PA level and
self-perceived benefits and barriers to exercise. This study with UK and Chinese patients
has received ethical approval from the NHS Research Ethics Committee: NRES
Committee East Midlands-Northampton (REC reference 12/EM/0184) and the Ethical
committee of the Affiliated Hospital of Nantong University (Ref. 2015-12), respectively.
The UK and Chinese HD Patients recruited in the study completed a short demographic
section, followed by 4 validated questionnaires regarding exercise behaviour during their
HD sessions or at home.
• The Duke Activity Status Index (DASI) is used for assessing participants’ exercise
capacity.
• GP Physical Activity Questionnaire (GPPAQ) is used for assessing PA level.
• Leisure Time Exercise Questionnaire (LTEQ) is used for measuring exercise levels
during individual leisure time.
• Dialysis Patient-Perceived Exercise Benefits and Barriers Scale (DPPEBBS) is used
for assessing dialysis patients’ beliefs and feeling about exercise.
If the HD patients agreed to allow their medical records to be accessed, researchers
extracted the patients’ clinical parameters from the medical records.
Subjects
Inclusion criteria
All patients receiving HD who were willing and able to participant in the study from the
UK and the hospitals in Nantong City.
Recruitment
The UK HD patients were recruited from the UK. The 16 hospitals involved include
Leicester General Hospital, Loughborough Hospital, Leicester Hamilton Renal Dialysis
Unit, Basidon and Thurrock University hospital, The Royal London Hospital,
Nottingham Hospital, Sheffield Teaching Hospitals, Dorset County Hospital, St Georges
Hospital, York Teaching Hospital, Mid Essex Hospital Services NHS Trust, Royal Derby
Hospital, Royal Free Hospital, Imperial College Healthcare NHS Trust, Lincoln County
Hospital and Lancashire Teaching Hospital. Chinese HD patients were recruited from all

44
7 hospitals in Nantong city which set up HD units, including the affiliated Hospital of
Nantong University, the First People’s Hospital of Nantong, the Third People’s Hospital
of Nantong, the Fourth People’s Hospital of Nantong, the Sixth People’s Hospital of
Nantong, Nantong geriatric rehabilitation hospital and Nantong Hospital of Traditional
Chinese Medicine.
During the study process, a notice was prominently placed in the receptions of each HD
units involved, informing patients that a survey about exercise behaviour was being
carried out. Patients who were unwilling to take part were asked to inform the unit staff.
All HD patients were approached and recruited during their dialysis sessions. The survey
was briefly explained to patients. The patients who were interested in the study were then
provided with the Patients Information Sheet. If the patient was then willing to complete
the survey, the questionnaires which were each marked with a unique non-identifiable
participant study code, were then supplied for the patients to complete during their
dialysis session or at home. After the researcher collected the completed questionnaires,
the patients were asked for the permission to access medical records for further
information. If the patient agreed, written consent forms marked with the same code as
the questionnaires were explained to the patients and obtained. Study documents were
dealt with in the same way as in the DISH study. A flow diagram illustrating the study
design is shown in Figure2- 6.

45
Figure2- 6Flow diagram of the QCKD study
1156 UK HD patients from 16 hospitals in the UK were recruited and completed the
study. 783 Chinese HD patients who resided in Nantong, including municipal and rural
regions were approached. 221 declined mainly due to lack of interest, family issue and
adverse medical condition. 542 Chinese HD patients participated in the study. The
recruitment rate was 69.2%.
2.2.3 The COCO study
The COCO study was an exploratory observational single centre study that involved HD
patients and healthy controls from the UK and China, respectively. The study was

46
designed to objectively measure HD patients’ physical functions and PA levels in the UK
and China. Additionally, information regarding QoL, symptoms relating to renal disease,
and body composition in HD patients, and the relationship with physical function and PA
levels was explored. All aspects of the study including the UK and Chinese participants
were approved by the NHS Research Ethics Committee: South East Scotland REC 01
(Ethics Ref. 14/EM/1049) and the Ethical committee of the Affiliated Hospital of
Nantong University (Ref. 2015-12), respectively. Participants were asked to complete a
series of outcome measure assessments once only. They had the option to separate the
assessment into several visits based on their own convenience or preference. The total
assessment time was about 2.5 hours altogether. Based on the underlying fatigue or
discomfort after the HD session, four physical performance tests were conducted with the
UK and Chinese HD patients before a HD session or on a non-HD day. A multi-sensor
system (Sensewear Armband [SWA]) was worn for 7 days by patients in order to assess
habitual PA levels, and this was then collected by the researcher. During this time, patients
completed 4 questionnaires, including the DASI, GPPAQ, Euro QOL-5 Dimensions-5
Level (EQ-5D-5L) and Palliative care Outcome Scale–Symptoms Renal (POS-S).
Patients’ body composition was assessed by Body Composition Monitor (BCM) before
the dialysis session. The outcome measures in the COCO study are shown in
Table2- 2.
Table2- 2Outcome measures in the COCO study
Outcome measures Measure tools
Physical Function: Physical performance tests: Shuttle Walking Test (SWT), Sit to Stand
(STS) 60, Handgrip Strength (HGS) and Short Physical Performance
Battery (SPPB)
Habitual physical activity: Multi-sensor system (SWA) over 7 days at home
Body composition: Fresenius Body Composition Monitor (BCM)
Questionnaires: The DASI, GPPAQ, Euro QOL-5 Dimensions-5 Level (EQ-5D-
5L) and Palliative care Outcome Scale–Symptoms Renal (POS-S)
The healthy participants arrived at the laboratory or the University at a convenient time
for a completion all outcome measures above, except for the POS-S. The flow diagram
illustrating the study design is shown in Figure2- 7.

47
Figure2- 7Flow diagram of the COCO study
Subjects
Inclusion criteria
HD patients and healthy controls aged ≥ 18 years who were willing and able to take part
in the study from the UK and China.

48
Exclusion criteria
Table2- 3Exclusion criteria for HD patients in the COCO study
Exclusion criteria
Age <18 years
Patients unable to walk e.g. amputation, unable to mobilise/wheelchair dependent
Pregnancy
Any element of study assessment protocol considered by own clinician to be contraindicated due to
severe co-morbidity or any other reason:
Cardiovascular events (severe heart failure, myocardial infarction, unstable angina, stroke et al.) in
the last 3 months;
Severe Chronic Obstructive Pulmonary Disease (COPD);
Active liver disease et al.
Clinically overt infection in the last 6 weeks
Insufficient command of English, Mandarin or Nantong Dialects to understand the patient information
sheet and give consent, or unable to understand the patient information sheet and give consent for any
other reason.
Table2- 4Exclusion criteria for healthy controls in the COCO study
Exclusion criteria
Age <18 years
Participants with ambulatory problem, E.g. amputation, unable to mobilise/wheelchair dependent
Any personal medical history of having kidney disease, diabetes, chronic lung disease, heart disease,
cancer or any other significant long-term condition
Clinically overt infection in the last 6 weeks
Pregnancy
Insufficient command of English, Mandarin or Nantong Dialects to understand the information sheet
and give consent, or unable to understand the information sheet and give consent for any other reason
Recruitment
Eligible patients at HD units from Leicester renal network and the affiliated hospital o
Nantong University in the UK and China were identified by unit staff, respectively. The
unit staff briefly explained the study to the potential patients during routine dialysis
sessions. The patients who expressed an interest in participating in the study were
provided with the patient information sheets and discussed the study in more details with
the researcher. At least 48 hours was given to the patients to decide whether to participate.
If they were interested in the study after consideration, written consent was obtained from
all participants prior to entering the study. Study documents were dealt with in the same

49
way as in the DISH study.
The healthy participants were recruited from hospital, university and the community via
leaflets. Potential healthy controls who were interested in the study were screened by
assessing whether they reported a number of chronic health issues or any other problems
precluding them from participation. The healthy controls with no known chronic diseases
were explained to them along with further information prior to written consent being
given. The healthy Chinese controls were screened after the completion of the study with
HD patients. HD patients who had already completed the study were classified into age
ranges (<30, 30-40, 40-50, 50-60, >60 years) and gender groups (male and female).
Healthy controls were subsequently approached according to the proportion of patients
from each age and gender groups. Additionally, some elderly participants with minor
illnesses or well-controlled chronic health issues were deemed eligible to participate.
42 UK HD patients were approached and 12 declined to participate in the study due to
lack of interest or because of concerns that it would be time-consuming. 11 healthy
controls were recruited to the study and 1 dropped out. The consort diagram depicting
UK HD patients and healthy controls flow through the study are showed inFigure2- 8 and
Figure2- 9.

50
Figure2- 8Flowchart of recruitment process and included HD patients in the UK
Figure2- 9Flowchart of recruitment process and included healthy controls in the UK

51
43 Chinese HD patients were approached in the study, of these, 2 refused to take part and
1 withdrew due to a serious medical condition which developed during the study. 50
Chinese healthy controls who were age and gender-matched were screened, and 6
withdrew due to family issues or lack of interest during the study. The consort diagram
depicting Chinese HD patients and healthy controls flow through the study are shown in
Figure2- 10 and Figure2- 11.
Figure2- 10Flowchart of recruitment process and included HD patients in China

52
Figure2- 11Flowchart of recruitment process and included healthy controls in China
All participants involved in all aspects of the research were free to withdraw at any time
without giving any reason. Patients’ medical care or legal rights were not affected. All
aspects of the research conformed to the ethical principles outlined in the Declaration of
Helsinki (World Medical Association 2013).
2.3 Outcome measures
2.3.1 Outcome measures in the DISH study
Demographic characteristics include age, gender and dialysis vintage and
anthropometric parameters (Body Mass Index [BMI], MAC), which were collected from
participants’ medical records.
Protein and energy intake and intake of trace elements, minerals and vitamins,
including iron, calcium, phosphate, potassium, sodium and vitamin C and D intake. These
parameters were collected from the 24-hour dietary recall interviews.
Nutritional blood parameters include serum albumin, cholesterol, phosphate, calcium,
parathyroid hormone (PTH), Haemoglobin (Hgb), haematocrit, sodium, potassium,
transferrin saturation, iron and ferritin. These parameters were collected from participants’
medical records during the month of the patients’ entry into the study.

53
2.3.2 Outcome measures in the QCKD study
Demographics were obtained from the demographic section which was combined with
the questionnaires, including age, gender, ethnicity, dialysis vintage, smoking history
(current smoker, ex-smoker or never smoked), BMI, general information about
comorbidity and medication. More detailed comorbidities covered diabetes, hypertension,
ischaemic heart disease, stroke/Transient Ischemic Attack (TIA), peripheral vascular
disease, asthma or COPD, musculoskeletal disease, neurological disease and mental
disease. Additionally, condition and symptoms reported by the patients were recorded in
the study as well. Oral medications including anti-hypertensives, antidepressant, oral
bicarbonate and statins were also noted.
Questionnaires were completed during the patients’ HD sessions except for patients who
preferred to take questionnaires home to complete. Following a detailed explanation,
patients who could write then filled in the questionnaires by themselves. For patients who
were restricted in their ability to write due to arteriovenous (AV) fistula access or other
issues, researchers wrote the patients answers verbatim. For patients who took the
questionnaires home, the researchers collected them from the units once they had been
finished.
The Duke Activity Status Index (DASI) is a self-administered questionnaire which is
strongly correlated to VO2peak in development (r=0.81, P<0.0001) and validation phase
(r=0.58, P<0.0001) (Hlatky, Boineau et al. 1989b)in the general population. Meanwhile,
as a surrogate of VO2peak for HD patients, the DASI has also been documented as being
a powerful marker of physical function (Nonoyama, Brooks et al. 2010). The DASI
consists of two responses ‘yes’ and ‘no’ which refer to 12 activities of personal care,
ambulation, household tasks, sexual function and recreational activities. A response of
‘no’ indicates a score of zero, and a response of ‘yes’ to each item is marked as a value
based on metabolic cost by calculating Metabolic Equivalent of Task (METs), which
means the Energy Expenditure (EE) of a specific physical activity. The question is
weighted depending on the level of activity and the values of each specific activity are
summed up to produce a numerical total score (0.00-58.2 METs).
The GP physical activity questionnaire (GPPAQ) is widely accepted for assessing PA
in general practice (Weiler, Stamatakis 2010) and people’s risk of heart disease, stroke,
diabetes and kidney disease as part of the NHS Health Check programme (Physical

54
Activity Policy, Health Improvement Directorate 2009). As a recommendation provided
by NICE to identify those with “Inactive” PA and incentivise PA interventions, it was
also used for patients with Chronic Kidney Disease (CKD) and renal transplant recipients
(Takahashi, Hu et al. 2018, Clarke, Young et al. 2015b). The GPPAQ was designed to
take less than one minute to complete and the results can categorize patients into one of
four ‘Physical Activity Index’ (PAI) categories, ‘Inactive’, ‘Moderately Inactive’,
‘Moderately Active’ and ‘Active’. All those who do not achieve ‘Active’ periods have
the potential to benefit from increasing their PA level. The Calculation of the four-level
PAI is shown in Table2- 5.The GPPAQ walking pace question including 4 options (slow,
steady, brisk and fast walking pace) is the second section of this questionnaire.
Table2- 5Calculation of the four-level Physical Activity Index (PAI)
PAI Calculation
Inactive Sedentary job and no physical exercise or cycling
Moderately inactive Sedentary job and some but < 1 hour physical exercise and / or cycling per week
OR Standing job and no physical exercise or cycling
Moderately active
Sedentary job and 1-2.9 hours physical exercise and / or cycling per week OR
Standing job and some but < 1 hour physical exercise and / or
cycling per week OR Physical job and no physical exercise or cycling
Active
Sedentary job and ≥ 3 hours physical exercise and / or cycling per week OR
Standing job and 1-2.9 hours physical exercise and / or cycling per week OR
Physical job and some but < 1 hour physical exercise and / or cycling per week
OR Heavy manual job
The Leisure Time Exercise Questionnaire (LTEQ) is a self-administered assessment
tool to measure exercise levels during individual leisure time (Godin, Shephard 1985). It
was utilized to understand exercise level with CKD patients (Eng, Martin Ginis 2007,
Beddhu, Baird et al. 2009) or dialysis patients (Stack, Molony et al. 2005b), and even in
a study regarding the development of barriers and motivators of exercise questionnaire
for HD patients (Goodman, Ballou 2004a). Eric D. Goodman et al. documented that the
LTEQ was reviewed by the same jury of experts who evaluated the barriers and
motivators questionnaire (Goodman, Ballou 2004a). The jury had the unanimous opinion
that the LTEQ has appropriate applicability for HD patients. Its questions mainly record
the times of strenuous, moderate, and mild exercise in the last 7 days, and weekly
frequencies of these patterns of exercise are multiplied by 9, 5, and 3 METs, respectively.
Therefore, summing up the values of the separate components in arbitrary units reflects

55
the intensity of a subject’s activity. Apart from the total exercise activity, a Health
Contribution Score (HCS) (Godin 2011) to categorise respondents as “Active” ≥24 units,
“Moderately Active” (14–23 units) or “Insufficiently Active” (<14 units) was calculated
in order to suggest correlations between the volume of exercise and health benefits. The
HCS is the sum of the frequency of the strenuous and moderate PA multiplied by 9 and
5 METs, respectively.
The Dialysis Patient-Perceived Exercise Benefits and Barriers Scale (DPPEBBS)
was designed to assess dialysis patients’ beliefs and feeling about exercise(Zheng, You
et al. 2010). It has been shown to be a valid and reliable instrument for evaluating the
perceived benefits and barriers to exercise in HD patients (Zheng, You et al. 2010). There
are 24 items in the DPPEBBS which are categorized into 12 benefits and 12 barrier items.
The answers to the DPPEBBS are presented on a 4-point Likert-type scale, where 1
means ‘‘strongly disagree’’, 2 means ‘‘disagree’’, 3 means ‘‘agree’’, and 4 means
‘‘strongly agree’, and the code of the barrier items is reversed. This scale consisted of six
aspects, namely, daily life, symptoms, physical function, care needs, exercise-associated
untoward outcomes and information on dialysis patients.
All the 4 questionnaires in the Chinese version have been validated in China except for
the GPPAQ. In order to explore further possibilities and include it in the outcomes in the
Chinese study, the GPPAQ was translated into Chinese by two professional translators
with excellent knowledge of English and back into English iteratively by two bilinguals
who had no knowledge of the original version of the questionnaire. Modifications were
made in the conceptual and logistical aspects until consensus was reached by the
translation group.
Clinical information relevant to the analysis of the questionnaire responses were
obtained from patient’s medical records after asking for the patient’s consent, involving
bicarbonate(mmol/L), urea(mmol/L) and creatinine(umol/L), Urea Reduction Ratio
(URR)(%), albumin(g/L), C-Reactive Protein (CRP)(mg/L), triglycerides(mmol/L),
cholesterol(mmol/L), phosphate(mmol/L), Alkaline Phosphatase
(ALP)(iu/L),calcium(mmol/L), PTH(pmol/L), Hgb(g/dL) and haematocrit(L/L). All
parameters were recorded with the pre-dialysis results. Pre-dialysis urea and creatinine
were recorded with the average of three available dialysis days that are closest to the
survey day. When there was no data available for the required date, the closest date

56
available was accepted. The results available with >3 months old were omitted from the
data collection records.
2.3.3 Outcome measures in the COCO study
Questionnaires
The DASI and GPPAQ were described in2.3.2 (Outcome measures in the QCKD study).
The Euro QOL-5 Dimensions-5 Level (EQ-5D-5L) was originally developed by the
Euro QoL group and now appears to have increased reliability and an improved ability to
discriminate different levels of health over 20 years (Janssen, Birnie et al. 2008b, Pickard,
De Leon et al. 2007, Janssen, Birnie et al. 2008a). It has been validated and applied to the
study of patients with a variety of health status issues and a range of different populations
(Janssen, Lubetkin et al. 2011, Pickard, Wilke et al. 2007, Wailoo, Davis et al. 2010),
including HD patients (Faridah, Jamaiyah et al. 2010a). Additionally, the EQ-5D-5L was
recommended by NICE and confirmed as being useful in the NHS patient‐reported
outcome measures programme (Devlin, Appleby et al. 2010). It comprised a 5-item
descriptive system (mobility, self-care, usual activities, pain/discomfort, and
anxiety/depression) containing 5 levels. Scores from each of the 5 dimensions are
combined to give a single index value that is presented in country specific value sets.
Additionally, an EQ-Visual Analogue Scale (EQ-VAS) allows the participants to judge
their current health status from the worst (0) to the best health (100) they can imagine. In
the study, the index value representing the participant’s QoL with 5 dimensions rather
their health status with only one overall dimension was utilized for the QoL evaluation
due to its underlying accuracy (Saffari, Pakpour et al. 2013).
The Palliative Care Outcome Scale–Symptoms Renal (POS-S) was specifically
developed for assessing symptom burden in patients with renal disease (Murphy, Murtagh
et al. 2009). It was a reliable and valid self-reported questionnaire (Palliative care
outcome scale , Gutiérrez Sánchez Daniel, Leiva-Santos et al. 2017) and has been widely
used for understanding symptom burden in patients with renal disease (Sexton, Lowney
et al. 2016, Brown, Collett et al. 2015). Donal J. Sexton et al. revealed that symptom
burden assessed by the POS-S were the predictors of all-cause mortality in HD (Sexton,
Lowney et al. 2016). The POS-S mainly measures the presence and severity of 17
symptom related diseases in the previous 7 days. The questionnaire also includes the

57
addition of three open fields, enabling patients to add any symptoms not listed that they
had been experiencing over the past 7 days. The patient rated each symptom as absent,
slight, moderate, severe, and overwhelming. The end of the questionnaire asked which
symptom affected the patient the most and which symptom, if any, improved the most.
Physical performance tests
Physical performance tests including the Shuttle Walking Test (SWT), Sit to Stand (STS)
60, Handgrip Strength (HGS) and Short Physical Performance Battery (SPPB), were
conducted for evaluating physical function with HD patients and healthy controls in the
UK and China. Participants were given a chance to become familiar with the tests before
they were conducted.
SWT
The SWT is a validated test of maximal exercise capacity in patients receiving HD and
has been used in studies with dialysis patients as a vital assessment tool for physical
function (Greenwood, Naish et al. 2014c, Lane, Wu et al. 2013, Wilund, Tomayko et al.
2010). It is simple to perform, well-tolerated and reproducible after a familiarization test,
and is often preferred to other measures (Witham, Sugden et al. 2012, Revill, Morgan et
al. 1999).The SWT includes the Incremental Shuttle Walking Test (ISWT) and Endurance
Shuttle Walking Test (ESWT). Participants were asked to walk a 10-meter shuttle course
at a speed controlled by an external audible bleep signal. For the ISWT, participants
walked back and forth continuously at a progressively increasing pace. The test was
terminated when participants failed to complete the shuttle course in the allowed time.
Subsequently, the walking speed can be calculated from the ISWT performance, which
equates to 85% of predicted VO2peak, and this was used in the ESWT. For the ESWT,
participants were asked to walk as long as they could at a constant speed and pace
obtained from the participant’s ISWT performance by an external audible signal, and the
total time walked was then recorded. In the study, the ESWT (meters) was calculated by
multiplying the ESWT speed (meter/min) that participants achieved from the ISWT by
the endurance (min) that participants walked.

58
HGS
The HGS is a reliable and simple assessment of muscle power (Lauretani, Russo et al.
2003) as well as an independent predictor of NS (Flood, Chung et al. 2013). Besides
being a better predictor of clinical outcomes and low muscle mass (Lauretani, Russo et
al. 2003), the HGS has also been reported as being a good simple measure of muscle
strength in arms or legs (Cruz-Jentoft, Baeyens et al. 2010a). Additionally, it has been
reported that the HGS is capable of predicting poor mobility status and disability for
Activities of Daily Living(ADL) (Al Snih, Markides et al. 2004). A hand-held
dynamometer was used to measure HGS three times before patients’ dialysis sessions and
an average reading was obtained by averaging the three readings. Participants were asked
to remain seated with the shoulder adducted elbow flexed at 90ᵒ and forearm in a neutral
position (Limaye, Frankham et al. 2001, Tander, Akpolat et al. 2007, Duruoz, Cerrahoglu
et al. 2003, Jamal, Leiter et al. 2006). The dynamometer was held with the side opposite
to the vascular access arm by the patients and the dominant hand by the healthy controls.
Participants were asked to squeeze the handle as hard as they could. 30 seconds was
allowed for the interval between measurements.
STS
As well as being a surrogate for a walking test (Ozalevli, Ozden et al. 2007), an ideal tool
for evaluating pulmonary rehabilitation (Vaidya, de Bisschop et al. 2016), and eliciting a
comparable end-exercise physiological response to the 6 Minute Walk Test
(6MWT)(Crook, GilbertBüsching et al. 2017), the STS60 has been confirmed as a
reliable and valid measure of functional outcome, especially in elderly people (Gross,
Stevenson et al. 1998), COPD patients (Crook, GilbertBüsching et al. 2017, Zanini,
Aiello et al. 2015) and renal transplants (Bohannon, Smith et al. 1995). For the HD
patients, Eva Segura-Orti et al. reported the excellent test-retest reliability of the STS60
(Eva Segura-Ortí, Francisco José Martínez-Olmos 2011). Overall, STS60 is a good
measure of functional ability and has been reported as being a good proxy for muscular
endurance conditioning appropriate for dialysis patients (Bennett, Breugelmans et al.
2007, Kopple, Kim et al. 2015).The participant started from a seated position on a hard,
upright chair, with arms folded across the chest, the feet flat on the floor and the knees
bent at 90ᵒ. For the test, the subject simply stood up fully and then sat down again to the

59
starting position, without using their arms. For the STS60, this is the number of STS
cycles achieved in 60 seconds and is a surrogate measure of muscular endurance.
SPPB
The SPPB was originally designed for elderly patients for testing lower extremity
function (Fish 2011). It has been validated (Freire, Guerra et al. 2012) and has been
widely used across diverse populations of elderly people by providing objective function
measurements (Guralnik, Ferrucci et al. 2000, Volpato, Cavalieri et al. 2010). A number
of studies with CKD patients reviewed the SPPB as a reliable function tool, evaluating
physical function (TAŞOĞLU, Bayrakci et al. 2017, Painter, Agarwal et al. 2017) and
the effect of exercise intervention (Bohm, Storsley et al. 2018).The SPPB includes a
walking test (gait speed test), muscle strength test (STS5) and a balance test. Participants
were asked to walk a 5m course twice at their usual walking speed with a walking aid if
it was normally used. The duration times were recorded when the participant completed
the 4m course and an average score was obtained from the participant’s two performances.
The time taken for the participant to complete the STS cycles over 5 times as quickly as
possible was then recorded for the measurement of the STS5, which is a surrogate
measure of muscular power. In terms of the balance test, participant attempted to stand
with 3 different movements for 10 seconds in each one. The first movement was to stand
still with the feet together side by side (side-by-side). If successful, they would continue
to stand with the side of the heel of one foot touching the big toe of the other foot (semi-
tandem position). If successful, the final 10s position was assessed, with the heel of one
foot in front of and touching the big toe of the other foot (full tandem position). These
three separate tests had their own scoring system, ranging from 0 to 4. The scores from
the separate tests were used to calculate the overall SPPB score.
Physical activity level
The SWA (BodyMedia, Inc., Pittsburgh, PA, USA) was used for assessing habitual PA
levels of the UK HD patients, Chinese HD patients and healthy controls in the study. It is
a typical Multi-sensor system (MSSs), which combines triaxial accelerometer with heat
production, galvanic skin response, and skin temperature (David Andre, Ray Pelletier et
al. 2006). In a few studies with chronic disease, it has been shown to be a valid measuring
tool against the indirect calorimeter (VO2) (Van Remoortel, Raste et al. 2012, Rabinovich,
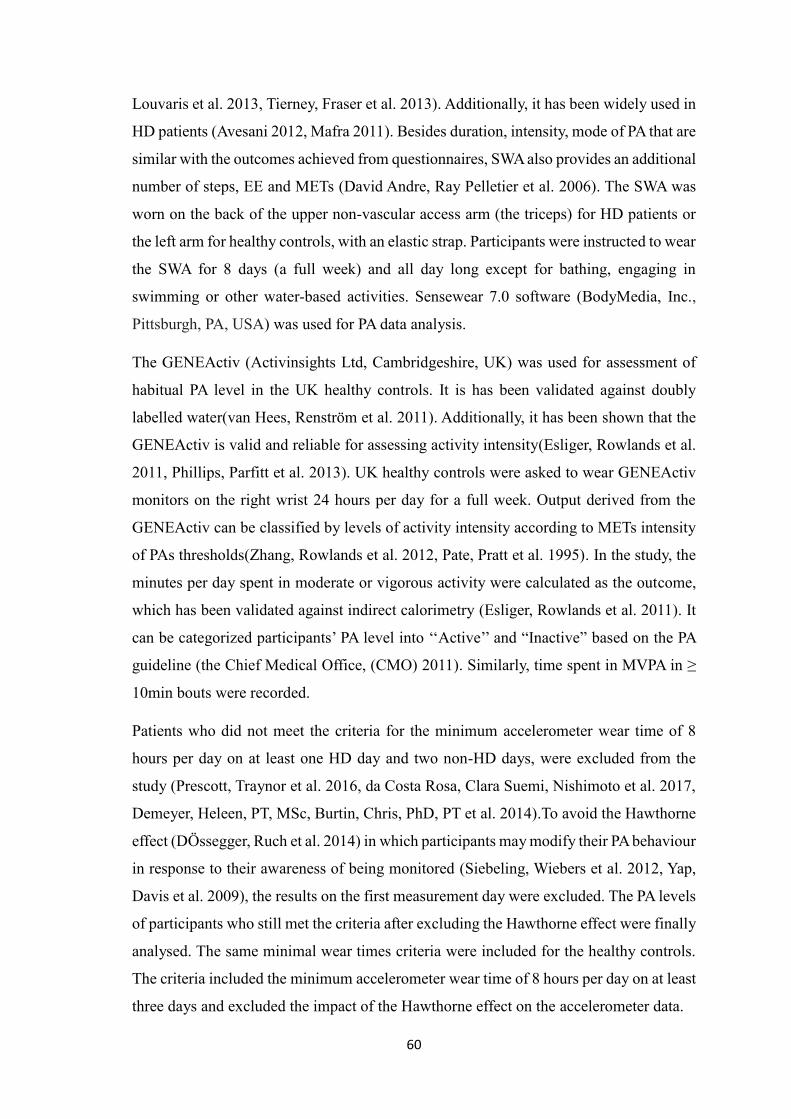
60
Louvaris et al. 2013, Tierney, Fraser et al. 2013). Additionally, it has been widely used in
HD patients (Avesani 2012, Mafra 2011). Besides duration, intensity, mode of PA that are
similar with the outcomes achieved from questionnaires, SWA also provides an additional
number of steps, EE and METs (David Andre, Ray Pelletier et al. 2006). The SWA was
worn on the back of the upper non-vascular access arm (the triceps) for HD patients or
the left arm for healthy controls, with an elastic strap. Participants were instructed to wear
the SWA for 8 days (a full week) and all day long except for bathing, engaging in
swimming or other water-based activities. Sensewear 7.0 software (BodyMedia, Inc.,
Pittsburgh, PA, USA) was used for PA data analysis.
The GENEActiv (Activinsights Ltd, Cambridgeshire, UK) was used for assessment of
habitual PA level in the UK healthy controls. It is has been validated against doubly
labelled water(van Hees, Renström et al. 2011). Additionally, it has been shown that the
GENEActiv is valid and reliable for assessing activity intensity(Esliger, Rowlands et al.
2011, Phillips, Parfitt et al. 2013). UK healthy controls were asked to wear GENEActiv
monitors on the right wrist 24 hours per day for a full week. Output derived from the
GENEActiv can be classified by levels of activity intensity according to METs intensity
of PAs thresholds(Zhang, Rowlands et al. 2012, Pate, Pratt et al. 1995). In the study, the
minutes per day spent in moderate or vigorous activity were calculated as the outcome,
which has been validated against indirect calorimetry (Esliger, Rowlands et al. 2011). It
can be categorized participants’ PA level into ‘‘Active’’ and “Inactive” based on the PA
guideline (the Chief Medical Office, (CMO) 2011). Similarly, time spent in MVPA in ≥
10min bouts were recorded.
Patients who did not meet the criteria for the minimum accelerometer wear time of 8
hours per day on at least one HD day and two non-HD days, were excluded from the
study (Prescott, Traynor et al. 2016, da Costa Rosa, Clara Suemi, Nishimoto et al. 2017,
Demeyer, Heleen, PT, MSc, Burtin, Chris, PhD, PT et al. 2014).To avoid the Hawthorne
effect (DÖssegger, Ruch et al. 2014) in which participants may modify their PA behaviour
in response to their awareness of being monitored (Siebeling, Wiebers et al. 2012, Yap,
Davis et al. 2009), the results on the first measurement day were excluded. The PA levels
of participants who still met the criteria after excluding the Hawthorne effect were finally
analysed. The same minimal wear times criteria were included for the healthy controls.
The criteria included the minimum accelerometer wear time of 8 hours per day on at least
three days and excluded the impact of the Hawthorne effect on the accelerometer data.

61
The Chief Medical Office (CMO) in the UK’s own PA guidelines for PA levels in adults
recommends a minimum of either ≥150 min of Moderate to Vigorous Physical Activity
(MVPA) in ≥ 10 min bouts or ≥75 mins of Vigorous Physical Activity (VPA) per week
for adults(the Chief Medical Office, (CMO) 2011). According to the model proposed by
Pate et al. for classifying the METs intensity of PAs (light, < 3METs; moderate, 3-6METs;
vigorous, > 6METs)(Pate, Pratt et al. 1995), time spent on MVPA in ≥ 10 min bouts
derived from the SWA were recorded. Although the utilization of <5000 steps /d as a step-
defined sedentary lifestyle index still requires additional studies for further confirmation,
it has been demonstrated as a multiform utility for researchers and practitioners
(McKercher, Schmidt et al. 2009, Kozey-Keadle, Libertine et al. 2011, Cavanaugh, Kochi
et al. 2009). Based on the numbers of steps taken, the participants were categorized as
sedentary (<5000 steps/d), somewhat active (5000 to 7499 steps/d), and active (≥7500
steps/d) (Tudor-Locke, Craig et al. 2012).
The Lean tissue Index (LTI) and Fat Tissue Index (FTI)
Participants’ body composition (Lean tissue index [LTI] and fat tissue index [FTI]) were
assessed using the Fresenius Body Composition Monitor (BCM) in the study. The BCM
is currently a commonly used bio-impedance methodology with a 3-Compartment (3-C)
model. Thus, as a tool for distinguishing OH, lean and fat tissue mass, the BCM has been
extensively used for understanding the body composition of dialysis patients (Van Biesen,
Williams et al. 2011, Van Biesen, Claes et al. 2013), and has played an important role in
evaluating NS(Rosenberger, Kissova et al. 2014) and predicting PEW (Magnard,
Deschamps et al. 2013a, Broers, Martens et al. 2015a). Patients were requested to lie flat
on a bed or a couch and electrodes of the BCM were placed on one hand and foot to
assess body composition before the dialysis session. The procedure usually took around
two minutes.
The LTI (LTM/height2) and FTI (FTM/height2) obtained from BCM are the respective
tissue masses normalized to height square. The classification of LTI and FTI were based
on the reference ranges, which were derived from the BCM measurements of 1000
healthy adult subjects aged 18–75 (Fresenius Medical Care ). The reference population
is age and gender specific due to the variation of the body composition throughout life
and between genders. Participants in the study were classified into 3 groups by LTI and
FTI, respectively. There were low LTI (LTI <10th percentile of a reference population),

62
normal LTI (LTI between 10th percentile and 90th percentile), and high LTI (LTI ≥90th
percentile), low FTI (FTI <10th percentile of a reference population), normal FTI (FTI
between 10th percentile and 90th percentile), and high FTI (FTI ≥90th percentile).
Demographics
The HD patients’ demographic information was obtained from their medical records with
the patient’s consent. Healthy controls’ demographics were obtained by interviewing
individuals. The demographics included age, gender, ethnicity, dialysis vintage, BMI, and
general information about comorbidity and medication.
2.4 Statistical analysis
Categorical data were summarised into number and percentage of the participants.
continuous data were checked for normality of distribution using Shapiro-Wilk tests.
Whilst variables with normally distributed were presented as mean ± standard deviation
(SD), non-normally distributed variables were shown as median [interquartile range
(IQR)]. When the comparison of two variables were presented in the same table or figure,
they were shown with median (IQR) if at least one of them was non-normally distributed.
Independent-sample t tests or non-parametric test were performed to compare the
differences of two groups. The differences between the two groups were compared using
independent t test and Mann Whitney test on parametric and non-parametric data
respectively. Pearson correlation coefficient was performed to evaluate the relationship
between continuous variables but only when both variables were normally distributed;
otherwise Spearman’s correlation coefficient was used. The Spearman correlation
coefficient was performed to evaluate the monotonic relationship between two
continuous or ordinal variables, or two ordinal variables (Hauke, Kossowski 2011).
When testing for differences in the means of the dependent variable broken down by the
levels of the independent variable, a one-way analysis of variance (ANOVA) or
independent t-test were used if there was a categorical independent variable (with two or
more categories) and a normally distributed interval dependent variable. When dependent
variable was non-normally distributed, non-parametric test was used. Chi-square test was
used if both dependent and independent variables are categorical or nominal.
Validation of the DASI and GPPAQ walking pace against physical performance tests

63
were achieved using the linear regression. Regression analysis was performed when
significant difference was presented in age or gender between any two groups.
Multivariable linear and multi-nominal logistic regression was used for showing the
difference in a series of dependent variables representing continuous and nominal
variables between any two groups after controlling for age and gender. After controlling
for age and gender, dependent variables in two groups were displayed as mean (95%CI
[confidence interval]: lower limitation – upper limitation), showing in the next time, there
is 95% possibility for dependent variables to present with the value within the range
between lower and upper limitation. ΔR2 Adjusted means how much age, gender and
groups explain the variance in the dependent variable.
All statistical analyses were performed using the statistical package of Social Sciences
(IBM SPSS Statistics v.24, New York, USA.) Graphs were drawn with Excel 2013
(Microsoft, Washington, USA.), EDraw Max (v9.0 EDraw Mind Map, Shenzhen, China),
and GraphPad Prism (v.7 Graphpad Software Inc, CA, USA). Statistical significance was
taken as P<0.05.

64
Chapter 3
Demographics and Clinical
Information of Participants in the
DISH, QCKD and COCO Studies

65
3.1 Abstract
According to reports from the UK Renal Registry (UKRR) and the Chinese National
Renal Data System (CNRDS), there are a number of differences in terms of demographics
and clinical parameters between UK and Chinese HD patients. These demographic and
clinical characteristics affect HD patients’ lifestyle. The aim of this chapter was to
characterise and compare the demographic and clinical information of HD patients and
healthy controls between the UK and China. Age and gender distributions in the UK and
Chinese HD patients were consistent with those in the overall respective populations.
While the mean age in the UK HD patients was older than in Chinese patients, UK HD
patients had higher BMI than Chinese patients. The difference of demographics and
clinical parameters between UK and Chinese HD patients may be potential associated
factors that lead to the disparity of lifestyle behaviors between two cultural groups.
3.2 Introduction
Kidney disease is more common as patients’ age increases. The age group with the
majority of ESRD patients in the UK was 65 to 74 years (UK Renal Registry 2016).
Different from diabetes as primary cause of ESRD in UK HD patients (UK Renal
Registry 2016), the primary cause of ESRD is glomerulonephritis in China (Xie, Chen
2008, Chinese National Renal Data System 2015).It is understood that
glomerulonephritis can occur at any age. Patients aged 2 to 15 years were the most
affected age group. However, diabetes is strongly associated with patients who are around
45 years and older (Centers for Disease Control and Prevention 2014). Furthermore,
ESRD due to diabetes might take longer in the progress of CKD. Therefore, Chinese HD
patients ought to be relatively younger than their UK counterparts. Consistently, the
average age in Chinese HD patient was 54.9 years based on the CNRDS report in 2014,
which was younger than UK HD patients (Chinese National Renal Data System 2015).
ESRD incidence rate in male patients was higher than female, which was prevalent in
almost every country with the exception of Estonia and Colombia (United States Renal
Data System, USRDS 2017). Prevalence of ESRD patients by gender and age groups in
the UK showed that males in any age groups had a higher prevalence rate than female
(UK Renal Registry 2016). The percentage of males was higher than that of female in
Chinese HD patients from 2011 to 2014. Male HD patients in 2014 accounted for 58.9%

66
of the overall Chinese HD patients (Chinese National Renal Data System 2015).
Similarly, differences in various clinical parameters are present between UK and Chinese
HD patients. The mean hemoglobin (Hgb) levels of 11.0g/dl in UK HD patients was
higher than 10.1g/dl in Chinese patients based on nation-wide scale reports with HD
patients. Other clinical parameters, such as serum ferritin, calcium, potassium and sodium
were all reported to be different between UK and Chinese HD patients (UK Renal
Registry 2016, Chinese National Renal Data System 2015).
It has long been known that HD patients’ demographics, such as age and gender,
influence their lifestyle (Liu 2012, Johansen, Kaysen et al. 2013, Brown, Yore et al. 2005).
Furthermore, there is strong correlation between lifestyle and clinical conditions in HD
patients (Kaizu, Ohkawa et al. 2003b, Johansen, Chertow et al. 2000b). Consequently,
understanding of HD patients’ demographics and clinical information is a fundamental
element in exploring the disparity of lifestyles between UK and Chinese HD patients.
Furthermore, it can promote the understanding of the relationship between lifestyle,
demographics and clinical information in HD patients.
The aims of this chapter were to characterize and compare the demographics and clinical
information of all the participants involved in the studies in the UK and China, including
HD patients and healthy controls.
3.3 Methods
The data included in this chapter were derived from the DISH (Chapter 2, section 2.2.1),
QCKD (Chapter 2, section 2.2.2) and COCO studies (Chapter 2, section 2.2.3). The
detailed methods are described in Chapter 2. Demographics of HD patients in the QCKD
study were obtained from a demographic section combined with the questionnaires
(Chapter 2, section 2.3.2). Demographics of healthy controls in the COCO study were
collected through interviews (Chapter 2, section 2.3.3). The other demographic and
clinical information of the HD patients in these three studies were all collected from the
patients’ medical records (Chapter 2, section 2.3.1, 2.3.2, 2.3.3).

67
3.4 Results
3.4.1 Demographics and nutritional blood parameters of haemodialysis patients in
the DISH study
Demographic characteristics of the UK haemodialysis patients
The demographic details of the UK HD patients in the DISH study are shown in Table3-
1. The mean age of the UK HD patients was 56.83 years, ranging from 25 to 80 years old.
The percentages of male and female were 57.5% and 42.5%. The median dialysis vintage
was 31.5 months. The mean Mid-Arm Circumference (MAC) and Body Mass Index
(BMI) were 29.6cm and 26.6kg/m2, respectively. Hypertension and anti-hypertensives
were the most commonly reported comorbidity and medication for the UK HD patients
in the study, respectively.

68
Table3- 1Demographic characteristics of the UK HD patients in the DISH study
Demographic Characteristics
UK HD patients
(n=40)
n
Mean± SD;
Median (IQR);
ratio (%)
Age (years) 40 56.8±16.1
Males: Females 40 23:17
HD vintage (Months) 40 31.5(15.8-60.3)
MAC (cm) 32 29.6±5.4
BMI (kg/m2) 33 26.6±5.9
Co-morbidity
Diabetes 12 30%
Hypertension 26 65%
Ischaemic Heart Disease 7 17.5%
Stroke/TIA 1 2.5%
Peripheral Vascular Disease 1 2.5%
Asthma or COPD 3 7.5%
Musculoskeletal disease 7 17.5%
Neurological disease 0 0.0%
Mental Health Illness 3 7.5%
Medication
Anti-hypertensives 40 100%
Antidepressants 4 10%
Oral Bicarbonate 8 20%
Statins 24 60%

69
Nutritional blood parameters of the UK haemodialysis patients
Table3- 2 shows nutritional blood parameters of the UK HD patients. All nutritional
blood parameters were within the normal range expect for cholesterol (3.8±1.1mmol/L)
and haematocrit levels (35.5±4.3L/L), which were lower than the normal range (>3.9 or
<5.2-7.8 mmol/L, 40.0-54.0L/L).
Table3- 2Nutritional blood parameters of the UK HD patients in the DISH study
Nutritional blood
parameters
UK HD patients
(n=40)
Normal range
n
Mean± SD;
Median (IQR);
ratio (%)
Albumin (g/L) 39 38.3±3.8 35-50
Cholesterol (mmol/L) 36 3.8±1.1 >3.9 or <5.2-7.8
Phosphate (mmol/L) 39 1.6±0.4 1.1-1.7
Calcium (mmol/L) 39 2.4±0.1 2.2-2.5
Hgb (g/dL) 39 12.1
(11.0-14.6) 11.5-17.5
Haematocrit (L/L) 39 35.5±4.3 40.0-54.0
Sodium (mEq/L) 39 135.0
(134.0-137.0) 135-145
Potassium (mEq/L) 39 4.4± 0.8 3.5-5.5
Transferrin Saturation 34 Male: 25.0±6.5%
Female: 20.9±4.5%
Male: 15–50%;
Female: 12–45%
Iron (umol/L) 33 Male: 12.3±3.2
Female: 10.8±2.3
Male: 11.6–31.7;
Female: 9.0–30.4
Ferritin (ng/ml) 39 Male: 2.9±1.7
Female: 5.5±2.6
Male:12-300;
Female:12-150 ng/ml

70
Demographic characteristics of Chinese haemodialysis patients
For demographic data of Chinese HD patients see Table3- 3. The mean age of Chinese
HD patients was 42.5 years, ranging from 25 to 62 years old. The percentages of male
and female were 48.8% and 51.2%. The median dialysis vintage was 60.0 months. The
mean BMI was 21.4kg/m2. Hypertension and anti-hypertensives were the most
commonly reported comorbidity and medication for Chinese HD patients in the study,
respectively.

71
Table3- 3Chinese HD patients’ demographic characteristics in the DISH study
Demographic Characteristics
Chinese HD patients
(n=43)
n
Mean± SD;
Median (IQR);
ratio (%)
Age (years) 43 42.5±9.1
Males: Females 43 21:22
HD vintage (Months) 43 60.0(36.0-84.0)
BMI (kg/m2) 43 21.4±2.6
Co-morbidity
Diabetes 1 2.3%
Hypertension 10 23%
Ischaemic Heart Disease 3 6.9%
Stroke/TIA 2 4.6%
Peripheral Vascular Disease 0 0.0%
Asthma or COPD 0 0.0%
Musculoskeletal disease 4 9.2%
Neurological disease 0 0.0%
Mental Health Illness 0 0.0%
Medication
Anti-hypertensives 43 100%
Antidepressants 0 0.0%
Oral Bicarbonate 9 23%
Statins 1 2.3%

72
Nutritional blood parameters of Chinese haemodialysis patients
Table3- 4 shows nutritional blood parameters of Chinese HD patients. Phosphate level
(2.1±0.5mmol/L) was higher than the normal range (1.1-1.7mmol/L). However,
haemoglobin (Hgb) (11.0 [10.1-12.0] g/dL) and haematocrit (33.7±5.7L/L) levels were
lower than the normal range (11.5-17.5g/dL, 40.0-54.0L/L).
Table3- 4 Nutritional blood parameters of Chinese HD patients in the DISH study
Nutritional blood
parameters
UK HD patients
(n=40)
Normal range
n Mean± SD;
Median (IQR);
ratio (%)
Phosphate (mmol/L) 39 2.1±0.5 1.1-1.7
Calcium (mmol/L) 39 2.3±0.3 2.2-2.5
Hgb (g/dL) 39 11.0
(10.1-12.0) 11.5-17.5
Haematocrit (L/L) 39 33.7±5.7 40.0-54.0
Sodium (mEq/L) 39 136.0
(135.0-139.0) 135-145
Potassium (mEq/L) 39 5.0±0.6 3.5-5.5
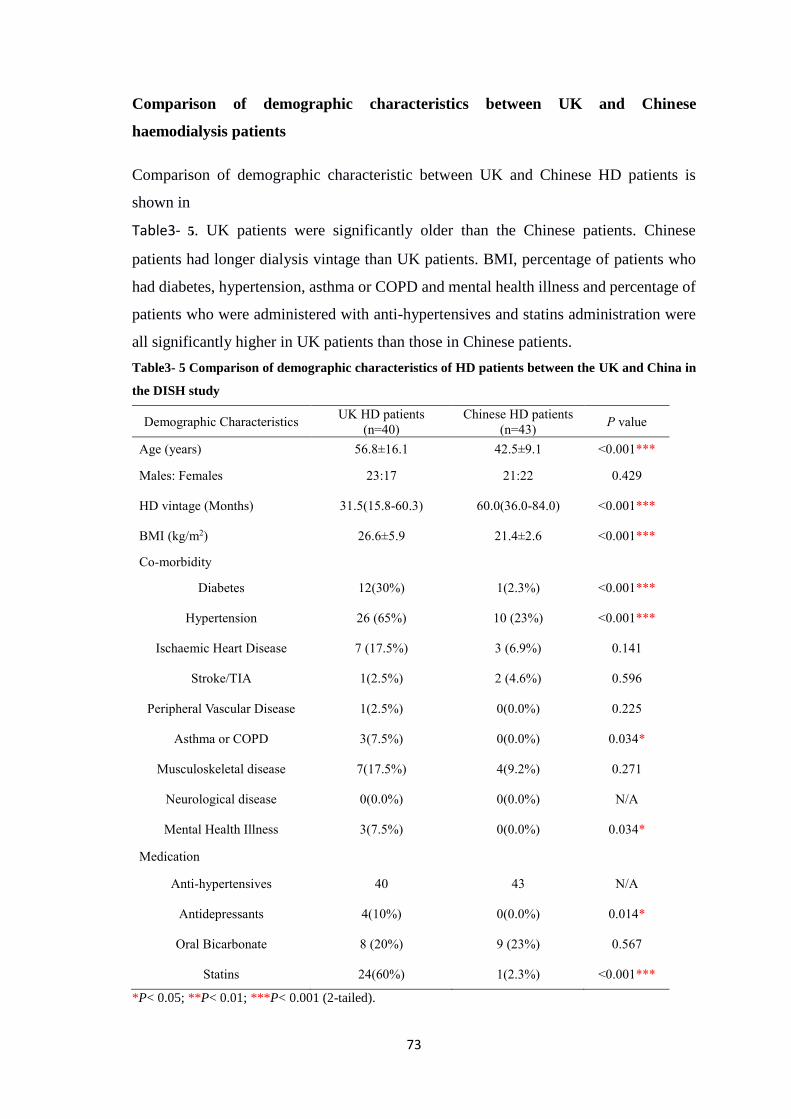
73
Comparison of demographic characteristics between UK and Chinese
haemodialysis patients
Comparison of demographic characteristic between UK and Chinese HD patients is
shown in
Table3- 5. UK patients were significantly older than the Chinese patients. Chinese
patients had longer dialysis vintage than UK patients. BMI, percentage of patients who
had diabetes, hypertension, asthma or COPD and mental health illness and percentage of
patients who were administered with anti-hypertensives and statins administration were
all significantly higher in UK patients than those in Chinese patients.
Table3- 5 Comparison of demographic characteristics of HD patients between the UK and China in
the DISH study
Demographic Characteristics UK HD patients
(n=40)
Chinese HD patients
(n=43) P value
Age (years) 56.8±16.1 42.5±9.1 <0.001***
Males: Females 23:17 21:22 0.429
HD vintage (Months) 31.5(15.8-60.3) 60.0(36.0-84.0) <0.001***
BMI (kg/m2) 26.6±5.9 21.4±2.6 <0.001***
Co-morbidity
Diabetes 12(30%) 1(2.3%) <0.001***
Hypertension 26 (65%) 10 (23%) <0.001***
Ischaemic Heart Disease 7 (17.5%) 3 (6.9%) 0.141
Stroke/TIA 1(2.5%) 2 (4.6%) 0.596
Peripheral Vascular Disease 1(2.5%) 0(0.0%) 0.225
Asthma or COPD 3(7.5%) 0(0.0%) 0.034*
Musculoskeletal disease 7(17.5%) 4(9.2%) 0.271
Neurological disease 0(0.0%) 0(0.0%) N/A
Mental Health Illness 3(7.5%) 0(0.0%) 0.034*
Medication
Anti-hypertensives 40 43 N/A
Antidepressants 4(10%) 0(0.0%) 0.014*
Oral Bicarbonate 8 (20%) 9 (23%) 0.567
Statins 24(60%) 1(2.3%) <0.001***
*P< 0.05; **P< 0.01; ***P< 0.001 (2-tailed).

74
Comparison of Nutritional blood parameters between UK and Chinese
haemodialysis patients
Comparison of nutritional blood parameters in the UK and Chinese HD patients is shown
in Table3- 6.The UK HD patients had significantly higher Hgb and haematocrit levels
than Chinese HD patients. Chinese HD patients had significantly higher phosphate,
sodium and potassium concentrations than their UK counterparts.
Table3- 6Comparison of nutritional blood parameters of HD patients between the UK and China in
the DISH study
Nutritional blood
parameters
UK HD patients
(n=40)
Chinese HD patients
(n=43) P value
Phosphate (mmol/L) 1.6±0.4 2.1±0.5 <0.001***
Calcium (mmol/L) 2.4±0.1 2.3±0.3 0.160
Hgb (g/dL) 12.1
(110-14.6)
11.0
(10.1-12.0) <0.001***
Haematocrit (L/L) 35.5±4.3 33.7±5.7 0.036*
Sodium (mEq/L) 135.0
(134.0-137.0)
136.0
(135.0-139.0) 0.022*
Potassium (mEq/L) 4.4± 0.8 5.0±0.6 <0.001***
*P< 0.05; **P< 0.01; ***P< 0.001 (2-tailed).
3.4.2 Demographics and clinical information of haemodialysis patients in the
QCKD study
Demographic characteristics
Table3- 7 shows the UK HD patients’ demographic characteristics. The median age of
the UK HD patients was 65.0 years, ranging from 16 to 82 years old. Ethnicity included
British, South Asian, African and some other mixed or non-mixed ethnicity groups.
Among these ethnicity groups, white British predominated in the subjects (59.0%), and
the second most common was Southern Asian (12.7%). The current smokers accounted
for 9.5% of patients but the majority of participants in the study had never been smokers
in the study (49.7%). Both the median complications and medications were 2 which
ranged from 0 to 6.

75
Table3- 7Demographics characteristics in the UK HD patients in the QCKD study
Demographics
Characteristics
UK HD patients
(n=1156)
n Median (IQR);
ratio (%)
Age (y) 1126 65.0 (53.0-74.0)
Male/ Female 1132 727(64.2%) /
405 (35.8%)
Dialysis vintage (y) 1087 7.0 (3.0-14.0)
BMI (kg/m2) 633 26.0 (22.4-31.0)
Current smoker/
ex-smoker/never smoke 1121
107(9.5%)/ 457(40.8%)
/557(49.7%)
Ethnicity
British
South Asian
African
Caribbean
Any other Asian background
Any other black background
White and black African
Irish
Bangladeshi
Any other ethnic group
1134
667
144
101
85
16
15
15
14
13
43
58.8%
12.7%
8.9%
7.5%
2.3%
1.3%
1.3%
1.2%
1.1%
3.8%
Co-morbidities
(count per person) 882 2(1-3)
Medications
(count per person) 867 2(1-3)

76
Clinical information
Table3- 8 shows the characteristics of Clinical information in the UK HD patients. The
median pre-dialysis urea (17.5[14.3-21.0] vs. 2.5-6.7mmol/L) and creatinine
(688.4[553.1-860.5] vs. 79.0-118.0umol/L), Parathyroid hormone (PTH) (45.7[21.2-93.5]
vs. 1.6-9.3pmol/L) and C-reactive Protein (CRP) (11.0[6.0-24.0] vs. <3.0 mg/L) in the
UK HD patients were higher than the normal range. Urea Reduction Ratio (URR) with
74.3% in the patients was higher than 65% which is considered the minimum acceptable
dose (National Kidney Foundation 2006). Conversely, the median Hgb (11.2[10.2-12.0]
vs. 11.5-17.5 g/dL) and haematocrit (0.34[0.31-0.37] vs. 0.40-0.54 L/L) were slightly
lower than the normal range.
Table3- 8Clinical information in the UK HD patients in the QCKD study
Clinical information
UK HD patients
n=1156 Normal range
n Mean± SD;
Median (IQR)
Bicarbonate (mmol/L) 840 24.0(22.0-26.0) 22–26
Urea (mmol/L) 849 17.5(14.3-21.0) 2.5-6.7
Creatinine (umol/L) 760 688.4
(553.1-860.5) 79-118
URR (%) 672 74.3 (69.0-79.0) >65
Albumin (g/L) 872 38.0(34.0-41.0) 35-50
Triglycerides (mmol/L) 286 1.4(0.9-2.0) <1.7
Cholesterol (mmol/L) 544 3.9(3.2-4.6) >3.9 or
<5.2-7.8
Phosphate (mmol/L) 861 1.5(1.3-1.8) 1.1-1.7
ALP (iu/L) 856 98.0(73.0-133.0) 44-147
Calcium (mmol/L) 852 2.3(2.2-2.4) 2.2-2.7
PTH (pmol/L) 745 45.7(21.2-93.5) 1.6-9.3
Hgb (g/dL) 879 11.2(10.2-12.0) 11.5-17.5
Haematocrit (L/L) 844 0.34(0.31-0.37) 0.40-0.54
CRP (mg/L) 581 11.0(6.0-24.0) <3.0

77
Demographic characteristics of Chinese HD patients
Table3- 9characterizes Chinese HD patients’ demographics characteristics. The median
of age in Chinese HD patients was 52.0 years, ranging from 16 to 89 years. The majority
of patients (69.3%) had never smoked. The median number of concomitant complications
and medications was 1 and 2 with range from 0 to 6, respectively. All Chinese patients
in the study had never been diagnosed with any mental disease.
Table3- 9Demographics characteristics in Chinese HD patients in the QCKD study
Demographics
Characteristics
Chinese HD patients
n=542
n Median (IQR); ratio (%)
Age (y) 542 52.0 (45.0-63.3)
Male/ Female 542 315(58.1%)/
227 (41.9%)
Dialysis vintage (y) 541 4.0 (2.0-8.0)
BMI (kg/m2) 542 21.7 (19.6-24.0)
Current smoker/ex-smoker
/never smoke 537
58(10.8%) /107(19.9%)
/372 (69.3%)
Co-morbidities (count per person) 542 1(1-2)
Medications (count per person) 542 2(1-3)

78
Clinical information of Chinese haemodialysis patients
Table3- 10 presents the Chinese HD patients’ clinical information. The mean or median
pre-dialysis urea (26.4±24.2 vs. 2.5-6.7mmol/L) and creatinine (969.1±314.1 vs.79.0-
118.0umol/L) levels, phosphate (1.8±0.7 vs. 1.1-1.7mmol/L) and PTH levels (29.6 [12.8-
54.1] vs. 1.6-9.3pmol/L) in Chinese HD patients were higher than the normal range.
Triglycerides, cholesterol, albumin, CRP and ALP were not described due to too much
missing data in the patients’ medical records. The mean or median bicarbonate (21.6±3.5
vs. 22.0–26.0 mmol/L), Hgb (10.5[9.4-11.5] vs.11.5-17.5 g/dL) and haematocrit levels
(32.0±13.0 vs.40.0-54.0 L/L) were lower than the normal range.
Table3- 10Characteristics of clinical information in Chinese HD patients in the QCKD study
Clinical information
Chinese HD patients
n=542 Normal
range n Mean± SE;
Median (IQR)
Bicarbonate (mmol/L) 485 21.6±3.5 22–26
pre-dialysis Urea (mmol/L) 470 26.4±24.2 2.5-6.7
pre-dialysis Creatinine (umol/L) 475 969.1±314.1 79-118
Albumin (g/L) 184 39.3±5.6 35-50
Phosphate (mmol/L) 520 1.8±0.7 1.1-1.7
Calcium (mmol/L) 520 2.3±0.3 2.2-2.7
PTH (pmol/L) 466 29.6 (12.8-54.1) 1.6-9.3
Hgb (g/dL) 513 10.5(9.4-11.5) 11.5-17.5
Haematocrit (L/L) 518 32.0±13.0 40.0-54.0

79
Comparison of demographics between UK and Chinese haemodialysis patients
Table3- 11 is the comparison of the demographics between the UK and Chinese HD
patients.UK HD patients were older and had higher BMI and longer dialysis vintage than
Chinese HD patients (all P<0.001). Chinese patients had more female, less ex-smokers
and comorbidities than their UK counterparts (all P<0.001).
Table3- 11Comparison of demographics in the HD patients between the UK and China in the QCKD
study
Demographic
characteristics
UK HD patients
n=1156
Chinese HD patients
n=542 P value
n Median (IQR);
ratio (%) n
Median IQR);
ratio (%)
Age (y) 1126 65.0
(53.0-74.0) 542
52.0
(45.0-63.25) <0.001***
Male/ Female 1132 727(64.2%) /
405 (35.8%) 542
315(58.1%)/
227 (41.9%) 0.004**
Dialysis vintage (y) 1087 7.0
(14.0-3.0) 541
4.0
(8.0-2.0) <0.001***
BMI (kg/m2) 633 26.0
(31.0-22.4) 542
21.7
(19.6-24.0) <0.001***
Current smoker/
ex-smoker/
never smoke
1121
107(9.5%)/
457(40.8%)
/557(49.7%)
537
58(10.8%)
/107(19.9%)
/372 (69.3%)
<0.001***
Comorbidity
(count per person) 882 2(1-3) 542 1(1-2) <0.001***
Medication
(count per person) 867 2(1-3) 542 2(1-3) 0.836
**P< 0.01; ***P< 0.001 (2-tailed).

80
Comparison of clinical information between UK and Chinese haemodialysis
patients
Table3- 12 shows the comparison of clinical information between UK and Chinese HD
patients. The UK HD patients’ urea, creatinine and phosphate levels were significantly
lower than their Chinese counterparts (all P<0.001). However, their PTH, Hgb and
haematocrit levels were significantly higher than Chinese patients (all P<0.001).
Table3- 12Comparison of clinical information between the UK and Chinese HD patients in the
QCKD study
Clinical
information
UK HD patients
n=1156
Chinese HD patients
n=542 P value
n Mean± SD;
Median (IQR) n Mean± SD;
Median (IQR)
Urea
(mmol/L) 849
17.5
(14.3-21.0) 470
25.0
(21.1-29.3) <0.001***
Creatinine
(umol/L) 760
688.4
(860.5-553.1) 475
985.5
(800.0-1176.4) <0.001***
Phosphate
(mmol/L) 861
1.5
(1.8-1.3) 520
1.8
(1.4-2.2) <0.001***
PTH
(pmol/L) 745
45.7
(21.2-93.5) 466
29.6
(12.8-54.1) <0.001***
Hgb (g/dL) 879 11.2
(12.0-10.2) 513
10.5
(9.38-11.5) <0.001***
Haematocrit
(L/L) 844
34.0
(31.0-37.0) 518
32.0
(29.0-35.0) <0.001***
***P< 0.001 (2-tailed).
3.4.3 Demographics of haemodialysis patients and healthy controls in the COCO
study
Demographics of haemodialysis patients and healthy controls in the UK
Demographics of the UK haemodialysis patients
Table3- 13 shows the UK HD patients’ demographic characteristics. The median age in
the UK HD patients was 56.3 years, ranging from 25 to 79 years old. Ethnicity mainly
included British and South Asian. Among these ethnicity groups, Southern Asian
predominated in the subjects (56.7 %), and the second most common was white British
(30.0%). The most frequently reported comorbidities were hypertension (76.7%) and
diabetes (46.7%). The main medications administrated were anti-hypertensives (60.0%)
and statins (56.7%).

81
Table3- 13Demographic characteristics in the UK HD patients in the COCO study
Demographic
characteristics
UK HD patients n=30
n Mean±SD; Median (IQR);
ratio (%)
Age (years) 30 56.3±13.8
Males: Females 30 24(80. 0%)/6(20. 0%)
HD vintage (Months) 30 23.5(10.00-40.00)
Current smoker/ex-smoker/never smoke 25 1 (4. 0%)/9 (36. 0%)/15 (60. 0%)
BMI (kg/m2) 30 27.1±4.6
Ethnicity 30
South Asian 17 56.7 %
British 9 30.0%
Caribbean 1 3.3%
Any other Asian background 2 6.6%
Any other black background 1 3.3%
Co-morbidity
Diabetes 14 46.7%
Hypertension 23 76.7%
Ischaemic Heart Disease 5 16.7%
Stroke/TIA 0 2.5%
Peripheral Vascular Disease 0 2.5%
Asthma or COPD 1 3.3%
Musculoskeletal disease 5 16.7%
Neurological disease 1 3.3%
Mental Health Illness 3 10.0%
Medication
Antihypertensives 18 60.0%
Antidepressants 1 3.3%
Oral Bicarbonate 5 16.7%
Statins 17 56.7%

82
Demographics of the UK healthy controls
Table3- 14shows the UK healthy controls’ demographic characteristics. The median age
in UK healthy controls was 45.1 years, ranging from 18 to 70 years old. Ethnicity mainly
included British, South Asian and Caribbean. Among these ethnicity groups, white
British predominated in the subjects (80.0%), and Southern Asian and Caribbean
accounted for 10.0%, respectively. Hypertension was the only comorbidity in the group
and only one participant (11.1%) had it. None of the 10 healthy controls took any
medication.

83
Table3- 14Demographics characteristics in UK healthy controls in the COCO study
Demographics characteristics UK healthy controls (n=10)
n Mean±SD; Median (IQR); ratio (%)
Age (years) 10 45.1±16.0
Males: Females 10 6(60. 0%)/4(40. 0%)
Current smoker/ex-smoker/never smoke 8 0 (0. 0%)/2 (25. 0%)/6 (75. 0%)
BMI (kg/m2) 10 25.7(22.7-31.0)
Ethnicity 10
British 8 80. 0%
South Asian 1 10.0%
Caribbean 1 10.0%
Co-morbidity
Diabetes 0 0.0%
Hypertension 1 11.1%
Ischaemic Heart Disease 0 0.0%
Stroke/TIA 0 0.0%
Peripheral Vascular Disease 0 0.0%
Asthma or COPD 0 0.0%
Musculoskeletal disease 0 0.0%
Neurological disease 0 0.0%
Mental Health Illness 0 0.0%
Medication
Antihypertensives 0 0.0%
Antidepressants 0 0.0%
Oral Bicarbonate 0 0.0%
Statins 0 0.0%

84
Comparison of demographics between haemodialysis patients and healthy controls
in the UK
Table3- 15 shows the comparison of demographic between HD patients and healthy
controls in the UK. The UK HD patients were significantly older than healthy controls.
More HD patients suffered from diabetes (P=0.002) and hypertension (P=0.008) than
their healthy counterparts. Furthermore, they took more anti-hypertensives (P=0.001) and
statins (P=0.002) than healthy controls.

85
Table3- 15Comparison of demographics between HD patients and healthy controls in the UK in the
COCO study
Demographic
characteristics
HD patients
(n=30)
Healthy Controls
(n=10) P value
Age (years) 56.3±13.8 45.1±16.0 0.039*
Males: Females 24:6 6:4 0.220
Current smoker/
ex-smoker/never smoke 1/9/15 0/2/6 0.237
BMI (kg/m2) 26.6(23.9-29.8) 25.7(22.7-31.0) 0.755
Ethnicity
British/South Asian/
Caribbean/
Any other Asian background/
Any other black background/
9/17/1/2/1
British/South Asian/
Caribbean/:
8/1/1
Co-morbidity
Diabetes 14(46.7%) 0(0.0%) 0.002**
Hypertension 23(76.7%) 1 (11.1%) 0.008**
Ischaemic Heart
Disease 5 (16.7%) 0(0.0%) 0.092
Stroke/TIA 0(2.5%) 0 (0.0%) N/A
Peripheral vascular
disease 0(2.5%) 0(0.0%) N/A
Asthma or COPD 1(3.3%) 0(0.0%) 0.466
Musculoskeletal disease 5(16.7%) 0(0.0%) 0.092
Neurological disease 1(3.3%) 0(0.0%) 0.466
Mental Health Illness 3(10.0%) 0(0.0%) 0.199
Medication
Anti-hypertensives 18(60.0%) 0(0.0%) 0.001***
Antidepressants 1(3.3%) 0(0.0%) 0.514
Oral Bicarbonate 5 (16.7%) 0(0.0%) 0.132
Statins 17(56.7%) 0(0.0%) 0.002**
*P< 0.05; **P< 0.01; ***P< 0.001 (2-tailed).

86
Demographics of participants in China
Demographics of Chinese haemodialysis patients
Table3- 16 shows Chinese HD patients’ demographic characteristics. The median age in
Chinese HD patients was 48.6 years, ranging from 30 to 65 years old. The majority of
patients (60%) had never smoked. The most frequently reported comorbidities were
hypertension (62.5%) and ischaemic heart disease(22.5%). No one in the study was
diagnosed with any mental health illness or had been administered antidepressant. The
main medications were anti-hypertensives (82.5%) and oral bicarbonate (22.5%). There
was no missing data for any characteristics.
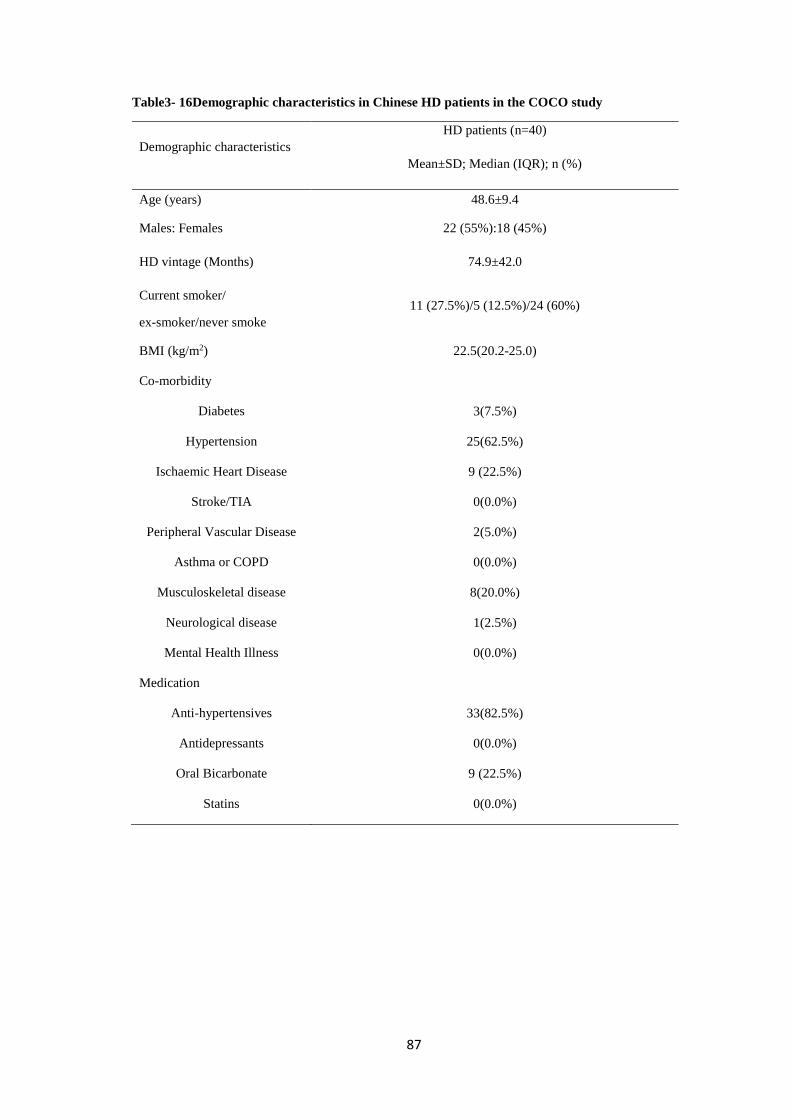
87
Table3- 16Demographic characteristics in Chinese HD patients in the COCO study
Demographic characteristics
HD patients (n=40)
Mean±SD; Median (IQR); n (%)
Age (years) 48.6±9.4
Males: Females 22 (55%):18 (45%)
HD vintage (Months) 74.9±42.0
Current smoker/
ex-smoker/never smoke
11 (27.5%)/5 (12.5%)/24 (60%)
BMI (kg/m2) 22.5(20.2-25.0)
Co-morbidity
Diabetes 3(7.5%)
Hypertension 25(62.5%)
Ischaemic Heart Disease 9 (22.5%)
Stroke/TIA 0(0.0%)
Peripheral Vascular Disease 2(5.0%)
Asthma or COPD 0(0.0%)
Musculoskeletal disease 8(20.0%)
Neurological disease 1(2.5%)
Mental Health Illness 0(0.0%)
Medication
Anti-hypertensives 33(82.5%)
Antidepressants 0(0.0%)
Oral Bicarbonate 9 (22.5%)
Statins 0(0.0%)

88
Demographics of Chinese healthy controls
Table3- 17 shows Chinese healthy controls’ demographic characteristics. The median age
in Chinese healthy controls was 50.7 years, ranging from 30 to 73 years old. The majority
of healthy controls had never smoked. Hypertension (4.5%) and anti-hypertensives (4.5%)
was the only reported comorbidity and medication, respectively. There was no missing
data for any characteristics.
Table3- 17Demographics characteristics in Chinese healthy controls in the COCO study
Demographics characteristics Healthy Controls (n=44)
Mean±SD; Median (IQR); n (%)
Age (years) 50.7±11.2
Males: Females 22 (50%):22 (50%)
Current smoker/
ex-smoker/never smoke 10(22.7%)/2(4.5%)/32 (72.7%)
BMI (kg/m2) 23.7±3.0
Co-morbidity
Diabetes 0(0.0%)
Hypertension 2(4.5%)
Ischaemic Heart Disease 0(0.0%)
Stroke/TIA 0 (0.0%)
Peripheral Vascular Disease 0(0.0%)
Asthma or COPD 0(0.0%)
Musculoskeletal disease 0(0.0%)
Neurological disease 1(0.0%)
Mental Health Illness 0(0.0%)
Medication
Anti-hypertensives 2(4.5%)
Antidepressants 0(0.0%)
Oral Bicarbonate 0(0.0%)
Statins 0(0.0%)

89
Comparison of demographics between haemodialysis patients and healthy controls
in China
Table3- 18 shows the comparison of demographics between the HD patients and Healthy
controls in China. The percentages of hypertension (P<0.001), ischaemic heart (P=0.001)
and musculoskeletal disease (P=0.002) in the HD patients were significantly higher than
those in healthy controls. Furthermore, patients administered more anti-hypertensives
(P<0.001) and oral bicarbonate (P=0.001) than healthy controls.

90
Table3- 18 Comparison of demographics between the HD patients and Healthy controls in China in
the COCO study
Demographics characteristics HD patients
(n=40)
Healthy Controls
(n=44) P value
Age (years) 48.6±9.4 50.7±11.2 0.344
Males: Females 22:18 22:22 0.595
Smoking status
Current smoker/
ex-smoker/never smoke
11/5/24 10/2/32 0.082
BMI (kg/m2) 22.5(20.2-25.0) 23.7±3.0 0.08
Co-morbidity
Diabetes 3(7.5%) 0(0.0%) 0.104
Hypertension 25(62.5%) 2(0.0%) <0.001***
Ischaemic Heart Disease 9 (22.5%) 0(0.0%) 0.001***
Stroke/TIA 0(0.0%) 0 (0.0%) N/A
Peripheral Vascular Disease 2(5.0%) 0(0.0%) 0.499
Asthma or COPD 0(0.0%) 0(0.0%) N/A
Musculoskeletal disease 8(20.0%) 0(0.0%) 0.002**
Neurological disease 1(2.5%) 1(2.3%) 0.946
Mental Health Illness 0(0.0%) 0(0.0%) N/A
Medication
Antihypertensives 33(82.5%) 2(0.0%) <0.001***
Antidepressants 0(0.0%) 0(0.0%) N/A
Oral Bicarbonate 9 (22.5%) 0(0.0%) 0.001***
Statins 0(0.0%) 0(0.0%) N/A
*P< 0.05 (2-tailed); **P< 0.01 (2-tailed); ***P< 0.001 (2-tailed)

91
Comparison of demographics between UK and Chinese haemodialysis patients
The comparison of demographics between UK and Chinese HD patients is shown in
Table3- 19.The UK HD patients were older (P=0.011) and had higher BMI (P<0.001)
than their Chinese counterparts. The percentage of female and dialysis vintage in Chinese
HD patients were significantly higher than those of the UK cohorts (all P<0.001). The
UK patients had more cases of diabetes (P<0.001) and mental health illness (P=0.022)
and administered more statins than Chinese patients. However, more anti-hypertensives
were administered in Chinese patients than those of the UK cohorts (P<0.001).

92
Table3- 19Comparison of demographics in HD patients between UK and China in the COCO study
Demographics characteristics UK HD
patients (n=30)
Chinese HD
patients (n=40) P value
Age (years) 56.3±13.8 48.6±9.4 0.011*
Males: Females 24:6 22:18 <0.001***
HD vintage (Months) 23.5
(10.0-40.0)
72.0
(48.0-96.0) <0.001***
Current smoker/
ex-smoker/never smoke 1/9/15 11/5/24 0.473
BMI (kg/m2) 26.6
(23.9-29.8)
22.5
(20.2-25.0) <0.001***
Co-morbidity
Diabetes 14(46.7%) 3(7.5%) <0.001***
Hypertension 23(76.7%) 25(62.5%) 0.648
Ischaemic Heart Disease 5 (16.7%) 9 (22.5%) 0.546
Stroke/TIA 0(2.5%) 0(0.0%) N/A
Peripheral Vascular Disease 0(2.5%) 2(5.0%) 0.092
Asthma or COPD 1(3.3%) 0(0.0%) 0.190
Musculoskeletal disease 5(16.7%) 8(20.0%) 0.723
Neurological disease 1(3.3%) 1(2.5%) 0.837
Mental Health Illness 3(10.0%) 0(0.0%) 0.022*
Medication
Anti-hypertensives 18(60.0%) 33(82.5%) 0.036*
Antidepressants 1(3.3%) 0(0.0%) 0.190
Oral Bicarbonate 5 (16.7%) 9 (22.5%) 0.546
Statins 17(56.7%) 0(0.0%) <0.001***
*P< 0.05 (2-tailed); **P< 0.01 (2-tailed); ***P< 0.001 (2-tailed)
3.5 Discussion
The mean age of UK HD patients was 65 years old in the QCKD study, which was
conducted with a large sample of HD population. It is in agreement with the finding that
65-74 year old cohorts among the age groups account for the highest proportion of HD
prevalence in UK HD patients (UK Renal Registry 2016). The mean ages of 56.3 and
56.8 years old in UK HD patients from the DISH and COCO studies were lower than the
average age of the overall UK HD patients. The average age in overall Chinese HD
patient was 54.9 years old, which was also similar to the mean age of 52.0 years found in

93
the QCKD study with large Chinese HD population (Chinese National Renal Data System
2015). Similarly, the mean age of 42.5 and 48.6 years old in Chinese HD patients from
the DISH and COCO studies were lower than the average age of the overall Chinese HD
patients. Obviously, the mean age of the UK HD patient groups recruited in these three
studies were all older than those in Chinese patient groups, which was consistent with the
findings in the nation-wide scale reports with UK and Chinese HD patients (UK Renal
Registry 2016, Chinese National Renal Data System 2015). More males than females
were recruited into these present studies, which was also consistent with the fact that
more male HD patients suffer from ESRD found in respective reports (UK Renal Registry
2016, Chinese National Renal Data System 2015).
The mean BMI in the UK HD patient groups from these three studies were all higher than
those in Chinese patient groups, which was consistent with a finding that the mean BMI
in UK participants aged between 40 and 59 years old were higher than their Chinese
counterparts (Zhou, Stamler et al. 2003). Mounting studies reported that high BMI
confers better survival(Lowrie, Li et al. 2002, Port, Ashby et al. 2002, Beddhu, Pappas et
al. 2003b). Given the relationship between body components, NS and activity (Mak,
Ikizler et al. 2011), the difference in BMI between UK and Chinese HD patients may
result in the disparity of lifestyle.
Although comorbidities were collected in the studies instead of primary causes of ESRD,
it has been found that less Chinese HD patients suffered from diabetes than UK patients.
This may corroborate the fact that diabetes is the primary cause in UK HD patients with
ESRD but not in Chinese patients(Xie, Chen 2008, Chinese National Renal Data System
2015, United States Renal Data System, USRDS 2017).
Besides the disparity of demographics between UK and Chinese HD patients, the
predominant findings in terms of clinical information were lower serum creatinine and
higher hemoglobin and hematocrit levels in UK HD patients compared with Chinese HD
patients. It indicated that UK HD patients may have worse NS, less muscle mass and
anemia than Chinese patients. Better anemia status in UK HD patients compared with
Chinese patients is consistent with the finding regarding anaemia in the overall HD
patients between the UK and China. However, given the unclear impact of creatinine on
HD patients’ lifestyle as a predictor of good NS and muscle mass, further exploration of
the association between creatinine, NS and activity is required.

94
3.6 Conclusion
The age and gender distribution of UK and Chinese HD patients were consistent with
those in the overall UK and Chinese HD populations, which may indicate patients
involved in the research were good representations of their respective populations. UK
HD patients were older and had higher BMI than Chinese HD patients, predicting the
lifestyle between UK and Chinese HD patients may be different. Additionally, the
difference of clinical parameters between UK and Chinese HD patients may also lead to
the disparity of lifestyle behaviors between these two cultural groups.

95
Chapter 4
Comparison of dietary Intake
between UK and Chinese
Haemodialysis Patients

96
4.1 Abstract
Malnutrition is highly prevalent in HD patients with a high risk of systemic inflammation,
muscle wasting, poor Quality of Life (QoL) and mortality. A thorough understanding of
dietary intake provides insight into Nutritional Status (NS). Diet pattern or habits are
closely associated with cultures. The aim of the study was to understand and compare
diet intake between UK and Chinese HD patients. Further, the study was aiming to
explore the underlying associated factors that lead to the discrepancy of nutritional blood
parameters between the two cultural groups. 24-hour diet recall interviews were
undertaken with patients in the UK and China during four normal dialysis sessions
distributed evenly in two consecutive weeks to explore diet intake for the previous 24
hours on dialysis and non-dialysis days. Demographic and nutritional blood parameters
were collected from patients’ medical records. Malnutrition was commonly present in the
UK and Chinese HD patients. UK HD patients had better nutrition management in serum
iron, phosphate and potassium than Chinese HD patients. Chinese patients need more
attention to dietary calcium intake as part of the management of their Chronic Kidney
Disease (CKD) associated mineral bone disease. Further exploration of sodium additives
as well as dialysate sodium concentration is required for understanding serum sodium.
Vitamin C and D deficiency are potentially highly prevalent in the UK and Chinese HD
patients. Increasing vitamin intake may improve the deficiency status.
4.2 Background
The assessment of NS of HD patients is a complicated and challenging process (Pifer et
al. 2002). Although diet intake is a major predictor of NS and outcome, it has been not
frequently determined in previous studies. In order to update previous guidance and
develop evidence-base practice guidelines regarding protein requirement for HD patients,
the Renal Nutrition Group of the British Dietetic Association reviewed 2931 studies in a
systematic review (Naylor et al. 2013). The research proposed that dietary assessments
were poor, which was ascribed to the estimates of protein intake deriving from
normalised Protein Catabolic Rate (nPCR) and normalised Protein Nitrogen Appearance
(nPNA), rather than food intake records as measurements of evaluating NS (Naylor et al.
2013). No other methods of assessing NS but dietary interview or diary can detect in time
the change of diet intake before nutritional blood parameters changing (Fouque,
Vennegoor et al. 2007). Additionally, dietary interview has more advantages than 3-day

97
diet diary in obtaining complete record of intake and time consuming(Griffiths et al.
1999).
In 2002, the European Dialysis and Transplantation Nurses Association/European Renal
Care Association proposed a European guideline for the nutritional care of adult renal
patients, which included a number of dietary recommendations regarding nutritional
intake, involving energy, protein, phosphate, potassium, sodium/fluid management,
vitamins and minerals (Dietitians Special Interest Group 2002). Nutritional guidelines
suggest 35 kcal/kg/d for HD patients who are less than 60 years of age as the
recommended daily energy intake, and 30 to 35 kcal/kg/d for individuals aged 60 years
or older. Energy expenditure in HD patients is similar to that in healthy population. The
recommendations for HD patients are approximately the same comparing with the advice
proposed for healthy individuals who are the same age and engaged in mild physical
activity in the Recommended Dietary Allowances (RDA) (Veeneman, Kingma et al.2005,
Food and Nutrition Board 1989). The recommended Dietary Protein Intake (DPI) is 1.2
g/kg/d (Kopple 2001). However, increasing studies have shown that energy and protein
intake are lower than the recommendation for HD patients (Bossola et al. 2005, De et al.
2006, Burrowes et al. 2005). Additionally, a study with Italian HD patients showed that
the dietary intake of trace elements and vitamins were under the recommended values
except for copper (Bossola et al. 2014).
It has been suggested that a number of supplements, such as bicarbonate, selenium
supplementation and Renal-Specific Oral Nutrition Supplement (RS-ONS) were
positively associated with the improvement of NS in HD patients in some studies(de
Brito-Ashurst 2009, Salehi et al. 2013, Sezer et al. 2014). However, problems are still
present on a wide range of different aspects of HD patients’ NS. HD patients are subject
to food restrictions requiring them to limit dietary sodium, phosphate, potassium and fluid
intake. Although some studies have demonstrated that restricting these micronutrients
can prevent complications such as high blood pressure, fluid overload and reduced
myocardial conduction velocity (Inal et al. 2014, Cupisti et al. 2013, Sanghavi et al. 2013),
these restrictions contraindicated recommendations for healthy dietary habits
(Hollingdale, Sutton & Hart 2008). It has been suggested that dietary restrictions during
HD treatment may worsen the medical condition, induced hypoglycaemia and nutritional
derangements (Kalantar-Zadeh et al. 2015). It is unclear what the best dietary approach
for HD patients is highlighted by the fact that there is a lack of national and international

98
consensus. In fact, different countries, even different regions in a same country hold
different attitudes towards food restriction (Kalantar-Zadeh, Ikizler 2013). Additionally,
cultures influence dietary habits and patterns. Dietary intake assessment for HD patients
not only provides data to compare with the recommended energy and protein amounts to
adjust dietary pattern and habits in different cultural groups, but also is able to evaluate
the regulations about food restriction or intradialytic food consumption applied by
comparing dietary intake between on dialysis and non-dialysis day.
The aims of this study have previously been described in the number(1)of 1.6 section
in Chapter 1. Briefly, the primary aim was to explore and compare HD patients’
nutritional intake, including protein and energy intake, dietary intake of trace elements,
minerals and vitamins, and nutritional blood parameters between the UK and China.
4.3 Methods
The data included in this chapter was derived from the DISH study (Chapter 2, section
2.2.1). The detailed methods are described in Chapter 2. Briefly, in this cross-sectional
study, 24-hour diet recall interviews were undertaken with HD patients in UK and China
during four normal dialysis sessions distributed evenly in two consecutive weeks.
Patients were asked to recall food intake for the previous 24 hours on dialysis and non-
dialysis days in the interviews. Demographic and nutritional blood parameters were
collected from patients’ medical records (Chapter 2, Section 2.3.1).
4.4 Results
4.4.1 Energy and protein intake
The mean age of patients in the UK and China was 56.8 and 42.5 years respectively, so
35 kcal/kg/d was utilised as the reference to assess if patients’ energy intake on dialysis,
non-dialysis and an average day were adequate.

99
Haemodialysis patients’ energy and protein intake in the UK and China
Energy and protein intake on dialysis, non-dialysis and an average day of the UK and
Chinese HD patients were all lower the recommended value of 35 kcal/kg/d and 1.2g/kg/d
for HD patients. There were no differences in energy or protein intake between dialysis
and non-dialysis days in the UK patients. However, Chinese HD patients showed more
energy (Z=-2.00, P=0.045) and protein (Z=-1.969, P=0.049) intake on dialysis days
compared to non-dialysis days. HD patients’ energy and protein intake on dialysis, non-
dialysis and an average day in the UK and China is shown in Table4- 1.
Table4- 1HD patients’ energy and protein intake in the UK and China
UK HD patients
(n=40)
Chinese HD patients
(n=43)
Energy intake
(Kcal/kg/d)
Protein intake
(g/kg/d)
Energy intake
(Kcal/kg/d)
Protein intake
(g/kg/d)
Dialysis day 26.24±10.95 0.91±0.44 24.40
(17.44-30.88)
1.00
(0.74-1.29)
Non-dialysis day 24.60±9.45 0.89
(0.66-1.11)
19.7
(16.07-25.62)
0.84
(0.59-1.06)
t/Z t=-1.393 Z =-0.495 Z =-2.00 Z=-1.969
P value 0.171 0.620 0.045* 0.049*
An average day 25.30±9.42 0.95
(0.64-1.11)
21.00
(17.65-26.66)
0.91
(0.75-1.12)
daily amount 35 1.2 35 1.2
*P< 0.05 (2-tailed).

100
Comparison of energy and protein intake in haemodialysis patients between UK and
China
There was no significant difference in energy and protein intake on dialysis (Z =-0.761,
P=0.447), non-dialysis (Z =-1.736, P=0.083) and an average day (Z =-1.554, P=0.120)
between two cohorts from the UK and China. The comparison of energy and protein
intake on dialysis, non-dialysis and average day in HD patients between the UK and
China are shown inFigure4- 1 and Figure4- 2, respectively.
Figure4- 1Comparison of energy intake on dialysis, non-dialysis and average day in HD patients
between the UK and China
The red line denotes the recommended energy of 35 Kcal/kg/d for HD patients,
* denotes significant difference between dialysis and non-dialysis day within group
Data is presented as median and interquartile range (IQR)
UK HD patients n=40, Chinese HD patients n=43

101
Figure4- 2Comparison of protein intake on dialysis, non-dialysis and average day in HD patients
between the UK and China
The red line denotes the recommended protein of 1.2 g/kg/d for HD patients,
* denotes significant difference between dialysis and non-dialysis day within group
Data is presented as median and IQR
UK HD patients n=40, Chinese HD patients n=43

102
4.4.2 Dietary intake of trace elements, minerals and vitamins
Haemodialysis patients’ iron intake in the UK and China
Both the UK and Chinese male patients’ iron intake on dialysis, non-dialysis and an
average day were much higher than the recommended value 8mg for HD male patients.
However, female patients’ iron intake both in the UK and China were lower than the
recommended 15mg for the HD female. There were no significant differences in iron
intake for either men or women between dialysis and non-dialysis days, whether in the
UK or in China. HD patients’ iron intake in the UK and China is showed in the Table4-
2.
Table4- 2HD patients’ iron intake in the UK and China
UK HD patients (n=40) Chinese HD patients (n=43)
iron intake (mg)
Male
(n=23)
Female
(n=17)
Male
(n=21)
Female
(n=22)
Dialysis day 12.26
(8.12-17.46)
7.34
(5.01-8.16)
16.75
(8.65-18.80)
12.70
(9.36-17.6)
Non-dialysis day 10.23
(7.99-14.14)
6.91
(6.20-12.27)
13.45
(10.93-19.23)
11.43
(9.25-15.29)
t/Z t=-1.196 t=1.736 Z=-0.122 Z=-0.796
P value 0.244 0.102 0.903 0.426
An average day 11.19
(8.82-16.01)
6.90
(5.69-10.24)
15.09
(11.61-21.45)
13.40
(9.81-15.98)
Recommended
daily amount 8 15 8 15

103
Comparison of iron intake in haemodialysis patients between the UK and China
There was no significant difference in iron intake on dialysis (Z=-1.216, P=0.231), non-
dialysis (Z=-1.733, P=0.090) or an average day (Z=-1.915, P=0.055) in male HD patients
between two cultures. However, Chinese female patients had significantly higher iron
intake than UK female patients on dialysis (Z=-4.022, P<0.001), non-dialysis (Z=-2.549,
P=0.011) and average day (Z=-3.370, P=0.001).
The comparison of iron intake on dialysis, non-dialysis and average day in male and
female HD patients between the UK and China are showed in Figure4- 3and Figure4- 4,
respectively.
Figure4- 3Comparison of iron intake on dialysis, non-dialysis and average day in male HD patients
between the UK and China
The red line denotes the recommended iron of 8mg for male HD patients;
Data is presented as median and IQR;
UK male HD patients n=23, Chinese male HD patients n=21

104
Figure4- 4Comparison of iron intake on dialysis, non-dialysis and average day in female HD patients
between the UK and China
The red line denotes the recommended iron of 15mg for female HD patients,
†Denoted significant difference between UK and Chinese HD patients
Data is presented as median and IQR;
UK female HD patients n=17, Chinese female HD patients n=22

105
Calcium intake and serum calcium between UK and Chinese haemodialysis
patients
Calcium intake
The median calcium intake in the UK HD patients was within the recommended amount
of 500-800 mg/d. However, Chinese HD patients’ median calcium intake was below the
recommended amount. There was no significant difference in calcium intake between
dialysis and non-dialysis days in the UK HD patients (Z=-1.089, P =0.276). Calcium
intake on non-dialysis day was significantly higher than on dialysis day (Z=-2.801,
P=0.005) in Chinese patients (Table4- 3).
Table4- 3HD patients’ calcium intake in the UK and China
Mineral
intake
HD
patients HD day
Non-HD
day P Average day
Recommended
amount
Calcium
(mg/d)
UK
(n=40)
665.0
(445.4-884.9)
609.2
(491.1-778.4) .276
618.1
(520.1-777.2) 500-800
Chinese
(n=43)
300.5
(204.5-462)
397.5
(231.5-596.5) .005**
360.2
(241.1-552.8)
**P< 0.01 (2-tailed).

106
Comparison of calcium intake between UK and Chinese haemodialysis patients
UK HD patients’ calcium consumption was significantly higher than Chinese HD cohorts
(Z=-5.350, P<0.001 on dialysis day; Z=-3.545, P<0.001 on non-dialysis day; Z=-4.684,
P<0.001 on an average day). The comparison of calcium intake on dialysis, non-dialysis
and an average day in HD patients between the UK and China is showed in Figure4- 5.
Figure4- 5Comparison of calcium intake on dialysis, non-dialysis and average day in HD patients
between the UK and China
The red line denotes the recommended calcium intake with 500-800mg for HD patients,
†Denoted significant difference between the UK and Chinese HD patients
* Denoted significant difference between dialysis and non-dialysis day within group.
Data is presented as median and IQR; UK HD patients n=40, Chinese HD patients n=43

107
Comparison of serum calcium between UK and Chinese haemodialysis patients
Both UK (2.37±0.10mmol/L) and Chinese HD patients’ mean serum calcium
(2.31±0.25mmol/L) were within the normal range of 2.2-2.5 mmol/L. There was no
significant difference in serum calcium concentration in HD patients between the UK and
China (t=1.424, P=0.160). The comparison of serum calcium concentration between UK
and Chinese HD patients is demonstrated in Figure4- 6.
Figure4- 6Comparison of serum calcium concentration in HD patient from UK and China
The red line denotes the normal range of serum calcium with 2.2-2.5 mmol/L for HD patients,
Data is presented as mean± SD,
UK HD patients n=40, Chinese HD patients n=43

108
Phosphate intake and serum phosphorus between UK and Chinese haemodialysis
patients
Phosphate intake
The median phosphate intake in the UK HD patients was within the recommended
amount of 800-1000 mg/d. Chinese HD patients’ median phosphate intake was below the
recommendation (Figure4- 7). There was no significant difference in phosphate intake
between dialysis and non-dialysis days both in the UK (Z=-0.403, P=0.687) and Chinese
HD patients (Z=-0.042, P =0.966) (Table4- 4).
Table4- 4HD patients’ phosphate intake in the UK and China
Mineral
intake
HD
patients HD day Non-HD day
P
value Average day
Recommended
daily amount
Phosphate
(mg/d)
UK
(n=40)
909.15
(720.9-1198.0)
900.09
(743.3-1222.9) 0.687
927.45
(702.6-1188.5) 800-1000
Chinese
(n=43)
719.5
(486.5-951.0)
734.99
(472.0-936.0) 0.966
697.14
(541.7-975.3)

109
Comparison of phosphate intake between UK and Chinese haemodialysis patients
Consumption of phosphate in the UK HD patients was significantly higher than those in
Chinese HD cohorts on dialysis days (Z=-2.06, P=0.039), non-dialysis days (Z=-2.889,
P=0.004) and an average day (Z=-2.679, P=0.007). The comparison of phosphate intake
on dialysis, non-dialysis and an average day between UK and Chinese HD patients is
showed in Figure4- 7.
Figure4- 7Comparison of phosphorus intake on dialysis, non-dialysis and average day in HD patients
between the UK and China
The red line denotes the recommended phosphorus intake of 800-1000mg for HD patients;
†Denoted significant difference between the UK and Chinese HD patients;
Data is presented as median and IQR;
UK HD patients n=40, Chinese HD patients n=43

110
Comparison of serum phosphorus between UK and Chinese haemodialysis
patients
The mean serum phosphate in the UK HD patients (1.60±0.44mmol/L) was within the
normal range of 1.1-1.7mmol/L. Chinese HD patients’ mean serum phosphate
(2.11±0.53mmol/L) was higher than the normal range. Serum phosphorus concentration
(t=-4.739, P<0.001) in the UK HD patients were significantly lower than that in Chinese
HD cohorts. The comparison of serum phosphorus concentration between UK and
Chinese HD patients is demonstrated in Figure4- 8.
Figure4- 8Comparison of serum phosphorus concentration in HD patient between the UK and China
The red line denotes the normal range of serum phosphorus with 1.1-1.7 mmol/L for HD patients;
†Denoted significant difference between the UK and Chinese HD patients;
Data is presented as mean± SD;
UK HD patients n=40, Chinese HD patients n=43.

111
Potassium intake and serum potassium between UK and Chinese haemodialysis
patients
Potassium intake
The mean or median potassium intake in the UK and Chinese HD patients on dialysis,
non-dialysis and an average day were more than the recommended daily intake of 800-
1000mg (Figure4- 9). There was no significant difference in potassium intake between
dialysis and non-dialysis days both in the UK (t=1.037, P=0.306) and Chinese HD
patients (Z=-1.618, P=0.106) (Table4- 5).
Table4- 5HD patients’ potassium intake in the UK and China
Mineral
intake
HD
patients HD day Non- HD day
P
value Average day
Recommended
daily amount
Potassium
(mg/d)
UK
(n=40)
1996.78±
731.03
2120.39±
736.07 0.306
2067.41±
632.02 800-1000
Chinese
(n=43)
1202.70±
510.41
1176.5
(878-1802.5) 0.106
1158.57
(859.57-1720.57)

112
Comparison of potassium intake between UK and Chinese haemodialysis patients
Potassium intake in the UK HD patients was significantly higher than that in Chinese
patients on dialysis days (Z=-5.698, P<0.001), non-dialysis days (Z=-4.347, P<0.001)
and an average day (Z=-4.848, P<0.001). The comparison of potassium intake on dialysis,
non-dialysis and average day between UK and Chinese HD patients is showed inFigure4-
9.
Figure4- 9Comparison of potassium intake on dialysis, non-dialysis and average day in HD patients
between the UK and China
The red line denotes the recommended potassium intake with 800-1000mg for HD patients; †Denoted significant difference between the UK and Chinese HD patients;
Data is presented as median and IQR;
UK HD patients n=40, Chinese HD patients n=43.

113
Serum potassium between the UK and Chinese haemodialysis patients
The serum potassium (4.43± 0.79mEq/L) in the UK HD patients was within the normal
range of 3.5-5.5mEq/L. Chinese HD patients’ serum potassium (5.04±0.64mEq/L) was
also within the normal range. The mean serum potassium concentration in the UK HD
patients was significantly lower than that in Chinese HD cohorts (t=-3.844, P<0.001).
The comparison of serum potassium concentration is demonstrated in Figure4- 10.
Figure4- 10Comparison of serum potassium concentration in HD patient from the UK and China
The red line denotes the normal range of serum potassium with 3.5-5.5mEq/L for HD patients; †Denoted significant difference between the UK and Chinese HD patients;
Data is presented as mean± SD;
UK HD patients n=40, Chinese HD patients n=43

114
Sodium intake and serum sodium between UK and Chinese haemodialysis patients
Sodium intake
The median sodium intake in the UK HD patients on the non-dialysis and an average day
were within the recommended daily sodium intake of 2000-2300mg. The median sodium
intake on the dialysis day was below the recommendation. Chinese HD patients’ sodium
intake on dialysis, non-dialysis and an average day were all below the recommended
amount (Figure4- 11). There was no significant difference in sodium intake between
dialysis and non-dialysis days with HD patients in the UK (Z=-0.551, P=0.582) and
China (Z=-0.966, P=0.334) (Table4- 6).
Table4- 6HD patients’ sodium intake in the UK and China
Mineral
intake
HD
patients HD day Non- HD day
P
value Average day Recommended
daily amount
Sodium
(mg/d)
UK
(n=40)
1951.03
(1347.8 -2427.1)
2005.76
(1539.4-2790.5) 0.582
2078.52
(1482.8-2599.8)
2000-2300
Chinese
(n=43)
553.55
(383.8-836.1)
471.25
(281.4-751.9) 0.334
563.34
(368.5-676.6)

115
Comparison of sodium intake between UK and Chinese haemodialysis patients
Consumption of sodium in the UK HD patients were significantly higher than that of
Chinese patients on their dialysis days (Z=-6.534, P<0.001), non-dialysis days (Z=-6.744,
P<0.001) and an average day (Z=-6.963, P<0.001). The comparison of sodium intake on
dialysis, non-dialysis and an average day between UK and Chinese HD patients is showed
in Figure4- 11.
Figure4- 11Comparison of sodium intake on dialysis, non-dialysis and average day in HD patients
between the UK and China
The red line denotes the recommended sodium intake with 2000-2300mg for HD patients, †Denoted significant difference between the UK and Chinese HD patients
Data is presented as median and IQR
UK HD patients n=40, Chinese HD patients n=43

116
Comparison of serum sodium between UK and Chinese haemodialysis patients
Both median serum sodium concentration in the UK (135.0 [134.0-137.0]mEq/L) and
Chinese HD patients (136.0 [135.0-139.0]mEq/L) were with the normal range of 135-
145mEq/L. The median serum sodium concentration in the UK HD patients was
significantly lower than that in Chinese patients (Z=-2.288, P=0.022). The comparison
of serum sodium concentration between UK and Chinese HD patients is demonstrated in
Figure4- 12.
Figure4- 12Comparison of serum sodium concentration in HD patient from the UK and China
The red line denotes the normal range of serum sodium with 135-145mEq/L for HD patients; †Denoted significant difference between the UK and Chinese HD patients;
Data is presented as median and IQR;UK HD patients n=40, Chinese HD patients n=43

117
Vitamin C intake between UK and Chinese haemodialysis patients
Vitamin C intake
Both median vitamin C intake in the UK and Chinese HD patients were lower than the
recommended vitamin C intake of 75-90mg on dialysis, non-dialysis and an average day
(Figure4- 13). There was no significant difference in vitamin C intake between dialysis
and non-dialysis day with HD patients in the UK (Z=-4.03, P=0.687) and China (Z=-
1.482, P=0.138) (Table4- 7).
Table4- 7HD patients’ vitamin C intake in the UK and China
Vitamin
intake
HD
patients HD day Non- HD
day P value Average day
Recommended
daily amount
Vitamin C
(mg/d)
UK
(n=40)
28.04
(16.9-66.0)
30.21
(17.2-94.9) 0.687
39.28
(20.6-72.0) 75-90
China
(n=43)
57.75
(31.3-77.5)
60.55
(37.3-86.5) 0.138
63.69
(40.6-82.6)

118
Comparison of vitamin C intake between UK and Chinese haemodialysis patients
UK HD patients had significantly less vitamin C intake than Chinese patients on dialysis
(Z=-2.205, P=0.027), non-dialysis (Z=-1.996, P=0.046), and an average day (Z=-2.260,
P=0.024). The comparison of vitamin C intake on dialysis, non-dialysis and average day
between UK and Chinese HD patients is showed in Figure4- 13.
Figure4- 13Comparison of vitamin C intake on dialysis, non-dialysis and average day in HD patients
between the UK and China
The red line denotes the recommended 75-90mg of vitamin C for HD patients, †Denoted significant difference between the UK and Chinese HD patients
Data is presented as median and IQR;
UK HD patients n=40, Chinese HD patients n=43

119
Vitamin D intake between UK and Chinese haemodialysis patients
Vitamin D intake
UK and Chinese HD patients consumed much less vitamin D on dialysis, non-dialysis
and average day than the recommended daily vitamin D intake of 15 µg (Figure4- 14).
There was no significant difference in vitamin D intake between dialysis and non-dialysis
day with HD patients in the UK (Z=-0.167, P=0.868) and China (Z=-1.149, P=0.250)
(Table4- 8).
Table4- 8HD patients’ vitamin C intake in the UK and China
Vitamin
intake
HD
patients HD day
Non-HD
day P value Average day Recommended
daily amount
Vitamin D
(mg/d)
UK
(n=40)
1.85
(0.8-4.4)
2.03
(0.9-3.2) 0.868 2.12
(1.0-3.9) 15
Chinese
(n=43)
1.2
(0.3-3.6)
1.6
(1.1-3.0) 0.250
1.94
(1.0-3.2)

120
Comparison of vitamin D intake between UK and Chinese haemodialysis patients
There was no significant difference in vitamin D intake between two cultural HD patients
on dialysis (Z=-1.368, P=0.171), non-dialysis (Z=-0.360, P=0.719) and an average day
(Z=-0.164, P=0.870). The comparison of vitamin D intake on dialysis, non-dialysis and
an average day between UK and Chinese HD patients is showed in Figure4- 14.
Figure4- 14Comparison of vitamin D intake on dialysis, non-dialysis and average day in HD patients
between the UK and China
The recommended vitamin D daily amount for HD patients is 15µg,
Data is presented as median and IQR;
UK HD patients n=40, Chinese HD patients n=43

121
4.5 Discussion
4.5.1 Dietary insufficiency in UK and Chinese haemodialysis patients
Inadequate energy and protein intake and low serum cholesterol levels (3.8±1.1mmol/L)
in this study indicated what is already published about the high prevalence of malnutrition
in UK dialysis patients (Huidobro, Velasco & Rojas 2001, Combe et al. 2004). What is
less clear is the role of Body Mass Index (BMI), which was high in this group (26.6kg/m2)
and commonly viewed as a predictor of good NS when BMI≥23 kg/m2(Fouque et al.
2008, Fouque et al. 2007). As described above, it is not clear which component of body
composition confers survival benefits upon HD patients or the best way to determine the
correlation between BMI and NS. Assessment of body composition may be a more
efficient way to evaluate NS for HD patients compared to BMI (Valtuille et al. 2015). In
an Argentine study involving 9 HD units, it was reported that BMI was reliable measure
of Fat Mass (FM) for HD patients but not of muscle mass. It is also worth noting that
malnutrition can still be present in HD patients, irrespective of BMI (Valtuille et al. 2015),
which is compatible with both the dietary and anthropometric data (BMI ≥23kg/m2) from
this study.
Albumin and cholesterol concentrations were not analysed for Chinese HD patients’ due
to too much missing data. However, the lower energy and protein intake compared to the
recommended amount still confirmed that malnutrition was commonly present in Chinese
HD patients. Additionally, the BMI (21.4kg/m2) in Chinese HD patients was lower than
the recommended level of ≥23kg/m2 by the European Best Practice Guidelines
(EBPG)(Fouque et al. 2007a) and may corroborate the evidence of malnutrition present
in this study. The high prevalence of malnutrition in the UK and Chinese HD patients
were consistent with the findings showed in previous studies (Bossola et al. 2005,
Lacquaniti et al. 2009, Bazanelli et al. 2006). Various causes contribute to malnutrition
in HD patients, such as inadequate dietary intake (Locatelli et al. 2002a), metabolic
disorders (Bossola et al. 2005) and the dialysis procedure itself (Locatelli et al. 2002b).
This study confirmed that insufficient energy and protein intake may result in
malnutrition within the HD population both in the UK and China.
The dietary intake of Chinese HD patients consisted of low consumption of meat, seafood,
dairy produce and fruit, compared with UK HD patients. Although more UK HD patients
follow a vegetarian diet, the consumption of vegetables was similar between the two

122
populations. These different dietary habits and patterns may have contributed to the
differences in nutritional intake and blood parameters observed between the two groups.
4.5.2 Provision of food during haemodialysis
Active therapeutic interventions, including intradialytic parenteral nutrition, oral
nutritional supplementation, and provision of meals during HD have been shown to
improve serum albumin and life expectancy (Kalantar-Zadeh et al. 2003, Ikizler 2013,
Pupim et al. 2006, Pupim, Cuppari & Ikizler 2006). Based on the information collected
during the study, the dialysis units in both the UK and China supplied patients with food
during dialysis sessions. In the UK, the patients were provided snacks including biscuits
and drinks. In China, the unit provided a lunch including rice, meat and vegetables for
patients in the morning shift while snacks involving two eggs and one stuffed bun were
provided for patients in the midday and evening shifts. Although energy and protein
intake on dialysis day in Chinese HD patients were still lower than the recommended
amount(Fouque et al. 2007), it was significantly higher than that on non-dialysis day. The
finding was inconsistent with the result obtained from the HEMO study(Burrowes et al.
2003). In this cross-sectional study involving 15 clinical centres across the U.S., it was
reported that dietary energy and protein intake were lower on dialysis days than on non-
dialysis days. While monitoring and interventions were suggested for patients with poor
appetite, counselling to increase the consumption of energy and protein, especially on
HD days was of importance for HD patients. Intra-dialytic food provision with Chinese
HD patients in this DISH study may provide convincing evidence to improve energy and
protein intake on dialysis days for other countries, including the UK. More emphasis
should be placed on NS for HD patients as well as appropriate health education reminding
patients to consume adequate energy and protein(Ford et al. 2004) in both cultural groups.
Meanwhile, in order to keep the balance of diet restriction and adequate nutrition intake
(Burrowes et al. 2003), it is necessary for professional healthcare providers to provide
counselling along with intradialytic nutrition.
4.5.3 Iron intake and serum iron in the UK and Chinese haemodialysis patients
The mean iron intake in the UK (12.4mg) and Chinese male HD patients (16.0mg)
exceeded the recommended amount (8mg). Conversely, female patients in the UK (6.9mg)
and China (13.3mg) had lower iron intake than the recommendation (15mg). While there

123
was no difference in iron intake between UK and Chinese male patients, the iron intake
of female HD patients in the UK was significantly lower than that in China. The specific
reasons of iron shortage within HD patients found in previous studies are possibly
ascribed to the repeated loss of blood during dialysis sessions (Coyne et al. 2007), low
bioavailability of iron using oral supplementation due to the parallel administration of
drugs binding phosphate salts(Alleyne, Horne & Miller 2008) and lack of adequate iron
intake (Szpanowska-Wohn, Kolarzyk & Chowaniec 2008). This study adds to the
evidence from previously published data, that insufficient iron intake among female HD
patients is a contributing factor of underlying poor iron status.
The comparison of serum ferritin between UK and Chinese HD patients was unable to be
performed due to the missing data in Chinese patients. As a result, haemoglobin (Hgb)
was used to estimate iron status for patients (Alvarez-Ossorio et al. 2000). UK HD
patients’ Hgb level was significantly higher than Chinese patients. It was consistent with
the discrepancy of Hgb in the UK and Chinese HD patients on a nation-wide scale (UK
Renal Registry 2016, Chinese National Renal Data System 2015). Meanwhile, the
disparity of Hgb between these two cultural groups may reveal that adverse serum iron
status was present among Chinese HD patients in the study. A systematic analysis of
anaemia burden concluded insufficient iron intake and diets containing poorly
bioavailable iron sources were the causes of anaemia in low-income countries
(Kassebaum et al. 2013), which was in agreement with the finding that Chinese female
patients’ iron intake was lower compared to the recommended amount. However, it is
found that UK HD patients had less iron intake than their Chinese HD counterparts,
especially, in female HD patients. Interestingly, the better iron status in UK patients was
shown than in Chinese patients. The finding indicated that diet is not the factor which
mostly influence iron status in HD patients. It has been documented that intravenous iron
that is expensive but has the advantage of much higher bioavailability than oral iron is
commonly used in Western countries, but seldom used in Chinese HD patients(Li, Wang
2008). Additionally, better control of blood loss during HD and maintaining
bioavailability of oral iron supplementation are potential factors as well. Chinese HD
patients may need more attention to the management of iron supplementation and blood
loss during HD comparing to dietary iron intake than UK HD patients. However, it is
worth noting that iron deficiency is not the only cause of anaemia in patients with HD
hence Hb level is a far less accurate way to assess iron status in CKD, i.e. Anaemia of

124
chronic diseases was the most frequent anaemia (45%) in patients with HD (AI-Rubaie,
Hasan & AI-Rubay 2016).
4.5.4 Calcium intake and serum calcium in the UK and Chinese haemodialysis
patients
The mean daily calcium intake in UK HD patients was within the recommended amount.
Chinese patients had lower calcium intake than the recommendation. The amount of
calcium contained within prescribed phosphate binders was not collected in this study,
making it hard to tell whether it is wholly dietary calcium intake or intake combined with
calcium-based phosphate binder that contributed to the serum calcium levels in both
cultures. Prescribed medications may be one factor contributing to similar serum calcium
concentrations between UK and Chinese HD patients. This finding may confirm that
serum calcium is not a reliable predictor of calcium intake (Byrne et al. 2009). Despite
this, UK HD patients’ dietary calcium intake was significantly higher than Chinese
patients. The INTERMAP study found that calcium intake in Asian patients was lower
than Western populations (Zhou et al. 2003). Calcium intake in Chinese males and
females was lower than those in Western countries (US and UK) as well as other Asian
populations (e.g. Japan) (Zhou et al. 2003). The result indicated that low calcium
consumption in Chinese population might be associated with the development of adverse
blood pressure levels and high risk of stroke (Zhou et al. 2003). Consistent with the
finding from the INTERMAP study that low calcium intake is present in Chinese HD
patients, Chinese HD patients may require reasonable intervention regarding the change
of the dietary pattern pointing to more calcium intake. Moreover, intradialytic food
provision is probably required for Chinese HD patients to be counselled and adjusted to
improve the low calcium intake.
Although serum calcium levels in two groups were within the normal range and no
significant difference between two cultural groups, 15(34.9%) Chinese HD patients had
hypocalcaemia (<2.2 mmol/l) and none of UK HD patients suffered from it. Additionally,
the percent of UK patients who were in normal range of serum calcium was up to 87.2%,
whilst there were only 20 (46.5%) of Chinese patients who had normal calcium level.
The result corroborated the evidence regarding the distribution of hypocalcaemia in the
overall UK and Chinese HD patients with 10.6% comparing to 36.0% (UK Renal
Registry 2016, Chinese National Renal Data System 2015). It may indicate the more

125
potential risk of mortality in Chinese HD patients than their UK counterparts. It is
noteworthy that low serum calcium in HD patients is ascribed to a number of factors
including reduced renal reabsorption of calcium and the inability of the kidneys to
activate vitamin D (Peacock 2010). Besides the structured approach of increasing dietary
calcium intake, correction of low calcium should include active vitamin D
supplementation as well as possible adjustments to the dialysate calcium concentration.
4.5.5 Phosphate intake and serum phosphate in the UK and Chinese haemodialysis
patients
Neither UK nor Chinese HD patients had excessive phosphate intake when compared to
the recommended daily amount. However, an interesting finding regarding the
comparison of phosphate intake and serum phosphate concentration was present in the
study. Although protein intake was comparable between populations, UK patients
reported higher phosphate intake on dialysis, non-dialysis and average day than their
Chinese counterparts. Despite higher dietary intake and BMI, serum phosphate levels
were lower in UK patients compared to those in China. This is consistent with serum
phosphate concentration distribution in the overall UK and Chinese HD patients, which
showed fewer patients with a serum phosphate above the standard in the UK HD patients
than their Chinese counterparts (UK Renal Registry 2016, Chinese National Renal Data
System 2015). There was no difference in the percentage of patients’ prescribed
phosphate binders between two groups (UK, n%=20% [8/40]; China n%=21% [9/43]).
The results above suggested that strategies to improve compliance with medications and
increasing dialysis phosphate removal would have a greater impact on
hyperphosphataemia than increased nutritional support in Chinese HD patients.
4.5.6 Potassium intake and serum potassium in the UK and Chinese haemodialysis
patients
Potassium intake was higher than the recommended value for both UK and Chinese HD
patients. The increased intake may translate to high serum levels of potassium, which
may lead to a variety of comorbidities and cardiovascular mortality(Noori et al., 2010,
Pun et al., 2011). Appropriate restriction of potassium-rich food and nutrition counselling
are required for these two populations. Despite higher potassium intake, UK patients had
lower serum potassium concentrations than Chinese patients. Besides the restriction of

126
potassium intake in both two cultural groups, the findings suggested that better
medication management may be required to prevent hyperkalaemia than stronger dietary
restriction in Chinese HD patients. Medications include Angiotensin-Converting Enzyme
Inhibitors (ACEIs), potassium sparing diuretics, non-selective beta blockers, Non-
steroidal anti-inflammatory drugs (NSAIDs), and unfractionate heparin, which all
contribute to hyperkalaemia in HD patients (El-Sharkawy, Khedr et al. 2009).
Additionally, improving compliance or vascular access problems to increase dialysis
efficacy is an efficient strategy to prevent hyperkalaemia as well (El-Sharkawy, Khedr et
al. 2009).
4.5.7 Sodium intake and serum sodium in the UK and Chinese haemodialysis
patients
The median sodium intake in the UK HD patients was within the recommended value.
The median sodium intake in Chinese patients was markedly below the recommendation.
The study failed to collect the sodium additives data in both two cultural groups. However,
it assumed that sodium additives intake data in Chinese HD patients would be greater
than that in the UK patients (Anderson et al. 2010). Therefore, the estimated sodium
intake with additives may be opposed to the measured intake. In the Dialysis Outcomes
and Practice Patterns Study (DOPPS), higher mortality risk appeared in HD patients with
mean serum sodium levels <140mEq/l with any groups of dialysate sodium levels
compared to patients with mean serum sodium levels ≥ 140mEq/l and a dialysate sodium
level of 140mEq/l (Hecking et al. 2012). Thus, both UK and Chinese HD patients with
serum sodium concentration of 135.0mEq/l and 136.0mEq/l in the study had a potentially
high risk of mortality. It has been reported that HD patients with mean serum sodium
<137mEq/l, compared with dialysate sodium prescriptions of 140mEq/l, patients
simultaneously with >140mEq/l of dialysate sodium concentration had a lower mortality
risk (Hecking et al. 2012). The study failed to collect HD patients’ dialysate sodium level
in the UK and China. Therefore, it is hard to compare the possible survival between UK
and Chinese HD patients according to their serum sodium concentrations. The assessment
of sodium intake combined with dialysate sodium concentration may be imperative to
better understand the correlation between serum sodium and mortality.

127
4.5.8 Vitamin C in the UK and Chinese haemodialysis patients
The median vitamin C intakes in both UK and Chinese HD patients were below the
recommended amount. It may in part explain the dietary restriction of vegetables and
fruits recommended for HD patients (Deicher, Hörl 2003)and the high prevalence of
vitamin C deficiency in HD patients all over the world (Fumeron et al. 2005, Deicher et
al. 2005, Richter et al. 2008). As well as loss of the vitamin C during HD sessions, vitamin
C deficiency in HD patients is primarily ascribed to food restriction of vitamin C-rich
foods to avoid hyperkalaemia(Deicher, Hörl 2003). In the study, the median vitamin C
intake in Chinese patients was significantly higher than that in UK patients. Interestingly,
Chinese patients had lower potassium intake than their UK counterparts. A thorough
understanding of dietary pattern in Chinese HD patients is noteworthy to be explored and
recommended for UK HD patients in order to balance potassium restriction and adequate
vitamin C intake.
4.5.9 Vitamin D in the UK and Chinese haemodialysis patients
The median vitamin D intakes in both UK and Chinese HD patients were much lower
than the recommended value. The vitamin D intake in almost all the HD patients in the
study was below the recommended dietary allowance (RDA) of 600IU/ day by the
Institute of Medicine (IOM) (Ross et al. 2011). Insufficient vitamin D intake could lead
to serum vitamin D deficiency, which was corroborated by the findings that decreased
consumption of vitamin D-rich foods contribute to the high prevalence of vitamin D
deficiency and insufficiency among HD patients (Krassilnikova et al. 2014). The high
prevalence of vitamin D deficiency in HD patients is due to renal dysfunction which is
associated with impaired conversion of 25(OH)D to 1,25(OH)2D in HD patients.
Meanwhile, vitamin D deficiency is also associated with hyperparathyroidism, low serum
calcium and obesity(Jean et al. 2008), which are not unusually common in HD patients.
However, as we all know, the provitamin D which can convert to vitamin D or
1,25(OH)2D is initially synthesized in the skin or acquired from the diet. Therefore,
insufficient sunlight exposure(Clayton, Singer 2009, Korkor, Bretzmann & Eastwood
2009) and diet rich in vitamin D intake (Korkor, Bretzmann & Eastwood 2009) may be
the primary causes of vitamin D insufficiency or deficiency. The data in the study
indicated dietary insufficiency as one contributing factor to vitamin D deficiency among
HD patients.

128
It has been shown that vitamin D deficiency results in a series of adverse complications,
including CVD (Wang et al. 2008), osteoporosis and fracture (Jean, Charra & Chazot
2008), consequently, leads to a high mortality risk in HD patients (Grandi, Breitling &
Brenner 2010, Mitri, Muraru & Pittas 2011, Souberbielle et al. 2010, Wolf et al. 2007).
Proper intervention is imperative to correct vitamin D deficiency for HD patients. It has
been reported that there is strong association between vitamin D level and active vitamin
D therapy (therapy with activated vitamin D) in HD patients, which significantly increase
survival rate(Wolf et al. 2007). In another study, HD patients with serum 25(OH) D level
<75mmol/L were administered with oral 25(OH) D3. It was found that oral vitamin D
supplementation corrected most vitamin D deficiency or insufficiency in HD patients,
which improved bone turnover, serum albumin, calcium and phosphate levels without
any evident toxicity (Souberbielle et al. 2010). Meanwhile, a better understanding of
vitamin D status with nutrition counselling to promote vitamin D intake, especially
routine clinical assessment of vitamin D in China is required for HD patients.
4.5.10 Limitations
Whilst 24-hour diet recall is recommended for both well-nourished and malnourished HD
patients as a routine assessment tool due to its reliable and efficient construct by European
best practice guidelines (EBPG) (Fouque, Vennegoor et al. 2007),it is not without its
flaws. It may underestimate actual intake with elderly patients who suffer from memory
or cognition impairment (Liu, Coresh et al. 2004, Woodrow, Oldroyd et al. 1996), which
are common in HD patients (Terekeci, Kucukardali et al. 2010). However, the interview
including asking patients to recall their diet 5 times may partly counteract the
underestimation of diet intake. Moreover, convenience sampling is easy to carry out with
relatively smaller cost and time compared with probability sampling techniques.
However, the convenience sample is unable to be representative of the population being
studied due to the failure of being chosen at random (Etikan, Musa et al. 2016). In this
study, the recruitment of 40 UK and 43 Chinese HD patients was a pragmatically selected
number chosen to facilitate this exploratory feasibility trial. Additionally, missing data
such as serum ferritin in Chinese patients, sodium additives serum Vitamin C and Din
both two groups present in this study is another limitation as well.

129
4.6 Conclusion
Malnutrition was prevalent in both the UK and Chinese HD patients. Food provision
during dialysis session has the potential to improve energy and protein intake for HD
patients. The management of intravenous iron preparations and blood loss during HD
session in Chinese HD patients may require more attention than those in their UK
counterparts to improve serum iron status. Chinese patients need closer attention paying
to their dietary calcium intake as part of the management of their CKD associated mineral
bone disease. The management of hyperphosphatemia in Chinese dialysis patients should
concentrate on more targeted prescription of phosphate binding medications management
and dialysis phosphate removal, rather than dietary restriction. More attention to
strengthen medication management and increase dialysis efficacy may be required to
prevent hyperkalaemia than dietary restriction in Chinese HD patients. In order to gain
better understanding of serum sodium in HD patients, sodium intake including additives
combined with dialysate sodium concentration are required. Insufficient vitamin C and
D intakes were common in both UK and Chinese HD patients, which may lead to
underlying vitamin C and D deficiency. The diet pattern balancing potassium restriction
and adequate vitamin C intake in Chinese HD patients could be recommended to UK
patients. Proper intervention and vitamin intake counselling may enhance vitamin C and
D intake and improve deficiency status.

130
Chapter 5
Validity of the Duke Activity Status
Index (DASI) and General Practice
Physical Activity Questionnaire and
(GPPAQ)Walking Pace Question

131
5.1 Abstract
In order to determine the validity of the Duke Activity Status Index (DASI) and General
Practice Physical Activity Questionnaire (GPPAQ) walking pace question in assessing
physical function and gait speed in HD patients, these two questionnaires were validated
against the Shuttle Walking Test (SWT) and gait speed test with the UK and Chinese HD
patients, respectively. Significant positive correlation between the DASI and Incremental
Shuttle Walking Test (ISWT) were shown in the two cultural groups. All categories of
the measured gait speed classified by the GPPAQ walking criteria showed significant
overlap of results. However, there was a significant difference between the mean gait
speed of the “slow”, “steady” and “brisk” GPPAQ walking pace categories in the UK HD
patients, in particular, the question was capable of identifying patients with slow pace.
Although there was no significant difference between the mean gait speed of the four
GPPAQ categories (P=0.107), only 1 patient reporting walking pace as “slow” exceeded
the GPPAQ walking pace cut off of slow gait speed in Chinese patients. In conclusion,
the DASI was valid for providing physical function measurement with HD patients. The
GPPAQ walking question was potentially valuable for evaluating gait speed in the UK
HD patients.
5.2 Background
Credible and applicable evidence used in research must be assessed and applied by
researchers whenever possible if their work is to gain acceptance by others (Shortell,
Rundall & Hsu 2007, Swan et al. 2012). Reliability and validity are important concepts
in research. Reliability refers to the repeatability or reproducibility of a survey
instrument’s data. It mainly composes test-retest, alternate-form and internal consistency.
Of these, test-retest is the most commonly utilized indicator of survey instrument
reliability. Test-retest is used for evaluating how reproducible results are by having a
group of participants complete a survey at two different points in time (Litwin, Fink 1995).
Validity refers to the credibility of a survey instrument, namely, it is used to evaluate if
the instrument measures what it claims to measure (Litwin, Fink 1995, Pavlov et al. 2013).
It consists of the content and criterion validity. The content validity covers face and
construct validity, which involves whether the instrument measures at face value what it
claims to and the degree to which a test captures a specific theoretical construct,
respectively. However, it has been reported that the face validity only assesses the

132
judgement of responders rather than what the survey really measures (Pavlov et al. 2013).
Additionally, a combination of different methods is required for achieving the construct
of an instrument (Pavlov et al. 2013). Concurrent validity refers to the extent to which an
instrument correlates with an external criterion, occurring at the same time and which is
generally a well-established measurement procedure. This process has been shown to be
a fast and highly appropriate way of validating the instrument; especially personal
attributes, such as depression, strengths and weakness (Stephanie 2015, Andrews, Brown
1993, Blackhurst, Brandt & Kalinowski 1998). The correlation between the instrument
and the well-established measurement procedure can be obtained with the Pearson
correlation coefficient. The strength of this association was interpreted based on Cohen’s
guidelines with r value (small: r = 0.10 to 0.29; medium: r = 0.30 to 0.49; large: r = 0.50
to 1.0) (Pallant 2011). Obviously, if an instrument is valid, it must be reliable according
to the nature of validity and reliability. However, even if a test can be measured reliably,
that does not make it a valid instrument which measures what it sets out to measure.
It has been documented that simple efficient questionnaires may be preferred to provide
a wide spectrum of therapeutic results for patients compared with the time consuming
and complex objective measures (Koufaki, Kouidi 2010). Furthermore, the main strength
of a questionnaire’s ability to easily assess a large population making it efficient for
collecting population-based information. This was the reason that the DASI and GPPAQ
were chosen in the study to assess HD patients’ activity in a large sample of the
population. However, poorly worded questions, ambiguous responses and non-response
bias are well-known limitations of questionnaires (McLafferty 2003). Whilst the DASI
has previously been used in renal disease patients (Pia Kontos et al. 2017, Pietro Ravani
et al. 2012), few studies have focused on its validity in HD patients. It is understood that
only one study pertaining to the reliability and validation of the DASI was conducted
with stage 3-4 CKD patients. The DASI was reliable with a test-retest reliability of 71%
when eGFR ≥35 ml/min per 1.732 and 81% when eGFR <35 ml/min per 1.732. However,
another main finding in the study was that the DASI overestimated Peak Oxygen
Consumption (VO2peak) by 4.3ml/ kg per min(Pietro Ravani et al. 2012). The GPPAQ
walking pace question included in the GPPAQ was usually used for categorizing
participants into active or inactive groups. A study with 60-74 year old adults set a cut-
off where participants who reported walking at a brisk or fast pace for ≥3h/week were
considered as active. The sensitivity and specificity of GPPAQ walking pace to identify

133
‘Active’ and ‘Inactive’ individuals against accelerometer were 39% and 70%. However,
it is understood that the validity of the GPPAQ walking pace had not been explored.
Therefore, establishing the validity of the DASI and GPPAQ walking pace is important
for obtaining simple and efficient questionnaires to evaluate physical function or gait
speed when dealing with a large group of HD patients. As described in the introduction
chapter, the SWT has higher reliability and accuracy when compared to questionnaires
for assessing physical function. Additionally, the Short Physical Performance Battery
(SPPB) applied in the study is capable of objectively measuring HD patients’ gait speed.
Therefore, examining the validity of the DASI and GPPAQ walking pace question against
well-established objective measure tools is feasible and meaningful in this study. As
descried above, the Sit-to-Stand 60 (STS60) and handgrip strength (HGS) assess muscle
endurance and strength, and the SPPB mainly assesses lower extremity mobility. Whilst
the SWT, STS60, SPPB and HGS were utilized for evaluating physical function with HD
patients within the thesis, only the SWT exactly measures exercise capacity, which is
congruent with the construct of the DASI. Hence, the DASI was only validated against
the SWT in the study.
The aims of this study have previously been described in the number (2) of Section 1.6
in Chapter 1. Briefly, this study was aiming to validate the DASI and GPPAQ walking
pace question against the SWT and gait speed tests with the UK and Chinese HD patients.
5.3 Methods
The data included in this chapter was derived from the COCO study (Chapter 2, section
2.2.3). The detailed methods are described in Chapter 2. Specifically, the results of the
DASI (section 2.3.2), GPPAQ walking pace question (section 2.3.2), the SWT (section
2.3.3) and the objective gait speed measure from the SPPB (section 2.3.3) were used.
As a reminder, The DASI assesses participants’ exercise capacity to perform activities
ranging from self-care to household work and strenuous exercise. The SWT composes
incremental and endurance SWT, which measure participants’ exercise capacity as the
walking pace increases and the endurance capacity when the participants are asked to
walk as long as they could at a constant walking speed. Besides the PA level assessment,
the GPPAQ contains a question, which asked participants to describe their walking pace.
Participants can choose one from four options regarding their own walking pace which
could be categorized into slow (less than 3mph), steady (3-4mph), brisk (3-4mph) and

134
fast pace (over 4mph). Gait speed test from the SPPB was measured by having
participants complete a 4m course at their usual walking pace.
5.4 Results
5.4.1 Demographics of haemodialysis patients
The demographics of the UK and Chinese HD patients in this chapter are shown in the
Table3- 13 and Table3- 16 of the Chapter 3.
5.4.2 Validity of the DASI against the Shuttle Walking test in the UK and Chinese
haemodialysis patients
Significant positive correlation between the DASI and ISWT with r of 0.67 (P<0.001)
and 0.39 (P<0.05) were shown in the UK and Chinese HD patients, respectively (Figure5-
1 and Figure5- 2). However, there were no significant associations between the DASI
and ESWT with r of 0.35 (P =0.076) and 0.28 (P=0.098) in two HD cohorts (Figure5- 3
and Figure5- 4).

135
Figure5- 1Linear regression showing DASI against the ISWT in UK HD patients
Figure5- 2Linear regression showing DASI against the ISWT in Chinese HD patients

136
Figure5- 3Linear regression showing DASI against the Endurance Shuttle Walking Test (ESWT) in
the UK HD patients
Figure5- 4Linear regression showing DASI against the ESWT in Chinese HD patients

137
5.4.3 Validity of the GPPAQ walking pace question against the gait speed
objectively measured by the SPPB
UK haemodialysis patients
The UK HD patients’ gait speed measured in the SPPB corresponded to their self-
reported walking pace obtained from the GPPAQ (Table5- 1). Patients were categorised
as “slow”, “steady” or “brisk” based on their response to the GPPAQ. No one reported
his or her walking pace as “fast”. Following this the mean gait speed of each category, as
measured in the SPPB, was calculated. A positive trend of measured gait speed was seen
across categories, however all categories showed significant overlap of results. Only 1
(8.3%) patient correctly evaluated his/her walking pace as “steady” based on the gait
speed measurement. The mean of the “steady” and “brisk” speed was lower than the range
defined by the GPPAQ walking pace question criteria. However, the mean of “brisk” gait
speed was higher than that of “steady” speed. There was a significant difference between
the mean gait speed of the three GPPAQ categories (P=0.008). This was most evident
with the steady walking pace which was significantly higher than slow speed (P=0.003).
Table5- 1Validation of the GPPAQ walking pace against gait speed obtained from the SPPB in the
UK HD patients
N=30 Walking pace
(GPPAQ)
Mean (SD)
(mph) (SPPB)
Range
(mph) (SPPB)
Tests of Between-
Subjects Effects
17 Slow (<3 mph) 1.75(0.53) 0.71-2.50
P=0.008** 12 Steady (3-4 mph) 2.41(0.42) 1.91-3.20
1 Brisk (3-4 mph) 2.61 (0.00) 2.61-2.61

138
Chinese haemodialysis patients
Except for the “fast” category, the mean gait speed in the SPPB categorized by patients’
self-reported walking pace from slow to brisk also appeared to have a positive trend.
However, the mean of gait speed of the “fast” group was lower than that of the brisk
group. The range of gait speed obtained from the SPPB overlapped in four categories.
All the walking paces reported as “brisk” and “fast” by patients were not consistent with
their gait speed when objectively measured. Walking pace reported as “slow” and “steady”
by 1 (6.3%) and 16 (94.1%) patients appeared inconsistent with measured gait speed from
the SPPB. There was no significant difference between the mean gait speed of the four
GPPAQ categories (P=0.107) (Table5- 2).
Table5- 2Validation of the GPPAQ walking pace against gait speed obtained from the SPPB in
Chinese HD patients
N=40 Walking pace
(GPPAQ)
Mean (SD)
(mph) (SPPB)
Range
(mph) (SPPB)
Tests of
Between-Subjects Effects
16 Slow (<3 mph) 2.20(0.52) 1.36-3.58
P=0.107
17 Steady (3-4 mph) 2.44(0.30) 1.86-3.06
5 Brisk (3-4 mph) 2.68 (0.22) 2.42-2.98
2 Fast (> 4 mph) 2.67 (0.82) 2.09-3.25
5.5 Discussion
There were ‘large’ and ‘medium’ positive correlation between the DASI and the ISWT
with r of 0.67 and 0.39 in the UK and Chinese HD patients respectively, confirming that
the DASI is valid for providing HD patients with a standardized assessment of physical
function. The finding was consistent with a number of studies that validated the DASI
against the objective measure of maximal exercise capacity. As early as 1989, a study
(Hlatky et al. 1989) with 50 subjects demonstrated that the DASI provided a standardized
measure of physical function and had a large correlation with the VO2peak (r=0.58,
P<0.0001). Coutinho-Myrrha et al. found that there was a significant positive correlation
between the DASI in a Portuguese version and the VO2max (r=0.51, P<0.001) in patients
with CVD (Coutinho-Myrrha, Dias et al. 2014). From this study, the evidence was
extended that the DASI is valid for measuring exercise capacity with HD patients. The

139
disparity of the degree of correlation between the DASI and the ISWT between two
cultural groups may be due to the difference of questionnaire versions. The DASI was
designed and developed by Hlatky and colleagues in English (Hlatky et al. 1989).
However, the Chinese version of the DASI was developed by cross-culturally translated
and adapting (Yinian Peng 2016), which may influence the validity of the DASI in
Chinese HD patients.
The VO2peak is viewed as the ‘gold standard’ of measuring exercise capacity. However, it
is often impractical due to costs, and the fact that it is complex and physically demanding,
especially in vulnerable chronic disease patients. Given its simple, progressive nature and
high reliability, the SWT has been widely used in a number of studies (Billings et al.
2013, Green et al. 2001). The validation of the ISWT against VO2peak showed a strong
relationship between measures, with r values ranging from 0.54 to 0.88 in varying
populations, such as obese women, patients with coronary artery bypass surgery and
COPD(Jürgensen et al. 2015, Fowler, Singh & Revill 2005, Arnardóttir et al. 2006).
Whilst the DASI assesses a participant’s capacity for accomplishing a particular activity,
the ISWT measures participants’ physical capacity to complete a fixable shuttle course
in an allowed time. Obviously, this explained the strong relationship between the DASI
and the ISWT. However, the DASI does not evaluate the endurance of conducting certain
activities, which may explain why there was no significant association between the DASI
and ESWT in two HD cohorts.
The GPPAQ walking question appeared to have a mixed level of validity with HD
patients of different cultures in the study. Gait speed classified into “steady”, “brisk” and
“fast” categories in Chinese HD patients were not consistent with the standard of the
GPPAQ walking pace, which was set according to the Centres for Disease Control and
Prevention (CDC) (the Centres for Disease Control and Prevention, (CDC) 2015).
Meanwhile, the GPPAQ walking question was unable to distinguish Chinese participants’
walking pace categories, which may indicate that the GPPAQ walking question is not
reliable for Chinese HD patients. However, it showed stepwise increase in mean gait
speed of the UK patients between categories. One explanation may be that the GPPAQ
had never been validated with Chinese population. As mentioned in the method, the
GPPAQ was only translated into Chinese for investigating more potentials in the research.
Furthermore, the conversion of units of walking pace from mph to km/s for the Chinese
version of the GPPAQ walking pace may be another underlying reason. Since mph is not

140
a commonly used unit in China. Nonetheless, it was found that slow pace reports based
on the CDC criteria were in agreement with the gait speed measured with the SPPB in
the UK HD patients and only one Chinese patient exceeded CDC cut off of slow gait
speed, suggesting that the GPPAQ walking pace question may be valid for assessing slow
pace (Kutner, Zhang et al. 2015). It have been shown in mounting studies that the vast
majority of HD patients had slow gait speed(Painter, Marcus 2013, Johansen, Chertow et
al. 2001, Painter, Carlson et al. 2000). Additionally, it is noteworthy that the vague
classification between the “steady” and “brisk” walking pace in the GPPAQ may be an
underlying limitation, which led to participants’ incapability or confusion with
differentiating these two categories. Therefore, the findings may suggest that different
criteria of walking pace with “slow” or “not slow” pace in the CDC is required for HD
patients.
Strengths and Limitations
The study reported the unknown previous results regarding the relationship between the
DASI and SWT, and the GPPAQ walking pace question and gait speed test. However,
several limitations are still present. The DASI and GPPAQ were not administered a
second time with the same HD patients in the study, therefore test-retest reliability of
these two questionnaires was unable to be measured. However, according to the
relationship between reliability and validity, the validation against well-established tests
is arguably the most important criteria that determines the quality of the DASI and
GPPAQ walking pace question. Furthermore, questionnaire validation is an
overwhelming process. The process mainly includes piloting test the questionnaire on a
subset of the intended population and checking reliability and validity of questionnaires.
In the present study only criterion validity of the DASI and GPPAQ walking pace
question were examined. Additionally, recommendations on sample size for
questionnaire validation are various. Based on the statistical sophistication of Exploratory
Factor Analysis (EFA) and Confirmatory Factor Analysis (CFA), sample size estimations
are invariably based on ‘rules of thumb’ that number of participants to number of items
ratios ranges from 3-10(Cattell 2012, Everitt 1975). Additionally, minimum sample size
requirements are 50 (de Winter, Dodou et al. 2009), 100(Kline 2000), 150(Hutcheson,
Sofroniou 1999), or 200(Gorsuch 1983). However, the sample size were only 30 and 40
UK and Chinese HD patients in this study, which were lower than the recommended
overall sample size minima. Finally, the validity of the GPPAQ was not analyzed in the

141
study, although accelerometers were applied in HD patients for measuring their habitual
PA level. As mentioned above, the GPPAQ is used for assessing participants’ PA level in
the past 7 days. However, the accelerometers were given to patients after the GPPAQ had
been taken home to complete rather than over the 7 day period preceding the completion
of GPPAQ in the study. Therefore, the PA level measurements failed to correspond to the
time period covered by the questionnaire. This may lead to a poor or inaccurate validation
for the GPPAQ against accelerometry.
5.6 Conclusion
The DASI showed valid performance in the UK and Chinese HD patients and could be
of use for providing physical function measurements with HD patients. The standard of
the GPPAQ walking pace question failed to prompt HD patients to accurately report their
walking pace. However, it was capable of distinguishing different categories of patients’
walking pace in UK HD patients. Specifically, the questionnaire was able to identify
patients with slow walking pace, showing the possible usefulness for evaluating gait
speed in the UK HD patients.

142
Chapter 6
Physical Function of Haemodialysis
Patients in the UK and China

143
6.1 Abstract
Impaired physical function has been commonly reported in HD patients, which leads to
a number of adverse symptoms and complications, consequently, results in a high
mortality risk. In-depth exploration regarding the potential disparity of physical function
with HD patients between different cultures may be beneficial to improve physical
function for each cohort. In order to characterize and compare physical function between
UK and Chinese HD patients and explore the contributing factors of physical function
pertaining to demographics and clinical information, a combination of the Duke Activity
Status Index (DASI) and GP Physical Activity Questionnaire (GPPAQ) walking pace
question and physical performance tests (Shuttle Walking Test [SWT], Sit-to-Stand 60
[STS60], Short Physical Performance Battery [SPPB] and Handgrip Strength [HGS])
were conducted with HD patients in two cultural groups. Low physical function was
highly prevalent in the UK and Chinese HD patients. High nutritional status (NS) or
muscle mass, low inflammation, bone metabolism derangement and comorbidity were
positively associated with physical function in HD patients. Anemia was negatively
correlated with Chinese HD patients’ physical function. UK HD patients had significantly
lower physical function than Chinese patients, which may be ascribed to the higher (Body
Mass Index) BMI, lower creatinine, worse protein status and bone metabolism in UK
patients compared to their Chinese counterparts.
6.2 Background
It has long been known that HD patients experience impaired physical function (Jette,
Posen et al. 1977). This manifestation has been corroborated by ample studies (Diesel,
Noakes et al. 1990, Johansen 1999, Van Den Ham, Eugénie C H, Kooman et al. 2005,
Marcus, LaStayo et al. 2015), of these, Johansen et al. reported that levels of exercise
capacity in HD patients were only 60% to 70% of age-expected levels (Johansen 1999).
E.Sterky et al. conducted sit-to-stand and staircase tests to compare physical capacity
between elderly HD patients and healthy controls matched for age and gender(Sterky,
Stegmayr 2005). The results showed that HD patients have 50% less functional capacity
than the controls. A significant body of studies have shown that reduced physical function
are associated with worse symptoms and complications, increase hospitalization rates and
compromise Quality of Life (QoL) (Marcus, LaStayo et al. 2015, DeOreo 1997, Li, Li et
al. 2010a, Johansen, Shubert et al. 2003). Consequently, mounting studies have revealed

144
that declining physical function is an independent predictor of increased mortality in HD
patients (DeOreo 1997, Marcus, LaStayo et al. 2015, Knight, Ofsthun et al. 2003).Given
the burden caused by impaired physical function and the high prevalence profoundly
affecting HD patients, assessment of physical function performed with valid and simple
measurement tools, such as questionnaires or objective instruments, is urgently needed
for HD patients. As described above, the DASI has been shown to be a valid questionnaire
for assessing the UK and Chinese HD patients’ physical function. Whilst the DASI plays
a crucial role in assessing exercise capacity for a large HD population, objective physical
performance tests provide accurate and effective measure of physical function for HD
patients (Cobo, Gallar et al. 2015). In the present study, subjective and objective measures
were combined to gain a comprehensive understanding of physical function within the
UK and Chinese HD patients. Consequently, this understanding provides insight into the
potential demographics and clinical outcomes associated with physical function and may
also inform the design of a patient-centred exercise prescription or intervention.
The aims of this study have previously been described in the number (3) of 1.6 section.
Briefly, the primary aim of this study was to characterise and compare HD patients’
physical function between the UK and China.
6.3 Methods
The data included in this chapter was derived from the QCKD and COCO study (Chapter
2, section 2.2.2 and 2.2.3). The detailed methods are described in Chapter 2. Results from
the DASI and GPPAQ walking pace question completed in the QCKD study (section
2.3.2) and physical performance tests completed in the COCO study (section 2.3.3) were
analysed.
Briefly, the DASI and GPPAQ walking pace question were conducted for assessing
exercise capacity and walking pace with both the UK and Chinese HD patients after
recruiting them into the QCKD study. Physical performance tests include SWT, STS60,
SPPB and HGS, which were utilized for measuring exercise capacity, muscle endurance,
lower extremity function and muscle strength with HD patients and healthy controls in
the UK and China, respectively. All these tests were assessed with patients before a HD
session or on a non-HD day. For healthy controls, tests were conducted at their convenient
time.

145
6.4 Results
6.4.1 Physical function measured by questionnaires in the UK haemodialysis
patients
Demographics and clinical information
The UK HD patients in this section were from the QCKD study. Their demographics and
clinical information were shown inTable3- 7 and Table3- 8.
The DASI
1109 UK HD patients completed the DASI, and the valid response rate was 96.0%. The
median DASI score in the UK HD patients was 17.95Metabolic Equivalent of Task
(METs), with an IQR of 30.2-99.5 and range of 0.00-58.2. Figure6- 1 shows the histogram
of the frequency of the DASI scores with 3.1% and 3.2% of patients having the minimum
and maximum DASI score of 0 and 58.2METs.
Figure6- 1Histogram of the frequency of the DASI scores

146
Relationship between the DASI score and categorical variables of demographics and
clinical information
The DASI score in male HD patients were significantly higher than that in female patients
(Z=-4.529, P<0.001). There was no significant difference in DASI score between White
British and South Asian patients (Z=-1.574, P=0.144), current smokers and those who
have never smoked (Z=-0.906, P=0.365), ex-smokers and never smoked (Z=-0.018,
P=0.986) and current smokers and ex-smoker (Z=-8.37, P=0.403).
Relationship between the DASI score and continuous variables of demographics and
clinical information
The DASI score was negatively correlated to age, dialysis vintage, number of co-
morbidities, high CRP and ALPlevels. Conversely, higher DASI score was positively
associated with urea and creatinine, phosphate, albumin and cholesterol levels. Table6- 1
shows the correlations between the DASI, demographics and clinical information.
Table6- 1Correlations between the DASI score and continuous variables of demographics and
clinical information
Continuous variables DASI Score (METs)
Age (y) Rho=-0.258 P<0.001***
Dialysis Vintage (y) Rho=-0.079 P=0.01**
BMI (kg/m2) Rho=-0.063 P=0.118
urea (mmol/L) Rho=0.137 P<0.001***
creatinine (umol/L) Rho=0.225 P<0.001***
Albumin (g/L) Rho=0.180 P<0.001***
CRP (mg/L) Rho=-0.222 P<0.001***
cholesterol (mmol/L) Rho= 0.144 P=0.001***
phosphate (mmol/L) Rho= 0.096 P=0.006**
ALP (iu/L) Rho= -0.177 P<0.001***
Hgb (g/dL) Rho= 0.033 P=0.331
haemotocrit (L/L) Rho= 0.024 P=0.487
Co-morbidities (count per person) Rho= -0.329 P<0.001***
**P< 0.01; ***P< 0.001 (2-tailed).

147
GPPAQ walking pace
736 (63.7%) patients reported their walking pace as slow. However, only 18(1.6%)
patients considered their walking pace as fast. The distribution of walking pace in the UK
HD patients is demonstrated in Table6- 2.
Table6- 2 Distribution of walking pace in the UK HD patients
Questionnaire HD patients in each category n (%)
GPPAQ Walking
pace
Slow Steady Brisk Fast
736 (63.7) 266 (23.0) 39(3.4) 18(1.6)
Relationship between the GPPAQ walking pace and categorical variables
Male patients’ walking pace was significantly faster than female (X2=4.519, P=0.034).
There was no significant difference in walking pace between ethnicities (X2=1.798,
P=0.615) and different types of smoking status (X2=2.641, P=0.852).

148
Relationship between the GPPAQ walking pace and continuous variables
There were negative correlations between walking pace, age, dialysis vintage, BMI,
number of co-morbidities, ALP, CRP and PTHlevels. Walking pace was positively
associated with creatinine, cholesterol and albumin levels. Table6- 3shows the correlation
between walking pace, demographics and clinical information.
Table6- 3Correlation between walking speed and continuous variables of demographics and clinical
information
Continuous variables Walking pace
Age (y) Rho=-0.208 P<0.001***
Dialysis vintage (y) Rho=-0.069 P=0.026*
BMI (kg/m2) Rho=-0.083 P=0.043*
urea (mmol/L) Rho=0.059 P=0.098
creatinine (umol/L) Rho=0.153 P<0.001***
albumin (g/L) Rho=0.137 P<0.001***
CRP (mg/L) Rho=-0.189 P=0.001***
cholesterol (mmol/L) Rho=0.111 P=0.012*
ALP (iu/L) Rho=-0.180 P<0.001***
PTH (pmol/L) Rho= -0.082 P=0.030*
Hgb (g/dL) Rho= 0.054 P=0.124
haemotocrit (L/L) Rho=0.008 P=0.820
Co-morbidities
(count per person) Rho= -0.278 P<0.001***
**P< 0.05; **P< 0.01; ***P< 0.001 (2-tailed).
6.4.2 Physical function measured by physical performance tests in the UK
haemodialysis patients and healthy controls
Demographics
The HD patients and healthy controls in this section came from the COCO study. The
Demographics of the UK HD patients and healthy controls are shown in the Table3- 13
and Table3- 14of Chapter 3, respectively. The comparison of demographics between HD
patients and healthy controls in the UK is shown in Table3- 15.
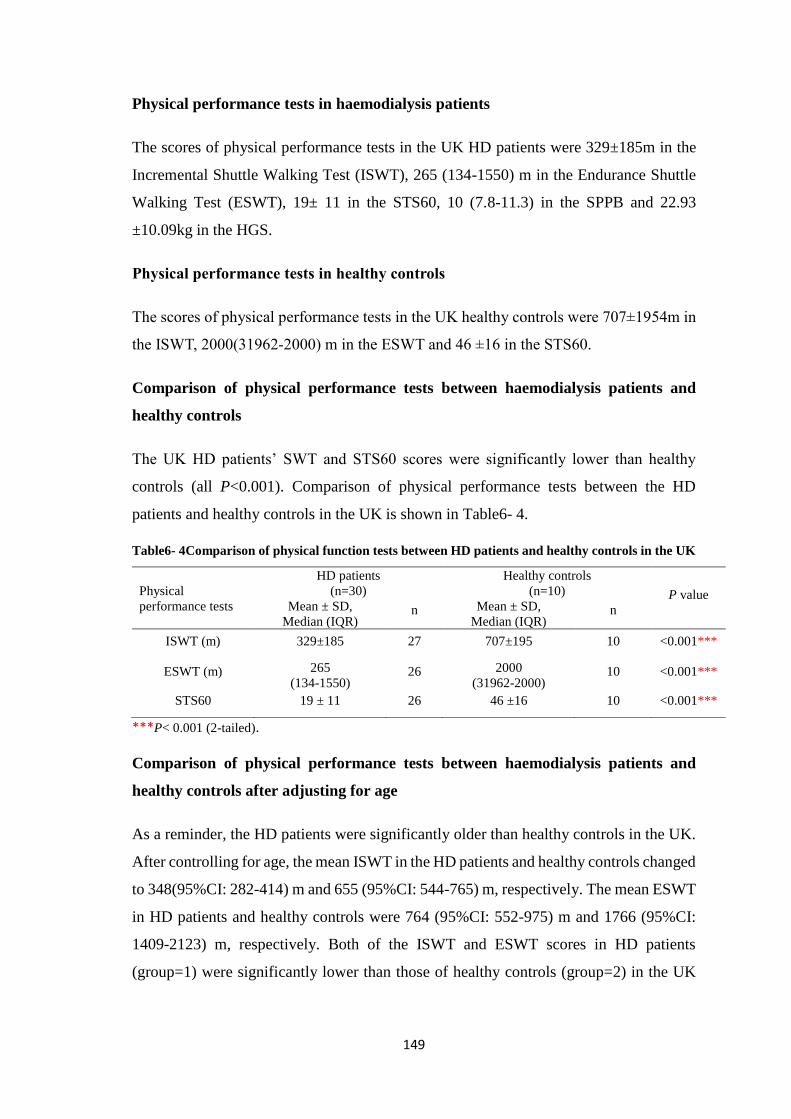
149
Physical performance tests in haemodialysis patients
The scores of physical performance tests in the UK HD patients were 329±185m in the
Incremental Shuttle Walking Test (ISWT), 265 (134-1550) m in the Endurance Shuttle
Walking Test (ESWT), 19± 11 in the STS60, 10 (7.8-11.3) in the SPPB and 22.93
±10.09kg in the HGS.
Physical performance tests in healthy controls
The scores of physical performance tests in the UK healthy controls were 707±1954m in
the ISWT, 2000(31962-2000) m in the ESWT and 46 ±16 in the STS60.
Comparison of physical performance tests between haemodialysis patients and
healthy controls
The UK HD patients’ SWT and STS60 scores were significantly lower than healthy
controls (all P<0.001). Comparison of physical performance tests between the HD
patients and healthy controls in the UK is shown in Table6- 4.
Table6- 4Comparison of physical function tests between HD patients and healthy controls in the UK
***P< 0.001 (2-tailed).
Comparison of physical performance tests between haemodialysis patients and
healthy controls after adjusting for age
As a reminder, the HD patients were significantly older than healthy controls in the UK.
After controlling for age, the mean ISWT in the HD patients and healthy controls changed
to 348(95%CI: 282-414) m and 655 (95%CI: 544-765) m, respectively. The mean ESWT
in HD patients and healthy controls were 764 (95%CI: 552-975) m and 1766 (95%CI:
1409-2123) m, respectively. Both of the ISWT and ESWT scores in HD patients
(group=1) were significantly lower than those of healthy controls (group=2) in the UK
Physical
performance tests
HD patients
(n=30)
Healthy controls
(n=10) P value Mean ± SD,
Median (IQR) n Mean ± SD,
Median (IQR) n
ISWT (m) 329±185 27 707±195 10 <0.001***
ESWT (m) 265
(134-1550) 26 2000
(31962-2000) 10 <0.001***
STS60 19 ± 11 26 46 ±16 10 <0.001***

150
(R2Adjusted =0.569 and R2
Adjusted =0.597, both P<0.001) after adjusting for age (Table6- 5
and Table6- 6).
After controlling for age, the mean STS60 in HD patients and healthy controls in the UK
was 20 (95%CI: 15-25) and 45 (95%CI: 36-53), respectively. The STS60 in the HD
patients (group=1) was still significantly lower than that of the healthy controls (group=2)
in the UK (R2Adjusted =0.48, P<0.001) (Table6- 7).
Table6- 5Multiariable linear regression analysis for the comparison of the ISWT between HD
patients and healthy controls in the UK after controlling for age
Variable B SE B β P
(Constant) 378.311
(69.337,687.285) 152.036 .018
Age -6.318
(-10.151, -2.485) 1.886 -.388 .002**
Groups 306.810
(175.186,438.434) 64.768 .549 .000***
B: Unstandardized coefficient, SE: Standard Error, β: standardized Coefficients. *** P<0.001
Table6- 6Multiariable linear regression analysis for the comparison of the ESWT between HD
patients and healthy controls in the UK after controlling for age
Variable B SE B β P
(Constant) 987.314
(-8.656, 1983.284) 490.084 .052
Age -22.961
(-35.317, -10.605)
6.080 -.423 .001***
Groups 1002.113
(577.827,1426.400) 208.777 .538 .000***
B: Unstandardized coefficient, SE: Standard Error, β: standardized Coefficients. **P<0.01.
*** P<0.001
Table6- 7Multiariable linear Regression analysis for the comparison of the STS60 between HD
patients and healthy controls in the UK after controlling for age
Variable B SE B β P
(Constant) 4.470
(-20.879,29.819) 12.459 .722
Age -.175
(-.486, .137) .153 -.150 .262
Groups 24.905
(14.644,35.167) 5.044 .000***
B: Unstandardized coefficient, SE: Standard Error, β: standardized Coefficients. ***P<0.001
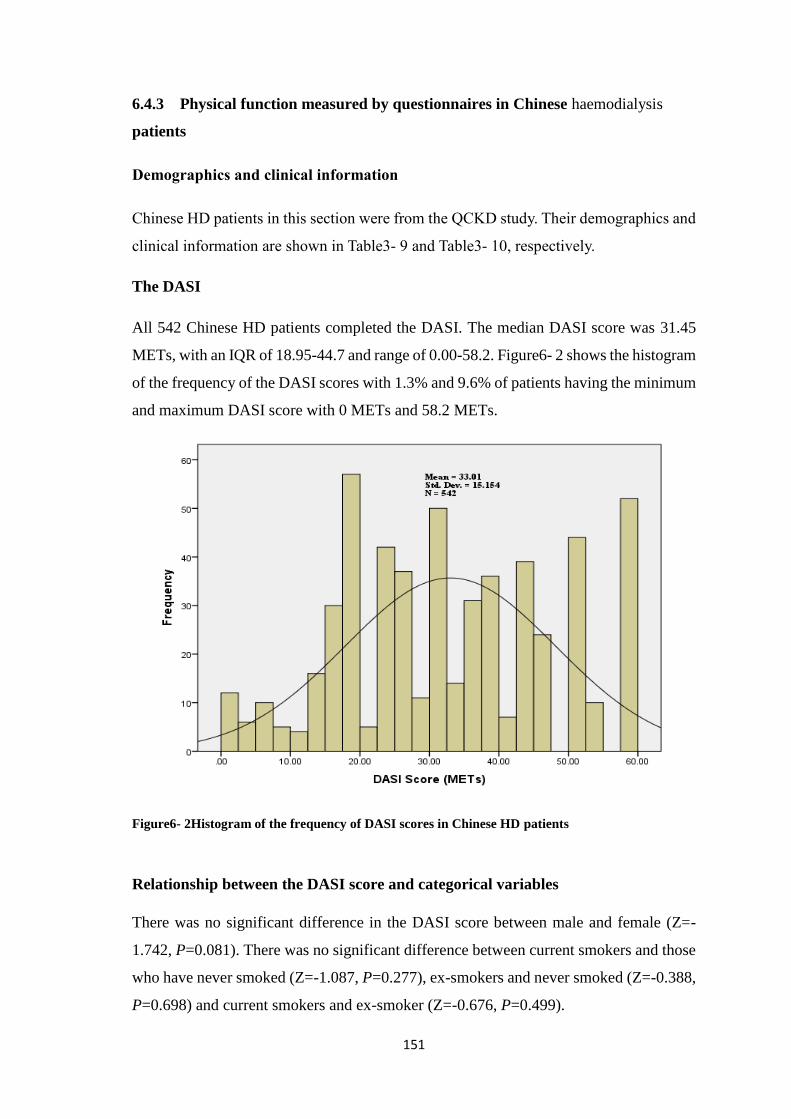
151
6.4.3 Physical function measured by questionnaires in Chinese haemodialysis
patients
Demographics and clinical information
Chinese HD patients in this section were from the QCKD study. Their demographics and
clinical information are shown in Table3- 9 and Table3- 10, respectively.
The DASI
All 542 Chinese HD patients completed the DASI. The median DASI score was 31.45
METs, with an IQR of 18.95-44.7 and range of 0.00-58.2. Figure6- 2 shows the histogram
of the frequency of the DASI scores with 1.3% and 9.6% of patients having the minimum
and maximum DASI score with 0 METs and 58.2 METs.
Figure6- 2Histogram of the frequency of DASI scores in Chinese HD patients
Relationship between the DASI score and categorical variables
There was no significant difference in the DASI score between male and female (Z=-
1.742, P=0.081). There was no significant difference between current smokers and those
who have never smoked (Z=-1.087, P=0.277), ex-smokers and never smoked (Z=-0.388,
P=0.698) and current smokers and ex-smoker (Z=-0.676, P=0.499).

152
Relationship between the DASI score and continuous variables
The DASI score was negatively correlated to age and number of co-morbidities.
Conversely, higher DASI score was positively associated with creatinine, phosphate, Hgb
and haematocrit levels. Table6- 8 shows the correlations between the DASI,
demographics and clinical information.
Table6- 8Correlations between the DASI score and continuous variables of demographics and
clinical information
Continuous variables Walking speed P value
Age (y) Rho=-0.445 P<0.001***
vintage (y) Rho=-0.017 P=0.692
BMI(kg/m2) Rho=-0.037 P=0.388
urea(mmol/L) Rho=0.121 P=0.009**
creatinine (umol/L) Rho=0.265 P<0.001***
Hgb (g/dL) Rho=0.123 P=0.005**
haemotocrit (L/L) Rho=0.096 P=0.029*
phosphate (mmol/L) Rho=0.136 P=0.002**
Co-morbidities
(count per person) Rho=-0.331 P<0.001***
**P< 0.05; **P< 0.01; ***P< 0.001 (2-tailed).
GPPAQ walking pace
224 (41.4%) patients reported their walking pace as slow. However, only 15(2.8%)
patients considered their walking pace as fast. The distribution of walking pace in
Chinese HD patients is demonstrated in Table6- 9.
Table6- 9the distribution of walking pace in Chinese HD patients
Questionnaire HD patients in each category n (%)
GPPAQ Walking
speed
Slow Steady Brisk Fast
224 (41.4) 240 (44.3) 62(11.5) 15(2.8)

153
Relationship between walking pace and categorical variables
There was no significant difference in walking pace between genders (X2=4.404,
P=0.221) and different smoking status (X2=11.902, P=0.064) in Chinese HD patients.
Relationship between walking pace and continuous variables
Creatinine and Hgb levels were positively correlated with walking pace. Conversely,
there was negative association between walking pace, age, BMI and number of co-
morbidities. Table6- 10 shows the correlations between walking pace and continuous
variables of demographics and clinical information.
Table6- 10Correlation between walking speed and continuous variables of demographics and clinical
information
Continuous variables Walking speed P value
Age (y) Rho=-0.301 P<0.001***
Vintage (y) Rho=0.006 P=0.881
BMI (kg/m2) Rho=-0.159 P<0.001***
urea(mmol/L) Rho=0.073 P=0.115
creatinine (umol/L) Rho=0.143 P=0.002**
Hgb (g/dL) Rho=0.106 P=0.016*
haemotocrit (L/L) Rho=0.076 P=0.086
Co-morbidities
(count per person) Rho= -0.278 P<0.001***
**P< 0.05; **P< 0.01; ***P< 0.001 (2-tailed).
6.4.4 Physical function measured by physical performance tests in Chinese
haemodialysis patients and healthy controls
Demographics
The HD patients and healthy controls in this section came from the COCO study. The
demographics of Chinese HD patients and healthy controls are shown in theTable3-
16and Table3- 17of Chapter 3, respectively.

154
Physical performance tests in haemodialysis patients
The scores of physical performance tests in Chinese HD patients were 440 (310-478) m
in the ISWT, 625 (287-1234) m in the ESWT, 30 ± 11 in the STS60, 12 (11.00-12.00) in
the SPPB and 29.54 ±9.49 kg in the HGS.
Physical performance tests in healthy controls
The scores of physical performance tests in Chinese healthy controls were 515±1071m
in the ISWT, 1884 (939-2000) m in the ESWT, 46 ±16 in the STS60, 12 (12.00-12.00)
in the SPPB and 36.61±10.33 kg in the HGS.
Comparison of physical performance tests between haemodialysis patients and
healthy controls
All physical performance tests in the HD patients were significantly lower than those in
healthy controls (all P<0.01). Comparison of physical performance tests between HD
patients and healthy controls in China is shown in Table6- 11.
Table6- 11Comparison of physical performance tests between HD patients and healthy controls in
China
**P< 0.01 (2-tailed); ***P< 0.001 (2-tailed)
Physical
function tests
Chinese HD patients
(n=40)
Chinese healthy controls
(n=44) P value
Mean ± SD,
Median (IQR) n
Mean ± SD,
Median (IQR) n
ISWT (m) 440
(310-478) 36
545
(448-593) 42 <0.001***
ESWT (m) 625
(287-1234) 36 1884
(939-2000) 42 <0.001***
STS60 30 ± 11 38 46 ±16 44 <0.001***
SPPB 12
(11.00-12.00) 39
12
(12.00-12.00) 44 <0.001***
HGS 29.54 ±9.49 40 36.61±10.33 43 0.002**

155
6.4.5 Comparison of physical function measured by questionnaires between the
UK and Chinese haemodialysis patients
Comparison of the DASI between UK and Chinese haemodialysis patients
The UK HD patients’ median DASI score was significantly lower than Chinese cohorts
(UK vs. China: 17.95[30.2-99.5] METs vs 31.45[44.7-18.95] METs). Comparison of the
DASI score between UK and Chinese HD patients is shown in Figure6- 3.
Figure6- 3Comparison in DASI score between UK and Chinese HD patients

156
Comparison of the DASI between UK and Chinese haemodialysis patients after
adjusting for age and gender
As a reminder, the UK HD patients were significantly older and had more males than
their Chinese counterparts. After controlling for age and gender, the mean DASI with the
HD patients in the UK and China were 22.199 (95%CI: 21.353-23.046) METs and 30.695
(95%CI: 29.465-31.925) METs, respectively. The DASI score in the UK HD patients
(group=1) is significantly lower than that in Chinese HD patients (group=2) (R2
Adjusted=0.240, P<0.001) (Table6- 12).
Table6- 12Multivariable linear regression analysis for the comparison of the DASI between UK and
Chinese HD patients after adjusting for age and gender
Variable B SE B â P
(Constant) 41.240
(36.796, 45.684) 2.266 <.001***
Age -.364
(-.410, -.317)
.024 -.348 <.001***
Gender -4.246
(-5.656, -2.836)
.719 -.127 <.001***
Groups 8.496
(6.969,10.022) .778 .247 <.001***
B: Unstandardized coefficient, SE: Standard Error, â: standardized Coefficients. ***P<0.001

157
Comparison of the GPPAQ walking pace between UK and Chinese haemodialysis
patients
The percentages of “steady”, “brisk” and “fast” walking pace in the UK HD patients were
less than those in Chinese cohort. However, the percentage of “slow” walking pace in the
UK HD patients was more than that in their Chinese counterparts. The UK HD patients’
overall walking pace was significantly slower than Chinese HD patients (X2=125.349,
P<0.001). Comparison of walking pace categories between UK and Chinese HD patients
is shown in Figure6- 4.
Figure6- 4Comparison of walking pace categories between the UK and Chinese HD patients

158
Comparison of the GPPAQ walking pace between UK and Chinese haemodialysis
patients after adjusting for age and gender
‘Fast’ walking pace was taken as a reference category in the multi-nominal logistic
regression model. After controlling for age and gender, the UK HD patients (group=1)
who had “slow” walking pace were 8.194 times than those with “Fast” pace compared to
Chinese HD patients(group=2) (P<0.001). The UK HD patients with “Steady” and “Brisk”
walking pace appeared 25.957 and 5.060 times than those with “fast” pace compared to
Chinese HD cohorts, respectively (both P<0.001) (Table6- 13).
Table6- 13 Multi-nominal logistic regression analysis for the comparison of walking pace between
the UK and Chinese HD patients adjusting for age and gender
GPPAQ
Walking pace B SE B P β
Slow
Intercept -2.075 .511 ˂.001***
Age .049 .008 ˂.001*** 1.840
(1.190,2.845))
Gender .610 .222 .006** 1.050
(1.034, 1.066)
[Group=1.00] 2.103 .270 ˂.001*** 8.194
(4.824,13.918)
[Group=2.00] 0 a
Steady
Intercept -2.403 .571 ˂.001***
Age .025 .008 .003** 1.025
(1.008,1.042)
Gender .355 .249 .154 1.426
(.875,2.323)
[Group=1.00] 3.256 .304 ˂.001*** 25.957
(14.303,47.107)
[Group=2.00] 0 a .
Brisk
Intercept -1.749 .690 .011*
Age .007 .010 .504 1.509
(.826,2.755)
Gender .411 .307 .181 1.007
(.987,1.027)
[Group=1.00] 1.621 .345 ˂.001*** 5.060
(2.572,9.953)
[Group=2.00] 0 a .
B: Unstandardized coefficient, SE: Standard Error, â: standardized Coefficients. *P<0.05, **P<0.01,
***P<0.001, Pseudo R2=0.163 a. This parameter is set to zero because it is redundant.

159
6.4.6 Comparison of physical function measured by physical performance tests
between UK and Chinese haemodialysis patients
Except for the ESWT, all physical performance tests in the UK HD patients were
significantly lower than those in their Chinese counterparts. The comparison in physical
performance tests between UK and Chinese HD patients is shown in Table6- 14.
Table6- 14Comparison in physical performance tests between the UK and Chinese HD patients
Physical
performance
tests
UK HD patients
(n=30)
Chinese HD patients
(n=40) P value Mean ± SD,
Median (IQR) n Mean ± SD,
Median (IQR) n
ISWT (m) 340
(160-510) 27
440
(310-478) 36 0.042*
ESWT (m) 265
(134-1550) 26
625
(287-1234) 36 0.098
STS60 19 ± 11 26 30 ± 11 38 <0.001***
SPPB 10.00
(7.75-11.25) 26
12.00
(11.00-12.00) 39 <0.001***
HGS (Kg) 22.93 ±10.09 28 29.54 ±9.49 40 0.008**
*P< 0.05; **P< 0.01; ***P< 0.001 (2-tailed)
Comparison of physical performance tests between the UK and Chinese
haemodialysis patients after controlling for age and gender
After controlling for age and gender, the mean ISWT in the UK and Chinese HD patients
was to 343 (95%CI: 295-392) m and 401 (95%CI: 360-443) m, respectively. There was
no significant difference in the ISWT between the UK (group=1) and Chinese HD
patients (group=2) after controlling for age and gender (ΔR2 Adjusted =0.378, P=.085)
(Table6- 15).
After controlling for age and gender, the mean STS60 in the UK and Chinese HD patients
changed to 21 (95%CI: 16-25) and 29 (95%CI: 26-33), the SPPB were 9.622 (95%CI:
8.982-10.261) and 11.098 (95%CI: 10.583-11.614) and the HGS were 22.24(95%CI:
19.252-25.227) and 30.02 (95%CI: 27.564-32.475) kg, respectively. The UK HD patients
(group=1) performed lower STS60 (ΔR2 Adjusted =0.305, P=.002), SPPB (ΔR2
Adjusted
=0.366, P=.001) and HGS (ΔR2 Adjusted =0.469, P<.001) than Chinese HD patients
(group=2) after controlling for age and gender (Table6- 16, Table6- 17 and Table6- 18).

160
Table6- 15Multiariable linear regression analysis for the ISWT between UK and Chinese HD
patients after adjusting for age and gender
Variable B SE B β P
(Constant) 821.471
(591.771,1051.171) 114.793 .000
Age -6.658
(-9.399, -3.916) 1.370 -.536 .000***
Gender -143.334
(-211.173, -5.496) 33.902 -.449 .000***
Groups 58.038
(-8.315,124.392) 33.160 .189 .085
Unstandardized coefficient, SE: Standard Error, β: standardized Coefficients. ***P<0.001
Table6- 16Multiariable linear regression analysis for the STS60 between UK and Chinese HD
patients after adjusting for age and gender
Variable B SE B β P
(Constant) 40.876
(20.597,61.155) 10.138 .000
Age -.396
(-.638, -.154) .121 -.381 .002**
Gender -6.106
(-11.720, -.493) 2.806 -.241 .034*
Groups 8.754
(3.223, 14.284) 2.765 .358 .002**
Unstandardized coefficient, SE: Standard Error, β: standardized Coefficients. *P<0.05, **P<0.01,
***P<0.001

161
Table6- 17Multiariable linear regression analysis for the SPPB between UK and Chinese HD
patients after adjusting for age and gender
Variable B SE B β P
(Constant) 12.448
(9.508, 15.389) 1.470 .000
Age -.070
(-.105, -.035) .017 -.436 .000***
Gender -.496
(-1.356, .364) .430 -.121 .254
Groups 1.477
(.631,2.322) .423 .370 .001***
Unstandardized coefficient, SE: Standard Error, β: standardized Coefficients. ***P≤0.001
Table6- 18Multiariable linear regression analysis for the HGS between UK and Chinese HD
patients after adjusting for age and gender
Variable B SE B β P
(Constant) 47.248
(33.137,61.358) 7.063 .000
Age -.277
(-.449, -.105) .086 -.318 .002**
Gender -13.669
(-17.719, -9.618) 2.028 -.638 .000***
Groups 7.780
(3.729 11.831) 2.028 .378 .000***
Unstandardized coefficient, SE: Standard Error, β: standardized Coefficients. **P<0.01, ***P<0.001

162
6.5 Discussion
6.5.1 Physical function in the UK haemodialysis patients
The UK HD patients appeared to show a lower level of physical function as assessed
by objective and subjective measures. The mean DASI score in this study’s 1109 UK
HD patients was 21.02METs. It is lower than 23.8METs found in 128 UK HD patients
(Greenwood et al. 2012b)and 22.2METs in 70 Scotland HD patients(Prescott 2015).
This confirmed the fact that UK HD patients had impaired exercise capacity. Similarly,
non-dialysis patients also had much higher DASI scores compared to the UK HD
patients (38.9 METs vs.17.95 METs) (Kurella, Ireland et al. 2004a). This provides
more evidence that physical function in Chronic Kidney Disease (CKD) patients
decreases as kidney function declines (Hawkins, Sevick et al. 2011). The UK HD
patients in the study had significant lower physical performance scores than their age
and gender-matched healthy controls as well. The performance of the SWT with
328.5m in the study were higher than the finding of a study exploring a pragmatic
exercise rehabilitation programme where 128 HD patients’ baseline ISWT scores were
247.7m(Greenwood, Lindup et al. 2012c). In terms of the STS60 test, both two studies
showed the same results of 19.3(Greenwood, Lindup et al. 2012c). The SPPB and HGS
scores in the study were slightly lower than those in other studies with U.S., Japanese,
Brazilian HD patients (Saitoh, Ogawa et al. 2016, Leal, Stockler-Pinto et al. 2011,
Kutner, Zhang et al. 2014).
There are a number of potential causes leading to impaired physical function.
Increasing age and female sex were negatively associated with the UK HD patients’
physical function, which is consistent with the findings that accelerated ageing or
disorders related to being old and female contributed to the declined physical
functioning with HD patients in previous studies (Liu 2012, Johansen, Kaysen et al.
2013, Brown, Yore et al. 2005). However, Painter and Roshanravan in a recent study
found that patients with CKD had a higher prevalence of impaired physical function
and frailty, regardless of age, compared to the general population of elderly adults.
(Painter, Roshanravan 2013). Creatinine is a breakdown product of creatine phosphate
in muscle. A number of studies have shown that serum creatinine strongly correlated
with muscle mass in healthy populations (Schutte, Longhurst et al. 1981, Baxmann,
Ahmed et al. 2008). When creatinine is filtered out of the blood by the kidney, there is
163
little to no tubular reabsorption of it. Therefore, creatinine clearance is usually used to
assess glomerular filtration rate (GFR). Under unstable kidney function, serum
creatinine concentration is influenced by fluctuated GFR. Serum creatinine failed to
reflect skeletal muscle mass in patients with chronic kidney disease (CKD). However,
referring to dialysis patients in whom renal function is minimal to non-existent, serum
creatinine still can be regarded as a reliable and cost-effective surrogate marker of
muscle mass (Donadio, Halim et al.2008, Noori, Kovesdy et al.2010, Kalantar-Zadeh,
Streja et al.2012). This notion is consistent with the finding of the positive relationship
between serum creatinine and physical function in the study.
Physical function in HD patients was positively correlated with good NS (Laws,
Tapsell et al. 2000) , which have been defined by several nutritional blood parameters,
including albumin, phosphate and cholesterol concentrations (Johansen, Chertow et al.
2000).This was consistent with the correlation between the DASI score and clinical
markers in the study, suggesting that with higher levels of albumin, phosphate and
cholesterol, HD patients’ physical function increases, and vice versa. The positive
correlation between biochemical indexes of NS and physical function is interesting
since low physical function with HD patients is associated with high mortality risks,
and poor NS also predicted increased mortality. Both physical function and NS are
well-documented predictors of mortality in the HD patients (Lopes, Lantz et al. 2014,
O'Hare, Tawney et al. 2003). However, the interaction between physical function and
NS may exist as well. Cholesterol with higher than 1.5g/l and lower than 2-3 g/l was
considered as the optimal level to lower the influence of systemic inflammation and
malnutrition (Liu, Coresh et al. 2004, Fouque, Vennegoor et al. 2007). The median
cholesterol in this study was 1.5g/l. This may be the reason that it indicated a positive
association between physical function and cholesterol. Higher phosphate levels also
predict better NS in HD patients (González-Parra, Gracia-Iguacel et al. 2012).
However, it is noteworthy that higher serum phosphate leads to the development of
Mineral and bone disorder (MBD) with HD patients, which negatively influences
physical function and PA level(Johansen, Chertow 2007). The serum phosphate level
was slightly beyond the normal range in the UK HD patients, it probably explained
higher phosphate level associated with the better NS but did not negatively influence
on the MBD.

164
Additionally, physical function decreased with the higher CRP and ALP
concentrations in the study. These findings indicated that there was a strong correlation
between inflammation, bone metabolism derangement and physical function. It was
consistent with the finding that inflamed HD patients are less active (Mafra, Deleaval
et al. 2011). As an enzyme playing a critical role in removing phosphate groups from
many types of molecules, ALP is a predicable biochemical marker of bone metabolism
(Bergman, Qureshi et al. 2017), resulting in a high risk of mortality. Although it is not
as specific as ALP as an indicator of bone turnover, PTH assessment was also
recommended as an adjunctive test for bone metabolism (Rhee, Molnar et al. 2014).
Meanwhile, PTH is associated with coronary artery calcification and CVD (Rhee,
Molnar et al. 2014). These reasons partly explained the negative correlation between
the ALP, PTH levels and physical function.
The International Task Force on Nutrition and Ageing stated that gait speed is a crucial
indicator for older adults’ adverse outcomes (Van Kan, Rolland et al. 2009). HD
patients have been viewed as a model of early ageing. Although it has been confirmed
as a sensitive health predictor with the nature of being easily measured, limited studies
focused on the association of gait speed and HD patients. Slow gait speed, defined
as<3 mph (1.34 m/s) in the GPPAQ and <0.8 m/s in the SPPB, characterized with 63.7%
and 31.0% of the UK HD patients in the QCKD and COCO study, respectively. The
latter is similar to 34.7% of the HD patients who regarded as slow gait speed from the
United States Renal Data System (USRDS) study (Kutner, Zhang et al. 2014). Besides
the strong correlation between walking pace, NS, inflammation, bone metabolism and
comorbidity, in the analysis BMI was shown to negatively associate with walking pace.
This seems to be contradictory to the positive correlation between BMI and survival
(Leavey, McCullough et al. 2001). High BMI may predict better NS and increase
muscle mass (Mafra, Guebre-Egziabher et al. 2008), which are all positively associated
with physical function. It is understood that BMI is a vague measure of body
composition, which is hard to distinguish which part of body composition contributes
high survival in HD patients. More in depth analysis of body composition would be
more useful, which was shown in Chapter 9.

165
6.5.2 Physical function in Chinese haemodialysis patients
Although exercise capacity demonstrated with the DASI score in Chinese HD patients
was higher than other HD patients (31.45 METs vs. 23.8 METs) (Greenwood, Lindup
et al. 2012a), it still appeared to be lower than that in the non-dialysis patients (31.45
METs vs. 38.9 METs) (Kurella, Ireland et al. 2004b). Similarly, Chinese HD patients
had higher score in all the physical performance tests than those in other studies
conducted with UK, Japanese, Brazilian HD patients(440.0 vs. 247.7m in the ISWT,
30.2 vs. 19.3 in the STS60, 12.0 vs. 10.9 in the SPPB and 22.9 vs. 23.2 in the HGS)
(Saitoh, Ogawa et al. 2016, Leal, Stockler-Pinto et al. 2011, Greenwood, Lindup et al.
2012, Kutner, Zhang et al. 2014). However, they had significantly lower physical
function than their age and gender matched healthy population.
Surprisingly, there was no difference in exercise capacity shown with the DASI
between genders. It was inconsistent with the finding that female CKD patients were
negatively correlated to physical function (Hiraki, Yasuda et al. 2013). The potential
explanation is that the female patients were much younger than the male patients in
the study and age is a predominant factor that inversely impact on physical function in
HD patients.
The correlation between physical function, albumin, cholesterol, ALP and CRP was
not explored in Chinese HD patients due to too much missing data of these markers in
patients’ medical records. Similar to the findings in the UK HD patients, it has been
shown that more muscle mass, good NS, and decreased comorbidity were positively
correlated with higher exercise capacity in Chinese HD patients. Apart from that, it
has been found that there was negative correlation between anaemia and physical
function. Anaemia results in fatigue or diminished muscle oxygenation (Cobo, Gallar
et al. 2015), which contributes to compromised functional capacity. Essentially,
anaemia has been confirmed as being a contributory factor for the decline in maximal
exercise capacity (Clyne, Jogestrand et al. 1994). However, the correlation between
physical function and Hgb was not shown with the UK HD patients in the study. One
possible explanation may be that Chinese patients had more severe anaemia than UK
patients, which was corroborated by the discrepancy in anaemia between UK and
Chinese HD patients from the reports of national renal data systems (Chinese National
Renal Data System 2015, UK Renal Registry 2016). A cross sectional study with the

166
9 largest HD units from 6 cities around China showed that anaemia was highly
prevalent in Chinese HD patients. About 60% of patients were unable to achieve the
Hgb target of 110g/l even though 85% of these patients were administered with
erythropoietin (Zhou, Jiang et al. 2012). Similarly, the results of the DISH study
confirmed the worse anaemia in Chinese HD patients than UK patients.
6.5.3 Comparison of physical function between UK and Chinese haemodialysis
patients
Given the discrepancy of age profiles between UK and Chinese HD patients when
compared to national registry data (Chinese National Renal Data System 2015, UK
Renal Registry 2015), the UK and Chinese samples from this study were representative
of their respective populations. It is understood that few studies focused on Chinese
HD patients’ BMI level. A multi-sample cross-sectional study with a population aged
40-59 years in four countries including the UK and China found that mean BMI of
Chinese participants were much lower than that of UK participants at the end of the
20th century (Zhou, Stamler et al. 2003). Despite the fact that BMI levels in the Chinese
population have increased due to ‘richer diets’ and rapidly growing prosperity since
the 1990s (Zhou, Stamler et al. 2003, Shankar 2010), in the study, it was still revealed
that Chinese HD patients had a significantly lower BMI level than their UK
counterparts.
After controlling for age and gender between the two cultures, the UK HD patients
still had significantly lower physical function than their Chinese counterparts. This
was shown by the UK HD patients’ worse exercise capacity obtained from the QCKD
study and muscle function from the COCO study, compared to their Chinese
counterparts. The higher serum creatinine, phosphate and lower PTH concentrations
in Chinese HD patients than the UK cohorts may indicate that the higher muscle mass
or NS, protein status and better bone metabolism in Chinese HD patients contributed
to the higher physical function than the UK patients. The COCO study revealed that
Chinese HD patients had higher muscle function. However, there was no significant
difference in exercise capacity, assessed by the SWT, between the UK and Chinese
HD patients. It has been known that decreased muscle mass or strength are causes of
the reduced physical function in HD patients (Johansen, Shubert et al. 2003). In order
to better understand physical function between these two cultural groups, further

167
exploration of the differences between body composition and their effect on physical
function is needed. Another underlying reason behind it may be the disparity of BMI
between these two cultural groups. It was revealed that higher BMI was significantly
associated with the prevalence of physical function limitation (Ylitalo, Karvonen-
Gutierrez et al. 2013). Although higher BMI levels predicted better NS or
metabolically healthier (Wildman, Muntner et al. 2008), the adverse impact of higher
BMI or obesity on physical function may outweigh its potential benefits being a
predictor of better NS (Coakley, Kawachi et al. 1998).
6.5.4 Strengths and limitations
It is understood that this is the largest study of exploring physical function in HD
patients in the UK and China. However, it does have its limitations. Convenience
sampling was applied when objective measure tools were conducted in the study. The
sample suffered from the inherent bias and was unlikely to be good representative of
the population of being studied. However, the sample size is pragmatic for the
exploratory feasibility study. Patients were recruited from dialysis units in the
Leicester Renal Network and all 7 hospitals in Nantong city from China, with a total
population of approximately 400 and 700 HD patients attending regularly. The number
of patients required was therefore readily attainable. Additionally, the cross-sectional
study conducted with questionnaires in Chinese HD patients was limited to patients
who underwent their HD sessions in hospitals located in Nantong city. They may be
unable to be representative of the Chinese HD population. However, these patients
resided in Nantong, including municipal and rural regions. They may be a good
representation of the whole Nantong HD patients. Additionally, too much missing
clinical information, such as albumin and cholesterol in Chinese patients interfered the
influencing factors of physical function. Although statistically significant correlations
in physical function and clinical parameters in the UK and Chinese HD patients has
been shown,there is a chance that a Type I error has been made due to multiple
correlations being performed. Type I error can be controlled by applying a correction
factor such as Bonferroni or Sidak’s, which would adjust the P value or a-level and
reduce the likelihood of Type I error. There is not a statistically significant (P=0.098)
difference in the ESWT between UK and Chinese HD patients. However, it may be

168
ascribed to the occurrence of type II error due to the small sample size in the COCO
study i.e. there may be a difference, but the sample size was too small to detect it.
6.6 Conclusion
Low physical function was highly prevalent in both the UK and Chinese HD patients.
In order to improve the impaired physical function in HD patients, a series of
interventions enhancing NS and muscle mass and controlling inflammation, bone
metabolism derangement and comorbidity may be needed. Anaemia was commonly
present in Chinese HD patients, which negatively correlate with physical function.
Physical function in the UK HD cohort was significantly lower than the Chinese HD
cohort. This may be attributed to the higher BMI, lower creatinine, worse protein status
and bone metabolism in UK patients. It is necessary to further explore which
components of body composition led to the difference in BMI between two HD groups,
and how muscle and fat masses affect physical function within HD patients.

169
Chapter 7
Physical Activity Levels in
Haemodialysis Patients in the UK
and China

170
7.1 Abstract
HD patients have substantially high risks of comorbidity and mortality, which partly
attributes to sedentary lifestyle. In order to design a realistic and effective intervention
for HD patients, a thorough understanding of physical activity (PA) or exercise level
covering all its dimensions and domains is required. It is understood that patients’
health behaviour participation may be influenced by culture. The aim of this study was
to characterise and compare PA level between UK and Chinese HD patients. While
the GP physical activity (GPPAQ) and Leisure Time Exercise Questionnaire (LTEQ)
subjectively assessed PA and exercise levels, the Multi-sensor system (MSSs) were
utilized for objectively measuring habitual PA levels with HD patients in the UK and
China. Low PA level was highly prevalent in the UK and Chinese HD patients.
Impaired bone metabolism and increased age, inflammation and comorbidities were
negatively correlated with HD patients’ PA level. High muscle mass and good
nutritional status (NS) were positively correlated with patients’ PA participation.
Anaemia in Chinese HD patients was negatively associated with PA levels. Higher
muscle mass, better NS and bone metabolism, and incomplete patients transport
services may contribute to the higher PA level in Chinese HD patients compared with
the UK HD patients.
7.2 Background
Physical inactivity is a highly prevalent concern in HD patients all over the world. The
importance of motivating HD patients to exercise has attracted increased attention
from healthcare providers worldwide. However, it is still unclear how to incorporate
exercise into patients’ daily lives. While the benefits of exercise for CKD patients have
been highlighted by National Institute of Clinical Excellence (NICE)(The National
Institute of Clinical Excellence, (NICE) 2015) , they fail to provide specific exercise
prescription or program information. The Clinical Practice Guidelines produced by the
Kidney Disease Improving Global Outcomes (KDIGO)recommends that CKD
patients should aim to conduct PA at least five times every week, with each session
lasting for 30 minutes or more (Levin et al. 2013). However, the guideline does not
specify the ideal modality or intensity of exercise but does suggest exercise should be
individualised based on patients’ cardiovascular health.

171
It has been documented that people’s health status varies in different cultures (Ren,
Amick 1996, Chen, Kazanjian & Wong 2009). However, limited studies examining
health behaviours focused on people from different cultures (Sweeting, West 1995,
Hawkins et al. 2008). Relatively few studies about exercise in HD patients in low to
middle income countries such as China have been completed; with the majority of
research focusing on Caucasian populations in high-income countries (Capitanini et al.
2014, de Lima et al. 2013, Johansen, Painter 2012). Little consensus has been reached
on how to take care of HD patients in China, particularly when it comes to exercise.
Additionally, haemodialysis units in China are heavily burdened with a large patient
population. Thus, PA or exercise as a recommendation to effectively improve
morbidity and mortality of HD patients is often overlooked by healthcare professionals.
Generally, previous studies have focused on limited aspects of PA or exercise levels.
For example, a study measured PA levels of HD patients using the estimated number
of steps/day and showed there was a positive correlation between PA level, younger
patients, less morbidities, better NS and body composition, referring to higher Lean
Mass (LM) and less Fat Mass (FM) (Cobo et al. 2015). Although walking steps
assessment is an attractive measure to quantify PA in a simple and inexpensive way,
it only involves a part of daily PA. Modalities as well as frequency and intensity of PA
or exercise are missed out. Furthermore, other studies have only investigated HD
patients’ activity scores, determining PA level by comparing results to established
norms by age and gender(Johansen et al. 2010)or classifying patients into active or
inactive categories (Lopes et al. 2014). However, in order to gain a thorough
understanding of HD patients’ PA level, so as to design an effective patient-centred
exercise intervention, a comprehensive assessment of PA or exercise should be utilised.
This assessment should cover all dimensions of exercise prescription, such as
frequency, duration and intensity of exercise, and domains, including in occupational,
leisure time, domestic and transport exercise (Greenwood et al. 2014).
The aims of this study have previously been described in the number (4) of 1.6 section
in Chapter 1. Briefly, the primary aim of this study was to characterise and compare
HD patients’ physical activity (PA) level between the UK and China.

172
7.3 Methods
The data included in this chapter was derived from the QCKD and COCO study
(Chapter 2, section 2.2.2 and 2.2.3). The detailed methods are described in Chapter 2.
Specifically, the results of the GP Physical Activity Questionnaire (GPPAQ) (section
2.3.2), the Leisure Time Exercise Questionnaire (LTEQ) (section 2.3.2), the
Sensewear armband (SWA) (section 2.3.3) and GENEActiv (section 2.3.3) were
utilized.
As a reminder, the GPPAQ and LTEQ are two questionnaires, which were used for
assessing PA level and exercise level during individual leisure time, respectively. The
SWA and GENEActiv are two Multi-sensor system (MSSs) or generally viewed as tri-
axial accelerometers, which were used for assessing habitual PA levels.
7.4 Results
7.4.1 Physical activity level measured by questionnaires in the UK
haemodialysis patients
Demographics and clinical information of the UK haemodialysis patients
The UK HD patients in this section were from the QCKD study. Their demographics
and clinical information are shown in Table3- 7andTable3- 8, respectively.
GP Physical Activity Questionnaire (GPPAQ)
1093 UK HD patients provided the complete GPPAQ, and the valid response rate was
94.6%. The vast majority of patients (78.5%) remained inactive. Conversely, the
lowest proportion of patients (4.2%) led an active lifestyle. The distribution of Physical
Activity Index (PAI) in the UK HD patients is shown in Table7- 1.
Table7- 1Distribution of Physical Activity Index in the UK HD patients
Questionnaire Outcome HD patients in each category n (%)
GPPAQ PAI Inactive Moderately Inactive
Moderately
Active Active
907 (78.5) 78(6.7) 59(5.1) 49(4.2)

173
Relationship between GPPAQ and categorical variables
Male patients had a significantly higher activity level than females (X2=17.288,
P=0.001). There was no difference in the level between White British participants and
South Asian cohorts (X2=4.768, P=0.190). There was also no significant difference in
PA levels between different smoking statuses (X2=0.357, P=0.836). The distribution
of PAI in genders, ethnicities and smoking status is shown in Table7- 2.
Table7- 2The distribution of PAI in genders, ethnicities and smoking status in the UK HD patients
PAI
Gender
(n=1132)
Ethnicity
(n=761)
Smoking status
(n=1086)
Male
(n,%)
Female
(n,%)
British
(n,%)
South
Asian
(n,%)
Current
smoker
(n,%)
Ex-
smoker
(n,%)
Never
smoke
(n,%)
Inactive 568
(80.7)
339
(87.4)
538
(83.8)
91
(76.5)
83
(81.4)
373
(83.8)
447
(82.9)
Moderately
Inactive
49
(7. 0)
29
(7.5)
42
(6.5)
11
(9.2)
8
(7.8)
28
(6.3)
40
(7.4)
Moderately
Active
44
(6.3) 15 (3.9)
33
(5.1)
7
(5.9)
6
(5.9)
25
(5.6)
27
(5. 0)
Active 43
(6.1)
5
(1.3)
29
(4.5)
10
(8.4)
5
(4.9)
19
(4.3)
25
(4.6)

174
Relationship between the GPPAQ and continuous variables
The correlation between the GPPAQ, demographic and clinical information showed
that the PA level was negatively associated with the increasing age, C-Reactive Protein
(CRP), ALP levels and number of co-morbidities. Urea, creatinine and phosphate
levels were positively correlated with activity level. Table7- 3 shows the Spearman’s
rank correlations between PAI category, demographics and clinical information.
Table7- 3 Correlation between PAI category and continuous variables in the UK HD patients
Continuous variables PAI category P value
Age(y) Rho=-0.265 P<0.001***
vintage (y) Rho=-0.01 P=0.753
BMI (kg/m2) Rho=-0.004 P=0.917
Urea(mmol/L) Rho=0.135 P<0.001***
creatinine(umol/L) Rho=0.180 P<0.001***
albumin(g/L) Rho=0.109 P=0.002**
CRP (mg/L) Rho=-0.144 P=0.001***
cholesterol(mmol/L) Rho=0.065 P=0.137
Phosphate(mmol/L) Rho=0.095 P=0.006**
ALP (iu/L) Rho=-0.100 P=0.004**
URR(%) Rho=0.066 P=0.096
Hgb (g/dL) Rho=0.028 P=0.416
haemotocrit (L/L) Rho=0.016 P=0.647
Co-morbidities
(count per person) Rho=-0.137 P<0.001***
**P< 0.01; ***P< 0.001 (2-tailed)
Leisure Time Exercise Questionnaire (LTEQ)
1063 UK HD patients completed the first question of the LTEQ, which focuses on the
number of times that patients participated in different intensity exercises in a usual
week. 1045 and 915 patients provided the complete responses in the frequency of
activity completed long enough to work up a sweat and the types of usual exercise,
respectively. The median total LTEQ score was 3.00(0.00-15.00) METs. 948 (89.2%)
patients were classed as insufficiently active in their HCS, suggesting they are not
active enough to benefit their health. 742 (71.0%) patients reported that they never or
rarely exercise long enough to work up a sweat in a usual week. The LTEQ score, HCS

175
categories and percentage of patients who completed exercise ‘long enough to work
up a sweat’ in a typical 7-day period are shown in Table7- 4.
Table7- 4LTEQ, HCS and percentage of patients that complete exercise ‘long enough to work up
a sweat’ in a typical week in UK HD patients
LTEQ (METs) UK HD patients
n=1063 Median (IQR)
Total 3.00(0.00-15.00)
Health Contribution Score Categories n=1063 %
Active 73 6.9
Moderately Active 42 3.9
Insufficiently Active 948 89.2
Frequency of activity completed long enough to work
up a sweat n=1045 %
Never or rarely 742 71.0
Sometimes 226 21.6
Often 77 7.4
The dominant type of exercise in the UK HD patients was walking, followed by
cycling and swimming. Types of exercise in which patients participated during their
usual life are demonstrated in Table7- 5.
Table7- 5Types of exercise completed by patients: number of patients reported and percentages
Walking (747 [81.6%])
Cycling (65 [7.1%])
Swimming (52 [5.7%])
Weightlifting (24 [2.6%])
Running (18 [2.0%])
Aerobics (15 [1.6%])
Tennis (14 [1.5%])
Football (13 [1.4%])
Table tennis (12 [1.3%])
Dancing, yoga, badminton, fishing, Tai Chi, Golf, Cricket, Gym, Jogging (Total activities:39 [4.3%])

176
Relationship between the total LTEQ score and categorical variables
Female and White British patients had significantly lower LTEQ score than their male
(female /male: 0.00(0.00-12.00)/3.00(0.00-20.00), Z=-2.485, P=0.013) and South
Asian counterparts (White British/South Asian: 3.00 (0.00-12.00)/9.00 (0.00-21.00),
Z=-3.849, P<0.001). There was no significant difference in the total LTEQ score
(F=0.949, P=0.387) between different smoking status.
Relationship between the LTEQ score and continuous variables
Significant negative associations were seen between the total LTEQ score, older age,
higher CRP, ALP levels and a greater number of co-morbidities. The total LTEQ score
was positively correlated with creatinine levels and Urea Reduction Ratio (URR).
Table7- 6 show the Spearman’s rank correlations between the LTEQ score
demographics and clinical information.
Table7- 6 Spearman’s rank correlation between LTEQ score and continuous variables
Continuous variables LTEQ score P value
Age (y) Rho=-0.151 <0.001***
vintage (y) Rho=-0.054 P=0.083
BMI (kg/m2) Rho=-0.050 P=0.222
urea (mmol/L) Rho=0.028 P=0.428
creatinine (umol/L) Rho=0.096 0.01*
albumin(g/L) Rho=0.052 P=0.138
cholesterol(mmol/L) Rho=0.020 P=0.660
CRP (mg/L) Rho=-0.142 0.001***
phosphate(mmol/L) Rho=0.040 P=0.259
ALP (iu/L) Rho=-0.093 0.008**
URR (%) Rho=0.084 0.036*
Hgb (g/dL) Rho=0.042 P=0.229
haemotocrit (L/L) Rho=0.002 P=0.955
Co-morbidities
(count per person) Rho=-0.158 <0.001***
*P< 0.05; **P< 0.01; ***P< 0.001 (2-tailed)

177
7.4.2 Physical activity level measured by tri-axial accelerometry of the
haemodialysis patients and healthy controls in the UK
Demographics of the HD patients and healthy controls
Patients and healthy controls in this part were those who were recruited in the COCO
study. For detailed information regarding their demographics the reader is asked to
refer to Table3- 13and Table3- 14in chapter 3, respectively.
Physical activity level measured by Sensewear armband (SWA) in
haemodialysis patients
21 (70%) UK HD patients agreed to wear the SWA, of these, 20 (95%) patients met
the minimum wearing compliance (≥8 hours per day and ≥3 days with at least one HD
day and two non-HD days) after excluding the impact of the Hawthorne effect. There
were 17 (85.0%) male and 3 (15.0%) female in these 20 patients. The mean days of
wearing SWA were 2.85 (range 2-3) and 3.85 (range 2-4) on HD and non-HD days,
respectively. The mean wear hours of a usual day were 20.61±2.91, showing with
19.19±2.75 and 21.67±3.35 hours on a usual HD day and non-HD day.
The median daily steps and weekly Moderate to Vigorous Physical Activity (MVPA)
were 2688 (995-6968) and 321 (82-1023) min, respectively. There was no significant
difference in the percent of “sedentary” and “active” HD patients when comparing
daily steps on HD days and non-HD days. However, daily steps and MVPA on HD
days were significantly lower than those on non-HD days in UK HD patients. The
comparison of PA levels between HD days and non-HD days in UK HD patients is
shown in Table7- 7.
Table7- 7Comparison of PA level on between HD day and non-HD day in the UK HD patients
Outcomes HD day Non-HD day P value
Daily
Steps
Category
<5000
(sedentary)
N (%)
≥7500
(active)
N (%)
<5000
(sedentary)
N (%)
≥7500
(active)
N (%) 0.429
14 (70%) 3(15%) 14 (70%) 5(25%)
1636.5 (672.0-5701.5) 2917.5 (1242.25-7914.5) 0.030*
MVPA 39(2-85) 60 (21-188) 0.011*
*P<0.05 (2-tailed)

178
Physical activity level with GENEActiv in healthy controls
10(100%) UK healthy controls wore the GENEActiv. One participant’s data was
missing due to a malfunction with the monitor. 9(90%) patients still met the minimum
wearing compliance (≥8 hours per day and at least 3 days in the week) after excluding
the impact of the Hawthorne effect. There were 5 (55.6%) males and 4 (44.4%) females
in the healthy control group. The median weekly MVPA were 1426.44±318.42min.
Comparison of PA levels between haemodialysis patients and healthy controls
The median MVPA in HD patients (1447 [1278-1712] min) was significantly lower
than that in healthy control (321 [82-1023] min) (Z=-3.158, P=0.001).
Comparison of PA levels between haemodialysis patients and healthy controls
adjusting for age
As a reminder, the HD patients were significantly older than healthy controls in the
UK. The mean weekly MVPA in HD patients and healthy controls were 697 (95%CI:
370-1025) min and 1347 (95%CI: 839-1855) min after controlling for age, respectively.
The weekly MVPA in HD patients (group=1) is significantly lower than that in healthy
controls in the UK (group=2) (R2 Adjusted =.328, P=0.044) (Table7- 8).
Table7- 8Multiariable linear regression analysis for the comparison of weekly MVPA between
HD patients and healthy controls after adjusting for age
Variable B SE B â P
(Constant) 644.544
(-999.381, 2288.469) 799.758 .428
Age -10.782
(-30.366, 8.801) 9.527 -.210 .268
Groups 1280.153 306.664 .394 .044*
B: Unstandardized coefficient, SE: Standard Error, â: standardized Coefficients. *P<0.05
7.4.3 Physical activity level measured by questionnaires in Chinese
haemodialysis patients
Demographics and clinical information of Chinese haemodialysis patients
Patients involved in this part came from the QCKD study, for detailed information
regarding demographics and clinical information it refers to the Table3- 9 and Table3-
10in Chapter 3, respectively.

179
GPPAQ
All Chinese HD patients recruited in the study provided the complete GPPAQ. 352
(64.9%) patients were physically inactive, followed by 99(18.3%) patients with active
PA level. The distribution of PAI in Chinese HD patients is demonstrated in Table7-
9.
Table7- 9the distribution of PAI in Chinese HD patients
Questionnaire Outcome HD patients in each category n (%)
GPPAQ PAI Inactive Moderately
Inactive Moderately Active Active
352 (64.9) 49 (9.0) 42 (7.7) 99(18.3)
Relationship between GPPAQ and categorical variables
There was no significant difference in PA level between genders (X2=4.404, P=0.221)
and smoking status (X2=11.902, P=0.064). The distribution of PAI in genders and
smoking status is shown Table7- 10.
Table7- 10The distribution of PAI in genders and smoking status in Chinese HD patients
PAI
Gender
(n=542)
Smoking status
(n=537)
Male
(n,%)
Female
(n,%)
Current smoker
(n,%)
Ex-smoker
(n,%)
Never smoked
(n,%)
Inactive 197 (62.5) 155 (68.3) 29 (50. 0) 66 (61.7) 255 (68.5)
Moderately
Inactive 30 (9.5) 19 (8.4) 5(8.6) 12 (11.2) 32 (8.6)
Moderately
Active 22 (7. 0) 20 (8.8) 6(1.3) 6 (5.6) 29 (7.8)
Active 66 (21. 0) 33 (14.5) 18 (31. 0) 23 (21.4) 56 (15.1)

180
Relationship between the GPPAQ and continuous variables
PA levels were negatively associated with age, parathyroid hormone (PTH), and
number of co-morbidities. Table7- 11 shows the Spearman’s rank correlations between
PAI and the continuous variable of demographics and clinical information in Chinese
HD patients.
Table7- 11Spearman’s rank correlation between PAI category and continuous variables
Continuous variables PAI category P value
Age (y) Rho=-0.202 <0.001***
vintage (y) Rho=0.003 P=0.945
BMI (kg/m2) Rho=0.002 P=0.960
urea (mmol/L) Rho=-0.011 P=0.819
creatinine (umol/L) Rho=0.060 0.193
phosphate(mmol/L) Rho=-0.004 P=0.922
PTH (pmol/L) Rho=-0.099 0.033*
Hgb (g/dL) Rho=0.048 P=0.282
haemotocrit (L/L) Rho=0.061 P=0.168
Co-morbidities
(count per person) Rho=-0.137 <0.001***
*P< 0.05; ***P< 0.001 (2-tailed)

181
Leisure Time Exercise Questionnaire (LTEQ)
The median total LTEQ score was 21.00(6.00-21.00) METs. 453(83.6%) patients had
an insufficiently active exercise level. 304 (56.1%) patients reported they never or
rarely exercised long enough to work up a sweat in a usual week. The total LTEQ
score, HCS categories and percentage of patients who complete exercise ‘long enough
to work up a sweat’ in a typical 7-day period are shown in Table7- 12.
Table7- 12The LTEQ, HCS categories and percentage of patients that complete exercise ‘long
enough to work up a sweat’ in a typical week in Chinese HD patients
Outcome measures Chinese HD patients (n=542)
LTEQ (METs) Median (IQR)
Total 21.00(6.00-21.00)
Health Contribution Score Categories
Active, n (%) 73(13.5%)
Moderately Active, n (%) 16(2.9%)
Insufficiently Active, n (%) 453(83.6%)
Frequency of activity completed long enough to work
up a sweat
Never or rarely, n (%) 304(56.1)
Sometimes, n (%) 167(30.8)
Often, n (%) 71(13.1)
The dominant type of exercise in everyday life was walking (85.1%), followed by
running and cycling. Types of exercise participated by patients in their everyday life
are demonstrated in Table7- 13.
Table7- 13Types of exercise completed by patients: number of patients reported and percentages
Walking (461[85.1%])
Running (73 [13.5%])
Cycling (25 [4.6%])
Square Dancing (13 [2.4%])
Aerobics (10 [1.8%])
Fishing (8 [1.5%])
yoga, badminton, table tennis, basketball, swimming, push-up, Lula hoop, Tai Chi,
snooker, Weightlifting (Total activities:22 [4.1%])

182
Relationship between the LTEQ score and categorical variables
The total LTEQ score in male patients was significantly higher than that in females
(male/female: 21.00[6.00-21.00]/21.00(0.00-21.00), Z=-2.224, P=0.025).
Relationship between the LTEQ score and continuous variables
Higher LTEQ score were significantly associated with the younger age. The total
LTEQ score was positively correlated with higher pre-dialysis creatinine, Hgb and
haematocrit levels. Table7- 14shows the Spearman’s rank correlations between the
LTEQ score, demographics and clinical information.
Table7- 14Spearman’s rank correlation between LTEQ score, demographics and clinical
information
Continuous variables LTEQ score P value
Age (y) Rho=-0.120 0.005***
vintage (y) Rho=0.043 P=0.315
BMI (kg/m2) Rho=-0.013 P=0.760
urea (mmol/L) Rho=-0.012 P=0.802
Pre-dialysis creatinine(umol/L) Rho=0.096 0.036*
phosphate(mmol/L) Rho=-0.046 P=0.291
PTH (pmol/L) Rho=0.019 P=0.686
Hgb (g/dL) Rho= 0.174 <0.001**
haematocrit (L/L) Rho= 0.160 <0.001***
Co-morbidities
(count per person) Rho=-0.070
P=0.101
*P< 0.05; **P<0.01; ***P< 0.001 (2-tailed)
7.4.4 Physical activity level measured by Sensewear Armband (SWA) of the
haemodialysis patients and healthy controls in China
Demographics of haemodialysis patients and healthy controls in China
Patients and healthy controls in the section were from the COCO study. For detailed
information regarding the demographics in the HD patients and healthy controls the
reader is asked to refer to the Table3- 16and Table3- 17in chapter 3, respectively.

183
Physical activity level with SWA in haemodialysis patients
30 (75%) Chinese HD patients agreed to wear the SWA, of these, 23 (76.7%) patients
met the minimum wearing compliance (≥8 hours per day and ≥3 days with at least one
HD day and two non-HD days) after excluding the impact of the Hawthorne effect.
There were 11 (47.8%) male and 12 (52.2%) female in 23 patients. The mean days of
wearing SWA were 2.09 (range 1-3) and 3.78 (range 2-5) on HD and non-HD days,
respectively. The mean wear hours of a usual day were 20.64±2.11, showing
19.63±3.21 and 21.43±2.18 on an average HD day and non-HD day.
The mean daily steps on an average day and weekly MVPA were 5192 ± 2741 and
664±447 min, respectively. There was no significant difference in the percent of
‘‘sedentary’’ (P=0.767) and ‘‘active’’ (P=0.459) HD patients based on the daily septs
on between HD and non-HD day. Meanwhile, there were no significant difference in
daily steps and weekly MVPA between on HD and non-HD day in Chinese HD
patients. The comparison of PA level on between HD day and non-HD day in Chinese
HD patients is shown in Table7- 15.
Table7- 15Comparison of PA level on between HD day and non-HD day in Chinese HD patients
Outcomes HD day Non-HD day P value
Daily
Steps
Category
<5000
(sedentary)
N (%)
≥7500
(active)
N (%)
<5000
(sedentary)
N (%)
≥7500
(active)
N (%)
0.767;
0.459
13 (56.5%) 3(13.0%) 12 (52.2%) 6(26.1%)
4928.87±2532.39 5405.84±3135.59 0.225
MVPA 92.17±70.55 97.43±71.94 0.701
PA level with SWA in healthy controls
35 (87.5%) Chinese healthy controls agreed to wear the SWA, of these, 33 (94.3%)
met the minimum wearing compliance (≥8 hours per day and at least 3 days in the
week) after excluding the impact of the Hawthorne effect. There were 16 (48.5%) male
and 17 (51.5%) female in 33 patients. The mean days of wearing SWA were 6.73 (5-
7) and 6.27 (4-7) valid wearing days, respectively. The mean wear hours of a usual
day were 18.87±3.70.

184
The median of daily steps on an average day and weekly MVPA were 7227 (5133-
10146) and 711 (378-1295) min, respectively. 7 (21.2%) and 15 (45.5%) were viewed
as ‘‘sedentary’’ and ‘‘active’’ based on less 5000 and more than 7500 steps per day.
Comparison of PA levels between haemodialysis patients and healthy controls in
China
The daily steps on an average day in HD patients were significantly lower than those
in healthy controls in China. However, there was no significant difference in weekly
MVPA between HD patients and healthy controls in China. The comparison of daily
steps and weekly MVPA are shown in Figure7- 1 and Figure7- 2 , respectively.
Figure7- 1Comparison of daily steps between HD patients and healthy controls in China

185
Figure7- 2Comparison of weekly MVPA between HD patients and healthy controls in China
7.4.5 Comparison of physical activity level measured by questionnaires between
UK and Chinese haemodialysis patients
Comparison of demographics and clinical information between the UK and
Chinese haemodialysis patients
The patients in this section were from the QCKD study. The comparison of
demographics and clinical information between the UK and Chinese HD patients are
shown in Table3- 11and Table3- 12of Chapter 3, respectively.

186
Comparison of the GPPAQ between UK and Chinese haemodialysis patients
The percentage of patients with “Inactive” PA in UK HD patients was more than that
in Chinese HD patients. However, the percentages of patients with “Moderately
Inactive”, “Moderately Active” and “Active” categories in UK HD patients was less
than those in their Chinese counterparts. The UK HD patients’ overall PA level was
significantly lower than Chinese HD patients (X2=15.209, P<0.001). Comparison of
PAI categories between the UK and Chinese HD patients is shown in Figure7- 3.
Figure7- 3Comparison of the PAI categories between UK and Chinese HD patients

187
Comparison of the GPPAQ between UK and Chinese haemodialysis patients
after adjusting for age and gender
The UK patients were significantly older and had more males than the Chinese patients
in the QCKD study. ‘Active’ of PAI was taken as a reference category in the multi-
nominal logistic regression model. After controlling for age and gender, the UK HD
patients conducting ‘Inactive’ PA level appeared 4.007 times than performing ‘Active’
compared to Chinese HD cohorts (P<0.001). The UK HD patients conducting
‘Moderately Inactive’ and ‘Moderately Active’ PA level appeared 3.410 and 2.915
times than performing ‘Active’ compared to Chinese HD cohorts, respectively (both
P<0.001) (Table7- 16).
Table7- 16Multi-nominal logistic regression Analysis for the comparison of the GPPAQ
GPPAQ B SE B P β
Inactive
Intercept -2.281 .456 .000
Age .045 .006 <.001*** 1.046
(1.033, 1.060)
Gender .878 .207 <.001*** 2.406
(1.603, 3.611)
[Group=1.00] 1.388 .195 <.001*** 4.007
(2.737, 5.867)
[Group=2.00] 0a
Moderately
Inactive
Intercept -1.748 .585 .003
Age .003 .008 .738 1.003
(.987, 1.019)
Gender .673 .267 .012* 1.960
(1.162, 3.308)
[Group=1.00] 1.227 .259 . <.001*** 3.410
(2.052, 5.666)
[Group=2.00] 0a
Moderately
Active
Intercept -1.858 .623 .003
Age .006 .009 .499 1.006
(.989, 1.023)
Gender .532 .285 .062 1.702
(.974, 2.977)
[Group=1.00] 1.070 .274 <.001*** 2.915
(1.704, 4.986)
[Group=2.00] 0a
B: Unstandardized coefficient, SE: Standard Error, â: standardized Coefficients. ***P<0.001, Pseudo
R2=0.122 a. This parameter is set to zero because it is redundant.

188
Comparison of leisure time exercise behaviour (LTEQ) between UK and Chinese
haemodialysis patients
The UK HD patients participated had significantly fewer total exercise scores than
Chinese HD patients did. A lower proportion of HD patients in the UK were active
than those in China based on the analysis of HCS. Conversely, more UK HD patients
than Chinese patients were reported as being insufficiently active. The comparison of
the total LTEQ score and HCS categories between UK and Chinese HD patients is
shown in Table7- 17.
Table7- 17Comparison of the total LTEQ score and HCS categories between UK and Chinese HD
patients
Outcomes UK HD patients
(n=1063)
China HD patients
(n=542) P value
LTEQ (METs) Median (IQR)
Total 3.00(0.00-15.00) 21.00(6.00-21.00) <0.001***
HCS
Active, n (%) 73(6.9%) 73(13.5%)
<0.001*** Moderately Active, n (%) 42(3.9%) 16(2.9%)
Insufficiently Active, n (%) 948(89.2%) 453(83.6%)
***P< 0.001 (2-tailed)

189
Comparison of leisure time exercise behaviour (LTEQ) between UK and Chinese
haemodialysis patients after adjusting for age and gender
The mean LTEQ score in HD patients in the UK and China appeared 11.709 (95%CI:
10.367-13.051) and 19.316 (95%CI: 17.411-21.221) after controlling for age and
gender, respectively. The LTEQ score in UK HD patients (group=1) was significantly
lower than that in Chinese HD patients (group=2) (R2 Adjusted =.115, P<0.001) (Table7-
18).
Table7- 18Multiariable linear regression Analysis for the comparison of the total LTEQ score
between UK and Chinese HD patients after adjusting for age and gender
Variable B SE B β P
(Constant) 24.036
(17.051,31.020) 3.561 .000***
Age -4.616
(-6.839, -2.394) 1.133 -.099 .000***
Gender -.228
(-.302, -.155) .037 -.156 .000***
Groups 7.607
(5.224, 9.990) 1.215 .159 .000***
B: Unstandardized coefficient, SE: Standard Error, β: standardized Coefficients. ***P<0.001
7.4.6 Comparison of PA level measured by Sensewear Armband (SWA)
between UK and Chinese haemodialysis patients
Comparison of demographics between UK and Chinese haemodialysis patients
The patients in this section were recruited in the COCO study. The Comparison of
demographics between UK and Chinese HD patients is shown in Table3- 19 of Chapter
3.

190
Comparison of PA level measured by SWA between UK and Chinese
haemodialysis patients
There was no significant difference in the percentage of HD patients who appeared
sedentary (P=0.122) or active (P=0.314) between the UK and China. Moreover, there
was no significant difference in daily steps and weekly MVPA between the UK and
Chinese HD patients. The Comparison of PA level between UK and Chinese HD
patients is shown in Table7- 19.
Table7- 19Comparison of PA level between UK and Chinese HD patients
Outcomes UK HD patients
(n=20)
Chinese HD patients
(n=23) P value
Daily
Steps
Category
N (%)
<5000
(sedentary) 15 (75%) 12 (52.2%) 0.122
≥7500
(active) 5(25%) 3 (13.0%) 0.314
steps 2688
(995-6968)
4865
(3290-6576) 0.064
Weekly MVPA 321
(82-1023)
620
(378-1123) 0.330

191
7.5 Discussion
7.5.1 PA level in the UK haemodialysis patients
Along with the high prevalence of poor physical function, physical inactivity was also
a common phenomenon in the UK HD patients. This may support that physical
inactivity plays important role in leading to reduced physical function (Kosmadakis et
al. 2010, Tawney, Tawney & Kovach 2003). Additionally to the 78.5% and 89.2% of
UK HD patients from the QCKD study who were classed as inactive in physical
activity index (PAI) and insufficiently active in health contribution score (HCS), 75%
of the patients from the COCO did not reach the cut-off point of 5000 steps per day,
which was regarded as sedentary(Tudor-Locke et al. 2012). Moreover, the UK HD
patients spent significantly less time on MVPA than their age and gender-matched
healthy control group. A study measuring steps using pedometers reported that 71%
of HD patients were sedentary(Cobo et al. 2015), which was similar to the 75% of
patients in this current study. Additionally, the UK HD patients had 2917 and 1636
steps/day on non-HD and HD days in the study, which was lower than 3767 and 2274
steps/day on non-HD and HD days in Sweden HD patients, and lower than an average
3500-4500 steps/day in the other HD patients (Nowicki, Murlikiewicz & Jagodziñska
2010, Avesani et al. 2012, Zamojska et al. 2006).
The study suggested that male HD patients had higher PA levels and performed more
exercise than females, which was consistent with the finding that male HD patients’
physical function are higher than females (Liu 2012, Johansen, Kaysen et al. 2013,
Brown, Yore et al. 2005).This was also in agreement with the finding in a study that
male patients with ESRD participated in exercise more frequently and had fewer
limitations in moderate and strenuous exercise than their female counterparts (Stack,
Murthy 2008).Similar to the correlation between physical function, demographics and
clinical information, PA level in the UK HD patients was negatively affected by the
increased age, inflammation, worse bone metabolism and comorbidities. Conversely,
higher level of muscle mass and better nutritional status (NS) were positively
correlated with patients’ PA level. Additionally, underlying physical aspects related to
dialysis procedure contributed to the low PA level in UK HD patients, such as 4 hours
of inactivity during HD session or tiredness after the session. These contributing
factors of physical inactivity were consistent with the clinical determinants and the HD
192
process, which were documented to be associated with reduced PA level with HD
patient (Cobo et al. 2015, Violan et al. 2002).
7.5.2 PA level in Chinese haemodialysis patients
Chinese HD patients’ mean daily steps were 5192, higher than the average 3500-4500
steps/day of HD patients in the previous studies (Nowicki, Murlikiewicz &
Jagodziñska 2010, Avesani et al. 2012, Zamojska et al. 2006). As well as this, they
had more steps on non-HD (5405) or HD days (4928) than those in other study (Cobo
et al. 2015). However, there was still 52.2% of Chinese HD patients were considered
sedentary based on the cut-off point of 5000 steps/day. Additionally, besides 64.9%
and 83.6% of patients showed inactive in PAI and insufficiently active in HCS, the
daily steps in Chinese HD patients were significantly lower than their age and gender
matched healthy controls.
It was found that male HD patients had higher exercise levels than females in this study.
However, there was no difference in PA level between genders in Chinese HD patients.
It is understood that household work was the Chinese HD patients’ major type of PA
(Li, Li & Fan 2010).The disparity of perceptions and attitudes towards housework
between genders informed by Chinese traditional beliefs may be a hidden barrier for
male patients’ housework participation. Since, it is women who are subject to taking
the primary responsibility in doing housework and being caregivers in Chinese
traditional beliefs (Robinson 1985), especially when the patients are males.
The correlation between PA level, albumin, cholesterol, ALP and CRP were not
explored as too much data was missing for these parameters. However, the results still
showed the positive relationship between higher activity levels, more muscle mass and
good NS in Chinese HD patients. The strong association between PA and anaemia was
consistent with the independent correlation between Hgb and the number of steps with
chronic HD patients in a cross-sectional study (Zamojska et al. 2006). A decline in PA
level in HD patients is ascribed to impaired strength caused by anaemia. Moreover,
the reduction in physical function resulted from anaemia, consequently led to the
decreased physical performance (Penninx et al. 2004). Additionally, bone turnover
caused by increased PTH was negatively correlated with Chinese patients’ PA level.

193
It is understood that PA level is lower on HD days compared with non-HD days due
to lack of activity during the 4-hour HD session (Cobo et al. 2015, Majchrzak et al.
2005). However, surprisingly, there was no significant difference in PA level between
dialysis and non-dialysis days in Chinese HD patients, which was inconsistent with
the findings in the previous studies (Cobo et al. 2015, Violan et al. 2002). One
explanation may be ascribed to the lack of patients transport services in China which
was applied for dialysis patients with good quality in the UK. Chinese HD patients,
especially those who resided in rural areas, usually require frequent travel between
their home and HD units by public transportation, which may increase their PA levels
on dialysis days.
7.5.3 Comparison of PA level between UK and Chinese haemodialysis patients
Despite more severe anaemia being present in Chinese HD patients than UK HD
patients, Chinese patients showed higher activity levels than UK patients, which was
in agreement with the finding reported in chapter 6 that UK HD patients had worse
physical function than their Chinese counterparts. In accordance with a global
investigation (Hallal et al. 2012) regarding PA levels with the same age profile,
including the UK and China, the percentage of physical inactivity was 34.8% (34.5-
35.1) in Europe and 17.10% (16.8-17.2) in Southeast Asia, respectively. More
participants in China preferred to walk to work compared with those in Switzerland,
the U.S. and Australia. Additionally, the frequency of cycling in Chinese adults (>20%)
was much higher than in the UK adults (<2%). This analysis suggests that physical
inactivity was more prevalent in high income countries than those in low income
countries. This study extended the previous findings with HD patients in the UK and
China. Underlying reasons for this difference may include: higher muscle mass, better
NS and bone metabolism in Chinese HD patients versus UK HD patients. Additionally,
incompletepatients transport services in China which forced patient to travel between
their home and HD units by themselves may increase their PA level, consequently
cause the higher activity level in Chinese HD patients than UK patients.
It is noteworthy that there was no significant difference in daily steps and weekly
MVPA between the UK and Chinese HD patients in the COCO study. However,
although that is not statistically significant (P=0.064) in daily steps between UK and
Chinese HD patients, the difference of their value (2688 [995-6968] vs.4865[3290-

194
6576] in the UK and Chinese HD patients) is clinically significant. There is a chance
than Type II error has been made, as a small sample size in the COCO study. The
simplest method to minimize the probability of committing this type of statistical error
is to increase the sample size or the power of the test to increase the chances to capture
the differences in the statistical tests. The occurrence of error may confirm that UK
HD patients had lower PA level than Chinese patients. However, according to the
difference between the subjective and objective results of PA level , it may suggest
that HD patients’ PA level is influenced by various factors, such as physical and
psychological determinants(Ishii, Shibata & Oka 2010, Nantel, Mathieu & Prince
2010). Further exploration regarding the associated factors resulting in the disparity of
physical function and PA levels between UK and Chinese HD patients, including HD
patients’ perception of exercise is needed.
7.5.4 Strengths and limitations
It is understood that this is the study of PA level with the largest UK and Chinese HD
population. However, it does have limitations. Too much missing clinical information
in Chinese HD patients’ medical records led to the failure with the exploration of more
influencing factors of PA levels. The GPPAQ is designed to understand participant’s
PA level for discussion and motivational interviewing for anyone who is categorized
into less than active (Guidance and guidelines, NICE 2013). It was widely used for
collecting data from a variety of disease status issues (Takahashi, Hu et al. 2018,
Clarke, Young et al. 2015b, Weiler, Stamatakis 2010). However, GPPAQ scoring is
limited to employment status, physical exercise and cycling. For participants who are
retired or unemployed, individuals are not classified as active unless they perform
physical exercise or cycling for at least 3 hours. However, walking, housework and
gardening may be particularly relevant to this population. Furthermore, whilst the
reliability of the GPPAQ has been shown to be reasonable, its validity in adults
between 60 and 74 years old was poor (Ahmad, Harris et al. 2015). When compared
to accelerometer the GPPAQ showed low sensitivity and poor agreement for
identifying active primary care patients. Actually, it has been removed from the general
practice 2014/15 hypertension QOF. However, the GPPAQ is still recommended to be
used in the National Health Service (NHS) health check(Public Health England 2014).
Moreover, the NICE would continue to support GPPAQ’s use as a validated tool

195
although further studies are recommended to be explored (Guidance and guidelines,
NICE 2013). Finally, the Chinese version of the GPPAQ is currently not validated for
its use in adults, which is another limitation in this study. However, it has been cross-
culturally translated and adapted before being applied. Additionally, similar to the
potential limits of statistical analysis when using a large number of multiple
correlations in Chapter 6, although it has been shown statistically significant
correlation between PA level and clinical parameters, there is the possibility of the
occurrence of Type I error.
7.6 Conclusion
Low PA level was highly prevalent in the UK HD patients. Increased age, more
inflammation, worse bone metabolism, more comorbidities and HD process have been
shown to be negatively associated with PA level of the UK HD patients. Meanwhile,
high muscle mass and better NS were positively correlated with their PA levels.
Similar to their UK counterparts, Chinese HD patients also presented a sedentary
lifestyle. Besides high muscle mass and good NS have been shown to be positively
correlated with PA level in Chinese HD patients, improved anaemia was associated
with the increased PA levels. When using questionnaires to subjectively measure
physical inactivity, a higher prevalence of physical inactivity was seen in the UK HD
patients compared to the Chinese HD patients. Chinese HD patients’ higher muscle
mass, better NS and bone metabolism, and incomplete patients transport services may
contribute to the underlying causes. More potential associated factors including
patients’ perception of exercise may give a more thorough understanding of PA levels
with HD patients in the two cultural cohorts.

196
Chapter 8
Self-perceived Benefits and Barriers
to Exercise in the UK and Chinese
Haemodialysis patients

197
8.1 Abstract
While the perceived benefits of exercise motivate HD patients’ participation in
exercise, perceptions of barriers to exercise inhibits their participation. Perception and
attitudes towards exercise are influenced by health beliefs that are strongly correlated
with cultures. The aim of this study was to understand and compare self-perceived
benefits and barriers to exercise in the UK and Chinese HD patients. The Dialysis
Patient-Perceived Exercise Benefits and Barriers Scale (DPPEBBS) was conducted
with HD patients in the UK and China, respectively. The perception of exercise
benefits in the UK and Chinese HD patients was significantly greater than that of
barriers to exercise. It has been suggested that HD patients have the potential to accept
exercise behaviour change intervention. The findings of perceived barriers to exercise
revealed that HD patients should focus on enhancing physical and functional self-
efficacy. Whilst more attention should be attracted to strengthen the management of
falling for the UK HD patients, fostering patients’ understanding of how to conduct an
exercise suitable for HD is required for Chinese HD patients. Older and female UK
HD patients should focus more on the benefits of exercise, while attention needs to be
focused both on enhancing the perception of exercise benefits and on decreasing
barriers for younger and female Chinese patients, respectively. Perceived exercise
benefits were significantly less in the UK HD patients compared with Chinese HD
patients, which may partly explain the fact that UK HD patients had lower physical
activity (PA) levels than Chinese HD patients.
8.2 Background
PA and regular exercise are recommended to optimize health, quality of life (QoL) and
decrease mortality risk, but the majority of HD patients lead very sedentary lives. Great
efforts have been made to encourage patients to be active. However, there are few
studies that explore the contributing factors to the sedentary behaviour in HD patients
(Fiaccadori et al. 2014). Identifying and understanding the influencing factors of
participating in PA or exercise is required to inform the design of a personalized
exercise intervention or facilitate the incorporation of exercise prescriptions into
clinical practice.

198
Physical inactivity may be influenced not only by the poor physiological condition
caused by kidney disease or dialysis itself, but also by HD patients’ perception
regarding benefits and barriers to exercise. It has been shown that motivation for
performing exercise may arise from a patient’s recognition of exercise benefits (Clarke
et al. 2015a). It is necessary to understand HD patients’ self-perceived benefits and
foster better understanding of the benefits of exercise on their kidney diseases in order
to promote the motivation to exercise.
Commonly reported barriers to exercise implementation were renal symptoms and
comorbidities that HD patients suffered from(Goodman, Ballou 2004a, Painter,
Stewart & Carey 1999, Stack, Murthy 2008, Stack et al. 2005). One survey regarding
barriers to exercise participation among HD patients revealed that 92% of participants
reported at least one barrier to PA (Liu 2012). Among all the obstacles, shortness of
breath (48%) and fatigue on dialysis and non-dialysis days (67 and 40%, respectively)
were the most frequent barriers to PA. Lack of motivation was the second barrier
closely associated with less PA, followed by the presence of a number of medical
conditions and not having enough time on dialysis days. Apart from these, other
studies reported that the most common barriers to PA or exercise performance were:
lack of motivation, lack of confidence seeking exercise in the course of rehabilitation,
insufficient understanding of the disease and negative attitudes toward exercise
(Goodman, Ballou 2004a, Kontos et al. 2007, Tawney et al. 2000). Mounting evidence
has demonstrated that the perceived barriers to exercise were inversely associated with
exercise behaviour in HD patients (Goodman, Ballou 2004b, Delgado, Johansen 2011,
Kontos et al. 2007). Thorough understanding of perceived barriers to exercise is
necessary for the proper interventions development (Hefferon et al. 2013).
The aim of this chapter has previously been described in number (5) of section 1.6 in
Chapter 1. Briefly, the primary aim was to explore and compare HD patients’
perceived exercise benefits and barriers in the UK and China.
8.3 Methods
The data included in this chapter was derived from the QCKD study (Chapter 2, section
2.2.2). The detailed methods are described in Chapter 2. Specifically, the DPPEBBS
was used (section 2.3.2). As a reminder, the DPPEBBS assesses HD patients’
perceived benefits and barriers to exercise.

199
8.4 Results
8.4.1 Self-perceived benefits and barriers to exercise in the UK haemodialysis
patients
Demographics
Patients in this part came from the QCKD study. UK HD patients’ demographics are
shown in Table3- 7of Chapter 3.
DPPEBBS
The scores of 1-4 in exercise benefits mean from ‘‘strongly disagree’’ to ‘‘strongly
agree”. The code of the barrier items is reversed. The median average exercise benefits
and barriers score were 2.82 (2.55-3.09) and 2.42 (2.17-2.67), respectively. The mean
perceived exercise benefits score was significantly higher than the barrier score (Z=-
15.875, P<.001). 75.4%-78.6% patients recognized the top 5 patient perceived exercise
benefits. The most frequently reported benefits were improving QoL, controlling body
weight, preventing body function decline, muscle atrophy, and promoting an
optimistic life. 47.2%-70.4% patients recognized the top 5 patient perceived exercise
barriers. The most commonly reported barriers to exercise were predominantly
physical, such as tiredness, lower extremity muscle fatigue and body pain.
Additionally, patients showed concern about falling and the thirst caused from exercise.
The most reported benefits and barriers to exercise are shown in Figure8- 1 and
Figure8- 2, respectively.

200
Figure8- 1The major benefits of exercise held by UK HD patients reported with DPPEBBS
Figure8- 2The major barriers to exercise held by UK HD patients reported with DPPEBBS
Relationship between DPPEBBS and demographics
Average benefits score was negatively associated with increased age (rho=-0.123,
P<0.001), and female sex (Z=-2.203, P=0.028). However, there was no association
between the score of barriers to exercise, age (rho=0.038, P=0.253) and gender (Z=-
1.057, P=0.291). Not only did White British HD patients have significantly lower
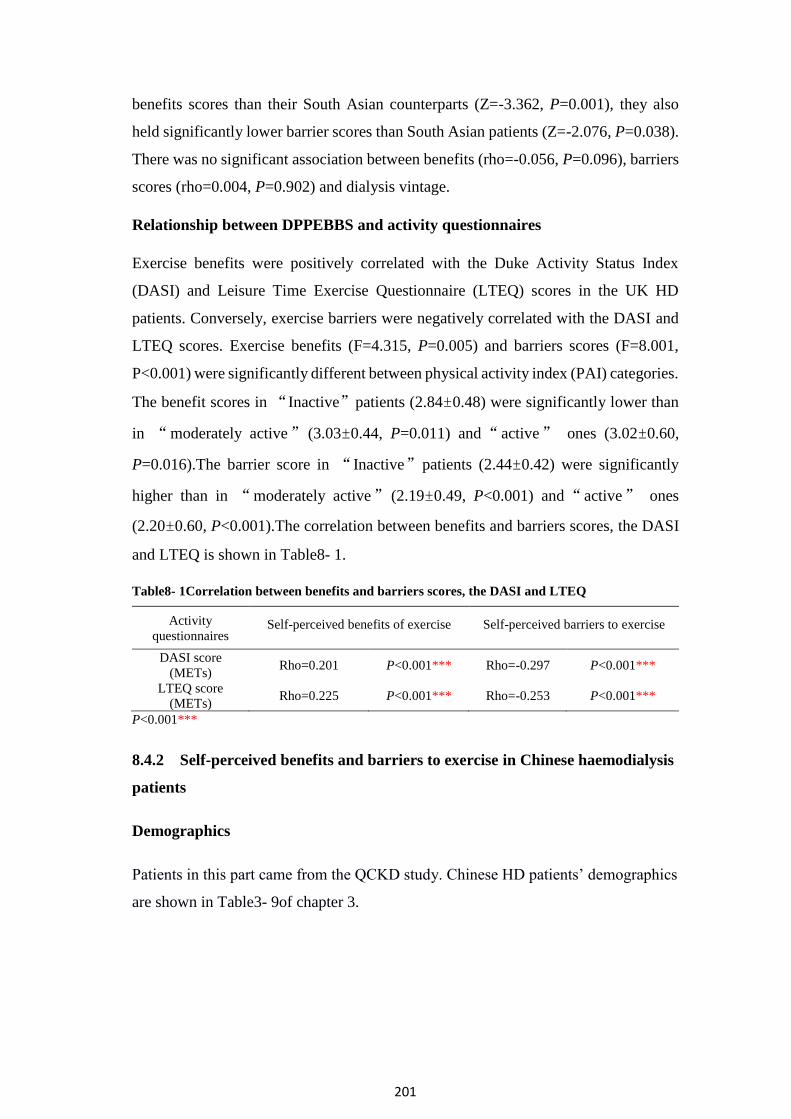
201
benefits scores than their South Asian counterparts (Z=-3.362, P=0.001), they also
held significantly lower barrier scores than South Asian patients (Z=-2.076, P=0.038).
There was no significant association between benefits (rho=-0.056, P=0.096), barriers
scores (rho=0.004, P=0.902) and dialysis vintage.
Relationship between DPPEBBS and activity questionnaires
Exercise benefits were positively correlated with the Duke Activity Status Index
(DASI) and Leisure Time Exercise Questionnaire (LTEQ) scores in the UK HD
patients. Conversely, exercise barriers were negatively correlated with the DASI and
LTEQ scores. Exercise benefits (F=4.315, P=0.005) and barriers scores (F=8.001,
P<0.001) were significantly different between physical activity index (PAI) categories.
The benefit scores in “Inactive”patients (2.84±0.48) were significantly lower than
in “moderately active” (3.03±0.44, P=0.011) and“active” ones (3.02±0.60,
P=0.016).The barrier score in “Inactive”patients (2.44±0.42) were significantly
higher than in “moderately active” (2.19±0.49, P<0.001) and“active” ones
(2.20±0.60, P<0.001).The correlation between benefits and barriers scores, the DASI
and LTEQ is shown in Table8- 1.
Table8- 1Correlation between benefits and barriers scores, the DASI and LTEQ
Activity
questionnaires Self-perceived benefits of exercise Self-perceived barriers to exercise
DASI score
(METs) Rho=0.201 P<0.001*** Rho=-0.297 P<0.001***
LTEQ score
(METs) Rho=0.225 P<0.001*** Rho=-0.253 P<0.001***
P<0.001***
8.4.2 Self-perceived benefits and barriers to exercise in Chinese haemodialysis
patients
Demographics
Patients in this part came from the QCKD study. Chinese HD patients’ demographics
are shown in Table3- 9of chapter 3.

202
DPPEBBS
The median average exercise benefits and barriers scores were 2.92 (2.67-3.17) and
2.42 (2.08-2.67), respectively. The mean perceived exercise benefits score was
significantly higher than the barrier score (Z=-15.219, P<.001). 82.4%-87.8% patients
recognized the top 5 patient-perceived exercise benefits. The most frequently reported
benefits were promoting an optimistic life, preventing muscle atrophy, improving
mood, self-care abilities, and QoL. 41.9%-70.1% patients recognized the top 5 patient-
perceived exercise barriers. The most commonly reported barriers were predominantly
physical, such as: tiredness, lower extremity muscle fatigue and body pain.
Additionally, patients lacked an understanding of how to do exercise and had concern
about thirst caused from exercise. The most reported benefits and barriers to exercise
are shown in Figure8- 3 and Figure8- 4, respectively.
Figure8- 3The major benefits of exercise held by Chinese HD patients reported with DPPEBBS

203
Figure8- 4The major barriers to exercise held by Chinese HD patients reported with DPPEBBS
Relationship between DPPEBBS and demographics
Female patients reported significantly higher barriers scores than male (Z=-3.348,
P=0.001). However, there was no significant difference in exercise benefits scores
between genders (Z=-0.938, P=0.348). There was no significant correlation between
benefits score and dialysis vintage (rho=-0.023, P=0.596). However, barrier scores
were positively correlated with dialysis vintage (rho=0.093, P=0.032). Increasing age
was positively correlated with benefits score (rho=0.131, P=0.002), but positively
correlated with barriers score (rho=0.158, P<0.001).
Relationship between DPPEBBS and activity questionnaires
There was no significant correlation between benefits scores and the DASI score.
However, the barriers to exercise score was negatively correlated with the DASI score.
Exercise benefits (F=4.659, P=0.003) and barriers scores (F=13.841, P<0.001) were
significantly different between PAI categories.“Active ”patients perceived more
benefits than “inactive” ones (2.91±0.43 vs. 2.87±0.45, P<0.001).The barrier score
in “ active” patients were significantly lower than in “moderately active”
(2.34±0.43, P=0.01), “moderately inactive” (2.36±0.47, P=0.002) and “inactive”
(2.45±0.42, P<0.001). Exercise benefits were positively correlated with the LTEQ

204
scores. Conversely, barriers were negatively correlated with the LTEQ scores. The
correlation between benefits and barriers scores, the DASI and LETQ are shown in
Table8- 2.
Table8- 2Correlation between benefits and barriers scores, the DASI and LTEQ
Activity
questionnaires Self-perceived benefits of exercise Self-perceived barriers to exercise
DASI score (METs) Rho=0.007 P=0.871 Rho=-0.404 P<0.001***
LTEQ score Rho=0.202 P<0.001*** Rho=-0.297 P<0.001***
P<0.001***
8.4.3 Comparison of self-perceived benefits and barriers to exercise between
UK and Chinese haemodialysis patients
Comparison of demographics between UK and Chinese haemodialysis patients
The comparison of demographics between UK and Chinese HD patients is shown in
Table3- 11 of Chapter 3.
Comparison of perceived benefits and barriers to exercise between UK and
Chinese haemodialysis patients
UK HD patients (2.91[2.55-3.09]) had a significantly lower mean average perceived
benefits of exercise score than Chinese patients (2.92 [2.67-3.17]) (Z=-3.363,
P=0.001). However, there was no significant difference in the mean average perceived
barriers to exercise score between the two cohorts (Z=-1.590, P=0.112). The
comparisons in exercise benefits and barriers scores between UK and Chinese HD
patients are shown in Figure8- 5 and Figure8- 6, respectively.

205
Figure8- 5Comparison in benefits score between UK and Chinese HD patients
Figure8- 6Comparison in barriers score between UK and Chinese HD patients

206
Comparison of perceived benefits of exercise between UK and Chinese
haemodialysis patients after adjusting for age and gender
The mean perceived benefits of exercise score with HD patients in the UK and China
was 2.838 (95%CI: 2.806-2.870) and 2.905 (95%CI: 2.864-2.947) after controlling for
age and gender, respectively. The benefits score in the UK HD patients (group=1) was
significantly lower than that in Chinese HD patients (group=2) (R2Adjusted =.015,
P=0.014) (Table8- 3).
Table8- 3 Multivariable linear regression analysis for the comparison of perceived benefits of
exercise between UK and Chinese HD patients after adjusting for age and gender
Variable B SE B β P
(Constant) 2.940
(2.778, 3.103) .083 .000
Age -.055
(-.107, -.004) .026 -.055 .035*
Gender -.002
(-.003, .000) .001 -.050 .068
Groups .067
(.013, .121) .027 .067 .014*
B: Unstandardized coefficient, SE: Standard Error, β: standardized Coefficients. *P<0.05
8.5 Discussion
The perceived benefits and barriers to a behaviour are of importance in the health
promotion model (N.J. Pender 1996). It has been documented that the greater
perception of benefits to exercise facilitated individuals’ exercise participation, while
the greater perception of barriers to exercise impede them engaging in exercise(Brown
2005, Cuaderes, Parker & Burgin 2004, Grubbs, Carter 2002). Unsurprisingly, whilst
motivation for performing exercise is related to HD patients’ recognition of exercise
benefits (Clarke et al. 2015b), perceived barriers to exercise negatively impact on
exercise engagement with HD patients (Goodman, Ballou 2004b, Delgado, Johansen
2011, Kontos et al. 2007). These are consistent with the findings in this study, which
showed that perception of exercise benefits was positively associated with physical
function and activity level but perceived barriers to exercise negatively affect them in
both the UK and Chinese HD patients. Both UK and Chinese HD patients perceived
more benefits than barriers, which is similar with the Jordanian ESRD patients who
had a higher mean score of benefits than that of barriers(Darawad, Khalil 2013), and
with American HD patients who reported more salient motivators compared with

207
barriers(Goodman, Ballou 2004b). This study showed that a high percentage of
patients recognized a range of potential exercise benefits in the UK and Chinese HD
patients, which is in agreement with reports from prior studies (Johansen, Painter 2012,
Delgado, Johansen 2012, Jhamb et al. 2016), suggesting openness to an appropriate
exercise behaviour change intervention. Moreover, UK and Chinese HD patients had
a better understanding of the direct benefits of exercise, such as preventing muscular
atrophy and improving mood. Additionally, some benefits items in the questionnaire
that are shared with the general population, involving promoting an optimistic life and
better QoL, were grounded in HD patients’ perceptions. However, indirect benefits of
exercise, including relieving pain, preventing other diseases, and especially decreasing
medical costs in Chinese HD patients need to be understood by patients. The findings
in this study regarding common barriers to exercise for patients, suggested that
exercise intervention for the UK HD patients should focus on enhancing physical and
functional self-efficacy, including management of the risk of falling. Additionally to
reinforcing physical and functional self-efficacy, fostering patients’ understanding of
how to conduct appropriate exercise suitable for HD and widening exercise
information resources are essential to increase the motivation of exercise participation
in Chinese HD patients.
It has been documented that Chinese HD patients were younger than HD patients in
the other countries (UK Renal Registry 2016, United States Renal Data System,
USRDS 2015, Chinese National Renal Data System 2015). Interestingly, younger
Chinese HD patients perceived fewer exercise benefits than older ones, which is
consistent with results reported by Jordanian (Darawad, Khalil 2013). During the
survey, a few young Chinese patients mentioned that they quit their jobs when they
had been diagnosed with ESRD. The life of unemployment and/or self-pity may
weaken their ability to meet the responsibilities necessary to support their family. As
a result, they might lose interest in or passion for doing anything including increasing
awareness of the health benefits of exercise. However, UK HD patients perceived
fewer exercise benefits with age increases. Additionally, it has been showed that
Chinese female HD patients reported more barriers, and UK female HD patients held
fewer benefits for exercise than their respective male counterparts. There were no
findings pertaining to the correlation between demographics and perceived benefits
and barriers to exercise in HD patients in a previous study (Goodman, Ballou 2004b).

208
This study extends the findings that exercise counselling or education for the UK HD
patients needs to focus more attention on the benefits of exercise for older and female
patients. Meanwhile, more attention should be put on increasing motivation and
removing barriers to exercise for younger and female Chinese HD patients,
respectively.
Although there was no significant difference in perceived barriers between UK and
Chinese HD patients, Chinese HD patients perceived more benefits of exercise than
the UK patients. This may increase Chinese patients’ motivation for engaging in
exercise and consequently increase PA level more than their UK counterparts (Clarke
et al. 2015b). Fostering HD patients’ recognition of exercise benefits, especially for
the UK HD patients, is essential for increasing motivation of patients’ exercise
participation. As described in the previous physical function chapter, UK HD patients
had lower physical function than Chinese HD patients, which might explain the
possibility that UK patients with worse physical function may lack motivation of an
understanding of exercise benefits. It may be supported by the positive correlation
between exercise capacity (the DASI score) and benefits of exercise which was
reported in this study. However, although this is statistically significant in perceived
exercise benefits between UK and Chinese HD patients, the median difference (0.01)
is not clinically significant. So this may mean there is no meaningful difference
between the populations. Additionally, it has been shown that the effect of improving
QoL was regarded as the main exercise benefit and physical symptoms are considered
the main barrier to exercise by HD patients. Therefore, further exploration of the
contributing factors of PA levels, including QoL and symptoms, may be required to
understand HD patients’ activity in the UK and China.
Limitations
The DPPEBBS is a validated questionnaire which further explores the specific
perception of dialysis patients about exercise. However, it was originally developed in
China. Therefore, the terminology on its English version may be slightly unclear to
English speakers. In this study, a supplementary explanatory sheet was used to aid
comprehension. Additionally, the first question which refers to the cost of dialysis
treatment is not relevant to National Health Service (NHS) patients. This question was
deleted with a single strikethrough and not required for UK participants to complete.

209
Thus, there were only 11 items about exercise benefits left in the English version.
However, the results of the DPPEBBS were described with the average scores of
exercise benefits and barriers. This may have partly eliminated the impact of
questionnaire modification. Variance explained by age, gender and group in perceived
benefits of exercise was only 1.5%. It indicates that many other factors associated with
exercise benefits were not included in the model in the study. Additionally, dependent
variables for linear regression should be continuous or scalar. However, score from the
DPPEBBS is ordinal. The ordinal regression may be the most appropriate analysis
rather than the linear regression.
8.6 Conclusion
UK and Chinese HD patients perceived more benefits than barriers. The majority of
UK and Chinese HD patients recognized a range of exercise benefits, suggesting
openness to exercise behaviour change intervention. In-depth understanding of indirect
exercise benefits is required for HD patients in two cultural groups. Exercise
intervention for HD should focus on enhancing physical and functional self-efficacy,
including management of the risk of falling for the UK patients and providing more
information about exercise engagement for Chinese patients. While more attention to
exercise benefits needs to be focused on old and female patients in UK HD patients,
young and female Chinese HD patients should have more attention put on
understanding benefits and removing barriers to exercise. UK HD patients perceived
fewer exercise benefits than Chinese HD patients, which in part explains the lower PA
level in UK HD patients compared with Chinese patients.

210
Chapter 9
Relationship between Physical
Function, Activity and Quality of
Life, Symptoms and Body
Composition in UK and Chinese
haemodialysis Patients

211
9.1 Abstract
In previous results, the BMI in UK HD patients were higher than Chinese patients, but
this was coupled with dietary insufficiency and was negatively correlated with
physical function. These findings may be inconsistent with previous research
indicating that higher BMI predicts better survival in HD patients. Poor Quality of Life
(QoL) and symptom burden in HD patients lead to high mortality risk. It was found in
previous results that improving QoL and the impact of symptoms were the commonly
reported exercise benefit and barrier by both UK and Chinese HD patients. Therefore,
the aim of this study was to explore the relationship between physical function, activity
and QoL, symptoms and body composition in UK and Chinese HD Patients. The Euro
QOL-5 Dimensions-5 Level (EQ-5D-5L), Palliative Care Outcome Scale–Symptoms
Renal (POS-S) and Body Composition Monitor (BCM) were used to assess QoL,
symptom burden and body composition. Physical performance tests and triaxial
accelerometer were used for evaluating physical function and PA levels. There was a
negative correlation between low QoL in the UK HD patients and physical function
and PA levels. QoL scores were higher in the Chinese group and did not demonstrate
any correlation with physical function and PA level. The most commonly reported
symptoms in the UK and Chinese HD patients were physical, including pain, fatigue
and weakness, which significantly affected physical function and PA levels. Higher
BMI in the UK HD patients when compared to Chinese patients was ascribed to high
Fat Mass (FM). Poorer QoL, greater impact of symptoms and higher FM may explain
the lower physical function and activity level in the UK HD patients compared with
their Chinese counterparts.
9.2 Background
Several studies indicate that higher BMI conveys survival advantage in HD patients
(Lowrie, Li et al. 2002, Port, Ashby et al. 2002, Beddhu, Pappas et al. 2003). However,
there were mixed consequences regarding which body component confers the survival.
Some studies ascribed survival advantage in HD patients to both increased fat and
muscle mass (Huang, Tighiouart et al. 2010) or independent higher muscle mass
(Mafra, Guebre-Egziabher et al. 2008), whilst others attributed the positive finding to
higher FM (Kalantar-Zadeh, Kuwae et al. 2006, Beddhu, Pappas et al. 2003). However,
Kamyar Kalantar-Zadeh et al. also revealed that negative relationship between QoL

212
and FM percentage (Kalantar-Zadeh, Kuwae et al. 2006). The influence of FM for HD
patients requires reconsideration and further exploration. UK HD patients had
significant higher BMI than Chinese HD patients in all studies of this thesis.
Meanwhile, high BMI failed to predict good NS and was negatively correlated with
physical function. Therefore, to determine whether fat or muscle mass contributed to
the disparity of BMI between UK and Chinese HD patients and which body component
negatively associated with NS and physical function is necessary.
It was found in previous results that HD patients in both the UK and China have
impaired physical function. It is widely known that muscle functionality and muscle
mass are not congruent. In another words, reduced muscle strength or muscle
functionality is unable to explain the muscle mass status (Hughes, Frontera et al. 2001).
Both loss of skeletal muscle mass (SMM) and strength are independent predictors of
mortality in HD patients (Cruz-Jentoft, Baeyens et al. 2010). Therefore, assessment of
muscle mass may provide additional diagnostic and prognostic information to physical
function evaluation. Low protein or energy intake and reduced muscle mass are
integral diagnosis criteria of Protein-Energy Wasting (PEW) (Mak, Ikizler et al. 2011).
As found in the DISH study, both the UK and Chinese HD patients had lower daily
protein and energy intake than the recommended amount. Therefore, body
composition measurement gives insight into the understanding of PEW and provides
valuable information for the multidimensional nutritional assessment in HD patients
(Broers, Martens et al. 2015).
QoL plays an important role in evaluating the strategies to improve the well-being of
HD patients or prevent adverse outcomes (Fukuhara, Lopes et al. 2003), impact of
illness and the quality of healthcare (Wan, Chen et al. 2015, Fukuhara, Yamazaki et al.
2007, Dashti-Khavidaki, Sharif et al. 2013). Furthermore, it has been confirmed that
improved QoL is beneficial in improving dialysis outcomes (Chambers, Germain et al.
2010). Additionally, it is an efficient predictor in identifying risks of hospitalization
and mortality in HD patients (Mapes, Lopes et al. 2003). However, large studies have
confirmed that HD patients experience poor QoL (Yang, Griva et al. 2015a, Yang, Lau
et al. 2015, Faridah, Jamaiyah et al. 2010, Kang, Lee et al. 2015a, Katayama, Miyatake
et al. 2014, Okubo, Kai et al. 2014, Walters, Hays et al. 2002). Impaired QoL is
affected by a number of factors in HD patients, such as increased age, female gender,

213
lack of formal education, multiple co-morbidities, medications (Sa'ed H Zyoud, Dala
N Daraghmeh et al. 2016), and even cultures (Hicks, Cleary et al. 2004a).
HD patients also suffer from multiple physiological and psychological symptoms
(Gutiérrez Sánchez Daniel, Leiva-Santos et al. 2017). Over 50% of dialysis patients
reported that the most prevalent physiological symptoms were fatigue, pain, muscle
cramps, difficulty sleeping and sexual dysfunction (Weisbord, Fried et al. 2005,
Weisbord, Fried et al. 2007, Rosas, Joffe et al. 2001, Palmer 2003). A study of 60 HD
patients found that more than half experienced weakness, difficulty sleeping and
depression (Gutiérrez Sánchez Daniel, Leiva-Santos et al. 2017). Yong et al. revealed
that the five most prevalent and intense symptoms amongst Hong Kong HD patients
were fatigue, aversion to the cold, pruritus, lower torso weakness and difficulty
sleeping. All symptoms were also inversely associated with QoL and survival (Yong,
Kwok et al. 2009).
The findings regarding perception of exercise indicated that the most frequently
reported patients-perceived benefits of exercise in UK HD patients was the
improvement of QoL, which was also recognized in the top 5 exercise benefits for
Chinese HD patients. Meanwhile, the most commonly reported patients-perceived
barriers to exercise were physical symptoms in both UK and Chinese HD patients. In
order to understand how well these factors influence physical function and PA, a
thorough understanding of QoL and symptoms related to renal disease is required.
The aim of this chapter has previously been described in number (6) of section 1.6 in
Chapter 1. Briefly, the primary aim was to understand the relationship between
physical function, activity and QoL, symptoms and body Composition in UK and
Chinese HD Patients.
9.3 Methods
The data included in this chapter was derived from the COCO study (Chapter 2, section
2.2.3). The detailed methods are described in Chapter 2. Specifically, the results of the
EQ-5D-5L, POS-S and BCM (section 2.3.3) were used.
Briefly the EQ-5D-5L and POS-S were administered to UK and Chinese HD patients
to assess QoL and symptoms relating to renal disease. The BCM was used to assess
214
HD patients’ body composition, including Lean Tissue Index (LTI) and fat tissue index
(FTI). Physical performance tests (Shuttle Walking Test [SWT], Sit-to-Stand 60
[STS60], Short Physical Performance Battery [SPPB] and Handgrip Strength [HGS])
and triaxial accelerometer (Sensewear Armband [SWA]) were used to assess physical
function and PA level. The purpose of exploring the correlation between physical
function and symptoms was to understand the continuous impact of symptoms on
physical function. Among these 4 physical performance tests, only SWT needs a
period of time to complete. It takes around one minute to perform STS60, SPPB and
HGS. Therefore, only SWT was used for showing HD patients’ physical function when
evaluating the correlation between physical function and symptoms. Additionally,
some symptoms in the POS-S are not closely related with exercise, such as mouth
problems, changes in skin and so on. In this study, symptoms assumed to be connected
to exercise, (pain, shortness of breath, weakness or lack of energy, drowsiness, poor
mobility, restless legs and difficulty sleeping) were chosen to show the relationship
between symptoms, physical function and PA level. Moderate to Mild Physical
Activity (MVPA) as an outcome derived from SWA was obtained for assessing HD
patients’ PA level. MVPA refers to the time that participants spend on moderate and
vigorous intensities of PAs, which involves duration and intensity of exercise. It is a
more comprehensive and efficient outcome measure compared with daily steps.
Therefore, only MVPA was selected to be an outcome of PA level.
9.4 Results
9.4.1 QoL, symptom burdens and body composition in the UK haemodialysis
patients
Demographics
Patients in the part were recruited in the COCO study. For detailed information
regarding demographics the reader is asked to refer to Table3- 13 in chapter 3.
Quality of life
29 (96.7%) UK HD patients completed the EQ5D-5L. The mean index value was0.68
(±0.26) with a range of 0.054-1.

215
Symptom burden relating to renal disease
The most commonly reported renal symptoms in the UK HD patients was ‘‘weakness’’
(97%), with the highest mean score of impact (1.79 ±1.01), while the least experienced
symptom was ‘‘mouth problem’’ (17%), with the lowest mean score of impact
(0.31±0.76). The most commonly experienced renal symptoms with percentage of
patients reporting each symptom and mean (± SD) impact scores of renal symptoms in
the UK HD patients are shown in Figure9- 1 and Table9- 1(in descending order). The
5 most commonly reported symptoms and all other symptoms reported by participants
with a percentage above 50% are highlighted in red and yellow, respectively.
Figure9- 1Renal symptoms reported in a usual week by UK HD patients

216
Table9- 1Impact scores for each of the renal symptoms in UK HD patients
Symptom Impact
Symptom Mean Impact Score ±SD
(on a scale of 0 [not at all] to 4 [Overwhelmingly])
Weakness 1.79±1.01
Difficulty sleeping 1.76±1.21
Poor mobility 1.48±1.24
Itching 1.48±1.24
Restless legs 1.38±1.18
Pain 1.34±1.17
Drowsiness 1.24±1.15
Shortness of breath 1.10±1.11
Constipation 0.90±1.01
Changes in skin 0.86±0.99
Nausea 0.83±1.14
Poor appetite 0.83±0.93
Feeling depressed 0.79±1.05
Feeling anxious 0.72±0.80
Vomiting (being sick) 0.45±1.02
Diarrhoea 0.45±0.69
Mouth problems 0.31±0.76
Relationship between QoL and physical function and PA level
The index value of QoL significantly correlated with all the physical performance tests
and PA level. HGS had a medium positive association with the index value. The
associations between index value, whilst other physical function tests (SWT, STS60,
SPPB) and PA level (weekly MVPA) were all large. The correlation between QoL and
physical function and PA level is shown in Table9- 2.
Table9- 2Correlational relationship between QoL (EQ5D-5L index value), physical function
(SWT, STS60, SPPB, and HGS) and PA level (Weekly MVPA) in UK HD patients
QoL Physical Function PA level
ISWT ESWT STS60 SPPB HGS (Weekly MVPA)
Index
value .759** .562** .611** .612** .390* .732**
*P< 0.05 (2-tailed); **P< 0.01 (2-tailed).

217
Relationship between symptom burden, physical function and PA level
The Incremental Shuttle Walking Test (ISWT) was negatively correlated with “pain”,
“shortness of breath”, “weakness”, “poor mobility” and “restless legs”. PA level was
significantly negatively correlated with “pain” and “poor mobility”. “Poor mobility”
showed the largest correlation with physical function and PA level. Correlation
between impact of symptoms, physical function and PA level is shown in Table9- 3.
Table9- 3Correlational relationship between impact of renal symptoms, physical function (SWT)
and PA level (Weekly MVPA) in the UK HD patients
Renal Symptoms N Median
(range)
Physical Function PA level
ISWT ESWT (Weekly MVPA)
Pain 29 1(0-4) -.412* -.361 -.488*
Shortness of breath 29 1(0-4) -.500** -.226 -.433
Weakness 29 2(0-4) -.412* -.089 -.261
Drowsiness 29 1(0-3) -.325 -.095 -.019
Poor mobility 29 1(0-4) -.577** -.335 -.531*
Difficulty sleeping 29 2(0-4) -.187 -.052 -.217
Restless legs 29 1(0-4) -.483* -.356 -.216
*P< 0.05 (2-tailed); **P< 0.01 (2-tailed).
Body composition
44.8% and 72.4% of the UK HD patients showed low LTI and high FTI, respectively.

218
Relationship between body composition, physical function and PA level
LTI was positively associated with physical function tests and PA level. Except for the
HGS, FTI was negatively associated with the other physical function tests and PA level.
The association between LTI, FTI, physical function and PA is shown in Table9- 4.
Table9- 4Correlational relationship between body composition (LTI, FTI), physical function
(SWT, STS60, SPPB, HGS) and PA level (Weekly MVPA) in UK HD patients
Body
composition N Mean(±SD)
Physical Function PA level
(Weekly
MVPA) ISWT ESWT STS60 SPPB HGS
LTI
(kg/m2) 29 13.99±3.76 .513** .394* .669** .540** .498** .487**
FTI
(kg/m2) 29 12.29±5.18 -.600** -.660** -.418* -.578** -.377 -.482*
*P< 0.05 (2-tailed); **P< 0.01 (2-tailed)
9.4.2 QoL, symptom burdens and body composition in Chinese haemodialysis
patients
Demographics
Patients in the section were from the COCO study. For detailed information regarding
demographics in Chinese HD patients the reader is asked to refer to the Table3- 16 in
chapter 3.
Quality of life
All Chinese HD patients (n=40) completed the EQ5D-5L questionnaires. The mean
index value was 0.95 (±0.08) with a range of 0.652-1.
Symptom burden relating to renal disease
The most common reported renal symptoms in Chinese HD patients was ‘Itching’’
(75%), with the highest mean score (± SD) of impact (1.10±0.87), while the least
experienced symptom was ‘‘Diarrhoea’’ (15%), with the lowest mean (±SD) score of
impact (0.15±0.36). The common experienced renal symptoms with percentage of
patients reporting each symptom and mean impact scores of renal symptoms in
Chinese HD patients were shown in Figure9- 2 and Table9- 5 (in descending order).
The 5 most commonly reported symptoms and all other symptoms reported by

219
participants with a percentage above 50% are highlighted in red and yellow,
respectively.
Figure9- 2Renal symptoms reported in a usual week by Chinese HD patients

220
Table9- 5Impact scores for each of the renal symptoms in Chinese HD patients
Symptom Impact
Symptom Mean Impact Score ±SD
(on a scale of 0 [not at all] to 4 [Overwhelmingly])
Itching 1.10±0.87
Difficulty sleeping 1.08±1.00
Mouth problems 0.80±0.88
Weakness or lack of energy 0.78±0.70
Drowsiness 0.75±0.81
Pain 0.70±0.82
Poor appetite 0.60±0.67
Changes in skin 0.58±0.68
Constipation 0.48±0.72
Shortness of breath 0.43±0.59
Poor mobility 0.35±0.70
Feeling anxious 0.35±0.58
Restless legs 0.30±0.52
Nausea 0.28±0.51
Vomiting (being sick) 0.28±0.45
Feeling depressed 0.23±0.48
Diarrhoea 0.15±0.36
Relationship between QoL, physical function and PA level
There was no significant association between QoL, physical function and PA level in
Chinese HD patients, which is shown in Table9- 6.
Table9- 6Correlational relationship between QoL (EQ5D-5L index value), physical function
(SWT, STS60, SPPB, HGS) and PA level (Weekly MVPA) in Chinese HD patients
QoL
Physical Function PA level
ISWT ESWT STS60 SPPB HGS (Weekly MVPA)
Index value .249 .221 .106 .154 .233 0.020
*P< 0.05 (2-tailed); **P< 0.01 (2-tailed).
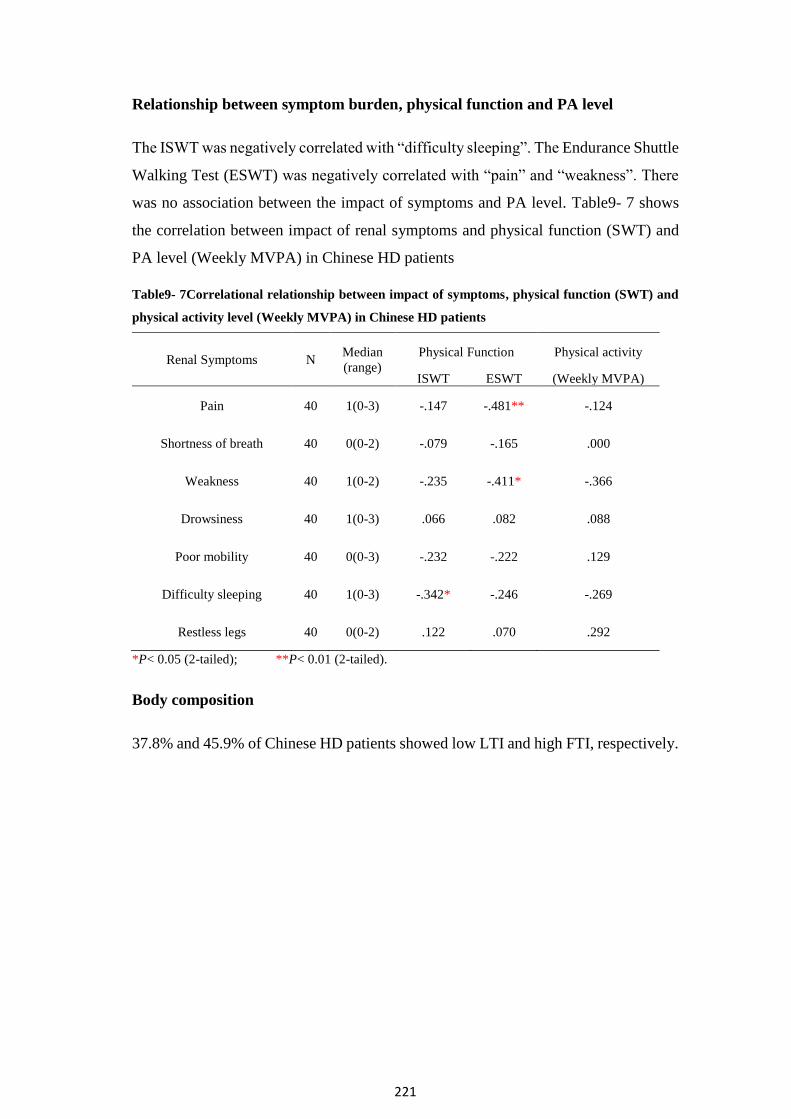
221
Relationship between symptom burden, physical function and PA level
The ISWT was negatively correlated with “difficulty sleeping”. The Endurance Shuttle
Walking Test (ESWT) was negatively correlated with “pain” and “weakness”. There
was no association between the impact of symptoms and PA level. Table9- 7 shows
the correlation between impact of renal symptoms and physical function (SWT) and
PA level (Weekly MVPA) in Chinese HD patients
Table9- 7Correlational relationship between impact of symptoms, physical function (SWT) and
physical activity level (Weekly MVPA) in Chinese HD patients
Renal Symptoms N Median
(range)
Physical Function Physical activity
ISWT ESWT (Weekly MVPA)
Pain 40 1(0-3) -.147 -.481** -.124
Shortness of breath 40 0(0-2) -.079 -.165 .000
Weakness 40 1(0-2) -.235 -.411* -.366
Drowsiness 40 1(0-3) .066 .082 .088
Poor mobility 40 0(0-3) -.232 -.222 .129
Difficulty sleeping 40 1(0-3) -.342* -.246 -.269
Restless legs 40 0(0-2) .122 .070 .292
*P< 0.05 (2-tailed); **P< 0.01 (2-tailed).
Body composition
37.8% and 45.9% of Chinese HD patients showed low LTI and high FTI, respectively.

222
Relationship between body composition, physical function and PA level
There was a significant and positive association between the LTI, physical
performance tests and PA level. The negative association was shown between FTI,
ISWT and HGS. The relationship between body composition, physical function and
PA level in Chinese HD patients is shown in Table9- 8.
Table9- 8Correlational relationship between body composition (LTI, FTI) and physical function
(SWT, STS60, SPPB, HGS) and physical activity level (Weekly MVPA) in Chinese HD patients
Body
composition N Mean
(SD)
Physical Function PA level
ISWT ESWT STS60 SPPB HGS (Weekly
MVPA)
LTI
(kg/m2) 37 13.61
(2.11) .523** .456** .569** .359* .699** .460*
FTI
(kg/m2) 37 8.78
(3.26) -.403* -.302 -.288 -.152 -.325* -.139
*P< 0.05 (2-tailed); **P< 0.01 (2-tailed)
9.4.3 Comparison of QoL, symptom burdens and body composition between
UK and Chinese haemodialysis patients
Comparison of demographics between UK and Chinese haemodialysis patients
Table3- 19 (Chapter 3) compares demographics between UK and Chinese HD patients.
Comparison of QoL between UK and Chinese haemodialysis patients
UK HD patients (0.68±0.26) had significantly lower index value than their Chinese
counterparts (0.95 ±0.08) (t=-6.457, P<0.001). Comparison of QoL (index value)
between UK and Chinse HD patients is shown in Figure9- 3.

223
Figure9- 3Comparison of QoL (index value) between UK and Chinse HD patients
Comparison of QoL between UK and Chinese haemodialysis patients after
controlling for age and gender
UK patients were significantly older and had more males than the Chinese patients.
After controlling for age and gender, the mean index value in UK and Chinese HD
patients were 0.681 (95%CI: 0.612-0.750) and 0.951 (95%CI: 0.894-1.009),
respectively. UK HD patients (group=1) had significant worse QoL than their Chinese
counterparts (group=2) after controlling for age and gender (R2 Adjusted=0.364, P<0.001)
(Table9- 9).
Table9- 9Multiariable linear regression analysis for the QoL between UK and Chinese HD
patients after adjusting for age and gender
Variable B SE B Β P
(Constant) .539
(.213,.865) .163 .002
Age -.002
(-.006,.002) .002 -.093 .384
Gender -.029
(-.124,.067) .048 -.062 .552
Groups .270
(.177,.363) .047 .604 <.001***
Unstandardized coefficient, SE: Standard Error, β: standardized Coefficients. ***P<0.001

224
Comparison of symptoms between UK and Chinese haemodialysis patients
adjusting for age and gender
UK HD patients suffered from a significantly greater impact in their symptoms than
their Chinese counterparts, in relation to pain (Z=-2.419, P=0.016), shortness of breath
(Z=-2.774, P=0.006), weakness (Z=-4.175, P<0.001), poor mobility (Z=-4.245,
P=<0.001), difficulty sleeping (Z=-2.335, P=0.020) and restless legs (Z=-4.273,
P<0.001).
After controlling for age and gender, UK HD patients suffered greater impact from
pain (R2Adjusted=0.111, P=0.003), shortness of breath (R2
Adjusted=0.138, P=0.003),
weakness(R2Adjusted =0.306, P<0.001), poor mobility (R2
Adjusted =0.278, P<0.001),
difficulty sleeping (R2Adjusted=0.212, P=0.001), and restless legs (R2
Adjusted
=0.266,P<0.001) than their Chinese counterparts (group=2). Unadjusted (mean±SD)
and adjusted (mean [95%CI: lower bound -upper bound)]) impact of symptoms related
to renal disease between UK and Chinese HD patients is shown Table9- 10.
Table9- 10Unadjusted and adjusted symptoms related to renal disease between UK and Chinese
HD patients
UK HD patients
n=29
Chinese HD patients
n=40
Renal Symptoms
Unadjusted
impact
(mean±SD)
Adjusted impact
Mean
(95%CI: lower bound -
upper bound)
Unadjusted
impact
(mean±SD)
Adjusted impact
Mean
(95%CI: lower bound
-upper bound)
Pain 1.34±1.17 1.43(1.06-1.81) 0.70±0.82† 0.64(0.32-0.95) **
Shortness of
breath 1.10±1.11 1.11(0.78-1.45) 0.43±0.59†† 0.42(0.14-0.70) **
Weakness 1.79±1.01 1.88(1.55-2.20) 0.78±0.70††† 0.71(0.44-0.99) ***
Poor mobility 1.48±1.24 1.46(1.09-1.84) 0.35±0.70††† 0.37(0.05-0.68) ***
Difficulty
sleeping 1.76±1.21 1.91(1.51-2.31) 1.08±1.00† 0.96(0.63-1.30) ***
Restless legs 1.38±1.18 1.34(1.01-1.68) 0.30±0.52††† 0.33(0.05-0.61) ***
†Denoted significant difference in unadjusted impact of symptoms between UK and Chinese HD
patients, †P< 0.05; ††P< 0.01; †††P< 0.001 (2-tailed);
* Denoted significant difference in adjusted impact of symptoms between UK and Chinese HD
patients; *P< 0.05 (2-tailed), **P< 0.01, ***P< 0.001 (2-tailed)

225
Comparison of LTI and FTI between UK and Chinese haemodialysis patients
There was no significant difference in the percentage of low LTI between UK and
Chinese HD patients. However, the UK HD patients had a higher proportion of high
FTI than their Chinese counterparts. The number and percentage of LTI and FTI in
different categories, and the comparison of low LTI and high FTI between UK and
Chinese HD patients is shown in Table9- 11. Similarly, there was no significant
difference in LTI between UK and Chinese HD patients (t=0.490, P=0.627). UK HD
patients had higher FTI than Chinese HD patients (t=3.187, P=0.003). The comparison
of LTI and FTI between the UK and Chinese HD patients are shown in Figure9- 4 and
Figure9- 5.
Table9- 11Comparison of percentage of low LTI and high FTI between the UK and Chinese HD
patients
Body
composition Category
UK HD patients
n (%)
Chinese HD patients
n (%)
P value
LTI Low 13 (44.8) 14 (37.8)
0.566 Normal 15 (51.7) 23(62.2)
High 1(3.5) 0 (0.0)
FTI Low 0(0.0) 1(2.7)
0.039* Normal 8(27.6) 19 (51.4)
High 21 (72.4) 17 (45.9)
*P< 0.05 (2-tailed)
Figure9- 4Comparison of LTI between UK and Chinese HD patients

226
Figure9- 5Comparison of FTI between UK and Chinese HD patients
Comparison of LTI and FTI between UK and Chinese haemodialysis patients
after adjusting for age and gender
After controlling for age and gender, the mean FTI in UK and Chinese HD patients
were 12.338 (95%CI: 10.786-13.890) and 8.741 (95%CI: 7.379-10.102), respectively.
UK HD patients (group=1) had significantly higher FTI than their Chinese
counterparts (group=2) after controlling for age and gender (R2 Adjusted =-.221, P=0.001)
(Table9- 12).
Table9- 12Multiariable linear regression analysis for the FTI between UK and Chinese HD
patients after adjusting for age and gender
Variable B SE B β P
(Constant) 7.321
(.112,14.531) 3.607 .047
Age .092
(.003,.181) .044 .246 .043*
Gender 2.833
(.636,5.031) 1.099 .303 .012*
Groups -3.597
(-5.737, -1.456) 1.071 -.397 .001***
Unstandardized coefficient, SE: Standard Error, β: standardized Coefficients. *P<0.05,***P≤0.001
227
9.5 Discussion
UK HD patients in this study had similar QoL with index value of 0.68±0.26 with that
in patients from Korea (0.70 ± 0.20) (Kang, Lee et al. 2015b) and Taiwan (0.65 ±0.23)
(Sakthong, Kasemsup 2012). The level of QoL is lower for UK HD patients than for
Japanese HD patients with 0.75 ± 0.17 (Katayama, Miyatake et al. 2014) and higher
than for Palestine 0.37 ± 0.44 (Sa'ed H Zyoud, Dala N Daraghmeh et al. 2016) and
Singaporean patients 0.60 ± 0.21(Yang, Griva et al. 2015b). Surprisingly, Chinese
HD patients had a remarkably higher QoL with the index value of 0.95±0.08 than HD
patients from other countries. Socioeconomic factors, such as education levels and
residency in different regions, healthcare systems, and clinical parameters, including
age, female, dialysis vintage and comorbidities all affect HD patients’ QoL (Sa'ed H
Zyoud, Dala N Daraghmeh et al. 2016, Hicks, Cleary et al. 2004b). These associated
factors could explain the variations in QoL levels for HD patients in different countries.
Meanwhile, the various relationship between QoL, patterns of medical practice and
mortality among international ESRD patients showed that QoL is culture-specific
(Rayner, Pisoni et al. 2003, Bleyer, Hylander et al. 1999, Held, Brunner et al. 1990,
Hicks, Cleary et al. 2004c). Age is a powerful determinant of QoL in HD patients
(Iliescu, Coo et al. 2003, Valderrábano, Jofre et al. 2001), which may explain the high
QoL in Chinese HD patients who are younger than other HD patients (Chinese
National Renal Data System 2015, UK Renal Registry 2015, United States Renal Data
System, USRDS 2015). Sa’ed H. Zyoud attributed low QoL to physical inactivity in
female HD patients in developing countries (Zyoud, Daraghmeh et al. 2016). However,
as discussed in the previous chapters, Chinese female HD patients showed the similar
PA level to male patients due to the possibility that Chinese women are expected to
take primary responsibilities in doing housework and being caregivers in traditional
Chinese culture (Wai‐Ying 2001). The high PA level in Chinese female HD patients
may contribute to a high QoL level. It has been shown that increasing PA or exercise
levels improves the levels of QoL in HD patients(Painter, Carlson et al. 2000, Mi Rye
Suh, R N, Hyuk Jung et al. 2002), which is consistent with the finding that a positive
relationship between QoL, physical function ad PA level was present in the UK HD
patients. It also can corroborate HD patients’ perception that exercise can improve
QoL, which was the predominant self-perceived exercise benefit. However, the high

228
prevalence of optimal QoL level in Chinese HD patients could not determine a
correlation with physical function and PA level.
It has been highlighted that the commonly reported symptoms related to renal disease
focus on physiological complaints with both UK and Chinese HD patients, such as
weakness, pain, itching, shortness of breath, poor mobility and so on, which were
consistent with the reports from previous investigations with HD patients (Murtagh,
Addington-Hall et al. 2007b, O'Connor, Corcoran 2012). In the current study, 97% of
UK HD patients suffered from weakness, which showed a higher proportion than 60.2%
in HD patients who experienced weakness from Iran (Omrani, Fallahi et al. 2015). 63%
of Chinese HD patients reported experiencing weakness. 69% of UK HD patients and
53% of Chinese patients reported experiencing pain in the study, which is higher than
50% of Canadian HD patients with pain (Davison 2003). Similarly, 76% and 75% of
UK and Chinese patients who suffered from itching was higher than 55% of HD
patients from a systematic review (Murtagh, Addington-Hall et al. 2007b).
It is noted in the study that physical symptoms, including pain, short of breath,
weakness, mobility and leg restless negatively affected Incremental Shuttle Walking
Test (ISWT) in the UK HD patients. There was a significantly negative correlation
between Shuttle Walking Test (SWT), pain, weakness and difficulty sleeping in
Chinese HD patients. Meanwhile, poor mobility and pain significantly associated with
UK HD patients’ PA level. This indicated that physical function may increase as
symptoms improve, and that consequently, PA levels could possibly be augmented as
well. These results were in agreement with the findings that physical outcomes are
direct determinants of physical function and maintenance of PA in previous studies
(Merkus, Jager et al. 1999, Curtin, Bultman et al. 2002, Knight, Ofsthun et al. 2003,
van Stralen, De Vries et al. 2009). Likewise, the increasing PA level may potentially
to lead to decreased symptom burden and increased physical function, which has been
confirmed by previous studies (Windsor, Nicol et al. 2004a, Sarna, Conde 2001,
Windsor, Nicol et al. 2004b). The walking speed used in the ESWT is determined by
the performance in the ISWT, which equates to 85% of predicted Peak Oxygen
Consumption (VO2peak) achieved from the ISWT. This may explain the finding that
there was no significant correlation between symptoms and ESWT in the UK HD
patients. Since, the impact of symptoms on the performance in the ISWT may lead to
a lower walking speed compared to participants’ actual capacity. Thus, symptoms may

229
not influence HD patients’ performance in a low level of the ESWT. Chinese HD
patients reported that only weakness, pain and difficulty sleeping affected exercise
capacity, the potential low impacts of these symptoms might not be great enough to
affect patients’ PA level.
Nearly half of the UK HD patients in the study appeared to have a low LTI based on
the norms obtained from 1000 healthy volunteers(Fresenius Medical Care). The mean
LTI (13.99 kg/m2) in the UK cohort was higher than the average value of 12.7 kg/m2
in HD patients from 3 European centres (Wizemann, Wabel et al. 2009). It was also
higher than the one in 37,345 HD patients from 17 European countries (median: 14.3
vs. 12.2 kg/m2) (Marcelli, Usvyat et al. 2015). 72.4% of UK HD patients had high FTI.
The mean FTI in UK HD patients was higher than that in other European HD patients
(12.29 vs. 8.2kg/m2) (Wizemann, Wabel et al. 2009).
Compared with the previous findings, the LTI of Chinese HD patients was higher than
that in HD patients from other European studies (mean: 13.6 vs 12.7 kg/m2;median:
15.30 vs.12.2 kg/m2) (Wizemann, Wabel et al. 2009, Marcelli, Usvyat et al. 2015).
However, Chinese HD patients showed lower FTI than European HD patients (mean:
7.7 vs 8.2 kg/m2;median: 6.7 vs.9.8 kg/m2) (Wizemann, Wabel et al. 2009, Marcelli,
Usvyat et al. 2015). This may be an underlying explanation for the finding that there
was no significant correlation between FTI, muscle capacity and PA level in Chinese
HD patients.
Positive associations between higher BMI and better survival in HD patients have been
confirmed by a number of studies (Johansen, Young et al. 2004, Kalantar-Zadeh,
Abbott et al. 2005, Port, Ashby et al. 2002). However, controversy has been raised due
to the fact that higher BMI with higher Fat Mass (FM) had an increased prevalence of
inflammation, atherosclerosis, CVD and all-cause mortality (Pecoits‐Filho, Nordfors
et al. 2002, Menon, Wang et al. 2003). The underlying explanations for the conflicting
findings could be that the increased death risks caused by obesity (high BMI with high
FM) were not so much as occurs in malnutrition (low muscle and FM). Essentially,
only well-nourished HD patients with high BMI and high muscle mass had the lowest
mortality risk (Beddhu, Pappas et al. 2003, Beddhu 2004). The findings in the study
provided evidence that increased LTI contributed to the high physical function and PA

230
levels. Conversely, the higher FTI negatively affected activity outcomes in HD
patients.
Loss of muscle mass (sarcopenia) and a decline in muscle strength (myopathy) may
contribute to HD patients’ reduced functional capacity and physical inactivity (Beddhu
2004). This was corroborated by the finding of the significant positive correlation
between LTI, physical function and PA level in UK and Chinese HD patients in this
study. However, there was no significant difference in LTI between UK and Chinese
HD patients, which may partly explain the finding that there was no significant
difference in exercise capacity and PA level in this study. The higher BMI in the UK
HD patients than Chinese patients was ascribed to the increased FM. Based on the
negative correlation between the FTI, physical function and PA level, the higher FM
may contribute to the lower physical function and PA levels in the UK HD patients
than Chinese patients found in the QCKD study. It could explain the finding that UK
HD patients with higher BMI than Chinese patients showed lower physical function
and PA level compared with their Chinese counterparts. Additionally, it has been
reported that the FTI contributes to adverse clinical outcomes (Pecoits‐ Filho,
Nordfors et al. 2002, Menon, Wang et al. 2003, Cordeiro, Qureshi et al. 2009), which
may lead to serious symptom burdens. This is consistent with the findings which
indicated that UK HD patients had greater symptom burdens and poorer QoL when
compared to Chinese HD patients.
The relationship between body components and BMI in UK and Chinese HD patients
found in this study is also presumably applicable in the QCKD and DISH studies. Thus,
it could be concluded that high BMI with high FM is unable to determine the good NS
for HD patients. Additionally, the effect of serum creatinine as the predictor of muscle
mass has not been confirmed, which is required to be further explored.
Limitations
The POS-S is a reliable and valid questionnaire which specially assesses symptom
burden in patients with renal disease (Murphy, Murtagh et al. 2009). It has been
translated into different languages and validated with a variety of patients with
different stages of renal disease (Gutiérrez Sánchez Daniel, Leiva-Santos et al. 2017).
However, there is currently no valid Chinese version of the POS-S. In the study, the
English version of POS-S was translated to Chinese by two professional translators

231
who had medical knowledge and back into English by two more translators who had
no knowledge of the original version of the questionnaire but had medical background.
Adaptations in the conceptual aspect were made until consensus was reached by the
translation group and professional healthcare providers. Actually, the POS-S only
refers to 17 symptoms that are commonly related to renal disease. It was not necessary
to adapt the questionnaire in terms of logistical aspects, which may have guaranteed
the quality of the Chinese version of POS-S.
9.6 Conclusion
The impaired QoL in the UK HD patients was correlated with low physical function
and PA level. There was no significant correlation between Chinese HD patients’ good
QoL, physical function and PA level. UK and Chinese HD patients’ symptom burdens
relating to renal disease mainly referred to physical discomforts. These physical
symptoms significantly affected UK HD patients’ exercise capacity and PA level. The
few symptoms and low impact on Chinese HD patients may be the reason why
symptoms did not influence PA levels. The higher BMI in UK HD patients than
Chinese patients was ascribed to high FM, which may explain the finding that UK HD
patients had lower muscle function and PA level. Poorer QoL, greater impact from
symptom burdens as well as higher FM in UK HD patients may contribute to lower
physical function and PA level compared with Chinese HD patients.

232
Chapter 10
General Discussion

233
Healthy lifestyle behaviors play a crucial role in the initiation and progression of
Chronic Kidney Disease (CKD), and can prevent the deterioration of kidney
function(EI Kossi, Bello et al. 2007). The European Dialysis and Transplantation
Nurses Association/European Renal Care Association have proposed a series of
recommended dietary intake amount for maintaining good nutritional status (NS) with
HD patients. Moreover, the National Institute of Clinical Excellence (NICE)
recommends regular exercise and even the Kidney Disease Improving Global
Outcomes (KDIGO) suggests physical activity (PA) at least five times every week for
HD patients to improve medical conditions and complications, and consequently
decrease their high risk of mortality. However, it has been widely reported that
malnutrition is highly prevalent in HD patients. Additionally, most HD patients have
very sedentary lives. Dietary patterns and habits, and perceptions and attitudes towards
exercise are strongly associated with lifestyle. It is understood that these factors are
influenced by cultures. Therefore, to comprehensively understand HD patients’
lifestyle, the studies presented in this thesis have been designed to explore and compare
HD patients’ nutritional status (NS) and physical activity between UK and China.
The dietary intake of UK and Chinese HD patients was evaluated, alongside
demographics and nutritional blood parameters that provided insight into the
underlying disparity of nutritional components between UK and Chinese HD patients.
A high prevalence of malnutrition was present in both UK and Chinese HD patients.
UK HD patients had better micronutrients management, such as iron, phosphate and
potassium, than Chinese patients. However, there was no significant difference in
energy and protein intake between UK and Chinese patients.
The understanding of physical function and PA in UK and Chinese HD patients was
obtained by a combination of questionnaires and objective measures, which were
conducted in two separate studies. Both UK and Chinese HD patients had impaired
physical function and PA level. Although there was no significant difference in
habitual PA level objectively measured by triaxial accelerometers between UK and
Chinese patients, physical function and self-reported PA level with a large HD
population were lower in UK patients than Chinese patients.
Demographic (age, gender, muscle and fat mass), clinical (nutrition, inflammation and
bone derangement) and psychological parameters (perceived benefits and barriers to

234
exercise), QoL and symptoms were potential influencing factors of physical function
and activity level in UK and Chinese patients. Anaemia in Chinese HD patients was
negatively correlated with physical function and activity levels. Lower protein status
and bone metabolism, higher fat mass and symptom burden, and fewer perceived
exercise benefits in UK HD patients may contribute to the lower physical function and
activity level than in Chinese HD patients.
Figure10- 1 shows schematic representation of the order of the studies presented in
this thesis, which reported the primary conclusions and additional problems that need
to be explored in the following chapters.

235
Nutritional status Activity
Figure10- 1schematic representation of the order of the studies presented in this thesis
Chapter8-Self-perceived benefits and barriers to Exercise in UK and Chinese
HD patients
Primary Conclusions:
• UK and Chinese HD patients were found to perceive more benefits than
barriers to exercise.
• The self-perceived benefits of exercise were fewer in UK HD patients than
Chinese patients.
Additional problems that need to be further explored:
• Improving QoL and impact of symptoms were the commonly reported
exercise benefits and barriers. The relationship between physical function,
activity and OoL and symptoms is required to be explored.
Chapter 4- Comparison of nutritional intake between UK and Chinese HD Patients Primary Conclusions:
• Malnutrition was highly prevalent in UK
and Chinese HD patients
• UK HD patients had better nutrition
management than Chinese patients
Additional problems that need to be further
explored:
• Body composition is necessary to be
explored to better understand the
relationship between BMI and NS.
Chapter 5-Validity of the DASI and GPPAQ walking pace question Primary Conclusions:
• The DASI is valid for assessing
physical function in UK and Chinese
HD patients.
• The GPPAQ walking pace question
showed possible valuable for
providing walking pace assessment in
UK HD patients
Chapter9-Relationship between physical function, activity and quality of
life, symptoms and body composition in UK and Chinese HD patients
Primary Conclusions
• The high fat mass contributed to high BMI in UK HD patients. High BMI
with high fat mass was not able to explain good NS. High fat mass was
negatively correlated with physical function and PA level in HD patients.
• The effect of serum creatinine as the predictor of muscle mass has not been
confirmed.
• Poorer QoL, more impact of symptom burdens as well as higher fat mass in
UK HD patients may contribute to lower physical function and activity level
compared with Chinese HD patients.
Chapter6-Physical Function of Haemodialysis Patients in UK and China
Chapter7-Physical activity level of Haemodialysis Patients in UK and China
Primary Conclusions:
• Both UK and Chinese HD patients had impaired physical function and a low
PA level.
• UK HD patients had lower physical function and PA levels than Chinese
patients. Additional problems that need to be further explored:
• Link between creatinine, NS and muscle mass and in-depth understanding of
the relationship between body components and physical function

236
The whole thesis provided the evidence for improving lifestyle with HD patients in the
UK and China. Comparison of nutritional status, physical function and activity level
between UK and Chinese HD patients revealed the disparity of lifestyle between two
cultural groups and the potential influencing factors of these lifestyle behaviours.
These findings can promote UK and Chinese HD patients to learn from each other to
efficiently adapt lifestyle.
Referring to the study of nutrition in UK and Chinese HD patients, insufficient energy
and protein intake is the predominant problem. Health education pertaining to nutrition
(Ford et al. 2004), dietary instruction or counselling are required to encourage HD
patients to consume more energy and protein (Burrowes et al. 2003). Meanwhile, intra-
dialytic food provision in Chinese HD patients has the potentials to improve energy
and protein intake. It is worthwhile to be further explored and recommended to UK
HD patients. Additionally, findings in this study suggested that Chinese HD patients
should pay more attention to supplementation, medication management and dialysis
efficacy than dietary intake compared with UK HD patients. The source of funding for
dialysis therapy varies between UK and China (Prasad, Jha 2015). All treatments of
HD patients on the NHS is free for UK residences (NHS trusts 2018). However, in
China, although HD patients living in urban areas who are employed can get generous
insurance coverage, patients who live in rural areas may need to make substantial co-
payments (Prasad, Jha 2015). In recent years, medical insurance in China has
broadened the coverage and decreased in the self-pay percentage (Zhou, Zeng et al.
2017). However, Chinese HD patients still need to undertake enormous financial
pressure for their medication administrations, and even healthcare system bears great
expenditure of clinical examination. These socioeconomic factors may lead to
inadequate supplementation or medication usage and insufficient input to HD patients
in China. Furthermore, poor healthcare systems and busy HD units with tension from
large population in China are unable to provide efficient HD to eligible patients (Prasad,
Jha 2015). However, it is long been known that the UK has well-established HD
systems. Other environmental factors such as lack of the counselling from renal
dietitians or non-specialist dietitians in China may contribute to the poor nutrition
management in Chinese HD patients. As a matter of fact, although specific
physiotherapists or kinesiologists are rarely available at dialysis units within the UK
to provide education or instructions for patients’ exercise engagement, the services are

237
particularly underdeveloped in China, which may exacerbate patients’ lack of access
and even awareness to seek their disease-appropriate exercise information(Pang,
Kurosawa 2003). It is presumed that professional healthcare providers, such as doctors
and nurses at HD units in China may need to take responsibilities of counselling
nutrition and exercise information with HD patients. Therefore, it is worthy to gain a
thorough understanding of their perceptions about HD patients’ nutritional status and
exercise participation, especially for Chinese healthcare providers (Jhamb, McNulty
et al. 2016, Greenwood, Naish et al. 2014).
Apart from findings above, the controversial relationship between high
BMI(26.6kg/m2) (Fouque et al. 2008, Fouque et al. 2007) and malnutrition in the UK
HD patients indicated that patients’ body composition needs to be explored in order to
better understand the relationship between BMI and NS. This exploration was
described in Chapter 9. The comparison of body composition between UK and Chinese
HD patients revealed that the high BMI in UK HD patients was ascribed to high fat
mass (FM) rather muscle mass. This finding may indicate that high fat mass is not
correlated with good NS. Similarly, higher fat mass in UK HD patients than Chinese
patients partly explained the lower physical function and activity level compared with
Chinese patients, which were found in Chapters 6 and 7. Numerous studies have
reported that higher BMI predict better survival in HD patients (Johansen, Young et
al. 2004, Kalantar-Zadeh, Abbott et al. 2005, Port, Ashby et al. 2002). However, the
negative correlation between high BMI with high FM, NS, physical function and
activity level is unable to support the notion above. It corroborated the finding that
only high BMI with high muscle mass confirmed the positive relationship between
BMI and survival (Beddhu, Pappas et al. 2003, Beddhu 2004).
Although UK HD patients had higher BMI than their Chinese counterparts,
malnutrition was highly prevalent both in UK and Chinese HD patient as well as there
was no difference in energy intake between two cultural groups. UK HD patients
possibly have had higher energy intake or BMI than Chinese patients before started
HD, which has been confirmed by the finding that mean BMI of Chinese general
population was lower than in the UK(Ramachandran, Snehalatha 2010). Adaption of
dietary pattern and habits to prevent obesity in the UK may be required. Moreover,
lower PA level in UK HD patients than Chinese patients found in this study may

238
indicate UK patients had less calories consumption, which further deteriorates patients’
physical function and activity.
10.1 Practical Implications
A series of findings within the thesis aimed at comparing diet intake and nutritional
blood parameters between UK and Chinese HD patients. Based on these findings
practical implications have been shown as follows:
(1) Energy, protein and vitamin C and D intake need to increase in UK and Chinese
HD patients.
(2) More attention should be given to intravenous iron supplementation and the
control of blood loss during dialysis in female patients, phosphate binding
medications management and dialysis removal with phosphate, and medication
management and increase dialysis efficacy to prevent hyperkalaemia than
nutritional support in Chinese HD patients.
(3) Excessive potassium intake in UK and Chinese HD patients needs to be
controlled.
A number of findings in terms of physical function and PA level in UK and Chinese
HD patients were shown within the thesis. Based on these findings the following
practical applications have been derived:
(1) Given the strength that the GPPAQ walking pace question may be valid for
assessing slow pace in HD patients, the question can be changed to two
categories of “slow” and “not slow” walking pace with the criteria from the
CDC, which is more suitable for HD patients.
(2) Although the GPPAQ is still recommended by the NICE, the reaction of the GP
hypertension QOF and the finding that it is not a valid tool for assessing PA in older
adults, question its continued use in National Health Service (NHS) health checks.
Currently pedometers and accelerometers are being used for the measure of PA
level. Pedometers only measure steps and do not determine exercise intensity.
Accelerometers are able to assess steps as well as the intensity. However, they are
usually expensive and uncomfortable to wear. Nevertheless, with the
improvements of technology, effective, portable and cheap accelerometers will be

239
a good option to replace invalid questionnaires for providing more robust measures
of PA level.
10.2 Future research
10.2.1 Nutrition
(1) This thesis reports that the energy and protein intake on HD days were
significantly higher than that on non-HD day in Chinese HD patients. It is
concluded that intra-dialytic food provision may contribute to the finding.
Moreover, high phosphate and potassium intake reported as concerns in the
provision of meals during HD treatment (Kalantar-Zadeh, Tortorici et al. 2015) did
not be found higher on HD day than those on non-HD day. That food during HD
sessions is provided or banned with HD patients is still an issue which is worth
being further explored.
(2) The findings showed Chinese HD patients had higher vitamin C intake but
lower potassium intake than UK patients. It is widely known that the low vitamin
C intake in HD patients is primarily to fulfill the aim of avoiding hyperkalaemia. It
would seem appropriate to understand diet pattern and habits in terms of the
balance of sufficient vitamin C intake and restriction of potassium intake in
Chinese HD patients.
(3) Given the finding that HD patients had severely insufficient vitamin D intake,
increasing vitamin D intake and vitamin D supplementation in combination have
the potential to correct vitamin D deficiency and insufficiency. It has been reported
that vitamin D supplementations improved the complications in HD patients,
including improving excessive bone turnover and reducing plasma levels of
vascular adhesion molecules (Assimon, Salenger et al. 2012, Jean, Terrat et al.
2008). Future investigation can further explore the role of vitamin D
supplementations.
10.2.2 Activity
In light of impaired physical function and low PA level in both UK and Chinese HD
patients, a series of realistic and effective exercise interventions based on the findings
in this thesis can be designed and implemented.

240
(1) Interventions can be conducted with UK and Chinese HD patients to confirm
the role of some influencing factors in improving physical function and PA level.
These factors include improved NS and bone metabolism derangement, increased
muscle mass and decreased FM, comorbidities and physical symptoms.
(2) The majority of HD patients in the UK and China viewed walking as their
favorite modality of exercise, which is consistent with the findings evidenced in
the previous studies (Clarke, Young et al. 2015a, Chen, Wang et al. 2014). For
dialysis patients, regular walking for 6 months improved their physical capacity,
health-related QoL and post-dialysis fatigue symptoms (Malagoni, Catizone et al.
2008). Therefore, exercise intervention can be designed with HD patients by first
focusing on walking and then build other types of exercise into their daily walking.
(3) In order to promote professional healthcare providers to support HD patients’
healthy lifestyle behaviours, especially in China, it is required to understand their
perceptions and attitudes towards patients’ nutrition management and exercise
participation. Additionally, it has been found that family support and
encouragement were key elements in motivating patients’ involvement in
exercise(Clarke et al., 2015). Therefore, one of future directions can focus on
exploring and adapting these environmental factors or supportive strength.
(4) Given the findings of self-perceived benefits and barriers to exercise, exercise
interventions focusing on physical and functional self-efficacy can be
recommended to UK and Chinese HD patients. Meanwhile, interventions should
include the strategies to alleviate concerns about falling for UK HD patients. For
Chinese HD patients, more attention to obtain information of exercise
implementation is required for designing intervention.
(5) HD patients’ other psychological determinants, such as stage of change relating
to exercise and exercise self-efficacy to explore their confidence in implementing
exercise when facing some situations, can be assessed to further explore the impact
of perceptions or attitudes towards exercise. Furthermore, qualitative studies can
be conducted to further identify the underlying impact of culture on patients’
perceptions about facilitators and barriers to exercise between UK and Chinese HD
patients.

241
(6) It has been found that a high percentage of patients recognized a range of direct
exercise benefits in UK and Chinese HD patients. Other benefits, especially
indirect exercise benefits can be advised with HD patients. Interventions about
increase awareness of exercise benefits are worthwhile conducting with HD
patients to motivate their exercise participation.
(7) Currently intra-dialytic exercise is the most commonly implemented exercise
interventions with UK HD patients. However, few studies have reported the intra-
dialytic exercise in Chinese HD patients(Yin, Wan 2016). It has been documented
that intra-dialytic exercise is safe and effective(Greenwood, Naish et al. 2014b).
Moderate-intensity intra-dialytic exercise conducted for 6 months have confirmed
the effect of increasing VO2peak and self-reported physical function(Cheema, Singh
2005, Smart, Steele 2011). Additionally, intra-dialytic exercise also plays important
roles in reducing cardiovascular risk and improving arterial stiffness(Toussaint,
Polkinghorne et al. 2008). However, the clinical trials reporting these conclusions
have many limitations, including small sample sizes, insufficient exercise dose and
variable reported outcomes(Young, March et al. 2018). Therefore, larger and
longer-term clinical trials are suggested to be conducted in order to obtain credible
conclusions. Meanwhile, implementation of intra-dialytic exercise and
understanding of its effect with Chinese HD patients are especially needed.
Strengths and Limitations
This thesis reported previous unknown data on the disparity of lifestyle between UK
and Chinese HD patients, including diet intake, physical function and activity level.
Understanding of influencing factors that result in these differences is able to promote
these two cultural groups to effectively improve lifestyle behaviours. Additionally, the
work of the thesis showed previously unknown prevalence of low physical function
and self-reported physical inactivity in UK and Chinese HD patients. Meanwhile, the
combination of valid questionnaires and objective measures ensured large HD cohorts
are accessible and the reliability and accuracy of the assessments.
Studies in China only involved HD patients from Nantong, one city in the East of
China. It is unlikely to be representative of the whole Chinese HD patients due to
geographic and economic differences among cities and regions in China.

242
The mean BMI of UK HD patients in the DISH, QCKD and COCO studies were all
higher than those in Chinese HD patients. However, HD patients’ body composition
were only explored in the COCO study. The finding that high BMI was ascribed to
high fat mass may be not applicable to the HD patients from the QCKD and DISH. In
the thesis, this finding was used as an underlying associated factor explaining the
relationship between BMI, NS and activity level.
Having a small sample size in the DISH study particularly in the COCO study limits
the power of the analysis. Another adverse consequence of a small sample is the
increase of type 2 error, which is the failure to reject a false null hypothesis so as to
cause false negatives. Additionally, all of the studies in the thesis are un-randomized
and there is no blinding. There may be some selection bias in which patients were
chosen to be part of the studies. Therefore, the sample obtained may be not entirely
representative of the HD population intended to be analyzed. Taking a random sample
of the HD population can reduce the likelihood of selection bias.
10.3 Conclusion
The body of work presented in this thesis highlights the high prevalence of
malnutrition, low physical function and physical activity level in UK and Chinese HD
patients.UK HD patients had better control of micronutrients than Chinese HD patients.
Chinese HD patients had a higher physical function and activity level than UK patients.
UK HD patients need to focus more attention on decreasing fat mass, bone metabolism
management, improvement of protein status and QoL, remission of symptoms and
more exercise benefits acquisition compared with Chinese patients. The importance of
maintaining a healthy lifestyle should be emphasised in two cultural groups and this
can be achieved by promoting continued communication between the UK and China.

243
Appendices
A list of appendices in this thesis
Studies in the UK Studies in China
The DISH The QCKD The COCO The DISH The QCKD The COCO
Appendix A
Ethics approval letter REC letter REC letter REC letter REC letter (as a whole)
Appendix B
Patients information sheet
(PIS) and Consent form
PIS
(HD patients)
PIS
(HD patients)
PIS
(HD patients)
PIS
(healthy controls)
PIS
(HD patients)
PIS
(HD patients)
PIS
(HD patients)
PIS
(healthy controls)
Consent form
(HD patients)
Consent form
(HD patients)
Consent form
(HD patients)
Consent form
(healthy controls)
Consent form
(HD patients)
Consent form
(HD patients)
Consent form
(HD patients)
Consent form
(healthy controls)
Appendix C
Interview record and
questionnaires
24-Hour
Dietary Recall
record
DASI,GPPAQ,
LTEQ,DPPEBBS
DASI,GPPAQ,
EQ5D-5L,
POS-S
DASI,GPPAQ,
EQ5D-5L
24-Hour
Dietary Recall
record
DASI,GPPAQ,
LTEQ,DPPEBBS
DASI,GPPAQ,
EQ5D-5L,
POS-S
DASI,GPPAQ,
EQ5D-5L

244
Appendix A Ethics approval letter

245
A.1 The DISH study

246
A.2 The QCKD study

247

248

249
A.3 The COCO study

250

251

252

253
A.4. Ethics approval letterin Chinese study

254
Appendix B Patients information
sheet (PIS) and Consent form

255
B.1 The DISH study
B.1.1 PIS in the UK study

256

257
Do I have to take part?
It is up to you to decide whether or not to take part. If you do decide to take part you
will be given this information sheet to keep and asked to sign a consent form. If you
decide to take part you are still free to withdraw at any time and without giving a reason.
A decision to withdraw, or a decision not to take part, will not affect the standard of care
you receive.
What will happen to me if I take part?
During the study, we will ask you to continue your life in the usual way. You should
follow your usual recommended diet and take your medicines as prescribed.
If you decide to take part we will ask you about the food you have eaten and where you
bought it from in four separate interviews. We can either hold the interviews in person
during your regular haemodialysis sessions, or we can interview you over the telephone,
which ever you prefer. In each of these interviews, a member of the research team will
ask you about the food that you ate on one particular day. This would either be the day
before the interview, or the day before that. These interviews are called “24-hour dietary
recall” and each one will take about 15-30 minutes. During the 24-hour dietary recall
interviews the researcher will ask you to list everything that you have eaten or drank
during the 24-hour period in question, and then will go through the list with you to collect
details on where you bought the food, how it was cooked, and the portion sizes you ate,
and to ensure that nothing was missed. The researcher will be aiming to get as true a
picture of what you ate as possible and will not judge any of your food choices but will
ask some questions to make sure that they have recorded your intake as accurately as
possible.

258

259
All of the information we collect will be stored anonymously using a study participant
code and will not be identifiable as belonging to you.
What are the possible disadvantages and risks of taking part?
The main disadvantage of taking part is the time commitment involved. The study will
involve 4 interviews in total, which will last around 15-30 minutes each, and the
completion of the Food Security Questionnaire which will take about 10 minutes.
However, these will be arranged with participants at a practical time that suites them
during their normal dialysis sessions, with the option of having the two dietary recall
interviews where you are asked to remember your dietary habits for dialysis days, carried
out over the phone.
What are the possible benefits of taking part?
There are no direct benefits to you of taking part in this research. We hope that the results
of the study will help us understand how the dietary habits haemodialysis patients, and
their ability to afford food, relates to their nutritional status. This will help us to better
understand the causes and effects of malnutrition in haemodialysis patients and to design
research studies that may lead to improved treatments for other haemodialysis patients in
the future.
What happens when the research study stops?
Your usual clinical care will continue unchanged.

260
What if something goes wrong?
In the very unlikely event of you being harmed by taking part in this research project,
there are no special compensation arrangements. If you are harmed due to someone’s
negligence, then you may have grounds for legal action but you may have to pay for it.
Regardless of this, if you wish to complain, or have any concerns about any aspect of the
way you have been approached or treated during the course of this study, the normal
National Health Service complaints mechanisms would be available to you.
If you wish to make a complaint about the study you can contact the UHL Patient
Information and Liaison Service by post to PILS, The Firs, Glenfield Hospital, Leicester
LE39QP, telephone08081 788337 (free phone number), or email [email protected]
Will my taking part in this study be kept confidential?
All information which is collected about you during the course of the research will be
kept strictly confidential. Any information about you which leaves the hospital will
have your name and address removed so that you cannot be recognised from it.
With your permission, we will inform your GP that you are taking part in this study.
We want to compare the data we get from this study with similar data collected from
American patients from the University of Illinois. Therefore, your data may be shared
with the American researchers, but it will be completely anonymous and no one will be
able to identify who you are from this information.
While you are taking part in the study, your contact details will be made available to the
researchers so that they can contact you to arrange the details of your research study
appointments.
What will happen to the results of the research study?

261
We expect the results of the research to become available from 2015. We will publicise
the results in posters and leaflets in clinical areas so you can read them while you are
there, and we will write a report about them in our Kidney Research Newsletter. If you
would like us to send you a written report of the results, or if you would like to receive
our Kidney Research Newsletter, please ask the researcher or contact the Chief
Investigator, Dr Alice Smith (contact details at the end of this document).
The results may also be published in a medical journal. All information will be
anonymised so you will not be identified in any report or publication.
Who is organising and funding the research?
The research is being organised and funded by the Leicester Kidney Exercise Team at
the John Walls Renal Unit, Leicester General Hospital and is led by Dr Alice Smith,
Honorary Senior Lecturer.
Any research that involves NHS patients or staff, information from NHS medical records
or uses NHS premises or facilities must be reviewed by an NHS Research Ethics
Committee before it can go ahead. This study has been reviewed by the Proportionate
Review Subcommittee of the South East Scotland Research Ethics Committee 01, and
given a favourable opinion which means that the committee is satisfied that your rights
will be respected, that any risks have been reduced to a minimum and balanced against
possible benefits and that you have been given sufficient information on which to make
an informed decision.
Contact for Further Information
If you would like any further information about this study please contact the Chief
Investigator Dr Alice Smith, or Dr James Burton on 0116 252 3061.

262
Alternatively, if you have questions about the study and you would prefer to ask someone
not directly involved with the research team, you can contact the University Hospitals of
Leicester Research and Development Office, Leicester General Hospital, LE5 4PW, by
phone on 0116 258 8351, or email [email protected]
Thank you for reading this Information Sheet, and for considering taking part in
this study.
Dr Alice Smith
Leicester Kidney Exercise Team, Academic Unit, Leicester General Hospital, LE5 4PW.
Tel 0116 258 4346 Email [email protected]
You will be given a copy of this information sheet and signed consent form to keep

263
B.1.2 PIS in Chinese study
DISH-C: 中国血液透析患者的饮食类型,食品保障和营养状态
患者信息表
2014-7-14
尊敬的患者朋友:
您正在被邀请参与我们的研究。但是在您做出决定之前,请您先了解我们研究
的目的和内容。请仔细阅读下面的信息,您也可以和其他人讨论后做出决定。如果
有任何问题或是您想获得更多的信息请向我们咨询。
研究目的
血液透析患者经常需要摄入更多的能量和蛋白,但是很多人并没有做到。能量
与蛋白的摄入不足会引起营养不良,进而导致肌肉无力,疲劳,造成体力活动能力
下降。
理解血液透析患者营养不良的原因是我们采取措施、解决问题的第一步。在本
研究中,我们将会询问到您的饮食以及购买食物的地点。我们也会请您填写一张
关于您对食物购买能力的调查问卷,还将从您的病历中获得一些涉及营养状态的
数据。
这是一个可行性的研究,获得的数据将会被用于将来更深入的研究。我们将会
分析数据以评估血液透析患者的饮食习惯和购买食物的能力,进而进一步评价其
营养状态。
一个类似的研究已经在美国和英国开展,另有在巴西的研究也即将进行,之后
我们会将四个国家的数据进行比较,以获得更有用的信息。

264
为什么选择我?
您之所以被选择是因为您正在南通地区接受常规的血液透析治疗。此研究的
目的是为了更好的理解血透患者饮食习惯、食物购买能力与营养状态的关系。
我必须参加吗?
您是否参加完全取决于您的决定。如果您决定参加,我们将会请您签署一份知
情同意书。但是,即使您决定参加本研究,您也有权利勿需给出任何理由的随时退
出研究。您退出研究的决定或是拒绝参加的决定都不会影响到您的治疗。
如果我参加此项研究将需要做些什么?
在整个研究过程中,请继续保持您正常的生活习惯和治疗。
如果您决定参加本研究,我们将会和您进行四次的访谈。在每次的访谈中,我
们会询问并记录您所摄入的食物以及购物食物的地点。你可以选择我们访谈的方
式,在您透析的过程中或者进行电话联系。在每一次的访谈中,研究者将会问您在
特定某一天的饮食,可能是透析的前一天或是大前天。这些访谈我们称之为“24 小
时饮食回顾”,每一次将持续 15-20分钟。在每一次“24 小时饮食回顾”中,研究
者会请您列举您所摄入的任何东西(食物,水,饮料等),之后您还会被问到某些
细节问题,包括您购买食物的地点,如何烹饪以及摄入的量。研究者的目标是尽可
能的对您的饮食有深入的了解,而不是对您食物的选择做出评价。
我们的目的是为了全面的了解您的饮食。我们知道,有些患者在透析日和非透
析日饮食是不同的,所以我们四次的访谈将有两天涉及到透析日的饮食,两天为
非透析日的饮食。另外,某些患者会发现他们在一个月的某些日子里无法负担他
们所需的饮食,因此我们将两次访谈安排在月初,两次安排在月末。

265
具体来说,四次“24小时饮食回顾”会有如下的安排:
1. 月末最后一周的透析日
2. 月末最后一周的非透析日
3. 月初第一周的透析日(接下来的一周)
4. 月初第一周的非透析日
关于非透析日的访谈将会在第二天的透析日进行
关于透析日的访谈可以按照您的意愿在第二天进行电话联系或在您下一次的
透析日(2 天后)进行。
我们也会请您填写一份“食物保障问卷”,这份问卷涉及到您对食物的购买能
力。填写问卷的时间为 5-10 分钟。在整个研究过程中,您仅会被要求填写这一份
问卷,而且可以在透析过程中完成。
如果您允许,我们将会从您的病历中提取某些涉及到营养状态的血液检查数
据。我们会从您上一次的常规检查中获得数据,不需对您进行抽血检查。
所有收集到的信息都会通过一个研究编号进行匿名使用,整个过程中不会涉
及到您的任何个人信息。
我参加此项研究可能的不利或危险是什么?
参加本次研究最大的影响就是您的时间。这个研究包括四次访谈,每次会花费
您 15-20 分钟。另外,“食物保障问卷”也会耽误您 10 分钟左右。但是我们会将
访谈安排在您透析过程中的合适时间, 或者我们会在合适的时间里和您电话联系。
我参加此项研究的好处是什么?
抱歉的说,您参加本研究没有任何直接的好处。我们希望这个研究的结果能够帮
助理解血液透析患者的营养状态与饮食习惯和食物购买能力的关系。这样,我们

266
就能更好的理解血透患者营养不良的原因以及影响因素,从而设计出有效的干预
措施促进血透患者的治疗。
当研究结束时会发生什么?
常规的临床治疗依旧正常进行。
如果研究不顺利会怎么样?
参加本研究会伤害到您的可能性几乎为零,所以我们也没有什么特殊的补偿措
施。如果您对我们的研究过程有任何的不满,您可以向医院的投诉部门就行投
诉。
我参加此项研究的数据信息会被保密吗?
在本研究中所收集的任何数据信息将会被严格的保密。任何被带出医院的信息都
将不会包含您的姓名和地址,以确保您的个人信息不会被泄露。经过您的允许,
我们将会告知您的主治医生您参与了此项研究。
我们会将此次收集到的数据与美国伊利诺斯大学、英国莱斯特地区以及巴西的研
究数据相比较,因此您的信息将会和其他国家的研究者共享,但是共享将会是完
全匿名的,没有人可以从数据信息中确认您的身份。
如果你参与了本研究,你的联系方式将会被这个研究的研究者们所共享,以便于
我们可以更好的为您做研究的安排。

267
研究的结果将如何处理?
我们预期研究的结果将于 2015 年底完成。我们将会把研究结果以海报或手册的
方式在病房里展示,这样您就可以在到达医院的时候看到。另外,我们也会将结
果形成报告或者文章。如果您有需要,请联系我们或护士(联系方式显示在下
方),我们会将报告或文章邮寄或直接送到您手上。
谁组织或资助此项研究?
本研究是由宋艳副教授(南通大学)以及南通大学附属医院组织负责。
谁将对本研究进行评价监督?
任何涉及到患者病历信息或使用到其规定或设施的研究都应在开展之前通过伦理
委员会的审查。本研究已经经南通大学附属医院伦理委员会办公室审核通过,意
味着伦理委员认定您的权利在本研究中将会被充分的保护和尊重,对您的影响以
及对您利益的冲突已经被减少到最低,另外,在您做出决定之前,您已经被给予
了充分的信息说明。
更多的信息
如果您想获得更多关于此项研究的信息,请联系研究者宋艳,手机(86)
1386190853
固定电话:0513-85051784. 电子邮件:[email protected]
感谢您阅读患者信息表,请考虑参与此项研究!

268
B.1.3 Consent form in the UK study
Study Code
DISH
LEICESTER GENERAL HOSPITAL Gwendolen Road
Leicester
LE5 4PW
Leicester Kidney Exercise Team University of Leicester Academic Unit
Tel 0116 258 4346 Email [email protected]

269
B.1.4 Consent form in Chinese study

270
B.2 The QCKD study
B.2.1 PIS in the UK study
LEICESTER GENERAL HOSPITAL Gwendolen Road
Leicester LE5 4PW
Tel: 0116 249 0490

271
What will happen to me if I take part?
If you agree to participate, you will be asked to fill in some questionnaires about exercise,
which should take no more than 10-15 minutes. You can fill them in while you are in the
clinic waiting area or during your routine dialysis session, and the researcher will collect
them from you when you have finished, or else you can leave them with the clinic
reception or renal unit staff.
The questionnaires will be marked with a code: they will not have your name or any
other identifiable information on them. We can analyse the information you provide on
the form without knowing who you are.
However, the information will be even more valuable to us if we can add to it some of
your clinical information obtained from your medical records. Therefore, the researcher
will ask for your permission to access your records and extract the required information:
your blood and urine results, blood pressure, weight, ethnicity, any other medical
conditions, and the drugs you are taking.
If you agree, this information will be extracted from your records and will be added to
the study database in an anonymous form, separately to any information from which you
could be identified. If you agree to this, you will be asked to sign a consent form.
Finally, the researcher will ask you if you are interested in possibly participating in Part
2, when we will talk to patients in more detail about physical activity and exercise. If you
may be interested in Part 2, we will ask you to fill in a Contact Form so we can give you
more information at a later date. This does not mean you have to take part: the study will
be explained to you nearer the time, and you will be free to decide whether or not you
wish to participate. We will only be able to talk to a limited number of volunteers in Part
2, so even if you do agree to take part, we may not invite you to participate if too many
patients volunteer for it.
On the Contact Form, you can also choose to be informed about other research projects
in the future. If you fill in the Contact Form, we will store it securely, separately from
your survey form and clinical information, and we will only use it to contact you for the
purposes you have chosen.

272
273
Will my taking part in this study be kept confidential?
All information which is collected about you during the course of the research will be
labelled with a code instead of your personal details. We will keep a separate list of the
codes and patient identities. If you prefer to remain completely anonymous, you can
return your questionnaire without your name or personal details.
What will happen to the results of the research study?
We expect the results of the research to become available in 2015. We will publicise the
results with posters and leaflets in clinical areas so you can read about them while you
are there, and we will write a report about them in our Exercise Newsletter. If you would
like us to send you a written report of the results, or if you would like to receive our
Exercise Newsletter, please ask the researcher or contact the Chief Investigator, Dr Alice
Smith (contact details at the end of this document). The results will also be published in
a medical journal. All information will be anonymised so you will not be identified in
any report or publication.
Who is organising and funding the research?
The research is being organised by Senior Research Scientist Dr Alice Smith and staff
at the John Walls Renal Unit, and funded by a research grant from the British Renal
Society.
Who has reviewed the study?
All research that involves NHS patients or staff, information from NHS medical records
or uses NHS premises or facilities must be approved by an NHS Research Ethics
Committee before it goes ahead. This study has been reviewed by the NHS
Research Ethics Committee East Midlands - Northampton. Approval means that the
committee is satisfied that your rights will be respected, that any risks have been reduced
to a minimum and balanced against possible benefits and that you have been given
sufficient information on which to make an informed decision.
Contact for Further Information

274
Contact for Further Information
If you would like any further information about this study please contact the Chief
Investigator Dr Alice Smith, or Dr James Burton on 0116 252 3061.
Dr Alice Smith,
Leicester Kidney Exercise Team,
C/O Dr Barratt’s secretary,
John Walls Renal Unit,
Leicester General Hospital, LE5 4PW.
Tel 0116 252 5033
Email [email protected]
Thank you for reading this, and for considering taking part in this study.
You will be given a copy of this information sheet and if applicable, your signed
consent form to keep

275
B.2.2 PIS in Chinese study
肾脏疾病患者的体力活动
第一部分
QCKD 第一部分 患者信息单
2014-9-17
尊敬的患者:
您将被邀请参与我们的研究。在您做出决定之前,请您先了解我们研究的目的和内容。
请仔细阅读下面的信息,您也可以和其他人讨论后做出决定。如果有任何问题或是您想获得
更多的信息都请向我们咨询。
本研究的目的是什么?
保持积极锻炼的生活方式对健康是大有裨益的。研究者发现这条原则对于肾脏疾病的患
者来说同样适用。我们想帮助肾脏病患者增加他们的活动量。因此,了解肾脏病患者目前的
活动水平以及对锻炼、活动的态度显得尤为重要。本研究的目的就是为了收集这样的信息。
本研究包括两部分。第一部分涉及肾脏病患者活动、锻炼习惯的调查。第二部分涉及对
于患者进行锻炼、活动方面的焦点团体访谈和一对一访谈。现阶段,我们邀请您参与的是第
一部分。
为什么选择我?
您被邀请参加本研究是因为您是肾脏病患者,我们将要组织 1900名肾脏患者参与本研
究。
我必须参加吗?
您是否参加完全取决于您的意愿。如果您决定参加,我们将会请您签署一份知情同意
书。即使您已决定参加本研究,您也有权利随时退出研究,不需任何理由。您拒绝参加或退
出研究的决定都不会影响到您的治疗和合法权益。

276
如果我参加此项研究将需要做些什么?
如果您同意参加本研究,您将会被要求填写一份关于锻炼、活动的量表,这可能会花费
您 10-15分钟。您可以在候诊或透析过程中填写。当您完成后,我们的研究者会来收取,您
也可以把量表放到护士站或交给我们的医务人员。
我们将会给您一个研究编号,您的姓名或任何身份认证信息都不会出现在量表上,因此
请不用担心您的个人信息会被泄露。为了使本研究更为有意义,我们将通过您的授权,从您
的病历中提取与肾脏疾病以及运动相关的血液、尿液检查结果,比如钙、磷、尿素、肌酐浓
度,蛋白肌酐比,体重,腹腰围,服药情况以及病史等临床数据。如果您同意上述要求,我
们会请您签署一份知情同意书,同意这部分信息将会被从您的病历中提取并以匿名的形式用
于本研究。
最后,研究者将会询问您是否愿意参与本研究的第二部分。在这部分研究中,我们将会
涉及到关于您更多的活动水平和锻炼的信息。如果您对第二部分感兴趣,我们会请您填写一
份联系表,以便今后可以向您了解更多的信息。当然,这也并不意味着您必须参加,我们将
会在开展第二部分研究时再向您进行详细的解释,到那时您再决定是否参与。这里我们要说
明的是,在第二部分研究中,我们只能邀请有限的参与者,所以即使您同意参与,我们也可
能会因为人数过多而无法将您纳入其中。
在联系表中,您也能选择是否愿意被通知将来我们可能要开展的研究。如果您填写了联
系表,我们会将它妥善保存,并与调查量表、临床信息分开放置,避免个人信息泄露的问
题。在您同意参与研究的前提下,我们才会和您联系。
保密原则
研究者在您的调查量表和临床信息中使用研究编号代替您的姓名。本研究中收集到的您
所有的信息与数据也将会和您的个人信息分开放置,并妥善保存。

277
我需要做什么?
您所需要做的只是填写调查量表然后把它交给我们。您无需为了本研究改变您的生活习
惯。
参加本研究会有什么可能的坏处和风险吗?
参与本研究唯一的影响就是需要您在候诊或透析过程中花费几分钟来协助研究者填写量
表。
参加本研究有什么潜在的好处?
参加本研究没有直接的好处。
当研究结束时会发生什么?
你常规的临床治疗护理一切正常进行。
如果研究不顺利会怎么样?
参加本研究会伤害到您的可能性几乎为零,所以我们也没有什么特殊的补偿措施。如果
您对我们的研究过程有任何的不满,您可以向医院的投诉部门进行投诉。
我参与此项研究的信息会被保密吗?
在本研究中所收集的任何数据信息将会以研究编码标记,而不是您的姓名。我们会对编
号信息和您的身份信息分开放置。如果您想保持完全的匿名,您也可以收回不包含您姓名或
其他个人信息的量表。
研究的结果将如何处理?

278
本研究预期于 2015年底完成。我们将会把研究结果通过海报或手册的方式在病房展
示,这样您就可以在就医期间看到。另外,我们也会将结果形成报告或文章。如果您有需
要,请联系我们或护士(联系方式显示在下方),我们会将报告或文章直接邮寄或送达给
您。
谁组织或资助此项研究?
本研究是由宋艳副教授(南通大学)以及南通大学附属医院组织负责。
谁将对本研究进行评价监督?
任何涉及到患者病历信息或使用到其规定或设施的研究都应在开展之前通过伦理委员会
的审查。本研究已经经南通大学附属医院伦理委员会办公室审核通过,意味着伦理委员认定
您的权利在本研究中将会被充分的保护和尊重,对您的影响以及对您利益的冲突已经被减少
到最低,另外,在您做出决定之前,您已经被给予了充分的信息说明。
更多的信息
如果您想获得更多关于此项研究的信息,请联系研究者宋艳,手机(86)1386190853固
定电话:0513-85051784. 电子邮件:[email protected]
感谢您阅读患者信息表,请考虑参与此项研究!
在同意参与此项研究之后,
您将会受到此份患者信息单以及签过姓名的知情同意书的复印件!
谢谢!
279
B.2.3 Consent form in the UK study
LEICESTER GENERAL HOSPITAL
Gwendolen Road Leicester
LE5 4PW Tel: 0116 249 0490
Participant
Code :....................................
Name : …………………………………
….
Date of Birth ……………………………..

280
B.2.4 Consent form in Chinese study

281
B.3 The COCO study
B.3.1 PIS in the UK study
UK HD patients
COCO : CardiOvascular Risk Factors and Physical COndition in Kidney Patients
Patient Information Sheet
Version 5 23rd November 2015
You are being invited to take part in a research study. Before you decide, it is important
for you to understand why the research is being done and what it will involve. Please
take time to read the following information carefully and discuss it with others if you
wish. Ask us if there is anything that is not clear or if you would like more information.
Take time to decide whether or not you wish to take part.
What is the purpose of the study?
Kidney disease can affect the health of the heart and blood vessels and can also cause
muscle wasting which leads to muscle weakness, tiredness, and a reduced physical
capacity. This tends to get worse for patients on dialysis, and even though a kidney
transplant can really benefit patients and restore kidney function, some of the negative
effects often still remain.
Our previous research has shown that exercise can help kidney patients get fitter,
strengthen the muscles and improve the health of the heart and blood vessels. This
suggests that regular exercise might be very helpful for kidney patients, but we don’t
yet know what types of exercise will be best for people at different stages of kidney
disease.
University of Leicester Academic Unit Tel 0116 258 4346
Email [email protected]
LEICESTER GENERAL HOSPITAL
Gwendolen Road Leicester
LE5 4PW
Leicester Kidney Exercise Team

282

283
284
Body fat and muscle: We will measure these us ing two safe, non-invasive techniques;
DEXA and BIA.
Height, weight, and waist and hip circumference: We will measure these once in the
same way as your doctor, nurse or dietician uses during clinic visits.
Blood samples: We will take one 30ml (2 tablespoon) blood sample from a vein in your
arm. As explained above, you need to refrain from eating or drinking anything other
than water on the morning of the blood test.
Urine sample : we will ask you to provide a 20ml urine sample at your convenience
during one of the study visits.
Habitual physical activity: We will ask you to wear a wrist-watch style activity monitor
continuously for 7 days that will measure how much physical activity you do.
Food diary: we will ask you to record everything you eat and drink for 7 days in a food
diary which we will give you to take home with you
The Kidney Transplant Questionnaire: A member of the research team will ask you 25
questions about some of the problems that kidney transplant patients commonly
experience in their day to day lives. You will only complete this questionnaire if you
are a kidney transplant patient.
Other questionnaires: We will ask you to do a quick and simple questionnaire
assessment of your “cognitive function” – that is, memory and problem -solving. The
researcher will go through this with you, and it will take about 15 minutes. We will also
ask you to fill in a series of questionnaires to assess your quality of life, the impact of
any symptoms you suffer from, your level of fatigue, your physic al activity habits and
opinions, and your feelings about the likelihood of falling. We will explain these
questionnaires to you and allow you to fill them in during the quiet time while you are
resting between your walking tests, at other times during you r visits or, if you prefer,
you can take some, or all, of the questionnaires home with you to complete in your own
time.

285

286

287
We would like to keep any samples remaining after the end of this research for use in
future studies that obtain ethical approval, such as measurement of newly-discovered
factors associated with heart health or immune function, or to investigate in more detail
any new findings that may emerge from the COCO study. At the end of COCO, we would
like to either use your remaining samples in further research straight away, or transfer
them to a research sample storage bank for use in studies that follow later on. However,
if you would prefer your samples not to be used in such future research, you can indicate
this on the Consent Form. In this case, we will destroy any of your samples that remain
after the end of COCO.
What will happen to the results of the research study?
We expect the results of the research to become available from 2016. We will publicise
the results in posters and leaflets in clinical areas so you can read them while you are
there, and we will write a report about them in our Kidney Research Newsletter. If you
would like us to send you a written report of the results, or if you would like to receive
our Kidney Research Newsletter, please ask the researcher or contact the Chief
Investigator, Dr Alice Smith (contact details at the end of this document).
The results will also be published in a medical journal. All information will be
anonymised so you will not be identified in any report or publication.
Who is organising and funding the research?
The research is being organised by the Leicester Kidney Exercise Team at the John Walls
Renal Unit, Leicester General Hospital and is led by Dr Alice Smith, Honorary Senior
Lecturer. The study is partly funded by the Leicester Kidney Care Appeal.
Any research that involves NHS patients or staff, information from NHS medical records
or uses NHS premises or facilities must be approved by an NHS Research Ethics
Committee before it can go ahead.
This study has been reviewed by the NHS Research Ethics Committee East Midlands
(Derby). Approval means that the committee is satisfied that your rights will be respected,
that any risks have been reduced to a minimum and balanced against possible benefits
and that you have been given sufficient information on which to make an informed
decision.

288
Contact for Further Information
If you would like any further information about this study please contact the Chief
Investigator Dr Alice Smith, or Dr James Burton on 0116 258 4346.
Dr Alice Smith,
Leicester Kidney Exercise Team, Academic Unit,
Leicester General Hospital, LE5 4PW.
Tel 0116 258 4346 Email [email protected]
Thank you for reading this Information Sheet, and for considering taking part in
this study.
You will be given a copy of this information sheet and signed consent form to keep

289
Appendix 1
Details of the Tests and Measurements
This section of the information sheet describes the assessment tests in more
detail. Each assessment will be carried out once.
Physical performance tests : We will carry out two different tests of physical
function and performance : a shuttle walk test and a sit-to-stand test.
The shuttle walk test has two parts. You will be asked to walk around two cones
placed on the floor 10 metres apart, at a speed timed by a recorded bleep sound.
For the first part, the bleep signal gets a little faster every minute so that you have
to increase your walking speed to keep up. The test is stopped when you can no
longer walk fast enough to keep up with the bleep. This test measures your
maximum physical capacity. After this you will have a rest and the researcher will
calculate a walking speed that equates to 85% of your maximum capacity. For
the second part of the test, you will walk at this 85% speed (in time with a steady
bleep) for as long as you can. The test is stopped when you can no longer keep
walking at that speed. This test measures your stamina. Before doing these tests,
you will be taught how to do it and allowed to practice.
The gait speed test measures your normal walking speed over a short distance
(4 metres). We will use a laser gate device to accurately time you as you walk
this short distance at your usual, comfortable walking pace.
The sit-to-stand test measures how easily you can stand up from a chair without
using your hands. First of all we will measure how many times you can do this
in 1 minute. Then we will time how long it takes you to perform 5. You will be
given a chance to practice beforehand, and time to recover between each test.

290
The handgrip strength test is a quick and simple technique that provides a good
overall estimate of your strength. We use a device called a dynamometer which
you hold in your hand. The researcher will show you what to do and will give you
a chance to practice before doing the test for real. You will sit comfortably with
your elbow by your side and arm bent at a right angle. You will hold the
dynamometer and squeeze it as hard as you can to generate the strength reading.
You will do this three times with each hand and we will use the maximum reading
as your strength measurement.
The balance tests are a very quick and simple way of measuring how good your
balance is in 3 different standing positions. The researcher will show you what to
do. You start with your feet together side by side and try to stand perfectly still for
10 seconds (timed by the researcher). If you are able to do this, you then move
one foot forward a bit so that the heel is alongside the toe of your other foot, and
again try to stand perfectly still for 10 seconds. Finally, you move one foot directly
in front of the other and again try to stand still for 10 seconds.
Blood vessel health (Pulse Wave Velocity): This non-invasive test measures how
long it takes a pulse to travel between two points, a point on your neck and a
point at the top of your leg. We will place a sensor on each of these points and
use a computer to measure how long a pulse takes to travel between them. We
will also measure your blood pressure using a cuff in the same way your doctor
usually measures it. It is a completely painless procedure, but you will be asked
to remain still and not talk whilst the measurement is being taken. The pulse is
easy to detect, but it is hard to find at the top of the leg through thick clothing, so
you will be asked to wear light weight clothing or shorts for this assessment. It
should take no longer than 5 minutes, including the time for you to get
comfortable and for the researcher to position the sensors correctly.
Heart Function (Cardiac Bio-reactance): This is a safe, simple, non-invasive test
which measures several aspects of heart function. The test involves lying on a
couch and having four sticky electrodes (like those used for ECG which you may
have had before) placed on your chest. A small, painless electric current is then
passed through your body. The test is quick and will take around five minutes.

291
Body fat and muscle: These will be measured in two ways. An x-ray device called
DEXA, often used in the NHS to assess the strength of bones, will be used and
a technique called BIA will also be used.
DEXA scans are quick and painless and involve lying on an X-ray table so that
the body can be scanned. This test uses a very small amount of x-ray radiation,
which is equal to the dose you would receive form the natural background
radiation by living in Leicester for about 10 days. The radiation dose is also less
than the difference in yearly dose from natural sources between different
locations in the United Kingdom.
BIA is a simple, safe and quick procedure which involves lying flat on a couch for
around 2 minutes and having two sticky electrodes (similar to those used for ECG
which you may have experienced) placed on one hand and foot. A small electric
current which causes no pain is then passed down one side of your body.
Height, weight and waist circumference: Height and weight will be measured in
the same way as your doctor uses during clinic visits by a member of the research
team. We will also measure waist and hip circumference using a tape measure.
Blood Sample: We will take a blood sample from you from a vein in your arm.
The sample will be 30ml (2 tablespoons) and will be used to measure for markers
of inflammation.
Urine Sample: We will give you a container to collect some of your urine when
you need to go to the toilet during one of the study visits.
Habitual physical activity: Habitual physical activity: We will ask you to wear a
wrist-watch style activity monitor continuously for 7 days that will measure how
much physical activity you do. The watch is waterproof and does not have to be
removed while washing. We will request that you do not remove the watch during
the 7 days.

292
Food diary : we will give you a food diary containing enough record sheets for 7
days. In this we will ask you to record everything you eat and drink for 7 days.
The researcher will explain how to fill this in and you will take it home with you.
The Kidney Transplant Questionnaire: A researcher sit down with you in a quiet
private room to ask 25 questions about problems which can affect your quality of
life as a kidney transplant patient. These questions will be read out to you in a
standard way and the researcher will record your answers on the questionnaire
form. This questionnaire is only relevant for people with a kidney transplant. If
you are on dialysis or have early CKD, you won’t need to fill it in.
Other Questionnaires: The researcher will ask you to do a simple questionnaire
test of memory and problem-solving, which will take about 15 mins. We will also
give you a series of questionnaires to complete yourself. Some or all of these
can be filled out during assessment visits, or you may take them home to
complete them there if you prefer. These are assessing your quality of life, the
impact of symptoms associated with your kidney transplant, your level of fatigue,
your physical activity habits and opinions, and your fear of falling.
Clinical parameters: With your permission we will extract information related to
your kidney disease and general health from your medical records. This will
include age, gender, ethnicity and postcode, your recent blood and urine tests
results, other health problems you may suffer from, and the drugs you are taking.
This will be stored anonymously using a study participant code and will not be
identifiable as belonging to you.

293
DXA Scan Patient Information Leaflet
You have been referred for a Dual Energy X-ray Absorptiometry (DXA) Scan. The information
in this leaflet will explain what will happen before, during, and after this procedure and also
answer any questions that you may have.
What is a DXA Scan?
A DXA scan is the most accurate and reliable way of measuring body composition, i.e.
percentage body fat and lean mass. The scanner uses X-rays, which pass through bone and
soft tissue. The X-rays are detected by the scanner which then calculates your body
composition data.
Are there any risks?
Although DXA uses X-rays, this is at a very low dose and any risks are negligible.
Before your DXA Scan
A DXA scan may not be suitable:
if you have severe mobility problems
if you are unable to lie flat for a few minutes
if you are pregnant, or think you may be
if your weight exceeds 204 kg (32 stone)
if you have had an X-ray with barium, contrast dye or a nuclear medicine test within the last 72
hours
When you come for your scan, you should try to wear light clothes that have no metal (e.g. zips,
bras, buckles, belts, buttons and studs). Tight waistbands should also be avoided. You will then
be able to have the scan in your own clothes rather than having to change into a hospital gown.

294
You will also be asked to remove any jewellery (including piercings), watches or hair accessories.
You should inform the operator of any internal artefacts that may be seen in your scan (e.g. metal
implants, pacemaker, surgical pins etc.).
What will happen during the scan?
You will be asked to lie on a firm couch while the scanner arm passes over you. You will not be
in a tunnel, although the scanner arm may pass near your face. You will not need to have an
injection. The scan will take around 10 minutes. The operator will be in the room with you
during the scan.
Does it hurt?
The scan itself is painless. However, you will need to lie flat during the scan, which some
people find uncomfortable.
When happens to the information collected?
The results will be provided to your study coordinator.
Who should I contact if I have any questions?
If you have any questions about your scan or the information in this leaflet you should contact
your study coordinator.

295
Healthy controls
COCO : CardiOvascular Risk Factors and Physical COndition in Kidney Patients
Control Information Sheet
Version 2 23rd November 2015
You are being invited to take part in a research study. Before you decide, it is important
for you to understand why the research is being done and what it will involve. Please
take time to read the following information carefully and discuss it with others if you
wish. Ask us if there is anything that is not clear or if you would like more information.
Take time to decide whether or not you wish to take part.
What is the purpose of the study?
Kidney disease can affect the health of the heart and blood vessels and can also cause
muscle wasting which leads to muscle weakness, tiredness, and a reduced physical
capacity. For some people, a kidney transplant can be really beneficial and restore kidney
function, but some of the negative effects often still remain.
Exercise can help healthy people get fitter, strengthen the muscles and improve the health
of the heart and blood vessels. However, we do not know if kidney patients can also
benefit in the same way from regular exercise. The Leicester Kidney Exercise Team are
carrying out a number of research studies to investigate how exercise might help patients
with kidney disease, including people on dialysis and those with a kidney transplant.
University of Leicester Academic Unit
Tel 0116 258 4346
Email [email protected]
LEICESTER GENERAL HOSPITAL
Gwendolen Road Leicester
LE5 4PW
Leicester Kidney Exercise Team

296
Do I have to take part?
It is up to you to decide whether or not to take part. If you do decide to take part you
will be given this information sheet to keep and asked to sign a consent form. If you
decide to take part you are still free to withdraw at any time and without giving a reason.
What will happen to me if I take part?
During the study, we ask you to continue your life in the usual way. You should follow
your usual diet and activities, and if you are on any prescribed medicines you should
continue taking them as normal.
If you decide to take part we will arrange for you to attend for 2 or 3 visits for assessments.
These visits will be flexible and scheduled at your convenience – you can choose whether
to come for two longer visits or three shorter ones.
At one of these visits we will ask you to arrive in a “fasted” state – this means not having
eaten or drunk anything except water since the previous night. This is needed for the
blood test. You can choose which visit this will be, and we will arrange it for the morning
so you don’t have to be hungry for too long! We will take the blood as soon as you arrive
and then we will offer you tea or coffee and some breakfast such as toast or cereal. If it
suits you, you can choose to call by briefly one morning just for the blood test, and do all
the other assessments on other occasions.
We will also ask you to carry on with your life as normal while wearing a wrist-watch
style activity monitor for one week, and recording everything you eat and drink over 7
days.
Assessments
During the visits, researchers will carry out the tests listed below. More detailed
information about all these tests can be in Appendix 1 at the end of this Information Sheet.
We will arrange the dates and times of the assessment visits to suit you.
1. Physical performance tests: Your physical performance will be tested using walking
tests, sit to stand tests (rising from chair), hand grip strength test and balance tests. We
will show you how to do the tests and allow you to practice before you do the test for real.
Altogether we will ask 60 kidney patients and 20 healthy controls to take part in the study.
If you are aware that you do have a significant long term health problem, please tell the
researchers that you don’t think you are suitable as a healthy control in this study. You
don’t have to tell them any details about your condition.

297
2. Blood vessel health: We will use a very easy and non-invasive test called Pulse Wave
Velocity (PWV) to measure the health of your blood vessels.
3. Heart Function: Another easy and non-invasive test, called Cardiac Bio-reactance, will
be used to measure the function of the heart.
4. Body fat and muscle: We will measure these using two safe, non-invasive techniques;
DEXA and BIA.
5. Height, weight, and waist and hip circumference: We will measure these once in the
same way as your doctor, nurse or dietician uses during clinic visits.
6. Blood samples: We will take one 30ml (2 tablespoon) blood sample from a vein in
your arm. As explained above, you need to refrain from eating or drinking anything other
than water on the morning of the blood test.
7. Urine sample : we will ask you to provide a 20ml urine sample at your convenience
during one of the study visits.
8. Habitual physical activity: We will ask you to wear a wrist-watch style activity monitor
continuously for 7 days that will measure how much physical activity you do.
10.Food diary: we will ask you to record everything you eat and drink for 7 days in a
food diary which we will give you to take home with you.
11.Questionnaires: We will ask you to do a quick and simple questionnaire assessment
of your “cognitive function” – that is, memory and problem-solving. The researcher will
go through this with you, and it will take about 15 minutes. We will also ask you to fill
in a series of questionnaires to assess your quality of life, the impact of any symptoms
you suffer from, your level of fatigue, your physical activity habits and opinions, and
your feelings about the likelihood of falling. We will explain these questionnaires to
you and allow you to fill them in during the quiet time while you are resting between

298
What are the possible disadvantages and risks of taking part?
The main disadvantage of taking part is the time commitment involved in the hospital
visits for assessments (2 or 3 visits in total). We will reimburse your travel expenses
and car parking for these visits.
Taking blood samples from your arm may cause slight pain or some bruising
afterwards, but is not dangerous.
At the visit involving the blood test, we will ask you to arrive in a “fasted” state – this
means not having eaten or drunk anything except water since the previous night. You
can choose which visit this will be, and we will arrange it for the morning so you don’t
have to be hungry for too long! We will take the blood as soon as you arrive and then
we will offer you tea or coffee and some breakfast such as toast or cereal. If it suits you,
you can choose to call by the hospital briefly one morning just for the blood test, and do
all the other assessments on other occasions.
You will need to fill in a series of questionnaires, which takes about half an hour. You
will be given quiet time during a rest period to do this, or you can take them home to
complete if you prefer.
We will fit you with an accelerometer, which is a lightweight waterproof device worn on
the wrist like a watch. We will ask you to wear it continuously for 7 days. The device is
not uncomfortable and should not cause you any problems.
We will ask you to complete a food diary, in which you write down everything you eat
and drink over a period of 7 days.
What are the possible benefits of taking part?
There are no direct benefits to you of taking part in this research. We hope that the results
of the study will help us understand how the physical condition of kidney patients relates
to their overall health, and to design research studies that will lead to improved treatments
for kidney patients in the future.

299
What happens when the research study stops?
You will carry on with your normal routine.
What if something goes wrong?
In the very unlikely event of you being harmed by taking part in this research project,
there are no special compensation arrangements. If you are harmed due to someone’s
negligence, then you may have grounds for legal action but you may have to pay for it.
Regardless of this, if you wish to complain, or have any concerns about any aspect of
the way you have been approached or treated during the course of this study, the normal
National Health Service complaints mechanisms would be available to you.
If you wish to make a complaint about the study you can contact the UHL Patient
Information and Liaison Service by post to PILS, The Firs, Glenfield Hospital,
Leicester LE3 9QP, telephone 08081 788337 (free phone number), or email pils@uhl-
tr.nhs.uk
Will my taking part in this study be kept confidential?
All information which is collected about you during the course of the research will be
kept strictly confidential. Any information about you which leaves the hospital will
have your name and address removed so that you cannot be recognised from it.
While you are taking part in the study, your contact details will be made available to the
researchers so that they can contact you to arrange the details of your research study
appointments.
When you enter the study we will ask you to provide the researchers with the name and
contact details of your own GP. In the unlikely event that one of the tests we carry out as
part of the study shows any abnormal results, we will inform your GP so that he or she
can decide what further action to take.
What will happen to any samples collected during the research?
Blood samples and urine samples collected as part of the research will be stored in the
research laboratory, and may be used in laboratory tests at the Universities of Leicester
and Loughborough. All samples will be labelled with an anonymous code and it will not
300
used as a basis for diagnosis or treatment, either now or in the future.
However, there is a small chance that one of the tests we carry out during the study may
show an abnormal result. In this case, we will contact your own GP so that he or she can
decide what action to take.
We would like to keep any samples remaining after the end of this research for use in
future studies that obtain ethical approval, such as measurement of newly-discovered
factors associated with heart health or immune function, or to investigate in more detail
any new findings that may emerge from the COCO study. At the end of COCO, we would
like to either use your remaining samples in further research straight away, or transfer
them to a research sample storage bank for use in studies that follow later on. However,
if you would prefer your samples not to be used in such future research, you can indicate
this on the Consent Form. In this case, we will destroy any of your samples that remain
after the end of COCO.
What will happen to the results of the research study?
We expect the results of the research to become available from 2016. We will write a
report about them in our Kidney Research Newsletter. If you would like us to send you a
written report of the results, or if you would like to receive our Kidney Research
Newsletter, please ask the researcher or contact the Chief Investigator, Dr Alice Smith
(contact details at the end of this document).
The results will also be published in a medical journal. All information will be
anonymised so you will not be identified in any report or publication.
Who is organising and funding the research?
The research is being organised by the Leicester Kidney Exercise Team at the John Walls
Renal Unit, Leicester General Hospital and is led by Dr Alice Smith, Honorary Senior
Lecturer. The study is partly funded by the Leicester Kidney Care Appeal.
Any research that involves NHS patients or staff, information from NHS medical records
or uses NHS premises or facilities must be approved by an NHS Research Ethics
Committee before it can go ahead.
This study has been reviewed by the NHS Research Ethics Committee East Midlands
(Derby). Approval means that the committee is satisfied that your rights will be respected,
that any risks have been reduced to a minimum and balanced against possible benefits

301
and that you have been given sufficient information on which to make an informed
decision.
Contact for Further Information
If you would like any further information about this study please contact the Chief
Investigator Dr Alice Smith, or Dr James Burton on 0116 258 4346.
Dr Alice Smith,
Leicester Kidney Exercise Team, Academic Unit,
Leicester General Hospital, LE5 4PW.
Tel 0116 258 4346 email [email protected]
Thank you for reading this Information Sheet, and for considering taking part in
this study.
You will be given a copy of this information sheet and signed consent form to keep

302
Appendix 1
Details of the Tests and Measurements
This section of the information sheet describes the assessment tests in more detail. Each
assessment will be carried out once.
1. Physical performance tests : We will carry out two different tests of physical function
and performance : a shuttle walk test and a sit-to-stand test.
The shuttle walk test has two parts. You will be asked to walk around two cones placed
on the floor 10 metres apart, at a speed timed by a recorded bleep sound. For the first part,
the bleep signal gets a little faster every minute so that you have to increase your walking
speed to keep up. The test is stopped when you can no longer walk fast enough to keep
up with the bleep. This test measures your maximum physical capacity. After this you
will have a rest and the researcher will calculate a walking speed that equates to 85% of
your maximum capacity. For the second part of the test, you will walk at this 85% speed
(in time with a steady bleep) for as long as you can. The test is stopped when you can no
longer keep walking at that speed. This test measures your stamina. Before doing these
tests, you will be taught how to do it and allowed to practice.
The gait speed test measures your normal walking speed over a short distance (4 metres).
We will use a laser gate device to accurately time you as you walk this short distance at
your usual, comfortable walking pace.
The sit-to-stand test measures how easily you can stand up from a chair without using
your hands. First of all we will measure how many times you can do this in 1 minute.
Then we will time how long it takes you to perform 5. You will be given a chance to
practice beforehand, and time to recover between each test.
The handgrip strength test is a quick and simple technique that provides a good overall
estimate of your strength. We use a device called a dynamometer which you hold in your
hand. The researcher will show you what to do and will give you a chance to practice
before doing the test for real. You will sit comfortably with your elbow by your side and

303
bent at a right angle. You will hold the dynamometer and squeeze it as hard as you can
to generate the strength reading. You will do this this three times with each hand and we
will use the maximum reading as your strength measurement.
The balance tests are a very quick and simple way of measuring how good your balance
is in 3 different standing positions. The researcher will show you what to do. You start
with your feet together side by side and try to stand perfectly still for 10 seconds (timed
by the researcher). If you are able to do this, you then move one foot forward a bit so that
the heel is alongside the toe of your other foot, and again try to stand perfectly still for 10
seconds. Finally, you move one foot directly in front of the other and again try to stand
still for 10 seconds.
These physical performance tests are easy to do and are widely used in patients with many
chronic diseases, including kidney disease. If you are not used to exercise you may feel
rather breathless after the shuttle walk tests, and you may experience some mild muscle
stiffness later. These are normal effects of unaccustomed exercise, and nothing to worry
about.
1. Blood vessel health (Pulse Wave Velocity): This non-invasive test measures how long it
takes a pulse to travel between two points, a point on your neck and a point at the top of
your leg. We will place a sensor on each of these points and use a computer to measure
how long a pulse takes to travel between them. We will also measure your blood pressure
using a cuff in the same way your doctor usually measures it. It is a completely painless
procedure, but you will be asked to remain still and not talk whilst the measurement is
being taken. The pulse is easy to detect, but it is hard to find at the top of the leg through
thick clothing, so you will be asked to wear light weight clothing or shorts for this
assessment. It should take no longer than 5 minutes, including the time for you to get
comfortable and for the researcher to position the sensors correctly.
2. Heart Function (Cardiac Bio-reactance): This is a safe, simple, non-invasive test which
measures several aspects of heart function. The test involves lying on a couch and having
four sticky electrodes (like those used for ECG which you may have had before) placed

304
1. on your chest. A small, painless electric current is then passed through your body. The
test is quick and will take around five minutes.
2. Body fat and muscle: These will be measured in two ways. An x-ray device called DEXA,
often used in the NHS to assess the strength of bones, will be used and a technique called
BIA will also be used.
DEXA scans are quick and painless and involve lying on an X-ray table so that the body
can be scanned. This test uses a very small amount of x-ray radiation, which is equal to
the dose you would receive form the natural background radiation by living in Leicester
for about 10 days. The radiation dose is also less than the difference in yearly dose from
natural sources between different locations in the United Kingdom.
BIA is a simple, safe and quick procedure which involves lying flat on a couch for around
2 minutes and having two sticky electrodes (similar to those used for ECG which you
may have experienced) placed on one hand and foot. A small electric current which
causes no pain is then passed down one side of your body.
3. Height, weight and waist circumference: Height and weight will be measured in the same
way as your doctor uses during clinic visits by a member of the research team. We will
also measure waist and hip circumference using a tape measure.
4. Blood Sample: We will take a blood sample from you from a vein in your arm. The
sample will be 30ml (2 tablespoons) and will be used to measure for markers of
inflammation.
5. Urine Sample: We will give you a container to collect some of your urine when you need
to go to the toilet during one of the study visits.
6. Habitual physical activity: Habitual physical activity: We will ask you to wear a wrist-
watch style activity monitor continuously for 7 days that will measure how much physical
activity you do. The watch is waterproof and does not have to be removed while washing.
We will request that you do not remove the watch during the 7 days.

305
1. Food diary : we will give you a food diary containing enough record sheets for 7 days. In
this we will ask you to record everything you eat and drink for 7 days. The researcher
will explain how to fill this in and you will take it home with you.
2. Questionnaires: The researcher will ask you to do a simple questionnaire test of memory
and problem-solving, which will take about 15 mins. We will also give you a series of
questionnaires to complete yourself. Some or all of these can be filled out during
assessment visits, or you may take them home to complete them there if you prefer.
These are assessing your quality of life, the impact of symptoms associated with your
kidney transplant, your level of fatigue, your physical activity habits and opinions, and
your fear of falling.

306
B.3.2 PIS in Chinese study
Chinese HD patients

307

308
身体脂肪和肌肉:我们将使用两种安全的、非侵入性的技术来测量它们; DEXA和 BIA。
身高、体重、腰围和臀围:我们将以你的医生、护士或营养师在门诊就诊时使用的方式
来测量这些指标。
血样:我们将从你手臂上的静脉中取出一个 30ml(2汤匙)的血样。如上所述,在验血
时,你需要避免吃或喝除水以外的任何东西。
尿样:我们会要求您在某次评估期间方便的时候提供一个 20ml的尿样。
习惯性体力活动:我们会要求你连续 7天佩戴腕表式的活动监测器,以测量你做了多少
体力活动。
饮食日记:我们会要求你把你 7天的饮食都记录在饮食日记里,我们会请你带回家记
录。
肾移植问卷:研究小组的一个成员会问你 25 个问题,关于肾移植患者日常生活中经常遇
到的一些问题。如果你是肾脏移植病人,你必须填写这份问卷。
其他的问卷调查:我们会让你做一个快速简单的问卷调查评估你的认知功能,也就是记
忆力和解决问题的能力。研究者会和你一起检查,大约需要15分钟。我们还会要求你填写一
系列的问卷来评估你的生活质量,你所遭受的任何症状的影响,你的疲劳程度,你的身体活
动习惯和观点,以及你对摔倒可能性的感觉。我们将解释这些问卷,并请你在安静的环境里
填写。 您可以在你的行走测试休息期间,或者其他评估时间,或者如果你愿意,你可以带一
些,或全部问卷带回家完成。
临床参数:经您同意,我们将从您的病历中提取有关您的肾脏疾病和一般健康的信息。
这将以研究参与者代码匿名的方式使用,属于您个人的信息不会被识别。

309
参加本研究会有什么可能的缺点和风险吗?
参与本研究主要的影响就是您花在 上面的时间(总共2-3次)。我们将要补偿您每次的车
费和停车费。
抽取血液标本可能会引起轻微的疼痛或皮肤青紫,但是都没有危险性。在血液检查的那次
评估中,我们会请您请您禁食—这意味着从前一天晚上您就不能进食或饮用任何除了水之外
的饮品。这是为了血液检查之用。您可以选择方便的时候,我们也会把检查放在早上,这样可
以减少您饥饿的时间。在您到达之时,我们会马上为您抽血,然后会为您提供早餐。
您还需要填写一些量表,这大概要占用您半个小时。您可以在休息时在安静的环境中完成
量表,或者选择带回家去完成它们。
除此之外,我们还请您使用一个运动加速器来评估您的活动水平。这是一个防水佩戴在胳
膊上的小型测量仪。我们需要您持续佩戴7天。这个仪器不会让您不舒服也不会引起任何问题。
参加本研究有什么潜在的好处?
参加本研究没有直接的好处。我们希望研究的结果能帮助我们理解肾病患者的体力状态
和健康的关系,以便今后能设计出可以改善肾病患者治疗的研究方案。
当研究结束时会发生什么?
您常规的临床治疗护理一切正常进行。
如果研究不顺利会怎么样?
参加本研究会伤害到您的可能性几乎为零,所以我们也没有什么特殊的补偿措施。如果您
被某人的失职带来伤害,您有理由采取法律行动,但是您可能需要自己支付费用。如果您对我
们的研究过程有任何的不满,您可以向医院的相关部门进行投诉。

310
若您对研究有任何的不满,您可以向医院的伦理委员会联系。电 话:0513-85052390 邮
箱:[email protected] 地 址:江苏省南通市西寺路 20号南通大学附属医院 13号楼 3楼 伦
理委员会办公室
我参与此项研究的信息会被保密吗?
在本研究中所收集的任何数据信息将会以研究编码标记,而不是您的姓名。您留在医院里
的任何涉及您个人身份信息的文件都会被去除,您的个人隐私会得到保护。在您参与研究期
间,研究者会保留您的联系方式以便和您及时沟通研究的相关信息。
再得到您的允许之后,我们会通知您的主治医生您参与了此项研究。
研究的结果将如何处理?
本研究预期于2016年完成。我们将会把研究结果通过海报或手册的方式在病房展示,这样
您就可以在就医期间看到。另外,我们也会将结果形成报告或文章。如果您有需要,请联系我
们或护士(联系方式显示在下方),我们会将报告或文章直接邮寄或送达给您。
谁组织或资助此项研究?
本研究是由宋艳副教授(南通大学)以及南通大学附属医院组织负责。
谁将对本研究进行评价监督?
任何涉及到患者病历信息或使用到其规定或设施的研究都应在开展之前通过伦理委员会
的审查。本研究已经经南通大学附属医院伦理委员会办公室审核通过,意味着伦理委员认定
您的权利在本研究中将会被充分的保护和尊重,对您的影响以及对您利益的冲突已经被减少
到最低,另外,在您做出决定之前,您已经被给予了充分的信息说明。
更多的信息
如果您想获得更多关于此项研究的信息,请联系研究者宋艳,手机(86)1386190853固
定电话:0513-85051784. 电子邮件:[email protected]
感谢您阅读患者信息表,请考虑参与此项研究!

311
附件
测量评估细节
这个部分为本研究评估内容的细节介绍。每个评估只进行一次。
1. 身体活动能力测试:穿梭行走试验有两个部分。您将会被要求跟着外部的提示音来绕着相
距10米的两个标志物来回的走动。在第一部分,提示音每分钟都会加快一点以提示您需要加快
步速跟上节奏。当您没法再加快速度以跟上提示音,测试结束。这一部分测试最大的活动能
力。之后请您休息一下。研究者会用您最大活动能力的85%计算出步速。在第二部分,我们请
您以计算出来的步速继续绕着标记物往返走动。在这一部分中,步速不变,请您尽可能的完成
往返的次数。同样,如若您无法以此步速跟上提示音,测试结束。穿梭行走试验第二部分测试
的是耐力。在正式测量之前, 您将被告知如何进行测量并且会给您练习的机会。
步速试验是通过一段短距离(4m)测量您正常的步速。我们将用激光门仪器来精确的在您通
过这段短距离时计时。
坐-立试验测量的是您不借助手的帮助从椅子上站立的能力。首先,我们要测量您一分钟内
进行此项试验的次数。然后我们将记录您快速完成5次试验所用的时间。您会先有一段练习
的时间,在每次测试之间也会有休息的时间。
手持式力量测试是一种快速而简单的技术,可以对您的力量进行全面的评估。我们使用一种
叫做测功仪的装置,您可以拿在手里。研究人员会告诉您该做什么,并给您一个练习的机
会,然后再做真正的测试。您可以舒服地坐着,肘放在身体两侧,手臂弯曲成直角。您将握
住测功器,尽可能用力挤压,以产生强度读数。您将用每只手做三次,我们将使用最大读数
作为您的力量测量。
平衡测试是一种非常快速和简单的方法,用来测量您在3个不同的站立位置时的平衡能力。
研究人员会告诉您该做什么。您把双脚并排放在一起,试着保持完全静止10秒钟(研究者计
时)。如果您能做到这一点,您就把一只脚向前挪一点,这样脚后跟就会和另一只脚的脚趾

312
并排,然后再试着保持完全静止10秒钟。最后,您把一只脚直接放在另一只脚的前面,然后
再试着站立10秒钟。
2.血管健康(脉搏波速度):这个非侵入性的测试测量了脉搏在两点之间传播的时间,一个点在
您脖子上,一个点在您腿的顶部。我们将在每一个点上放置一个传感器,并使用计算机来测量
脉冲在它们之间传播的时间。我们也会用袖带测量您的血压,就像您的医生通常测量血压一
样。这是一种完全无痛的过程,但您会被要求在测量过程中保持静止不说话。脉搏很容易检测
到,但是通过厚的衣服很难在腿的顶部找到,所以您会被要求穿轻便的衣服或短裤进行评估。
它应该不超过5分钟,包括让您感到舒适和研究者正确定位传感器的时间。
3.心脏功能(心脏生物电抗):这是一种安全、简单、无创的检测方法,可以检测心脏功能的几
个方面。这个测试包括躺在沙发上,在您的胸部放置四个粘贴的电极(就像您以前可能有过的
心电图一样)。小的,无痛的电流通过您的身体。整个测量过程很快,大约需要5分钟。
4.身体脂肪和肌肉:这些将以两种方式测量。一种被称为DEXA的X光设备将会被使用,这种设备
通常被用于英国国家医疗服务系统(NHS),用于评估骨骼的强度。一种叫做BIA的技术也将被使
用。
DEXA扫描仪扫描快速、无痛,检查者躺在一张X射线桌子上面,这样身体可以被扫描。这项
测试使用的X射线辐射量非常少。
BIA检测过程简单、安全、快速。被检查者平躺在沙发上约2分钟左右,两个带有粘性的电极
(类似于那些您可能经历过的用于心电图的)分别置于一只手和脚。一股不会引起疼痛的小电
流就会从您身体的一侧流过。
5.身高、体重和腰围:身高和体重的测量方法与您的医生在门诊就诊时所使用的方法相同。我
们还将用卷尺测量腰围和臀围。
6.血液样本:我们将从您手臂上的静脉中抽取血液样本。样本容量为30ml(2汤匙),用于检测炎
症标志物。

313
7.尿液样本:我们会给您一个容器,当您需要去厕所的时候收集您的一些尿液。
8.习惯性体力活动:习惯性体力活动:我们会要求您佩戴活动加速仪,持续7天,以测量您做了
多少体力活动。我们要求您除了在洗澡、游泳在接触水的时候拿下监测仪,其余时间请持续佩
戴。
9.食物日记:我们会给您一个食物日记,里面有足够7天的记录。在这本日记中,我们将要求您
记录下您在7天内吃的和喝的所有东西。研究者会解释如何填写,我们请您会把它带回家做记
录。
10.肾脏移植调查问卷:一名研究人员和您一起坐在一个安静的私人房间里,就影响肾脏移植
患者生活质量的问题问您25个问题。这些问题将以一种标准的方式向您宣读,研究者将在调查
表上记录您的答案。本问卷仅适用于肾移植患者。如果您正在透析或有早期的CKD,您将不需
要填写它。
11.其他调查问卷:研究人员会让您做一个简单的关于记忆和解决问题的调查问卷,大约需要
15分钟。我们也会给您一系列的问卷请您自己完成。有些或所有这些可以在评估期间填写,或
者您可以带回家完成,如果您喜欢的话。这些是评估您的生活质量,与肾脏移植相关的症状的
影响,您的疲劳程度,您的身体活动习惯和观点,以及您对跌倒的恐惧。
12.临床参数:经您同意,我们将从您的病历中提取有关您的肾脏疾病和一般健康的信息。这将
包括年龄、性别、种族和邮编、您最近的血液和尿液检测结果、您可能遭受的其他健康问题,
以及您正在服用的药物。这将以研究参与者代码匿名的方式使用,属于您个人的信息不会被识
别。

314
DXA对扫描患者信息传单
向您推荐进行双能量X射线吸收测量(DXA)扫描。本小册子中的信息将解释在此过程之
前、期间和之后将发生的事情,并回答您可能提出的任何问题。
DXA扫描仪是什么?
DXA扫描是测量身体成分的最准确和最可靠的一种方式。如:身体的脂肪和肌肉百分
比。扫描仪使用X射线,通过骨骼和软组织。扫描仪会检测到X光,然后计算出你的身体成分
数据。
DXA扫描有风险吗?
尽管DXA测定仪使用X射线,但是这种剂量非常低并且风险可以忽略不计。
DXA测定前,以下情况可能不适合DXA检测:
•如果你有严重的移动障碍
•如果你不能平躺几分钟
•如果你已经怀孕,或认为你可能已经怀孕
•如果你的体重超过204公斤
•如果你接触X射线与钡,请在过去72小时内对比染色或扫描测。
请你应该尽量穿着没有金属(如拉链、胸罩、扣、腰带、按钮和钉)的衣服。也要避免紧
身腰带。这样,你就可以穿自己的衣服上去进行扫描,而不用换上医院的长袍。你也将被要
求移除任何珠宝(包括穿孔)、手表或发饰。操作员将会告知你任何内部物品也要去除(例如
金属植入物、起搏器、外科针等)。
在扫描期间会发生什么事?

315
你将被要求躺在沙发上同时扫描器手臂经过你。你不是在隧道里,尽管扫描器的手臂可
能会经过你的脸。你不需要打针。扫描大约需要10分钟。在扫描过程中操作员会和你在房间
里。
扫描疼吗?
扫描本身是无痛苦的。然而,在扫描过程中,你需要平躺,有些人会觉得不舒服。
何时信息收集?
请将研究结果将提供给你的研究者。
你应该和谁联系?
如果你扫描过程或有任何关于这个小册子的问题,你应该联系你的研究者。

316
Healthy controls
COCO :肾脏疾病患者的心血管危险因素及体力状态
健康对照组信息单
2015-11-23
您正在被邀请参与我们的研究。但是在您做出决定之前,请您先了解我们研究的目的和内
容。请仔细阅读下面的信息,您也可以和其他人讨论后做出决定。如果有任何问题或是您想获
得更多的信息请向我们咨询。
研究目的
肾脏疾病影响心血管健康的同时也会引起肌肉萎缩, 后者会导致肌肉无力, 疲劳以及体
力下降。这些反应在透析患者身上表现的更为突出。虽然肾移植能够使患者受益,恢复肾功
能,但是某些消极的影响依旧存在。
运动可以帮助健康的人变得更健康,增强肌肉,改善心脏和血管的健康。然而,我们不知
道肾脏病人是否也能从定期锻炼中获得同样的好处。莱斯特肾脏锻炼小组正在进行多项研究,
以研究锻炼可能如何帮助肾病患者,包括透析患者和肾移植患者。
为了帮助我们的研究,我们需要了解目前肾脏病人的身体状况和身体活动习惯,以及这些
与健康相关的其他重要因素,以及生活质量的关系。我们还需要了解这些因素在肾脏病人和同
年龄、同性别的健康人中的差异。
这项研究旨在收集这些信息,这将有助于我们开展关于肾病患者运动的最佳未来研究。
我们将邀请肾脏患者进行一系列的行走能力、日常身体活动水平、身体成分和心脏健康的测试
和测量,进行血液测试和尿液测试,并填写一些简单的问卷。
我们也会请一些年龄和性别相同的健康人做同样的测试,这样我们就可以比较结果,以研
究肾病对患者的影响。

317
测试将在医院研究中心进行,参与者可以选择两次,每次大约 2小时,或者三次短时间的
测试。
我们将分析从研究中收集的数据,以帮助我们评估锻炼对肾脏病人的益处,并设计未来关
于锻炼和肾脏病人健康的研究。
为什么选择我?
您之所以被选中,是因为您的年龄与参与这项研究的一些肾脏病人差不多,就您所知,您
有不错的健康状况,没有任何已知的疾病。一组健康的人参加这样的研究被称为“健康对照
组”。
我们正在做的这项研究是为了更好地了解肾病患者的身体活动与健康和生活质量之间的
关系,以及肾病患者和健康人之间的差异。
我们将邀请 60名肾脏患者和 20名健康对照者参与这项研究。
如果您意识到您有严重的长期健康问题,请告诉研究者您认为您不适合在这项研究中作
为一个健康的对照。您不必告诉他们您的具体情况。
我必须参加吗?
您是否参加完全取决于您的意愿。如果您决定参加,我们将会请您签署一份知情同意书。
即使您已决定参加本研究,您也有权利随时退出研究,不需任何理由。您拒绝参加或退出研究
的决定都不会影响到您的治疗和合法权益。
如果我参加此项研究将需要做些什么?
整个研究不会影响到您的正常生活,我们不需要您做出任何调整。请您还是遵循您的日常
饮食和活动,如果您正在服用任何处方药,您应该继续正常服用。
如果您愿意参加此项研究,我们将安排您进行 2-3次的评估测试。这些测试是灵活的。您
可以选择两次,每次大约 2小时,或者三次短时间的测试。

318
在其中的一次测试之前我们会请您禁食—这意味着从前一天晚上您就不能进食或饮用任
何除了水之外的饮品。这是为了血液检查之用。您可以选择方便的时候,我们也会把检查放在
早上,这样可以减少您饥饿的时间。在您到达之时,我们会马上为您抽血,然后会为您提供早
餐。在要求您佩戴测量活动检测仪的那一周里请您继续正常的生活节奏,无需做出任何调整。
评估
在研究期间,研究者将进行下面列出的测试。关于所有这些测试的更详细的信息可以在本
信息表的附录 1中找到。我们会根据您的需要,安排评估的时间和时间。
身体活动能力测试:你的身体表现将通过行走测试、坐立测试(从椅子上站起来)、握力测
试和平衡测试来测试。我们将向您展示如何进行测试,并允许您在真正进行测试之前进行实
践。
血管健康:我们将使用一种非常简单和非侵入性的测试,叫做脉搏波速度(PWV)来测量你
的血管的健康状况。
心脏功能:另一种简单的、非侵入性的测试,叫做心脏生物电抗,将被用来测量心脏的功
能。
身体脂肪和肌肉:我们将使用两种安全的、非侵入性的技术来测量它们; DEXA和 BIA。
身高、体重、腰围和臀围:我们将以你的医生、护士或营养师在门诊就诊时使用的方式来
测量这些指标。
血样:我们将从你手臂上的静脉中取出一个 30ml(2汤匙)的血样。如上所述,在验血
时,你需要避免吃或喝除水以外的任何东西。
尿样:我们会要求您在某次评估期间方便的时候提供一个 20ml的尿样。
习惯性体力活动:我们会要求你连续 7天佩戴腕表式的活动监测器,以测量你做了多少
体力活动。
饮食日记:我们会要求你把你 7 天的饮食都记录在饮食日记里,我们会请你带回家记录。

319
肾移植问卷:研究小组的一个成员会问你 25个问题,关于肾移植患者日常生活中经常遇
到的一些问题。如果你是肾脏移植病人,你必须填写这份问卷。
其他的问卷调查:我们会让你做一个快速简单的问卷调查评估你的认知功能,也就是记忆
力和解决问题的能力。研究者会和你一起检查,大约需要15分钟。我们还会要求你填写一系列
的问卷来评估你的生活质量,你所遭受的任何症状的影响,你的疲劳程度,你的身体活动习惯
和观点,以及你对摔倒可能性的感觉。我们将解释这些问卷,并请你在安静的环境里填写。 您
可以在你的行走测试休息期间,或者其他评估时间,或者如果你愿意,你可以带一些,或全部问
卷带回家完成。
临床参数:经您同意,我们将从您的病历中提取有关您的肾脏疾病和一般健康的信息。
这将以研究参与者代码匿名的方式使用,属于您个人的信息不会被识别。
参加本研究会有什么可能的缺点和风险吗?
参与本研究主要的影响就是您花在上面的时间(总共2-3次)。我们将要补偿您每次过来
的车费和停车费。
抽取血液标本可能会引起轻微的疼痛或皮肤青紫,但是都没有危险性。在血液检查的那次
评估中,我们会请您请您禁食—这意味着从前一天晚上您就不能进食或饮用任何除了水之外
的饮品。这是为了血液检查之用。您可以选择方便的时候,我们也会把检查放在早上,这样可
以减少您饥饿的时间。在您到达之时,我们会马上为您抽血,然后会为您提供早餐。
您还需要填写一些量表,这大概要占用您半个小时。您可以在休息时在安静的环境中完成
量表,或者选择带回家去完成它们。
除此之外,我们还请您使用一个运动加速器来评估您的活动水平。这是一个防水佩戴在胳
膊上的小型测量仪。我们需要您持续戴7天。这个仪器不会让您不舒服也不会引起任何问题。
我们会要求您完成一份饮食日记,您在日记中写下您在7天内吃的和喝的所有东西。

320
参加本研究有什么潜在的好处?
参加本研究没有直接的好处。我们希望研究的结果能帮助我们理解肾病患者的体力状态
和健康的关系,以便今后能设计出可以改善肾病患者治疗的研究方案。
当研究结束时会发生什么?
您将继续您的日常生活。
如果研究不顺利会怎么样?
参加本研究会伤害到您的可能性几乎为零,所以我们也没有什么特殊的补偿措施。如果您
被某人的失职带来伤害,您有理由采取法律行动,但是您可能需要自己支付费用。如果您对我
们的研究过程有任何的不满,您可以向医院的相关部门进行投诉。
若您对研究有任何的不满,您可以向医院的伦理委员会联系。电 话:0513-85052390 邮 箱:
[email protected] 地 址:江苏省南通市西寺路 20号南通大学附属医院 13号楼 3楼 伦理委
员会办公室
在研究过程中收集的样本会如何处理?
作为研究的一部分,采集的血液样本和尿液样本将被储存在研究实验室中。所有的样本都
将被贴上匿名的标签,从上面不可能识别您的信息。对采集的样本进行的任何检测都是研究计
划的一部分,任何结果都不会作为诊断或治疗的基础,无论是现在还是将来。
然而,我们在研究过程中进行的任何的一项测试可能显示出异常结果的可能性很小。在这
种情况下,我们将告知您,以便您可以决定采取什么措施。

321
我们想保持任何剩余样品待本研究结束后经伦理批准用于未来的研究,如测量新发现的
与心脏健康相关的因素或免疫功能,或详细调查任何可能来自本研究的新发现。在研究结束时,
我们希望将您的剩余样本直接用于进一步研究,或者将它们转移到一个研究样本存储库中,以
便以后的研究中使用。但是,如果您希望您的样品不用于今后的研究,您可以在同意书上注
明。在这种情况下,我们将销毁您们在研究结束后留下的任何样品。
研究的结果将如何处理?
本研究预期于2016年完成。我们将会把研究结果通过海报或手册的方式在病房展示,这样
您就可以在就医期间看到。另外,我们也会将结果形成报告或文章。如果您有需要,请联系我
们或护士(联系方式显示在下方),我们会将报告或文章直接邮寄或送达给您。关于您的任何
个人信息都不会出现在报告或文章中。
谁组织或资助此项研究?
本研究是由宋艳副教授(南通大学)以及南通大学附属医院组织负责。
谁将对本研究进行评价监督?
任何涉及到患者病历信息或使用到其规定或设施的研究都应在开展之前通过伦理委员会
的审查。本研究已经经南通大学附属医院伦理委员会办公室审核通过,意味着伦理委员认定您
的权利在本研究中将会被充分的保护和尊重,对您的影响以及对您利益的冲突已经被减少到
最低,另外,在您做出决定之前,您已经被给予了充分的信息说明。
更多的信息
如果您想获得更多关于此项研究的信息,请联系研究者宋艳,手机(86)13861908536,固定
电话:0513-85051784. 电子邮件:[email protected]
感谢您阅读患者信息表,请考虑参与此项研究!
在同意参与此项研究之后,
您将会受到此份患者信息单以及签过姓名的知情同意书的复印件!谢谢!

322
附件
测量评估细节
这个部分为本研究评估内容的细节介绍。每个评估只进行一次。
1.身体活动能力测试:穿梭行走试验有两个部分。您将会被要求跟着外部的提示音来绕着相距
10米的两个标志物来回的走动。在第一部分,提示音每分钟都会加快一点以提示您需要加快步
速跟上节奏。当您没法再加快速度以跟上提示音,测试结束。这一部分测试最大的活动能力。
之后请您休息一下。研究者会用您最大活动能力的85%计算出步速。在第二部分,我们请您以
计算出来的步速继续绕着标记物往返走动。在这一部分中,步速不变,请您尽可能的完成往返
的次数。同样,如若您无法以此步速跟上提示音,测试结束。穿梭行走试验第二部分测试的是
耐力。在正式测量之前, 您将被告知如何进行测量并且会给您练习的机会。
步速试验是通过一段短距离(4m)测量您正常的步速。我们将用激光门仪器来精确的在您通
过这段短距离时计时。
坐-立试验测量的是您不借助手的帮助从椅子上站立的能力。首先,我们要测量您一分钟内
进行此项试验的次数。然后我们将记录您快速完成5次试验所用的时间。您会先有一段练习
的时间,在每次测试之间也会有休息的时间。
手持式力量测试是一种快速而简单的技术,可以对您的力量进行全面的评估。我们使用一种
叫做测功仪的装置,您可以拿在手里。研究人员会告诉您该做什么,并给您一个练习的机
会,然后再做真正的测试。您可以舒服地坐着,肘放在身体两侧,手臂弯曲成直角。您将握
住测功器,尽可能用力挤压,以产生强度读数。您将用每只手做三次,我们将使用最大读数
作为您的力量测量。
平衡测试是一种非常快速和简单的方法,用来测量您在3个不同的站立位置时的平衡能力。
研究人员会告诉您该做什么。您把双脚并排放在一起,试着保持完全静止10秒钟(研究者计
时)。如果您能做到这一点,您就把一只脚向前挪一点,这样脚后跟就会和另一只脚的脚趾

323
并排,然后再试着保持完全静止10秒钟。最后,您把一只脚直接放在另一只脚的前面,然后
再试着站立10秒钟。
2.血管健康(脉搏波速度):这个非侵入性的测试测量了脉搏在两点之间传播的时间,一个点在
您脖子上,一个点在您腿的顶部。我们将在每一个点上放置一个传感器,并使用计算机来测量
脉冲在它们之间传播的时间。我们也会用袖带测量您的血压,就像您的医生通常测量血压一
样。这是一种完全无痛的过程,但您会被要求在测量过程中保持静止不说话。脉搏很容易检测
到,但是通过厚的衣服很难在腿的顶部找到,所以您会被要求穿轻便的衣服或短裤进行评估。
它应该不超过5分钟,包括让您感到舒适和研究者正确定位传感器的时间。
3.心脏功能(心脏生物电抗):这是一种安全、简单、无创的检测方法,可以检测心脏功能的几
个方面。这个测试包括躺在沙发上,在您的胸部放置四个粘贴的电极(就像您以前可能有过的
心电图一样)。小的,无痛的电流通过您的身体。整个测量过程很快,大约需要5分钟。
4.身体脂肪和肌肉:这些将以两种方式测量。一种被称为DEXA的X光设备将会被使用,这种设备
通常被用于英国国家医疗服务系统(NHS),用于评估骨骼的强度。一种叫做BIA的技术也将被使
用。
DEXA扫描仪扫描快速、无痛,检查者躺在一张X射线桌子上面,这样身体可以被扫描。这项
测试使用的X射线辐射量非常少。
BIA检测过程简单、安全、快速。被检查者平躺在沙发上约2分钟左右,两个带有粘性的电极
(类似于那些您可能经历过的用于心电图的)分别置于一只手和脚。一股不会引起疼痛的小电
流就会从您身体的一侧流过。
5.身高、体重和腰围:身高和体重的测量方法与您的医生在门诊就诊时所使用的方法相同。我
们还将用卷尺测量腰围和臀围。
6.血液样本:我们将从您手臂上的静脉中抽取血液样本。样本容量为30ml(2汤匙),用于检测炎
症标志物。

324
7.尿液样本:我们会给您一个容器,当您需要去厕所的时候收集您的一些尿液。
8.习惯性体力活动:习惯性体力活动:我们会要求您佩戴活动加速仪,持续7天,以测量您做了
多少体力活动。我们要求您除了在洗澡、游泳在接触水的时候拿下监测仪,其余时间请持续佩
戴。
9.食物日记:我们会给您一个食物日记,里面有足够7天的记录。在这本日记中,我们将要求您
记录下您在7天内吃的和喝的所有东西。研究者会解释如何填写,我们请您会把它带回家做记
录。
10.肾脏移植调查问卷:一名研究人员和您一起坐在一个安静的私人房间里,就影响肾脏移植
患者生活质量的问题问您25个问题。这些问题将以一种标准的方式向您宣读,研究者将在调查
表上记录您的答案。本问卷仅适用于肾移植患者。如果您正在透析或有早期的CKD,您将不需
要填写它。
11.其他调查问卷:研究人员会让您做一个简单的关于记忆和解决问题的调查问卷,大约需要
15分钟。我们也会给您一系列的问卷请您自己完成。有些或所有这些可以在评估期间填写,或
者您可以带回家完成,如果您喜欢的话。这些是评估您的生活质量,与肾脏移植相关的症状的
影响,您的疲劳程度,您的身体活动习惯和观点,以及您对跌倒的恐惧。
12.临床参数:经您同意,我们将从您的病历中提取有关您的肾脏疾病和一般健康的信息。这将
包括年龄、性别、种族和邮编、您最近的血液和尿液检测结果、您可能遭受的其他健康问题,
以及您正在服用的药物。这将以研究参与者代码匿名的方式使用,属于您个人的信息不会被识
别。

325
DXA对扫描患者信息传单
向您推荐进行双能量X射线吸收测量(DXA)扫描。本小册子中的信息将解释在此过程之
前、期间和之后将发生的事情,并回答您可能提出的任何问题。
DXA扫描仪是什么?
DXA扫描是测量身体成分的最准确和最可靠的一种方式。如:身体的脂肪和肌肉百分
比。扫描仪使用X射线,通过骨骼和软组织。扫描仪会检测到X光,然后计算出您的身体成分
数据。
DXA扫描有风险吗?
尽管DXA测定仪使用X射线,但是这种剂量非常低并且风险可以忽略不计。
DXA测定前,以下情况可能不适合DXA检测:
•如果您有严重的移动障碍
•如果您不能平躺几分钟
•如果您已经怀孕,或认为您可能已经怀孕
•如果您的体重超过204公斤
•如果您接触X射线与钡,请在过去72小时内对比染色或扫描测。
请您应该尽量穿着没有金属(如拉链、胸罩、扣、腰带、按钮和钉)的衣服。也要避免紧
身腰带。这样,您就可以穿自己的衣服上去进行扫描,而不用换上医院的长袍。您也将被要
求移除任何珠宝(包括穿孔)、手表或发饰。操作员将会告知您任何内部物品也要去除(例如
金属植入物、起搏器、外科针等)。
326
在扫描期间会发生什么事?
您将被要求躺在沙发上同时扫描器手臂经过您。您不是在隧道里,尽管扫描器的手臂可
能会经过您的脸。您不需要打针。扫描大约需要10分钟。在扫描过程中操作员会和您在房间
里。
扫描疼吗?
扫描本身是无痛苦的。然而,在扫描过程中,您需要平躺,有些人会觉得不舒服。
何时信息收集?
请将研究结果将提供给您的研究者。
您应该和谁联系?
如果您扫描过程或有任何关于这个小册子的问题,您应该联系您的研究者。

327
B.3.3 Consent form in the UK study
UK HD patients
Study Code
COCO
Leicester Kidney Exercise Team University of Leicester Academic Unit
Leicester General Hospital
Leicester LE5 4PW
Tel 0116 258 4346
Email [email protected]

328
UK Heathy controls
Study Code
COCO
Leicester Kidney Exercise Team University of Leicester Academic Unit
Leicester General Hospital Leicester LE5 4PW Tel 0116 258 4346
Email [email protected]

329
B.3.4 Consent form in Chinese study
Chinese HD patients
患者知情同意书
肾病患者的心血管风险和身体状况
研究者:宋艳
请在此处打“√”
1. 我已阅读并理解 2015年 11月 23日的关于该研究的肾病患者信息单
并已询问了相关问题。
2. 我自愿参与该研究项目,并且无需提交任何理由、随时有退出该研
究的自由,我的临床治疗和合法权利都不会受到影响。
3. 研究组相关工作人员已获得我的联系方式,因此他们可以联系我并
安排相关研究细节。
4. 我的主治医生也将知晓我参与研究。
5. 我已获知这个研究所收集的标本将被存放于南通大学附属医院实验室。
YES NO
6. 对于该项研究结束时余留的标本,我允许其存放于研究资料库
中或用于符合伦理学要求的后续研究。
7. 所收集的标本进行的任何实验都是该研究项目中的一部分,不管现
在还是将来,任何结果都不用作诊断或治疗的基础。
8. 研究小组、资助者以及研究相关的伦理组织,所有这些相关责任人
能获得我的医学相关信息和(或)数据。
8. 我同意加入该项研究。
______________________ _________ ___________
患者姓名 日期 签名
______________________ _________ ___________
研究人员 日期 签名
研究代码
coco

330
Healthy controls
健康对照组知情同意书
肾病患者的心血管风险和身体状况
研究者:宋艳
请在此处打“√”
1. 我已阅读并理解 2015年 11月 23日的关于该研究的健康对照组信息
单并已询问了相关问题。
2. 我自愿参与该研究项目,并且无需提交任何理由、随时有退出该研
究的自由,我的临床治疗和合法权利都不会受到影响。
3. 研究组相关工作人员已获得我的联系方式,因此他们可以联系我并
安排相关研究细节。
4. 我已获知这个研究所收集的标本将被存放于南通大学附属医院实验
室。
YES NO
5. 对于该项研究结束时余留的标本,我允许其存放于研究资料库
中或用于符合伦理学要求的后续研究。(如果你不同意,请选择
“否”,该研究结束时,你的标本将被废弃)
6. 所收集的标本进行的任何实验都是该研究项目中的一部分,不管现
在还是将来,任何结果都不用作诊断或治疗的基础。
7. 若在研究中发现任何涉及本人健康、且并不令人乐观的研究结果,
研究者应当通知我以便采取适当措施。
8. 研究小组、资助者以及研究相关的伦理组织,所有这些相关责任人
能获得我的医学相关信息和(或)数据。
9.我同意加入该项研究。
______________________ _________ ___________
患者姓名 日期 签名
______________________ _________ ___________
研究人员 日期 签名

331
Appendix C. Interview record and
questionnaires using in this thesis

332
C.1 The DISH study
C.1.1 UK HD patients
24-Hour Dietary Recall Instructions
Separate interviews will be conducted for a dialysis day and non-dialysis days in each of
the first and last weeks of a month to account for variations in eating patterns associated
with treatment. The interviews will be conducted using a modified version of the USDA
5-pass method:
1. Ask the patient to confirm that the day in question was either a dialysi s or non-
dialysis day
2. Ask the patient to recall everything eaten during the 24-hours in question.
1. Start by asking the patient to list all foods and beverages consumed during
the 24-hours. Do not interrupt and allow the patient to finish.
2. Go through the li st a second time prompting for anything that may have
been forgotten such as beverages, snacks, and condiments.
3. Gather details on the portion sizes, cooking methods, brands, etc. Be sure
to ask them the point of purchase (supermarket, convenience store, q uick
service restaurants, restaurant, etc.). Try to get the specific name of the
place when possible.
4. Review the list and prompt for details regarding the time and location of
the foods and beverages consumed.
5. Review the recall one additional time to ensure accuracy.
The interviewer should remember:
1. Be objective. Do not give any opinions of the food choices, whether good or bad.
Remind the patient that he or she will not be judged, and therefore should be
honest in disclosing everything consumed.
2. Do not over-prompt, which can sway a response.
3. Probe to record all supplements , especially probing for protein bars or meal -
replacement drinks (some examples: Ensure, Boost, Glucerna).
4. Be sure to record enough detail. The below tips can help with this.
Tips
• Be very careful about recording objective portion sizes. For example, 1 small bowl
of cereal will mean different things to different people. Be sure to record the kind of
cereal (eg Cheerios) and the kind of milk (eg semi-skimmed). Volume (in ml,
tablespoons, teaspoonsetc), weight (in grams or ounces), or dimensions (in cm or
inches) are appropriate units.
• Packaging can be very helpful but participants will rarely provide this information. If
you do have packaging, you can record the amount in grams or ounces.

333
Incorrect Correct
1 bowl cereal 1 fist Frosted Flakes
1 bagel 1 medium plain bagel (3” diameter)
1 container yogurt 1 container Yoplait blueberry lowfat yogurt (6oz)
1 cup oatmeal (also applies
to rice, pasta, etc)
1 cup cooked oatmeal, OR ½ cup dry oatmeal with ½
cup water
1 glass milk 200ml skimmed milk
1 ham & cheese sandwich 1 sandwich:
-Lean ham, 3 oz; -Swiss cheese, 1 oz
-Whole wheat bread: 2 slices; -Mayo: 2 Tb
VOLUME: 1 teaspoon = 5 ml; 1 tablespoon = 15ml; 1 fl. oz = 2 Tablespoons
1 pint = 568ml;1 litre = 2.1 pints
WEIGHT: 1 lb = 16 oz (not the same as fluid ounces!);1 ounce = 28 grams
COMMON PORTION APPROXIMATIONS:
1 cup size of your fist; ½ cup half of your fist or one hand cupped
1 Tablespoonsize of your thumb
1 Teaspoon size of your thumbnail
3 oz/84g (meat)size of the palm of your hand
1 oz (crisps) two cupped hands
• You cannot usually convert between volume and weight yourself. It is easy to
make a mistake. For example, 1 cup of crisps does not weigh 8 oz (actually it
weighs about 1 oz.)! In this case, you must look on the label to see the weight,
or just record volume.
• Remember to record whether a food was measured before or after cooking. T his
especially applies to oatmeal, pasta, rice, meats, and fish. During the cooking
process, grains will gain and meats will lose water weight & volume. (Example:
1 cup dry pasta = 2 cups cooked pasta).
• Record all fluids consumed, including water and ice.
• Condiments such as sugar, butter, cream cheese, mayo, salad dressings, and sour
cream can add many calories, and must be kept track of carefully. Always ask if
there was anything else eaten alongside.
• For multi-ingredient foods, it is best to record all components. Otherwise, you must
specify the brand. Examples of multi-ingredient foods: sandwiches, pizza, soup,
salads, etc.
• Here are some examples to help you:

334
-Lettuce: 2 leaves; -Tomato: 2 slices, 3” diameter
1 cheeseburger 1 cheeseburger:
-1 beef patty 3 oz; -1 slice American cheese, 1 oz
-Mayo: 1Tb; -ketchup: 1tsp
-mustard: 1 tsp; -onions, pickles, lettuce, tomato
OR, record size, toppings & fast food brand
1 slice pizza 1/8th of veggie pizza from 16” pizza
1 bag of chips 1 small bag of Walkers plain crisps
1 potato (applies to all
whole fruits & vegetables)
1 medium potato or 3” diameter
1 piece of cake 1 slice of chocolate, three-layer round cake (1/8th
cake)
1 cookie 1 chocolate chip cookie, 2 ¼ inch diameter
1 chocolate bar 1 snickers bar
Before taking recall, ask if yesterday was a typical eating day for them. If it was out of
the ordinary, wait and do another day.
Examples that could affect intake: Major medical procedures, sickness, hospitalization,
stress, travel, social events, our testing, etc.

335
Time
Food Item Amount/Portion Additional Info (location, cooking
method, brand)
Remember to probe for beverages, snacks, condiments, side dishes, desserts, etc.
EXTRA BEVERAGES – such as water, ice, or soda consumed throughout the day, but not mentioned earlier.
Don’t forget alcohol!
SUPPLEMENTS – any additional shakes or bars, such as Ensure, Boost or Glucerna?
DISH Study Diet Recall Record Sheet
Study ID : __________ Date of Interview : __________
Interview Number (1-4) : _____
Date of Diet Recall : __________Dialysis day? Yes / No (delete as appropriate)

336
C.1.2 Chinese HD patients
时间 食物 量/分量
附加信息(地点,烹饪
方法,食品商标) .注意提醒摄入的饮品,零食,调味品,配菜,甜品等
额外的饮品 – 之前未提及的一天中摄入的水,冰或苏打等,不要忘记酒精类饮品!
补充剂 – 任何额外的蛋白粉,能量棒等
DISH 饮食回顾记录表
研究编号 : ________访谈日期 : ______访谈次数 (1-4) : _____
饮食回顾日期 : __________ 透析日? 是 / 不是

337
C.2 The QCKD study
C.2.1 UK HD patients
Section 1: About You Date questionnaire filled
in : ..........................
These questions ask a few details about you which will help us make sense of the
research findings. Please tick the boxes to indicate your answer s or write the
information where indicated.
1. Are you Male Female
2. What was your age in years at your last birthday? ______ Years
3. Do you smoke? Yes, I am a current smoker
No, I have never smoked
I used to smoke but I gave up ______ years ago
4. When was your kidney problem first diagnosed? ______ years ago
5. Which of the following statements best describes you?
I am a kidney patient but I don’t need any form of dialysis and I don’t have a transplant
I am on unit-based haemodialysis I am on home haemodialysis
I am on peritoneal dialysis with exchanges during the day
I am on overnight peritoneal dialysis I have a functioning kidney
transplant
Other (please explain) :

338
6.Are you diabetic? Yes No
7.Have you ever had a heart problem or a stroke? Yes No
8. Do you have any other medical conditions as well as kidney disease?
Yes No
If yes, please write here what other conditions you have :
9.Is there anything else which makes physical activity difficult for you?
Yes No
If yes, please briefly explain :
10.What is your ethnic group?
Choose ONE section from A to E, then tick the appropriate box to indicate your ethnic group :
A : White
British
Irish
Any other White
background (please
write
in) ………………………………
……….
B : Mixed
White and Black
Caribbean
White and Black African
White and Asian
Any other mixed
background (please write in)
……………………………………
D : Black or Black British
Caribbean
African
Any other Black
background (please write
in) ………………………………
……
E : Chinese or other ethnic
group
Chinese
Any other
(please write in)
……………………………………
Not stated
I prefer not to say

339
1 Take care of yourself, that is, eat, dress, bathe or use the toilet?
Yes No
2 Walk indoors, such as around your house? Yes No
3 Walk a block or two on level ground? Yes No
4 Climb a flight of stairs or walk up a hill? Yes No
5 Run a short distance? Yes No
6 Do light work around the house like dusting or washing dishes
Yes No
7 Do moderate work around the house like vacuuming, sweeping floors or carrying groceries?
Yes No
8 Do heavy work around the house like scrubbing floors or lifting or moving heavy furniture?
Yes No
9 Do garden work like raking leaves, weeding or pushing a lawn mower?
Yes No
10 Have sexual relations? Yes No
11 Participate in moderate recreational activities like golf, bowling, dancing, doubles tennis or throwing a ball?
Yes No
12 Participate in strenuous sports like swimming, singles tennis, football, basketball or skiing?
Yes No
Section Two : About your physical activity and exercise habits
2A : DUKE ACTIVITY STATUS INDEX
Can you: (please circle yes or no)

340
Please tick one box only
a
I am not in employment (e.g. retired, retired for health reasons, unemployed, fulltime careretc)
b
I spend most of my time at work sitting (such as in an office)
c
I spend most of my time at work standing or walking. However, my work does not require much intense physical effort (e.g. shop assistant, hairdresser, security guard, childminder, etc.)
d
My work involves definite physical effort including handling of heavy objects and use of tools (e.g. plumber, electrician, carpenter, cleaner, hospital nurse, gardener, postal delivery worker etc)
e
My work involves vigorous physical activity including handling of very heavy objects (e.g. scaffolder, construction worker, refuse collector, etc.)
Continued overleaf ....
2B : GP PHYSICAL ACTIVITY QUESTIONNAIRE
1. Please tell us the type and amount of physical activity involved in your
work :
(if you do not work, please tick box a)

341
Please tick one box only on each row
None Some but less than
1 hour
1 hour but less than 3 hours
3 hours or more
a
Physical exercise such as swimming, jogging, aerobics, football, tennis, gym workout etc
b
Cycling, including cycling to work and during leisure time
c
Walking, including walking to work, shopping, for pleasure etc
d Housework or Childcare
e Gardening or DIY
2.How would you describe your usual walking pace? Please tick one box only.
Slow pace (i.e. less than 3 mph)
Steady average pace
Brisk pace
Fast pace (i.e. over 4mph)
2B : GP PHYSICAL ACTIVITY QUESTIONNAIRE continued
2.During the last week how many hours did you spend on each of the following
activities?
Please answer whether you are in employment or not

342

343

344

345
C.2.2 Chinese HD patients

346

347
1
照顾自我的日常活动,比如:吃饭,穿衣,洗澡和上
厕所 是 否
2 在室内行走,例如在你的屋内走动? 是 否
3 到户外,在平地行走到下一个街口或巷口? 是 否
4 爬一层楼梯或走上一小段上坡路? 是 否
5 做短距离的跑步? 是 否
6 做一些轻度的家务,例如擦拭家具或洗碗? 是 否
7 做一些中度的家务,例如使用吸尘器,扫地或提一些
杂货食品? 是 否
8 做一些重度的家务,例如洗刷地板或搬移较重的家
具? 是 否
9 做庭院工作,像扫落叶,除杂草或操作电动割草机? 是 否
10 性交活动? 是 否
11 参与中度的休闲活动,例如打高尔夫球,保龄球,双
人网球,跳交谊舞或投掷球? 是 否
12 参与费力的运动,例如:游泳,单人网球,足球,篮
球或滑雪? 是 否
第二部分:关于您的体力活动和锻炼习惯
2A : DUKE 活动状况指标
您是否可以执行这些活动,请圈出符合您的情况
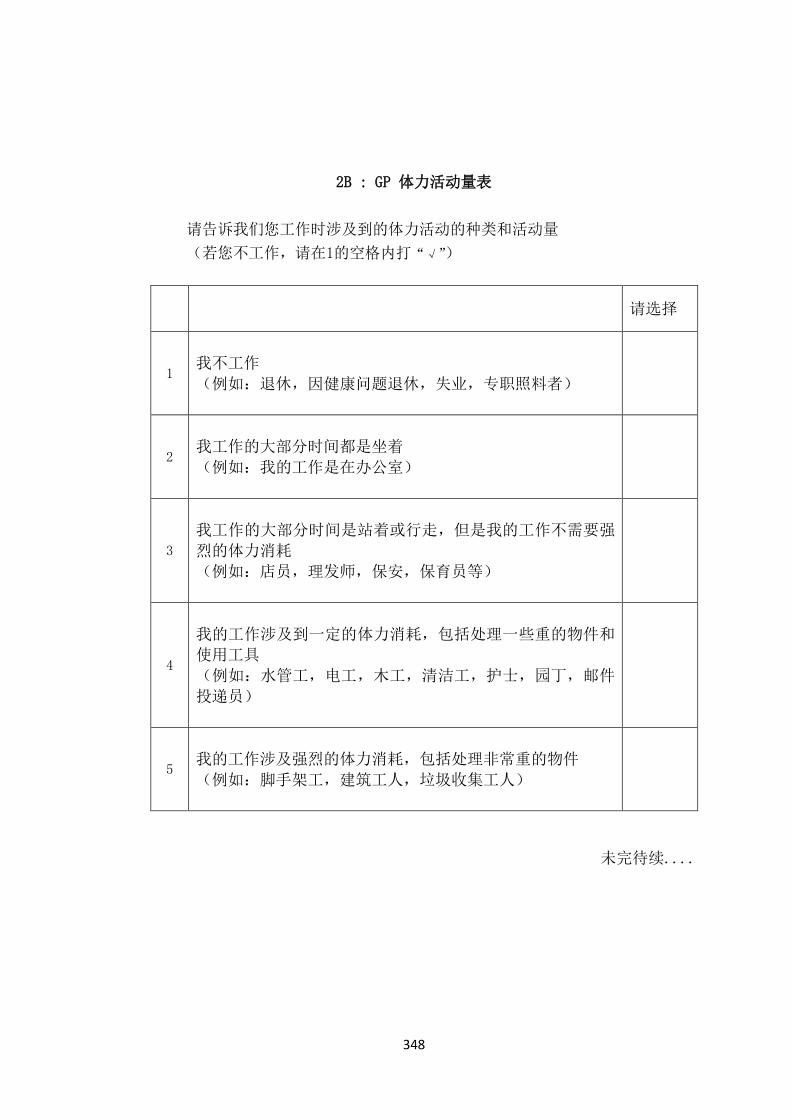
348
请选择
1
我不工作
(例如:退休,因健康问题退休,失业,专职照料者)
2
我工作的大部分时间都是坐着
(例如:我的工作是在办公室)
3
我工作的大部分时间是站着或行走,但是我的工作不需要强
烈的体力消耗
(例如:店员,理发师,保安,保育员等)
4
我的工作涉及到一定的体力消耗,包括处理一些重的物件和
使用工具
(例如:水管工,电工,木工,清洁工,护士,园丁,邮件
投递员)
5
我的工作涉及强烈的体力消耗,包括处理非常重的物件
(例如:脚手架工,建筑工人,垃圾收集工人)
未完待续....
2B : GP 体力活动量表
请告诉我们您工作时涉及到的体力活动的种类和活动量
(若您不工作,请在1的空格内打“√”)

349
请在每一行选择一个答案
没有 不超过 1
个小时 1-3小时
超过 3 小
时
a
运动,比如游泳,慢跑,有氧运
动,足球,网球,去健身房等
b
骑脚踏车,包括上班或空闲时间
c
行走,包括步行上班,购物或休
闲等
d
家务活或照顾孩子
e
园艺或 DIY
2.您怎么描述您一般的步伐节奏(步速)? 请选择
慢速
稳定的步速
轻快的步速
快速
2B : GP 体力活动量表
2.在过去的一周内您花在下列活动上的时间有多少?
请先回答您是否工作

350
2C: 休闲时间身体活动测量问卷
1. 想一想一周里,你闲暇时间从事下列运动的频率有几次?
2. a) 费力的活动(心跳很快,例如:快跑、慢跑、壁球,篮球,比赛性的游泳,长距离脚
踏车)
次数__________________
b) 中等费力活动(未筋疲力尽,例如:快走,网球,慢慢地骑脚踏车,排球,羽毛球,
非比赛的游泳)
次数________________
c) 轻度活动(轻度费力,例如:钓鱼,高尔夫,散步等)
次数______________
3. 想一想一周里,您常不常从事规律运动到流汗的程度(心跳很快的程度)?
经常 偶尔 不曾(很少)
4. 当您锻炼时,您经常从事的运动有哪些?
步行 骑脚踏车 跑步
游泳 举重 有氧运动
篮球 足球 羽毛球
乒乓球 网球 徒步
其他
(请列出)__________________

351

352
C.3 The COCO study
C.3.1 UK HD patients and healthy controls
MOBILITY
I have no problems in walking about ❑
I have slight problems in walking about ❑
I have moderate problems in walking about ❑
I have severe problems in walking about ❑
I am unable to walk about ❑
SELF-CARE
I have no problems washing or dressing myself ❑
I have slight problems washing or dressing myself ❑
I have moderate problems washing or dressing myself ❑
I have severe problems washing or dressing myself ❑ I am unable to wash or dress myself ❑
USUAL ACTIVITIES (e.g. work, study, housework, family or leisure activities)
I have no problems doing my usual activities ❑
I have slight problems doing my usual activities ❑
I have moderate problems doing my usual activities ❑
I have severe problems doing my usual activities ❑
I am unable to do my usual activities ❑
PAIN / DISCOMFORT
I have no pain or discomfort ❑
I have slight pain or discomfort ❑
I have moderate pain or discomfort ❑
I have severe pain or discomfort ❑
The Duke Activity Status Index (DASI) and GP Physical Activity Questionnaire
(GPPAQ) have previously been shown in C.2.1 UK HD patients of section C.2 the
QCKD study in Appendix C.
Health Questionnaire (English version for the UK)
Under each heading, please tick the ONE box that best describes your health TODAY

353
I have extreme pain or discomfort ❑
ANXIETY / DEPRESSION
I am not anxious or depressed ❑
I am slightly anxious or depressed ❑ I am moderately anxious or depressed ❑
I am severely anxious or depressed ❑
I am extremely anxious or depressed ❑

354
We would like to know how good or bad your health
is TODAY
This scale is numbered from 0 to 100.
100 means the best health you can imagine.
0 means the worst health you can imagine.
Mark an X on the scale to indicate how your health
is TODAY.
Now, please write the number you marked on the
scale in the box below
YOUR HEALTH TODAY =

355

356
C.3.2 Chinese HD patients and healthy controls
健康问卷 (中国大陆简体中文版)
在每个标题下,请在能最恰当地描述您今天的健康状况的一个方格上打“√”
行动能力
我四处走动没有困难 ❑
我四处走动有一点困难 ❑
我四处走动有中度困难 ❑
我四处走动有严重的困难 ❑
我无法四处走动 ❑
自我照顾
我自己洗澡或穿衣没有困难 ❑
我自己洗澡或穿衣有一点困难 ❑
我自己洗澡或穿衣有中度困难 ❑
我自己洗澡或穿衣有严重困难 ❑ 我无法自已洗澡或穿衣 ❑
日常活动(如工作、学习、家务、家庭或休闲活动)
我进行日常活动没有困难 ❑
我进行日常活动有一点困难 ❑
我进行日常活动有中度的困难 ❑
我进行日常活动有严重的困难 ❑
我无法进行日常活动 ❑
疼痛或不舒服
我没有疼痛或不舒服 ❑
我有一点疼痛或不舒服 ❑
我有中度的疼痛或不舒服 ❑
我有严重的疼痛或不舒服 ❑
我有非常严重的疼痛或不舒服 ❑
The Duke Activity Status Index (DASI) and GP Physical Activity Questionnaire
(GPPAQ) have previously been shown in C.2.2 Chinese HD patients of section C.2 the
QCKD study in Appendix C.

357
焦虑或沮丧
我没有焦虑或沮丧 ❑
我有一点焦虑或沮丧 ❑
我有中度的焦虑或沮丧 ❑
我有严重的焦虑或沮丧 ❑
我有非常严重的焦虑或沮丧 ❑

358

359
息照护结局量表—症状—肾脏
下列是一组您可能存在或者不曾经历的症状。在过去的一周内,这些症状在多大程度上影响到您?
请在相应的方框内打勾。(每行仅选择一个)
完全没有
(未受到影响)
轻微地
(但是没有影响到
想要止住它)
中度地
(限制了某些活动或
注意力集中)
严重地
(活动或注意力明显
受到影响)
完全地
(无法思考其他事情)
疼痛
气促(呼吸短促)
虚弱或乏力
恶心(有要生病的感觉)
呕吐(生病)
食欲不佳
便秘
口腔问题(牙龈肿胀,牙龈出
血,舌苔发白,嘴巴
发苦,口干等)
困倦
研究编号:
日期

360
活动不便
完全没有
(未受到影响)
轻微地
(但是没有影响到
想要止住它)
中度地
(限制了某些活动或
注意力集中)
严重地
(活动或注意力明显
受到影响)
完全地
(无法思考其他事情)
瘙痒
睡眠障碍(入睡困难,早睡,
多梦)
不宁腿或腿部难以保持静止
感觉焦虑
感觉抑郁
皮肤改变(色素沉着,角化
等)
腹泻
其他
症状:
哪个(些)症状最为严重地影响到您?
哪个(些)症状改善最多?

361
Bibliography
ABBOTT, K.C., GLANTON, C.W., TRESPALACIOS, F.C., OLIVER, D.K., ORTIZ,
M.I., AGODOA, L.Y., CRUESS, D.F. and KIMMEL, P.L., 2004. Body mass index,
dialysis modality, and survival: Analysis of the United States Renal Data System Dialysis
Morbidity and Mortality Wave II Study. Kidney International, 65(2), pp. 597-605.
AFSHAR, R., SANAVI, S., SALIMI, J. and AHMADZADEH, M., 2010. Hematological
profile of chronic kidney disease (CKD) patients in Iran, in pre-dialysis stages and after
initiation of hemodialysis. Saudi Journal of Kidney Diseases and Transplantation, 21(2),
pp. 368.
AHMAD, S., HARRIS, T., LIMB, E., KERRY, S., VICTOR, C., EKELUND, U., ILIFFE,
S., WHINCUP, P., BEIGHTON, C., USSHER, M. and COOK, D.G., 2015. Evaluation of
reliability and validity of the General Practice Physical Activity Questionnaire (GPPAQ)
in 60-74 year old primary care patients. BMC family practice, 16(1), pp. 113.
AHMED, J. and WEISBERG, L.S., 2001. Hyperkalemia in Dialysis Patients. Seminars
in dialysis, 14(5), pp. 348-356.
AINSLIE, P. N., REILLY, T., and WESTERTERP, K. R.,2003. Estimating human
energy expenditure. Sports medicine, 33(9), pp.683-698.
AINSWORTH, B., CAHALIN, L., BUMAN, M. and ROSS, R., 2015. The current state
of physical activity assessment tools. Progress in cardiovascular diseases, 57(4), pp. 387-
395.
Al-RUBAIE, H. A., HASAN, D. D., and Al-RUBAY, R. A., 2016. Classification of
anemia in hemodialysis patients in relation to vascular access and its correlation with
hepcidin and ferritin. Journal of the Faculty of Medicine, 58(2), pp.159-164.
ALBERT, M.A., GLYNN, R.J. and RIDKER, P.M., 2004. Effect of physical activity on
serum C-reactive protein. The American Journal of Cardiology, 93(2), pp. 221-225.
ALBERT, N.M., HAIL, M.D., LI, J. and YOUNG, J.B., 2004. Equivalence of the
bioimpedance and thermodilution methods in measuring cardiac output in hospitalized
patients with advanced, decompensated chronic heart failure. American Journal of
Critical Care : An Official Publication, American Association of Critical-Care Nurses,
13(6), pp. 469-479.
ALDERMAN, M.H., COHEN, H. and MADHAVAN, S., 1998. Dietary sodium intake
and mortality: the National Health and Nutrition Examination Survey (NHANES I). The
Lancet, 351(9105), pp. 781-785.
ALFREY, A.C., 2004. The role of abnormal phosphorus metabolism in the progression
of chronic kidney disease and metastatic calcification. Kidney international, 66(S90), pp.
S17.

362
AL-HEJAILI, F., KORTAS, C., LEITCH, R., HEIDENHEIM, A.P., CLEMENT, L.,
NESRALLAH, G. and LINDSAY, R.M., 2003. Nocturnal but not short hours quotidian
hemodialysis requires an elevated dialysate calcium concentration. Journal of the
American Society of Nephrology : JASN, 14(9), pp. 2322-2328.
ALLEYNE, M., HORNE, M.K. and MILLER, J.L., 2008. Individualized treatment for
iron-deficiency anemia in adults. The American Journal of Medicine, 121(11), pp. 943-
948.
ALMERAS, C. and ARGILES, A., 2009. The general picture of uremia. Seminars in
dialysis, 22(4), pp. 329-333.
AL SNIH, S., MARKIDES, K.S., OTTENBACHER, K.J. and RAJI, M.A., 2004. Hand
grip strength and incident ADL disability in elderly Mexican Americans over a seven-
year period. Aging clinical and experimental research, 16(6), pp. 481-486.
ALVAREZ-OSSORIO, L., KIRCHNER, H., KLÜTER, H. and SCHLENKE, P., 2000.
Low ferritin levels indicate the need for iron supplementation: strategy to minimize iron-
depletion in regular blood donors. Transfusion medicine (Oxford, England), 10(2), pp.
107-112.
AMANN, K., BUZELLO, M., SIMONAVICIENE, A., MILTENBERGER-MILTENYI,
G., KOCH, A., NABOKOV, A., GROSS, M.L., GLESS, B., MALL, G. and RITZ, E.,
2000. Capillary/myocyte mismatch in the heart in renal failure--a role for erythropoietin?
Nephrology, dialysis, transplantation : official publication of the European Dialysis and
Transplant Association - European Renal Association, 15(7), pp. 964-969.
AMERICAN DIETETIC ASSOCIATION, 2011. Practice paper of the American Dietetic
Association: using the dietary reference intakes. Journal of the American Dietetic
Association, 111(5), pp. 762-770.
AN, W.S., KIM, S., KIM, K., BAE, H. and RHA, S., 2009. Associations between oxidized
LDL to LDL ratio, HDL and vascular calcification in the feet of hemodialysis patients.
Journal of Korean medical science, 24(Suppl 1), pp. S120.
ANDERSON, C.A., APPEL, L.J., OKUDA, N., BROWN, I.J., CHAN, Q., ZHAO, L.,
UESHIMA, H., KESTELOOT, H., MIURA, K. and CURB, J.D., 2010. Dietary sources
of sodium in China, Japan, the United Kingdom, and the United States, women and men
aged 40 to 59 years: the INTERMAP study. Journal of the American Dietetic Association,
110(5), pp. 736-745.
ANDREWS, B. and BROWN, G.W., 1993. Self-esteem and vulnerability to depression:
The concurrent validity of interview and questionnaire measures. Journal of abnormal
psychology, 102(4), pp. 565.
ARMSTRONG, T. and BULL, F., 2006. Development of the world health organization
global physical activity questionnaire (GPAQ). Journal of Public Health, 14(2), pp. 66-

363
70.
ARNARDÓTTIR, R.H., EMTNER, M., HEDENSTRÖM, H., LARSSON, K. and
BOMAN, G., 2006. Peak exercise capacity estimated from incremental shuttle walking
test in patients with COPD: a methodological study. Respiratory research, 7(1), pp. 127.
ASSIMON, M.M., SALENGER, P.V., EL‐FAWAL, H.A. and MASON, D.L., 2012.
Nutritional vitamin D supplementation in haemodialysis: a potential vascular benefit?
Nephrology, 17(3), pp. 237-242.
ASTOR, B.C., MUNTNER, P., LEVIN, A., EUSTACE, J.A. and CORESH, J., 2002.
Association of kidney function with anemia: the Third National Health and Nutrition
Examination Survey (1988-1994). Archives of Internal Medicine, 162(12), pp. 1401-1408.
ATKINS, R.C., 2005. The epidemiology of chronic kidney disease. Kidney
international.Supplement, (94), pp. 14.
AVESANI, C.M., CARRERO, J.J., AXELSSON, J., QURESHI, A.R., LINDHOLM, B.
and STENVINKEL, P., 2006. Inflammation and wasting in chronic kidney disease:
Partners in crime. Kidney international, 70(S104), pp. S13.
AVESANI, C.M., TROLONGE, S., Deléaval, P., BARIA, F., MAFRA, D., Faxén-
IRVING, G., CHAUVEAU, P., TETA, D., KAMIMURA, M.A. and CUPPARI, L., 2011a.
Physical activity and energy expenditure in haemodialysis patients: an international
survey. Nephrology Dialysis Transplantation, 27(6), pp. 2430-2434.
AVESANI, C.M., TROLONGE, S., DELÉAVAL, P., BARIA, F., MAFRA, D., FAXÉN-
IRVING, G., CHAUVEAU, P., TETA, D., KAMIMURA, M.A., CUPPARI, L., CHAN,
M., HEIMBÜRGER, O. and FOUQUE, D., 2011b. Physical activity and energy
expenditure in haemodialysis patients: an international survey. Nephrology, dialysis,
transplantation : official publication of the European Dialysis and Transplant
Association - European Renal Association, 27(6), pp. 2430.
AXELSSON, J., RASHID QURESHI, A., SULIMAN, M.E., HONDA, H., PECOITS-
FILHO, R., HEIMBÜRGER, O., LINDHOLM, B., CEDERHOLM, T., STENVINKEL,
P., MEDICINSKA OCH FARMACEUTISKA VETENSKAPSOMRÅDET,
MEDICINSKA FAKULTETEN, UPPSALA UNIVERSITET and INSTITUTIONEN
FÖR FOLKHÄLSO- OCH VÅRDVETENSKAP, 2004. Truncal fat mass as a contributor
to inflammation in end-stage renal disease. The American Journal of Clinical Nutrition,
80(5), pp. 1222.
BARTOK, C. and SCHOELLER, D.A., 2004. Estimation of segmental muscle volume
by bioelectrical impedance spectroscopy. Journal of applied physiology (Bethesda, Md.:
1985), 96(1), pp. 161-166.
BASALEEM, H.O., ALWAN, S.M., AHMED, A.A. and AL-SAKKAF, K.A., 2004.
Assessment of the nutritional status of end-stage renal disease patients on maintenance

364
hemodialysis. Saudi journal of kidney diseases and transplantation : an official
publication of the Saudi Center for Organ Transplantation, Saudi Arabia, 15(4), pp. 455.
BAUER, J., CAPRA, S. and FERGUSON, M., 2002. Use of the scored Patient-Generated
Subjective Global Assessment (PG-SGA) as a nutrition assessment tool in patients with
cancer. European journal of clinical nutrition, 56(8), pp. 779-785.
BAUMGARTNER, R.N., KOEHLER, K.M., ROMERO, L. and GARRY, P.J., 1996.
Serum albumin is associated with skeletal muscle in elderly men and women. The
American Journal of Clinical Nutrition, 64(4), pp. 552-558.
BAUTOVICH, A., KATZ, I., SMITH, M., LOO, C.K. and HARVEY, S.B., 2014.
Depression and chronic kidney disease: A review for clinicians. Australian & New
Zealand Journal of Psychiatry, 48(6), pp. 530-541.
BAXMANN, A.C., AHMED, M.S., MARQUES, N.C., MENON, V.B., PEREIRA, A.B.,
KIRSZTAJN, G.M. and HEILBERG, I.P., 2008. Influence of muscle mass and physical
activity on serum and urinary creatinine and serum cystatin C. Clinical Journal of the
American Society of Nephrology, 3(2), pp. 348-354.
BAZANELLI, A.P., KAMIMURA, M.A., VASSELAI, P., DRAIBE, S.A. and CUPPARI,
L., 2010. Underreporting of energy intake in peritoneal dialysis patients. J Ren Nutr,
20(4),.
BAZANELLI, A.P., KAMIMURA, M.A., DA SILVA, C.B., AVESANI, C.M., LOPES,
M.G.G., MANFREDI, S.R., DRAIBE, S.A. and CUPPARI, L., 2006. RESTING
ENERGY EXPENDITURE IN PERITONEAL DIALYSIS PATIENTS. Peritoneal
Dialysis International, 26(6), pp. 697.
BEDDHU, S., 2004. Hypothesis: the body mass index paradox and an obesity,
inflammation, and atherosclerosis syndrome in chronic kidney disease, Seminars in
dialysis 2004, Wiley Online Library, pp. 229-232.
BEDDHU, S., BAIRD, B.C., ZITTERKOPH, J., NEILSON, J. and GREENE, T., 2009.
Physical activity and mortality in chronic kidney disease (NHANES III). Clinical Journal
of the American Society of Nephrology, 4(12), pp. 1901-1906.
BEDDHU, S., PAPPAS, L.M., RAMKUMAR, N. and SAMORE, M., 2003. Effects of
body size and body composition on survival in hemodialysis patients. Journal of the
American Society of Nephrology, 14(9), pp. 2366-2372.
BENNETT, P.N., BREUGELMANS, L., AGIUS, M., SIMPSON‐GORE, K. and
BARNARD, B., 2007. A HAEMODIALYSIS EXERCISE PROGRAMME USING
NOVEL EXERCISE EQUIPMENT: A PILOT STUDY. Journal of Renal Care, 33(4), pp.
153-158.
BERGMAN, A., QURESHI, A.R., HAARHAUS, M., LINDHOLM, B., BARANY, P.,
HEIMBURGER, O., STENVINKEL, P. and ANDERSTAM, B., 2017. Total and bone-

365
specific alkaline phosphatase are associated with bone mineral density over time in end-
stage renal disease patients starting dialysis. Journal of nephrology, 30(2), pp. 255-262.
BERGSTRÖM, J., FÜRST, P., ALVESTRAND, A. and LINDHOLM, B., 1993. Protein
and energy intake, nitrogen balance and nitrogen losses in patients treated with
continuous ambulatory peritoneal dialysis. Kidney international, 44(5), pp. 1048-1057.
BIANCARI, F., KANTONEN, I., MÄTZKE, S., ALBÄCK, A., ROTH, W., EDGREN, J.
and LEPÄNTALO, M., 2002. Infrainguinal endovascular and bypass surgery for critical
leg ischemia in patients on long-term dialysis. Annals of Vascular Surgery, 16(2), pp. 210-
214.
BILLINGS, C.G., AUNG, T., RENSHAW, S.A. and BIANCHI, S.M., 2013. Incremental
shuttle walk test in the assessment of patients with obstructive sleep apnea–hypopnea
syndrome. Journal of sleep research, 22(4), pp. 471-477.
BLACKHURST, A., BRANDT, J. and KALINOWSKI, J., 1998. Effects of personal and
work-related attributes on the organizational commitment and life satisfactions of women
student affairs administrators. NASPA journal, 35(2), pp. 86-99.
BLEYER, A.J., HYLANDER, B., SUDO, H., NOMOTO, Y., DE LA TORRE, E., CHEN,
R.A. and BURKART, J.M., 1999. An international study of patient compliance with
hemodialysis. Jama, 281(13), pp. 1211-1213.
BLOCK, G.A., KLASSEN, P.S., LAZARUS, J.M., OFSTHUN, N., LOWRIE, E.G. and
CHERTOW, G.M., 2004. Mineral metabolism, mortality, and morbidity in maintenance
hemodialysis. Journal of the American Society of Nephrology, 15(8), pp. 2208-2218.
BLUNDELL, J.E., GIBBONS, C., CAUDWELL, P., FINLAYSON, G. and HOPKINS,
M., 2015. Appetite control and energy balance: impact of exercise. Obesity reviews,
16(S1), pp. 67-76.
BOHANNON, R.W., SMITH, J., HULL, D., PALMERI, D. and BARNHARD, R., 1995.
Deficits in lower extremity muscle and gait performance among renal transplant
candidates. Archives of Physical Medicine and Rehabilitation, 76(6), pp. 547-551.
BOHM, C.J., STORSLEY, L.J., HIEBERT, B.M., NELKO, S., TANGRI, N., CHESKIN,
L.J., MCADAMS-DEMARCO, M.A. and RIGATTO, C., 2018. Impact of Exercise
Counseling on Physical Function in Chronic Kidney Disease: An Observational Study.
Canadian journal of kidney health and disease, 5, pp. 2054358117753615.
BOLIGNANO, D., LACQUANITI, A., COPPOLINO, G., DONATO, V., CAMPO, S.,
FAZIO, M.R., NICOCIA, G. and BUEMI, M., 2009. Neutrophil gelatinase-associated
lipocalin (NGAL) and progression of chronic kidney disease. Clinical journal of the
American Society of Nephrology : CJASN, 4(2), pp. 337-344.
BOSSOLA, M., MUSCARITOLI, M., TAZZA, L., PANOCCHIA, N., LIBERATORI,
M., GIUNGI, S., TORTORELLI, A., ROSSI, F.,F. and LUCIANI, G., 2005a. Variables

366
associated with reduced dietary intake in hemodialysis patients. J Ren Nutr, 15(2), pp.
244-252.
BOSSOLA, M., DI STASIO, E., VIOLA, A., LEO, A., CARLOMAGNO, G.,
MONTEBURINI, T., CENERELLI, S., SANTARELLI, S., BOGGI, R. and MIGGIANO,
G., 2014. Dietary intake of trace elements, minerals, and vitamins of patients on chronic
hemodialysis. International urology and nephrology, 46(4), pp. 809-815.
BOSSOLA, M., MUSCARITOLI, M., TAZZA, L., GIUNGI, S., TORTORELLI, A.,
ROSSI, F.,Filippo and LUCIANI, G., 2005b. Malnutrition in hemodialysis patients: what
therapy? American Journal of Kidney Diseases : The Official Journal of the National
Kidney Foundation, 46(3), pp. 371.
BRENNER, B.M., 2008. Brenner & Rector's the kidney, 8th edn (Philadelphia, Saunders
Elsevier).
BROERS, N.J., MARTENS, R.J., CORNELIS, T., DIEDEREN, N.M., WABEL, P., VAN
DER SANDE, FRANK M, LEUNISSEN, K.M. and KOOMAN, J.P., 2015a. Body
composition in dialysis patients: a functional assessment of bioimpedance using different
prediction models. Journal of Renal Nutrition, 25(2), pp. 121-128.
BROWN, D.R., YORE, M.M., HAM, S.A. and MACERA, C.A., 2005. Physical activity
among adults >or=50 yr with and without disabilities, BRFSS 2001. Medicine and
science in sports and exercise, 37(4), pp. 620.
BROWN, M.A., COLLETT, G.K., JOSLAND, E.A., FOOTE, C., LI, Q. and BRENNAN,
F.P., 2015. CKD in elderly patients managed without dialysis: survival, symptoms, and
quality of life. Clinical journal of the American Society of Nephrology : CJASN, 10(2),
pp. 260-268.
BROWN, S.A., 2005. Measuring perceived benefits and perceived barriers for physical
activity. American Journal of Health Behavior, 29(2), pp. 107-116.
BRUUNSGAARD, H., 2005. Physical activity and modulation of systemic low-level
inflammation. Journal of leukocyte biology, 78(4), pp. 819-835.
BURROWES, J.D., LARIVE, B., COCKRAM, D.B., DWYER, J., KUSEK, J.W.,
MCLEROY, S., POOLE, D., ROCCO, M.V. and HEMODIALYSIS (HEMO) STUDY
GROUP, 2003a. Effects of dietary intake, appetite, and eating habits on dialysis and non-
dialysis treatment days in hemodialysis patients: cross-sectional results from the HEMO
study. Journal of renal nutrition : the official journal of the Council on Renal Nutrition
of the National Kidney Foundation, 13(3), pp. 191-198.
BURROWES, J.D., LARIVE, B., CHERTOW, G.M., COCKRAM, D.B., DWYER, J.T.,
GREENE, T., KUSEK, J.W., LEUNG, J., ROCCO, M.V., HEMODIALYSIS (HEMO)
STUDY GROUP and FOR THE HEMO STUDY GROUP, 2005. Self-reported appetite,
hospitalization and death in haemodialysis patients: findings from the Hemodialysis

367
(HEMO) Study. Nephrology, dialysis, transplantation : official publication of the
European Dialysis and Transplant Association - European Renal Association, 20(12), pp.
2765-2774.
BURTON, J.O., JEFFERIES, H.J., SELBY, N.M. and MCINTYRE, C.W., 2009.
Hemodialysis-Induced Cardiac Injury: Determinants and Associated Outcomes. Clinical
Journal of the American Society of Nephrology, 4(5), pp. 914-920.
BUTLER, P. J., GREEN, J. A., BOYD, I. L., and SPEAKMAN, J. R.,2004. Measuring
metabolic rate in the field: the pros and cons of the doubly labelled water and heart rate
methods. Functional ecology, 18(2), pp.168-183.
BUTTE, N.F., EKELUND, U. and WESTERTERP, K.R., 2012. Assessing physical
activity using wearable monitors: measures of physical activity. Medicine and Science in
Sports and Exercise, 44(1 Suppl 1), pp. S12.
BYRNE, F.N., KINSELLA, S., MURNAGHAN, D.J., KIELY, M. and EUSTACE, J.A.,
2009. Lack of correlation between calcium intake and serum calcium levels in stable
haemodialysis subjects. Nephron Clinical Practice, 113(3), pp. c168.
CALLAGHAN, P., KHALIL, E. and MORRES, I., 2010. A prospective evaluation of the
Transtheoretical Model of Change applied to exercise in young people. International
journal of nursing studies, 47(1), pp. 3-12.
CAPITANINI, A., LANGE, S., D'ALESSANDRO, C., SALOTTI, E., TAVOLARO, A.,
BARONTI, M.E., GIANNESE, D. and CUPISTI, A., 2014. Dialysis exercise team: the
way to sustain exercise programs in hemodialysis patients. Kidney & blood pressure
research, 39(2-3), pp. 129-133.
CARRERO, J.J., CHMIELEWSKI, M., AXELSSON, J., SNAEDAL, S.,
HEIMBURGER, O., BARANY, P., SULIMAN, M.E., LINDHOLM, B., STENVINKEL,
P. and QURESHI, A.R., 2008. Muscle atrophy, inflammation and clinical outcome in
incident and prevalent dialysis patients. Clinical Nutrition, 27(4), pp. 557-564.
CARRERO, J.,Jesús, STENVINKEL, P., CUPPARI, L., IKIZLER, T.,Alp,
KALANTAR-ZADEH, K., KAYSEN, G., MITCH, E., PRICE, S.,Russ, WANNER, C.,
WANG, Y.M., TER, W.,Pieter and FRANCH, A., 2013. Etiology of the protein-energy
wasting syndrome in chronic kidney disease: a consensus statement from the
International Society of Renal Nutrition and Metabolism (ISRNM). Journal of renal
nutrition : the official journal of the Council on Renal Nutrition of the National Kidney
Foundation, 23(2), pp. 77.
CARVALHO, E.V., REBOREDO, M.M., GOMES, E.P., TEIXEIRA, D.R., ROBERTI,
N.C., MENDES, J.O., OLIVEIRA, J.C.A., SANDERS-PINHEIRO, H. and PINHEIRO,
B.V., 2014a. Physical Activity in Daily Life Assessed by an Accelerometer in Kidney
Transplant Recipients and Hemodialysis Patients. Transplantation Proceedings, 46(6),
pp. 1713-1717.

368
CASPERSEN, C.J., POWELL, K.E. and CHRISTENSON, G.M., 1985. Physical activity,
exercise, and physical fitness: definitions and distinctions for health-related research.
Public health reports, 100(2), pp. 126.
CATTELL, R., 2012. The scientific use of factor analysis in behavioral and life sciences.
Springer Science & Business Media.
CAVANAUGH, J.T., KOCHI, N. and STERGIOU, N., 2009. Nonlinear analysis of
ambulatory activity patterns in community-dwelling older adults. Journals of
Gerontology Series A: Biomedical Sciences and Medical Sciences, 65(2), pp. 197-203.
CENTERS FOR DISEASE CONTROL AND PREVENTION, 2014. Diabetes 2014
report card. Available at:)(Accessed January 29, 2017)
http://www.cdc.gov/diabetes/pdfs/library/diabetesreportcard2014.pdf View in rticle, .
CHAMBERS, E.J., GERMAIN, M. and BROWN, E., 2010. Supportive care for the renal
patient. Oxford University Press.
CHAN, M., KELLY, J., BATTERHAM, M. and TAPSELL, L., 2012. Malnutrition
(subjective global assessment) scores and serum albumin levels, but not body mass index
values, at initiation of dialysis are independent predictors of mortality: a 10-year clinical
cohort study. Journal of Renal Nutrition, 22(6), pp. 547-557.
CHEEMA, B.S.B., 2008. Review article: Tackling the survival issue in end‐stage renal
disease: Time to get physical on haemodialysis. Nephrology, 13(7), pp. 560-569.
CHEEMA, B.S.B. and SINGH, M.A.F., 2005. Exercise training in patients receiving
maintenance hemodialysis: a systematic review of clinical trials. American Journal of
Nephrology, 25(4), pp. 352-364.
CHEN, A.W., KAZANJIAN, A. and WONG, H., 2009. Why do Chinese Canadians not
consult mental health services: health status, language or culture? Transcultural
Psychiatry, 46(4), pp. 623-641.
CHEN, I.R., WANG, S.M., LIANG, C.C., KUO, H.L., CHANG, C.T., LIU, J.H., LIN,
H.H., WANG, I.K., YANG, Y.F., CHOU, C.Y. and HUANG, C.C., 2014. Association of
walking with survival and RRT among patients with CKD stages 3-5. Clinical journal of
the American Society of Nephrology : CJASN, 9(7), pp. 1183-1189.
CHEN, J., PENG, H., YUAN, Z., ZHANG, K., XIAO, L., HUANG, J., WANG, J. and
HUANG, H., 2013a. Combination with anthropometric measurements and MQSGA to
assess nutritional status in Chinese hemodialysis population. International journal of
medical sciences, 10(8), pp. 974.
CHENG, X., NAYYAR, S., WANG, M., LI, X., SUN, Y., HUANG, W., ZHANG, L., WU,
H., JIA, Q., LIU, W., SUN, X., LI, J., LUN, L., ZHOU, C., CUI, T., ZHANG, A., WANG,
K., WANG, S., SUN, W. and ZUO, L., 2013. Mortality rates among prevalent
hemodialysis patients in Beijing: a comparison with USRDS data. Nephrology, dialysis,

369
transplantation : official publication of the European Dialysis and Transplant
Association - European Renal Association, 28(3), pp. 724.
CHERTOW, G.M., LOWRIE, E.G., WILMORE, D.W., GONZALEZ, J., LEW, N.L.,
LING, J., LEBOFF, M.S., GOTTLIEB, M.N., HUANG, W., ZEBROWSKI, B.,
COLLEGE, J. and LAZARUS, J.M., 1995. Nutritional assessment with bioelectrical
impedance analysis in maintenance hemodialysis patients. Journal of the American
Society of Nephrology, 6(1), pp. 75-81.
CHINESE NATIONAL RENAL DATA SYSTEM, 2015-last update, Annual Data Report
of Chinese National Renal Data System. Available: http://www.hd.cnrds.net/hd.
CHRISTENSSON, L., UNOSSONS, M. and EK, A.C., 2003. Measurement of perceived
health problems as a means of detecting elderly people at risk of malnutrition. . J Nutr
Health Aging., 7(4), pp. 257-262.
CHUNG, S.H., LINDHOLM, B. and LEE, H.B., 2003. Is malnutrition an independent
predictor of mortality in peritoneal dialysis patients? Nephrology Dialysis
Transplantation, 18(10), pp. 2134-2140.
CHURCH, T.S., BARLOW, C.E., EARNEST, C.P., KAMPERT, J.B., PRIEST, E.L. and
BLAIR, S.N., 2002. Associations Between Cardiorespiratory Fitness and C-Reactive
Protein in Men. Arteriosclerosis, Thrombosis, and Vascular Biology: Journal of the
American Heart Association, 22(11), pp. 1869-1876.
CIGARRÁN, S., POUSA, M., CASTRO, M.J., GONZÁLEZ, B., MARTÍNEZ, A.,
BARRIL, G., AGUILERA, A., CORONEL, F., STENVINKEL, P. and CARRERO, J.J.,
2013. Endogenous testosterone, muscle strength, and fat-free mass in men with chronic
kidney disease. J Ren Nutr, 23(5), pp. 89.
CLARKE, A.L., YOUNG, H.M., HULL, K.L., HUDSON, N., BURTON, J.O. and
SMITH, A.C., 2015a. Motivations and barriers to exercise in chronic kidney disease: a
qualitative study. Nephrology, dialysis, transplantation : official publication of the
European Dialysis and Transplant Association - European Renal Association, 30(11), pp.
1885-1892.
CLAYTON, P. and SINGER, R., 2009. 25‐Hydroxyvitamin D levels in prevalent
Australian dialysis patients. Nephrology, 14(6), pp. 554-559.
CLYNE, N., JOGESTRAND, T., LINS, L.E. and PEHRSSON, S.K., 1994. Progressive
decline in renal function induces a gradual decrease in total hemoglobin and exercise
capacity. Nephron, 67(3), pp. 322-326.
COAKLEY, E.H., KAWACHI, I., MANSON, J.E., SPEIZER, F.E., WILLET, W.C. and
COLDITZ, G.A., 1998. Lower levels of physical functioning are associated with higher
body weight among middle-aged and older women. International journal of obesity,
22(10), pp. 958.

370
COBO, G., GALLAR, P., GAMA-AXELSSON, T., DI GIOIA, C., QURESHI, A.R.,
CAMACHO, R., VIGIL, A., HEIMBÜRGER, O., ORTEGA, O. and RODRIGUEZ, I.,
2015. Clinical determinants of reduced physical activity in hemodialysis and peritoneal
dialysis patients. Journal of nephrology, 28(4), pp. 503-510.
COHEN, L.M., MOSS, A.H., WEISBORD, S.D. and GERMAIN, M.J., 2006. Renal
palliative care. Journal of palliative medicine, 9(4), pp. 977-992.
COLLINSAJ, F., 2012. UnitedStatesRenalData System2011AnnualDataReport:
Atlasofchronickidneydisease& end stagerenaldiseaseintheUnitedStates.
AmJKidneyDis, 59(1Suppl1), pp. A7.
COMBE, C., MCCULLOUGH, K.P., ASANO, Y., GINSBERG, N., MARONI, B.J. and
PIFER, T.B., 2004. Kidney Disease Outcomes Quality Initiative (K/DOQI) and the
Dialysis Outcomes and Practice Pattern Study (DOPPS): nutrition guidelines, indicators,
and practices. American Journal of Kidney Diseases, 44(5), pp. 39-46.
CORDEIRO, A.C., QURESHI, A.R., STENVINKEL, P., HEIMBÜRGER, O.,
AXELSSON, J., BÁRÁNY, P., LINDHOLM, B. and CARRERO, J.J., 2009. Abdominal
fat deposition is associated with increased inflammation, protein–energy wasting and
worse outcome in patients undergoing haemodialysis. Nephrology Dialysis
Transplantation, 25(2), pp. 562-568.
CORESH, J., SELVIN, E., STEVENS, L.A., MANZI, J., KUSEK, J.W., EGGERS, P.,
VAN LENTE, F. and LEVEY, A.S., 2007. Prevalence of chronic kidney disease in the
United States. Jama, 298(17), pp. 2038-2047.
COUTINHO-MYRRHA, M.A., DIAS, R.C., FERNANDES, A.A., ARAÚJO, C.G.,
HLATKY, M.A., PEREIRA, D.G. and BRITTO, R.R., 2014. Duke Activity Status Index
for cardiovascular diseases: validation of the Portuguese translation. Arquivos Brasileiros
de Cardiologia, 102(4), pp. 383-390.
COVIC, A., NISTOR, I., DONCIU, M., DUMEA, R., BOLIGNANO, D. and
GOLDSMITH, D., 2014. Erythropoiesis-stimulating agents (ESA) for preventing the
progression of chronic kidney disease: a meta-analysis of 19 studies. American Journal
of Nephrology, 40(3), pp. 263-279.
COYNE, D.W., KAPOIAN, T., SUKI, W., SINGH, A.K., MORAN, J.E., DAHL, N.V.,
RIZKALA, A.R. and DRIVE STUDY GROUP, 2007. Ferric gluconate is highly
efficacious in anemic hemodialysis patients with high serum ferritin and low transferrin
saturation: results of the Dialysis Patients’ Response to IV Iron with Elevated Ferritin
(DRIVE) Study. Journal of the American Society of Nephrology, 18(3), pp. 975-984.
CRITCHLEY, P., PLACH, N., GRANTHAM, M., MARSHALL, D., TANIGUCHI, A.,
LATIMER, E. and JADAD, A.R., 2001. Efficacy of haloperidol in the treatment of nausea
and vomiting in the palliative patient: a systematic review. Journal of pain and symptom
management, 22(2), pp. 631-634.

371
CROOK, S., GILBERTBÜSCHING, SCHULTZ, K., LEHBERT, N., JELUSIC, D.,
KEUSCH, S., WITTMANN, M., SCHULER, M., RADTKE, T. and FREY, M., 2017. A
multicentre validation of the 1-min sit-to-stand test in patients with COPD. European
Respiratory Journal, 49(3), pp. 1601871.
CROUTER, S.E., SCHNEIDER, P.L., KARABULUT, M. and BASSETT, D.R., 2003.
Validity of 10 electronic pedometers for measuring steps, distance, and energy cost.
Medicine and science in sports and exercise, 35(8), pp. 1455-1460.
CRUZ-JENTOFT, A.J., BAEYENS, J.P., BAUER, J.M., BOIRIE, Y., CEDERHOLM, T.,
LANDI, F., MARTIN, F.C., MICHEL, J.P., ROLLAND, Y., SCHNEIDER, S.M.,
TOPINKOVA, E., VANDEWOUDE, M., ZAMBONI, M. and EUROPEAN WORKING
GROUP ON SARCOPENIA IN OLDER PEOPLE, 2010a. Sarcopenia: European
consensus on definition and diagnosis: Report of the European Working Group on
Sarcopenia in Older People. Age and Ageing, 39(4), pp. 412-423.
CUADERES, E., PARKER, D. and BURGIN, C., 2004. Leisure time physical activity in
adult Native Americans. Southern Online Journal of Nursing Research, 1(5), pp. 1-18.
CUPISTI, A., GALLIENI, M., RIZZO, M.A., CARIA, S., MEOLA, M. and BOLASCO,
P., 2013. Phosphate control in dialysis. International journal of nephrology and
renovascular disease, 6, pp. 193.
CURTIN, R.B., BULTMAN, D.C., THOMAS-HAWKINS, C., WALTERS, B.A. and
SCHATELL, D., 2002. Hemodialysis patients' symptom experiences: Effects on physical
and mental functioning/Commentary and response. Nephrology Nursing Journal, 29(6),
pp. 562.
DA COSTA ROSA, CLARA SUEMI, NISHIMOTO, D.Y., JÚNIOR, I.F.F., CIOLAC,
E.G. and MONTEIRO, H.L., 2017. Factors Associated With Levels of Physical Activity
in Chronic Kidney Disease Patients Undergoing Hemodialysis: The Role of Dialysis
Versus Nondialysis Day. Journal of Physical Activity and Health, 14(9), pp. 726-732.
DARAWAD, M.W. and KHALIL, A.A., 2013. Jordanian dialysis patients' perceived
exercise benefits and barriers: a correlation study. Rehabilitation Nursing, 38(6), pp. 315-
322.
DASHTI-KHAVIDAKI, S., SHARIF, Z., KHALILI, H., BADRI, S., ALIMADADI, A.,
AHMADI, F., GATMIRI, M. and RAHIMZADEH, S., 2013. The use of pharmaceutical
care to improve health-related quality of life in hemodialysis patients in Iran.
International journal of clinical pharmacy, 35(2), pp. 260-267.
DAVID ANDRE, RAY PELLETIER, JONNY FARRINGDON, SCOTT SAFIER,
WALTER TALBOTT, RON STONE, NISARG VYAS, JASON TRIMBLE, DONNA
WOLF, SURESH VISHNUBHATLA, SCOTT BOEHMKE, JOHN STIVORIC and
ASTRO TELLER, 2006. The Development of the SenseWear® armband, a Revolutionary
Energy Assessment Device to Assess Physical Activity and Lifestyle.

372
DAVISON, S.N., 2003. Pain in hemodialysis patients: prevalence, cause, severity, and
management. American Journal of Kidney Diseases : The Official Journal of the National
Kidney Foundation, 42(6), pp. 1239-1247.
DE BRITO-ASHURST, I., 2009. Bicarbonate supplementation slows progression of
CKD and improves nutritional status. J Am Soc Nephrol, 20(9), pp. 2075-2084.
DE LIMA, M.C., CICOTOSTE CDE, L., CARDOSO KDA, S., FORGIARINI, L.A.,Jr,
MONTEIRO, M.B. and DIAS, A.S., 2013. Effect of exercise performed during
hemodialysis: strength versus aerobic. Renal failure, 35(5), pp. 697-704.
DE MUTSERT, R., GROOTENDORST, D.C., AXELSSON, J., BOESCHOTEN, E.W.,
KREDIET, R.T., DEKKER, F.W., NECOSAD STUDY GROUP and THE NECOSAD
STUDY GROUP, 2008. Excess mortality due to interaction between protein-energy
wasting, inflammation and cardiovascular disease in chronic dialysis patients.
Nephrology Dialysis Transplantation, 23(9), pp. 2957-2964.
DE WINTER, J.D., DODOU, D. and WIERINGA, P.A., 2009. Exploratory factor
analysis with small sample sizes. Multiariable behavioral research, 44(2), pp. 147-181.
DE, I.C., KAMIMURA, M.A., DRAIBE, S.A., CANZIANI, M.E.F., MANFREDI, S.R.,
AVESANI, C.M., SESSO, R. and CUPPARI, L., 2006. Nutritional parameters and
mortality in incident hemodialysis patients. Journal of Renal Nutrition, 16(1), pp. 27-35.
DEICHER, R., ZIAI, F., BIEGLMAYER, C., SCHILLINGER, M. and HORL, W.H.,
2005. Low total vitamin C plasma level is a risk factor for cardiovascular morbidity and
mortality in hemodialysis patients. Journal of the American Society of Nephrology, 16(6),
pp. 1811-1818.
DEICHER, R. and HÖRL, W.H., 2003. Vitamin C in chronic kidney disease and
hemodialysis patients. Kidney and Blood Pressure Research, 26(2), pp. 100-106.
DELGADO, C. and JOHANSEN, K.L., 2012. Barriers to exercise participation among
dialysis patients. Nephrology, dialysis, transplantation : official publication of the
European Dialysis and Transplant Association - European Renal Association, 27(3), pp.
1152-1157.
DELIGIANNIS, A., KOUIDI, E., TASSOULAS, E., GIGIS, P., TOURKANTONIS, A.
and COATS, A., 1999. Cardiac effects of exercise rehabilitation in hemodialysis patients.
International journal of cardiology, 70(3), pp. 253-266.
DELMONICO, M.J., HARRIS, T.B., LEE, J., VISSER, M., NEVITT, M.,
KRITCHEVSKY, S.B., TYLAVSKY, F.A. and NEWMAN, A.B., 2007. Alternative
definitions of sarcopenia, lower extremity performance, and functional impairment with
aging in older men and women. Journal of the American Geriatrics Society, 55(5), pp.
769-774.
DELUCA, H.F., 2004. Overview of general physiologic features and functions of vitamin

373
D. The American Journal of Clinical Nutrition, 80(6), pp. 1696S.
DEMEYER, HELEEN, PT, MSC, BURTIN, CHRIS, PHD, PT, VAN REMOORTEL,
HANS, PHD, PT, HORNIKX, MIEK, PT, MSC, LANGER, DANIEL, PHD, PT,
DECRAMER, MARC, MD, PHD, GOSSELINK, RIK, PHD, PT, JANSSENS, WIM,
MD, PHD and TROOSTERS, THIERRY, PHD, PT, 2014. Standardizing the Analysis of
Physical Activity in Patients With COPD Following a Pulmonary Rehabilitation Program.
Chest, 146(2), pp. 318-327.
DEOREO, P.B., 1997. Hemodialysis patient-assessed functional health status predicts
continued survival, hospitalization, and dialysis-attendance compliance. American
Journal of Kidney Diseases, 30(2), pp. 204-212.
DEVLIN, N.J., APPLEBY, J. and BUXTON, M., 2010. Getting the most out of PROMs:
putting health outcomes at the heart of NHS decision-making. King's Fund.
DIESEL, W., NOAKES, T.D., SWANEPOEL, C. and LAMBERT, M., 1990. Isokinetic
muscle strength predicts maximum exercise tolerance in renal patients on chronic
hemodialysis. American Journal of Kidney Diseases, 16(2), pp. 109-114.
DIETITIANS SPECIAL INTEREST GROUP, 2002. European Guidelines for the
Nutritional Care of Adult Renal Patients.
DOBSAK, P., HOMOLKA, P., SVOJANOVSKY, J., REICHERTOVA, A., SOUCEK, M.,
NOVAKOVA, M., DUSEK, L., VASKU, J., EICHER, J. and SIEGELOVA, J., 2012.
Intra‐Dialytic Electrostimulation of Leg Extensors May Improve Exercise Tolerance and
Quality of Life in Hemodialyzed Patients. Artificial Organs, 36(1), pp. 71-78.
DOMAŃSKI, M. and CIECHANOWSKI, K., 2012. Sarcopenia: a major challenge in
elderly patients with end-stage renal disease. Journal of aging research, 2012.
DONADIO, C., HALIM, A.B., CAPRIO, F., GRASSI, G., KHEDR, B., and
MAZZANTINI, M.,2008. Single- and multi-frequency bioelectrical impedance analyses
to analyse body composition in maintenance haemodialysis patients: comparison with
dual-energy X-ray absorptiometry. Physiol Meas, 29 (6), pp. S517–24.
DÖSSEGGER, A., RUCH, N., JIMMY, G., BRAUN-FAHRLÄNDER, C., MÄDER, U.,
HÄNGGI, J., HOFMANN, H., PUDER, J.J., KRIEMLER, S. and BRINGOLF-ISLER,
B., 2014. Reactivity to accelerometer measurement of children and adolescents. Medicine
and science in sports and exercise, 46(6), pp. 1140.
DOUGLAS, C., MURTAGH, F.E., CHAMBERS, E.J., HOWSE, M. and ELLERSHAW,
J., 2009. Symptom management for the adult patient dying with advanced chronic kidney
disease: a review of the literature and development of evidence-based guidelines by a
United Kingdom Expert Consensus Group. Palliative medicine, 23(2), pp. 103-110.
DRAWZ, P. and RAHMAN, M., 2015. CHronic kidney disease. Annals of Internal
Medicine pages = {ITC1-}, 162(11).

374
DRECHSLER, C., PILZ, S., OBERMAYER-PIETSCH, B., VERDUIJN, M.,
TOMASCHITZ, A., KRANE, V., ESPE, K., DEKKER, F., BRANDENBURG, V. and
MÄRZ, W., 2010. Vitamin D deficiency is associated with sudden cardiac death,
combined cardiovascular events, and mortality in haemodialysis patients. European heart
journal, 31(18), pp. 2253-2261.
DRENOWATZ, C., HAND, G.A., SAGNER, M., SHOOK, R.P., BURGESS, S. and
BLAIR, S.N., 2015. The prospective association between different types of exercise and
body composition. Medicine and science in sports and exercise, 47(12), pp. 2535.
DU, J., HU, Z. and MITCH, W.E., 2005. Molecular mechanisms activating muscle
protein degradation in chronic kidney disease and other catabolic conditions. European
journal of clinical investigation, 35(3), pp. 157-163.
DURUOZ, M.T., CERRAHOGLU, L., DINCER-TURAN, Y. and KURSAT, S., 2003.
Hand function assessment in patients receiving haemodialysis. Swiss medical weekly,
133(31-32), pp. 433-438.
EI KOSSI, M., BELLO, A.K., HAMER, R. and EI NAHS, A.M., 2007. Chronic Kidney
Disease-Prevention of Progression and of Cardiovascular Complications. In: D.
GOLDSMITH, S. JAYAWARDENE and P. ACKLAND, eds, ABC of Kidney Diseases.
Blackwell,Oxford, UK, pp. 11-14.
EKNOYAN, G. and LEVIN, N.W., 2000. Foreword. American Journal of Kidney
Diseases, 35(6), pp. s3.
EL-SHARKAWY, M., KHEDR, E., ABDELWHAB, S., ALI, M. and EL SAID, K., 2009.
Prevalence of hyperkalemia among hemodialysis patients in Egypt. Renal failure, 31(10),
pp. 891-898.
ENG, J.J. and MARTIN GINIS, K.A., 2007. Using the theory of planned behavior to
predict leisure time physical activity among people with chronic kidney disease.
Rehabilitation Psychology, 52(4), pp. 435.
ESCHBACH, J.W. and ADAMSON, J.W., 1985. Anemia of end-stage renal disease
(ESRD). Kidney international, 28(1), pp. 1-5.
ESLIGER, D.W., ROWLANDS, A.V., HURST, T.L., CATT, M., MURRAY, P. and
ESTON, R.G., 2011. Validation of the GENEA Accelerometer. Medicine and Science in
Sports and Exercise, 43(6), pp.1085-1093.
ETIKAN, I., MUSA, S.A. and ALKASSIM, R.S., 2016. Comparison of convenience
sampling and purposive sampling. American Journal of Theoretical and Applied
Statistics, 5(1), pp. 1-4.
EVA SEGURA-ORTÍ and FRANCISCO JOSÉ MARTÍNEZ-OLMOS, 2011. Test-retest
reliability and minimal detectable change scores for sit-to-stand-to-sit tests, the six-
minute walk test, the one-leg heel-rise test, and handgrip strength in people undergoing

375
hemodialysis. Physical Therapy, 91(8), pp. 1244-1252.
EVERITT, B.S., 1975. Multiariable analysis: The need for data, and other problems. The
British Journal of Psychiatry, 126(3), pp. 237-240.
FARIDAH, A., JAMAIYAH, H., GOH, A. and SORAYA, A., 2010a. The validation of
the EQ-5D in Malaysian dialysis patients. Med J Malaysia, 65(Suppl A), pp. 114-119.
FIACCADORI, E., SABATINO, A., SCHITO, F., ANGELLA, F., MALAGOLI, M.,
TUCCI, M., CUPISTI, A., CAPITANINI, A. and REGOLISTI, G., 2014. Barriers to
Physical Activity in Chronic Hemodialysis Patients: A Single-Center Pilot Study in an
Italian Dialysis Facility. Kidney and Blood Pressure Research, 39(2-3), pp. 169.
FIEDLER, R., DORLIGJAV, O., SEIBERT, E., ULRICH, C., MARKAU, S. and
GIRNDT, M., 2011. Vitamin D deficiency, mortality, and hospitalization in hemodialysis
patients with or without protein-energy wasting. Nephron.Clinical practice, 119(3), pp.
c220-c226.
FINKELSTEIN, F.O., WUERTH, D., TROIDLE, L.K. and FINKELSTEIN, S.H., 2008.
Depression and end-stage renal disease: a therapeutic challenge. Kidney international,
74(7), pp. 843-845.
FISH, J., 2011. Short physical performance battery. Encyclopedia of Clinical
Neuropsychology. Springer, pp. 2289-2291.
FLANIGAN, M.J., 2000. Role of sodium in hemodialysis. Kidney international, 58, pp.
S78.
FLEISCHMANN, E., TEAL, N., DUDLEY, J., MAY, W., BOWER, J.D. and
SALAHUDEEN, A.K., 1999. Influence of excess weight on mortality and hospital stay
in 1346 hemodialysis patients. Kidney international, 55(4), pp. 1560-1567.
FLOOD, A., CHUNG, A., PARKER, H., KEARNS, V. and O’SULLIVAN, T.A., 2013.
The use of hand grip strength as a predictor of nutrition status in hospital patients. Clinical
Nutrition, 33(1), pp. 106-114.
FOLEY, R.N., WANG, C., ISHANI, A., COLLINS, A.J. and MURRAY, A.M., 2007.
Kidney function and sarcopenia in the United States general population: NHANES III.
American Journal of Nephrology, 27(3), pp. 279-286.
FOOD AND NUTRITION BOARD, 1989.Recommended Daily Allowances; ed 10;
Washington, DC, America: National Academy Press.
FORD, J.C., POPE, J.F., HUNT, A.E. and GERALD, B., 2004. The effect of diet
education on the laboratory values and knowledge of hemodialysis patients with
hyperphosphatemia. Journal of renal nutrition : the official journal of the Council on
Renal Nutrition of the National Kidney Foundation, 14(1), pp. 36-44.
FOUQUE, D., KALANTAR-ZADEH, K., KOPPLE, J., CANO, N., CHAUVEAU, P.,

376
CUPPARI, L., FRANCH, H., GUARNIERI, G., IKIZLER, T.A. and KAYSEN, G., 2008a.
A proposed nomenclature and diagnostic criteria for protein–energy wasting in acute and
chronic kidney disease. Kidney international, 73(4), pp. 391-398.
FOUQUE, D., VENNEGOOR, M., TER WEE, P., WANNER, C., BASCI, A., CANAUD,
B., HAAGE, P., KONNER, K., KOOMAN, J. and MARTIN-MALO, A., 2007a. EBPG
guideline on nutrition. Nephrology Dialysis Transplantation, 22(suppl_2), pp. ii87.
FOWLER, S.J., SINGH, S.J. and REVILL, S., 2005. Reproducibility and validity of the
incremental shuttle walking test in patients following coronary artery bypass surgery.
Physiotherapy, 91(1), pp. 22-27.
FREIRE, A.N., GUERRA, R.O., ALVARADO, B., GURALNIK, J.M. and
ZUNZUNEGUI, M.V., 2012. Validity and reliability of the short physical performance
battery in two diverse older adult populations in Quebec and Brazil. Journal of aging and
health, 24(5), pp. 863-878.
FRESENIUS MEDICAL CARE. Body Composition Monitor- REFERENCE
RANGES.
FUKUHARA, S., LOPES, A.A., BRAGG-GRESHAM, J.L., KUROKAWA, K., MAPES,
D.L., AKIZAWA, T., BOMMER, J., CANAUD, B.J., PORT, F.K. and HELD, P.J., 2003.
Health-related quality of life among dialysis patients on three continents: the Dialysis
Outcomes and Practice Patterns Study. Kidney international, 64(5), pp. 1903-1910.
FUKUHARA, S., YAMAZAKI, S., HAYASHINO, Y. and GREEN, J., 2007. Measuring
health-related quality of life in patients with end-stage renal disease: why and how.
Nature Reviews Nephrology, 3(7), pp. 352.
FUMERON, C., NGUYEN-KHOA, T., SALTIEL, C., KEBEDE, M., BUISSON, C.,
DRÜEKE, T.B., LACOUR, B. and MASSY, Z.A., 2005a. Effects of oral vitamin C
supplementation on oxidative stress and inflammation status in haemodialysis patients.
Nephrology Dialysis Transplantation, 20(9), pp. 1874-1879.
G. GODIN, R J SHEPHARD, 1985. A simple method to assess exercise behavior in the
community. Can. J. Appl. Sport Sci., 10, pp. 141–146.
GILG, J., RAO, A. and FOGARTY, D., 2013. UK Renal Registry 16th annual report:
chapter 1 UK renal replacement therapy incidence in 2012: national and centre-specific
analyses. Nephron.Clinical practice, 125(1-4), pp. 1-27.
GODIN, G., 2011. The Godin-Shephard leisure-time physical activity questionnaire.
Health & Fitness Journal of Canada, 4(1), pp. 18-22.
GOLDBERG, A.P., GELTMAN, E.M., HAGBERG, J.M., GAVIN, J.R.3., DELMEZ,
J.A., CARNEY, R.M., NAUMOWICZ, A., OLDFIELD, M.H. and HARTER, H.R., 1983.
Therapeutic benefits of exercise training for hemodialysis patients. Kidney Int Suppl,
24(16), pp. 303-309.

377
GOLDBERG, A.P., HAGBERG, J.M., DELMEZ, J.A., HAYNES, M.E. and HARTER,
H.R., 1980a. Metabolic effects of exercise training in hemodialysis patients. Kidney
international, 18(6), pp. 754-761.
GOLDBERG, A.P., HAGBERG, J., DELMEZ, J.A., CARNEY, R.M., MCKEVITT, P.M.,
EHSANI, A.A. and HARTER, H.R., 1980b. The metabolic and psychological effects of
exercise training in hemodialysis patients. The American Journal of Clinical Nutrition,
33(7), pp. 1620-1628.
GOMES, E.P., REBOREDO, M.M., CARVALHO, E.V., TEIXEIRA, D.R., CARVALHO,
LAÍS FERNANDA CALDI D’ORNELLAS, OLIVEIRA, JULIO CÉSAR ABREU DE,
SANDERS-PINHEIRO, H., CHEBLI, J.M.F., PAULA, R.B.D. and PINHEIRO, B.D.V.,
2015. Physical activity in hemodialysis patients measured by triaxial accelerometer.
BioMed research international, 2015.
GONZÁLEZ-PARRA, E., GRACIA-IGUACEL, C., ORTIZ, A. and JESÚS EGIDO,
2012. Phosphorus and nutrition in chronic kidney disease. International journal of
nephrology, 2012, pp. 1-5.
GOODMAN, E.D. and BALLOU, M.B., 2004a. Perceived barriers and motivators to
exercise in hemodialysis patients. Nephrology Nursing Journal, 31(1), pp. 23.
GOODMAN, W.G., GOLDIN, J., KUIZON, B.D., YOON, C., GALES, B., SIDER, D.,
WANG, Y., CHUNG, J., EMERICK, A. and GREASER, L., 2000. Coronary-artery
calcification in young adults with end-stage renal disease who are undergoing dialysis.
New England Journal of Medicine, 342(20), pp. 1478-1483.
GOODPASTER, B.H., PARK, S.W., HARRIS, T.B., KRITCHEVSKY, S.B., NEVITT,
M., SCHWARTZ, A.V., SIMONSICK, E.M., TYLAVSKY, F.A., VISSER, M. and
NEWMAN, A.B., 2006. The loss of skeletal muscle strength, mass, and quality in older
adults: the health, aging and body composition study. The Journals of Gerontology Series
A: Biological Sciences and Medical Sciences, 61(10), pp. 1059-1064.
GORSUCH, R.L., 1983. Factor analysis, 2nd. Hillsdale, NJ: LEA .
GRACIA-IGUACEL, C., GONZáLEZ-PARRA, E., PéREZ-GóMEZ, M.,Vanesa,
MAHÃLLO, I., EGIDO, J., ORTIZ, A. and CARRERO, J., 2013. Prevalence of protein-
energy wasting syndrome and its association with mortality in haemodialysis patients in
a centre in Spain. NefrologÃa : publicación oficial de la Sociedad Española Nefrologia,
33(4), pp. 495.
GRANDI, N.C., BREITLING, L.P. and BRENNER, H., 2010. Vitamin D and
cardiovascular disease: systematic review and meta-analysis of prospective studies.
Preventive medicine, 51(3-4), pp. 228-233.
GREEN, D.J., WATTS, K., RANKIN, S., WONG, P. and O'DRISCOLL, J.G., 2001. A
comparison of the shuttle and 6 minute walking tests with measured peak oxygen

378
consumption in patients with heart failure. Journal of science and medicine in sport, 4(3),
pp. 292-300.
GREENWOOD, S.A., LINDUP, H., TAYLOR, K., KOUFAKI, P., RUSH, R.,
MACDOUGALL, I.C. and MERCER, T.H., 2012a. Evaluation of a pragmatic exercise
rehabilitation programme in chronic kidney disease. Nephrology, dialysis,
transplantation : official publication of the European Dialysis and Transplant
Association - European Renal Association, 27 Suppl 3, pp. 34.
GREENWOOD, S.A., NAISH, P., CLARK, R., O'CONNOR, E., PURSEY, V.A.,
MACDOUGALL, I.C., MERCER, T.H. and KOUFAKI, P., 2014a. Intra-dialytic exercise
training: a pragmatic approach. Journal of renal care, 40(3), pp. 219-226.
GREENWOOD, S.A., LINDUP, H., TAYLOR, K., KOUFAKI, P., RUSH, R.,
MACDOUGALL, I.C. and MERCER, T.H., 2012b. Evaluation of a pragmatic exercise
rehabilitation programme in chronic kidney disease. Nephrology, dialysis,
transplantation : official publication of the European Dialysis and Transplant
Association - European Renal Association, 27 Suppl 3, pp. iii126.
GREENWOOD, S.A., NAISH, P., CLARK, R., O'CONNOR, E., PURSEY, V.A.,
MACDOUGALL, I.C., MERCER, T.H. and KOUFAKI, P., 2014b. INTRA‐DIALYTIC
EXERCISE TRAINING: A PRAGMATIC APPROACH. Journal of Renal Care, 40(3),
pp. 219-226.
GRIFFITHS, A., RUSSELL, L., BRESLIN, M., RUSSELL, G. and DAVIES, S., 1999.
A comparison of two methods of dietary assessment in peritoneal dialysis patients.
Journal of Renal Nutrition, 9(1), pp. 26-31.
GROSS, M.M., STEVENSON, P.J., CHARETTE, S.L., PYKA, G. and MARCUS, R.,
1998. Effect of muscle strength and movement speed on the biomechanics of rising from
a chair in healthy elderly and young women. Gait & posture, 8(3), pp. 175-185.
GRUBBS, L. and CARTER, J., 2002. The relationship of perceived benefits and barriers
to reported exercise behaviors in college undergraduates. Family & community health,
25(2), pp. 76-84.
GUIDANCE AND GUIDELINES, | NICE, May, 2013-last update, Physical activity:
brief advice for adults in primary care | [Homepage of NICE], [Online]. Available:
https://www.nice.org.uk/guidance/PH44 [Jul 23, 2018].
GURALNIK, J.M., FERRUCCI, L., PIEPER, C.F., LEVEILLE, S.G., MARKIDES, K.S.,
OSTIR, G.V., STUDENSKI, S., BERKMAN, L.F. and WALLACE, R.B., 2000. Lower
extremity function and subsequent disability: consistency across studies, predictive
models, and value of gait speed alone compared with the short physical performance
battery. The Journals of Gerontology Series A: Biological Sciences and Medical Sciences,
55(4), pp. M231.

379
GUTIÉRREZ SÁNCHEZ DANIEL, LEIVA-SANTOS, J.P. and CUESTA-VARGAS,
A.I., 2017. Symptom Burden Clustering in Chronic Kidney Disease Stage 5. Clinical
nursing research, , pp. 1054773817740671.
GUTZWILLER, J.P., SCHNEDITZ, D., HUBER, A.R., SCHINDLER, C., GARBANI,
E. and ZEHNDER, C.E., 2003. Increasing blood flow increases kt/V(urea) and potassium
removal but fails to improve phosphate removal. Clin Nephrol, 59(2), pp. 130-6.
HALL, Y.N. and CHERTOW, G.M., 2007. End stage renal disease. Clinical evidence,
2007.
HALLAL, P.C., ANDERSEN, L.B., BULL, F.C., GUTHOLD, R., HASKELL, W.,
EKELUND, U. and LANCET PHYSICAL ACTIVITY SERIES WORKING GROUP,
2012. Global physical activity levels: surveillance progress, pitfalls, and prospects. The
lancet, 380(9838), pp. 247-257.
HALLAN, S.I., CORESH, J., ASTOR, B.C., ASBERG, A., POWE, N.R.,
ROMUNDSTAD, S., HALLAN, H.A., LYDERSEN, S. and HOLMEN, J., 2006.
International comparison of the relationship of chronic kidney disease prevalence and
ESRD risk. Journal of the American Society of Nephrology : JASN, 17(8), pp. 2275-2284.
HAUKE, J. and KOSSOWSKI, T., 2011. Comparison of Values of Pearson's and
Spearman's Correlation Coefficients on the Same Sets of Data. Quaestiones
Geographicae, 30(2), pp. 87-93.
HAWKINS, M.S., SEVICK, M.A., RICHARDSON, C.R., FRIED, L.F., ARENA, V.C.
and KRISKA, A.M., 2011. Association between physical activity and kidney function:
National Health and Nutrition Examination Survey. Medicine and science in sports and
exercise, 43(8), pp. 1457-1464.
HAWKINS, S.S., LAMB, K., COLE, T.J. and LAW, C., 2008. Influence of moving to the
UK on maternal health behaviours: prospective cohort study. Bmj, 336(7652), pp. 1052-
1055.
HAYHURST, W.S. and AHMED, A., 2015. Assessment of physical activity in patients
with chronic kidney disease and renal replacement therapy. SpringerPlus, 4, pp. 3.
eCollection 2015.
HAYS, R.D., KALLICH, J.D., MAPES, D.L., COONS, S.J. and CARTER, W.B., 1994.
Development of the kidney disease quality of life (KDQOL TM) instrument. Quality of
Life Research, 3(5), pp. 329-338.
HECKING, E., BRAGG-GRESHAM, J.L., RAYNER, H.C., PISONI, R.L.,
ANDREUCCI, V.E., COMBE, C., GREENWOOD, R., MCCULLOUGH, K.,
FELDMAN, H.I. and YOUNG, E.W., 2004. Haemodialysis prescription, adherence and
nutritional indicators in five European countries: results from the Dialysis Outcomes and
Practice Patterns Study (DOPPS). Nephrology Dialysis Transplantation, 19(1), pp. 100-

380
107.
HECKING, M., KARABOYAS, A., SARAN, R., SEN, A., HÖRL, W.H., PISONI, R.L.,
ROBINSON, B.M., SUNDER-PLASSMANN, G. and PORT, F.K., 2012. Predialysis
serum sodium level, dialysate sodium, and mortality in maintenance hemodialysis
patients: the Dialysis Outcomes and Practice Patterns Study (DOPPS). American Journal
of Kidney Diseases, 59(2), pp. 238-248.
HEDAYATI, S.S., BOSWORTH, H.B., BRILEY, L.P., SLOANE, R.J., PIEPER, C.F.,
KIMMEL, P.L. and SZCZECH, L.A., 2008. Death or hospitalization of patients on
chronic hemodialysis is associated with a physician-based diagnosis of depression.
Kidney international, 74(7), pp. 930-936.
HEFFERON, K., MURPHY, H., MCLEOD, J., MUTRIE, N. and CAMPBELL, A., 2013.
Understanding barriers to exercise implementation 5-year post-breast cancer diagnosis: a
large-scale qualitative study. Health education research, 28(5), pp. 843-856.
HEIMBÜRGER, O., QURESHI, A.R., BLANER, W.S., BERGLUND, L. and
STENVINKEL, P., 2000. Hand-grip muscle strength, lean body mass, and plasma
proteins as markers of nutritional status in patients with chronic renal failure close to start
of dialysis therapy. American Journal of Kidney Diseases, 36(6), pp. 1213-1225.
HEIWE, S. and JACOBSON, S.H., 2011. Exercise training for adults with chronic kidney
disease. The Cochrane database of systematic reviews, (10):CD003236. doi(10), pp.
CD003236.
HELD, P.J., BRUNNER, F., ODAKA, M., GARCIA, J.R., PORT, F.K. and GAYLIN,
D.S., 1990. Five-year survival for end-stage renal disease patients in the United States,
Europe, and Japan, 1982 to 1987. American Journal of Kidney Diseases, 15(5), pp. 451-
457.
HICKS, L.S., CLEARY, P.D., EPSTEIN, A.M. and AYANIAN, J.Z., 2004a. Differences
in health-related quality of life and treatment preferences among black and white patients
with end-stage renal disease. Quality of Life Research, 13(6), pp. 1129-1138.
HIRAKI, K., YASUDA, T., HOTTA, C., IZAWA, K.P., MORIO, Y., WATANABE, S.,
SAKURADA, T., SHIBAGAKI, Y. and KIMURA, K., 2013. Decreased physical function
in pre-dialysis patients with chronic kidney disease. Clinical and experimental
nephrology, 17(2), pp. 225-231.
HLATKY, M.A., BOINEAU, R.E., HIGGINBOTHAM, M.B., LEE, K.L., MARK, D.B.,
CALIFF, R.M., COBB, F.R. and PRYOR, D.B., 1989a. A brief self-administered
questionnaire to determine functional capacity (The Duke Activity Status Index). The
American Journal of Cardiology, 64(10), pp. 651-654.
HOLLINGDALE, R., SUTTON, D. and HART, K., 2008. FACILITATING DIETARY
CHANGE IN RENAL DISEASE: INVESTIGATING PATIENTS’ PERSPECTIVES.

381
Journal of Renal Care, 34(3), pp. 136-142.
HOU, F., JIANG, J., CHEN, J., YU, X., ZHOU, Q., CHEN, P., MEI, C., XIONG, F., SHI,
W. and ZHOU, W., 2012. China collaborative study on dialysis: a multi-centers cohort
study on cardiovascular diseases in patients on maintenance dialysis. BMC nephrology,
13(1), pp. 94.
HSU, C., MCCULLOCH, C.E. and CURHAN, G.C., 2002. Epidemiology of anemia
associated with chronic renal insufficiency among adults in the United States: results
from the Third National Health and Nutrition Examination Survey. Journal of the
American Society of Nephrology, 13(2), pp. 504-510.
HUANG, C.X., TIGHIOUART, H., BEDDHU, S., CHEUNG, A.K., DWYER, J.T.,
EKNOYAN, G., BECK, G.J., LEVEY, A.S. and SARNAK, M.J., 2010. Both low muscle
mass and low fat are associated with higher all-cause mortality in hemodialysis patients.
Kidney International, 77(7), pp. 624-629.
HUANG, X., SJÖGREN, P., CEDERHOLM, T., ÄRNLÖV, J., LINDHOLM, B.,
RISÉRUS, U., CARRERO, J.J. and KLINISK NUTRITION OCH METABOLISM, 2014.
Serum and adipose tissue fatty acid composition as biomarkers of habitual dietary fat
intake in elderly men with chronic kidney disease. Nephrology, dialysis, transplantation :
official publication of the European Dialysis and Transplant Association - European
Renal Association, 29(1), pp. 128.
HUGHES, V.A., FRONTERA, W.R., WOOD, M., EVANS, W.J., DALLAL, G.E.,
ROUBENOFF, R. and SINGH, M.A.F., 2001. Longitudinal muscle strength changes in
older adults: influence of muscle mass, physical activity, and health. The Journals of
Gerontology Series A: Biological Sciences and Medical Sciences, 56(5), pp. B217.
HUIDOBRO, A., VELASCO, N. and ROJAS, T., 2001. Prevalence of calorie protein
malnutrition among patients in chronic hemodialysis in a regional hospital in Chile.
Revista medica de Chile, 129(5), pp. 495-502.
HUISH, S.A., FLETCHER, S., DUNN, J.A., HEWISON, M. and BLAND, R., 2016.
Prevalence and treatment of hypovitaminosis D in the haemodialysis population of
Coventry. The Journal of steroid biochemistry and molecular biology, 164, pp. 214-217.
HUTCHESON, G.D. and SOFRONIOU, N., 1999. The multiariable social scientist:
Introductory statistics using generalized linear models. Sage.
HWU, Y., COATES, V.E. and BOORE, J.R.P., 2001. The health behaviours of Chinese
people with chronic illness. International journal of nursing studies, 38(6), pp. 629-641.
IKIZLER, T.A., PUPIM, L.B., BROUILLETTE, J.R., LEVENHAGEN, D.K., FARMER,
K., HAKIM, R.M. and FLAKOLL, P.J., 2002. Hemodialysis stimulates muscle and
whole body protein loss and alters substrate oxidation. American Journal of Physiology-
Endocrinology And Metabolism, 282(1), pp. E116.

382
IKIZLER, T.,Alp, 2013. A patient with CKD and poor nutritional status. Clinical journal
of the American Society of Nephrology : CJASN, 8(12), pp. 2174.
ILIESCU, E.A., COO, H., MCMURRAY, M.H., MEERS, C.L., QUINN, M.M., SINGER,
M.A. and HOPMAN, W.M., 2003. Quality of sleep and health‐related quality of life in
haemodialysis patients. Nephrology Dialysis Transplantation, 18(1), pp. 126-132.
INAL, S., ERTEN, Y., TEK, N., OKYAY, G.U., ÖNEÇ, K., AKBULUT, G. and
ŞANLIER, N., 2014. The effect of dietary salt restriction on hypertension in peritoneal
dialysis patients. Turkish journal of medical sciences, 44(5), pp. 814-819.
ISEKI, K., YAMAZATO, M., TOZAWA, M. and TAKISHITA, S., 2002.
Hypocholesterolemia is a significant predictor of death in a cohort of chronic
hemodialysis patients. Kidney international, 61(5), pp. 1887-1893.
ISHII, K., SHIBATA, A. and OKA, K., 2010. Environmental, psychological, and social
influences on physical activity among Japanese adults: structural equation modeling
analysis. International Journal of Behavioral Nutrition and Physical Activity, 7(1), pp.
61.
ISOYAMA, N., QURESHI, A.,Rashid, AVESANI, C.,Maria, LINDHOLM, B.,
Bà Rà NY, P., HEIMBüRGER, O., CEDERHOLM, T., STENVINKEL, P. and
CARRERO, J.,Jesús, 2014. Comparative associations of muscle mass and muscle
strength with mortality in dialysis patients. Clinical journal of the American Society of
Nephrology : CJASN, 9(10), pp. 1720.
JACOBS, J.,D R., AINSWORTH, B.E., HARTMAN, T.J. and LEON, A.S., 1993. A
simultaneous evaluation of 10 commonly used physical activity questionnaires. Medicine
and science in sports and exercise, 25(1), pp. 81-91.
JAMAL, S.A., LEITER, R.E., JASSAL, V., HAMILTON, C.J. and BAUER, D.C., 2006.
Impaired muscle strength is associated with fractures in hemodialysis patients.
Osteoporosis International, 17(9), pp. 1390-1397.
JANSSEN, M.F., BIRNIE, E. and BONSEL, G.J., 2008a. Quantification of the level
descriptors for the standard EQ-5D three-level system and a five-level version according
to two methods. Quality of Life Research, 17(3), pp. 463-473.
JANSSEN, M.F., LUBETKIN, E.I., SEKHOBO, J.P. and PICKARD, A.S., 2011. The use
of the EQ‐5D preference‐based health status measure in adults with type 2 diabetes
mellitus. Diabetic Medicine, 28(4), pp. 395-413.
JANSSEN, M.F., BIRNIE, E., HAAGSMA, J.A. and BONSEL, G.J., 2008b. Comparing
the standard EQ‐5D three‐level system with a five‐level version. Value in Health, 11(2),
pp. 275-284.
JEAN, G., CHARRA, B. and CHAZOT, C., 2008. Vitamin D deficiency and associated
factors in hemodialysis patients. Journal of Renal Nutrition, 18(5), pp. 395-399.

383
JEAN, G., TERRAT, J., VANEL, T., HUROT, J., LORRIAUX, C., MAYOR, B. and
CHAZOT, C., 2008. Daily oral 25-hydroxycholecalciferol supplementation for vitamin
D deficiency in haemodialysis patients: effects on mineral metabolism and bone markers.
Nephrology Dialysis Transplantation, 23(11), pp. 3670-3676.
JEONG, J.H., WU, P., KISTLER, B.M., FITSCHEN, P.J., BIRUETE, A.G., PHILLIPS,
S.A., ALI, M.M., FERNHALL, B. and WILUND, K.R., 2015. The presence and impact
of diastolic dysfunction on physical function and body composition in hemodialysis
patients. Journal of nephrology, 28(6), pp. 739-747.
JETTE, M., POSEN, G. and CARDARELLI, C., 1977. Effects of an exercise programme
in a patient undergoing hemodialysis treatment. The Journal of sports medicine and
physical fitness, 17(2), pp. 181.
JHAMB, M., MCNULTY, M.L., INGALSBE, G., CHILDERS, J.W., SCHELL, J.,
CONROY, M.B., FORMAN, D.E., HERGENROEDER, A. and DEW, M.A., 2016a.
Knowledge, barriers and facilitators of exercise in dialysis patients: a qualitative study of
patients, staff and nephrologists. BMC nephrology, 17(1), pp. 192.
JIN, H., FANG, W., ZHU, M., YU, Z., FANG, Y., YAN, H., ZHANG, M., WANG, Q.,
CHE, X. and XIE, Y., 2016. Urgent-start peritoneal dialysis and hemodialysis in ESRD
patients: complications and outcomes. PloS one, 11(11), pp. e0166181.
JOHANSEN, K.L., 2007. Exercise in the end-stage renal disease population. Journal of
the American Society of Nephrology : JASN, 18(6), pp. 1845-1854.
JOHANSEN, K.L., CHERTOW, G.M., DA, M., CAREY, S. and PAINTER, P., 2001.
Determinants of physical performance in ambulatory patients on hemodialysis. Kidney
international, 60(4), pp. 1586-1591.
JOHANSEN, K.L., CHERTOW, G.M., NG, A.V., MULLIGAN, K., CAREY, S.,
SCHOENFELD, P.Y. and KENT-BRAUN, J.A., 2000a. Physical activity levels in
patients on hemodialysis and healthy sedentary controls. Kidney international, 57(6), pp.
2564-2570.
JOHANSEN, K.L., KAYSEN, G.A., YOUNG, B.S., HUNG, A.M., DA SILVA, M. and
CHERTOW, G.M., 2003. Longitudinal study of nutritional status, body composition, and
physical function in hemodialysis patients. The American Journal of Clinical Nutrition,
77(4), pp. 842-846.
JOHANSEN, K.L. and PAINTER, P., 2012a. Exercise in individuals with CKD.
American Journal of Kidney Diseases : The Official Journal of the National Kidney
Foundation, 59(1), pp. 126-134.
JOHANSEN, K.L., 1999. Physical Functioning and Exercise Capacity in Patient on
Dialysis. Advances in Renal Replacement Therapy, 6(2), pp. 141-148.
JOHANSEN, K.L. and CHERTOW, G.M., 2007. Chronic kidney disease mineral bone

384
disorder and health-related quality of life among incident end-stage renal-disease patients.
Journal of Renal Nutrition, 17(5), pp. 305-313.
JOHANSEN, K.L., CHERTOW, G.M., KUTNER, N.G., DALRYMPLE, L.S., GRIMES,
B.A. and KAYSEN, G.A., 2010. Low level of self-reported physical activity in
ambulatory patients new to dialysis. Kidney international, 78(11), pp. 1164-1170.
JOHANSEN, K.L., KAYSEN, G.A., DALRYMPLE, L.S., GRIMES, B.A., GLIDDEN,
D.V., ANAND, S. and CHERTOW, G.M., 2013. Association of Physical Activity with
Survival among Ambulatory Patients on Dialysis: The Comprehensive Dialysis Study.
Clinical Journal of the American Society of Nephrology, 8(2), pp. 248-253.
JOHANSEN, K.L., PAINTER, P.L., SAKKAS, G.K., GORDON, P., DOYLE, J. and
SHUBERT, T., 2006. Effects of resistance exercise training and nandrolone decanoate on
body composition and muscle function among patients who receive hemodialysis: A
randomized, controlled trial. Journal of the American Society of Nephrology : JASN,
17(8), pp. 2307-2314.
JOHANSEN, K.L., PAINTER, P., KENT-BRAUN, J.A., NG, A.V., CAREY, S., DA
SILVA, M. and CHERTOW, G.M., 2001. Validation of questionnaires to estimate
physical activity and functioning in end-stage renal disease. Kidney international, 59(3),
pp. 1121-1127.
JOHANSEN, K.L., SAKKAS, G.K., DOYLE, J., SHUBERT, T. and ADAMS DUDLEY,
R., 2003. Exercise counseling practices among nephrologists caring for patients on
dialysis. American Journal of Kidney Diseases, 41(1), pp. 171-178.
JOHANSEN, K.L., SHUBERT, T., DOYLE, J., SOHER, B., SAKKAS, G.K. and KENT-
BRAUN, J.A., 2003. Muscle atrophy in patients receiving hemodialysis: effects on
muscle strength, muscle quality, and physical function. Kidney international, 63(1), pp.
291-297.
JOHANSEN, K.L., YOUNG, B., KAYSEN, G.A. and CHERTOW, G.M., 2004a.
Association of body size with outcomes among patients beginning dialysis. The American
Journal of Clinical Nutrition, 80(2), pp. 324-332.
JUNG, E.S., LEE, J., LEE, J.W., YOON, H., KIM, D.K., OH, K., KIM, Y.S., HAN, J.S.
and JOO, K.W., 2013. Increasing the dialysate sodium concentration based on serum
sodium concentrations exacerbates weight gain and thirst in hemodialysis patients. The
Tohoku journal of experimental medicine, 230(2), pp. 117-121.
JÜRGENSEN, S.P., TRIMER, R., DOURADO, V.Z., THOMMAZO‐LUPORINI, D.,
BONJORNO‐JUNIOR, J.C., OLIVEIRA, C.R., ARENA, R., MENDES, R.G. and
BORGHI‐SILVA, A., 2015. Shuttle walking test in obese women: test‐retest reliability
and concurrent validity with peak oxygen uptake. Clinical physiology and functional
imaging, 35(2), pp. 120-126.

385
KAIZU, Y., OHKAWA, S., ODAMAKI, M., IKEGAYA, N., HIBI, I., MIYAJI, K. and
KUMAGAI, H., 2003a. Association between inflammatory mediators and muscle mass
in long-term hemodialysis patients. American journal of kidney diseases, 42(2), pp. 295-
302.
KALANTAR‐ZADEH, K., TORTORICI, A.R., CHEN, J.L.T., KAMGAR, M., LAU, W.,
MORADI, H., RHEE, C.M., STREJA, E. and KOVESDY, C.P., 2015. Dietary
Restrictions in Dialysis Patients: Is There Anything Left to Eat? Seminars in dialysis,
28(2), pp. 159-168.
KALANTAR-ZADEH, K., ABBOTT, K.C., SALAHUDEEN, A.K., KILPATRICK, R.D.
and HORWICH, T.B., 2005. Survival advantages of obesity in dialysis patients. American
Journal of Clinical Nutrition, 81(3), pp. 543-554.
KALANTAR-ZADEH, K., 2007. Inflammatory marker mania in chronic kidney disease:
pentraxins at the crossroad of universal soldiers of inflammation. Clinical journal of the
American Society of Nephrology : CJASN, 2(5), pp. 872-875.
KALANTAR-ZADEH, KAMYAR, MD, MPH, PHD and IKIZLER, T.A., MD, 2013. Let
Them Eat During Dialysis: An Overlooked Opportunity to Improve Outcomes in
Maintenance Hemodialysis Patients. Journal of Renal Nutrition, 23(3), pp. 157-163.
KALANTAR-ZADEH, K., IKIZLER, T.,Alp, BLOCK, G., AVRAM, M. and KOPPLE,
D., 2003. Malnutrition-inflammation complex syndrome in dialysis patients: causes and
consequences. American Journal of Kidney Diseases : The Official Journal of the
National Kidney Foundation, 42(5), pp. 864.
KALANTAR-ZADEH, K., KILPATRICK, D., KUWAE, N. and WU, Y., 2005. Reverse
epidemiology: a spurious hypothesis or a hardcore reality? Blood purification, 23(1), pp.
57.
KALANTAR-ZADEH, K., KUWAE, N., WU, D.Y., SHANTOUF, R.S., FOUQUE, D.,
ANKER, S.D., BLOCK, G. and KOPPLE, J.D., 2006. Associations of body fat and its
changes over time with quality of life and prospective mortality in hemodialysis patients.
The American journal of clinical nutrition, 83(2), pp. 202.
KALANTAR-ZADEH, K., RODRIGUEZ, R.A. and HUMPHREYS, M.H., 2004.
Association between serum ferritin and measures of inflammation, nutrition and iron in
haemodialysis patients. Nephrology Dialysis Transplantation, 19(1), pp. 141-149.
KALANTAR-ZADEH, K., STREJA, E., KOVESDY, C.P., OREOPOULOS, A., NOORI, N.,
JING, J., NISSENSON, A.R., KRISHNAN, M., KOPPLE, J.D. and MEHROTRA, R., 2010.
The obesity paradox and mortality associated with surrogates of body size and muscle mass in
patients receiving hemodialysis, Mayo Clinic Proceedings 2010, Elsevier, pp. 991-1001.
KALANTAR-ZADEH, K., STREJA, E., MOLNAR, M.Z., LUKOWSKY, L.R.,
KRISHNAN, M., KOVESDY C.P., and GREENLAND, K. S., 2012. Mortality
prediction by surrogates of body composition: an examination of the obesity paradox in

386
hemodialysis patients using composite ranking score analysis. Am J Epidemiol, 175 (8),
pp.793–803.
KALANTAR-ZADEH, K., TORTORICI, R., CHEN, L.T., KAMGAR, M., LAU, W.,
MORADI, H., RHEE, M., STREJA, E. and KOVESDY, P., 2015. Dietary restrictions in
dialysis patients: is there anything left to eat? Seminars in dialysis, 28(2), pp. 159.
KAMIMURA, M.A., AVESANI, C.M., CENDOROGLO, M., CANZIANI, M.E.F.,
DRAIBE, S.A. and CUPPARI, L., 2003. Comparison of skinfold thicknesses and
bioelectrical impedance analysis with dual‐energy X‐ray absorptiometry for the
assessment of body fat in patients on long‐term haemodialysis therapy. Nephrology
Dialysis Transplantation, 18(1), pp. 101-105.
KAMIMURA, M.A., DOS SANTOS, NELMA SCHEYLA José, AVESANI, C.M.,
CANZIANI, M.E.F., DRAIBE, S.A. and CUPPARI, L., 2003. Comparison of three
methods for the determination of body fat in patients on long-term hemodialysis therapy.
Journal of the American Dietetic Association, 103(2), pp. 195-199.
KANG, G.W., LEE, I.H., AHN, K.S., LEE, J., JI, Y. and WOO, J., 2015a. Clinical and
psychosocial factors predicting health‐related quality of life in hemodialysis patients.
Hemodialysis International, 19(3), pp. 439-446.
KARABULUT, M., CROUTER, S.E. and BASSETT, D.R., 2005. Comparison of two
waist-mounted and two ankle-mounted electronic pedometers. European journal of
applied physiology, 95(4), pp. 335-343.
KASSEBAUM, N.J., JASRASARIA, R., JOHNS, N., WULF, S., CHOU, D., LOZANO,
R., NAGHAVI, M. and MURRAY, C.J., 2013. A systematic analysis of global anaemia
burden between 1990 and 2010. The Lancet, 381, pp. S72.
KATAYAMA, A., MIYATAKE, N., NISHI, H., UZIKE, K., SAKANO, N.,
HASHIMOTO, H. and KOUMOTO, K., 2014. Evaluation of physical activity and its
relationship to health-related quality of life in patients on chronic hemodialysis.
Environmental health and preventive medicine, 19(3), pp. 220.
KATO, A., ISHIDA, J., ENDO, Y., TAKITA, T., FURUHASHI, M., MARUYAMA, Y.
and ODAMAKI, M., 2011. Association of abdominal visceral adiposity and thigh
sarcopenia with changes of arteriosclerosis in haemodialysis patients. Nephrology,
dialysis, transplantation : official publication of the European Dialysis and Transplant
Association - European Renal Association, 26(6), pp. 1967-1976.
KAVANAGH, J.J. and MENZ, H.B., 2008. Accelerometry: a technique for quantifying
movement patterns during walking. Gait & posture, 28(1), pp. 1-15.
KAYIKCIOGLU, M., TUMUKLU, M., OZKAHYA, M., OZDOGAN, O., ASCI, G.,
DUMAN, S., TOZ, H., CAN, L.H., BASCI, A. and OK, E., 2008. The benefit of salt
restriction in the treatment of end-stage renal disease by haemodialysis. Nephrology

387
Dialysis Transplantation, 24(3), pp. 956-962.
KAZE, F.F., KENGNE, A.F., MAMBAP, A.T., HALLE, M., MBANYA, D. and
ASHUNTANTANG, G., 2015. Anemia in patients on chronic hemodialysis in Cameroon:
prevalence, characteristics and management in low resources setting. African health
sciences, 15(1), pp. 253-260.
KDOQI and NATIONAL KIDNEY FOUNDATION., 2006. KDOQI Clinical Practice
Guidelines and Clinical Practice Recommendations for Anemia in Chronic Kidney
Disease. Am J Kidney Dis, 47(5 Suppl 3), pp. 11.
KENDRICK, J. and CHONCHOL, M., 2011. The role of phosphorus in the development
and progression of vascular calcification. American Journal of Kidney Diseases : The
Official Journal of the National Kidney Foundation, 58(5), pp. 826-834.
KHOUEIRY, G., WAKED, A., GOLDMAN, M., EL-CHARABATY, E., DUNNE, E.,
SMITH, M., KLEINER, M., LAFFERTY, J., KALANTAR-ZADEH, K. and EL-
SAYEGH, S., 2011. Dietary intake in hemodialysis patients does not reflect a heart
healthy diet. Journal of Renal Nutrition, 21(6), pp. 438-447.
KIM, J., BRAMLETT, M.H., WRIGHT, L.K. and POON, L.W., 1998. Racial Differences
in Health Status and Health Behaviors of Older Adults. Nursing research, 47(4), pp. 243-
250.
KIM, J., CHOI, S.R., CHOI, M.J., KIM, S.G., LEE, Y.K., NOH, J.W., KIM, H.J. and
SONG, Y.R., 2013. Prevalence of and factors associated with sarcopenia in elderly
patients with end-stage renal disease. Clinical Nutrition, 33(1), pp. 64-68.
KIRKMAN, D.L., MULLINS, P., JUNGLEE, N.A., KUMWENDA, M., JIBANI, M.M.
and MACDONALD, J.H., 2014. Anabolic exercise in haemodialysis patients: a
randomised controlled pilot study. Journal of Cachexia, Sarcopenia and Muscle, 5(3), pp.
199-207.
KISTLER, B., BENNER, D., BURGESS, M., STASIOS, M., KALANTAR-ZADEH, K.
and WILUND, K.R., 2014. To eat or not to eat—international experiences with eating
during hemodialysis treatment. Journal of Renal Nutrition, 24(6), pp. 349-352.
KLEINMAN, A., 1978. Concepts and a model for the comparison of medical systems as
cultural systems. Social Science and Medicine.Part B Medical Anthropology, 12, pp. 85-
93.
KLINE, P., 2000. A psychometrics primer. Free Assn Books.
KLOPPENBURG, W.D., DE JONG, P.E. and HUISMAN, R.M., 2002. The contradiction
of stable body mass despite low reported dietary energy intake in chronic haemodialysis
patients. Nephrology, dialysis, transplantation : official publication of the European
Dialysis and Transplant Association - European Renal Association, 17(9), pp. 1628-1633.

388
KNIGHT, E.L., OFSTHUN, N., TENG, M., LAZARUS, J.M. and CURHAN, G.C.,
2003a. The association between mental health, physical function, and hemodialysis
mortality. Kidney international, 63(5), pp. 1843-1851.
KONTOS, P.C., MILLER, K., BROOKS, D., JASSAL, S.V., SPANJEVIC, L., DEVINS,
G.M., DE SOUZA, M.J., HECK, C., LAPRADE, J. and NAGLIE, G., 2007. Factors
influencing exercise participation by older adults requiring chronic hemodialysis: a
qualitative study. International urology and nephrology, 39(4), pp. 1303-1311.
KOOIENGA, L., 2007. Phosphorus balance with daily dialysis. Seminars in dialysis,
20(4), pp. 342.
KOPPLE, J.D., 1998. Dietary protein and energy requirements in ESRD patients.
American Journal of Kidney Diseases : The Official Journal of the National Kidney
Foundation, 32(6), pp. 97.
KOPPLE, J.D., 2001a. National Kidney Foundation K/DOQI Clinical Practice
Guidelines for Nutrition in Chronic Renal Failure. American Journal of Kidney Diseases,
37(1), pp. S70.
KOPPLE, J.D., KIM, J.C., SHAPIRO, B.B., ZHANG, M., LI, Y., PORSZASZ, J.,
BROSS, R., FEROZE, U., UPRETI, R. and KALANTAR-ZADEH, K., 2015. Factors
affecting daily physical activity and physical performance in maintenance dialysis
patients. Journal of Renal Nutrition, 25(2), pp. 217-222.
KORKOR, A.B., BRETZMANN, C.M. and EASTWOOD, D.C., 2009. Vitamin D
deficiency in dialysis patients and its effect on various disease markers. Dialysis &
Transplantation, 38(11), pp. 461-464.
KOSMADAKIS, G.C., BEVINGTON, A., SMITH, A.C., CLAPP, E.L., VIANA, J.L.,
BISHOP, N.C. and FEEHALLY, J., 2010. Physical exercise in patients with severe kidney
disease. Nephron.Clinical practice, 115(1), pp. c16.
KOUFAKI, P. and KOUIDI, E., 2010. Current Best Evidence Recommendations on
Measurement and Interpretation of Physical Function in Patients with Chronic Kidney
Disease. Sports Medicine, 40(12), pp. 1055-1074.
KOUFAKI, P. and MERCER, T., 2006. Exercise assessment for people with end-stage
renal failure. Sport and Exercise Physiology Testing Guidelines, 2, pp. 189-198.
KOUIDI, E., IACOVIDES, A., IORDANIDIS, P., VASSILIOU, S., DELIGIANNIS, A.,
IERODIAKONOU, C. and TOURKANTONIS, A., 1997. Exercise renal rehabilitation
program: psychosocial effects. Nephron, 77(2), pp. 152-158.
KOVESDY, C.P., KOPPLE, J.D. and KALANTAR-ZADEH, K., 2013. Management of
protein-energy wasting in non-dialysis-dependent chronic kidney disease: reconciling
low protein intake with nutritional therapy. The American Journal of Clinical Nutrition,
97(6), pp. 1163.

389
KOVESDY, C.P., REGIDOR, D.L., MEHROTRA, R., JING, J., MCALLISTER, C.J.,
GREENLAND, S., KOPPLE, J.D. and KALANTAR-ZADEH, K., 2007. Serum and
dialysate potassium concentrations and survival in hemodialysis patients. Clinical
Journal of the American Society of Nephrology, 2(5), pp. 999-1007.
KOZEY-KEADLE, S., LIBERTINE, A., STAUDENMAYER, J. and FREEDSON, P.,
2011. The feasibility of reducing and measuring sedentary time among overweight, non-
exercising office workers. Journal of obesity, 2012.
KRASSILNIKOVA, M., OSTROW, K., BADER, A., HEEGER, P. and MEHROTRA, A.,
2014. Low dietary intake of vitamin D and vitamin D deficiency in hemodialysis patients.
Journal of nephrology & therapeutics, 4(3),pp.166.
KREDIET, R.T., BOESCHOTEN, E.W., GROOTENDORST, D.C., MUTSERT, D.,
Renée, MANEN, V.,Jeannette G., DEKKER, F.W., BRANDTS, H., NETHERLANDS
COOPERATIVE STUDY ON THE ADEQUACY OF DIALYSIS-2 STUDY GROUP
and FOR THE NETHERLANDS COOPERATIVE STUDY ON THE ADEQUACY OF
DIALYSIS-2 STUDY GROUP, 2009. Subjective global assessment of nutritional status
is strongly associated with mortality in chronic dialysis patients. American Journal of
Clinical Nutrition, 89(3), pp. 787-793.
KUMAR, M.A., BITLA, A.R., RAJU, K.V., MANOHAR, S.M., KUMAR, V.S. and
NARASIMHA, S.R., 2012. Branched chain amino acid profile in early chronic kidney
disease. Saudi journal of kidney diseases and transplantation : an official publication of
the Saudi Center for Organ Transplantation, Saudi Arabia, 23(6), pp. 1202-1207.
KURELLA, M., IRELAND, C., HLATKY, M.A., SHLIPAK, M.G., YAFFE, K.,
HULLEY, S.B. and CHERTOW, G.M., 2004a. Physical and sexual function in women
with chronic kidney disease. American Journal of Kidney Diseases, 43(5), pp. 868-876.
KUTNER, N.G., ZHANG, R., HUANG, Y. and PAINTER, P., 2015. Gait speed and
mortality, hospitalization, and functional status change among hemodialysis patients: a
US Renal Data System special study. American Journal of Kidney Diseases, 66(2), pp.
297-304.
KUTNER, N.G., ZHANG, R., HUANG, Y. and WASSE, H., 2014. Gait speed and
hospitalization among ambulatory hemodialysis patients: USRDS special study data.
World journal of nephrology, 3(3), pp. 101.
LACQUANITI, A., BOLIGNANO, D., CAMPO, S., PERRONE, C., DONATO, V.,
FAZIO, M.,Rosaria, BUEMI, A., STURIALE, A. and BUEMI, M., 2009. Malnutrition in
the elderly patient on dialysis. Renal failure, 31(3), pp. 239.
LAMBIE, S.H., TAAL, M.W., FLUCK, R.J. and MCINTYRE, C.W., 2005. Online
conductivity monitoring: validation and usefulness in a clinical trial of reduced dialysate
conductivity. ASAIO journal, 51(1), pp. 70-76.

390
LANE, A.D., WU, P.T., KISTLER, B., FITSCHEN, P., TOMAYKO, E., JEONG, J.H.,
CHUNG, H.R., YAN, H., RANADIVE, S.M., PHILLIPS, S., FERNHALL, B. and
WILUND, K., 2013. Arterial stiffness and walk time in patients with end-stage renal
disease. Kidney & blood pressure research, 37(2-3), pp. 142-150.
LAURETANI, F., RUSSO, C.R., BANDINELLI, S., BARTALI, B., CAVAZZINI, C., DI
IORIO, A., CORSI, A.M., RANTANEN, T., GURALNIK, J.M. and FERRUCCI, L.,
2003. Age-associated changes in skeletal muscles and their effect on mobility: an
operational diagnosis of sarcopenia. Journal of applied physiology, 95(5), pp. 1851-1860.
LAVILLE, M. and FOUQUE, D., 2000. Nutritional aspects in hemodialysis. Kidney
international, 58(S76), pp. S139.
LAWS, R.A., TAPSELL, L.C. and KELLY, J., 2000a. Nutritional status and its
relationship to quality of life in a sample of chronic hemodialysis patients. Journal of
Renal Nutrition, 10(3), pp. 139-147.
LEAL, V.O., M.S, STOCKLER-PINTO, M.B., M.S, FARAGE, N.E., M.S, ARANHA,
L.N., M.S, FOUQUE, DENIS, M.D., PH.D, ANJOS, LUIZ A., M.D., PH.D and MAFRA,
DENISE, R.D., PH.D, 2011a. Handgrip strength and its dialysis determinants in
hemodialysis patients. Nutrition, 27(11), pp. 1125-1129.
LEAVEY, S.F., MCCULLOUGH, K., HECKING, E., GOODKIN, D., PORT, F.K. and
YOUNG, E.W., 2001. Body mass index and mortality in ‘healthier’as compared with
‘sicker’haemodialysis patients: results from the Dialysis Outcomes and Practice Patterns
Study (DOPPS). Nephrology Dialysis Transplantation, 16(12), pp. 2386-2394.
LEINIG, C.,Erthal, MORAES, T., RIBEIRO, S., RIELLA, M.,Carlos, OLANDOSKI, M.,
MARTINS, C. and PECOITS-FILHO, R., 2011. Predictive value of malnutrition markers
for mortality in peritoneal dialysis patients. Journal of renal nutrition : the official journal
of the Council on Renal Nutrition of the National Kidney Foundation, 21(2), pp. 176.
LET’S GET MOVING: COMMISSIONING GUIDANCE, March,16, 2012-last update,
Resources for commissioning Let's Get Moving interventions - GOV.UK. Available:
https://www.gov.uk/government/publications/let-s-get-moving-revised-commissioning-
guidance [Mar 29, 2018].
LEVEY, A.S., BETO, J.A., CORONADO, B.E., EKNOYAN, G., FOLEY, R.N.,
KASISKE, B.L., KLAG, M.J., MAILLOUX, L.U., MANSKE, C.L. and MEYER, K.B.,
1998. Controlling the epidemic of cardiovascular disease in chronic renal disease: what
do we know? What do we need to learn? Where do we go from here? National Kidney
Foundation Task Force on Cardiovascular Disease. American Journal of Kidney Diseases,
32(5), pp. 853-906.
LEVIN, A., STEVENS, P.E., BILOUS, R.W., CORESH, J., DE, A.L.M., DE, P.E.,
GRIFFITH, K.E., HEMMELGARN, B.R., ISEKI, K., LAMB, E.J., LEVEY, A.S.,
RIELLA, M.C., SHLIPAK, M.G., WANG, H., WHITE, C.T. and WINEARLS, C.G.,

391
2013. Kidney disease: Improving global outcomes (KDIGO) CKD work group. KDIGO
2012 clinical practice guideline for the evaluation and management of chronic kidney
disease. Kidney International Supplements, 3(1), pp. 1-150.
LI, H. and WANG, S., 2008. Intravenous iron sucrose in Chinese hemodialysis patients
with renal anemia. Blood purification, 26(2), pp. 151-156.
LI, M., LI, L. and FAN, X., 2010a. Patients having haemodialysis: physical activity and
associated factors. Journal of advanced nursing, 66(6), pp. 1338.
LIMAYE, V., FRANKHAM, A., DISNEY, A. and PILE, K., 2001. Evaluation of hand
function in patients undergoing long term haemodialysis. Annals of the Rheumatic
Diseases, 60(3), pp. 278-280.
LIN, C., TU, Y., CHIANG, W., WU, S., CHANG, Y. and CHI, C., 2013. Electrolyte
abnormalities and laboratory findings in patients with out-of-hospital cardiac arrest who
have kidney disease. The American Journal of Emergency Medicine, 31(3), pp. 487.
LITWIN, M.S. and FINK, A., 1995. How to measure survey reliability and validity. Sage.
LIU, X., 2012. Research on the Physical Activity and the Influencial Factors of
Maintenance Hemodialysis Patients, Peking Union Medical College.
LIU, Y., CORESH, J., EUSTACE, J.A., LONGENECKER, J.C., JAAR, B., FINK, N.E.,
TRACY, R.P., POWE, N.R. and KLAG, M.J., 2004a. Association between Cholesterol
Level and Mortality in Dialysis Patients: Role of Inflammation and Malnutrition. Journal
of the American Medical Association, 291(4), pp. 451-459.
LIU, Y., CHUNG, Y., CHANG, J. and YEH, M., 2015. Effects of Aerobic Exercise
During Hemodialysis on Physical Functional Performance and Depression. Biological
research for nursing, 17(2), pp. 214-221.
LO, C.Y., LO, W.K., LI, L., CHAN, M.L., CHAN, T.M., SO, E., TANG, S., YUEN, M.C.
and CHENG, I.K., 1998. Benefits of exercise training in patients on continuous
ambulatory peritoneal dialysis. American Journal of Kidney Diseases, 32(6), pp. 1011-
1018.
LOCATELLI, F., FOUQUE, D., HEIMBURGER, O., DRUEKE, T.B., CANNATA-
ANDIA, J.B., HORL, W.H. and RITZ, E., 2002a. Nutritional status in dialysis patients:
a European consensus. Nephrology, dialysis, transplantation : official publication of the
European Dialysis and Transplant Association - European Renal Association, 17(4), pp.
563-572.
LOCATELLI, F., CANAUD, B., ECKARDT, K., STENVINKEL, P., WANNER, C. and
ZOCCALI, C., 2003. Oxidative stress in end‐stage renal disease: an emerging threat to
patient outcome. Nephrology Dialysis Transplantation, 18(7), pp. 1272-1280.
LOCATELLI, F., PISONI, R.L., COMBE, C., BOMMER, J., ANDREUCCI, V.E.,

392
PIERA, L., GREENWOOD, R., FELDMAN, H.I., PORT, F.K. and HELD, P.J., 2004.
Anaemia in haemodialysis patients of five European countries: association with
morbidity and mortality in the Dialysis Outcomes and Practice Patterns Study (DOPPS).
Nephrology Dialysis Transplantation, 19(1), pp. 121-132.
LOPES, A.A., BRAGG-GRESHAM, J.L., ELDER, S.J., GINSBERG, N., GOODKIN,
D.A., PIFER, T., LAMEIRE, N., MARSHALL, M.R., ASANO, Y., AKIZAWA, T.,
PISONI, R.L., YOUNG, E.W. and PORT, F.K., 2010. Independent and joint associations
of nutritional status indicators with mortality risk among chronic hemodialysis patients
in the Dialysis Outcomes and Practice Patterns Study (DOPPS). . J Ren Nutr, 20(4), pp.
224-234.
LOPES, A.A., LANTZ, B., MORGENSTERN, H., WANG, M., BIEBER, B.A.,
GILLESPIE, B.W., LI, Y., PAINTER, P., JACOBSON, S.H. and RAYNER, H.C., 2014.
Associations of self-reported physical activity types and levels with quality of life,
depression symptoms, and mortality in hemodialysis patients: the DOPPS. Clinical
journal of the American Society of Nephrology , pp. CJN. 12371213.
LOWRIE, E.G. and LEW, N.L., 1990. Death risk in hemodialysis patients: the predictive
value of commonly measured variables and an evaluation of death rate differences
between facilities. American Journal of Kidney Diseases, 15(5), pp. 458-482.
LOWRIE, E.G., LI, Z., OFSTHUN, N. and LAZARUS, J.M., 2002. Body size, dialysis
dose and death risk relationships among hemodialysis patients. Kidney international,
62(5), pp. 1891-1897.
LUKASKI, H.C., BOLONCHUK, W.W., HALL, C.B. and SIDERS, W.A., 1986.
Validation of tetrapolar bioelectrical impedance method to assess human body
composition. Journal of applied physiology, 60(4), pp. 1327-1332.
MACDONALD, J.H., MARCORA, S.M., JIBANI, M., PHANISH, M.K., HOLLY, J. and
LEMMEY, A.B., 2005. Intradialytic exercise as anabolic therapy in haemodialysis
patients a pilot study. Clinical Physiology and Functional Imaging, 25(2), pp. 113-118.
MACDONALD, J.H., MARCORA, S.M., JIBANI, M., ROBERTS, G., KUMWENDA,
M.J., GLOVER, R., BARRON, J. and LEMMEY, A.B., 2006. Bioelectrical impedance
can be used to predict muscle mass and hence improve estimation of glomerular filtration
rate in non-diabetic patients with chronic kidney disease. Nephrology Dialysis
Transplantation, 21(12), pp. 3481-3487.
MADUELL, F. and NAVARRO, V., 2001. Assessment of salt intake in hemodialysis.
Nefrologia: publicacion oficial de la Sociedad Espanola Nefrologia, 21(1), pp. 71-77.
MAFRA, D., GUEBRE-EGZIABHER, F. and FOUQUE, D., 2008. Body mass index,
muscle and fat in chronic kidney disease: questions about survival. Nephrology Dialysis
Transplantation, 23(8), pp. 2461-2466.

393
MAFRA, D., DELEAVAL, P., TETA, D., CLEAUD, C., ARKOUCHE, W., JOLIVOT, A.
and FOUQUE, D., 2011. Influence of inflammation on total energy expenditure in
hemodialysis patients. Journal of Renal Nutrition, 21(5), pp. 387-393.
MAGNARD, J., DESCHAMPS, T., CORNU, C., PARIS, A. and HRISTEA, D., 2013a.
Effects of a six-month intradialytic physical ACTIvity program and adequate NUTritional
support on protein-energy wasting, physical functioning and quality of life in chronic
hemodialysis patients: ACTINUT study protocol for a randomised controlled trial. BMC
nephrology, 14, pp. 259.
MAJCHRZAK, K.M., PUPIM, L.B., CHEN, K., MARTIN, C.J., GAFFNEY, S.,
GREENE, J.H. and IKIZLER, T.A., 2005. Physical activity patterns in chronic
hemodialysis patients: comparison of dialysis and nondialysis days. Journal of Renal
Nutrition, 15(2), pp. 217-224.
MAK, R.H., IKIZLER, A.T., KOVESDY, C.P., RAJ, D.S., STENVINKEL, P. and
KALANTAR-ZADEH, K., 2011. Wasting in chronic kidney disease. Journal of cachexia,
sarcopenia and muscle, 2(1), pp. 9-25.
MALAGONI, A.M., CATIZONE, L., MANDINI, S., SOFFRITTI, S., MANFREDINI,
R., BOARI, B., RUSSO, G., BASAGLIA, N., ZAMBONI, P. and MANFREDINI, F.,
2008. Acute and long-term effects of an exercise program for dialysis patients prescribed
in hospital and performed at home. Journal of nephrology, 21(6), pp. 871-878.
MAPES, D.L., LOPES, A.A., SATAYATHUM, S., MCCULLOUGH, K.P., GOODKIN,
D.A., LOCATELLI, F., FUKUHARA, S., YOUNG, E.W., KUROKAWA, K. and SAITO,
A., 2003. Health-related quality of life as a predictor of mortality and hospitalization: the
Dialysis Outcomes and Practice Patterns Study (DOPPS). Kidney international, 64(1),
pp. 339-349.
MARCELLI, D., USVYAT, L.A., KOTANKO, P., BAYH, I., CANAUD, B., ETTER, M.,
GATTI, E., GRASSMANN, A., WANG, Y. and MARELLI, C., 2015. Body composition
and survival in dialysis patients: results from an international cohort study. Clinical
journal of the American Society of Nephrology, , pp. CJN. 08550814.
MARCUS, B.H. and OWEN, N., 1992. Motivational readiness, self-efficacy and
decision-making. Journal of Applied Social Psychology, 22(1), pp. 3-16.
MARCUS, R.L., LASTAYO, P.C., IKIZLER, T.A., WEI, G., GIRI, A., CHEN, X.,
MORRELL, G., PAINTER, P. and BEDDHU, S., 2015. Low physical function in
maintenance hemodialysis patients is independent of muscle mass and comorbidity.
Journal of Renal Nutrition, 25(4), pp. 371-375.
MASSRY, S.G., COBURN, J.W., CHERTOW, G.M., HRUSKA, K., LANGMAN, C.,
MALLUCHE, H., MARTIN, K., MCCANN, L.M., MCCARTHY, J.T. and MOE, S.,
2003. K/DOQI clinical practice guidelines for bone metabolism and disease in chronic
kidney disease. American Journal of Kidney Diseases, 42(4 SUPPL. 3), pp.265.

394
MATTHEW, C.E., 2005. Calibration of accelerometer output for adults. Medicine and
science in sports and exercise, 37(11 Suppl), pp. 512.
MC CAUSLAND, F.R., BRUNELLI, S.M. and WAIKAR, S.S., 2011. Dialysate sodium,
serum sodium and mortality in maintenance hemodialysis. Nephrology Dialysis
Transplantation, 27(4), pp. 1613-1618.
MC, R.,Finnian, WAIKAR, S. and BRUNELLI, M., 2012. Increased dietary sodium is
independently associated with greater mortality among prevalent hemodialysis patients.
Kidney international, 82(2), pp. 204.
MCCLELLAN, W., ARONOFF, S.L., BOLTON, W.K., HOOD, S., LORBER, D.L.,
TANG, K.L., TSE, T.F., WASSERMAN, B. and LEISEROWITZ, M., 2004. The
prevalence of anemia in patients with chronic kidney disease. Current medical research
and opinion, 20(9), pp. 1501-1510.
MCKERCHER, C.M., SCHMIDT, M.D., SANDERSON, K.A., PATTON, G.C.,
DWYER, T. and VENN, A.J., 2009. Physical activity and depression in young adults.
American Journal of Preventive Medicine, 36(2), pp. 161-164.
MCLAFFERTY, S.L., 2003. Conducting Questionnaire Surveys. Key Methods in
Geography, .
MELANSON, E.L., KNOLL, J.R., BELL, M.L., DONAHOO, W.T., HILL, J.O., NYSSE,
L.J., LANNINGHAM-FOSTER, L., PETERS, J.C. and LEVINE, J.A., 2004.
Commercially available pedometers: considerations for accurate step counting.
Preventive medicine, 39(2), pp. 361-368.
MENON, V., WANG, X., GREENE, T., BECK, G.J., KUSEK, J.W., MARCOVINA,
S.M., LEVEY, A.S. and SARNAK, M.J., 2003. Relationship between C-reactive protein,
albumin, and cardiovascular disease in patients with chronic kidney disease. American
journal of kidney diseases, 42(1), pp. 44-52.
MERKUS, M.P., JAGER, K.J., DEKKER, F.W., DE HAAN, R.J., BOESCHOTEN, E.W.
and KREDIET, R.T., 1999. Physical symptoms and quality of life in patients on chronic
dialysis: results of The Netherlands Cooperative Study on Adequacy of Dialysis
(NECOSAD). Nephrology, dialysis, transplantation: official publication of the European
Dialysis and Transplant Association-European Renal Association, 14(5), pp. 1163-1170.
MI RYE SUH, R N, HYUK JUNG, H., BAE KIM, S., SIK PARK, J. and SEOK YANG,
W., 2002. EFFECTS OF REGULAR EXERCISE ON ANXIETY, DEPRESSION, AND
QUALITY OF LIFE IN MAINTENANCE HEMODIALYSIS PATIENTS. Renal failure,
24(3), pp. 337-345.
MICHAUD, J., NAUD, J., OUIMET, D., DEMERS, C., PETIT, J., LEBLOND, F.A.,
BONNARDEAUX, A., GASCON-BARRÉ, M. and PICHETTE, V., 2010. Reduced
hepatic synthesis of calcidiol in uremia. Journal of the American Society of Nephrology,

395
21(9), pp. 1488-1497.
MILLER, B.W., CRESS, C.L., JOHNSON, M.E., NICHOLS, D.H. and SCHNITZLER,
M.A., 2002. Exercise during hemodialysis decreases the use of antihypertensive
medications. American Journal of Kidney Diseases, 39(4), pp. 828-833.
MITRI, J., MURARU, M.D. and PITTAS, A.G., 2011. Vitamin D and type 2 diabetes: a
systematic review. European journal of clinical nutrition, 65(9), pp. 1005.
MOLSTED, S., ANDERSEN, J.L., EIDEMAK, I. and HARRISON, A.P., 2013.
Increased rate of force development and neuromuscular activity after high‐load resistance
training in patients undergoing dialysis. Nephrology, 18(12), pp. 770-776.
MORADI, H., STREJA, E., KASHYAP, M.L., VAZIRI, N.D., FONAROW, G.C. and
KALANTAR-ZADEH, K., 2014. Elevated high-density lipoprotein cholesterol and
cardiovascular mortality in maintenance hemodialysis patients. Nephrology Dialysis
Transplantation, 29(8), pp. 1554-1562.
MORISHITA, Y., KUBO, K., MIKI, A., ISHIBASHI, K., KUSANO, E. and NAGATA,
D., 2014. Positive association of vigorous and moderate physical activity volumes with
skeletal muscle mass but not bone density or metabolism markers in hemodialysis
patients. International urology and nephrology, 46(3), pp. 633-639.
MURPHY, E.L., MURTAGH, F.E., CAREY, I. and SHEERIN, N.S., 2009.
Understanding symptoms in patients with advanced chronic kidney disease managed
without dialysis: use of a short patient-completed assessment tool. Nephron Clinical
Practice, 111(1), pp. c80.
MURRAY, A.M., 2008. Cognitive impairment in the aging dialysis and chronic kidney
disease populations: an occult burden. Advances in chronic kidney disease, 15(2), pp.
123-132.
MURTAGH, F.E., ADDINGTON-HALL, J.M., DONOHOE, P. and HIGGINSON, I.J.,
2006. Symptom management in patients with established renal failure managed without
dialysis. EDTNA/ERCA journal (English ed.), 32(2), pp. 93-98.
MURTAGH, F.E., MURPHY, E., SHEPHERD, K.A., DONOHOE, P. and EDMONDS,
P.M., 2006. End-of-life care in end-stage renal disease: renal and palliative care. British
journal of nursing (Mark Allen Publishing), 15(1), pp. 8-11.
MURTAGH, F.E., ADDINGTON-HALL, J. and HIGGINSON, I.J., 2007. The
prevalence of symptoms in end-stage renal disease: a systematic review. Advances in
chronic kidney disease, 14(1), pp. 82-99.
N.J. PENDER, 1996. Health Promotion in Nursing Practice(1996) pp. 51–75. Appleton
& Lange, Stanford, CT.
NANTEL, J., MATHIEU, M. and PRINCE, F., 2010. Physical activity and obesity:

396
biomechanical and physiological key concepts. Journal of obesity, 2011, pp.650230.
NATIONAL KIDNEY FOUNDATION, 2006. 2006 Updates Clinical Practice
Guidelines and Recommendations.
NATIONAL KIDNEY FOUNDATION, 2002. K/DOQI clinical practice guidelines for
chronic kidney disease: evaluation, classification, and stratification. American Journal of
Kidney Diseases : The Official Journal of the National Kidney Foundation, 39(2 Suppl
1), pp. 1.
NATIONAL KIDNEY FOUNDATION ANEMIA WORKING GROUP, 2001. NKF-
K/DOQI Clinical Practice Guidelines for Anemia of Chronic Kidney Disease, 2000. Am
J Kidney Dis, 37(1), pp. S238.
NAYLOR, H.L., JACKSON, H., WALKER, G.H., MACAFEE, S., MAGEE, K.,
HOOPER, L., STEWART, L., MACLAUGHLIN, H.L. and RENAL NUTRITION
GROUP OF THE BRITISH DIETETIC ASSOCIATION, 2013. B ritish Dietetic
Association evidence‐based guidelines for the protein requirements of adults undergoing
maintenance haemodialysis or peritoneal dialysis. Journal of Human Nutrition and
Dietetics, 26(4), pp. 315-328.
NHS HEALTH CHECK PROGRAM STANDARDS, Feb, 2014-last update, NHS
Health Check Program Standards. Available:
http://www.healthcheck.nhs.uk/news/nhs_health_check_programme_standards_launche
d/.
NHS TRUSTS, -10-04, 2018-last update, The principles and values of the NHS in
England - NHS Choices [Homepage of Department of Health], [Online]. Available:
https://www.nhs.uk/NHSEngland/thenhs/about/Pages/nhscoreprinciples.aspx [Aug 10,
2018].
NIELSEN, P.K., LADEFOGED, J. and OLGAARD, K., 1994. Lean body mass by Dual
Energy X-ray Absorptiometry (DEXA) and by urine and dialysate creatinine recovery in
CAPD and pre-dialysis patients compared to normal subjects. Advances in peritoneal
dialysis.Conference on Peritoneal Dialysis, 10, pp. 99-103.
NIGWEKAR, S.U., BHAN, I. and THADHANI, R., 2012. Ergocalciferol and
cholecalciferol in CKD. American Journal of Kidney Diseases, 60(1), pp. 139-156.
NONOYAMA, M.L., BROOKS, D., PONIKVAR, A., JASSAL, S.V., KONTOS, P.,
DEVINS, G.M., SPANJEVIC, L., HECK, C., LAPRADE, J. and NAGLIE, G., 2010.
Exercise program to enhance physical performance and quality of life of older
hemodialysis patients: a feasibility study. International urology and nephrology, 42(4),
pp. 1125-1130.
NOORI, N., KALANTAR-ZADEH, K., KOVESDY, C.P., MURALI, S.B., BROSS, R.,
NISSENSON, A.R. and KOPPLE, J.D., 2010. Dietary potassium intake and mortality in

397
long-term hemodialysis patients. American Journal of Kidney Diseases, 56(2), pp. 338-
348.
NOORI, N., KOPPLE, J.D., KOVESDY, C.P., FEROZE, U., SIM, J.J., MURALI, S.B.,
LUNA, A., GOMEZ, M., LUNA, C., BROSS, R., NISSENSON, A.R., and
KALANTAR-ZADEH, K.,2010. Mid-arm muscle circumference and quality of life and
survival in maintenance hemodialysis patients. Clin J Am Soc Nephrol, 5 (12), pp. 2258–
68.
NOWICKI, M., MURLIKIEWICZ, K. and JAGODZIŃSKA, M., 2010. Pedometers as a
means to increase spontaneous physical activity in chronic hemodialysis patients. Journal
of nephrology, 23(3), pp. 297-305.
O'CONNOR, N.R. and CORCORAN, A.M., 2012. End-stage renal disease: symptom
management and advance care planning. American Family Physician, 85(7), pp. 705-710.
OE, B., OE, P.L. and STEVENS, P., 1998. Four-site skinfold anthropometry (FSA) versus
body impedance analysis (BIA) in assessing nutritional status of patients on maintenance
hemodialysis: which method is to be preferred in routine patient care? Clinical
nephrology, 49(3), pp. 180-185.
O'HARE, A.M., TAWNEY, K., BACCHETTI, P. and JOHANSEN, K.L., 2003a.
Decreased survival among sedentary patients undergoing dialysis: Results from the
dialysis morbidity and mortality study wave 2. American Journal of Kidney Diseases,
41(2), pp. 447-454.
OKUBO, R., KAI, H., KONDO, M., SAITO, C., YOH, K., MORITO, N., USUI, J. and
YAMAGATA, K., 2014. Health-related quality of life and prognosis in patients with
chronic kidney disease: a 3-year follow-up study. Clinical and experimental nephrology,
18(5), pp. 697-703.
OMRANI, V.F., FALLAHI, S., ROSTAMI, A., SIYADATPANAH, A.,
BARZGARPOUR, G., MEHRAVAR, S., MEMARI, F., HAJIALIANI, F. and JONEIDI,
Z., 2015. Prevalence of intestinal parasite infections and associated clinical symptoms
among patients with end-stage renal disease undergoing hemodialysis. Infection, 43(5),
pp. 537-544.
OSSAREH, S., FARROKHI, F. and ZEBARJADI, M., 2016. Survival of Patients on
Hemodialysis and Predictors of Mortality. Iranian journal of kidney diseases,
10(6),pp.369.
OWEN JR, W.F., LEW, N.L., LIU, Y., LOWRIE, E.G. and LAZARUS, J.M., 1993. The
urea reduction ratio and serum albumin concentration as predictors of mortality in
patients undergoing hemodialysis. New England Journal of Medicine, 329(14), pp. 1001-
1006.
OZALEVLI, S., OZDEN, A., ITIL, O. and AKKOCLU, A., 2007. Comparison of the sit-
to-stand test with 6min walk test in patients with chronic obstructive pulmonary disease.

398
Respiratory medicine, 101(2), pp. 286-293.
OZKAHYA, M., OK, E., TOZ, H., ASCI, G., DUMAN, S., BASCI, A., KOSE, T. and
DORHOUT MEES, E.J., 2006. Long-term survival rates in haemodialysis patients
treated with strict volume control. Nephrology Dialysis Transplantation, 21(12), pp.
3506-3513.
PAINTER, P., STEWART, A.L. and CAREY, S., 1999. Physical functioning: definitions,
measurement, and expectations. Advances in Renal Replacement Therapy, 6(2), pp. 110-
123.
PAINTER, P., 2005. Physical functioning in end‐stage renal disease patients: Update
2005. Hemodialysis International, 9(3), pp. 218-235.
PAINTER, P.L., AGARWAL, A. and DRUMMOND, M., 2017. Physical Function and
Physical Activity in Peritoneal Dialysis Patients. Peritoneal Dialysis International, 37(6),
pp. 598-604.
PAINTER, P., CARLSON, L., CAREY, S., PAUL, S.M. and MYLL, J., 2000a. Physical
functioning and health-related quality-of-life changes with exercise training in
hemodialysis patients. American Journal of Kidney Diseases, 35(3), pp. 482-492.
PAINTER, P. and MARCUS, R., 2013. Physical Function and Gait Speed In Patients with
Chronic Kidney Disease. Nephrology Nursing Journal, 40(6), pp. 529-540.
PAINTER, P., and ROSHANRAVAN, B., 2013. The association of physical activity and
physical function with clinical outcomes in adults with chronic kidney disease. Current
opinion in nephrology and hypertension, 22(6), pp. 615-623.
PALLANT, J., 2011. SPSS survival manual : a step by step guide to data analysis using
IBM SPSS 4th New South Wales, Australia: Ed. Allen & Unwin.
PALLIATIVE CARE OUTCOME SCALE, Palliative care outcome scale. Available:
https://pos-pal.org/maix/.
PALMER, B.F., 2003. Sexual dysfunction in men and women with chronic kidney disease
and end-stage kidney disease. Advances in Renal Replacement Therapy, 10(1), pp. 48-60.
PALMER, S., VECCHIO, M., CRAIG, J.C., TONELLI, M., JOHNSON, D.W.,
NICOLUCCI, A., PELLEGRINI, F., SAGLIMBENE, V., LOGROSCINO, G.,
FISHBANE, S. and STRIPPOLI, G.F.M., 2013. Prevalence of depression in chronic
kidney disease: systematic review and meta-analysis of observational studies. Kidney
international, 84(1), pp. 179.
PANG, H. and KUROSAWA, K., 2003. A survey on physiotherapists both in China and
Japan. Chin J Rehabil Theory Practice, 9(10), pp. 583-584.
PARFREY, P.S., 2000. Cardiac disease in dialysis patients: diagnosis, burden of disease,
prognosis, risk factors and management. Nephrol Dial Transplant, 15(Suppl 5), pp. 58-

399
68.
PARSONS, T.L., TOFFELMIRE, E.B. and KING-VANVLACK, C.E., 2006. Exercise
training during hemodialysis improves dialysis efficacy and physical performance.
Archives of Physical Medicine and Rehabilitation, 87(5), pp. 680-687.
PATE, R.R., PRATT, M., BLAIR, S.N., HASKELL, W.L., MACERA, C.A.,
BOUCHARD, C., BUCHNER, D., ETTINGER, W., HEATH, G.W. and KING, A.C.,
1995. Physical activity and public health: a recommendation from the Centers for Disease
Control and Prevention and the American College of Sports Medicine. Jama, 273(5), pp.
402-407.
PAVLOV, I., WATSON, J., SKINNER, B.F., THORNDIKE, E., BANDURA, A.,
MASLOW, A., ROGERS, C., PIAGET, J., BRUNER, J. and TOLMAN, E., 2013. What
is Validity?
PEACOCK, M., 2010. Calcium metabolism in health and disease. Clinical Journal of the
American Society of Nephrology, 5(Supplement 1), pp. S30.
PECOITS‐FILHO, R., NORDFORS, L., HEIMBÜRGER, O., LINDHOLM, B.,
ANDERSTAM, B., MARCHLEWSKA, A. and STENVINKEL, P., 2002. Soluble leptin
receptors and serum leptin in end‐stage renal disease: relationship with inflammation and
body composition. European journal of clinical investigation, 32(11), pp. 811-817.
PENNINX, B.W., PAHOR, M., CESARI, M., CORSI, A.M., WOODMAN, R.C.,
BANDINELLI, S., GURALNIK, J.M. and FERRUCCI, L., 2004. Anemia is associated
with disability and decreased physical performance and muscle strength in the elderly.
Journal of the American Geriatrics Society, 52(5), pp. 719-724.
PHILLIPS, L.R., PARFITT, G. and ROWLANDS, A.V., 2013. Calibration of the GENEA
accelerometer for assessment of physical activity intensity in children. Journal of science
and medicine in sport, 16(2), pp. 124-128.
PHYSICAL ACTIVITY GUIDELINES ADVISORY COMMITTEE, 2008. Physical
activity guidelines advisory committee report, 2008. Washington, DC: US Department of
Health and Human Services, 2008, pp. H14.
PHYSICAL ACTIVITY POLICY, HEALTH IMPROVEMENT DIRECTORATE, 2009.
The General Practice Physical Activity Questionnaire (GPPAQ) A screening tool to
assess adult physical activity levels, within primary care.
PIA KONTOS, SHABBIR MH ALIBHAI, KAREN-LEE MILLER, DINA BROOKS,
ROMEO COLOBONG, TRISHA PARSONS, SARBJIT VANITA JASSAL, ALISON
THOMAS, MALCOLM BINNS and GARY NAGLIE, 2017. A prospective 2-site parallel
intervention trial of a research-based film to increase exercise amongst older
hemodialysis patients. BMC Nephrology, 18(1), pp.37.
PICKARD, A.S., DE LEON, M.C., KOHLMANN, T., CELLA, D. and ROSENBLOOM,

400
S., 2007. Psychometric comparison of the standard EQ-5D to a 5 level version in cancer
patients. Medical care, 45(3), pp. 259-263.
PICKARD, A.S., WILKE, C.T., LIN, H. and LLOYD, A., 2007. Health utilities using the
EQ-5D in studies of cancer. PharmacoEconomics, 25(5), pp. 365-384.
PIETRO RAVANI, BRETT KILB, HARMAN BEDI, SHARON GROENEVELD,
SERDAR YILMAZ, STEFAN MUSTATA and ALBERTA KIDNEY DISEASE
NETWORK, 2012. The Duke Activity Status Index in Patients with Chronic Kidney
Disease: A Reliability Study. Clinical Journal of the American Society of Nephrology,
7(4), pp. 573-580.
PIFER, T.B., MCCULLOUGH, K.P., PORT, F.K., GOODKIN, D.A., MARONI, B.J.,
HELD, P.J. and YOUNG, E.W., 2002. Mortality risk in hemodialysis patients and
changes in nutritional indicators: DOPPS. Kidney international, 62(6), pp. 2238-2245.
PODUVAL, R.D., WOLGEMUTH, C., FERRELL, J. and HAMMES, M.S., 2003.
Hyperphosphatemia in dialysis patients: is there a role for focused counseling? Journal
of Renal Nutrition, 13(3), pp. 219-223.
POLLOCK, J.B. and JAFFERY, J.B., 2007. Knowledge of Phosphorus Compared With
Other Nutrients in Maintenance Dialysis Patients. Journal of Renal Nutrition, 17(5), pp.
323-328.
PORT, F.K., ASHBY, V.B., DHINGRA, R.K., ROYS, E.C. and WOLFE, R.A., 2002.
Dialysis dose and body mass index are strongly associated with survival in hemodialysis
patients. Journal of the American Society of Nephrology, 13(4), pp. 1061-1066.
PRASAD, N. and JHA, V., 2015. Hemodialysis in Asia. Kidney Diseases, 1(3), pp. 165-
177.
PRESCOTT, S., TRAYNOR, J., SHILLIDAY, I., RUSH, R. and MERCER, T., 2016.
Minimum recommended accelerometer wear time for reliable estimation of physical
activity of people receiving maintenance haemodialysis. Physiotherapy, 102, pp. e205.
PRESCOTT, S., 2015. Physical activity, physical function and arterial stiffness of people
undergoing maintenance haemodialysis for stage 5 chronic kidney disease, Queen
Margaret University, Edinburgh.
PUBLIC HEALTH ENGLAND, Jun 2, 2015-last update, CKD prevalence estimates for
local and regional populations. Available:
https://www.gov.uk/government/publications/ckd-prevalence-estimates-for-local-and-
regional-populations [May 4, 2018].
PUBLIC HEALTH ENGLAND, Feb, 2014-last update, NHS Health Check programme
standards: a framework for quality improvement. Available:
https://www.healthcheck.nhs.uk/latest_news/nhs_health_check_programme_standards_
launched1/.

401
PUN, P.H., LEHRICH, R.W., HONEYCUTT, E.F., HERZOG, C.A. and MIDDLETON,
J.P., 2011. Modifiable risk factors associated with sudden cardiac arrest within
hemodialysis clinics. Kidney international, 79(2), pp. 218-227.
PUPIM, L.B., CUPPARI, L. and IKIZLER, T.A., 2006. Nutrition and metabolism in
kidney disease. Seminars in nephrology, 26(2), pp. 134-157.
PUPIM, L.B., MAJCHRZAK, K.M., FLAKOLL, P.J. and IKIZLER, T.A., 2006a.
Intradialytic oral nutrition improves protein homeostasis in chronic hemodialysis patients
with deranged nutritional status. Journal of the American Society of Nephrology : JASN,
17(11), pp. 3149-3157.
RABINOVICH, R.A., LOUVARIS, Z., RASTE, Y., LANGER, D., VAN REMOORTEL,
H., GIAVEDONI, S., BURTIN, C., REGUEIRO, E.M., VOGIATZIS, I. and
HOPKINSON, N.S., 2013. Validity of physical activity monitors during daily life in
patients with COPD. European Respiratory Journal, 42(5), pp. 1205-1215.
RAHIMI, K., SECKNUS, M., ADAM, M., HAYERIZADEH, B., FIEDLER, M.,
THIERY, J. and SCHULER, G., 2005. Correlation of exercise capacity with high-
sensitive C-reactive protein in patients with stable coronary artery disease. American
Heart Journal, 150(6), pp. 1282-1289.
RAIMANN, J.G., LEVIN, N.W., CRAIG, R.G., SIROVER, W., KOTANKO, P. and
HANDELMAN, G., 2013Is vitamin C intake too low in dialysis patients? Seminars in
dialysis 2013, Wiley Online Library, pp. 1-5.
RAMACHANDRAN, A. and SNEHALATHA, C., 2010. Rising burden of obesity in Asia.
Journal of obesity, 2010.
RAO A, CASULA A, CASTLEDINE C, 2014. The Renal Association UK renal registry
The Seventeenth Annual Report.
RAVANI, P., KILB, B., BEDI, H., GROENEVELD, S., YILMAZ, S., MUSTATA, S.,
ALBERTA KIDNEY DISEASE NETWORK and ALBERTA KIDNEY DISEASE
NETWORK, 2012. The Duke Activity Status Index in Patients with Chronic Kidney
Disease: A Reliability Study. Clinical Journal of the American Society of Nephrology,
7(4), pp. 573.
RAYNER, H.C., PISONI, R.L., GILLESPIE, B.W., GOODKIN, D.A., AKIBA, T.,
AKIZAWA, T., SAITO, A., YOUNG, E.W. and PORT, F.K., 2003. Creation, cannulation
and survival of arteriovenous fistulae: data from the Dialysis Outcomes and Practice
Patterns Study. Kidney international, 63(1), pp. 323-330.
REN, X.S. and AMICK, B.C., 1996. Race and self assessed health status: the role of
socioeconomic factors in the USA. Journal of Epidemiology & Community Health, 50(3),
pp. 269-273.
REVILL, S.M., MORGAN, M.D., SINGH, S.J., WILLIAMS, J. and HARDMAN, A.E.,

402
1999. The endurance shuttle walk: a new field test for the assessment of endurance
capacity in chronic obstructive pulmonary disease. Thorax, 54(3), pp. 213-222.
RHEE, C.M. and KALANTAR-ZADEH, K., 2014. Resistance exercise: an effective
strategy to reverse muscle wasting in hemodialysis patients? Journal of Cachexia,
Sarcopenia and Muscle, 5(3), pp. 177-180.
RHEE, C.M., MOLNAR, M.Z., LAU, W.L., RAVEL, V., KOVESDY, C.P., MEHROTRA,
R. and KALANTAR-ZADEH, K., 2014. Comparative mortality-predictability using
alkaline phosphatase and parathyroid hormone in patients on peritoneal dialysis and
hemodialysis. Peritoneal Dialysis International, 34(7), pp. 732-748.
RICHTER, A., KUHLMANN, M.K., SEIBERT, E., KOTANKO, P., LEVIN, N.W. and
HANDELMAN, G.J., 2008a. Vitamin C deficiency and secondary hyperparathyroidism
in chronic haemodialysis patients. Nephrology Dialysis Transplantation, 23(6), pp. 2058-
2063.
RICHTER, A., KUHLMANN, M.K., SEIBERT, E., KOTANKO, P., LEVIN, N.W. and
HANDELMAN, G.J., 2008b. Vitamin C deficiency and secondary hyperparathyroidism
in chronic haemodialysis patients. Nephrology Dialysis Transplantation, 23(6), pp. 2058-
2063.
RIVARA, M.B., RAVEL, V., KALANTAR-ZADEH, K., STREJA, E., LAU, W.L.,
NISSENSON, A.R., KESTENBAUM, B., DE BOER, I.H., HIMMELFARB, J. and
MEHROTRA, R., 2015. Uncorrected and albumin-corrected calcium, phosphorus, and
mortality in patients undergoing maintenance dialysis. Journal of the American Society
of Nephrology, 26(7), pp. 1671-1681.
ROBINSON, J.C., 1985. Of women and washing machines: Employment, housework,
and the reproduction of motherhood in socialist China. The China Quarterly, 101, pp. 32-
57.
RODRIGUES, J.C.D., SANTIN, F.G., BRITO, F.S., CARRERO, J.J., LINDHOLM, B.
and AVESANI, C.M., 2015. FP772OBESITY IN ELDERLY HEMODIALYSIS
PATIENTS: LOW SENSITIVITY AND SPECIFICITY OF BODY MASS INDEX.
Nephrology Dialysis Transplantation, 30(suppl_3), pp. iii335.
RON D. HAYS ET AL., 1997-last update, Kidney Disease Quality of Life Short Form
(KDQOL-SFTM), version 1.3: A manual for use and scoring.
ROSAS, S.E., JOFFE, M., FRANKLIN, E., STROM, B.L., KOTZKER, W.,
BRENSINGER, C., GROSSMAN, E., GLASSER, D. and FELDMAN, H.I., 2001.
Prevalence and determinants of erectile dysfunction in hemodialysis patients. Kidney
international, 59(6), pp. 2259-2266.
ROSENBERGER, J., KISSOVA, V., MAJERNIKOVA, M., STRAUSSOVA, Z. and
BOLDIZSAR, J., 2014. Body composition monitor assessing malnutrition in the

403
hemodialysis population independently predicts mortality. Journal of renal nutrition : the
official journal of the Council on Renal Nutrition of the National Kidney Foundation,
24(3), pp. 172.
ROSS, A.C., MANSON, J.E., ABRAMS, S.A., ALOIA, J.F., BRANNON, P.M.,
CLINTON, S.K., DURAZO-ARVIZU, R.A., GALLAGHER, J.C., GALLO, R.L. and
JONES, G., 2011. The 2011 report on dietary reference intakes for calcium and vitamin
D from the Institute of Medicine: what clinicians need to know. The Journal of Clinical
Endocrinology & Metabolism, 96(1), pp. 53-58.
ROWLANDS, A.V., THOMAS, P.W., ESTON, R.G. and TOPPING, R., 2004. Validation
of the RT3 triaxial accelerometer for the assessment of physical activity. Medicine and
science in sports and exercise, 36(3), pp. 518-524.
SADLIER, D.M. and MAGEE, C.C., 2007. Prevalence of 25 (OH) vitamin D (calcidiol)
deficiency at time of renal transplantation: a prospective study. Clinical transplantation,
21(6), pp. 683-688.
SA'ED H ZYOUD, DALA N DARAGHMEH, DIANA O MEZYED, RAZAN L
KHDEIR, MAYAS N SAWAFTA, NORA A AYASEH, GHADA H TABEEB, WALEED
M SWEILEH, RAHMAT AWANG and SAMAH W AL-JABI, 2016. Factors affecting
quality of life in patients on haemodialysis: a cross-sectional study from Palestine. BMC
nephrology, 17(1), pp. 44.
SAFFARI, M., PAKPOUR, A.H., NADERI, M.K., KOENIG, H.G., BALDACCHINO,
D.R. and PIPER, C.N., 2013. Spiritual coping, religiosity and quality of life: a study on
Muslim patients undergoing haemodialysis. Nephrology, 18(4), pp. 269-275.
SAITOH, M., OGAWA, M., DOS SANTOS, M.R., KONDO, H., SUGA, K., ITOH, H.
and TABATA, Y., 2016a. Effects of Intradialytic Resistance Exercise on Protein Energy
Wasting, Physical Performance and Physical Activity in Ambulatory Patients on Dialysis:
A Single‐Center Preliminary Study in a Japanese Dialysis Facility. Therapeutic Apheresis
and Dialysis, 20(6), pp. 632-638.
SAKTHONG, P. and KASEMSUP, V., 2012. Health utility measured with EQ-5D in Thai
patients undergoing peritoneal dialysis. Value in Health, 15(1), pp. S84.
SALEHI, M., SOHRABI, Z., EKRAMZADEH, M., FALLAHZADEH, M.K.,
AYATOLLAHI, M., GERAMIZADEH, B., HASSANZADEH, J. and SAGHEB, M.M.,
2013. Selenium supplementation improves the nutritional status of hemodialysis patients:
a randomized, double-blind, placebo-controlled trial. Nephrology, dialysis,
transplantation : official publication of the European Dialysis and Transplant
Association - European Renal Association, 28(3), pp. 716.
SANGHAVI, S., WHITING, S., URIBARRI, J. and URIBARRI, J., 2013. Potassium
Balance in Dialysis Patients. Seminars in dialysis, 26(5), pp. 597-603.

404
SARNA, L. and CONDE, F., 2001.Physical activity and fatigue during radiation therapy:
a pilot study using actigraph monitors. Oncology nursing forum,28(6),pp.1043.
SCARMEAS, N., LUCHSINGER, J.A., SCHUPF, N., BRICKMAN, A.M.,
COSENTINO, S., TANG, M.X. and STERN, Y., 2009. Physical activity, diet, and risk of
Alzheimer disease. Jama, 302(6), pp. 627-637.
SCHOELLER, D.A., ALON, A., MANEKAS, D., MIXSON, L.A., LASSETER, K.C.,
NOONAN, G.P., BOLOGNESE, J.A., HEYMSFIELD, S.B., BEALS, C.R. and NUNES,
I., 2012. Segmental bioimpedance for measuring amlodipine-induced pedal edema: a
placebo-controlled study. Clinical therapeutics, 34(3), pp. 580-592.
SCHUTTE, J.E., LONGHURST, J.C., GAFFNEY, F.A., BASTIAN, B.C., and
BLOMQVIST, C.G., 1981. Total plasma creatinine: an accurate measure of total
striated muscle mass. J Appl Physiol, 51(3), pp.762–6.
SEXTON, D.J., LOWNEY, A.C., O'SEAGHDHA, C.M., MURPHY, M., O'BRIEN, T.,
CASSERLY, L.F., MCQUILLAN, R., PLANT, W.D., EUSTACE, J.A., KINSELLA, S.M.
and CONLON, P.J., 2016. Do patient‐reported measures of symptoms and health status
predict mortality in hemodialysis? An assessment of POS‐S Renal and EQ‐5D.
Hemodialysis International, 20(4), pp. 618-630.
SEZER, S., BAL, Z., TUTAL, E., UYAR, M.E. and ACAR, N.O., 2014. Long-Term Oral
Nutrition Supplementation Improves Outcomes in Malnourished Patients With Chronic
Kidney Disease on Hemodialysis. Journal of Parenteral and Enteral Nutrition, 38(8), pp.
960-965.
SHANKAR, B., 2010. Obesity in China: the differential impacts of covariates along the
BMI distribution. Obesity, 18(8), pp. 1660-1666.
SHEPHARD, R.J., 2003. Limits to the measurement of habitual physical activity by
questionnaires. British journal of sports medicine, 37(3), pp. 197-206.
SHERMAN, R.A., 2009. Dietary phosphorus restriction in dialysis patients: potential
impact of processed meat, poultry, and fish products as protein sources. Am J Kidney Dis,
54(1), pp. 18-23.
SHIBAGAKI, Y. and TAKAICHI, K., 1998. Significant reduction of the large-vessel
blood volume by food intake during hemodialysis. Clinical nephrology, 49(1), pp. 49-54.
SHORTELL, S.M., RUNDALL, T.G. and HSU, J., 2007. Improving patient care by
linking evidence-based medicine and evidence-based management. Jama, 298(6), pp.
673-676.
SIEBELING, L., WIEBERS, S., BEEM, L., PUHAN, M.A. and TER RIET, G., 2012.
Validity and reproducibility of a physical activity questionnaire for older adults:
questionnaire versus accelerometer for assessing physical activity in older adults. Clinical
Epidemiology, 1, pp. 171.

405
SIGAL, R.J. and KENNY, G.P., 2010. Combined aerobic and resistance exercise for
patients with type 2 diabetes. Jama, 304(20), pp. 2298-2299.
SLOMOWITZ, L.A., MONTEON, F.J., GROSVENOR, M., LAIDLAW, S.A. and
KOPPEL, J.D., 1989. Effect of energy intake on nutritional status in maintenance
hemodialysis patients. Kidney international, 35(2), pp. 704-711.
SMART, N. and STEELE, M., 2011. Exercise training in haemodialysis patients: a
systematic review and meta‐analysis. Nephrology, 16(7), pp. 626-632.
SONG, W. and SOHNG, K., 2012. Effects of progressive resistance training on body
composition, physical fitness and quality of life of patients on hemodialysis. Journal of
Korean Academy of Nursing, 42(7), pp. 947-956.
SOUBERBIELLE, J., BODY, J., LAPPE, J.M., PLEBANI, M., SHOENFELD, Y.,
WANG, T.J., BISCHOFF-FERRARI, H.A., CAVALIER, E., EBELING, P.R. and
FARDELLONE, P., 2010. Vitamin D and musculoskeletal health, cardiovascular disease,
autoimmunity and cancer: Recommendations for clinical practice. Autoimmunity reviews,
9(11), pp. 709-715.
STACK, A.G., MOLONY, D.A., RIVES, T., TYSON, J. and MURTHY, B.V.R., 2005a.
Association of physical activity with mortality in the US dialysis population. American
Journal of Kidney Diseases, 45(4), pp. 690-701.
STACK, A.G. and MURTHY, B., 2008a. Exercise and Limitations in Physical Activity
Levels among New Dialysis Patients in the United States: An Epidemiologic Study.
Annals of Epidemiology, 18(12), pp. 880-888.
STEDDON, S. and SHARPLES, E., 2011. Renal Association Clinical Practice Guideline
in mineral and bone disorders in CKD. Nephron Clinical Practice, 118(Suppl. 1), pp.
c152.
STEIBER, A.L., KALANTAR-ZADEH, K., SECKER, D., MCCARTHY, M., SEHGAL,
A. and MCCANN, L., 2004. Subjective Global Assessment in chronic kidney disease: a
review . J Ren Nutr., 14(4), pp. 191-200.
STEIBER, L., HANDU, J., CATALINE, R., DEIGHTON, R. and WEATHERSPOON, J.,
2003. The impact of nutrition intervention on a reliable morbidity and mortality indicator:
the hemodialysis-prognostic nutrition index. Journal of renal nutrition : the official
journal of the Council on Renal Nutrition of the National Kidney Foundation, 13(3), pp.
186.
STENVER, D.I., GOTFREDSERN, A., HILSTED, J. and NIELSEN, B., 1995. Body
composition in hemodialysis patients measured by dual-energy X-ray absorptiometry.
American Journal of Nephrology, 15(2), pp. 105-110.
STENVINKEL, P., HEIMBURGER, O. and LINDHOLM, B., 2004. Wasting, but not
malnutrition, predicts cardiovascular mortality in end-stage renal disease. Nephrology

406
Dialysis Transplantation, 19(9), pp. 2181-2183.
STENVINKEL, P., HEIMBÜRGER, O., LINDHOLM, B., KAYSEN, G.A. and
BERGSTRÖM, J., 2000. Are there two types of malnutrition in chronic renal failure?
Evidence for relationships between malnutrition, inflammation and atherosclerosis (MIA
syndrome). Nephrology, dialysis, transplantation : official publication of the European
Dialysis and Transplant Association - European Renal Association, 15(7), pp. 953-960.
STENVINKEL, P., PECOITS-FILHO, R. and LINDHOLM, B., 2003. Coronary artery
disease in end-stage renal disease: no longer a simple plumbing problem. Journal of the
American Society of Nephrology, 14(7), pp. 1927-1939.
STEPHANIE, June 23, 2015-last update, Concurrent Validity Definition and Examples.
Available: http://www.statisticshowto.com/concurrent-validity/ [Jun 4, 2018].
STEPHENSON, G.R., MORETTI, E.W., EL-MOALEM, H., CLAVIEN, P.A. and
TUTTLE-NEWHALL, J.E., 2001. Malnutrition in liver transplant patients: preoperative
subjective global assessment is predictive of outcome after liver transplantation.
Transplantation, 72(4), pp. 666-670.
STERKY, E. and STEGMAYR, B.G., 2005. Elderly patients on haemodialysis have 50%
less functional capacity than gender- and age-matched healthy subjects. Scandinavian
journal of urology and nephrology, 39(5), pp. 423-430.
STEWART, A.L. and PAINTER, P.L., 1997. Issues in measuring physical functioning and
disability in arthritis patients. Arthritis Care and Research : The Official Journal of the
Arthritis Health Professions Association, 10(6), pp. 395-405.
STOLIC, R.V., TRAJKOVIC, G.Z., PERIC, V.M., STOLIC, D.Z., SOVTIC, S.R.,
ALEKSANDAR, J.N. and SUBARIC-GORGIEVA, G.D., 2010. Impact of metabolic
syndrome and malnutrition on mortality in chronic hemodialysis patients. Journal of
Renal Nutrition, 20(1), pp. 38-43.
SU, C., YABES, J., PIKE, F., WEINER, E., BEDDHU, S., BURROWES, D., ROCCO,
V. and UNRUH, L., 2013. Changes in anthropometry and mortality in maintenance
hemodialysis patients in the HEMO Study. American Journal of Kidney Diseases : The
Official Journal of the National Kidney Foundation, 62(6), pp. 1141.
SUEGA, K., BAKTA, M., DHARMAYUDHA, T.G., LUKMAN, J.S. and SUWITRA,
K., 2005. Profile of Anemia in Chronic Renal Failure Patients: Comparision Between
Predialyzed and Dialyzed Patients at The Division of Nephrology, Department of Internal
Medicine, Sanglah Hospital, Denpasar, Bali, Indonesia. Inflammation, 1, pp. 6-9.
SVENDSEN, O.L., HAARBO, J., HEITMANN, B.L., GOTFREDSEN, A. and
CHRISTIANSEN, C., 1991. Measurement of body fat in elderly subjects by dual-energy
x-ray absorptiometry, bioelectrical impedance, and anthropometry. The American
Journal of Clinical Nutrition, 53(5), pp. 1117.

407
SWAN, J., CLARKE, A., NICOLINI, D., POWELL, J., SCARBROUGH, H.,
ROGINSKI, C., GKEREDAKIS, E., MILLS, P. and TAYLOR-PHILLIPS, S., 2012.
Evidence in management decisions (EMD)—advancing knowledge utilization in
healthcare management. Final Report.NIHR Health Services and Delivery Programme, .
SWEETING, H. and WEST, P., 1995. Family life and health in adolescence: a role for
culture in the health inequalities debate. Social science & medicine, 40(2), pp. 163-175.
SZPANOWSKA-WOHN, A., KOLARZYK, E. and CHOWANIEC, E., 2008. Estimation
of intake of zinc, copper and iron in the diet of patients with chronic renal failure treated
by haemodialysis. Biological trace element research, 124(2), pp. 97-102.
TAKAHASHI, A., HU, S.L. and BOSTOM, A., 2018. Physical Activity in Kidney
Transplant Recipients: A Review. American Journal of Kidney Diseases .
TANDER, B., AKPOLAT, T., DURMUS, D. and CANTURK, F., 2007. Evaluation of
hand functions in hemodialysis patients. Renal failure, 29(4), pp. 477-480.
TANGVORAPHONKCHAI, K., HUNG, R., SADEGHI‐ALAVIJEH, O. and
DAVENPORT, A., 2018. Differences in Prevalence of Muscle Weakness (Sarcopenia) in
Haemodialysis Patients Determined by Hand Grip Strength Due to Variation in Guideline
Definitions of Sarcopenia. Nutrition in Clinical Practice,33(2), pp.255-260.
TAŞOĞLU, Ö, BAYRAKCI, N., ÖZCAN, D.S., ÖZKAYAR, N., TAŞOĞLU, İ and
ÖZGİRGİN, N., 2017. A functional tool demonstrating the physical function decline
independent of age in patients with predialysis chronic kidney disease. Turkish journal of
medical sciences, 47(1), pp. 91-97.
TAWNEY, K.W., TAWNEY, P.J.W. and KOVACH, J., 2003. RENAL RESEARCH
INSTITUTE SYMPOSIUM: Disablement and Rehabilitation in End‐Stage Renal
Disease. Seminars in dialysis, 16(6), pp. 447-452.
TAWNEY, K.W., TAWNEY, P.J., HLADIK, G., HOGAN, S.L., FALK, R.J., WEAVER,
C., MOORE, D.T. and LEE, M.Y., 2000. The life readiness program: a physical
rehabilitation program for patients on hemodialysis. American journal of kidney diseases,
36(3), pp. 581-591.
TENTORI, F., 2008. Mortality risk for dialysis patients with different levels of serum
calcium, phosphorus, and PTH: the Dialysis Outcomes and Practice Patterns Study
(DOPPS). Am J Kidney Dis, 52(3), pp. 519-530.
TENTORI, F., ELDER, S.J., THUMMA, J., PISONI, R.L., BOMMER, J., FISSELL,
R.B., FUKUHARA, S., JADOUL, M., KEEN, M.L., SARAN, R., RAMIREZ, S.P.B. and
ROBINSON, B.M., 2010. Physical exercise among participants in the Dialysis Outcomes
and Practice Patterns Study (DOPPS): correlates and associated outcomes. Nephrology,
dialysis, transplantation : official publication of the European Dialysis and Transplant
Association - European Renal Association, 25(9), pp. 3050-3062.

408
TEREKECI, H.M., KUCUKARDALI, Y., ONEM, Y., ERIKCI, A.A., KUCUKARDALI,
B., SAHAN, B., SAYAN, O., CELIK, S., GULEC, M. and SANISOGLU, Y.S., 2010.
Relationship between anaemia and cognitive functions in elderly people. European
journal of internal medicine, 21(2), pp. 87-90.
THE CENTRES FOR DISEASE CONTROL AND PREVENTION, (CDC), 2015-last
update, Measuring Physical Activity Intensity. Available:
https://www.cdc.gov/physicalactivity/basics/measuring/index.html.
THE CHIEF MEDICAL OFFICE, (CMO), 11 July, 2011-last update, UK physical
activity guidelines - GOV.UK. Available:
https://www.gov.uk/government/publications/uk-physical-activity-guidelines [Apr 10,
2018].
THE NATIONAL INSTITUTE OF CLINICAL EXCELLENCE, (NICE), 2015. early
identification and management of chronic kidney disease in adults in primary and
secondary care.
THOMAS, D.R., 2007. Loss of skeletal muscle mass in aging: examining the relationship
of starvation, sarcopenia and cachexia. Clinical nutrition, 26(4), pp. 389-399.
TIERNEY, M., FRASER, A., PURTILL, H. and KENNEDY, N., 2013. Study to
determine the criterion validity of the SenseWear Armband as a measure of physical
activity in people with rheumatoid arthritis. Arthritis care & research, 65(6), pp. 888-895.
TONELLI, M., WIEBE, N., KNOLL, G., BELLO, A., BROWNE, S., JADHAV, D.,
KLARENBACH, S. and GILL, J., 2011. Systematic review: kidney transplantation
compared with dialysis in clinically relevant outcomes. American journal of
transplantation : official journal of the American Society of Transplantation and the
American Society of Transplant Surgeons, 11(10), pp. 2093-2109.
TORKINGTON, M., MACRAE, M. and ISLES, C., 2006. Uptake of and adherence to
exercise during hospital haemodialysis. Physiotherapy, 92(2), pp. 83-87.
TORUN, D., MICOZKADIOGLU, H., TORUN, N., OZELSANCAK, R., SEZER, S.,
ADAM, F.U., OZDEMIR, F.N. and HABERAL, M., 2007. Increased Body Mass Index
Is Not a Reliable Marker of Good Nutrition in Hemodialysis Patients. Renal failure, 29(4),
pp. 487-493.
TOUSSAINT, N.D., POLKINGHORNE, K.R. and KERR, P.G., 2008b. Impact of
intradialytic exercise on arterial compliance and B‐type natriuretic peptide levels in
hemodialysis patients. Hemodialysis International, 12(2), pp. 254-263.
TUDOR-LOCKE, C., CRAIG, C.L., THYFAULT, J.P. and SPENCE, J.C., 2012. A step-
defined sedentary lifestyle index:< 5000 steps/day. Applied physiology, nutrition, and
metabolism, 38(2), pp. 100-114.
UK RENAL REGISTRY, 2016. 2016 - The Nineteenth Annual Report.

409
UK RENAL REGISTRY, 2015. 2015 - The Eighteenth Annual Report.
UNITED STATES RENAL DATA SYSTEM, (USRDS), 2008. Seven: Transplantation.
UNITED STATES RENAL DATA SYSTEM, USRDS, 2017-last update, v2 CH1
Incidence, Prevalence, Patient Characteristics, and Treatment Modalities. Available:
https://www.usrds.org/2017/view/v2_01.aspx.
UNITED STATES RENAL DATA SYSTEM, USRDS, 2015. USRDS annual data report:
Epidemiology of kidney disease in the United States. Bethesda, MD: National Institutes
of Health, National Institute of Diabetes and Digestive and Kidney Diseases. United
States Renal, .
URIBARRI, J., 2007. Phosphorus homeostasis in normal health and in chronic kidney
disease patients with special emphasis on dietary phosphorus intake. Seminars in dialysis,
20(4), pp. 295.
US RECOMBINANT HUMAN ERYTHROPOIETIN PREDIALYSIS STUDY GROUP,
1991. Double-blind, placebo-controlled study of the therapeutic use of recombinant
human erythropoietin for anemia associated with chronic renal failure in predialysis
patients. American Journal of Kidney Diseases, 18(1), pp. 50-59.
USRDS, 2008-last update, 2008 USRDS Annual Data Report. Available:
https://www.usrds.org/2008/view/esrd_07.asp.
VAIDYA, T., DE BISSCHOP, C., BEAUMONT, M., OUKSEL, H., JEAN, V.,
DESSABLES, F. and CHAMBELLAN, A., 2016. Is the 1-minute sit-to-stand test a good
tool for the evaluation of the impact of pulmonary rehabilitation? Determination of the
minimal important difference in COPD. International journal of chronic obstructive
pulmonary disease, 11, pp. 2609.
VALDERRÁBANO, F., JOFRE, R. and LÓPEZ-GÓMEZ, J.M., 2001. Quality of life in
end-stage renal disease patients. American Journal of Kidney Diseases, 38(3), pp. 443-
464.
VALTUILLE, R., CASOS, M.E., FERNANDEZ, E.A., GUINSBURG, A. and
MARELLI, C., 2015. Nutritional markers and body composition in hemodialysis patients.
International scholarly research notices, 58(15.8), pp. 60
VAN BIESEN, W., CLAES, K., COVIC, A., FAN, S., LICHODZIEJEWSKA-
NIEMIERKO, M., SCHODER, V., VERGER, C. and WABEL, P., 2013. A multicentric,
international matched pair analysis of body composition in peritoneal dialysis versus
haemodialysis patients. Nephrology Dialysis Transplantation, 28(10), pp. 2620-2628.
VAN BIESEN, W., WILLIAMS, J.D., COVIC, A.C., FAN, S., CLAES, K.,
LICHODZIEJEWSKA-NIEMIERKO, M., VERGER, C., STEIGER, J., SCHODER, V.,
WABEL, P., GAULY, A., HIMMELE, R. and EUROBCM STUDY GROUP, 2011. Fluid
status in peritoneal dialysis patients: the European Body Composition Monitoring

410
(EuroBCM) study cohort. PloS one, 6(2), pp. e17148.
VAN DEN HAM, E C, KOOMAN, J.P., CHRISTIAANS, M.H., NIEMAN, F.H., VAN
KREEL, B.K., HEIDENDAL, G.A. and VAN HOOFF, J.P., 1999. Body composition in
renal transplant patients: bioimpedance analysis compared to isotope dilution, dual
energy X-ray absorptiometry, and anthropometry. Journal of the American Society of
Nephrology : JASN, 10(5), pp. 1067-1079.
VAN DEN HAM, EUGÉNIE C H, KOOMAN, J.P., SCHOLS, A.M., NIEMAN, F.H.,
DOES, J.D., FRANSSEN, F.M., AKKERMANS, M.A., JANSSEN, P.P. and VAN
HOOFF, J.P., 2005. Similarities in skeletal muscle strength and exercise capacity between
renal transplant and hemodialysis patients. American journal of transplantation, 5(8), pp.
1957-1965.
VAN HEES, V.T., RENSTRÖM, F., WRIGHT, A., GRADMARK, A., CATT, M., CHEN,
K.Y., LÖF, M., BLUCK, L., POMEROY, J. and WAREHAM, N.J., 2011. Estimation of
daily energy expenditure in pregnant and non-pregnant women using a wrist-worn tri-
axial accelerometer. PloS one, 6(7), pp. e22922.
VAN KAN, G.A., ROLLAND, Y., ANDRIEU, S., BAUER, J., BEAUCHET, O.,
BONNEFOY, M., CESARI, M., DONINI, L.M., GILLETTE-GUYONNET, S. and
INZITARI, M., 2009. Gait speed at usual pace as a predictor of adverse outcomes in
community-dwelling older people an International Academy on Nutrition and Aging
(IANA) Task Force. The journal of nutrition, health & aging, 13(10), pp. 881-889.
VAN REMOORTEL, H., GIAVEDONI, S., RASTE, Y., BURTIN, C., LOUVARIS, Z.,
GIMENO-SANTOS, E., LANGER, D., GLENDENNING, A., HOPKINSON, N.S. and
VOGIATZIS, I., 2012. Validity of activity monitors in health and chronic disease: a
systematic review. International Journal of Behavioral Nutrition and Physical Activity,
9(1), pp. 84.
VAN REMOORTEL, H., RASTE, Y., LOUVARIS, Z., GIAVEDONI, S., BURTIN, C.,
LANGER, D., WILSON, F., RABINOVICH, R., VOGIATZIS, I. and HOPKINSON,
N.S., 2012. Validity of six activity monitors in chronic obstructive pulmonary disease: a
comparison with indirect calorimetry. PloS one, 7(6), pp. e39198.
VAN STRALEN, M.M., DE VRIES, H., MUDDE, A.N., BOLMAN, C. and LECHNER,
L., 2009. Determinants of initiation and maintenance of physical activity among older
adults: a literature review. Health Psychology Review, 3(2), pp. 147-207.
VEENEMAN, J. M., KINGMA, H. A., STELLAARD, F., DE JONG, P. E.,
REIJNGOUD, D. J., and HUISMAN, R. M., 2005. Oxidative metabolism appears to be
reduced in long-term hemodialysis patients. American journal of kidney diseases, 46(1),
pp. 102-110.
VER, N., CUKOR, D., CONSTANTINER, M. and KIMMEL, P.L., 2012. Depression and
mortality in end-stage renal disease. Current psychiatry reports, 14(1), pp. 36-44.

411
VIOLAN, M.A., POMES, T., MALDONADO, S., ROURA, G., DE LA FUENTE, I.,
VERDAGUER, T., LLORET, R., TORREGROSA, J.V. and CAMPISTOL, J.M.,
2002Exercise capacity in hemodialysis and renal transplant patients, Transplantation
proceedings 2002, Elsevier, pp. 417-418.
VOLPATO, S., CAVALIERI, M., SIOULIS, F., GUERRA, G., MARALDI, C., ZULIANI,
G., FELLIN, R. and GURALNIK, J.M., 2010. Predictive value of the Short Physical
Performance Battery following hospitalization in older patients. Journals of Gerontology
Series A: Biomedical Sciences and Medical Sciences, 66(1), pp. 89-96.
WÄCHTER, S., VOGT, M., KREIS, R., BOESCH, C., BIGLER, P., HOPPELER, H. and
KRÄHENBÜHL, S., 2002. Long-term administration of L-carnitine to humans: effect on
skeletal muscle carnitine content and physical performance. Clinica Chimica Acta,
318(1-2), pp. 51-61.
WAI‐YING, W., 2001. Confucian ethics and virtue ethics. Journal of Chinese Philosophy,
28(3), pp. 285-300.
WAIKAR, S.S. and BRUNELLI, S.M., 2011. The reply. American Journal of Medicine,
124(8),.
WAILOO, A., DAVIS, S. and TOSH, J., 2010. The Incorporation of Health Benefits in
Cost Utility Analysis Using the EQ-5D: A Report by the Decision Support Unit. Sheffield:
School of Health and Related Research, University of Sheffield .
WALD, R., 2008. Disordered mineral metabolism in hemodialysis patients: an analysis
of cumulative effects in the Hemodialysis (HEMO) Study. Am J Kidney Dis, 52(3), pp.
531-540.
WALTERS, B.A., HAYS, R.D., SPRITZER, K.L., FRIDMAN, M. and CARTER, W.B.,
2002. Health-related quality of life, depressive symptoms, anemia, and malnutrition at
hemodialysis initiation. American Journal of Kidney Diseases, 40(6), pp. 1185-1194.
WAN, E.Y., CHEN, J.Y., CHOI, E.P., WONG, C.K., CHAN, A.K., CHAN, K.H. and
LAM, C.L., 2015. Patterns of health-related quality of life and associated factors in
Chinese patients undergoing haemodialysis. Health and quality of life outcomes, 13(1),
pp. 108.
WANG, T.J., PENCINA, M.J., BOOTH, S.L., JACQUES, P.F., INGELSSON, E.,
LANIER, K., BENJAMIN, E.J., D’AGOSTINO, R.B., WOLF, M. and VASAN, R.S.,
2008. Vitamin D deficiency and risk of cardiovascular disease. Circulation, 117(4), pp.
503-511.
WANNER, C., KRANE, V., MÄRZ, W., OLSCHEWSKI, M., MANN, J.F.E., RUF, G.,
RITZ, E. and GERMAN DIABETES AND DIALYSIS STUDY INVESTIGATORS,
2005. Atorvastatin in Patients with Type 2 Diabetes Mellitus Undergoing Hemodialysis.
The New England journal of medicine, 353(3), pp. 238-248.

412
WEILER, R. and STAMATAKIS, E., 2010. Physical activity in the UK: a unique
crossroad? British journal of sports medicine, 44(13), pp. 912-914.
WEISBORD, S.D., FRIED, L.F., ARNOLD, R.M., FINE, M.J., LEVENSON, D.J.,
PETERSON, R.A. and SWITZER, G.E., 2005. Prevalence, severity, and importance of
physical and emotional symptoms in chronic hemodialysis patients. Journal of the
American Society of Nephrology, 16(8), pp. 2487-2494.
WEISBORD, S.D., FRIED, L.F., MOR, M.K., RESNICK, A.L., UNRUH, M.L.,
PALEVSKY, P.M., LEVENSON, D.J., COOKSEY, S.H., FINE, M.J. and KIMMEL, P.L.,
2007. Renal provider recognition of symptoms in patients on maintenance hemodialysis.
Clinical Journal of the American Society of Nephrology, 2(5), pp. 960-967.
WIGGINS, K.L., 2002. Guidelines for nutrition care of renal patients. American Dietetic
Associati.
WILDMAN, R.P., MUNTNER, P., REYNOLDS, K., MCGINN, A.P., RAJPATHAK, S.,
WYLIE-ROSETT, J. and SOWERS, M.R., 2008. The obese without cardiometabolic risk
factor clustering and the normal weight with cardiometabolic risk factor clustering:
prevalence and correlates of 2 phenotypes among the US population (NHANES 1999-
2004). Archives of Internal Medicine, 168(15), pp. 1617-1624.
WILUND, K.R., TOMAYKO, E.J., WU, P.T., RYONG CHUNG, H.,
VALLURUPALLI, S., LAKSHMINARAYANAN, B. and FERNHALL, B., 2010.
Intradialytic exercise training reduces oxidative stress and epicardial fat: a pilot study.
Nephrology, dialysis, transplantation : official publication of the European Dialysis and
Transplant Association - European Renal Association, 25(8), pp. 2695-2701.
WINDSOR, P.M., NICOL, K.F. and POTTER, J., 2004a. A randomized, controlled trial
of aerobic exercise for treatment‐related fatigue in men receiving radical external beam
radiotherapy for localized prostate carcinoma. Cancer, 101(3), pp. 550-557.
WITHAM, M.D., SUGDEN, J.A., SUMUKADAS, D., DRYBURGH, M. and
MCMURDO, M.E., 2012. A comparison of the Endurance Shuttle Walk test and the Six
Minute Walk test for assessment of exercise capacity in older people. Aging clinical and
experimental research, 24(2), pp. 176-180.
WIZEMANN, V., 2000. Regular dialysis treatment in Germany: the role of non-profit
organisations. Journal of nephrology, 13, pp. 16.
WIZEMANN, V., WABEL, P., CHAMNEY, P., ZALUSKA, W., MOISSL, U., RODE, C.,
MALECKA-MASALSKA, T. and MARCELLI, D., 2009. The mortality risk of
overhydration in haemodialysis patients. Nephrology Dialysis Transplantation, 24(5), pp.
1574-1579.
WOLF, M., SHAH, A., GUTIERREZ, O., ANKERS, E., MONROY, M., TAMEZ, H.,
STEELE, D., CHANG, Y., CAMARGO, C.A. and TONELLI, M., 2007. Vitamin D levels

413
and early mortality among incident hemodialysis patients. Kidney international, 72(8),
pp. 1004-1013.
WOLFE, R.A., ROYS, E.C. and MERION, R.M., 2010. Trends in organ donation and
transplantation in the United States, 1999-2008. American journal of transplantation :
official journal of the American Society of Transplantation and the American Society of
Transplant Surgeons, 10(4 Pt 2), pp. 961-972.
WOODROW, G., OLDROYD, B., TURNEY, J.H., TOMPKINS, L., BROWNJOHN,
A.M. and SMITH, M.A., 1996a. Whole body and regional body composition in patients
with chronic renal failure. Nephrology Dialysis Transplantation, 11(8), pp. 1613-1618.
WOODROW, G., OLDROYD, B., TURNEY, J.H., DAVIES, P.S., DAY, J.M. and SMITH,
M.A., 1996b. Four-component model of body composition in chronic renal failure
comprising dual-energy X-ray absorptiometry and measurement of total body water by
deuterium oxide dilution. Clinical science, 91(6), pp. 763-769.
WORLD MEDICAL ASSOCIATION, 2013. Ethical Principles for Medical Research
Involving Human Subjects.
WU, Y., HE, Q., YIN, X., HE, Q., CAO, S. and YING, G., 2014a. Effect of individualized
exercise during maintenance haemodialysis on exercise capacity and health-related
quality of life in patients with uraemia. Journal of International Medical Research, 42(3),
pp. 718-727.
XIE, Y. and CHEN, X., 2008. Epidemiology, major outcomes, risk factors, prevention
and management of chronic kidney disease in China. American Journal of Nephrology,
28(1), pp. 1-7.
XUE, J.L., DAHL, D., EBBEN, J.P. and COLLINS, A.J., 2003. The association of initial
hemodialysis access type with mortality outcomes in elderly medicare ESRD patients.
American Journal of Kidney Diseases, 42(5), pp. 1013-1019.
YANG, B., XU, J., XUE, Q., WEI, T., XU, J., YE, C., MEI, C. and MAO, Z., 2015. Non-
pharmacological interventions for improving sleep quality in patients on dialysis:
systematic review and meta-analysis. Sleep Medicine Reviews, 23, pp. 68-82.
YANG, F., GRIVA, K., LAU, T., VATHSALA, A., LEE, E., NG, H.J., MOOPPIL, N.,
FOO, M., NEWMAN, S.P. and CHIA, K.S., 2015a. Health-related quality of life of Asian
patients with end-stage renal disease (ESRD) in Singapore. Quality of Life Research,
24(9), pp. 2163-2171.
YANG, F., LAU, T., LEE, E., VATHSALA, A., CHIA, K.S. and LUO, N., 2015.
Comparison of the preference-based EQ-5D-5L and SF-6D in patients with end-stage
renal disease (ESRD). The European Journal of Health Economics, 16(9), pp. 1019-1026.
YANOVSKI, S.Z., HUBBARD, V.S., LUKASKI, H.C. and HEYMSFIELD, S.B., 1996.
No title. Bioelectrical impedance analysis in body composition measurement-

414
Proceedings of a National Institutes of Health Technology Assessment Conference held
in Bethesda, MD, December 12-14, 1994-Introduction, .
YAP, T.L., DAVIS, L.S., GATES, D.M., HEMMINGS, A.B. and PAN, W., 2009. The
Effect of Tailored E-mails in the Workplace. Workplace Health & Safety, 57(8), pp. 313-
319.
YIN, S. and WAN, F., 2016. Effect of intra-dialytic exercises on micro-inflammatory state
in maintenance hemodialysis patients. Modern Clinical Nursing, 15(8), pp. 54-58.
YINIAN PENG, 2016. 中文版杜克活动状况指数的研制及用于心血管疾病患者的信
效度研究, 重庆医科大学.
YLITALO, K.R., KARVONEN-GUTIERREZ, C.A., FITZGERALD, N., ZHENG, H.,
STERNFELD, B., EL KHOUDARY, S.R. and HARLOW, S.D., 2013. Relationship of
race-ethnicity, body mass index, and economic strain with longitudinal self-report of
physical functioning: the Study of Women's Health Across the Nation. Annals of
Epidemiology, 23(7), pp. 401-408.
YONG, D., KWOK, A., WONG, D., SUEN, M., CHEN, W.T. and TSE, D., 2009a.
Symptom burden and quality of life in end-stage renal disease: a study of 179 patients on
dialysis and palliative care. Palliative medicine, 23(2), pp. 111-119.
YONG, D., KWOK, A., WONG, D., SUEN, M., CHEN, W.T. and TSE, D., 2009b.
Symptom burden and quality of life in end-stage renal disease: a study of 179 patients on
dialysis and palliative care. Palliative medicine, 23(2), pp. 111-119.
YOUNG, E.W., ALBERT, J.M., SATAYATHUM, S., GOODKIN, D.A., PISONI, R.L.,
AKIBA, T., AKIZAWA, T., KUROKAWA, K., BOMMER, J. and PIERA, L., 2005.
Predictors and consequences of altered mineral metabolism: the Dialysis Outcomes and
Practice Patterns Study. Kidney international, 67(3), pp. 1179-1187.
YOUNG, H.M., HUDSON, N., CLARKE, A.L., DUNGEY, M., FEEHALLY, J.,
BURTON, J.O. and SMITH, A.C., 2015. Patient and staff perceptions of intradialytic
exercise before and after implementation: a qualitative study. PLoS One, 10(6), pp.
e0128995.
YOUNG, H.M., MARCH, D.S., GRAHAM-BROWN, M.P., JONES, A.W., CURTIS, F.,
GRANTHAM, C.S., CHURCHWARD, D.R., HIGHTON, P., SMITH, A.C. and SINGH,
S.J., 2018. Effects of intradialytic cycling exercise on exercise capacity, quality of life,
physical function and cardiovascular measures in adult haemodialysis patients: a
systematic review and meta-analysis. Nephrology Dialysis Transplantation, .
ZAMOJSKA, S., SZKLAREK, M., NIEWODNICZY, M. and NOWICKI, M., 2006.
Correlates of habitual physical activity in chronic haemodialysis patients. Nephrology,
dialysis, transplantation : official publication of the European Dialysis and Transplant
Association - European Renal Association, 21(5), pp. 1323-1327.

415
ZANINI, A., AIELLO, M., CHERUBINO, F., ZAMPOGNA, E., AZZOLA, A., CHETTA,
A. and SPANEVELLO, A., 2015. The one repetition maximum test and the sit-to-stand
test in the assessment of a specific pulmonary rehabilitation program on peripheral
muscle strength in COPD patients. International journal of chronic obstructive
pulmonary disease, 10, pp. 2423.
ZHANG, C.H., SHEN, S. and WANG, S.X., 2012. Serum level of 25 (OH) D and its
relevant influencing factors in patients on maintenance hemodialysis. Zhonghua yi xue
za zhi, 92(24), pp. 1690-1693.
ZHANG, K., DONG, J., CHENG, X., BAI, W., GUO, W., WU, L. and ZUO, L., 2012.
Association between vitamin C deficiency and dialysis modalities. Nephrology, 17(5), pp.
452-457.
ZHANG, L., WANG, F., WANG, L., WANG, W., LIU, B., LIU, J., CHEN, M., HE, Q.,
LIAO, Y., YU, X., CHEN, N., ZHANG, J.E., HU, Z., LIU, F., HONG, D., MA, L., LIU,
H., ZHOU, X., CHEN, J., PAN, L., CHEN, W., WANG, W., LI, X. and WANG, H., 2012.
Prevalence of chronic kidney disease in China: a cross-sectional survey. Lancet (London,
England), 379(9818), pp. 815-822.
ZHANG, L. and WANG, H., 2009. Chronic kidney disease epidemic: cost and health care
implications in China. Seminars in nephrology, 29(5), pp. 483-486.
ZHANG, L., LIU, Y. and GUO, W., 2015. Analysis of relations of Kidney Qi and
Primitive Qi,Circle of life Qi,Movement Qi between Kidney and Real Qi . Liaoning TCM
Journal, 42(10), pp. 1878-1879.
ZHANG, S., ROWLANDS, A.V., MURRAY, P. and HURST, T.L., 2012. Physical
activity classification using the GENEA wrist-worn accelerometer.
ZHENG, J., YOU, L., LOU, T., CHEN, N., LAI, D., LIANG, Y., LI, Y., GU, Y., LV, S.
and ZHAI, C., 2010. Development and psychometric evaluation of the Dialysis patient-
perceived Exercise Benefits and Barriers Scale. International journal of nursing studies,
47(2), pp. 166-180.
ZHOU, B.F., STAMLER, J., DENNIS, B., MOAG-STAHLBERG, A., OKUDA, N.,
ROBERTSON, C., ZHAO, L., CHAN, Q. and ELLIOTT, P., 2003. Nutrient intakes of
middle-aged men and women in China, Japan, United Kingdom, and United States in the
late 1990s: the INTERMAP study. Journal of human hypertension, 17(9), pp. 623.
ZHOU, L., ZENG, X. and FU, P., 2017. Community hemodialysis in China:
Opportunities and challenges. Chinese medical journal, 130(18), pp. 2143.
ZHOU, Q.G., JIANG, J.P., WU, S.J., TIAN, J.W., CHEN, J.H., YU, X.Q., CHEN, P.Y.,
MEI, C.L., XIONG, F. and SHI, W., 2012. Current pattern of Chinese dialysis units: a
cohort study in a representative sample of units. Chinese medical journal, 125(19), pp.
3434-3439.

416
ZITTERMANN, A., 2006. Vitamin D and disease prevention with special reference to
cardiovascular disease. Progress in biophysics and molecular biology, 92(1), pp. 39-48.
ZITTERMANN, A., 2003. Vitamin D in preventive medicine: are we ignoring the
evidence? British Journal of Nutrition, 89(5), pp. 552-572.
ZOCCALI, C., TRIPEPI, G. and MALLAMACI, F., 2005Predictors of cardiovascular
death in ESRD, Seminars in nephrology 2005, Elsevier, pp. 358-362.
ZUO, L., WANG, M. and CHINESE ASSOCIATION OF BLOOD PURIFICATION
MANAGEMENT OF CHINESE HOSPITAL ASSOCIATION, 2010. Current burden and
probable increasing incidence of ESRD in China. Clinical nephrology, 74 Suppl 1, pp.
20.
ZYOUD, S.H., DARAGHMEH, D.N., MEZYED, D.O., KHDEIR, R.L., SAWAFTA,
M.N., AYASEH, N.A., TABEEB, G.H., SWEILEH, W.M., AWANG, R. and AL-JABI,
S.W., 2016. Factors affecting quality of life in patients on haemodialysis: a cross-
sectional study from Palestine. BMC nephrology, 17(1), pp. 44.