Acupuncture for low back pain: an overview of systematic reviews
The Spine Journal 11 (2011) 402–411
Clinical Study
Modic changes and associated features in Southern Europeanchronic low back pain patients
Estanislao Arana, MD, MHA, PhDa,b,c,*, Francisco M. Kovacs, MD, PhDc,d,Ana Royuela, MScc,e,f, Ana Estremera, MDc,g, Beatriz Asenjo, MD, PhDc,h,
Helena Saras�ıbar, MDc,g, Guillermo Amengual, MDc,g, Isabel Galarraga, MDc,i,Ana Alonso, MDj, Carlos Casillas, MD, PhDk, Alfonso Muriel, MScc,e,f, Julia Montoya, MDj,
Cristina Ord�o~nez, MDj, Carmen Mart�ınez, MDc,g, Javier Zamora, PhDc,e,f,Carlos Campillo, MD, MPH, PhDc,l, V�ıctor Abraira, PhDc,e,f
aServicio de Radiolog�ıa, Fundaci�on Instituto Valenciano de Oncolog�ıa, Valencia, SpainbFundaci�on Instituto de Investigaci�on en Servicios de Salud, Valencia, Spain
cSpanish Back Pain Research Network, Fundaci�on Kovacs, Paseo de Mallorca 36, 07012 Palma de Mallorca, SpaindDepartamento Cient�ıfico, Fundaci�on Kovacs, Paseo de Mallorca 36, 07012 Palma de Mallorca, Spain
eCIBER Epidemiolog�ıa y Salud P�ublica (CIBERESP), SpainfUnidad de Bioestad�ıstica Cl�ınica. Hospital Ram�on y Cajal, IRYCIS. Ctra. Colmenar Km. 9.1, 28034 Madrid, Spain
gHospital Son Ll�atzer, Ctra. De Manacor, Km. 4, 07198 Palma de Mallorca, SpainhHospital Carlos Haya, Avda Carlos Haya s/n, 29011 M�alaga, Spain
iHospital de Manacor, Ctra. De Manacor s/n, 07500 Manacor, Mallorca, SpainjFundaci�on Jim�enez D�ıaz Avda, Reyes Cat�olicos, 2 - 28040 Madrid, Spain
kInstituto de Traumatolog�ıa Uni�on de Mutuas, Av. del Lled�o, 67 / Juan de Herrera, 27 12004 Castell�on, SpainlIb-Salut, Calle Reina Esclaramunda 9, 07003 Palma de Mallorca, Spain
Received 17 January 2011; accepted 23 March 2011
Abstract BACKGROUND CONTEXT: Conflicting r
FDA device/drug
Author disclosure
close. AR: Nothing t
to disclose. HS: Nothi
to disclose. AA: Noth
ing to disclose. JM:
Nothing to disclose.
VA: Nothing to disclo
1529-9430/$ - see fro
doi:10.1016/j.spinee.2
eports exist regarding the prevalence of Modicchanges among low back pain (LBP) patients and factors associated with their existence.PURPOSE: To assess the prevalence of Modic changes and other findings on lumbar magnetic res-onance imaging (MRI) among Spanish adult chronic LBP patients and the patient characteristicsand radiological findings associated with Modic changes.STUDY DESIGN: A cross-sectional imaging study among chronic LBP patients.PATIENT SAMPLE: Four hundred eighty-seven patients (263 women and 224 men) undergoinglumbar spine MRI examination for chronic LBP.OUTCOME MEASURES: Gender, age, body mass index (BMI), lifetime smoking exposure,degree of physical activity, and image features (disc degeneration, type and extension of Modicchanges, disc contour, annular tears, spinal stenosis, and spondylolisthesis).METHODS: Ten radiologists from six hospitals across six cities in Spain consecutively recruitedadult patients in whom lumbar MRI had been prescribed for LBP lasting$3 months. Patients’ char-acteristics and imaging findings were assessed through previously validated instruments. A multivar-iate logistic regression model was developed to assess the features associated with Modic changes.RESULTS: Modic changes were found in 81% of the patients. The most common was Type II(51.3%), affecting only the end plate. Variables associated with Type I changes were disc contour
status: not applicable.
s: EA: Nothing to disclose. FMK: Nothing to dis-
o disclose. AE: Nothing to disclose. BA: Nothing
ng to disclose. GA: Nothing to disclose. IG: Nothing
ing to disclose. CC: Nothing to disclose. AM: Noth-
Nothing to disclose. CO: Nothing to disclose. CM:
JZ: Nothing to disclose. CC: Nothing to disclose.
se.
This study was funded by the Kovacs Foundation, a not-for-profit
Spanish institution specializing in neck and back pain research, and with
no links to the health industry.
* Corresponding author. Fundaci�on Instituto Valenciano de Oncolog�ıa,C/ Beltr�an B�aguena, 19, 46009 Valencia, Spain. Tel.: þ34 961114360.
E-mail address: [email protected] (E. Arana)
nt matter � 2011 Elsevier Inc. All rights reserved.
011.03.019

403E. Arana et al. / The Spine Journal 11 (2011) 402–411
abnormalities, spondylolisthesis, and disc degeneration. The same variables were associated witha higher risk of Type II or any type ofModic changes, as well as beingmale, and having a higher BMI.CONCLUSIONS: Modic changes are found in 81% (95% confidence interval, 77–85) of adultSpanish patients in whom an MRI is prescribed for chronic LBP. Modic changes are more likelyto be found in males with a high BMI, who also show disc contour abnormalities, spondylolisthesis,or disc degeneration. � 2011 Elsevier Inc. All rights reserved.
Keywords: Disc degeneration; Modic changes; Vertebral end plate; Magnetic resonance imaging; Chronic low back pain
Introduction
Low back pain (LBP) is defined as the pain between thecostal margins and the inferior gluteal folds, which may beassociated with pain referred down to the leg (‘‘leg pain’’),and is usually accompanied by painful limitation of move-ment. Diagnosis of unspecific LBP discard pain is related toconditions such as fractures, direct trauma, or systemic dis-eases, such as spondylodiscitis, neoplastic-, infectious-,vascular-, metabolic-, or endocrine-related processes [1].
In some cases, LBP is caused by disc protrusion, discherniation, or spinal stenosis. However, most prevalentradiological findings among LBP patients are similarlycommon among healthy subjects. In most cases, it is impos-sible to prove what is actually causing the pain, which ishence diagnosed as ‘‘unspecific’’ [1].
Signal intensity changes of vertebral end plates and sub-chondral bone (‘‘Modic changes’’) are often observed inmagnetic resonance images (MRIs) taken from the generalpopulation [2], asymptomatic subjects [3], and patientswith LBP [4]. Three different types of changes have beendescribed [5]. Type I (low T1 and high T2 signals) isthought to reflect an ongoing active degenerative process,Type II (high T1 and T2 signals) is believed to correspondto a more stable chronic degeneration, and Type III (lowT1 and T2 signals) is considered to be a sign of subchondralbone sclerosis [5].
Knowledge about the determinants of Modic changesand their evolution is limited [6,7] and should be furtherstudied [6]. Genetic risk factors have been shown to influ-ence the development and severity of disc degeneration andend plate herniations [8], which suggest that there may bedifferences in the prevalence of Modic changes across eth-nic groups. Data on the prevalence of Modic changesamong Southern European chronic LBP patients and thefactors associated with them are scarce [9].
The use of normalized forms has been encouraged tomin-imize the variability in radiological reporting. The ‘‘NordicModic Consensus Group Classification’’ (NMCGC) isa structured form designed for reporting findings on MRI,which has shown to be reliable in studies performed in differ-ent countries [10–13]. As a result, its dissemination has beenencouraged [14].
The objectives of this study were to determine the prev-alence of Modic changes and other image findings in a co-hort of Spanish chronic LBP patients, using a previouslyvalidated version of the NMCGC and to explore imaging
and demographic characteristics associated with a higherrisk for Modic changes among these patients.
Methods
Setting
This study was performed in the radiology departments ofsix general hospitals—four from Spanish National HealthService (SNHS) and two private—in different Spanish cities,which cover 2,191,882 inhabitants. These radiology depart-ments perform the MRI studies prescribed in their respectiveareas for both inpatient and outpatient practices.
Subjects
This study was approved by the hospitals’ institutionalreview boards, and all participants signed an informed con-sent form. Inclusion criteria were undergoing a lumbar MRIfor chronic LBP at one of the participating radiologydepartments. ‘‘Chronic’’ was defined as LBP lasting for3 months or more [15].
Exclusion criteria were having undergone spine surgery,being pregnant, suffering from cauda equina syndrome,scoliosis with O15� curvature, vertebral fractures, or paincaused by systemic diseases (such as inflammatory spondy-loarthropathies, spinal infection, or tumor).
Previous systematic review in LBP patients has founda median prevalence for Modic changes of approximately43% [16]. Hence, sample size was calculated to detecta prevalence of 50%65%, with a 95% confidence, assum-ing that one-fourth of the patients invited to participatewould refuse to do so. Therefore, sample size was estab-lished in 513 subjects.
Assessments
Procedure
The design of this study did not require any modifica-tions to the patients’ routine clinical management. As a partof their clinical evaluation, patients were asked to rate theintensity of LBP, leg pain, and LBP-related disability. Painintensity was measured with a 10-cm visual analog scale(for which 05no pain and 105worst possible pain) [17].Two separate scales were used for LBP and leg pain.LBP-related functional disability was measured using the
ContextThe prevalence of Modic changes in specific populations
is being explored. This article examines such changes
and their radiographic associations in Spanish patients
with chronic low back pain.
ContributionModic changes, most commonly Type II, were found in
81% of patients studied and were associated with disc
degeneration, spondylolisthesis, and disc contour abnor-
malities. Associations with body mass index and male
gender were also noted.
ImplicationThe findings are consistent with the current literature and
suggest that Modic changes are common findings in pa-
tients with significant degenerative lumbar processes.
Questions regarding correlation with pain and impair-
ment, causation, and prognostic importance remain open.—The Editors
404 E. Arana et al. / The Spine Journal 11 (2011) 402–411
validated Spanish version of the Roland-Morris question-naire, in which disability is scored from 0 to 24 points(better to worse) [18].
Before undergoing an MRI, participants used a self-administered questionnaire to provide data on age, gender,height, weight, lifetime smoking exposure (years smokedand the average number of cigarettes smoked per day),and level of physical activity. To estimate the latter, previ-ously validated methods were used [19]. According to thesemethods, the self-administered questionnaire gathered dataon self-perceived level of physical requirements duringdaily activities (classified as requiring the patient to‘‘remain seated,’’ ‘‘standstill,’’ ‘‘walk,’’ ‘‘walk and liftobjects from time to time,’’ or being ‘‘severely physicallydemanding’’). To assess the level of physical activity atwork, the questionnaire asked whether the job requiredphysical exertion (such as lifting heavy objects or digging)or adopting certain positions for a specified duration (kneel-ing or squatting$1 hour a day; remaining standstill or bend-ing forward $1 hour a day; remaining seated for $5 hoursa day; driving a car, tractor, or similar $4 hours a day for$3 months a year; walking for $4 hours a day; lifting,pushing, or carrying objects for$5 kg,$2 twice per minutefor $2 hours a day; lifting, pushing, or carrying objects for$20 kg $20 times a day). To estimate the level of physicalactivity during leisure or sport, the questionnaire gatheredthe number of days per week in which heart rate increasedfor more than 10 minutes in a row (while performing activ-ities, such as working in the garden, jogging, or other sports)and the mean duration of such sessions [19].
Patients completed all the self-administered question-naires by themselves, in private. The only instructions they
received were those included in the standard validated ver-sions of the self-administered questionnaires. They re-ceived no help or additional instructions from healthcare personnel, research staff, or other third parties. Oncecompleted, the questionnaires were collected by auxiliarypersonnel not related to the study. Data were introducedinto a database at a central coordination office by two ad-ministrative assistants separately to double-check that thedata introduced coincided with the ratings on thequestionnaires.
Magnetic resonance imaging
All examinations were performed on six 1.5-T MRI sys-tems with a six-channel phased-array spine coil. The fol-lowing sequences were used without fat suppression:
� A localizer sequence of five images, 30�/10�/50� (rep-etition time [TR]/echo time [TE]/flip angle), consistingof two coronal and three sagittal images in orthogonalplanes.
� Sagittal T1-weighted spin echo, 440 to 550/14 to 20(TR/TE), 156 to 307�192 to 512 matrix, 270-mmfield of view, 11 slices of 4-mm thickness, and2 acquisitions.
� Sagittal T2-weighted turbo spin echo 2,896 to 3,300/102 to 120 (TR/effective TE), 156 to 307�192 to512 matrix, 270-mm field of view, 11 slices of 4-mmthickness, 2 acquisitions, and 12 echo train length.
� Axial T2-weighted turbo spin echo 2,896 to 3,040/103 to 120 (TR/effective TE), 224 to 190�256 to512 matrix, 180-mm field of view, 15 slices of 5-mmthickness, 3 acquisitions, and 5 echo train length. Sliceswere placed in the plane of the five lower discs.
MRI evaluation
Radiologists were unaware of patients’ clinical features.They were asked to report their findings using the Spanishversion of the NMCGC [10,12], in which all the variablesare recorded separately for all the lumbar segments (fromL1–L2 to L5–S1) (Table 1).
Because different types of Modic changes could exist atthe same level, variables were recorded separately for pre-dominant and nonpredominant types at each level. ‘‘Predom-inant’’ typewas defined as the most extended at a given level.Recorded variables were presence (no changes, Type I, II, orIII) [5], location (the upper or lower vertebral end plate),maximum height (craniocaudally) affected by Modicchanges (only the end plate, less than 25% of vertebral body,between 25% and 50%, more than 50%), maximum volumethat was (craniocaudally) affected by Modic changes (onlythe end plate, less than 25% of vertebral body, between25% and 50%, more than 50%), end plate extension affectedby Modic changes in the anteroposterior axis (less than 25%of the end plate, between 25% and 50%,more than 50%), and
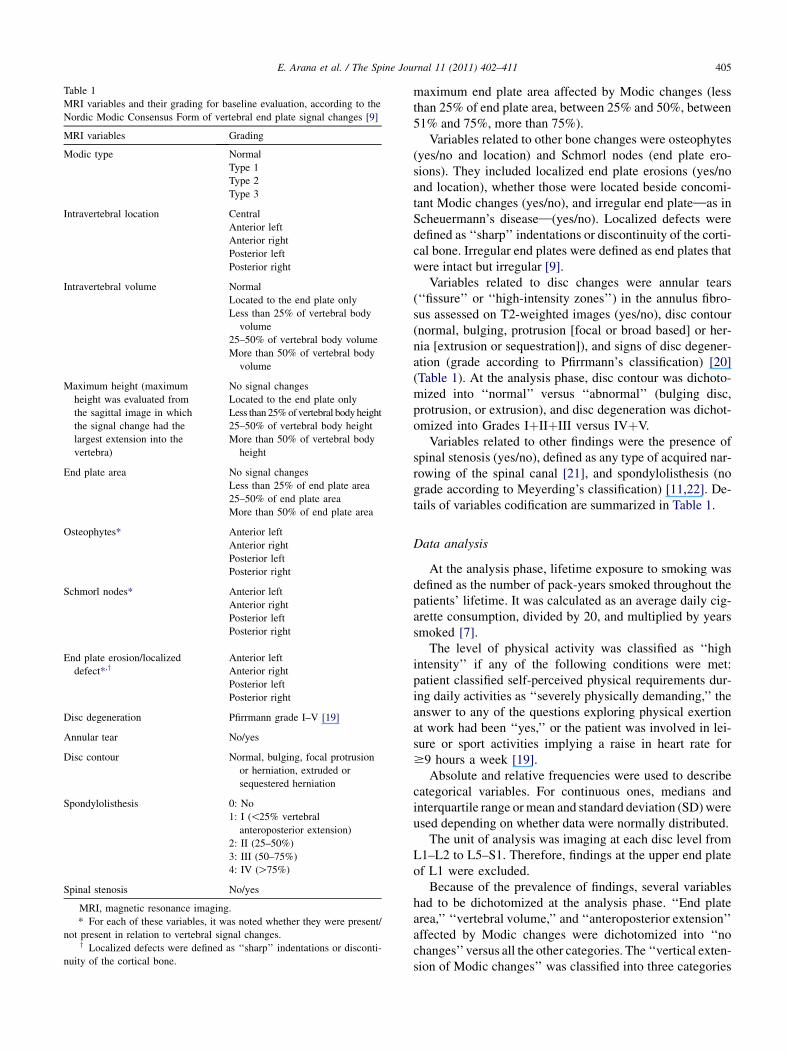
Table 1
MRI variables and their grading for baseline evaluation, according to the
Nordic Modic Consensus Form of vertebral end plate signal changes [9]
MRI variables Grading
Modic type Normal
Type 1
Type 2
Type 3
Intravertebral location Central
Anterior left
Anterior right
Posterior left
Posterior right
Intravertebral volume Normal
Located to the end plate only
Less than 25% of vertebral body
volume
25–50% of vertebral body volume
More than 50% of vertebral body
volume
Maximum height (maximum
height was evaluated from
the sagittal image in which
the signal change had the
largest extension into the
vertebra)
No signal changes
Located to the end plate only
Less than 25%of vertebral bodyheight
25–50% of vertebral body height
More than 50% of vertebral body
height
End plate area No signal changes
Less than 25% of end plate area
25–50% of end plate area
More than 50% of end plate area
Osteophytes* Anterior left
Anterior right
Posterior left
Posterior right
Schmorl nodes* Anterior left
Anterior right
Posterior left
Posterior right
End plate erosion/localized
defect*,yAnterior left
Anterior right
Posterior left
Posterior right
Disc degeneration Pfirrmann grade I–V [19]
Annular tear No/yes
Disc contour Normal, bulging, focal protrusion
or herniation, extruded or
sequestered herniation
Spondylolisthesis 0: No
1: I (!25% vertebral
anteroposterior extension)
2: II (25–50%)
3: III (50–75%)
4: IV (O75%)
Spinal stenosis No/yes
MRI, magnetic resonance imaging.
* For each of these variables, it was noted whether they were present/
not present in relation to vertebral signal changes.y Localized defects were defined as ‘‘sharp’’ indentations or disconti-
nuity of the cortical bone.
405E. Arana et al. / The Spine Journal 11 (2011) 402–411
maximum end plate area affected by Modic changes (lessthan 25% of end plate area, between 25% and 50%, between51% and 75%, more than 75%).
Variables related to other bone changes were osteophytes(yes/no and location) and Schmorl nodes (end plate ero-sions). They included localized end plate erosions (yes/noand location), whether those were located beside concomi-tant Modic changes (yes/no), and irregular end plate—as inScheuermann’s disease—(yes/no). Localized defects weredefined as ‘‘sharp’’ indentations or discontinuity of the corti-cal bone. Irregular end plates were defined as end plates thatwere intact but irregular [9].
Variables related to disc changes were annular tears(‘‘fissure’’ or ‘‘high-intensity zones’’) in the annulus fibro-sus assessed on T2-weighted images (yes/no), disc contour(normal, bulging, protrusion [focal or broad based] or her-nia [extrusion or sequestration]), and signs of disc degener-ation (grade according to Pfirrmann’s classification) [20](Table 1). At the analysis phase, disc contour was dichoto-mized into ‘‘normal’’ versus ‘‘abnormal’’ (bulging disc,protrusion, or extrusion), and disc degeneration was dichot-omized into Grades IþIIþIII versus IVþV.
Variables related to other findings were the presence ofspinal stenosis (yes/no), defined as any type of acquired nar-rowing of the spinal canal [21], and spondylolisthesis (nograde according to Meyerding’s classification) [11,22]. De-tails of variables codification are summarized in Table 1.
Data analysis
At the analysis phase, lifetime exposure to smoking wasdefined as the number of pack-years smoked throughout thepatients’ lifetime. It was calculated as an average daily cig-arette consumption, divided by 20, and multiplied by yearssmoked [7].
The level of physical activity was classified as ‘‘highintensity’’ if any of the following conditions were met:patient classified self-perceived physical requirements dur-ing daily activities as ‘‘severely physically demanding,’’ theanswer to any of the questions exploring physical exertionat work had been ‘‘yes,’’ or the patient was involved in lei-sure or sport activities implying a raise in heart rate for$9 hours a week [19].
Absolute and relative frequencies were used to describecategorical variables. For continuous ones, medians andinterquartile range ormean and standard deviation (SD)wereused depending on whether data were normally distributed.
The unit of analysis was imaging at each disc level fromL1–L2 to L5–S1. Therefore, findings at the upper end plateof L1 were excluded.
Because of the prevalence of findings, several variableshad to be dichotomized at the analysis phase. ‘‘End platearea,’’ ‘‘vertebral volume,’’ and ‘‘anteroposterior extension’’affected by Modic changes were dichotomized into ‘‘nochanges’’versus all the other categories. The ‘‘vertical exten-sion of Modic changes’’ was classified into three categories
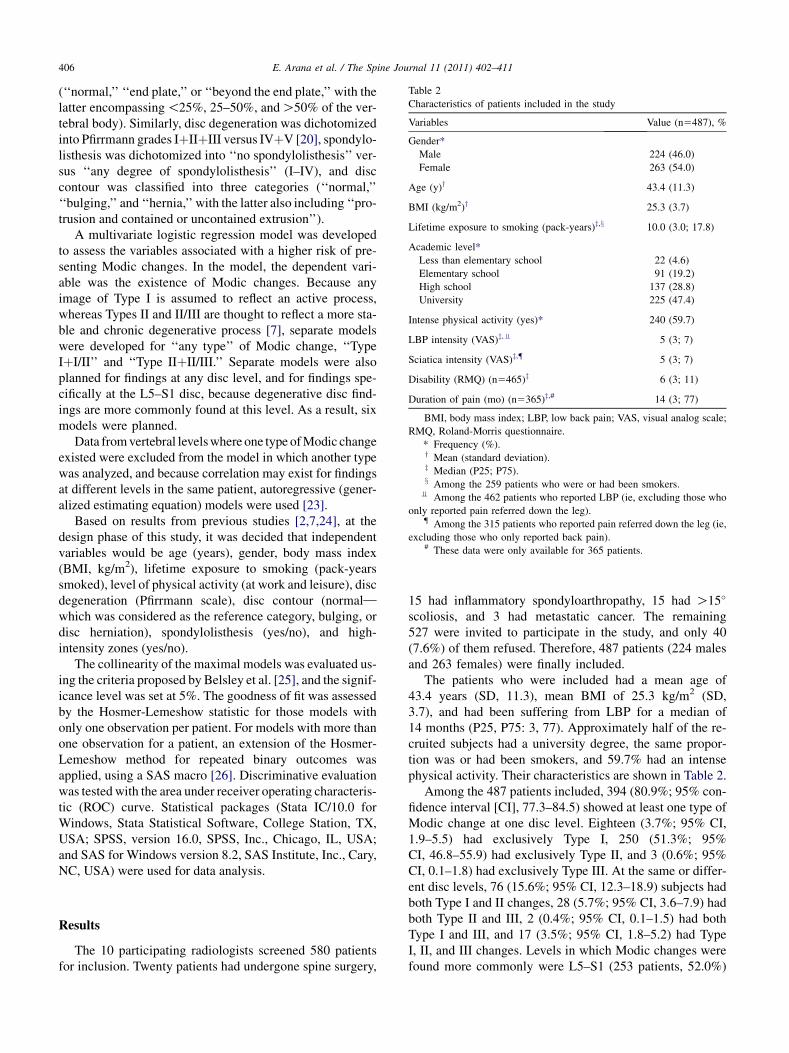
Table 2
Characteristics of patients included in the study
Variables Value (n5487), %
Gender*
Male 224 (46.0)
Female 263 (54.0)
Age (y)y 43.4 (11.3)
BMI (kg/m2)y 25.3 (3.7)
Lifetime exposure to smoking (pack-years)z,x 10.0 (3.0; 17.8)
Academic level*
Less than elementary school 22 (4.6)
Elementary school 91 (19.2)
High school 137 (28.8)
University 225 (47.4)
Intense physical activity (yes)* 240 (59.7)
LBP intensity (VAS)z,v 5 (3; 7)
Sciatica intensity (VAS)z,{ 5 (3; 7)
Disability (RMQ) (n5465)z 6 (3; 11)
Duration of pain (mo) (n5365)z,# 14 (3; 77)
BMI, body mass index; LBP, low back pain; VAS, visual analog scale;
RMQ, Roland-Morris questionnaire.
* Frequency (%).y Mean (standard deviation).z Median (P25; P75).x Among the 259 patients who were or had been smokers.
v Among the 462 patients who reported LBP (ie, excluding those who
only reported pain referred down the leg).{ Among the 315 patients who reported pain referred down the leg (ie,
excluding those who only reported back pain).# These data were only available for 365 patients.
406 E. Arana et al. / The Spine Journal 11 (2011) 402–411
(‘‘normal,’’ ‘‘end plate,’’ or ‘‘beyond the end plate,’’ with thelatter encompassing!25%, 25–50%, andO50% of the ver-tebral body). Similarly, disc degeneration was dichotomizedinto Pfirrmann grades IþIIþIII versus IVþV [20], spondylo-listhesis was dichotomized into ‘‘no spondylolisthesis’’ ver-sus ‘‘any degree of spondylolisthesis’’ (I–IV), and disccontour was classified into three categories (‘‘normal,’’‘‘bulging,’’ and ‘‘hernia,’’ with the latter also including ‘‘pro-trusion and contained or uncontained extrusion’’).
A multivariate logistic regression model was developedto assess the variables associated with a higher risk of pre-senting Modic changes. In the model, the dependent vari-able was the existence of Modic changes. Because anyimage of Type I is assumed to reflect an active process,whereas Types II and II/III are thought to reflect a more sta-ble and chronic degenerative process [7], separate modelswere developed for ‘‘any type’’ of Modic change, ‘‘TypeIþI/II’’ and ‘‘Type IIþII/III.’’ Separate models were alsoplanned for findings at any disc level, and for findings spe-cifically at the L5–S1 disc, because degenerative disc find-ings are more commonly found at this level. As a result, sixmodels were planned.
Data fromvertebral levelswhere one type ofModic changeexisted were excluded from the model in which another typewas analyzed, and because correlation may exist for findingsat different levels in the same patient, autoregressive (gener-alized estimating equation) models were used [23].
Based on results from previous studies [2,7,24], at thedesign phase of this study, it was decided that independentvariables would be age (years), gender, body mass index(BMI, kg/m2), lifetime exposure to smoking (pack-yearssmoked), level of physical activity (at work and leisure), discdegeneration (Pfirrmann scale), disc contour (normal—
which was considered as the reference category, bulging, ordisc herniation), spondylolisthesis (yes/no), and high-intensity zones (yes/no).
The collinearity of the maximal models was evaluated us-ing the criteria proposed by Belsley et al. [25], and the signif-icance level was set at 5%. The goodness of fit was assessedby the Hosmer-Lemeshow statistic for those models withonly one observation per patient. For models with more thanone observation for a patient, an extension of the Hosmer-Lemeshow method for repeated binary outcomes wasapplied, using a SAS macro [26]. Discriminative evaluationwas tested with the area under receiver operating characteris-tic (ROC) curve. Statistical packages (Stata IC/10.0 forWindows, Stata Statistical Software, College Station, TX,USA; SPSS, version 16.0, SPSS, Inc., Chicago, IL, USA;and SAS for Windows version 8.2, SAS Institute, Inc., Cary,NC, USA) were used for data analysis.
Results
The 10 participating radiologists screened 580 patientsfor inclusion. Twenty patients had undergone spine surgery,
15 had inflammatory spondyloarthropathy, 15 had O15�
scoliosis, and 3 had metastatic cancer. The remaining527 were invited to participate in the study, and only 40(7.6%) of them refused. Therefore, 487 patients (224 malesand 263 females) were finally included.
The patients who were included had a mean age of43.4 years (SD, 11.3), mean BMI of 25.3 kg/m2 (SD,3.7), and had been suffering from LBP for a median of14 months (P25, P75: 3, 77). Approximately half of the re-cruited subjects had a university degree, the same propor-tion was or had been smokers, and 59.7% had an intensephysical activity. Their characteristics are shown in Table 2.
Among the 487 patients included, 394 (80.9%; 95% con-fidence interval [CI], 77.3–84.5) showed at least one type ofModic change at one disc level. Eighteen (3.7%; 95% CI,1.9–5.5) had exclusively Type I, 250 (51.3%; 95%CI, 46.8–55.9) had exclusively Type II, and 3 (0.6%; 95%CI, 0.1–1.8) had exclusively Type III. At the same or differ-ent disc levels, 76 (15.6%; 95% CI, 12.3–18.9) subjects hadboth Type I and II changes, 28 (5.7%; 95% CI, 3.6–7.9) hadboth Type II and III, 2 (0.4%; 95% CI, 0.1–1.5) had bothType I and III, and 17 (3.5%; 95% CI, 1.8–5.2) had TypeI, II, and III changes. Levels in which Modic changes werefound more commonly were L5–S1 (253 patients, 52.0%)

0% 20% 40% 60% 80% 100%
L1–L2 (n=84)
L2–L3 (n=105)
L3–L4 (n=148)
L4–L5 (n=224)
L5–S1 (n=253)
I II III I/II II/III I/III I/II/III No Modic
Figure. Prevalence of Modic changes at each vertebral level (487
patients). Bars: relative frequencies.
407E. Arana et al. / The Spine Journal 11 (2011) 402–411
and L4–L5 (224 patients, 46.0%). The types of Modicchanges found at each level are shown in the Figure.
Table 3 shows imaging findings at each disc level. Over-all prevalence was 89.5% (95% CI, 86.7–92.4) for osteo-phytes, 79.9% (95% CI, 76.2–83.5) for disc bulging,71.9% (95% CI, 67.8–76.0) for spinal stenosis, 70.8%(95% CI, 66.7–75.0) for disc degeneration (Pfirrmanngrades IVþV), 58.7% (95% CI, 54.3–63.2) for annulartears, 29.2% (95% CI, 25.0–33.3) for end plate erosion,28.7% (95% CI, 24.6–32.9) for disc hernia, 17.2% (95%CI, 13.8–20.7) for Schmorl nodes, and 8.8% (95% CI,6.2–11.5) for spondylolisthesis. All these findings weremore common at the L4–L5 and L5–S1 levels.
The variable ‘‘BMI’’ had to be centered because of col-linearity problems. For the models focusing on findings atthe L5–S1 level, the Hosmer-Lemeshow test showed thatthe expected and observed frequencies were similar forModic IþI/II (p5.330) and Modic IIþII/III (p5.435), butnot for any type of Modic change (p5.030). For thesemodels, the area under the ROC curves were 0.87 (95%CI, 0.81–0.92), 0.76 (95% CI, 0.71–0.82), and 0.77 (95%CI, 0.72–0.82), respectively.
For the models focusing on findings at any vertebrallevel, the Hosmer-Lemeshow test showed that the expectedand observed frequencies were similar for Modic IþI/II(p5.355) and Modic IIþII/III (p5.110). The p value forany type of Modic change was .053. The area under theROC curves were 0.84 (95% CI, 0.78–0.89) for the modelon Modic IþI/II, 0.74 (95% CI, 0.71–0.76) for the modelon Modic IIþII/III, and 0.75 (95% CI, 0.72–0.77) for anytype of Modic change.
According to these models, the prevalence of Modicchanges IþI/II at any level was associated with the exis-tence of disc degeneration, bulging, disc herniation, andspondylolisthesis. At the L5–S1 level, a statistically signif-icant association between the prevalence of these types ofModic changes and the existence of spondylolisthesis wasfound (Table 4).
The prevalence of Modic changes IIþII/III at any levelwas positively associated with older age, higher BMI, discherniation, male gender, and disc degeneration. At the
L5–S1 level, only the association with the two latters wasstatistically significant (Table 4).
The prevalence of any type of Modic change at any levelwas positively associated with male gender, BMI, disc de-generation, bulging, disc herniation, and spondylolisthesis.At the L5–S1 level, it was positively associated with malegender, disc degeneration, disc herniation, and spondylolis-thesis (Table 4).
Table 5 shows the association between the maximal ver-tical extension of Modic changes and disc degeneration anddisc contour abnormalities. At all the disc levels, disc de-generation and bulging were associated with the existenceof Modic changes affecting the end plate and, especially,the vertebral body. This was also true for disc herniationat the L4–L5 and L5–S1 levels. This association couldnot be calculated for the upper levels because of the lowprevalence of disc herniation (Table 5).
Discussion
Results from this study showed that among Spanishchronic LBP patients in whom an MRI is prescribed in rou-tine clinical practice, the prevalence of any type of Modicchanges is 80.9% (95% CI, 77.3–84.5). Other prevalentfindings are annular tears at L4–L5 (33.1%; 95% CI,28.8–37.3) and L5–S1 (36.8%; 95% CI, 32.4–41.1) levels,spinal stenosis at L4–L5 (47.6%; 95% CI, 43.1–52.2) andL5–S1 (50.9%; 95% CI, 46.4–55.5) levels, and spondylolis-thesis at the L5–S1 (6.2%; 95% CI, 3.9–8.4) level.
Generally speaking, the prevalence of spondylolisthesis,annular tears, disc contour abnormalities, and spinal steno-sis falls within the range reported by previous studiesamong LBP patients [9,27–30]. Not surprisingly, the prev-alence of Modic changes found in this study is higher thanthe one found among nonclinical populations (around 6%)[10] and a miscellanea of acute and chronic LBP patients(around 56%) [4]. However, it is in the upper range re-ported in a recent systematic review [16], and it is alsohigher than the prevalence found in other settings amongchronic LBP patients (62%) [30,31]. Differences in theprevalence of findings across studies can be explained bythe kind of subjects that were recruited (acute vs. chronicvs. a miscellanea of both types), sample size and represen-tativeness, and potential genetic differences across differentpopulations [8]. In addition, the use of a standardized formto report findings may have enabled radiologists participat-ing in this study to report even the smallest signal change.
Type II were the type of Modic changes most commonlyfound in this study. This is coherent with what has beenfound among adult patients and working populations inmost previous reports, both in Northern Europe [7,32]and North America [33]. However, in Northern Europe,Type I was the most common finding among the generalpopulation [10]. This may be because of the fact that TypeI can regress to normal bone marrow or convert to Type II,
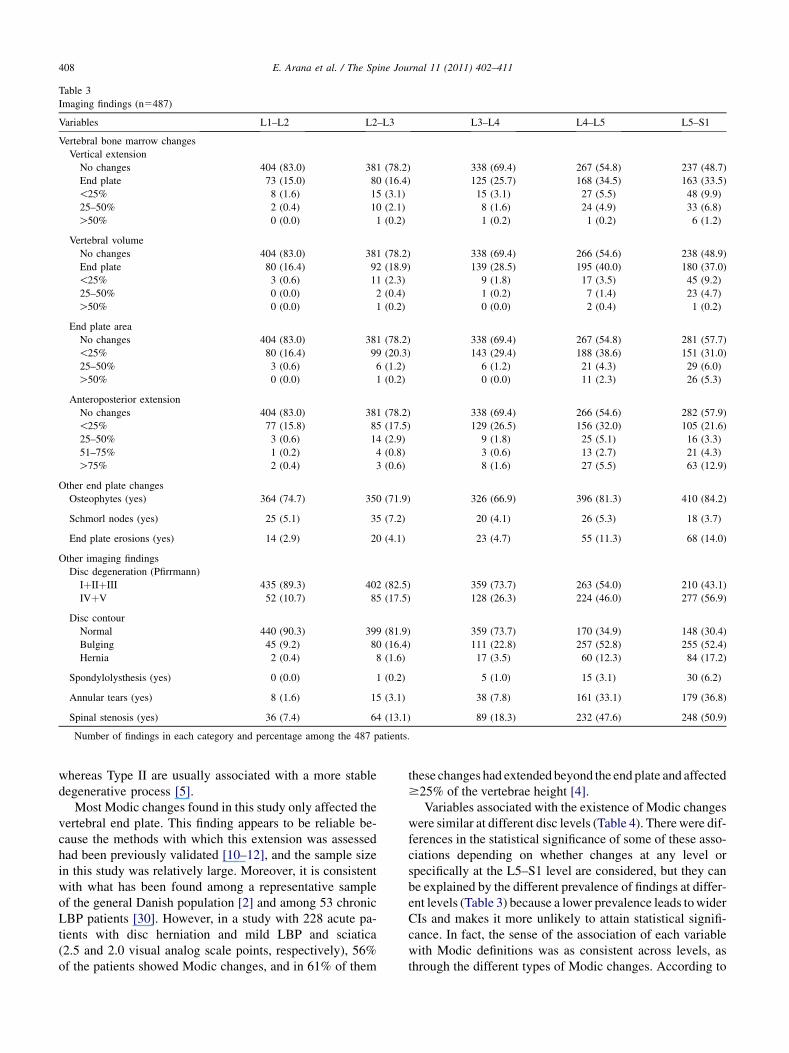
Table 3
Imaging findings (n5487)
Variables L1–L2 L2–L3 L3–L4 L4–L5 L5–S1
Vertebral bone marrow changes
Vertical extension
No changes 404 (83.0) 381 (78.2) 338 (69.4) 267 (54.8) 237 (48.7)
End plate 73 (15.0) 80 (16.4) 125 (25.7) 168 (34.5) 163 (33.5)
!25% 8 (1.6) 15 (3.1) 15 (3.1) 27 (5.5) 48 (9.9)
25–50% 2 (0.4) 10 (2.1) 8 (1.6) 24 (4.9) 33 (6.8)
O50% 0 (0.0) 1 (0.2) 1 (0.2) 1 (0.2) 6 (1.2)
Vertebral volume
No changes 404 (83.0) 381 (78.2) 338 (69.4) 266 (54.6) 238 (48.9)
End plate 80 (16.4) 92 (18.9) 139 (28.5) 195 (40.0) 180 (37.0)
!25% 3 (0.6) 11 (2.3) 9 (1.8) 17 (3.5) 45 (9.2)
25–50% 0 (0.0) 2 (0.4) 1 (0.2) 7 (1.4) 23 (4.7)
O50% 0 (0.0) 1 (0.2) 0 (0.0) 2 (0.4) 1 (0.2)
End plate area
No changes 404 (83.0) 381 (78.2) 338 (69.4) 267 (54.8) 281 (57.7)
!25% 80 (16.4) 99 (20.3) 143 (29.4) 188 (38.6) 151 (31.0)
25–50% 3 (0.6) 6 (1.2) 6 (1.2) 21 (4.3) 29 (6.0)
O50% 0 (0.0) 1 (0.2) 0 (0.0) 11 (2.3) 26 (5.3)
Anteroposterior extension
No changes 404 (83.0) 381 (78.2) 338 (69.4) 266 (54.6) 282 (57.9)
!25% 77 (15.8) 85 (17.5) 129 (26.5) 156 (32.0) 105 (21.6)
25–50% 3 (0.6) 14 (2.9) 9 (1.8) 25 (5.1) 16 (3.3)
51–75% 1 (0.2) 4 (0.8) 3 (0.6) 13 (2.7) 21 (4.3)
O75% 2 (0.4) 3 (0.6) 8 (1.6) 27 (5.5) 63 (12.9)
Other end plate changes
Osteophytes (yes) 364 (74.7) 350 (71.9) 326 (66.9) 396 (81.3) 410 (84.2)
Schmorl nodes (yes) 25 (5.1) 35 (7.2) 20 (4.1) 26 (5.3) 18 (3.7)
End plate erosions (yes) 14 (2.9) 20 (4.1) 23 (4.7) 55 (11.3) 68 (14.0)
Other imaging findings
Disc degeneration (Pfirrmann)
IþIIþIII 435 (89.3) 402 (82.5) 359 (73.7) 263 (54.0) 210 (43.1)
IVþV 52 (10.7) 85 (17.5) 128 (26.3) 224 (46.0) 277 (56.9)
Disc contour
Normal 440 (90.3) 399 (81.9) 359 (73.7) 170 (34.9) 148 (30.4)
Bulging 45 (9.2) 80 (16.4) 111 (22.8) 257 (52.8) 255 (52.4)
Hernia 2 (0.4) 8 (1.6) 17 (3.5) 60 (12.3) 84 (17.2)
Spondylolysthesis (yes) 0 (0.0) 1 (0.2) 5 (1.0) 15 (3.1) 30 (6.2)
Annular tears (yes) 8 (1.6) 15 (3.1) 38 (7.8) 161 (33.1) 179 (36.8)
Spinal stenosis (yes) 36 (7.4) 64 (13.1) 89 (18.3) 232 (47.6) 248 (50.9)
Number of findings in each category and percentage among the 487 patients.
408 E. Arana et al. / The Spine Journal 11 (2011) 402–411
whereas Type II are usually associated with a more stabledegenerative process [5].
Most Modic changes found in this study only affected thevertebral end plate. This finding appears to be reliable be-cause the methods with which this extension was assessedhad been previously validated [10–12], and the sample sizein this study was relatively large. Moreover, it is consistentwith what has been found among a representative sampleof the general Danish population [2] and among 53 chronicLBP patients [30]. However, in a study with 228 acute pa-tients with disc herniation and mild LBP and sciatica(2.5 and 2.0 visual analog scale points, respectively), 56%of the patients showed Modic changes, and in 61% of them
these changes had extended beyond the end plate and affected$25% of the vertebrae height [4].
Variables associated with the existence of Modic changeswere similar at different disc levels (Table 4). Therewere dif-ferences in the statistical significance of some of these asso-ciations depending on whether changes at any level orspecifically at the L5–S1 level are considered, but they canbe explained by the different prevalence of findings at differ-ent levels (Table 3) because a lower prevalence leads towiderCIs and makes it more unlikely to attain statistical signifi-cance. In fact, the sense of the association of each variablewith Modic definitions was as consistent across levels, asthrough the different types of Modic changes. According to
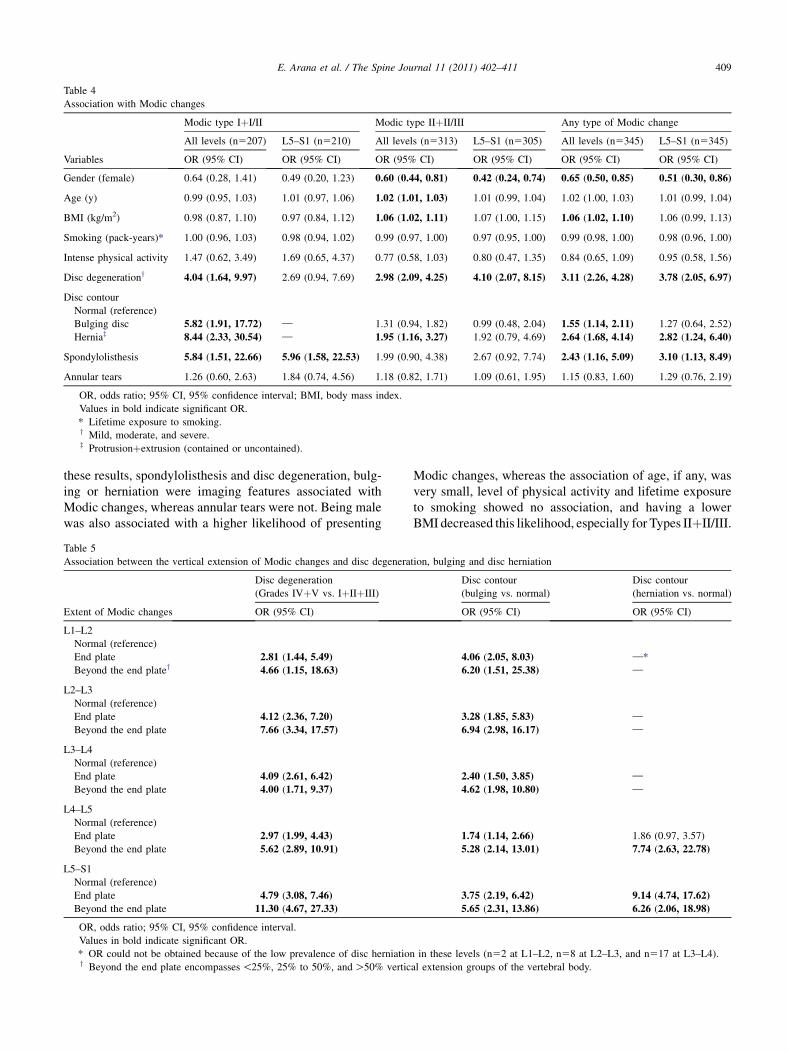
Table 4
Association with Modic changes
Variables
Modic type IþI/II Modic type IIþII/III Any type of Modic change
All levels (n5207) L5–S1 (n5210) All levels (n5313) L5–S1 (n5305) All levels (n5345) L5–S1 (n5345)
OR (95% CI) OR (95% CI) OR (95% CI) OR (95% CI) OR (95% CI) OR (95% CI)
Gender (female) 0.64 (0.28, 1.41) 0.49 (0.20, 1.23) 0.60 (0.44, 0.81) 0.42 (0.24, 0.74) 0.65 (0.50, 0.85) 0.51 (0.30, 0.86)
Age (y) 0.99 (0.95, 1.03) 1.01 (0.97, 1.06) 1.02 (1.01, 1.03) 1.01 (0.99, 1.04) 1.02 (1.00, 1.03) 1.01 (0.99, 1.04)
BMI (kg/m2) 0.98 (0.87, 1.10) 0.97 (0.84, 1.12) 1.06 (1.02, 1.11) 1.07 (1.00, 1.15) 1.06 (1.02, 1.10) 1.06 (0.99, 1.13)
Smoking (pack-years)* 1.00 (0.96, 1.03) 0.98 (0.94, 1.02) 0.99 (0.97, 1.00) 0.97 (0.95, 1.00) 0.99 (0.98, 1.00) 0.98 (0.96, 1.00)
Intense physical activity 1.47 (0.62, 3.49) 1.69 (0.65, 4.37) 0.77 (0.58, 1.03) 0.80 (0.47, 1.35) 0.84 (0.65, 1.09) 0.95 (0.58, 1.56)
Disc degenerationy 4.04 (1.64, 9.97) 2.69 (0.94, 7.69) 2.98 (2.09, 4.25) 4.10 (2.07, 8.15) 3.11 (2.26, 4.28) 3.78 (2.05, 6.97)
Disc contour
Normal (reference)
Bulging disc 5.82 (1.91, 17.72) — 1.31 (0.94, 1.82) 0.99 (0.48, 2.04) 1.55 (1.14, 2.11) 1.27 (0.64, 2.52)
Herniaz 8.44 (2.33, 30.54) — 1.95 (1.16, 3.27) 1.92 (0.79, 4.69) 2.64 (1.68, 4.14) 2.82 (1.24, 6.40)
Spondylolisthesis 5.84 (1.51, 22.66) 5.96 (1.58, 22.53) 1.99 (0.90, 4.38) 2.67 (0.92, 7.74) 2.43 (1.16, 5.09) 3.10 (1.13, 8.49)
Annular tears 1.26 (0.60, 2.63) 1.84 (0.74, 4.56) 1.18 (0.82, 1.71) 1.09 (0.61, 1.95) 1.15 (0.83, 1.60) 1.29 (0.76, 2.19)
OR, odds ratio; 95% CI, 95% confidence interval; BMI, body mass index.
Values in bold indicate significant OR.
* Lifetime exposure to smoking.y Mild, moderate, and severe.z Protrusionþextrusion (contained or uncontained).
409E. Arana et al. / The Spine Journal 11 (2011) 402–411
these results, spondylolisthesis and disc degeneration, bulg-ing or herniation were imaging features associated withModic changes, whereas annular tears were not. Being malewas also associated with a higher likelihood of presenting
Table 5
Association between the vertical extension of Modic changes and disc degenera
Extent of Modic changes
Disc degeneration
(Grades IVþV vs. IþIIþIII)
OR (95% CI)
L1–L2
Normal (reference)
End plate 2.81 (1.44, 5.49)
Beyond the end platey 4.66 (1.15, 18.63)
L2–L3
Normal (reference)
End plate 4.12 (2.36, 7.20)
Beyond the end plate 7.66 (3.34, 17.57)
L3–L4
Normal (reference)
End plate 4.09 (2.61, 6.42)
Beyond the end plate 4.00 (1.71, 9.37)
L4–L5
Normal (reference)
End plate 2.97 (1.99, 4.43)
Beyond the end plate 5.62 (2.89, 10.91)
L5–S1
Normal (reference)
End plate 4.79 (3.08, 7.46)
Beyond the end plate 11.30 (4.67, 27.33)
OR, odds ratio; 95% CI, 95% confidence interval.
Values in bold indicate significant OR.
* OR could not be obtained because of the low prevalence of disc herniationy Beyond the end plate encompasses!25%, 25% to 50%, andO50% vertic
Modic changes, whereas the association of age, if any, wasvery small, level of physical activity and lifetime exposureto smoking showed no association, and having a lowerBMI decreased this likelihood, especially for Types IIþII/III.
tion, bulging and disc herniation
Disc contour
(bulging vs. normal)
Disc contour
(herniation vs. normal)
OR (95% CI) OR (95% CI)
4.06 (2.05, 8.03) —*
6.20 (1.51, 25.38) —
3.28 (1.85, 5.83) —
6.94 (2.98, 16.17) —
2.40 (1.50, 3.85) —
4.62 (1.98, 10.80) —
1.74 (1.14, 2.66) 1.86 (0.97, 3.57)
5.28 (2.14, 13.01) 7.74 (2.63, 22.78)
3.75 (2.19, 6.42) 9.14 (4.74, 17.62)
5.65 (2.31, 13.86) 6.26 (2.06, 18.98)
in these levels (n52 at L1–L2, n58 at L2–L3, and n517 at L3–L4).
al extension groups of the vertebral body.

410 E. Arana et al. / The Spine Journal 11 (2011) 402–411
These results are concordant with previous reports onthe positive association of Modic changes with being male[33], a higher BMI [7] or heavier body weight [33], anddisc degeneration and disc contour abnormalities [5,33].The lack of association between smoking and Modicchanges also agrees with studies conducted among LBPpatients [7] and the general population [6], even after ad-justing for intense physical activity. This contrasts withearly reports [34]. Another previous study had suggestedthat, specifically in patients with disc herniation, spondylo-listhesis is not associated with a higher prevalence of Modicchanges [35]. However, in this study, both disc herniationand spondylolisthesis were independently associated witha higher prevalence of Type IþI/II and any Modic typechanges (Table 4).
Results from previous studies are inconsistent regardingthe association between Modic changes and high levels ofphysical activity. Results from this study are in accordancewith recent reports suggesting that there is no associationbetween Modic changes and the level of physical activity.In a Danish population-based cohort, no association wasfound at different times [6,34]. Nevertheless, a study amongmale workers suggested that high levels of physical activitywere related to an increased prevalence of ‘‘any type’’ ofModic changes, although this association disappeared whenModic subtypes were analyzed separately [36]. In a recentstudy with twins, anthropometric factors were found tohave a modest effect but which was still greater than theeffect of occupational physical demands [37].
From a clinical perspective, Modic changes extendingbeyond 25% of the vertebral height are the only ones thathave been suggested to be associated with an adverse out-come in LBP patients [38] and with higher pain scores dur-ing the preceding 3 months [4]. Results from this studyshowed that the height and extent of Modic changes corre-late with the degree of disc degeneration and abnormalitiesin disc contour, especially disc herniation (Table 5). Thisassociation was shown in a recent longitudinal study inwhich these findings were the only ones related with theappearance of new Modic changes [6].
It is difficult to analyze factors associated with the exis-tence of different types ofModic changes separately becausethey may coexist in the same patient and same disc level. Inthis study, associations were analyzed separately for ‘‘TypesIþI/II,’’ ‘‘Types IIþII/III,’’ and ‘‘any type of Modicchanges.’’ The latter might be seen as controversial, but ithas been shown that Modic changes can change from onetype to another, and that Type II changes may be less stablethan previously assumed [2]. Moreover, end plate sclerosisexists in all types of Modic changes, especially in mixedModic types, and not only in Type III changes [39].
Strengths of this study include its sample size, which issignificantly larger than those recruited in most studiesincluded in systematic reviews analyzing Modic changes inLBP patients [16,31], the use of a previously validated formto report imaging findings [11,12], and a comprehensiveMRI
protocol that was developed following recommended stan-dards for assessing Modic changes [40].
The SNHS is a tax-funded governmental organizationthrough which all health care services are provided freeto every resident in Spain (except aesthetic surgery andsome dental procedures) [41,42]. Only a small minorityof patients in the upper economic class seek health careexclusively through private health care [9]. LBP-relatedclinical practice is roughly consistent within the SNHS,both in primary and hospital care [41,42], and it generallyfollows current evidence-based guidelines [43]. In thisstudy, the sample was recruited consecutively in routineclinical practice in radiology departments of hospitals thatperform all the MRI studies prescribed in primary andhospital care in their respective areas. All these featuressuggest that generalizability of these results to patients inwhom an MRI is prescribed for chronic LBP within theSNHS and private practice should not be a concern.
This study also has someweaknesses. It did not aim to as-sess the association between imaging findings and pain ordisability. The reliability of the assessment of lumbar MRIis only moderate at best [11–13,44]. However, this limitationholds true irrespective of the intensity of the magnetic field,nomenclature used, or degree of experience and specialtyof the clinician interpreting the images [11–13,45,46], andit should be acknowledged as an intrinsic to the use of lumbarMRI, both in experimental and clinical contexts [47,48].
In conclusion, this study shows that Modic changes arefound in 81% of adult Spanish chronic LBP patients in whoman MRI is prescribed; they usually only affect the vertebralend plate and aremore likely to be found inmale patientswitha high BMI. Radiological features associated with a higherlikelihood of presenting Modic changes are disc contourabnormalities, spondylolisthesis, and disc degeneration.Modic changes are not associated with annular tears, physi-cal exercise, or lifetime exposure to smoking, and their asso-ciation with older age, if any, is very small.
References
[1] Waddell G. The back pain revolution. London, UK: Churchill Living-
stone, 2004:1–61.
[2] Jensen TS, Bendix T, Sorensen JS, et al. Characteristics and natural
course of vertebral endplate signal (Modic) changes in the Danish
general population. BMC Musculoskelet Disord 2009;10:81.
[3] Kanayama M, Togawa D, Takahashi C, et al. Cross-sectional mag-
netic resonance imaging study of lumbar disc degeneration in
200 healthy individuals. J Neurosurg Spine 2009;11:501–7.
[4] Kuisma M, Karppinen J, Niinimaki J, et al. Modic changes in end-
plates of lumbar vertebral bodies: prevalence and association with
low back and sciatic pain among middle-aged male workers. Spine
2007;32:1116–22.
[5] Modic MT, Steinberg PM, Ross JS, et al. Degenerative disk disease:
assessment of changes in vertebral body marrow with MR imaging.
Radiology 1988;166:193–9.
[6] Jensen TS, Kjaer P, Korsholm L, et al. Predictors of new vertebral
endplate signal (Modic) changes in the general population. Eur Spine
J 2010;19:129–35.
411E. Arana et al. / The Spine Journal 11 (2011) 402–411
[7] Kuisma M, Karppinen J, Haapea M, et al. Are the determinants of
vertebral endplate changes and severe disc degeneration in the lum-
bar spine the same? A magnetic resonance imaging study in
middle-aged male workers. BMC Musculoskelet Disord 2008;9:51.
[8] Jim JJ, Noponen-Hietala N, Cheung KM, et al. The TRP2 allele of
COL9A2 is an age-dependent risk factor for the development and
severity of intervertebral disc degeneration. Spine 2005;30:2735–42.
[9] Arana E, Marti-Bonmati L, Vega M, et al. Relationship between low
back pain, disability, MR imaging findings and health care provider.
Skeletal Radiol 2006;35:641–7.
[10] Jensen TS, Sorensen JS, Kjaer P. Intra- and interobserver reproduc-
ibility of vertebral endplate signal (Modic) changes in the lumbar
spine: the Nordic Modic Consensus Group classification. Acta Radiol
2007;48:748–54.
[11] Arana E, Royuela A, Kovacs FM, et al. Lumbar spine: agreement in
the interpretation of 1.5-T MR images by using the Nordic Modic
Consensus Group classification form. Radiology 2010;254:809–17.
[12] Kovacs FM, Royuela A, Jensen TS, et al. Agreement in the interpre-
tation of magnetic resonance images of the lumbar spine. Acta Radiol
2009;50:497–506.
[13] Arana E, Kovacs FM, Royuela A, et al. The influence of nomencla-
ture in the interpretation of lumbar disk contour on MRI: a compari-
son of the agreement using the Combined Task Force and the Nordic
nomenclatures. AJNR Am J Neuroradiol 2011 Apr 14; [Epub ahead
of print].
[14] Benoist M. The Michel Benoist and Robert Mulholland yearly
European Spine Journal Review: a survey of the ‘‘medical’’ articles
in the European Spine Journal, 2009. Eur Spine J 2010;19:3–10.
[15] Merskey HB, Bogduk N. Detailed descriptions of pain syndromes. In:
Merskey HB, Bogduk N, eds. Classification of chronic pain. Seattle,
WA: IASP Press, 1994:39–58.
[16] Jensen TS, Karppinen J, Sorensen JS, et al. Vertebral endplate signal
changes (Modic change): a systematic literature review of prevalence
and association with non-specific low back pain. Eur Spine J
2008;17:1407–22.
[17] Huskisson EC. Measurement of pain. Lancet 1974;2:1127–31.
[18] Kovacs FM,Llobera J, Gil Del RealMT, et al. Validation of the Spanish
version of the Roland-Morris questionnaire. Spine 2002;27:538–42.
[19] Kuorinka I, Jonsson B, Kilbom A, et al. Standardised Nordic ques-
tionnaires for the analysis of musculoskeletal symptoms. Appl Ergon
1987;18:233–7.
[20] Pfirrmann CW, Metzdorf A, Zanetti M, et al. Magnetic resonance
classification of lumbar intervertebral disc degeneration. Spine
2001;26:1873–8.
[21] Arnoldi CC, Brodsky AE, Cauchoix J, et al. Lumbar spinal stenosis
and nerve root entrapment syndromes. Definition and classification.
Clin Orthop Relat Res 1976;115:4–5.
[22] Weishaupt D, Zanetti M, Hodler J, Boos N. MR imaging of the lum-
bar spine: prevalence of intervertebral disk extrusion and sequestra-
tion, nerve root compression, end plate abnormalities, and
osteoarthritis of the facet joints in asymptomatic volunteers. Radiol-
ogy 1998;209:661–6.
[23] Hardin JW, Hilbe JM. Generalized estimating equations. In:
Hardin JW, Hilbe JM, eds. Chapter 3: Generalized estimating equa-
tions. New York, NY: Chapman & Hall, 2003:55–134.
[24] Videman T, Battie MC, Parent E, et al. Progression and determinants
of quantitative magnetic resonance imaging measures of lumbar disc
degeneration: a five-year follow-up of adult male monozygotic twins.
Spine 2008;33:1484–90.
[25] Belsley DA, Kuh E, Welsch RE. Detecting and assessing collinearity.
In: Belsley DA, Kuh E, Welsch RE, eds. Regression diagnostics:
identifying influential data and sources of collinearity. New Jersey:
John Wiley & Sons, 1980:85–117.
[26] Horton NJ, Bebchuk JD, Jones CL, et al. Goodness-of-fit for GEE: an
example with mental health service utilization. Stat Med 1999;18:
213–22.
[27] Leboeuf C, Kimber D, White K. Prevalence of spondylolisthesis,
transitional anomalies and low intercrestal line in a chiropractic
patient population. J Manipulative Physiol Ther 1989;12:200–4.
[28] Kjaer P, Leboeuf-Yde C, Korsholm L, et al. Magnetic resonance
imaging and low back pain in adults: a diagnostic imaging study of
40-year-old men and women. Spine 2005;30:1173–80.
[29] Mariconda M, Galasso O, Imbimbo L, et al. Relationship between
alterations of the lumbar spine, visualized with magnetic reso-
nance imaging, and occupational variables. Eur Spine J 2007;16:
255–66.
[30] Kleinstuck F, Dvorak J, Mannion AF. Are ‘‘structural abnormalities’’
on magnetic resonance imaging a contraindication to the successful
conservative treatment of chronic nonspecific low back pain? Spine
2006;31:2250–7.
[31] Zhang YH, Zhao CQ, Jiang LS, et al. Modic changes: a systematic
review of the literature. Eur Spine J 2008;17:1289–99.
[32] Karppinen J, Daavittila I, Solovieva S, et al. Genetic factors are asso-
ciated with modic changes in endplates of lumbar vertebral bodies.
Spine 2008;33:1236–41.
[33] Karchevsky M, Schweitzer ME, Carrino JA, et al. Reactive endplate
marrow changes: a systematic morphologic and epidemiologic eval-
uation. Skeletal Radiol 2005;34:125–9.
[34] Kjaer P, Korsholm L, Bendix T, et al. Modic changes and their asso-
ciations with clinical findings. Eur Spine J 2006;15:1312–9.
[35] Shen M, Razi A, Lurie J, et al. Retrolisthesis and lumbar disc herni-
ation: a preoperative assessment of patient function. Spine J 2007;7:
406–13.
[36] Kuisma M. Magnetic resonance imaging of lumbar degenerative
bone marrow (Modic) changes [doctoral thesis]. Oulu, Finland: Fac-
ulty of Medicine, Acta Universitatis Ouluensis D Medica; 2009.
[37] Battie MC, Videman T, Kaprio J, et al. The Twin Spine Study: con-
tributions to a changing view of disc degeneration. Spine J 2009;9:
47–59.
[38] Carragee EJ, Alamin TF, Miller JL, Carragee JM. Discographic, MRI
and psychosocial determinants of low back pain disability and remis-
sion: a prospective study in subjects with benign persistent back pain.
Spine J 2005;5:24–35.
[39] Kuisma M, Karppinen J, Haapea M, et al. Modic changes in vertebral
endplates: a comparison of MR imaging and multislice CT. Skeletal
Radiol 2009;38:141–7.
[40] Modic MT, Ross JS. Lumbar degenerative disk disease. Radiology
2007;245:43–61.
[41] Kovacs FM, Fernandez C, Cordero A, et al. Non-specific low back
pain in primary care in the Spanish National Health Service: a pro-
spective study on clinical outcomes and determinants of manage-
ment. BMC Health Serv Res 2006;6:57.
[42] Grupo VPM-IRYS. Variaciones en cirug�ıa ortop�edica y
traumatolog�ıa. [Variations in orthopaedic surgery and trauma]. Atlas
Var Pract Med Sist Nac Salud 2005;1:17–37.
[43] Airaksinen O, Brox JI, Cedraschi C, et al. European guidelines for the
management of chronic nonspecific low back pain. Eur Spine J
2006;15:S192–300.
[44] Bombardier C, Kerr MS, Shannon HS, Frank JW. A guide to inter-
preting epidemiologic studies on the etiology of back pain. Spine
1994;19:2047S–56S.
[45] Carrino JA, Lurie JD, Tosteson AN, et al. Lumbar spine: reliability of
MR imaging findings. Radiology 2009;250:161–70.
[46] Lurie JD, Doman DM, Spratt KF, et al. Magnetic resonance imaging
interpretation in patients with symptomatic lumbar spine disc herni-
ations: comparison of clinician and radiologist readings. Spine
2009;34:701–5.
[47] Lurie JD, Tosteson AN, Tosteson TD, et al. Reliability of readings of
magnetic resonance imaging features of lumbar spinal stenosis. Spine
2008;33:1605–10.
[48] Jarvik JG, Deyo RA. Moderate versus mediocre: the reliability of
spine MR data interpretations. Radiology 2009;250:15–7.
Copyright © 2022 FDOKUMEN