MODERN TECHNIQUE AND TECHNOLOGIES MTT' 2011
266
1 Ministry of Education and Science Public Educational Institution of High Professional Education Tomsk Polytechnic University Proceedings of the 17th International Scientific and Practical Conference of Students, Post-graduates and Young Scientists MODERN TECHNIQUE AND TECHNOLOGIES MTT’ 2011 April 18 - 22, 2011 TOMSK, RUSSIA
-
Upload
khangminh22 -
Category
Documents
-
view
0 -
download
0
Transcript of MODERN TECHNIQUE AND TECHNOLOGIES MTT' 2011

1
Ministry of Education and Science Public Educational Institution of High Professional Education
Tomsk Polytechnic University
Proceedings of the 17th International Scientific and Practical Conference
of Students, Post-graduates and Young Scientists
MODERN TECHNIQUE
AND TECHNOLOGIES
MTT’ 2011
April 18 - 22, 2011 TOMSK, RUSSIA

2
UDK 62.001.001.5 (063) BBK 30.1L.0 S56
Russia, Tomsk, April 18 - 22, 2011
The seventeeth International Scientific and Practical Conference of Students, Postgraduates and Young Scientists
“Modern Techniques and Technologies” (MTT’2011), Tomsk, Tomsk Polytechnic University. –
Tomsk: TPU Press, 2011.- 266 p.
Editorial board of proceedings of the conference in English: 1. Zolnikova L.M., Academic Secretary of the Conference 2. Sidorova O.V., leading expert of a department SRWM S&YS SA 3. Golubeva K.A., editor
UDK 62.001.001.5 (063)

3
CONFERENCE SCIENTIFIC PROGRAM COMMITTEE V.A. Vlasov Chairman of Scientific Program Committee,
ViceRector on Research, Professor, Tomsk, Russia
L.M. Zolnikova Academic Secretary of the Conference, TPU, Tomsk, Russia
O.V. Sidorova Academic Secretary of the Conference, TPU, Tomsk, Russia
A.A. Sivkov 1th Section Chairman, TPU, Tomsk, Russia
S.V. Syvushkin 2th Section Chairman, TPU, Tomsk, Russia
B.B. Moyzes 3th Section Chairman, TPU, Tomsk, Russia
O.P. Muravliov 4th Section Chairman, TPU, Tomsk, Russia
G.S. Evtushenko 5th Section Chairman, TPU, Tomsk, Russia
B.S. Zenin 6th Section Chairman, TPU, Tomsk, Russia
V.A. Rudnitskiy 7th Section Chairman, TPU, Tomsk, Russia
A.P. Potylitsyn 8th Section Chairman, TPU, Tomsk, Russia
V.K. Kuleshov 9th Section Chairman, TPU, Tomsk, Russia
A.S. Zavorin 10th Section Chairman, TPU, Tomsk, Russia
M.S. Kukhta 11th Section Chairman, TPU, Tomsk, Russia
A.A. Gromov 12th Section Chairman, TPU, Tomsk, Russia
A.A. Stepanov 13th Section Chairman, TPU, Tomsk, Russia

XVII Modern Technique and Technologies 2011
4

Section I: Power Engineering
5
Section I
POWER INGENEERING
XVII Modern Technique and Technologies 2011
6
INVESTIGATIONS IN SPHERE OF WIRELESS ELECTRICITY
R.S. Gladkikh, P.A. Ilin, I.S. Kovalev
Scientific Supervisor: Prof., Dr. phys.-mat. V.F. Myshkin
Scientific Advisor: Teach., A.E. Markhinin
Tomsk Polytechnic University, Russia, Tomsk, Lenin str., 30, 634050
E-mail: [email protected]
Nowadays it is impossible to imagine the life of a modern person without the electric devices, each of them requires charging. Numerous wires fill our space. In the remote villages there is no possibility to use electricity, because carrying out of electric systems demands big material inputs. New technologies such as Bluetooth and WI-FI allow to carry out an information transfer without any wires and direct connection of devices. And why not it is impossible to make the same with electricity?
At the end of the 18th century the well-known Serbian inventor Nikola Tesla started working on this question. For this purpose at the beginning of 1900th he constructed a powerful installation for transfer of high-frequency electric power without wires on considerable distances and this project (the project «Wordenkliff ») was sponsored with money of Dzh. P.Morgan, a billionaire from New York. He wished to provide with the electric power the population of the most distant places of the globe. In addition it was supposed to transfer information. Before Tesla conducted experiments with the big high-voltage resonant transformer made in 1898 in a wooden tower in height of 60 meters on a raised plateau to Colorado Springs (USA). Eyewitnesses told then about the bulbs burning without electro batteries and generators of a current, and about many other things «miracles». Firm «Westinghouse» became interested in the project «Wordenkliff» and put the best (for those times) the electro technical equipment for experiments. However by 1906 financing was stopped.[1]
Besides, there were attempts of transmission of energy by means of a laser beam. However in this case between subjects there should be no physical obstacles - that does this theory not applicable under house conditions.[2]
In 1943 the Soviet electrical engineer G.Babat constructed the first-ever electric car fed from the distance which was named by «High Frequences-auto». Next year on one of the Soviet factories electro penalties with the engine capacity about 2 kW has been placed in operation. It moved on asphalt paths along which under the earth copper tubes of small diameter were laid. Through them an alternating current frequency of 50 Hz passed. The effective radius of action of these wires was equal to 2-3 m in each side. The first steps have been made, but, unfortunately, losses of electric energy were great: on each square meter of a line 1 kW of capacity was lost, and for a drive just 4 %
of energy was used only, and the other 96 % was lost irrevocably. With further investigations scientists tried to increase frequency of the feeding current, but unsuccessfully. At last, it was revealed, that the greatest losses arise because of the underground vertical currents raised HF by a field. But losses on radiation, and small coefficient of efficiency still appeared. After long research at the end of 1947 the experimental line where on each square meter of a surface 10 W of electric capacity was consumed was constructed in Moscow. Wires from thin-walled copper or aluminum tubes were laid in isolated channels or in asbesto-cement pipes. Electro penalties were modified too - all metal parts were removed from it if it was possible. In 1954, in the USSR some lines of the sailing transport charged from coast with high frequency energy were launched. But all designed devices didn’t not find applications because of the big losses and small coefficient of efficiency.
But progress doesn’t stand on one place. Recently American scientists successfully tested the device, allowing to transfer of energy without wires. Experts of the Massachusetts institute of technology managed to light a 60-W bulb, being at a 2 m distance from the energy source. The experimental device consists of two coils in diameter of 60 cm with a copper wire, the transmitter connected to the energy source, and the receiver which is connected with the bulb. The lamp continued to light, even when there were wooden or metal subjects, and also electronic devices between it and coils. Coefficient of efficiency of energy transmissions thus made about 40 %. In the device which was named «WiTricity», the phenomenon of a resonance of electromagnetic waves of low frequency (in this case 10 MHz) is used. In particular, WiTricity is based on using 'strongly-coupled' resonances to achieve a high power-transmission efficiency. Aristeidis Karalis, referring to the team's experimental demonstration, says that "the usual non-resonant magnetic induction would be almost 1 million times less efficient in this particular system".
The researchers suggest that the exposure levels will be below the threshold for FCC safety regulations, and the radiated-power levels will also comply with the FCC radio interference regulations.“Now our problem is to reduce the sizes of our prototype, to increase distance to which the electric power is transferred, and to
Section I: Power Engineering
7
improve transfer effectiveness ratio, professor Marin Soljachich, the head of group of the scientists working over the invention speaks said.[3]
The Russian scientists also work on this subject. The new device designed by inventors consists of a parabolic mirror. In the mirror’s focuse high-voltage electric rated dischargers is situated on the circle scheme, each of them is connected to the high-voltage condenser. In a device operating time there are oscillatory, consisting of rated dischargers and condensers, the contours which are letting out electromagnetic waves of short length. If in mirror’s focus big quantity of such contours is arranged, the offered device can send in space electromagnetic radiation of the big capacity in a pulse mode. This clot of energy moves in space with a velocity of light – almost instantly. Results of its movement can be various and very important. The idea of reflection of an electromagnetic clot of energy from an ionosphere and its movement back to the Earth allows to realize this idea. If the receiver in the form of the oscillatory contour which is adjusted for certain length of a wave is placed on clot’s way electromagnetic energy of a clot will be transformed to a high-frequency alternating current which can be transformed to an alternating current of industrial frequency or a direct current of the necessary voltage.
If impulses of a transmission of energy go one behind another through short time intervals it will be possible to transfer the big capacities of the electric power without wires to huge distances not only on the Earth, but also in space: on satellites and from satellites, on the Moon and back.[4]
So, it is planned to make the first in history scale experiment on receiving of the transformed solar energy from the satellite. The state Palau is located in the Pacific ocean with population of about twenty thousand persons. At the conference of the United Nations which took place in Indonesia and concerned the problems of climate representatives of Palau agreed to co-operate with the USA in experiment using of a solar energy as an ecologically pure fuel. America suggests Palau to place on one of the desert islands (island Helen) accepting aerial with the built in rectifier (so-called rectifying antenna) with the diameter of about 80 meters. The satellite, that revolve on low orbit (less than 500 kilometers), will transfer energy in the form of microwaves to the rectifying antenna which will be transformed into direct current. It is expected, that capacity of system will reach one megawatt. It is enough to provide one thousand houses with energy, but the primary goal of experiment is to confirm safety of such a method.
But research is being conducted not just for desert territories. So, wireless transfer of electric power has been tested successfully on experimental installation, and now there is a construction of its full-size variant for supply with
electricity of the remote village on island Rejunion operated by Frenchmen in the Indian ocean. This village becomes the first-ever community using microwave technology of power supply. The village is located at the bottom of a canyon kilometer-deep, and it was impossible to supply it with electricity by wires. Its inhabitants should use solar batteries constructed on roofs of houses, but it costs too much, and the place on roofs is not sufficient. Microwave systems stand more cheaply than solar batteries and diesel generators together, but also they do not require masts for a suspension bracket of wires which quite often cause protests of supporters of environment protection. As representatives of the French space research agency CNES which developed new technology, electro supply by means of usual networks effectively enough in the centre of their arrangement speak, but expenses increase very quickly in process of enlargement of distance to the consumer. Therefore the microwave technology can appear favorable and in accessible areas. The agency intends to begin trial transfer of the electric power on island by means of microwaves in 10 months, and the plant will be placed in operation in three years. [4]
So, recent experiment of IBM was finished with success too. The result is transfer of electric power to hundreds W without wires with efficiency more than 80 % on distance up to 1 meter. This result is serious enough in development of this area. The company wants to carry out further researches in this direction. Scientists are going to reduce the sizes of installation-energy source, to increase volume of transferred energy and to raise efficiency of this system.
Nowadays electric systems are the most favorable and popular kind of transfer of the electric power. But the experiments which are passing all over the world, will probably prove safety, convenience and rationality of a transmission of energy without wires.
Then the mankind can get rid of wires both in industrial branches, and in everyday life. It will provide electricity to the areas which are located far from civilization. Also we can receive the energy which has been saved up on solar batteries in space. The alternative method of an energy transmission will promote technological progress.
References 1. N. Tesla «Tesla about electricity»,
autobiography, Minsk, 1970 2. R.V. Pol’ «Doctrine about electricity»,
PolScience, Warsaw, 1975. 3. Wireless transfer of electricity/ 4(31)/2009,
scientific magazine «PRO electricity», Moscow.
4. Innovations in electricity/ 06.1995, scientific magazine «Electricity», Moscow.

XVII Modern Technique and Technologies 2011
8
RECONSTRUCTION AND VISUALISATION OF LIMITER BOUNDAR Y
FOR KTM TOKAMAK Malakhov A.A
Supervisor: Pavlov V.M., Assoc., PhD
Tomsk Polytechnic University, 30, Lenin Avenue, Tomsk, 634050, Russia
E-mail: [email protected]
1. Introduction A tokamak is a device using a magnetic field to
confine plasma in the shape of a torus (doughnut). Achieving stable plasma equilibrium requires magnetic field lines that move around the torus in a helical shape. Such a helical field can be generated by adding a toroidal field (traveling around the torus in circles) and a poloidal field (traveling in circles orthogonal to the toroidal field). In a tokamak, the toroidal field is produced by electromagnets that surround the torus, and the poloidal field is the result of a toroidal electric current that flows inside the plasma. This current is induced inside the plasma with a second set of electromagnets. (Figure 1)
The tokamak is one of several types of magnetic confinement devices, and is one of the most-researched candidates for producing controlled thermonuclear fusion power. Magnetic fields are used for confinement since no solid material could withstand the extremely high temperature of the plasma. An alternative to the tokamak is the stellarator. The Tokamak is not as well known as the common "uranium core reactor" or UCR.
Figure 1 - Reactor structure Development of methods, algorithms and the
software for recovery of a magnetic surface of plasma with usage of exterior magnetic measurements it is necessary for control of position and the plasma form in a real-time mode, and for the decision of others physical diagnostics and the analysis in an interval between discharges.
The magnetic topology is first derived using the magnetic measurements, from which the shape and position of the last closed magnetic flux surface (LCFS) and the radial dependence of the
relevant shape parameters (like elongation and triangularity) are determined.
2. Equilibrium reconstruction technique To achieve high reconstruction quality, many
efficient methods and numerical codes for magnetic analysis have been developed. Among them, the fixed filament current approximation method is the frequently used one. Modification of this algorithm using gradient descent method is proposed in [3].
But the task to find the form and position of plasma has no unambiguous decision. That is for the same indications of sensors probably to construct some models of the form of a plasma cord, each of which will satisfy in turn to conditions. To solve this problem it is necessary to construct a plasma boundary taking into account that it must be restricted by the delimiter. It will give more exact information to engineers supervising process.
The application of the presented project allows calculating the plasma parameters at a given time. The primary goal is adding corrections and additions in the main program. In particular libraries with functions allowing to construct limiter plasma boundary both ready functions implemented in the main application and new methods are used. The application skeleton diagram is represented in the Figure 2
Plasma parameters “calculator”
Reconstruction
Visualisation
Libraries with functions
Draw functions
Field functoins
AVI functions
Main programm
BOUNDARY
DATA files
file
Figure 2 - The program simplified diagram 3. Methods In the main program there is a function which
calculates components of a vector of a magnetic induction and a magnetic flux in any point of the camera. This function will be at the heart of algorithm of calculation of plasma boundary. Various methods of calculation of this task have
Section I: Power Engineering
9
been found in a work progress. They differed from each other in the speed of performance (that is important for plasma control in a real-time mode), and in the error of calculations.
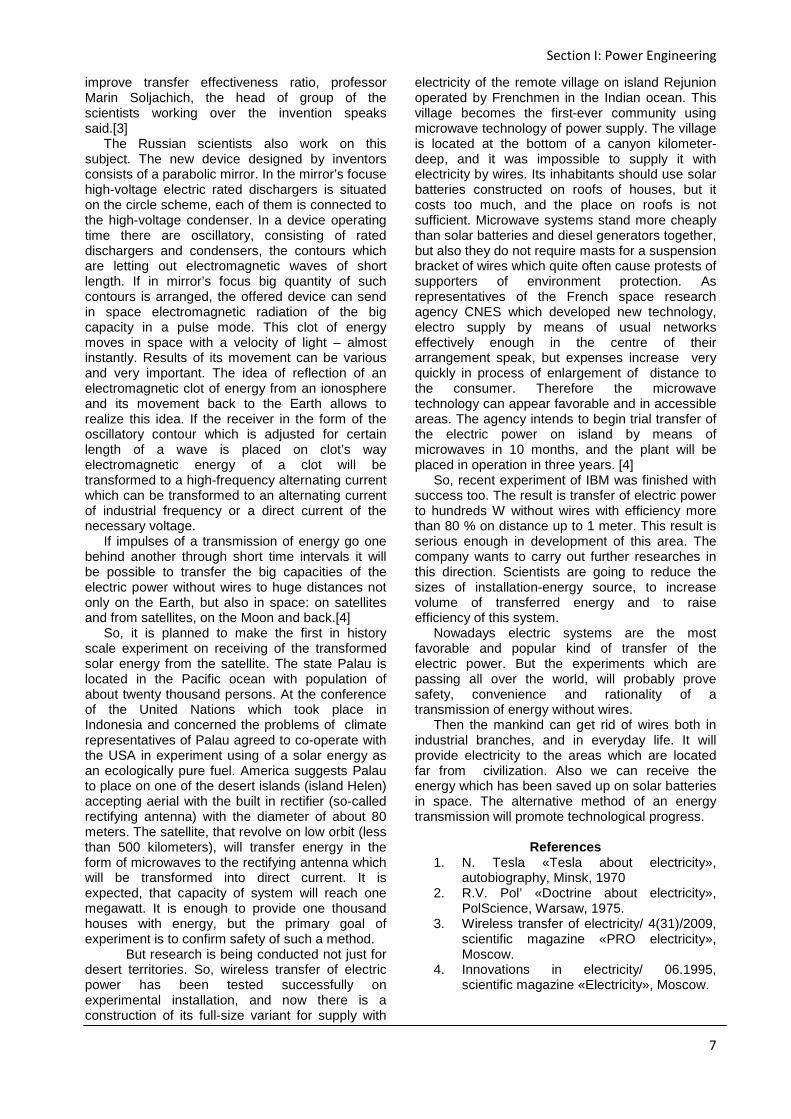
The first obvious and most simple method is represented schematically in Figure 3.
Figure 3 – First method This method is based on that all boundary is
represented in the form of set of points. Each point settles up from previous by an increment to it of a vector depending on vector B. Theoretically the error approaches to zero in case of step reduction. The reference point is a point of a contact of a diaphragm and plasma.
In order to increase the speed of the subroutine the first method has been upgraded. In each point of boundary its local radius is figured out from the previous points. It allows notifying boundary offset, to modify coordinates of points. The refined metod is in the Figure 4.
Figure 4 – The refined method 4. Benchmarking and testing In the course of the subroutine test it has been
clarified that the first method is insufficiently exact. The first and last points didn't coincide with the big error. (Fugure 5)
Figure 5 – Boundary counted on the first
method
Reduction of a step doesn't give the positive result as the error on each step is added. Also runtime is much more admissible (3 msec)
And the second method successfully calculates boundary during rather small time.
5. Conclusion and future developments An application in MS Visual C++ 2005 was
designed using methods and algorithms which were described before.
Results: 1. Visualization possibility of limiter plasma
boundaries, and also saving of the data in a separate file is implemented
2. Files of input and output of the data are probably to change
3. Numerical experiments have been made. On the average time of calculation of boundary of plasma is less 1мс
Prospects: 1. Various other physical processes which flow
in the camera, should be considered 2. The maximum code optimization of the
program 3. Check for the speed and insistence of
computing resources 4. Program check immediately in actual practice
on КТМ the TOKAMAK 6. References [1] E.A.Azizov, KTM project (Kazakhstan
Tokamak for Material Testing), Moscow, 2000; [2] L. Landau, E. Lifshitz, Course of
Theoretical Physics, vol 8, Electrodynamics of Continuous Media 2nd ed. Pergamon Press, 1984;
[3] Q. Jinping, Equilibrium Reconstruction in EAST Tokamak, Plasma Science and Technology, Vol.11, No.2, Apr. 2009.
[4] W. Zwingmann, Equilibrium analysis of steady state tokamak discharges, Nucl. Fusion 43 842, 2003;
[5] O. Barana, Real-time determination of internal inductance and magnetic axis radial position in JET, Plasma Phys. Control. Fusion 44, 2002;
[6] L. Zabeo, A versatile method for the real time determination of the safety factor and density profiles in JET, Plasma Phys. Control. Fusion 44, 2002.
[7] Raeder, J.; et al (1986). Controlled Nuclear Fusion. John Wiley & Sons

XVII Modern Technique and Technologies 2011
10
MAGNETIC GENERATOR THE BEST SOLUTION FOR FREE POWER
Morozov A.L., Skryl A.A.
Supervisor: Professor Kachin S. I.
Language Advisor, Senior Instructor: Sokolova E.Y.
Tomsk Polytechnic University, 634050, Russia, Tomsk, St. Lenina 30
E-mail: [email protected]
Mankind had been concerned for many years
and is still concerned with the problem to find the best, the most economical and as a consequence the most environmental friendly source of energy. That is why the interest in the topic of “perpetual motion” by the international community remains a huge and growing, as the needs of civilization in energy and in connection with the imminent exhaustion of the organic non-renewable fuels, and especially with the advent of the global energy and environmental crisis of civilization. When building a society of the future it is important to develop new energy sources that can provide our needs. Nowadays the issue of finding reliable, efficient, clean, and renewable source of energy is extremely vital for many countries including Russia despite the fact that our country is rich in different fossil fuels and has sufficient gas and oil reserves to supply national industry and even other countries for some time to come. However, it is necessary to bear in mind that most of these reserves will be used up over next some years. In spite of the fact that our country is in the happy position of having huge quantities of gas and oil underground we need to find new innovative ways to tackle the issue of finding secure and reliable source of energy for the long term. In the future reconstruction of the country and the coming energy crisis, new sources of energy, based on breakthrough technologies will be absolutely necessary. [1,2]
The intention of this article is to present the concept of high efficient, reliable and costless power that can be produced by a magnetic generator. This magnetic generator was designed to meet the requirements to generate free power. The trials showed high efficiency, durability and superior performance of this machine. In order to show the advantages of the proposed system the following tasks should be fulfilled: • To analyze the conventional technology • To choose the option offering the best characteristics • To compare the conventional technology with the designed one.
A conventional magnetic generator is a piece of equipment that uses the properties of electromagnetism to generate electricity without needing an external fuel source that is crucial nowadays. The basic structure of a magnetic generator is fairly simple. Firstly, wheel is needed to rotate around an axis. This wheel rotating
around the axis functions as a flywheel. This flywheel should be aligned with magnets. All these magnets are of the same polarity. The flywheel needs to be installed inside a stationary wheel. The inner surface of the stationary wheel should be aligned with magnets of the opposite polarity.
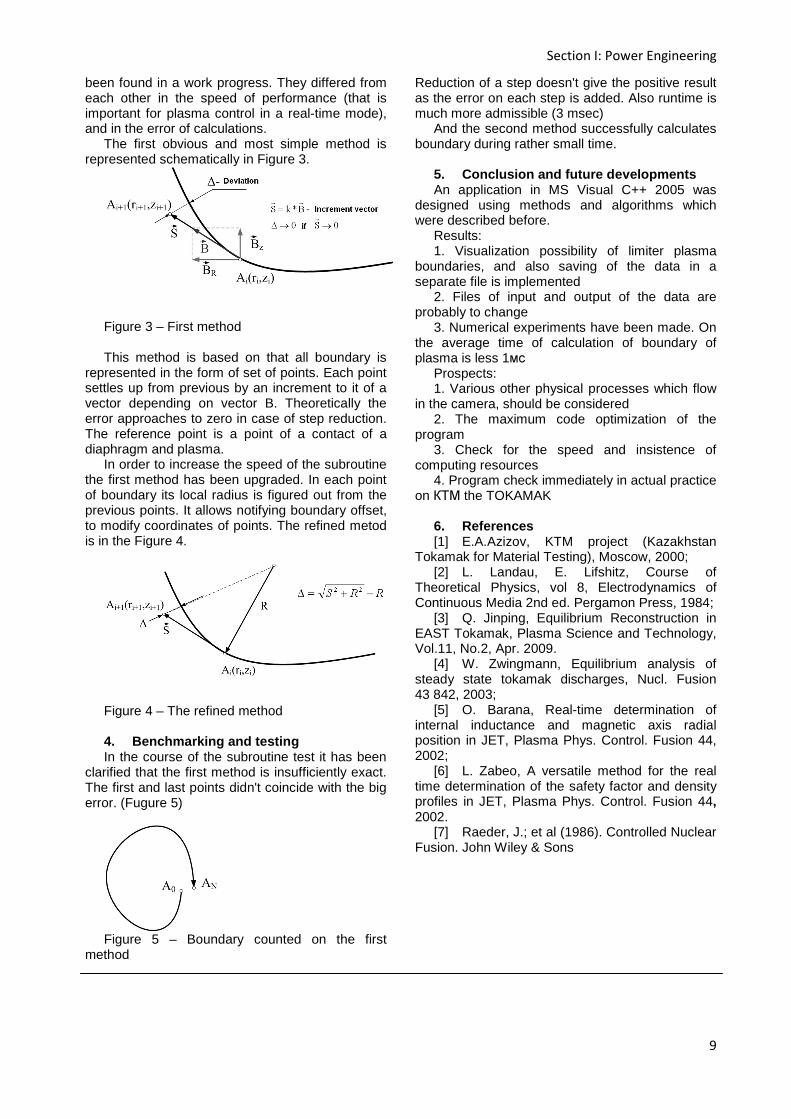
Now it is necessary to show the technical features of the designed magnetic generator. The construction of this generator is presented below in Fig.1 and Fig.2. This magnetic generator consists of a stator (fixed part), that includes a wheel with some magnets with windings where the voltage is collected. A rotor is installed inside a stator to intensify the magnetic field. The rotor which is installed inside the stator consists of a magnet. The difference of the proposed machine is in a rotor construction.
To enable the machine to operate, simply give the flywheel a spin. The opposite magnets are attracted to each other causing the flywheel to rotate faster. Electricity will be generated as the speed of the flywheel increases.
The main issue to be solved was to adjust the frequency of this machine in order to obtain desired industrial frequency of 50 Hz that is appropriate for almost all tools, mechanism and equipment that are employed. We suggest two possible ways to solve this problem. The first introduced method that helps to overcome this problem is to vary the frequency by changing the number of poles. Increasing the number of poles leads to increase of frequency level. The second proposed method is to adjust the gap between the rotor and the stator, that in turns causes the change of frequency level. To decrease the effect of electromagnetic waves and reduce the rotation frequency of this machine the stator shielding can be used as a brake. As a result the magnets will not be demagnetized. Trials so far suggest the new design is exceptionally durable and compared with the old version is highly efficient and runs extremely smoothly. This new technology can be used either in industry or for residential needs.
Comparing magnetic generator for example with a diesel generator we can show the advantages of this magnetic generator. Firstly, this magnetic generator does not need any fuel to work. As a diesel generator burns diesel to operate, the magnetic one uses only the power of magnetic flux from a permanent magnet. Secondly, taking into consideration this advantage we can
Section I: Power Engineering
11
S
N
S
N
1 2 3 4 5
N
S N
S
understand that the magnetic generator is environmentally friendly. Thirdly, using this generator you become independent from any external power. Thus, you can forget about bills for electricity. Fourthly, a diesel generator is equipped with combustion chambers, that cause noise and vibration. The magnetic generator does not have any combustion chambers, as a result any noise and vibrations are completely eliminated.
We have come up with completely unique profile of the given machine, that enables to
enhance the technology and system operating costs, compared with the existing and conventional magnetic generator. Some special features such as some changes in construction and frequency adjustment have been added that differentiate the proposed technology from conventional systems. The new source of energy proposed is first of all practical and cheap, secondly economical to set up and maintain, highly efficient and finally kind to our planet. [3]
Figure 1. Main view Figure 2. Top view
References
1. www.bukisa.com/articles/241506_an-introduction-to-how-magnetic-energy-is-the-new-residential-alternative-to-produce-free-electricity
2. www.33energy.com/free/ 3. www.eco20-20.com/Magnetic-Motor-
Generator.html
ASYNCHRONOUS MODE OF SYNCHRONOUS GENERATOR
Feodorova Ye. A.
Scientific advisor: Kolomiec N.V., Ph.D., docent
Linguistic Advisor: Korobov A.V.
Tomsk Polytechnic University, 634050, Russia, Tomsk, Lenin str., 30
E-mail: [email protected]
The aim of this article is to give an overview of
asynchronous mode of generator, its consequences, and ways of protection. Analysis of reasons of asynchronous mode occurrences, parameters of the power system and additional measures to be taken for such mode elimination will help to prevent significant system faults that in a turn can cause an avalanche-like switching off of consumers, bringing not just damage to the equipment, but also result in unforeseen expenses.
The term, asynchronous mode, means short-time work of power system with nonsynchronous work of one or several generators, which is caused by loss of excitation or instability. In asynchronous mode of excited synchronous generator the phase shift between the EMD’s vectors of generator and voltage vector of the system changes constantly. In this situation synchronous machines work either
in generator mode, or in traction mode, and this process is accompanied by high values of compensating current, big deviation in voltage and also by high values of torque, which, in its turn, affects generator and turbine. The stable asynchronous mode is possible after excitation loss by the generator [1].
Asynchronous mode, caused by loss of excitation is a commonly encountered problem therefore it should be considered in details. It should be noted, that reasons of excitation loss are various. It can be caused by fault in exciting circuit, or trip of secondary protection and control circuits, it also can happen due to mistakes made by operation staff.
Based on conditions in a certain power system, generator operated in asynchronous mode with loss of excitation, can return into parallel work with
XVII Modern Technique and Technologies 2011
12
power system, with help of special measures such as emergency automation, or shift into stable asynchronous mode.
This mode is characterized by consuming of reactive power from a power system by generator for getting its excitation, and still producing a certain amount of active power to system. Volume of generated active power in stable asynchronous mode should be reduced compared to normal (previous) mode. At the same time braking synchronous torque reduces to zero, generator’s rotation speed increases and this leads to a slip (0.3-0.7%).
Stable asynchronous mode is acceptable for short-time period of work both for generator and power system. “Rules of technical operation of power plants and networks in RF” allow operation of generators in asynchronous mode without excitation for a certain period of time. For turbo generators with rated power 63-500 MW short-term operation (not exceeding 15minutes) in asynchronous modes is allowed. In this case load shouldn`t exceed 45-50% from the rated [2]. As in asynchronous mode generator consumes sufficiently large amount of reactive power, the rated power of electrical system should be sufficient for maintaining of voltage at the busbar of adjacent connections at a level not less than 70% of the rated voltage, to ensure stable operation of generators working in parallel.
In whole, long-term operation of turbo generator in asynchronous mode is restricted due to the following reasons:
- Increase of stator current by means of significant increase of reactive component of current.
- Losses from whirling currents in rotor body. - Increased losses of current in stator. - Shortage of reactive power in power
system. Use of asynchronous mode with subsequent
resynchronization of generator (after restoration of excitation) allows keeping it in operation. But in certain cases asynchronous mode can be restricted because of shortage of reactive power in a particular network section. In this case generator must be stopped immediately.
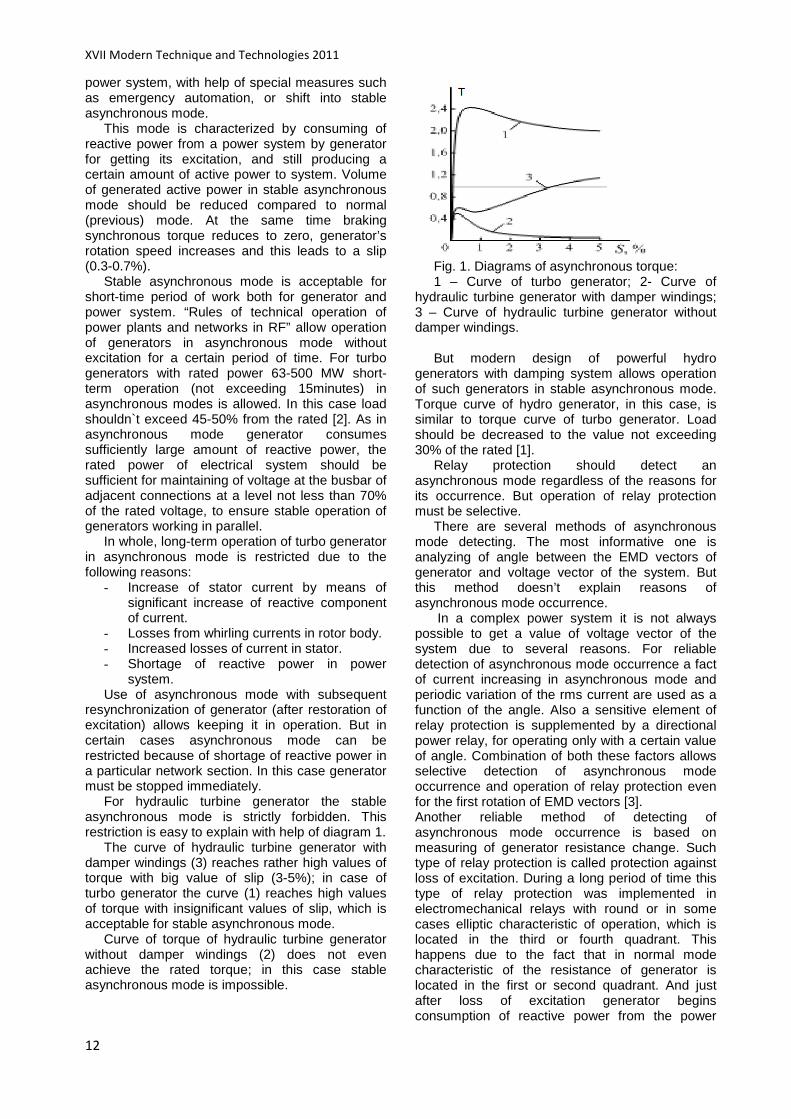
For hydraulic turbine generator the stable asynchronous mode is strictly forbidden. This restriction is easy to explain with help of diagram 1.
The curve of hydraulic turbine generator with damper windings (3) reaches rather high values of torque with big value of slip (3-5%); in case of turbo generator the curve (1) reaches high values of torque with insignificant values of slip, which is acceptable for stable asynchronous mode.
Curve of torque of hydraulic turbine generator without damper windings (2) does not even achieve the rated torque; in this case stable asynchronous mode is impossible.
Fig. 1. Diagrams of asynchronous torque: 1 – Curve of turbo generator; 2- Curve of
hydraulic turbine generator with damper windings; 3 – Curve of hydraulic turbine generator without damper windings.
But modern design of powerful hydro
generators with damping system allows operation of such generators in stable asynchronous mode. Torque curve of hydro generator, in this case, is similar to torque curve of turbo generator. Load should be decreased to the value not exceeding 30% of the rated [1].
Relay protection should detect an asynchronous mode regardless of the reasons for its occurrence. But operation of relay protection must be selective.
There are several methods of asynchronous mode detecting. The most informative one is analyzing of angle between the EMD vectors of generator and voltage vector of the system. But this method doesn’t explain reasons of asynchronous mode occurrence.
In a complex power system it is not always possible to get a value of voltage vector of the system due to several reasons. For reliable detection of asynchronous mode occurrence a fact of current increasing in asynchronous mode and periodic variation of the rms current are used as a function of the angle. Also a sensitive element of relay protection is supplemented by a directional power relay, for operating only with a certain value of angle. Combination of both these factors allows selective detection of asynchronous mode occurrence and operation of relay protection even for the first rotation of EMD vectors [3]. Another reliable method of detecting of asynchronous mode occurrence is based on measuring of generator resistance change. Such type of relay protection is called protection against loss of excitation. During a long period of time this type of relay protection was implemented in electromechanical relays with round or in some cases elliptic characteristic of operation, which is located in the third or fourth quadrant. This happens due to the fact that in normal mode characteristic of the resistance of generator is located in the first or second quadrant. And just after loss of excitation generator begins consumption of reactive power from the power

Section I: Power Engineering
13
system, and as result vector of generator resistance shifts into the third or fourth quadrant.
But round and elliptic shape of relays characteristics is not always enough to protect generator against loss of excitation, which represents one of the reasons of asynchronous mode occurrence. Nowadays relay protection against loss of excitation is based on microprocessor technology, as an element of relay protection for generator. It lets one to program different shapes of resistance characteristics, thus improving reliability of relay operation.
Set of relays for generator also includes automated elimination of asynchronous operation. Such type of automation must detect a fact of asynchronous mode occurrence and generate a signal for disconnection of the part of power system with nonsynchronous work of generators. This type of automation is called “disconnection” automation.
Today such sets of protection relays are manufactured by both Russian and foreign companies, for example: EKRA, Ltd, STC “Mechanotronica”, AREVA T&D, Siemens, VAMP and etc [4].
This article shows, that special set of additional measures, relay protection and automation, that are widely represented in the electro-technical market, can prevent negative consequences of asynchronous mode, such as avalanche-like switching off of consumers, and massive system faults.
References:
1. Pavlov G.M., Merkuriev G.V. Automatics of power systems. - Training Center of RAO UES of Russia, 2001.-387 p. with fig.
2. Rules of technical operation of power plants and networks in RF. Ministry of Energy. –M.: CC “Energoservice”, 2003- 368 p.
3. Vavin V.N. Relay protection of block of turbogenerator-transformer. – M.: Energoizdat, 1982.-256 p. with fig.
4. [Electronic resource]. - Mode of access: http://www.ekra.ru/production/gen/sub_rza_stancionnogo_oborudovaniya/
5.

XVII Modern Technique and Technologies 2011
14

Section II: Instrument Making
15
Section II
INSTRUMENT MAKING

XVII Modern Technique and Technologies 2011
16
A NEW TYPE OF TORQUE MOTOR WITH PACK OF PLATES Ivanova A.G.
Scientific adviser: Martemjanov V.M., candidate of science, associate professor
Linguistic adviser: Kozlova N.I.
Tomsk polytechnic university, 634050, g. Tomsk, pr. Lenina, 30
E-mail: [email protected]
Conventional direct current (DC) motors are
highly efficient and their characteristics make them suitable for use as servomotors. However, their only drawback is that they need a commutator and brushes which are subject to wear and require maintenance. When the functions of commutator and brushes were implemented by solid-state switches, maintenance-free motors were realized. These motors are now known as brushless DC motors.
Brushless motor, working as an executive device of automatics reductorfree systems is called a torque motor. The motor construction is illustrated in picture 1. There are polyphase stator windings, a permanent magnet rotor, a position pole sensor (usually Hall elements) and an electronic commutator, which is not shown in the picture 1 [1].
Pic.1. Disassembled view of a brushless dc motor For increasing the torque of the brushless
torque motor it is necessary to increase the current, flowing in the stator winding. This may cause overheating and the destruction of stator winding, having bad heat rejectionbecause of itsdesign philosophy. In most brushless motors there is slot insulation of conductors inferromagnetic stator core or a stator core made of dielectric materials.
To solve this problem, a new type of a torque motor is worked out. A big shaft torque is formed due to the current consumption increase and the active part of the motor is not overheated. The active element of the brushless torque motor is a laminated structure. A part of this structure is a pack of plates.
To explain the operation principle of the executive device with a pack of plates, let’s consider a homogeneous rectangular, electrically
conducting plate made of copper or aluminum [2]. The points of connection to the electrical circuit are at its diagonally situated corners (pic.2).
Pic.2. Electrically conducting plate
It can be affirmed that separate currents Ii,
composing the current distributed over the plate, have two components Ix and Iy in each point of the plate. The magnetic flux with induction B crosses the plate on a normal. The operating zone of the magnetic flux is marked by the dotted line.
If to sum up all the current components flowing in the magnetic flux operating zone, we will see that there are two components of the full current Ix and Iy in the zone. The correlation between these two components is determined by the conductive plate geometry.
The current Ix, interacting with the magnetic flux creates the force Fy, directed along the axis Y. The current Iy, interacting with the magnetic flux, creates the force Fx, directed along the axis X.
These forces will act between the plate and the magnetic field source, causing their mutual movement.
Let’s suppose that the plate is immovable, and the source of magnetic field can move along the axis X. In this case, the action of the force Fy created by current Ix will be compensated in the bracket support of the magnetic field source. And the force Fx caused by the current Iy will create the necessary torque on some shoulder.
The created force can be increased by a serial electrical connection of another analogous plate. This plate is assembled over (or under) the first one. Their surfaces have to be parallel and separated by an electrically insulating material.
The scheme of plates connection is the following [3]: at two diagonally lying corner points of the plates there are contacts which lie on
Section II: Instrument Making
17
diagonals of the same direction on the odd plates, and on the even plates – on diagonals of different directions. Each plate is connected to the neighboring plates into a series electrical circuit by using jumpers (pic.3).
Pic.3. Pack of plates connection
In this case the forces Fx created by the currents of both plates are summarized. And the forces Fy are deducted. The force Fx, is directed along the axis X and creates the necessary torque of the motor. Further increasing of this force is carried out by the additional installation and similar serial connections of new pairs of plates connected to the plates circuit. Finally, these plates represent a united pack in a constructional case.
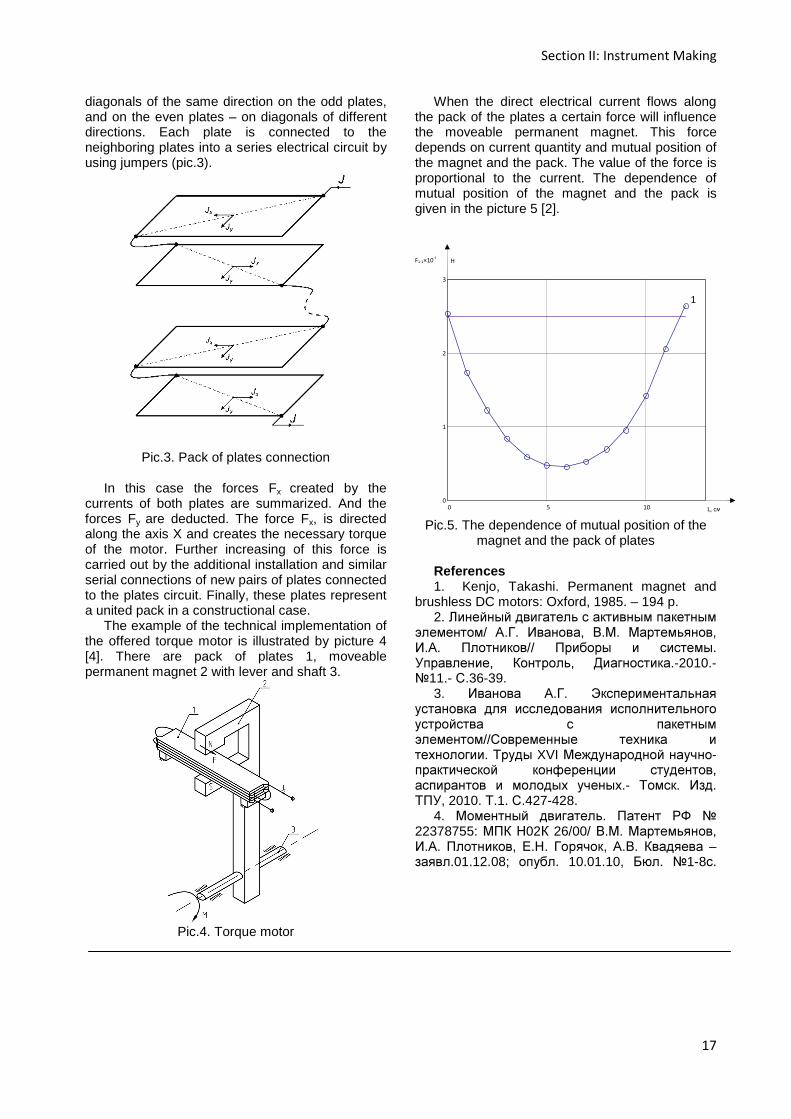
The example of the technical implementation of the offered torque motor is illustrated by picture 4 [4]. There are pack of plates 1, moveable permanent magnet 2 with lever and shaft 3.
Pic.4. Torque motor
When the direct electrical current flows along the pack of the plates a certain force will influence the moveable permanent magnet. This force depends on current quantity and mutual position of the magnet and the pack. The value of the force is proportional to the current. The dependence of mutual position of the magnet and the pack is given in the picture 5 [2].
Pic.5. The dependence of mutual position of the
magnet and the pack of plates
References 1. Kenjo, Takashi. Permanent magnet and
brushless DC motors: Oxford, 1985. – 194 p. 2. Линейный двигатель с активным пакетным
элементом/ А.Г. Иванова, В.М. Мартемьянов, И.А. Плотников// Приборы и системы. Управление, Контроль, Диагностика.-2010.-11.- С.36-39.
3. Иванова А.Г. Экспериментальная установка для исследования исполнительного устройства с пакетным элементом//Современные техника и технологии. Труды XVI Международной научно-практической конференции студентов, аспирантов и молодых ученых.- Томск. Изд. ТПУ, 2010. Т.1. С.427-428.
4. Моментный двигатель. Патент РФ 22378755: МПК Н02К 26/00/ В.М. Мартемьянов, И.А. Плотников, Е.Н. Горячок, А.В. Квадяева – заявл.01.12.08; опубл. 10.01.10, Бюл. 1-8с.
0 5 10 0
1
2
3
F1-1×10⁻⁴
H
L, см
1
XVII Modern Technique and Technologies 2011
18
SCINTILLATION DETECTORS OF IONIZING RADIATION M.K. Kovalev
Research advisor: P.V. Efimov
Linguistic advisor: G.V. Shvalova
Tomsk Polytechnic University, 634050, Tomsk, Russia
e-mail: [email protected]
INTRODUCTION
Ionizing radiation enters our lives in a variety of ways. Ionizing radiation has many practical uses in medicine, nondestructive testing and other areas, but presents a health hazard if used improperly. Therefore it is necessary to develop advanced and effective methods the radiation registration. This area should be the sphere of interest for professionals working in the field of nondestructive testing and applying their research instruments based on the sources of ionizing radiation. Just the topic seems to be interesting for the military specialists, for airports security officers and those who had deals with other crowded places.
There are not so much physical phenomena allowing the registration of radiation. Nevertheless, various instruments and devices are used for the detection of radiations, and the development of new detectors, recording equipments, and methods of data processing still remains an urgent task. In order to obtain the necessary information, ionizing radiation usually is converted by means of various detectors in the electrical signal which is further processed. Ionizing radiation can be detected by means of variety gauges based on different principles of operation: - Ionization counters: - Ionization chamber, - Proportional counter, - Geiger counter. - Particle track devices: - Cloud chamber, - Bubble chamber, - Spark chamber. - Scintillation counters: - Organic scintillator, - Inorganic scintillator, - Gaseous scintillator.
The best known ionization converting device is the Geiger-Muller counter. This device consists of two parts, a detecting tube and a counter. The heart of the system is the detecting tube, which consists of a pair of electrodes surrounded by an ionizable gas. As radiation enters the tube, it ionizes the gas. The ions produced travel toward the electrodes, between which a high voltage is added. The ions cause pulses of current at the electrodes, which are picked up and recorded on the counter. [1] Other ionization counters also work on the principle of collecting information on ions
formed by the radiation passes through the detector.
The radiation detection can take the form of devices which visualize the track of the ionizing particle. In its most basic form, a cloud chamber is a sealed housing containing a supersaturated vapor of water or alcohol. When an alpha or beta particle interacts with the gas mixture, it ionizes it. The resulting ions act as condensation nuclei, around which a mist will form (because the mixture is on the point of condensation). The high energies of alpha and beta particles mean that a trail is left, due to much number of ions being produced along the path of the charged particle[2].
Luminescent materials, when struck by an incoming particle, absorb its energy and scintillate, i.e. reemit the absorbed energy in the form of light.[3].
Scintillators can be made from a variety of materials, depending on the intended applications.
This article takes a closer look on the scintillation detector.
SCINTILLATION MATERIALS
As mentioned above, a scintillator is the material which exhibits scintillation - the property of luminescence when substance of scintillator is excited by ionizing radiation.[4] Scintillator can be organic (crystals, plastics, or liquid) or inorganic (crystals or glasses). Scintillators can be also gaseous.
Inorganic scintillators are usually crystals grown in furnaces at high temperature, for example, alkali metal halides, often with a small amount of activator impurity. The most widely used inorganic crystal is NaI(Tl) (sodium iodide doped with thallium).
Some organic scintillators are pure crystals. The most common types are anthracene (C14H10), stilbene (C14H12), and naphthalene (C10H8). Anthracene has the highest light output among all organic scintillators and is therefore chosen as a reference: the light outputs of other scintillators are sometimes expressed as a number of percent of anthracene light.
Plastic and liquid scintillators represent solutions of organic fluorescent substances in a transparent solvent. The most widely used solvents are toluene, xylene, benzene, phenylcyclohexane, triethylbenzene, and decalin. The most widely used
Section II: Instrument Making
19
plastic solvents are polyvinyltoluene and polystyrene.
Gaseous scintillators consist of nitrogen and the noble gases - helium, argon, krypton, and xenon, with helium and xenon receiving the most attention. The scintillation process has placed due to the de-excitation of single atoms excited by the passage of an incoming particle. This de-excitation is very rapid, so the detector response function must be quite fast.
The most common used glass scintillators are cerium-activated lithium or boron silicates. Lithium is more widely used then boron since it has a greater energy release on capturing a neutron and therefore greater light output.[4]
Scintillators are defined by their light output (number of emitted photons per unit of absorbed energy), short fluorescence decay time, and optical transparency at wavelengths of their own specific emission energy. The latter two characteristics set them apart from the variety of phosphors. The lower the decay time of a scintillator, that is, the shorter the duration of its flashes of fluorescence and, so, the less so-called "dead time" of the detector, the more ionizing events per unit of time it will be able to detect.
Choosing the optimal combination of properties of the scintillator, create different types of detectors based on them.
SCINTILLATION DETECTORS
The first device which used a scintillator was built in 1903 by Sir William Crookes who used a ZnS screen. The scintillations produced by the screen were visible to the naked eye if viewed by a microscope in a darkened room, the device was known as a spinthariscope.
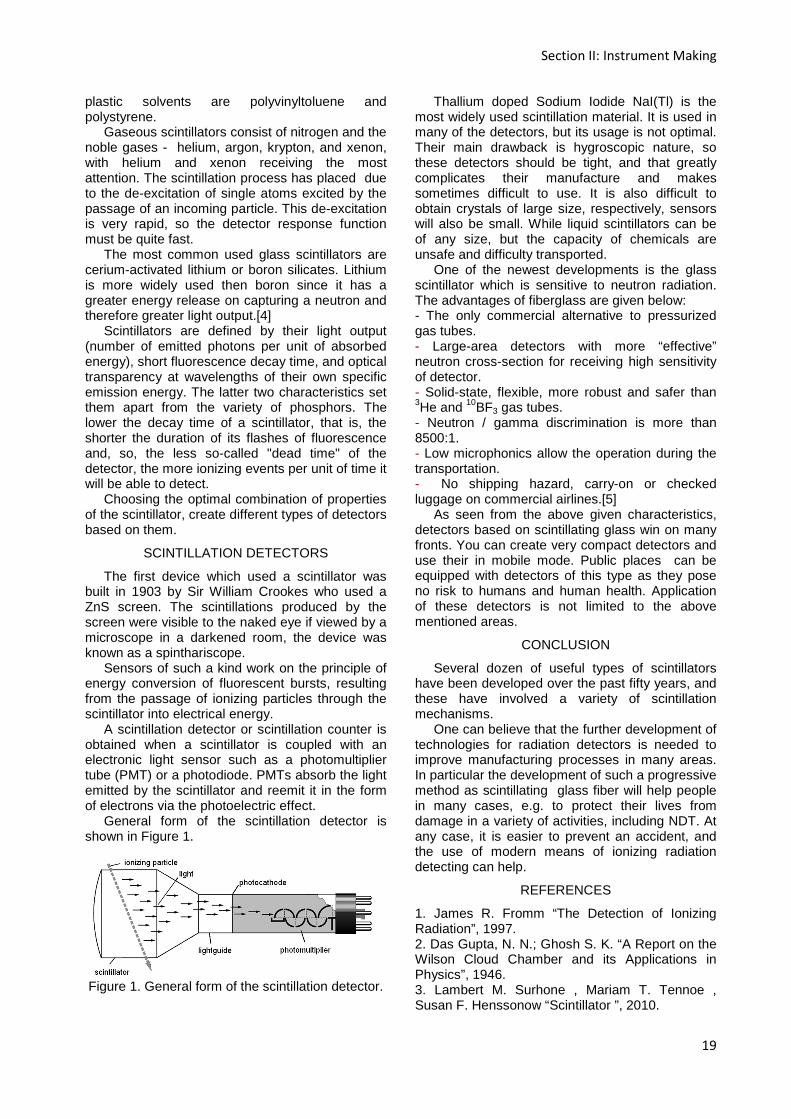
Sensors of such a kind work on the principle of energy conversion of fluorescent bursts, resulting from the passage of ionizing particles through the scintillator into electrical energy.
A scintillation detector or scintillation counter is obtained when a scintillator is coupled with an electronic light sensor such as a photomultiplier tube (PMT) or a photodiode. PMTs absorb the light emitted by the scintillator and reemit it in the form of electrons via the photoelectric effect.
General form of the scintillation detector is shown in Figure 1.
Figure 1. General form of the scintillation detector.
Thallium doped Sodium Iodide NaI(Tl) is the most widely used scintillation material. It is used in many of the detectors, but its usage is not optimal. Their main drawback is hygroscopic nature, so these detectors should be tight, and that greatly complicates their manufacture and makes sometimes difficult to use. It is also difficult to obtain crystals of large size, respectively, sensors will also be small. While liquid scintillators can be of any size, but the capacity of chemicals are unsafe and difficulty transported.
One of the newest developments is the glass scintillator which is sensitive to neutron radiation. The advantages of fiberglass are given below: - The only commercial alternative to pressurized gas tubes. - Large-area detectors with more “effective” neutron cross-section for receiving high sensitivity of detector. - Solid-state, flexible, more robust and safer than 3He and 10BF3 gas tubes. - Neutron / gamma discrimination is more than 8500:1. - Low microphonics allow the operation during the transportation. - No shipping hazard, carry-on or checked luggage on commercial airlines.[5]
As seen from the above given characteristics, detectors based on scintillating glass win on many fronts. You can create very compact detectors and use their in mobile mode. Public places can be equipped with detectors of this type as they pose no risk to humans and human health. Application of these detectors is not limited to the above mentioned areas.
CONCLUSION
Several dozen of useful types of scintillators have been developed over the past fifty years, and these have involved a variety of scintillation mechanisms.
One can believe that the further development of technologies for radiation detectors is needed to improve manufacturing processes in many areas. In particular the development of such a progressive method as scintillating glass fiber will help people in many cases, e.g. to protect their lives from damage in a variety of activities, including NDT. At any case, it is easier to prevent an accident, and the use of modern means of ionizing radiation detecting can help.
REFERENCES
1. James R. Fromm “The Detection of Ionizing Radiation”, 1997. 2. Das Gupta, N. N.; Ghosh S. K. “A Report on the Wilson Cloud Chamber and its Applications in Physics”, 1946. 3. Lambert M. Surhone , Mariam T. Tennoe , Susan F. Henssonow “Scintillator ”, 2010.
XVII Modern Technique and Technologies 2011
20
4. Leo, W. R. “Techniques for Nuclear and Particle Physics Experiments”, 1994.
5. R. Seymour, C. D. Hull, T. Crawford, M. Bliss. “IAEA International Conference on Security of Material. Stockholm, 7-11 May 2001”
SYSTEM OF GAS FLOW CONTROL AND REGULATION
Nazarova K. O.
The scientific adviser Gurin, L. B., Ph. D., associate professor, Linguistic adviser Kozlova N.I., senior
instructor
Tomsk Polytechnic University, 634050, Russia, Tomsk, Lenina, 30
E-mail: [email protected]
Gas flow measurement in industrial installations is necessary for the Gas calculations with gas supply organization, as well as for internal control, determining unit costs of gas and accountability.
Today, the most common method of metering the high costs of gas is the method of differential pressure. This method of measuring gas flow is realized in the information-measuring systems of many companies. Method of calculating the flow and the definition of uncertainty (error) flow measurement is normalized by standard “GOST 8.586.1,2,3,4,5 - 2005 Flow Measurement and amount of liquids and gases by means of orifice devices”. The method of differential pressure based on the creation of a measuring pipe with orifice local narrowing the flow of potential energy is transformed into kinetic energy. The average flow velocity at the point of restriction is increased, and the static pressure is less than the static pressure before the orifice. As the flow rate increases the pressure drop increases as well therefore it can serve as a substance flow measuring.
When measuring flow by variable pressure drop of the liquid diaphragms are widely used due to their simple design, ease of assembly and disassembly. But these flow meters have some disadvantages. Flow measurement accuracy depends on the discharge coefficient, which is the ratio of actual flow rate to the theoretical value. It changes its value during the operation and increases the accuracy of flow measurement. Factors affecting the value of the expiry of the change are the geometric dimensions of the diaphragm, which may be caused by hydraulic shock in the pipeline, the inevitable dulling the sharp edge entrance aperture, surface roughness measuring pipeline, the distance between the local resistances in the measuring pipe, etc. The accuracy of flow measurement using orifice depends on the quality of their installation and the availability to them the estimated diameter of pipe
sections without additional sources of disturbance (burrs, welds, bends, tees, valves and fittings).
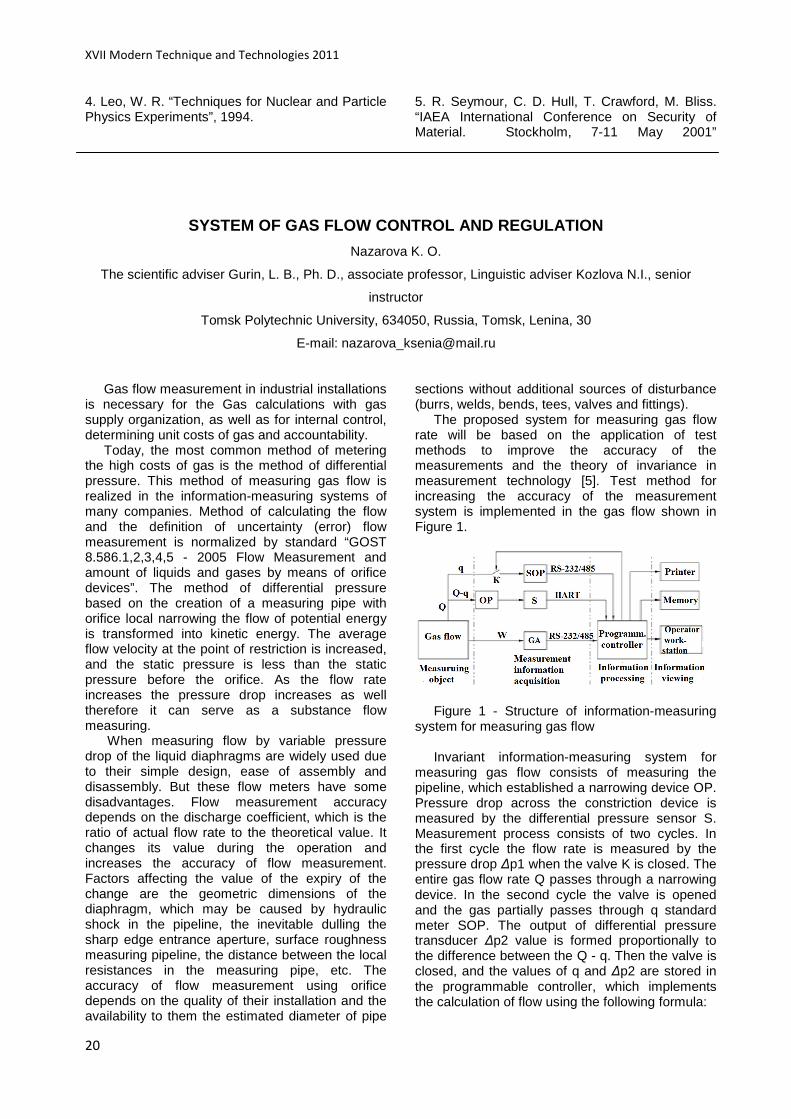
The proposed system for measuring gas flow rate will be based on the application of test methods to improve the accuracy of the measurements and the theory of invariance in measurement technology [5]. Test method for increasing the accuracy of the measurement system is implemented in the gas flow shown in Figure 1.
Figure 1 - Structure of information-measuring
system for measuring gas flow Invariant information-measuring system for
measuring gas flow consists of measuring the pipeline, which established a narrowing device OP. Pressure drop across the constriction device is measured by the differential pressure sensor S. Measurement process consists of two cycles. In the first cycle the flow rate is measured by the pressure drop ∆p1 when the valve K is closed. The entire gas flow rate Q passes through a narrowing device. In the second cycle the valve is opened and the gas partially passes through q standard meter SOP. The output of differential pressure transducer ∆p2 value is formed proportionally to the difference between the Q - q. Then the valve is closed, and the values of q and ∆p2 are stored in the programmable controller, which implements the calculation of flow using the following formula:
Section II: Instrument Making
21
∆∆∆
∆
∆
(1)
Equation (1) is invariant under the discharge
coefficient, which allows not take into account the effect of disturbing effects such as blunting of the input edge, the roughness of the inner surface of the measuring pipe, the violation of the flow profile. An exemplary meter is connected periodically in the time interval between the inclusions discharge coefficient is constant. Opening and closing of the valve is controlled by programmable controller. Crane opens automatically after a certain period of time. The processed information can be displayed in the form of daily reports and printed at the operator’s workstation. The distinctive features of this system are less expensive items and no need for manual data entry, which eliminates the possibility of personal errors of the operator.
The design of the main unit of the system - flowmeter - can be implemented using several variants of the calculations of its parameters:
- calculation of flow parameters for a given value of the upper pressure limit of differential pressure switch and the characteristics of the medium;
- calculation of flow parameters for a given value of maximum pressure loss in the constriction device and the characteristics of the medium;
- calculation of flow parameters for a given flow and pipeline, which provides the minimum uncertainty of the flow outcome measuring and the amount of substance;
- calculation of the flow rate on the set parameters of the known orifice, as well as verification of the compliance with the requirements of GOST 8.586. 1, 2, 3, 4, 5 - 2005 with respect to the straight sections of pipeline and flow measurement in general (so-called inverse calculation of the flow).
Main design relationship between the pressure drop ∆P, Pa on constriction device and the flow rate Q are determined by the flow equation:
∗ ∗ 2 ∗ ∆ (2),
where ρ – density of the medium before the
constriction device, kg/m3;
– the area of flow section of orifice, m2, d - diameter of the aperture; α – coefficient of discharge, formula (3,5) GOST 8,586.1–2005; ε – correction factor (compressibility factor), taking into account the expansion of the medium by lowering its pressure during the flow through the constriction device (for an incompressible medium ε = 1). Knowing that, ∗ , where β - the relative diameter of the diaphragm (B.3, GOST 8.586.1–2005) and using formulas (5,4) (5,6) GOST 8.586.1–2005 and
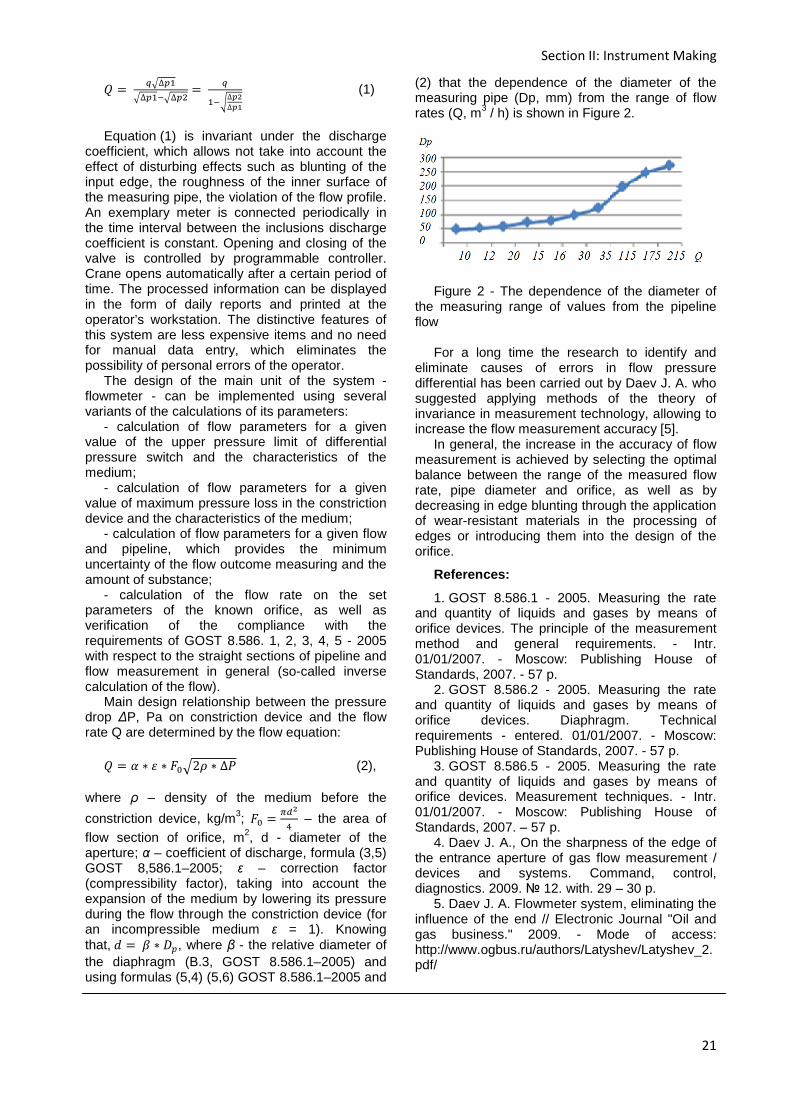
(2) that the dependence of the diameter of the measuring pipe (Dp, mm) from the range of flow rates (Q, m3 / h) is shown in Figure 2.
Figure 2 - The dependence of the diameter of
the measuring range of values from the pipeline flow
For a long time the research to identify and
eliminate causes of errors in flow pressure differential has been carried out by Daev J. A. who suggested applying methods of the theory of invariance in measurement technology, allowing to increase the flow measurement accuracy [5].
In general, the increase in the accuracy of flow measurement is achieved by selecting the optimal balance between the range of the measured flow rate, pipe diameter and orifice, as well as by decreasing in edge blunting through the application of wear-resistant materials in the processing of edges or introducing them into the design of the orifice.
References:
1. GOST 8.586.1 - 2005. Measuring the rate and quantity of liquids and gases by means of orifice devices. The principle of the measurement method and general requirements. - Intr. 01/01/2007. - Moscow: Publishing House of Standards, 2007. - 57 p.
2. GOST 8.586.2 - 2005. Measuring the rate and quantity of liquids and gases by means of orifice devices. Diaphragm. Technical requirements - entered. 01/01/2007. - Moscow: Publishing House of Standards, 2007. - 57 p.
3. GOST 8.586.5 - 2005. Measuring the rate and quantity of liquids and gases by means of orifice devices. Measurement techniques. - Intr. 01/01/2007. - Moscow: Publishing House of Standards, 2007. – 57 p.
4. Daev J. A., On the sharpness of the edge of the entrance aperture of gas flow measurement / devices and systems. Command, control, diagnostics. 2009. 12. with. 29 – 30 p.
5. Daev J. A. Flowmeter system, eliminating the influence of the end // Electronic Journal "Oil and gas business." 2009. - Mode of access: http://www.ogbus.ru/authors/Latyshev/Latyshev_2.pdf/
XVII Modern Technique and Technologies 2011
22
CONSTRUCTIONS OF THE PRECISION GEARS WITH AN ELASTI C LOAD
OF INCREASED DURABILITY
Staheev E. V.
Resarch supervisor: Yangulov V. S., DSc, T.S. Mylnikova, senior teacher.
Tomsk Polytechnic University
30, Lenin Avenue, Tomsk, 634050, Russia,
E-mail: [email protected]
Application of the tooth gears as the part of the
spacecraft reducers is considered to be a highly specific sphere. The main problem of these gears is nonserviceability over a long operating life (20 and more years). The word nonserviceability means no ability to ensure the specified accuracy for moving the output shaft. The open-circuit, which in its turn depends on the space between gearings, is considered to be the main factor influencing the functionality of the gear. The removal of the space for a long time period is a very hard implementing goal since the spacecrafts (shuttles as an example) cannot be maintained and no change of any of the tools is available. That is why the method for producing the reducers for spacecrafts has been suggested.
Wave gears with intermediate bodies (WGIB) improve the reliability and durability of gears by increasing the hardness of work surfaces (more than 60 units of Rockwell) and the decrease in tension in the deformed element. The main advantage of the gear construction with intermediate bodies is that they provide a permanent and elastic load over a very long period of time. The experience in application of these types of gears has shown that they can be used with a guarantee within the period of up to 20 years and the error of the output shaft will not exceed 2 seconds of arc.
Consider a few examples of the constructions of such gears.
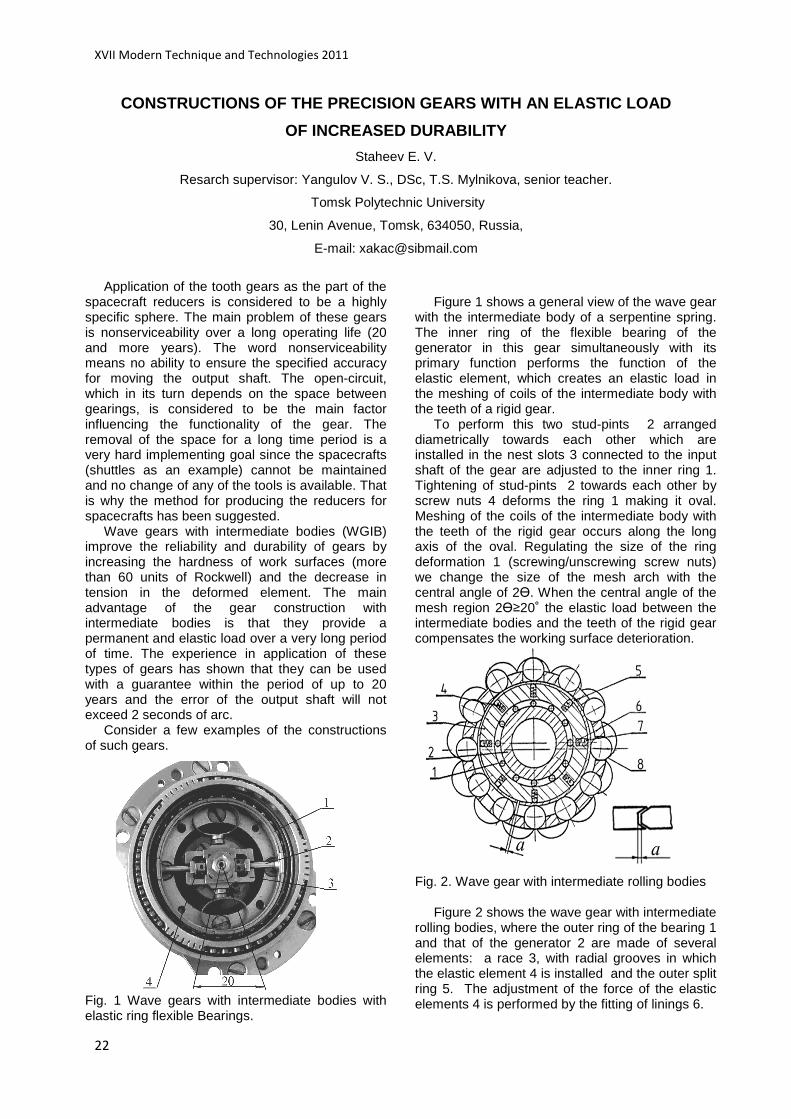
Fig. 1 Wave gears with intermediate bodies with elastic ring flexible Bearings.
Figure 1 shows a general view of the wave gear
with the intermediate body of a serpentine spring. The inner ring of the flexible bearing of the generator in this gear simultaneously with its primary function performs the function of the elastic element, which creates an elastic load in the meshing of coils of the intermediate body with the teeth of a rigid gear.
To perform this two stud-pints 2 arranged diametrically towards each other which are installed in the nest slots 3 connected to the input shaft of the gear are adjusted to the inner ring 1. Tightening of stud-pints 2 towards each other by screw nuts 4 deforms the ring 1 making it oval. Meshing of the coils of the intermediate body with the teeth of the rigid gear occurs along the long axis of the oval. Regulating the size of the ring deformation 1 (screwing/unscrewing screw nuts) we change the size of the mesh arch with the central angle of 2Ө. When the central angle of the mesh region 2Ө≥20˚ the elastic load between the intermediate bodies and the teeth of the rigid gear compensates the working surface deterioration.
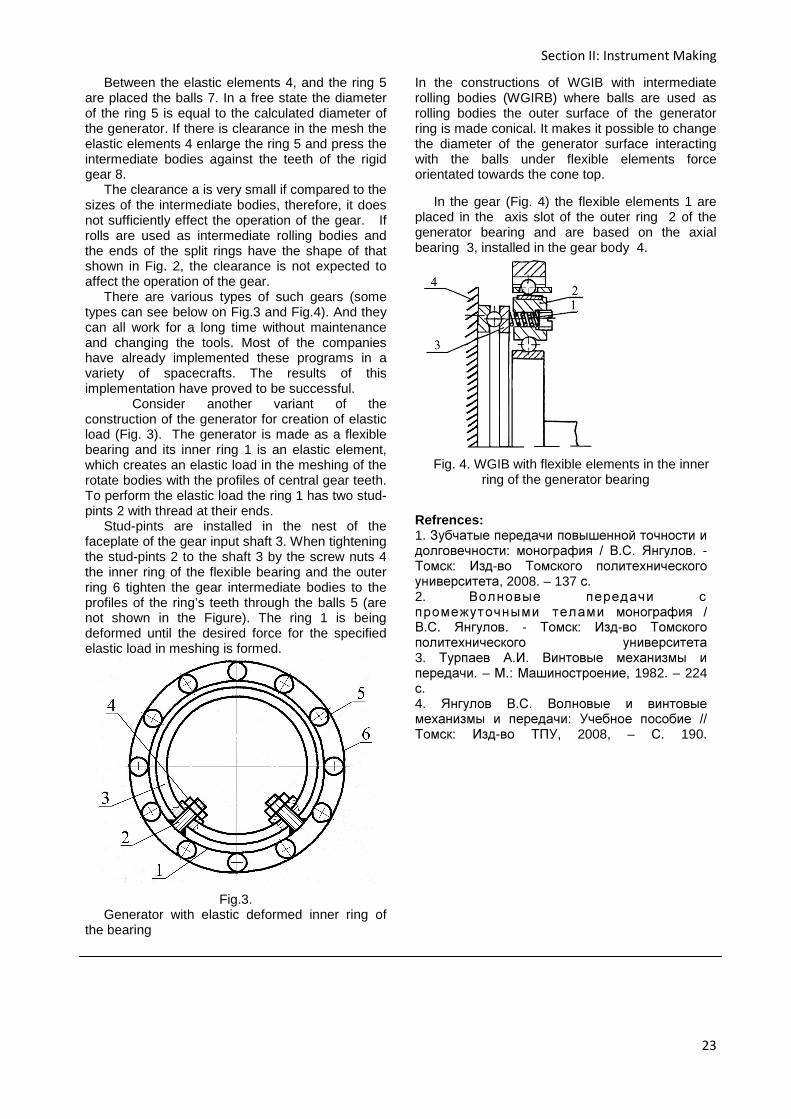
Fig. 2. Wave gear with intermediate rolling bodies
Figure 2 shows the wave gear with intermediate rolling bodies, where the outer ring of the bearing 1 and that of the generator 2 are made of several elements: a race 3, with radial grooves in which the elastic element 4 is installed and the outer split ring 5. The adjustment of the force of the elastic elements 4 is performed by the fitting of linings 6.
Section II: Instrument Making
23
Between the elastic elements 4, and the ring 5 are placed the balls 7. In a free state the diameter of the ring 5 is equal to the calculated diameter of the generator. If there is clearance in the mesh the elastic elements 4 enlarge the ring 5 and press the intermediate bodies against the teeth of the rigid gear 8.
The clearance a is very small if compared to the sizes of the intermediate bodies, therefore, it does not sufficiently effect the operation of the gear. If rolls are used as intermediate rolling bodies and the ends of the split rings have the shape of that shown in Fig. 2, the clearance is not expected to affect the operation of the gear.
There are various types of such gears (some types can see below on Fig.3 and Fig.4). And they can all work for a long time without maintenance and changing the tools. Most of the companies have already implemented these programs in a variety of spacecrafts. The results of this implementation have proved to be successful.
Consider another variant of the construction of the generator for creation of elastic load (Fig. 3). The generator is made as a flexible bearing and its inner ring 1 is an elastic element, which creates an elastic load in the meshing of the rotate bodies with the profiles of central gear teeth. To perform the elastic load the ring 1 has two stud-pints 2 with thread at their ends.
Stud-pints are installed in the nest of the faceplate of the gear input shaft 3. When tightening the stud-pints 2 to the shaft 3 by the screw nuts 4 the inner ring of the flexible bearing and the outer ring 6 tighten the gear intermediate bodies to the profiles of the ring’s teeth through the balls 5 (are not shown in the Figure). The ring 1 is being deformed until the desired force for the specified elastic load in meshing is formed.
Fig.3. Generator with elastic deformed inner ring of
the bearing
In the constructions of WGIB with intermediate rolling bodies (WGIRB) where balls are used as rolling bodies the outer surface of the generator ring is made conical. It makes it possible to change the diameter of the generator surface interacting with the balls under flexible elements force orientated towards the cone top.
In the gear (Fig. 4) the flexible elements 1 are placed in the axis slot of the outer ring 2 of the generator bearing and are based on the axial bearing 3, installed in the gear body 4.
Fig. 4. WGIB with flexible elements in the inner
ring of the generator bearing
Refrences: 1. Зубчатые передачи повышенной точности и долговечности: монография / В.С. Янгулов. - Томск: Изд-во Томского политехнического университета, 2008. – 137 с. 2. Волновые передачи с промежуточными телами монография / В.С. Янгулов. - Томск: Изд-во Томского политехнического университета 3. Турпаев А.И. Винтовые механизмы и передачи. – М.: Машиностроение, 1982. – 224 с. 4. Янгулов В.С. Волновые и винтовые механизмы и передачи: Учебное пособие // Томск: Изд-во ТПУ, 2008, – С. 190.
XVII Modern Technique and Technologies 2011
24
MASTER-OSCILLATOR POWER-AMPLIFIER SYSTEM CONTROLLER
Sukharnikov K.V., Gubarev F.A.
Linguistic advisor: Nakonechnaya M.E.
Tomsk Polytechnic University, 30 Lenin Avenue, Tomsk, Russia, 634050, e-mail: [email protected]
V.E. Zuev Institute of Atmospheric Optics SB RAS, 1 Academician Zuev square, Tomsk, Russia,
634021
Copper and copper compound vapour lasers (CVLs) are commonly used sources of high power visible light. They have two output wavelengths at 510.6 nm (green) and 578.2 nm (yellow). CVLs are pulsed lasers operating at kilohertz pulse repetition frequencies. The pulse width is typically a few tens of nanoseconds. The average power of these lasers can range from units to more than thousands of watts of lasing power [1–3].
Low- and medium-power high-quality output beams of CVLs can be obtained by using single-laser configuration. But there is a limit of high-quality beam energy obtained in this case. The best solution of this problem at high power is the use of master-oscillator power-amplifier (MOPA) systems [1].
MOPA refers to a configuration consisting of a master laser and an optical amplifier to boost the output power. It is in principle a more complex system than a laser which directly produces the required output power, but it also has some advantages. With a MOPA system instead of a laser, it can be easier to reach the required performance such as wavelength tuning range, beam quality or pulse duration if the required power is very high.
High efficiency of this system requires accurate matching and precision synchronization of a master-oscillator and power-amplifier.
Hence, the main aim of the work is to design a timing device with precision delay adjustment, high frequency stability, good noise immunity and low supply power. We need that sort of a device to study CuBr laser with capacitive discharge excitation [4] in a power-amplifier mode.
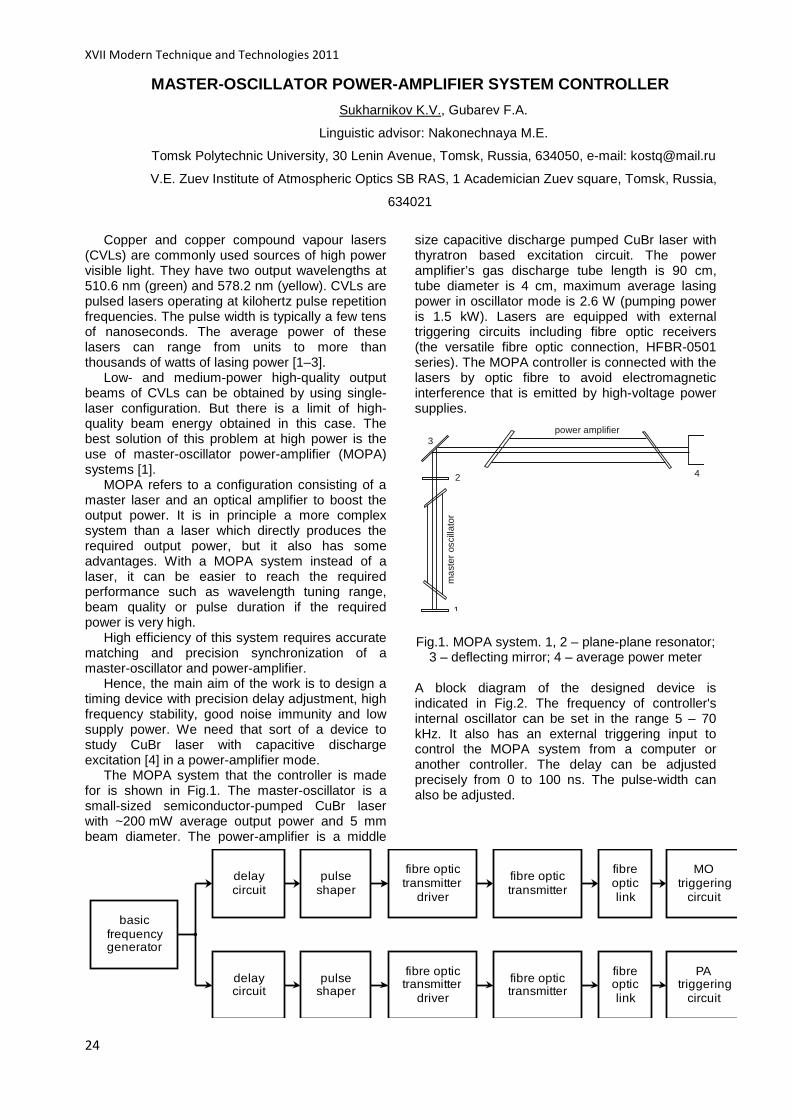
The MOPA system that the controller is made for is shown in Fig.1. The master-oscillator is a small-sized semiconductor-pumped CuBr laser with ~200 mW average output power and 5 mm beam diameter. The power-amplifier is a middle
size capacitive discharge pumped CuBr laser with thyratron based excitation circuit. The power amplifier’s gas discharge tube length is 90 cm, tube diameter is 4 cm, maximum average lasing power in oscillator mode is 2.6 W (pumping power is 1.5 kW). Lasers are equipped with external triggering circuits including fibre optic receivers (the versatile fibre optic connection, HFBR-0501 series). The MOPA controller is connected with the lasers by optic fibre to avoid electromagnetic interference that is emitted by high-voltage power supplies.
Fig.1. MOPA system. 1, 2 – plane-plane resonator; 3 – deflecting mirror; 4 – average power meter
A block diagram of the designed device is indicated in Fig.2. The frequency of controller's internal oscillator can be set in the range 5 – 70 kHz. It also has an external triggering input to control the MOPA system from a computer or another controller. The delay can be adjusted precisely from 0 to 100 ns. The pulse-width can also be adjusted.
ma
ster
osc
illat
or
power amplifier
4
1
2
3
basicfrequencygenerator
delaycircuit
pulseshaper
fibre optictransmitter
driver
delaycircuit
pulseshaper
fibre optictransmitter
driver
fibre optictransmitter
fibre optictransmitter
fibreopticlink
fibreopticlink
MOtriggering
circuit
PAtriggering
circuit
Section II: Instrument Making
25
Fig.2. MOPA controller's block diagram. MO – master oscillator, PA – power amplifier
Precision timing in basic frequency generator,
delay circuits and pulse shapers (Fig.2) are provided by CMOS timers ICM7555. They have improved performance in comparison with standard 555 timers, such as extremely low supply current and high-speed operation. We use a domestic power pack Robiton SN500S. The stability of supply voltage is provided by precision voltage regulator L7812. High noise immunity is achieved due to application of LC- or C- low-pass filters, absence of galvanic coupling with high-current circuits and metal protective shield.
Initially the device has hand adjustment but the system may be enhanced to full computer control owing to modular build and external triggering input.
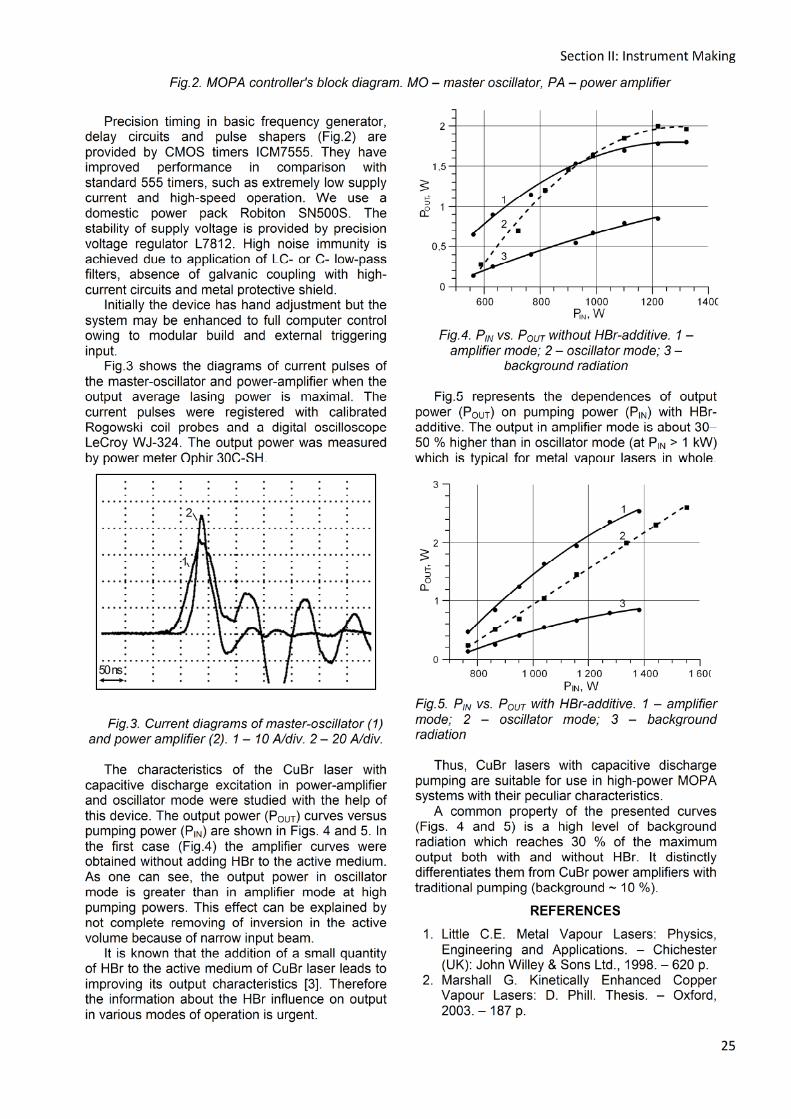
Fig.3 shows the diagrams of current pulses of the master-oscillator and power-amplifier when the output average lasing power is maximal. The current pulses were registered with calibrated Rogowski coil probes and a digital oscilloscope LeCroy WJ-324. The output power was measured by power meter Ophir 30C-SH.
Fig.3. Current diagrams of master-oscillator (1) and power amplifier (2). 1 – 10 A/div. 2 – 20 A/div.
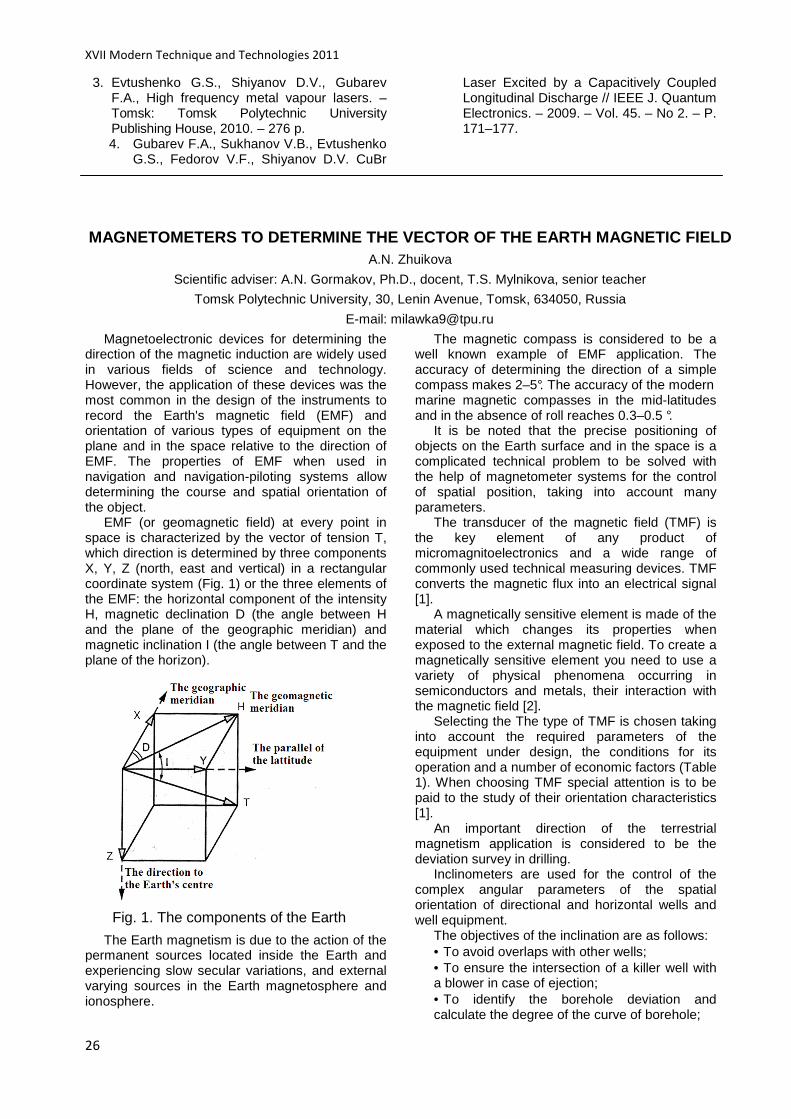
The characteristics of the CuBr laser with
capacitive discharge excitation in power-amplifier and oscillator mode were studied with the help of this device. The output power (POUT) curves versus pumping power (PIN) are shown in Figs. 4 and 5. In the first case (Fig.4) the amplifier curves were obtained without adding HBr to the active medium. As one can see, the output power in oscillator mode is greater than in amplifier mode at high pumping powers. This effect can be explained by not complete removing of inversion in the active volume because of narrow input beam.
It is known that the addition of a small quantity of HBr to the active medium of CuBr laser leads to improving its output characteristics [3]. Therefore the information about the HBr influence on output in various modes of operation is urgent.
Fig.4. PIN vs. POUT without HBr-additive. 1 –
amplifier mode; 2 – oscillator mode; 3 – background radiation
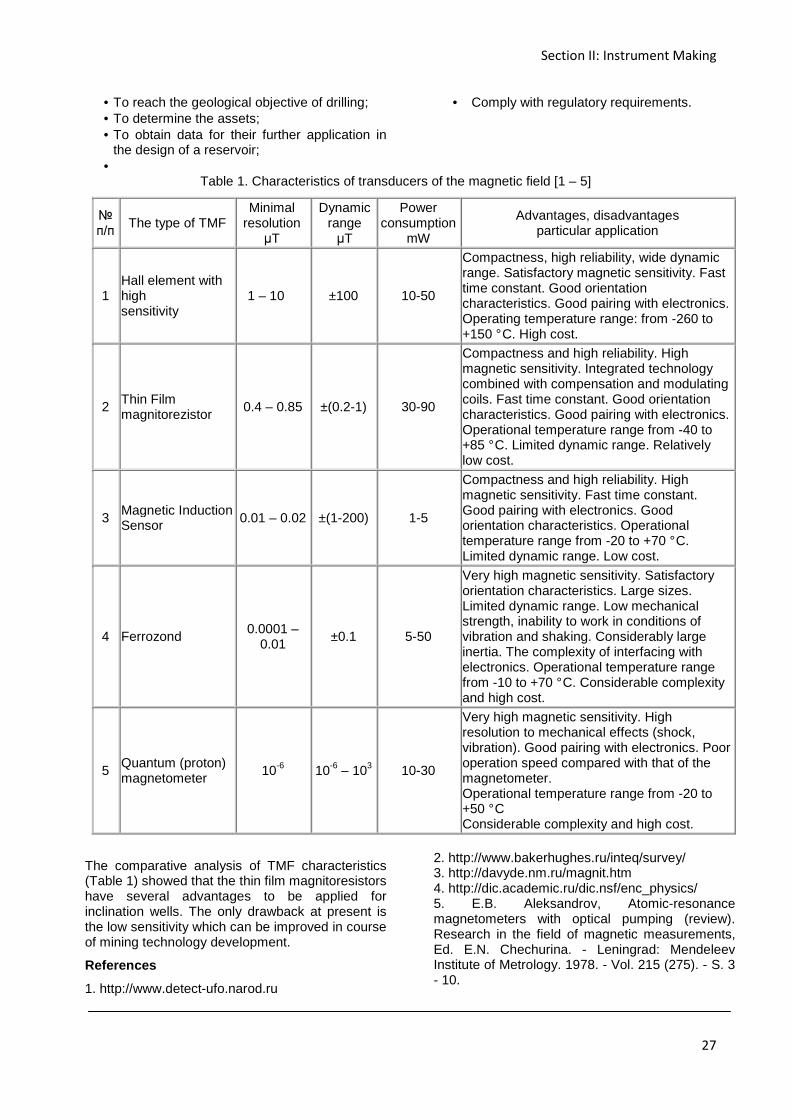
Fig.5 represents the dependences of output
power (POUT) on pumping power (PIN) with HBr-additive. The output in amplifier mode is about 30–50 % higher than in oscillator mode (at PIN > 1 kW) which is typical for metal vapour lasers in whole.
Fig.5. PIN vs. POUT with HBr-additive. 1 – amplifier mode; 2 – oscillator mode; 3 – background radiation
Thus, CuBr lasers with capacitive discharge
pumping are suitable for use in high-power MOPA systems with their peculiar characteristics.
A common property of the presented curves (Figs. 4 and 5) is a high level of background radiation which reaches 30 % of the maximum output both with and without HBr. It distinctly differentiates them from CuBr power amplifiers with traditional pumping (background ~ 10 %).
REFERENCES
1. Little C.E. Metal Vapour Lasers: Physics, Engineering and Applications. – Chichester (UK): John Willey & Sons Ltd., 1998. – 620 p.
2. Marshall G. Kinetically Enhanced Copper Vapour Lasers: D. Phill. Thesis. – Oxford, 2003. – 187 p.
XVII Modern Technique and Technologies 2011
26
3. Evtushenko G.S., Shiyanov D.V., Gubarev F.A., High frequency metal vapour lasers. – Tomsk: Tomsk Polytechnic University Publishing House, 2010. – 276 p. 4. Gubarev F.A., Sukhanov V.B., Evtushenko
G.S., Fedorov V.F., Shiyanov D.V. CuBr
Laser Excited by a Capacitively Coupled Longitudinal Discharge // IEEE J. Quantum Electronics. – 2009. – Vol. 45. – No 2. – P. 171–177.
MAGNETOMETERS TO DETERMINE THE VECTOR OF THE EARTH MAGNETIC FIELD
A.N. Zhuikova
Scientific adviser: A.N. Gormakov, Ph.D., docent, T.S. Mylnikova, senior teacher
Tomsk Polytechnic University, 30, Lenin Avenue, Tomsk, 634050, Russia
E-mail: [email protected]
Magnetoelectronic devices for determining the direction of the magnetic induction are widely used in various fields of science and technology. However, the application of these devices was the most common in the design of the instruments to record the Earth's magnetic field (EMF) and orientation of various types of equipment on the plane and in the space relative to the direction of EMF. The properties of EMF when used in navigation and navigation-piloting systems allow determining the course and spatial orientation of the object.
EMF (or geomagnetic field) at every point in space is characterized by the vector of tension T, which direction is determined by three components X, Y, Z (north, east and vertical) in a rectangular coordinate system (Fig. 1) or the three elements of the EMF: the horizontal component of the intensity H, magnetic declination D (the angle between H and the plane of the geographic meridian) and magnetic inclination I (the angle between T and the plane of the horizon).
The Earth magnetism is due to the action of the
permanent sources located inside the Earth and experiencing slow secular variations, and external varying sources in the Earth magnetosphere and ionosphere.
The magnetic compass is considered to be a well known example of EMF application. The accuracy of determining the direction of a simple compass makes 2–5°. The accuracy of the modern marine magnetic compasses in the mid-latitudes and in the absence of roll reaches 0.3–0.5 °.
It is be noted that the precise positioning of objects on the Earth surface and in the space is a complicated technical problem to be solved with the help of magnetometer systems for the control of spatial position, taking into account many parameters.
The transducer of the magnetic field (TMF) is the key element of any product of micromagnitoelectronics and a wide range of commonly used technical measuring devices. TMF converts the magnetic flux into an electrical signal [1].
A magnetically sensitive element is made of the material which changes its properties when exposed to the external magnetic field. To create a magnetically sensitive element you need to use a variety of physical phenomena occurring in semiconductors and metals, their interaction with the magnetic field [2].
Selecting the The type of TMF is chosen taking into account the required parameters of the equipment under design, the conditions for its operation and a number of economic factors (Table 1). When choosing TMF special attention is to be paid to the study of their orientation characteristics [1].
An important direction of the terrestrial magnetism application is considered to be the deviation survey in drilling.
Inclinometers are used for the control of the complex angular parameters of the spatial orientation of directional and horizontal wells and well equipment.
The objectives of the inclination are as follows: • To avoid overlaps with other wells; • To ensure the intersection of a killer well with a blower in case of ejection; • To identify the borehole deviation and calculate the degree of the curve of borehole;
Fig. 1. The components of the Earth magnetic field
Section II: Instrument Making
27
• To reach the geological objective of drilling; • To determine the assets; • To obtain data for their further application in
the design of a reservoir; •
• Comply with regulatory requirements.
Table 1. Characteristics of transducers of the magnetic field [1 – 5]
п/п The type of TMF
Minimal resolution
µT
Dynamic range µT
Power consumption
mW
Advantages, disadvantages particular application
1 Hall element with high sensitivity
1 – 10 ±100 10-50
Compactness, high reliability, wide dynamic range. Satisfactory magnetic sensitivity. Fast time constant. Good orientation characteristics. Good pairing with electronics. Operating temperature range: from -260 to +150 ° C. High cost.
2 Thin Film magnitorezistor
0.4 – 0.85 ±(0.2-1) 30-90
Compactness and high reliability. High magnetic sensitivity. Integrated technology combined with compensation and modulating coils. Fast time constant. Good orientation characteristics. Good pairing with electronics. Operational temperature range from -40 to +85 ° C. Limited dynamic range. Relatively low cost.
3 Magnetic Induction Sensor 0.01 – 0.02 ±(1-200) 1-5
Compactness and high reliability. High magnetic sensitivity. Fast time constant. Good pairing with electronics. Good orientation characteristics. Operational temperature range from -20 to +70 ° C. Limited dynamic range. Low cost.
4 Ferrozond 0.0001 –
0.01 ±0.1 5-50
Very high magnetic sensitivity. Satisfactory orientation characteristics. Large sizes. Limited dynamic range. Low mechanical strength, inability to work in conditions of vibration and shaking. Considerably large inertia. The complexity of interfacing with electronics. Operational temperature range from -10 to +70 ° C. Considerable complexity and high cost.
5 Quantum (proton) magnetometer
10-6 10-6 – 103 10-30
Very high magnetic sensitivity. High resolution to mechanical effects (shock, vibration). Good pairing with electronics. Poor operation speed compared with that of the magnetometer. Operational temperature range from -20 to +50 ° C Considerable complexity and high cost.
The comparative analysis of TMF characteristics (Table 1) showed that the thin film magnitoresistors have several advantages to be applied for inclination wells. The only drawback at present is the low sensitivity which can be improved in course of mining technology development.
References
1. http://www.detect-ufo.narod.ru
2. http://www.bakerhughes.ru/inteq/survey/ 3. http://davyde.nm.ru/magnit.htm 4. http://dic.academic.ru/dic.nsf/enc_physics/ 5. E.B. Aleksandrov, Atomic-resonance magnetometers with optical pumping (review). Research in the field of magnetic measurements, Ed. E.N. Chechurina. - Leningrad: Mendeleev Institute of Metrology. 1978. - Vol. 215 (275). - S. 3 - 10.

XVII Modern Technique and Technologies 2011
28

Section III: Technology, Equipment and Machine-Building Production Automation
29
Section III
TECHNOLOGY, EQUIPMENT AND MACHINE-BUILDING PRODUCTION AUTOMATION
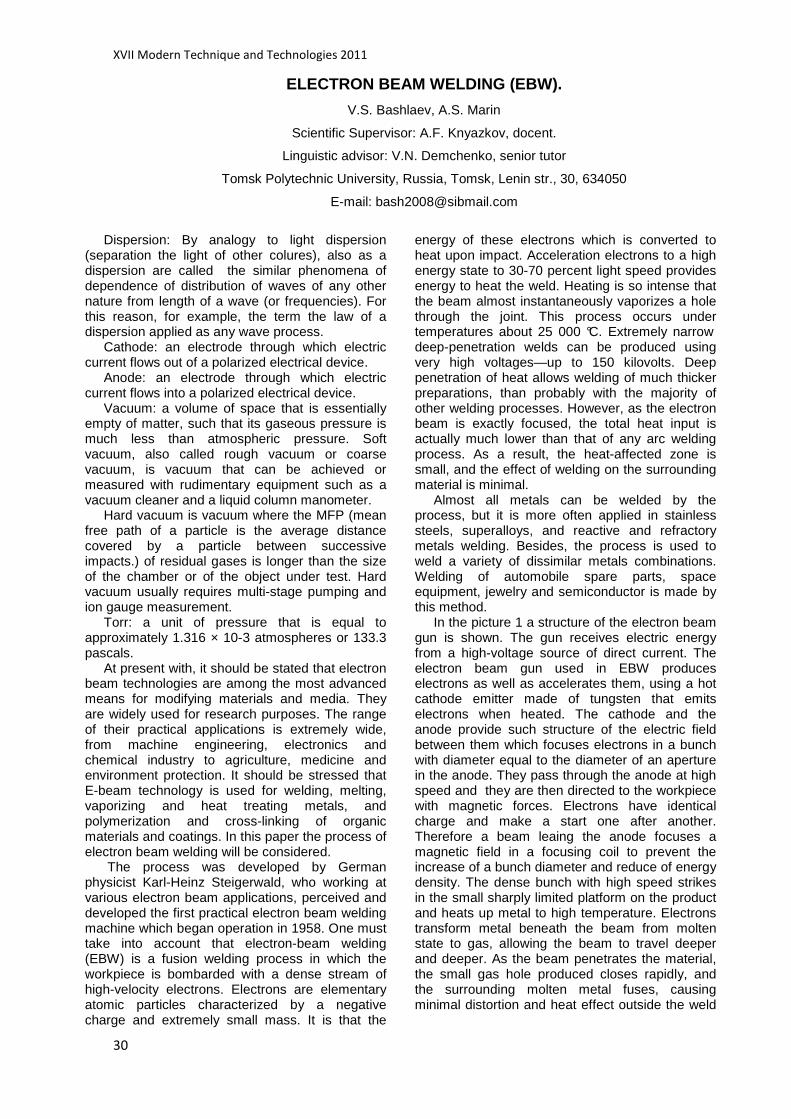
XVII Modern Technique and Technologies 2011
30
ELECTRON BEAM WELDING (EBW).
V.S. Bashlaev, A.S. Marin
Scientific Supervisor: A.F. Knyazkov, docent.
Linguistic advisor: V.N. Demchenko, senior tutor
Tomsk Polytechnic University, Russia, Tomsk, Lenin str., 30, 634050
E-mail: [email protected]
Dispersion: By analogy to light dispersion
(separation the light of other colures), also as a dispersion are called the similar phenomena of dependence of distribution of waves of any other nature from length of a wave (or frequencies). For this reason, for example, the term the law of a dispersion applied as any wave process.
Cathode: an electrode through which electric current flows out of a polarized electrical device.
Anode: an electrode through which electric current flows into a polarized electrical device.
Vacuum: a volume of space that is essentially empty of matter, such that its gaseous pressure is much less than atmospheric pressure. Soft vacuum, also called rough vacuum or coarse vacuum, is vacuum that can be achieved or measured with rudimentary equipment such as a vacuum cleaner and a liquid column manometer.
Hard vacuum is vacuum where the MFP (mean free path of a particle is the average distance covered by a particle between successive impacts.) of residual gases is longer than the size of the chamber or of the object under test. Hard vacuum usually requires multi-stage pumping and ion gauge measurement.
Torr: a unit of pressure that is equal to approximately 1.316 × 10⁻³ atmospheres or 133.3 pascals.
At present with, it should be stated that electron beam technologies are among the most advanced means for modifying materials and media. They are widely used for research purposes. The range of their practical applications is extremely wide, from machine engineering, electronics and chemical industry to agriculture, medicine and environment protection. It should be stressed that E-beam technology is used for welding, melting, vaporizing and heat treating metals, and polymerization and cross-linking of organic materials and coatings. In this paper the process of electron beam welding will be considered.
The process was developed by German physicist Karl-Heinz Steigerwald, who working at various electron beam applications, perceived and developed the first practical electron beam welding machine which began operation in 1958. One must take into account that electron-beam welding (EBW) is a fusion welding process in which the workpiece is bombarded with a dense stream of high-velocity electrons. Electrons are elementary atomic particles characterized by a negative charge and extremely small mass. It is that the
energy of these electrons which is converted to heat upon impact. Acceleration electrons to a high energy state to 30-70 percent light speed provides energy to heat the weld. Heating is so intense that the beam almost instantaneously vaporizes a hole through the joint. This process occurs under temperatures about 25 000 °C. Extremely narrow deep-penetration welds can be produced using very high voltages—up to 150 kilovolts. Deep penetration of heat allows welding of much thicker preparations, than probably with the majority of other welding processes. However, as the electron beam is exactly focused, the total heat input is actually much lower than that of any arc welding process. As a result, the heat-affected zone is small, and the effect of welding on the surrounding material is minimal.
Almost all metals can be welded by the process, but it is more often applied in stainless steels, superalloys, and reactive and refractory metals welding. Besides, the process is used to weld a variety of dissimilar metals combinations. Welding of automobile spare parts, space equipment, jewelry and semiconductor is made by this method.
In the picture 1 a structure of the electron beam gun is shown. The gun receives electric energy from a high-voltage source of direct current. The electron beam gun used in EBW produces electrons as well as accelerates them, using a hot cathode emitter made of tungsten that emits electrons when heated. The cathode and the anode provide such structure of the electric field between them which focuses electrons in a bunch with diameter equal to the diameter of an aperture in the anode. They pass through the anode at high speed and they are then directed to the workpiece with magnetic forces. Electrons have identical charge and make a start one after another. Therefore a beam leaing the anode focuses a magnetic field in a focusing coil to prevent the increase of a bunch diameter and reduce of energy density. The dense bunch with high speed strikes in the small sharply limited platform on the product and heats up metal to high temperature. Electrons transform metal beneath the beam from molten state to gas, allowing the beam to travel deeper and deeper. As the beam penetrates the material, the small gas hole produced closes rapidly, and the surrounding molten metal fuses, causing minimal distortion and heat effect outside the weld

Section III: Technology, Equipment and Machine-Building Production Automation
31
zone. The device is placed in the vacuum chamber. [1]
Picture1 – Electron Beam Gun It must be noted that the quantity of heat and
penetration depth depend on several variables. The cores from them are number and speed of electrons, diameter of an electronic beam and its speed. Greater beam current causes the increase in heat input and penetration, while higher travel speed decreases the amount of heat input and reduces penetration. Besides, the diameter of a beam can be distinguished. If the focus is located above the preparation surface, the width of welding increases, but penetration decreases. And if the focus is located below the preparation surface, the depth of welding increases, but the width decreases.
Moreover, the process of electron beam welding is divided into three methods. Each of these methods is applied in certain welding environment. The first method developed requires that the welding chamber must be in hard vacuum. This method allows to weld workpieces to 15 sm thickness, and the distance between the welding weapon and the workpiece can be even 0.7 m. The second method gives a chance to perform EBW in soft vacuum, under pressure of 0.1 torr. This allows to use larger welding chambers and reduce the time and equipment required to attain evacuate the chamber. But this reduces the maximum stand-off distance by half and decreases the maximum material thickness to 5 sm. The last method is called nonvacuum or out-of-vacuum EBW, because it is performed at atmospheric pressure. The distance between workpiece and an electron beam gun is lowered to 4 sm, and the maximum thickness of the material is 5 sm. The third method is good because the size of welded workpiece has no value in the absence of the welding chamber.
Advantages and disadvantages of the process will be considered further.
The advantages of Electron Beam Welding, which are the following: [2]
• Total energy input is approximately 1/25 of conventional welding energy
• Low heat input results in minimal distortion • Close tolerances • Deep welding of workpieces with extremely
limited heat-affected zones
• Repeatability of weld parameters job to job, lot to lot
• High-strength weld integrity (clean, strong and consistent)
• No fluxes or shielding gases to affect the properties of the weld
• Penetration control to 10% welding in vac. 1x10-TORR, producing contamination-free welds
• Joining of similar and dissimilar metals • Cost-effective joining meets difficult design
requirements and restraint • Welding in hard reached areas with other
processes • Magnified optical viewing for additional
welding accuracy (20-40x typical) The EBW Limitations: [3] • High equipment cost • Work chamber size constraints • Time delay when welding in vacuum • High weld workpieces costs • X-rays produced during welding • Rapid solidification rates can cause
cracking in some materials In the conclusion it would be desirable to sum
up and once again to underline clear advantages of EBW. This technology is a reliable and cost effective method of joining a wide range of metals. From pacemakers used in the medical industry to sensors used on fighter aircraft, Electron Beam applications are almost limitless. The welding is performed in a vacuum, therefore welds are clean and free from oxidation. Due to the extreme density and precise control of the electrons, high weld 'depth to width' ratios can be achieved; up to 20-1 is obtainable. With minimal or no distortion, Electron Beam Welding is often the final step of a production sequence.
Referents 1. The collection of proceedings of students of Russia [Electronic resource] http://www.cs-alternativa.ru/text/2052 2. Official site company Acceleron Inc. [Electronic resource]http://www.acceleroninc.com/ebweld/ebweld.htm 3. Site of Welding Procedures and Techniques http://www.weldingengineer.com/ 1%20Electron%20Beam.htm

XVII Modern Technique and Technologies 2011
32
PROBLEM OF TRANSFERRING ELECTRODE METAL
Bocharov A.I.
Scientific Advisor: Kobzeva N.А.
Tomsk Polytechnic University, 634050, Lenina av. 30, Tomsk, Russia
E-mail: [email protected]
Introduction Welding is a fabrication or sculptural process
that joins materials, usually metals or thermoplastics, by causing coalescence. This is often done by melting the workpieces and adding a filler material to form a pool of molten material (the weld pool) that cools to become a strong joint, with pressure sometimes used in conjunction with heat, or by itself, to produce the weld. This is in contrast with soldering and brazing, which involve melting a lower-melting-point material between the workpieces to form a bond between them, without melting the workpieces.
Many different energy sources can be used for welding, including a gas flame, an electric arc, a laser, an electron beam, friction, and ultrasound. While often an industrial process, welding can be done in many different environments, including open air, under water and in outer space. Regardless of location, however, welding remains dangerous, and precautions are taken to avoid burns, electric shock, eye damage, poisonous fumes, and overexposure to ultraviolet light.
Until the end of the 19th century, the only welding process was forge welding, which blacksmiths had used for centuries to join iron and steel by heating and hammering them. Arc welding and oxyfuel welding were among the first processes to develop late in the century, and resistance welding followed soon after. Welding technology advanced quickly during the early 20th century as World War I and World War II drove the demand for reliable and inexpensive joining methods. Following the wars, several modern welding techniques were developed, including manual methods like shielded metal arc welding, now one of the most popular welding methods, as well as semi-automatic and automatic processes such as gas metal arc welding, submerged arc welding, flux-cored arc welding and electroslag welding. Developments continued with the invention of laser beam welding and electron beam welding in the latter half of the century. Today, the science continues to advance. Robot welding is becoming more commonplace in industrial settings, and researchers continue to develop new welding methods and gain greater understanding of weld quality and properties.[1 p. 95]
Problem of welding But, unfortunately, like any process, welding is
not without problems. One of these problems is splashing of electrode
metal. This leads to a decrease in the quality of the weld and the loss of electrode wire. This is especially affected by arc welding. To fix this
process, we must understand how the process of transferring a drop in the weld pool. Arc welding is a type of welding that uses a welding power supply to create an electric arc between an electrode and the base material to melt the metals at the welding point.
Small-droplet metal transfer can be implemented in any position. However, in practice, the use of small-drip and spray transfer is limited only by welding in the down position, because despite the fact that when welding in the vertical and overhead positions of all the drops reach the weld pool, the latter flows down due to excessive size. Due to the fact that this type of transfer requires the use of high welding current, which leads to high heat input and high weld pool, it is not acceptable for welding sheet metal. It is used for welding metals of large thickness (typically greater than 3 mm thick), especially when welding heavy steel and shipbuilding.
The main characteristics of welding process with a fine-droplet transfer are: the high arc stability, lack of spatter, moderate formation of welding fumes, good wetting the edges of the seam and high penetration, smooth and uniform surface of the weld, the possibility of welding at higher modes and a high deposition rate.
Because of these advantages of small-droplet metal transfer is always desirable, where its application may, however, it requires a strict selection and maintenance of welding process parameters.[2 p. 62]
This problem occurs at each facility where the welded structures are used. For example at the plant "Voshod" in the Novgorod region produces weldments (farms).
Ways to small-droplet metal transfer I want to offer a couple ways to fix this problem. 3.1) Raising the voltage of arc welding. This method allows for the transfer of electrode
metal into the molten pool in small drops or spray. Maybe it's because when the voltage of the arc current increases electrodynamics force. When it reaches a critical value, we needed to begin the transfer process.
This is a simple way which does not require excessive investment because all modern welders are designed to increase the value of current strength.
But this method has two significant disadvantages: Increased consumption of electricity; Increased consumption of protective gas.
These are serious drawbacks because these resources are very expensive.
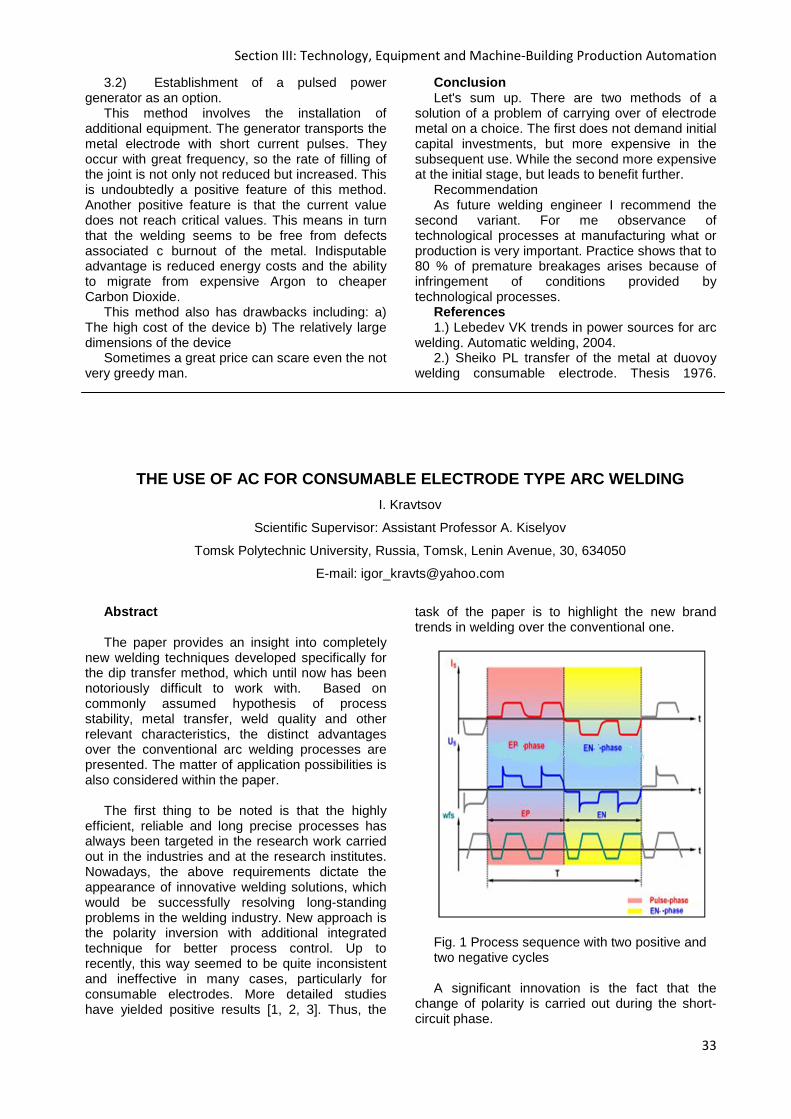
Section III: Technology, Equipment and Machine-Building Production Automation
33
3.2) Establishment of a pulsed power generator as an option.
This method involves the installation of additional equipment. The generator transports the metal electrode with short current pulses. They occur with great frequency, so the rate of filling of the joint is not only not reduced but increased. This is undoubtedly a positive feature of this method. Another positive feature is that the current value does not reach critical values. This means in turn that the welding seems to be free from defects associated c burnout of the metal. Indisputable advantage is reduced energy costs and the ability to migrate from expensive Argon to cheaper Carbon Dioxide.
This method also has drawbacks including: a) The high cost of the device b) The relatively large dimensions of the device
Sometimes a great price can scare even the not very greedy man.
Conclusion Let's sum up. There are two methods of a
solution of a problem of carrying over of electrode metal on a choice. The first does not demand initial capital investments, but more expensive in the subsequent use. While the second more expensive at the initial stage, but leads to benefit further.
Recommendation As future welding engineer I recommend the
second variant. For me observance of technological processes at manufacturing what or production is very important. Practice shows that to 80 % of premature breakages arises because of infringement of conditions provided by technological processes.
References 1.) Lebedev VK trends in power sources for arc
welding. Automatic welding, 2004. 2.) Sheiko PL transfer of the metal at duovoy
welding consumable electrode. Thesis 1976.
THE USE OF AC FOR CONSUMABLE ELECTRODE TYPE ARC WEL DING
I. Kravtsov
Scientific Supervisor: Assistant Professor A. Kiselyov
Tomsk Polytechnic University, Russia, Tomsk, Lenin Avenue, 30, 634050
E-mail: [email protected]
Abstract The paper provides an insight into completely
new welding techniques developed specifically for the dip transfer method, which until now has been notoriously difficult to work with. Based on commonly assumed hypothesis of process stability, metal transfer, weld quality and other relevant characteristics, the distinct advantages over the conventional arc welding processes are presented. The matter of application possibilities is also considered within the paper.
The first thing to be noted is that the highly
efficient, reliable and long precise processes has always been targeted in the research work carried out in the industries and at the research institutes. Nowadays, the above requirements dictate the appearance of innovative welding solutions, which would be successfully resolving long-standing problems in the welding industry. New approach is the polarity inversion with additional integrated technique for better process control. Up to recently, this way seemed to be quite inconsistent and ineffective in many cases, particularly for consumable electrodes. More detailed studies have yielded positive results [1, 2, 3]. Thus, the
task of the paper is to highlight the new brand trends in welding over the conventional one.
Fig. 1 Process sequence with two positive and two negative cycles A significant innovation is the fact that the
change of polarity is carried out during the short-circuit phase.
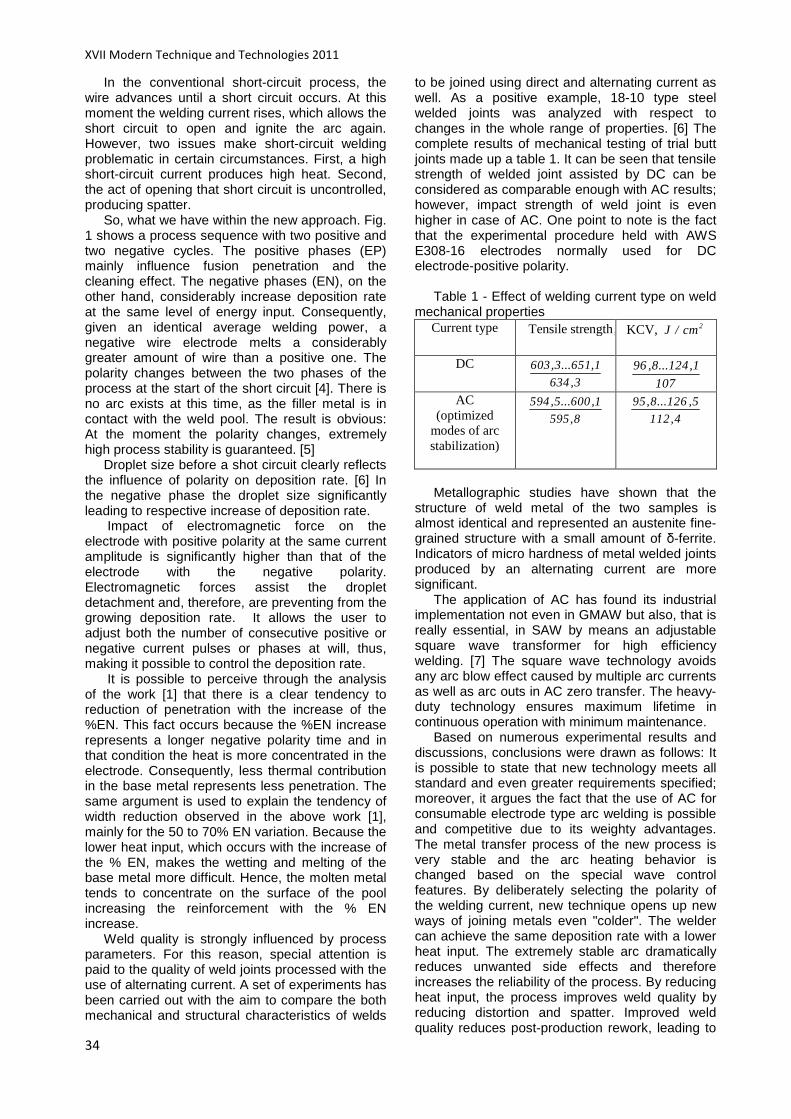
XVII Modern Technique and Technologies 2011
34
In the conventional short-circuit process, the wire advances until a short circuit occurs. At this moment the welding current rises, which allows the short circuit to open and ignite the arc again. However, two issues make short-circuit welding problematic in certain circumstances. First, a high short-circuit current produces high heat. Second, the act of opening that short circuit is uncontrolled, producing spatter.
So, what we have within the new approach. Fig. 1 shows a process sequence with two positive and two negative cycles. The positive phases (EP) mainly influence fusion penetration and the cleaning effect. The negative phases (EN), on the other hand, considerably increase deposition rate at the same level of energy input. Consequently, given an identical average welding power, a negative wire electrode melts a considerably greater amount of wire than a positive one. The polarity changes between the two phases of the process at the start of the short circuit [4]. There is no arc exists at this time, as the filler metal is in contact with the weld pool. The result is obvious: At the moment the polarity changes, extremely high process stability is guaranteed. [5]
Droplet size before a shot circuit clearly reflects the influence of polarity on deposition rate. [6] In the negative phase the droplet size significantly leading to respective increase of deposition rate.
Impact of electromagnetic force on the electrode with positive polarity at the same current amplitude is significantly higher than that of the electrode with the negative polarity. Electromagnetic forces assist the droplet detachment and, therefore, are preventing from the growing deposition rate. It allows the user to adjust both the number of consecutive positive or negative current pulses or phases at will, thus, making it possible to control the deposition rate.
It is possible to perceive through the analysis of the work [1] that there is a clear tendency to reduction of penetration with the increase of the %EN. This fact occurs because the %EN increase represents a longer negative polarity time and in that condition the heat is more concentrated in the electrode. Consequently, less thermal contribution in the base metal represents less penetration. The same argument is used to explain the tendency of width reduction observed in the above work [1], mainly for the 50 to 70% EN variation. Because the lower heat input, which occurs with the increase of the % EN, makes the wetting and melting of the base metal more difficult. Hence, the molten metal tends to concentrate on the surface of the pool increasing the reinforcement with the % EN increase.
Weld quality is strongly influenced by process parameters. For this reason, special attention is paid to the quality of weld joints processed with the use of alternating current. A set of experiments has been carried out with the aim to compare the both mechanical and structural characteristics of welds
to be joined using direct and alternating current as well. As a positive example, 18-10 type steel welded joints was analyzed with respect to changes in the whole range of properties. [6] The complete results of mechanical testing of trial butt joints made up a table 1. It can be seen that tensile strength of welded joint assisted by DC can be considered as comparable enough with AC results; however, impact strength of weld joint is even higher in case of AC. One point to note is the fact that the experimental procedure held with AWS E308-16 electrodes normally used for DC electrode-positive polarity.
Table 1 - Effect of welding current type on weld
mechanical properties Current type Tensile strength,
KCV,
2J / cm
DC 603,3...651,1
634,3 96 ,8...124,1
107
AC (optimized
modes of arc stabilization)
594,5...600,1
595,8 95,8...126 ,5
112,4
Metallographic studies have shown that the
structure of weld metal of the two samples is almost identical and represented an austenite fine-grained structure with a small amount of δ-ferrite. Indicators of micro hardness of metal welded joints produced by an alternating current are more significant.
The application of AC has found its industrial implementation not even in GMAW but also, that is really essential, in SAW by means an adjustable square wave transformer for high efficiency welding. [7] The square wave technology avoids any arc blow effect caused by multiple arc currents as well as arc outs in AC zero transfer. The heavy-duty technology ensures maximum lifetime in continuous operation with minimum maintenance.
Based on numerous experimental results and discussions, conclusions were drawn as follows: It is possible to state that new technology meets all standard and even greater requirements specified; moreover, it argues the fact that the use of AC for consumable electrode type arc welding is possible and competitive due to its weighty advantages. The metal transfer process of the new process is very stable and the arc heating behavior is changed based on the special wave control features. By deliberately selecting the polarity of the welding current, new technique opens up new ways of joining metals even "colder". The welder can achieve the same deposition rate with a lower heat input. The extremely stable arc dramatically reduces unwanted side effects and therefore increases the reliability of the process. By reducing heat input, the process improves weld quality by reducing distortion and spatter. Improved weld quality reduces post-production rework, leading to
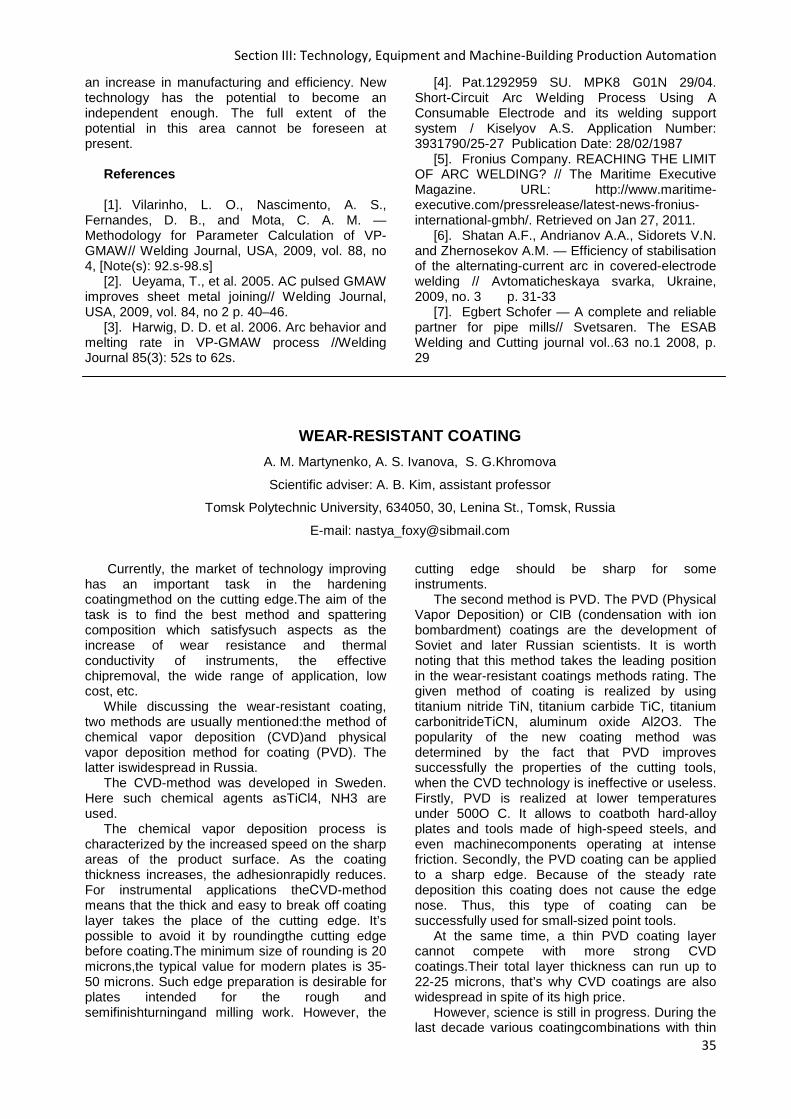
Section III: Technology, Equipment and Machine-Building Production Automation
35
an increase in manufacturing and efficiency. New technology has the potential to become an independent enough. The full extent of the potential in this area cannot be foreseen at present.
References [1]. Vilarinho, L. O., Nascimento, A. S.,
Fernandes, D. B., and Mota, C. A. M. — Methodology for Parameter Calculation of VP-GMAW// Welding Journal, USA, 2009, vol. 88, no 4, [Note(s): 92.s-98.s]
[2]. Ueyama, T., et al. 2005. AC pulsed GMAW improves sheet metal joining// Welding Journal, USA, 2009, vol. 84, no 2 p. 40–46.
[3]. Harwig, D. D. et al. 2006. Arc behavior and melting rate in VP-GMAW process //Welding Journal 85(3): 52s to 62s.
[4]. Pat.1292959 SU. MPK8 G01N 29/04. Short-Circuit Arc Welding Process Using A Consumable Electrode and its welding support system / Kiselyov A.S. Application Number: 3931790/25-27 Publication Date: 28/02/1987
[5]. Fronius Company. REACHING THE LIMIT OF ARC WELDING? // The Maritime Executive Magazine. URL: http://www.maritime-executive.com/pressrelease/latest-news-fronius-international-gmbh/. Retrieved on Jan 27, 2011.
[6]. Shatan A.F., Andrianov A.A., Sidorets V.N. and Zhernosekov A.M. — Efficiency of stabilisation of the alternating-current arc in covered-electrode welding // Avtomaticheskaya svarka, Ukraine, 2009, no. 3 p. 31-33
[7]. Egbert Schofer — A complete and reliable partner for pipe mills// Svetsaren. The ESAB Welding and Cutting journal vol..63 no.1 2008, p. 29
WEAR-RESISTANT COATING
A. M. Martynenko, A. S. Ivanova, S. G.Khromova
Scientific adviser: A. B. Kim, assistant professor
Tomsk Polytechnic University, 634050, 30, Lenina St., Tomsk, Russia
E-mail: [email protected]
Currently, the market of technology improving
has an important task in the hardening coatingmethod on the cutting edge.The aim of the task is to find the best method and spattering composition which satisfysuch aspects as the increase of wear resistance and thermal conductivity of instruments, the effective chipremoval, the wide range of application, low cost, etc.
While discussing the wear-resistant coating, two methods are usually mentioned:the method of chemical vapor deposition (CVD)and physical vapor deposition method for coating (PVD). The latter iswidespread in Russia.
The CVD-method was developed in Sweden. Here such chemical agents asTiCl4, NH3 are used.
The chemical vapor deposition process is characterized by the increased speed on the sharp areas of the product surface. As the coating thickness increases, the adhesionrapidly reduces. For instrumental applications theСVD-method means that the thick and easy to break off coating layer takes the place of the cutting edge. It’s possible to avoid it by roundingthe cutting edge before coating.The minimum size of rounding is 20 microns,the typical value for modern plates is 35-50 microns. Such edge preparation is desirable for plates intended for the rough and semifinishturningand milling work. However, the
cutting edge should be sharp for some instruments.
The second method is PVD. The PVD (Physical Vapor Deposition) or CIB (condensation with ion bombardment) coatings are the development of Soviet and later Russian scientists. It is worth noting that this method takes the leading position in the wear-resistant coatings methods rating. The given method of coating is realized by using titanium nitride TiN, titanium carbide TiC, titanium carbonitrideTiCN, aluminum oxide Al2O3. The popularity of the new coating method was determined by the fact that PVD improves successfully the properties of the cutting tools, when the CVD technology is ineffective or useless. Firstly, PVD is realized at lower temperatures under 500O C. It allows to coatboth hard-alloy plates and tools made of high-speed steels, and even machinecomponents operating at intense friction. Secondly, the PVD coating can be applied to a sharp edge. Because of the steady rate deposition this coating does not cause the edge nose. Thus, this type of coating can be successfully used for small-sized point tools.
At the same time, a thin PVD coating layer cannot compete with more strong CVD coatings.Their total layer thickness can run up to 22-25 microns, that’s why CVD coatings are also widespread in spite of its high price.
However, science is still in progress. During the last decade various coatingcombinations with thin
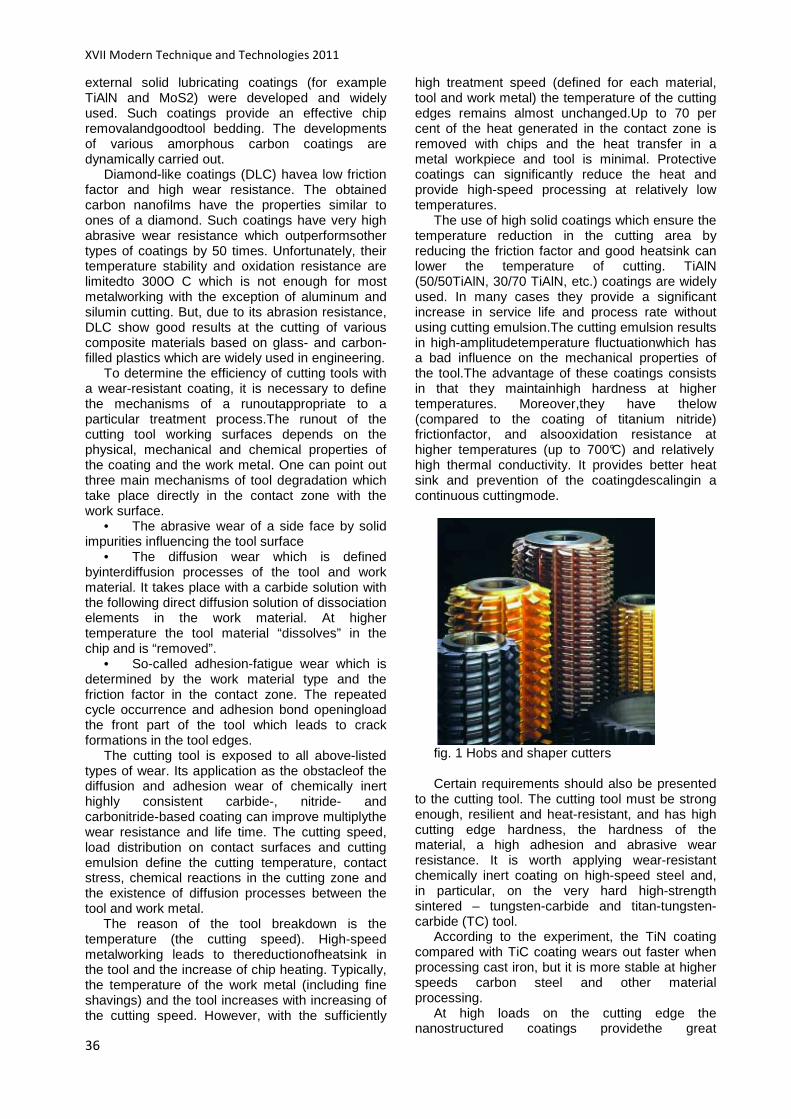
XVII Modern Technique and Technologies 2011
36
external solid lubricating coatings (for example TiAlN and MoS2) were developed and widely used. Such coatings provide an effective chip removalandgoodtool bedding. The developments of various amorphous carbon coatings are dynamically carried out.
Diamond-like coatings (DLC) havea low friction factor and high wear resistance. The obtained carbon nanofilms have the properties similar to ones of a diamond. Such coatings have very high abrasive wear resistance which outperformsother types of coatings by 50 times. Unfortunately, their temperature stability and oxidation resistance are limitedto 300O C which is not enough for most metalworking with the exception of aluminum and silumin cutting. But, due to its abrasion resistance, DLC show good results at the cutting of various composite materials based on glass- and carbon-filled plastics which are widely used in engineering.
To determine the efficiency of cutting tools with a wear-resistant coating, it is necessary to define the mechanisms of a runoutappropriate to a particular treatment process.The runout of the cutting tool working surfaces depends on the physical, mechanical and chemical properties of the coating and the work metal. One can point out three main mechanisms of tool degradation which take place directly in the contact zone with the work surface.
• The abrasive wear of a side face by solid impurities influencing the tool surface
• The diffusion wear which is defined byinterdiffusion processes of the tool and work material. It takes place with a carbide solution with the following direct diffusion solution of dissociation elements in the work material. At higher temperature the tool material “dissolves” in the chip and is “removed”.
• So-called adhesion-fatigue wear which is determined by the work material type and the friction factor in the contact zone. The repeated cycle occurrence and adhesion bond openingload the front part of the tool which leads to crack formations in the tool edges.
The cutting tool is exposed to all above-listed types of wear. Its application as the obstacleof the diffusion and adhesion wear of chemically inert highly consistent carbide-, nitride- and carbonitride-based coating can improve multiplythe wear resistance and life time. The cutting speed, load distribution on contact surfaces and cutting emulsion define the cutting temperature, contact stress, chemical reactions in the cutting zone and the existence of diffusion processes between the tool and work metal. The reason of the tool breakdown is the temperature (the cutting speed). High-speed metalworking leads to thereductionofheatsink in the tool and the increase of chip heating. Typically, the temperature of the work metal (including fine shavings) and the tool increases with increasing of the cutting speed. However, with the sufficiently
high treatment speed (defined for each material, tool and work metal) the temperature of the cutting edges remains almost unchanged.Up to 70 per cent of the heat generated in the contact zone is removed with chips and the heat transfer in a metal workpiece and tool is minimal. Protective coatings can significantly reduce the heat and provide high-speed processing at relatively low temperatures.
The use of high solid coatings which ensure the temperature reduction in the cutting area by reducing the friction factor and good heatsink can lower the temperature of cutting. TiAlN (50/50TiAlN, 30/70 TiAlN, etc.) coatings are widely used. In many cases they provide a significant increase in service life and process rate without using cutting emulsion.The cutting emulsion results in high-amplitudetemperature fluctuationwhich has a bad influence on the mechanical properties of the tool.The advantage of these coatings consists in that they maintainhigh hardness at higher temperatures. Moreover,they have thelow (compared to the coating of titanium nitride) frictionfactor, and alsooxidation resistance at higher temperatures (up to 700°C) and relatively high thermal conductivity. It provides better heat sink and prevention of the coatingdescalingin a continuous cuttingmode.
fig. 1 Hobs and shaper cutters Certain requirements should also be presented
to the cutting tool. The cutting tool must be strong enough, resilient and heat-resistant, and has high cutting edge hardness, the hardness of the material, a high adhesion and abrasive wear resistance. It is worth applying wear-resistant chemically inert coating on high-speed steel and, in particular, on the very hard high-strength sintered – tungsten-carbide and titan-tungsten-carbide (TC) tool.
According to the experiment, the TiN coating compared with TiC coating wears out faster when processing cast iron, but it is more stable at higher speeds carbon steel and other material processing.
At high loads on the cutting edge the nanostructured coatings providethe great
Section III: Technology, Equipment and Machine-Building Production Automation
37
advantages in the manufacture of cutting tools. Superdispersedmaterials with the increased area of grain boundaries have a more balanced relationship between the hardness, which positively influences the durability, and strength characteristics of the material. In nanomaterials obstructing of the cracks movement and branching occurs due to hardening of the grain boundaries.
The coating creation for cutting tools of the new generation is most effective by using the innovative concept of nanometric structure and alternating layers of nanometer thickness of different composition structure and functionality.
References
1. Износостойкие покрытия как движитель инновационного процесса в технологии инструментальных материалов и современной металлообработке / 20.04.2010Максимов Михаил http://popnano.ru/analit/index.php?task=view&id=1150&limitstart=0
2. Покрытия для режущего инструмента В. Титов, к. т. н.Научнотехнический центр компании «ГлобусСталь» http://www.rmo.ru/ru/nmoborudovanie/nmoborudovanie/2004-/26_29_nmo_1_04.pdf
3. Coat, please. Susan Woods, associate editor. October, 2004. http://www.ctemag.com/pdf/2004/0410-CoatPlease.pdf
SOFTWARE FOR MATHEMATICAL MODELING OF WELDING PROCE SS.
Mishin M.A
Scientific Supervisor: Krektuleva R.A., docent.
Linguistic advisor: Demchenko V.N.
Tomsk Polytechnic University, Russia, Tomsk, Lenin str., 30, 634050
E-mail: [email protected]
Abstract This article is about new software that can be
used in welding industry. It describes software products, their main properties and features. The article will be of interest to students and professionals involved in welding processes modeling.
Key words – welding process, mathematical models, software, physical process, thermal problem.
Introduction Currently, computer technology allows to make
a great number of calculations almost instantly. The technique has become vital in mathematical modeling of processes, mechanisms, events, etc. These models are widely applied in the production the process, as they help identify and describe properties with sufficient accuracy, control the process, quality, etc. The mathematical model describing the welding process is one of them.
There are many platforms which simulate processes of heat transfer, mass transfer, X-rays and other radiations, in general, all physical processes. Welding includes all these processes, therefore it requires high-quality software to show all known physical processes a pictorial form.
This article reviews present day programs of mathematical modeling of welding processes.
Describtion of programs for welding
modeling Today Ansys, MSC.Sinda, MEZA, MSC.Marc,
MatLab are the most popular programs. ANSYS is a finite element analysis software
package, solving problems in various fields of engineering (strength of structures, thermodynamics, fluid dynamics, electromagnetism), including interdisciplinary analysis.
ANSYS is a versatile finite element software package (the developer is the company ANSYS Inc.), which allows to solve a wide range of tasks of a single user environment (and, what is more, on the same finite element model) in the areas of:
• Strength; • Heat; • Fluid dynamics; • Electromagnetism; Interdisciplinary bound analysis combines all
four types; design optimization is based on all the types of analysis mentioned above.[1]
MSC Sinda is a general-purpose software package for solving thermal analysis of structures, analysis of radiation level influencing the design, simulation and evaluation of thermal stresses arising in the product during the operation, etc.
The complex MSC Sinda is the industry standard in the field of complex thermal
XVII Modern Technique and Technologies 2011
38
calculations using finite difference method and the construction of thermal RC-network as well as thermal substructures (super-elements) for radiation analysis.[2]
The field of MSC Sinda application is very extensive. Due to its capabilities software package MSC Sinda is used in a variety of industries to solve complex problems of thermal analysis of structures:
• electronic equipment (from individual devices to complex systems);
• equipment for electronic circuit boards processing;
• components of car engines, aircrafts, etc.; • cooling systems and air conditioning; • thermal losses of buildings and structures; • spacecrafts, launch vehicles, control unit; • solar panels; • energy sources, fuel cells, generators; • electronic devices, avionics; • small and large household appliances. MSC.Marc systems are the most powerful and
advanced tools used to address these problem. The basis of process simulation is the application of nonlinear finite element analysis method. Its results can be presented both in numerical and graphic forms.
MSC.Marc enables the user to solve a wide range of problems of structures analysis, processes and contacts using the finite element method. These procedures provide a solution to simple and complex, linear and nonlinear problems. The analyst has a graphical access to all components of the interface of MSC.Marc Mentat and MSC.Patran. MSC.Marc also includes parallel processing of complex tasks using a new method.[2]
MEZA is designed to calculate various thermal problems, with different functions of external influences. The calculation is carried out using an explicit difference scheme.[3]
Models consisting of several materials can be calculated. The program supports up to 31 materials in one sample. The program offers the possibility change of materials in an accessible form. (Parameter changes do not result in changes in base materials, but only in changes for this process)
The function of external influences, i.e. heat sources are supported by the program in the form of shared libraries. After connecting to the above-mentioned libraries outside influences, individual for each source, become available in the program options.
You can view the isotherms in any section of the sample perpendicular to one of the axes, as well as viewing the phase formation and the temperature in each point of the sample.[4]
The possibility of constructing three-dimensional graphs is supported by:
1. Sample surface temperature. 2. Isosurface of sample temperature. 3.The general sample configuration The user is also given the opportunity to select
an unlimited number of control points in the sample. Each checkpoint accumulates a statistical data processes occurring in it: the temperature change during the process time, phase transitions, the change in the rate of growth temperature increase.[5]
MATLAB is a software package for solving technical computing. In welding industry this software package is used because it helps calculate linear and nonlinear transient thermal problems. This becomes especially relevant, because until recently the calculation was made only in fixed systems, but it is not entirely correct.
Obtaining more accurate data helps clarify the mode parameters, the effect on properties and quality of compounds.[6]
Conclusion In conclusion it is necessary to emphasize the
importance of learning software for welding production specialists. In the new age of information technology, where the computer has become an integral part of human introduction in automated welding lines, as well, welding software is a hot topic for study and research
Referents 1 Official site program products ANSYS
[Electronic resource] http://www.ansys.msk.ru 2 Official site program products MSC.Sinda
[Electronic resource] http://www.mscsoftware.ru 3. Никифоров Н.И., Кректулева Р.А.
Математическое моделирование технологического процесса кислородной резки//Сварочное производство, 1998. - 4. – С. 3-6
4. Кректулева Р.А., Бежин О.Н., Косяков В.А. Формирование тепловых локализованных структур в сварном шве при импульсно-дуговой сварке неплавящимся электродом.// ПМТФ, 1998. - 6. – с.172-177.
5. Бежин О.Н., Дураков В.Г., Кректулева Р.А. и др. Компьютерное моделирование и микроструктурное исследование градиентных композиционных структур, формирующихся при поверхностной электронно-лучевой обработке углеродистой стали / В сб.: Экспериментальные методы в физике структурно-неоднородных конденсированных сред: Тр. 2-й международный науч.-техн. конф. – Барнаул, 2001. – с. 22-28
6. Official site program products Matlab [Electronic resource] http://www.matlab.exponenta.ru
Section III: Technology, Equipment and Machine-Building Production Automation
39
RESEARCH OF STRUCTURE AND PROPERTIES OF LASER WELDE D JOINT
IN AUSTENITIC STAINLESS STEELS.
Oreshkin A.A
Scientific Supervisor: Cand. Sc. Haydarova A. A.
Linguistic advisor: Demchenko V.N.
Tomsk Polytechnic University, Russia, Tomsk, Lenin str., 30, 634050
E-mail: [email protected]
Abstract Fusion zone shape and final solidification
structure of different types of austenitic stainless steels with different thicknesses were evaluated as a function of laser parameters. Both bead-on-plate and autogenous butt weld joints were made using a carbon dioxide laser with a maximum output of 5 kW in the continuous wave mode. Based on metal thickness, laser power, welding speed, defocusing distance and the type of shielding gas combinations should be carefully selected so that weld joints should have complete penetration, minimum fusion zone size and acceptable weld profile are produced.
Introduction C02 laser beam welding with a continuous
wave is a high energy density and low heat input process. The result of this is a small heat-affected zone (HAZ), which cools very rapidly with very little distortion, and a high depth-to-width ratio for the fusion zone.
The heat flow and fluid flow in the weld pool can significantly influence temperature gradients, cooling rates and solidification structure. In addition, the fluid flow and the convective heat transfer in the weld pool are known to control the penetration and shape of the fusion zone [1].
Generally, laser beam welding involves many variables; laser power, welding speed, defocusing distance and type of shielding gas, any of which may have an important effect on heat flow and fluid flow in the weld pool. This, in turn, will affect penetration depth, shape and final solidification structure of the fusion zone. Both the shape and microstructure of the fusion zone will considerably influence the prop¬erties of the weldment.
Many papers [2-4] deal with the shape and solidification structure of the fusion zone of laser beam welds in relation to different laser parameters. However, the effect of all influencing factors of laser welding has not been extensively researched yet. More investigation is required to understand the combined effect of laser parame¬ters on the shape and microstructure of the fusion zone.
The present investigation is concerned with laser power, welding speed, defocusing distance and type of shielding gas and their effects on the fusion zone shape and final solidification structure of some austenitic stainless steels.
Experimental procedure Three types of commercial austenitic stainless
steels, 03Х18Н11, 03Х17Н14М3 and 08Х18Н14М2Б, were used. The thickness of both 03Х18Н11 and 03Х17Н14М3 steels was 3 mm while that of 08Х18Н14М2Б steel was 5 mm. Both bead-on-plate and autogenous butt weld joints were made by using a carbon dioxide laser a maximum output of 5 kW in the contin¬uous wave mode.
Bead-on-plate was made on plates with 3 mm thickness while autogenous butt weld joints were made on plates with 3 and 5 mm thickness. Speci¬mens with machined surfaces were prepared as square butt joints with dimensions of 125 X 150 mm and were fixed firmly to prevent distortion.
Combinations of laser power (P) of 2-5 kW and welding speed (S) of 0.5-3 m/min resulted in nominal heat inputs ranging from 0.04 to 0.48 kJ/mm. The defocusing distance was in the range of —5 to 3 mm. Shielding was produced using either argon or helium gas.
Laser power effect The effect of heat input as a function of laser
power, was clarified using type 03Х18Н11 and type 03Х17Н14М3 steels. Both welding speed and defocusing distance were kept constant at 3 m/min and zero respectively.
Complete penetration for the 3 mm base metal was obtained at laser power equal to or greater than 4 kW. The weld bead showed a characteristic of laser welding with depth/width ratio close to 3. No welding cracks or porosity were found in any of the welds, this may be partly due to the good crack resistance of the base metal and the welding conditions provided.
The results indicated also that the development of the weld pool is essentially symmetrical about the axis of the laser beam. Yet, lack of symmetry at the root side was observed particularly at higher welding speed with an unsteady fluid flow in the weld pool. This is due to the presence of two strong and opposing forces, namely, the electromag¬netic and the surface tension gradient forces. At these locations, the electromagnetic force may overcome the surface tension force, thereby, influ¬encing convective heat transfer. As a result, any local perturbation in the weld pool can
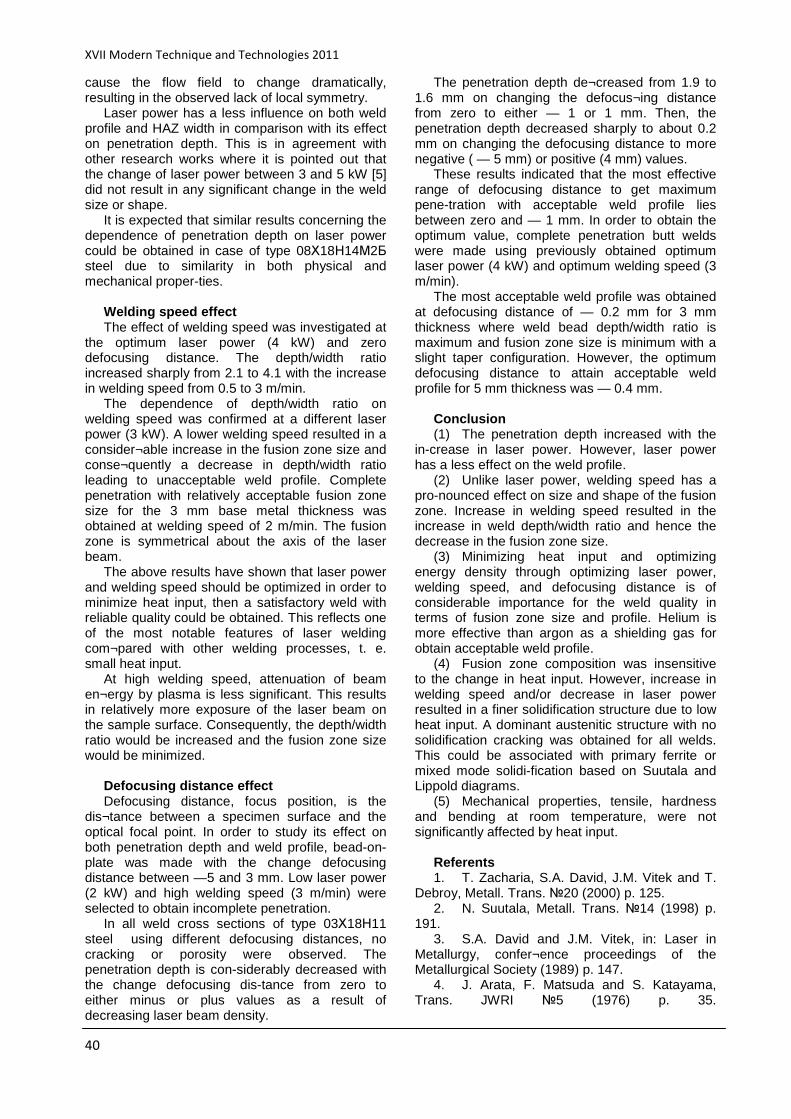
XVII Modern Technique and Technologies 2011
40
cause the flow field to change dramatically, resulting in the observed lack of local symmetry.
Laser power has a less influence on both weld profile and HAZ width in comparison with its effect on penetration depth. This is in agreement with other research works where it is pointed out that the change of laser power between 3 and 5 kW [5] did not result in any significant change in the weld size or shape.
It is expected that similar results concerning the dependence of penetration depth on laser power could be obtained in case of type 08Х18Н14М2Б steel due to similarity in both physical and mechanical proper-ties.
Welding speed effect The effect of welding speed was investigated at
the optimum laser power (4 kW) and zero defocusing distance. The depth/width ratio increased sharply from 2.1 to 4.1 with the increase in welding speed from 0.5 to 3 m/min.
The dependence of depth/width ratio on welding speed was confirmed at a different laser power (3 kW). A lower welding speed resulted in a consider¬able increase in the fusion zone size and conse¬quently a decrease in depth/width ratio leading to unacceptable weld profile. Complete penetration with relatively acceptable fusion zone size for the 3 mm base metal thickness was obtained at welding speed of 2 m/min. The fusion zone is symmetrical about the axis of the laser beam.
The above results have shown that laser power and welding speed should be optimized in order to minimize heat input, then a satisfactory weld with reliable quality could be obtained. This reflects one of the most notable features of laser welding com¬pared with other welding processes, t. e. small heat input.
At high welding speed, attenuation of beam en¬ergy by plasma is less significant. This results in relatively more exposure of the laser beam on the sample surface. Consequently, the depth/width ratio would be increased and the fusion zone size would be minimized.
Defocusing distance effect Defocusing distance, focus position, is the
dis¬tance between a specimen surface and the optical focal point. In order to study its effect on both penetration depth and weld profile, bead-on-plate was made with the change defocusing distance between —5 and 3 mm. Low laser power (2 kW) and high welding speed (3 m/min) were selected to obtain incomplete penetration.
In all weld cross sections of type 03Х18Н11 steel using different defocusing distances, no cracking or porosity were observed. The penetration depth is con-siderably decreased with the change defocusing dis-tance from zero to either minus or plus values as a result of decreasing laser beam density.
The penetration depth de¬creased from 1.9 to 1.6 mm on changing the defocus¬ing distance from zero to either — 1 or 1 mm. Then, the penetration depth decreased sharply to about 0.2 mm on changing the defocusing distance to more negative ( — 5 mm) or positive (4 mm) values.
These results indicated that the most effective range of defocusing distance to get maximum pene-tration with acceptable weld profile lies between zero and — 1 mm. In order to obtain the optimum value, complete penetration butt welds were made using previously obtained optimum laser power (4 kW) and optimum welding speed (3 m/min).
The most acceptable weld profile was obtained at defocusing distance of — 0.2 mm for 3 mm thickness where weld bead depth/width ratio is maximum and fusion zone size is minimum with a slight taper configuration. However, the optimum defocusing distance to attain acceptable weld profile for 5 mm thickness was — 0.4 mm.
Conclusion (1) The penetration depth increased with the
in-crease in laser power. However, laser power has a less effect on the weld profile.
(2) Unlike laser power, welding speed has a pro-nounced effect on size and shape of the fusion zone. Increase in welding speed resulted in the increase in weld depth/width ratio and hence the decrease in the fusion zone size.
(3) Minimizing heat input and optimizing energy density through optimizing laser power, welding speed, and defocusing distance is of considerable importance for the weld quality in terms of fusion zone size and profile. Helium is more effective than argon as a shielding gas for obtain acceptable weld profile.
(4) Fusion zone composition was insensitive to the change in heat input. However, increase in welding speed and/or decrease in laser power resulted in a finer solidification structure due to low heat input. A dominant austenitic structure with no solidification cracking was obtained for all welds. This could be associated with primary ferrite or mixed mode solidi-fication based on Suutala and Lippold diagrams.
(5) Mechanical properties, tensile, hardness and bending at room temperature, were not significantly affected by heat input.
Referents 1. T. Zacharia, S.A. David, J.M. Vitek and T.
Debroy, Metall. Trans. 20 (2000) p. 125. 2. N. Suutala, Metall. Trans. 14 (1998) p.
191. 3. S.A. David and J.M. Vitek, in: Laser in
Metallurgy, confer¬ence proceedings of the Metallurgical Society (1989) p. 147.
4. J. Arata, F. Matsuda and S. Katayama, Trans. JWRI 5 (1976) p. 35.
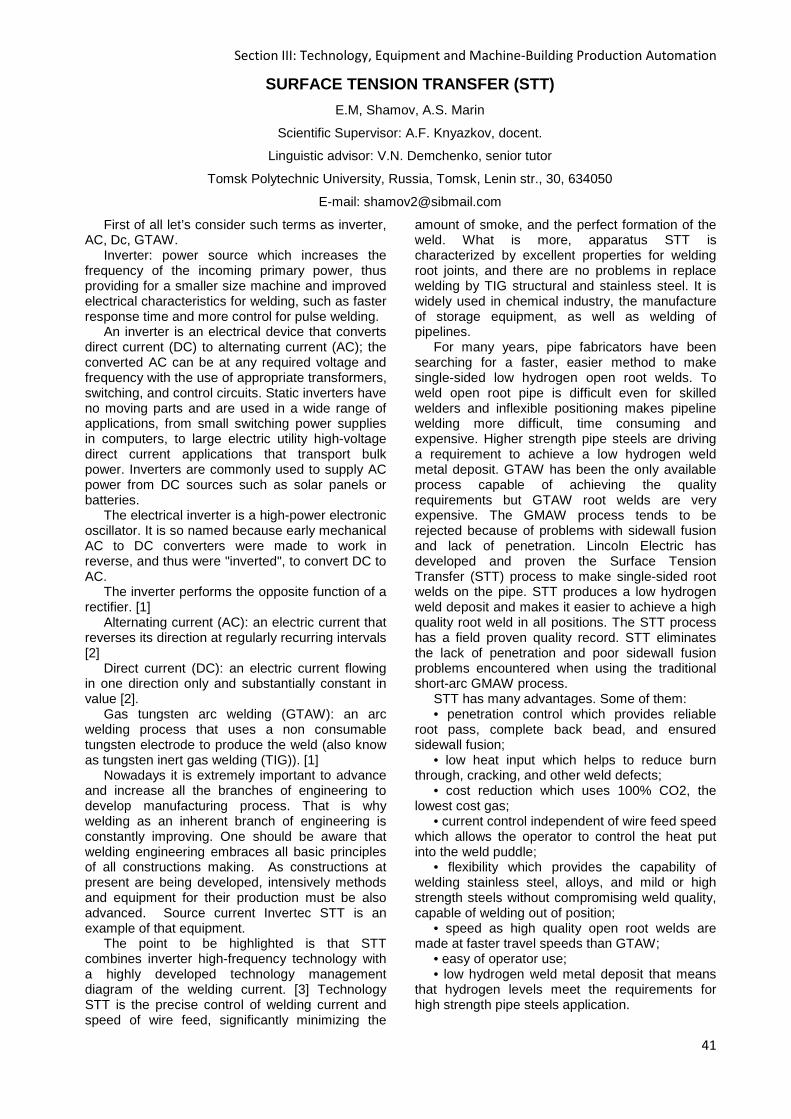
Section III: Technology, Equipment and Machine-Building Production Automation
41
SURFACE TENSION TRANSFER (STT)
E.M, Shamov, A.S. Marin
Scientific Supervisor: A.F. Knyazkov, docent.
Linguistic advisor: V.N. Demchenko, senior tutor
Tomsk Polytechnic University, Russia, Tomsk, Lenin str., 30, 634050
E-mail: [email protected]
First of all let’s consider such terms as inverter, AC, Dc, GTAW.
Inverter: power source which increases the frequency of the incoming primary power, thus providing for a smaller size machine and improved electrical characteristics for welding, such as faster response time and more control for pulse welding.
An inverter is an electrical device that converts direct current (DC) to alternating current (AC); the converted AC can be at any required voltage and frequency with the use of appropriate transformers, switching, and control circuits. Static inverters have no moving parts and are used in a wide range of applications, from small switching power supplies in computers, to large electric utility high-voltage direct current applications that transport bulk power. Inverters are commonly used to supply AC power from DC sources such as solar panels or batteries.
The electrical inverter is a high-power electronic oscillator. It is so named because early mechanical AC to DC converters were made to work in reverse, and thus were "inverted", to convert DC to AC.
The inverter performs the opposite function of a rectifier. [1]
Alternating current (AC): an electric current that reverses its direction at regularly recurring intervals [2]
Direct current (DC): an electric current flowing in one direction only and substantially constant in value [2].
Gas tungsten arc welding (GTAW): an arc welding process that uses a non consumable tungsten electrode to produce the weld (also know as tungsten inert gas welding (TIG)). [1]
Nowadays it is extremely important to advance and increase all the branches of engineering to develop manufacturing process. That is why welding as an inherent branch of engineering is constantly improving. One should be aware that welding engineering embraces all basic principles of all constructions making. As constructions at present are being developed, intensively methods and equipment for their production must be also advanced. Source current Invertec STT is an example of that equipment.
The point to be highlighted is that STT combines inverter high-frequency technology with a highly developed technology management diagram of the welding current. [3] Technology STT is the precise control of welding current and speed of wire feed, significantly minimizing the
amount of smoke, and the perfect formation of the weld. What is more, apparatus STT is characterized by excellent properties for welding root joints, and there are no problems in replace welding by TIG structural and stainless steel. It is widely used in chemical industry, the manufacture of storage equipment, as well as welding of pipelines.
For many years, pipe fabricators have been searching for a faster, easier method to make single-sided low hydrogen open root welds. To weld open root pipe is difficult even for skilled welders and inflexible positioning makes pipeline welding more difficult, time consuming and expensive. Higher strength pipe steels are driving a requirement to achieve a low hydrogen weld metal deposit. GTAW has been the only available process capable of achieving the quality requirements but GTAW root welds are very expensive. The GMAW process tends to be rejected because of problems with sidewall fusion and lack of penetration. Lincoln Electric has developed and proven the Surface Tension Transfer (STT) process to make single-sided root welds on the pipe. STT produces a low hydrogen weld deposit and makes it easier to achieve a high quality root weld in all positions. The STT process has a field proven quality record. STT eliminates the lack of penetration and poor sidewall fusion problems encountered when using the traditional short-arc GMAW process.
STT has many advantages. Some of them: • penetration control which provides reliable
root pass, complete back bead, and ensured sidewall fusion;
• low heat input which helps to reduce burn through, cracking, and other weld defects;
• cost reduction which uses 100% CO2, the lowest cost gas;
• current control independent of wire feed speed which allows the operator to control the heat put into the weld puddle;
• flexibility which provides the capability of welding stainless steel, alloys, and mild or high strength steels without compromising weld quality, capable of welding out of position;
• speed as high quality open root welds are made at faster travel speeds than GTAW;
• easy of operator use; • low hydrogen weld metal deposit that means
that hydrogen levels meet the requirements for high strength pipe steels application.
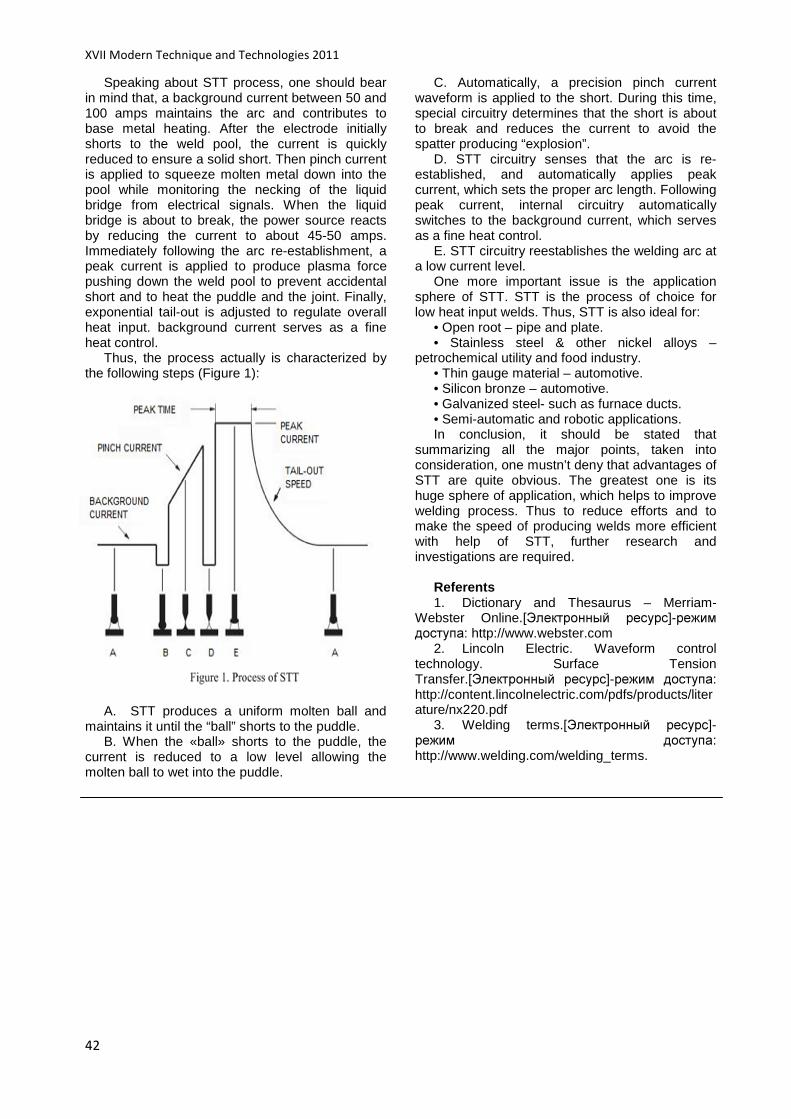
XVII Modern Technique and Technologies 2011
42
Speaking about STT process, one should bear in mind that, a background current between 50 and 100 amps maintains the arc and contributes to base metal heating. After the electrode initially shorts to the weld pool, the current is quickly reduced to ensure a solid short. Then pinch current is applied to squeeze molten metal down into the pool while monitoring the necking of the liquid bridge from electrical signals. When the liquid bridge is about to break, the power source reacts by reducing the current to about 45-50 amps. Immediately following the arc re-establishment, a peak current is applied to produce plasma force pushing down the weld pool to prevent accidental short and to heat the puddle and the joint. Finally, exponential tail-out is adjusted to regulate overall heat input. background current serves as a fine heat control.
Thus, the process actually is characterized by the following steps (Figure 1):
A. STT produces a uniform molten ball and
maintains it until the “ball” shorts to the puddle. B. When the «ball» shorts to the puddle, the
current is reduced to a low level allowing the molten ball to wet into the puddle.
C. Automatically, a precision pinch current waveform is applied to the short. During this time, special circuitry determines that the short is about to break and reduces the current to avoid the spatter producing “explosion”.
D. STT circuitry senses that the arc is re-established, and automatically applies peak current, which sets the proper arc length. Following peak current, internal circuitry automatically switches to the background current, which serves as a fine heat control.
E. STT circuitry reestablishes the welding arc at a low current level.
One more important issue is the application sphere of STT. STT is the process of choice for low heat input welds. Thus, STT is also ideal for:
• Open root – pipe and plate. • Stainless steel & other nickel alloys –
petrochemical utility and food industry. • Thin gauge material – automotive. • Silicon bronze – automotive. • Galvanized steel- such as furnace ducts. • Semi-automatic and robotic applications. In conclusion, it should be stated that
summarizing all the major points, taken into consideration, one mustn’t deny that advantages of STT are quite obvious. The greatest one is its huge sphere of application, which helps to improve welding process. Thus to reduce efforts and to make the speed of producing welds more efficient with help of STT, further research and investigations are required.
Referents 1. Dictionary and Thesaurus – Merriam-
Webster Online.[Электронный ресурс]-режим доступа: http://www.webster.com
2. Lincoln Electric. Waveform control technology. Surface Tension Transfer.[Электронный ресурс]-режим доступа: http://content.lincolnelectric.com/pdfs/products/literature/nx220.pdf
3. Welding terms.[Электронный ресурс]-режим доступа: http://www.welding.com/welding_terms.

Section IV: Electro Mechanics
43
Section IV
ELECTRO MECHANICS
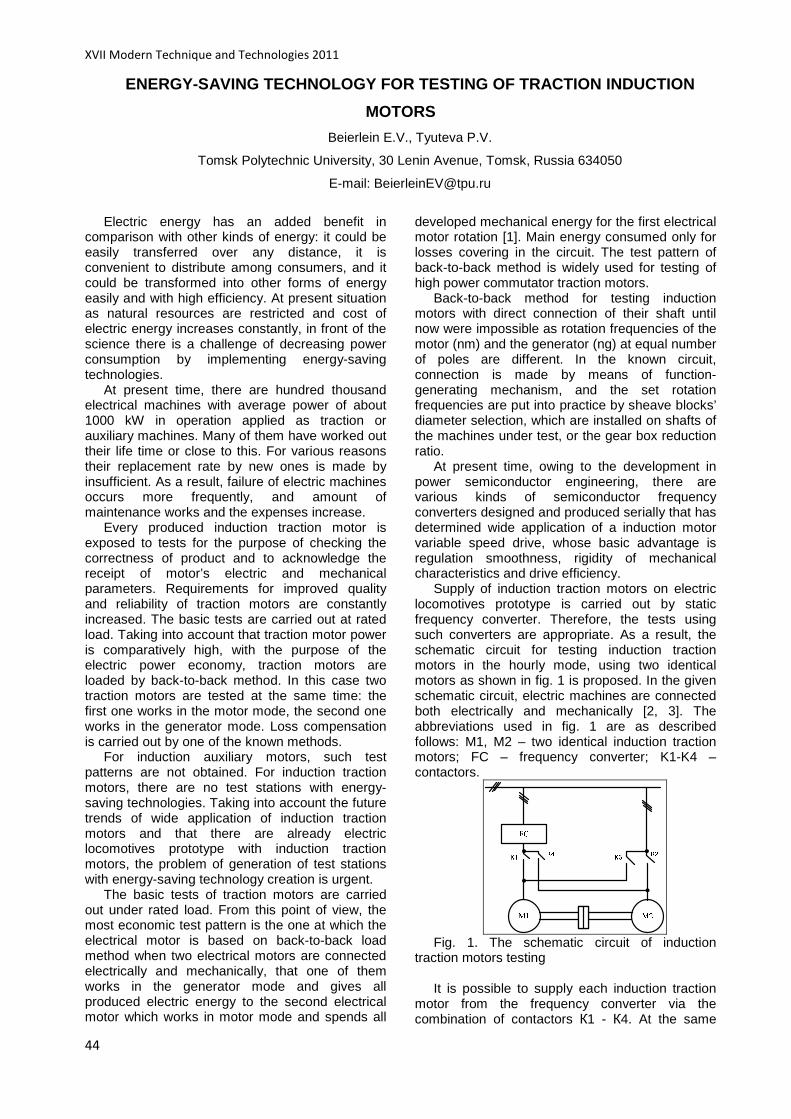
XVII Modern Technique and Technologies 2011
44
ENERGY-SAVING TECHNOLOGY FOR TESTING OF TRACTION IN DUCTION
MOTORS
Beierlein E.V., Tyuteva P.V.
Tomsk Polytechnic University, 30 Lenin Avenue, Tomsk, Russia 634050
E-mail: [email protected]
Electric energy has an added benefit in
comparison with other kinds of energy: it could be easily transferred over any distance, it is convenient to distribute among consumers, and it could be transformed into other forms of energy easily and with high efficiency. At present situation as natural resources are restricted and cost of electric energy increases constantly, in front of the science there is a challenge of decreasing power consumption by implementing energy-saving technologies.
At present time, there are hundred thousand electrical machines with average power of about 1000 kW in operation applied as traction or auxiliary machines. Many of them have worked out their life time or close to this. For various reasons their replacement rate by new ones is made by insufficient. As a result, failure of electric machines occurs more frequently, and amount of maintenance works and the expenses increase.
Every produced induction traction motor is exposed to tests for the purpose of checking the correctness of product and to acknowledge the receipt of motor’s electric and mechanical parameters. Requirements for improved quality and reliability of traction motors are constantly increased. The basic tests are carried out at rated load. Taking into account that traction motor power is comparatively high, with the purpose of the electric power economy, traction motors are loaded by back-to-back method. In this case two traction motors are tested at the same time: the first one works in the motor mode, the second one works in the generator mode. Loss compensation is carried out by one of the known methods.
For induction auxiliary motors, such test patterns are not obtained. For induction traction motors, there are no test stations with energy-saving technologies. Taking into account the future trends of wide application of induction traction motors and that there are already electric locomotives prototype with induction traction motors, the problem of generation of test stations with energy-saving technology creation is urgent.
The basic tests of traction motors are carried out under rated load. From this point of view, the most economic test pattern is the one at which the electrical motor is based on back-to-back load method when two electrical motors are connected electrically and mechanically, that one of them works in the generator mode and gives all produced electric energy to the second electrical motor which works in motor mode and spends all
developed mechanical energy for the first electrical motor rotation [1]. Main energy consumed only for losses covering in the circuit. The test pattern of back-to-back method is widely used for testing of high power commutator traction motors.
Back-to-back method for testing induction motors with direct connection of their shaft until now were impossible as rotation frequencies of the motor (nm) and the generator (ng) at equal number of poles are different. In the known circuit, connection is made by means of function-generating mechanism, and the set rotation frequencies are put into practice by sheave blocks’ diameter selection, which are installed on shafts of the machines under test, or the gear box reduction ratio.
At present time, owing to the development in power semiconductor engineering, there are various kinds of semiconductor frequency converters designed and produced serially that has determined wide application of a induction motor variable speed drive, whose basic advantage is regulation smoothness, rigidity of mechanical characteristics and drive efficiency.
Supply of induction traction motors on electric locomotives prototype is carried out by static frequency converter. Therefore, the tests using such converters are appropriate. As a result, the schematic circuit for testing induction traction motors in the hourly mode, using two identical motors as shown in fig. 1 is proposed. In the given schematic circuit, electric machines are connected both electrically and mechanically [2, 3]. The abbreviations used in fig. 1 are as described follows: M1, M2 – two identical induction traction motors; FC – frequency converter; K1-K4 – contactors.
Fig. 1. The schematic circuit of induction
traction motors testing It is possible to supply each induction traction
motor from the frequency converter via the combination of contactors К1 - К4. At the same
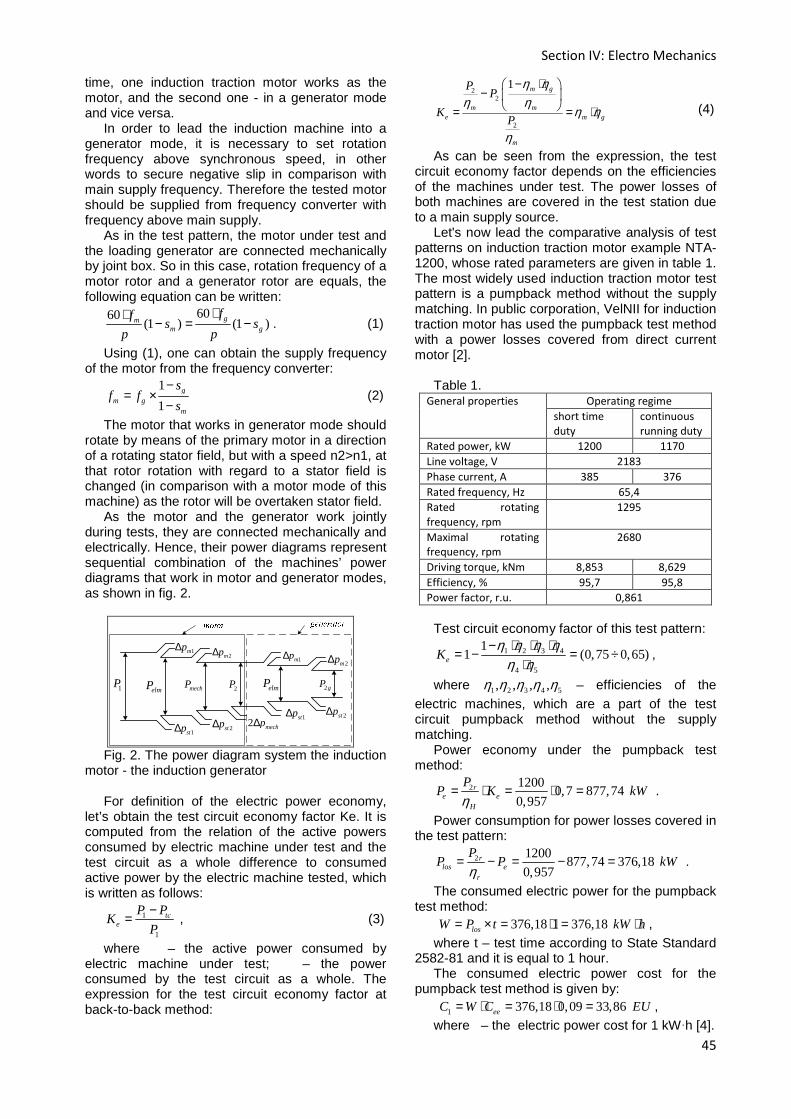
Section IV: Electro Mechanics
45
time, one induction traction motor works as the motor, and the second one - in a generator mode and vice versa.
In order to lead the induction machine into a generator mode, it is necessary to set rotation frequency above synchronous speed, in other words to secure negative slip in comparison with main supply frequency. Therefore the tested motor should be supplied from frequency converter with frequency above main supply.
As in the test pattern, the motor under test and the loading generator are connected mechanically by joint box. So in this case, rotation frequency of a motor rotor and a generator rotor are equals, the following equation can be written:
6060(1 ) (1 )gm
m g
ffs s
p p
⋅⋅− = − . (1)
Using (1), one can obtain the supply frequency of the motor from the frequency converter:
1
1g
m gm
sf f
s
−= ×
− (2)
The motor that works in generator mode should rotate by means of the primary motor in a direction of a rotating stator field, but with a speed n2>n1, at that rotor rotation with regard to a stator field is changed (in comparison with a motor mode of this machine) as the rotor will be overtaken stator field.
As the motor and the generator work jointly during tests, they are connected mechanically and electrically. Hence, their power diagrams represent sequential combination of the machines’ power diagrams that work in motor and generator modes, as shown in fig. 2.
1P
1mp∆
1stp∆
2mp∆
2stp∆ 2 mechp∆
1mp∆2mp∆
1stp∆ 2stp∆
elmP mechP 2P elmP 2gP
Fig. 2. The power diagram system the induction
motor - the induction generator For definition of the electric power economy,
let’s obtain the test circuit economy factor Ke. It is computed from the relation of the active powers consumed by electric machine under test and the test circuit as a whole difference to consumed active power by the electric machine tested, which is written as follows:
1
1
tсe
P PK
P
−= , (3)
where – the active power consumed by electric machine under test; – the power consumed by the test circuit as a whole. The expression for the test circuit economy factor at back-to-back method:
22
2
1 m g
m me m g
m
PP
KP
η ηη η
η η
η
− ⋅ −
= = ⋅ (4)
As can be seen from the expression, the test circuit economy factor depends on the efficiencies of the machines under test. The power losses of both machines are covered in the test station due to a main supply source.
Let's now lead the comparative analysis of test patterns on induction traction motor example NTA-1200, whose rated parameters are given in table 1. The most widely used induction traction motor test pattern is a pumpback method without the supply matching. In public corporation, VelNII for induction traction motor has used the pumpback test method with a power losses covered from direct current motor [2].
Table 1.
General properties Operating regime
short time
duty
continuous
running duty
Rated power, kW 1200 1170
Line voltage, V 2183
Phase current, А 385 376
Rated frequency, Hz 65,4
Rated rotating
frequency, rpm
1295
Maximal rotating
frequency, rpm
2680
Driving torque, kNm 8,853 8,629
Efficiency, % 95,7 95,8
Power factor, r.u. 0,861
Test circuit economy factor of this test pattern:
1 2 3 4
4 5
11 (0,75 0,65)eK
η η η ηη η
− ⋅ ⋅ ⋅= − = ÷
⋅,
where 1 2 3 4 5, , , ,η η η η η – efficiencies of the electric machines, which are a part of the test circuit pumpback method without the supply matching.
Power economy under the pumpback test method:
2 12000,7 877,74
0,957r
e eH
PP K kW
η= ⋅ = ⋅ = .
Power consumption for power losses covered in the test pattern:
2 1200877,74 376,18
0,957r
los er
PP P kW
η= − = − = .
The consumed electric power for the pumpback test method:
376,18 1 376,18losW P t kW h= × = ⋅ = ⋅ , where t – test time according to State Standard
2582-81 and it is equal to 1 hour. The consumed electric power cost for the
pumpback test method is given by: 1 376,18 0,09 33,86eeC W C EU= ⋅ = ⋅ = , where – the electric power cost for 1 kW·h [4].

XVII Modern Technique and Technologies 2011
46
The pumpback test method for induction traction motors without supply matching contains many auxiliary machines that results additional energy transformations. Taking into account the weakness of the pumpback method, such as too many auxiliary machines that lead to increase in the test station area, meshing of the control circuit and increase in the amount of energy transformations, the back-to-back test method has been offered. The back-to-back test method has allowed minimizing weaknesses of the pumpback test method. Economy factor of the back-to-back test method:
(0,94 0,88)e m gK η η= ⋅ = ÷ .
Power economy under the back-to-back test method:
2 12000,9 1065,83
0,957r
e rr
PP K kW
η= ⋅ = ⋅ = .
Power consumption for power losses covered in the back-to-back test method:
2 12001065,83 188,09
0,957r
los er
PP P kW
η= − = − = .
The consumed electric energy for the back-to-back test method:
188,09 1 188,09losW P t kW h= × = ⋅ = ⋅ . The consumed electric energy cost for the
back-to-back test method: 2 188,09 0,09 16,93eeC W C EU= ⋅ = ⋅ = . The consumed electric power cost economy
with the back-to-back method in comparison with pumpback method with power losses covered from direct current motor used for induction traction motors testing is given by:
1 2 33,86 16,93 16,93 .eE C C EU= − = − = The percentage of consumed electric power
cost economy with the back-to-back method in comparison with pumpback method with power losses covered from direct current motor used for induction traction motors testing:
1 2%
1
33,86 16,93100 % 50 %
33,86
C CE
C
− −= = ⋅ = .
Since the back-to-back test method is used at the same time, two induction traction motors are tested and the cost will be evenly distributed. The consumed electric power cost for each motor:
22
16,938,47
2sp
CC EU
m= = = ,
where m –amount of simultaneously tested induction traction motors.
Specific consumed electric power cost economy when the back-to-back method in comparison with pumpback method with a power losses covering from direct current motor used for induction traction motors testing:
1 2 33,86 8,47 25,39esp spE C C EU= − = − = .
The percentage of specific consumed electric power cost economy with the back-to-back method in comparison with pumpback method with power
losses covered from direct current motor used for induction traction motors testing:
1 2%
1
33,86 8,47100 % 75 %
33,86sp
sp
C CE
C
− −= = ⋅ = .
As a result, the energy saving in testing of average and high power induction motors, for example induction traction motors, could be achieved by usage of the back-to-back method and the realized saving could be about 75 % from consumed energy for the testing.
For definition of annual electric power saving we shall take an advantage of tested amount of direct current traction motors. At the average test station in the course of year about 1000 direct current traction motors are tested, propose that at transition on induction traction motors amount of machines were tested will remain at the same level. The annual consumed electric power economy by a back-to-back test method will make 25390 EU.
In conclusion, it is significant to note that the proposed test pattern under the back-to-back method for testing of high power induction traction motors achieves savings in the electric power. The electric power economy in the given test pattern depends on the efficiencies of the machines under test.
The comparative economic analysis shows that the consumed electric power economy makes about 50 % at the application with the back-to-back method in comparison with pumpback method. It has been found that the specific electric power economy on one induction traction motor is about 75 % (when the back-to-back test method is used for testing two induction traction motors at the same time.
Furthermore, the usage of the back-to-back test method allows not only to save electric energy during testing, but also to reduce the test station area and to reduce the amount of man-hours for one motor testing.
REFERENCES 1. Zherve, G.K. Industrial tests of electric
machines. - Leningrad: publishing house. Energoatomizdat, 1984. – 506 p.
2. Beierlein, E.V., Cukublin, A.B., Rapoport, O.L. The test circuit of variable speed traction induction motors // News of institution of higher education. Electromechanics. – 2006. – 3. – pp. 46-48.
3. Beierlein, E.V., Cukublin, A.B., Rapoport, O.L. The Device for traction motors testing // Useful model patent. 80018 from January, 29th, 2009.
4. Electricity prices by type of user - Euro per kWh. Industrial consumers // EUROSTAT. 4/30/2009. - http://epp.eurostat.ec.europa.eu/tgm/table.do?tab=table&init=1&plugin=0&language=en&pcode=tsier040

Section V: The Use of Modern Technical and Information Means in Health Services
47
Section V
THE USE OF MODERN TECHNICAL AND INFORMATION MEANS IN HEALTH SERVICES
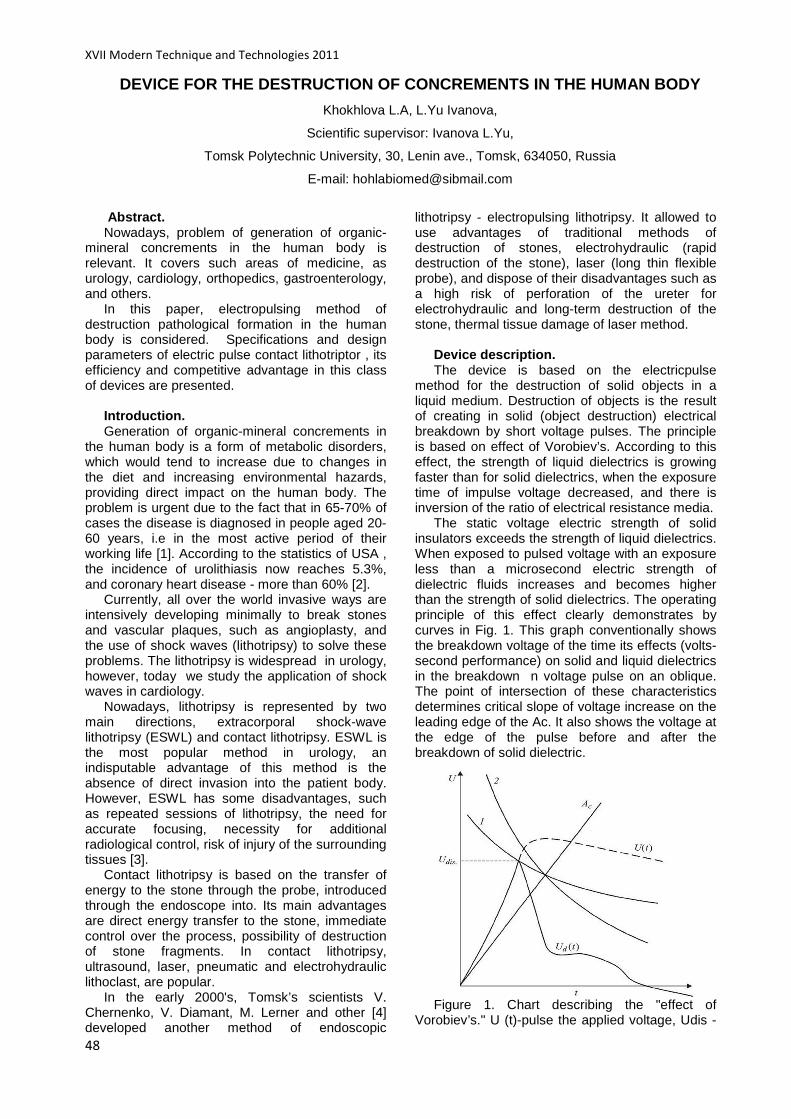
XVII Modern Technique and Technologies 2011
48
DEVICE FOR THE DESTRUCTION OF CONCREMENTS IN THE HUMAN BODY
Khokhlova L.A, L.Yu Ivanova,
Scientific supervisor: Ivanova L.Yu,
Tomsk Polytechnic University, 30, Lenin ave., Tomsk, 634050, Russia
E-mail: [email protected]
Abstract. Nowadays, problem of generation of organic-
mineral concrements in the human body is relevant. It covers such areas of medicine, as urology, cardiology, orthopedics, gastroenterology, and others.
In this paper, electropulsing method of destruction pathological formation in the human body is considered. Specifications and design parameters of electric pulse contact lithotriptor , its efficiency and competitive advantage in this class of devices are presented.
Introduction. Generation of organic-mineral concrements in
the human body is a form of metabolic disorders, which would tend to increase due to changes in the diet and increasing environmental hazards, providing direct impact on the human body. The problem is urgent due to the fact that in 65-70% of cases the disease is diagnosed in people aged 20-60 years, i.e in the most active period of their working life [1]. According to the statistics of USA , the incidence of urolithiasis now reaches 5.3%, and coronary heart disease - more than 60% [2].
Currently, all over the world invasive ways are intensively developing minimally to break stones and vascular plaques, such as angioplasty, and the use of shock waves (lithotripsy) to solve these problems. The lithotripsy is widespread in urology, however, today we study the application of shock waves in cardiology.
Nowadays, lithotripsy is represented by two main directions, extracorporal shock-wave lithotripsy (ESWL) and contact lithotripsy. ESWL is the most popular method in urology, an indisputable advantage of this method is the absence of direct invasion into the patient body. However, ESWL has some disadvantages, such as repeated sessions of lithotripsy, the need for accurate focusing, necessity for additional radiological control, risk of injury of the surrounding tissues [3].
Contact lithotripsy is based on the transfer of energy to the stone through the probe, introduced through the endoscope into. Its main advantages are direct energy transfer to the stone, immediate control over the process, possibility of destruction of stone fragments. In contact lithotripsy, ultrasound, laser, pneumatic and electrohydraulic lithoclast, are popular.
In the early 2000's, Tomsk’s scientists V. Chernenko, V. Diamant, M. Lerner and other [4] developed another method of endoscopic
lithotripsy - electropulsing lithotripsy. It allowed to use advantages of traditional methods of destruction of stones, electrohydraulic (rapid destruction of the stone), laser (long thin flexible probe), and dispose of their disadvantages such as a high risk of perforation of the ureter for electrohydraulic and long-term destruction of the stone, thermal tissue damage of laser method.
Device description. The device is based on the electricpulse
method for the destruction of solid objects in a liquid medium. Destruction of objects is the result of creating in solid (object destruction) electrical breakdown by short voltage pulses. The principle is based on effect of Vorobiev’s. According to this effect, the strength of liquid dielectrics is growing faster than for solid dielectrics, when the exposure time of impulse voltage decreased, and there is inversion of the ratio of electrical resistance media.
The static voltage electric strength of solid insulators exceeds the strength of liquid dielectrics. When exposed to pulsed voltage with an exposure less than a microsecond electric strength of dielectric fluids increases and becomes higher than the strength of solid dielectrics. The operating principle of this effect clearly demonstrates by curves in Fig. 1. This graph conventionally shows the breakdown voltage of the time its effects (volts-second performance) on solid and liquid dielectrics in the breakdown n voltage pulse on an oblique. The point of intersection of these characteristics determines critical slope of voltage increase on the leading edge of the Ac. It also shows the voltage at the edge of the pulse before and after the breakdown of solid dielectric.
Figure 1. Chart describing the "effect of
Vorobiev’s." U (t)-pulse the applied voltage, Udis -
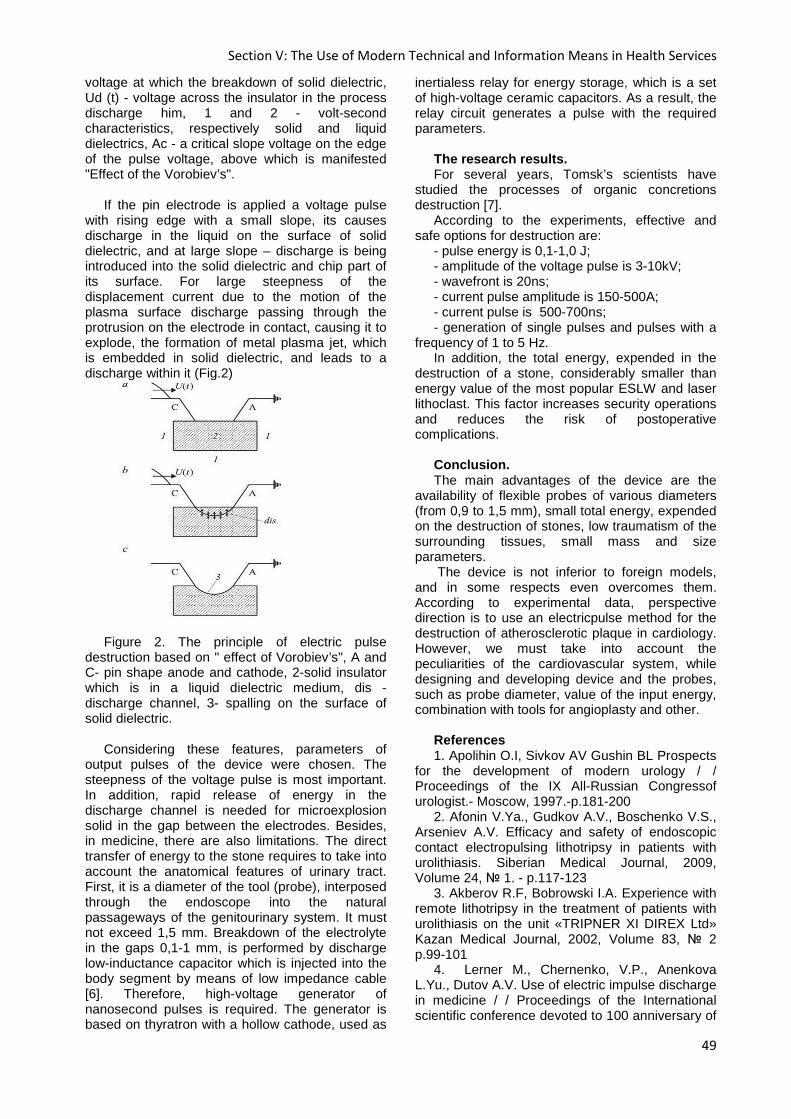
Section V: The Use of Modern Technical and Information Means in Health Services
49
voltage at which the breakdown of solid dielectric, Ud (t) - voltage across the insulator in the process discharge him, 1 and 2 - volt-second characteristics, respectively solid and liquid dielectrics, Ac - a critical slope voltage on the edge of the pulse voltage, above which is manifested "Effect of the Vorobiev’s".
If the pin electrode is applied a voltage pulse
with rising edge with a small slope, its causes discharge in the liquid on the surface of solid dielectric, and at large slope – discharge is being introduced into the solid dielectric and chip part of its surface. For large steepness of the displacement current due to the motion of the plasma surface discharge passing through the protrusion on the electrode in contact, causing it to explode, the formation of metal plasma jet, which is embedded in solid dielectric, and leads to a discharge within it (Fig.2)
Figure 2. The principle of electric pulse
destruction based on " effect of Vorobiev’s", A and C- pin shape anode and cathode, 2-solid insulator which is in a liquid dielectric medium, dis - discharge channel, 3- spalling on the surface of solid dielectric.
Considering these features, parameters of
output pulses of the device were chosen. The steepness of the voltage pulse is most important. In addition, rapid release of energy in the discharge channel is needed for microexplosion solid in the gap between the electrodes. Besides, in medicine, there are also limitations. The direct transfer of energy to the stone requires to take into account the anatomical features of urinary tract. First, it is a diameter of the tool (probe), interposed through the endoscope into the natural passageways of the genitourinary system. It must not exceed 1,5 mm. Breakdown of the electrolyte in the gaps 0,1-1 mm, is performed by discharge low-inductance capacitor which is injected into the body segment by means of low impedance cable [6]. Therefore, high-voltage generator of nanosecond pulses is required. The generator is based on thyratron with a hollow cathode, used as
inertialess relay for energy storage, which is a set of high-voltage ceramic capacitors. As a result, the relay circuit generates a pulse with the required parameters.
The research results. For several years, Tomsk’s scientists have
studied the processes of organic concretions destruction [7].
According to the experiments, effective and safe options for destruction are:
- pulse energy is 0,1-1,0 J; - amplitude of the voltage pulse is 3-10kV; - wavefront is 20ns; - current pulse amplitude is 150-500A; - current pulse is 500-700ns; - generation of single pulses and pulses with a
frequency of 1 to 5 Hz. In addition, the total energy, expended in the
destruction of a stone, considerably smaller than energy value of the most popular ESLW and laser lithoclast. This factor increases security operations and reduces the risk of postoperative complications.
Conclusion. The main advantages of the device are the
availability of flexible probes of various diameters (from 0,9 to 1,5 mm), small total energy, expended on the destruction of stones, low traumatism of the surrounding tissues, small mass and size parameters.
The device is not inferior to foreign models, and in some respects even overcomes them. According to experimental data, perspective direction is to use an electricpulse method for the destruction of atherosclerotic plaque in cardiology. However, we must take into account the peculiarities of the cardiovascular system, while designing and developing device and the probes, such as probe diameter, value of the input energy, combination with tools for angioplasty and other.
References 1. Apolihin O.I, Sivkov AV Gushin BL Prospects
for the development of modern urology / / Proceedings of the IX All-Russian Congressof urologist.- Moscow, 1997.-p.181-200
2. Afonin V.Ya., Gudkov A.V., Boschenko V.S., Arseniev A.V. Efficacy and safety of endoscopic contact electropulsing lithotripsy in patients with urolithiasis. Siberian Medical Journal, 2009, Volume 24, 1. - p.117-123
3. Akberov R.F, Bobrowski I.A. Experience with remote lithotripsy in the treatment of patients with urolithiasis on the unit «TRIPNER XI DIREX Ltd» Kazan Medical Journal, 2002, Volume 83, 2 p.99-101
4. Lerner M., Chernenko, V.P., Anenkova L.Yu., Dutov A.V. Use of electric impulse discharge in medicine / / Proceedings of the International scientific conference devoted to 100 anniversary of
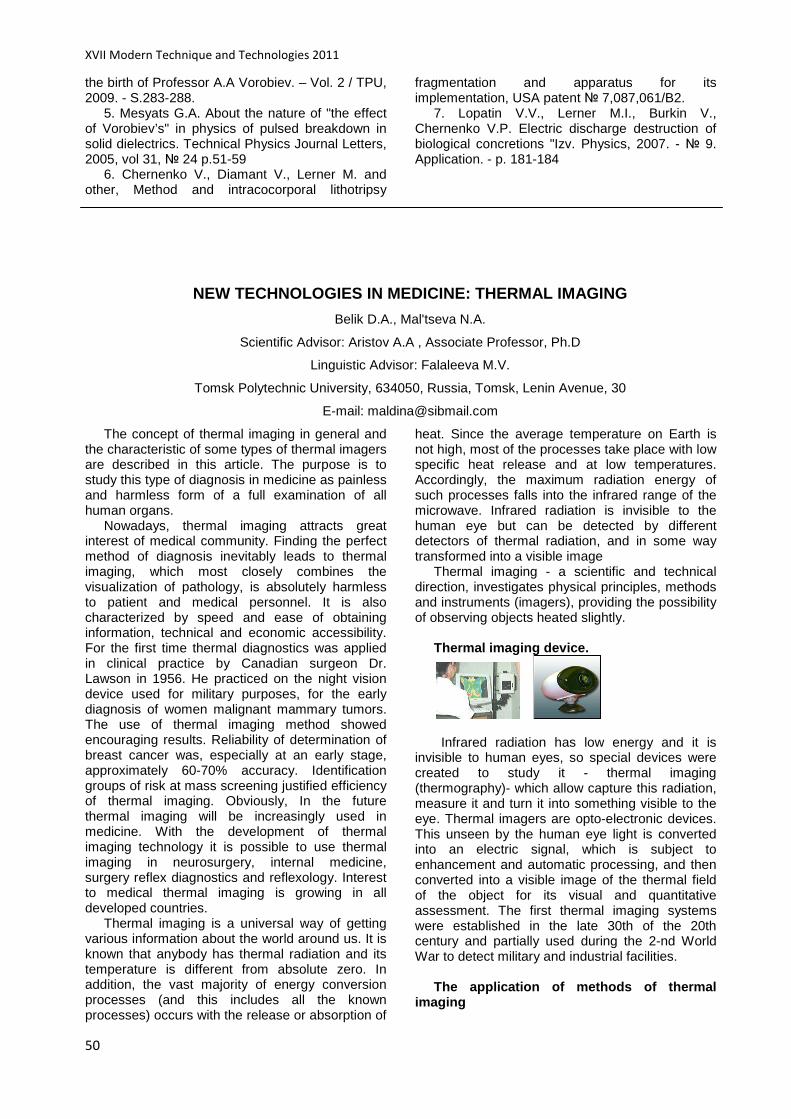
XVII Modern Technique and Technologies 2011
50
the birth of Professor A.A Vorobiev. – Vol. 2 / TPU, 2009. - S.283-288.
5. Mesyats G.A. About the nature of "the effect of Vorobiev’s" in physics of pulsed breakdown in solid dielectrics. Technical Physics Journal Letters, 2005, vol 31, 24 p.51-59
6. Chernenko V., Diamant V., Lerner M. and other, Method and intracocorporal lithotripsy
fragmentation and apparatus for its implementation, USA patent 7,087,061/B2.
7. Lopatin V.V., Lerner M.I., Burkin V., Chernenko V.P. Electric discharge destruction of biological concretions "Izv. Physics, 2007. - 9. Application. - p. 181-184
NEW TECHNOLOGIES IN MEDICINE: THERMAL IMAGING
Belik D.A., Mal'tseva N.A.
Scientific Advisor: Aristov A.A , Associate Professor, Ph.D
Linguistic Advisor: Falaleeva M.V.
Tomsk Polytechnic University, 634050, Russia, Tomsk, Lenin Avenue, 30
E-mail: [email protected]
The concept of thermal imaging in general and the characteristic of some types of thermal imagers are described in this article. The purpose is to study this type of diagnosis in medicine as painless and harmless form of a full examination of all human organs.
Nowadays, thermal imaging attracts great interest of medical community. Finding the perfect method of diagnosis inevitably leads to thermal imaging, which most closely combines the visualization of pathology, is absolutely harmless to patient and medical personnel. It is also characterized by speed and ease of obtaining information, technical and economic accessibility. For the first time thermal diagnostics was applied in clinical practice by Canadian surgeon Dr. Lawson in 1956. He practiced on the night vision device used for military purposes, for the early diagnosis of women malignant mammary tumors. The use of thermal imaging method showed encouraging results. Reliability of determination of breast cancer was, especially at an early stage, approximately 60-70% accuracy. Identification groups of risk at mass screening justified efficiency of thermal imaging. Obviously, In the future thermal imaging will be increasingly used in medicine. With the development of thermal imaging technology it is possible to use thermal imaging in neurosurgery, internal medicine, surgery reflex diagnostics and reflexology. Interest to medical thermal imaging is growing in all developed countries.
Thermal imaging is a universal way of getting various information about the world around us. It is known that anybody has thermal radiation and its temperature is different from absolute zero. In addition, the vast majority of energy conversion processes (and this includes all the known processes) occurs with the release or absorption of
heat. Since the average temperature on Earth is not high, most of the processes take place with low specific heat release and at low temperatures. Accordingly, the maximum radiation energy of such processes falls into the infrared range of the microwave. Infrared radiation is invisible to the human eye but can be detected by different detectors of thermal radiation, and in some way transformed into a visible image
Thermal imaging - a scientific and technical direction, investigates physical principles, methods and instruments (imagers), providing the possibility of observing objects heated slightly.
Thermal imaging device.
Infrared radiation has low energy and it is
invisible to human eyes, so special devices were created to study it - thermal imaging (thermography)- which allow capture this radiation, measure it and turn it into something visible to the eye. Thermal imagers are opto-electronic devices. This unseen by the human eye light is converted into an electric signal, which is subject to enhancement and automatic processing, and then converted into a visible image of the thermal field of the object for its visual and quantitative assessment. The first thermal imaging systems were established in the late 30th of the 20th century and partially used during the 2-nd World War to detect military and industrial facilities.
The application of methods of thermal
imaging
Section V: The Use of Modern Technical and Information Means in Health Services
51
Thermal imaging is used in many spheres of human activity. For example, thermal imagers are used for military intelligence and security facilities. Objects of conventional military equipment are visible at a distance of 2-3 km. Today, a video of the microwave with image on a computer screen has sensitivity in a few hundred degrees. This means that if you open the front door, your thermal imprint is visible on the handle for half an hour. Even at home with the lights out, you'll shine even behind the curtain. In the metro you can easily distinguish the people who have just entered. And the presence of the common cold in humans and whether he had anything interesting can be seen at a distance of several hundred meters. It is useful to use thermal imaging to locate defects in different settings. Naturally, when any installation or site observed increases or decreases in heat for some process in place where it should not be, or heat in these sites varies greatly, the problem can be corrected in a timely manner. Sometimes, certain defects can be seen only by the thermal imager. For example, bridges and heavy supporting structures during the aging metal or off-design strain begin to stand out more energy than it should. It becomes possible to diagnose the state of an object without disturbing its integrity, although there may be difficulties associated with not very high accuracy caused by intermediate structures. Thus, the imager can be used as an operational and, perhaps, the only controller security status of many objects and to prevent catastrophe. Check operation of flues, ventilation, heat and mass transfer, atmospheric phenomena become orders of magnitude easier, simpler, and more informative. Thermal imaging has found wide application in medicine.
The use of thermal imaging in medicine. In modern medicine, a thermal imaging survey
is a powerful diagnostic method to detect such pathologies which are difficult to control in other ways. Thermal imaging research is used to diagnose the early stages (before radiographic manifestations, and in some cases long before the complaints of the patient) the following diseases: inflammation and swelling of the mammary glands, organs of gynecological sphere, skin, lymph nodes, ENT disease, nerve damage and limb vessels, varicose veins, inflammatory disease of the gastrointestinal tract, liver, kidneys, osteochondrosis and spinal tumors. Absolutely harmless device, imager, is effectively used in obstetrics and pediatrics.
In a healthy body the temperature distribution is symmetrical about the midline of the body. Violation of this symmetry is the basic criterion for thermal imaging diagnostics. On parts of the body with abnormally high or low temperatures the symptoms of more than 150 diseases in the earliest stages of their occurrence can be recognized. Thermography - a method of
functional diagnostics, based on the detection of infrared radiation of the human body, is proportional to its temperature. Distribution and intensity of thermal radiation in the norm is the definite feature of physiological processes occurring in the body. There are two main types of thermography:
a. Contact cholesteric thermography. b. Teletermografy. Teletermografy is based on the conversion of
infrared radiation of the human body into an electrical signal that is visualized on the screen image.
Contact cholesteric thermography is based on the optical properties of cholesteric liquid crystals, which show a change of color in the rainbow colors when applying them to heat emission surface. Cold areas correspond to red, the coldest to hot-blue.
After considering various methods of thermal imaging we need to know how to interpreted thermo graphic images. There are visual and quantitative ways to evaluate thermal picture. Visual (qualitative) assessment of thermography means to determine the location, size, shape and structure of foci of enhanced emission, as well as roughly estimate the magnitude of infrared radiation. However, the visual assessment can not accurately measure the temperature. Moreover, the rise of the apparent temperature in the thermograph is dependent on the scan rate and magnitude of the field. Difficulties for the clinical evaluation of thermography are that the temperature rises in a small area of the site is hardly noticeable. As a result, small in size pathological focus cannot be detected.
Radiometric approach is very promising. It involves using the latest technology and can be used to conduct mass preventive examination, obtaining quantitative information on pathological processes in the studied areas, as well as to evaluate the effectiveness of thermography.
Conclusion. And in conclusion we would like to say that the
topic of thermal imaging is a very hot topic today because there are few methods of investigation, which would be carried out without interference and the negative impaction on our body. Thermal imaging can be called a universal way of receiving information about the world. In modern medicine, a thermal imaging survey is a powerful diagnostic method to detect such diseases that are poorly controlled by other ways. Thermal imaging survey is used to • diagnosis various diseases in early stages,
and in some cases long before complaints of the patient. We are convinced that the thermal
• survey will be widely used in medicine and will be actively implemented in medical institutions in our country.
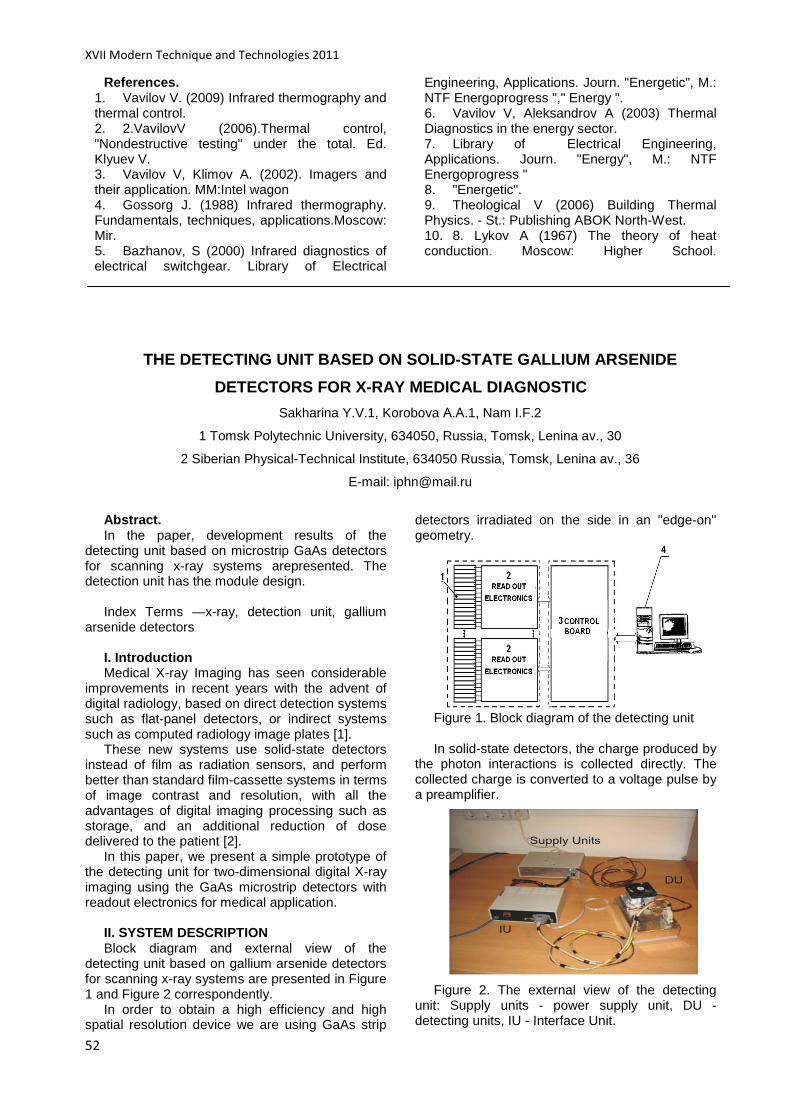
XVII Modern Technique and Technologies 2011
52
References. 1. Vavilov V. (2009) Infrared thermography and thermal control. 2. 2.VavilovV (2006).Thermal control, "Nondestructive testing" under the total. Ed. Klyuev V. 3. Vavilov V, Klimov A. (2002). Imagers and their application. MM:Intel wagon 4. Gossorg J. (1988) Infrared thermography. Fundamentals, techniques, applications.Moscow: Mir. 5. Bazhanov, S (2000) Infrared diagnostics of electrical switchgear. Library of Electrical
Engineering, Applications. Journ. "Energetic", M.: NTF Energoprogress "," Energy ". 6. Vavilov V, Aleksandrov A (2003) Thermal Diagnostics in the energy sector. 7. Library of Electrical Engineering, Applications. Journ. "Energy", M.: NTF Energoprogress " 8. "Energetic". 9. Theological V (2006) Building Thermal Physics. - St.: Publishing ABOK North-West. 10. 8. Lykov A (1967) The theory of heat conduction. Moscow: Higher School.
THE DETECTING UNIT BASED ON SOLID-STATE GALLIUM ARS ENIDE
DETECTORS FOR X-RAY MEDICAL DIAGNOSTIC
Sakharina Y.V.1, Korobova А.А.1, Nam I.F.2
1 Tomsk Polytechnic University, 634050, Russia, Tomsk, Lenina av., 30
2 Siberian Physical-Technical Institute, 634050 Russia, Tomsk, Lenina av., 36
E-mail: [email protected]
Abstract. In the paper, development results of the
detecting unit based on microstrip GaAs detectors for scanning x-ray systems arepresented. The detection unit has the module design.
Index Terms —x-ray, detection unit, gallium
arsenide detectors I. Introduction Medical X-ray Imaging has seen considerable
improvements in recent years with the advent of digital radiology, based on direct detection systems such as flat-panel detectors, or indirect systems such as computed radiology image plates [1].
These new systems use solid-state detectors instead of film as radiation sensors, and perform better than standard film-cassette systems in terms of image contrast and resolution, with all the advantages of digital imaging processing such as storage, and an additional reduction of dose delivered to the patient [2].
In this paper, we present a simple prototype of the detecting unit for two-dimensional digital X-ray imaging using the GaAs microstrip detectors with readout electronics for medical application.
II. SYSTEM DESCRIPTION Block diagram and external view of the
detecting unit based on gallium arsenide detectors for scanning x-ray systems are presented in Figure 1 and Figure 2 correspondently.
In order to obtain a high efficiency and high spatial resolution device we are using GaAs strip
detectors irradiated on the side in an "edge-on'' geometry.
Figure 1. Block diagram of the detecting unit In solid-state detectors, the charge produced by
the photon interactions is collected directly. The collected charge is converted to a voltage pulse by a preamplifier.
Figure 2. The external view of the detecting
unit: Supply units - power supply unit, DU - detecting units, IU - Interface Unit.

Section V: The Use of Modern Technical and Information Means in Health Services
53
Due to interaction of x-ray with gallium arsenide detectors (1) the electron-hole pairs are generated. This pairs under action of electric field move to electrodes and induce current impulse on electrodes of microstrip detector. This impulse is transmitted to the input of multichannel read-out electronics (2) which operates in single photon-counting mode as well as in the integrating mode.
Under action of operating impulses from the interface unit (3) the signal from each element of the detector get to the analog-to-digital converter (ADC), after digitization the data transmit to the data processing device (4) for example computer. In the data processing device it is possible to receive any kind of representation of the information received from detectors, including the visualization as an image, one axis of this image coincides with the scanning direction, and the second axis is formed by the line of detectors.
Microstrip detectors with the integrated chip combine into one module. The advantages of the modular structure are: • Scale simplicity. I.e. change of quantity of modules should not demand development of new modules. • Change of one parameter of the detection unit (the size of the detector, type of the primary converter, type of the interface for data input in the personal computer, etc.) should not entail change of circuitry more than one module
The control board in IU operates the functioning of the modules. Modular design also means that modules can be easily scaled to fit the application‚ when required. The control board also converts analog signals from microstrip detectors to digital data and transmits it to the device for data processing and visualization. The main element of this board is a special reprogrammed chip. It allows using this unit not only in mammography but also in non destroying testing systems and for custom control. The only thing is needed to change the modules.
III. RESULTS Spatial resolution. The spatial resolution is measured by using
L659061 test pattern. Three x-ray images of tis pattern are shown in Figure3.
a) b)
c) Figure 3. X-ray images of L659061 test pattern:
a) the L659061 test pattern is parallel b) the L659061 test pattern is perpendicular and c) the displacement angle L659061 test pattern is equal 45 ° with respect to direction of DU motion.
Preliminary estimation of images showed
spatial resolution of 8 line pairs per mm. As a result, we can visualize objects with 50 µm in size as illustrated in figure 4.
Figure 4. X-ray imaging of set of steel wire (Fe)
d=63 and 50 mm correspondently Contrast. Contrast sensitivity was measured using a
special contrast - detail pattern. It can be visualized aluminum disk with the thickness of 100 microns on the background of the aluminum plate with the thikness 1,5 mm in the x-ray image of contrast-detail pattern (figure 5.)
Figure 5. X-ray image of detail-contrast pattern
for contrast sensitivity determination. Dynamic range. Images were obtained aluminum wedge (Figure
6). According to the results the dynamic range of the detecting unit is at least 500.
Figure 6. X-ray image of aluminum wedge. IV. CONCLUSION Currently, digital detectors are develops in the
world. This is the most effective method for detecting X-rays. Even slight improvements in the presentation of information and efficiency play an important role for consumers. Therefore, the proposed technology, which reduces the radiation dose to the patient, firstly will reduce the fear of the population before the X-rays and increase the flow of the surveyed patients, secondly the price will

XVII Modern Technique and Technologies 2011
54
make it possible to buy digital x-ray systems for many clinics, used X-ray film.
This work is supported by: АВЦП 2.1.2/12752; РФФИ 09-02-99028-р_офи; ФЦП «Кадры», ГК
02.740.11.0164 от 25июня 2009
REFERENCES [1] P. Rato Mendes, Topics on ionising radiation
physics and detectors, course at the Fourth Southern European EPS School ‘‘Physics in Medicine’’, Faro, September, 2001.
[2] M. Overdick, Flat X-ray detectors for medical imaging, keynote lecture at the Fourth International Workshop on Radiation Imaging Detectors, Amsterdam, September, 2002, Nucl. Instr. and Meth. A (2003), these proceedings.
ELECTROCARDIOGRAPH WITH NANOELECTRODES
FOR INDIVIDUAL APPLICATION
N.S. Starikova, M.A. Yuzhakova, P.G. Penkov
Research supervisor: D.K. Avdeeva, DSc
Tomsk Polytechnic University, 634050, Russia, Tomsk, 30, Lenin Ave.
E-mail: [email protected]
Heart diseases are a major public health problem that takes the lives of a great number of people in Russia each year, more than lung cancer, breast cancer, stroke, and AIDS combined. Deaths from heart diseases can be lowered by electrocardiography.
ECG (Electrocardiograph) is a useful tool for detecting symptoms of heart diseases.
[1]. Depolarisation initiated at the SA node spreads as a wavefront across the two atria, and also at a higher speed along the three inter-nodal tracts to the AV node. There is a delay at the AV node, then the wavefront travels at high speed down the His bundle in the interventricular septum, dividing the two ventricles. The His bundle branches into the Purkinje system which conducts the wavefronts along much of the endocardial surfaces of the two ventricles. The wavefronts then spread more slowly through the normal myocardium. They spread from the inside to the outside of the ventricles. Wavefronts travel with higher velocity in the direction of the fibre orientation. The morphology of the resulting ECG recorded on the chest surface depends on the orientation of the heart, the active recording electrode and the reference electrode.
The signal waveform produced for each heart beat consists of the P wave, due to atrial depolarisation, the QRS complex due to ventricular depolarisation, and the T wave caused by ventricular repolarisation. The effects of summing all the electrical activity in the heart can be represented by an electrical dipole whose magnitude and direction is constantly changing. The scalar magnitude of the ECG is then the dot product of the dipole and the electrode orientation.
Generally 12 lead positions are commonly used to record the ECG. The first three are known as
leads I, II and III (Fig.1). They are left arm to right arm for I, i.e. the active lead is on the left arm (usually the left wrist) and the reference electrode is on the right arm (wrist). Lead II is left leg (ankle) to right arm, and lead III is left leg to left arm. The right ankle is usually grounded. The lead vectors can be represented by an equilateral triangle, known as Eindhoven's triangle. The direction of lead I vector is 0 degrees by convention. The direction of lead II is 60 degrees and lead III is 120 degrees.
The remaining lead positions use a common reference, known as Wilson's central terminal. This consists of the right and left wrists joined to the left
Figure 1. Commonly used lead positions
ankle, each through a suitably large resistor. The first three active electrodes are the right and left wrists and the left ankle. In practice this means that when one limb is an active electrode, it is shunted by the resistance that is part of the
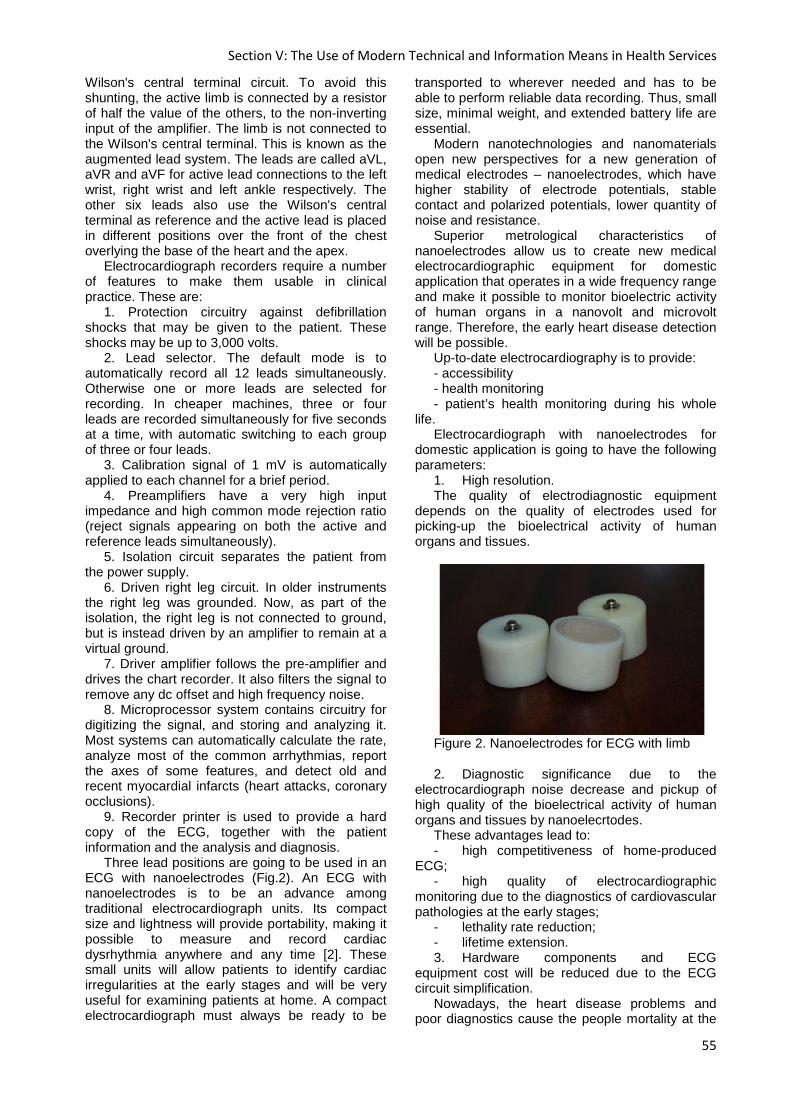
Section V: The Use of Modern Technical and Information Means in Health Services
55
Wilson's central terminal circuit. To avoid this shunting, the active limb is connected by a resistor of half the value of the others, to the non-inverting input of the amplifier. The limb is not connected to the Wilson's central terminal. This is known as the augmented lead system. The leads are called aVL, aVR and aVF for active lead connections to the left wrist, right wrist and left ankle respectively. The other six leads also use the Wilson's central terminal as reference and the active lead is placed in different positions over the front of the chest overlying the base of the heart and the apex.
Electrocardiograph recorders require a number of features to make them usable in clinical practice. These are:
1. Protection circuitry against defibrillation shocks that may be given to the patient. These shocks may be up to 3,000 volts.
2. Lead selector. The default mode is to automatically record all 12 leads simultaneously. Otherwise one or more leads are selected for recording. In cheaper machines, three or four leads are recorded simultaneously for five seconds at a time, with automatic switching to each group of three or four leads.
3. Calibration signal of 1 mV is automatically applied to each channel for a brief period.
4. Preamplifiers have a very high input impedance and high common mode rejection ratio (reject signals appearing on both the active and reference leads simultaneously).
5. Isolation circuit separates the patient from the power supply.
6. Driven right leg circuit. In older instruments the right leg was grounded. Now, as part of the isolation, the right leg is not connected to ground, but is instead driven by an amplifier to remain at a virtual ground.
7. Driver amplifier follows the pre-amplifier and drives the chart recorder. It also filters the signal to remove any dc offset and high frequency noise.
8. Microprocessor system contains circuitry for digitizing the signal, and storing and analyzing it. Most systems can automatically calculate the rate, analyze most of the common arrhythmias, report the axes of some features, and detect old and recent myocardial infarcts (heart attacks, coronary occlusions).
9. Recorder printer is used to provide a hard copy of the ECG, together with the patient information and the analysis and diagnosis.
Three lead positions are going to be used in an ECG with nanoelectrodes (Fig.2). An ECG with nanoelectrodes is to be an advance among traditional electrocardiograph units. Its compact size and lightness will provide portability, making it possible to measure and record cardiac dysrhythmia anywhere and any time [2]. These small units will allow patients to identify cardiac irregularities at the early stages and will be very useful for examining patients at home. A compact electrocardiograph must always be ready to be
transported to wherever needed and has to be able to perform reliable data recording. Thus, small size, minimal weight, and extended battery life are essential.
Modern nanotechnologies and nanomaterials open new perspectives for a new generation of medical electrodes – nanoelectrodes, which have higher stability of electrode potentials, stable contact and polarized potentials, lower quantity of noise and resistance.
Superior metrological characteristics of nanoelectrodes allow us to create new medical electrocardiographic equipment for domestic application that operates in a wide frequency range and make it possible to monitor bioelectric activity of human organs in a nanovolt and microvolt range. Therefore, the early heart disease detection will be possible.
Up-to-date electrocardiography is to provide: - accessibility - health monitoring - patient’s health monitoring during his whole
life. Electrocardiograph with nanoelectrodes for
domestic application is going to have the following parameters:
1. High resolution. The quality of electrodiagnostic equipment
depends on the quality of electrodes used for picking-up the bioelectrical activity of human organs and tissues.
Figure 2. Nanoelectrodes for ECG with limb 2. Diagnostic significance due to the
electrocardiograph noise decrease and pickup of high quality of the bioelectrical activity of human organs and tissues by nanoelecrtodes.
These advantages lead to: - high competitiveness of home-produced
ECG; - high quality of electrocardiographic
monitoring due to the diagnostics of cardiovascular pathologies at the early stages;
- lethality rate reduction; - lifetime extension. 3. Hardware components and ECG
equipment cost will be reduced due to the ECG circuit simplification.
Nowadays, the heart disease problems and poor diagnostics cause the people mortality at the

XVII Modern Technique and Technologies 2011
56
age of 40-50, generally male. Episodic heart monitoring cannot detect primary factors of preinfarction angina.
To solve this problem, it is necessary to create a computerized multifunctional electrocardiograph for individual application that is convenient in operation. The device should be affordable for ordinary people to monitor the heart state without having to leave their home.
ECG with nanoelectrodes should be meant for constant heart monitoring with saving these data in an individual database. It will also have some software for self-diagnostics.
ECG with nanoelectrodes is to become an indispensable device for millions of people. These ECGs with nanoelectrodes will be very convenient and allow patients to monitor their current heart state without having to leave their home thus, reducing the risks of heart disease.
References: 1. RASFD, retrieved February 21, 2011 from
http://www.rasfd.com/ 2. Medical Practice (Family Medicine): Future
Approaches , retrieved February 21, 2011 from http://giduv.com/journal/2004/2/obschaja_vrachebnaja_praktika
APPLICATION OF BIOFEEDBACK FOR TRAINING FOR MONITOR ING
THE STATUS OF PREGNANT MOTHER-FETUS Timkina K. V.1, Khlopova A.A.2, Kiselyova E.Yu.1, Tolmachev I.V.2
The scientific adviser: Tolmachev I.V., Kiselyova E.Yu.
Tomsk Polytechnic University, 30, Lenin Ave., Tomsk, 634050, Russia
Siberian State Medical University, 2, Moskowskii Tr., Tomsk, 634050, Russia
E-mail: [email protected]
The problem of non-invasive methods of fetal monitoring, with the possibility of correction of the state, is still relevant, in connection with the progression of pathology of pregnancy.
Prolonged stress regulatory systems of the mother leads to depletion of adaptive reserves, disruption of physiological rhythms and mechanisms of regulation that can not affect the functional status of the fetus.
In this regard, an urgent problem of modern medicine is the development of techniques of correction of the pregnant woman based on accessing natural resources of the human body. One such method is to control with biofeedback training. Biofeedback - a method of medical rehabilitation, in which a person using electronic devices instantly and continuously provided with information about the physiological performance of his internal organs by light, sound, visual and tactile feedback signals. Based on this information, people can learn to arbitrarily change these under normal conditions of intangible parameters.
The purpose of this study is: Evaluating the effectiveness of biofeedback
training for pregnant women when monitoring the status of the mother-fetus
Tasks: 1. Development and implementation of the
algorithm biofeedback training for pregnant women as a software application.
2. Research on groups of pregnant women with follow-up evaluating the effectiveness of biofeedback-training.
Developed software application for biofeedback-training, providing management during the session heart rate due to respiratory arrhythmia, which is a good indicator of quality respiratory patient Fig. 1.
Fig. 1. Form the main form of biofeedback-
training. If the patient achieves the maximum heart rate
fluctuations during breathing, it is called diaphragmatic breathing, relaxation, which increases the oxygenation of the blood and helps prevent fetal hypoxia. In addition, the developed software application allows you to evaluate the functional status of the fetus at each stage of biofeedback-training.
Biofeedback training technique. In the group to assess the effectiveness of the
training includes pregnant women with gestational age 32-35 weeks, with physiological, not pathological mother and fetus. For more effective
Section V: The Use of Modern Technical and Information Means in Health Services
57
learning management skills HR needs at least 2 training accomplishments with a break of 2 days.
The room for the biofeedback training should be at room temperature, insulation, quiet atmosphere without the annoying factors (strangers, conversations). The woman must be in a comfortable chair in front of the monitor. The abdominal wall are superimposed five abdominal electrodes, greased conductive gel. The instructor gives general advice on the implementation of the session. Next, the patient begins to do the job.
The structure of the script. The total duration of the session - 18 minutes.
The beginning of the session. Check the contact with the device. Duration of the stage - at the discretion of the instructor.
Step 1. Record before the session. Screensaver with text and voice instructions for general relaxation, followed by video images of relaxing the content. Images are selected on the subject "Nature", in the color scheme, aimed at calming the nervous system: yellow - green and blue - blue. This step allows us to write the initial state of the patient and fetus. The duration of treatment - 3,5 min.
Step 2. Instructions 1. The patient in the form of speech offered the job by breathing to try to control an animated picture "flower". Duration of this stage - 30 seconds.
Step 3. Session 1. At this stage the problem of the patient to verify the possibility of changes in heart rate and select the most effective way to impact. On the screen is a flower, which, depending on the patient's heart rate ranged from (average + 2 * standard deviation) before (Average - 2 * standard deviation) is in the dissolved state or closed. Each change of heart rate is accompanied by the sound a note of the piano. The same patient can monitor the heart rate, which is displayed on the screen. Duration of this stage - 2 minutes.
Step 4. Rest 1. After the session the patient with an audio message informing about the rest, displays a video sequence of relaxing the content of "Nature". Duration of this stage - 40 sec.
Step 5. Instruction 2. The patient presented in the form of a sound job of managing the animated picture "animal", it is necessary for the animal to run faster. Because session is aimed at increasing heart rate, the patient is warned about the possibility of dizziness.
Step 6. Session 2. The patient tries to increase heart rate relative to the background value and hold at this level. The patient presented on the screen of an animal that can run faster with an increase in heart rate in the range of (Average + 2 * standard deviation) before (Average - 2 * standard deviation).
Another stimulus - the sound, it is necessary to achieve maximum volume activating nature of the music. Duration of this stage - 1 min.
Step 7. Rest 2. After the session the patient with an audio message informing about the rest, displays a video sequence of relaxing the content of "Animals". Duration of this stage - 40 sec.
Step 8. Instruction 3. The patient presented in the form of a sound job of managing the animated picture "person", it is necessary that the person smile, if done correctly set the music becomes louder.
Step 9. Session 3. The patient tries to lower the heart rate relative to the background value and hold at this level. For the patient displayed a person who feel sad when an increase in heart rate and smiles with a decrease in heart rate, heart rate range of (Average + 2 * standard deviation) before (Average - 2 * standard deviation). Necessary make maximum volume of the relaxing music. Duration of this stage - 2 minutes.
Step 10. Rest 3. After the session the patient with an audio message informing about the rest, displays a video sequence of relaxing the content of "Kids". Duration of this stage - 40 sec.
Step 11. Instruction 4. The patient presented in the form of a sound job of managing the animated picture "The steam locomotive, steam locomotive to be moved from station to station.
Step 12. Session 4. The patient tries to control heart rate relative to the background values in both parties, to raise and lower the heart rate for maximum respiratory cardiac arrhythmia.
The patient presented on-screen animated picture "The locomotive, which moves from station to station, depending on heart rate, heart rate range of (Average + 2 * standard deviation) before (Average - 2 * standard deviation). Duration of the stage - 2 minutes.
Step 13. Recording after the session. Patient with audible message informing that you can relax after the session. The screen displays the content of video sequence of relaxing, "Water-Plants. " Duration of the stage - 3,5 min.
Step 14. Finish. Screensaver with text about the end of the session and applause as a reward for a job. Duration of the stage - 15 sec.
After each stage of training is evaluated several characteristics of the state of the mother and fetus on the screen and stored in the database: Mo, DX, AMO, IN, HR. These characteristics reflect the state of the autonomic nervous system of mother and fetus. Each of the calculated parameters in the analysis cardiointervalograms attached to a specific physiological meaning [Baevsky R. M, 1995]. Based on the data to monitor the dynamics of indicators of maternal and fetal between each stage of the training, as well as between sessions.
The effectiveness of biofeedback-training can be estimated on the basis of the parameters characterizing the stress level of the fetus (Mo, DX, AMO, IN, fetal heart rate) and functional status of the mother (Mo, DX, AMO, IN, HR mother).

XVII Modern Technique and Technologies 2011
58

Section VI: Material Science
59
Section VI
MATERIAL SCIENCE

XVII Modern Technique and Technologies 2011
60
ANALYSIS OF THE CORROSION RESISTANCE OF STEEL GROUP S 316 AND 317
Bekterbekov N.B.
Scientific adviser: Trushenko E.A. candidate of technical science
Tomsk Polytechnic University, 634050, Tomsk, Russia
E-mail: [email protected]
316, 316L & 317L (UNS S31600) / (UNS S31603) / (UNS S31703) Chromium-Nickel-Molybdenum 1 General Properties Russian equivalent of Standard: AISI 316 –
10X17H13M2, AISI 316L – 03X17H14M3, AISI 316Ti - 10X17H13M2T. Type 316 austenitic stainless steel is a commonly used alloy for products that require excellent overall corrosion resistance. Alloys 316 (UNS S31600), 316L (S31603), and 317L (S31703) are molybdenum-bearing austenitic stainless steels which are more resistant to general corrosion and pitting/crevice corrosion than the conventional chromium-nickel austenitic stainless steels such as Alloy 304. These alloys also offer higher creep, stress-to-rupture, and tensile strength at elevated temperatures. Alloy 317L containing 3 to 4% of molybdenum is preferred to Alloys 316 or 316L, which contain 2 to 3% of molybdenum in applications requiring enhanced pitting and general, corrosion resistance. In addition to excellent corrosion resistance and strength properties, 316, 316L Alloys, and 317L Cr-Ni-Mo alloys provide excellent fabric ability and formability, which are typical of the austenitic stainless steels.
Table.1 Chemical composition as represented
by ASTM A240 and ASME SA-240 specifications are indicated in the table below. Percentage by Weight (maximum unless
range is specified) Element Alloy 316 Alloy 316L Alloy 317L Carbon 0.08 0.030 0.030
Manganese 2.00 2.00 2.00 Silicon 0.75 0.75 0.75
Chromium 16.00/18.00 16.00/18.00 18.00/20.00 Nickel 10.00/14.00 10.00/14.00 11.00/15.00
Molybdenum 2.00/3.00 2.00/3.00 3.00/4.00 Phosphorus 0.045 0.045 0.045
Sulfur 0.030 0.030 0.030 Nitrogen 0.10 0.10 0.10
Iron Bal. Bal. Bal. 2 Resistance to Corrosion General Corrosion Alloys 316, 316L, and 317L are more resistant
to atmospheric and other mild types of corrosion than 18-8 stainless steels. In general, media that do not corrode 18-8 stainless steels will not attack
these molybdenum-containing grades. One exception is highly oxidizing acids such as nitric acid to which molybdenum-bearing stainless steels are less resistant. Alloys 316 and 317L are considerably more resistant to sulfuric acid solutions than any other chromium-nickel types. At temperatures as high as 120°F (38°C), both types have excellent resistance to higher concentrations. Service tests are usually desirable as operating conditions and acid contaminants may significantly affect corrosion rate. If there is condensation of sulfur-bearing gases, these alloys are much more resistant than other types of stainless steels. In such applications, however, acid concentration has a marked influence on the rate of attack and should be carefully determined. Molybdenum-bearing Alloys 316 and 317L stainless steels also provide resistance to a wide variety of other environments. As shown by the laboratory corrosion data below, these alloys offer excellent resistance to boiling 20% phosphoric acid. They are also widely used in handling hot organic and fatty acids. This is a factor in the manufacture and handling of certain food and pharmaceutical products where molybdenum-containing stainless steels are often required in order to minimize metallic contamination. In general, Alloy 316 and 316L grades can be considered to perform equally well for a given environment. The same is true for Alloy 317L. A notable exception is in environments sufficiently corrosive to cause inter granular corrosion of welds and heat-affected zones on susceptible alloys. In such media, Alloy 316L and 317L grades are preferable for the weld condition since low carbon levels enhance resistance to inter granular corrosion.
Table.2 Corrosion Resistance in Boiling
Solutions Table.2 Corrosion Resistance in Boiling Solutions
Boiling Test
Solution
Corrosion Rate in Mils per Year (mm/y) for Cited Alloys
Alloy 316L Alloy 317L Base Metal
Welded Base Metal
Welded
20% Acetic Acid
0.12 (0.003)
0.12 (0.003)
0.48 (0.012)
0.36 (0.009)
45% Formic Acid
23.4 (0.594)
20.9 (0.531)
18.3 (0.465)
24.2 (0.615)
1% Hydrochloric Acid
0.96 (0.024)
63.6 (1.615)
54.2 (1.377)
51.4 (1.306)
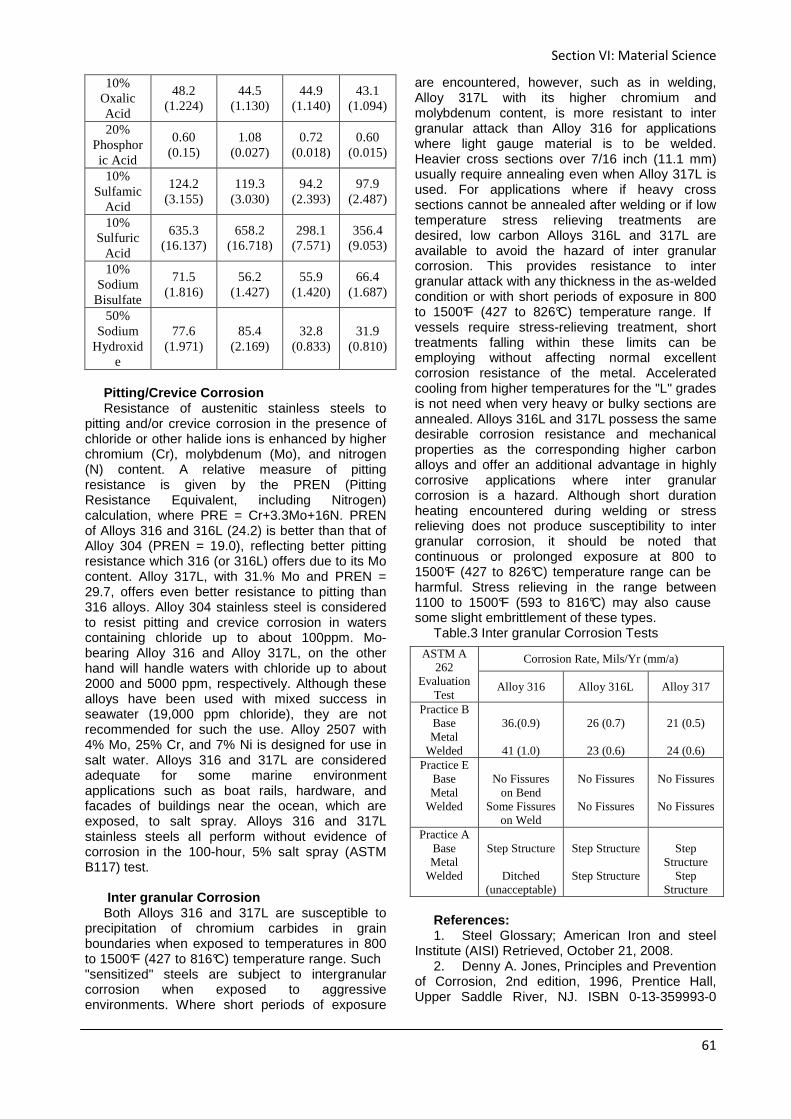
Section VI: Material Science
61
10% Oxalic Acid
48.2 (1.224)
44.5 (1.130)
44.9 (1.140)
43.1 (1.094)
20% Phosphoric Acid
0.60 (0.15)
1.08 (0.027)
0.72 (0.018)
0.60 (0.015)
10% Sulfamic
Acid
124.2 (3.155)
119.3 (3.030)
94.2 (2.393)
97.9 (2.487)
10% Sulfuric
Acid
635.3 (16.137)
658.2 (16.718)
298.1 (7.571)
356.4 (9.053)
10% Sodium Bisulfate
71.5 (1.816)
56.2 (1.427)
55.9 (1.420)
66.4 (1.687)
50% Sodium
Hydroxide
77.6 (1.971)
85.4 (2.169)
32.8 (0.833)
31.9 (0.810)
Pitting/Crevice Corrosion Resistance of austenitic stainless steels to
pitting and/or crevice corrosion in the presence of chloride or other halide ions is enhanced by higher chromium (Cr), molybdenum (Mo), and nitrogen (N) content. A relative measure of pitting resistance is given by the PREN (Pitting Resistance Equivalent, including Nitrogen) calculation, where PRE = Cr+3.3Mo+16N. PREN of Alloys 316 and 316L (24.2) is better than that of Alloy 304 (PREN = 19.0), reflecting better pitting resistance which 316 (or 316L) offers due to its Mo content. Alloy 317L, with 31.% Mo and PREN = 29.7, offers even better resistance to pitting than 316 alloys. Alloy 304 stainless steel is considered to resist pitting and crevice corrosion in waters containing chloride up to about 100ppm. Mo-bearing Alloy 316 and Alloy 317L, on the other hand will handle waters with chloride up to about 2000 and 5000 ppm, respectively. Although these alloys have been used with mixed success in seawater (19,000 ppm chloride), they are not recommended for such the use. Alloy 2507 with 4% Mo, 25% Cr, and 7% Ni is designed for use in salt water. Alloys 316 and 317L are considered adequate for some marine environment applications such as boat rails, hardware, and facades of buildings near the ocean, which are exposed, to salt spray. Alloys 316 and 317L stainless steels all perform without evidence of corrosion in the 100-hour, 5% salt spray (ASTM B117) test.
Inter granular Corrosion Both Alloys 316 and 317L are susceptible to
precipitation of chromium carbides in grain boundaries when exposed to temperatures in 800 to 1500°F (427 to 816°C) temperature range. Such "sensitized" steels are subject to intergranular corrosion when exposed to aggressive environments. Where short periods of exposure
are encountered, however, such as in welding, Alloy 317L with its higher chromium and molybdenum content, is more resistant to inter granular attack than Alloy 316 for applications where light gauge material is to be welded. Heavier cross sections over 7/16 inch (11.1 mm) usually require annealing even when Alloy 317L is used. For applications where if heavy cross sections cannot be annealed after welding or if low temperature stress relieving treatments are desired, low carbon Alloys 316L and 317L are available to avoid the hazard of inter granular corrosion. This provides resistance to inter granular attack with any thickness in the as-welded condition or with short periods of exposure in 800 to 1500°F (427 to 826°C) temperature range. If vessels require stress-relieving treatment, short treatments falling within these limits can be employing without affecting normal excellent corrosion resistance of the metal. Accelerated cooling from higher temperatures for the "L" grades is not need when very heavy or bulky sections are annealed. Alloys 316L and 317L possess the same desirable corrosion resistance and mechanical properties as the corresponding higher carbon alloys and offer an additional advantage in highly corrosive applications where inter granular corrosion is a hazard. Although short duration heating encountered during welding or stress relieving does not produce susceptibility to inter granular corrosion, it should be noted that continuous or prolonged exposure at 800 to 1500°F (427 to 826°C) temperature range can be harmful. Stress relieving in the range between 1100 to 1500°F (593 to 816°C) may also cause some slight embrittlement of these types.
Table.3 Inter granular Corrosion Tests
References: 1. Steel Glossary; American Iron and steel
Institute (AISI) Retrieved, October 21, 2008. 2. Denny A. Jones, Principles and Prevention
of Corrosion, 2nd edition, 1996, Prentice Hall, Upper Saddle River, NJ. ISBN 0-13-359993-0
ASTM A 262
Evaluation Test
Corrosion Rate, Mils/Yr (mm/a)
Alloy 316 Alloy 316L Alloy 317
Practice B Base Metal
Welded
36.(0.9)
41 (1.0)
26 (0.7)
23 (0.6)
21 (0.5)
24 (0.6)
Practice E Base Metal
Welded
No Fissures
on Bend Some Fissures
on Weld
No Fissures
No Fissures
No Fissures
No Fissures
Practice A Base Metal
Welded
Step Structure
Ditched
(unacceptable)
Step Structure
Step Structure
Step
Structure Step
Structure
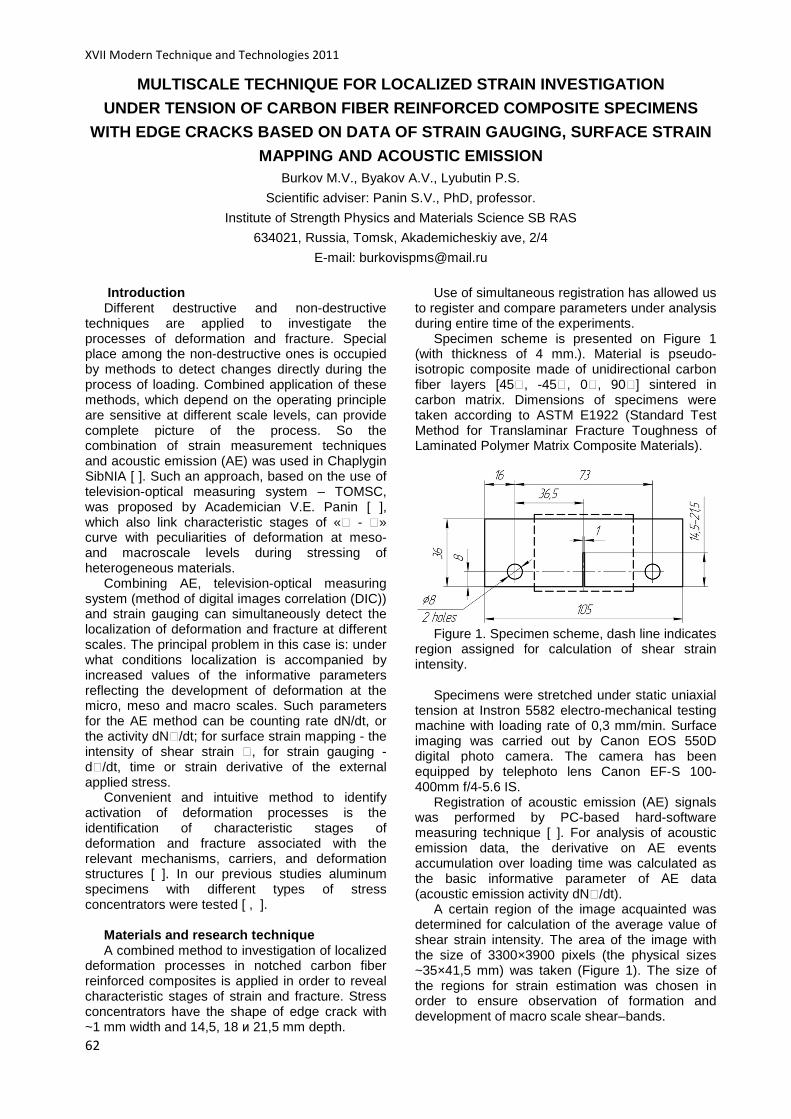
XVII Modern Technique and Technologies 2011
62
MULTISCALE TECHNIQUE FOR LOCALIZED STRAIN INVESTIGA TION
UNDER TENSION OF CARBON FIBER REINFORCED COMPOSITE SPECIMENS
WITH EDGE CRACKS BASED ON DATA OF STRAIN GAUGING, S URFACE STRAIN
MAPPING AND ACOUSTIC EMISSION Burkov M.V., Byakov A.V., Lyubutin P.S.
Scientific adviser: Panin S.V., PhD, professor.
Institute of Strength Physics and Materials Science SB RAS
634021, Russia, Tomsk, Akademicheskiy ave, 2/4
E-mail: [email protected]
Introduction Different destructive and non-destructive
techniques are applied to investigate the processes of deformation and fracture. Special place among the non-destructive ones is occupied by methods to detect changes directly during the process of loading. Combined application of these methods, which depend on the operating principle are sensitive at different scale levels, can provide complete picture of the process. So the combination of strain measurement techniques and acoustic emission (AE) was used in Chaplygin SibNIA [ ]. Such an approach, based on the use of television-optical measuring system – TOMSC, was proposed by Academician V.E. Panin [ ], which also link characteristic stages of «= - =» curve with peculiarities of deformation at meso- and macroscale levels during stressing of heterogeneous materials.
Combining AE, television-optical measuring system (method of digital images correlation (DIC)) and strain gauging can simultaneously detect the localization of deformation and fracture at different scales. The principal problem in this case is: under what conditions localization is accompanied by increased values of the informative parameters reflecting the development of deformation at the micro, meso and macro scales. Such parameters for the AE method can be counting rate dN/dt, or the activity dN=/dt; for surface strain mapping - the intensity of shear strain =, for strain gauging - d=/dt, time or strain derivative of the external applied stress.
Convenient and intuitive method to identify activation of deformation processes is the identification of characteristic stages of deformation and fracture associated with the relevant mechanisms, carriers, and deformation structures [ ]. In our previous studies aluminum specimens with different types of stress concentrators were tested [ , ].
Materials and research technique A combined method to investigation of localized
deformation processes in notched carbon fiber reinforced composites is applied in order to reveal characteristic stages of strain and fracture. Stress concentrators have the shape of edge crack with ~1 mm width and 14,5, 18 и 21,5 mm depth.
Use of simultaneous registration has allowed us to register and compare parameters under analysis during entire time of the experiments.
Specimen scheme is presented on Figure 1 (with thickness of 4 mm.). Material is pseudo-isotropic composite made of unidirectional carbon fiber layers [45=, -45=, 0=, 90=] sintered in carbon matrix. Dimensions of specimens were taken according to ASTM E1922 (Standard Test Method for Translaminar Fracture Toughness of Laminated Polymer Matrix Composite Materials).
Figure 1. Specimen scheme, dash line indicates
region assigned for calculation of shear strain intensity.
Specimens were stretched under static uniaxial
tension at Instron 5582 electro-mechanical testing machine with loading rate of 0,3 mm/min. Surface imaging was carried out by Canon EOS 550D digital photo camera. The camera has been equipped by telephoto lens Canon EF-S 100-400mm f/4-5.6 IS.
Registration of acoustic emission (АE) signals was performed by PC-based hard-software measuring technique [ ]. For analysis of acoustic emission data, the derivative on AE events accumulation over loading time was calculated as the basic informative parameter of АE data (acoustic emission activity dN=/dt).
A certain region of the image acquainted was determined for calculation of the average value of shear strain intensity. The area of the image with the size of 3300×3900 pixels (the physical sizes ~35×41,5 mm) was taken (Figure 1). The size of the regions for strain estimation was chosen in order to ensure observation of formation and development of macro scale shear–bands.
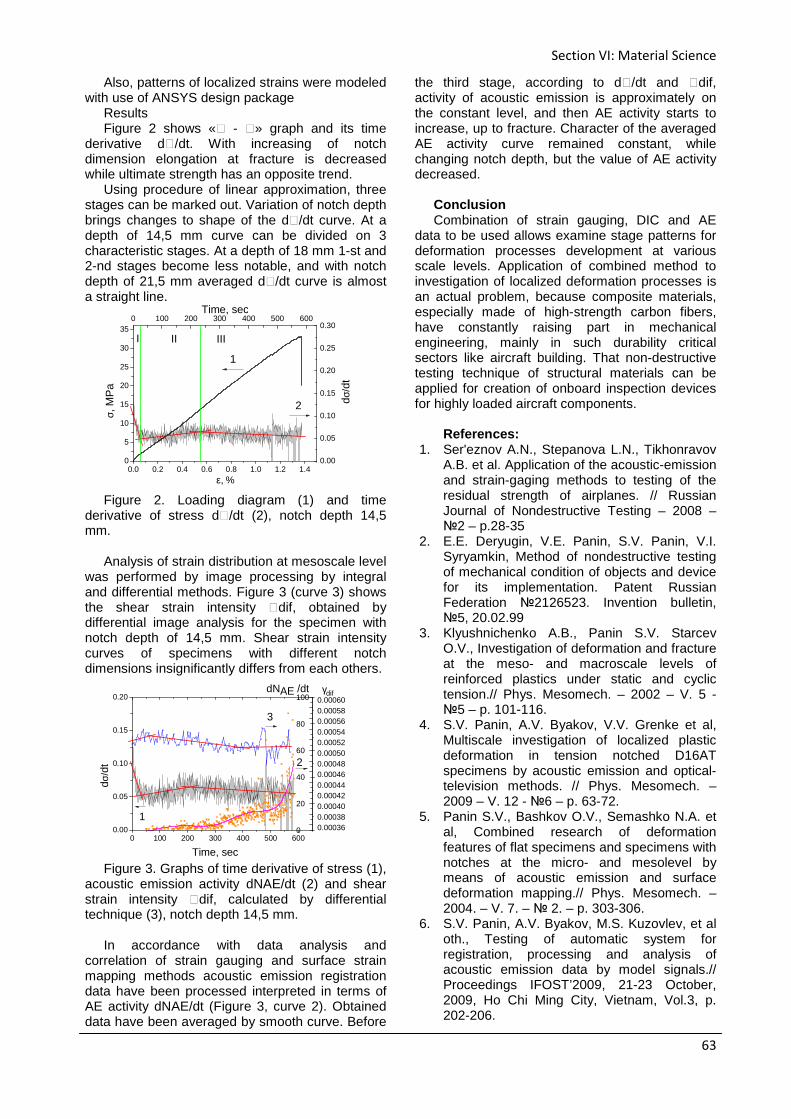
Section VI: Material Science
63
Also, patterns of localized strains were modeled with use of ANSYS design package
Results Figure 2 shows «= - =» graph and its time
derivative d=/dt. With increasing of notch dimension elongation at fracture is decreased while ultimate strength has an opposite trend.
Using procedure of linear approximation, three stages can be marked out. Variation of notch depth brings changes to shape of the d=/dt curve. At a depth of 14,5 mm curve can be divided on 3 characteristic stages. At a depth of 18 mm 1-st and 2-nd stages become less notable, and with notch depth of 21,5 mm averaged d=/dt curve is almost a straight line.
0.0 0.2 0.4 0.6 0.8 1.0 1.2 1.40
5
10
15
20
25
30
35
σ, M
Pa
ε, %
0 100 200 300 400 500 600
0.00
0.05
0.10
0.15
0.20
0.25
0.30
dσ/d
t
Time, sec
I II III
2
1
Figure 2. Loading diagram (1) and time
derivative of stress d/dt (2), notch depth 14,5 mm.
Analysis of strain distribution at mesoscale level
was performed by image processing by integral and differential methods. Figure 3 (curve 3) shows the shear strain intensity =dif, obtained by differential image analysis for the specimen with notch depth of 14,5 mm. Shear strain intensity curves of specimens with different notch dimensions insignificantly differs from each others.
0 100 200 300 400 500 6000.00
0.05
0.10
0.15
0.20
Time, sec
3
1
2
dNAE /dt γdif
dσ/d
t
0.000360.000380.000400.000420.000440.000460.000480.000500.000520.000540.000560.000580.00060
0
20
40
60
80
100
Figure 3. Graphs of time derivative of stress (1),
acoustic emission activity dNAE/dt (2) and shear strain intensity dif, calculated by differential technique (3), notch depth 14,5 mm.
In accordance with data analysis and
correlation of strain gauging and surface strain mapping methods acoustic emission registration data have been processed interpreted in terms of AE activity dNAE/dt (Figure 3, curve 2). Obtained data have been averaged by smooth curve. Before
the third stage, according to d=/dt and =dif, activity of acoustic emission is approximately on the constant level, and then AE activity starts to increase, up to fracture. Character of the averaged AE activity curve remained constant, while changing notch depth, but the value of AE activity decreased.
Conclusion Combination of strain gauging, DIC and AE
data to be used allows examine stage patterns for deformation processes development at various scale levels. Application of combined method to investigation of localized deformation processes is an actual problem, because composite materials, especially made of high-strength carbon fibers, have constantly raising part in mechanical engineering, mainly in such durability critical sectors like aircraft building. That non-destructive testing technique of structural materials can be applied for creation of onboard inspection devices for highly loaded aircraft components.
References:
1. Ser'eznov A.N., Stepanova L.N., Tikhonravov A.B. et al. Application of the acoustic-emission and strain-gaging methods to testing of the residual strength of airplanes. // Russian Journal of Nondestructive Testing – 2008 – 2 – p.28-35
2. E.E. Deryugin, V.E. Panin, S.V. Panin, V.I. Syryamkin, Method of nondestructive testing of mechanical condition of objects and device for its implementation. Patent Russian Federation 2126523. Invention bulletin, 5, 20.02.99
3. Klyushnichenko A.B., Panin S.V. Starcev O.V., Investigation of deformation and fracture at the meso- and macroscale levels of reinforced plastics under static and cyclic tension.// Phys. Mesomech. – 2002 – V. 5 - 5 – p. 101-116.
4. S.V. Panin, A.V. Byakov, V.V. Grenke et al, Multiscale investigation of localized plastic deformation in tension notched D16AT specimens by acoustic emission and optical-television methods. // Phys. Mesomech. – 2009 – V. 12 - 6 – p. 63-72.
5. Panin S.V., Bashkov O.V., Semashko N.A. et al, Combined research of deformation features of flat specimens and specimens with notches at the micro- and mesolevel by means of acoustic emission and surface deformation mapping.// Phys. Mesomech. – 2004. – V. 7. – 2. – p. 303-306.
6. S.V. Panin, A.V. Byakov, M.S. Kuzovlev, et al oth., Testing of automatic system for registration, processing and analysis of acoustic emission data by model signals.// Proceedings IFOST’2009, 21-23 October, 2009, Ho Chi Ming City, Vietnam, Vol.3, p. 202-206.
XVII Modern Technique and Technologies 2011
64
COMPUTER SIMULATION OF MODE OF DEFORMATION IN MULTI LAYER
SYSTEMS. FINITE-ELEMENT METHOD
A.A. Fernandez, V.E. Panin, G.S. Bikineev
Scientific advisor: Dr. D.D. Moiseenko, Ph.D
Tomsk polytechnic university, 634050, Russia, Tomsk, Lenin av., 30
Institute of strength physics and materials science SB RAS,
634021, Russia, Tomsk, Academichesky av., 2/4
1. Introduction «Impact» is a program designed to be a free
and simple alternative to the advanced commercial Finite Element codes available today. The guideline during the development of the program has been to keep things clear and simple in design. «Impact» has been designed to be easily extendible and modular to enable programmers a way to easy add features to the program without having to enter other parts of the code. «Impact» has been written in Java. This choice of language may seem strange at first, but with the recent development of Java engines, speed penalty is not that significant. On the other hand, the Object Oriented features and the high portability of Java is a clear advantage for the future.
«Impact» is a Finite Element Code which is based on an Explicit Time stepping algorithm. These kinds of codes are used to simulate dynamic phenomena such as car crashes and similar, usually involving large deformations.
There are quite few explicit codes around which might seem strange since the other cousins (implicit finite elements) are quite common. The implicit codes are used to simulate static loads in structures. Something that explicit codes do does not manage very well.
«Impact» is written in Java for two reasons: 1. Java is an Object Oriented language and that suits Finite Element Programming perfectly;
2. Java is clean, simple and extremely portable. At the moment, «Impact» can only handle
dynamic incompressible problems. Examples of problems with this kind of limitation are basically most real world dynamic problems. The following is a list of problems that «Impact» will be able to solve in the future:
1. Collisions of any type; 2. Forming operations; 3. Dynamic events such as chassis movement
etc. 2. Theoretical Base The explicit code is based on the simple
formula of F=M*A where F represents the force, M is the mass of a body and A is the resulting acceleration of that body.
All the code does is to calculate the acceleration of a body using small time step to translate this acceleration into a little displacement
of the body. This displacement is then used to calculate a responding force since the body is elastic and can be stretched (thus creating a reaction force). This force is then used to calculate the acceleration and then the process is repeated again from the beginning. As long as the time step is sufficiently small, the results are accurate.
3. Modelling principles The starting point for the user is «Pre
Processor ». It is used for: 1. Creating geometry through the use of points,
curves, surfaces and volumes; 2. Creation of finite element models by meshing
of curves, surfaces and volumes; 3. Setting of loads and boundary conditions; 4. Setting of solver parameter values such as
time step etc.; 5. Exporting of files «.in», which are input files
for the solver. «Pre Processor» operates on a full 3D view,
which can be zoomed and rotated using the third mouse button either alone or in combination with CTRL and/or SHIFT key. «Pre Processor» works with two types of graphical objects: Geometry and Mesh. The geometry is CAD geometry but with build in mesh attributes. A curve for example can have a mesh attached to it. It can also have a material and a thickness, which is automatically transferred to the mesh. On the top left side is a selection menu of the «Graphics mode» . Several options are available such as «Surface», which displays a shaded model. «Wireframe» is faster since no shading occurs. «Solid» is used for completely shaded view.
To generate a model the user should start with points and then create curves based on these points. Finally, surfaces should be created based on the curves. If a point is later moved, the curve based on this point will be changed. By double clicking on «Geometry» the attributes of that geometry will appear on the edit field in the lower left corner.
The user can change any attribute and press «Update» to modify the model. The mesh of a surface is automatically based on the mesh of the curves, which create the surface. If the mesh is modified on a curve, the mesh on the surface is also changed.
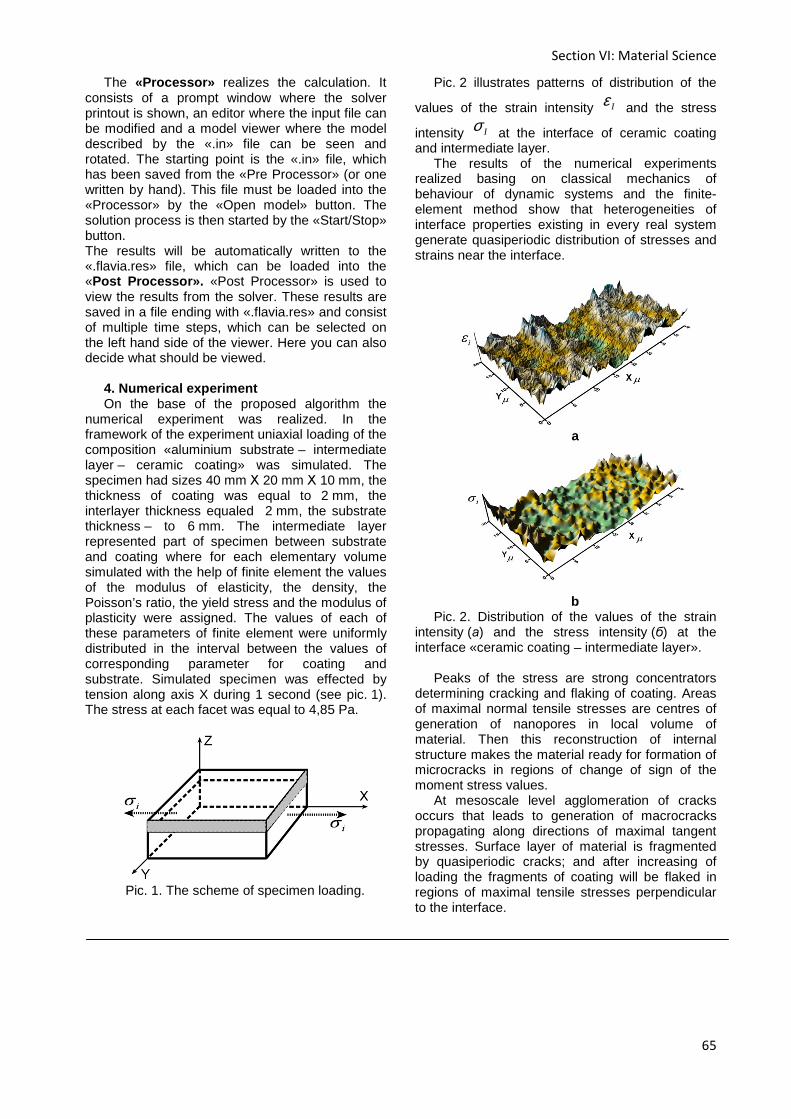
Section VI: Material Science
65
The «Processor» realizes the calculation. It consists of a prompt window where the solver printout is shown, an editor where the input file can be modified and a model viewer where the model described by the «.in» file can be seen and rotated. The starting point is the «.in» file, which has been saved from the «Pre Processor» (or one written by hand). This file must be loaded into the «Processor» by the «Open model» button. The solution process is then started by the «Start/Stop» button. The results will be automatically written to the «.flavia.res» file, which can be loaded into the «Post Processor». «Post Processor» is used to view the results from the solver. These results are saved in a file ending with «.flavia.res» and consist of multiple time steps, which can be selected on the left hand side of the viewer. Here you can also decide what should be viewed.
4. Numerical experiment On the base of the proposed algorithm the
numerical experiment was realized. In the framework of the experiment uniaxial loading of the composition «aluminium substrate – intermediate layer – ceramic coating» was simulated. The specimen had sizes 40 mm Х 20 mm Х 10 mm, the thickness of coating was equal to 2 mm, the interlayer thickness equaled 2 mm, the substrate thickness – to 6 mm. The intermediate layer represented part of specimen between substrate and coating where for each elementary volume simulated with the help of finite element the values of the modulus of elasticity, the density, the Poisson’s ratio, the yield stress and the modulus of plasticity were assigned. The values of each of these parameters of finite element were uniformly distributed in the interval between the values of corresponding parameter for coating and substrate. Simulated specimen was effected by tension along axis X during 1 second (see pic. 1). The stress at each facet was equal to 4,85 Pa.
Pic. 1. The scheme of specimen loading.
Pic. 2 illustrates patterns of distribution of the
values of the strain intensity Iε and the stress
intensity Iσ at the interface of ceramic coating and intermediate layer.
The results of the numerical experiments realized basing on classical mechanics of behaviour of dynamic systems and the finite-element method show that heterogeneities of interface properties existing in every real system generate quasiperiodic distribution of stresses and strains near the interface.
a
b
Pic. 2. Distribution of the values of the strain intensity (а) and the stress intensity (б) at the interface «ceramic coating – intermediate layer».
Peaks of the stress are strong concentrators
determining cracking and flaking of coating. Areas of maximal normal tensile stresses are centres of generation of nanopores in local volume of material. Then this reconstruction of internal structure makes the material ready for formation of microcracks in regions of change of sign of the moment stress values.
At mesoscale level agglomeration of cracks occurs that leads to generation of macrocracks propagating along directions of maximal tangent stresses. Surface layer of material is fragmented by quasiperiodic cracks; and after increasing of loading the fragments of coating will be flaked in regions of maximal tensile stresses perpendicular to the interface.
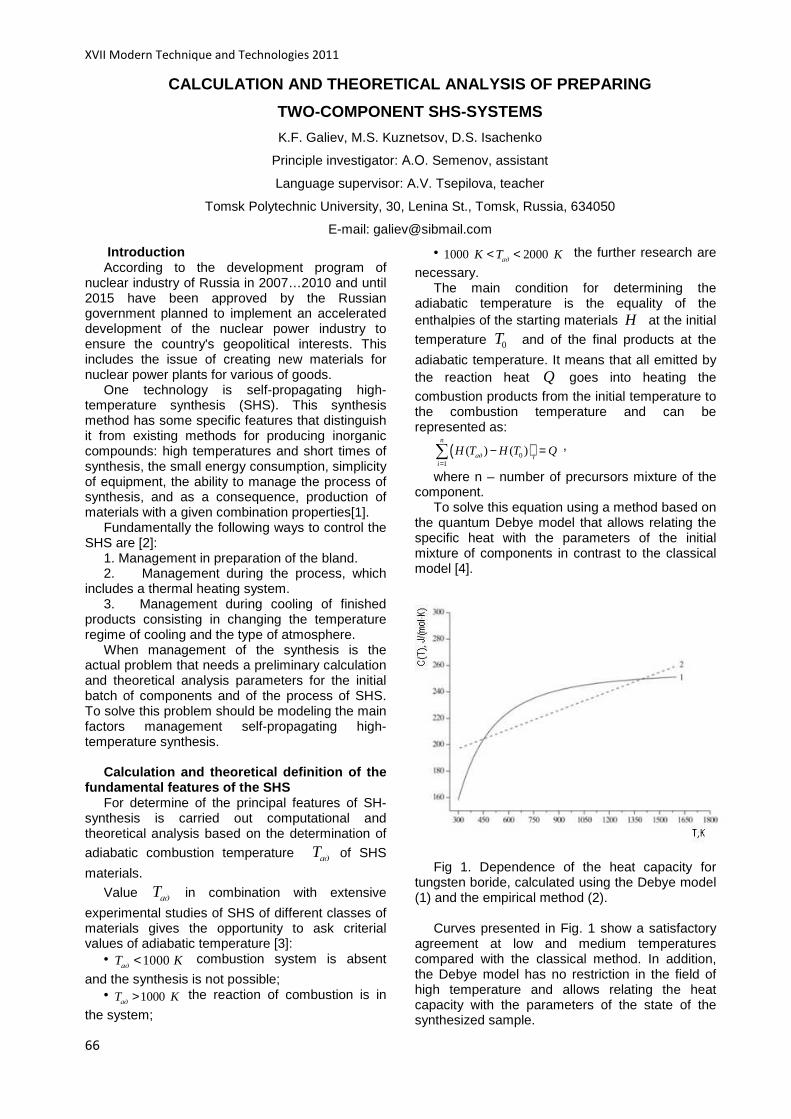
XVII Modern Technique and Technologies 2011
66
CALCULATION AND THEORETICAL ANALYSIS OF PREPARING
TWO-COMPONENT SHS-SYSTEMS
K.F. Galiev, M.S. Kuznetsov, D.S. Isachenko
Principle investigator: А.О. Semenov, assistant
Language supervisor: A.V. Tsepilova, teacher
Tomsk Polytechnic University, 30, Lenina St., Tomsk, Russia, 634050
E-mail: [email protected]
Introduction According to the development program of
nuclear industry of Russia in 2007…2010 and until 2015 have been approved by the Russian government planned to implement an accelerated development of the nuclear power industry to ensure the country's geopolitical interests. This includes the issue of creating new materials for nuclear power plants for various of goods.
One technology is self-propagating high-temperature synthesis (SHS). This synthesis method has some specific features that distinguish it from existing methods for producing inorganic compounds: high temperatures and short times of synthesis, the small energy consumption, simplicity of equipment, the ability to manage the process of synthesis, and as a consequence, production of materials with a given combination properties[1].
Fundamentally the following ways to control the SHS are [2]:
1. Management in preparation of the bland. 2. Management during the process, which
includes a thermal heating system. 3. Management during cooling of finished
products consisting in changing the temperature regime of cooling and the type of atmosphere.
When management of the synthesis is the actual problem that needs a preliminary calculation and theoretical analysis parameters for the initial batch of components and of the process of SHS. To solve this problem should be modeling the main factors management self-propagating high-temperature synthesis.
Calculation and theoretical definition of the
fundamental features of the SHS For determine of the principal features of SH-
synthesis is carried out computational and theoretical analysis based on the determination of
adiabatic combustion temperature ад
T of SHS
materials.
Value ад
T in combination with extensive
experimental studies of SHS of different classes of materials gives the opportunity to ask criterial values of adiabatic temperature [3]:
• 1000 ад
T K<
combustion system is absent
and the synthesis is not possible; • 1000
адT K>
the reaction of combustion is in
the system;
• 1000 2000ад
K T K< <
the further research are
necessary. The main condition for determining the
adiabatic temperature is the equality of the enthalpies of the starting materials H at the initial
temperature 0T and of the final products at the
adiabatic temperature. It means that all emitted by the reaction heat Q goes into heating the combustion products from the initial temperature to the combustion temperature and can be represented as:
( )01
( ) ( )n
ад ii
H T H T Q=
− =∑ ,
where n – number of precursors mixture of the component.
To solve this equation using a method based on the quantum Debye model that allows relating the specific heat with the parameters of the initial mixture of components in contrast to the classical model [4].
Fig 1. Dependence of the heat capacity for
tungsten boride, calculated using the Debye model (1) and the empirical method (2).
Curves presented in Fig. 1 show a satisfactory
agreement at low and medium temperatures compared with the classical method. In addition, the Debye model has no restriction in the field of high temperature and allows relating the heat capacity with the parameters of the state of the synthesized sample.

Section VI: Material Science
67
Modeling the dynamics of temperature fields
in the directed synthesis For modeling the dynamics of temperature
fields is required to solve the heat equation:
( )2 212 2
VqT T T Ta
r r C T tr z
∂ ∂ ∂ ∂⋅ + ⋅ + + =
∂ ρ ∂∂ ∂
,
where a – thermal diffusivity coefficient; ρ –
density of the sample; Vq – volumetric heat
source. Equation is a boundary problem with the
boundary and initial conditions:
1. ( ) ( )4 4r R s r R s
r R
TT T T T
r = ==
∂λ = ±α − ± εσ −∂
,
0
0r
T
t =
∂λ =∂
;
2. ( ) ( )4 4z H s z H s
z H
TT T T T R
z = ==
∂λ = ±α − ± εσ −∂
,
Г
0z
TT
t =
∂λ =∂
,
where λ – thermal conductivity coefficient; α – heat transfer coefficient; ε – coefficient of "blackness" of the surface; σ – Stefan-
Boltzmann constant; sT – ambient temperature;
ГT
– preheating temperature of the sample; R –
sample radius; H – height of the original sample. On the basis of the calculated data laboratory
experiments on the synthesis of tungsten boride were conducted.
Implementation of modeling the main
factors of management the SHS as an example of synthesis of tungsten boride
Material used as a control and protection system is a tungsten boride. The synthesis of materials based on tungsten boride was carried out by the following reaction:
W + B → WB Fig. 2 shows the thermogram of the combustion
system tungsten-boron with equal initial conditions. The measurements were performed for the central point of the cylindrical sample. There is a satisfactory agreement between the experimental and calculated data. The difference amounts to
different parts is about 5 to 12%, which agrees well with an error of calculation due to an error of the mathematical model used in the calculations of two-component systems.
Fig. 2. Experimental and calculated
thermograms SHS system WB Satisfactory agreement between calculated and
experimental data at this stage suggests the correctness of the numerical methods and the possibility of calculating the other two-component SHS systems.
REFERENCES 1. A.G. Merzhanov, B.I. Khaikin. Combustion of
a substance with a solid reaction layer. // Reports of the Academy of Sciences CAS. – 1967. Т. 173. – 6. – P. 1382–1385.
2. A.G. Merzhanov. Self-Propagating High-Temperature Synthesis / Physical Chemistry: Modern Problems. Yearbook. Ed. Y.M. Kolotyrkin - Moscow: Khimiya, 1983. - P. 6 - 45.
3. V.I Boiko, D.G. Demyanyuk, O.Y. Dolmatov, I.V. Shamanin, D.S. Isachenko. Self-Propagating High-Temperature Synthesis of absorbing material for nuclear power plant // Proceedings of the Tomsk Polytechnic University. - 2005. - T. 308. - 4. - P. 78-81.
4. E.A. Levashov, A.S. Rogachev, V.I. Yuhvid, I.P. Borovinskaya. Physical chemical and technological bases of self-propagating high-temperature synthesis.- Moscow: Publishing Bean, 1999. - 176.
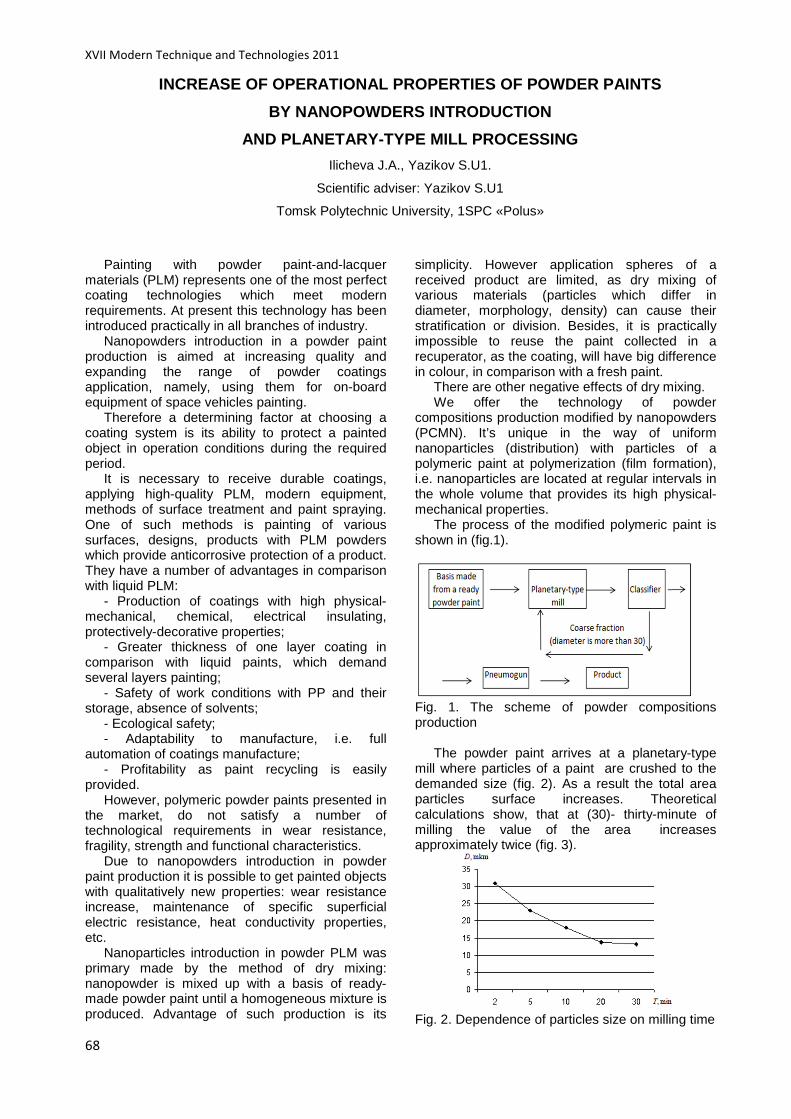
XVII Modern Technique and Technologies 2011
68
INCREASE OF OPERATIONAL PROPERTIES OF POWDER PAINTS
BY NANOPOWDERS INTRODUCTION
AND PLANETARY-TYPE MILL PROCESSING
Ilicheva J.A., Yazikov S.U1.
Scientific adviser: Yazikov S.U1
Tomsk Polytechnic University, 1SPC «Polus»
Painting with powder paint-and-lacquer
materials (PLM) represents one of the most perfect coating technologies which meet modern requirements. At present this technology has been introduced practically in all branches of industry.
Nanopowders introduction in a powder paint production is aimed at increasing quality and expanding the range of powder coatings application, namely, using them for on-board equipment of space vehicles painting.
Therefore a determining factor at choosing a coating system is its ability to protect a painted object in operation conditions during the required period.
It is necessary to receive durable coatings, applying high-quality PLM, modern equipment, methods of surface treatment and paint spraying. One of such methods is painting of various surfaces, designs, products with PLM powders which provide anticorrosive protection of a product. They have a number of advantages in comparison with liquid PLM:
- Production of coatings with high physical-mechanical, chemical, electrical insulating, protectively-decorative properties;
- Greater thickness of one layer coating in comparison with liquid paints, which demand several layers painting;
- Safety of work conditions with PP and their storage, absence of solvents;
- Ecological safety; - Adaptability to manufacture, i.e. full
automation of coatings manufacture; - Profitability as paint recycling is easily
provided. However, polymeric powder paints presented in
the market, do not satisfy a number of technological requirements in wear resistance, fragility, strength and functional characteristics.
Due to nanopowders introduction in powder paint production it is possible to get painted objects with qualitatively new properties: wear resistance increase, maintenance of specific superficial electric resistance, heat conductivity properties, etc.
Nanoparticles introduction in powder PLM was primary made by the method of dry mixing: nanopowder is mixed up with a basis of ready-made powder paint until a homogeneous mixture is produced. Advantage of such production is its
simplicity. However application spheres of a received product are limited, as dry mixing of various materials (particles which differ in diameter, morphology, density) can cause their stratification or division. Besides, it is practically impossible to reuse the paint collected in a recuperator, as the coating, will have big difference in colour, in comparison with a fresh paint.
There are other negative effects of dry mixing. We offer the technology of powder
compositions production modified by nanopowders (PCMN). It’s unique in the way of uniform nanoparticles (distribution) with particles of a polymeric paint at polymerization (film formation), i.e. nanoparticles are located at regular intervals in the whole volume that provides its high physical-mechanical properties.
The process of the modified polymeric paint is shown in (fig.1).
Fig. 1. The scheme of powder compositions production
The powder paint arrives at a planetary-type
mill where particles of a paint are crushed to the demanded size (fig. 2). As a result the total area particles surface increases. Theoretical calculations show, that at (30)- thirty-minute of milling the value of the area increases approximately twice (fig. 3).
Fig. 2. Dependence of particles size on milling time
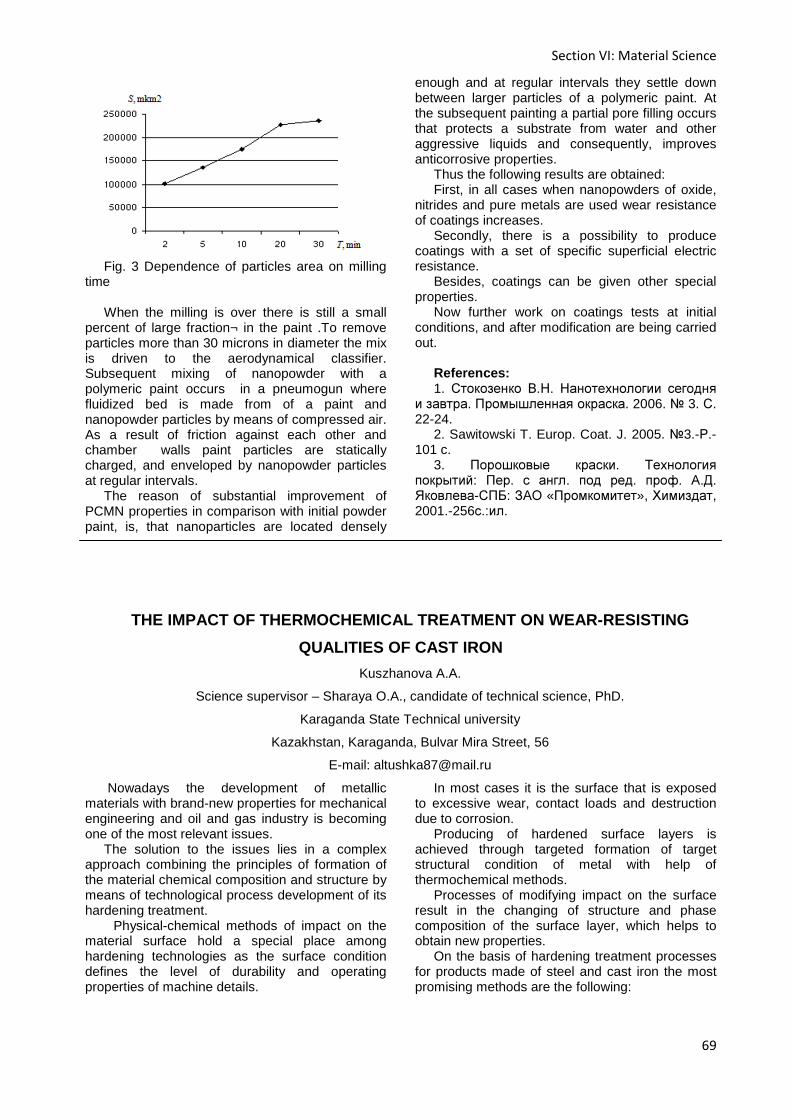
Section VI: Material Science
69
Fig. 3 Dependence of particles area on milling
time When the milling is over there is still a small
percent of large fraction¬ in the paint .To remove particles more than 30 microns in diameter the mix is driven to the aerodynamical classifier. Subsequent mixing of nanopowder with a polymeric paint occurs in a pneumogun where fluidized bed is made from of a paint and nanopowder particles by means of compressed air. As a result of friction against each other and chamber walls paint particles are statically charged, and enveloped by nanopowder particles at regular intervals.
The reason of substantial improvement of PCMN properties in comparison with initial powder paint, is, that nanoparticles are located densely
enough and at regular intervals they settle down between larger particles of a polymeric paint. At the subsequent painting a partial pore filling occurs that protects a substrate from water and other aggressive liquids and consequently, improves anticorrosive properties.
Thus the following results are obtained: First, in all cases when nanopowders of oxide,
nitrides and pure metals are used wear resistance of coatings increases.
Secondly, there is a possibility to produce coatings with a set of specific superficial electric resistance.
Besides, coatings can be given other special properties.
Now further work on coatings tests at initial conditions, and after modification are being carried out.
References: 1. Стокозенко В.Н. Нанотехнологии сегодня
и завтра. Промышленная окраска. 2006. 3. С. 22-24.
2. Sawitowski T. Europ. Coat. J. 2005. 3.-Р.-101 c.
3. Порошковые краски. Технология покрытий: Пер. с англ. под ред. проф. А.Д. Яковлева-СПБ: ЗАО «Промкомитет», Химиздат, 2001.-256с.:ил.
THE IMPACT OF THERMOCHEMICAL TREATMENT ON WEAR-RESI STING
QUALITIES OF CAST IRON
Kuszhanova A.A.
Science supervisor – Sharaya O.A., candidate of technical science, PhD.
Karaganda State Technical university
Kazakhstan, Karaganda, Bulvar Mira Street, 56
E-mail: [email protected]
Nowadays the development of metallic materials with brand-new properties for mechanical engineering and oil and gas industry is becoming one of the most relevant issues.
The solution to the issues lies in a complex approach combining the principles of formation of the material chemical composition and structure by means of technological process development of its hardening treatment.
Physical-chemical methods of impact on the material surface hold a special place among hardening technologies as the surface condition defines the level of durability and operating properties of machine details.
In most cases it is the surface that is exposed to excessive wear, contact loads and destruction due to corrosion.
Producing of hardened surface layers is achieved through targeted formation of target structural condition of metal with help of thermochemical methods.
Processes of modifying impact on the surface result in the changing of structure and phase composition of the surface layer, which helps to obtain new properties.
On the basis of hardening treatment processes for products made of steel and cast iron the most promising methods are the following:
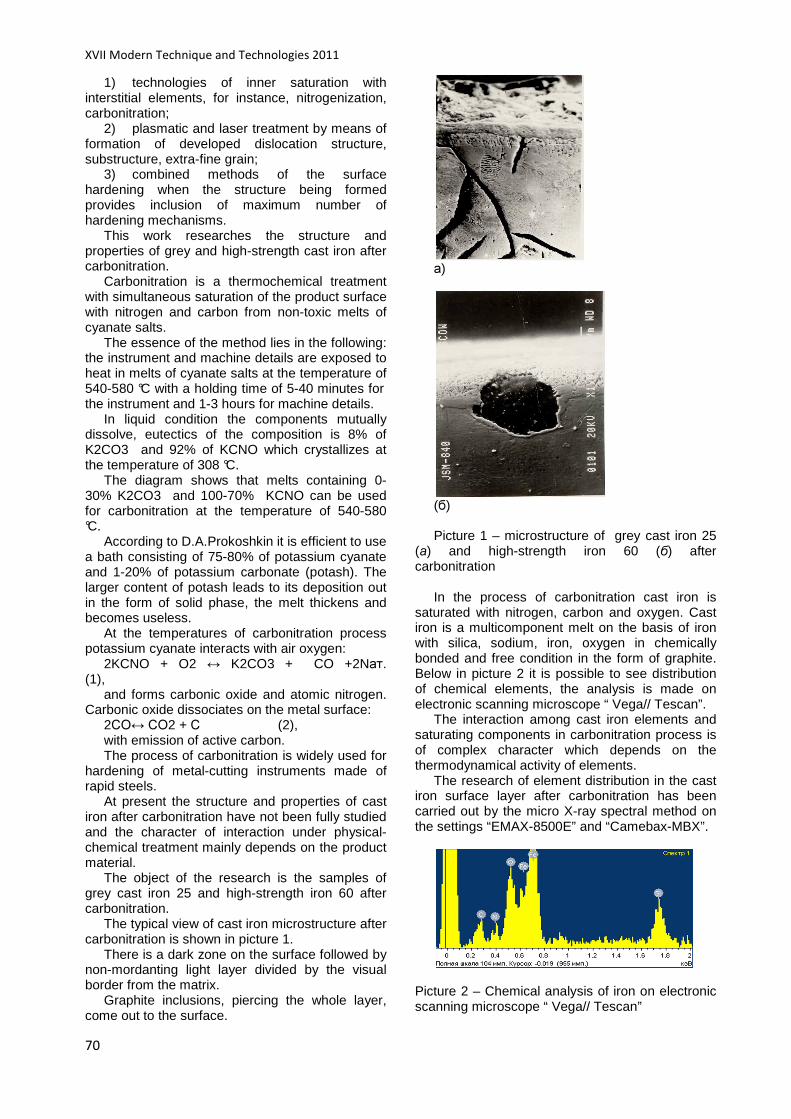
XVII Modern Technique and Technologies 2011
70
1) technologies of inner saturation with interstitial elements, for instance, nitrogenization, carbonitration;
2) plasmatic and laser treatment by means of formation of developed dislocation structure, substructure, extra-fine grain;
3) combined methods of the surface hardening when the structure being formed provides inclusion of maximum number of hardening mechanisms.
This work researches the structure and properties of grey and high-strength cast iron after carbonitration.
Carbonitration is a thermochemical treatment with simultaneous saturation of the product surface with nitrogen and carbon from non-toxic melts of cyanate salts.
The essence of the method lies in the following: the instrument and machine details are exposed to heat in melts of cyanate salts at the temperature of 540-580 °C with a holding time of 5-40 minutes for the instrument and 1-3 hours for machine details.
In liquid condition the components mutually dissolve, eutectics of the composition is 8% of K2CO3 and 92% of KCNO which crystallizes at the temperature of 308 °C.
The diagram shows that melts containing 0-30% K2CO3 and 100-70% KCNO can be used for carbonitration at the temperature of 540-580 °C.
According to D.A.Prokoshkin it is efficient to use a bath consisting of 75-80% of potassium cyanate and 1-20% of potassium carbonate (potash). The larger content of potash leads to its deposition out in the form of solid phase, the melt thickens and becomes useless.
At the temperatures of carbonitration process potassium cyanate interacts with air oxygen:
2KCNO + O2 ↔ K2CO3 + CO +2Nат. (1),
and forms carbonic oxide and atomic nitrogen. Carbonic oxide dissociates on the metal surface:
2СО↔ СО2 + С (2), with emission of active carbon. The process of carbonitration is widely used for
hardening of metal-cutting instruments made of rapid steels.
At present the structure and properties of cast iron after carbonitration have not been fully studied and the character of interaction under physical-chemical treatment mainly depends on the product material.
The object of the research is the samples of grey cast iron 25 and high-strength iron 60 after carbonitration.
The typical view of cast iron microstructure after carbonitration is shown in picture 1.
There is a dark zone on the surface followed by non-mordanting light layer divided by the visual border from the matrix.
Graphite inclusions, piercing the whole layer, come out to the surface.
а)
(б) Picture 1 – microstructure of grey cast iron 25
(а) and high-strength iron 60 (б) after carbonitration
In the process of carbonitration cast iron is
saturated with nitrogen, carbon and oxygen. Cast iron is a multicomponent melt on the basis of iron with silica, sodium, iron, oxygen in chemically bonded and free condition in the form of graphite. Below in picture 2 it is possible to see distribution of chemical elements, the analysis is made on electronic scanning microscope “ Vega// Tescan”.
The interaction among cast iron elements and saturating components in carbonitration process is of complex character which depends on the thermodynamical activity of elements.
The research of element distribution in the cast iron surface layer after carbonitration has been carried out by the micro X-ray spectral method on the settings “EMAX-8500E” and “Camebax-MBX”.
Picture 2 – Chemical analysis of iron on electronic scanning microscope “ Vega// Tescan”
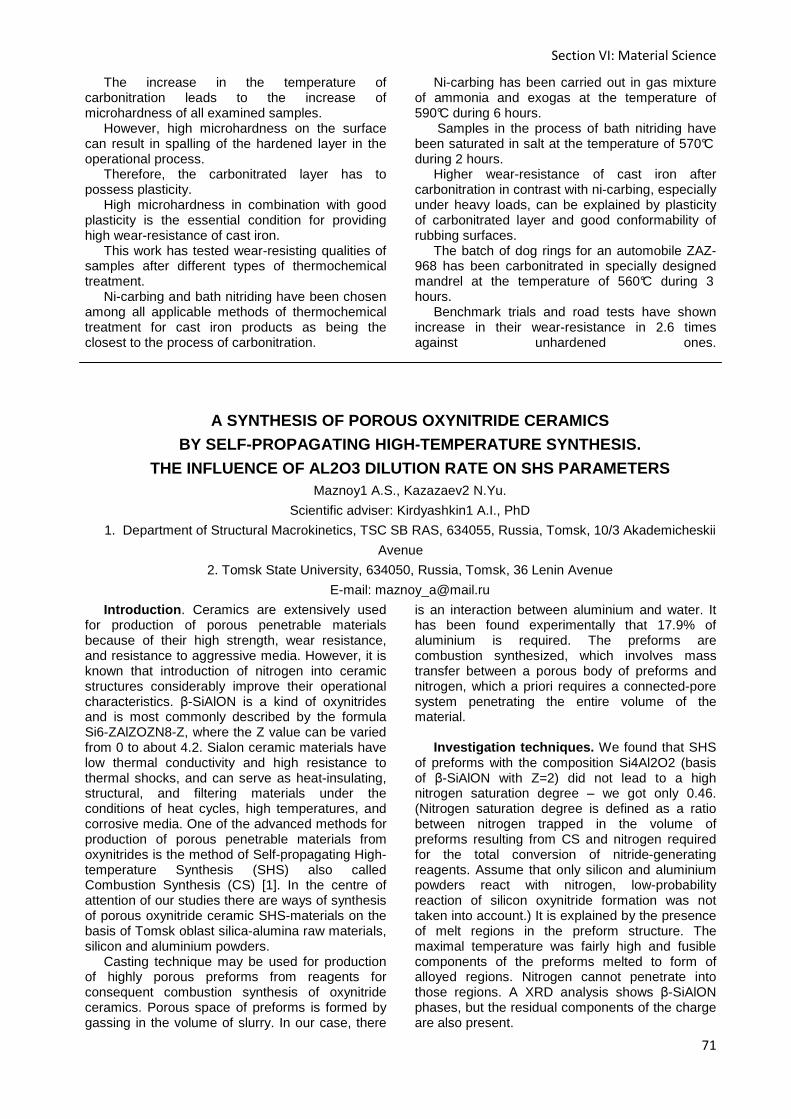
Section VI: Material Science
71
The increase in the temperature of carbonitration leads to the increase of microhardness of all examined samples.
However, high microhardness on the surface can result in spalling of the hardened layer in the operational process.
Therefore, the carbonitrated layer has to possess plasticity.
High microhardness in combination with good plasticity is the essential condition for providing high wear-resistance of cast iron.
This work has tested wear-resisting qualities of samples after different types of thermochemical treatment.
Ni-carbing and bath nitriding have been chosen among all applicable methods of thermochemical treatment for cast iron products as being the closest to the process of carbonitration.
Ni-carbing has been carried out in gas mixture of ammonia and exogas at the temperature of 590°C during 6 hours.
Samples in the process of bath nitriding have been saturated in salt at the temperature of 570°C during 2 hours.
Higher wear-resistance of cast iron after carbonitration in contrast with ni-carbing, especially under heavy loads, can be explained by plasticity of carbonitrated layer and good conformability of rubbing surfaces.
The batch of dog rings for an automobile ZAZ-968 has been carbonitrated in specially designed mandrel at the temperature of 560°C during 3 hours.
Benchmark trials and road tests have shown increase in their wear-resistance in 2.6 times against unhardened ones.
A SYNTHESIS OF POROUS OXYNITRIDE CERAMICS
BY SELF-PROPAGATING HIGH-TEMPERATURE SYNTHESIS.
THE INFLUENCE OF AL2O3 DILUTION RATE ON SHS PARAMET ERS Maznoy1 A.S., Kazazaev2 N.Yu.
Scientific adviser: Kirdyashkin1 A.I., PhD
1. Department of Structural Macrokinetics, TSC SB RAS, 634055, Russia, Tomsk, 10/3 Akademicheskii
Avenue
2. Tomsk State University, 634050, Russia, Tomsk, 36 Lenin Avenue
E-mail: [email protected]
Introduction . Ceramics are extensively used for production of porous penetrable materials because of their high strength, wear resistance, and resistance to aggressive media. However, it is known that introduction of nitrogen into ceramic structures considerably improve their operational characteristics. β-SiAlON is a kind of oxynitrides and is most commonly described by the formula Si6-ZAlZOZN8-Z, where the Z value can be varied from 0 to about 4.2. Sialon ceramic materials have low thermal conductivity and high resistance to thermal shocks, and can serve as heat-insulating, structural, and filtering materials under the conditions of heat cycles, high temperatures, and corrosive media. One of the advanced methods for production of porous penetrable materials from oxynitrides is the method of Self-propagating High-temperature Synthesis (SHS) also called Combustion Synthesis (CS) [1]. In the centre of attention of our studies there are ways of synthesis of porous oxynitride ceramic SHS-materials on the basis of Tomsk oblast silica-alumina raw materials, silicon and aluminium powders.
Casting technique may be used for production of highly porous preforms from reagents for consequent combustion synthesis of oxynitride ceramics. Porous space of preforms is formed by gassing in the volume of slurry. In our case, there
is an interaction between aluminium and water. It has been found experimentally that 17.9% of aluminium is required. The preforms are combustion synthesized, which involves mass transfer between a porous body of preforms and nitrogen, which a priori requires a connected-pore system penetrating the entire volume of the material.
Investigation techniques. We found that SHS
of preforms with the composition Si4Al2O2 (basis of β-SiAlON with Z=2) did not lead to a high nitrogen saturation degree – we got only 0.46. (Nitrogen saturation degree is defined as a ratio between nitrogen trapped in the volume of preforms resulting from CS and nitrogen required for the total conversion of nitride-generating reagents. Assume that only silicon and aluminium powders react with nitrogen, low-probability reaction of silicon oxynitride formation was not taken into account.) It is explained by the presence of melt regions in the preform structure. The maximal temperature was fairly high and fusible components of the preforms melted to form of alloyed regions. Nitrogen cannot penetrate into those regions. A XRD analysis shows β-SiAlON phases, but the residual components of the charge are also present.
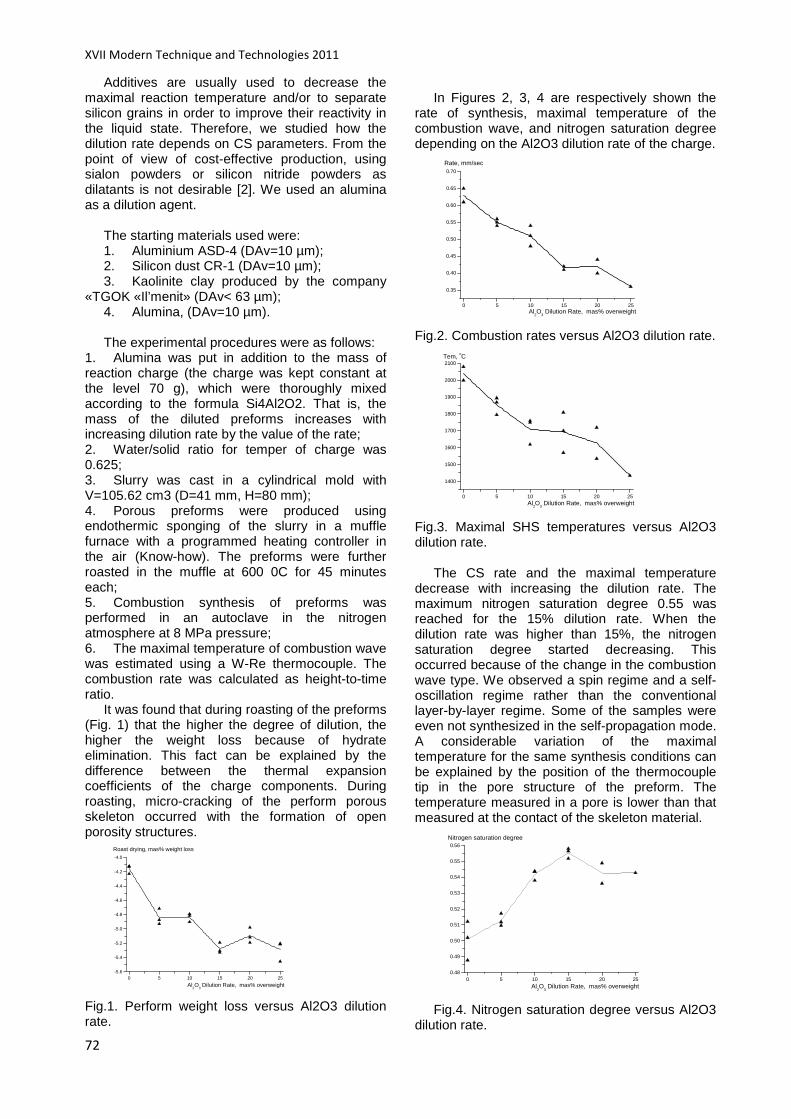
XVII Modern Technique and Technologies 2011
72
Additives are usually used to decrease the maximal reaction temperature and/or to separate silicon grains in order to improve their reactivity in the liquid state. Therefore, we studied how the dilution rate depends on CS parameters. From the point of view of cost-effective production, using sialon powders or silicon nitride powders as dilatants is not desirable [2]. We used an alumina as a dilution agent.
The starting materials used were: 1. Aluminium ASD-4 (DAv=10 µm); 2. Silicon dust CR-1 (DAv=10 µm); 3. Kaolinite clay produced by the company
«TGOK «Il’menit» (DAv< 63 µm); 4. Alumina, (DAv=10 µm). The experimental procedures were as follows:
1. Alumina was put in addition to the mass of reaction charge (the charge was kept constant at the level 70 g), which were thoroughly mixed according to the formula Si4Al2O2. That is, the mass of the diluted preforms increases with increasing dilution rate by the value of the rate; 2. Water/solid ratio for temper of charge was 0.625; 3. Slurry was cast in a cylindrical mold with V=105.62 cm3 (D=41 mm, H=80 mm); 4. Porous preforms were produced using endothermic sponging of the slurry in a muffle furnace with a programmed heating controller in the air (Know-how). The preforms were further roasted in the muffle at 600 0C for 45 minutes each; 5. Combustion synthesis of preforms was performed in an autoclave in the nitrogen atmosphere at 8 MPa pressure; 6. The maximal temperature of combustion wave was estimated using a W-Re thermocouple. The combustion rate was calculated as height-to-time ratio.
It was found that during roasting of the preforms (Fig. 1) that the higher the degree of dilution, the higher the weight loss because of hydrate elimination. This fact can be explained by the difference between the thermal expansion coefficients of the charge components. During roasting, micro-cracking of the perform porous skeleton occurred with the formation of open porosity structures.
0 5 10 15 20 25-5.6
-5.4
-5.2
-5.0
-4.8
-4.6
-4.4
-4.2
-4.0
Al2O
3 Dilution Rate, mas% overweight
Roast drying, mas% weight loss
Fig.1. Perform weight loss versus Al2O3 dilution rate.
In Figures 2, 3, 4 are respectively shown the
rate of synthesis, maximal temperature of the combustion wave, and nitrogen saturation degree depending on the Al2O3 dilution rate of the charge.
0 5 10 15 20 25
0.35
0.40
0.45
0.50
0.55
0.60
0.65
0.70
Al2O
3 Dilution Rate, mas% overweight
Rate, mm/sec
Fig.2. Combustion rates versus Al2O3 dilution rate.
0 5 10 15 20 25
1400
1500
1600
1700
1800
1900
2000
2100
Al2O
3 Dilution Rate, mas% overweight
Tem, oC
Fig.3. Maximal SHS temperatures versus Al2O3 dilution rate.
The CS rate and the maximal temperature
decrease with increasing the dilution rate. The maximum nitrogen saturation degree 0.55 was reached for the 15% dilution rate. When the dilution rate was higher than 15%, the nitrogen saturation degree started decreasing. This occurred because of the change in the combustion wave type. We observed a spin regime and a self-oscillation regime rather than the conventional layer-by-layer regime. Some of the samples were even not synthesized in the self-propagation mode. A considerable variation of the maximal temperature for the same synthesis conditions can be explained by the position of the thermocouple tip in the pore structure of the preform. The temperature measured in a pore is lower than that measured at the contact of the skeleton material.
0 5 10 15 20 250.48
0.49
0.50
0.51
0.52
0.53
0.54
0.55
0.56
Al2O
3 Dilution Rate, mas% overweight
Nitrogen saturation degree
Fig.4. Nitrogen saturation degree versus Al2O3
dilution rate.
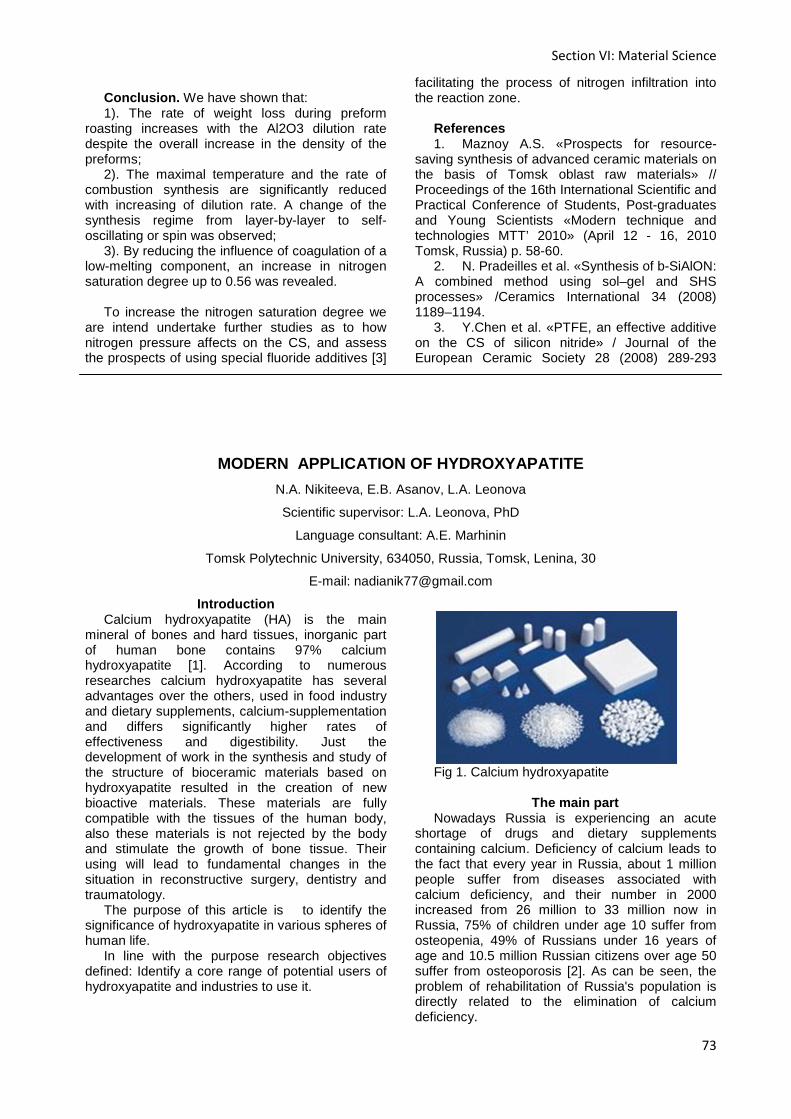
Section VI: Material Science
73
Conclusion. We have shown that: 1). The rate of weight loss during preform
roasting increases with the Al2O3 dilution rate despite the overall increase in the density of the preforms;
2). The maximal temperature and the rate of combustion synthesis are significantly reduced with increasing of dilution rate. A change of the synthesis regime from layer-by-layer to self-oscillating or spin was observed;
3). By reducing the influence of coagulation of a low-melting component, an increase in nitrogen saturation degree up to 0.56 was revealed.
To increase the nitrogen saturation degree we
are intend undertake further studies as to how nitrogen pressure affects on the CS, and assess the prospects of using special fluoride additives [3]
facilitating the process of nitrogen infiltration into the reaction zone.
References 1. Maznoy A.S. «Prospects for resource-
saving synthesis of advanced ceramic materials on the basis of Tomsk oblast raw materials» // Proceedings of the 16th International Scientific and Practical Conference of Students, Post-graduates and Young Scientists «Modern technique and technologies MTT’ 2010» (April 12 - 16, 2010 Tomsk, Russia) p. 58-60.
2. N. Pradeilles et al. «Synthesis of b-SiAlON: A combined method using sol–gel and SHS processes» /Ceramics International 34 (2008) 1189–1194.
3. Y.Chen et al. «PTFE, an effective additive on the CS of silicon nitride» / Journal of the European Ceramic Society 28 (2008) 289-293
MODERN APPLICATION OF HYDROXYAPATITE
N.A. Nikiteeva, E.B. Asanov, L.A. Leonova
Scientific supervisor: L.A. Leonova, PhD
Language consultant: A.E. Marhinin
Tomsk Polytechnic University, 634050, Russia, Tomsk, Lenina, 30
E-mail: [email protected]
Introduction Calcium hydroxyapatite (HA) is the main
mineral of bones and hard tissues, inorganic part of human bone contains 97% calcium hydroxyapatite [1]. According to numerous researches calcium hydroxyapatite has several advantages over the others, used in food industry and dietary supplements, calcium-supplementation and differs significantly higher rates of effectiveness and digestibility. Just the development of work in the synthesis and study of the structure of bioceramic materials based on hydroxyapatite resulted in the creation of new bioactive materials. These materials are fully compatible with the tissues of the human body, also these materials is not rejected by the body and stimulate the growth of bone tissue. Their using will lead to fundamental changes in the situation in reconstructive surgery, dentistry and traumatology.
The purpose of this article is to identify the significance of hydroxyapatite in various spheres of human life.
In line with the purpose research objectives defined: Identify a core range of potential users of hydroxyapatite and industries to use it.
Fig 1. Calcium hydroxyapatite
The main part Nowadays Russia is experiencing an acute
shortage of drugs and dietary supplements containing calcium. Deficiency of calcium leads to the fact that every year in Russia, about 1 million people suffer from diseases associated with calcium deficiency, and their number in 2000 increased from 26 million to 33 million now in Russia, 75% of children under age 10 suffer from osteopenia, 49% of Russians under 16 years of age and 10.5 million Russian citizens over age 50 suffer from osteoporosis [2]. As can be seen, the problem of rehabilitation of Russia's population is directly related to the elimination of calcium deficiency.
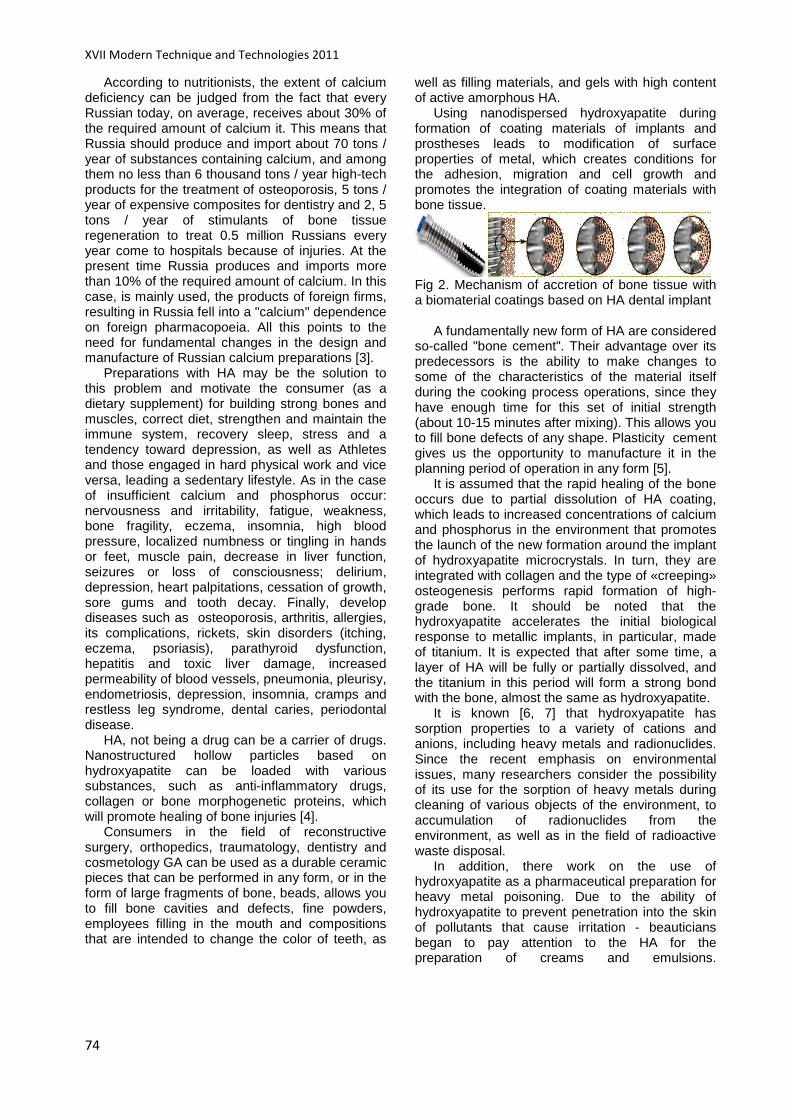
XVII Modern Technique and Technologies 2011
74
According to nutritionists, the extent of calcium deficiency can be judged from the fact that every Russian today, on average, receives about 30% of the required amount of calcium it. This means that Russia should produce and import about 70 tons / year of substances containing calcium, and among them no less than 6 thousand tons / year high-tech products for the treatment of osteoporosis, 5 tons / year of expensive composites for dentistry and 2, 5 tons / year of stimulants of bone tissue regeneration to treat 0.5 million Russians every year come to hospitals because of injuries. At the present time Russia produces and imports more than 10% of the required amount of calcium. In this case, is mainly used, the products of foreign firms, resulting in Russia fell into a "calcium" dependence on foreign pharmacopoeia. All this points to the need for fundamental changes in the design and manufacture of Russian calcium preparations [3].
Preparations with HA may be the solution to this problem and motivate the consumer (as a dietary supplement) for building strong bones and muscles, correct diet, strengthen and maintain the immune system, recovery sleep, stress and a tendency toward depression, as well as Athletes and those engaged in hard physical work and vice versa, leading a sedentary lifestyle. As in the case of insufficient calcium and phosphorus occur: nervousness and irritability, fatigue, weakness, bone fragility, eczema, insomnia, high blood pressure, localized numbness or tingling in hands or feet, muscle pain, decrease in liver function, seizures or loss of consciousness; delirium, depression, heart palpitations, cessation of growth, sore gums and tooth decay. Finally, develop diseases such as osteoporosis, arthritis, allergies, its complications, rickets, skin disorders (itching, eczema, psoriasis), parathyroid dysfunction, hepatitis and toxic liver damage, increased permeability of blood vessels, pneumonia, pleurisy, endometriosis, depression, insomnia, cramps and restless leg syndrome, dental caries, periodontal disease.
HA, not being a drug can be a carrier of drugs. Nanostructured hollow particles based on hydroxyapatite can be loaded with various substances, such as anti-inflammatory drugs, collagen or bone morphogenetic proteins, which will promote healing of bone injuries [4].
Consumers in the field of reconstructive surgery, orthopedics, traumatology, dentistry and cosmetology GA can be used as a durable ceramic pieces that can be performed in any form, or in the form of large fragments of bone, beads, allows you to fill bone cavities and defects, fine powders, employees filling in the mouth and compositions that are intended to change the color of teeth, as
well as filling materials, and gels with high content of active amorphous HA.
Using nanodispersed hydroxyapatite during formation of coating materials of implants and prostheses leads to modification of surface properties of metal, which creates conditions for the adhesion, migration and cell growth and promotes the integration of coating materials with bone tissue.
Fig 2. Mechanism of accretion of bone tissue with a biomaterial coatings based on HA dental implant
A fundamentally new form of HA are considered
so-called "bone cement". Their advantage over its predecessors is the ability to make changes to some of the characteristics of the material itself during the cooking process operations, since they have enough time for this set of initial strength (about 10-15 minutes after mixing). This allows you to fill bone defects of any shape. Plasticity cement gives us the opportunity to manufacture it in the planning period of operation in any form [5].
It is assumed that the rapid healing of the bone occurs due to partial dissolution of HA coating, which leads to increased concentrations of calcium and phosphorus in the environment that promotes the launch of the new formation around the implant of hydroxyapatite microcrystals. In turn, they are integrated with collagen and the type of «creeping» osteogenesis performs rapid formation of high-grade bone. It should be noted that the hydroxyapatite accelerates the initial biological response to metallic implants, in particular, made of titanium. It is expected that after some time, a layer of HA will be fully or partially dissolved, and the titanium in this period will form a strong bond with the bone, almost the same as hydroxyapatite.
It is known [6, 7] that hydroxyapatite has sorption properties to a variety of cations and anions, including heavy metals and radionuclides. Since the recent emphasis on environmental issues, many researchers consider the possibility of its use for the sorption of heavy metals during cleaning of various objects of the environment, to accumulation of radionuclides from the environment, as well as in the field of radioactive waste disposal.
In addition, there work on the use of hydroxyapatite as a pharmaceutical preparation for heavy metal poisoning. Due to the ability of hydroxyapatite to prevent penetration into the skin of pollutants that cause irritation - beauticians began to pay attention to the HA for the preparation of creams and emulsions.
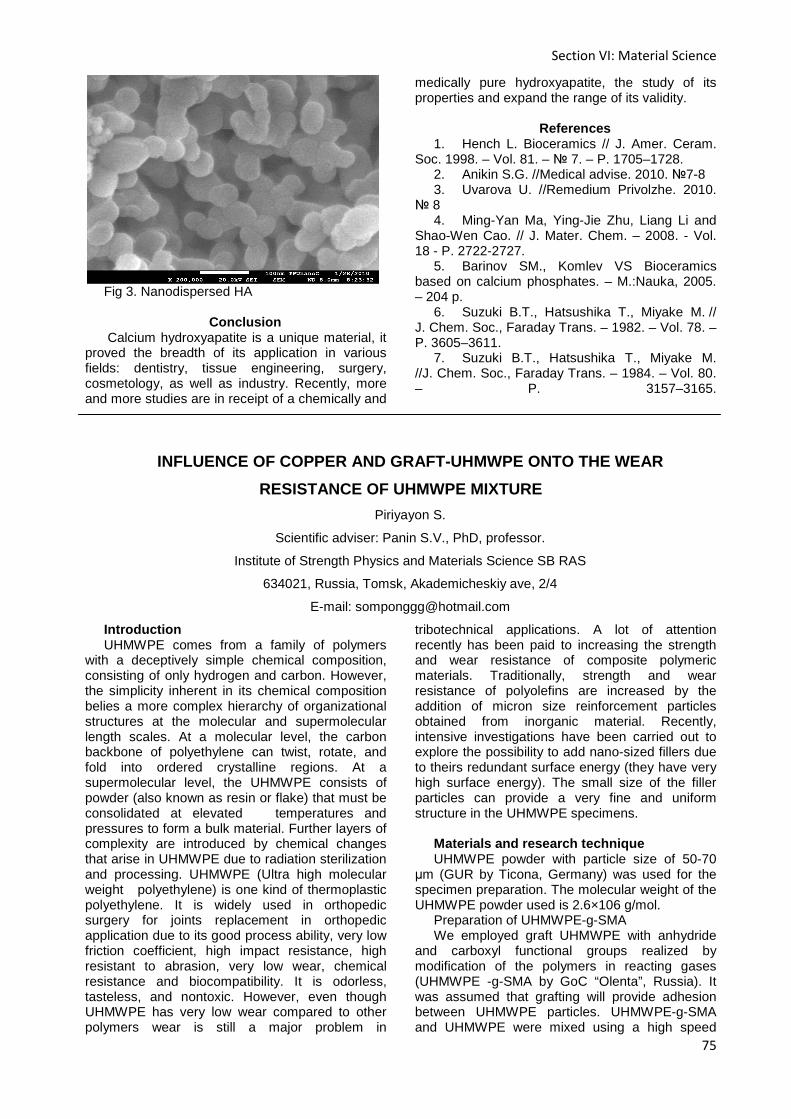
Section VI: Material Science
75
Fig 3. Nanodispersed HA
Conclusion Calcium hydroxyapatite is a unique material, it
proved the breadth of its application in various fields: dentistry, tissue engineering, surgery, cosmetology, as well as industry. Recently, more and more studies are in receipt of a chemically and
medically pure hydroxyapatite, the study of its properties and expand the range of its validity.
References
1. Hench L. Bioceramics // J. Amer. Ceram. Soc. 1998. – Vol. 81. – 7. – P. 1705–1728.
2. Anikin S.G. //Medical advise. 2010. 7-8 3. Uvarova U. //Remedium Privolzhe. 2010.
8 4. Ming-Yan Ma, Ying-Jie Zhu, Liang Li and
Shao-Wen Cao. // J. Mater. Chem. – 2008. - Vol. 18 - P. 2722-2727.
5. Barinov SM., Komlev VS Bioceramics based on calcium phosphates. – M.:Nauka, 2005. – 204 p.
6. Suzuki B.T., Hatsushika T., Miyake M. // J. Chem. Soc., Faraday Trans. – 1982. – Vol. 78. – P. 3605–3611.
7. Suzuki B.T., Hatsushika T., Miyake M. //J. Chem. Soc., Faraday Trans. – 1984. – Vol. 80. – P. 3157–3165.
INFLUENCE OF COPPER AND GRAFT-UHMWPE ONTO THE WEAR
RESISTANCE OF UHMWPE MIXTURE
Piriyayon S.
Scientific adviser: Panin S.V., PhD, professor.
Institute of Strength Physics and Materials Science SB RAS
634021, Russia, Tomsk, Akademicheskiy ave, 2/4
E-mail: [email protected]
Introduction UHMWPE comes from a family of polymers
with a deceptively simple chemical composition, consisting of only hydrogen and carbon. However, the simplicity inherent in its chemical composition belies a more complex hierarchy of organizational structures at the molecular and supermolecular length scales. At a molecular level, the carbon backbone of polyethylene can twist, rotate, and fold into ordered crystalline regions. At a supermolecular level, the UHMWPE consists of powder (also known as resin or flake) that must be consolidated at elevated temperatures and pressures to form a bulk material. Further layers of complexity are introduced by chemical changes that arise in UHMWPE due to radiation sterilization and processing. UHMWPE (Ultra high molecular weight polyethylene) is one kind of thermoplastic polyethylene. It is widely used in orthopedic surgery for joints replacement in orthopedic application due to its good process ability, very low friction coefficient, high impact resistance, high resistant to abrasion, very low wear, chemical resistance and biocompatibility. It is odorless, tasteless, and nontoxic. However, even though UHMWPE has very low wear compared to other polymers wear is still a major problem in
tribotechnical applications. A lot of attention recently has been paid to increasing the strength and wear resistance of composite polymeric materials. Traditionally, strength and wear resistance of polyolefins are increased by the addition of micron size reinforcement particles obtained from inorganic material. Recently, intensive investigations have been carried out to explore the possibility to add nano-sized fillers due to theirs redundant surface energy (they have very high surface energy). The small size of the filler particles can provide a very fine and uniform structure in the UHMWPE specimens.
Materials and research technique UHMWPE powder with particle size of 50-70
µm (GUR by Ticona, Germany) was used for the specimen preparation. The molecular weight of the UHMWPE powder used is 2.6×10⁶ g/mol.
Preparation of UHMWPE-g-SMA We employed graft UHMWPE with anhydride
and carboxyl functional groups realized by modification of the polymers in reacting gases (UHMWPE -g-SMA by GoC “Olenta”, Russia). It was assumed that grafting will provide adhesion between UHMWPE particles. UHMWPE-g-SMA and UHMWPE were mixed using a high speed
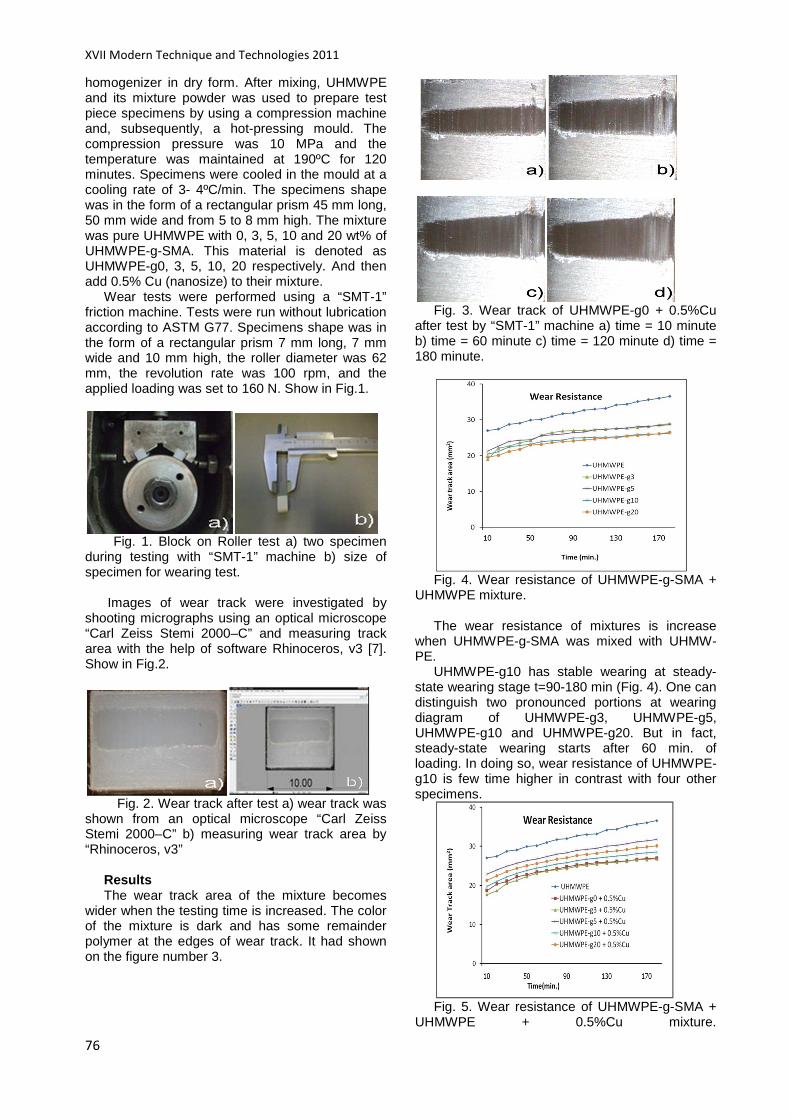
XVII Modern Technique and Technologies 2011
76
homogenizer in dry form. After mixing, UHMWPE and its mixture powder was used to prepare test piece specimens by using a compression machine and, subsequently, a hot-pressing mould. The compression pressure was 10 MPa and the temperature was maintained at 190ºC for 120 minutes. Specimens were cooled in the mould at a cooling rate of 3- 4ºC/min. The specimens shape was in the form of a rectangular prism 45 mm long, 50 mm wide and from 5 to 8 mm high. The mixture was pure UHMWPE with 0, 3, 5, 10 and 20 wt% of UHMWPE-g-SMA. This material is denoted as UHMWPE-g0, 3, 5, 10, 20 respectively. And then add 0.5% Cu (nanosize) to their mixture.
Wear tests were performed using a “SMT-1” friction machine. Tests were run without lubrication according to ASTM G77. Specimens shape was in the form of a rectangular prism 7 mm long, 7 mm wide and 10 mm high, the roller diameter was 62 mm, the revolution rate was 100 rpm, and the applied loading was set to 160 N. Show in Fig.1.
Fig. 1. Block on Roller test a) two specimen during testing with “SMT-1” machine b) size of specimen for wearing test.
Images of wear track were investigated by shooting micrographs using an optical microscope “Carl Zeiss Stemi 2000–C” and measuring track area with the help of software Rhinoceros, v3 [7]. Show in Fig.2.
Fig. 2. Wear track after test a) wear track was shown from an optical microscope “Carl Zeiss Stemi 2000–C” b) measuring wear track area by “Rhinoceros, v3”
Results The wear track area of the mixture becomes
wider when the testing time is increased. The color of the mixture is dark and has some remainder polymer at the edges of wear track. It had shown on the figure number 3.
Fig. 3. Wear track of UHMWPE-g0 + 0.5%Cu
after test by “SMT-1” machine a) time = 10 minute b) time = 60 minute c) time = 120 minute d) time = 180 minute.
Fig. 4. Wear resistance of UHMWPE-g-SMA +
UHMWPE mixture. The wear resistance of mixtures is increase
when UHMWPE-g-SMA was mixed with UHMW-PE.
UHMWPE-g10 has stable wearing at steady-state wearing stage t=90-180 min (Fig. 4). One can distinguish two pronounced portions at wearing diagram of UHMWPE-g3, UHMWPE-g5, UHMWPE-g10 and UHMWPE-g20. But in fact, steady-state wearing starts after 60 min. of loading. In doing so, wear resistance of UHMWPE-g10 is few time higher in contrast with four other specimens.
Fig. 5. Wear resistance of UHMWPE-g-SMA +
UHMWPE + 0.5%Cu mixture.

Section VI: Material Science
77
The wear resistance of mixtures is increased when UHMWPE-g-SMA is mixed with UHMW-PE.
and 0.5%Cu. UHMWPE-g3 + 0.5%Cu has stable wearing at steady-state wearing stage t=70-180 min (Fig. 5). One can distinguish two pronounced portions at wearing diagram of UHMWPE-g3 + 0.5%Cu and UHMWPE-g0 + 0.5%Cu. But in fact, steady-state wearing starts after 70 min. of loading.
Conclusion The wear resistance of UHMWPE + UHMWPE -
g-SMA specimens is increased when UHMWPE -g-SMA is mixed with UHMWPE powder. However, when mixed with Cu nanosize, it can improve the wear resistance of the mixture. The wear track area for UHMWPE-g10, UHMWPE-g3 + 0.5%Cu specimen is lower at the steady state wearing stage in each group of mixture. Wear resistance of the specimen is nearly equal to one of the non-modified specimen. Next steps can fill other filler to
increase the strength, hardness and wear resistance.
Reference 1. Wang H, Fang P, Chen Z, Wang S, Xu Y
and Fang Z, Polymer Int. 57:50 (2008). 2. Steven M. Kurt, The UHMW-PE handbook,
Elsevier 2004, p 109. 3. Oklopkova A.A., Popov S.N., Sleptzova S.A.,
Petrova P.N., Avvakumov E.G. Polymer nanocomposites for tribotechnical applications. Structural chemistry, 45 (supplement), S169-S173: 2004.
4. Oklopkova A.A., Petrova P.N., Sleptzova S.A. and Gogoleva O.V. Polyolefin composites for tribotechnical application in friction unite ofautomobiles. Chemistry for sustainable development, 13, 793-799 : 2005.
5. Andreeva I.N., Veselovskaya E.V., Nalivaiko E.I., et al. Ultrahigh molecular weight polyethylene of high density. Leningrad: IzdatelstvoKhimia (Chemistry); 1982.
THE EFFECT OF ELECTRON BEAM IRRADIATION ON WEAR PRO PERTIES
OF UHMWPE
T. Poowadin, L.A. Kornienko, M.A. Poltaranin
Scientific adviser: Panin S.V., PhD, professor.
Institute of Strength Physics and Materials Science SB RAS
634021, Russia, Tomsk, Akademicheskiy ave, 2/4
E-mail: [email protected]
Abstract Electron beam irradiation dose of 25–300 kGy
was applied to modify Ultra high molecular weight polyethylene (UHMWPE) that is the theme of our work. Many studies have been carried out to improve wear properties of UHMWPE by the introduction of crosslink to the chain structure of UHMWPE by means of electron beam radiation. It is a well known that increasing crosslink density increase wear resistance and oxidative resistance. However it can reduce the mechanical properties of UHMWPE. In our work, all specimens were investigated under dry condition of “block-on-roller” wear tests. The results obtained with irradiated samples exhibited high wear resistance relative to increasing of radiation dose. Furthermore, the three-dimensional profilometer was employed to study the changes of the surface layer of irradiated specimens.
Keywords: UHMWPE; electron beam; crosslink;
wear resistance; nanohardness
Introduction Nowadays, polymer materials are present in
almost all fields, as for example, automotive industry, agricultural engineering, food processing, medical prosthesis, aerospace and so on. These materials have been recognized for their resistance to wear and have been developed continuously. UHMWPE is a member of the family of polyethylene in which the polymer is formed from ethylene (C2H4). It is being increasingly used in industry as components or parts of machines because of its unique properties of high abrasion resistance, high impact strength, very low friction coefficient, very low wear, chemical resistance and biocompatibility. [1]
However, even though UHMWPE has very low wear compared to other polymers. Wear is still a major problem in tribological applications. A lot of attention recently has been paid to improve tribological properties and wear resistance of UHMWPE by means of various radiation e.g., gamma (=) and ultraviolet (UV) rays, X-rays and electron beam [2,3]. The effect of electron beam irradiation on physical properties of UHMWPE has
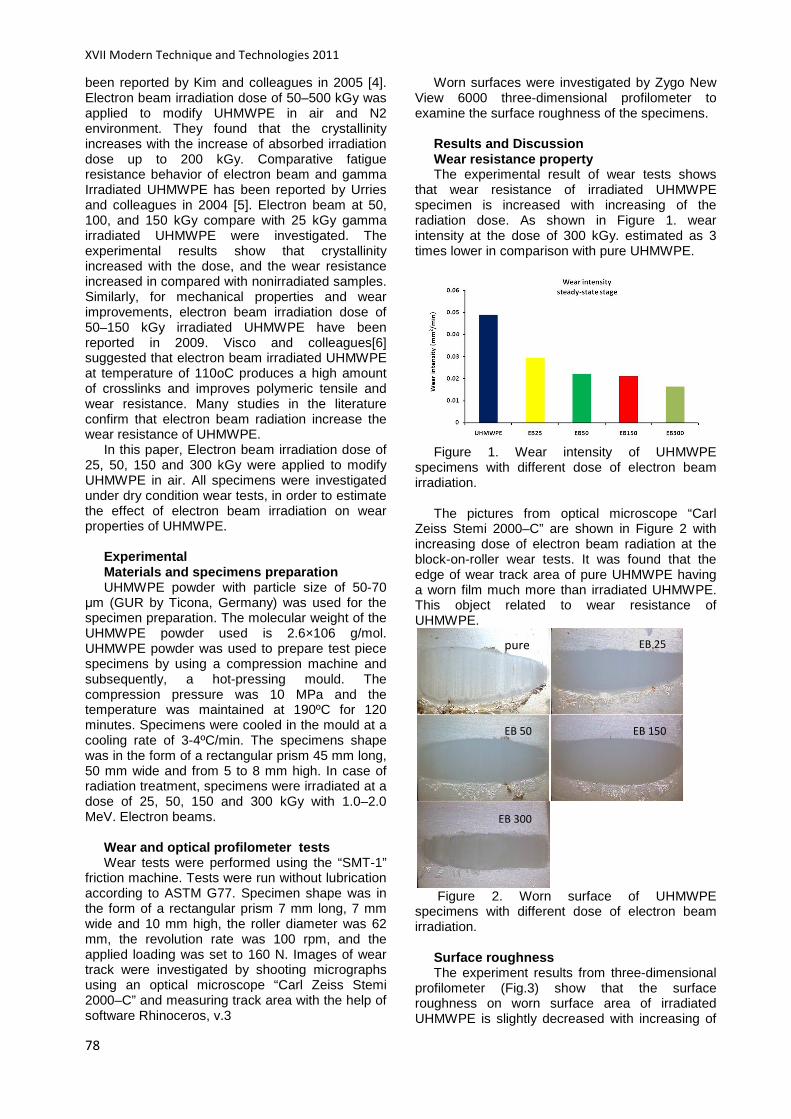
XVII Modern Technique and Technologies 2011
78
been reported by Kim and colleagues in 2005 [4]. Electron beam irradiation dose of 50–500 kGy was applied to modify UHMWPE in air and N2 environment. They found that the crystallinity increases with the increase of absorbed irradiation dose up to 200 kGy. Comparative fatigue resistance behavior of electron beam and gamma Irradiated UHMWPE has been reported by Urries and colleagues in 2004 [5]. Electron beam at 50, 100, and 150 kGy compare with 25 kGy gamma irradiated UHMWPE were investigated. The experimental results show that crystallinity increased with the dose, and the wear resistance increased in compared with nonirradiated samples. Similarly, for mechanical properties and wear improvements, electron beam irradiation dose of 50–150 kGy irradiated UHMWPE have been reported in 2009. Visco and colleagues[6] suggested that electron beam irradiated UHMWPE at temperature of 110oC produces a high amount of crosslinks and improves polymeric tensile and wear resistance. Many studies in the literature confirm that electron beam radiation increase the wear resistance of UHMWPE.
In this paper, Electron beam irradiation dose of 25, 50, 150 and 300 kGy were applied to modify UHMWPE in air. All specimens were investigated under dry condition wear tests, in order to estimate the effect of electron beam irradiation on wear properties of UHMWPE.
Experimental Materials and specimens preparation UHMWPE powder with particle size of 50-70
µm (GUR by Ticona, Germany) was used for the specimen preparation. The molecular weight of the UHMWPE powder used is 2.6×10⁶ g/mol. UHMWPE powder was used to prepare test piece specimens by using a compression machine and subsequently, a hot-pressing mould. The compression pressure was 10 MPa and the temperature was maintained at 190ºC for 120 minutes. Specimens were cooled in the mould at a cooling rate of 3-4ºC/min. The specimens shape was in the form of a rectangular prism 45 mm long, 50 mm wide and from 5 to 8 mm high. In case of radiation treatment, specimens were irradiated at a dose of 25, 50, 150 and 300 kGy with 1.0–2.0 MeV. Electron beams.
Wear and optical profilometer tests Wear tests were performed using the “SMT-1”
friction machine. Tests were run without lubrication according to ASTM G77. Specimen shape was in the form of a rectangular prism 7 mm long, 7 mm wide and 10 mm high, the roller diameter was 62 mm, the revolution rate was 100 rpm, and the applied loading was set to 160 N. Images of wear track were investigated by shooting micrographs using an optical microscope “Carl Zeiss Stemi 2000–C” and measuring track area with the help of software Rhinoceros, v.3
Worn surfaces were investigated by Zygo New View 6000 three-dimensional profilometer to examine the surface roughness of the specimens.
Results and Discussion Wear resistance property The experimental result of wear tests shows
that wear resistance of irradiated UHMWPE specimen is increased with increasing of the radiation dose. As shown in Figure 1. wear intensity at the dose of 300 kGy. estimated as 3 times lower in comparison with pure UHMWPE.
Figure 1. Wear intensity of UHMWPE
specimens with different dose of electron beam irradiation.
The pictures from optical microscope “Carl
Zeiss Stemi 2000–C” are shown in Figure 2 with increasing dose of electron beam radiation at the block-on-roller wear tests. It was found that the edge of wear track area of pure UHMWPE having a worn film much more than irradiated UHMWPE. This object related to wear resistance of UHMWPE.
Figure 2. Worn surface of UHMWPE
specimens with different dose of electron beam irradiation.
Surface roughness The experiment results from three-dimensional
profilometer (Fig.3) show that the surface roughness on worn surface area of irradiated UHMWPE is slightly decreased with increasing of
pure
EB 25
EB 50
EB 150
EB 300
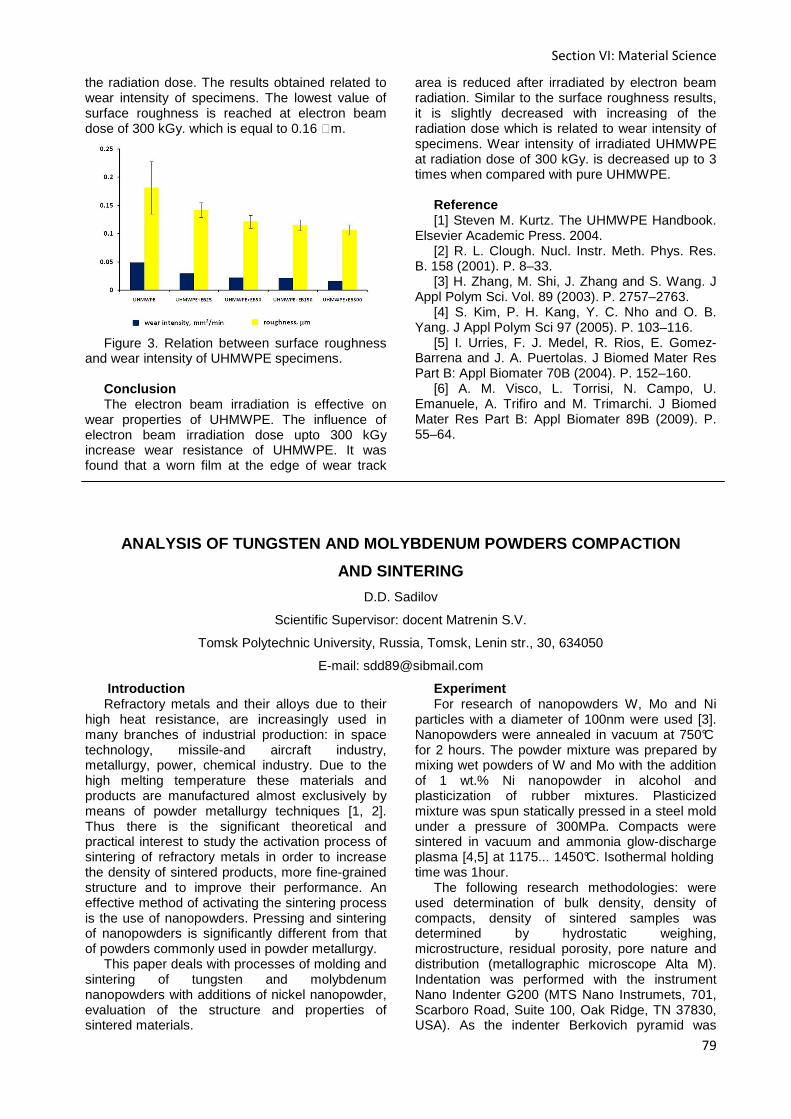
Section VI: Material Science
79
the radiation dose. The results obtained related to wear intensity of specimens. The lowest value of surface roughness is reached at electron beam dose of 300 kGy. which is equal to 0.16 =m.
Figure 3. Relation between surface roughness
and wear intensity of UHMWPE specimens. Conclusion The electron beam irradiation is effective on
wear properties of UHMWPE. The influence of electron beam irradiation dose upto 300 kGy increase wear resistance of UHMWPE. It was found that a worn film at the edge of wear track
area is reduced after irradiated by electron beam radiation. Similar to the surface roughness results, it is slightly decreased with increasing of the radiation dose which is related to wear intensity of specimens. Wear intensity of irradiated UHMWPE at radiation dose of 300 kGy. is decreased up to 3 times when compared with pure UHMWPE.
Reference [1] Steven M. Kurtz. The UHMWPE Handbook.
Elsevier Academic Press. 2004. [2] R. L. Clough. Nucl. Instr. Meth. Phys. Res.
B. 158 (2001). P. 8–33. [3] H. Zhang, M. Shi, J. Zhang and S. Wang. J
Appl Polym Sci. Vol. 89 (2003). P. 2757–2763. [4] S. Kim, P. H. Kang, Y. C. Nho and O. B.
Yang. J Appl Polym Sci 97 (2005). P. 103–116. [5] I. Urries, F. J. Medel, R. Rios, E. Gomez-
Barrena and J. A. Puertolas. J Biomed Mater Res Part B: Appl Biomater 70B (2004). P. 152–160.
[6] A. M. Visco, L. Torrisi, N. Campo, U. Emanuele, A. Trifiro and M. Trimarchi. J Biomed Mater Res Part B: Appl Biomater 89B (2009). P. 55–64.
ANALYSIS OF TUNGSTEN AND MOLYBDENUM POWDERS COMPACT ION
AND SINTERING
D.D. Sadilov
Scientific Supervisor: docent Matrenin S.V.
Tomsk Polytechnic University, Russia, Tomsk, Lenin str., 30, 634050
E-mail: [email protected]
Introduction Refractory metals and their alloys due to their
high heat resistance, are increasingly used in many branches of industrial production: in space technology, missile-and aircraft industry, metallurgy, power, chemical industry. Due to the high melting temperature these materials and products are manufactured almost exclusively by means of powder metallurgy techniques [1, 2]. Thus there is the significant theoretical and practical interest to study the activation process of sintering of refractory metals in order to increase the density of sintered products, more fine-grained structure and to improve their performance. An effective method of activating the sintering process is the use of nanopowders. Pressing and sintering of nanopowders is significantly different from that of powders commonly used in powder metallurgy.
This paper deals with processes of molding and sintering of tungsten and molybdenum nanopowders with additions of nickel nanopowder, evaluation of the structure and properties of sintered materials.
Experiment For research of nanopowders W, Mo and Ni
particles with a diameter of 100nm were used [3]. Nanopowders were annealed in vacuum at 750°C for 2 hours. The powder mixture was prepared by mixing wet powders of W and Mo with the addition of 1 wt.% Ni nanopowder in alcohol and plasticization of rubber mixtures. Plasticized mixture was spun statically pressed in a steel mold under a pressure of 300MPa. Compacts were sintered in vacuum and ammonia glow-discharge plasma [4,5] at 1175... 1450°C. Isothermal holding time was 1hour.
The following research methodologies: were used determination of bulk density, density of compacts, density of sintered samples was determined by hydrostatic weighing, microstructure, residual porosity, pore nature and distribution (metallographic microscope Alta M). Indentation was performed with the instrument Nano Indenter G200 (MTS Nano Instrumets, 701, Scarboro Road, Suite 100, Oak Ridge, TN 37830, USA). As the indenter Berkovich pyramid was

XVII Modern Technique and Technologies 2011
80
used, the load was 50g. The design of the device allows to display a chart of indentation on the monitor in real time. Primary data - the load and the depth of penetration. According to the chart the implementation unit automatically calculates the elastic modulus EIT and microhardness HIT.
Table 1 shows the calculated density of compacts ρ and their relative density θ. Each of the three was obtained by pressing at the same compaction pressure.
Table 1 Compact Density
Fig. 1 and table 2 shows the density and
shrinkage of sintered compacts of the investigated compositions, as well as test data for indentation. For comparative evaluation the values of homologous temperature of sintering and relative density = are shown. Sintering temperature 1175=С correspond to homologous 0.4 for W and 0.5 for Mo, 1313=C - 0.45 and 0.55, 1450=C - 0.5 and 0.6, respectively.
Fig.1 Relative density of samples from the
homologous temperature sintering The compactions of nanopowder were not
sintered completely at these temperatures, but adding Ni nanopowder rapidly activate sintering
process. Molybdenum compacts sintered at these temperatures, however, had a significant porosity. In this case Ni nanopowder additive significantly activated sintering. Modulus of elasticity EIT and microhardness HIT was determined only in samples which sintered densities were up to 80%.
Table 2 Properties of samples sintered in vacuum
Composition t,°С
ρ, g/cm3
θ, %
У, %
EIT,
MPa HIT,
MPa
1
Mo-Ni
1450 9,39 92 11,2
264422 3178
2 1313 8,25 86 8,2 - -
3 1175 7,65 75 5,2 - -
4
Mo
1450 8,17 80 7,3 203251 2315
5 1313 7,67 74 5,4 - -
6 1175 7,12 69 2,8 - -
7
W
1450 11,53 60 0,2 - -
8 1313 11,56 60 0,3 - -
9 1175 11,62 60 0,4 - -
10
W-Ni
1450 16,98 88 10,5
322091 3426
11 1313 15,64 80 8,4 - -
12 1175 14,47 74 7 - -
Table 3 shows the results of measuring the
density and shrinkage of compacts sintered in ammonia glow-discharge plasma, their elastic modulus and microhardness. Tungsten sample without nickel addition, as in case of vacuum sintering, almost tough. It is obvious that temperature of 1450 = C is insufficient for solid-phase sintering of W nanopowder. Addition of 1% Ni nanopowder activated tungsten sintering. Comparing the results of compacts sintering from W nanopowder in vacuum and in ammonia glow-discharge plasma showed that in the second case the samples had higher values of elasticity modulus and microhardness. This effect is explained by the fact that the powder compacts sintering in a glow discharge plasma is activated.
Composition ρ, g/cm3 θ, %
1 Mo-Ni
6,8 66
2 6,6 64 3 6,7 65 4
Mo 6,67 65
5 6,64 65 6 6,63 65 7
W 11,57 60
8 11,57 60 9 11,64 60 10
W-Ni 12,42 64
11 11,75 61 12 11,74 61
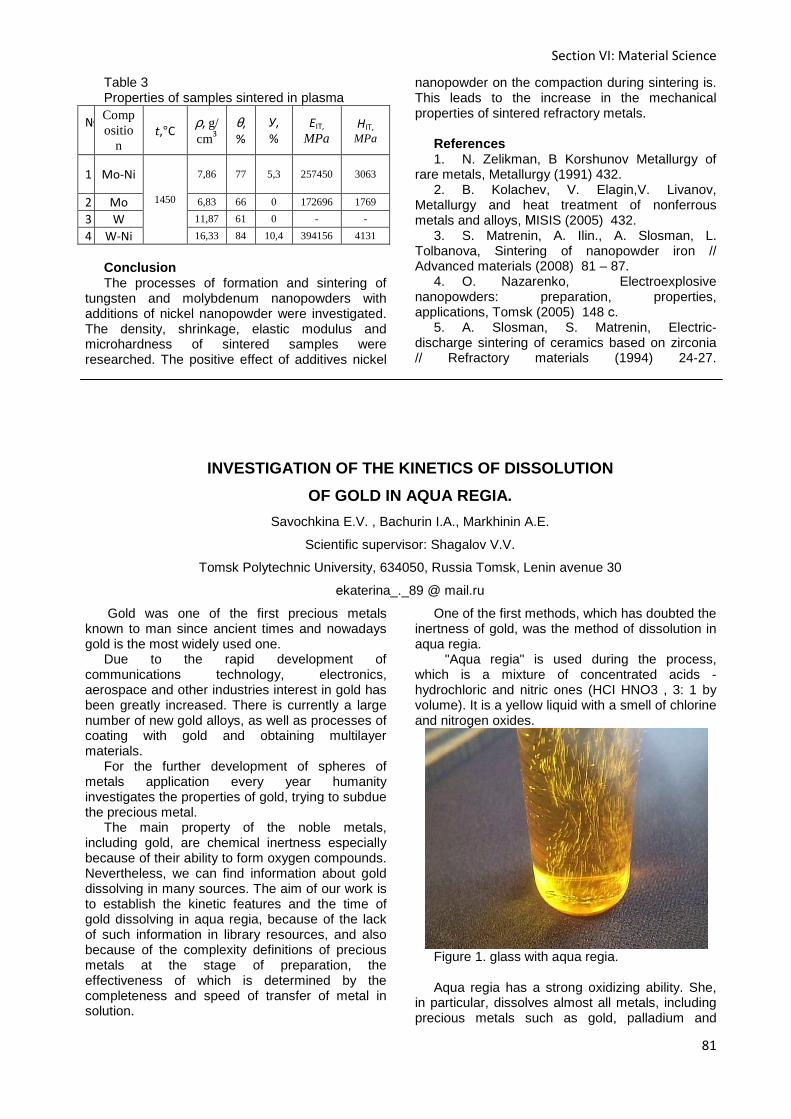
Section VI: Material Science
81
Table 3 Properties of samples sintered in plasma
Compositio
n
t,°С ρ, g/ cm3
θ,
%
У,
%
EIT,
MPa
HIT,
MPa
1 Mo-Ni
1450
7,86 77 5,3 257450 3063
2 Mo 6,83 66 0 172696 1769
3 W 11,87 61 0 - -
4 W-Ni 16,33 84 10,4 394156 4131
Conclusion The processes of formation and sintering of
tungsten and molybdenum nanopowders with additions of nickel nanopowder were investigated. The density, shrinkage, elastic modulus and microhardness of sintered samples were researched. The positive effect of additives nickel
nanopowder on the compaction during sintering is. This leads to the increase in the mechanical properties of sintered refractory metals.
References 1. N. Zelikman, B Korshunov Metallurgy of
rare metals, Metallurgy (1991) 432. 2. B. Kolachev, V. Elagin,V. Livanov,
Metallurgy and heat treatment of nonferrous metals and alloys, МISIS (2005) 432.
3. S. Matrenin, A. Ilin., A. Slosman, L. Tolbanova, Sintering of nanopowder iron // Advanced materials (2008) 81 – 87.
4. O. Nazarenko, Electroexplosive nanopowders: preparation, properties, applications, Tomsk (2005) 148 с.
5. A. Slosman, S. Matrenin, Electric-discharge sintering of ceramics based on zirconia // Refractory materials (1994) 24-27.
INVESTIGATION OF THE KINETICS OF DISSOLUTION
OF GOLD IN AQUA REGIA.
Savochkina E.V. , Bachurin I.A., Markhinin A.E.
Scientific supervisor: Shagalov V.V.
Tomsk Polytechnic University, 634050, Russia Tomsk, Lenin avenue 30
еkaterina_._89 @ mail.ru
Gold was one of the first precious metals known to man since ancient times and nowadays gold is the most widely used one.
Due to the rapid development of communications technology, electronics, aerospace and other industries interest in gold has been greatly increased. There is currently a large number of new gold alloys, as well as processes of coating with gold and obtaining multilayer materials.
For the further development of spheres of metals application every year humanity investigates the properties of gold, trying to subdue the precious metal.
The main property of the noble metals, including gold, are chemical inertness especially because of their ability to form oxygen compounds. Nevertheless, we can find information about gold dissolving in many sources. The aim of our work is to establish the kinetic features and the time of gold dissolving in aqua regia, because of the lack of such information in library resources, and also because of the complexity definitions of precious metals at the stage of preparation, the effectiveness of which is determined by the completeness and speed of transfer of metal in solution.
One of the first methods, which has doubted the inertness of gold, was the method of dissolution in aqua regia.
"Aqua regia" is used during the process, which is a mixture of concentrated acids - hydrochloric and nitric ones (HCI HNO3 , 3: 1 by volume). It is a yellow liquid with a smell of chlorine and nitrogen oxides.
Figure 1. glass with aqua regia. Aqua regia has a strong oxidizing ability. She,
in particular, dissolves almost all metals, including precious metals such as gold, palladium and
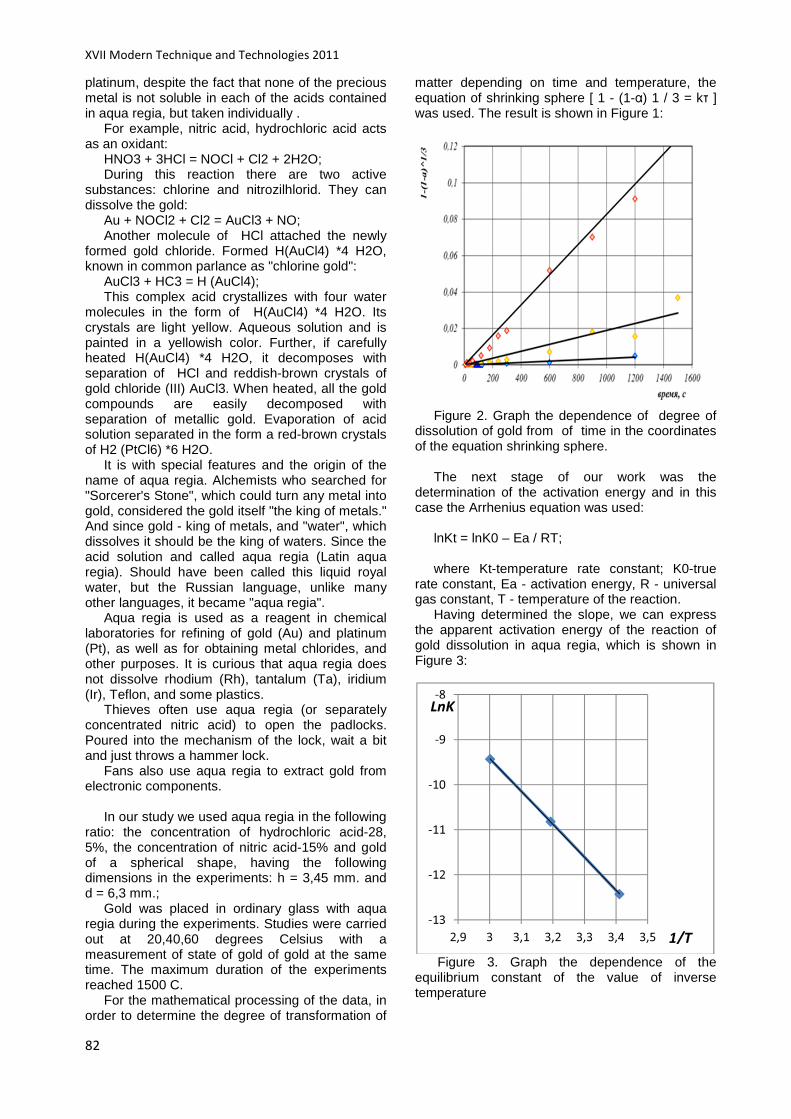
XVII Modern Technique and Technologies 2011
82
platinum, despite the fact that none of the precious metal is not soluble in each of the acids contained in aqua regia, but taken individually .
For example, nitric acid, hydrochloric acid acts as an oxidant:
HNO3 + 3HCl = NOCl + Cl2 + 2H2O; During this reaction there are two active
substances: chlorine and nitrozilhlorid. They can dissolve the gold:
Au + NOCl2 + Cl2 = AuCl3 + NO; Another molecule of HCl attached the newly
formed gold chloride. Formed H(AuCl4) *4 H2O, known in common parlance as "chlorine gold":
AuCl3 + HC3 = H (AuCl4); This complex acid crystallizes with four water
molecules in the form of H(AuCl4) *4 H2O. Its crystals are light yellow. Aqueous solution and is painted in a yellowish color. Further, if carefully heated H(AuCl4) *4 H2O, it decomposes with separation of HCl and reddish-brown crystals of gold chloride (III) AuCl3. When heated, all the gold compounds are easily decomposed with separation of metallic gold. Evaporation of acid solution separated in the form a red-brown crystals of H2 (PtCl6) *6 H2O.
It is with special features and the origin of the name of aqua regia. Alchemists who searched for "Sorcerer's Stone", which could turn any metal into gold, considered the gold itself "the king of metals." And since gold - king of metals, and "water", which dissolves it should be the king of waters. Since the acid solution and called aqua regia (Latin aqua regia). Should have been called this liquid royal water, but the Russian language, unlike many other languages, it became "aqua regia".
Aqua regia is used as a reagent in chemical laboratories for refining of gold (Au) and platinum (Pt), as well as for obtaining metal chlorides, and other purposes. It is curious that aqua regia does not dissolve rhodium (Rh), tantalum (Ta), iridium (Ir), Teflon, and some plastics.
Thieves often use aqua regia (or separately concentrated nitric acid) to open the padlocks. Poured into the mechanism of the lock, wait a bit and just throws a hammer lock.
Fans also use aqua regia to extract gold from electronic components.
In our study we used aqua regia in the following
ratio: the concentration of hydrochloric acid-28, 5%, the concentration of nitric acid-15% and gold of a spherical shape, having the following dimensions in the experiments: h = 3,45 mm. and d = 6,3 mm.;
Gold was placed in ordinary glass with aqua regia during the experiments. Studies were carried out at 20,40,60 degrees Celsius with a measurement of state of gold of gold at the same time. The maximum duration of the experiments reached 1500 C.
For the mathematical processing of the data, in order to determine the degree of transformation of
matter depending on time and temperature, the equation of shrinking sphere [ 1 - (1-α) 1 / 3 = kτ ] was used. The result is shown in Figure 1:
Figure 2. Graph the dependence of degree of
dissolution of gold from of time in the coordinates of the equation shrinking sphere.
The next stage of our work was the
determination of the activation energy and in this case the Arrhenius equation was used:
lnKt = lnK0 – Ea / RT; where Kt-temperature rate constant; K0-true
rate constant, Ea - activation energy, R - universal gas constant, T - temperature of the reaction.
Having determined the slope, we can express the apparent activation energy of the reaction of gold dissolution in aqua regia, which is shown in Figure 3:
Figure 3. Graph the dependence of the
equilibrium constant of the value of inverse temperature
-13
-12
-11
-10
-9
-8
2,9 3 3,1 3,2 3,3 3,4 3,5 1/T
LnK

Section VI: Material Science
83
We got the value of activation energy equal to 60.8 kJ. This value is in the area of chemical reaction, so it indicates that the limiting stage is the stage of a chemical reaction.
Conclusions: In our work the kinetic characteristics of the
process of gold dissolution in aqua regia at the temperature range 298-333K and the time interval from 50 to 1500 seconds were determined. Activation energy of dissolution was also determined, which was 60 kJ. It was established that the rate-limiting step of the process was the stage of a chemical reaction. Now we carry out the same researches of gold dissolution in iodide, bromide, thiosulfate solutions and in the solution of potassium tetrafluorobromide. After that we are going to compare the kinetic features of the above mentioned processes.
Literature: 1.Неорганическая химия: в 3 т. / Под ред.
Ю.Д. Третьякова. Т. 3: Химия переходных элементов. Кн. 2 / [А.А. Дроздов, В.П. Зломанов, Г.Н. Мазо, Ф.М. Спиридонов]. – М.: Академия, 2007. –400 с.
2.Барре П. Кинетика гетерогенных процессов. – М.: Мир, 1976.– 399 с.
3. Mitkin V.N. Fluorination of Aurum Metal and its Application Possibilities in the Synthesis, Analysis and Recovery Technology for Secondary Raw Materials // Aurum: Proc. of Intern. Symp. TMS 2000. – Nashville: Tennessee, 2000. – P. 377–390.
4. V.N. Mitkin. / Fluorine Oxidants in the Analytical Chemistry of Noble Metals/ журнал аналитической химии, том 56, 2, 2001
5. Материалы сайта: http://kristall.lan.krasu.ru/Education/Aurum/aurum.html.
http://www.xumuk.ru/encyklopedia/2/3685.html.
EFFECT OF MOLDING PRESSURE ON MECHANICAL PROPERTIES
AND ABRASIVE WEAR RESISTANCE OF UHMWPE
Sonjaitham N.
Scientific adviser: Panin S.V., PhD, professor.
Tomsk Polytechnic University, 634021, Russia, Tomsk, Lenin ave
E-mail: [email protected]
Introduction Ultra-high molecular weight polyethylene
(UHMWPE) is a polymer with extremely high molecular weight. It possesses excellent wear resistance, high impact strength, good sliding quality, and low friction loss, and its self-lubrication performance can be widely used in engineering applications [1–4]. Often, machine parts such as bearings, gears, bushings, linings, chain guides, hoppers, and sprockets. All these applications are characterized mainly by their high demands on wear resistance[5]. Other than UHMWPE has been used as a replacement for cartilage in total joint prosthesis, such as hip/knee joint replacement because its good biological compatibility and high resistance to the biological environment [6].
The tribological behavior of UHMWPE is much influenced by its mechanical property. Therefore, many different methods have been applied to enhance the mechanical properties of UHMWPE. The process of consolidation in UHMWPE requires proper designation of pressure, temperature and time. Changes in these three molding variables can impact the mechanical properties of UHMWPE [7].
The aim of the work is to study the effect of molding pressure on mechanical properties and abrasive wear resistance of UHMWPE.
Materials and research technique UHMWPE powder with particle size of 50-70
µm (GUR by Ticona, Germany) was used for the specimen preparation. The molecular weight of the UHMWPE powder used is 2.6×10⁶ g/mol. UHMWPE powder was used to prepare test piece specimens by using a compression machine and, subsequently, a hot-pressing mould. The compression under pressure of 10, 15 and 20 MPa and the temperature was maintained at 190ºC for 120 minutes. Specimens were cooled in the mould at a cooling rate of 3-4ºC/min. The specimens shape was a rectangular prism 45 mm long, 50 mm wide and 8 mm high.
Tensile tests wear performed using a “Instron-5582” universal machine. Specimens shape and method according to ASTM 638 (Standard Test Method for Tensile Properties of Plastics).
Wear tests were performed using a “MИ-2” abrasive testing machine. Tests were run without lubrication according to ГОСТ 426-77 (Standard Test Method for determination of abrasion resistance under slipping). Specimens shape was in the form of a rectangular prism 10 mm long, 10 mm wide and 8 mm high and using abrasive paper with grit grade of 240 (series 1913 siawat fc made
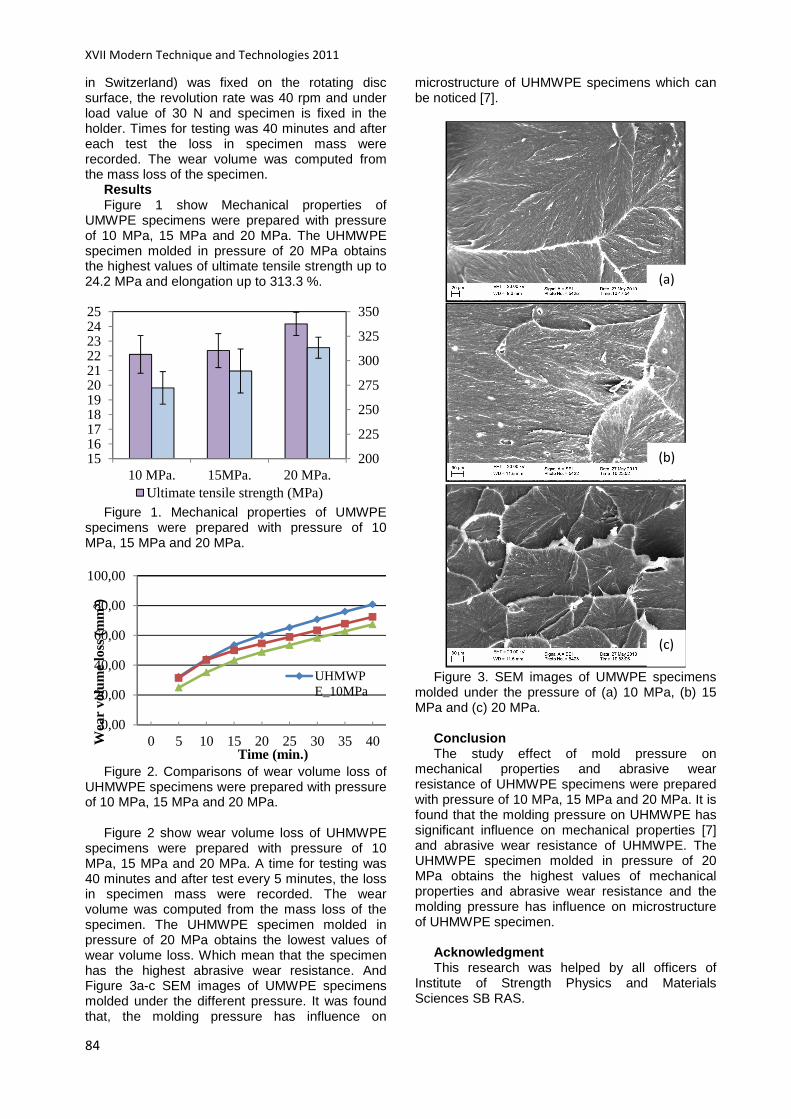
XVII Modern Technique and Technologies 2011
84
in Switzerland) was fixed on the rotating disc surface, the revolution rate was 40 rpm and under load value of 30 N and specimen is fixed in the holder. Times for testing was 40 minutes and after each test the loss in specimen mass were recorded. The wear volume was computed from the mass loss of the specimen.
Results Figure 1 show Mechanical properties of
UMWPE specimens were prepared with pressure of 10 MPa, 15 MPa and 20 MPa. The UHMWPE specimen molded in pressure of 20 MPa obtains the highest values of ultimate tensile strength up to 24.2 MPa and elongation up to 313.3 %.
Figure 1. Mechanical properties of UMWPE
specimens were prepared with pressure of 10 MPa, 15 MPa and 20 MPa.
Figure 2. Comparisons of wear volume loss of
UHMWPE specimens were prepared with pressure of 10 MPa, 15 MPa and 20 MPa.
Figure 2 show wear volume loss of UHMWPE
specimens were prepared with pressure of 10 MPa, 15 MPa and 20 MPa. A time for testing was 40 minutes and after test every 5 minutes, the loss in specimen mass were recorded. The wear volume was computed from the mass loss of the specimen. The UHMWPE specimen molded in pressure of 20 MPa obtains the lowest values of wear volume loss. Which mean that the specimen has the highest abrasive wear resistance. And Figure 3a-c SEM images of UMWPE specimens molded under the different pressure. It was found that, the molding pressure has influence on
microstructure of UHMWPE specimens which can be noticed [7].
Figure 3. SEM images of UMWPE specimens
molded under the pressure of (a) 10 MPa, (b) 15 MPa and (c) 20 MPa.
Conclusion The study effect of mold pressure on
mechanical properties and abrasive wear resistance of UHMWPE specimens were prepared with pressure of 10 MPa, 15 MPa and 20 MPa. It is found that the molding pressure on UHMWPE has significant influence on mechanical properties [7] and abrasive wear resistance of UHMWPE. The UHMWPE specimen molded in pressure of 20 MPa obtains the highest values of mechanical properties and abrasive wear resistance and the molding pressure has influence on microstructure of UHMWPE specimen.
Acknowledgment This research was helped by all officers of
Institute of Strength Physics and Materials Sciences SB RAS.
200
225
250
275
300
325
350
1516171819202122232425
10 MPa. 15MPa. 20 MPa.Ultimate tensile strength (MPa)
0,00
20,00
40,00
60,00
80,00
100,00
0 5 10 15 20 25 30 35 40Wea
r vo
lum
e lo
ss (
mm
3 )
Time (min.)
UHMWPE_10MPa
(a)
(b)
(c)
Section VI: Material Science
85
Reference 1. D.S. Xiong, S.R. Ge, Friction and wear
properties of UHMWPE/Al2O3 ceramic under different lubricating conditions, Wear 250 (2001) 242–245.
2. C.Z. Liu, J.Q. Wu, J.Q. Li, L.Q. Ren, J. Tong, A.D. Arnell, Tribological behaviours of PA/UHMWPE blend under dry and lubricating condition, Wear 260 (2006) 109–115.
3. Y. Xue, W. Wu, O. Jacobs, B. Schdel, Tribological behaviour of UHMWPE/HDPE blends reinforced with multi-wall carbon nanotubes, Polymer Testing 25 (2006) 221–229.
4. Hsien-Chang Kuo, Ming-Chang Jeng, The influence of injection molding on tribological
characteristics of ultra high molecular weight polyethylene under dry sliding, Wear 268 (2010) 803–810
5. L.M. Brunner and T.A. Tervoort, abrasive wear of Ultra-high molecular weight polyethylene, Encyclopedia of Materials: Science and Technology (2006) 1-8.
6. D. DOWSON, The James Clayton Memorial Lecture 2000, An rdinary meeting of the Institution held at IMechE Headquarters, London, on Wednesday 28 June 2000.
7. Shibo Wang , Shirong Ge, The mechanical property and tribological behavior of UHMWPE: Effect of molding pressure, Wear 263 (2007) 949–956
STUDY OF FRACTURE PATTERNS OF SPRAYED PROTECTIVE CO ATINGS
AS FUNCTION OF THEIR ADHESION
Yussif S.A.K., Alkhimov A.P., Kupriyanov S.N.
Scientific adviser: Panin S.V., PhD, professor.
Tomsk Polytechnic University, 634034, Russia, Tomsk, Lenina ave, 30
E-mail: [email protected]
Introduction In the last few years a number of technologies
for spraying protective, hardening and functional coating possessing high operating characteristics were worked out. Analysis of literature testifies that the character of plastic deformation at the mesoscale level in the composition with pronounced plane “coating-substrate” interface is principally determined by a thickness of the coating as well as a value of adhesive strength and also by the relationship between mechanical characteristics of interfaced materials [1]. So during investigation of plastic deformation pattern at mesoscale level in “low-carbon steel – thermal sprayed coating” composition was shown that under loading of specimens with the protective coatings whose ultimate strength is lower then yield strength of a substrate crack nucleation does not occur at the surface but on the outer surface of the coating [1]. It was also shown that at certain thickness of a thermal sprayed coating a failure of the composition occurs by the way of adhesive- cohesive cracking. If this takes place the coating retains on the surface of substrate up to high degrees of plastic deformation. Development of such effect was related to a presence of pores in the coating on which an effective relaxation of stress concentrators acting in the tops of cracks propagating in a coating took place. With increasing the thickness of the coating higher than a certain value (150 m=) a cross porosity is reduced that resulted in development of plastic
deformation by way of total adhesive flaking of the coating.
One more regularity revealed and described in [1] was establishing the relationship between the value of adhesive strength and the pattern of plastic deformation evolution at mesolevel in the substrate. In particular, it was shown that under low level of adhesive bonding the flaking of the coating can occur only due to the action of shear stresses in the region of the Luders band propagation.. As this take place localization of plastic deformation in the subsurface layer of the substrate happens only in a small zone of forthcoming flaking of the coating that was revealed by the analysis of displacement vector fields. If the value of adhesive strength was increased, for instance by preliminary shot-blasting of a substrate, the flaking of a coating was occurred at the expense of local bend of specimens. The bending was observed in the region of specimens where a top of adhesive crack was revealed. The latter, in its turn, propagated along the interface parallel to the front of Luders band [1].
This work presents results of investigation of plastic deformation processes at the mesolevel in the composition with double-layer gas-dynamic coatings of a various composition having different value of adhesive stress accordingly.
Materials and research technique Low carbon steel was used as substrate
materials. The coating was sprayed onto both
XVII Modern Technique and Technologies 2011
86
plane faces of specimens by the cold gas-dynamic spraying. A double-layer coatings based on copper, zinc and aluminum were formed by using different deposition conditions.
The specimens for testing were dump-bell shaped. The size of working part of specimens was 24,9=2,7=4,9 mm. Test on static uniaxial tension was carried out using the “IMASH 2078” mechanical testing machine at the rate of 0.05 mm/sec. The patterns of plastic flow were investigated with the help of Television - Optical Meter for Surface Characterization “TOMSC” The plastic deformation behavior at mesolevel was studied by the analysis of constructed displacement vector fields of surface patches.
Results The analysis of results obtained allowed us to
reveal three major way of plastic deformation evolution at mesolevel in investigated compositions that is defined, first of all, by relationship between cohesive and adhesive strength of the coatings.
The first scenario of plastic flow development consists in initial cohesive cracking of the coating along the entire length of specimen gauge length followed by its breaking down into fragments with the following plastic deformation localization in the vicinity of the interface and completed by adhesive flaking of the formed coating fragments.
The second way of plastic deformation evolution in composition with gas-dynamic coatings is the relay-race cohesive cracking of the coating accompanied by formation of coating fragments between two neighbouring transverse cracks and its further adhesive flaking.
The third scenario of plastic flow evolution in the investigated compositions is the complete adhesive flaking of the coating that does not accompanied by its cracking.
The pattern of plastic deformation development at the mesoscale level in compositions whose plastic flow is accompanied by coating flaking (because of low adhesive strength) was already investigated in [1] by an example of thermal–sprayed hardening coatings on a base of PG–10Ni–01 and PG–19Ni–01 powders. This compositions had low ductility and cracking of the coating occurred even below value of applied stress of 100 MPa. The evolution of plastic flow at mesoscale level in compositions investigated in this work develops by the similar way. At the same time the revealing dependence between pattern of continuity disturbance in “coating–substrate” composition and the value of adhesive strength of the coating is the major advantage of the investigations carried out. Let us point out main features which were not described in [1] and which are typical for such compositions.
The local bending of the coating is the reason of the primary crack nucleation and spreading in the composition under investigation. It can be
stated that plastic deformation in the coating initiates earlier then in the substrate (ductile aluminum, zinc and copper served as a coating material) that results in restraining homogeneous pattern of plastic flow development in the coating by the steel substrate. The latter governs local bending of the coating (it is seen in the displacement vector fields).
At the stage of the secondary cracking plastic deformation develops more intensively in the substrate and the fragments of the cracked coating retards homogeneous plastic flow evolution in the first one. As the result the substrate material begins to experience the local bending resulting in the propagation of a secondary crack from interface towards surface of the coating.
The pattern of plastic deformation development is traced more completely under deformation evolution by the first scenario. It is possible to state that the local bending precedes the formation of the continuity disturbance at the interface (spreading of the adhesive crack) under substantial value of the adhesive bonding. The latter is accompanied by a vortex motion of material that increases the power of stress concentrator acting at the interface and provides the flaking of the coating fragments. Thus, the results obtained as well as materials of the previous investigations of coated materials allow to reckon that the vortex pattern of plastic deformation development precedes the formation of discontinuity. But under low level of adhesive bonding (3 scenario) the size of region with vortex manner of plastic flow evolution is too small. That is why the latter was not observed on the displacement vector fields with the magnifications used in this work.
Under plastic flow evolution by the 2 scenario the value of adhesive bonding was rather high in order to simply flake out the coating from the substrate. At the same time initiation of the transverse cracks in the coating makes it possible the nucleation and spreading adhesive cracks from these cracks along the interface. The process of adhesive crack growth was also intensified by the local bending of the specimen due to restraining the homogeneous plastic flow development in subsurface layer of the substrate. It is possible to contend that quasi–periodic flaking clearly correlating with the thickness of the coating is determined by the local bending of the specimens under crack nucleation in the coating. The latter being a structural notch governs the bending of the specimens but the emergence of a next crack provides bending of the opposite side that “retains a given axis of loading”.
Conclusion 1. Depending on the relationships between
adhesive and cohesive strengths of gas-dynamic sprayed coatings three major ways of plastic flow
Section VI: Material Science
87
evolution can be revealed in composition under investigation:
• The first version consists in initial cohesive (primary) cracking of the coating resulted in its dividing into fragments and followed by further evolution of localized plastic deformation at the vicinity of the interface completed by the adhesive separation of coating fragments.
• The second scenario of plastic flow evolution in compositions with the gas-dynamic coatings is the relay-race cohesive cracking of the coating with the consequent formation of coating fragment and its further adhesive flaking.
• The third scenario of plastic deformation development in the investigated compositions is the complete adhesive flaking of the coating which does not exert influence on the development of plastic flow in the substrate.
2. Incompatibility of plastic flow evolution in the coating and substrate results in the local bending of specimen which is the major reason of stress concentrator nucleation at the interface. As a result of their relaxation the propagation of transverse
cohesive crack in the coating as well as of adhesive crack along the interface takes place. The secondary cohesive cracking favored the fragmentation of the coating stipulating adhesive flaking process of small size fragments.
3. The presence of gas-dynamic coating restrains the homogeneous plastic deformation development in the substrate as whole causing low pronounciation of strain-induced relief in the subsurface layer at low strains in comparison with the underliying substrate material. With the increasing strain this effect is revealed as the formation of longitudinal “folds” with the extantion of some hundreds microns at the boundary between the subsurface layer and “under–liying” substrate material.
References 1. V. A. Klimenov, S. V. Panin, V. P.
Bezborodov Investigation of plastic deformation at mesoscale level and fracture of “thermal coating – substrate” composition under tension. Physical mesomechanics. Vol. 2, No. 1-2, p. 141-156: 1999.
COMPOSITION INFLUENCE OF UHMWPE BASED PLASTICS
ON WEAR RESISTANCE
Ziganshin A.I.
Scientific advisor: Kondratuk A.A.
Linguistic advisor: Demchenko V. N.
Tomsk Polytechnic University, 634050, Russia, Tomsk, 30 Lenin st.
E-mail: [email protected]
Developing constructions and separate parts of machines require knowledge of contacting surfaces mass loss. It’s all the matter of abrasive micro particles, which inevitably deposit on the surface. Nowadays, there are many investigations of new materials on UHMWPE base with different fillers. That’s why, it’s very important to study the dependence of wear resistance on the composition. UHMWPE is polyethylene with mass about 1,5*106 g/mol. This fact defines its unique mechanical and physical properties, making it different from other polyethylene trades. Specific properties determine its application areas.
UHMWPE is used, when simple polyethylene and other thermoplastics can’t withstand hard exploitation facilities. High impact elasticity, chemical, corrosion and wear resistance defines a wide range of application for durable parts. [1] Due to low friction coefficient, heat generation friction is decreased to minimum. Such parts don’t require lubrication for the maintenance. Creation of UHMWPE based composite materials allows
increase characteristics of polymer materials and expends areas of their application.
The concept of fracture depends on matrix properties, contents of particles and its adhesion with matrix. The increase of filler content can lead to the change fracture mechanism from plastic to brittle. Thermoplastics, such as polyamide, polyformaldehyde, polycarbonate, are often used, as polymer matrix for wear resistant materials. These materials are used to manufacture parts by casting under pressure, extrusion or heat pressure, so they are very useful for serial production. Disperse powders with laminate crystalline lattice are widely used, as anti-friction fillers. For instance, there are graphite, boron nitride and disperse powders of nonferrous metals, such as copper. Fluoroplastic-4, polyethylene wax and liquid anti-friction fillers are also used as organic products. They can be used in combination as well. Fillers content is 1 – 15%. The content increase can worsen properties. [2]
For mass loss research of UHMWPE based polymer materials, the authors fabricated flat
XVII Modern Technique and Technologies 2011
88
cylindrical specimens of different composites, where disperse copper and boron nitride were used, as fillers.
There were following compositions: UHMWPE “TNHK” and UHMWPE “Ticona” without fillers, UHMWPE “TNHK” + 3% Cu, UHMWPE “TNHK” + 7% Cu, UHMWPE “TNHK” + 10% Cu, UHMWPE “TNHK” + 13% Cu, UHMWPE “TNHK” + 50% Cu, UHMWPE “TNHK” + 50% Cu( after heat treatment(150ºC)), UHMWPE “TNHK” + 81% Cu, UHMWPE “TNHK” + 81% Cu( after heat treatment(150ºC)), UHMWPE “TNHK” + 3% BN, UHMWPE “TNHK” + 7% BN, UHMWPE “TNHK” + 10% BN, UHMWPE “TNHK” + 13% BN. Wear resistance research was carried out with help of the device IIP-1 in dry abrasive wear condition with free moving particles on steel surface. The research objects were cylindrical form specimens with following dimensions: height = 10 mm, diameter = 15 mm. The basic wear evaluation method was the mass measurement loss with special scales TYP WA – 33 with 0,00005 grams accuracy. Measurement period was 90 minutes.
Graphs 1-4 were drawn according to the experiment results. Previously, mass loss of “TNHK” and “Ticona” was estimated (fig. 1).
Figure 1. “TNHK” and “Ticona” During 60 minutes there was no difference
between wears, but after 90 minutes loss of “TNHK” mass was greater, than “Ticona” one. Analysis of obtained results for powder copper specimens allow make the conclusion: increasing of filler amount leads to reduction of wear resistance, except specimen with 13% of copper (fig 3). As for specimens with boron nitride, there is wear increase in 3 – 7% of filler, and decrease in 10 – 13% (fig 2).
Figure 2. “TNHK” + BN (3, 7, 10, 13%) Moreover, the effect of high temperature
influence on the matrix destruction was researched (fig. 3,4).
Figure 3. “TNHK” + Cu (3, 7, 10, 13, 50%)
0
0,005
0,01
0,015
0,02
0,025
0 50 100
we
ar
Δm
, g
time t, min
TNHK Ticona
0
0,2
0,4
0,6
0,8
1
1,2
0 50 100
we
ar
Δm
, g
time t, min
BN=3% BN=7%
BN=10% BN=13%
0
0,01
0,02
0,03
0,04
0,05
0,06
0 50 100
we
ar
Δm
, g
time t, min
Cu=3% Cu=7%
Cu=10% Cu=13%
Cu=50% Cu=50%h/t
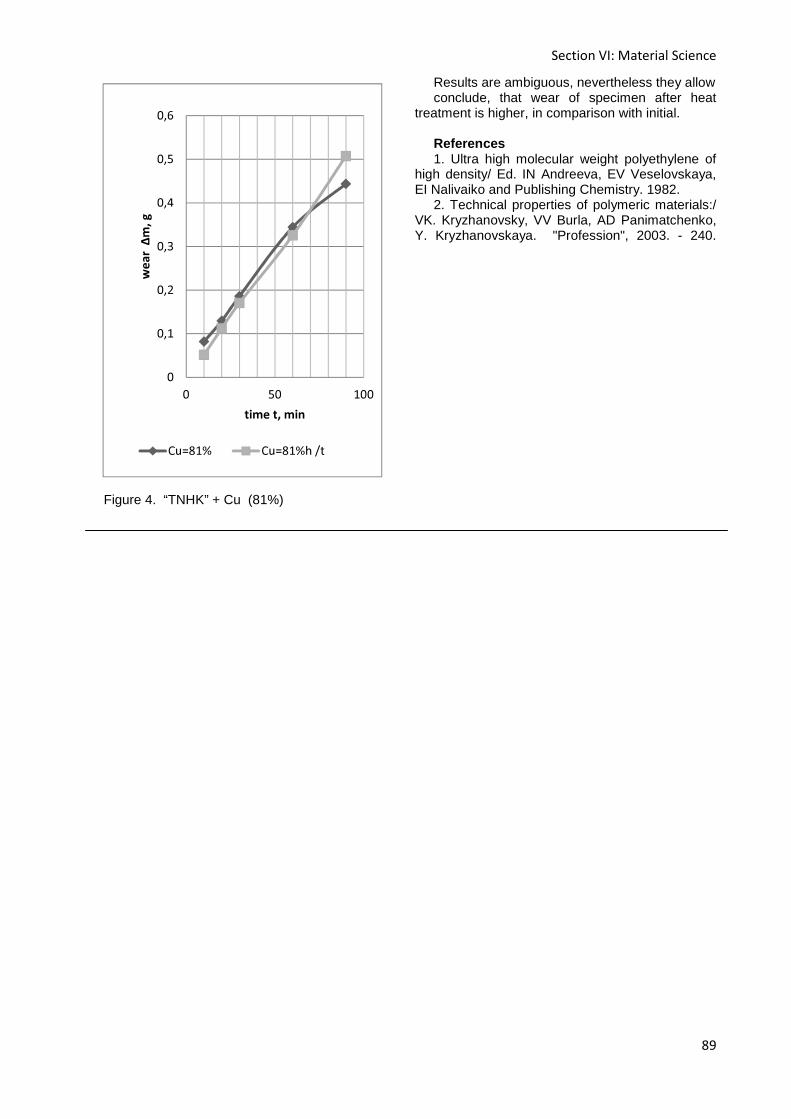
Section VI: Material Science
89
Figure 4. “TNHK” + Cu (81%)
Results are ambiguous, nevertheless they allow conclude, that wear of specimen after heat
treatment is higher, in comparison with initial. References 1. Ultra high molecular weight polyethylene of
high density/ Ed. IN Andreeva, EV Veselovskaya, EI Nalivaiko and Publishing Chemistry. 1982.
2. Technical properties of polymeric materials:/ VK. Kryzhanovsky, VV Burla, AD Panimatchenko, Y. Kryzhanovskaya. "Profession", 2003. - 240.
0
0,1
0,2
0,3
0,4
0,5
0,6
0 50 100
we
ar
Δm
, g
time t, min
Cu=81% Cu=81%h /t

XVII Modern Technique and Technologies 2011
90

Section VII: Informatics and Control in Engineering Systems
91
Section VII
INFORMATICS AND CONTROL IN ENGINEERING SYSTEMS
XVII Modern Technique and Technologies 2011
92
SIMULATION PROCESS PROCEEDING IN THE ELECTROLYZER
FOR FLUORINE PRODUCTION FOR COMPUTER SIMULATOR
FOR OPERATOR OF TECHNOLOGICAL PROCESS Belaynin A.V., Denisevich A.A., Nagaitseva O.V.
Supervisor: Nagaitseva O.V., assistant
Ermakova Ya.V., teacher
Tomsk Polytechnic University, 634050, Russia, Tomsk, 30 Lenin str.
E-mail: [email protected]
Computer simulator is developed for training the operating personnel safe and effective methods to control electrolyzer for fluorine production in the workplace and different emergencies. Electrolyzer’s structure is given in [1]. The key element of the computer simulator is a production simulator model which includes several interconnected elements. The model of the processes proceeding in the electrolyzer which formed the basis of the technological scheme of fluorine production is the basic one.
This article presents the results of creating of mathematical models of technological process in the electolyzer for fluorine production, in the range of HF concentration– 38-42 % and electrolyte temperature – 368-378 K. It’s conformed to the normal mode.
Based on the previous models there was obtained a new mathematical formulation of process model [2] for the development of which cell modeling was used. In accordance with it, the volume of the apparatus was divided into three zones (with numbers 0,1,2). These zones are described by the set of lumped parameters (concentration of hydrogen fluoride, mass, temperature and electrolyte conductivity).
Zone 0 includes the central section of the apparatus and part of heat exchanger. The central section does not contain cathode cells, but hydrogen fluoride (HF), the measurement electrolyte temperature and HF concentration are realized with its help. Zones 1 and 2 include two sections and part of heat exchanger. The fist zone states left central zone and the second – right one.
Electrolyte hydrodynamics is described by the model of ideal shuffle in each zone. And at the same time electrolyte is considered to be a single-phase incompressible fluid medium. The effect of the gas phase formed as result of electrolysis is ignored. Process of heat and mass transfer between zones are agreed by natural electrolyte circulation in the volume of the appratus [5] and are described by the flow G. It is supposed that the injected gaseous hydrogen fluoride passes into the electrolyte immediately.
The load current is equal to the sum of current flowing through each section, as sections in electric circuit are connected in parallel. Then the current of first and second zones will be calculated:
1 ,II k I= ⋅ 2 (1 )II k I= − ⋅ (1)
where Ik – irregularity coefficient of current distribution in the zones is determined on the basis of statistical processing of data given by the operating industrial electrolyzer.
Composition of the electrolyte is changed due to the consumption of HF for the hydrogen and fluorine formation, HF evaporation from electrolyte surface into space under electrolyzer cover and HF supply for its compensation. This process occurs in the process of fluorine production in the electrolyzer. Loss of electrolyte because of its removing with eletrolyzer products are considered to be insignificant. According to it, the material balance of HF for each zone can be calculated by the system of equations (2):
0 20 0 0HF
HF HF HF HF1
0HF HFHF HF
( 2 )
( ) , 1,22
ku
kk
k k k kI u
dCm G G C G G C G
dtdC G
m G C GC G G kdt
=
= + − + −∑
= + − − − = (2) In accordance with the overall reaction (1) and
Faraday’s law, HF mass flow needed for the hydrogen and fluorine formation in each zone can be calculated by the relation (3):
2
HFeF
F
2k kI
MG k I
M= ⋅ ⋅ ⋅
(3)
where 2,HF FM M
– molar mass of HF and F2,
respectively, eFk – electrochemical equivalent of fluorine.
In this case, HF is consumed only in the first and the second zones, as cathode cells are placed there.
Consumption of HF, evaporating from the electrolyte surface into space under the electrolyzer cover for the k- zone is calculated by the relation:
AS CSk k kuG G G= + (4)
where kASG , CS
kG – mass flow of HF, evaporating into anode and cathode space under electrolyzer cover respectively.
According to the experimental data, the average content of HF in the fluorine product makes up 6% in operating temperature range and concentration of HF. So in concordance with Faraday’s law and explanation given above we can
estimate the total mass flow of HF ( ),АП
G
Section VII: Informatics and Control in Engineering Systems
93
evaporating from the electrolyte surface into anode space under the electrolyzer cover by the relation:
АП
6
94 эFG k I= ⋅ ⋅ (5)
Since the 1st and the 2nd zones are structurally identical, and zone 0 doesn’t have anode space,
ASG is divided into two equal parts between the first and the second zones and for zero zone it equals to zero.
Consumption of HF evaporating into the cathode space can be estimated as
AS
CS
AS
CS
S G
S G=
, (6)
where ,AS CSS S – surface area of all anode and cathode space under the electolyzer cover. Then consumption of HF for k-th zone evaporating into the cathode space is defined by the following expression:
CSCS
kk
ASAS
SG G
S=
, (7)
where kCSS – surface area of the cathode space
in k-th zone. In describing the heat exchange process,
electrolyzer is represented by the system which receives heat from the electric current (Joule heat) and which gives off heat trough the heat exchanger, outer walls of the shell and with removing products. The value of heat consumption from the evaporation of the electrolyte and other factors is negligible and therefore it is ignored. On the basis of hydrodynamics band model of electrolyte it is considered that heat from the electric current is released and with output product it is removed only in the first and second zones. Zones are exchanged with heat by means of the circulation flow G. According to this, heat balance through the flow of electrolyte can be described by the following equations (8):
0 20 0 0e
HF1
0eel H G
2
, 1,2
kG G H en
kk
k k k k kG G en
dQQ Q Q Q Q
dtdQ
Q Q Q Q Q Q kdt
− +=
+ −
= + − − −∑
= + − − − − =
where k – number of zone, Qke , H GQ ,Q ,k k k
enQ ,
HFQ , 0Q G+ , Q ,Qk k
G el− - heat, contained in the electrolyte, carried away by the heat exchanger, flue gases, the environment, brought in by HF, direct flow and reversed flows between zones and Joule heat, respectively.
Temperature of cooling water at the output of each zone is determined by the equation (9):
0 0 00 0( ) ( )
3
(2,5 ) 2,5 ( )2
w w ww w H e w
k k kV w w k k
w w H e w
dT G dTc S K D T T
dt dldT G dT
c S K D T Tdt dl
ρ + = π −ρ + = π −
As a hydrodynamic model of the cooling water flow the model of ideal displacement is accepted.
The total voltage drop in the electrolytic cell is determined by the following expression:
d el elecU E E E E= + + ∆ + (10) Theoretical decomposition voltage (Ed) for the
reaction in the temperature range from 263 K to 383 is 2.92 V on the average, changing the value in no more than 0.01 in [4].
Voltage drop in the electrolyte (Eel) can be defined as follows:
el elE I R= ⋅ ,
1 2
1 2el el
elel el
R RR
R R
⋅=
+ (11)
where elR , 1elR ,
2elR – resistance of the
electrolyte in interelectrode space is combined, in the first and second areas of modeling, respectively.
Electrolyte resistance in k-th zone:
el1kk kel el
lR
S= ⋅
σ , (12) where l – length between electrode (equal for
both zones), kelS ,
kelσ – average cross section area
of the electrolyte between electrodes, and electrolyte conductivity in k-th zone.
The value of electrolyte conductivity is calculated by the empirical dependence which is showed in [5].
Theoretically, the total polarization can be determined by the laws derived from the Tafel equation [3].
Value elecE includes the value of the voltage drop in the electrodes and contacts, and is about 0.05 V, it is calculated in [2].
Preliminary assessment of qualitative operation of the model was carried out in Matlab, which showed its efficiency. In future, it will be a detailed study of static and dynamic model adequacy using data on the operation of workable apparatus.
References 1. Нагайцева О.В., Ливенцова Н.В.,
Ливенцов С.Н. // Изв. ТПУ. Управление, вычислительная техника и информатика. – 2009 – Т. 315. – 5. С. 89 – 93.
2. Ливенцова Н.В. Система автоматизированного управления среднетемпературным электролизером производства фтора // Дис. Канд. Техн. Наук: 05.13.06. – ТПУ, 2008. – 199 с.
3. Багоцкий В.С. Основы электрохимии. – М.: Химия, 1988. – 400 с.
4. Галкин Н.П., Крутиков А.Б. Технология фтора. – М.: Атомиздат, 1968. – 188 с.
5. Химия фтора. Ч.1. // Под ред. И.Л. Кнунянца: Пер. с англ. – М.: Иностр. литер, 1948. – 248 с.
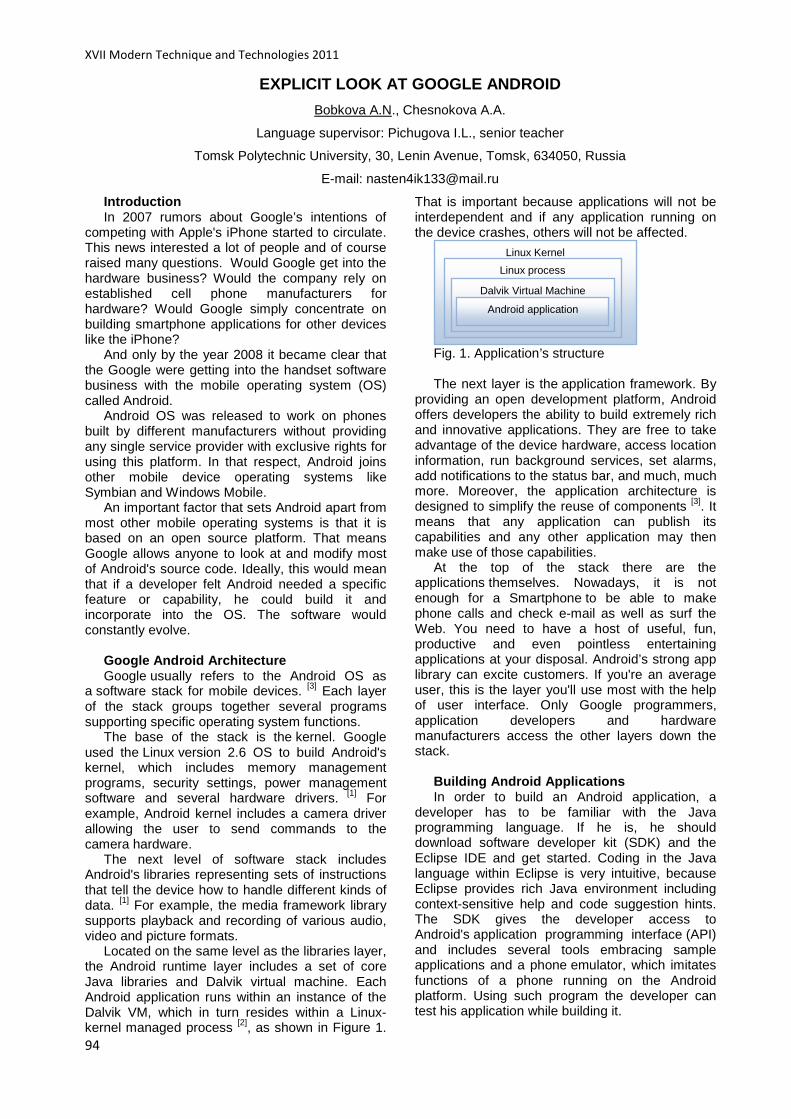
XVII Modern Technique and Technologies 2011
94
EXPLICIT LOOK AT GOOGLE ANDROID
Bobkova A.N., Chesnokova A.A.
Language supervisor: Pichugova I.L., senior teacher
Tomsk Polytechnic University, 30, Lenin Avenue, Tomsk, 634050, Russia
E-mail: [email protected]
Introduction In 2007 rumors about Google’s intentions of
competing with Apple's iPhone started to circulate. This news interested a lot of people and of course raised many questions. Would Google get into the hardware business? Would the company rely on established cell phone manufacturers for hardware? Would Google simply concentrate on building smartphone applications for other devices like the iPhone?
And only by the year 2008 it became clear that the Google were getting into the handset software business with the mobile operating system (OS) called Android.
Android OS was released to work on phones built by different manufacturers without providing any single service provider with exclusive rights for using this platform. In that respect, Android joins other mobile device operating systems like Symbian and Windows Mobile.
An important factor that sets Android apart from most other mobile operating systems is that it is based on an open source platform. That means Google allows anyone to look at and modify most of Android's source code. Ideally, this would mean that if a developer felt Android needed a specific feature or capability, he could build it and incorporate into the OS. The software would constantly evolve.
Google Android Architecture Google usually refers to the Android OS as
a software stack for mobile devices. [3] Each layer of the stack groups together several programs supporting specific operating system functions.
The base of the stack is the kernel. Google used the Linux version 2.6 OS to build Android's kernel, which includes memory management programs, security settings, power management software and several hardware drivers. [1] For example, Android kernel includes a camera driver allowing the user to send commands to the camera hardware.
The next level of software stack includes Android's libraries representing sets of instructions that tell the device how to handle different kinds of data. [1] For example, the media framework library supports playback and recording of various audio, video and picture formats.
Located on the same level as the libraries layer, the Android runtime layer includes a set of core Java libraries and Dalvik virtual machine. Each Android application runs within an instance of the Dalvik VM, which in turn resides within a Linux-kernel managed process [2], as shown in Figure 1.
That is important because applications will not be interdependent and if any application running on the device crashes, others will not be affected.
Fig. 1. Application’s structure The next layer is the application framework. By
providing an open development platform, Android offers developers the ability to build extremely rich and innovative applications. They are free to take advantage of the device hardware, access location information, run background services, set alarms, add notifications to the status bar, and much, much more. Moreover, the application architecture is designed to simplify the reuse of components [3]. It means that any application can publish its capabilities and any other application may then make use of those capabilities.
At the top of the stack there are the applications themselves. Nowadays, it is not enough for a Smartphone to be able to make phone calls and check e-mail as well as surf the Web. You need to have a host of useful, fun, productive and even pointless entertaining applications at your disposal. Android’s strong app library can excite customers. If you're an average user, this is the layer you'll use most with the help of user interface. Only Google programmers, application developers and hardware manufacturers access the other layers down the stack.
Building Android Applications In order to build an Android application, a
developer has to be familiar with the Java programming language. If he is, he should download software developer kit (SDK) and the Eclipse IDE and get started. Coding in the Java language within Eclipse is very intuitive, because Eclipse provides rich Java environment including context-sensitive help and code suggestion hints. The SDK gives the developer access to Android's application programming interface (API) and includes several tools embracing sample applications and a phone emulator, which imitates functions of a phone running on the Android platform. Using such program the developer can test his application while building it.
Linux Kernel
Linux process
Dalvik Virtual Machine
Android application
Section VII: Informatics and Control in Engineering Systems
95
Google cares about its developers by providing generous support for them. It includes different tutorials on Android developer Web site and tips on basic programming steps like testing and debugging software. Google even provides step-by-step instructions on how to build an application named Hello World, which is a usual start point for almost every programmer in learning almost every programming language.
Another feature of Android is multi-tasking support. As it was mentioned, this feature is possible due to Dalvik virtual machine. So, Android developers can create complex applications that run not only in the foreground but also in the background of other applications.
Each Android application can have (but it is not obligatory) four basic building blocks called application components. Each of them serves a distinct purpose and has a distinct lifecycle that defines how the component is created and destroyed:
• Activities. An activity represents a single screen with a user interface. For example, a map application could have a basic map screen, a trip planner screen and a route overlay screen. That is three activities.
• Intents. Intent is the mechanism aimed at moving from one activity to another. Android also permits broadcast intent receivers which are intents triggered by external events like moving to a new location or an incoming phone call. [2]
• Services. A service is a component that runs in the background to perform long-running operations. [2] A service does not provide a user interface. For example, a service might play music in the background while the user is in different application, or it might fetch data over the network without blocking user interaction with an activity.
• Content providers. A content provider allows an application to share information with other applications. For example, the Android system provides a content provider that manages the user's contact information. Therefore any application with the proper permissions can query part of the content provider to read and write information about a particular person. [2]
An Android application is composed of more than just code – it requires resources that are separate from the source code, such as images, audio files, and anything relating to the visual presentation of the application. For example, you should define animations, menus, styles, colors, and the layout of activity user interfaces with XML files. This approach makes it easy to update “appearance” of your application without modifying the code. Furthermore, it enables you to optimize your application for a variety of device configurations (such as different languages and screen sizes).
So, developers must keep a lot of different considerations in mind while building Android applications.In addition to unveiled above
Android’s internal content, there are some facts that are probably of some interest.
Interesting Facts about Android 1) History. Android OS was not the brainchild
of Google. It was devised in 2003 by tiny startup company Android Inc and sold to Google for $50 million in 2005. At the time of the acquisition, as nothing was known about the work of Android Inc., some guessed that Google was planning to enter the mobile phone market. Google put the concept in cold storage until several companies, including Google, HTC, Motorola, Intel, Qualcomm, Sprint Nextel, T-Mobile, and NVIDIA, came together to form the Open Handset Alliance at the end of 2007. They stated their goal for developing open standards for mobile devices, and unveiled Android. [3]
2) Updates. Like all software and operating systems Android gets regular updates which are quite intriguingly named using words associated with pastries and pastry baking moving forwards in alphabetical order: 1.5 – Cupcake, 1.6 – Donut, 2.0 / 2.1 – Éclair, 2.2 – Froyo, 2.3 / 2.4 – Gingerbread, 3.0 – Honeycomb, possible mid-2011 release – Ice Cream Sandwich. [3]
3) Enormous code length. The Android OS is made up of over 12 million lines of code, which includes 3 million lines of XML, 2.8 million lines of C, 2.1 million lines of Java, and 1.75 million lines of C++. [3]
4) Developer Challenge. The Android Developer Challenge (ADC) was launched by Google in 2008, with the aim of providing awards for high-quality mobile applications built on the Android platform. There are 10 specially-designated ADC 2 categories, which developers submit their apps to and for which Google offers prizes totaling 10 million dollars. [3]
Conclusion Android is hitting the today’s market and
properly competing with the most famous operating system for mobile devises Apple's iPhone. And the reasons of Android’s enhancing popularity are its considerable advantages. First of all, Google do not try to save Android’s code from curios developers. Moreover, their curiosity is encouraged with comprehensive support and excited challenges. In addition, Android supports various modern multimedia formats. So, a large number of opportunities, freedom and support for different phone models ranging from very simple and cheap to expensive and filled with high-end stuff, these all are fairly raising Android to the first place in the mobile world.
References 1. Yudin M. Google Android Architecture.
[Electronic resource] Access mode: http://www.realcoding.net/article/view/4767

XVII Modern Technique and Technologies 2011
96
2. Programming Basis for Android Platform. [Electronic resource] Access mode: http://softandroid.ru/articles/razrabotka/2363-article.html
3. Android Operating System. [Electronic resource] Access mode: http://en.wikipedia.org/wiki/Android_(operating system)
THE DEVELOPMENT OF WEB-APPLICATION FOR CLASSIFIER R EPRESENTATION
OF INTEGRAL CLASSIFIER SYSTEM
Ksenia Fedorova
Scientific adviser: S.V. Axyonov, M.V. Yurova
Tomsk Polytechnic University, Russia, Tomsk city, Lenin Street, 30
E-mail: [email protected]
Introduction Classifiers are the most important factor in the
backbone of informatization and the basis of a common language for presenting information. Their role in the implementation of integrated information environment is particularly important.
Classifiers should be used for: 1. definite presentation of information which
facilitates interaction with external systems; 2. input information by selecting a value from
the list. Due to the necessity of the work with classifiers,
we must be able to view the existing classifiers, information and a list of values, as well as edit existing data.
The aim of this work is to create exactly the web-application for displaying the qualifiers of USK (Unified System Classifier). Development of such application is necessary because there are problems of local application:
it’s difficult to scale solutions; the need for significant processing power
and storage space at each workplace; high administration costs of the client side,
which are growing exponentially and depending on the number of workplaces.
In order to achieve this goal we should solve the following tasks:
1. to explore the principles of building the unified information environment of the university and integral classifier system;
2. to analyze the existing application for classifiers maintenance;
3. to develop an application. Functions description Developed application allows making the
following steps: for a user with administrator privileges: • create and edit the description of the
classifier; • maintain a table of access rights;
• review the description and list of classifiers values;
• view the hierarchy of existing classifications. for normal users: • review the description and list of classifiers
values; • view the hierarchy of existing classifiers; • change the password. Authorization When the application is loading the user should
enter a login and password. After clicking on button "Login" the user
authentication with help of the function my_auth (p_username in VARCHAR2, p_password in VARCHAR2). This function returns a value of «true», if the input data correspond to stored information in the table «APP_USERS». If the function returns a value of «false», the user is invited to re-enter the data.
Table «APP_USERS» includes the attribute "Administrator Rights", which contains «Y» or «N» values. You can assign rights to users for viewing, creating or editing information about the classifiers with help of this attribute.
Configuring and Administering Applications After successful authentication the user is
referred to the home page, which contains the main parts of the application.
Fig. 1. Type of the main page for the
administrator If the user has administrator rights, he has got
an access to the page of creating and editing
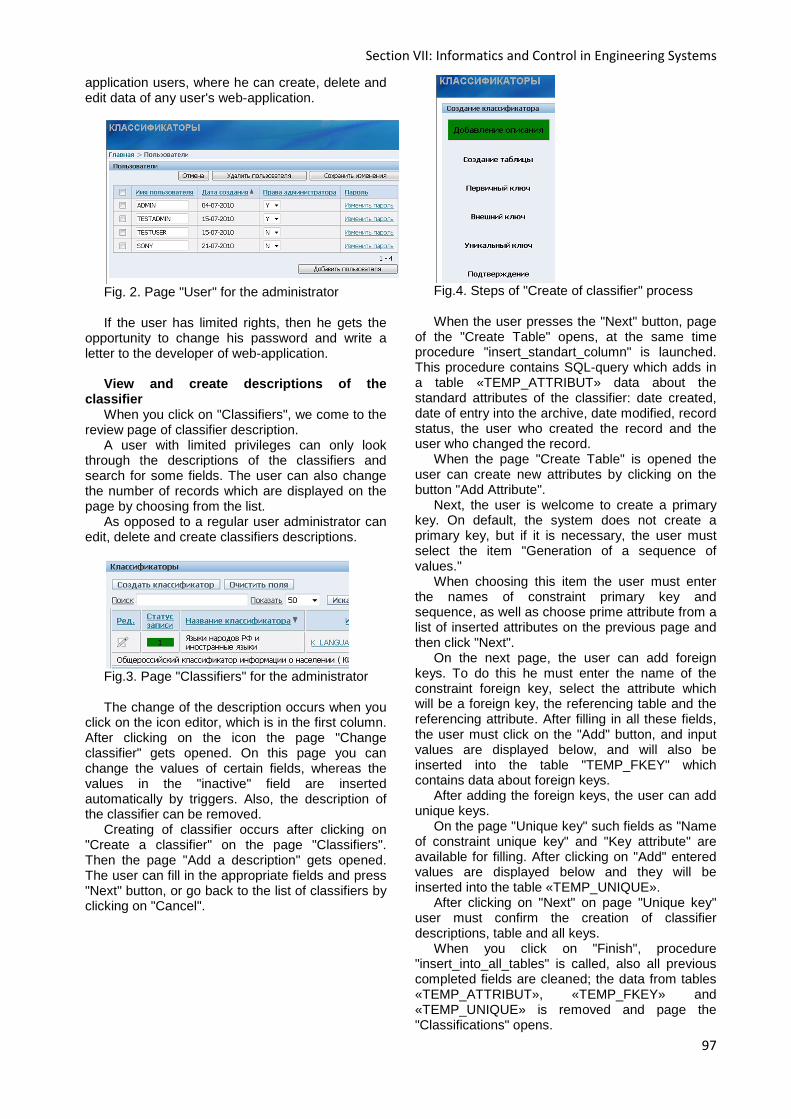
Section VII: Informatics and Control in Engineering Systems
97
application users, where he can create, delete and edit data of any user's web-application.
Fig. 2. Page "User" for the administrator If the user has limited rights, then he gets the
opportunity to change his password and write a letter to the developer of web-application.
View and create descriptions of the
classifier When you click on "Classifiers", we come to the
review page of classifier description. A user with limited privileges can only look
through the descriptions of the classifiers and search for some fields. The user can also change the number of records which are displayed on the page by choosing from the list.
As opposed to a regular user administrator can edit, delete and create classifiers descriptions.
Fig.3. Page "Classifiers" for the administrator The change of the description occurs when you
click on the icon editor, which is in the first column. After clicking on the icon the page "Change classifier" gets opened. On this page you can change the values of certain fields, whereas the values in the "inactive" field are inserted automatically by triggers. Also, the description of the classifier can be removed.
Creating of classifier occurs after clicking on "Create a classifier" on the page "Classifiers". Then the page "Add a description" gets opened. The user can fill in the appropriate fields and press "Next" button, or go back to the list of classifiers by clicking on "Cancel".
Fig.4. Steps of "Create of classifier" process When the user presses the "Next" button, page
of the "Create Table" opens, at the same time procedure "insert_standart_column" is launched. This procedure contains SQL-query which adds in a table «TEMP_ATTRIBUT» data about the standard attributes of the classifier: date created, date of entry into the archive, date modified, record status, the user who created the record and the user who changed the record.
When the page "Create Table" is opened the user can create new attributes by clicking on the button "Add Attribute".
Next, the user is welcome to create a primary key. On default, the system does not create a primary key, but if it is necessary, the user must select the item "Generation of a sequence of values."
When choosing this item the user must enter the names of constraint primary key and sequence, as well as choose prime attribute from a list of inserted attributes on the previous page and then click "Next".
On the next page, the user can add foreign keys. To do this he must enter the name of the constraint foreign key, select the attribute which will be a foreign key, the referencing table and the referencing attribute. After filling in all these fields, the user must click on the "Add" button, and input values are displayed below, and will also be inserted into the table "TEMP_FKEY" which contains data about foreign keys.
After adding the foreign keys, the user can add unique keys.
On the page "Unique key" such fields as "Name of constraint unique key" and "Key attribute" are available for filling. After clicking on "Add" entered values are displayed below and they will be inserted into the table «TEMP_UNIQUE».
After clicking on "Next" on page "Unique key" user must confirm the creation of classifier descriptions, table and all keys.
When you click on "Finish", procedure "insert_into_all_tables" is called, also all previous completed fields are cleaned; the data from tables «TEMP_ATTRIBUT», «TEMP_FKEY» and «TEMP_UNIQUE» is removed and page the "Classifications" opens.
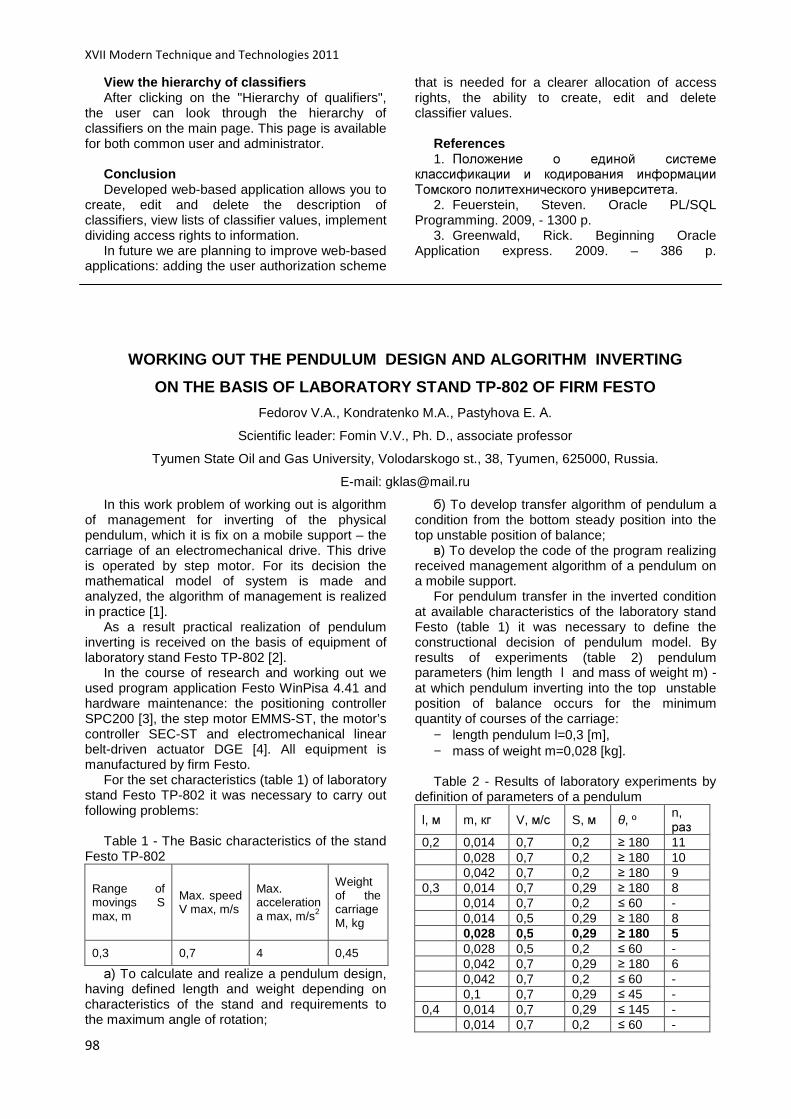
XVII Modern Technique and Technologies 2011
98
View the hierarchy of classifiers After clicking on the "Hierarchy of qualifiers",
the user can look through the hierarchy of classifiers on the main page. This page is available for both common user and administrator.
Conclusion Developed web-based application allows you to
create, edit and delete the description of classifiers, view lists of classifier values, implement dividing access rights to information.
In future we are planning to improve web-based applications: adding the user authorization scheme
that is needed for a clearer allocation of access rights, the ability to create, edit and delete classifier values.
References 1. Положение о единой системе
классификации и кодирования информации Томского политехнического университета.
2. Feuerstein, Steven. Oracle PL/SQL Programming. 2009, - 1300 p.
3. Greenwald, Rick. Beginning Oracle Application express. 2009. – 386 p.
WORKING OUT THE PENDULUM DESIGN AND ALGORITHM INV ERTING
ON THE BASIS OF LABORATORY STAND TP-802 OF FIRM FES TO
Fedorov V.A., Kondratenko M.A., Pastyhova E. А.
Scientific leader: Fomin V.V., Ph. D., associate professor
Tyumen State Oil and Gas University, Volodarskogo st., 38, Tyumen, 625000, Russia.
E-mail: [email protected]
In this work problem of working out is algorithm of management for inverting of the physical pendulum, which it is fix on a mobile support – the carriage of an electromechanical drive. This drive is operated by step motor. For its decision the mathematical model of system is made and analyzed, the algorithm of management is realized in practice [1].
As a result practical realization of pendulum inverting is received on the basis of equipment of laboratory stand Festo TP-802 [2].
In the course of research and working out we used program application Festo WinPisa 4.41 and hardware maintenance: the positioning controller SPC200 [3], the step motor EMMS-ST, the motor’s controller SEC-ST and electromechanical linear belt-driven actuator DGE [4]. All equipment is manufactured by firm Festo.
For the set characteristics (table 1) of laboratory stand Festo TP-802 it was necessary to carry out following problems:
Table 1 - The Basic characteristics of the stand
Festo TP-802
Range of movings S max, m
Max. speed V max, m/s
Max. acceleration a max, m/s2
Weight of the carriage M, kg
0,3 0,7 4 0,45
а) To calculate and realize a pendulum design, having defined length and weight depending on characteristics of the stand and requirements to the maximum angle of rotation;
б) To develop transfer algorithm of pendulum a condition from the bottom steady position into the top unstable position of balance;
в) To develop the code of the program realizing received management algorithm of a pendulum on a mobile support.
For pendulum transfer in the inverted condition at available characteristics of the laboratory stand Festo (table 1) it was necessary to define the constructional decision of pendulum model. By results of experiments (table 2) pendulum parameters (him length l and mass of weight m) - at which pendulum inverting into the top unstable position of balance occurs for the minimum quantity of courses of the carriage:
− length pendulum l=0,3 [m], − mass of weight m=0,028 [kg]. Table 2 - Results of laboratory experiments by
definition of parameters of a pendulum
l, м m, кг V, м/с S, м θ, º n, раз
0,2 0,014 0,7 0,2 ≥ 180 11 0,028 0,7 0,2 ≥ 180 10 0,042 0,7 0,2 ≥ 180 9 0,3 0,014 0,7 0,29 ≥ 180 8 0,014 0,7 0,2 ≤ 60 - 0,014 0,5 0,29 ≥ 180 8 0,028 0,5 0,29 ≥ 180 5 0,028 0,5 0,2 ≤ 60 - 0,042 0,7 0,29 ≥ 180 6 0,042 0,7 0,2 ≤ 60 - 0,1 0,7 0,29 ≤ 45 - 0,4 0,014 0,7 0,29 ≤ 145 - 0,014 0,7 0,2 ≤ 60 -
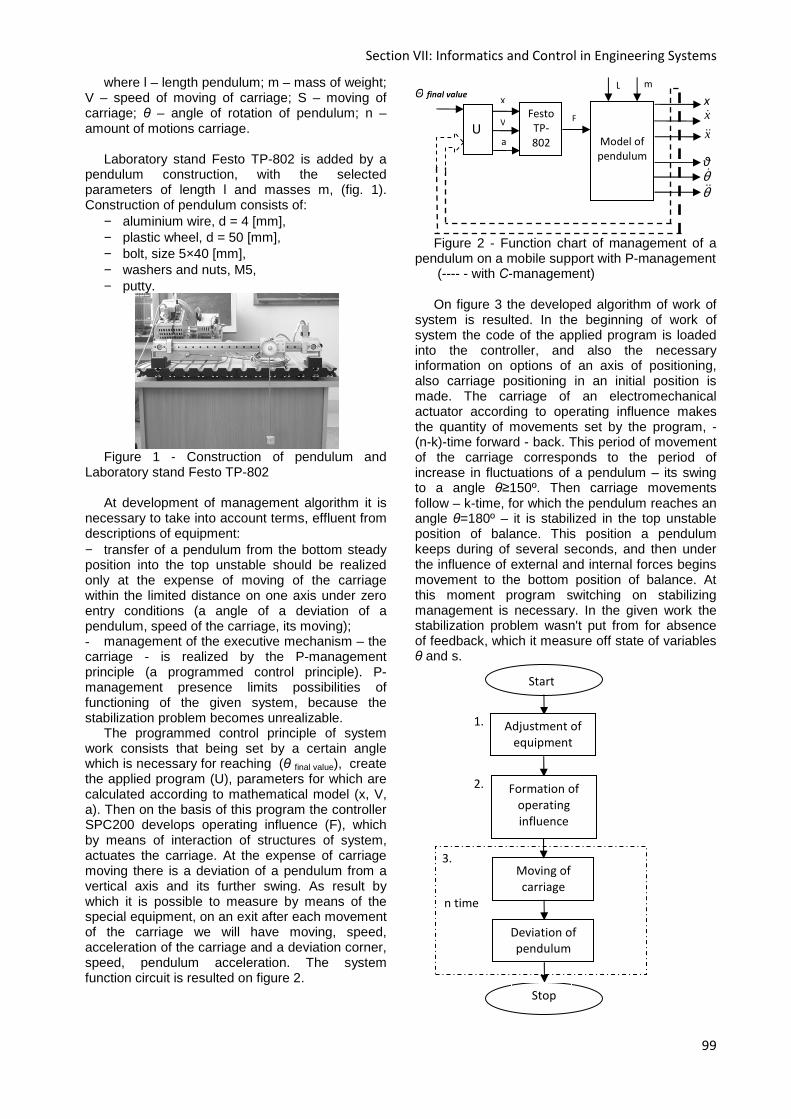
Section VII: Informatics and Control in Engineering Systems
99
where l – length pendulum; m – mass of weight; V – speed of moving of carriage; S – moving of carriage; θ – angle of rotation of pendulum; n – amount of motions carriage.
Laboratory stand Festo TP-802 is added by a
pendulum construction, with the selected parameters of length l and masses m, (fig. 1). Construction of pendulum consists of:
− aluminium wire, d = 4 [mm], − plastic wheel, d = 50 [mm], − bolt, size 5×40 [mm], − washers and nuts, M5, − putty.
Figure 1 - Construction of pendulum and
Laboratory stand Festo TP-802 At development of management algorithm it is
necessary to take into account terms, effluent from descriptions of equipment: − transfer of a pendulum from the bottom steady position into the top unstable should be realized only at the expense of moving of the carriage within the limited distance on one axis under zero entry conditions (a angle of a deviation of a pendulum, speed of the carriage, its moving); - management of the executive mechanism – the carriage - is realized by the P-management principle (a programmed control principle). P-management presence limits possibilities of functioning of the given system, because the stabilization problem becomes unrealizable.
The programmed control principle of system work consists that being set by a certain angle which is necessary for reaching (θ final value), create the applied program (U), parameters for which are calculated according to mathematical model (x, V, a). Then on the basis of this program the controller SPC200 develops operating influence (F), which by means of interaction of structures of system, actuates the carriage. At the expense of carriage moving there is a deviation of a pendulum from a vertical axis and its further swing. As result by which it is possible to measure by means of the special equipment, on an exit after each movement of the carriage we will have moving, speed, acceleration of the carriage and a deviation corner, speed, pendulum acceleration. The system function circuit is resulted on figure 2.
Figure 2 - Function chart of management of a
pendulum on a mobile support with P-management (---- - with С-management) On figure 3 the developed algorithm of work of
system is resulted. In the beginning of work of system the code of the applied program is loaded into the controller, and also the necessary information on options of an axis of positioning, also carriage positioning in an initial position is made. The carriage of an electromechanical actuator according to operating influence makes the quantity of movements set by the program, - (n-k)-time forward - back. This period of movement of the carriage corresponds to the period of increase in fluctuations of a pendulum – its swing to a angle θ≥150º. Then carriage movements follow – k-time, for which the pendulum reaches an angle θ=180º – it is stabilized in the top unstable position of balance. This position a pendulum keeps during of several seconds, and then under the influence of external and internal forces begins movement to the bottom position of balance. At this moment program switching on stabilizing management is necessary. In the given work the stabilization problem wasn't put from for absence of feedback, which it measure off state of variables θ and s.
Start
Adjustment of
equipment
Formation of
operating
influence
Moving of
carriage
Deviation of
pendulum
Stop
n time
1.
2.
3.
θ
θ&&
m L
a
V
Model of
pendulum
Festo
TP-
802
X
x&
θ&
F
x
x&&
U
Θ final value

XVII Modern Technique and Technologies 2011
100
Figure 3 - Algorithm of work of a control system of a pendulum on a mobile support (The block 3 carried out n time)
Result of determination of a control object
(creation and the mathematical model analysis, in this case) and control techniques will be the code of the application program implementing the received control algorithm by a pendulum with a mobile support. It contains the information on relocation of the carriage on certain distance with certain speed and the acceleration, written down on language of the assembler of an appropriate program application.
Literature sources: 1. Astrom K.J., Block D.J., Spong M.W. The
Reaction Wheel Pendulum. Morgan and Claypool, 2007. – 112 p.
2. Festo AG & Co. KG. // Автоматизация производства [Электронный ресурс]. – 2008. - Режим доступа: http://www.festo.ru.
3. SPC200 Smart Positioning Controller. WinPISA software package. Festo AG & Co. KG, 2005. - 381 p.
4. Positioning system. Smart Positioning Controller SPC200. Manual. Festo AG & Co. KG, Dept. KI-TD. 2005. - 371 p.
STATISTICAL METHODS
IN EVALUATING MARKETING CAMPAIGN EFFECTIVENESS
Garanina N.A..
Supervised by: Berestneva O.G.
Tomsk Polytechnic University, 634050, Russia, Tomsk, Lenina str., 30
E-mail: [email protected]
Advertising is a kind of investment in your own profit. And therefore it should be planned carefully. But in fact companies do not use any applications for planning it, they simply test advertising and then launch it on the media. This is a consequence of the fact that marketing managers usually do not know how to use different mathematical applications which can help them to find the most optimal way of budget management. And nowadays companies lose their money but no one can tell them for sure what had gone wrong… This article shows the way how marketing managers can use regression analysis in Microsoft Excel and therefore change their situation for the better. Maybe Microsoft Excel usually performs ordinary arithmetic operations. But there are some additional packages (e.g. statistical analysis package) which can be used for solving some difficult marketing tasks.
How can people understand whether this or that marketing campaign is going to be successful or not? Everyone has one’s own answer to this question. In my opinion, the more people know about our brand and our company on the whole, the more effective was our campaign. I guess it is one of the rare situations when such categories as QUALITY (of the marketing campaign) and QUANTITY (of the people informed) are in direct dependence from each other. And we should not forget that effective advertising should have optimal cost.
We should analyze marketing data to optimize our costs and find out the best plan for marketing campaign. Besides we can analyze this data in two
different ways: formal (by using statistical and econometrical methods) and informal (by using only qualitative assessment). And preference should be given to the formal one, even in spite of the fact that it is very time-consuming because there are a lot of difficulties connected with simulation of marketing situations: complexity and unpredictability of the object, nonlinearity of marketing processes, instability of marketing linkages, the complexity of measuring marketing variables, etc.
However, these methods have a high degree of accuracy and objectivity, which can not be said about the informal. In this evaluation of marketing effectiveness I use pair regression analysis. Such kind of analysis is used when a researcher wants to know how one variable affects the other.
Let’s analyze the activity of one company that mainly produces and sells the product X. The company organizes regular promotions to familiarize consumers with product X and that, of course, affects the level of sales. After analyzing the time series of sales and money spent on advertising, we can obtain:
• correlation between advertising costs and sales levels;
• econometric model that relates sales to advertising costs;
• some characteristics of the influence of advertising on sales.
Problem: there are two time series (advertising costs and sales). Their values were recorded every month during the year.
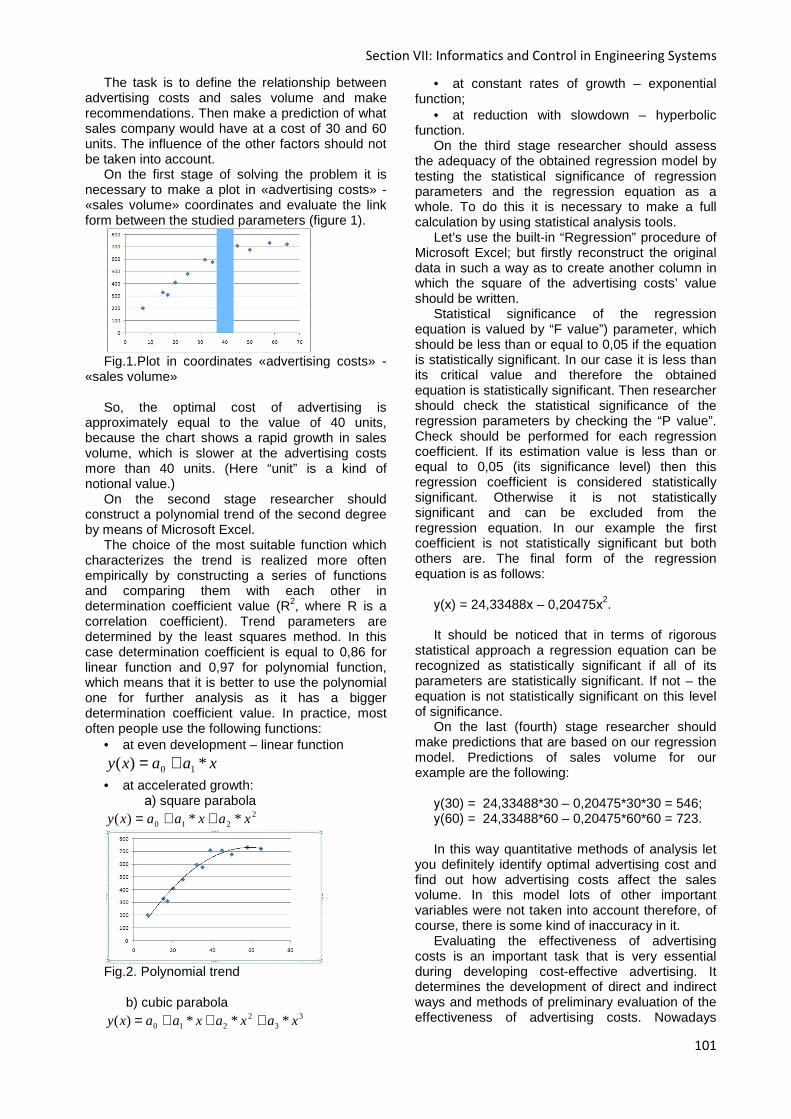
Section VII: Informatics and Control in Engineering Systems
101
The task is to define the relationship between advertising costs and sales volume and make recommendations. Then make a prediction of what sales company would have at a cost of 30 and 60 units. The influence of the other factors should not be taken into account.
On the first stage of solving the problem it is necessary to make a plot in «advertising costs» - «sales volume» coordinates and evaluate the link form between the studied parameters (figure 1).
Fig.1.Plot in coordinates «advertising costs» -
«sales volume» So, the optimal cost of advertising is
approximately equal to the value of 40 units, because the chart shows a rapid growth in sales volume, which is slower at the advertising costs more than 40 units. (Here “unit” is a kind of notional value.)
On the second stage researcher should construct a polynomial trend of the second degree by means of Microsoft Excel.
The choice of the most suitable function which characterizes the trend is realized more often empirically by constructing a series of functions and comparing them with each other in determination coefficient value (R2, where R is a correlation coefficient). Trend parameters are determined by the least squares method. In this case determination coefficient is equal to 0,86 for linear function and 0,97 for polynomial function, which means that it is better to use the polynomial one for further analysis as it has a bigger determination coefficient value. In practice, most often people use the following functions:
• at even development – linear function
xaaxy *)( 10 +=
• at accelerated growth: а) square parabola
2210 **)( xaxaaxy ++=
Fig.2. Polynomial trend b) cubic parabola
33
2210 ***)( xaxaxaaxy +++=
• at constant rates of growth – exponential function;
• at reduction with slowdown – hyperbolic function.
On the third stage researcher should assess the adequacy of the obtained regression model by testing the statistical significance of regression parameters and the regression equation as a whole. To do this it is necessary to make a full calculation by using statistical analysis tools.
Let’s use the built-in “Regression” procedure of Microsoft Excel; but firstly reconstruct the original data in such a way as to create another column in which the square of the advertising costs’ value should be written.
Statistical significance of the regression equation is valued by “F value”) parameter, which should be less than or equal to 0,05 if the equation is statistically significant. In our case it is less than its critical value and therefore the obtained equation is statistically significant. Then researcher should check the statistical significance of the regression parameters by checking the “P value”. Check should be performed for each regression coefficient. If its estimation value is less than or equal to 0,05 (its significance level) then this regression coefficient is considered statistically significant. Otherwise it is not statistically significant and can be excluded from the regression equation. In our example the first coefficient is not statistically significant but both others are. The final form of the regression equation is as follows:
у(х) = 24,33488х – 0,20475х2. It should be noticed that in terms of rigorous
statistical approach a regression equation can be recognized as statistically significant if all of its parameters are statistically significant. If not – the equation is not statistically significant on this level of significance.
On the last (fourth) stage researcher should make predictions that are based on our regression model. Predictions of sales volume for our example are the following:
у(30) = 24,33488*30 – 0,20475*30*30 = 546; у(60) = 24,33488*60 – 0,20475*60*60 = 723. In this way quantitative methods of analysis let
you definitely identify optimal advertising cost and find out how advertising costs affect the sales volume. In this model lots of other important variables were not taken into account therefore, of course, there is some kind of inaccuracy in it.
Evaluating the effectiveness of advertising costs is an important task that is very essential during developing cost-effective advertising. It determines the development of direct and indirect ways and methods of preliminary evaluation of the effectiveness of advertising costs. Nowadays

XVII Modern Technique and Technologies 2011
102
integrated approach to assessing advertising effectiveness, taking into account its economic and communicative (mental) performance, sales increase and encouraging consumers to make the subsequent choice, is considered to be very perspective. Microsoft Excel has very friendly interface and can be widely used for this purpose.
This technology of analyzing the advertising effectiveness basing on statistical methods is used for analyzing the marketing campaign by “Bio-ice-cream” Ltd.
References 1. Lashkova, E.V., Kucenko, A.I. Marketing:
practice research. – M.: Publishing Center “Academy”, 2008. – 240.
2. Furati, K.M., Zuhair Nashed, Abul Hasan Siddiqi. Mathematical Models and Methods for Real World Systems. - Chapman & Hall/CRC, 2005 – 455.
3. Phillips, J. Measured the Effectiveness of Your Advertising Campaign. – Access mode: http://www.articlesbase.com/marketing-articles/measuring-the-effectiveness-of-your-advertising-campaign-564280.html
4. Mokrov, A.V. Predicting the effectiveness of advertising campaign: the race in real time. – Access mode: http://www.sostav.ru/columns/opinion/2006/stat41/
CALCULATION AND VISUALIZATION OF THE X-POINT LOCATI ON
FOR PLASMA FOR KTM TOKAMAK
Khokhryakov V.S.
Supervisor: Pavlov V.M., Assoc., PhD
Tomsk Polytechnic University, 30, Lenin Avenue, Tomsk, 634050, Russia
E-mail: [email protected]
1. Introduction Coordination of the Kazakhstan Tokamak for
Material testing studies (KTM) supports ITER project in plasma material interaction investigations [1]. Thus KTM software support becomes extremely urgent.
Accurate knowledge of the magnetic field structure and the current distribution in a tokamak is of fundamental importance for achieving optimum tokamak performance.
Development of methods, particular algorithms and software for plasma’s magnetic surface recovery using external magnetic measurements is necessary to control the position and shape of the plasma in real time, and for solving other physical diagnosis and analysis in the interval between the discharges.
The magnetic topology is first derived using the magnetic measurements, from which the shape and position of the last closed magnetic flux surface (LCFS) and the radial dependence of the relevant shape parameters (like elongation and triangularity) are determined.
Figure 1. Plasma’s magnetic surface 2. Diverter, control wheels In modern Tokamaks a much more
complicated diverter configuration created by the coils of poloidal magnetic field. These coils are necessary even for a plasma of circular cross section: with their help create a vertical magnetic field component, which is in contact with the main current of the plasma allows the plasma loop is rolled to the wall in the direction of large radius. In the diverter configuration, the poloidal magnetic field coils arranged so that a section plasma was
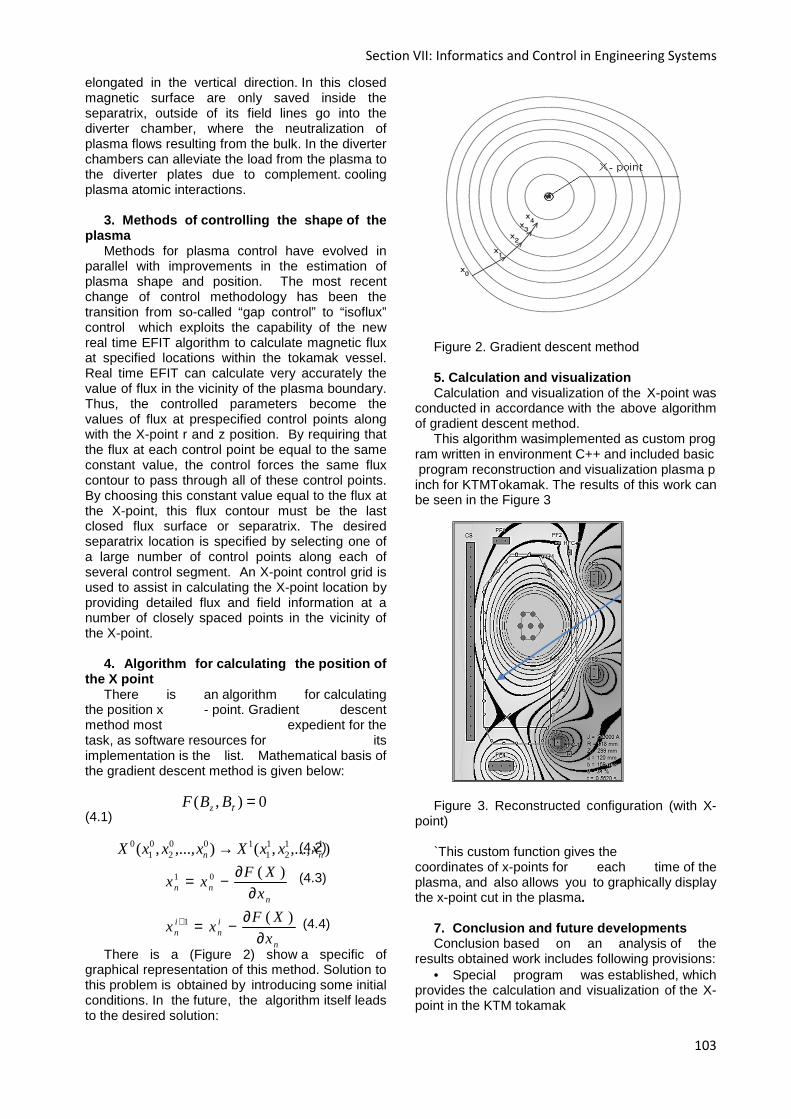
Section VII: Informatics and Control in Engineering Systems
103
elongated in the vertical direction. In this closed magnetic surface are only saved inside the separatrix, outside of its field lines go into the diverter chamber, where the neutralization of plasma flows resulting from the bulk. In the diverter chambers can alleviate the load from the plasma to the diverter plates due to complement. cooling plasma atomic interactions.
3. Methods of controlling the shape of the
plasma Methods for plasma control have evolved in
parallel with improvements in the estimation of plasma shape and position. The most recent change of control methodology has been the transition from so-called “gap control” to “isoflux” control which exploits the capability of the new real time EFIT algorithm to calculate magnetic flux at specified locations within the tokamak vessel. Real time EFIT can calculate very accurately the value of flux in the vicinity of the plasma boundary. Thus, the controlled parameters become the values of flux at prespecified control points along with the X-point r and z position. By requiring that the flux at each control point be equal to the same constant value, the control forces the same flux contour to pass through all of these control points. By choosing this constant value equal to the flux at the X-point, this flux contour must be the last closed flux surface or separatrix. The desired separatrix location is specified by selecting one of a large number of control points along each of several control segment. An X-point control grid is used to assist in calculating the X-point location by providing detailed flux and field information at a number of closely spaced points in the vicinity of the X-point.
4. Algorithm for calculating the position of
the X point There is an algorithm for calculating
the position x - point. Gradient descent method most expedient for the task, as software resources for its implementation is the list. Mathematical basis of the gradient descent method is given below:
(4.1) (4.2) (4.3) (4.4) There is a (Figure 2) show a specific of
graphical representation of this method. Solution to this problem is obtained by introducing some initial conditions. In the future, the algorithm itself leads to the desired solution:
Figure 2. Gradient descent method 5. Calculation and visualization Calculation and visualization of the X-point was
conducted in accordance with the above algorithm of gradient descent method.
This algorithm wasimplemented as custom program written in environment C++ and included basic program reconstruction and visualization plasma pinch for KTMTokamak. The results of this work can be seen in the Figure 3
Figure 3. Reconstructed configuration (with X-
point) `This custom function gives the
coordinates of x-points for each time of the plasma, and also allows you to graphically display the x-point cut in the plasma.
7. Conclusion and future developments Conclusion based on an analysis of the
results obtained work includes following provisions: • Special program was established, which
provides the calculation and visualization of the X-point in the KTM tokamak
0),( =τBBF z
),...,,(),...,,( 112
11
1002
01
0nn xxxXxxxX →
1 0
1
( )
( )
n nn
i in n
n
F Xx x
x
F Xx x
x+
∂= −∂
∂= −∂
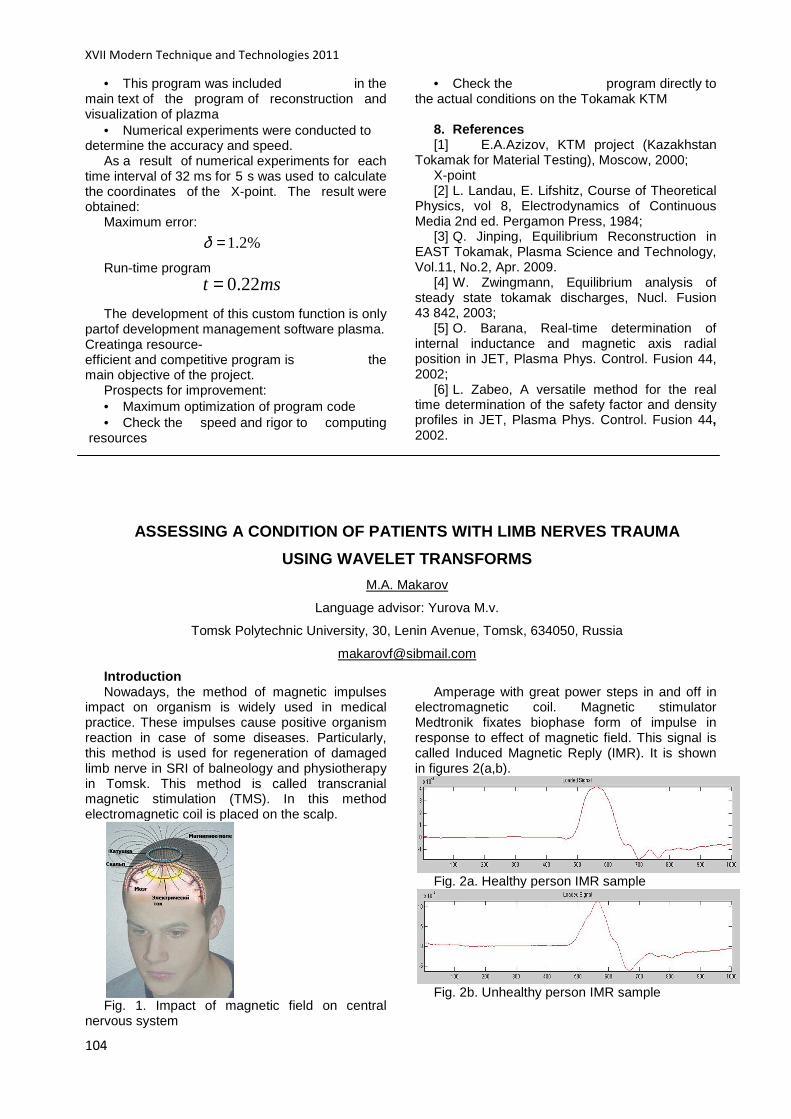
XVII Modern Technique and Technologies 2011
104
• This program was included in the main text of the program of reconstruction and visualization of plazma
• Numerical experiments were conducted to determine the accuracy and speed.
As a result of numerical experiments for each time interval of 32 ms for 5 s was used to calculate the coordinates of the X-point. The result were obtained:
Maximum error: Run-time program The development of this custom function is only
partof development management software plasma.Creatinga resource-efficient and competitive program is the main objective of the project.
Prospects for improvement: • Maximum optimization of program code • Check the speed and rigor to computing
resources
• Check the program directly to the actual conditions on the Tokamak KTM
8. References [1] E.A.Azizov, KTM project (Kazakhstan
Tokamak for Material Testing), Moscow, 2000; X-point [2] L. Landau, E. Lifshitz, Course of Theoretical
Physics, vol 8, Electrodynamics of Continuous Media 2nd ed. Pergamon Press, 1984;
[3] Q. Jinping, Equilibrium Reconstruction in EAST Tokamak, Plasma Science and Technology, Vol.11, No.2, Apr. 2009.
[4] W. Zwingmann, Equilibrium analysis of steady state tokamak discharges, Nucl. Fusion 43 842, 2003;
[5] O. Barana, Real-time determination of internal inductance and magnetic axis radial position in JET, Plasma Phys. Control. Fusion 44, 2002;
[6] L. Zabeo, A versatile method for the real time determination of the safety factor and density profiles in JET, Plasma Phys. Control. Fusion 44, 2002.
ASSESSING A CONDITION OF PATIENTS WITH LIMB NERVES TRAUMA
USING WAVELET TRANSFORMS
M.A. Makarov
Language advisor: Yurova M.v.
Tomsk Polytechnic University, 30, Lenin Avenue, Tomsk, 634050, Russia
Introduction Nowadays, the method of magnetic impulses
impact on organism is widely used in medical practice. These impulses cause positive organism reaction in case of some diseases. Particularly, this method is used for regeneration of damaged limb nerve in SRI of balneology and physiotherapy in Tomsk. This method is called transcranial magnetic stimulation (TMS). In this method electromagnetic coil is placed on the scalp.
Fig. 1. Impact of magnetic field on central
nervous system
Amperage with great power steps in and off in
electromagnetic coil. Magnetic stimulator Medtronik fixates biophase form of impulse in response to effect of magnetic field. This signal is called Induced Magnetic Reply (IMR). It is shown in figures 2(a,b).
Fig. 2a. Healthy person IMR sample
Fig. 2b. Unhealthy person IMR sample
%2.1=δ
0.22t ms=
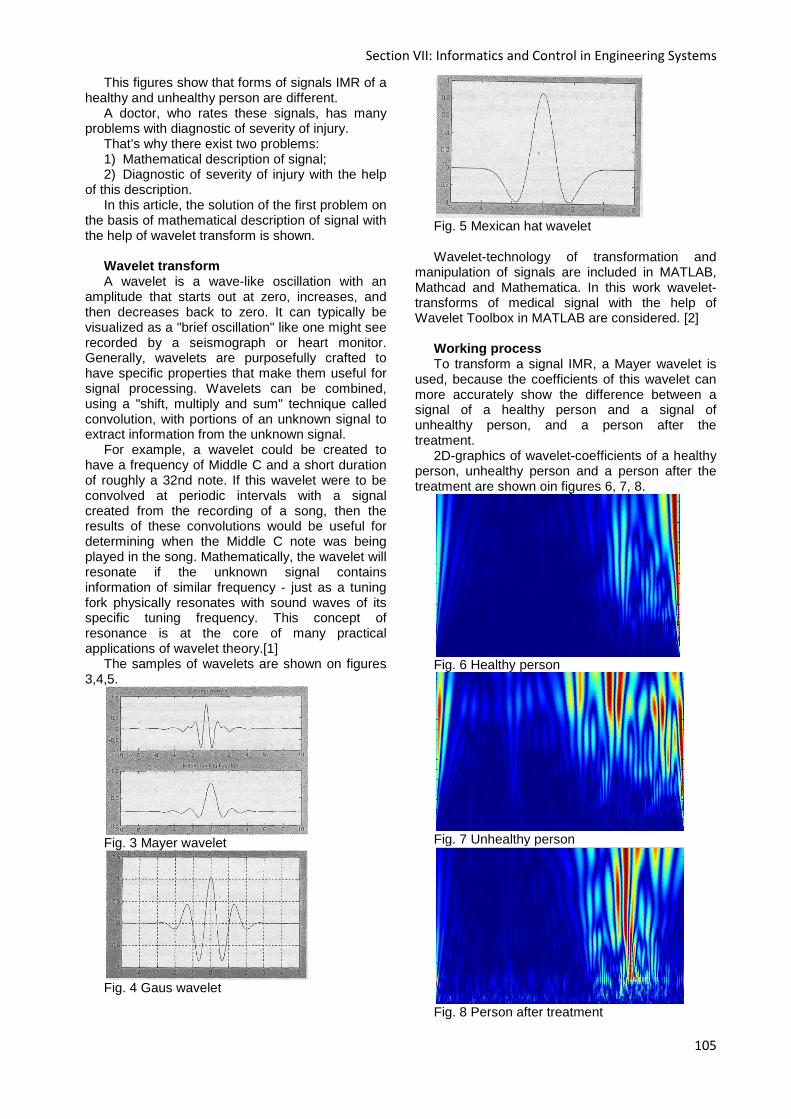
Section VII: Informatics and Control in Engineering Systems
105
This figures show that forms of signals IMR of a healthy and unhealthy person are different.
A doctor, who rates these signals, has many problems with diagnostic of severity of injury.
That’s why there exist two problems: 1) Mathematical description of signal; 2) Diagnostic of severity of injury with the help
of this description. In this article, the solution of the first problem on
the basis of mathematical description of signal with the help of wavelet transform is shown.
Wavelet transform A wavelet is a wave-like oscillation with an
amplitude that starts out at zero, increases, and then decreases back to zero. It can typically be visualized as a "brief oscillation" like one might see recorded by a seismograph or heart monitor. Generally, wavelets are purposefully crafted to have specific properties that make them useful for signal processing. Wavelets can be combined, using a "shift, multiply and sum" technique called convolution, with portions of an unknown signal to extract information from the unknown signal.
For example, a wavelet could be created to have a frequency of Middle C and a short duration of roughly a 32nd note. If this wavelet were to be convolved at periodic intervals with a signal created from the recording of a song, then the results of these convolutions would be useful for determining when the Middle C note was being played in the song. Mathematically, the wavelet will resonate if the unknown signal contains information of similar frequency - just as a tuning fork physically resonates with sound waves of its specific tuning frequency. This concept of resonance is at the core of many practical applications of wavelet theory.[1]
The samples of wavelets are shown on figures 3,4,5.
Fig. 3 Mayer wavelet
Fig. 4 Gaus wavelet
Fig. 5 Mexican hat wavelet Wavelet-technology of transformation and
manipulation of signals are included in MATLAB, Mathcad and Mathematica. In this work wavelet-transforms of medical signal with the help of Wavelet Toolbox in MATLAB are considered. [2]
Working process To transform a signal IMR, a Mayer wavelet is
used, because the coefficients of this wavelet can more accurately show the difference between a signal of a healthy person and a signal of unhealthy person, and a person after the treatment.
2D-graphics of wavelet-coefficients of a healthy person, unhealthy person and a person after the treatment are shown oin figures 6, 7, 8.
Fig. 6 Healthy person
Fig. 7 Unhealthy person
Fig. 8 Person after treatment
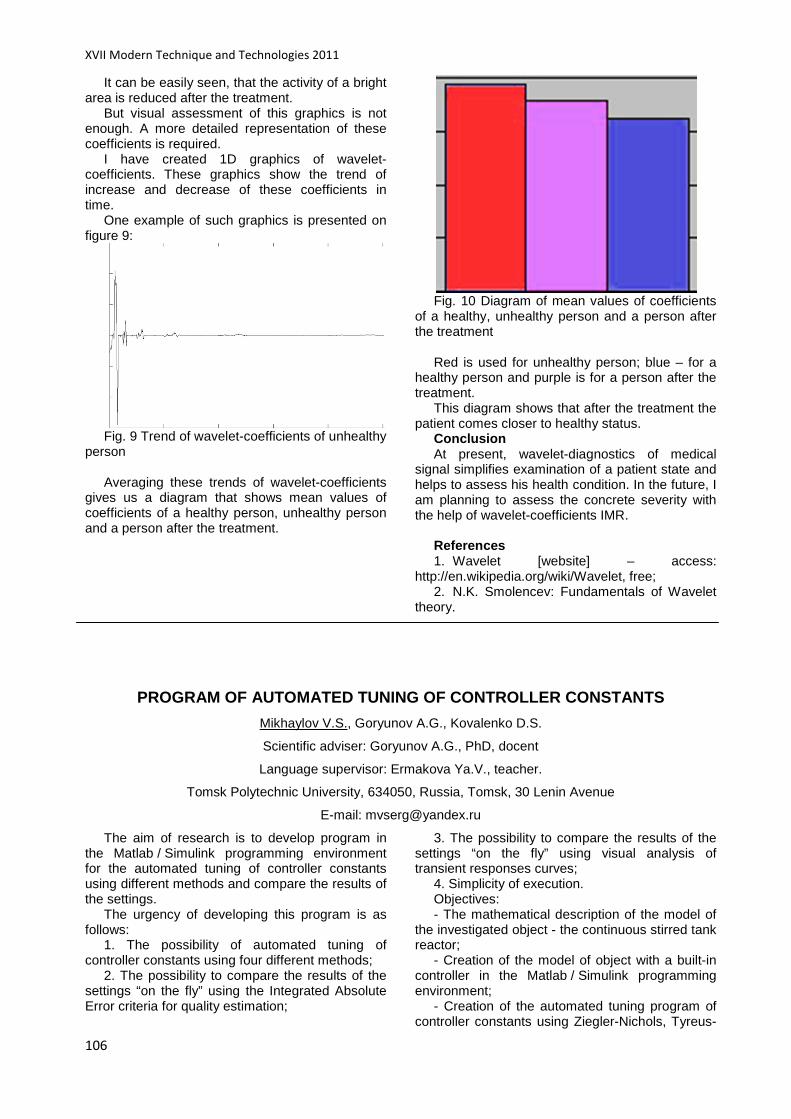
XVII Modern Technique and Technologies 2011
106
It can be easily seen, that the activity of a bright area is reduced after the treatment.
But visual assessment of this graphics is not enough. A more detailed representation of these coefficients is required.
I have created 1D graphics of wavelet-coefficients. These graphics show the trend of increase and decrease of these coefficients in time.
One example of such graphics is presented on figure 9:
Fig. 9 Trend of wavelet-coefficients of unhealthy
person Averaging these trends of wavelet-coefficients
gives us a diagram that shows mean values of coefficients of a healthy person, unhealthy person and a person after the treatment.
Fig. 10 Diagram of mean values of coefficients
of a healthy, unhealthy person and a person after the treatment
Red is used for unhealthy person; blue – for a
healthy person and purple is for a person after the treatment.
This diagram shows that after the treatment the patient comes closer to healthy status.
Conclusion At present, wavelet-diagnostics of medical
signal simplifies examination of a patient state and helps to assess his health condition. In the future, I am planning to assess the concrete severity with the help of wavelet-coefficients IMR.
References 1. Wavelet [website] – access:
http://en.wikipedia.org/wiki/Wavelet, free; 2. N.K. Smolencev: Fundamentals of Wavelet
theory.
PROGRAM OF AUTOMATED TUNING OF CONTROLLER CONSTANTS
Mikhaylov V.S., Goryunov A.G., Kovalenko D.S.
Scientific adviser: Goryunov A.G., PhD, docent
Language supervisor: Ermakova Ya.V., teacher.
Tomsk Polytechnic University, 634050, Russia, Tomsk, 30 Lenin Avenue
E-mail: [email protected]
The aim of research is to develop program in the Matlab / Simulink programming environment for the automated tuning of controller constants using different methods and compare the results of the settings.
The urgency of developing this program is as follows:
1. The possibility of automated tuning of controller constants using four different methods;
2. The possibility to compare the results of the settings “on the fly” using the Integrated Absolute Error criteria for quality estimation;
3. The possibility to compare the results of the settings “on the fly” using visual analysis of transient responses curves;
4. Simplicity of execution. Objectives: - The mathematical description of the model of
the investigated object - the continuous stirred tank reactor;
- Creation of the model of object with a built-in controller in the Matlab / Simulink programming environment;
- Creation of the automated tuning program of controller constants using Ziegler-Nichols, Tyreus-
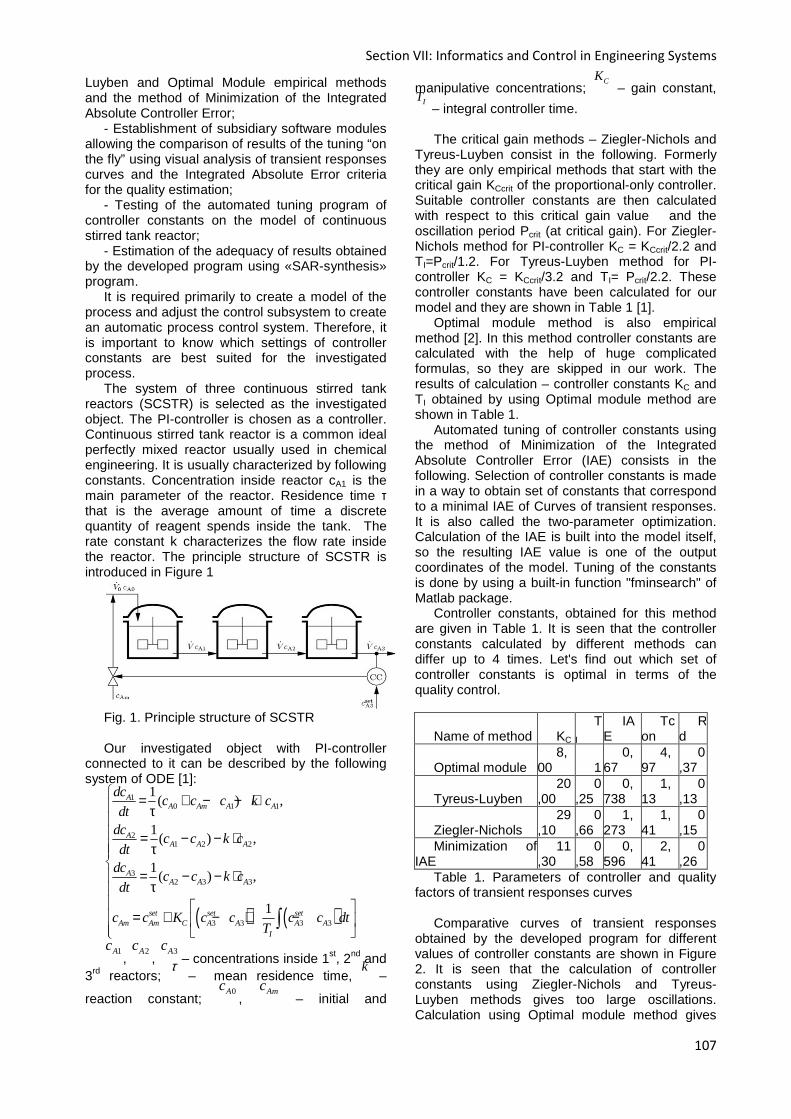
Section VII: Informatics and Control in Engineering Systems
107
Luyben and Optimal Module empirical methods and the method of Minimization of the Integrated Absolute Controller Error;
- Establishment of subsidiary software modules allowing the comparison of results of the tuning “on the fly” using visual analysis of transient responses curves and the Integrated Absolute Error criteria for the quality estimation;
- Testing of the automated tuning program of controller constants on the model of continuous stirred tank reactor;
- Estimation of the adequacy of results obtained by the developed program using «SAR-synthesis» program.
It is required primarily to create a model of the process and adjust the control subsystem to create an automatic process control system. Therefore, it is important to know which settings of controller constants are best suited for the investigated process.
The system of three continuous stirred tank reactors (SCSTR) is selected as the investigated object. The PI-controller is chosen as a controller. Continuous stirred tank reactor is a common ideal perfectly mixed reactor usually used in chemical engineering. It is usually characterized by following constants. Concentration inside reactor cA1 is the main parameter of the reactor. Residence time τ that is the average amount of time a discrete quantity of reagent spends inside the tank. The rate constant k characterizes the flow rate inside the reactor. The principle structure of SCSTR is introduced in Figure 1
Fig. 1. Principle structure of SCSTR Our investigated object with PI-controller
connected to it can be described by the following system of ODE [1]:
( ) ( )
10 1 1
21 2 2
32 3 3
3 3 3 3
1( ) ,
1( ) ,
1( ) ,
1
AA Am A A
AA A A
AA A A
set set setAm Am C A A A A
I
dcc c c k c
dtdc
c c k cdt
dcc c k c
dt
c c K c c c c dtT
= + − − ⋅ τ = − − ⋅ τ
= − − ⋅τ
= + − + −
∫
1Ac,
2Ac,
3Ac – concentrations inside 1st, 2nd and
3rd reactors; τ
– mean residence time, k
–
reaction constant; 0Ac,
Amc – initial and
manipulative concentrations; CK
– gain constant, IT – integral controller time. The critical gain methods – Ziegler-Nichols and
Tyreus-Luyben consist in the following. Formerly they are only empirical methods that start with the critical gain KCcrit of the proportional-only controller. Suitable controller constants are then calculated with respect to this critical gain value and the oscillation period Pcrit (at critical gain). For Ziegler-Nichols method for PI-controller KC = KCcrit/2.2 and TI=Pcrit/1.2. For Tyreus-Luyben method for PI-controller KC = KCcrit/3.2 and TI= Pcrit/2.2. These controller constants have been calculated for our model and they are shown in Table 1 [1].
Optimal module method is also empirical method [2]. In this method controller constants are calculated with the help of huge complicated formulas, so they are skipped in our work. The results of calculation – controller constants KC and TI obtained by using Optimal module method are shown in Table 1.
Automated tuning of controller constants using the method of Minimization of the Integrated Absolute Controller Error (IAE) consists in the following. Selection of controller constants is made in a way to obtain set of constants that correspond to a minimal IAE of Curves of transient responses. It is also called the two-parameter optimization. Calculation of the IAE is built into the model itself, so the resulting IAE value is one of the output coordinates of the model. Tuning of the constants is done by using a built-in function "fminsearch" of Matlab package.
Controller constants, obtained for this method are given in Table 1. It is seen that the controller constants calculated by different methods can differ up to 4 times. Let's find out which set of controller constants is optimal in terms of the quality control.
Name of method KC T
I IA
E Tc
on R
d
Optimal module 8,
00 1 0,
67 4,
97 0
,37
Tyreus-Luyben 20
,00 0
,25 0,
738 1,
13 0
,13
Ziegler-Nichols 29
,10 0
,66 1,
273 1,
41 0
,15 Minimization of
IAE 11
,30 0
,58 0,
596 2,
41 0
,26 Table 1. Parameters of controller and quality
factors of transient responses curves Comparative curves of transient responses
obtained by the developed program for different values of controller constants are shown in Figure 2. It is seen that the calculation of controller constants using Ziegler-Nichols and Tyreus-Luyben methods gives too large oscillations. Calculation using Optimal module method gives
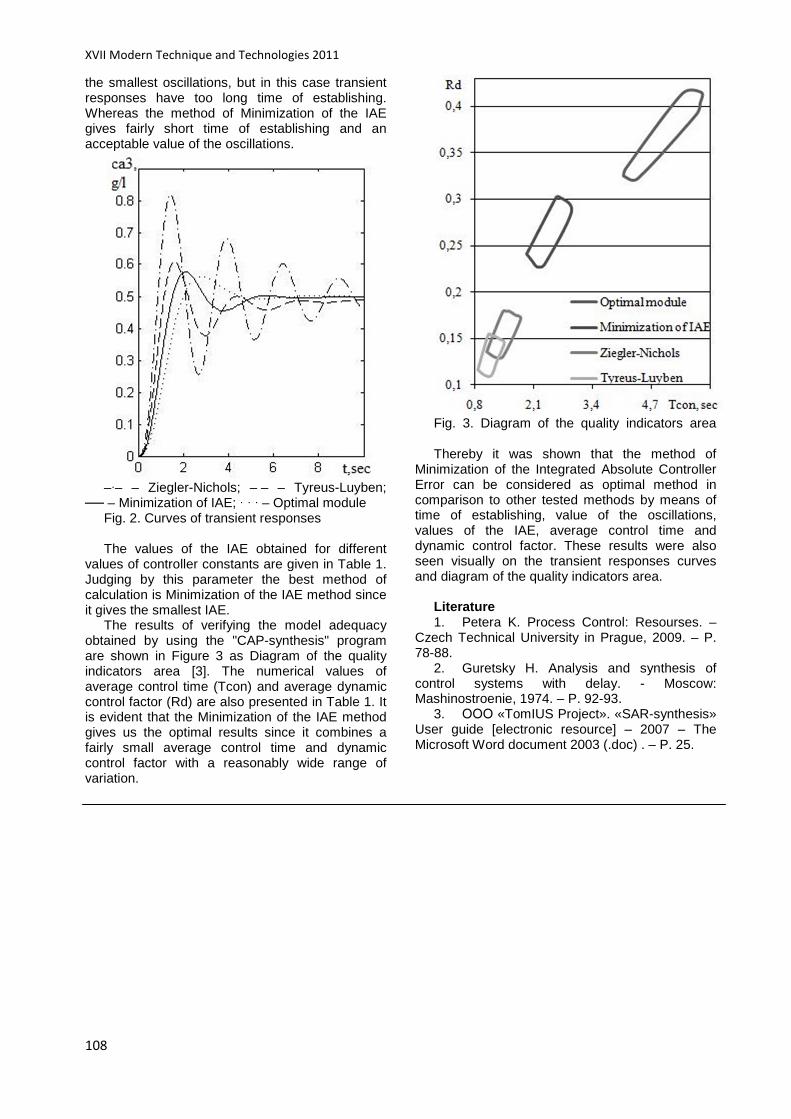
XVII Modern Technique and Technologies 2011
108
the smallest oscillations, but in this case transient responses have too long time of establishing. Whereas the method of Minimization of the IAE gives fairly short time of establishing and an acceptable value of the oscillations.
–·– – Ziegler-Nichols; – – – Tyreus-Luyben;
– Minimization of IAE; · · · – Optimal module Fig. 2. Curves of transient responses The values of the IAE obtained for different
values of controller constants are given in Table 1. Judging by this parameter the best method of calculation is Minimization of the IAE method since it gives the smallest IAE.
The results of verifying the model adequacy obtained by using the "CAP-synthesis" program are shown in Figure 3 as Diagram of the quality indicators area [3]. The numerical values of average control time (Tcon) and average dynamic control factor (Rd) are also presented in Table 1. It is evident that the Minimization of the IAE method gives us the optimal results since it combines a fairly small average control time and dynamic control factor with a reasonably wide range of variation.
Fig. 3. Diagram of the quality indicators area
Thereby it was shown that the method of
Minimization of the Integrated Absolute Controller Error can be considered as optimal method in comparison to other tested methods by means of time of establishing, value of the oscillations, values of the IAE, average control time and dynamic control factor. These results were also seen visually on the transient responses curves and diagram of the quality indicators area.
Literature 1. Petera K. Process Control: Resourses. –
Czech Technical University in Prague, 2009. – P. 78-88.
2. Guretsky H. Analysis and synthesis of control systems with delay. - Moscow: Mashinostroenie, 1974. – P. 92-93.
3. ООО «TomIUS Project». «SAR-synthesis» User guide [electronic resource] – 2007 – The Microsoft Word document 2003 (.doc) . – P. 25.
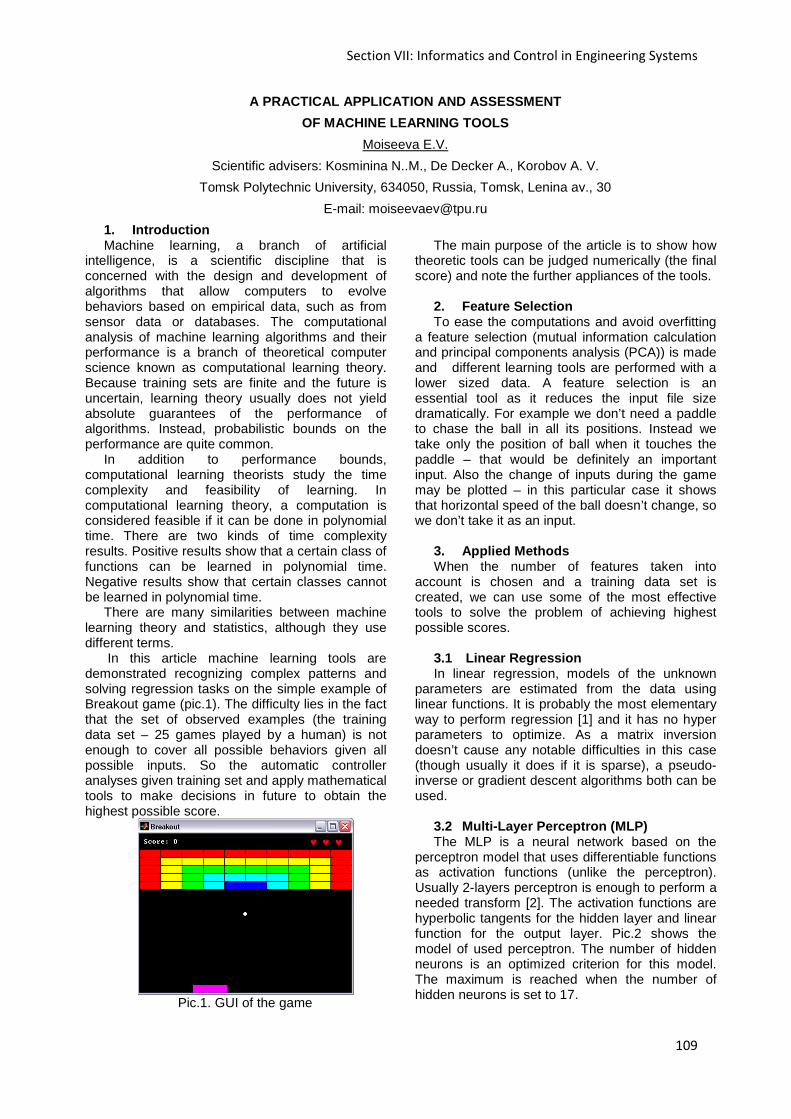
Section VII: Informatics and Control in Engineering Systems
109
A PRACTICAL APPLICATION AND ASSESSMENT
OF MACHINE LEARNING TOOLS
Moiseeva E.V.
Scientific advisers: Kosminina N..M., De Decker A., Korobov A. V.
Tomsk Polytechnic University, 634050, Russia, Tomsk, Lenina av., 30
E-mail: [email protected]
1. Introduction Machine learning, a branch of artificial
intelligence, is a scientific discipline that is concerned with the design and development of algorithms that allow computers to evolve behaviors based on empirical data, such as from sensor data or databases. The computational analysis of machine learning algorithms and their performance is a branch of theoretical computer science known as computational learning theory. Because training sets are finite and the future is uncertain, learning theory usually does not yield absolute guarantees of the performance of algorithms. Instead, probabilistic bounds on the performance are quite common.
In addition to performance bounds, computational learning theorists study the time complexity and feasibility of learning. In computational learning theory, a computation is considered feasible if it can be done in polynomial time. There are two kinds of time complexity results. Positive results show that a certain class of functions can be learned in polynomial time. Negative results show that certain classes cannot be learned in polynomial time.
There are many similarities between machine learning theory and statistics, although they use different terms.
In this article machine learning tools are demonstrated recognizing complex patterns and solving regression tasks on the simple example of Breakout game (pic.1). The difficulty lies in the fact that the set of observed examples (the training data set – 25 games played by a human) is not enough to cover all possible behaviors given all possible inputs. So the automatic controller analyses given training set and apply mathematical tools to make decisions in future to obtain the highest possible score.
Pic.1. GUI of the game
The main purpose of the article is to show how
theoretic tools can be judged numerically (the final score) and note the further appliances of the tools.
2. Feature Selection To ease the computations and avoid overfitting
a feature selection (mutual information calculation and principal components analysis (PCA)) is made and different learning tools are performed with a lower sized data. A feature selection is an essential tool as it reduces the input file size dramatically. For example we don’t need a paddle to chase the ball in all its positions. Instead we take only the position of ball when it touches the paddle – that would be definitely an important input. Also the change of inputs during the game may be plotted – in this particular case it shows that horizontal speed of the ball doesn’t change, so we don’t take it as an input.
3. Applied Methods When the number of features taken into
account is chosen and a training data set is created, we can use some of the most effective tools to solve the problem of achieving highest possible scores.
3.1 Linear Regression In linear regression, models of the unknown
parameters are estimated from the data using linear functions. It is probably the most elementary way to perform regression [1] and it has no hyper parameters to optimize. As a matrix inversion doesn’t cause any notable difficulties in this case (though usually it does if it is sparse), a pseudo-inverse or gradient descent algorithms both can be used.
3.2 Multi-Layer Perceptron (MLP) The MLP is a neural network based on the
perceptron model that uses differentiable functions as activation functions (unlike the perceptron). Usually 2-layers perceptron is enough to perform a needed transform [2]. The activation functions are hyperbolic tangents for the hidden layer and linear function for the output layer. Pic.2 shows the model of used perceptron. The number of hidden neurons is an optimized criterion for this model. The maximum is reached when the number of hidden neurons is set to 17.
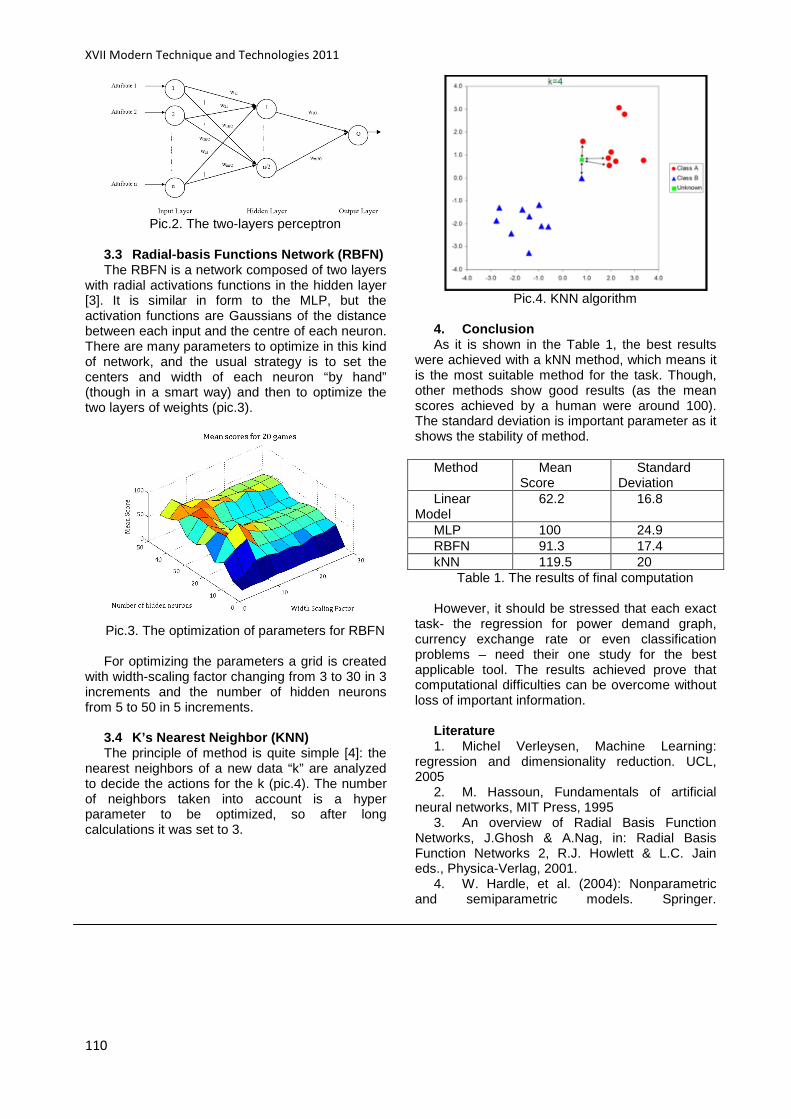
XVII Modern Technique and Technologies 2011
110
Pic.2. The two-layers perceptron
3.3 Radial-basis Functions Network (RBFN) The RBFN is a network composed of two layers
with radial activations functions in the hidden layer [3]. It is similar in form to the MLP, but the activation functions are Gaussians of the distance between each input and the centre of each neuron. There are many parameters to optimize in this kind of network, and the usual strategy is to set the centers and width of each neuron “by hand” (though in a smart way) and then to optimize the two layers of weights (pic.3).
Pic.3. The optimization of parameters for RBFN For optimizing the parameters a grid is created
with width-scaling factor changing from 3 to 30 in 3 increments and the number of hidden neurons from 5 to 50 in 5 increments.
3.4 K’s Nearest Neighbor (KNN) The principle of method is quite simple [4]: the
nearest neighbors of a new data “k” are analyzed to decide the actions for the k (pic.4). The number of neighbors taken into account is a hyper parameter to be optimized, so after long calculations it was set to 3.
Pic.4. KNN algorithm
4. Conclusion As it is shown in the Table 1, the best results
were achieved with a kNN method, which means it is the most suitable method for the task. Though, other methods show good results (as the mean scores achieved by a human were around 100). The standard deviation is important parameter as it shows the stability of method.
Method Mean
Score Standard
Deviation Linear
Model 62.2 16.8
MLP 100 24.9 RBFN 91.3 17.4 kNN 119.5 20
Table 1. The results of final computation However, it should be stressed that each exact
task- the regression for power demand graph, currency exchange rate or even classification problems – need their one study for the best applicable tool. The results achieved prove that computational difficulties can be overcome without loss of important information.
Literature 1. Michel Verleysen, Machine Learning:
regression and dimensionality reduction. UCL, 2005
2. M. Hassoun, Fundamentals of artificial neural networks, MIT Press, 1995
3. An overview of Radial Basis Function Networks, J.Ghosh & A.Nag, in: Radial Basis Function Networks 2, R.J. Howlett & L.C. Jain eds., Physica-Verlag, 2001.
4. W. Hardle, et al. (2004): Nonparametric and semiparametric models. Springer.

Section VII: Informatics and Control in Engineering Systems
111
CONTROL SYSTEM OF RESOURCES IN TECHNICAL SYSTEMS
AT LIQUIDATION OF EMERGENCY SITUATIONS
Naumov I.S., Pushkarev A.M.
The supervisor of studies: Pushkarev A.M., candidate of engineering sciences, professor
Perm State Technical University, 614990, Russia, Perm, Komsomolsky Av. 29.
E-mail: [email protected]
Scales of emergency situations and damage from them constantly grow that demands operatively and soundly to develop measures for localization and liquidation of emergency situations. Control systems in the conditions of emergency situations are with that end in view created.
In such situations it is necessary not only to define precisely level of danger and to develop the list of prime measures of counteraction, but also quickly and precisely to define structure of the resources necessary for counteraction emergency situations, and also ways and tactics of their use according to the chosen strategy of counteraction. As a rule, there is a set of variants of counteraction arisen emergency situations. In a situation when emergency situations develops promptly that causes necessity of operative decision-making, the probability of acceptance of erroneous decisions increases that, as it is known, strongly influences the counteraction end result. Even in a case when information for decision-making enough, as a rule, are made the determined decisions offering one, it is far not an optimum variant of counteraction. All above-stated is fair for a situation when there was one emergency situation. However such situation is вырожденным a case: as a rule, in reality occurrence of one emergency situation is at the bottom of development of several indirectly connected with it emergency situations, that is there is complex emergency situations. In such situation the above described problems become insuperable. The decision of a problem of the automated designing and operational planning of measures of counteraction to complex emergency situations is carried out by means of modern methods and models.
Unfortunately, numerous examples at us in the country and abroad show that quite often it appears the convincing information insufficiently that from a management fast reaction on arising emergency situations, fast reciprocal actions has followed. The principal causes causing such delay is: a lag effect of information system, check of reliability of the information on occurrence emergency situations, psychological features of the person. Hence, the accurate picture on occurrence is necessary, for localization and this or that liquidation emergency situation.
For a sustainable development of any enterprise and the country acceptance of
measures on reduction of a damage caused emergency situations and quantities of the resources used at its prevention and liquidation as a whole is necessary. Versatile problems which should dare in interests of management of risk, lean against such high technology spheres, as physical mechanisms of development of emergencies and failures, formations of the dangerous natural phenomena, models and methods of the forecast of force, time and a place of their occurrence, ways of prevention of their occurrence, decrease in force or softening of consequences emergency situations, economic researches, methods of optimum planning.
Development of system of the prevention of the dangerous phenomena, ways of reduction of danger and softening of consequences emergency situations is considered one of priority spheres of activity at all levels − international, state, regional and local. However the dangerous natural and technogenic phenomena as a source of emergency situations can be predicted only on very small from the point of view of carrying out of preventive actions time intervals. It leads to necessity of use as the initial given frequencies of these events.
Perfection of the control systems focused on localization and liquidation emergency situations is necessary. This perfection can be provided with following parameters: a substantiation of productivity of the equipment; a substantiation of the means necessary for the maintenance of staff and their equipment by means; a substantiation of structure of systems of localization and liquidation of emergency situations.
The effective preventive plan is formed on the basis of optimum distribution of resources, forces and the means necessary for realization of actions for the purpose of greatest possible blocking emergency situations.
The basic criteria of formation of the optimum preventive plan under the prevention and liquidation of consequences emergency situations are a damage minimum; a minimum of the general expenses for realization of preventive actions; a minimum of general time of realization of operative actions for liquidation emergency situations and its consequences. As restrictions on total amounts of resources, forces and the means allocated for realization of actions, for presence of necessary forces and means in points of their disposition,
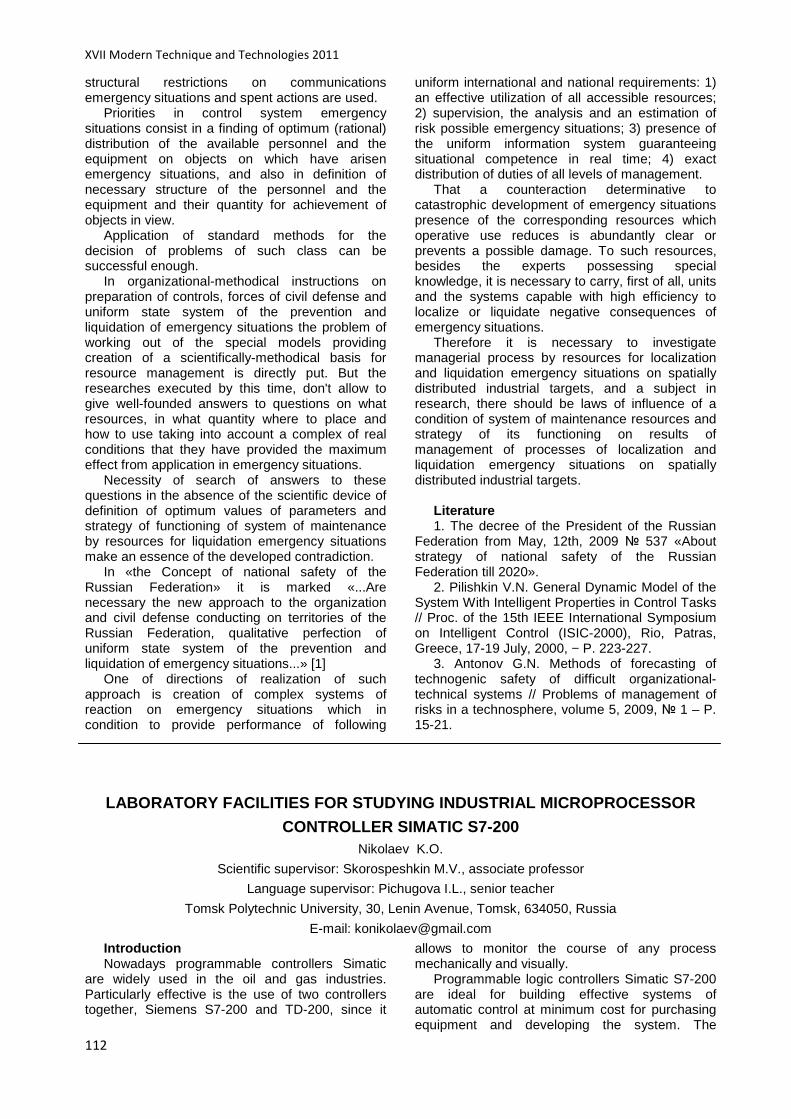
XVII Modern Technique and Technologies 2011
112
structural restrictions on communications emergency situations and spent actions are used.
Priorities in control system emergency situations consist in a finding of optimum (rational) distribution of the available personnel and the equipment on objects on which have arisen emergency situations, and also in definition of necessary structure of the personnel and the equipment and their quantity for achievement of objects in view.
Application of standard methods for the decision of problems of such class can be successful enough.
In organizational-methodical instructions on preparation of controls, forces of civil defense and uniform state system of the prevention and liquidation of emergency situations the problem of working out of the special models providing creation of a scientifically-methodical basis for resource management is directly put. But the researches executed by this time, don't allow to give well-founded answers to questions on what resources, in what quantity where to place and how to use taking into account a complex of real conditions that they have provided the maximum effect from application in emergency situations.
Necessity of search of answers to these questions in the absence of the scientific device of definition of optimum values of parameters and strategy of functioning of system of maintenance by resources for liquidation emergency situations make an essence of the developed contradiction.
In «the Concept of national safety of the Russian Federation» it is marked «...Are necessary the new approach to the organization and civil defense conducting on territories of the Russian Federation, qualitative perfection of uniform state system of the prevention and liquidation of emergency situations...» [1]
One of directions of realization of such approach is creation of complex systems of reaction on emergency situations which in condition to provide performance of following
uniform international and national requirements: 1) an effective utilization of all accessible resources; 2) supervision, the analysis and an estimation of risk possible emergency situations; 3) presence of the uniform information system guaranteeing situational competence in real time; 4) exact distribution of duties of all levels of management.
That a counteraction determinative to catastrophic development of emergency situations presence of the corresponding resources which operative use reduces is abundantly clear or prevents a possible damage. To such resources, besides the experts possessing special knowledge, it is necessary to carry, first of all, units and the systems capable with high efficiency to localize or liquidate negative consequences of emergency situations.
Therefore it is necessary to investigate managerial process by resources for localization and liquidation emergency situations on spatially distributed industrial targets, and a subject in research, there should be laws of influence of a condition of system of maintenance resources and strategy of its functioning on results of management of processes of localization and liquidation emergency situations on spatially distributed industrial targets.
Literature 1. The decree of the President of the Russian
Federation from May, 12th, 2009 537 «About strategy of national safety of the Russian Federation till 2020».
2. Pilishkin V.N. General Dynamic Model of the System With Intelligent Properties in Control Tasks // Proc. of the 15th IEEE International Symposium on Intelligent Control (ISIC-2000), Rio, Patras, Greece, 17-19 July, 2000, − P. 223-227.
3. Antonov G.N. Methods of forecasting of technogenic safety of difficult organizational-technical systems // Problems of management of risks in a technosphere, volume 5, 2009, 1 – P. 15-21.
LABORATORY FACILITIES FOR STUDYING INDUSTRIAL MICRO PROCESSOR
CONTROLLER SIMATIC S7-200 Nikolaev K.O.
Scientific supervisor: Skorospeshkin M.V., associate professor
Language supervisor: Pichugova I.L., senior teacher
Tomsk Polytechnic University, 30, Lenin Avenue, Tomsk, 634050, Russia
E-mail: [email protected]
Introduction Nowadays programmable controllers Simatic
are widely used in the oil and gas industries. Particularly effective is the use of two controllers together, Siemens S7-200 and TD-200, since it
allows to monitor the course of any process mechanically and visually.
Programmable logic controllers Simatic S7-200 are ideal for building effective systems of automatic control at minimum cost for purchasing equipment and developing the system. The

Section VII: Informatics and Control in Engineering Systems
113
controllers can operate in real time or can be used to construct the units of local automation systems and distributed I / O data exchange via the PPI or MPI interface, industrial networks PROFIBUS-DP, Industrial Ethernet and AS-Interface, modem communication systems.
The package for programming STEP 7-Micro/WIN provides user-friendly environment for developing, editing, and controlling the logic needed to control your application. STEP 7-Micro/WIN has three program editors with which you can conveniently and efficiently develop a control program for your application. To assist you in finding the required information STEP 7-Micro/WIN offers extensive online help system and a CD with documentation that contains an electronic version of the guidelines, tips on application and other useful information.
Fig. 1. General view of the laboratory complex The laboratory complex includes the following
devices: 1. controller table, which contains the
following elements: a) Power supply controller-LOGO! Power
6EP1332-1SH42 b) Unit controller SIMATIC STEP 7-200 (CPU
224) c) communication processor CP243-1IT d) Text Display e) PPI / USB (converting interface) f) Terminal-Block Connector 2. control buttons box for input signals; 3. computer monitor; 4. complex computer; 5. work station desks with slide out keyboard
drawer. This laboratory complex consists of the
industrial controller Simatic S7-200, input devices of discrete signals, output devices of digital signals; communication processor CP 243-1 IT, which provides communications between the controller and the computer via Ethernet, TD 200 text display for programmable controllers S7-200 which is used for a fixed installation or as a hand-held device, a PPI / USB - RS485 communication cable, a PC with software package Step7-Micro/WIN installed.
This laboratory complex allows to input / output digital signals, to program controllers in various languages.
"Traffic Light" program was implemented as an example of the complex work. It is shown in Figure 2:
Fig.2. Traffic Light Program in working condition In this example, the commands from the family
«Bit Logic» are used. Bit instructions designed to perform operations
on Boolean variables (one of two values: 0 or 1), the result of their performance is a variable of Boolean type. Let us consider the following commands:
-Closing Contact -Opening Contact
These commands get the value from memory or from the process image register if the data type is I and Q. In blocks AND [AND] and OR [OR], we can use maximum seven inputs. Circuit closing contact is closed (enabled) when the bit is 1. Circuit opening contact is closed (enabled) when the bit is 0. In FBD commands corresponding to circuit closing contacts are represented by blocks
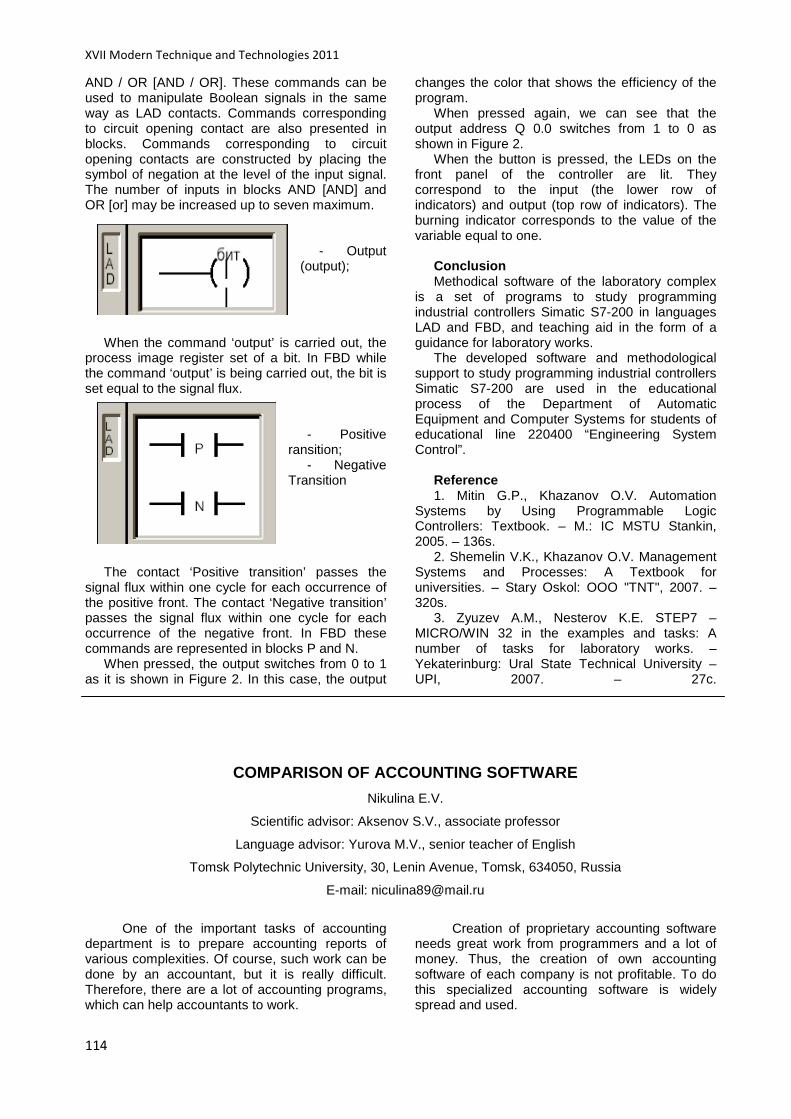
XVII Modern Technique and Technologies 2011
114
AND / OR [AND / OR]. These commands can be used to manipulate Boolean signals in the same way as LAD contacts. Commands corresponding to circuit opening contact are also presented in blocks. Commands corresponding to circuit opening contacts are constructed by placing the symbol of negation at the level of the input signal. The number of inputs in blocks AND [AND] and OR [or] may be increased up to seven maximum.
- Output
(output);
When the command ‘output’ is carried out, the
process image register set of a bit. In FBD while the command ‘output’ is being carried out, the bit is set equal to the signal flux.
- Positive
ransition; - Negative
Transition
The contact ‘Positive transition’ passes the
signal flux within one cycle for each occurrence of the positive front. The contact ‘Negative transition’ passes the signal flux within one cycle for each occurrence of the negative front. In FBD these commands are represented in blocks P and N.
When pressed, the output switches from 0 to 1 as it is shown in Figure 2. In this case, the output
changes the color that shows the efficiency of the program.
When pressed again, we can see that the output address Q 0.0 switches from 1 to 0 as shown in Figure 2.
When the button is pressed, the LEDs on the front panel of the controller are lit. They correspond to the input (the lower row of indicators) and output (top row of indicators). The burning indicator corresponds to the value of the variable equal to one.
Conclusion Methodical software of the laboratory complex
is a set of programs to study programming industrial controllers Simatic S7-200 in languages LAD and FBD, and teaching aid in the form of a guidance for laboratory works.
The developed software and methodological support to study programming industrial controllers Simatic S7-200 are used in the educational process of the Department of Automatic Equipment and Computer Systems for students of educational line 220400 “Engineering System Control”.
Reference 1. Mitin G.P., Khazanov O.V. Automation
Systems by Using Programmable Logic Controllers: Textbook. – M.: IC MSTU Stankin, 2005. – 136s.
2. Shemelin V.K., Khazanov O.V. Management Systems and Processes: A Textbook for universities. – Stary Oskol: OOO "TNT", 2007. – 320s.
3. Zyuzev A.M., Nesterov K.E. STEP7 –MICRO/WIN 32 in the examples and tasks: A number of tasks for laboratory works. – Yekaterinburg: Ural State Technical University – UPI, 2007. – 27c.
COMPARISON OF ACCOUNTING SOFTWARE
Nikulina E.V.
Scientific advisor: Aksenov S.V., associate professor
Language advisor: Yurova M.V., senior teacher of English
Tomsk Polytechnic University, 30, Lenin Avenue, Tomsk, 634050, Russia
E-mail: [email protected]
One of the important tasks of accounting
department is to prepare accounting reports of various complexities. Of course, such work can be done by an accountant, but it is really difficult. Therefore, there are a lot of accounting programs, which can help accountants to work.
Creation of proprietary accounting software needs great work from programmers and a lot of money. Thus, the creation of own accounting software of each company is not profitable. To do this specialized accounting software is widely spread and used.
Section VII: Informatics and Control in Engineering Systems
115
Classical Russian accounting complex consists of the following components: a chart of account, business transactions journal, the log of order, general ledger, reports on analytical accounts, balance sheet, financial reporting forms, cash and bank.
All modern accounting programs are based on the creation of documents for the enterprises. The process of working with this program is the following: the accountant enters the primary documents, for example, credit cash order, acceptance certification and others, into the program and then they are processed by the program. The result of this process is generated business transactions. Each business transaction is a set of accounting transactions.
So, the main goal of accounting tasks automation is providing automatic generation of business transactions, and also providing convenient storage and analyzis of accounting information.
The most famous and popular Russian developers of automated accounting systems are “1C” (a series of programs “1C: Enterprise”), “IT” (the family of “BOSS”), “Atlant - Inform” (series “Accord”), “Galaxy - Sail” (a series of programs “Galactica” and “Parus”), “DRC” (“Turbo - Accounrant”), “Intelligence – the service” (a series of “BEST”), “Infinitesimal” (a series of software products from “minimum” to “maximum”), “Informatics” (“Info - Accountant”), “Infosoft” (“Integrator”), “Omega” (a series of “Abacus”), “Tsifey” (“Standards”) and “R-Style Software Lab” (“Universal Accounting Cyril and Methodius”, a series RS - Balance).
Nowadays “1C” is the most famous and sold products in Russia. The popularity of this program is provided by powerful advertising, extensive dealer network, low price and competent marketing strategy. The main feature of the system is the scheme “accounting transaction – general ledger – balance sheet”. The basic package includes a set of loadable forms of primary documents, which can be reconfigured, if it is necessary, changed in the form and the filling algorithm. The flexibility of the platform allows using this software in various areas.
“Info-Accountant” is a Russian company. The main activity is development of computer programs to automate the accounting records in commercial and nonprofit organizations, as well as in public institutions. More than 18 years, “Info-Accountant” is a leading developer of automation software for accounting, tax, inventory and personnel records, which is easy to learn and easy to use. Unlike other accountant software, “Info-Accountant” is a complex program of automation accounting. All sections of accounting and tax records are included in the basic distribution version. In further work with the program users needn’t buy various additions, for example, “Salary and Personnel”.
Corporation “Galaxy - Sail” offers a program called “Sail”. The development is designed for small and medium-sized enterprises in various fields of activity. It allows to automate not only accounting but also financial and economic activities of enterprises. From traditional accounting software, this system differs in convenience to work, simplicity to work and low price. Also, the system solves the tasks of management accounting, for example, profit calculating and support of decision-making in management.
System “BEST” is a trading system, but nevertheless provides automation of all main areas accounting for the enterprises. “BEST” is a closed system and cannot be changed by the user. Software company conducts the modification of basic modules which are adapted to the specifics. This software is complex automation system for accounting, tax and management for small and medium enterprises, which work in commerce, manufacturing, services and other enterprises.
Also, there is a vast range of small accounting programs, which can do one accounting tasks, for example, programs to work with personnel, calculate salary, make different types of report, make report in Pension Fund or Tax Administration. Some of such programs are free; users can download them via Internet.
Moreover, there are programs, which can be used for enterprises with simplified tax system or usual tax system.
All changes in legislation are taken into account in the future updates of programs. Usually updates come once a month, and if it is necessary more often.
There are two accounting programs, which are most distributed, such as “1C” and “Info - Accountant”. Now compare them. Table 1 shows differences between the functions of these accounting software and Table 2 shows identical functions.
Table 1. Differences between the functions of
accounting software Characteristic 1C Info -
Accountant Updated the program inside of version
Impossible To 10 updates
Description of the program help file
Very little Enough complete for all sections
Coding of accounts
Needed installation plan of card of accounts
Any number of symbols
Number of subaccounts levels
Five Unlimited
Preliminary account of
To get the correct
There is no need.

XVII Modern Technique and Technologies 2011
116
results report, accountant needs do it. It is only possible in monopolistic mode.
Reports in graphical form
Impossible Possible in all graphical forms
Updating document after formation
Possible, but sometimes it leads to damage of documents by inexperienced users.
Impossible
Transferring data between business transactions journal
It is possible, but the number of characteristic is limited. Also there is no control over the repetition of identical transactions.
It is possible for all characteristics.
Exchanging data with other programs
There is exchanging information with data base DBF.
There is exchanging information approximately all data bases.
Table 2. Similarities in the functions of
accounting software Characteristic 1C Info -
Accountant Characteristic of accounts
Each accounts (and subaccounts) have definition in the section of balance: active, passive, active-passive and off-balance.
Storing of accounts
Storing is available to last level of subaccounts.
The integrity from journal of accountant transaction
It is complete with automatic updates data bases.
Coding of accounting
Number of symbols is not limited.
codes Centralized updating documents
It is available in each accounting programs.
Opportunity to work for several enterprises
It is available in each accounting programs.
Opportunity to independently adapt standard business transactions
It is available in each accounting programs.
So, “1C: Enterprise” can be used for companies with different activities, from small shop to large corporation. Most of budgetary institutions and state-financed organizations choose this accounting program, for example, administrative authorities, Pension Funds, Tax Administrations and many others. This product is more widespread in Russia than “Info-Accountant”. It is used by organizations, which work in manufacturing, commerce, services and others. “Info-Accountant” can also be used for enterprises with different activities. There are special programs for companies, which work in different sphere and with different tax system, for example programs for companies with simplified tax system or usual tax system, to work with personnel and salary, warehouse and others.
Nowadays there is a lot of accounting software in the market. All software has standard functions and additional, in which they differ. The choice of each company depends on the size of company, their budgets and activities. Beyond a doubt small company can’t buy expensive accounting software, also they needn’t all functions of such programs, so they buy chip software with standard operations. But there are a lot of huge companies with a vast range of activities, and they need to have complex software to complete all tasks.
References 1. Anton Gagen. Accounting software.
Overview of the major accounting software. [Electronic version]. Information Agency “Financial Lawyer”. 12.06.2008. http://www.financial-lawyer.ru/newsbox/document/165-528055.html
2. http://www.buhsoft.ru/?title=about.php 3. http://www.snezhana.ru/buh_report/ 4. http://1c.ru/ 5. http://parus.ru/ 6. http://www.aton-c.ru/105.html

Section VII: Informatics and Control in Engineering Systems
117
SPHERICAL FUNCTIONS IN METHODS OF LIGHTING PROCESSI NG
Parubets V.V.
Research advisor: Professor Berestneva O.G.
Tomsk Polytechnic University, 634050, 30 Lenin av., Tomsk, Russia
E-mail: [email protected]
The level of realistic images in modern video games depends on quality of lighting. Despite the existing mathematical models and a lot of optimization methods, possible complexity of the scene, amounts of different light sources, as well as various types of material objects in the scene makes lighting calculations non-trivial and requires massive computing power.
In the classic form lighting calculation is presented by the following model [11]:
∫+
+=
S
iiir
e
dxxGxLxf
xLxL
ωωω
ωω
)',(),'(),(
),(),( 00
(1),
),( 0ωxL – intensity of the reflected light flux
from x in ω0 direction; ),( 0ωxLe – flux intensity of
light emitted by the surface; ),( 0ωω →ir xf
– Dual-beam light distribution function of the surface at x, transforming light ωi into reflected light ω0;
),'( ixL ω– flux intensity of light coming from the
other objects in the direction ωi; )',( xxG –
geometric relationship between x и 'x . Bidirectional function of the reflected light
(BFRL) is defined as the ratio of the amount of energy (light), as reflected in the direction ω0 to the amount of energy that falls on the surface with the direction ωi. Let the amount of energy reflected in the direction ω0 is L0, and the amount of energy that came from the direction ωi equals Ei, than BFRL is:
ii E
LBFRL 0
0 ),( =ωω
(2),
ω0 и ωi — differential solid angles, which can be uniquely two angles in spherical coordinates (azimuth and zenith).
BLDF is defined as the ratio of the amount of energy (light), scattered in the direction ω0 to the amount of energy that falls on the surface from all directions of the visible hemisphere. Let the amount of energy dissipated in the direction ω0, is equal L0. Let’s consider a uniform distribution of the scattered light, thus BLDF is independent from the direction of gaze (ω0). Including BLDF visibility function,will make it self-shadowing:
ii
i VE
LBLDF =)(ω
(5),
L – the amount of energy scattered equally in all directions ω0 – takes the value 0 or 1, depending on whether, stream of light coming in this direction is overlapped by object geometry or not. Thus, using BLDF we can represent any point of the object without view-depending lighting effects(hotspots, etc.)
BLDF is nothing more than a scalar field on a sphere (ωi can be uniquely represented as a point with a value on the unit sphere). This begs the question of approximation of this function in a convenient basis for our functional area. Under such a basis is very suitable basis of associated spherical functions of real variable, forming a complete orthonormal basis functions on the sphere [5, 8, 9]:
=<−>
= −
0)),(cos(
0)),(cos()sin(2
0)),(cos()cos(2
),(00 mPK
mPmK
mPmK
y
ll
ml
ml
ml
ml
ml
θθϕ
θϕϕθ
(6),
)!(4
)!)(12(
ml
mllK m
l +−+
=π
– normalization coefficient, Pl
m(x) – adjoint Legendre polynomial. Thus, DFRS represented in this basis as:
∑∑= −=
≈n
l
l
lm
ml
mlx Ycf
0
),(),( ϕθϕθ
(7),
where the coefficients are defined as:
( ) ( ) .m ml x l
S
c f s Y s ds= ∫
(8)
This method worked well in video games [7] and the creation of visual effects in movies [1].
The brightness of each object point is calculated as:
( ) ,D SL kL l k L= + −
(9),
k – diffuse reflectance coefficient (k<1), l – ratio of total reflection.
Positive aspects of the method: • Designed for a wide spectrum of materials. • Is ideal for calculating global illumination or
lighting from non-point sources. • Errors associated with rotating light
sources are excluded. • Enables translating lighting-calculation to
the graphics processor. Shortcomings: • Need to perform a preliminary calculation
of expansion coefficients for each vertex stage. • The method is applicable only for static
geometry.
XVII Modern Technique and Technologies 2011
118
• Emergence of inaccuracies in the field of low-density geometry and near shadow-casting objects.
According to the above list of problems of this method, we define the possible methods to solve them.
A preliminary calculation of the coefficients of expansion and is parallelizable task, in order to find solution a variety of methods can be applied. The most successful in terms of efficiency and cost, will be arranged for all computing power of the GPU [12].
If there is a stage of dynamic objects and materials which can also be considered as a combination of perfectly specular and perfectly diffuse, Cook-Torrance model can be applied[9].
Calculated as the scalar product of the normal and the normalized light source position:
LNK d •=
(10),
N – normal , L – light source position. Amount of reflected light depends on coefficient
of Fresnel [8]
)1()),(1( 05
0 FNVFF −⋅−+=
(11),
Geometric component, which takes into account self-shadowing.
=
),(
),)(,(2,
),(
),)(,(2,1min
HV
NLNH
HV
NVNHG
(12),
Component, taking into account the surface roughness, using the distribution of Beckman [10]
−
=22
2
),(
1),(
42 ),(4
1 NHm
NH
eNHm
D
(13).
The general formula for calculating the reflected light:
),)(,( NLNV
DGFK
⋅⋅=
(14),
V – vector view, H – normalized sum of L и V vectors.
This model eliminates the preliminary calculation at all, and all the calculations on the light-rendering transfer to the processor card, using a pair of vertex and pixel shader.
This problem is somewhat specific: on the one hand, the simplier scene is, the faster it is rendered, but is obvious that simplicity leads to bad quality. There are several ways for soluting this problen:
1. Adaptive or uniform seal geometry. We partition the surface of the scene into small segments uniformly or only in those places where you need to make shading. Illumination between adjacent polygons can be approximated.
2. Using techniques of smoothed shadow maps (ShadowMap) [3, 4, 6] for shading objects. This method allows to calculate the shading of
objects and save this information in a special texture, which is then applied to the whole scene.
1. A method of calculating the lighting based on the use of spherical functions.
2. Application of an optimized model for processing lighting allows to get rid of described disadvantages and develop a full framework for the graphics engine of modern three-dimensional computer games.
References 1. Chen H., Liu X., Advances in Real-Time
Rendering in 3D Graphics and Game Course // ACM.com. 2009. URL: http://portal.acm.org/ft_gateway.cfm?id=1404437&type=pdf (access date: 25.03.2010).
2. D. Moroz «Avatar» – Making a movie // 3dnews.ru. 2010. URL: http://www.3dnews.ru/editorial/iavatari_sozdanie_filma (access date: 25.03.2010). (in Russian)
3. Foley J.D., Feiner S.K., Hughes J.F. Computer Graphics: Principles and Practice. –Addison-Wesley, 1990.
4. Lokovic T., Veach E. Deep Shadow Maps // SIGGRAPH’2000: In Proc. of SIGGRAPH. – New Orleans, 2000. – Т. 1. – P. 385–392.
5. A. Kaplayan Details of the use of spherical functions for interactive rendering // Gamedev.ru. 2009. URL: http://www.gamedev.ru/code/articles/Spherical_functions (access date: 25.03.2010). (in Russian)
6. Max N. Horizon Mapping: Shadows for Bump-Mapped Surfaces // The Visual Computer. – 1998. – 7. – P. 109–117.
7. Oat C. Irradiance Volumes for Real-Time Rendering // ShaderX5: Advanced Rendering Techniques. – Charles River Media, 2006. – P. 385–392
8. G. Arkfen Mathematical Methods in Physics – Moscow: Atomizdat, 1970. – P. 413–420. (in Russian)
9. V. Schleich Quantum optics in phase space – Moscow: Physmatlit, 2005. – P. 740–742. (in Russian)
10. V. Reznik Rapid implementation of the model Cook-Torrance lighting with GLSL // Gamedev.ru. 2009.URL: http://www.gamedev.ru/code/articles/Cook-Torrance (access date: 25.03.2010). (in Russian)
11. A. Kaplayan Technology preliminary calculation of the lighting model to get the soft shadows on dynamic non-point sources of light // Gamedev.ru. 2005. URL:http://kriconf.ru/2005/rec/KRI_2005_Programming_03apr_gal12_01_Anton_Kaplanyan_Akella.ppt (access date: 25.03.2010). (in Russian)
12. A. Bashkirev Using ATI Stream technology // Gamedev.ru. 2010.URL: http://www.gamedev.ru/code/articles/use_stream (access date: 25.03.2010). (in Russian)
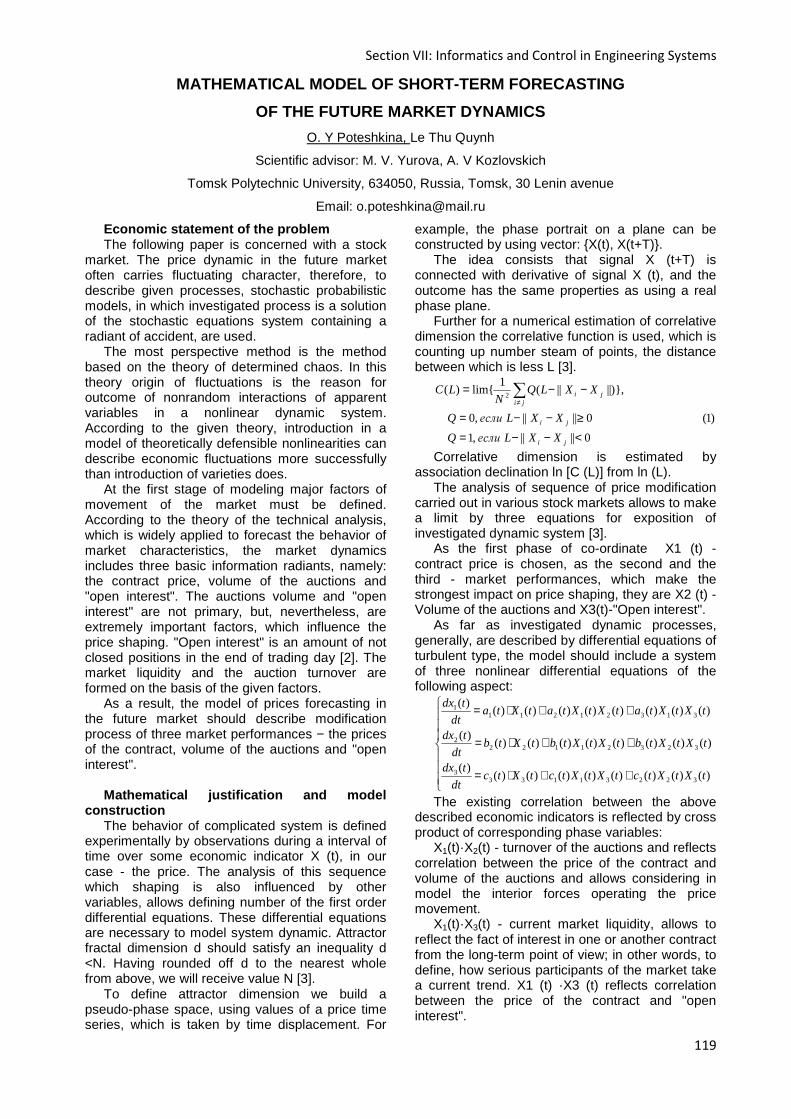
Section VII: Informatics and Control in Engineering Systems
119
MATHEMATICAL MODEL OF SHORT-TERM FORECASTING
OF THE FUTURE MARKET DYNAMICS
O. Y Poteshkina, Le Thu Quynh
Scientific advisor: M. V. Yurova, A. V Kozlovskich
Tomsk Polytechnic University, 634050, Russia, Tomsk, 30 Lenin avenue
Email: [email protected]
Economic statement of the problem The following paper is concerned with a stock
market. The price dynamic in the future market often carries fluctuating character, therefore, to describe given processes, stochastic probabilistic models, in which investigated process is a solution of the stochastic equations system containing a radiant of accident, are used.
The most perspective method is the method based on the theory of determined chaos. In this theory origin of fluctuations is the reason for outcome of nonrandom interactions of apparent variables in a nonlinear dynamic system. According to the given theory, introduction in a model of theoretically defensible nonlinearities can describe economic fluctuations more successfully than introduction of varieties does.
At the first stage of modeling major factors of movement of the market must be defined. According to the theory of the technical analysis, which is widely applied to forecast the behavior of market characteristics, the market dynamics includes three basic information radiants, namely: the contract price, volume of the auctions and "open interest". The auctions volume and "open interest" are not primary, but, nevertheless, are extremely important factors, which influence the price shaping. "Open interest" is an amount of not closed positions in the end of trading day [2]. The market liquidity and the auction turnover are formed on the basis of the given factors.
As a result, the model of prices forecasting in the future market should describe modification process of three market performances − the prices of the contract, volume of the auctions and "open interest".
Mathematical justification and model
construction The behavior of complicated system is defined
experimentally by observations during a interval of time over some economic indicator X (t), in our case - the price. The analysis of this sequence which shaping is also influenced by other variables, allows defining number of the first order differential equations. These differential equations are necessary to model system dynamic. Attractor fractal dimension d should satisfy an inequality d <N. Having rounded off d to the nearest whole from above, we will receive value N [3].
To define attractor dimension we build a pseudo-phase space, using values of a price time series, which is taken by time displacement. For
example, the phase portrait on a plane can be constructed by using vector: X(t), X(t+T).
The idea consists that signal X (t+T) is connected with derivative of signal X (t), and the outcome has the same properties as using a real phase plane.
Further for a numerical estimation of correlative dimension the correlative function is used, which is counting up number steam of points, the distance between which is less L [3].
0||||,1
)1(0||||,0
,||)||(1
lim)(2
<−−=
≥−−=
−−= ∑≠
ji
ji
jiji
XXLеслиQ
XXLеслиQ
XXLQN
LC
Correlative dimension is estimated by
association declination ln [C (L)] from ln (L). The analysis of sequence of price modification
carried out in various stock markets allows to make a limit by three equations for exposition of investigated dynamic system [3].
As the first phase of co-ordinate X1 (t) - contract price is chosen, as the second and the third - market performances, which make the strongest impact on price shaping, they are X2 (t) - Volume of the auctions and X3(t)-"Open interest".
As far as investigated dynamic processes, generally, are described by differential equations of turbulent type, the model should include a system of three nonlinear differential equations of the following aspect:
++⋅=
++⋅=
++⋅=
)()()()()()()()()(
)()()()()()()()()(
)()()()()()()()()(
322311333
323211222
313212111
tXtXtctXtXtctXtcdt
tdx
tXtXtbtXtXtbtXtbdt
tdx
tXtXtatXtXtatXtadt
tdx
The existing correlation between the above
described economic indicators is reflected by cross product of corresponding phase variables:
X1(t)·X2(t) - turnover of the auctions and reflects correlation between the price of the contract and volume of the auctions and allows considering in model the interior forces operating the price movement.
X1(t)·X3(t) - current market liquidity, allows to reflect the fact of interest in one or another contract from the long-term point of view; in other words, to define, how serious participants of the market take a current trend. X1 (t) ·X3 (t) reflects correlation between the price of the contract and "open interest".
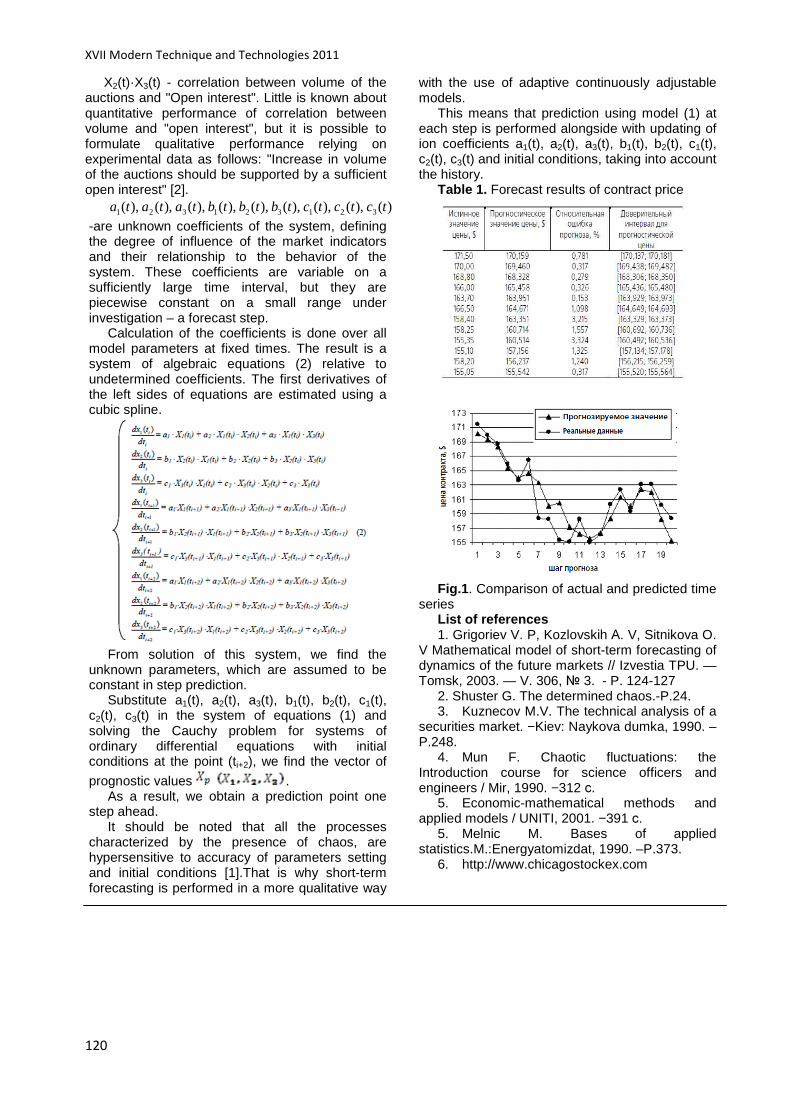
XVII Modern Technique and Technologies 2011
120
X2(t)·X3(t) - correlation between volume of the auctions and "Open interest". Little is known about quantitative performance of correlation between volume and "open interest", but it is possible to formulate qualitative performance relying on experimental data as follows: "Increase in volume of the auctions should be supported by a sufficient open interest" [2].
)(),(),(),(),(),(),(),(),( 321321321 tctctctbtbtbtatata
-are unknown coefficients of the system, defining the degree of influence of the market indicators and their relationship to the behavior of the system. These coefficients are variable on a sufficiently large time interval, but they are piecewise constant on a small range under investigation – a forecast step.
Calculation of the coefficients is done over all model parameters at fixed times. The result is a system of algebraic equations (2) relative to undetermined coefficients. The first derivatives of the left sides of equations are estimated using a cubic spline.
From solution of this system, we find the
unknown parameters, which are assumed to be constant in step prediction.
Substitute a1(t), a2(t), a3(t), b1(t), b2(t), c1(t), c2(t), c3(t) in the system of equations (1) and solving the Cauchy problem for systems of ordinary differential equations with initial conditions at the point (ti+2), we find the vector of
prognostic values . As a result, we obtain a prediction point one
step ahead. It should be noted that all the processes
characterized by the presence of chaos, are hypersensitive to accuracy of parameters setting and initial conditions [1].That is why short-term forecasting is performed in a more qualitative way
with the use of adaptive continuously adjustable models.
This means that prediction using model (1) at each step is performed alongside with updating of ion coefficients a1(t), a2(t), a3(t), b1(t), b2(t), c1(t), c2(t), c3(t) and initial conditions, taking into account the history.
Table 1. Forecast results of contract price
Fig.1 . Comparison of actual and predicted time
series List of references 1. Grigoriev V. P, Kozlovskih А. V, Sitnikova O.
V Mathematical model of short-term forecasting of dynamics of the future markets // Izvestia TPU. — Tomsk, 2003. — V. 306, 3. - P. 124-127
2. Shuster G. The determined chaos.-P.24. 3. Kuznecov M.V. The technical analysis of a
securities market. −Kiev: Naykova dumka, 1990. –P.248.
4. Mun F. Chaotic fluctuations: the Introduction course for science officers and engineers / Mir, 1990. −312 с.
5. Economic-mathematical methods and applied models / UNITI, 2001. −391 с.
5. Melnic M. Bases of applied statistics.M.:Energyatomizdat, 1990. –P.373.
6. http://www.chicagostockex.com

Section VII: Informatics and Control in Engineering Systems
121
INDUSTRIAL DRIVE CONTROL SYSTEM
Ripp R.E. Belov A.M.
Scientific supervisor: Skorospeshkin V.N., associate professor
Language supervisor: Pichugova I.L., senior teacher
Tomsk Polytechnic University, 30, Lenin Avenue, Tomsk, 634050, Russia
E-mail: [email protected]
Abstract This paper proposes a project aimed to improve
development process of industrial automation systems containing drives. The project consists of codes for programmable logical controllers and operator interface. The program for controllers has modular structure and can be adopted for any automation system. The application was developed using Siemens software (STEP 7, WinCC, PLCSIM) and was tested on Programmable Logic Controller Siemens CPU 314 2DP.
Introduction The Industrial drive control system (IDCS)
shares concept with SIMODYN D developed by Siemens. IDC system has the following advantages over SIMODYN D [1]: • Ability to modify source code and add new blocks to extend system functions. Source code has description of all variables and block diagrams
to describe algorithms of each block. SIMODYN’s code is available only as set of functional blocks what can’t be changed. • Structure of program forms in organization block. • Adaptive operator interface gets system parameters from “control” block and organizes itself according to the system characteristics. • Reasonable price. SIMODYN D software ranges between €4300 and €4700.
Structure of the system The Industrial drive control system consists of
individual functional blocks and an operator control panel. The components can be installed in the widest range of system configurations to meet the individual requirements. Functional blocks are implemented in ST programming language [2],[3] and can be used on any automation system supporting Structured Text (ST) as source code.
Figure 1. Industrial Drive Control system’s structure
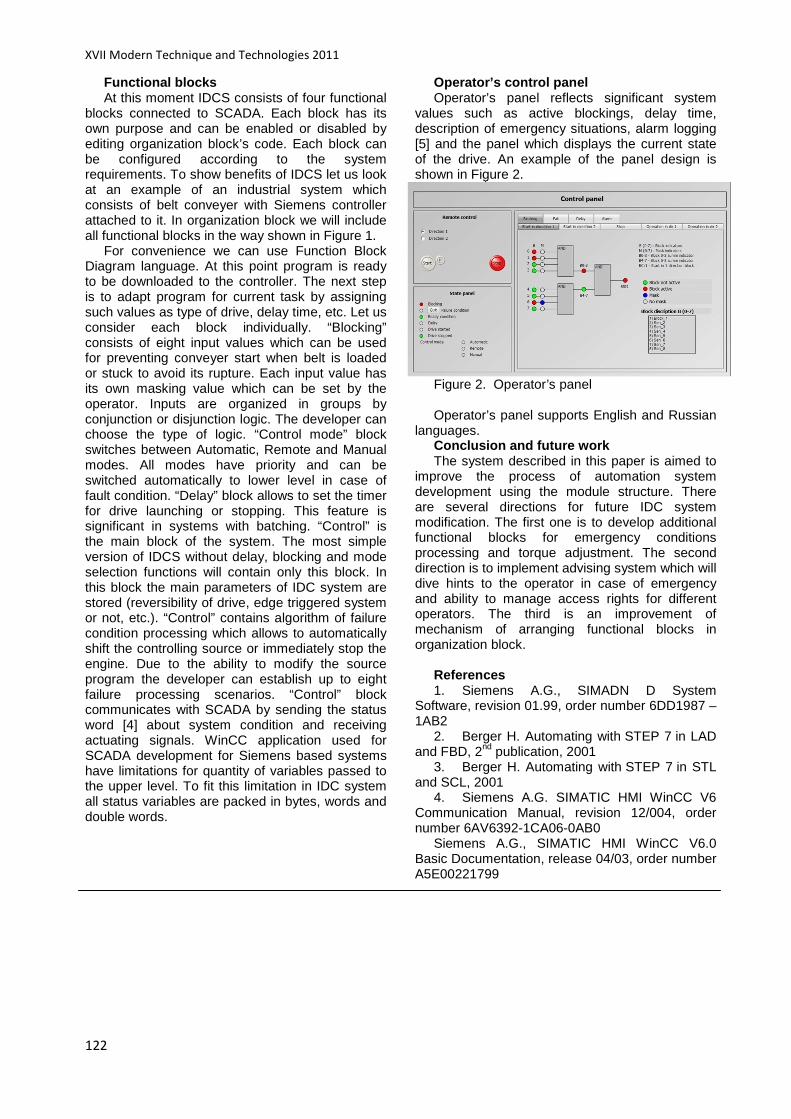
XVII Modern Technique and Technologies 2011
122
Functional blocks At this moment IDCS consists of four functional
blocks connected to SCADA. Each block has its own purpose and can be enabled or disabled by editing organization block’s code. Each block can be configured according to the system requirements. To show benefits of IDCS let us look at an example of an industrial system which consists of belt conveyer with Siemens controller attached to it. In organization block we will include all functional blocks in the way shown in Figure 1.
For convenience we can use Function Block Diagram language. At this point program is ready to be downloaded to the controller. The next step is to adapt program for current task by assigning such values as type of drive, delay time, etc. Let us consider each block individually. “Blocking” consists of eight input values which can be used for preventing conveyer start when belt is loaded or stuck to avoid its rupture. Each input value has its own masking value which can be set by the operator. Inputs are organized in groups by conjunction or disjunction logic. The developer can choose the type of logic. “Control mode” block switches between Automatic, Remote and Manual modes. All modes have priority and can be switched automatically to lower level in case of fault condition. “Delay” block allows to set the timer for drive launching or stopping. This feature is significant in systems with batching. “Control” is the main block of the system. The most simple version of IDCS without delay, blocking and mode selection functions will contain only this block. In this block the main parameters of IDC system are stored (reversibility of drive, edge triggered system or not, etc.). “Control” contains algorithm of failure condition processing which allows to automatically shift the controlling source or immediately stop the engine. Due to the ability to modify the source program the developer can establish up to eight failure processing scenarios. “Control” block communicates with SCADA by sending the status word [4] about system condition and receiving actuating signals. WinCC application used for SCADA development for Siemens based systems have limitations for quantity of variables passed to the upper level. To fit this limitation in IDC system all status variables are packed in bytes, words and double words.
Operator’s control panel Operator’s panel reflects significant system
values such as active blockings, delay time, description of emergency situations, alarm logging [5] and the panel which displays the current state of the drive. An example of the panel design is shown in Figure 2.
Figure 2. Operator’s panel Operator’s panel supports English and Russian
languages. Conclusion and future work The system described in this paper is aimed to
improve the process of automation system development using the module structure. There are several directions for future IDC system modification. The first one is to develop additional functional blocks for emergency conditions processing and torque adjustment. The second direction is to implement advising system which will dive hints to the operator in case of emergency and ability to manage access rights for different operators. The third is an improvement of mechanism of arranging functional blocks in organization block.
References 1. Siemens A.G., SIMADN D System
Software, revision 01.99, order number 6DD1987 – 1AB2
2. Berger H. Automating with STEP 7 in LAD and FBD, 2nd publication, 2001
3. Berger H. Automating with STEP 7 in STL and SCL, 2001
4. Siemens A.G. SIMATIC HMI WinCC V6 Communication Manual, revision 12/004, order number 6AV6392-1CA06-0AB0
Siemens A.G., SIMATIC HMI WinCC V6.0 Basic Documentation, release 04/03, order number A5E00221799
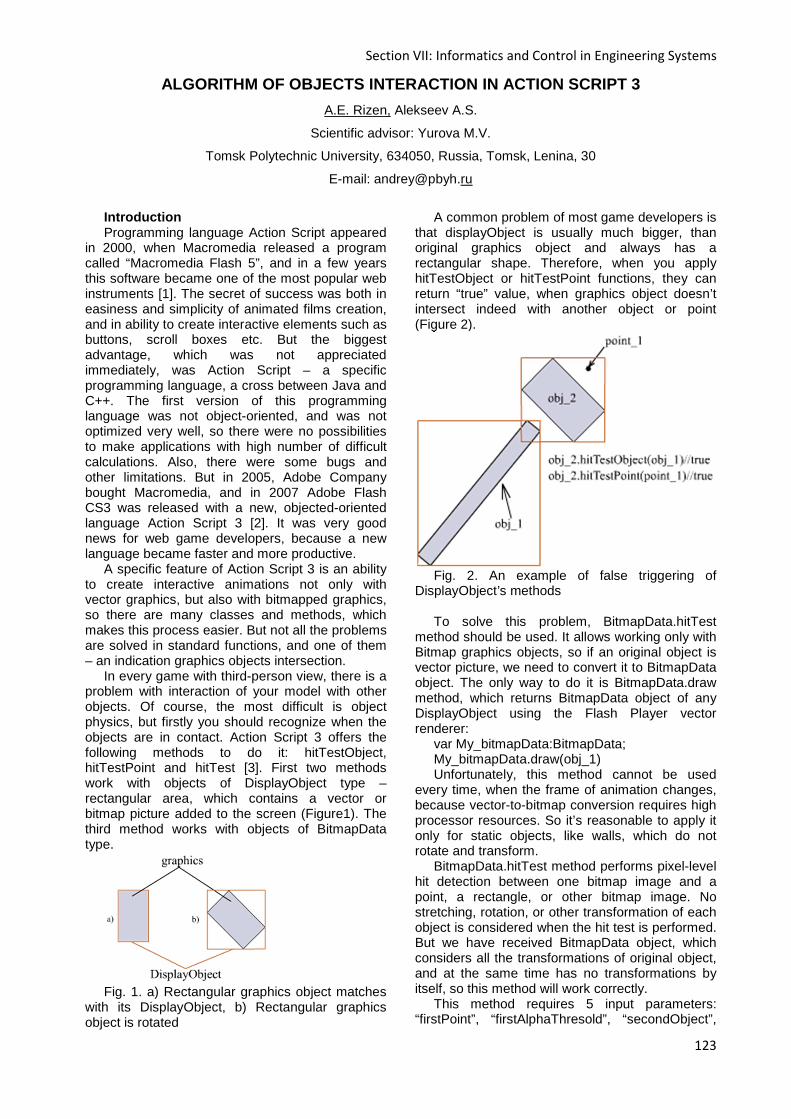
Section VII: Informatics and Control in Engineering Systems
123
ALGORITHM OF OBJECTS INTERACTION IN ACTION SCRIPT 3
A.E. Rizen, Alekseev A.S.
Scientific advisor: Yurova M.V.
Tomsk Polytechnic University, 634050, Russia, Tomsk, Lenina, 30
E-mail: [email protected]
Introduction Programming language Action Script appeared
in 2000, when Macromedia released a program called “Macromedia Flash 5”, and in a few years this software became one of the most popular web instruments [1]. The secret of success was both in easiness and simplicity of animated films creation, and in ability to create interactive elements such as buttons, scroll boxes etc. But the biggest advantage, which was not appreciated immediately, was Action Script – a specific programming language, a cross between Java and C++. The first version of this programming language was not object-oriented, and was not optimized very well, so there were no possibilities to make applications with high number of difficult calculations. Also, there were some bugs and other limitations. But in 2005, Adobe Company bought Macromedia, and in 2007 Adobe Flash CS3 was released with a new, objected-oriented language Action Script 3 [2]. It was very good news for web game developers, because a new language became faster and more productive.
A specific feature of Action Script 3 is an ability to create interactive animations not only with vector graphics, but also with bitmapped graphics, so there are many classes and methods, which makes this process easier. But not all the problems are solved in standard functions, and one of them – an indication graphics objects intersection.
In every game with third-person view, there is a problem with interaction of your model with other objects. Of course, the most difficult is object physics, but firstly you should recognize when the objects are in contact. Action Script 3 offers the following methods to do it: hitTestObject, hitTestPoint and hitTest [3]. First two methods work with objects of DisplayObject type – rectangular area, which contains a vector or bitmap picture added to the screen (Figure1). The third method works with objects of BitmapData type.
Fig. 1. a) Rectangular graphics object matches
with its DisplayObject, b) Rectangular graphics object is rotated
A common problem of most game developers is
that displayObject is usually much bigger, than original graphics object and always has a rectangular shape. Therefore, when you apply hitTestObject or hitTestPoint functions, they can return “true” value, when graphics object doesn’t intersect indeed with another object or point (Figure 2).
Fig. 2. An example of false triggering of
DisplayObject’s methods To solve this problem, BitmapData.hitTest
method should be used. It allows working only with Bitmap graphics objects, so if an original object is vector picture, we need to convert it to BitmapData object. The only way to do it is BitmapData.draw method, which returns BitmapData object of any DisplayObject using the Flash Player vector renderer:
var My_bitmapData:BitmapData; My_bitmapData.draw(obj_1) Unfortunately, this method cannot be used
every time, when the frame of animation changes, because vector-to-bitmap conversion requires high processor resources. So it’s reasonable to apply it only for static objects, like walls, which do not rotate and transform.
BitmapData.hitTest method performs pixel-level hit detection between one bitmap image and a point, a rectangle, or other bitmap image. No stretching, rotation, or other transformation of each object is considered when the hit test is performed. But we have received BitmapData object, which considers all the transformations of original object, and at the same time has no transformations by itself, so this method will work correctly.
This method requires 5 input parameters: “firstPoint”, “firstAlphaThresold”, “secondObject”,

XVII Modern Technique and Technologies 2011
124
“secondBitmapDataPoint”, “secondAlphaThresold”. Using this parameters, a programmer should set coordinates of top-left point of original BitmapData, set method-visibility for pixels with different opaqueness, set the second object and, if the second object is BitmapData too, set the same parameters for it. As a result, as it was stated previously, the first object should be static. But the second object is usually dynamic - it rotates and transforms about 30 times per second while a user controls it. Thus, the most effective way to recognize the edges is to create small circle-shaped graphics objects (let’s call them “key points”) on the corners and at the sides of dynamic object (Figure 3).
Fig. 3 – a) rectangular graphics object with key
points, b) rotated rectangular graphics object with key points
The number and size of key points depends on
the size of the object, its maximum coordinate shift per frame, and minimum size of other objects. Every DisplayObject of key points should be used as the second object in hitTest function. Big advantage of this solution is that all key points can be used like sensors. For example, if dynamic object is a car, and static object is a wall, every key point recognizes which side of the car is damaged by hitting the wall. Furthermore, key points, which are situated in the corners, can provide signals for making rotary motion of the car, while other key points can provide signals for translational motion. Another advantage is that dynamic object can be scaled and rotated any way: DisplayObjects of key points are always on required places. For example, if there is a need to create a flat isometric dynamic object, a programmer should place original object into MovieClip object, and set property scaleY to 0.5. The result is shown on Figure 4.
Figure 4 – a) rotation of original graphics object,
b) rotation of scaled (isometric) graphics object
In both cases hitTest function works correctly. The principle, described in this work is used in
flash game “Forsage” (Figure5), which is now being created for the project “Galactego”.
Fig.5 – interface of “Forsage” Falsh game. The problem of object interaction in Flash
games is a current issue for every Flash game developer, and there are many different algorithms being created. But usually each of them are not universal, and has limited capabilities for work with rotatable and deformable objects. Algorithm described in this work is not completely universal, but it should be very useful for most 2D Flash games with objects interaction.
References 1. Adobe Flash [Электронный ресурс].
Режим доступа: http://ru.wikipedia.org/wiki/Adobe_Flash , свободный.
2. Adobe купила Macromedia. Взгляд с неожиданной стороны [Электронный ресурс]. Режим доступа: http://blogs.msdn.com/b/rentgen/archive/2005/04/21/410379.aspx , свободный.
3. Справочник по языку Action Script 3.0 и его компонентам [Электронный ресурс]. - Режим доступа: http://help.adobe.com/ru_RU/AS3LCR/Flash_10.0/flash/display/BitmapData.html, свободный.
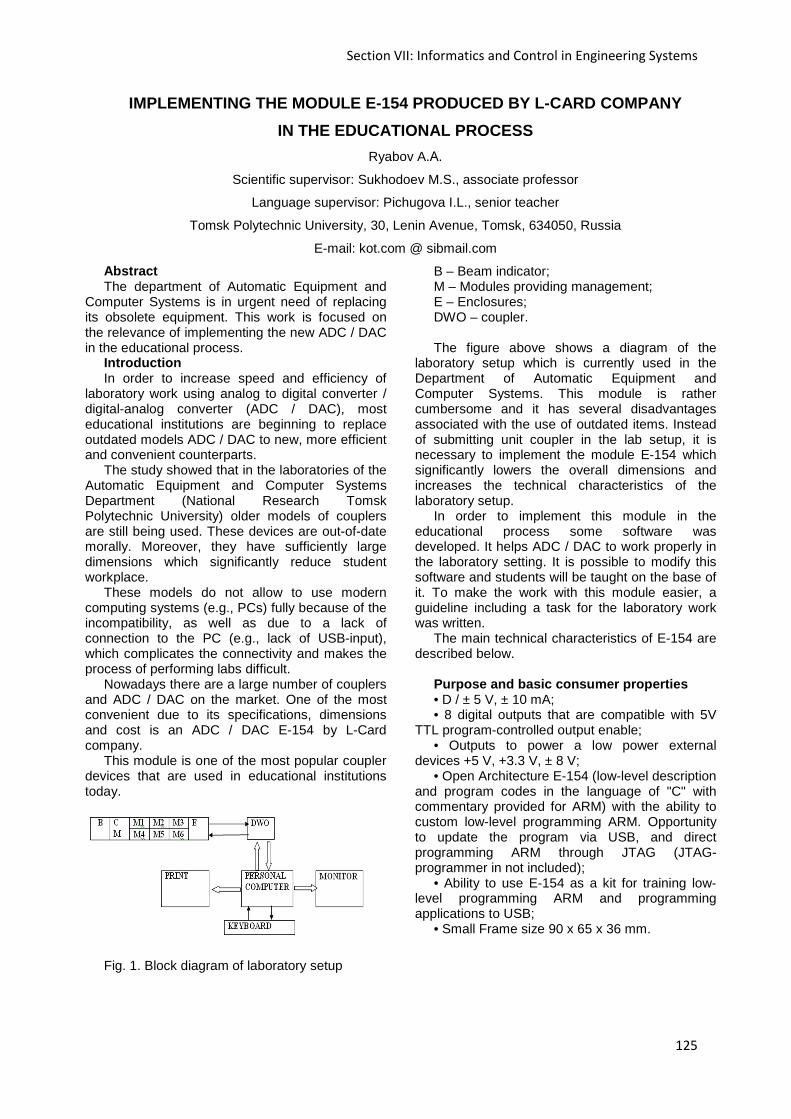
Section VII: Informatics and Control in Engineering Systems
125
IMPLEMENTING THE MODULE E-154 PRODUCED BY L-CARD CO MPANY
IN THE EDUCATIONAL PROCESS
Ryabov A.А.
Scientific supervisor: Sukhodoev M.S., associate professor
Language supervisor: Pichugova I.L., senior teacher
Tomsk Polytechnic University, 30, Lenin Avenue, Tomsk, 634050, Russia
E-mail: kot.com @ sibmail.com
Abstract The department of Automatic Equipment and
Computer Systems is in urgent need of replacing its obsolete equipment. This work is focused on the relevance of implementing the new ADC / DAC in the educational process.
Introduction In order to increase speed and efficiency of
laboratory work using analog to digital converter / digital-analog converter (ADC / DAC), most educational institutions are beginning to replace outdated models ADC / DAC to new, more efficient and convenient counterparts.
The study showed that in the laboratories of the Automatic Equipment and Computer Systems Department (National Research Tomsk Polytechnic University) older models of couplers are still being used. These devices are out-of-date morally. Moreover, they have sufficiently large dimensions which significantly reduce student workplace.
These models do not allow to use modern computing systems (e.g., PCs) fully because of the incompatibility, as well as due to a lack of connection to the PC (e.g., lack of USB-input), which complicates the connectivity and makes the process of performing labs difficult.
Nowadays there are a large number of couplers and ADC / DAC on the market. One of the most convenient due to its specifications, dimensions and cost is an ADC / DAC E-154 by L-Card company.
This module is one of the most popular coupler devices that are used in educational institutions today.
Fig. 1. Block diagram of laboratory setup
B – Beam indicator; M – Modules providing management; E – Enclosures; DWO – coupler. The figure above shows a diagram of the
laboratory setup which is currently used in the Department of Automatic Equipment and Computer Systems. This module is rather cumbersome and it has several disadvantages associated with the use of outdated items. Instead of submitting unit coupler in the lab setup, it is necessary to implement the module E-154 which significantly lowers the overall dimensions and increases the technical characteristics of the laboratory setup.
In order to implement this module in the educational process some software was developed. It helps ADC / DAC to work properly in the laboratory setting. It is possible to modify this software and students will be taught on the base of it. To make the work with this module easier, a guideline including a task for the laboratory work was written.
The main technical characteristics of E-154 are described below.
Purpose and basic consumer properties • D / ± 5 V, ± 10 mA; • 8 digital outputs that are compatible with 5V
TTL program-controlled output enable; • Outputs to power a low power external
devices +5 V, +3.3 V, ± 8 V; • Open Architecture E-154 (low-level description
and program codes in the language of "C" with commentary provided for ARM) with the ability to custom low-level programming ARM. Opportunity to update the program via USB, and direct programming ARM through JTAG (JTAG-programmer in not included);
• Ability to use E-154 as a kit for training low-level programming ARM and programming applications to USB;
• Small Frame size 90 x 65 x 36 mm.

XVII Modern Technique and Technologies 2011
126
Fig 2. Appearance of E-154
Fig. 3. Functional diagram of E-154 Functional diagram Let us consider what is in the functional
diagram of E-154 (Fig. 3). The system consists of: • Controller. All the logic of internal controls are
built into the program ARM-controller type AT91SAM7S64 (for brevity, we shall call it ARM). The functional diagram shows only the peripheral interface lines ARM which are involved in the E-154, and shows only those basic and alternative functions of these lines, which are used or can be used.
• USB-interface is used for interconnection with the computer, power supply circuit +5 V USB is used to power the E-154;
• JTAG-interface could be used for teaching and training evaluation work. It is important that access to the JTAG-connector can only be possible when the top cover E-154 is removed;
• ADC (A / D) is a 12-bit analog-digital converter of successive approximation type AD7895 AR;
• Analog section consists of an 8-input ADC (ADC1 ... ADC8), an electronic switch K1, an amplifier with controllable gain of A1;
• Registers of digital output and control the analog section. This register Rg1 c serial input and parallel data output parallel register Rg2a control the analog section, a parallel register Rg2b digital output;
• DAC is arranged on the principle of averaging the pulse-width modulated signal from the line PWM2 ARM. DAC channel consists of a lowpass filter F1, the amplifier A2 and the output DAC;
• Digital inputs DI1 ... DI8 with alternative input / output functions;
• Jumpers J1 backup boot mode E-154. Access to the jumper J1 is possible only if the top cover of E-154 is removed;
• The VD1 is a red LED, switched from the output port logical unit PA3 ARM;
• The voltage (in linear principle) is used to obtain a stabilized voltage +3.3 V, used to supply ARM;
• DC / DC converter uses the specified port signals PWM0, PWM1. Inverter output voltage is ± 8 V used to power the analog channel ADC.
Standard software This module has two libraries: Lusbapi and
LComp. Both libraries are designed to work in the Windows operating environments, such as Windows "98/2000/XP/Vista. Both Lusbapi and LComp provide a full functional support of the module E-154. The advantage of using the library LComp is greater as it offers support for products developed by the L-Card company. Let us compare: Lusbapi only supports USB devices but the library LComp provides work with ISA and PCI products by L-Card company therewith.
Conclusion The implementation of E-154 in the educational
process of the Automatic Equipment and Computer Systems Department (National Research Tomsk Polytechnic University) is meant to be in 2011. In this regard, teaching software for mastering skills to work with this tool has been developed. Now there is a need to develop a new section of the lecture course within the framework of which students will be given new material.
References 1. Methodical instructions for carrying out the
laboratory work "Initial processing of information in a computerized management system". – Tomsk: TPU, 2009
2. E-154. User's Guide. [Electronic resource] Access mode: http://www.Lcard.ru – free.
3. E-154. Programmer's Guide. [Electronic resource] Access mode: http://www.Lcard.ru – free.
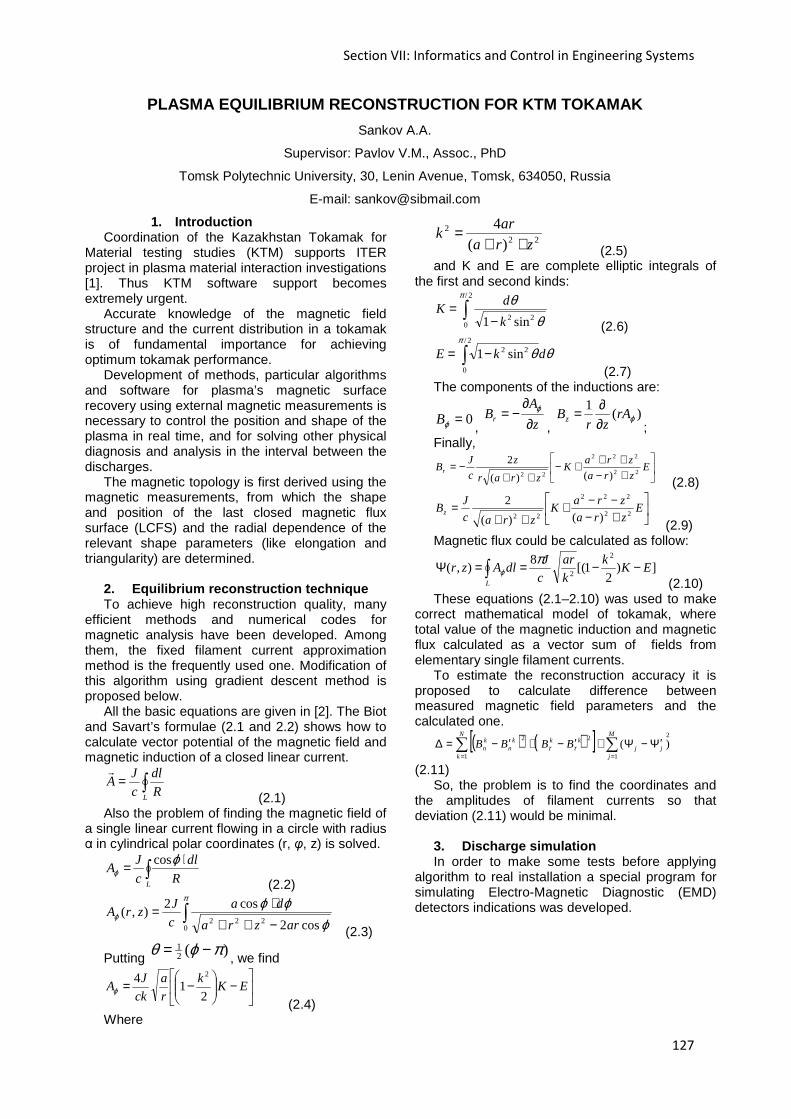
Section VII: Informatics and Control in Engineering Systems
127
PLASMA EQUILIBRIUM RECONSTRUCTION FOR KTM TOKAMAK
Sankov A.A.
Supervisor: Pavlov V.M., Assoc., PhD
Tomsk Polytechnic University, 30, Lenin Avenue, Tomsk, 634050, Russia
E-mail: [email protected]
1. Introduction Coordination of the Kazakhstan Tokamak for
Material testing studies (KTM) supports ITER project in plasma material interaction investigations [1]. Thus KTM software support becomes extremely urgent.
Accurate knowledge of the magnetic field structure and the current distribution in a tokamak is of fundamental importance for achieving optimum tokamak performance.
Development of methods, particular algorithms and software for plasma’s magnetic surface recovery using external magnetic measurements is necessary to control the position and shape of the plasma in real time, and for solving other physical diagnosis and analysis in the interval between the discharges.
The magnetic topology is first derived using the magnetic measurements, from which the shape and position of the last closed magnetic flux surface (LCFS) and the radial dependence of the relevant shape parameters (like elongation and triangularity) are determined.
2. Equilibrium reconstruction technique To achieve high reconstruction quality, many
efficient methods and numerical codes for magnetic analysis have been developed. Among them, the fixed filament current approximation method is the frequently used one. Modification of this algorithm using gradient descent method is proposed below.
All the basic equations are given in [2]. The Biot and Savart’s formulae (2.1 and 2.2) shows how to calculate vector potential of the magnetic field and magnetic induction of a closed linear current.
∫=L R
dl
c
JAr
(2.1) Also the problem of finding the magnetic field of
a single linear current flowing in a circle with radius α in cylindrical polar coordinates (r, φ, z) is solved.
∫⋅=
L R
dl
c
JA
ϕϕ
cos
(2.2)
∫ −++⋅=
π
ϕϕ
ϕϕ0
222 cos2
cos2),(
arzra
da
c
JzrA
(2.3)
Putting )(2
1 πϕθ −=, we find
−
−= EK
k
r
a
ck
JA
21
4 2
ϕ
(2.4) Where
222
)(
4
zra
ark
++=
(2.5) and K and E are complete elliptic integrals of
the first and second kinds:
∫ −=
2/
022 sin1
π
θθ
k
dK
(2.6)
∫ −=2/
0
22 sin1π
θθ dkE (2.7)
The components of the inductions are:
0=ϕB, z
ABr ∂
∂−= ϕ
, )(
1ϕrA
zrBz ∂
∂=;
Finally,
+−+++−
++−= E
zra
zraK
zrar
z
c
JBr 22
222
22 )()(
2
(2.8)
+−−−+
++= E
zra
zraK
zrac
JBz 22
222
22 )()(
2
(2.9) Magnetic flux could be calculated as follow:
])2
1[(8
),(2
2EK
k
k
ar
c
JdlAzr
L
−−==Ψ ∫π
ϕ (2.10)
These equations (2.1–2.10) was used to make correct mathematical model of tokamak, where total value of the magnetic induction and magnetic flux calculated as a vector sum of fields from elementary single filament currents.
To estimate the reconstruction accuracy it is proposed to calculate difference between measured magnetic field parameters and the calculated one.
( ) ( )[ ] ∑∑==
Ψ′−Ψ+′−+′−=∆M
jjj
N
k
kkkn
kn BBBB
1
2
1
22)(ττ
(2.11)
So, the problem is to find the coordinates and the amplitudes of filament currents so that deviation (2.11) would be minimal.
3. Discharge simulation In order to make some tests before applying
algorithm to real installation a special program for simulating Electro-Magnetic Diagnostic (EMD) detectors indications was developed.
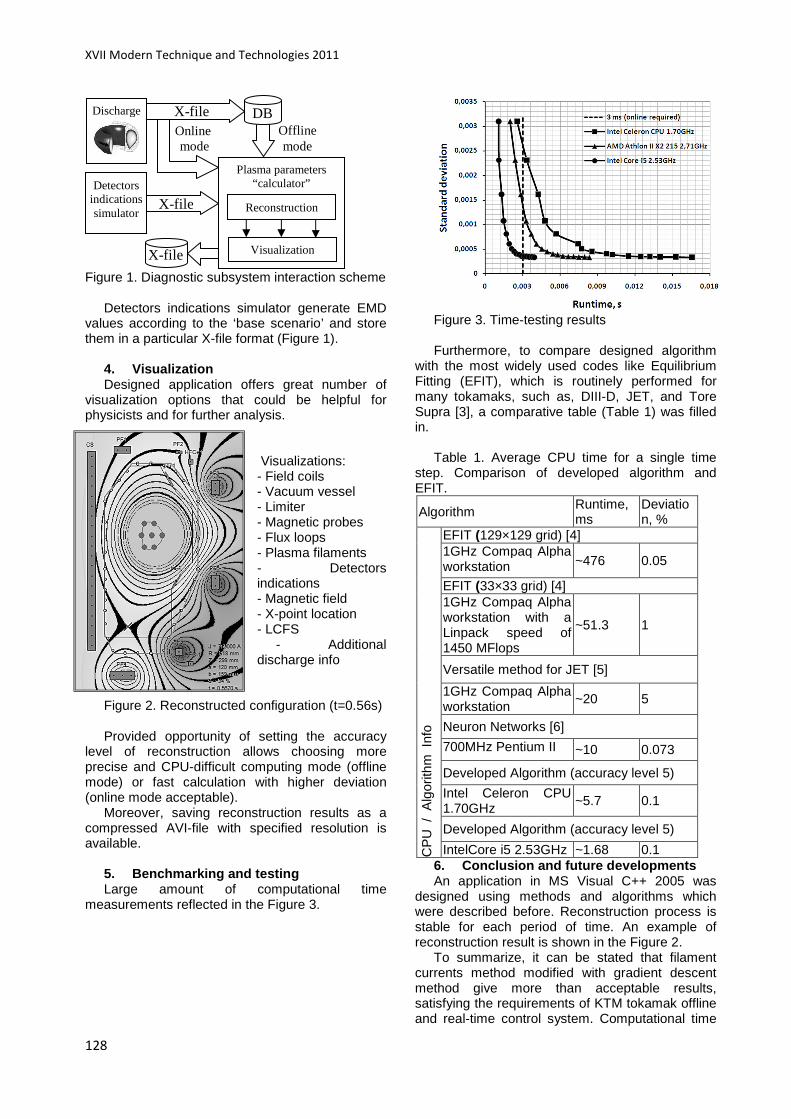
XVII Modern Technique and Technologies 2011
128
Figure 1. Diagnostic subsystem interaction scheme
Detectors indications simulator generate EMD values according to the ‘base scenario’ and store them in a particular X-file format (Figure 1).
4. Visualization Designed application offers great number of
visualization options that could be helpful for physicists and for further analysis.
Visualizations: - Field coils - Vacuum vessel - Limiter - Magnetic probes - Flux loops - Plasma filaments - Detectors indications - Magnetic field - X-point location - LCFS
- Additional discharge info
Figure 2. Reconstructed configuration (t=0.56s) Provided opportunity of setting the accuracy
level of reconstruction allows choosing more precise and CPU-difficult computing mode (offline mode) or fast calculation with higher deviation (online mode acceptable).
Moreover, saving reconstruction results as a compressed AVI-file with specified resolution is available.
5. Benchmarking and testing Large amount of computational time
measurements reflected in the Figure 3.
Figure 3. Time-testing results Furthermore, to compare designed algorithm
with the most widely used codes like Equilibrium Fitting (EFIT), which is routinely performed for many tokamaks, such as, DIII-D, JET, and Tore Supra [3], a comparative table (Table 1) was filled in.
Table 1. Average CPU time for a single time
step. Comparison of developed algorithm and EFIT.
Algorithm Runtime, ms
Deviation, %
CP
U /
Alg
orith
m I
nfo
EFIT (129×129 grid) [4] 1GHz Compaq Alpha workstation ~476 0.05
EFIT (33×33 grid) [4] 1GHz Compaq Alpha workstation with a Linpack speed of 1450 MFlops
~51.3 1
Versatile method for JET [5]
1GHz Compaq Alpha workstation
~20 5
Neuron Networks [6]
700MHz Pentium II ~10 0.073
Developed Algorithm (accuracy level 5)
Intel Celeron CPU 1.70GHz
~5.7 0.1
Developed Algorithm (accuracy level 5)
IntelCore i5 2.53GHz ~1.68 0.1 6. Conclusion and future developments An application in MS Visual C++ 2005 was
designed using methods and algorithms which were described before. Reconstruction process is stable for each period of time. An example of reconstruction result is shown in the Figure 2.
To summarize, it can be stated that filament currents method modified with gradient descent method give more than acceptable results, satisfying the requirements of KTM tokamak offline and real-time control system. Computational time
Detectors indications simulator
Plasma parameters “calculator”
Discharge
X-file
X-file
Online mode
Offline mode
X-file
DB
Reconstruction
Visualization
Section VII: Informatics and Control in Engineering Systems
129
of proposed algorithm on average is less than constraints 3ms. The use of the developed algorithm is also foreseen for the near future.
7. References [1] E.A.Azizov, KTM project (Kazakhstan
Tokamak for Material Testing), Moscow, 2000; [2] L. Landau, E. Lifshitz, Course of
Theoretical Physics, vol 8, Electrodynamics of Continuous Media 2nd ed. Pergamon Press, 1984;
[3] Q. Jinping, Equilibrium Reconstruction in EAST Tokamak, Plasma Science and Technology, Vol.11, No.2, Apr. 2009.
[4] W. Zwingmann, Equilibrium analysis of steady state tokamak discharges, Nucl. Fusion 43 842, 2003;
[5] O. Barana, Real-time determination of internal inductance and magnetic axis radial position in JET, Plasma Phys. Control. Fusion 44, 2002;
[6] L. Zabeo, A versatile method for the real time determination of the safety factor and density profiles in JET, Plasma Phys. Control. Fusion 44, 2002.
MODERN ON-LINE EDUCATION
Turenko M.V., Savchenko, E.N.
Scientific advisor: Aksenov S.V., Yurova M.V.
Tomsk Polytechnic University, 634050, Russia, Tomsk, Lenin St., 30
E-mail: [email protected]
Introduction Modern students and schoolchildren are
basically Internet generation; electronic way of receiving information (in this case educational) is a normal component of their life. Generally, the use of high technologies in education is welcomed by students, — knowledge, skills, experience will be useful in self-improvement and career growth. Information communication technologies have become their working tool.
Existence of On-line Education is known for many people, but not half of them trust it. The reason is lack of information, an unusual mode of study. Meanwhile, distance education allows people to save energy, time, eventually, money and, above all, its quality is highly competitive with traditional education. Materials in textbooks are presented in electronic form, constantly updated, allowing students to get the latest information.
Studying at special Internet Universities, providing training of students, one can get a certificate and state-recognized diploma.
Organization of the learning process at
Internet Universities As a rule, students aren't taught at Internet
universities, they are given opportunity for learning. If you want to study and get all possible knowledge, there are various video courses, articles, forums providing full and comprehensive information on a subject which is interesting for you. You can independently go deep into gigabytes of knowledge; ask question if something appears not clear, and receive the fullest answer from the authors of this course- professors and teachers of Russian and foreign high schools, employees of the scientific research institutes and
state organizations, business representatives- they will answer you with pleasure.
Examinations and tests are carried out in the form of a test (it is widespread also in full-time universities), so the quality of education is reliable. When exam is taken at the Internet University, atmosphere is more relaxing. The student is less worried, can concentrate and focus on the tasks. Do not think that it is easy to cheat at home. There are programs to monitor everything that a tester is doing, for example, Mipko Personal Monitor, Internet-spyware.
Difference from distance education Unlike distance learning, binding a student to
educational buildings, on-line learning provides opportunity to study no matter how far a student is from educational institution. Moreover, if studying part-time, a student has to come to the university many times, while studying on-line he doesn’t have to do it. The concept of Internet universities structure is that interaction between a teacher and a student occurs in virtual space: each of them thus is sitting at the computer, supporting communication process via the Internet.
The convenience of On-line training lies in its independence from a geographical position of the student; it opens great opportunities for people somehow limited in moving. The majority of people wishing to get second higher education - are people busy at their primary work, and getting education via the Internet –is the only convenient way for them. Getting second speciality through the Internet is chosen as a convenient mode of study by young and also having many children mothers, invalids, people limited in moving (military men, the people working shifts), and also our

XVII Modern Technique and Technologies 2011
130
compatriots from the countries of near and far Abroad for whom Internet universities is a unique accessible mode of study in a native language.
How to become a student of the Internet
University To become a student of the one of numerous
Internet universities is simple enough. For this purpose it is necessary to pass registration process, having specified personal data. Then, a wide choice of the courses accessible to study is provided for you. Some of them are on a fee-paying basis, but the fee is much lower than training cost at classical University. There are courses which are realized by the high schools having the state accreditation; at these courses you receive state-recognized diploma after completing the training course. After choosing a particular course and possible payment, all training materials on the given subject are sent to you for further studying. At some universities possibility to order courses on DVD or in printing is provided, and also to download all course in one archive. It will considerably cut down your expenses for the Internet traffic.
Advantages of On-line education • The main advantage of studying via the
Internet is mobility. You can study worldwide, irrespective of time of day.
• Another advantage is tuition fee. In most cases you pay only to your provider for the Internet connection.
• Internet universities unite only students who really wish to study and receive knowledge, nobody will force them it to do.
• Everyone sets for himself a convenient rate of work, to arrange it under the vital rhythm and personal circumstances and requirements. A student and a teacher can communicate over a distance during any time convenient for them.
Disadvantages of On-line education • The main drawback of studying via the
Internet is that in most cases you get the diploma which is not state-recognized and isn't so highly ranked at employment. But above all, the most important thing is the knowledge you get.
• To study at the Internet universities, you need a computer and access to the Internet. But there is a great number of the Internet cafes providing this service, but it’s not free.
• Moreover, there is such disadvantage as lack of live personal contact between a student and a teacher who could bring additional emotions, tell “by the way” something interesting. It considerably impoverishes and narrows your dialogue.
• Educational programs and courses can be insufficiently developed because of lack of competent experts, able to create well- developed course books.
Examples of foreign online universities Prepress help This online university was created by two
California experts in the field of professional trainings, conducting group sessions with employees of such leading companies as Apple, Heidelberg, PPC ScenicSoft etc. In parallel with courses that are available to Internet users, the university organizes retreats, full-time and part-time classes may be combined. In online store, which is also available on the website, you can buy academic literature on the subject of training courses. [7]
VTC Online University VTC Online University offers a wide range of
learning areas, which include not only the area of prepress and design software, but almost all branches of computer knowledge. Among the clients of the university, there are such companies as IBM and General Motors, Siemens and Coca-Cola, many international corporations and research organizations. [5]
Sessions.edu Sessions.edu – is the oldest among online
learning centers that have received official accreditation. It was founded in 1997 and brings together professionals in education and graphic design from America, Europe and the Far East. Over the years thousands of participants from more than 90 countries have graduated from the university. Students choose one of five virtual schools and after completing all essential courses obtain an official certificate, confirmed by the Committee Distance Education and Training Council of New York State. [6]
Example of online university in Russia Institute of Distance Education "INTUIT" - the
first Internet-based project that specializes in the mass training of IT professionals on various programs (the license for educational activity was obtained in 2010). [3] “INTUIT” offers a variety of courses in IT - technologies, such as:
Course Name Number of
entering students
Number of graduates
Introduction into HTML
39875 15163
Administering Microsoft Windows XP Professional networks
2516 375
Visual Basic 1187 193 Networks administering on the platform of MS
105 817

Section VII: Informatics and Control in Engineering Systems
131
Windows Server SQL Server 2000
1475 122
Conclusion Main principles of On-line education have been
discussed, as well as its advantages and disadvantages. On-line learning will be a good choice for motivated and ambitious person, who doesn’t have possibility to be trained at classical university. If you choose to study in one of Internet universities, be ready to spend many hours at the computer watching video-lessons or reading
various books. A great deal of self-checking and will is required, but as a result you will get excellent education for little money and become really valuable expert.
References 1. http://e-college.ru/ 2. http://www.uchimvas.ru/ 3. http://www.intuit.ru/ 4. http://ru.wikipedia.org/ 5. http://apex.vtc.com/graphics.htm 6. http://www.sessions.edu/wwl/ 7. http://www.prepresshelp.com/
DEVELOPING BUDGETARY DOCUMENTATION WITH SUBSYSTEM
“IMPLEMENTATION OF LOCAL SETTLEMENTS BUDGETS” OF SY STEM “ACC-
FINANCE”BUDGETARY FUNDS RECEPIENT
AUTOMATED WORKPLACE
Trippel Anna
Scientific advisor: Axyonov S, Yurova M.
Tomsk Polytechnic University, 30, Lenin Avenue, Tomsk, 634050, Russia
E-mail: [email protected]
Introduction Current situation in economics, including also
situation in budget field, is a new challenge to financial power of regions. At present, a burning issue in our state is a target use of budget; therefore it is necessary to control budget implementation. One of the ways to solve this problem is special-purpose software for creating budgetary documentation. Target use of budget implementation and transparency of funds flow is provided due to the use of special-purpose software in financial system. Integrated system of automated control centre «ACC-Finance» is oriented to increase the efficiency of budget implementation in Russian Federation.
The main goals and functions of Finance Office of Tomsk Region Administration are implemented by means of «ACC-Finance»-computer-aided system for financial and treasury authorities. Work on the budget settlement of Tomsk region is carried out in the AWP "spending units". Most of the functions of the settlements on the budget are carried out using subsystem performance budgets of local settlements workstation recipient's budget system “ACC Finance”.
Fig.1 Data access in «ACC-Finance» Detailed description of «ACC-Finance»
software Special-purpose software «ACC-Finance» is an
operator workplace of budget recipient organization, which is involved in «ACC-Finance». An operator provides payment in «Client-Bank» system.

XVII Modern Technique and Technologies 2011
132
Workstation is oriented to automate functions of budget recipient relating to budget implementation. The whole operator workplace consists of several programs:
• operator workstation • digital signature and coding systems • transmission system in charge of
connection with financial agency In order to show the main functions of special-
purpose software «ACC-Finance», an algorithm for creating several budgetary documentations is described below.
Work with budgetary documentation Generally, the work with outgoing
documentation is realized in the following way: a document is created; a document entry is filled from database directory or manually in. Next, the document is checked on correct completion and later the user can edit it. Then the document is signed with digital signature and send to financial agency or bank. From the direction of financial agency document is checked and processed. As a consequence of control, a client is getting information about the document state when a client connects with financial agency. Document state is determined according to the status.
Later on, actions with documentation depend on its type and current status. As a rule, if all stages were correct here work with the document is finished. If the document was refused, then a client sends it to archives. If it is necessary, a client can recall the document until it has an accepted status "completed".
Before sending to financial agency, a document is signed with digital signature. Financial agency can demand one or several signatures in a document. Usually digital signature is stored on a special «key» floppy disk or portable data medium.
To sign the document, it is necessary to execute the following actions:
1) To insert a «key» floppy disk in the disk drive or to connect portable data medium to personal computer. As a rule, each signature demands separate floppy disk or portable data medium.
2) To choose the document in the list necessary to sign. To sign a document is possible if only its status is "new".
3) To press right button of the mouse to open contextual menu and choose action «sign».
After executing this action, a document gets status "signed".
For more detailed studying of «ACC-Finance» functions, there is necessity to consider creation of such documents as: the agreement on delivery of the electric power; the bill of debt; budget call for payment of expenditures for petrol.
While creating the document «Agreement», it is necessary to fill in following field: document
number (automated); date of creation document; action character; organization entry of payer; organization entry of executor; budget name. Also, it is necessary to provide the following data: total sum of the agreement; schedule of payment according to the agreement; delivery terms; product or service name. After input of necessary information the document is kept. At the time of keeping the document is checked on data correctness. When the document is saved, it receives status "new". When the document is signed, it is sent to financial agency.
For registration of the agreement and also other bills of debt (for example, bills of debt based on invoice), a document «Bill of debt» is provided. In the document «Bill of debt without fixed sum» the sum is not given, as it cannot be predetermined, the sum is determined on fact. The document «Bill of debt» is created with decipherment according to the budget. In order to create the document «Bill of debt» it is necessary to select suitable menu item. A window with a list of documents will open. Electronic document «Bill of debt» consists of set of bookmarks. Here it is necessary to fill in the following field: organization entry of payer and executor; budget data. The sequence of filling of these fields is similar to the way that fields are filled in electronic document "Agreement". Schedule of payment and nomenclature can be kept blank in general way.
Electronic document «Budget call for payment of expenditures» represents a requirement to a financial agency on expenditures of budget. The document «Budget call for payment of expenditures» is a basis for implementation of budget flow by financial agency. Budget call is filled in at first, then is signed and sent to financial agency similar to the way of creating of all outgoing documents. As a consequence of processing in «ACC-Finance», the system is displaying the document status synchronously.
Processing will continue until the document gets one of final statuses. To create the electronic document «Budget call for payment of expenditures» is necessary in general way to fill in the following field in a form: organization entry of payer; organization entry of executor; payment identifier; responsible persons; supporting document; action character; date of performance; details of the document, which serve as a basis for forming a string of budget mural. Payment identifier is filled if payment of taxes is realized in the document.
Conclusion The main feature of this information system is
integrated database. This integrated database is used for keeping and processing all operations of budget implementation on Russian Federation territory. An important point is that the server equipment is located on the territory of Russian
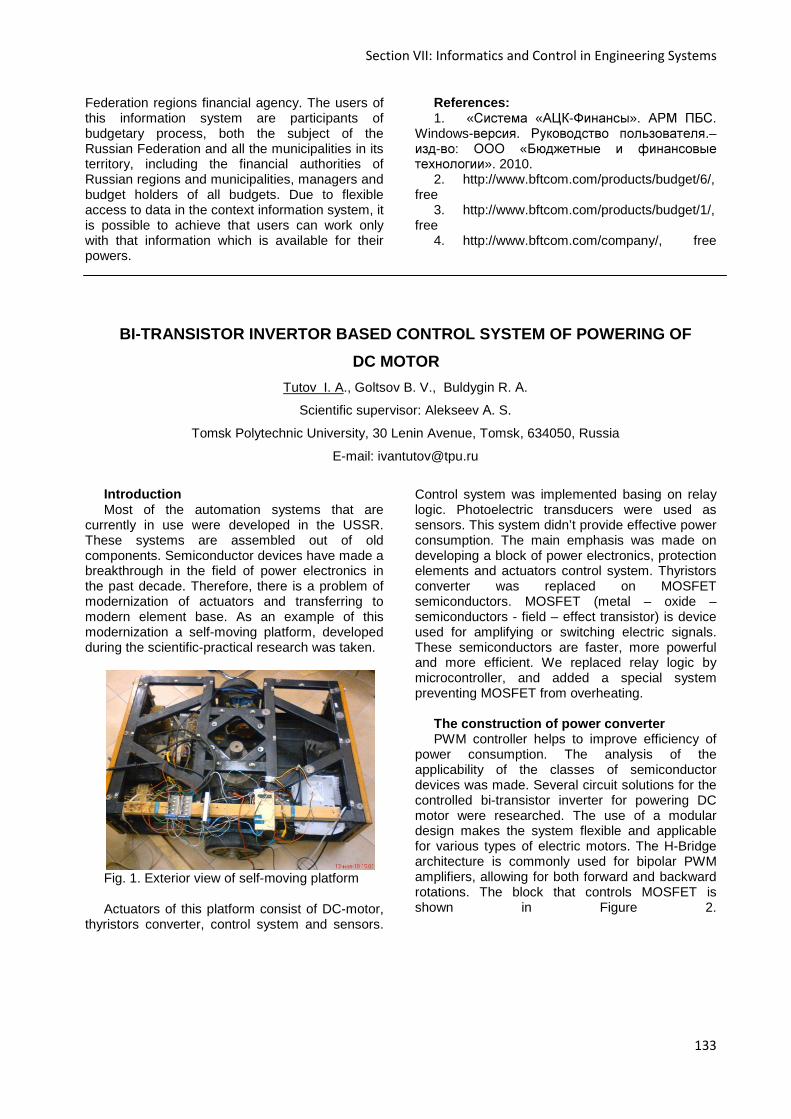
Section VII: Informatics and Control in Engineering Systems
133
Federation regions financial agency. The users of this information system are participants of budgetary process, both the subject of the Russian Federation and all the municipalities in its territory, including the financial authorities of Russian regions and municipalities, managers and budget holders of all budgets. Due to flexible access to data in the context information system, it is possible to achieve that users can work only with that information which is available for their powers.
References: 1. «Система «АЦК-Финансы». АРМ ПБС.
Windows-версия. Руководство пользователя.– изд-во: ООО «Бюджетные и финансовые технологии». 2010.
2. http://www.bftcom.com/products/budget/6/, free
3. http://www.bftcom.com/products/budget/1/, free
4. http://www.bftcom.com/company/, free
BI-TRANSISTOR INVERTOR BASED CONTROL SYSTEM OF POWE RING OF
DC MOTOR
Tutov I. A., Goltsov B. V., Buldygin R. А.
Scientific supervisor: Alekseev А. S.
Tomsk Polytechnic University, 30 Lenin Avenue, Tomsk, 634050, Russia
E-mail: [email protected]
Introduction Most of the automation systems that are
currently in use were developed in the USSR. These systems are assembled out of old components. Semiconductor devices have made a breakthrough in the field of power electronics in the past decade. Therefore, there is a problem of modernization of actuators and transferring to modern element base. As an example of this modernization a self-moving platform, developed during the scientific-practical research was taken.
Fig. 1. Exterior view of self-moving platform Actuators of this platform consist of DC-motor,
thyristors converter, control system and sensors.
Control system was implemented basing on relay logic. Photoelectric transducers were used as sensors. This system didn’t provide effective power consumption. The main emphasis was made on developing a block of power electronics, protection elements and actuators control system. Thyristors converter was replaced on MOSFET semiconductors. MOSFET (metal – oxide – semiconductors - field – effect transistor) is device used for amplifying or switching electric signals. These semiconductors are faster, more powerful and more efficient. We replaced relay logic by microcontroller, and added a special system preventing MOSFET from overheating.
The construction of power converter PWM controller helps to improve efficiency of
power consumption. The analysis of the applicability of the classes of semiconductor devices was made. Several circuit solutions for the controlled bi-transistor inverter for powering DC motor were researched. The use of a modular design makes the system flexible and applicable for various types of electric motors. The H-Bridge architecture is commonly used for bipolar PWM amplifiers, allowing for both forward and backward rotations. The block that controls MOSFET is shown in Figure 2.

XVII Modern Technique and Technologies 2011
134
Fig. 2. MOSFET control block Temperature control block (shown in Figure
4) was developed and assembled as an additional element. This block switches on a cooling fan when the set temperature is reached by generating a signal of MOSFET overheating when the temperature exceeds the limiting. Temperature sensors are thermistors, mounted on the drain of power transistors.
Fig. 3. Temperature control block Block of Basic Logic (BBL) generates a
signal for disabling the motor after receiving an interruption signal from the sensor and transmits control signals from the microcontroller (shown in Figure 4).
Developed microprocessor control block could be applied for testing complex algorithms, analyzing the signals from sensors and interaction with various computer systems.
Fig. 4. Block of Basic Logic
Using two blocks that control MOSFET gives possibility for operator to perform control in manual mode. If blocks that control MOSFET are connected to microprocessor block they will control self-moving platform in automatic mode. Connection of driver blocks to BBL is giving capabilities for controlling platform via basic algorithms by analyzing the signal from sensors. Blocks that control MOSFET, BBL and microprocessor block ensure the fulfillment of program of platform moving by analyzing the signals from different sensors. Various control system are shown in Figure 5
Fig. 5. Variants of control system
organization. Numbers on figure show: 1- control panel; 2 – block that controls MOSFET; 3 – DC motor; 4 - microprocessor block; 5 – BBL; 6 – sensors
Joystick is used to control the platform in
manual mode. Joystick rotation can be performed on two mutually perpendicular axes (shown in Figure 6). The output signal is analogous, and varies from 0V to 5V. This signal is transmitted to ADC which is embedded in microcontroller. According to the program microcontroller detects initial position of a joystick and compares this position with the next one. Using this data microcontroller defines

Section VII: Informatics and Control in Engineering Systems
135
direction and duty factor for PWM to control DC motors.
Fig. 6. Coordinate system of control signal for
DC motors Second method of controlling platform with
joystick doesn’t use microcontroller. This system is based on operational amplifiers or (and) analog timers. It is inbuilt in control panel.
Conclusion As a result of research work a power
converter of DC motor has been upgraded. A set of modules that give possibility for studying of different approaches to the control of the DC motor were developed. This set of modules will be used in the educational process at the Department of ICSU in the courses "Computer control of mechatronic systems", "Electromechanical and Mechatronic Systems", "Automatic Electric actuators of oil and gas industry".
References 1. Герман-Галкин С.Г. Компьютерное
моделирование полупроводниковых систем в MATLAB 6.0: учебное пособие. – СПб.: КОРОНА принт, 2001.
2. Datasheet. IRFZ48N 3. Datasheet. TLP521GS 4. Datasheet. NE556 All Datasheet can be find on
http://www.alldatasheet.com, free enter
SOLUTION OF BOUNDARY VALUE PROBLEMS ON THE CALCULAT ION
OF ELECTROMAGNETIC FIELD
NON-FERROMAGNETIC BETATRON IN COMSOL MULTIPHYSICS
M.D. Vakulenko
Language advisor: M.V.Yurova
Tomsk Polytechnic University
Introduction With the help of differential equations,
mathematical models can describe almost all phenomena occurring in the world, like physical, chemical, biological, economic or social processes. In addition, the computer’s power becomes more significant, and that’s why variety of mathematical packages, modeling of plural objects and processes has appeared last time.
Research purpose The aim of the research, presented in this
paper, is to create an electromagnetic field in a small volume of a betatron with a lack of iron and with minimal material costs.
Research Object
Figure 1. Cross section of the betatron.
0 0.05 0.1
-0.06
-0.04
-0.02
0
0.02
0.04
0.06
r, м
z, м
3
1
2
4
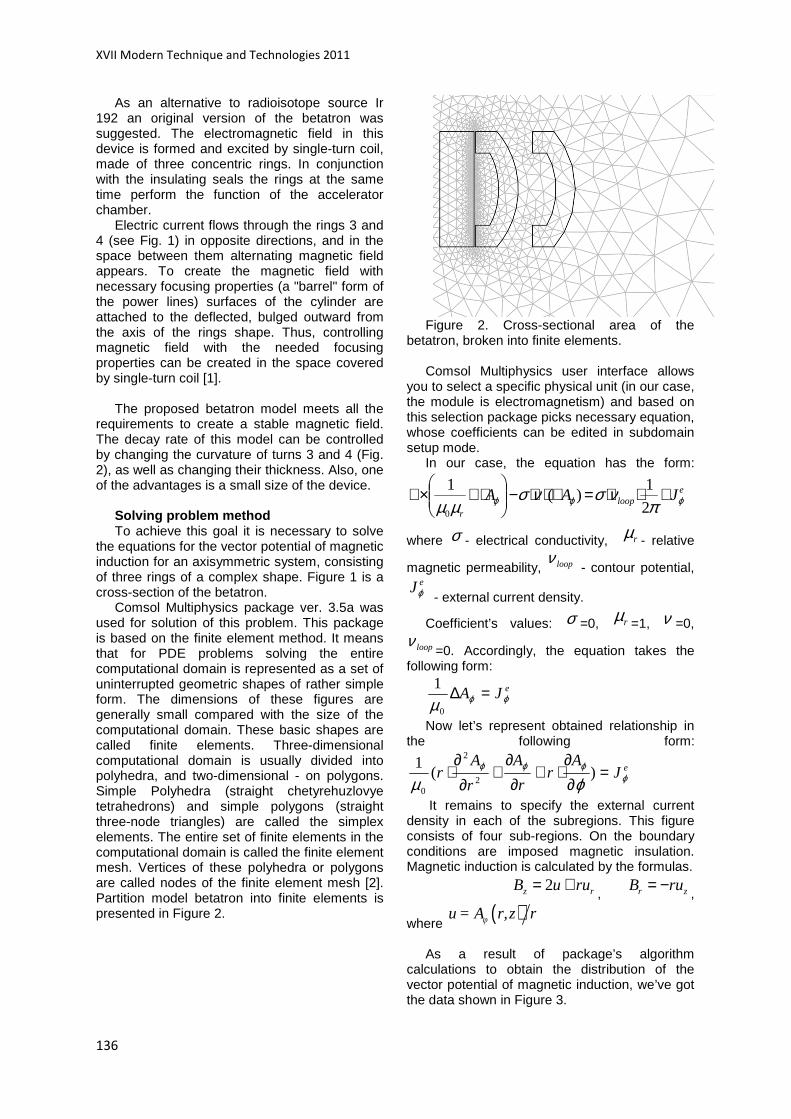
XVII Modern Technique and Technologies 2011
136
As an alternative to radioisotope source Ir 192 an original version of the betatron was suggested. The electromagnetic field in this device is formed and excited by single-turn coil, made of three concentric rings. In conjunction with the insulating seals the rings at the same time perform the function of the accelerator chamber.
Electric current flows through the rings 3 and 4 (see Fig. 1) in opposite directions, and in the space between them alternating magnetic field appears. To create the magnetic field with necessary focusing properties (a "barrel" form of the power lines) surfaces of the cylinder are attached to the deflected, bulged outward from the axis of the rings shape. Thus, controlling magnetic field with the needed focusing properties can be created in the space covered by single-turn coil [1].
The proposed betatron model meets all the
requirements to create a stable magnetic field. The decay rate of this model can be controlled by changing the curvature of turns 3 and 4 (Fig. 2), as well as changing their thickness. Also, one of the advantages is a small size of the device.
Solving problem method To achieve this goal it is necessary to solve
the equations for the vector potential of magnetic induction for an axisymmetric system, consisting of three rings of a complex shape. Figure 1 is a cross-section of the betatron.
Comsol Multiphysics package ver. 3.5a was used for solution of this problem. This package is based on the finite element method. It means that for PDE problems solving the entire computational domain is represented as a set of uninterrupted geometric shapes of rather simple form. The dimensions of these figures are generally small compared with the size of the computational domain. These basic shapes are called finite elements. Three-dimensional computational domain is usually divided into polyhedra, and two-dimensional - on polygons. Simple Polyhedra (straight chetyrehuzlovye tetrahedrons) and simple polygons (straight three-node triangles) are called the simplex elements. The entire set of finite elements in the computational domain is called the finite element mesh. Vertices of these polyhedra or polygons are called nodes of the finite element mesh [2]. Partition model betatron into finite elements is presented in Figure 2.
Figure 2. Cross-sectional area of the
betatron, broken into finite elements. Comsol Multiphysics user interface allows
you to select a specific physical unit (in our case, the module is electromagnetism) and based on this selection package picks necessary equation, whose coefficients can be edited in subdomain setup mode.
In our case, the equation has the form:
eloop
r
JAA ϕϕϕ πνσνσ
µµ+⋅⋅=∇⋅⋅−
⋅∇×∇
2
1)(
1
0
where σ - electrical conductivity, rµ - relative
magnetic permeability, loopν - contour potential,
eJϕ - external current density.
Coefficient’s values: σ =0, rµ =1, ν =0,
loopν=0. Accordingly, the equation takes the
following form:
eJA ϕϕµ=∆
0
1
Now let’s represent obtained relationship in
the following form:
eJA
rr
A
r
Ar ϕ
ϕϕϕ
ϕµ=
∂∂
⋅+∂
∂+
∂∂
⋅ )(1
2
2
0 It remains to specify the external current
density in each of the subregions. This figure consists of four sub-regions. On the boundary conditions are imposed magnetic insulation. Magnetic induction is calculated by the formulas.
2z rB u ru= +
, r zB ru= −,
where ( )φ
u = A r,z r
As a result of package’s algorithm
calculations to obtain the distribution of the vector potential of magnetic induction, we’ve got the data shown in Figure 3.
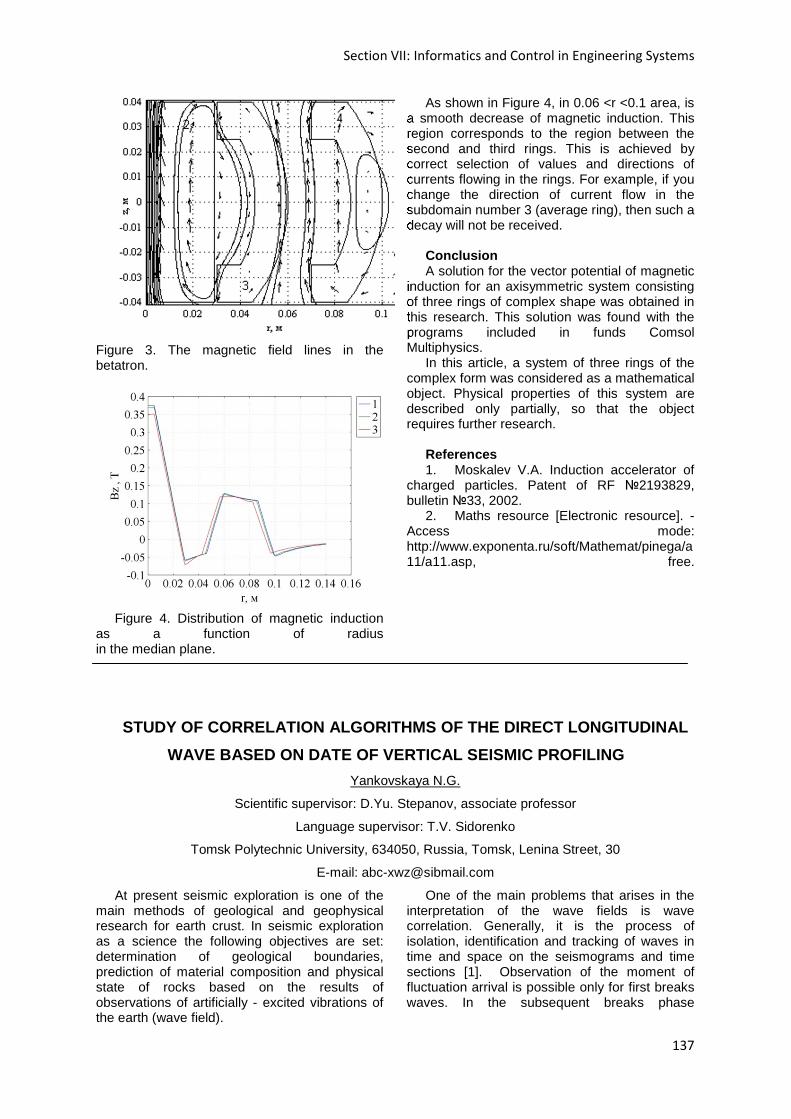
Section VII: Informatics and Control in Engineering Systems
137
Figure 3. The magnetic field lines in the betatron.
Figure 4. Distribution of magnetic induction
as a function of radius in the median plane.
As shown in Figure 4, in 0.06 <r <0.1 area, is a smooth decrease of magnetic induction. This region corresponds to the region between the second and third rings. This is achieved by correct selection of values and directions of currents flowing in the rings. For example, if you change the direction of current flow in the subdomain number 3 (average ring), then such a decay will not be received.
Conclusion A solution for the vector potential of magnetic
induction for an axisymmetric system consisting of three rings of complex shape was obtained in this research. This solution was found with the programs included in funds Comsol Multiphysics.
In this article, a system of three rings of the complex form was considered as a mathematical object. Physical properties of this system are described only partially, so that the object requires further research.
References 1. Moskalev V.A. Induction accelerator of
charged particles. Patent of RF 2193829, bulletin 33, 2002.
2. Maths resource [Electronic resource]. - Access mode: http://www.exponenta.ru/soft/Mathemat/pinega/a11/a11.asp, free.
STUDY OF CORRELATION ALGORITHMS OF THE DIRECT LONGI TUDINAL
WAVE BASED ON DATE OF VERTICAL SEISMIC PROFILING
Yankovskaya N.G.
Scientific supervisor: D.Yu. Stepanov, associate professor
Language supervisor: T.V. Sidorenko
Tomsk Polytechnic University, 634050, Russia, Tomsk, Lenina Street, 30
E-mail: [email protected]
At present seismic exploration is one of the main methods of geological and geophysical research for earth crust. In seismic exploration as a science the following objectives are set: determination of geological boundaries, prediction of material composition and physical state of rocks based on the results of observations of artificially - excited vibrations of the earth (wave field).
One of the main problems that arises in the interpretation of the wave fields is wave correlation. Generally, it is the process of isolation, identification and tracking of waves in time and space on the seismograms and time sections [1]. Observation of the moment of fluctuation arrival is possible only for first breaks waves. In the subsequent breaks phase
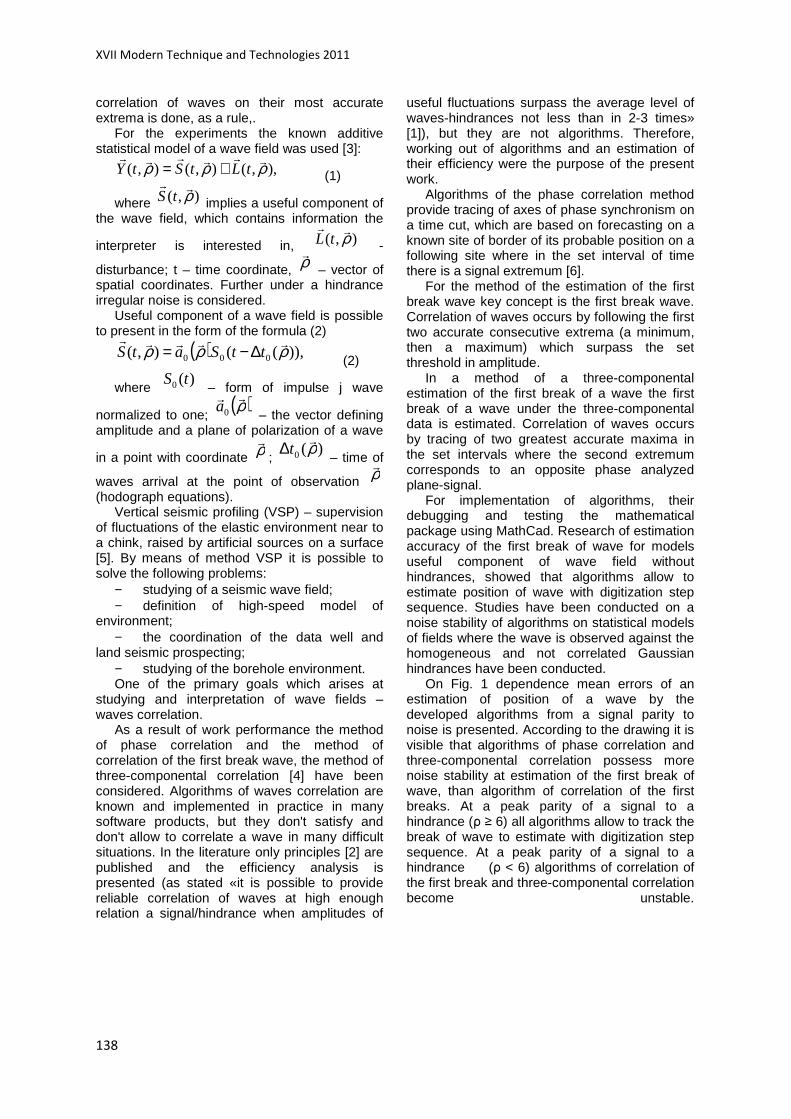
XVII Modern Technique and Technologies 2011
138
correlation of waves on their most accurate extrema is done, as a rule,.
For the experiments the known additive statistical model of a wave field was used [3]:
),,(),(),( ρρρ r
r
r
r
r
r
tLtStY += (1)
where ),( ρrr
tS implies a useful component of the wave field, which contains information the
interpreter is interested in, ),( ρrr
tL -
disturbance; t – time coordinate, ρr – vector of spatial coordinates. Further under a hindrance irregular noise is considered.
Useful component of a wave field is possible to present in the form of the formula (2)
( ) )),((),( 000 ρρρ rrrr
r
ttSatS ∆−= (2)
where )(0 tS
– form of impulse j wave
normalized to one; ( )ρrr
0a – the vector defining
amplitude and a plane of polarization of a wave
in a point with coordinate ρr ; )(0 ρrt∆
– time of
waves arrival at the point of observation ρr (hodograph equations).
Vertical seismic profiling (VSP) – supervision of fluctuations of the elastic environment near to a chink, raised by artificial sources on a surface [5]. By means of method VSP it is possible to solve the following problems:
− studying of a seismic wave field; − definition of high-speed model of
environment; − the coordination of the data well and
land seismic prospecting; − studying of the borehole environment. One of the primary goals which arises at
studying and interpretation of wave fields – waves correlation.
As a result of work performance the method of phase correlation and the method of correlation of the first break wave, the method of three-componental correlation [4] have been considered. Algorithms of waves correlation are known and implemented in practice in many software products, but they don't satisfy and don't allow to correlate a wave in many difficult situations. In the literature only principles [2] are published and the efficiency analysis is presented (as stated «it is possible to provide reliable correlation of waves at high enough relation a signal/hindrance when amplitudes of
useful fluctuations surpass the average level of waves-hindrances not less than in 2-3 times» [1]), but they are not algorithms. Therefore, working out of algorithms and an estimation of their efficiency were the purpose of the present work.
Algorithms of the phase correlation method provide tracing of axes of phase synchronism on a time cut, which are based on forecasting on a known site of border of its probable position on a following site where in the set interval of time there is a signal extremum [6].
For the method of the estimation of the first break wave key concept is the first break wave. Correlation of waves occurs by following the first two accurate consecutive extrema (a minimum, then a maximum) which surpass the set threshold in amplitude.
In a method of a three-componental estimation of the first break of a wave the first break of a wave under the three-componental data is estimated. Correlation of waves occurs by tracing of two greatest accurate maxima in the set intervals where the second extremum corresponds to an opposite phase analyzed plane-signal.
For implementation of algorithms, their debugging and testing the mathematical package using MathCad. Research of estimation accuracy of the first break of wave for models useful component of wave field without hindrances, showed that algorithms allow to estimate position of wave with digitization step sequence. Studies have been conducted on a noise stability of algorithms on statistical models of fields where the wave is observed against the homogeneous and not correlated Gaussian hindrances have been conducted.
On Fig. 1 dependence mean errors of an estimation of position of a wave by the developed algorithms from a signal parity to noise is presented. According to the drawing it is visible that algorithms of phase correlation and three-componental correlation possess more noise stability at estimation of the first break of wave, than algorithm of correlation of the first breaks. At a peak parity of a signal to a hindrance (ρ ≥ 6) all algorithms allow to track the break of wave to estimate with digitization step sequence. At a peak parity of a signal to a hindrance (ρ < 6) algorithms of correlation of the first break and three-componental correlation become unstable.
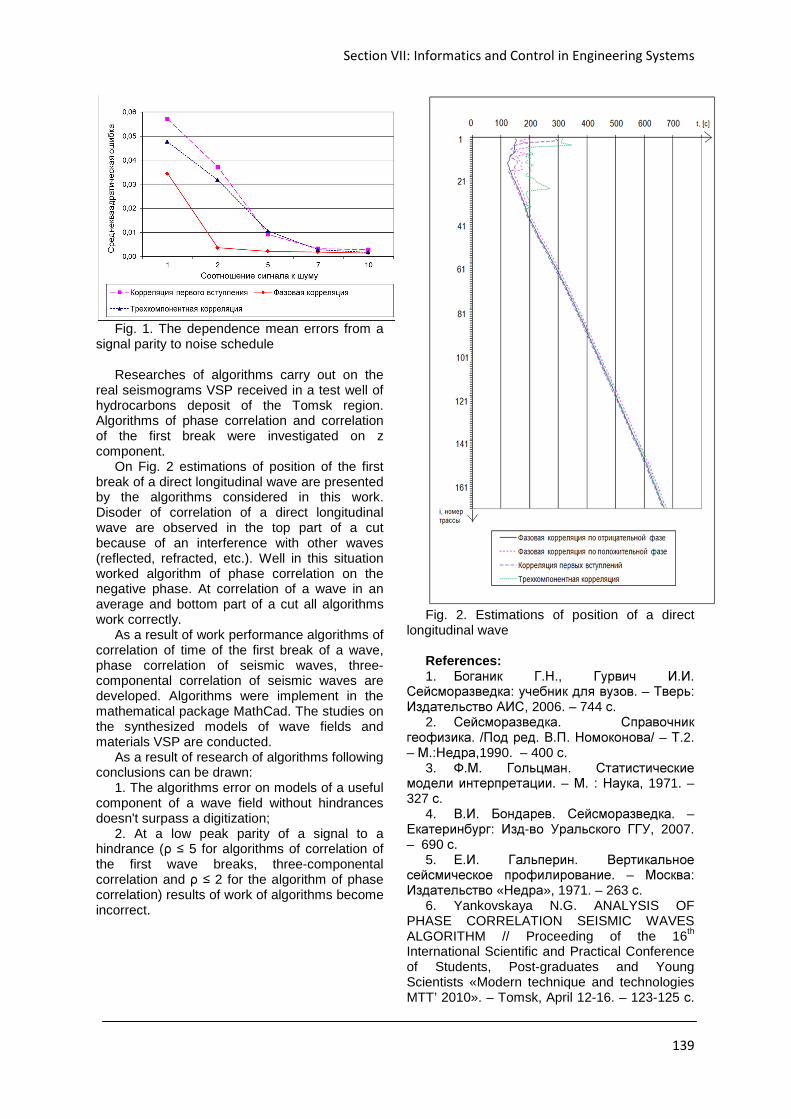
Section VII: Informatics and Control in Engineering Systems
139
Fig. 1. The dependence mean errors from a
signal parity to noise schedule Researches of algorithms carry out on the
real seismograms VSP received in a test well of hydrocarbons deposit of the Tomsk region. Algorithms of phase correlation and correlation of the first break were investigated on z component.
On Fig. 2 estimations of position of the first break of a direct longitudinal wave are presented by the algorithms considered in this work. Disoder of correlation of a direct longitudinal wave are observed in the top part of a cut because of an interference with other waves (reflected, refracted, etc.). Well in this situation worked algorithm of phase correlation on the negative phase. At correlation of a wave in an average and bottom part of a cut all algorithms work correctly.
As a result of work performance algorithms of correlation of time of the first break of a wave, phase correlation of seismic waves, three-componental correlation of seismic waves are developed. Algorithms were implement in the mathematical package MathCad. The studies on the synthesized models of wave fields and materials VSP are conducted.
As a result of research of algorithms following conclusions can be drawn:
1. The algorithms error on models of a useful component of a wave field without hindrances doesn't surpass a digitization;
2. At a low peak parity of a signal to a hindrance (ρ ≤ 5 for algorithms of correlation of the first wave breaks, three-componental correlation and ρ ≤ 2 for the algorithm of phase correlation) results of work of algorithms become incorrect.
Fig. 2. Estimations of position of a direct
longitudinal wave References: 1. Боганик Г.Н., Гурвич И.И.
Сейсморазведка: учебник для вузов. – Тверь: Издательство АИС, 2006. – 744 с.
2. Сейсморазведка. Справочник геофизика. /Под ред. В.П. Номоконова/ – Т.2. – М.:Недра,1990. – 400 с.
3. Ф.М. Гольцман. Статистические модели интерпретации. – М. : Наука, 1971. – 327 с.
4. В.И. Бондарев. Сейсморазведка. – Екатеринбург: Изд-во Уральского ГГУ, 2007. – 690 с.
5. Е.И. Гальперин. Вертикальное сейсмическое профилирование. – Москва: Издательство «Недра», 1971. – 263 с.
6. Yankovskaya N.G. ANALYSIS OF PHASE CORRELATION SEISMIC WAVES ALGORITHM // Proceeding of the 16th International Scientific and Practical Conference of Students, Post-graduates and Young Scientists «Modern technique and technologies MTT’ 2010». – Tomsk, April 12-16. – 123-125 с.

XVII Modern Technique and Technologies 2011
140

Section VIII: Modern Physical Methods in Science, Engineering and Medicine
141
Section VIII
MODERN PHYSICAL METHODES IN SCIENCE, ENGINEERING AND MEDICINE

XVII Modern Technique and Technologies 2011
142
NUCLEAR SECURITY CULTURE
Andreevsky E.V.
Principal investigator: Daneykin J.V., associate professor
Tomsk Polytechnic University, 634050, Russia, Tomsk, Lenin avenue, 30
e-mail: [email protected]
Nowadays, in modern conditions of rapid development of nuclear energy and wide spreading of nuclear technologies, there is a particularly acute problem of improving the reliability of the protection of nuclear materials and facilities, of the role of the human factor in security, and of increasing the level of nuclear safety culture at nuclear facilities.
Nuclear security culture is a combination of qualities, principles, attitudes and behaviors of individuals, organizations and institutions, which serves for maintaining and improving nuclear security. [1]
Modern systems of physical protection of nuclear materials and facilities, account and control of nuclear materials allow continuous monitoring of nuclear materials. However, experience shows that it is impossible to achieve the required level of security of facilities and nuclear materials with only technical measures. The equipment itself doesn’t provide security. Security, including nuclear security, is provided by people. The role of human factor in dealing with nuclear materials and work at nuclear facilities is extremely high. The staff of nuclear facility constantly interacts with hardware, makes operational management decisions. It is necessary to ensure nuclear safety is a conscious and internal need of the staff of nuclear facility. [1]
Nuclear security culture is: - Knowledge and competence, which are
formed by selection and training of personnel, as well as by self-education;
- Personal understanding of the importance of nuclear security, coming out of awareness about the consequences of default of rules of nuclear security;
- Motivation of strict compliance with the rules of nuclear security which is implemented through the common goals set by management, through a system of rewards and punishments and the independent position of each employee;
- Priority of security issues in the minds of staff in relation to other technological matters and rules of conduct;
- Control, supervision, self-estimation, willingness to accept criticism;
- Everyone's responsibility and understanding rights and responsibilities. [1]
Table 1. Features of nuclear security culture
[2] Development of an adequate level of nuclear
security culture implies a close interaction between state, officials and various organizations, as was shown in Table 1. Below are the components of a nuclear security culture, which should work as a whole in order to ensure the development of nuclear security culture through cooperation and dialogue: -The role of the state;
-The role of various organizations; - The role of the management; - The role of staff; - The role of the public; - The role of the international community. [2] The main role of the state lies in the fact that
it must establish the right policies in the field of nuclear security, which should be based on a specific threat assessment, international aspects and national identity.
Also, the state provides safety of information concerning nuclear security and nuclear technologies in general, develops a legal framework for account, control, physical protection and other issues of handling with nuclear materials.
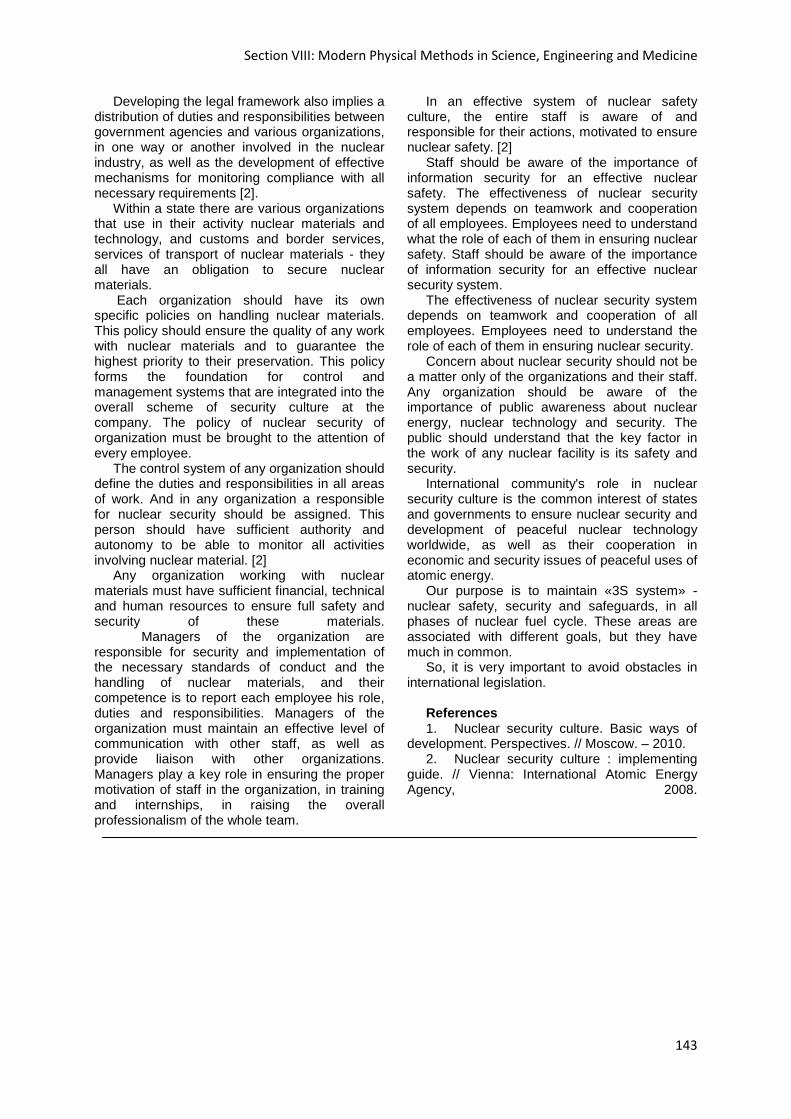
Section VIII: Modern Physical Methods in Science, Engineering and Medicine
143
Developing the legal framework also implies a distribution of duties and responsibilities between government agencies and various organizations, in one way or another involved in the nuclear industry, as well as the development of effective mechanisms for monitoring compliance with all necessary requirements [2].
Within a state there are various organizations that use in their activity nuclear materials and technology, and customs and border services, services of transport of nuclear materials - they all have an obligation to secure nuclear materials.
Each organization should have its own specific policies on handling nuclear materials. This policy should ensure the quality of any work with nuclear materials and to guarantee the highest priority to their preservation. This policy forms the foundation for control and management systems that are integrated into the overall scheme of security culture at the company. The policy of nuclear security of organization must be brought to the attention of every employee.
The control system of any organization should define the duties and responsibilities in all areas of work. And in any organization a responsible for nuclear security should be assigned. This person should have sufficient authority and autonomy to be able to monitor all activities involving nuclear material. [2]
Any organization working with nuclear materials must have sufficient financial, technical and human resources to ensure full safety and security of these materials. Managers of the organization are responsible for security and implementation of the necessary standards of conduct and the handling of nuclear materials, and their competence is to report each employee his role, duties and responsibilities. Managers of the organization must maintain an effective level of communication with other staff, as well as provide liaison with other organizations. Managers play a key role in ensuring the proper motivation of staff in the organization, in training and internships, in raising the overall professionalism of the whole team.
In an effective system of nuclear safety culture, the entire staff is aware of and responsible for their actions, motivated to ensure nuclear safety. [2]
Staff should be aware of the importance of information security for an effective nuclear safety. The effectiveness of nuclear security system depends on teamwork and cooperation of all employees. Employees need to understand what the role of each of them in ensuring nuclear safety. Staff should be aware of the importance of information security for an effective nuclear security system.
The effectiveness of nuclear security system depends on teamwork and cooperation of all employees. Employees need to understand the role of each of them in ensuring nuclear security.
Concern about nuclear security should not be a matter only of the organizations and their staff. Any organization should be aware of the importance of public awareness about nuclear energy, nuclear technology and security. The public should understand that the key factor in the work of any nuclear facility is its safety and security.
International community's role in nuclear security culture is the common interest of states and governments to ensure nuclear security and development of peaceful nuclear technology worldwide, as well as their cooperation in economic and security issues of peaceful uses of atomic energy.
Our purpose is to maintain «3S system» - nuclear safety, security and safeguards, in all phases of nuclear fuel cycle. These areas are associated with different goals, but they have much in common.
So, it is very important to avoid obstacles in international legislation.
References 1. Nuclear security culture. Basic ways of
development. Perspectives. // Moscow. – 2010. 2. Nuclear security culture : implementing
guide. // Vienna: International Atomic Energy Agency, 2008.
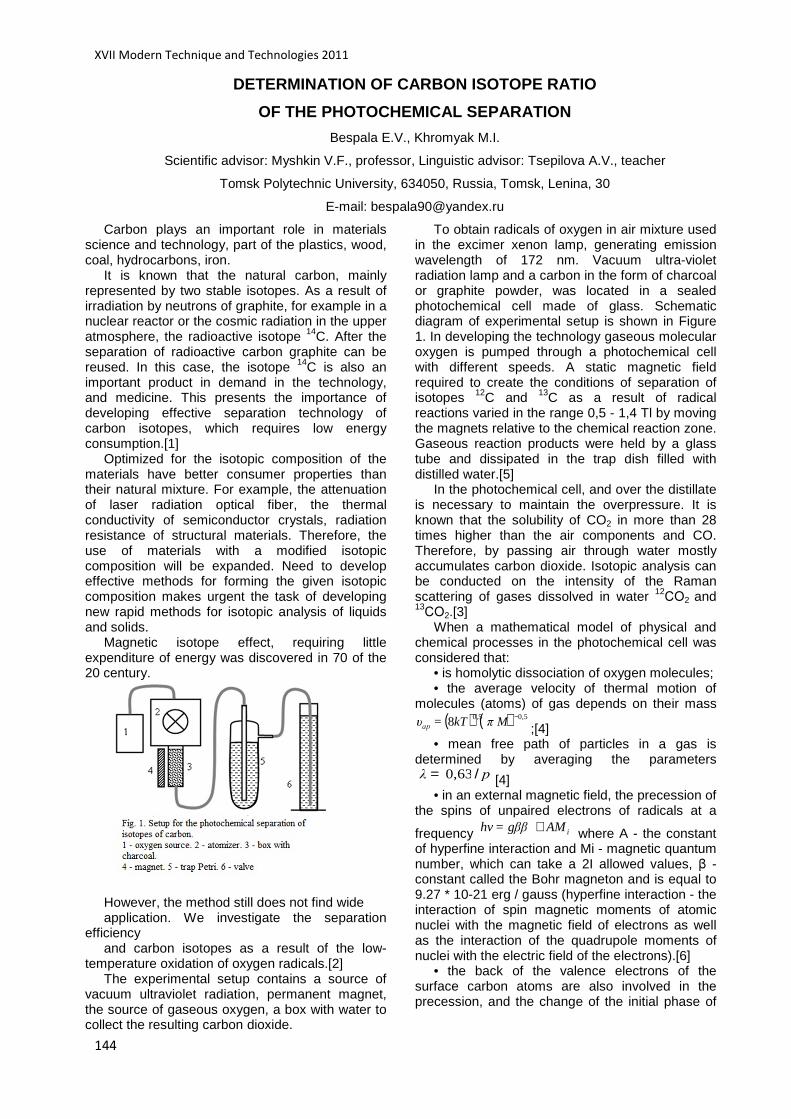
XVII Modern Technique and Technologies 2011
144
DETERMINATION OF CARBON ISOTOPE RATIO
OF THE PHOTOCHEMICAL SEPARATION
Bespala E.V., Khromyak M.I.
Scientific advisor: Myshkin V.F., professor, Linguistic advisor: Tsepilova A.V., teacher
Tomsk Polytechnic University, 634050, Russia, Tomsk, Lenina, 30
E-mail: [email protected]
Carbon plays an important role in materials science and technology, part of the plastics, wood, coal, hydrocarbons, iron.
It is known that the natural carbon, mainly represented by two stable isotopes. As a result of irradiation by neutrons of graphite, for example in a nuclear reactor or the cosmic radiation in the upper atmosphere, the radioactive isotope 14C. After the separation of radioactive carbon graphite can be reused. In this case, the isotope 14C is also an important product in demand in the technology, and medicine. This presents the importance of developing effective separation technology of carbon isotopes, which requires low energy consumption.[1]
Optimized for the isotopic composition of the materials have better consumer properties than their natural mixture. For example, the attenuation of laser radiation optical fiber, the thermal conductivity of semiconductor crystals, radiation resistance of structural materials. Therefore, the use of materials with a modified isotopic composition will be expanded. Need to develop effective methods for forming the given isotopic composition makes urgent the task of developing new rapid methods for isotopic analysis of liquids and solids.
Magnetic isotope effect, requiring little expenditure of energy was discovered in 70 of the 20 century.
However, the method still does not find wide application. We investigate the separation
efficiency and carbon isotopes as a result of the low-
temperature oxidation of oxygen radicals.[2] The experimental setup contains a source of
vacuum ultraviolet radiation, permanent magnet, the source of gaseous oxygen, a box with water to collect the resulting carbon dioxide.
To obtain radicals of oxygen in air mixture used in the excimer xenon lamp, generating emission wavelength of 172 nm. Vacuum ultra-violet radiation lamp and a carbon in the form of charcoal or graphite powder, was located in a sealed photochemical cell made of glass. Schematic diagram of experimental setup is shown in Figure 1. In developing the technology gaseous molecular oxygen is pumped through a photochemical cell with different speeds. A static magnetic field required to create the conditions of separation of isotopes 12C and 13C as a result of radical reactions varied in the range 0,5 - 1,4 Tl by moving the magnets relative to the chemical reaction zone. Gaseous reaction products were held by a glass tube and dissipated in the trap dish filled with distilled water.[5]
In the photochemical cell, and over the distillate is necessary to maintain the overpressure. It is known that the solubility of CO2 in more than 28 times higher than the air components and CO. Therefore, by passing air through water mostly accumulates carbon dioxide. Isotopic analysis can be conducted on the intensity of the Raman scattering of gases dissolved in water 12СО2 and 13СО2.[3]
When a mathematical model of physical and chemical processes in the photochemical cell was considered that:
• is homolytic dissociation of oxygen molecules; • the average velocity of thermal motion of
molecules (atoms) of gas depends on their mass ( ) ( ) 0,50,58 −MπkT=υ
ар ;[4] • mean free path of particles in a gas is
determined by averaging the parameters λ = 0,63/ р [4]
• in an external magnetic field, the precession of the spins of unpaired electrons of radicals at a
frequency iAMgββ=hv + where A - the constant of hyperfine interaction and Mi - magnetic quantum number, which can take a 2I allowed values, β - constant called the Bohr magneton and is equal to 9.27 * 10-21 erg / gauss (hyperfine interaction - the interaction of spin magnetic moments of atomic nuclei with the magnetic field of electrons as well as the interaction of the quadrupole moments of nuclei with the electric field of the electrons).[6]
• the back of the valence electrons of the surface carbon atoms are also involved in the precession, and the change of the initial phase of
Section VIII: Modern Physical Methods in Science, Engineering and Medicine
145
the dynamics of the spin state occurs in a collision with particles of the gas phase;
• frequency of average particle collisions with
the gas phase carbon atoms on the surface of wood coal determined by the equation
( )арυn=N 0,25
(n - the concentration of gas-particle);[7]
• oxidation of the carbon atoms occurs only when the state of antiparallel spins of the colliding atoms (radicals) of carbon and oxygen (singlet radical pair);[6]
Vacuum ultraviolet radiation lamps used to form atoms (radicals), oxygen from the molecular gas. Oxygen, after the passage of the atomizer, enters the chamber of a chemical reactor, which was charcoal. In the chemical reaction occurring in an external magnetic field, there is separation of the isotopes 12C and 13C as a result of radical reaction between oxygen and carbon atoms.[5]
To determine the effectiveness of the separation of a mixture of isotopes, isotopic analysis was carried out by Raman scattering, the ratio of dissolved and isotopic modifications 12 CO2 and 13CO2. Distilled water is used for the concentration of carbon dioxide.[8]
The figure shows the Raman spectrum of dissolved carbon dioxide. By visually comparing the Raman spectra of carbon dioxide of natural composition and formed in a photochemical cell, you can see that the ratio of natural isotope concentrations of carbon has been lost. This can
be explained by separation of carbon isotopes in the course of radical reactions in a magnetic field.
Extended contact with enriched and natural mixtures of isotopic exchange takes place. It is therefore necessary to reduce the contact time of the initial and final products. In our case, the reaction products are removed from the reactor automatically (a new portion of the oxidant). Communication and gas collector made of glass.
1. Watanabe I., Okumara T. // Jpn. J. Appl. Phys. - 1985. - V.24. - P.L122.
2. Barklie R.C. // Diamond Relat. Mater. - 2001. - V.10. - P.174.
3. Wagoner G. // Phys. Rev. 1960. - V.118. - P.647.
4. Веrnstein Н.I., А11еn G. // J. Opt. Soc. Am. – 1955. – V.45. – P.237.
5. Myshkin V.F., Khromyak M.I., Bespala E.V. and other. Development of photochemical method of separation of carbon isotopes/ V International Scientific Conference "Physical and technical problems of nuclear energy and industry." - Tomsk. - 2010. - s.161.
6. Bayes K. // Photolysis of Carbon Suboxide. - 1961 Journal of the American Chemical Society. – P.3712–3713.
7. Heimann R.B.; Evsyukov S.E.; Kavan L // Carbyne and Carbynoid Structures Series: Physics and Chemistry of Materials with Low-Dimensional Structures. -1999. –P.452.
8. Singh R. // Raman and the Discovery of the Raman Effect / Physics in Perspective. -2002. – P. 399–420
INTERNATIONAL URANIUM ENRICHMENT CENTER IN ANGARSK
Kushnerevich A. A., Chegodaeva D. V.
Koshelev F. P.
Tomsk Polytechnic University, 634050, Russia, Tomsk, Lenina, 30
E-mail: [email protected]
January 25th, 2006 at the meeting of the
Eurasian Economic Community (EurAsEC), Russian President Vladimir Putin initiate creation of international centers to provide services in the field of nuclear fuel cycle in Russia. The first step of practical implementation of the initiative was to create an international uranium enrichment center (IUEC).
Angarsk Electrolysis Chemical Complex (AECC) was chosen as the site for IUEC. It is equipped with gas centrifuges (GCs) of the sixth generation. Angarsk is the youngest Centrifuge Company in Russia: the first stages of GCs were launched in December 1990. Currently, the power of the separating production of AECC is about 5%
of global capacity, and 50% of the capacity of the company are loaded by export orders from China, Finland, Czech Republic, Switzerland and South Korea. [1]
October 6, 2006 the Russian government approved the Federal Task Program (FTP) "Development of Nuclear Industry of Russia in 2007-2010 and up to 2015 ", which is supplemented and adjusted the sectoral plans to modernize the separating production. Under the new federal program, reconstruction of the existing separating production of AECC should be completed by 2013 and to 2015 capacity of separating production will reach 4,2 millions SWU. For modernization aims of enrichment facilities 10

XVII Modern Technique and Technologies 2011
146
billion rubles were provided, or about 425 million U.S. dollars. In this case, 100% of funds should come from extrabudgetary sources.
Besides, it is planned that to 2015 at the plant will be made auxiliary separating facilities, equivalent to 5 mln SWU. Totally, to 2015 separating facilities at AECC will be increased by 9,2 mln SWU. [2]
Reasons, according to which for the creation of the International Uranium Enrichment Centre was chosen AECC:
1. The comparative simplicity of AECC arrangement under IAEA safeguards.
Three of four enrichment plants in Russia (UEIP, ECP and SCP) are located on the territory of the closed administrative-territorial formations (CATF), access to which is denied.
AECC is located in the city, in which do not act such serious limitations. Angarsk plant in 1980. was removed from the weapon cycle to produce highly enriched uranium (HEU) and has no other defense industry, which greatly facilitates the implementation of IAEA safeguards in the enterprise and access to an object of foreign specialists.
In addition, experts of AECC have experience in setting gas centrifuge plant under IAEA safeguards, designed by Soviet scientists.
2. The presence of the underloaded infrastructure at the plant.
Plant has the infrastructure to accommodate additional separating facilities, since the AECC was created last of all enrichment plants in Russia. Major production areas were released after the replacement of gaseous diffusion enrichment installations by the centrifugal ones.
3. The presence of the sublimate production. Sublimation domestic enterprises or enterprises
for uranium conversion, ie for the production of raw material for further enrichment, are located on the AECC and the SCC. Angarsk holds about 15% of world capacity (about 8 tons per year) based on complete conversion of uranium (U3O8-UF6). The other two enrichment plants in Russia (UEIP ECP) are forced to transport the material from sublimate plants of Angarsk and Seversk.
4. Lack of units associated with the development and manufacture of centrifuges.
AECC has no units associated with the development of new types of centrifuges, including ninth generation centrifuge of supercritical pattern, which are located on UEIP and ECP, that also facilitates the access and movement of foreign specialists in the enterprise and reduces the potential risk of dissemination of knowledge of centrifuge technology in co-operation with countries that can search for foreign assistance in developing their own enrichment capacity, based on the centrifuge method of uranium isotope separation. This provision is particularly important,
given the nature of the non-proliferation initiative to create IUEC.
Ideology of IUEC focused primarily on countries that are beginning to develop nuclear power and having limited demand for enrichment services. The initiative does not involve the provision of large-scale separation services for the resale of the product with high added value in the global market. Condition of IUEC operation is to provide a market-neutral, which means that preferential access to uranium enrichment services through the Centre to end users. The exception to this rule is Kazakhstan, whose territory has no available nuclear power reactors, but the intentions of the country's leadership to build a nuclear power plant are known.
An important condition for the project is to set the IUEC under IAEA safeguards. To perform IUEC under IAEA safeguards Rosatom initiated the endorsement of the question at the inter-agency level, after that the government has decided to include it in the list of facilities open to international inspectors. At first time separating installations, located on the territory of Russia, were included in the list of facilities that are open to IAEA inspections. [1]
Under the proposed scheme, any country wishing to develop their nuclear energy and which is a member of the Treaty on the Nonproliferation of Nuclear Weapons and a member of the IAEA, could become a co-owner of the International Centre. Rejection of the development of national enrichment program is welcomed, but it is not a prerequisite.
Countries - existing and potential IUEC members can be divided into three main categories.
Firstly, countries that only develop plans for the development of nuclear energy and do not possess sufficient expertise, as well as economic and political motivation for the creation of national separation of production. This group includes Algeria, Belarus, Cuba, Egypt, Indonesia, Jordan, Kazakhstan, Libya, Lithuania, Malaysia, Morocco, Thailand, Turkey, Uzbekistan and the Persian Gulf countries.
Secondly, the countries that have considerable experience in operating nuclear power plants, but currently have a policy of acquiring separating services of the world market and a temporary refusal to build their own enrichment plants. These countries include Armenia, Belgium, Bulgaria, Hungary, Spain, Romania, Slovakia, Slovenia, Ukraine, Finland, Czech Republic, Switzerland, Sweden and South Korea.
The third group of countries – are states that have their own enrichment facilities in the industrial scale or they are actively working to create them, but have not yet reached the capacity, which is able to meet national needs. This group of

Section VIII: Modern Physical Methods in Science, Engineering and Medicine
147
countries includes Brazil, Iran, Japan. United States, which provide only 12% of its needs for enrichment services, may also be assigned to this group.
In Kazakhstan, on the 129 deposits are concentrated around 21% of global uranium reserves. In 2006, uranium mining in the country amounted about 5000 tons, or 10% of the volume of global production. By 2010 it is planned that the company Kazatomprom, part of a triplet of leading uranium companies in the world, annually will produce 18 thousand tons of uranium, and by 2015 will be reach peak production - 27 tons. Totally by 2050 the country plans to produce about 1.2 million tons of uranium. Thus, Kazakhstan is interested in acquiring such a production as uranium enrichment. Russia, in turn, wants a guaranteed supply of natural uranium from Kazakhstan. In part, these requirements will be met through IUEC.
The main reason for the possible interest of Iran to participate in the project is the lack of their own enrichment capacity to meet the country needs of nuclear energy. It seems that Iran's participation in the International Uranium Enrichment Centre may be considered by the government as a project that could improve the status of state in the international arena and especially in the Middle East region since it will allow the state to participate in a joint project of high-tech area with development in the field of nuclear power countries like Russia and Ukraine, perhaps - South Korea and Japan.
South Korea is actively seeking new sources of raw materials for nuclear power in the Central Asian region. September 25, 2006 Prime Ministers of Uzbekistan and South Korea signed a memorandum of understanding on the supply of Uzbek uranium. The agreement provides for annual deliveries of 300 tons of uranium ore in the period from 2010 to 2014. By virtue of geographical proximity of Angarsk to the Central Asian region, placing orders for uranium enrichment Uzbek and Kazakh origin IUEC under certain conditions can be for South Korea's more economical than transporting uranium company
Urenco, which services the South Koreans are using now.
Japan is actively seeking new sources of raw materials for its own nuclear power plant in Central Asia and Russia. Japanese companies are interested in developing uranium deposits in Kazakhstan and Uzbekistan, as well as uranium ore Elkon deposit (Yakutia). Japan needs to enrichment services in Russia may grow in the near future. Currently, a Japanese company have already bought 12-16% of the required amount of enrichment services in Russia, but they do not exclude the development of bilateral relations in which this figure will increase to 25-33%. Japanese companies are showing increased interest in the details of creating IUEC on Russian territory.
Creating IUEC can bring Russia considerable foreign and domestic dividends – from indirect extension of the Russian presence in the global uranium market to increase in the investment attractiveness of the Irkutsk region that will house the company. No less important is to restore Russia's position, which is one of the depositories of the Treaty on the Nonproliferation of Nuclear Weapons, as a key player in the process of strengthening the nonproliferation regime.
The International Uranium Enrichment Center will not solve all existing problems in nonproliferation, but is able to offer a new basis for resolving the current crises in the area and prevent the emergence of new threats in the potential, offering novice in the field of nuclear energy (temporary) alternative to national uranium enrichment capabilities. In particular, one element of a package solution of the crisis around Iran's enrichment program could be part of the State in the International Center. [2]
References: 1. Angarsk project: enrichment VS.
proliferation / A. A. Khlopkov / Safety Index: Russian Journal of International Security — M. 2 (85), 2008 – P. 43-62
Reliable substitute munitions - as they help to non-proliferation / Linton F. Brooks / — M. 3 (83), 2008 – P. 135-138
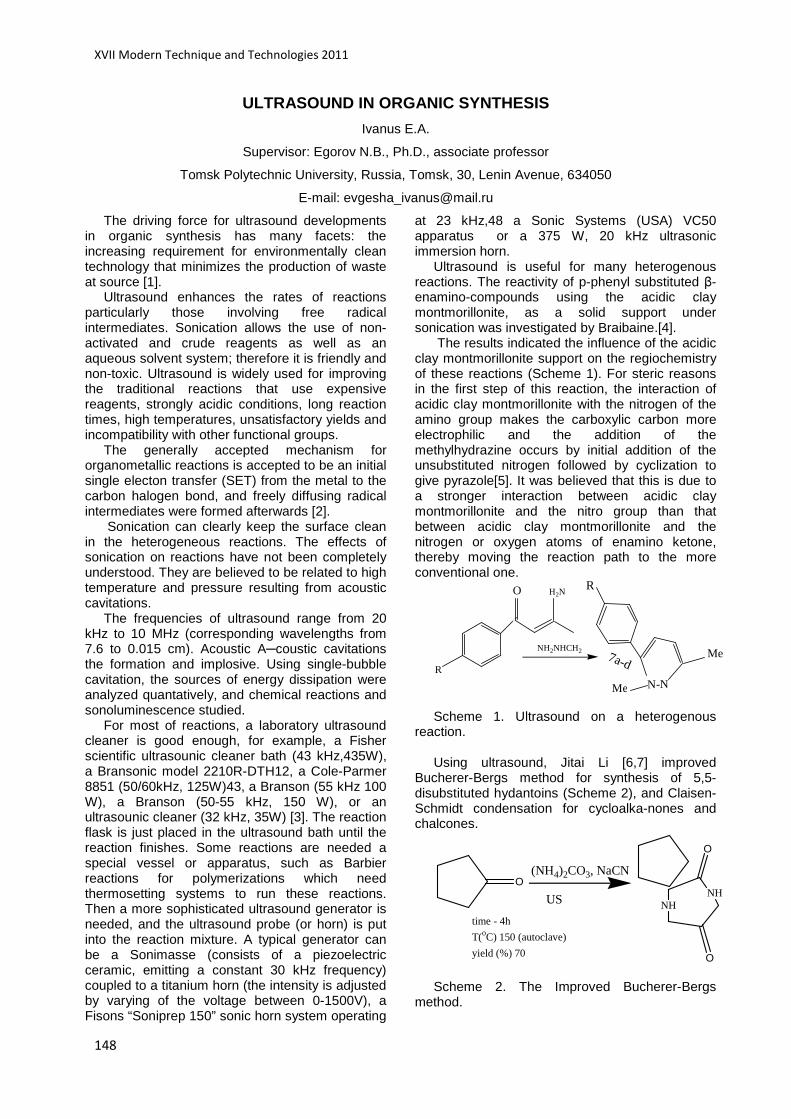
XVII Modern Technique and Technologies 2011
148
ULTRASOUND IN ORGANIC SYNTHESIS
Ivanus E.A.
Supervisor: Egorov N.B., Ph.D., associate professor
Tomsk Polytechnic University, Russia, Tomsk, 30, Lenin Avenue, 634050
E-mail: [email protected]
The driving force for ultrasound developments in organic synthesis has many facets: the increasing requirement for environmentally clean technology that minimizes the production of waste at source [1].
Ultrasound enhances the rates of reactions particularly those involving free radical intermediates. Sonication allows the use of non-activated and crude reagents as well as an aqueous solvent system; therefore it is friendly and non-toxic. Ultrasound is widely used for improving the traditional reactions that use expensive reagents, strongly acidic conditions, long reaction times, high temperatures, unsatisfactory yields and incompatibility with other functional groups.
The generally accepted mechanism for organometallic reactions is accepted to be an initial single electon transfer (SET) from the metal to the carbon halogen bond, and freely diffusing radical intermediates were formed afterwards [2].
Sonication can clearly keep the surface clean in the heterogeneous reactions. The effects of sonication on reactions have not been completely understood. They are believed to be related to high temperature and pressure resulting from acoustic cavitations.
The frequencies of ultrasound range from 20 kHz to 10 MHz (corresponding wavelengths from 7.6 to 0.015 cm). Acoustic Acoustic cavitations the formation and implosive. Using single-bubble cavitation, the sources of energy dissipation were analyzed quantatively, and chemical reactions and sonoluminescence studied.
For most of reactions, a laboratory ultrasound cleaner is good enough, for example, a Fisher scientific ultrasounic cleaner bath (43 kHz,435W), a Bransonic model 2210R-DTH12, a Cole-Parmer 8851 (50/60kHz, 125W)43, a Branson (55 kHz 100 W), a Branson (50-55 kHz, 150 W), or an ultrasounic cleaner (32 kHz, 35W) [3]. The reaction flask is just placed in the ultrasound bath until the reaction finishes. Some reactions are needed a special vessel or apparatus, such as Barbier reactions for polymerizations which need thermosetting systems to run these reactions. Then a more sophisticated ultrasound generator is needed, and the ultrasound probe (or horn) is put into the reaction mixture. A typical generator can be a Sonimasse (consists of a piezoelectric ceramic, emitting a constant 30 kHz frequency) coupled to a titanium horn (the intensity is adjusted by varying of the voltage between 0-1500V), a Fisons “Soniprep 150” sonic horn system operating
at 23 kHz,48 a Sonic Systems (USA) VC50 apparatus or a 375 W, 20 kHz ultrasonic immersion horn.
Ultrasound is useful for many heterogenous reactions. The reactivity of p-phenyl substituted β-enamino-compounds using the acidic clay montmorillonite, as a solid support under sonication was investigated by Braibaine.[4].
The results indicated the influence of the acidic clay montmorillonite support on the regiochemistry of these reactions (Scheme 1). For steric reasons in the first step of this reaction, the interaction of acidic clay montmorillonite with the nitrogen of the amino group makes the carboxylic carbon more electrophilic and the addition of the methylhydrazine occurs by initial addition of the unsubstituted nitrogen followed by cyclization to give pyrazole[5]. It was believed that this is due to a stronger interaction between acidic clay montmorillonite and the nitro group than that between acidic clay montmorillonite and the nitrogen or oxygen atoms of enamino ketone, thereby moving the reaction path to the more conventional one.
O H2N
NH2NHCH2
R
R
Me N-N
Me7a-d
Scheme 1. Ultrasound on a heterogenous
reaction. Using ultrasound, Jitai Li [6,7] improved
Bucherer-Bergs method for synthesis of 5,5-disubstituted hydantoins (Scheme 2), and Claisen-Schmidt condensation for cycloalka-nones and chalcones.
O
US
O
O
NHNH
(NH4)2CO3, NaCN
time - 4h
T(oC) 150 (autoclave)
yield (%) 70
Scheme 2. The Improved Bucherer-Bergs
method.
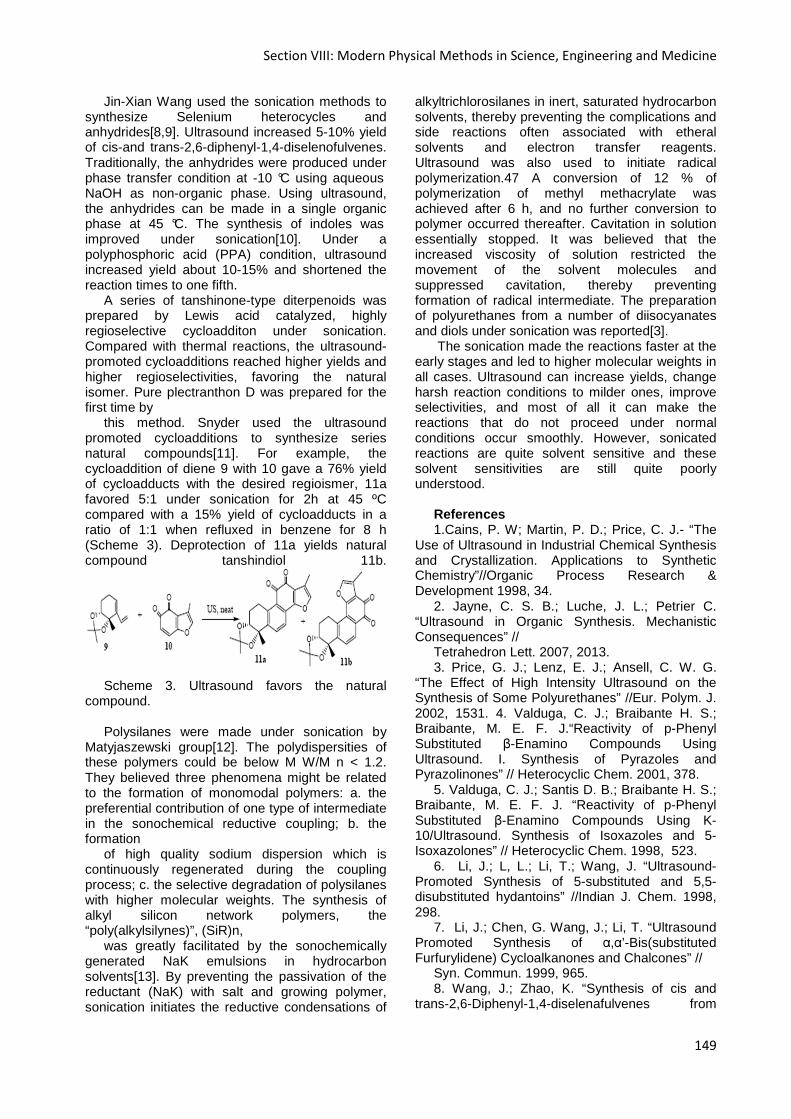
Section VIII: Modern Physical Methods in Science, Engineering and Medicine
149
Jin-Xian Wang used the sonication methods to synthesize Selenium heterocycles and anhydrides[8,9]. Ultrasound increased 5-10% yield of cis-and trans-2,6-diphenyl-1,4-diselenofulvenes. Traditionally, the anhydrides were produced under phase transfer condition at -10 °C using aqueous NaOH as non-organic phase. Using ultrasound, the anhydrides can be made in a single organic phase at 45 °C. The synthesis of indoles was improved under sonication[10]. Under a polyphosphoric acid (PPA) condition, ultrasound increased yield about 10-15% and shortened the reaction times to one fifth.
A series of tanshinone-type diterpenoids was prepared by Lewis acid catalyzed, highly regioselective cycloadditon under sonication. Compared with thermal reactions, the ultrasound-promoted cycloadditions reached higher yields and higher regioselectivities, favoring the natural isomer. Pure plectranthon D was prepared for the first time by
this method. Snyder used the ultrasound promoted cycloadditions to synthesize series natural compounds[11]. For example, the cycloaddition of diene 9 with 10 gave a 76% yield of cycloadducts with the desired regioismer, 11a favored 5:1 under sonication for 2h at 45 ºC compared with a 15% yield of cycloadducts in a ratio of 1:1 when refluxed in benzene for 8 h (Scheme 3). Deprotection of 11a yields natural compound tanshindiol 11b.
Scheme 3. Ultrasound favors the natural
compound. Polysilanes were made under sonication by
Matyjaszewski group[12]. The polydispersities of these polymers could be below M W/M n < 1.2. They believed three phenomena might be related to the formation of monomodal polymers: a. the preferential contribution of one type of intermediate in the sonochemical reductive coupling; b. the formation
of high quality sodium dispersion which is continuously regenerated during the coupling process; c. the selective degradation of polysilanes with higher molecular weights. The synthesis of alkyl silicon network polymers, the “poly(alkylsilynes)”, (SiR)n,
was greatly facilitated by the sonochemically generated NaK emulsions in hydrocarbon solvents[13]. By preventing the passivation of the reductant (NaK) with salt and growing polymer, sonication initiates the reductive condensations of
alkyltrichlorosilanes in inert, saturated hydrocarbon solvents, thereby preventing the complications and side reactions often associated with etheral solvents and electron transfer reagents. Ultrasound was also used to initiate radical polymerization.47 A conversion of 12 % of polymerization of methyl methacrylate was achieved after 6 h, and no further conversion to polymer occurred thereafter. Cavitation in solution essentially stopped. It was believed that the increased viscosity of solution restricted the movement of the solvent molecules and suppressed cavitation, thereby preventing formation of radical intermediate. The preparation of polyurethanes from a number of diisocyanates and diols under sonication was reported[3].
The sonication made the reactions faster at the early stages and led to higher molecular weights in all cases. Ultrasound can increase yields, change harsh reaction conditions to milder ones, improve selectivities, and most of all it can make the reactions that do not proceed under normal conditions occur smoothly. However, sonicated reactions are quite solvent sensitive and these solvent sensitivities are still quite poorly understood.
References 1.Cains, P. W; Martin, P. D.; Price, C. J.- “The
Use of Ultrasound in Industrial Chemical Synthesis and Crystallization. Applications to Synthetic Chemistry”//Organic Process Research & Development 1998, 34.
2. Jayne, C. S. B.; Luche, J. L.; Petrier C. “Ultrasound in Organic Synthesis. Mechanistic Consequences” //
Tetrahedron Lett. 2007, 2013. 3. Price, G. J.; Lenz, E. J.; Ansell, C. W. G.
“The Effect of High Intensity Ultrasound on the Synthesis of Some Polyurethanes” //Eur. Polym. J. 2002, 1531. 4. Valduga, C. J.; Braibante H. S.; Braibante, M. E. F. J.“Reactivity of p-Phenyl Substituted β-Enamino Compounds Using Ultrasound. I. Synthesis of Pyrazoles and Pyrazolinones” // Heterocyclic Chem. 2001, 378.
5. Valduga, C. J.; Santis D. B.; Braibante H. S.; Braibante, M. E. F. J. “Reactivity of p-Phenyl Substituted β-Enamino Compounds Using K-10/Ultrasound. Synthesis of Isoxazoles and 5-Isoxazolones” // Heterocyclic Chem. 1998, 523.
6. Li, J.; L, L.; Li, T.; Wang, J. “Ultrasound-Promoted Synthesis of 5-substituted and 5,5-disubstituted hydantoins” //Indian J. Chem. 1998, 298.
7. Li, J.; Chen, G. Wang, J.; Li, T. “Ultrasound Promoted Synthesis of α,α’-Bis(substituted Furfurylidene) Cycloalkanones and Chalcones” //
Syn. Commun. 1999, 965. 8. Wang, J.; Zhao, K. “Synthesis of cis and
trans-2,6-Diphenyl-1,4-diselenafulvenes from
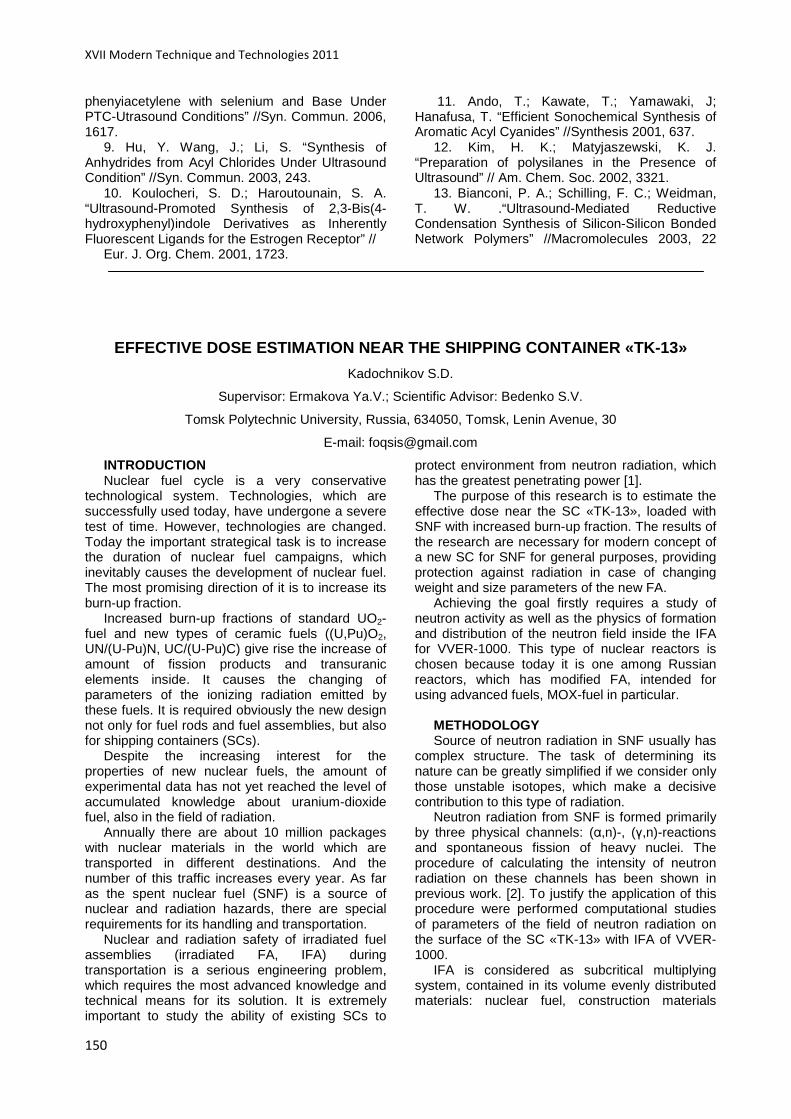
XVII Modern Technique and Technologies 2011
150
phenyiacetylene with selenium and Base Under PTC-Utrasound Conditions” //Syn. Commun. 2006, 1617.
9. Hu, Y. Wang, J.; Li, S. “Synthesis of Anhydrides from Acyl Chlorides Under Ultrasound Condition” //Syn. Commun. 2003, 243.
10. Koulocheri, S. D.; Haroutounain, S. A. “Ultrasound-Promoted Synthesis of 2,3-Bis(4-hydroxyphenyl)indole Derivatives as Inherently Fluorescent Ligands for the Estrogen Receptor” //
Eur. J. Org. Chem. 2001, 1723.
11. Ando, T.; Kawate, T.; Yamawaki, J; Hanafusa, T. “Efficient Sonochemical Synthesis of Aromatic Acyl Cyanides” //Synthesis 2001, 637.
12. Kim, H. K.; Matyjaszewski, K. J. “Preparation of polysilanes in the Presence of Ultrasound” // Am. Chem. Soc. 2002, 3321.
13. Bianconi, P. A.; Schilling, F. C.; Weidman, T. W. .“Ultrasound-Mediated Reductive Condensation Synthesis of Silicon-Silicon Bonded Network Polymers” //Macromolecules 2003, 22
EFFECTIVE DOSE ESTIMATION NEAR THE SHIPPING CONTAIN ER «TK-13»
Kadochnikov S.D.
Supervisor: Ermakova Ya.V.; Scientific Advisor: Bedenko S.V.
Tomsk Polytechnic University, Russia, 634050, Tomsk, Lenin Avenue, 30
E-mail: [email protected]
INTRODUCTION Nuclear fuel cycle is a very conservative
technological system. Technologies, which are successfully used today, have undergone a severe test of time. However, technologies are changed. Today the important strategical task is to increase the duration of nuclear fuel campaigns, which inevitably causes the development of nuclear fuel. The most promising direction of it is to increase its burn-up fraction.
Increased burn-up fractions of standard UO2-fuel and new types of ceramic fuels ((U,Pu)O2, UN/(U-Pu)N, UC/(U-Pu)C) give rise the increase of amount of fission products and transuranic elements inside. It causes the changing of parameters of the ionizing radiation emitted by these fuels. It is required obviously the new design not only for fuel rods and fuel assemblies, but also for shipping containers (SCs).
Despite the increasing interest for the properties of new nuclear fuels, the amount of experimental data has not yet reached the level of accumulated knowledge about uranium-dioxide fuel, also in the field of radiation.
Annually there are about 10 million packages with nuclear materials in the world which are transported in different destinations. And the number of this traffic increases every year. As far as the spent nuclear fuel (SNF) is a source of nuclear and radiation hazards, there are special requirements for its handling and transportation.
Nuclear and radiation safety of irradiated fuel assemblies (irradiated FA, IFA) during transportation is a serious engineering problem, which requires the most advanced knowledge and technical means for its solution. It is extremely important to study the ability of existing SCs to
protect environment from neutron radiation, which has the greatest penetrating power [1].
The purpose of this research is to estimate the effective dose near the SC «TK-13», loaded with SNF with increased burn-up fraction. The results of the research are necessary for modern concept of a new SC for SNF for general purposes, providing protection against radiation in case of changing weight and size parameters of the new FA.
Achieving the goal firstly requires a study of neutron activity as well as the physics of formation and distribution of the neutron field inside the IFA for VVER-1000. This type of nuclear reactors is chosen because today it is one among Russian reactors, which has modified FA, intended for using advanced fuels, MOX-fuel in particular.
METHODOLOGY Source of neutron radiation in SNF usually has
complex structure. The task of determining its nature can be greatly simplified if we consider only those unstable isotopes, which make a decisive contribution to this type of radiation.
Neutron radiation from SNF is formed primarily by three physical channels: (α,n)-, (γ,n)-reactions and spontaneous fission of heavy nuclei. The procedure of calculating the intensity of neutron radiation on these channels has been shown in previous work. [2]. To justify the application of this procedure were performed computational studies of parameters of the field of neutron radiation on the surface of the SC «TK-13» with IFA of VVER-1000.
IFA is considered as subcritical multiplying system, contained in its volume evenly distributed materials: nuclear fuel, construction materials

Section VIII: Modern Physical Methods in Science, Engineering and Medicine
151
(steel 12X18H10T, zirconium alloy E-110), Gd2O3-absorber and neutron sources.
Estimating power dose radiation near SC «TK-13» it is considered that the container is fully loaded with IFAs. Also it is believed that internal part of the container is a homogeneous mixture of 12 IFAs with identical fuel burn-up fractions and initial enrichment value. Fuel burn-up fraction is about 40 Megawatt-day/kg, the initial enrichment of 235U is about 4,4%. Exposure time in the water pool is about three years.
Analysis of methods of estimating radiation protection has shown that the method of relaxation lengths can be used to calculate the protection against neutron radiation in the most cases [1, 3].
A simplified picture of the attenuation of neutrons in layers of SC is that the fast neutrons slow down into the thermal group. Thermal neutrons, in turn, are absorbed by materials for radiation protection.
DEVELOPMENT Based on the design of the SC «TK-13», the
effective protection estimation is carried out according to the simplified model [3]. SC has a cylindrical shape and consists of layers of steel and antifreeze (for neutron protection). The arrangement of layers is consistent and close to each other.
To find the neutron activity of one FA, we used the relation: AFA = AΣ·MFUEL/NFA,
neutron/(sec·FA), (1)
where AΣ is a total fuel neutron activity, neutron/(sec·ton(U)); MFUEL is a mass of loaded fuel, ton; NFA is a number of FA in VVER-1000.
Thus, the average value of neutron flux density on the inner surface of SC «TK-13» is determined by the relation [2]: F = SVh/4 = S/4πR2
EQ, (2) where SV is a volumetric source output,
neutron/(cm3·sec); h is a height of the source (in our case the height of the active part of the FA), cm; S is a source intensity of 12 IFA, neutron/sec; R2
EQ is an equivalent radius of the source of neutron radiation, cm.
For estimation the power of effective dose caused by neutrons on the outer surface of SC, we use the relation [2]: P = F·δN, Sv/sec, (3)
where δN is a dose per unit neutron fluence, Sv·cm2.
RESULTS The calculation was performed for the standard
FA loaded with fuel enriched to 4,4% for 235U and with MOX fuel both irradiated in VVER-1000. The starting loading of VVER-1000 contains 65,6 ton of (U-Pu) MOX fuel; with a content of 235U about 0,2% and a content of Pu about 4,7%. Isotopic
composition of Pu is that: 239Pu – 94%, 240Pu – 5%, 241Pu – 1%. Table 1 shows the total dose radiation close to SC «TK-13» loaded with fuels with different burn-up fractions and exposure time.
Table 1. The results of the calculation of the
total dose radiation close to SC «TK-13» loaded with uranium and MOX fuels
Exposure time, years
Power dose radiation, mSv/hour
Radial direction
In the direction of generatrix
Cover Botto
m 50 Megawatt·day/kg(U/U-Pu)
0,5 0,71/8,
55 1,08/1
8,28 0,26/
4,17
1,0 0,65/7,
62 0,96/1
6,17 0,23/
3,69
3,0 0,55/6,
61 0,83/1
4,28 0,20/
3,20
10,0 0,40/4,
84 0,61/1
0,32 0,15/
2,32 54 Megawatt·day/kg (U/U-Pu)
0,5 0,99/1
0,06 1,48/2
1,45 0,35/
4,84
1,0 0,87/8,
90 1,31/1
8,98 0,31/
4,30
3,0 0,79/7,
92 1,14/1
6,88 0,28/
3,82
10,0 0,55/5,
58 0,82/1
1,92 0,20/
2,71 58 Megawatt·day/kg (U/U-Pu)
0,5 1,34/1
1,63 1,08/1
8,28 0,48/
5,82
1,0 1,18/10,29
0,96/16,17
0,42/5,10
3,0 1,05/8,
94 0,83/1
4,28 0,37/
4,54
10,0 0,76/6,
46 0,61/1
0,32 0,27/
3,22 RESEARCH The results of the work are the following. During
the research the computational model of the formation of the neutron field near the standard uranium and MOX fuels irradiated in a reactor VVER-1000 was successfully verified [4]. Also the total specific neutron activity of irradiated fuel of VVER-1000 was determined. This activity is primary based on (α,n)-reactions on oxygen and other light elements in impurities in oxide fuel, on spontaneous fission of uranium and actinides, (γ,n)-reaction on the nuclei them [3]. It is important to mention that the inclusion of (α,n)-reactions on oxygen, as well as photonuclear processes, multiply the interest of our research, because these mechanisms of neutron production were not previously considered in the calculation and design of the protective shells of SC.

XVII Modern Technique and Technologies 2011
152
Also it was found that protective properties of SC «TK-13» repeatedly become worse in case when SC is loaded with IFA with uranium and MOX fuels with high burn-up fractions.
Analysis of experimental data with respect to understanding the physics of nuclear reactions showed that it is necessary to improve radiation protection during the transportation of IFA with a high burn-up fuel by means of:
1) regulating the placement of SNF with different burn-up fractions in SC providing the screening effect of IFA to each other;
2) new design of SC capable to change protective properties for different modifications of IFA.
REFERENCES
1. Гусев Н.Г., Машкович В.П., Суворов А.П. Защита от ионизирующего излучения, Т.1. – Атомиздат, Москва, 1980.
2. Беденко С.В., Гнетков Ф.В., Кадочников С.Д. Дозовые характеристики полей нейтронов облученного керамического ядерного топлива различных типов. – Известия вузов. Ядерная энергетика, Обнинск, 2010.
3. Шаманин И.В., Гаврилов П.М., Беденко С.В., Мартынов В.В. Нейтронно-физические аспекты обращения с облученным ядерным топливом с повышенной глубиной выгорания. – Известия ТПУ, Т.3, ТПУ, Томск, 2008.
4. Шаманин И.В., Силаев М.Е., Беденко С.В., Мартынов В.В. Оценка вклада реакции (α,n) в нейтронную активность ОТВС реактора ВВЭР-1000. – Известия ТПУ, Т.2, ТПУ, Томск, 2007.
5. Bair J. R., Haas F. X. Total Neutron Yield From The Reaction 13C(α,n)16O and 17,18O(α,n)20,21Ne // Phys. Rev. C. – Vol.7. – No.4. – 1973. – pp. 1356-1364.
6. West D., Sherwood A. C. Measurements Of Thick-Target (α,n) Yields From Light Elements // Nucl. Energy. – Vol.9. – 1982. – pp. 551-577.
7. Harissopulos S., Becker H. W., Hammer J. W., Lagoyannis A., Rolfs C., Strieder F. Cross-section Of The 13C(α,n)16O reaction: A Background For The Measurement Of Geo-neutrinos // Phys. Rev. – 2005. – pp. 72-80.
ANALYSIS OF TRIGA MARK II REACTOR POOL WATER SAMPLE WITH HIGH
PURITY GERMANIUM GAMMA SPECTROMETER, ESTIMATION
OF DETERMINED ISOTOPES INFLUENCE ON ENVIROMENT
AND REACTOR STAFF
Karyakin E.I. , Mаtyskin A.V.
Supervisor: Ostvald R.V.
Tomsk Polytechnic University, 634050 Tomsk, Lenin Avenue 30
E-mail: [email protected]
Most radioactive sources produce gamma rays of various energies and intensities. When these emissions are collected and analyzed with a gamma spectroscopy system, a gamma energy spectrum can be produced and isotopic composition can be defined.
Gamma analysis of reactor water is very important, because it provides information about processes which are going in the core and are not visible yet. Spectrum allows us to determine which isotopes are presented in water and then the reason of its presence should be investigated. Gamma examination of reactor water is routine procedure on TRIGA Mark II reactor, but it is pointed only on exact isotopes, presence of which
means serious problem, but all other information is usually omitted.
Objective : to carry out examination of TRIGA
Mark II reactor water by Ortec high purity germanium gamma spectrometer, to determine all gamma-emitting isotopes, to investigate from which mother nuclei the determined isotopes were produced in reactor core and to suppose influence of determined isotopes on reactor staff and environment.
Spectrum analysis
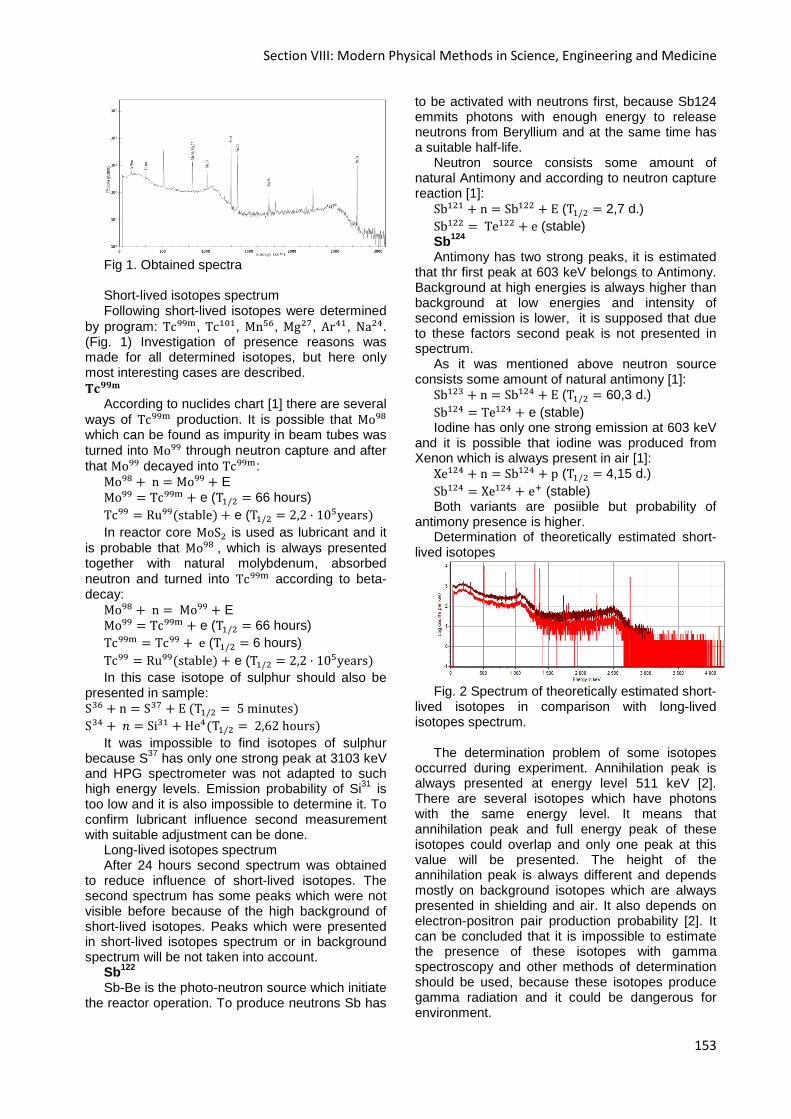
Section VIII: Modern Physical Methods in Science, Engineering and Medicine
153
Fig 1. Obtained spectra Short-lived isotopes spectrum Following short-lived isotopes were determined
by program: Tc, Tc, Mn, Mg, Ar, Na. (Fig. 1) Investigation of presence reasons was made for all determined isotopes, but here only most interesting cases are described.
According to nuclides chart [1] there are several ways of Tc production. It is possible that Mo which can be found as impurity in beam tubes was turned into Mo through neutron capture and after that Mo decayed into Tc:
Mo n Mo E Mo Tc e (T/ 66 hours) Tc Rustable e (T/ 2,2 10years
In reactor core MoS is used as lubricant and it is probable that Mo, which is always presented together with natural molybdenum, absorbed neutron and turned into Tc according to beta-decay:
Mo n Mo E Mo Tc e (T/ 66 hours) Tc Tc e (T/ 6 hours) Tc Rustable e (T/ 2,2 10years In this case isotope of sulphur should also be
presented in sample: S n S ET/ 5minutes S $ Si HeT/ 2,62hours
It was impossible to find isotopes of sulphur because S37 has only one strong peak at 3103 keV and HPG spectrometer was not adapted to such high energy levels. Emission probability of Si31 is too low and it is also impossible to determine it. To confirm lubricant influence second measurement with suitable adjustment can be done.
Long-lived isotopes spectrum After 24 hours second spectrum was obtained
to reduce influence of short-lived isotopes. The second spectrum has some peaks which were not visible before because of the high background of short-lived isotopes. Peaks which were presented in short-lived isotopes spectrum or in background spectrum will be not taken into account.
Sb122 Sb-Be is the photo-neutron source which initiate
the reactor operation. To produce neutrons Sb has
to be activated with neutrons first, because Sb124 emmits photons with enough energy to release neutrons from Beryllium and at the same time has a suitable half-life.
Neutron source consists some amount of natural Antimony and according to neutron capture reaction [1]:
Sb n Sb E (T/ 2,7 d.) Sb Te e (stable) Sb124 Antimony has two strong peaks, it is estimated
that thr first peak at 603 keV belongs to Antimony. Background at high energies is always higher than background at low energies and intensity of second emission is lower, it is supposed that due to these factors second peak is not presented in spectrum.
As it was mentioned above neutron source consists some amount of natural antimony [1]:
Sb n Sb E (T/ 60,3 d.) Sb Te e (stable) Iodine has only one strong emission at 603 keV
and it is possible that iodine was produced from Xenon which is always present in air [1]:
Xe n Sb p (T/ 4,15 d.) Sb Xe e (stable) Both variants are posiible but probability of
antimony presence is higher. Determination of theoretically estimated short-
lived isotopes
Fig. 2 Spectrum of theoretically estimated short-
lived isotopes in comparison with long-lived isotopes spectrum.
The determination problem of some isotopes
occurred during experiment. Annihilation peak is always presented at energy level 511 keV [2]. There are several isotopes which have photons with the same energy level. It means that annihilation peak and full energy peak of these isotopes could overlap and only one peak at this value will be presented. The height of the annihilation peak is always different and depends mostly on background isotopes which are always presented in shielding and air. It also depends on electron-positron pair production probability [2]. It can be concluded that it is impossible to estimate the presence of these isotopes with gamma spectroscopy and other methods of determination should be used, because these isotopes produce gamma radiation and it could be dangerous for environment.
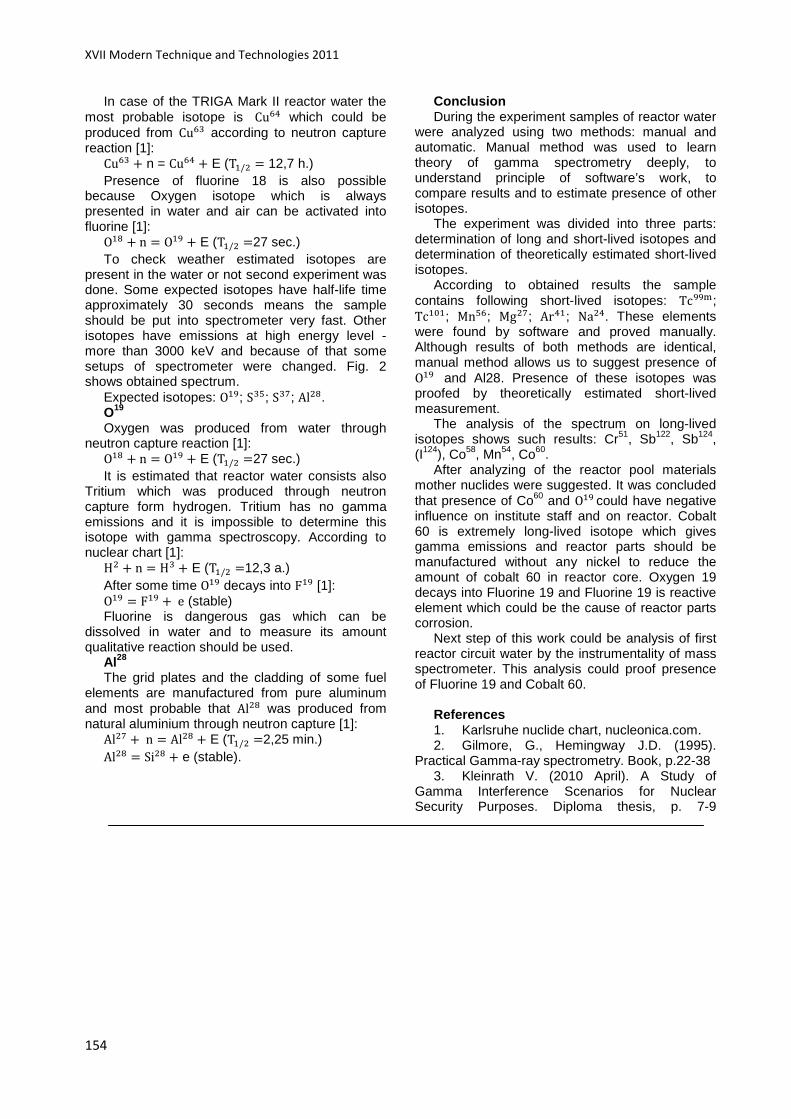
XVII Modern Technique and Technologies 2011
154
In case of the TRIGA Mark II reactor water the most probable isotope is Cu which could be produced from Cu according to neutron capture reaction [1]:
Cu + n = Cu + E (T/ = 12,7 h.) Presence of fluorine 18 is also possible
because Oxygen isotope which is always presented in water and air can be activated into fluorine [1]:
O + n = O + E (T/ =27 sec.) To check weather estimated isotopes are
present in the water or not second experiment was done. Some expected isotopes have half-life time approximately 30 seconds means the sample should be put into spectrometer very fast. Other isotopes have emissions at high energy level - more than 3000 keV and because of that some setups of spectrometer were changed. Fig. 2 shows obtained spectrum.
Expected isotopes: O; S; S; Al. O19 Oxygen was produced from water through
neutron capture reaction [1]: O + n = O + E (T/ =27 sec.) It is estimated that reactor water consists also
Tritium which was produced through neutron capture form hydrogen. Tritium has no gamma emissions and it is impossible to determine this isotope with gamma spectroscopy. According to nuclear chart [1]:
H + n = H + E (T/ =12,3 a.) After some time O decays into F [1]: O = F + e (stable) Fluorine is dangerous gas which can be
dissolved in water and to measure its amount qualitative reaction should be used.
Al 28 The grid plates and the cladding of some fuel
elements are manufactured from pure aluminum and most probable that Al was produced from natural aluminium through neutron capture [1]:
Al + n = Al + E (T/ =2,25 min.) Al = Si + e (stable).
Conclusion During the experiment samples of reactor water
were analyzed using two methods: manual and automatic. Manual method was used to learn theory of gamma spectrometry deeply, to understand principle of software’s work, to compare results and to estimate presence of other isotopes.
The experiment was divided into three parts: determination of long and short-lived isotopes and determination of theoretically estimated short-lived isotopes.
According to obtained results the sample contains following short-lived isotopes: Tc; Tc; Mn; Mg; Ar; Na. These elements were found by software and proved manually. Although results of both methods are identical, manual method allows us to suggest presence of O and Al28. Presence of these isotopes was proofed by theoretically estimated short-lived measurement.
The analysis of the spectrum on long-lived isotopes shows such results: Cr51, Sb122, Sb124, (I124), Co58, Mn54, Co60.
After analyzing of the reactor pool materials mother nuclides were suggested. It was concluded that presence of Co60 and Ocould have negative influence on institute staff and on reactor. Cobalt 60 is extremely long-lived isotope which gives gamma emissions and reactor parts should be manufactured without any nickel to reduce the amount of cobalt 60 in reactor core. Oxygen 19 decays into Fluorine 19 and Fluorine 19 is reactive element which could be the cause of reactor parts corrosion.
Next step of this work could be analysis of first reactor circuit water by the instrumentality of mass spectrometer. This analysis could proof presence of Fluorine 19 and Cobalt 60.
References 1. Karlsruhe nuclide chart, nucleonica.com. 2. Gilmore, G., Hemingway J.D. (1995).
Practical Gamma-ray spectrometry. Book, p.22-38 3. Kleinrath V. (2010 April). A Study of
Gamma Interference Scenarios for Nuclear Security Purposes. Diploma thesis, p. 7-9

Section VIII: Modern Physical Methods in Science, Engineering and Medicine
155
RISK AND THREATS ESTIMATION OF FNPP PHYSICAL PROTEC TION
Khalyavin I.V.
Scientific adviser: Demyanyuk D.G. A/Prof .
Tomsk Polytechnic University, 30, Lenin pr, Tomsk, Russia, 634050
Email: [email protected]
The power safety is one of the most important national safety components of any country. Electric energy consumption increases in times all over the world every year, so the big hopes are laid on nuclear power engineering. In connection with, new NPP building programs are developed. But it is impossible to build everywhere the NPP in view of region feature. Delivery of such power-suppiers like coal, oil or fuel oil can be restricted for the same reason. As an instance can be regions of the long-rang north. Atomic engineering development dost not stand pat and disposing in those regions FNPP can became the solution of the problem.
Floating nuclear power plant – Russian project, which is devoted to construction of low capacity floating nuclear power plant.
In general, NPP LC – the dump floating platform of 144m long, 33m wide and 21500 t displacement, which has 2 reactor plants KLT-40S of 70 MW electric power and 140 GCal/h heat power. They produce and transmit an electric energy and heat accordingly to the transformer substation and the heat point. Such kind of platforms can be used for sea water desalination [1,3].
The reactor and systems of the first contour are concluded in the containment counted for pressure, originating at a depressurization of the first contour. The special protective leakproof fence provides protection against a crash of helicopter, an explosive wave and other external actions.
Constant perfection of performances of safety of reactor installation, a heading of the advanced achievements in the field of metal science, machining of metals, an electrical technology, automatics, microelectronics, computer technique, diagnostic predetermine "present" of the reactor installation КЛТ-40С meeting the highest demands, shown to atomic energy resource new generation.
Concerning to the commercial part, nowadays the FNPP construction cost with all infrastructure is evaluated at 9.1 billion rubles, but the first FNPP unit cost which was launched at summer 2010, according to Kirienko, was about 14.1 billion rubles and 2 billion more is necessary for the waterside and hydraulic structures construction [3-5]. Allegedly, it’s considerably less, than it would be required for the construction of the similar capacity terrestrial NPP. And the payback time should be 10-11 years from 40 years of its service [1,2].
Using of FNPP in Russia is planned for the Far East and in northern areas. Besides, a list of
potential customers includes: China, Indonesia, Japan, South-east Asia, the Middle East and Asia-Pacific region.
The alternative, which Russia can offer foreign associates, looks like: floating power-generating unit remain in the property of Russia and Russian’s replaceable crew-watch. The electric power, heat, sweet water are sold to the consumer on the basis of the long-term contract. On the one hand, this scheme ensures reliability of deliveries of heat, an electricity, sweet water and does not demand from country-customer to create own expensive infrastructure for the handling with nuclear and radioactive materials. On the other hand it’s help to save non-proliferation regime of nuclear materials and dual-purpose technology. After the maintenance expiry of the term floating power-generating unit and all nuclear materials are returned to Russia [2,4].
There was a limited amount of information about FNPP physical protection in many official sources. Activity on organization FNPP physical protection begins from documentary registration. In territory of Russia standard-legal baseline consist from the Federal act “About atomic energy application” (the head XI) and “Rules of physical protection of nuclear material, nuclear-power plants and storing place of nuclear materials.” It’s may be in the future is FNPP will be put on mass production, it will be necessary to develop new references on organization of FNPP physical protection for the purpose articulating of the best and effective expedients of realization of some PP principles for an aquatic environment.
But what are the conditions of the object physical security in case of its application it other countries? It’s worth to take into account, that FNPP is II category nuclear object, according to the IAEA-TECDOC-1487 documents, and, besides, it’s supposed to use fuel enriched to between 20 and 50 percent of the uranium-235 isotope. It’s in turn may be an attractive target for terrorists to seize, disrupt, create a small nuclear warhead or a "dirty bomb " [2-4].
List of threats has this form: • I design threat for FNPP with KLT-40С is an
entrapment by pirates, terrorists of a vessel and crew (in the capacity of hostages) during parking FNPP on a place of use for the purpose of blackmail and repayment reception; simultaneously with misappropriation of nuclear materials for their subsequent not authorised use;

XVII Modern Technique and Technologies 2011
156
• II design threat for FNPP with KLT-40C is a diversion with use of explosives or heavy mechanical affecting by means of other self-moving vessel, leading to fracture of case FEB, as consequence, to crash and emission of radioactivity within a sanitary-protective band.
If we analyze the places of the alleged operation, the countries of Southeast Asia are particularly concerned its instability. For instance, over 90 terrorist attacks in Indonesia between 1997 and 2003 were committed [6]. PS construction must be carefully designed by special agencies of both countries with the ability to use higher levels of protection for both active and passive. For example, the use of Russian Navies for the FNPP watershed protection. That’s in turn can lead to the increase in energy cost. As the financial basis of the construction and operation doesn’t contain PS, and its cost can range from 10 to 50 percent of the producing energy value. Because of this, the FNPP application may be economically disadvantageous for the customer's country.
Thus, the analysis has shown, that maintenance FNPP in foreshore waters of the island states of Indonesia and Malaysia can be unsafe not only for the adjacent states, but also for other countries of the world. As in case of successful implementation by terrorists of design threat, the vessel can be captureed, nuclear materials are stolen and used in criminal intents in any other state of the world.[4].
Considering a high crime rate, it is possible to tell, that the probability of realisation of design threat is very high. In this connection system PS of FNPP it should be effective in counteraction to
exterior mechanical affectings of the infringer, protection of case FEB and timely detection of not authorised penetration watercraft and terrorists-divers in guarded water and underwater space of station
Thus, today, risk assessment, analysis and FNPP PS construction is paramount objective to ensure a stable and safe operation of the facility not only in Russia but also abroad.
References:
1. “With a kind on a sale” [electronic source ] – access mode: http://www.rg.ru/2009/04/22/lomonosov.html 2. “Floating nuclear power stations: the analysis of physical safety in the conditions of export” [electronic source ] – access mode: http://www.polarlights.ru/ru/thesises/read/mnuItm:thesises/catId:18/thesisId:93/# 3. “The nuclear power stations have floated” [electronic source ] – access mode: http://www.rg.ru/2010/07/07/reg-zapad/energoblok.html 4. “The first-ever floating generating set is floated” [electronic source ] – access mode: http://www.rosenergoatom.ru/rus/press/main-themes/article/?article-id=A0F23201-B563-4B0C-B264-A07A148CDA9B 5. “Economic feasibility FNPP” [electronic source ] – access mode: http://www.rosenergoatom.ru/rus/development/floating_npp/economic/ 6. “Saudi on trial for Jakarta bombings” [electronic source ] – access mode: http://english.aljazeera.net/news/asia-pacific/2010/02/20102247284344906.html
RADIOACTIVE WASTE IMMOBILIZATION USING THE TECHNIQU E
OF SELF-PROPAGATING HIGH-TEMPERATURE SYNTHESIS
A.V. Kononenko, M.S. Kuznetsov, D.S. Isachenko.
Principal investigator: Semenov, S.A., assistant
Language supervisor: Tsepilova, A.V., teacher
Tomsk Polytechnic University, 30, Lenina St., Tomsk, Russia, 634050
E-mail: [email protected]
Key words : immobilization, radioactive waste Introduction
Scientific and technological progress and the latest scientific and technological revolution the end of the 20th century led to and essentially new – man-caused civilization whose achievements, such as electricity, nuclear energy, electronics,
space communications, etc., have a negative feature, the environmental crisis. Simultaneously with the introduction into our lives new and promising technologies, based on an increasingly broad and full utilization of natural resources the amount of substances harmful for humans and the surrounding environment of substances - so-called industrial waste is constantly growing. Here belong radioactive waste, pesticides and chemical warfare
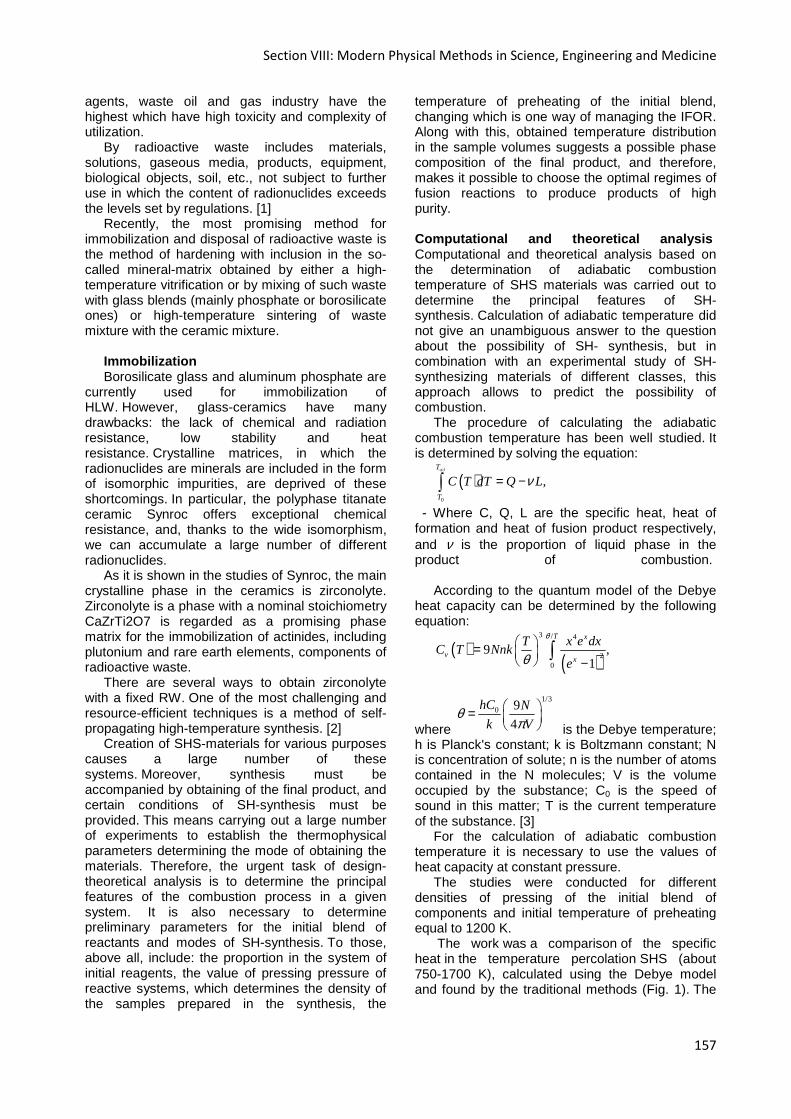
Section VIII: Modern Physical Methods in Science, Engineering and Medicine
157
agents, waste oil and gas industry have the highest which have high toxicity and complexity of utilization.
By radioactive waste includes materials, solutions, gaseous media, products, equipment, biological objects, soil, etc., not subject to further use in which the content of radionuclides exceeds the levels set by regulations. [1]
Recently, the most promising method for immobilization and disposal of radioactive waste is the method of hardening with inclusion in the so-called mineral-matrix obtained by either a high-temperature vitrification or by mixing of such waste with glass blends (mainly phosphate or borosilicate ones) or high-temperature sintering of waste mixture with the ceramic mixture.
Immobilization Borosilicate glass and aluminum phosphate are
currently used for immobilization of HLW. However, glass-ceramics have many drawbacks: the lack of chemical and radiation resistance, low stability and heat resistance. Crystalline matrices, in which the radionuclides are minerals are included in the form of isomorphic impurities, are deprived of these shortcomings. In particular, the polyphase titanate ceramic Synroc offers exceptional chemical resistance, and, thanks to the wide isomorphism, we can accumulate a large number of different radionuclides.
As it is shown in the studies of Synroc, the main crystalline phase in the ceramics is zirconolyte. Zirconolyte is a phase with a nominal stoichiometry CaZrTi2O7 is regarded as a promising phase matrix for the immobilization of actinides, including plutonium and rare earth elements, components of radioactive waste.
There are several ways to obtain zirconolyte with a fixed RW. One of the most challenging and resource-efficient techniques is a method of self-propagating high-temperature synthesis. [2]
Creation of SHS-materials for various purposes causes a large number of these systems. Moreover, synthesis must be accompanied by obtaining of the final product, and certain conditions of SH-synthesis must be provided. This means carrying out a large number of experiments to establish the thermophysical parameters determining the mode of obtaining the materials. Therefore, the urgent task of design-theoretical analysis is to determine the principal features of the combustion process in a given system. It is also necessary to determine preliminary parameters for the initial blend of reactants and modes of SH-synthesis. To those, above all, include: the proportion in the system of initial reagents, the value of pressing pressure of reactive systems, which determines the density of the samples prepared in the synthesis, the
temperature of preheating of the initial blend, changing which is one way of managing the IFOR. Along with this, obtained temperature distribution in the sample volumes suggests a possible phase composition of the final product, and therefore, makes it possible to choose the optimal regimes of fusion reactions to produce products of high purity. Computational and theoretical analysis Computational and theoretical analysis based on the determination of adiabatic combustion temperature of SHS materials was carried out to determine the principal features of SH-synthesis. Calculation of adiabatic temperature did not give an unambiguous answer to the question about the possibility of SH- synthesis, but in combination with an experimental study of SH-synthesizing materials of different classes, this approach allows to predict the possibility of combustion.
The procedure of calculating the adiabatic combustion temperature has been well studied. It is determined by solving the equation:
( )0
,ад
T
T
C T dT Q Lν= −∫
- Where C, Q, L are the specific heat, heat of formation and heat of fusion product respectively, and ν is the proportion of liquid phase in the product of combustion.
According to the quantum model of the Debye heat capacity can be determined by the following equation:
( )( )
3 / 4
20
9 ,1
T x
vx
T x e dxC T Nnk
e
θ
θ = −
∫
where
1/3
0 9
4
hC N
k Vθ
π = is the Debye temperature;
h is Planck's constant; k is Boltzmann constant; N is concentration of solute; n is the number of atoms contained in the N molecules; V is the volume occupied by the substance; C0 is the speed of sound in this matter; T is the current temperature of the substance. [3]
For the calculation of adiabatic combustion temperature it is necessary to use the values of heat capacity at constant pressure.
The studies were conducted for different densities of pressing of the initial blend of components and initial temperature of preheating equal to 1200 K.
The work was a comparison of the specific heat in the temperature percolation SHS (about 750-1700 K), calculated using the Debye model and found by the traditional methods (Fig. 1). The
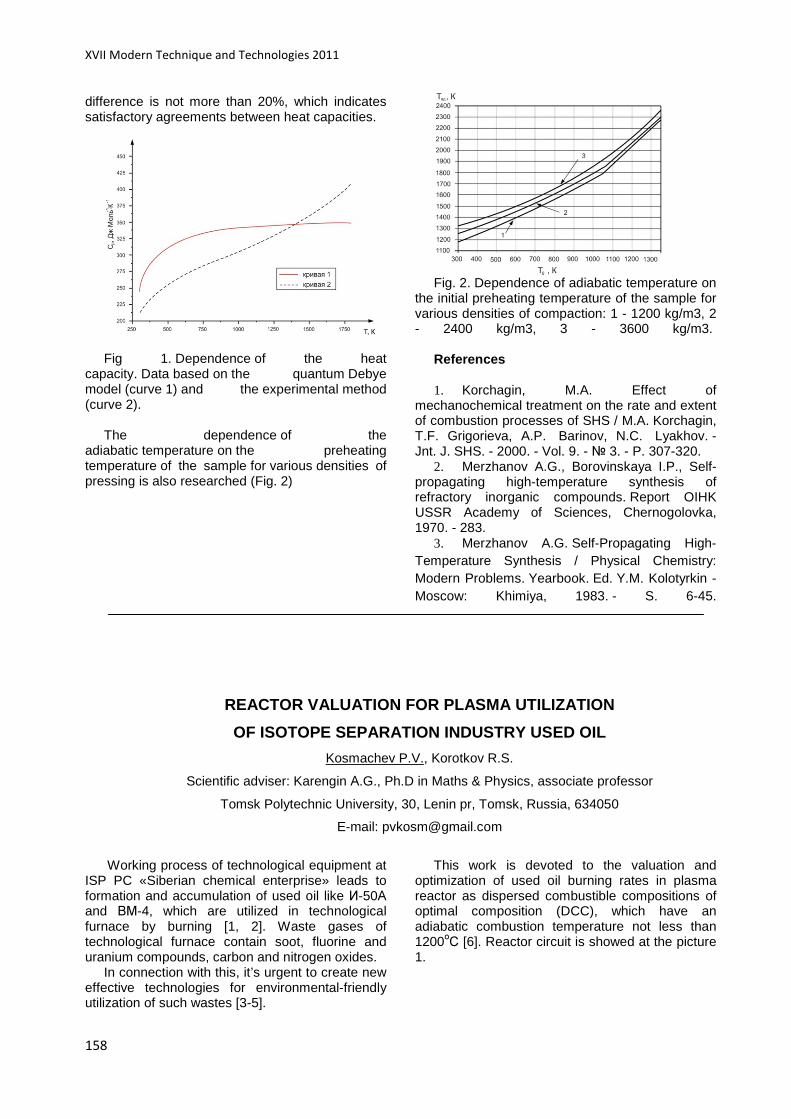
XVII Modern Technique and Technologies 2011
158
difference is not more than 20%, which indicates satisfactory agreements between heat capacities.
Fig 1. Dependence of the heat
capacity. Data based on the quantum Debye model (curve 1) and the experimental method (curve 2).
The dependence of the
adiabatic temperature on the preheating temperature of the sample for various densities of pressing is also researched (Fig. 2)
Fig. 2. Dependence of adiabatic temperature on
the initial preheating temperature of the sample for various densities of compaction: 1 - 1200 kg/m3, 2 - 2400 kg/m3, 3 - 3600 kg/m3.
References
1. Korchagin, M.A. Effect of mechanochemical treatment on the rate and extent of combustion processes of SHS / M.A. Korchagin, T.F. Grigorieva, A.P. Barinov, N.C. Lyakhov. - Jnt. J. SHS. - 2000. - Vol. 9. - 3. - P. 307-320.
2. Merzhanov A.G., Borovinskaya I.P., Self-propagating high-temperature synthesis of refractory inorganic compounds. Report OIHK USSR Academy of Sciences, Chernogolovka, 1970. - 283.
3. Merzhanov A.G. Self-Propagating High-Temperature Synthesis / Physical Chemistry: Modern Problems. Yearbook. Ed. Y.M. Kolotyrkin - Moscow: Khimiya, 1983. - S. 6-45.
REACTOR VALUATION FOR PLASMA UTILIZATION
OF ISOTOPE SEPARATION INDUSTRY USED OIL
Kosmachev P.V., Korotkov R.S.
Scientific adviser: Karengin А.G., Ph.D in Maths & Physics, associate professor
Tomsk Polytechnic University, 30, Lenin pr, Tomsk, Russia, 634050
E-mail: [email protected]
Working process of technological equipment at
ISP PC «Siberian chemical enterprise» leads to formation and accumulation of used oil like И-50А and ВМ-4, which are utilized in technological furnace by burning [1, 2]. Waste gases of technological furnace contain soot, fluorine and uranium compounds, carbon and nitrogen oxides.
In connection with this, it’s urgent to create new effective technologies for environmental-friendly utilization of such wastes [3-5].
This work is devoted to the valuation and optimization of used oil burning rates in plasma reactor as dispersed combustible compositions of optimal composition (DCC), which have an adiabatic combustion temperature not less than 1200оС [6]. Reactor circuit is showed at the picture 1.
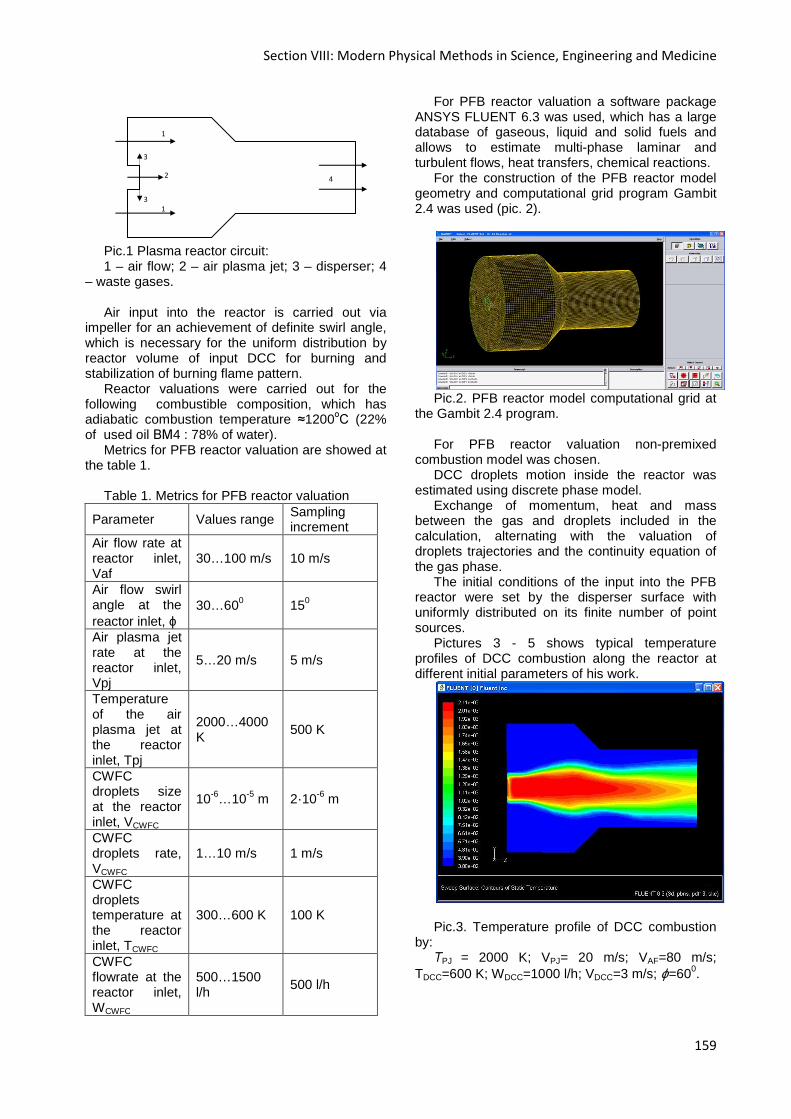
Section VIII: Modern Physical Methods in Science, Engineering and Medicine
159
Pic.1 Plasma reactor circuit: 1 – air flow; 2 – air plasma jet; 3 – disperser; 4
– waste gases. Air input into the reactor is carried out via
impeller for an achievement of definite swirl angle, which is necessary for the uniform distribution by reactor volume of input DCC for burning and stabilization of burning flame pattern.
Reactor valuations were carried out for the following combustible composition, which has adiabatic combustion temperature ≈1200оС (22% of used oil ВМ4 : 78% of water).
Metrics for PFB reactor valuation are showed at the table 1.
Table 1. Metrics for PFB reactor valuation
Parameter Values range Sampling increment
Air flow rate at reactor inlet, Vaf
30…100 m/s 10 m/s
Air flow swirl angle at the reactor inlet, ϕ
30…600 150
Air plasma jet rate at the reactor inlet, Vpj
5…20 m/s 5 m/s
Temperature of the air plasma jet at the reactor inlet, Tpj
2000…4000 K
500 K
CWFC droplets size at the reactor inlet, VCWFC
10-6…10-5 m 2·10-6 m
CWFC droplets rate, VCWFC
1…10 m/s 1 m/s
CWFC droplets temperature at the reactor inlet, TCWFC
300…600 K 100 K
CWFC flowrate at the reactor inlet, WCWFC
500…1500 l/h
500 l/h
For PFB reactor valuation a software package ANSYS FLUENT 6.3 was used, which has a large database of gaseous, liquid and solid fuels and allows to estimate multi-phase laminar and turbulent flows, heat transfers, chemical reactions.
For the construction of the PFB reactor model geometry and computational grid program Gambit 2.4 was used (pic. 2).
Pic.2. PFB reactor model computational grid at
the Gambit 2.4 program. For PFB reactor valuation non-premixed
combustion model was chosen. DCC droplets motion inside the reactor was
estimated using discrete phase model. Exchange of momentum, heat and mass
between the gas and droplets included in the calculation, alternating with the valuation of droplets trajectories and the continuity equation of the gas phase.
The initial conditions of the input into the PFB reactor were set by the disperser surface with uniformly distributed on its finite number of point sources.
Pictures 3 - 5 shows typical temperature profiles of DCC combustion along the reactor at different initial parameters of his work.
Pic.3. Temperature profile of DCC combustion
by: ТPJ = 2000 K; VPJ= 20 m/s; VAF=80 m/s;
TDCC=600 K; WDCC=1000 l/h; VDCC=3 m/s; ϕ=600.
1
1
2
3
3
4
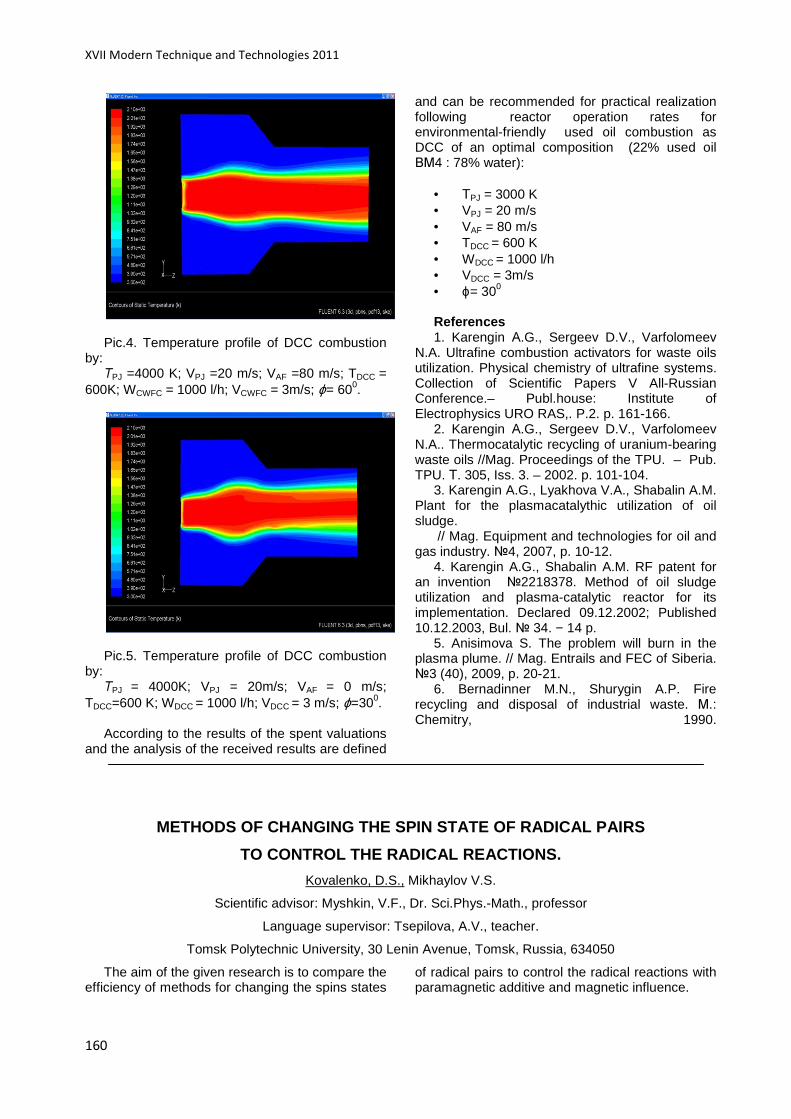
XVII Modern Technique and Technologies 2011
160
Pic.4. Temperature profile of DCC combustion
by: ТPJ =4000 K; VPJ =20 m/s; VAF =80 m/s; TDCC =
600K; WCWFC = 1000 l/h; VCWFC = 3m/s; ϕ= 600.
Pic.5. Temperature profile of DCC combustion
by: ТPJ = 4000K; VPJ = 20m/s; VAF = 0 m/s;
TDCC=600 K; WDCC = 1000 l/h; VDCC = 3 m/s; ϕ=300. According to the results of the spent valuations
and the analysis of the received results are defined
and can be recommended for practical realization following reactor operation rates for environmental-friendly used oil combustion as DCC of an optimal composition (22% used oil ВМ4 : 78% water):
• ТPJ = 3000 K • VPJ = 20 m/s • VAF = 80 m/s • TDCC = 600 K • WDCC = 1000 l/h • VDCC = 3m/s • ϕ= 300 References 1. Karengin А.G., Sergeev D.V., Varfolomeev
N.A. Ultrafine combustion activators for waste oils utilization. Physical chemistry of ultrafine systems. Collection of Scientific Papers V All-Russian Conference.– Publ.house: Institute of Electrophysics URO RAS,. P.2. p. 161-166.
2. Karengin А.G., Sergeev D.V., Varfolomeev N.A.. Thermocatalytic recycling of uranium-bearing waste oils //Mag. Proceedings of the TPU. – Pub. TPU. Т. 305, Iss. 3. – 2002. p. 101-104.
3. Karengin A.G., Lyakhova V.A., Shabalin A.M. Plant for the plasmacatalythic utilization of oil sludge.
// Mag. Equipment and technologies for oil and gas industry. 4, 2007, p. 10-12.
4. Karengin A.G., Shabalin A.M. RF patent for an invention 2218378. Method of oil sludge utilization and plasma-catalytic reactor for its implementation. Declared 09.12.2002; Published 10.12.2003, Bul. 34. − 14 p.
5. Anisimova S. The problem will burn in the plasma plume. // Mag. Entrails and FEC of Siberia. 3 (40), 2009, p. 20-21.
6. Bernadinner M.N., Shurygin A.P. Fire recycling and disposal of industrial waste. М.: Chemitry, 1990.
METHODS OF CHANGING THE SPIN STATE OF RADICAL PAIRS
TO CONTROL THE RADICAL REACTIONS.
Kovalenko, D.S., Mikhaylov V.S.
Scientific advisor: Myshkin, V.F., Dr. Sci.Phys.-Math., professor
Language supervisor: Tsepilova, A.V., teacher.
Tomsk Polytechnic University, 30 Lenin Avenue, Tomsk, Russia, 634050
The aim of the given research is to compare the efficiency of methods for changing the spins states
of radical pairs to control the radical reactions with paramagnetic additive and magnetic influence.
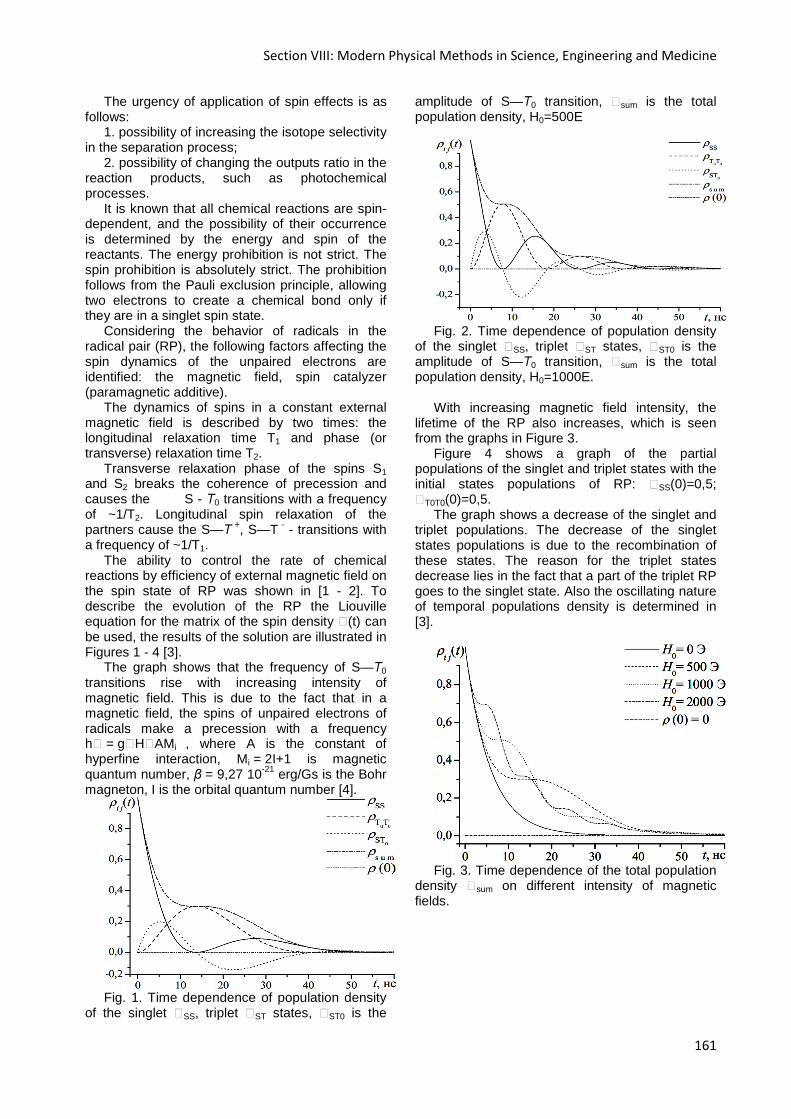
Section VIII: Modern Physical Methods in Science, Engineering and Medicine
161
The urgency of application of spin effects is as follows:
1. possibility of increasing the isotope selectivity in the separation process;
2. possibility of changing the outputs ratio in the reaction products, such as photochemical processes.
It is known that all chemical reactions are spin-dependent, and the possibility of their occurrence is determined by the energy and spin of the reactants. The energy prohibition is not strict. The spin prohibition is absolutely strict. The prohibition follows from the Pauli exclusion principle, allowing two electrons to create a chemical bond only if they are in a singlet spin state.
Considering the behavior of radicals in the radical pair (RP), the following factors affecting the spin dynamics of the unpaired electrons are identified: the magnetic field, spin catalyzer (paramagnetic additive).
The dynamics of spins in a constant external magnetic field is described by two times: the longitudinal relaxation time T1 and phase (or transverse) relaxation time T2.
Transverse relaxation phase of the spins S1 and S2 breaks the coherence of precession and causes the S - Т0 transitions with a frequency of ~1/T2. Longitudinal spin relaxation of the partners cause the S—Т
+, S—T - - transitions with a frequency of ~1/T1.
The ability to control the rate of chemical reactions by efficiency of external magnetic field on the spin state of RP was shown in [1 - 2]. To describe the evolution of the RP the Liouville equation for the matrix of the spin density (t) can be used, the results of the solution are illustrated in Figures 1 - 4 [3].
The graph shows that the frequency of S—Т0 transitions rise with increasing intensity of magnetic field. This is due to the fact that in a magnetic field, the spins of unpaired electrons of radicals make a precession with a frequency h = gHAMi , where A is the constant of hyperfine interaction, Mi = 2I+1 is magnetic quantum number, β = 9,27 10-21 erg/Gs is the Bohr magneton, I is the orbital quantum number [4].
Fig. 1. Time dependence of population density
of the singlet SS, triplet ST states, ST0 is the
amplitude of S—Т0 transition, sum is the total population density, H0=500E
Fig. 2. Time dependence of population density
of the singlet SS, triplet ST states, ST0 is the amplitude of S—Т0 transition, sum is the total population density, H0=1000E.
With increasing magnetic field intensity, the
lifetime of the RP also increases, which is seen from the graphs in Figure 3.
Figure 4 shows a graph of the partial populations of the singlet and triplet states with the initial states populations of RP: SS(0)=0,5; T0T0(0)=0,5.
The graph shows a decrease of the singlet and triplet populations. The decrease of the singlet states populations is due to the recombination of these states. The reason for the triplet states decrease lies in the fact that a part of the triplet RP goes to the singlet state. Also the oscillating nature of temporal populations density is determined in [3].
Fig. 3. Time dependence of the total population
density sum on different intensity of magnetic fields.
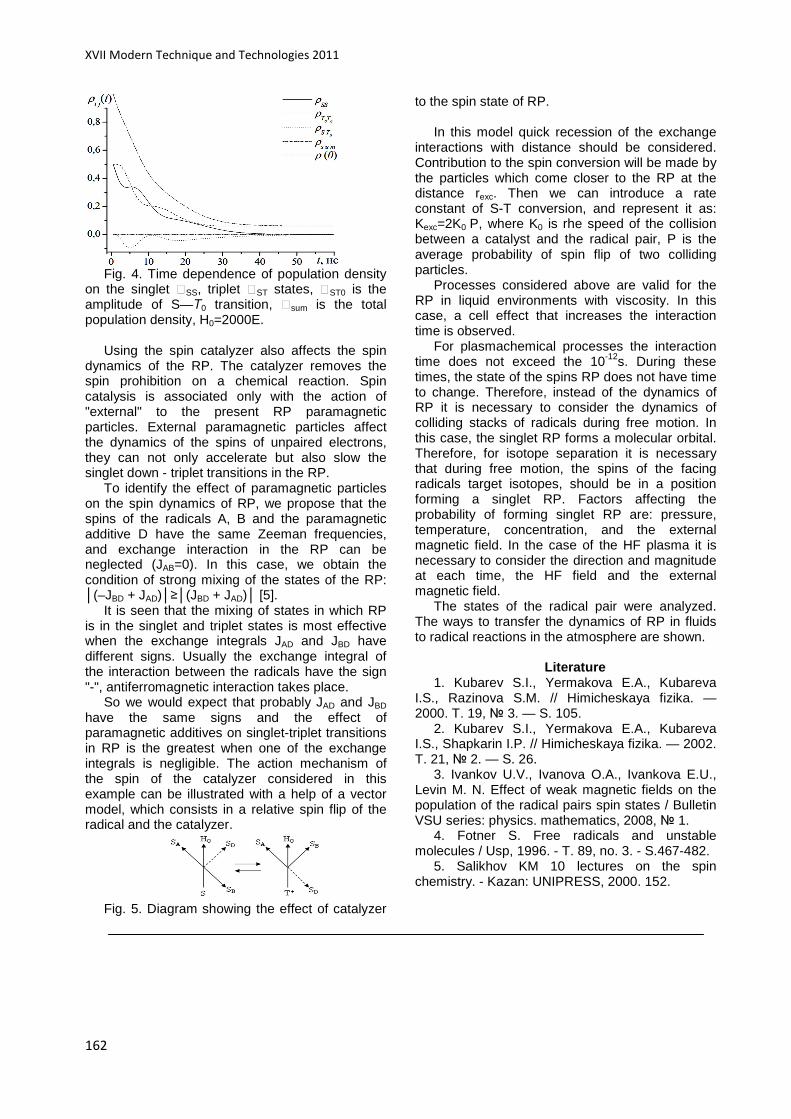
XVII Modern Technique and Technologies 2011
162
Fig. 4. Time dependence of population density
on the singlet SS, triplet ST states, ST0 is the amplitude of S—Т0 transition, sum is the total population density, H0=2000E.
Using the spin catalyzer also affects the spin
dynamics of the RP. The catalyzer removes the spin prohibition on a chemical reaction. Spin catalysis is associated only with the action of "external" to the present RP paramagnetic particles. External paramagnetic particles affect the dynamics of the spins of unpaired electrons, they can not only accelerate but also slow the singlet down - triplet transitions in the RP.
To identify the effect of paramagnetic particles on the spin dynamics of RP, we propose that the spins of the radicals A, B and the paramagnetic additive D have the same Zeeman frequencies, and exchange interaction in the RP can be neglected (JAB=0). In this case, we obtain the condition of strong mixing of the states of the RP: (–JBD + JAD)≥(JBD + JAD) [5].
It is seen that the mixing of states in which RP is in the singlet and triplet states is most effective when the exchange integrals JAD and JBD have different signs. Usually the exchange integral of the interaction between the radicals have the sign "-", antiferromagnetic interaction takes place.
So we would expect that probably JAD and JBD have the same signs and the effect of paramagnetic additives on singlet-triplet transitions in RP is the greatest when one of the exchange integrals is negligible. The action mechanism of the spin of the catalyzer considered in this example can be illustrated with a help of a vector model, which consists in a relative spin flip of the radical and the catalyzer.
Fig. 5. Diagram showing the effect of catalyzer
to the spin state of RP. In this model quick recession of the exchange
interactions with distance should be considered. Contribution to the spin conversion will be made by the particles which come closer to the RP at the distance rexc. Then we can introduce a rate constant of S-T conversion, and represent it as: Kexc=2K0 P, where K0 is rhe speed of the collision between a catalyst and the radical pair, P is the average probability of spin flip of two colliding particles.
Processes considered above are valid for the RP in liquid environments with viscosity. In this case, a cell effect that increases the interaction time is observed.
For plasmachemical processes the interaction time does not exceed the 10-12s. During these times, the state of the spins RP does not have time to change. Therefore, instead of the dynamics of RP it is necessary to consider the dynamics of colliding stacks of radicals during free motion. In this case, the singlet RP forms a molecular orbital. Therefore, for isotope separation it is necessary that during free motion, the spins of the facing radicals target isotopes, should be in a position forming a singlet RP. Factors affecting the probability of forming singlet RP are: pressure, temperature, concentration, and the external magnetic field. In the case of the HF plasma it is necessary to consider the direction and magnitude at each time, the HF field and the external magnetic field.
The states of the radical pair were analyzed. The ways to transfer the dynamics of RP in fluids to radical reactions in the atmosphere are shown.
Literature
1. Kubarev S.I., Yermakova E.A., Kubareva I.S., Razinova S.M. // Himicheskaya fizika. — 2000. T. 19, 3. — S. 105.
2. Kubarev S.I., Yermakova E.A., Kubareva I.S., Shapkarin I.P. // Himicheskaya fizika. — 2002. T. 21, 2. — S. 26.
3. Ivankov U.V., Ivanova O.A., Ivankova E.U., Levin M. N. Effect of weak magnetic fields on the population of the radical pairs spin states / Bulletin VSU series: physics. mathematics, 2008, 1.
4. Fotner S. Free radicals and unstable molecules / Usp, 1996. - T. 89, no. 3. - S.467-482.
5. Salikhov KM 10 lectures on the spin chemistry. - Kazan: UNIPRESS, 2000. 152.
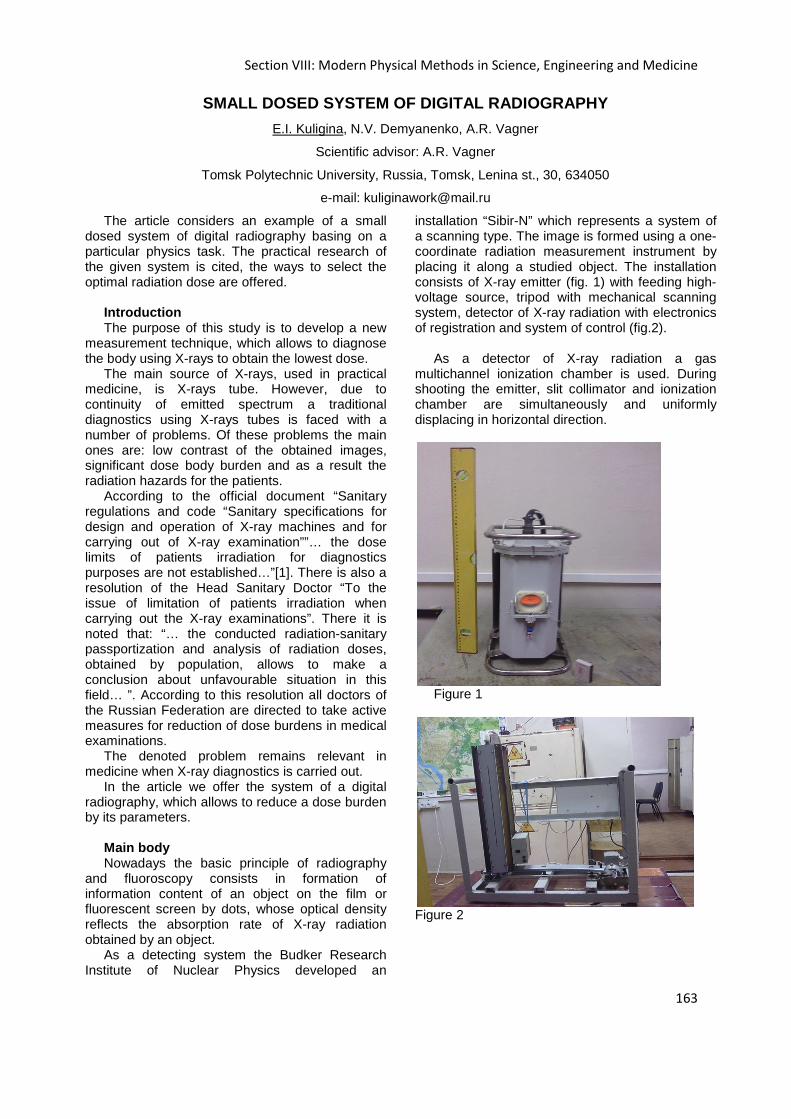
Section VIII: Modern Physical Methods in Science, Engineering and Medicine
163
SMALL DOSED SYSTEM OF DIGITAL RADIOGRAPHY
E.I. Kuligina, N.V. Demyanenko, A.R. Vagner
Scientific advisor: A.R. Vagner
Tomsk Polytechnic University, Russia, Tomsk, Lenina st., 30, 634050
e-mail: [email protected]
The article considers an example of a small dosed system of digital radiography basing on a particular physics task. The practical research of the given system is cited, the ways to select the optimal radiation dose are offered.
Introduction The purpose of this study is to develop a new
measurement technique, which allows to diagnose the body using X-rays to obtain the lowest dose.
The main source of X-rays, used in practical medicine, is X-rays tube. However, due to continuity of emitted spectrum a traditional diagnostics using X-rays tubes is faced with a number of problems. Of these problems the main ones are: low contrast of the obtained images, significant dose body burden and as a result the radiation hazards for the patients.
According to the official document “Sanitary regulations and code “Sanitary specifications for design and operation of X-ray machines and for carrying out of X-ray examination””… the dose limits of patients irradiation for diagnostics purposes are not established…”[1]. There is also a resolution of the Head Sanitary Doctor “To the issue of limitation of patients irradiation when carrying out the X-ray examinations”. There it is noted that: “… the conducted radiation-sanitary passportization and analysis of radiation doses, obtained by population, allows to make a conclusion about unfavourable situation in this field… ”. According to this resolution all doctors of the Russian Federation are directed to take active measures for reduction of dose burdens in medical examinations.
The denoted problem remains relevant in medicine when X-ray diagnostics is carried out.
In the article we offer the system of a digital radiography, which allows to reduce a dose burden by its parameters.
Main body Nowadays the basic principle of radiography
and fluoroscopy consists in formation of information content of an object on the film or fluorescent screen by dots, whose optical density reflects the absorption rate of X-ray radiation obtained by an object.
As a detecting system the Budker Research Institute of Nuclear Physics developed an
installation “Sibir-N” which represents a system of a scanning type. The image is formed using a one-coordinate radiation measurement instrument by placing it along a studied object. The installation consists of X-ray emitter (fig. 1) with feeding high-voltage source, tripod with mechanical scanning system, detector of X-ray radiation with electronics of registration and system of control (fig.2).
As a detector of X-ray radiation a gas
multichannel ionization chamber is used. During shooting the emitter, slit collimator and ionization chamber are simultaneously and uniformly displacing in horizontal direction.
Figure 1
Figure 2

XVII Modern Technique and Technologies 2011
164
Figure 3 The object under research is a computer mouse
Genius (Fig. 3) The installation control is carried out via
computer. This allows to perform shooting of several images, to watch the picture on the monitor, to enter in the archive, and also to look through pictures from the archive. Via the programs of mathematical processing of a digital image one can transform the image to the form appropriate for visual analysis. Nowadays such programs as underlining of an outline, extension of density range, simultaneously observed on the monitor are used. A digital form of an image allows to obtain quantitative diagnostic information – to measure distances, angles, sizes of organs and pathologic formations. One can measure a relative density at any point of a picture or average relative density at an optional section of a picture. [2]
Visually one can see that a simple computer
mouse was completely examined by X-rays. (Fig. 4)
Figure 4 Basic parameters of an installation : • The number of an image elements
vertically: 1536
• Picture width: 410 mm • Horizontal size of a picture can change.
Maximum 716 mm. • Effective radiation dose in the picture of
the chest: 7-15 mcSv • Productivity, pictures in an hour: 60 • Contrast sensitivity (dose of 0,2 mR): 1% • Dynamic range (photographic width):
>480 • Space resolution in the plane of a detector
to 2,0 pairs l./mm. • Scanning time: 2.5, 5, 10 s. • Maximum scanning rate of mechanics: 1200 mm The given installation was developed by the
staff of Department of Applied Physics in collaboration with a laboratory of detecting systems of SD RAS.
The given measurement technique has a number of advantages:
• Operative transformation of an image to the form appropriate for visual analysis. It is achieved by the change of lower and upper borders of density ranges represented on the monitor with the help of 256 gradations of gray;
• Formation of a computer data base with an archive of pictures, the transmission of pictures by electron nets, printing of hard copies on a printer;
• Automated accounting of individual radiation doses of each patient;
• The appearance of an image on the screen just after shooting makes operative diagnostics possible
Conclusion The main difference of the described system of
digital radiography from the analogs is high sensitivity of X-ray radiation registration in the range of energies from 15 to 60 keV, that allows to reduce a dose burden on a studied object (patient). The system possesses a space resolution to 2 pairs l/mm required for carrying out X-ray examinations. Expressivity and a possibility to carry out the analysis of images during diagnostics can be one more advantage of digital systems of radiography. It is known that in radiography diagnostics one uses different spectral characteristics of X-ray radiation: 10-20 keV in mammography, 40-50 keV in fluorography and diagnostics of extremities and head, 50-70 keV for diagnostics of abdominal cavity and pelvis. Therefore it is necessary to investigate the dependence of image contrast on parameters of X-ray radiation beam to achieve the minimal values of dose burden at the noted.

Section VIII: Modern Physical Methods in Science, Engineering and Medicine
165
REFERENCES
1. Sanitary regulations and code of Russian Federation :SanPin 2.6.1.1192-03
2. http://www.inp.nsk.su/products/medicine
PRACTICAL APPLICATION OF HIGH-POWER ION BEAMS
Y. A. Kustov, R. K. Cherdizov
Supervisors: M. S. Kuznetsov, assistant of the Department of Physics and power plants,
Applied Physics and Engineering Institute, TPU
A.P. Eonov, Senior Lecturer of Department of Foreign Languages of Applied Physics and Engineering
Tomsk Polytechnic University, 634050, Russia, Tomsk, Lenina ave., 30
E-mail: [email protected]
Today the important practical application is the interaction of concentrated flows of energy (CFE) with metals. Interacting with the substance, the flows, such as powerful ion beams (PIB), can change their properties [1]. In particular, for the industry it is useful to obtain metals with optimum parameters of hardness and brittleness without the use of expensive alloying elements. However, this can be achieved using powerful ion beams. Interacting with the substance, the ions transfer to the energy substance, momentum, electric charge and mass. Mass is carried by ions or neutral atoms, they can condense on the surface or implanted into the billet or spraying it. This is the "processing effect." The basic process of this interaction is the scattering of ions. Usually, nonrelativistic ion beams are used. During the scattering of ions there are the following physical processes: elastic and inelastic collisions with electrons of the substance, with nuclei, generating different types of radiation primary or secondary accompany the movement of particles, in the matter. Process of elastic scattering of ions on electrons can be neglected because of the large differences in their masses [2]. In elastic scattering of ions it is possible to scatter the “forward-backward” or at small angles, it all depends on the particles mass. The potential energy has the form of the Coulomb interaction, or it is described by the Thomas-Fermi and Rutherford equations. Inelastic scattering is the process of ionization, excitation, dissociation and charge exchange. Depending on the wave vector of the incident ion and the size of an atom, the process is described by the Thomas-Fermi and Bethe-Born equations. The electrons of an atom can change their energy levels, ionization or excitation of the atom can occur.
While the motion of ions in matter, their nuclear inhibition and electronic inhibition happen, due to multiple scattering - elastic and inelastic. While electronic inhibition the energy of the ion spend to ion excitation or ionization of atoms. Nuclear inhibition is typical for ions of low energy, energy losses correspond to the theory of loss of O.B. Firsov.[3] Ions have a run in amorphous and crystal materials. In amorphous material in the first approximation, it does not depend on energy, in crystal material spectrum runs are described by the Gaussian distribution [2]. In monocrystals there are directions along which the atoms form channels, limited by chains of atoms on sides. Getting into a such channel, an ion moves almost without any obstruction, without any scattering. This is the channeling effect. Channeling occurs rarely, but it is enough to the ion to get into a channel in a short span, to dissipate on a framed atom and move in the channel, according to the approximate sine wave. This is acceptable if the angle is less than the critical angle scattering in the channel, which is calculated by the formula [2]. When channeling, electron scattering dominates. The dose of radiation, the ordering of the surface affect, to the effect of channeling the temperature. During the collision of atoms and ions of substance, atoms shift from its equilibrium position due to the energy transfer process. As a result, the crystal structure is broken and transformed into the amorphous. A cascade of collisions develops. The radiation effects are formed, that are not thermodynamic equilibrium and can be fixed by collisions. The maximum occurrence of penetrating ions is deeper than the maximum of generated defects. Electrons scatted by ions transfer their energy to the others in the field of the ion track. There is a lot of pressure, until the yield strength,
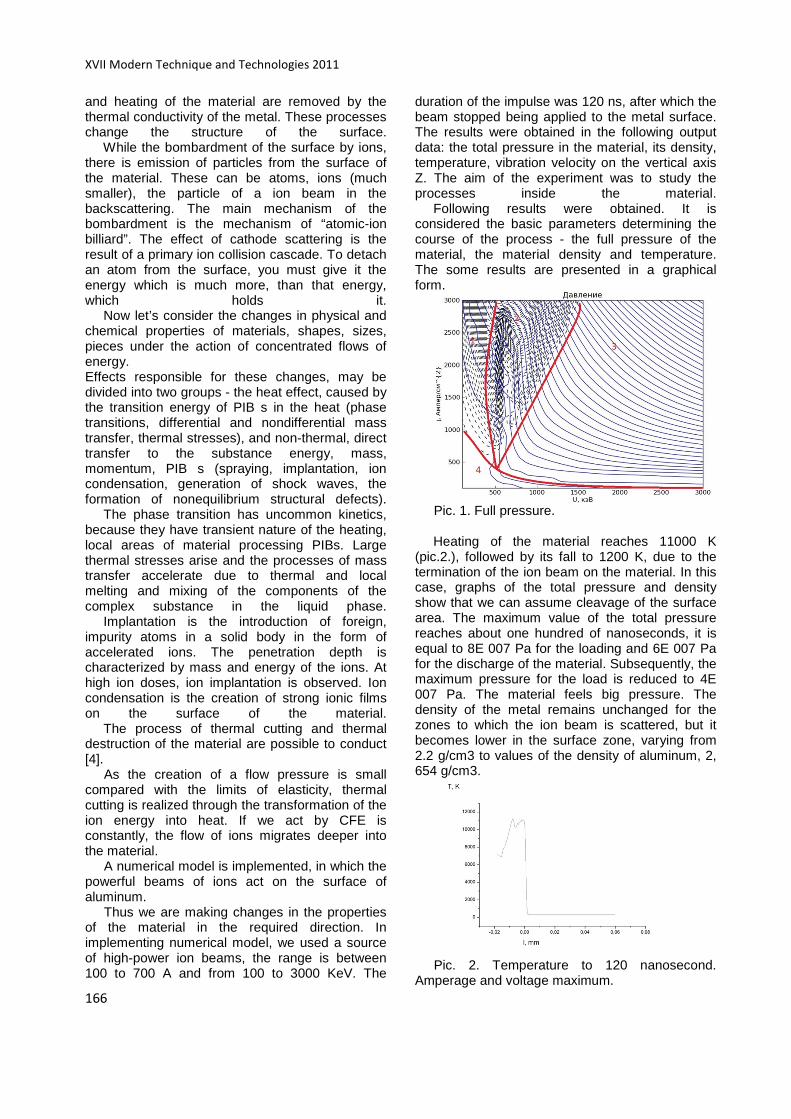
XVII Modern Technique and Technologies 2011
166
and heating of the material are removed by the thermal conductivity of the metal. These processes change the structure of the surface. While the bombardment of the surface by ions, there is emission of particles from the surface of the material. These can be atoms, ions (much smaller), the particle of a ion beam in the backscattering. The main mechanism of the bombardment is the mechanism of “atomic-ion billiard”. The effect of cathode scattering is the result of a primary ion collision cascade. To detach an atom from the surface, you must give it the energy which is much more, than that energy, which holds it. Now let’s consider the changes in physical and chemical properties of materials, shapes, sizes, pieces under the action of concentrated flows of energy. Effects responsible for these changes, may be divided into two groups - the heat effect, caused by the transition energy of PIB s in the heat (phase transitions, differential and nondifferential mass transfer, thermal stresses), and non-thermal, direct transfer to the substance energy, mass, momentum, PIB s (spraying, implantation, ion condensation, generation of shock waves, the formation of nonequilibrium structural defects). The phase transition has uncommon kinetics, because they have transient nature of the heating, local areas of material processing PIBs. Large thermal stresses arise and the processes of mass transfer accelerate due to thermal and local melting and mixing of the components of the complex substance in the liquid phase. Implantation is the introduction of foreign, impurity atoms in a solid body in the form of accelerated ions. The penetration depth is characterized by mass and energy of the ions. At high ion doses, ion implantation is observed. Ion condensation is the creation of strong ionic films on the surface of the material. The process of thermal cutting and thermal destruction of the material are possible to conduct [4].
As the creation of a flow pressure is small compared with the limits of elasticity, thermal cutting is realized through the transformation of the ion energy into heat. If we act by CFE is constantly, the flow of ions migrates deeper into the material.
A numerical model is implemented, in which the powerful beams of ions act on the surface of aluminum.
Thus we are making changes in the properties of the material in the required direction. In implementing numerical model, we used a source of high-power ion beams, the range is between 100 to 700 A and from 100 to 3000 KeV. The
duration of the impulse was 120 ns, after which the beam stopped being applied to the metal surface. The results were obtained in the following output data: the total pressure in the material, its density, temperature, vibration velocity on the vertical axis Z. The aim of the experiment was to study the processes inside the material. Following results were obtained. It is considered the basic parameters determining the course of the process - the full pressure of the material, the material density and temperature. The some results are presented in a graphical form.
Pic. 1. Full pressure.
Heating of the material reaches 11000 K (pic.2.), followed by its fall to 1200 K, due to the termination of the ion beam on the material. In this case, graphs of the total pressure and density show that we can assume cleavage of the surface area. The maximum value of the total pressure reaches about one hundred of nanoseconds, it is equal to 8E 007 Pa for the loading and 6E 007 Pa for the discharge of the material. Subsequently, the maximum pressure for the load is reduced to 4E 007 Pa. The material feels big pressure. The density of the metal remains unchanged for the zones to which the ion beam is scattered, but it becomes lower in the surface zone, varying from 2.2 g/cm3 to values of the density of aluminum, 2, 654 g/cm3.
Pic. 2. Temperature to 120 nanosecond.
Amperage and voltage maximum.

Section VIII: Modern Physical Methods in Science, Engineering and Medicine
167
The analysis of the graphs for the full pressure (pic.1.) at the time of the pulse stopping is 120 ns, and it gives the following results: the schedule is divided into 4 zones. Zone 1 – Zone of plasma formation under the influence of the ion beams, zone 2 - zone of presumptive cleavage, according to the data obtained in this zone of spalling. Zone 3 - Zone of plastic-elastic deformation, in which the ablative processes occur, Zone 4 - the zone of elastic deformation. Thus, spraying sample and transformating of the material in the low-temperature plasma and spalling of the material occurs. We can achieve the desired properties of the material for the industry.
Список литературы. [1]. И.Н. Царёва, В.Л. Кутузов,
Модификация поверхности твёрдых сплавов мощными ионными пучками, Известия РАН, физическая серия, 2006 год, том 70, 6.
[2]. Клебанов Ю.Д. Физические основы применения концентрированных потоков энергии в технической обработке материалов, Издательство МГТУ «Станкин», Янус-К, 2005 г.
[3]. Лозаннский Э.Д., Фирсов О.Б., Теория искры, М., Атомиздат, 1975 г., 272 с.
[4]. В.И. Бойко, Ю.В. Данейкин, А.В. Хадкевич, К.В. Юшицин, Влияние механизмов генерации на профиль импульса механических напряжений в металлической мишени при воздействии мощных ионных пучков.
NUCLEAR FUSION
Novoselov I.Y., Kuzero D.B.
Supervisor: Vidyaev D.G., teacher: Ermakova Ya.V.
Tomsk Polytechnic University, 30, Lenin St., Tomsk, Russia, 634050
E-mail: [email protected]
The energy demand in the world is growing
(especially for electricity) due to the increase in the world population and the energy growth consumed per capita. Our present energy system relies heavily on fossil fuels, which supply 80% of the world energy demand. In order to overcome the well known problems related to our present energy system, such as climate change and security of supply, we need to move to a sustainable energy mix. [1]
Energy is used partly for domestic heating and appliances, partly for transport, and partly for services, industry and commerce. Electricity production consumes a substantial share of this energy use and, for reasons given below this share is expected to increase considerably in future.
The world's population is projected to increase substantially in this century (although the amount is in dispute). The proportion of the population living in developing regions will mostly increase, and expansion of access to electricity in developing countries is essential for improving standard of living. Furthermore, for international stability, nations will seek electricity supply solutions which allow them to become as far as possible independent of the possessors of scarce fuel resources.
Despite the drive towards ever-increasing efficiency in electricity use, the growth of individual electricity demand, particularly by the dominant population lived in developing countries, the world electricity consumption is expected to increase substantially by the middle of the 21st century.
According to the Intergovernmental Panel on Climate Change (IPCC), the large increase in greenhouse gas emissions, including CO2, over the last century has led to a considerable increase in temperature, resulting in a destabilisation of long term weather patterns. To stabilize greenhouse gas concentrations in the atmosphere at a level that would prevent dangerous effects on the climate system, the present energy supply system needs to change considerably. [2.Р.28]
Today most of the worldwide electricity demand is satisfied by fossil fuels, basically by oil, natural gas and coal. If this pattern does not change, oil and gas resources will last for a couple of generations at present levels of consumption. Increasing scarcity will drive the prices up. At higher prices, oil and gas from unconventional sources such as oil shales and tar sands can also be supplied. Coal reserves are abundant, but their use raises local and global environmental concern. The suppliers of fossil fuels and related technologies are working on technologies to
XVII Modern Technique and Technologies 2011
168
separate CO2 from exhaust gases and to bury it, but the development, acceptability and economics of this technology are still uncertain. [1]
Oil is also currently the major fuel for transport, and there seems to be no alternative in sight for air transport. In future, because of the increased price and reduction in oil availability, the greater interest is likely to focus on battery-powered electric vehicles and the use of hydrogen fuel generated by splitting water, recombining it to release energy in fuel cells or burning it directly. This will have the effect of increasing electricity demand, and its share in energy demand, particularly in developed countries.
In the past, nuclear energy based on fission has been adopted by many developed and the most advanced developing countries. Technically, the ability to deploy fission as a long-term energy source has been demonstrated, and the fuel cycle economics and environmental impact are known. The long term wider deployment of fission depends on a full public appreciation of the options and alternatives, allowing them to make balanced judgement. Clearly, having developed the technology, and the infrastructure of its management, it is highly likely, to at least justify the economics of the infrastructure, that fission will continue to have a future role alongside other electricity supply alternatives. [3.P.49]
Against this background, new energy sources are needed. The renewable energy technologies, namely solar, wind, tidal, wave, biomass, geothermal and hydro are already fully or in the process of being developed. Their future use is expected to grow under favourable market conditions, especially over the first half of this century. However they suffer from isolated availability and are variable in nature, besides they are subject to sudden local climatic change, and require complex management of the electricity supply network or the additional cost of accompanying energy storage. They can make a large contribution in countries with a distributed population and lack of electricity network, but they can only cover a minor part of the energy demands at those locations where developed nations currently live.
For the second half of this century, controlled fusion looks also to be a promising development line. Although not all is yet understood of the physics and engineering of a power station based on controlled fusion, the basic principles have been elaborated in detail, and no matters of principle have been identified to stop its development into a viable source of electricity in the future. The open questions facing fusion are rather how to optimise the process, and make it attractive and economically viable. [2.Р.157]
Fusion power is power generated by nuclear fusion reactions. In this kind of reaction, two light atomic nuclei fuse together to form a heavier nucleus and release energy. The basic concept behind any fusion reaction is to bring two or more atoms close enough together so that the strong nuclear force in their nuclei will pull them together into one larger atom. This is because the strong nuclear force holds the nucleons together - the combined nucleus is a lower energy state than the nucleons separately. The difference in mass is released as energy according to Einstein's mass-energy equivalence formula E = mc2. If the input atoms are sufficiently massive, the resulting fusion product will be heavier than the reactants, in this case the reaction requires external source of energy. [1]
Fusion between the atoms is opposed by their shared electrical charge, specifically the net positive charge of the nuclei. In order to overcome this electrostatic force, or "Coulomb barrier", some external source of energy must be supplied. The easiest way to do this is to heat the atoms, which has the side effect of stripping the electrons from the atoms and leaving them as bare nuclei. In most experiments the nuclei and electrons are left in fluid known as plasma. The temperatures required to provide the nuclei with enough energy to overcome their repulsion is a function of the total charge, so hydrogen, which has the smallest nuclear charge therefore reacts at the lowest temperature. Helium has an extremely low mass per nucleon and therefore is energetically favoured as a fusion product. As a consequence, most fusion reactions combine isotopes of hydrogen ("protium", deuterium, or tritium) to form isotopes of helium (3He or 4He). [3.P.62]
A similar situation occurs when heavy nuclei are split. Again the binding energies of the pieces can be more than that of the whole (i.e. they are in a lower energy state), and the excess energy is released in the "fission" process.
The easiest and most immediately promising nuclear reaction to be used for fusion power is: D + T → 4He + n
Deuterium is a naturally occurring isotope of hydrogen and as such is universally available. The large mass ratio of the hydrogen isotopes makes the separation rather easy compared to the difficult uranium enrichment process. Tritium is also an isotope of hydrogen, but it occurs naturally in only negligible amounts due to its radioactive half-life of 12.32 years. Consequently, the deuterium-tritium fuel cycle requires the breeding of tritium from lithium using one of the following reactions: n + 6Li → T + 4He:n + 7Li → T + 4He + n
For confinement plasma on earth we use the magnetic force. If we twist the magnetic field lines
Section VIII: Modern Physical Methods in Science, Engineering and Medicine
169
of the torus, we get a helical magnetic field structure. This twist balances the separation of the electrons and ions and the plasma becomes limited. For useful energy production the plasma must be at very high temperatures, Tp with sufficient particle densities, np and confinement periods, tc. The largest current experiment is the Joint European Torus [JET]. In 1997, JET produced a peak of 16.1 MW of fusion power (65% of input power), with fusion power of over 10 MW sustained for over 0.5 sec. The Plasma is confined by both a toroidal and a poloidal magnetic field produced by a toroidal current (up to 15MA) flowing within the plasma. In June 2005, the construction of the experimental reactor ITER, designed to produce several times more fusion power than the power put into the plasma over many minutes, was announced. ITER-FEAT will be built in Cadarach, France, is expected to be completed in 2012. The first Commercial Fusion Reactor will be ready by 2030-2035.
Advantages of fusion energy • First of all, fusion is almost limitless fuel
supply. The basic fuels are distributed widely around the globe.
• Fusion power plants will not generate gases such as carbon dioxide that cause global warming and climate change;
• Fusion is suitable for the large-scale electricity production required for the increasing energy needs of large cities.
• A product of a fusion reaction (He) is not radioactive as in fission reactors;
• Plasma cools down extremely quickly - no possibility for uncontrolled power runaway or meltdown;
• It's safe - if comes to irregularities the fusion reaction turns off by itself;
• Very low operation, decommissioning, fuel and maintenance costs; Capital costs can easily be reduced by standardization;
• Fuel costs can be reduced by the use of lithium breeders and development of higher-efficiency separation methods for deuterium from sea water;
A defining moment in the development of fusion power came in the 1950s when, flushed with the apparent success of early experiments, a respected researcher made the prediction that fusion power would be developed within 50 years. This statement has come back to haunt the programme 50 years later, as the energy source is still at least 50 years away from commercialisation. Public incredulity is understandable, but the delay is a direct result of the generally highly complex and specialised challenges to be faced in developing this potentially attractive and very long term energy source. These challenges are comparable in complexity to understanding the origins of the universe through high energy physics, and realising the dream of exploring and exploiting outer space. Nevertheless, the challenge of developing energy source on earth based on the power that drives the sun and stars is proving to be a daunting task, requiring the very best science and technology humanity has to offer. However, there is steady progress towards the goal.
Sources of information:
1. www.iter.org/infirmation; 2. B. Burakov, E. Anderson, M.Yagovkina,
M.Zamoryanskaya, and E. Nikolaeva, J. Nucl. Sci. Technol., Supplement 3, 733 (2002);
3. W.J. Weber and F.P. Roberts, Nuclear Technologies 60, 178 (1983);
X-RAY DETECTOR
D.G. Prokopyev, M.A. Lelekov
Scientific adviser: G.I. Ayzenshtat
Tomsk Polytechnic University,30 Lenin prospect, Tomsk, 634050, Russia
E-mail: [email protected]
The main purpose of medical X-ray systems is the maximum reduction of harmful radiation exposure to patients. It is one of the biggest challenges in mammography because it requires to provide both high spatial resolution (better than 5-10 line pairs per millimeter), and extremely high
contrast. [1] To achieve this goal, the most appropriate would be semiconductor detectors with direct conversion of photon energy to the charge. Attempts to create such GaAs detectors have been undertaken in the works [2, 3]. So the article [2] demonstrated the successful work of the
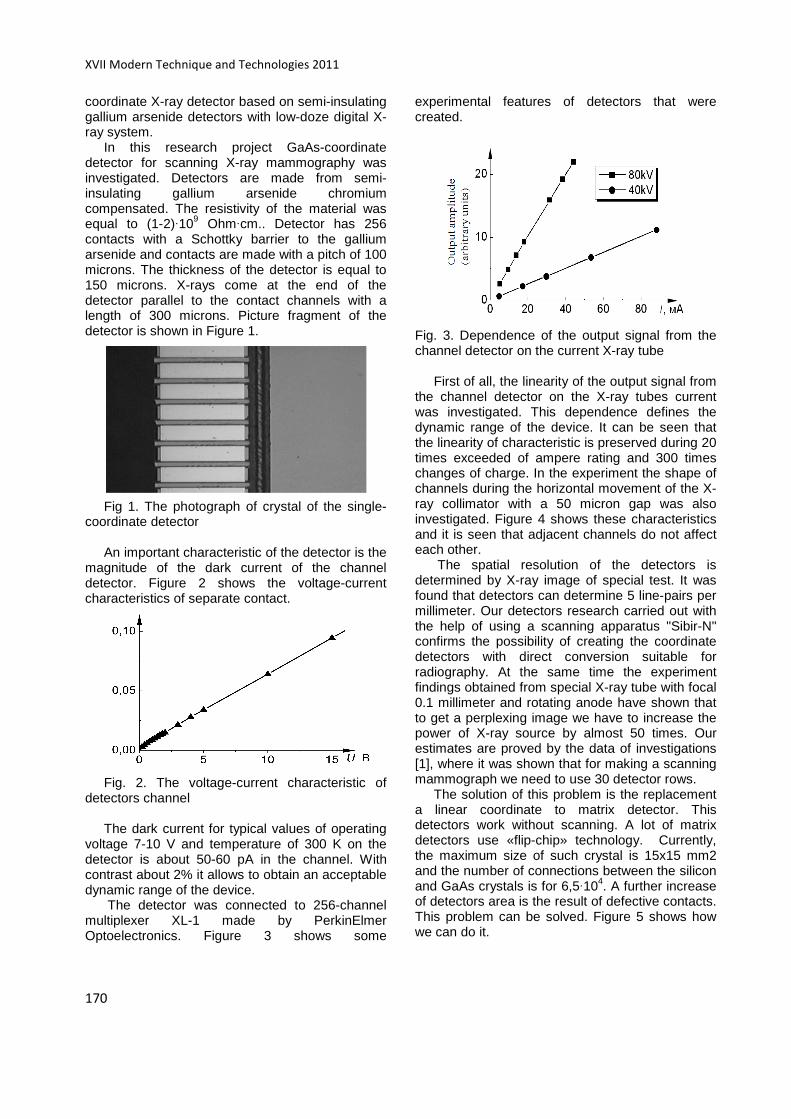
XVII Modern Technique and Technologies 2011
170
coordinate X-ray detector based on semi-insulating gallium arsenide detectors with low-doze digital X-ray system.
In this research project GaAs-coordinate detector for scanning X-ray mammography was investigated. Detectors are made from semi-insulating gallium arsenide chromium compensated. The resistivity of the material was equal to (1-2)·109 Ohm·cm.. Detector has 256 contacts with a Schottky barrier to the gallium arsenide and contacts are made with a pitch of 100 microns. The thickness of the detector is equal to 150 microns. X-rays come at the end of the detector parallel to the contact channels with a length of 300 microns. Picture fragment of the detector is shown in Figure 1.
Fig 1. The photograph of crystal of the single-
coordinate detector An important characteristic of the detector is the
magnitude of the dark current of the channel detector. Figure 2 shows the voltage-current characteristics of separate contact.
Fig. 2. The voltage-current characteristic of
detectors channel The dark current for typical values of operating
voltage 7-10 V and temperature of 300 K on the detector is about 50-60 pA in the channel. With contrast about 2% it allows to obtain an acceptable dynamic range of the device.
The detector was connected to 256-channel multiplexer XL-1 made by PerkinElmer Optoelectronics. Figure 3 shows some
experimental features of detectors that were created.
Fig. 3. Dependence of the output signal from the channel detector on the current X-ray tube
First of all, the linearity of the output signal from
the channel detector on the X-ray tubes current was investigated. This dependence defines the dynamic range of the device. It can be seen that the linearity of characteristic is preserved during 20 times exceeded of ampere rating and 300 times changes of charge. In the experiment the shape of channels during the horizontal movement of the X-ray collimator with a 50 micron gap was also investigated. Figure 4 shows these characteristics and it is seen that adjacent channels do not affect each other.
The spatial resolution of the detectors is determined by X-ray image of special test. It was found that detectors can determine 5 line-pairs per millimeter. Our detectors research carried out with the help of using a scanning apparatus "Sibir-N" confirms the possibility of creating the coordinate detectors with direct conversion suitable for radiography. At the same time the experiment findings obtained from special X-ray tube with focal 0.1 millimeter and rotating anode have shown that to get a perplexing image we have to increase the power of X-ray source by almost 50 times. Our estimates are proved by the data of investigations [1], where it was shown that for making a scanning mammograph we need to use 30 detector rows.
The solution of this problem is the replacement a linear coordinate to matrix detector. This detectors work without scanning. A lot of matrix detectors use «flip-chip» technology. Currently, the maximum size of such crystal is 15x15 mm2 and the number of connections between the silicon and GaAs crystals is for 6,5·104. A further increase of detectors area is the result of defective contacts. This problem can be solved. Figure 5 shows how we can do it.

Section VIII: Modern Physical Methods in Science, Engineering and Medicine
171
Fig. 5. Fragment of the proposed detector In this detector each pixel has storage capacitor
and field-effect transistor. In each row of the matrix detector the outputs are connected with the keys, as shown in Fig. 5. The gates of transistors in each column are connected with the appropriate channels. The work of the scheme is organized that control signals come to the columns sequentially in time. The signals from key of each row are arrived at the same time on the channels of special integrated circuits.
If the control signal arrives to the n-column then the signals of the detector from corresponding rows of a matrix will be simultaneously removed on all channels of silicon circuits. And on the m-channel of the integrated circuits a charge accumulated on capacitor of mn matrix element will come.
The performance of detector is carried out in the following way. After penetration through the object X-rays are absorbed in the detector. In this case, the ionization of material occurs and in each pixel of matrix the currents that charge a condenser appear. In the process of accumulation of capacitor charges in field-effect transistors the channels are closed. For pickup the information on the transistor gates special signals are fed.
Physically a detector is a plate of semi-insulating gallium arsenide. It has one side with active and passive components of the integrated
circuit. For the formation of field-effect transistors and lower capacitor plates by ion implantation method the selective layers of n-type conductivity are preformed. As a dielectric of capacitors silicon nitride is commonly used. On a surface of the detector the upper plates and a metallic interconnection of contacts are created. On the other side of plate which is a cathode of detector a film of metal is covered.
Exposure time of using a matrix detector should be around 0,15 - 0,3 sec. With the 50 microns pitch of pixel-detector capacity of storage capacitors will be for about 1 pF. In the result the effective resistance of the channel as follows from our experiments will be more than value Ri = 3·1012. Thus the response time will be τ = 3 sec., and discharge time of capacitor will be a few seconds. The cooling of detector to 20 degrees will increase this time to 15 seconds that will make it possible to transfer the charge accumulated on the condenser in the integrated circuit without distortion. The performance of matrix detector depends on the values of stray currents flowing on the surface of a detector structure. Unfortunately nowadays the assessment of the real values of these currents without special experiments is not possible.
Thus the experimental findings of linear coordinate detectors on gallium arsenide have shown that they can become the basis of digital x-ray devices with the extremely small cross-sectional area of detector. In mammography for use GaAs detectors it is required to make matrix-detector with a large area. It is needed to carry out different tests for prospects clarification of this research project.
References 1. Lundqvist M., Silicon Strip Detectors for
Scanned Multi-Slit X-Ray Imaging, Kungl Tekniska Hogskolan Stockholm 2003.
2. Ayzenshtat G.I., Babichev E.A., Baru S.E et. al. Nucl. Instr. and Meth. - 2003.Vol.A509, p.268-273.
3. Dubecky, A. Perd’ochova, P. Scepko, et al. Nucl. Instr. and Meth. -2005.-A546,- p.118-124.
XVII Modern Technique and Technologies 2011
172
OVERVIEW OF PUREX PROCESS
Shentsov K.E., Eliseev K.A., Gorunov A.G.
Supervisor: Demyanenko N.V.
Tomsk Polytechnic University, 634050, Russia, Tomsk, Lenina avenue, 30
E-mail: [email protected]
Nowadays the PUREX process is the sole accepted reprocessing technique. Its boundary conditions change all the time: former metallic low burn up fuels have been replaced by present ceramic oxide fuels with high burn ups, and tomorrow fast breeder fuels with high plutonium contents which have to be processed. In addition, more and more restrictive conditions are being imposed upon waste treatment and more and more stringent safety regulations are being felt. Within these constraints this report presents a survey of the results of recent developments in process technology and gives some reference to the importance of process analytical statements with respect to plant operation. Moreover, recommendations are made for the installation and design of analytical laboratories and some experiences are communicated in the field of process analytical chemistry. What is PUREX process?
PUREX is an acronym standing for Plutonium-Uranium Recovery by EXtraction — de facto standard aqueous nuclear reprocessing method for the recovery of uranium and plutonium from the used nuclear fuel. It is based on liquid-liquid extraction ion-exchange.[1]
The PUREX process was invented by Herbert H. Anderson and Larned B. Asprey at the Metallurgical Laboratory at the University of Chicago, as a part of the Manhattan Project under Glenn T. Seaborg; their patent "Solvent Extraction Process for Plutonium" filed in 1947, mentions tributyl phosphate (TBP) as the major reactant which accomplishes the bulk of the chemical extraction.
Extraction is one of the most important common methods of separation, concentration and purification of substances. Extraction methods are universal, easy and effective and therefore widely used, including a nuclear fuel reprocessing technology. The basis of the extraction processes is the distribution of one or more components between two immiscible or nearly immiscible aqueous and organic phases. Below we consider the main stages of the process.
First of all, the water phase gets into extraction unit. This phase is a nitric acid solution of irradiated nuclear fuel of industrial reactor. Extraction unit is designed for the extraction of uranium and plutonium in order to refine from the fission products. The extract of this unit is pumped into the washing unit, where the additional refining occurs using a washing solution. Then the extract
gets into the first reextraction unit, in which the restoration-displacing reextraction of plutonium occurs using displacing and restoration solutions. The next stage in the second reextraction unit is the reextraction of uranium using a diluted solution of nitric acid. Unit of regeneration of the extractant restores it for further use by washing in order to remove the fission products and decomposition products of tributyl phosphate using nitric acid and soda solution.
The main advantages of the extraction separation methods are: high selectivity, speed and simplicity of the process technology. Via extraction one can get high separation coefficients that cannot be achieved via other methods, such as precipitation processes. Extraction methods are well suited for the selection of both macro-and trace substances. All these advantages of extraction are of particular importance in radiochemistry for the extraction of certain natural or artificial radioactive isotopes, nuclear fuel reprocessing and refining of various non-radioactive materials used in nuclear power. For example, using extraction one can successfully solve the problem of fast release of radioactive isotopes with small half-lives. In the chemical reprocessing of nuclear fuel one applies the extraction methods of separation of uranium and plutonium from fission products, as well as for extracting valuable components from the remaining mixture of fission products and non-radioactive materials shells of fuel elements (cartridges).
The main regularities of extraction Extraction system is characterizeв by the
distribution coefficient (α) of the substance between two phases, defined as the ratio of equilibrium concentrations of substances in the organic and aqueous phases. The greater α, the higher the extraction ability of the extractant. However, the value of α, in general, depends not only on the properties of the extractant, but also on many other factors: the concentration of the substance distributed in the initial aqueous solution, the presence of acids and salts, the nature of the diluent, the composition of the extracted complex, etc. The selectivity of the extraction process for separation of the pair of elements is determined by the separation factor, equal to the ratio of distribution coefficients. It is well known that the extraction of salts occurs due

Section VIII: Modern Physical Methods in Science, Engineering and Medicine
173
to the formation of new soluble in organic solvents of compounds.
In the simplest case, the extraction reaction can be written in the form of the equation
oв вMe A Me An
n mn mS S−+ + =
Where the constant of the reaction:
[ ][ ]
oo1
в
Me A
Men m
n ms
SK +
±
γ= ⋅γ ⋅ γ
Consequently,
[ ][ ] [ ] [ ]
1o
oв
Me AA
Me
n mn mn m s
SK S
+±γ ⋅ γα = = ⋅ ⋅ ⋅
γ
where γo - activity coefficient of Me in the organic phase; γ± - mean molar activity coefficient of salt; γs - activity coefficient of the extractant.[2,3]
The instrumental design of the
radiochemical industries According to the way of phase contact,
industrial extractors are divided into differential- contact (Column devices), stepped and the intermediate structures. Devices of the first group are characterized by continuous contact between the phases and gradual change in concentration of the extracted component along the length (height) of the device. With such a concentration profile the phases are not equilibrated at any point of the extractor. These devices are more compact and require limited production areas; however, due to longitudinal mixing (caused by convective axial flows, stagnant zones, turbulent fluctuations, etc.) the average driving force can significantly decrease. Devices of the second group consist of discrete steps, in each of which a phase contact occurs. Then they are separated and move as counterflow to the next step. Longitudinal mixing is less pronounced, but the need to phase separation between the neighboring steps may lead to a substantial increase in the size of the extractor.
Column extractors The most prevalent among the column
extractors are plate and pulse columns. Pulse columns consist of the reaction zone and auxiliary parts. The first one is a cylindrical body with the plates positioned inside. At the bottom of the column there is a special camera – pulsation camera (pulse-camera), which is connected with the source of momentum transfer into the column – pulsator by a pulse conductor. Pulsation of the liquid in the column further crushes the drop of the dispersed phase, increasing the area of interfacial
interaction, and thereby improving the extraction process. Aqueous phase comes from the top of the column, and the organic phase - from the bottom.
Stepped extractors Stepped or pallet extractors include different
types of mixer-settlers. A section of such a device is approximated in efficiency to one theoretical stage. To reach the required number of steps the sections are connected into cascade. Frequently, several sections, separated by partitions, are combined in one body (box-type extractors). Each section (step) has the mixing and settling chambers. Phase mixing can be pulsating or mechanical (turbine stirrer, simultaneously transporting liquid from one step to another, are most often used).
Extractors of intermediate structures
(centrifugal extractors) Among the devices that occupy an intermediate
position between the differential-contact and the stepped devices, the most widespread are centrifugal extractors, in which the separation and sometimes mixing of the phases occur in the field of centrifugal forces. The working body (rotor) of these devices consists of a set of helical ribbons, perforated at both ends of the cylinders. The initial solution and the extractant are moving towards each other, with the heavier phase - from center to periphery, and a lighter - in the opposite direction. Liquid-liquid contact occurs on the path of their movement and dispersion - the passage through the perforated part of the cylinder.[4]
Reference:
1. The modern PUREX process and it’s analytical requirements. F.Baumgartner, D. Ertel.
2. Карпачева С.М., Захаров Е.И. Основы теории и расчета пульсационных колонных реакторов. – М.: Атомиздат, 1980. – 256 с.
3. Горюнов А.Г., Дядик В.Ф., Ливенцов С.Н., Лысенок А.А., Чурсин Ю.А. Математическое моделирование процесса экстракции урана как объекта управления: учебное пособие – Томск: Изд-во Томского политехнического университета, 2008. – 143 с.
4. Копырин А.А., Карелин А.И., Карелин В.А. Технология производства и радиохимической переработки ядерного топлива: учеб. пособие для вузов. – М.: ЗАО «Атомэнергоиздат», 2006. – 576 с.
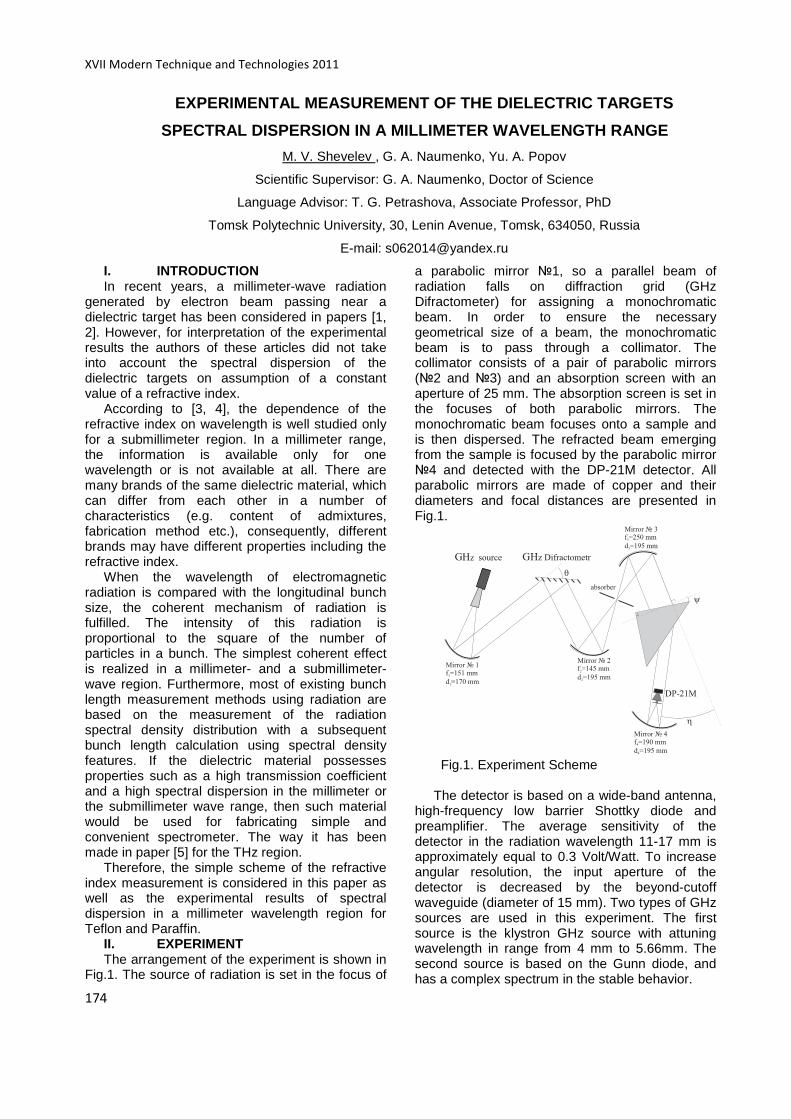
XVII Modern Technique and Technologies 2011
174
EXPERIMENTAL MEASUREMENT OF THE DIELECTRIC TARGETS
SPECTRAL DISPERSION IN A MILLIMETER WAVELENGTH RANG E
M. V. Shevelev , G. A. Naumenko, Yu. A. Popov
Scientific Supervisor: G. A. Naumenko, Doctor of Science
Language Advisor: T. G. Petrashova, Associate Professor, PhD
Tomsk Polytechnic University, 30, Lenin Avenue, Tomsk, 634050, Russia
E-mail: [email protected]
I. INTRODUCTION In recent years, a millimeter-wave radiation
generated by electron beam passing near a dielectric target has been considered in papers [1, 2]. However, for interpretation of the experimental results the authors of these articles did not take into account the spectral dispersion of the dielectric targets on assumption of a constant value of a refractive index.
According to [3, 4], the dependence of the refractive index on wavelength is well studied only for a submillimeter region. In a millimeter range, the information is available only for one wavelength or is not available at all. There are many brands of the same dielectric material, which can differ from each other in a number of characteristics (e.g. content of admixtures, fabrication method etc.), consequently, different brands may have different properties including the refractive index.
When the wavelength of electromagnetic radiation is compared with the longitudinal bunch size, the coherent mechanism of radiation is fulfilled. The intensity of this radiation is proportional to the square of the number of particles in a bunch. The simplest coherent effect is realized in a millimeter- and a submillimeter- wave region. Furthermore, most of existing bunch length measurement methods using radiation are based on the measurement of the radiation spectral density distribution with a subsequent bunch length calculation using spectral density features. If the dielectric material possesses properties such as a high transmission coefficient and a high spectral dispersion in the millimeter or the submillimeter wave range, then such material would be used for fabricating simple and convenient spectrometer. The way it has been made in paper [5] for the THz region.
Therefore, the simple scheme of the refractive index measurement is considered in this paper as well as the experimental results of spectral dispersion in a millimeter wavelength region for Teflon and Paraffin.
II. EXPERIMENT The arrangement of the experiment is shown in
Fig.1. The source of radiation is set in the focus of
a parabolic mirror 1, so a parallel beam of radiation falls on diffraction grid (GHz Difractometer) for assigning a monochromatic beam. In order to ensure the necessary geometrical size of a beam, the monochromatic beam is to pass through a collimator. The collimator consists of a pair of parabolic mirrors (2 and 3) and an absorption screen with an aperture of 25 mm. The absorption screen is set in the focuses of both parabolic mirrors. The monochromatic beam focuses onto a sample and is then dispersed. The refracted beam emerging from the sample is focused by the parabolic mirror 4 and detected with the DP-21M detector. All parabolic mirrors are made of copper and their diameters and focal distances are presented in Fig.1.
Fig.1. Experiment Scheme The detector is based on a wide-band antenna,
high-frequency low barrier Shottky diode and preamplifier. The average sensitivity of the detector in the radiation wavelength 11-17 mm is approximately equal to 0.3 Volt/Watt. To increase angular resolution, the input aperture of the detector is decreased by the beyond-cutoff waveguide (diameter of 15 mm). Two types of GHz sources are used in this experiment. The first source is the klystron GHz source with attuning wavelength in range from 4 mm to 5.66mm. The second source is based on the Gunn diode, and has a complex spectrum in the stable behavior.
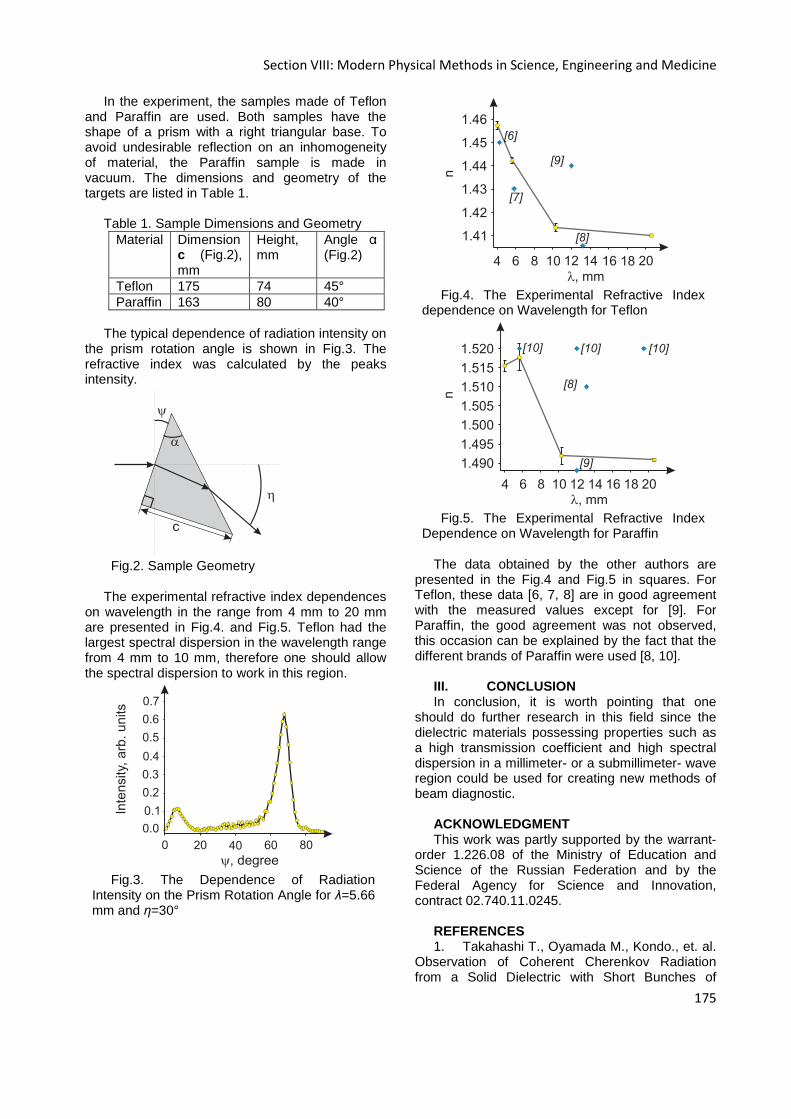
Section VIII: Modern Physical Methods in Science, Engineering and Medicine
175
In the experiment, the samples made of Teflon and Paraffin are used. Both samples have the shape of a prism with a right triangular base. To avoid undesirable reflection on an inhomogeneity of material, the Paraffin sample is made in vacuum. The dimensions and geometry of the targets are listed in Table 1.
Table 1. Sample Dimensions and Geometry
Material Dimension c (Fig.2), mm
Height, mm
Angle α (Fig.2)
Teflon 175 74 45° Paraffin 163 80 40°
The typical dependence of radiation intensity on
the prism rotation angle is shown in Fig.3. The refractive index was calculated by the peaks intensity.
Fig.2. Sample Geometry
The experimental refractive index dependences
on wavelength in the range from 4 mm to 20 mm are presented in Fig.4. and Fig.5. Teflon had the largest spectral dispersion in the wavelength range from 4 mm to 10 mm, therefore one should allow the spectral dispersion to work in this region.
Fig.3. The Dependence of Radiation
Intensity on the Prism Rotation Angle for λ=5.66 mm and η=30°
Fig.4. The Experimental Refractive Index
dependence on Wavelength for Teflon
Fig.5. The Experimental Refractive Index
Dependence on Wavelength for Paraffin The data obtained by the other authors are
presented in the Fig.4 and Fig.5 in squares. For Teflon, these data [6, 7, 8] are in good agreement with the measured values except for [9]. For Paraffin, the good agreement was not observed, this occasion can be explained by the fact that the different brands of Paraffin were used [8, 10].
III. CONCLUSION In conclusion, it is worth pointing that one
should do further research in this field since the dielectric materials possessing properties such as a high transmission coefficient and high spectral dispersion in a millimeter- or a submillimeter- wave region could be used for creating new methods of beam diagnostic.
ACKNOWLEDGMENT This work was partly supported by the warrant-
order 1.226.08 of the Ministry of Education and Science of the Russian Federation and by the Federal Agency for Science and Innovation, contract 02.740.11.0245.
REFERENCES 1. Takahashi T., Oyamada M., Kondo., et. al.
Observation of Coherent Cherenkov Radiation from a Solid Dielectric with Short Bunches of

XVII Modern Technique and Technologies 2011
176
Electrons // Phys. Rev. E.-2000.-V.62,-6.-P.8606-8611.
2. Horiuchi N., Ochiai T., Inoue J. Exotic Radiation from a Photonic Crystal Excited by an Ultrarelativistic Electron Beam // Phys. Rev. E. -2006.- V.74.- 5.- P.056601-056605.
3. James W. Lamb. Miscellaneous Data on Materials for Millimetre and Submillimetre Optics // International Journal of Infrared and Millimeter Waves. –1996. –V.17.- 12.-P.1997-2034.
4. Mohammed N., Hua Chi, Tkachov I. Millimeter- and Submillimeter – Wave Transmission and Dielectric Properties of Radome Materials // Proc. SPIE.- 1995.- V.2558.- P.73-85.
5. Meijer A. S., Pijpers J.H., Nienhuys H. K., et. al. A THz Spectrometer Based on a CsI Prism // J. Opt. A: Pure Appl. Opt.- 2008.-V.8- P.095303-095310.
6. Breeden K.H., Sheppard A.P. A Note the Millimeter Wave Dielectric Constant and Loss Value of Some Common Materials // Radio science.- 1968.-2.- P.205.
7. Culshaw W. and Anderson M.V. Measurement of Permittivity and Dielectric Loss with a Millimeter Wave Fabry-Perot Interferometer // Proc. Inst. Elec. Eng.- 1962.- Part B, Suppl.23,109.- P.820-826.
8. Haas R.W., Zimmerman P.W. 22-Ghz Measurements of Dielectric Constants and Loss Tangents of Castable Dielectrics at Room and Cryogenic Temperatures // IEE Trans. Microwave Theory Tech.- 1976.- V.MTT-24.- P.882-883.
9. Von Hipple A.R. Dielectric Materials and Applications.- New York, 1954.
10. Harvey A.F. Microwave Engineering.- London: academic Press,1963.
NON DESTRUCTIVE TESTING FOR NUCLEAR POWER PLANT
LIFE ASSESSMENT
Sednev D.A.
Supervisor: Demyanyuk D.G., associate professor, PhD., Ermakova Ya.V., teacher
Tomsk Polytechnic University, 634050 Russia, Tomsk, 30 Lenin str.
E-mail: [email protected]
Non-destructive testing (NDT) is a noninvasive technique for determining the integrity of a material, component or structure. Because it allows inspection without interfering with a product's final use, NDT provides an excellent balance between quality control and cost-effectiveness. [1]
The long list of NDT methods and techniques includes: radiographic testing (RT), ultrasonic testing (UT), liquid penetrant testing (PT), magnetic particle testing (MT), eddy current testing (ET), visual testing VT as well as leak testing LT, acoustic emission AE, thermal and infrared testing, microwave testing, strain gauging, holography, acoustic microscopy, computer tomography, non-destructive analytical methods, non-destructive material characterization methods and many more.
The “major six” (or basic) NDT methods, which are largely used in routine services to industry are:
• Visual inspection • Liquid penetrant testing • Magnetic particle testing • Electromagnetic or eddy current testing • Radiography • Ultrasonic testing [2]
The main goal of NDT is to predict or assess the performance and service life of a component or a system at various stages of manufacturing and service cycles. NDT is used for quality control of the facilities and products, and for fitness or purpose assessment (so-called plant life assessment) to evaluate remaining operation life of nuclear power plant (NPP) components, such as processing lines, pipes and vessels. Monitoring feedback of these components takes essential role due to large exposure by hydrogen damage (mostly it is hydrogen embrittlement) [3]
Non destructive testing technology as applied for plant life assessment (PLA) is a trend in many developed and developing countries. PLA plays a great role for nuclear engineering duе to about 40 years life time of majority of world’s nuclear power plants (Fig.1).
Fig.1. Timeline of world’s NPP construction
Section VIII: Modern Physical Methods in Science, Engineering and Medicine
177
NDT for plant life assessment deals with application of NDT techniques to detect discontinuities in an industrial manufacturing process that can affect the mechanical strength of a product and may cause its premature failure. Plant life assessment in many cases means the remaining life assessment of a structure, component or product.
NDT life assessment services include: • Equipment integrity analysis • Corrosion monitoring of structures and
equipment • Corrosion damage evaluation • Fatigue and creep damage prediction • Fitness-for-service evaluation [4] An industrial product is designed to perform a
certain function for a certain period of time to the satisfaction of its user. In older design procedures, the presence of the discontinuities was taken care of by including a safety factor in the design of the product. But nowadays since high emphasis is being placed on the use of as little material as possible to reduce the cost and weight, the presence of discontinuities is no way tolerable.
The pace of change in the power generation and petrochemical industries has never been higher with a continuing move from principles of “engineering excellence” to a highly commercial management style aimed at maximizing company profits and minimizing corporate exposure. [5] In this competitive arena, there is increased emphasis on maintaining plant and equipment in productive use well beyond its original design date. This must be achieved without increasing the risk to plant safety, personnel or the environment. Increasingly, run/repair decisions must be made for old, or even new, plant components containing service induced and design allowable defects, based on state of the art analysis and life assessment techniques.
Plant life assessment is applied to any kind of processing lines, structures, vessels or pipes which are designed to operate for a specific life time taking account the temperature, corrosion and material. To ensure extended life operation of processing lines beyond design life a policy of NDT routine inspections has to be outlined. To assess and monitor the quality of the product during its manufacturing and service life without interfering with service performance of the product the NDT techniques provide the best choice. On line and on-site NDT techniques are used for plant life assessment.
Assessing the condition and remaining life of power plant components operating at high temperatures and at high stresses is necessary to optimize inspection and maintenance schedules, to make “RUN, REPAIR, REPLACE” decisions and to
avoid unplanned outages. [4] While two different approaches are available for residual life assessment of power plant components, one using data analysis based on operational history and the other based on periodic examination of critical components, the latter method is widely adopted as it is more accurate since it does not rely on standard material data with their associated uncertainties and does not necessarily require knowledge of the operational stress-temperature data.
Any engineering component, when put in service, is designed to last for definite period referred to as “design life” of the component. There are many factors, which adversely affect the define life and lead to premature retirement of the component from service. Such factors include unanticipated stresses (residual services), operation outside designed limit (excessive temperature, load cycling), environmental effects, degradation of material properties in service etc. On the other hand, there can be some favorable factors, which result in lesser degradation of the component then expected in his design life. [4]
Assessment of structural integrity requires three inputs:
• Material properties (e.g. yield strength, fracture toughness etc.)
• Flaw characteristics (type, location, size, shape, orientation)
• Stresses (residual, service). [6] NDT has been traditionally used for flaw
characterization and measurement of residual stress. In the last 10–15 years, extensive studies have been reported on material characterization by NDT. Combining these inputs many parameters, including mechanical properties, factor of safety in design, conservative operation of unit, inaccuracy in data extrapolation, overestimation of corrosion effects etc, can be assessed. Since constructing a new plant is always much more expensive than extending the life of existing plants these parameters are vital for plant maintenance and normal performance in long run. In this regard, NDT provides all the three vital inputs necessary for assessment of structural integrity of a plant.
Residual life assessment (RLA) and plant life extension (PLEX) are complementary terms to plant life assessment (PLA). Life extension of engineering components is based on the principle that flaw size at the end of extended life will be less than that the critical value, with appropriate safety factor, and it is economical to operate the flawed component safely. NDT methods selected for residual life assessment have high reliability and not necessarily high sensitivity. The concept of “How small a flaw can be detected?” is replaced by “How large a flaw can be missed?” The topic of
XVII Modern Technique and Technologies 2011
178
RLA and PLEX is of national importance since many operating power, chemical and petrochemical plants are approaching their end of design life [7]
As more and more power plant equipments are reaching their designed life, utility owners are forced to take vital decisions on “RUN, REPAIR, REPLACE” for different components. Innovative NDT techniques are developed continuously and, coupled with on-line monitoring and special computer programs, the decision making process has become more realistic and cost saving.
This paper was prepared within frameworks of creation TPU International scientific and educational laboratory of non-destructive testing for finding application of NDT in nuclear engineering sphere.
References: 1. Guidebook for the fabrication of non-
destructive testing test specimens, IAEA, Vienna, 2001 Printed by the IAEA in Austria June 2001
2. General Introduction to NDT Presentation - NDT Resource Center, www.ndt-ed.org/GeneralResources/IntroToNDT/Intro_to_NDT.ppt
3. Training guidelines in non-destructive testing techniques 2008 edition, IAEA, Vienna, 2008 Printed by the IAEA in Austria December 2008
4. Non-destructive testing for plant life assessment, IAEA, Vienna, 2005 Printed by the IAEA in Austria August 2005
5. Role of NDT in Nuclear Power Plant Management - 3nd International Conference on NDE in Relation to Structural Integrity for Nuclear and Pressurized Components, November 14-16, 2001, Seville Spain. http://www.ndt.net/abstract/ndesi01/data/80.htm
6. L.M.Davies LMD Consultancy, England B. Gueorguiev, P. Trampus IAEA - Role of NDT in condition based maintenance of nuclear power plant components http://www.ndt.net/article/wcndt00/papers/idn078/idn078.htm
Leonard J. Bond, Senior Member IEEE, Tom T. Taylor, Steven R. Doctor, Senior Member IEEE, Amy B. Hull, and Shah N. Malik - Proactive Management of Materials Degradation for Nuclear Power Plant Systems - International Conference on Prognostics and Health Management – 2008
RISKS EVALUATION OF CREATION NUCLEAR WEAPON
WITH REACTOR-GRADE PU, WHICH ACCUMULATED
IN PRESSURISED HEAVY WATER REACTOR
Sednev D.A.
Supervisor: Demyanyuk D.G., associate professor, PhD., Ermakova Ya.V., teacher
Tomsk Polytechnic University, 634050 Russia, Tomsk, 30 Lenin str.
E-mail: [email protected]
During the last decades five states have created nuclear weapon, but they weren’t members of “Possessor-5 club” (community of official possessors of nuclear weapon). These states were India, Pakistan, Israel, Democratic Republic of Korea and South African Republic. But only SAR could renounce military program in 1990 and dismantle all military facilities under International Atomic Energy Agency control in 1993. World community also worried about existing of the so-called “threshold countries”. This stage means that state obtains extremely high level in nuclear technologies and nuclear weapon can be acquired in very short period. Of course the state has to have strong reason to do this and made proper political decision.
Topicality of non-proliferation problems connected with Pu confirmed by the following fact: three out of four non official nuclear states – Israel, India and DPRK obtain nuclear weapon by “plutonium way”. Only Pakistan made warheads from high enriched uranium. [1] Today Pakistan tries to acquire plutonium nuclear weapon with wider effective casualty radius by accumulating Pu with Khusab heavy water research reactor. According to public statements made by US officials, this unsafeguarded heavy water reactor generates an estimated 8-10 kilotons of weapons grade plutonium per year, which is enough for one to two nuclear weapons.
Today, there are two main approaches, which are used for solving problems of nuclear weapon proliferation - technical and political. Political
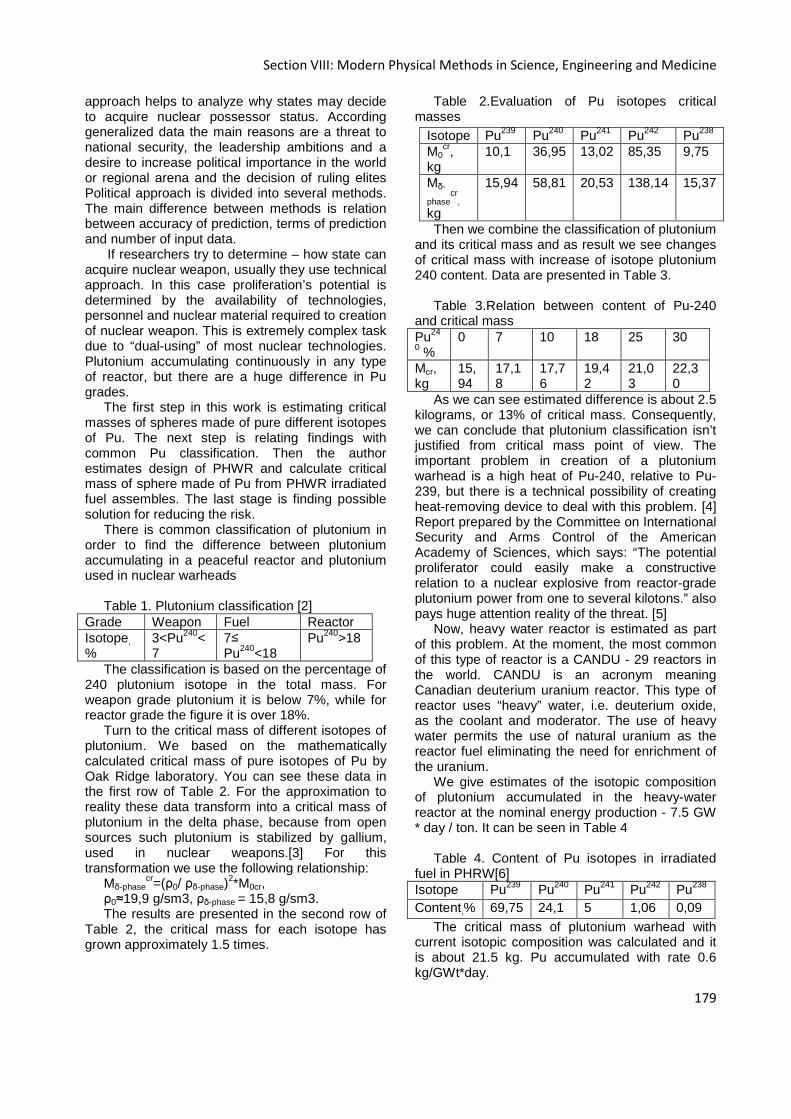
Section VIII: Modern Physical Methods in Science, Engineering and Medicine
179
approach helps to analyze why states may decide to acquire nuclear possessor status. According generalized data the main reasons are a threat to national security, the leadership ambitions and a desire to increase political importance in the world or regional arena and the decision of ruling elites Political approach is divided into several methods. The main difference between methods is relation between accuracy of prediction, terms of prediction and number of input data.
If researchers try to determine – how state can acquire nuclear weapon, usually they use technical approach. In this case proliferation’s potential is determined by the availability of technologies, personnel and nuclear material required to creation of nuclear weapon. This is extremely complex task due to “dual-using” of most nuclear technologies. Plutonium accumulating continuously in any type of reactor, but there are a huge difference in Pu grades.
The first step in this work is estimating critical masses of spheres made of pure different isotopes of Pu. The next step is relating findings with common Pu classification. Then the author estimates design of PHWR and calculate critical mass of sphere made of Pu from PHWR irradiated fuel assembles. The last stage is finding possible solution for reducing the risk.
There is common classification of plutonium in order to find the difference between plutonium accumulating in a peaceful reactor and plutonium used in nuclear warheads
Table 1. Plutonium classification [2]
Grade Weapon Fuel Reactor Isotope,
% 3<Pu240<7
7≤ Pu240<18
Pu240>18
The classification is based on the percentage of 240 plutonium isotope in the total mass. For weapon grade plutonium it is below 7%, while for reactor grade the figure it is over 18%.
Turn to the critical mass of different isotopes of plutonium. We based on the mathematically calculated critical mass of pure isotopes of Pu by Oak Ridge laboratory. You can see these data in the first row of Table 2. For the approximation to reality these data transform into a critical mass of plutonium in the delta phase, because from open sources such plutonium is stabilized by gallium, used in nuclear weapons.[3] For this transformation we use the following relationship:
Mδ-phasecr=(ρ0/ ρδ-phase)
2*M0cr, ρ0≈19,9 g/sm3, ρδ-phase = 15,8 g/sm3. The results are presented in the second row of
Table 2, the critical mass for each isotope has grown approximately 1.5 times.
Table 2.Evaluation of Pu isotopes critical masses
Then we combine the classification of plutonium and its critical mass and as result we see changes of critical mass with increase of isotope plutonium 240 content. Data are presented in Table 3.
Table 3.Relation between content of Pu-240
and critical mass Pu24
0 % 0 7 10 18 25 30
Mcr, kg
15,94
17,18
17,76
19,42
21,03
22,30
As we can see estimated difference is about 2.5 kilograms, or 13% of critical mass. Consequently, we can conclude that plutonium classification isn’t justified from critical mass point of view. The important problem in creation of a plutonium warhead is a high heat of Pu-240, relative to Pu-239, but there is a technical possibility of creating heat-removing device to deal with this problem. [4] Report prepared by the Committee on International Security and Arms Control of the American Academy of Sciences, which says: “The potential proliferator could easily make a constructive relation to a nuclear explosive from reactor-grade plutonium power from one to several kilotons.” also pays huge attention reality of the threat. [5]
Now, heavy water reactor is estimated as part of this problem. At the moment, the most common of this type of reactor is a CANDU - 29 reactors in the world. CANDU is an acronym meaning Canadian deuterium uranium reactor. This type of reactor uses “heavy” water, i.e. deuterium oxide, as the coolant and moderator. The use of heavy water permits the use of natural uranium as the reactor fuel eliminating the need for enrichment of the uranium.
We give estimates of the isotopic composition of plutonium accumulated in the heavy-water reactor at the nominal energy production - 7.5 GW * day / ton. It can be seen in Table 4
Table 4. Content of Pu isotopes in irradiated
fuel in PHRW[6] Isotope Pu239 Pu240 Pu241 Pu242 Pu238 Content,% 69,75 24,1 5 1,06 0,09
The critical mass of plutonium warhead with current isotopic composition was calculated and it is about 21.5 kg. Pu accumulated with rate 0.6 kg/GWt*day.
Isotope Pu239 Pu240 Pu241 Pu242 Pu238 M0
cr, kg
10,1 36,95 13,02 85,35 9,75
Mδ-
phasecr
, kg
15,94 58,81 20,53 138,14 15,37
XVII Modern Technique and Technologies 2011
180
According to our evaluation plutonium can be accumulated for a warhead within a relatively short period of time with the help of such reactors design. The problem is exacerbated by the channel design, which allows overload the fuel without reactor shutdown. This fact gives possibility to select the optimal duration of the irradiation period to achieving the best quality of Pu. Now we are starting to perform calculations to identify relations between isotopic composition of plutonium, the burnup and the duration of the campaign. The first results show significant increase plutonium’s purity while reducing energy production by about 30%
To summarize the main threats to the nonproliferation regime by heavy water reactors:
1. Time is more than pure Pu, than other widely used reactor designs.
2. More approachable technology of fuel production, which create great danger of producing illegal or "shadow" fuel for accumulating Pu.
3. Low nominal energy production and as result - small difference between the nominal mode of operation and such level of energy production, in which the quality of accumulating plutonium will significantly increase.
4. The possibility of on-power refueling the reactor power (CANDU), which complicates the procedure of international monitoring.
Indian heavy-water research reactor CIRUS can serve as an example of these problems. It has successfully accumulated Pu for a nuclear test in 1974. These threats reflect the potential for supply of reactors of this type to the countries which aren’t enough politically stable and the necessary national systems for handling nuclear materials.
As the technical means that can reduce risk and provide increased control of the IAEA, the following devices should be installed:
• Spent fuel bundle counter - a radiation monitoring system, which keep records of spent nuclear fuel at its premises in the pool for storage.
• Core discharge monitor - a radiation monitoring system for monitoring discharge of spent nuclear fuel from the reactor core. Such a system can be applied to reactors refueling when stopped and on-power (CANDU).
• Reactor power monitor - a neutron monitor, placed outside the biological shield, it allows track changes in burnup reactor in online mode.
• Unattended Fuel Flow Monitor - detectors of neutron and gamma radiation permanently placed in the reactor and provide continuous tracking of incoming and outgoing assemblies that minimizes the risk of fuel leakage.
All these systems are unattended and have several advantages: higher efficiency of IAEA safeguards, the continuity of control, decrease the amount of inspection activities, reducing radiation exposure of the inspectors, reducing interference with operation of the plant. Besides this unattended tracking system can significantly reduce the cost of providing the IAEA safeguards.
References 1. Pakistan Nuclear Weapons [Electronic
version]. from http://www.fas.org/nuke/guide/pakistan/nuke/
2. Plutonium Isotopes [Electronic version]. from: http://www.globalsecurity.org/wmd/intro/pu-isotope.htm
3. R.Q.Wright. Critical Masses of Bare Spheres Proceedings of the Annual Meeting of the American Nuclear Society. June 4-8, 2000. P. 167.
4. Andryushin I.A., Yudin Yu.A. Risks of proliferation and the problem of plutonium - Sarov, Saransk. "Krasniy Octyabr" 2007 pp.12-13
5. CANDU®: Setting the Standard for Proliferation Resistance [Electronic version] from: http://www.nuclearfaq.ca/Whitlock_IAEA_conf_Oct_2009.pdf
6. The evolution of CANDU® fuel cycles and their potential contribution to world peace [Electronic version], from: http://www.nuclearfaq.ca/brat_fuel.htm
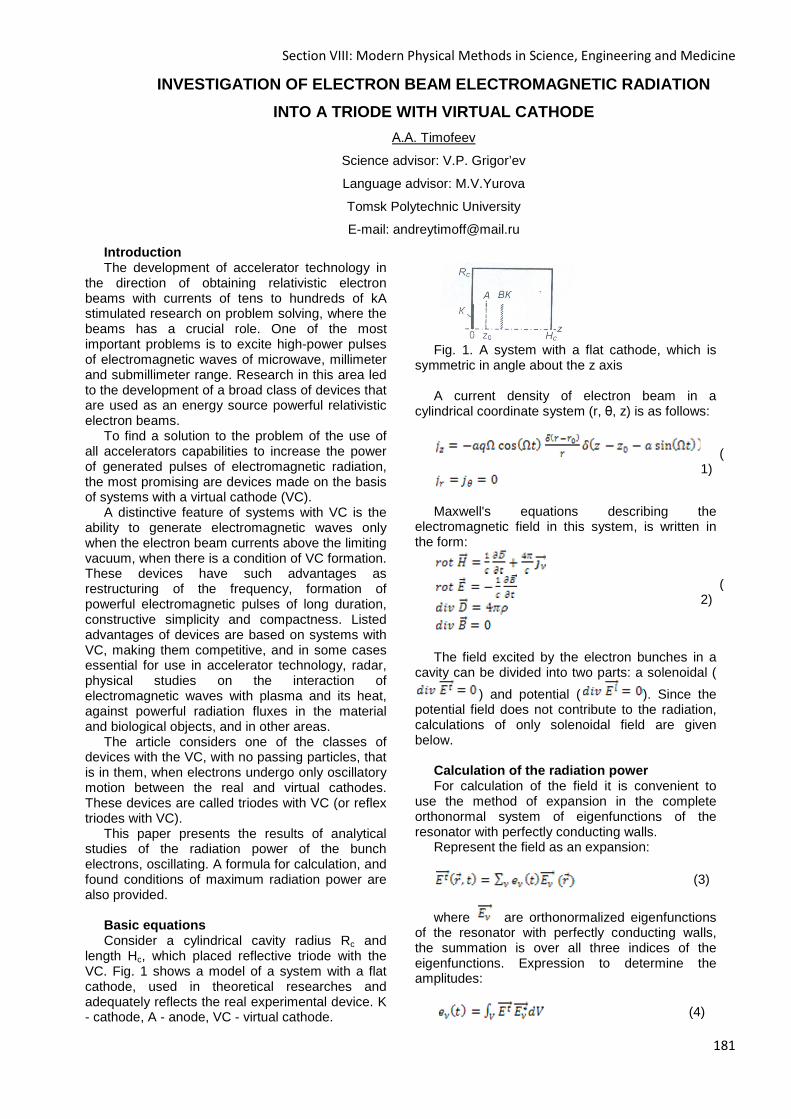
Section VIII: Modern Physical Methods in Science, Engineering and Medicine
181
INVESTIGATION OF ELECTRON BEAM ELECTROMAGNETIC RADI ATION
INTO A TRIODE WITH VIRTUAL CATHODE
А.А. Timofeev
Science advisor: V.P. Grigor’ev
Language advisor: M.V.Yurova
Tomsk Polytechnic University
E-mail: [email protected]
Introduction The development of accelerator technology in
the direction of obtaining relativistic electron beams with currents of tens to hundreds of kA stimulated research on problem solving, where the beams has a crucial role. One of the most important problems is to excite high-power pulses of electromagnetic waves of microwave, millimeter and submillimeter range. Research in this area led to the development of a broad class of devices that are used as an energy source powerful relativistic electron beams.
To find a solution to the problem of the use of all accelerators capabilities to increase the power of generated pulses of electromagnetic radiation, the most promising are devices made on the basis of systems with a virtual cathode (VC).
A distinctive feature of systems with VC is the ability to generate electromagnetic waves only when the electron beam currents above the limiting vacuum, when there is a condition of VC formation. These devices have such advantages as restructuring of the frequency, formation of powerful electromagnetic pulses of long duration, constructive simplicity and compactness. Listed advantages of devices are based on systems with VC, making them competitive, and in some cases essential for use in accelerator technology, radar, physical studies on the interaction of electromagnetic waves with plasma and its heat, against powerful radiation fluxes in the material and biological objects, and in other areas.
The article considers one of the classes of devices with the VC, with no passing particles, that is in them, when electrons undergo only oscillatory motion between the real and virtual cathodes. These devices are called triodes with VC (or reflex triodes with VC).
This paper presents the results of analytical studies of the radiation power of the bunch electrons, oscillating. A formula for calculation, and found conditions of maximum radiation power are also provided.
Basic equations Consider a cylindrical cavity radius Rc and
length Hc, which placed reflective triode with the VC. Fig. 1 shows a model of a system with a flat cathode, used in theoretical researches and adequately reflects the real experimental device. K - cathode, A - anode, VC - virtual cathode.
Fig. 1. A system with a flat cathode, which is
symmetric in angle about the z axis A current density of electron beam in a
cylindrical coordinate system (r, θ, z) is as follows:
(1)
Maxwell's equations describing the
electromagnetic field in this system, is written in the form:
(2)
The field excited by the electron bunches in a
cavity can be divided into two parts: a solenoidal (
) and potential ( ). Since the potential field does not contribute to the radiation, calculations of only solenoidal field are given below.
Calculation of the radiation power For calculation of the field it is convenient to
use the method of expansion in the complete orthonormal system of eigenfunctions of the resonator with perfectly conducting walls.
Represent the field as an expansion:
(3)
where are orthonormalized eigenfunctions of the resonator with perfectly conducting walls, the summation is over all three indices of the eigenfunctions. Expression to determine the amplitudes:
(4)

XVII Modern Technique and Technologies 2011
182
From Maxwell's equations (2) and expression
(4), applying the formula of vector analysis, and bringing the system to a second order differential equation, we obtain the inhomogeneous differential equation for determining :
, (5)
where
(6) integration over the volume of the cavity.
Parameter accounts the finite conductivity of metallic walls of the real cavity.
Radiation power of electron bunches in a cavity is defined by
(7)
where is a field induced by the bunch of charged particles in the triode, the integration over the entire volume.
As far as in the considered case the beam has only one component of the velocity different from zero, to determine the radiation power the calculation of only one component of the is done.
(8)
Coefficient determines from normalization of
the eigenfunctions and has the form:
(9)
are solutions of dispersion equations
. Using the properties of Bessel functions and
Jacobi transformation, we can find from equation (6):
(10)
Substituting (10) in equation (5), we obtain an
expression for the amplitudes . Substituting
in (3), we find the field , induced by
the beam in an arbitrary point inside the transistor. Using the calculated value for the field energy
in (7) and averaging over the oscillation
period, we find the average output power :
(11)
Since the power of radiation in a triode has a
resonant character, there is a reason to consider the radiation at a resonant frequency . Then (11) can be rewritten as:
(12)
With the increasing order of the Bessel function,
the value of its square will rapidly decrease. Therefore, the main contribution to the power of radiation generated by an electron beam will be made by the first member of the series containing the Bessel function of the first order. Then from (15) we obtain:
(13)
Take the parameters of an existing device: the length of h = 45 cm, radius = 15 cm, quality factor Q = 100, the distance between the anode and cathode = 1.5 cm, the amplitude (equal to the distance between the cathode and anode) a = 1.5 cm, beam radius ( ring) electrons = 5 cm, the charge of an electron beam
C. As a result, we obtain the radiation power of 150 MW (the value obtained taking into account only the main contribution of the first harmonic) at a wavelength about 10 cm.
References 1. Диденко А.Н., Григорьев В.П.,
Жерлицын А.Г. Генерация электромагнитных колебаний в системах с виртуальным

Section VIII: Modern Physical Methods in Science, Engineering and Medicine
183
катодом // В сб.: Плазменная электроника / Под ред. В.И. Курилко. – Киев: Наукова думка, 1989.
2. Григорьев В.П., Коваль Т.В. Теория генерации электромагнитных колебаний в
системах с виртуальным катодом // Известия вузов. Физика. – 1998. – 4.
3. Соколов А.А., Тернов И.М. Релятивистский электрон. М.: Наука, 1974.
NEUTRON TRANSMUTATION DOPING OF SILICON IN THE CHAN NEL
OF NUCLEAR REACTOR IRT-T Timoshin S.V., Litvinov P.I.
Scientific Supervisors: Chertkov Yu.B., Ph.D., Associate Professor, Ermakova Ya.V., Teacher
Tomsk Polytechnic University, 634050, Russia, Tomsk, Lenin str., 30
E-mail: [email protected]
Volumetric properties of semiconductors can strongly depend on the presence of defects in the crystal structure; therefore very pure substances are now produced mainly for the electronics industry. Dopants are used to control the amount and type of the semiconductor. For example, widespread silicon can be doped by element of the subgroup V of the Mendeleev’s periodic system of elements – phosphorus, which, being a donor creates a n-type of conductivity.
The method of NTD of semiconductors based on isotope nuclear transformations of semiconductor materials when they capture slow (thermal) neutrons. To conduct NTD samples or whole bars of semiconductor crystals irradiated with neutrons in nuclear reactors. In neutron capture reaction this isotope becomes another isotope with mass number one more
1A Ac Z ZN Nσ +Φ = ,
(1) here Ф (cm-2) – fluence of thermal neutrons, σc
(cm2) – capture cross section of thermal neutron of
this isotope, 1, A A
Z ZN N+
(cm-3) – the concentration of the initial and final reaction products, respectively, Z – charge of the nucleus, A – the mass number. If
the resulting isotope 1A
Z N+
is stable, then a nuclear reaction does not lead to doping. The most interesting is the case when the resulting isotope is
unstable. After a half-life 1 2T it becomes a nucleus
of new element: a number more 11
AZ N+
+ in the case
of - -decayβ or a number less than
11
AZ N+
− in the case of K-capture.
Relevance of NTD is conditioned by its two main advantages before metallurgical methods of doping. This is, firstly, the high accuracy of doping, since the concentration of impurities injected at constant neutron flux is proportional to the time of irradiation, which can be controlled with great accuracy. Secondly, it is highly uniform distribution of impurities determined by a random distribution of isotopes, small neutron capture cross section σc and uniformity of the neutron flux. In consideration
of σc values lie approximately in the region 10-23-10-24 cm2, it is easy to determine that the maximum thermal neutron flux in the modern nuclear reactors and in a reasonable time of irradiation, the concentration of injected impurities of phosphorus in Si does not exceed a few units at 1015 cm3. It is sufficient for a number of important practical applications, especially for production of high-power diodes and thyristors [1].
This fact led to the creation in Europe and USA industrial technology of silicon NTD of hundreds tons per year based on specially created materials science research reactors.
Research nuclear reactor IRT-T is a pool-type reactor. Desalinated water is used as neutron moderator and coolant in the reactor. Criticality of the reactor was produced in 1967. Since 1977 to 1984 because of progressive corrosion radical reconstruction of the reactor was carried out, which resulted in upgraded or newly constructed reactor tank and innertank device, core cooling system, control and protection systems, instrumentation and electrical systems, radiation monitoring, etc. It made possible to increase the reactor power from 2 to 6 MW.
The main tasks of research nuclear reactor IRT-T are usage of neutron radiation for scientific and practical tasks and training of highly qualified specialists in the design and operation of nuclear facilities, studying of their usage impacts and ways to eliminate these impacts.
The reactor has 10 horizontal experimental channels (HEC) and 14 vertical experimental channels (VEC). Maximum density of the thermal neutron flux is equal to 1,1·1014 neutrons/(cm2·s), and maximum density of the fast neutron flux is equal to 2·1013 neutrons/(cm2·s) are achieved at power level of 6 MW.
Three radial HEC equipped with pneumatic conveying systems with automated analytical facilities at measurement positions. Two radial HEC equipped with devices for irradiation of bulk samples with extracted beam of neutrons. One radial HEC equipped with low-temperature setting, which is designed for research in radioactive
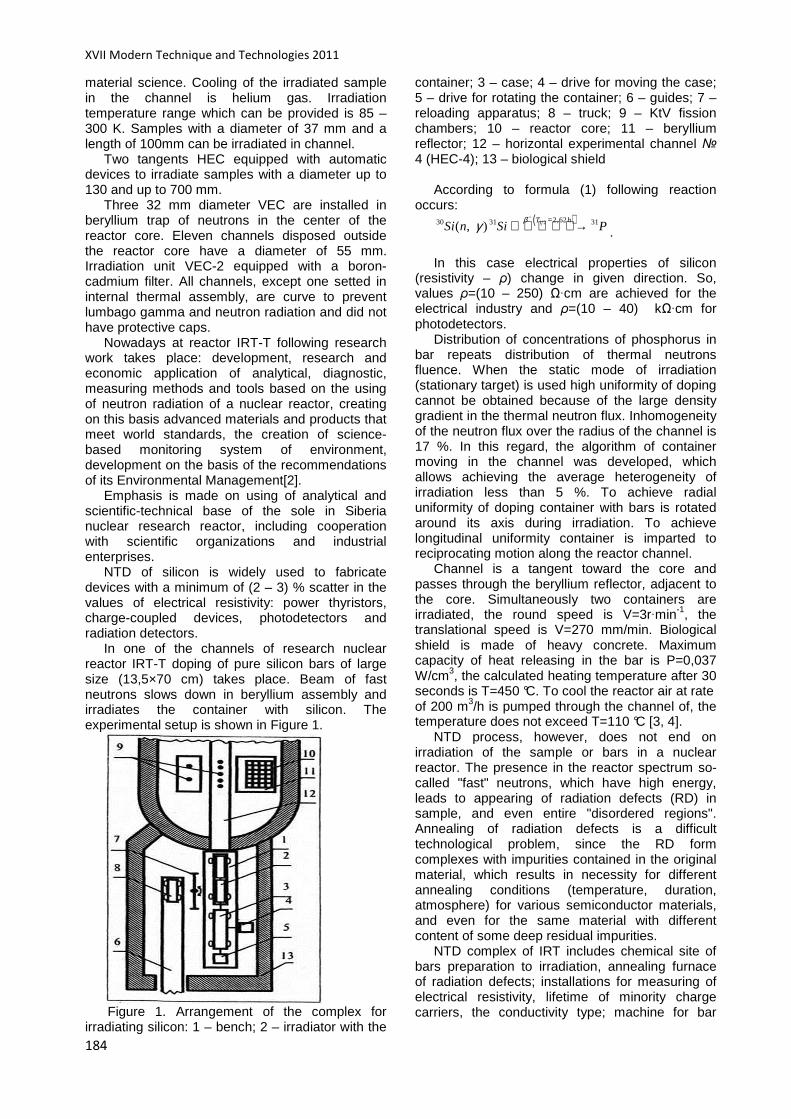
XVII Modern Technique and Technologies 2011
184
material science. Cooling of the irradiated sample in the channel is helium gas. Irradiation temperature range which can be provided is 85 – 300 K. Samples with a diameter of 37 mm and a length of 100mm can be irradiated in channel.
Two tangents HEC equipped with automatic devices to irradiate samples with a diameter up to 130 and up to 700 mm.
Three 32 mm diameter VEC are installed in beryllium trap of neutrons in the center of the reactor core. Eleven channels disposed outside the reactor core have a diameter of 55 mm. Irradiation unit VEC-2 equipped with a boron-cadmium filter. All channels, except one setted in internal thermal assembly, are curve to prevent lumbago gamma and neutron radiation and did not have protective caps.
Nowadays at reactor IRT-T following research work takes place: development, research and economic application of analytical, diagnostic, measuring methods and tools based on the using of neutron radiation of a nuclear reactor, creating on this basis advanced materials and products that meet world standards, the creation of science-based monitoring system of environment, development on the basis of the recommendations of its Environmental Management[2].
Emphasis is made on using of analytical and scientific-technical base of the sole in Siberia nuclear research reactor, including cooperation with scientific organizations and industrial enterprises.
NTD of silicon is widely used to fabricate devices with a minimum of (2 – 3) % scatter in the values of electrical resistivity: power thyristors, charge-coupled devices, photodetectors and radiation detectors.
In one of the channels of research nuclear reactor IRT-T doping of pure silicon bars of large size (13,5×70 cm) takes place. Beam of fast neutrons slows down in beryllium assembly and irradiates the container with silicon. The experimental setup is shown in Figure 1.
Figure 1. Arrangement of the complex for
irradiating silicon: 1 – bench; 2 – irradiator with the
container; 3 – case; 4 – drive for moving the case; 5 – drive for rotating the container; 6 – guides; 7 – reloading apparatus; 8 – truck; 9 – KtV fission chambers; 10 – reactor core; 11 – beryllium reflector; 12 – horizontal experimental channel 4 (HEC-4); 13 – biological shield
According to formula (1) following reaction
occurs: ( )1 2 2,6230 31 31( , )T h
Si n Si Pβγ
− =→ .
In this case electrical properties of silicon (resistivity – ρ) change in given direction. So, values ρ=(10 – 250) Ω·cm are achieved for the electrical industry and ρ=(10 – 40) kΩ·cm for photodetectors.
Distribution of concentrations of phosphorus in bar repeats distribution of thermal neutrons fluence. When the static mode of irradiation (stationary target) is used high uniformity of doping cannot be obtained because of the large density gradient in the thermal neutron flux. Inhomogeneity of the neutron flux over the radius of the channel is 17 %. In this regard, the algorithm of container moving in the channel was developed, which allows achieving the average heterogeneity of irradiation less than 5 %. To achieve radial uniformity of doping container with bars is rotated around its axis during irradiation. To achieve longitudinal uniformity container is imparted to reciprocating motion along the reactor channel.
Channel is a tangent toward the core and passes through the beryllium reflector, adjacent to the core. Simultaneously two containers are irradiated, the round speed is V=3r·min-1, the translational speed is V=270 mm/min. Biological shield is made of heavy concrete. Maximum capacity of heat releasing in the bar is P=0,037 W/cm3, the calculated heating temperature after 30 seconds is T=450 °C. To cool the reactor air at rate of 200 m3/h is pumped through the channel of, the temperature does not exceed T=110 °C [3, 4].
NTD process, however, does not end on irradiation of the sample or bars in a nuclear reactor. The presence in the reactor spectrum so-called "fast" neutrons, which have high energy, leads to appearing of radiation defects (RD) in sample, and even entire "disordered regions". Annealing of radiation defects is a difficult technological problem, since the RD form complexes with impurities contained in the original material, which results in necessity for different annealing conditions (temperature, duration, atmosphere) for various semiconductor materials, and even for the same material with different content of some deep residual impurities.
NTD complex of IRT includes chemical site of bars preparation to irradiation, annealing furnace of radiation defects; installations for measuring of electrical resistivity, lifetime of minority charge carriers, the conductivity type; machine for bar

Section VIII: Modern Physical Methods in Science, Engineering and Medicine
185
slicing. Performance of the complex is about 4500 kg of doped silicon per year.
REFERENCES:
1. Шлимак И.С., Нейтронное трансмутационное легирование полупроводников: наука и приложения, Физика твердого тела, 1999 г., том 41, стр. 794 – 798;
2. Рябчиков А.И., Ускорители заряженных частиц и другие излучательные установки НИИ ЯФ и их использование в науке и
технологиях, Известия Томского политехнического университета, 2000 г., том 303, стр. 17 – 43;
3. Варлачев В.А., Солодовников В.С., Способ нейтронно-трансмутационного легирования кремния, Патент Российской Федерации от 15.12.1991г.;
4. Забаев В.Н., Применение ускорителей в науке и промышленности: Учебное пособие.- Томск: Изд-во ТПУ, 2008г. – 190 с.
NUCLEAR FORENSIC ANALYSIS
Trofimov A.V.
Scientific advisor: Silaev M.E., associate professor
Tomsk Polytechnic University, 634050, Russia, Tomsk, Lenina, 30
E-mail: [email protected]
The discovery of energy hidden in atoms, practical confirmation of Einstein E=mc2 energy-mass conversion equation created an idea of practical application of this energy. Simultaneously as the World War II spread to people and nations the idea of a weapon based on nuclei fission was born. Many scientists were involved in construction process because of many reasons from the sorrow that Hitler's regime forced them to immigrate to patriotic ideas and leadership.
Historically there were two centers of researches — in Germany under the patronage of Werner Heisenberg and in the USA under leadership of Robert Oppenheimer. Two rivals, two tigers were combating for the possession of nuclear weapon and in this confrontation information played the key role.
The head of Manhattan Project Brigadier General Leslie R. Groves in 1943 assigned Luis Alvarez, a future Noble laureate for physics, to find out whether the Germans were operating any nuclear reactors and, if so, where they were. Alvarez's method was based on detecting radioactive gases that appeared during fission of uranium-235 (U-235), uranium-238 (U-238) and plutonium-239 (Pu-239). The searched gas was xenon-133 (Xe-133), a noble gas that escapes reactor in detectable quantities without chemical reacting with other elements. Xe-133 does not appear in the atmosphere naturally because of 5.243 days half-life. The separation from the oxygen and nitrogen in the air is also not that much complicated.
In the autumn 1944 Alvarez's xenon-detection system was constructed and successfully launched to collect air samples over Germany, but no xenon was found. Thereby it was clear that no nuclear
reactors were operating in Germany. A new form of intelligent gathering was initiated. It was later named as «nuclear forensic».
In 1991 the end of the Cold War and fragmentation of the USSR resulted in the formation of 12 independent successor states. Of these, Russia, Belarus, Ukraine and Kazakhstan inherited nuclear arsenal of the former Soviet Union. By 1996 all former Soviet Union nuclear weapons were relocated and centralized in Russia. But depressed economic and social situation in former Soviet Union stimulated illegal smuggling and black-market sales of various nuclear materials. Obtaining the technology of producing fissile materials is the main obstacle to nuclear proliferation. Even for developed national nuclear programs the cost of producing highly enriched uranium (HEU) or weapon-grade plutonium is a question of several tens of thousands of dollars (U.S.). Nuclear smuggling could eliminate these technical and economic barriers.
Nuclear material located in many countries could be possessed by terrorists and used for a crude nuclear weapon or radiological dispersion device (RDD), the «dirty bomb». It consists of highly radioactive material in combination with a conventional explosive to disseminate radiation contamination through the near environment without a nuclear explosion. A RDD is not a weapon of mass destruction but one of mass disruption. For terror groups the appeal of RDDs is their shock value. Psychological effect of mass panic, rather than death and destruction, are the operational targets. The chief physical consequence of an RDD would be economic and would result from the widespread decontamination and required demolition in a urban environment.
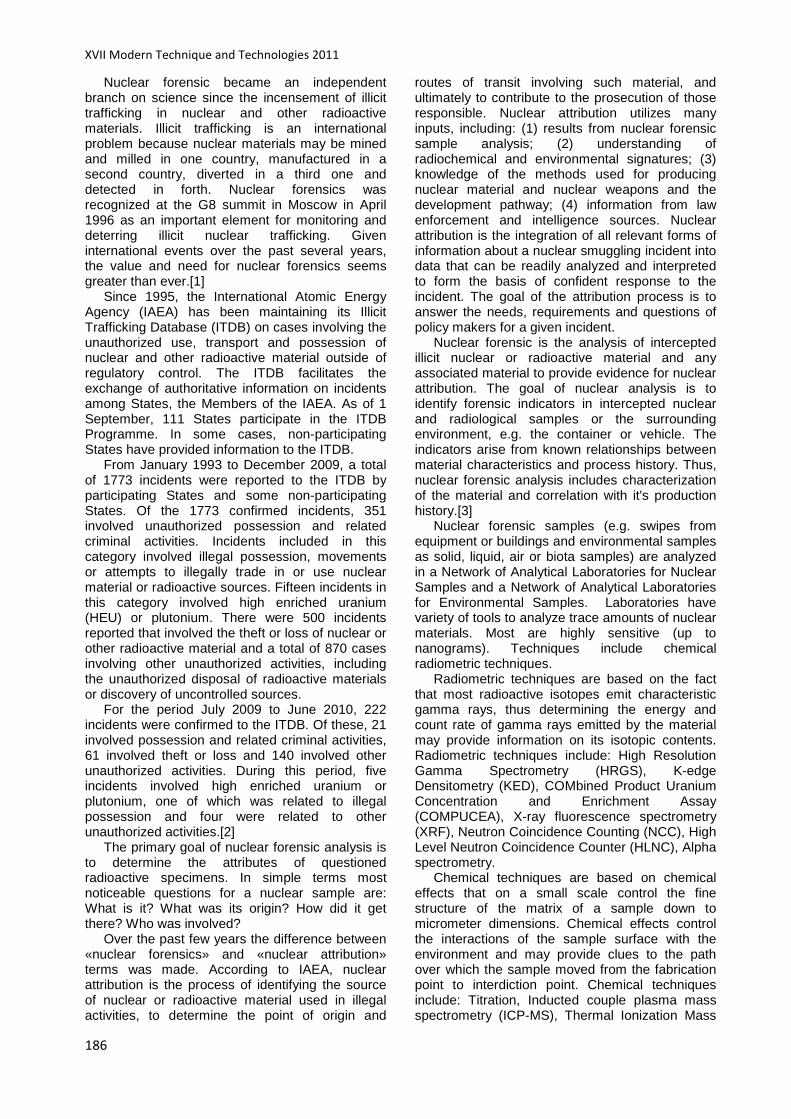
XVII Modern Technique and Technologies 2011
186
Nuclear forensic became an independent branch on science since the incensement of illicit trafficking in nuclear and other radioactive materials. Illicit trafficking is an international problem because nuclear materials may be mined and milled in one country, manufactured in a second country, diverted in a third one and detected in forth. Nuclear forensics was recognized at the G8 summit in Moscow in April 1996 as an important element for monitoring and deterring illicit nuclear trafficking. Given international events over the past several years, the value and need for nuclear forensics seems greater than ever.[1]
Since 1995, the International Atomic Energy Agency (IAEA) has been maintaining its Illicit Trafficking Database (ITDB) on cases involving the unauthorized use, transport and possession of nuclear and other radioactive material outside of regulatory control. The ITDB facilitates the exchange of authoritative information on incidents among States, the Members of the IAEA. As of 1 September, 111 States participate in the ITDB Programme. In some cases, non-participating States have provided information to the ITDB.
From January 1993 to December 2009, a total of 1773 incidents were reported to the ITDB by participating States and some non-participating States. Of the 1773 confirmed incidents, 351 involved unauthorized possession and related criminal activities. Incidents included in this category involved illegal possession, movements or attempts to illegally trade in or use nuclear material or radioactive sources. Fifteen incidents in this category involved high enriched uranium (HEU) or plutonium. There were 500 incidents reported that involved the theft or loss of nuclear or other radioactive material and a total of 870 cases involving other unauthorized activities, including the unauthorized disposal of radioactive materials or discovery of uncontrolled sources.
For the period July 2009 to June 2010, 222 incidents were confirmed to the ITDB. Of these, 21 involved possession and related criminal activities, 61 involved theft or loss and 140 involved other unauthorized activities. During this period, five incidents involved high enriched uranium or plutonium, one of which was related to illegal possession and four were related to other unauthorized activities.[2]
The primary goal of nuclear forensic analysis is to determine the attributes of questioned radioactive specimens. In simple terms most noticeable questions for a nuclear sample are: What is it? What was its origin? How did it get there? Who was involved?
Over the past few years the difference between «nuclear forensics» and «nuclear attribution» terms was made. According to IAEA, nuclear attribution is the process of identifying the source of nuclear or radioactive material used in illegal activities, to determine the point of origin and
routes of transit involving such material, and ultimately to contribute to the prosecution of those responsible. Nuclear attribution utilizes many inputs, including: (1) results from nuclear forensic sample analysis; (2) understanding of radiochemical and environmental signatures; (3) knowledge of the methods used for producing nuclear material and nuclear weapons and the development pathway; (4) information from law enforcement and intelligence sources. Nuclear attribution is the integration of all relevant forms of information about a nuclear smuggling incident into data that can be readily analyzed and interpreted to form the basis of confident response to the incident. The goal of the attribution process is to answer the needs, requirements and questions of policy makers for a given incident.
Nuclear forensic is the analysis of intercepted illicit nuclear or radioactive material and any associated material to provide evidence for nuclear attribution. The goal of nuclear analysis is to identify forensic indicators in intercepted nuclear and radiological samples or the surrounding environment, e.g. the container or vehicle. The indicators arise from known relationships between material characteristics and process history. Thus, nuclear forensic analysis includes characterization of the material and correlation with it's production history.[3]
Nuclear forensic samples (e.g. swipes from equipment or buildings and environmental samples as solid, liquid, air or biota samples) are analyzed in a Network of Analytical Laboratories for Nuclear Samples and a Network of Analytical Laboratories for Environmental Samples. Laboratories have variety of tools to analyze trace amounts of nuclear materials. Most are highly sensitive (up to nanograms). Techniques include chemical radiometric techniques.
Radiometric techniques are based on the fact that most radioactive isotopes emit characteristic gamma rays, thus determining the energy and count rate of gamma rays emitted by the material may provide information on its isotopic contents. Radiometric techniques include: High Resolution Gamma Spectrometry (HRGS), K-edge Densitometry (KED), COMbined Product Uranium Concentration and Enrichment Assay (COMPUCEA), X-ray fluorescence spectrometry (XRF), Neutron Coincidence Counting (NCC), High Level Neutron Coincidence Counter (HLNC), Alpha spectrometry.
Chemical techniques are based on chemical effects that on a small scale control the fine structure of the matrix of a sample down to micrometer dimensions. Chemical effects control the interactions of the sample surface with the environment and may provide clues to the path over which the sample moved from the fabrication point to interdiction point. Chemical techniques include: Titration, Inducted couple plasma mass spectrometry (ICP-MS), Thermal Ionization Mass

Section VIII: Modern Physical Methods in Science, Engineering and Medicine
187
spectrometry (TIMS), Isotope dilution Thermal Ionization Mass spectrometry (IDMS), Secondary ion mass spectroscopy (SIMS).
The potential threats of nuclear terrorism focus scientists and IAEA experts on developing advanced techniques to control nuclear technologies worldwide. Nuclear smuggling, nuclear terrorism, nuclear arms proliferation. It is not to be forgotten that Energy of Nature tamed by mankind to bring benefits and economic prosperity
can demolish human beings in their pursuit for economic exuberance.
[1]Future of the Nuclear Security Environment
in 2015: Proceedings of a Russian-U.S. Workshop pp. 179-181
[2]The ITDB provided by IAEA, <http://www-ns.iaea.org/security/itdb.asp>
[3]Nuclear forensics support. — Vienna : International Atomic Energy Agency, 2006. pp. 2-3
MANAGEMENT OF SHS – TECHNOLOGY
WHITH USING MECHANICAL ACTIVATION
Voytenko D.U., Isachenko D.S., Kuznetsov M.S.
Principal investigator : Semenov A, assistant
Tomsk Polytechnic University, 634050, Russia, Tomsk, Lenin avenue, 30
e-mail: [email protected]
Keywords : Self - propagating high - temperature, mechanical activation.
The development of natural science
foundations of technology of new materials by self-propagating high-temperature synthesis has been carried out at Tomsk Polytechnic University during recent years. The technology of self-propagating high-temperature synthesis (SHS) is based on the ability of a number of inorganic elements and compounds to enter into an exothermic reaction that propagates over the volume of the reaction medium in the wave regime [1,2].
There are several ways to manage self-propagating high-temperature synthesis, which should be considered in relation to specific stages and parametres [2].
The variable parameters of the SHS during the preparation of the initial mixture may include chemical composition, component ratio and particle size distribution of the initial reagents, the density of the initial charge, the initial sample size, initial temperature, initial pressure.
In this article we shall consider the method of influencing the course of the SHS by changing the parameters of the initial components of the charge, namely, the mechanical activation of charge and the variation of pressure acting on the initial sample.
SHS technologies can be used in nuclear technology, as evidenced by theoretical and experimental studies [3].
Experiments were conducted to identify patterns of influence of time of mechanical activation on macrokinetic characteristics of the combustion process as a factor in process control, as well as the structure and phase composition of
the materials obtained on the basis of tungsten boride.
The initial batch was prepared on the basis of the the following exothermic reaction:
W+B WB→ After mechanical activation in a ball mill and
vacuum drying, initial charge was pressed into cylindrical specimens with a diameter of 30 mm and a height of 12-15 mm to density values lying in the range 2·103-7·103 kg/m3.
On basis of the data obtained a graph showing the dependence of the velocity of the combustion front from the time of mechanical activation of initial components of the charge for the tungsten boride was constructed. It is presented in Figure 1.
Fig. 1. The change of the speed of the
combustion front depending on the time of mechanical activation of initial components of the charge for the tungsten boride.
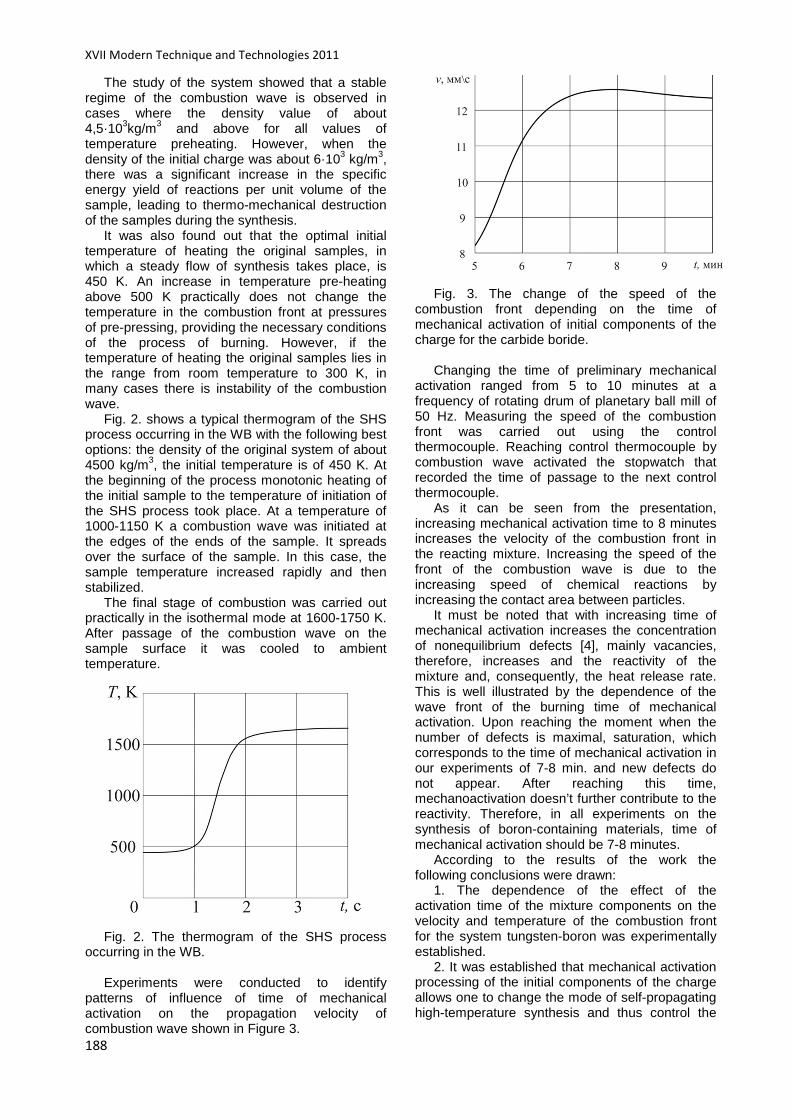
XVII Modern Technique and Technologies 2011
188
The study of the system showed that a stable regime of the combustion wave is observed in cases where the density value of about 4,5·103kg/m3 and above for all values of temperature preheating. However, when the density of the initial charge was about 6·103 kg/m3, there was a significant increase in the specific energy yield of reactions per unit volume of the sample, leading to thermo-mechanical destruction of the samples during the synthesis.
It was also found out that the optimal initial temperature of heating the original samples, in which a steady flow of synthesis takes place, is 450 K. An increase in temperature pre-heating above 500 K practically does not change the temperature in the combustion front at pressures of pre-pressing, providing the necessary conditions of the process of burning. However, if the temperature of heating the original samples lies in the range from room temperature to 300 K, in many cases there is instability of the combustion wave.
Fig. 2. shows a typical thermogram of the SHS process occurring in the WB with the following best options: the density of the original system of about 4500 kg/m3, the initial temperature is of 450 K. At the beginning of the process monotonic heating of the initial sample to the temperature of initiation of the SHS process took place. At a temperature of 1000-1150 K a combustion wave was initiated at the edges of the ends of the sample. It spreads over the surface of the sample. In this case, the sample temperature increased rapidly and then stabilized.
The final stage of combustion was carried out practically in the isothermal mode at 1600-1750 K. After passage of the combustion wave on the sample surface it was cooled to ambient temperature.
Fig. 2. The thermogram of the SHS process
occurring in the WB. Experiments were conducted to identify
patterns of influence of time of mechanical activation on the propagation velocity of combustion wave shown in Figure 3.
Fig. 3. The change of the speed of the
combustion front depending on the time of mechanical activation of initial components of the charge for the carbide boride.
Changing the time of preliminary mechanical
activation ranged from 5 to 10 minutes at a frequency of rotating drum of planetary ball mill of 50 Hz. Measuring the speed of the combustion front was carried out using the control thermocouple. Reaching control thermocouple by combustion wave activated the stopwatch that recorded the time of passage to the next control thermocouple.
As it can be seen from the presentation, increasing mechanical activation time to 8 minutes increases the velocity of the combustion front in the reacting mixture. Increasing the speed of the front of the combustion wave is due to the increasing speed of chemical reactions by increasing the contact area between particles.
It must be noted that with increasing time of mechanical activation increases the concentration of nonequilibrium defects [4], mainly vacancies, therefore, increases and the reactivity of the mixture and, consequently, the heat release rate. This is well illustrated by the dependence of the wave front of the burning time of mechanical activation. Upon reaching the moment when the number of defects is maximal, saturation, which corresponds to the time of mechanical activation in our experiments of 7-8 min. and new defects do not appear. After reaching this time, mechanoactivation doesn’t further contribute to the reactivity. Therefore, in all experiments on the synthesis of boron-containing materials, time of mechanical activation should be 7-8 minutes.
According to the results of the work the following conclusions were drawn:
1. The dependence of the effect of the activation time of the mixture components on the velocity and temperature of the combustion front for the system tungsten-boron was experimentally established.
2. It was established that mechanical activation processing of the initial components of the charge allows one to change the mode of self-propagating high-temperature synthesis and thus control the

Section VIII: Modern Physical Methods in Science, Engineering and Medicine
189
steam water
picture 1
phase composition and properties of the final product, which is confirmed by experimental data.
References 1. Boiko VI, Dolmatov O., Shamanin IV, Nuzhin
OA / / Combust. - 1996. - T. 32, 1. - S. 58-65. 2. Merzhanov AG, Borovinskaya IP, Self-
propagating high-temperature synthesis of
refractory inorganic compounds. Report OIHK USSR Academy of Sciences, Chernogolovka, 1970. -283 sec.
3. Reactor Materials. The authors. Ed. DM Skorova. - Moscow: Atomizdat. 1968. - 385.
4. Kirsanov VV, The processes of radiation defect formation in metals. - M.: Energoatomizdat, 1985. – 395.
RENEWABLE AND UNTRADITIONAL ENERGY SOURCES
Zaitsev E.
Supervisor: Astapenko A. V.
Tomsk Polytechnic University, 30, Lenin St., Tomsk, Russia, 634050
E-mail: [email protected]
In the present article we’ll try to consider energy, and exactly the renewable (or alternative) energy sources and types of its obtaining. Beginning a narration about energy, we’d like to cite a famous expression about money, but it can be referred to the energy as well: «..it can not suffice, it can be enough, but it never happens much...».
To start with, we’d like to familiarize you with an unfavourable statistics, it is as follows: scientists calculated that the reserves of conventional energy sources have been steadily decreasing, for example coal suffices for 200 years, oil - for 90 years, gas - for 50 years, uranium - on 27 - 80 years. But that's not all, when we use the traditional sources of energy, we increase environmental contamination, break the atmosphere heat balance and it gradually leads to global climate change. For instance, power plants operated on fuel burning are the main pollutants. They deliver anthropogenic carbon (mainly in the form of CO2), about 50% of sulfur dioxide, nitrogen oxides, 35% and the same amount of dust into the atmosphere. According to some data, thermal
power plants pollute the environment by radioactive substances 2-4 times more than nuclear power plants of the same capacity. On the assumption of the mentioned facts, it can be noted that humanity is gradually lead to the so-called "deadlock" and to prevent this we should take some measures. One of the ways is starting to develop alternative energy sources as fast as possible. Firstly, they are much more ecological than traditional ones and, secondly, they are practically inexhaustible.
We'll try to describe renewable (alternative) ways of energy production. We believe that the problem does not consist only in energy generating, but in its reasonable use. It is necessary to develop and introduce technologies with low consumption of electricity. But, as always the problem is money, or the absence of it.
Let us consider renewable (alternative) sources of energy obtaining. The first place is given by us to a geothermal way, i.e. obtaining the energy from heat of the Earth. There are a lot hot wells on our planet. In some countries, geothermal energy accounts for a considerable part of a power balance of the country (for example, Iceland). Geothermal plants are not necessary to be built near the hot wells. One can build a power plant and at any other place, but it will cost more. It is necessary to dig a hole of several kilometers. Earth's temperature should be about 350 C or higher. Two tubes are put down into the hole. The water comes through one tube and the steam comes back through the other one.
The installation has the following form: (picture 1)
Besides it is possible to obtain not only energy, but the heat as well that would be more effective because for heat it is not necessary to dig so deeply. We are sure that such an installation will cover the expenses very quickly. And impact on environment is minimal. There are already such stations in the world. For example, in the USA
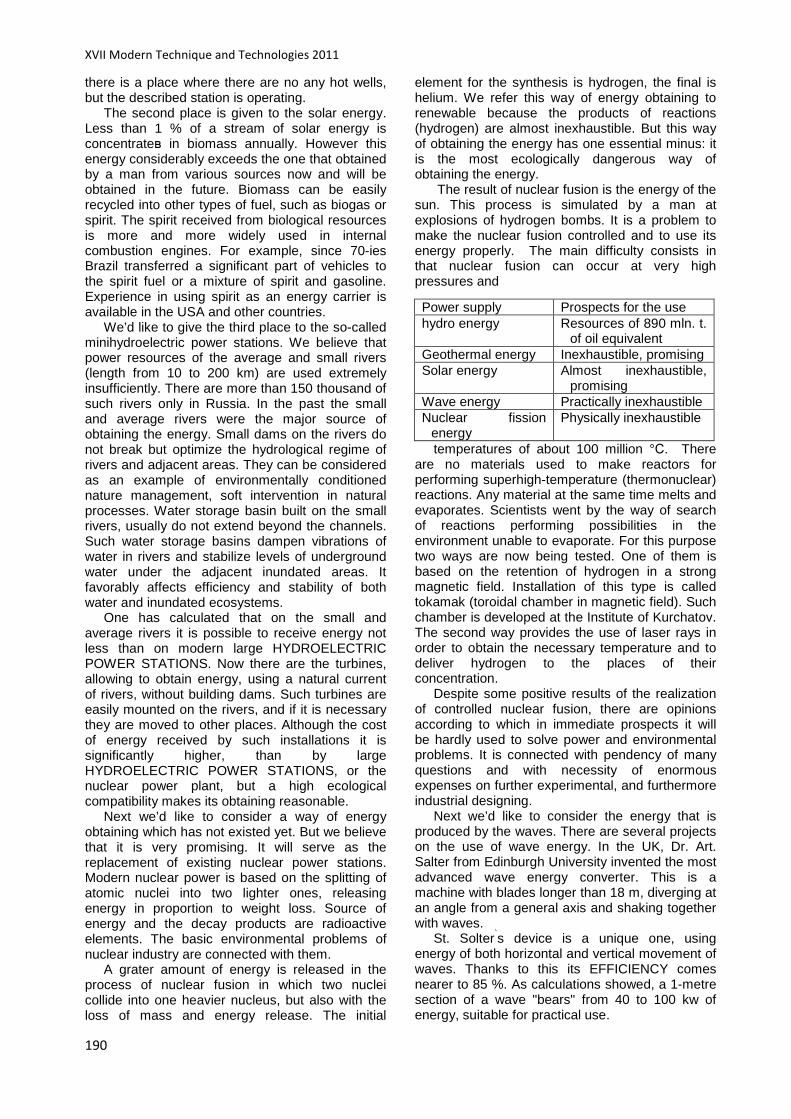
XVII Modern Technique and Technologies 2011
190
there is a place where there are no any hot wells, but the described station is operating.
The second place is given to the solar energy. Less than 1 % of a stream of solar energy is concentrateв in biomass annually. However this energy considerably exceeds the one that obtained by a man from various sources now and will be obtained in the future. Biomass can be easily recycled into other types of fuel, such as biogas or spirit. The spirit received from biological resources is more and more widely used in internal combustion engines. For example, since 70-ies Brazil transferred a significant part of vehicles to the spirit fuel or a mixture of spirit and gasoline. Experience in using spirit as an energy carrier is available in the USA and other countries.
We’d like to give the third place to the so-called minihydroelectric power stations. We believe that power resources of the average and small rivers (length from 10 to 200 km) are used extremely insufficiently. There are more than 150 thousand of such rivers only in Russia. In the past the small and average rivers were the major source of obtaining the energy. Small dams on the rivers do not break but optimize the hydrological regime of rivers and adjacent areas. They can be considered as an example of environmentally conditioned nature management, soft intervention in natural processes. Water storage basin built on the small rivers, usually do not extend beyond the channels. Such water storage basins dampen vibrations of water in rivers and stabilize levels of underground water under the adjacent inundated areas. It favorably affects efficiency and stability of both water and inundated ecosystems.
One has calculated that on the small and average rivers it is possible to receive energy not less than on modern large HYDROELECTRIC POWER STATIONS. Now there are the turbines, allowing to obtain energy, using a natural current of rivers, without building dams. Such turbines are easily mounted on the rivers, and if it is necessary they are moved to other places. Although the cost of energy received by such installations it is significantly higher, than by large HYDROELECTRIC POWER STATIONS, or the nuclear power plant, but a high ecological compatibility makes its obtaining reasonable.
Next we’d like to consider a way of energy obtaining which has not existed yet. But we believe that it is very promising. It will serve as the replacement of existing nuclear power stations. Modern nuclear power is based on the splitting of atomic nuclei into two lighter ones, releasing energy in proportion to weight loss. Source of energy and the decay products are radioactive elements. The basic environmental problems of nuclear industry are connected with them.
A grater amount of energy is released in the process of nuclear fusion in which two nuclei collide into one heavier nucleus, but also with the loss of mass and energy release. The initial
element for the synthesis is hydrogen, the final is helium. We refer this way of energy obtaining to renewable because the products of reactions (hydrogen) are almost inexhaustible. But this way of obtaining the energy has one essential minus: it is the most ecologically dangerous way of obtaining the energy.
The result of nuclear fusion is the energy of the sun. This process is simulated by a man at explosions of hydrogen bombs. It is a problem to make the nuclear fusion controlled and to use its energy properly. The main difficulty consists in that nuclear fusion can occur at very high pressures and
temperatures of about 100 million °С. There are no materials used to make reactors for performing superhigh-temperature (thermonuclear) reactions. Any material at the same time melts and evaporates. Scientists went by the way of search of reactions performing possibilities in the environment unable to evaporate. For this purpose two ways are now being tested. One of them is based on the retention of hydrogen in a strong magnetic field. Installation of this type is called tokamak (toroidal chamber in magnetic field). Such chamber is developed at the Institute of Kurchatov. The second way provides the use of laser rays in order to obtain the necessary temperature and to deliver hydrogen to the places of their concentration.
Despite some positive results of the realization of controlled nuclear fusion, there are opinions according to which in immediate prospects it will be hardly used to solve power and environmental problems. It is connected with pendency of many questions and with necessity of enormous expenses on further experimental, and furthermore industrial designing.
Next we’d like to consider the energy that is produced by the waves. There are several projects on the use of wave energy. In the UK, Dr. Art. Salter from Edinburgh University invented the most advanced wave energy converter. This is a machine with blades longer than 18 m, diverging at an angle from a general axis and shaking together with waves.
St. Solter`s device is a unique one, using energy of both horizontal and vertical movement of waves. Thanks to this its EFFICIENCY comes nearer to 85 %. As calculations showed, a 1-metre section of a wave "bears" from 40 to 100 kw of energy, suitable for practical use.
Power supply Prospects for the use hydro energy Resources of 890 mln. t.
of oil equivalent Geothermal energy Inexhaustible, promising Solar energy Almost inexhaustible,
promising Wave energy Practically inexhaustible Nuclear fission
energy Physically inexhaustible
Section VIII: Modern Physical Methods in Science, Engineering and Medicine
191
Wave energy on a small scale is already used in Japan. There are more than 300 buoys and beacons are fed by the electric power produced by generators, driven by sea waves. In the port of Madras in India, a floating beacon on which the electricity generator is driven by energy of sea waves is successfully operating. Nowadays wave generators are used more often for energy supply of navigating buoys and radio beacons. Japan started their operation in 1965 and later built an experimental wave ES with capacity of 125 kW, with a perspective to 1250 kW. Works on creation of stations of this kind are guided in Russia, Sweden, the USA, England and other countries. In Norway, in 1985 the first station of this type with capacity of 200 kW was built near Bergen, where in the future it is expected to install a series of such units and to significantly increase the capacity. Difficulties on creation of wave power stations are connected with non-uniformity of their work, biological and other pollution of working parts and water throughput channels (accretion seaweed, cockleshells, salts), destruction owing to rust, etc. Their advantage is full ecological purity and operation possibility in an automatic mode.
At the end we’d like to represent a table of power supplies considered in the given article, their condition, development prospects:
In the conclusion we’d like to highlight the reasons for the reluctance to use renewable energy sources:
1) financing - perhaps, the most important problem.
2) many renewable energy sources are little-studied
3) low efficiency factor 4) different administrative barriers As for our country, Russia ranks almost the last
in all types of renewable energy sources There is no industry that brings together all the disparate development of a unified strategic plan. In the concept of Fuel and Energy Ministry the renewable energy sources play the secondary and supporting role. In the concepts of Russian Academy of Sciences, of leading institutions, as reflected in the "Clean Energy" (1993), there are practically no any strategies for the full transition to alternative energy and it still relies on small, independent power in the very distant future. This certainly affects the economic backlog of the country, and also the environmental situation both in the country and all over the world.
THE USE OF ISOTOPES IN MEDICINE
Zarif K.
Supervisor: Astapenko A.V.
Tomsk Polytechnic University, 30, Lenin St., Tomsk, Russia, 634050
E-mail: [email protected]
Isotopes - atoms with a modified (more often - increased) number of neutrons in the nucleus. Physical characteristics of substances, consisting of the isotopes differ from the characteristics of substances, which include ordinary atoms. Isotopes are used in the construction materials, instrumentation, nuclear power, medicine.
In the process of studying this issue, I’ve
learned that isotopes are used in all spheres of human activity. One of the biggest areas where isotopes are used is medicine. Relevance of this topic is obvious: the number of patients with cancer has grown up in the world. Many patients can not have surgery under general anesthesia for some reasons, and this kind of patients needs radionuclides to be delivered directly into the cancer tumor. Medicine of the XXI century is going to deal with this problem. Nuclear Medicine is a specialty, which is ensured by means of radionuclide diagnosis of physiological and biochemical processes in the body of a patient.
The use of radionuclides in the life sciences is essential at the present stage. It is now known about 2300 radioactive isotopes. The most
widespread use of ROP is in nuclear medicine and biochemistry. Research and practical work using RN are carried out particularly in such areas such as: analysis, physiology and metabolism, diagnosis, therapy and ecology. Application of artificial radioactive isotopes in biochemical research and nuclear medicine began shortly after the creation of the first cyclotron by Lawrence (1930) and the discovery of the neutron by Chadwick (1932).
Radionuclides for diagnostics. Development in the mid-70's method of positron
emission tomography (PET) has had a revolutionary impact on the study of functions of internal organs, especially the state of the brain, as well as in oncology and cardiology.
Today, PET - the most informative method of radionuclide diagnostics, providing spatial resolution images of the body, the possibility of measuring the absolute activity in the target organ, which gives a quantitative assessment of physiological processes.
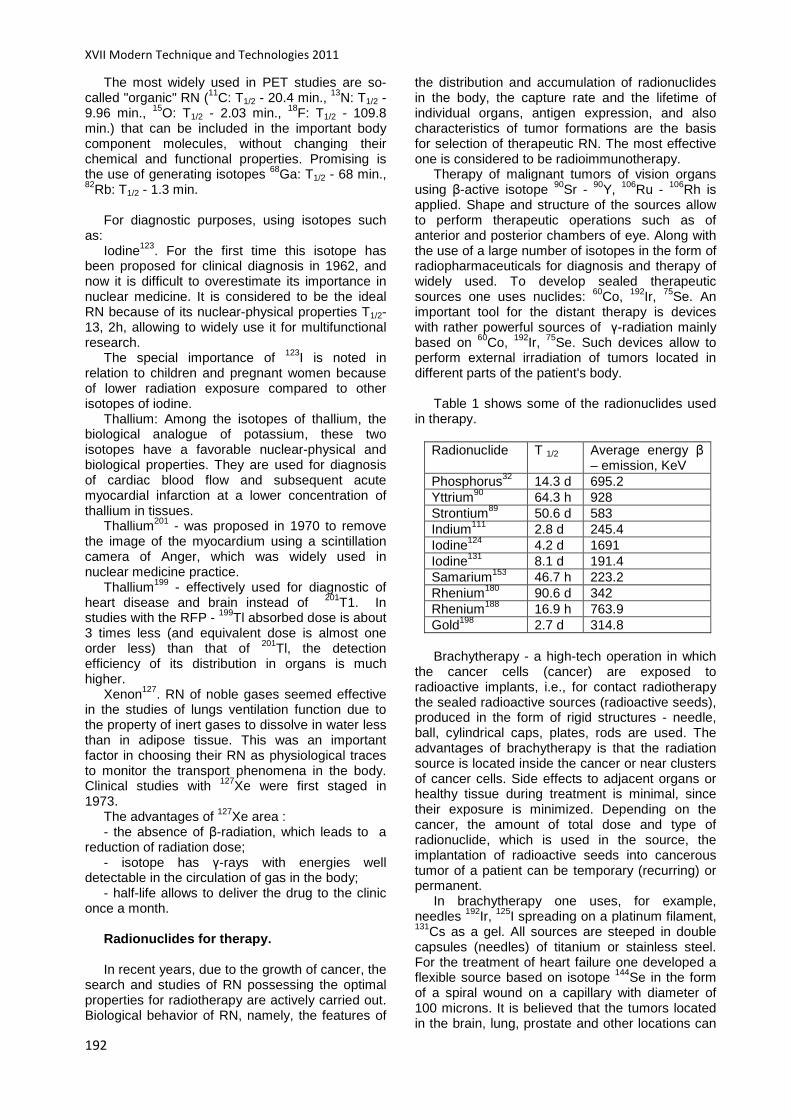
XVII Modern Technique and Technologies 2011
192
The most widely used in PET studies are so-called "organic" RN (11C: T1/2 - 20.4 min., 13N: T1/2 - 9.96 min., 15O: T1/2 - 2.03 min., 18F: T1/2 - 109.8 min.) that can be included in the important body component molecules, without changing their chemical and functional properties. Promising is the use of generating isotopes 68Ga: T1/2 - 68 min., 82Rb: T1/2 - 1.3 min.
For diagnostic purposes, using isotopes such
as: Iodine123. For the first time this isotope has
been proposed for clinical diagnosis in 1962, and now it is difficult to overestimate its importance in nuclear medicine. It is considered to be the ideal RN because of its nuclear-physical properties T1/2-13, 2h, allowing to widely use it for multifunctional research.
The special importance of 123I is noted in relation to children and pregnant women because of lower radiation exposure compared to other isotopes of iodine.
Thallium: Among the isotopes of thallium, the biological analogue of potassium, these two isotopes have a favorable nuclear-physical and biological properties. They are used for diagnosis of cardiac blood flow and subsequent acute myocardial infarction at a lower concentration of thallium in tissues.
Thallium201 - was proposed in 1970 to remove the image of the myocardium using a scintillation camera of Anger, which was widely used in nuclear medicine practice.
Thallium199 - effectively used for diagnostic of heart disease and brain instead of 201T1. In studies with the RFP - 199Tl absorbed dose is about 3 times less (and equivalent dose is almost one order less) than that of 201Tl, the detection efficiency of its distribution in organs is much higher.
Xenon127. RN of noble gases seemed effective in the studies of lungs ventilation function due to the property of inert gases to dissolve in water less than in adipose tissue. This was an important factor in choosing their RN as physiological traces to monitor the transport phenomena in the body. Clinical studies with 127Xe were first staged in 1973.
The advantages of 127Xe area : - the absence of β-radiation, which leads to a
reduction of radiation dose; - isotope has γ-rays with energies well
detectable in the circulation of gas in the body; - half-life allows to deliver the drug to the clinic
once a month. Radionuclides for therapy. In recent years, due to the growth of cancer, the
search and studies of RN possessing the optimal properties for radiotherapy are actively carried out. Biological behavior of RN, namely, the features of
the distribution and accumulation of radionuclides in the body, the capture rate and the lifetime of individual organs, antigen expression, and also characteristics of tumor formations are the basis for selection of therapeutic RN. The most effective one is considered to be radioimmunotherapy.
Therapy of malignant tumors of vision organs using β-active isotope 90Sr - 90Y, 106Ru - 106Rh is applied. Shape and structure of the sources allow to perform therapeutic operations such as of anterior and posterior chambers of eye. Along with the use of a large number of isotopes in the form of radiopharmaceuticals for diagnosis and therapy of widely used. To develop sealed therapeutic sources one uses nuclides: 60Co, 192Ir, 75Se. An important tool for the distant therapy is devices with rather powerful sources of γ-radiation mainly based on 60Co, 192Ir, 75Se. Such devices allow to perform external irradiation of tumors located in different parts of the patient's body.
Table 1 shows some of the radionuclides used
in therapy. Radionuclide T 1/2 Average energy β
– emission, KeV Phosphorus32 14.3 d 695.2 Yttrium90 64.3 h 928 Strontium89 50.6 d 583 Indium111 2.8 d 245.4 Iodine124 4.2 d 1691 Iodine131 8.1 d 191.4 Samarium153 46.7 h 223.2 Rhenium180 90.6 d 342 Rhenium188 16.9 h 763.9 Gold198 2.7 d 314.8 Brachytherapy - a high-tech operation in which
the cancer cells (cancer) are exposed to radioactive implants, i.e., for contact radiotherapy the sealed radioactive sources (radioactive seeds), produced in the form of rigid structures - needle, ball, cylindrical caps, plates, rods are used. The advantages of brachytherapy is that the radiation source is located inside the cancer or near clusters of cancer cells. Side effects to adjacent organs or healthy tissue during treatment is minimal, since their exposure is minimized. Depending on the cancer, the amount of total dose and type of radionuclide, which is used in the source, the implantation of radioactive seeds into cancerous tumor of a patient can be temporary (recurring) or permanent.
In brachytherapy one uses, for example, needles 192Ir, 125I spreading on a platinum filament, 131Cs as a gel. All sources are steeped in double capsules (needles) of titanium or stainless steel. For the treatment of heart failure one developed a flexible source based on isotope 144Se in the form of a spiral wound on a capillary with diameter of 100 microns. It is believed that the tumors located in the brain, lung, prostate and other locations can
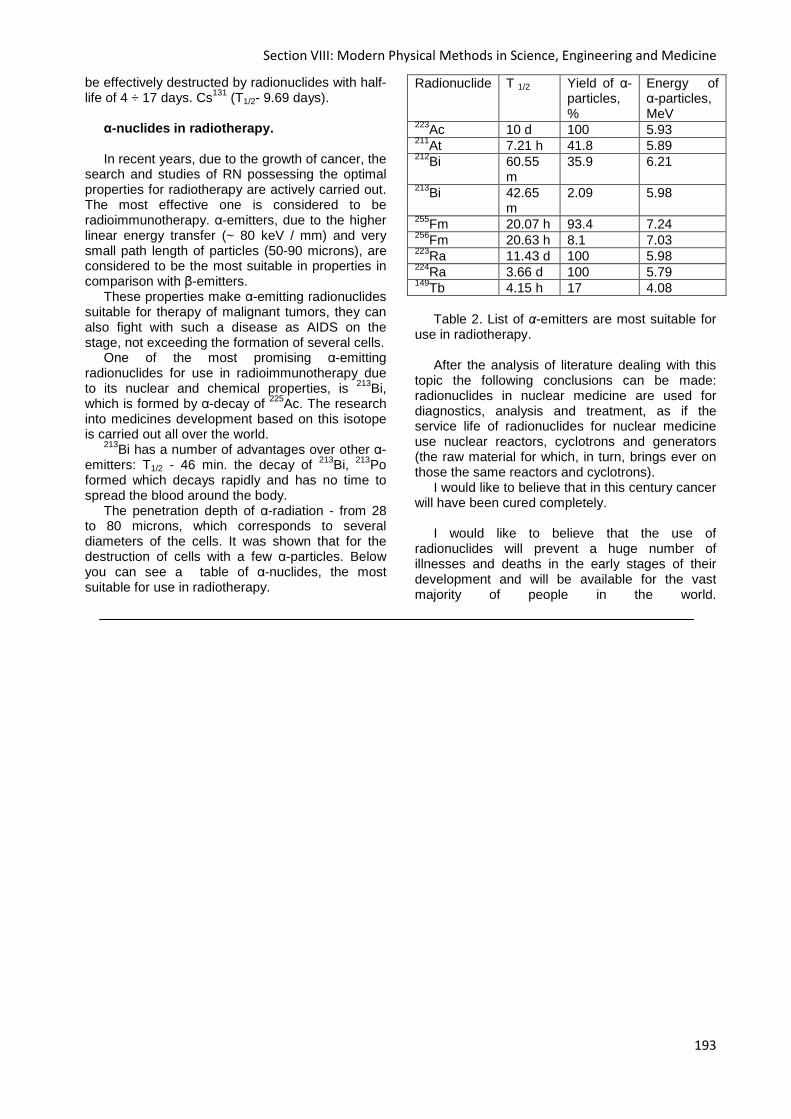
Section VIII: Modern Physical Methods in Science, Engineering and Medicine
193
be effectively destructed by radionuclides with half-life of 4 ÷ 17 days. Cs131 (T1/2- 9.69 days).
α-nuclides in radiotherapy. In recent years, due to the growth of cancer, the
search and studies of RN possessing the optimal properties for radiotherapy are actively carried out. The most effective one is considered to be radioimmunotherapy. α-emitters, due to the higher linear energy transfer (~ 80 keV / mm) and very small path length of particles (50-90 microns), are considered to be the most suitable in properties in comparison with β-emitters.
These properties make α-emitting radionuclides suitable for therapy of malignant tumors, they can also fight with such a disease as AIDS on the stage, not exceeding the formation of several cells.
One of the most promising α-emitting radionuclides for use in radioimmunotherapy due to its nuclear and chemical properties, is 213Bi, which is formed by α-decay of 225Ac. The research into medicines development based on this isotope is carried out all over the world.
213Bi has a number of advantages over other α-emitters: T1/2 - 46 min. the decay of 213Bi, 213Po formed which decays rapidly and has no time to spread the blood around the body.
The penetration depth of α-radiation - from 28 to 80 microns, which corresponds to several diameters of the cells. It was shown that for the destruction of cells with a few α-particles. Below you can see a table of α-nuclides, the most suitable for use in radiotherapy.
Radionuclide T 1/2 Yield of α-particles, %
Energy of α-particles, MeV
223Ac 10 d 100 5.93 211At 7.21 h 41.8 5.89 212Bi 60.55
m 35.9 6.21
213Bi 42.65 m
2.09 5.98
255Fm 20.07 h 93.4 7.24 256Fm 20.63 h 8.1 7.03 223Ra 11.43 d 100 5.98 224Ra 3.66 d 100 5.79 149Tb 4.15 h 17 4.08
Table 2. List of α-emitters are most suitable for
use in radiotherapy. After the analysis of literature dealing with this
topic the following conclusions can be made: radionuclides in nuclear medicine are used for diagnostics, analysis and treatment, as if the service life of radionuclides for nuclear medicine use nuclear reactors, cyclotrons and generators (the raw material for which, in turn, brings ever on those the same reactors and cyclotrons).
I would like to believe that in this century cancer will have been cured completely.
I would like to believe that the use of
radionuclides will prevent a huge number of illnesses and deaths in the early stages of their development and will be available for the vast majority of people in the world.

XVII Modern Technique and Technologies 2011
194

Section IX: Quality Management Control
195
Section IX
QUALITY MANAGEMENT CONTROL

XVII Modern Technique and Technologies 2011
196
IS the INTEGRATED MANAGEMENT SYSTEM POSSIBLE
in RUSSIAN ENTERPRISES?
Barsukova N.B.
Linguistic Advisor: Shvalova G.V., Technical Advisor: Alekseev L.A.
Tomsk Polytechnic University,
634050, Russia, Tomsk, Lenin Street, 30
E-mail: [email protected]
The concept of quality has appeared for the first time in the thoughts of Plato, Cicero or Aristotle. It has been used in numerous areas of human activity from the quality of material goods and services, processing, exchange, management to human living in general [1]. Definitions of quality are proposed in the books of Joseph M. Juran, W. Edwards Deming, Armand V. Feigenbaum, Philip B. Crosby and others, but in common, that quality means the satisfaction of the customer’s requirements [2]. Thus, the quality has become one of the fundamental and essential elements for companies to take the stable position on the market.
In improving their management systems, business entities more and more often compete for various quality awards, thus striving to distinguish their market identity. Contemporary trends in environmental protection and the European Union’s requirements make companies give more consideration to pro-ecological activities.
An increasing number of enterprises, wishing to create their image, will be interested in using not only quality standards, but also environmental management systems, or Health and Safety and Industrial Hygiene management systems [1]. The integration of these areas is not a new idea, as already Gemichi Taguchi believed that the quality of the product is a loss transferred by the product to society, starting from the time of shipping that product. He assumed therefore that each product delivered to the user causes a loss, which is the lower, the higher the quality of that product is. These losses are commonly understood as the contamination of the natural environment and associated diseases resulting from the progress of civilization, occupational health and safety, but also the consumer’s dissatisfaction or the manufacturer’s losses caused by the disadvantageous image of the organization, which result in a loss of selling markets in the long term [3].
Understanding both the present and future needs of the customer, meeting the customer’s requirements, the loss function – all these terms enable quality systems to encompass areas that have not been previously associated with the concept of quality.
In the majority of enterprises the Integrated Management Systems exists already, which combines an environmental management system
and a safety and an industrial hygiene management system with general quality management systems. This integration may not only concern systems implemented in accordance with the requirements of ISO standards, but also can be applied in areas, such as a logistics system, the accreditation of laboratories, a financial system and others. The integration of these systems generally is the result of the wish to improve the management process. But individual areas still coexist side by side, while not interacting one with another, because quality is perceived only how the requirements of the ISO 9000 standards.
So, what is the integrated management system?
It is a part of system of the general organization management, which is corresponded to the requirements of two or more international standards of management systems and functions as a single entity. The integrated management system consists of ISO 9000 (Quality Management System), ISO 14000 (environmental management system), OHSAS 14000 (health management system and safety at work).
The integrated management system has several advantages. It helps to promote more successful organizations, both domestic and international markets. Today, many foreign companies have such a system and have appreciated the benefits of its introduction [4].
And what about Russian enterprises, is it possible such system for them?
In the enterprise, which was considered, there has been integrated management system for some years. The Systems of management JSC “Samara’s Cable Company” (SCC) has the certificates of the correspondence to the requirements of standard: ISO 9001:2000, ISO 16949:2002; GOST RV 15.002-2003; ISO 14001:2004. Each standard has their own peculiarities, and their integration helps to use the international experience. Besides, the experience of external audits also leads to increasing of IMS efficiency.
The development of the management system is defined by longing to satisfy the requirements of the consumers in different branches, to take into account the interests of shareholders and personnel of company, as well as requirements of society in common. Besides, the meaning of ecological characteristics of organizations is
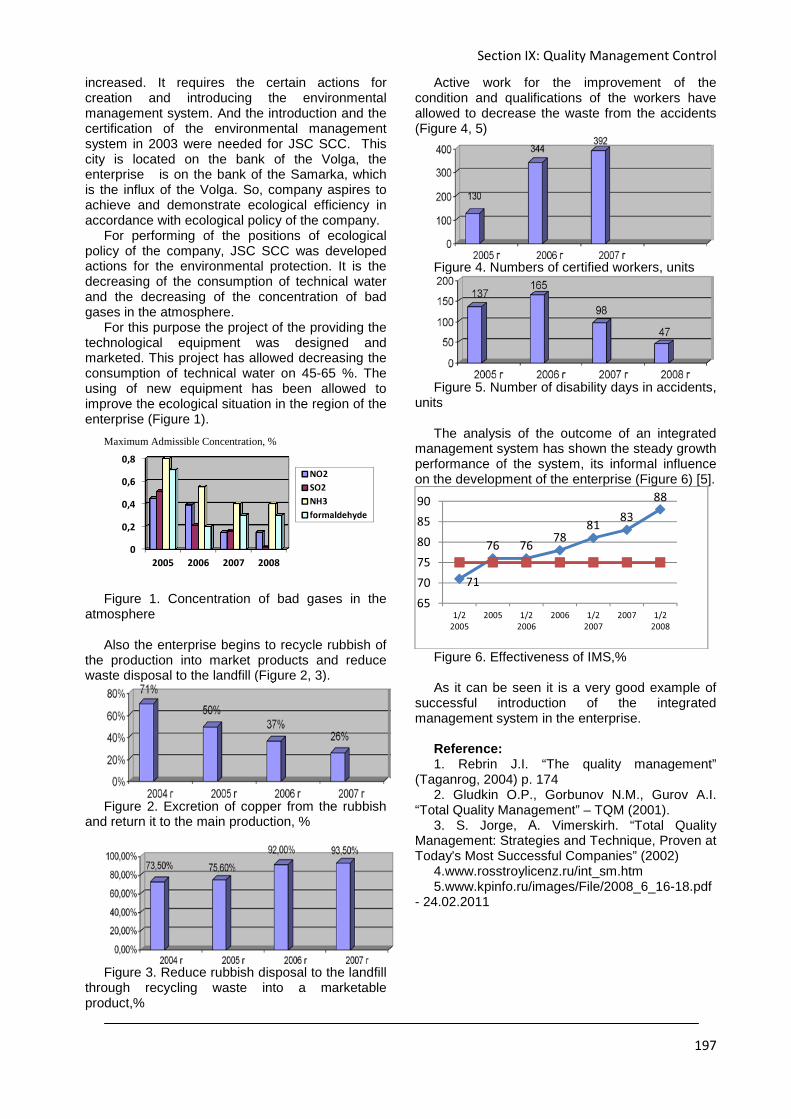
Section IX: Quality Management Control
197
Maximum Admissible Concentration, %
increased. It requires the certain actions for creation and introducing the environmental management system. And the introduction and the certification of the environmental management system in 2003 were needed for JSC SCC. This city is located on the bank of the Volga, the enterprise is on the bank of the Samarka, which is the influx of the Volga. So, company aspires to achieve and demonstrate ecological efficiency in accordance with ecological policy of the company.
For performing of the positions of ecological policy of the company, JSC SCC was developed actions for the environmental protection. It is the decreasing of the consumption of technical water and the decreasing of the concentration of bad gases in the atmosphere.
For this purpose the project of the providing the technological equipment was designed and marketed. This project has allowed decreasing the consumption of technical water on 45-65 %. The using of new equipment has been allowed to improve the ecological situation in the region of the enterprise (Figure 1).
Figure 1. Concentration of bad gases in the
atmosphere Also the enterprise begins to recycle rubbish of
the production into market products and reduce waste disposal to the landfill (Figure 2, 3).
Figure 2. Excretion of copper from the rubbish
and return it to the main production, %
Figure 3. Reduce rubbish disposal to the landfill
through recycling waste into a marketable product,%
Active work for the improvement of the condition and qualifications of the workers have allowed to decrease the waste from the accidents (Figure 4, 5)
Figure 4. Numbers of certified workers, units
Figure 5. Number of disability days in accidents,
units The analysis of the outcome of an integrated
management system has shown the steady growth performance of the system, its informal influence on the development of the enterprise (Figure 6) [5].
Figure 6. Effectiveness of IMS,% As it can be seen it is a very good example of
successful introduction of the integrated management system in the enterprise.
Reference: 1. Rebrin J.I. “The quality management”
(Taganrog, 2004) p. 174 2. Gludkin O.P., Gorbunov N.M., Gurov A.I.
“Total Quality Management” – TQM (2001). 3. S. Jorge, А. Vimerskirh. “Total Quality
Management: Strategies and Technique, Proven at Today's Most Successful Companies” (2002)
4.www.rosstroylicenz.ru/int_sm.htm 5.www.kpinfo.ru/images/File/2008_6_16-18.pdf
- 24.02.2011
0
0,2
0,4
0,6
0,8
2005 2006 2007 2008
NO2
SO2
NH3
formaldehyde
71
76 7678
8183
88
65
70
75
80
85
90
1/2
2005
2005 1/2
2006
2006 1/2
2007
2007 1/2
2008
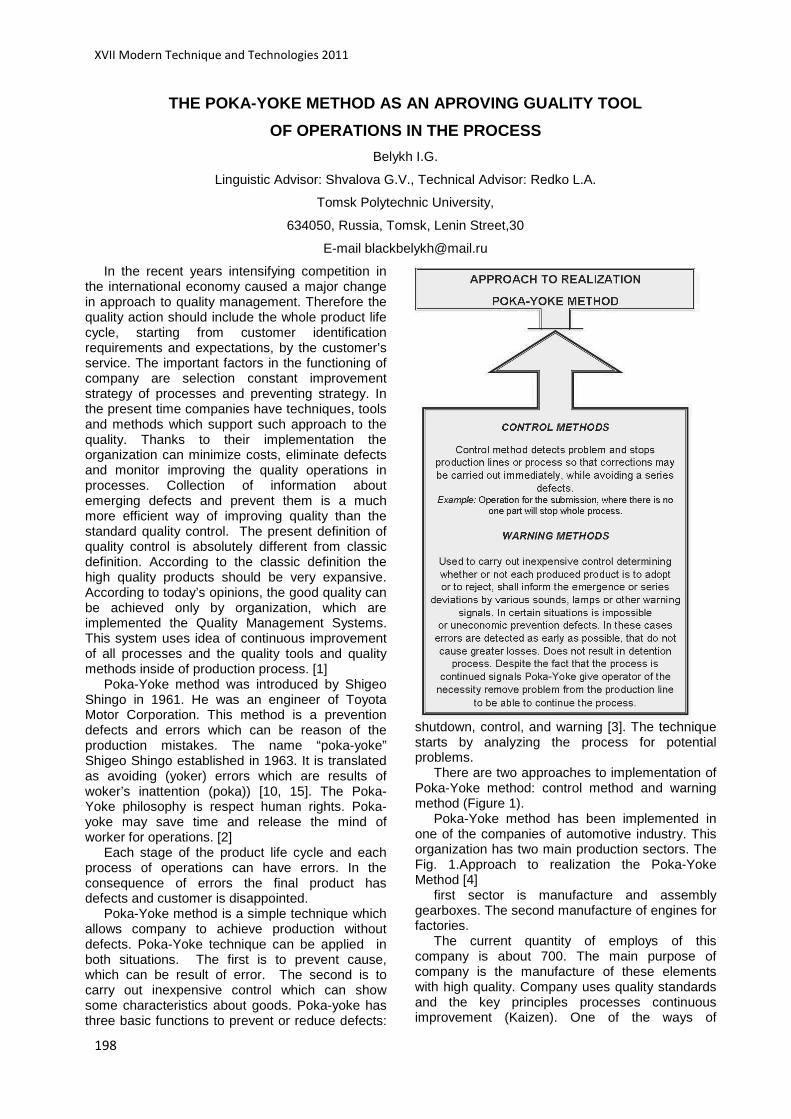
XVII Modern Technique and Technologies 2011
198
THE POKA-YOKE METHOD AS AN APROVING GUALITY TOOL
OF OPERATIONS IN THE PROCESS
Belykh I.G.
Linguistic Advisor: Shvalova G.V., Technical Advisor: Redko L.A.
Tomsk Polytechnic University,
634050, Russia, Tomsk, Lenin Street,30
E-mail [email protected]
In the recent years intensifying competition in the international economy caused a major change in approach to quality management. Therefore the quality action should include the whole product life cycle, starting from customer identification requirements and expectations, by the customer’s service. The important factors in the functioning of company are selection constant improvement strategy of processes and preventing strategy. In the present time companies have techniques, tools and methods which support such approach to the quality. Thanks to their implementation the organization can minimize costs, eliminate defects and monitor improving the quality operations in processes. Collection of information about emerging defects and prevent them is a much more efficient way of improving quality than the standard quality control. The present definition of quality control is absolutely different from classic definition. According to the classic definition the high quality products should be very expansive. According to today’s opinions, the good quality can be achieved only by organization, which are implemented the Quality Management Systems. This system uses idea of continuous improvement of all processes and the quality tools and quality methods inside of production process. [1]
Poka-Yoke method was introduced by Shigeo Shingo in 1961. He was an engineer of Toyota Motor Corporation. This method is a prevention defects and errors which can be reason of the production mistakes. The name “poka-yoke” Shigeo Shingo established in 1963. It is translated as avoiding (yoker) errors which are results of woker’s inattention (poka)) [10, 15]. The Poka-Yoke philosophy is respect human rights. Poka-yoke may save time and release the mind of worker for operations. [2]
Each stage of the product life cycle and each process of operations can have errors. In the consequence of errors the final product has defects and customer is disappointed.
Poka-Yoke method is a simple technique which allows company to achieve production without defects. Poka-Yoke technique can be applied in both situations. The first is to prevent cause, which can be result of error. The second is to carry out inexpensive control which can show some characteristics about goods. Poka-yoke has three basic functions to prevent or reduce defects:
shutdown, control, and warning [3]. The technique starts by analyzing the process for potential problems.
There are two approaches to implementation of Poka-Yoke method: control method and warning method (Figure 1).
Poka-Yoke method has been implemented in one of the companies of automotive industry. This organization has two main production sectors. The Fig. 1.Approach to realization the Poka-Yoke Method [4]
first sector is manufacture and assembly gearboxes. The second manufacture of engines for factories.
The current quantity of employs of this company is about 700. The main purpose of company is the manufacture of these elements with high quality. Company uses quality standards and the key principles processes continuous improvement (Kaizen). One of the ways of
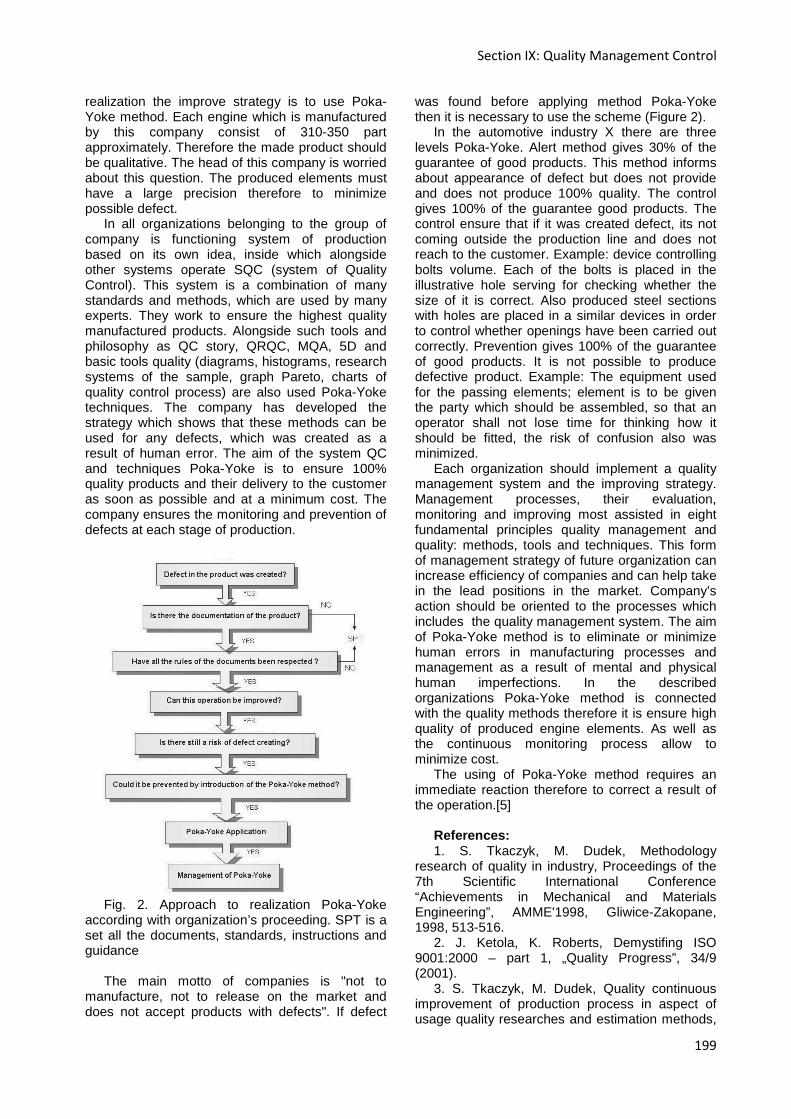
Section IX: Quality Management Control
199
realization the improve strategy is to use Poka-Yoke method. Each engine which is manufactured by this company consist of 310-350 part approximately. Therefore the made product should be qualitative. The head of this company is worried about this question. The produced elements must have a large precision therefore to minimize possible defect.
In all organizations belonging to the group of company is functioning system of production based on its own idea, inside which alongside other systems operate SQC (system of Quality Control). This system is a combination of many standards and methods, which are used by many experts. They work to ensure the highest quality manufactured products. Alongside such tools and philosophy as QC story, QRQC, MQA, 5D and basic tools quality (diagrams, histograms, research systems of the sample, graph Pareto, charts of quality control process) are also used Poka-Yoke techniques. The company has developed the strategy which shows that these methods can be used for any defects, which was created as a result of human error. The aim of the system QC and techniques Poka-Yoke is to ensure 100% quality products and their delivery to the customer as soon as possible and at a minimum cost. The company ensures the monitoring and prevention of defects at each stage of production.
Fig. 2. Approach to realization Poka-Yoke according with organization’s proceeding. SPT is a set all the documents, standards, instructions and guidance
The main motto of companies is "not to
manufacture, not to release on the market and does not accept products with defects". If defect
was found before applying method Poka-Yoke then it is necessary to use the scheme (Figure 2).
In the automotive industry X there are three levels Poka-Yoke. Alert method gives 30% of the guarantee of good products. This method informs about appearance of defect but does not provide and does not produce 100% quality. The control gives 100% of the guarantee good products. The control ensure that if it was created defect, its not coming outside the production line and does not reach to the customer. Example: device controlling bolts volume. Each of the bolts is placed in the illustrative hole serving for checking whether the size of it is correct. Also produced steel sections with holes are placed in a similar devices in order to control whether openings have been carried out correctly. Prevention gives 100% of the guarantee of good products. It is not possible to produce defective product. Example: The equipment used for the passing elements; element is to be given the party which should be assembled, so that an operator shall not lose time for thinking how it should be fitted, the risk of confusion also was minimized.
Each organization should implement a quality management system and the improving strategy. Management processes, their evaluation, monitoring and improving most assisted in eight fundamental principles quality management and quality: methods, tools and techniques. This form of management strategy of future organization can increase efficiency of companies and can help take in the lead positions in the market. Company’s action should be oriented to the processes which includes the quality management system. The aim of Poka-Yoke method is to eliminate or minimize human errors in manufacturing processes and management as a result of mental and physical human imperfections. In the described organizations Poka-Yoke method is connected with the quality methods therefore it is ensure high quality of produced engine elements. As well as the continuous monitoring process allow to minimize cost.
The using of Poka-Yoke method requires an immediate reaction therefore to correct a result of the operation.[5]
References: 1. S. Tkaczyk, M. Dudek, Methodology
research of quality in industry, Proceedings of the 7th Scientific International Conference “Achievements in Mechanical and Materials Engineering”, AMME'1998, Gliwice-Zakopane, 1998, 513-516.
2. J. Ketola, K. Roberts, Demystifing ISO 9001:2000 – part 1, „Quality Progress”, 34/9 (2001).
3. S. Tkaczyk, M. Dudek, Quality continuous improvement of production process in aspect of usage quality researches and estimation methods,
XVII Modern Technique and Technologies 2011
200
Proceedings of the 11th Scientific International Conference “Achievements in Mechanical and Materials Engineering”, AMME'2002, Gliwice-Zakopane,, 2002, 567-570.
4. J.R. Grout, B.T. Downs, A Brief Tutorial on Mistake-proofing, Poka-Yoke, and ZQC, www.csob.berry.edu.
5. Shimbum N. K., Improving Product Quality by Preventing Defects, Productivity Press, Cambridge, Massachusetts 1998.
KAIZEN IN EDUCATION
Chebodaeva A.V.
Scientific adviser: Redko L.A.
Linguistic advisor: Shvalova G.V.
Tomsk Polytechnic University, Lenin Street, 30 Tomsk, Russia, 634034,
E-mail: [email protected]
The goal of the work is to regard the improving quality of education. It is considered to be very important nowadays. According to Japanese philosophy of continuous improvement there is a method which can help to make education better. It names “Kaizen”.
Kaizen (改善), Japanese for "improvement" or "change for the better", refers to philosophy or practices that focus upon continuous improvement of processes in manufacturing, engineering, supporting business processes, and management. It has been applied in healthcare, psychotherapy, life-coaching, government, banking, and many other industries.
The aim of kaizen is to eliminate waste and to improve processes. Kaizen was the first to be implemented in several Japanese businesses after the Second World War, influenced in part by American business and the quality management teachers who visited the country. It has since spread throughout the world and is now being implemented in many other venues besides just business and productivity.
Here are ten principles of Kaizen: 1. Concentration on clients; 2. Continuous changes; 3. Open acceptance of problems; 4. Openness of system; 5. Creation of working team; 6. Management with projects with help of
interfunctional teams; 7. Creation of “supporting” relationships; 8. Development of self-discipline; 9. Informing of each staff; 10. Delegation of work to each staff.
Here are possible results of application of
Kaizen philosophy: 1. Reduction of costs: costs of time, physical
costs, material costs, mental and emotional costs.
2. Increasing teaching quality and studying. 3. Exchange with experience. 4. Development of team working skills. 5. Small volume of financing. 6. Attraction of students in the process of
improving. 7. Increasing the motivation to the
educational process of teachers and students.
Kaizen is a daily process, the purpose of which
goes beyond the simple productivity improvement. It is also a process that, when done correctly, humanizes the workplace, eliminates overly hard work, and teaches people how to perform experiments on their work using the scientific method and how to learn to spot eliminate waste in business processes
At industry Kaizen as a rule takes up four-five days. Over a this period the special group of people with the help of professional expert reveal, measure, and formulates methods of correction of problems, connected with process. Kaizen- is a special form of activity, where people research problems and make solutions in order to satisfy the customer.
In education such group can include students. Students can create quality circles, where they will carry out all functions of Kaizen group.
In education sphere Kaizen can be very important. The processes in education are very close to processes in industry. In industry by results we mean production and services. The product of university is specialists firstly. Some processes in education can be improved with the help of Kaizen. For example, processes of giving lectures by a lecturer in order to make them more informative and easier for accepting, the processes of making presentations by students, education of great specialists and etc.

Section IX: Quality Management Control
201
The whole society is the main big client of educational process and it can be suggested that on this stage the university can put into students’ minds idea of quality (table1). Active participators of Kaizen should be students. They are very active, strong and open-minded. Creation of quality circles by students can be the great step to Kaizen establishment. The quality circles the Japanese idea too. The main goal is to create a team who is interested in the quality problem. Motivated people can improve the quality level. This kind of people can solve different problems connected with quality. Also the students’ big energy of youngness, power, intellect and enthusiasm which will provide big success. Going this way Kaizen can improve quality of the whole educational process.
Table 1. 10 research principles in education
with the application of kaizen. Principle Realization in
education sphere 1 Concentration
on clients Students, university, university stuff, society, industry.
2 Continuous changes
New methods of learning, new ways of working and communication
3 Open acceptance of problems
Acceptance of bad problem, lack of time problem, misunderstanding between people.
4 Openness of system
Openness to new ideas, new people, projects
5 Creation of working team
Creation of quality circles by students
6 Projects management
Projects management with
with help of interfunctional teams
help of interfunctional teams
7 Creation of “supporting” relationships
Development of teamwork
8 Development of self-disciplines
Development of self-disciplines
9 Informing of each staff
Informing of each participator of improving
10 Delegation of work to each staff
Delegating of work to participators of team
What problems can appear with implementing
of Kaizen in education system in Russia? Another mentality; Another habits; The lack of experience. The lack of knowledge and specialists.
Kaizen is a style of life, it is the whole
philosophy. If you want to imply it, you will live with this philosophy. It is not so easy, but it will give real improvements.
References:
1. Gemba Kaizen: A Commonsense, Low-Cost Approach to Management. Masaaki Imai. – M.:Alpina Business Books, 2005. –346p.
2. Application of KAIZEN in education as an element of overcoming the resistance organization innovation.]. –http://wwconf.ru/innovlichn/67-section-1/93-kaizen
LEAN MANUFACTURING
Garmaeva A.S., Sagalakova T.N.
Technical advisor: Oglezneva L.A., Linguistic advisor: Shvalova G.V.
Tomsk Polytechnic University, 634050, Russia, Tomsk, Lenin street, 30
E-mail: [email protected]
Lean Manufacturing or Lean is a manufacturing term used to describe a manufacturing, industrial or service operation which operates with little or no type of muda (waste), thus making the operation very efficient
and only consisting of value adding steps from start to finish, as can be seen in a value stream map. The term lean centers around the idea that the customer purchasing a good or service is only willing to pay for the value added "steps" in making
XVII Modern Technique and Technologies 2011
202
or delivering such a service. Therefore the non value adding "steps" and its associated costs are barred by the manufacturing company, thus reducing margins for the manufacturer. Many of the concepts are derived from the Toyota Production system, who is considered to be the pioneer in several lean manufacturing concepts and principles.
For many, Lean is the set of "tools" that assists in the identification and steady elimination of waste (muda). As waste is eliminated quality improves while production time and cost are reduced. Examples of such "tools" are Value Stream Mapping, Five S, Kanban (pull systems), and poka-yoke (error-proofing). [1]
There is a second approach to Lean Manufacturing, which is promoted by Toyota, in which the focus is upon improving the "flow" or smoothness of work, thereby steadily eliminating mura ("unevenness") through the system and not upon 'waste reduction' per se. Techniques to improve flow include production leveling, "pull" production (by means of kanban) and the Heijunka box. This is a fundamentally different approach from most improvement methodologies, which may partially account for its lack of popularity.
The difference between these two approaches is not the goal itself, but rather the prime approach to achieving it. The implementation of smooth flow exposes quality problems that already existed, and thus waste reduction naturally happens as a consequence. The advantage claimed for this approach is that it naturally takes a system-wide perspective, whereas a waste focus sometimes wrongly assumes this perspective.
Manufacturing went through a revolution at the start of the 20th century with the creation of the assembly line to mass produce the Ford model T by Henry Ford. Even then when the lean manufacturing concept was years away, Ford had a focus on reducing time and material waste, increasing quality, and lowering cycle times, in order to achieve a lower cost vehicle which was reflected in the price reduction of the model T year on year. This focus allowed him to reduce costs, even though he payed his workers well, and provide a great value product to the customer.
Toyota later developed the Just in time model (J IT) as we know it today. The model aims at continuous flow of materials through a process with minimal inventory or work in progress (WIP) through the different value adding work stations or stages. J IT is pull system which adapts to consumer demand, and is usually implemented with a kanban system.
In today's world more and more organizations are realizing how important quality and customer satisfaction is in order to sustain a competitive business. There is also a pressure to reduce manufacturing, operating and inventory costs and increase efficiencies not only in manufacturing but
in different types of industries, such as banking, business and community services. The challenge today is adapting these concepts and technologies to this wide range of industries successfully. The key to success in implementing lean manufacturing principles in any organization is to foster a culture of continuous improvement within its company culture, quality focus, lean thinking, and customer satisfaction as the organization's ultimate goal. This shift in culture, if not already present, must come from top management and be embraced by all layers of the organization. [2]
Types of waste While the elimination of waste may seem like a
simple and clear subject it is noticeable that waste is often very conservatively identified. This then hugely reduces the potential of such an aim. The elimination of waste is the goal of Lean, and Toyota defined three broad types of waste: muda, muri and mura; it should be noted that for many Lean implementations this list shrinks to the first waste type only with corresponding benefits decrease. To illustrate the state of this thinking Shigeo Shingo observed that only the last turn of a bolt tightens it—the rest is just movement. This ever finer clarification of waste is the key to establishing distinctions between value-adding activity, waste and non-value-adding work. Non-value adding work is waste that must be done under the present work conditions. One key is to measure, or estimate, the size of these wastes, to demonstrate the effect of the changes achieved and therefore the movement toward the goal.
The "flow" (or smoothness) based approach aims to achieve J IT, by removing the variation caused by work scheduling and thereby provide a driver, rationale or target and priorities for implementation, using a variety of techniques. The effort to achieve JIT exposes many quality problems that are hidden by buffer stocks; by forcing smooth flow of only value-adding steps, these problems become visible and must be dealt with explicitly.
Muri is all the unreasonable work that management imposes on workers and machines because of poor organization, such as carrying heavy weights, moving things around, dangerous tasks, even working significantly faster than usual. It is pushing a person or a machine beyond its natural limits. This may simply be asking a greater level of performance from a process than it can handle without taking shortcuts and informally modifying decision criteria. Unreasonable work is almost always a cause of multiple variations.
To link these three concepts is simple in TPS and thus Lean. Firstly, muri focuses on the preparation and planning of the process, or what work can be avoided proactively by design. Next, mura then focuses on how the work design is implemented and the elimination of fluctuation at
Section IX: Quality Management Control
203
the scheduling or operations level, such as quality and volume. Muda is then discovered after the process is in place and is dealt with reactively. It is seen through variation in output. It is the role of management to examine the muda, in the processes and eliminate the deeper causes by considering the connections to the muri and mura of the system. The muda and mura inconsistencies must be fed back to the muri, or planning, stage for the next project.
A typical example of the interplay of these wastes is the corporate behavior of "making the numbers" as the end of a reporting period approaches. Demand is raised to 'make plan,' increasing (mura), when the "numbers" are low, which causes production to try to squeeze extra capacity from the process, which causes routines and standards to be modified or stretched. This stretch and improvisation leads to muri-style waste, which leads to downtime, mistakes and back flows, and waiting, thus the muda of waiting, correction and movement.
The original seven muda are: • Transport (moving products that is not actually
required to perform the processing) • Inventory (all components, work in process and
finished product not being processed) • Motion (people or equipment moving or walking
more than is required to perform the processing)
• Waiting (waiting for the next production step) • Overproduction (production ahead of demand) • Over Processing (resulting from poor tool or
product design creating activity) • Defects (the effort involved in inspecting for and
fixing defects) Later an eighth waste was defined by
Womacket al. (2003); it was described as manufacturing goods or services that do not meet customer demand or specifications. Many others
have added the "waste of unused human talent" to the original seven wastes. These wastes were not originally a part of the seven deadly wastes defined by Taiichi Ohno in TPS, but were found to be useful additions in practice. For a complete listing of the "old" and "new" wastes see Bicheno and Holweg (2009)
Some of these definitions may seem rather idealistic, but this tough definition is seen as important and they drove the success of TPS. The clear identification of non-value-adding work, as distinct from wasted work, is critical to identifying the assumptions behind the current work process and to challenging them in due course. Breakthroughs in SMED and other process changing techniques rely upon clear identification of where untapped opportunities may lie if the processing assumptions are challenged. [3]
Well, Lean manufacturing strategies can save millions of dollars and produce excellent results. Advantages include lower lead times, reduced set-up times, lower equipment expense, and of course, increased profits. It gives the manufacturer a competitive edge by reducing costs and increasing quality, and by allowing the manufacturer to be more responsive to customer demands.
References: 1. Pettersen, J.,. “Defining lean production:
some conceptual and practical issues”. The TQM Journal, 21(2), 127 – 142, 2009
2. Ruffa, Stephen A. “Going Lean: How the Best Companies Apply Lean Manufacturing Principles to Shatter Uncertainty, Drive Innovation, and Maximize Profits”. AMACOM. ISBN 0-8144-1057-X. (2008)
3. Вумек Джеймс П., Джонс Даниел Т. “Бережливое производство. Как избавиться от потерь и добиться процветания вашей компании”. -М.,: Альпина Бизнес Букс, 2008.
EFFECTIVENESS OF FAILURE MODES AND EFFECTS ANALYSIS (FMEA)
Minenkova J.A.
Scientific adviser: Oglezneva L.A., assistant professor
Linguistic adviser: Shvalova G.V.
Tomsk Polytechnic University, 634050, Russia, Tomsk, Lenina Street, 30
E-mail: [email protected]
One of the most important aims of any organization is to eliminate defects and faults to satisfy clients. But it is more effectively and cheap to analyze process in planning and uncover potential failures. A challenge task of the article is
to consider the opportunities and effectiveness of FMEA method.
According to the Society of Automotive Engineers (SAE) International Aerospace Recommended Practice (ARP) 5580, Recommended Failure Modes and Effects (FMEA)
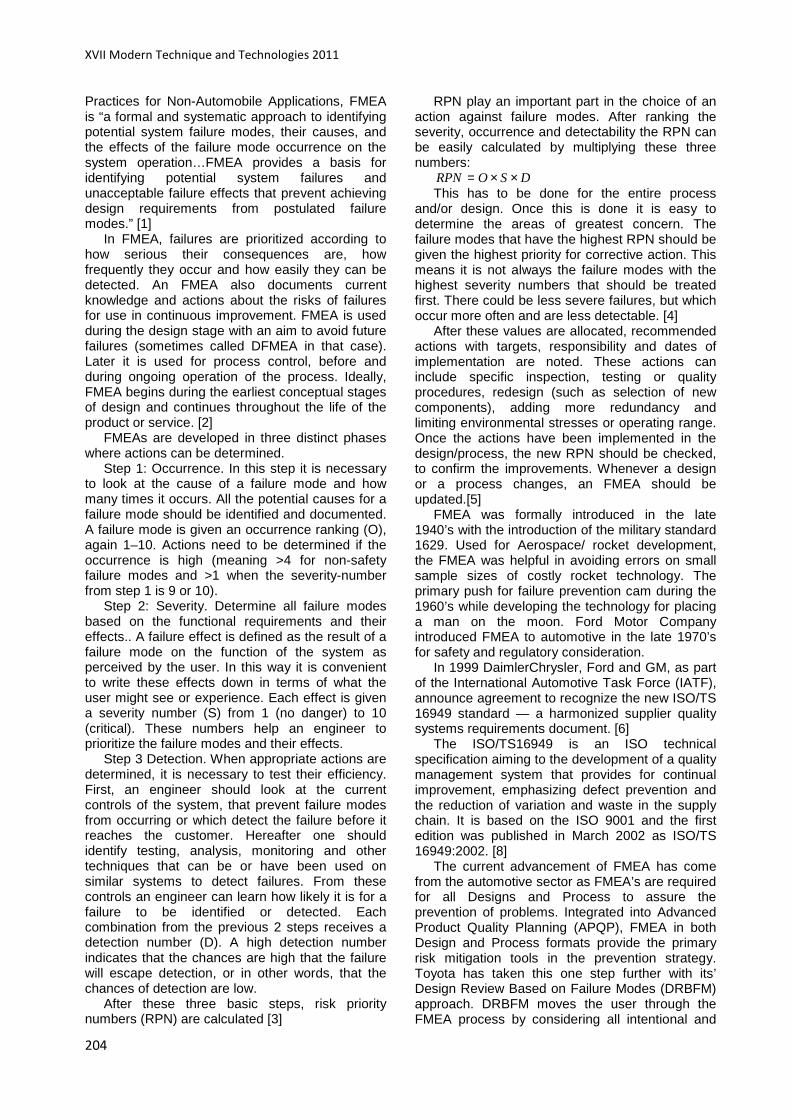
XVII Modern Technique and Technologies 2011
204
Practices for Non-Automobile Applications, FMEA is “a formal and systematic approach to identifying potential system failure modes, their causes, and the effects of the failure mode occurrence on the system operation…FMEA provides a basis for identifying potential system failures and unacceptable failure effects that prevent achieving design requirements from postulated failure modes.” [1]
In FMEA, failures are prioritized according to how serious their consequences are, how frequently they occur and how easily they can be detected. An FMEA also documents current knowledge and actions about the risks of failures for use in continuous improvement. FMEA is used during the design stage with an aim to avoid future failures (sometimes called DFMEA in that case). Later it is used for process control, before and during ongoing operation of the process. Ideally, FMEA begins during the earliest conceptual stages of design and continues throughout the life of the product or service. [2]
FMEAs are developed in three distinct phases where actions can be determined.
Step 1: Occurrence. In this step it is necessary to look at the cause of a failure mode and how many times it occurs. All the potential causes for a failure mode should be identified and documented. A failure mode is given an occurrence ranking (O), again 1–10. Actions need to be determined if the occurrence is high (meaning >4 for non-safety failure modes and >1 when the severity-number from step 1 is 9 or 10).
Step 2: Severity. Determine all failure modes based on the functional requirements and their effects.. A failure effect is defined as the result of a failure mode on the function of the system as perceived by the user. In this way it is convenient to write these effects down in terms of what the user might see or experience. Each effect is given a severity number (S) from 1 (no danger) to 10 (critical). These numbers help an engineer to prioritize the failure modes and their effects.
Step 3 Detection. When appropriate actions are determined, it is necessary to test their efficiency. First, an engineer should look at the current controls of the system, that prevent failure modes from occurring or which detect the failure before it reaches the customer. Hereafter one should identify testing, analysis, monitoring and other techniques that can be or have been used on similar systems to detect failures. From these controls an engineer can learn how likely it is for a failure to be identified or detected. Each combination from the previous 2 steps receives a detection number (D). A high detection number indicates that the chances are high that the failure will escape detection, or in other words, that the chances of detection are low.
After these three basic steps, risk priority numbers (RPN) are calculated [3]
RPN play an important part in the choice of an action against failure modes. After ranking the severity, occurrence and detectability the RPN can be easily calculated by multiplying these three numbers:
DSORPN ××= This has to be done for the entire process
and/or design. Once this is done it is easy to determine the areas of greatest concern. The failure modes that have the highest RPN should be given the highest priority for corrective action. This means it is not always the failure modes with the highest severity numbers that should be treated first. There could be less severe failures, but which occur more often and are less detectable. [4]
After these values are allocated, recommended actions with targets, responsibility and dates of implementation are noted. These actions can include specific inspection, testing or quality procedures, redesign (such as selection of new components), adding more redundancy and limiting environmental stresses or operating range. Once the actions have been implemented in the design/process, the new RPN should be checked, to confirm the improvements. Whenever a design or a process changes, an FMEA should be updated.[5]
FMEA was formally introduced in the late 1940’s with the introduction of the military standard 1629. Used for Aerospace/ rocket development, the FMEA was helpful in avoiding errors on small sample sizes of costly rocket technology. The primary push for failure prevention cam during the 1960’s while developing the technology for placing a man on the moon. Ford Motor Company introduced FMEA to automotive in the late 1970’s for safety and regulatory consideration.
In 1999 DaimlerChrysler, Ford and GM, as part of the International Automotive Task Force (IATF), announce agreement to recognize the new ISO/TS 16949 standard — a harmonized supplier quality systems requirements document. [6]
The ISO/TS16949 is an ISO technical specification aiming to the development of a quality management system that provides for continual improvement, emphasizing defect prevention and the reduction of variation and waste in the supply chain. It is based on the ISO 9001 and the first edition was published in March 2002 as ISO/TS 16949:2002. [8]
The current advancement of FMEA has come from the automotive sector as FMEA’s are required for all Designs and Process to assure the prevention of problems. Integrated into Advanced Product Quality Planning (APQP), FMEA in both Design and Process formats provide the primary risk mitigation tools in the prevention strategy. Toyota has taken this one step further with its’ Design Review Based on Failure Modes (DRBFM) approach. DRBFM moves the user through the FMEA process by considering all intentional and
Section IX: Quality Management Control
205
incidental changes and their effects on the performance of a product or process. These changes drive potential causes which require follow-up action to resolve the risk. [4]
The reliability and maintenance of machinery is critical to many manufactures as down time for maintenance or repair must be kept to an absolute minimum. FMEA is a tool which assists the designers and builders of tooling and equipment to determine when to improve reliability of components and where to use common parts. All R&M activities must consider the cost of ownership or total Life Cycle Costs (LCC) which must be determined well in advance of building the equipment. FMEA is an integral part of this LCC determination.
Failure Mode and Effects Analysis has always been a part of the Aerospace industry since it’s first use in rocketry. FMEA continues to be an integral part of the development of Aircraft, Missile systems, Radar, Communications, electronics and other key interfacing technologies. New innovations in this prevention technology have increased its’ effectiveness.
Failure Mode and Effects Analysis is being deployed in many more industries than just Automotive and Aerospace. Medical device and drug delivery has added FMEA as a means to understand the risks not considered by individual design and process personnel. The Food and Drug Administration (FDA) has recognized FMEA as a design verification method for Drugs and Medical Devices.
Hospitals also have begun to use FMEA to prevent the possibility of process errors and mistakes leading to incorrect surgery or medication administration. This use is driven from the Joint Commission of Accreditation of Health Care Organization (JCAHO). [7]
In conclusion, FMEA is one of the most effective improving methods. More over it doesn’t take a lot of money. Because cheaper to uncover failures in initial stages of total Life Cycle Costs (LCC) when costs are low. Some examples of using FMEA in different industries were shown in the article. And it can be asserted that Failure Mode and Effects Analysis in Medical, Machinery development will be such effective as in Automobile and Aerospace.
References: 1. Benjamin A. Berman (2008) Effective Risk
Management and Quality Improvement by Application of FMEA and Complementary Techniques from http://www.paragonrx.com;
2. Failure Mode and Effects Analysis. Retrieved February 21, 2011 from http://en.wikipedia.org/wiki/Failure_Mode_and_Effects_Analysis;
3. Otto, Kevin; Wood, Kristin (2001). Product Design - Techniques in Reverse Engineering and New Product Development. Prentice Hall;
4. Zigmund Bluvband, Pavel Grabov (2009) Failure Analysis of FMEA, ALD Ltd.;
5. Failure Mode and Effects Analysis. Retrieved February 21, 2011 from http://www.answers.com;
6. Automotive_Industry_Action_Group. Retrieved February19, 2011 from http://en.wikipedia.org/wiki/Automotive_Industry_Action_Group;
7. FMEA. Retrieved February 18, 2011 from http://www.quality-one.com/services/fmea.php
8. Kartha, C.P. (2004). "A comparison of ISO 9000:2000 quality system standards, QS9000, ISO/TS 16949 and Baldrige criteria". The TQM Magazine Volume 16 (Emerald Group Publishing Limited) Number 5: p. 336.
THE SEVEN BASIC TOOLS OF QUALITY AND THEIR USE
FOR COMPANY IMPROVEMENT ACTIVITY
Peskova E.S., Turchenko T.P.,
Linguistic advisor: Shvalova G.V., Technical advisor: Redko L.A.,
Tomsk Polytechnic University, 634050, Russia, Tomsk, st.Lenina,30
E-mail: [email protected]
"The Old Seven" "The First Seven"
"The Basic Seven"[1]
In today’s businesses managers and decision makers often face diversified and complicated problems. The complexity of the problem solving
requires the use of quality tools and techniques to assist organization in analysis of information and associated data.
The use and application of quality tools and techniques within an effective problem solving methodology are essential to understand and facilitate improvement in any process. Most of

XVII Modern Technique and Technologies 2011
206
the quality-related problems can be solved with the seven basic quality tools and techniques (7QC).
What are 7 Basic Tools of Quality Control? The term ‘Seven Basic Tools of Quality
relates to the graphical statistical techniques. These tools are easy to understand and implement and does not need complex analytical competence [2].
7 QC tools are fundamental instruments of Quality improvement [3]. The seven basic quality tools are used to identify procedures, ideas, statistics, cause and effect concerns and other issues relevant to their organizations. They can be used to enhance the effectiveness, efficiency, standardization and overall quality of procedures, products, services and work environment, in accordance with ISO 9000 standards. These tools and techniques are utilized in manufacturing and services organizations to aid in the analysis, documentation and organization of quality systems [4]. Quality tools can be used in all phases of production process, from the beginning of a product development up to a product marketing and customer support [5].
The Seven Basic Tools of Quality can be used singularly or in tandem to investigate a process and identify areas for improvement. Considered that 95% of a company’s problems could be improved using these seven tools [6].
The seven tools are: • The flowchart – a type of diagram showing the steps as boxes of various kinds, and their order by connecting these with arrows which may illustrate a step-by-step solution to a given problem and usually represents flow of data.
• The check sheet – a simple document that is used for collecting data. The document is typically a blank form designed for the quick, easy, and efficient recording of the desired information, which can be either quantitative or qualitative.
• The Pareto chart – a chart where individual values are represented in descending order by bars and the cumulative total is represented by the line. The left vertical axis represents usually the frequency of occurrence or another value. The right vertical axis is the cumulative percentage of the occurrences or total of another value.
• Ishikawa diagram – a diagram that show the causes of event. Causes are usually grouped into major categories. The basic categories include: Man (People), Method (Process), Machine (Equipment), Material, Measurement, Environment.
• The histogram – a graphical display of tabular frequencies shown as adjacent rectangles with an area proportional to the frequency of occurrence or value.
• The control chart (Shewhart chart) – determines whether or not a process is stable, with variation only coming from sources common to the process.
• The scatter diagram – an illustration of values for two variables for a set of data. The data is displayed as points, each having the value of one variable on the horizontal axis and the value of the other variable on the vertical axis [2].
With the help Seven Basic Tools of Quality companies can improve their activities. Let’s consider this aspect in detail.
1. Why do companies need to improve processes and quality?
Edwards Deming in 1986 answered this fundamental question in his famous Deming chain Reaction. The benefits from quality and process improvements to manufacturing organizations are: • Improve Quality. • Costs decrease because of less rework, fewer mistakes, fewer delays, snags, better use of machine-time and materials.
• Productivity Improves • Capture the market with better quality and lower price
• Stay in Business • Provide jobs and more jobs.
2. How to ensure continuous process improvement?
The most common process of continuous improvement is the PDCA Cycle, which was first developed by Walter Shewhart in the 1920s. The four steps in the cycle which is also known as the Deming Wheel [4].
The PDCA-cycle is integral part of process management and is designed to be used as dynamic model. The completion of one turn of cycle flows into the beginning of the next. Main purpose of PDCA-cycle application is in process improvement. When the process improvement starts with a careful planning it results in corrective and preventive actions, supported by appropriate quality assurance tools, which leads to true process improvement. Application of seven basic quality tools in correlation with four steps of PDCA-cycle shown on Figure 1[5].

Section IX: Quality Management Control
207
Figure 1. PDCA-cycle 3. When do companies should use Seven
Basic Tools of Quality? Before developing any framework for the
integration of QC7, it is important to understand clearly the problems for which, QC7 tools and techniques are used. Each approach should be used in a right place at a right time. Table 1 represents more information about tools and techniques including the reason and the time to apply them. The Table provides valuable guidelines for analyzers as well as decision makers to employ most effective approaches [7]. Table 1. The reason and the time to application of QC7 Quality tools
Why use? When to use?
The check sheet
•For recording data in a period of time •For recording data when it’s necessary to investigate important products in a period of time •In order to be certain that the solution is effective
•When we need to observe an operation and record its data in a period of time •When we want to identify that which potential problems should be specified first •In a measurement phase of continuous improvement cycles or when we want to make a problem measurable •In a control phase of continuous improvement cycles for measuring changes of performance
The histogram
• When we need to observe an operation and record its data in a period of time • When we want to identify that which potential problems should be specified first •In a measurement phase of continuous improvement cycles or when we want to make a problem measurable •In a control phase of continuous improvement cycles for measuring changes of performance
• When we want to know that if the process is under control • When we want to analyze the process •When we want to approve changes in a process •When we want to evaluate a process
The Pareto chart
•For displaying important results relationships of a problem or situation •For separating small and large critical results
•In a measurement or analyze phase of continuous improvement cycles •Wherever we want to concentrate on efforts and resources
Ishikawa diagram
•For identifying causes of effects •For categorizing and organizing potential causes in different categories •For identifying variables control without reducing their effects
•In a phase of analyzing a problem or process improvement •When we try to identify the causes of a performance reduction
The flowchart
•For graphical representation of data
•For comparing processes •For displaying trends
The scatter diagram
•For investigating the influence of input to output • For identifying the nature of a relationship •For measuring a relationship
•When we want to collect the data of causes of a problem •When we want to identify the effect of changes to the outcome of process
The control chart
•For recognition of changes in a process •For evaluating the process and making sure that it’s under control
•When we want to evaluate critical processes in an organization •When we want to collect data of a process (in
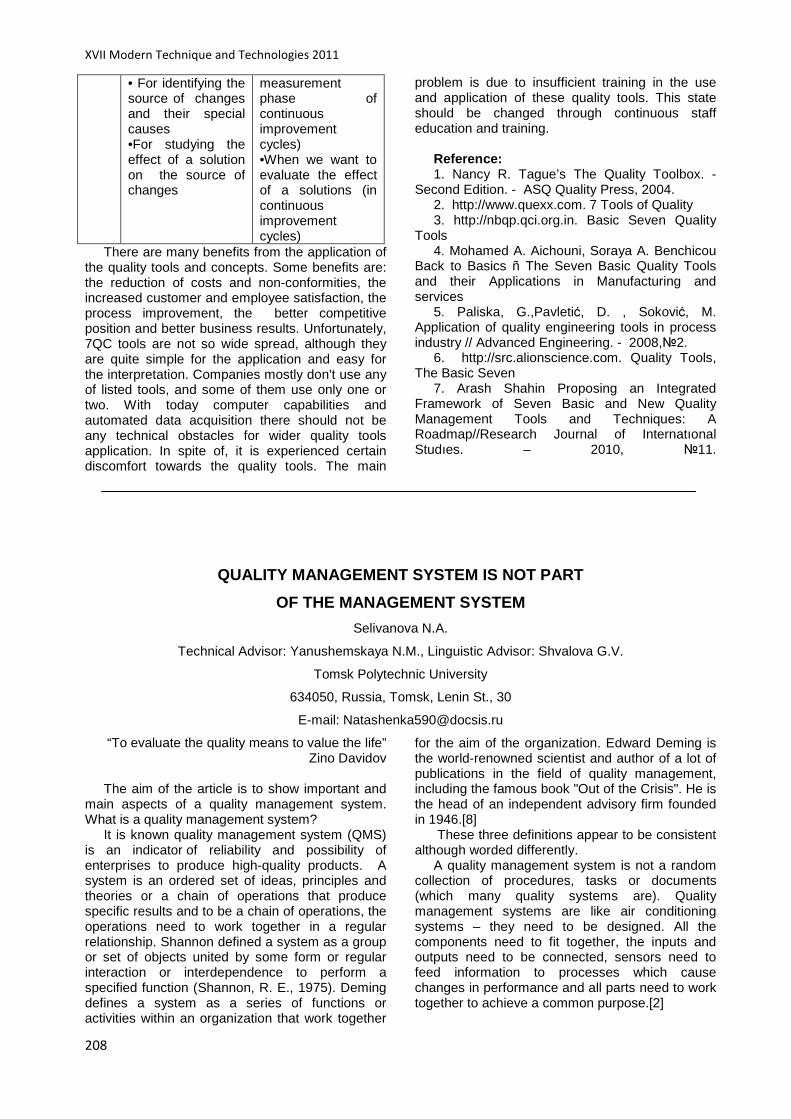
XVII Modern Technique and Technologies 2011
208
• For identifying the source of changes and their special causes •For studying the effect of a solution on the source of changes
measurement phase of continuous improvement cycles) •When we want to evaluate the effect of a solutions (in continuous improvement cycles)
There are many benefits from the application of the quality tools and concepts. Some benefits are: the reduction of costs and non-conformities, the increased customer and employee satisfaction, the process improvement, the better competitive position and better business results. Unfortunately, 7QC tools are not so wide spread, although they are quite simple for the application and easy for the interpretation. Companies mostly don't use any of listed tools, and some of them use only one or two. With today computer capabilities and automated data acquisition there should not be any technical obstacles for wider quality tools application. In spite of, it is experienced certain discomfort towards the quality tools. The main
problem is due to insufficient training in the use and application of these quality tools. This state should be changed through continuous staff education and training.
Reference: 1. Nancy R. Tague’s The Quality Toolbox. -
Second Edition. - ASQ Quality Press, 2004. 2. http://www.quexx.com. 7 Tools of Quality 3. http://nbqp.qci.org.in. Basic Seven Quality
Tools 4. Mohamed A. Aichouni, Soraya A. Benchicou
Back to Basics ñ The Seven Basic Quality Tools and their Applications in Manufacturing and services
5. Paliska, G.,Pavletić, D. , Soković, M. Application of quality engineering tools in process industry // Advanced Engineering. - 2008,2.
6. http://src.alionscience.com. Quality Tools, The Basic Seven
7. Arash Shahin Proposing an Integrated Framework of Seven Basic and New Quality Management Tools and Techniques: A Roadmap//Research Journal of Internatıonal Studıes. – 2010, 11.
QUALITY MANAGEMENT SYSTEM IS NOT PART
OF THE MANAGEMENT SYSTEM
Selivanova N.A.
Technical Advisor: Yanushemskaya N.M., Linguistic Advisor: Shvalova G.V.
Tomsk Polytechnic University
634050, Russia, Tomsk, Lenin St., 30
E-mail: [email protected]
“To evaluate the quality means to value the life” Zino Davidov
The aim of the article is to show important and
main aspects of a quality management system. What is a quality management system?
It is known quality management system (QMS) is an indicator of reliability and possibility of enterprises to produce high-quality products. A system is an ordered set of ideas, principles and theories or a chain of operations that produce specific results and to be a chain of operations, the operations need to work together in a regular relationship. Shannon defined a system as a group or set of objects united by some form or regular interaction or interdependence to perform a specified function (Shannon, R. E., 1975). Deming defines a system as a series of functions or activities within an organization that work together
for the aim of the organization. Edward Deming is the world-renowned scientist and author of a lot of publications in the field of quality management, including the famous book "Out of the Crisis". He is the head of an independent advisory firm founded in 1946.[8]
These three definitions appear to be consistent although worded differently.
A quality management system is not a random collection of procedures, tasks or documents (which many quality systems are). Quality management systems are like air conditioning systems – they need to be designed. All the components need to fit together, the inputs and outputs need to be connected, sensors need to feed information to processes which cause changes in performance and all parts need to work together to achieve a common purpose.[2]

Section IX: Quality Management Control
209
QMS built on requirements of global standard (ISO 9001). ISO is the world largest standards developing organization. Between 1947 and the present day, ISO has published more than 18 000 International Standards, ranging from standards for activities such as agriculture and construction, through mechanical engineering, to medical devices, to the newest information technology developments. [3]
Global standard can be applied to any organization, large or small, whatever its product or service, in any sector of activity, and whether it is a business enterprise, a public administration, or a government department.
ISO 9001 defines a quality management as a set of interrelated or interacting processes that achieve the quality policy and quality objective. But the word quality gets in the way of our thinking. It makes us think that quality management systems operate alongside environmental management systems, safety management systems, and financial management systems. In clause 3.11 of ISO 9001 is stated that the quality management system is ‘that part of the organization’s management system that focuses on the achievement of outputs in relation to the quality objectives’, therefore the quality management system must exist to achieve the organization’s quality objectives. [3]
Management system standards provide a model to follow in setting up and operating a management system. This model incorporates the features on which experts in the field have reached a consensus as being the international state of the art.
The quality management system builds on such principles as:
1) PDCA Dr. E. Deming developed cycle PDCA (The
Plan – Do – Check – Act) for the operating principle of ISO's management system standards.
Plan – establish objectives and make plans (analyze your organization's situation, establish your overall objectives and set your interim targets, and develop plans to achieve them).
Do – implement your plans (do what you planned to).
Check – measure your results (measure/monitor how far your actual achievements meet your planned objectives).
Act – correct and improve your plans and how you put them into practice (correct and learn from your mistakes to improve your plans in order to achieve better results next time).
2) Eight principles of quality control: a) Customer Focus b) Leadership
c) Involvement of people d) Process approach e) Factual approach to decision making f) Systems approach g) Continual improvement h) Mutually beneficial supplier relationships. [3] Customer Focus Organizations depend on their customers and
therefore should understand current and future customer needs, meet customer requirements and strive to exceed customer expectations.[3]
Leadership Leaders establish unity of purpose and direction
for the organization. They should create and maintain the internal environment in which people can become fully involved in achieving the organization’s objectives. Leadership begins at home. [7]
Edward Deming developed a basic understanding of a leadership in the modern sense. He singled out nine characteristics of a leader.
Characteristic features of the leader in Management: 1. Understands how to work his group is combined with the objectives of the company; 2. Works with previous and subsequent stages of the process; 3. Trying to create pleasing atmosphere for work; 4. He is the coach and counselor, but does not judge; 5. Uses the numbers for understanding the motives of his people and himself. Uses statistical calculations;
6. Works for improvement of the system; 7. Creates an atmosphere of trust;
8. Does not expect perfection; 9. Listens and learns, does not punish others. [9]
Also a very important thing for the leadership is management style. It should be a democratic management style. The democratic management style is one of the most popular forms of the management in the largest corporations in today’s business market.
Qualities necessary for effective use of staff of the democratic leadership style: High level of training; The desire to take responsibility; Thirst for creativity and personal growth; Interest in the work; Focus on the perspective of life and
organizational goals; High level of self-control. The advantages of a democratic leadership
style: Qualification of decisions; High level of student’s motivation. The disadvantages of the democratic
leadership style: Slowing the decision-making process;
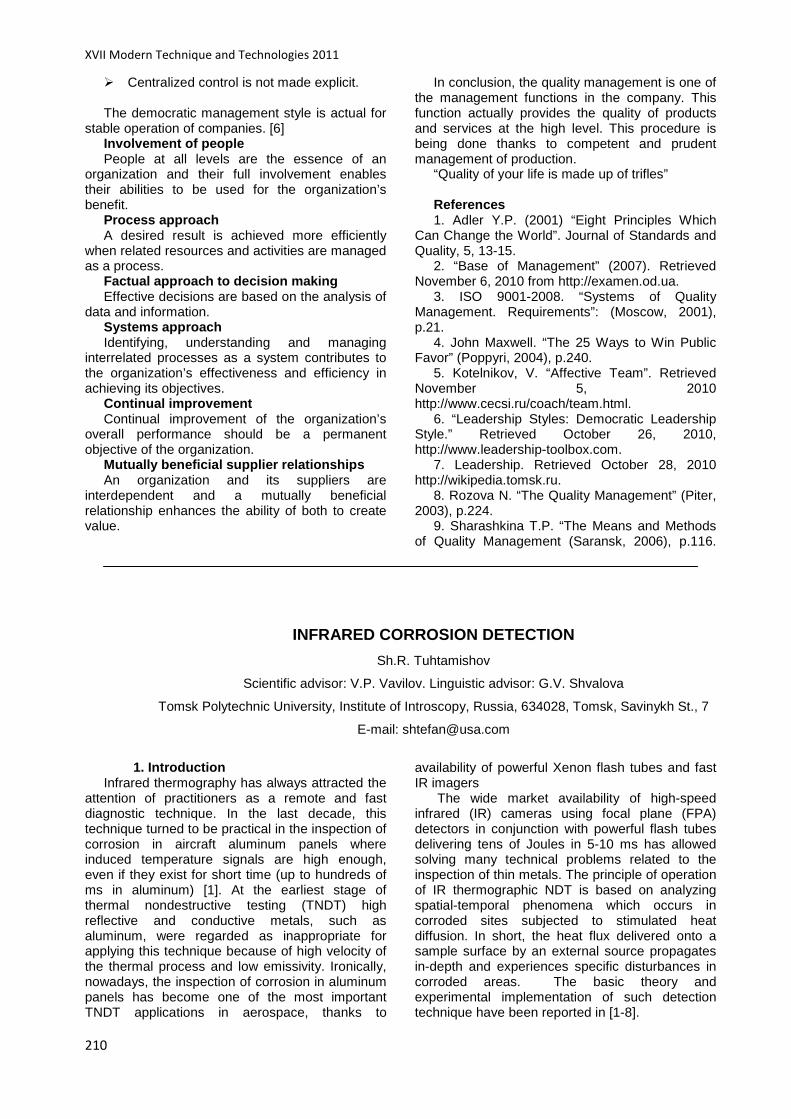
XVII Modern Technique and Technologies 2011
210
Centralized control is not made explicit. The democratic management style is actual for
stable operation of companies. [6] Involvement of people People at all levels are the essence of an
organization and their full involvement enables their abilities to be used for the organization’s benefit.
Process approach A desired result is achieved more efficiently
when related resources and activities are managed as a process.
Factual approach to decision making Effective decisions are based on the analysis of
data and information. Systems approach Identifying, understanding and managing
interrelated processes as a system contributes to the organization’s effectiveness and efficiency in achieving its objectives.
Continual improvement Continual improvement of the organization’s
overall performance should be a permanent objective of the organization.
Mutually beneficial supplier relationships An organization and its suppliers are
interdependent and a mutually beneficial relationship enhances the ability of both to create value.
In conclusion, the quality management is one of the management functions in the company. This function actually provides the quality of products and services at the high level. This procedure is being done thanks to competent and prudent management of production.
“Quality of your life is made up of trifles” References 1. Adler Y.P. (2001) “Eight Principles Which
Can Change the World”. Journal of Standards and Quality, 5, 13-15.
2. “Base of Management” (2007). Retrieved November 6, 2010 from http://examen.od.ua.
3. ISO 9001-2008. “Systems of Quality Management. Requirements”: (Moscow, 2001), p.21.
4. John Maxwell. “The 25 Ways to Win Public Favor” (Poppyri, 2004), p.240.
5. Kotelnikov, V. “Affective Team”. Retrieved November 5, 2010 http://www.cecsi.ru/coach/team.html.
6. “Leadership Styles: Democratic Leadership Style.” Retrieved October 26, 2010, http://www.leadership-toolbox.com.
7. Leadership. Retrieved October 28, 2010 http://wikipedia.tomsk.ru.
8. Rozova N. “The Quality Management” (Piter, 2003), p.224.
9. Sharashkina T.P. “The Means and Methods of Quality Management (Saransk, 2006), p.116.
INFRARED CORROSION DETECTION
Sh.R. Tuhtamishov
Scientific advisor: V.P. Vavilov. Linguistic advisor: G.V. Shvalova
Tomsk Polytechnic University, Institute of Introscopy, Russia, 634028, Tomsk, Savinykh St., 7
E-mail: [email protected]
1. Introduction Infrared thermography has always attracted the
attention of practitioners as a remote and fast diagnostic technique. In the last decade, this technique turned to be practical in the inspection of corrosion in aircraft aluminum panels where induced temperature signals are high enough, even if they exist for short time (up to hundreds of ms in aluminum) [1]. At the earliest stage of thermal nondestructive testing (TNDT) high reflective and conductive metals, such as aluminum, were regarded as inappropriate for applying this technique because of high velocity of the thermal process and low emissivity. Ironically, nowadays, the inspection of corrosion in aluminum panels has become one of the most important TNDT applications in aerospace, thanks to
availability of powerful Xenon flash tubes and fast IR imagers
The wide market availability of high-speed infrared (IR) cameras using focal plane (FPA) detectors in conjunction with powerful flash tubes delivering tens of Joules in 5-10 ms has allowed solving many technical problems related to the inspection of thin metals. The principle of operation of IR thermographic NDT is based on analyzing spatial-temporal phenomena which occurs in corroded sites subjected to stimulated heat diffusion. In short, the heat flux delivered onto a sample surface by an external source propagates in-depth and experiences specific disturbances in corroded areas. The basic theory and experimental implementation of such detection technique have been reported in [1-8].
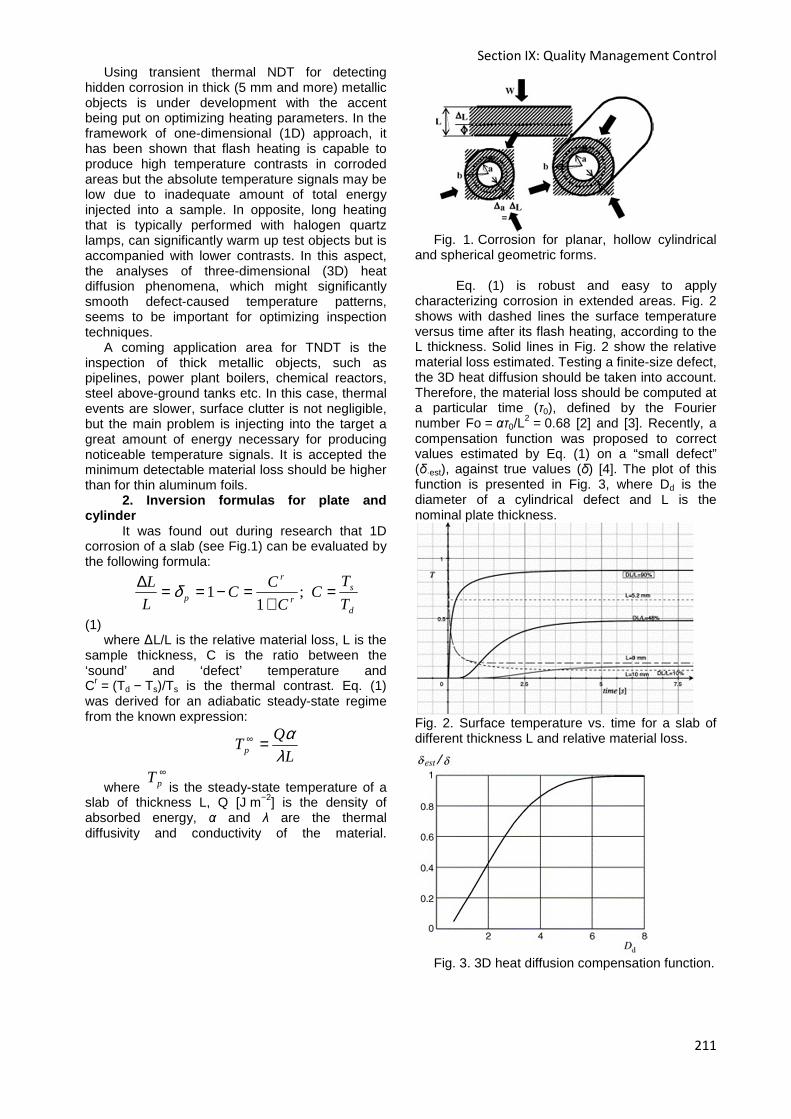
Section IX: Quality Management Control
211
Using transient thermal NDT for detecting hidden corrosion in thick (5 mm and more) metallic objects is under development with the accent being put on optimizing heating parameters. In the framework of one-dimensional (1D) approach, it has been shown that flash heating is capable to produce high temperature contrasts in corroded areas but the absolute temperature signals may be low due to inadequate amount of total energy injected into a sample. In opposite, long heating that is typically performed with halogen quartz lamps, can significantly warm up test objects but is accompanied with lower contrasts. In this aspect, the analyses of three-dimensional (3D) heat diffusion phenomena, which might significantly smooth defect-caused temperature patterns, seems to be important for optimizing inspection techniques.
A coming application area for TNDT is the inspection of thick metallic objects, such as pipelines, power plant boilers, chemical reactors, steel above-ground tanks etc. In this case, thermal events are slower, surface clutter is not negligible, but the main problem is injecting into the target a great amount of energy necessary for producing noticeable temperature signals. It is accepted the minimum detectable material loss should be higher than for thin aluminum foils.
2. Inversion formulas for plate and cylinder
It was found out during research that 1D corrosion of a slab (see Fig.1) can be evaluated by the following formula:
d
sr
r
p T
TC
C
CC
L
L =+
=−==∆;
11δ
(1)
where ∆L/L is the relative material loss, L is the sample thickness, C is the ratio between the ‘sound’ and ‘defect’ temperature and Cr = (Td − Ts)/Ts is the thermal contrast. Eq. (1) was derived for an adiabatic steady-state regime from the known expression:
L
QTp λ
α=∞
where ∞pT
is the steady-state temperature of a slab of thickness L, Q [J m−2] is the density of absorbed energy, α and λ are the thermal diffusivity and conductivity of the material.
Fig. 1. Corrosion for planar, hollow cylindrical
and spherical geometric forms. Eq. (1) is robust and easy to apply
characterizing corrosion in extended areas. Fig. 2 shows with dashed lines the surface temperature versus time after its flash heating, according to the L thickness. Solid lines in Fig. 2 show the relative material loss estimated. Testing a finite-size defect, the 3D heat diffusion should be taken into account. Therefore, the material loss should be computed at a particular time (τ0), defined by the Fourier number Fo = ατ0/L
2 = 0.68 [2] and [3]. Recently, a compensation function was proposed to correct values estimated by Eq. (1) on a “small defect” (δ·est), against true values (δ) [4]. The plot of this function is presented in Fig. 3, where Dd is the diameter of a cylindrical defect and L is the nominal plate thickness.
Fig. 2. Surface temperature vs. time for a slab of different thickness L and relative material loss.
Fig. 3. 3D heat diffusion compensation function.
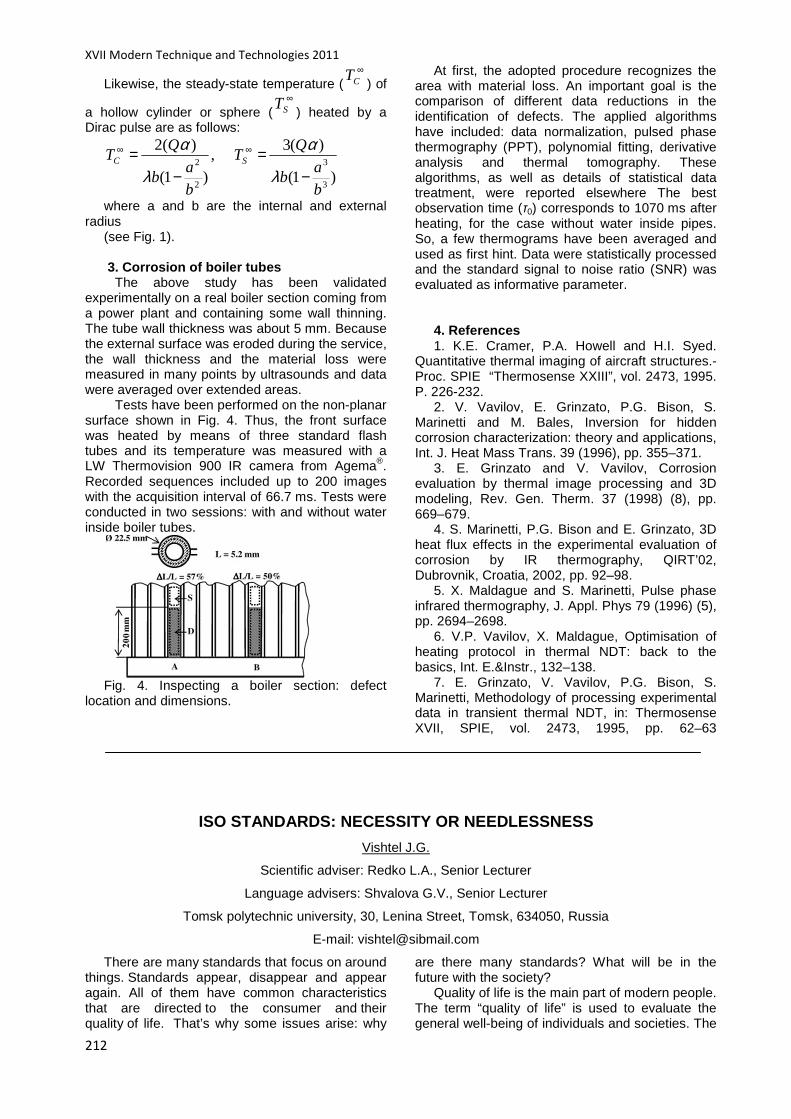
XVII Modern Technique and Technologies 2011
212
Likewise, the steady-state temperature (∞
CT) of
a hollow cylinder or sphere (∞
ST) heated by a
Dirac pulse are as follows:
)1(
)(3,
)1(
)(2
3
3
2
2
b
ab
QT
b
ab
QT SC
−=
−= ∞∞
λ
α
λ
α
where a and b are the internal and external
radius (see Fig. 1). 3. Corrosion of boiler tubes The above study has been validated
experimentally on a real boiler section coming from a power plant and containing some wall thinning. The tube wall thickness was about 5 mm. Because the external surface was eroded during the service, the wall thickness and the material loss were measured in many points by ultrasounds and data were averaged over extended areas.
Tests have been performed on the non-planar surface shown in Fig. 4. Thus, the front surface was heated by means of three standard flash tubes and its temperature was measured with a LW Thermovision 900 IR camera from Agema®. Recorded sequences included up to 200 images with the acquisition interval of 66.7 ms. Tests were conducted in two sessions: with and without water inside boiler tubes.
Fig. 4. Inspecting a boiler section: defect
location and dimensions.
At first, the adopted procedure recognizes the area with material loss. An important goal is the comparison of different data reductions in the identification of defects. The applied algorithms have included: data normalization, pulsed phase thermography (PPT), polynomial fitting, derivative analysis and thermal tomography. These algorithms, as well as details of statistical data treatment, were reported elsewhere The best observation time (τ0) corresponds to 1070 ms after heating, for the case without water inside pipes. So, a few thermograms have been averaged and used as first hint. Data were statistically processed and the standard signal to noise ratio (SNR) was evaluated as informative parameter.
4. References 1. K.E. Cramer, P.A. Howell and H.I. Syed.
Quantitative thermal imaging of aircraft structures.- Proc. SPIE “Thermosense XXIII”, vol. 2473, 1995. P. 226-232.
2. V. Vavilov, E. Grinzato, P.G. Bison, S. Marinetti and M. Bales, Inversion for hidden corrosion characterization: theory and applications, Int. J. Heat Mass Trans. 39 (1996), pp. 355–371.
3. E. Grinzato and V. Vavilov, Corrosion evaluation by thermal image processing and 3D modeling, Rev. Gen. Therm. 37 (1998) (8), pp. 669–679.
4. S. Marinetti, P.G. Bison and E. Grinzato, 3D heat flux effects in the experimental evaluation of corrosion by IR thermography, QIRT’02, Dubrovnik, Croatia, 2002, pp. 92–98.
5. X. Maldague and S. Marinetti, Pulse phase infrared thermography, J. Appl. Phys 79 (1996) (5), pp. 2694–2698.
6. V.P. Vavilov, X. Maldague, Optimisation of heating protocol in thermal NDT: back to the basics, Int. E.&Instr., 132–138.
7. E. Grinzato, V. Vavilov, P.G. Bison, S. Marinetti, Methodology of processing experimental data in transient thermal NDT, in: Thermosense XVII, SPIE, vol. 2473, 1995, pp. 62–63
ISO STANDARDS: NECESSITY OR NEEDLESSNESS
Vishtel J.G.
Scientific adviser: Redko L.A., Senior Lecturer
Language advisers: Shvalova G.V., Senior Lecturer
Tomsk polytechnic university, 30, Lenina Street, Tomsk, 634050, Russia
E-mail: [email protected]
There are many standards that focus on around things. Standards appear, disappear and appear again. All of them have common characteristics that are directed to the consumer and their quality of life. That’s why some issues arise: why
are there many standards? What will be in the future with the society?
Quality of life is the main part of modern people. The term “quality of life” is used to evaluate the general well-being of individuals and societies. The

Section IX: Quality Management Control
213
term is used in a wide range of contexts, including the fields of international development, healthcare, and politics. Quality of life should not be confused with the concept of standard of living, which is based primarily on income. Instead, standard indicators of the quality of life include not only wealth and employment, but also the building of environment, physical and mental health, education, recreation and leisure time, and social belonging. [2]
Quality of life is growing every year. Now all processes in a society focused on the consumer. In accordance with ISO 9001 there is a principle which is called "customer focus". At the current market all manufacturers are focused on the desires of the consumer. Therefore the society receives benefits such as high-quality products, appliances and so on.
In today's market the producer cannot keep all the information about the production in mind. For the help of producers there are specific standards developed for all types of products and services. Standard - is an example, model that is developed for the comparison with other similar objects. Now there are millions of standards in all over the world. Standards for quality products and services are more important in a society. Now a great attention is paid to such types of standards as the standards for water, air, soil and education. All these words are indicators of quality of life aren’t they? One of these companies is the International Organization for Standardization. Today many standards are used in life and about 200 standards are under the development. Why society does need so many documents? Is it effectively? Why do they need?
Companies that implemented ISO get a huge mass of advantages. At first they get a global status, respect and trust of consumers. Secondly they decide a lot of problems: • Supply the officer by ready-made solutions to work in unusual situations; • Standardize the response to the impact of a competitor • Create a tool for rating the quality of services;
Let’s regard some of the most interesting
standards. 1. ISO 19250:2010 ‘Water quality’. It detects
of Salmonella, specifies a method for the detection of presumptive or a confirmed salmonella bacteria in water samples and is applicable to both water intended for drinking water purposes and also recreational waters. Salmonella bacteria are widely occurring all over the world. Their pathogenesis varies depending on the species and susceptibility of the host. According to the United Nations, an estimated 884 million people lack access to safe drinking water and a total of more than 2.6 billion people do not have an access to basic sanitation. The publication of ISO 19250:2010 is timely since a recent resolution adopted by the UN General Assembly affirms : "Safe and clean drinking water
and sanitation is a human right essential to the full enjoyment of life and all other human rights". The standard will also help to meet the objectives of one of the UN Millennium Development Goals which targets the reduction by half by 2015 of the proportion of people who can not reach or afford safe drinking water and sanitation.[3]
2. The next standard is TC 146 ‘Air quality’ that is under the development. It will be about standardization of tools for air quality characterization of emissions, workspace air, ambient air, indoor air, in particular measurement methods for air pollutants (particles, gases, micro-organisms) and for meteorological parameters, measurement planning, procedures for Quality Assurance/Quality Control (QA/QC) and methods for the evaluation of results including the determination of uncertainty.
3. TS 147 ‘Water quality’. It regulates the standardization in the field of water quality, including the definition of terms, sampling of waters, the measurement and reporting of water characteristics.
4. ТК 190 ‘Soil quality’. It determines the standardization in the field of soil quality:
• Soils in situ; • Soil materials intended for reuse in or on
soils, including dredged sub-aquatic soil materials (= excavated sediments).[3]
5. TC 224 ‘Service activities relating to drinking water supply systems and wastewater systems – The quality criteria of the service and performance indicators’. The standardization includes the definition of a language common to the different stakeholders, the definition of the characteristics of the elements of the service according to the consumers expectations, a list of requirements to fulfill for the management of a drinking water supply system and a wastewater system, a service quality criteria and a related system of performance indicators, without setting any target values or thresholds.[3]
6. ISO 8124-1:2009 ‘Safety of toys -- Part 1: Safety aspects related to mechanical and physical properties’. ISO 8124-1:2009 specifies requirements and test methods for toys intended for use by children in various age groups from birth to 14 years. It also requires that appropriate warnings and/or instructions for use to be given on certain toys or their packaging. Due to linguistic problems that may occur in different countries, the wording of these warnings and instructions is not specified but given as general information in Annex B. It should be noted that different legal requirements exist in many countries with regard to such marking.
ISO 8124-1:2009 does not purport to cover or to include every conceivable potential hazard of a particular toy or a toy category. Except for labeling requirements indicating the functional hazards and the age range for which the toy is intended, it has no requirements for those characteristics of toys

XVII Modern Technique and Technologies 2011
214
that represent an inherent and recognized hazard that is integral to the function of the toy. [3]
7. One standard is developed and will tell about how to help to reducing a danger of driver distraction to be featured at Fully Networked Car workshop. International Standards could help reduce the dangers of “driver distraction” –caused by using mobile phones and other communication equipment at the wheel – which can have lethal consequences. Standards and design guidelines for ICT (information and communication technology) systems and devices, whether portable or fixed in the vehicle, can contribute to decreasing a driver distraction, allowing the driver to focus on operating the vehicle and the road ahead. [3]
Each standard regulates its own region. Apparently a lot of standards that are already developed or under the development are aimed at environmental protection. Undoubtedly it is necessary for the society papers because the world's ecology is in a deplorable state now. But many of the standards focus on different objects: toys, machineries, equipments and even how to drive a car not to get into an accident. Why do so many standards that regulate every
aspect of life? ISO standards orient on all spheres literally. For the manufacturer it has a big role. With the help of the standard the processes and quality of product is being coordinated. These standards do not matter for the consumer.
Maybe soon the standards will be about quality of life...? How to live, where and how to choose the right path, how will be in love, when to go tot work. It turns out that people’s life will be applied to all stages of product life cycle: a design, a planning, an operation and a disposal.
Of course this is a controversial question. As a result this is understandable that
all standards are needed for optimizing processes and they should not be in a big quantity.
It is obviously seen the necessity of standards in modern life. They should be oriented to the improvement of some kinds of processes.
References: 1. ISO 9001:2008. Method of cancellation.-Instead of ISO
9001:2001 2. Quality of life http://en.wikipedia.org, free 3. http://iso.org, free

Section X: Heat and Power Engineering
215
Section X
HEAT AND POWER INGENEERING

XVII Modern Technique and Technologies 2011
216
LAMINAR NATURAL CONVECTION IN A VERTICAL CYLINDRICA L CAVITY
М.А. Al-Ani, M.A. Sheremet
Supervisor: Professor G. V. Kuznetsov
Institute of Power Engineering, Tomsk Polytechnic University
E-mail: [email protected]
The laminar natural convection in a vertical cylinder cavity investigated in this work. The cavity is insulated at the bottom with a constant laterally heat flux and uniform cooling heat flux in the top of the cavity. The laminar axisymmetric flow of a Newtonian fluid under Boussinesq approximation has been considered. The equations of mass conservation, momentum and energy are solved with implicit finite difference method. The influence of the parameters Ra, Pr and aspect ratio is analyzed on the thermal and dynamic behavior of fluid in the cavity.
Introduction: Many studies have been conducted concerning
natural convection in cylindrical cavity heated or cooled from the side wall, some of these are experimentally [1] and other are numerically [2, 3]. The aim of this study is to present the features of a developed numerical approach for mathematical simulation of natural convection in the cylindrical cavity (Fig. 1) filled with fluid of Pr = 0.7 for range of 103 < Ra < 105.
Mathematical model: The non dimensional equations of continuity,
momentum and energy are [4]:
( ) ( ) 22
Pr;
Ra
U V
R Z RR
∂ Ω ∂ Ω∂Ω Ω ∂Θ + + = ∇ Ω − + ∂τ ∂ ∂ ∂
(
(1)
2 2;R
R R
∂Ψ∇ Ψ − = − Ω∂
(
(2) ( ) ( ) 21
.Ra Pr
U V U
R Z R
∂ Θ ∂ Θ∂Θ Θ+ + = ∇ Θ −∂τ ∂ ∂ ⋅
(
(3)
0
0z
T
z =
∂ =∂
1/ 2r D
Tq
r =
∂ =∂
2z H
Tq
z =
∂ =∂
Fig. 1. The domain of interest Boundary conditions: The non-dimensional boundary conditions are
[2, 4] :
0, 0 1, 0, 0, 0;R ZR R
∂Ψ ∂Θ= ≤ ≤ Ψ = = =∂ ∂
( )1 2 , 0 1, 0, 0, 1;R Al ZR R
∂Ψ ∂Θ= ≤ ≤ Ψ = = =∂ ∂
( )0, 0 1 2 , 0, 0, 0;Z R AlZ Z
∂Ψ ∂Θ= ≤ ≤ Ψ = = =∂ ∂
( )1, 0 1 2 , 0, 0, ,Z R Al qZ Z
∂Ψ ∂Θ= ≤ ≤ Ψ = = =∂ ∂
where 3Ra zg TH= β∆ να – Rayleigh number; v
– kinematic viscosity; α – thermal diffusivity; Pr = ν α – Prandtl number;
22
2
1R
R R R Z
∂ ∂ ∂ ∇ = + ∂ ∂ ∂
(
– Laplace operator; 4q Al= − – heat flux; Al H D= – aspect ratio.
The equations (1) – (3) have been solved numerically using finite difference method [4, 5] with the implicit two-layer difference scheme. The enclosure is filled with uniform rectangular grid 81*81. The convective terms are discretized applying the scheme of the second order allowing considering a sign of velocity and the diffusive terms with the central difference scheme. The parabolic equations have been solved on the basis of A.A. Samarskii [4] locally one-dimensional scheme. The discretised equations have been solved by Thomas algorithm. The Poisson’s equation for the stream function (2) has been discretised by means of five-point difference scheme as “cross”. The obtained difference equation has been solved by the successive over relaxation method. Optimum value of the relaxation parameter has been chosen on the basis of computing.
Results and discussions: The flow and thermal fields of the working fluid
in the cylindrical cavity subjected to specified boundary conditions has been studied for Rayleigh number (103–105), the aspect ratio are assumed 1/2 in order to check the validity of the model a comparison has been made with [2] and we got good agreement between the results as shown in Figs. (1–4).
The streamlines are presented in Figs. (2, 3) for different values of the Rayleigh number. For Ra = 103 the streamlines are smooth and the direction of the flow is counterclockwise because of the heat source on the vertical wall and the fluid is cooled in the upper end of the cavity. Increase in the value of Ra leads to make the streamlines clustered together near the heated vertical walls. Heat is supplied at the vertical wall and lost through the upper end, for Ra = 103, the effect of
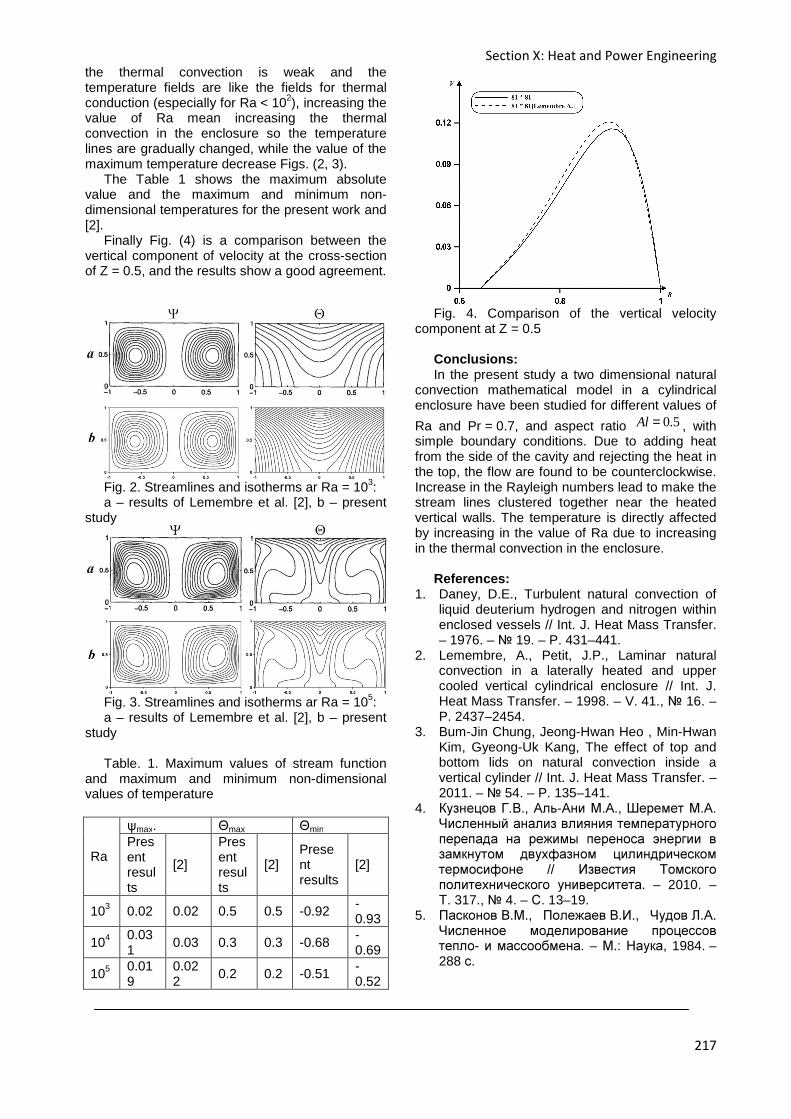
Section X: Heat and Power Engineering
217
the thermal convection is weak and the temperature fields are like the fields for thermal conduction (especially for Ra < 102), increasing the value of Ra mean increasing the thermal convection in the enclosure so the temperature lines are gradually changed, while the value of the maximum temperature decrease Figs. (2, 3).
The Table 1 shows the maximum absolute value and the maximum and minimum non-dimensional temperatures for the present work and [2].
Finally Fig. (4) is a comparison between the vertical component of velocity at the cross-section of Z = 0.5, and the results show a good agreement.
Fig. 2. Streamlines and isotherms ar Ra = 103: a – results of Lemembre et al. [2], b – present
study
Fig. 3. Streamlines and isotherms ar Ra = 105: a – results of Lemembre et al. [2], b – present
study Table. 1. Maximum values of stream function
and maximum and minimum non-dimensional values of temperature
Ra
ψmax. Θmax Θmin Present results
[2]
Present results
[2] Present results
[2]
103 0.02 0.02 0.5 0.5 -0.92 -0.93
104 0.031
0.03 0.3 0.3 -0.68 -0.69
105 0.019
0.022
0.2 0.2 -0.51 -0.52
Fig. 4. Comparison of the vertical velocity
component at Z = 0.5 Conclusions: In the present study a two dimensional natural
convection mathematical model in a cylindrical enclosure have been studied for different values of
Ra and Pr = 0.7, and aspect ratio 0.5Al = , with simple boundary conditions. Due to adding heat from the side of the cavity and rejecting the heat in the top, the flow are found to be counterclockwise. Increase in the Rayleigh numbers lead to make the stream lines clustered together near the heated vertical walls. The temperature is directly affected by increasing in the value of Ra due to increasing in the thermal convection in the enclosure.
References:
1. Daney, D.E., Turbulent natural convection of liquid deuterium hydrogen and nitrogen within enclosed vessels // Int. J. Heat Mass Transfer. – 1976. – 19. – P. 431–441.
2. Lemembre, A., Petit, J.P., Laminar natural convection in a laterally heated and upper cooled vertical cylindrical enclosure // Int. J. Heat Mass Transfer. – 1998. – V. 41., 16. – P. 2437–2454.
3. Bum-Jin Chung, Jeong-Hwan Heo , Min-Hwan Kim, Gyeong-Uk Kang, The effect of top and bottom lids on natural convection inside a vertical cylinder // Int. J. Heat Mass Transfer. – 2011. – 54. – P. 135–141.
4. Кузнецов Г.В., Аль-Ани М.А., Шеремет М.А. Численный анализ влияния температурного перепада на режимы переноса энергии в замкнутом двухфазном цилиндрическом термосифоне // Известия Томского политехнического университета. – 2010. – Т. 317., 4. – С. 13–19.
5. Пасконов В.М., Полежаев В.И., Чудов Л.А. Численное моделирование процессов тепло- и массообмена. – М.: Наука, 1984. – 288 с.

XVII Modern Technique and Technologies 2011
218
ALTERNATIVE OF WASTEWATER TREATMENT FOR CHP
K.U. Afanasyev
The scientific adviser: L.I. Molodegnikova
Tomsk Polytechnic University, 634050, Russia, Tomsk, Lenin av. 30
E-mail: [email protected]
Ponds and streams are a complex ecological system of the existence ecological community - the community of living organisms. These systems were created over a long period of evolution. Reservoirs are not only collections of water in which water is averaged over the quality, but in these processes continuously changing of the matter composition occur the approach to equilibrium, which may be disrupted due to many reasons, but especially as a result of effluent discharge.
Thermal power plants are major sources of wastewater such as: 1. Cooling water, causing mainly thermal
pollution of heat carrier; 2. Wastewater water treatment plants and
condensate polishing; 3. Water contaminated with petroleum products; 4. Water from flushing of outer surfaces of steam
generators and peak hot-water boilers using oil fuel;
5. Waste solution after the chemical treatment of thermal equipment and its conservation;
6. Water systems, hydraulic ash at thermal power plants using solid fuels;
7. Municipal and household water; 8. Water from the hydraulic cleaning fuel path; 9. Rain water from the territory of CHP.
Water of water treatment plants is one of the most dangerous on the composition.
Direct discharge of sewage water treatment plants to water is impossible because of sharp change in pH values beyond 6,5-8,5 optimal for water in the reservoirs, as well as high content of coarse impurities and salts. Purification of such waters should be limited to removing the main part of salt, coarse impurities and correction of pH, in accordance with the requirements, imposed by health regulations, governing discharges of wastewater into water bodies.
If the removal of coarse impurities and regulation of pH is not difficult, the decline in the concentration of truly dissolved solids should be kept to a repetition of the same processes that were used in water treatment plants. This will ultimately lead to a sharp increase in the number of discharges of salts with a significant increase in the total costs of water treatment.
Solution of this problem may be the using of evaporators for deep concentration and evaporation of the wastewater.
The most suitable for evaporation of wastewater evaporator unit can be divided into the
facilities in which the solution contacts the surface heating and the facilities in which the solution is not in contact with the surface heating. In plants of the first type salt deposits are formed with a corresponding reduction in heat flux density and performance facilities. We have periodic stops for cleaning the heating surface, because technical and economic parameters are reduced and operation of facilities is complicated. The degree of concentration of the solution in them is significantly limited due to a sharp increase in deposits with increasing concentration of the solution.
One way to reduce salt deposits on the surfaces of heating installations concentration of saline water is the use of evaporator with submerged burner (ESB).
The main advantages of evaporator with submerged burner are: 1. High thermal efficiency; 2. High heat transfer coefficient; 3. High degree of concentration; 4. Low specific consumption of heat; 5. Reduction of corrosion; 6. Immutability of the technical characteristics
with time of operation; 7. Low material consumption, low specific fuel
consumption, relatively low capital and operating costs compared to other fuel using heat exchangers;
8. Relatively small size and weight with a high thermal stress of heat exchange area;
9. Wide range of heat output and ease of management compared with other heat-generating devices;
10. Ease of operation, maintenance and repair; 11. ESB is not subject to boiler inspection; 12. The presence of liquid solutes, mineral oils,
suspensions, crystals and other contaminants is usually straightforward and has no effect on the performance of ESB;
13. ESB explosion-proof during operation compared to other devices that use fuel.
These devices have good conditions for heat exchange between the heated gases and liquids, since bubbling heated gases are dissipated in the form of bubbles and form a large surface.
Intensive mixing of the solution accelerates the heating process.
During the work we have designed evaporator with submerged burners for the concentration of sodium sulfate solution Na2SO4 from wastewater formed during regeneration and flushing cationite and anionite filters of water treatment plant CHP.

Section X: Heat and Power Engineering
219
Figure 1 Evaporator with submerged burner (ESB)
Proposed to use the device with a submersible burner, located in the central part of the body, are used to evaporate salt solutions. Crystallized salt can be removed with a special valve located at the bottom of the conical bottom. Gas-vapor mixture is Figure 1 Evaporator with submerged burner (ESB)discharged through the unit mounted on the lid of the tube, inside which are placed fender guards for the separation of solution drops. The disadvantage of such apparatus is the uneven distribution of gas through the cross section of the disc, especially in devices of large size and lack of fluid circulation in the lower part of the apparatus.
We have designed plan of devise and selected or designed the main types of equipment, such as:
1. Submerged burner; 2. Venture’s scrubber; 3. Cyclone demister; 4. Pumps.
During the project material, thermal, hydrodynamic calculations of the evaporator with submerged burner have been conducted. We determined dimensions and basic construction materials of the evaporator with submerged burner.
Performance of the device from the original product is L = 5000 kg / h. In the device the solution of the following composition enters:
1. 1.365% NаCl; 2. 0.85% Na2SO4; 3. 0.025% more salt; 4. 77.6% H2O.
The temperature of solution is 50˚C. After evaporation of the solution we get 45% Na2SO4 and 55% H20.
Evaporation of the effluent occurs in the apparatus (1) with a gas burner submerged (2). Solution which we want to evaporate from the collection (5) with the help of the pump (6) is served to the venture’s scrubber (3) to flush the outgoing gas mixture from the apparatus. Department of effluent from the gas-vapor mixture occurs in the cyclone (4). These effluents are
accumulated in an intermediate tank (7), from tank with the help of pump (8) effluents are received in the apparatus (1). Evaporated solution is
fed from the apparatus in the tank (6), which is equipped with a mechanical stirrer. Clarified solution from the top of the septic tank overflows into the collector (7), and again goes to evaporation. Sludge, which is formed at the bottom, is removed through the lower pipe in the slurry tank periodically.
Installation is designed for evaporation of 5t / h solution.
You can see the installation in the figure 1. Evaporation of effluents in the APG will reduce
to 25 times the volume of pond sludge. The sodium sulfate, which we can get on our
evaporation installation, can find wide using in various industries. It is one of the main components of the mixture in glass production, it is also used for wood processing (so-called kraft pulping), for dying cotton fabrics, for production viscose silk, and various chemical compounds - silicate and sodium sulfide, ammonium sulfate, sodium, sulfuric acid. Sodium sulfate solution is used as heat storage in devices that preserve solar energy.
References
1. Submerged combustion devices: a manual for schools / A.N Alabovsky, P.G Udyma. M.: MEI, 1994. – 255.
2. Apparatus with submerged burners / P.G Udyma. - 2 ed., Ext. and revised. M: Mechanical Engineering, 1973. - 271. Taubman, E.I Thermal deactivation of saline industrial wastewater. - L.: Chemistry, 1975. - 208.
3. Protection of water and air basin emissions from thermal power plants: a manual / L. Richter, E.P Volkov, V.N Pokrovsky. - M.: Energoizdat, 1981. - 295.
4. GOST 9931 - 79.

XVII Modern Technique and Technologies 2011
220
STEAM GENERATORS OPERATION PROBLEMS
ON NPP AND THEIR SOLUTIONS
Chubreev D. O., Ivanov S. A.
Supervisor: Kuznetsova A. A.; Advisor: Korotkih A.G.
Tomsk Polytechnic University, 634050 Tomsk, Lenin Avenue 30
E-mail: [email protected]
Working steam production in NPP is carried out in special heat exchanger installations – steam generators (SG).
In nuclear reactors in addition to thermal and chemical processes the neutronic processes causing the specificity of these units and allocating them in a special class of heat exchangers occur. Simultaneous consideration of such combinations as reactor - SG and heat transfer devices – SG is impractical. However, it should be kept in mind that the basic regularities of thermo-physical and physical-chemical processes in the steam production are the same as for boiling reactors as for SG. The influence redetermination of these processes of very high heat fluxes, coolant high-velocity and ionizing radiation is necessary for boiling reactors.
Steam generator of NPP is heat exchanger that is used for working steam production due to the heat contributed to it by reactor coolant. SG is one of the basic units of double-loop NPP. The efficiency of the steam generators is one of the most important components of NPP safe operation with VVER reactors. Steam generators are the most destroyable heat exchange equipments of the first loop NPP.
SG scheme and the design of its components should provide the necessary performance and set steam parameters in any mode of a nuclear power plant operation. The fulfillment of this requirement provides the most efficient station operation as at
nominal as at variable. Unit capacity of SG should be the maximum
possible under the given conditions. This requirement is associated with the improvement of techno-economic as indicators in the consolidation of power unit assembly.
All the elements of SG should have the unconditional reliability and absolute security. Heat transfer surface in SG is made of a large number of small-diameter pipes, that’s it concentrates a large number of pipe joints of first the radiation circuit. Therefore the reliability of the work of NPP is determined by the reliability SG work. Also it is necessary to solve the questions of SG radiation protection correctly and to provide all the durability of the structure.
The connections of SGs elements and details must provide the density, excluding the possibility of the current from one loop to another. Insignificant content of coolant in the working body
is unacceptable, because the steam turbine loop doesn’t have any biological protection. Penetration of the working substance in the first loop may lead to an emergency situation in a reactor.
The possibility of corrosion processes intensification must be excluded. The reliability decrease of SG and the pollution of the coolant by corrosion products are meant here. Their excessive fall into the first loop will increase the radioactivity of the coolant and the deposition of radioactive corrosion products in the first circuit. The deposits of corrosion products on the fuel elements are the most dangerous. In this case happen a sharp decrease in heat transfer may.
SG must generate the steam of sufficient purity that ensures the reliability of high-superheaters, as well as a reliable and efficient operation of the turbine.
The elements design of SG should be simple and compact, and should provide the easy installation and operation, the possibility of detecting and eliminating damages, the possibility of complete drainage.
The corrosion damage of steam generators heat exchanger tubes is one of the most important factors affecting the SG resource.
Defective pipes are exposed to damping and the welds can be repaired. The tubes with small defects may be in operations if raised and fixed flow between contours does not exceed the allowable regulatory limits.
Recently the setting trend of criterion for damping depending on the type of defect and its location is dominated in the world.
The work on developing criteria for damping within the parameters of the defects is led in Russia.
During operation the SG is subjected to various loads resulting in various problems. These problems mainly relate to such types as: depressurization of the SG, orrosive cracking, early intensive degradation of heat transfer tubes (HTT), damage of the elements of the SG and many other problems. SGN-200M steam generator which is operated at the reactor type BN-600 consists of eight sections. Each section consists of three modules: the evaporator, the main and reheater. Constructively the modules are similar and represent a vertical straight-tube heat exchangers. The main drawback of the sodium its
Section X: Heat and Power Engineering
221
chemical activity with respect to water and oxygen. The steam generator is a device the heat transfer surface of which directly separates the water and sodium that’s works in the most difficult conditions. The interaction of water with sodium results in damage of the steam generator. In connection with this the violation of the integrity of SG can happen. In this regard on the NPP the scheme with sodium coolant are made three-circuit because of the possibility of between contours leaks in the steam generators. As a result the damage of the SG doesn’t lead to nuclear accidents at nuclear power plants. Also in such SG to avoid the increase of pressures there are devices of passive principle of action in the form of spontaneously triggered high-membranes. VVER steam generators form the third physical barrier of distribution of the radioactive medium and are maintained in the most severe corrosive conditions. Corrosion cracking under stress of tubes steam occurs in the presence of tensile stresses in the medium containing activators. Cracking initiates induces in the field of ulceration. In recent years the damages of the reservoirs have not been identified but there were cases of damages of 111 and 23 weld joints that are the most loaded with design elements of PG in the investigation of SG in terms of the increased specific contamination a deviation from the norms of eddy current testing (ECT), pollution of the pockets collector, as well as the presence of corrosive impurities in PG. Early intensive degradation of HTT is caused by non-project SG load. Lately for estimation of HTT state ECT is widely used which is the main source of information on the corrosion state Institute of tubes of SG. ECT data allow one to obtain numerical characteristics associated with the state of each heat exchange tube. The application of ECT for the detection of defects in heat pipes and selectively fainter-of defective pipe can improve the reliability of sequence of steam and power in general. Based on the findings of the defect of HTT SG needs to do analysis of the SG, to assess their resource or to take measures to quickly influence the process of aging of HTT SG. To reduce the sediment on the surface of HTT chemical cleaning are made which leads to a positive impact on the state of SG, slows the process of new defects. In order to not charge the SG not to change entirely because of failure companies spend some investments for research, repair and modernization of SG.
Heat exchange tubes are the main factor determining the steam resource. Life extension steam generator is performed with a considerable uncertainty remaining life of tubes because to this time there is no method of determining the resource of HTT SG with corrosion defects, taking into account all operational factors.
Conclusions
Output from the foregoing it is possible to identify some of the most important operational problem of SG: 1) Corrosion cracking under stress; 2) Early intensive degradation of the HTT; 3) The harming the elements of SG; 4) The accumulation of sludge and other harmful substances in the SG. From the above we can conclude that for the avoidance of operational problems SG required: 1) For the highest corrosion resistance of austenitic steel should be used; 2) In order to avoid early degradation of the HTT was not you should use the equipment under normal conditions; 3) The washing should be not only the specific pollution rebelled but the local acumination of sludge on the bottom of the steam generator and into the pockets of the collector; 4) Make some investments; 5) For diagnostic purposes the metal of SG in the plant must be equipped with eddy current SG units for sewers and pipes.
References 1. Ю.М. Липов, Ю.М. Третьяков,
Котельные установкиfи парогенераторы.-М., 2003
2. А.П. Ковалев,gН.С. Лелеев, Парогенерато-ры.-М., Энергоатомиздат, 1985
3. Н.Г. Рассохин , Парогенераторные установки атомных электростанций.-М., 2000
4. 4. К.В. Дергачев: Электронная система прогнозирования эрозии рабочих лопаток
турбин атомных станций. Научно-технический журнал “Ядерная энергетика”, 2001
5. Денисов В.В., Карсонов В.И., Н.Б. Трунов: Конструкция, эксплуатация и продление ресурса ПГ энергоблока БН-600. Журнал “Атомная энергия”,2005
6. Bushehr NPP – Preliminary Safety Analysis Report (PSAR), Atomic Energy Organization of Iran,
2000
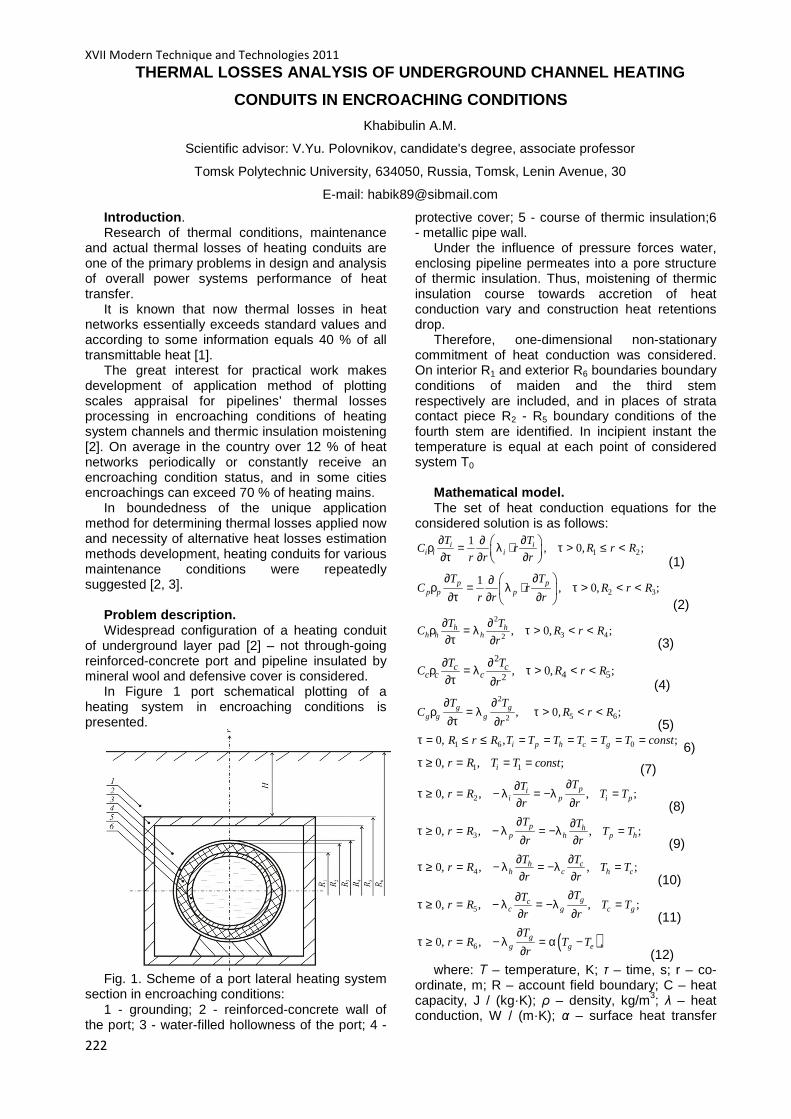
XVII Modern Technique and Technologies 2011
222
THERMAL LOSSES ANALYSIS OF UNDERGROUND CHANNEL HEAT ING
CONDUITS IN ENCROACHING CONDITIONS
Khabibulin A.M.
Scientific advisor: V.Yu. Polovnikov, candidate's degree, associate professor
Tomsk Polytechniс University, 634050, Russia, Tomsk, Lenin Avenue, 30
E-mail: [email protected]
Introduction . Research of thermal conditions, maintenance
and actual thermal losses of heating conduits are one of the primary problems in design and analysis of overall power systems performance of heat transfer.
It is known that now thermal losses in heat networks essentially exceeds standard values and according to some information equals 40 % of all transmittable heat [1].
The great interest for practical work makes development of application method of plotting scales appraisal for pipelines’ thermal losses processing in encroaching conditions of heating system channels and thermic insulation moistening [2]. On average in the country over 12 % of heat networks periodically or constantly receive an encroaching condition status, and in some cities encroachings can exceed 70 % of heating mains.
In boundedness of the unique application method for determining thermal losses applied now and necessity of alternative heat losses estimation methods development, heating conduits for various maintenance conditions were repeatedly suggested [2, 3].
Problem description. Widespread configuration of a heating conduit
of underground layer pad [2] – not through-going reinforced-concrete port and pipeline insulated by mineral wool and defensive cover is considered.
In Figure 1 port schematical plotting of a heating system in encroaching conditions is presented.
Fig. 1. Scheme of a port lateral heating system
section in encroaching conditions: 1 - grounding; 2 - reinforced-concrete wall of
the port; 3 - water-filled hollowness of the port; 4 -
protective cover; 5 - course of thermic insulation;6 - metallic pipe wall.
Under the influence of pressure forces water, enclosing pipeline permeates into a pore structure of thermic insulation. Thus, moistening of thermic insulation course towards accretion of heat conduction vary and construction heat retentions drop.
Therefore, one-dimensional non-stationary commitment of heat conduction was considered. On interior R1 and exterior R6 boundaries boundary conditions of maiden and the third stem respectively are included, and in places of strata contact piece R2 - R5 boundary conditions of the fourth stem are identified. In incipient instant the temperature is equal at each point of considered system T0
Mathematical model. The set of heat conduction equations for the
considered solution is as follows:
1 21
, 0, ;i ii i i
T TC r R r R
r r r
∂ ∂∂ ρ = λ ⋅ τ > ≤ < ∂τ ∂ ∂ (1)
2 31
, 0, ;p pp p p
T TC r R r R
r r r
∂ ∂ ∂ρ = λ ⋅ τ > < < ∂τ ∂ ∂ (2) 2
3 42, 0, ;h h
h h hT T
C R r Rr
∂ ∂ρ = λ τ > < <∂τ ∂ (3)
2
4 52, 0, ;c c
c c cT T
C R r Rr
∂ ∂ρ = λ τ > < <∂τ ∂ (4)
2
5 62, 0, ;g g
g g g
T TC R r R
r
∂ ∂ρ = λ τ > < <
∂τ ∂ (5) 1 6 00, , ;i p h c gR r R T T T T T T constτ = ≤ ≤ = = = = = =
6) 1 10, , ;ir R T T constτ ≥ = = = (7)
20, , , ;pii p i p
TTr R T T
r r
∂∂τ ≥ = − λ = −λ =∂ ∂ (8)
30, , , ;p hp h p h
T Tr R T T
r r
∂ ∂τ ≥ = − λ = −λ =∂ ∂ (9)
40, , , ;h ch c h c
T Tr R T T
r r
∂ ∂τ ≥ = − λ = −λ =∂ ∂ (10)
50, , , ;gcc g c g
TTr R T T
r r
∂∂τ ≥ = − λ = −λ =∂ ∂ (11)
( )60, , ,gg g e
Tr R T T
r
∂τ ≥ = − λ = α −
∂ (12) where: Т – temperature, K; τ – time, s; r – co-
ordinate, m; R – account field boundary; C – heat capacity, J / (kg·K); ρ – density, kg/m3; λ – heat conduction, W / (m·K); α – surface heat transfer
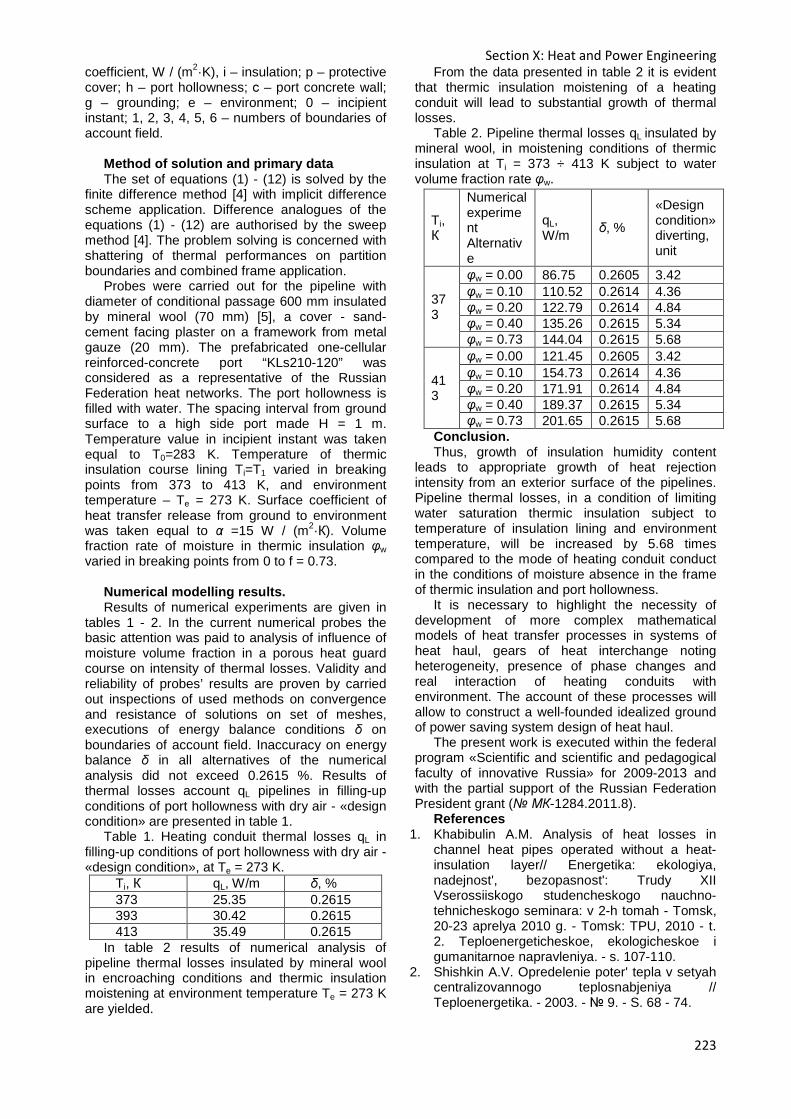
Section X: Heat and Power Engineering
223
coefficient, W / (m2·K), i – insulation; p – protective cover; h – port hollowness; с – port concrete wall; g – grounding; e – environment; 0 – incipient instant; 1, 2, 3, 4, 5, 6 – numbers of boundaries of account field.
Method of solution and primary data The set of equations (1) - (12) is solved by the
finite difference method [4] with implicit difference scheme application. Difference analogues of the equations (1) - (12) are authorised by the sweep method [4]. The problem solving is concerned with shattering of thermal performances on partition boundaries and combined frame application.
Probes were carried out for the pipeline with diameter of conditional passage 600 mm insulated by mineral wool (70 mm) [5], a cover - sand-cement facing plaster on a framework from metal gauze (20 mm). The prefabricated one-cellular reinforced-concrete port “KLs210-120” was considered as a representative of the Russian Federation heat networks. The port hollowness is filled with water. The spacing interval from ground surface to a high side port made H = 1 m. Temperature value in incipient instant was taken equal to T0=283 K. Temperature of thermic insulation course lining Ti=T1 varied in breaking points from 373 to 413 K, and environment temperature – Te = 273 K. Surface coefficient of heat transfer release from ground to environment was taken equal to α =15 W / (m2·К). Volume fraction rate of moisture in thermic insulation φw varied in breaking points from 0 to f = 0.73.
Numerical modelling results. Results of numerical experiments are given in
tables 1 - 2. In the current numerical probes the basic attention was paid to analysis of influence of moisture volume fraction in a porous heat guard course on intensity of thermal losses. Validity and reliability of probes’ results are proven by carried out inspections of used methods on convergence and resistance of solutions on set of meshes, executions of energy balance conditions δ on boundaries of account field. Inaccuracy on energy balance δ in all alternatives of the numerical analysis did not exceed 0.2615 %. Results of thermal losses account qL pipelines in filling-up conditions of port hollowness with dry air - «design condition» are presented in table 1.
Table 1. Heating conduit thermal losses qL in filling-up conditions of port hollowness with dry air - «design condition», at Te = 273 K.
Ti, К qL, W/m δ, % 373 25.35 0.2615 393 30.42 0.2615 413 35.49 0.2615
In table 2 results of numerical analysis of pipeline thermal losses insulated by mineral wool in encroaching conditions and thermic insulation moistening at environment temperature Te = 273 K are yielded.
From the data presented in table 2 it is evident that thermic insulation moistening of a heating conduit will lead to substantial growth of thermal losses.
Table 2. Pipeline thermal losses qL insulated by mineral wool, in moistening conditions of thermic insulation at Ti = 373 ÷ 413 K subject to water volume fraction rate φw.
Conclusion. Thus, growth of insulation humidity content
leads to appropriate growth of heat rejection intensity from an exterior surface of the pipelines. Pipeline thermal losses, in a condition of limiting water saturation thermic insulation subject to temperature of insulation lining and environment temperature, will be increased by 5.68 times compared to the mode of heating conduit conduct in the conditions of moisture absence in the frame of thermic insulation and port hollowness.
It is necessary to highlight the necessity of development of more complex mathematical models of heat transfer processes in systems of heat haul, gears of heat interchange noting heterogeneity, presence of phase changes and real interaction of heating conduits with environment. The account of these processes will allow to construct a well-founded idealized ground of power saving system design of heat haul.
The present work is executed within the federal program «Scientific and scientific and pedagogical faculty of innovative Russia» for 2009-2013 and with the partial support of the Russian Federation President grant ( МК-1284.2011.8).
References 1. Khabibulin A.M. Analysis of heat losses in
channel heat pipes operated without a heat-insulation layer// Energetika: ekologiya, nadejnost', bezopasnost': Trudy XII Vserossiiskogo studencheskogo nauchno-tehnicheskogo seminara: v 2-h tomah - Tomsk, 20-23 aprelya 2010 g. - Tomsk: TPU, 2010 - t. 2. Teploenergeticheskoe, ekologicheskoe i gumanitarnoe napravleniya. - s. 107-110.
2. Shishkin A.V. Opredelenie poter' tepla v setyah centralizovannogo teplosnabjeniya // Teploenergetika. - 2003. - 9. - S. 68 - 74.
Ti, К
Numerical experiment Alternative
qL, W/m
δ, %
«Design condition» diverting, unit
373
φw = 0.00 86.75 0.2605 3.42 φw = 0.10 110.52 0.2614 4.36 φw = 0.20 122.79 0.2614 4.84 φw = 0.40 135.26 0.2615 5.34 φw = 0.73 144.04 0.2615 5.68
413
φw = 0.00 121.45 0.2605 3.42 φw = 0.10 154.73 0.2614 4.36 φw = 0.20 171.91 0.2614 4.84 φw = 0.40 189.37 0.2615 5.34 φw = 0.73 201.65 0.2615 5.68

XVII Modern Technique and Technologies 2011
224
3. Metodicheskie ukazaniya po opredeleniyu teplovyh poter' v vodyanyh setyah: RD 34.09.255 - 97. M.: SPO ORGRES, 1998. - 18 s.
4. Samarskii A. A., Gulin A. N. Chislennye metody matematicheskoi fiziki. M.: Nauchnyi mir, 2000. - 316 s.
Pereverzev V.A., Shumov V.V. Spravochnik mastera teplovyh setei. L.: Energoatomizdat, 1987. - 272 s.
ENERGY EFFICIENCY OF LUMINOUS DEVICES
A.S. Kobenko, V.D. Nikitin
Scientific adviser: V.D. Nikitin, candidate of technological science, associate professor
Linguistic consultant: Demchenko V.N
Tomsk Polytechnic University,
634050, Russia, Tomsk, Lenin avenue, 30
E-mail: [email protected]
Maintenance of lighting systems is a subject which, like death and taxes, seems to be with us always. Various theories, studies and proposals have been discussed many times in the past, from the floor and in print.
Comprehensive maintenance studies are involved when they try to simulate actual conditions found in factory production areas and maintenance studies attempted in actual industrial areas present problems too. Working factories are usually unable to provide space for prolonged testing; such tests must be prolonged if the results are value. Establishing a test area which remains “constant” over a long period of test-time has been another real problem, yet reliable and realistic data depend on such condition.
Maintenance data are of particular importance to industry these days, all the more so with the current demand for higher levels of illumination. Poorly maintained lighting systems depreciate in light output – ergo, reduce production output.
Lack of available information in practice has led to many hazy estimations, if not guesses, in applying maintenance factors for luminaries in industrial areas. This is especially true for new types of fluorescent luminaries currently used for factory lighting. The prime purpose of the in-service study was to provide at least a start in maintenance data for present-day industrial lighting systems. Only one condition of an interior was tested, i.e. dust and dirt influence. The results show evidence of the necessity of actual in-service data in proper application of maintenance factors for specific job-areas.
Although there are many varieties and combinations of reflector styles and fluorescent lamps used in production areas, in general they fall into three categories as described in the Taylor-Bradley paper “Visual Comfort and Cost Analysis for Production Lighting” (Illuminating Engineering, April 1956, p. 293). These classifications are:
– solid top reflectors with all light directed downward;
– slotted top reflectors with approximately 10 per cent uplight;
– slotted top reflectors with approximately 30 per cent uplight. [1, p.389]
Worldwide consumption of electric energy (EE) for lighting purpose increases with every year and its costs also increase. It is necessary to look for ways of consumption reduction and generation of EE. Energy saving isn’t a fashion tendency. It is a necessary condition of survival.
Lighting is one of effective fields for EE economy. Energy efficiency is a difficult task.
A lighting set is considered to be efficient if it creates high-quality lighting and saves capital and operating costs, including minimum energy consumption.
Lighting setting efficiency depends on: – luminous efficiency of light source and its life
time; – light and power parameters of lighting
devices; – stability of parameters during lamps
exploitation; –electricity tariffs; – hours of lighting installations use a year. Moreover, lamps, installation and service costs
have a significant value as well as energy conservation methods, modern methods and modes light exploitation.
Electricity must not be saved due to the decline of illumination standards, disconnection of some light devices or turn off lamplight, because losses from worsening of illumination considerably excel economized electricity.
As researches showed, there is a real possibility to reduce the use electric power twice without worsening illumination. It can be done due to the perfection of facilities and methods of illumination, reconstruction of operating installations and organization of their exploitation.

Section X: Heat and Power Engineering
225
To solve the problem of energy conservation in illumination is to use power saving lighting technique and technologies.
Efficiency of a lamp is characterized by its efficiency coefficient, which is defined by the deflector blades type and quality of its optical components.
During operation pollution occurs, as well as the aging of lighting materials of optical elements. All the factors thereby reduce their light efficiency, change the luminous intensity distribution.
Characteristics change of lighting devices, the index of lighting installations also change:
– average brightness (illumination); – brightness distribution (illumination) on the
surface. Environmental safety of lighting devices
determine the safety factor in the design and efficiency of lighting installations.
Changing dynamics of lighting and the development of compensation methods are very important but it is difficult technical and economic challenge.
To describe the illumination dependence of the operating time required experimental and very time-consuming research (how the materials were obtained in [2]).
There is an analytical approach based on expansion published in the mid of XX century (Matanovich’s [3] technique).
Table 1. Parameters γ,β and degree τ
1( )( )
2 1 22 1 0 0 1 2 (1)Ô Ô Ô Ô Ô Ôγ −= −− − +
2 1 1( ) ( 2 )0 1 0 0 1 2 (2)Ô Ô Ô Ô Ô Ôβ − −= − ⋅ ⋅ − +
ln( ) ln( )1 0 1 1 2 (3)t Ô Ô Ô Ôτ = − − − There are three events which lead to a
decrease of brightness during the operation (decrease of lamp’s discharge, which depends on physical properties of lamps; decrease of lighting device luminous flux which depends on dust content in lamps and these devices; decrease flux, which falls on the calculated surface and depends on surface contamination areas), described by exponential equations, which differ in parameters values γi , βi and degree,τi , где i=1,2,3. The equations given in ([4], formulas (11.3, 11.5, 11.6)).
In this paper, we propose a method based on solving a system of three equations (Table 2).
Table 2. Method based on solving a system of
three equations
Determination of the three events (decrease of
flow, dust and reduction the reflection coefficient) separately is a very difficult task. It is possible to realize the generalized Ф, which depends on the time of operation.
Literature: 1. Taylor G.Y., Bradly R.D. Maintenance factors
and features of industrial fluorescent luminaries, Illuminating Eng., 1959, 6, p. 389-397.
2.Taylor G.Y., Bradly R.D. Maintenance factors and features of industrial fluorescent luminaries, Illuminating Eng., 1959, 6, p. 389-397. Reduced by: redaction by V.V. Meshkov – Problems of lighting technology in foreign countries, Collection of abstracts, issue 2, М. – L.,gosenergoizdat, 1962, 144с.
3. Matanovic D., Lichttechnik, 1959, 12. Reduced by: Yu. B. Ayzenberg and V. F. Efimkin – Lighting devices with fluorescent lamps. М., «Energy», 1968. – 368с.
4. Lighting technologe’s reference book / Reduced by: Yu. B. Ayzenberg. – М. : Energoatomizdat, 1995. – 528с.
System of equations:
1 1( )1 0 11 1( 2 ) (4)2 0 1
1
Ô Ô åxp t
Ô Ô åxp t
γ β τ
γ β τ
β γ
− −⋅ = + − ⋅− −⋅ = + − ⋅
+ =
The solution of the quadratic equation:
Interim equations:
1 2 2(1 4( ))1 202
(5)
tÔ Ô Ô
åβτ
− ± − −=
Equation (6) gives a flow value which is
predictable at the moment 0 41t t≤ ≤
Final equation:
0
1 11 1
1 20 1 2 2 1
20 1 1 2 0 1
( 2 )
( ) ( ) ( ) (6)
t
t t t t
Ô Ô Ô Ô Ô Ô Ô
Ô Ô Ô Ô Ô Ô− −
−
⋅ − ⋅
= − + ⋅ − +
+ − ⋅ − −
If we replace 0,t = 1,t t=and 2t t=
we get
appropriately “nodal” meaning of 0,Ф 1Ф
and
2Ф
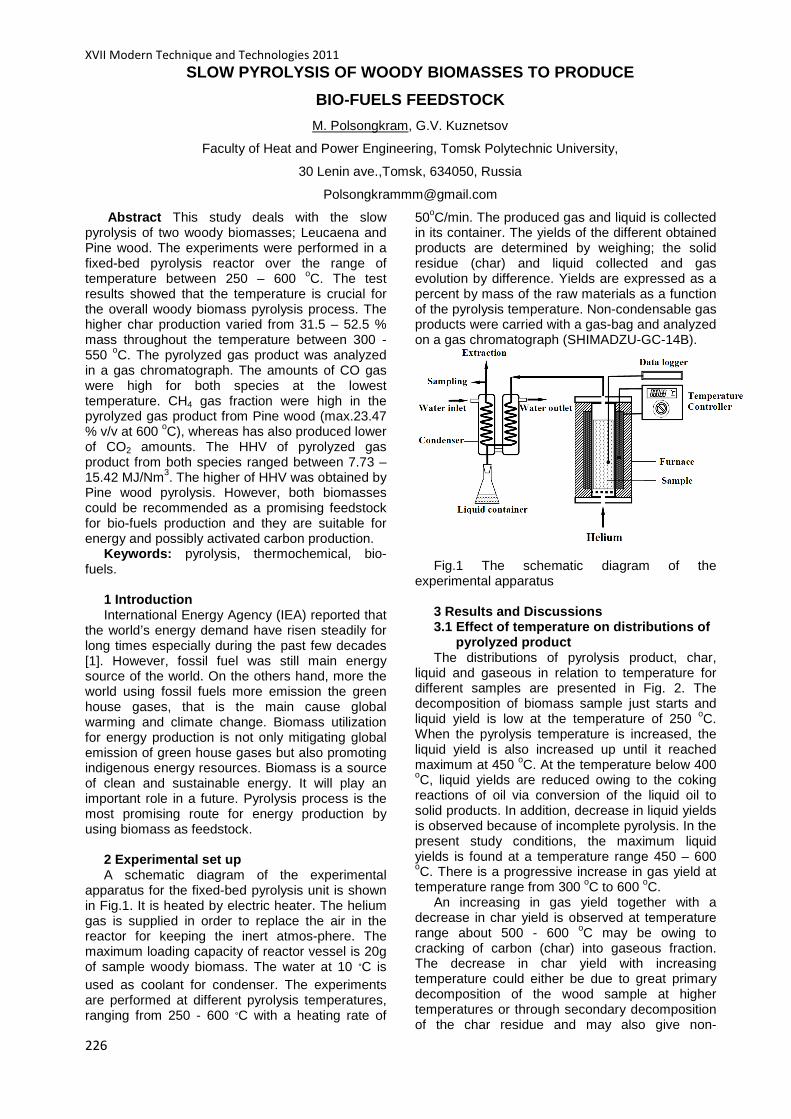
XVII Modern Technique and Technologies 2011
226
SLOW PYROLYSIS OF WOODY BIOMASSES TO PRODUCE
BIO-FUELS FEEDSTOCK
M. Polsongkram, G.V. Kuznetsov
Faculty of Heat and Power Engineering, Tomsk Polytechnic University,
30 Lenin ave.,Tomsk, 634050, Russia
Abstract This study deals with the slow pyrolysis of two woody biomasses; Leucaena and Pine wood. The experiments were performed in a fixed-bed pyrolysis reactor over the range of temperature between 250 – 600 oC. The test results showed that the temperature is crucial for the overall woody biomass pyrolysis process. The higher char production varied from 31.5 – 52.5 % mass throughout the temperature between 300 - 550 oC. The pyrolyzed gas product was analyzed in a gas chromatograph. The amounts of CO gas were high for both species at the lowest temperature. CH4 gas fraction were high in the pyrolyzed gas product from Pine wood (max.23.47 % v/v at 600 oC), whereas has also produced lower of CO2 amounts. The HHV of pyrolyzed gas product from both species ranged between 7.73 – 15.42 MJ/Nm3. The higher of HHV was obtained by Pine wood pyrolysis. However, both biomasses could be recommended as a promising feedstock for bio-fuels production and they are suitable for energy and possibly activated carbon production.
Keywords: pyrolysis, thermochemical, bio-fuels.
1 Introduction International Energy Agency (IEA) reported that
the world’s energy demand have risen steadily for long times especially during the past few decades [1]. However, fossil fuel was still main energy source of the world. On the others hand, more the world using fossil fuels more emission the green house gases, that is the main cause global warming and climate change. Biomass utilization for energy production is not only mitigating global emission of green house gases but also promoting indigenous energy resources. Biomass is a source of clean and sustainable energy. It will play an important role in a future. Pyrolysis process is the most promising route for energy production by using biomass as feedstock.
2 Experimental set up A schematic diagram of the experimental
apparatus for the fixed-bed pyrolysis unit is shown in Fig.1. It is heated by electric heater. The helium gas is supplied in order to replace the air in the reactor for keeping the inert atmos-phere. The maximum loading capacity of reactor vessel is 20g of sample woody biomass. The water at 10 ๐C is used as coolant for condenser. The experiments are performed at different pyrolysis temperatures, ranging from 250 - 600 ๐C with a heating rate of
50oC/min. The produced gas and liquid is collected in its container. The yields of the different obtained products are determined by weighing; the solid residue (char) and liquid collected and gas evolution by difference. Yields are expressed as a percent by mass of the raw materials as a function of the pyrolysis temperature. Non-condensable gas products were carried with a gas-bag and analyzed on a gas chromatograph (SHIMADZU-GC-14B).
Fig.1 The schematic diagram of the
experimental apparatus 3 Results and Discussions 3.1 Effect of temperature on distributions of pyrolyzed product The distributions of pyrolysis product, char,
liquid and gaseous in relation to temperature for different samples are presented in Fig. 2. The decomposition of biomass sample just starts and liquid yield is low at the temperature of 250 oC. When the pyrolysis temperature is increased, the liquid yield is also increased up until it reached maximum at 450 oC. At the temperature below 400 oC, liquid yields are reduced owing to the coking reactions of oil via conversion of the liquid oil to solid products. In addition, decrease in liquid yields is observed because of incomplete pyrolysis. In the present study conditions, the maximum liquid yields is found at a temperature range 450 – 600 oC. There is a progressive increase in gas yield at temperature range from 300 oC to 600 oC.
An increasing in gas yield together with a decrease in char yield is observed at temperature range about 500 - 600 oC may be owing to cracking of carbon (char) into gaseous fraction. The decrease in char yield with increasing temperature could either be due to great primary decomposition of the wood sample at higher temperatures or through secondary decomposition of the char residue and may also give non-
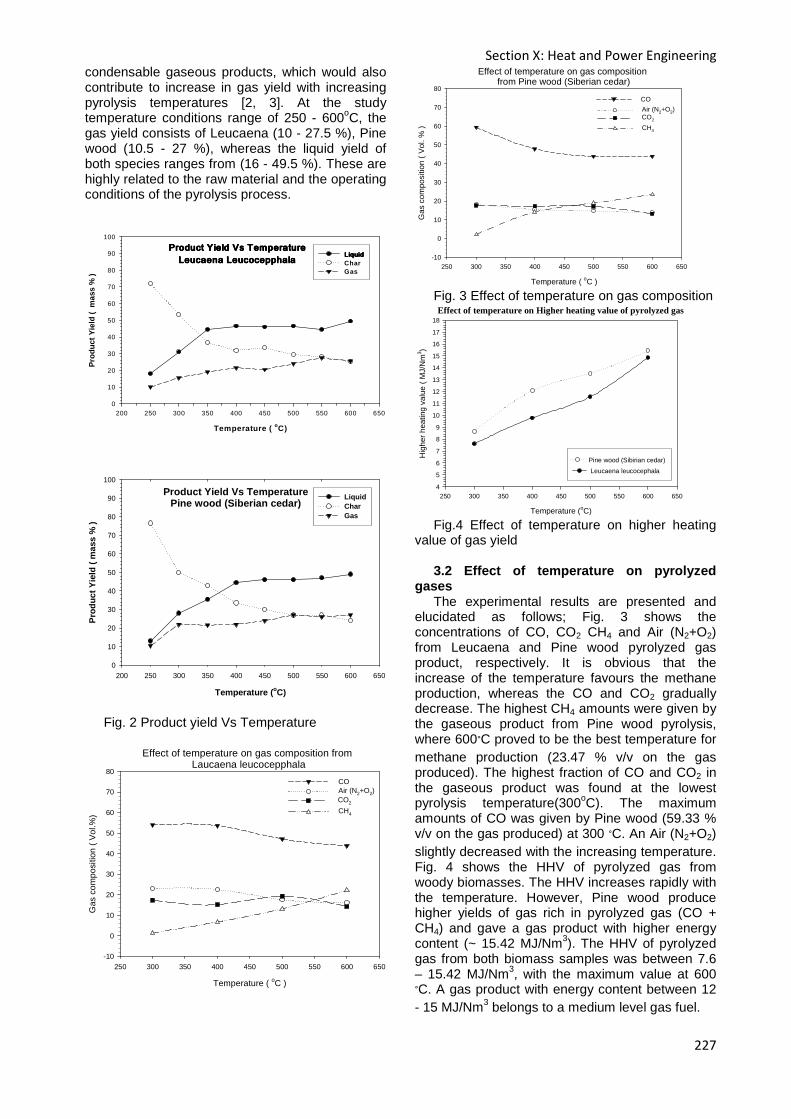
Section X: Heat and Power Engineering
227
condensable gaseous products, which would also contribute to increase in gas yield with increasing pyrolysis temperatures [2, 3]. At the study temperature conditions range of 250 - 600oC, the gas yield consists of Leucaena (10 - 27.5 %), Pine wood (10.5 - 27 %), whereas the liquid yield of both species ranges from (16 - 49.5 %). These are highly related to the raw material and the operating conditions of the pyrolysis process.
Product Yield Vs TemperatureProduct Yield Vs TemperatureProduct Yield Vs TemperatureProduct Yield Vs Temperature
Leucaena LeucocepphalaLeucaena LeucocepphalaLeucaena LeucocepphalaLeucaena Leucocepphala
Temperature ( oC)
200 250 300 350 400 450 500 550 600 650
Pro
duct
Yie
ld (
mas
s %
)
0
10
20
30
40
50
60
70
80
90
100
LiquidLiquidLiquidLiquid
CharGas
Product Yield Vs TemperaturePine wood (Siberian cedar)
Temperature ( oC)
250 350 450 550 650200 300 400 500 600
Pro
duct
Yie
ld (
mas
s %
)
0
10
20
30
40
50
60
70
80
90
100
LiquidCharGas
Fig. 2 Product yield Vs Temperature
Effect of temperature on gas composition from Laucaena leucocepphala
Temperature ( oC )
250 300 350 400 450 500 550 600 650
Gas
com
posi
tion
( V
ol.%
)
-10
0
10
20
30
40
50
60
70
80
Air (N2+O2)CO
CH4
CO2
Effect of temperature on gas composition from Pine wood (Siberian cedar)
Temperature ( oC )
250 300 350 400 450 500 550 600 650
Gas
com
posi
tion
( V
ol. %
)
-10
0
10
20
30
40
50
60
70
80
Air (N2+O2)
CO
CH4
CO2
Fig. 3 Effect of temperature on gas composition Effect of temperature on Higher heating value of pyrolyzed gas
Temperature (oC)
250 300 350 400 450 500 550 600 650
Hig
her
heat
ing
valu
e (
MJ/
Nm
3 )
4
5
6
7
8
9
10
11
12
13
14
15
16
17
18
Leucaena leucocephala
Pine wood (Sibirian cedar)
Fig.4 Effect of temperature on higher heating
value of gas yield 3.2 Effect of temperature on pyrolyzed
gases The experimental results are presented and
elucidated as follows; Fig. 3 shows the concentrations of CO, CO2 CH4 and Air (N2+O2) from Leucaena and Pine wood pyrolyzed gas product, respectively. It is obvious that the increase of the temperature favours the methane production, whereas the CO and CO2 gradually decrease. The highest CH4 amounts were given by the gaseous product from Pine wood pyrolysis, where 600๐C proved to be the best temperature for methane production (23.47 % v/v on the gas produced). The highest fraction of CO and CO2 in the gaseous product was found at the lowest pyrolysis temperature(300oC). The maximum amounts of CO was given by Pine wood (59.33 % v/v on the gas produced) at 300 ๐C. An Air (N2+O2) slightly decreased with the increasing temperature. Fig. 4 shows the HHV of pyrolyzed gas from woody biomasses. The HHV increases rapidly with the temperature. However, Pine wood produce higher yields of gas rich in pyrolyzed gas (CO + CH4) and gave a gas product with higher energy content (~ 15.42 MJ/Nm3). The HHV of pyrolyzed gas from both biomass samples was between 7.6 – 15.42 MJ/Nm3, with the maximum value at 600 ๐C. A gas product with energy content between 12 - 15 MJ/Nm3 belongs to a medium level gas fuel.

XVII Modern Technique and Technologies 2011
228
4. Conclusion The best of thermochemical conversion is the
pyrolysis process, which include all chemical changes occurring when heat is applied to the material in the absence of oxygen. The products of biomass pyrolysis include char, liquids and gases. Typically, the slow pyrolysis is conducted for hours to a maximum temperature of 400 - 600 ๐C. The pyrolyzed gas mainly composed of CO, CH4, and can be used directly to fire processes such as kilns, as fuel in steam boilers, and increasingly as a gaseous fuel in ICEs and gas turbines. It is noticeable that the temperature is crucial for the overall biomass pyrolysis process.
References [1] International Energy Agency (IEA), 2010
Key world energy statistics, [2] Horne, P.A. and Williams, P.T., 1996,
Influence of temperature on the products from the flash pyrolysis of biomass, Journal of fuel 75: 1051-1059.
[3] Sukiran, M.A., Chin, C.M. and Bakar, N.K.A., 2009, Bio-oils from Pyrolysis of Oil Plam Empty Fruit Bunches, American journal of Applied Sciences 6 (5): 869-875

Section XI: Design and Technology of Art Processing of Materials
229
Section XI
DESIGN AND TECHNOLOGY OF ART PROCESSING OF MATERIALS
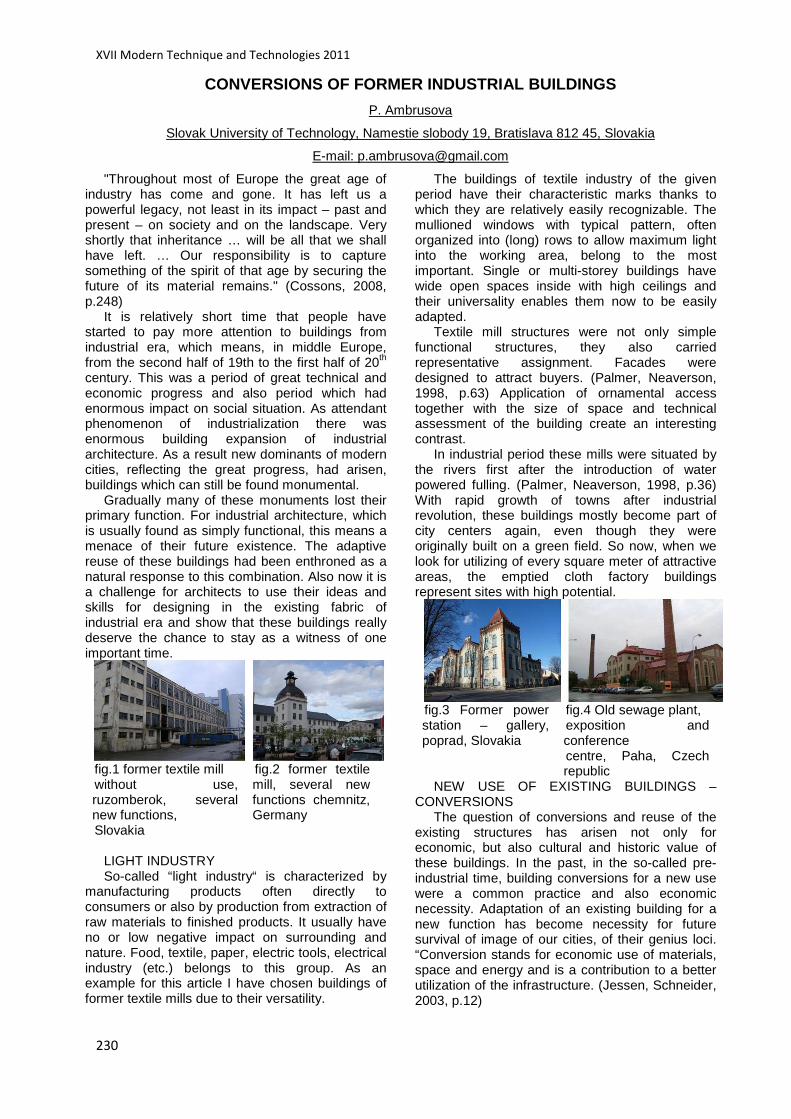
XVII Modern Technique and Technologies 2011
230
CONVERSIONS OF FORMER INDUSTRIAL BUILDINGS
P. Ambrusova
Slovak University of Technology, Namestie slobody 19, Bratislava 812 45, Slovakia
E-mail: [email protected]
"Throughout most of Europe the great age of industry has come and gone. It has left us a powerful legacy, not least in its impact – past and present – on society and on the landscape. Very shortly that inheritance … will be all that we shall have left. … Our responsibility is to capture something of the spirit of that age by securing the future of its material remains." (Cossons, 2008, p.248)
It is relatively short time that people have started to pay more attention to buildings from industrial era, which means, in middle Europe, from the second half of 19th to the first half of 20th century. This was a period of great technical and economic progress and also period which had enormous impact on social situation. As attendant phenomenon of industrialization there was enormous building expansion of industrial architecture. As a result new dominants of modern cities, reflecting the great progress, had arisen, buildings which can still be found monumental.
Gradually many of these monuments lost their primary function. For industrial architecture, which is usually found as simply functional, this means a menace of their future existence. The adaptive reuse of these buildings had been enthroned as a natural response to this combination. Also now it is a challenge for architects to use their ideas and skills for designing in the existing fabric of industrial era and show that these buildings really deserve the chance to stay as a witness of one important time.
fig.1 former textile mill without use, ruzomberok, several new functions, Slovakia
fig.2 former textile mill, several new functions chemnitz, Germany
LIGHT INDUSTRY So-called “light industry“ is characterized by
manufacturing products often directly to consumers or also by production from extraction of raw materials to finished products. It usually have no or low negative impact on surrounding and nature. Food, textile, paper, electric tools, electrical industry (etc.) belongs to this group. As an example for this article I have chosen buildings of former textile mills due to their versatility.
The buildings of textile industry of the given period have their characteristic marks thanks to which they are relatively easily recognizable. The mullioned windows with typical pattern, often organized into (long) rows to allow maximum light into the working area, belong to the most important. Single or multi-storey buildings have wide open spaces inside with high ceilings and their universality enables them now to be easily adapted.
Textile mill structures were not only simple functional structures, they also carried representative assignment. Facades were designed to attract buyers. (Palmer, Neaverson, 1998, p.63) Application of ornamental access together with the size of space and technical assessment of the building create an interesting contrast.
In industrial period these mills were situated by the rivers first after the introduction of water powered fulling. (Palmer, Neaverson, 1998, p.36) With rapid growth of towns after industrial revolution, these buildings mostly become part of city centers again, even though they were originally built on a green field. So now, when we look for utilizing of every square meter of attractive areas, the emptied cloth factory buildings represent sites with high potential.
fig.3 Former power station – gallery, poprad, Slovakia
fig.4 Old sewage plant, exposition and conference centre, Paha, Czech republic
NEW USE OF EXISTING BUILDINGS –CONVERSIONS
The question of conversions and reuse of the existing structures has arisen not only for economic, but also cultural and historic value of these buildings. In the past, in the so-called pre-industrial time, building conversions for a new use were a common practice and also economic necessity. Adaptation of an existing building for a new function has become necessity for future survival of image of our cities, of their genius loci. “Conversion stands for economic use of materials, space and energy and is a contribution to a better utilization of the infrastructure. (Jessen, Schneider, 2003, p.12)
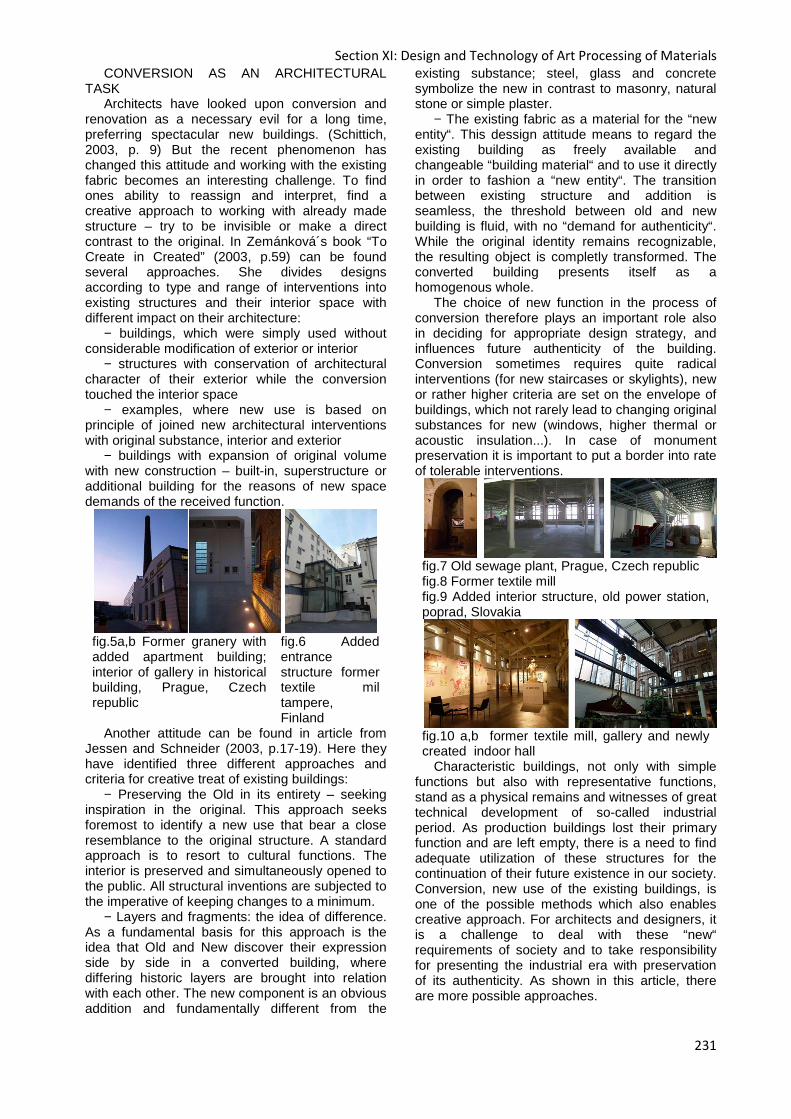
Section XI: Design and Technology of Art Processing of Materials
231
CONVERSION AS AN ARCHITECTURAL TASK
Architects have looked upon conversion and renovation as a necessary evil for a long time, preferring spectacular new buildings. (Schittich, 2003, p. 9) But the recent phenomenon has changed this attitude and working with the existing fabric becomes an interesting challenge. To find ones ability to reassign and interpret, find a creative approach to working with already made structure – try to be invisible or make a direct contrast to the original. In Zemánková´s book “To Create in Created” (2003, p.59) can be found several approaches. She divides designs according to type and range of interventions into existing structures and their interior space with different impact on their architecture:
− buildings, which were simply used without considerable modification of exterior or interior
− structures with conservation of architectural character of their exterior while the conversion touched the interior space
− examples, where new use is based on principle of joined new architectural interventions with original substance, interior and exterior
− buildings with expansion of original volume with new construction – built-in, superstructure or additional building for the reasons of new space demands of the received function.
fig.5a,b Former granery with added apartment building; interior of gallery in historical building, Prague, Czech republic
fig.6 Added entrance structure former textile mil tampere, Finland
Another attitude can be found in article from Jessen and Schneider (2003, p.17-19). Here they have identified three different approaches and criteria for creative treat of existing buildings:
− Preserving the Old in its entirety – seeking inspiration in the original. This approach seeks foremost to identify a new use that bear a close resemblance to the original structure. A standard approach is to resort to cultural functions. The interior is preserved and simultaneously opened to the public. All structural inventions are subjected to the imperative of keeping changes to a minimum.
− Layers and fragments: the idea of difference. As a fundamental basis for this approach is the idea that Old and New discover their expression side by side in a converted building, where differing historic layers are brought into relation with each other. The new component is an obvious addition and fundamentally different from the
existing substance; steel, glass and concrete symbolize the new in contrast to masonry, natural stone or simple plaster.
− The existing fabric as a material for the “new entity“. This dessign attitude means to regard the existing building as freely available and changeable “building material“ and to use it directly in order to fashion a “new entity“. The transition between existing structure and addition is seamless, the threshold between old and new building is fluid, with no “demand for authenticity“. While the original identity remains recognizable, the resulting object is completly transformed. The converted building presents itself as a homogenous whole.
The choice of new function in the process of conversion therefore plays an important role also in deciding for appropriate design strategy, and influences future authenticity of the building. Conversion sometimes requires quite radical interventions (for new staircases or skylights), new or rather higher criteria are set on the envelope of buildings, which not rarely lead to changing original substances for new (windows, higher thermal or acoustic insulation...). In case of monument preservation it is important to put a border into rate of tolerable interventions.
fig.7 Old sewage plant, Prague, Czech republic fig.8 Former textile mill fig.9 Added interior structure, old power station, poprad, Slovakia
fig.10 a,b former textile mill, gallery and newly created indoor hall
Characteristic buildings, not only with simple functions but also with representative functions, stand as a physical remains and witnesses of great technical development of so-called industrial period. As production buildings lost their primary function and are left empty, there is a need to find adequate utilization of these structures for the continuation of their future existence in our society. Conversion, new use of the existing buildings, is one of the possible methods which also enables creative approach. For architects and designers, it is a challenge to deal with these “new“ requirements of society and to take responsibility for presenting the industrial era with preservation of its authenticity. As shown in this article, there are more possible approaches.

XVII Modern Technique and Technologies 2011
232
References: 1. Burkhardt, B. 2008. Preservation of Buildings
from the Modern Era. In: Schittich, Ch. (ed.) 2008. Building in Existing Fabric. Munchen: Detail, Birkhäuser, 2008.
2. Cossons, N. 2008. Yesterday´s Industry, Tomorrow´s Legacy? In: Industrial Heritage, 2008. Praha: Czech Technical University.
3. Jessen, J. - Schneider, J. 2008. Conversions – the New Normal. In: Schittich, Ch. (ed.) 2008. Building in Existing Fabric. Munchen: Detail, Birkhäuser, 2008.
4. Munce, J. 1961. Industrial Architecture, An analysis of international building practice. London: Iliffe Books, 1961.
5. Palmer, M. - Neaverson, P. 2005. Industrial Archaeology, Oxon: Routledge, 2005.
6. Schittich, Ch. 2008. Creative Conversions. In: Schittich, Ch. (ed.) 2008. Building in Existing Fabric. Munchen: Detail, Birkhäuser, 2008.
7. Zemánková, H. 2003. Tvořit ve vytvořeném /To Create in Created/. Brno: University of Technology, 2003.
COMMUNICATIVE POSSIBILITIES OF INFOGRAFICS
Bolshakova. V.V., Kuhta M.S., Khromova S.G.
TOMSK POLITECHNIC UNIVERSITY, 634050, Russia, Tomsk, av. Lenina, 30
E-mail:[email protected]
The image is one of the forms of communications playing an important role in the presentation of ideas. One competent image is worth of 1000 words. As it is known a person receives 90 % of the information by means of sight and only 10 % using other sense organs. It can simplify the meaning and at the same time to convey the necessary information. Images make the information more attractive and convincing.
It is difficult to tell but visual images definitely have a conclusive value in the distribution of ideas. Especially, when the images are competently integrated into the text. The unique, original image can draw attention of a great number of spectators. One of popular forms of the distribution of ideas by means of visual images is infografics.
Infografics (from lat. informatio — a notification, an explanation, a statement) is an alternative way of giving information, data and knowledge. That is a visual representation of information, data or knowledge.
Information visualization has been applied since the most ancient times. There are Victorian examples of infografics in the form of maps with images of islands or the star sky (Fig.1.). In the 19th century Irish engineer Matthew Senkej outlined the scheme of comparison of the steam engine available at that time with a certain ideal engine without power losses for one of the lectures. The scheme was represented by the lines showing the interrelations of the objects, and the width of a line represented the force of this communication [4]. Now the given method of infografics construction is very popular. At the beginning of the 20th century graphic presentations were also used, and the bright researcher was Willard Brinton. In his book «Graphic Presentation» (1939) the visualization of information is considered from historical preconditions and rock paintings, through the
various types of schedules and diagrams, through colour use to practical application. The final chapters are called «graphic diagrams in advertizing, posters, at exhibitions and in conference halls» [3]. But infografics as a concept appeared for the first time in the USA in the 1980s. The first people who began to use the combination of a drawing and a text were the publishers of the newspaper «USA Today» started the project in 1982. For some years the newspaper was included into the top five most readable editions of the country. One of the most appreciable and claimed by readers innovations were the detailed, well traced images with explaining comments. The American readers quickly understood and accepted the advantages of such information transfer. Infografics transferred the message faster than the text (one qualitatively made drawing replaced several pages of the text) and gave more details, than a standard illustration (thanks to details of a drawing and exact comments). Now the recognized genius of information design is considered to be Edward Tafti. He is the author of about ten books and the owner of great number of awards [1].
The methods of infografics are used when it is necessary to explain the difficult information clear and quickly. It is applied in maps, journalism, technical texts and education. And it is also widely used in computer sciences, mathematics and statistics, for simplification of process of working out and the distribution of the conceptual information (Fig. 2.).
There are some features of infografics: graphic objects, useful information loading, and colourful representation, distinct and intelligent representation of a theme.
Visually infografics can be presented in different forms, for example, a caricature, a diagram, an illustration, emblems or simple drawings. As a
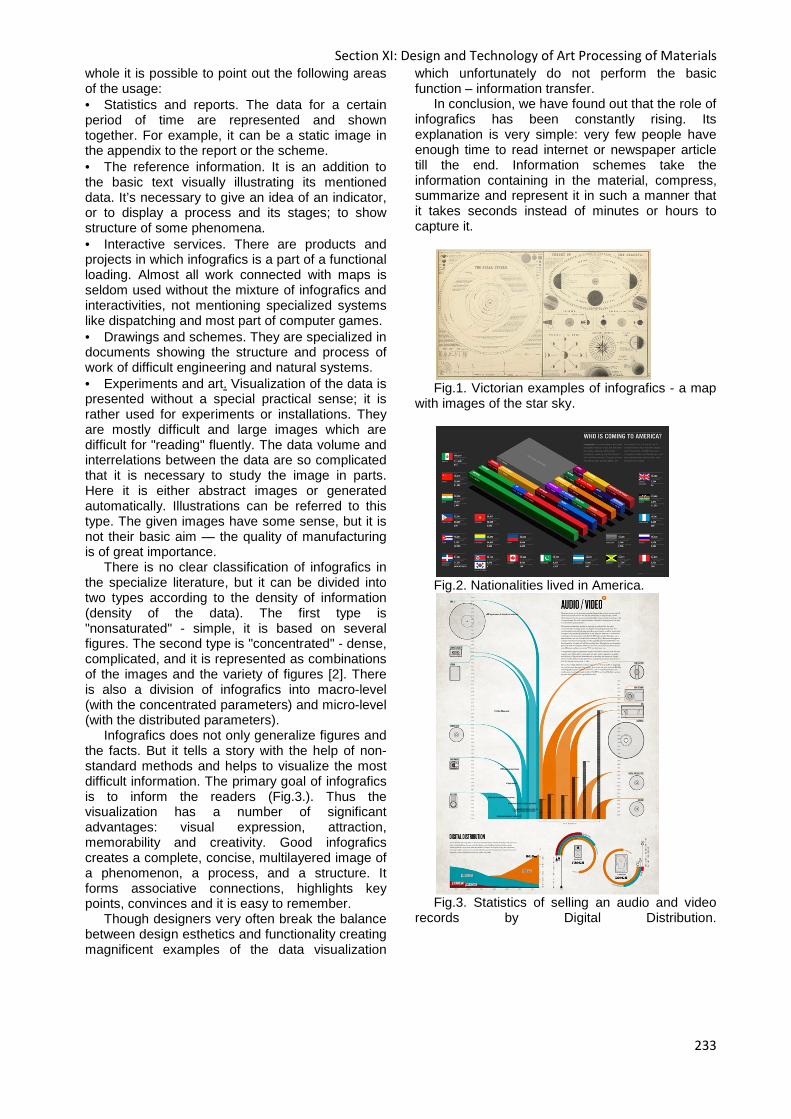
Section XI: Design and Technology of Art Processing of Materials
233
whole it is possible to point out the following areas of the usage: • Statistics and reports. The data for a certain period of time are represented and shown together. For example, it can be a static image in the appendix to the report or the scheme. • The reference information. It is an addition to the basic text visually illustrating its mentioned data. It’s necessary to give an idea of an indicator, or to display a process and its stages; to show structure of some phenomena. • Interactive services. There are products and projects in which infografics is a part of a functional loading. Almost all work connected with maps is seldom used without the mixture of infografics and interactivities, not mentioning specialized systems like dispatching and most part of computer games. • Drawings and schemes. They are specialized in documents showing the structure and process of work of difficult engineering and natural systems. • Experiments and art. Visualization of the data is presented without a special practical sense; it is rather used for experiments or installations. They are mostly difficult and large images which are difficult for "reading" fluently. The data volume and interrelations between the data are so complicated that it is necessary to study the image in parts. Here it is either abstract images or generated automatically. Illustrations can be referred to this type. The given images have some sense, but it is not their basic aim — the quality of manufacturing is of great importance.
There is no clear classification of infografics in the specialize literature, but it can be divided into two types according to the density of information (density of the data). The first type is "nonsaturated" - simple, it is based on several figures. The second type is "concentrated" - dense, complicated, and it is represented as combinations of the images and the variety of figures [2]. There is also a division of infografics into macro-level (with the concentrated parameters) and micro-level (with the distributed parameters).
Infografics does not only generalize figures and the facts. But it tells a story with the help of non-standard methods and helps to visualize the most difficult information. The primary goal of infografics is to inform the readers (Fig.3.). Thus the visualization has a number of significant advantages: visual expression, attraction, memorability and creativity. Good infografics creates a complete, concise, multilayered image of a phenomenon, a process, and a structure. It forms associative connections, highlights key points, convinces and it is easy to remember.
Though designers very often break the balance between design esthetics and functionality creating magnificent examples of the data visualization
which unfortunately do not perform the basic function – information transfer.
In conclusion, we have found out that the role of infografics has been constantly rising. Its explanation is very simple: very few people have enough time to read internet or newspaper article till the end. Information schemes take the information containing in the material, compress, summarize and represent it in such a manner that it takes seconds instead of minutes or hours to capture it.
Fig.1. Victorian examples of infografics - a map
with images of the star sky.
Fig.2. Nationalities lived in America.
Fig.3. Statistics of selling an audio and video
records by Digital Distribution.
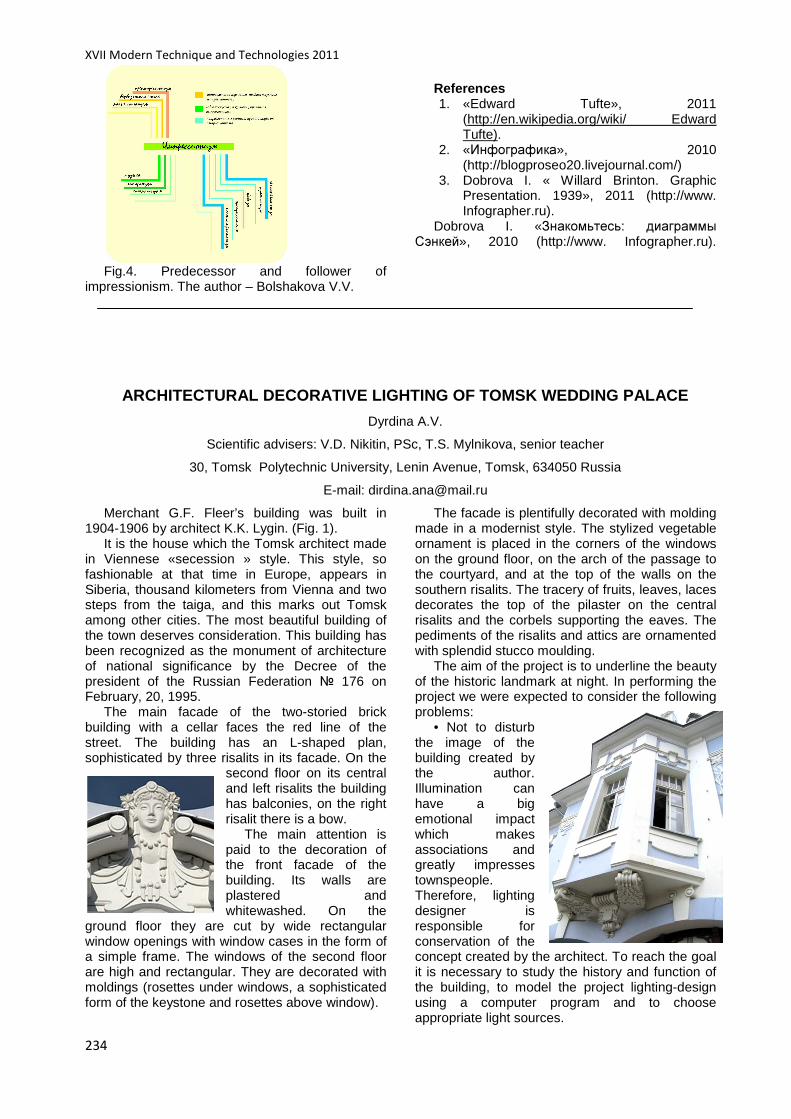
XVII Modern Technique and Technologies 2011
234
Fig.4. Predecessor and follower of
impressionism. The author – Bolshakova V.V.
References 1. «Edward Tufte», 2011
(http://en.wikipedia.org/wiki/ Edward Tufte).
2. «Инфографика», 2010 (http://blogproseo20.livejournal.com/)
3. Dobrova I. « Willard Brinton. Graphic Presentation. 1939», 2011 (http://www. Infographer.ru).
Dobrova I. «Знакомьтесь: диаграммы Сэнкей», 2010 (http://www. Infographer.ru).
ARCHITECTURAL DECORATIVE LIGHTING OF TOMSK WEDDING PALACE
Dyrdina A.V.
Scientific advisers: V.D. Nikitin, PSc, T.S. Mylnikova, senior teacher
30, Tomsk Polytechnic University, Lenin Avenue, Tomsk, 634050 Russia
E-mail: [email protected]
Merchant G.F. Fleer’s building was built in 1904-1906 by architect K.K. Lygin. (Fig. 1).
It is the house which the Tomsk architect made in Viennese «secession » style. This style, so fashionable at that time in Europe, appears in Siberia, thousand kilometers from Vienna and two steps from the taiga, and this marks out Tomsk among other cities. The most beautiful building of the town deserves consideration. This building has been recognized as the monument of architecture of national significance by the Decree of the president of the Russian Federation 176 on February, 20, 1995.
The main facade of the two-storied brick building with a cellar faces the red line of the street. The building has an L-shaped plan, sophisticated by three risalits in its facade. On the
second floor on its central and left risalits the building has balconies, on the right risalit there is a bow.
The main attention is paid to the decoration of the front facade of the building. Its walls are plastered and whitewashed. On the
ground floor they are cut by wide rectangular window openings with window cases in the form of a simple frame. The windows of the second floor are high and rectangular. They are decorated with moldings (rosettes under windows, a sophisticated form of the keystone and rosettes above window).
The facade is plentifully decorated with molding made in a modernist style. The stylized vegetable ornament is placed in the corners of the windows on the ground floor, on the arch of the passage to the courtyard, and at the top of the walls on the southern risalits. The tracery of fruits, leaves, laces decorates the top of the pilaster on the central risalits and the corbels supporting the eaves. The pediments of the risalits and attics are ornamented with splendid stucco moulding.
The aim of the project is to underline the beauty of the historic landmark at night. In performing the project we were expected to consider the following problems:
• Not to disturb the image of the building created by the author. Illumination can have a big emotional impact which makes associations and greatly impresses townspeople. Therefore, lighting designer is responsible for conservation of the concept created by the architect. To reach the goal it is necessary to study the history and function of the building, to model the project lighting-design using a computer program and to choose appropriate light sources.
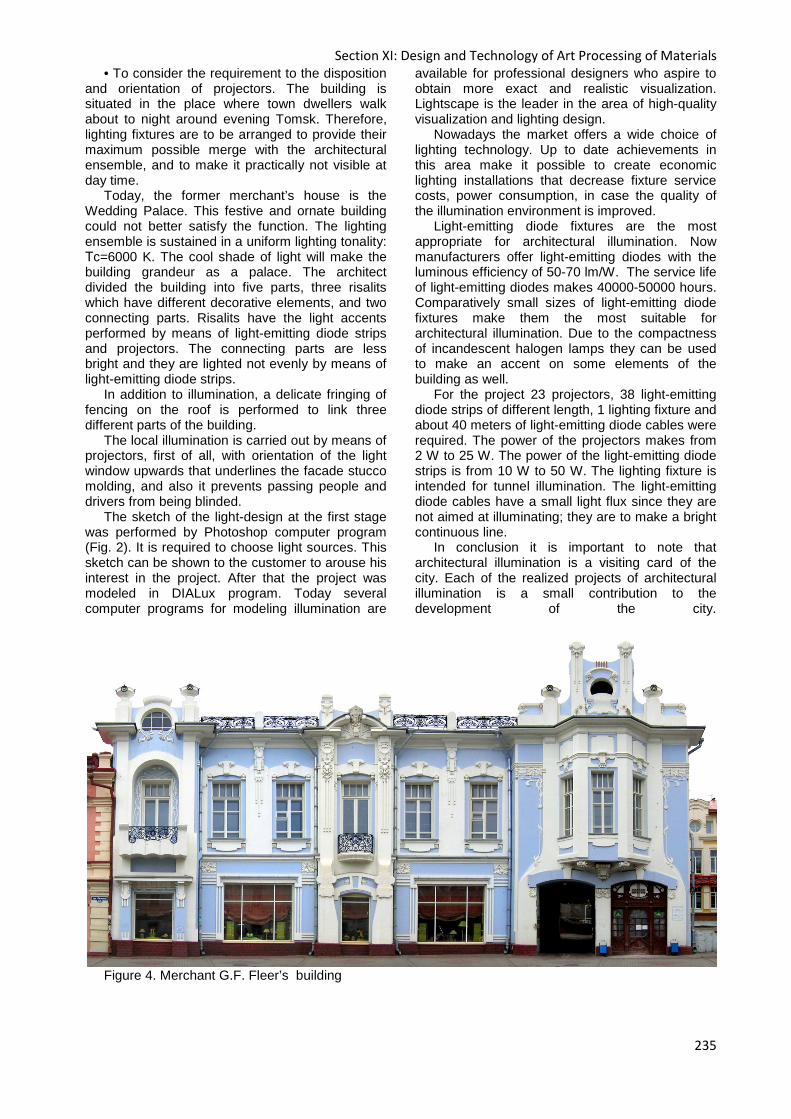
Section XI: Design and Technology of Art Processing of Materials
235
• To consider the requirement to the disposition and orientation of projectors. The building is situated in the place where town dwellers walk about to night around evening Tomsk. Therefore, lighting fixtures are to be arranged to provide their maximum possible merge with the architectural ensemble, and to make it practically not visible at day time.
Today, the former merchant’s house is the Wedding Palace. This festive and ornate building could not better satisfy the function. The lighting ensemble is sustained in a uniform lighting tonality: Тc=6000 K. The cool shade of light will make the building grandeur as a palace. The architect divided the building into five parts, three risalits which have different decorative elements, and two connecting parts. Risalits have the light accents performed by means of light-emitting diode strips and projectors. The connecting parts are less bright and they are lighted not evenly by means of light-emitting diode strips.
In addition to illumination, a delicate fringing of fencing on the roof is performed to link three different parts of the building.
The local illumination is carried out by means of projectors, first of all, with orientation of the light window upwards that underlines the facade stucco molding, and also it prevents passing people and drivers from being blinded.
The sketch of the light-design at the first stage was performed by Photoshop computer program (Fig. 2). It is required to choose light sources. This sketch can be shown to the customer to arouse his interest in the project. After that the project was modeled in DIALux program. Today several computer programs for modeling illumination are
available for professional designers who aspire to obtain more exact and realistic visualization. Lightscape is the leader in the area of high-quality visualization and lighting design.
Nowadays the market offers a wide choice of lighting technology. Up to date achievements in this area make it possible to create economic lighting installations that decrease fixture service costs, power consumption, in case the quality of the illumination environment is improved.
Light-emitting diode fixtures are the most appropriate for architectural illumination. Now manufacturers offer light-emitting diodes with the luminous efficiency of 50-70 lm/W. The service life of light-emitting diodes makes 40000-50000 hours. Comparatively small sizes of light-emitting diode fixtures make them the most suitable for architectural illumination. Due to the compactness of incandescent halogen lamps they can be used to make an accent on some elements of the building as well.
For the project 23 projectors, 38 light-emitting diode strips of different length, 1 lighting fixture and about 40 meters of light-emitting diode cables were required. The power of the projectors makes from 2 W to 25 W. The power of the light-emitting diode strips is from 10 W to 50 W. The lighting fixture is intended for tunnel illumination. The light-emitting diode cables have a small light flux since they are not aimed at illuminating; they are to make a bright continuous line.
In conclusion it is important to note that architectural illumination is a visiting card of the city. Each of the realized projects of architectural illumination is a small contribution to the development of the city.
Figure 4. Merchant G.F. Fleer’s building
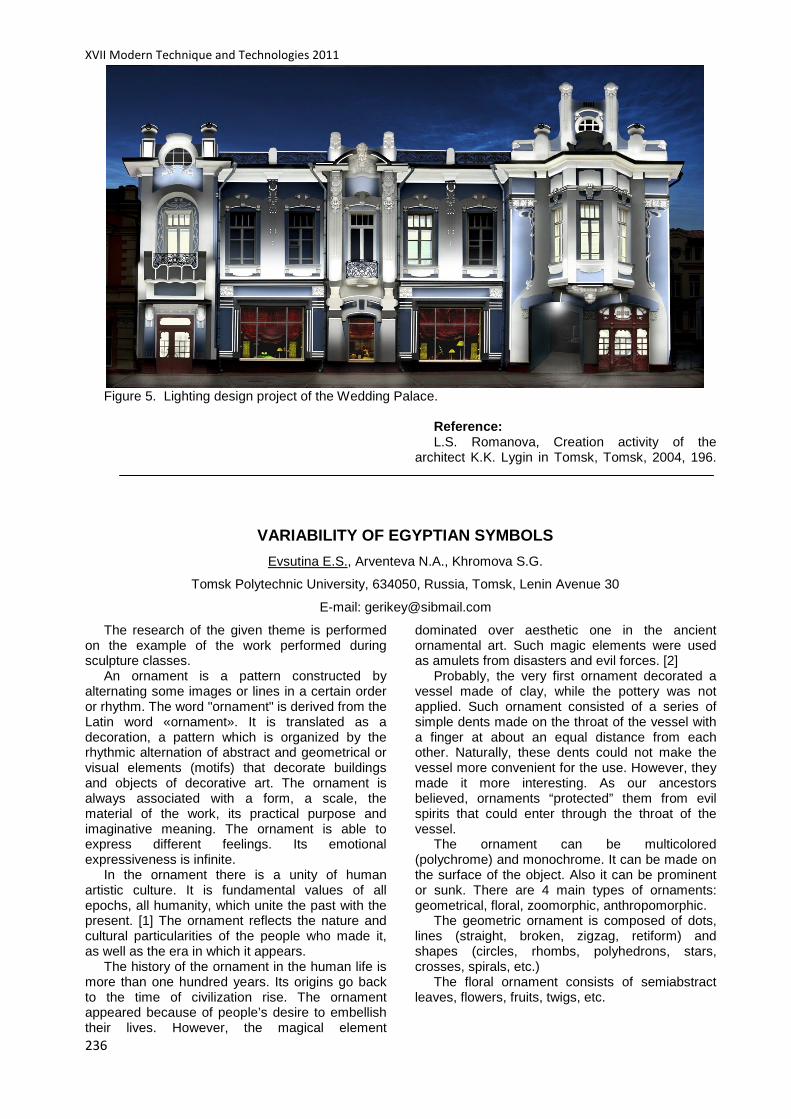
XVII Modern Technique and Technologies 2011
236
Figure 5. Lighting design project of the Wedding Palace.
Reference: L.S. Romanova, Creation activity of the
architect K.K. Lygin in Tomsk, Tomsk, 2004, 196.
VARIABILITY OF EGYPTIAN SYMBOLS
Evsutina E.S., Arventeva N.A., Khromova S.G.
Tomsk Polytechnic University, 634050, Russia, Tomsk, Lenin Avenue 30
E-mail: [email protected]
The research of the given theme is performed on the example of the work performed during sculpture classes.
An ornament is a pattern constructed by alternating some images or lines in a certain order or rhythm. The word "ornament" is derived from the Latin word «ornament». It is translated as a decoration, a pattern which is organized by the rhythmic alternation of abstract and geometrical or visual elements (motifs) that decorate buildings and objects of decorative art. The ornament is always associated with a form, a scale, the material of the work, its practical purpose and imaginative meaning. The ornament is able to express different feelings. Its emotional expressiveness is infinite.
In the ornament there is a unity of human artistic culture. It is fundamental values of all epochs, all humanity, which unite the past with the present. [1] The ornament reflects the nature and cultural particularities of the people who made it, as well as the era in which it appears.
The history of the ornament in the human life is more than one hundred years. Its origins go back to the time of civilization rise. The ornament appeared because of people’s desire to embellish their lives. However, the magical element
dominated over aesthetic one in the ancient ornamental art. Such magic elements were used as amulets from disasters and evil forces. [2]
Probably, the very first ornament decorated a vessel made of clay, while the pottery was not applied. Such ornament consisted of a series of simple dents made on the throat of the vessel with a finger at about an equal distance from each other. Naturally, these dents could not make the vessel more convenient for the use. However, they made it more interesting. As our ancestors believed, ornaments “protected” them from evil spirits that could enter through the throat of the vessel.
The ornament can be multicolored (polychrome) and monochrome. It can be made on the surface of the object. Also it can be prominent or sunk. There are 4 main types of ornaments: geometrical, floral, zoomorphic, anthropomorphic.
The geometric ornament is composed of dots, lines (straight, broken, zigzag, retiform) and shapes (circles, rhombs, polyhedrons, stars, crosses, spirals, etc.)
The floral ornament consists of semiabstract leaves, flowers, fruits, twigs, etc.
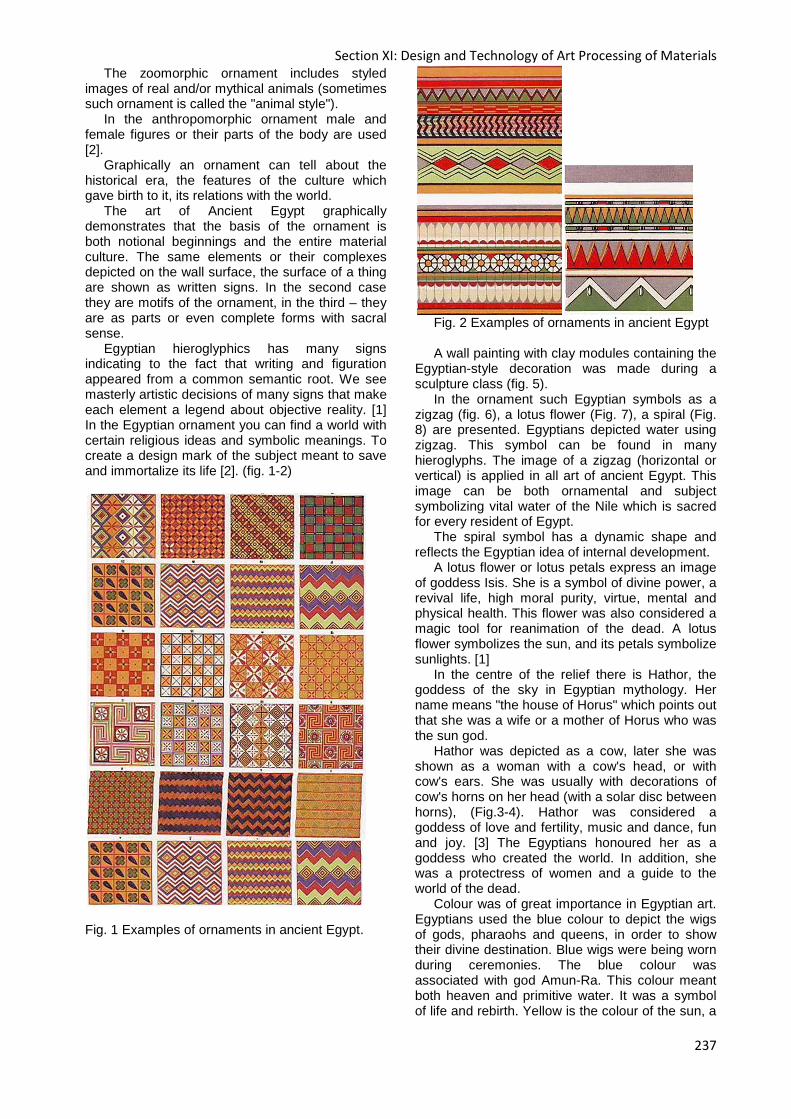
Section XI: Design and Technology of Art Processing of Materials
237
The zoomorphic ornament includes styled images of real and/or mythical animals (sometimes such ornament is called the "animal style").
In the anthropomorphic ornament male and female figures or their parts of the body are used [2].
Graphically an ornament can tell about the historical era, the features of the culture which gave birth to it, its relations with the world.
The art of Ancient Egypt graphically demonstrates that the basis of the ornament is both notional beginnings and the entire material culture. The same elements or their complexes depicted on the wall surface, the surface of a thing are shown as written signs. In the second case they are motifs of the ornament, in the third – they are as parts or even complete forms with sacral sense.
Egyptian hieroglyphics has many signs indicating to the fact that writing and figuration appeared from a common semantic root. We see masterly artistic decisions of many signs that make each element a legend about objective reality. [1] In the Egyptian ornament you can find a world with certain religious ideas and symbolic meanings. To create a design mark of the subject meant to save and immortalize its life [2]. (fig. 1-2)
Fig. 1 Examples of ornaments in ancient Egypt.
Fig. 2 Examples of ornaments in ancient Egypt A wall painting with clay modules containing the
Egyptian-style decoration was made during a sculpture class (fig. 5).
In the ornament such Egyptian symbols as a zigzag (fig. 6), a lotus flower (Fig. 7), a spiral (Fig. 8) are presented. Egyptians depicted water using zigzag. This symbol can be found in many hieroglyphs. The image of a zigzag (horizontal or vertical) is applied in all art of ancient Egypt. This image can be both ornamental and subject symbolizing vital water of the Nile which is sacred for every resident of Egypt.
The spiral symbol has a dynamic shape and reflects the Egyptian idea of internal development.
A lotus flower or lotus petals express an image of goddess Isis. She is a symbol of divine power, a revival life, high moral purity, virtue, mental and physical health. This flower was also considered a magic tool for reanimation of the dead. A lotus flower symbolizes the sun, and its petals symbolize sunlights. [1]
In the centre of the relief there is Hathor, the goddess of the sky in Egyptian mythology. Her name means "the house of Horus" which points out that she was a wife or a mother of Horus who was the sun god.
Hathor was depicted as a cow, later she was shown as a woman with a cow's head, or with cow's ears. She was usually with decorations of cow's horns on her head (with a solar disc between horns), (Fig.3-4). Hathor was considered a goddess of love and fertility, music and dance, fun and joy. [3] The Egyptians honoured her as a goddess who created the world. In addition, she was a protectress of women and a guide to the world of the dead.
Colour was of great importance in Egyptian art. Egyptians used the blue colour to depict the wigs of gods, pharaohs and queens, in order to show their divine destination. Blue wigs were being worn during ceremonies. The blue colour was associated with god Amun-Ra. This colour meant both heaven and primitive water. It was a symbol of life and rebirth. Yellow is the colour of the sun, a
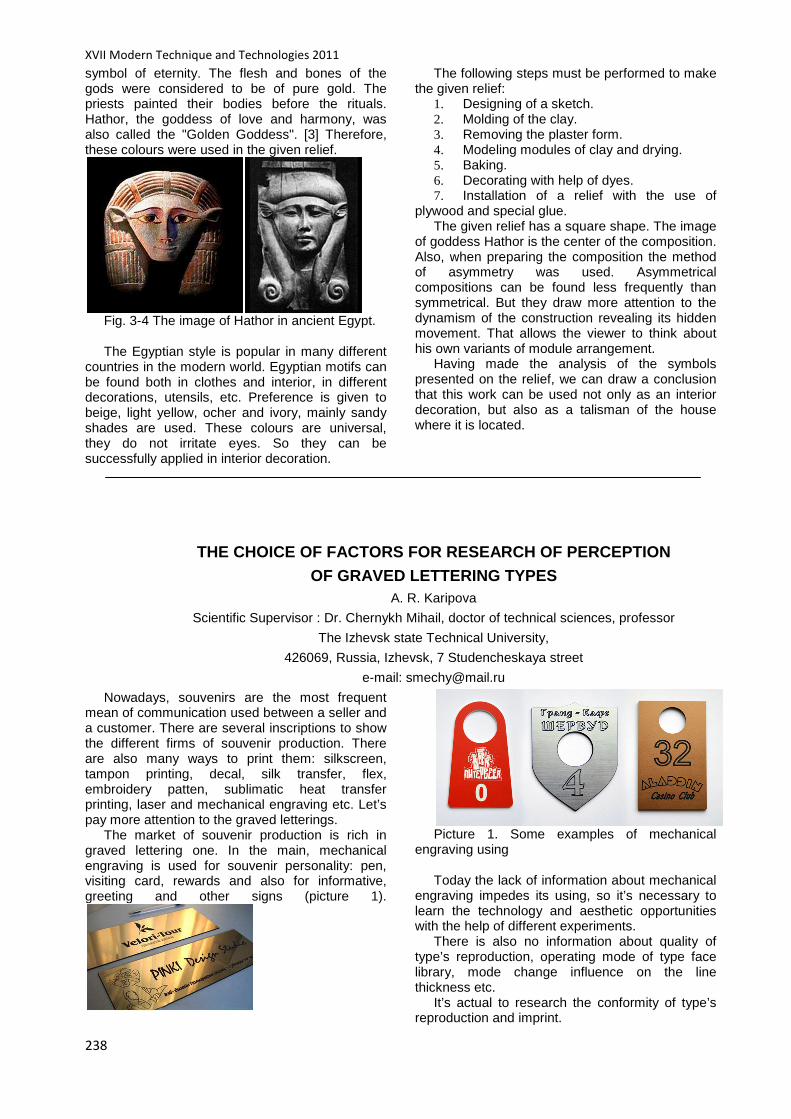
XVII Modern Technique and Technologies 2011
238
symbol of eternity. The flesh and bones of the gods were considered to be of pure gold. The priests painted their bodies before the rituals. Hathor, the goddess of love and harmony, was also called the "Golden Goddess". [3] Therefore, these colours were used in the given relief.
Fig. 3-4 The image of Hathor in ancient Egypt. The Egyptian style is popular in many different
countries in the modern world. Egyptian motifs can be found both in clothes and interior, in different decorations, utensils, etc. Preference is given to beige, light yellow, ocher and ivory, mainly sandy shades are used. These colours are universal, they do not irritate eyes. So they can be successfully applied in interior decoration.
The following steps must be performed to make the given relief:
1. Designing of a sketch. 2. Molding of the clay. 3. Removing the plaster form. 4. Modeling modules of clay and drying. 5. Baking. 6. Decorating with help of dyes. 7. Installation of a relief with the use of
plywood and special glue. The given relief has a square shape. The image
of goddess Hathor is the center of the composition. Also, when preparing the composition the method of asymmetry was used. Asymmetrical compositions can be found less frequently than symmetrical. But they draw more attention to the dynamism of the construction revealing its hidden movement. That allows the viewer to think about his own variants of module arrangement.
Having made the analysis of the symbols presented on the relief, we can draw a conclusion that this work can be used not only as an interior decoration, but also as a talisman of the house where it is located.
THE CHOICE OF FACTORS FOR RESEARCH OF PERCEPTION
OF GRAVED LETTERING TYPES A. R. Karipova
Scientific Supervisor : Dr. Chernykh Mihail, doctor of technical sciences, professor
The Izhevsk state Technical University,
426069, Russia, Izhevsk, 7 Studencheskaya street
e-mail: [email protected]
Nowadays, souvenirs are the most frequent mean of communication used between a seller and a customer. There are several inscriptions to show the different firms of souvenir production. There are also many ways to print them: silkscreen, tampon printing, decal, silk transfer, flex, embroidery patten, sublimatic heat transfer printing, laser and mechanical engraving etc. Let’s pay more attention to the graved letterings.
The market of souvenir production is rich in graved lettering one. In the main, mechanical engraving is used for souvenir personality: pen, visiting card, rewards and also for informative, greeting and other signs (picture 1).
Picture 1. Some examples of mechanical
engraving using Today the lack of information about mechanical
engraving impedes its using, so it’s necessary to learn the technology and aesthetic opportunities with the help of different experiments.
There is also no information about quality of type’s reproduction, operating mode of type face library, mode change influence on the line thickness etc.
It’s actual to research the conformity of type’s reproduction and imprint.

Section XI: Design and Technology of Art Processing of Materials
239
Mode types and imprint can be realized due to 3 schemes: cross-hatch (picture 2a), engraved outline (picture 2b) or built-up letter. So having chosen a suitable it’s necessary to choose the variant of its reproduction.
a) b) Picture 2. The principle of mechanical
engraver’s work a – cross-hatch, b – engraved outline The results of research, mode on double layer
plastic, show the factors, which influence on the reproduction of type face library:
1) Type Picture 3 shows that the engraver “doesn’t
print” some symbols. The letter “e” may be a bright example.
а)
b)
Picture 3. The opportunities of type face library reproduction
a – graphic file, b – a letter made on the engraving machine
2) Principle (scheme) of reproduction: cross-
hatch, engraved outline or built-up letter. The reproduction and readable of inscription
depend on the chosen scheme. Picture 4 shows that built-up letter is the most
successful combination of the type face library reproduction.
a) b) c) Picture 4. Some variants of the type face library
reproduction: а – cross-hatch, b – engraved outline, c – built-
up letter 3) Conveying speed. 4) Number of rotation. 5) Material. The results of research were made on the
double layers plastic. Other materials can give other results.
6) Depth of cut. Shape and size of cutter.
THE FUNCTIONAL AND AESTHETIC DESIGN OF BIRDS’ FEEDI NG-RACK
Kukhta A.E.
The scientific adviser – S.S. Moskvitin, zoological museum’s head
Tomsk State University, Zoological museum, 634050 Russia, Tomsk, Lenina st., 36
E-mail: [email protected]
The birds are the indispensable and substantial element of any habitat. They are one of few natural components of the fauna in the urban area. The
bird-watching always attracted human’s attention being the possibility of contacting the nature [1].
Feeding-racks are one of the basic tools to attract the birds to the urban area [2]. Also the

XVII Modern Technique and Technologies 2011
240
additional feeding allows the birds to survive better in the difficult times like winter when the natural fodder supplies significantly decrease and become difficult to access. During such period the birds willingly eat the feeds supplied by human. The feeding-rack provides the safety of the feed, protects it from the snow and other bad exposures. The modern requirements to the city’s appearance define another criterion to the feeding-rack – it must look aesthetic and must blend harmoniously to the allocated space.
The variety of feeding-rack’s designs is large but it’s possible to pick out some basic types of the construction as provided by the complexity of the making.
The simple-designed feeding-racks made from improvised materials (plastic bottles, cardboard boxes etc) are used most often; they can be hung as outdoors as in the window space of buildings. The main feature is simplicity of the design and of the making which can take less than several minutes [3]. The imperfection of such feeding-racks is that they can’t completely take into account birds’ needs – the possibility of an approach and landing; the comfort of getting and picking the feed up; the possibility of the simultaneous use by several individuals or by different species – first of all that’s provided by features of the materials used for making. The aesthetics of such feeding-racks leave much to be desired. Plastic bottles and cardboard boxes attached to trees’ branches most of all resemble to a trash got stuck upon the tree.
The author-designed feeding-racks are generally used for hanging in the window space of buildings and rarely in the city parks. As a rule such feeding-racks are original, have a complex structure and are created considering the aesthetic component – have a nice and thorough construction, harmony of forms. Also the comfort of the use it by birds is taken into consideration. The imperfections of such feeding-racks are the complexity of the construction as a rule including a whole set of different elements; the necessity in the use of different fasteners; the long duration of making. The important advantage of such feeding-racks is complete taking into account needs as from birds’ as from humans’ sides as well as harmonious combination with an aesthetic component of the perception. Another advantage is the possibility of moral-ethical upbringing of human [4]. The designing and the creation of a birds’ feeding rack in the family circle assists in the development of feeling of the concern and the responsibility to the environment for parents and children.
We designed the feeding-rack having it would completely satisfy the criteria of the aesthetics and be handy as to humans as to birds. First, we selected the basic features that the standard window-placed feeding-rack must satisfy.
1. The solidity – the feedfing-rack must keep the enough solidity to do not break during
everyday use and being in hard weather conditions (also keeping the good appearance).
2. The durability – the materials must be selected and processed properly to bear bad conditions (the moisture, the cold, the strokes etc) in long term without the loss of the functional and aesthetic qualities.
3. The usability to birds – the feeding-rack must be steady enough for the bird could land it. It must contain sufficient quantity of the feed and keep it from bad mechanical and climatic conditions (like the wind dispersion, the snow burying etc). The size of the feeding-rack must provide the simultaneous use of it by several individuals. First of all it must attract the sparrow-like birds: the great tit (Parus major), the bullfinch (Purrhula purrhula), the waxwing (Bombycilla garrulus).
4. The usability to humans – the feeding-rack must be handy to human. First of all it means the comfort of adding (pouring) the feed inside it. Also it must be easily secured in the window place by different methods if possible (depending on the circumstances of the use and on the window place’s materials).
5. The aesthetic qualities – considering that the feeding-rack is placed near the window, its appearance is very important. The materials it’s made from must be processed properly and must have an attractive look. The construction of the feeding-rack must provide the possibility of the bird-watching if possible.
According to the listed criteria we designed the feeding-rack.
1. The solidity of the construction is provided by the use of glue and screws; in the hard places both fasten-methods are used. It’s possible to use self-tapping screws instead of ordinary ones; this slightly simplifies the process of assembly.
2. The feeding-rack is covered with drying oil and lacquered in several layers. The convenience of the fastening is provided by rubber protectors located in the most probable places of contact of the feeding-rack with other objects (the window).
3. 3 perches for the birds 8 mm in diameter provide comfortable landing to medium-sized sparrow-like birds along the whole perimeter of the feeding-rack. The 18 mm board together with the area of the feeding table make considerable by the volume capacity for the feed while the roof keeps its safety to the precipitations and the wind. The size of the feeding-rack and the ledge of the perches are estimated so as to birds larger than the waxwing would run into difficulties trying to access it.
4. The part of the roof of the feeding-rack is constructed hinged and can open for the convenience of pouring the feed. There’re holes in the back wall of the feeding-rack for fastening it by the cord or by the screws with washers.
5. The lacquered surface provides pleasant aesthetic perception. The form of the feeding-rack being stretched in the horizontal plane is caused by the convenience of placing it facing the window:
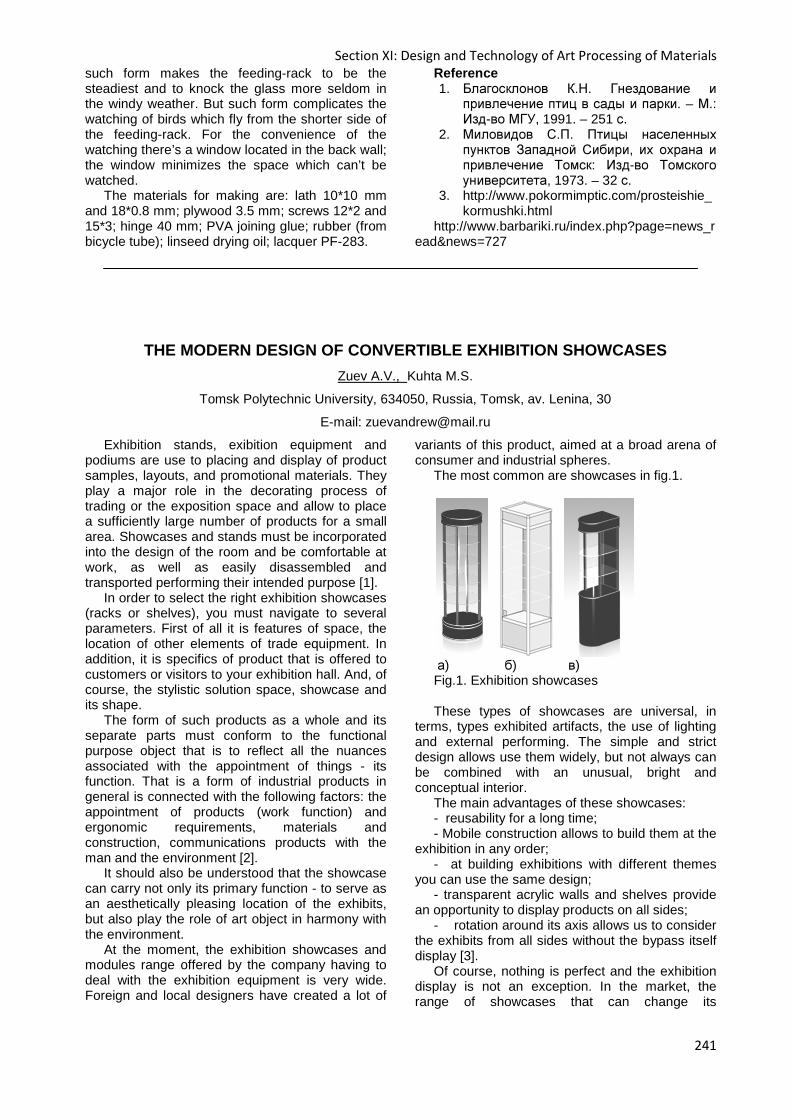
Section XI: Design and Technology of Art Processing of Materials
241
such form makes the feeding-rack to be the steadiest and to knock the glass more seldom in the windy weather. But such form complicates the watching of birds which fly from the shorter side of the feeding-rack. For the convenience of the watching there’s a window located in the back wall; the window minimizes the space which can’t be watched.
The materials for making are: lath 10*10 mm and 18*0.8 mm; plywood 3.5 mm; screws 12*2 and 15*3; hinge 40 mm; PVA joining glue; rubber (from bicycle tube); linseed drying oil; lacquer PF-283.
Reference 1. Благосклонов К.Н. Гнездование и
привлечение птиц в сады и парки. – М.: Изд-во МГУ, 1991. – 251 с.
2. Миловидов С.П. Птицы населенных пунктов Западной Сибири, их охрана и привлечение Томск: Изд-во Томского университета, 1973. – 32 с.
3. http://www.pokormimptic.com/prosteishie_kormushki.html
http://www.barbariki.ru/index.php?page=news_read&news=727
THE MODERN DESIGN OF CONVERTIBLE EXHIBITION SHOWCAS ES
Zuev A.V., Kuhta M.S.
Tomsk Polytechnic University, 634050, Russia, Tomsk, av. Lenina, 30
E-mail: [email protected]
Exhibition stands, exibition equipment and podiums are use to placing and display of product samples, layouts, and promotional materials. They play a major role in the decorating process of trading or the exposition space and allow to place a sufficiently large number of products for a small area. Showcases and stands must be incorporated into the design of the room and be comfortable at work, as well as easily disassembled and transported performing their intended purpose [1].
In order to select the right exhibition showcases (racks or shelves), you must navigate to several parameters. First of all it is features of space, the location of other elements of trade equipment. In addition, it is specifics of product that is offered to customers or visitors to your exhibition hall. And, of course, the stylistic solution space, showcase and its shape.
The form of such products as a whole and its separate parts must conform to the functional purpose object that is to reflect all the nuances associated with the appointment of things - its function. That is a form of industrial products in general is connected with the following factors: the appointment of products (work function) and ergonomic requirements, materials and construction, communications products with the man and the environment [2].
It should also be understood that the showcase can carry not only its primary function - to serve as an aesthetically pleasing location of the exhibits, but also play the role of art object in harmony with the environment.
At the moment, the exhibition showcases and modules range offered by the company having to deal with the exhibition equipment is very wide. Foreign and local designers have created a lot of
variants of this product, aimed at a broad arena of consumer and industrial spheres.
The most common are showcases in fig.1.
а) б) в) Fig.1. Exhibition showcases These types of showcases are universal, in
terms, types exhibited artifacts, the use of lighting and external performing. The simple and strict design allows use them widely, but not always can be combined with an unusual, bright and conceptual interior.
The main advantages of these showcases: - reusability for a long time; - Mobile construction allows to build them at the
exhibition in any order; - at building exhibitions with different themes
you can use the same design; - transparent acrylic walls and shelves provide
an opportunity to display products on all sides; - rotation around its axis allows us to consider
the exhibits from all sides without the bypass itself display [3].
Of course, nothing is perfect and the exhibition display is not an exception. In the market, the range of showcases that can change its
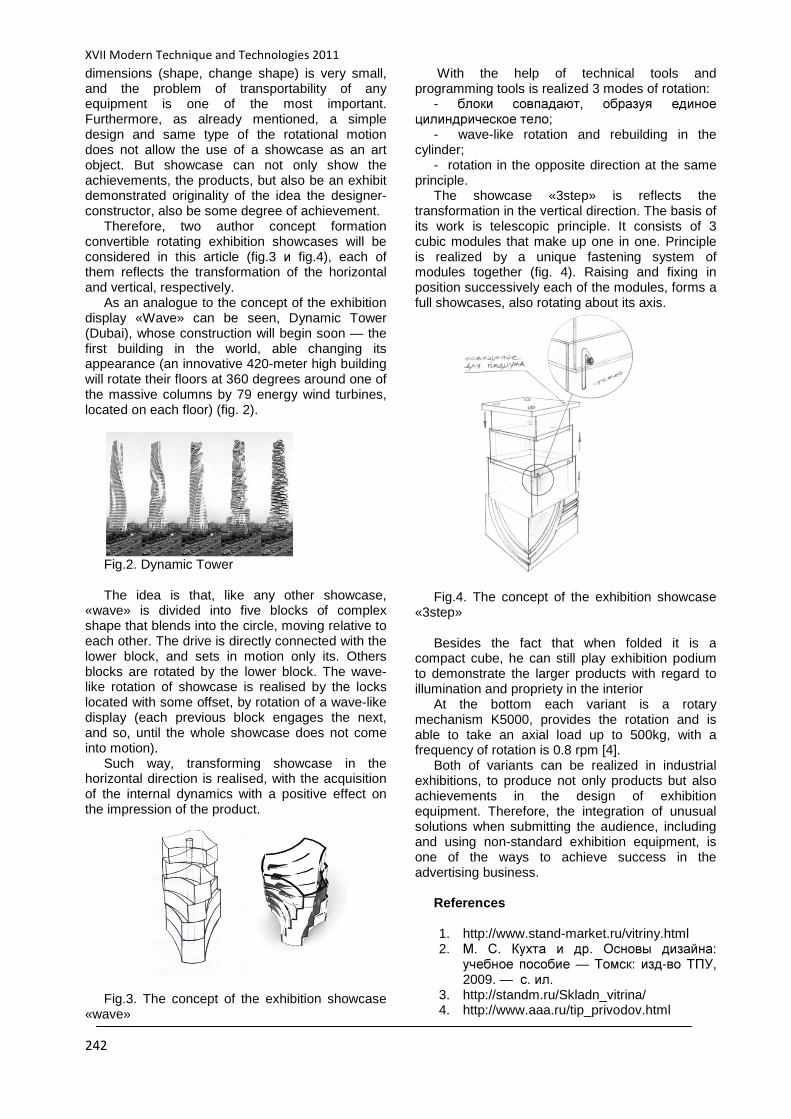
XVII Modern Technique and Technologies 2011
242
dimensions (shape, change shape) is very small, and the problem of transportability of any equipment is one of the most important. Furthermore, as already mentioned, a simple design and same type of the rotational motion does not allow the use of a showcase as an art object. But showcase can not only show the achievements, the products, but also be an exhibit demonstrated originality of the idea the designer-constructor, also be some degree of achievement.
Therefore, two author concept formation convertible rotating exhibition showcases will be considered in this article (fig.3 и fig.4), each of them reflects the transformation of the horizontal and vertical, respectively.
As an analogue to the concept of the exhibition display «Wave» can be seen, Dynamic Tower (Dubai), whose construction will begin soon — the first building in the world, able changing its appearance (an innovative 420-meter high building will rotate their floors at 360 degrees around one of the massive columns by 79 energy wind turbines, located on each floor) (fig. 2).
Fig.2. Dynamic Tower The idea is that, like any other showcase,
«wave» is divided into five blocks of complex shape that blends into the circle, moving relative to each other. The drive is directly connected with the lower block, and sets in motion only its. Others blocks are rotated by the lower block. The wave-like rotation of showcase is realised by the locks located with some offset, by rotation of a wave-like display (each previous block engages the next, and so, until the whole showcase does not come into motion).
Such way, transforming showcase in the horizontal direction is realised, with the acquisition of the internal dynamics with a positive effect on the impression of the product.
Fig.3. The concept of the exhibition showcase
«wave»
With the help of technical tools and programming tools is realized 3 modes of rotation:
- блоки совпадают, образуя единое цилиндрическое тело;
- wave-like rotation and rebuilding in the cylinder;
- rotation in the opposite direction at the same principle.
The showcase «3step» is reflects the transformation in the vertical direction. The basis of its work is telescopic principle. It consists of 3 cubic modules that make up one in one. Principle is realized by a unique fastening system of modules together (fig. 4). Raising and fixing in position successively each of the modules, forms a full showcases, also rotating about its axis.
Fig.4. The concept of the exhibition showcase
«3step» Besides the fact that when folded it is a
compact cube, he can still play exhibition podium to demonstrate the larger products with regard to illumination and propriety in the interior
At the bottom each variant is a rotary mechanism K5000, provides the rotation and is able to take an axial load up to 500kg, with a frequency of rotation is 0.8 rpm [4].
Both of variants can be realized in industrial exhibitions, to produce not only products but also achievements in the design of exhibition equipment. Therefore, the integration of unusual solutions when submitting the audience, including and using non-standard exhibition equipment, is one of the ways to achieve success in the advertising business.
References 1. http://www.stand-market.ru/vitriny.html 2. М. С. Кухта и др. Основы дизайна:
учебное пособие — Томск: изд-во ТПУ, 2009. — с. ил.
3. http://standm.ru/Skladn_vitrina/ 4. http://www.aaa.ru/tip_privodov.html

Section XII: Nanomaterials, Nanotechnologies and New Energetics
243
Section XII
NANOMATERIALS, NANOTECHNOLOGIES AND NEW ENERGETICS
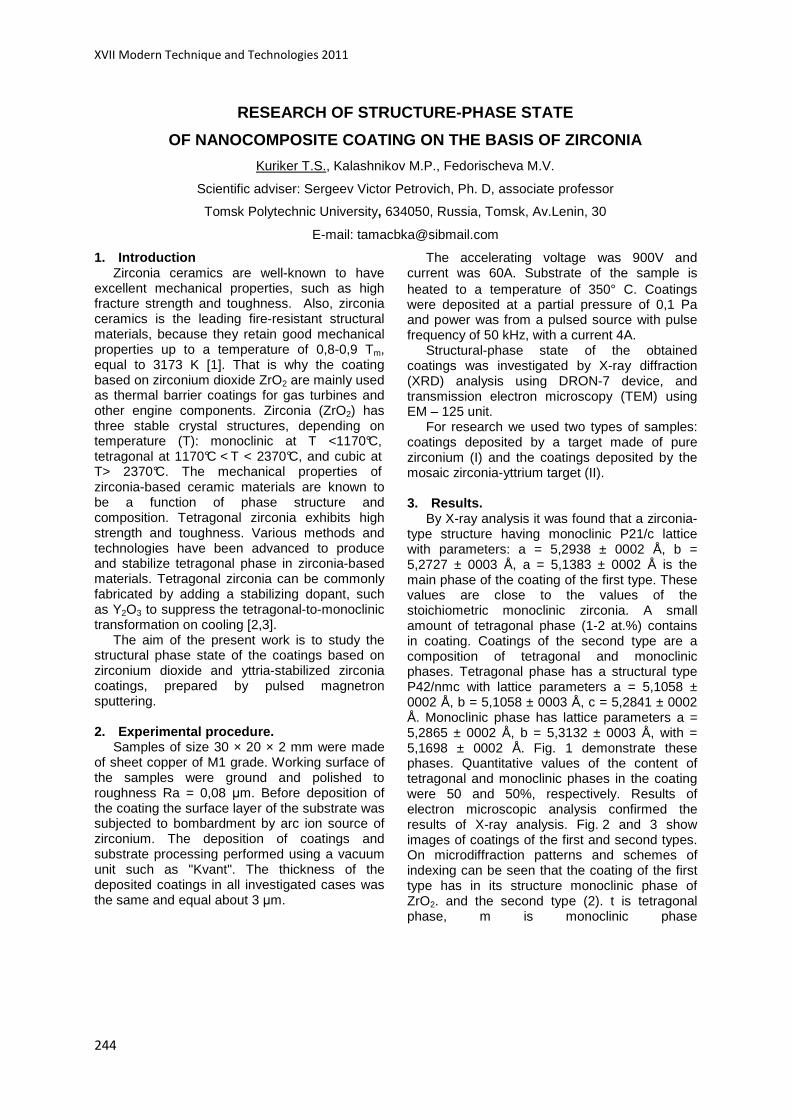
XVII Modern Technique and Technologies 2011
244
RESEARCH OF STRUCTURE-PHASE STATE
OF NANOCOMPOSITE COATING ON THE BASIS OF ZIRCONIA
Kuriker T.S., Kalashnikov M.P., Fedorischeva M.V.
Scientific adviser: Sergeev Victor Petrovich, Ph. D, associate professor
Tomsk Polytechnic University, 634050, Russia, Tomsk, Av.Lenin, 30
E-mail: [email protected]
1. Introduction Zirconia ceramics are well-known to have
excellent mechanical properties, such as high fracture strength and toughness. Also, zirconia ceramics is the leading fire-resistant structural materials, because they retain good mechanical properties up to a temperature of 0,8-0,9 Tm, equal to 3173 K [1]. That is why the coating based on zirconium dioxide ZrO2 are mainly used as thermal barrier coatings for gas turbines and other engine components. Zirconia (ZrO2) has three stable crystal structures, depending on temperature (T): monoclinic at T <1170°C, tetragonal at 1170°C < T < 2370°C, and cubic at T> 2370°C. The mechanical properties of zirconia-based ceramic materials are known to be a function of phase structure and composition. Tetragonal zirconia exhibits high strength and toughness. Various methods and technologies have been advanced to produce and stabilize tetragonal phase in zirconia-based materials. Tetragonal zirconia can be commonly fabricated by adding a stabilizing dopant, such as Y2O3 to suppress the tetragonal-to-monoclinic transformation on cooling [2,3].
The aim of the present work is to study the structural phase state of the coatings based on zirconium dioxide and yttria-stabilized zirconia coatings, prepared by pulsed magnetron sputtering.
2. Experimental procedure.
Samples of size 30 × 20 × 2 mm were made of sheet copper of M1 grade. Working surface of the samples were ground and polished to roughness Ra = 0,08 µm. Before deposition of the coating the surface layer of the substrate was subjected to bombardment by arc ion source of zirconium. The deposition of coatings and substrate processing performed using a vacuum unit such as "Kvant". The thickness of the deposited coatings in all investigated cases was the same and equal about 3 µm.
The accelerating voltage was 900V and current was 60A. Substrate of the sample is heated to a temperature of 350° C. Coatings were deposited at a partial pressure of 0,1 Pa and power was from a pulsed source with pulse frequency of 50 kHz, with a current 4A.
Structural-phase state of the obtained coatings was investigated by X-ray diffraction (XRD) analysis using DRON-7 device, and transmission electron microscopy (TEM) using EM – 125 unit.
For research we used two types of samples: coatings deposited by a target made of pure zirconium (I) and the coatings deposited by the mosaic zirconia-yttrium target (II).
3. Results.
By X-ray analysis it was found that a zirconia-type structure having monoclinic P21/c lattice with parameters: a = 5,2938 ± 0002 Å, b = 5,2727 ± 0003 Å, a = 5,1383 ± 0002 Å is the main phase of the coating of the first type. These values are close to the values of the stoichiometric monoclinic zirconia. A small amount of tetragonal phase (1-2 at.%) contains in coating. Coatings of the second type are a composition of tetragonal and monoclinic phases. Tetragonal phase has a structural type P42/nmc with lattice parameters a = 5,1058 ± 0002 Å, b = 5,1058 ± 0003 Å, c = 5,2841 ± 0002 Å. Monoclinic phase has lattice parameters a = 5,2865 ± 0002 Å, b = 5,3132 ± 0003 Å, with = 5,1698 ± 0002 Å. Fig. 1 demonstrate these phases. Quantitative values of the content of tetragonal and monoclinic phases in the coating were 50 and 50%, respectively. Results of electron microscopic analysis confirmed the results of X-ray analysis. Fig. 2 and 3 show images of coatings of the first and second types. On microdiffraction patterns and schemes of indexing can be seen that the coating of the first type has in its structure monoclinic phase of ZrO2. and the second type (2). t is tetragonal phase, m is monoclinic phase
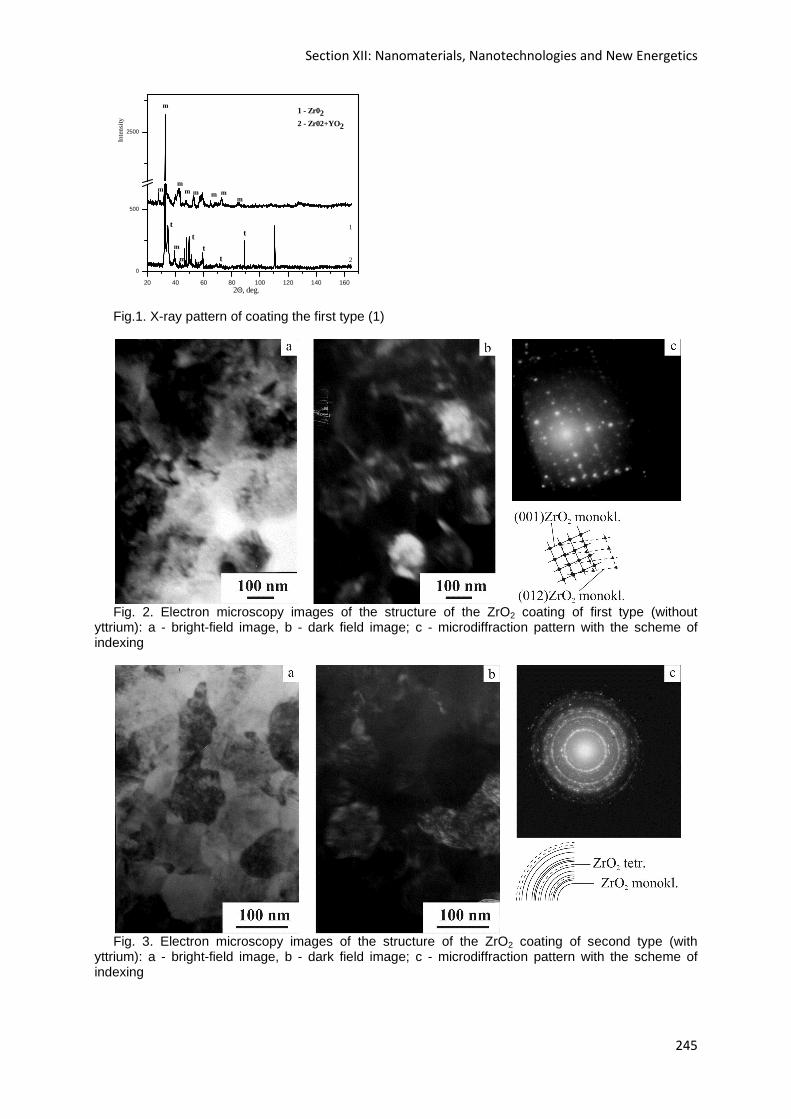
Section XII: Nanomaterials, Nanotechnologies and New Energetics
245
20 40 60 80 100 120 140 160
0
500
2500
t
tt
t
m
mm
mm
mmm
m
m
t
m
Inte
nsi
ty
2Θ, deg.
1
2
1 - Zr022 - Zr02+YO2
Fig.1. X-ray pattern of coating the first type (1)
Fig. 2. Electron microscopy images of the structure of the ZrO2 coating of first type (without
yttrium): a - bright-field image, b - dark field image; c - microdiffraction pattern with the scheme of indexing
Fig. 3. Electron microscopy images of the structure of the ZrO2 coating of second type (with
yttrium): a - bright-field image, b - dark field image; c - microdiffraction pattern with the scheme of indexing
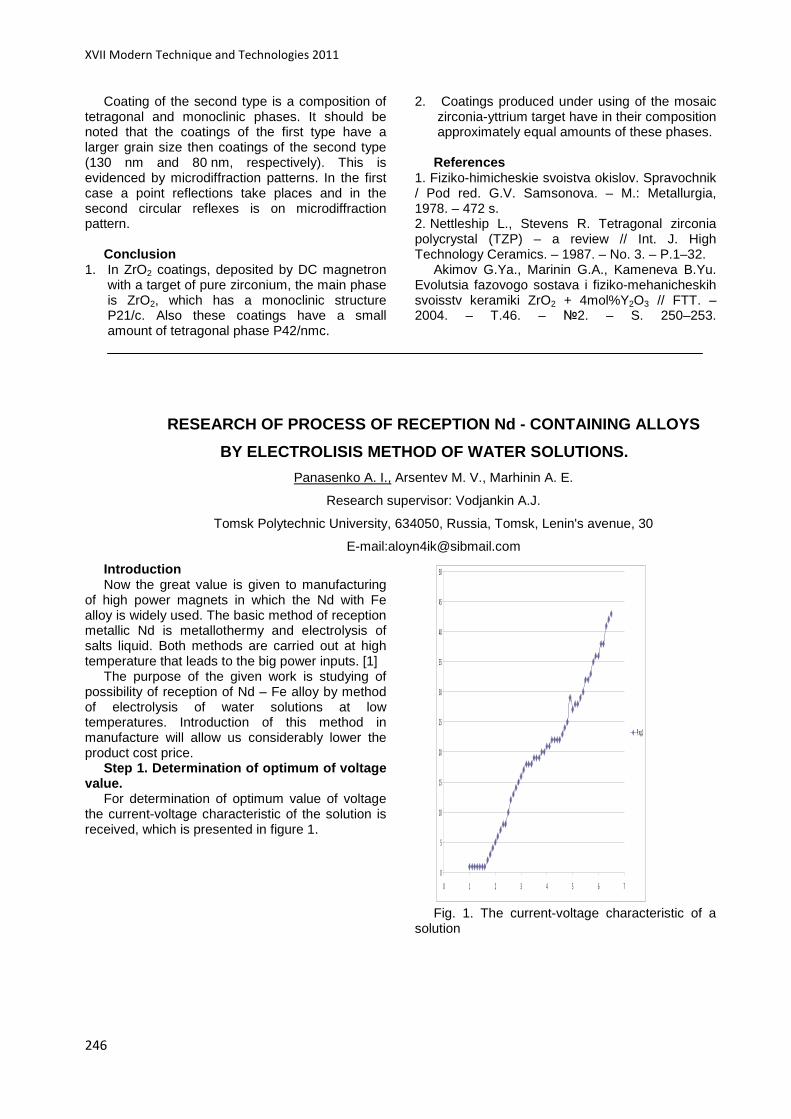
XVII Modern Technique and Technologies 2011
246
Coating of the second type is a composition of tetragonal and monoclinic phases. It should be noted that the coatings of the first type have a larger grain size then coatings of the second type (130 nm and 80 nm, respectively). This is evidenced by microdiffraction patterns. In the first case a point reflections take places and in the second circular reflexes is on microdiffraction pattern.
Conclusion
1. In ZrO2 coatings, deposited by DC magnetron with a target of pure zirconium, the main phase is ZrO2, which has a monoclinic structure P21/c. Also these coatings have a small amount of tetragonal phase P42/nmc.
2. Coatings produced under using of the mosaic zirconia-yttrium target have in their composition approximately equal amounts of these phases.
References
1. Fiziko-himicheskie svoistva okislov. Spravochnik / Pod red. G.V. Samsonova. – M.: Metallurgia, 1978. – 472 s. 2. Nettleship L., Stevens R. Tetragonal zirconia polycrystal (TZP) – a review // Int. J. High Technology Ceramics. – 1987. – No. 3. – P.1–32.
Akimov G.Ya., Marinin G.A., Kameneva B.Yu. Evolutsia fazovogo sostava i fiziko-mehanicheskih svoisstv keramiki ZrO2 + 4mol%Y2O3 // FTT. – 2004. – T.46. – 2. – S. 250–253.
RESEARCH OF PROCESS OF RECEPTION Nd - CONTA INING ALLOYS
BY ELECTROLISIS METHOD OF WATER SOLUTIONS.
Panasenko A. I., Arsentev M. V., Marhinin A. E.
Research supervisor: Vodjankin A.J.
Tomsk Polytechnic University, 634050, Russia, Tomsk, Lenin's avenue, 30
E-mail:[email protected]
Introduction Now the great value is given to manufacturing
of high power magnets in which the Nd with Fe alloy is widely used. The basic method of reception metallic Nd is metallothermy and electrolysis of salts liquid. Both methods are carried out at high temperature that leads to the big power inputs. [1]
The purpose of the given work is studying of possibility of reception of Nd – Fe alloy by method of electrolysis of water solutions at low temperatures. Introduction of this method in manufacture will allow us considerably lower the product cost price.
Step 1. Determination of optimum of voltage value.
For determination of optimum value of voltage the current-voltage characteristic of the solution is received, which is presented in figure 1.
Fig. 1. The current-voltage characteristic of a
solution
0
5
10
15
20
25
30
35
40
45
50
0 1 2 3 4 5 6 7
Р яд1

Section XII: Nanomaterials, Nanotechnologies and New Energetics
247
Given results show that process begins at voltage of 1,7 volts that corresponds to potential of emission of iron. And after voltage increase above 4,5 volt sharp growth of a current strength is observed that is accompanied by emission of hydrogen and output decrease of current. Hence optimum value of voltage for process carrying out makes 4,5 volts.
Step 2. An electrode choice. It is necessary to study influence of cathode
material on alloy structure. Results of the conducted researches are showed in table 1.
Material Graphite
Fe Al Zr Cu
C (Nd, % of weights)
12 25 17 15 13
Table 1. An electrode choice According to the data resulted in the table
follows that the greatest content of Nd has been received by the iron cathode use.
Step 3. Studying of elemental composition, by method of the Roentgen fluorescent analysis.
The analysis of an alloy is conducted by RFla method or the purpose of detection of metals relation between Nd and iron. The analysis is conducted of K – series for iron and L - series for neodymium, since K –series of Nd requires analysis carrying out at big energies.
Lines of characteristic radiation for iron and Nd: Fek α – 6.40 keV, Fek α – 7.05 keV, NdL α – 5.24 keV, NdL β – 5.73 keV. According to results of the analysis the alloy
contains 25 % Nd and 75 % of iron. The spectrum of the received alloy is shown in
figure 2.
Fig. 2. Roentgen fluorescent alloy spectrum. The given analysis has allowed to make sure of
Nd and Fe in alloy and to give qualitative evaluation of their structure.
Also at studying of phase composition of the alloy, the analysis has shown that the alloy has amorphous structure.
Step 4. The proof of presence of a metal
phase. For the proof of presence of a metal phase a
number of experiments on dissolution of a ready product in hydrochloric acid and measurement of volume of hydrogen received at reaction. Experiments are conducted on laboratory installation which is intended for detection of a part of a metallic phase in a product by means of measurement of volume of the emitted gas. The given laboratory installation is shown in figure 3.
Installation consist of: 1 – separating funnel, 2 – Vurz flask, 3 – gas clock. Fig. 3. The scheme of laboratory installation Results of experiments are presented in table 2.
Мsp (g) Vt (ml) Vp (ml) C met (%)
1 0,112 67,0 64,0 94,3
2 0,113 67,8 65,0 96,1
3 0,112 67,0 63,0 94,0
Table 2. Alloy dissolution in hydrochloric acid According to the received results the presence
of a metal phase has made from 94 to 96 percent. [2]
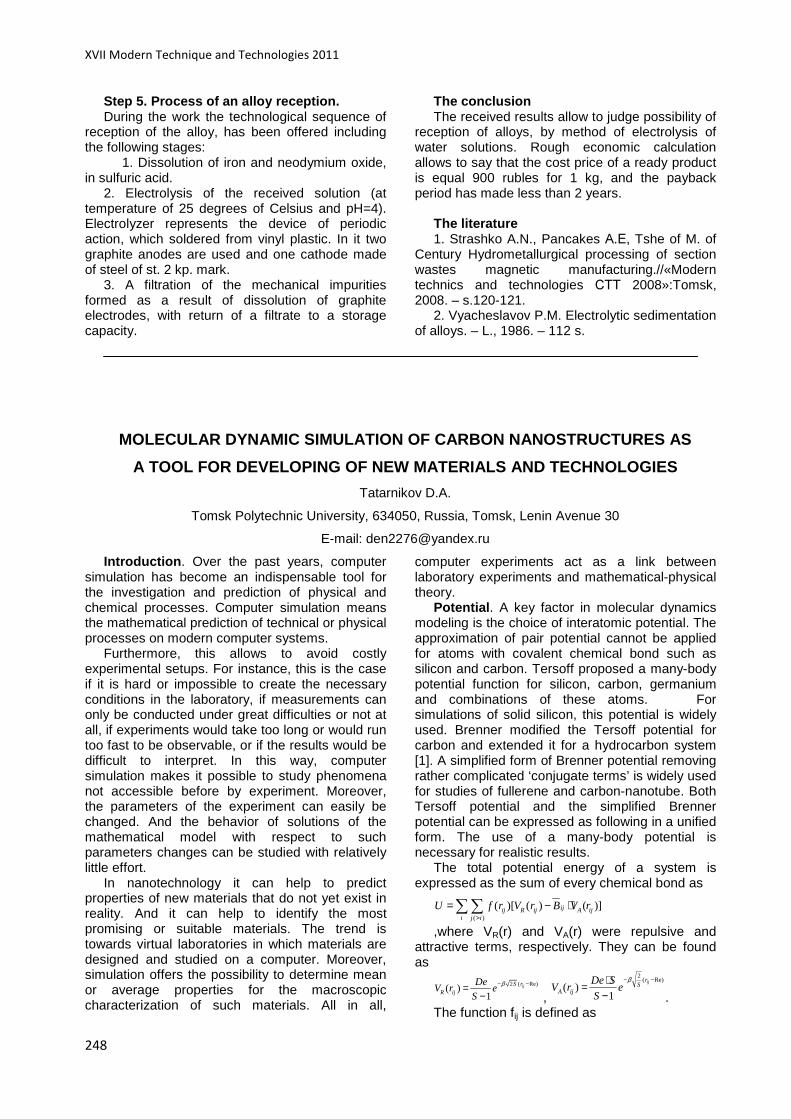
XVII Modern Technique and Technologies 2011
248
Step 5. Process of an alloy reception. During the work the technological sequence of
reception of the alloy, has been offered including the following stages:
1. Dissolution of iron and neodymium oxide, in sulfuric acid.
2. Electrolysis of the received solution (at temperature of 25 degrees of Celsius and pH=4). Electrolyzer represents the device of periodic action, which soldered from vinyl plastic. In it two graphite anodes are used and one cathode made of steel of st. 2 kp. mark.
3. A filtration of the mechanical impurities formed as a result of dissolution of graphite electrodes, with return of a filtrate to a storage capacity.
The conclusion The received results allow to judge possibility of
reception of alloys, by method of electrolysis of water solutions. Rough economic calculation allows to say that the cost price of a ready product is equal 900 rubles for 1 kg, and the payback period has made less than 2 years.
The literature 1. Strashko A.N., Pancakes А.Е, Tshe of M. of
Century Hydrometallurgical processing of section wastes magnetic manufacturing.//«Modern technics and technologies СТТ 2008»:Tomsk, 2008. – s.120-121.
2. Vyacheslavov P.M. Electrolytic sedimentation of alloys. – L., 1986. – 112 s.
MOLECULAR DYNAMIC SIMULATION OF CARBON NANOSTRUCTUR ES AS
A TOOL FOR DEVELOPING OF NEW MATERIALS AND TECHNOLO GIES
Tatarnikov D.A.
Tomsk Polytechnic University, 634050, Russia, Tomsk, Lenin Avenue 30
E-mail: [email protected]
Introduction . Over the past years, computer simulation has become an indispensable tool for the investigation and prediction of physical and chemical processes. Computer simulation means the mathematical prediction of technical or physical processes on modern computer systems.
Furthermore, this allows to avoid costly experimental setups. For instance, this is the case if it is hard or impossible to create the necessary conditions in the laboratory, if measurements can only be conducted under great difficulties or not at all, if experiments would take too long or would run too fast to be observable, or if the results would be difficult to interpret. In this way, computer simulation makes it possible to study phenomena not accessible before by experiment. Moreover, the parameters of the experiment can easily be changed. And the behavior of solutions of the mathematical model with respect to such parameters changes can be studied with relatively little effort.
In nanotechnology it can help to predict properties of new materials that do not yet exist in reality. And it can help to identify the most promising or suitable materials. The trend is towards virtual laboratories in which materials are designed and studied on a computer. Moreover, simulation offers the possibility to determine mean or average properties for the macroscopic characterization of such materials. All in all,
computer experiments act as a link between laboratory experiments and mathematical-physical theory.
Potential . A key factor in molecular dynamics modeling is the choice of interatomic potential. The approximation of pair potential cannot be applied for atoms with covalent chemical bond such as silicon and carbon. Tersoff proposed a many-body potential function for silicon, carbon, germanium and combinations of these atoms. For simulations of solid silicon, this potential is widely used. Brenner modified the Tersoff potential for carbon and extended it for a hydrocarbon system [1]. A simplified form of Brenner potential removing rather complicated ‘conjugate terms’ is widely used for studies of fullerene and carbon-nanotube. Both Tersoff potential and the simplified Brenner potential can be expressed as following in a unified form. The use of a many-body potential is necessary for realistic results.
The total potential energy of a system is expressed as the sum of every chemical bond as
( )
( )[ ( ) ( )]ijij R ij A iji j i
U f r V r B V r>
= − ⋅∑∑
,where VR(r) and VA(r) were repulsive and attractive terms, respectively. They can be found as
2 ( Re)( )1
ijS r
R ij
DeV r e
Sβ− −=
− ,
2( Re)
( )1
ijrS
A ij
De SV r e
S
β− −⋅=− .
The function fij is defined as
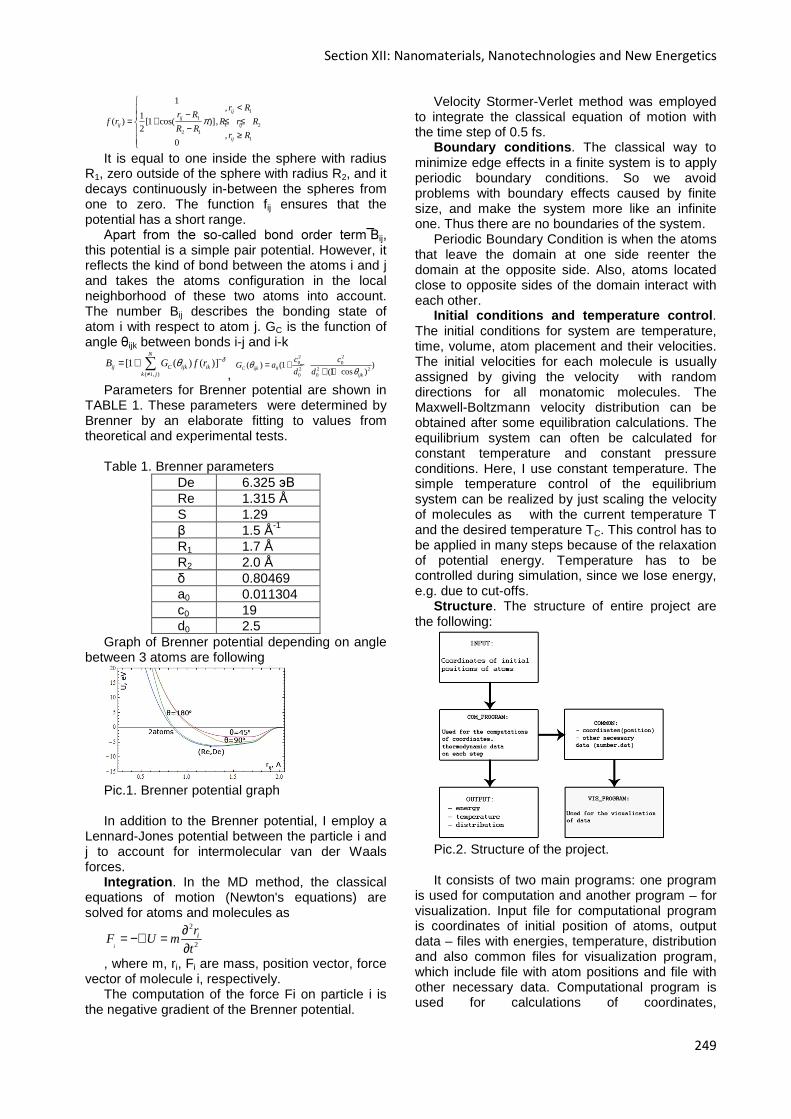
Section XII: Nanomaterials, Nanotechnologies and New Energetics
249
11
1 22 1
1
1,
1( ) [1 cos( )],
2,
0
ijij
ij ij
ij
r Rr R
f r R r RR R
r R
π
< −= + ≤ ≤ − ≥
It is equal to one inside the sphere with radius
R1, zero outside of the sphere with radius R2, and it decays continuously in-between the spheres from one to zero. The function fij ensures that the potential has a short range.
Apart from the so-called bond order term Bij, this potential is a simple pair potential. However, it reflects the kind of bond between the atoms i and j and takes the atoms configuration in the local neighborhood of these two atoms into account. The number Bij describes the bonding state of atom i with respect to atom j. GC is the function of angle θijk between bonds i-j and i-k
( , )
[1 ( ) ( )]N
ij C ijk ikk i j
B G f r δθ −
≠
= + ∑,
2 20 0
0 2 2 20 0
( ) (1 )(1 cos )C ijk
ijk
c cG a
d dθ
θ= + −
+ + Parameters for Brenner potential are shown in
TABLE 1. These parameters were determined by Brenner by an elaborate fitting to values from theoretical and experimental tests.
Table 1. Brenner parameters
De 6.325 эВ Re 1.315 Å S 1.29 β 1.5 Å-1
R1 1.7 Å R2 2.0 Å δ 0.80469 a0 0.011304 c0 19 d0 2.5
Graph of Brenner potential depending on angle between 3 atoms are following
Pic.1. Brenner potential graph In addition to the Brenner potential, I employ a
Lennard-Jones potential between the particle i and j to account for intermolecular van der Waals forces.
Integration . In the MD method, the classical equations of motion (Newton's equations) are solved for atoms and molecules as
2
2i
irF U mt
∂= −∇ =∂
, where m, ri, Fi are mass, position vector, force vector of molecule i, respectively.
The computation of the force Fi on particle i is the negative gradient of the Brenner potential.
Velocity Stormer-Verlet method was employed to integrate the classical equation of motion with the time step of 0.5 fs.
Boundary conditions . The classical way to minimize edge effects in a finite system is to apply periodic boundary conditions. So we avoid problems with boundary effects caused by finite size, and make the system more like an infinite one. Thus there are no boundaries of the system.
Periodic Boundary Condition is when the atoms that leave the domain at one side reenter the domain at the opposite side. Also, atoms located close to opposite sides of the domain interact with each other.
Initial conditions and temperature control . The initial conditions for system are temperature, time, volume, atom placement and their velocities. The initial velocities for each molecule is usually assigned by giving the velocity with random directions for all monatomic molecules. The Maxwell-Boltzmann velocity distribution can be obtained after some equilibration calculations. The equilibrium system can often be calculated for constant temperature and constant pressure conditions. Here, I use constant temperature. The simple temperature control of the equilibrium system can be realized by just scaling the velocity of molecules as with the current temperature T and the desired temperature TC. This control has to be applied in many steps because of the relaxation of potential energy. Temperature has to be controlled during simulation, since we lose energy, e.g. due to cut-offs.
Structure . The structure of entire project are the following:
Pic.2. Structure of the project. It consists of two main programs: one program
is used for computation and another program – for visualization. Input file for computational program is coordinates of initial position of atoms, output data – files with energies, temperature, distribution and also common files for visualization program, which include file with atom positions and file with other necessary data. Computational program is used for calculations of coordinates,
XVII Modern Technique and Technologies 2011
250
thermodynamic data on each step. Visualization program is used for visualization of data. Further tasks . • Parallelization: a further main theme is the parallelization of the algorithms using MPI. This allows to treat problems with large numbers of particles on parallel computers with distributed memory. This is done by distributing the computations to several processors, which can then execute these computations simultaneously, at least to some extent. In addition, parallelization also has the advantage that on a parallel computer there is often more memory available than on a single processor machine, and hence, larger problems can be tackled. • Statistical analysis: collecting of statistical data, investigation behavior of the system under different conditions, working with large quantity of atoms. • Research of the nanostructure formation: it is very important to find optimal conditions of the formation of nanostructures in order to use these conditions in experiments. • New materials: we have some ideas of some new forms of carbon structures, we need to
simulate them and explore their properties, whether they can exist or not.
Conclusion . The production of fullerene and nanotubes and the experimental study of their material properties is difficult. Computer simulation is therefore an important tool to gain further insight.
Certain types of nanocarbons such as fullerenes, nanotubes, and graphene clusters can serve as basic building blocks for constructing more complicated structures that might exhibit new properties and find novel applications. Nanocarbon materials possess remarkable properties, and the potential applications look unlimited.
To sum up, it is necessary to emphasize the increasing role of atomic modeling of carbon nanostructures as a tool for developing new materials and technologies because through modeling you go to experiments in developing new technologies and applications involving carbon nanostructures.
References. Brenner, D. W., 1990, “Empirical Potential for
Hydrocarbons for Use in Simulating the Chemical Vapor Deposition of Diamond Films,” Phys. Rev. B, 42-15, 9458-947
ELECTROSURFACE CHARACTERISTICS OF PARTICLES OF CLAY MINERALS
IN AQUEOUS SUSPENSIONS
Vo Dai Tu, Truong Xuan Nam
Scientific supervisor: Yakovleva A.A., a doctor of technical science, professor
Irkutsk State Technical University
664074, Russia, Irkutsk city, Lermontova st., 83
Email: [email protected]
Clay minerals are the most popular type of minerals, which play an important role in industry and economy.
Irkutsk region is a rich reserve of various clay minerals such as fusible clays (Kuitunsky, Tulunsky, Nikolsky deposits), high-melting clays (Nikolsky, Bulusinsky deposits), refractory clays (Troshkovsky, Kamensky), kaolins (in Irkutsk coal field), bentonites (Razgonsky deposit), talc (Onotsky deposit) et al. [1, 2].
Clay minerals of Irkutsk region have not been practically studied in point of view of colloid-chemical characteristics. Their interrelation between structure features, dispersion and adsorption properties has not been estimated. Besides, the estimating of their electrosurface characteristics in suspension form is particularly an important and complicated problem.
Colloid properties of clay minerals appear under their free interaction with disperse medium. Surface of clay mineral particles has negative charge, which creates an electrical field around the particles [3]. Due to its influence counterions of disperse medium are adsorbed on mineral surface and form double electric layer (DEL). In aqueous suspension, the counterions are the protons of water dipoles [4, 5]. It is known that DEL consists of adsorption and diffuse layers [6 -8]. The potential jump φ0 on the solid-solution border is the sum of adsorption layer potential and diffuse layer potential φδ. The thickness of adsorption layer d is equal to diameter of counterion, and the thickness of diffuse layer is indicated by δ. It being known that diffuse layer almost stipulates most of colloid-chemical properties of clay minerals (Fig.).

Section XII: Nanomaterials, Nanotechnologies and New Energetics
251
The purpose of this work is estimating the electrosurface characteristics of clay minerals.
For investigating, the aqueous suspensions with 5 g/l content of clay mineral were prepared. Various types of clay minerals of Irkutsk region such as Nikolsky kaolinite (NK), Troshkovsky kaolinite containing montmorillonite trace (TK), Slyuyansky mixed-layer montmorillonite-muscovite (SMM), Onotsky talc (OT). Their characteristics are given in table 1.
Surface charge density qs: For describing the adsorption of ions on clay
particles, the Gibbs equation for surface charge density can be used [7]:
+= zFГqs , where z is the charge of cation; F – Faraday
constant; Г+ - Gibbs adsorption magnitude of cations.
Fig. The structure of double electrical layer and the electrical potential in depending on distance from particle surface.
Table 1. Characteristics of investigated clay
minerals
Clay minerals
Average size of particles in suspension, µm(1)
pH of suspension
Specific surface area, m2/g(2)
NK 2 6,41±0,04 82 TK 2 6,08±0,05 145 SMM 2 5,49±0,14 167 ОT 2 7,45±0,05 10
(1) – estimated by sedimentation analysis method according to the Stoke law [9, 10]
(2) – determined by the approach of maximum pressure of bubble after sodium oleate adsorption [9, 10]
The adsorption magnitude x of cations per unit
weight of clay in the result of ion exchange between protons of clay mineral DEL with
potassium cations in potassium chloride solution 0.1 M is determined by using potentiometric titration method.
Gibbs adsorption magnitude is calculated according to the equation:
0S
xГ =+
, where S0 is the specific surface area of
minerals. Potentiometric titration method can give the
possibility to estimate the acidity called the isoelectric point (pHIP), at which particle is uncharged [10].
The values of surface charge density and isoelectric point of clay minerals are shown in table 2.
Table 2. Surface charge density and isoelectric
point Clay minerals
qs, C/m2 рНIP
NK 0,0059 6,00±0,05 TK 0,0133 4,50±0,05 SMM 0,0173 4,70±0,05 ОT 0,0289 7,37±0,07
Electrokinetic potential ζ: the potential jump
appearing in diffuse layer of DEL on slip plane is called electrokinetic or ζ-potential. Slip plane separates the immobile part of liquid phase connecting to solid surface from another part in solution. The removal of phases in disperse system happens at slip plane (Fig.). Electrokinetic potential plays the main role in studying the stability and interaction of particles in disperse systems [7, 8, 11].
Electrokinetic potential of studied minerals is determined by electrophoresis of their suspensions at voltage 140÷150 V using Ken-Berton electrophoresis plant [9 - 11]. The U-shaped tube with diameter less than 4 mm was used in electrophoresis of clay minerals to receive clear experiment pattern and reliable results.
Electrokinetic potential values are calculated according to equation:
0τεεµς
U
Ls=,
where µ is the dynamic viscosity of medium; L – distance from anode to cathode; U − voltage; ε – dielectric penetrability; ε0 – electric constant; s – removal of border between phases, which is determined as the movement of layer of clay suspensions to anode via some appointed time τ.
Results of electrokinetic potential measurements are given in table 3.

XVII Modern Technique and Technologies 2011
252
Table 3. Electrokinetic potential of investigated minerals
Clay minerals ζ, mV NK -4,92±0,52 TK -16,34±3,09 SMM -5,94±1,83 ОT -30,9±3,05
Thus, some electrosurface characteristics of
clay minerals such as surface charge density, isoelectric point and electrokinetic potential are estimated. These data are very significant parameters to understand and study clay minerals.
References 1. Ostashkina E.F., Kuzmenko O.V., Nikitina
T.B. Explanatory note to the overview map of deposits of construction materials of the Irkutsk region. M.: Obedinenye “Soyuzgeolfond”. 1988. V. 1. 348 p.
2. Maltseva G.D. Industrial types of deposits of non-metallic minerals. Irkutsk: Izd-vo ISTU. 2003. 98 p.
3. Kotelnikov D.D., Konyukhov A.I. Clay minerals of sedimentary rock. М.: Nedra. 1986. 247 p.
4. Maged A. Osman, Michael Ploetze and Ulrich W. Suter // Journ. of mater. chem. 2003. Vol. 13. P. 2359-2366.
5. Ivanova A.V., Mikhailovna N.A. Technological tests of clay. Ekater.: Izd-vo GOU-VPO IGTU-UPI. 2005. 41 p.
6. Frumkin A.I. Electrode processes. M.: Nauka. 1988. 240 p.
7. Frolov Yu.G. Course of colloid chemistry. Surface phenomena and disperse systems. M.: Khimya. 1988. 464 p.
8. Shukin E.D., Pertsov A.B., Amelina E.A. Colloid chemistry. М.: Vissh. shk.. 2006. 444 p.
9. Frolov Yu.G., Grodsky A.S. Laboratory works and tasks for colloid chemistry. M.: Khimya. 1986. 214 p.
10. Grigorov O.N., Karpova I.F., Kozmina Z.P., Tikhomolova K.P., Fridrikhsberg D.A., Chernoberezhsky Yu.M. Guide book for practical works of colloid chemistry. М.: Khimya. 1964. 332 p.
11. Voyutsky S.S. Course of colloid chemistry. М.: Khimya. 1976. 512 p.

Section XIII: Round Table «Technic philosophy»
253
Section XIII
ROUND TABLE «TECHNIC PHYLOSOPHY»

XVII Modern Technique and Technologies 2011
254
INFLUENCE OF CELL PHONES
Filinova A.S.
Instructor: Sokolova E.Ya.. Starcheva.E.V.
TPU, 634050, Russia, city Тоmsk, Lenina str, 30
E-mail: [email protected]
The intention of this article is to study the influence of cell phones on humans, to determine and calculate the magnitude of electrical field intensity produced by cell phones. The urgency of the problem discussed in this paper is to show harmful impact of this device on people and find the solution to this problem.
The scientist of TSU determined that the degree of person’s perception decreases within one minute of cell phone operation.1 In their trials an encephalograph was used. We came up with the suggestion to use measuring instrument of electrical field intensity intended for industrial frequency with aerials-converters of E3-50 type to prove the harmful impact of electrical field on people
Figure 1- measuring instrument of electrical
field intensity intended for industrial frequency with aerials-converters of E3-50 type
Mobile phones use electromagnetic field in the
microwave range which may be harmful to human health.2 As it is known electromagnet field consists of electrical and magnetic fields.
1.Electrical field (in physics) surrounds electrically charged particles and time-varying magnetic fields . This electric field exerts a force on other electrically charged objects. 3 The consequences of impact of electrical field are as follows:
- Undue fatigability - Decrease of people’s performance -Some problems with heart - Blood pressure change4
2.A magnetic field is a field of force produced by moving electrical charges by electric field that vary in time and by the intrinsic magnetic field of elementary particles associated with the spin of the particle5 The harmful impact of magnetic field is:
- Depression - Alzheimer's dementia - Cases of suicides -Parkinson’s disease4 The practical part of the given article is
concerned with metering trials of voltage of electrical field produced by cell phones while making calls. In order to get reliable results it is necessary to convert voltage of electric field into electrical field intensity and compare the obtained results with standard requirements. These results are presented in the table below.
Table1- obtained results
U,mB Ei,kB E,kB
30 4,82946 8,364871 S.E.(T-n)
500 46,62526 80,75732 S.E.(China)
20 3,691808 6,394399 Nokia (Fin)
300 29,4165 50,95087 Nokia(China)
120 13,52616 23,428 LG
20 1,923427 3,331473 Apple iphone
fAii KKЕ ⋅=
Kf=1,
++⋅=
Ai
AiAiAi
UC
UBUAK
222 )()()( zyx EEEE ++=
А = 0,0841; В = 79,9; С = 10,48 Standard safety requirement for electrical field
intensity for people is shown in the equation below. E<0,5 kB.4
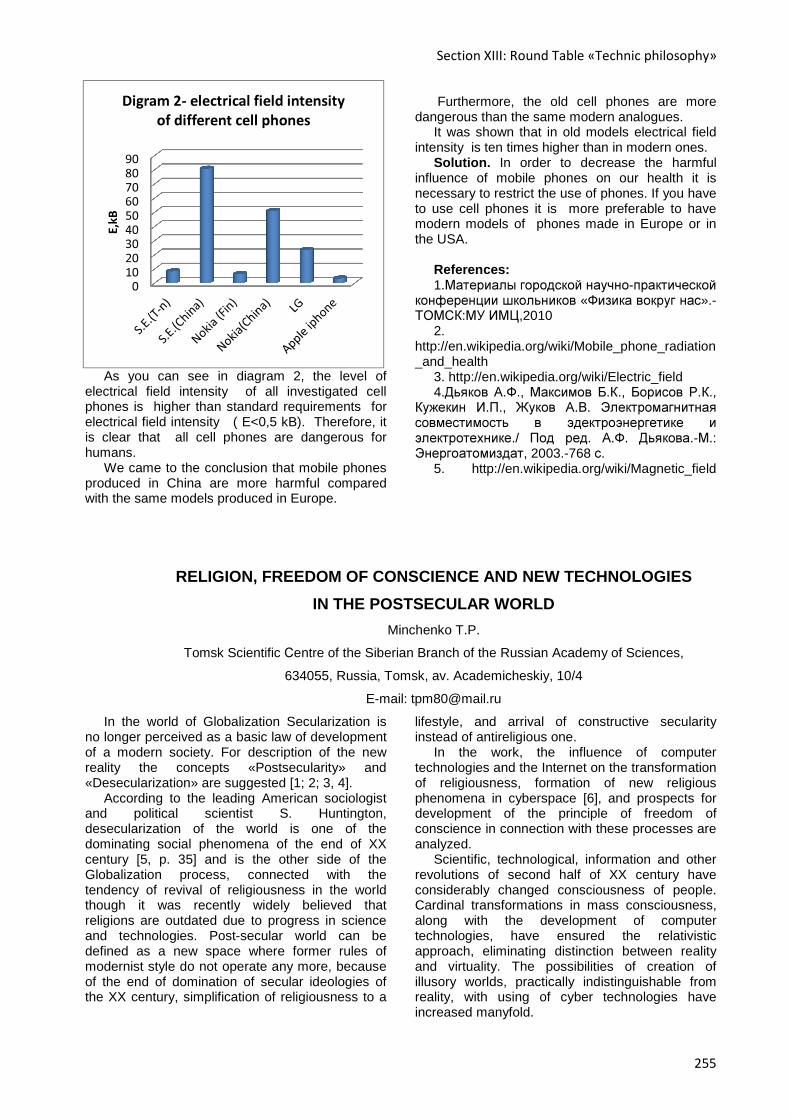
Section XIII: Round Table «Technic philosophy»
255
As you can see in diagram 2, the level of electrical field intensity of all investigated cell phones is higher than standard requirements for electrical field intensity ( E<0,5 kB). Therefore, it is clear that all cell phones are dangerous for humans.
We came to the conclusion that mobile phones produced in China are more harmful compared with the same models produced in Europe.
Furthermore, the old cell phones are more dangerous than the same modern analogues.
It was shown that in old models electrical field intensity is ten times higher than in modern ones.
Solution. In order to decrease the harmful influence of mobile phones on our health it is necessary to restrict the use of phones. If you have to use cell phones it is more preferable to have modern models of phones made in Europe or in the USA.
References: 1.Материалы городской научно-практической
конференции школьников «Физика вокруг нас».-ТОМСК:МУ ИМЦ,2010
2. http://en.wikipedia.org/wiki/Mobile_phone_radiation_and_health
3. http://en.wikipedia.org/wiki/Electric_field 4.Дьяков А.Ф., Максимов Б.К., Борисов Р.К.,
Кужекин И.П., Жуков А.В. Электромагнитная совместимость в эдектроэнергетике и электротехнике./ Под ред. А.Ф. Дьякова.-М.: Энергоатомиздат, 2003.-768 с.
5. http://en.wikipedia.org/wiki/Magnetic_field
RELIGION, FREEDOM OF CONSCIENCE AND NEW TECHNOLOGIE S
IN THE POSTSECULAR WORLD
Minchenko T.P.
Tomsk Scientific Сentre of the Siberian Branch of the Russian Academy of Sciences,
634055, Russia, Tomsk, av. Academicheskiy, 10/4
E-mail: [email protected]
In the world of Globalization Secularization is no longer perceived as a basic law of development of a modern society. For description of the new reality the concepts «Postsecularity» and «Desecularization» are suggested [1; 2; 3, 4].
According to the leading American sociologist and political scientist S. Huntington, desecularization of the world is one of the dominating social phenomena of the end of XX century [5, p. 35] and is the other side of the Globalization process, connected with the tendency of revival of religiousness in the world though it was recently widely believed that religions are outdated due to progress in science and technologies. Post-secular world can be defined as a new space where former rules of modernist style do not operate any more, because of the end of domination of secular ideologies of the XX century, simplification of religiousness to a
lifestyle, and arrival of constructive secularity instead of antireligious one.
In the work, the influence of computer technologies and the Internet on the transformation of religiousness, formation of new religious phenomena in cyberspace [6], and prospects for development of the principle of freedom of conscience in connection with these processes are analyzed.
Scientific, technological, information and other revolutions of second half of XX century have considerably changed consciousness of people. Cardinal transformations in mass consciousness, along with the development of computer technologies, have ensured the relativistic approach, eliminating distinction between reality and virtuality. The possibilities of creation of illusory worlds, practically indistinguishable from reality, with using of cyber technologies have increased manyfold.
0
10
20
30
40
50
60
70
80
90
E,kB
Digram 2- electrical field intensity
of different cell phones
XVII Modern Technique and Technologies 2011
256
In addition, one of the essential features of modern development is that the intensification of introduction of high technologies into everyday life is faces the crisis phenomena in traditional religions, a widespread occurrence of «religions of the New century» [7], transformation of religious identity, and emergence of a new religious formation, the meaning of which is idolization of the cyberspace [8, p. 349].
Many religious innovators are architects of formation of religious relation to high technologies in last quarter of XX century. T. Leary, one of the authors of the idea that computer technologies open new possibilities for religious life and culture, wrote in the 1980s years about creative capacity of these technologies owing to which a person becomes similar to the Creator, constructing new worlds in cyberspace and moving free in space-time continuum. According to Leary, this leads to elimination of traditional religions, giving a chance to a person to realize his true religiousness. Cyberdelics become the main stimulator of its realization, and the result is «high technologies paganism» [9].
In 1990s the cult of high technologies starts to form in the western society, which was affected not only by the founders of virtual reality, but also manufacturers of computer novelties. Computer technologies not only find a new sense in the religious context, but also become a necessary tool of creation. A new mythology and images of new gurus are created, and there are appear people, capable of creating by means of a computer keyboard.
Now the first typologies of religion-induced spaces in the Internet emerge [10]. On the whole, cyberspace is, first of all, religion environment. Thus it is possible to distinguish two types of existence of religion in the Worldnet, depending on the criterion of belonging religion to this specific environment.
The first type is formed by religious electronic resources arisen beyond the cyberspace and acts as a virtual reflection of a real religious life of various confessions [11]. It is not absolutely correct to refer these forms of digital resources to new forms of cyber - religion as no new dogma or a cult is formed here, no new religious social institute is established. It not a new religion, rather a new form of presentation of an existing religion, and the Internet acts here as one more form of communication.
Religious doctrines created and existing only in cyberspace are different type of religiousness. From the standpoint of these doctrines, computer technologies are given the properties of sacred objects or divine deities. A feature of cyber-religion as an independent religious form is that the virtual reality in the Internet is considered as the highest reality dominating over ordinary existence. In the
Russian Internet, in «Manifest Kiber-very», the evolution of religious forms and modern reference points are presented as follows: «Ancient gods were basically gods of fertility and gods of war. Then people began to worship to the God of Love. The Cyber-god is the God of knowledge. Possibilities which cyberspace gives for understanding, are infinite, as is infinite this space. Moreover, it is possible to speak about cyberspace as about «the last bastion of the god» because, in contrast to space, no person can ever get into it in his physical form. … Leave your trace in cyberspace – and you will be endowed by an eternal virtual life» [12]. The supporters of cyber-religion underline the ontological status of cyberspace. They substantiate objective existence of a virtual reality (rather than in the human consciousness or in the computer), and computers are only means of penetration into this space.
At the same time, in the Internet, there are also ironical reactions on idolization of cyberspaces, for example, «Seteism» («Νetism») [13].
There are various opinions about the place and role of religion in cyberspace: from technomysticism, which is defined as «belief in the universal force of technology» [8, p. 346], to the cybernetic pessimism negatively assessing the Internet and development of the mankind on the way technical, rather than organic progress. This approach considers immersing to a virtual reality as the form of escape from the real world with its actual problems; the Internet and other technical achievements, instead of uniting people, lead to isolation of users and imitation of human relations, including religious ones. The ideas of M. Mamardashvili on the anthropological catastrophe due to imitation of existence [14], or J. Baudrillard's criticism of «hyper-reality» century which «… represents only similarities, copies replacing nowadays lost true originals» [15, p. 333] may be philosophical basis of this position.
Irrespective of various approaches to an assessment of existence of religion in cyberspace, workers agree that in the future, the development of the Internet will increasingly influence to religion and transformation of religious forms.
At the end of ХХ − the beginning of ΧXI centuries, during the epoch of intensive development of science and techniques, characterized by opening new possibilities in the field of information, and considerable growth of the number of users of the Internet, on the one hand, and processes of desecularization, on the another, we see not only the use of results of scientific and technical progress by believers for preservation, presentation and development of the religion, but also generation of new religious forms directly related to the development of high technologies.
In this connection, the principle of freedom of conscience, the basis of which is a world outlook
Section XIII: Round Table «Technic philosophy»
257
identity as a condition for preservation of authenticity of human existence, becomes more topical. As a certain ideology (religious or secular) is behind the system of values and norms of each culture, we come to understanding the necessity of reconsideration of the outlook and ideological bases of this concept through substantiation of a principle of a freedom of conscience in postsecular epoch. Therefore, working out of concept of world outlook identity is necessary for finding a criterion of demarcation of the true and virtual reality, as one of the principal concepts related with the understanding of human nature and his role in a society and the world. Thus, in turn will lead to a new understanding of the meaning of the principle of freedom of conscience in the postsecular world.
Literature 1. Peter Berger and the Study of Religion. − L.
& N. Y.: Routledge, 2001. 2. Kyrlezhev A. Postsecular epoch //Continent.
– 2004/ − 120. 3. Morozov A. Whether the postsecular epoch
has come?//Continent. − 2007. − 131. 4. Uzlaner D. In what sense the Modern World
can be called postsecular / Continent − 2008. − 136
5. Huntington S. The Clash of Civilizations?//The Policy. − 1994. − 1.
6 Cyberspace is the electronic medium of computer networks, in which online communication takes place. The term «cyberspace» was first used by the cyberpunk science fiction author William
Gibson in the 1980's in novel «Burning Chrome» and popularized in the novel «Neuromancer».
7. Mitrokhin L.N. Religions of «The New century ». - М − 1985. − 157.
8. Maxwell P. Virtual Religion in Context//Religion. - 2002. − 32. − P. 343-354.
9. Leary T. Chaos and cyberculture // http://www.bookap.by.ru/trans/langod/gl31.shtm
10. Karaflogka A. Religious Discourse and Cyberspace//Religion. - 2002. − 32. − P. 279-291; Helland Ch. Surfing for Salvation//Religion. - 2002.32. P. 293-303.
11. Examples confessional sites in runet: official site Russian Orthodox Church - www.mospat.ru an Islamic site - islam.ru, Buddhist sites - www.buddhism.ru or dzen.ru, etc
12.Manifest Kiber-very// http://www.kulichki.com/XromoiAngel/source/manifest.htm
13. See e.g.: «In the beginning there was a Network Primary. The network Primary was Uniform, and there was it the Virtual God. … truly I speak to you! Entered into the Network and realized by elements of the Network Primary will be rescued. Rescue in overcoming of an urgency of our world. The Network Primary be abide through you»//http://www. uis.kiev.ua/-_ xyz/netism.html
14. Mamardashvili M. The Consciousness and Civilization //Mamardashvili M. As I understand Philosophy. - М - 1992. - p. 107-121.13.
15. MacWilliams M. Virtual Pilgrimages on the Internet//Religion. - 2002. − 32. – p. 315-335
"LIVING AIR" IN EVERY HOME. REALITY OR DREAM?
Surnenko E.A.
Scientific advisor: Grebennikov V.V., Associate Professor, Ph.D.
Linguistic advisor: Falaleeva M.V.
Tomsk Polytechnic University, 634050, Russia, Tomsk, Lenin Avenue, 30
E-mail: [email protected]
Actuality of the topic is proved by the fact that few places stay on our planet where you can enjoy the clean ionized air. This is due to the large number of industrial plants and deforestation. There are many air purifiers. They clear the air quite well, but do not return its initial beneficial effects. In this paper, the process of ionization, its main types, the effect of ionized air on the person are described. Also the competitiveness of an artificial ionized air is estimated in comparison to clean air with the natural ionization.
Every person, being on vacation in the mountains, at sea or in the forest, noticed that it is
much easier to breathe there than in the city. "By constructing a dwelling, - said Professor A. L. Chizhevsky, - the person has deprived himself of a normal ionized air, he has perverted the natural environment for him and came into conflict with the nature of the organism [1]."Under natural conditions in the air we breathe, there are some molecules which have electric charges. Charged molecules are called light ions, the charge can be both positive and negative. The process of charging the molecule is called ionization.
Ionization is divided into two types: natural and artificial. There are many reasons for natural air
XVII Modern Technique and Technologies 2011
258
ionization: the cosmic and solar radiation, natural background radiation of the earth - the presence of radioactive substances in the earth's crust, soil, rocks and natural radioactivity of the air. Cosmic rays are the main air ionizer. Spraying water into the air, atmospheric electricity, friction particles of sand, snow make the contribution in ionization as well. But the most effective ionizer is a storm cloud. But there is the only way of getting artificial ionization - to use the ionizer. Ionizer is a device, which generates a negatively charged particle. The main problem lies in the fact that, most people live in cities where natural ionization is practically not possible. Soil is covered with asphalt; people spend indoors much time, the air outside is strongly gassy exhaust. Our body, each of its cage, allocates breathing a positive charge - a pest, or as said Chizhevsky "dregs of the body" [1]. That is why it is hard to breathe in a crowded public transport, cinemas, libraries, office. We are simply poison to each other. And even the air conditioner in this case does not help because it only cools the air. Return the same life-giving oxygen to the negative charge cans only ionizer [2]. The results we have are the following: the state of depression and fatigue, decreased attention and reaction, irritability, lost of mental ability and headache at the end of the day. Air conditioners, giving the room air are good options for temperature, humidity, cleanliness, but they absolutely do not add negative ions.
Day by day, people living in the city, have a hard ions starvation, which in combination with other negative "benefits of civilization" impact on health lead to many diseases including chronic ones. If the ionized molecules are deposited on the liquid particles or dust particle, in this case such an ion is called heavy. According to the rules, both very high and very low content of ions in the air is assigned to a group of physically harmful factors.
Pure forest air includes 700-1500 negative ions in 1 cm3 approximately; the number of negative ions is 50-100 thousand to 1 cm3 near waterfalls, at the sea coast. It was established that the 15-20 minutes in the air with a concentration of 10 000 - 100 000 ions in 1 cm3 is enough to eliminate the adverse effects in human’s body which are result from being in a room with a shortage of air ions. Thus, the human race needs in the devices that generate negative ions. Ionizers, according to the method of oxygen molecules ionization, are classified into: plasma-ionizers; ultraviolet ionizers; thermal ionizers; corona ionizers; radium ionizers; water ionizers; electroeffluvial ionizers.
Needle ionizers have electrodes in the form of needles. They served a lot of stress, with resultant coronary level and stands out ozone and negative ions. In a wave of air ionizer uses a special wave generator. As a result, the wave radiation emits negative ions and ozone. Ozone concentration zones can be adjusted. In radiokatalitichesky ionizer air is emitted from a specially designed wavelength. When light enters the catalytic plate, which is made from rare and precious metals, saturation of air with negative ions. Plasma ionizer - a high-voltage air ionizer that works instead of charcoal filter in addition to ionization, and still performs cleanup. Ionizer Air Ionizer UV is a UV lamp. It performs the ionization, clean air and neutralizes unpleasant odors. In elektroefflyuvialy ionizer ionization method based on unit shipments in the formation of air the lungs of negatively charged ions of oxygen. This flow of ions quickly clears the room from all the microbes, allergens, dust, and radionuclide.
The latter method is the safest and received the greatest distribution. In this type of discharge ozone and nitrogen oxides are not practically formed. These are highly poisonous gases and their concentration in air is strictly regulated by sanitary norms.
Ionized air is a powerful preventive and stimulating factor. To make the air "living" means to create the oxygen ions in such concentration and such a balance that exists in the mountains or seaside resorts. Artificial ionization has some peculiarities. As a result of environmental pollution the air contains various impurities. Gas composition of atmosphere in nature differs from the gas composition in the internal environment of buildings - so you need to do a great work to create the natural curative air. One of the problems is that long-term operation of the ionizer cannot ensure steady distribution of ions in a confined space. Their concentration is maximum near the ionizer (can repeatedly exceed the maximum allowable concentration) and decreases with distance from the instrument (a few meters from the ionizer – it is at the level of the minimum required). This is explained by the limited lifetime of ions, which depends on many factors.
Nowadays, there are many ionizers, but none of them can replace pure natural air so far. It is necessary to know that, for example, pure forest air for some people with allergies is very bad. According to Dr. William C. Shiel, tiny particles from trees and plants and flowers, known as pollen is inhaled by man through the nose or throat and cause seasonal allergic rhinitis from pollen allergies, otherwise it is called hay fever. Ionizers purify the air of pollen and other contaminants. This fact ensures that people with allergies can breathe easier. The main purpose of

Section XIII: Round Table «Technic philosophy»
259
most inventions is to make human life better [3]. It is very rare equipment, which is not only aimed at improving physical health, but also contributes to psychological recovery. In other words, the scope of the biological effects of air ionization is very wide. It covers the major systems of vital activity: cardiovascular, processes of respiration and metabolism, physical, chemical and morphological properties of the blood, endocrine function and basic properties of the nervous system [4].
Some authors, who wish to restrict the use of ions, try to find a contraindication to the use of ionizers for many years. Many of them say that the impact of negative ions in the body leads to diseases of the liver, kidneys and other organs. However, these attempts are not successful. Nobody proved that the light air ions of oxygen in natural dosages (103-104 at 1sm3) could harm the healthy or diseased organism. Ooverdose of light negative air ions, air ions of oxygen is impossible. Blood can not absorb more oxygen molecules than the number of hemoglobin molecules need. No more than 3% of oxygen is dissolved in plasma. Anything that cannot be absorbed by the blood will breathe out again.Until the present moment, many experiments have been conducted, but the explanation of the mechanism of ionized gases action on the neuropsychic activity has not been given yet. There is the opinion that neuro-reflex action of ions occurs through the respiratory tract [5]. Others believe that they directly affect the nervous system. Finally, there is the explanation that the effects of ions on neuro-psychic sphere are the result of initial actions on the autonomic nervous system, whereby negative ions cause dilation of capillary blood vessels. As a consequence of this a soothing effect of negative ionization on the cerebral cortex is evident, and a state of relaxation and mental rest. It is surprising that much time is needed to create an ideal ionizer [6]. Just imagine that a device capable of emitting clean and healthy air in a few seconds will be invented. Ideal ionizer should represent a range of different devices. For example, device which is required to calculate the light ions, which must maintain of production light ions, also the device is
needed to provide clean air in front of the ionization, since the heavy ions are hazardous to health. When working the ionizer around it accumulates the greatest number of negative ions of oxygen, which contributes to their uneven distribution in space. After turning off the device, their concentration rapidly drops to background levels [7].
But when you consider all aspects, it would certainly be a great invention, which will give humanity a great force of nature. But it goes without saying, the more power the greater the responsibility [8]. With the invention of the ionizer, humanity will go on the process of deforestation, water contamination, and releasing harmful gases from factories and cars. Trying to improve what we have, we can make it worse.
Nevertheless, it is possible to make every home cleaner by means of "Living Air". And this is a great achievement of our science.
References
1. A.L.Chizhevsky "Aeroionifikatsiya in the national economy", 2 nd ed. Short Stroiizdat Moscow 1989. p.410-482 2. Journal of Radio 3 Room 2000. V. Korovin, ELECTRONICS DOMESTIC Moscow 3. medicinenet.com; pollen and allergies 4. "Psychiatric News"; Negative Ions May Offer Unexpected MH Benefit; Joan Arehart-Treichel; 5 Jan. 2007 5. "Air ionizers wipe out hospital infections". The New Scientist 6. http://www.newscientist.com/article/dn3228-air-ionizers-wipe-out-hospital-infections.htm. Retrieved 2011-02-16. 7. Ponomarenko G.N. Physical methods of treatment: A Handbook. - Izd.2 th pererab.i ext. - St.: MMA, 2002. -299 p. 8. Air ion behavior in ventilated rooms Indoor and Built Environment, 17 (2). pp. 173–182., Fletcher, L.A., Noakes, C.J., Sleigh, P.A., Beggs, C.B. and Shepherd, S.J. (2008)

260
Table of Contents
Section I: Power engineering INVESTIGATIONS IN SPHERE OF WIRELESS ELECTRICITY R.S. Gladkikh, P.A. Ilin, I.S. Kovalev …………………………………………………………………………….....6 RECONSTRUCTION AND VISUALISATION OF LIMITER BOUNDAR Y FOR KTM TOKAMAK Malakhov A.A ………………………………………………………………………………………………………….8 MAGNETIC GENERATOR THE BEST SOLUTION FOR FREE POWE R Morozov A.L., Skryl A.A.…………………………………………………………………………………………….10 ASYNCHRONOUS MODE OF SYNCHRONOUS GENERATOR Feodorova Ye. A. ……………………………………………………………………………………………………11
Section II: Instrument making
A NEW TYPE OF TORQUE MOTOR WITH PACK OF PLATES Ivanova A.G.…………………………………………………………………………………………………….........16 SCINTILLATION DETECTORS OF IONIZING RADIATION M.K. Kovalev ………………………………………………………………………………………………………...18 SYSTEM OF GAS FLOW CONTROL AND REGULATION Nazarova K. O.…………………………………………………………………………………………………….....20 CONSTRUCTIONS OF THE PRECISION GEARS WITH AN ELASTI C LOAD OF INCREASED DURABILITY Staheev E. V.……………………………………………………………………………………………………........22 MASTER-OSCILLATOR POWER-AMPLIFIER SYSTEM CONTROLLER Sukharnikov K.V., Gubarev F.A.…………………………………………………………………………………....24 MAGNETOMETERS TO DETERMINE THE VECTOR OF THE EARTH MAGNETIC FIELD A.N. Zhuikova………………………………………………………………………………………………..............26
Section III: Technology, equipment and machine-buil ding
production automation ELECTRON BEAM WELDING (EBW) V.S. Bashlaev, A.S. Marin ……………………………………………………………………………….. ……….30 PROBLEM OF TRANSFERRING ELECTRODE METAL Bocharov A.I.………………………………………………………………………………………………………...32 THE USE OF AC FOR CONSUMABLE ELECTRODE TYPE ARC WEL DING I. Kravtsov ……………………………………………………………………………….. …………………………33 WEAR-RESISTANT COATING A. M. Martynenko, A. S. Ivanova, S. G.Khromova………………………………………….. ………………....35 SOFTWARE FOR MATHEMATICAL MODELING OF WELDING PROCE SS Mishin M.A…………………………………………………………………………………………………………...37 RESEARCH OF STRUCTURE AND PROPERTIES OF LASER WELDE D JOINT IN AUSTENITIC STAINLESS STEELS Oreshkin A.A ……………………………………………………………………………….. ……………………....39 SURFACE TENSION TRANSFER (STT) E.M, Shamov, A.S. Marin …………………………………………………………………………………………. 41

261
Section IV: Electro mechanics ENERGY-SAVING TECHNOLOGY FOR TESTING OF TRACTION INDUCTION MOTORS Beierlein E.V., Tyuteva P.V.…………………………………………………………………………………….......44
Section V: The use of modern technical and informat ion
means in health services DEVICE FOR THE DESTRUCTION OF CONCREMENTS IN THE HUMAN BODY Khokhlova L.A, L.Yu Ivanova………………………………………………………………………………………48 NEW TECHNOLOGIES IN MEDICINE: THERMAL IMAGING Belik D.A., Mal'tseva N.A.…………………………………………………………………………………………..50 THE DETECTING UNIT BASED ON SOLID-STATE GALLIUM ARS ENIDE DETECTORS FOR X-RAY MEDICAL DIAGNOSTIC Sakharina Y.V., Korobova А.А.1, Nam I.F.………………………………………………………………………..52 ELECTROCARDIOGRAPH WITH NANOELECTRODES FOR INDIVIDUAL APPLICATION N.S. Starikova, M.A. Yuzhakova, P.G. Penkov …………………………………………………………………..54 APPLICATION OF BIOFEEDBACK FOR TRAINING FOR MONITOR ING THE STATUS OF PREGNANT MOTHER-FETUS Timkina K. V.1, Khlopova A.A.2, Kiselyova E.Yu.1, Tolmachev I.V.2………………………………………….56
Section VI: Material science
ANALYSIS OF THE CORROSION RESISTANCE OF STEEL GROUP S 316 AND 317 Bekterbekov N.B.……………………………………………………………………………………………………..60 MULTISCALE TECHNIQUE FOR LOCALIZED STRAIN INVESTIGA TION UNDER TENSION OF CARBON FIBER REINFORCED COMPOSITE SPECIMENS WITH ED GE CRACKS BASED ON DATA OF STRAIN GAUGING, SURFACE STRAIN MAPPING AND ACOUS TIC EMISSION Burkov M.V., Byakov A.V., Lyubutin P.S.………………………………………………………………………….62 COMPUTER SIMULATION OF MODE OF DEFORMATION IN MULTI LAYER SYSTEMS. FINITE-ELEMENT METHOD A.A. Fernandez, V.E. Panin, G.S. Bikineev ………………………………………………………………………64 CALCULATION AND THEORETICAL ANALYSIS OF PREPARING TWO-COMPONENT SHS-SYSTEMS K.F. Galiev, M.S. Kuznetsov, D.S. Isachenko ……………………………………………………………………66 INCREASE OF OPERATIONAL PROPERTIES OF POWDER PAINTS BY NANOPOWDERS INTRODUCTION AND PLANETARY-TYPE MILL PROCESSING Ilicheva J.A., Yazikov S.U ………………………………………………………………………………….............68 THE IMPACT OF THERMOCHEMICAL TREATMENT ON WEAR-RESI STING QUALITIES OF CAST IRON Kuszhanova A.A.……………………………………………………………………………………………………. 69 A SYNTHESIS OF POROUS OXYNITRIDE CERAMICS BY SELF-PROPAGATING HIGH-TEMPERATURE SYNTHESIS. THE INFLUENCE OF AL2O3 DILUTION RATE ON SHS PARAMET ERS Maznoy1 A.S., Kazazaev2 N.Yu.…………………………………………………………………………………..71 MODERN APPLICATION OF HYDROXYAPATITE N.A. Nikiteeva, E.B. Asanov, L.A. Leonova ………………………………………………………………………73 INFLUENCE OF COPPER AND GRAFT-UHMWPE ONTO THE WEAR RESISTANCE OF UHMWPE MIXTURE Piriyayon S.…………………………………………………………………………………………………………..75 THE EFFECT OF ELECTRON BEAM IRRADIATION ON WEAR PRO PERTIES OF UHMWPE T. Poowadin, L.A. Kornienko, M.A. Poltaranin …………………………………………………………………..77
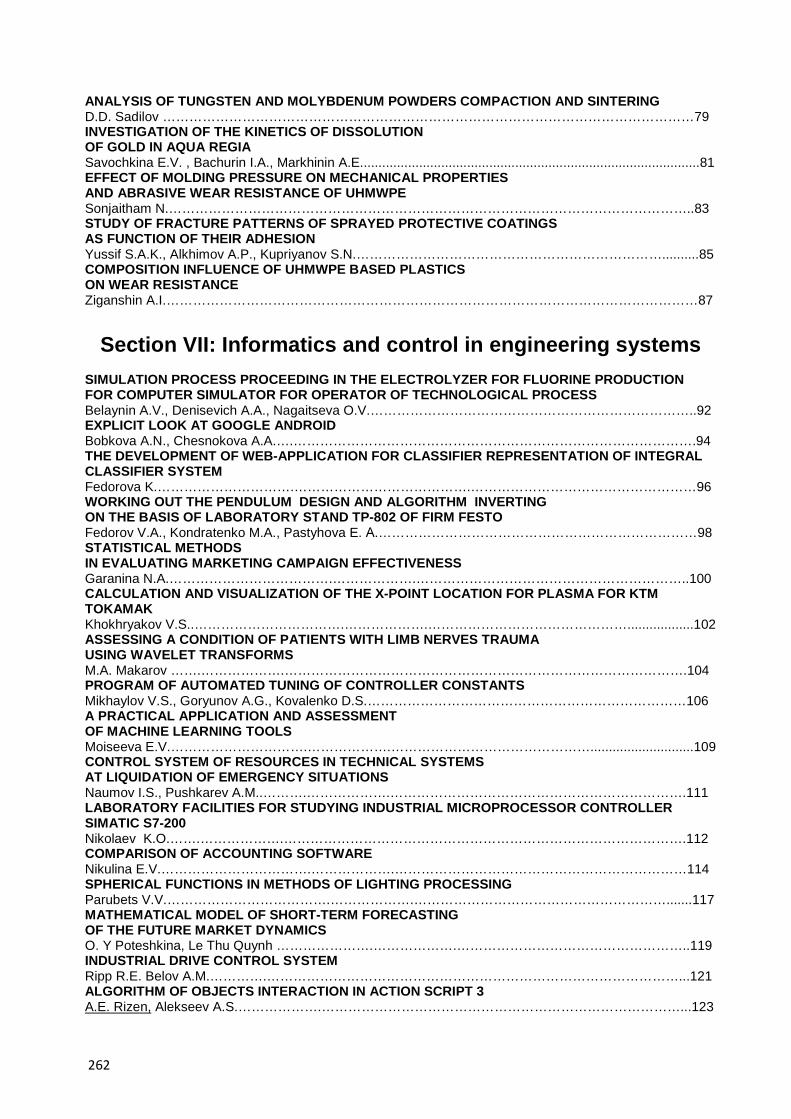
262
ANALYSIS OF TUNGSTEN AND MOLYBDENUM POWDERS COMPACT ION AND SINTERING D.D. Sadilov …………………………………………………………………………………………………………79 INVESTIGATION OF THE KINETICS OF DISSOLUTION OF GOLD IN AQUA REGIA Savochkina E.V. , Bachurin I.A., Markhinin A.E............................................................................................81 EFFECT OF MOLDING PRESSURE ON MECHANICAL PROPERTIES AND ABRASIVE WEAR RESISTANCE OF UHMWPE Sonjaitham N.………………………………………………………………………………………………………..83 STUDY OF FRACTURE PATTERNS OF SPRAYED PROTECTIVE CO ATINGS AS FUNCTION OF THEIR ADHESION Yussif S.A.K., Alkhimov A.P., Kupriyanov S.N.……………………………………………………………..........85 COMPOSITION INFLUENCE OF UHMWPE BASED PLASTICS ON WEAR RESISTANCE Ziganshin A.I.…………………………………………………………………………………………………………87
Section VII: Informatics and control in engineering systems
SIMULATION PROCESS PROCEEDING IN THE ELECTROLYZER F OR FLUORINE PRODUCTION FOR COMPUTER SIMULATOR FOR OPERATOR OF TECHNOLOGICA L PROCESS Belaynin A.V., Denisevich A.A., Nagaitseva O.V.………………………………………………………………..92 EXPLICIT LOOK AT GOOGLE ANDROID Bobkova A.N., Chesnokova A.A.….……………………………………………………………………………….94 THE DEVELOPMENT OF WEB-APPLICATION FOR CLASSIFIER R EPRESENTATION OF INTEGRAL CLASSIFIER SYSTEM Fedorova K.………………………….………………………………….……………………………………………96 WORKING OUT THE PENDULUM DESIGN AND ALGORITHM INV ERTING ON THE BASIS OF LABORATORY STAND TP-802 OF FIRM FES TO Fedorov V.A., Kondratenko M.A., Pastyhova E. А.………………………………………………………………98 STATISTICAL METHODS IN EVALUATING MARKETING CAMPAIGN EFFECTIVENESS Garanina N.A.……………………………….……………….……………………………………………………..100 CALCULATION AND VISUALIZATION OF THE X-POINT LOCATI ON FOR PLASMA FOR KTM TOKAMAK Khokhryakov V.S..…………………………….……………….………………………………………..................102 ASSESSING A CONDITION OF PATIENTS WITH LIMB NERVES TRAUMA USING WAVELET TRANSFORMS M.A. Makarov …….……………….……………………………………………………………………………….104 PROGRAM OF AUTOMATED TUNING OF CONTROLLER CONSTANTS Mikhaylov V.S., Goryunov A.G., Kovalenko D.S.………………………………………………………………106 A PRACTICAL APPLICATION AND ASSESSMENT OF MACHINE LEARNING TOOLS Moiseeva E.V.………………………….……………….………………………………………............................109 CONTROL SYSTEM OF RESOURCES IN TECHNICAL SYSTEMS AT LIQUIDATION OF EMERGENCY SITUATIONS Naumov I.S., Pushkarev A.M..……….……………….………………………………………………………….111 LABORATORY FACILITIES FOR STUDYING INDUSTRIAL MICRO PROCESSOR CONTROLLER SIMATIC S7-200 Nikolaev K.O.…….……………….……………………………………………………………………………….112 COMPARISON OF ACCOUNTING SOFTWARE Nikulina E.V.…………………………….……………….…………………………………………………………114 SPHERICAL FUNCTIONS IN METHODS OF LIGHTING PROCESSI NG Parubets V.V.……………………………….……………….………………………………………………….......117 MATHEMATICAL MODEL OF SHORT-TERM FORECASTING OF THE FUTURE MARKET DYNAMICS O. Y Poteshkina, Le Thu Quynh ………………….……………….……………………………………………..119 INDUSTRIAL DRIVE CONTROL SYSTEM Ripp R.E. Belov A.M.………….…………………………………………………………………………………...121 ALGORITHM OF OBJECTS INTERACTION IN ACTION SCRIPT 3 A.E. Rizen, Alekseev A.S.……………….………………………………………………………………………...123
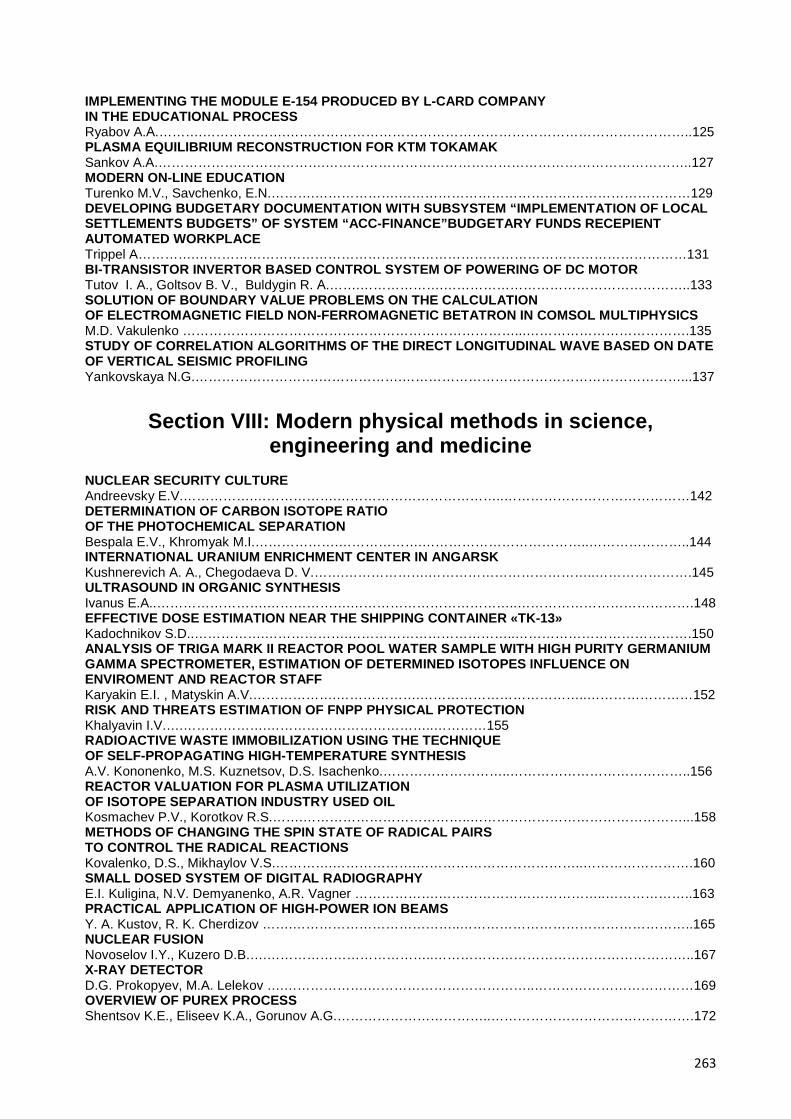
263
IMPLEMENTING THE MODULE E-154 PRODUCED BY L-CARD CO MPANY IN THE EDUCATIONAL PROCESS Ryabov A.А.……….……………….………………………………………………………………………………..125 PLASMA EQUILIBRIUM RECONSTRUCTION FOR KTM TOKAMAK Sankov A.A.……………….……………….………………………………………………………………………..127 MODERN ON-LINE EDUCATION Turenko M.V., Savchenko, E.N.……….……………….…………………………………………………………129 DEVELOPING BUDGETARY DOCUMENTATION WITH SUBSYSTEM “ IMPLEMENTATION OF LOCAL SETTLEMENTS BUDGETS” OF SYSTEM “ACC-FINANCE”BUDGETA RY FUNDS RECEPIENT AUTOMATED WORKPLACE Trippel A………….…………………………………………………………………………………………………131 BI-TRANSISTOR INVERTOR BASED CONTROL SYSTEM OF POWE RING OF DC MOTOR Tutov I. A., Goltsov B. V., Buldygin R. А.…….……………….………………………………………………..133 SOLUTION OF BOUNDARY VALUE PROBLEMS ON THE CALCULAT ION OF ELECTROMAGNETIC FIELD NON-FERROMAGNETIC BETATRON IN COMSOL MULTIPHYSICS M.D. Vakulenko …………………………………………………………………...……………………………….135 STUDY OF CORRELATION ALGORITHMS OF THE DIRECT LONGI TUDINAL WAVE BASED ON DATE OF VERTICAL SEISMIC PROFILING Yankovskaya N.G.……………………….……………….………………………………………………………...137
Section VIII: Modern physical methods in science,
engineering and medicine NUCLEAR SECURITY CULTURE Andreevsky E.V.…………….……………….………………………………..……………………………………142 DETERMINATION OF CARBON ISOTOPE RATIO OF THE PHOTOCHEMICAL SEPARATION Bespala E.V., Khromyak M.I.……………….……………….………………………………..…………………..144 INTERNATIONAL URANIUM ENRICHMENT CENTER IN ANGARSK Kushnerevich A. A., Chegodaeva D. V.…….……………….………………………………..………………….145 ULTRASOUND IN ORGANIC SYNTHESIS Ivanus E.A..…………………….……………….………………………………..………………………………….148 EFFECTIVE DOSE ESTIMATION NEAR THE SHIPPING CONTAIN ER «TK-13» Kadochnikov S.D..…………….……………….………………………………..………………………………….150 ANALYSIS OF TRIGA MARK II REACTOR POOL WATER SAMPLE WITH HIGH PURITY GERMANIUM GAMMA SPECTROMETER, ESTIMATION OF DETERMINED ISOTOP ES INFLUENCE ON ENVIROMENT AND REACTOR STAFF Karyakin E.I. , Mаtyskin A.V.……………….……………….………………………………..……………………152 RISK AND THREATS ESTIMATION OF FNPP PHYSICAL PROTEC TION Khalyavin I.V.….……………….………………………………..…………155 RADIOACTIVE WASTE IMMOBILIZATION USING THE TECHNIQU E OF SELF-PROPAGATING HIGH-TEMPERATURE SYNTHESIS A.V. Kononenko, M.S. Kuznetsov, D.S. Isachenko.………………………..…………………………………..156 REACTOR VALUATION FOR PLASMA UTILIZATION OF ISOTOPE SEPARATION INDUSTRY USED OIL Kosmachev P.V., Korotkov R.S.…….………………………………..…………………………………………...158 METHODS OF CHANGING THE SPIN STATE OF RADICAL PAIRS TO CONTROL THE RADICAL REACTIONS Kovalenko, D.S., Mikhaylov V.S.………….……………….………………………………..…………………….160 SMALL DOSED SYSTEM OF DIGITAL RADIOGRAPHY E.I. Kuligina, N.V. Demyanenko, A.R. Vagner ……………….………………………………..………………..163 PRACTICAL APPLICATION OF HIGH-POWER ION BEAMS Y. A. Kustov, R. K. Cherdizov …….………………………………..……………………………………………..165 NUCLEAR FUSION Novoselov I.Y., Kuzero D.B.….………………………………..…………………………………………………..167 X-RAY DETECTOR D.G. Prokopyev, M.A. Lelekov ….……………….………………………………..………………………………169 OVERVIEW OF PUREX PROCESS Shentsov K.E., Eliseev K.A., Gorunov A.G.……………………………..……………………………………….172

264
EXPERIMENTAL MEASUREMENT OF THE DIELECTRIC TARGETS SPECTRAL DISPERSION IN A MILLIMETER WAVELENGTH RANGE M. V. Shevelev , G. A. Naumenko, Yu. A. Popov ……………………..……………………………………….174 NON DESTRUCTIVE TESTING FOR NUCLEAR POWER PLANT LIFE ASSESSMENT Sednev D.A..………………………………..………………………………………………………………………176 RISKS EVALUATION OF CREATION NUCLEAR WEAPON WITH REACTOR-GRADE PU, WHICH ACCUMULATED IN PRESSURISED HEAVY WATER REACTOR Sednev D.A..……………….………………………………..……………………………………………………...178 INVESTIGATION OF ELECTRON BEAM ELECTROMAGNETIC RADI ATION INTO A TRIODE WITH VIRTUAL CATHODE А.А. Timofeev ……………………………..……………………………………………………………………….181 NEUTRON TRANSMUTATION DOPING OF SILICON IN THE CHAN NEL OF NUCLEAR REACTOR IRT-T Timoshin S.V., Litvinov P.I.……………………..………………………………………………………………….183 NUCLEAR FORENSIC ANALYSIS Trofimov A.V.……………………………..…………………………………………………………………………185 MANAGEMENT OF SHS – TECHNOLOGY WHITH USING MECHANICAL ACTIVATION Voytenko D.U., Isachenko D.S., Kuznetsov M.S.……………………..………………………………………...187 RENEWABLE AND UNTRADITIONAL ENERGY SOURCES Zaitsev E..………………………………..………………………………………………………………………….189 THE USE OF ISOTOPES IN MEDICINE Zarif K.……………….………………………………..……………………………………………………………..191
Section IX: Quality management control
IS the INTEGRATED MANAGEMENT SYSTEM POSSIBLE in RUSSIAN ENTERPRISES? Barsukova N.B.…………………….…………….…………………………………..……………………………..196 THE POKA-YOKE METHOD AS AN APROVING GUALITY TOOL OF OPERATIONS IN THE PROCESS Belykh I.G.………....……………….………………………………………………………..................................198 KAIZEN IN EDUCATION Chebodaeva A.V.…………………….…………….…………………………………..…………………………..200 LEAN MANUFACTURING Garmaeva A.S., Sagalakova T.N.….………………………………………………………...............................201 EFFECTIVENESS OF FAILURE MODES AND EFFECTS ANALYSIS (FMEA) Minenkova J.A.………………….…………….…………………………………..……………………………….203 THE SEVEN BASIC TOOLS OF QUALITY AND THEIR USE FOR COMPANY IMPROVEMENT ACTIVITY Peskova E.S., Turchenko T.P..………………………………………………………........................................205 QUALITY MANAGEMENT SYSTEM IS NOT PART OF THE MANAGEMENT SYSTEM Selivanova N.A.………………….…………….…………………………………..………………………………208 INFRARED CORROSION DETECTION Garmaeva A.S., Sagalakova T.N.….………………………………………………………...............................210 ISO STANDARDS: NECESSITY OR NEEDLESSNESS Vishtel J.G.……………….…………….…………………………………..………………………………………212
Section X: Heat and power engineering
LAMINAR NATURAL CONVECTION IN A VERTICAL CYLINDRICA L CAVITY М.А. Al-Ani …………………….…………….…………………………..………………………………..……….216 ALTERNATIVE OF WASTEWATER TREATMENT FOR CHP K.U. Afanasyev …………………………..………………………………..……………………………………...218 STEAM GENERATORS OPERATION PROBLEMS

265
ON NPP AND THEIR SOLUTIONS Chubreev D. O., Ivanov S. A.………….…………………………..………………………………..…………….220 THERMAL LOSSES ANALYSIS OF UNDERGROUND CHANNEL HEAT ING CONDUITS IN ENCROACHING CONDITIONS Khabibulin A.M.…………….…………….…………………………..………………………………..…………...222 ENERGY EFFICIENCY OF LUMINOUS DEVICES A.S. Kobenko, V.D. Nikitin ………..………………………………..……………………………………………..224 SLOW PYROLYSIS OF WOODY BIOMASSES TO PRODUCE BIO-FUELS FEEDSTOCK M. Polsongkram, G.V. Kuznetsov ……….…………………………..………………………………..……….....226
Section XI: Design and technology of art processing of
Materials CONVERSIONS OF FORMER INDUSTRIAL BUILDINGS P. Ambrusova ……………………….…………………………………………………………………………….230 COMMUNICATIVE POSSIBILITIES OF INFOGRAFICS Bolshakova. V.V., Kuhta M.S., Khromova S.G.……………………………….…………................................232 ARCHITECTURAL DECORATIVE LIGHTING OF TOMSK WEDDING PALACE Dyrdina A.V.…………………….……………………………………………….…………..................................234 VARIABILITY OF EGYPTIAN SYMBOLS Evsutina E.S., Arventeva N.A., Khromova S.G.…………………………….…………...................................236 THE CHOICE OF FACTORS FOR RESEARCH OF PERCEPTION OF GRAVED LETTERING TYPES A. R. Karipova………………………….…………..........................................................................................238 THE FUNCTIONAL AND AESTHETIC DESIGN OF BIRDS’ FEEDI NG-RACK Kukhta A.E.…………………….……………………………………………….…………...................................239 THE MODERN DESIGN OF CONVERTIBLE EXHIBITION SHOWCAS ES Evsutina E.S., Arventeva N.A., Khromova S.G.…………………………….…………...................................241
Section XII: Nanomaterials, nanotechnologies and ne w
energetics RESEARCH OF STRUCTURE-PHASE STATE OF NANOCOMPOSITE COATING ON THE BASIS OF ZIRCONIA Kuriker T.S., Kalashnikov M.P., Fedorischeva M.V.……….………….........................................................244 RESEARCH OF PROCESS OF RECEPTION Nd - CONTAINING AL LOYS BY ELECTROLISIS METHOD OF WATER SOLUTIONS Panasenko A. I., Arsentev M. V., Marhinin A. E.……….…………..............................................................246 MOLECULAR DYNAMIC SIMULATION OF CARBON NANOSTRUCTUR ES AS A TOOL FOR DEVELOPING OF NEW MATERIALS AND TECHNOLO GIES Tatarnikov D.A..……….…………................................................................................................................248 ELECTROSURFACE CHARACTERISTICS OF PARTICLES OF CLAY MINERALS IN AQUEOUS SUSPENSIONS Vo Dai Tu, Truong Xuan Nam ……….………….........................................................................................250
Section XIII: Round table «Technic philosophy»
INFLUENCE OF CELL PHONES Stepanov K.A..…………………………………….…………...........................................................................254 RELIGION, FREEDOM OF CONSCIENCE AND NEW TECHNOLOGIE S IN THE POSTSECULAR WORLD Minchenko T.P..…………………………………….………….........................................................................255 "LIVING AIR" IN EVERY HOME. REALITY OR DREAM? Surnenko E.A.…………………………………….…………...........................................................................257

266
17th International Scientific and Practical Conference of Students, Post-graduates and Young Scientists
MODERN TECHNIQUE AND TECHNOLOGIES
MTT’ 2011
April 18−22, 2011, Tomsk, Russia
Подписано к печати 01.06.2011 Формат 60х84/8. Бумага «Классика». Печать RISO. Усл. печ. л. 13.43. Уч._изд. л. 12. 15.
Заказ 424. Тираж 100 экз. Национальный Исследовательский Томский политехнический университет
Система менеджмента качества Томского политехнического университета сертифицирована
NATIONAL QUALITY ASSURANCE по стандарту ISO 9001:2000 . 634050, г. Томск, пр. Ленина, 30.