Models and Tools for the Design, Assessment, and Evolution ...
151
THÈSE Pour obtenir le grade de DOCTEUR DE L’UNIVERSITÉ GRENOBLE ALPES Spécialité : GI: Génie Industriel: conception et production Arrêtée ministériel : 25 mai 2016 Présentée par Asiye KURT Thèse dirigée par Van-Dat CUNG et co-encadrée par Mario CORTES-CORNAX, Agnès FRONT et Fabien MANGIONE préparée au sein du Laboratoire G-SCOP et LIG dans l’École Doctorale I-MEP2 - Ingénierie - Matériaux, Mécanique, En- vironnement, Energétique, Procédés, Production Modèles et outils pour la conception, l’évaluation et l’évolution des chaînes logis- tiques circulaires Models and tools for the design, assessment, and evolution of Circular Supply Chains Thèse soutenue publiquement le 17 Décembre 2021, devant le jury composé de : Madame Maria DI MASCOLO DIRECTRICE DE RECHERCHE, CNRS délégation Alpes, Présidente Monsieur Khaled HADJ-HAMOU PROFESSEUR DES UNIVERSITES, INSA Lyon, Rapporteur Madame Dalila TAMZALIT MAITRE DE CONFERENCES-HDR, IUT Nantes, Rapportrice Madame Evren SAHIN PROFESSEURE DES UNIVERSITES, CentraleSupélec, Examinatrice Monsieur Julien BOISSIERE MAITRE DE CONFERENCES, Université Savoie Mont-Blanc, Examinateur Monsieur Van-Dat CUNG PROFESSEUR DES UNIVERSITES, Grenoble INP, Directeur de thèse Monsieur Mario CORTES-CORNAX MAITRE DE CONFERENCES, Université Grenoble Alpes, Co-Encadrant de thèse Madame Agnès FRONT PROFESSEURE DES UNIVERSITES, Université Grenoble Alpes, Co- Encadrante de thèse Monsieur Fabien MANGIONE MAITRE DE CONFERENCES, Grenoble INP, Co-Encadrant de thèse
-
Upload
khangminh22 -
Category
Documents
-
view
2 -
download
0
Transcript of Models and Tools for the Design, Assessment, and Evolution ...
THÈSEPour obtenir le grade de
DOCTEUR DE L’UNIVERSITÉ GRENOBLE ALPESSpécialité : GI: Génie Industriel: conception et production
Arrêtée ministériel : 25 mai 2016
Présentée par
Asiye KURT
Thèse dirigée par Van-Dat CUNGet co-encadrée par Mario CORTES-CORNAX, Agnès FRONT et FabienMANGIONE
préparée au sein du Laboratoire G-SCOP et LIGdans l’École Doctorale I-MEP2 - Ingénierie - Matériaux, Mécanique, En-vironnement, Energétique, Procédés, Production
Modèles et outils pour la conception,l’évaluation et l’évolution des chaînes logis-tiques circulaires
Models and tools for the design, assessment,and evolution of Circular Supply Chains
Thèse soutenue publiquement le 17 Décembre 2021,devant le jury composé de :
Madame Maria DI MASCOLODIRECTRICE DE RECHERCHE, CNRS délégation Alpes, PrésidenteMonsieur Khaled HADJ-HAMOUPROFESSEUR DES UNIVERSITES, INSA Lyon, RapporteurMadame Dalila TAMZALITMAITRE DE CONFERENCES-HDR, IUT Nantes, RapportriceMadame Evren SAHINPROFESSEURE DES UNIVERSITES, CentraleSupélec, ExaminatriceMonsieur Julien BOISSIEREMAITRE DE CONFERENCES, Université Savoie Mont-Blanc, ExaminateurMonsieur Van-Dat CUNGPROFESSEUR DES UNIVERSITES, Grenoble INP, Directeur de thèseMonsieur Mario CORTES-CORNAXMAITRE DE CONFERENCES, Université Grenoble Alpes, Co-Encadrant dethèseMadame Agnès FRONTPROFESSEURE DES UNIVERSITES, Université Grenoble Alpes, Co-Encadrante de thèseMonsieur Fabien MANGIONEMAITRE DE CONFERENCES, Grenoble INP, Co-Encadrant de thèse

Acknowledgments
Acknowledgments
First and foremost, I would like to express my gratitude to my thesis director Prof. Van-DatCung and co-supervisors Prof. Agnès Front, Dr. Mario Cortes-Cornax, and Dr. Fabien Mangionefor believing in me and supporting my work during three years. Their deep knowledge and pre-cious experience have supported and encouraged me during my academic research life.
I would also like to thank two reviewers of my thesis Prof. Kaheld Hadj-Hamou and Dr DalilaTamzalit, for the time they have invested in reading my thesis and for giving constructive criticism.I also wish to thank the other members of the jury, Prof. Evren Sahin, Prof. Maria Di Mascolo andDr. Julien Boissière, for the precious and insightful discussion during my defense. Special thanksto Prof. Maria Di Mascolo and Dr. Julien Boissière, for having followed my thesis as a part of myCSI.
I would like to thank the founder of this work, the French National Research Agency (ANR)for supporting our work through ”Investissements d’avenir program (ANR-15-IDEX-02) - CrossDisciplinary Program CIRCULAR”.
I would like to express my sincere gratitude to thank Dr. Nadine Mandran for her preciousadvice and discussion on the design of experiments.
I would like to thank Liu Zhenyu, Soufiane Kaddouri, Abdessalem Tebbikh, Idir Nait-Ali, andSami Bouhroum for working with me during their internship. It was a pleasure to work with you.
I also thank the administrative and IT team of G-SCOP and LIG, in particular Marie-Jo, Fadila,Kévin, and Oliver. I would like to offer my special thanks to my lab-mates in G-SCOP, in particularAkash, Bilge, Florian, Lucas, Tamara, and Tatiana, for their friendship.
I wish also to thank my dear friends Alican, Can, and Emre, for their support and friendshipduring my thesis.
Lastly, I would like to express my gratitude to my family, especially my parents, sisters andnephews for their unconditional support.
i

Résumé
Résumé
L’économie circulaire vise à minimiser la consommation des ressources et la production desdéchets ainsi que la pollution en maintenant le plus long temps possible les produits, les com-posants et les matériaux dans la phase d’utilisation. Cela pourrait être obtenu avec des stratégiesde conception de produits ou des activités d’économie circulaire liées à la fin de vie des objetstelles que la réutilisation, la remise à neuf, la repurposing, le recyclage, etc. Les chaînes lo-gistiques circulaires, qui intègrent l’approche de l’économie circulaire dans la chaîne logistique,soutiennent ces activités et jouent un rôle important dans l’application des principes de l’économiecirculaire.
Divers concepts dans la littérature tels que les chaînes logistiques en boucle fermée, la logis-tique inverse, les chaînes logistiques vertes, etc., ont déjà exploré l’intégration des activités del’économie circulaire dans les chaînes d’approvisionnement. Cependant, le concept d’économiecirculaire apporte de nouvelles approches : (1) appliquer plusieurs activités d’économie circulaireen parallèle plutôt que d’appliquer une seule activité, (2) utiliser des matériaux encore et encore,et (3) promouvoir des boucles ouvertes entre des secteurs distincts par "repurposing". De plus,l’activité de "repurposing" n’est pas suffisamment explorée jusqu’à présent. Cependant, cette ac-tivité, qui ajoute de la valeur aux produits usagés en les détournant de leur destination initiale eten les utilisant dans des applications moins exigeantes, pourrait être un nouveau moyen potentield’accroître la circularité dans les chaînes logistiques circulaires. En outre, le manque de connais-sances et de senibilisation sur les chaînes logistiques circulaires constitue un obstacle difficile pourles gestionnaires de chaînes d’approvisionnement. Par conséquent, les implications de l’économiecirculaire dans les chaînes logistiques doivent être explorées, structurées et formalisées. De nou-veaux outils sont également nécessaires pour promouvoir le concept de chaîne logistique circulaireet soutenir sa conception ainsi que son évolution.
L’objectif principal de cette thèse de doctorat est d’explorer et de conceptualiser les structuresdes chaînes logistiques dans le concept d’économie circulaire. Nous visons à créer des méth-odes et des outils pour soutenir la conception et l’évolution de la chaîne logistique circulaire, enconsidérant la "repurposing" comme une activité d’économie circulaire de premier ordre. Lescontributions principales de cette thèse sont :
• un modèle générique formalisé en utilisant le Langage de Modélisation Unifié (UML) pourconceptualiser les chaînes logistiques circulaires,
• un outil de classification des indicateurs de chaîne logistique circulaire où les différentesdimensions de la circularité sont décrites,
• un nouvel indicateur pour évaluer la circularité des chaînes logistiques,
• un jeu sérieux pour promouvoir les chaînes logistiques circulaires et accroître la connais-sance ainsi que la sensibilisation sur leurs structures et les activités d’économie circulaireimpliquées.
Enfin, en adoptant le cadre As-IS/As-IF, les contributions susmentionnées sont intégrées dansune première version d’une méthode d’évolution continue. Cette méthode aide à identifier d’éventuellesévolutions pour améliorer la circularité des chaînes logistiques.
Mots clés: Économie Circulaire, Chaîne Logistique, Repurposing, Indicateur de Circularité, JeuSérieux, Evolution Continue.
iii

Abstract
Abstract
The Circular Economy aims at minimizing resource inputs, waste, and pollution by keepingas long as possible products, components, and materials in use. This could be reached by productdesign strategies or E-o-L (End of Life) activities (also called Circular Economy activities), suchas reuse, remanufacturing, repurposing, recycling, etc. Circular Supply Chains, which integratethe Circular Economy approach into supply chains, support these activities and play an importantrole in the application of Circular Economy principles.
Various concepts in the literature such as Closed-Loop Supply Chains, Reverse Logistics,Green Supply Chains, etc., have been already explored the integration of Circular Economy ac-tivities in supply chains. However, the Circular Economy concept brings some new approaches:(1) applying multiple Circular Economy activities in parallel rather than applying single activities,(2) using materials over and over again, and (3) promoting open-loops between distinct sectorsthrough repurposing. In addition, repurposing activity has not been sufficiently explored so far.However, this activity adds value to used products by diverting them from their initial purpose andusing them in less demanding applications. This could be a new potential mean to increasing cir-cularity in Circular Supply Chains. Besides, the lack of knowledge and awareness about CircularSupply Chains constitutes a challenging barrier for Supply Chain managers. Therefore, the im-plications of Circular Economy in supply chains need to be explored, structured and formalized.New tools are also needed to promote the Circular Supply Chains and support their design andevolution.
The main objective of this Ph.D. thesis is to explore and conceptualize supply chains structuresin the context of Circular Economy. We aim at creating methods and tools to support Circular Sup-ply Chain design and evolution, considering repurposing activity as a first-class Circular Economystrategy. The main contributions of this thesis are:
• A generic model formalized by using the Unified Modeling Language (UML) to designCircular Supply Chains.
• A classification tool for Circular Supply Chain indicators, where different circularity dimen-sions are described.
• A new indicator to assess the circularity of Supply Chains.
• A serious game to promote Circular Supply Chains and increase knowledge and awarenessof their structures and the Circular Economy activities involved.
Finally, adopting As-IS/As-IF framework, the aforementioned contributions are integrated into afirst version of a continual evolution method. This method helps identifying possible evolutions toimprove the circularity of supply chains.
Keywords: Circular Economy, Supply Chain, Repurposing, Circularity Indicator, Serious Game,Continual Evolution.
v

Contents
Acknowledgments . . . . . . . . . . . . . . . . . . . . . . . . . . . . . . . . . . . . . i
Résumé iii
Abstract v
Table of Contents . . . . . . . . . . . . . . . . . . . . . . . . . . . . . . . . . . . . . vii
1 Introduction 11.1 Context . . . . . . . . . . . . . . . . . . . . . . . . . . . . . . . . . . . . . . . 2
1.1.1 Cross-Disciplinary CIRCULAR Project . . . . . . . . . . . . . . . . . . 31.1.2 Challenges, Research Gaps and Research Question . . . . . . . . . . . . 3
1.2 Main Contributions . . . . . . . . . . . . . . . . . . . . . . . . . . . . . . . . . 41.3 Structure of the manuscript . . . . . . . . . . . . . . . . . . . . . . . . . . . . . 6
2 The Circular Economy, Supply Chains and Our Positioning 82.1 Introduction . . . . . . . . . . . . . . . . . . . . . . . . . . . . . . . . . . . . . 92.2 The Circular Economy and Supply Chains . . . . . . . . . . . . . . . . . . . . . 9
2.2.1 The Circular Economy . . . . . . . . . . . . . . . . . . . . . . . . . . . 92.2.2 Supply Chains . . . . . . . . . . . . . . . . . . . . . . . . . . . . . . . 12
2.3 Supply Chains in the CE Context . . . . . . . . . . . . . . . . . . . . . . . . . . 142.3.1 Interrelated concepts in the literature . . . . . . . . . . . . . . . . . . . 142.3.2 Circular Supply Chains in the Literature . . . . . . . . . . . . . . . . . . 16
2.4 Circular Supply Chain Components . . . . . . . . . . . . . . . . . . . . . . . . 172.4.1 Circular Material Flows . . . . . . . . . . . . . . . . . . . . . . . . . . 172.4.2 Circular Economy Activities and Hierarchization . . . . . . . . . . . . . 18
2.5 Our Previous Work on Conceptualizing CSCs . . . . . . . . . . . . . . . . . . . 212.5.1 A Hierarchical Framework for the CE Activities . . . . . . . . . . . . . 222.5.2 An Extended Model for Circular Supply Chains . . . . . . . . . . . . . . 23
2.6 Conclusion . . . . . . . . . . . . . . . . . . . . . . . . . . . . . . . . . . . . . 24
3 Conceptualizing Circular Supply Chains through a Generic Model 273.1 Introduction . . . . . . . . . . . . . . . . . . . . . . . . . . . . . . . . . . . . . 283.2 Circular Supply Chain Characteristics and Previous Works . . . . . . . . . . . . 293.3 Formalization of CSC Model in UML . . . . . . . . . . . . . . . . . . . . . . . 313.4 Use Cases Illustrating the Use of the Generic Model . . . . . . . . . . . . . . . . 35
3.4.1 Textile Products . . . . . . . . . . . . . . . . . . . . . . . . . . . . . . . 353.4.2 Li-Ion Batteries of Electric Vehicles . . . . . . . . . . . . . . . . . . . . 36
3.5 Conclusion . . . . . . . . . . . . . . . . . . . . . . . . . . . . . . . . . . . . . 38
vii
Table of Contents
4 A Classification Tool for Circular Supply Chain Indicators 414.1 Introduction . . . . . . . . . . . . . . . . . . . . . . . . . . . . . . . . . . . . . 424.2 Indicators and Classifications considering CE . . . . . . . . . . . . . . . . . . . 424.3 A Classification Tool for Circular Supply Chain Indicators . . . . . . . . . . . . 444.4 Classifying Existing Indicators through our Tool . . . . . . . . . . . . . . . . . . 484.5 Conclusion . . . . . . . . . . . . . . . . . . . . . . . . . . . . . . . . . . . . . 50
5 Assessing Circularity in Supply Chains: A Global Circularity Indicator 525.1 Introduction . . . . . . . . . . . . . . . . . . . . . . . . . . . . . . . . . . . . . 535.2 Existing indicators and methods for CSCs and our positioning . . . . . . . . . . 535.3 Mathematical Representation of CSCs . . . . . . . . . . . . . . . . . . . . . . . 545.4 Global Circularity Indicator . . . . . . . . . . . . . . . . . . . . . . . . . . . . . 555.5 Calculation of Circularity Coefficient for Each Loop . . . . . . . . . . . . . . . 605.6 A Web-Based Tool for Proposed Indicators: CircuSChain Calculator . . . . . . . 635.7 Conclusion . . . . . . . . . . . . . . . . . . . . . . . . . . . . . . . . . . . . . 64
6 A Serious Game for Circular Supply Chains 676.1 Introduction . . . . . . . . . . . . . . . . . . . . . . . . . . . . . . . . . . . . . 686.2 Background . . . . . . . . . . . . . . . . . . . . . . . . . . . . . . . . . . . . . 68
6.2.1 Beer Distribution Game . . . . . . . . . . . . . . . . . . . . . . . . . . 686.2.2 Serious Games related to the Circular Supply Chains . . . . . . . . . . . 69
6.3 Methodology . . . . . . . . . . . . . . . . . . . . . . . . . . . . . . . . . . . . 696.4 CircuSChain Game . . . . . . . . . . . . . . . . . . . . . . . . . . . . . . . . . 71
6.4.1 Game Description . . . . . . . . . . . . . . . . . . . . . . . . . . . . . 716.4.2 Game Flows . . . . . . . . . . . . . . . . . . . . . . . . . . . . . . . . 72
6.5 Experiment and Analysis . . . . . . . . . . . . . . . . . . . . . . . . . . . . . . 776.6 Conclusion . . . . . . . . . . . . . . . . . . . . . . . . . . . . . . . . . . . . . 80
7 A Continual Evolution Method for Circular Supply Chains 847.1 Introduction . . . . . . . . . . . . . . . . . . . . . . . . . . . . . . . . . . . . . 857.2 Background . . . . . . . . . . . . . . . . . . . . . . . . . . . . . . . . . . . . . 857.3 The As-IS/As-IF Framework . . . . . . . . . . . . . . . . . . . . . . . . . . . . 87
7.3.1 Process Model of As-IS/As-IF Framework . . . . . . . . . . . . . . . . 877.3.2 Product Meta-Model of As-IS/As-IF Framework . . . . . . . . . . . . . 91
7.4 Circular Supply Chain Continual Evolution Method (CircuSChain) . . . . . . . 917.4.1 How to Read the Protocols of the Method? . . . . . . . . . . . . . . . . 937.4.2 Analysis Strategy . . . . . . . . . . . . . . . . . . . . . . . . . . . . . . 937.4.3 Diagnosis Strategy . . . . . . . . . . . . . . . . . . . . . . . . . . . . . 997.4.4 Evolution Strategy . . . . . . . . . . . . . . . . . . . . . . . . . . . . . 1017.4.5 Product Meta-Model . . . . . . . . . . . . . . . . . . . . . . . . . . . . 104
7.5 Conclusion . . . . . . . . . . . . . . . . . . . . . . . . . . . . . . . . . . . . . 1057.5.1 Implications for the practice and the theory . . . . . . . . . . . . . . . . 1057.5.2 Limitations and future works . . . . . . . . . . . . . . . . . . . . . . . . 105
8 General Conclusion 108
Bibliography I
List of figures XII
List of Tables XV
viii

Table of Contents
Résumé étendu XVII
A Abbreviations XXIII
B Questionnaires XXIV
ix


1Introduction
Contents1.1 Context . . . . . . . . . . . . . . . . . . . . . . . . . . . . . . . . . . . . . . 2
1.1.1 Cross-Disciplinary CIRCULAR Project . . . . . . . . . . . . . . . . . 31.1.2 Challenges, Research Gaps and Research Question . . . . . . . . . . . 3
1.2 Main Contributions . . . . . . . . . . . . . . . . . . . . . . . . . . . . . . . 41.3 Structure of the manuscript . . . . . . . . . . . . . . . . . . . . . . . . . . . 6
1
Chapter 1. Introduction
1.1 Context
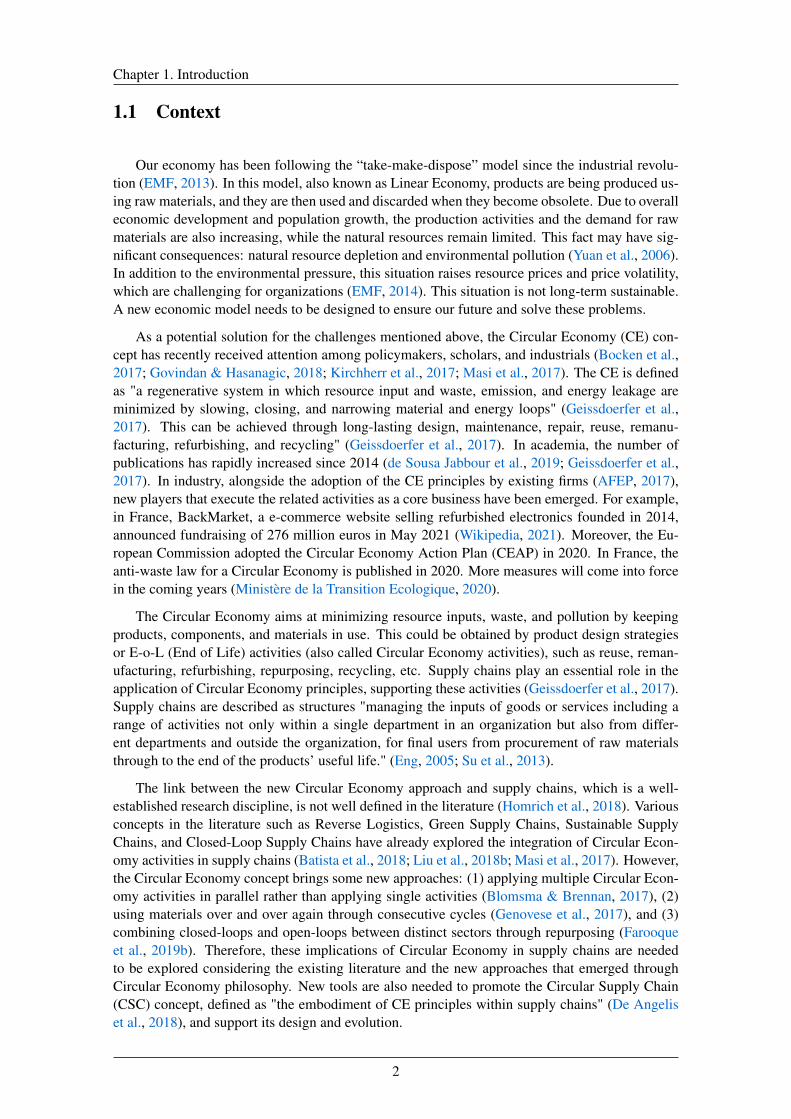
Our economy has been following the “take-make-dispose” model since the industrial revolu-tion (EMF, 2013). In this model, also known as Linear Economy, products are being produced us-ing raw materials, and they are then used and discarded when they become obsolete. Due to overalleconomic development and population growth, the production activities and the demand for rawmaterials are also increasing, while the natural resources remain limited. This fact may have sig-nificant consequences: natural resource depletion and environmental pollution (Yuan et al., 2006).In addition to the environmental pressure, this situation raises resource prices and price volatility,which are challenging for organizations (EMF, 2014). This situation is not long-term sustainable.A new economic model needs to be designed to ensure our future and solve these problems.
As a potential solution for the challenges mentioned above, the Circular Economy (CE) con-cept has recently received attention among policymakers, scholars, and industrials (Bocken et al.,2017; Govindan & Hasanagic, 2018; Kirchherr et al., 2017; Masi et al., 2017). The CE is definedas "a regenerative system in which resource input and waste, emission, and energy leakage areminimized by slowing, closing, and narrowing material and energy loops" (Geissdoerfer et al.,2017). This can be achieved through long-lasting design, maintenance, repair, reuse, remanu-facturing, refurbishing, and recycling" (Geissdoerfer et al., 2017). In academia, the number ofpublications has rapidly increased since 2014 (de Sousa Jabbour et al., 2019; Geissdoerfer et al.,2017). In industry, alongside the adoption of the CE principles by existing firms (AFEP, 2017),new players that execute the related activities as a core business have been emerged. For example,in France, BackMarket, a e-commerce website selling refurbished electronics founded in 2014,announced fundraising of 276 million euros in May 2021 (Wikipedia, 2021). Moreover, the Eu-ropean Commission adopted the Circular Economy Action Plan (CEAP) in 2020. In France, theanti-waste law for a Circular Economy is published in 2020. More measures will come into forcein the coming years (Ministère de la Transition Ecologique, 2020).
The Circular Economy aims at minimizing resource inputs, waste, and pollution by keepingproducts, components, and materials in use. This could be obtained by product design strategiesor E-o-L (End of Life) activities (also called Circular Economy activities), such as reuse, reman-ufacturing, refurbishing, repurposing, recycling, etc. Supply chains play an essential role in theapplication of Circular Economy principles, supporting these activities (Geissdoerfer et al., 2017).Supply chains are described as structures "managing the inputs of goods or services including arange of activities not only within a single department in an organization but also from differ-ent departments and outside the organization, for final users from procurement of raw materialsthrough to the end of the products’ useful life." (Eng, 2005; Su et al., 2013).
The link between the new Circular Economy approach and supply chains, which is a well-established research discipline, is not well defined in the literature (Homrich et al., 2018). Variousconcepts in the literature such as Reverse Logistics, Green Supply Chains, Sustainable SupplyChains, and Closed-Loop Supply Chains have already explored the integration of Circular Econ-omy activities in supply chains (Batista et al., 2018; Liu et al., 2018b; Masi et al., 2017). However,the Circular Economy concept brings some new approaches: (1) applying multiple Circular Econ-omy activities in parallel rather than applying single activities (Blomsma & Brennan, 2017), (2)using materials over and over again through consecutive cycles (Genovese et al., 2017), and (3)combining closed-loops and open-loops between distinct sectors through repurposing (Farooqueet al., 2019b). Therefore, these implications of Circular Economy in supply chains are neededto be explored considering the existing literature and the new approaches that emerged throughCircular Economy philosophy. New tools are also needed to promote the Circular Supply Chain(CSC) concept, defined as "the embodiment of CE principles within supply chains" (De Angeliset al., 2018), and support its design and evolution.
2
1.1. Context
1.1.1 Cross-Disciplinary CIRCULAR Project
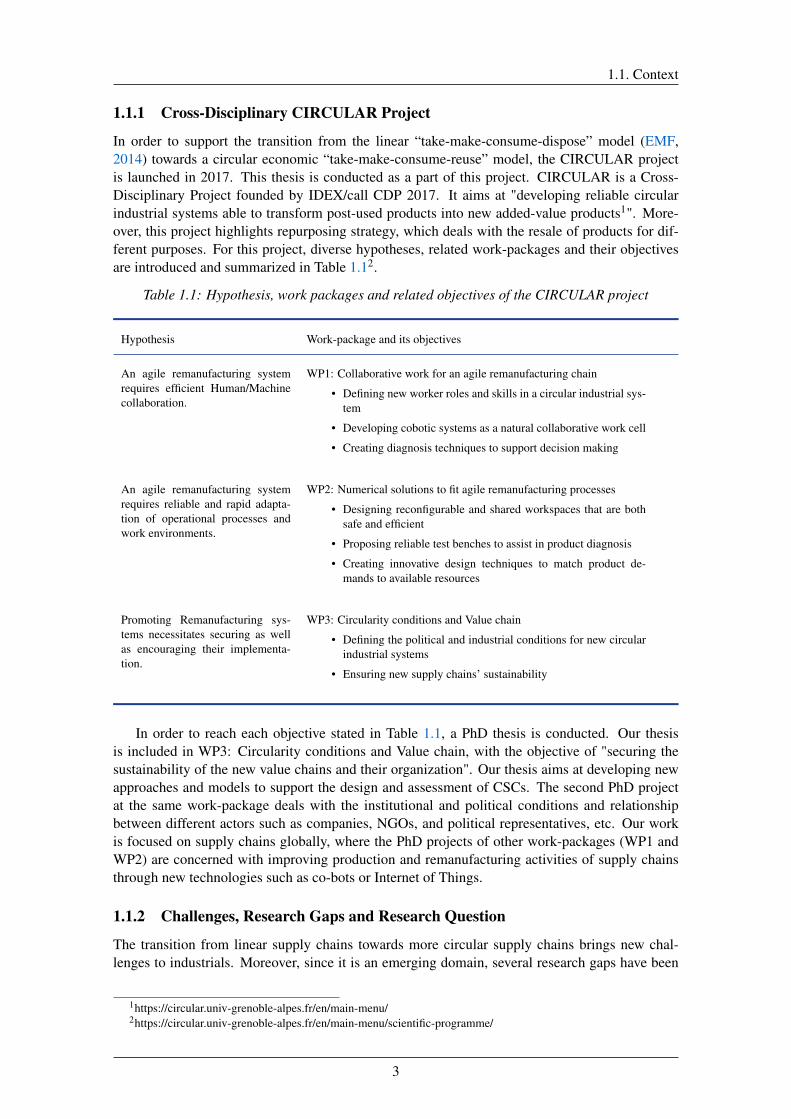
In order to support the transition from the linear “take-make-consume-dispose” model (EMF,2014) towards a circular economic “take-make-consume-reuse” model, the CIRCULAR projectis launched in 2017. This thesis is conducted as a part of this project. CIRCULAR is a Cross-Disciplinary Project founded by IDEX/call CDP 2017. It aims at "developing reliable circularindustrial systems able to transform post-used products into new added-value products1". More-over, this project highlights repurposing strategy, which deals with the resale of products for dif-ferent purposes. For this project, diverse hypotheses, related work-packages and their objectivesare introduced and summarized in Table 1.12.
Table 1.1: Hypothesis, work packages and related objectives of the CIRCULAR project
Hypothesis Work-package and its objectives
An agile remanufacturing systemrequires efficient Human/Machinecollaboration.
WP1: Collaborative work for an agile remanufacturing chain
• Defining new worker roles and skills in a circular industrial sys-tem
• Developing cobotic systems as a natural collaborative work cell
• Creating diagnosis techniques to support decision making
An agile remanufacturing systemrequires reliable and rapid adapta-tion of operational processes andwork environments.
WP2: Numerical solutions to fit agile remanufacturing processes
• Designing reconfigurable and shared workspaces that are bothsafe and efficient
• Proposing reliable test benches to assist in product diagnosis
• Creating innovative design techniques to match product de-mands to available resources
Promoting Remanufacturing sys-tems necessitates securing as wellas encouraging their implementa-tion.
WP3: Circularity conditions and Value chain
• Defining the political and industrial conditions for new circularindustrial systems
• Ensuring new supply chains’ sustainability
In order to reach each objective stated in Table 1.1, a PhD thesis is conducted. Our thesisis included in WP3: Circularity conditions and Value chain, with the objective of "securing thesustainability of the new value chains and their organization". Our thesis aims at developing newapproaches and models to support the design and assessment of CSCs. The second PhD projectat the same work-package deals with the institutional and political conditions and relationshipbetween different actors such as companies, NGOs, and political representatives, etc. Our workis focused on supply chains globally, where the PhD projects of other work-packages (WP1 andWP2) are concerned with improving production and remanufacturing activities of supply chainsthrough new technologies such as co-bots or Internet of Things.
1.1.2 Challenges, Research Gaps and Research Question
The transition from linear supply chains towards more circular supply chains brings new chal-lenges to industrials. Moreover, since it is an emerging domain, several research gaps have been
1https://circular.univ-grenoble-alpes.fr/en/main-menu/2https://circular.univ-grenoble-alpes.fr/en/main-menu/scientific-programme/
3

Chapter 1. Introduction
observed in the literature. These new challenges and research gaps motivate our research work.Circular Economy requires new supply chain configurations, where multiple CE activities are
applied in parallel. In addition, products or materials should be used over and over again throughclosed and open-loops. Closed-loops consist in collecting used products and integrating them intothe original supply chain through circular activities such as direct reuse, reuse with remanufac-turing, recycling, etc., while open-loops concern integration used products into different supplychains. Therefore, these complex supply chains need to be conceptualized and modeled first inorder to be analyzed and improved. Moreover, supply chains and material flows are needed to beassessed to show the advantages of implementing CE practices (Winans et al., 2017). Blomsma &Brennan (2017) highlight the need for assessment tools for these multiple activity configurations.Indeed, a successful transition to a CSC requires a continual measurement of progress towardscircularity (Jain et al., 2018).
One of the challenges to implement CSC or CE practices is the insufficient knowledge andawareness among supply chain members (Govindan & Hasanagic, 2018; Mangla et al., 2018) andcustomers (Vermunt et al., 2019), as well as the lack of appropriate training and development pro-grams about Circular Economy for supply chain members (Mangla et al., 2018). The inadequacyof scientific skills of supply chain members restricts the adoption of the CE (Mangla et al., 2018).
Besides these challenges, the repurposing activity remains scarcely explored among industri-als and scholars. There are limited studies about the adoption of repurposing activity in CSCs.However, this CE activity adds value to used products by diverting them from their initial purposeand using them in less demanding applications. Therefore, it has to be included as a new potentialmean to increasing circularity in CSCs.
While our global objective is to support the design and assessment of CSCs, according to thechallenges and the research gaps, the following research questions are raised:
• RQ1: What are the implications of the CE on supply chains and how to integrate repurpos-ing activity into CSCs?
• RQ2: How to conceptualize and model the complex configurations of CSCs?
• RQ3: How to assess the circularity of the supply chains?
• RQ4: How to raise awareness and increase the knowledge about CSCs using the proposedtools?
• RQ5: How to help organizations to support circularity in supply chains continuously?
1.2 Main Contributions
To answer the aforementioned research questions, we develop several tools with differentmethods. Our contribution and main methodologies are presented below.
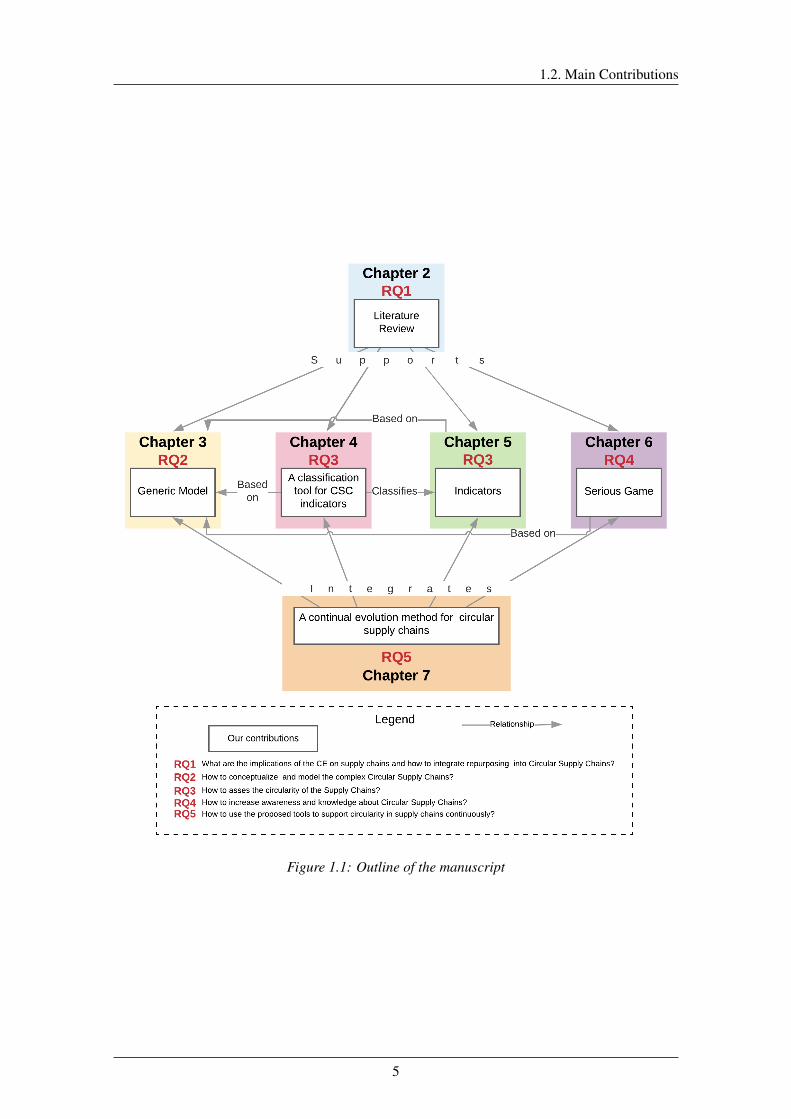
Figure 1.1 summarizes our contributions, their relationship, and addressed the research ques-tions.
Firstly, to determine the implications of the CE on supply chains and integrate repurposingactivity, a literature review is conducted. We explore CE approaches related to supply chains, theinterrelated concepts to CSCs and CSC components. Then, we explain our positioning regardingthe literature.
Secondly, to conceptualize and model the complex Circular Supply Chains, we rely on theliterature in order to propose the main CSC characteristics. They constitute the basis for the
4
1.2. Main Contributions
Figure 1.1: Outline of the manuscript
5
Chapter 1. Introduction
development of our generic model for CSCs. The Unified Modeling Language (UML) is used toformalize the generic model.
Thirdly, in order to support the assessment of the circularity in CSCs, we propose a classifica-tion tool for CSC indicators based on the CSC characteristics. This tool defines the dimensionsof circularity to measure. Some indicators for each dimension along with a composite indica-tor that considers several dimensions are proposed. A web-based tool prototype is developedto help to setup a CSC configuration and automatically calculate these related indicators.
Fourthly, in order to contribute to increasing knowledge and awareness about circular supplychains, a serious game is proposed. The scenario of the game is designed on the basis of ourgeneric model. This game is experimented with industrial engineering students.
Finally, to explore the use of these tools to support circularity in supply chains in a continuousway, a preliminary version of a continuous evolution method for circular supply chains isintroduced. This method is developed by adapting As-IS/As-IF framework (Çela et al., 2019).
1.3 Structure of the manuscript
The structure of the thesis is composed of an introduction, a general literature review chapter,five chapters presenting our main contributions and a conclusion.
This introduction chapter has given some insights into the context of the research, which ispart of a cross-disciplinary project. Section 1.2 has presented a summary of the challenges andthe research gaps completed by five research questions. Our contributions in order to answer thestated research questions are introduced as well.
Literature review chapter (Chapter 2) gives a generic literature background about CE andCSCs. It also introduces the components of CSCs and our positioning regarding the literature.This chapter provides a global basis for all the remaining contributions. A literature backgroundfor each tool is then provided in each related chapter.
Chapter 3 introduces the generic model for circular supply chains. The generic model is illus-trated by two use cases based on the literature.
Chapter 4 presents the classification tool for circular supply chain indicators. In this chapter,we also present some new potential indicators and classification of existing indicators from theliterature through our classification tool.
Chapter 5 presents the Global Circularity Indicator and the web-based tool prototype to calcu-late proposed indicators in this chapter and Chapter 4.
Chapter 6 introduces the CircuSChain Game with game design process, game flows, and theexperiment.
Chapter 7 integrates all the proposed tools into a continuous evolution method. This chapterdescribes the As-IS/As-IF framework and its adaption for CSCs. The protocols explaining how touse our tools within this method is included in this chapter.
Finally, the conclusion chapter (Chapter 8) summarizes our work and gives a general conclu-sion.
6

2The Circular Economy, Supply Chains and
Our Positioning
Contents2.1 Introduction . . . . . . . . . . . . . . . . . . . . . . . . . . . . . . . . . . . 92.2 The Circular Economy and Supply Chains . . . . . . . . . . . . . . . . . . 9
2.2.1 The Circular Economy . . . . . . . . . . . . . . . . . . . . . . . . . . 92.2.2 Supply Chains . . . . . . . . . . . . . . . . . . . . . . . . . . . . . . 12
2.3 Supply Chains in the CE Context . . . . . . . . . . . . . . . . . . . . . . . . 142.3.1 Interrelated concepts in the literature . . . . . . . . . . . . . . . . . . 142.3.2 Circular Supply Chains in the Literature . . . . . . . . . . . . . . . . . 16
2.4 Circular Supply Chain Components . . . . . . . . . . . . . . . . . . . . . . 172.4.1 Circular Material Flows . . . . . . . . . . . . . . . . . . . . . . . . . 172.4.2 Circular Economy Activities and Hierarchization . . . . . . . . . . . . 18
2.5 Our Previous Work on Conceptualizing CSCs . . . . . . . . . . . . . . . . 212.5.1 A Hierarchical Framework for the CE Activities . . . . . . . . . . . . 222.5.2 An Extended Model for Circular Supply Chains . . . . . . . . . . . . . 23
2.6 Conclusion . . . . . . . . . . . . . . . . . . . . . . . . . . . . . . . . . . . . 24
Related publications: Kurt, A., Cung, V.-D., Mangione, F., Cortes-Cornax, M., & Front, A. (2019).An extended circular supply chain model including repurposing activities. In 2019 InternationalConference on Control, Automation and Diagnosis (ICCAD) (pp. 287–292).: IEEE
Dubois, F., Basia, A., Kurt, A., Bettinelli, M., Zheng, P., Jourdain, V., & Guelle, K. (2019). Produc-tion of the future to support circular economy-development of a dedicated platform by means of amultidisciplinary approach. In 2019 International Conference on Control, Automation and Diagnosis(ICCAD) (pp. 144–148).: IEEE
8
2.1. Introduction
2.1 Introduction
In this chapter, we explore the implications of CE in supply chains and explain our position-ing. First, we provide a general background from the literature on the Circular Economy andsupply chains (Section 2.2). We also explain our positioning regarding various supply chain andCE themes and present supply chain components. In Section 2.3, CSCs in the literature and itsrelated concepts are introduced. In Section 2.4, CSC components (material flows and activities)are presented. After introducing our positioning, our previous works from the master thesis, whichis a preliminary work for this PhD thesis, are presented in Section 2.5.
2.2 The Circular Economy and Supply Chains
In this section, we give a brief background about the CE and supply chains. Since these twoconcepts contain various themes, we also explain our positioning with the themes on which wehave focused our work.
2.2.1 The Circular Economy
The CE concept has been introduced as a potential solution for material depletion and environmen-tal problems. Stahel (1982) proposed a self-replenishing system to extend product life. However,in the literature, the “Circular Economy” term has been introduced first in the book “Environmen-tal economics: an elementary introduction”, by Pearce & Turner (1990).
Moreover, in terms of policy, the CE was initially implemented in Germany in 1996 with a lawestablishing a closed-loop waste management system (Su et al., 2013). In 2002, China formallyaccepted the CE as an economic policy (Yuan et al., 2006).
In France, the CE has gained attention in the early 2010’s and was formalized by the foundationof l’Institut National de l’Economie Circulaire in 2013 (Grebert & Mothe, 2019). In 2015, the CEnotion appeared for the first time in French law 1.
In recent years, the Circular Economy concept has received more attention among policymak-ers, scholars, and industrials (Bocken et al., 2017; Govindan & Hasanagic, 2018; Kirchherr et al.,2017; Masi et al., 2017). In academia, the number of publications has rapidly increased since 2014(de Sousa Jabbour et al., 2019; Geissdoerfer et al., 2017). In industry, CE principles have beenadopted by existing firms while new market players have focused their core business on relatedactivities. The Ellen MacArthur Foundation (EMF) has also emerged as a respected reference onthis topic and has published different studies about the CE concept since 2013 (EMF, 2013, 2014,2015).
According to EMF, the CE is based on three principles.
1. Design out waste and pollution at the product design phase through new technologies andmaterials.
2. Keep products and materials in use by reuse, repair, remanufacturing, recycling, etc., strate-gies.
3. Regenerate natural systems by returning valuable nutrients to the ecosystem or using renew-able energy instead of relying on fossil fuels.
1https://www.ecologie.gouv.fr/loi-transition-energetique-croissance-verte
9
Chapter 2. The Circular Economy, Supply Chains and Our Positioning
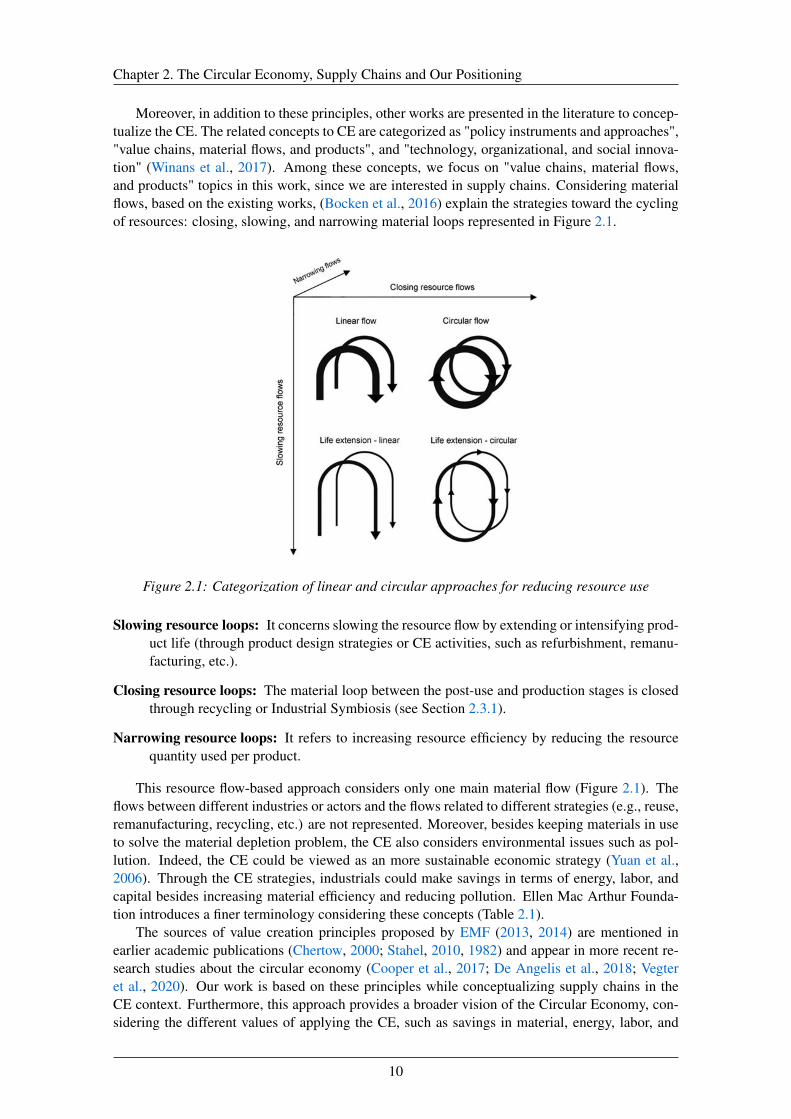
Moreover, in addition to these principles, other works are presented in the literature to concep-tualize the CE. The related concepts to CE are categorized as "policy instruments and approaches","value chains, material flows, and products", and "technology, organizational, and social innova-tion" (Winans et al., 2017). Among these concepts, we focus on "value chains, material flows,and products" topics in this work, since we are interested in supply chains. Considering materialflows, based on the existing works, (Bocken et al., 2016) explain the strategies toward the cyclingof resources: closing, slowing, and narrowing material loops represented in Figure 2.1.
Figure 2.1: Categorization of linear and circular approaches for reducing resource use
Slowing resource loops: It concerns slowing the resource flow by extending or intensifying prod-uct life (through product design strategies or CE activities, such as refurbishment, remanu-facturing, etc.).
Closing resource loops: The material loop between the post-use and production stages is closedthrough recycling or Industrial Symbiosis (see Section 2.3.1).
Narrowing resource loops: It refers to increasing resource efficiency by reducing the resourcequantity used per product.
This resource flow-based approach considers only one main material flow (Figure 2.1). Theflows between different industries or actors and the flows related to different strategies (e.g., reuse,remanufacturing, recycling, etc.) are not represented. Moreover, besides keeping materials in useto solve the material depletion problem, the CE also considers environmental issues such as pol-lution. Indeed, the CE could be viewed as an more sustainable economic strategy (Yuan et al.,2006). Through the CE strategies, industrials could make savings in terms of energy, labor, andcapital besides increasing material efficiency and reducing pollution. Ellen Mac Arthur Founda-tion introduces a finer terminology considering these concepts (Table 2.1).
The sources of value creation principles proposed by EMF (2013, 2014) are mentioned inearlier academic publications (Chertow, 2000; Stahel, 2010, 1982) and appear in more recent re-search studies about the circular economy (Cooper et al., 2017; De Angelis et al., 2018; Vegteret al., 2020). Our work is based on these principles while conceptualizing supply chains in theCE context. Furthermore, this approach provides a broader vision of the Circular Economy, con-sidering the different values of applying the CE, such as savings in material, energy, labor, and
10

2.2. The Circular Economy and Supply Chains
Sources of value creation Illustration
The power of circling longer concerns keeping products, components, and mate-rials in use as long as possible. It could be possible in two ways: firstly, increasingthe time of use of a product in one loop (e.g., the extension of use time by designstrategies or product sharing) and secondly, increasing the time of use by multipleconsecutive loops such as reuse, remanufacturing, recycling, etc. Indeed the CEis described as a system where materials are used over and over again (Genoveseet al., 2017).
The power of inner circle concerns potential savings on different dimensions. Thiscould be possible with short loops. In other words, if the loop is tighter, the less aproduct has to be changed during reprocessing. Having shorter loops means higherthe circularity is. Therefore, it means more potential savings in terms of labor,material, energy, pollution, and capital. For example, the reuse loop is more circularthan the recycling loop, as the first one is shorter. Here, a finer representation offlows is provided.
The power of cascaded use concerns material flow across distinct supply chains.This could be possible by repurposing the products for different purposes or theIndustrial Symbiosis strategy.
The power of pure inputs states that the uncontaminated materials increase thecollection efficiency and therefore help extend product longevity.
Table 2.1: Value creation principles proposed by EMF (2013, 2014)
11
Chapter 2. The Circular Economy, Supply Chains and Our Positioning
pollution. The last principle (value creation through the power of pure inputs) relates to productdesign and collection activities (EMF, 2013, 2014). The product design, which is considered as astrategy of CE (Bocken et al., 2016), is an essential factor. Indeed, the CE is defined "regenerativeand restorative by design" (EMF, 2013). However, in this thesis, we do not focus on the productdesign concept but on the structure of supply chains when products are already designed.
A background about supply chains that support creating circular values (explained throughEMF principles) is given in the next section.
2.2.2 Supply Chains
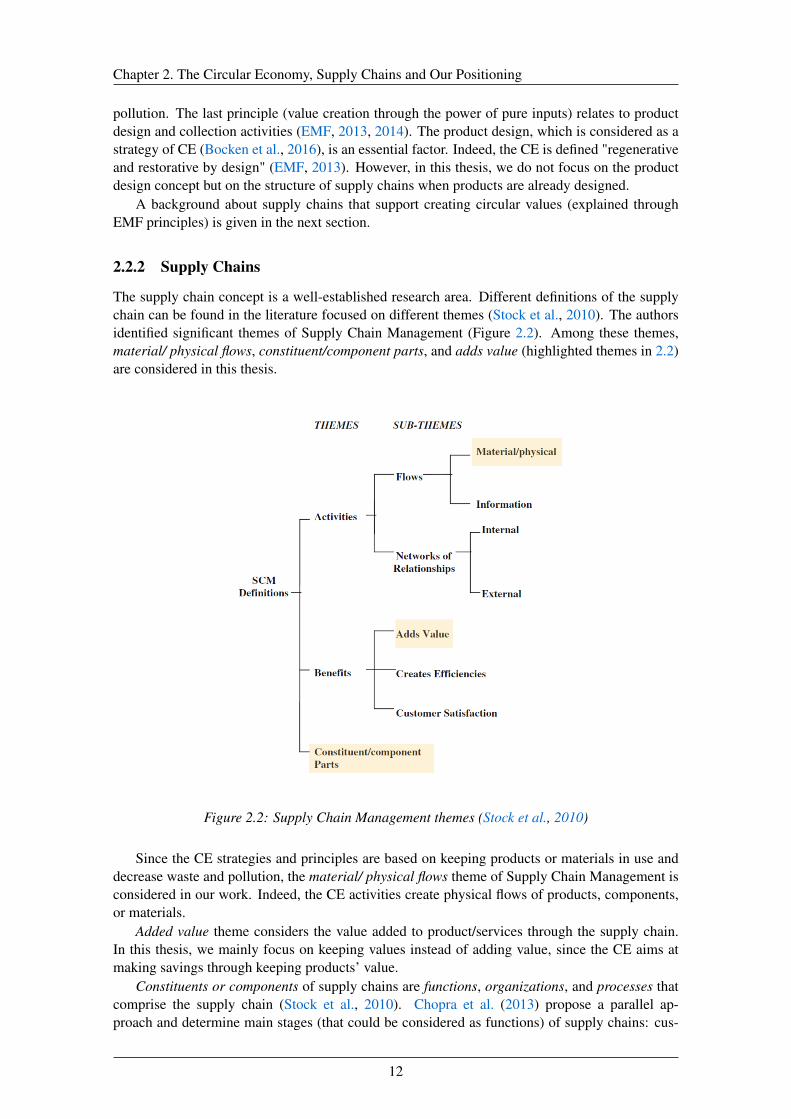
The supply chain concept is a well-established research area. Different definitions of the supplychain can be found in the literature focused on different themes (Stock et al., 2010). The authorsidentified significant themes of Supply Chain Management (Figure 2.2). Among these themes,material/ physical flows, constituent/component parts, and adds value (highlighted themes in 2.2)are considered in this thesis.
Figure 2.2: Supply Chain Management themes (Stock et al., 2010)
Since the CE strategies and principles are based on keeping products or materials in use anddecrease waste and pollution, the material/ physical flows theme of Supply Chain Management isconsidered in our work. Indeed, the CE activities create physical flows of products, components,or materials.
Added value theme considers the value added to product/services through the supply chain.In this thesis, we mainly focus on keeping values instead of adding value, since the CE aims atmaking savings through keeping products’ value.
Constituents or components of supply chains are functions, organizations, and processes thatcomprise the supply chain (Stock et al., 2010). Chopra et al. (2013) propose a parallel ap-proach and determine main stages (that could be considered as functions) of supply chains: cus-
12
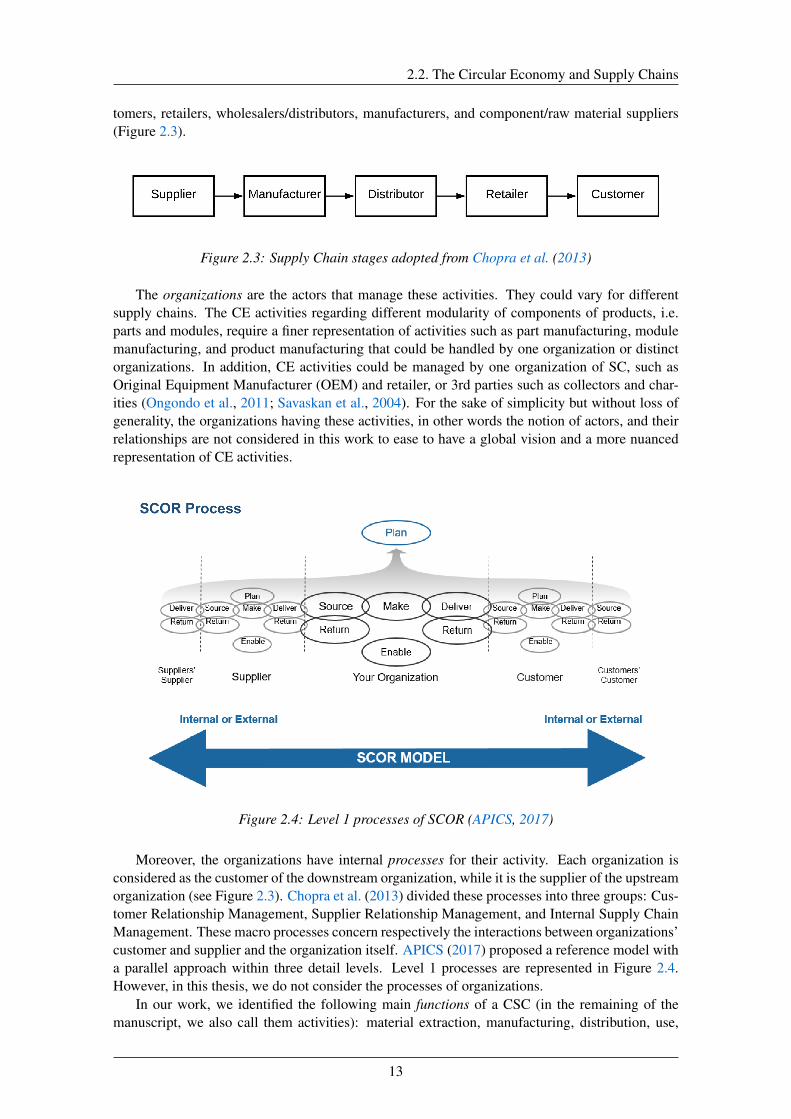
2.2. The Circular Economy and Supply Chains
tomers, retailers, wholesalers/distributors, manufacturers, and component/raw material suppliers(Figure 2.3).
Figure 2.3: Supply Chain stages adopted from Chopra et al. (2013)
The organizations are the actors that manage these activities. They could vary for differentsupply chains. The CE activities regarding different modularity of components of products, i.e.parts and modules, require a finer representation of activities such as part manufacturing, modulemanufacturing, and product manufacturing that could be handled by one organization or distinctorganizations. In addition, CE activities could be managed by one organization of SC, such asOriginal Equipment Manufacturer (OEM) and retailer, or 3rd parties such as collectors and char-ities (Ongondo et al., 2011; Savaskan et al., 2004). For the sake of simplicity but without loss ofgenerality, the organizations having these activities, in other words the notion of actors, and theirrelationships are not considered in this work to ease to have a global vision and a more nuancedrepresentation of CE activities.
Figure 2.4: Level 1 processes of SCOR (APICS, 2017)
Moreover, the organizations have internal processes for their activity. Each organization isconsidered as the customer of the downstream organization, while it is the supplier of the upstreamorganization (see Figure 2.3). Chopra et al. (2013) divided these processes into three groups: Cus-tomer Relationship Management, Supplier Relationship Management, and Internal Supply ChainManagement. These macro processes concern respectively the interactions between organizations’customer and supplier and the organization itself. APICS (2017) proposed a reference model witha parallel approach within three detail levels. Level 1 processes are represented in Figure 2.4.However, in this thesis, we do not consider the processes of organizations.
In our work, we identified the following main functions of a CSC (in the remaining of themanuscript, we also call them activities): material extraction, manufacturing, distribution, use,
13

Chapter 2. The Circular Economy, Supply Chains and Our Positioning
collection, and CE activities such as reuse, remanufacturing, and recycling, etc. that allows keep-ing products in use.
Although the other themes exist and they are stated by Stock et al. (2010), such as networks ofrelationships, efficiencies and, information flows could support the transition towards a CE, thesethemes are not taken into account in our work neither.
To sum up, in this thesis, we focus on the main components of CSCs - material flows andactivities - that will be explored more in details in the next sections. Moreover, considering theCE, we rely on the power of inner circle, the power of circling longer, and the power of cascadeduse principles of EMF (EMF, 2014).
2.3 Supply Chains in the CE Context
The link between the recent Circular Economy approach and supply chains is not well de-fined in the literature (Homrich et al., 2018). Therefore, in order to bridge between supply chainsand the Circular Economy, several concepts related to CSCs and their links to the CE have beenstudied in the literature (Batista et al., 2018; Liu et al., 2018b; Masi et al., 2017) such as reverselogistics (De Brito & Dekker, 2004), green supply chains (Srivastava, 2007), sustainable sup-ply chains (Seuring & Müller, 2008), closed-loop supply chains (Guide Jr & Van Wassenhove,2006), and eco-industrial parks (Côté & Cohen-Rosenthal, 1998). In this section, we first give anoverview of these interrelated concepts. Then, we present CSCs in the recent literature. Finally,the aforementioned components of CSCs - material flows and activities - are investigated.
2.3.1 Interrelated concepts in the literature
In this section, we investigate previous interrelated CSC concepts such as Reverse Logistics,Closed-Loop Supply Chains, Green/Sustainable Supply Chains, and Industrial Symbiosis. Someconcepts consider the structure of supply chains, while others have a broader approach regardingother strategies, such as procurement, product design, etc.
Reverse Logistics
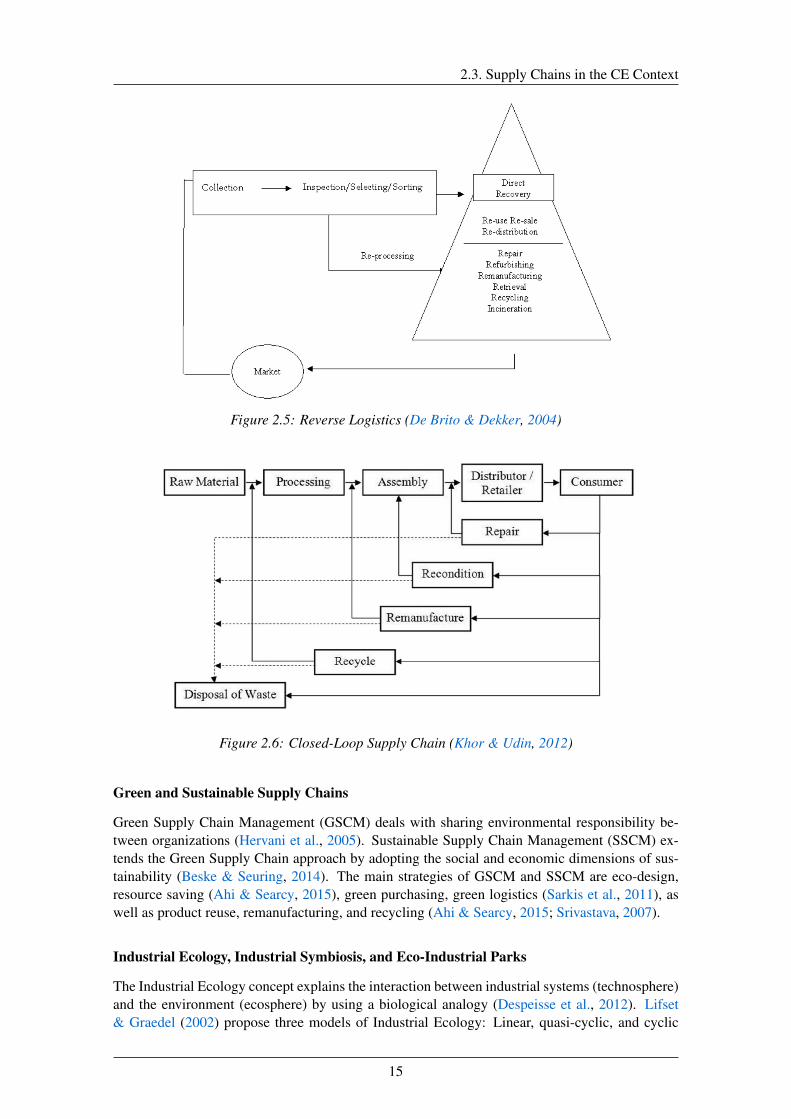
Reverse Logistics is described as “the process of planning, implementing and controlling the ef-ficient, effective inbound flow and storage of secondary goods and related information, oppositeto the traditional supply chain directions for the purpose of recovering value and proper disposal”(De Brito & Dekker, 2004). "Recovering value" corresponds to CE activities (reuse, remanufac-turing, repurposing, etc.). Reverse logistics proposes a specific structure that addresses mainlyreverse flows of the supply chain. Figure 2.5 represents Reverse Logistics concept, material flowsstarting with collection, followed by inspection/selecting/sorting activities and CE activities.
Closed-Loop Supply Chains
The notion of Closed-Loop Supply Chain (CLSC) is described as the integration of forward andreverse flows (Govindan et al., 2015). Closed-Loop Supply Chains have two objectives: first, tosatisfy customers’ demands (as like a classic supply chain); second, to collect the used productsand revaluate them in the best way (Govindan & Soleimani, 2017). An example of CLSC structureis given in Figure 2.6. In addition to the reverse logistics activities, CLSCs consider linear supplychain activities such as material extraction, production, distribution, etc.
14
2.3. Supply Chains in the CE Context
Figure 2.5: Reverse Logistics (De Brito & Dekker, 2004)
Figure 2.6: Closed-Loop Supply Chain (Khor & Udin, 2012)
Green and Sustainable Supply Chains
Green Supply Chain Management (GSCM) deals with sharing environmental responsibility be-tween organizations (Hervani et al., 2005). Sustainable Supply Chain Management (SSCM) ex-tends the Green Supply Chain approach by adopting the social and economic dimensions of sus-tainability (Beske & Seuring, 2014). The main strategies of GSCM and SSCM are eco-design,resource saving (Ahi & Searcy, 2015), green purchasing, green logistics (Sarkis et al., 2011), aswell as product reuse, remanufacturing, and recycling (Ahi & Searcy, 2015; Srivastava, 2007).
Industrial Ecology, Industrial Symbiosis, and Eco-Industrial Parks
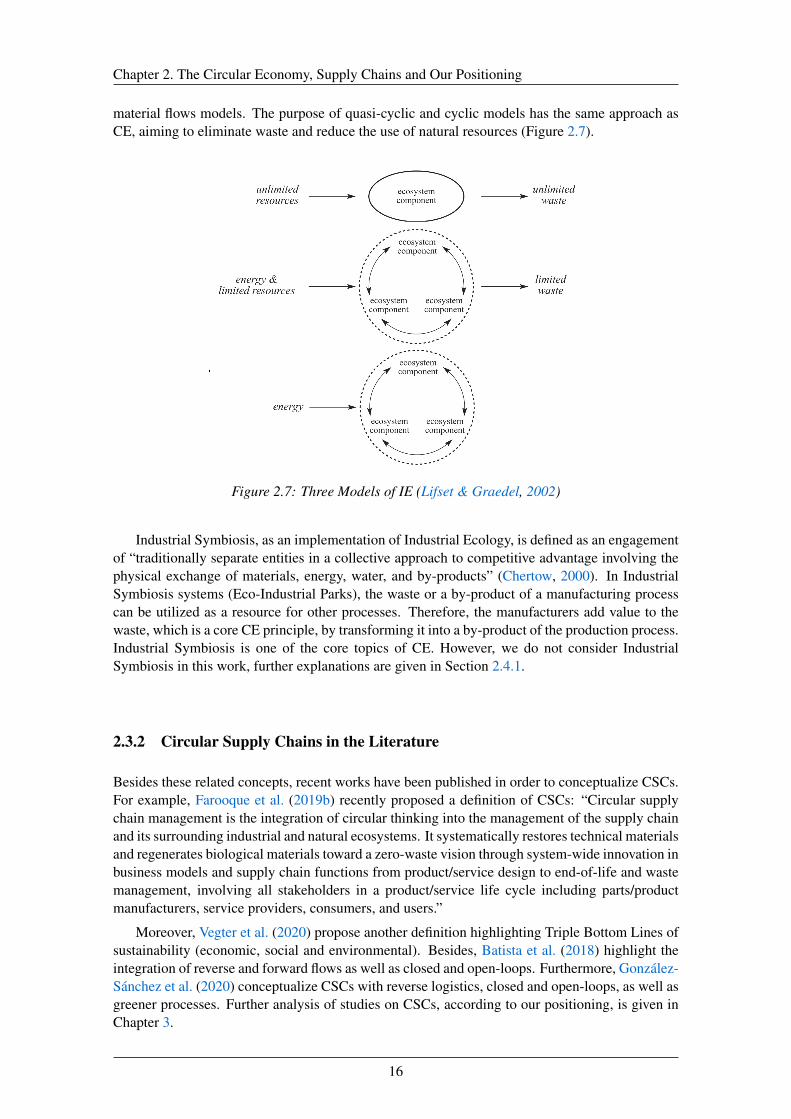
The Industrial Ecology concept explains the interaction between industrial systems (technosphere)and the environment (ecosphere) by using a biological analogy (Despeisse et al., 2012). Lifset& Graedel (2002) propose three models of Industrial Ecology: Linear, quasi-cyclic, and cyclic
15
Chapter 2. The Circular Economy, Supply Chains and Our Positioning
material flows models. The purpose of quasi-cyclic and cyclic models has the same approach asCE, aiming to eliminate waste and reduce the use of natural resources (Figure 2.7).
Figure 2.7: Three Models of IE (Lifset & Graedel, 2002)
Industrial Symbiosis, as an implementation of Industrial Ecology, is defined as an engagementof “traditionally separate entities in a collective approach to competitive advantage involving thephysical exchange of materials, energy, water, and by-products” (Chertow, 2000). In IndustrialSymbiosis systems (Eco-Industrial Parks), the waste or a by-product of a manufacturing processcan be utilized as a resource for other processes. Therefore, the manufacturers add value to thewaste, which is a core CE principle, by transforming it into a by-product of the production process.Industrial Symbiosis is one of the core topics of CE. However, we do not consider IndustrialSymbiosis in this work, further explanations are given in Section 2.4.1.
2.3.2 Circular Supply Chains in the Literature
Besides these related concepts, recent works have been published in order to conceptualize CSCs.For example, Farooque et al. (2019b) recently proposed a definition of CSCs: “Circular supplychain management is the integration of circular thinking into the management of the supply chainand its surrounding industrial and natural ecosystems. It systematically restores technical materialsand regenerates biological materials toward a zero-waste vision through system-wide innovation inbusiness models and supply chain functions from product/service design to end-of-life and wastemanagement, involving all stakeholders in a product/service life cycle including parts/productmanufacturers, service providers, consumers, and users.”
Moreover, Vegter et al. (2020) propose another definition highlighting Triple Bottom Lines ofsustainability (economic, social and environmental). Besides, Batista et al. (2018) highlight theintegration of reverse and forward flows as well as closed and open-loops. Furthermore, González-Sánchez et al. (2020) conceptualize CSCs with reverse logistics, closed and open-loops, as well asgreener processes. Further analysis of studies on CSCs, according to our positioning, is given inChapter 3.
16
2.4. Circular Supply Chain Components
2.4 Circular Supply Chain Components
In this section, we explore material flows and activities as CSC components introduced inSection 2.2. First, different types of circular material flows from literature are explained. Second,CE activities and hierarchical frameworks of these activities are presented.
2.4.1 Circular Material Flows
CSC includes different types of material flows. Regarding the origins and the destinations of flows,circular flows have two types: closed and open-loops. CSC is described as a combination of closedand open-loops (Batista et al., 2018; De Angelis et al., 2018; Farooque et al., 2019b).
Closed-Loops
The closed-loops consist in collecting used products and integrating them into the original supplychain through circular activities such as direct reuse, reuse with remanufacturing, recycling, etc.
Open-Loops
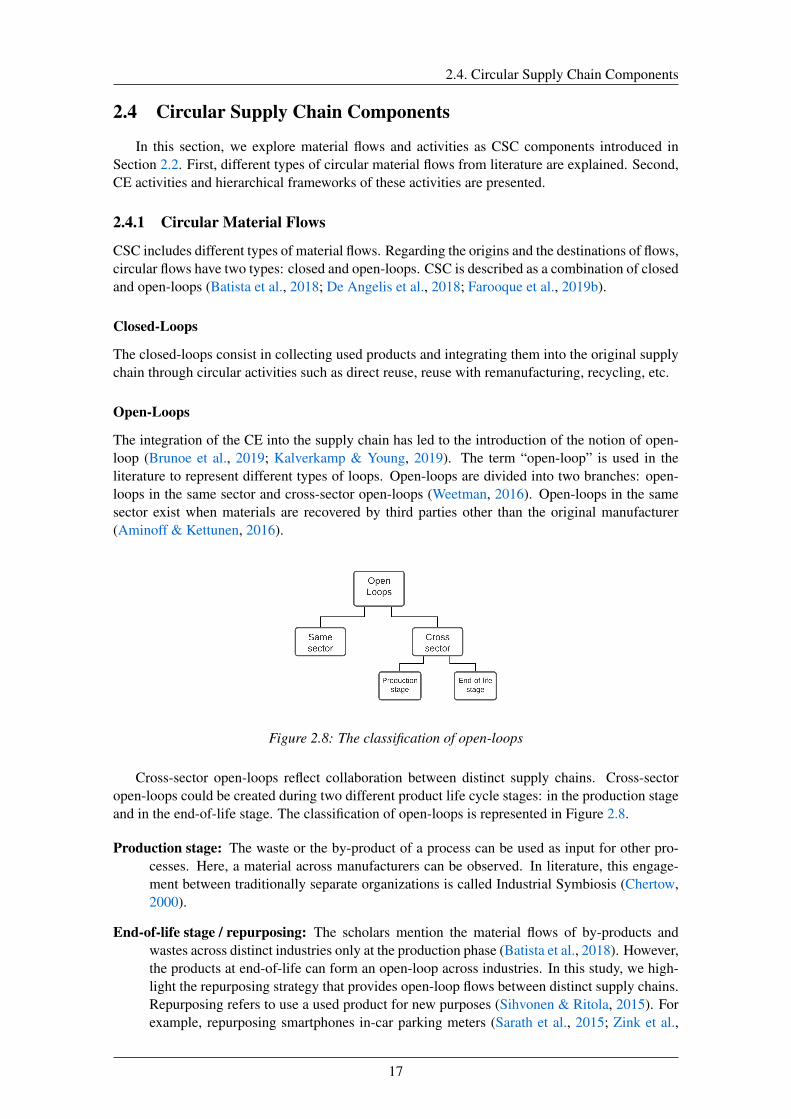
The integration of the CE into the supply chain has led to the introduction of the notion of open-loop (Brunoe et al., 2019; Kalverkamp & Young, 2019). The term “open-loop” is used in theliterature to represent different types of loops. Open-loops are divided into two branches: open-loops in the same sector and cross-sector open-loops (Weetman, 2016). Open-loops in the samesector exist when materials are recovered by third parties other than the original manufacturer(Aminoff & Kettunen, 2016).
Figure 2.8: The classification of open-loops
Cross-sector open-loops reflect collaboration between distinct supply chains. Cross-sectoropen-loops could be created during two different product life cycle stages: in the production stageand in the end-of-life stage. The classification of open-loops is represented in Figure 2.8.
Production stage: The waste or the by-product of a process can be used as input for other pro-cesses. Here, a material across manufacturers can be observed. In literature, this engage-ment between traditionally separate organizations is called Industrial Symbiosis (Chertow,2000).
End-of-life stage / repurposing: The scholars mention the material flows of by-products andwastes across distinct industries only at the production phase (Batista et al., 2018). However,the products at end-of-life can form an open-loop across industries. In this study, we high-light the repurposing strategy that provides open-loop flows between distinct supply chains.Repurposing refers to use a used product for new purposes (Sihvonen & Ritola, 2015). Forexample, repurposing smartphones in-car parking meters (Sarath et al., 2015; Zink et al.,
17
Chapter 2. The Circular Economy, Supply Chains and Our Positioning
2014) or repurposing of electric vehicle batteries in stationary applications (Brissaud &Zwolinski, 2017; Richa et al., 2017; Schulz et al., 2020). Repurposing forms material flowsfrom customers to the distinct supply chains. For example, Nissan and Eaton have a partner-ship in order to repurpose used electric vehicles batteries of Nissan in a residential energystorage system.
Technical and Biological Cycles
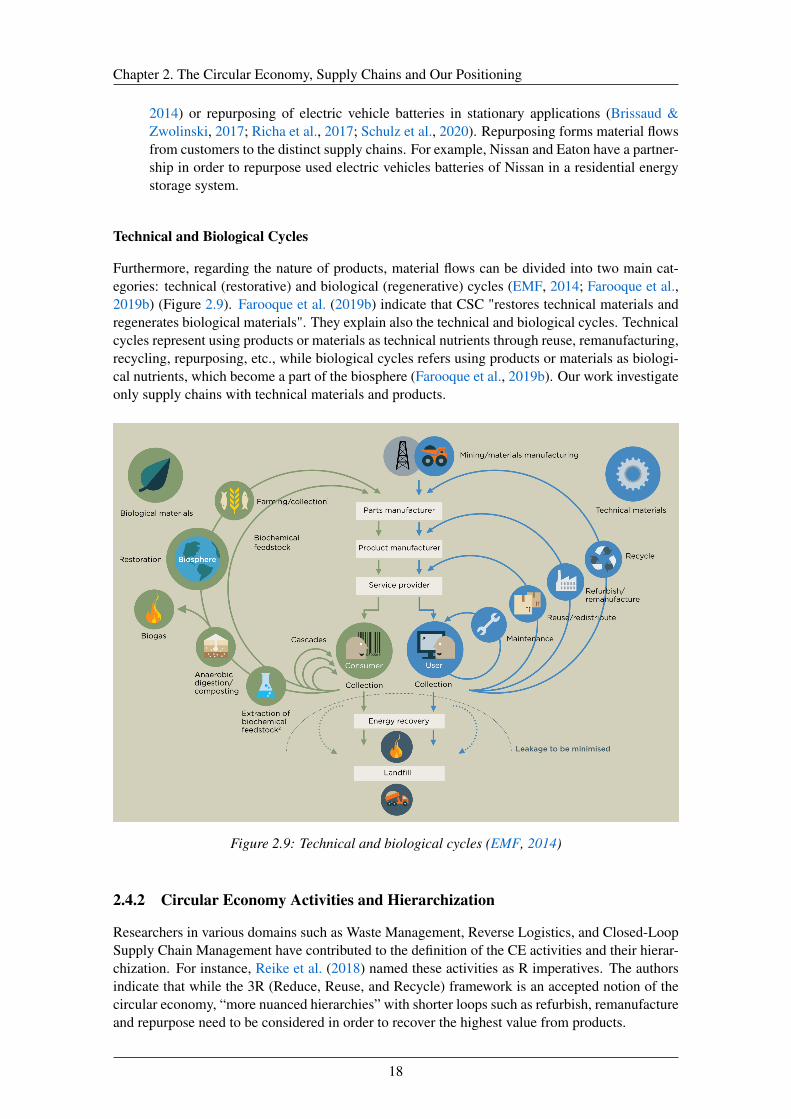
Furthermore, regarding the nature of products, material flows can be divided into two main cat-egories: technical (restorative) and biological (regenerative) cycles (EMF, 2014; Farooque et al.,2019b) (Figure 2.9). Farooque et al. (2019b) indicate that CSC "restores technical materials andregenerates biological materials". They explain also the technical and biological cycles. Technicalcycles represent using products or materials as technical nutrients through reuse, remanufacturing,recycling, repurposing, etc., while biological cycles refers using products or materials as biologi-cal nutrients, which become a part of the biosphere (Farooque et al., 2019b). Our work investigateonly supply chains with technical materials and products.
Figure 2.9: Technical and biological cycles (EMF, 2014)
2.4.2 Circular Economy Activities and Hierarchization
Researchers in various domains such as Waste Management, Reverse Logistics, and Closed-LoopSupply Chain Management have contributed to the definition of the CE activities and their hierar-chization. For instance, Reike et al. (2018) named these activities as R imperatives. The authorsindicate that while the 3R (Reduce, Reuse, and Recycle) framework is an accepted notion of thecircular economy, “more nuanced hierarchies” with shorter loops such as refurbish, remanufactureand repurpose need to be considered in order to recover the highest value from products.
18
2.4. Circular Supply Chain Components
Circular Economy Activities
The CE activities found in the literature are explained hereafter.
Refuse is described as “Make product redundant by abandoning its function or by offering thesame function with a radically different product” (Potting et al., 2017). This applies both tousers and manufacturers. From a consumer perspective, refuse is the tendency of purchasingand consuming less. From the manufacturer point of view, it concerns refusing to use amaterial or a process (Reike et al., 2018).
Reduce is applied in three ways: reduce the waste production, dematerialization (“consume fewernatural resources or materials”), and life cycle extensions (through product sharing or pool-ing) (Reike et al., 2018).
Rethink deals with the “intensive use of the product” such as product sharing (Potting et al.,2017), like reduce strategy.
We note that these aforementioned activities are out of our scope of study since they are appliedto manufacturers in their product design processes and to customers in the use activity.
The following CE activities are of more interest for us and we consider them as CSC compo-nents.
Reuse is described as using the product, which is still in good condition for its original function(Potting et al., 2017). This activity requires minor modifications in the used product.
Repurposing relates to using a used product for new purposes (Sihvonen & Ritola, 2015). For ex-ample, repurposing electric vehicle batteries in stationary applications (Brissaud & Zwolin-ski, 2017; Richa et al., 2017). Besides, this term is also described as using discarded com-ponents in a new product with a different purpose (Potting et al., 2017; Reike et al., 2018).Sihvonen & Ritola (2015) use the term “Resynthetise” to describe the latter. This activity isnot sufficiently explored in the literature nor adapted in industrial applications. We conducta research on ScienceDirect and WoS databases within "circular economy AND repurpos-ing" keywords between 2010 and 2020, and obtained only thirty-seven results. Most ofthe selected studies are based on the repurposing of Electric Vehicle Batteries. Few studieshave been found on the applications of repurposing activity in the electronics, plastics, tex-tile, bio-waste, and glass sectors. Repurposing activities have been applied on a small scale,such as repurposing wooden pallets and tires as furniture. Adopting this approach on anindustrial scale could be a new opportunity to obtain the highest value from a used product.
Upgrading improves the products’ performance and its functionality is changed. However, anupgraded product belongs to the initial product’s family, its purpose does not change likerepurposing (Brissaud & Zwolinski, 2017).
Repair brings the used product to a working state (Thierry et al., 1995), to be used by the cur-rent user or new user in a secondary market (Sihvonen & Ritola, 2015). It requires fixingdefective parts (King et al., 2006).
Refurbishing (or reconditioning) brings the used product to a particular quality. The expectedquality is lower than a new product (Thierry et al., 1995). To provide this specific quality,critical modules are checked and replaced if needed (King et al., 2006; Sihvonen & Ritola,2015).
Remanufacturing has been used to describe two scenarios in the literature. The first scenario isbringing used products up to new product quality that can require the full disassembly ofthe product (Ijomah et al., 1999; King et al., 2006; Reike et al., 2018; Thierry et al., 1995).
19
Chapter 2. The Circular Economy, Supply Chains and Our Positioning
The second scenario is related to integrating valuable parts of the used product back to themanufacturing activity with the same function (Potting et al., 2017). Thierry et al. (1995)use the term “cannibalization” for the second definition. This activity requires more workthan refurbishing (King et al., 2006).
Recycling is transforming used products into materials and reusing them in manufacturing ac-tivities. In recycling, the product loses its identity and functionality (Thierry et al., 1995).In recycling, products could be used as materials of lower quality (downcycling) or higherquality (upcycling) (Hofmann, 2019).
Recovery is defined as the “incineration of materials with energy recovery” (Potting et al., 2017).In this activity, the product transforms into energy and loses its identity and functionality.
Re-mine involves “landfill mining” or “urban mining”, which means scrapping valuable materialsand from landfills (Reike et al., 2018).
Hierarchization of Circular Economy Activities
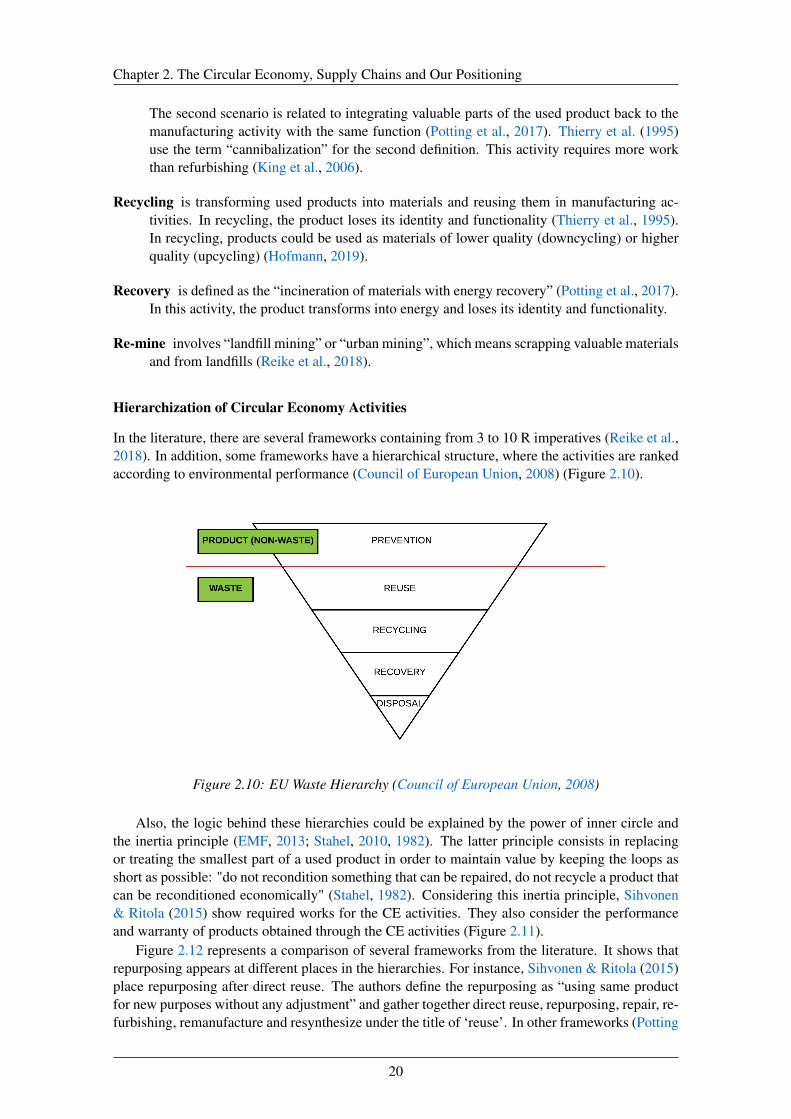
In the literature, there are several frameworks containing from 3 to 10 R imperatives (Reike et al.,2018). In addition, some frameworks have a hierarchical structure, where the activities are rankedaccording to environmental performance (Council of European Union, 2008) (Figure 2.10).
Figure 2.10: EU Waste Hierarchy (Council of European Union, 2008)
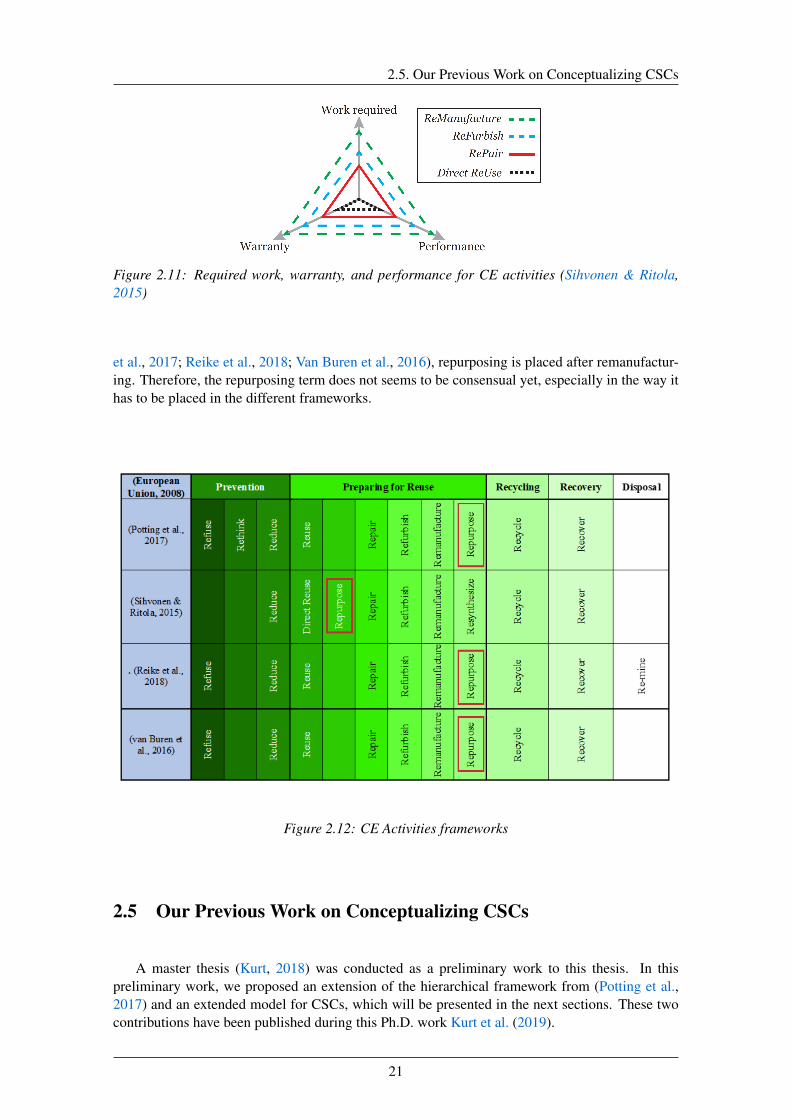
Also, the logic behind these hierarchies could be explained by the power of inner circle andthe inertia principle (EMF, 2013; Stahel, 2010, 1982). The latter principle consists in replacingor treating the smallest part of a used product in order to maintain value by keeping the loops asshort as possible: "do not recondition something that can be repaired, do not recycle a product thatcan be reconditioned economically" (Stahel, 1982). Considering this inertia principle, Sihvonen& Ritola (2015) show required works for the CE activities. They also consider the performanceand warranty of products obtained through the CE activities (Figure 2.11).
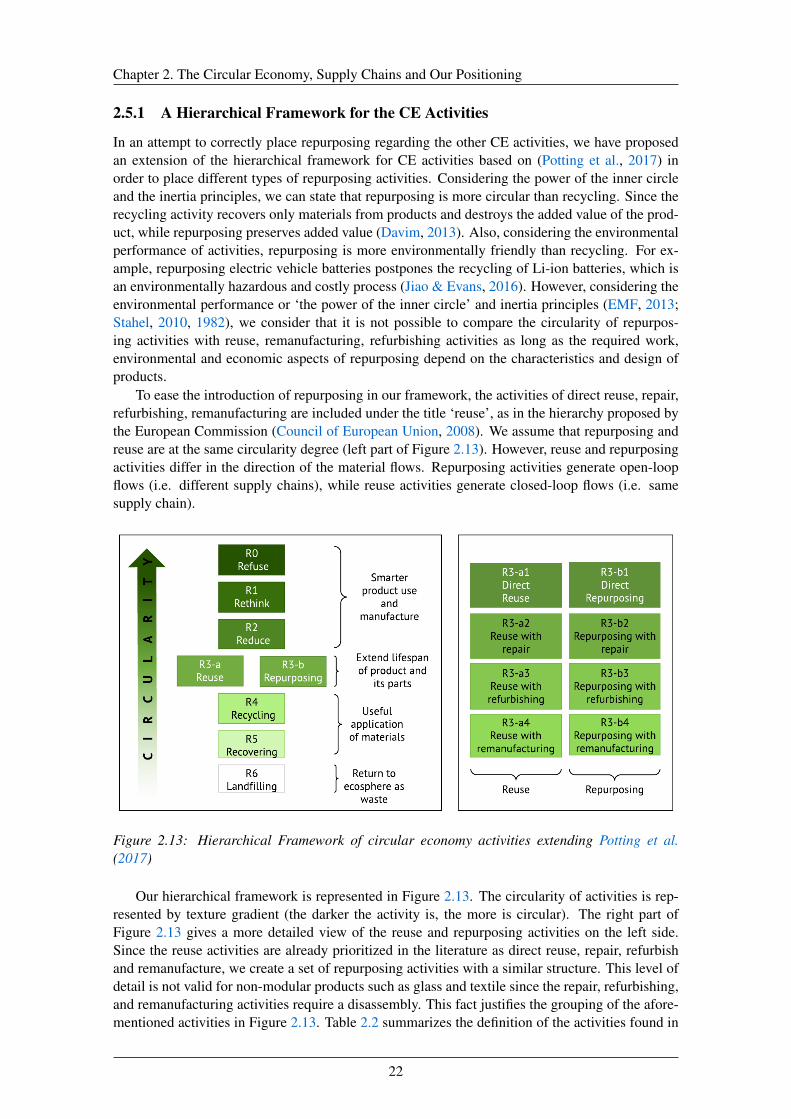
Figure 2.12 represents a comparison of several frameworks from the literature. It shows thatrepurposing appears at different places in the hierarchies. For instance, Sihvonen & Ritola (2015)place repurposing after direct reuse. The authors define the repurposing as “using same productfor new purposes without any adjustment” and gather together direct reuse, repurposing, repair, re-furbishing, remanufacture and resynthesize under the title of ‘reuse’. In other frameworks (Potting
20
2.5. Our Previous Work on Conceptualizing CSCs
Figure 2.11: Required work, warranty, and performance for CE activities (Sihvonen & Ritola,2015)
et al., 2017; Reike et al., 2018; Van Buren et al., 2016), repurposing is placed after remanufactur-ing. Therefore, the repurposing term does not seems to be consensual yet, especially in the way ithas to be placed in the different frameworks.
Figure 2.12: CE Activities frameworks
2.5 Our Previous Work on Conceptualizing CSCs
A master thesis (Kurt, 2018) was conducted as a preliminary work to this thesis. In thispreliminary work, we proposed an extension of the hierarchical framework from (Potting et al.,2017) and an extended model for CSCs, which will be presented in the next sections. These twocontributions have been published during this Ph.D. work Kurt et al. (2019).
21
Chapter 2. The Circular Economy, Supply Chains and Our Positioning
2.5.1 A Hierarchical Framework for the CE Activities
In an attempt to correctly place repurposing regarding the other CE activities, we have proposedan extension of the hierarchical framework for CE activities based on (Potting et al., 2017) inorder to place different types of repurposing activities. Considering the power of the inner circleand the inertia principles, we can state that repurposing is more circular than recycling. Since therecycling activity recovers only materials from products and destroys the added value of the prod-uct, while repurposing preserves added value (Davim, 2013). Also, considering the environmentalperformance of activities, repurposing is more environmentally friendly than recycling. For ex-ample, repurposing electric vehicle batteries postpones the recycling of Li-ion batteries, which isan environmentally hazardous and costly process (Jiao & Evans, 2016). However, considering theenvironmental performance or ‘the power of the inner circle’ and inertia principles (EMF, 2013;Stahel, 2010, 1982), we consider that it is not possible to compare the circularity of repurpos-ing activities with reuse, remanufacturing, refurbishing activities as long as the required work,environmental and economic aspects of repurposing depend on the characteristics and design ofproducts.
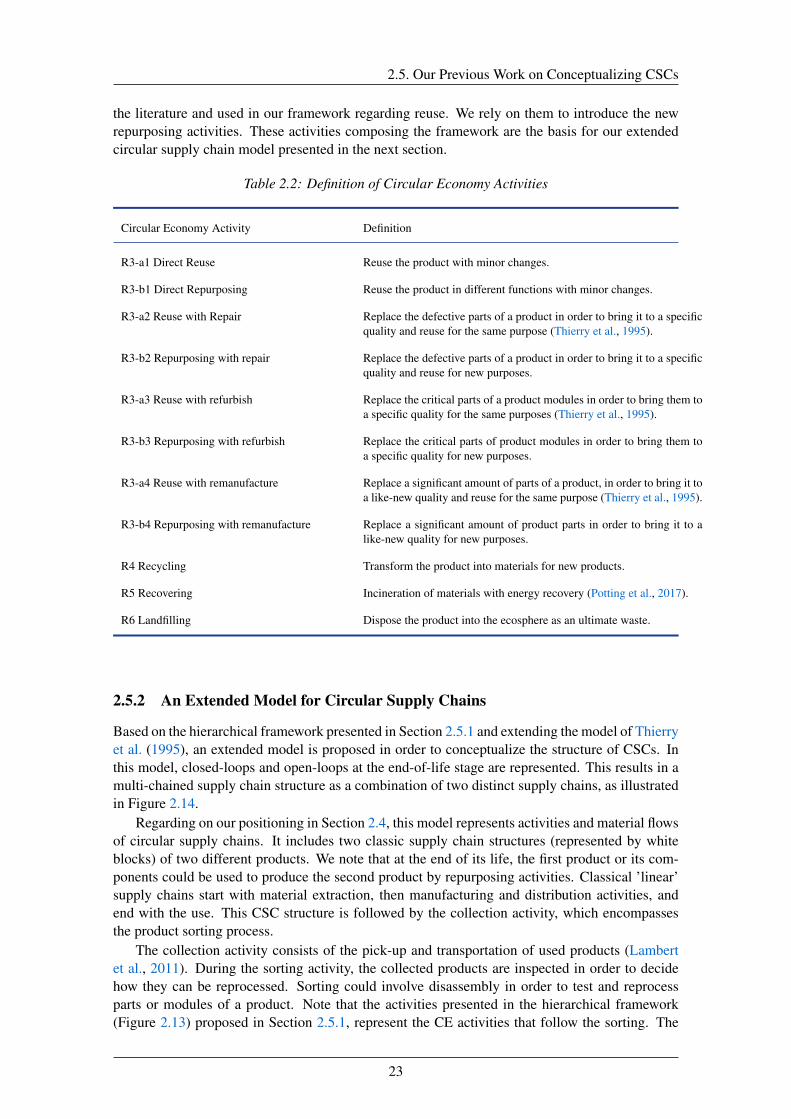
To ease the introduction of repurposing in our framework, the activities of direct reuse, repair,refurbishing, remanufacturing are included under the title ‘reuse’, as in the hierarchy proposed bythe European Commission (Council of European Union, 2008). We assume that repurposing andreuse are at the same circularity degree (left part of Figure 2.13). However, reuse and repurposingactivities differ in the direction of the material flows. Repurposing activities generate open-loopflows (i.e. different supply chains), while reuse activities generate closed-loop flows (i.e. samesupply chain).
Figure 2.13: Hierarchical Framework of circular economy activities extending Potting et al.(2017)
Our hierarchical framework is represented in Figure 2.13. The circularity of activities is rep-resented by texture gradient (the darker the activity is, the more is circular). The right part ofFigure 2.13 gives a more detailed view of the reuse and repurposing activities on the left side.Since the reuse activities are already prioritized in the literature as direct reuse, repair, refurbishand remanufacture, we create a set of repurposing activities with a similar structure. This level ofdetail is not valid for non-modular products such as glass and textile since the repair, refurbishing,and remanufacturing activities require a disassembly. This fact justifies the grouping of the afore-mentioned activities in Figure 2.13. Table 2.2 summarizes the definition of the activities found in
22
2.5. Our Previous Work on Conceptualizing CSCs
the literature and used in our framework regarding reuse. We rely on them to introduce the newrepurposing activities. These activities composing the framework are the basis for our extendedcircular supply chain model presented in the next section.
Table 2.2: Definition of Circular Economy Activities
Circular Economy Activity Definition
R3-a1 Direct Reuse Reuse the product with minor changes.
R3-b1 Direct Repurposing Reuse the product in different functions with minor changes.
R3-a2 Reuse with Repair Replace the defective parts of a product in order to bring it to a specificquality and reuse for the same purpose (Thierry et al., 1995).
R3-b2 Repurposing with repair Replace the defective parts of a product in order to bring it to a specificquality and reuse for new purposes.
R3-a3 Reuse with refurbish Replace the critical parts of a product modules in order to bring them toa specific quality for the same purposes (Thierry et al., 1995).
R3-b3 Repurposing with refurbish Replace the critical parts of product modules in order to bring them toa specific quality for new purposes.
R3-a4 Reuse with remanufacture Replace a significant amount of parts of a product, in order to bring it toa like-new quality and reuse for the same purpose (Thierry et al., 1995).
R3-b4 Repurposing with remanufacture Replace a significant amount of product parts in order to bring it to alike-new quality for new purposes.
R4 Recycling Transform the product into materials for new products.
R5 Recovering Incineration of materials with energy recovery (Potting et al., 2017).
R6 Landfilling Dispose the product into the ecosphere as an ultimate waste.
2.5.2 An Extended Model for Circular Supply Chains
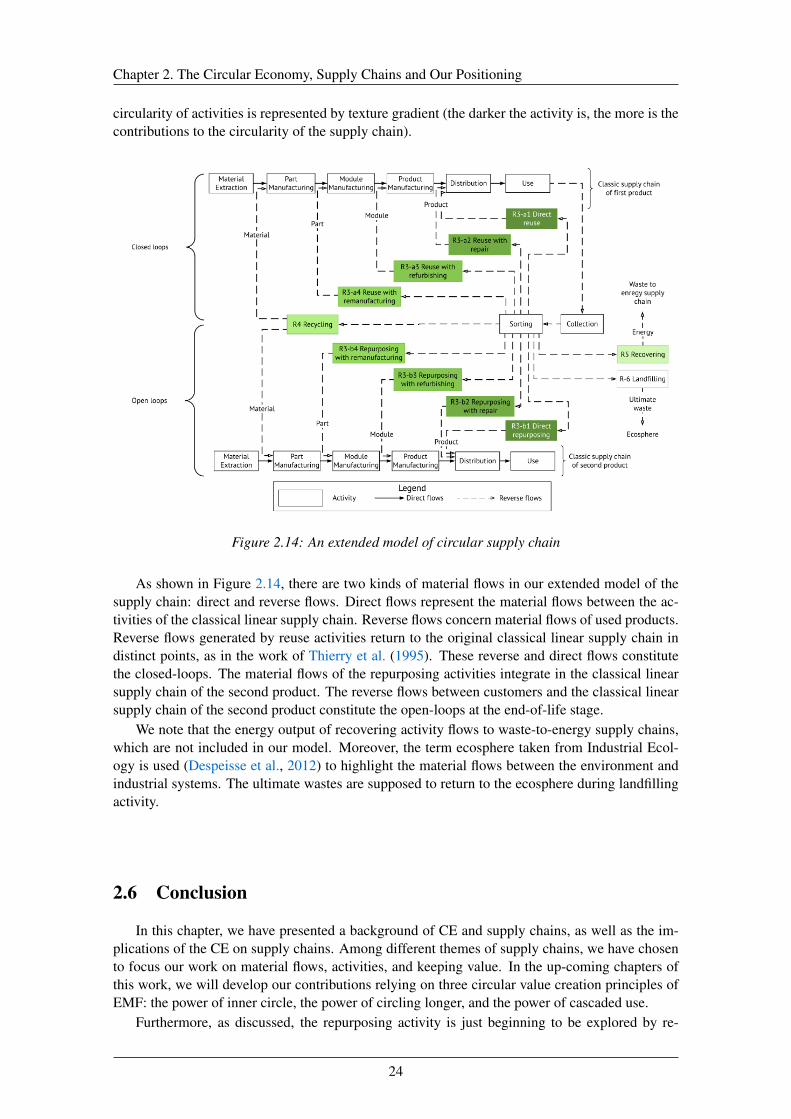
Based on the hierarchical framework presented in Section 2.5.1 and extending the model of Thierryet al. (1995), an extended model is proposed in order to conceptualize the structure of CSCs. Inthis model, closed-loops and open-loops at the end-of-life stage are represented. This results in amulti-chained supply chain structure as a combination of two distinct supply chains, as illustratedin Figure 2.14.
Regarding on our positioning in Section 2.4, this model represents activities and material flowsof circular supply chains. It includes two classic supply chain structures (represented by whiteblocks) of two different products. We note that at the end of its life, the first product or its com-ponents could be used to produce the second product by repurposing activities. Classical ’linear’supply chains start with material extraction, then manufacturing and distribution activities, andend with the use. This CSC structure is followed by the collection activity, which encompassesthe product sorting process.
The collection activity consists of the pick-up and transportation of used products (Lambertet al., 2011). During the sorting activity, the collected products are inspected in order to decidehow they can be reprocessed. Sorting could involve disassembly in order to test and reprocessparts or modules of a product. Note that the activities presented in the hierarchical framework(Figure 2.13) proposed in Section 2.5.1, represent the CE activities that follow the sorting. The
23
Chapter 2. The Circular Economy, Supply Chains and Our Positioning
circularity of activities is represented by texture gradient (the darker the activity is, the more is thecontributions to the circularity of the supply chain).
Figure 2.14: An extended model of circular supply chain
As shown in Figure 2.14, there are two kinds of material flows in our extended model of thesupply chain: direct and reverse flows. Direct flows represent the material flows between the ac-tivities of the classical linear supply chain. Reverse flows concern material flows of used products.Reverse flows generated by reuse activities return to the original classical linear supply chain indistinct points, as in the work of Thierry et al. (1995). These reverse and direct flows constitutethe closed-loops. The material flows of the repurposing activities integrate in the classical linearsupply chain of the second product. The reverse flows between customers and the classical linearsupply chain of the second product constitute the open-loops at the end-of-life stage.
We note that the energy output of recovering activity flows to waste-to-energy supply chains,which are not included in our model. Moreover, the term ecosphere taken from Industrial Ecol-ogy is used (Despeisse et al., 2012) to highlight the material flows between the environment andindustrial systems. The ultimate wastes are supposed to return to the ecosphere during landfillingactivity.
2.6 Conclusion
In this chapter, we have presented a background of CE and supply chains, as well as the im-plications of the CE on supply chains. Among different themes of supply chains, we have chosento focus our work on material flows, activities, and keeping value. In the up-coming chapters ofthis work, we will develop our contributions relying on three circular value creation principles ofEMF: the power of inner circle, the power of circling longer, and the power of cascaded use.
Furthermore, as discussed, the repurposing activity is just beginning to be explored by re-
24
2.6. Conclusion
searchers and industrials. Today to the best of our knowledge, there are only a few applicationsof this activity. Repurposing activities have been applied on a small scale, such as repurposingwooden pallets and tires as furniture. Operating the repurposing activity on an industrial scalecould be a new opportunity to obtain the highest value from a used product. In addition, con-sidering environmental performance, repurposing is more environmentally friendly than recyclingor discarding. This is the reason why repurposing activity will have an important place in ourcontributions.
In this chapter, we have presented our positioning on the CE and supply chain concepts, ad-dressing research question RQ1: What are the implications of the CE on supply chains and howto integrate repurposing activity into CSCs?, through a literature review. The positioning and def-initions given in this chapter will constitute a basis for the following chapters that addresses otherresearch questions. In the following chapters, more specific literature background is given relatedto other research questions.
25

3Conceptualizing Circular Supply Chains through
a Generic Model
Contents3.1 Introduction . . . . . . . . . . . . . . . . . . . . . . . . . . . . . . . . . . . 283.2 Circular Supply Chain Characteristics and Previous Works . . . . . . . . . 293.3 Formalization of CSC Model in UML . . . . . . . . . . . . . . . . . . . . . 313.4 Use Cases Illustrating the Use of the Generic Model . . . . . . . . . . . . . 35
3.4.1 Textile Products . . . . . . . . . . . . . . . . . . . . . . . . . . . . . . 353.4.2 Li-Ion Batteries of Electric Vehicles . . . . . . . . . . . . . . . . . . . 36
3.5 Conclusion . . . . . . . . . . . . . . . . . . . . . . . . . . . . . . . . . . . . 38
27

Chapter 3. Conceptualizing Circular Supply Chains through a Generic Model
3.1 Introduction
As mentioned in state of the art (Chapter 2), supply chain management is transitioning fromthe management and appraisal of single CE activities to complex configurations where multipleCE activities are applied simultaneously (Blomsma & Brennan, 2017). Configuring multiple CEactivities within a supply chain makes it possible to choose the most relevant activities for a usedproduct according to its state and thereby prevent value loss. Moreover, the CE brings a scenariowhere products or materials are used over and over again (Genovese et al., 2017) through closedand open-loops (Farooque et al., 2019b). Therefore, the CE results in a complex structure thatneeds to be conceptualized at the strategic level in order to be analyzed and improved. Indeed, amodel should help to provide a better understanding and management of the different possibilitiesbased on an assessment of circularity.
Furthermore, as mentioned in Chapter 2, a lack of consensus about the needed CE activitieshas been observed. In particular, concerning the repurposing activity, which is relatively new inthe literature and scarcely considered. This notion implies open-loops between distinct supplychains, adding value to used products by diverting them from their initial purpose and using themin less demanding applications (Bauer et al., 2017).
Thus, regarding the research question RQ2, this chapter follows the methodology we haveadopted and given in Figure 3.1 which is a zoom in on Figure 1.1. In Section 3.2, we providethe characteristics of a CSC (C0-At least one CE activity, C1-Consecutive material use loops,C2-Several simultaneous CE activity options, C3-Open-loops and integration of distinct supplychains) adapting circular value creation principles of EMF (2013) to supply chain components.An analysis of the related works in the literature according to the four CSC characteristics iscarried out. The generic model is presented in Section 3.3. This model generalizes and formalizesusing the Unified Modeling Language (UML) the Extended Model (Kurt et al., 2019) given inChapter 2. We provide use cases illustrating our generic model in Section 3.4. Finally, Section 3.5gives concluding remarks.
Figure 3.1: Our methodology for the development of a generic model
28
3.2. Circular Supply Chain Characteristics and Previous Works
3.2 Circular Supply Chain Characteristics and Previous Works
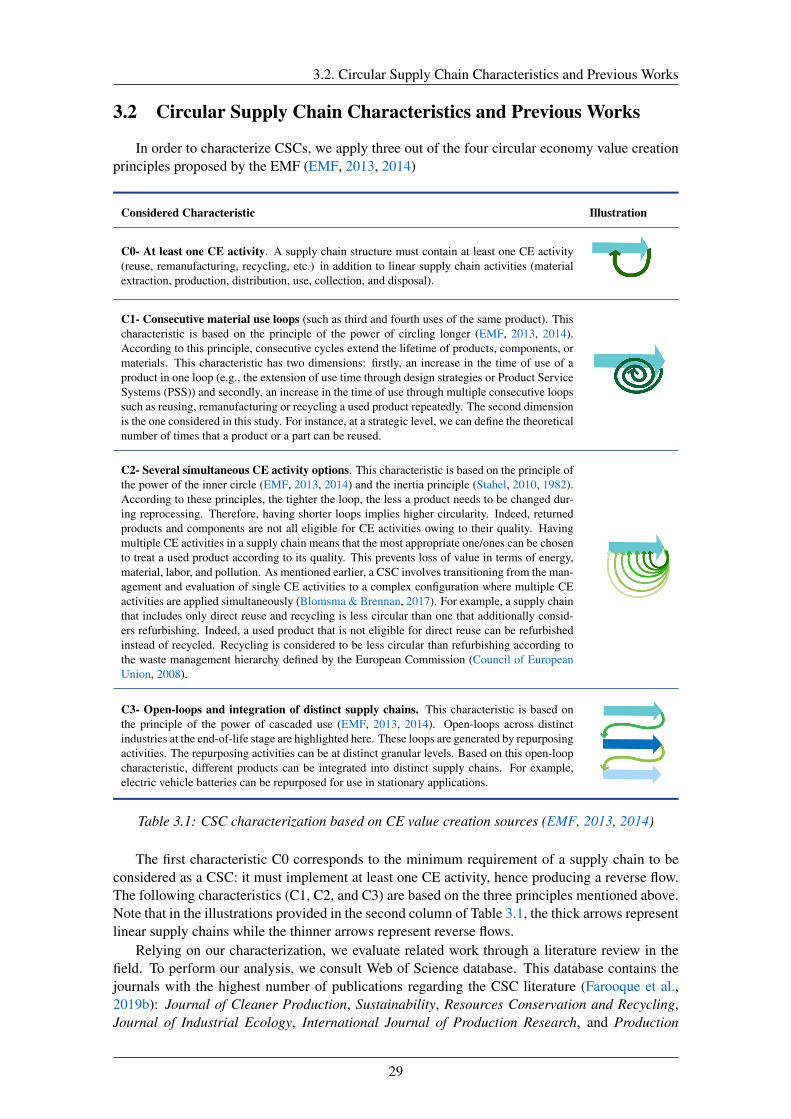
In order to characterize CSCs, we apply three out of the four circular economy value creationprinciples proposed by the EMF (EMF, 2013, 2014)
Considered Characteristic Illustration
C0- At least one CE activity. A supply chain structure must contain at least one CE activity(reuse, remanufacturing, recycling, etc.) in addition to linear supply chain activities (materialextraction, production, distribution, use, collection, and disposal).
C1- Consecutive material use loops (such as third and fourth uses of the same product). Thischaracteristic is based on the principle of the power of circling longer (EMF, 2013, 2014).According to this principle, consecutive cycles extend the lifetime of products, components, ormaterials. This characteristic has two dimensions: firstly, an increase in the time of use of aproduct in one loop (e.g., the extension of use time through design strategies or Product ServiceSystems (PSS)) and secondly, an increase in the time of use through multiple consecutive loopssuch as reusing, remanufacturing or recycling a used product repeatedly. The second dimensionis the one considered in this study. For instance, at a strategic level, we can define the theoreticalnumber of times that a product or a part can be reused.
C2- Several simultaneous CE activity options. This characteristic is based on the principle ofthe power of the inner circle (EMF, 2013, 2014) and the inertia principle (Stahel, 2010, 1982).According to these principles, the tighter the loop, the less a product needs to be changed dur-ing reprocessing. Therefore, having shorter loops implies higher circularity. Indeed, returnedproducts and components are not all eligible for CE activities owing to their quality. Havingmultiple CE activities in a supply chain means that the most appropriate one/ones can be chosento treat a used product according to its quality. This prevents loss of value in terms of energy,material, labor, and pollution. As mentioned earlier, a CSC involves transitioning from the man-agement and evaluation of single CE activities to a complex configuration where multiple CEactivities are applied simultaneously (Blomsma & Brennan, 2017). For example, a supply chainthat includes only direct reuse and recycling is less circular than one that additionally consid-ers refurbishing. Indeed, a used product that is not eligible for direct reuse can be refurbishedinstead of recycled. Recycling is considered to be less circular than refurbishing according tothe waste management hierarchy defined by the European Commission (Council of EuropeanUnion, 2008).
C3- Open-loops and integration of distinct supply chains. This characteristic is based onthe principle of the power of cascaded use (EMF, 2013, 2014). Open-loops across distinctindustries at the end-of-life stage are highlighted here. These loops are generated by repurposingactivities. The repurposing activities can be at distinct granular levels. Based on this open-loopcharacteristic, different products can be integrated into distinct supply chains. For example,electric vehicle batteries can be repurposed for use in stationary applications.
Table 3.1: CSC characterization based on CE value creation sources (EMF, 2013, 2014)
The first characteristic C0 corresponds to the minimum requirement of a supply chain to beconsidered as a CSC: it must implement at least one CE activity, hence producing a reverse flow.The following characteristics (C1, C2, and C3) are based on the three principles mentioned above.Note that in the illustrations provided in the second column of Table 3.1, the thick arrows representlinear supply chains while the thinner arrows represent reverse flows.
Relying on our characterization, we evaluate related work through a literature review in thefield. To perform our analysis, we consult Web of Science database. This database contains thejournals with the highest number of publications regarding the CSC literature (Farooque et al.,2019b): Journal of Cleaner Production, Sustainability, Resources Conservation and Recycling,Journal of Industrial Ecology, International Journal of Production Research, and Production
29

Chapter 3. Conceptualizing Circular Supply Chains through a Generic Model
Planning and Control. Recent articles published between 2017 and 2021 were selected. Thegeographical scope was determined as worldwide. Using "circular supply chain" as a keyword,we obtain 573 papers published in aforementioned journals. We perform title screening and ab-stract and full-text reading as part of our review. We also identify some other important worksfound during full-text reading process. Our review aimed to explore generic CSC models andtheir limits compared with our own characterization. In order to explore the appropriate studies,we select 33 papers supporting at least two of the defined characteristics and/or a CSC model.
As already stipulated, the characteristics introduced in Section 3.2 were used to analyze theselected studies. The results of this analysis are summarized in Table 3.2. We do not show theC0 in the table, since it is the minimum requirement of a supply chain to be considered as a CSC,and all selected studies mentioned this characteristic. The first column represents characteristicC1: consecutive material-use loops. These loops reflect product multiple-use cycles and werementioned in 11 of the papers studied. Note that C2 (inclusion of several CE activity optionssimultaneously) is not found in any of the papers and is therefore not shown in Table 3.2. Thesecond column represents characteristic C3 (open-loops and integration of distinct supply chains).The notion of an open-loop with repurposing appeared in 17 papers. However, the granularity ofrepurposing activities described in Section 2.5.1 of Chapter 2 is not presented in any paper. Inaddition, none of these studies includes the integration of several distinct supply chains, whichis why this characteristic is considered as only Partially supported. The third column representsthe formalization level of the proposed models : some models only propose a description or thecharacteristics of CSCs in natural language (NL), whereas others also offer an informal model(IM). The informal models are examples of CSC representations without any rule or modelingstandard underpinning them. Note that any of the analyzed papers proposes a formal model (FM).In all, 28 papers contained such informal models. As shown in Table 3.2, 16 of these studies didnot consider characteristic C3 related to open-loops and the integration of distinct supply chains.Therefore, we focus on the 12 studies presenting an informal model and considering characteristicC3.
Table 3.2: Analysis of literature review based on our CSC characteristics (C2 not covered in anypaper)
Reference Consecutivematerial loops
(C1)
Open-loops and in-tegration of distinctsupply chains (C3)
Formalizationlevel
de Lima et al. (2021) x Partially NLAlamerew & Brissaud (2020) Partially NL+IMAlizadeh-Basban & Taleizadeh (2020) NL+IMDesing et al. (2020) Partially NL+IMGalvão et al. (2020) NL+IMGonzález-Sánchez et al. (2020) Partially NLJulianelli et al. (2020) NL+IMShekarian (2020) NL+IMTseng et al. (2020) x NL+IMTurken et al. (2020) NL+IMVegter et al. (2020) x Partially NLWerning & Spinler (2020) NL+IMBianchini et al. (2019) Partially NL+IMde Sousa Jabbour et al. (2019) Partially NL+IMFarooque et al. (2019a) Partially NL+IMFarooque et al. (2019b) x NL+IMHofmann (2019) x Partially NLHoward et al. (2019) x Partially NL+IMKalverkamp & Young (2019) NL+IMKurt et al. (2019) (Our work) Partially NL+IMLüdeke-Freund et al. (2019) Partially NL+IMTaghikhah et al. (2019) NL+IMBatista et al. (2018) Partially NL+IMDe Angelis et al. (2018) Partially NLFlygansvær et al. (2018) NL+IMKalmykova et al. (2018) Partially NL+IMKazancoglu et al. (2018) NL+IMMishra et al. (2018) x NL+IMReike et al. (2018) x Partially NL+IM
30
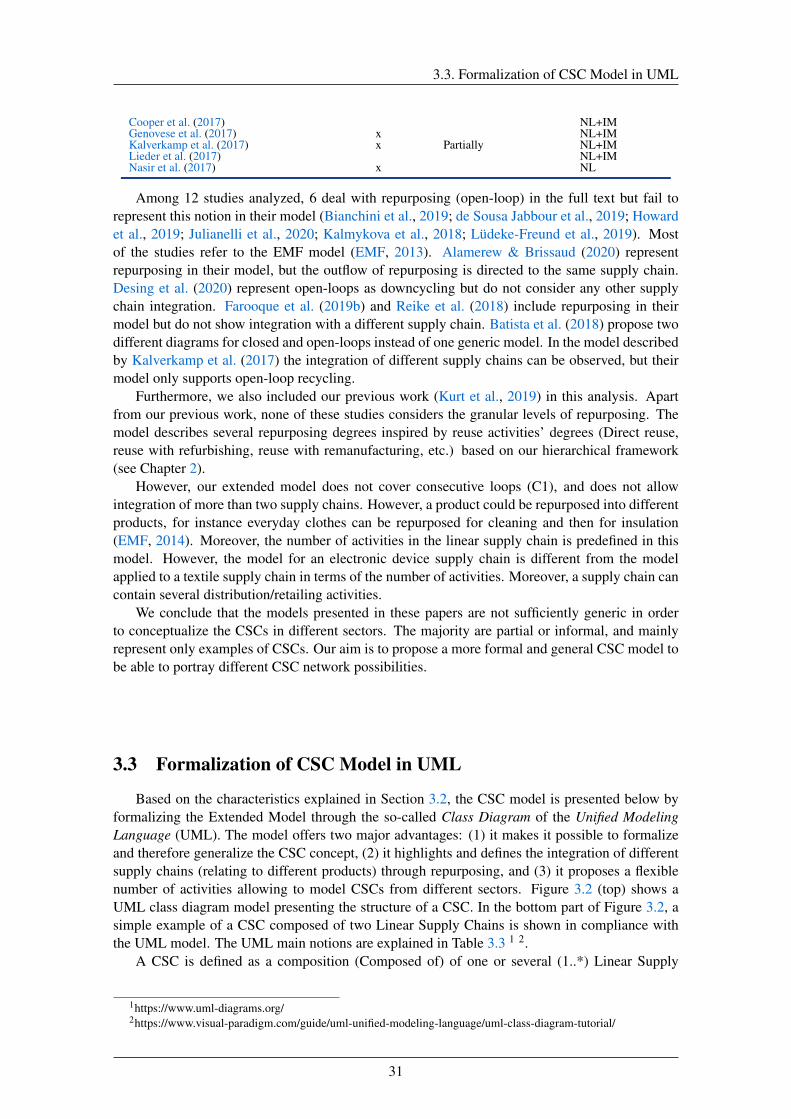
3.3. Formalization of CSC Model in UML
Cooper et al. (2017) NL+IMGenovese et al. (2017) x NL+IMKalverkamp et al. (2017) x Partially NL+IMLieder et al. (2017) NL+IMNasir et al. (2017) x NL
Among 12 studies analyzed, 6 deal with repurposing (open-loop) in the full text but fail torepresent this notion in their model (Bianchini et al., 2019; de Sousa Jabbour et al., 2019; Howardet al., 2019; Julianelli et al., 2020; Kalmykova et al., 2018; Lüdeke-Freund et al., 2019). Mostof the studies refer to the EMF model (EMF, 2013). Alamerew & Brissaud (2020) representrepurposing in their model, but the outflow of repurposing is directed to the same supply chain.Desing et al. (2020) represent open-loops as downcycling but do not consider any other supplychain integration. Farooque et al. (2019b) and Reike et al. (2018) include repurposing in theirmodel but do not show integration with a different supply chain. Batista et al. (2018) propose twodifferent diagrams for closed and open-loops instead of one generic model. In the model describedby Kalverkamp et al. (2017) the integration of different supply chains can be observed, but theirmodel only supports open-loop recycling.
Furthermore, we also included our previous work (Kurt et al., 2019) in this analysis. Apartfrom our previous work, none of these studies considers the granular levels of repurposing. Themodel describes several repurposing degrees inspired by reuse activities’ degrees (Direct reuse,reuse with refurbishing, reuse with remanufacturing, etc.) based on our hierarchical framework(see Chapter 2).
However, our extended model does not cover consecutive loops (C1), and does not allowintegration of more than two supply chains. However, a product could be repurposed into differentproducts, for instance everyday clothes can be repurposed for cleaning and then for insulation(EMF, 2014). Moreover, the number of activities in the linear supply chain is predefined in thismodel. However, the model for an electronic device supply chain is different from the modelapplied to a textile supply chain in terms of the number of activities. Moreover, a supply chain cancontain several distribution/retailing activities.
We conclude that the models presented in these papers are not sufficiently generic in orderto conceptualize the CSCs in different sectors. The majority are partial or informal, and mainlyrepresent only examples of CSCs. Our aim is to propose a more formal and general CSC model tobe able to portray different CSC network possibilities.
3.3 Formalization of CSC Model in UML
Based on the characteristics explained in Section 3.2, the CSC model is presented below byformalizing the Extended Model through the so-called Class Diagram of the Unified ModelingLanguage (UML). The model offers two major advantages: (1) it makes it possible to formalizeand therefore generalize the CSC concept, (2) it highlights and defines the integration of differentsupply chains (relating to different products) through repurposing, and (3) it proposes a flexiblenumber of activities allowing to model CSCs from different sectors. Figure 3.2 (top) shows aUML class diagram model presenting the structure of a CSC. In the bottom part of Figure 3.2, asimple example of a CSC composed of two Linear Supply Chains is shown in compliance withthe UML model. The UML main notions are explained in Table 3.3 1 2.
A CSC is defined as a composition (Composed of) of one or several (1..*) Linear Supply
1https://www.uml-diagrams.org/2https://www.visual-paradigm.com/guide/uml-unified-modeling-language/uml-class-diagram-tutorial/
31
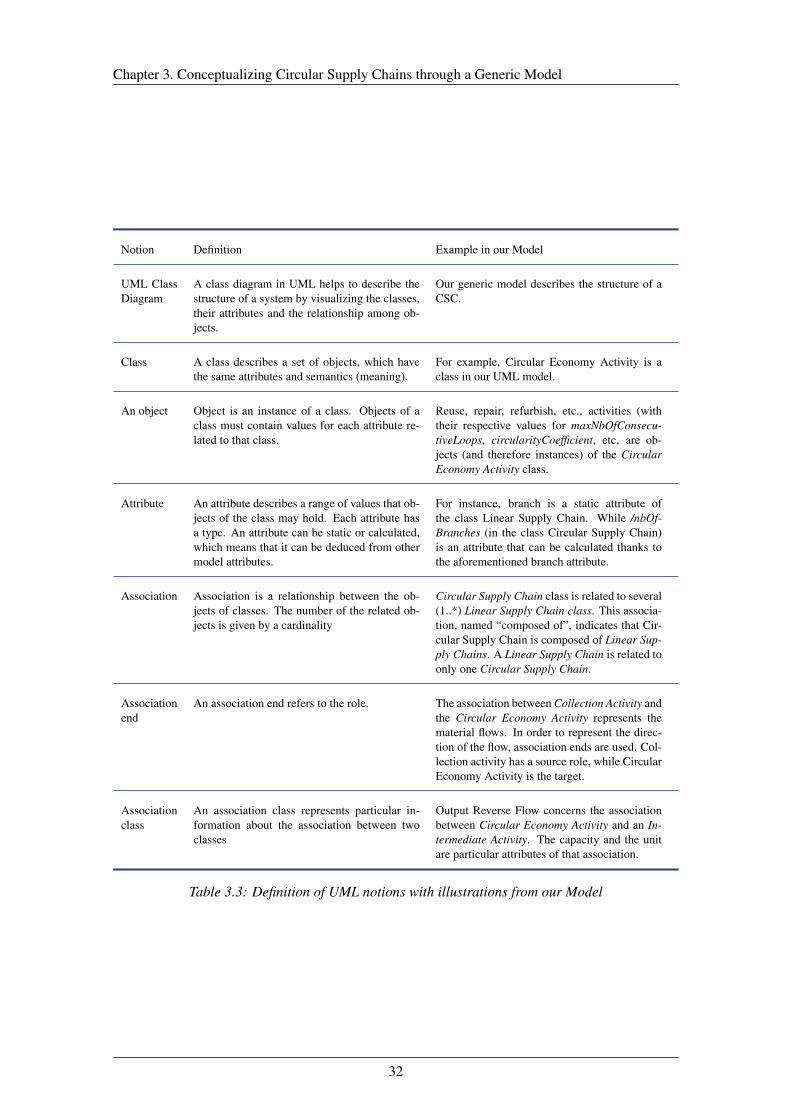
Chapter 3. Conceptualizing Circular Supply Chains through a Generic Model
Notion Definition Example in our Model
UML ClassDiagram
A class diagram in UML helps to describe thestructure of a system by visualizing the classes,their attributes and the relationship among ob-jects.
Our generic model describes the structure of aCSC.
Class A class describes a set of objects, which havethe same attributes and semantics (meaning).
For example, Circular Economy Activity is aclass in our UML model.
An object Object is an instance of a class. Objects of aclass must contain values for each attribute re-lated to that class.
Reuse, repair, refurbish, etc., activities (withtheir respective values for maxNbOfConsecu-tiveLoops, circularityCoefficient, etc, are ob-jects (and therefore instances) of the CircularEconomy Activity class.
Attribute An attribute describes a range of values that ob-jects of the class may hold. Each attribute hasa type. An attribute can be static or calculated,which means that it can be deduced from othermodel attributes.
For instance, branch is a static attribute ofthe class Linear Supply Chain. While /nbOf-Branches (in the class Circular Supply Chain)is an attribute that can be calculated thanks tothe aforementioned branch attribute.
Association Association is a relationship between the ob-jects of classes. The number of the related ob-jects is given by a cardinality
Circular Supply Chain class is related to several(1..*) Linear Supply Chain class. This associa-tion, named “composed of”, indicates that Cir-cular Supply Chain is composed of Linear Sup-ply Chains. A Linear Supply Chain is related toonly one Circular Supply Chain.
Associationend
An association end refers to the role. The association between Collection Activity andthe Circular Economy Activity represents thematerial flows. In order to represent the direc-tion of the flow, association ends are used. Col-lection activity has a source role, while CircularEconomy Activity is the target.
Associationclass
An association class represents particular in-formation about the association between twoclasses
Output Reverse Flow concerns the associationbetween Circular Economy Activity and an In-termediate Activity. The capacity and the unitare particular attributes of that association.
Table 3.3: Definition of UML notions with illustrations from our Model
32

3.3. Formalization of CSC Model in UML
Chains and at least one CE Activity together with the corresponding reverse flows. Linear SupplyChain is composed of an Extraction Activity, a Collection Activity, a Use Activity, a Disposal Ac-tivity, and one or multiple Intermediate Activities. An Intermediate Activity could be Productionor Distribution. A Linear Activity is a source or target of Linear Flows except for the ExtractionActivity (target only) and the Disposal Activity (source only). Allowing multiple Intermediate Ac-tivities gives our model the flexibility that helps supporting supply chains of different sizes fromdifferent sectors. For example, supply chains with numerous production activities (part, module,product manufacturing) or distribution activities (wholesaling, retailing, etc.) could be modeled.
A Circular Economy Activity is connected to the Linear Supply Chain through Reverse Flowvia a Linear Activity. The source of the Reverse Flow is the Collection Activity, while the targetis Intermediate Activity. If the CE Activity is connected to the Intermediate Activity of the sameLinear Supply Chain as the Collection Activity, which is the source of the Input Reverse Flow, theLoopType of the CE Activity is closed. On the other hand, if the loop type is open (i.e. repurpos-ing), the Output Reverse Flow relates to an Intermediate Activity of a different supply chain. CEActivity also has a CEActivityType attribute, which can be reuse, repair, refurbish, remanufacture,recycle or recover based on the hierarchy proposed in Section 2.5.1. In this new model, the termsused in this hierarchy, such as direct repurposing, refurbishing with repurposing, etc., have beendiscarded. Instead, we use for example open-loop reuse and open-loop refurbishing, etc. terms.Here, we also differentiate closed or open-loop recycling and recovering, while in the ExtendedModel, we assume that there is no need to differentiate the activities where the used products turninto materials or energy for simplicity reasons.
These activities are hierarchized according to the inertia principle (Stahel, 2010, 1982) (SeeChapter 2). In addition, we propose a circularity coefficient (circularityCoefficient) for each CEActivity to determine their degree of circularity. In the example in Figure 3.2, the CE activitiesare represented in green squares. Blue squares represent Linear Activities such as extraction,production, distribution, and use. CE Activities such as reuse, remanufacturing, recycling, etc.,have different color gradients according to their circularity coefficient. The darker the activitiesare, the greater their circularity.
A CSC has two attributes according to the type of product (branch) and its requirements (level).Branches refer to the type of products produced along the supply chain. Levels refer to the require-ments of the product produced along the related Linear Supply Chain. Since repurposing is thereuse of used products for different applications that are less demanding than the original ones, theproducts of integrated Linear Supply Chains have lower requirements. Different indicators can ex-press the level of requirements according to product type, such as quality, state of health, capacity,deterioration level, etc. For example, in the bottom part of Figure 3.2, branches are representedalong the horizontal axis and levels along the vertical axis. The calculated attribute nbOfBranchesis the number of integrated Linear Supply Chains of different products while nbOfLevels is thenumber of the requirement levels of the integrated Linear Supply Chains.
This model supports the proposed characteristics (see Section 3.2). According to the model, aCSC should contain at least one CE activity, which conforms to the characteristic C0. Character-istic C1 is supported by the attribute maxNbOfConsecutiveLoops. This attribute mainly concernsclosed-loop activities as the value for open-loop activities is 1 by default when activated. Theflow cascade in the model directly represents the consecutive open-loops. Since our focus is onthe strategic level, we consider this characteristic as a projection of the possible capacity of thesupply chain. For an operational level, the real value of the number of consecutive loops can thenbe calculated and compared with the one defined at the strategic level. Figure 3.2 illustrates aclosed-loop activity that can be performed five (5) times in a row and where the input capacity isdefined as 0.7 (70% of the material flow), and the output capacity is defined as 0.6 (60%).
Since the model proposes numerous options of CE Activities, it also supports characteristicC2 by allowing visualization of a CSC with several simultaneous CE activities. The number oflinear activities, as well as CE activities, depends on the type of product managed by the supply
33
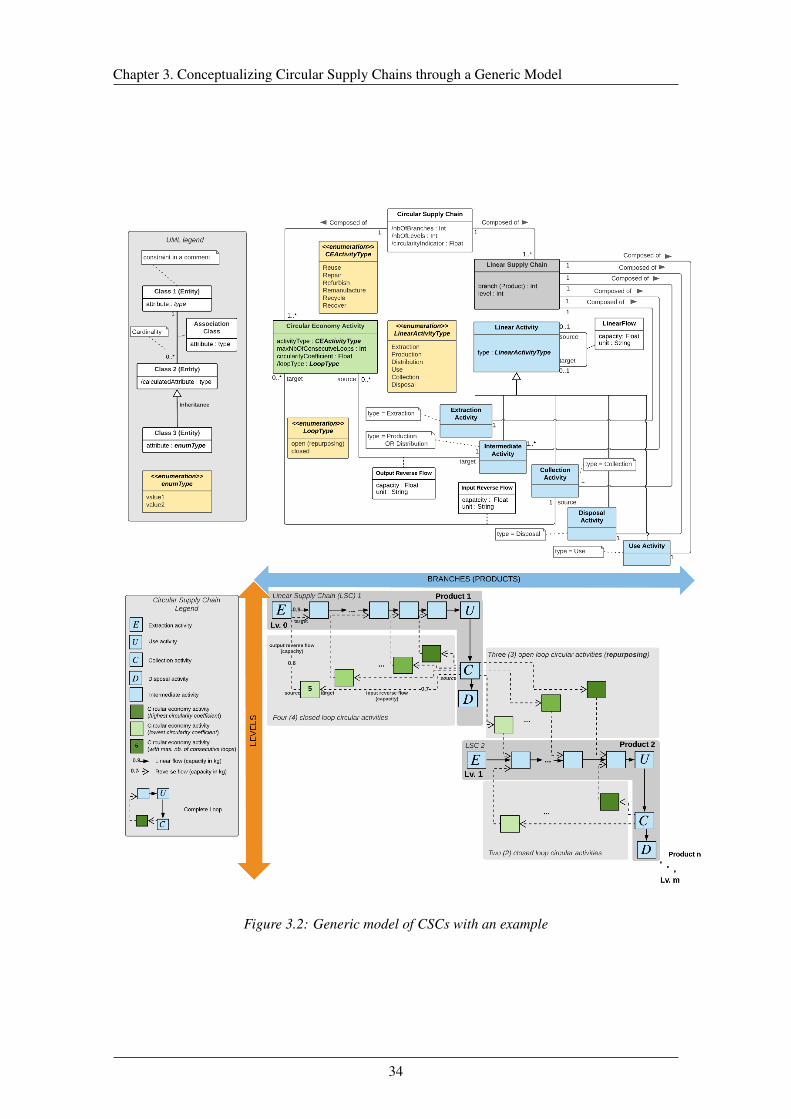
Chapter 3. Conceptualizing Circular Supply Chains through a Generic Model
Figure 3.2: Generic model of CSCs with an example
34

3.4. Use Cases Illustrating the Use of the Generic Model
chain. For example, the manufacturing process for a vehicle might have a higher granularity thana textile product, which is a less modular product.
Representing repurposing activities that can result in different branches (corresponding toproducts) and levels, produces a network with a tree structure. This supports characteristic C3.As can be seen from Figure 3.2, the root of the tree corresponds to the Linear Supply Chain ofLevel 0 and Product 1. The CSC should be considered as part of the scope of a product. Itsrelated Linear Supply Chain is the root of the CSC considered. When the product is at the endof its first life, it can be repurposed to form a different product (branch) with fewer requirements(levels). Therefore, the integrated Linear Supply Chains of other less demanding products are ata lower level and on a different branch than those of the root. For instance, electric vehicle bat-teries (Product 1) can be repurposed for other applications such as laptop batteries (Product 2) orelectric bicycle batteries (Product 3), both of which have the same requirement level. Therefore,the repurposing of the electric vehicle batteries through either branch can be considered as equallycircular (based on this dimension alone). In this case, the electric vehicle battery supply chain isconnected to two linear supply chains at the same level but with different branches.
Another example explained in the following section is a Linear Supply Chain connected toothers with different levels (through repurposing). For instance, textile products can be repur-posed for use as cleaning cloths. Following this second use as cleaning products, they can thenbe repurposed again as insulation products. The quality requirement level of cleaning cloths isassumed to be higher than insulation products since the first are still fabrics while insulating prod-ucts are made of textile fibers. The best repurposing route, therefore, puts cleaning products first(Level +1) followed by insulation products (Level +2).
3.4 Use Cases Illustrating the Use of the Generic Model
These product examples are from two different sectors and present different modularity levels.They show that our model is generic and flexible enough to be used for different kinds of products.
3.4.1 Textile Products
The first example outlines the CSC for textile products (Figure 3.3). This CSC is composed offour linear supply chains: clothes, cleaning cloths, insulation material, and waste-to-energy. Inthis example, product quality is used as an indicator of requirement levels (levels on the diagram).
For the linear parts of the clothing and cleaning cloth supply chains, we refer to the textilesupply chain model provided by Nordås (2004). Five activities describe the textile supply chain:material extraction of raw materials, fabric production, clothing production, distribution, retailing,and use.
With respect to Product 1 (clothes), there are various possible CE activities: closed-loop reuse,open-loop reuse (repurposing), closed and open-loop recycling, and open-loop energy recovery.For this product, closed-loop reuse would be the redistribution of the clothes through second-handshops. This CE activity requires few changes to the main product. The second CE activity isopen-loop reuse (repurposing). In this case, used clothes can be repurposed for use as cleaningcloths (EMF, 2014). In this example, the clothes are transformed into the fabric and reused ascleaning cloths. The quality requirement for cleaning cloths is assumed to be lower than that ofclothes. The cleaning cloth supply chain is therefore at a lower level. The linear supply chain forinsulation products is based on the work of Pavel & Blagoeva (2018). As illustrated in Figure 3,clothes and cleaning cloths can be recycled. This involves transforming them into textile fibers.
35
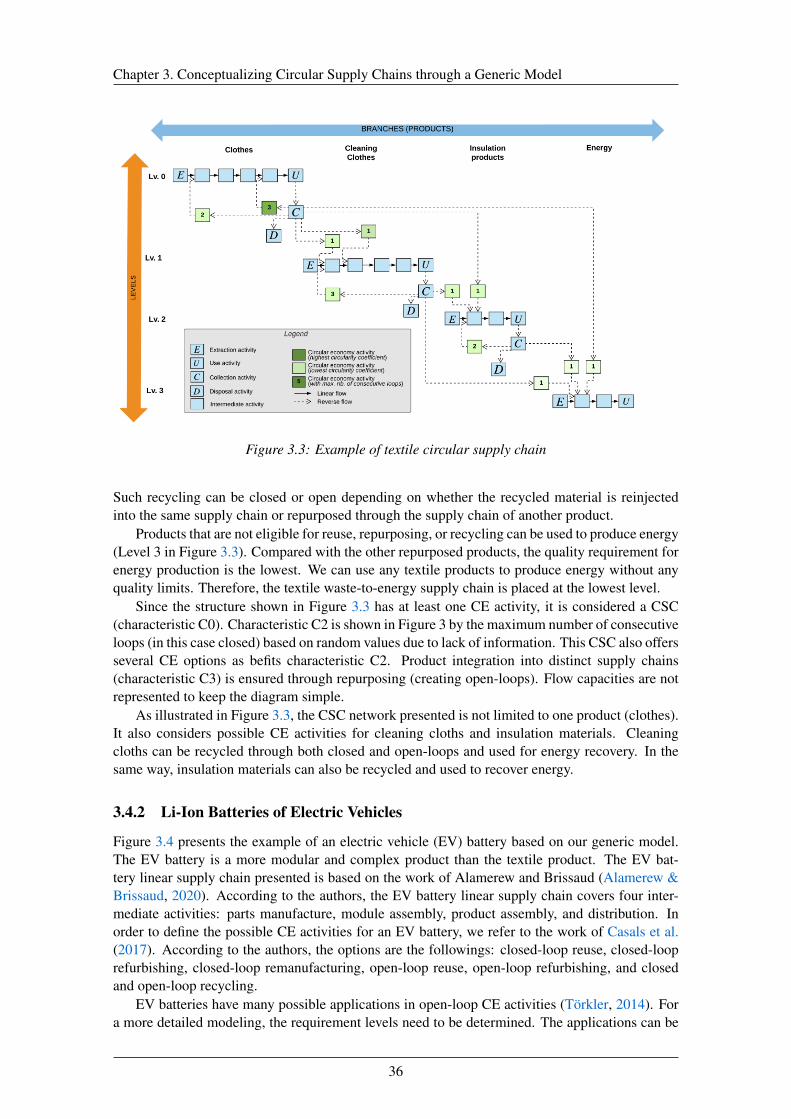
Chapter 3. Conceptualizing Circular Supply Chains through a Generic Model
Figure 3.3: Example of textile circular supply chain
Such recycling can be closed or open depending on whether the recycled material is reinjectedinto the same supply chain or repurposed through the supply chain of another product.
Products that are not eligible for reuse, repurposing, or recycling can be used to produce energy(Level 3 in Figure 3.3). Compared with the other repurposed products, the quality requirement forenergy production is the lowest. We can use any textile products to produce energy without anyquality limits. Therefore, the textile waste-to-energy supply chain is placed at the lowest level.
Since the structure shown in Figure 3.3 has at least one CE activity, it is considered a CSC(characteristic C0). Characteristic C2 is shown in Figure 3 by the maximum number of consecutiveloops (in this case closed) based on random values due to lack of information. This CSC also offersseveral CE options as befits characteristic C2. Product integration into distinct supply chains(characteristic C3) is ensured through repurposing (creating open-loops). Flow capacities are notrepresented to keep the diagram simple.
As illustrated in Figure 3.3, the CSC network presented is not limited to one product (clothes).It also considers possible CE activities for cleaning cloths and insulation materials. Cleaningcloths can be recycled through both closed and open-loops and used for energy recovery. In thesame way, insulation materials can also be recycled and used to recover energy.
3.4.2 Li-Ion Batteries of Electric Vehicles
Figure 3.4 presents the example of an electric vehicle (EV) battery based on our generic model.The EV battery is a more modular and complex product than the textile product. The EV bat-tery linear supply chain presented is based on the work of Alamerew and Brissaud (Alamerew &Brissaud, 2020). According to the authors, the EV battery linear supply chain covers four inter-mediate activities: parts manufacture, module assembly, product assembly, and distribution. Inorder to define the possible CE activities for an EV battery, we refer to the work of Casals et al.(2017). According to the authors, the options are the followings: closed-loop reuse, closed-looprefurbishing, closed-loop remanufacturing, open-loop reuse, open-loop refurbishing, and closedand open-loop recycling.
EV batteries have many possible applications in open-loop CE activities (Törkler, 2014). Fora more detailed modeling, the requirement levels need to be determined. The applications can be
36
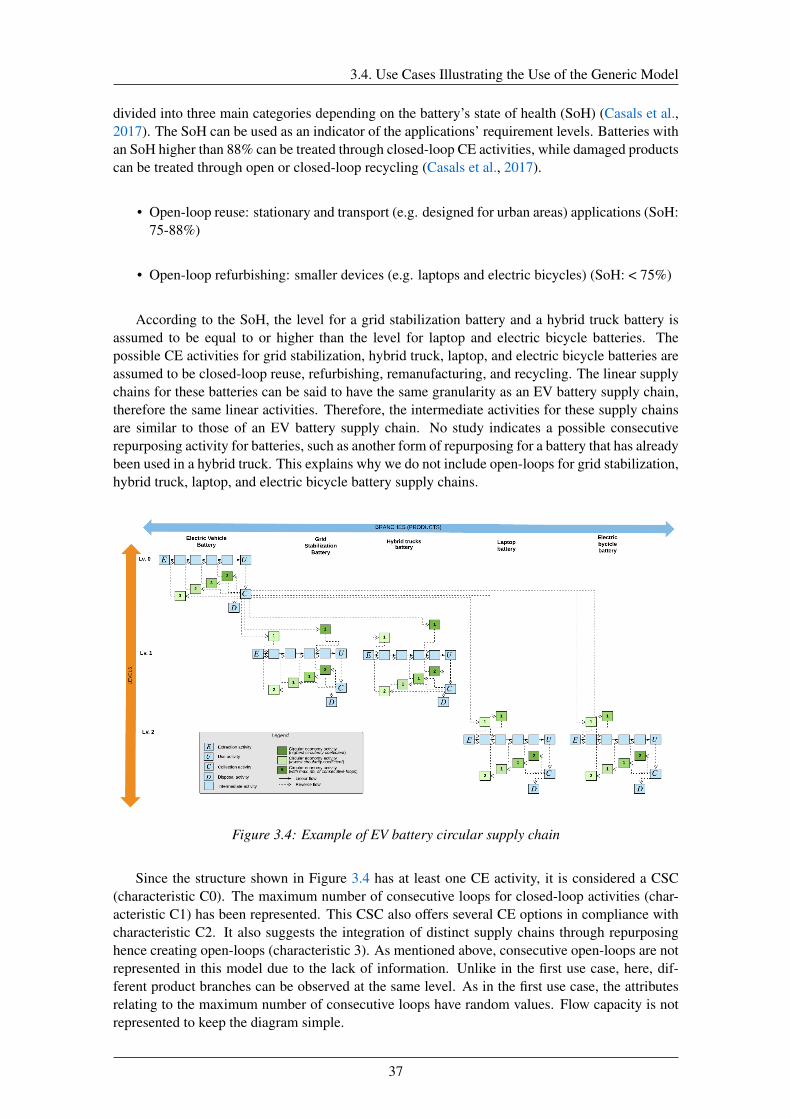
3.4. Use Cases Illustrating the Use of the Generic Model
divided into three main categories depending on the battery’s state of health (SoH) (Casals et al.,2017). The SoH can be used as an indicator of the applications’ requirement levels. Batteries withan SoH higher than 88% can be treated through closed-loop CE activities, while damaged productscan be treated through open or closed-loop recycling (Casals et al., 2017).
• Open-loop reuse: stationary and transport (e.g. designed for urban areas) applications (SoH:75-88%)
• Open-loop refurbishing: smaller devices (e.g. laptops and electric bicycles) (SoH: < 75%)
According to the SoH, the level for a grid stabilization battery and a hybrid truck battery isassumed to be equal to or higher than the level for laptop and electric bicycle batteries. Thepossible CE activities for grid stabilization, hybrid truck, laptop, and electric bicycle batteries areassumed to be closed-loop reuse, refurbishing, remanufacturing, and recycling. The linear supplychains for these batteries can be said to have the same granularity as an EV battery supply chain,therefore the same linear activities. Therefore, the intermediate activities for these supply chainsare similar to those of an EV battery supply chain. No study indicates a possible consecutiverepurposing activity for batteries, such as another form of repurposing for a battery that has alreadybeen used in a hybrid truck. This explains why we do not include open-loops for grid stabilization,hybrid truck, laptop, and electric bicycle battery supply chains.
Figure 3.4: Example of EV battery circular supply chain
Since the structure shown in Figure 3.4 has at least one CE activity, it is considered a CSC(characteristic C0). The maximum number of consecutive loops for closed-loop activities (char-acteristic C1) has been represented. This CSC also offers several CE options in compliance withcharacteristic C2. It also suggests the integration of distinct supply chains through repurposinghence creating open-loops (characteristic 3). As mentioned above, consecutive open-loops are notrepresented in this model due to the lack of information. Unlike in the first use case, here, dif-ferent product branches can be observed at the same level. As in the first use case, the attributesrelating to the maximum number of consecutive loops have random values. Flow capacity is notrepresented to keep the diagram simple.
37
Chapter 3. Conceptualizing Circular Supply Chains through a Generic Model
3.5 Conclusion
Supply chains play a critical role in the transition to a more circular economy. However, theimplementation of the CE from a supply chain point of view is still at a nascent stage in practiceand in the literature. Moreover, repurposing activity, which is a new potential for CSCs, is scarcelyincluded in the previous studies. To the best of our knowledge, there are no generic modeling toolsto help supply chain managers make strategic decisions in this transition to more circular supplychains.
In this chapter, we have first proposed CSC characteristics. Based on these characteristics,we have analyzed the existing works. Our analysis of published studies aimed to determine theirlimits according to these characteristics. We have observed that the simultaneous use of circularactivities is not well supported in current models. In addition, consecutive material-use closedand open-loops are generally only partially supported. Furthermore, the related work modelsare mainly relied on examples in order to represent CSCs and do not offer any formalization orgeneralization. Therefore, we have introduced a generic model by generalizing and formalizingthe extended model of our previous work. The advantages of our generic model are illustratedthrough two use cases from different industrial sectors: textiles and Li-Ion batteries.
Implications for theory and practice
First, the proposed CSC characteristics in this work contribute to theory in bridging between theCE and supply chains as well as the conceptualization of CSCs, by clarifying the CSC structuresaccording to the CE principles. Moreover, based on this contribution, a generic model of CSC isproposed. Finally, it provides a basis for developing new indicators (see Chapter 5).
Considering the implications for practice, the generic model helps decision-makers modelcomplex CSCs in a semi-formalized way using CE activities. This model helps conceptualize,formalize and visualize complex CSCs. Even though we do not take into account the actor notionin our model, this representation could be used by different actors of CSCs to have a global visionand support inter-actor communication, especially in the case of repurposing, where the actorsfrom distinct sectors are collaborating.
Moreover, our contributions consider repurposing activities as a first-class citizen, which isscarcely studied in the literature and rarely adopted by industrials. In the future, more products,components, and materials will be designed to be reused and repurposed as much as possible untilno further value can be obtained from them. The complex structures of CSCs in the future might berepresented through the modeling and visualization tools developed based on our generic model.
Limitations and future works
In order to ensure that CSCs would accommodate the best CE activities, decision-makers need notonly a modeling tool to design and structure the CSC networks but also an indication on the CSCcircularity and return on investment (ROI). Our generic model can provide a basis to assess CSCcircularity and identify vital parameters to be considered, such as flow capacity, the maximumnumber of consecutive loops, and the circularity coefficient. The assessment of CSCs will beaddressed in Chapters 4 and 5.
Furthermore, a proposed product’s requirement level is multidimensional and depends on theproduct type. This can be represented through quality, state of health, capacity, deterioration level,etc. Therefore, further investigations are needed to adapt this dimension to different product types.
Finally, the generic model presented here focuses mainly on activities and material flows. But,of course, supply chains do not consist of material flows and activities alone. They also requirecollaboration between actors (material extractors, manufacturers, distributors, collectors, users,etc.). Moreover, CSCs require an even greater collaborative effort since, to ensure circularity,they involve actors from traditionally separate sectors. Indeed, the actor dimension is another
38

3.5. Conclusion
important aspect of the CSC, which needs to be further explored. For instance, measuring eachactor’s contribution to CSC circularity may be a worthwhile goal. In the future, our generic modelwill include this actor dimension to provide managers with a more nuanced way to design andanalyze CSCs and identify and explore potential collaboration. To this end, an integration with theSCOR model (APICS, 2017), which describes the processes for each supply chain actor, could beinvestigated.
39

4A Classification Tool for Circular Supply Chain
Indicators
Contents4.1 Introduction . . . . . . . . . . . . . . . . . . . . . . . . . . . . . . . . . . . 424.2 Indicators and Classifications considering CE . . . . . . . . . . . . . . . . . 424.3 A Classification Tool for Circular Supply Chain Indicators . . . . . . . . . 444.4 Classifying Existing Indicators through our Tool . . . . . . . . . . . . . . . 484.5 Conclusion . . . . . . . . . . . . . . . . . . . . . . . . . . . . . . . . . . . . 50
Related publication: Kurt, A., Cortes-Cornax, M., Cung, V.-D., Front, A., & Mangione, F. (2021).A classification tool for circular supply chain indicators. In IFIP International Conference on Ad-vances in Production Management Systems (pp. 644–653).: Springer.
41

Chapter 4. A Classification Tool for Circular Supply Chain Indicators
4.1 Introduction
This chapter addresses research question RQ3: How to assess the circularity of the SupplyChains? We introduce a Classification Tool for Circular Supply Chain Indicators to help academicsand Supply Chain managers to understand Supply Chain circularity as well as to support thedevelopment and the classification of circularity indicators for new CSC structures. Some newpotential indicators for each dimension are also proposed. To illustrate the usefulness of this tool,we propose a classification of some existing circularity indicators issued from a literature survey.
While developing this tool, we rely on the value creation principles of EMF. We analyze theseprinciples considering CSC characteristics introduced in Chapter 3 and proposed the correspond-ing dimensions for each principle. Dimensions constitute the classification criteria for our tool.For each dimension, closed and open-loop attributes are considered. In addition, level and branchnotions are taken into account for the power of cascaded use principle. Moreover, potential in-dicators for each dimension have been proposed. Our methodology is summarized in Figure 4.1which zooms in on Figure 1.1.
Figure 4.1: Adopted methodology for the development of our classification tool for CSC indicators
Thus, the structure of the chapter is as follows. Section 4.2 provides a literature background ofclassification works. Section 4.3 introduces our classification tool of CSC indicators illustrated onsome CSC structures. Some existing indicators from the literature are classified with our tool inSection 4.4. Finally, Section 4.5 concludes the chapter and gives some insights for future works.
4.2 Indicators and Classifications considering CE
Indicators that are used in performance measurement influence the decisions to be made atthe strategic, the tactical, and the operational levels (Gunasekaran et al., 2001). These levelsconcern respectively long-term, mid-term and short term decisions. In Supply Chain Managementliterature, indicators are classified according to these decision levels (Gunasekaran et al., 2004).
42
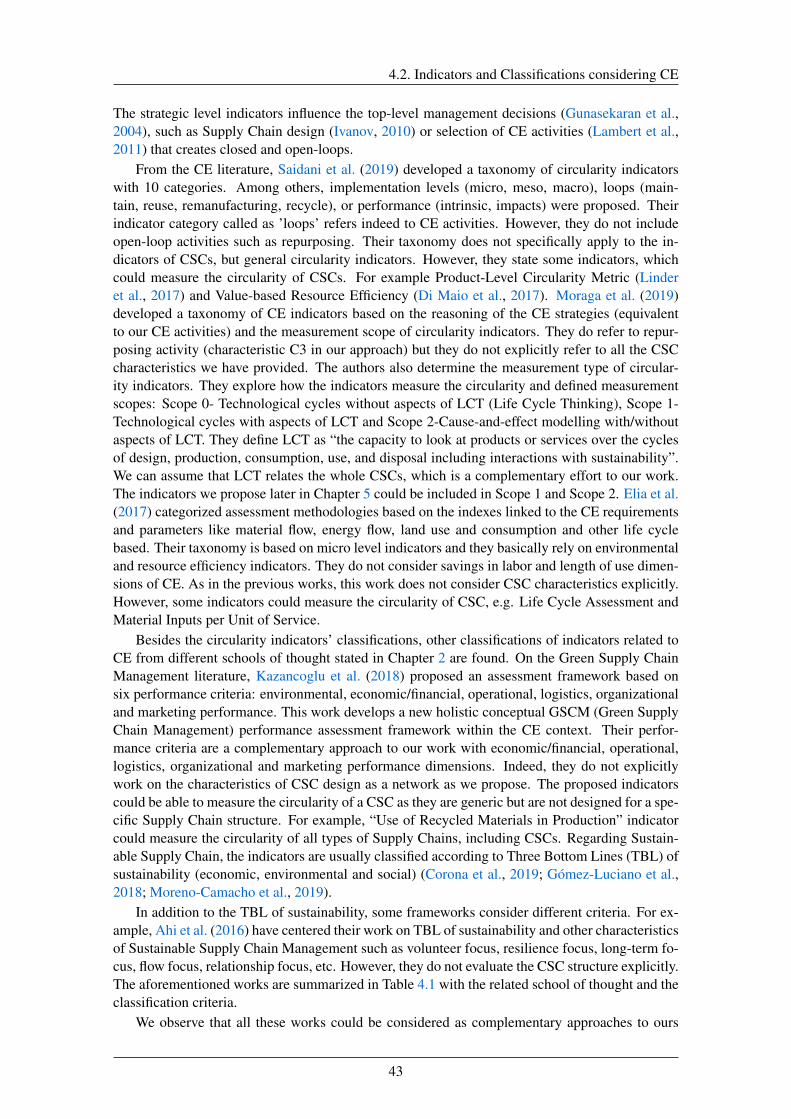
4.2. Indicators and Classifications considering CE
The strategic level indicators influence the top-level management decisions (Gunasekaran et al.,2004), such as Supply Chain design (Ivanov, 2010) or selection of CE activities (Lambert et al.,2011) that creates closed and open-loops.
From the CE literature, Saidani et al. (2019) developed a taxonomy of circularity indicatorswith 10 categories. Among others, implementation levels (micro, meso, macro), loops (main-tain, reuse, remanufacturing, recycle), or performance (intrinsic, impacts) were proposed. Theirindicator category called as ’loops’ refers indeed to CE activities. However, they do not includeopen-loop activities such as repurposing. Their taxonomy does not specifically apply to the in-dicators of CSCs, but general circularity indicators. However, they state some indicators, whichcould measure the circularity of CSCs. For example Product-Level Circularity Metric (Linderet al., 2017) and Value-based Resource Efficiency (Di Maio et al., 2017). Moraga et al. (2019)developed a taxonomy of CE indicators based on the reasoning of the CE strategies (equivalentto our CE activities) and the measurement scope of circularity indicators. They do refer to repur-posing activity (characteristic C3 in our approach) but they do not explicitly refer to all the CSCcharacteristics we have provided. The authors also determine the measurement type of circular-ity indicators. They explore how the indicators measure the circularity and defined measurementscopes: Scope 0- Technological cycles without aspects of LCT (Life Cycle Thinking), Scope 1-Technological cycles with aspects of LCT and Scope 2-Cause-and-effect modelling with/withoutaspects of LCT. They define LCT as “the capacity to look at products or services over the cyclesof design, production, consumption, use, and disposal including interactions with sustainability”.We can assume that LCT relates the whole CSCs, which is a complementary effort to our work.The indicators we propose later in Chapter 5 could be included in Scope 1 and Scope 2. Elia et al.(2017) categorized assessment methodologies based on the indexes linked to the CE requirementsand parameters like material flow, energy flow, land use and consumption and other life cyclebased. Their taxonomy is based on micro level indicators and they basically rely on environmentaland resource efficiency indicators. They do not consider savings in labor and length of use dimen-sions of CE. As in the previous works, this work does not consider CSC characteristics explicitly.However, some indicators could measure the circularity of CSC, e.g. Life Cycle Assessment andMaterial Inputs per Unit of Service.
Besides the circularity indicators’ classifications, other classifications of indicators related toCE from different schools of thought stated in Chapter 2 are found. On the Green Supply ChainManagement literature, Kazancoglu et al. (2018) proposed an assessment framework based onsix performance criteria: environmental, economic/financial, operational, logistics, organizationaland marketing performance. This work develops a new holistic conceptual GSCM (Green SupplyChain Management) performance assessment framework within the CE context. Their perfor-mance criteria are a complementary approach to our work with economic/financial, operational,logistics, organizational and marketing performance dimensions. Indeed, they do not explicitlywork on the characteristics of CSC design as a network as we propose. The proposed indicatorscould be able to measure the circularity of a CSC as they are generic but are not designed for a spe-cific Supply Chain structure. For example, “Use of Recycled Materials in Production” indicatorcould measure the circularity of all types of Supply Chains, including CSCs. Regarding Sustain-able Supply Chain, the indicators are usually classified according to Three Bottom Lines (TBL) ofsustainability (economic, environmental and social) (Corona et al., 2019; Gómez-Luciano et al.,2018; Moreno-Camacho et al., 2019).
In addition to the TBL of sustainability, some frameworks consider different criteria. For ex-ample, Ahi et al. (2016) have centered their work on TBL of sustainability and other characteristicsof Sustainable Supply Chain Management such as volunteer focus, resilience focus, long-term fo-cus, flow focus, relationship focus, etc. However, they do not evaluate the CSC structure explicitly.The aforementioned works are summarized in Table 4.1 with the related school of thought and theclassification criteria.
We observe that all these works could be considered as complementary approaches to ours
43
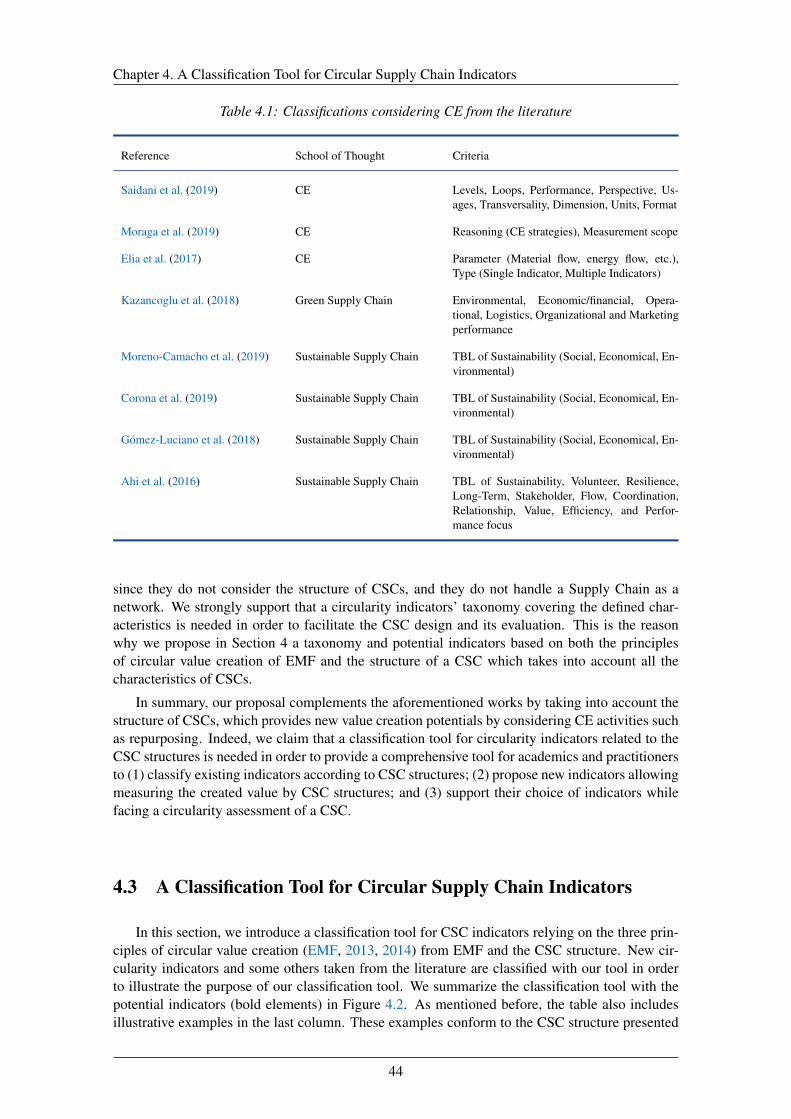
Chapter 4. A Classification Tool for Circular Supply Chain Indicators
Table 4.1: Classifications considering CE from the literature
Reference School of Thought Criteria
Saidani et al. (2019) CE Levels, Loops, Performance, Perspective, Us-ages, Transversality, Dimension, Units, Format
Moraga et al. (2019) CE Reasoning (CE strategies), Measurement scope
Elia et al. (2017) CE Parameter (Material flow, energy flow, etc.),Type (Single Indicator, Multiple Indicators)
Kazancoglu et al. (2018) Green Supply Chain Environmental, Economic/financial, Opera-tional, Logistics, Organizational and Marketingperformance
Moreno-Camacho et al. (2019) Sustainable Supply Chain TBL of Sustainability (Social, Economical, En-vironmental)
Corona et al. (2019) Sustainable Supply Chain TBL of Sustainability (Social, Economical, En-vironmental)
Gómez-Luciano et al. (2018) Sustainable Supply Chain TBL of Sustainability (Social, Economical, En-vironmental)
Ahi et al. (2016) Sustainable Supply Chain TBL of Sustainability, Volunteer, Resilience,Long-Term, Stakeholder, Flow, Coordination,Relationship, Value, Efficiency, and Perfor-mance focus
since they do not consider the structure of CSCs, and they do not handle a Supply Chain as anetwork. We strongly support that a circularity indicators’ taxonomy covering the defined char-acteristics is needed in order to facilitate the CSC design and its evaluation. This is the reasonwhy we propose in Section 4 a taxonomy and potential indicators based on both the principlesof circular value creation of EMF and the structure of a CSC which takes into account all thecharacteristics of CSCs.
In summary, our proposal complements the aforementioned works by taking into account thestructure of CSCs, which provides new value creation potentials by considering CE activities suchas repurposing. Indeed, we claim that a classification tool for circularity indicators related to theCSC structures is needed in order to provide a comprehensive tool for academics and practitionersto (1) classify existing indicators according to CSC structures; (2) propose new indicators allowingmeasuring the created value by CSC structures; and (3) support their choice of indicators whilefacing a circularity assessment of a CSC.
4.3 A Classification Tool for Circular Supply Chain Indicators
In this section, we introduce a classification tool for CSC indicators relying on the three prin-ciples of circular value creation (EMF, 2013, 2014) from EMF and the CSC structure. New cir-cularity indicators and some others taken from the literature are classified with our tool in orderto illustrate the purpose of our classification tool. We summarize the classification tool with thepotential indicators (bold elements) in Figure 4.2. As mentioned before, the table also includesillustrative examples in the last column. These examples conform to the CSC structure presented
44
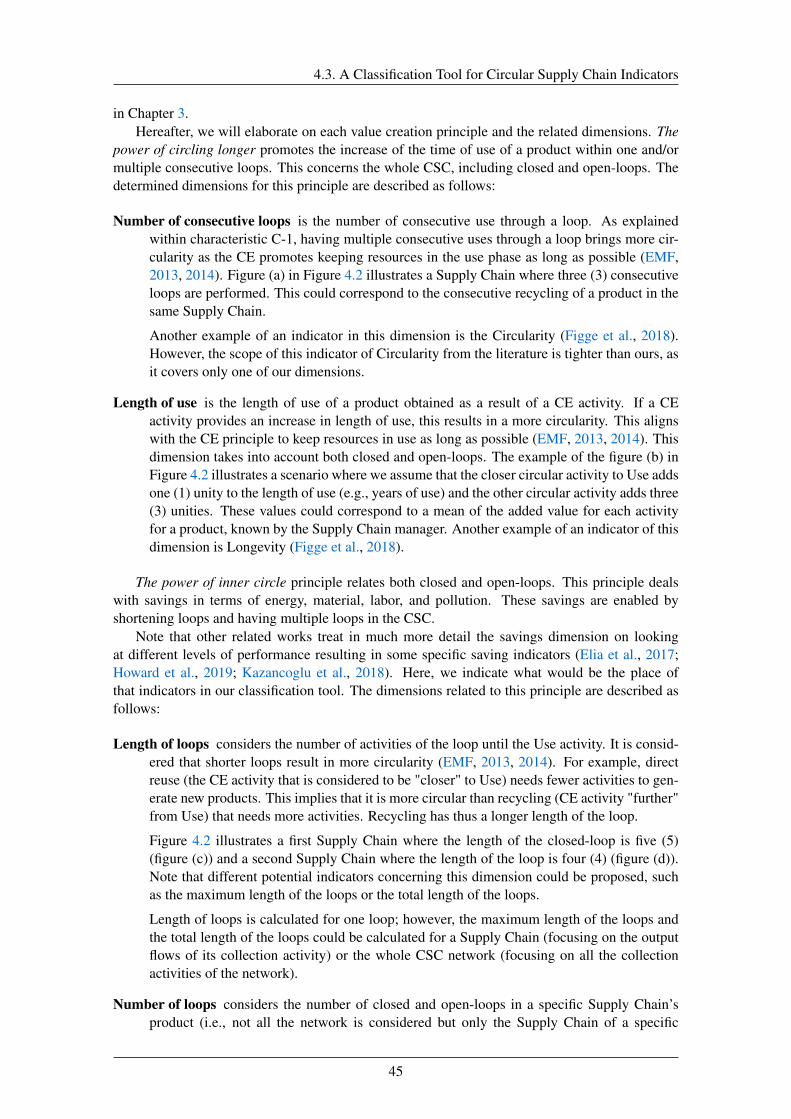
4.3. A Classification Tool for Circular Supply Chain Indicators
in Chapter 3.Hereafter, we will elaborate on each value creation principle and the related dimensions. The
power of circling longer promotes the increase of the time of use of a product within one and/ormultiple consecutive loops. This concerns the whole CSC, including closed and open-loops. Thedetermined dimensions for this principle are described as follows:
Number of consecutive loops is the number of consecutive use through a loop. As explainedwithin characteristic C-1, having multiple consecutive uses through a loop brings more cir-cularity as the CE promotes keeping resources in the use phase as long as possible (EMF,2013, 2014). Figure (a) in Figure 4.2 illustrates a Supply Chain where three (3) consecutiveloops are performed. This could correspond to the consecutive recycling of a product in thesame Supply Chain.
Another example of an indicator in this dimension is the Circularity (Figge et al., 2018).However, the scope of this indicator of Circularity from the literature is tighter than ours, asit covers only one of our dimensions.
Length of use is the length of use of a product obtained as a result of a CE activity. If a CEactivity provides an increase in length of use, this results in a more circularity. This alignswith the CE principle to keep resources in use as long as possible (EMF, 2013, 2014). Thisdimension takes into account both closed and open-loops. The example of the figure (b) inFigure 4.2 illustrates a scenario where we assume that the closer circular activity to Use addsone (1) unity to the length of use (e.g., years of use) and the other circular activity adds three(3) unities. These values could correspond to a mean of the added value for each activityfor a product, known by the Supply Chain manager. Another example of an indicator of thisdimension is Longevity (Figge et al., 2018).
The power of inner circle principle relates both closed and open-loops. This principle dealswith savings in terms of energy, material, labor, and pollution. These savings are enabled byshortening loops and having multiple loops in the CSC.
Note that other related works treat in much more detail the savings dimension on lookingat different levels of performance resulting in some specific saving indicators (Elia et al., 2017;Howard et al., 2019; Kazancoglu et al., 2018). Here, we indicate what would be the place ofthat indicators in our classification tool. The dimensions related to this principle are described asfollows:
Length of loops considers the number of activities of the loop until the Use activity. It is consid-ered that shorter loops result in more circularity (EMF, 2013, 2014). For example, directreuse (the CE activity that is considered to be "closer" to Use) needs fewer activities to gen-erate new products. This implies that it is more circular than recycling (CE activity "further"from Use) that needs more activities. Recycling has thus a longer length of the loop.
Figure 4.2 illustrates a first Supply Chain where the length of the closed-loop is five (5)(figure (c)) and a second Supply Chain where the length of the loop is four (4) (figure (d)).Note that different potential indicators concerning this dimension could be proposed, suchas the maximum length of the loops or the total length of the loops.
Length of loops is calculated for one loop; however, the maximum length of the loops andthe total length of the loops could be calculated for a Supply Chain (focusing on the outputflows of its collection activity) or the whole CSC network (focusing on all the collectionactivities of the network).
Number of loops considers the number of closed and open-loops in a specific Supply Chain’sproduct (i.e., not all the network is considered but only the Supply Chain of a specific
45

Chapter 4. A Classification Tool for Circular Supply Chain Indicators
product). In parallel with characteristic C2, the increased number of loops results in morecircularity in CSCs in general.
Figure 4.2 illustrates two examples of supply chains where the number of closed-loops andthe number of open-loops are calculated (figures (e) and (f)). The number is two (2) in bothcases, which correspond to the number of simultaneous CE activities involved in each case.The number of open-loops could be calculated for an individual Supply Chain (focusingon the output flows of its collection activity) or for the whole network (focusing on all thecollection activities of the network).
Savings refers to savings obtained in terms of energy, material, labor and pollution as a result of aCE activity or a CSC compared to the new production process of a product. This dimensionis important since CE seeks to minimize the use of the aforementioned resources (EMF,2013, 2014) and it is treated in detail in (Elia et al., 2017; Howard et al., 2019; Kazancogluet al., 2018). Moreover, our classification tool adds savings on the labor dimension, whichis scarcely explored in the literature.
A possibility to calculate the savings concerning energy, material, labor, or pollution isillustrated in Figure 4.2 as the ratio between the sum of saving values of the linear path andthe sum of values of the circular path. The saving values for each activity regarding energy,material, labor, or pollution should be known by the supply chain designer beforehand.Therefore, savings’ values could be calculated for only one loop, for an individual supplychain, or the whole CSC network depending on the quantities of the flows in the consideredsystem. Figure 4.2 illustrates two examples of closed and open-loops (figures (g) and (h)).
The power of cascaded use refers to characteristic C-3: the integration of distinct supplychains. This principle is related to the number of levels and the number of branches introduced inChapter 3 and relates to open-loops as we focus here on repurposing activities. These dimensionsare defined as follows:
Number of branches concerns the number of integrated supply chains with different productbranches. Figure 4.2 illustrates an example of a supply chain with two branches (figure (i)),which means that a repurposed product (or material of a product) could be redirected to twodifferent other supply chains.
Number of levels concerns the stages where a product or material could be repurposed with adecreasing requirement level. Figure (j) of Figure 4.2 illustrates an example of a supplychain with two levels. Note that different branches could be placed at the same level sincethe related products could have the same requirement level.
The indicators considered in our classification tool allow measuring circularity at the strategiclevel. In addition, some of the indicators could be applied at all levels (Circularity and Longevity(Figge et al., 2018), Added length of use for each activity and savings dimension’s indicators). Forinstance, indicators in savings dimensions could be calculated at the strategic level by using thematerial flow capacity of CSC, and at the tactical level by using actual material flow quantity.
Figure 4.2 only proposes some examples of potential indicators related to each dimension.Note that some aggregated indicators could consider different dimensions. Our vision is that inorder to have a meaningful assessment of CSC, either an appropriate global indicator to measurethe circularity of a CSC should cover all the presented dimensions, or a multi-criteria approachis needed. However, the proposed indicators related to only one dimension are also helpful togive some insights in the comparison and assessment of CSCs. Moreover, these indicators couldsupport the selection of CE activities (Lambert et al., 2011) in supply chain design. For example, asupply chain designer could compare the CE activities by the added length of use for each activity(figure (b) of the Figure 4.2).
46
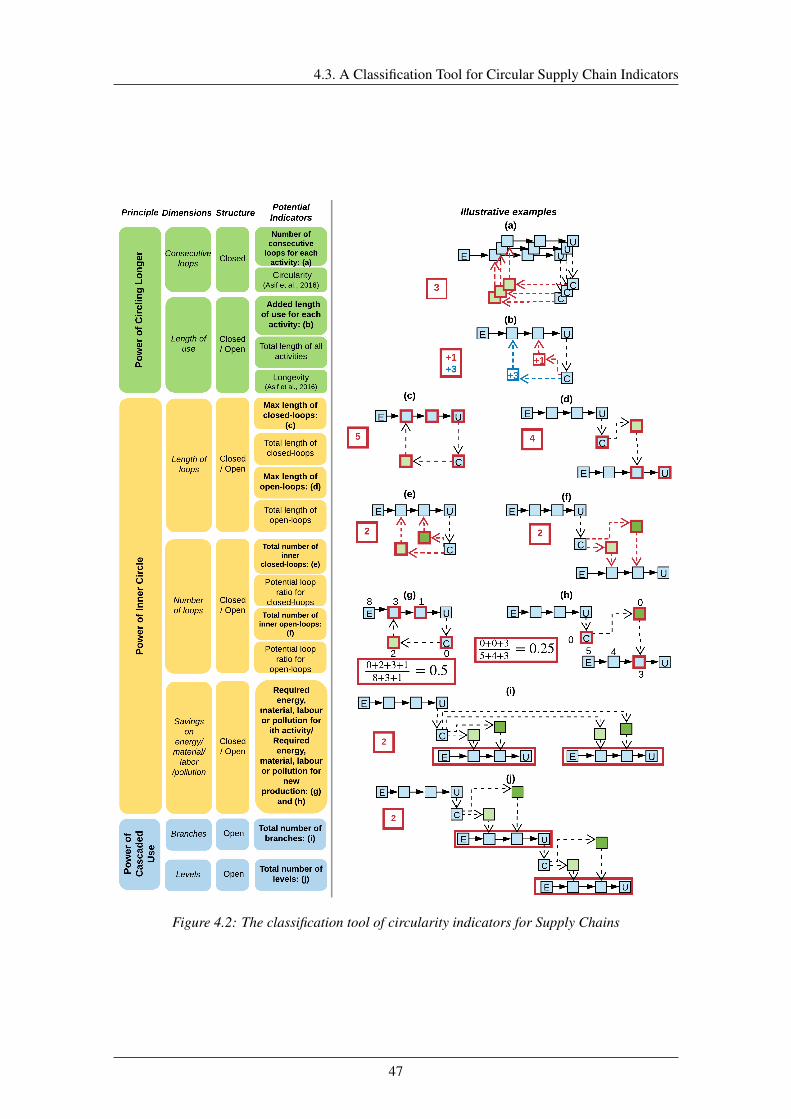
4.3. A Classification Tool for Circular Supply Chain Indicators
Figure 4.2: The classification tool of circularity indicators for Supply Chains
47
Chapter 4. A Classification Tool for Circular Supply Chain Indicators
4.4 Classifying Existing Indicators through our Tool
In this section, we classify indicators from the literature to illustrate our classification tool.Numerous indicators that support only one proposed dimension are found in the literature. Someexamples are given below:
• Length of use: Longevity (Figge et al., 2018) and Utility during use phase (Azevedo et al.,2017)
• Consecutive Loops: Circularity (Figge et al., 2018)
• Savings in pollution : Indicators used in LCA method
• Savings in material : Reuse ratio (Osiro et al., 2018) and Reusing rate of products/materials(Bilal et al., 2020)
• Savings in energy : energy consumption (Bilal et al., 2020) and recovered energy returnedto the product (Ávila-Gutiérrez et al., 2019)
• Savings in labor: is not sufficiently taken into account. It is considered as the cost of reworkin (Kazancoglu et al., 2018).
To the best of our knowledge, there is no indicator considering the length of loops or thenumber of loops dimensions. In the literature, some of the indicators consider several dimensions.We rely on the work of Saidani et al. (2017) to choose the indicators classified in Table 4.2.
48

4.4. Classifying Existing Indicators through our Tool
Tabl
e4.
2:C
lass
ifica
tion
ofin
dica
tors
that
cons
ider
seve
rald
imen
sion
s
Indi
cato
rR
efer
ence
The
pow
erof
circ
ling
long
erT
hepo
wer
ofIn
nerc
ycle
Len
gth
ofus
eC
onse
cutiv
elo
ops
Len
gth
oflo
ops
Num
ber
oflo
ops
Savi
ngs
onM
ater
ial
Savi
ngs
onE
nerg
ySa
ving
son
Lab
orSa
ving
son
Pollu
tion
Res
ourc
epr
oduc
tivity
ofin
dust
rial
proc
ess
Liu
etal
.(20
18a)
xx
x
Cir
cula
rity
mat
eria
lind
i-ca
torC
irc(
T)
Paul
iuk
etal
.(20
17)
x
Prod
uct-
Lev
elC
ircu
lar-
ityM
etri
c(P
CM
)L
inde
reta
l.(2
017)
xx
Cir
cula
rE
cono
my
Inde
x(C
EI)
DiM
aio
etal
.(20
15)
x
Cir
cula
rity
Inde
x(C
I)C
ulle
n(2
017)
xx
Mat
eria
lCir
cula
rity
Indi
-ca
tor(
MC
I)E
MF
(201
5)x
x
Prod
uct
Cir
cula
rity
Indi
-ca
tor
Bra
cque
néet
al.(
2020
)x
x
Com
bini
ngC
ircu
lari
tyan
dL
onge
vity
Figg
eet
al.(
2018
)x
xx
Cir
cula
rity
Cal
cula
tor
(CC
)Pa
uwet
al.(
2021
)x
x
Hyb
rid
LC
AM
odel
(HL
CA
M)
Gen
oves
eet
al.(
2017
)x
xx
x
49
Chapter 4. A Classification Tool for Circular Supply Chain Indicators
4.5 Conclusion
In this chapter, we have proposed a classification tool for CSC indicators based on EMF circu-lar value creation principles. This tool can help academics to analyze existing or new circularityindicators according to CSC structures by using the proposed dimensions as classification criteria.It also facilitates supply chain managers categorizing and choosing appropriate circularity indi-cators to assess the circularity of CSCs. Moreover, we have proposed new potential circularityindicators along with some from the literature (e.g., Longevity) for each dimension in order toillustrate our classification tool. The proposed indicators could support strategic decisions such asselecting CE activities in supply chain design.
Nevertheless, this classification tool still needs some improvements. First, while developingthis proposal, we do not include the fourth principle of EMF, which is the power of pure inputs.This principle deals with the design process of a product, which we consider out of the scope ofthe analysis of CSCs. The power of pure inputs also increases collection efficiency (EMF, 2013).Therefore, a new dimension could be set up to consider the collection and sorting efficiency indi-cators. Moreover, the design of products is a factor that influences the choice of implementation ofCE activities. For example, with the eco-conception approach, the products could be designed forsome special CE activities. In this context, Asif et al. (2016) proposed product design attributessuch as reusability, remanufacturability, and recyclability indexes. These indexes could be help-ful to determine a CSC structure as circular as possible (ideal case) according to the design ofa product. Second, this classification tool does not include pure economic indicators and socialsustainability indicators. Possible integration in the classification tool of these concepts will alsobe explored.
Moreover, proposed potential indicators consider only one dimension. To better assess the cir-cularity in supply chains, a composite indicator or a multi-criteria approach is needed. In the nextchapter (Chapter 5), we will further analyze existing indicators considering several dimensionsmentioned in Table 4.2, and propose a composite indicator.
50

5Assessing Circularity in Supply Chains:
A Global Circularity Indicator
Contents5.1 Introduction . . . . . . . . . . . . . . . . . . . . . . . . . . . . . . . . . . . 535.2 Existing indicators and methods for CSCs and our positioning . . . . . . . 535.3 Mathematical Representation of CSCs . . . . . . . . . . . . . . . . . . . . . 545.4 Global Circularity Indicator . . . . . . . . . . . . . . . . . . . . . . . . . . 555.5 Calculation of Circularity Coefficient for Each Loop . . . . . . . . . . . . . 605.6 A Web-Based Tool for Proposed Indicators: CircuSChain Calculator . . . 635.7 Conclusion . . . . . . . . . . . . . . . . . . . . . . . . . . . . . . . . . . . . 64
In this chapter, we worked with Liu Zhenyu, who is a Master 1 student, for the developmentof CircuSChain Calculator, as a part of a research project (TER in french) of Master MIASHS(see: https://lig-membres.imag.fr/PPerso/membres/pellier/doku.php?id=teaching:projets:ter) at Uni-versity Grenoble Alpes.
52
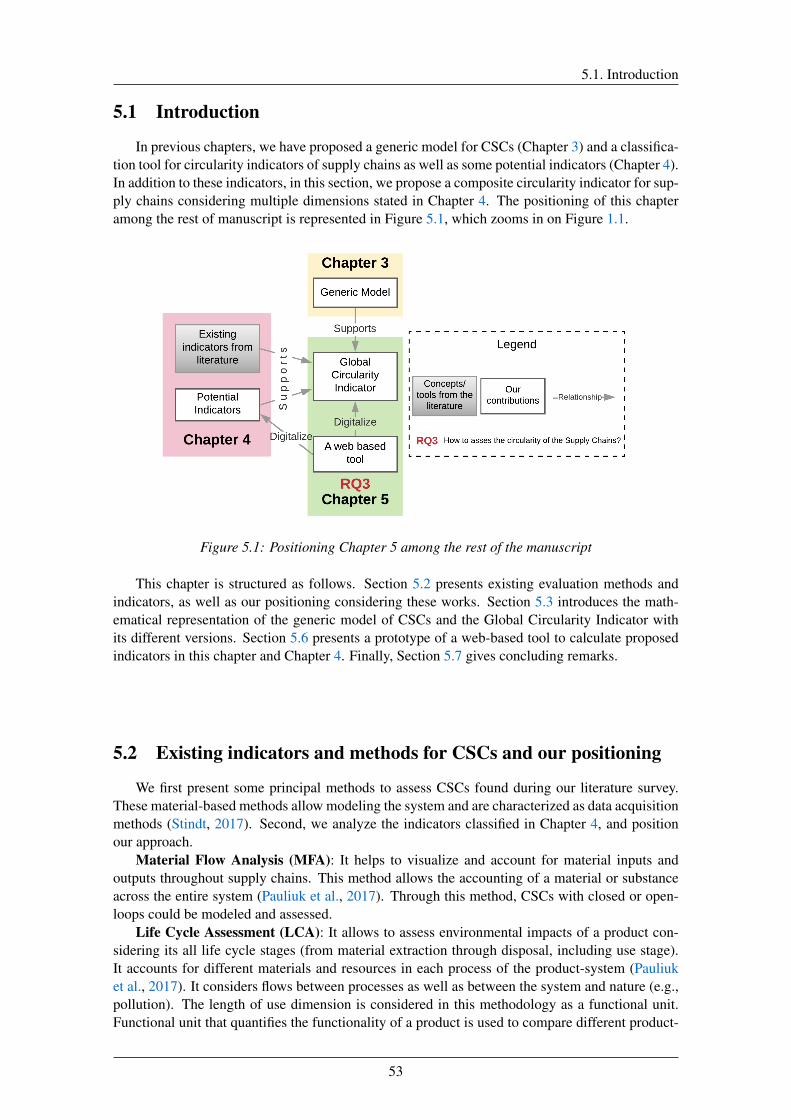
5.1. Introduction
5.1 Introduction
In previous chapters, we have proposed a generic model for CSCs (Chapter 3) and a classifica-tion tool for circularity indicators of supply chains as well as some potential indicators (Chapter 4).In addition to these indicators, in this section, we propose a composite circularity indicator for sup-ply chains considering multiple dimensions stated in Chapter 4. The positioning of this chapteramong the rest of manuscript is represented in Figure 5.1, which zooms in on Figure 1.1.
Figure 5.1: Positioning Chapter 5 among the rest of the manuscript
This chapter is structured as follows. Section 5.2 presents existing evaluation methods andindicators, as well as our positioning considering these works. Section 5.3 introduces the math-ematical representation of the generic model of CSCs and the Global Circularity Indicator withits different versions. Section 5.6 presents a prototype of a web-based tool to calculate proposedindicators in this chapter and Chapter 4. Finally, Section 5.7 gives concluding remarks.
5.2 Existing indicators and methods for CSCs and our positioning
We first present some principal methods to assess CSCs found during our literature survey.These material-based methods allow modeling the system and are characterized as data acquisitionmethods (Stindt, 2017). Second, we analyze the indicators classified in Chapter 4, and positionour approach.
Material Flow Analysis (MFA): It helps to visualize and account for material inputs andoutputs throughout supply chains. This method allows the accounting of a material or substanceacross the entire system (Pauliuk et al., 2017). Through this method, CSCs with closed or open-loops could be modeled and assessed.
Life Cycle Assessment (LCA): It allows to assess environmental impacts of a product con-sidering its all life cycle stages (from material extraction through disposal, including use stage).It accounts for different materials and resources in each process of the product-system (Pauliuket al., 2017). It considers flows between processes as well as between the system and nature (e.g.,pollution). The length of use dimension is considered in this methodology as a functional unit.Functional unit that quantifies the functionality of a product is used to compare different product-
53
Chapter 5. Assessing Circularity in Supply Chains: A Global Circularity Indicator
systems.Life Cycle Cost Assessment (LCCA) has the same approach as LCA. However, this method
allows assessing the cost of a product-service system. It considers savings in material, energy andlabor dimensions together by representing the cost of these resources (Barringer et al., 1995). Thismethod also takes into account investment, training, research and development cost, etc.
In addition to these well-known approaches, we also consider some composite indicators basedon material flows that allow assessing CSCs. These indicators are also classified in Chapter 4.Some of these indicators allow assessing only a specific scenario of CSC. For instance, MaterialCircularity Indicator (EMF, 2015), Product Circularity Indicator (Bracquené et al., 2020), Circu-larity Calculator (Pauw et al., 2021), Circular Economy Index (Di Maio et al., 2015), CircularityIndex (Cullen, 2017), as well as Circularity, Longevity (Figge et al., 2018), Circularity MaterialIndicator (based on MaTrace) (Pauliuk et al., 2017) and Resource Productivity for industrial pro-cess (based on MFA) (Liu et al., 2018a) require some modifications in order to assess CSCs thatare characterized and modeled in Chapter 3.
Besides, Product-Level Circularity Metric (Linder et al., 2017) is not based on a specific sys-tem or supply chain and allows the evaluation of all CSCs configurations. However, while calculat-ing this indicator, the savings in labor, which is considered as a circularity dimension in our workdoes not influence the circularity. Therefore, this indicator does not sufficiently cover the circular-ity dimensions we defined. Indeed, none of these indicators considers all dimensions mentionedin Chapter 4.
Furthermore, in these works, open-loops are not sufficiently addressed. For example, materialCircularity Indicator (EMF, 2015), Product-Level Circularity Metric (Linder et al., 2017), CircularEconomy Index (Di Maio et al., 2015), and Circularity Calculator (Pauw et al., 2021) consider onlyopen-loop recycling among open-loop activities.
Therefore, a new material flow-based indicator that supports all dimensions of circularity andallows the assessment of all CSC configurations, including open-loops, is needed. In this chapter,we propose the Global Circularity Indicator, which considers the length of use, length of loops,and savings dimensions.
We define a circularity coefficient for each CE activity considering one product and obtain thecircularity of the supply chain by multiplying it by the number of products revaluated through theCE activity (flow capacity or flow quantity). Some existing indicators have the same approach. Forexample, Material Circularity Indicator (EMF, 2015) considers the number of produced products,while Circularity and Longevity (Figge et al., 2018) take into account the percentage of productsthat returned and revaluated through CE activities.
While defining circularity coefficient for savings dimension, we account resources for eachactivity in the loop, inspiring from LCA, MFA or LCCA. We take into account the amount ofrequired resources to revaluate a product by a CE activity, like Product-Level Circularity (Linderet al., 2017). Some existing indicators such as Circularity and Longevity (Figge et al., 2018),Circularity Calculator (Pauw et al., 2021) consider the amount of revaluated material, while someothers take into account both required resources and the amount of revaluated material, such asCircularity Index (Cullen, 2017), Circular Economy Index (Di Maio et al., 2015), Material Cir-cularity Indicator (EMF, 2015), Resource Productivity for industrial process (Liu et al., 2018a),Circularity Material Indicator (Pauliuk et al., 2017).
5.3 Mathematical Representation of CSCs
In this section, based on the generic model introduced in Chapter 3, we propose a mathematicalrepresentation of CSCs. This representation allows calculating the Global Circularity Indicator.
54
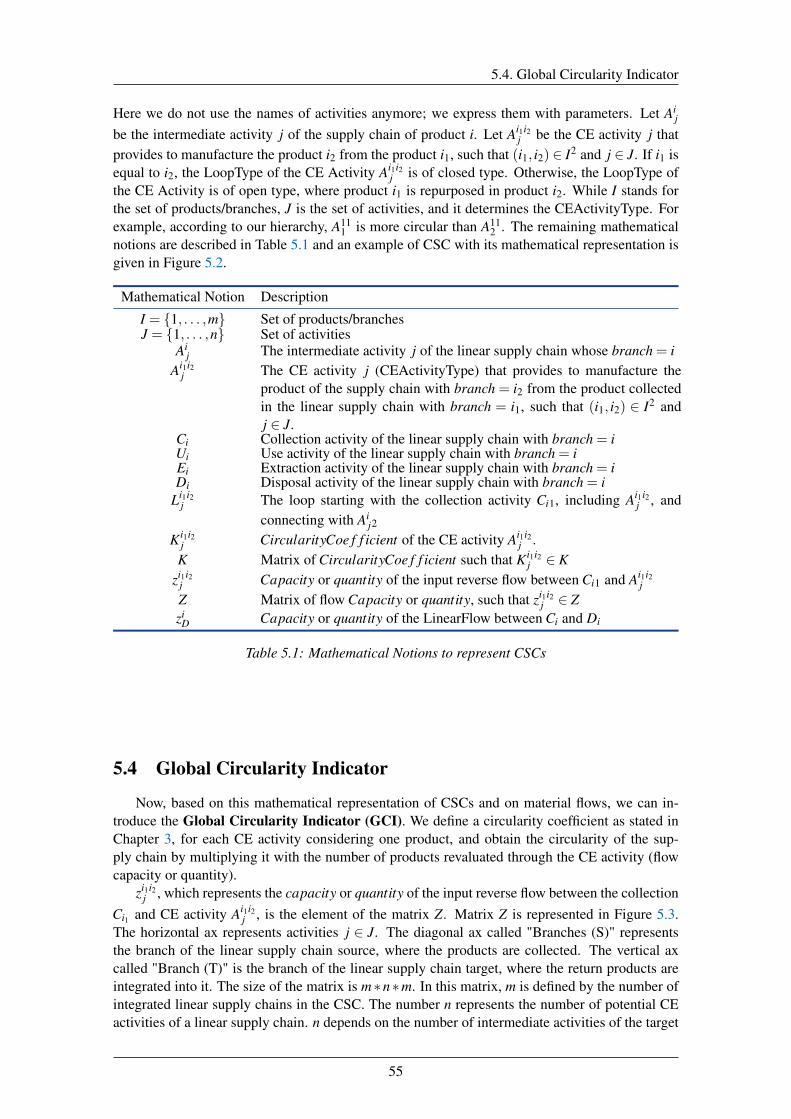
5.4. Global Circularity Indicator
Here we do not use the names of activities anymore; we express them with parameters. Let Aij
be the intermediate activity j of the supply chain of product i. Let Ai1i2j be the CE activity j that
provides to manufacture the product i2 from the product i1, such that (i1, i2) ∈ I2 and j ∈ J. If i1 isequal to i2, the LoopType of the CE Activity Ai1i2
j is of closed type. Otherwise, the LoopType ofthe CE Activity is of open type, where product i1 is repurposed in product i2. While I stands forthe set of products/branches, J is the set of activities, and it determines the CEActivityType. Forexample, according to our hierarchy, A11
1 is more circular than A112 . The remaining mathematical
notions are described in Table 5.1 and an example of CSC with its mathematical representation isgiven in Figure 5.2.
Mathematical Notion Description
I = {1, . . . ,m} Set of products/branchesJ = {1, . . . ,n} Set of activities
Aij The intermediate activity j of the linear supply chain whose branch = i
Ai1i2j The CE activity j (CEActivityType) that provides to manufacture the
product of the supply chain with branch = i2 from the product collectedin the linear supply chain with branch = i1, such that (i1, i2) ∈ I2 andj ∈ J.
Ci Collection activity of the linear supply chain with branch = iUi Use activity of the linear supply chain with branch = iEi Extraction activity of the linear supply chain with branch = iDi Disposal activity of the linear supply chain with branch = i
Li1i2j The loop starting with the collection activity Ci1, including Ai1i2
j , andconnecting with Ai
j2
Ki1i2j CircularityCoe f f icient of the CE activity Ai1i2
j .K Matrix of CircularityCoe f f icient such that Ki1i2
j ∈ Kzi1i2
j Capacity or quantity of the input reverse flow between Ci1 and Ai1i2j
Z Matrix of flow Capacity or quantity, such that zi1i2j ∈ Z
ziD Capacity or quantity of the LinearFlow between Ci and Di
Table 5.1: Mathematical Notions to represent CSCs
5.4 Global Circularity Indicator
Now, based on this mathematical representation of CSCs and on material flows, we can in-troduce the Global Circularity Indicator (GCI). We define a circularity coefficient as stated inChapter 3, for each CE activity considering one product, and obtain the circularity of the sup-ply chain by multiplying it with the number of products revaluated through the CE activity (flowcapacity or quantity).
zi1i2j , which represents the capacity or quantity of the input reverse flow between the collection
Ci1 and CE activity Ai1i2j , is the element of the matrix Z. Matrix Z is represented in Figure 5.3.
The horizontal ax represents activities j ∈ J. The diagonal ax called "Branches (S)" representsthe branch of the linear supply chain source, where the products are collected. The vertical axcalled "Branch (T)" is the branch of the linear supply chain target, where the return products areintegrated into it. The size of the matrix is m∗n∗m. In this matrix, m is defined by the number ofintegrated linear supply chains in the CSC. The number n represents the number of potential CEactivities of a linear supply chain. n depends on the number of intermediate activities of the target
55
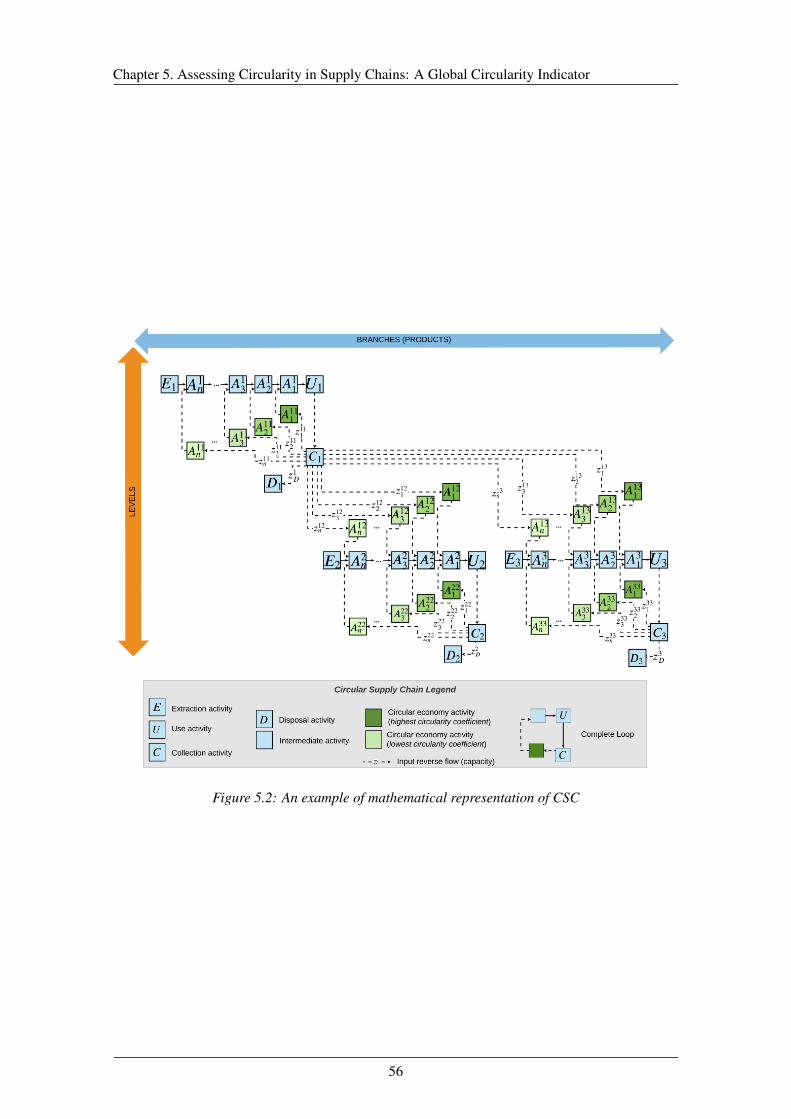
Chapter 5. Assessing Circularity in Supply Chains: A Global Circularity Indicator
Figure 5.2: An example of mathematical representation of CSC
56
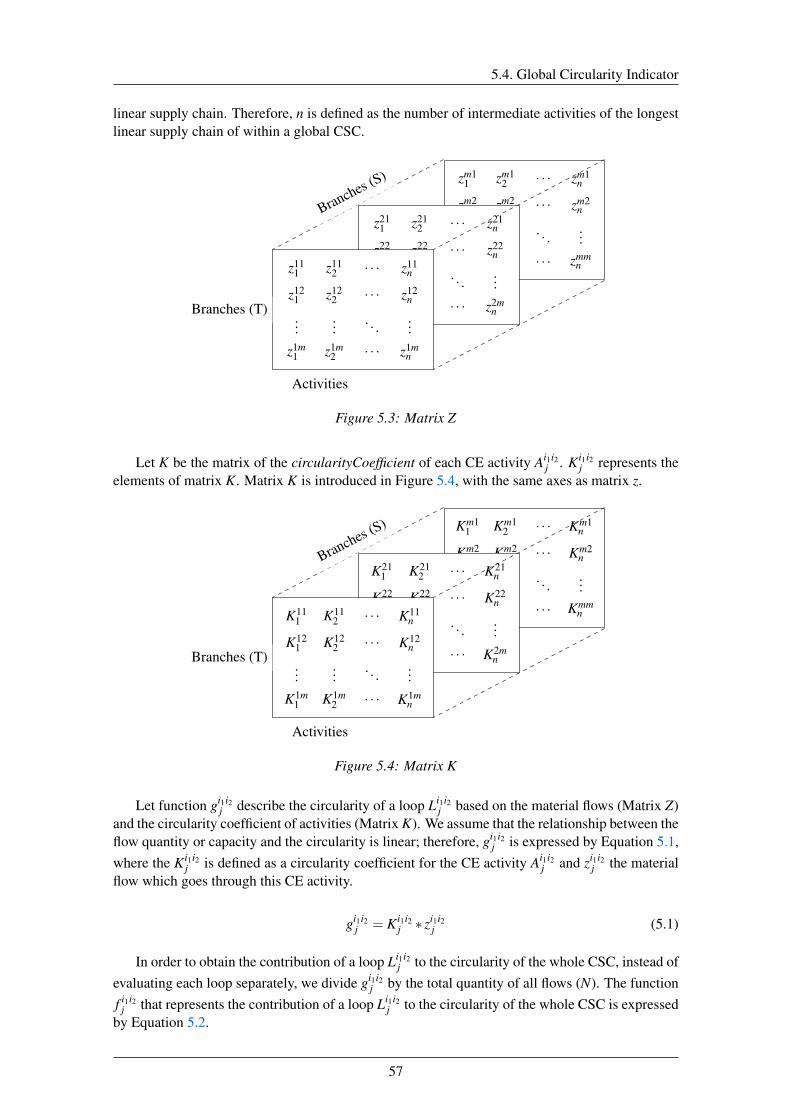
5.4. Global Circularity Indicator
linear supply chain. Therefore, n is defined as the number of intermediate activities of the longestlinear supply chain of within a global CSC.
zm11 zm1
2. . . zm1
n
zm21 zm2
2. . . zm2
n
......
. . ....
zmm1 zmm
2 . . . zmmn
z211 z21
2. . . z21
n
z221 z22
2. . . z22
n
......
. . ....
z2m1 z2m
2. . . z2m
n
z111 z11
2. . . z11
n
z121 z12
2. . . z12
n
......
. . ....
z1m1 z1m
2. . . z1m
n
Branches (S)
Activities
Branches (T)
Figure 5.3: Matrix Z
Let K be the matrix of the circularityCoefficient of each CE activity Ai1i2j . Ki1i2
j represents theelements of matrix K. Matrix K is introduced in Figure 5.4, with the same axes as matrix z.
Km11 Km1
2. . . Km1
n
Km21 Km2
2. . . Km2
n
......
. . ....
Kmm1 Kmm
2 . . . Kmmn
K211 K21
2. . . K21
n
K221 K22
2. . . K22
n
......
. . ....
K2m1 K2m
2. . . K2m
n
K111 K11
2. . . K11
n
K121 K12
2. . . K12
n
......
. . ....
K1m1 K1m
2. . . K1m
n
Branches (S)
Activities
Branches (T)
Figure 5.4: Matrix K
Let function gi1i2j describe the circularity of a loop Li1i2
j based on the material flows (Matrix Z)and the circularity coefficient of activities (Matrix K). We assume that the relationship between theflow quantity or capacity and the circularity is linear; therefore, gi1i2
j is expressed by Equation 5.1,where the Ki1i2
j is defined as a circularity coefficient for the CE activity Ai1i2j and zi1i2
j the materialflow which goes through this CE activity.
gi1i2j = Ki1i2
j ∗ zi1i2j (5.1)
In order to obtain the contribution of a loop Li1i2j to the circularity of the whole CSC, instead of
evaluating each loop separately, we divide gi1i2j by the total quantity of all flows (N). The function
f i1i2j that represents the contribution of a loop Li1i2
j to the circularity of the whole CSC is expressedby Equation 5.2.
57
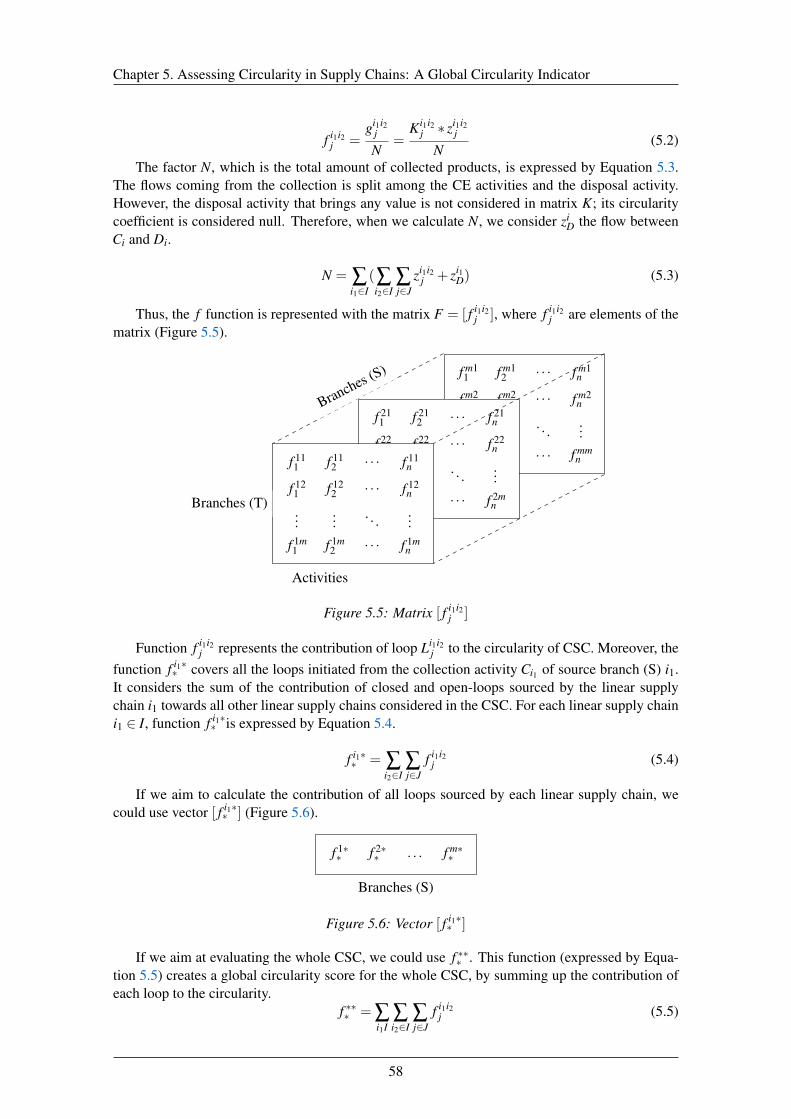
Chapter 5. Assessing Circularity in Supply Chains: A Global Circularity Indicator
f i1i2j =
gi1i2j
N=
Ki1i2j ∗ zi1i2
j
N(5.2)
The factor N, which is the total amount of collected products, is expressed by Equation 5.3.The flows coming from the collection is split among the CE activities and the disposal activity.However, the disposal activity that brings any value is not considered in matrix K; its circularitycoefficient is considered null. Therefore, when we calculate N, we consider zi
D the flow betweenCi and Di.
N = ∑i1∈I
(∑i2∈I
∑j∈J
zi1i2j + zi1
D) (5.3)
Thus, the f function is represented with the matrix F = [ f i1i2j ], where f i1i2
j are elements of thematrix (Figure 5.5).
f m11 f m1
2. . . f m1
n
f m21 f m2
2. . . f m2
n
......
. . ....
f mm1 f mm
2 . . . f mmn
f 211 f 21
2. . . f 21
n
f 221 f 22
2. . . f 22
n
......
. . ....
f 2m1 f 2m
2. . . f 2m
n
f 111 f 11
2. . . f 11
n
f 121 f 12
2. . . f 12
n
......
. . ....
f 1m1 f 1m
2. . . f 1m
n
Branches (S)
Activities
Branches (T)
Figure 5.5: Matrix [ f i1i2j ]
Function f i1i2j represents the contribution of loop Li1i2
j to the circularity of CSC. Moreover, thefunction f i1∗∗ covers all the loops initiated from the collection activity Ci1 of source branch (S) i1.It considers the sum of the contribution of closed and open-loops sourced by the linear supplychain i1 towards all other linear supply chains considered in the CSC. For each linear supply chaini1 ∈ I, function f i1∗∗ is expressed by Equation 5.4.
f i1∗∗ = ∑
i2∈I∑j∈J
f i1i2j (5.4)
If we aim to calculate the contribution of all loops sourced by each linear supply chain, wecould use vector [ f i1∗∗ ] (Figure 5.6).
f 1∗∗ f 2∗
∗ . . . f m∗∗
Branches (S)
Figure 5.6: Vector [ f i1∗∗ ]
If we aim at evaluating the whole CSC, we could use f ∗∗∗ . This function (expressed by Equa-tion 5.5) creates a global circularity score for the whole CSC, by summing up the contribution ofeach loop to the circularity.
f ∗∗∗ = ∑i1I
∑i2∈I
∑j∈J
f i1i2j (5.5)
58
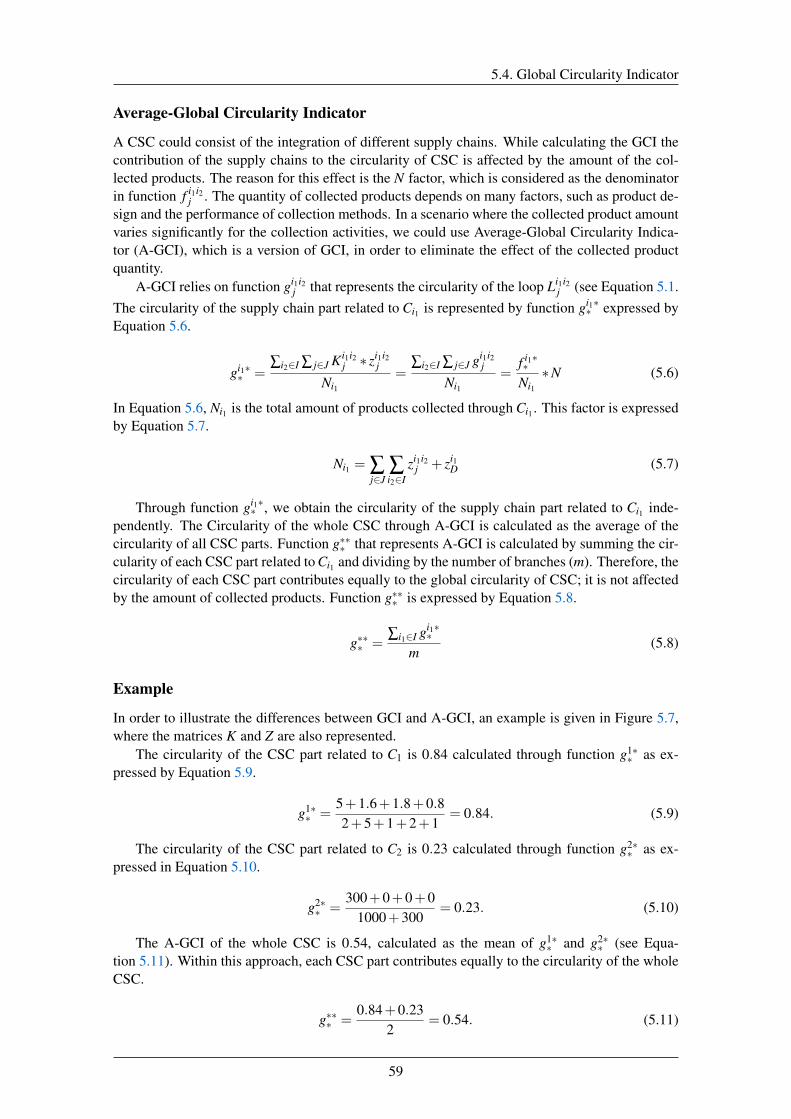
5.4. Global Circularity Indicator
Average-Global Circularity Indicator
A CSC could consist of the integration of different supply chains. While calculating the GCI thecontribution of the supply chains to the circularity of CSC is affected by the amount of the col-lected products. The reason for this effect is the N factor, which is considered as the denominatorin function f i1i2
j . The quantity of collected products depends on many factors, such as product de-sign and the performance of collection methods. In a scenario where the collected product amountvaries significantly for the collection activities, we could use Average-Global Circularity Indica-tor (A-GCI), which is a version of GCI, in order to eliminate the effect of the collected productquantity.
A-GCI relies on function gi1i2j that represents the circularity of the loop Li1i2
j (see Equation 5.1.The circularity of the supply chain part related to Ci1 is represented by function gi1∗∗ expressed byEquation 5.6.
gi1∗∗ =
∑i2∈I ∑ j∈J Ki1i2j ∗ zi1i2
j
Ni1=
∑i2∈I ∑ j∈J gi1i2j
Ni1=
f i1∗∗Ni1∗N (5.6)
In Equation 5.6, Ni1 is the total amount of products collected through Ci1 . This factor is expressedby Equation 5.7.
Ni1 = ∑j∈J
∑i2∈I
zi1i2j + zi1
D (5.7)
Through function gi1∗∗ , we obtain the circularity of the supply chain part related to Ci1 inde-pendently. The Circularity of the whole CSC through A-GCI is calculated as the average of thecircularity of all CSC parts. Function g∗∗∗ that represents A-GCI is calculated by summing the cir-cularity of each CSC part related to Ci1 and dividing by the number of branches (m). Therefore, thecircularity of each CSC part contributes equally to the global circularity of CSC; it is not affectedby the amount of collected products. Function g∗∗∗ is expressed by Equation 5.8.
g∗∗∗ =∑i1∈I gi1∗∗
m(5.8)
Example
In order to illustrate the differences between GCI and A-GCI, an example is given in Figure 5.7,where the matrices K and Z are also represented.
The circularity of the CSC part related to C1 is 0.84 calculated through function g1∗∗ as ex-
pressed by Equation 5.9.
g1∗∗ =
5+1.6+1.8+0.82+5+1+2+1
= 0.84. (5.9)
The circularity of the CSC part related to C2 is 0.23 calculated through function g2∗∗ as ex-
pressed in Equation 5.10.
g2∗∗ =
300+0+0+01000+300
= 0.23. (5.10)
The A-GCI of the whole CSC is 0.54, calculated as the mean of g1∗∗ and g2∗
∗ (see Equa-tion 5.11). Within this approach, each CSC part contributes equally to the circularity of the wholeCSC.
g∗∗∗ =0.84+0.23
2= 0.54. (5.11)
59
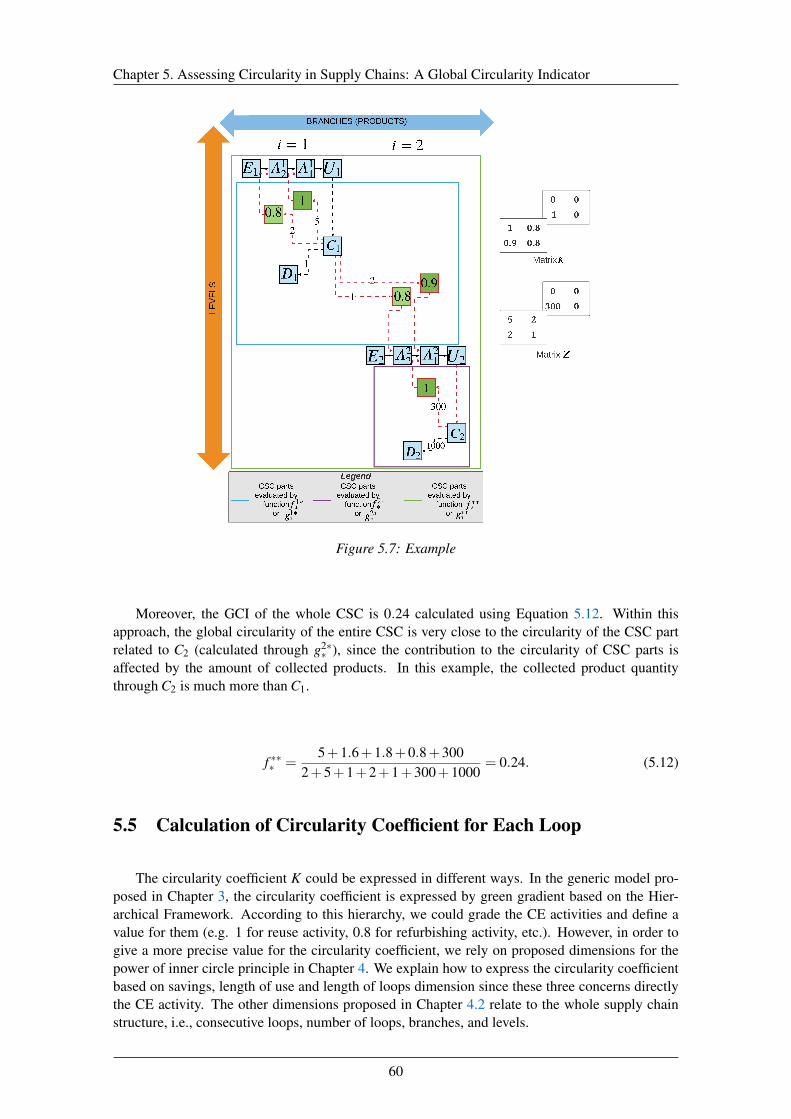
Chapter 5. Assessing Circularity in Supply Chains: A Global Circularity Indicator
Figure 5.7: Example
Moreover, the GCI of the whole CSC is 0.24 calculated using Equation 5.12. Within thisapproach, the global circularity of the entire CSC is very close to the circularity of the CSC partrelated to C2 (calculated through g2∗
∗ ), since the contribution to the circularity of CSC parts isaffected by the amount of collected products. In this example, the collected product quantitythrough C2 is much more than C1.
f ∗∗∗ =5+1.6+1.8+0.8+300
2+5+1+2+1+300+1000= 0.24. (5.12)
5.5 Calculation of Circularity Coefficient for Each Loop
The circularity coefficient K could be expressed in different ways. In the generic model pro-posed in Chapter 3, the circularity coefficient is expressed by green gradient based on the Hier-archical Framework. According to this hierarchy, we could grade the CE activities and define avalue for them (e.g. 1 for reuse activity, 0.8 for refurbishing activity, etc.). However, in order togive a more precise value for the circularity coefficient, we rely on proposed dimensions for thepower of inner circle principle in Chapter 4. We explain how to express the circularity coefficientbased on savings, length of use and length of loops dimension since these three concerns directlythe CE activity. The other dimensions proposed in Chapter 4.2 relate to the whole supply chainstructure, i.e., consecutive loops, number of loops, branches, and levels.
60
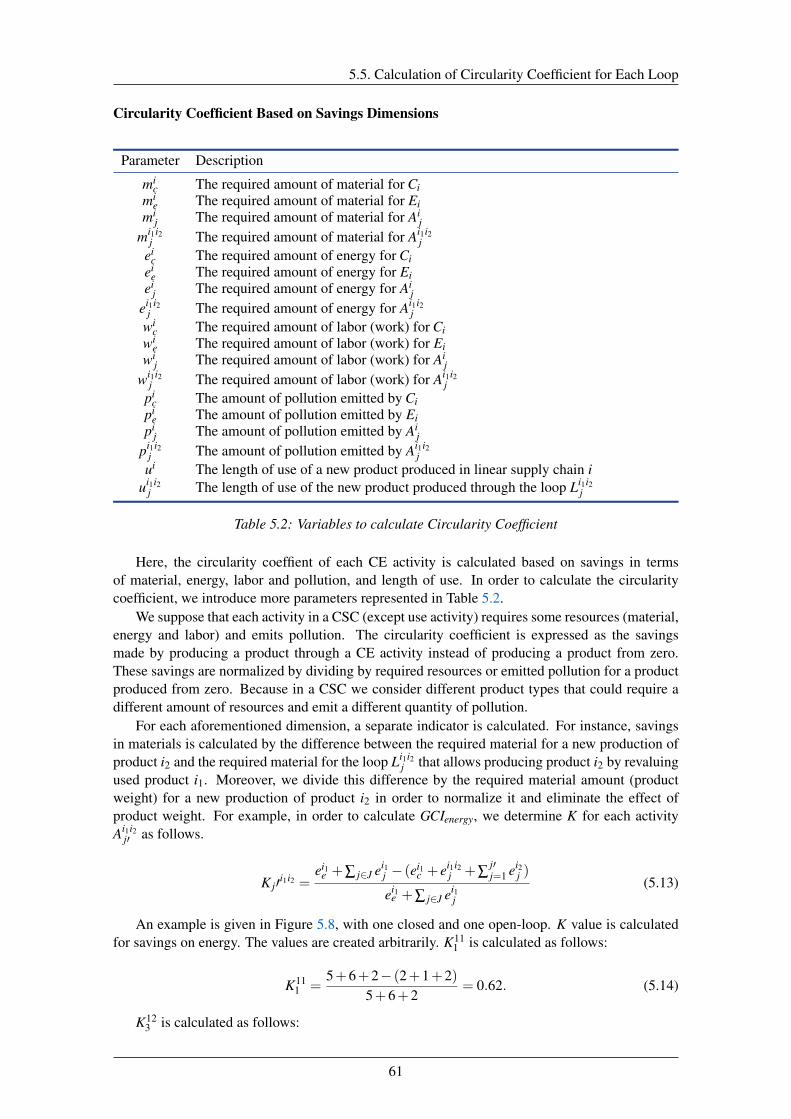
5.5. Calculation of Circularity Coefficient for Each Loop
Circularity Coefficient Based on Savings Dimensions
Parameter Description
mic The required amount of material for Ci
mie The required amount of material for Ei
mij The required amount of material for Ai
jmi1i2
j The required amount of material for Ai1i2j
eic The required amount of energy for Ci
eie The required amount of energy for Ei
eij The required amount of energy for Ai
jei1i2
j The required amount of energy for Ai1i2j
wic The required amount of labor (work) for Ci
wie The required amount of labor (work) for Ei
wij The required amount of labor (work) for Ai
jwi1i2
j The required amount of labor (work) for Ai1i2j
pic The amount of pollution emitted by Ci
pie The amount of pollution emitted by Ei
pij The amount of pollution emitted by Ai
jpi1i2
j The amount of pollution emitted by Ai1i2j
ui The length of use of a new product produced in linear supply chain iui1i2
j The length of use of the new product produced through the loop Li1i2j
Table 5.2: Variables to calculate Circularity Coefficient
Here, the circularity coeffient of each CE activity is calculated based on savings in termsof material, energy, labor and pollution, and length of use. In order to calculate the circularitycoefficient, we introduce more parameters represented in Table 5.2.
We suppose that each activity in a CSC (except use activity) requires some resources (material,energy and labor) and emits pollution. The circularity coefficient is expressed as the savingsmade by producing a product through a CE activity instead of producing a product from zero.These savings are normalized by dividing by required resources or emitted pollution for a productproduced from zero. Because in a CSC we consider different product types that could require adifferent amount of resources and emit a different quantity of pollution.
For each aforementioned dimension, a separate indicator is calculated. For instance, savingsin materials is calculated by the difference between the required material for a new production ofproduct i2 and the required material for the loop Li1i2
j that allows producing product i2 by revaluingused product i1. Moreover, we divide this difference by the required material amount (productweight) for a new production of product i2 in order to normalize it and eliminate the effect ofproduct weight. For example, in order to calculate GCIenergy, we determine K for each activityAi1i2
j′ as follows.
K j′i1i2 =ei1
e +∑ j∈J ei1j − (ei1
c + ei1i2j +∑
j′j=1 ei2
j )
ei1e +∑ j∈J ei1
j
(5.13)
An example is given in Figure 5.8, with one closed and one open-loop. K value is calculatedfor savings on energy. The values are created arbitrarily. K11
1 is calculated as follows:
K111 =
5+6+2− (2+1+2)5+6+2
= 0.62. (5.14)
K123 is calculated as follows:
61
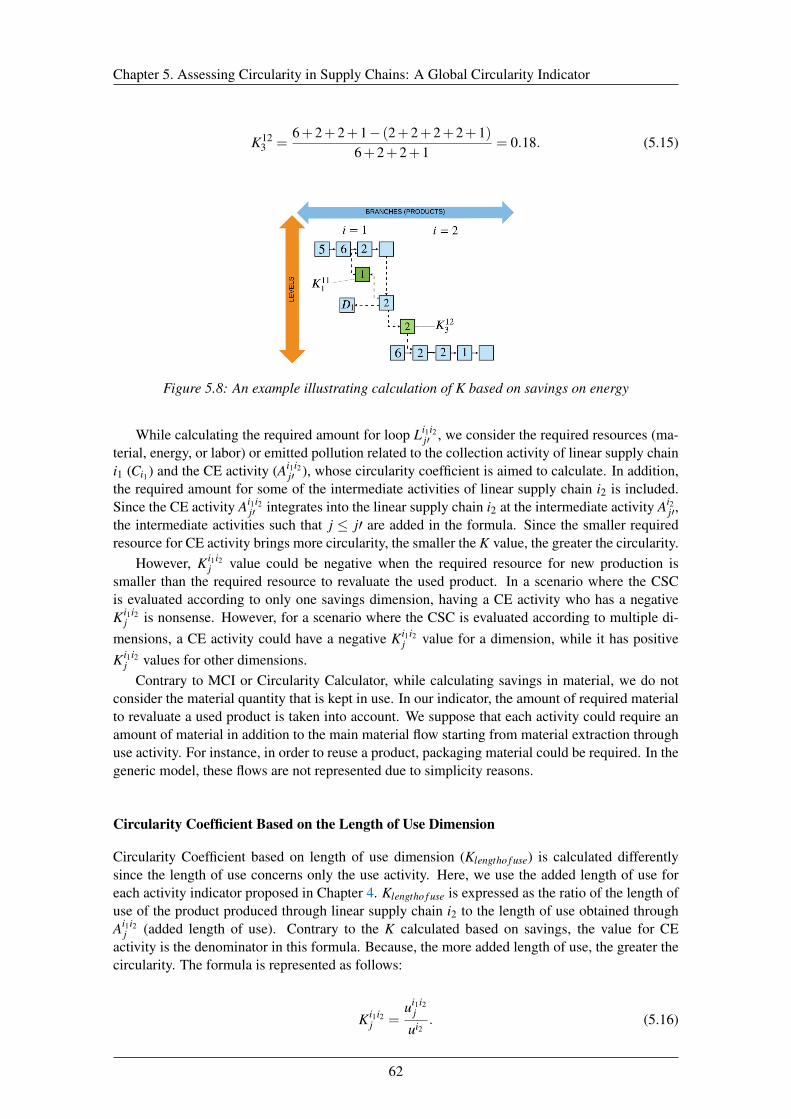
Chapter 5. Assessing Circularity in Supply Chains: A Global Circularity Indicator
K123 =
6+2+2+1− (2+2+2+2+1)6+2+2+1
= 0.18. (5.15)
Figure 5.8: An example illustrating calculation of K based on savings on energy
While calculating the required amount for loop Li1i2j′ , we consider the required resources (ma-
terial, energy, or labor) or emitted pollution related to the collection activity of linear supply chaini1 (Ci1) and the CE activity (Ai1i2
j′ ), whose circularity coefficient is aimed to calculate. In addition,the required amount for some of the intermediate activities of linear supply chain i2 is included.Since the CE activity Ai1i2
j′ integrates into the linear supply chain i2 at the intermediate activity Ai2j′,
the intermediate activities such that j ≤ j′ are added in the formula. Since the smaller requiredresource for CE activity brings more circularity, the smaller the K value, the greater the circularity.
However, Ki1i2j value could be negative when the required resource for new production is
smaller than the required resource to revaluate the used product. In a scenario where the CSCis evaluated according to only one savings dimension, having a CE activity who has a negativeKi1i2
j is nonsense. However, for a scenario where the CSC is evaluated according to multiple di-mensions, a CE activity could have a negative Ki1i2
j value for a dimension, while it has positiveKi1i2
j values for other dimensions.Contrary to MCI or Circularity Calculator, while calculating savings in material, we do not
consider the material quantity that is kept in use. In our indicator, the amount of required materialto revaluate a used product is taken into account. We suppose that each activity could require anamount of material in addition to the main material flow starting from material extraction throughuse activity. For instance, in order to reuse a product, packaging material could be required. In thegeneric model, these flows are not represented due to simplicity reasons.
Circularity Coefficient Based on the Length of Use Dimension
Circularity Coefficient based on length of use dimension (Klengtho f use) is calculated differentlysince the length of use concerns only the use activity. Here, we use the added length of use foreach activity indicator proposed in Chapter 4. Klengtho f use is expressed as the ratio of the length ofuse of the product produced through linear supply chain i2 to the length of use obtained throughAi1i2
j (added length of use). Contrary to the K calculated based on savings, the value for CEactivity is the denominator in this formula. Because, the more added length of use, the greater thecircularity. The formula is represented as follows:
Ki1i2j =
ui1i2j
ui2. (5.16)
62
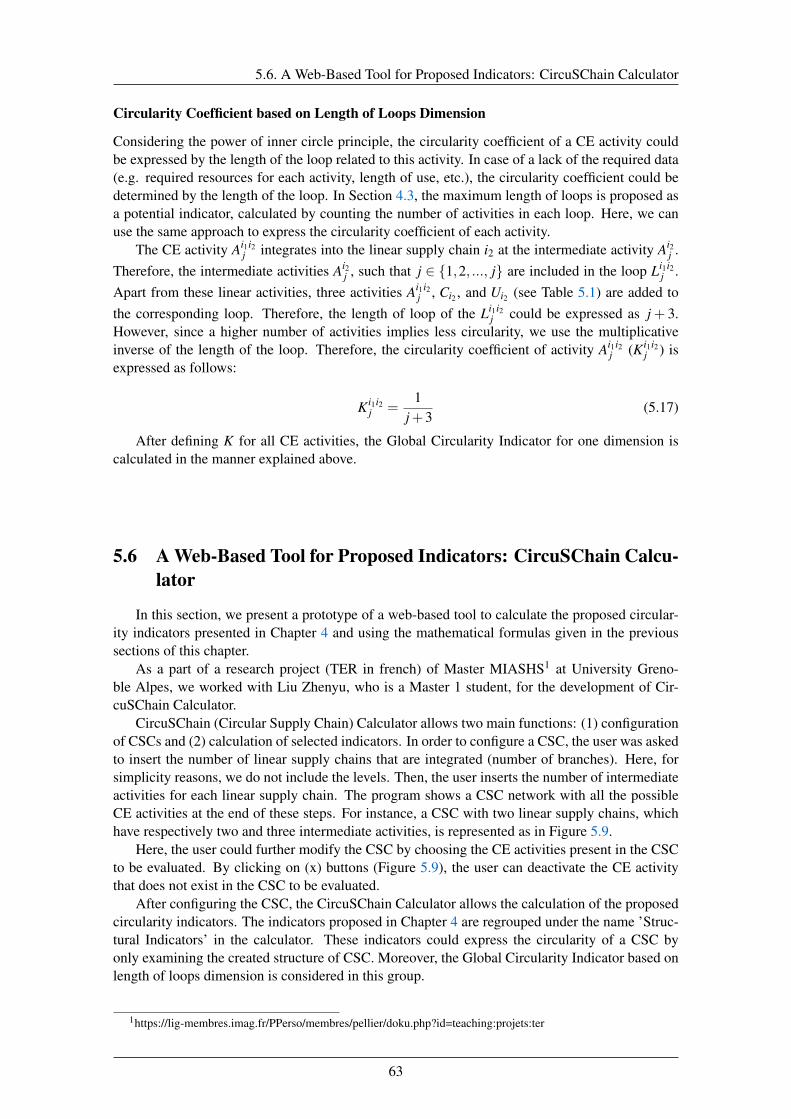
5.6. A Web-Based Tool for Proposed Indicators: CircuSChain Calculator
Circularity Coefficient based on Length of Loops Dimension
Considering the power of inner circle principle, the circularity coefficient of a CE activity couldbe expressed by the length of the loop related to this activity. In case of a lack of the required data(e.g. required resources for each activity, length of use, etc.), the circularity coefficient could bedetermined by the length of the loop. In Section 4.3, the maximum length of loops is proposed asa potential indicator, calculated by counting the number of activities in each loop. Here, we canuse the same approach to express the circularity coefficient of each activity.
The CE activity Ai1i2j integrates into the linear supply chain i2 at the intermediate activity Ai2
j .Therefore, the intermediate activities Ai2
j , such that j ∈ {1,2, ..., j} are included in the loop Li1i2j .
Apart from these linear activities, three activities Ai1i2j , Ci2 , and Ui2 (see Table 5.1) are added to
the corresponding loop. Therefore, the length of loop of the Li1i2j could be expressed as j + 3.
However, since a higher number of activities implies less circularity, we use the multiplicativeinverse of the length of the loop. Therefore, the circularity coefficient of activity Ai1i2
j (Ki1i2j ) is
expressed as follows:
Ki1i2j =
1j+3
(5.17)
After defining K for all CE activities, the Global Circularity Indicator for one dimension iscalculated in the manner explained above.
5.6 A Web-Based Tool for Proposed Indicators: CircuSChain Calcu-lator
In this section, we present a prototype of a web-based tool to calculate the proposed circular-ity indicators presented in Chapter 4 and using the mathematical formulas given in the previoussections of this chapter.
As a part of a research project (TER in french) of Master MIASHS1 at University Greno-ble Alpes, we worked with Liu Zhenyu, who is a Master 1 student, for the development of Cir-cuSChain Calculator.
CircuSChain (Circular Supply Chain) Calculator allows two main functions: (1) configurationof CSCs and (2) calculation of selected indicators. In order to configure a CSC, the user was askedto insert the number of linear supply chains that are integrated (number of branches). Here, forsimplicity reasons, we do not include the levels. Then, the user inserts the number of intermediateactivities for each linear supply chain. The program shows a CSC network with all the possibleCE activities at the end of these steps. For instance, a CSC with two linear supply chains, whichhave respectively two and three intermediate activities, is represented as in Figure 5.9.
Here, the user could further modify the CSC by choosing the CE activities present in the CSCto be evaluated. By clicking on (x) buttons (Figure 5.9), the user can deactivate the CE activitythat does not exist in the CSC to be evaluated.
After configuring the CSC, the CircuSChain Calculator allows the calculation of the proposedcircularity indicators. The indicators proposed in Chapter 4 are regrouped under the name ’Struc-tural Indicators’ in the calculator. These indicators could express the circularity of a CSC byonly examining the created structure of CSC. Moreover, the Global Circularity Indicator based onlength of loops dimension is considered in this group.
1https://lig-membres.imag.fr/PPerso/membres/pellier/doku.php?id=teaching:projets:ter
63
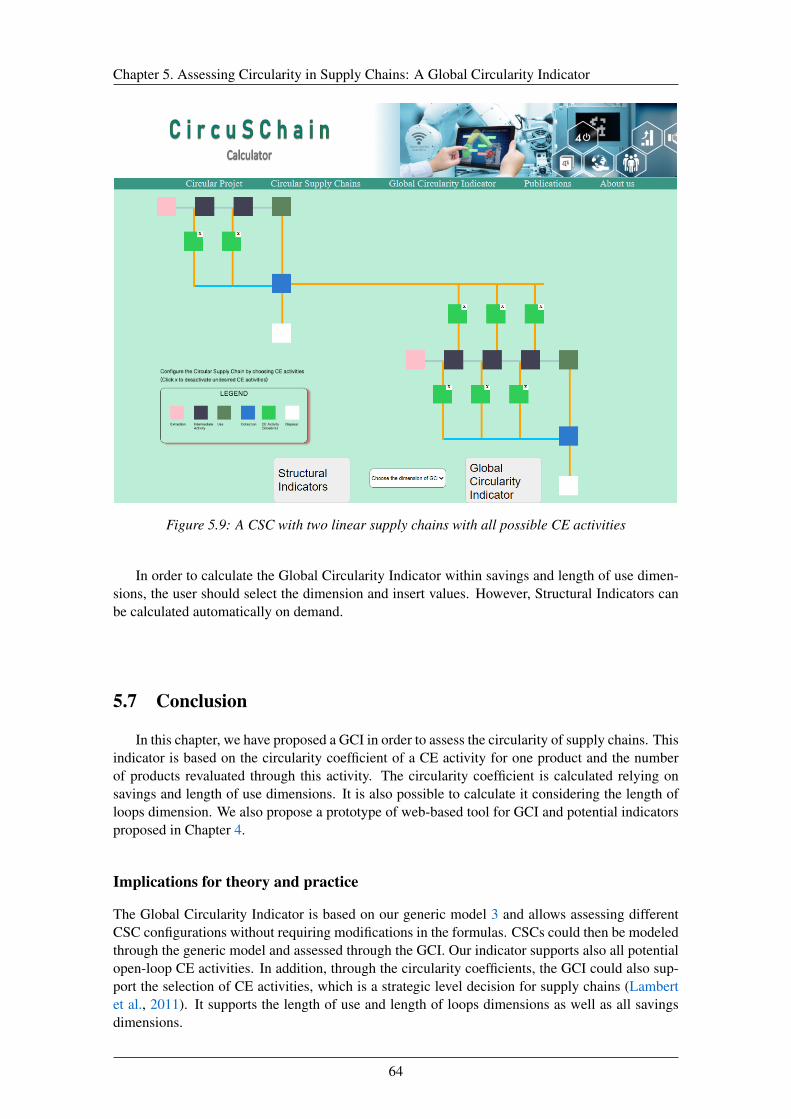
Chapter 5. Assessing Circularity in Supply Chains: A Global Circularity Indicator
Figure 5.9: A CSC with two linear supply chains with all possible CE activities
In order to calculate the Global Circularity Indicator within savings and length of use dimen-sions, the user should select the dimension and insert values. However, Structural Indicators canbe calculated automatically on demand.
5.7 Conclusion
In this chapter, we have proposed a GCI in order to assess the circularity of supply chains. Thisindicator is based on the circularity coefficient of a CE activity for one product and the numberof products revaluated through this activity. The circularity coefficient is calculated relying onsavings and length of use dimensions. It is also possible to calculate it considering the length ofloops dimension. We also propose a prototype of web-based tool for GCI and potential indicatorsproposed in Chapter 4.
Implications for theory and practice
The Global Circularity Indicator is based on our generic model 3 and allows assessing differentCSC configurations without requiring modifications in the formulas. CSCs could then be modeledthrough the generic model and assessed through the GCI. Our indicator supports also all potentialopen-loop CE activities. In addition, through the circularity coefficients, the GCI could also sup-port the selection of CE activities, which is a strategic level decision for supply chains (Lambertet al., 2011). It supports the length of use and length of loops dimensions as well as all savingsdimensions.
64

5.7. Conclusion
Limitations and future works
However, our GCI has some limitations. It does not allow yet measuring the contribution of eachactor to the circularity of a CSC, although it gives insights into the contribution of different CSCparts. It does not take into account consecutive loops dimension. However, this dimension couldbe considered in the formula inspiring from (Figge et al., 2018). Furthermore, we can currentlycalculate a separate GCI indicator for each dimension. In order to have a global vision, a multi-criteria approach or an aggregation method could be helpful. Finally, an experimental study isneeded in order to evaluate and validate our indicator.
65

6A Serious Game for Circular Supply Chains
Contents6.1 Introduction . . . . . . . . . . . . . . . . . . . . . . . . . . . . . . . . . . . 686.2 Background . . . . . . . . . . . . . . . . . . . . . . . . . . . . . . . . . . . 68
6.2.1 Beer Distribution Game . . . . . . . . . . . . . . . . . . . . . . . . . 686.2.2 Serious Games related to the Circular Supply Chains . . . . . . . . . . 69
6.3 Methodology . . . . . . . . . . . . . . . . . . . . . . . . . . . . . . . . . . . 696.4 CircuSChain Game . . . . . . . . . . . . . . . . . . . . . . . . . . . . . . . 71
6.4.1 Game Description . . . . . . . . . . . . . . . . . . . . . . . . . . . . 716.4.2 Game Flows . . . . . . . . . . . . . . . . . . . . . . . . . . . . . . . 72
6.5 Experiment and Analysis . . . . . . . . . . . . . . . . . . . . . . . . . . . . 776.6 Conclusion . . . . . . . . . . . . . . . . . . . . . . . . . . . . . . . . . . . . 80
In this chapter, we worked with Soufiane Kaddouri, as a part of a research internship of IndustrialEngineering Master at Grenoble INP (Kaddouri, 2021), as well as Abdessalem Tebbikh, Idir Nait-Ali, and Sami Bouhroum as a part of excellence internship at Univeristé Grenoble Alpes.
Related publication: Kurt, A., Cortes-Cornax, M., Cung, V.-D., Mangione, F., & Kaddouri, S.(2022). CircuSChain Game: A serious game to explore circular supply chains. In Handbook ofResearch on Promoting Economic and Social Development Through Serious Games. IGI Globale.(Accepted).
67
Chapter 6. A Serious Game for Circular Supply Chains
6.1 Introduction
This chapter addresses research question RQ4: How to raise awareness and increase the knowl-edge about CSCs using the proposed tools? The transition from linear supply chains to CSCs ischallenging for companies due to the insufficient knowledge and awareness among supply chainmembers (Govindan & Hasanagic, 2018; Mangla et al., 2018) and customers (Vermunt et al.,2019), as well as lack of appropriate training and development programs about CE for supplychain members (Mangla et al., 2018).
Besides, serious games have been used in training in business and management areas sincethe 1950s and 1960s (Qualters et al., 2008). The serious games that combine gaming and learning(Neck & Greene, 2011) help participants learn decision-making in complex systems (Qualterset al., 2008). Scholars stated as well the advantages of serious games for attracting students’attention and helping them retain the acquired knowledge (Madani et al., 2017). Moreover, seriousgames could be a way to increase environmental awareness (Ponce et al., 2020).
Therefore, in order to overcome the challenges due to the insufficient knowledge and aware-ness about CSCs, we develop a serious game named CircuSChain (Circular Supply Chain) Game,based on the well-known Beer Distribution Game (Sterman, 1989). The game is tested by anexperiment with industrial engineering students. CircuSChain Game considers proposed CSCcharacteristics and the Generic Model (Chapter 3).
This chapter is structured as follows. Section 6.2 presents the background of the work. Sec-tion 6.3 gives the adopted methodology. The CircuSChain Game is introduced in Section 6.4 withits characteristics and the game flows. Section 6.5 presents the experiment, as well as its analysis.Finally, Section 6.6 gives some concluding remarks.
6.2 Background
First, the Beer Distribution Game is introduced since the CircuSChain Game is based on thisgame. Second, some related serious games about CSCs from literature are presented to show thatthere are only a few Serious Games related to CSC, and none of them consider all the CSCs char-acteristics we have defined in our generic model in Chapter 3.
6.2.1 Beer Distribution Game
The serious game developed in this chapter is based on the « Beer Distribution Game » createdin the 1960s. The Beer Distribution Game has board and computer game versions. This gameillustrates the bullwhip effect in supply chains. Through this game, material and information flowin a linear supply chain are simulated (Metters, 1997).
The Beer Distribution Game is played by four players: a retailer, a wholesaler, a distributor,and a factory. Final customer orders are satisfied by the retailer, who receives products fromthe wholesaler. The wholesaler orders from the distributor and sends products to the retailer.The distributor, who is supplied from the factory, ships products to the wholesaler. The factoryproduces the products. In each period, the supply chain members decide the quantity to order fromtheir suppliers, and the factory decides how much to produce. Players take into consideration theinventory and backlog cost. There is one period of shipping and order receiving delays. In the BeerDistribution Game, materials flow from upstream to downstream actors, and information movesin the reverse direction via material flows, like real supply chains.
68

6.3. Methodology
6.2.2 Serious Games related to the Circular Supply Chains
Some Serious Games from related concepts, such as Closed-Loop Supply Chains or SustainableSupply Chains are also included in this section. Table 6.1 presents selected serious games andtheir contents.
Serious Game Reference Concept
Chain of Com-mand and Looper
Aguiar et al.(2018); Cuesta &Nakano (2017)
Environment: Closed-loop Supply Chain, recycle remanufacturing,CO² emissions, government environmental regulations, and investmentin green technologies.Economic: Supply chain optimization through lead times and produc-tion efficiencySocial: Ethics between firmsRisk management: Supply risk mitigation
In The Loop Whalen et al.(2018)
Material criticality
CE concepts (Product as service, maintenance, repair, reuse, remanu-facturing, refurbishing)Other potential solutions (Diversify supply chain or increase supplychain transparency, material substitution, invest in new technologies,etc.)
Shortfall Sivak et al.(2007)
Environment: Waste disposal, recovery, and recycling
Economic: ProfitCircuSChainGame
Our proposition CE concepts: CO² emissions, reuse, refurbishing, remanufacturing, re-cycling, and repurposingMaterial scarcityEconomic: Profit
Table 6.1: Serious games about the CE
As seen in Table 6.1, repurposing activities or open-loops are not considered by these games.However, repurposing activities and their related open-loops constitute a new potential for CSCs.Moreover, these works complement our work since they consider other approaches, such as social,risk (Aguiar et al., 2018; Cuesta & Nakano, 2017), new technologies, and material substitution(Whalen et al., 2018).
6.3 Methodology
CircuSChain Game is designed based on Beer Distribution Game and our generic model. Ourmethodology is represented in Figure 6.1, which zooms in on Figure 1.1.
As suggested by Carrión-Toro et al. (2020), the development of serious games requires a spe-cific design methodology. In this article, the authors mentioned several serious game designmethodologies, such as (Avila-Pesantez et al., 2019; Jiménez-Hernández et al., 2016; Marfisi-Schottman et al., 2010). Since the CircuSChain Game is a board game, the seven steps method-ology proposed by Marfisi-Schottman et al. (2010) that is designed for both digital and boardgames has been chosen. The other methodologies mainly target video/digital games. Besides,this methodology suits CircuSChain Game better because it contains a pedagogical quality controlstep for board games that allows determining the game parameters and testing the game during thedesign phase.
Since the developed game is based on the Beer Distribution Game, the elements of this previ-ous game are maintained in some steps. The seven steps of the adopted methodology can be statedas follows:
Step 1: concerns the determination of the pedagogical objectives. Note that the objectives of theCircuSChain Game are different from those of the Beer Distribution Game (bullwhip effect,inventory management, order and transport lead-times, etc.). Through the CircuSChain
69
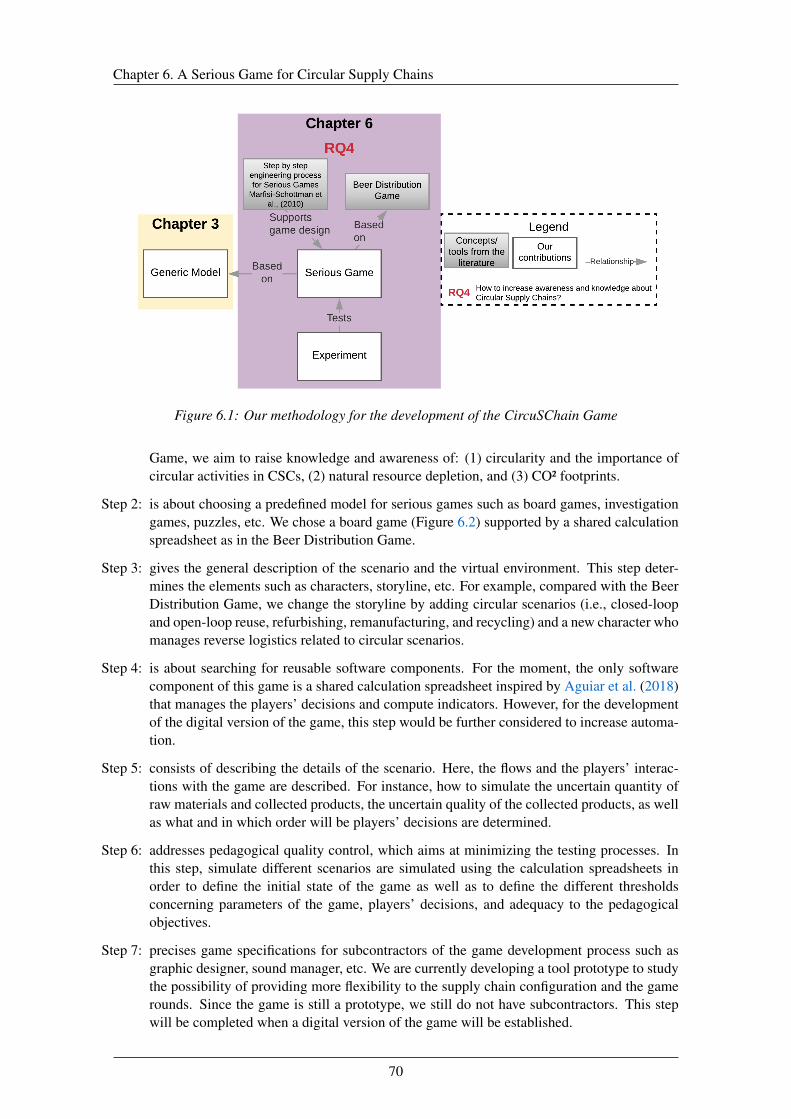
Chapter 6. A Serious Game for Circular Supply Chains
Figure 6.1: Our methodology for the development of the CircuSChain Game
Game, we aim to raise knowledge and awareness of: (1) circularity and the importance ofcircular activities in CSCs, (2) natural resource depletion, and (3) CO² footprints.
Step 2: is about choosing a predefined model for serious games such as board games, investigationgames, puzzles, etc. We chose a board game (Figure 6.2) supported by a shared calculationspreadsheet as in the Beer Distribution Game.
Step 3: gives the general description of the scenario and the virtual environment. This step deter-mines the elements such as characters, storyline, etc. For example, compared with the BeerDistribution Game, we change the storyline by adding circular scenarios (i.e., closed-loopand open-loop reuse, refurbishing, remanufacturing, and recycling) and a new character whomanages reverse logistics related to circular scenarios.
Step 4: is about searching for reusable software components. For the moment, the only softwarecomponent of this game is a shared calculation spreadsheet inspired by Aguiar et al. (2018)that manages the players’ decisions and compute indicators. However, for the developmentof the digital version of the game, this step would be further considered to increase automa-tion.
Step 5: consists of describing the details of the scenario. Here, the flows and the players’ interac-tions with the game are described. For instance, how to simulate the uncertain quantity ofraw materials and collected products, the uncertain quality of the collected products, as wellas what and in which order will be players’ decisions are determined.
Step 6: addresses pedagogical quality control, which aims at minimizing the testing processes. Inthis step, simulate different scenarios are simulated using the calculation spreadsheets inorder to define the initial state of the game as well as to define the different thresholdsconcerning parameters of the game, players’ decisions, and adequacy to the pedagogicalobjectives.
Step 7: precises game specifications for subcontractors of the game development process such asgraphic designer, sound manager, etc. We are currently developing a tool prototype to studythe possibility of providing more flexibility to the supply chain configuration and the gamerounds. Since the game is still a prototype, we still do not have subcontractors. This stepwill be completed when a digital version of the game will be established.
70
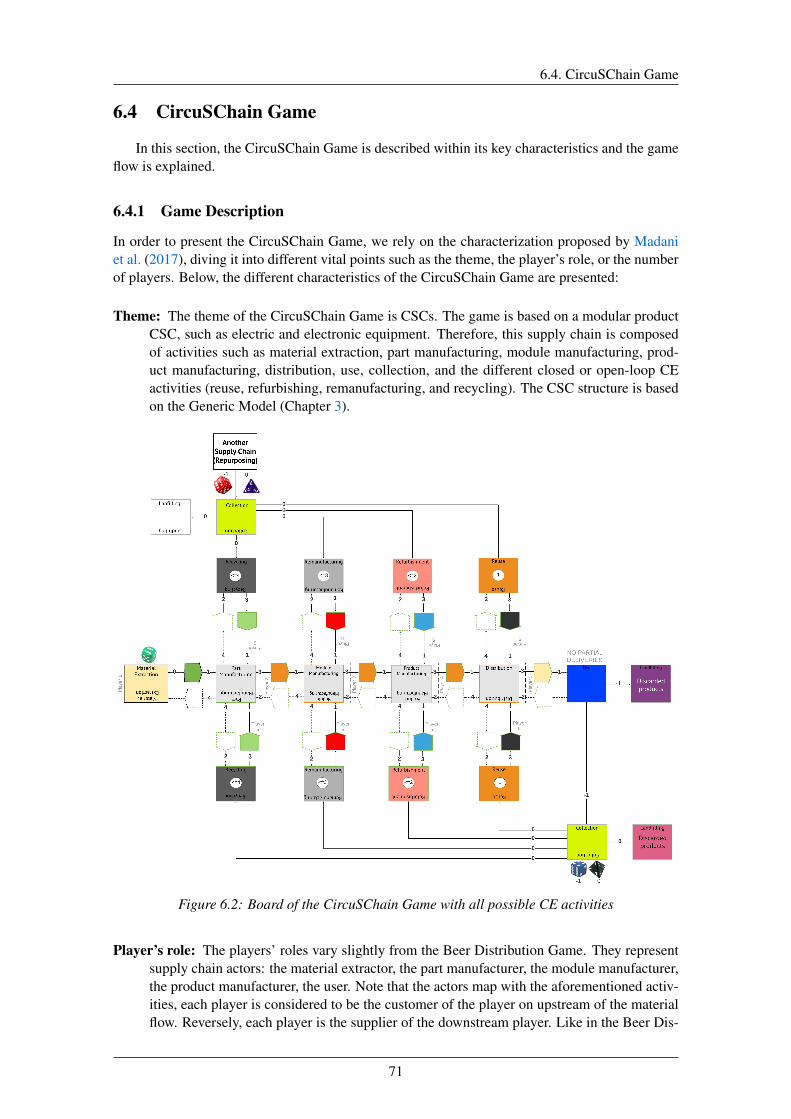
6.4. CircuSChain Game
6.4 CircuSChain Game
In this section, the CircuSChain Game is described within its key characteristics and the gameflow is explained.
6.4.1 Game Description
In order to present the CircuSChain Game, we rely on the characterization proposed by Madaniet al. (2017), diving it into different vital points such as the theme, the player’s role, or the numberof players. Below, the different characteristics of the CircuSChain Game are presented:
Theme: The theme of the CircuSChain Game is CSCs. The game is based on a modular productCSC, such as electric and electronic equipment. Therefore, this supply chain is composedof activities such as material extraction, part manufacturing, module manufacturing, prod-uct manufacturing, distribution, use, collection, and the different closed or open-loop CEactivities (reuse, refurbishing, remanufacturing, and recycling). The CSC structure is basedon the Generic Model (Chapter 3).
Figure 6.2: Board of the CircuSChain Game with all possible CE activities
Player’s role: The players’ roles vary slightly from the Beer Distribution Game. They representsupply chain actors: the material extractor, the part manufacturer, the module manufacturer,the product manufacturer, the user. Note that the actors map with the aforementioned activ-ities, each player is considered to be the customer of the player on upstream of the materialflow. Reversely, each player is the supplier of the downstream player. Like in the Beer Dis-
71

Chapter 6. A Serious Game for Circular Supply Chains
tribution Game, the players control the material flow (production and transportation) andinformation flow (demands).
Number of players: The CircuSChain Game is designed as a team game. Each team is consti-tuted of at most five members.
Game objective: Each team has a global but multi-criteria objective, which is to minimize CO²emissions, extracted natural resources and discarded products, as well as make an economicprofit by fulfilling user orders and minimizing costs. While selecting indicators, we exploitthe indicators classified with our classification tool in Chapter 5. The selected indicators arethe profit, the circularity rate (Cullen, 2017), the quantity of CO² emissions, the quantity ofnatural resources consumed, and the quantity of discarded products. The profit is calculatedconsidering inventory, production, shipping, missing sales, and inventory costs, as well asrevenue coming from sold products.
Participants: Our main target groups are students and supply chain professionals. Potentially,the game could target other persons interested in the role of CSC within the CE.
Type of game: Our game is designed as a board game supported by a collaborative calculationspreadsheet. Thanks to the latter, players indicate in their own tab their respective demandsto suppliers. Moreover, different automatic calculations provide the computation of theaforementioned indicators based on production and inventory management. Indeed, it couldbe considered as a hybrid simulation game since it is designed as a board game that usescomputer simulation to obtain results.
Graphics: A playing board is designed for CircuSChain Game. As seen in Figure 6.2, the boardcontains an inventory-manufacturing rectangle for each player. These rectangles are calledwith the name of the activity, such as material extraction, use landfilling, etc. Betweenthese inventory-manufacturing rectangles of each player, the transport and demand arrowsare placed to simulate material and information flows between the CSC actors. We designa game board with a modular structure in order to modify the structure of the supply chain.This structure eases transforming the linear supply chain in CSC by plugging the collectionand the selected CE activities into the linear supply chain.
6.4.2 Game Flows
As Beer Distribution Game, there is one period of delay in material and information flows. In theCircuSChain Game, in order to simulate the products, tokens are used. The total raw materialsavailable for the extraction are limited for the whole game. Additionally, the available quantity ofraw materials is considered limited and uncertain for each round. It is simulated by a 6-sided dice.The demands are represented by cards filled by players (and noted in their respective calculationspreadsheet’s tab). Final customer order quantities represented by order cards are drawn at randomand unknown to the players at the beginning of each round, represented by order cards.
The first version of the CircuSChain Game is played in three years. Each year has six roundsthat represent a period of two months. This division is justified thanks to previous simulations andtests in order to fit in a three-hour session. During each year, the players manage the material andinformation flows (demands). The game flows in each year are explained below.
First Year Simulation: Linear Supply Chain
In the first year, the players manage a linear supply chain as in the Beer Distribution Game. Thegame board of this year is represented in Figure 6.3. This year is designed in order to learn thegame flows and raise awareness of natural resource depletion and CO² emissions.
72
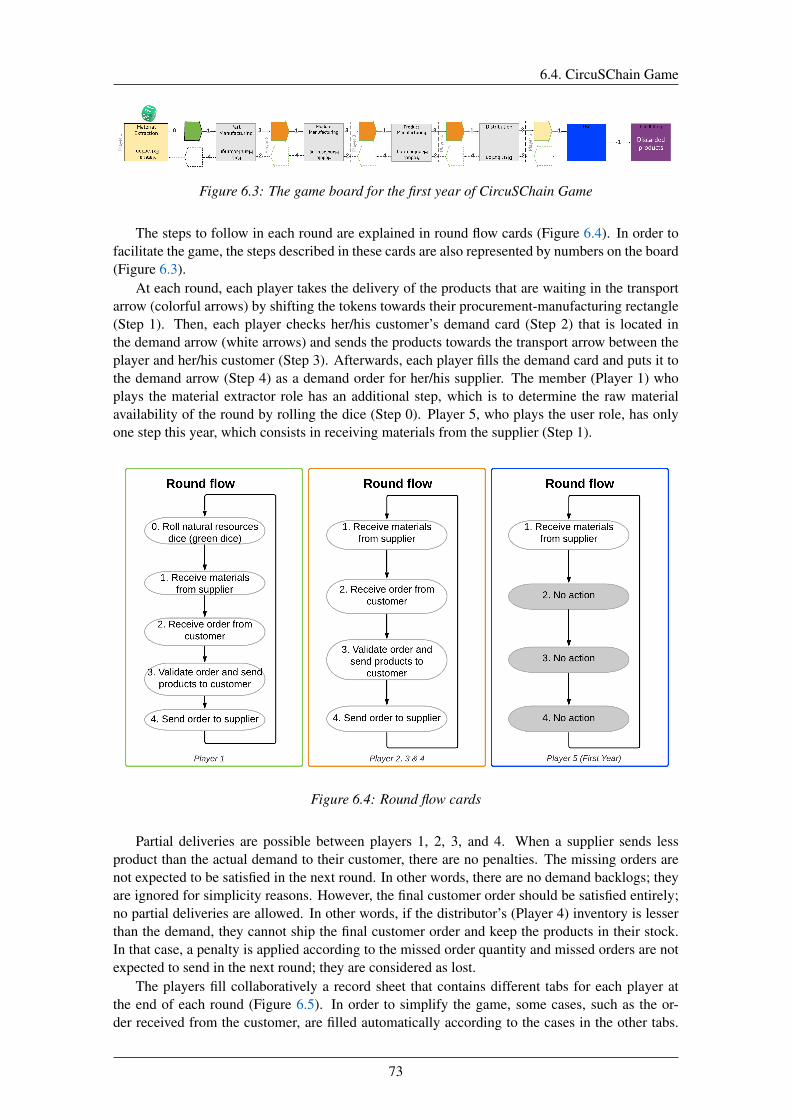
6.4. CircuSChain Game
Figure 6.3: The game board for the first year of CircuSChain Game
The steps to follow in each round are explained in round flow cards (Figure 6.4). In order tofacilitate the game, the steps described in these cards are also represented by numbers on the board(Figure 6.3).
At each round, each player takes the delivery of the products that are waiting in the transportarrow (colorful arrows) by shifting the tokens towards their procurement-manufacturing rectangle(Step 1). Then, each player checks her/his customer’s demand card (Step 2) that is located inthe demand arrow (white arrows) and sends the products towards the transport arrow between theplayer and her/his customer (Step 3). Afterwards, each player fills the demand card and puts it tothe demand arrow (Step 4) as a demand order for her/his supplier. The member (Player 1) whoplays the material extractor role has an additional step, which is to determine the raw materialavailability of the round by rolling the dice (Step 0). Player 5, who plays the user role, has onlyone step this year, which consists in receiving materials from the supplier (Step 1).
Figure 6.4: Round flow cards
Partial deliveries are possible between players 1, 2, 3, and 4. When a supplier sends lessproduct than the actual demand to their customer, there are no penalties. The missing orders arenot expected to be satisfied in the next round. In other words, there are no demand backlogs; theyare ignored for simplicity reasons. However, the final customer order should be satisfied entirely;no partial deliveries are allowed. In other words, if the distributor’s (Player 4) inventory is lesserthan the demand, they cannot ship the final customer order and keep the products in their stock.In that case, a penalty is applied according to the missed order quantity and missed orders are notexpected to send in the next round; they are considered as lost.
The players fill collaboratively a record sheet that contains different tabs for each player atthe end of each round (Figure 6.5). In order to simplify the game, some cases, such as the or-der received from the customer, are filled automatically according to the cases in the other tabs.
73
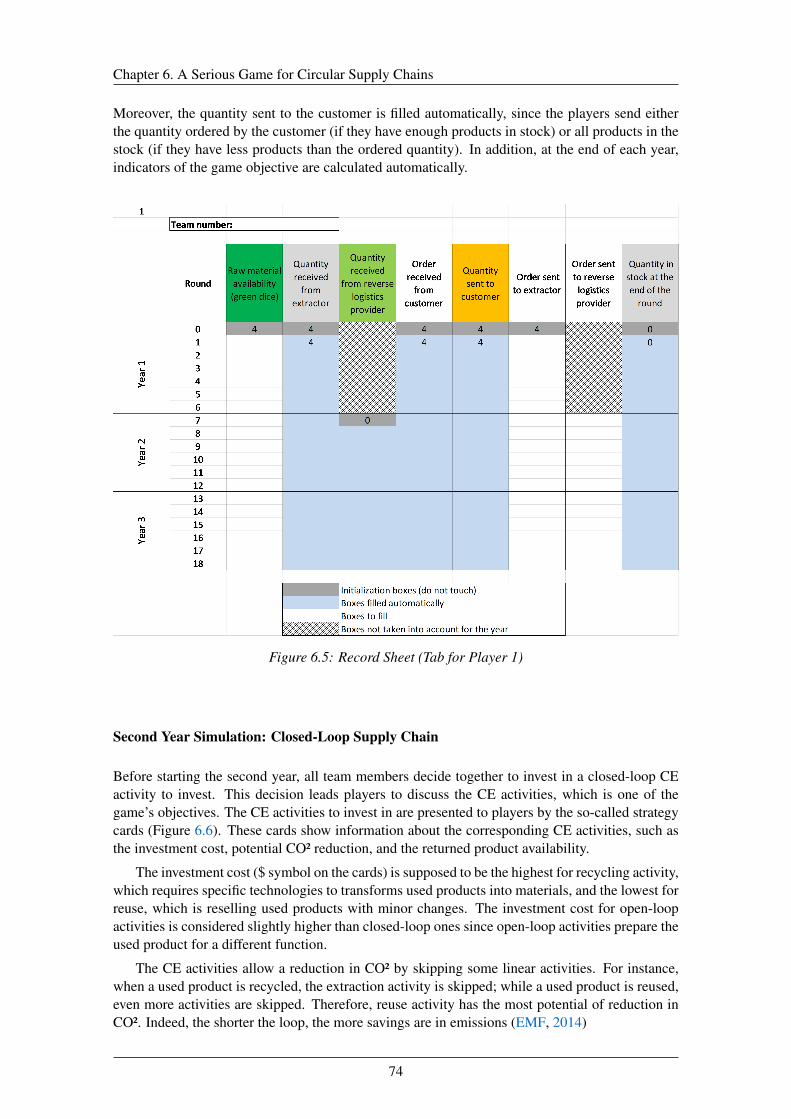
Chapter 6. A Serious Game for Circular Supply Chains
Moreover, the quantity sent to the customer is filled automatically, since the players send eitherthe quantity ordered by the customer (if they have enough products in stock) or all products in thestock (if they have less products than the ordered quantity). In addition, at the end of each year,indicators of the game objective are calculated automatically.
Figure 6.5: Record Sheet (Tab for Player 1)
Second Year Simulation: Closed-Loop Supply Chain
Before starting the second year, all team members decide together to invest in a closed-loop CEactivity to invest. This decision leads players to discuss the CE activities, which is one of thegame’s objectives. The CE activities to invest in are presented to players by the so-called strategycards (Figure 6.6). These cards show information about the corresponding CE activities, such asthe investment cost, potential CO² reduction, and the returned product availability.
The investment cost ($ symbol on the cards) is supposed to be the highest for recycling activity,which requires specific technologies to transforms used products into materials, and the lowest forreuse, which is reselling used products with minor changes. The investment cost for open-loopactivities is considered slightly higher than closed-loop ones since open-loop activities prepare theused product for a different function.
The CE activities allow a reduction in CO² by skipping some linear activities. For instance,when a used product is recycled, the extraction activity is skipped; while a used product is reused,even more activities are skipped. Therefore, reuse activity has the most potential of reduction inCO². Indeed, the shorter the loop, the more savings are in emissions (EMF, 2014)
74

6.4. CircuSChain Game
Figure 6.6: Strategy Cards
The availability of products is related to the used products state. We suppose that the returnedproducts are not all eligible for all CE activities. For instance, reuse activity requires a goodproduct state, while recycling does not have any requirement. Therefore, all collected products aresupposed to be recyclable. In other words, it is considered that all products, even the most damagedones, could be recycled. Therefore, the availability is the highest for recycling and the lowest forreuse. Through the modular structure of the board, the collection activity and the selected CEactivity are added to the board. In the second year, the member who plays the user role (Player5) also under-takes the reverse logistics provider role and manages the added collection and CEactivities.
In order to simulate the uncertainties of the quantity and the quality state of the returnedproducts, which are the biggest challenges in reverse logistics (Werning & Spinler, 2020), a 6-sided and a 4-sided dice are used, respectively. For instance, reuse requires a good product state(represented by 1 on the 4-sided dice), while the others have less stringent requirements, such asrefurbishing (≤ 2 on the 4-sided dice), remanufacturing (≤ 3 on the 4-sided dice), and recycling(≤ 4 on the 4-sided dice). In order to remind the quality state requirements of each CE activity,numbers from 1 to 4 are indicated on each CE activity rectangle on the game board.
Collection and sorting of the used products are simulated by Player 5 (reverse logistics provider).The round flow card for Player 5 designed for the second and third years is represented by Fig-ure 6.7. First, player 5 rolls the 6-sided dice in order to determine the quantity of the collectedproduct (Step -1) and then the 4-sided dice to determine the state of the returned products (Step 0).If the products’ state is eligible for the selected CE activity, s/he moves the products through thecorresponding CE activity’s rectangle (Step 0). In the other cases, products are moved to landfillrectangle. Then, s/he checks the customer’s order (Step 2) and sends products to their customer(Step 3). The customer of Player 5 is one of the other players, who manage the linear supply chain.
75
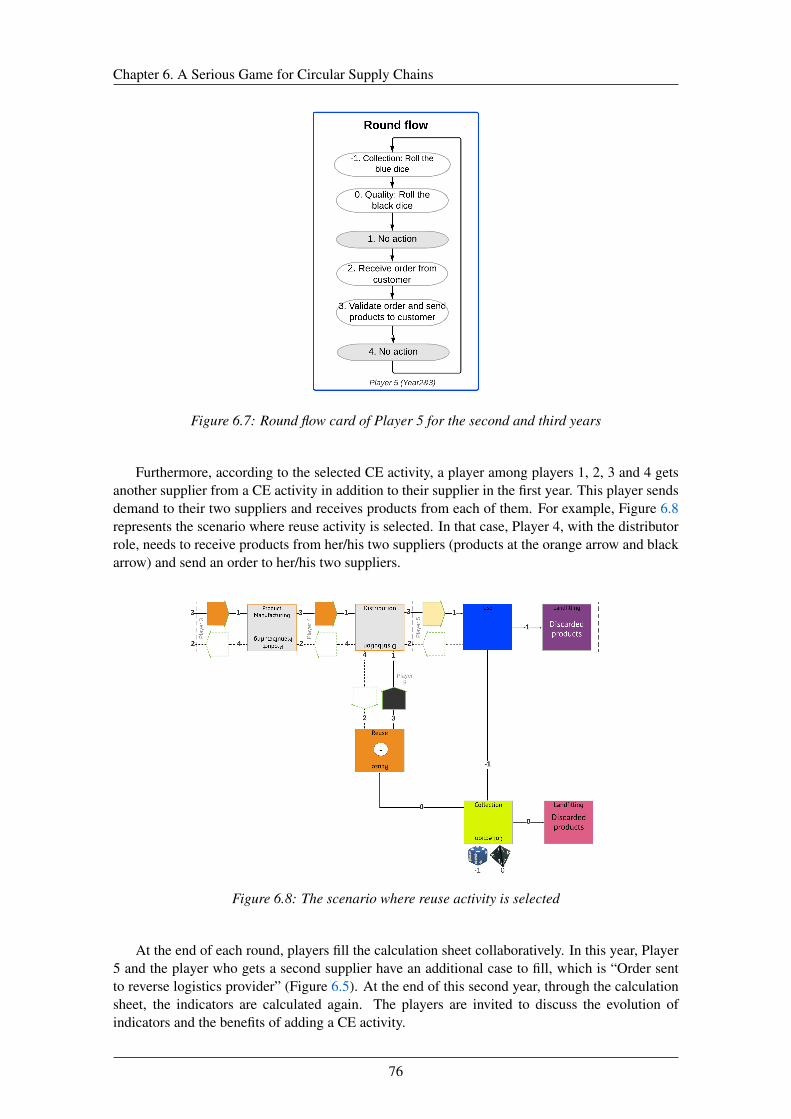
Chapter 6. A Serious Game for Circular Supply Chains
Figure 6.7: Round flow card of Player 5 for the second and third years
Furthermore, according to the selected CE activity, a player among players 1, 2, 3 and 4 getsanother supplier from a CE activity in addition to their supplier in the first year. This player sendsdemand to their two suppliers and receives products from each of them. For example, Figure 6.8represents the scenario where reuse activity is selected. In that case, Player 4, with the distributorrole, needs to receive products from her/his two suppliers (products at the orange arrow and blackarrow) and send an order to her/his two suppliers.
Figure 6.8: The scenario where reuse activity is selected
At the end of each round, players fill the calculation sheet collaboratively. In this year, Player5 and the player who gets a second supplier have an additional case to fill, which is “Order sentto reverse logistics provider” (Figure 6.5). At the end of this second year, through the calculationsheet, the indicators are calculated again. The players are invited to discuss the evolution ofindicators and the benefits of adding a CE activity.
76
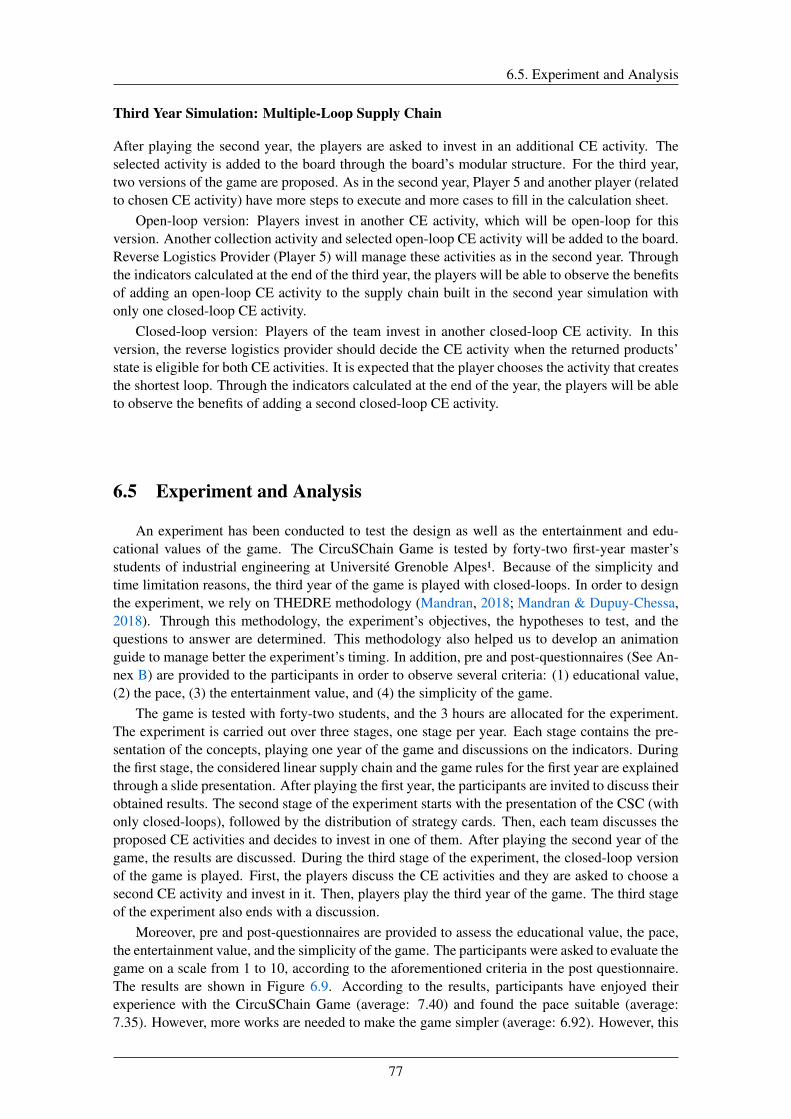
6.5. Experiment and Analysis
Third Year Simulation: Multiple-Loop Supply Chain
After playing the second year, the players are asked to invest in an additional CE activity. Theselected activity is added to the board through the board’s modular structure. For the third year,two versions of the game are proposed. As in the second year, Player 5 and another player (relatedto chosen CE activity) have more steps to execute and more cases to fill in the calculation sheet.
Open-loop version: Players invest in another CE activity, which will be open-loop for thisversion. Another collection activity and selected open-loop CE activity will be added to the board.Reverse Logistics Provider (Player 5) will manage these activities as in the second year. Throughthe indicators calculated at the end of the third year, the players will be able to observe the benefitsof adding an open-loop CE activity to the supply chain built in the second year simulation withonly one closed-loop CE activity.
Closed-loop version: Players of the team invest in another closed-loop CE activity. In thisversion, the reverse logistics provider should decide the CE activity when the returned products’state is eligible for both CE activities. It is expected that the player chooses the activity that createsthe shortest loop. Through the indicators calculated at the end of the year, the players will be ableto observe the benefits of adding a second closed-loop CE activity.
6.5 Experiment and Analysis
An experiment has been conducted to test the design as well as the entertainment and edu-cational values of the game. The CircuSChain Game is tested by forty-two first-year master’sstudents of industrial engineering at Université Grenoble Alpes¹. Because of the simplicity andtime limitation reasons, the third year of the game is played with closed-loops. In order to designthe experiment, we rely on THEDRE methodology (Mandran, 2018; Mandran & Dupuy-Chessa,2018). Through this methodology, the experiment’s objectives, the hypotheses to test, and thequestions to answer are determined. This methodology also helped us to develop an animationguide to manage better the experiment’s timing. In addition, pre and post-questionnaires (See An-nex B) are provided to the participants in order to observe several criteria: (1) educational value,(2) the pace, (3) the entertainment value, and (4) the simplicity of the game.
The game is tested with forty-two students, and the 3 hours are allocated for the experiment.The experiment is carried out over three stages, one stage per year. Each stage contains the pre-sentation of the concepts, playing one year of the game and discussions on the indicators. Duringthe first stage, the considered linear supply chain and the game rules for the first year are explainedthrough a slide presentation. After playing the first year, the participants are invited to discuss theirobtained results. The second stage of the experiment starts with the presentation of the CSC (withonly closed-loops), followed by the distribution of strategy cards. Then, each team discusses theproposed CE activities and decides to invest in one of them. After playing the second year of thegame, the results are discussed. During the third stage of the experiment, the closed-loop versionof the game is played. First, the players discuss the CE activities and they are asked to choose asecond CE activity and invest in it. Then, players play the third year of the game. The third stageof the experiment also ends with a discussion.
Moreover, pre and post-questionnaires are provided to assess the educational value, the pace,the entertainment value, and the simplicity of the game. The participants were asked to evaluate thegame on a scale from 1 to 10, according to the aforementioned criteria in the post questionnaire.The results are shown in Figure 6.9. According to the results, participants have enjoyed theirexperience with the CircuSChain Game (average: 7.40) and found the pace suitable (average:7.35). However, more works are needed to make the game simpler (average: 6.92). However, this
77
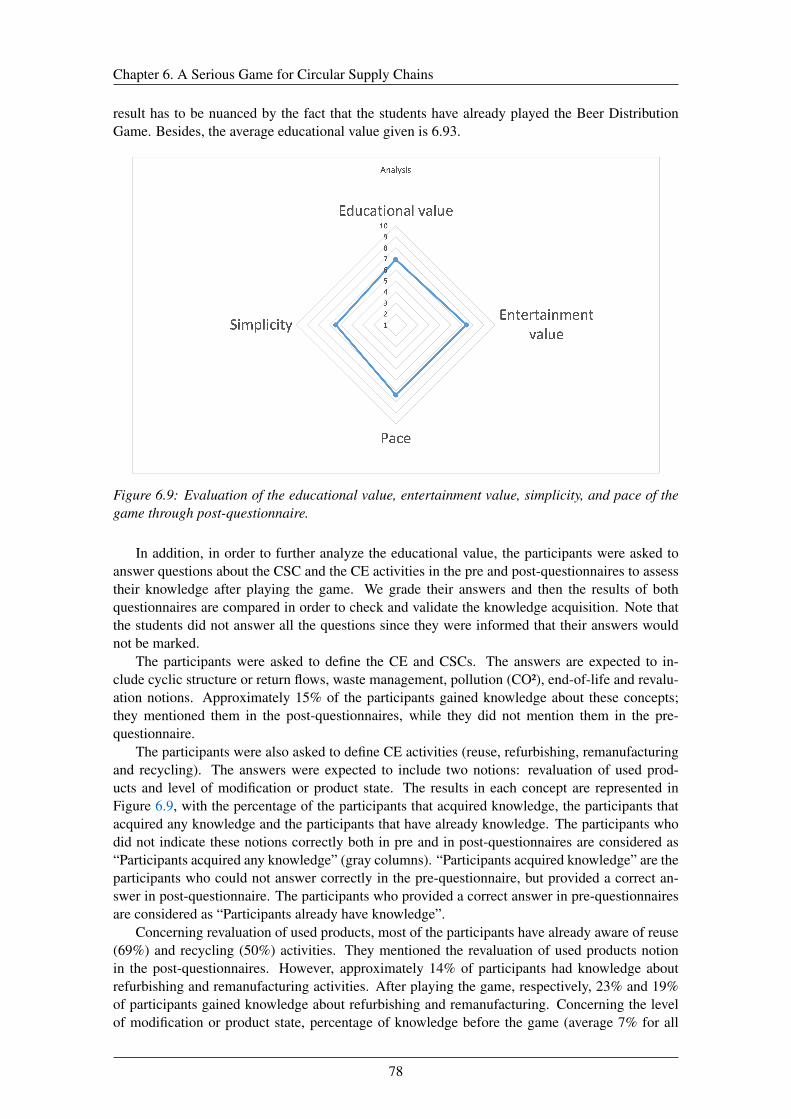
Chapter 6. A Serious Game for Circular Supply Chains
result has to be nuanced by the fact that the students have already played the Beer DistributionGame. Besides, the average educational value given is 6.93.
Figure 6.9: Evaluation of the educational value, entertainment value, simplicity, and pace of thegame through post-questionnaire.
In addition, in order to further analyze the educational value, the participants were asked toanswer questions about the CSC and the CE activities in the pre and post-questionnaires to assesstheir knowledge after playing the game. We grade their answers and then the results of bothquestionnaires are compared in order to check and validate the knowledge acquisition. Note thatthe students did not answer all the questions since they were informed that their answers wouldnot be marked.
The participants were asked to define the CE and CSCs. The answers are expected to in-clude cyclic structure or return flows, waste management, pollution (CO²), end-of-life and revalu-ation notions. Approximately 15% of the participants gained knowledge about these concepts;they mentioned them in the post-questionnaires, while they did not mention them in the pre-questionnaire.
The participants were also asked to define CE activities (reuse, refurbishing, remanufacturingand recycling). The answers were expected to include two notions: revaluation of used prod-ucts and level of modification or product state. The results in each concept are represented inFigure 6.9, with the percentage of the participants that acquired knowledge, the participants thatacquired any knowledge and the participants that have already knowledge. The participants whodid not indicate these notions correctly both in pre and in post-questionnaires are considered as“Participants acquired any knowledge” (gray columns). “Participants acquired knowledge” are theparticipants who could not answer correctly in the pre-questionnaire, but provided a correct an-swer in post-questionnaire. The participants who provided a correct answer in pre-questionnairesare considered as “Participants already have knowledge”.
Concerning revaluation of used products, most of the participants have already aware of reuse(69%) and recycling (50%) activities. They mentioned the revaluation of used products notionin the post-questionnaires. However, approximately 14% of participants had knowledge aboutrefurbishing and remanufacturing activities. After playing the game, respectively, 23% and 19%of participants gained knowledge about refurbishing and remanufacturing. Concerning the levelof modification or product state, percentage of knowledge before the game (average 7% for all
78
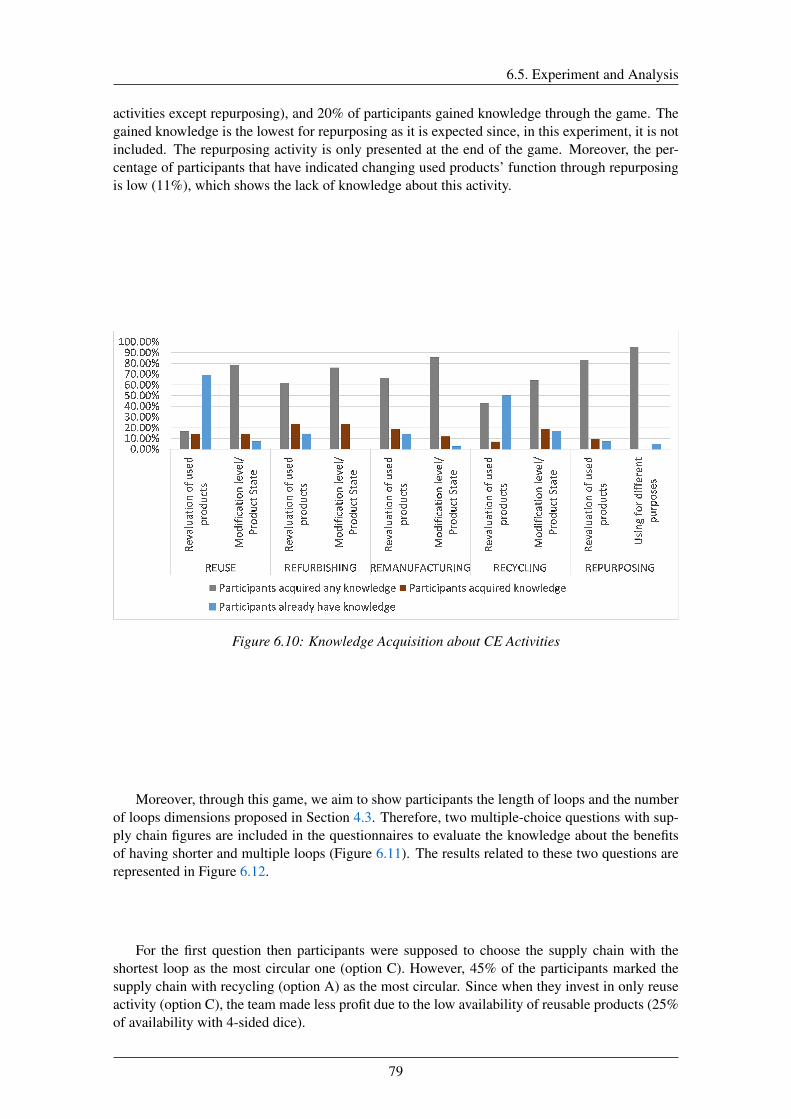
6.5. Experiment and Analysis
activities except repurposing), and 20% of participants gained knowledge through the game. Thegained knowledge is the lowest for repurposing as it is expected since, in this experiment, it is notincluded. The repurposing activity is only presented at the end of the game. Moreover, the per-centage of participants that have indicated changing used products’ function through repurposingis low (11%), which shows the lack of knowledge about this activity.
Figure 6.10: Knowledge Acquisition about CE Activities
Moreover, through this game, we aim to show participants the length of loops and the numberof loops dimensions proposed in Section 4.3. Therefore, two multiple-choice questions with sup-ply chain figures are included in the questionnaires to evaluate the knowledge about the benefitsof having shorter and multiple loops (Figure 6.11). The results related to these two questions arerepresented in Figure 6.12.
For the first question then participants were supposed to choose the supply chain with theshortest loop as the most circular one (option C). However, 45% of the participants marked thesupply chain with recycling (option A) as the most circular. Since when they invest in only reuseactivity (option C), the team made less profit due to the low availability of reusable products (25%of availability with 4-sided dice).
79
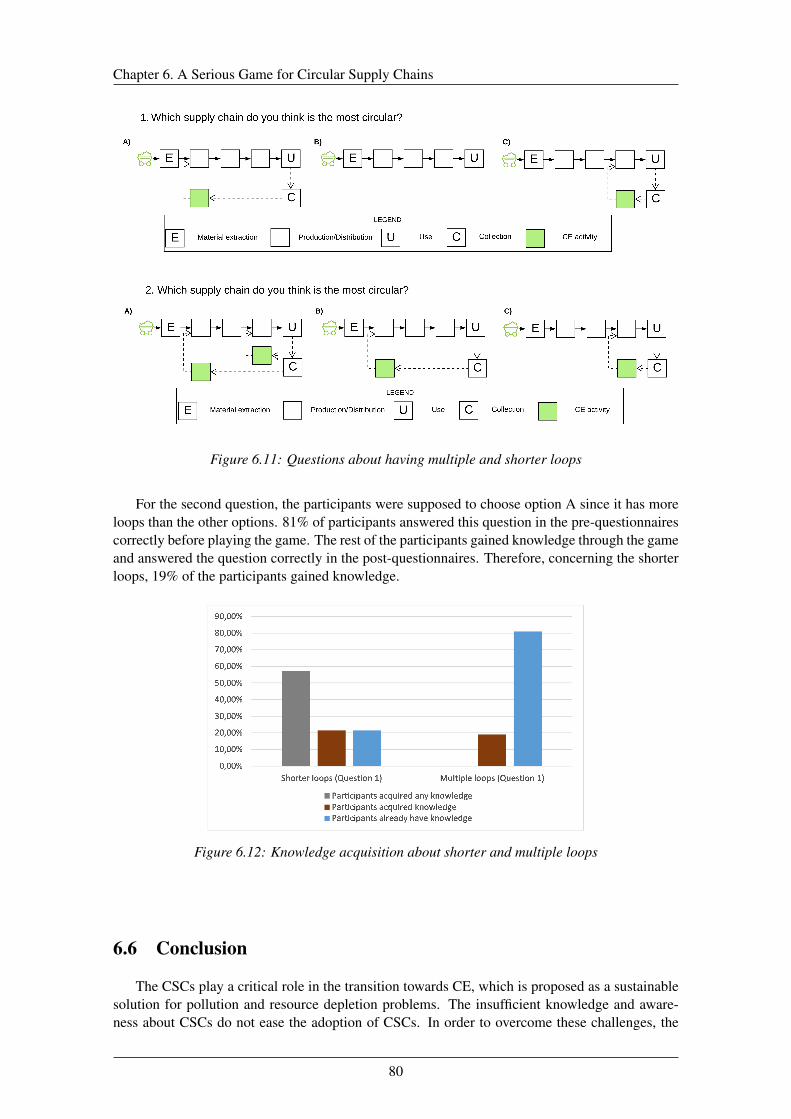
Chapter 6. A Serious Game for Circular Supply Chains
Figure 6.11: Questions about having multiple and shorter loops
For the second question, the participants were supposed to choose option A since it has moreloops than the other options. 81% of participants answered this question in the pre-questionnairescorrectly before playing the game. The rest of the participants gained knowledge through the gameand answered the question correctly in the post-questionnaires. Therefore, concerning the shorterloops, 19% of the participants gained knowledge.
Figure 6.12: Knowledge acquisition about shorter and multiple loops
6.6 Conclusion
The CSCs play a critical role in the transition towards CE, which is proposed as a sustainablesolution for pollution and resource depletion problems. The insufficient knowledge and aware-ness about CSCs do not ease the adoption of CSCs. In order to overcome these challenges, the
80
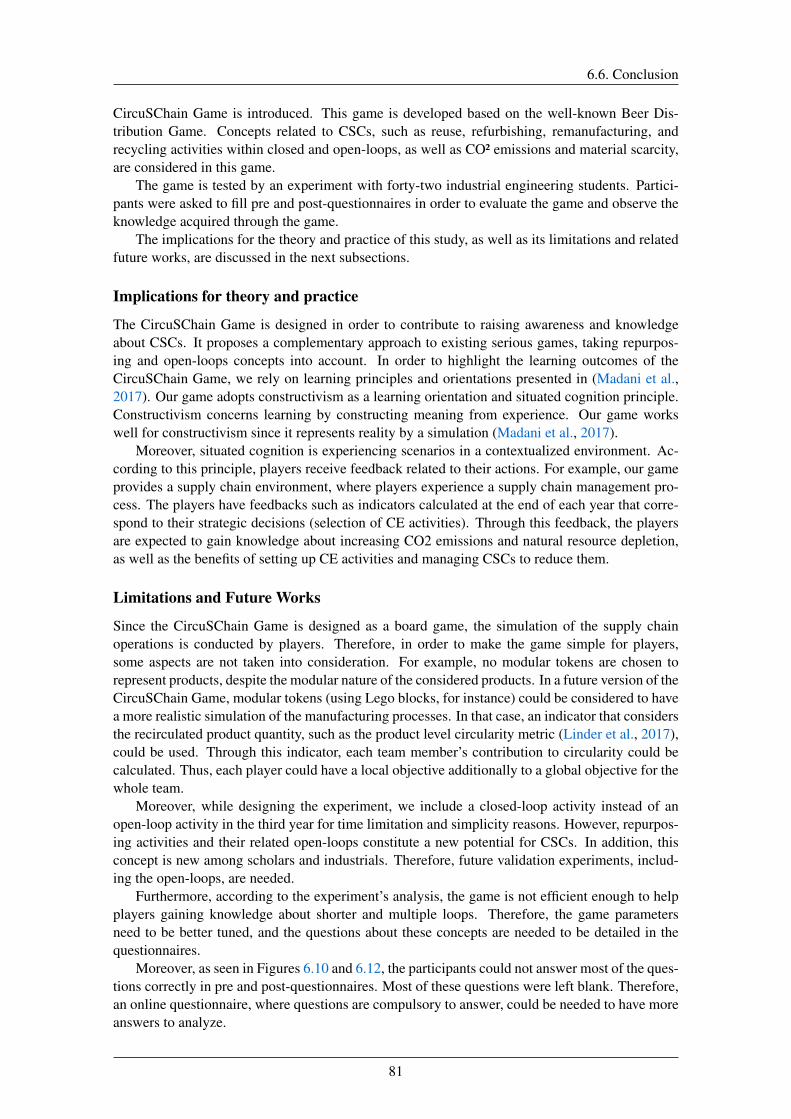
6.6. Conclusion
CircuSChain Game is introduced. This game is developed based on the well-known Beer Dis-tribution Game. Concepts related to CSCs, such as reuse, refurbishing, remanufacturing, andrecycling activities within closed and open-loops, as well as CO² emissions and material scarcity,are considered in this game.
The game is tested by an experiment with forty-two industrial engineering students. Partici-pants were asked to fill pre and post-questionnaires in order to evaluate the game and observe theknowledge acquired through the game.
The implications for the theory and practice of this study, as well as its limitations and relatedfuture works, are discussed in the next subsections.
Implications for theory and practice
The CircuSChain Game is designed in order to contribute to raising awareness and knowledgeabout CSCs. It proposes a complementary approach to existing serious games, taking repurpos-ing and open-loops concepts into account. In order to highlight the learning outcomes of theCircuSChain Game, we rely on learning principles and orientations presented in (Madani et al.,2017). Our game adopts constructivism as a learning orientation and situated cognition principle.Constructivism concerns learning by constructing meaning from experience. Our game workswell for constructivism since it represents reality by a simulation (Madani et al., 2017).
Moreover, situated cognition is experiencing scenarios in a contextualized environment. Ac-cording to this principle, players receive feedback related to their actions. For example, our gameprovides a supply chain environment, where players experience a supply chain management pro-cess. The players have feedbacks such as indicators calculated at the end of each year that corre-spond to their strategic decisions (selection of CE activities). Through this feedback, the playersare expected to gain knowledge about increasing CO2 emissions and natural resource depletion,as well as the benefits of setting up CE activities and managing CSCs to reduce them.
Limitations and Future Works
Since the CircuSChain Game is designed as a board game, the simulation of the supply chainoperations is conducted by players. Therefore, in order to make the game simple for players,some aspects are not taken into consideration. For example, no modular tokens are chosen torepresent products, despite the modular nature of the considered products. In a future version of theCircuSChain Game, modular tokens (using Lego blocks, for instance) could be considered to havea more realistic simulation of the manufacturing processes. In that case, an indicator that considersthe recirculated product quantity, such as the product level circularity metric (Linder et al., 2017),could be used. Through this indicator, each team member’s contribution to circularity could becalculated. Thus, each player could have a local objective additionally to a global objective for thewhole team.
Moreover, while designing the experiment, we include a closed-loop activity instead of anopen-loop activity in the third year for time limitation and simplicity reasons. However, repurpos-ing activities and their related open-loops constitute a new potential for CSCs. In addition, thisconcept is new among scholars and industrials. Therefore, future validation experiments, includ-ing the open-loops, are needed.
Furthermore, according to the experiment’s analysis, the game is not efficient enough to helpplayers gaining knowledge about shorter and multiple loops. Therefore, the game parametersneed to be better tuned, and the questions about these concepts are needed to be detailed in thequestionnaires.
Moreover, as seen in Figures 6.10 and 6.12, the participants could not answer most of the ques-tions correctly in pre and post-questionnaires. Most of these questions were left blank. Therefore,an online questionnaire, where questions are compulsory to answer, could be needed to have moreanswers to analyze.
81
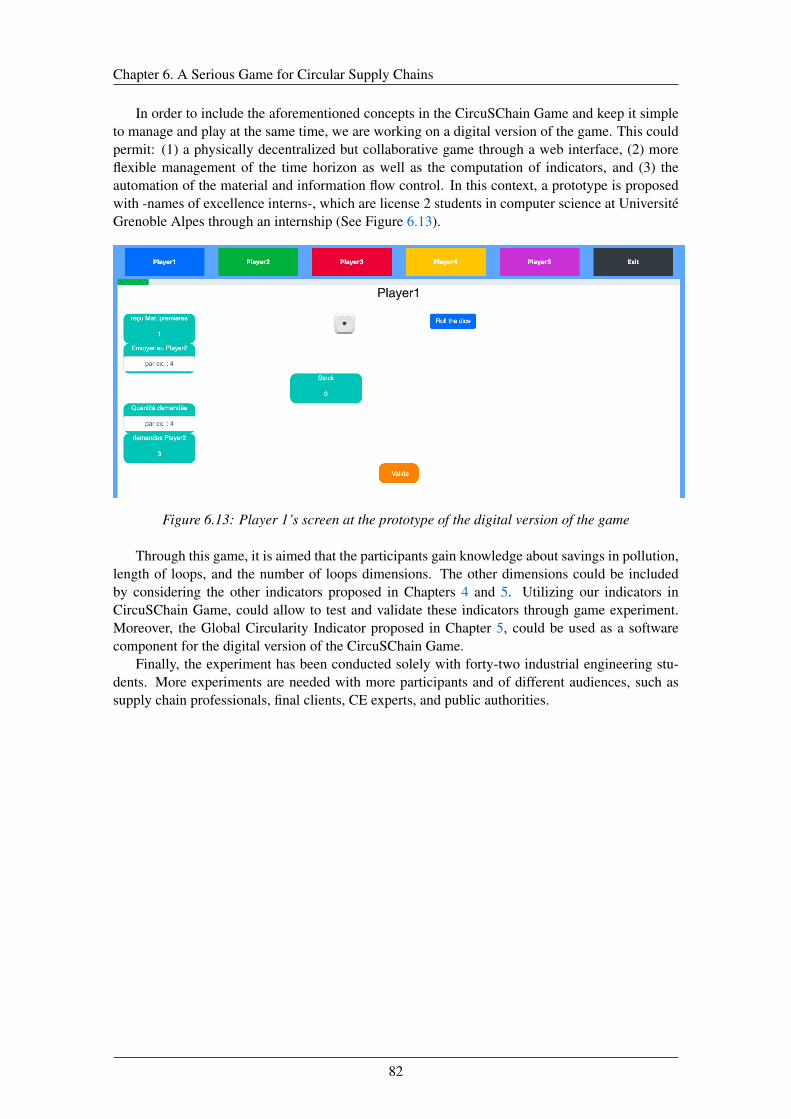
Chapter 6. A Serious Game for Circular Supply Chains
In order to include the aforementioned concepts in the CircuSChain Game and keep it simpleto manage and play at the same time, we are working on a digital version of the game. This couldpermit: (1) a physically decentralized but collaborative game through a web interface, (2) moreflexible management of the time horizon as well as the computation of indicators, and (3) theautomation of the material and information flow control. In this context, a prototype is proposedwith -names of excellence interns-, which are license 2 students in computer science at UniversitéGrenoble Alpes through an internship (See Figure 6.13).
Figure 6.13: Player 1’s screen at the prototype of the digital version of the game
Through this game, it is aimed that the participants gain knowledge about savings in pollution,length of loops, and the number of loops dimensions. The other dimensions could be includedby considering the other indicators proposed in Chapters 4 and 5. Utilizing our indicators inCircuSChain Game, could allow to test and validate these indicators through game experiment.Moreover, the Global Circularity Indicator proposed in Chapter 5, could be used as a softwarecomponent for the digital version of the CircuSChain Game.
Finally, the experiment has been conducted solely with forty-two industrial engineering stu-dents. More experiments are needed with more participants and of different audiences, such assupply chain professionals, final clients, CE experts, and public authorities.
82

7A Continual Evolution Method for Circular Supply
Chains
Contents7.1 Introduction . . . . . . . . . . . . . . . . . . . . . . . . . . . . . . . . . . . 857.2 Background . . . . . . . . . . . . . . . . . . . . . . . . . . . . . . . . . . . 857.3 The As-IS/As-IF Framework . . . . . . . . . . . . . . . . . . . . . . . . . . 87
7.3.1 Process Model of As-IS/As-IF Framework . . . . . . . . . . . . . . . 877.3.2 Product Meta-Model of As-IS/As-IF Framework . . . . . . . . . . . . 91
7.4 Circular Supply Chain Continual Evolution Method (CircuSChain) . . . 917.4.1 How to Read the Protocols of the Method? . . . . . . . . . . . . . . . 937.4.2 Analysis Strategy . . . . . . . . . . . . . . . . . . . . . . . . . . . . . 937.4.3 Diagnosis Strategy . . . . . . . . . . . . . . . . . . . . . . . . . . . . 997.4.4 Evolution Strategy . . . . . . . . . . . . . . . . . . . . . . . . . . . . 1017.4.5 Product Meta-Model . . . . . . . . . . . . . . . . . . . . . . . . . . . 104
7.5 Conclusion . . . . . . . . . . . . . . . . . . . . . . . . . . . . . . . . . . . . 1057.5.1 Implications for the practice and the theory . . . . . . . . . . . . . . . 1057.5.2 Limitations and future works . . . . . . . . . . . . . . . . . . . . . . . 105
84
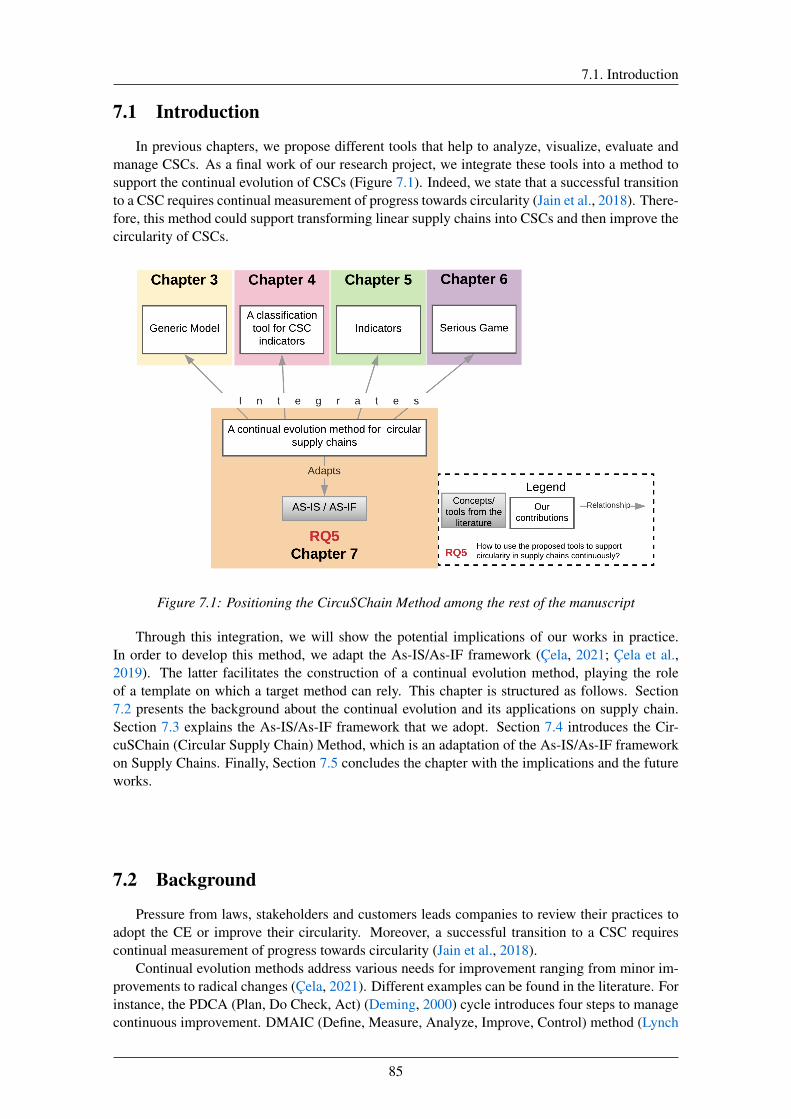
7.1. Introduction
7.1 Introduction
In previous chapters, we propose different tools that help to analyze, visualize, evaluate andmanage CSCs. As a final work of our research project, we integrate these tools into a method tosupport the continual evolution of CSCs (Figure 7.1). Indeed, we state that a successful transitionto a CSC requires continual measurement of progress towards circularity (Jain et al., 2018). There-fore, this method could support transforming linear supply chains into CSCs and then improve thecircularity of CSCs.
Figure 7.1: Positioning the CircuSChain Method among the rest of the manuscript
Through this integration, we will show the potential implications of our works in practice.In order to develop this method, we adapt the As-IS/As-IF framework (Çela, 2021; Çela et al.,2019). The latter facilitates the construction of a continual evolution method, playing the roleof a template on which a target method can rely. This chapter is structured as follows. Section7.2 presents the background about the continual evolution and its applications on supply chain.Section 7.3 explains the As-IS/As-IF framework that we adopt. Section 7.4 introduces the Cir-cuSChain (Circular Supply Chain) Method, which is an adaptation of the As-IS/As-IF frameworkon Supply Chains. Finally, Section 7.5 concludes the chapter with the implications and the futureworks.
7.2 Background
Pressure from laws, stakeholders and customers leads companies to review their practices toadopt the CE or improve their circularity. Moreover, a successful transition to a CSC requirescontinual measurement of progress towards circularity (Jain et al., 2018).
Continual evolution methods address various needs for improvement ranging from minor im-provements to radical changes (Çela, 2021). Different examples can be found in the literature. Forinstance, the PDCA (Plan, Do Check, Act) (Deming, 2000) cycle introduces four steps to managecontinuous improvement. DMAIC (Define, Measure, Analyze, Improve, Control) method (Lynch
85
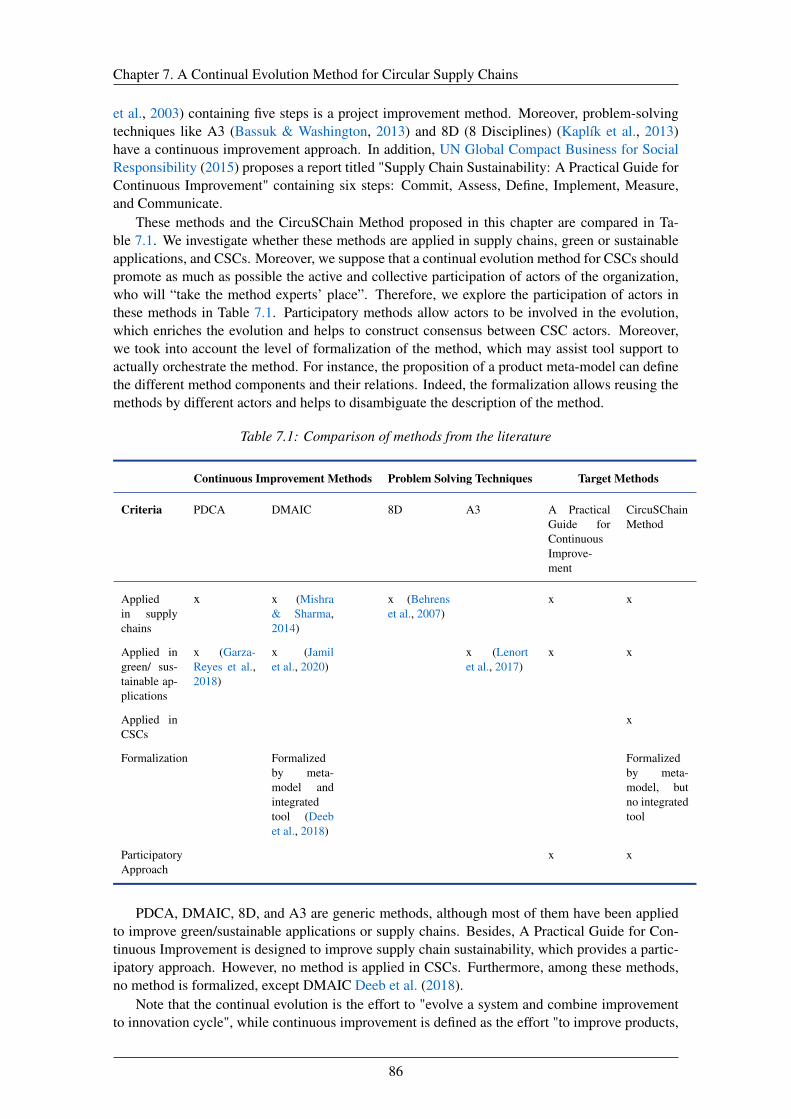
Chapter 7. A Continual Evolution Method for Circular Supply Chains
et al., 2003) containing five steps is a project improvement method. Moreover, problem-solvingtechniques like A3 (Bassuk & Washington, 2013) and 8D (8 Disciplines) (Kaplík et al., 2013)have a continuous improvement approach. In addition, UN Global Compact Business for SocialResponsibility (2015) proposes a report titled "Supply Chain Sustainability: A Practical Guide forContinuous Improvement" containing six steps: Commit, Assess, Define, Implement, Measure,and Communicate.
These methods and the CircuSChain Method proposed in this chapter are compared in Ta-ble 7.1. We investigate whether these methods are applied in supply chains, green or sustainableapplications, and CSCs. Moreover, we suppose that a continual evolution method for CSCs shouldpromote as much as possible the active and collective participation of actors of the organization,who will “take the method experts’ place”. Therefore, we explore the participation of actors inthese methods in Table 7.1. Participatory methods allow actors to be involved in the evolution,which enriches the evolution and helps to construct consensus between CSC actors. Moreover,we took into account the level of formalization of the method, which may assist tool support toactually orchestrate the method. For instance, the proposition of a product meta-model can definethe different method components and their relations. Indeed, the formalization allows reusing themethods by different actors and helps to disambiguate the description of the method.
Table 7.1: Comparison of methods from the literature
Continuous Improvement Methods Problem Solving Techniques Target Methods
Criteria PDCA DMAIC 8D A3 A PracticalGuide forContinuousImprove-ment
CircuSChainMethod
Appliedin supplychains
x x (Mishra& Sharma,2014)
x (Behrenset al., 2007)
x x
Applied ingreen/ sus-tainable ap-plications
x (Garza-Reyes et al.,2018)
x (Jamilet al., 2020)
x (Lenortet al., 2017)
x x
Applied inCSCs
x
Formalization Formalizedby meta-model andintegratedtool (Deebet al., 2018)
Formalizedby meta-model, butno integratedtool
ParticipatoryApproach
x x
PDCA, DMAIC, 8D, and A3 are generic methods, although most of them have been appliedto improve green/sustainable applications or supply chains. Besides, A Practical Guide for Con-tinuous Improvement is designed to improve supply chain sustainability, which provides a partic-ipatory approach. However, no method is applied in CSCs. Furthermore, among these methods,no method is formalized, except DMAIC Deeb et al. (2018).
Note that the continual evolution is the effort to "evolve a system and combine improvementto innovation cycle", while continuous improvement is defined as the effort "to improve products,
86

7.3. The As-IS/As-IF Framework
services, or processes" (Çela, 2021). In this chapter, we propose a continual evolution methodcalled CircuSChain and constructed by adapting the As-IS/As-IF framework that targets to inte-grate or improve the circularity in supply chains through innovations. The CircuSChain Methodis a participatory approach formalized through a meta-model.
7.3 The As-IS/As-IF Framework
This section presents the As-IS/As-IF framework that we adapted. As mentioned before, ourview is that a continual evolution method should be based on continual evolution cycles, (byopposition to project-based approaches that have delimited budget and dates), promote as muchas possible the active and collective participation of actors of the organization. We also take intoaccount the level of formalization of the method and domain-specificity. As-IS/As-IF frameworkaims at helping method engineers to develop continual evolution methods for a system acting asa template that can be adapted for a specific domain. It is based on continual evolution cyclesand allows to formalize these methods. The As-IS/As-IF framework could be considered to bepositioned on the Plan step of the Deming Cycle.
As-IS/As-IF proposes two models to formalize continual evolution methods: the ProcessModel and the Product Meta-Model (Figure 7.2). The Product Meta-Model describes the elementsneeded to characterize the As-IS system and imagine the As-IF systems. The Process Model de-scribes the main strategies and intentions of the continual evolution process (Çela et al., 2019).As-IS system is the current state of the system, while As-IF is described as "an evolution scenarioimagined as if a change is deployed over the current system" (Çela, 2021).
7.3.1 Process Model of As-IS/As-IF Framework
The Process Model is represented using the intentional map formalism (Rolland et al., 1999)through a general map and three sub-maps. In these maps, the ellipses represent the intentionsas well as the start and points, while arrows represent the strategies to reach these intentions. Thegeneral map represents the core strategy. The core strategy characterizes the As-IS System andimagines As-IF System (Çela, 2021).
Core process model is represented in Figure 7.3. This map presents three main strategies to"Characterize As-IS System" and "Imagine As-IF System": analysis, diagnosis, and evo-lution. It starts with the characterization of the As-IS System by diagnosis and analysisstrategies. Then, the As-IS system evolves into an As-IF system through evolution strategy.Finally, the imagined As-IF system could be deployed and becomes the next As-IS systemof continual evolution. If the imagined scenario is not suitable, it is possible to go back byfailure analysis strategy and review the As-IS system to imagine other As-IF systems. It isalso possible to stop the project with by choice strategy at any moment.
87
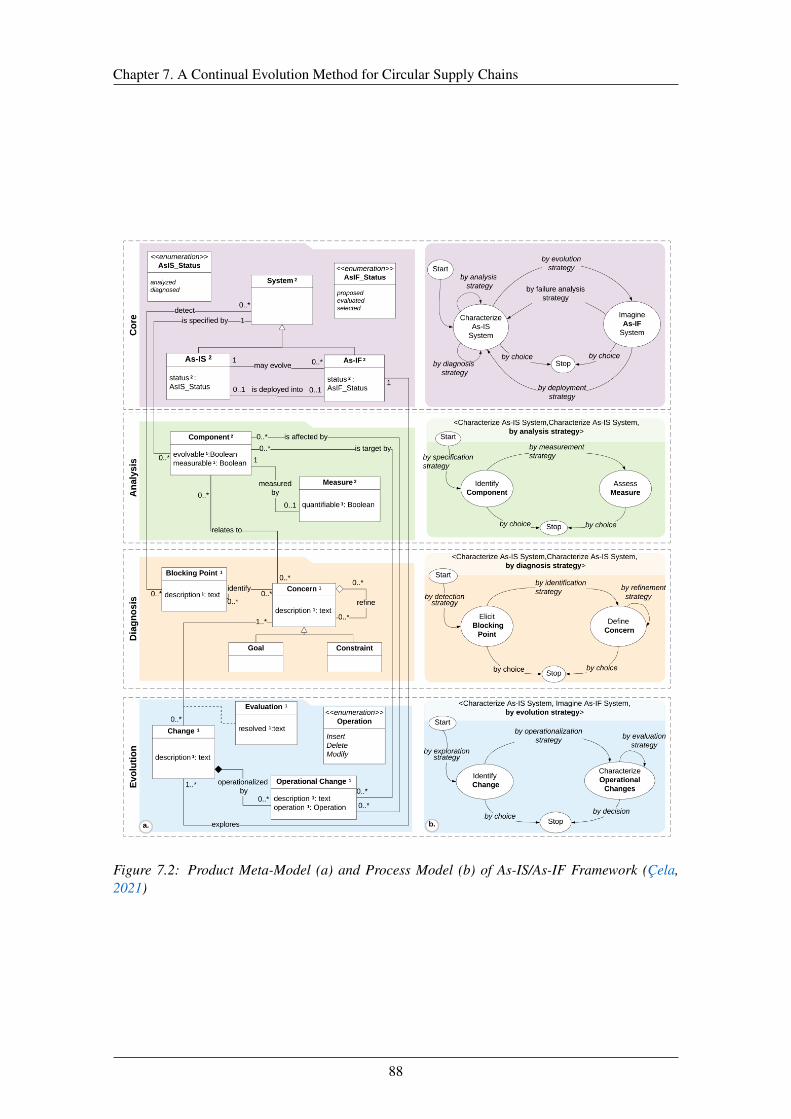
Chapter 7. A Continual Evolution Method for Circular Supply Chains
Figure 7.2: Product Meta-Model (a) and Process Model (b) of As-IS/As-IF Framework (Çela,2021)
88
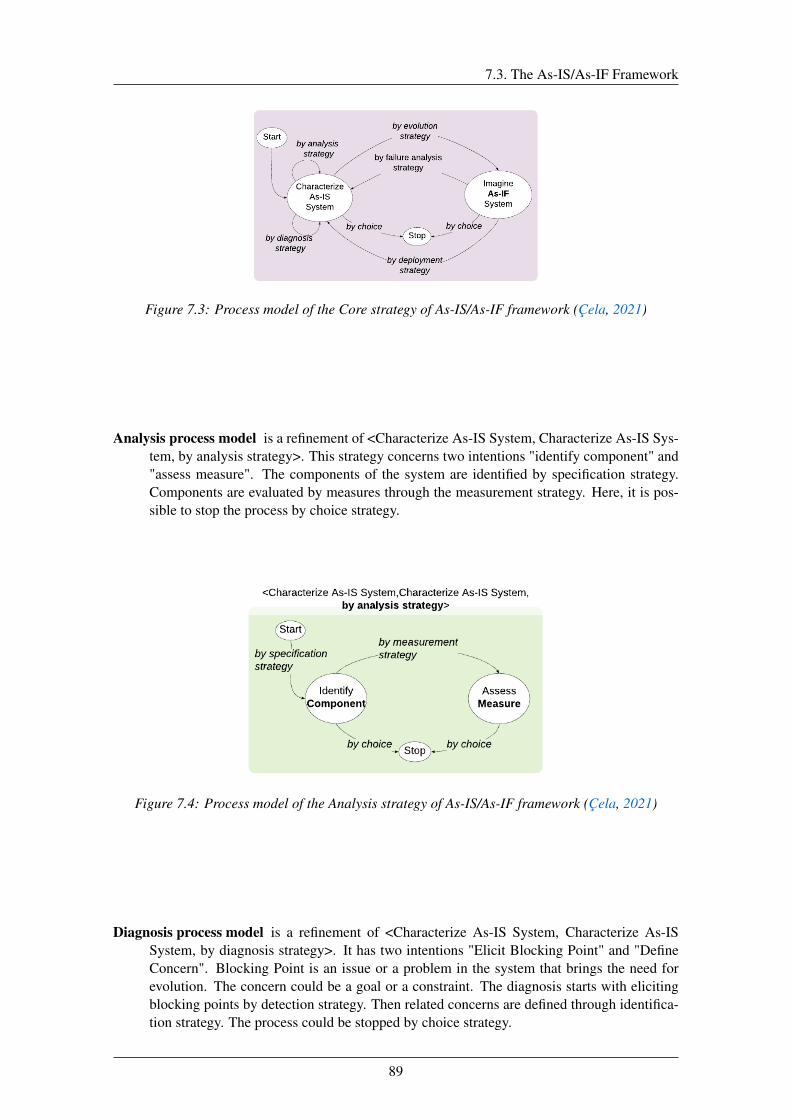
7.3. The As-IS/As-IF Framework
Figure 7.3: Process model of the Core strategy of As-IS/As-IF framework (Çela, 2021)
Analysis process model is a refinement of <Characterize As-IS System, Characterize As-IS Sys-tem, by analysis strategy>. This strategy concerns two intentions "identify component" and"assess measure". The components of the system are identified by specification strategy.Components are evaluated by measures through the measurement strategy. Here, it is pos-sible to stop the process by choice strategy.
Figure 7.4: Process model of the Analysis strategy of As-IS/As-IF framework (Çela, 2021)
Diagnosis process model is a refinement of <Characterize As-IS System, Characterize As-ISSystem, by diagnosis strategy>. It has two intentions "Elicit Blocking Point" and "DefineConcern". Blocking Point is an issue or a problem in the system that brings the need forevolution. The concern could be a goal or a constraint. The diagnosis starts with elicitingblocking points by detection strategy. Then related concerns are defined through identifica-tion strategy. The process could be stopped by choice strategy.
89
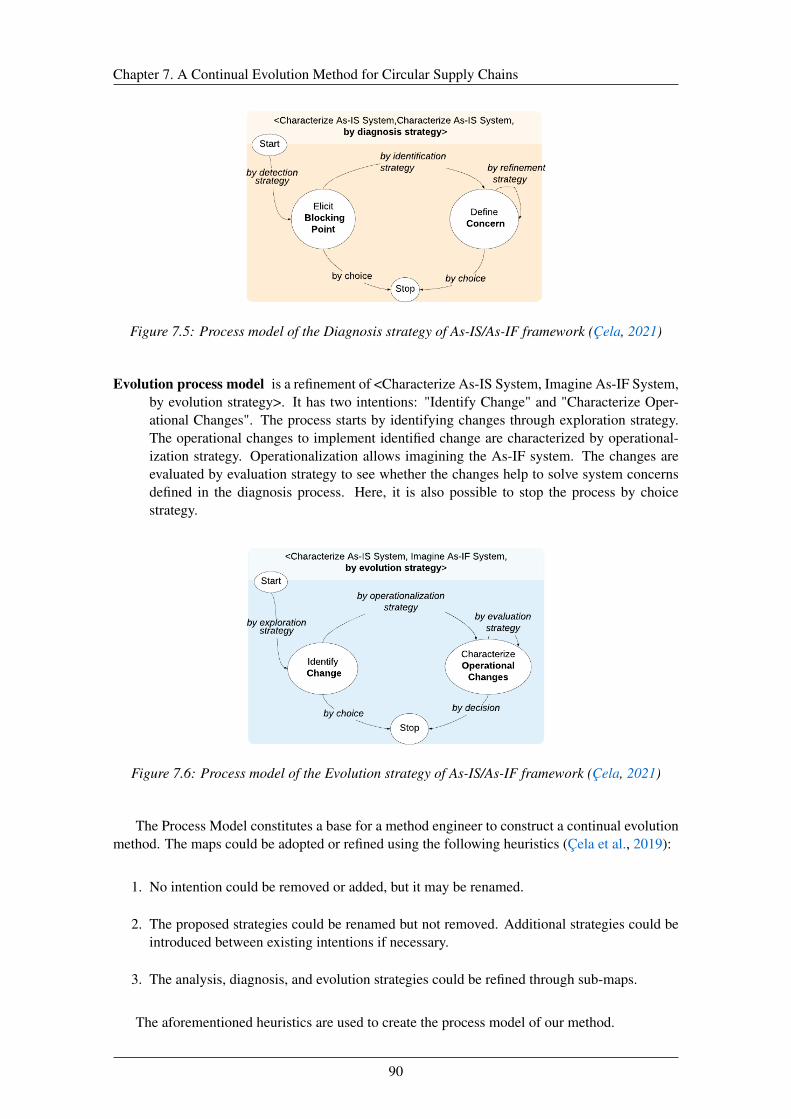
Chapter 7. A Continual Evolution Method for Circular Supply Chains
Figure 7.5: Process model of the Diagnosis strategy of As-IS/As-IF framework (Çela, 2021)
Evolution process model is a refinement of <Characterize As-IS System, Imagine As-IF System,by evolution strategy>. It has two intentions: "Identify Change" and "Characterize Oper-ational Changes". The process starts by identifying changes through exploration strategy.The operational changes to implement identified change are characterized by operational-ization strategy. Operationalization allows imagining the As-IF system. The changes areevaluated by evaluation strategy to see whether the changes help to solve system concernsdefined in the diagnosis process. Here, it is also possible to stop the process by choicestrategy.
Figure 7.6: Process model of the Evolution strategy of As-IS/As-IF framework (Çela, 2021)
The Process Model constitutes a base for a method engineer to construct a continual evolutionmethod. The maps could be adopted or refined using the following heuristics (Çela et al., 2019):
1. No intention could be removed or added, but it may be renamed.
2. The proposed strategies could be renamed but not removed. Additional strategies could beintroduced between existing intentions if necessary.
3. The analysis, diagnosis, and evolution strategies could be refined through sub-maps.
The aforementioned heuristics are used to create the process model of our method.
90
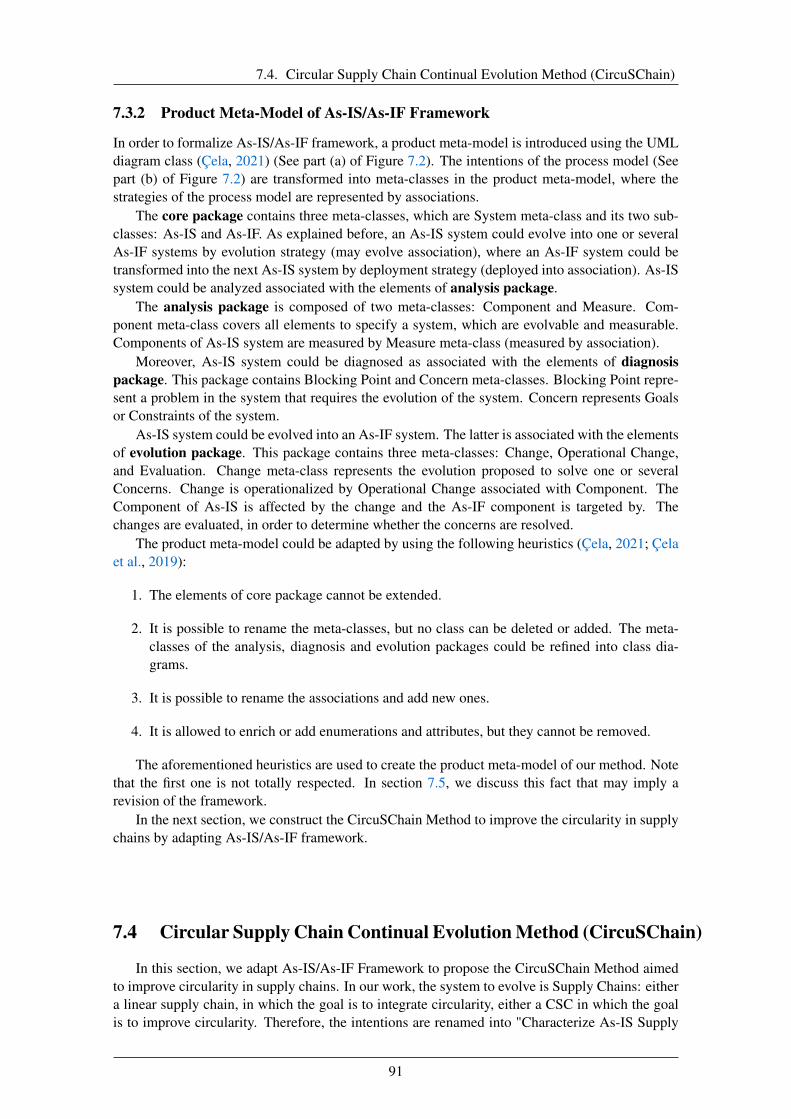
7.4. Circular Supply Chain Continual Evolution Method (CircuSChain)
7.3.2 Product Meta-Model of As-IS/As-IF Framework
In order to formalize As-IS/As-IF framework, a product meta-model is introduced using the UMLdiagram class (Çela, 2021) (See part (a) of Figure 7.2). The intentions of the process model (Seepart (b) of Figure 7.2) are transformed into meta-classes in the product meta-model, where thestrategies of the process model are represented by associations.
The core package contains three meta-classes, which are System meta-class and its two sub-classes: As-IS and As-IF. As explained before, an As-IS system could evolve into one or severalAs-IF systems by evolution strategy (may evolve association), where an As-IF system could betransformed into the next As-IS system by deployment strategy (deployed into association). As-ISsystem could be analyzed associated with the elements of analysis package.
The analysis package is composed of two meta-classes: Component and Measure. Com-ponent meta-class covers all elements to specify a system, which are evolvable and measurable.Components of As-IS system are measured by Measure meta-class (measured by association).
Moreover, As-IS system could be diagnosed as associated with the elements of diagnosispackage. This package contains Blocking Point and Concern meta-classes. Blocking Point repre-sent a problem in the system that requires the evolution of the system. Concern represents Goalsor Constraints of the system.
As-IS system could be evolved into an As-IF system. The latter is associated with the elementsof evolution package. This package contains three meta-classes: Change, Operational Change,and Evaluation. Change meta-class represents the evolution proposed to solve one or severalConcerns. Change is operationalized by Operational Change associated with Component. TheComponent of As-IS is affected by the change and the As-IF component is targeted by. Thechanges are evaluated, in order to determine whether the concerns are resolved.
The product meta-model could be adapted by using the following heuristics (Çela, 2021; Çelaet al., 2019):
1. The elements of core package cannot be extended.
2. It is possible to rename the meta-classes, but no class can be deleted or added. The meta-classes of the analysis, diagnosis and evolution packages could be refined into class dia-grams.
3. It is possible to rename the associations and add new ones.
4. It is allowed to enrich or add enumerations and attributes, but they cannot be removed.
The aforementioned heuristics are used to create the product meta-model of our method. Notethat the first one is not totally respected. In section 7.5, we discuss this fact that may imply arevision of the framework.
In the next section, we construct the CircuSChain Method to improve the circularity in supplychains by adapting As-IS/As-IF framework.
7.4 Circular Supply Chain Continual Evolution Method (CircuSChain)
In this section, we adapt As-IS/As-IF Framework to propose the CircuSChain Method aimedto improve circularity in supply chains. In our work, the system to evolve is Supply Chains: eithera linear supply chain, in which the goal is to integrate circularity, either a CSC in which the goalis to improve circularity. Therefore, the intentions are renamed into "Characterize As-IS Supply
91
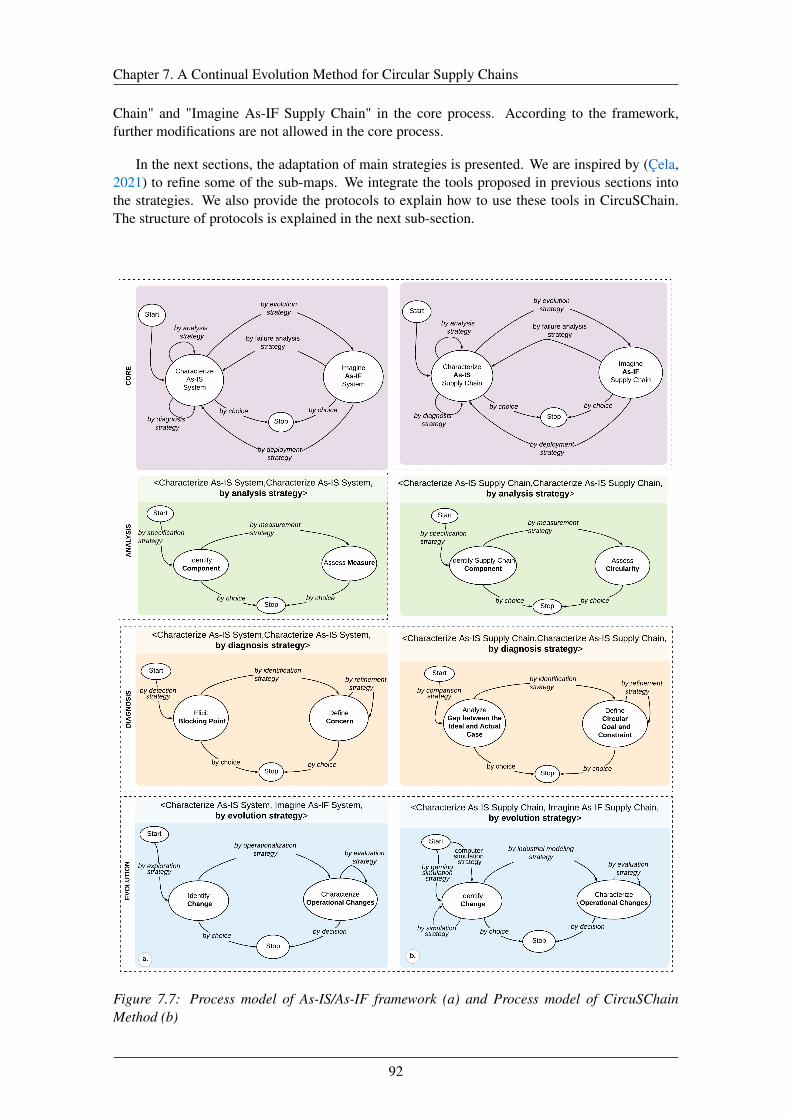
Chapter 7. A Continual Evolution Method for Circular Supply Chains
Chain" and "Imagine As-IF Supply Chain" in the core process. According to the framework,further modifications are not allowed in the core process.
In the next sections, the adaptation of main strategies is presented. We are inspired by (Çela,2021) to refine some of the sub-maps. We integrate the tools proposed in previous sections intothe strategies. We also provide the protocols to explain how to use these tools in CircuSChain.The structure of protocols is explained in the next sub-section.
Figure 7.7: Process model of As-IS/As-IF framework (a) and Process model of CircuSChainMethod (b)
92

7.4. Circular Supply Chain Continual Evolution Method (CircuSChain)
7.4.1 How to Read the Protocols of the Method?
The strategies of CircuSChain Method are implemented through sessions. We propose protocolsexplaining these sessions (See tables in the next sections). In this section, we explain how tointerpret these tables (Table 7.2).
At the top of Table 7.2, general information about the protocol is given. The name of the strat-egy and two associated intentions are expressed as <intention, intention, by strategy>. The typeof session is also given. Three section types are proposed: telephone interview, focus group andindividual work. Individual work is done by the animator. Focus group and telephone interviewsare leaded by an animator within the participation of actors. Participants for each session arestated at the top of the tables. Moreover, a figure representing the strategy is given. The strategyimplemented in the session is highlighted with bold letters and arrows in the figures.
Protocol: < Intention, Intention, by strategy>
Session Type: Telephone interview, Focus group, or Individual work
Participants:N° Step Description Participants’ role Supports Dur. (in min)
1 Step name Brief description of the step. Questionsasked by animator are represented as fol-lows:• Questions asked by animator?
Passive or Ac-tive/Collective orActive/Individual
Tools proposedin this thesis,Other tools andsupports
10
Table 7.2: Protocol example
Furthermore, each step in the session is detailed in the protocol. The first column (N°) showsthe sequence of steps, while the second one (Step) represents the step’s name (Table 7.2). A briefdescription of the step is given in the third column (Description). In this column, the questionsasked by the animator are highlighted by italic letters.
In the fourth column (Participants’ role), the role of participants is described. Participantscould participate in the sessions passively. For example, when the animator explains the contextor the tools, the role of participants is passive. Participants could be included in sessions actively.For example, during the telephone interview, the participants’ role is active/individual. However,during focus groups, participants could be included actively and collectively (active/collective).
The fifth column (Supports) represents the supports needed in each step. The tools proposedin previous chapters are used as supports and highlighted with bold letters in this column. Theanimator is supposed to have knowledge about the tools beforehand. The last column (Dur.)expresses the duration in minutes of each step.
7.4.2 Analysis Strategy
Analysis strategy aims to characterize the As-IS supply chain. In this strategy, the first intentionaims to "Identify Supply Chain Component". Since the objective is to improve circularity ina continuous way, the measure is changed to circularity. Here we also refine specification andmeasurement strategies through sub-maps.
A. <Start, Identify Supply Chain Components, by specification strategy>
Through specification strategy (Figure 7.8), Supply Chain Components are identified. The com-ponents to be identified are activities and flows (stated in Chapter 2) as well as actors and product
93
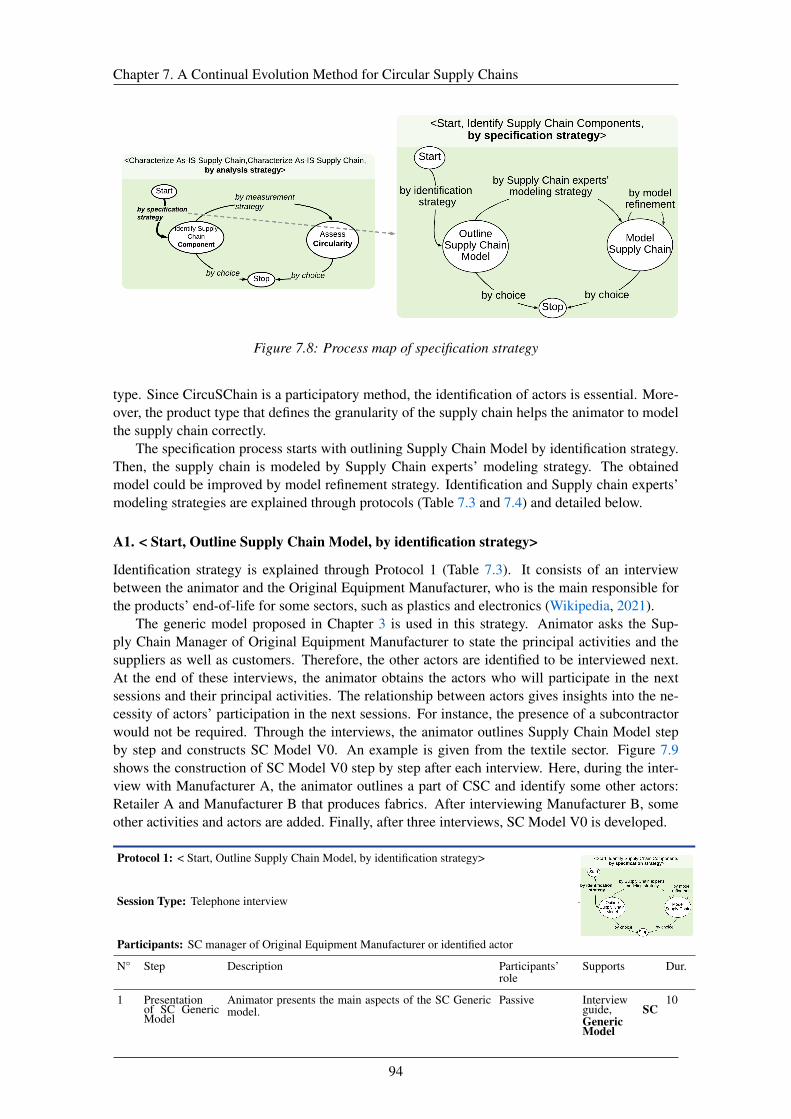
Chapter 7. A Continual Evolution Method for Circular Supply Chains
Figure 7.8: Process map of specification strategy
type. Since CircuSChain is a participatory method, the identification of actors is essential. More-over, the product type that defines the granularity of the supply chain helps the animator to modelthe supply chain correctly.
The specification process starts with outlining Supply Chain Model by identification strategy.Then, the supply chain is modeled by Supply Chain experts’ modeling strategy. The obtainedmodel could be improved by model refinement strategy. Identification and Supply chain experts’modeling strategies are explained through protocols (Table 7.3 and 7.4) and detailed below.
A1. < Start, Outline Supply Chain Model, by identification strategy>
Identification strategy is explained through Protocol 1 (Table 7.3). It consists of an interviewbetween the animator and the Original Equipment Manufacturer, who is the main responsible forthe products’ end-of-life for some sectors, such as plastics and electronics (Wikipedia, 2021).
The generic model proposed in Chapter 3 is used in this strategy. Animator asks the Sup-ply Chain Manager of Original Equipment Manufacturer to state the principal activities and thesuppliers as well as customers. Therefore, the other actors are identified to be interviewed next.At the end of these interviews, the animator obtains the actors who will participate in the nextsessions and their principal activities. The relationship between actors gives insights into the ne-cessity of actors’ participation in the next sessions. For instance, the presence of a subcontractorwould not be required. Through the interviews, the animator outlines Supply Chain Model stepby step and constructs SC Model V0. An example is given from the textile sector. Figure 7.9shows the construction of SC Model V0 step by step after each interview. Here, during the inter-view with Manufacturer A, the animator outlines a part of CSC and identify some other actors:Retailer A and Manufacturer B that produces fabrics. After interviewing Manufacturer B, someother activities and actors are added. Finally, after three interviews, SC Model V0 is developed.
Protocol 1: < Start, Outline Supply Chain Model, by identification strategy>
Session Type: Telephone interview
Participants: SC manager of Original Equipment Manufacturer or identified actor
N° Step Description Participants’role
Supports Dur.
1 Presentationof SC GenericModel
Animator presents the main aspects of the SC Genericmodel.
Passive Interviewguide, SCGenericModel
10
94
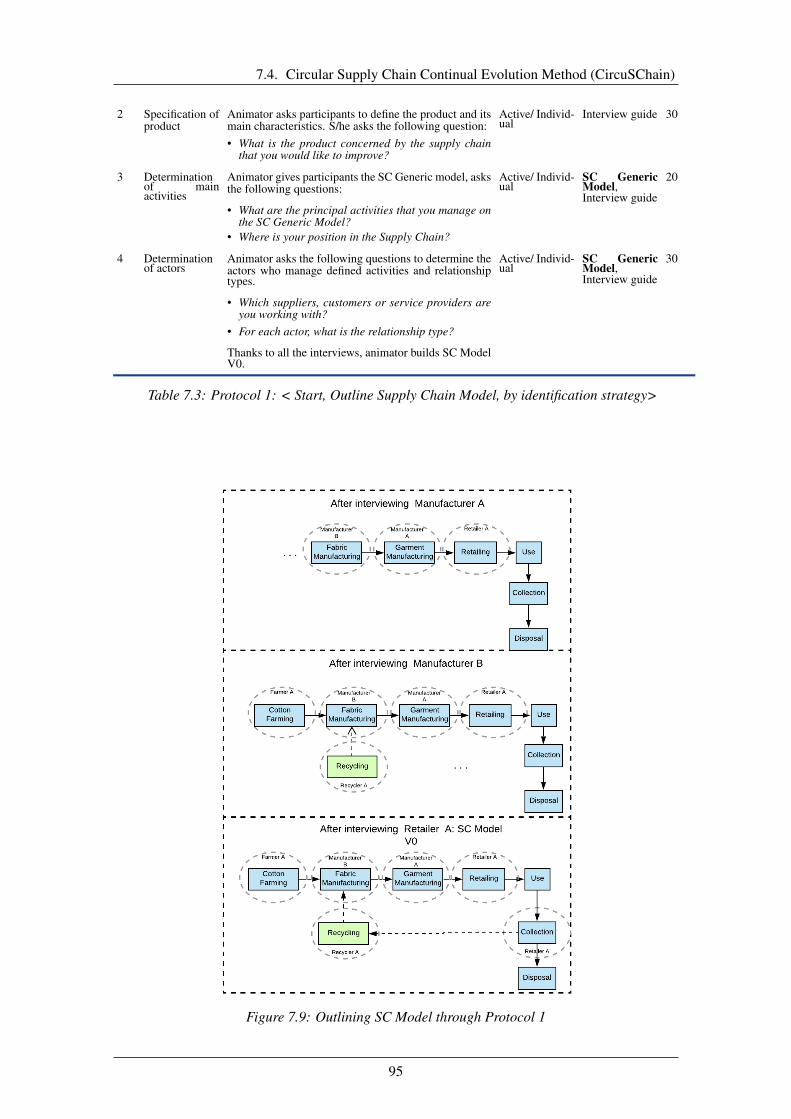
7.4. Circular Supply Chain Continual Evolution Method (CircuSChain)
2 Specification ofproduct
Animator asks participants to define the product and itsmain characteristics. S/he asks the following question:• What is the product concerned by the supply chain
that you would like to improve?
Active/ Individ-ual
Interview guide 30
3 Determinationof mainactivities
Animator gives participants the SC Generic model, asksthe following questions:
• What are the principal activities that you manage onthe SC Generic Model?
• Where is your position in the Supply Chain?
Active/ Individ-ual
SC GenericModel,Interview guide
20
4 Determinationof actors
Animator asks the following questions to determine theactors who manage defined activities and relationshiptypes.
• Which suppliers, customers or service providers areyou working with?
• For each actor, what is the relationship type?
Thanks to all the interviews, animator builds SC ModelV0.
Active/ Individ-ual
SC GenericModel,Interview guide
30
Table 7.3: Protocol 1: < Start, Outline Supply Chain Model, by identification strategy>
Figure 7.9: Outlining SC Model through Protocol 1
95
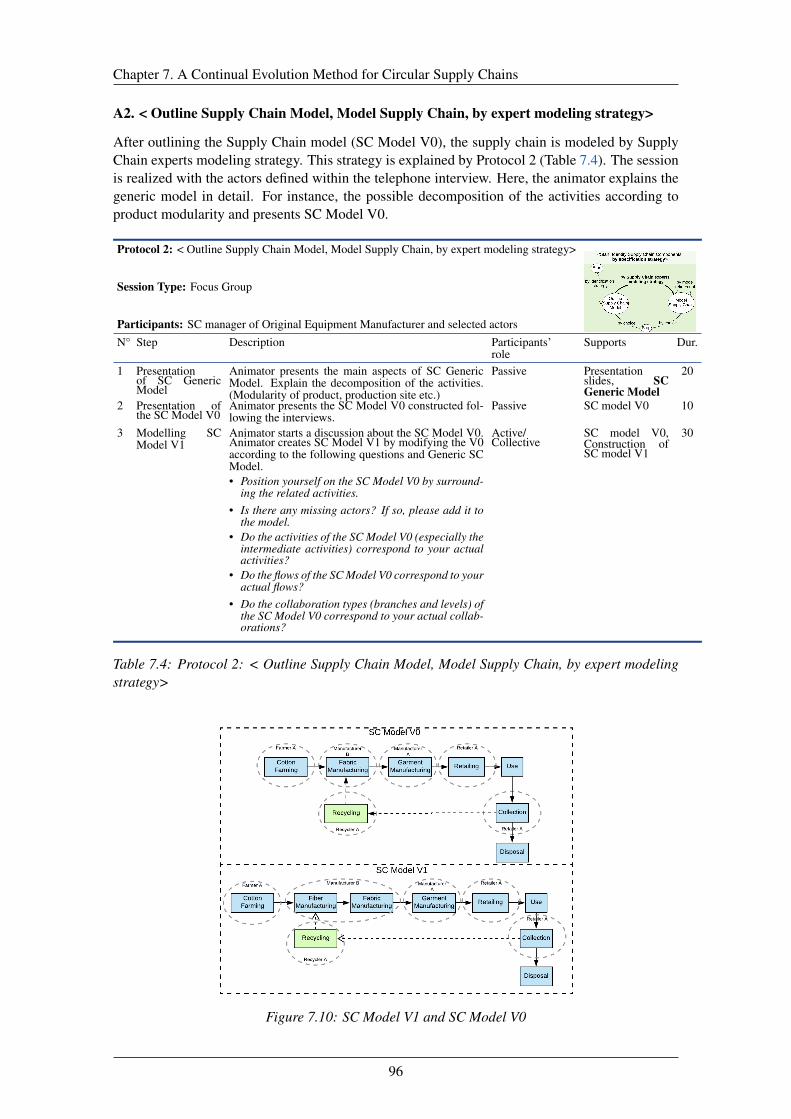
Chapter 7. A Continual Evolution Method for Circular Supply Chains
A2. < Outline Supply Chain Model, Model Supply Chain, by expert modeling strategy>
After outlining the Supply Chain model (SC Model V0), the supply chain is modeled by SupplyChain experts modeling strategy. This strategy is explained by Protocol 2 (Table 7.4). The sessionis realized with the actors defined within the telephone interview. Here, the animator explains thegeneric model in detail. For instance, the possible decomposition of the activities according toproduct modularity and presents SC Model V0.
Protocol 2: < Outline Supply Chain Model, Model Supply Chain, by expert modeling strategy>
Session Type: Focus Group
Participants: SC manager of Original Equipment Manufacturer and selected actorsN° Step Description Participants’
roleSupports Dur.
1 Presentationof SC GenericModel
Animator presents the main aspects of SC GenericModel. Explain the decomposition of the activities.(Modularity of product, production site etc.)
Passive Presentationslides, SCGeneric Model
20
2 Presentation ofthe SC Model V0
Animator presents the SC Model V0 constructed fol-lowing the interviews.
Passive SC model V0 10
3 Modelling SCModel V1
Animator starts a discussion about the SC Model V0.Animator creates SC Model V1 by modifying the V0according to the following questions and Generic SCModel.• Position yourself on the SC Model V0 by surround-
ing the related activities.• Is there any missing actors? If so, please add it to
the model.• Do the activities of the SC Model V0 (especially the
intermediate activities) correspond to your actualactivities?
• Do the flows of the SC Model V0 correspond to youractual flows?
• Do the collaboration types (branches and levels) ofthe SC Model V0 correspond to your actual collab-orations?
Active/Collective
SC model V0,Construction ofSC model V1
30
Table 7.4: Protocol 2: < Outline Supply Chain Model, Model Supply Chain, by expert modelingstrategy>
Figure 7.10: SC Model V1 and SC Model V0
96
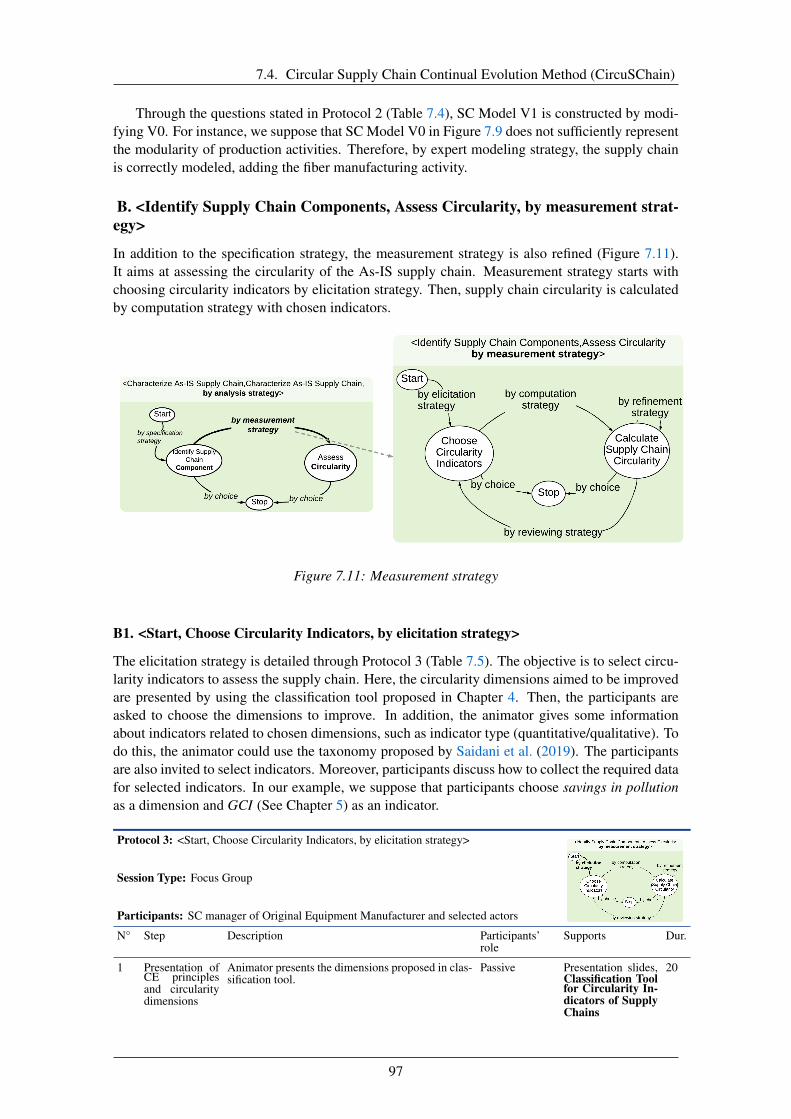
7.4. Circular Supply Chain Continual Evolution Method (CircuSChain)
Through the questions stated in Protocol 2 (Table 7.4), SC Model V1 is constructed by modi-fying V0. For instance, we suppose that SC Model V0 in Figure 7.9 does not sufficiently representthe modularity of production activities. Therefore, by expert modeling strategy, the supply chainis correctly modeled, adding the fiber manufacturing activity.
B. <Identify Supply Chain Components, Assess Circularity, by measurement strat-egy>
In addition to the specification strategy, the measurement strategy is also refined (Figure 7.11).It aims at assessing the circularity of the As-IS supply chain. Measurement strategy starts withchoosing circularity indicators by elicitation strategy. Then, supply chain circularity is calculatedby computation strategy with chosen indicators.
Figure 7.11: Measurement strategy
B1. <Start, Choose Circularity Indicators, by elicitation strategy>
The elicitation strategy is detailed through Protocol 3 (Table 7.5). The objective is to select circu-larity indicators to assess the supply chain. Here, the circularity dimensions aimed to be improvedare presented by using the classification tool proposed in Chapter 4. Then, the participants areasked to choose the dimensions to improve. In addition, the animator gives some informationabout indicators related to chosen dimensions, such as indicator type (quantitative/qualitative). Todo this, the animator could use the taxonomy proposed by Saidani et al. (2019). The participantsare also invited to select indicators. Moreover, participants discuss how to collect the required datafor selected indicators. In our example, we suppose that participants choose savings in pollutionas a dimension and GCI (See Chapter 5) as an indicator.
Protocol 3: <Start, Choose Circularity Indicators, by elicitation strategy>
Session Type: Focus Group
Participants: SC manager of Original Equipment Manufacturer and selected actors
N° Step Description Participants’role
Supports Dur.
1 Presentation ofCE principlesand circularitydimensions
Animator presents the dimensions proposed in clas-sification tool.
Passive Presentation slides,Classification Toolfor Circularity In-dicators of SupplyChains
20
97
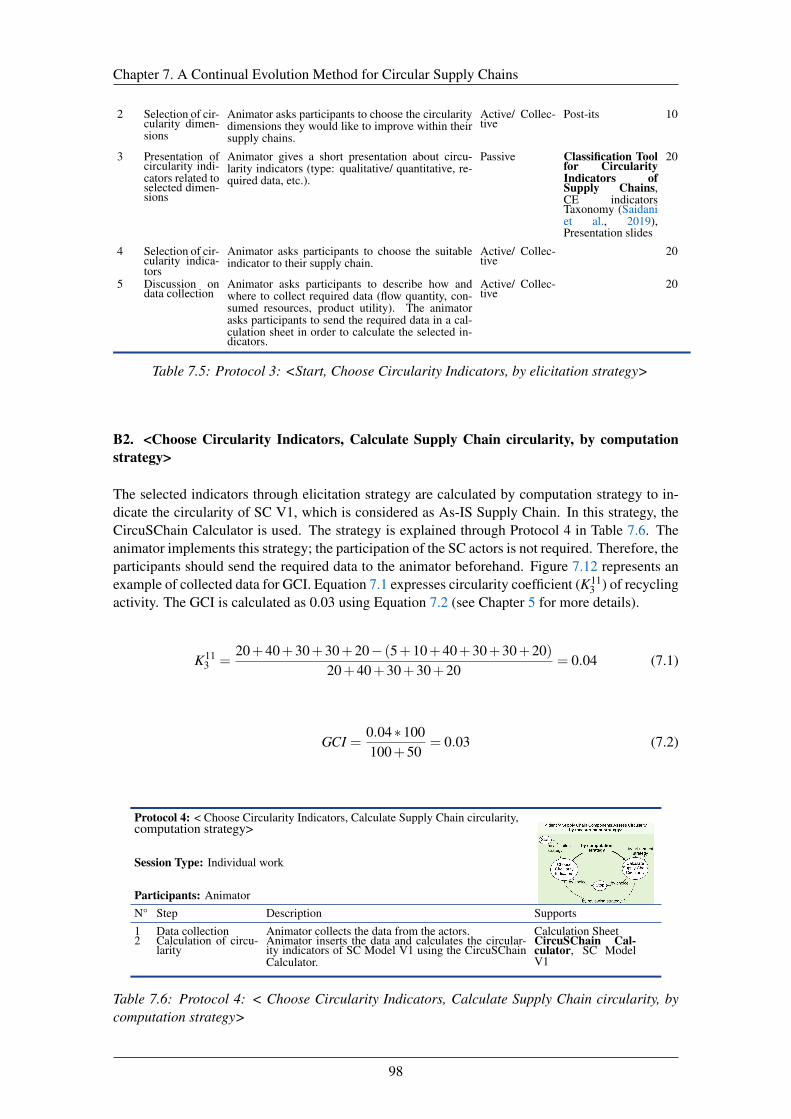
Chapter 7. A Continual Evolution Method for Circular Supply Chains
2 Selection of cir-cularity dimen-sions
Animator asks participants to choose the circularitydimensions they would like to improve within theirsupply chains.
Active/ Collec-tive
Post-its 10
3 Presentation ofcircularity indi-cators related toselected dimen-sions
Animator gives a short presentation about circu-larity indicators (type: qualitative/ quantitative, re-quired data, etc.).
Passive Classification Toolfor CircularityIndicators ofSupply Chains,CE indicatorsTaxonomy (Saidaniet al., 2019),Presentation slides
20
4 Selection of cir-cularity indica-tors
Animator asks participants to choose the suitableindicator to their supply chain.
Active/ Collec-tive
20
5 Discussion ondata collection
Animator asks participants to describe how andwhere to collect required data (flow quantity, con-sumed resources, product utility). The animatorasks participants to send the required data in a cal-culation sheet in order to calculate the selected in-dicators.
Active/ Collec-tive
20
Table 7.5: Protocol 3: <Start, Choose Circularity Indicators, by elicitation strategy>
B2. <Choose Circularity Indicators, Calculate Supply Chain circularity, by computationstrategy>
The selected indicators through elicitation strategy are calculated by computation strategy to in-dicate the circularity of SC V1, which is considered as As-IS Supply Chain. In this strategy, theCircuSChain Calculator is used. The strategy is explained through Protocol 4 in Table 7.6. Theanimator implements this strategy; the participation of the SC actors is not required. Therefore, theparticipants should send the required data to the animator beforehand. Figure 7.12 represents anexample of collected data for GCI. Equation 7.1 expresses circularity coefficient (K11
3 ) of recyclingactivity. The GCI is calculated as 0.03 using Equation 7.2 (see Chapter 5 for more details).
K113 =
20+40+30+30+20− (5+10+40+30+30+20)20+40+30+30+20
= 0.04 (7.1)
GCI =0.04∗100100+50
= 0.03 (7.2)
Protocol 4: < Choose Circularity Indicators, Calculate Supply Chain circularity,computation strategy>
Session Type: Individual work
Participants: AnimatorN° Step Description Supports1 Data collection Animator collects the data from the actors. Calculation Sheet2 Calculation of circu-
larityAnimator inserts the data and calculates the circular-ity indicators of SC Model V1 using the CircuSChainCalculator.
CircuSChain Cal-culator, SC ModelV1
Table 7.6: Protocol 4: < Choose Circularity Indicators, Calculate Supply Chain circularity, bycomputation strategy>
98
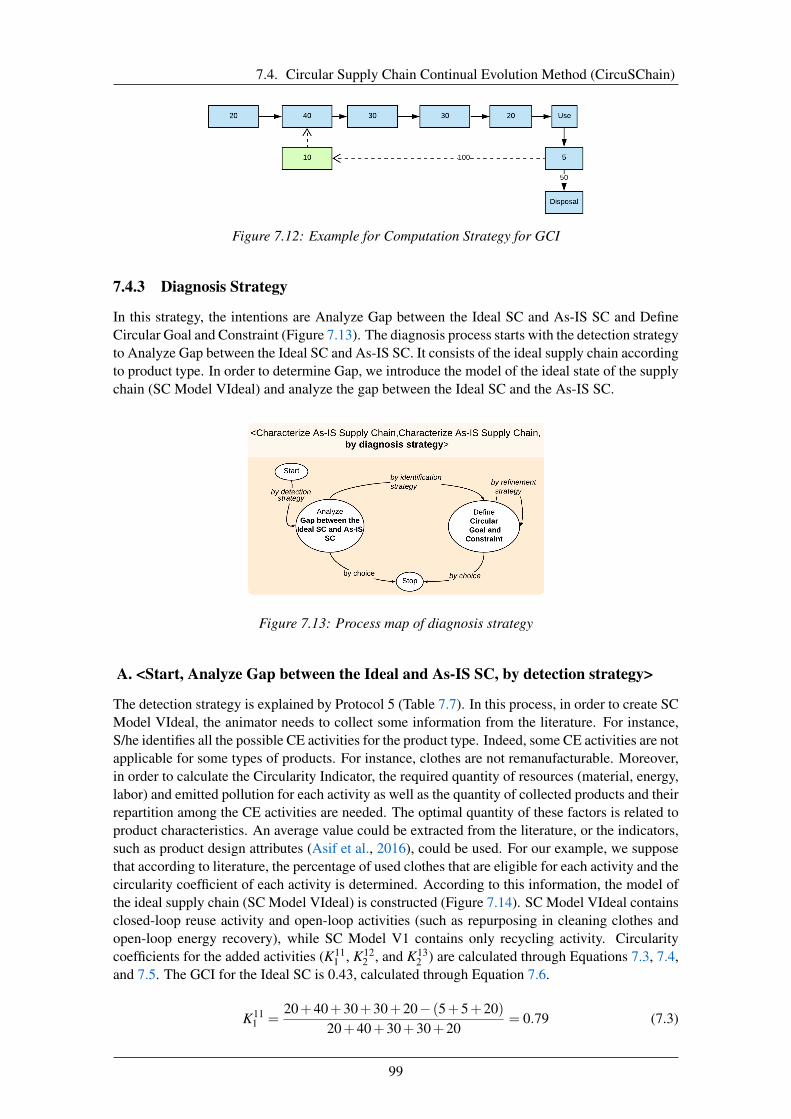
7.4. Circular Supply Chain Continual Evolution Method (CircuSChain)
Figure 7.12: Example for Computation Strategy for GCI
7.4.3 Diagnosis Strategy
In this strategy, the intentions are Analyze Gap between the Ideal SC and As-IS SC and DefineCircular Goal and Constraint (Figure 7.13). The diagnosis process starts with the detection strategyto Analyze Gap between the Ideal SC and As-IS SC. It consists of the ideal supply chain accordingto product type. In order to determine Gap, we introduce the model of the ideal state of the supplychain (SC Model VIdeal) and analyze the gap between the Ideal SC and the As-IS SC.
Figure 7.13: Process map of diagnosis strategy
A. <Start, Analyze Gap between the Ideal and As-IS SC, by detection strategy>
The detection strategy is explained by Protocol 5 (Table 7.7). In this process, in order to create SCModel VIdeal, the animator needs to collect some information from the literature. For instance,S/he identifies all the possible CE activities for the product type. Indeed, some CE activities are notapplicable for some types of products. For instance, clothes are not remanufacturable. Moreover,in order to calculate the Circularity Indicator, the required quantity of resources (material, energy,labor) and emitted pollution for each activity as well as the quantity of collected products and theirrepartition among the CE activities are needed. The optimal quantity of these factors is related toproduct characteristics. An average value could be extracted from the literature, or the indicators,such as product design attributes (Asif et al., 2016), could be used. For our example, we supposethat according to literature, the percentage of used clothes that are eligible for each activity and thecircularity coefficient of each activity is determined. According to this information, the model ofthe ideal supply chain (SC Model VIdeal) is constructed (Figure 7.14). SC Model VIdeal containsclosed-loop reuse activity and open-loop activities (such as repurposing in cleaning clothes andopen-loop energy recovery), while SC Model V1 contains only recycling activity. Circularitycoefficients for the added activities (K11
1 , K122 , and K13
2 ) are calculated through Equations 7.3, 7.4,and 7.5. The GCI for the Ideal SC is 0.43, calculated through Equation 7.6.
K111 =
20+40+30+30+20− (5+5+20)20+40+30+30+20
= 0.79 (7.3)
99
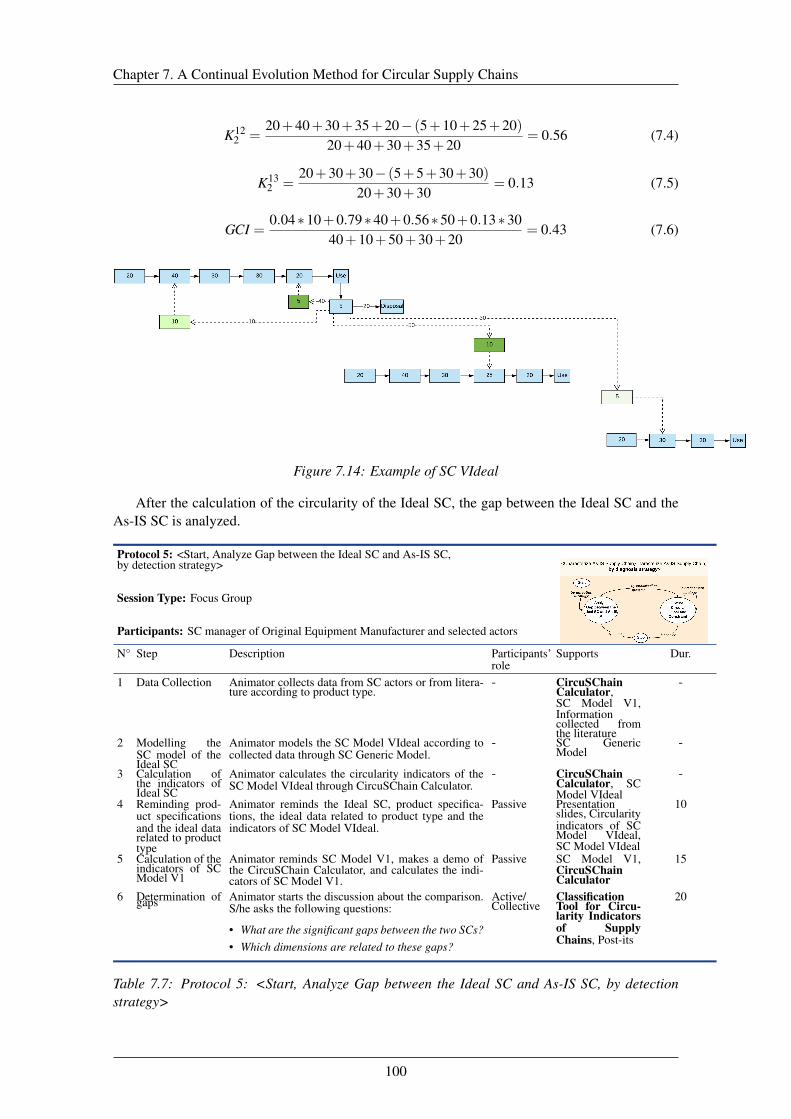
Chapter 7. A Continual Evolution Method for Circular Supply Chains
K122 =
20+40+30+35+20− (5+10+25+20)20+40+30+35+20
= 0.56 (7.4)
K132 =
20+30+30− (5+5+30+30)20+30+30
= 0.13 (7.5)
GCI =0.04∗10+0.79∗40+0.56∗50+0.13∗30
40+10+50+30+20= 0.43 (7.6)
Figure 7.14: Example of SC VIdeal
After the calculation of the circularity of the Ideal SC, the gap between the Ideal SC and theAs-IS SC is analyzed.
Protocol 5: <Start, Analyze Gap between the Ideal SC and As-IS SC,by detection strategy>
Session Type: Focus Group
Participants: SC manager of Original Equipment Manufacturer and selected actors
N° Step Description Participants’role
Supports Dur.
1 Data Collection Animator collects data from SC actors or from litera-ture according to product type.
- CircuSChainCalculator,SC Model V1,Informationcollected fromthe literature
-
2 Modelling theSC model of theIdeal SC
Animator models the SC Model VIdeal according tocollected data through SC Generic Model.
- SC GenericModel
-
3 Calculation ofthe indicators ofIdeal SC
Animator calculates the circularity indicators of theSC Model VIdeal through CircuSChain Calculator.
- CircuSChainCalculator, SCModel VIdeal
-
4 Reminding prod-uct specificationsand the ideal datarelated to producttype
Animator reminds the Ideal SC, product specifica-tions, the ideal data related to product type and theindicators of SC Model VIdeal.
Passive Presentationslides, Circularityindicators of SCModel VIdeal,SC Model VIdeal
10
5 Calculation of theindicators of SCModel V1
Animator reminds SC Model V1, makes a demo ofthe CircuSChain Calculator, and calculates the indi-cators of SC Model V1.
Passive SC Model V1,CircuSChainCalculator
15
6 Determination ofgaps Animator starts the discussion about the comparison.S/he asks the following questions:
• What are the significant gaps between the two SCs?• Which dimensions are related to these gaps?
Active/Collective
ClassificationTool for Circu-larity Indicatorsof SupplyChains, Post-its
20
Table 7.7: Protocol 5: <Start, Analyze Gap between the Ideal SC and As-IS SC, by detectionstrategy>
100

7.4. Circular Supply Chain Continual Evolution Method (CircuSChain)
B. <Analyze Gap between the Ideal SC and As-IS SC, Define Circular Goals andConstraints by identification strategy>
After analyzing Gap between the Ideal SC and As-IS SC, Circular Goal and Constraint are definedby identification strategy. In order to explain the identification strategy, Protocol 6 (Table 7.8) isintroduced. By identification strategy, participants are invited to discuss about their goals andconstraints.
Protocol 6: <Analyze Gap between Ideal SC and As-IS SC, Define Circular Goal andConstraint, by identification strategy>
Session Type: Focus Group
Participants: SC manager of Original Equipment Manufacturer and selected actors
N° Step Description Participants’role
Supports Dur.
1 Reminding themain gaps be-tween the IdealSC and As-IS SC
Animator reminds the main gaps between the IdealSC and As-IS SC
Passive Circularity in-dicators of SCModel VIdealand SC ModelV1
10
2 Discussion aboutthe constraints
Animator starts a discussion about the constraints toreach each goal through the following questions:• What are the economic constraints?• Is there any need for a new actor? If so, what are
the constraints about these actors?• What are the flows’ capacities?• What are the market constraints?
Active/Collective
Post-its statingconstraint types
30
3 Determination ofgoals consideringthe constraints
Animator starts a discussion about the goals relatedto the gaps, considering the constraints, in order toachieve the Ideal SC through the following question:
• What is the goal you aim to reach?
Active/Collective
Post-its 10
4 Synthesis Animator summarizes the goals and the constraintsand establishes priorities with the participants.
Active/Collective
10
Table 7.8: Protocol 6: <Analyze Gap between Ideal SC and As-IS SC, Define Circular Goal andConstraint, by identification strategy>
For our example, the new open-loop activities that exist in SC Model VIdeal requires collabo-ration with new actors. Therefore, the lack of actors could be a constraint (Figure 7.15). The goalcould be defined lower than the Ideal SC.
Figure 7.15: Example of identified goals and constraints
7.4.4 Evolution Strategy
Evolution strategy has two intentions: Identify Change and Characterize Operational changes.Gaming simulation and computer simulation strategies are introduced to identify change. The
101
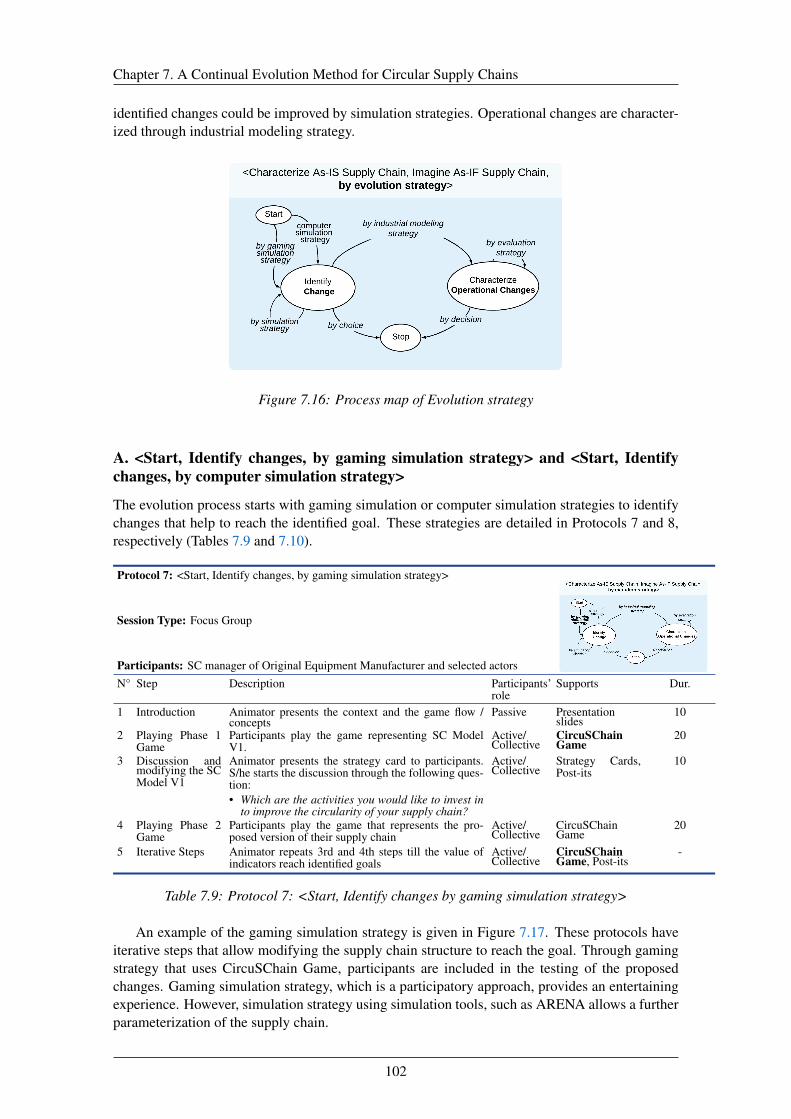
Chapter 7. A Continual Evolution Method for Circular Supply Chains
identified changes could be improved by simulation strategies. Operational changes are character-ized through industrial modeling strategy.
Figure 7.16: Process map of Evolution strategy
A. <Start, Identify changes, by gaming simulation strategy> and <Start, Identifychanges, by computer simulation strategy>
The evolution process starts with gaming simulation or computer simulation strategies to identifychanges that help to reach the identified goal. These strategies are detailed in Protocols 7 and 8,respectively (Tables 7.9 and 7.10).
Protocol 7: <Start, Identify changes, by gaming simulation strategy>
Session Type: Focus Group
Participants: SC manager of Original Equipment Manufacturer and selected actorsN° Step Description Participants’
roleSupports Dur.
1 Introduction Animator presents the context and the game flow /concepts
Passive Presentationslides
10
2 Playing Phase 1Game
Participants play the game representing SC ModelV1.
Active/Collective
CircuSChainGame
20
3 Discussion andmodifying the SCModel V1
Animator presents the strategy card to participants.S/he starts the discussion through the following ques-tion:• Which are the activities you would like to invest in
to improve the circularity of your supply chain?
Active/Collective
Strategy Cards,Post-its
10
4 Playing Phase 2Game
Participants play the game that represents the pro-posed version of their supply chain
Active/Collective
CircuSChainGame
20
5 Iterative Steps Animator repeats 3rd and 4th steps till the value ofindicators reach identified goals
Active/Collective
CircuSChainGame, Post-its
-
Table 7.9: Protocol 7: <Start, Identify changes by gaming simulation strategy>
An example of the gaming simulation strategy is given in Figure 7.17. These protocols haveiterative steps that allow modifying the supply chain structure to reach the goal. Through gamingstrategy that uses CircuSChain Game, participants are included in the testing of the proposedchanges. Gaming simulation strategy, which is a participatory approach, provides an entertainingexperience. However, simulation strategy using simulation tools, such as ARENA allows a furtherparameterization of the supply chain.
102
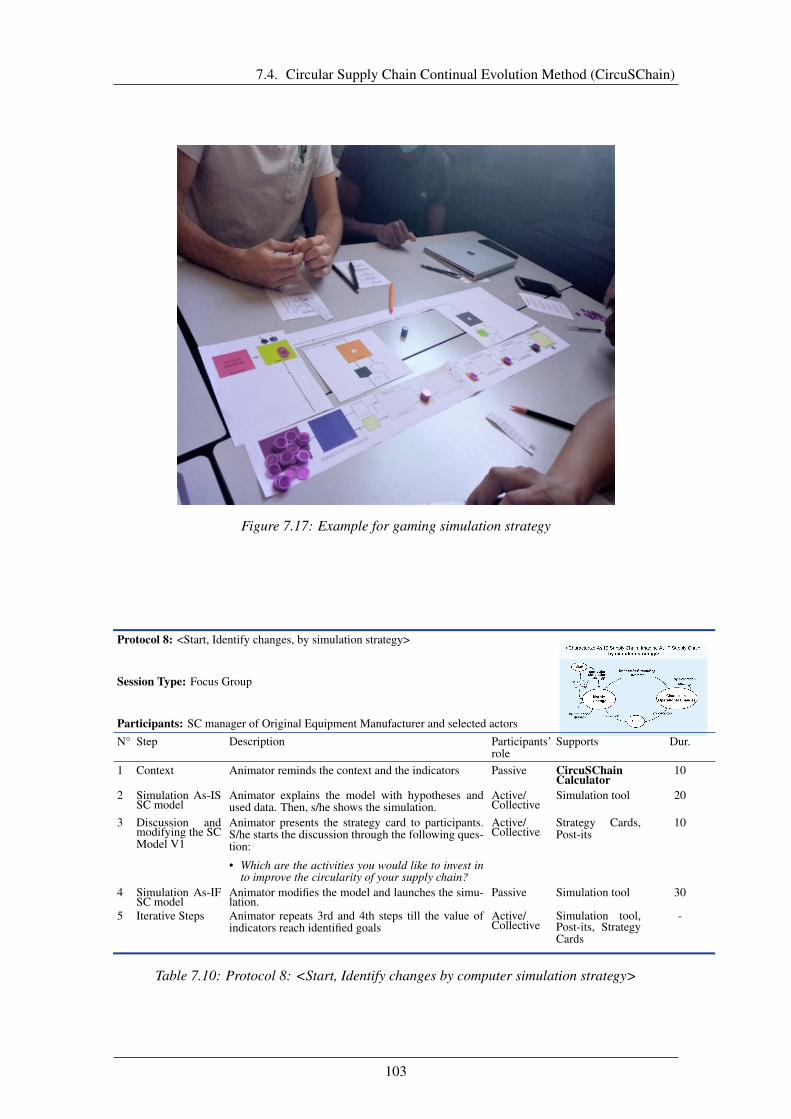
7.4. Circular Supply Chain Continual Evolution Method (CircuSChain)
Figure 7.17: Example for gaming simulation strategy
Protocol 8: <Start, Identify changes, by simulation strategy>
Session Type: Focus Group
Participants: SC manager of Original Equipment Manufacturer and selected actorsN° Step Description Participants’
roleSupports Dur.
1 Context Animator reminds the context and the indicators Passive CircuSChainCalculator
10
2 Simulation As-ISSC model
Animator explains the model with hypotheses andused data. Then, s/he shows the simulation.
Active/Collective
Simulation tool 20
3 Discussion andmodifying the SCModel V1
Animator presents the strategy card to participants.S/he starts the discussion through the following ques-tion:
• Which are the activities you would like to invest into improve the circularity of your supply chain?
Active/Collective
Strategy Cards,Post-its
10
4 Simulation As-IFSC model
Animator modifies the model and launches the simu-lation.
Passive Simulation tool 30
5 Iterative Steps Animator repeats 3rd and 4th steps till the value ofindicators reach identified goals
Active/Collective
Simulation tool,Post-its, StrategyCards
-
Table 7.10: Protocol 8: <Start, Identify changes by computer simulation strategy>
103
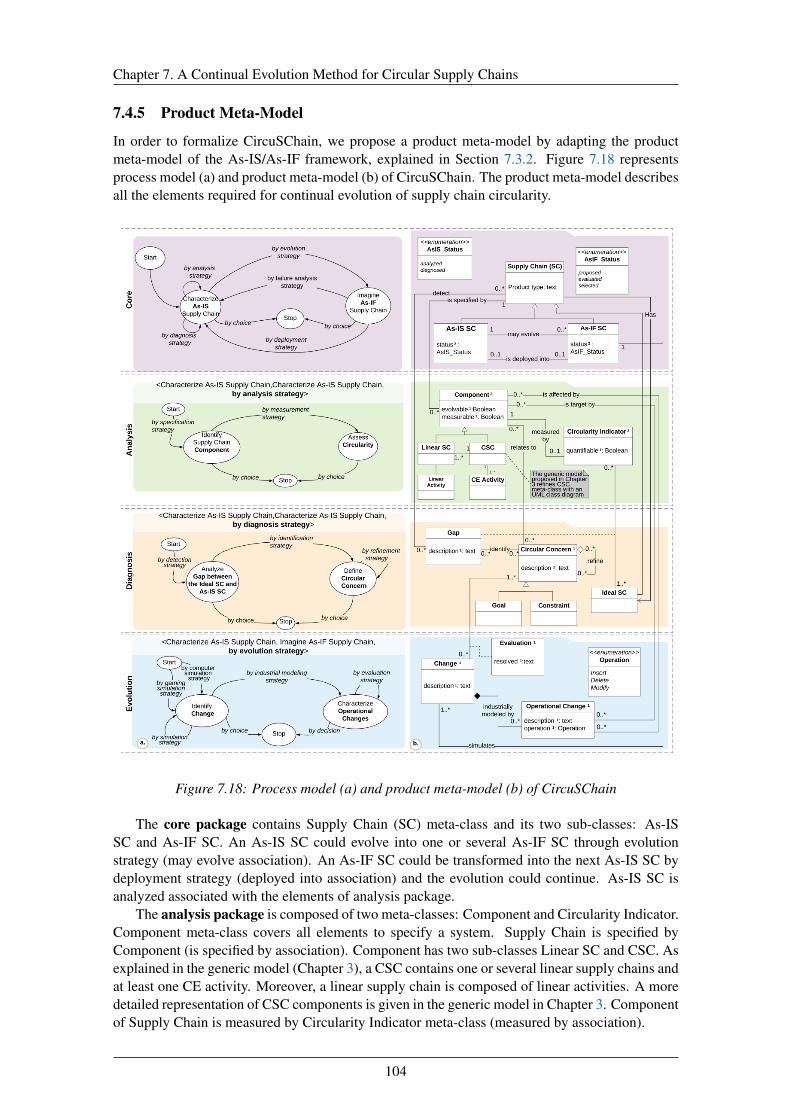
Chapter 7. A Continual Evolution Method for Circular Supply Chains
7.4.5 Product Meta-Model
In order to formalize CircuSChain, we propose a product meta-model by adapting the productmeta-model of the As-IS/As-IF framework, explained in Section 7.3.2. Figure 7.18 representsprocess model (a) and product meta-model (b) of CircuSChain. The product meta-model describesall the elements required for continual evolution of supply chain circularity.
Figure 7.18: Process model (a) and product meta-model (b) of CircuSChain
The core package contains Supply Chain (SC) meta-class and its two sub-classes: As-ISSC and As-IF SC. An As-IS SC could evolve into one or several As-IF SC through evolutionstrategy (may evolve association). An As-IF SC could be transformed into the next As-IS SC bydeployment strategy (deployed into association) and the evolution could continue. As-IS SC isanalyzed associated with the elements of analysis package.
The analysis package is composed of two meta-classes: Component and Circularity Indicator.Component meta-class covers all elements to specify a system. Supply Chain is specified byComponent (is specified by association). Component has two sub-classes Linear SC and CSC. Asexplained in the generic model (Chapter 3), a CSC contains one or several linear supply chains andat least one CE activity. Moreover, a linear supply chain is composed of linear activities. A moredetailed representation of CSC components is given in the generic model in Chapter 3. Componentof Supply Chain is measured by Circularity Indicator meta-class (measured by association).
104
7.5. Conclusion
Moreover, As-IS SC is diagnosed as associated with the elements of diagnosis package. Thispackage contains Gap, Circular Concern, and Ideal SC meta-classes. Ideal SC is a subclass ofSupply Chain Meta-class and Supply Chain has an Ideal SC associated with Circularity Indica-tor. Gap between the Ideal and As-IS SC is detected (detect association). Gaps identify CircularConcern, which represents Goal or Constraint of the supply chain.
As previously stated, As-IS SC could be evolved into an As-IF SC, associated with the ele-ments of evolution package. Change, Operational Change, and Evaluation are the three meta-classes of this package. The Change meta-class represents the suggested evolution to address oneor more Concerns. Change is industrially modeled by Operational Change (industrially modeledby association). Change is evaluated in order to determine whether the related Concern is resolved(Evolution meta-class).
7.5 Conclusion
In this chapter, we have adapted As-IS/As-IF framework for supply chain circularity improve-ment. This framework guides the creation of a continual evolution method for a chosen system.Here our system is a supply chain whose circularity needs to be improved. While adapting thisframework, some modifications have been made in the analysis, diagnosis, and evolution strate-gies. Some strategies in these packages are refined by sub-maps. The proposed tools in the pre-vious chapters are integrated into the CircuSChain Method. Protocols explain the use of thesetools.
7.5.1 Implications for the practice and the theory
This work proposes preliminary work to develop a continual evolution method for CSCs. It en-hances the tools proposed previously and shows a potential way to use these tools in an integratedway. While adapting this tool, we propose the notion of the Ideal SC and add it into the pro-cess model and product meta-model. Note that the As-IS/As-IF heuristics do not allow to the addnew meta-classes in the meta-model. However, this notion is considered here important, and thischange will help evolving the framework itself so other adaptation could benefit of the ideal casenotion.
This method would help Supply Chain managers to transform their linear Supply Chain into aCSC and then improve its circularity in a continuous way.
7.5.2 Limitations and future works
In this work, we have not focus on the deployment strategy. Indeed, the framework is still notprecise on this aspect. Future works could permit to develop this strategy to deploy the imaginedAs-IF Supply Chain. Developing this part focusing on supply chains could also help to developthis part of the framework in a bottom-up approach.
Furthermore, we have not refine the industrial modeling strategy. This strategy attains char-acterization of Operational Changes. Future works are needed to explore possible strategies andtools to characterize operational changes. As explained in Chapter 2, our work is based on theactivities, not processes of supply chains. SCOR model (stated in Chapter 2) allowing model theprocesses within actors could be used.
Moreover, some tools are needed to be selected or developed for some strategies. For instance,for Protocol 1, an interview guide needs to be developed. Considering the elicitation strategy,(Protocol 3) our classification tool does not provide some information (e.g. required data, indicator
105

Chapter 7. A Continual Evolution Method for Circular Supply Chains
type (quantitative, qualitative), etc.) to help participants choose circularity indicators. Saidani et al.(2019) proposed a taxonomy providing this information. Our classification tool could be extendedinspired by this work.
Concerning the calculation strategy (Protocol 5), the animator needs to collect data of the IdealSC that depends on the product design from the literature. New indicators are needed to define theproducts’ attributes, such as the product design attributes of (Asif et al., 2016). For example, for aproduct type, the percentage of the collected products, which are reusable, remanufacturable, etc.,could be defined. Moreover, for the simulation strategy (Protocol 9), suitable simulation tools areneeded to be selected to simulate Supply Chains.
Finally, a tool to integrate all the tools used in the CircuSChain Method is needed to furtherformalize the method. This will be very helpful in order to guide participants of the method toimplement the different strategies and use the tools to reach the different goals.
106

8General Conclusion
The Circular Economy concept is introduced as a potential solution for material depletion andenvironmental problems. The Circular Economy aims at minimizing resource inputs, waste, andpollution by keeping products, components, and materials in use. This could be obtained by CEactivities, such as reuse, remanufacturing, repurposing, recycling, etc. Supply chains play anessential role in the application of CE principles by supporting these activities.
The CE brings some new implications on supply chains: (1) applying multiple CE activities inparallel rather than applying single activities, (2) using materials over and over again through con-secutive cycles, and (3) combining closed and open-loops between distinct supply chains throughreuse and repurposing. Therefore CE requires new CSC structures that need to be conceptual-ized and modeled. Furthermore, one of the challenges of implementing CSC or CE practices isthe insufficient knowledge and awareness among supply chain members. Moreover, a successfultransition to a CSC requires continuous measurement of progress towards circularity. In addition,the repurposing activity, which could be a new potential mean to increasing circularity in CSCs,remains scarcely explored among scholars and industrials.
Five key research questions (RQ1 to RQ5) have been formulated according to the challengesmentioned above. Therefore, in this thesis, efforts have been made to address these researchquestions.
First, RQ1 has been addressed in Chapter 2 through a literature review in order to establisha link between the CE and supply chain concepts and clarify our positioning. The repurposingactivities have been integrated into a hierarchical framework of CE activities and defined as open-loops in an extended model of CSCs developed during our previous work.
Then, in order to answer RQ2, in Chapter 3, we have proposed CSC characteristics to definethe scope of CSCs. The proposed characteristics in this work contribute to the theory in construct-ing the bridge between the CE and supply chains as well as the conceptualization of CSCs, byclarifying the CSC structures according to the CE principles. Based on these characteristics, ageneric model is constructed using the Unified Modeling Language (UML). The generic modelhelps decision-makers model complex CSCs in a standard way. This model helps to conceptualize,formalize and visualize complex CSCs. This standard representation could be used by differentactors of CSCs, and it supports inter-actor communication, especially in the case of repurposing,where the actors from distinct sectors are collaborating.
In response to RQ3, first, in Chapter 4, we have developed a classification tool for CSC in-dicators based on EMF circular value creation principles. This tool can help to analyze existingor new circularity indicators according to CSC structures by using the proposed dimensions as
108
classification criteria. It also facilitates supply chain managers to categorize and choose appropri-ate circularity indicators to assess the circularity of CSCs. Moreover, we propose new potentialcircularity indicators for each dimension that could support strategic decisions such as selectingCE activities in supply chain design. Second, in Chapter 5, we have defined a Global CircularityIndicator (GCI) in order to evaluate the circularity of CSCs. It relies on our generic model andallows the evaluation of different CSC configurations, without requiring modifications in the for-mula. CSCs could be modeled through a generic model and evaluated through this GCI. It alsosupports the different dimensions that constitute the classification tool.
To overcome the challenges stated in RQ4 regarding to the insufficient knowledge and aware-ness about CSCs, the CircuSChain Game is introduced in Chapter 6. This game is developedbased on the well-known Beer Distribution Game. The game has been tested by an experimentwith forty-two industrial engineering students.
Finally, in Chapter 7, we have integrated these contributions into a preliminary version of acontinual evolution method to help organizations to support circularity in supply chains contin-uously to address RQ5. To develop the CircuSChain Method, we have adapted the As-IS/As-IFframework for supply chains. The used framework guides the creation of our continual evolutionmethod. CircuSChain Method integrates previously proposed tools and shows a potential way touse them in an industrial scenario. This method would help supply chain managers to transformtheir linear supply chain into a CSC and then improve its circularity in a continuous way.
All of our contributions support various repurposing activities that create open-loops. Theseactivities have been scarcely explored in the literature, while related industrial applications remainlimited. This activity adds value to used products in a different way could be a new potentialfor CSCs. Note that the product design is a critical factor for the implementation of repurposingactivities. In future, where the products will be designed to be repurposed over and over again indifferent applications, our contributions would be more valuable.
Our works have contributed to bring these first bricks to support the design, assessment, andevolution of CSCs. However, we are aware that limits exist as mentioned in each chapter but theyconstitute future research opportunities, such as the inclusion of the actor dimension in the genericmodel, the introduction of TBL -especially social and economic aspects- of the sustainability inthe classification tool, the adoption of a multi-criteria approach for our Global Circularity Indica-tor, the validation of the CircuSChain Game through more exhaustive user experiments, and therefinement of deployment strategy in CircuSChain Method.
Related own publications
• Kurt, A., Cortes-Cornax, M., Cung, V.-D., Front, A., & Mangione, F. (2021). A classifica-tion tool for circular supply chain indicators. In IFIP International Conference on Advancesin Production Management Systems (pp. 644–653).: Springer.
• Kurt, A., Cortes-Cornax, M., Cung, V.-D., Mangione, F., & Kaddouri, S. (2022). Cir-cuSChain Game: A serious game to explore circular supply chains. In Handbook of Re-search on Promoting Economic and Social Development Through Serious Games. IGIGlobale. (Accepted).
• Kurt, A., Cung, V.-D., Mangione, F., Cortes-Cornax, M., & Front, A. (2019). An extendedcircular supply chain model including repurposing activities. In 2019 International Confer-ence on Control, Automation and Diagnosis (ICCAD) (pp. 287–292).: IEEE
• Dubois, F., Basia, A., Kurt, A., Bettinelli, M., Zheng, P., Jourdain, V., & Guelle, K. (2019).Production of the future to support circular economy-development of a dedicated platformby means of a multidisciplinary approach. In 2019 International Conference on Control,Automation and Diagnosis (ICCAD) (pp. 144–148).: IEEE
109

Bibliography
AFEP (2017). Trajectoires économie circulaire. Available online: https://afep.com/wp-content/uploads/2017/05/AFEP_100_Engagements_economie_circulaire_-33_entreprises.pdf. Ac-cessed: 04/10/21.
Aguiar, V. A. C., Rosly, M. M., & Nakano, M. (2018). A single player serious game for sustainablesupply chain management. STUDIES IN SIMULATION AND GAMING, 28(1), 60–72.
Ahi, P., Jaber, M. Y., & Searcy, C. (2016). A comprehensive multidimensional framework for as-sessing the performance of sustainable supply chains. Applied Mathematical Modelling, 40(23-24), 10153–10166.
Ahi, P. & Searcy, C. (2015). An analysis of metrics used to measure performance in green andsustainable supply chains. Journal of Cleaner Production, 86, 360–377.
Alamerew, Y. A. & Brissaud, D. (2020). Modelling reverse supply chain through system dynam-ics for realizing the transition towards the circular economy: A case study on electric vehiclebatteries. Journal of Cleaner Production, 254, 120025.
Alizadeh-Basban, N. & Taleizadeh, A. A. (2020). A hybrid circular economy-game theoreticalapproach in a dual-channel green supply chain considering sale’s effort, delivery time, andhybrid remanufacturing. Journal of Cleaner Production, 250, 119521.
Aminoff, A. & Kettunen, O. (2016). Sustainable supply chain management in a circular econ-omy—towards supply circles. In International Conference on Sustainable Design and Manu-facturing (pp. 61–72).: Springer.
APICS (2017). Supply chain operations reference model (scor) version 12.0. Available online:http://www.apics.org/docs/default-source/scor-training/scor-v12-0-framework-introduction.pdf?sfvrsn=2. Accessed: 17/09/21.
Asif, F. M., Lieder, M., & Rashid, A. (2016). Multi-method simulation based tool to evaluateeconomic and environmental performance of circular product systems. Journal of CleanerProduction, 139, 1261–1281.
Ávila-Gutiérrez, M. J., Martín-Gómez, A., Aguayo-González, F., & Córdoba-Roldán, A. (2019).Standardization framework for sustainability from circular economy 4.0. Sustainability, 11(22),6490.
Avila-Pesantez, D., Delgadillo, R., & Rivera, L. A. (2019). Proposal of a conceptual model forserious games design: A case study in children with learning disabilities. IEEE Access, 7,161017–161033.
Azevedo, S. G., Godina, R., & Matias, J. C. d. O. (2017). Proposal of a sustainable circular indexfor manufacturing companies. Resources, 6(4), 63.
Barringer, H. P., Weber, D. P., Westside, M. H., et al. (1995). Life-cycle cost tutorials. In FourthInternational Conference on Process Plant Reliability, Gulf Publishing Company: Citeseer.
I
Bibliography
Bassuk, J. A. & Washington, I. M. (2013). The a3 problem solving report: a 10-step scientificmethod to execute performance improvements in an academic research vivarium. PloS one,8(10), e76833.
Batista, L., Bourlakis, M., Liu, Y., Smart, P., & Sohal, A. (2018). Supply chain operations for acircular economy. Production Planning & Control, 29(6), 419–424.
Bauer, T., Brissaud, D., & Zwolinski, P. (2017). Design for high added-value end-of-life strategies.In Sustainable Manufacturing (pp. 113–128). Springer, Cham.
Behrens, B.-A., Wilde, I., & Hoffmann, M. (2007). Complaint management using the extended8d-method along the automotive supply chain. Production Engineering, 1(1), 91–95.
Beske, P. & Seuring, S. (2014). Putting sustainability into supply chain management. SupplyChain Management: an international journal, 19(3), 322–331.
Bianchini, A., Rossi, J., & Pellegrini, M. (2019). Overcoming the main barriers of circular econ-omy implementation through a new visualization tool for circular business models. Sustainabil-ity, 11(23), 6614.
Bilal, M., Khan, K. I. A., Thaheem, M. J., & Nasir, A. R. (2020). Current state and barriers to thecircular economy in the building sector: Towards a mitigation framework. Journal of CleanerProduction, 276, 123250.
Blomsma, F. & Brennan, G. (2017). The emergence of circular economy: a new framing aroundprolonging resource productivity. Journal of Industrial Ecology, 21(3), 603–614.
Bocken, N. M., De Pauw, I., Bakker, C., & Van Der Grinten, B. (2016). Product design and busi-ness model strategies for a circular economy. Journal of industrial and production engineering,33(5), 308–320.
Bocken, N. M., Ritala, P., & Huotari, P. (2017). The circular economy: exploring the introductionof the concept among s&p 500 firms. Journal of Industrial Ecology, 21(3), 487–490.
Bracquené, E., Dewulf, W., & Duflou, J. R. (2020). Measuring the performance of more circularcomplex product supply chains. Resources, Conservation and Recycling, 154, 104608.
Brissaud, D. & Zwolinski, P. (2017). The scientific challenges for a sustainable consumptionand production scenario: the circular reuse of materials for the upgrading and repurposing ofcomponents. Procedia CIRP, 61, 663–666.
Brunoe, T. D., Andersen, A.-L., & Nielsen, K. (2019). Changeable manufacturing systems sup-porting circular supply chains. Procedia CIRP, 81, 1423–1428.
Carrión-Toro, M., Santorum, M., Acosta-Vargas, P., Aguilar, J., & Pérez, M. (2020). iplus auser-centered methodology for serious games design. Applied Sciences, 10(24), 9007.
Casals, L. C., García, B. A., & Cremades, L. V. (2017). Electric vehicle battery reuse: Preparingfor a second life. Journal of Industrial Engineering and Management, 10(2), 266–285.
Çela, O. (2021). A General Framework for the Continual Evolution Methods; Adaptation to theContinual Evolution of Organization’s Business Processes. PhD thesis, Universite GrenobleAlpes.
Çela, O., Cortes-Cornax, M., Rieu, D., et al. (2019). Methodological framework to guide thedevelopment of continual evolution methods. In International Conference on Advanced Infor-mation Systems Engineering (pp. 48–63).: Springer.
II
Bibliography
Chertow, M. R. (2000). Industrial symbiosis: literature and taxonomy. Annual review of energyand the environment, 25(1), 313–337.
Chopra, S., Meindl, P., & Kalra, D. V. (2013). Supply chain management: Strategy, planning, andoperation, volume 232. Pearson Boston, MA.
Cooper, S. J., Giesekam, J., Hammond, G. P., Norman, J. B., Owen, A., Rogers, J. G., & Scott, K.(2017). Thermodynamic insights and assessment of the ‘circular economy’. Journal of CleanerProduction, 162, 1356–1367.
Corona, B., Shen, L., Reike, D., Carreón, J. R., & Worrell, E. (2019). Towards sustainable devel-opment through the circular economy—a review and critical assessment on current circularitymetrics. Resources, Conservation and Recycling, 151, 104498.
Côté, R. P. & Cohen-Rosenthal, E. (1998). Designing eco-industrial parks: a synthesis of someexperiences. Journal of cleaner production, 6(3-4), 181–188.
Council of European Union (2008). Directive 2008/98/ec of the european parliament and of thecouncil of 19 november 2008 on waste and repealing certain directives.
Cuesta, V. & Nakano, M. (2017). Chain of command: a sustainable supply chain managementserious game. International Journal of Automation Technology, 11(4), 552–562.
Cullen, J. (2017). Circular economy: theoretical benchmark or perpetual motion machine? Jour-nal of Industrial Ecology, 21(3), 483–486.
Davim, J. P. (2013). Sustainable manufacturing. John Wiley & Sons.
De Angelis, R., Howard, M., & Miemczyk, J. (2018). Supply chain management and the circulareconomy: towards the circular supply chain. Production Planning & Control, 29(6), 425–437.
De Brito, M. P. & Dekker, R. (2004). A framework for reverse logistics. In Reverse logistics (pp.3–27). Springer.
de Lima, F. A., Seuring, S., & Sauer, P. C. (2021). A systematic literature review exploringuncertainty management and sustainability outcomes in circular supply chains. InternationalJournal of Production Research, (pp. 1–34).
de Sousa Jabbour, A. B. L., Luiz, J. V. R., Luiz, O. R., Jabbour, C. J. C., Ndubisi, N. O., de Oliveira,J. H. C., & Junior, F. H. (2019). Circular economy business models and operations management.Journal of cleaner production, 235, 1525–1539.
Deeb, S., Bril-El Haouzi, H., Aubry, A., & Dassisti, M. (2018). A generic framework to supportthe implementation of six sigma approach in smes. IFAC-PapersOnLine, 51(11), 921–926.
Deming, W. E. (2000). Out of the Crisis. MIT press.
Desing, H., Brunner, D., Takacs, F., Nahrath, S., Frankenberger, K., & Hischier, R. (2020). A cir-cular economy within the planetary boundaries: towards a resource-based, systemic approach.Resources, Conservation and Recycling, 155, 104673.
Despeisse, M., Ball, P. D., Evans, S., & Levers, A. (2012). Industrial ecology at factory level–aconceptual model. Journal of cleaner production, 31, 30–39.
Di Maio, F., Rem, P. C., Baldé, K., & Polder, M. (2017). Measuring resource efficiency andcircular economy: A market value approach. Resources, Conservation and Recycling, 122,163–171.
III
Bibliography
Di Maio, F., Rem, P. C., et al. (2015). A robust indicator for promoting circular economy throughrecycling. Journal of Environmental Protection, 6(10), 1095.
Elia, V., Gnoni, M. G., & Tornese, F. (2017). Measuring circular economy strategies through indexmethods: A critical analysis. Journal of Cleaner Production, 142, 2741–2751.
EMF (2013). Towards the circular economy volume 1: An economic and business rationale for anaccelerated transition.
EMF (2014). Towards the circular economy—vol 3: Accelerating the scale-up across globalsupply chains.
EMF (2015). Circularity indicators: An approach to measuring circularity.
Eng, T.-Y. (2005). The influence of a firm’s cross-functional orientation on supply chain perfor-mance. Journal of Supply Chain Management, 41(4), 4–16.
Farooque, M., Zhang, A., & Liu, Y. (2019a). Barriers to circular food supply chains in china.Supply Chain Management: An International Journal, 24(5), 677–696.
Farooque, M., Zhang, A., Thürer, M., Qu, T., & Huisingh, D. (2019b). Circular supply chainmanagement: A definition and structured literature review. Journal of Cleaner Production, 228,882–900.
Figge, F., Thorpe, A. S., Givry, P., Canning, L., & Franklin-Johnson, E. (2018). Longevity andcircularity as indicators of eco-efficient resource use in the circular economy. Ecological eco-nomics, 150, 297–306.
Flygansvær, B., Dahlstrom, R., & Nygaard, A. (2018). Exploring the pursuit of sustainability inreverse supply chains for electronics. Journal of Cleaner Production, 189, 472–484.
Galvão, G. D. A., Homrich, A. S., Geissdoerfer, M., Evans, S., Scoleze Ferrer, P. S., & Carvalho,M. M. (2020). Towards a value stream perspective of circular business models. Resources,Conservation and Recycling, 162, 105060.
Garza-Reyes, J. A., Romero, J. T., Govindan, K., Cherrafi, A., & Ramanathan, U. (2018). Apdca-based approach to environmental value stream mapping (e-vsm). Journal of Cleaner Pro-duction, 180, 335–348.
Geissdoerfer, M., Savaget, P., Bocken, N. M., & Hultink, E. J. (2017). The circular economy–anew sustainability paradigm? Journal of cleaner production, 143, 757–768.
Genovese, A., Acquaye, A. A., Figueroa, A., & Koh, S. L. (2017). Sustainable supply chainmanagement and the transition towards a circular economy: Evidence and some applications.Omega, 66, 344–357.
Gómez-Luciano, C. A., Domínguez, F. R. R., González-Andrés, F., & De Meneses, B. U. L.(2018). Sustainable supply chain management: Contributions of supplies markets. Journal ofcleaner production, 184, 311–320.
González-Sánchez, R., Settembre-Blundo, D., Ferrari, A. M., & García-Muiña, F. E. (2020). Maindimensions in the building of the circular supply chain: A literature review. Sustainability,12(6), 2459.
Govindan, K. & Hasanagic, M. (2018). A systematic review on drivers, barriers, and practicestowards circular economy: a supply chain perspective. International Journal of ProductionResearch, 56(1-2), 278–311.
IV
Bibliography
Govindan, K. & Soleimani, H. (2017). A review of reverse logistics and closed-loop supply chains:a journal of cleaner production focus. Journal of Cleaner Production, 142, 371–384.
Govindan, K., Soleimani, H., & Kannan, D. (2015). Reverse logistics and closed-loop supplychain: A comprehensive review to explore the future. European journal of operational research,240(3), 603–626.
Grebert, F. & Mothe, C. (2019). Les conditions d’émergence et de développement des projetsd’économie circulaire.
Guide Jr, V. D. R. & Van Wassenhove, L. N. (2006). Closed-loop supply chains: an introductionto the feature issue (part 1). Production and Operations Management, 15(3), 345–350.
Gunasekaran, A., Patel, C., & McGaughey, R. E. (2004). A framework for supply chain perfor-mance measurement. International journal of production economics, 87(3), 333–347.
Gunasekaran, A., Patel, C., & Tirtiroglu, E. (2001). Performance measures and metrics in a supplychain environment. International journal of operations & production Management, 21(1/2),71–87.
Hervani, A. A., Helms, M. M., & Sarkis, J. (2005). Performance measurement for green supplychain management. Benchmarking: An international journal, 12(4), 330–353.
Hofmann, F. (2019). Circular business models: business approach as driver or obstructer of sus-tainability transitions? Journal of Cleaner Production, 224, 361–374.
Homrich, A. S., Galvao, G., Abadia, L. G., & Carvalho, M. M. (2018). The circular economyumbrella: Trends and gaps on integrating pathways. Journal of Cleaner Production, 175, 525–543.
Howard, M., Hopkinson, P., & Miemczyk, J. (2019). The regenerative supply chain: a frameworkfor developing circular economy indicators. International Journal of Production Research,57(23), 7300–7318.
Ijomah, W. L., Bennett, J. P., & Pearce, J. (1999). Remanufacturing: evidence of environmen-tally conscious business practice in the uk. In Proceedings first international symposium onenvironmentally conscious design and inverse manufacturing (pp. 192–196).: IEEE.
Ivanov, D. (2010). An adaptive framework for aligning (re) planning decisions on supply chainstrategy, design, tactics, and operations. International journal of production research, 48(13),3999–4017.
Jain, S., Jain, N. K., & Metri, B. (2018). Strategic framework towards measuring a circular supplychain management. Benchmarking: An International Journal, 25(8), 3238–3252.
Jamil, N., Gholami, H., Mat Saman, M. Z., Streimikiene, D., Sharif, S., & Zakuan, N. (2020).Dmaic-based approach to sustainable value stream mapping: towards a sustainable manufactur-ing system. Economic research-Ekonomska istraživanja, 33(1), 331–360.
Jiao, N. & Evans, S. (2016). Business models for sustainability: the case of second-life electricvehicle batteries. Procedia Cirp, 40, 250–255.
Jiménez-Hernández, E. M., Oktaba, H., Piattini, M., Díaz-Barriga, F. F., Revillagigedo-Tulais,A. M., & Flores-Zarco, S. V. (2016). Methodology to construct educational video games insoftware engineering. In 2016 4th International Conference in Software Engineering Researchand Innovation (CONISOFT) (pp. 110–114).: IEEE.
V
Bibliography
Julianelli, V., Caiado, R. G. G., Scavarda, L. F., & Cruz, S. P. d. M. F. (2020). Interplay betweenreverse logistics and circular economy: critical success factors-based taxonomy and framework.Resources, Conservation and Recycling, 158, 104784.
Kaddouri, S. (2021). Development of a serious game in the transition towards circular economy .Master’s thesis, INP Grenoble, France.
Kalmykova, Y., Sadagopan, M., & Rosado, L. (2018). Circular economy–from review of theoriesand practices to development of implementation tools. Resources, conservation and recycling,135, 190–201.
Kalverkamp, M., Pehlken, A., & Wuest, T. (2017). Cascade use and the management of productlifecycles. Sustainability, 9(9), 1540.
Kalverkamp, M. & Young, S. B. (2019). In support of open-loop supply chains: Expanding thescope of environmental sustainability in reverse supply chains. Journal of Cleaner Production,214, 573–582.
Kaplík, P., Prístavka, M., Bujna, M., & Vidernan, J. (2013). Use of 8d method to solve problems.In Advanced Materials Research, volume 801 (pp. 95–101).: Trans Tech Publ.
Kazancoglu, Y., Kazancoglu, I., & Sagnak, M. (2018). A new holistic conceptual framework forgreen supply chain management performance assessment based on circular economy. Journalof Cleaner Production, 195, 1282–1299.
Khor, K. S. & Udin, Z. M. (2012). Impact of reverse logistics product disposition towards businessperformance in malaysian e&e companies. Journal of Supply Chain and Customer RelationshipManagement, 2012, 1.
King, A. M., Burgess, S. C., Ijomah, W., & McMahon, C. A. (2006). Reducing waste: repair,recondition, remanufacture or recycle? Sustainable development, 14(4), 257–267.
Kirchherr, J., Reike, D., & Hekkert, M. (2017). Conceptualizing the circular economy: An analysisof 114 definitions. Resources, conservation and recycling, 127, 221–232.
Kurt, A. (2018). A Generic Framework to Model and Assess the Circularity of Supply Chains .Master’s thesis, INP Grenoble, France.
Kurt, A., Cung, V.-D., Mangione, F., Cortes-Cornax, M., & Front, A. (2019). An extended circu-lar supply chain model including repurposing activities. In 2019 International Conference onControl, Automation and Diagnosis (ICCAD) (pp. 287–292).: IEEE.
Lambert, S., Riopel, D., & Abdul-Kader, W. (2011). A reverse logistics decisions conceptualframework. Computers & Industrial Engineering, 61(3), 561–581.
Lenort, R., Staš, D., Holman, D., & Wicher, P. (2017). A3 method as a powerful tool for searchingand implementing green innovations in an industrial company transport. Procedia engineering,192, 533–538.
Lieder, M., Asif, F. M., Rashid, A., Mihelic, A., & Kotnik, S. (2017). Towards circular economyimplementation in manufacturing systems using a multi-method simulation approach to link de-sign and business strategy. The International Journal of Advanced Manufacturing Technology,93(5), 1953–1970.
Lifset, R. & Graedel, T. E. (2002). Industrial ecology: goals and definitions. In A handbook ofindustrial ecology (pp. 3–15). Edward Elgar Cheltenham, UK.
VI
Bibliography
Linder, M., Sarasini, S., & van Loon, P. (2017). A metric for quantifying product-level circularity.Journal of Industrial Ecology, 21(3), 545–558.
Liu, B., Chen, D., Zhou, W., Nasr, N., Wang, T., Hu, S., & Zhu, B. (2018a). The effect ofremanufacturing and direct reuse on resource productivity of china’s automotive production.Journal of Cleaner Production, 194, 309–317.
Liu, J., Feng, Y., Zhu, Q., & Sarkis, J. (2018b). Green supply chain management and the circulareconomy: Reviewing theory for advancement of both fields. International Journal of PhysicalDistribution & Logistics Management, 48(8), 794–817.
Lüdeke-Freund, F., Gold, S., & Bocken, N. M. (2019). A review and typology of circular economybusiness model patterns. Journal of Industrial Ecology, 23(1), 36–61.
Lynch, D. P., Bertolino, S., & Cloutier, E. (2003). How to scope dmaic projects. Quality progress,36(1), 37–41.
Madani, K., Pierce, T. W., & Mirchi, A. (2017). Serious games on environmental management.Sustainable Cities and Society, 29, 1–11.
Mandran, N. (2018). THEDRE : langage et méthode de conduite de la recherche : TraceableHuman Experiment Design Research. PhD thesis, Universite Grenoble Alpes.
Mandran, N. & Dupuy-Chessa, S. (2018). Supporting experimental methods in information systemresearch. In 2018 12th International Conference on Research Challenges in Information Science(RCIS) (pp. 1–12).: IEEE.
Mangla, S. K., Luthra, S., Mishra, N., Singh, A., Rana, N. P., Dora, M., & Dwivedi, Y. (2018).Barriers to effective circular supply chain management in a developing country context. Pro-duction Planning & Control, 29(6), 551–569.
Marfisi-Schottman, I., George, S., & Tarpin-Bernard, F. (2010). Tools and methods for efficientlydesigning serious games. In Proceedings of the 4th Europeen Conference on Games BasedLearning ECGBL (pp. 226–234).
Masi, D., Day, S., & Godsell, J. (2017). Supply chain configurations in the circular economy: Asystematic literature review. Sustainability, 9(9), 1602.
Metters, R. (1997). Quantifying the bullwhip effect in supply chains. Journal of operationsmanagement, 15(2), 89–100.
Ministère de la Transition Ecologique (2020). The anti waste law in the daily lives of the frenchpeople. Available online:https://www.ecologie.gouv.fr/sites/default/files/en_DP%20PJL.pdf.Accessed: 04/10/21.
Mishra, J. L., Hopkinson, P. G., & Tidridge, G. (2018). Value creation from circular economy-ledclosed loop supply chains: a case study of fast-moving consumer goods. Production Planning& Control, 29(6), 509–521.
Mishra, P. & Sharma, R. K. (2014). A hybrid framework based on sipoc and six sigma dmaicfor improving process dimensions in supply chain network. International Journal of Quality &Reliability Management, 31(5), 522–546.
Moraga, G., Huysveld, S., Mathieux, F., Blengini, G. A., Alaerts, L., Van Acker, K., De Meester,S., & Dewulf, J. (2019). Circular economy indicators: What do they measure? Resources,Conservation and Recycling, 146, 452–461.
VII
Bibliography
Moreno-Camacho, C. A., Montoya-Torres, J. R., Jaegler, A., & Gondran, N. (2019). Sustainabilitymetrics for real case applications of the supply chain network design problem: A systematicliterature review. Journal of cleaner production, 231, 600–618.
Nasir, M. H. A., Genovese, A., Acquaye, A. A., Koh, S., & Yamoah, F. (2017). Comparing linearand circular supply chains: A case study from the construction industry. International Journalof Production Economics, 183, 443–457.
Neck, H. M. & Greene, P. G. (2011). Entrepreneurship education: known worlds and new frontiers.Journal of small business management, 49(1), 55–70.
Nordås, H. K. (2004). The global textile and clothing industry post the agreement on textiles andclothing. Number 5. WTO discussion paper.
Ongondo, F. O., Williams, I. D., & Cherrett, T. J. (2011). How are weee doing? a global reviewof the management of electrical and electronic wastes. Waste management, 31(4), 714–730.
Osiro, L., Lima-Junior, F. R., & Carpinetti, L. C. R. (2018). A group decision model based onquality function deployment and hesitant fuzzy for selecting supply chain sustainability metrics.Journal of Cleaner Production, 183, 964–978.
Pauliuk, S., Kondo, Y., Nakamura, S., & Nakajima, K. (2017). Regional distribution and losses ofend-of-life steel throughout multiple product life cycles—insights from the global multiregionalmatrace model. Resources, Conservation and Recycling, 116, 84–93.
Pauw, I. D., Grinten, B. V. D., Flipsen, B., & Alvarez-mendez, L. (2021). The Circularity Calcu-lator , a Tool For Circular Product Development with Circularity and Potential Value CaptureIndicators . In PLATE: Product Lifetimes And The Environment.
Pavel, C. & Blagoeva, D. (2018). Competitive landscape of the EU’s insulation materials industryfor energy-efficient buildings. Technical report.
Pearce, D. W. & Turner, R. K. (1990). Economics of natural resources and the environment. JHUpress.
Ponce, P., Meier, A., Méndez, J. I., Peffer, T., Molina, A., & Mata, O. (2020). Tailored gamificationand serious game framework based on fuzzy logic for saving energy in connected thermostats.Journal of Cleaner Production, 262, 121167.
Potting, J., Hekkert, M., Worrell, E., & Hanemaaijer, A. (2017). Circular economy: measuringinnovation in the product chain. Number 2544. PBL Publishers.
Qualters, D. M., Isaacs, J. A., Cullinane, T. P., Laird, J., & McDonald, A. (2008). A game approachto teach environmentally benign manufacturing in the supply chain. International Journal forthe Scholarship of Teaching and Learning, 2(2), n2.
Reike, D., Vermeulen, W. J., & Witjes, S. (2018). The circular economy: new or refurbished as ce3.0?—exploring controversies in the conceptualization of the circular economy through a focuson history and resource value retention options. Resources, Conservation and Recycling, 135,246–264.
Richa, K., Babbitt, C. W., & Gaustad, G. (2017). Eco-efficiency analysis of a lithium-ion batterywaste hierarchy inspired by circular economy. Journal of Industrial Ecology, 21(3), 715–730.
Rolland, C., Prakash, N., & Benjamen, A. (1999). A multi-model view of process modelling.Requirements engineering, 4(4), 169–187.
VIII

Bibliography
Saidani, M., Yannou, B., Leroy, Y., & Cluzel, F. (2017). How to assess product performancein the circular economy? proposed requirements for the design of a circularity measurementframework. Recycling, 2(1), 6.
Saidani, M., Yannou, B., Leroy, Y., Cluzel, F., & Kendall, A. (2019). A taxonomy of circulareconomy indicators. Journal of Cleaner Production, 207, 542–559.
Sarath, P., Bonda, S., Mohanty, S., & Nayak, S. K. (2015). Mobile phone waste management andrecycling: Views and trends. Waste management, 46, 536–545.
Sarkis, J., Zhu, Q., & Lai, K.-h. (2011). An organizational theoretic review of green supply chainmanagement literature. International journal of production economics, 130(1), 1–15.
Savaskan, R. C., Bhattacharya, S., & Van Wassenhove, L. N. (2004). Closed-loop supply chainmodels with product remanufacturing. Management science, 50(2), 239–252.
Schulz, M., Bey, N., Niero, M., & Hauschild, M. (2020). Circular economy considerations inchoices of lca methodology: How to handle ev battery repurposing? Procedia CIRP, 90, 182–186.
Seuring, S. & Müller, M. (2008). From a literature review to a conceptual framework for sustain-able supply chain management. Journal of cleaner production, 16(15), 1699–1710.
Shekarian, E. (2020). A review of factors affecting closed-loop supply chain models. Journal ofCleaner Production, 253, 119823.
Sihvonen, S. & Ritola, T. (2015). Conceptualizing rex for aggregating end-of-life strategies inproduct development. Procedia Cirp, 29, 639–644.
Sivak, S., Sivak, M., Isaacs, J., Laird, J., & McDonald, A. (2007). Managing the tradeoffs inthe digital transformation of an educational board game to a computer-based simulation. InProceedings of the 2007 ACM SIGGRAPH symposium on Video games (pp. 97–102).
Srivastava, S. K. (2007). Green supply-chain management: a state-of-the-art literature review.International journal of management reviews, 9(1), 53–80.
Stahel, W. (2010). The performance economy. Springer.
Stahel, W. R. (1982). The product life factor. An Inquiry into the Nature of Sustainable Societies:The Role of the Private Sector (Series: 1982 Mitchell Prize Papers), NARC.
Sterman, J. D. (1989). Modeling managerial behavior: Misperceptions of feedback in a dynamicdecision making experiment. Management science, 35(3), 321–339.
Stindt, D. (2017). A generic planning approach for sustainable supply chain management-howto integrate concepts and methods to address the issues of sustainability? Journal of cleanerproduction, 153, 146–163.
Stock, J. R., Boyer, S. L., & Harmon, T. (2010). Research opportunities in supply chain manage-ment. Journal of the Academy of Marketing Science, 38(1), 32–41.
Su, B., Heshmati, A., Geng, Y., & Yu, X. (2013). A review of the circular economy in china:moving from rhetoric to implementation. Journal of cleaner production, 42, 215–227.
Taghikhah, F., Voinov, A., & Shukla, N. (2019). Extending the supply chain to address sustain-ability. Journal of cleaner production, 229, 652–666.
IX
Bibliography
Thierry, M., Salomon, M., Van Nunen, J., & Van Wassenhove, L. (1995). Strategic issues inproduct recovery management. California management review, 37(2), 114–136.
Törkler, A. (2014). Electrodes and cells manufacturing white paper: Batteries refurbishing &reuse. Boulogne-Billancourt, European Li-Ion Battery Advanced Manufacturing (ELIBAMA).
Tseng, M.-L., Chiu, A. S., Liu, G., & Jantaralolica, T. (2020). Circular economy enables sustain-able consumption and production in multi-level supply chain system. Resources, Conservationand Recycling, 154, 104601.
Turken, N., Cannataro, V., Geda, A., & Dixit, A. (2020). Nature inspired supply chain solutions:definitions, analogies, and future research directions. International Journal of Production Re-search, 58(15), 4689–4715.
UN Global Compact Business for Social Responsibility (2015). Supply Chain Sustainability: APractical Guide for Continuous Improvement (Second Edition). Technical report.
Van Buren, N., Demmers, M., Van der Heijden, R., & Witlox, F. (2016). Towards a circulareconomy: The role of dutch logistics industries and governments. Sustainability, 8(7), 647.
Vegter, D., van Hillegersberg, J., & Olthaar, M. (2020). Supply chains in circular business models:processes and performance objectives. Resources, Conservation and Recycling, 162, 105046.
Vermunt, D., Negro, S., Verweij, P., Kuppens, D., & Hekkert, M. (2019). Exploring barriers toimplementing different circular business models. Journal of Cleaner Production, 222, 891–902.
Weetman, C. (2016). A circular economy handbook for business and supply chains: Repair,remake, redesign, rethink. Kogan Page Publishers.
Werning, J. P. & Spinler, S. (2020). Transition to circular economy on firm level: Barrier identifi-cation and prioritization along the value chain. Journal of Cleaner Production, 245, 118609.
Whalen, K. A., Berlin, C., Ekberg, J., Barletta, I., & Hammersberg, P. (2018). ‘all they do iswin’: Lessons learned from use of a serious game for circular economy education. Resources,Conservation and Recycling, 135, 335–345.
Wikipedia (2021). Back market. Available online: https://fr.wikipedia.org/wiki/Back_Market.Accessed: 04/10/21.
Wikipedia (2021). Extended producer responsibility. Available online:https://en.wikipedia.org/wiki/Extended_producer_responsibility. Accessed: 07/10/21.
Winans, K., Kendall, A., & Deng, H. (2017). The history and current applications of the circulareconomy concept. Renewable and Sustainable Energy Reviews, 68, 825–833.
Yuan, Z., Bi, J., & Moriguichi, Y. (2006). The circular economy: A new development strategy inchina. Journal of Industrial Ecology, 10(1-2), 4–8.
Zink, T., Maker, F., Geyer, R., Amirtharajah, R., & Akella, V. (2014). Comparative life cycleassessment of smartphone reuse: repurposing vs. refurbishment. The International Journal ofLife Cycle Assessment, 19(5), 1099–1109.
X

List of Figures
1.1 Outline of the manuscript . . . . . . . . . . . . . . . . . . . . . . . . . . . . . . 5
2.1 Categorization of linear and circular approaches for reducing resource use . . . . 102.2 Supply Chain Management themes (Stock et al., 2010) . . . . . . . . . . . . . . 122.3 Supply Chain stages adopted from Chopra et al. (2013) . . . . . . . . . . . . . . 132.4 Level 1 processes of SCOR (APICS, 2017) . . . . . . . . . . . . . . . . . . . . 132.5 Reverse Logistics (De Brito & Dekker, 2004) . . . . . . . . . . . . . . . . . . . 152.6 Closed-Loop Supply Chain (Khor & Udin, 2012) . . . . . . . . . . . . . . . . . 152.7 Three Models of IE (Lifset & Graedel, 2002) . . . . . . . . . . . . . . . . . . . 162.8 The classification of open-loops . . . . . . . . . . . . . . . . . . . . . . . . . . 172.9 Technical and biological cycles (EMF, 2014) . . . . . . . . . . . . . . . . . . . 182.10 EU Waste Hierarchy (Council of European Union, 2008) . . . . . . . . . . . . . 202.11 Required work, warranty, and performance for CE activities (Sihvonen & Ritola,
2015) . . . . . . . . . . . . . . . . . . . . . . . . . . . . . . . . . . . . . . . . 212.12 CE Activities frameworks . . . . . . . . . . . . . . . . . . . . . . . . . . . . . . 212.13 Hierarchical Framework of circular economy activities extending Potting et al.
(2017) . . . . . . . . . . . . . . . . . . . . . . . . . . . . . . . . . . . . . . . . 222.14 An extended model of circular supply chain . . . . . . . . . . . . . . . . . . . . 24
3.1 Our methodology for the development of a generic model . . . . . . . . . . . . . 283.2 Generic model of CSCs with an example . . . . . . . . . . . . . . . . . . . . . . 343.3 Example of textile circular supply chain . . . . . . . . . . . . . . . . . . . . . . 363.4 Example of EV battery circular supply chain . . . . . . . . . . . . . . . . . . . . 37
4.1 Adopted methodology for the development of our classification tool for CSC in-dicators . . . . . . . . . . . . . . . . . . . . . . . . . . . . . . . . . . . . . . . 42
4.2 The classification tool of circularity indicators for Supply Chains . . . . . . . . . 47
5.1 Positioning Chapter 5 among the rest of the manuscript . . . . . . . . . . . . . . 535.2 An example of mathematical representation of CSC . . . . . . . . . . . . . . . . 565.3 Matrix Z . . . . . . . . . . . . . . . . . . . . . . . . . . . . . . . . . . . . . . . 575.4 Matrix K . . . . . . . . . . . . . . . . . . . . . . . . . . . . . . . . . . . . . . . 575.5 Matrix [ f i1i2
j ] . . . . . . . . . . . . . . . . . . . . . . . . . . . . . . . . . . . . . 585.6 Vector [ f i1∗∗ ] . . . . . . . . . . . . . . . . . . . . . . . . . . . . . . . . . . . . . 585.7 Example . . . . . . . . . . . . . . . . . . . . . . . . . . . . . . . . . . . . . . . 605.8 An example illustrating calculation of K based on savings on energy . . . . . . . 625.9 A CSC with two linear supply chains with all possible CE activities . . . . . . . 64
6.1 Our methodology for the development of the CircuSChain Game . . . . . . . . . 706.2 Board of the CircuSChain Game with all possible CE activities . . . . . . . . . . 716.3 The game board for the first year of CircuSChain Game . . . . . . . . . . . . . . 736.4 Round flow cards . . . . . . . . . . . . . . . . . . . . . . . . . . . . . . . . . . 736.5 Record Sheet (Tab for Player 1) . . . . . . . . . . . . . . . . . . . . . . . . . . 74
XII
List of figures
6.6 Strategy Cards . . . . . . . . . . . . . . . . . . . . . . . . . . . . . . . . . . . . 756.7 Round flow card of Player 5 for the second and third years . . . . . . . . . . . . 766.8 The scenario where reuse activity is selected . . . . . . . . . . . . . . . . . . . . 766.9 Evaluation of the educational value, entertainment value, simplicity, and pace of
the game through post-questionnaire. . . . . . . . . . . . . . . . . . . . . . . . 786.10 Knowledge Acquisition about CE Activities . . . . . . . . . . . . . . . . . . . . 796.11 Questions about having multiple and shorter loops . . . . . . . . . . . . . . . . . 806.12 Knowledge acquisition about shorter and multiple loops . . . . . . . . . . . . . . 806.13 Player 1’s screen at the prototype of the digital version of the game . . . . . . . . 82
7.1 Positioning the CircuSChain Method among the rest of the manuscript . . . . . . 857.2 Product Meta-Model (a) and Process Model (b) of As-IS/As-IF Framework (Çela,
2021) . . . . . . . . . . . . . . . . . . . . . . . . . . . . . . . . . . . . . . . . 887.3 Process model of the Core strategy of As-IS/As-IF framework (Çela, 2021) . . . 897.4 Process model of the Analysis strategy of As-IS/As-IF framework (Çela, 2021) . 897.5 Process model of the Diagnosis strategy of As-IS/As-IF framework (Çela, 2021) 907.6 Process model of the Evolution strategy of As-IS/As-IF framework (Çela, 2021) 907.7 Process model of As-IS/As-IF framework (a) and Process model of CircuSChain
Method (b) . . . . . . . . . . . . . . . . . . . . . . . . . . . . . . . . . . . . . 927.8 Process map of specification strategy . . . . . . . . . . . . . . . . . . . . . . . . 947.9 Outlining SC Model through Protocol 1 . . . . . . . . . . . . . . . . . . . . . . 957.10 SC Model V1 and SC Model V0 . . . . . . . . . . . . . . . . . . . . . . . . . . 967.11 Measurement strategy . . . . . . . . . . . . . . . . . . . . . . . . . . . . . . . . 977.12 Example for Computation Strategy for GCI . . . . . . . . . . . . . . . . . . . . 997.13 Process map of diagnosis strategy . . . . . . . . . . . . . . . . . . . . . . . . . 997.14 Example of SC VIdeal . . . . . . . . . . . . . . . . . . . . . . . . . . . . . . . 1007.15 Example of identified goals and constraints . . . . . . . . . . . . . . . . . . . . 1017.16 Process map of Evolution strategy . . . . . . . . . . . . . . . . . . . . . . . . . 1027.17 Example for gaming simulation strategy . . . . . . . . . . . . . . . . . . . . . . 1037.18 Process model (a) and product meta-model (b) of CircuSChain . . . . . . . . . . 104
8.1 Le plan du manuscrit . . . . . . . . . . . . . . . . . . . . . . . . . . . . . . . . XIX
XIII

List of Tables
1.1 Hypothesis, work packages and related objectives of the CIRCULAR project . . 3
2.1 Value creation principles proposed by EMF (2013, 2014) . . . . . . . . . . . . . 112.2 Definition of Circular Economy Activities . . . . . . . . . . . . . . . . . . . . . 23
3.1 CSC characterization based on CE value creation sources (EMF, 2013, 2014) . . 293.2 Analysis of literature review based on our CSC characteristics (C2 not covered in
any paper) . . . . . . . . . . . . . . . . . . . . . . . . . . . . . . . . . . . . . . 303.3 Definition of UML notions with illustrations from our Model . . . . . . . . . . . 32
4.1 Classifications considering CE from the literature . . . . . . . . . . . . . . . . . 444.2 Classification of indicators that consider several dimensions . . . . . . . . . . . 49
5.1 Mathematical Notions to represent CSCs . . . . . . . . . . . . . . . . . . . . . 555.2 Variables to calculate Circularity Coefficient . . . . . . . . . . . . . . . . . . . . 61
6.1 Serious games about the CE . . . . . . . . . . . . . . . . . . . . . . . . . . . . 69
7.1 Comparison of methods from the literature . . . . . . . . . . . . . . . . . . . . . 867.2 Protocol example . . . . . . . . . . . . . . . . . . . . . . . . . . . . . . . . . . 937.3 Protocol 1: < Start, Outline Supply Chain Model, by identification strategy> . . 957.4 Protocol 2: < Outline Supply Chain Model, Model Supply Chain, by expert mod-
eling strategy> . . . . . . . . . . . . . . . . . . . . . . . . . . . . . . . . . . . 967.5 Protocol 3: <Start, Choose Circularity Indicators, by elicitation strategy> . . . . 987.6 Protocol 4: < Choose Circularity Indicators, Calculate Supply Chain circularity,
by computation strategy> . . . . . . . . . . . . . . . . . . . . . . . . . . . . . 987.7 Protocol 5: <Start, Analyze Gap between the Ideal SC and As-IS SC, by detection
strategy> . . . . . . . . . . . . . . . . . . . . . . . . . . . . . . . . . . . . . . 1007.8 Protocol 6: <Analyze Gap between Ideal SC and As-IS SC, Define Circular Goal
and Constraint, by identification strategy> . . . . . . . . . . . . . . . . . . . . . 1017.9 Protocol 7: <Start, Identify changes by gaming simulation strategy> . . . . . . . 1027.10 Protocol 8: <Start, Identify changes by computer simulation strategy> . . . . . . 103
XV

Résumé étendu
Résumé étendu
Notre économie suivait le modèle linéaire depuis la révolution industrielle (EMF, 2013). Dansun tel modèle, les produits qui sont fabriqués à partir de matières premières, sont jetés aprèsleur utilisation, lorsqu’ils deviennent obsolètes. En raison du développement économique et dela croissance démographique, les activités de production et la demande de matières premièresaugmentent sans cesse, tandis que les ressources naturelles restent limitées. Cela peut avoirdes conséquences importantes, comme l’épuisement des ressources naturelles et la pollution del’environnement (Yuan et al., 2006). En plus de la pression sur l’environnement, cette situation estsusceptible de provoquer une augmentation et une volatilité importante des prix des ressources.Elle engendre ainsi des difficultés pour les organisations (EMF, 2014) et ne permet pas une dura-bilité à long terme. C’est pourquoi, un nouveau modèle économique doit être conçu pour assurernotre avenir et résoudre ces problèmes. En tant qu’une solution potentielle aux défis mentionnésci-dessus, le concept d’économie circulaire a récemment retenu l’attention des responsables poli-tiques, des chercheurs académiques et des industriels (Bocken et al., 2017; Govindan & Hasanagic,2018; Kirchherr et al., 2017; Masi et al., 2017).
L’économie circulaire vise à minimiser la consommation des ressources et la production desdéchets ainsi que la pollution en maintenant le plus long temps possible les produits, les com-posants et les matériaux dans la phase d’utilisation. Cela pourrait être obtenu avec des stratégiesde conception de produits ou des activités d’économie circulaire liées à la fin de vie des objetstelles que la réutilisation, la remise à neuf, la "repurposing", le recyclage, etc. Les chaînes lo-gistiques circulaires, qui intègrent l’approche de l’économie circulaire dans la chaîne logistique,soutiennent ces activités et jouent un rôle important dans l’application des principes de l’économiecirculaire.
Divers concepts dans la littérature tels que les chaînes logistiques en boucle fermée, la lo-gistique inverse, les chaînes logistiques vertes, etc., ont déjà exploré l’intégration des activitésde l’économie circulaire dans les chaînes logistiques. Cependant, le concept d’économie circu-laire apporte de nouvelles approches : (1) appliquer plusieurs activités d’économie circulaire enparallèle plutôt que d’appliquer une seule activité (Blomsma & Brennan, 2017), (2) utiliser desmatériaux encore et encore (Genovese et al., 2017), et (3) promouvoir des boucles ouvertes entredes secteurs distincts par "repurposing" (Farooque et al., 2019b). De plus, l’activité de repurposingn’est pas suffisamment explorée jusqu’à présent. Cependant, cette activité, qui ajoute de la valeuraux produits usagés en les détournant de leur destination initiale et en les utilisant dans des appli-cations moins exigeantes, pourrait être un nouveau moyen potentiel d’accroître la circularité dansles chaînes logistiques circulaires. En outre, le manque de connaissances et de sensibilisation surles chaînes logistiques circulaires constitue un obstacle difficile pour les gestionnaires de chaîneslogistiques (Govindan & Hasanagic, 2018; Mangla et al., 2018).
Par conséquent, les implications de l’économie circulaire dans les chaînes logistiques doiventêtre explorées, structurées et formalisées. De nouveaux outils sont également nécessaires pourpromouvoir le concept de chaîne logistique circulaire et soutenir sa conception ainsi que son évo-lution.
L’objectif principal de cette thèse de doctorat est d’explorer et de conceptualiser les structuresdes chaînes logistiques dans le concept d’économie circulaire. En considérant les enjeux et lespistes de recherche inexplorées précités, les questions de recherche suivantes se posent :
XVII
Résumé étendu
• QR1 : Quelles sont les implications de l’économie circulaire sur les chaînes logistiques etcomment intégrer l’activité de repurposing dans les chaînes logistiques circulaires ?
• QR2 : Comment conceptualiser et modéliser les configurations complexes des chaînes lo-gistiques circulaires ?
• QR3 : Comment évaluer la circularité des chaînes logistiques ?
• QR4 : Comment sensibiliser les décideurs et accroître leurs connaissances sur les chaîneslogistiques circulaires à l’aide des outils proposés ?
• QR5 : Comment aider les organisations à soutenir de manière continue la circularité dansles chaînes logistiques ?
Pour répondre aux questions de recherche susmentionnées, nous développons plusieurs outilsavec diverses méthodes. La Figure 8.1 résume nos contributions, les relations entre ces contribu-tions et les questions de recherche abordées.
Premièrement, dans le Chapitre 2, nous adressons la QR1. Dans ce chapitre, une revuede la littérature est menée pour déterminer les implications de l’économie circulaire sur leschaînes logistiques et intégrer l’activité de repurposing. D’abord, nous explorons les approches del’économie circulaire liées aux chaînes logistiques et les concepts principaux de la littérature dechaînes logistiques. Ensuite, nous expliquons les concepts interdépendants des chaînes logistiquescirculaires tels que les chaînes logistiques en boucle fermée, la logistique inverse, les chaînes lo-gistiques vertes, etc. Par rapport à ces concepts de la littérature, nous expliquons le positionnementde nos travaux de recherche.
Nous considérons les flux de matière et les activités comme des composants principales deschaînes logistiques circulaires. Dans ce chapitre, nous déterminons ces composants: des bouclesfermées et ouvertes, les activités d’économie circulaire telles que la réutilisation, la remise à neuf,la repurposing, le recyclage, etc.
Par ailleurs, nous déterminons les composants des chaînes logistiques circulaires comme desboucles fermées et ouvertes, ainsi que les activités d’économie circulaire telles que la réutilisation,la remise à neuf, la repurposing, le recyclage, etc.
Nous présentons aussi le modèle hiérarchique des activités d’économie circulaire et le modèleétendu des chaînes logistiques circulaires fondés sur un précédent de travail de Master (Kurt, 2018;Kurt et al., 2019) que nous avons mené. Ces deux modèles aident à l’intégration de l’activitérepurposing dans les chaînes logistiques circulaires à des niveaux de circularité différents.
Dans le Chapitre 3, nous adressons la QR2. D’abord, nous nous appuyons sur la littéra-ture (EMF, 2013, 2014) et les composants des chaînes logistiques circulaires, afin de proposer lesprincipales caractéristiques des chaînes logistiques circulaires. Ces caractéristiques aidant àconceptualiser les chaînes logistiques circulaires sont listées ci-dessous :
• C0 : au moins une activité d’économie circulaire,
• C1 : boucles consécutives d’utilisation du matériel,
• C2 : plusieurs options d’activité d’économie circulaire simultanées,
• C3 : boucles ouvertes et intégration de chaînes logistiques distinctes.
La première caractéristique C0 correspond à l’exigence minimale d’une chaîne logistique pourêtre considérée comme une chaîne logistique circulaire. Cette caractéristique a été déjà men-tionnée dans la littérature des chaînes logistiques en boucle fermée, de la logistique inverse, deschaînes logistiques vertes, etc. Les trois autres caractéristiques sont spécifiques aux chaînes logis-tiques circulaires.
XVIII
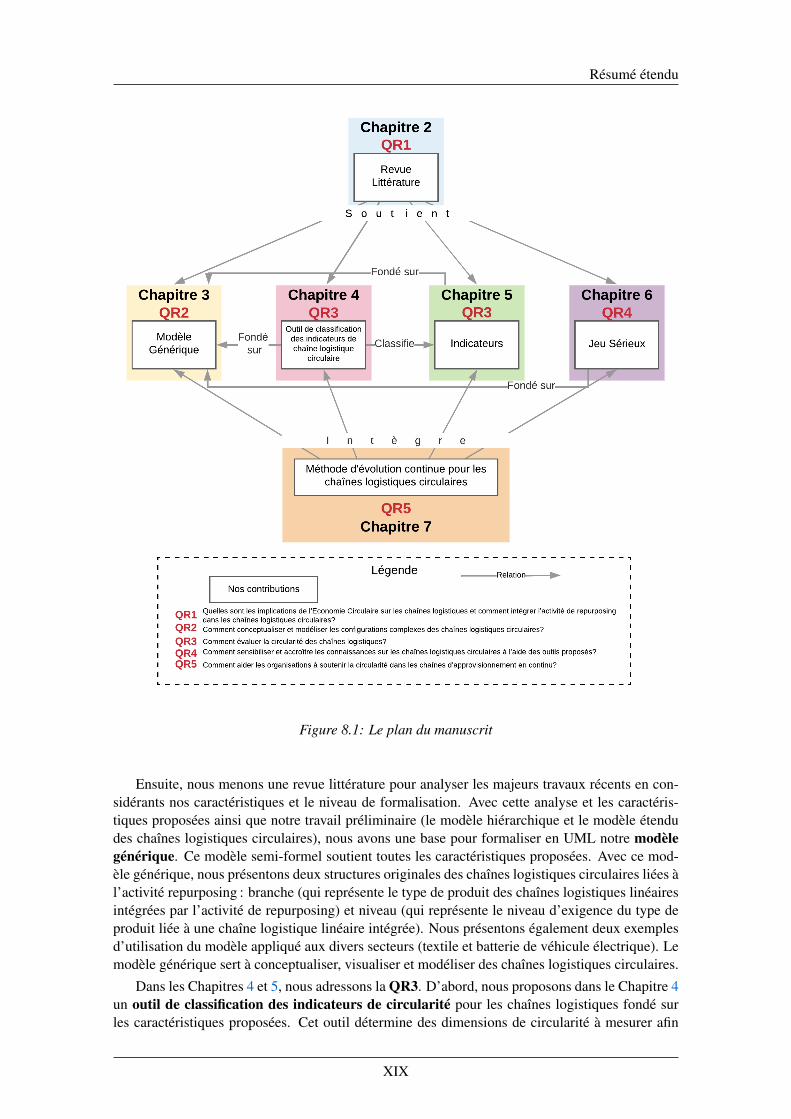
Résumé étendu
Figure 8.1: Le plan du manuscrit
Ensuite, nous menons une revue littérature pour analyser les majeurs travaux récents en con-sidérants nos caractéristiques et le niveau de formalisation. Avec cette analyse et les caractéris-tiques proposées ainsi que notre travail préliminaire (le modèle hiérarchique et le modèle étendudes chaînes logistiques circulaires), nous avons une base pour formaliser en UML notre modèlegénérique. Ce modèle semi-formel soutient toutes les caractéristiques proposées. Avec ce mod-èle générique, nous présentons deux structures originales des chaînes logistiques circulaires liées àl’activité repurposing : branche (qui représente le type de produit des chaînes logistiques linéairesintégrées par l’activité de repurposing) et niveau (qui représente le niveau d’exigence du type deproduit liée à une chaîne logistique linéaire intégrée). Nous présentons également deux exemplesd’utilisation du modèle appliqué aux divers secteurs (textile et batterie de véhicule électrique). Lemodèle générique sert à conceptualiser, visualiser et modéliser des chaînes logistiques circulaires.
Dans les Chapitres 4 et 5, nous adressons la QR3. D’abord, nous proposons dans le Chapitre 4un outil de classification des indicateurs de circularité pour les chaînes logistiques fondé surles caractéristiques proposées. Cet outil détermine des dimensions de circularité à mesurer afin
XIX
Résumé étendu
d’évaluer des chaînes logistiques circulaires. Nous proposons les dimensions suivantes en consid-érant les caractéristiques des chaînes logistiques circulaires : le nombre des boucles consécutives,la longueur d’utilisation, la longueur des boucles, le nombre des boucles, les économies en ter-mes de matière, les économies en termes d’énergie, les économies en termes de main d’œuvre,les économies en termes de pollution, le nombre de branches et le nombre de niveaux. Dansce chapitre, nous proposons également des indicateurs potentiels qui mesurent chaque dimensionindividuellement. Finalement, nous classifions des indicateurs importants qui existent dans la lit-térature pour illustrer l’utilisation de notre outil. Ce dernier peut également permettre d’analyseret classifier des nouveaux indicateurs et aider à choisir des indicateurs pertinents pour évaluer leschaînes logistiques circulaires.
Ensuite, dans le Chapitre 5, nous proposons un indicateur global de circularité (appelé GCIGlobal Circularity Indicator) pour évaluer la circularité des chaînes logistiques, en s’appuyant surles dimensions de circularité et notre modèle générique. Dans ce chapitre, nous détaillons la con-struction de notre indicateur en nous appuyant sur le modèle générique. Ici, nous introduisons lesnotions mathématiques accompagnant notre modèle générique, comme le coefficient de circular-ité de chaque activité d’économie circulaire et le nombre de produits qui sont revalorisé par cetteactivité. Un GCI peut être calculé pour diverses dimensions comme les économies en termes dematières, énergie, main d’œuvre, pollution ainsi que la longueur d’utilisation et la longueur desboucles. Une méthode d’agrégation ou une approche multi-critère pourrait alors être utilisée pourévaluer ensemble ces dimensions des chaînes logistiques circulaires. Par ailleurs, nous présentonsaussi un outil Web qui sert à configurer des chaînes logistiques circulaires en considérant le mod-èle générique et calculer l’indicateur global de circularité ainsi que les indicateurs proposés dansle Chapitre 4 d’une manière automatique.
Dans le Chapitre 6, nous traitons la QR4. Nous proposons un jeu sérieux, baptisé Cir-cuSChain, pour promouvoir les chaînes logistiques circulaires et accroître la connaissance ainsique la sensibilisation sur leurs structures et les activités d’économie circulaire impliquées. Le jeuCircuSChain, fondé sur Beer Distrubution Game (Sterman, 1989), est conçu de manière cohérenteavec les caractéristiques et le modèle générique proposés. Nous utilisons la méthode de Marfisi-Schottman et al. (2010) pour la conception du jeu. Le jeu CircuSChain considère des divers con-cepts des chaînes logistiques circulaires comme la pollution (émission de CO2), les activités del’économie circulaire et l’épuisement de matières. Sur la forme du jeu CircuSChain, il est conçucomme un jeu de société de 5 joueurs. Les joueurs doivent coopérer pour faire fonctionner unechaîne logistique linéaire pour satisfaire les demandes et évaluer sa performance. Puis, les joueurspeuvent ajouter au fur et à mesure des activités d’économie circulaire et d’évaluer ses nouvellesperformances circulaires quant à celle de la chaîne linéaire.
Le jeu est testé par des étudiants en Génie Industriel de niveau Master pour une première ex-périmentation. Grâce à cette expérimentation, nous observons le rythme, les valeurs pédagogiqueet ludique et le niveau de complexité des règles régissant le jeu. A travers ce jeu sérieux permettantl’apprentissage par la pratique, nous essayons de promouvoir les chaînes logistiques circulaires etaccroître la connaissance de ces chaînes. Une version numérique du jeu pourrait aider à améliorerla gestion du jeu en simplifiant d’une part le paramétrage du jeu; et d’autre part, en automatisantla synchronisation des flux informationnels et physiques entre joueurs. Des expérimentations avecd’autres publics, comme des experts de l’économie circulaire et des industriels, sont égalementenvisagés afin de consolider la validation du jeu.
Finalement, la QR5 est abordée dans le Chapitre 7. En adoptant le cadre As-IS/As-IF (Çelaet al., 2019), les contributions susmentionnées sont intégrées dans une première version d’uneméthode d’évolution continue, que nous appelons Méthode CircuSChain. Dans ce chapitre,nous présentons le cadre utilisé As-IS/As-IF, qui guide la création des méthodes participativesd’évolution continue pour un système spécifique. Le cadre As-IS/As-IF permet de représenterdes méthodes d’évolution continue par un modèle de processus (Rolland et al., 1999) et de lesformaliser par un méta-modèle de produit. Nous montrons comment notre méthode CircuSChain
XX
Résumé étendu
peut aider à identifier les évolutions potentielles pour transformer les chaînes logistiques linéairesen chaînes logistiques circulaires ou améliorer la circularité des chaînes logistiques déjà circu-laires. En effet, la méthode CircuSChain permet d’abord d’analyser et de diagnostiquer la chaînelogistique circulaire telle qu’elle est (chaîne logistique actuelle ou As-IS Supply Chain en anglais).Ensuite, une As-IS Supply Chain pourrait évoluer en un ou plusieurs As-IF Supply Chains (chaîneslogistiques potentielles dans le futur) grâce à la stratégie d’évolution. Une As-IF Supply Chainpourrait être transformée en la prochaine As-IS Supply Chain par la stratégie de déploiement etc’est ainsi que l’évolution pourrait se poursuivre.
Les stratégies de la méthode CircuSChain sont mises en œuvre à travers des sessions. Afinde faciliter et de guider l’animation des sessions, nous proposons des protocoles pour les straté-gies majeures. Grâce aux protocoles, nous précisons les types de sessions (travail individuel,focus group ou groupe de discussion, et entretien téléphonique), les participants, les étapes de lastratégie, la durée des étapes et les outils nécessaires pour chaque stratégie. Cette méthode pro-pose une approche préliminaire pour développer une méthode d’évolution continue des chaîneslogistiques circulaires. Elle complète les outils proposés dans cette thèse et montre une possibilitéde les utiliser de manière intégrée.
Pour conclure, nous avons développé un ensemble d’outils méthodologiques et pratiques pouraider à la conception, l’évaluation et l’évolution des chaînes logistiques circulaires. Tout d’abord,nous avons exploré et intégré l’activité de repurposing dans les chaînes logistiques circulairesen proposant des activités de repurposing dans différents niveaux. Ces activités, qui créent desboucles ouvertes, ont été peu explorées jusqu’à présent dans la littérature et leurs applicationsindustrielles restent encore limitées. Ces activités, valorisant différemment les produits usagés,pourraient constituer un élément intéressant pour accroître la circularité des chaînes logistiques.Toutes nos contributions proposées dans cette thèse considèrent diverses activités de repurposing.Notez que la conception du produit est un facteur critique pour la mise en œuvre des activitésde repurposing. Dans le futur, si les produits seront pensés et conçus pour être revalorisés par desactivités de repurposing dans différentes applications industrielles, nos outils pourraient facilementprendre en compte ces activités.
Nos travaux ont contribué à apporter les premières briques pour aider à la conception, l’évaluationet l’évolution des chaînes logistiques circulaires. Nous sommes conscients que des limites existentcomme mentionnées dans chaque chapitre. Cependant, elles constituent des opportunités pour destravaux de recherche futurs, telles que l’inclusion de la dimension acteur dans le modèle générique,l’introduction des aspects sociaux et économiques du développement durable dans l’outil de clas-sification, l’adoption d’une approche multi-critère pour notre indicateur global de circularité, laversion numérique du jeu CircuSChain, sa validation par des expérimentations utilisateurs plusexhaustives et l’affinement de la stratégie de déploiement dans la méthode CircuSChain.
XXI

AAbbreviations
A-GCI: Average-Global Circularity Indicator
CE: Circular Economy
CSC: Circular Supply Chain
DMAIC: Define, Measure, Analyze, Improve, Control
EMF: Ellen MacArthur Foundation
GCI: Global Circularity Indicator
IM: Informal Model
LCA: Life Cycle Assessment
LCC: Life Cycle Cost
LCT: Life Cycle Thinking
MFI: Material Flow Analysis
NL: Natural Language
PDCA: Plan, Do, Act, Check
PSS: Product Service Systems
SC: Supply Chain
SoH: State of the Health
TBL: Triple Bottom Line
UML: Unified Modeling Language
XXIII
BQuestionnaires
XXIV
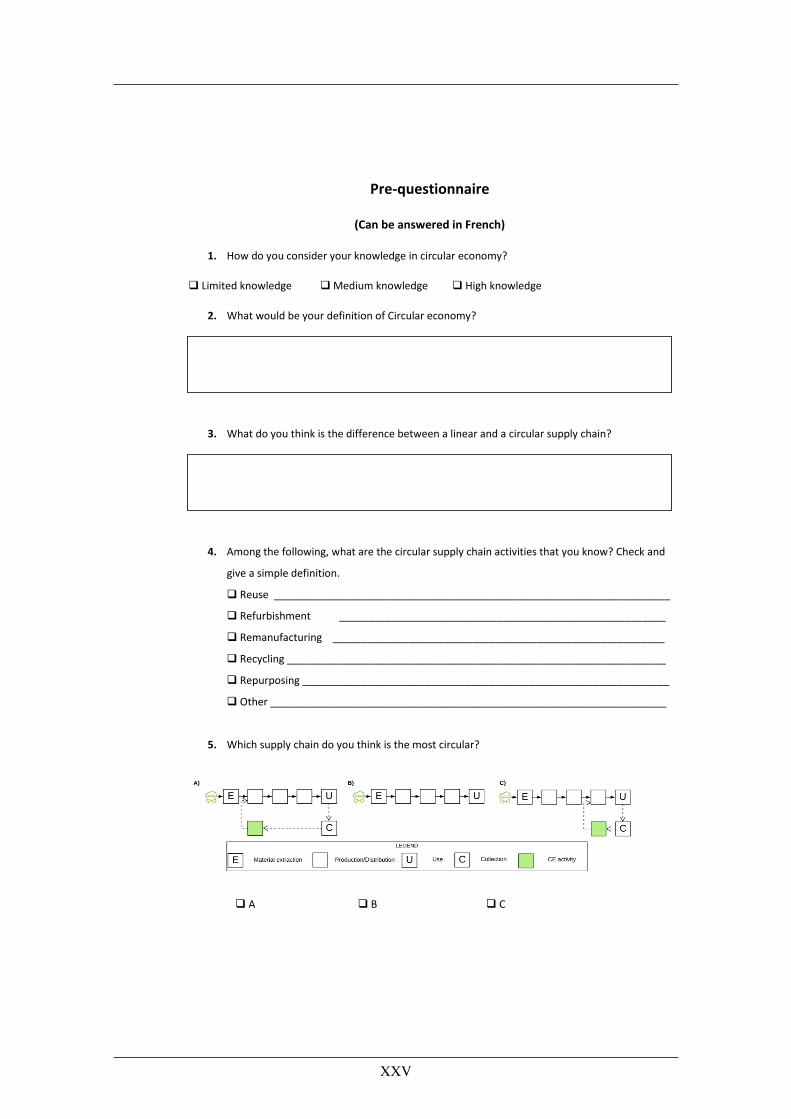
Pre-questionnaire
(Can be answered in French)
1. How do you consider your knowledge in circular economy?
Limited knowledge Medium knowledge High knowledge
2. What would be your definition of Circular economy?
3. What do you think is the difference between a linear and a circular supply chain?
4. Among the following, what are the circular supply chain activities that you know? Check and
give a simple definition.
Reuse ____________________________________________________________________
Refurbishment ________________________________________________________
Remanufacturing _________________________________________________________
Recycling _________________________________________________________________
Repurposing _______________________________________________________________
Other ____________________________________________________________________
5. Which supply chain do you think is the most circular?
A B C
XXV
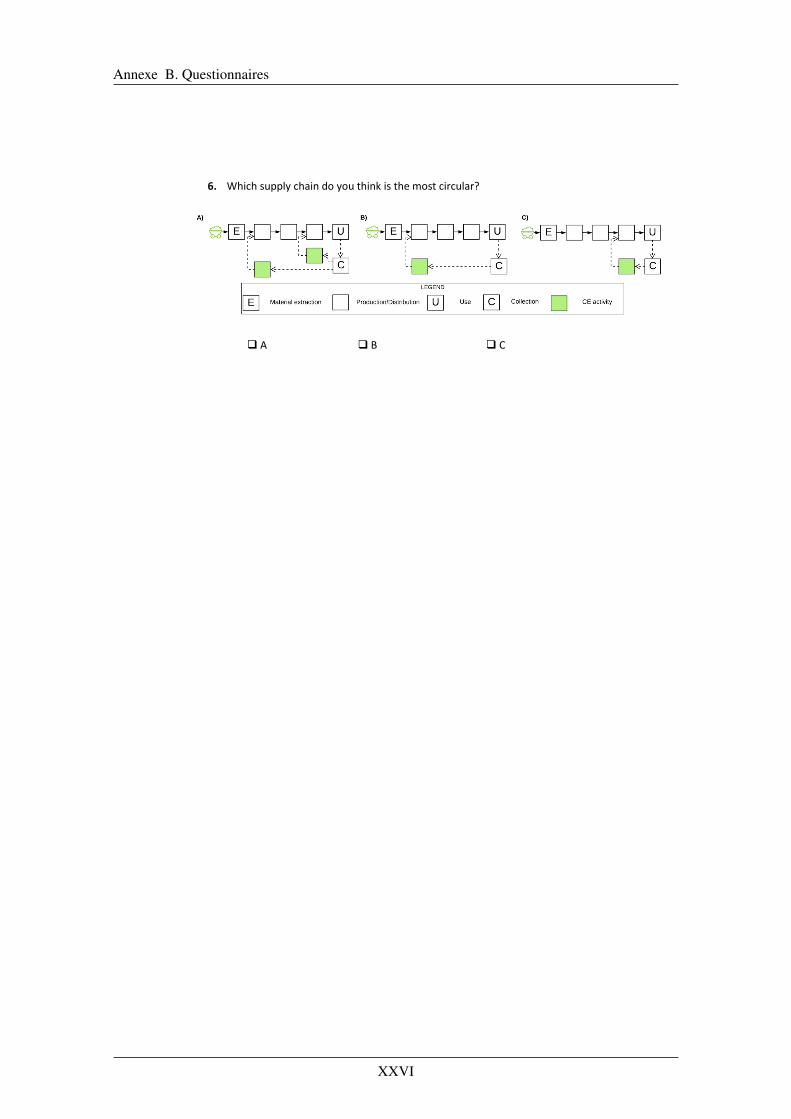
Annexe B. Questionnaires
6. Which supply chain do you think is the most circular?
A B C
XXVI
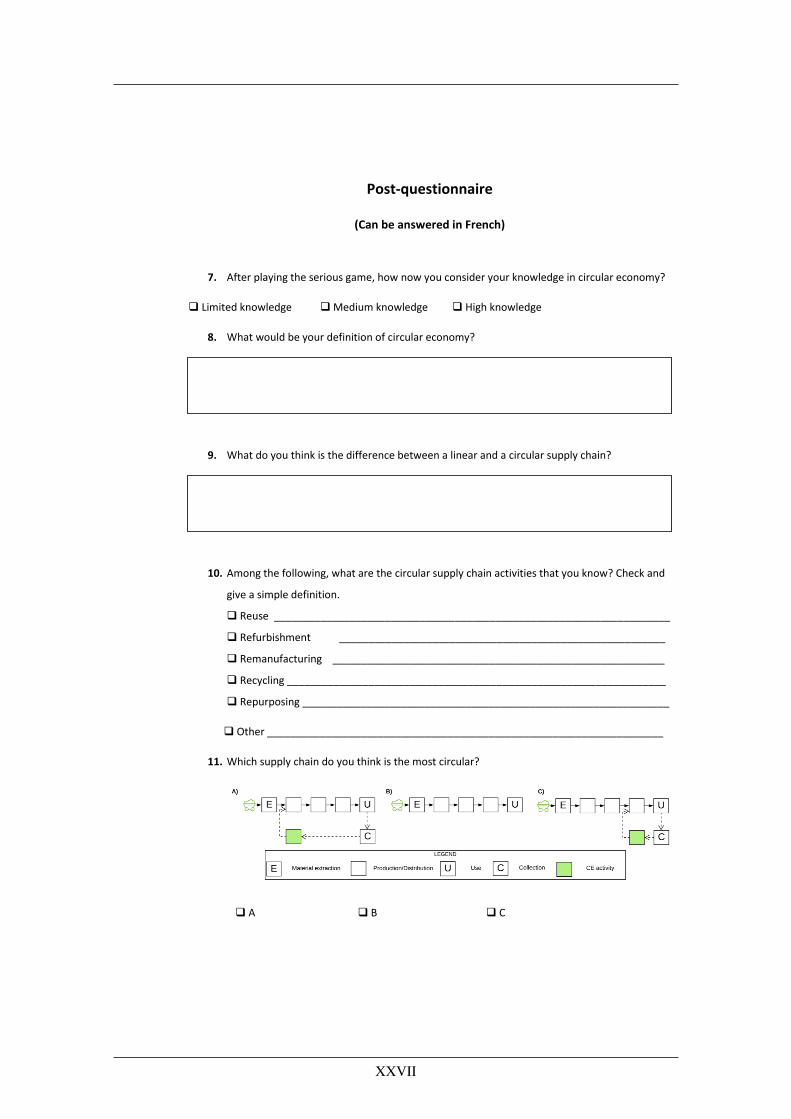
Post-questionnaire
(Can be answered in French)
7. After playing the serious game, how now you consider your knowledge in circular economy?
Limited knowledge Medium knowledge High knowledge
8. What would be your definition of circular economy?
9. What do you think is the difference between a linear and a circular supply chain?
10. Among the following, what are the circular supply chain activities that you know? Check and
give a simple definition.
Reuse ____________________________________________________________________
Refurbishment ________________________________________________________
Remanufacturing _________________________________________________________
Recycling _________________________________________________________________
Repurposing _______________________________________________________________
Other ____________________________________________________________________
11. Which supply chain do you think is the most circular?
A B C
XXVII
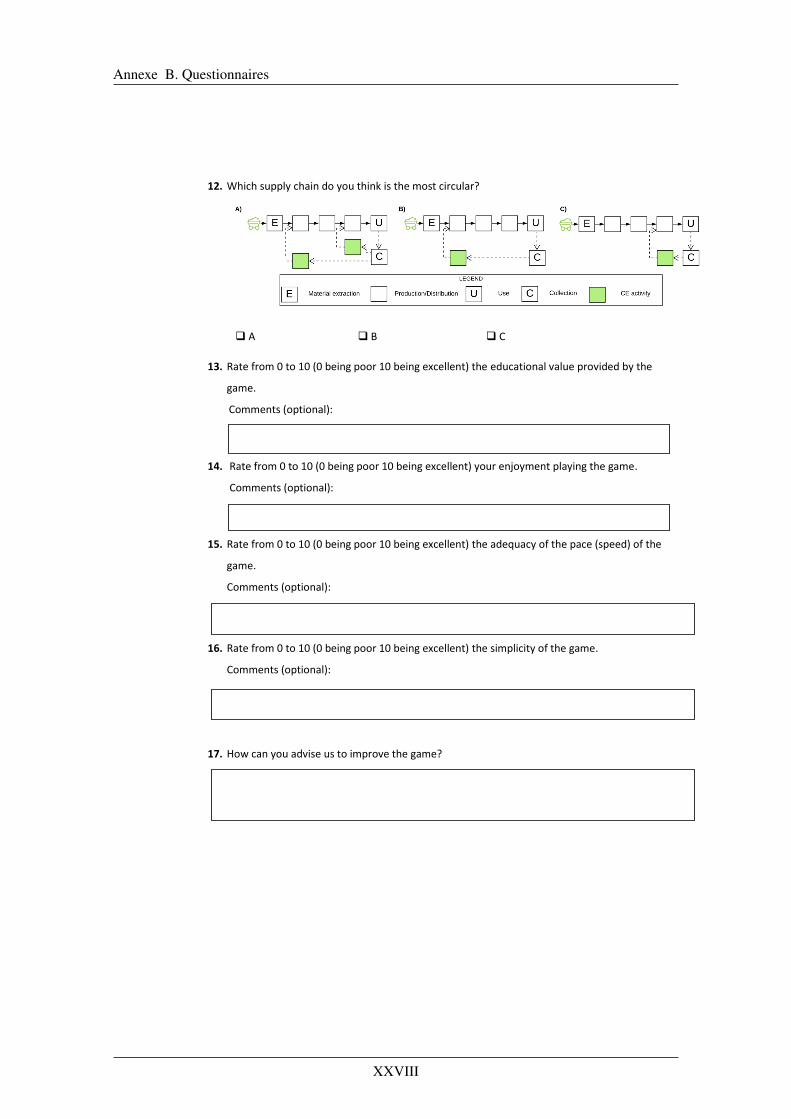
Annexe B. Questionnaires
12. Which supply chain do you think is the most circular?
A B C
13. Rate from 0 to 10 (0 being poor 10 being excellent) the educational value provided by the
game.
Comments (optional):
14. Rate from 0 to 10 (0 being poor 10 being excellent) your enjoyment playing the game.
Comments (optional):
15. Rate from 0 to 10 (0 being poor 10 being excellent) the adequacy of the pace (speed) of the
game.
Comments (optional):
16. Rate from 0 to 10 (0 being poor 10 being excellent) the simplicity of the game.
Comments (optional):
17. How can you advise us to improve the game?
XXVIII
Modèles et outils pour la conception, l’évaluation et l’évolution des chaîneslogistiques circulaires
Models and tools for the design, assessment, and evolution of CircularSupply Chains
RésuméL’économie circulaire vise à minimiser la consommation des ressources et la production desdéchets ainsi que la pollution en maintenant les produits, les composants et les matériauxdans le phase d’utilisation. Cela pourrait être atteint par des stratégies de conception deproduits ou des activités d’économie circulaire telles que la réutilisation, la remise à neuf, larepurposing, le recyclage, etc. Les chaînes logistiques circulaires, qui intègrent l’approchede l’économie circulaire dans la chaîne logistique, soutiennent ces activités et jouent un rôleimportant dans l’application des principes de l’économie circulaire. Divers concepts dans lalittérature tels que les chaînes logistiques en boucle fermée, la logistique inverse, les chaîneslogistiques vertes, etc., ont déjà exploré l’intégration des activités de l’économie circulairedans les chaînes d’approvisionnement. Cependant, le concept d’économie circulaire apportede nouvelles approches : (1) appliquer plusieurs activités d’économie circulaire en paral-lèle plutôt que d’appliquer d’une seule activité, (2) utiliser des matériaux encore et encore,et (3) promouvoir des boucles ouvertes entre des secteurs distincts par repurposing . Deplus, l’activité de repurposing n’est pas suffisamment explorée. Cependant, cette activitéajoute de la valeur aux produits usagés en les détournant de leur destination initiale et en lesutilisant dans des applications moins exigeantes, pourrait être un nouveau moyen potentield’accroître la circularité dans les chaînes logistiques circulaires. Par conséquent, les implica-tions de l’économie circulaire dans les chaînes logistiques doivent être explorées, structuréeset formalisées. De nouveaux outils sont également nécessaires pour promouvoir le conceptde chaîne logistique circulaire et soutenir sa conception ainsi que son évolution. L’objectifprincipal de cette thèse de doctorat est d’explorer et de conceptualiser les structures deschaînes logistiques dans le concept d’économie circulaire. Nous visons à créer des méth-odes et des outils pour soutenir la conception et l’évolution de la chaîne logistique circulaire,en considérant la repurposing comme une stratégie d’économie circulaire de premier ordre.Les contributions principales de cette thèse sont: (1) Un modèle générique formalisé en util-isant le Langage de Modélisation Unifié (UML) pour conceptualiserles chaînes logistiquescirculaires, (2) Un outil de classification des indicateurs de la chaîne logistique circulaire oùdifférentes dimensions de la circularité sont décrites, (3) Un nouvel indicateur pour évaluer lacircularité des chaînes logistiques, (4) Un jeu sérieux pour promouvoir les chaînes logistiquescirculaires. Enfin, en adoptant le cadre As-IS/As-IF, les contributions susmentionnées sontintégrées dans une première version d’une méthode d’évolution continue. Cette méthodeaide à identifier d’éventuelles évolutions pour améliorer la circularité des chaînes logistiques.Mots-clés : Economie Circulaire, Chaîne Logistique, Repurposing, Modèle, Indicateur deCircularité, Jeu Sérieux, Evolution Continue.
AbstractThe Circular Economy aims at minimizing resource inputs, waste, and pollution by keepingas long as possible products, components, and materials in use. This could be reached byproduct design strategies or E-o-L (End of Life) activities (also called Circular Economy ac-tivities), such as reuse, remanufacturing, repurposing, recycling, etc. Circular Supply Chains,which integrate the Circular Economy approach into supply chains, support these activitiesand play an important role in the application of Circular Economy principles.Various concepts in the literature such as Closed-Loop Supply Chains, Reverse Logistics,Green Supply Chains, etc., have been already explored the integration of Circular Economyactivities in supply chains. However, the Circular Economy concept brings some new ap-proaches: (1) applying multiple Circular Economy activities in parallel rather than applyingsingle activities, (2) using materials over and over again, and (3) promoting open-loops be-tween distinct sectors through repurposing. In addition, repurposing activity has not beensufficiently explored so far. However, this activity adds value to used products by divertingthem from their initial purpose and using them in less demanding applications. This could bea new potential mean to increasing circularity in Circular Supply Chains. Besides, the lack ofknowledge and awareness about Circular Supply Chains constitutes a challenging barrier forSupply Chain managers. Therefore, the implications of Circular Economy in supply chainsneed to be explored, structured and formalized. New tools are also needed to promote theCircular Supply Chains and support their design and evolution. The main objective of thisPh.D. thesis is to explore and conceptualize supply chains structures in the context of Circu-lar Economy. We aim at creating methods and tools to support Circular Supply Chain designand evolution, considering repurposing activity as a first-class Circular Economy strategy.The main contributions of this thesis are: (1) A generic model formalized by using the Uni-fied Modeling Language (UML) to design Circular Supply Chains, (2) A classification tool forCircular Supply Chain indicators, where different circularity dimensions are described, (3) Anew indicator to assess the circularity of Supply Chains, and (4) A serious game to promoteCircular Supply Chains and increase knowledge and awareness about their structures andCircular Economy activities involved. Finally, adopting As-IS/As-IF framework, the aforemen-tioned contributions are integrated into a first version of a continual evolution method. Thismethod helps identifying possible evolutions to improve the circularity of supply chains.Keywords : Circular Economy, Supply Chain, Repurposing, Circularity Indicator, SeriousGame, Continual Evolution.