models and analysis of vocal emissions for biomedical ...
253
-
Upload
khangminh22 -
Category
Documents
-
view
0 -
download
0
Transcript of models and analysis of vocal emissions for biomedical ...


Contents I
Atti- 33 -

II MAVEBA 2007

Contents III
MODELS AND ANALYSIS
OF VOCAL EMISSIONS
FOR BIOMEDICAL APPLICATIONS
5th INTERNATIONAL WORKSHOP
December 13-15, 2007,
Firenze, Italy
Edited by
Claudia Manfredi
Firenze University Press2007

IV MAVEBA2007
Modelsandanalysisofvocalemissionsforbiomedicalapplications:5thinternationalworkshop:December13-15,2007:Firenze,Italy/editedbyClaudiaManfredi.-–Firenze:Firenzeuniversitypress,2007.(Atti,33)http://digital.casalini.it/97888456747
ISBN978-88-8453-674-7(online)ISBN97888-8453-673-3(print)
612.78(ed.20)Voce-Patologiamedica
Cover:designedbyCdC,Firenze,Italy.
©2007FirenzeUniversityPress
UniversitàdegliStudidiFirenzeFirenzeUniversityPressBorgoAlbizi,28,50122Firenze,Italyhttp://epress.unifi.it/
Printed in Italy

Contents V
INTERNATIONAL PROGRAM COMMITTEE
P. Alku (FI) G. Donzelli (IT) C. Larson (USA) M. Remacle (BE)A. Barney (UK) J. Doorn (AR) A.-M.Laukkanen (FI) T. Ritchings (UK)D. Berckmans (BE) U. Eysholdt (DE) F. Locchi (IT) S. Ruffo (IT)P. Blasi (IT) A. Fourcin (UK) J. Lucero (BR) O. Schindler (IT)L. Bocchi (IT) O. Fujimura (JP) C. Manfredi (IT) R. Shiavi (USA)P. Bruscaglioni (IT) A. Giovanni (FR) C. Marchesi (IT) H. Shutte (NL)S. Cano Ortiz (CU) H. Herzel (DE) G. Kubin (AT) J. Sundberg (SE)R. Carlson (SE) D. Howard (UK) V. Misun (CZ) J. Svec (CZ)M. Clements (USA) M. Kob (DE) C. Moore (UK) R. Tadeusiewicz (PL)A. Corvi (IT) A. Krot (BY) X. Pelorson (FR) I. Titze (USA)P.H.Dejonckere (NL) U. Laine (FI) P. Perrier (FR) U. Uergens (DE)
LOCAL ORGANISING COMMITTEE
L. Bocchi Dept. of Electr. & Telecomm.P. Bruscaglioni Dept. of PhysicsA. Corvi Dept. of Mechanics & Ind. Techn.F. Dori Dept. of Electr.& Telecomm.E. Iadanza Dept. of Electr.& Telecomm.C. Manfredi Dept. of Electr.& Telecomm. – Conference ChairC. Marchesi Dept. of Comp. & Syst. Sci.
SPONSORS
COST Action 2103
Ente CRF – Ente Cassa di Risparmio di Firenze
IEEE EMBS – IEEE Engineering in Medicine and Biology Society
ELSEVIER EDS. – Biomedical Signal Processing and Control - Elsevier
ISCA – International Speech and Communication Association
A.I.I.M.B. – Associazione Italiana di Ingegneria Medica e Biologica
I.N.F.M. – Istituto Nazionale per la Fisica della Materia

VI MAVEBA 2007

Models and analysis of vocal emissions for biomedical applications: 5th international workshop: December 13-15, 2007: Firenze, Italy, ed. by C. Manfredi,ISBN 978 88-8453-673-3 (print) ISBN 978-88-8453-674-7 (online)© Firenze university press, 2007.
Contents VII
CONTENTS
Foreword .....................................................................................................................................XI
Theoretical models I
S. Ben Elhadj Fraj, F. Grenez, J. Schoentgen, Towards the simulation of pathological voice qualities ........................................................................................................................................... 3
M. Vasilakis, Y. Stylianou, A mathematical model for accurate measurement of jitter ........................... 7
W. Wokurek, Towards a temporal high-resolution formant analysis ......................................................11
P. J. Murphy, Physical and perceptual correlates of voice using acoustic analysis ............................... 17
P.H. Dejonckere, J.W.M.A.F. Martens, H. Versnel, M. Moerman, The effect of visible speech on perceptual rating of pathological voices, and on correlation between perception and acoustics.......... 21
J.I. Godino-Llorente, R. Fraile, N. Sáenz-Lechón, V. Osma-Ruiz, P. Gómez-Vilda,Automatic detection of voice impairments from text-dependent running speech using a discriminative approach ..................................................................................................................... 25
F. Amato, M. Cannataro, C. Cosentino, A. Garozzo, N. Lombardo, C. Manfredi, F. Montefusco,G. Tradigo, P. Veltri, Early detection of voice diseases via a web-based system.................................... 29
Visualization of normal and pathological speech data ................................................................................................................. 33
O. Amir, M. Wolf, N. Amir, A clinical comparison between MDVP and PRAAT softwares: is there a difference?............................................................................................................................... 37
Mechanical models I
folds vibration in the human larynx ........................................................................................................ 43
P. S. Popolo, I.R. Titze, Relating vocal fold amplitude of vibration to skin accelation level on the anterior neck ................................................................................................................................ 47
C. Drioli, F. Avanzini, Improved fold closure in mass-spring low-dimensional glottal models.......................................................................................................................................... 51
the oscillating glottis............................................................................................................................... 55

VIII MAVEBA2007
Posters
M.Pedersen,K.Munck, Advanced voice assessment. A prospective case-control study of jitter%, shimmer% and Qx%, glottis closure cohesion factor (Spead by Laryngograph Ltd.) and Long Time Average Spectra ............................................................................................................. 61
R.Fernández-Baillo,P.Gómez,C.Ramirez,B.Scola,Pre-post surgery evaluation based on the profile of glottal source ................................................................................................................ 65
J. Krutišová, J. Klečková, Data warehouse for prosody features ........................................................... 69
P.Chytil,C.Jo,K.Drake,D.Graville,M.Wax,M.Pavel, Detection of pathological diseases using a parametric model of vocal folds and neural networks ............................................................... 71
S.Ferrari,M.Silva,M.Guarino,D.Berckmans,Characterisation of cough sounds to monitor respiratory infections in intensive pig farming ....................................................................................... 75
S.Buchaillard,M.Brix,P.Perrier,Y.Payan, Use of a biomechanical tongue model to predict the impact of tongue surgery on speech production ............................................................................... 79
J. Klečková, J. Krutišová, Using nonverbal communication in dialog system....................................... 83
H.KhadiviHeris,B.S.Aghazadeh,M.Nikkhah-Bahrami, Classification of pathological voice signals using self-similarity based wavelet packet feature extraction and Davies-Bouldin criterion ........ 85
G.Sommavilla,P.Cosi,C.Drioli,G.Paci, SmS-festival:a new TTS framework.................................. 89
C.A.Ferrer,M.S.deBodt,Y.Maryn,P.VandeHeyning,M.E.Hernández-Díaz, Properties of the cepstral peak prominence and its usefulness in vocal quality measurements......................................... 93
M.Pützer,W.Wokurek, Correlates of temporal high-resolution formant analysis and glottal excitation in laryngeal dystonia before and after botulinum toxin treatment. A case study ................... 97
A.Sitchi,F.Grenez,J.Schoentgen, An experiment in vocal tract length estimation........................... 101
J. Horáček, A-M. Laukkanen, P. Šidlof, Estimation of output-cost–ratio using an aeroelastic model of voice production ..................................................................................................................... 105
M.Kob,T.Frauenrath, A system for parallel measurement of glottis opening and larynx position .... 109
C. Manfredi, G. Cantarella, A multi-purpose user-friendly voice analysis tool: application to lipofilling treatment ............................................................................................................................113
Theoretical models II
T.Dubuisson,T.Dutoit, Improvement of source-tract decomposition of speech using analogy with Lf model for glottal source and tube model for vocal tract..........................................................119
Z.Ciota, methodology of fundamental frequency extraction and analysis using microphone speech signal and vocal tract model ..................................................................................................... 123

Contents IX
A.Gömmel,C.Butenweg,M.Kob, A fluid-structure interaction model of vocal fold oscillation..... 127
E.Marchetto,F.Avanzini,C.Drioli, Estimation of a physical model of the vocal folds via dynamic programming techniques .................................................................................................. 129
Continuous speech/prosody
M.Airas,P.Alku,M.Vainio, Laryngeal voice quality changes in expression of prominence in continuous speech ...................................................................................................................................135
M.E.Hernández-DiazHuici,W.Verhelst,Spectral transition features in dysarthric speech ...................139
L. Devillers, L. Vidrascu, Real-life emotions detection on human-human medical call center interactions ... 143
A.Alpan,F.Grenez,J.Schoentgen, Estimation of vocal noise and cycle duration jitter in connected speech .....................................................................................................................................147
Neurological dysfunctions
M. Landau, T. Yingthawornsuk, D.M. Wilkes, R.G. Shiavi, R.M. Salomon, Predicting severity of mental state using vocal output characteristics ................................................................................ 153
H.KaymazKeskinpala,T.Yingthawornsuk,D.M.Wilkes,R.G.Shiavi,R.M.Salomon, Distinguishing high risk suicidal subjects among depressed subjects using mel–frequencycepstrum coefficients and cross validation technique ....................................................... 157
Mechanical models II
T. Lukkari, J. Malinen, P. Palo, Recording speech during magnetic resonance imaging ..................... 163
L.M.T. Jesus, A. Araújo, I.M. Costa, Articulatory oral space measures using the modified a-space .......167
J.G. Švec, M. Frič, F. Šram, H.K. Schutte, mucosal waves on the vocal folds: conceptualization based on videokymography .........................................................................................................................171
J.Groleau,M.Chabanas,C.Marécaux,N.Payrard,B.Segaud,M.Rochette,P.Perrier,Y.Payan, A biome-chanical model of the face including muscles for the prediction of deformations during speech production .. 173
P. Šidlof, O. Doaré, O. Cadot, A. Chaigne, J. Horáček, Piv measurements of velocity fields in glottis on a physical vocal fold model ....................................................................................................177
Pathology detection/classification II
P. Gómez, R. Fernández, R. Martínez, C. Muñoz, L.M. Mazaira, A. Álvarez, J.I. Godino, Detecting pathology in the glottal spectral signature of female voice ................................................. 183
C.J.Moore,K.Manickam,N.Slevin, A physiological basis for two group, healthy male voicing identified using spectral approximate entropy ...................................................................................... 187
X MAVEBA 2007
B.S. Aghazadeh, H. Khadivi Heris, H. Ahmadi, M. Nikkhah-Bahrami, Fuzzy wavelet packet ......................... 191
M. Bacauskiene, A. Gelzinis, M. Kaseta, M. Kovalenko, R. Pribuisiene, V. Uloza, A. Verikas,Multiple feature sets and genetic search based discrimination of pathological voices........................ 195
A-laryngeal speech
M.B.J. Moerman, J.P. Martens, D. Chevalier, G. Friedrich, M. Hess, G. Lawson, A.K. Licht,F. Ogut, E. Reckenzaun, M. Remacle, V. Woisard, P.H. Dejonckere, Towards a basic protocol for functional assessment of substitution voices: preliminary results of an international trial............ 201
Pitch contour from formants for alaryngeal speech..................................................... 205
Newborn infant cry
F.M. Martínez, J.J. Azpiroz, A.E. Martínez, Analysis of noise in cry signal using frequency and time-frequency tools .......................................................................................................................................211
L. Bocchi, L. Spaccaterra, S. Orlandi, F. Acciai, F. Favilli, E. Atrei, C. Manfredi, G.P. Donzelli,Blood oxygenation vs cry in preterm newborn infants ......................................................................... 215
S. Cano, I. Suaste, D. Escobedo, T. Ekkel, C.A. Reyes,.................................................. 219
Non-human sounds
M. Gamba, J. Medard, H. Andriamialison, G. Rakotoarisoa, C. Giacoma, Vocal tract modeling ................................................................ 225
Singing voice
T. Sangiorgi, L. Mazzei, F. Felici, S. Lapi, G. Testi, C. Manfredi, P. Bruscaglioni,Objective analysis of the singing voice as related to singer posture .................................................... 231
Mozart’s voice
P. DeJonckere “Mozart’s voice” ........................................................................................................... 237
Author Index ............................................................................................................................239

Models and analysis of vocal emissions for biomedical applications: 5th international workshop: December 13-15, 2007: Firenze, Italy, ed. by C. Manfredi,ISBN 978 88-8453-673-3 (print) ISBN 978-88-8453-674-7 (online)© Firenze university press, 2007.
Contents XI
FOREWORD
On behalf of the organising committee, I would like to welcome all the participants to the 5th Inter-national Workshop on Models and Analysis of Vocal Emissions for Biomedical Applications, MAVEBA 2007, held 13-15 December 2007, in Firenze, Italy.
Since 1999, the workshop has been held uninterruptedly every two years, aiming at stimulating con-tacts between specialists active in research and industrial developments, in the growing area of voice signals and image analysis for biomedical applications. The scope of the Workshop includes all aspects of voice modelling and analysis, ranging from fundamental research to all kinds of biomedical applications and related established and advanced technologies.
The Workshop is unique in its aims and is largely interdisciplinary, concerning voice analysis under both biomedical and technical perspective. Participants spreading over the medical, engineering, physics
sections are presented:
1. Theoretical models
3. Mechanical models 4. Continuous speech and prosody5. A-laryngeal speech6. Newborn infant cry7. Neurological dysfunction8. Singing voice9. Non-human sounds
Moreover, this 5th edition hosts two important sponsored events:
The Working Groups and Management Committee meetings of COST Action 2103 (President: Philippe de Jonckere, NL), “Advanced voice quality assessment”, which is one of the actions promoted by the intergovernmental network for search.The meeting of representatives from the Editorial Board of the Elsevier Journal: Biomedical Signal Processing and Control, along with a “mini workshop” on the publication process for authors, to bring useful information and suggestions, especially for young researchers.
Finally, I would like to thank the members of the organising committee and all the reviewers, who gave freely of their time to assess the highly disparate work of the workshop, helping in improving the
Telecommunications that contributed to make this workshop a successful one.

XII MAVEBA2007
SpecialthankstotheFiesoleSchoolofMusicfortheirgenerousparticipation,andtoboththedirectionandassociationoftheOspedaleS.GiovannidiDio,whohasallowedtheMAVEBAparticipantsenjoyingthewonderfulmonumentalentranceoftheoldestHospitalinFirenze.
Great thankfulness goes to the supporters and sponsors, who confidently gave financial contribution totheMAVEBAworkshop.
Dr.ClaudiaManfrediConferenceChair

Theoretical models I


Models and analysis of vocal emissions for biomedical applications: 5th international workshop: December 13-15, 2007: Firenze, Italy, ed. by C. Manfredi,ISBN 978 88-8453-673-3 (print) ISBN 978-88-8453-674-7 (online)© Firenze university press, 2007.
Abstract: The presentation concerns a synthesizer for disordered voices. The simulation of dysphonia is a topic the relevance of which is growing, but to which few studies have been devoted. The simulator that is discussed here involves a nonlinear memory-less model of the glottal area that is driven by a harmonic excitation the instantaneous frequency and amplitude of which are controlled. The glottal airflow rate is generated by means of an aerodynamic model of the glottis, which also comprises trachea-source and source-tract interactions as well as the generation of turbulence noise at the glottis. Trachea and vocal tract are modelled by means of a concatenation of lossy cylindrical pipes of identical length, but different cross-sections. The text concerns the presentation of the synthesizer and its synthetic output, as well as the results of a perceptual evaluation of the naturalness of simulated speech sounds in the framework of a stimuli comparison paradigm.
I. INTRODUCTION
The presentation concerns a synthesizer for pathological voices. Motivations for developing simulators of disordered voices are the discovery of speech cues that are relevant to the perception of abnormal voices; the preparation of reference stimuli in the framework of the perceptual assessment of disordered voices; the training of speech therapists in the auditory evaluation of dysphonic speakers; as well as the testing of the reliability or validity of acoustic cues of disordered speech.
Earlier attempts have often involved conventional formant synthesizers driven by a concatenated-curve model of the glottal excitation, such as the well-known Liljencrants-Fant model [11]. Problems with concatenated-curve models of the glottal excitation are that they are prone to aliasing because their bandwidth is unknown a priori and perturbations of the glottal cycle lengths have to be synchronized with the cycle onset, which is a physiologically unlikely assumption. Also, tract-source interaction and generation of additive noise rely on ad hoc assumptions. We have presented earlier a glottal source model based on nonlinear shaping functions [10][14]. This model enables directly controlling the bandwidth as well as instantaneous frequency of the glottal source signal and the perturbations thereof. Source-tract interaction as well
as the generation of additive noise have to be simulated heuristically, however.
TOWARDS THE SIMULATION OF PATHOLOGICAL VOICE QUALITIES
S. Ben Elhadj Fraj1, F. Grenez1, J. Schoentgen1,2
1Laboratory of Images, Signals & Telecommunication Devices, Université Libre de Bruxelles, 50, Avenue F. D. Roosevelt, 1050 Brussels, Belgium 2National Fund for Scientific Research, Belgium
Here, we therefore present a synthesizer that involves models of the glottal area and airflow through the glottis. Instead of the glottal source signal, the time-evolving glottal area is modelled by means of a nonlinear memory-less signal model that transforms a trigonometric driving function into the desired glottal area waveform. One attractive property of the model is that the instantaneousfrequency and harmonic richness of the glottal area are controlled by the instantaneous frequency and amplitude of the harmonic driving function [1].
The glottal airflow rate is generated by means of an aerodynamic model, which includes interactions between the glottis and the infra- and supra-glottal ducts [2]. The propagation of the acoustic wave through the trachea and vocal tract is simulated by means of concatenated tubes. Wall vibration, viscous and thermal losses as well as acoustic reflection and radiation at the lips and glottis are taken into account.
Random modulation noise such as jitter or tremor and abnormal voice qualities such as diplophonia, biphonationand irregular vocal cycles are mimicked by means of stochastic or deterministic models of the time-evolving instantaneous frequency of the driving harmonic of the glottal area model [10]. The text focuses on the presentation of the model and its synthetic output, as well as on preliminary results of a perceptual evaluation of the naturalness of simulated vowel categories.
II. MODELSThe block diagram of the synthesizer is presented in
Fig.1. Symbols fs, bs, f1 and b1 designate forward and backward components of the acoustic pressure wave propagating in the infra- and supra-glottal tracts.
Fig.1: Block diagram of the synthesizer
subglottal tract
lung pressure
speech signal
sbsf
1f 1b
aerodynamic model of the
glottal airflow
glottal area shaping function
model
polynomial coefficients
glottal area template
cosinusoid Fourier
coefficients
vocal tract lip radiation

A. Nonlinear memory-less glottal area model
A reason for opting for a shaping function model of the glottal area is that such a model gives explicit control over the instantaneous frequency of the glottal area and over its shape, which may evolve smoothly from a constant to the template area via a quasi-sinusoid.
The glottal area is assumed to evolve symmetrically during glottal opening and closing. The open glottis template is therefore a half-cycle cosinesoid positioned symmetrically about the time origin. The half-cycle is padded to the left and right with zeros to model glottal closure. Combined zero and hemi-cosinesoidal curves form the glottal area template, which is an even time function. The greyish blocks in Fig.1 summarise operations that are carried out once. They obtain the shaping polynomial on the base of the glottal area template. The polynomial coefficients are indeed calculated from the Fourier series coefficients of the template by means of a constant linear transform [1].
The polynomial shaping function per se forms the glottal area model, which outputs the template exactly when the model is driven by a cosine the amplitude of which is equal to unity and the period of which is equal to the length of the area template. The instantaneous length of an area cycle and its spectral slope and amplitude are controlled via the instantaneous frequency and amplitude of the driving cosine to output areas that differ from the template.
Fig.2: Glottal area (above) and glottal airflow waveform (below)
1.06 1.08 1.1 1.12 1.14 1.16 1.18 1.2 1.22
x 104
0
0.05
0.1
0.15
sample number
cm
²
glottal area
1.06 1.08 1.1 1.12 1.14 1.16 1.18 1.2 1.22
x 104
0
100
200
300
sample number
cm
³/s
glottal airflow
B. Aerodynamic model of the glottis and interactive source-filter coupling
Assuming continuity at the glottal boundaries, Titze has derived an algebraic equation for the dependence of the airflow rate on glottal area, incident components of the infra- and supra-glottal acoustic pressure waves,
sound speed and density of air [2]. Both epi-laryngeal and sub-glottal pressures, which are the pressures downstream and upstream of the glottis, are expressed as the sum of forward and backward propagating components, which are obtained by a temporal simulation of the wave propagation in the sub-glottal and supra-glottal tracts [2].
In Fig.2, one sees the area outputted by the polynomial shaping function model and the waveform outputted by Titze’s glottal flow model. One notices oscillatory ripples in the glottal flow waveform owing to source-tract interaction.
C. Trachea and vocal tract models
C.1. Lossless model In agreement with the Kelly-Lochbaum model of
wave propagation, trachea and vocal tract are mimicked by means of a concatenation of cylindrical pipes of identical lengths, but different cross-sections. In the lossless case, the reflection coefficient at the lips equals -1 and the reflection coefficient at the glottis +1. That is, no acoustic energy is transmitted to the outside.
The wave propagation can be simulated digitally if the time step between samples is chosen to be the time interval the acoustic wave takes to travel the length of one pipe. Here, the sampling frequency equals 88.2 kHz.
C.2. Lossy model Several models have been proposed to simulate losses
in the framework of wave propagation models. To simulate wall vibration losses, an auxiliary (transversal) tube is inserted at each junction between adjacent pipes [3]. Acoustic losses due to friction at the tract walls and heat losses through the walls are modelled according to [7].
To mimic acoustic reflection and emission at the glottis, proposals by Flanagan [4] or Badin & Fant [5] have been implemented. Both models give results that are auditorily equivalent.
Several lip radiation models have been investigated, each model using a reflection coefficient that depends on frequency [4][6]. As an alternative, a conical tubelet, the opening of which is controlled, has been connected at the lip end of the vocal tract to simulate the transition from 1-dimensional to 3-dimensional wave propagation. Informal listening tests have suggested retaining the lip radiation model proposed by Flanagan [4].
Tracheal losses are taken into account via a real attenuation coefficient at the lung end. The numerical value of this coefficient has been investigated on the base of perceptual experiments that are reported hereafter.
C.3. Vowel area functions Six French vowel categories, [a], [i], [u], [o], [e] and
[ ], have been synthesized. The pipe cross-sections have been fixed on the base of published data. The area
4 MAVEBA 2007

functions of [a] and [i] have been recovered from [12] and the area functions of [u], [o], [e] and [ ] from [13]. The latter have been interpolated to increase the spatial resolution from 1 cm to 0.396825 cm. The length of the tracheal tube has been equal to 14.2857 cm and its cross-section equal to 1.2 cm2.
D. Models of vocal perturbations
Additive noise owing to turbulence is mimicked by means of a model proposed by Titze [2]. Vocal jitter and frequency tremor are simulated via diffusion models of the phase of the cosine that is driving the glottal area model [8]. Vocal amplitude shimmer and amplitude tremor arise passively in the glottal and tract models via modulation distortion [9]. Deterministically varying glottal cycle lengths are used to simulate diplophonia and biphonation and stochastically fluctuating glottal cycle lengths are used to simulate random cycles [10].
III. AUDITORY EVALUATION
A. Vowel category identification
The first experiment concerns vowel category identification. The objective is to test whether human listeners are able to identify the six synthetic target vowel categories [a], [i], [u], [o], [e] and [ ].
Tab.1: Auditory vowel category identification in percent
identified as:
[a] [i] [u] [o] [e] other
[a] 92 0 0 0 0 1 7
[i] 0 93 0 0 1 0 6
[u] 0 0 81 8 0 0 11
[o] 0 0 7 78 0 0 15
[e] 0 0 1 0 75 7 17
synth
etic v
ow
els
:
0 0 0 0 25 53 22
The open quotient of the glottis and the lung reflection coefficient are among the parameters that influence perceived naturalness of vowel timbre. Therefore, each vowel category has been synthesized with glottal open quotients equal to 50, 62 or 83 % and lung reflection coefficients equal to 0.2, 0.5 or 0.8 giving a total of nine vocal timbres per category. The source fundamental frequency has been equal to 100 Hz. The glottal cycles have been perturbation-free. The lengths of the synthetic stimuli have been 1 second.
Eight French-speaking judges have listened to the 54 realizations in an arbitrary order. They have been asked to recognize and identify the vowel category by ticking one item in a list of 11 different monosyllabic French words. Each word has been [pV] or [pVR], with V an oral French vowel. The word list has been completed by an “indefinite” bin.
B. Auditory evaluation of voice source timbres
The objective of the second experiment has been to determine the preferred voice timbre within each vowel category. The experiment has been carried out within the framework of a stimuli comparison paradigm. The pair-wise comparison paradigm has the advantage that untrained judges are able to rank voice timbres without having to assign explicitly scores to stimuli according to perceived quality dimensions (e.g. naturalness, clarity, brilliance, etc.), which are difficult to define and on which even professional judges may not agree.
Tab.2: Vocal timbre average ranks per vowel category
Pulmonary reflection coefficient & glottal open quotient (%)
[a] [i] [u] [o] [e]
0,2 - 50 6,2 5,1 1,9 7,0 5,3 4,4
0,5 - 50 6,4 4,3 2,6 5,8 5,8 3,8
0,8 - 50 5,6 3,7 1,9 5,8 5,8 2,8
0,2 - 62 4,9 5,7 3,2 4,5 4,4 3,6
0,5 - 62 5,0 4,9 4,9 3,3 4,9 3,8
0,8 - 62 4,5 5,7 6,8 1,1 4,9 5,5
0,2 - 83 1,3 3,4 6,3 2,1 0,6 4,0
0,5 - 83 1,1 2,6 4,5 3,0 1,9 4,4
0,8 - 83 1,1 0,6 3,8 3,5 2,3 3,6
The 9 timbres for each vowel category have been presented pair-wise, that is a total of 9 x 8/2=36 pairs per category. The judges have been informed of the target category by means of a monosyllabic French word comprising the target as a nucleus.
The judges have been asked to indicate their preferred timbre within each pair by clicking on a button that is part of a user interface. The listeners can also select an “equal preference” button when they consider that the voice qualities of both stimuli are equivalent. They have the opportunity to listen to each member of a pair as often as they wish.
For each pair, a software that handles stimuli presentation assigns to the preferred stimulus the score 1 and to the other the score 0. When both are considered
Theoretical models I 5

equal, each is assigned the score 0.5. Once all 36 comparisons have been carried out, the stimuli are ranked according to their scores. An average rank of 8 would mean that all the judges have preferred this timbre every time it has been presented. An average rank of 4 would mean that this timbre has been preferred as often as it has been disfavoured and a rank of 0 would mean that the listeners have always preferred the other stimuli in the pair.
IV. RESULTS AND DISCUSSION
Table 1 shows the percentage of identification of the synthetic target categories with the reference categories (11 French vowels & one “indefinite” bin). Because of lack of space, only identifications with reference categories are reported that also are target categories. Other misidentifications are pooled under the heading “other”. One sees that confusions exist between vowels that differ in the degree of aperture, e.g. vowel [a] has been identified once as [ ] and vowel [i] once as [e]. Confusions between [o] and [u] appear to be balanced, that is, roughly as many [o] are identified as [u] and [u] are identified as [o]. The pair [e][ ] is unbalanced, however, category [ ] has been identified far more often as [e] than [e] as [ ]. Given that the vowel sounds are sustained and presented in isolation, the misidentification with neighboring categories of similar aperture are expected.
The right-most column in Table 1 reports the percentage of identifications of the target categories with the remaining reference categories. The total percentage of misidentification suggests that extreme vowels [a], [i] and [u] are less likely to be misidentified than vowels [o], [e] and [ ], which is plausible because the former have less neighbours they may be misidentified with.
Table 2 reports the ranked preference of within- category timbres for the vowel categories that have been reported in Table 1. A principal component analysis has been carried out on the vowel categories. The results show that two principal components explain 89% of the total variance after rotation. Categories [a], [i] and [e] are strongly correlated (> 0.5) with the first component. Categories [u] and [ ] are strongly correlated with the second component and category [o] is strongly negatively correlated with the second component.
Category [o] is therefore unique. Inspection of Table 2 shows that [o] is the only category that is strongly preferred when the voice timbre is characterized by an open quotient of 50% and disfavored when characterized by an open quotient of 62%. Categories [u] and [ ] on the contrary, are strongly preferred when the open quotient equals 62% and disfavored when it equals 50%. Principal component 2 therefore captures the antagonist behavior
of vowel categories [u], [o] and [ ] with regard to the open quotients of 50% and 62%.
Timbres of categories [a], [i] and [e] are strongly or moderately preferred when the open quotients equal 50% or 62% respectively.
Principal components analysis therefore shows that category [o] behaves differently from all the other categories for which an open quotient of 62% is either strongly or moderately preferred.
The analysis also shows that the pulmonary reflection coefficient has no major influence on listener preference. Auditory tests confirm that higher reflection coefficient gives rise to timbres that are perceived as more brilliant.
ACKNOWLEDGEMENT
The authors would like to acknowledge support of COST Action 2103 “Advanced Voice Function Assessment”.
REFERENCES
[1] J. Schoentgen, “Shaping function models of the phonatory excitation signal,” JASA, 114(5), pp.2906-2912, November 2003.[2] I.R. Titze, The Myoelastic Aerodynamic Theory of Phonation, National Center of Voice and Speech, USA, 2006, pp.265.[3] G. Fant, “Vocal tract wall effects, losses and resonance bandwidths”, STL-QPSR 2-3, pp.25-52. [4] J. L. Flanagan and L.R. Rabiner, Speech Synthesis, Bell Laboratories, Murray Hill, N.J. USA, 1972. [5] P. Badin and G. Fant, “Notes on vocal tract computation”, STL-QPSR 2-3, pp.53-109, 1984. [6] H. Deng, R. K. Ward, M. P. Beddoes and D. O’Shaughnessy, “Obtaining lip and glottal reflection coefficients from vowel sounds”, Proc. IEEE Int. Conf. on Acoustics, Speech and Signal Processing, ICASSP 2006, Toulouse (France), pp.373-376, May 2006. [7] J. Abel, Tamara Smyth and Julius O. Smith III, “A simple, accurate wall loss filter for acoustic tubes”, Proc. Int. Conference on Digital Audio Effects (DAFx-03), London, UK, September 2003. [8] J. Schoentgen, “Stochastic models of Jitter”, JASA, 109(4), pp.1631-1650, April 2001. [9] J. Schoentgen, “Modulation frequency and modulation Level owing to vocal microtremor”, JASA, 112, pp.690-700, 2002. [10] J. Hanquinet, F. Grenez and J. Schoentgen, “Synthesis of disordered speech”, INTERSPEECH, Lisbon (Portugal), pp.1077-1080, September 2005. [11] G. Fant, J. Liljencrants and Q. Lin, “A four-parameter model of the glottal flow”, STL-QPSR, 26(4). [12] B. Story, I.R. Titze and E. Hoffman, “Vocal tract area functions from magnetic resonance imaging”, JASA. 100, pp.537-554, 1996. [13] M. Mrayati: “Contributions aux études sur la parole”, Institut National Polytechnique de Grenoble, France, 1976. [14] J. Hanquinet, F. Grenez and J. Schoentgen, “Synthesis of disordered voices”, NOLISP, Barcelona, Spain, pp.231-241, April 2005.
6 MAVEBA 2007

Models and analysis of vocal emissions for biomedical applications: 5th international workshop: December 13-15, 2007: Firenze, Italy, ed. by C. Manfredi,ISBN 978 88-8453-673-3 (print) ISBN 978-88-8453-674-7 (online)© Firenze university press, 2007.
A MATHEMATICAL MODEL FOR ACCURATE MEASUREMENT OFJITTER
Miltiadis Vasilakis1,2 and Yannis Stylianou1,2∗1Department of Computer Science, University of Crete, Hellas
2Institute of Computer Science, Foundation of Research and Technology Hellas (FORTH)
Abstract: Jitter is a fundamental metric of voicequality. The majority of jitter estimators produce anaverage value over a duration of several pitch peri-ods. This paper proposes a method for short-time jittermeasurement, based on a mathematical model whichdescribes the coupling of two periodic phenomena. Themovement of one of the two periodic phenomena withrespect to the other is what is considered as jitter andwhat the proposed method measures. Through testswith synthetic jitter signals it has been verified thatthe suggested method provides accurate local estimatesof jitter. Further evaluation was conducted on ac-tual normal and pathological voice signals from theMassachusetts Eye and Ear Infirmary (MEEI) Disor-dered Voice Database. Compared with correspondingparameters from the Multi-Dimension Voice Program(MDVP) and the Praat system, the proposed methodoutperformed both in normal vs. pathological voicediscrimination.Keywords: Jitter, short-time, pathological voice.
I. INTRODUCTION
Evaluation of voice quality is an essential diagnostic aidfor the assessment of pathological voice. Methods basedon acoustic analysis have several advantages. In compar-ison to methods such as videoendoscopy or electroglot-tography (EGG), they cost less, require less time and arenon-invasive for the patient. Furthermore, acoustic analy-sis can produce automatic quantitive results, which, apartfrom assisting clinical doctors, can be exploited for unsu-pervised classification of a voice as pathological or nor-mal, or even detect specific cases of dysphonia.
The main effect of a pathological condition, as we per-ceive it, is noise. The parameters produced by acousticanalysis for voice quality, usually quantify the presence ofthis aperiodic component; mainly additive noise, such asin cases of breathiness, or modulation noise, such as incases of roughness. Further regarding modulation noise,this can be detected either in frequency, called jitter, or inamplitude, called shimmer. Jitter is defined as perturba-tions of the glottal source signal that occur during vowel
∗This work was supported by GSRT, research program 05AK-MON106
phonation and affect the glottal pitch period. The mea-surement of jitter can be performed by using the radiatedspeech signal, or by using measurements of glottal con-ductivity through (EGG). The computation may take placein the time domain, in the frequency domain (magnitudespectrum), or using cepstrum.
Several methods have been proposed for the computa-tion of quantitative values for jitter. Time domain methodsare usually based on pitch period measurements that areused to estimate an average value of jitter, over a numberof several periods. If N is the total number of pitch peri-ods and u(n) is the pitch period sequence, the definitionsof widely accepted jitter measurements are given below.Local jitter is the period-to-period variability of pitch (%)
1N−1
�N−1n=1 |u(n+ 1) − u(n)|1N
�n=1N u(n)
(1)
Absolute jitter is the period-to-period variability of pitchin time
1N − 1
N−1�n=1
|u(n+ 1) − u(n)| (2)
Relative Average Perturbation (RAP) jitter provides thevariability of pitch with a smoothing factor of 3 periods(%)
1N−2
�N−2n=1
|2u(n+1)−u(n)−u(n+2)|3
1N
�n=1N u(n)
(3)
Pitch Period Perturbation Quotient (PPQ) provides thevariability of pitch with a smoothing factor of 5 periods(%)
1N−4
�N−4n=1
|4u(n+2)−u(n)−u(n+1)−u(n+3)−u(n+4)|5
1N
�n=1N u(n)
(4)The pitfall with such techniques is that they heavily rely ona periodicity that doesn’t actually exist in speech, whilesome methods specifically provide a jitter value that is apercentage of that notion of periodicity. In order to over-come this problem (the existence of non-periodicity), astandard solution is to perform a low pass filtering beforepitch estimation, which solution essentially destroys the
1

details of the speech signal; it reduces the effect of non-
periodicity, which is however what we would like to mea-
sure.
An alternative to calculating an average value for jit-
ter, is that of short-time tracking. A sequence of jitter
values on small intervals can be more precise without as-
suming long-term periodicity and may even provide bet-
ter insight on the evolution of pathological voices. In this
work we suggest the use of a mathematical model that
enables us to combine two periodical phenomena, in or-
der to achieve the local aperiodicity. Based on that, we
identify jitter as the movement of one of the two peri-
odic phenomena with respect to the other. This move-
ment is exactly what we try to measure. Using such a
model we are able to calculate the value of short-time jitter
with high precision. Comparison was made with the corre-
sponding jitter measurements provided by PRAAT [1] and
Multi-Dimensional Voice Program (MDVP) [2] of Kay-
Pentax, on the database Massachusetts Eye and Ear Infir-
mary (MEEI) Disordered Voice Database [3].
The paper is organized as follows. In section II
we present the mathematical model we propose and the
method we derived from it to measure short-time values
of jitter. The conducted experiments and their results are
presented in section III. Section IV concludes the paper.
1
ampl
itude
time (samples)
P − ε P − εP + ε P + ε
Figure 1: Glottal impulse train of the proposed jitter
model.
II. METHOD
Jitter may be expressed as a perturbation on the glottal
excitation impulse train. A simple mathematical model
can be obtained by considering a cyclic perturbation, with
pitch deviation of a constant value, applied every second
impulse [4]. The glottal impulse train can be expressed
−40
−38
−36
−34
−32
−30
−28
−26
radian frequency (ω)
pow
er (
dB)
H(0, ω)
S(0, ω)
H(1, ω)
S(1, ω)
H(2, ω)
S(2, ω)
Figure 2: Power spectrum of the harmonic and subhar-
monic parts. It is worth to note that crossings between the
two parts, reveal the value of jitter.
then as
p[n] =+∞∑
k=−∞δ[n − (2k)P ]+
+∞∑k=−∞
δ[n + ε − (2k + 1)P ]
(5)
where P is the pitch period and ε is the pitch deviation,
both in samples. This model, shown in Fig. 1, realizes
the combination of two periodic phenomena and ε is the
movement that corresponds to the local aperiodicity of jit-
ter and therefore the value we should seek to measure. The
value of ε can range from 0 (no jitter) to P (pitch halving).
The power spectrum of the impulse train can be shown
to be
|P (ω)|2 =
= 2(1 + cos [(ε − P )ω])
[+∞∑
k=−∞
2π
2Pδ(ω − k
2π
2P)
]2
= 2(1 + cos [(ε − P )ω])
⎡⎣ +∞∑
l=−∞,k=2l
π2
P 2δ(ω − l
2π
P)+
++∞∑
l=−∞,k=2l+1
π2
P 2δ(ω − l
2π
P− π
P)
⎤⎦
The last part can be written as
|P (ω)|2 = H(ε, ω) + S(ε, ω) (6)
where H(ε, ω) is the influenced by jitter harmonic part of
the power spectrum, while S(ε, ω) is the subharmonic part
that appears because of the jitter.
The two power spectra for various values of ε are de-
picted in Fig. 2. We observe that the harmonic and sub-
harmonic parts for a certain value of ε crossover that many
2
8 MAVEBA 2007

times. The structure remains the same also on the output
from a linear system when the input is the impulse train
p[n].Based on this perceived structure of power spectra a
short-time jitter estimator has been developed. Initially,
for a given speech signal, a pitch estimation takes place
that provides us with a temporal sequence of the pitch pe-
riod. A sliding frame is used to allow us to examine the
signal gradually in time. The size of the frame can be
either fixed to 4 times the average pitch period, or vari-
able to 4 times the local pitch period. The frame step used
is accordingly either one average pitch period, or one lo-
cal pitch period. A hanning window is then applied to
the frame and the power spectrum is computed. The size
of the Discrete Fourier Transform is that of the small-
est power of 2 that is closest to the length of the frame.
From the power spectrum, the harmonic and subharmonic
parts are taken into account, and by counting the number
of crossings between them, the jitter value of the current
frame is estimated. In order to overcome potential spec-
trum resolution problems, a threshold is used to determine
if a crossing has occurred. If the harmonic and subhar-
monic parts, after a candidate crossing, never reach a dif-
ference over the threshold value, before the next potential
crossing, then it is not regarded as one. Through testing,
the threshold value has been set to 3dB. In the end a short-
time jitter sequence with integer values (i.e. in samples)
is obtained. Taking into account the sampling frequency
of the signal the sequence is converted to μsec. It is evi-
dent, that the larger the sampling frequency, the larger the
resolution of the measurement.
III. EXPERIMENTS AND RESULTS
In order to verify the validity of the proposed method, in
theory and in practice, experiments were carried out with
both synthetic and actual pathological voice signals. The
actual signals were taken from the MEEI Disordered Voice
Database [3].
A. Synthetic Signals
The synthetic signals were created using glottal impulse
trains as described in (5). These were used to excite an
AR model of order 50, extracted from a sustained record-
ing of vowel /a/, with an average fundamental frequency
of 125Hz. This was done for sampling frequencies of 16and 48kHz, and for ε values from 0 to 10% of each pitch
period. The duration of the signals were set to 1sec.
Using a fixed frame size, with knowledge of the actual
pitch period, we did confirm our observations. The struc-
ture of the glottal excitation was maintained on the final
signal and exact measurement of the short-time jitter was
possible. Fig. 3 shows the power spectrum of a frame
of the synthetic signal, with sampling frequency 48kHz
0 5 10 15 20−80
−70
−60
−50
−40
−30
−20harmonic & subharmonic parts of the power spectrum
frequency (kHz)
pow
er (
dB)
2.4 2.45 2.5 2.55 2.6
−55
−50
−45
a closer look at the first crossing
frequency (kHz)
pow
er (
dB)
0 5 10 15 20−80
−70
−60
−50
−40
−30
−20synthetic jitter signal (fs = 48kHz, ε = 5): power spectrum of a single frame
frequency (kHz)
pow
er (
dB)
H(ε, ω)
S(ε, ω)
|P(ω)|2
acceptedcrossing
rejectedcrossings
the circles indicatecrossings betweenthe harmonic andsubharmonic parts
Figure 3: In the experiments with synthetic signals, the
proposed method measures exactly the local jitter value.
and ε = 5. The crossings counted correspond to the jit-
ter movement, while two false crossings are correctly re-
jected.
To verify our results, we used as a reference the
Praat [1] system. The absolute jitter (2) measurement as it
is implemented in Praat [Jitter (local, absolute)] was used.
Since our method calculates a sequence of short-time val-
ues, we used for comparison the average jitter value. Hav-
ing in mind Fig. 1, absolute jitter (2) would return a jitter
value of 2×ε, while the average value we measure is 1×ε.
To do an analogous comparison we use double the average
jitter value.
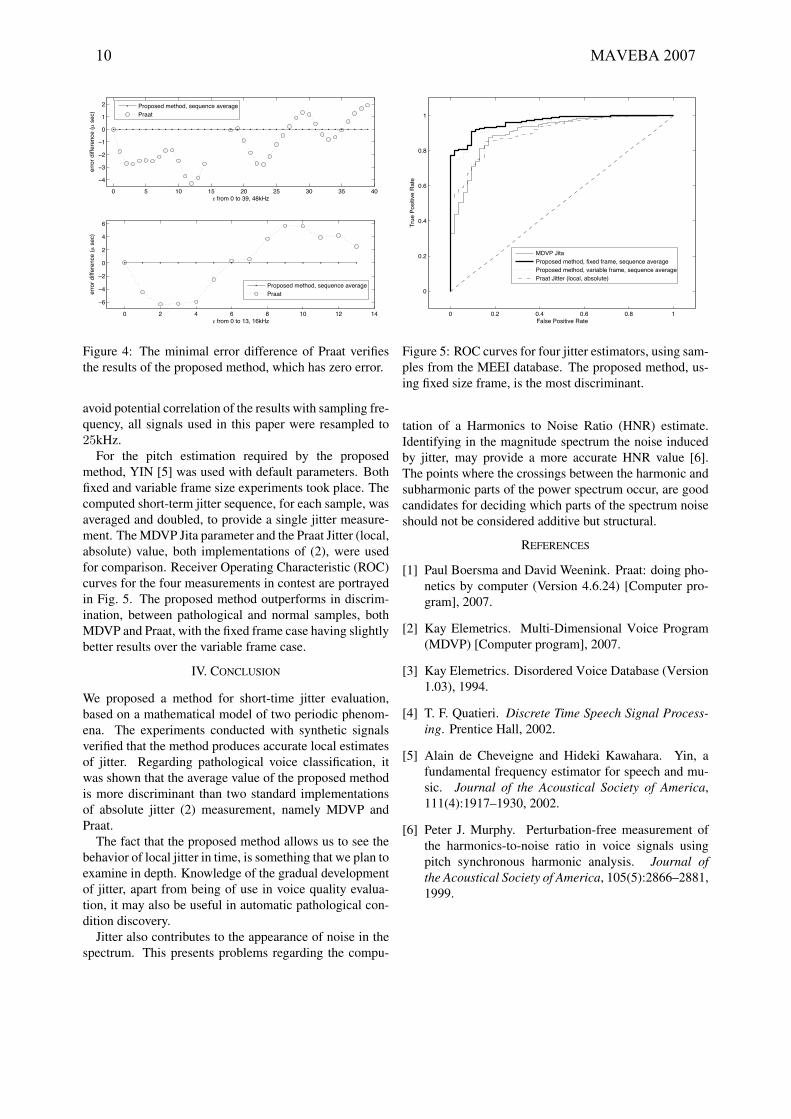
The error difference between the actual jitter value and
the results of our method and Praat are presented in Fig. 4,
for 16 and 48kHz. The proposed method has zero error,
while the error difference of Praat is of the order of some
μseconds for all ε values, except three cases in the 48kHz,
where Praat determined the signals as unvoiced and didn’t
return jitter measurements.
B. MEEI Disordered Voice Database
The MEEI Disordered Voice Database contains sustained
vowel and reading text samples, from 53 subjects with nor-
mal voice and 657 subjects with a wide variety of patho-
logical conditions. Also included for most of the signals
were the acoustic analysis parameters produced by the
Multi-Dimensional Voice Program (MDVP) [2]. For the
purpose of our experiments, all 53 of the normal voice
samples and 632 of the pathological voice samples were
used, and specifically the sustained recordings of vowel
/a/. The excluded pathological voice samples were the
ones that lacked the MDVP parameters. The sampling
frequency of the selected signals were originally either 25or 50kHz, with the normal voice ones only of 50kHz. To
3
Theoretical models I 9
0 5 10 15 20 25 30 35 40
−4
−3
−2
−1
0
1
2
ε from 0 to 39, 48kHz
erro
r di
ffere
nce
(μ s
ec)
0 2 4 6 8 10 12 14
−6
−4
−2
0
2
4
6
ε from 0 to 13, 16kHz
erro
r di
ffere
nce
(μ s
ec)
Proposed method, sequence averagePraat
Proposed method, sequence averagePraat
Figure 4: The minimal error difference of Praat verifies
the results of the proposed method, which has zero error.
avoid potential correlation of the results with sampling fre-
quency, all signals used in this paper were resampled to
25kHz.
For the pitch estimation required by the proposed
method, YIN [5] was used with default parameters. Both
fixed and variable frame size experiments took place. The
computed short-term jitter sequence, for each sample, was
averaged and doubled, to provide a single jitter measure-
ment. The MDVP Jita parameter and the Praat Jitter (local,
absolute) value, both implementations of (2), were used
for comparison. Receiver Operating Characteristic (ROC)
curves for the four measurements in contest are portrayed
in Fig. 5. The proposed method outperforms in discrim-
ination, between pathological and normal samples, both
MDVP and Praat, with the fixed frame case having slightly
better results over the variable frame case.
IV. CONCLUSION
We proposed a method for short-time jitter evaluation,
based on a mathematical model of two periodic phenom-
ena. The experiments conducted with synthetic signals
verified that the method produces accurate local estimates
of jitter. Regarding pathological voice classification, it
was shown that the average value of the proposed method
is more discriminant than two standard implementations
of absolute jitter (2) measurement, namely MDVP and
Praat.
The fact that the proposed method allows us to see the
behavior of local jitter in time, is something that we plan to
examine in depth. Knowledge of the gradual development
of jitter, apart from being of use in voice quality evalua-
tion, it may also be useful in automatic pathological con-
dition discovery.
Jitter also contributes to the appearance of noise in the
spectrum. This presents problems regarding the compu-
0 0.2 0.4 0.6 0.8 1
0
0.2
0.4
0.6
0.8
1
False Positive Rate
Tru
e P
ositi
ve R
ate
MDVP JitaProposed method, fixed frame, sequence averageProposed method, variable frame, sequence averagePraat Jitter (local, absolute)
Figure 5: ROC curves for four jitter estimators, using sam-
ples from the MEEI database. The proposed method, us-
ing fixed size frame, is the most discriminant.
tation of a Harmonics to Noise Ratio (HNR) estimate.
Identifying in the magnitude spectrum the noise induced
by jitter, may provide a more accurate HNR value [6].
The points where the crossings between the harmonic and
subharmonic parts of the power spectrum occur, are good
candidates for deciding which parts of the spectrum noise
should not be considered additive but structural.
REFERENCES
[1] Paul Boersma and David Weenink. Praat: doing pho-
netics by computer (Version 4.6.24) [Computer pro-
gram], 2007.
[2] Kay Elemetrics. Multi-Dimensional Voice Program
(MDVP) [Computer program], 2007.
[3] Kay Elemetrics. Disordered Voice Database (Version
1.03), 1994.
[4] T. F. Quatieri. Discrete Time Speech Signal Process-ing. Prentice Hall, 2002.
[5] Alain de Cheveigne and Hideki Kawahara. Yin, a
fundamental frequency estimator for speech and mu-
sic. Journal of the Acoustical Society of America,
111(4):1917–1930, 2002.
[6] Peter J. Murphy. Perturbation-free measurement of
the harmonics-to-noise ratio in voice signals using
pitch synchronous harmonic analysis. Journal ofthe Acoustical Society of America, 105(5):2866–2881,
1999.
4
10 MAVEBA 2007

Models and analysis of vocal emissions for biomedical applications: 5th international workshop: December 13-15, 2007: Firenze, Italy, ed. by C. Manfredi,ISBN 978 88-8453-673-3 (print) ISBN 978-88-8453-674-7 (online)© Firenze university press, 2007.
TOWARDS A TEMPORAL HIGH-RESOLUTION FORMANT
ANALYSIS
Wolfgang Wokurek
Institut fur Maschinelle Sprachverarbeitung, Universitat Stuttgart, Deutschland
Abstract: An attempt to analyse formantmovements within the cycle of vocal fold vi-bration by linear prediction is presented. Toachieve a high temporal resolution the dura-tion of the analysis window is adjusted shorterthan the fundamental period. The measure-ment noise increased thereby is counteractedby averaging the parameter estimates by clus-tering. Preprocessing by a linear band passfilter and by polynomial regression is dis-cussed. The function of the method is demon-strated by analysing a synthetic formant withknown resonance parameter contours. Thenthe method is applied to the first and sec-ond formant of the vowels [ ], [ ], and [ ]of a male speaker. The instantaneous formantand bandwidth contours and compared to theelectroglottographic recorded contours of vo-cal fold tissue contact. An interpretation interms of time varying acoustic coupling of thesubglottal cavity through the larynx is pro-posed.Keywords: subglottal coupling, linear predic-tion, electroglottography
I. Introduction
Parameterization and modeling of voice quality is thefield of research of this work. Two measurement tech-niques are the starting point for the actual develope-ment: electroglottography and the harmonic spec-trum of the sound.
The time domain contour of electroglottographyserves as a reference to the physiological kinematicof phonation. It shows the degree of tissue contact inthe larynx immediately. Unfortunately it gives onlylimited information of the acoustic excitation of thevocal tract.
Based on the observations of [2], spectral estimatesthat correlate with voice quality parameters like openquotient and glottal opening were developed. Thismethod uses analysis windows that include at least
two pitch periods in order to show the spectral peaksof the harmonic signal structure. This long term anal-ysis causes a certain noise immunity but the follow-ing three features are considered as disadvantages: (i)The amplitude of the fundamental oscillation is usedas a reference point. But this low frequency compo-nent is not essential for speech preception and is nottransferred to the listener over the telephone. (ii) Theamplitude transfer function of the vocal tract has tobe estimated and compensated for, which proofed tobe very complicated in practice. (iii) Rough voice andother voice quality phenomena that deviate funda-mentally from the periodic structure are theoreticallyand practically not well covered by the measurementson the harmonic spectrum.
Therefore a different analysis method is proposedthat measures at the formants in spectral regionswhere the speech signal is most prominent and mostrelevant for speech perception. It also uses the acous-tic recording and tries to observe the modulation ofthe formant parameters center frequency and band-width due to the movements of the vocal folds.
A further alternative technique to derive the acous-tic excitation of the vocal tract is inverse filtering. Inparticular the application of time variant inverse fil-ters seems promising but is clearly beyond the scopeof this study.
II. Method
During voiced phonation the opening and closing vo-cal folds imprint time variation on the acoustic pa-rameters of the vocal tract. In particular, changes tothe frequencies and bandwidths of the resonances, i.e.formants, were predicted [3, pp.299]. The time scaleof these temporal changes to the formant frequenciesand bandwidths is the duration of a single pitch cycleand shorter, i.e. typically 5-10 milliseconds.
The standard tool for formant analysis, linear pre-diction, usually is applied to segments of e.g. 25msthat containing more than a single pitch cycle. Withsuch a long analysis window changes that take place
1

within a pitch cycle are not resolved and only con-tribute on an average to the frequency and bandwidthestimates of the formants. Using a shorter analysiswindow together with pre- and postprocessing, regu-lar modulations of the frequency and the bandwidthof the first formant within each pitch cycle can bedisplayed. They seem to reflect physical events thatare visible in the electroglottogram (EGG) like glot-tal closure and opening. Furthermore, the parametermodulations seem to display the appropriate changeswhere the EGG does not show changes in tissue con-tact, e.g. in phases of incomplete closure [1].
A. Signal conditioning
A standard first-order difference filter is applied forpreemphasis of the formants over the low frequencycomponents of voiced excitation. The zero of the filteris located on the real axis at 0.99.
The speech components with higher frequenciesthan the intended first two formants are supressedby a lowpass filter with a cut-off frequency of 2.5kHz.
In [1] polynomial regression is used to reduce thesegment of the excitation waveform within the ac-tual analysis window before the correlation sequenceis computed. Alternatively a best matching constant,straight line or parabola is subtracted from the in-put signal. The polynomial degree is selected aftervisual inspection of the resulting formant parametercontour. For female speech and for other than modalvoice quality the formant parameter contours becomemore regular in some cases.
A high pass filter with a cut off frequency abovethe fundamental frequency of the voice and below thecenter frequency of first formant is used here. It has amuch more clear influence on the signal, seems to pro-duce more stable results and eliminates the selectionof the polynomial degree.
Combining the lowpass and the highpass filter char-acteristic results in a bandpass with a passband from275Hz to 2.5kHz. A 400 point FIR filter designedwith a kaiser window and a minimum stop band sup-pression of about 60dB is used.
B. Formant parameters
After preprocessing an estimate of the autocorrela-tion sequence is transformed to the linear predictionpolynomial by the Levinson-Durbin algorithm. Atypical analysis window duration of 200 points cor-responds to 4ms at the used sampling rate of 48kHz.The order of the linear prediction polynomial is se-lected to be 49 which corresponds roughly to a pole
per kilohertz of the total bandwidth of the digitizedsignal and one pole on the real axis.
The roots of this polynomial are extracted as theeigenvalues of the polynomials companion matrix.Angle and radius of each root is mapped to its fre-quency and bandwidth. These frequencies and band-widths are stored togehter with the center time of thecurrent analysis window. These raw parameter esti-mates scatter broadly around the time varying pa-rameters of the resonator. To reduce the noise inthese parameter estimates by averaging or clustering,a large number of analysis frames is used by movingthe analysis window only 10 points or 0.2ms.
C. Noise reduction
The raw parameter estimates are processed to thefrequency and bandwidth estimates of the first andsecond formant by averaging or clustering. First afrequency interval is selected. Currently this is doneafter visual inspection of either the scatter plot of theraw frequency estimates or a wide band spectrogram.
The following averaging method is used for the firstformant in [1]. Every 5 subsequent raw frequency esti-mates within the frequency interval are averaged andplotted as the formant estimate contour. The accom-paning raw bandwidth estimates are limited to a max-imum of 600Hz to limit outliers, averaged and plottedas the bandwidth estimate contour. Unfortunatelythe window duration of this smoothing technique de-pends on the density of the raw estimates and variesaround 1ms. Either there are short time intervalswithout any estimate in the considered frequency in-terval and the smoothing extended over these ’holes’.Or there are more than one poles at the same instantand the 5 point averaging ends before 1ms.
To proceed to a more automated averaging tech-nique, k-means clustering is used here. Now a widerfrequency interval is specified. For short isolated vow-els the broad interval of [300Hz,2200Hz] and 4 initialclusters resulted in good estimates of the first two for-mants. If front to back vowel movements are analysedit is better to specify the range for each formant sep-arately. In time direction an interval of 4ms durationis located at the beginning of the speech segment andmoved in 2ms steps through the signal. At every po-sition of the time frequency window the k-means clus-tering is started. To find the first and second formantthe clustering algorithm seeks for clusters, starting atthe resulting center frequencies of the last frame. Theinitial cluster centers are either the centers of the fre-quency intervals selected manually, or the resonancesof an one sided open tube at 500 + n ∗ 1000Hz are
12 MAVEBA 2007

used, following a simple model of an [ ] or [ ] sound.
D. Synthesized formant
To learn to what extent this analysis method is ableto display short term variations of formant parame-ters, a single formant with a prescribed formant andbandwidth contour is synthesized. The changing pa-rameters are implemented by a time varying recursivefilter of second order. The filter is excited by an im-pulse every time the contour of the center frequencyreaches its maximum. Frequency and bandwidth arechanged along a sinusoidal contour that starts witha period of 12ms and is accelerated to a period of8ms within 50ms. The center frequency of the ar-tificial formant is moved between 500Hz and 600Hz.The bandwidth is moved between 100Hz and 200Hzinversely phased with the center frequency. The pa-rameter contours are shown in the upper track of Fig.1 and Fig. 2.
E. Speech material
The vowels [ ], [ ], and [ ] of a male speaker withnormal pitch and with modal phonation are recordedwith a sampling rate of 48ksps and with 16 bits linearamplitude resolution. The acoustic signal is trans-duced with an AKG CK 62-ULS condenser micro-phone connected to an AKG C 460 B preamplifier.The EGG signal is measured with a laryngographmodel Lx Proc type PCLX from Laryngograph LTD.The recording room is anechoic with a reverberationtime of 27 milliseconds.
III. Results
A. Synthesized formant
The synthesized signal is band pass filtered with apassband between 275Hz and 825Hz. No preempha-sis is applied since no source spectrum needs to becorrected in this simplified, impulse shaped sourcesignal.
Fig. 1 shows the contour of the center frequencyof the synthesized time varying formant and the re-sult of the frequency estimation algorithm of Sec. II..Accordingly the filter bandwidth and its analysis isshown in Fig. 2.
The cluster centers within the frequency range of275Hz and 825Hz are taken as frequency estimates.The contour of the frequency estimate follows the con-tour of the artificial resonance. There is a positivebias of about 30Hz.
0.05 0.06 0.07 0.08 0.09 0.1500
550
600
F /
Hz
0.05 0.06 0.07 0.08 0.09 0.1500
550
600
650
TIME / ms
F_e
st /
Hz
Figure 1: Center frequency of an artificial formantand its estimate.
0.05 0.06 0.07 0.08 0.09 0.1100
150
200
B /
Hz
0.05 0.06 0.07 0.08 0.09 0.10
200
400
600
TIME / ms
B_e
st /
Hz
Figure 2: Inversely phased bandwidth contour and itsfalsely phased estimate.
Fig. 2 shows an estimated bandwidth contour thatis erroneously inversely phased to the filter bandwidth.The minima approach the original 100Hz but themaxima go up to 400Hz doubling the maximum filterbandwidth.
To further investigate the falsely phased bandwidthestimate the filter bandwidth contour is put in phasewith the frequency contour. The bandwidth estimateof this modified filter output has slightly modifiedamplitudes but does not change its phase. Rather itseems to resemble the frequency contour. This ob-servation is a drawback in the interpretation of thebandwidth contour that needs further to be investi-gated.
Theoretical models I 13

B. Vowels
The first two formants are considered. The preem-phasis filter is used and the band pass filter has apassband between 275Hz and 2.5kHz. The durationof the analysis window is 4 milliseconds.
Within the stable regions of each vowel 50ms are lo-cated in a scatter plot of the raw frequency estimates.The frequency intervals around each first and secondformant are identified in the same diagram. The re-sult of the clustering algorithm Sec. II.C is shown inFigs. 3 - 5.
0 10 20 30 40 50110012001300
F2
/ Hz
0 10 20 30 40 50650700750
F1
/ Hz
0 10 20 30 40 500
5001000
B1
/ Hz
0 10 20 30 40 50−5
05
x 104
TIME / ms
EG
G
Figure 3: Vowel [ ]
Due to the acoustic wave propagation all frequencyand bandwidth contours are delayed about 2ms withrespect to the electroglottographic contour. Everyformant parameter contour shown is modulated bythe vocal fold cycle to a certain extent. The closed vo-cal folds increase the first formant of all vowels shown.The second formant is increased after a short delayin [ ] and [ ] and decreased in [ ]. The bandwidthof the first formant of [ ] and [ ] is decreased by theclosed vocal folds and increased in [ ].
IV. Conclusion
Frequency and bandwidth of the first and the fre-quency of the second formant are analysed by linearprediction with a short window and show rapid move-ments that could be caused by the opening and clos-ing of the vocal folds. Clustering of the raw param-eter estimates is demonstrated to be an appropriatesmoothing technique. However, analysing the outputof a synthetic time varying filter showed no influenceof the filter bandwidth to the estimated bandwidth.
0 10 20 30 40 50210022002300
F2
/ Hz
0 10 20 30 40 50250300350
F1
/ Hz
0 10 20 30 40 50200400600
B1
/ Hz
0 10 20 30 40 50−2
02
x 104
TIME / ms
EG
G
Figure 4: Vowel [ ]
0 10 20 30 40 50500600700
F2
/ Hz
0 10 20 30 40 50300400500
F1
/ Hz
0 10 20 30 40 500
5001000
B1
/ Hz
0 10 20 30 40 50−5
05
x 104
TIME / ms
EG
G
Figure 5: Vowel [ ]
References
[1] M. Putzer and W. Wokurek. Correlates of tempo-ral high-resolution first formant analysis and glot-tal excitation. In XVI ICPhS, volume 3, pages2089–2092, Saarbrucken, August 2007.
[2] K. M. Stevens and H. M. Hanson. Classifica-tion of glottal vibration from acoustic measure-ments. In O. Fujimura and M. Hirano, editors,Vocal Fold Physiology, pages 147–170. CambridgeMA: Hiltop University Press, 1998.
[3] K. N. Stevens. Acoustic Phonetics. Current Stud-ies in Linguistics. The MIT Press, Cambridge,Massachusets, 1998.
14 MAVEBA 2007

Pathology detection/ classification I


Models and analysis of vocal emissions for biomedical applications: 5th international workshop: December 13-15, 2007: Firenze, Italy, ed. by C. Manfredi,ISBN 978 88-8453-673-3 (print) ISBN 978-88-8453-674-7 (online)© Firenze university press, 2007.
Abstract: Acoustic analysis of voice is potentially useful for objective assessment and characterization of voice disorders. However, before extracting acoustic measures of voice it is firstly pertinent to ask; what do we mean by voice? In describing voice, the perceptual impression formed by the listener or the physical characteristics of the production mechanism may be of primary interest. With this in mind specific correlations with perception and source production are worthy of attention. The voiced speech signal recorded using a microphone comprises a glottal source signal, which has been resonated and radiated. Hence this signal is only indirectly related to the underlying source production mechanism. Furthermore it is only indirectly related to the perception of voice quality because auditory processing is not considered. Indices commonly extracted from the acoustic speech waveform include the harmonics-to-noise ratio (HNR), jitter and shimmer. This presentation inquires into how these measures relate to physical and perceptual characterizations and into how progress on these issues may be advanced.
Keywords : Acoustic analysis, harmonics-to-noise ratio
I. INTRODUCTION
Acoustic analysis of voice signals potentially provides an attractive mechanism for rating voice quality and for assessing the state of the larynx non-invasively, or even remotely. A number of commercial acoustic analysis systems are presently available for use in voice clinics. Although these systems may be helpful, at least for documentation purposes (e.g. objective monitoring of pre-/post- op, over the course of therapy etc.), a number of problems persist that seem to have prevented acoustic analysis techniques making a much greater impact on voice assessment and rehabilitation.
Acoustic analysis of voice refers to signal processing of the microphone recorded voice signal. Early studies of spectrographic [1] and sonographic [2] displays revealed the presence of excessive noise and cycle length and cycle amplitude perturbations when comparing pathological voices to normal voices. In order to quantify these waveform variations indices termed harmonics-to-noise ratio (HNR), jitter and shimmer were introduced. (c.f. [3])
PHYSICAL AND PERCEPTUAL CORRELATES OF VOICE USING ACOUSTIC ANALYSIS
P. J. MurphyDepartment of Electronic and Computer Engineering, University of Limerick, Limerick, Ireland.
II. THEORY
The harmonics-to-noise ratio (HNR) is defined as the ratio of the periodic component to aperiodic component in voiced speech.
T
j
M
iavgi
T
javg
jsjs
jsM
1 1
2
1
2
10
)()(
)(
log10HNR(s) (1)
HNR(s) indicates the harmonics-to-noise ratio of the voiced speech waveform, s. M is the total number of fundamental periods, i is the ith fundamental period (of length T) and savg is the waveform averaged over M fundamental periods.
From the above definition it can be inferred that the ratio is sensitive to all forms of signal aperiodicity though it is often considered to reflect a measure of signal (or harmonic) energy to turbulent noise energy at the glottis.
Jitter is a measure of the temporal variation in glottal cycle length from cycle to cycle. Shimmer reflects the variation of peak amplitude in a glottal cycle from cycle to cycle. It is interesting to note that these indices are defined for the speech waveform although it is generally glottal source characteristics that are inferred. Some consequences of source/filter theory in inferring source changes as measured from the speech waveform have been highlighted recently [4].
As these indices are extracted from the voiced speech signal it is not immediately clear how the measures relate to the physical state of the vocal folds or to the perception of voice quality. Let us consider HNR as a specific example.
The harmonics-to-noise ratio (HNR(g)) of the glottal waveform is defined as

T
j
M
iavgii
T
javg
jgjnjg
jgM
1 1
2
1
2
10
)()()(
)(
log10HNR(g) (2)
T
j
M
ii
T
javg
jn
jgM
1 1
2
1
2
10
)(
)(
log10HNR(g) (3)
In comparing Eq.(1) and Eq,(3) it can be inferred that
HNR(s) HNR(g) (4)
Eq.(1) represents the harmonics-to-noise ratio of the voiced speech signal, while Eq.(3) represents the harmonics-to-noise ratio at the glottis. Although HNR(g) is of more interest (for physical correlations at least) it is HNR(s) that is measured in reality because it is the microphone recorded voiced speech signal (s) that is generally available.
Writing s, the voiced speech waveform in terms of g, the glottal waveform, n, glottal noise, v, the vocal tract and r, the radiation load, for the ith period allows for a more detailed comparison of Eq.(1) and Eq.(3)
si=(gi+ni)*vi*ri (5)
For convenience vi and ri can be represented as vri to incorporate the combined effect of vocal tract filtering and radiation at the lips. As the segment of interest is considered to result from a quasi-stationary process the filtering and radiation effects can simply be represented as vr (in reality small fluctuations in vr will lead to increased aperiodicity). Hence period i can be represented as
si=(gi+ni)*vr (6)
Hence the average voiced speech waveform can be written as
M
vrnvrg
M
vrngs
M
i
M
iii
M
iii
avg1 11 (7)
as ni is random noise the second term disappears to give
vrgM
vrgavg
M
ii
1avgs (8)
similarly the variance can be written as
(9) M
i
M
iiavgii vrnvrgvrng
1 1
22
Hence HNR(s) can be written as
M
ii
avg
vrn
vrgM
1
2
2
HNR(s) (10)
Comparing Eq.10 with Eq.3 it can be seen that vr is retained within the calculation of HNR(s). Hence HNR(s) does not tell us does directly about HNR(g). Viewing this problem from the frequency domain facilitates an alternative calculation that allows for the removal of vr from the resulting harmonics-to-noise measure.
Given that the periodic voiced speech waveform, s can be represented as
s=(g+n)*vr (11)
where g is a periodic glottal pulse and n is glottal noise, the corresponding frequency domain representation is:
Sk=(Gk+Nk) VkRk (12)
where Sk, Gk, Nk, V and R are the Fourier transforms of their corresponding time-domain functions and k is the frequency index. The corresponding HNR for voiced speech can be shown to be
2/
1
2
2/
1
2
,2/
HNR(S)M
kkkk
M
kkkkavg
RVN
RVGM
(13)
Taking an alternative summation allows VR to be removed from the calculation.
M/2
12
2,
M/2
12
2, 22
HNR(G)'k k
kavg
k kkk
kkkavg
N
G
MRVN
RVG
M
(14)
to provide a glottal source related HNR, HNR(G)’. In general this ratio is not equal to the HNR(g) (Eq.3) as rather than summing the signal energy and dividing by the summed noise energy, the harmonics-to-noise ratio at each frequency point k is estimated and an average of these ratios is determined. Gk is non-zero at harmonic locations and Nk is estimated at between-harmonic locations. HNR(G)’ as calculated above, is, to a first approximation, independent of the influence of the vocal tract.
18 MAVEBA 2007

Eq.14 employs the spectrum of voiced speech to extract an index related to the signal-to-noise of the glottal source. Alternative strategies are required in an attempt to extract measures related to the perception of voice quality. In a speech coding context frequency weighting has been employed to match aspects of the auditory processing mechanism [5]. A basic auditory perceptual harmonics-to-noise ratio (HNR(A)) is given as
B
bbw
B
bbN
bSbw
1
1 2
2
10log10
HNR(A) (15)
where |Sb|2 and |Nb|
2 represent the signal and noise energies, respectively, in frequency band b, and wb
represents the frequency weighting for band, b. The frequency bands are spaced in accordance with the critical bands of the ear [5]. Although such measures have been employed in quality assessment of speech coding and transmission systems, to date, they do not appear to have been employed specifically for voice quality assessment.
III. METHOD
A. Synthesis
The vowel a/ is synthesized using an implementation of a discrete time model for speech production with the Rosenberg glottal flow pulse [6] used as the source function. A sequence of these pulses are used as input into a delay line digital filter [7], where the filter coefficients are obtained based on area function data for the Russian vowel a/ as given by Fant [8]. Radiation at the lips is modeled by the first order difference equation R(z)=1-z
-1. Random noise is introduced to the glottal
pulse via a random noise generator arranged to give noise of a user specified variance (4%, 8% and 16% s.d.). Signals are created for these three levels of additive noise for frequencies beginning at 80 Hz and increasing in six, approximately equi-spaced steps of 60 Hz up to 350 Hz. A sampling frequency of 10 kHz is used throughout.
B. Analysis
The present method employs a spectral based HNR estimation technique similar to the one described in [9]. A Hamming window length of 2048, padded up to 4096 and hopped by 1024 points providing 8 individual spectral estimates for about 1.2 seconds of speech is used in the spectral estimation process. The harmonic energy estimates are obtained by summing the points within the mainlobe width (8 4096/2/2048), while noise estimates are calculated by summing the energy between harmonic mainlobes. The measures, HNR(S) – harmonics-to-noise
ratio of the voiced speech signal and glottal related HNR (HNR(G)’) are extracted from the speech spectra. An auditory perceptual HNR (HNR(A)) is not examined in the present study.
III. RESULTS
HNR(S) is plotted against fundamental frequency in Fig.1. It is observed that as f0 increases HNR(S) increases in a nonlinear fashion, for equal noise levels of the glottal source.
0
10
20
30
80 110 160 220 290 350f0 (Hz)
HN
R(S
) (d
B)
noise 4 noise 8 noise 16
Fig.1 The harmonics-to-noise ratio of the speech signal, HNR(s) versus fundamental frequency (f0) for three levels of glottal noise, 4%, 8% and 16%.
In contrast to Fig.1, HNR(G) does not change as f0 changes, i.e. 4%, 8% and 16% glottal noise gives rise to HNR(g)’s of 28 dB, 22 dB and 16 dB respectively, for all values of f0, as expected. However in practice G is typically not available for analysis. Fig.2 shows HNR(G)15 plotted for the frequency range from 1 to 5 kHz (i.e. the 0-1 kHz region is excluded from the calculation). The variation in HNR(G)15 is similar to the variation of HNR(S). Fig.3 shows the variation of the
Fig.2 The bandlimited (1-5 kHz) harmonics-to-noise ratio of the glottal signal, HNR(G)15 versus fundamental frequency (f0), for three levels of glottal noise, 4%, 8% and 16%.
Pathology detection/classification I 19
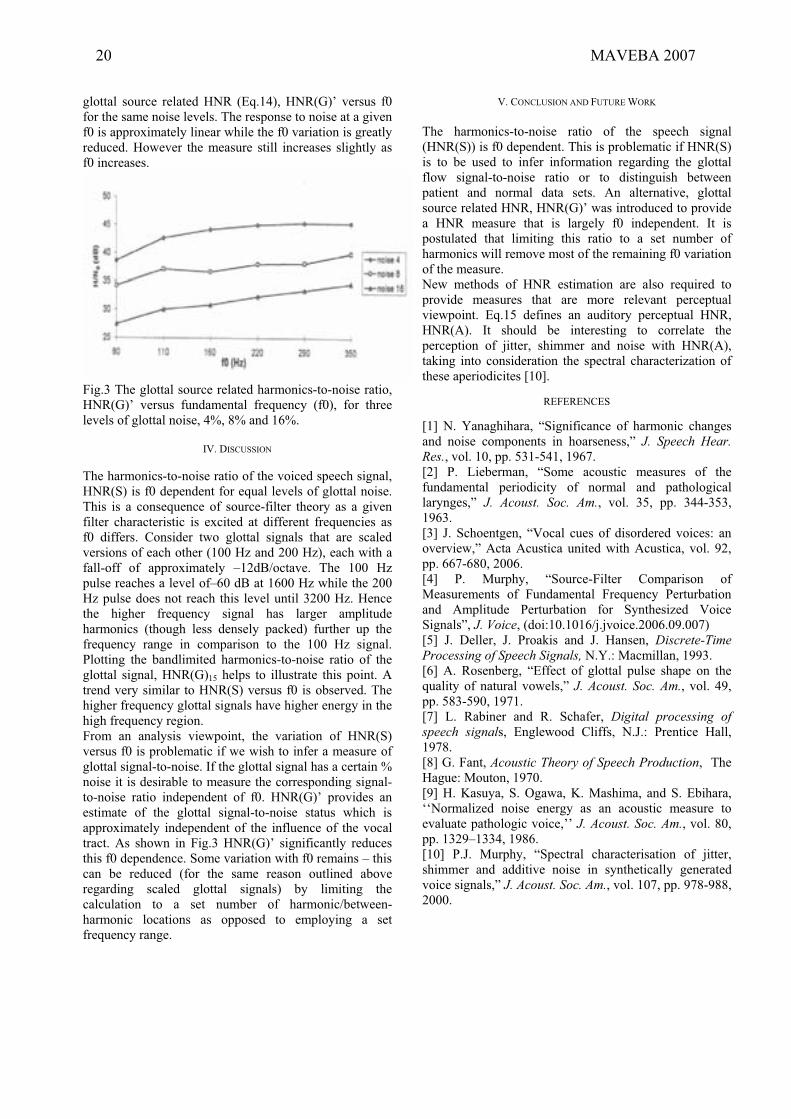
glottal source related HNR (Eq.14), HNR(G)’ versus f0 for the same noise levels. The response to noise at a given f0 is approximately linear while the f0 variation is greatly reduced. However the measure still increases slightly as f0 increases.
Fig.3 The glottal source related harmonics-to-noise ratio, HNR(G)’ versus fundamental frequency (f0), for three levels of glottal noise, 4%, 8% and 16%.
IV. DISCUSSION
The harmonics-to-noise ratio of the voiced speech signal, HNR(S) is f0 dependent for equal levels of glottal noise. This is a consequence of source-filter theory as a given filter characteristic is excited at different frequencies as f0 differs. Consider two glottal signals that are scaled versions of each other (100 Hz and 200 Hz), each with a fall-off of approximately –12dB/octave. The 100 Hz pulse reaches a level of–60 dB at 1600 Hz while the 200 Hz pulse does not reach this level until 3200 Hz. Hence the higher frequency signal has larger amplitude harmonics (though less densely packed) further up the frequency range in comparison to the 100 Hz signal. Plotting the bandlimited harmonics-to-noise ratio of the glottal signal, HNR(G)15 helps to illustrate this point. A trend very similar to HNR(S) versus f0 is observed. The higher frequency glottal signals have higher energy in the high frequency region. From an analysis viewpoint, the variation of HNR(S) versus f0 is problematic if we wish to infer a measure of glottal signal-to-noise. If the glottal signal has a certain % noise it is desirable to measure the corresponding signal-to-noise ratio independent of f0. HNR(G)’ provides an estimate of the glottal signal-to-noise status which is approximately independent of the influence of the vocal tract. As shown in Fig.3 HNR(G)’ significantly reduces this f0 dependence. Some variation with f0 remains – this can be reduced (for the same reason outlined above regarding scaled glottal signals) by limiting the calculation to a set number of harmonic/between-harmonic locations as opposed to employing a set frequency range.
V. CONCLUSION AND FUTURE WORK
The harmonics-to-noise ratio of the speech signal (HNR(S)) is f0 dependent. This is problematic if HNR(S) is to be used to infer information regarding the glottal flow signal-to-noise ratio or to distinguish between patient and normal data sets. An alternative, glottal source related HNR, HNR(G)’ was introduced to provide a HNR measure that is largely f0 independent. It is postulated that limiting this ratio to a set number of harmonics will remove most of the remaining f0 variation of the measure. New methods of HNR estimation are also required to provide measures that are more relevant perceptual viewpoint. Eq.15 defines an auditory perceptual HNR, HNR(A). It should be interesting to correlate the perception of jitter, shimmer and noise with HNR(A), taking into consideration the spectral characterization of these aperiodicites [10].
REFERENCES
[1] N. Yanaghihara, “Significance of harmonic changes and noise components in hoarseness,” J. Speech Hear. Res., vol. 10, pp. 531-541, 1967. [2] P. Lieberman, “Some acoustic measures of the fundamental periodicity of normal and pathological larynges,” J. Acoust. Soc. Am., vol. 35, pp. 344-353, 1963. [3] J. Schoentgen, “Vocal cues of disordered voices: an overview,” Acta Acustica united with Acustica, vol. 92, pp. 667-680, 2006. [4] P. Murphy, “Source-Filter Comparison of Measurements of Fundamental Frequency Perturbation and Amplitude Perturbation for Synthesized Voice Signals”, J. Voice, (doi:10.1016/j.jvoice.2006.09.007) [5] J. Deller, J. Proakis and J. Hansen, Discrete-Time Processing of Speech Signals, N.Y.: Macmillan, 1993. [6] A. Rosenberg, “Effect of glottal pulse shape on the quality of natural vowels,” J. Acoust. Soc. Am., vol. 49, pp. 583-590, 1971. [7] L. Rabiner and R. Schafer, Digital processing of speech signals, Englewood Cliffs, N.J.: Prentice Hall, 1978. [8] G. Fant, Acoustic Theory of Speech Production, The Hague: Mouton, 1970. [9] H. Kasuya, S. Ogawa, K. Mashima, and S. Ebihara, ‘‘Normalized noise energy as an acoustic measure to evaluate pathologic voice,’’ J. Acoust. Soc. Am., vol. 80, pp. 1329–1334, 1986. [10] P.J. Murphy, “Spectral characterisation of jitter, shimmer and additive noise in synthetically generated voice signals,” J. Acoust. Soc. Am., vol. 107, pp. 978-988, 2000.
20 MAVEBA 2007

Models and analysis of vocal emissions for biomedical applications: 5th international workshop: December 13-15, 2007: Firenze, Italy, ed. by C. Manfredi,ISBN 978 88-8453-673-3 (print) ISBN 978-88-8453-674-7 (online)© Firenze university press, 2007.
THE EFFECT OF VISIBLE SPEECH ON PERCEPTUAL RATING OF PATHOLOGICAL VOICES, AND ON CORRELATION
BETWEEN PERCEPTION AND ACOUSTICS.
P. H. Dejonckere, J.W.M.A.F. Martens, H. Versnel, M. Moerman The Institute of Phoniatrics, Department of Otorhinolaryngology, University Medical Centre Utrecht, NL.
COST action 2103 : Advanced Voice Function Assessment
Abstract : The inter-rater variability in perceptual voice evaluation still limits the widespread clinical use of the best available rating system. Support of visible speech in experimental conditions demonstrates a significant enhancement of the inter-rater agreement. However it does not influence the correlation between perceptual and conventional acoustic parameters. The addition of visible speech to the clinical setting is feasible since nowadays affordable computer programs provide the spectrogram in quasi real time. Keywords : Dysphonia, Perceptual evaluation, Visible Speech, Acoustic analysis.
I. INTRODUCTION
The GIRBAS scale introduced by Hirano [1] has become a commonly used scale for perceptually rating severity of deviance in voice quality . However judgments of different raters (even experienced) might differ considerably [2;3]. Acoustical analysis of pathological voice has several advantages as being quantitative and non-invasive, and cost and time efficient. As a disadvantage, most acoustical analysis relies on quasi-periodic waveforms and thus cannot be used on noisy and irregular voices. Further, because of the lack of one-to-one relations between acoustical and perceptual voice parameters, the perceptual assessment cannot be replaced by acoustical analysis. Sound spectrograms are another approach : the spectrogram enables visualization of speech (therefore sometimes being referred to as visible speech) and has been widely used in voice and speech research. It was also clinically applied to
evaluate voice [4]. The present study examined whether adding visible speech would enhance the interrater agreement of perceptual ratings of pathological voices. Since spectrograms reveal acoustical properties which are related to parameters as jitter and noise-to-harmonic ratio, it is conceivable that visible speech increases the correlations between acoustical and perceptual parameters. Therefore, also the effect of visible speech on these correlations was examined in this study.
II. MATERIALS AND METHODS
Pathological voices Seventy pathological voices of all kinds of etiologies were digitally recorded. The recorded voice tracks consisted of a prolonged /a/ with a duration of several seconds and a spoken sentence in Dutch.
Visible speech The visible speech consisted of two spectrograms (0 – 4000 Hz) of the sustained /a/ : One spectrogram is produced with a fine frequency resolution (bandwidth: 59 Hz) showing harmonics and the other with a fine time resolution (bandwidth: 300 Hz) showing glottal pulses.
Perceptual evaluation Six experienced raters independently evaluated the voice samples (prolonged /a/ and sentence, all on a CD) in two sessions with an interval of 4-10 months between the sessions. During the second evaluation session the accessory visible speech of the sustained /a/ was presented to the
experts simultaneously with the acoustic presentation of the voice samples (prolonged /a/ and sentence).
Acoustic evaluation A variety of acoustic parameters as was calculated using the multidimensional voice program (MDVP, Kay Elemetrics Corp.) on a relatively stationary part of the prolonged /a/.
AgreementAgreement between perceptual evaluations of two experts can be estimated using the parameter kappa ( introduced by Cohen. Cohen’s kappa corrects for agreement by chance. To assess the agreement among the six raters we computed kappa according to Fleiss [5] who extended Cohen’s kappa for more than two raters. To determine whether the agreements found in the conventional and visible-speech conditions significantly differ, the two kappa values were statistically tested. Acoustical versus perceptual parameters Since the perceptual parameters (G, I, R, B, A and S) are ordinal, the correlation between the acoustic and perceptual evaluations is calculated using the Spearman rank correlation coefficient.
III. RESULTS
Interrater agreement The ratings of the 70 voices were used to calculate for six raters. The agreement between ratings was significantly higher with than without visible speech for the perceptual parameters G, R and B (Fig. 1).
Acoustical and perceptual parameters We correlated the perceptual parameters G, I, R, B, A and S with various acoustical parameters for ratings with and without visible speech. No significant changes in correlation were found. Fig. 2 shows the effect for jitter and shimmer. We investigated the effect of different selection windows on the correlations between acoustical
and perceptual parameters. We compared the entire vowel including onset ramp and offset damp, the standard window, and a fixed-duration (1 s) window 250 ms to 1250 ms after onset. These different selection windows did not produce different results on the correlations between acoustical and perceptual parameters.
IV. DISCUSSION
Our study produced two pronounced results. First, the interrater agreement was clearly larger with than without visible speech (information as provided in spectrograms of the voice track) for rating grade, breathiness and roughness. Second, visible speech had no effect on the correlations of the GIRBAS ratings with acoustical parameters. The addition of visible speech to the clinical setting is feasible since affordable computer programs can provide it in quasi-real-time. Hence, the enhancement of the interrater agreement is an important finding. No systematic shifts have been found with the addition of visible speech: on the average, G increased whereas B decreased, and R did not shift. Considering the wide distribution of ratings, the ratings with visible speech seem to distinguish well between various voices. Our results confirm the notion that perceptual rating cannot be replaced by acoustical parameters at least as produced by MDVP paradigms. Perceptual and acoustic measures can be considered complementary. Hence, an optimal evaluation of voice quality is achieved according to a multidimensional protocol, including acoustic and perceptual measures [6;7].
V. CONCLUSION
Support of visible speech demonstrates a significant enhancement of the inter-rater agreement in perceptual voice evaluation. It does not influence the correlation between perceptual and conventional acoustic parameters.
22 MAVEBA 2007

Figure 1. Kappa for 6 raters for G, I, R, B, A and S without and with visible speech. White bars reflect kappa values without visible speech, black bars reflect kappa values with visible speech. Significant differences between kappa with and without visible speech are * : p < 0.05, ** : p < 0.001.
Figure 2. Correlations between perceptual parameters grade, roughness and breathiness with the acoustic parameters jitter and shimmer. White bars reflect correlation coefficients without visible speech, black bars reflect correlation coefficients with visible speech. Differences were not significant (p>0.05).
-0.2
0
0.2
0.4
0.6
0.8
G R B G R B
jitter shimmer
Rh
o(S
pe
arm
an
)
without visible speech
with visible speech
Pathology detection/classification I 23

REFERENCES
[1] Hirano M. Clinical examination of voice. New York: Springer Verlag; 1981.
[2] Kreiman J, Gerratt BR, Precoda K. Listener experience and perception of voice quality.J.Speech Hear.Res. 1990; 33:103-115.
[3] Kreiman J, Gerratt BR. Sources of listener disagreement in voice quality assessment.J.Acoust.Soc.Am. 2000; 108:1867-1876.
[4] Rontal E, Rontal M, Rolnick MI. Objective evaluation of vocal pathology using voice spectrography. Ann.Otol.Rhinol.Laryngol. 1975; 84:662-671.
[5] Fleiss JL.Measuring nominal scale agreement among many raters. Psychological bulletin1971; 76:378-382.
[6] Bhuta T, Patrick L, Garnett JD. Perceptual evaluation of voice quality and its correlation with acoustic measurements. J.Voice 2004; 18:299-304.
[7] Dejonckere PH, Bradley P, Clemente P et al. A basic protocol for functional assessment of voice pathology, especially for investigating the efficacy of (phonosurgical) treatments and evaluating new assessment techniques. Guideline elaborated by the Committee on Phoniatrics of the European Laryngological Society (ELS). Eur.Arch.Otorhinolaryngol. 2001; 258:77-82.
24 MAVEBA 2007

Models and analysis of vocal emissions for biomedical applications: 5th international workshop: December 13-15, 2007: Firenze, Italy, ed. by C. Manfredi,ISBN 978 88-8453-673-3 (print) ISBN 978-88-8453-674-7 (online)© Firenze university press, 2007.
Abstract: Most of the vocal and voice diseases cause changes in the acoustic voice signal. Acoustic analysis is a useful tool to diagnose this kind of diseases, furthermore it presents several advantages: it is a non-invasive tool, an objective diagnostic and, also, it can be used for the evaluation of surgical and pharmacological treatments and rehabilitation processes. Most of the approaches found in the literature address the automatic detection of voice impairments from speech by using the sustained phonation of vowels. In this paper it is proposed a new scheme for the detection of voice impairments from text dependent running speech. The proposed methodology is based on the segmentation of speech into voiced and non voiced frames, parameterising each frame with mel frequency cepstral parameters. The classification is carried out using a discriminative approach based on a Multilayer Perceptron Network. The data used to train the system were taken from the voice disorders database distributed by Kay Elemetrics. The material used for training and testing contains the running speech corresponding to the well known “rainbow passage” of 226 patients (53 normal and 173 pathological). The results obtained are compared with those using sustained vowels. The text-dependent running speech showed a light improvement in the accuracy of the detection.
Keywords: running speech, pathological voices, mel cepstral parameters, multilayer perceptron
I. INTRODUCTION
Current panorama of acoustic analysis allows us to calculate a great amount of measurements of long term acoustic parameters. Such parameters (fo, jitter, shimmer, Harmonics to Noise Ratio (HNR), Normalized Noise Energy (NNE), Voice Turbulence Index (VTI), Glottal to Noise Excitation Ratio (GNE), Signal to Noise Ratio (SNR), Frequency Amplitude Tremor (FATR), etc. [1]) were developed to measure quality and “degree of normality” of voice registers from the sustained phonation of vowels. However, some of these parameters
are based on an accurate estimation of the fundamental frequency, a rather complicate task in the presence of certain pathologies On the other hand, there are other works in the literature using short time features for the detection of voice impairments from the sustained phonation of vowels. Some of them address the automatic detection of voice impairments from the excitation waveform collected with a laryngograph [2] or extracted from the acoustic data by inverse filtering [3]. However, due to the fact that inverse filtering is based on the assumption of a linear model, such methods do not behave well when pathology is present due to non-linearities introduced by pathology in itself. Other authors have proposed also nonlinear signal processing for the same task [4]. On the other hand, there are authors that obtained good results addressing the detection of voice impairments from running speech using different techniques [5;6].
In this paper we are presenting an alternative approach for the detection of voice disorders using text dependent running speech comparing the results with those obtained using sustained vowels. It is well known that, regarding the evaluation of the voice quality and the presence of pathologies, the running speech contains much more information than the sustained phonation of vowels. This is why the widely used perceptual GRBAS scale (Grade of dysphonia, Roughness, Breathiness, Asthenicity, and Strainess) [15] is usually evaluated by the specialists using running speech.
The preliminary results obtained in this work showed a light improvement in the accuracy of the detection using text dependent running speech rather than the sustained phonation of vowels.
The paper is organized as follows: Section II gives an overview of the methodology used in this study. Section 3 contains the results obtained. And finally, Section 4 presents a short discussion and the conclusions.
II. METHODOS
The acoustic samples used for this work are registers from patients with normal voices and a wide variety of organic, neurological, and traumatic voice disorders. These pathologies reveal themselves either as a
AUTOMATIC DETECTION OF VOICE IMPAIRMENTS FROM TEXT-DEPENDENT RUNNING SPEECH USING
A DISCRIMINATIVE APROACH
1 Godino-Llorente, J.I.; 1 Fraile, Rubén; 1 Sáenz-Lechón, N.; 1 Osma-Ruiz, V.; 2 Gómez-Vilda, P; 1 Department of Circuits and Systems Engineering, Universidad Politécnica de Madrid, Spain.
1 Department of Architecture and Technology of Informatics, Universidad Politécnica de Madrid, Spain e-mail: [email protected]

modification of the excitation organ morphology (i.e. the vocal folds) or in a variation of the normal vibration pattern of the vocal folds, which may result in the increment of mass or rigidity of certain organs, thus resulting in a different pattern of vibration altering the periodicity (bimodal vibration), reducing higher modes of vibration (mucosal wave), and introducing more turbulent components in the voice record. Within this group the following pathologies can be enumerated among others: polyps, nodules, paralysis, cysts, sulcus, edemas, carcinomas, etc.
The speech samples used in this work were collected by the Massachusetts Eye and Ear Infirmary (MEEI) Voice and Speech Labs [11] in a controlled environment using a condenser microphone placed at 30 cm from the mouth. The registers stored in this database were recorded with different sampling frequencies (from 50 to 10 kHz) and 16 bits of resolution. This database contains the sustained phonation of the vowel /ah/ and recordings of the “rainbow passage”. This text-dependent passage has been widely used in speech therapy to evaluate the quality of the speech from the perceptual point of view. Previous to the study, the files stored in the database were low pass filtered and their sampling rate was adjusted to be 25 and 10 kHz respectively for the sustained vowels and the text-dependent recordings. A subset of 171 pathological and 53 normal speakers has been taken according to those enumerated by Parsa et al. in [5].
Voice registers were framed using 50% overlapped and 40 ms long Hanning windows. Every frame is pre-processed in order to avoid unvoiced segments and parameterized to reduce the dimensionality and complexity of the detector (Fig. 1)
The parameterization is carried out using a non-parametric approach capable of modeling the effects of pathologies on both the excitation (vocal folds) and the system (vocal tract). The parametric approach used is that known as FFT based Mel-frequency Cepstral Coefficients (MFCC) [8]. Such method is based on the human perception system establishing a logarithmic relationship between the real frequency (Hz) and perceptual frequency (mels). It performs the cosine transform over the logarithm of the energy, calculated from frequency bands that are bandwidth dependent on the central frequency of each filter. An improved representation can be obtained extending the analysis to include in-formation about the speed and time evolution of those parameters calculated. First ( ) and second ( ) derivatives [9] were included joining the feature vector, allowing to time-delocalize the analysis. The calculation of and was carried out by means of anti-symmetric moving-average Finite Impulse Response (FIR) filters to avoid phase distortion of the temporal sequence (length 9 for , and 3 for ).
The segmentation of voiced and unvoiced frames was carried out with a voiced-unvoiced detector based on the techniques reported in [10].
Fig. 1 shows the scheme used for the feature extraction and classification. The modeling is addressed by means of a Multilayer Perceptron (MLP) neural network using the non-parametric short-term MFCCs. Every vector of parameters is used to feed a three layered MLP [7] with 100 hidden neurons and two output nodes characterized by a logistic activation function. The input layer has as many inputs as MFCC parameters. Learning is carried out by backpropagation algorithm with momentum. It is well known that the output of each output node of such structure in a two-class problem may be interpreted as the likelihood that the input pattern belongs to each class. So, each speaker is characterized with the same number of vectors as voiced frames extracted from each record. For each frame, both the likelihood to be normal and the likelihood to be pathological are calculated as a result of the score assigned to each output node. An index, (called likelihood ratio or log-likelihood ratio) is obtained subtracting the log-likelihood (likelihood in the logarithmic domain) to be normal, from the log-likelihood to be pathological. The decision about normality or abnormality is taken establishing a threshold over the normalized likelihood ratio.
The scores given by detectors for normal and pathological voices were used to plot the true and false score curves. Decisions about presence or absence of pathology are taken establishing a decision boundary that ensures the minimum classification error. Fig. 2 shows the problem of finding an optimum decision threshold that corresponds to the point where the distributions of both classes is equal is called Equal Error Rate (EER), and usually it is considered as an optimum point for the decision. However, the EER point might not be the best threshold due to the scatter of the density functions; in such a case, a new decision threshold is needed. Under these conditions, the threshold that corresponds to the minimum average error rate is called Minimum Cost Point (MCP). According to the Bayes decision theory, this point might be calculated by taking into account the difference in the risk of the two possible errors (false acceptance or false positive and false rejection or false negative).
Fig. 1: Scheme used for the feature extraction and classification
For the evaluation of the accuracy of the system, we have adopted a cross-validation scheme, namely the bootstrap method to assess the generalization of the
SignalHanningwindows
MFCCs Derivatives
Unvoiced speechdetector / removal
MLP
Parameterization
Decision
26 MAVEBA 2007

model. Each experiment is repeated N times, with a different test set, randomly chosen from the whole set of files. The final results are averaged across these repetitions, and confidence intervals are computed using the standard deviation of the measures. We repeated the experiment 11 times, combining the files detailed in the training and test sets randomly. The accuracy of the system was calculated by cross validation of the results. For each run, the available data files were divided into two subsets: 70% to train the system, 30% to validate results. The number of voice samples from the database was 234 (53 normal and 171 pathological voices) according to the criteria found in [12].
The final results are presented through confusion matrices, where we define the next measures: true positive rate (tp), also called sensitivity, is the ratio between pathological files correctly classified and the total number of pathological voices; false negative rate (fn), that is the ratio between pathological files wrongly classified and the total number of pathological files; true negative rate (tn), sometimes called specificity, is the ratio between normal files correctly classified and the total number of normal files; false positive rate (fp), that is the ratio between normal files wrongly classified and the total number of normal files. The final accuracy of the system is the ratio between all the hits obtained by the system and the total number of files.
Fig. 2. Probability distribution functions for both classes. The dashed lines correspond to the Minimum Cost Point and the Equal Error Rate.
Throughout this work, the measurements enumerated were calculated using the EER threshold. The scores are compared to the EER threshold value in order to compute the confusion matrix. If we move this threshold we obtain a set of possible operating points for the system, which can be represented through a Detector Error Tradeoff (DET) plot [13], widely used in speaker verification. In this plot, the false positives are plotted against the false negatives, for different threshold values. In the DET curve we plot error rates on both axes, giving uniform treatment to both types of error, and using a scale for both axes which spreads out the plot and better distinguishes different well performing systems and usually produces plots that are close to linear. Another choice is to represent the false positives in terms of the true positives
in a Receiver Operating Characteristic (ROC) [14]. ROC displays the diagnostic accuracy expressed in terms of sensitivity against (1-specificity) at all possible threshold values in a convenient way. The ROC used to be characterized and complemented using its Area Under the Curve (AUC) [14].
III. RESULTS
We repeated the experiment 11 times, combining the files in the training and test sets randomly. Table 1 shows the mean and standard deviation values of the confusion matrix. The total accuracy of the system is 95.9%±2.8.
Fig. 3 shows the DET and ROC plots that summarize obtained results. The DET plot in Fig. 3b shows the overall performance of the detector. Moreover, the ROC plot in Fig. 3a along with the AUC shows an idea of the overall performance of the detector. The DET and ROC were drawn averaging the scores obtained with the 11 test sets.
0 0.2 0.4 0.6 0.8 10
0.1
0.2
0.3
0.4
0.5
0.6
0.7
0.8
0.9
1
False positive rate
Tru
e po
sitiv
e ra
te
ROC curve. AUC = 0.997
a)
0.1 0.2 0.5 1 2 5 10 20 40
0.1
0.2
0.5
1
2
5
10
20
40
False Alarm probability (in %)
Mis
s p
roba
bilit
y (in
%)
Sustained vowels
Running speech
DET plot showing the optimum detection cost point
b) Fig. 3: Performance curves of the detector. a) ROC
plot using text-dependent running speech; b) DET plot for the text-dependent running speech and for the sustained vowels corpus
It can be noticed that using the same parameterization and classification approaches the performance with text-
Pathology detection/classification I 27

dependent running speech lightly improved the results with respect to those obtained with sustained vowels.
Table 1: Results of the classification (in %) (mean ± standard deviation) using text-dependent running speech.
Actual diagnosis
Pathological Normal
Pathological tp=97.1±3.4 fp=10±8.9 Detector’s decision Normal fn=2.9±3.4 tn=90±8.9
IV. DISCUSSION AND CONCLUSIONS
This work has presented a methodology to automatically detect voice pathologies based on a MLP detector and short term MFCC features using text dependent running speech and comparing the results with those obtained with the sustained phonation of the /ah/ vowel. It is well known that, regarding the quality of voice and the presence of pathologies, the running speech contains much more information than the sustained phonation of vowels. So, as expected, the results showed and improvement of the accuracy of the detection using text-dependent running speech. These results match very well with the fact that the perceptual evaluation usually made by otolaryngologists or speech therapists use to be based on running speech rather than on sustained vowels.
On the other hand, the MFCC parameters had been previously used for laryngeal pathology detection with sustained vowels, and they had demonstrated a good performance, surpassing other short time features like linear prediction based measurements. However, they had never been used with running speech. This preliminary work demonstrated that short-term MFCC revealed to be a good parameterization approach also for the detection of voice impairments using text-dependent running speech. So the proposed detection scheme may be used for laryngeal pathology detection with efficiency around 96%.
The current study opens up the way to extend this methods for classification tasks between different disorders, perceptual vocal qualities (e.g.: hoarseness, breathiness, etc), or the categorization of the speech registers into different degrees of impairment, such as the GRBAS scale.
VI. ACKNOWLEDGMENTS
This research was carried out under grant TEC2006-12887-C02 from the Ministry of Science and Technology of Spain.
REFERENCES
[1] Baken, R. J. and Orlikoff, R., Clinical measurement of speech and voice, 2 ed., Singular Publishing Group, 2000. [2] Ritchings, R. T., McGillion, M. A., and Moore, C. J., "Pathological voice quality assessment using artificial
neural networks," Medical Engineering & Physics, vol. 24, no. 8, pp. 561-564, 2002. [3] Childers, D. G. and Sung-Bae, K., "Detection of laryngeal function using speech and electroglottographic data," IEEE Transactions on Biomedical Engineering, vol. 39, no. 1, pp. 19-25, 1992. [4] Hansen, J. H. L., Gavidia-Ceballos, L., and Kaiser, J. F., "A nonlinear operator-based speech feature analysis method with application to vocal fold pathology assessment," IEEE Transactions on Biomedical Engineering, vol. 45, no. 3, pp. 300-313, 1998. [5] Parsa, V. and Jamieson, D. G., "Acoustic discrimination of pathological voice: sustained vowels versus continuous speech," Journal of Speech, Language and Hearing Research, vol. 44, no. 2, pp. 327-339, 2001. [6] Umapathy, K., Krishnan, S., Parsa, V., and Jamieson, D. G., "Discrimination of pathological voices using a time-frequency approach," IEEE Transactions on Biomedical Engineering, vol. 52, no. 3, pp. 421-430, 2005. [7] Bishop, C. M., Neural networks for pattern recognition, 2 ed., Oxford University Press, 1995. [8] Davis, S. B. and Mermelstein, P., "Comparison of parametric representations for monosyllabic word recognition in continuously spoken sentences," IEEE Transactions on Acoustics, Speech and Signal Processing, vol. 28, no. 4, pp. 357-366, 1980. [9] Rabiner, L. R. and Juang, B. H., Fundamentals of speech recognition, Englewood Cliffs, NJ: Prentice Hall, 1993. [10] Childers, D. G., Speech processing and synthesis toolboxes, New York: John Wiley & Sons, 2000. [11] Massachusetts Eye and Ear Infirmary, Voice Disorders Database, Version.1.03 [CD-ROM], Lincoln Park, NJ: Kay Elemetrics Corp, 1994. [12] Parsa, V. and Jamieson, D. G., "Identification of pathological voices using glottal noise measures," Journal of Speech, Language and Hearing Research, vol. 43, no. 2, pp. 469-485, 2000. [13] Martin A, Doddington GR, Kamm T, Ordowski M, Przybocki M. The DET curve in assessment of detection task performance. IV, 1895-1898. 1997. Rhodes, Crete. Proceedings of Eurospeech '97. [14] Hanley, J. A. and McNeil, B. J., "The meaning and use of the area under a receiver operating characteristic (ROC) curve", Radiology, vol. 143, no. 1, pp. 29-36, 1982. [15] Hirano, M., Psycho-acoustic evaluation of voice, New York: Springer-Verlag, 1981.
28 MAVEBA 2007

Models and analysis of vocal emissions for biomedical applications: 5th international workshop: December 13-15, 2007: Firenze, Italy, ed. by C. Manfredi,ISBN 978 88-8453-673-3 (print) ISBN 978-88-8453-674-7 (online)© Firenze university press, 2007.
Abstract: Voice is the result of the coordination of the whole pneumophonoarticulatory apparatus. The analysis of the voice allows the identification of the diseases of the vocal apparatus and currently is carried out from an expert doctor through methods based on the auditory analysis. The paper presents a web-based system for the acquisition and automatic analysis of vocal signals. Vocal signals are submitted by the users through a simple web-interface and are analyzed in real-time by using state-of-the art signal processing techniques, providing first-level information on possible voice alterations. The system offers different analysis functions to the doctors that may analyze suspected cases in detail. The system is currently being tested in the otorhinolaryngologist setting to carry out mass prevention via screening at a regional scale.Keywords : Voice Analysis, Otorhinolaryngology
I. INTRODUCTION
Voice is the result of a complex mechanism involving different organs of the pneumophonoarticulatory apparatus. In particular, it is the result of the vibration of the upper part of the mucosa covering the vocal cords. Such vibration determines the production of a sound, the larynx-fundamental tone, that is enriched by a set of harmonicas, generated by the resonance cavities in the upper part of the larynx. Any modification of this system may cause a qualitative and/or quantitative alteration of the voice, defined as dysphonia. Dysphonia can be due to both organic factors (organic dysphonia) and other factors (dysfunctional dysphonia).
Dysphonia is one of the major symptoms of benign laryngeal diseases, such as polyps or nodules, but it is often the first symptom of neoplastic diseases such as laryngeal cancer as well. Spectral "noise" is strictly linked to air flow turbulences in the vocal tract, mainly due to irregular vocal folds vibration and/or closure, causing dysphonia. Such symptom requires a set of endoscopic analysis (by using videolaryngoscope, VLS) for accurate analysis.
However, clinical experience has pointed out that dysphonia is often underestimated by patients, and sometimes even by family doctors. As widely reported in literature [1, 2], an early detected glottis tumour (T1, T2 stadium) can be solved in 100 % of cases with surgical intervention. Thus, the screening of voice alteration is extremely important in larynx diseases.
EARLY DETECTION OF VOICE DISEASES VIA A WEB-BASED SYSTEM
F. Amato1, M. Cannataro1, C. Cosentino1, A. Garozzo2, N. Lombardo2, C. Manfredi3, F. Montefusco1, G. Tradigo1, P. Veltri1
1School of Biomedical Engineering, Università degli Studi Magna Graecia di Catanzaro, Catanzaro, Italy 2School of Otorhinolaryngology, Università degli Studi Magna Graecia di Catanzaro, Catanzaro, Italy 3Department of Electronics and Telecommunications, Università degli Studi di Firenze, Firenze, Italy
Several experiences of using algorithmic approaches for the automatic analysis of signals exist. Software tools (commercial and freely available) allow manipulating voice components in an efficient way (e.g. WinPitch1,VOICEBOX2) and permits specialists to manipulate and analyze voice signals. Many automatic systems are based on voice signal processing whereas others combine signal processing with machine learning and data mining algorithms. The problem is that most of them are usable only locally and none of them offers remote collection and analysis as well as storing in central data bases for further use. The system described in [3] is one of the few remote data analysis systems. The problem is that voice is loaded by using telephone standard, which is known having low signal quality that decreases quality of classification.
However, in our knowledge, no systems of remote screening is available, that allows setting up a data base of voice signals, at the same time giving disabled patients a simple test for voice screening, without the need of moving to the laboratory.
The paper presents the architecture and the first implementation of REVA (Remote Voice Analysis), a web based system for the acquisition and automatic analysis of vocal signals. The system consists of a client module where a user, after registration is driven into a test phase where voice signal is registered, after a verification of the minimum hardware requirements. The voice signal, cleaned from noises, is sent through the Internet to the remote server which is in charge of analyzing it; the server will return to the client the signal analysis results and the possible voice anomalies will be related to potential diseases. After testing in the University of Catanzaro Hospital, the system will be
1 http://www.winpitch.com/ 2 http://www.ee.ic.ac.uk/hp/staff/dmb/voicebox/voicebox.html

finalized for diagnostics in the otorhinolaryngologist setting, in particular to carry out mass prevention via screening at a regional/national scale.
The rest of the paper is organized as follows. Section 2 describes the system architecture. Section 3 presents the first prototype implementation. Section 4 points out the benefits and the Section 5 concludes the paper and sketches future work.
II. SYSTEM ARCHITECTURE
The REVA system employs a client/server architecture deployed as a web based application.
Fig. 1 REVA Architeture
The main modules of the system are shown in Fig. 1:1. The Presentation Module represents the web
interface between the system and the user. It is used to allow interaction with both the final users and the doctors. It contains the system description and the disease description. Its main tasks consist of giving the instructions for the system use and returning the analysis result to the user. Moreover, a specialized interface for the doctors is also provided.
2. The Data Acquisition Module is in charge of managing user personal data. After data is collected, the user is guided to the voice recording phase.
3. The Vocal Data Registration Module acquires the vocal samples and, after checking whether they are suitable for the analysis, sends the audio files to the server.
4. The Vocal Data Analysis Module, after the audio file has been received, extracts key signal parameters and performs the analysis for classification. It returns the result to the Administrator module.
5. The Data Administrator Module saves the data in the database and generates the response for the Presentation Module. The response is also sent by e-mail.
6. The Database Module contains data acquired through client interface. Voice signals are stored both in the raw data format as well as in a
preprocessed format, where the main parameters related to the signal are stored.
III. PROTOTYPE
The REVA system has been implemented by using the Java technology. In particular the client is implemented through a Java Applet, while the server functions have been implemented by using the Java Server Pages. The database is implemented by using the open source relational MySQL DBMS.
In the following a brief description of the system functionalities is provided, both from the client and server sides.
A. Client module
The minimal system requirements for the remote user consist of a PC with Internet connection, web browser, audio card and microphone. The user visits the web site where the remote diagnostic service is available. The main page of the site provides a detailed description about the service offered, the scopes and effectiveness of the service itself.
To make a test, the user accesses the registration page entering his/her data and other information useful for the diagnosis. When the registration phase is completed, the user enters the testing phase, accesses a new page (see Fig. 2), which drives him/her through the acquisition of vocal samples.
Fig. 2 Patient view: voice recording.
The file containing the audio registration is analysed on the client, for a preprocessing phase (for instance, to exclude empty, inconsistent or too long files or to reduce noise). If the registration is validated, the audio file is sent to the server through the Internet. The result of the signal analysis is transmitted to the user both via a new webpage and via e-mail.
Note that patient's personal (name, surname, etc.) and clinical data are collected into an XML document that is sent to the server together with the audio file. Metadata are stored with audio files into the database such that for those patients periodically accessing to the service, the medical specialist and the system are able to monitor and analyze the voice signals.
30 MAVEBA 2007

B. Server module
s a listener process waiting for the connections of the remote users. It receives from the cl
e audio sample va
the stored voice sa
had a surgery intervention);
ysis techniques
samples requires a su able elaboration, to extrapolate from the audio re
logies) as well as irregularities in vo
ularities and pa
respectively the Average Magnitude D
obtained by filtering the signal with a proper Continuous Wavelet Transform (CWT) and
ex
The server host
ient both an XML file, containing the metadata of users asking for service, and the related audio files (in WAVE format), obtained from registration. Vocal files and metadata are archived into the database.
The server executes a preliminary elaboration of the signal (preprocessing) to extract from th
rious information useful for classification. At this point the classification procedure of the vocal signal is run by using the parameters defined in a preliminary phase with the doctors and based on their experiences and using a statistical study of available samples (see the next subsection). For a returning user a comparison with the previously registered samples is foreseen, to evaluate the temporal evolution of the user voice.
On the server side a different web interface allows doctors and specialists to analyze
mples. Data coming from user submissions are automatically stored into the database where a simple Electronic Patient Record (EPR) stores voice samples, signal parameters, metadata and information about patients. Using such interface the doctor can:
visualize the last entered voice samples requiring attention;
load, listen and compare voice signals (e.g. for patients that
analyze them with the implemented voice analysis module (see Fig. 3).
C. Vocal signals anal
The classification of the vocal itgistration a set of significant parameters. For such a
purpose, computations are usually performed mapping signal data into the frequency domain [4].
The main parameters of clinical interest, considered for the evaluation, are:
Fundamental frequency tracking (linked to laryngeal and vocal folds patho
cal folds oscillation (jitter and shimmer). Measures of dysphony (voice quality indexes, based
on "noise" estimation, as caused by irregthologies producing turbulences in the air flow from
the glottis). The pitch estimation is performed via two approaches
which use ifference Function (AMDF) and Simple Inverse Filter
Tracking (SIFT) [5, 6]. In the first approach the estimate of the fundamental
frequency value (f0) is
tracting its time periodicity by means of the AMDF method [7].
Fig. 3 Doctor view: spectral analysis of voice samples.
Given a signal frame of length M: Mkkx ,,0, ,
the AMDF is defined as:
,1
1
1,,0 MM
ixixM
AMDFi
The scale factor 1M eliminates the decreasing
trend of the AMDF method, due to the truncated sum noi DF minze to reco
. Forsy signals, the AM imum is usually greater than
ro. Hence, in order ver f0, one has to select the value that gives the minimum of the AMDF function (
0fFs , where Fs is the sampling frequency [7]).
The method is appealing, due to the low computational burden, but it is more sensitive to the noise than other a . pproaches
ugh an Auto Regressive (AR) model. The fo
In the second approach, which relies on Linear Prediction (LP) analysis of data, the vocal tract is described thro
llowing procedure is implemented on each data frame of length
inf1 FM , where Finf is the lowest value in the
frequency range of interest for f0:- estimation of the correct order p of the model
A ans of Singular Value Decomposition (SVD) approach;
R by me
rward – backward algorithm
-
- – pass filtering of the residual sequence in
elation sequence (AS)
The cprocedur e most r
A me cesp
signal
- computation of the AR parameters, which enable to determine the varying vocal tract inverse filter IF, through the fo[8]; estimation of the residual sequence by applying the signal to the filter IF; bandthe range 50 – 1.5 KHz and evaluation of the maximum of the autocorrof the residuals in the frequency range of 60 – 250 Hz ( /0 sFf , where is the index
corresponding to the maximum of the AS). omputational complexity is rather high, but this e is one of th obust and accurate. asure of the dysphonic component of the voi
ectrum related to the total signal energy is evaluated by using the NNE index [9]. Given the speech
nwnsnx , where s(n) is the periodic component
Pathology detection/classification I 31

an
is defined as
d w(n) is the additive noise component, let X(k), S(k)and W(k) be the discrete fourier transform (DFT) of x(n), s(n) and w(n), respectively. The adaptive NNE (ANNE)
HH
H
L NNkkW
kANNE LN
N
Nmm
,,,
~
log102
2
L
kXNm
m
where NTNfNTNfN HHLL ,, number of
DFT points, L number of frames in the analysis interval, and fH respectively the lowest and the highest freq es of the frequency band of
fL and uenci
interest.2~ kWm
oise energy is an estimate of the unknown n
2kWm , 2kX mis the signal energy and T is the sampling
period. At lower ANNE values, the noise energy is larger on that signal frame. The signal is more noisy for ANNE
vo nals analysis was implemented using the software Matlab.
IV. DISCUSSION
values close to zero. The ice sig
stem for the acquisition and automatic alysis of vocal sig t to remark that the
oal of the proposed nt is neither to replace the o
chological block in pr
cessed on the Internet, even the less wealthy patients may use it, also when the suspect of a pathology is very light.
leda
h simple web-interface and are analyzed in real-time by
using state-of-the essing techniques, roviding first-level information on possible voice
al
r's Guide to Digital Signal ProPublishing, 1997.
s,” IEEE Trans.
[4]mination of pathological voices
[5]
[6] into
[7] roakis, and J. H. L. Hansen,
[8]
coust. Soc. Amer.,vol. 80, no. 5, pp. 1329–1334, 1986.
The main goal of the proposed system is the realization f a web based syo
an nals. It is importan instrumeg
d ctor specialist, nor to provide a diagnosis; rather it is aimed to give a response about the potential presence of pathologies of the larynx or the vocal tract, and to advise potentially affected patients to go to a specialist for an accurate voice control.
The possibility to produce in a simple and rapid way the detection of voice alterations for a possible huge amount of users, is one of the main requirements of the system. This is an important goal required and suggested by clinical experiences, where patients with voice anomalies often delay specialist's controls, in most cases limiting treatments effectiveness. Thus, the idea behind the system raises from the need of educating patients to the auto diagnosis by using a simple, remotely accessible and user friendly system.
The system will be made completely and freely (prior to free registration) accessible from a web portal. This solution offers several advantages:
elimination of the discomfort due to time and/or distance constraints, that often induce the patient to indefinitely postpone the specialist's visit;
removal of a possible psyesence of the doctor (due, for example, to the fear
deriving from a possible investigation via endoscope); since the system can be freely ac
The use of the client-server system would allow a diagnostic analysis from the client (patient) side and, at the same time, will allow populating a national sca
tabase containing several types of vocal anomalies.
V. CONCLUSION
The paper presented a web-based system for the remote acquisition and automatic analysis of vocal signals. Vocal signals are submitted by the users througa
art signal procp
terations. Future work will regard the experimentation of the
system in the Department of Otorhinolaryngology of our University for full clinical validation and for post-surgery control, i.e. for checking the status of patients after surgical intervention and during follow-out.
REFERENCES
[1] J. C. Stemple, L. E. Glaze, and B. K. Gerdemann, Clinical Voice Pathology: Theory and Management,Thomson Delmar Learning, 2000.
] S. W. Smith, The Scientist and Enginee[2cessing, California Technical
[3] R. J. Moran, R. B. Reilly, P. de Chazal, and P. D. Lacy, “Telephony-based voice pathology assessment using automated speech analysiBiomed. Eng., vol. 53, no. 3, pp. 468-477, 2006. K. Umapathy, S. Krishnan, V. Parsa, and D.G. Jamieson, “Discriusing a time-frequency approach,” IEEE Trans. Biomed. Eng., vol. 52, no. 3, pp 421-430, 2005. C. Manfredi, M. D’Aniello, P. Bruscaglioni, and A. Ismaelli, “A comparative analysis of fundamental frequency estimation methods with application to pathological voices,” Med. Eng. Phys., vol. 22, no. 2, pp. 135 – 147, 2000. C. Manfredi, and G. Peretti, “A new insight postsurgical objective voice quality evaluation: application to thyroplastic medialization,” IEEE Trans. Biomed. Eng., vol. 53, no. 3, pp 442-451, 2006. J. R. Deller, J. G. PDiscrete-time Processing of Speech Signals, New York: Maxwell McMillan, 1993. Marple SL., Digital spectral analysis with applications, Englewood Cliffs, NJ: Prentice-Hall, 1987.
[9] H. Kasuya, S. Ogawa, K. Mashima, and S. Ebihara, “Normalized noise energy as an acoustic measure to evaluate pathologic voice,” J. A
32 MAVEBA 2007

Models and analysis of vocal emissions for biomedical applications: 5th international workshop: December 13-15, 2007: Firenze, Italy, ed. by C. Manfredi,ISBN 978 88-8453-673-3 (print) ISBN 978-88-8453-674-7 (online)© Firenze university press, 2007.
Abstract: Techniques for the visualization of high-dimensional data are common in exploratory dataanalysis and can be very useful for gaining anintuition into the structure of a data set. The classicalmethod of principal component analysis is the onemost often employed, however in recent years anumber of other nonlinear techniques have been introduced. In the present paper, principal componentanalysis, and two newer methods, are applied to a set of speech data and their results are compared.Keywords : PCA, LLE, Kernel PCA
I. INTRODUCTION
Techniques which transform a high-dimensional spaceinto a space of fewer dimensions, often with one, two or three-dimensions, are collectively known asdimensionality reduction techniques. They can be veryuseful in helping us visualize data sets which we aretrying to analyze, often providing clues about propertiesof the data, such as possible clusters within the data.
The most commonly used classical method fordimensionality reduction is perhaps principal componentanalysis (PCA), also known as the Karhunen-Loèvetransform, or singular value decomposition [1]. PCAperforms a linear mapping of the data to a lower dimensional space in such a way, that the variance of thedata in the low-dimensional representation is maximized.A disadvantage of PCA is that the embedded subspacehas to be linear. For example, if the data are located on acircle in a 3-dimensional Euclidean space, R3, PCA will not be able to identify this structure. Anotherdisadvantage is that PCA depends critically on the unitsin which the features are measured.
In recent years, a number of other visualizationtechniques have become available, and their application to data sets, such as those involving speech, is just beingconducted [2,3,4]. Among these methods, those of kernelPCA (KPCA) [5] and local linear embedding (LLE) [6,7]are particularly relevant for our purposes in the presentpaper.
KPCA is a (usually) nonlinear extension of PCA usingkernel methods. Kernel methods have been successfullyapplied in the fields of pattern analysis and patternrecognition [8], often providing better classificationperformance than other methods, and frequently playing a
vital part in the nonlinear extension of classical algorithms.. LLE, on the other hand, provides low-dimensional, neighborhood-preserving embeddings. Thismeans that points which are ‘close’ to one another in adata space will also be close when projected onto thelow-dimensional space.
VISUALIZATION OF NORMAL AND PATHOLOGICAL SPEECH DATA
J. Goddard1, F. Martínez1, G. Schlotthauer2, M.E. Torres2, H.L. Rufiner2,31Departamento de Ingeniería Eléctrica, Universidad Autonoma Metropolitana, Iztapalapa, Mexico
2Facultad de Ingeniería, Universidad Nacional de Entre Ríos, Paraná, Argentina3Facultad de Ingeniería y Ciencias Hídricas, Universidad Nacional de Litoral, Santa Fe, Argentina
In the paper, our aim is to briefly describe thesemethods, and then apply and compare them on a set ofnormal and pathological speech data.
II. METHODOS
PCA is an unsupervised learning algorithm that attempts to efficiently represent the data by findingorthonormal axes which maximally decorrelate the data.The data is then projected onto these orthogonal axes. The principal components are precisely this set of qorthonormal vectors, where q is often 2 or 3.
There are several equivalent ways to find the principalcomponents, one being that of finding the first qeigenvectors w of the covariance matrix C of the data set, corresponding to the q largest eigenvalues.Mathematically, if {x1,…,xN} is a zero mean data set fromthe Euclidean space Rn, then the covariance matrix isgiven by:
N
j
Tjj xx
NC
1
1 (1)
and the corresponding eigenvalue equation is
wCw (2)
PCA provides a linear mapping of the data onto thelower q-dimensional space, and suffers from several problems, some of which have been mentioned in theintroduction. In order to define a nonlinear extension of PCA, KPCA has been introduced. KPCA uses the notionof a kernel to modify the corresponding algorithm.Generally, if X is a data set, then a (positive-definite)kernel k on XxX is defined as a real-valued function:
k:XxX R (3)
such that:(i) k is symmetric: k(x,y) = k(y,x) x,y X, and(ii) k is positive definite: n 1

0),(1,
N
jijiji xxkaa (4)
a1,…,aN R and x1,…,xN X It can be shown that given a kernel k, there exists a
(Reproducing Kernel) Hilbert space H and a transformation : X H such that
k(x,y) = < (x), (y)> (5)
holds. H is often referred to as feature space and is ofteninfinite-dimensional.
The most commonly used kernels are the polynomialand radial base function kernels defined on Rmx Rm by:
k(x,y) = (<x,y> + 1)d (5)
k(x,y) = exp(-||x-y||2/2 2) (6)
respectively, where d = 1,2,… and R. For thesekernels the transformation is not defined explicitly, andthe kernels are applied directly in the original data space.This is known as the ‘kernel trick’.
For the kernels of Eq (5) and (6), it can be shown thatKPCA is conceptually the same as performing standardPCA with the data set { (x1),…, (xN)} in the featurespace H (with the above notation). Fortunately, the kernel trick, referred to above, can also be applied in this case and the explicit use of avoided. Instead, the NxN kernel matrix K, is defined through Kij = k(xi,xj), and theequation:
aNKa (7)
is solved for R and a = (a1,…,aN)T RN.A projection p of a pattern y in data space onto a
principal component in feature space can be found using:
N
iii xykap
1),( (8)
In order to use KPCA, we have to decide on a kernelfunction and, as for PCA, the number of dimensions onwhich to project.
LLE is an unsupervised learning algorithm thatcomputes low-dimensional, neighborhood-preservingembeddings of high-dimensional inputs. LLE does this byapplying three steps. First, for each point in the data, it’sk nearest neighbors to the other points in the data are found (usually using Euclidean distance, although in thepresent paper other distance metrics are also tried). Then,each point is approximated by convex combinations of it’s k nearest neighbors, to obtain a matrix ofreconstruction weights W. Finally, low-dimensional
embeddings Yi (usually in a space of one or two-dimensions) are found such that the local convex representations are preserved. Mathematically, thisprocess can be expressed by: If {x1,…,xN} is the dataset,and for each vector xi we let Ni denote the indices of it’s knearest neighbors, then the second step, of finding thereconstruction weights W, corresponds to minimizing theobjective function:
i Njjiji
i
xWxWE
2
)( (9)
subject toj
ijW 1.
The embeddings {y1,…,yN} of the original data,corresponding to the third step, are obtained by minimizing the following objective function:
i Njjiji
i
yWyYO
2
)( (10)
An advantage of LLE is that it has few free parametersto set and a non-iterative solution thus avoidingconvergence to a local minimum.
Interesting relationships have recently been foundbetween KPCA and LLE, as well as other well-knowndimensionality reduction techniques c.f. [10].
III. DATA
In the present paper, the data used consisted of realvoice samples of the sustained vowel ‘ah’ for bothnormal patients and those with dysphonic speechdisorders. The voice samples were taken from the“Disordered Voice Database” [11], acquired at theMassachusetts Eye and Ear Infirmary Voice and SpeechLaboratory and distributed by Kay Elemetrics. The clinical information includes diagnostic informationalong with patient identification, age, sex, smokingstatus, and more. The files on normal subjects werecollected at Kay.
The eight variables used in the paper are the same asthose chosen in [12], namely: degree of voice breaks,three variables related to jitter (local, relative averageperturbation, five-point period perturbation quotient),three related to shimmer (local, three-point amplitudeperturbation, eleven-point amplitude perturbation), andharmonics-to-noise ratio.
For completeness, we include their definitions (c.f.[12] for more details):1) Degree of voice breaks is the total duration of thebreaks between the voiced parts of the signal, divided by
34 MAVEBA 2007

the total duration of the analyzed part of signal. Silencesat the beginning and at the end of the signal are notconsidered breaks.2) Jitter or period perturbation quotienta) Jitter ratio (local) or jitt is defined as:
n
ii
n
iii
Pn
PPn
jitt
1
1
11
1
1
1
1000 (11)
where Pi is the period of the ith cycle, in ms, and n is thenumber of periods in the sample.b) Relative average perturbation (RAP):
n
ii
n
ii
iii
Pn
PPPPn
RAP
1
1
2
11
1
32
1
(12)
c) Five-point period perturbation quotient (ppq5):
n
ii
n
ii
jji
Pn
PP
n
ppq
1
2
3
2
2
1
34
1
5 (13)
3) Shimmer or amplitude perturbation quotienta) Shimmer (shimm):
n
ii
n
iii
An
AAn
shimm
1
1
11
1
1
1
(14)
where Ai is the amplitude of the ith cycle, and n is thenumber of periods in the sample.b) Three-point amplitude perturbation quotient (apq3):
n
ii
n
ii
iii
An
AAAAn
apq
1
1
2
11
1
32
1
3 (15)
c) Eleven-point ampitude perturbation quotient (apq11).
n
ii
n
ii
jji
An
A
A
n
apq
1
5
6
5
5
1
1110
1
11 (16)
4) Harmonics-to-noise ratio: This parameter quantifiesthe amount of glottal noise in the vowel waveform. In contrast to perturbation measures, it attempts to resolvethe vowel waveform into signal and noise components,computing their energies ratio.
In total there were 34 subjects with dysphonic speechdisorders, and a further 53 normal subjects. For eachsubject, an 8-variable vector was associated. Theminimum, maximum and standard deviation for each ofthe eight variables is given in Table 1.
Table 1. minimum, maximum and standard deviation for each of
the 8 variables for the normal and pathological data
Normal0.105 0.048 0.070 0.064 0.375 0.567 0 17.520.682 0.368 0.447 0.463 3.011 3.770 0 30.370.11 0.069 0.067 0.088 0.589 0.744 0 2.941Pathological0.131 0.064 0.074 0.119 0.654 0.937 0 2.5156.061 3.701 4.783 1.756 10.80 16.63 0.164 28.041.4233 0.8221 1.0783 0.431 2.524 3.304 0.035 6.83
IV. RESULTS
PCA, KPCA, and LLE were applied to the real voice samples described in the previous section. Software for
Fig. 1 PCA, LLE, and KPCA applied to the data with 2 dimensions.
Pathology detection/classification I 35

these techniques has been developed by [13,14]. Fig.1shows the three techniques applied to the data andprojected onto two-dimensions. In this case, k=8 waschosen for LLE, and a radial base function kernels with
=1 for KPCA.In Fig.2, the same parameters are used but with the
data projected onto three-dimensions.
Fig 2. PCA, LLE, and KPCA applied to the data with 3 dimensions.
In order to obtain a simple comparison between thethree methods, a k-nearest neighbor classifier was appliedto the projected data using k=1,3. For this, the data wassplit randomly into training and test sets subsets withsizes of 66% and 33%, respectively. The classification results are shown in Table 2, where in the first row, LLEnmeans that k=n was taken, and Gn means that =n wasused.
Table 2. Results of applying knn to the projected data
PCA LLE3 LLE5 LLE8 G0.5 G1 G5Two-dimensionsk=1 68.97 55.17 68.97 79.31 68.97 65.52 75.86k=3 79.31 68.97 79.31 72.41 65.52 75.86 68.97Three-dimensionsk=1 79.31 55.17 68.97 72.41 65.52 75.86 75.86k=3 65.52 65.52 79.31 72.41 65.52 75.86 72.41
V. CONCLUSIONS
In the present paper, the dimensionality reductiontechniques of PCA, KPCA, and LLE were applied tospeech data from both normal and pathological subjects.The data has been projected onto both two and three-dimensional Euclidean spaces, and different parametersoccurring in KPCA and LLE have been varied. Theprojected data is shown in Figs.1 and 2.
In order to obtain a simple comparison between thethree methods, a k-nearest neighbor classifier was introduced and applied to the projected data. In Table 2 it can be seen that LLE, along with PCA, achieve the bestclassification performances. Whilst this is obviously not a definitive result, and will depend on the data set and
parameters employed, it is encouraging and providesmotivation to continue the exploration of alternativemethods to PCA in the case of speech data.
REFERENCES
[1] I.T. Jolliffe, Principal Component Analysis, Springer,1986.[2] M.A. Carreira-Perpinan, “Continuous latent variablemodels for dimensionality reduction and sequential data reconstruction,” PhD thesis, Dept. of Computer Science,University of Sheffield, UK, 2001.[3] V. Jain and L. K. Saul, “Exploratory analysis andvisualization of speech and music by locally linearembedding,” In Proceedings of the InternationalConference of Speech, Acoustics, and Signal Processing(ICASSP-04), vol.3, pp.984-987, Canada, 2004.[4] A. Kocsor and L. Tóth, “Kernel-Based FeatureExtraction with a Speech Technology Application,” IEEETransaction on Signal Processing, Vol. 52, No. 8,pp.2250-2263.[5] B. Schölkopf, A. Smola, and K.-R. Müller, “KernelPrincipal Component Analysis,” In B. Schölkopf, C. J. C.Burges, and A.J. Smola, editors, Advances in Kernel Methods---Support Vector Learning, pp. 327–352, MITPress, Cambridge, MA, 1999.[6] S. Roweis and L. Saul, “Nonlinear dimensionalityreduction by locally linear embedding,” Science, v.290,no.5500, pp.2323-2326, 2000.[7] Locally linear embedding homepage:http://www.cs.toronto.edu/~roweis/lle/.[8] J. Shawe-Taylor and N. Cristianini, Kernel Methodsfor Pattern Analysis, Cambridge University Press, 2004.[10] J. Ham, D.D. Lee, S. Mika, and B. Schölkopf, “A kernel view of the dimensionality reduction ofmanifolds,” Proceedings of the Twenty-First International Conference on Machine Learning, pp. 369-376, (Eds.) R.Greiner and D. Schuurmans, 2004.[11] Kay Elemetrics Corporation. Disordered VoiceDatabase Model 4337. Massachusetts Eye and EarInfirmary Voice and Speech Lab, Boston, MA., 1994. [12] G. Schlotthauer, M. E. Torres, y C. Jackson-Menaldi, “Automatic classification of dysphonic voices,”WSEAS Transactions on Signal Processing, vol. 2, no. 9, pp. 1260-1267, September 2006.[13] L.J.P. van der Maaten, “An Introduction toDimensionality Reduction Using Matlab,” TechnicalReport MICC 07-07. Maastricht University, Maastricht,The Netherlands, 2007.[14] T. Wittman, “Manifold Learning Matlab Demo,”Department of Mathematics, University of Minnesota,2005.
36 MAVEBA 2007

Models and analysis of vocal emissions for biomedical applications: 5th international workshop: December 13-15, 2007: Firenze, Italy, ed. by C. Manfredi,ISBN 978 88-8453-673-3 (print) ISBN 978-88-8453-674-7 (online)© Firenze university press, 2007.
Abstract: MDVP and Praat are computer programs commonly used for acoustic analysis of voice in clinical and research settings. Both softwares extract a set of acoustic parameters, many of which are defined similarly. The purpose of the present study was to compare the results obtained by both programs, and examine whether they can clinically distinguish among pathological groups differently than the other. Fifty-eight women participated in the study. Of these women, 28 were diagnosed with functional dysphonia and 30 women were diagnosed with benign mass-lesions (ten nodules, ten polyps and ten cysts). Voice samples, which consisted of six productions of the vowels /a/ and /i/, were analyzed using MDVP and Praat. Results show similar mean fundamental-frequency (mF0) values for both programs (P>0.05). However, jitter, shimmer, Noise-to-harmonic ratio (NHR) and degree of unvoiced (DUV) were significantly lower using Praat, in comparison with MDVP. High correlation coefficients were found between the parallel pairs of acoustic parameters extracted by the two programs. Jitter values obtained using MDVP, for the vowel /i/, revealed a significant group difference between the nodule and cyst groups (P<0.05). This group contrast was not observed using Praat. Results suggest that although high correlations are found between values obtained by both programs, individual numerical values vary greatly. Therefore, combining results from both programs is not advisable. In addition, there are indications that linear transformation for the results from one program to the other might lead to erroneous conclusions, and should be carried out with caution. Keywords: Acoustic analysis, MDVP, Praat, Clinical implications.
I. INTRODUCTION
Acoustic analysis of voice is considered valuable for
quantifying measures of voice quality in various
experimental as well as clinical settings. The validity of
this tool has been challenged by many studies, since it is
yet unclear which set of acoustic measures best represents
voice quality. Moreover, the relationship between
vibratory properties of the vocal folds and specific
acoustic measures has not been substantiated yet. While
previous studies have included various sets of acoustic
measures, the majority of these studies have examined,
among other parameters, fundamental frequency (F0),
measures of frequency-perturbation (e.g., jitter), measures
of amplitude-perturbation (e.g., shimmer) and various
noise-indices.
Ostensibly, the values for the perturbation measures
mentioned above should not be dependent on the
software used to calculate them. Jitter and shimmer, for
example, are defined by simple and standardized
formulas [1]. The problem lies in the raw data on which
these calculations are based, i.e. the F0 contour.
However, there is no standardized algorithm for
calculation of F0. While different methods for calculating
F0 may yield relatively small differences in mean F0,
they can largely influence the perturbation measures. This
introduces a difficulty for the clinical voice specialist,
because the different programs could report different
values, when analyzing identical voice samples. The
discrepancy between results obtained by such programs
was previously noticed and addressed by various
researchers [2,3].
In the present study, we examined the clinical results
of the analyses performed by two programs: MDVP (Kay
Elemetrics) and Praat (Boersma & Weenink). These
programs are commonly used for acoustic analysis in
clinical as well as research settings, and while MDVP is a
commercial package, Praat is distributed for free use.
Both softwares provide a calculation of a set of parallel
acoustic measures. Therefore, we were interested to learn
whether: (1) the two programs provide similar or
different values for this set of basic acoustic measures;
and (2) whether the results obtained by one of the
programs would distinguish better between specific
pathological groups.
II. METHODS
Participants: Fifty-eight women who were examined in
the Voice Clinic at the "Sheba" Medical Center, Tel-
Hashomer, were included in the study. All patients were
women over the age of 18, and all patients had undergone
a laryngeal stroboscopy and a voice evaluation. Of these
women, 28 were diagnosed with functional dysphonia
(i.e., patients were dysphonic, with no organic finding).
Thirty women were diagnosed with vocal fold benign
mass-lesions. Of these women, 10 were diagnosed with
vocal nodules, 10 with polyps and the remaining 10 were
diagnosed with cysts.
Recordings: Each patient was recorded, individually, in a
quiet room. Recordings were performed using a
Sennheiser PC160 headset microphone, connected
A CLINICAL COMPARISON BETWEEN MDVP AND PRAAT SOFTWARES: IS THERE A DIFFERENCE?
O. Amir1,2
, M. Wolf2, N. Amir
1
1Department of Communication Disorders, Tel-Aviv University, Tel-Aviv, Israel
2Voice Clinic, Otolaryngology, Head and Neck Surgery Department, Sheba Medical Center, Tel-Hashomer, Israel.

directly to a computer, with a sampling rate of 48 kHz. Each subject was recorded producing the vowels /a/ and /i/ six times. Acoustic analyses: All recordings were analyzed twice: using MDVP and using Praat. The MDVP analyses were performed manually. During the analyses, pitch limitations were performed, when necessary, to avoid erroneous F0 values. The Praat analyses were performed automatically, controlled by a specially written Matlab program. In these analyses, F0 identification was set to a range of 110-500 Hz, to minimize octave errors. Although the two programs provide extensive sets ofacoustic parameters, only five parallel measures were included, that are calculated by both programs. These measures included mean fundamental frequency (mF0),jitter, Shimmer, noise-to-harmonic ratio (NHR) and percentage of unvoiced segments (referred to as DUV in MDVP and as DEG in Praat). Both programs calculate F0 using algorithms based on the autocorrelation method [4,5]. Nevertheless, there are differences between the two implementations, which cause noticeable differences between the results obtained by the two programs. The details of the implementations are well documented, though to the best of our knowledge, there is no comparison of their absoluteaccuracy. Fig. 1 illustrates an example of the differences between the two programs in tracking F0. In this figure, the calculated F0 points are presented over a shortsegment, for a single file that was included in this study. Apparently, MDVP presents a larger spread of values in comparison with Praat, though overall F0 means are similar (181.07Hz in MDVP and 181.16Hz in Praat). This is further corroborated in the following section.
Fig. 1. F0 values calculated by Praat and MDVP over a short segment
Statistical Analyses: Results for the repeated recordings were averaged prior to the statistical analyses. Separate Analyses-of-Variance were performed for each vowel. In these analyses, Pathology (nodule, polyp, cyst and
functional) was treated as a main factor, and Programs (MDVP and Praat) was treated as a repeated factor. In addition, Pearson correlation coefficients were calculated to compare between the results obtained by the two programs.
III. RESULTS
Table 1 presents the results of the acoustic analyses performed by the two programs for the four pathological groups. Results show that similar numerical values were obtained for mF0 in the two programs. However, the values obtained for the jitter, shimmer, NHR and DUV measures were, in general, higher in MDVP than those obtained using Praat. Statistical analyses revealedsignificant differences between the two programs for Jitter [(F1,53=68.84, p<0.001), (F1,53=49.29, p<0.001), for /a/ and /i/ respectively], Shimmer [(F1,53=3.61, p=0.063), (F1,53=5.11, p=0.028), for /a/ and /i/, respectively], NHR [(F1,53=336.16, p<0.001), (F1,53=408.48, p<0.001), for /a/ and /i/ respectively] and for DUV [(F1,53=26.70, p<0.001), (F1,53=32.88, p<0.001), for /a/ and /i/ respectively]. No significant differences were found between the two programs for mF0 (p>0.05).
Fig. 2. Individual participants’ jitter values for /a/, calculated by MDVP versus Praat, along with linear regression and correlation coefficient: (a) full range of jitter values; (b) jitter values range (MDVP) between 0 and 3%; (c) Jitter values (MDVP) >3%.
0.9 1 1.1 1.2 1.3 1.4 1.5 1.6 1.7
160
165
170
175
180
185
190
195
200
Time [s]
F0
[Hz]
Praat
MDVP
0 1 2 3 4 5 6 7 80
2
4
6
Jitter (%) - MDVP
Jitt
er (
%)
- P
raat
(a) Jitter - full range of values
r=0.82
p=4.85 × 10⁻¹⁵
0 0.5 1 1.5 2 2.5 30
1
2
3
Jitter (%) - MDVP
Jitt
er (
%)
- P
raat
(b) Jitter (MDVP) between 0 and 3%
r=0.39p=0.0069
3 3.5 4 4.5 5 5.5 6 6.5 7 7.50
2
4
6
Jitter (%) - MDVP
Jitt
er (
%)
- P
raat
(c) Jitter (MDVP) over 3%
r=0.87p=0.0011
r=0,82 p=0.0049
38 MAVEBA 2007

No significant main effect was found for Pathology,for any of the acoustic measures tested (p>0.05). A significant Program X Pathology interaction was found only for the jitter measure in the vowel /i/ (F1,53=3.88, p=0.014). Post-hoc analysis revealed a significant group difference between the nodule group (mean=1.67, SD=1.40) and cyst group (mean=3.16, SD=1.77), when analysis was performed using the MDVP program (p<0.05). This group difference was not observed using the Praat program (p>0.05). Finally, high correlation coefficient values were observed between the results obtained in the two programs. Correlations for mF0 were 0.963<r<0.970. Correlations for the perturbation measures ranged between 0.719<r<0.932. However, correlations for the DUV measure were moderate (0.481<r<0.672). It should
be noted, though, that although high correlation coefficients were obtained for most parameters, further inspection of the data revealed additional information. Fig. 2, for example, presents the correlation between the jitter values for the vowel /a/, obtained using MDVP and Praat. It is evident that a high correlation coefficient value was obtained when computing the correlation over the entire range of values. However, when the sample was limited to stimuli with relatively lower jitter values (0 to 3%), the correlation decreased to 0.39, even though this range covered the majority of values. In contrast, when voice samples with higher jitter values were examined, the correlation coefficient was high, though the sample size was smaller. Similar findings were observed for all other parameters and vowels.
Table 1. Results of Acoustic Analyses Performed by the MDVP and Praat Programs for the Four Pathological Groups.
IV. DISCUSSION
The results of our study support previous findings,suggesting that different programs present different values of acoustic measures. This is attributed to algorithmic differences between the programs (see Boersma & Winink, Praat manual). On the one hand, our data show that in most cases, similar group differences (or lack of differences) were obtained in both programs, and strong correlations were found between the two programs. Furthermore, mean F0 values are also similar for the two programs. These
findings could support common use of both programs.On the other hand, values of the perturbation and noise measures were notably different between the two programs, and under specific conditions, MDVP appeared to differentiate among pathological groupsbetter than Praat. The latter finding suggests thatcombining results from the two programs, for clinical purposes, is not recommended, despite the use of the seemingly parallel acoustic measures.
Vowel Parameter MDVP Pratt Nodule Polyp Cyst Functional Nodule Polyp Cyst Functional
mF0 (Hz.)
197.65(22.73)
206.40(36.41)
225.36(225.36)
201.62(38.51)
198.36 (22.46)
205.96 (36.45)
217.61 (45.43)
204.64 (35.95)
Jitter (%)
1.77 (1.68)
2.39 (1.06)
2.00 (1.47)
2.01 (1.64)
1.16 (1.37)
0.93 (0.27)
0.96 (0.77)
0.85 (0.91)
Shimmer (%)
7.00 (9.18)
7.76 (3.46)
6.49 (3.20)
5.85 (4.30)
5.01 (5.09)
7.58 (3.75)
6.30 (4.37)
5.12 (3.91)
NHR 0.19 (0.13)
0.20 (0.09)
0.15 (0.04)
0.17 (0.11)
0.09 (0.16)
0.09 (0.08)
0.07 (0.10)
0.06 (0.10)
/a/
DUV 14.06 (19.46)
18.13 (18.13)
8.66 (8.63)
12.70 (19.16)
2.57 (5.49)
0.50 (0.58)
1.53 (2.46)
1.25 (3.10)
mF0 (Hz.)
211.20 (25.01)
214.20 (36.16)
220.80 (34.40)
206.32 (38.68)
211.21 (25.07)
213.38 (34.08)
217.64 (35.72)
209.33 (35.51)
Jitter (%)
1.67 (1.40)
2.49 (1.05)
3.16 (1.77)
1.94 (1.29)
1.15 (1.44)
1.09 (0.54)
1.20 (0.91)
1.20 (1.63)
Shimmer (%)
4.57 (4.88)
5.88 (2.78)
5.93 (4.07)
4.72 (5.02)
3.01 (3.20)
5.92 (3.41)
5.25 (4.84)
3.84 (4.74)
NHR 0.15 (0.06)
0.16 (0.04)
0.17 (0.06)
0.15 (0.08)
0.04 (0.06)
0.05 (0.04)
0.04 (0.04)
0.04 (0.07)
/i/
DUV 10.31 (11.84)
10.21 (7.35)
11.68 (13.11)
0.93 (12.86)
0.53 (0.94)
1.86 (3.12)
1.59 (2.31)
1.43 (4.28)
Pathology detection/classification I 39
It is interesting to observe that the strong correlations between the values calculated by the two programs initially suggested that values from one program can be linearly transformed to approximate the values calculated by another program. A more detailed analysis showed this to be inaccurate. As shown in Fig. 2, examining jitter values between 0 and 3% only, which covered the majority of the cases we studied,revealed a far lower correlation between MDVP and Praat values. Similar results were observed for other measures and vowels. This further suggests that results obtained from both programs are not comparable.
Finally, based on these findings, it should be noted that the use of the reported thresholds for "normal" voice, as presented by MDVP, for example, should berestricted to measures calculated by a specific program, and could not be used for analyses made with other programs. This is especially pertinent when examining measures that are based on cycle-to-cycle variation.
IV. REFERENCES
[1] Baken, R.J, Clinical Measurement of Speech and Voice, Needham Heights, MA: Allyn and Bacon, 1987, pp.95-196. [2] Smith, I., Ceuppens, P. & De Bodt M.S. (2005). A comparative study of acoustic voice measurements bymeans of Dr. Speech and Computerized Speech Lab. Journal of Voice, 19, (2), 187-196. [3] Karnell, M.P., Hall, K.D. & Landahl, K.L. (1995). Comparison of fundamental frequency and perturbation measures among three analysis systems. Journal of Voice, 9, 383-393. [4] Deliyski, D. D. MDVP software instruction manual, Kay Elemetrics Corp., Appendix E. [5] Boersma, P. Accurate short-term analysis of thefundamental frequency and the harmonics-to-noise ratio of a sampled sound (1993), IFA proceedings, 17.
40 MAVEBA 2007

Mechanical models I


Models and analysis of vocal emissions for biomedical applications: 5th international workshop: December 13-15, 2007: Firenze, Italy, ed. by C. Manfredi,ISBN 978 88-8453-673-3 (print) ISBN 978-88-8453-674-7 (online)© Firenze university press, 2007.
Abstract: 3D FE model of the larynx including the vocal folds, arytenoid, thyroid and cricoid cartilages was developed. The vocal fold tissue is modeled as a three layered material representing the epithelium vocal ligament and muscle. First, the frequency modal analysis of the model was performed for nonlinear material characteristics and increasing pre-stress of the vocal folds. Then the results of numerical simulation of the vocal folds oscillations excited by a prescribed aerodynamic pressure loading the surface of the tissue is presented . The FE contact elements are used for modeling the vocal folds collisions. Keywords: Biomechanics of human voice, parametric FE model of the human larynx, numerical simulation of the vocal folds vibration.
I. INTRODUCTION
Design of a model of the human vocal folds, which would enable to model some pathological situations and voice disorders, is becoming an important part of the voice research. Having in mind an intention, to estimate vocal fold tissue damage from the changes in vibration regimes of the vocal folds, a new three-dimensional fully parametric finite element (FE) volume model of the larynx was developed. The model respects the phonation position of the vocal folds and enables easily to vary their geometrical configuration, the longitudinal tension (pre-stress) and the nonlinear material properties of the individual vocal fold tissue layers. The geometry and relations between the arytenoids, thyroid and cricoid cartilages was derived from CT images of a physical enlarged resin model of the human larynx from the collections of the Anatomical Institute of the 3rd
Medical Faculty of the Charles University in Prague and on the bases of the book [6]. This model is a copy of the original physical model from Germany (Deutches Hygiene-Museum, Institute für biologisch-anatomische Anschauungsmaterialen, Dresden).
II. METHODS
A. FE model The 3D complex dynamic FE model of the human
larynx was developed by transferring the CT image data
from the DICOM format to the FE mesh. The geometrical configuration of the cross-section of the vocal fold was taken from Hirano [3] and three layers of the vocal fold tissue are considered: epithelium, vocal ligament and muscle with different physical and material properties (see Fig. 1). Full parameterization of the model enables to vary the thickness and material properties of the individual layers.
The model enables to take into account longitudinal tension (pre-stress) and adduction of the vocal folds by positioning of the arytenoids and thyroid cartilages– see Fig. 2. The initial position corresponds to the original CT images of the physical model. The model was
Fig.2 FE model of the human larynx with the vocal folds between the arytenoids and thyroid cartilages.
Fig.1 Schema of the vocal fold with three layers.
THREE-DIMENSIONAL FINITE ELEMENT MODELLING OF VOCAL FOLDS VIBRATION IN THE HUMAN LARYNX
T. Vampola1, J. Horáček 2, I. Klepáček 3
1Department of of Mechanics, Biomechanics and Mechatronics, Faculty of Mechanical Engineering, Czech Technical University in Prague, Czech Republic
2 Institute of Thermomechanics, Academy of Sciences of the Czech Republic, Czech Republic 3 3rd Faculty of Medicine, Charles University, Prague, Czech Republic

created by 3D quadratic volume and shell finite elements.
B. Material parameters The ligament layer consists of the tissue fibers that are
oriented in the longitudinal direction z between the arytenoids and thyroid cartilages. The stiffness of the vocal fold tissue in this direction is substantially higher than the stiffness in the perpendicular direction x. This is the reason why a plane orthotropic model was used [1], where the matrix of the elastic constants is defined as
1 1 1 0 0 0
1 1 1 0 0 0
1 1 1 0 0 0
10 0 0 0 0
10 0 0 0 0
10 0 0 0 0
E E Ep p p lp l
E E Ep p p lp l
E E Epl p pl p l
Gp
Gl
Gl
μ μ
μ μ
μ μ
− − −⎡ ⎤− −⎢ ⎥⎢ ⎥− − −⎢ ⎥− −⎢ ⎥⎢ ⎥− − −− −⎢ ⎥
= ⎢ ⎥−⎢ ⎥
⎢ ⎥⎢ ⎥−⎢ ⎥⎢ ⎥⎢ ⎥−⎢ ⎥⎣ ⎦
C ,
where Ep is Young modulus, μp is Poisson number and Gp is shear modulus in perpendicular direction x to the ligament fibers. Analogical constants are denoted by the index l for the longitudinal direction z. The cartilages were modeled by an isotropy material. For a loose connective tissue between the vocal fold muscle and the thyroid cartilage a model of an incompressible material was used. The material constants considered for thetissues are summarized in Tab. 1.
Orthotropic properties of the three layers of the vocal fold living tissue (epithelium, vocal ligament and muscle) are modeled by respecting the material
nonlinearities with increasing prolongation ε of the tissue. Nonlinear stiffness of the tissue fibers was considered in the longitudinal direction z. The Young modulus in relation to the strain for all three layers is shown in Fig .3.
III. RESULTS
The frequency-modal characteristics of the model were computed for increasing tension of the vocal folds and an influence of 20% changes in uncertain values of material characteristics of the tissues was modeled. The frequency-modal properties of the FE model are shown in Tab. 2 and Figs. 4-6.
Tab.3 Participation factor for x, y and z direction for the strain ε=5% and first three eigenfrequencies.
excitation direction
x y z
Fi [Hz] γx γy γz
107.4 0.477E-03 0.736E-03 0.947E-08
130.5 0.375E-03 0.299E-03 0.675E-07
140.4 0.459E-03 0.282E-04 0.776E-07
Tab.1 Considered nominal values of material constants of individual tissue layers according to [2] - E=Epithelium, L=Ligament, M=Muscle, C=Cartilage, LT=Loose connectiveTissue.
E L M C LT
Gp [kPa] 0.526 0.868 1.052 - -
Gl [kPa] 10 40 12 - -
μp 0.9 0.9 0.9 0.47 0.4999
Ep [kPa] 2 3.3 4 30 0.12
Et(ε) [kPa] 100 10 5 - -
ρ [kgm-3] 1020 1020 1020 1020 1020
μpl = μlp 0 0 0 - -
Fig.3 Young modulus of the epithelium, ligament andmuscle versus the strain [4].
Tab.2 Changes of vocal fold eigenfrequencies with increasing vocal fold tissue prolongation ε in the longitudinal direction.
ε [%] F1[Hz] F2[Hz] F3[Hz]
5 107.40 130.50 140.41
15 137.82 154.50 163.44
25 165.68 177.66 185.75
35 193.68 201.71 209.24
44 MAVEBA 2007

A dominant vibration direction for each eigenmode was studied by using the participation factor iγ , which is
a measure of a coincidence of one selected eigenmode with the forced mode shape of vibration when the structure excited in a given direction:
{ }DMφ
DMφ
Ti
Ti
max=iγ , (1)
where φi is the eigenmode, M is the mass matrix of the structure and D is the forced mode shape of vibration excited in the direction x, y or z. The calculated participation factor for first three eigenmodes and all three directions x,y,z are summarized in Tab. 3. The displacements in horizontal and vertical directions x and y, respectively, are dominant for the first mode for which a rotation around the longitudinal axis z prevails. The vibration in the horizontal direction x dominates for the second eigenmode, while for the third eigenmode,
the vibration amplitudes of the membranous part of the vocal fold tissue prevail in the vertical y direction.
Then the motion of the vocal folds was numerically simulated for a prescribed intraglottal pressure loading the vocal folds by a periodic function in the time domain –see Figs.7.
The pressure signal loading the vocal fold surface was generated by the aeroelastic model [5] of the vocal folds during self-sustained vibrations for a given subglottal pressure and prephonatory glottal gap. Implementation of the contact elements on the vocal folds surface enabled to model the impact stresses in the vocal fold tissue layers during the vocal folds collision.
The vibration response of the vocal folds after loading the tissue by the prescribed intraglottal pressure is shown in Figs. 8-10.
Fig.4 First eigenmode of the FE model of the right vocal fold - F1=107.4 Hz.
Fig.5 Second eigenmode of the FE model of the rightvocal fold - F2=130.5 Hz.
Fig.6 Third eigenmode of the FE model of the right vocal fold - F3=140.4 Hz.
Fig.7 Aerodynamic pressure loading the vocal folds in time and space domain along the vocal fold surface in the
vertical y direction during one period of the oscillation cycle – fundamental frequency F0 ≈ 100 Hz, subglottal pressure subP =378.4 Pa, prephonatory glottal half-gap
g0=0.2 mm.
Mechanical models I 45

Fig. 10 Contact area at the right vocal fold during the vocal folds collision shown as isolines of the vocal folds
distance.
IV. CONCLUSIONS
The geometry of the model is possible to modify easily as well as to apply optimization procedures for finding proper model parameters of the system in relation to the tuning both the vocal folds vibration characteristics, and the larynx model in general.
The computated fundamental eigenfrequencies and mode shapes of vibration are qualitatively similar like for other simplified models in literature [2,7] and the obtained increase of the eigenfrequencies by increasing the vocal fold tension is also realistic. The considered changes in the material properties, in case of the 20% reduction of the Young modulus of the vocal fold tissue in the longitudinal direction were not found important. The generated motion of the vocal folds seems to bequalitatively similar to a vibration mode known from clinical measurements.
Preliminary results show that model the contact elements on the vocal folds surface enable numerical simulations of the collisions of the vocal folds and to predict stresses in the vocal fold tissue due to the impacts.
ACKNOWLEDGEMENTS
The research was supported by the project IAA2076401 Mathematical modeling of human vocal fold oscillations of the Grant Agency of the Academy of Sciences of the Czech Republic.
REFERENCES
[1] ABAQUS user’s manual - http://www.abaqus.com, 2000. [2] F. Alipour, D.A. Berry and I.R. Titze, “A finite-element model of vocal fold vibration”. Journal of Acoustical Society of America, 108 (6), 2000, pp. 3003-3012. [3] M. Hirano, “Phonosurgery, basic and clinical investigations”. In: The 76th Annular Convention of the Oto-Rhino-Laryngological Society of Japan, 1975. [4] Y. Kakita,Y, M. Hirano, K.Ohmaru “Physical properties of the vocal fold tissue: measurements on excised larynges. ,” Vocal Fold Physiology, 1981, pp.107-118. [5] J. Horáček, P. Šidlof and J.G. Švec, “Numerical simulation of self-oscillations of human vocal folds with Hertz model of impact forces,” Journal of Fluids and Structures 20, 2005, pp.853-869. [6] S. Standring, Gray´s Anatomy: The Anatomical Bases of Clinical Practice, 39th edition, Churchill Livingstone, 2004. [7] I.R. Titze, The Myoelastic Aerodynamic Theory of Phonation. National Centre for Voice and Speech, Denver and Iowa City, 2006.
Fig.8 Larynx displacements and vocal folds deformation at the maximum glottis opening phase of the forced
vibrations generated by the prescribed pressure.
Fig.9 Comparison of the deformation of the ligamentlayer in the central part of the vocal folds in the
maximum opening of the glottis and the maximum glottis closure during the collision phase.
46 MAVEBA 2007

Models and analysis of vocal emissions for biomedical applications: 5th international workshop: December 13-15, 2007: Firenze, Italy, ed. by C. Manfredi,ISBN 978 88-8453-673-3 (print) ISBN 978-88-8453-674-7 (online)© Firenze university press, 2007.
Abstract: The purpose of this research was to determine if a relationship between vocal fold amplitude of vibration and skin acceleration level could be found using regression techniques. The effects of accelerometer location and phonation frequency were examined. Keywords : vocal folds, vibration, acceleration
I. INTRODUCTION
The ability to measure amplitude of vocal fold vibration in vivo is of major importance in the field of speech science. In voice dosimetry, vocal fold vibration in human subjects during prolonged periods of speaking is studied in order to determine the effects of exposure to self-induced tissue vibration in vocalization [1]. Amplitude of vibration (A) is a variable in the calculation of two of the dose measures, distance dose Dd and energy dissipation dose De. These measures are important for understanding vocal fatigue and recovery, especially among professionals who rely on their voice for their livelihood.
In the current voice dosimetry study being conducted at the NCVS, the doses are calculated from skin acceleration levels (SAL) measured at the jugular notch, on the anterior neck of the subjects. The derivation of Afrom SAL requires using a series of empirical equations based on previously published canine model and human subject data, and a calibration curve based on a lengthy data collection session in the laboratory with each dosimetry subject.
The purpose of this research was to determine an equation relating SAL to A using regression techniques, for predicting A from SAL. Seven different sites on the anterior neck were investigated. Human SAL and A data were obtained in vivo during standard laryngeal exams using custom equipment and state-of-the-art imaging and audio recording and processing techniques.
II. METHODS
A. Subjects, Materials, Tasks, and Data Collection
Two vocally healthy subjects, a male and a female, with no known vocal fold pathologies were administered videostroboscopic laryngeal exams with a rigid
endoscope while wearing seven miniature accelerometers placed at various sites on the anterior neck, including at the jugular notch and above, below and lateral to the prominence of the thyroid cartilage. In order to obtain quantitative measurements of A in absolute dimensions, a two-point laser projection system was developed (Fig. 1a). The device projected two precisely-spaced green (wavelength = 532 nm) laser dots in the image frame, from which absolute dimensions could be determined in the laryngeal exam videos. Custom software was written to perform a frame-by-frame extraction of the absolute vocal fold length and glottal width at the mid-membranous point, and A was calculated as half the width (assuming symmetrical displacement of the vocal fold edge from the glottal midline for stable, periodic vibration of normal, healthy vocal folds).
RELATING VOCAL FOLD AMPLITUDE OF VIBRATION TO SKIN ACCELATION LEVEL ON THE ANTERIOR NECK
P. S. Popolo, I. R. TitzeDepartment of Speech Pathology and Audiology, University of Iowa, IA, USA and
National Center for Voice and Speech, The Denver Center for the Performing Arts, Denver, CO, USA
A lightweight, thin latex patch was designed to hold six accelerometers in a 2x3 array centered about the thyroid prominence, so that consistent, repeatable acceleration measurements could be made between the different subjects and different trials (Fig. 1b). The accelerometers were of the same type used in previous studies of long-term voice use [2], [3]. The patch was held firmly in place with a VelcroTM strap, and the surface of each accelerometer was attached to the skin with a temporary surgical adhesive. A seventh accelerometer was attached to the skin at the jugular notch with surgical adhesive and a small strip of medical tape. Fig. 2 shows the location of the seven accelerometer on the anterior neck. Fig. 3 shows a schematic of the experimental setup.
Subjects were asked to perform a series of sustained phonations on the vowel /i/ at a number of different intensity levels from soft to loud, and at three different pitches – comfortable, high, and falsetto. The accelerometer signals were amplified and digitally recorded to the hard drive of a data collection computer, at a sampling rate of 44.1 kHz. The video of the laryngeal exams was digitally recorded to the videostrobe host computer. All audio and video signals were time-synchronized so that SAL and A data points could be directly related to each other.
B. Data Processing and Statistical Analysis
Data was obtained from two separate trials for both subjects, with at least one week between trials. The subject/data sets were designated M01-1, M01-2, F01-1

and F01-2. A cyclical plot of vocal fold amplitude of vibration A was extracted from the video signal for each data set, at a sampling rate equal to the video frame rate of 30 Hz. Strobe rate was set to Fast, yielding 1.5 glottal cycles per second and 20 frames per glottal cycle. Between 90 and 180 seconds of this cyclical representation was obtained for each data set. Root-mean square (RMS) values of A were obtained over 66.7 ms windows, overlapping by 33.3 ms (corresponding to a window size of one glottal cycle and an overlap of one-half cycle). The corresponding time segments of the SALsignals from all seven accelerometers were RMS-averaged with the same window duration and overlap, so the sequence of RMS values of A and SAL were still time-synchronized.
Scatter plots were generated of the time-synchronized RMS values of A vs. SAL for each of the seven accelerometer signals. A was calibrated to mm and SALwas calibrated to m/s2. It was attempted to fit the data to a simple linear regression model,
01 * bSALbApredicted (1)
where b1 and b0 are the regression coefficients corresponding to the slope and intercept, respectively, of the regression line. The model was chosen based on the observation that, for sinusoidal vibration, the relation between displacement x and acceleration a is given by
RMSRMS xa2
2
(2)
where is the radian frequency of vibration. Statistical methods were employed to determine if there were significant differences between the fits obtained at the seven different locations, i.e., whether measuring the acceleration at different locations made any difference in the resulting fits; and if so, to determine which location showed the highest correlation to the vocal fold amplitude of vibration extracted from the video signal.
III. RESULTS
In plotting the RMS values of A vs. SAL, it was found that there was a clustering of the data points according to the fundamental frequencies of the phonations. Since pitch was not a variable but rather a parameter of the study (each subject did the same phonations at three different frequencies), it was decided to parameterize each plot of A vs. SAL by the frequency groupings Low, Medium and High. The linear regression fits were determined for each frequency group and each accelerometer location, as follows:
Model #1:AllLocationAllLocationAllLocationpredictedLocation bSALbA __0___1_ * (3)
Model #2: LowLocationLowLocationLowLocationpredictedLowLocation bSALbA __0___1__ * (4)
MedLocationMedLocationMedLocationpredictedMedLocation bSALbA __0___1__ * (5)
HiLocationHiLocationHiLocationpredictedHiLocation bSALbA __0___1__ * (6)
where Model #1 is the fit for the data points of all frequencies combined, for a given accelerometer location, and Model #2 is the set of fits for the data points grouped according to frequency of phonation, either low, medium or high, for a given accelerometer location. By fitting all subject data sets to the above models, b1coefficients (slopes) that were significantly different from zero could be obtained for most, but not all of the accelerometer location/frequency group data points. The test of non-zero slope is statistically the same as the test that the correlation coefficient r of the regression model is not equal to zero; i.e. that the linear regression equation is a valid representation of the relation between SAL and A. This was the consistently the case for all subject data sets for the low frequency data, at all accelerometer locations. Subject/set M01-1 also had non-zero b1’s for the medium frequency data, and subject/set M01-2 had non-zero b1’s for all three frequency groups. For this subject/set, statistical analyses showed that there were significant differences among the slopes of the fits for the three different frequencies at each accelerometer location, and that there were significant differences among the different locations. Furthermore, there was significant interaction between the effects of accelerometer location and frequency of phonation for this subject/set, in that there was a wider variation among the slopes of the different locations at low frequencies, but less variation among the slopes of different locations at medium and high frequencies of phonation. Looking only at the low frequency data for this subject/set, it was further found that certain pairings could be made, statistically, between the left and right counterparts of each location, which says that there is little difference between a left-right pair in the six locations around the thyroid prominence. Also, though there is not enough statistical evidence to distinguish between these six locations, taken as a group they are significantly different from the seventh location, the jugular notch.
Visual inspection of the b1 coefficients for the same subject in the two different trials showed no consistency, even though the repeatability of absolute measurements of vocal fold amplitude of vibration with the two-point laser projection system and videostroboscopy had been shown in an earlier study [4].
IV. DISCUSSION
48 MAVEBA 2007

The reason for the lack of intra-subject repeatability may have to do with the mechanism by which vocal fold vibration is transferred through tissue and measured as skin acceleration, and further investigation is needed. The lack of significant correlation between SAL and A at higher frequencies and in falsetto production may be due to the changes in vocal fold length, stiffness, and depth of vibration which characterize these types of phonation. The amplitude of vibration may not be adequately described by a linear model, and the “error” of the estimate may come not only from measurement error but also from the effects of unmeasured variables or un-included predictors, such as stiffness and length. Also, a two-dimensional measurement of horizontal amplitude of vibration does not describe the movement of tissue in the inferior-superior direction, which may contribute to the acceleration measured on the neck.
For the subject/set M01-2, the signals from the seven accelerometer locations all provided significant information for predicting the vocal fold amplitude of vibration. A principal component analysis may allow one to determine the relative amount that each signal contributes to the prediction, and if a subset of the signals can provide a reasonable estimate.
V. CONCLUSION
The current data set shows that there may be a significant correlation between SAL and A at lower phonation frequencies, i.e., at habitual speaking pitch. This relationship may hold if other parameters of vocal fold vibration, such as length and stiffness, are isolated or held constant. Further investigation is needed with more subjects and more repeated measures per subject.
REFERENCES
[1] I.R. Titze, J.G. Svec, and P.S. Popolo, “Vocal dose measures: quantifying accumulated vibration exposure in vocal fold tissue,” J Speech Lang Hear Res, vol. 46, pp. 919-932, 2003. [2] P.S. Popolo, J.G. Svec, I.R. Titze, “Adaptation of a Pocket PC for use as a wearable voice dosimeter,” JSpeech Lang Hear Res, vol 48, pp. 780-791, 2005. [3] H.A. Cheyne, H.M. Hanson, R.P Genereux, K.N. Stevens, R.E. Hillman, “Development and testing of a portable vocal accumulator,” J Speech Lang Hear Res,vol 46, pp. 1457-1467, 2003. [4] P.S. Popolo and I.R. Titze, “A new two-point laser projection system for quantitative laryngeal imaging,” in review.
Figure 1. (a) Two-point laser device mounted on a rigid endoscope. (b) The accelerometer array patch.
Figure 2. Accelerometer locations on anterior neck.
Figure 3. Experimental setup.
Mechanical models I 49

50 MAVEBA 2007
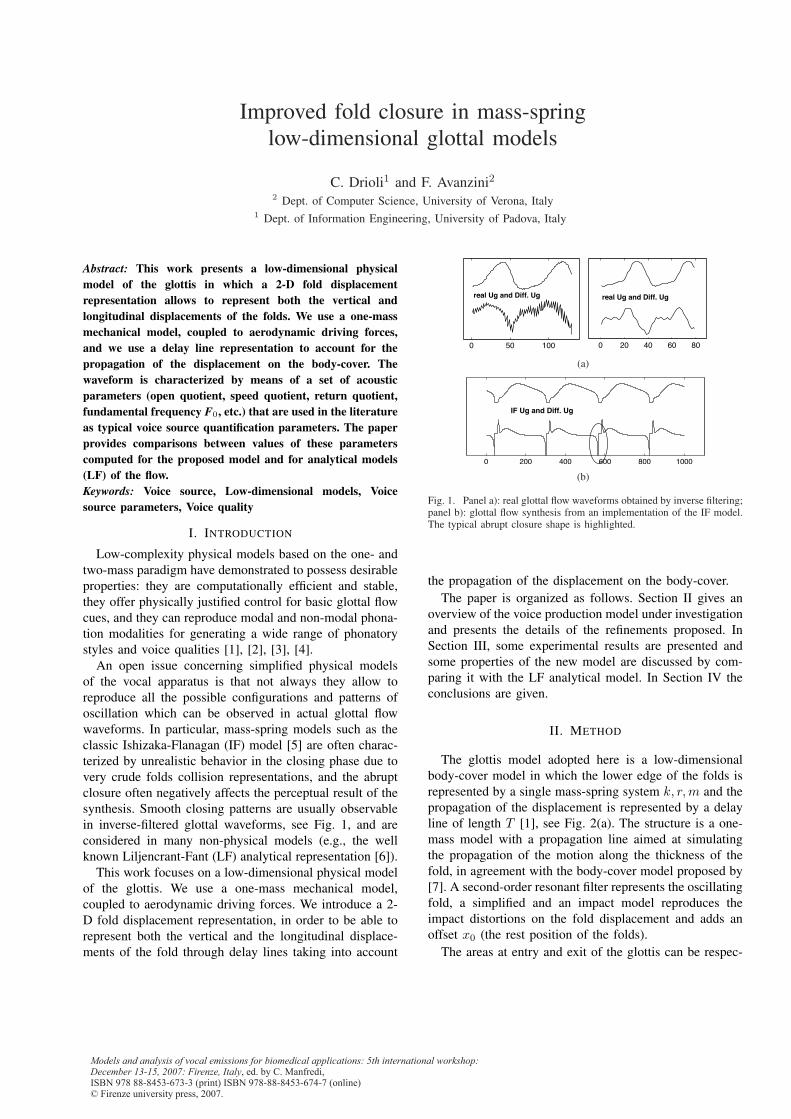
Models and analysis of vocal emissions for biomedical applications: 5th international workshop: December 13-15, 2007: Firenze, Italy, ed. by C. Manfredi,ISBN 978 88-8453-673-3 (print) ISBN 978-88-8453-674-7 (online)© Firenze university press, 2007.
Improved fold closure in mass-springlow-dimensional glottal models
C. Drioli1 and F. Avanzini22 Dept. of Computer Science, University of Verona, Italy
1 Dept. of Information Engineering, University of Padova, Italy
Abstract: This work presents a low-dimensional physicalmodel of the glottis in which a 2-D fold displacementrepresentation allows to represent both the vertical andlongitudinal displacements of the folds. We use a one-massmechanical model, coupled to aerodynamic driving forces,and we use a delay line representation to account for thepropagation of the displacement on the body-cover. Thewaveform is characterized by means of a set of acousticparameters (open quotient, speed quotient, return quotient,fundamental frequency F0, etc.) that are used in the literatureas typical voice source quantification parameters. The paperprovides comparisons between values of these parameterscomputed for the proposed model and for analytical models(LF) of the flow.Keywords: Voice source, Low-dimensional models, Voicesource parameters, Voice quality
I. INTRODUCTION
Low-complexity physical models based on the one- andtwo-mass paradigm have demonstrated to possess desirableproperties: they are computationally efficient and stable,they offer physically justified control for basic glottal flowcues, and they can reproduce modal and non-modal phona-tion modalities for generating a wide range of phonatorystyles and voice qualities [1], [2], [3], [4].
An open issue concerning simplified physical modelsof the vocal apparatus is that not always they allow toreproduce all the possible configurations and patterns ofoscillation which can be observed in actual glottal flowwaveforms. In particular, mass-spring models such as theclassic Ishizaka-Flanagan (IF) model [5] are often charac-terized by unrealistic behavior in the closing phase due tovery crude folds collision representations, and the abruptclosure often negatively affects the perceptual result of thesynthesis. Smooth closing patterns are usually observablein inverse-filtered glottal waveforms, see Fig. 1, and areconsidered in many non-physical models (e.g., the wellknown Liljencrant-Fant (LF) analytical representation [6]).
This work focuses on a low-dimensional physical modelof the glottis. We use a one-mass mechanical model,coupled to aerodynamic driving forces. We introduce a 2-D fold displacement representation, in order to be able torepresent both the vertical and the longitudinal displace-ments of the fold through delay lines taking into account
0 50 100
real Ug and Diff. Ug
0 20 40 60 80
real Ug and Diff. Ug
(a)
0 200 400 600 800 1000
IF Ug and Diff. Ug
(b)
Fig. 1. Panel a): real glottal flow waveforms obtained by inverse filtering;panel b): glottal flow synthesis from an implementation of the IF model.The typical abrupt closure shape is highlighted.
the propagation of the displacement on the body-cover.The paper is organized as follows. Section II gives an
overview of the voice production model under investigationand presents the details of the refinements proposed. InSection III, some experimental results are presented andsome properties of the new model are discussed by com-paring it with the LF analytical model. In Section IV theconclusions are given.
II. METHOD
The glottis model adopted here is a low-dimensionalbody-cover model in which the lower edge of the folds isrepresented by a single mass-spring system k, r,m and thepropagation of the displacement is represented by a delayline of length T [1], see Fig. 2(a). The structure is a one-mass model with a propagation line aimed at simulatingthe propagation of the motion along the thickness of thefold, in agreement with the body-cover model proposed by[7]. A second-order resonant filter represents the oscillatingfold, a simplified and an impact model reproduces theimpact distortions on the fold displacement and adds anoffset x0 (the rest position of the folds).
The areas at entry and exit of the glottis can be respec-

L
vocal fold
mk, r
propagation linePi
x1
Pl
Pm
T
x2
(a)
m
propagation line
(longitudinal displ.)
propagation line
(vertical displ.)
vocal fold
Lx2
T
Pm
Pl
x1
Pi
k, r
(b)
Fig. 2. Low-dimensional body-cover model of the vocal folds. Panel (a): the vertical displacement of the fold modeled through a single propagationline; panel (b): the vertical and longitudinal displacements of the fold are modeled through a two propagation lines. In both panels, from bottom to top,Pl is the lung pressure, Pm is the driving pressure acting on the vocal folds, m, k, and r represent respectively the mass, stiffness, and damping of thefold, T represents its thickness, x1 and x2 are the fold displacements at entrance and exit of the glottis, and Pi is the pressure at entrance of the vocaltract.
tively defined as
a1(t) = 2L(x01 + x1(t)) (1)
a2(t) = 2L(x02 + x1(t) − τ x1(t))= 2L(x02 + x2(t)), (2)
where L is the length of the folds, x01 and x02 are the
rest positions of the fold at entrance and exit to the glottis,
and τ = T/cf (cf being the wave velocity on the fold
surface) is the time taken by the wave to propagate from
the entrance to the upper end of the glottis. The glottal
area is finally modeled as the minimum cross-sectional
area between the areas at lower and the upper vocal fold
edge, i.e., a = min{a1, a2}. A detailed description of the
aerodynamics of the model can be found in the referenced
papers [2].
We develop here an extension to this one-delayed mass
model by allowing the layer to propagate along two di-
rections: 1. the vertical axis, and 2. the horizontal axis.
The scheme is loosely inspired to the 16-mass model
introduced in [8], in which an array of two-mass-spring
systems is organized longitudinally in order to represent
horizontal differences along the length of the cord, and the
longitudinal propagation on the body-cover of the fold. The
proposed model is shown in Fig. 2(b). The areas at entry
and exit of the glottis should be now computed taking into
account that the displacement may be not constant along
the longitudinal axis:
a1(t) = 2∫ L
0
(x01 + x1(l, t))dl (3)
a2(t) = 2∫ L
0
(x02 + x2(l, t))dl, (4)
where x1,2(l, t) = x1,2(0, t) − τlx1,2(l, t), τl = L/cf .
III. RESULTS
Let us characterize the glottal waveform by means of
a set of voice source parameters, allowing us to better
evaluate how the new longitudinal displacement parameter
affects the shape of the glottal flow pulse. Figure 3 shows
the time instants usually defined for a glottal cycle, referred
to an LF model.
Figure 4 shows three simulations performed with the
proposed low-dimensional body-cover model. The parame-
ter τl controlling the displacement delay on the longitudinal
axis is gradually increased from left to right. It can be
noticed that changes in this parameter mainly affect the
closing phase of the glottal cycle. More precisely, the
return time, i.e. the time interval between the minimum
of the flow derivative at time instant te and the closing
instant tc (see Fig. 3), scales with τl.
Typical voice source quantification parameters extracted
from the flow and the differentiated flow are direct ones,
such as P (the glottal cycle period), F0 = 1/P (the
fundamental frequency of oscillation), to (the opening
instant), tp (the maximum flow amplitude instant), te (the
negative peak instant), tc (the closing instant), and derivedones, such as the speed quotient SQ, the open quotient
OQ, the opening quotient OingQ, the closing quotient
CingQ, the return quotient RQ. For our discussion we
focus on the following ones, which are among the most
used in the literature [9]: return quotient RQ = (tc−te)/P ,
open quotient OQ = (te − to)/P , and speed quotient
SQ = (tp − to)/(tc − tp). The return quotient is directly
related to the return phase duration, the open quotient is
directly related to the duration of the open glottis interval
that precedes the closure instant, and speed quotient is a
measure of the ratio of the open phase to the closing and
return phases. Most of these cues have been recognized
to be particularly relevant for the study of the perceptual
52 MAVEBA 2007

Fig. 3. Glottal flow parameters referred to the LF model: time of glottalopening to; time and value tp,Ei of flow maximum; time and value te,Ee
of flow derivative minimum; time of glottal closure tc; glottal period P.
influence of the voice source characteristics, and for com-
paring different voice qualities (e.g., [10], [11]).
Analytical models, such as the LF, are widely appre-
ciated due to their effectiveness in controlling the voice
source parameters. One of the advantages is the possibility
of controlling each source parameter by acting on a well
identified analytical parameter. The return phase is typi-
cally easier to control in analytical models than in physical
ones, where the simplifications in the representation of
the folds collision usually results in an abrupt closure,
corresponding to RQ = 0. We focus on this aspect and
compare the improved low-dimensional physical model
with the LF class. To this aim, a set of 9 glottal flow
waveforms was generated both by an LF model and by
the proposed model. In both cases the parameter related
to the return phase was increased for each next run. The
result of the simulations and of the computation of the
voice source parameters is shown in Fig. 5.
The two sets of waveforms are characterized by same
period length, and approximately same OQ values. Due
to the differences in the shape of the pulse of the two
models, it was more difficult to obtain similar values for
the SQ parameter. The first thing that can be observed
by comparing panels a) and b) of Fig. 5 is that in both
models the parameter used to control the return phase does
not produce appreciable pitch variations. If this property
is an obvious one for analytical models, in which the
period length is analytically imposed, the same behavior
is not necessarily granted for a physical model, in which
each component in the dynamic loop may potentially
affect the stability and the frequency of oscillation. It has
been observed, for instance, that changing the length Tof the delay line representing the thickness of the fold,
may affect only the duration of the closed phase in some
0.1 0.11 0.12 0.130
0.02
0.04
0.06
0.08
Ug, d
Ug/d
t
(a)
0.1 0.11 0.12 0.130
0.02
0.04
0.06
0.08
Ug, d
Ug/d
t
(b)
0.1 0.11 0.12 0.130
0.02
0.04
0.06
0.08
Ug, d
Ug/d
t
(c)
Fig. 4. Result from numerical simulations performed with the proposedlow-dimensional body-cover model. Values of τl increase from panel (a)to panel (c).
circumstances, or both the duration of the closed phase
and of the overall period (i.e., it may affect the pitch). In
all the experiments conducted on the proposed model, no
appreciable pitch variations were observed in response to
variations of the parameter τl representing the length L of
the fold.
The comparison of panels a) and b) of the same figure
leads to other considerations. It can be seen that, as the
control parameters Prq and τl are raised, the behavior of
the three source parameters considered here, RQ, OQ, and
SQ, is qualitatively the same: RQ increases as expected
in both models, even if with this configuration of the low-
dimensional glottal model it was not possible to reach
the same values around 0.5 obtained with the LF one
(instability of the oscillation was observed if the param-
eter τl was further increased). Such high return quotient
values are however rarely observed in natural glottal flow
recordings. The OQ parameter is approximately constant
as expected (note from the definition that the return phase
does not contribute to the open quotient OQ), except in the
right-most part of the plot, where the curve rises slightly.
Finally, both curves representing the SQ parameter show
a decreasing trend, although the range spanned by the plot
related to the LF model is appreciably larger than the range
Mechanical models I 53

0 0.1 0.2 0.3 0.4 0.5 0.6 0.7 0.8 0.9 10
0.5
1
1.5
2
Prq
RQ
OQ
SQ0 100 200 300 400 500
−0.04
−0.02
0
0.02
0.04 Prq
=0.9
Prq
=0.1
(a)
0 0.1 0.2 0.3 0.4 0.5 0.6 0.7 0.8 0.9 10
0.5
1
1.5
2
τl
OQ
RQ
SQ0 100 200 300 400 500
−1
−0.5
0
0.5
1x 10
−3
τl=0.1
τl=0.9
(b)
Fig. 5. Glottal flow parameters computed on a set of 9 waveforms obtained by running the LF model (panel a)) and the proposed low-dimensionalbody-cover model (panel b)) while increasing the parameter responsible for the duration of the return phase (parameters on the x axes are normalized).
spanned by the plot related to the low-dimensional model.
Apparently, there is no straightforward explanation for this
inequality, apart from the evident differences in the pulse
shape.
In conclusion, some interesting properties of this class
of physical models emerged from the comparison with an-
alytical models, and further investigation will be conducted
in this direction.
IV. CONCLUSIONS
We proposed an extension to the mechanical compo-
nent of a low-dimensional vocal fold model previously
introduced, and we discuss the affectiveness of the new
scheme in terms of control of glottal flow cues pro-
viding comparisons with the LF analytical model. The
additional degree of freedom introduced with this new
scheme allows to control some relevant features of the
glottal flow waveform, such as the return quotient, that
are not directly accessible with similar models previously
proposed in the literature. Future research on this class
of models is foreseen with respect to a number of issues,
including: 1. the perceptual assessment of the synthesis to
gain understanding on the perceptual relevance of the new
parameters in terms of naturalness of the synthesis and of
voice quality controllability, 2. the refinement of the low-
dimensional model to adapt its glottal pulse shape to the
characteristics of the LF model, thus allowing improved
comparisons between the two classes of models, and 3.
the design of automatic parametric adaptation algorithms
to fit the model to real glottal waveforms.
REFERENCES
[1] F. Avanzini, P. Alku, and M. Karjalainen, “One-delayed-mass modelfor efficient synthesis of glottal flow,” Proc. of Eurospeech Conf, pp.51–54, September 2001.
[2] C. Drioli, “A flow waveform-matched low-dimensional glottalmodel based on physical knowledge,” J. Acoust. Soc. Am., vol. 117,no. 5, pp. 3184–3195, 2005.
[3] F. Avanzini, S. Maratea, and C. Drioli, “Physiological control oflow-dimensional glottal models with applications to voice sourceparameter matching,” Acta Acustica united with Acustica, vol. 92,no. Suppl.1, pp. 731–740, Sep. 2006.
[4] C. Drioli and F. Avanzini, “Non-modal voice synthesis by low-dimensional physical models,” in Proc. 3rd Int. Workshop on Mod-els and Analysis of Vocal Emissions for Biomedical Applications(MAVEBA), 2003.
[5] K. Ishizaka and J. L. Flanagan, “Synthesis of voiced sounds from atwo-mass model of the vocal cords,” The Bell Syst. Tech. J., vol. 51,no. 6, pp. 1233–1268, July-August 1972.
[6] G. Fant, J. Liljencrants, and Q. Lin, “A four-parameter model ofglottal flow,” STL-QPS, pp. 1–13, 1985.
[7] I. R. Titze, “The physics of small-amplitude oscillations of the vocalfolds,” J. Acoust. Soc. Am., vol. 83, no. 4, pp. 1536–1552, April1988.
[8] I. R. Titze and W. J. Strong, “Normal modes in vocal cord tissues,”The Journal of the Acoustical Society of America, vol. 57, no. 3,pp. 736–744, 1975.
[9] P. Alku and E. Vilkman, “A comparison of glottal voice quantifica-tion parameters in breathy, normal and pressed phonation of femaleand male speakers,” Folia Phoniatr. Logop., vol. 48, no. 5, pp. 240–254, Sep. 1996.
[10] A. E. Rosenberg, “Effect of glottal pulse shape on the quality ofnatural vowels,” J. Acoust. Soc. Am., vol. 49, no. 2, pp. 583–590,February 1971.
[11] D. Childers and C. Ahn, “Modeling the glottal volume-velocitywaveform for three voice types,” J. Acoust. Soc. Am., vol. 97, no. 1,pp. 505–519, January 1995.
54 MAVEBA 2007

Models and analysis of vocal emissions for biomedical applications: 5th international workshop: December 13-15, 2007: Firenze, Italy, ed. by C. Manfredi,ISBN 978 88-8453-673-3 (print) ISBN 978-88-8453-674-7 (online)© Firenze university press, 2007.
��������������������������������������������������������������������������������������������������������������������� � ��� � � � ��� � ����� � ������� � ��������� � ���������������� � �� � ��� � ���� � �� � ������ � �� � � � ������������������������������������������������������������������������������� � ������ � ������� � ��� � ������� � ������ � ����������������� ��������������������������������������������������������������������������������������������������������������������������������������������������������������������������������������������������� �������������� � ���������� � ���������������������������������������������������������
���������������
����������������������������������������������������������� � ��������� � ��� � ������ � ������������� � ���� � �������������� � ��� � ��������� � �������� � �� � ��� ���������������������� � ������� � ������ �� � � � ��������� � ���������������������������������������������������������������������������������������������������������������������������������� � ������ � ��� � ����� � ����� � ������������������ � ��� � ��������������������������������������������������������������������������������� ��������� � ������������� � �� � ���� � �������������������������������������������������������������������������������������������������������������������������������������������������������������������������������������������������������������������������������������� � �� � ������� � ��� � ������� � ��� � ��� � ��������� � ���
�������� � ����������� � ��� � �� � ��� � ������� � ������ � ����������������������������������������������������������������������������������������������������������������������������� � ���� � ������ � �� � ��� � ��������� � ���� � �� � ������������ ������ � ���� � ��� � ������� � ������ � ��� � ������������������������������������������������������������������������������������������������������������������������������������������������������������ � ������� � ������� � ��� � ��������� � �������� � ��� � ����
��������������������������������������������������������������������������������������������������������
�����������������������
��������������������������������������������������������������������������������������������������������������������������������������������������������������������������������������������������������������������������
� ��� ��� ����� �� ��� �� ���������������
����� � ���� ��� �� � � ��� � �� � ������ � �� � �������������������������� ������ ������������������������������������������������������������������������������������������������������������������������������������������������������������������ ���������� ������������� ���������� ������������������ � ������� ��� ������� � ��� � �������� ��� ��� ��� ��� � ������������������������������������� ��� ���������������������������������������������������������� ��� ��������������������������������������
���������� ����������� �������� ���
����� ������� �� �������� ���������� ���� ��������������������������������������������������������������������������������������������������������������������������������������������������� ��������������������������
���������������������������������������������������������� � ����� � �� � ��� � ����� � ����� � ��� � ������������ � ������ � ������������������������������������������������������������������������������������������������������������������� � ��� � ���� � �� � ��������� � ��� � ����� � �������� � �� � �������������������������������������������������������������������������������������������������������������������������������������������
�� � � � ��������������� ��� ����������� ��� ��� ���� �� � ��� ���
� � � �� ������������������ ����� ���� ��� � ����� � � ��
��������� ��� ��� � � �������� � �������� �������� �
����� ������������� �� � ������������� � ���������� ���� � ������������ ��� ������ �� ���� � ��� � �������� ���� � ��� �������������������������������������������������������� ��� ��������������������
�������������������������������
� � ����������� � ���������� � �� � ���� � ���� � ������ � ���������� � ��������� � ��� � ����� � ����� � ������������ � ����
����������������������������������������������������������������
������������������������������������������������������������������������������������������������������������������������������������������������������������������������
������������������������������������������������������������������������������������������������

���� ���������������� ����!������ �$�������� $���������������� ������
�����<���� ������������ �����������������������
��� &�}�~
���������
��}�~ &��}��~ ���}��~
` <��� >�� �� �
� W�� >�� �� �
� W�� !���"��� �� !���"����W>
'��� � >�>< � >�W
'��& � >�>� � <��
) � � <�> �
� >�� � �
� � >�� � �
������@\���`��{������
*������������ ���� ���� ����������������� ������� ������ �� �������Z@������ ���� �� � ������������ �$������ �+�������� ��� �� ���� �� � �� � �� ����� ��� ������� � �� ���� $��� � ���� � �� � �Z@ � �� � � ��� � � ����$ � �� �`�����������$���$����\�� ���� � �`�\� � ������������ � `�\ � � ������ ��� ����� ���������������$����� � � �� ������� ��+�
�������������� ������������������������>�}W~�*������� -������ �� � &������ � @��������| � �@���
��� � ������ � ��� ���������������� �������������������� ��������!���������$�$�������+�������� ����� ��������� �������� ���� �������������������� ����� ���<����� ���� � ��������� �W������ ������� ���������������� ��������� �}<~�
� � � /��<�W�
���� /� �
���� /��<�
� � � /�
� ����� /
��<��3�<
�
�� �� 3� -<|� 3
� <� �
�� 3� �� �3
� �� 3�-W|� 3
� <��
�� 3� �� �3 � �
�����������
�� � � /��<�
��� � /� �
��� � /��<�
<W �� � � /
� �� � � /��<�W �
� �W��� � /
��<��3�<
�
� � �� 3��< �W-<| � 3
��<�W <� �
�� 3��<�W �� �3
� �� 3��< �W -W| � 3
��<�W <��
�� 3��<�W �� �3 � 4
����
��� ������ ��� �"� ����/� � �������� �������������� ����/� �� ��"/������������ ���$��W��������"������ ��� �������� �$��������"������ ���������� ������&�������������� ����� ���� �� ������3� ������ ���� ����������| ��������� �������������& ���� 3 " � �� 3 � ��� �$ �3� �� �� ������������ �� ���� ��Q�-<"-W�3�
� �� � ������ ��� ������� � �$ �3��� ���$��W����� ���$� ����������� ������� ������� �� ������������� �� �� ����� ������� 3 " � �� 3 � �� ������&���� ������$����������� � �5|� �� �
}<~��������!�������$��W���� ������������� ���������& ���� ������&���� ������� �������������& ����������!��
�� <��� � � /
� � �� <��< �W�� ��<" /
��<�W � �� ���� �<" /
� � ����� �
��<�W�� � � /��< �W � �� W
��� � � /� � �� W
��<�W�� � � /�<��< �W �
�� ���� � � /<
� � �� ���<� W�� � � /
��<�W � ���
�� ������� ����� �����@����� � ������ ���� ��������������������������� � �� �"����
��/�� }�" ��~� ��� �� �� �� ���� ��� ��������� �������� !���� �� � �����<�
� � � /��<� �� � � /
��<�"��� � � /� � ��������������������
6�� �� ��$�������!���� �$����������������� ������ ������!����� �� � ���������������������&���������� �$������� ���������� �����? ����������� ��������� � �����<��� � ����� ���� ������� ������������� �� �� ������ ��� �� ����������$� � �" � �� � � ��� � �� � � ��� � � �� � �� � !����� � �� ���������������������������������>&�>�� ����
��$��W������� ������ ����/������� ����������� �5|�
�Z���@\���`���\{��{
�� ���� ������� ������! � ������� �������� ������!��$������ � ����� � @��� � ���� � ���Q>�><W � ����Q��< � ����<�"���Q<�> � ����Q<�WW� � |$�����" ���Q<�� � ����Q<���<>��� �����"�� Q�W�� ���� �������� ��� ��� ���� ��WQ<��� ���WQ<>W��W���������� ����� ���
�� ������������������ ����� �������������!�������� ����������!�����$ ������������� ��� ����������������� ���? �"�!� ������� ����� ���$���!������������ ��������������� �$���'Q>�>���>���������� ���� ��� ������������������ ����������������������������� ����� �����������������
"4�����-��� ��-���������$����������!���� ��� ������� ����������������� ������
�� ����� ������������ �����@�������� �"������� ����� ����� � ���� � �� � � ������ � � ������ ��� � ��&���� � �� � @�������� � � ������ � � �� � �� � ������ � �� ����&Q>�<�� � ���&QW��<������� ��&������$����������!������ �$ �� ������ ��� ��� � ���� � �������� � ������ � � ����$ � �� � �W� ���� � ������ ������ ���������������� ����� �$ �� �� ������� ������������������������ ���� ������ �������������� ����� ��
56 MAVEBA 2007

��$������� �$��������� �+�������� ����� ����������������� ������ ������!����� �� � ���������������$���'�������������
���������&�����$���'��&������� ����������
��������Q>�<�������QW��<�"�'Q>�>�"���QW��<�"�-Q<�<��
�������� �$ �� ������ ��� �������� ���������
��$������� ��� ������� �������������������Q>�><W"�� Q�W��"��WQ<��"���>&�>�� ����
%4�������-��� ��-��������������7�����8++�9;�� ����� ������������������ ��������� ���������� �!����
������������������!�������$�������� � ������� ���� ������ ���$� �� � ��&���� � �� � @��� � ���� � � !�� � ���� � � � ���������� � !� � � �� � $������ � !���� � �� � �� ���$ � ��� � � �� �������������� �$������ &� � ���� ���$�������������� ��Q���>��������Q>�>��W����������������������� �������������!�� �������� ���� �� �!��� � �� ���QW��W>� ��� ������� ��� � ���!�� �������� �� � ����� � �� �!���� ��� � �� �$�� �'� ��� �� ���
����������������� ������������������� ���$������������������" � !� � � �� � ���� � ���� �� � � ��� ��� � � �������������� � ��
-����� �! � �- � � ��� ' " ���
!���������� ��������������� ����$������� �� ������������������������ �$���'�����Q���
��$�������!���� �� ���������� �������������!�� �������������� ������������!�������$���������� ����!�� �������������������!���� �$ �������� ��!����� ���� �����}�"��~������������ � �� � ����� � !� � � �� � $�������!���� � �W'� � &� �� � �� ���������$�������!������������& ����������<> ����W> �"��� � � ��� �-Q¡<�<% � <�W�� � ��� � � ����� � �� � �� � ��� ����������������� � ���! � ���� � �� � � �������� � ����� � � � ���� &� ������ ������!� ���� �$���������� ������������
�����Q��"�'Q>�>�"�����Q>�<�������QW��>�"����QW��>�"��Q<�>��
�����Q�����W"�'���Q>�><"�����Q>�W�������QW�W��"���QW����"�-Q�����
�����Q���>����"�'Q>�>W��"�����Q>���������QW�W�<"���QW��W>"�-QW�>��
�����Q����"�'Q>�>�"�����Q>���<�����QW��>�"���QW��<�"�-Q<�<��
� ���Q������W"�'��&Q>�>�"�����Q>�<<������Q���<�"���QW��<�"�-Q<�>��
�����Q��"�'Q>�>�"�����Q>�<�������QW��>�"���QW��>�"�-Q<�>��
��$������� ����� ������� �������������������!���������������Q<>>�'?"���Q>�><W"�� Q�W��"��WQ<��"���>&�>�� ������ �������� ����� ������������ �����@�������� �"����
��� ����� �����! ������������ ������ ����������� �������� ���������� ������������ ������ ���
Mechanical models I 57

��$� � �� � ���� � �� � �� � ���! � �� � �� � � �������� � ����� � ���Q�����W"�'���Q>�><"���QW����"�-Q������
��$������� ������ ���$���'"�@�������� �������� ���� �����QW�������� ������ ���&������� ������ ��������Q<>>�'?"�
��Q>�><W"�� Q�W��"��WQ<��"���>&�>�� ����
��$�����@�������� ������$��� ������ ���&������� � ������� ���������������$��� ��������������������� �����
��$�������!���� �����$ ������� �$�� �'"�@�������� �������� ��� ���� ����� ������ ������ �������� ��QW�������� ������ � � �&��� � �� � ���� � ������ � � �! � � �� � ��������$������ � $�� �'� ��� � �� � ��&����� �� � @��� � ���� � � ������ ���� ���������������� �������<��¢<>��� ���������¢<>��� �"�� �� ���� ��� ��� ������ ������� ������� �� ����!�� ��� ��� ������������ ���� �������� ���������� ��������������
��$� � � � ���!� � �� � @��� � ���� � � ����$ � �� � �&�� � ������� ��������� ������ ������ � ������� ���������������$��� � ����������� � � ����� � � ���� � �� � �����! �� � ����� ��������� ��������Q������� ������ �|������ �@�������� �����������$�!��������� ������������$�!�� ������ ����� ��
Z��{@@`�£
�� ���� ������� ����������� ��� ���� ����$������� �������$��� �W����� �������� ��{��| �� +�������������� �������� � ����� ����� � ����� � ��� � � � � � � ��� �� � �� �� ���������� ���� �������� ���� �������������������� �������!����� ��������� ����� � ��� � �� ������������ � ������$ �� ���� �\� �� �� ��������� � ������� ��� � �� �$������ � ������ � �"��� ���� ���������������������� �������!��� �������� �$��������������� &������ ����� ������� ����� ������
����� �� ��������� �� ����������� ���$������ ����!������ �������������������!����� ������ ����������!��$��� ��������� $�������!���� � �W'���¡>�>W�" � ��! ���$ � �� � ��� �����!�� ������ ����� �� �$ �� ������ � �� ������ � �!��� �� ����� �������� ���$ �� ��������� �$������������� �������������
"3��!� '������� ���� � ������������ � !�� � ����������������� ������ � ����������@{@����>��>><>�����Y`�`{��������``W>>��>�<��
�\�\�\��\{
}<~���������"�@�������"������? �"�¤����� ������ ������������ � W � ��� � � � \�� � � ��� � ���� ��{��| � � +�������"¥����������� � <�� � ������-� ��� � � ������" � �� � � � ��\���"�� ����"�W>><�}W~ ��� �'��?��|�" ��� ���? �" � �� �'���� |" � ¤���!��� � � �������� ����������� ��!�������������� �� ���"¥�=���� ��'-����"���� ����������-��Z�����"����<"�W>>�"������WW��W���}�~ � `� � ��� ���" � X� � {������" � \� � ���| �" � ¤��� �������������������� �\�� �� +���������������� ������ �� ����������$����$ ���������� ��� ����$���� � �¥"� �``"���� ���<�<W�>"�<��<�}�~ ��� �������������" ��� ���? �" � �� ������" �¤`������ ������� ����� � �������� � �� � ������� � ����� ����� � ���!� � �� � ������� �¥" �=��'���- � �� � "'������- � �� � *����������������- � 8>�� @���� � �������� � `{��" � ��� � WW>�WW�"�W>>��}�~ � ������ � ����" � Y����� � '������" � ���� � Z ������" � `��'������ �$"�¤`����� ��������!��������������������� ������� � � �� ������ � ����� ���� � ����� �" �!��� ������������ � ��������� ����� ��$�¥"�"���"��-������"�<<���<<�>"�<����}�~���\��Z�����"�¦��� ������"���������� "�@�� � �$ "�`��'������ �$" � �� �X��� ��" � ¤\&� ��� ���� � ���������� � �� � ��+������� ��� � �� ��� � ��� � �� � ���! � �����$� � �� � $������¥"�?���������@��� ��� �5�E�������W��"�������>"�W>>��
58 MAVEBA 2007

Posters


Models and analysis of vocal emissions for biomedical applications: 5th international workshop: December 13-15, 2007: Firenze, Italy, ed. by C. Manfredi,ISBN 978 88-8453-673-3 (print) ISBN 978-88-8453-674-7 (online)© Firenze university press, 2007.
Continuous speech/prosody 223
A prospective case-control study of jitter%, shimmer% and Qx%, glottis closure cohesion factor (Spead by Laryngograph Ltd.) and Long Time Average Spectra
Mette Pedersen MD Ear-Nose-Throat specialist PhD1 and Kasper Munck MSc.21The Medical Center, Ear, Nose, Throat and Voice Unit. Østergade 18. DK-1100 Copenhagen Denmark
e-mail: [email protected], url: www.mpedersen.org, and 2SAS statistical Institute
1. Introduction It was suggested at the �uropean Oto-�hino-Laryngology
conference 2007 in Vienna that voice analysis is empiric and
that clinical voice treatment is not evidence based!! In the
Cochrane Handbook [1] advice for evaluation of quality of
research was made: �roups are made of the quality in 3
levels: Level A (randomized controlled trial/meta-analysis):
High-quality randomized controlled trial (�C�) that considers
all important outcomes. High-quality meta-analysis
(quantitative systematic review) using comprehensive search
strategies. Level B (other evidence): A well-designed, non
randomized clinical trial. A non quantitative systematic review
with appropriate search strategies and well-substantiated
conclusions, includes lower quality �C�s, clinical cohort
studies and case-controlled studies with non biased selection
of study participants and consistent findings. Other evidence,
such as high-quality, historical, uncontrolled studies, or well-
designed epidemiological studies with compelling findings, is
also included. Level C (consensus / expert opinion):
Consensus viewpoint or expert opinion.
�he purpose of this categorization is that good studies can be
structured in meta-analysis to affirm the results as it is done in
e.g. cancer and cardiology research.
In our two Cochrane reviews on vocal nodules [2] and laryngo-
pharyngeal reflux [3] no clinical evidence based studies were
found neither for the treatment of vocal nodules nor laryngo-
pharyngeal reflux. In the review of vocal nodules 659 papers
were evaluated, and in the review of laryngo-pharyngeal reflux
302 papers. �he problem most commonly found, was lack of a
clear baseline for inclusion in the studies, and, lack of
unanimous objective visual and acoustic criteria.
�herefore we have in a part one of this prospective case-
control study [4] first, tried to make a defined baseline of a
complaint of a non-functioning larynx, second, to standardize
simple object visual demands for larynx mucosa including the
vocal cords but based on oedema of the arytenoids, third, to
evaluate the measures of jitter percent, shimmer percent in
relation to the closed phase percent of the vocal cords.
�vidence of pathological parameters were defined for
sustained tons as well as the reading of a standard text, �able
1, difference was also found from before to after treatment,
�able 2, treatment as ealier discribed [5]
As part two we used the same patients material, for all with
sufficient data, in the same prospective controlled case-
controlled setup, for two still more advanced objective throat
function analysis: the Cohesion Factor of irregularity as defined
in the Spead program by Laryngograph Ltd. illucidating
kymographic aspects and Long �ime Averaging Spectrum
(L�AS).
MethodI. Inclusion criteria were a. subjective complaints of a non-
functioning larynx combined with b. a professional assessment
and visual score grouping the patients by swelling in the
arytenoids +/- pathological vocal cords. Patients without
swelling of the arytenoids and with normal vocal cords were
rated normal, score 1 by visual inspection. Patients with
swelling rated from 2 to 5 were abnormal. �here are individual
variations but a normal video-stroboscopy includes a normal
surface of the arytenoids without oedema and a normal shape,
as well as normal colour and movement at stroboscopy of the
vocal cords and all the rest of the mucosa of the larynx. Fig.
1A, normal, score 1, and Fig. 1� and C, abnormal scores
(score 3 and 5 presented).
II. �he parameter: the closed phase of the vocal cords defines
the exact point where the vocal cords meet in the synchro-
nized glottography with stroboscopy [6]. �his is difficult to see,
if there is oedema of the arytenoids or of the whole larynx
mucosa. �he closure of the vocal cords (Qx%) and the
fundamental frequency (Fx%) can under those circumstances
be compromised even if the vocal cords themselves have
movement. �he whole larynx can be affected due to infections,
allergy, reflux and misuse etc. [5]. �esting binary equal
movements of the vocal cords related to the total amount of
movements gives a Cohesion Factor of irregualrity (Spead by
Laryngograph Ltd.) for Qx% and Fx% analyzed for a
sustained tone for 4 seconds and reading of a standard text
(“the north win and the sun”). Fig. 2. �he abnormality degrees
of the arytenoids with visual scores of 4 is shown before and
after treatment.
III. �he clinical use of harmonics including formants was
empiric in pathology till now. �his patient material analysed for
the cohesion factor was also analysed for Long �ime Average
spectrograms (L�AS), for a sustained tone /a/ for 4 seconds
and a standard text (“the north win and the sun”). �he problem
was to point out the maximal intensities in pathology especially
related to formants, and the change related to treatment.
Fig. 3a shows the normal L�AS during reading the north win
and the sun, of 35 persons with normal larynx, score 1,
ADVANCED VOICE ASSESSMENT.

including normal arytenoids, the measurement taken from
Spead by Laryngograph Ltd. and placed in an Excel sheet.
The curves where extracted from individual sheets, harmonics
where measured individually on Multi Dimensional Voice
Profile system by Key Elemetrics and compared up to
12.000Hz.
The statistics where based on SAS JMP (survival analysis) of
the huge amounts of data. 3b shows the curves of 301 patients
with a visual score of deviant arytenoids form of 2-5.
Results
Table 3 shows the cohesion factor of Qx%, statistical analyses:
Cohesion factor % for 35 normals and 301 abnormals as
defined by oedema of the arytenoids and related pathological
mucosa.
Among others a significant difference was found for Qx% and
standard deviations between normal and abnormal measures,
Welch ANOVA p<0,0001 for sustained tone.
Analysis of Long Time Average Spectrograms (LTAS) showed
no overall difference between the pathological video -
stroboscopies Overlay Plot and the normals, but for the area
between 2500 and 4000 Hz Table 4.
Discussion
It has been shown that jitter% and the closed phase % Qx of
the vocal cords are better and evidence based, in a
prospective case-control study and in a prospective cohort
study, related to medical treatment of pathological changes of
the larynx including the arytenoid regions, - not only of the
vocal cords.
A differentiation can be made of whether the primary tone
generator (including the arytenoids, the mucosa and the vocal
cords) or the more coordination related factors of sound
making should be focused upon in medical treatment. The
cohesion % is significantly better in tone and text after
treatment. In the LTAS the area of 2500 to 4000 Hz has a
significantly higher value in dB after treatment when reading a
standard text.
It was earlier shown that phonetograms are better after
medical treatment [5]. So now we have evidence based
measurements for the future treatment of voice disorders.
Conclusion
The new parameter, the Irregularity % or cohesion factor
between all measured signals -and pairs of successive
vocal cycles that fall into the same analysis bin in the
histogram, has been presented as evidence based in a
clinical setting in a prospective case – control study, and
a cohort study before and after treatment. Normal values
and values after treatment are given. On the same material
the LTAS in the area of 2500-4000 Hz has been shown to
be of evidence based value in a clinical setting in the case
– control study as well as the cohort study before and
after treatment, - with higher intensity values in normals
and after treatment
REFERENCER:
[1].The Cochrane Handbook.2006
http://www.cochrane.dk/cochrane/handbook/hbook.htm
[2].Pedersesn M, McGlashan J Surgical versus non-surgical
interventions for vocal cord nodules, the Cochrane library,
Oxford. 2000 Protocol, 2001 review
[3].Hopkins C, Yousaf U, Pedersen M Acid Reflux Treatment
for Hoarseness [Review] print: 25th January 2006 in The
Cochrane Library Issue 1. 2006
[4].Pedersen M, Yousaf U. Videostroboscopic expert
evaluation of the larynx with running objective voice
measurement at the same time gives more secure results than
videos alone. Japan. Congress Report. The 5th International
Conference on Voice Physiology and Biomechanics: 2006
110-113.
[5].Pedersen M, Beranova A, Møller S. Dysphonia: Medical
treatment versus a medical voice hygiene advice approach.
European Archives of Otorhinolaryngology 2004 261; 6:312-
315
[6].Pedersen M (Fog) Electroglottography compared with
synchronized stroboscopy in normal persons. Folia phoniatr
1977 29:191-200
Fig. 1A Fig. 1B Fig. 1C Score 1 Score 3 Score 5
62 MAVEBA 2007

A:
arytenoids mean mean mean shape 1 jitter% Std Dev shimmer% Std Dev Qx% Std Dev N Comments 1 1 9,2 6,5 47,1 6,5 35
shape 2-5 4 10,5 8,2 6,6 45,3 12,7 338
statistics - - - - significant difference for Qx% and standard deviations between normal and abnormal
measures, Welch ANOVA p<0,0001
B:arytenoids frequency loudness shape 1 variation% Std Dev variation% Std Dev Qx% Std Dev N normals SD 9 6,9 15,4 5,1 48,7 6,5 35 for frequency variation <6,9 abnormal> 11,1
shape 2-5 12,3 11,1 16,4 5,6 46,0 11,4 338 1,4 338 normals SD for normals SD for statistics p 0,03 * - p 0,011 * Qx% <6,5 statistics p 0,03 * - p 0,011 * Qx% <6,5 abnormals >11.4 abnormals >11.4 *p as given (Wilcoxon test) *p as given (Wilcoxon test)
A: 77 patients with examinations before and after treatment, A: 77 patients with examinations before and after treatment,
intonation of a sustained tone /ah/. intonation of a sustained tone /ah/. arytenoids arytenoids abnormality (shape 5 1 pt.) (shape 5 3 ptt.) abnormality (shape 5 1 pt.) (shape 5 3 ptt.) shape 4 1. examination Std Dev 2. examination Std Dev N 1
st 32/ 2nd.25 shape 4 1. examination Std Dev 2. examination Std Dev N 1
st 32/ 2nd.25
mean jitter% 5.7 17.9 1,1 1,1 mean jitter% 5.7 17.9 1,1 1,1 mean shimmer% 7,4 5,2 6,8 3,7 mean shimmer% 7,4 5,2 6,8 3,7 mean Qx% 43,7 14,4 48,1 6,1 mean Qx% 43,7 14,4 48,1 6,1 shape 3 1.examination Std Dev 2. examination Std Dev N 1
st 26/ 2nd30 shape 3 1.examination Std Dev 2. examination Std Dev N 1
st 26/ 2nd30
mean jitter% 3,8 8,7 1,6 3,0 mean jitter% 3,8 8,7 1,6 3,0 mean shimmer% 7,4 3,9 7,3 3,6 mean shimmer% 7,4 3,9 7,3 3,6 mean Qx% 42,3 14,5 48,1 7,1 mean Qx% 42,3 14,5 48,1 7,1 shape 2 1.examination Std Dev 2. examination Std Dev N 1
st 16/ 2nd18 shape 2 1.examination Std Dev 2. examination Std Dev N 1
st 16/ 2nd18
mean jitter% 4,9 11,1 2,2 3,3 mean jitter% 4,9 11,1 2,2 3,3 mean shimmer% 4,9 8,7 1,6 3,1 mean shimmer% 4,9 8,7 1,6 3,1 mean Qx% 45,4 7,5 50,3 9,2 mean Qx% 45,4 7,5 50,3 9,2 (shape 1 2 ptt.) (shape 1 1 pt). (shape 1 2 ptt.) (shape 1 1 pt).
Arytenoids score 4, Fx % cohesion factor before treatment after treatment Arytenoids score 4, Fx % cohesion factor before treatment after treatment
Arytenoids score 4, Qx % cohesion factor before treatment after treatment Arytenoids score 4, Qx % cohesion factor before treatment after treatment
Fig. 2 Fig. 2
Table 2.statistics For Tone, no significant change was found of jitter% and shimmer% with paired t-test.For Qx% there was a significant better closure of the glottis of 4,6% ( 43,8% to 48,4%) with a significance of 0,0008 with paired t-test.For the reading of a standard text the regularity frequency% was reduced with 1,98% (p= 0,053), the regularity of loudness% with 1,7% (p=0,004)and the Qx% was better with a change of 2,56% (p=0.044) analysed with paired t-tests.
Table 1 Groups of consecutive digitized videostroboscopies evaluated by 2-3 observers on the spot, and voice analysis at the same time of normal controls: arytenoids shape grade1, without laryngeal complaints versus: abnormal clients with laryngeal complaints, arytenoids shape grade 2-5, measured with SPEAD by the firm Laryngograph ltd.
A: sustained tone /ah/.
B: reading of a standard text:
the North wind and the sun.
Posters 63

Fig. 3a shows the normals visual score 1 related to LTAS and 3b the abnormal arytenoids visual score 2-5 related to LTAS
-30
-20
-10
0
10
20
30
40
50
Pow
er
(Db)
-2000 0 1000 2000 3000 4000 50006000 7000 8000 900010000 12000
Mean(quency (Hz))
1
2
3
4
5
6
7
8
9
10
Me
an
(ow
er
(dB
))
3000 4000
Mean(equency (Hz) P)
Sustained tone Qx% Reading of a text Qx%
Arytenoid 1 19 (12-26) range 35 (30-40) *p 0,042
Arytenoids 2-5 18 (15-20) range 41 (39-42) difference
Sustained tone Fx% Reading of a text Fx% Arytenoids 1 1,9 (1-6) range 13 (8-19) *p ,03
Arytenoids 2-5 5,3 (3,7-5,8) range 19(18-21) difference
Table 3. Cohesion factors for Qx% and Fx%
Product-Limit Survival
Fit
Survival Plot
1 vs 2-5
for the overlay plot of
2.500–4.000Hz
Table 4. LTAS in normals with arytenoids score 1 vs abnormals with arytenoids score 2-5
Table 5. LTAS Product-Limit Survival Fit Survival Plot group 2-4 before and after treatment showed a significant difference
Overlay Plot group 2-4 before and after treatment
Product-Limit Survival Fit
Survival Plot
1
2-5
Tests Between Groups 1 and 2-5 arytenoids reading
of a standard text showed a significant difference.
Test ChiSquare DF Prob>ChiSq
Log-Rank 9,1651 1 0,0025
Wilcoxon 5,8763 1 0,0153
LTAS. Product-Limit Survival Fit Survival Plot group 2-4
before and after treatment showed a significant difference
0,0
0,1
0,2
0,3
0,4
0,5
0,6
0,7
0,8
0,9
1,0
Su
rviv
ing
0 10 20 30 40 50
Power (Db)
Tests Between Groups of score 2-4 of the arytenoides
By reading of a standard text before and after treatment
Test ChiSquare DF Prob>ChiSq
Log-Rank 1,6061 1 0,2050
Wilcoxon 5,3489 1 0,0207
Sustained tone Qx% Reading of a text Qx%
before 17 (12-22) range 44 (40-48) p*0,015
after 14 (9-19) range 37 (33-41) difference
Sustained tone Fx% Reading of a text Fx%
before 4.5 (1.8-7.2) 22 (19-26)
after 3 (0.3-5.7) 17 ( 14-22)
Cohesion factor before and after treatment arytenoids score 2-4
64 MAVEBA 2007
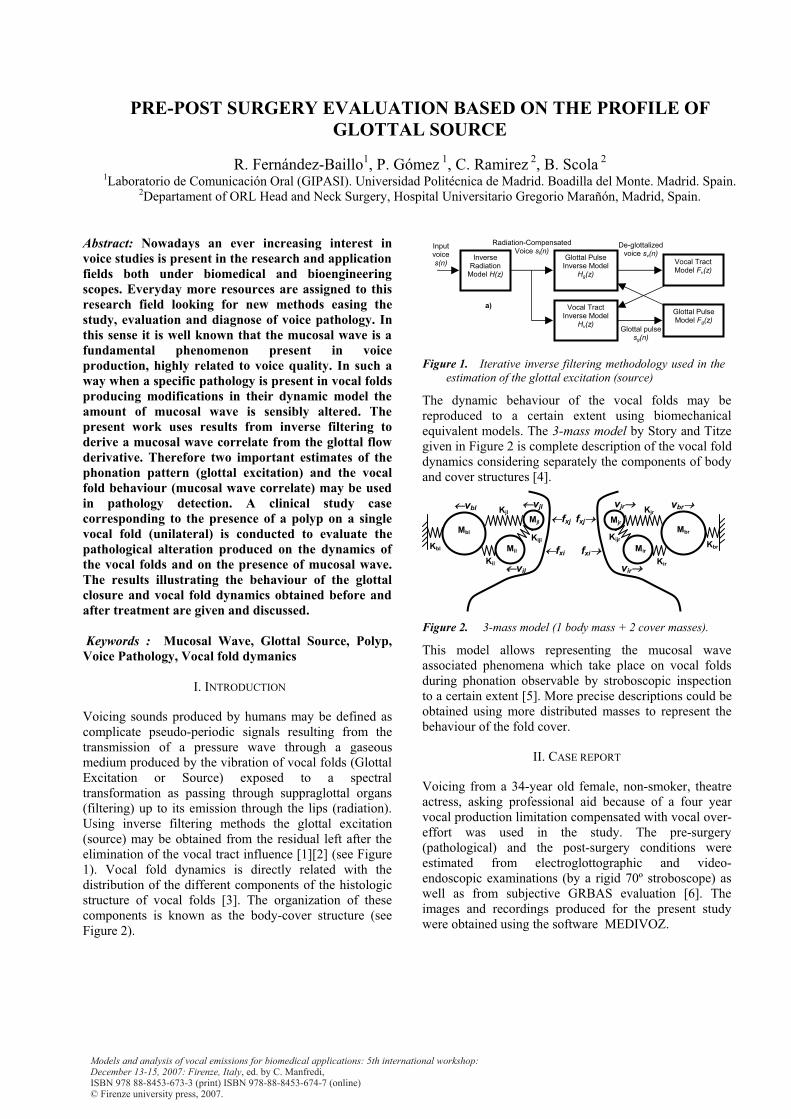
Models and analysis of vocal emissions for biomedical applications: 5th international workshop: December 13-15, 2007: Firenze, Italy, ed. by C. Manfredi,ISBN 978 88-8453-673-3 (print) ISBN 978-88-8453-674-7 (online)© Firenze university press, 2007.
Abstract: Nowadays an ever increasing interest in voice studies is present in the research and application fields both under biomedical and bioengineering scopes. Everyday more resources are assigned to this research field looking for new methods easing the study, evaluation and diagnose of voice pathology. In this sense it is well known that the mucosal wave is a fundamental phenomenon present in voice production, highly related to voice quality. In such a way when a specific pathology is present in vocal folds producing modifications in their dynamic model the amount of mucosal wave is sensibly altered. The present work uses results from inverse filtering to derive a mucosal wave correlate from the glottal flow derivative. Therefore two important estimates of the phonation pattern (glottal excitation) and the vocal fold behaviour (mucosal wave correlate) may be used in pathology detection. A clinical study case corresponding to the presence of a polyp on a single vocal fold (unilateral) is conducted to evaluate the pathological alteration produced on the dynamics of the vocal folds and on the presence of mucosal wave. The results illustrating the behaviour of the glottal closure and vocal fold dynamics obtained before and after treatment are given and discussed.
Keywords : Mucosal Wave, Glottal Source, Polyp, Voice Pathology, Vocal fold dymanics
I. INTRODUCTION
Voicing sounds produced by humans may be defined as complicate pseudo-periodic signals resulting from the transmission of a pressure wave through a gaseous medium produced by the vibration of vocal folds (Glottal Excitation or Source) exposed to a spectral transformation as passing through suppraglottal organs (filtering) up to its emission through the lips (radiation). Using inverse filtering methods the glottal excitation (source) may be obtained from the residual left after the elimination of the vocal tract influence [1][2] (see Figure 1). Vocal fold dynamics is directly related with the distribution of the different components of the histologic structure of vocal folds [3]. The organization of these components is known as the body-cover structure (see Figure 2).
Figure 1. Iterative inverse filtering methodology used in the estimation of the glottal excitation (source)
PRE-POST SURGERY EVALUATION BASED ON THE PROFILE OF GLOTTAL SOURCE
R. Fernández-Baillo1, P. Gómez 1, C. Ramirez 2, B. Scola 2 1Laboratorio de Comunicación Oral (GIPASI). Universidad Politécnica de Madrid. Boadilla del Monte. Madrid. Spain.
2Departament of ORL Head and Neck Surgery, Hospital Universitario Gregorio Marañón, Madrid, Spain.
The dynamic behaviour of the vocal folds may be reproduced to a certain extent using biomechanical equivalent models. The 3-mass model by Story and Titze given in Figure 2 is complete description of the vocal fold dynamics considering separately the components of body and cover structures [4].
Figure 2. 3-mass model (1 body mass + 2 cover masses).
ve
II. CASE REPORT
oicing from a 34-year old female, non-smoker, theatre
This model allows representing the mucosal waassociated phenomena which take place on vocal folds during phonation observable by stroboscopic inspection to a certain extent [5]. More precise descriptions could be obtained using more distributed masses to represent the behaviour of the fold cover.
Vactress, asking professional aid because of a four year vocal production limitation compensated with vocal over-effort was used in the study. The pre-surgery (pathological) and the post-surgery conditions were estimated from electroglottographic and video-endoscopic examinations (by a rigid 70º stroboscope) as well as from subjective GRBAS evaluation [6]. The images and recordings produced for the present study were obtained using the software MEDIVOZ.
Inverse Radiation
Model H(z)
Glottal Pulse Inverse Model
Hg(z)
Radiation-Compensated Voice sl(n)
Vocal Tract Model Fv(z)
Vocal Tract Inverse Model
Hv(z)
Input voice s(n)
De-glottalized voice sv(n)
a)
Glottal pulse sg(n)
Glottal Pulse Model Fg(z)
Mjl
Mil
Kil
Kjl
Mjr
Mir
Kir
Kjr
fxi
Kijl Kijr
fxi
fxj
vjl
vil
vjr
vir
fxj Mbl
Kbr
Mbr
vbl vbr
Kbl
Continuous speech/prosody 223
A prospective case-control study of jitter%, shimmer% and Qx%, glottis closure cohesion factor (Spead by Laryngograph Ltd.) and Long Time Average Spectra
Mette Pedersen MD Ear-Nose-Throat specialist PhD1 and Kasper Munck MSc.21The Medical Center, Ear, Nose, Throat and Voice Unit. Østergade 18. DK-1100 Copenhagen Denmark
e-mail: [email protected], url: www.mpedersen.org, and 2SAS statistical Institute
1. Introduction It was suggested at the �uropean Oto-�hino-Laryngology
conference 2007 in Vienna that voice analysis is empiric and
that clinical voice treatment is not evidence based!! In the
Cochrane Handbook [1] advice for evaluation of quality of
research was made: �roups are made of the quality in 3
levels: Level A (randomized controlled trial/meta-analysis):
High-quality randomized controlled trial (�C�) that considers
all important outcomes. High-quality meta-analysis
(quantitative systematic review) using comprehensive search
strategies. Level B (other evidence): A well-designed, non
randomized clinical trial. A non quantitative systematic review
with appropriate search strategies and well-substantiated
conclusions, includes lower quality �C�s, clinical cohort
studies and case-controlled studies with non biased selection
of study participants and consistent findings. Other evidence,
such as high-quality, historical, uncontrolled studies, or well-
designed epidemiological studies with compelling findings, is
also included. Level C (consensus / expert opinion):
Consensus viewpoint or expert opinion.
�he purpose of this categorization is that good studies can be
structured in meta-analysis to affirm the results as it is done in
e.g. cancer and cardiology research.
In our two Cochrane reviews on vocal nodules [2] and laryngo-
pharyngeal reflux [3] no clinical evidence based studies were
found neither for the treatment of vocal nodules nor laryngo-
pharyngeal reflux. In the review of vocal nodules 659 papers
were evaluated, and in the review of laryngo-pharyngeal reflux
302 papers. �he problem most commonly found, was lack of a
clear baseline for inclusion in the studies, and, lack of
unanimous objective visual and acoustic criteria.
�herefore we have in a part one of this prospective case-
control study [4] first, tried to make a defined baseline of a
complaint of a non-functioning larynx, second, to standardize
simple object visual demands for larynx mucosa including the
vocal cords but based on oedema of the arytenoids, third, to
evaluate the measures of jitter percent, shimmer percent in
relation to the closed phase percent of the vocal cords.
�vidence of pathological parameters were defined for
sustained tons as well as the reading of a standard text, �able
1, difference was also found from before to after treatment,
�able 2, treatment as ealier discribed [5]
As part two we used the same patients material, for all with
sufficient data, in the same prospective controlled case-
controlled setup, for two still more advanced objective throat
function analysis: the Cohesion Factor of irregularity as defined
in the Spead program by Laryngograph Ltd. illucidating
kymographic aspects and Long �ime Averaging Spectrum
(L�AS).
MethodI. Inclusion criteria were a. subjective complaints of a non-
functioning larynx combined with b. a professional assessment
and visual score grouping the patients by swelling in the
arytenoids +/- pathological vocal cords. Patients without
swelling of the arytenoids and with normal vocal cords were
rated normal, score 1 by visual inspection. Patients with
swelling rated from 2 to 5 were abnormal. �here are individual
variations but a normal video-stroboscopy includes a normal
surface of the arytenoids without oedema and a normal shape,
as well as normal colour and movement at stroboscopy of the
vocal cords and all the rest of the mucosa of the larynx. Fig.
1A, normal, score 1, and Fig. 1� and C, abnormal scores
(score 3 and 5 presented).
II. �he parameter: the closed phase of the vocal cords defines
the exact point where the vocal cords meet in the synchro-
nized glottography with stroboscopy [6]. �his is difficult to see,
if there is oedema of the arytenoids or of the whole larynx
mucosa. �he closure of the vocal cords (Qx%) and the
fundamental frequency (Fx%) can under those circumstances
be compromised even if the vocal cords themselves have
movement. �he whole larynx can be affected due to infections,
allergy, reflux and misuse etc. [5]. �esting binary equal
movements of the vocal cords related to the total amount of
movements gives a Cohesion Factor of irregualrity (Spead by
Laryngograph Ltd.) for Qx% and Fx% analyzed for a
sustained tone for 4 seconds and reading of a standard text
(“the north win and the sun”). Fig. 2. �he abnormality degrees
of the arytenoids with visual scores of 4 is shown before and
after treatment.
III. �he clinical use of harmonics including formants was
empiric in pathology till now. �his patient material analysed for
the cohesion factor was also analysed for Long �ime Average
spectrograms (L�AS), for a sustained tone /a/ for 4 seconds
and a standard text (“the north win and the sun”). �he problem
was to point out the maximal intensities in pathology especially
related to formants, and the change related to treatment.
Fig. 3a shows the normal L�AS during reading the north win
and the sun, of 35 persons with normal larynx, score 1,
ADVANCED VOICE ASSESSMENT.

The final results from the pre-surgery study of the vocal folds determined the presence of a gelatine-type polyp [7](pointed by the arrow in Figure 3 left) affecting the free lip of the medial third of the left vocal fold, substrate-attached and mildly edematous. Contra-lateral lesions were not observed. The glottal closure produced during phonation was incomplete and the mucosal wave on the vocal cord affected was asymmetric and reduced.
Figure 3. The left and right templates respectively show the conditions of pre- and post-surgery vocal folds in a gelatine-type polyp.
The patient followed surgical treatment to excise the lesion and to re-establish the anatomical healthy condition of the vocal fold, respecting the vocal ligament, the anterior commissure and Reinke’s space, to ease the vibration conditions of the vocal folds for the mucosal wave to be re-installed
III. METHODS
3.1 Sample collection
The voice recording protocol included three utterances of vowel /a/ with a duration not shorter than 3 sec. for each emission. Segments of 0.2 sec. were produced from the recording central parts for the analysis. These segments were processed to derive the average acoustic wave and the cover dynamic component [8].3.2 Estimating the glottal flow derivative and the
mucosal wave correlate
The dynamic behaviour of the vocal fold cover may be described using a simplified 2-mass model if the average acoustic wave is eliminated from the glottal excitation, as the residual dynamics can be referred to the vocal fold body mass [9][10]. This new dynamic system will consider only the cover masses, related with the mucosal wave phenomenon. The modelling of the mucosal wave correlate will be described by the dynamic behaviour of each of the four masses (two per vocal fold cover) to external forces (induced by pressure differences) as a general equation of the kind:
t ti,jl,r
j,il,r
ijl,r
j,il,r
j,il,r
j,il,rj,i
l,rj,il,r
j,il,r
j,il,r 0dt)vv(KdtvK
dt
dvMRvf
where l,r is the force acting over the sub-glottal (i) or supra-glottal (j) mass on the right (r) or left (l) vocal fold on the direction of the vocal fold movement (considered
normal to the larynx transversal section), is the velocity of the mass considered , will be the loss parameter (viscosity and heat dissipation), j,i
l,r will be the spring elastic constants of the springs linking the cover masses to the body mass, and l,r will be the elastic constant of the spring linking both masses. This 2-mass model explains the behaviour of the mucosal wave observed when exploring the vocal folds in movement during phonation to a certain extent enough for the purposes of the present study, more complete descriptions requiring more complex models. The separation of the average acoustic wave from the cover dynamic component allows the differentiate study of both components, associated respectively to the movement of the body and cover masses
j,if
K
ijK
j,il,rv
j,il,rM j,i
l,rR
[11] .
3.3 Analyzing the glottal flow derivative and the
mucosal wave correlate
The analysis of the glottal source in the time domain allows the evaluation of the normal or non-normal phonation conditions depending on the resulting profile. For such the following singular points during the open-close phases of a glottal excitation with period given by T have to be determined as: return interval (Tr=tr), closed interval (Tc=to-tr), open interval (To=tcl-to) and closing interval (Tcl=T-tcl) (see Figure 4).
Figure 4. Singular points in the opening-closing phases of a phonation cycle according to the L-F model.
To evaluate these points the direct glottal flow derivative is not used, due to the uncertainty about the point where the closure ends and the opening starts resulting from higher order vibration cycles superimposed on that signal. Instead, it may be shown that the mucosal wave correlate provide more reliable indications about where that instant is to be estimated. The derivative of the mucosal wave correlate gives also precise hints to localize the end of the return phase and the beginning of the closing phase. The estimation of the different points may be carried out as follows:
tr to
orcTr
Tc To Tcl
c’r’o’
tcl
66 MAVEBA 2007

Tr: Return Interval. After full closure the static pressure conditions (atmospheric) are re-established by reversal flow. This process is known as the return phase. It may be estimated from the first minimum on the derivative of the mucosal wave correlate.
Tc: Complete Closure Interval. The glottal pathway has been interrupted by full contact of both vocal folds at the supra-glottal end. The inertial behaviour of the flow of gas results in a sharp pressure decay, arriving to a minimum.
To: Open Interval . At the end of the closure phase the open phase starts at the subglottal end. Its starting may shown to be related with the minimum observed on the mucosal wave correlate.
Tcl: Closing phase interval, the equivalent section between vocal folds having arrived to a maximum a decrease is initiated. Its start may be estimated at the intersection of the line extending from the end of the return phase with the glottal excitation.
The amount of stress in the vocal folds and the mucosal wave energy may be estimated from the profile of the mucosal wave power spectral density [12].
III. RESULTS AND DISCUSSION
The results obtained on pre- and post-surgery for the same patient are given in Figure 5. In the pre-surgery exploration voice was defined by the presence of roughness (tense and hoarse voice) and aerial leakage. These characteristics can be appreciated in the profile of the glottal excitation (upper template). The profile presents a short period of T=4.5 msec, expressing the tension existing between vocal folds during phonation. Tense voice is usually associated with a diminishing of the mucosal wave amplitude/energy relative to that of the average acoustic wave, as it may be assumed that the highest the tension the less mucosal wave will be present. In the case studied the diminishing in the mucosal wave is not symmetrical as it affects most to the closure interval of the phonation cycle, where it is more intense during the return and open intervals (the closure interval appears to be extremely short, as the polyp produces incomplete closure). The profile of the glottal excitation is almost a reflected version of the Liljencrants-Fant (L-F) pattern [12] with respect to the vertical axis. This asymmetry may be due to the influence of the vocal fold affected by the polyp, where the mucosal wave appears much more diminished. The presence of the polyp in the medial third of the fold has produced a change in the histological structure of the fold, resulting in an increment in the lax conjunctive tissue on the fold cover
[13], which becomes a more rigid dynamic structure behaving as a single mass, i. e., the affected fold have switched to a 1-mass structure. The healthy vocal fold keeps an intact histological structure as it appears that a contact lesion is not present, and the reduction in the mucosal wave is due to the tension associated to the pathological vocal fold. The resulting dynamics of both vocal folds diverges from the ideal 3+3-mass cover model to become a 3+1 one.
Figure 5. Estimating time intervals on the glottal source and the mucosal wave correlate. Top: pre-surgery. Bottom: post-surgery.
A second characteristic of the excitation is the presence of aerial leakage. The polyp has originated a mass protruding in the glottal cleft where fold contact takes place during the closed phase, impeding an effective glottal closure and deriving a flow leakage. The phonation times given in Fig.5 (top) show that the aerial escape is marked by a rather short Tc and an increment in
Tc To Tcl
Tr
Tc ToTr Tcl
Posters 67

the duration of the open interval To. The flow injection during the open phase is produced at the beginning of the interval, the pressure decaying to the static conditions as the aerial escape does not allow an efficient burst to be injected. The result is a profile with a premature and incomplete open phase which gives the mirror-like reflection appearance to the profile when compared against the well known L-F one. The objective of surgery in this case was to restore the vocal fold anatomy to normality by an excision to eliminate the edema and stroma and the epithelial hiper-keratosis. The post-surgical glottal excitation produced is shown in Fig.5 (bottom). The resulting profile is much more similar to the classical L-F one. The amount of mucosal wave is now more balanced along the phonation cycle, the tension observed during the closing phase having disappeared. The 2-mass cover model behaviour seems to have been recovered. The normalization of the glottal excitation profile is stated in the duration of the different intervals: the return phase is more relaxed, the closure has been increased and the burst due to flow injection recovers the classical hunchback-like pattern. Aerial escape has almost disappeared, although a slight leakage is still appreciable as a result of the phonation gesture acquired during the persistence of the pathology. Its complete elimination is the role reserved for voice rehabilitation procedures to grant the success of surgery and avoid the recursive appearance of the pathology. The control of flow and the improvement in the glottal closure efficiency result in a larger and better conformed flow injection. The dynamics of the vocal folds has been re-established with a better adduction and a re-established mucosal wave pattern.
V. CONCLUSIONS
The mucosal wave correlates may serve to track the voice quality during the rehabilitation phase to optimize the altered functionality of the vocal folds. The mucosal wave appears as a critical element for the study of voice pathology, as it may help in determining the duration of each phase and its relative relevance or condition. Pathologies inducing an increment in tension produce a reduction of the mucosal wave in certain parts of the phonation cycle. The study of the mucosal wave profile may serve as an indicator of the phonation conditions, not only to determine the presence of pathology, but to establish the evolution of treatment in an objective way.
Acknowledgments
This work is being funded by grants TIC2003-08756 and TEC2006-12887-C02-01/02 from Plan Nacional de I+D+i, Ministry of Education and Science, by grant CCG06-UPM/TIC-0028 from CAM/UPM, and by project HESPERIA (http.//www.proyecto-hesperia.org) from the
Programme CENIT, Centro para el Desarrollo Tecnológico Industrial, Ministry of Industry, Spain.
REFERENCES
[1] Sokorin VN, Leonov AS, Thrushkin AV. Estimation of stability and accuracy of inverse problem solution of the vocal tract. Speech Communication.Vol. 30, No 1, January 2000, pp 55-74.
[2] Haykin S. Adaptive filter theory. Prentice-Hall, Englewood Cliffs, NJ. 1996.
[3] Hiarino M, Kusita S, Kiyokawa K and cols. Basic and clinical investigation. Otologia (Fukuska), 1975; 21:231-242.
[4] Gómez P., Fernández-Baillo R., Rodino JI. Estudio de la patología vocal basado en la estimación del correlato de la Onda Mucosa de los pliegues vocales. Congreso Anual Sociedad Española de Ingeniería Biomédica. CASEIB’06. pp.337-342. Pamplona.2006
[5] Rosen CA.Stroboscopy as a research instrument: development of a perceptual evaluation tool. Laryngoscope. 2005 Mar 115 (3): 423-8.
[6] Hirano M, Hibi S, Yoshida T, Hirade Y, Kasuya H, Kikuchi Y. Acoustic análisis of pathological voice: Some results of clinical application. Acta Otolaryngologica. Vol. 105, No 5-6, pp. 432-438, 1998.
[7] Kleinsasser O. Pthogenesis of vocal cord polyps. Ann. Otol. Rhinol. Laryngol. 1982: 91: 378-381.
[8] Titze IR. Summary Statement. Workshopon Acoustic Voice Analysis. National Center of Voice and Speech. 1994.
[9] Ishizaka K., Flanagan J., Synthesis of voiced sounds from a two-mass model of the vocal cords. Bell Systems Technical Journal, Vol 51, 1972, pp. 1233-1268
[10] Giovanni, A., Ouaknine, M., Guelfucci, B., Yu, P., Zanaret, M. and Triglia, J. M., “Nonlinear Behavior of Vocal Fold Vibration: The Role of Coupling Between the Vocal Folds”, Journal of Voice, Vol. 13, No. 4, 1999, pp. 465-476.
[11] Gómez P., Fernández-Baillo R., Nieto A., Díaz F., Fernández Camacho FJ., Rodellar V., Álvarez A and Martínez R. Evaluation of voice pathology based on the estimation of the vocal fold biomechanical parameters. Journal of Voice. Vol. 21, No. 4, pp. 450–476
[12] Fant G., Liljentcrants J., Lin Q., "A four-parameter model of glottal flow", STL-QSPR, Vol. 4, 1985, pp 1-13. Reprinted in Speech Acoustics and Phonetics: Selected Writings, G. Fant, Kluwer Academic Publishers, Dordrecht 2004, pp. 95-108.
[13] Bartual R., Bartual J., Morera H., Fortez J., Barbera E. Los pólipos laríngeos. Acta del Decimononus Conventos de la Societas Oto-Rhino-Laryngologica Latina. Madrid. Gráficas Reunidas S.A., 1972; 247-271
68 MAVEBA 2007

Models and analysis of vocal emissions for biomedical applications: 5th international workshop: December 13-15, 2007: Firenze, Italy, ed. by C. Manfredi,ISBN 978 88-8453-673-3 (print) ISBN 978-88-8453-674-7 (online)© Firenze university press, 2007.
Abstract: Speech is the most direct and intuitive form of human communication. Speaker uses to emphasize his utterance a set of non-verbal features. It is called prosody. The prosody serves a critical information for the recognition and understanding system. This paper describes an idea to use data warehouse properties for storage of prosody features. The work presented in this paper was supported by the project number 2C06009. Keywords: Spontaneous speech, prosody features, data warehouse
I. INTRODUCTION
The main goal of this paper is introduction to a feasible solution of problems concerning prosody features in spontaneous speech. Speech is the most direct and intuitive form of human communication. The people do not speak monotone word by word, but they use elements, that affect and accent the interpretation of the parol utterance. The people gesture, due to many variations in melody, intonation, pause and accent of speech represent their emotion and their spirits, for example joy, anger, sadness, surprise or fear. The set of these non-verbal features is called prosody. The prosody serves a critical information for the recognition and understanding system. These non-verbal features support and emphasize an utterance meaning. The speech recognition quality is increased by the speaker´s style determination by using prosody features, because prosody
dependences on speaker’s age and sex represents speaker’s attitude and emotion. usually betrays speaker - foreigner. is affected by aphasia.
II. PROSODY AND ITS FEATURES
Prosody is integrated exclusively into spoken speech. It is set of features, so-called suprasegmental component of an utterance. Just missing prosody is the main reason of unnatural synthetic speech sounding. Prosody advances intelligibility of utterances, on the other hand a false understanding of prosody can modify its meaning. Fundamental prosodic features included fundamental frequency F0, voice energy and a speaking rate. Accent, intonation, emotive timbre, pause, filling and repeating group derived prosodic features.
These attributes play an important role for a correct recognition and understanding of spontaneous speech and they can be detectable on prosodic segments like as
Fundamental unit of spoken speech. Integrated intonation unit. Syllable group with one word accent. Elementary segment, where prosody can be used.
Why is not only speech recognition, but also nonverbal communication and speaker identification very important? In Czech language with its free-word-ordering intonation serves a critical information for the recognition and understanding system. For some sentence the intonation is essentials to determine the core of a communication, depending on a speaker who emphasizes a meaning of the sentence. The design of the module for suprasegmental type processing is based on the partitioning of the speech into sentence. There are words with the same sounding, but these words have a different meaning. Correct understanding of these words consists in utterance context. On the other hand in Czech stress syllable a vowel quality just as a vowel quantity do not differ from unstress syllable. Everybody of speakers, but even the same speaker speaks the same word differently. It depends on situation and background, where it happens. A word, but also a whole utterance can be pronounced in more or less disturb and noisy backround. It is important for utterance style, whether a speech appears from a read text or speech is spontaneous utterance. A hearer recognizes these two categories although their lexical , syntactic and semantic structures are identical. Prosody contribution is very significant for distinguish between perception of read text and spontaneous speech perception. A spontaneous speech, especially in a dialogue, replies to an utterance purport. It is affected not only by its subject, but also by the others cues, speaker’s feeling or noise environment. A perception and understanding of an utterance meaning make for various long pauses. These pauses could not ever become evident or these could be shorter in read text with the same subject. An utterance is actually encapsulated unit both in light of meaning and purport and in light of sound side. An utterance of a speaker (for example a foreigner or a small child) can be only a word sequence, understandable in the existing situation, but it can not be a sentence in light of grammar.
DATA WAREHOUSE FOR PROSODY FEATURES
Jana Krutišová, Jana Kle kováDepartment of Computer Science and Engineering, University of West Bohemia, Pilsen, Czech Republic

On the other hand a sentence can contain only one short word, its purport and its meaning is unmistakable from context. For example a short sentence „And ?“ can represent the same meaning as a sentence „What happens?“ or „What will happen?“ Even it can be substituted only by gesture in a specific situation. Prosody distinguishes every speaker, because people usually do not use a literaty language in everyday communication. Wherefore prosody often show up for example geographic or social speaker origin, it shows speaker’s attitude. The prosody importance appears also from previous work concerning automatic dialogue acts recognition in Czech based on sentences structure.
III. USE OF A DATA WAREHOUSE
There are many factors affecting a verbal communication, gesture, a context of a previous utterance and a next utterance, information about speaker’s individuality, his customs and his attitude. .
Fig.1 Star schema for a storage of prosody characteristics
By above reasons it is very important to look at multidimensional view. Although a data warehouse technology is not standard process for spontaneous speech area, we try to use multidimensional database architecture and its properties for storage of prosody characteristics. A hypercube as an underlying structure from data warehouse technology can be implemented by star schema. In this case, all data are contained in two
types of tables called a fact table and a dimension table. There is a single fact table in a center of a star schema.
IV. DISCUSSION
A fact table contains the measurements or metrics or facts of processes in view. In addition to the measurements, a fact table contains foreign keys for the dimension tables, several dimension tables are used of text information storage about values in a fact table. The dimension attributes also contain one or more hierarchical relationships. Our schema consists of three dimension tables and fact table for the first experiment (Fig.1).
V. CONCLUSION
The future goal will try to use data warehouse properties for storage of prosody features.
Design multidimensional model for saving of prosodic features.
Select suitable tool for implementation of the designed model.
Verify, if we can use data warehouse properties for spontaneous utterances monitoring and how we can do it.
REFERENCES
[1] Abelin A., Allwood J.: Cross-linguistic interpretation of emotional prosody. In Proceedings of the ISCA Workshop on Speech and Emotion, 2000.
[2] Kleckova J.,Krutisova J. Matousek V. Schwarz J.: Important prosody characteristics for spontaneous speech recognition In: Proceedings of the 9th international conference on neural information processing : ICONIP`02. - Singapore : Nanyang Technological University, 2002. - ISBN 981-04-7525-X. - S. 1-5
[3] Inmon, W. H.: Building the Data Warehouse – Second Edition, JOHN WILEY & SONS, Inc. New York, 1996
70 MAVEBA 2007

Models and analysis of vocal emissions for biomedical applications: 5th international workshop: December 13-15, 2007: Firenze, Italy, ed. by C. Manfredi,ISBN 978 88-8453-673-3 (print) ISBN 978-88-8453-674-7 (online)© Firenze university press, 2007.
Vocal Tract Lips Radiation Speech
Nonlinear Least-
Squares Fitting
Estimation of Vocal Tract
Estimation of Lips
Radiation
Estimated Speech
Estimated Vocal Tract Parameters
Mathematical Model
Estimated Voice Source Parameters
Human
Machine
Voice source:
lungs, vocal folds
Abstract: There are a number of clinical conditions that affect directly or indirectly the function of the vocal folds and thereby the pressure waveforms of elicited sounds. If the relationships between the clinical conditions and the voice quality are sufficiently reliable, it should be possible to detect these diseases or disorders. The focus of this paper is to determine the set of features and their values that would characterize the speaker’s state of vocal folds. To the extent that these features can capture the anatomical, physiological, and neurological aspects of the speaker they can be potentially used to mediate an unobtrusive approach to diagnosis. We will show a new approach to this problem, supported with results obtained from two disordered voice corpora. Keywords : Model, glottal pulse, pathological voice
I. INTRODUCTION
Production of voice is influenced by the cognitive, neurological and physical state of speaker. In fact, voice production depends on the precise interaction of many components including anatomical, physiological and neural aspects of the body. It is, therefore, not surprising that voice characteristics would be affected by a wide range of disorders and diseases. Hormonal imbalance, neurological disturbances, lung disease, and mental functioning can influence and often interfere with the ability to produce a clear and intelligible voice. Conversely, it should be possible to use acoustical analysis of signals generated by patients to assess the health and the mental state of the patient.
Existing attempts for voice-based diagnosis have been based on features which are only remotely connected to the physical characteristics of the vocal folds. We describe a new method to estimate vocal fold dynamics using a parametric model of glottis movements in order to assess the health of the vocal folds and detect pathological conditions of the larynx. This approach would ultimately enable clinicians to assess and diagnose individuals using only their vocalizations. Although the sensitivity and specificity of the diagnosis are likely to be limited, this is a very feasible approach for triaging individuals for further testing and treatment. We envision that in the future this diagnosis can be performed over the telephone. Therefore, the analysis would be conducted as
an unobtrusive exam and would contribute to the comfort the patient.
DETECTION OF PATHOLOGICAL DISEASES USING A PARAMETRIC MODEL OF VOCAL FOLDS AND NEURAL NETWORKS
P. Chytil1,2, C. Jo3, K. Drake4, D. Graville4, M. Wax4, M. Pavel11Biomedical Engineering Department, Oregon Health & Science University, Portland, Oregon, USA
2Faculty of Electrical Engineering and Communications, Brno University of Technology, Czech Republic 3School of Mechatronics, Changwon National University, Changwon, Gyeongnam, Korea
4Department of Otolaryngology, Oregon Health & Science University, Portland, Oregon, USA
II. METHODS
Our general approach to the diagnosis of larynx pathologies consisted of two phases: (1) estimation of the vocal tract transfer function H( ) and the pitch F0 and (2) estimation of the parameters of the best fitting glottal pulse generating model. This approach is similar to the previous work on the characterization of the quality of voice using parameters of the Fant model [1]. The vocal tract transfer function was estimated assuming that the frequency distribution of the glottal pulse within the relevant region was approximately constant. Given this estimate, we found the parameters of a mathematical model that would maximize the correspondence between the observed and synthetically generated utterances filtered by H( ). The resulting computed speech signal model was fitted to the speech signal. In particular, the best-fitting set of models’ parameters was then estimated for each subject’s data by maximizing the correlation between the computed and the actual signals prior to the lip transformation. The optimization was performed using the Nelder-Mead simplex search method, because of the complex error surface due to nonlinearities, discontinuities and the complex interactions among the model parameters. The block diagram of the process of estimation of the parameters is shown in Fig. 1.
In this study we report the results based on the
Fig. 1. Block diagram of the parameters estimation process.

Fujisaki-Ljungqvist (FL) model [2]. The glottal flow and its derivative of this model are represented by polynomial segments. The choice of a polynomial model provides a convenient way to vary the number of parameters, which is useful for evaluating their relative importance. In its most elaborate form, the model has three timing parameters controlling open phase duration, pulse skew and the time interval from glottal closure to maximum negative flow D. In addition, there are three amplitude-related parameters controlling the slope at glottal opening A, the slope prior to closure B and the slope following closure C. Although the offset parameter A (see Fig. 2)has not been in prior applications, we have included it since a secondary excitation can often be observed at glottal opening. The rounded closure, that is often evident in the glottal flow waveforms, is sometimes attributed to a gradual glottal closure leaving a small residual flow after the main excitation stops. We also included a component attributable to the period of negative flow due to the lowering of the vocal cords following the glottal closure. The mathematical representation of the glottal flow in the FL model is given by:
2
3 2 22 3( ) ( ) ( ) 2 3
2(C- ) 2C- ( ) ( ) W<t W+DD 2
W+D<t T
( )
A R AA tRB F B Ft R t R t R R t W
F FCt W t WD
E t
2 0<t R2
,
R tR
(1)
where W=R+F and are defined by:
2 2
4 6,
2
AR FBR F
(2)
.3( )
CDD T W
(3)
Fig. 2. One period of FL model showing glottal flow Ug(t) and glottal flow derivative E(t) and its parameters.
We have evaluated three different methods of obtaining the estimation of the glottal pulse from the speech signal:
1) Estimation process of the vocal tract using the LPC coefficients [3], based on a questionable assumption that the glottal pulse is a pulse train with a uniform spectrum. The order of the LPC coefficients was selected to 32 (for sampling frequency of 16 kHz) to be sufficiently high to characterize the vocal tract, and yet sufficiently low not alter the shape of the glottal pulses.
2) Cepstral [4], in which the vocal tract estimation is based on the notion that the frequency ranges of the vocal cord filtering action and the glottal forcing functions do not overlap. This method uses homomorphic filtering, whereby the multiplication of the transfer functions is transformed into an addition as a consequence of the logarithmic transformation. In particular, this method is based on cepstral filtering – liftering.
3) Interactive Adaptive Inverse Filtering [5], where the vocal tract transfer function is estimated by minimizing the contribution of the average glottal pulse. This method iterates two phases. The first phase generates an estimate of the glottal excitation, which is subsequently used as input of the second phase that generates a more accurate estimate. Typically, the inverse filtered signal is no longer than a couple of hundreds of milliseconds to ensure minimal changes in the vocal tract transfer function.
The evaluation process involved estimation of the model parameters, constructing feature vectors and using those for the classification of the voice samples. The vector of features included the maximum value of the correlation function, the amplitude normalized parameters of a model (A, B, C) and the temporal parameters (R, F, D) multiplied by F0. These features were estimated using three samples of 32ms window from a modeled subject at the 100ms, 200ms and 300ms from the beginning of the utterance. The classification was implemented with a feed-forward back-propagation network using gradient descent error for learning. The topology of the neural network comprised one input layer, one layer of hidden units and one output layer. A separate network was used for each estimation technique: number of inputs depends on the model, m hidden units and l output unit. The number of hidden units is in the range of 5-54. This neural network approach was chosen because of its computational efficiency, performance and simplicity.
III. RESULTS
In order to evaluate this approach, we used the Kay Elemetrics Disordered Voice Database [6], that comprises over 1,400 voice samples of approximately 700 subjects and includes sustained phonation and running speech samples from patients with a wide variety of organic, neurological, traumatic, and psychogenic voice disorders, as well as from 53 normal speakers. We used only utterances with steady pronounced vowel /a/. In addition,
72 MAVEBA 2007

we used the Korean Disordered Speech Database [7] that consists of 28 benign and 31 malignant pathological speakers and 41 normal speakers. This database was collected using the Kay Elemetrics database as a template. The utterances in this database are vowels /a/, /e/, /i/, /o/, /u/. Again we used only the vowel /a/. The sampling frequency and the bit resolution is the same as in Kay Elemetrics. However we have down-sampled all the data to 16kHz for both databases. In this paper we describe the classification results obtained with databases combined.
Fig. 3. Maximum value of correlation for FL models with respect to method of inverse filtration.
Since the classification is based on the correspondence between the models and the data, we first present the frequency distribution of the correlations between the model and the data shown in Fig. 3. The graph shows the distribution of the maximum values of correlation of the model and particular inverse filtering method. Although this model generally fits a large proportion of the speakers, there was small number of cases with only marginal fit to the model. This was mostly due to the effects of the pathology of the glottal signal generation process. An example of the ability of the model to fit pathological speakers is shown in Fig. 4-6.
Fig. 4. Signal fit for a pathological speaker, solid line is real speech and dashed line is re-synthesized speech from the model (max of correlation value is 0.972).
Fig. 5. Signal fit for a pathological speaker, solid line is real speech and dashed line is re-synthesized speech from the model (max of correlation value is 0.932).
Fig. 6. Signal fit for a pathological speaker, solid line is real speech and dashed line is re-synthesized speech from the model (max of correlation value is 0.804).
The classification was performed using feed-forward neural networks trained individually for each type of diagnosis. In order to prevent over-fitting, we used a cross-validation approach to train the classifier [8]. The results of test sets are shown in Fig. 7.
IV. DISCUSSION
The results of the binary classification process are shown in Fig. 7 in terms of the proportion of correct discrimination between pathological and healthy speakers (sensitivity and specificity). We have used a confusion matrix to determine accuracy of the methods. In each case the neural network was determined using binary classification of specific pathology vs. normal. The resulting performance of the glottal pulse model in conjunction with the simple neural network classification process is commensurate with many clinical tests.
In case of “A-P squeezing” and “A-P squeezing (mild)” we found that the results of a mild case of this pathology yields worse accuracy compared to the fully
Posters 73

Fig. 7. Accuracy of pathology detection using FL model and all three inverse filtering methods.
develop pathology. This is analogical to general findings, since the mild case of diseases is closer to a healthy state, therefore, it is harder to recognize it as a diseases.
Also results for the case of “pathological voice – diagnosis N/A” would confirm that this approach is suitable for general detection of the pathologies since the group consists of variety of pathological voices without known diagnosis.
V. CONCLUSION
These results suggest that this method has a potential to triage pathologies in human voice and moreover, relate the values of the parameters to the state of the speech generation mechanisms. The average accuracy of detection across the pathological voice and normal voice was for LPC method 88.7%, for cepstral method 90.83% and for IAIF method 92.42%. We achieved the best average accuracy of detection across the pathological voice and normal voice using FL model with IAIF method.
REFERENCES
[1] C. Gobl, “A preliminary study of acoustic voice quality correlates”, Speech Transmission Laboratory Quarterly Progress and Status Report, vol. 4, 1989, pp. 9-22.
[2] H. Fujisaki and M. Ljungqvist, “Proposal and Evaluation of Models for the Glottal Source Waveform”, In Proceedings of Acoustics, Speech, and Signal Processing, ICASSP’86, IEEE, Tokyo, Japan, 1986, pp. 1605-1608. [3] Y. Qi and N. Bi, “A Simplified Approximation of The Four-Parameter LF Model of Voice Source”, Journal of the Acoustical Society of America, vol. 96, no. 2, 1994, pp. 1182-1185. [4] P. Chytil and M. Pavel, “Estimation of Vocal Fold Characteristics using a Parametric Source Model”, Eleventh Australasian International Conference on Speech Science and Technology, Auckland, New Zealand, 2006. [5] P. Alku, “Glottal wave analysis with pitch synchronous Interactive Adaptive Inverse Filtering”,Speech Communication, vol 11, 1992, pp. 109-118. [6] KayPentax. “Disordered Voice Database”, ver 1.03.http://www.kayelemetrics.com/Product%20Info/CSL%20Options/4337/4337.htm, 1994. [7] “Korean Disordered Voice Database”. ver 1.0., Changwon National University, Korea, 1999. [8] R.O. Duda and P.E. Hart and D.H. Stork,.”Pattern Classification”, 2nd ed., New York, Wiley-Interscience, 2000.
74 MAVEBA 2007

Models and analysis of vocal emissions for biomedical applications: 5th international workshop: December 13-15, 2007: Firenze, Italy, ed. by C. Manfredi,ISBN 978 88-8453-673-3 (print) ISBN 978-88-8453-674-7 (online)© Firenze university press, 2007.
CHARACTERISATION OF COUGH SOUNDS TO MONITOR RESPIRATORY INFECTIONS IN INTENSIVE PIG FARMING
Sara Ferrari 1, Mitchell Silva 2, Marcella Guarino 1, Daniel Berckmans 21Department of Veterinarian Sciences and Technologies for food Safety, Faculty of Veterinary Medicine, University
of Milan, Italy. 2 Department of Biosystems, Division M3-BIORES: Measure, Model & Manage Bioresponses, Catholic University of
Leuven, Belgium.
Abstract: Cough is a symptom and central element for diagnosis of very common respiratory affection causes of death and loss of productivity in intensive pig farms. The aim of this research is the comparison between acoustic features of cough sounds originating from infectious and non infectious diseases. The acoustic parameters investigated are Peak Frequency and Duration of cough signals. The differences resulting from the sound analysis confirmed variability in acoustics parameters according to a state of health or disease. Infections change the status of respiratory system; thus infectious cough (I) sounds are different than healthy ones (H). Duration of single coughs is significant different among the classes analyzed: non infectious coughs (H), Actinobacillus(A) and Pasteurella’s (P) ones. Frequency analysis allows a more general classification between H and I. Sounds can be used in an alarm system based on an algorithm to identifies automatically cough sounds and provide early warning system for the farmer about the health status of his herd. Keywords : cough, diseases, prevention, sound
I. INTRODUCTION
Respiratory pathologies are frequent in pig husbandry and cough is their principal symptom. The importance of coughing as a means of prognosis has been shown since pig vocalisation is directly related to pain and classification of such sounds has been attempt [6]. In this regard, there have been studies to identify the characters of coughs in pigs and automatically identify them in field recordings for diagnostic purposes [1, 11, 12, 13, 14].
The following analysis considers databases of coughs collected both in field and lab condition. Two types of cough were infectious, caused by multrifactorial respiratory diseases mainly caused by Actinobacillus Pleuropneumoniae and Pasterurella Multocida, the third type of cough was chemically induced in lab conditions. Actinobacillus Pleuropneumoniae is considered as a main primary bacterial agent which causes pleuropneumonia [9]
whilst Pasteurella Multocida is the most important secondary one [2,8]. Actinobacillus pleuropneumoniae causes Pleuropneumonia and it currently consists of a widespread problem in intensive pig breeding farming. It interacts with Mycolplasma, Arterivirus or PCV-2. Pasteurella Multocida is an opportunist invader main cause of pulmonary pasteurellosis so often associated to Herpesvirus (PRV), Arterivirus, and Mycoplasma Hyopneumoniae. It is also cause of the progressive atrophic rhinitis, a significant cost-effective problem in the worldwide farms. Drop of production to slow death with progressive decay is typical of these diseases and prevention with strategic medical treatments is often ineffective and costs are often bigger than benefits.
The aim of this work, by comparing I and H, is improving labelling (classification) of coughs recorded giving physic values to specifics sounds that will be used as inputs in an automatic alarm system based on an algorithm that will recognize cough sounds from an installation in a farm and will provide early warning to the farmer on the welfare status of his herd.
II. MATERIALS AND METHODS
A. Animals
I have been collected in two affected pig farms fattening compartments, both of them served for the Parma ham production and hosted 200 animals divided in 10 to 16 barns, in each farm. The floor was fully slatted and liquid feeding was served. The 180 Pasteurella sick pigs (40 kg) were a hybrid strain Landrace x LW + Danish Duroc boar. The serologic diagnosis (isolation in pure culture) and the necroscopic results (hypertrophyic lung section with blank areas necrotic focuses and fibrinous pleurisy) assured a pneumonia due to Pasteurella Multocida associated to other infectious agents. The 200 pigs suffering from infection due to A. Pleuropneumoniae (26-35 kg) were a Italian Landrace X Large White X Duroc cross. The necroscopy showed haemorrhagic

and necrotic lung lesions.Others concurrent infections were also present.
H was induced by inhalation of citric acid (namely 0.8 moles per litre of citric acid dissolved in solution of 0.9% NaCl) in six Belgian Landrace x Duroc piglets (20-40 kg) free from respiratory diseases. These sounds have been recorded in lab conditions (for more information on this installation, and the data acquisition process see [7] ).
B. Sound analysis
For I sound acquisition 7microphones (Monacor ECM 3005) were used with a frequency response of 50-16000 Hz, connected via preamplifiers (Monacor SPR-6) to an 8 channel Soundscape (SS8IO-3). The Soundscape unit, which allows for simultaneous recording was connected via a TDIF cable to a PCI audio card (Mixtreme 192). All recordings were sampled at a sample rate of 44.1 kHz with a resolution of 16 bit. All microphones were hanged in the stable.
H were caused by a temporary irritation of the upper respiratory tract caused by stimulation of the cough receptors directly resulting in coughing. On the contrary I were caused, in P case, by a deep bacterial infection of the lungs since the infectious processstarts at the alveolar bronchiole junction producing exudates and in the A disease by a lung and pleurisy lesion with large red-blue areas in the upper diaphragmatic lobes with an overlying pleurisy.
The characteristics of the cough sounds were identified in both time and frequency domain. The signal from the microphone was band pass filtered between 100 Hz and 10800 Hz to get rid of the low frequency noise. A comparison between healthy and sick coughs sounds has been made by considering theduration of the signal and the energy in the frequency content. The duration of a single cough, the number of hits and the time between the coughs in a cough attack were considered. This is illustrated in Fig .1.
Fig.1: Pig cough attack (14 hits showed) represented in time domain (above) and in frequency domain (below).The arrows indicate the parameters studied. a) length of a cough, b) time between two cough, c) total length of the cough attack.
These parameters have been counted with auditive and visual observation on the sound spectrum by theoperator using Adobe Audition program. For every cough signal the peak frequency (maximal energy content) was calculated. The analysis of variance has been done on both the length of single coughs and cough attacks among the three classes of coughs to evaluate the certain interclasses distinction in time and frequency domain. For recording and labelling of the cough sounds in both lab and field Adobe Audition 1.5 was used, for the signal processing Matlab 7.1 and SAS statistical package 2004 for the statistical analysis.
III. RESULTS
During the recording sessions we collected851coughs from pigs affected by P and 186 coughs coming from pigs sick of A coming from respectively 91 and 26 cough attacks.
The average number of coughs in a cough attack was 13 for H and 9 and 7 for P and A ones (table I).
Table 1. number of cough attacks and single coughs in the collected database.
Type of cough
Nr. attacks
Nr.coughs
Min nr.coughs in attack
Max.nr. cough in attack
Mean number of coughs
H 11 149 4 22 13.54 P 91 851 5 25 9.35 A 26 186 3 19 7.15
The results are illustrated in tables I and table II. The comparison made against the database of Hinvestigated first of all the duration of the sounds.
Table 2. duration of both cough attack and single sound signals, standard deviation of mean duration of single coughs.
Type of cough
Mean duration attack (s)
Mean duration single cough (s)
DS single coughs
A 5.17 0.53 0.70 H 8.61 0.43 0.13 P 6.77 0.67 0.2
Concerning the differences in length of the three classes of single coughs and attacks investigated the variance analysis results (SAS,GLM) show highly significantly differences among the classes (P<0.001). The results among the duration of the three classes of cough attack show that the length of the coughs attack has a significantly difference between H and A(P<0.0387) and between A and P (P<0.0493) but not between H and P (P<0.3418).
The analysis lead over peak frequency of the singlecough shows that lung diseases lower the peak
0 1 2 3 4 5 6 7 8 9 10 11
- 0 .8
- 0 .6
- 0 .4
- 0 .2
0
0.2
0.4
0.6
Time [s]
Fre
quen
cy[H
z]
Time [s]
Am
plitu
de
0 1 2 3 4 5 6 7 8 9 10 11
0
0.5
1
1.5
2
x 104
ab
c
ab
c
0 1 2 3 4 5 6 7 8 9 10 11
- 0 .8
- 0 .6
- 0 .4
- 0 .2
0
0.2
0.4
0.6
Time (s)
Fre
quen
cy(H
z)A
mpl
itude
(dB
)
0 1 2 3 4 5 6 7 8 9 10 11
0
0.5
1
1.5
2
x 104
B
Time (s)
A
C
0 1 2 3 4 5 6 7 8 9 10 11
- 0 .8
- 0 .6
- 0 .4
- 0 .2
0
0.2
0.4
0.6
Time [s]
Fre
quen
cy[H
z]
Time [s]
Am
plitu
de
0 1 2 3 4 5 6 7 8 9 10 11
0
0.5
1
1.5
2
x 104
ab
c
ab
c
0 1 2 3 4 5 6 7 8 9 10 11
- 0 .8
- 0 .6
- 0 .4
- 0 .2
0
0.2
0.4
0.6
Time (s)
Fre
quen
cy(H
z)A
mpl
itude
(dB
)
0 1 2 3 4 5 6 7 8 9 10 11
0
0.5
1
1.5
2
x 104
B
Time (s)
A
C
76 MAVEBA 2007

frequency of the cough. There is a significant difference between peak frequency of coughs originating from A and H cough sounds. The range for H is between 750 Hz and 1800 Hz for peak frequency. For P and A this is between 200 Hz and 1100 Hz (table III). The peak frequencies of P coughs are clearly lower than H cough sounds (H VS P: P>0.0062; significant), but less significant than with A (P > 0.0694) (table III; Fig. 2). Highly significant is also the diversity between H and A coughs having P> 0.00002.
Table 3. peak frequency mean among the three classes of single coughs.
Type of cough Peak frequency Range A 200-1100 Hz H 750-1800 Hz P 200-1100 Hz
Fig.2: boxplot of the peak frequency of the three classes of analysed coughs. The representation shows the values obtained from the frequency analysis divided in quartiles. the rectangle contains the mean 50% of the distribution and the horizontal line is the median. The difference between the two sick coughs and the healthy one stands in a lower mean of the maximum frequency in sick coughs.
IV. DISCUSSION and CONCLUSIONS
The possibility to make a distinction between pathological and healthy cough sound by physical sound features is shown. As this work improves characterisation of the features of cough, caused by specific agents, in terms of acoustical parameters, it will be useful to improve cough sound labelling as it provides significant differences between cough arising from infected or non infected animals. Literature in the past already focused on this distinction, but specifically in humans. Van Hirtum and Berckmans shown already several ways to work with pig cough, from the assessment of the cough towards vocalization [11] through the automated recognition of spontaneous versus voluntary cough [12] to the recognition of
cough sound by using an algorithm for recognition in lab condition [14]; anyway literature on acoustic features of different respiratory diseases is stillunknown. In this paper sound analysis considers features like frequency energy content and duration of cough.
In terms of peak frequency, of cough signal, sick coughs show a significantly lower peak frequency than healthy coughs (200-1100Hz for I and 750-1800 Hz for H). This incongruous with the findings of Korpas et al. who state that frequencies of 300 Hz to 500 Hz are the most expressive in healthy human coughs whereas in cough sounds of bronchitis the bands between 500-1200 Hz are the most expressive [5]. Sound differences in cough between humans and pigs can be explained by differences in the amount of air pushed in through the air pipe or by the dimension and characteristics of the air pipe itself. On the other hand, Van Hirtum and Berckmans [14] and Ferrari et al. [4] showed that the fundamental frequency for non infectious pig cough sounds in laboratory conditions is higher than those of infectious coughs; our study in field conditions confirms their results.
When considering the duration of a single cough, itcan be seen that there is a significant difference between the two groups of cough sounds, having a mean duration of 0.53-0.67 s for A and P while 0.43 s was observed for H. This lead us to consider the length of these signals as a tool to distinguish sounds. The trend was also observed by other authors, concluding that the duration of infectious coughs is longer compared to non infectious ones due to airways obstruction by infection and inflammation [5, 11] both in sick humans and pigs. Concerning the duration of a single cough or a cough attack in the whole nothing is found in literature. Further analysis should be done to clarify these findings. Although a connection between the time and frequency domain characteristics and physical system parameters for pig vocalizations is not yet known, the present results indicate that such aconnection exists and remains to be determined. By understanding the effect of respiratory airway inflammation and structural changes of its cell walls on cough sounds, information can be extracted aboutthe status of the animals. In field situations this can lead to an interesting acoustic monitoring system. The acoustics features characterizing a sick cough can be used as inputs for on-line cough counters algorithm.
It is suggested that the present application integrated in an automatic detection system can be used to continuously monitor animal health and might help in advance animal welfare in pig houses considered thecontrols problems due to the high number of animalshosted. This automatic approach can save medical costs and supply information of how to face, in terms of bio security, the problem of prevention and spread
Healthy Pasteurella Actinobacillus
0
500
1000
1500
2000
2500
freq
uenc
y[H
z]
Peak Frequency among the three classes of single cough sounds
Healthy Pasteurella Actinobacillus
0
500
1000
1500
2000
2500
freq
uenc
y[H
z]
Peak Frequency among the three classes of single cough sounds
Posters 77

of respiratory pathologies especially unavoidable diseases like the multifactor ones in intensive farms.
Dunlop [3] and Stevens and [10] stated that approximately 62% by weight of the antimicrobials
used in food animal production were administered topigs. However, consumers and regulatory authorities
have been concerned for several years about the large-scale use of in-feed antimicrobials at subtherapeutic levels in food animal production [15]. The potential risks include chemical residues in meat and the development of resistance to commonly used antimicrobials by bacteria important in human medicine. As a result, the pig industry and the regulatory bodies are attempting to limit the use of antimicrobials and encouraging improved biosecurity, management practices and vaccination policies in pig units.
Modern pork production is searching for a variety of tools to ensure health, welfare and productivity ofpigs. Considering the instability of the use of antibiotics a new tools in prevention like sound analysis looks promising. Sound analysis in field conditions provides additional, non invasive quantitative informations and is candidate for developing automatic on-line health monitoring tool.
REFERENCES
[1] J.M. Aerts, P. Jans and D.Halloy, “Labelling ofcough data from pigs for on-line disease monitoringby sound analysis,” Trans. ASAE, JAN-FEB 48 (1), pp.351-354, 1955.
[2] A. Ciprian, C. Pijoan, T. Cruz, J. Camacho, J. Tortora, G. Colmenares, R. Revilla and M. De La Garcia, “Mycoplasma hypopneumoniae increases the susceptibility of pigs to experimental Pasteurella multocida pneumonia,”Canadian journal of Veterinary Research, vol. 52, pp.434-438, 1988.
[3] R.H. Dunlop, S.A. Mcewen, A.H. Meek, W.D. Black, R.C. Clarke and R.M. Frienship, “Individual and group antimicrobial usage rates on 34 farrow-to-finish swine farms in Ontario, Canada,” Preventive Veterinary Medicine, vol.34, pp. 247-264, 1998.
[4] S. Ferrari, M. Silva, J.M. Aerts, M. Guarino and D. Berckmans, “Characterisation of cough sound to monitor Pasteurella infections in pigs,” Proceedings of the 3rd European Conference on Precision Livestock Farming (ECPLF). Skiathos, Greece, pp. 117-123, 2007.
[5] J. Korpa´sˇ, J. Sadlonˇova´ and M. Vrabec, “Analysis of the Cough Sound: an Overview,” Pulm. Pharmacol. Ther., vol. 9, pp.261-268, 1996.
[6] G.Marx, J. Horn, B. Thielebein, E. Knubel and M. Von Borrel, “Analysis of pain-related vocalisation in young pigs,” J. Sound Vibr., vol. 266, pp.687-698, 2003.
[7] B. Moreaux, D. Beerens and P.Gustin, “Development of a cough induction test in pigs: effects of SR 48968 and enalapril,” J. Vet. Pharmacol. Ther., vol. 22, pp. 387-389,1999.
[8] C.Pijoan, “ Pneumonic pasteurellosis,” in Diseases of Swine7th edition, A.D. Leman, B. Straw, R. Glock, W. L. Mengeling, S. D'Allaire, J. Taylor, D. J. Ames, Eds. Iowa State University Press, 1992, pp. 537-551.
[9] T.N.K. Sebunya and J.R. Saunders, “Haemophilus pleuropneumoniae infection in swine: a review,” Journal of the American Veterinary Medical Association, vol.182, pp.1331-1337, 1983.
[10] K.B. Stevens, J. Gilbert, W.D. Strachan, J.Robertson, A.M. Johnston and D.U. Pfeiffer. “Characteristics of commercial pig farms in Great Britain and their use of antimicrobials,” Veterinary Record, vol.161, pp. 45-52, 2007.
[11] A.Van Hirtum and D. Berckmans, “Assessing the sound of cough towards vocality,” Med. Eng. Phys., vol 24 (7-8), pp. 535-540, 2002a.
[12] A.Van Hirtum and D. Berckmans, “Automated recognition of spontaneous versus voluntary cough,” Med. Eng. Phys., vol. 24 (7-8), pp. 541-545, 2002b.
[13] A.Van Hirtum and D. Berckmans, “Fuzzy approach for improved recognition of citric acid induced piglet coughing from continuous registration,” J. Sound Vibr., vol.266, pp. 677-686, 2003a.
[14] A.Van Hirtum and D. Berckmans, “ Considering the influence of artificial environmental noise to study cough time-frequency features,” J. Sound Vibr., vol. 266, pp. 667-675, 2003b.
[15] World Health Organization, “WHO global strategy for containment of antimicrobial resistance,” WHO/CDS/CSR/DRS/2001.2a. Geneva, World Health Organization, 2001.
78 MAVEBA 2007

Models and analysis of vocal emissions for biomedical applications: 5th international workshop: December 13-15, 2007: Firenze, Italy, ed. by C. Manfredi,ISBN 978 88-8453-673-3 (print) ISBN 978-88-8453-674-7 (online)© Firenze university press, 2007.
Abstract: This paper presents predictions of the consequences of tongue surgery on speech production. For this purpose, a 3D finite element model of the tongue is used that represents this articulator as a deformable structure in which tongue muscles anatomy is realistically described. Two examples of tongue surgery, which are common in the treatment of cancers of the oral cavity, are modelled, namely a hemiglossectomy and a large resection of the mouth floor. In both cases, three kinds of possible reconstruction are simulated, assuming flaps with different stiffness. Predictions are computed for the cardinal vowels /i, a, u/ in the absence of any compensatory strategy, i.e. with the same motor commands as the one associated with the production of these vowels in non-pathological conditions. The estimated vocal tract area functions and the corresponding formants are compared to the ones obtained under normal conditions. Keywords: biomechanical modelling, tongue surgery, glossectomy, speech production
I. INTRODUCTION
Resection surgery can be required in case of a cancerous tongue tumour or for particular pathologies like a macroglossia, characterized by an abnormally voluminous tongue. In case of noticeable loss of bulk or volume, the tongue is reconstructed using a local or distant flap in order to limit the functional consequences, of which choice is still a debated question. The surgical procedure can impair the tongue mobility and tongue deformation capabilities, whichcan deteriorate the three basic functions of the human life, namely mastication, swallowing and speech. The surgery consequences can then induce a noticeable decrease of the patients’s quality of life. The current project aims at developing some software that would allow surgeons to predict the consequences of a tongue resection for a given patient, using a 3D biomechanical model of the oral cavity, combined with a synthesizer based on the vocal tract area function. By now, the model has been tested for two common exeresis schemes for a particular subject. In this paper, we first introduce briefly the model used for this study and the implementation followed for two glossectomies (resection and reconstruction). Then we present the results obtained for the cardinal vowels /i, a, u/ in terms of formants deviations and
tongue mobility, compared to the non pathological case.
II. METHODS
A 3D biomechanical tongue model The 3D biomechanical model of the oral cavity used in this study was originally designed by Gérard et al.[1] and was further enhanced for speech production control [2] (Fig. 1). The tongue and the hyoid bone are represented by mobile 3D volumetric meshes, while the jaw, teeth, palate, and pharynx are modelled by static surface elements describing the oral cavity limits with which the tongue interacts due to mechanical contacts.
Figure 1: 3D model of the tongue in the midsagittal plane (apex on the left).
Modelling tongue resections To model a surgical resection followed by a flap reconstruction, the muscles fibres located in the resected area are removed and the biomechanical properties of the corresponding elements are modified to account for the elastic properties of the flap. Tissues stiffness identical to the one of the passive tissues, 5 times smaller or 6 times higher are considered. In addition, since little is known about the force generation capabilities of muscles that have been partially shortened, three options were tested for the activation of sectioned fibres: 1) no activation, 2) low activation or 3) similar level of activation as in the normal case. Additional details about our general modelling approach can be found in [3]. The first simulated surgery corresponds to a left hemiglossectomy (Fig. 2, right panel). The left part of the styloglossus is removed as well as the left anterior parts of the longitudinal muscle, of the transversalis, and of the verticalis, and the upper part of the left hyoglossus. The medium and anterior parts of the left
USE OF A BIOMECHANICAL TONGUE MODEL TO PREDICT THE IMPACT OF TONGUE SURGERY ON SPEECH PRODUCTION
Stéphanie Buchaillard1,3, Muriel Brix2, Pascal Perrier1, Yohan Payan3
1ICP /GIPSA-lab, UMR CNRS 5216, INP Grenoble, France2University Hospital, Grenoble, France
3TIMC-IMAG, UMR CNRS 5525, Université Joseph Fourier, Grenoble, France

genioglossus are nearly entirely removed, whereas its posterior part is only partially affected. The second simulated surgery corresponds to a largemouth floor resection (Fig. 2, left panel). In that case, the mobile tongue is totally preserved. The anterior part of the genioglossus is removed as well as the two major muscles of the mouth floor, namely the geniohyoid and the mylohyoid muscles, in their whole.
Figure 2: Left: modelling of a mouth floor resection; right: modelling of a left hemiglossectomy
Motor control of the model The tongue model is deformed and controlled by a functional model of muscle force generation mechanisms, namely the Equilibrium Point Hypothesis [4]. Motor commands have been first inferred for the original structure for the three studied vowels, and simulations were then carried out for the various surgery conditions with these original muscles’ motor commands hold during 200 ms. Motor commands selection was based on considerations on the tongue shapes in the mid-sagittal plane [5] combined with published EMG data[6][7].
From tongue shapes to acoustic properties The final tongue surface was interpolated by natural cubic spline curves. Then, intersections between the different articulators and a 3D semi-polar grid were computed to estimate the vocal tract area function.The associated formants were finally computed and compared with each others.
III. RESULTS
A. Impact of a left hemiglossectomy Only the results for the second case (intermediate level of activation for the sectioned fibers) are presented, most fibers being either intact or fullyremoved after resection.
(a) Impact on the tongue mobility After a hemiglossectomy, we noticed an important deviation of the apex, either on the healthy tissue side for vowels /u/ and /i/ (Fig. 3) or on the flap side for vowel /a/, as well as its rotation. The deviation is more or less important for the different vowels according to the flap biomechanical properties. After reconstruction, the smaller the stiffness of the flap, the larger the asymmetry of the tongue shaping. This is especially true for vowels /i, u/, due to the
styloglossus activation, but also for vowel /a/, probably due to the combined activation of the anterior genioglossus and hyoglossus, two muscles slightly effected by the exeresis. In the case of vowel /a/, we also found a more important flattening of the tongue with decreasing flap stiffness: a high stiffness flap restrict the tongue movements.
Figure 3 : Impact of a left hemiglossectomy on the tongue symmetry for vowel /i/. (a): non pathological case, (b)-(d): reconstruction with flaps of increasing stiffness (0.2, 1 or 5 times the stiffness of passive tongue tissues).
(b) Impact on the acoustic signal Figures 4 and 6 show the variations of the first two formants associated with the different resections and reconstructions.
Figure 4: F1/F2 formant patterns for a left hemiglossectomy for flaps with different stiffness (x-marks: small stiffness, crosses: medium stiffness; diamond: high stiffness). Triangles join the extreme vowels obtained with the non-pathological model.
A left hemiglossectomy (Figure 4) has a negligible impact on the production of vowels /a/ and /u/. For /i/the formants deviation is more important, resulting in an average increase of 8% for F1 and average decrease of 9% for F2. In terms of formant changes, a softer flap seems to have less impact, particularly for /a/, but the differences between flaps are slight. These
(a) (b)
(c) (d)
80 MAVEBA 2007

results are consistent with the variations observed on the tongue shapes.
B. Impact of a large mouth floor resection The anterior part of the genioglossus being resected, large discrepancies appeared between the three cases studied concerning the modeling of force generationin sectioned fibers. The simulations showed that the smaller the activity of the sectioned fiber, the more important the differences with the non pathologicalcase. Since the implementation of the resection is done symmetrically, no rotation of the tongue was induced.
(a) Impact on the tongue mobility The simulations revealed a large impact of mouth floor resection on tongue elevation and protractionmovements, for vowels /u/ and /i/. The mylohyoid muscle allows the rigidification of the mouth floor, essential to tongue elevation. Furthermore, the posterior genioglossus is the main muscle involved in protraction movement. Its partial resection limits the contraction of the anterior part of the tongue base. For vowels /a/, a high stiffness flap limits the tonguemobility and limits the flattening of the tongue. For the different vowels, a high stiffness flap seems the most appropriate voice. Figure 5 shows the results for vowels \i\ for with the different reconstruction schemes and for the non pathological case. A high stiffness flap favors the tongue protraction movements whereas a small stiffness flap can lead to a total obstruction of the vocal tract. Similar results were observed for vowels \u\ and \a\ (reduction of the airway section in the pharyngeal area). The hypotheses made concerning the activation of the sectioned fibers lead to significant differences: obstruction or not of the vocal tract for vowel \i\,backward rotation of the apex for vowel \a\ in the absence of activation (inactivation of the anteriorgenioglossus that cannot counteract anymore the activation of the hyoglossus) and backward movement more or less pronounced for \i,a,u\. Comparison of simulation results with data collected on patients could shed light on the hypothesis (no activation, partial activation or full activation) that seems to be the most realistic. However, the choice of the activation did not impact the effect of the flap properties on the tongue mobility.
Figure 5: Shape of the tongue in the mid-sagittal plane aftera mouth floor resection for vowel \i\ (mid level of activation for the sectioned fibers). The plain contour represents the non pathological case, the dotted contour the reconstructed model with the small stiffness flap, the dashed contour the medium stiffness flap and the dashed-dot contour the high stiffness flap.
(b) Impact on the acoustic signal Figure 6 plots the first and second formants for vowel \i\ for the partial and full activation hypotheses. Results can be summarized as follows: • A large mouth floor resection seems to have
severe consequences on speech production. For vowel /u/, keeping the motor commands inferred for non- pathological conditions leads to an obstruction of the vocal tract in the pharyngeal region, due to the resection of the anterior part of the posterior genioglossus that counteracted the effects of the styloglossus activation before surgery. Therefore, not formant could be computed.
• The current pattern of activation did not permit toproduce the high front vowel /i/ (average increase of 23% for F1 and average decrease of 17% for F2), with important discrepancies according to the flap. A high stiffness flap leads to a higher increase of F1, whereas a small stiffness flap leads to a higher decrease of F2.
• For vowel /a/, we can observe a decrease in F1 and F2, particularly for low stiffness flaps, correspond to a deviation from vowel /a/ to vowel /o/.
Combined with the tongue shapes observation, our results show that for mouth floor resection high stiffness flap should be favoured. Indeed, only this kind of flap can allow the tongue to reach a front high position close to /i/.
Posters 81

Figure 6: F1/F2 formant patterns for a mouth floor resection for flaps with different stiffness (small stiffness represented by x-marks, medium stiffness by crosses and high stiffness by diamonds). Triangles join the extreme vowels obtained with the non-pathological model. Top panel: no activation, bottom panel low activation for the sectioned fibres.
III. DISCUSSION
Simulations with a realistic 3D biomechanical modelcould be of a significant improvement in planning tongue surgery systems. In terms of F1/F2 patterns changes our results are in good agreement with measurements made on patients [8]. The role of the flap stiffness on tongue mobility could also be assessed and, interestingly, it is different for the hemiglossectomy than for the mouth floor resection.Further improvements of the model include algorithmic aspects aiming at a significant decrease of the computation time and mesh matching methods to design patient specific oral cavity models.
REFERENCES
[1] Gérard, J-M, Perrier, P. & Payan, Y. 3D biomechanical tongue modelling to study speech production In: J. Harrington & M. Tabain Editors, Speech Production: Models, Phonetic Processes, and Techniques. Psychology Press: New-York, USA; 2006. p. 85-102 [2] Buchaillard, S., Perrier, P. & Payan Y. A 3D biomechanical vocal tract model to study speech production control: How to take into account the gravity? Proceedings of the 7th International Seminar on Speech Production, Ubatuba, Brazil; 2006. p. 403-410
[3] Buchaillard, S., Brix, M., Perrier, P. & Payan, P. Simulations of the consequences of tongue surgery on tongue mobility: Implications for speech productionin post-surgery conditions. International Journal of Medical Robotics and Computer Assisted Surgery (In press) [4] Feldman AG. Once more on the Equilibrium-Point hypothesis (λ model) for motor control. Journal of Motor Behavior. 1986; 18(1):17-54. [5] Bothorel, A., Simon P., Wioland, F. & Zerling, J.-P. Cinéradiographie des voyelles et des consonnes du français. Institut de Phonétique, Université Marc Bloch, Strasbourg, France, 1986 [6] Miyawaki, K., Hirose, H., Ushijima, T. & Sawashima, M. A preliminary report on the electromyographic study of the activity of lingual muscles. Annual Bulletin of the RILP,1975; 9:91–106[7] Baer, T., Alfonso, P.J. & Honda, K. Electromyography of the tongue muscles during vowels in /əpvp/ environment. Annual Bulletin of the RILP, 1988; 22:7–19. [8] Savariaux, C., Perrier, P., Pape, D. & Lebeau, J. Speech production after glossectomy and reconstructive lingual surgery: a longitudinal study. Proceedings of the 2nd International Workshop on Models and Analysis of Vocal Emissions for Biomedical Applications (MAVEBA), 2001, Firenze, Italy.
82 MAVEBA 2007

Models and analysis of vocal emissions for biomedical applications: 5th international workshop: December 13-15, 2007: Firenze, Italy, ed. by C. Manfredi,ISBN 978 88-8453-673-3 (print) ISBN 978-88-8453-674-7 (online)© Firenze university press, 2007.
Abstract: The work presented in this paper was supported by the project number 2C06009. Verbal communication is the most obvious instrument used to express our thoughts and ideas, considering only this part of speech without regarding its nonverbal part, may lead to overlooking important information of utterance or even misunderstanding it. The contributed paper deals with use of automatic system for recognition of facial expressions which have been being created for the Czech dialog system. Keywords : Face detection, feature extraction.
I. INTRODUCTION
Understanding human emotions and their nonverbal messages is one of the most necessary and important skills for making the next generation of human-computer interfaces (HCI) easier, more natural and effective. Indeed, the first step toward an automatic emotion sensitive human-computer system having the ability to automatically detect users’ nonverbal signals is the development of an accurate and real-time automatic NVC analyzer. Such an analyzer must deal mainly with users’ facial expressions and paralanguage. Nonverbal communication has many functions in the communication process. By virtue of nonverbal communication, we simply express our emotions. In many cases we are able to exhibit our feelings by facial expression and gestures much more quickly than by using words. It regulates relationships and may support or replace verbal communication [1]. On the other hand nonverbal communication has its disadvantages and seamy sides too. Difficulties may arise if communicators are unaware of the types of messages they are sending, and how the receiver is interpreting those messages. No dictionary can accurately classify nonverbal signals. Their meanings vary not only by culture and situation, but also by the degree of intention of their use. Many of them are ambiguous and could cause misunderstandings. Effective communication is the combined harmony of verbal and nonverbal actions. Main categories of nonverbal communication: facial expression, posture, gesture, proximity, gaze, paralanguage, touch, adornment.
II. METHODOS
Facial expression carries most of our nonverbal meanings and often is considered as the most important category of nonverbal communication (by many experts 55-85 percent of NVC is exchanged by them). Although the human face is capable of creating 250,000 expressions, less than 100 sets of them constitute meaningful symbols. Three main categories of conversational signals have been identified: syntactic display - used to stress words, or clauses (raising or lowering eyebrows can be used to emphasize a word or clause), speaker displays: illustrate the ideas conveyed (“I don’t know” can be expressed by the corners of the mouth being pulled up or down), and listener comment display - used in response to an utterance (incredulity can be expressed with a longer duration of eyebrow raising). The goal of the our research can be divided into the following topics: speech signal processing focused on the speaker recognition, definition of a speaker dependent features suitable for the speaker recognition, automatic recognition of facial expression. The first goal aimed at the speech signal processing focused on the speaker recognition was accomplished by the proposal of the voice activity detection (VAD) using neural network. The VAD with an error lower than 1% is a good result. The second goal was accomplished by defining a new set of the speaker dependent features / the Speaker Dependent Frequency Cepstrum Coefficients (SDFFCC). The third goal - we have described the structure of Automatic Recognition of Facial Expression (ARFE) and have seen that the most important stages of the system are: the face localization, the Gabor wavelet representation of the facial image and the classification of the stage performed by Adaboost.
III. RESULTS
The dataset consists of 45 adult volunteers and 15 infants. None of the subjects wore eyeglasses. Some of the subjects had hair covering their foreheads, no subject wore caps, or had makeup on their brows, eyelids or lips. The subjects included both male (60%) and female (40%). The important condition was maximum illumination with a minimum of facial shadows. The primary idea was to ask each volunteer to look at some examples of all 6+1 facial expressions (happy, fear, anger, disgust, sadness, surprise and neutral) and try to copy them. Also the
USING NONVERBAL COMMUNICATION IN DIALOG SYSTEM
Jana Klečková, Jana KrutišováDepartment of Computer Science and Engineering, University of West Bohemia in Pilsen, Pilsen, Czech Republic

primary idea was that each expression has to be repeated several times and the best one is chosen for the training set. Unfortunately, in reality this was different. During this data gathering, we have come to know that people are able to exhibit their neutral expression with hardly or no effort. Also, we have come to know that they are able to simply smile for many minutes without any pauses. But other expressions such as a fear expression, disgust expression or angry expression are very difficult andmaybe impossible for people without theatrical experiences. Therefore sometimes a simple facial expression recording lasts more than a half hour for one person in place of only two minutes planned. All these problems resulted in the fact, that in the present day, the gathered training set provides only three acceptable facial expressions: neutral, happy and surprise. Unfortunately, also not all of the surprise expressions are really perfect surprise expressions. The final training set contains 75 images, 25 images per expression from 60 volunteers. The significant role of facial expressions convinces us to use visual input to process and analyze them. The facialexpression recognition problem can be divided into the following three partial problems: face detection; facial feature extraction; facial expression classification. In despite of significant advances of computer vision in recent years, developing robust and accurate facialexpression recognition in an automatic way and in real-time is still very problematic and at present belongs to one of the greatest dreams and most active areas in thecomputer vision. The system automatically detects frontal faces in complex backgrounds and makes classification for each found face (see Fig.1). The only requirements of the system are frontal faces, a good illumination condition and acceptable light direction. In other words, faces should not contain shadows and must be well lighted.
Fig.1 Experiment conditions
After a face was detected in an arbitrary image, which could be a digitized video signal or a digitized image, the
face finder returns the coordinates of a square box around the face.
Fig.2 ARFE - static images mode
IV. DISCUSSION
One of the factors, which put down the accuracy of the current version of ARFE is the used face detection and localization system provided by OpenCV. ARFE is based on state of the art approaches, is a multi-user system (see Fig. 2) and has two working modes: static images and dynamic images (photo and video) mode. This is possible due to the fact, that each frame is processed and classified separately This system provides an excellent face detection system. But unfortunately, the face localization performed by this system is not accurate enough for an automatic facial expression recognition system and without any doubt is in need of an improvement [2]. This problem could be solved by a combination of the present day ARFE and a local approach dealing directly with facial features.
V. CONCLUSION
In this paper, we presented two variants of a The work presented in this paper was supported by the project under contract number 2C06009. new method for automatic dialog acts recognition based on word clusters. A prototype of the dialog system is being developed in the Department of Computer Science. The proposed system is fully automatic, user-independent and real-time working. First experiments show that the speech recognition quality is increased by using automatic facial expression recognition system [3]. Obtained results are interesting and at least show that designing of a fully automatic facial expression system in a constrained environment in the present day is possible.
REFERENCES
[1] Maja Pantic and L.J.M. Rothkrantz, Automatic Analysis of Facial Expressions: The State of the Art.IEEE Transactions on Pattern Analysis and Machine Intelligence, vol. 22, no. 12, 2000 [2] Nikolaus Voß and Barbel Mertsching. Design and Implementation of an Accelerated Gabor Filter Bank Using Parallel Hardware. Springer-Verlag Berlin Heidelberg 2001. [3] Pavel Král, Cristoph Cerisara, and Jana Klečková, “Automatic Dialog Acts Recognition based on Sentence Structure,” in ICASSP’06, Toulouse, France, May 2006.
84 MAVEBA 2007

Models and analysis of vocal emissions for biomedical applications: 5th international workshop: December 13-15, 2007: Firenze, Italy, ed. by C. Manfredi,ISBN 978 88-8453-673-3 (print) ISBN 978-88-8453-674-7 (online)© Firenze university press, 2007.
Abstract: This paper suggests the nonlinear parameter of self-similarity as a novel feature to be employed in wavelet packet based voice signal analysis. Two groups of normal and pathological voice signals have been decomposed using wavelet packets. Next, self similar characteristics of reconstructed signals in each node have been calculated. Consequently, discrimination ability of each node has been obtained using Davies-Bouldin criterion. In the following, eight most discriminant nodes have been identified to construct feature vector parameters. To reduce the feature vector dimensionality Principal component analysis (PCA) has been employed. Finally, an artificial neural network has been trained to classify normal and pathological voices. The results show that self-similarity parameter can be a reliable feature in wavelet packet based voice signal analysis. Moreover, selected sub-bands are distributed over the whole available frequencies which shows that pathological factors do not influence specific frequency range which accentuates the role of WP decomposition.
Keywords: vocal disorder, wavelet packet, self-similarity, Davies-Bouldin Criterion
I. INTRODUCTION
The vibration pattern of the vocal folds, excited by the air-flow through the glottis, is an important indicator of laryngeal function. In fact, any abnormality of the larynx will be evident in the glottal waveform and reflects on the audible quality of speech. Pathological voices are strongly corrupted with random variations of their features, which often assume the aspect of noise [1].
Unilateral vocal fold paralysis (UVFP) is caused by injury to the recurrent laryngeal nerve. Patients with UVFP may have significant impairment of vocal fold function, including a breathy paralytic dysphonia. UVFP most commonly occurs following a surgical iatrogenic injury to the vagus or recurrent laryngeal nerve. It results in glottal incompetence, either partial or complete, because of the poor or reduced vocal fold closure resulting in a weak and uncoordinated vocal fold vibration. Such irregularities in the pattern of vocal fold vibration might induce pitch frequency fluctuations, airflow volume changes, amplitude and mucosal wave
reduction and also the noise-like turbulence of airflow in vicinity of the cords.
Physicians often use invasive techniques like Endoscopy to diagnose symptoms of voice disorders. It is, however, possible to identify disorders using certain features of speech signal in a non-invasive way. Several research groups have recently used wavelet packet based feature extraction. Schuck et al [2] have used Shannon entropy and energy features of wavelet packet decomposition and the best basis algorithm for normal/pathological speech signal classification. Fonseca et al [3] have employed mean squared values of reconstructed signals in discrete wavelet transform sub-bands and least square support vector machine classifier for identification of signals from patients with vocal fold nodules and normal signals. Guido et al [4] have tried different wavelets on the search for voice disorders. Mother wavelet of Daubechies with support length of 20 (db10) was found as the best wavelet for speech signal analysis among commonly used mother wavelets. Behroozmand et al [5] have used genetic algorithm for optimal selection of wavelet packet based energy and Shannon entropy features for identification of patients’ speech signal with unilateral vocal fold paralysis (UVFP). The results showed that the decomposition level of five is the most appropriate level to analyze pathological speech signals. Local discriminant bases (LDB) and wavelet packet decomposition have been used to demonstrate the significance of identifying the signal subspaces that contribute to the discriminatory characteristics of normal and pathological speech signals in a work by Umapathy et al [6].
Matassini et al [7] have analyzed voice signals in a feature space consisting quantities from chaos theory (like correlation dimension and first lyapunov exponent) besides conventional linear parameters among which nonlinear parameters have reported to have clear separation between normal and sick voices. Two nonlinear features of return period density entropy (RPDE) and fractal self-similarity have been studied by Little et al [8] for speech pathology detection and it has been shown that these two nonlinear measures, based parsimoniously upon the biophysics of speech production, can be both simple and robust, and are amenable to implementation as online algorithms.
CLASSIFICATION OF PATHOLOGICAL VOICE SIGNALS USING SELF-SIMILARITY BASED WAVELET PACKET FEATURE
EXTRACTION AND DAVIES-BOULDIN CRITERION
H. Khadivi Heris 1, B. S.Aghazadeh 1, M. Nikkhah-Bahrami11Department of Mechanical Engineering, Tehran University, Tehran, Iran

This work deals with classification of normal and
pathological voice signals (herein, patients with UVFP)
with the following procedure: measurement of self-
similarity parameter of the reconstructed signal of each
node in WP decomposition, discriminant feature selection
based on Davies-Bouldin index, normalizing feature
vector data, dimension reduction of feature vector by
means of PCA, and finally implementation of artificial
neural network for classification purpose.
Following the introduction, methods and materials are
reviewed in the next section. The results of this study are
discussed in section III. Finally, section V presents the
conclusions.
II. METHODOS
A. Wavelet Packet Transform
Recently, wavelet packets (WPs) have been widely
used by many researchers to analyze voice and speech
signals. There are many outstanding properties of wavelet
packets, which encourage researchers to employ them in
many widespread fields. It has been shown that sparsity
of coefficients’ matrix, computational efficiency, and
time-frequency analysis can be useful in dealing with
many engineering problems. The most important,
multiresolution property of WPs is helpful in voice signal
synthesis.
The hierarchical WP transform uses a family of
wavelet functions and their associated scaling functions
to decompose the original signal into subsequent sub-
bands. The decomposition process is recursively applied
to the both low and high frequency sub-bands to generate
the next level of the hierarchy. WPs can be described by
the following collection of basis functions [5]:
1 1
22 2 ( 2 ) 2 2
p p p pn n
mW x l h m l W x m (1)
1 1
2 12 2 ( 2 ) 2 2
p p p pn n
mW x l g m l W x m (2)
where p is scale index, l the translation index, h the low-
pass filter and g the high-pass filter with
( ) ( 1) (1 )kg k h k (3)
The WP coefficients at different scales and positions
of a discrete signal can be computed as follows:
,2 ( ). (2 )
p p pn k n
mC f m W m k (4)
1
2 , ,( 2 ).
p pn l n m
mC h m l C (5)
1
2 1, ,( 2 ).
p pn l n m
mC g m l C (6)
The basic reasoning behind wavelet packet based features
is that it can exploit and remove information
redundancies, which usually exist in the set of samples
obtained by the measuring devices. Also, wavelet packets
take the advantage of multi-resolution analysis.
B. Self-similarity
Although different definitions of second-order self-
similarity can be found in the literature, they share the
common idea of processes which do not change their
qualitative statistical behavior after aggregation. The
Hurst exponent ( )H characterizes the level of self
similarity, providing information on the recurrence rate of
similar patterns in time at different scales. Several
methods are available to estimate the Hurst parameter. In
this paper, wavelet based scaling exponent estimation has
been employed to calculate Hurst exponent. Let Y(t) be a
continuous-time second-order process with spectral
density ( ),Y v v . It can be shown [9] that the second
moments of the details, satisfy ( , ),Yd j k2
2
0( , ) ( )2 (2 )
j jY YEd j k v v dv (7)
where 2
0 0( ) ( )
ivtv t e dt is the Fourier transform
of0
. These second order quantities take a particularly
simple form in the case of Long-Range Dependence
(LRD), where by definition the spectral density follows a
power-low near the origin:
( ) , 0, [0,1), 0Y f fv c v v c (8)
Because of the inherent scaling properties in the
wavelet basis / 2
, 0( ) 2 (2 ), ,
j jj k t t k j k
which are naturally matched to the scaling properties of
LRD processes, one obtains:
2
0( , ) 2 ( , ),
jX fEd j k c C j (9)
where 0
( , )C is an integral independent of scale j. The
scaling parameter can therefore be estimated by
measuring the slope in a log-log plot of an estimate of the
Fig. 1. Estimation of parameter for a sample voice signal.
86 MAVEBA 2007

left hand side of (9) against j. Because of the ability of
wavelets to quasi-decorrelate scaling processes, such an
estimate has excellent statistical properties. Moreover, to
obtain Hurst parameter (H) the slope ( ) can be
transformed as ( 1) / 2H . Further review of these
methods can be found in the literature [9].
C. Davies-Bouldin index
The Davies-Bouldin (DB) criterion has been proven to
be effective in many biomedical applications when used
to evaluate the classification ability of feature space [11].
The DB index (DBI), or cluster separation index (CSI) is
based on the scatter matrices of the data and is usually
used to estimate class separability. It requires the
computation of cluster-to-cluster similarity:
( )ii jjij
ij
D DR
D (9)
where iiD and jjD are the dispersions of the ith and jth
clusters, respectively, and ijD is the distance between
their mean values. iiD and ijD are given by:
1/ 2
2
1
1 iN
ii n i nni
D y m y cluster iN
(10)
and
ij i jD m m (11)
where iN is the number of members is cluster i, ny is
the nth sample vector of cluster i, and im is the mean
vector of the cluster i. DBI is obtained through
determining the worst case of separation for each cluster
and averaging these values as follows:
1
1DB max
K
iji jiR
K (12)
where K is the total number of clusters. Herein, K is two
and DBI assesses the separability of Normal and disorder
voices clusters. It is shown that lower values of the DB
indexes indicate higher degree of cluster separability.
D. Database
Used in this study are sustained vowel phonation
samples from subjects from the Kay Elemetrics
Disordered Voice Database [12]. It includes signals from
53 normal voices, 54 unilateral vocal fold paralysis, 20
vocal fold polyp, and 20 vocal fold nodules. This
represents a wide variety of organic and neurogenic voice
disorders. Subjects were asked to sustain the vowel /a/
and voice recordings were made in a sound proof booth
on a DAT recorder at a sampling frequency of 44.1 kHz.
III. RESULTS AND DISCUSSION
The mother wavelet function of the tenth order
Daubechies (db10) and decomposition level of five has
been chosen in wavelet packet decomposition. Then, self-
similarity of the reconstructed signal in each sub-band of
the wavelet packet decomposition has been measured.
The most discriminant nodes have been selected
according to DB criterion. Fig 2 shows the DB value of
the discriminant nodes. As an illustration, the self-
similarity of the signals in the node (0), the most
discriminant node, has been demonstrated in fig 2. the
wavelet packet tree and the participating nodes in feature
vector has been shown in Fig 3. Having on hand the
feature vectors for all normal and pathological voices,
Principal component transformation has been performed
on the previously normalized feature vectors’ data. PCA
analysis of the feature vector led to optimum dimension
of six as the input feature vector of artificial neural
network (ANN). Then, 70 percent of the data has been
used for training ANN and 30 percent of the remaining
data has been used as validation and test data. Finally a
feedforward backpropagation multilayer classifier with
three hidden layers has been trained to classify voice
signals. The classification accuracy of 98 percent among
test and validation samples shows that self-similarity
based Wavelet Packet Feature Extraction is reliable for
normal and pathological voice signal analysis.
Furthormore, neural network classifier is an effective tool
for voice signal analysis.
Fig.2. DB values of first eight discriminant nodes. Fig. 3. The discrimination ability of the node (0)
Posters 87

V. CONCLUSION
In this study an efficient Self-similarity Based Wavelet
Packet Feature Extraction method and Davies-bouldin
criterion based optimal feature vector selection technique
has been utilized for the classification of normal voices
and pathological voices of patients suffering from
unilateral vocal fold paralysis by means of artificial
neural network. The classification accuracy of 98 percent
shows that the proposed nonlinear parameter of self-
similarity is a discriminant feature if calculated for
reconstructed signals of selected sub-bands. Furthermore,
Davies-bouldin criterion is an effective feature vector
selection tool for it has low computational cost. Also,
implementation of wavelet packets for feature generation
plays an important role to select discriminant feature
vector from the whole frequency range which takes the
advantage of its multi-resolution properties.
REFERENCES
[1] Titze IR., Principles of voice production, NJ: Prentice
Hall, Englewood Cliffs, 1994.
[2] A. Schuck Jr. , L. V. Guimaraes, J. O. Wisbech,
“Dysphonic voice classification using wavelet packet
transform and artificial neural network” ,in: Proc. of the 25th IEEE Annual EMBS International Conference, Cancum,Mexico, September 2003, pp. 2958-2961.2,
pp.68-73.
[3] E. S. Fonseca, R. C. Guido, C. Andre, Silvestre, J. C.
Pereira, “Discrete wavelet transform and support vector
machine applied to pathological voice signals
identification”, in: Proc. of the seventh IEEE International Symposium on Multimedia, ISM’05.
[4] R. C. Guido, J. C. Pereira, E. Fonseca, F. L. Sanchez,
Lucimar S. Vierira, “Trying different wavelets on the
search for voice disorders sorting”, in: Proc. of the 37th IEEE International Southeastern Symposium on System Theory, 2005, pp. 495-499.
[5] R. Behroozmand, F. Almasganj, “Optimal selection of
wavelet-packet-based features using genetic algorithm in
pathological assessment of patients’ speech signal with
unilateral vocal fold paralysis”, Computers in Biology and Medicine, Vol. 37, pp. 474-485, 2007.
[6] K. Umapathy, S. Krishnan, “Feature analysis of
pathological speech signals using local discriminant bases
technique”, Med. Bio. Eng. Comput., Vol. 43, pp. 457-
464, 2005.
[7] L. Matassini, R. Hegger, H. Kantz, C. Manfredi,
“Analysis of vocal disorders in a feature space”, Medical
Engineering & Physics, Vol. 22, pp. 413-418,2000
[8] M. Little, P. McSharry, I. Moroz, S. Roberts,
“Nonlinear biophysically-informed speech pathology
detection”, in: IEEE International Conference on
Acoustics Speech and Signal Processing, ICASSP 2006,
pp. 1080-1083.
[9] D.N. Veitch, M. S. Taqqu, P. Abry, Meaningful
MRA initialization for discrete time series, Signal
Processing, Vol. 80, No. 11, pp. 1971-1983,2000.
[10] G. Wang, Z. Wang, W. Chen and J. Zhuang,
“Classification of surface EMG signals using optimal
wavelet packet method based on Davies-Bouldin
criterion”, Med. and Biol. Eng. Comput. , Vol. 44, pp.
865-872, 2006.
[11] Disordered voice database (CD-ROM), Version
1.03, Massachusetts Eye and Ear Infirmary, Kay
Elemetrics Corporation, Boston, MA, Voice and Speech
Lab., October 1994.
Fig. 4. The most discriminant nodes in terms of self-similarity.
88 MAVEBA 2007
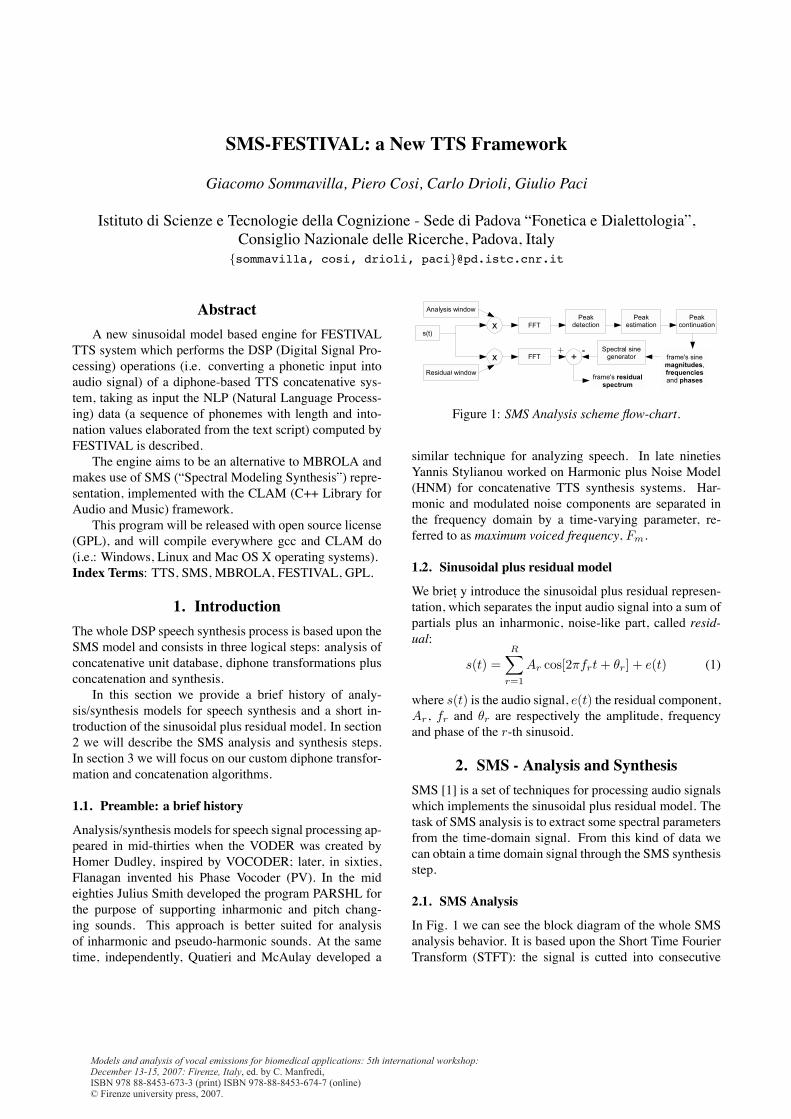
Models and analysis of vocal emissions for biomedical applications: 5th international workshop: December 13-15, 2007: Firenze, Italy, ed. by C. Manfredi,ISBN 978 88-8453-673-3 (print) ISBN 978-88-8453-674-7 (online)© Firenze university press, 2007.
SMS-FESTIVAL: a New TTS Framework
Giacomo Sommavilla, Piero Cosi, Carlo Drioli, Giulio Paci
Istituto di Scienze e Tecnologie della Cognizione - Sede di Padova “Fonetica e Dialettologia”,Consiglio Nazionale delle Ricerche, Padova, Italy
{sommavilla, cosi, drioli, paci}@pd.istc.cnr.it
Abstract
A new sinusoidal model based engine for FESTIVALTTS system which performs the DSP (Digital Signal Pro-cessing) operations (i.e. converting a phonetic input intoaudio signal) of a diphone-based TTS concatenative sys-tem, taking as input the NLP (Natural Language Process-ing) data (a sequence of phonemes with length and into-nation values elaborated from the text script) computed byFESTIVAL is described.
The engine aims to be an alternative to MBROLA andmakes use of SMS (“Spectral Modeling Synthesis”) repre-sentation, implemented with the CLAM (C++ Library forAudio and Music) framework.
This program will be released with open source license(GPL), and will compile everywhere gcc and CLAM do(i.e.: Windows, Linux and Mac OS X operating systems).Index Terms: TTS, SMS, MBROLA, FESTIVAL, GPL.
1. Introduction
The whole DSP speech synthesis process is based upon theSMS model and consists in three logical steps: analysis ofconcatenative unit database, diphone transformations plusconcatenation and synthesis.
In this section we provide a brief history of analy-sis/synthesis models for speech synthesis and a short in-troduction of the sinusoidal plus residual model. In section2 we will describe the SMS analysis and synthesis steps.In section 3 we will focus on our custom diphone transfor-mation and concatenation algorithms.
1.1. Preamble: a brief history
Analysis/synthesis models for speech signal processing ap-peared in mid-thirties when the VODER was created byHomer Dudley, inspired by VOCODER; later, in sixties,Flanagan invented his Phase Vocoder (PV). In the mideighties Julius Smith developed the program PARSHL forthe purpose of supporting inharmonic and pitch chang-ing sounds. This approach is better suited for analysisof inharmonic and pseudo-harmonic sounds. At the sametime, independently, Quatieri and McAulay developed a
Figure 1: SMS Analysis scheme ow-chart.
similar technique for analyzing speech. In late ninetiesYannis Stylianou worked on Harmonic plus Noise Model(HNM) for concatenative TTS synthesis systems. Har-monic and modulated noise components are separated inthe frequency domain by a time-varying parameter, re-ferred to as maximum voiced frequency, Fm.
1.2. Sinusoidal plus residual model
We brie y introduce the sinusoidal plus residual represen-tation, which separates the input audio signal into a sum ofpartials plus an inharmonic, noise-like part, called resid-ual:
s(t) =R�
r=1
Ar cos[2πfrt + θr] + e(t) (1)
where s(t) is the audio signal, e(t) the residual component,Ar, fr and θr are respectively the amplitude, frequencyand phase of the r-th sinusoid.
2. SMS - Analysis and Synthesis
SMS [1] is a set of techniques for processing audio signalswhich implements the sinusoidal plus residual model. Thetask of SMS analysis is to extract some spectral parametersfrom the time-domain signal. From this kind of data wecan obtain a time domain signal through the SMS synthesisstep.
2.1. SMS Analysis
In Fig. 1 we can see the block diagram of the whole SMSanalysis behavior. It is based upon the Short Time FourierTransform (STFT): the signal is cutted into consecutive

overlapping frames, which are multiplied by an analysiswindow and for each of these chunks a FFT is computed.We obtain a spectrum from which we detect the compo-nents present in the original sound. The harmonic analy-sis consists of peak detection, pitch detection and spectralpeak continuation. When the harmonic analysis is com-pleted, the residual component can be computed, and thusthe whole SMS analysis step is achieved.
2.1.1. Peak detection
In audio processing time-varying sinusoids are called par-tials, and each of them is the result of a main mode of vi-bration of the generating system. A partial in the frequencydomain can be identified by its spectral shape (magnitudeand phase), its relation to other partials, and its time evo-lution. So the first step of SMS analysis is the detection ofpartials, which are searched among prominent magnitudepeaks of the current frame spectrum.
Most natural sounds are not perfectly periodic and donot have nicely spaced and clearly defined peaks in the fre-quency domain. A practical solution is to detect as manypeaks as possible and delay the decision of what is a deter-ministic, or “well behaved” partial, to the next step in theanalysis: the peak continuation algorithm.
2.1.2. Pitch detection
Before continuing a set of peak trajectories through thecurrent frame it is useful to search for a possible fundamen-tal frequency. If it exists, we will have more informationto work with, and it will simplify and improve the trackingof partials.
The fundamental frequency can be defined as the com-mon divisor of the harmonic series that best explains thespectral peaks. It is possible that the common divisor doesnot belong to the set of detected peaks. For this reasonthe fundamental frequency is better called pitch (i.e. thatparticular frequency heard to be the main frequency of asound). The algorithm that choose the fundamental fre-quency can be simply described in three main steps: 1.Choose possible fundamental candidates. 2. Measure the“goodness” of the resulting harmonic series compared withthe spectral peaks. 3. Get the best candidate.
2.1.3. Peak continuation
From peak detection we obtain some “wrong behaved”partials that shouldn’t be considered. The basic idea of thealgorithm is that a set of “guides” advances in time throughthe spectral peaks, looking for the appropriate ones (ac-cording to the specified constraints) and forming trajecto-ries out of them. The instantaneous state of the guides,their frequency and magnitude, are continuously updatedas the guides are turned on, advanced, and finally turned
Figure 2: SMS Synthesis scheme flow-chart.
off. When a fundamental has been found in the currentframe, the guides can use this information to update theirvalues. Peak continuation algorithm completes harmonicanalysis.
2.1.4. Stochastic Analysis
Referring to formula (1), the stochastic component e(t) ofthe current frame is calculated by first re-generating thedeterministic signal with additive synthesis, and then sub-tracting it from the original waveform s(t) in the time do-main. This is possible because the phases of the originalsound are matched, so the shape of the original waveformis preserved. The stochastic representation is then obtainedby performing a spectral fitting of the residual signal.
2.2. SMS Synthesis
The SMS synthesis process is described in Fig. 2 where wecan see the two inputs that come from the analysis (possi-bly transformed) representing the deterministic (harmonic)component and the residual one as described in section 2.1.
The whole signal is processed in the frequency domain,where the two components are treated independently, thenwe return to time domain performing an inverse FFT. Forthe deterministic component the goal is to obtain the spec-trum of a sum of sinusoids. The stochastic signal is ob-tained by filtering white noise with residual spectral en-velope. Then we can use a single iFFT for the combinedspectrum. Finally in the time domain we impose the trian-gular window in the overlap-add process, combining suc-cessive frames to get the time-varying characteristics of thesound.
3. Speech Synthesis Architecture
The SMS engine performs the DSP operations of a text-to-speech system, taking as input a phonetic file computed byFESTIVAL [2], which describes the pronunciation of thetext script through a sequence of phonemes with length inms and intonation values in Hz.
90 MAVEBA 2007

Figure 3: Scheme of speech synthesis architecture opera-tions.
Our program aims to be an MBROLA [3] alternativeand thus it makes use of the same phonetic input formatand command line parameters. Both programs implementconcatenative synthesis using diphones (that must be ex-ternally supplied) as base units.
The three logical steps upon which the whole DSPspeech synthesis process is based are:
1. analysis: it has been theoretically described in sec-tion 2.1 and consists in converting the time do-main diphones’ database into a spectral parametersone stored in Sound Description Interface Format(SDIF);
2. transformations plus concatenation: it will be de-scribed further in this section;
3. synthesis: it has been described in section 2.2.
Fig. 3 shows a simplified block diagram of the trans-formations plus concatenation and the synthesis steps.
3.1. SMS Transformations
The task of the transformation step is to adapt everyrequired diphone to the parameters specified (for eachphoneme) by the phonetic input. By now those parame-ters describe only the duration of the phoneme and its pitchevolution.
So the main spectral transformations needed are timestretching and pitch shifting. Both these operations mod-ify magnitude and frequency of signal partials. These newvalues become incoherent with original phases. This prob-lem affects the re-synthesized signal, deteriorating its au-dio quality.
Thus it is necessary to re-calculate the sinusoids’phases; two ways for doing this are available: the phasecontinuation and the relative phase delay algorithms.
3.1.1. Time Stretching
The time stretching process is based upon linear interpo-lation and decimation of frequencies and magnitudes. The
algorithm preserves transition integrity and intelligibilitybetween different phonemes in every diphone, as much asthe input time requirements are satisfied.
3.1.2. Pitch Shifting
Pitch Shifting is the transformation that takes care of mod-ulating the intonation of the sentence to be uttered. It isperformed after time stretching to better fit the intonationrequirements.
The Pitch Shifting routine is implemented using a for-mant preserving algorithm, that tries to maintain the orig-inal timbre of sound. The magnitude of each transformedpartial is placed upon the original spectrum envelope, cor-responding to the original frequency scaled by a commonfactor.
3.1.3. Phase Continuation
The simplest way to reconstruct the phases is called phasecontinuation. Its behavior is to arbitrarily set the phase forevery partial of the first frame and then compute the val-ues frame-by-frame. In this way the algorithm discards alloriginal analyzed phase data. The formula used to propa-gate phase values is the following:
θk
i = θk
i−1 + πH(fk
i−1 + fk
i ) (2)
being fki
and θki
respectively the frequency and phase ofthe k-th partial of the i-th frame, and H the hop size.
3.1.4. Relative phase delay representation
A more complex method, theorized in [4], that helps topreserve the original waveform is based on the relativephase delay representation of the phase, defined as the dif-ference between the phase delay (phase/radian frequencyratio) of the partials and the phase delay of the fundamen-tal. This makes the waveform characterization independentfrom the phase of the first partial.
Once the relative phase delays are computed for eachframe it is therefore possible to propagate the phase of themodified fundamental, as described in equation (2), andrebuild the waveform by adding the relative phase delaysto the new fundamental phase delay.
3.1.5. SMS Diphones Concatenation
Once transformed, two successive diphones have to beconcatenated. This operation is mainly based on thetime stretching interpolation and decimation subroutine,although also pitch shifting is used. Basically the behaviorof this operation is to morph the last frames of a diphonewith the first frames of the following one. The pitch ofthose frames is matched and then magnitude and frequency
Posters 91
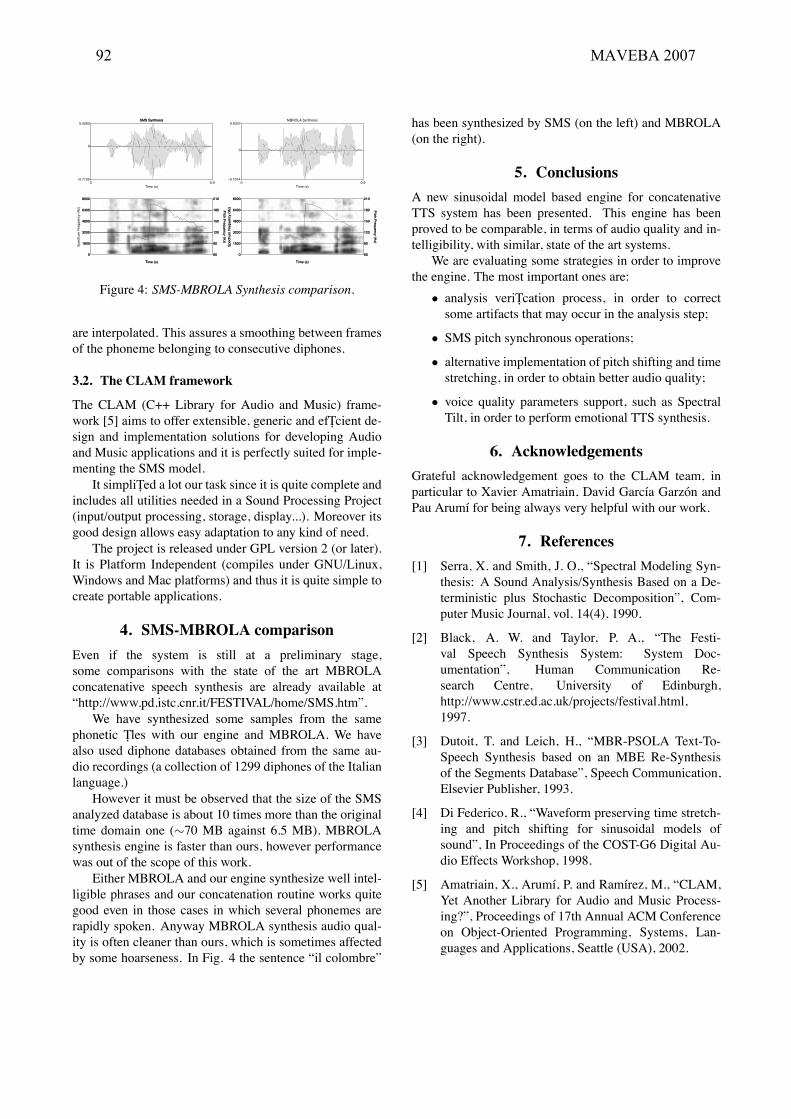
Time (s)0 0.9
–0.7725
0.5263
0
Time (s)0 0.9
–0.7014
0.6337
0
SMS SynthesisSMS Synthesis MBROLA Synthesis
0
1600
3200
4800
6400
8000
0
1600
3200
4800
6400
8000
Spe
ctru
m F
requ
ency
(H
z)
60
90
120
150
180
210
60
90
120
150
180
210
Pitch F
requency (Hz)
Pitch F
requency (Hz)
Time (s)Time (s)
0
1600
3200
4800
6400
8000
0
1600
3200
4800
6400
8000
Spe
ctru
m F
requ
ency
(H
z)S
pect
rum
Fre
quen
cy (
Hz)
60
90
120
150
180
210
60
90
120
150
180
210
Pitch F
requency (Hz)
Pitch F
requency (Hz)
Time (s)Time (s)
Figure 4: SMS-MBROLA Synthesis comparison.
are interpolated. This assures a smoothing between framesof the phoneme belonging to consecutive diphones.
3.2. The CLAM framework
The CLAM (C++ Library for Audio and Music) frame-work [5] aims to offer extensible, generic and efficient de-sign and implementation solutions for developing Audioand Music applications and it is perfectly suited for imple-menting the SMS model.
It simplified a lot our task since it is quite complete andincludes all utilities needed in a Sound Processing Project(input/output processing, storage, display...). Moreover itsgood design allows easy adaptation to any kind of need.
The project is released under GPL version 2 (or later).It is Platform Independent (compiles under GNU/Linux,Windows and Mac platforms) and thus it is quite simple tocreate portable applications.
4. SMS-MBROLA comparison
Even if the system is still at a preliminary stage,some comparisons with the state of the art MBROLAconcatenative speech synthesis are already available at“http://www.pd.istc.cnr.it/FESTIVAL/home/SMS.htm”.
We have synthesized some samples from the samephonetic files with our engine and MBROLA. We havealso used diphone databases obtained from the same au-dio recordings (a collection of 1299 diphones of the Italianlanguage.)
However it must be observed that the size of the SMSanalyzed database is about 10 times more than the originaltime domain one (∼70 MB against 6.5 MB). MBROLAsynthesis engine is faster than ours, however performancewas out of the scope of this work.
Either MBROLA and our engine synthesize well intel-ligible phrases and our concatenation routine works quitegood even in those cases in which several phonemes arerapidly spoken. Anyway MBROLA synthesis audio qual-ity is often cleaner than ours, which is sometimes affectedby some hoarseness. In Fig. 4 the sentence “il colombre”
has been synthesized by SMS (on the left) and MBROLA(on the right).
5. Conclusions
A new sinusoidal model based engine for concatenativeTTS system has been presented. This engine has beenproved to be comparable, in terms of audio quality and in-telligibility, with similar, state of the art systems.
We are evaluating some strategies in order to improvethe engine. The most important ones are:
• analysis verification process, in order to correctsome artifacts that may occur in the analysis step;
• SMS pitch synchronous operations;
• alternative implementation of pitch shifting and timestretching, in order to obtain better audio quality;
• voice quality parameters support, such as SpectralTilt, in order to perform emotional TTS synthesis.
6. Acknowledgements
Grateful acknowledgement goes to the CLAM team, inparticular to Xavier Amatriain, David Garcıa Garzon andPau Arumı for being always very helpful with our work.
7. References
[1] Serra, X. and Smith, J. O., “Spectral Modeling Syn-thesis: A Sound Analysis/Synthesis Based on a De-terministic plus Stochastic Decomposition”, Com-puter Music Journal, vol. 14(4), 1990.
[2] Black, A. W. and Taylor, P. A., “The Festi-val Speech Synthesis System: System Doc-umentation”, Human Communication Re-search Centre, University of Edinburgh,http://www.cstr.ed.ac.uk/projects/festival.html,1997.
[3] Dutoit, T. and Leich, H., “MBR-PSOLA Text-To-Speech Synthesis based on an MBE Re-Synthesisof the Segments Database”, Speech Communication,Elsevier Publisher, 1993.
[4] Di Federico, R., “Waveform preserving time stretch-ing and pitch shifting for sinusoidal models ofsound”, In Proceedings of the COST-G6 Digital Au-dio Effects Workshop, 1998.
[5] Amatriain, X., Arumı, P. and Ramırez, M., “CLAM,Yet Another Library for Audio and Music Process-ing?”, Proceedings of 17th Annual ACM Conferenceon Object-Oriented Programming, Systems, Lan-guages and Applications, Seattle (USA), 2002.
92 MAVEBA 2007

Models and analysis of vocal emissions for biomedical applications: 5th international workshop: December 13-15, 2007: Firenze, Italy, ed. by C. Manfredi,ISBN 978 88-8453-673-3 (print) ISBN 978-88-8453-674-7 (online)© Firenze university press, 2007.
Abstract: Unlike many acoustic measures, Cepstral Peak Prominence (CPP) has shown consistently high correlations with subjective vocal quality ratings. However, this superiority of the CPP index is reported based on empirical results, with its theoretical advantages not always clearly stated. In this paper the properties of the CPP which makes it a good predictor for vocal quality are addressed, as well as how it differs from other measures. The reported experimental setups of the previous studies are analyzed, and reasons for the observed variability in the results are given. After this discussion, the clinical usefulness of CPP is addressed. This paper can be useful for researchers as well as for clinicians, in planning the experimental setup and interpreting the relevance of the results. Keywords: Cepstrum, vocal quality, breathiness, roughness
I. INTRODUCTION
Many acoustic measures have been proposed to correlate with overall vocal quality or one of its dimensions (i.e. breathiness, roughness, strain, hoarseness, etc.; an extensive tabulation of methods can be found in [1]). In spite of the large number of measures available, there is a lack of consistent results across different studies for most of the measures (e.g. jitter, shimmer, HNR) [2]. Recent work [3][4][5] has shown the Cepstral Peak Prominence (CPP) [6] or its smoothed version (CPPs) [7] to correlate highly with vocal quality dimensions and overall grade. The high correlation in these latter studies has been consistent and notably superior to the other acoustic measures considered.
There are several topics, though, which should be more clearly stated. Most of these works provide experimental data, where CPP results better based on empirical evidence. The theoretical advantages of CPP over the rest of the acoustic measures are not always clearly stated. Some of the experimental setups also favor abnormally high values for the amount of variance explained.
In this paper we address the properties of the CPP that makes it a good predictor for vocal quality, and how it differs from other measures. Besides, the reported experimental setups of the previous studies are analyzed,
and reasons for the observed variability in the results are given. After this discussion, the clinical usefulness of CPP is addressed. This paper can be useful for clinicians, willing to interpret the results of the acoustic measures, as well as for researchers, in planning the experimental setup and explaining the relevance of the results.
II. CPP PROPERTIES
The origin of the CPP measure in [6] is, as its companion measure RPK for autocorrelation peak, a basic pitch detector. Both measures were devised to appraise the prominence of the peak that should occur at the pitch value in the cepstrum and autocorrelation functions, respectively. As such, CPP is sometimes erroneously believed to be a measure of signal periodicity, when, in fact, it only measures the periodicity of the signal spectrum. It is precisely this subtle difference (measuring spectral harmonic periodicity instead of strict periodicity) what makes it particularly suited for vocal quality measures, superior to many other measures.
Following is a categorization of measures in five groups, according to signal characteristics, which have been most correlated with different vocal quality dimensions. The first two are the more common amplitude (shimmer) and frequency (jitter) perturbations, absent in the original studies on CPP [6][7], while the other three groups are the ones actually included in those studies. The sensibility of CPP to the signal characteristics is commented, as well as its possible advantages and drawbacks compared to other measures.
1. Amplitude perturbations (shimmer). Signals with amplitude perturbations have frequently
been related to roughness [3], and sometimes with breathiness. The traditional measures of shimmer are obtained in the time domain, relying on a Pitch Detection Algorithm (PDA). CPP is sensitive to shimmer, since shimmer affects the spectral harmonic structure [8]. CPP values diminish as shimmer increases, and can be more robust than time-domain techniques relying on a PDA. It has been shown that shimmer, jitter and time-domain Harmonics-to-Noise Ratios (HNR) are quite sensitive to even small errors in the pulse boundaries [9].
PROPERTIES OF THE CEPSTRAL PEAK PROMINENCE AND ITS USEFULNESS IN VOCAL QUALITY MEASUREMENTS
C. A. Ferrer1,2, M. S. de Bodt2, Y. Maryn3, P. Van de Heyning2, M. E. Hernández-Díaz1
1Center for Studies on Electronics and Information Technologies, Central University of Las Villas, Santa Clara, Cuba 2Dept of Otorhinolaryngology, Head & Neck Surgery & Communication Disorders, Antwerp University, Belgium
3Dept of Speech-Language Pathology & Audiology, Sint-Jan General Hospital, Bruges, Belgium

2. Frequency perturbations (jitter) Jitter shares a similar condition than shimmer, being
mostly related to roughness, and less frequently to breathiness. Jitter affects spectral structure to a greater extent than shimmer [8] and CPP can therefore be also a good measure of this perturbation. The same advantage regarding the sensibility of time-domain measures of jitter to errors in the PDA holds in this case in favor of CPP.
3. Additive Noise The presence of additive noise has been related mainly
with breathiness. The prominence of the cepstral peak is also affected by increasing levels of noise, since it reduces the dip between harmonics. In fact, several studies have focused in this property to develop HNR measures [10][11]. CPP holds the advantage with respect to time-domain HNRs of not requiring accurate PDAs, and with respect to many frequency-domain HNRs which require the determination of the harmonic frequencies. Existing HNR measures have been regarded as overall disperiodicity measures, since they have been shown sensitive also to jitter and shimmer [10][8][11]. CPP also shares this feature, being sensitive to these three groups.
4. First Harmonic Amplitude A high amplitude of the first harmonic (with respect to
the second harmonic [7] or to the first formant [12]) has been related to breathiness. The underlying assumption is that breathy voices do not produce abrupt glottal closures, producing an excitation which is more rounded, almost sinusoidal. First harmonic amplitude prominences are closely related to glottal flow measures like the amplitude quotient or the speed quotient [13]. Here the CPP is superior to its companion RPK in [6] and to other HNR measures. The CPP will produce no prominent peak for a perfect sinusoid, since a sinusoid consists of only one harmonic (no spectral periodic structure). That is the main difference with other periodicity measures: a perfectly periodic signal not necessarily produces a high CPP. This lack of higher harmonics is also typical of nasal voices [1], extending the sensibility of CPP to the nasality dimension.
5. Spectral Tilt An increment in the energy content in the higher
portion of the spectrum has been related to breathiness [14]. CPP is not able to measure spectral tilt changes, which would be reflected in the lower part of the cepstra, discarded for its calculation. However, spectral tilt measures have been reported to have the smallest relevance in breathiness ratings in several other studies [6][7]. CPP inability to follow spectral tilt changes can be of negligible effect on its prediction of breathiness.
As seen, CPP can produce adequate response to most of the signal characteristics which have been related to many vocal quality dimensions (breathiness, roughness, hoarseness, nasality). If an orthogonal representation of the GRBAS scale is accepted [15], the CPP can be expected to be a better predictor of overall Grade, than of any individual dimension. This would occur because selective response of CPP to one particular dimension is affected by its sensitivity to the others.
The next section explains the results of the CPP index in several reported studies in terms of the previous discussion.
III. REPORTED STUDIES
The studies covered in this section are the original CPP and CPPs by Hillenbrand et. al. [6] and Hillenbrand & Houde [7], and more recent studies by Heman-Ackah et. al. [3], Awan & Roy [4] and Maryn et. al. [5].
Hillenbrand et. al. (1994) [6]. This study consisted in the voluntary control of three
breathiness phonation levels by 15 normal subjects on four vowels. The number of judges was high (20) and the rating scale was an unrestricted visual-analog (VA). The different acoustic indexes were calculated over three types of signals: the original, a band-pass filtered signal and a high-pass filtered version. CPP emerged as a very good predictor of breathiness ratings (Pearson’s r greater than 0.9, more than 80% of the variance explained by r2)with RPK in the band-pass signal showing similar results.
This study intentionally limited the perturbation to breathiness. This has, according to the discussion in Section II, a twofold consequence. First, breathiness ratings do coincide with “grade” since it is the only deviant dimension, and second, the obtained correlations can be high because CPP is not affected by interference with other distortions. The possible influence of using non-pathological speakers is addressed in the analysis of the next study.
Hillenbrand & Houde (1996) [7] Here a broad pathological database was screened to
select 20 recordings presenting mainly breathiness, as well as 5 recordings from nonpathological subjects. Recordings included a sustained vowel as well as running speech. The number of judges was 20, and the scale used was unrestricted VA. CPP and CPPs were again the best predictors, with similar results (up to 85% and 92% of the variance explained in the running speech and sustained vowels, respectively).
In this study no version of the RPK could match the performance of its equivalent cepstral measure (a best result of 72% of variance explained). A possible cause is that pathological speakers showed a stronger influence of first harmonic amplitudes and spectral tilt measures in
94 MAVEBA 2007

breathiness ratings than in the previous study, and CPP is better suited than RPK to reflect at least the former factor. Again, the restriction of deviant dimension to breathiness can explain the extremely high correlations obtained.
Heman-Ackah et. al. (2002) [3] Voices from 19 patients were available, preoperative
and postoperative, in both a sustained vowel and running speech. Two judges rated grade, breathiness and roughness in a 120 mm VA scale.
The results are lower than the ones in [6] and [7] with the cause being the absence of a selective screening of the deviant dimensions, which is more likely the case in the clinical practice. Here the results for grade (65%-75% of the variance explained) are considerably better than the ones for breathiness (50%) or roughness (20%-25%). These results are in complete correspondence with the discussion in Section II.
Awan & Roy (2005) [4] Recordings from 83 dysphonic and 51 normal female
subjects were rated by 12 judges as belonging to four groups or voice types: normal, breathy, rough and hoarse. The degree of the dimension was not the goal of the study, only the type.
The study found CPP to be good at discriminating normal from dysphonic voices, but it was not relevant for the separation among the different dysphonic types. A logarithmic shimmer measure was found best suited for the later purpose. This is also in correspondence with our analysis in Section II. CPP is similarly sensitive to breathy and rough signal characteristics, and can not be a reliable separator among them.
Maryn et. al. (2007) [5] This study comprised recordings from both a sustained
vowel and running speech, from 229 patients and 22 normal subjects. Samples were rated by five judges in the G, R and B dimensions of the GRBAS scale.
CPP ranked again the best among all acoustic measures considered, and again the correlation was strong with overall grade and breathiness ratings. Results are the lowest reported (50% of the variance explained for grade) but the size of the database is also the largest, thus including more variability than previous studies.
IV. DISCUSSION AND CONCLUSION
According to the previous sections, CPP can be expected to appraise overall grade better than any other acoustic measure of vocal quality previously reported. If proper screening of samples is performed (i.e. limit signal deviation to a single dimension) CPP can produce extremely high values of correlation with the individual dimensions.
A significant reduction in the percent of variance explained occurs when considering signals with a wide range of variability, but even in that case, CPP can still perform as the best single predictor of overall vocal quality. Another point in favor of CPP is its similar performance on sustained vowels and running speech. The desirability of using running speech for acoustic measures has been pointed out in several studies [7][5], and only a small fraction of the existing measures can work on running speech.
The usefulness of CPP is limited, though, in trying to separate the different dimensions of vocal quality. Its sensitivity to most of the relevant distortions found in pathological voice makes it better suited to predict grade than any individual dimension. Since the later is usually the case in clinical practice, complementary acoustic measures are needed to perform an accurate and exhaustive description of vocal quality in terms of objective measures.
REFERENCES [1] E. H. Buder “Acoustic analysis of vocal quality: a tabulation of algorithms 1902-1990” in Voice Quality Measurement R. D. Kent and M. J. Ball (Eds). Singular. San Diego. 2000. [2] J. Kreiman and B. Gerrat “Measuring Voice Quality” in Voice Quality Measurement R. D. Kent and M. J. Ball (Eds). Singular. San Diego. 2000 [3] Y. D. Heman-Ackah, D. D. Michael and G. S. Goding. “The relationship between cepstral peak prominence and selected parameters of dysphonia” JVoice. pp 20–27, 2002. [4] S. N. Awan and N. Roy. “Acoustic prediction of voice type in women with functional dysphonia” J Voice. pp 268–282, 2005 [5] Y. Maryn, P. Corthals. M. De Bodt and P. van Cauwenberghe “Cepstral peak prominence as a measure for overall voice quality in vowel as well as in continuous speech segments” 7th Pan European Voice Conference PEVOC7, 2007. [6] J. Hillenbrand, R. A. Cleveland and R. L. Erickson “Acoustic correlates of breathy vocal quality” J Speech Hear Res. pp 769–778, 1994. [7] J. Hillenbrand and R. A. Houde “Acoustic correlates of breathy vocal quality: dysphonic voices and continuous speech” J Speech Hear. Res. pp 311–321, 1996. [8] J Schoentgen “Spectral models of additive and modulation noise in speech and phonatory excitation signals” J Acoust. Soc. Am. pp 553-562, 2003. [9] J. Hillenbrand “A methodological study of perturbation and additive noise in synthetically generated voice signals”, J Speech Hear. Res. pp 448-461, 1987. [10] G. de Krom “A cepstrum based technique for determining a Harmonics-to-Noise ratio in speech signals” J Speech Hear. Res. pp. 254-266, 1993.
Posters 95

[11] P. J. Murphy. “Periodicity estimation in synthesized phonation signals using cepstral rahmonic peaks” Speech Comm. pp 1704-1713, 2006. [12] R Shrivastav “The use of an auditory model in predicting perceptual ratings of breathy voice quality”. JVoice. pp 502-512. 2003. [13] M. Airas and P. Alku “Comparison of Multiple Voice Source Parameters in Different Phonation Types” Proceedings of Interspeech 2007. pp 1410-1413, 2007.
[14] T. Fukazawa, A. El-Assuooty and I. Honjo “A new index for evaluation of the turbulent noise in pathological voice”. J Acoust. Soc. Am. Vol. 83, pp 1189-1193. 1988. [15] J. F. Bonastre, C. Fredouille, A. Ghio, A. Giovanni, G. Pouchoulin, J. Révis, B. Teston and P. Yu. “Complementary approaches for voice disorder assessment” Proceedings of Interspeech 2007. pp 1194-1197, 2007.
96 MAVEBA 2007

Models and analysis of vocal emissions for biomedical applications: 5th international workshop: December 13-15, 2007: Firenze, Italy, ed. by C. Manfredi,ISBN 978 88-8453-673-3 (print) ISBN 978-88-8453-674-7 (online)© Firenze university press, 2007.
Abstract: This study visualizes the glottal excitation in a temporally highly resolved estimate of the first formant. Instantaneous estimates during the glottal cycle of the frequency and bandwidth of the first formant closely follow the electroglottographic contour. This is demonstrated for phonation of an [a:] produced by one female patient with laryngeal dystonia. The observed contours in the F1 frequency and bandwidth can be interpreted with reference to the current status of patients’ typical phonation behaviour before and after botulinum toxin (BTX) treatment. The temporally highly resolved formant frequency and bandwidth contours reflect glottal features such as the different durations of the open phase and fundamental frequency and/or amplitude perturbations of the vocal fold vibration. For example, diplophonia is identifiable in parts of the phonation. These results suggest the possibility of quantifying differences in the intra-cycle first formant contours according to different voice qualities. Keywords: Linear prediciton, electroglottography, laryngeal dystonia, BTX- treatment
I. INTRODUCTION
In voiced speech the larynx produces a complex sound that excites the resonances of the vocal tract. Interpreting this situation in terms of narrowband spectral analysis, the source signal consists of the fundamental oscillation and higher harmonics. The harmonics which are close to the resonance frequency of the vocal tract get amplified. They convey information on the place and manner of articulation to the listener whereas the fine structure of the harmonic spectrum carries the voice quality. In this analysis the long window of the narrowband spectrum looks at the formants as slowly varying characteristics of the vocal tract. Spectral gradient measurements may be associated with voice quality to a certain extent [1], but the minimum vowel duration of about 50 milliseconds together with the necessary stationarity excludes many short vowels and diphthongs from analysis with this technique.
On the other hand it is evident that the vocal tract changes in the degree of coupling to the subglottal cavity with the movement of the vocal folds during the glottal cycle. Widely opened glottal folds couple the subglottal cavity and lower at least the lowest – the first – formant
and increase its bandwidth. In contrast the closed glottis acoustically decouples the subglottal cavity and leads to the highest frequency and the smallest bandwidth of the first formant. Immediately after the acoustic excitation by the completed glottal closure, the acoustic energy in the vocal tract is at its peak and this high-frequency low-bandwidth formant state is radiated most prominently.
The aim of the present study is to visualize the glottal excitation for phonation of an [A:] produced by one female patient with laryngeal dystonia (spasmodic dysphonia, adductor type) before and after BTX-treatment. The common adductor type of laryngeal dystonia is characterised by irregular hyperadduction of the vocal folds leading to a strangled and hoarse voice quality with breaks in pitch and phonation [2]. Accordingly, the acoustic output is characterised by amplitude and frequency perturbation and diplophonia in parts of the signal. Diplophonia is a beat frequency phenomenon caused by the independent vibration of the two vocal folds or different parts of the vocal folds at different frequencies.
In the present study instantaneous estimates of the first formant's frequency and bandwidth are undertaken closely following the electroglottographic contour. The instantaneous frequency and bandwidth of the first formant is estimated by the high temporal resolution linear prediction [3].
II. METHODS
A. Signal Analysis Sustained vowels are considered here to be produced
by a rapidly time varying system. The moving vocal folds themselves are the main source of this time variation. Their movements affect the acoustic termination of the vocal tract tube at its lower end. The aim of the analysis procedure are formant frequency and bandwidth estimates that track closely the changes of the acoustic resonator. Our approach is to use linear prediction within short signal frames of 3ms that do not deviate too much from the stationarity requirement of linear prediction. The uncertainty of the formant parameter estimates increases with shortened frame duration. It has already been demonstrated that this formant parameter uncertainty may be counteracted by polynomial regression prior to, and temporal smoothing posterior to the linear prediction [3,4].
CORRELATES OF TEMPORAL HIGH-RESOLUTION FORMANT ANALYSIS AND GLOTTAL EXCITATION IN LARYNGEAL DYSTONIA BEFORE AND
AFTER BOTULINUM TOXIN TREATMENT. A CASE STUDY
M. Pützer1, W. Wokurek2
1Institut für Phonetik, Universität des Saarlandes, Deutschland 2Institut für Maschinelle Sprachverarbeitung, Universität Stuttgart, Deutschland

The processing starts with a standard first order preemphasis filter with its zero at 0.99. Since the aim is to calculate the formant oscillation parameters, the next processing step is the suppression of the fundamental waveform to a great extent with a linear high pass filter of 400 Hz. The passband starts above the fundamental frequency of 250Hz and well below the classically expected frequency of the first formant of an open vowel around 800Hz. The passband is terminated at 2kHz tolimit the influence of higher formants and high frequency noise. This choice includes both the first and second formant of [A:] in the analysis and it produces better results than the other tested alternatives: a lowpass filter cuttoff at 1.2kHz, 1.5kHz or 3kHz.
The polynomial regression consists in subtracting abest matching constant, straight line or parabola from the signal in the analysed frame. This step is introduced to eliminate residual portions of the fundamental wavecontour. Fig. 1 and 2 include only the subtraction of the mean and fig. 3 and 4 the subtraction of the best matching parabola.
The order of the linear prediction is selected to be 51 which corresponds roughly to a pole per kilohertz of the total bandwidth of the digitized signal and one pole on the real axis. The analysis frames are shifted 200 microseconds yielding 5 frames each millisecond.
The formant parameters scatter broadly around the time varying changes of the resonator. To visualize the formant track without noise, each 7 successive formant parameters are averaged and shown in the plots. This temporal smoothing results in a time resolution of 1.4ms. In order to ignore outliers and reduce mixing the first and the second formant, parameter estimates within the ranges of 400Hz<F1<1.2kHz and 50Hz<B1<600Hz are averaged.
B. Speech material One female patient with adductor spasmodic dysphonia
was asked to produce the vowel [a:] at a normal pitch.Electroglottogram (EGG) and microphone signals wererecorded simultaneously, and both were digitised with a sampling rate of 50kHz and 16-bit amplitude resolution. The microphone signal was recorded using a headset condenser microphone (NEM 192.15, Beyerdynamic). By using a headset microphone, the distance to the lips remains constant during speech, independent of headmovements [5] The EGG-signal was measured with a Portable Laryngograph from Laryngograph Ltd. Both signals were fed directly into a Computerised Speech Lab (CSL) station (model 4300B).
III. RESULTS
Three contours show the different states of the speaker's voice quality: the electroglottographic measurement as a phonation reference, the instantaneous
frequency estimate of the first formant (F1), and the bandwidth estimate of the first formant (B1). The analysed signals shown in figs. 1 - 4 represent the voice quality (a) before BTX-treatment, (b) five days after BTX-treatment, (c) two months after BTX-treatment and (d) six months after BTX-treatment reflecting the state of relapse.
A. Before BTX-treatment EGG and instantaneous formant measurements of
hoarse voice quality are shown in fig. 1. The pitch cycles show partially strong fundamental frequency and amplitude perturbation. Accordingly, the EGG contours show variation from cycle to cycle indicating diplophonia. The F1 and B1 contours follow the EGG course less closely then in normal voice quality (modal voice) shown in fig. 3.
Fig. 1 Before BTX-treatment
B. Five days after BTX-treatment The tendency of the F1 contour to follow the EGG
contour is visible in fig. 2. Due to breathiness as a result of BTX-treatment, the open phase in the pitch cycle is very long. This long open phase is displayed by EGG and F1 frequency contours and by the high bandwidth of the first formant.
98 MAVEBA 2007

Fig. 2 Five days after BTX-treatment
C. Two months after BTX-treatment Two months after treatment, the contours are
comparable to modal voice quality. This voice quality has also been described in a recent study [4]. In fig. 3, the modal voice contours are shown for EGG, F1 and B1. The beginning of the closing phase of each pitch cycle is displayed as an ascent of the EGG contour. The ascent ends in the contact phase. The locally maximal contact is marked by the upper peak. After a delay of about 2 milliseconds the same upward and peak course is visible in the first formant frequency. In contrast to this, the bandwidth of the first formant is minimal during the closed phase, i.e. the peaks in EGG and F1 are aligned with a B1 valley in fig. 3. The low bandwidth indicates a low loss of acoustic energy in this phase of the pitch cycle when the subglottal cavity is minimally coupled to the supraglottal vocal tract. The beginning opening phase of the glottal cycle is characterised by a decreasing contact of the vocal fold tissue. The EGG contour, displaying the electrical conductivity across the larynx, falls and reaches its valley when the vocal folds are open. Again, after the acoustic delay the frequency of the first formant in fig. 3 decreases and reaches a valley. This is interpreted as a decreasing cavity resonance frequency due to an increasing acoustic coupling of the subglottal and supraglottal cavities. The first formant’s frequency is minimal and its bandwidth is maximal during the open phase. The increasingly large bandwidth corresponds to an increasingly large loss of acoustic energy in the subglottal cavity.
Fig. 3 Two months after BTX-treatment
D. Six months after BTX-treatment About six month after BTX-treatment, a state of
relapse is observed (see fig. 4). As mentioned above (see section A.), the pitch cycles again show partially strong fundamental frequency and amplitude perturbation. Equally, the EGG contours show some variation from cycle to cycle, again displaying diplophonia in parts of the signal. The F1 and B1 contours once more follow the EGG course less closely.
Fig. 4 Six months after BTX-treatment
IV. DISCUSSION
First formant analysis with high temporal resolution is a promising candidate as a tool for the acoustic observation of changes in voice quality during treatment with BTX. This is confirmed by the observation of similarities between the electroglottographic contour and the frequency and bandwidth contours of the first
Posters 99

formant. The observed contours can be interpreted with reference to the current status of patients’ typical phonation behaviour before and after BTX-treatment for adductor spasmodic dysphonia. For the pre-BTX-treatment phase, fundamental frequency and amplitude perturbation as well as diplophonia are apparent in parts of the vocal fold vibration. For the phase immediately after treatment, breathy voice quality with a long open phase and a large bandwidth of the first formant isobserved. This bandwidth of the first formant indicates a higher loss of acoustic energy in the subglottal cavity. The cavity is more strongly coupled to the supraglottal vocal tract. For the phase about two months after BTX-treatment, modal voice quality can be noted. The regularity of the glottal cycle can be seen in the oscillation of the first formant frequency and its narrow bandwidth. Finally, in the so-called relapse phase, pitch cycles with strong fundamental frequency and amplitude perturbation as well as diplophonia in parts can bedetected again.
V. CONCLUSION
The observations in the present study seem to reflect closely the (patho)physiological behaviour of vocal fold vibration caused by a merely symptomatic treatment of laryngeal dystonia. Therefore, they may help to determine the actual voice quality status during this treatment. For the future it may be interesting to quantify differences in the first formant contours according to different voice qualities.
REFERENCES
[1] M. Pützer, and W. Wokurek, „Multiparametrische Stimmprofildifferenzierung zu männlichen und weiblichen Normalstimmen auf der Grundlage akustischer Analysen,” Laryngol Rhino Otol, vol. 85, pp. 1-8, 2006. [2] M.F. Brin, A. Blitzer, and C. Stewart, „Laryngeal dystonia (spasmodic dysphonia): observations of 901patients and treatment with botulinum toxin,” Adv Neurol, vol. 78, pp. 237-252, 1998. [3] W. Wokurek, „Erfassung des glottalen Öffnungs-grades durch Formantveränderungen während der Sprachgrundperiode,“ Fortschritte der Akustik, Deutsche Arbeitsgemeinschaft für Akustik DAGA '07, Stuttgart. [4] M. Pützer, and W. Wokurek, „Correlates of temporal high-resolution first formant analysis and glottal excitation,” XVI ICPhS, August 6-10, 2007, Saarbrücken. [5] I. Titze, and W. Winholts, „Effect of microphone type and placement on voice perturbation measurements,” J Speech Hear Res, vol. 36, pp. 1177-1190, 1993.
100 MAVEBA 2007

Models and analysis of vocal emissions for biomedical applications: 5th international workshop: December 13-15, 2007: Firenze, Italy, ed. by C. Manfredi,ISBN 978 88-8453-673-3 (print) ISBN 978-88-8453-674-7 (online)© Firenze university press, 2007.
Abstract: The presentation concerns the estimation of the vocal tract length of a speaker on the base of her formant frequencies and the formant frequencies and known tract length of a reference speaker. The length prediction is founded on a rule inferred from Webster’s equation that describes the propagation of a planar acoustic wave in a loss-less vocal tract. The length prediction experiments have been cross-language, cross-gender and cross-corpora. Results show that the relative length prediction error is less than 3%, which is inferior to the error made assuming typical tract lengths of 15 and 17 cm for male and female speakers respectively.
I. INTRODUCTION
This study is devoted to the estimation of the vocal tract length of a speaker by means of his formant frequencies and the formant frequencies and default tract length of a reference speaker.
Several studies have been devoted to the topic of tract length estimation, because one may argue that the tract length is an anatomical cause of inter-speaker variability [2]. Possible applications of predicting tract lengths from acoustic data are speaker normalization and the facilitation of acoustic-to-articulatory inversion [1]. A majority of studies have focused on length normalization with a view to achieving speaker normalization, without attempting to estimate the tract length explicitly.
The default length is the vocal tract length with lips and larynx in neutral positions. Lip rounding or spreading and larynx raising or lowering are phonetically relevant gestures that mark vowel timbre and which overlay a speaker’s anatomically conditioned default length.
Several methods have been used to estimate the vocal tract length from speech. One is based on a known formula that relates the length of a uniform loss-less acoustic tube to its natural frequencies when the tube is open at one end and closed at the other. The vocal tract length is estimated by averaging several length values obtained by means of several observed formants [3], [4].
Paige et al. have proposed to estimate the tract length using low-order poles and zeros of the lip impedance, omitting the assumption of uniform cross-sections [5]. The lip impedance poles correspond to the natural frequencies of the tract closed at both ends, which cannot
be measured from the speech signal directly. Be that as it may, Paige’s approach has in common with [1] that it aims at obtaining length estimates on the base of acoustic data only.
AN EXPERIMENT IN VOCAL TRACT LENGTH ESTIMATION A.Sitchi1, F. Grenez1, J. Schoentgen1,2
1Laboratory of Images, Signals and Telecommunication Devices, Université Libre de Bruxelles, Bruxelles, Belgium 2National Fund for Scientific Research, Belgium
The method we have investigated enables estimating the unknown vocal tract length of a speaker by means of his formant frequencies as well as the known vocal tract length and formant frequencies of a reference speaker. The experiments that have been carried out include predicting tract lengths across genders and linguistic communities. The focus has been on default tract lengths, because the general framework has been acoustic-articulatory inversion, which assumes the default lengths to be known and the deviations therefrom to be computable.
II. METHODS
The method is based on an observation, made by Ungeheuer, concerning Webster’s equation, which describes the propagation of planar loss-less acoustic waves in non-uniform ducts [7]. Webster’s equation suggests that when the longitudinal dimension of an acoustic tube is multiplied by a constant, its natural frequencies change inversely proportional to that same constant. Applying this observation to the vocal tract would suggest that multiplying the length of the vocal tract by a number causes the formants frequencies to be divided by the same number. Mol, for instance, has tested this prediction by means of the Peterson and Barney data [8] by displaying the first and second formant averages for men, women and children in a chart and observing that the averages are positioned for each vowel on a straight line through the chart origin [6].
A. Estimation of the factor of proportionality
Because the first three formants of all vowels are assumed to obey the rule of inverse proportionality, one calculates as follows the multiplicative constant , which is assumed to explain inter-speaker formant differences owing to default length differences.

N
ii
N
irefi
F
F
1
1,
(1)
Symbol designates the formants frequencies of a
set of vowels of a reference speaker whose average vocal
tract length is known and the formant frequencies of a
set of vowels of the speaker whose vocal tract length is unknown. Symbol equals the number of formants per vowel time the number of vowel categories. It is desirable that the vowel categories and the number N of formant frequencies are identical for the target and reference speakers, because of the vowel-typical vocal tract lengthening and shortening that must be averaged out when the goal is the estimation of the default length.
refiF ,
iF
N
Once factor of proportionality, has been obtained, the unknown tract length L can be estimated via the known tract length of the reference speaker.
refLL (2)
B. Corpora
Corpora are divided into reference and test corpora. The first and the second reference corpora comprise the vocal tract lengths and first three formant frequencies of 10 French vowels sustained each by 4 speakers (2 males and 2 females) [9] and one male speaker [10] respectively). Hereafter, these speakers are labeled MS1,MS2, FS1, FS2 and MS3.
A third reference corpus comprises the tract lengths and first three formant frequencies for 10 American-English vowels sustained by one female speaker [11] (labeled FSAE).
The formant frequency data published in the framework of these corpora have been obtained via measured vocal tract cross-sections and lengths combined with acoustic models. The purpose has been to guarantee the best possible match between published acoustic and morphological data.
This is, however, problematic when the objective is to test relations (1) and (2) because for these corpora the formant frequency data cannot be assumed to be independent of the model the predictions of which they are expected to validate.
Therefore, only those corpora have been retained as test corpora for which the formant frequencies have been determined from the speech spectra directly, loose from any Webster’s equation-based modeling. One test corpus comprises the tract lengths and formant frequencies
measured for one male speaker who has sustained 10 American-English vowels [11]. The second test corpus comprises the vocal tract lengths and three formant frequencies of 5 Russian vowels produced by one male speaker [12]. The American English and Russian speakers are hereafter labeled MSAE and MSRrespectively.
The area functions and lengths published in [9] and [11] have been obtained by nuclear resonance imaging. The cross-sections and lengths in [12] are the well-known Russian vowel data published by G. Fant. They have been compiled on the base of X-ray images. The shapes and lengths published in [10] have been recorded by a combination of phonetic a priori knowledge, visual inspection of human speakers and X-ray imaging.
The default length for each speaker has been obtained by averaging the vowel-typical lengths.
III. RESULTS
A. Experiment 1
The experiment consists in predicting the vocal tract length of American-English test speaker MSAE by means of each reference speaker in turn. Table 1 shows the length prediction results. One sees that the absolute maximum relative error is less than 2 %.
Table 1: Relative error in % and proportionality factors obtained for American-English male test speaker MSAE.Symbol L is the measured default length.
B. Experiment 2
The experiment consists in predicting the vocal tract length of Russian test speaker MSR by means of each reference speaker in turn. This experiment has involved five of Fant’s Russian vowels [12]. The number of
Test: AEMSL = 17.14cm
References Relative error
(%)
1MS 0,93 -0,15
2MS 0,93 -0,54
1FS 1,08 -1,77
2FS 1,03 0,91
3MS 0,96 -0,91
AEFS 1,25 -0,06
102 MAVEBA 2007

vowels has been the same for all speakers. The Russian and reference vowel qualities have been chosen to be as similar as possible.Table 2 shows the length prediction results. One sees that the absolute maximum relative error is less than 2.5 %.
Table 2: Relative error in % and proportionality factors obtained for Russian male test speaker MSR. Symbol L is the measured default length.
C. Experiment 3
The experiment involves speakers MSR and MSAE as test and reference speakers respectively. Then the proportionality factor is equal to 1.04 and the relative error equal to -1.18 %. Inverting the roles of speakers MSR and MSAE gives rise to the same relative error in absolute value because relation (2) shows that estimating one length from another and vice versa means replacing constant by 1/ and the relative error by its negative.
D. Experiment 4
This experiment has been carried out with the six speakers originally assigned to the reference corpora. Within this experiment, each speaker has been given in turn the role of “reference” speaker from whom the lengths of the other five speakers are predicted. Table 3 reports the proportionality factors above the main diagonal and the relative error in percent below the main diagonal. The line indexes refer to “reference” and the column indexes to “test” speakers. In Table 3, the maximum relative error is less than 3% whoever the “reference” speaker. One should keep in mind that predicting the lengths of speakers belonging to these corpora is a necessary, but not sufficient, test. The reason is that for these speakers the formant frequencies have not been obtained
independently of Webster’s equation relation (2) is a consequence of.
Table 3: Relative error in % (below the diagonal) and proportionality factors (above the diagonal) for 6 speakers [9,10,11], each taking the role of “reference” speaker in turn. Symbol L is the measured default length in cm.
E. Comparison with standard assumptions
Often one assumes that the standard vocal tract length for men is 17 cm and for women 15 cm. One question is whether predicting the tract lengths by means of formant frequencies and the data of a reference speaker causes relative errors that are smaller than those that would have been obtained by making the above default assumptions. One sees in Table 4 that these assumptions cause relative errors between -9.2% and +8.6%. The (absolute) average is 6.1%, which must be compared to the average of 0.72% of Table 1 and 0.90% of Table 2. Table 4 therefore suggests favouring length prediction over length standardization via default values.
Table 4: Relative length error in % using standard tract lengths of 17 and 15 cm for males and females respectively. Symbols LOBS and LSTD designate the observed length and the standard length respectively in cm. Symbol designates the relative error in %.
MS1 MS2 FS1 FS2 MS3 MSAE FSAE MSR
LOBS 18,54 18,24 18 16,01 16,42 17,14 13,73 17,6
LSTD 17 17 17 15 15 17 15 178,31 6,8 5,56 6,31 8,65 0,82 -9,25 3,41
F. Correlation between factors of proportionality and length prediction errors
Relation (2) is applicable to arbitrary test and reference lengths, whatever the length difference. Relation (2) therefore predicts that no correlation is expected between calculated length errors and constants of proportionality
. For the grouped Experiments 1 and 2 and for
Test: MSRL = 17.6cm
References Relative error
(%)
1MS 0.95 -1.12
2MS 0.96 0.13
1FS 1.13 -2.41
2FS 1.08 -0.29
3MS 1.01 -0.96
AEFS 1.27 -0.47
MS1 MS2 MS3 FS1 FS2 FSAE
L=18,54 L=18,24 L=18 L=16,01 L=16,42 L=13,73MS1 0,99 0,96 0,85 0,9 0,74 MS2 0,69 0,97 0,86 0,9 0,75 MS3 -0,76 -1,46 0,88 0,93 0,77 FS1 -1,62 -2,33 -0,86 1,05 0,87 FS2 1,06 -0,38 1,81 2,64 0,83 FSAE 0,09 -0,6 0,85 1,68 -0,98
Posters 103

Experiment 4, the correlations between calculated lengths errors and factors of proportionality are -0.2494 and -0.1493 respectively. These are not statistically significant.
IV. DISCUSSION AND CONCLUSION
a) Results suggest that estimating unknown tract lengths via measured formant frequencies and a reference tract length is a valid method that causes errors that are smaller than those made by assigning standard lengths to male and female tracts. b) The different experiments have involved cross-linguistic & cross-gender length predictions. The results suggest that these cross-factor predictions do not cause length estimation errors to be larger than within-factor predictions. A possible explanation is that observed errors are the combined effect of measurement errors (morphological and acoustic), the disparity between the recording conditions of acoustic and length data (which may not have been simultaneous) as well as the disagreement between predicted and recorded data, and that these combined errors are larger than the average errors caused by cross-linguistic vowel category or gender mismatch. c) Length estimation errors and factors of proportionality
are not statistically significantly correlated. This is an indirect test of the validity of relation (2). Indeed, if relation (2) were a crude approximation only of an unknown relation between the vocal tract lengths of two speakers, one would expect to observe increasing length estimation errors with increasing factors of proportionality. The reason is that linear relation (2) is then expected to approximate that link the better the smaller the difference between the reference and test tract lengths. The lack of observed correlations suggests, however, that identity (2) is a valid approximation of the relation between the default vocal tract lengths of two speakers, whatever the difference in vocal tract size, as long as up to three formants are involved in the comparison.
ACKNOWLEDGEMENTS
We acknowledge support of FET project “Audio-visual to articulatory speech inversion” (ASPI) and of COST Action 2103 “Advanced voice assessment”.
REFERENCES
[1] S. Dusan, L. Deng, “ Vocal tract length normalization for acoustic-to-articulatory mapping using neural networks,” J. Acoust. Soc. Am, vol. 106, pp. 2181, 1999.
[2] D. Paczolay, A. Kocsor and L. Toth, “ Real-time vocal tract length normalization in a phonological awareness teaching system,” Lect. notes comput. Sc Springer Verlag, vol. 2807, pp. 309-314, 2003.
[3] S. Dusan, “Estimation of speaker’s height and vocal tract length from speech signal,” Proc. Inter-. SpeechLisbon, pp. 1989-1992, 2005.
[4] B.F. Necioglu, M.A. Clements and T.P. Barnwell, “Unsupervised estimation of the human vocal tract length over sentence level utterances,” Proc. IEEE ICASSP Istanbul, pp. 1319-1322, 2000.
[5] A. Paige, V.W. Zue, “Calculation of vocal tract length,” IEEE Transactions on audio and electroacoustics, vol. 18, pp. 268-270, 1970.
[6] H. Mol, Fundamentals of Phonetics, The Hague, Nederlands: Mouton, 1970.
[7] G. Ungeheuer, Elemente einer akustischen Theorie der Vokalartikulation, Germany: Springer Verlag, 1962.
[8] G. E. Peterson, H. L. Barney, “Control methods used in a study of the vowels,” J. Acoust. Soc. Am, vol. 24, pp. 175-184, 1952.
[9] M. George, Analyse du signal de parole par modélisation de la cinématique de la fonction d’aire du conduit vocal, Bruxelles : Université Libre de Bruxelles, 2001, pp. 177-178.
[10] M. Mryayti, Contributions aux études sur la parole.France : Institut National Polytechnique de Grenoble, 1976.
[11] B. Story, I. Titze and E. Hoffman, “Vocal tract area functions from magnetic resonance imaging,” J. Acoust. Soc. Am, vol. 100, pp. 537-554, 1996.
[12] G. Fant, Acoustic theory of speech production, The Hague, Nederlands: Mouton, 1970, pp.109.
104 MAVEBA 2007

Models and analysis of vocal emissions for biomedical applications: 5th international workshop: December 13-15, 2007: Firenze, Italy, ed. by C. Manfredi,ISBN 978 88-8453-673-3 (print) ISBN 978-88-8453-674-7 (online)© Firenze university press, 2007.
Abstract: The study deals with mathematical modelingof the vocal fold self-oscillations related to estimationof the so-called output-cost-ratio (OCR), which is computed from the numerically simulated soundpressure level at the glottal level and the impact stress (IS) during vocal folds collision. The dependence of OCR on prephonatory glottal width, fundamentalfrequency and lung pressure is discussed and partlycompared with a modified output cost ratio measuredin humans, where the closed quotient is used insteadof IS.Key words: Biomechanics of voice, numericalsimulation of vocal folds vibration.
I. INTRODUCTION
Impact stress (IS, i.e. the impact force divided by thecontact area) has been regarded as the main loading factorin voice production and the most plausible cause of vocalfold traumas like nodules. To quantify the cost of voiceproduction, Berry et al. [1,2] presented a parameter calledoutput-cost-ratio (OCR), which concerns the acousticoutput in relation to IS:
sup 0 020 log 20 logOCR P P IS IS , (1)
where Psup is supraglottal acoustic sound pressure(measured at a distance of 15 cm above the glottis of anexcised canine larynx), P0 and IS0 are constants.IS is difficult to measure directly in humans. The
present study investigates the output-cost-ratio using an aeroelastic model of voice production. The aeroelasticmodel of vocal folds vibration enabled to study theoutput-cost-ratio OCR in more details than in theexperiments with the excised larynges. The influence ofvarious parameters on OCR can be studied separately andin a more controllable way. It has been found that closed quotient (CQ, i.e. closed
time of the glottis divided by the period length) obtainedfrom electroglottographic (EGG) signal correlates with IS- see Verdolini et al.[9]. Laukkanen et al. [7] have tested in human subjects the so-called Quasi-Output-Cost ratiowhere CQ has been used instead of IS.The present study compares results of OCR obtained
with modelling to some of the results obtained for humansubjects by Laukkanen et al [7].
II. METHOD
IS magnitudes and sound pressure level (SPLsource)above the glottis were quantified using an aeroelastic
computer model of the vocal fold self-oscillationsemploying the Hertz model of impact forces during vocalfold collision - see [4,5]. The model is based on a two-degrees-of-freedom dynamic system allowing rotationand translation of the vocal-fold-shaped element vibratingon two springs and dampers - see Fig. 1. Self-oscillationsare excited by nonlinear aerodynamic forces resultingfrom the fluid-structure interaction.
ESTIMATION OF OUTPUT-COST–RATIO USING AN AEROELASTIC MODEL OF VOICE PRODUCTION
J. Horá ek1, A-M. Laukkanen2, P. Šidlof1
1Institute of Thermomechanics, Academy of Sciences of the Czech Republic, Prague, Czech Republic2Department of Speech Communication and Voice Research, University of Tampere, Tampere, Finland
The impact Hertz force is given as 3/ 2H HF k ,
where kH is the contact stiffness and is the penetrationof the vocal fold through the symmetry axis during collision. IS was calculated as the maximum value duringone oscillation period according to the formula:
,max2
32
HFISa
,2
3,max
13 ,4 Ha r F
E (2)
where ,3/ 2,max maxH HF k 2
43 1H
Ek r , r is the
radius of the curvature of the vocal fold model at the contact point, E is Young modulus and is Poissonnumber; for E = 8000 Pa, = 0.4. A parabolic shape ofthe vocal fold surface was considered, which gives theradius r. For the on-line numerical simulations in timedomain, the resulting system of four 1st order ordinarydifferential equations describing the vocal fold vibrationswas solved by the 4th order Runge-Kutta method.
Figure 1. Schema of the aeroelastic model – [4]
In calculating OCR with the model, values of P0 =20 µPa and IS0 = 1 Pa were used. Prephonatory glottal

half-width was set as g=0.2 – 0.5 mm, i.e. the glottalwidth varied between 0.4 and 1 mm. Fundamentalfrequency F0 was set to 100 and 400 Hz. Using themodel presented here, it was not possible to use negativepre-phonatory glottal width (corresponding to pressedphonation), which Berry et al. [1,2] also used. In thepresent study, the lung pressure (Plung) and airflow valueswere set within the range reported for healthy humans,(Plung < 3000 Pa, airflow rate Q < 0.8 l/s – see Hirano [3]).The computations were realized in the range of Plung fromthe phonation threshold pressures ( )thP to the phonation
instability pressure (PIP).
100
110
120
130
140
150
0 1 2 3 4 5 6 7P sen
SP
Lsourc
e(d
B)
g=0.2mm g=0.3mm g=0.4mm g=0.5mm
Figure 2. Computed SPLsource versus normalized excesssubglottal pressure Psen. (F0=100 Hz).
In measurements, the data were obtained from humansubjects (see - [7]). The subjects were 62 femalesproducing [pa:p:a] 5 times loudly. The sound pressurelevel (SPL) was registered at 40 cm from the subject’slips, closed quotient CQEGG was calculated from EGGsignal. The acoustic signal was recorded using a digitalrecorder and B&K 4164 microphone, and EGG signalwas registered with Glottal Enterprises dual-channelEGG. Oral pressure was registered with MSIF-II (GlottalEnterprises). The oral pressure during voiceless plosive[p] was used as an estimate of subglottic pressure. Theacoustic signal was analyzed for mean F0 and SPL usingIntelligent Speech Analyser (ISA) signal analysis device(developed by Raimo Toivonen, M.Sc. Eng). CQEGG ,vibration period T (F0=1/T) and the mean oral pressureduring [p] were measured by using a custom-madeprogram for measurement of AC- and DC signals(developed by Heikki Alatalo, DSP-Systems).
III. RESULTS AND DISCUSSION
Figure 2 shows the simulated SPLsource values, at theupper end (x=L) of the glottis, for all consideredprephonatory glottal half-widths g as a function of lungpressure, which is presented as a dimensionlessnormalized excess subglottal pressure
/sen lung th thP P P P (3)
As expected, after crossing the phonation onset at the phonation threshold pressure , the thP sourceSPL increases
with the pressure senP for all g values in a nearly linear
way. The highest sourceSPL values are reached for
g=0.5 mm near the PIP, where the lung pressure valuesare at a maximum.
The IS values obtained with the model (see Fig. 3) arein the range of the data reported for living subjects andexcised human and canine hemilarynges (see - [1,6,9]). ISincreased with the lung pressure reaching a plateau whengetting close to the PIP values. Again, the maximumvalues of IS were obtained for g=0.5 mm near PIP wherealso a lung pressure maximum occurs. Nearly zero ISvalues are near , i.e. near .thP 0senP
The OCR calculated according to the equation (1) fromthe simulated sourceSPL and IS values is shown in Fig. 4.
0
1000
2000
3000
4000
0 1 2 3 4 5 6 7P sen
IS (
Pa
)
g=0.2mm g=0.3mm
g=0.4mm g=0.5mm
Figure 3. Computed IS versus Psen. (F0=100 Hz).
The maximum of OCR appears near 0senP due to the
very low IS values near the phonation threshold. For all prephonatory glottal half-widths g, the OCR decreaseswith senP having minimal values at about 1.5senP ,
thereafter the OCR values slightly increase up to the PIPvalues, where the IS reaches a plateau, while sourceSPLstill increases (compare Fig. 4 with Figs. 2,3). We cannote that according to the model and the definition (1) ofthe OCR parameter, the most advantageous (economic)regime would be to phonate near the phonation onset. Itseems to be a peculiar but trivial and expected result,because at there are none or very small impacts
( ) and therefore OCR theoretically goes to theinfinity ( ).
thP0IS
OCR
50
60
70
80
0 1 2 3 4 5 6P sen
OC
R (
dB
)
7
g='0.2mm
g='0.3mm
g='0.4mm
g='0.5mm
Figure 4. Computed OCR versus Psen. (F0=100 Hz).
106 MAVEBA 2007

The OCR values varied with the prephonatory glottalwidth g in dependence on Plung in a qualitatively differentway, as the present settings were used (see Fig. 5).According to the results by Berry et al. [1] forF0=150 Hz, a prephonatory glottal width of 2 mm wasoptimal (gave the largest SPL with the lowest IS) in excised canine larynges, while with their model of thevocal folds with a vocal tract, a width of 1 mm was optimal (OCR values reached the maximum). Later Berry et al. [2] reported a broad maximum in the OCR curves at about 0.6 mm for excised canine larynges when Psub wasvaried in the range 1 – 1.6 kPa. The results of the presentstudy suggest that the optimal glottal width is dependenton the lung pressure (see Figs. 4 and 5). At low Plung
values a larger prephonatory glottal width seems to bemore economic, while at high Plungs values a smallerwidth would be more preferable. It should be noted,however, that using the present aeroelastic model,phonation with really small glottal widths (correspondingto pressed phonation) was not possible to model.
Because IS is difficult to measure in humans, CQ maybe used as a substitute for it, based on the fact that thereis a correlation between CQ and IS reported in excisedcanine larynges [9]. The relation between IS and CQobtained with the model of the present study is shown inFig. 6. In general, we can suppose the relation in thefollowing form:
IS = a CQ b, (4)
where a and b are constants dependent on g as shown inFig. 6. The exponent varied from b=1.2 to 3.7 independence on the prephonatory glottal half-width. After substituting IS from equation (4) to the formula(1) the OCR can be approximated by a Modified OutputCost Ratio parameter defined as
MOCR = SPLsource - 20*2*log CQ + const., (5)
where the constant b in equation (4) was approximated bythe value b=2 for all prephonatory glottal half-widths
considered. The computed MOCR is shown as function ofthe normalized subglottal pressure in Fig. 7. The MOCR parameter calculated from the datameasured in humans is shown in Fig. 8 as function of thesubglottal (oral) pressure. The trend, i.e. the increase of MOCR with Psub, is in good agreement with the modeleddata presented in Fig.7 for the higher Psen values.
y = 11898 x1.22
y = 121728 x2.86
y = 374217 x3.73
y = 9455.3 x1.39
0
1000
2000
3000
4000
0 0.1 0.2 0.3 0.4 0.5CQ
IS(P
a)
g=0.2mm
g=0.3mm
g=0.4mm
g=0.5mm
Figure 6. Computed IS versus CQ for variousprephonatory glottal half-widths. (F0= 100 Hz).
55
60
65
70
75
0.1 0.2 0.3 0.4 0.5 0.6
g [mm]
OC
R (
dB
)
Plungs=400Pa
Plungs=900Pa
Figure 5. Calculated output cost ratio OCR versusprephonatory glottal half-width g for F0=100 Hz andPlung= 400 and 900 Pa.
130
140
150
160
170
0 1 2 3 4 5 6 7P sen
MO
CR
(d
B)
g='0.2mm g='0.3mm
g='0.4mm g='0.5mm
Figure 7. Computed MOCR versus Psen for variousprephonatory glottal half-widths g. (F0= 100 Hz).
50
70
90
110
130
150
0 10 20P
sub (cmH
2O)
MO
CR
(dB
)
30
i
Figure 8. Measured MOCR versus subglottal pressure in humans - [7]. (Number of the subjects: N = 28).
The influence of the fundamental frequency onMOCR is demonstrated in Fig. 9, where the computedmodified output cost ratio is shown as function of thelung pressure for F0=100 Hz and F0=400 Hz, again forall prephonatory half-widths g considered. The tendencies
Posters 107

of MOCR changes from a maximum at pressure
through a minimum to another maximum at PIP pressurevalues are similar for both F0 values, however, the valuesof MOCR are higher for the higher fundamentalfrequency F0=400 Hz.
thP
130
140
150
160
170
180
190
200
0 1000 2000 3000 4000P lung (Pa)
MO
CR
(dB
)
g=0.2mm
g=0.3mm
g=0.4mm
g=0.5mm
1
100Hz 400Hz
Figure 9. Computed MOCR versus Plung for variousprephonatory glottal half-widths g for F0=100 and400Hz.
50
70
90
110
130
150
0 200 400 600F0 (Hz)
MO
CR
(dB
)
Figure 10. Measured MOCR versus fundamentalfrequency F0 in humans - [7].
The modelled influence of the fundamental frequencyis in good qualitative agreement with the data measuredin humans as shown in Fig.10, where the increase ofMOCR parameter with F0 is obvious.
IV. CONCLUSIONS
The present study tested an output-cost ratio parameterwhich is supposed to reflect economy of voice production. An aeroelastic model of vocal fold vibrationand material recorded from female subjects were used. Results obtained with modeling corresponded to thoseobtained from humans.
Based on the results, it looks like that the rate of SPLrise in relation to Psub and F0 exceeds the rise in IS. Thisresults in the fact that OCR does not correspond to theclinical and pedagogical observations suggesting thatusing loud phonation and high pitch (for an excessivelylong time) increases the risk of vocal fatigue and vocalfold traumas. A more complicated parameter, taking intoaccount the effects of F0 (=increased number of
collisions in time), loading aerodynamic and inertiaforces caused by the acceleration of the vocal fold tissuemight better reflect the mechanical vocal fold loading and thus better describe the economy of voice production.
ACKNOWLEDGEMENTS
The research was supported by the Grant Agency of theAcademy of Sciences of the Czech Republic (Project No.IAA2076401 Mathematical modeling of human vocalfold oscillations), by the Academy of Finland (Grant No.106139 Biomechanical study on the traumatizingmechanisms in vocal fold vibration), and by COST 2103Action Advanced Voice Function Assessment.
REFERENCES
[1] D.A. Berry, K. Verdolini, R.W. Chan and I.R. Titze “Indications of an Optimum Glottal Width in VocalProduction”. NCVS Status and Progress, 1998, Report12, June, pp.33-41.[2] D.A. Berry, K. Verdolini, D.W. Montequin, M.M.Hess, R.W. Chan and I.R. Titze “A quantitative output-cost ratio in voice production”. Journal of Speech,Language, and Hearing Research, vol. 44, 2001, pp. 29-37.[3] M. Hirano “Clinical examination of voice. Disordersof Human Communication 5. GE Arnold, F Winckel andBD Wyke, eds., 1981, Springer-Verlag, Wien.[4] J. Horá ek, P. Šidlof, J. G. Švec. “Numericalsimulation of self-oscillations of human vocal folds withHertz model of impact forces”. Journal of Fluids and Structures, vol. 20, 2005, pp. 853-869.[5] J. Horá ek, A.M. Laukkanen and P. Šidlof“Estimation of impact stress using an aeroelastic modelof voice production”. Logopedics Phoniatrics Vocology,2007, (in press).[6] J. Jiang and I. Titze “Measurement of vocal fold intraglottal stress and impact stress”. Journal of Voice,vol. 8, 1994, pp. 132-144.[7] A-M. Laukkanen, E. Mäki, K. Leppänen:Electroglottogram - based Estimation of Vocal Economy:“Quasi-Output-Cost-Ratio”. The 7th Pan-European Voice Conference.I.R. Titze “Toward occupational safetycriteria for vocalization”. Logopedics, Phoniatrics,Vocology, vol. 24, 1999, pp. 49-54.[9] K. Verdolini, M.M. Hess, I.R. Titze, W. Bierhals andM. Gross. „Investigation of vocal fold impact stress inhuman subjects”. Journal of Voice, vol. 13, 1999, pp.184-202.
108 MAVEBA 2007

Models and analysis of vocal emissions for biomedical applications: 5th international workshop: December 13-15, 2007: Firenze, Italy, ed. by C. Manfredi,ISBN 978 88-8453-673-3 (print) ISBN 978-88-8453-674-7 (online)© Firenze university press, 2007.
A SYSTEM FOR PARALLEL MEASUREMENT OF GLOTTISOPENING AND LARYNX POSITION
M. Kob1, Tobias Frauenrath1,21Department of Phoniatrics, Pedaudiology, and Communication Disorders, RWTH Aachen University, Germany
2Department of Experimental MR Imaging, RWTH Aachen University, Germany
Abstract: The simultaneous assessment of the statusof the glottis opening and the position of the larynxcan be beneficial for the diagnosis of disorders ofvoice production and swallowing. The method pre-sented here makes use of a time-multiplex algo-rithm for the measurement of space-resolved trans-fer impedances through the larynx. The fast se-quence of measurements allows a quasi simultane-ous assessment of both larynx position and EGGsignal in 32 channels. First results indicate a highpotential of the method for use as a non-invasivetool in the diagnosis of voice dysfunction, ventricu-lar fold phonation and swallowing disorders.Keywords : Voice assessment, larynx position,tomography, transfer impedance, EGG
I. INTRODUCTION
Complex phonatory manoeuvres such as swallowingand some singing styles require a synchronous adduc-tion/abduction and change of larynx position. In thecase of dysfunction, the synchronization can be dis-turbed, and a temporary or persistent dislocation of thelarynx might occur. The simultaneous assessment of larynx position and glottis opening requires costly im-aging devices with high spatial resolution such as sono-graph, CT or MRT and – at the same time – sufficientlyhigh temporal resolution such as EGG [1,2].
Non-invasive methods for assessment of dislocation ofthe larynx and glottal dynamics would be beneficial forthe ambulant diagnosis of voice-, speech-, and swallow-ing disorders. However, current methods are either in-vasive (CT) and/or require high costs/time (MRT), anddo not offer the possibility of simultaneous observationof the glottis dynamics with EGG (see Fig. 1).
The EGG device EG2 from Glottal enterprises allowsthe evaluation of the relative amplitude between twochannels using four electrodes [3]. This feature is usefulfor positioning of the electrodes but does not seem to beapplied to larynx position measurements yet.
Figure 1: simultaneous assessment of larynx positionand EGG signal
II. METHODS
This approach presents a device with a time-multiplexmethod for simultaneous acquisition of up to 36 chan-nels within one phonation cycle ([4], see Fig. 2). A3 MHz carrier signal is generated and fed to a multiplexunit that temporally distributes the signal to 6 electrodesthat are organized in a 2x3 matrix. The same matrixform is chosen for the receiving electrodes that subse-quently are connected to a de-multiplex unit, demodula-tor and preamplifier.
The signal generation, synchronization, control andevaluation of the transfer paths is performed with Lab-VIEW and a 200 kSample DAQ card.
Mux
submit-
�eMuxsignal-
processing
PCcontrol-unit
Larynx
receive-
elektrodes elektrodes
generator
Figure 2: Set-up of the 36-channel device for assess-ment of larynx position and EGG signal
The following properties characterise the set-up:Discrete, sine wave signal generator with2 MHz carrier; current is fixed with I < 10 mAGalvanic isolation; high speed CMOS timemultiplexing

Electrodes with 1 cm diameter; 2x6 arrays; op-tional use of contact gel; placement of the elec-trode array with elastic bands at the height of the glottisDemodulation of the received signal; the am-plitude of the signal represents the conductiv-ity; synchronous sampling yields the conduc-tivity and the EGG signal time series for eachchannel
Fig. 3 details the scheme for subsequent acquisition ofthe glottis status using the 36-channel multiplex ap-proach. Each path represents an EGG measurement for a specific sender-receiver combination. During onephonation cycle all 36 paths are sampled subsequentlyseveral times.
Figure 3: Concept of time-multiplex acquisition of theglottis status. During one phonation cycle the 36 paths
are sampled several times.
After each set of 36 channels the acquisition is pausedfor a time tau (see Fig. 4) and then the acquisition iscontinuously repeated until a user interrupt is detected.
tau 36 ch.
1
36 ch. tau
1
time
voltage
3534 362 3 4 5 6 7 1 3534 362 3 4 5 6 7 2
Figure 4: Repeated acquisition of the 36 channels.
At the time of acquisition of channel one, a hardwarehandshake signal is generated by the quartz synchro-nized micro controller switching unit and fed to theDAQ card, allowing a very precise timing control of thesignal processing.
The results are displayed in real-time on a LabVIEWVirtual Instrument. Simultaneously to the conductivityof all 36 channels an indicator is shown which repre-sents the overall quality of the contact between elec-trodes and skin. The position of the path(s) with highestconductivity is indicated as a moving ball on a two-dimensional plot.
In the software, a simple algorithm is used to calculatevertical and dorsal-ventral movement of the larynx froma comparison of impedance amplitudes in oppositepaths.
1
36 ch.
3534 362 3 4 5 6 7
1
36 ch.
3534 362 3 4 5 6 7
1
36 ch.
3534 362 3 4 5 6 7
1
36 ch.
3534 362 3 4 5 6 7
1
36 ch.
3534 362 3 4 5 6 7
1
36 ch.
3534 362 3 4 5 6 7
1
36 ch.
3534 362 3 4 5 6 7
1
36 ch.
3534 362 3 4 5 6 7
voltage measuredat each channel
36 channel EGG signalgenerated by sample and hold circuits
A major problem is the need for fast switching betweenthe electrodes to allow an accurate representation of theEGG curves. Since the electrodes and their leads havenon-negligible capacitances at 3 MHz, some effort mustbe made to reduce the transition times in order to obtainsatisfactory results at higher multiplex rates. For thisreason the switching has been entirely been imple-mented in hardware using CMOS switches with dedi-cated switching properties.
III. RESULTS
A. Performance evaluation of the method
The time-multiplex approach allows a very effectiveseparation of the different measurement channels. Themeasurement rate between two time slots could be re-duced to 23 µs, corresponding to a sample rate of44,100 Hz. The maximum sample duration within sucha time slot was 14 µs.
With 36 channels a glottal cycle could be sampled at 1,225 Hz in each channel which should be sufficient forlow-pitched voices. For the EGG analysis of higherpitches, the number of channels could be reduced.
The function of the position measurement was tested bya trained speaker who, in sequence, closed the glottisand the intra-oral space using his tongue. As a result,the ball on the 2D-plot, indicating the location of high-est conductivity, jumped according to the closure ofglottis or mouth cavity to the bottom or the top of theplot.
110 MAVEBA 2007

B. Application to singing and swallowing
The 36 channel device has been tested with healthy sub-jects performing swallowing manoeuvres. The resultfrom the position detection algorithm was visualised asa trajectory in the 2D-space. For subsequent swallowingtasks of the same subject similar patterns of the trajec-tory were observed.
In earlier studies [5], a two-channel device (EG2) hasbeen successfully applied to simultaneous EGG andlarynx position measurements of healthy subjects per-forming phonatory manoeuvres such as sweep singingor swallowing. The results from a sweep analysis are shown in Fig.5.
Figure 5: Analysis of a sweep signal, sung from a malehealthy subject with register break between modal and
head register. Top: sound pressure; Centre: EGG signal;Bottom: height information.
In the EGG signal the transition from modal to headregister is seen from the reduced amplitude betweenabout 2.8 and 5.5 s. In the height signal, an increase ofthe larynx position seems to coincide with the registertransition.
An evaluation of the complete spatial information fromthe 36 paths of the new approach will reveal a moredetailed view on the two-dimensional movement of thelarynx. We hope these results will be available at thetime of the conference.
IV. DISCUSSION
The non-invasive assessment of spatial informationfrom the 36 channel measurements has the potential toaccurately indicate changes in the position of the larynx. However, some problems must be solved before thedevice can be used for medical applications.
The normalization of the spatial information requires a calibration routine which allows the evaluation of indi-vidual reference positions for different subjects. We
currently investigate the application of optical methodswhich offer satisfactory repeatability and accuracy.
Preliminary results indicate that the spatial distributionof more complex manoeuvres such as swallowing ex-tends over a range which is larger than the actual area covered by the 12 electrodes. Possibly even more elec-trodes would be beneficial for an improved resolution.The realization of such even more complex set-up would probably require a different concept.Future implementations of the soft- and hardware con-cept should include a PC-based control of timing and switching scheme.
V. CONCLUSION
The multi-channel EGG system has a number of advan-tages compared to one- or two-channel EGG devices. Itallows the simultaneous measurement of EGG signal plus the evaluation of the larynx position in real-time.
The calibration of the position measurement is a topicof current work, and several options are evaluated, in-cluding numerical methods and measurements on mod-els and humans. Investigations of the accuracy and space resolution of the method in clinical studies are also planned.
Future applications of the method include the experi-mental study of complex phonation processes such as the combined vocal-ventricular fold phonation. Themethod has the potential to perform an analysis of con-current oscillatory patterns with high resolution, both in time and space.
REFERENCES
[1] Fabre, P.: Percutaneous electric process registeringglottic union during phonation: glottography at highfrequency; first results.. Bull Acad Natl Med 141
(1957), 66–69[2] Fourcin, A.J.; Abberton, E.: First applications of a
new laryngograph. Med Biol Illus 21 (1971), 172–182
[3] Rothenberg, M.: A multichannel electroglottograph.J. Voice 6 (1992), 36-43
[4] Frauenrath T.; Kob M.; Disselhorst-Klug Ch.; Gold-schmidt O.: Tomographie der Glottis durch Messungder elektrischen Transferimpedanz. Fortschritte derAkustik – DAGA 2006 (2006) 559–560
[5] Kob, M.; Goldschmidt, O.; Disselhorst-Klug, C.;Frauenrath, T.: Methode zur simultanen Erfassungvon EGG-Signal und Larynxposition. Fortschritteder Akustik – DAGA 2007 (2007), in print
Posters 111

112 MAVEBA 2007

Models and analysis of vocal emissions for biomedical applications: 5th international workshop: December 13-15, 2007: Firenze, Italy, ed. by C. Manfredi,ISBN 978 88-8453-673-3 (print) ISBN 978-88-8453-674-7 (online)© Firenze university press, 2007.
A MULTI-PURPOSE USER-FRIENDLY VOICE ANALYSIS TOOL: APPLICATION TO LIPOFILLING TREATMENT
Claudia Manfredi, Giovanna Cantarella1
Department of Electronics and Telecommunications, Università degli Studi di Firenze, Firenze, Italy 1 Department of Otolaryngology, Università degli Studi di Milano, Ospedale Maggiore IRCCS, Milano, Italy
Abstract - A multi-purpose software tool (BioVoice) is presented, capable of performing automatic analysis of a large range of voice signal, no manual setting being required to the user. This makes the tool feasible for application by non-expert users in several fields, ranging from high-pitched new-born cries, to adult healthy singing vocalizations and to irregular, pathological voice signals. Main voice characteristics (fundamental frequency and formants) are evaluated and tracked by means of robust analysis techniques that can handle the above mentioned wide range of signals, as internal settings for optimal frame length, frequency range of analysis and plots are automatically adjusted. Specific parameters are evaluated according to the kind of signal under study, and displayed with suitable plots and tables. In this paper, the method is applied to patient affected by laryngeal hemiplegia that underwent lipofilling treatment to recover phonatory capabilities. Keywords: multi-purpose voice analysis tool, robust parameter estimation, laryngeal hemiplegia.
I. INTRODUCTION
Voice analysis is of great relevance in several fields, ranging from newborn infant cry to singing voice and to hoarse adult voices. Hence, paediatricians, surgeons, but also singing teachers, psychologists and logopedicians are involved with this field of research. Nowadays, several analysis techniques and reference values have been proposed in literature and are in use. A huge number of indexes is available, some of which implemented in free or commercially available software tools [1], [2]. However, users often resort to a small subset of such indexes, due to difficulties in understanding subtle differences among parameters, and to deal with rather technical options, especially concerning spectral analysis. Moreover, often commercial software suffers some limitation, linked to the implemented analysis techniques that sometimes prevent the analysis of high-pitched and/or highly degraded voices. The BioVoice tool proposed here aims at providing few objective parameters and plots, easily understandable and
manageable by a wide range of users. The proposed software tool performs single or comparative analysis of main voice characteristics (fundamental frequency and formants) by means of robust analysis tools, specifically devoted to deal with a wide range of pitch values, and possibly highly degraded signals. At present, three main categories are considered with BioVoice: newborn infant cry, singing voice and adult hoarse voice.
II. METHOD
Basic voice characteristics (fundamental frequency (F0) and formants) are evaluated and tracked by means of robust analysis techniques that can handle the mentioned wide range of signals. To this aim, automatic adjustment of internal settings for optimal frame length, frequency range of analysis and plots are implemented. First, the signal is divided into short frames, whose length adaptively varies according to varying signal characteristics: the higher the F0 the shorter the frame length (kept fixed to 3 pitch periods). A voiced/unvoiced (V/UV) separation algorithm is implemented, to avoid F0 estimation on signal frames that have no harmonic content and could give misleading results. F0 tracking is achieved by means of a two-step procedure, based on well-established results: the AMDF approach is applied to a wavelet-smoothed SIFT estimation of F0, with optimised and varying adaptive filter order [3], [4]. Robust and high-resolution formant (resonance frequencies) estimation is implemented, based on parametric AutoRegressive (AR) PSD evaluation. The AR model order p is automatically selected by the program according to patient and signal characteristics, based on the relationship: p=2LFs/c, where: Fs=sampling frequency, L=vocal tract length (linked to patient’s age and sex), and c=sound speed [4]. Colour-coded spectrograms are also provided, with the tracking of formants Fi superimposed, whose number and frequency range depends on the signal under study. Mean values and std are also displayed. Other ad hoc parameters are added to these basic features, for each category. They are summarised here. Newborn infant cry - Newborn infant cry is characterised by high fundamental frequency F0 (>300Hz), possibly with

abrupt changes and voiced/unvoiced features of very short duration within a single utterance. The frequency range is thus set up to 10 kHz. F0, V/UV frames, spectrogram with the first 3 resonance frequencies superimposed, are plotted, all in coloured map. Some tables summarise mean, std, max, min values for F0 and F1-F3, as well as cry length and the corresponding maximum energy. These parameters are in fact considered among the most meaningful in newborn cry analysis (see [5] and references therein). Singing voice - Singing voice results from complex, voluntary movements of the larynx and of vocal tract articulators, and is characterized by possibly high-pitched, rapidly time-varying signals. As we deal with adult singers, the frequency range is set up to 6 kHz. F0, vibrato rate, vibrato extent, vocal intonation, spectrogram with the first 5 formants and PSD are plotted, along with formants maxima co-ordinates. These parameters are of importance for singers, being strictly related to correct vocal emission and hence to singer’s performance (see [6] and references therein). Adult hoarse voices - Among the huge number of available parameters for quantifying F0 irregularities, Jitter (J) and Relative Average Perturbation (RAP) were recognised by the physicians of relevance in most applications and implemented here. J and RAP mean and standard deviation (std) over the whole signal are also evaluated and displayed. An adaptive noise estimation technique is implemented, that allows tracking varying noise level during phonation. For pathological voices, spectral noise is in fact closely related to the degree of perceived hoarseness. Within BioVoice, noise variations are tracked by means of an adaptive version of the Normalised Noise Energy method, named ANNE (Adaptive Normalised Noise Energy) [7], [8]. It relies on a comb filtering approach, optimised in order to deal with data windows of varying length. Large negative ANNE values correspond to good voice quality, while values close to zero reflect the presence of strong noise. Spectrograms and PSD plots complete the set of pictures, allowing visual inspection of possible harmonic energy recovering. On the PSD plot, PSDtot, PSDlow, PSDhigh are reported, quantify the signal global energy, the low-frequency and the high-energy one, respectively. SNR is also provided. These indexes could further help the clinician in assessing voice quality recovering.
III. THE INTERFACE
A user-friendly interface (Fig. 1) allows selecting age, sex and type of vocal emission for each patient, performing computations without any other requirement. The software tool automatically adjusts internal settings for optimal frame length, frequency range of analysis and plots. Specifically, the interface allows for: – selecting data (.wav files);
– choosing the voice type, ranging from high-pitched new-born and possibly singers voices to adult voices: the overall allowed F0 range is 40Hz<F0<1300Hz;
– selecting the kind of analysis: single audio file or two files (for comparison).
A notice is added concerning computer time required: for long files (> 5s) and high sampling frequency (>40 kHz) the total time could approach 5min in total. A moving bar shows the residual time during computations. Plots and tables are displayed and saved in printable format, for a visual comparison of results, all in coloured map.
Figure 1 – BioVoice analysis tool: user interface
IV. EXPERIMENTAL RESULTS
BioVoice is applied here to nine patients (aged 18–74 years, mean 48) with breathy dysphonia, secondary to laryngeal hemiplegia or anatomical defects that underwent vocal fold lipoinjection. Lipostructure is a valuable technique for voice rehabilitation in glottis incompetence. Patients underwent pre- and post-treatment videolaryngostroboscopy, maximum phonation time (MPT) measurements, GRBAS perceptualevaluations, and Voice Handicap Index (VHI) self-assessments. Voice quality improved soon after surgery and remained stable over 3–26 months, as confirmed by GRBAS, MPT and VHI [9]. To show BioVoice features, one example is presented here, concerning a female patient. Before lipofilling, GRBAS scores were found as [3 3 2 2 0], denoting high level of dysphony, with a full recovering after the treatment (all GRBAS scores =0). Due to printing requests, figures are reported in a grey scale: (pre=light grey, post=black). Fig. 2 shows pre-and post treatment F0 tracking, along with its mean and std values. As pre- and post-treatment (PRT-POT) audio signals are usually of different length, the tool adjusts plots on the longer one. In this case, the PRT signal has a length of about 1.6s, while the POT one last about 3.6s.
114 MAVEBA 2007

Notice the long unvoiced period (above 2s) as found by the program for POT.
Figure 2 – Pre- and post surgical F0 tracking, mean and std values.
Good recovering is shown, with stable POT F0, around 207Hz, as compared to highly varying PRT that could be evaluated for less that 1s. Fig.3 reports Jitter, RAP and noise tracking (with mean and std values), both for PRT and POT signals. From the figure, it is clearly shown that lipofilling greatly enhances voice quality under all these parameters. Again, notice non-voiced regions, where parameters could not be computed. Fig.4 shows PRT and POT spectrograms with formant tracking superimposed (black dots), along with mean and std values: after treatment, harmonics and formants are almost recovered and show a more regular behaviour and higher energy level (dark black) with respect to PRT ones. To quantify such results, the PSD plot is displayed in fig. 5, where the almost unvoiced and noisy PRT frequency content of the signal is evidenced (light grey line). On the contrary, POT PSD is characterized by a rather well-structured high-energy harmonic shape in the frequency range typical of voiced emission in adults (≤2500Hz), and a low-energy one above this range, mainly related to noise (black line). Good recovering was found for almost all cases, and results were found in agreement with GRBAS scores. Due to the small number of available cases, statistical tests to assess reliability were not applied.
V. FINAL REMARKS
A new tool for voice analysis has been developed, based on robust adaptive techniques, capable to deal with a wide range of voice sounds. It is provided with a user-friendly
interface that requires few basic options to be made by the user. The method has already been successfully applied to pathological voices, to compare pre- and post-surgical voice quality in case of tyroplastic medialisation and cyst/nodule exeresis [10], [11].
Figure 3 – Jitter, RAP and NNE tracking.
As far as reliability of results is concerned, the method has been compared to one of the most used commercial software tools, i.e. MultiDimensional Voice Program (MDVP®, KayPentax Corp.), where NHR has been considered instead of NNE [11]. First results have shown that BioVoiceperforms more reliable analysis than MDVP. This could be due to more robust F0 estimation with BioVoice, and to the different analysis windows used: fixed for MDVP andadaptively tailored to varying F0 for BioVoice. The tool was developed under Matlab 7.3 and requires few minutes to perform complete pre-post analysis. If properly optimised and implemented under C++ environment, itcould perform computations in almost real time. Further work will concern finding more strict correlations among objective indexes and perceptive ones, as well as exploiting and adding new possibly helpful indexes and plots. When properly optimised, the tool could be implemented on a mobile device, as an aid for clinicians, logopaedicians and patients, also for rehabilitation purposes, after surgery or medical treatment.
ACKNOWLEDGMENTS
This work has been partially supported by “Ente Cassa di Risparmio di Firenze”, under the project: n. 2006.1517 "Analisi di segnali ed immagini vocali per applicazioni
Posters 115

biomediche", 2007, and COST Action 2103: “Voice Function Assessment”.
Figure 4 – Pre- (upper) and post-surgical (lower) spectrogram and formants tracking. Mean and std values are
displayed.
VI. REFERENCES
[1] Kay Elemetrics Corp., "Multi Dimensional Voice Program (MDVP). Operations manual", 1994.
[2] D. M. Howard, G. F. Welch, J. Brereton, E. Himonides, M. DeCosta, J. Williams, A. W. Howard, "WinSingad: A real-time display for the singing studio", Logopedics Phoniatrics Vocology vol. 29, num 3, p. 135-144, 2004.
Figure 5 – Pre- and post-surgical PSD plot. Global, low- and high-frequency PSD values are also reported.
[3] S.L. Marple, Digital spectral analysis with applications, Englewood Cliffs, NJ, U.S.A.: Prentice Hall, 1987.
[4] J.D. Markel, A.H. Gray, Linear prediction of speech, Berlin, DE: Spriger-Verlag, 1982.
[5] K. Wermke, W. Mende, C. Manfredi, P. Bruscaglioni, "Developmental Aspects of infant’s Cry melody and Formants", Medical Engineering and Physics, vol.24, n.7-8, pp..501-514, 2002.
[6] T.Sangiorgi, C.Manfredi, P.Bruscaglioni, “Objectiveanalysis of the singing voice as a training aid”, Logopedics Phoniatrics Vocology, vol.30, n.3-4, p.136-146, 2005.
[7] H. Kasuya, S. Ogawa, K. Mashima, S. Ebihara, “Normalised Noise Energy as an Acoustic Measure to Evaluate Pathologic Voice”, J. Acoust. Soc. Am., vol. 80, n.5, p.1329-1334, 1986.
[8] C. Manfredi, "Adaptive Noise Energy Estimation in Pathological Speech Signals", IEEE Trans. Biomed. Eng., 47, p.1538-1542, 2000.
[9] G.Cantarella, R.F.Mazzola, E.Domenichini, F.Arnone,B.Maraschi, “Vocal fold augmentation by autologous fat injection with lipostructure procedure”, Otolaryngology - Head and Neck Surgery, vol. 132, n. 2, p. 239-243, 2005.
[10]C.Manfredi, G.Peretti, “A new insight into post-surgical objective voice quality evaluation. Application to thyroplastic medialisation”, IEEE Trans. on Biomedical Engineering, vol.53, n.3, p.442-451, 2006.
[11]C.Manfredi, R.Canalicchio, G.Cecconi, G.Cantarella,“A robust tool to compare pre- and post-surgical voice quality”, EMBS Conf., Lyon, FR, 23-26 Aug. 2007.
116 MAVEBA 2007

Theoretical models II


Models and analysis of vocal emissions for biomedical applications: 5th international workshop: December 13-15, 2007: Firenze, Italy, ed. by C. Manfredi,ISBN 978 88-8453-673-3 (print) ISBN 978-88-8453-674-7 (online)© Firenze university press, 2007.
Abstract: In this paper we propose improvements to a recent algorithm of speech decomposition into glottal source and vocal tract contributions. This algorithm is based on the Zeros of the Z-Transform (ZZT) representation and requires restrictive conditions about the analysis window. Inaccurate results of decomposition can occur if these conditions are not fulfilled. The improvement method consists in considering an analogy with the LF model for the glottal source and a tube model for the vocal tract. Results are presented for a sustained vowel /a/ in both time and spectral domain. Future developments are also proposed. Keywords: Zeros of the Z-Transform, glottal source, vocal tract, speech decomposition, Glottal Closure Instant
I. INTRODUCTION
Analysis of the glottal source has been investigated by researchers because it has applications in different fields like speech recognition or voice quality modification. Among glottal source estimation techniques described in literature, some use iteratively the inverse filtering method [1] in order to remove the vocal tract contribution in speech while other apply the LP analysis only during the closed-phase of the glottal source [2] in order to minimize its effect on vocal tract estimation. Another method uses the ARX model [3] in order to jointly estimate glottal source model and vocal tract model parameters. Finally some methods focus on the estimation of glottal source parameters like Open Quotient [4] or Glottal Closure Instants (GCI) [5 ,6].
Recently another technique of decomposition of speech into glottal source and vocal tract contributions was proposed. This technique uses the ZZT representation of speech [7] and is particularly sensitive to GCIslocalization. Applied to real speech signals, errors on the estimation of these instants can sometimes lead to noisy decomposition results. That is why improvements of this decomposition are presented here.
This paper is organized as follows. In section II the ZZT representation is defined, the ZZT-based decomposition and its improvements are described. In section III the results of improvements are presented for a sustained vowel /a/ and compared with results obtained without correction. In section IV the results are discussed and the perspectives are presented.
II. METHODS
A. Database
Test signals were recorded (16 kHz-16 bits) in TCTS Lab and are real sustained vowels /a/, /e/, /o/ and real transitions between these vowels.
B. ZZT representation and decomposition algorithm
For a N samples signal x(n), the ZZT representation [7] is defined as the set of roots Zm of the z-transform X(z) of the signal x(n):
(1)
In order to decompose speech into glottal source (glottal flow derivative) and vocal tract impulse response [7], ZZT are computed on frames centered on each GCI(computed by the algorithm described in [5]) and where length is twice the fundamental period at the considered GCI. The glottal source spectrum is then computed from zeros with modulus greater than 1 (maximum-phase components) and the vocal tract spectrum from zeros with modulus lower than 1(minimum-phase components).
C. Improvement of the decomposition
Due to errors on the estimation of GCIs,decomposition results can sometimes be noisy, and thus not suitable for accurate analysis of the glottal source. Experiments showed that, if ZZT-based decomposition is computed for several frames whose center is shifted by few samples around a GCI, better results can be obtained for an instant close but not identical to this GCI. The method considers here, for a range of shifts around GCIsin voiced island of speech, the vocal tract candidate(VTC) and the glottal source candidate (GSC) obtained from ZZT-based decomposition in order to determine which shift provides the best results for each GCI.
Concerning the glottal source, an analogy is made with the LF model [8]. Indeed, considering GSCsobtained for shifts around a given GCI, inaccurate decompositions are mainly characterized by a lot of energy located in frequencies higher than 2 kHz, contrary to LF model in which energy is mainly located below 2 kHz. Each GSC is therefore characterized by the energy
IMPROVEMENT OF SOURCE-TRACT DECOMPOSITION OF SPEECH USING ANALOGY WITH LF MODEL FOR GLOTTAL SOURCE AND TUBE
MODEL FOR VOCAL TRACT
T. Dubuisson1, T. Dutoit 1
1. Circuit Theory and Signal Processing Lab (TCTS Lab), Faculté Polytechnique de Mons, Belgium
1
0
1
1
1 )()0()()(N
n
N
mm
Nn ZzzxznxzX

ratio between the 0-2000 Hz band and the whole spectrum:
=[0 2000 ]
[0 8000 ](2)
The vocal tract being a physical system with its own structure and elasticity, it is assumed that, during the production of a sustained vowel, it has to be as continuous as possible in terms of geometry. To expressthis continuity, the tube model [9] for the vocal tract is used and the radiuses of this model are computed by LP analysis [10] of the vocal tract impulse response (order set to 18). Each VTC is therefore characterized by avector of 19 radiuses.
Around each GCI, the shift corresponding to the best decomposition must be a compromise between two criterions:
GSC: among all the candidates, the elected one must be characterized by the biggest energy ratio between the 0-2000 Hz band and the whole spectrum.The criterion is thus the minimization of the energy in high frequencies.
VTC: during the production of a sustained vowel, the geometry of the vocal tract cannot vary too muchbetween two consecutive GCIs. Among all the VTCs,the elected candidate must be the one for which the vector of radiuses is the closest to the one corresponding to the candidates for the past and the next GCI. The criterion is thus the maximization of the continuity of the vocal tract geometry.
A dynamic programming algorithm is therefore implemented to optimize these criterions on the whole voiced island of speech (see Fig. 1).
Fig. 1 Dynamic programming algorithm (1 shift before and after each GCI 3 states)
In this algorithm each step corresponds to a GCI and each state corresponds to a particular shift around thisGCI. The goal of this algorithm is to find the best path among all the shifts by minimizing a cost function on the whole voiced island of speech:
, = 1, + /
1/+ ( , ) (3)
where i stands for the step index, j for the state index at step i, k for the state index at step i-1, TC (Transition
Cost) stands for the difference of the radiuses between VTC at state k and VTC at state j, OC (Observation Cost)stands for the inverse of the feature defined for the GSCat state j. At the end of the voiced island of speech, the best path is chosen as the one with the lowest cumulated cost. The position of the GCIs can thus be corrected according to this choice.
III. RESULTS
As explained in Section II, the dynamic programming algorithm determines the best shift around each GCIaccording to constraints defined by the cost function. Fig. 2 shows the evolution of its decision for the sustained vowel /a/ and for 4, 6 and 8 samples of shift before and after each GCI (9, 13 and 17 states).
Fig. 2 Decision of the algorithm (from top to bottom: 4, 6 and 8 samples of shifts before and after each GCI)
One may see in this figure that considering 4 samples of shift is not enough (saturation is visible in the decision of the algorithm) while computing the decomposition for 8 samples is not necessary (the decision is nearly the same than for 6 samples). However we will show in the next subsection that the results obtained for 4 samples of shift are accurate enough. A shift of 4 samples before and after each GCI is therefore considered as a good choice because the improvement obtained for more samples of shift does not justify the increasing cost of computation. From now on the results are presented for 4 samples of shift.
A. Results of improvements in time domain
Fig. 3 shows the glottal sources obtained with and without correction. One may see in this figure that the noisy components are corrected and that the accurate ones before correction remain unaltered. The vocal tract responses are not displayed because the spectral domain is more suitable in order to observe the improvement on this component.
120 MAVEBA 2007

Fig. 3 Improvement of the glottal source in time domain(a: without correction; b: with correction)
B. Results of improvements in spectral domain
In this study a GCI-synchronous spectrogram is computed. This representation shows the evolution of the normalized spectrum of each GCI-centered period of glottal source and vocal tract response. Fig. 4 shows the GCI-synchronous spectrogram for the glottal source without and with correction.
Fig. 4 Improvement of the glottal source in spectral domain (a: without correction; b: with correction)
Accurate glottal sources are characterized by a resonance in low frequencies (the glottal formant) and energy located below 2 kHz while the noisy ones have more energy in higher frequencies. After correction the noisy glottal sources are closer to the other accurate ones.
Concerning the vocal tract impulse response, the formants detected by Wavesurfer [11] on the speech signal are superimposed on the spectrogram in Fig. 5(dotted lines). The correlation between the trajectory of the formants and the ones detected by Wavesurfer is good before correction although there are discontinuities in the formant trajectories for some GCIs. These discontinuities
are less present after correction and the energy bursts in high frequencies have disappeared.
Fig. 5 Improvement of the vocal tract response in spectral domain (a: without correction; b: with correction)
C. Indicators of improvement
In order to quantify the amount of improvement for the two components, indicators are proposed. The glottal source indicator is defined as:
100 + (4)
where Mgfaf stands for the magnitude of the glottal formant (spectral resonance detected in the 0-250 Hz band) after correction, Mgfbe stands for this magnitude before correction, Faf stands for the energy ratio of the glottal source after correction and Fbe for this ratio before correction. Fig. 6 shows this indicator for the whole sustained vowel /a/.
Fig. 6 Glottal source indicator
Theoretical models II 121

This indicator shows strong peaks (full arrows) at the GCIs for which the resonance in low frequency is not strong enough before correction and smaller peaks (dotted arrows) at those for which the glottal sources have resonance in low frequencies before correction and are less noisy after correction.
The vocal tract indicator uses the information from Wavesurfer in order to quantify the improvement in an objective way. The formant indicator is defined as:
100 (5)
where Maf stands for the magnitude at the formant frequency in the vocal tract spectrum after correction and Mbe stands for this magnitude before correction. The indicator for the vocal tract is the sum of the formant indicator for the two first formants detected by Wavesurfer. Fig. 7 shows this indicator for the whole sustained vowel /a/.
Fig. 7 Vocal tract indicator
This indicator shows strong peaks (full arrows) at the GCIs for which the discontinuity in the formant trajectories is important before correction and smaller peaks (dotted arrows) at those for which the energy in high frequencies is more important than for other GCIsbefore correction, but without discontinuities.
IV. DISCUSSION AND CONCLUSION
The method presented here is based on the ZZTrepresentation. It thus differs from the inverse filtering based on LP analysis because the estimated LP filter contains both the contributions of glottal source and vocal tract. It also differs from the ARX based methods because the ZZT-based decomposition is not based on a glottal source model but only on phase properties of speechsignal.
The purpose of this method is the improvement of the decomposition of speech into glottal source and vocal
tract response using analogy with the LF model for glottal source and tube model for the vocal tract. These two components are characterized by features used in a dynamic programming algorithm in order to better determine the position of GCIs in voiced islands of speech. Accurate results are obtained for sustained vowels. ZZT-based decomposition and its improvement can lead to computation of parameters like open quotient or asymmetry coefficient [8] and adequacy between LF model and glottal sources obtained from real speech signals. In case of vocal folds pathology, the observation of ZZT-based decomposed sequences could lead to propose a new model for the glottal source.
ACKNOWLEDGEMENTS
Authors acknowledge support from the Walloon Region, Belgium, grant WALEO II ECLIPSE #516009, the COST Action Advanced Voice Function Assessment and the Interuniversity Attraction Pole program VI-4 DYSCO of the Belgian Science Policy.
REFERENCES
[1] P. Alku, -Proc. of
ICASSP 1992, IEEE, vol. 2, pp. 29-32, 1992.[2] E. Mooreglottal waveform estimation without precise glottal closure information, Proc. ICASSP 04, IEEE, vol. 14, pp. 492-501, 2004.[3] D. Vincent, O. Rosec, and T. Chonavelof the LF glottal source parameters based on ARX
Proc. Interspeech 2005, ISCA, pp. 333-336,2005.[4open quotient estimation using linear prediction, Proc. MAVEBA 1999, IEEE, pp. 12-17, 1999.[5event detection based on a time domain fixed point analysis, Proc. ICLSP 2000, ISCA, vol. 4, pp. 669-672, 2000.[6DYPSA algorithm for estimation of glottal closure instants in voiced speech, Proc. ICASSP 02, IEEE, vol. 1, pp. 820-857, 2002.[7] B. Bozkurt, L. Couvreur, and T. Dutoit, Chirp group delay analysis of speech signals, Speech. Comm., vol. 49, issue 3, pp. 159-176, 2007.[8] G. Fant, frequency domain analysis, STL-QPSR, vol. 2-3, pp. 121-156, 1995.[9 Proc. of 4th International Congress of Acoustics, pp. 1-4, 1962.[10] D.G. Childers, Speech Processing and Synthesis Toolboxes, John Wiley & Sons, 1999, pp. 95-127.[11] Wavesurfer : http://www.speech.kth.se/wavesurfer.
122 MAVEBA 2007
Models and analysis of vocal emissions for biomedical applications: 5th international workshop: December 13-15, 2007: Firenze, Italy, ed. by C. Manfredi,ISBN 978 88-8453-673-3 (print) ISBN 978-88-8453-674-7 (online)© Firenze university press, 2007.
Abstract: A model of vocal tract has been presented.According to the dimensions of natural tract,equivalent parameters of the model have beencalculated. The proposed model permits to extractimportant parameters of vocal signal, especially frequency parameters of glottal waves. The proposedsystem of speech processing permits also for analysisand synthesis of all phonemes. The system is orientedon the verification of speech malfunctions. Theimprovement of verification process can be improvedby using more sophisticated classifiers, like neural networks.Keywords: Vocal tract, fundamental frequency, speechverification, neural networks
I. INTRODUCTION
An influence of fundamental frequency fluctuations on the final speech sound can be verified using a vocal tractmodel. Anatomical structure of human vocal tract as wellas actions of all speech production organs, e.g. lips,velum, tongue, nostril, glottis, larynx and correspondingindividual muscle groups, are very complicated.Nevertheless, such natural vocal tract is a datum-point ofdifferent mathematical models [1, 2]. Our model shouldtake into account all elements and phenomenon'sappearing during speech process. Afterwards, it is necessary to define this part of vocal tract, which will bemodeling. In our model the following parts of anatomicaltract have been included: input signal source comingfrom larynx, faucal tract, mouth-tract, nasal tract and radiation impedances of both mouth and nose.
II. MODELING OF VOCAL TRACT
In the case of fundamental frequency calculation, two basic methods are available: autocorrelation and cepstrummethod. The first permits to obtain precise results, but wediscovered that additional incorrect glottis frequencieshave been created. We observed additional improperfrequencies especially for ranges lower than 100 Hz andhigher than 320 Hz. Additionally, our software indicatessome glottis excitations during breaks between phonesand in silence regions. Therefore, in this method it isnecessary to apply special filters to eliminate all incorrectfrequencies. Another method bases on cepstrum analysis.
The complex values of cepstrum C(T) can be obtainedusing the following equation:
METHODOLOGY OF FUNDAMENTAL FREQUENCY EXTRACTION AND ANALYSIS USING MICROPHONE SPEECH SIGNAL AND VOCAL
TRACT MODEL
Z. Ciota Department of Microelectronics and Computer Science, Technical University of Lodz, Poland
][log)( 1 F(x(t))FTC (1)
where F is Fourier transform and x(t) represents speechsignal.
In this transform the convolution of glottis excitationand vocal tract is converted, first to the product afterFourier transform, separated them finally as the sum. Inour method we use cepstrum analysis as less complex,especially when we applied modulo of cepstrum by usingmodulo of Fourier transform. The following values ofglottis frequency F0 have been taken into account: F0-minimum, F0-maximum, the range and average valuesincluding statistical properties [3, 4].
One of the possible methods is anatomical tractsreplacement by coaxial connections of cylindrical tubesections. Each section has to fit as much as possible to thedimensions, e.g. cross-sectional area and section length,of natural vocal tract. Such vocal tract model should takeinto account a faucal tract which folks into nasal tract andalso a mouth tract. It is also important to maintain thedimensions of natural tract: length of faucal tract (80mm), length of mouth tract (80-100 mm) and nasal tractlength (120 mm). Unfortunately, cross-sectional areascannot be unequivocally calculated, because people havedifferent cross-dimensions of vocal tracts. The complexity of the model depends on the number of tubesections.
Behavior of model sections can be analyzed as relations between pressures of acoustic wave pin,volumetric velocity Vin and corresponding outputquantities pout and Vout, for a current section. Moreover,an acoustic pressure and volumetric velocity correspondto electrical values: voltage and current respectively. In the next step we can replace each tube by electrical equivalent circuit. All parameters can be calculated fromgeometrical dimensions of the tube: inductance L as anequivalent of an air acoustic mass in the tube; capacitanceC as an equivalent of air acoustic compliance; serial resistance as an equivalent of resistance loss caused byviscotic friction near by tube walls; additional negativecapacitance Cn - an equivalent of inverse acoustic mass of vibratory tube walls; conductance G, an equivalent ofacoustic loss conductance of thermal conductivity near bytube walls; additional conductance Gs, an equivalent of

The knowledge of vocal tract parameters permits to
examine features and malfunction of a speech process. It
is also possible to examine which part of the vocal tract is
responsible for distortion of speech signal, including the
influence of fundamental frequency jitter on speech
quality. Examples of simulations for a vowel "I" and "A"
for the same excitation (fundamental frequency) are
presented in Fig. 1 and Fig. 2.
acoustic conductance of loss conductance of vibratory
tube walls; pulsation .
III. RESULTS
According to the above assumptions, we can calculate
equivalent parameters for all sections of the model.
However, the calculations are complicate and time-
consuming. To avoid these problems the model can be
simplified. One can establish that acoustic wave in the
channel is two-dimensional plane wave. Using such
model it is possible to obtain the transmittance of vocal
tract. As a source of soundless signals we propose a
nozzle model, because a time-domain characteristic of
soundless phonemes is random, and the signal can vary
for the same phoneme and for the same person. Using this
model we can present different features of noise
phonemes. It is possible to calculate a middle frequency
of the noise as well as a total acoustic power of the
channel. It is also possible to obtain frequency
characteristic.
The process of such vector recognition consists of two
main parts: a teaching and an appropriate recognition,
according to Fig. 3. During the teaching process you
create the base of parameters. The comparison of current
voice with the stored base gives the answer concerning
the emotional state or identification process of examined
utterance. The comparison process and the final decision
are based on the following standard classifiers: nearest
mean and nearest neighbour. The decision process can be
optimized using different distances and parameter
weights. This part of method is very important and still
open. Especially, in the present of low quality teaching
materials, it would be necessary to applied probabilistic
method and multilayer neural perceptrons [1].
Frequency [Hz]
Phas
e [d
eg]
Mod
ule
[dB
]Ex
cita
tion
[dB
]
Speechsignal
Extraction of glottisparameters
Resultingtemplates
Likelihoodcomparison
Results
Training Model of vocaltract
Fig. 1. Spectrum of input signal and vocal tract response
(module and phase) for a vowel IFig. 3. System for quality speech verification
Frequency [Hz]
Phas
e [d
eg]
Mod
ule
[dB]
Exc
itatio
n [d
B] The simplification of speech process in computer
systems gives a lot of redundancy, so fuzzy logic
approach to speech prediction seems to be a promising
solution. On the other hand, in the case of fuzzy system,
we have to use in the beginning of the design process,
pre-defined membership functions and a linguistic model,
applying an expert knowledge. Unfortunately, the system
should work correctly with different users and very often
with different languages. So, we have very limited
possibility to adapt our speech processor to strongly
varying conditions. Better solution can be obtained using
artificial neural network (ANN). Such system permits to
add two important developments: learning function and
adaptive possibilities. The linear predictor can be realized
by using multi-layer feedforward ANN.
Fig. 2. Spectrum of input signal and vocal tract response
(module and phase) for a vowel A
124 MAVEBA 2007

For high learning efficiency a standard
backpropagation method has been extended by adding a
momentum term. Basic idea of multi-layer feedforward
network is presented in Fig. 4. In the case of recognition
two important problems have to be taken into account.
The first is the highest system performance in terms of
the certainty of recognition and verification and the
second is the total cost of the system.
1
K
2
x1
x2
xJ
W11
W12
W1K 1
L
M
Wjk
.
.
.
Wij
yk
Hidden layers Output layer
.
.
.
.
.
.
.
.
.
. . .
Input layer
Fig. 4. Multi-layer feedforward neural network
Fig. 5. Examples of learning process for different number
of neurons in the hidden layer
Preliminary, we use as an example feedforward neural
network organized with one hidden layer identification
process. Input layer contains 64 neurons, hidden layer 40,
and output has 7 neurons. Input of the ANN has been
connected to the vector features of current speaker and
output states should indicated result of identification. The
learning process was based on the stored features. All
neuron models have been described by the same sigmoid
activation function, with the possibility to control of slope
parameter. As learning algorithm we applied standard
backpropagation method adding a momentum term,
which is necessary to avoid a local minimum.
An example of learning process is shown in Fig. 5.
Increasing of hidden layer neurons over 40, gives only
slightly and practically invisible improvement of learning
process. The preliminary simulations are promising, but
further researches are necessary, especially for bigger
output resolution.
Table 1. Fundamental frequency parameters for the same
person
Emotions F0 mean F0 max F0 min F0 rangeAnger 202 231 105 126
Joy 208 240 164 76
Extraction of fundamental frequency parameters for
female voice is shown in Table 1. It is very easy to
observe high sensitivity of such parameters to emotional
state of the speaker. The range of F0 is equal to 126 Hz.
for anger speech, while in the case of joy speech the
corresponding range decreases to 76 Hz.
IV. CONCLUSION
The frequency parameters of glottal waves have been
extracted using rather simple vocal tract model.
Autocorrelation and cepstrum methods are also helpful in
such extraction. The results are important not only for
speaker identification and emotion recognition, but can
be also helpful for glottis malfunction diagnosis.
The results of the speech processing system are
satisfying, but sometimes we can observe mistakes in
recognition process. However, some of these processes,
especially for emotion recognition, make difficulties also
for human evaluation. On the other hand, a quality of the
program depends on the training processes.
Unfortunately, it is difficult to obtain a proper base of
voice examples for different emotions. However our
program can recognize two states: positive and negative
emotions with almost 100% precision. Moreover, the
proposed algorithms can be applied not only for emotion
detection but also can be helpful in the process of medical
diagnosis of speech processes. The sensitivity of the
program for such emotions, like anger or fear is
measurable, but the vectors of properties can be in the
future modified. Moreover, a proper distance calculation
between vectors of examined person and database is very
important task, therefore we are trying to apply neural
networks to solve the problem.
On the other hand, the implementation of the proposed
algorithms using hardware-software system, including
mixed analog-digital approach, should improve the speed
and the quality of proper recognition [5]. Application of
mixed digital-analog realization to the design process of
Theoretical models II 125

sound processors may be better in comparison with
purely digital solution and very often we can achieve
better results, decreasing the chip surface and increasing
the speed parameter of the system.
The improvement of decision process can be achieved
by using more sophisticated classifiers, like a fuzzy
system for effective comparison a current speaker
features with a stored data base. The simplification of
recognition process in computer systems gives a lot of
redundancy, so fuzzy logic approach connected witch a
neural system seems to be promising solution. Such
fuzzy-neural system permits to add two important
developments: learning function and adaptive
possibilities. The system can be realized by using multi-
layer feedforward ANN.
Purely software realization of the system gives the
principal contradiction: parallel calculations e.g. neural
networks, are executed by serial paradigm (computer).
Unfortunately, fully hardware realization of a big neural
network is impossible, because physical connections
between the neural units present a big technological
problem. The better solution gives parallel-serial
approach. Mixed digital-analog realization can increase
the efficiency of such solution.
ACKNOWLEDGMENT
The research effort is sponsored by the grant of Polish
Ministry of Education and Science No. 3T11B 027 29
REFERENCES
[1] Progress in speech synthesis, edited by J. Santon et
al., Springer, New York 1996.
[2] P. Gray, M.P. Hollier, R.E. Massara: "Non-intrusive
speech-quality assessment using vocal-tract models" IEE Proc.-Vis. Image Signal Processing, vol. 147, no 6, 2006,
pp.493-501
[3] Z. Ciota : “Emotion Recognition on the Basis of
Human Speech”, ICECom-2005, 18th International Conference on Applied Electromagnetics and Communications, 12-14 October 2005, Dubrovnik,
Croatia, pp. 467-470
[4] Chul Min Lee, Shrikanth S. Narayanan: "Toward
Detecting Emotions in Spoken Dialogs", IEEE Trans. Speech and Audio Processing, vol. 13, no 2, March 2005,
pp.293-303
[5] Roberts W.J.J., Yariv Ephraim: "Speaker
Classification Using Composite Hypothesis Testing and
List Decoding", IEEE Trans. Speech and Audio Processing, vol. 13, no 2, March 2005, pp.211-219
126 MAVEBA 2007

Models and analysis of vocal emissions for biomedical applications: 5th international workshop: December 13-15, 2007: Firenze, Italy, ed. by C. Manfredi,ISBN 978 88-8453-673-3 (print) ISBN 978-88-8453-674-7 (online)© Firenze university press, 2007.
Abstract: Since fluid-structure interaction within the finite-element method is state of the art in many engi-neering fields, this method is used in voice analysis. A quasi two-dimensional model of the vocal folds includ-ing the ventricular folds is presented. First results of self-sustained vocal fold oscillation are presented and possibilities as well as limitations are discussed. Keywords: Fluid structure interaction, finite element method, vocal fold oscillation
I. INTRODUCTION
Fluid-structure interaction effects are of great impor-tance in models of vocal fold oscillation. This effect has been described by low degree of freedom approaches (multiple-mass models similar to [1]). Another possibility is a finite-element (FE) attempt. In flow analyses with moving boundaries the structural part (vocal fold tissues) is normally modeled separately from the fluid part (flowing air). Both of the domains have to be coupled to influence each other. For this purpose the Arbitrary La-grangian Eulerian method (ALE) is used which combines the Lagrangian structural model with the Eulerian fluid model. More and more of those models are currently de-veloped [2],[3],[4].
Since these effects are also topic in other fields of re-search such as mechanical or civil engineering, commer-cial codes have been designed that provide powerful methods for simulating the structural part, the fluid part, and the interaction of both of them. This study documents first results, limitations and possibilities of a fluid-structure interaction model of the vocal folds which is calculated by commercial solvers.
II. METHODS
The complete vocal fold model consists of two coupled domains: A fluid domain representing the air, and a struc-tural domain representing the vocal fold tissue. In princi-ple, each of the domains is a stand-alone simulation model. The structural part is solved by ANSYS, the fluid part by CFX. The simulations have been performed in transient mode with duration of 80 ms. Time steps have been adapted in a range between 0.1 ms and 2 ms in order to calculate stably and efficiently.
The model is a three-dimensional slice (thickness: 0.5 mm) from which only two dimensions are of interest. The considered section of the air domain is located in the frontal plane. It has a length of 30 mm and a width of 12 mm at its upper and lower end. The cranial-caudal thick-ness of the vocal fold is 7 mm. Concerning geometry, the local z-axis is a symmetry axis at x = 0.
Nevertheless, no half model with symmetry boundary condition has been applied at this axis in order to simu-late asymmetrical flow effects. The air is modeled as a transient, viscous, and laminar flow. The physical back-grounds of the flow are the standard Navier-Stokes equa-tions. At the lower boundary a relative pressure of 800 Pa is set. At the upper boundary, the relative pressure is zero. The lateral sides have wall boundaries. A “moving wall”, which changes the fluid mesh, is defined as boundary condition for each of the vocal folds. This moving wall is the coupling interface of the models. A multigrid solver and a general relaxation parameter of 0.3 are chosen in order to obtain better convergence with moving bounda-ries.
Fig. 1: Left: fluid mesh. Right: Structural mesh with contact lines.
For structural analysis, linear volume elements are used. Since the displacements are large, geometric non-linearity is taken into account. The mesh of the structural part is derived from the same geometric form as the fluid part. To avoid vocal folds interpenetration, a contact area was set up between them. Numerical problems of the fluid solver during a complete closure of the vocal folds are omitted by a small gap between the folds which cannot be
A FLUID-STRUCTURE INTERACTION MODEL OF VOCAL FOLD OSCILLATION
A. Gömmel1, C. Butenweg1, M. Kob 2
1Dept. of Civil Engineering, Structural Statics and Dynamics, RWTH Aachen University, Aachen, Germany 2Dept. of Phoniatrics, Pedaudiology, and Communication Disorders, RWTH Aachen – University Hospital

closed. In Fig. 1 a sketch of the models can be found. The
boundary conditions are bearings at the lateral ends of the
vocals folds. To simulate the stiffness caused by the
prestressed tension in the vocalis muscle and ligament,
orthotropic material properties have been defined. The
basis of the domain coupling is the ALE formulation. The
domains are coupled sequentially. The transfer of the
coupling information takes place along a common line of
the vocal fold (structure) and the airway (fluid) which can
be seen as black line in Fig. 1. The coupled calculation
consists of different calculation loops. First, the fluid so-
lution is obtained and the resulting pressures are trans-
ferred as loads onto the structural model which is solved
afterwards. The obtained displacements are then trans-
ferred back onto the fluid mesh until convergence is
reached.
III. RESULTS
The Young's modulus of the structure is 7.0 N/mm2 in
lateral direction and to 20.0 N/mm² in the other direc-
tions. The Poisson's ratios were set to 0.4 and the shear
moduli to 5.0 N/mm². Density was taken to 1040 kg/m².
These properties result in structural eigenfrequencies of
114 Hz (first), 188 Hz (second), and 247 Hz (third) (see
Fig. 2). After approximately 20 ms a relatively stable
oscillation could be achieved. The oscillation pattern was
a combination of the first and the second eigenforms
where the second eigenform was clearly dominant.
Fig. 2: Left: Extrema of the eigenforms of the first (114 Hz, top), second (188 Hz, middle), and third eigenfrequency (247 Hz, bot-
tom). Right: One oscillation period (t = 5 ms with t = 0.5 ms from number 1 to 10).
The obtained velocity profile (at the mid point between
the vocal folds at the caudal end) had an offset of 5-10
m/s due to the modeled gap between the folds. The spec-
trum of these velocities shows two peaks (176 Hz and
337 Hz, see Fig. 3). Concerning the flow in the supraglot-
tal area, a jet is formed which has the tendency to orient
towards one lateral side (Coanda effect).
0
10
20
30
40
0.03 0.04 0.04 0.05 0.05 0.06 0.06 0.07 0.07 0.08 0.08
t [s]
v [m
/s]
0
2
4
6
8
10
12
14
16
18
0 200 400 600 800
f [Hz]
Fig. 3: Velocities of the airflow at the caudal end of the vocal folds (top) and their spectrum
(bottom).
IV. DISCUSSION
Feasibility of a fluid-structure interaction model with
commercial finite-element codes was shown. The ob-
tained results have to be regarded as preliminary. The
oscillation pattern showed a predominant role of the sec-
ond eigenform while other models suggest a dominant
first eigenform [5],[6]. To get stable results in the fluid
solver, a small channel has to be left open. So a complete
closure of the vocal folds is impossible. The influence of
this constriction will have to be examined more explic-
itly. In future studies, more results will be calculated and
compared to literature data. The influence of the vocal
fold shape will be another point of interest.
REFERENCES
[1] K. Ishizaka, J.L. Flanagan: Synthesis of voiced
sounds from a two-mass model of the vocal cords. Bell
Sys. Tech. J. 51 (1972) 1233-1268
[2] M. de Oliveira Rosa, J. C. Pereira, M. Grellet, A. Al-
wan: A contribution to simulating a three-dimensional
larynx model using the finite element method. J. Acoust.
Soc. Am. 114 (2003) 2893-2905.
[3] Thomson: Fluid-Structure Interaction within the hu-
man Larynx. Dissertation. Purdue University, 2004.
[4] S. L. Thomson, L. Mongeau, F. S. H.: Aerodynamic
transfer of energy to the vocal folds. J. Acoust. Soc. Am.
118 (2005) 1689-1700.
[5] M. Kob: Physical modeling of the singing voice. PhD
thesis, RWTH Aachen University, 2002.
[6] I. R. Titze: The Myoelastic Aerodynamic theory of
Phonation, NCVS, 2006
128 MAVEBA 2007

Models and analysis of vocal emissions for biomedical applications: 5th international workshop: December 13-15, 2007: Firenze, Italy, ed. by C. Manfredi,ISBN 978 88-8453-673-3 (print) ISBN 978-88-8453-674-7 (online)© Firenze university press, 2007.
ESTIMATION OF A PHYSICAL MODEL OF THE VOCAL FOLDSVIA DYNAMIC PROGRAMMING TECHNIQUES
E. Marchetto1, F. Avanzini1, and C. Drioli21 Dept. of Information Engineering, University of Padova, Italy
2 Dept. of Computer Science, University of Verona, Italy
Abstract: This work presents a procedure for the estimationof a two-mass vocal fold model starting from a time-varyingtarget ow signal. The model is specied by a large number ofphysical parameters, computed as functions of four articula-tory parameters (three laryngeal muscle activations and sub-glottal pressure). Flow waveforms synthesized by the modelare characterized by means of a set of typical voice sourcequantication acoustic parameters. Given a sequences of tar-get acoustic parameters, dynamic programming techniquesand interpolation based on Radial Basis Function Networksare used to derive sequences of articulatory parameters thatlead to resynthesis of the target signal.Keywords: Voice source, Low-dimensional models, Estimation,Synthesis
I. INTRODUCTION
One open problem in research on low-dimensional vocalfold physical models is the relationship between parame-ters of the models and acoustic parameters related to voicequality. A recent work [1] studied the sensitivity of acoustic ow parameters to variation of physical parameters in atwo-mass model, and provided indications of the “actions”that the model employs to target different voice qualities.However low-level parameters (masses, spring stiffnesses,etc.) are not independently controlled by a speaker: morephysiologically motivated control spaces are needed. Arelated issue is the “inverse problem”, i.e. the problem ofestimating the time-varying control parameters to be usedas input to the physical model in order to resynthesize atarget acoustic signal. This involves inversion of a non-linear dynamical system with a large number of parame-ters. Moreover the solution is in principle non-unique. Apossible solution to the non-uniqueness problem is workingon temporal sequences of acoustic frames and estimatingarticulatory parameters through minimization of some costfunction that includes an “articulatory effort” component.This approach has been applied in [2] to the solution ofthe inverse problem for an articulatory vocal tract model.
This paper presents a procedure for the estimation of atwo-mass vocal fold model [3] starting from time-varyingacoustic parameters of a target ow signal. The model isspecied by a large number of low-level physical parame-ters. An additional modeling layer computes these physicalparameters as functions of four articulatory parameters
(three activation levels of laryngeal muscles and subglottalpressure) [4]. Glottal ow waveforms synthesized by themodel are characterized by means of a set of acousticparameters: fundamental frequency F0, open quotient OQ,speed quotient SQ, return quotient RQ, normalized ampli-tude quotient NAQ [5], etc., that are used in the literatureas typical voice source quantication parameters [6].
Therefore there are three related but distinct spaces ofparameters: articulatory, physical, and acoustic parameters.This work deals with the problem of mapping acousticinto articulatory parameters. We tackle the problem bycharacterizing temporal frames of glottal ow signals viasequences of acoustic parameters, and by developing amethodology to derive the corresponding sequences ofarticulatory parameters using dynamic programming tech-niques. The procedure is further improved by using RadialBasis Function Networks (RBFN) to interpolate pointsin the articulatory space. Results show that the physicalmodel controlled via the estimated parameters is able toresynthesize target ow signal with good accuracy.
Section II describes the physical model used in this workwhile Sec. III details the techniques used to estimate themodel starting from a target time-varying ow signal. Re-sults, as well as and current limitations and shortcomingsof the proposed approach, are discussed in Sec. IV
II. THE PHYSICAL MODEL
The analysis developed in the next sections is based ona two-mass model presented in [3] and depicted in Fig. 1.The model assumes in particular one-dimensional, quasi-stationary, frictionless and incompressible ow from thesubglottal region up to a time-varying separation pointzs along the glottis, where ow separation and free jetformation occurs. No pressure recovery is assumed at theglottal exit. The separation point zs is predicted in [3] tooccur when the glottal area a(z) exceeds the minimum areaby a given amount (10−20%). By introducing a separationconstant s (in the range 1.1−1.2), separation occurs whenthe glottal area takes the value as = min(sa1, a2).
The vocal tract is modeled as an inertive load. In thelimit of fundamental frequencies much lower than the rstformant frequency the air column acts approximately as amass that is accelerated as a unit, and the vocal tract inputpressure can be written as pv(t) = Ru(t) + Iu(t), where

tracheaandlungs
z
1r k1
kc
r2 k2
m2
xxx x
ae
1m
vocalfold
z
z
z
z
subglottalpressure (p )
s
x
glottis
ventricle
falsevocal fold
vocal tractvoc.tract inputpressure (p )
3
210 3
2
1
0
x(z)
a(z)
v
Fig. 1. Right: schematic diagram of the vocal fold, trachea, andsupraglottal vocal tract; left: two-mass vocal fold model.
R, I are the input resistance and inertance, respectively.Values for R, I are chosen from [7]. Being a first-ordersystem, this model does not account for resonances of thevocal tract, however it describes with sufficient accuracy itsmost relevant effects on vocal fold oscillation, in particularthe lowering of the oscillation threshold pressure [7].
Low-level physical parameters (masses, spring stiff-nesses, etc.) are not independently controlled by a speaker:more physiologically motivated control spaces are needed,which requires to establish a mapping between physiology(muscle activations) and physics (parameters of the two-mass model). A set of empirical rules, derived from [8],was used in [4] for controlling a two-mass physical model.The rules link vocal fold geometry to activation levels ofthree muscles: cricothyroid (aCT ), thyroarytenoid (aTA)and lateral cricoarytenoid (aLC). These levels are assumedto be normalized in the [0, 1] range. In addition, in thispaper we also consider the subglottal pressure ps. Inconclusion, the physical model is completely controlled bythe set of four articulatory parameters aCT , aTA, aLC , ps.
III. MODEL ESTIMATION
A. An articulatory codebook
The first step of the estimation procedure is to defineand populate a direct codebook, in which every vector ofarticulatory parameters aCT , aTA, aLC , ps is a “key” and isassociated with one and only one vector of acoustic param-eters. To this aim, a large number of numerical simulationsof the two-mass model is run on a dense grid of vectors ofacoustic parameters. For each simulation, relevant acousticparameters are extracted from the synthesized glottal fl owsignal using the APARAT toolkit [9].
90 95 100 105 110 115 120 125 130012
x 104
F0 (Hz)
1 1.5 2 2.5 3 3.5 4 4.5 5012
x 104
SQ (adim)
0.6 0.65 0.7 0.75 0.8 0.85 0.9012
x 104
OQ (adim)
0.4 0.45 0.5 0.55 0.6 0.65 0.7 0.75 0.8012
x 104
OingQ (adim)
0.1 0.12 0.14 0.16 0.18 0.2 0.22 0.24 0.26 0.28 0.3012
x 104
CingQ (adim)
0 0.002 0.004 0.006 0.008 0.01 0.012 0.014 0.016 0.018 0.020
1
2x 10
4
RQ (adim)
0.01 0.02 0.03 0.04 0.05 0.06 0.07 0.08 0.090
1
2x 10
4
NAQ (adim)
Fig. 2. Distribution of acoustic parameters in the direct codebook.
The direct codebook used in this work has been derivedon a grid where aCT and aTA vary in the range 0÷1 witha fixed step of 0.05, while the range for aLC is 0.25÷ 0.5with a fixed step of 0.025 (because sustained phonationonly occurs within this region), and ps varies in the range500 ÷ 1500 Pa with a fixed step of 50 Pa. The resultingcodebook contains 86125 vector pairs. Fig. 2 shows thedistribution of the 7 computed acoustic parameters in thedirect codebook.
B. Codebook inversion and dynamic codebook access
In order to solve the inverse problem, the direct code-book has to be inverted to obtain the inverse codebook.This however suffers from a non-uniqueness problem,i.e. an acoustic vector can be the key to one or morearticulatory vectors. We tackle the problem by workingon temporal sequences of acoustic vectors, rather than ona single vector. These may be obtained e.g. by analyzing atime-varying glottal fl ow signal on a frame-by-frame basis.Given a sequence of acoustic vectors xk we want to obtainan “optimal” sequence of articulatory vectors v
j
kin the
inverse codebook: as already explained, xk is in principleassociated with many candidate vectors v
j
kbecause of the
non-uniqueness problem. In particular we perform a searchin the acoustic space of the inverse codebook to find thenearest vectors (according to the euclidean distance) tothe given xk; the v
j
kare therefore the articulatory vectors
associated to these nearest vectors in the codebook.The optimal sequence of articulatory parameters is ob-
tained by minimizing a cost function with three terms. Anacoustic term accounts for the euclidean distance betweenxk and its discretized versions in the acoustic space of the
130 MAVEBA 2007

codebook (the vectors found by the search). An articula-tory term minimizes the euclidean distance between v
j
kand
vj
k−1, i.e. between every two articulatory vectors consecu-tive in time. This is the key term in the procedure, in orderto obtain smooth parameter variations: it minimizes the“articulatory effort”, in accordance with the physiologicalmuscle behavior. An accumulation term extends the costfunction domain to the entire input sequence, so that theobtained articulatory sequence is optimal in a global way.The (simplified) cost function is:
f(vj
k) = min
γ,δ
[τ1||xk − cδ
k||
2 + τ2||vj
k− v
γ
k−1||2 + f(vγ
k−1)]
where τ1,2 are weights for the acoustic and articulatoryterms, respectively; c
δ
kare the discretized acoustic vectors
close to xk. Dynamic programming techniques are theideal tool for the minimization of the cost function: inparticular the accumulation term would lead to exponentialcomplexity, if not computed with this approach.
C. Codebook clustering and interpolation with RBFNs
One problem in the proposed procedure is that a targetvector xk is typically not present in the inverse codebook,which is discrete; therefore every found v
j
kis not associated
with xk, but only with a vector near to xk . The limitationsof the discrete codebook can be overcome by interpolatingthe articulatory space; this allows to compute articulatoryvectors associated exactly to the given xk .
The interpolation uses RBFNs (Radial Basis FunctionNetworks) [10]. Since RBFNs only interpolate functionsand cannot handle multimaps, the inverse codebook has tobe manipulated and the non-uniqueness problem avoided.We have developed a novel algorithm that subdivides thecodebook in acoustic clusters and articulatory subclusters.Every cluster is associated to one or more subclusters. Thealgorithm guarantees that for every acoustic vector in agiven cluster there will be only one (or none) articulatoryvector in each associated subcluster. As a result in everysubcluster the subdivided codebook provides a uniquemapping, which is needed for RBFNs to work properly.
The algorithm first subdivides the acoustic space inclusters Ci using a standard technique. Random vectors,as many as the desired clusters, are generated and subse-quently moved with an iterative procedure [11] to becomecentroids. Centroids are iteratively displaced in such away that the sum of the distances between every centroidand the associated vectors is minimized. Clusters Ci arebuilt by associating every acoustic vector with the nearestcentroid. In order to obtain a uniform distribution ofvectors in every cluster, the iterative procedure is applied ina two-stage fashion. Moreover, in order to ensure a certaindegree of overlapping, the vectors which are closest toboundaries between two clusters are replicated in both.
Once the acoustic clusters Ci are built, the algorithmdetermines the s articulatory subclusters S
i
j(j = 1 . . . s)
associated to each Ci. Here s equals the maximum numberof articulatory vectors associated to the same acousticvector x
∗ in Ci. Every articulatory vector associated withx∗ is assigned to a distinct subcluster and used as a “seed”.
The remaining articulatory vectors are allocated as follows.When many articulatory vectors v
j
kare associated to the
same acoustic vector xk, every vj
kis assigned to a different
subcluster, chosen as the one with the nearest articulatorycentroid. The location of the subcluster centroid is updatedafter every new vector is added.
Having determined the clusters Ci, each associated withone or more subclusters S
i
j, within every S
i
jwe construct
four different RBFNs to interpolate each dimension ofthe articulatory space. Every acoustic vector associated tothe subcluster is used as center for one RBF (gaussianfunctions in our application). Values for the parameters ofthe functions (standard deviation, etc.) are found after anextensive set of experiments on the codebook. After thedetermination of all the RBFNs, the articulatory space canbe interpolated. The following procedure is used to feed thedynamic programming with interpolated vectors. Given anacoustic vector we find the k nearest acoustic clusters andall the associated subclusters. The acoustic vector is usedas input for the set of RBFNs in each subcluster. Finally,all the computed interpolated articulatory vector (as manyas the subclusters) are passed to the dynamic programmingprocedures, which proceeds with the optimization.
IV. RESULTS AND DISCUSSION
The proposed algorithms were initially tested and tunedusing artificial target sequences of acoustic vectors. Thesewere used as input to the system to obtain the correspond-ing articulatory parameters. Results from these preliminarytests provided two main indications. First, the syntheticsignals obtained by driving the physical model with thederived articulatory parameters follow closely the targetacoustic vectors. Second, the derived muscular activationsand subglottal pressure have physiologically plausible evo-lutions, i.e. they have smooth variations in time. Theseinitial results confirm the validity of the employed costfunction, and of the RBFN interpolation.
In order to test the proposed algorithms on real sig-nals, we have realized a complete synthesis-by-analysisprocedure. Starting from a recorded utterance (a sustainedvowel with varying pitch and voice quality) the signal isinverse filtered with APARAT. The estimated glottal fl owis analyzed frame-by-frame and a sequence of acousticvectors is obtained. The corresponding articulatory vectors(derived using the techniques described in Se. III) are usedto drive the physical model, and the resynthesized glottalfl ow is convolved with the time-varying formant filter ofthe vocal tract. The final result is a resynthesis of theutterance, in which the evolution of pitch and voice qualityare close to those of the original signal.
Theoretical models II 131

0 50 100 1500
0.5
1
a lc
0 50 100 1500
0.5
1
a ta
0 50 100 1500
0.5
1
a ct
0 50 100 150500
1000
1500
Frames
p s
(a)
0 50 100 150100
110
120
F0
0 50 100 1502
3
4
SQ
0 50 100 150
0.70.80.9
OQ
0 50 100 1500.02
0.04
0.06
0.08
Frames
NA
Q
(b)
Fig. 3. Example of the analysis-by-synthesis procedure. (a) Time sequences of articulatory parameters retrieved by the optimization procedure (solidline: no RBFNs; dashed line: RBFNs). (b) Time sequences of glottal fl ow acoustic parameters (dotted line: target sequences extracted from a recordedutterance; solid line: resynthesis without RBFNs; dashed line: resynthesis with RBFNs).
Fig. 3 shows the performance of the synthesis-by-analysis procedure on a real utterance (a sustained /e/). Thetime-varying acoustic vectors obtained in the resynthesisfollow with good accuracy the target ones, and informallistening tests confirm that the resynthesis is qualitativelysimilar to the target signal. In particular the NAQ is usuallywell followed, as shown in Fig. 3(b). This is a positiveresult as the NAQ is known to be strongly related to voicequality [5]. The effect of using RBFNs can be noticedin Fig. 3(a): the sequences of articulatory vectors interpo-lated by RBFNs are smoother than those obtained usingbare dynamic programming. A second advantage of usingRBFNs is that the amount of vectors that feeds the dynamicprogramming procedure is significantly reduced and thisleads to a corresponding decrease in the computation time.
While the results reported in this work indicated that theproposed approach is effective in estimating control pa-rameters of the physical model, both with synthetic targetdata and with real utterances, a number of limitations arestill hindering the performance of the estimation proceduredescribed in this work. These are mainly related to intrinsiclimitations of the two-mass model. Ranges of variation forthe acoustic parameters are generally narrow (see Fig. 2),and are sometimes non realistic. RQ and NAQ in particularassumes exceedingly low values, due to poor description ofthe fl ow at small glottal apertures, which results in abruptglottal closure and exceedingly high absolute values of thefl ow derivative peak. The relationship between physicalparameters of the models and acoustic parameters alsoneed to be assessed: as an example, the relation betweenps and F0 observed in the model is not in accordance withresults reported in the literature. Finally, a more systematicapproach to the determination of RBFNs parameters is
needed in order to fully exploit the benefits of interpolationin the codebook.
REFERENCES
[1] D. Sciamarella and C. D’Alessandro, “On the acoustic sensitivityof a symmetrical two-mass model of the vocal folds to the variationof control parameters,” Acta Acustica united with Acustica, vol. 90,no. 4, pp. 746–761, Jul. 2004.
[2] J. Schroeter and M. Sondhi, “Speech coding based on physiologicalmodels of speech production,” in Advances in Speech Signal Pro-cessing, S. Furui and M. Sondhi, Eds. New York: Dekker, 1992,pp. 231–263.
[3] N. J. C. Lous, G. C. J. Hofmans, R. N. J. Veldhuis, andA. Hirschberg, “A symmetrical two-mass vocal-fold model coupledto vocal tract and trachea, with application to prosthesis design,”Acta Acustica united with Acustica, vol. 84, pp. 1135–1150, 1998.
[4] F. Avanzini, S. Maratea, and C. Drioli, “Physiological control oflow-dimensional glottal models with applications to voice sourceparameter matching,” Acta Acustica united with Acustica, vol. 92,no. Suppl.1, pp. 731–740, Sep. 2006.
[5] P. Alku, T. Backstrom, and E. Vilkman, “Normalized amplitudequotient for parametrization of the glottal fl ow,” J. Acoust. Soc.Am., vol. 112, no. 2, pp. 701–710, Aug. 2002.
[6] P. Alku and E. Vilkman, “A comparison of glottal voice quantifica-tion parameters in breathy, normal and pressed phonation of femaleand male speakers,” Folia Phoniatr. Logop., vol. 48, no. 5, pp. 240–254, Sep. 1996.
[7] I. R. Titze and B. H. Story, “Acoustic interactions of the voicesource with the lower vocal tract,” J. Acoust. Soc. Am., vol. 101,no. 4, pp. 2234–2243, Apr. 1997.
[8] ——, “Rules for controlling low-dimensional vocal fold modelswith muscle activation,” J. Acoust. Soc. Am., vol. 112, no. 3, pp.1064–1027, Sep. 2002.
[9] M. Airas, H. Pulakka, T. Backstrom, and P. Alku, “A toolkit forvoice inverse filtering and parametrisation,” in Proc. 9th EuropeanConf. on Speech Communication and Technology (Interspeech’2005- Eurospeech), Lisbon, Sep. 2005, pp. 2145–2148.
[10] T. Poggio and F. Girosi, “Networks for approximation and learning,”Proceedings of the IEEE, vol. 78, no. 9, pp. 1481–1497, Sep. 1990.
[11] A. Gercho and R. M. Gray, Vector quantization and signal com-pression, ser. The Kluwer international series in engineering andcomputer science. Kluwer, 1992, boston.
132 MAVEBA 2007

Continuous speech/prosody


Models and analysis of vocal emissions for biomedical applications: 5th international workshop: December 13-15, 2007: Firenze, Italy, ed. by C. Manfredi,ISBN 978 88-8453-673-3 (print) ISBN 978-88-8453-674-7 (online)© Firenze university press, 2007.
Continuous speech/prosody 135
LARYNGEAL VOICE QUALITY CHANGES IN EXPRESSION OFPROMINENCE IN CONTINUOUS SPEECH
M. Airas1, P. Alku1, M. Vainio21 Helsinki University of Technology, Espoo, Finland
2 University of Helsinki, Finland
Abstract: In this study three di erent prominence andspeech melody related e ects on voice quality were
hypothesis that prominence as a function of sentenceand word stress is signaled with more pressed voice
in the parameterization results, and the original hy-
Keywords:
I ILocal increase of the voice fundamental frequency andattenuation of the respective changes elsewhere is usedto signal prominence relations within utterances, phrases,words, or series of utterances. Fundamental frequencyvariation, however, is not the sole e ect in the expressionof prominence. Several studies have reported spectral orglottalization changes as an e ect of prominence, suggest-ing that the changes are due to a tenser voice quality inprominent vowels [6].
[10] attributed it to be caused by both laryngeal andsupralaryngeal features of the voice production mecha-
ryngeal settings of speech. The major physiological source
erated by the vibrating vocal folds, the . Un-fortunately, direct measurement of this major source ofvoice quality is not possible from continuous speech dueto the hidden position of vocal folds, located deep withinthe larynx and surrounded by several vital organs. Hence,
speech is to use a technique called . Thisimplies that resonances of the vocal tract are cancelledfrom the speech pressure signal by feeding it through anti-
using some time, amplitude, frequency, or model-basedtechniques to gather numerical data of the studied phenom-ena.
centrated mainly on isolated vowels. In contrast to this,
as the source of voice quality behaves in the sentence andword level in expression of stress. One such study was per-
in a sentence, the focus of which varied [7]. The excita-tion parameter Ee values were found to be larger in focal
context, indicating voice quality changes in the expressionof focus. Swerts and Veldhuis reported some evidence for
harmonic amplitude di erence ( H12, or H1-H2) in thecontext of speech melody [13]. However, they also citedseveral other studies regarding F0 and OQ, in which con-tradictory views were presented, i.e. F0 and OQ did notcorrelate, or exhibited negative correlation. Epstein statedthat speakers use voice quality, as expressed by LF modelparameter changes, to distinguish between prominent andnon-prominent words in declarative and interrogative sen-tences [6].The understanding of the behaviour of voice quality in
expression of stress is limited to large extent by the lack
continuous speech. In order to address this issue, the cur-
tering and parameterization package. Using this sophisti-cated speech research tool, the authors further tested thehypothesis that stress is expressed with a pressed voicequality. Hence, this study extends on the previous workson the topic which have utilized only a handful of speakerswith restricted utterances or model-based parameters. Thisis performed using continuous speech and robust voicesource parameters together with statistical analyses.
II M MSpeech of healthy, native Finnish speakers was recorded.There were 11 speakers in total, of which 6 were women.The ages of the subjects ranged from 18 to 48 years, meanbeing 30 years. Two of the speakers smoked regularly orirregularly, while the others were non-smokers.The recordings were performed in an anechoic chamber.
The speakers were standing, reciting the text from a paperattached on a sheet of cardboard.The speakers were equipped with a headset microphone
consisting of a unidirectional Sennheiser electret capsule.The microphone signal was routed through a microphone
recorder. Low-frequency phase distortion introduced bythe digital recorder was corrected by acquiring the inputimpulse response of the device using anMLSmeasurement[12] and convolving the recorded signals using a time-reversed version of the impulse response.The speech material consisted of three passages of
Finnish text describing past weather conditions. The ma-terial was selected so that there were multiple [ ] vow-els with di erent levels of prominence suitable for inverse
erent speech melody–and henceprominence–related conditions using a long [ ] or [æ] seg-ment were chosen as follows: (1) A paragraph initial con-

136 MAVEBA 2007
tent word with a relatively high F0 in a lexically stressedsyllable (sentence stress condition). (2) The same segmentin a later repetition of the word (word stress condition). (3)A long [ ] in a lexically unstressed position. Each recita-tion took about one minute, and was repeated three times.The middle recitation was chosen for further processing.Three vowels from each passage, a total of nine, were thenmarked using Praat [4]. In total there were 3 3 11 99marked vowels.
to remove any low-frequency noise in the signal and then
ing the time instants marked in Praat. Further processing
rameterization software package, supporting two di erent
less interoperation with the MATLAB environment andeasy exporting of data to statistical software packages [1].
3].
shown in Fig. 1. Most notably, parametric spectral models
with the discrete all-pole modeling (DAP) method [5] in-stead of the conventional linear predictive analysis. Thisreduces the bias of the harmonic structure of the speechspectrum in the formant frequency estimates. In block no.
tuations captured during the recordings. Stages 2–6 form
e
as a basis for stages 7–12, which roughly repeat the process
mates, an example of which is shown in Fig. 2. The glottal
all parameters implemented in TKK Aparat were acquired,further analysis was restricted to only NAQ and AQ pa-rameters. NAQ, the normalized amplitude quotient, andAQ, the amplitude quotient, measure time-domain charac-teristics of the glottal closing phase from two amplitude-
Aacdmin, where
Aac dmin
AQT0, where T0 is the period
length. Both AQ and NAQ correlate well to the pressed-ness of voice, which contributes considerably to the voicequality.The e ect of various factors on the NAQ and AQ values
was tested using analysis of variance (ANOVA). First, thevalues were log-transformed to correct the skew in param-eter distributions. Then, ANOVA was performed using thevowel running number, speaker sex, sentence stress, andword stress as dependent variables and the log-transformedAQ as the independent variable. All statistical treatments
Figure 1: The block diagram of the IAIF method for theestimation of the glottal excitation (n) from the speechsignal s0(n). For further details of the di erent stages,please refer to [3].
were performed using the R statistical software environ-ment [9].
III R
is problematic due to, for example, rapid changes in for-mant frequencies. In spite of these inherent di culties, theanalyses conducted in the current study were successful
puted with the IAIF method for all the intended samples.-
tive quality evaluation on a scale of 0–3 was given for each
yielded a mean value of 2.4, which is considerably higher
thors.

Continuous speech/prosody 137
Figure 2: e material of the current study. The sample represents an[ easures required for the computation of NAQ and AQ arealso illustrated.
First, NAQ parameter values were inspected. Box-plotssummarizing the values are shown in the left half of Fig. 3.The mean value of the NAQ parameters computed for bothgenders was 0.108, while the standard deviance (std.dev)equaled 0.024. The respective values for males and fe-males were 0.102 (0.020) and 0.113 (0.025), i.e. the val-ues were smaller for males. For males, in vowels withoutand with sentence stress, the values were 0.098 (0.020) and0.109 (0.019). Two-way ANOVA with word and sentencestress as factors indicated that this di erence was not sta-
F(1 42) 3 65 p 0 063]. Formale vowels without and with word stress, the NAQ val-ues were 0.091 (0.016) and 0.107 (0.019), again indicatinghigher values for stressed cases. This result was statisti-
F(1 42) 4 49 p 0 040].
For females, the NAQ values were 0.109 (0.025) with-out sentence stress, and 0.120 (0.025) with it. The re-spective values without and with word stress were 0.105(0.020) and 0.117 (0.028). Again, the NAQ values werehigher for stressed cases, but the results were not sta-
F(1 51) 2 72 p 0 105 andF(1 51) 0 532 p 0 469, respectively].
Due to the NAQ values behaving contrary to the re-search hypothesis (see Section IV for details), AQ pa-rameter values were also studied. The summary box-plots are shown in the right half of Fig. 3. The meanAQ values for males and females were 0.841 (0.134) and0.567 (0.123), respectively, the considerably higher val-ues for males stemming mainly from the F0 di erencesbetween males and females. For males, the values were0.890 (0.129) without sentence stress and 0.745 (0.087)with it. This di[F(1 42) 16 0 p 0 001]. For males without andwith word stress, the values were 0.869 (0.126) and 0.828(0.138), respectively. This indicated lower AQ values instressed cases for males. However, the result was not sta-
F(1 42) 0 858 p 0 360]. Forfemales, the values were 0.605 (0.114) and 0.489 (0.105)without and with sentence stress, and 0.609 (0.103) and0.545 (0.128) without and with word stress, respectively.Hence, the values were smaller in the stressed cases for fe-
males as well. In the case of sentence stress, the result wasF(1 51) 14 0 p 0 001], but
not so in word stress [F(1 51) 0 0762 p 0 784].
IV C
The NAQ values were higher in stressed than unstressedcases for both males and females, although for the ma-
thissuggested that stress would be expressed using a breath-ier voice quality. This contradicted the original researchhypothesis predicting that stress would be expressed witha pressed voice quality. Therefore, AQ values were in-spected as well. As shown by the results, the AQ valuesbehaved as expected, exhibiting smaller values in stressedvowels. ANOVA analyses showed this result to be statis-
the case of word stress. The authors suspect, however, thatsince the word stress appears to behave in a similar manner
in ANOVA is only due to the small amount of material inthe study.There is plenty of evidence which shows that chang-
ing the glottal function from breathy towards pressed in
crease of both the absolute and the relative length of theglottal closing phase [e.g. 8]. In terms of NAQ and AQ,this implies that changing the phonation type from breathyto pressed in sustained phonation results in decrease ofboth of the parameters [2]. Interestingly, the current resultson the glottal function in continuous speech showed a dif-ferent trend according to which AQ decreased in stressedvowels in comparison to unstressed ones whereas the val-ues of NAQ increased. Hence, the initial hypothesis thatstress is expressed with a relatively more pressed voicequality could not be supported in this study. This unex-pected, yet highly interesting result might be explainedby the behaviour of sub-glottal pressure. In sustainedphonation, namely, a speaker is able to produce a longvowel by using a steady-state value of the sub-glottal pres-sure which, in parallel with glottal adductory forces con-trolled by the cricothyroid and thyroarytenoid muscles, re-sult in desired value of F0 and voice quality. In continuous
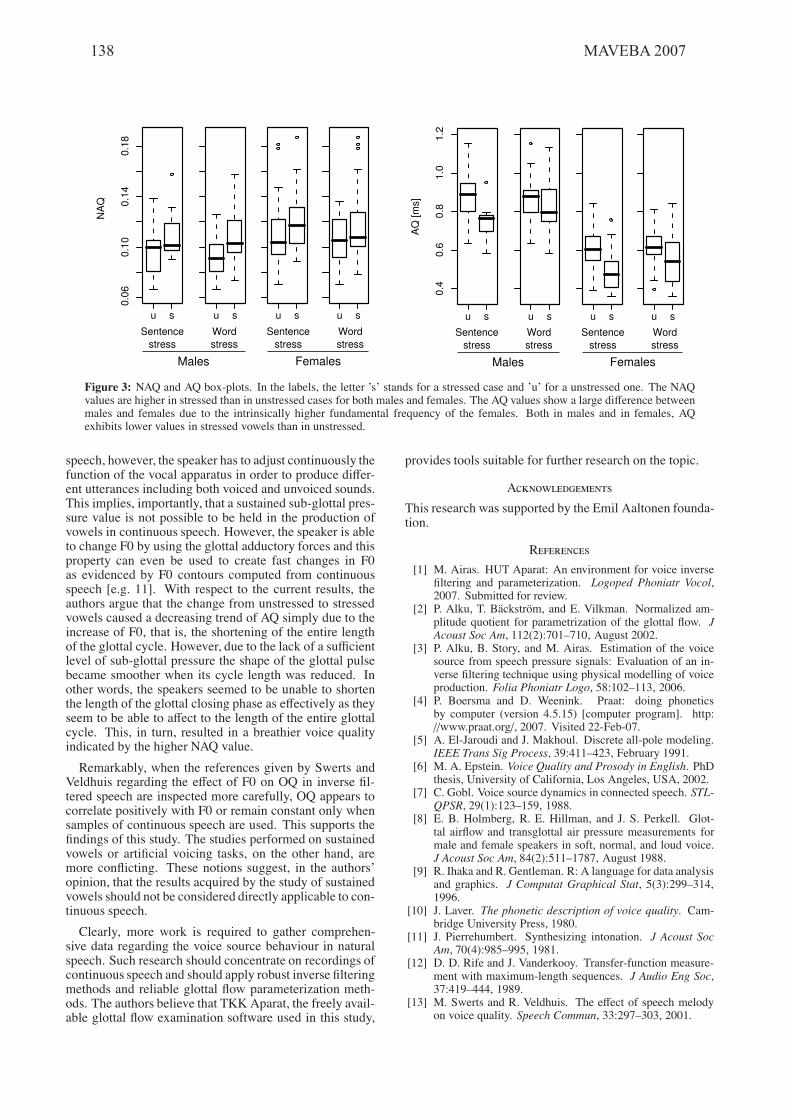
138 MAVEBA 2007
Figure 3: NAQ and AQ box-plots. In the labels, the letter ’s’ stands for a stressed case and ’u’ for a unstressed one. The NAQvalues are higher in stressed than in unstressed cases for both males and females. The AQ values show a large di erence betweenmales and females due to the intrinsically higher fundamental frequency of the females. Both in males and in females, AQexhibits lower values in stressed vowels than in unstressed.
speech, however, the speaker has to adjust continuously thefunction of the vocal apparatus in order to produce di er-ent utterances including both voiced and unvoiced sounds.This implies, importantly, that a sustained sub-glottal pres-sure value is not possible to be held in the production ofvowels in continuous speech. However, the speaker is ableto change F0 by using the glottal adductory forces and thisproperty can even be used to create fast changes in F0as evidenced by F0 contours computed from continuousspeech [e.g. 11]. With respect to the current results, theauthors argue that the change from unstressed to stressedvowels caused a decreasing trend of AQ simply due to theincrease of F0, that is, the shortening of the entire lengthof the glottal cycle. However, due to the lack of a su cientlevel of sub-glottal pressure the shape of the glottal pulsebecame smoother when its cycle length was reduced. Inother words, the speakers seemed to be unable to shortenthe length of the glottal closing phase as e ectively as theyseem to be able to a ect to the length of the entire glottalcycle. This, in turn, resulted in a breathier voice qualityindicated by the higher NAQ value.
Remarkably, when the references given by Swerts andVeldhuis regarding the etered speech are inspected more carefully, OQ appears tocorrelate positively with F0 or remain constant only whensamples of continuous speech are used. This supports the
opinion, that the results acquired by the study of sustainedvowels should not be considered directly applicable to con-tinuous speech.
Clearly, more work is required to gather comprehen-sive data regarding the voice source behaviour in naturalspeech. Such research should concentrate on recordings of
ods. The authors believe that TKKAparat, the freely avail-
provides tools suitable for further research on the topic.
A
This research was supported by the Emil Aaltonen founda-tion.
R
[1] M. Airas. HUT Aparat: An environment for voice inverseLogoped Phoniatr Vocol,
2007. Submitted for review.[2] P. Alku, T. Bäckström, and E. Vilkman. Normalized am-
JAcoust Soc Am, 112(2):701–710, August 2002.
[3] P. Alku, B. Story, and M. Airas. Estimation of the voicesource from speech pressure signals: Evaluation of an in-
production. Folia Phoniatr Logo, 58:102–113, 2006.[4] P. Boersma and D. Weenink. Praat: doing phonetics
by computer (version 4.5.15) [computer program]. http:www.praat.org , 2007. Visited 22-Feb-07.
[5] A. El-Jaroudi and J. Makhoul. Discrete all-pole modeling.IEEE Trans Sig Process, 39:411–423, February 1991.
[6] M. A. Epstein. Voice Quality and Prosody in English. PhDthesis, University of California, Los Angeles, USA, 2002.
[7] C. Gobl. Voice source dynamics in connected speech. STL-QPSR, 29(1):123–159, 1988.
[8] E. B. Holmberg, R. E. Hillman, and J. S. Perkell. Glot-
male and female speakers in soft, normal, and loud voice.J Acoust Soc Am, 84(2):511–1787, August 1988.
[9] R. Ihaka and R. Gentleman. R: A language for data analysisand graphics. J Computat Graphical Stat, 5(3):299–314,1996.
[10] J. Laver. The phonetic description of voice quality. Cam-bridge University Press, 1980.
[11] J. Pierrehumbert. Synthesizing intonation. J Acoust SocAm, 70(4):985–995, 1981.
[12] D. D. Rife and J. Vanderkooy. Transfer-function measure-ment with maximum-length sequences. J Audio Eng Soc,37:419–444, 1989.
[13] M. Swerts and R. Veldhuis. The e ect of speech melodyon voice quality. Speech Commun, 33:297–303, 2001.

Models and analysis of vocal emissions for biomedical applications: 5th international workshop: December 13-15, 2007: Firenze, Italy, ed. by C. Manfredi,ISBN 978 88-8453-673-3 (print) ISBN 978-88-8453-674-7 (online)© Firenze university press, 2007.
Abstract: Some spectral transition features areintroduced and tested in samples from dysarthricpatients. The goal is to explore their potential asdescriptors of articulatory deviations. Thispreliminary analysis includes only stop consonantsextracted from the diadochokinetic task. Results anddiscussion are detailed for each one of the dysarthricgroups included in the experiment.Keywords: Articulation, dysarthria, spectraltransitions
I. INTRODUCTION
Dysprosody and articulation problems are evident ineach of the different types of dysarthria [1]. While a lot has been done in order to find objective measures in thedomain of voice quality, there is a great lack in thedomains of articulation and prosody. Objective measuresin speech face difficulties related to the assumptionsinherent in signal processing, the variability of the signalamplified by the speech disorder, and these difficultiesincrease as more complex language- units, fromphonemes to running speech are analyzed [2].
Earlier research has shown that the Maximum Spectral Transition positions are related to the perceptual critical points that contain the most important information forconsonant and syllable perception [3][4]. Because it isapplicable as well in voiced as unvoiced segments,allowing the analysis of complex units, it seems to be a suitable tool to explore articulation in dysarthric speech.Furui [3] introduced the perceptually essential interval as the minimal interval of the syllable necessary to ensurethat no perceptual degradation in syllable identification is perceived compared with the original syllable and heproposed a spectral transition measure that can be used tomeasure the essential interval as illustrated in Fig. 1. His results revealed that syllable information for theconsonants having a front constriction is moreconcentrated in a short period than for the consonantshaving a back constriction.
This paper presents the results of a preliminaryanalysis of the stop consonants articulation by dysarthricpatients from the Mayo Clinic Database, under theassumption that those perceived as distorted consonantswill have shortened essential intervals or weak spectraltransitions.
SPECTRAL TRANSITION FEATURES IN DYSARTHRIC SPEECH
María E. Hernández – Díaz Huici1,2, Werner Verhelst 2 1 Center for Studies of Electronics and Information Technologies,
Central University Las Villas, Santa Clara, Cuba2 Department of Electronics and Informatics ETRO-DSSP, Vrije Universiteit Brussel, Brussels, Belgium
II. METHODS
The proposed features to characterize the strength and the duration of the spectral transitions are:
the essential interval, including its standarddeviation and kurtosis over a sequence ofpronunciations of the same syllable;the slope of the spectral transitions and theslope’s standard deviation over the sequence;the areas associated to spectral transitionextrema.
Fig. 1 shows the proposed transition features for a given syllable.
Fig. 1 Features extracted from the spectral transitioninterval for a CV syllable
Speech samples of 58 dysarthric patients (native speakersof English) were chosen from Aronson’s originalrecordings of several types of dysarthrias. To explore thenature of the spectral transitions in the stop consonants,the diadochokinetic task was selected from those dysarthric groups that report imprecise or distortedarticulation like the Flaccid, Spastic, Ataxic, Hypokinetic,and Hyperkinetic Dysarthrias types.
The analysis is achieved by comparing the extracted features from the spectral transition measure proposed byFurui [3] with the subjective (perceptual) evaluation made by three experts on the articulation of the syllables

/pa/, /ta/ and /ka/. Tables with the correlation of each group of patients were constructed for each one of thesyllables representing different articulators’ positions.Linear regressions with the features that exhibit a better correlation were made for the groups with commonresults.
III. RESULTS
A. Dysarthric- groups correlations across syllables /pa/,/ta/ and /ka/.
Flaccid and Spastic dysarthrias have better results in the /pa/ syllable and still correlate in the other twosyllables because they are characterized by imprecisebilabials, labiodentals, lingual dentals, lingual alveolar,and weak pressure consonants. The Organic VoiceTremor and Palato Pharyngeo Laryngeo Myoclonusgroups show consistent deviations in the articulatory–related dimensions.
Table I shows the results of the analysis for sequencesof utterances of the syllable /pa/.
Table I. Feature correlations for the different dysarthric groups uttering sequences of /pa/ syllables./pa/Corr.
E Estd Kurt Slope Sstd Areas Astd
Flaccid -0,13 -0,83 -0,91 -0,16 0,16 -0,13 -0,73Ataxic -0,06 -0,01 0,10 0,58 0,15 -0,11 0,11Spastic -0,48 -0,74 0,36 -0,79 -0,70 -0,48 -0,69Chorea -0,42 0,05 -0,36 0,34 0,36 -0,29 -0,03Parkins. -0,28 0,25 0,18 0,53 -0,13 -0,28 -0,16O. Trem. -0,20 -0,78 0,41 -0,65 0,67 -0,20 -0,65Dystonia -0,22 -0,09 -0,15 0,42 0,04 -0,35 0,60ALS 0,39 -0,44 0,10 0,56 -0,19 0,39 -0,43PPLM -0,82 -0,92 0,77 -0,99 -0,93 -0,82 -0,92
In Flaccid, and Spastic dysarthrias, the Organic Voice Tremor and Palato Pharyngeo Laryngeo Myoclonusgroups, the Essential-Interval Standard Deviation (Estd)and the Slope represent an excellent linear regressionwith statistics R2= 0.8764 F=23.6300 p=0.0001, for/pa /. More detailed information can be found in [5].
Ataxic Dysarthria exhibits a moderate correlation with the slope in /pa/ syllables and a non significantcorrelation with any of the measurements in the /ta/syllables, while it shows correlations with the slope and the standard deviation of the areas in /ka/. This can berelated to the timing abnormalities that characterize thisdisorder and which are more evident in consonants with larger VOT, as it is reported by Duffy [1].
Chorea only exhibits a strong correlation with the slopein /ta/ syllables. Parkinson-samples correlate only duringthe /ka/ syllables with the standard deviation of the slopeand the Kurtosis. The latest is the unique correlation
found for Dystonia. Irregular breakdowns, alternatingmotion rates, and tremor produce different effects in theimprecise articulation across the speakers, only when a major number of articulators are involved in theproduction of the sound, a correlation can be found.
Since imprecise articulation in ALS is a type of mixeddysarthria (related to flaccid and spastic dysarthria), thereis not a consistent tendency in this group of patients. Thetendency to increase the stop gap duration in thesespeakers made it possible to determine strong correlationswith the essential interval duration in /ta/ syllables andwith the slope and its standard deviation in /ka/ syllables.Together with Flaccid and Spastic groups, for ALS subjective evaluations, the Essential Interval kurtosis(Kurt) and the Areas represent an excellent linear regression. Figure 2 shows the residuals plot for the linearregression and Table II summarizes the mean values of the expert judgments for the patients and the values forthe parameters Kurt and Areas. The regression statistics are R2= 0.7638, F=19.4012, p=0.0002.
2 4 6 8 10 12 14
-1.5
-1
-0.5
0
0.5
1
1.5
Residual Case Order PlotR
es
idu
als
Case Number
Fig. 2 Residual case order plot for the /ka/ syllables
Table II. Patients for dysarthric groups with high correlations in/ka / syllables.
FD.SD.ALS Judgment Areas Kurt
1 2.666667 7.25 1.30982 2 8 3.22863 2 7 1.2024 0.666667 11 1.55 1 8.5 2.52666 0.666667 11 3.55037 1.333333 11.5 2.02438 2 8 2.52889 3 7 1.750110 2 8.75 1.974411 3 4.5 1.512 2 7 1.513 3 5 1.514 3 5.5 1.515 2.333333 5.25 1.9554
140 MAVEBA 2007

The parameters found in the syllables with backward constriction offer more information in general than the same set of parameters in the other articulatory positions. This might be related to the duration of the syllables transitions. Essential intervals for syllables with /k/ are up to 20 ms longer than the others, according to Fig. 10 in [3].
B. The most important parameters
A summary of the most important parameters for each of the three articulatory positions, together with the typical description of the disorder for each dysarthric group, is presented in table III.
Table III. Best correlating parameters with the subjective evaluations for each type of dysarthria in /pa/, /ta/, /ka/ syllables Dysarthria Articulation /pa/ /ta/ /ka/
Flaccid(multiple cranial nerves) n=5
Imprecise* Imprecise bilabials,labiodentals, lingualdentals, lingualalveolar, vowels, glides and liquids. Weak pressure consonants**
Kurt (-0,91)
EI, Areas (-0,84)
Spastic (Pseudo -bulbar) n=5
Slow:imprecise* Soundpressure level contrasts in consonants. Amplitude of release bursts for stops. Duration of phoneme to phoneme transitions**
Slope (-0,79)
Slope(-0,90)
EI(-0,89), Areas(-0,90) Kurtosis(-0,78), Sstd(0,78)
Mixed (ALS) n=6
Slow:imprecise* Reducedstrength of lip; tongue and jaw**
EI (0,76)
Slope (-0,99), Sstd (-0,80)
Ataxicn=8
Irregular breakdowns* Imprecise consonants**
Astd(0,69), Slope(-0,61)
Hypokinetic (Parkinsonism) n=8
Accelerated: imprecise* Failure to completely reach the articulatory targets or sustaincontacts for sufficientdurations**
Slope (-0,57)
Kurtosis(-0,83), Sstd(-0,80) (n=5)
Hyperkinetic(Dystonia) n=10
Fluctuatingdistortions (slow)*
Astd(0,60)
Kurtosis(0,76) (n=9)
(Chorea) n=8
Abrupt, intermittent distortions (quick)*
Slope(0,72)
(Organic Tremor) n=4
Normal: secondary irregular breakdowns*
Slope (-0,65) , Sstd (0,67)
Slope(-0,72)
Slope(0,87)
(Palato –Pharyngeo – Laryngeo Myoclunus) n=3
Normal, or flaccid, spastic, or ataxicdysarthria*
Slope(-0,99)
Sstd(-0,99)
-1 (n=2)
*Dysarthria: Differential Diagnosis. Arnold E. Aronson. Types Volume 1, Mentor Seminars 1993. **Motor Speech Disorders: Substrates, Differential Diagnosis, and Management. Joseph R. Duffy. Mosby 1995.
IV. DISCUSSION
According to the results summarized in table III and the linear regressions, our initial assumption is valid. The transitions are shorter, weaker and unstable as the severity score increases for the samples coming from Flaccid, Spastic and Mixed dysarthric groups. The proposed features are evidence of it in the following way:
1. The mean value of the slopes in the transitions of /pa/ and /ta/ syllables diminishes while the severity scores increase (Spastic, PPLM, OT, and Flaccid).
2. The mean value of the essential intervals or in the areas in the spectral transitions of /ka/ syllables diminishes while the severity scores increase (Flaccid, Spastic, and ALS).
3. The kurtosis of the essential intervals and the standard deviations in the transitions of /ka/ syllables are evidence of instabilities in the syllable repetitions beyond the normal speech variability (Flaccid, Spastic, Dystonia, Parkinson, and ALS).
Literature describes articulatory difficulties in those groups from the stop consonants and the involved articulators (Table III). It supports our results for the selected sounds.
Those groups, whose articulatory deviations are described as irregular breakdowns, fluctuating, or intermittent distortions, lack the regularities observed in the groups mentioned above; in their case, we found only modest correlations between the subjective evaluations and the parameters.
Continuous speech/prosody 141

V. CONCLUSION
A preliminary analysis of the stop consonants articulation by dysarthric patients using spectral transition measurements was presented. The results show that the proposed features open a possibility for the acoustic measurement of imprecise articulation.
Taking into account that experts evaluate articulation mainly on running speech or on a reading task, a new algorithm must be developed to extract the features under those conditions for all kinds of consonants.
Standards for healthy speakers for these features are necessary to allow a detailed analysis and a clinical interpretation. The features may then be included as part of an expert system to give a severity ranking to disordered speech.
ACKNOWLEDGMENT
This research was performed with a grant from the Institute for the Encouragement of Scientific Research and Innovation in Brussels (RIB-2006/006).
The authors thank the speech pathologists from the NKO department at the Antwerp University Hospital for
their collaboration in the subjective evaluations.
REFERENCES
[1] J. R. Duffy, Motor speech disorders substrates, differential diagnosis, and management, 2nd ed. St. Louis, Missouri: Elsevier Mosby, 2005, pp 484-487.
[2] J. Schoentgen, “Vocal cues of disordered voices: an overview”, Acta Acustica united with Acustica, vol. 92, pp 667-680, 2006.
[3] S. Furui, “On the role of spectral transitions for speech perception”, Journal of the Acoustical Society of America, vol. 80 (4) , pp 1016 – 1025, 1986.
[4] S. Dusan and L. Rabiner, “On the relation between Maximum Spectral Transition Positions and phone boundaries”, in Proceedings of Interspeech 2006,Pittsburgh, Pennsylvania, 2006, pp. 17 -21.
[5] M. Hernandez – Diaz Huici and W. Verhelst, Thedevelopment of objective tools to asses and manage articulation and prosody in hearing impaired and dysarthric patients, Research in Brussels’ Report, RIB – 2006/006, VUB 2007.
142 MAVEBA 2007

Models and analysis of vocal emissions for biomedical applications: 5th international workshop: December 13-15, 2007: Firenze, Italy, ed. by C. Manfredi,ISBN 978 88-8453-673-3 (print) ISBN 978-88-8453-674-7 (online)© Firenze university press, 2007.
Abstract: Our aim is to study the vocal expression of emotion in real-life spoken interactions in order to build emotion detection system. We make use of a corpus of naturally-occurring dialogs recorded in a real-life emergency medical call center. The context of emergency gives a large palette of complex and mixed emotions. About 30% of the utterances are annotated with non-neutral emotion labels on this medical corpus. The complexity of the emotion recognition task increases the higher the number of classes and the finest and closest these classes are. Finding relevant features of various types such as speech disfluencies or affect bursts becomes essential in order to improve the detection performances. Our experiments focus on a task of discriminating 2 to 5 emotions, Fear, Anger, Sadness, Neutral and Relief.
Keywords: Emotions, real-life spoken interactions, detection system, medical call center.
I. INTRODUCTION
This decade has seen an upsurge of interest in affective computing. Speech and Language are among the main channels to communicate human affective states. Affective Speech and language processing can be used alone or coupled with other multimodal channels in many systems such as call centers, robots, artificial animated agents for telephony, education, medical or games applications. Affective corpora are then fundamental both to developing sound conceptual analyses and to training these 'affective-oriented systems' at all levels - to recognise user affect, to express appropriate affective states, to anticipate how a user in one state might respond to a possible kind of reaction from the machine, etc. Our aim is to study the vocal expression of emotion in real-life spoken interactions in order to build emotion detection system.
In the computer science community, the widely used terms of emotion or emotional state are used without distinction from the more generic term affective state which may be viewed as more adequate from the psychological theory point of view. This “affective state” includes the emotions / feelings / attitudes / moods / and the interpersonal stances of a person. There is a significant gap between the affective states observed with artificial data (acted data or contrived data produced in laboratories) and those observed with real-life spontaneous data. Most of the time, researches are done on a sub-set of the big-six “basic” emotions described by Ekman [1] and on prototypical acted data. In the artificial data, the context is “rubbed out” or “manipulated” so we can expect to have much more simple full-blown affect states which are quite far away from spontaneous affective states. The affective state of a person at any given time
is a mixture of emotion/ attitude/ mood /interpersonal stance with often multi-trigger events (internal or external) occurring at different times: for instance a physical internal event as a stomach-ache triggering pain with an external event as “someone helping the sick person” triggering relief. Thus, far from being as simple as “basic emotion”, affective states in spontaneous data are a subtle blend of many more complex and often seemingly contradictory factors that are very relevant to human communication and that are perceived without any conscious effort by any native speaker of the language or member of the same cultural group.
The first challenge when studying real-life speech data is to find the set of appropriate descriptors attributed to an emotional behaviour. For a recent review of all emotion representation theories, the reader is referred to the Humaine NoE (www.emotion-research.net). Several studies define emotions using continuous abstract dimensions: Activation-Valence or Arousal-Valence-Power. But these three dimensions do not always enable to obtain a precise representation of emotion. For example, it is impossible to distinguish fear and anger. According to the appraisal theory [2], the perception and the cognitive evaluation of an event determine the type of the emotion felt by a person. Finally, the most widely used approach for the annotation of emotion is the discrete representation of emotion using verbal labels enabling to discriminate between different emotions categories. We have defined in the context of Humaine, an annotation scheme “Multi-level Emotion and Context Annotation Scheme” [3, 4] to represent the complex real-life emotions in audio and audiovisual natural data. This scheme is adapted to each different task. We are also involved as expert in the W3C incubator group on emotion representation.
The second challenge is to identify relevant cues that can be attributed to an emotional behaviour and separate them from those that are simply characteristic of spontaneous conversational speech. A large number of linguistic and paralinguistic features indicating emotional states are present in the speech signal. The aim is that of extracting the main voice characteristics of emotions, together with their deviation which are often present in real spontaneous interaction. Among the features mentioned in the literature as relevant for characterizing the manifestations of speech emotions, prosodic features are the most widely employed, because as mentioned above, the first studies on emotion detection were carried out with acted speech where the linguistic content was controlled. At the acoustic level, the different features which have been proposed are prosodic (fundamental frequency, duration, energy), and voice-quality features [5]. Additionally, lexical and dialogic cues can help as well to distinguish between emotion classes [3, 7, 8, 9]. The most widely used strategy is to compute as many features as possible. All the features are, more or less, correlated with each
REAL-LIFE EMOTIONS DETECTION ON HUMAN-HUMAN MEDICAL CALL CENTER INTERACTIONS
L. Devillers, L. VidrascuDepartment of Human-Machine Communication, LIMSI-CNRS, BP133, 91403 Orsay Cedex, France

other. Optimization algorithms are then often applied to select the most efficient features and reduce their number, thereby avoiding making hard a priori decisions about the relevant features. Trying to combine the information of different natures, paralinguistic features (prosodic, spectral, etc.) with linguistic features (lexical, dialogic), to improve emotion detection or prediction is also a research challenge. Due to the difficulty of categorization and annotation, most of the studies have only focused on a minimal set of emotions.
In this study, we show that by using a large number of different features, we can improve performances obtained with only classical prosodic features. Section 2 describes the corpus of real-life data. Section 3 is devoted to the description of the features used. In section 4, the methods for training models are briefly described. Section 5 summarizes our results which arethen discussed.
II. REAL-LIFE DATA
In the context of emergency, emotions are not played but really felt in a natural way. The aim of the medical call center service is to offer medical advice. The agent follows a precise,predefined strategy during the interaction to efficiently acquire important information. The role of the agent is to determine the call topic, the caller location, and to obtain sufficient details about this situation so as to be able to evaluate the call emergency and to take a decision. In the case of emergency calls, the patients often express stress, pain, fear of being sick or even real panic. In many cases, two or three persons speak during a conversation. The caller may be the patient or a third person (a family member, friend, colleague, caregiver, etc.).
The corpus (Table 1) contains 688 agent-client dialogs of around 20 hours (271 males, 513 females). The corpus has been transcribed following the LDC transcription guideline.
Table 1. Corpus Description
#agents 7 (3M, 4F) #clients 688 dialogs (271M, 513F)
#turns/dialog Average: 48 #distinct words 9.2 k
#total words 262 k
Some additional markers (Table 2) have been added to denote named-entities, breath, silence, intelligible speech, laugh, tears, clearing throat and other noises (mouth noise).
Table 2. Number of the main non-speech sounds markings on 20 hours of spontaneous speech.
#laugh 119 #tear 182
# « heu » 7347
#mouth noise 4500
#breath 243
The use of these data carefully respected ethical conventionsand agreements ensuring the anonymity of the callers, the
privacy of personal information and the non-diffusion of the corpus and annotations.
In our experiment, we define one list of emotion labels using a majority voting technique. A first list of labels was selected out of the fusion several lists of emotional labels defined within HUMAINE (European network on emotion http://emotion-research.net/). In a second step, several judges rated each emotion word of this list with respect to how much it sounded relevant for describing emotions present in our corpus.
We have defined an annotation scheme “Multi-level Emotion and Context Annotation Scheme” [3, 4] to represent the complex real-life emotions in audio and audiovisual natural data. It is a hierarchical framework allowing emotion representation at several layers of granularity (Table 3), with both dominant (Major) and secondary (Minor) labels and also the context representation. This scheme includes verbal (fromthe predefined list), dimensional and appraisal labels. Representing complex real-life emotion and computing inter-labeler agreement and annotation label confidences are important issues to address. A soft emotion vector is used to combine the decisions of the several coders and represent emotion mixtures [3, 4]. This representation allows to obtain a much more reliable and rich annotation and to select the part of the corpus without blended emotions for training models. Sets of “pure” emotions or blended emotions can then be used for testing models. About 30% of the utterances are annotated with non-neutral emotion labels on this medical corpus (Table 4).
Table 3. Emotion classes hierarchy: multi-level of granularity
Coarse level Fine-grained level (8 classes) (20 classes + Neutral)
Fear Fear, Anxiety, Stress, Panic,
Embarrassment
Anger Annoyance, Impatience, ColdAnger,
HotAnger
Sadness Sadness, Dismay, Disappointment,
Resignation, Despair Hurt Hurt
Surprise Surprise Relief Relief
Interest Interest, Compassion
Other Positive Amusement
Table 4. Repartition of fine labels (688 dialogues). Other gives the percentage of the 15 other labels. Neu: Neutral, Anx: Anxiety, Str: Stress, Rel: Relief, Hur: Hurt, Int: Interest, Com:Compassion, Sur: Surprise, Oth: Other.
Caller Neu. Anx. Str. Rel. Hur. Oth
10810 67.6% 17,7% 6.5% 2.7% 1.1% 4.5%Agent Neu. Int. Com. Ann. Sur. Oth
11207 89.2 6.1% 1.9% 1,7% 0.6% 0.6%
144 MAVEBA 2007

The Kappa coefficient (measuring the inter-labeler agreement) was computed for agents (0.35) and callers (0.57). The following experiments have been carried out on the callers voices for the coarse classes: Fear, Anger, Sadness, Relief and a “Neutral” state.
III. FEATURES
Prosodic features (mainly F0 and Energy) are classical features used in a majority of experiments on emotion detection. For accurate emotion detection in natural real-world speech dialogs, not only the prosodic information must be considered.
We use non-verbal speech cues such as speech disfluencies and affect bursts (laugh, tear, etc.) as relevant cues for emotion characterization. For example, we considered the autonomous main French filler pause "euh" as a marker of disfluency. It occurs as independent item and it has to be differentiated from vocalic lengthening. We correlate the filler pause with emotions in [10]. This correlation follows the orthographic (lexical) transcription of the dialogs and considers the number of occurrences of transcribed "euh" per emotion class. In [10], "euh" was correlated mainly with Fear sentences, followed by Anger sentences and finally the other emotions. In [11], affect bursts such as laughter or mouth noise are shown to be also helpful for emotion detection.
Since there is no common agreement on a top list of features and the feature choice seems to be data-dependent, our usual strategy is to use as many features as possible even if many of the features are redundant, and to optimize the choice of features with attribute selection algorithms. In the experiments reported in this paper, we divided the features into several types with a distinction between those that can be extracted automaticallywithout any human intervention (prosodic, spectral features, microprosody) and the others (duration features after automatic phonemic alignment, features extracted from transcription including disfluencies and affect bursts). Our set of features includes very local cues (such as for instance the local maximums or inspiration markers) as well as global cues (computed on a segmental unit) [12]. In Table 5, we summarize the different types of features and the number of cues used in our experiments.
We distinguish the following sets of features:
- “Blind”: automatic features extracted only from audio signal including paralinguistic features (prosodic, micro-prosodic, formants)
The Praat program [13] was used for the extraction of prosodic(F0 and energy), microprosody and spectral cues. It is based on a robust algorithm for periodicity detection carried out in the lag auto-correlation domain. Since F0 feature detection is subject to errors, a filter was used to eliminate some of the extreme values that are detected. Energy, spectral cues and formants were only extracted on voice parts (i.e.: parts where Praat detects F0). The paralinguistic features were normalized using Z-norm: zNorm(P) = (P-mean(P))/std(P). The aim is to erase speaker-differences without smoothing variations due to emotional speech.
- “Trans1”: duration features from phonemic alignment
For the moment we only extracted Duration features from the phonetic transcription, mean and maximum phone duration, phonemic speech rate (#phones/ turn length), length (max and mean) of hesitations.
- “Trans2”: features extracted from the transcription
Non linguistic event features: inspiration, expiration, mouth noise laughter, crying, number of truncated words and unintelligible voice. These features are marked during thetranscription phase.
Table 5: Summary of the feature types
Feature type # of cues
F0 related 25
Energy 20
Bandwidths 18Spectral & formant related Formants 30
Blind
Microprosody 14
Trans1 Duration features from phonemic alignment 11
Trans2
Speech disfluencies an affect burst from
transcription 11
IV. METHODS
The set of features described in section 3 is computed for all emotion segments in order to compare the performances that can be achieved using one type only and study the gain that can be added by mixing them. Therefore, we have focused on the performances that could be obtained using prosodic, spectral, disfluency and non-verbal events cues. The same train and test sets are used as for all experiments. Several studies have shown Support Vector Machine [14] (search of an optimal hyperplan to separate the data) to be an effective classifier for emotion detection. A SVM Gaussian classifier was therefore used for all experiments with the software weka [15]. Because SVM are two-class classification, the multi-class classification is solved using pairwise classification. Detection results are given using the CL score (class-wise averaged recognition i.e. average of the diagonal of the matrix).
V. RESULTS AND DISCUSSION
With only blind features and without any knowledge about the speech transcription, we obtained a detection rate of 45% on these 5 emotions. Still, the more emotional classes there are, the more different cues will be needed to achieve good detectionrates. By adding knowledge (Fig. 1) derived from the orthographic transcription (disfluencies, affect bursts, phonemic alignment) and after the selection of the best 25 features, weachieved 56% of good detection for the same 5 emotions.
Continuous speech/prosody 145

Features from all the types were selected among the 25 features: 15 features in the Blind set, 4 in Trans1 and 6 in Trans2.
Figure 1: CL score for the 5 classes Fear, Anger, Sadness, Relief and Neutral with different set of cues; Blind:
all parameters extracted automatically (F0, Formants, Energy, microprosody); Trans1: durations from phonemic alignment, Trans2: parameters extracted from the manual
transcription, all: everything 25-best : 25 best features
The experiments described in Fig. 2 focus on a task of discriminating 2 to 5 emotions among Fear, Anger, Sadness, Neutral and Relief.
Figure 2: Performances from 2 emotions to 5 emotions (Fe: Fear, N: Neutral state, Ag: Anger, Sd: Sadness, Re: Relief)
The complexity of the recognition task increases the higher the number of classes and the finest and closest these classes are. For only two emotions (such as Anger/Neutral or Fear/Neutral), we obtained with our best system more than 80% of good
detection. In conclusion, finding relevant features of various types becomes essential in order to improve the emotion detection performances on real-life spontaneous data. Some of these features such as affect burst or disfluencies could be detected automatically without any speech recognition. Future experiments will be devoted to the automatic detection of suchfeatures.
VI. ACKNOWLEDGEMENTS
This work was partially financed by several EC projects: FP5-Amities, FP6-CHIL and NoE HUMAINE. The work is conducted in the framework of a convention between a medical call center in France and the LIMSI-CNRS.
REFERENCES
[1] Ekman P. (1999) "Basic emotions." In Handbook of Cognition & Emotion, 301–320. New York: John Wiley. [2] Scherer K (1999) Appraisal Theory. In: Dalgleish, T. Power, M. (Eds), Handbook of Cognition and Emotion. John Wiley, New York, 637-663. [3] Devillers L., Vidrascu L. & Lamel L. (2005). Challenges in real-life emotion annotation and machine learning based detection, Journal of Neural Networks 2005, special issue: Emotion and Brain, vol18, Number 4, 407-422.[4] Devillers, L., Abrilian, S., Martin, J.-C (2005). Representing real life emotions in audiovisual data with non basic emotional patterns and context features, ACII. [5] Campbell, N. (2004). Accounting for Voice Quality Variation, Speech Prosody 2004, 217-220.[6] Batliner, A., Fisher, K., Huber, R., Spilker, J. & Noth, E. (2003). How to Find Trouble in Communication. Journal of Speech Communication, 40, 117-143. [7] Vogt, T., André, E., (2005) “Comparing Feature Sets for Acted and Spontaneous Speech in View of Automatic Emotion Recognition”, ICME, 2005. [8] Batliner, A. et al, “Whodunit — Towards the most Important Features Signaling Emotions in Speech: a Case Study on Feature and Extraction Types”, submitted in ACII 2007. [9] Devillers, L., Vasilescu, I. & Lamel, L. (2003). Emotion detection in task-oriented dialog corpus. Proceedings of IEEEInternational Conference on Multimedia. [10] Devillers, L., Vasilescu, I., & Vidrascu, L. (2004). Anger versus Fear detection in recorded conversations . Proceedings of Speech Prosody. 205-208. [11] Schröder, M., “Experimental study of affect bursts”, Proc. ISCA workshop “Speech and Emotion”, Newcastle, Northern Ireland , 2000, p 132-137. [12] Vidrascu L., Devillers L., (2007) Five emotion classes detection in real-world call center data: the use of various types of paralinguistic features, paraling07. [13] Boersma, P, (1993) “Accurate short-term analysis of the fundamental frequency and the harmonics-to-noise ratio of a sampled sound”, Proceedings of the Institute of Phonetic Sciences, 1993, p 97-110. [14] Vapnik, V.N. (1995), The Nature of Statistical Learning Theory, Springer-Verlag, 1995. [15] Witten, I.H. et al.., (1999) “Weka: Practical machine learning tools and techniques with Java implementations”, Proc ANNES’99 p 192-196.
50
55
60
65
70
75
80
85
90
0 1 2 3 4 5 6 7 8 9 10 11 12 13 14Fe/N Fe/Sd Ag/N Ax/St Fe/Ag Sd/N Fe/Ag/N Fe/Sd/N Fe/Ag/Sd/Re Fe/Ag/Sd/Re/N50
55
60
65
70
75
80
85
90
0 1 2 3 4 5 6 7 8 9 10 11 12 13 14Fe/N Fe/Sd Ag/N Ax/St Fe/Ag Sd/N Fe/Ag/N Fe/Sd/N Fe/Ag/Sd/Re Fe/Ag/Sd/Re/N
Acc
Ali
Trans
All
25att
%CL
35
40
45
50
55
60
5,5
Blind*
Trans1
Trans2
All
25att
CL (%)
Acc
Ali
Trans
All
25att
%CL
35
40
45
50
55
60
5,5
Blind*
Trans1
Trans2
All
25att
CL (%)
146 MAVEBA 2007

Models and analysis of vocal emissions for biomedical applications: 5th international workshop: December 13-15, 2007: Firenze, Italy, ed. by C. Manfredi,ISBN 978 88-8453-673-3 (print) ISBN 978-88-8453-674-7 (online)© Firenze university press, 2007.
Abstract: The objective is to describe analysis methods that enable tracking vocal dysperiodicities in running speech. Vocal dysperiodicities here refer to deviations from strict periodicity in voiced speech sounds. Two methods are described. They respectively enable the sample-by-sample extraction of vocal noise from the speech signal or the isolation of speech cycles in voiced segments to quantify perturbations of the cycle lengths and amplitudes (i.e. cycle duration jitter and amplitude shimmer). These methods share the property that they are not based on the assumption that the signal is locally periodic and that the average period length is known a priori. Keywords: Vocal noise, jitter, running speech
I. INTRODUCTION
The objective of the presentation is to describe analysis methods that enable tracking vocal dysperiodicities in running speech. Vocal dysperiodicities here refer to deviations from strict periodicity in voiced speech sounds. The description of vocal dysperiodicities is a common practice in the framework of the clinical assessment of vocal function.
Acoustic descriptors of vocal dysperiodicity are temporal or spectral. Frequently, they are extracted from sustained speech sounds. Privileging steady sounds when analyzing vocal disturbances is a matter of technical feasibility rather than clinical relevance. It is indeed the case that existing clinical voice analysis software is able to deal with sustained sounds only or is known to fail on speech produced by severely hoarse speakers. The reason is that many analysis methods are based on the hypothesis that the analyzed sounds are locally periodic. This is an assumption that is not valid under all circumstances, however [1]. Therefore, we have developed methods that enable estimating vocal dysperiodicities in speech that is not steady and that may be produced by severely hoarse speakers. The methods that are described make possible the sample-by-sample extraction of vocal noise from the speech signal, as well as the isolation of speech cycles in voiced segments to quantify perturbations of the cycle lengths and amplitudes (i.e. cycle duration jitter and amplitude shimmer). Descriptors of vocal jitter and
shimmer differ from descriptors of vocal noise in general insofar that they focus on modulation noise exclusively.
Generally speaking, the description of vocal jitter and shimmy is regarded to be meaningful only when the speech segments are pseudo-periodic. At this stage, it is not clear whether these limitations are the consequence of a lack of reliability of existing signal analysis methods or a lack of validity of the extracted vocal cues.
Two methods are described. They share the property that they are not based on the assumption that the signal is locally periodic and that the average period length is known a priori. The first method enables tracking noise (whatever the cause) in any speech sound produced by any speaker.
The second method consists in a multi-resolution analysis of the signal samples in terms of their salience. Sample salience designates the duration over which a signal sample is a maximum. Salience is a relevant signal feature because one observes that signal peaks that are similarly positioned in vocal cycles may have similar saliences even if the peak amplitudes differ widely. This also applies to peaks in cycles the durations of which are perturbed moderately. The salience of signal peaks can therefore be used to detect automatically voiced speech cycles because they display a preeminent peak in the vicinity of glottal closure.
II. METHODS
A. Extraction of vocal dysperiodicities
The method is based on the observation that when in a 2-dimensional graph one reports on the horizontal axis samples of a noise-free periodic signal and on the vertical axis samples that are identically positioned in an adjacent period then all sample pairs (x,y) are located on the bisector of the graph.
In a noisy signal, pairs (x,y) remain in the vicinity of the bisector, as shown in Fig.1. The cumulated distance between pairs and bisector over an analysis frame is a measure of the total signal noise in that frame and the individual distances between each pair and the bisector are sample-by-sample estimates of the noise (whatever its cause).
In practice, a sliding rectangular analysis window of 2.5 ms is used and auxiliary windows are time-shifted to the left and right to minimize the cumulated distance of
ESTIMATION OF VOCAL NOISE AND CYCLE DURATION JITTER IN CONNECTED SPEECH
A. Alpan1, F. Grenez1, J. Schoentgen1,2
1Laboratory of Images, Signals & Telecommunication Devices, Université Libre de Bruxelles, 50, Avenue F. D. Roosevelt, 1050 Brussels, Belgium
2National Fund for Scientific Research, Belgium

all sample pairs to the bisector. The positioning of analysis frames to the left and right of the main analysis window avoids comparing signal fragments that do not belong to the same phonetic segment because the minimum distance is retained as a measure of vocal noise [2, 6].
Before the calculation of the individual and cumulated distances, the within-window signal fragments are energy-normalized and their averages are removed. Energy-normalization enables compensating slow amplitude variations and average-normalization enables removing offsets. Without energy- and average-normalization sample pairs would be aligned on a straight line with a slope different from one and displaced from the origin.
An algebraic formulation of the procedure outline above shows that it is equivalent to the calculation of the variogram of the speech signal involving a current and left- and right-positioned analysis frames. The variogram is minimal for the shift of the auxiliary analysis window that minimizes the cumulated distances to the bisector [5].
To obtain vocal dysperiodicity estimates over a complete signal, the main window is shifted withoutoverlap or gap and the variogram analysis is repeated as often as necessary.
-0.1 -0.08 -0.06 -0.04 -0.02 0 0.02 0.04 0.06 0.08 0.1-0.1
-0.08
-0.06
-0.04
-0.02
0
0.02
0.04
0.06
0.08
0.1
current frame
auxi
liary
fram
e
Figure 1: Auxiliary versus main window samples for one frame of vowel [a] in sentence S1 produced by afemale normophonic speaker.
B. Global and segmental signal-to-dysperiodicity ratios
The vocal noise is summarized by means of global and segmental signal-to-dysperiodicity ratios (1), dysperiodicity e(n) being the distance of a sample pair to the bisector.
12
01
2
0
( )10log
( )
L
nL
n
x nSDR
e n
−
=−
=
=∑
∑
(1)
The global ratio involves the log-ratio of the signal and dysperiodicity energies over the whole signal duration. The segmental ratio involves the average of the log-ratio (1) computed for analysis segments of 5 ms. The latter is frequently used to summarize signal degradation owing to lossy coding. The reason is that it is expected to correlate better with perceived loss of signal quality than the global log-ratio [4].
C. Computation of the speech sample salience
The sample salience is defined as the longest interval over which a sample is a maximum. The estimation of the salience consists in considering all possible within-array analysis intervals and noting how often a sample is a maximum within each. Boundary effects are taken into account by rotating N times the samples within an array of length N so that each sample occupies once the left and right boundary positions.
Table 1: Illustration of a multi-resolution salience computation of an array (in bold).
1 2 0 4 3 6 1 2 1 1 2 0 4 3 6 1 2 1
1 3 1 5 1 9 1 3 1
2 1 4 1 9 1 4 2 1
1 3 1 9 1 4 2 1 3
2 1 9 1 4 1 1 4 1
1 9 1 3 2 1 4 1 4
9 1 2 1 1 3 1 4 1
1 6 2 1 3 1 8 1 9
5 1 1 2 1 7 1 9 1
2 1 4 1 6 1 9 1 2
1 3.1 1 4.8 1 9 1 3.7 1.6
The calculation of the sample salience involves thefollowing steps. The handling of boundary effects is discussed later.
1. Initialization of all sample saliences to one.
2. Division of the array length N into analysis intervals of length 2. The rightmost interval stops at the rightmost array boundary whatever its length (i.e. 1 or 2).
3. Determination of the maximum within each interval.
4. Assignment of a salience of 2 to the interval maxima.
5. Increase of the interval length by one.
6. Division of the array length N into analysis intervals of length n. The length of the rightmost analysis interval is comprised between 1 and n.
7. Determination of the interval maxima.
8. Assignment of salience n to each interval maximum.
148 MAVEBA 2007

9. Looping back to step 5.
10. Stop when the analysis interval length equals N.
The position of the analysis array within the signal may be arbitrary and the saliences of the samples in the rightmost interval are affected by the anomalous interval lengths. To obtain sample saliences that are less dependent on position, the N samples in the analysis array are rotated N times so that each sample is positioned once at the right and left boundaries, and the sample salience is calculated for each within-arrayrotation. The final sample salience is the average of the saliences computed for each rotation. In practice, rotation is carried out by copying the analysis array to the right and shifting the array stepwise from left to right N times. Tab.1 illustrates obtaining the sample salience for an array of length 9. Each line in Tab.1 gives the sample saliences for one array position. The last line gives the final average saliences, which are considered to be independent of the sample positions with regard to the array boundaries.
D. Extraction of the vocal cycle lengths and amplitudes
Preprocessing: The speech signal is low-pass filtered to remove additive noise as well as high-frequency formants. A zero phase filter is used to prevent phase distortion. The cut-off frequency is 900Hz.
Multi-resolution analysis: The cycle positions are determined on the base of the main cycle peaks that occur in the vicinity of glottal closure. These are extracted by computing the salience of each signal sample and discarding those samples that are not peaks.
The main cycle peak sequence is extracted by takinginto account the peaks one by one in the order of decreasing salience. For each peak sequence the coefficient of variation of the inter-peak durations is computed. The peak sequence giving rise to a minimal coefficient of variation is retained. The search interval for the minimum is fixed by the frequency band 50Hz to 400Hz in which the average vocal frequency is expected.
Salience analysis is performed twice, once for eachpolarity of the signal and the polarity giving the smallest coefficient of variation is retained.
E. Corpus
The corpus comprises sustained vowels [a] [i] and [u], as well as four sentences spoken by 22 normophonic and dysphonic speakers. Two of the sentences involve voiced segments exclusively and the other voiced and unvoiced segments. The four sentences are matched grammatically and have the same number of syllables. Seven judgeshave determined the degree of perceived overall deviation
from modal voice (i.e. grade) in the framework of acompared-items paradigm [3].
III. RESULTS AND DISCUSSION
A. Vocal noise
Vocal noise has been extracted by means of the algorithm described in section II.A. Global and segmental signal-to-dysperiodicity ratios have been computed and correlated with perceived degrees of hoarseness (grade). Tab.2 summarizes the Pearson correlation coefficients between perceived degree of hoarseness and global and segmental signal-to-dysperiodicity ratios.
Table 2: Pearson’s correlation coefficients betweenaverage hoarseness scores and global and segmental signal-to-dysperiodicity ratios for sustained vowel [a] and sentences S1-S4 obtained via energy-equalized (GV) and energy- and average-equalized variograms (AGV)
The results show that, for sustained vowels as well as spoken sentences, the global and segmental signal-to-dysperiodicity ratios correlate with the perceptual ratings. One observes that when energies as well as averages of the signal analysis frames are equalized, the correlation with perceived degree of hoarseness is increased. The increase is more marked for the global signal-to-dysperiodicity ratio. An explanation for this observation is discussed hereafter.
In the speech signal one occasionally observes large-amplitude, low-frequency “pop” noise caused by breath hitting the microphone housing. These parasitic transients are low-frequency and ignored or not perceived by human listeners. The energy of such low-frequency transients may be comparable to the total signal energy, however. The impact of such parasitic low-frequencypops is greater on the global signal-to-dysperiodicity ratio than on the segmental one because the latter dilutes the effects of isolated events by averaging over several segments. A consequence is that segmental signal-to-dysperiodicity ratios correlate better than global ratios with perceived hoarseness.
Average-equalizing the analysis windows removes most of the effects of low-frequency pop noise [2, 6]. A consequence is an increase of the correlation with perceived hoarseness for both segmental and global signal-to-dysperiodicity ratios. The increase is more marked for global than segmental signal-to-dysperiodicity
[a] S1 S2 S3 S4 Global -0.73 -0.71 -0.68 -0.70 -0.69
GV Segmental -0.70 -0.85 -0,79 -0.80 -0.66
Global -0.70 -0.72 -0.78 -0.87 -0.79 AGV
Segmental -0.68 -0.84 -0.78 -0.82 -0.70
Continuous speech/prosody 149

ratios because the former is more strongly affected by isolated large-amplitude events.
Fig.2 is a scattergram that shows on the horizontal axis perceptual scores of hoarseness for sentence S3 and on the vertical axis the global signal-to-dysperiodicity ratios, computed by means of the average-equalized and un-equalized variograms. Generally speaking, the effect of equalizing frame averages in addition to frame energies is to improve the linearity between perceptual and acoustic cues and to increase the Pearson correlation coefficient, which is a measure of linear correspondence.
One sees that the difference between the two analysis methods increases with the signal-to-dysperiodicity ratio. This is because when frame averages are not equalized the influence of low-frequency pop noise on the global signal-to-dysperiodicity ratio is stronger in clean signals.
2 4 6 8 10 12 14 16 18 20 228
10
12
14
16
18
20
22
24
26
28
Perceptual evaluation score
SD
R [d
B]
Generalized variogramAv. equal. generalized variogram
Figure 2: Global signal-to-dysperiodicity ratio (vertical axis) versus perceptual scores (horizontal axis) and linear regression lines for sentence S3. Increasing scores to the right on the horizontal axis correspond to increasing scores of perceived hoarseness, that is, decreasing signal-to-dysperiodicity ratios. The black and white dots correspond to global signal-to-dysperiodicity ratios obtained via average- & energy-equalized and energy-equalized variograms respectively.
B. Cycle duration jitter
Fig.3 illustrates the extraction of cycle lengths via the analysis of peak saliences (sections II.C, II.D). The upper trace is the unfiltered speech signal, i.e. a fragment of vowel [a] sustained by a female hoarse speaker (thedegree of hoarseness is 15 on a scale from 1 to 21). The voice is perceived as breathy rather than rough. The second graph shows the peak saliences of the low-pass filtered signal fragment and the bottom graph shows the cycle lengths extracted on the base of the cycle peak saliences and the inter-peak durations.
0.02 0.04 0.06 0.08 0.1 0.12 0.14 0.16-0.02
0
0.02
time [s]
0 5 10 15 20 25 30 35 403.8
3.9
4
cycle number
cycl
e le
ngt
h [m
s]
0.02 0.04 0.06 0.08 0.1 0.12 0.14 0.160
2000
4000
6000
time [s]
salie
nce
Figure 3: Fragment of vowel [a], peak saliences andcycle lengths.
V. ACKNOWLEDGMENT
This research was supported by the “Région Wallonne”, Belgium, in the framework of the “WALEO II” programme and by COST ACTION 2003 “Advanced voice function assessment”.
REFERENCES
[1] F. Klingholtz, “Acoustic recognition of voice disorders: A comparative study of running speech versus sustained vowels”, J. Acoust. Soc. Amer., 87(5), pp. 2218-2224, 1990. [2] A. Alpan, A. Kacha, F. Grenez, and J. Schoentgen, “Assessment of vocal dysperiodicities in connected disordered speech,” in Proc. Interspeech, Antwerp, Belgium, pp. 1178-1181, August 2007 [3] A. Kacha, F. Grenez, and J. Schoentgen, “Voicequality assessment by means of comparative judgments of speech tokens,” in Proc. Int. Conf. Spoken Lang. Process., Lisboa, Portugal, pp.1733-1736, September 2005. [4] N.S. Jayant and P. Noll, “Coding of waveforms: principles and applications to speech and video”, Prentice-Hall, Englewood Cliffs, 1984. [5] J. Haslett, “On the Sample Variogram and the Sample Autocovariance for Non- Stationary Time Series”, The Statistician, vol. 46, no. 4, pp. 475-485, 1997. [6] A. Kacha, F. Grenez, and J. Schoentgen, “Estimation of dysperiodicities in disordered speech”, Speech Communication, vol. 48, pp. 1178-1181, 2006.
150 MAVEBA 2007

Neurological dysfunctions


Models and analysis of vocal emissions for biomedical applications: 5th international workshop: December 13-15, 2007: Firenze, Italy, ed. by C. Manfredi,ISBN 978 88-8453-673-3 (print) ISBN 978-88-8453-674-7 (online)© Firenze university press, 2007.
PREDICTING SEVERITY OF MENTAL STATE USING VOCAL OUTPUT CHARACTERISTICS
Landau M1, Yingthawornsuk T1, Wilkes DM1, Shiavi RG1,2, Salomon RM3.1Department of Electrical and Computer Engineering, Vanderbilt University, Nashville, TN, USA
2Department of Biomedical Engineering, Vanderbilt University, Nashville, TN, USA 3Department of Psychiatry, Vanderbilt University School of Medicine, Nashville, TN, USA
Abstract: Acoustical properties of speech have been shown to be related to mental states such as depression and remission. In particular, energy in frequency bands has been used as features for group classification among the groups with mental states of remission, depression, and suicidal risk. The prediction algorithms presented develop an additional level of assessment and are designed to predict a score for the severity of the mental state, provided by the Beck Depression Inventory. Several multiple regression models have been produced relating the results of the inventory and the power in four frequency bands. Models were produced for both males and females using both spontaneous and automatic speech. Keywords: speech, mental states, power spectra, regression
I. Introduction
Methods to help to identify persons who are at elevated risk of suicide are sorely needed in clinical practice. This study represents an attempt to relate the frequency content in speech to the mental state of persons in two study groups: near-term suicidal and depressed. Vocal cues have been used as indicators in diagnosing the syndrome underlying a person’s abnormal behavior or emotional state by experienced clinicians [1], [2], but these skills are not in widespread clinical use. Considerable evidence suggests that emotional arousal produces changes in the speech production scheme by affecting the respiratory, phonatory, and articulatory processes that in turn are encoded in the acoustic signal [3], [4]. Certain changes in speech parameters may be specific to near-term suicidal states. Research has shown that depression has a major effect on the acoustic characteristics of voice as compared to normal controls. Prosody is slower and the energy in the speech is distributed differently over the frequency range between 0 and 2,000 Hz.
In published pilot studies [1], [5], [6], analytical techniques have been developed to determine if subjects were in one of three mental states: healthy control, non-suicidal depressed, or high-risk suicidal. In particular power spectral density, PSD, features of vocal output characteristics have been found to be effective in differentiating among those mental states. Subsequent studies have shown that these features are effective in differentiating among remitted, depressed and suicidal
speech in spontaneous speech and suicidal speech from depressed speech in automatic speech during reading. These results suggested that power spectral density analysis can be used to produce acoustical features for assessing suicide risk [7]. Because of this categorization accuracy, we hypothesized that these features could also be used to predict the severity of the mental state. For quantizing the mental state, a standard psychological assessment tool, the BeckDepression Inventory (BDI) was used [8]. This provides a numerical quantity from 0 to 64 with 0 indicating a normal state and 64 indicating a high-risk for suicide.
II. Methodology
Database Recordings were obtained from males and females in two different patient groups; high–risk suicide and depression. Each study subject from each patient group had two types of speech samples recorded. They are speech samples from the interviews with a therapist, spontaneous speech, and the speech samples from reading the "Rainbow Passage", automatic speech. The passage is used in speech science because it contains all of the normal sounds in spoken English and it is phonetically balanced [9].
The recordings of the 13 female patients and 11 male patients were obtained from ongoing study. The ages of the patients were between 25 and 65 years. All speech signals were sampled at a rate of 10 kHz. The background noise, long silent periods, and the voices other than the patient's voice were removed by using the GoldWave v.5.08 audio editor. The preprocessing is finished by dividing the edited continuous speech into 20-second segments. Two steps of preprocessing were used. First all edited speech was divided into 20 millisecond frames. All frames were tested for voicing and only voiced speech frames were kept. The voiced frames were concatenated into 20 second segments. Second, all speech segments were detrended and normalized to have a variance of 1 before analysis to compensate for possible differences in recording level among subjects. For each patient the length of the voiced interview speech was approximately 8 minutes and the reading speech was approximately 2 minutes.
Each subject also completed the Beck Depression Inventory, BDI, [8]. This is a standard, brief, self-rated inventory used as a measure for mood.

Feature Extraction
Power spectral densities (PSD's) of the voiced speech were obtained by using the Welch method with non–overlapping 100–point Hamming windows [1]. Four features were calculated in the four different frequency ranges: from 0 Hz to 500 Hz, 500 Hz to 1000 Hz, 1000 Hz to 1500 Hz, and finally from 1500 Hz to 2000 Hz. For each of the 500 Hz sub-bands (x1, x2, x3, x4), the percentages of the total power were calculated and stored. For each segment, the average power in each band over all frames was calculated and used as the feature set for that segment.
Regression Analysis
Because the percentages of power were used as features, only the power in the first three sub-bands can be independent and were used for analysis. The BDI and the acoustical features were stored in matrix form for regression analysis. The BDI is the dependent variable and the equation model is shown in equation 1. The BDI score is bdi(i) for subject i, the weighting coefficients, ak,and the sub-band energies, x1(i), x2(i), and x3(i)
0 1 1 2 2
3 3 4 1 2
( ) ( ) ( )( ) ( ) ( )
other cross-products
bdi i a a x i a x ia x i a x i x i (1)
In order to choose the most appropriate model, Akaike’s information criterion (AIC, eqn. 3) was utilized [10]. The AIC measures of the goodness of fit of the estimated model, by not only minimizing the Residual Sum of Squares (RSS, eqn. 2) but also assessing a penalty for the number of free parameters, (k), for any number of measurement samples (n).
2
2 1
2
1
ˆ( ( ) ); where
( ( ) )
n
avgin
avgi
b i bR b bdi
b i b(2)
2
2 lnRAIC k nn
(3)
All combinations of models up to second order were determined for males and females and both speech types.
III. Results
Table I displays the number of patients in each group, the range of values of the BDI scores and the energy band ratios in each of the three groups. The acronyms are: ‘sc’ for the suicidal patients, ‘dp’ for the depressed patients, ‘rm’ for the remitted patients, and ‘PSD’ for the power spectral density values. The table shows that there is a quasi-definitive range for each energy band ratio. The 1st energy band ratio seems to fall in the range of 1 - .546, the 2nd energy band’s ratio is between .546 - .054, and the 3rd energy band ratio will approximately fall in the range of .054 - .001. As expected, the suicidal patients have a higher BDI score, whereas the depressed patients have mid-range BDI scores, and remitted patients have the lowest total BDI scores. However, the remitted and depressed patient’s BDI scores overlap somewhat. For the males, the overlap range is 9 to 16 and for females, it is 18 to 21. There is also an overlap between the male reading depressed and suicidal scores. Notice from the number of patients in each group, the speech samples for both reading and interview sessions for everyone could not be always obtained. The overall results of the regression analysis are shown in Table II.
Table I. Range of Data Values Gender Session # Patients BDI Score (sc) BDI Score (dp) BDI Score (rm) PSD1 PSD2 PSD3
Male Reading 27 20 - 57 9 - 34 0 - 16 0.60 - 0.94 0.054 - 0.468 0.003 - 0.044
Male Interview 19 40 - 57 9 - 30 0 - 16 0.60 - 0.94 0.058 - 0.384 0.002 - 0.054
Female Reading 30 28 - 51 18 - 38 0 - 21 0.65 - 0.96 0.038 - 0.335 0.001 - 0.044
Female Interview 31 34 - 51 18 - 38 0 - 21 0.61 - 0.97 0.031 - 0.361 0.001 - 0.051
154 MAVEBA 2007

Table II. Final Model Hypotheses for Four Groups Gende
rSession
Model Hypothesis (Multiple Linear Equation)
Male Reading y = 21 - 36x1 + 13x2 + 4250x3 - 80406x32 - 3946x2x3
MaleInterview
y = -4030 + 4050x1 + 4120x2 + 193370x3 - 187970x1x3 - 192000x2x3 - 237010x32
Female Readingy = 8926 - 196261x1 - 15468x2 + 2705x3 + 10743x12 + 6710x22 + 17286x1x2 - 13213x2x3
Female Interview
y = 26240 - 57148x1 - 38456x2 - 35499x3 + 30935x12 + 12338x22 + 43308x1x2 + 43956x1x3
All regression models have a full linear component and some quadratic and cross-product terms. For the males, the squared 3rd energy band and the cross-product of the 2nd and 3rd energy bands are also important in both the reading and interview groups. The interview group has an additional cross-product term involving the 1st and 3rd energy bands. For the females, the squared and cross-product of the 1st and 2nd energy bands are also important in both the reading and interviewed groups. The interview group also has an additional cross-product term between the 1st and 3rd
energy bands. None of the models have the same coefficients for the linear terms. The R2 values for the four groups are listed in Table III. They range from 0.25 to 0.50. These indicate significant models.
Table III. R2 Values Gender Session R2
ValuesMale Reading 0.25
Male Interview
0.50
Female Reading 0.38
Female Interview
0.41
IV. Discussion and Conclusion
The percentage of power in the frequency bands appears to be significant predictors of mental state. Spontaneous speech tends to be modeled better. The first frequency band contains the dominant amount of energy. Three of the four models have the coefficient for the linear term of the first band being negative. This is consistent with background material that has been showing that energy below 500 Hz increases during depression. The spontaneous speech for males does not follow this concept. The conundrum is that none of the models are the same.
The average range of BDI scores for each mood class was determined from Table I and is shown in Table IV. For any future patient, the power spectral densities can be extracted from an audio recording of their interview or reading of the Rainbow Passage. However, there are overlap regions and thus there’s an ambiguity
between the mood classes, and more information about the patient’s history may be needed. The first three power spectral densities (energy band ratios) could be integrated into a more extensive model of the patient’s respective group, and the BDI score would be estimated. The clinician could thus determine the patient’s mood or state of mind by comparing the estimated BDI score with Table IV.
However, the inconsistencies cited above need to be clarified by a larger and more expanded database. Persons who are in the normal and in the remitted depressive category need to be considered because they, in general, have lower BDI scores. Also more patients in each category need to be measured to improve the statistical reliability.
Table IV. Final Range for Mood Classes Mood Class
Total BDI Score Range
Suicidal 30 – 64 Depressed 14 – 35 Remitted 0 - 18
V. References
1. France, D.J., et al., Acoustical properties of speech as indicators of depression and suicidal risk. IEEE transactions on Biomedical Engineering, 2000. 47: p. 829-837.
2. Scherer, K., Nonlinguistic Vocal Indicators of Emotion and Psychopathology, in Emotions in Personality and Psychopathology, C.E. Izard, Editor. 1979, Plenum Press: New York. p. 493-529.
3. Scherer, K.R., Vocal correlates of emotional arousal and affective disturbance, in Handbook of social psychophysiology, H. Wagner and A. Manstead, Editors. 1989, Wiley: New York.
4. Darby, J.K., Speech and voice studies in psychiatric populations, in Speech Evaluation in Psychiatry, J.K. Darby, Editor. 1981, Grune & Stratton, Inc.: New York.
5. Ozdas, A., et al., Analysis of Vocal Tract Characteristics for Near-term Suicidal Risk Assessment. Methods of Information in Medicine, 2004. 43: p. 36-38.
6. Ozdas, A., et al., Investigation of Vocal Jitter and Glottal Flow Spectrum as Possible Cues for Depression and Near-Term Suicidal Risk. IEEE
Neurological dysfunctions 155

Transactions on Biomedical Engineering, 2004. 51: p. 1530-1540.
7. Yingthawornsuk, T., et al. Direct Acoustic Feature using Iterative EM algorithm and Spectral Energy for Classifying Suicidal Speech. in Interspeech. 2007. Antwerp, Belgium.
8. Beck, A.T., et al., An inventory for measuring depression. Arch Gen Psychiatry, 1961. 4: p. 561-571.
9. Fairbanks, G., Voice and Articulation Drillbook. 1960, New York: Harper & Row.
10. Theodoridis, S. and K. Koutroumbas, PatternRecognition. second ed. 2003, Amsterdam: Elsevier.
156 MAVEBA 2007

Models and analysis of vocal emissions for biomedical applications: 5th international workshop: December 13-15, 2007: Firenze, Italy, ed. by C. Manfredi,ISBN 978 88-8453-673-3 (print) ISBN 978-88-8453-674-7 (online)© Firenze university press, 2007.
Abstract: This paper describes a way to distinguish high risk suicidal patients among depressed patients using mel-frequency cepstrum coefficients. Distinguishing high risk suicidal patients among depressed patients is an important problem; a practical solution to this would prevent the loss of many lives. In this study, the vocal characteristics of female and male patients' speech samples were analyzed and a small subset of the first ten mel-frequency cepstrum coefficients were used to classify high risk suicidal patients and depressed patients. Cross validation was used to observe classification performance. There were two different types of speech samples from both male and female patients. One of them was the speech sampled during a clinical interview and the other was speech sampled during a text-reading session. Keywords: Speech, MFCC, suicide, depression, cross validation
I. INTRODUCTION
It is reported [1] that mental disorders are very common in the United States and internationally. Twenty-six percent of Americans, 18 or older, carried a mental disorder in 2005. In the same year, major depressive disorder affected 6.7 percent of the U.S. population. [1] More than 90 percent of the people who committed suicide had a diagnosable mental disorder, most commonly a depressive disorder [2]; so, there is an important relationship between depression and suicide.
As can be seen from these statistics, suicide is an important public health problem and has a strong relationship with depression. Therefore, it is very important to evaluate a depressed patient's risk of committing suicide. Psychiatrists evaluate this risk using clinical interviews and rating scales, such as the Hamilton depression rating scale. [3] Additionally, it is known that psychological states affect a person's speech production system. It was proposed by S. E. Silverman that vocal parameters of human speech could assist in recognizing and then assessing suicide risk. [4]
Some researchers have studied the relationship between vocal tract characteristics and suicidal risk.
Tolkmitt et al. compared the formant information of vowels that occurs in the identical phonetic context during the patient's recovery period. [5] France et al. observed long term averages of the formant information and found that they were able to distinguish high risk suicidal patients from depressed and control patient groups. [6] Yingthawornsuk et al. used the percentages of the total power, its highest peak value and its frequency location to distinguish between high risk suicidal, depressed and remitted (had been depressed previously but recovered) groups.[7] In another study, Yingthawornsuk et al. used the spectral energy and the GMM based feature of the vocal tract system response for separating two groups of female patients carrying a diagnosis of depression and suicidal risk.[8] Kaymaz Keskinpala et al. used both energy in frequency bands, and first eight mel-cepstral coefficients to distinguish between high risk suicidal and depressed patients. [9] Ozdas used lower order mel-cepstral coefficients to distinguish high risk suicidal patients from non-suicidal ones using Gaussian mixture models and unimodal Gaussian models. [10]
Mel-frequency cepstral coefficients are useful parameters that have been used in many speech processing systems, such as in [10]. Logan proposed using mel-frequency cepstral coefficients for modeling music. [11] Godino-Llorente et al. used short term mel-cepstral parameters for pathological voice quality assessment. [12] Choi worked on compensating the mel-frequency cepstral coefficients for speech recognition in noisy environments. [13]
This paper presents work on distinguishing high risk suicidal patients from depressed patients using a small subset of the first ten mel-frequency cepstral coefficients for female and male patients. Cross validation was used to estimate the classification performance. The optimal mel- frequency cepstrum coefficients are found for female and male patients and for both the reading and interview sessions of each gender.
II. METHODOLOGY
A. Database A.1. Information about the Database
The database for this research is obtained from an ongoing study within the Department of Psychiatry at
DISTINGUISHING HIGH RISK SUICIDAL SUBJECTS AMONG DEPRESSED SUBJECTS USING MEL FREQUENCY CEPSTRUM COEFFICIENTS AND
CROSS VALIDATION TECHNIQUE
H. Kaymaz Keskinpala1, T. Yingthawornsuk 1, D. M. Wilkes1, R. G. Shiavi 1, 2, R. M. Salomon31Department of Electrical Engineering and Computer Science, Vanderbilt University, TN, USA
2Department of Biomedical Engineering, Vanderbilt University, TN, USA 3Department of Psychiatry, Vanderbilt University School of Medicine, TN, USA

Vanderbilt University School of Medicine and supported by the American Foundation for Suicide Prevention. The study and consent process was developed in collaboration with, and approved by the Vanderbilt University Institutional Review Board. The database is composed of recordings from male and female subjects whose ages are between 25 and 65 years of age. Psychiatric clinicians, not involved in this study, categorized these patients as depressed, and with or without high risk of suicide, and referred them to research personnel for consent procedures, diagnostic confirmation and a brief recording. The number of the female patients and male patients that are used in this study is shown in Table 1.
Table 1. Female and Male Patient DatabaseFemale / Male Interview Reading
Depressed 18 / 11 16 / 14High-Risk
Suicidal 11 / 9 9 / 9
The database contains two different types of speech samples. One sample type was recorded while the patient was interviewed by a physician or highly-trained research assistant. This type of speech sample was named the "Interview Session". The other one is named the "Reading Session" and was recorded while the patient read predetermined part of a book. Quiet, closed rooms in clinical settings provided the recording environments.
A.2. PreprocessingAll speech signals were digitized by using a 16 bit
analog to digital converter at a sampling rate of 10 kHz with an anti aliasing filter. GoldWave v.5.08 audio editor was used to remove the silences which are longer than 0.5 seconds and the voices that is not belong to the patient. In this study, 76 seconds of each female patient's continuous speech from both interview and reading sessions were stored for analysis. For male patients, 66 seconds of continuous speech were stored. All stored speech signals underwent detection for voiced and unvoiced speech segments. Only voiced segments were used for subsequent analysis.
B. Feature Extraction
The features used for the analysis were a small subset of the first ten mel frequency cepstrum coefficients in each patient's speech sample. Each speech signal was divided into 512 points of voiced segments. For each voiced speech segment the log magnitude spectrum was computed from discrete Fourier transform (DFT). The spectrum was then filtered by a series of 16 triangular band pass filters. The filter bank that is used in this work is similar to that was employed by Davis and Mermelstein [14] which simulates the critical band filtering by a set of triangular band-pass
filters. The bandwidths and center frequencies of these filters are chosen according to the mel - scale.
The human ear is more sensitive to changes in the low frequency portion of the frequency spectrum. [15] Thus, the mel scale was formulated for the sampling of the frequency spectrum based on this property of human auditory perception. The linear frequency spectrum was mapped based on the human auditory perception with mapping approximately linear on the 0 1 kHz range and logarithmic above 1 kHz. The following formula is the suggested formula that models this relationship in which Fmel is the perceived frequency and FHz is the actual frequency.
7001log2595 10
HZmel
FF (1)
Vocal tract length normalization was performed for each patient. The bandwidths and center frequencies of the filters in the mel scale filter bank were then adjusted according to this normalization factor. [16] The last step is to calculate the inverse discrete Fourier transform (IDFT) to obtain the mel-frequency cepstrum coefficients. The procedure is shown in Fig. 1 below.
Fig.1. Feature extraction procedure.
After the first ten mel-frequency cepstrum coefficients were calculated for each frame, the values in all frames are averaged to have one value for each mel-frequency cepstrum coefficient for each patient.
C. Cross Validation Classification
The k fold cross validation technique [17] with quadratic discriminant function was performed on the mel
frequency cepstrum coefficients data. The data files were split randomly into two subsets. One set is for training the data and the other is for testing the data. Sixty-five percent of the data was used to train the data for estimating the quadratic classification function. Then using this quadratic classification function, 35% of the
158 MAVEBA 2007
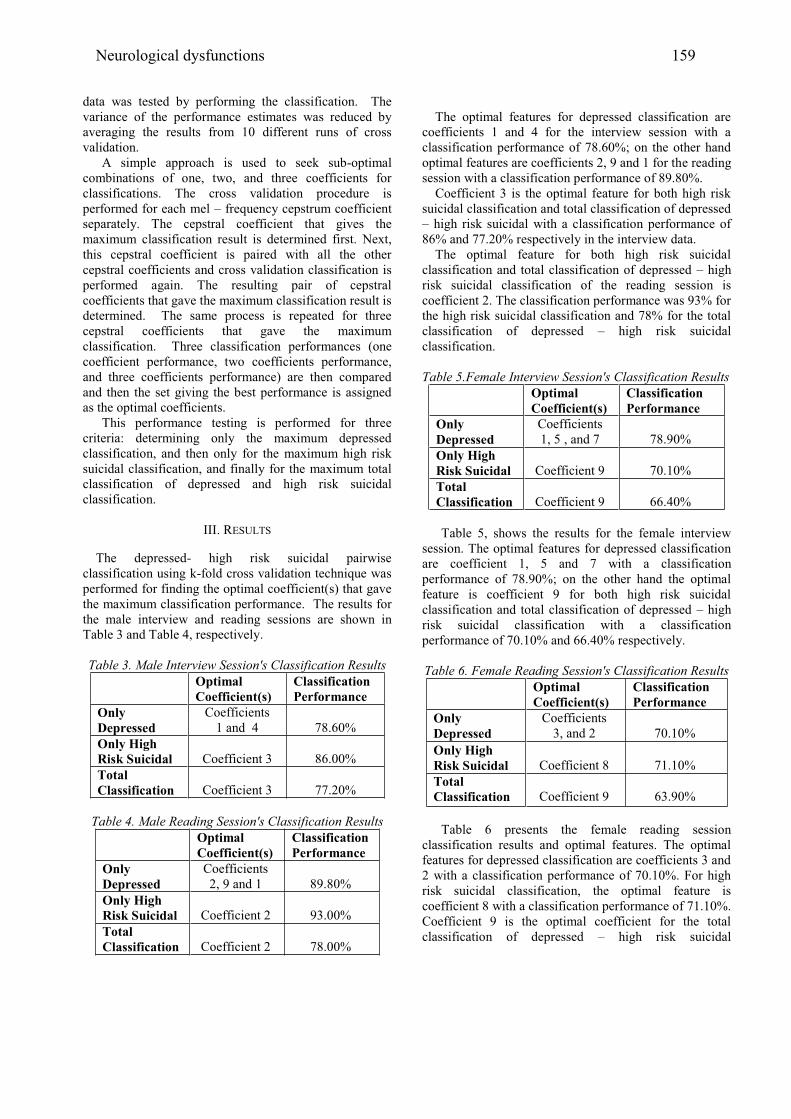
data was tested by performing the classification. The variance of the performance estimates was reduced by averaging the results from 10 different runs of cross validation.
A simple approach is used to seek sub-optimal combinations of one, two, and three coefficients for classifications. The cross validation procedure is performed for each mel frequency cepstrum coefficient separately. The cepstral coefficient that gives the maximum classification result is determined first. Next, this cepstral coefficient is paired with all the other cepstral coefficients and cross validation classification is performed again. The resulting pair of cepstral coefficients that gave the maximum classification result is determined. The same process is repeated for three cepstral coefficients that gave the maximum classification. Three classification performances (one coefficient performance, two coefficients performance, and three coefficients performance) are then compared and then the set giving the best performance is assigned as the optimal coefficients.
This performance testing is performed for three criteria: determining only the maximum depressed classification, and then only for the maximum high risk suicidal classification, and finally for the maximum total classification of depressed and high risk suicidal classification.
III. RESULTS
The depressed- high risk suicidal pairwise classification using k-fold cross validation technique was performed for finding the optimal coefficient(s) that gave the maximum classification performance. The results for the male interview and reading sessions are shown in Table 3 and Table 4, respectively.
Table 3. Male Interview Session's Classification ResultsOptimal
Coefficient(s)
Classification
Performance
Only
Depressed
Coefficients1 and 4 78.60%
Only High
Risk Suicidal Coefficient 3 86.00%Total
Classification Coefficient 3 77.20%
Table 4. Male Reading Session's Classification ResultsOptimal
Coefficient(s)
Classification
Performance
Only
Depressed
Coefficients2, 9 and 1 89.80%
Only High
Risk Suicidal Coefficient 2 93.00%Total
Classification Coefficient 2 78.00%
The optimal features for depressed classification are coefficients 1 and 4 for the interview session with a classification performance of 78.60%; on the other hand optimal features are coefficients 2, 9 and 1 for the reading session with a classification performance of 89.80%.
Coefficient 3 is the optimal feature for both high risk suicidal classification and total classification of depressed
high risk suicidal with a classification performance of 86% and 77.20% respectively in the interview data.
The optimal feature for both high risk suicidal classification and total classification of depressed high risk suicidal classification of the reading session is coefficient 2. The classification performance was 93% forthe high risk suicidal classification and 78% for the total classification of depressed high risk suicidal classification.
Table 5.Female Interview Session's Classification ResultsOptimal
Coefficient(s)
Classification
Performance
Only
Depressed
Coefficients 1, 5 , and 7 78.90%
Only High
Risk Suicidal Coefficient 9 70.10%Total
Classification Coefficient 9 66.40%
Table 5, shows the results for the female interview session. The optimal features for depressed classification are coefficient 1, 5 and 7 with a classification performance of 78.90%; on the other hand the optimal feature is coefficient 9 for both high risk suicidal classification and total classification of depressed high risk suicidal classification with a classification performance of 70.10% and 66.40% respectively.
Table 6. Female Reading Session's Classification ResultsOptimal
Coefficient(s)
Classification
Performance
Only
Depressed
Coefficients 3, and 2 70.10%
Only High
Risk Suicidal Coefficient 8 71.10%Total
Classification Coefficient 9 63.90%
Table 6 presents the female reading session classification results and optimal features. The optimal features for depressed classification are coefficients 3 and 2 with a classification performance of 70.10%. For high risk suicidal classification, the optimal feature is coefficient 8 with a classification performance of 71.10%. Coefficient 9 is the optimal coefficient for the total classification of depressed high risk suicidal
Neurological dysfunctions 159
classification with a classification performance of 63.90%.
IV. DISCUSSION AND CONCLUSIONS
This paper demonstrates that mel-frequency cepstrum coefficients are a good indicator for discriminating between depressed patients at high- and low- risk of suicidal behavior. Male and female patients were analyzed separately. The mel-frequency cepstrum coefficients discriminated among the depressed patients, with matching of the vocal to clinical assessment with a performance better than 70%.
The controlled text-reading tended to give better results for male subjects especially for high risk suicidal classification and depressed classification. The total classification was about the same for both reading session and interview sessions.
The maximum classification results that are obtained from the male subjects are noticeably better than the female subjects' results.
These findings may be limited by several factors, including the imperfections of the recording environments, the reliance on clinical assessments (by non-research as well as research diagnosticians) for a reference standard, and the variable timing of recordings relative to peak intensities of suicidal risk.
Never-the-less, the findings may ultimately be applicable to the development of clinically practical instruments for detecting vocal stress that could indicate a need for increased attention to suicidal risk assessment. These findings, along with other findings in the literature, indicate that feedback and feed-forward regulatory pathways for speech production are impaired in depression. Identifiable and quantifiable alterations in these pathways may provide needed paradigms for the study of the pathophysiology of depression.
REFERENCES
[1] R. C. Kessler, W.T. Chiu, O. Demler, E.E. Walters,Prevalence, severity, and comorbidity of twelve-month
DSM-IV disorders in the National Comorbidity Survey Replication (NCS-R) , Archives of General Psychiatry,vol. 62(6), pp. 617-627, 2005.[2] Y. Conwell, D. Brent Suicide and aging I: patterns of psychiatric diagnosis , International Psychogeriatrics,vol. 7(2), pp. 149-164, 1995.[3] M. Hamilton A rating scale for depression , Journal of Neurology, Neurosurgery and Psychiatry, Vol.23, 1960.[4] S.E. Silverman, Vocal parameters as predictors of near-term suicidal risk , U.S. Patent 5 148 483, 1992.[5] F. Tolkmit, H. Helfrich, R. Sandke, K.R. Scherer,Vocal Indicators of Psychiatric Treatment Effects in
Depressives and Schizophrenics , J. Communication Disorders, Vol.15, pp.209-222, 1982.
[6] D. J. France, et. al., Acoustical Properties of Speech as Indicators of Depression and Suicidal Risk , IEEETransaction on Biomedical Engineering, vol. 7(6), pp. 829-837, 2000.[7] T. Yingthawornsuk, H. Kaymaz Keskinpala, D.France, D. M. Wilkes, R.G. Shiavi, R. M. Salomon,Objective Estimation of Suicidal Risk using Vocal
Output Characteristics , International Conference on Spoken Language Processing, pp.649-652, 2006. [8] T. Yingthawornsuk, H. Kaymaz Keskinpala, D. M. Wilkes, R.G. Shiavi, R. M. Salomon, Direct Acoustic Feature Using Iterative EM Algorithm and Spectral
, Eighth Annual Conference of the International Speech Communication Association (INTERSPEECH 2007), pp. 766-769, 2007. [9] H. Kaymaz Keskinpala, T. Yingthawornsuk, D. M. Wilkes, R. G. Shiavi, R. M. Salomon, Screening for High Risk Suicidal States Using Mel-Cepstral Coefficients and Energy in Frequency Bands , Fifteenth European Signal Processing Conference (EUSIPCO2007), pp. 2229 - 2233, 2007.[10] A. Ozdas, Analysis of Paralinguistic Properties of Speech for Near-Term Suicidal Risk Assessment , Ph.D. Dissertation, Vanderbilt University, 2001.[11] B. Logan, Mel frequency cepstral coefficients for music modelling , Proceedings of International Symposium on Music Information Retrievel (ISMIR),2000.[12] J.I. Godino-Llorente, P. Gomez-Vilda, and M.Blanco-Velasco, Dimensionality Reduction of a Pathological Voice Quality Assessment System Based on Gaussian Mixture Models and Short Term Cepstral Parameters , IEEE Transaction on Biomedical Engineering, vol.53(10), pp.1943-1953, 2006.[13] E. H. C. Choi, On Compensating the Mel-Frequency Cepstral Coefficients for Noisy Speech Recognition , ACM International Conference of Proceeding Series, Proceedings of the 29th AustralasianComputer Science Conference, vol. 171(48), pp. 49-54, 2006. [14] S. B. Davis, P. Mermelstein, Comparison of parametric representations for monosyllabic word recognition in continuously spoken sentences , IEEETransactions on Acoustics Speech and Signal Processing,vol. 28(4), pp. 357-366, 1980.[15] W. Koeing, A New frequency scale for acoustic measurements , Bell Telephone Laboratory Record, vol. 27, pp. 299-301, 1949.[16] E. Eide, H. Gish, A Parametric Approach to Vocal Tract Length Normalization , ICASSP Proceedings,pp.346-348, 1996.[17] S. M. Weiss and C. A. Kulikowski, Computer Systems That Learn, Morgan Kaufmann, San Mateo, CA, 1991.
160 MAVEBA 2007

Mechanical models II


Models and analysis of vocal emissions for biomedical applications: 5th international workshop: December 13-15, 2007: Firenze, Italy, ed. by C. Manfredi,ISBN 978 88-8453-673-3 (print) ISBN 978-88-8453-674-7 (online)© Firenze university press, 2007.
Continuous speech/prosody 163

164 MAVEBA 2007
500 600 700 800 900 1000 1250 1500 1750 2000 2400 2800 3300420
0
2
Frequency (Hz)
Att
en
ua
tion
(d
B)

Mechanical models II 165
1000420 600 800500 700 900 1250 1500 1750 2000 2400 2800 3300
0
Frequency (Hz)
CM
RR
(d
B)
Acoustic CMRR, optimal @ 1kHzElectronic CMRR, optimal @ 1kHzAcoustic CMRR, optimal @ 2.8 kHz

166 MAVEBA 2007

Models and analysis of vocal emissions for biomedical applications: 5th international workshop: December 13-15, 2007: Firenze, Italy, ed. by C. Manfredi,ISBN 978 88-8453-673-3 (print) ISBN 978-88-8453-674-7 (online)© Firenze university press, 2007.
Abstract: The Modified A-Space method is described. It allows the detailed characterization of in terms of mid-sagittal-plane area, antero-posterior distance, occlusal plane area, posterior pharynx wall tilt, mandible arch width, and oral cavity volume. Keywords : Speech Production, Articulatory oral space measures
I. INTRODUCTION
The X-ray microbeam method for measurement of articulatory dynamics has been used to acquire large amounts of data, with reduced X-ray dosage, resulting in one of the most widely used freely available speech production databases. The X-ray Microbeam Speech Production Database (XRMB-SPD), developed at Wisconsin University, USA, includes a vast amount of coordinate data describing articulatory movements, and acoustic and electroglotographic data collected simultaneously [3]. Honda et al. [2] examined the geometry of the vocal track of American English and Japanese speakers from the XRMB-SPD, using a quadrilateral (A-Space) limited by the palate plane, the anterior nasal spine-menton line, the outline of the posterior pharyngeal wall, and a line parallel to the palatal plane, passing through the menton and extending to the pharyngeal wall. In this study the A-Space of different speakers varied in shape. The vowel articulations adapted to the form of the A-Space whilst consonant articulations were independent.
The Modified A-Space method was used to select 4 speakers in a study that relates occlusal classes with vowel, fricative and stop production adaptations [1]. It allows the detailed characterization of the XRMB-SPD speakers not just in terms of mid-sagittal-plane area, but also in terms of antero-posterior distance, occlusal plane area, posterior pharynx wall tilt, mandible arch width, and oral cavity volume. This last measure has proven to be far more reliable and has revealed more speaker dependent characteristics than the measure previously proposed in [2].
II. METHODS
XRMB-SPD provides occlusion classification, dental measures, anthropomorphic measures, reference pellets coordinates, biteplate records and palatal outlines, for
each of the 57 speakers. This was used to measure the articulatory oral space (AOS) in the absence of cephalometric analysis, based on the Modified A-Space described in Fig. 1.
Fig. 1: Top – Mid-sagittal-plane coordinates included in the XRMB-SPD (MAXn and MAXg – bridge of the nose; MAXi – buccal surface of the maxillary incisors;
MANm – juncture between the first and second mandibular molars; MANi – buccal surface of the central incisors; LL – lower lip; UL – upper lip; PAL – palate; PHA – middle pharynx wall; CON – condyle; COR –
coronoid process; GON – gonion; GNA – gnathion; MNI – lingual surface of the maxillary incisors). Bottom – a three dimensional representation of the maxillary arch
and mid-sagittal palate height of the anterior oral cavity (from the distal-buccal cusp tip of the second molar to the lips). The Modified A-Space measures M1, M2, M3, M4
and M5, are also represented.
ARTICULATORY ORAL SPACE MEASURES USING THE MODIFIED A-SPACE
Luis M. T. Jesus 1,2, André Araújo 2,3, Isabel. M. Costa 1,2
1ESSUA, Universidade de Aveiro, Aveiro, Portugal 2IEETA, Aveiro, Portugal 3Escola Superior de Tecnologia da Saúde do Porto, Instituto Politécnico do Porto, Porto, Portugal
MAXn
MAXg
MAXi
UL
LL
Mid-sagitalplane
MaxOPMaxillary
occlusal plane
yy
xx
PAL
MANiMANm
GNA
GON
CON
COR
MNI
AxisReference electrodesMobile electrodesStatic articulatory coordinatesStatic mandible coordinates
PHA
M1
M4
M5
MAXn
MAXg
MAXi
UL
LL
Mid-sagitalplane
MaxOPMaxillary
occlusal plane
yy
xx
PAL
MANiMANm
GNA
GON
CON
COR
MNI
AxisReference electrodesMobile electrodesStatic articulatory coordinatesStatic mandible coordinates
AxisReference electrodesMobile electrodesStatic articulatory coordinatesStatic mandible coordinates
PHA
M1
M4
M5
M2
M3

We extracted the following measures of the AOS, as shown in Fig. 1 and 2: M1 – antero-posterior distance, calculated from the upper incisors to the posterior pharynx wall; M2 – mid-sagittal plane area, from the mandible to the palate midline; M3 – occlusal plane area, from the distal-buccal cusp tip of the second molar to the lips; M4 – posterior pharynx wall tilt, i.e, the angle between the pharynx and the occlusal planes; M5 – mandible arch angle, calculated with several mandible points; M6 – anterior oral cavity volume. Areas of trapeziums (A1, A2, A3, A5 and A6) and a triangle (A4), and volumes of convex hulls of cubes and tetrahedrons were used to estimate the AOS, as shown in Fig. 2.
Fig.2 Measures M2, M3, M4, M5 and Oral Cavity Volume for speaker JW15, showing the mid-sagittal and
occlusal planes (top) and half of the oral cavity volume as reconstructed using the Modified A-Space (bottom).
III. RESULTS AND DISCUSSION
Results showed a considerably larger average oral cavity volume and greater antero-posterior distance AOS in male subjects than in females, as shown in Fig. 3.
The detailed characterization of the XRMB-SPD speakers, shown in Fig. 4 to 7, revealed great variability.
Fig. 3 M1, M2, M3 and M6 measures of the available 18 Class I male and 22 Class I female speakers.
IV. CONCLUSION
The Modified A-Space provided additional information, allowing the characterization of cranio-facial features and the selection of a uniform set of speakers in studies [1] involving XRMB-SPD. This method combines anatomical data and biomedical signals producing a reference dataset for research into speech production. We believe that this method may provide additional information to regular cephalometric analysis.
V. ACKNOWLEDGEMENTS
Supported (in part) by research grant number R01 DC 00820 from the National Institute of Deafness and Other Communicative Disorders, U. S. National Institutes of Health.
REFERENCES
[1] Araújo, A., A Influência de Diferentes Tipos de Oclusão Dentária na Produção de Sons da Fala. MSc. Thesis, Universidade de Aveiro, Aveiro, Portugal, 2007. [2] Honda, K., et al., Human Palate and Related Structures: Their Articulatoy Consequences. ICSLP 1996. [3] Westbury, J., X-ray microbeam speech production database user’s handbook. U. Wisconsin, 1994.
Mid-sagittal plane
Occlusal plane
168 MAVEBA 2007

Fig. 4 M1 and M2 measures of Class I speakers. Numbers in the x-axis represent the actual XRMB-SPD
speaker identification.
Fig. 5 M1 and M2 measures of Class II speakers. Numbers in the x-axis represent the actual XRMB-SPD
speaker identification.
Mechanical models II 169
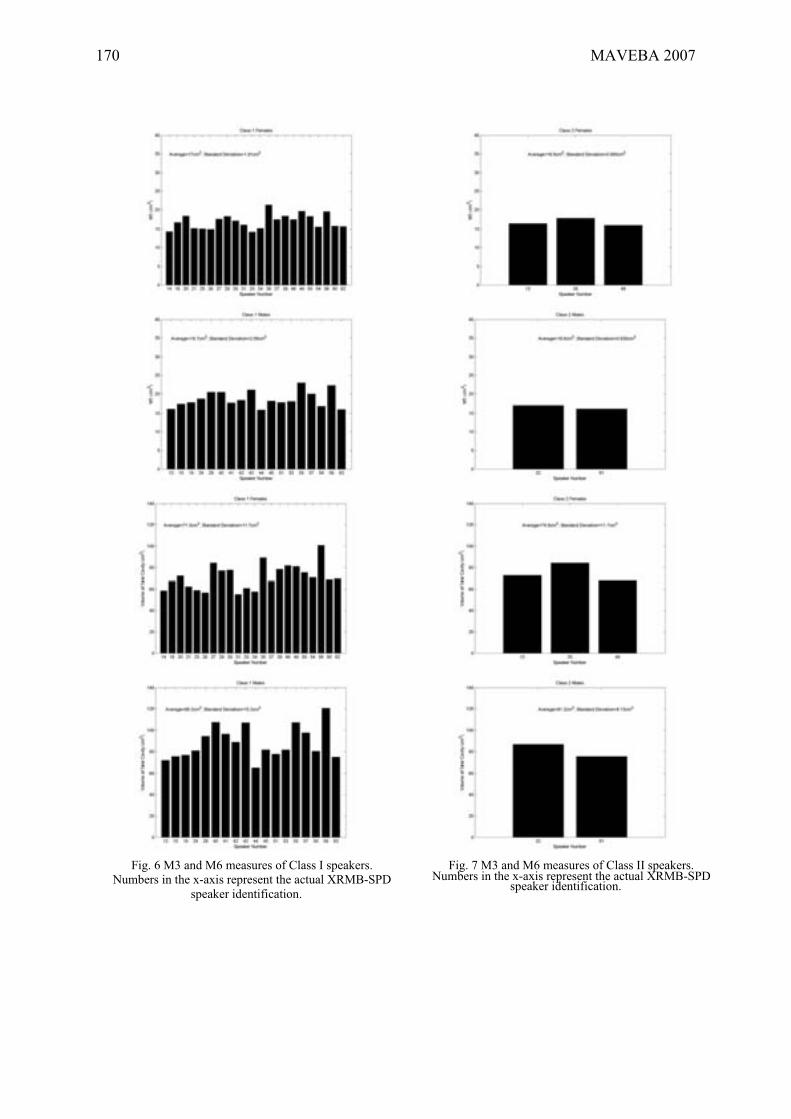
Fig. 6 M3 and M6 measures of Class I speakers. Numbers in the x-axis represent the actual XRMB-SPD
speaker identification.
Fig. 7 M3 and M6 measures of Class II speakers. Numbers in the x-axis represent the actual XRMB-SPD
speaker identification.
170 MAVEBA 2007

Models and analysis of vocal emissions for biomedical applications: 5th international workshop: December 13-15, 2007: Firenze, Italy, ed. by C. Manfredi,ISBN 978 88-8453-673-3 (print) ISBN 978-88-8453-674-7 (online)© Firenze university press, 2007.
Abstract: Mucosal waves have been considered of crucial importance for healthy vocal fold vibration, but their appearance and variability have been described only vaguely so far. We studied the appearance of the mucosal waves using videokymography. The mucosal wave was divided in two components: 1) the vertical phase differences between the lower and upper margins of the vocal folds, which are reflected in sharpness of the lateral peaks in kymograms and 2) the waves propagating laterally over the vocal fold surface which can be recognized as lateral movements on the vocal fold surface occurring during medial movement of the glottal edge. Different features of the laterally traveling mucosal waves were recognized. The suggested new classification of the mucosal wave properties opens new possibilities for more sensitive monitoring of the state of the vocal fold tissues in basic voice research and clinical practice.
Keywords : Mucosal waves, videokymography, high-speed videolaryngoscopy, vocal fold vibration
I. INTRODUCTION
Mucosal waves on the vocal folds have been considered of crucial importance for healthy vocal fold vibration. Their presence (absence) reflects on the pliability of the vocal fold mucosa. Mucosal waves are one of the basic laryngeal features evaluated routinely by clinicians using strobolaryngoscopy and used for diagnosis of voice disorders [1]. The waves are known to travel upwards along the medial vocal fold surface and then continue laterally over the upper surface of the vocal folds. Their appearance and variability has been described only vaguely so far, however. The purpose of the present study was to determine the basic features of the mucosal waves in order to allow their better specification and more sensitive evaluation using videokymography.
II. METHODS
More than 7,000 VKG examinations of patients with various types of voice disorders were performed and recorded at the Center for Communication Disorders, Medical Healthcom, Ltd, in Prague from 1996 to 2006. The details of the equipment were described elsewhere [2,3]. The VKG examinations were always preceded by strobovideolaryngoscopy. The subjects’ VKG examinations were usually around 1 to 5 minutes in duration and contained approximately 3,000 to 15,000 VKG images, ie, consecutive video fields of 18.4-ms duration. Of the 7,000 patient examinations, only about 20% were processed due to time constraints. The processing involved field-by-field viewing of the videotape recordings and a search for images with good focus, illumination, and contrast that showed clear vibration patterns at the locations of interest on the vocal folds. These images were digitized with the video board Miro PCTV. From these, 1 or more VKG images were selected by the examiner as the most representative for the subject and were then combined (with Corel Photo Paint software) with corresponding laryngoscopic and laryngostroboscopic images into a final set of images for the patient record [2-4].
For the purposes of the present study, 100 VKG images of sustained phonations from 45 subjects were retrospectively selected from these patient records. The images were selected so that they covered the widest possible spectrum of vocal fold behavior. The images were compared among themselves, and the differences in the appearance of the mucosal waves were analyzed visually.
III. RESULTS
Two components of the mucosal waves were distinguished: 1) the vertical phase differences between the lower and upper margins of the vocal folds, and 2) the continuing waves propagating laterally over the vocal fold surface. The vertical phase differences were found encoded in the videokymographic images in the
MUCOSAL WAVES ON THE VOCAL FOLDS: CONCEPTUALIZATION BASED ON VIDEOKYMOGRAPHY
J. G. Švec1,2, M. Fri 3, F. Šram 2, H. K. Schutte 4 1Laboratory of Biophysics, Dept. Experimental Physics, Palacký University Olomouc, the Czech Republic
2Voice Research Laboratory, Dept. Phoniatrics, Medical Healthcom, Ltd., Prague, the Czech Republic 3Musical Acoustics Research Centre, Faculty of Music AMU, Prague, the Czech Republic
4Groningen Voice Research Lab, Dept. Biomedical Engineering, University Medical Center Groningen, University of Groningen, the Netherlands
sharpness of the lateral peaks of the vocal-fold waveform contour. The laterally traveling mucosal waves were defined as lateral movements on the vocal fold surface occurring during medial movement of the glottal edge. Based on this new definition, we found four basic features which distinguished various types of laterally traveling mucosal waves: a) lateral extent, b) enhancement/light reflection, c) spatial separation from the vocal fold margin and d) delay in appearance after vocal fold peak displacement. These four features are considered to reflect different mucosal and geometrical properties of the vocal folds.
IV. DISCUSSION
The two components of the mucosal waves reflect, in principle, two different events. Whereas the mucosal movements on the medial surface and the corresponding vertical phase differences are actively driven by the glottal airflow, the laterally traveling waves on the upper vocal fold surface are passive continuations of the vertically traveling mucosal waves. The sharpness of the lateral peaks theoretically reflects pliability of the medial vocal fold surface. The sharper the lateral peaks, the larger the vertical phase differences, and the more pliable the medial vocal fold surface [5,6].
The new definition was found useful for recognizing the laterally traveling mucosal waves and distinguishing them from other events and artifacts on the vocal folds. The laterally traveling mucosal waves reveal on the pliability of the upper vocal fold surface. Theoretically, the larger the lateral extent of the wave, the more pliable the mucosa of the upper surface is [1]. Mucosal wave enhancement by a specular light reflection indicates horizontality of the upper vocal fold surface; separation of the mucosal wave from the margin suggests an enlarged amount of incompressible material in the mucosa (such as edema-fluids); and the appearance delay suggests that the upper surface of the vocal folds is extensively bulged (e.g., from excessive activity of the external part of thyroarytenoid (TA) muscle or due to structural abnormalities). The suggested new classification of the mucosal wave properties opens new possibilities for more sensitive monitoring of the state of the vocal fold tissues in basic voice research and clinical practice.
ACKNOWLEDGMENT
The work was supported by the Technology Foundation STW (Stichting Technische Wetenschappen) project GKG5973, Applied Science Division of NWO (Natuurwetenschappelijk Onderzoek), and the technology program of the Ministry of Economic Affairs, the Netherlands. In Czech Republic, the work was supported
by the Ministry of Education, Youth and Sports, project Eureka E!2614–NewVoice.
REFERENCES
[1] Hirano M, Bless DM. Videostroboscopic examination of the larynx. San Diego, California: Singular Publishing Group, 1993. [2] Švec JG, Šram F, Schutte HK. Videokymografie: nová vysokofrekven ní metoda vyset ování kmithlasivek. [Videokymography: a new high-speed method for the examination of vocal-fold vibrations]. Otorinolaryngol (Prague) 1999;48:155-62. English version available in [3]. [3] Švec JG. On vibration properties of human vocal folds: voice registers, bifurcations, resonance characteristics, development and application of videokymography [Dissertation]. Groningen, the Netherlands: University of Groningen, 2000. Available at http://irs.ub.rug.nl/ppn/240208714.[4] Schutte HK, Švec JG, Šram F. First results of clinical application of videokymography. Laryngoscope 1998;108: 1206-10. [5] Sundberg J, Högset C. Voice source differences between falsetto and modal registers in counter tenors, tenors and baritones. Logoped Phoniatr Vocol 2001; 26:26-36. [6] Švec JG, Šram F, Schutte HK. Videokymography in voice disorders: What to look for? Ann.Otol.Rhinol.Laryngol. 2007; 116 (3): 172-180.
172 MAVEBA 2007

Models and analysis of vocal emissions for biomedical applications: 5th international workshop: December 13-15, 2007: Firenze, Italy, ed. by C. Manfredi,ISBN 978 88-8453-673-3 (print) ISBN 978-88-8453-674-7 (online)© Firenze university press, 2007.
Abstract: A 3D biomechanical finite element model of the face is presented. Muscles are represented by piece-wise uniaxial tension cable elements linking the insertion points. Such insertion points are specific entities differing from nodes of the finite element mesh, which makes possible to change either the mesh or themuscle implementation totally independently of each other. Lip/teeth and upper lip/lower lip contacts are alsomodeled. Simulations of smiling and of an OrbicularisOris activation are presented and interpreted. The importance of a proper account of contacts and of anaccurate anatomical description is shown.Keywords : Face models, Muscle modeling, Lip/teeth interaction.
I. INTRODUCTION
Many biomechanical models of the human face havebeen proposed in the literature. They were generallydeveloped either in the context of computer graphicsanimation [1,2], or of computer-aided maxillofacialsurgery [3,4] or of speech production studies[5]. Most ofthem propose to model the face with a volumetric meshdefined by an external (the “visible” part of the face) andan internal surface (the part in contact with the skull), with some nodes or layers in between. Mechanics of thetissues (epidermis, dermis, hypodermis, fat and muscles)is then modelled through the relation betweendisplacements and forces of mass points, or throughstrain/stress relations in the case of finite element models.These studies have raised a number of important issues:(1) how to model muscles fibres and their action on the3D mesh; (2) how to account for the subject/patientspecific muscular morphology (in terms of fibresinsertions and interweaving); (3) how to control the largenumber of muscles in order to produce a given speecharticulation or facial mimics. Both latter points havealready been addressed and discussed by our group,respectively for computer-aided craniofacial surgery [4]and through a motor control model of tongue musclesactivation for speech production [6].
This paper deals with the first issue and proposes amethod to define from Computer Tomography (CT)images a subset of muscles fibres within a 3D mesh of theface. Contacts between lips and teeth are also handled.First results of facial mimics' simulations are presented.
A BIOMECHANICAL MODEL OF THE FACE INCLUDING MUSCLESFOR THE PREDICTION OF DEFORMATIONS DURING SPEECH
PRODUCTION
Julie Groleau1, Matthieu Chabanas1, Christophe Marécaux3, Natacha Payrard2,Brice Segaud2, Michel Rochette2, Pascal Perrier1 and Yohan Payan3
1ICP-GIPSA Lab, UMR CNRS 5216, INP Grenoble, France2ANSYS France, Villeurbanne, France
3TIMC-IMAG, UMR CNRS 5525, Université Joseph Fourier, Grenoble, France
II. METHODS
The starting point of this modeling work is the 3D Finite Element model of the face soft tissues, built out of CT scan of a single patient, which was originallyproposed in [4]. It relies on a volumetric mesh consistingof hexahedrons and wedges elements (Fig. 1, left). Thedisplacements of several nodes located on the internalsurface of the facial mesh are constrained in order torepresent attachments of the facial tissues on the skull.
While biological soft tissues are known to behave non-linearly [7], they were first represented by a homogeneous, isotropic, linear material. This hypothesiswas retained in a first stage in order to focus on musclesmodelling and contact management, before ongoing withmore realistic modelling. Simulations were computedusing the ANSYSTM v11 finite element software.
The first part of our study has consisted in building themuscles involved in facial mimics' generation. In order toensure anatomical and physical reliability, musclescourses and insertions were directly defined from medicalimages and anatomical charts (Fig.1, middle), with thehelp of a maxillofacial surgeon. The locations of pointsdescribing the muscle fibres were measured in thedifferent scan slices. These points were then integratedinto the mesh to model muscle insertions. They werelinked with piece-wise uniaxial tension cable elements to model muscle fibres (Fig. 1, right). The Orbicularis Oris muscle was designed slightly differently: it is representedby two ellipsoid cable elements centred on the mouthopening, and representing the marginal and the peripheralparts of the muscle.
The cable elements based approach allows integratingmuscles into the model independently of the mesh itself. Therefore, the mesh can be easily refined or modified,without requiring any change in the muscles structuredefinition. The fibers cable elements are controlled in

tension by their cross section area, their initial strain andan activation parameter. They generate forces that are applied to the soft tissues mesh thanks to the notion of dependencies. In other words, muscular fibres extremitiesare linked with the facets of the surrounding meshelements. When a muscle is activated, the correspondingcable elements exert forces on the mesh elements and induce, then, soft tissue deformations.
The second part of our study concerns lips-teeth and upper-lip/lower-lip contacts, which are of primaryimportance in lips movements and deformations. Teethare materialized in the model by surfaces extracted from the CT data and interpolated with Spline functions.ANSYS contact elements, which provide collisiondetection and sliding reaction, are used to mesh lips andteeth surfaces.
Fiber
Figure 1 Left: the finite element mesh of the face soft tissues. Middle: interactive segmentation of muscles fibers onCT data. Right: location of eleven muscles involved in facial mimics on the left side of the skull.
III. RESULTS
a. Simulating smiling lips.
Figure 2 presents the mesh deformations (incolours/grey scale) and the final face shape when theZygomaticus Major, the Risorius and the Levator LabiiSuperioris are activated simultaneously. The bottompanels show the results when lip/lip and lip/teethcontacts are taken into account, while the top panelsshow the results obtained without contact. In presenceof contacts, the mimic seems more realistic. This can beparticularly well assessed on the side views (rightpanel), where, in the absence of contacts, aninterpenetration of the lips can be noticed. On the contrary,, lips are slightly opened in the other condition,which is in agreement with data on smiling.
b. Orbicularis activation and lips protrusion.
An important issue for speech production concernsthe control of protruded lips, such as in the productionof /u/ or /y/ in French. It has been suggested in theliterature [8] that the interaction between an activationof the Orbicularis Oris and lip/lip and lip/teeth contactscould be responsible for this particular lip gesture. Thishypothesis was tested with our face model.
Two types of simulations were then run with theactivation of the Orbicularis Oris, without (Figure 3 top panels) and with (Figure 3 low panels) handlingcontacts. In the absence of contacts, a rounding of thelips is observed (top panel, left). Rounding is classicallyassociated with protrusion. However, the side view (toppanel, right) shows a strong retraction of the lips, whichis at the opposite of a protrusion. Including the contactlimits the retraction, but it does not generate anyprotrusion or rounding.The absence of protrusion can be explained by the factthat our model does not separately control the marginaland the peripheral parts of the Orbicularis Oris. Hondaet al. [8] found namely an EMG activation duringprotrusion only in the peripheral part of the muscle.Gomi et al. [5] confirmed this finding with theirbiomechanical lip model. However, the absence ofrounding is in agreement with Gomi et al.'s [5] statement (p.130) who suggested that not only theOrbicularis Oris, but also "additional musclescombinations (jaw opening, peripheralis or otherperioral muscles) would be required to form roundedlips." "
174 MAVEBA 2007

IV. DISCUSSION AND CONCLUSION
The face model presented in this paper integrates an original representation of muscle fibres and muscleforce generation in a 3D mesh based on piece-wiseuniaxial tension cable elements. It also models contactsbetween upper lip and lower lip and between lips andteeth in a realistic way.
Simulations of smiling lips show that the proposedmuscle representation is adapted to the generation of lipdeformations that are realistic both in amplitudes and indirections. This is an important result since thisrepresentation can be implemented independently of themesh. It will then facilitate the generation of speakerspecific mesh using mesh matching algorithm [9]. Itwill also increase the efficiency of such a modellingapproach to study the impact of face surgery on smilingand on mimics in general. Indeed, the geometricalstructure of the mesh can easily be modified to accountfor different kinds of surgeries, without inducing acareful, difficult and long redefinition of all musclesfibres in the mesh.
Our results show also the importance of contacts modelling, both for lips/teeth interactions, but also forupper lip/lower lip interaction. It is important, not onlybecause it prevents for unrealistic interpenetrations, butalso because it allows sliding movements that constrainand guide the movement. This is certainly a phenomenon underlying complex lip shaping such asprotrusion and rounding.
On the other hand, the simulations of theconsequences of the activation of the Orbicularis Oris,for which no distinction is made in our model betweenthe marginal and the peripheral parts, do not generaterounding. These results are in contradiction with thesimulations carried out by Gomi et al's [5] who didmake this distinction. This shows that collectingaccurate neurophysiological and anatomical data is amajor challenge to test hypotheses about the control ofspeech gestures, once realistic biomechanical modelsare available.
.
Figure 2 Simulation of smiling lips without (top panels) and with (bottom panels) handlingof lips-teeth and upper-lower lips contacts. Displacements are in mm.
Mechanical models II 175

Figure 3 Simulation of the Orbicularis Oris contraction, without (top panels) and with (bottom panels)handling of lips-teeth and upper-lip/lower-lip contacts.
REFERENCES[1] Lucero, J.C. & Munhall, G.K. (1999). A model offacial biomechanics for speech production. J. AcousticSoc. Am., 106(5):2834-2842.[2] Sifakis, E., Selle, A., Robinson-Mosher, A., Fedkiw,R. (2006). Simulating Speech with a Physics-BasedFacial Muscle Model. ACM SIGGRAPH/EurographicsSymposium on Computer Animation :261-270[3] Gladilin, E., Zachow, S., Deuflhard, P., Hege, H.C.(2001). Towards a Realistic Simulation of IndividualFacial Mimics. VMV:129-134.[4] Chabanas, M., Luboz, V. & Payan, Y. (2003). Patientspecific Finite Element model of the face soft tissue for computer-assisted maxillofacial surgery, Medical ImageAnalysis, Vol. 7, Issue 2, pp. 131-151.[5] Gomi, H, Nozoe, J, Dang, J, Honda, K. (2006). Aphysiologically based model of perioral dynamics forvarious lip deformations in speech articulation. InHarrington J. & Tabain M. (Eds.), Speech Production-
Models, Phonetic Processes, and Techniques. PsychologyPress, New-York, USA[6] Buchaillard, S, Perrier, P & Payan, Y. (2006) A 3Dbiomechanical vocal tract model to study speechproduction control: How to take into account the gravity?Proceedings of the 7th International Seminar on SpeechProduction (pp.403-410), Ubatuba, Brazil.[7] Gérard, J.-M., Ohayon, J., Luboz, V., Perrier, P. &Payan, Y. (2005). Non linear elastic properties of thelingual and facial tissues assessed by indentationtechnique. Application to the biomechanics of speechproduction. Medical Engineering & Physics,27, 884–892.[8] Honda K.,Kurita T., Kakita Y., and Maeda S.,Physiology of the lips and modeling of lip. gestures, JPhonetics, 23, 243-54[9] Couteau, B., Payan, Y. & Lavallée, S. (2000). TheMesh-Matching algorithm: an automatic 3D meshgenerator for finite element structures. Journal ofBiomechanics, 33(8), 1005-1009.
176 MAVEBA 2007

Models and analysis of vocal emissions for biomedical applications: 5th international workshop: December 13-15, 2007: Firenze, Italy, ed. by C. Manfredi,ISBN 978 88-8453-673-3 (print) ISBN 978-88-8453-674-7 (online)© Firenze university press, 2007.
PIV MEASUREMENTS OF VELOCITY FIELDS IN GLOTTIS
ON A PHYSICAL VOCAL FOLD MODEL
P. Sidlof1, Olivier Doare2, Olivier Cadot2, Antoine Chaigne2, Jaromır Horacek1
1Institute of Thermomechanics, Academy of Sciences of the Czech Republic, Prague, Czech Republic2Ecole Nationale Superieure de Techniques Avancees, Paris, France
Abstract : The velocity fields along a self-
vibrating physical model of vocal folds were
studied experimentally. The shape of the vocal
folds was specified according to data measured
on excised human larynges in phonation posi-
tion. The model was fabricated in 1:4 scale as
a silicone body vibrating in the wall of a plex-
iglass wind tunnel. The model is not excited
externally and oscillates only due to coupling
with the flow. In addition to acoustic, subglot-
tal pressure and impact intensity measurements,
flow velocity fields were recorded in the coronal
plane using particle image velocimetry, in the
domain immediately above glottis. Analysis of
the PIV images taken within 25 phases of one
vibration cycle gives good insight into the dy-
namics of the supraglottal flow.
Keywords: glottal flow, physical model, PIV
I. Introduction
Despite the numbers of sophisticated mathematicalmodels of vocal fold vibration and glottal flow devel-oped in recent years, experimental approaches still playan important role in vocal fold research. The computa-tional models can supply very useful data; nevertheless,it is necessary to keep in mind that many models arebased on important simplifications and that the resultscannot be extrapolated beyond the parameter limits,for which they were designed. The models often cannotavoid to include several ad hoc assumptions. Moreover,in vocal fold modeling one needs to enter many geomet-rical and tissue parameters, whose numerical values areoften not well known. Therefore, the results from themathematical models should always be verified usingexperimental data.
The most relevant data regarding vocal fold vibra-tion originate from measurements on living human sub-jects. However, since the human vocal folds are hardlyaccessible, the majority of processes occuring duringphonation cannot be measured directly in vivo. Thesecond possibility is to perform in vitro investigations,i.e. measurements on excised human or animal laryn-ges. This approach provides improved accessibility to
measured structures and tissues in better controlled lab-oratory conditions; yet many drawbacks of experimentson living tissues persist – technical complications, poormeasurement reproducibility and also ethical concerns.This is why several physical vocal fold models with well-defined and easily controllable parameters have been de-veloped in recent years – like the self-oscillating latex-tube model of Pelorson, Deverge et al. [5, 1], staticmodels of Shinwari, Scherer and Fulcher et al. [6, 3],Kob’s or Erath’s driven scaled models [4, 2] or the self-oscillating 1:1 vocal fold model of Thomson et al.[8].
Investigation of the supraglottal flow velocity fieldrepresents one of the cases, where both in vivo andin vitro measurements are hardly realizable. There-fore a self-vibrating mechanical model of human vo-cal folds was designed and fabricated at ENSTA Paris.The principal goal was to study the conditions, whereflow-induced vibrations of vocal folds occur and to in-vestigate the velocity fields in the supraglottal chan-nel immediately upstream the narrowest glottal gap bymeans of Particle Image Velocimetry (PIV). The mea-sured data were intended to be compared with the re-sults from a FEM computational model.
II. Methods
The physical model was proposed as a vocal-fold-shaped element vibrating in the rectangular channelwall. A 4:1 scaled vocal fold model, oscillating onlydue to coupling with airflow, was designed (see Fig. 1).In current setup, the upper vocal fold is fixed to avoiddifficulties with unsymmetric vocal fold vibration, thebottom one is supported by four flat springs. Best possi-ble effort was made to keep the important dimensionlesscharacteristics of the model close to the real situation.The shape of the vocal folds was specified according tomeasurements on excised human larynges, performed inthe Institute of Thermomechanics [7].
The vocal fold model was mounted into a plexiglasswind tunnel. In addition to the PIV system installedto measure the supraglottal flow field, the model wasalso equipped with accelerometers, pressure transduc-ers and microphones to measure and record vocal foldvibration.

accelerometers
1/8’’ microphoneto water manometer
to dynamicpressuretransduceradjusting screws
Figure 1: Design of the physical model of vocal folds (inconfiguration fixed upper - vibrating lower vocal fold).The vibrating elastic silicone rubber element is attachedto an aluminum profile, supported by four adjustablebrass flat springs.
To measure the mean flow in the channel, an ultra-sonic flowmeter was mounted near the downstream endof the circular channel. Two accelerometers, fixed underthe vibrating vocal fold, were used to record mechani-cal vibration. The 1:4 scale of the model allowed to usethe relatively large, but very sensitive type B&K 4507Cwithout affecting the system significantly.
III. Results
The primary purpose of the vibroacoustic measure-ments was to acquire supplementary data to the PIVrecords. Basically, the procedure consisted of settingthe flow rate, taking one ten-second record of the ac-celerometer, pressure and acoustic signals, and perform-ing a series of PIV measurements for approximately 25phases of the vocal fold motion. This procedure wasrepeated for the flow rate values ranging from mini-mum flow able to sustain vocal fold vibration up to amaximum value, where either the vibrations ceased orbecame chaotic or irregular.
Fig. 3 shows the measured waveforms and their spec-tra for a sample flow rate value, where regular vibra-tions with impacts occur.
An extensive series of PIV measurements was per-formed on the vibrating vocal fold model. The flow ratewas gradually increased from Q = 5.33 l/s (measure-ment No.001) to Q = 25.61 l/s (measurement No.044).Within each of the 44 measurements, approximately 25PIV records, corresponding to 25 distinct phases of thevocal fold oscillation cycle, were taken. This was re-alized using the synchronization signal (accelerometersignal converted to TTL) and the time-delay functionof the laser control software. Each PIV record consisted
of ten PIV measurements of the same phase within tensuccessive vibration cycles.
Fig. 2 demonstrates the results of one sample mea-surement (out of 44 in total). This measurement waschosen as a representative case of medium flow rate,large-amplitude regular oscillations, which subjectivelycorrespond the best to normal voice production.
It can be stated that the flow is not perfectly peri-odical in general. The turbulent structures, developingmainly due to presence of the boundary layer of thejet, interact mutually and with the jet in a disordered,stochastic way; this is why the flow fields of the samephase in successive oscillation cycles are not necessarilyidentical. The important flow structures, however, aregenerated periodically in accordance with the frequencyof vibration: within each oscillation cycle, a new jet iscreated with one pair of large vortices propagating alongthe jet front. The jet attaches to the channel wall andduring the closing phase it fades away and eventuallydisappears, leaving the turbulence to damp out.
The mathematical model, which was designed to cal-culate the 2D velocity and pressure fields in the prox-imity of the vibrating vocal folds, is based on the2D incompressible Navier-Stokes equations in arbitraryLagrangian-Eulerian formulation. The equations werediscretized by the finite element method. The numeri-cal scheme was completely programmed in the Fortran
language, making use only of open-source libraries forthe finite element discretization and for the numericalsolution of the resulting linear system. The results ofthe numerical simulations show the development of thesupraglottal jet and evolution of the recirculation vor-tices within one vocal fold oscillation cycle.
Figure 2: Instantaneous velocity field downstream theglottis. The vocal folds are on the left. The flow direc-tion is from the left to the right. The velocity modulusis in color. A free jet with a maximum flow velocityof U ≈ 17 m/s forms between the vocal folds. Twolarge-scale vortices develop at the sides of the jet front.
178 MAVEBA 2007

0 0.05 0.1 0.15 0.2 0.25Time �s�
-30
-20
-10
0
10
20
30
Acceleration�m�s2�
0 20 40 60 80 100frequency �Hz�
80
90
100
110
120
130
140
150
S�acc��dB�
0 0.05 0.1 0.15 0.2 0.25Time �s�
-20
0
20
40
Supragl.pressure�Pa�
0 20 40 60 80 100frequency �Hz�
110
120
130
140
150
160
S�psupra��dB�
Figure 3: Waveforms and frequency spectra of the acceleration, and supraglottal pressure. Measurement No. 012– medium flow rate Q = 8.58 l/s, ideal for regular vocal fold vibration with an impact in each cycle. Funda-mental frequency 13.2 Hz. On the acceleration waveform, the impact is clearly visible as a peak on the positivehalf-wave.
Figure 4: Sample velocity field during the vocal fold vibration cycle – velocity magnitude [m/s].
Figure 5: Sample pressure field during the vocal fold vibration cycle - dynamic pressure [Pa].
Mechanical models II 179

Figs. 4, 5 demonstrate the sample results calculatedwithin a numerical simulation using typical values of in-put parameters. The channel geometry is the same asfor the physical model. The mesh was triangular andconsisted of 16537 Taylor-Hood (P 2
/P1) elements. The
upper vocal fold was fixed, the motion of the bottomone was prescribed.
IV. Discussion
Neither the mathematical nor the physical model wasprimarily intended for direct comparison with real hu-man vocal folds. The strategy was first to validate themathematical model using results of the PIV measure-ments on the physical model; once a satisfactory cor-respondence between the computational and physicalmodels will be achieved, the geometry and boundaryconditions of the mathematical model can be modifiedin order to reflect the conditions occurring in real vocalfolds. For the validation of the model, it was advan-tageous to use the configuration with one vocal foldmoving and the other fixed.
The results from the mathematical and physicalmodel obtained so far seem to correspond when com-pared visually. It should be noted that there are someaspects, which make a systematic comparison difficultfor the time being – the main limitation is the fact thatthe vocal folds are not allowed to collide. The processesaccompanying glottal closure are complex and from thealgorithmic point of view, the separation of the compu-tational domain into two, necessity to introduce addi-tional boundary conditions and to handle pressure dis-continuity when reconnecting the domains represent avery complicated problem. Yet it will be necessary todeal with this task in future, if the mathematical modelshould be employed to model regular loud phonation.
Acknowledgments
The research has been financially supported by theGrant Agency of the Academy of Sciences of the CzechRepublic, project No. IAA2076401 Mathematical mod-
elling of human vocal folds oscillations.
References
[1] Deverge, M., Pelorson, X., Vilain, C., La-
gree, P., Chentouf, F., Willems, J., and
Hirschberg, A. Influence of collision on the flowthrough in-vitro rigid models of the vocal folds.Journal of the Acoustical Society of America 114
(2003), 3354–3362.
[2] Erath, B., and Plesniak, M. The occurrenceof the coanda effect in pulsatile flow through staticmodels of the human vocal folds. Experimental Flu-
ids 41 (2006), 735–748.
[3] Fulcher, L., Scherer, R., Zhai, G., and Zhu,
Z. Analytic representation of volume flow as a func-tion of geometry and pressure in a static physicalmodel of the glottis. Journal of Voice 20, 4 (2006),489–512.
[4] Kob, M., Kramer, S., Prevot, A., Triep, M.,
and Brucker, C. Acoustic measurement of peri-odic noise generation in a hydrodynamical vocal foldmodel. In Proceedings of Forum Acusticum (Bu-dapest, Hungary, 29 August – 2 September 2005),pp. 2731–2736.
[5] Pelorson, X. On the meaning and accuracy ofthe pressure-flow technique to determine constric-tion areas within the vocal tract. Speech Communi-
cation 35 (2001), 179–190.
[6] Shinwari, D., Scherer, R., Dewitt, K., and
Afjeh, A. Flow visualization and pressure distri-butions in a model of the glottis with a symmetricand oblique divergent angle of 10 degrees. Journal
of the Acoustical Society of America 113, 1 (2003),487–497.
[7] Sidlof, P., Svec, J. G., Horacek, J., Vesely,
J., Klepacek, I., and Havlık, R. Determina-tion of vocal fold geometry from excised human la-rynges: Methodology and preliminary results. InInternational Conference on Voice Physiology and
Biomechanics (Marseille, France, 18 – 20 August2004).
[8] Thomson, S. L., Mongeau, L., and Frankel,
S. H. Aerodynamic transfer of energy to the vocalfolds. Journal of the Acoustical Society of America
113 (2005), 1689–1700.
180 MAVEBA 2007

Pathology detection/


Models and analysis of vocal emissions for biomedical applications: 5th international workshop: December 13-15, 2007: Firenze, Italy, ed. by C. Manfredi,ISBN 978 88-8453-673-3 (print) ISBN 978-88-8453-674-7 (online)© Firenze university press, 2007.
Abstract: Pathology detection by the analysis of voice remained a challenging objective during last years’ research. Former studies have shown that the glottal signature defined on the glottal source spectral density contains helpful hints in determining the healthy or pathological condition of the subject. Therefore a good reconstruction of the glottal source after removing the vocal tract is essential for the study. Nevertheless it may be shown that gender is also strongly influencing this glottal signature. Therefore comparisons and clustering between healthy and pathological glottal signatures should have into account the patient’s gender. Through the present paper a new scheme for pathology detection is presented based on a priori determining the subject’s gender. Results from a database of healthy and pathological subjects are given to contribute in this sense. A study case is presented as an example in visualizing the interest of the approach.
Keywords: Glottal Signature, Gender Detection, Pathology Detection
I. INTRODUCTION
The spectral signature of the Glottal Flow Derivative is very much conditioned by the biomechanics of the glottal folds. Physiological and functional pathologies introduce important changes in glottal fold mechanical behaviour resulting in perceptible changes in the spectral profile of the Glottal Signals, which shows specific peaks and valleys (“V-troughs”) related with resonances and anti-resonances of the vocal fold biomechanics (see XFig.1X), as these are due to relations among equivalent masses and springs in classical k-mass models of the vocal folds. In former studies [1][2] it was established that the statistical distributions of the spectral profiles of the glottal flow derivative (glottal source) and mucosal wave correlate (the residual after the average acoustic wave is removed) are conditioned by gender. Therefore any study conducted to detect pathology using parameter distributions from the spectral profile of glottal signals has to have into account gender effects. The present study is intended to propose a methodology to detect pathology and assess its treatment using gender-specific glottal
source spectral parameters. The validity of the methodology will be checked on a study case.
II. GLOTTAL SIGNATURE
Being a well established fact that a relation between the spectral signature of voice and pathology exists [3] recent studies have established time and frequency domain parameterizations to carry out such comparisons. Especially interesting are the relations among the amplitudes of the first harmonics and formants in the spectral contents of voice (H1-A1, H1-A3, A1-A3, H1-H2,etc.) as well as on the glottal source spectral envelope [4]. Extending these definitions the present work presents a parameterization of the glottal signature which may be seen as a generalization of formant-harmonic relations.
Figure 1. Power spectral signature of the mucosal wave correlate from a typical male speaker based on the estimation of the two first “V-troughs” {TBM1 B, f BM1 B}, { TBm1B, f Bm1 B} and {TBM2 B, f BM2B},from which 8 singularity parameters are derived {pB18B, pB19B, pB21B,p B22B, pB27B, pB28B, pB30B, pB31B}. The decay rate and the notch slenderness of both troughs have been also added as parameters to the analysis set {p32, p33 and p34} as explained in the text. Relative amplitude is given in dB.
The parameterization proposed is based on the estimation of the singularities in the power spectral density of the glottal source residual after removing the average acoustic wave (mucosal wave correlate) shown in Fig.1. The parameterization is based on the estimation of each singularity amplitude and position (peaks and troughs)
p28
p22
p31
p18p27
p19
p21
TM1, fM1
TM2, fM2
p32
Tm1, fm1
p30
DETECTING PATHOLOGY IN THE GLOTTAL SPECTRAL SIGNATURE OF FEMALE VOICE
P. Gómez, R. Fernández, R. Martínez, C. Muñoz, L. M. Mazaira, A. Álvarez, J. I. GodinoGrupo de Informática Aplicada al Procesado de Señal e Imagen, Universidad Politécnica de Madrid, Boadilla del
Monte, Madrid, Spain, e-mail: [email protected]

relative to the largest peak {TM1, fM1} in the spectral distribution as
M1
m1m1M1m1m1 f
fTT ; (1)
M1
M2M2M1M2M2 f
f;TT (2)
therefore implicitly M1=0 and M1=1. The definitions for the first trough may be extended to any other in the spectral profile (provided that these meet certain conditions), assuming that each minimum at fmk follows a maximum at fMk<fmk as given by
Kk1;TTTT
Mmmkmk
MmMkMk (3)
Kk1;
ffff
Mm
mkmk
Mm
MkMk
(4)
and correspondingly for the slenderness factor of the trough
Kk1;ff2
TT2Tf
Mk1Mk
Mk1MkmkMmmk (5)
This last factor is strongly related with the tensions of the springs linking the corresponding masses on the k-massequivalent biomechanical model originating the peaks and troughs, and is a measure of the stress on vocal fold cover. The complete definition of the glottal signature is the following
;p;p;p;p;p;p
;p;p;p;p;p;Tp
m234m133Nf32
M331m230M228
m127M322m221
M219m118M117
(6)
It is of most importance to emphasize that the parameterization scheme proposed is normalized both in amplitude and frequency and pitch-independent.
II. METHODS
A database recorded within project MAPACI [5]X was used in the study, which is available for researchers upon request. The database contains both normal and pathologic cases assessed by video-endoscopy, EGG and GRBAS evaluation. A first study on the distribution of glottal spectral profiles by gender was carried out demonstrating that both genders are subject to different dispersion profiles [6], affecting mainly to specific parameters. Based on these results a second study was launched to determine which parameters played a more important role in gender detection [2]. The results of this study are summarized in Figure 2 showing that gender
may be blindly assessed from the spectral density of the glottal source, p32 being among the most gender-sensitive parameters, together with p28, p30 and p19, in respective order from larger to smaller sensitivity. Although a wider study on the statistical relevance of the parameter set is still pending, this study helped in determining that pathology studies should take into account the gender-sensitivity of distortion parameters as well. Therefore it called the attention on that any pathology study should take into account gender issues, pointing to the need to establish pattern comparison strategies within male or female profiles accordingly with the patient’s gender for a better detection and classification.
Figure 2. Example of unsupervised k-means clustering by gender produced using the parameters related with the spectral envelope energy decay (p32), and the slenderness of the first two “V-troughs” (p33 and p34). A set of 100 equally balanced normal speakers is separated as male ( ) and female ( )clusters. Male and female voice samples are clearly separated by p32=80. The only two mis-classified cases (male clustered as female) are pointed by arrows (#1A1 and #1F3).
Therefore another study was launched aiming to detect pathology using clues present in the glottal signature of female voice, as a first approach. For such, a set of 24 pathologic cases were selected from the data base of female speakers including 8 Reinke’s Edemae, 8 Nodules and 8 Functional. A second set of 24 normal female speakers was randomly selected from the normal database to serve as control group. Classical distortion parameters as jitter, shimmer and HNR were mixed with the glottal spectral profiles and dynamic estimates of the vocal fold body and cover biomechanics (masses, loses and tensions) from indirect power spectral density inversion X[1]X.
III. RESULTS
A general study of parameter relevance was conducted using k-means clustering, PCA dimensional reduction, and Back-annotation. Sample utterances of vowel /a/ from the study subjects were processed to obtain their
184 MAVEBA 2007
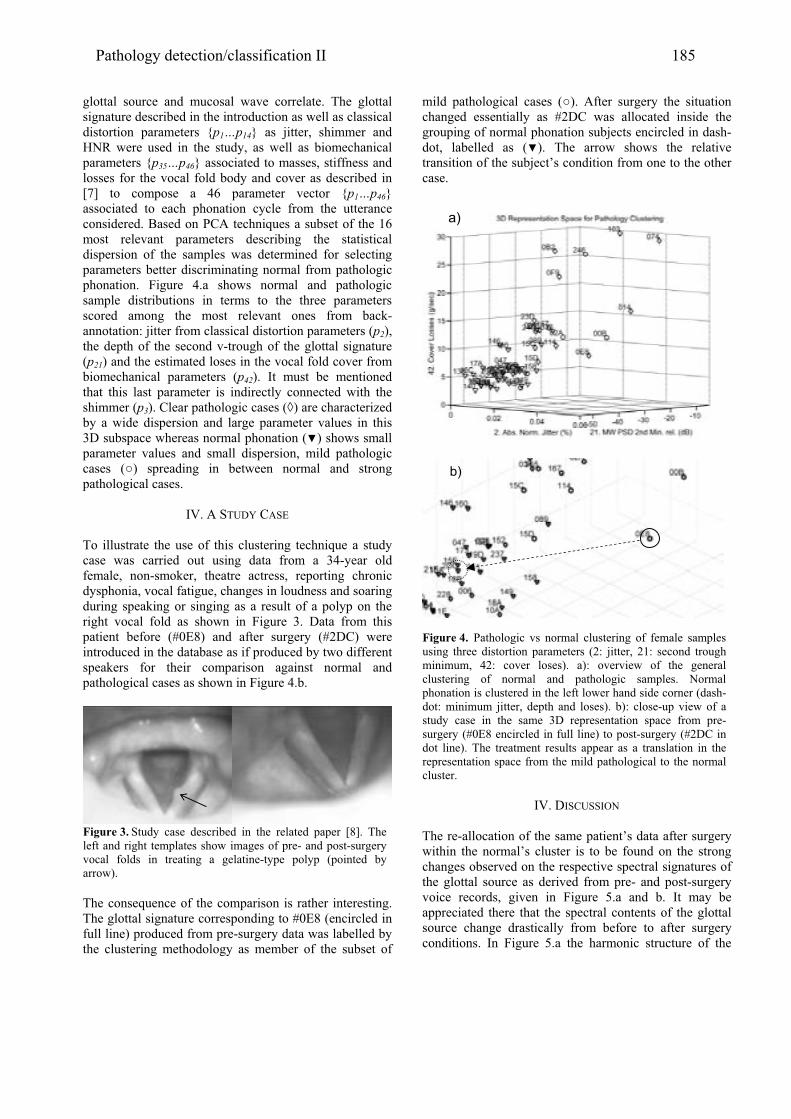
glottal source and mucosal wave correlate. The glottal signature described in the introduction as well as classical distortion parameters {p1…p14} as jitter, shimmer and HNR were used in the study, as well as biomechanical parameters {p35…p46} associated to masses, stiffness and losses for the vocal fold body and cover as described in [7] to compose a 46 parameter vector {p1…p46}associated to each phonation cycle from the utterance considered. Based on PCA techniques a subset of the 16 most relevant parameters describing the statistical dispersion of the samples was determined for selecting parameters better discriminating normal from pathologic phonation. Figure 4.a shows normal and pathologic sample distributions in terms to the three parameters scored among the most relevant ones from back-annotation: jitter from classical distortion parameters (p2), the depth of the second v-trough of the glottal signature (p21) and the estimated loses in the vocal fold cover from biomechanical parameters (p42). It must be mentioned that this last parameter is indirectly connected with the shimmer (p3). Clear pathologic cases ( ) are characterized by a wide dispersion and large parameter values in this 3D subspace whereas normal phonation ( ) shows small parameter values and small dispersion, mild pathologic cases ( ) spreading in between normal and strong pathological cases.
IV. A STUDY CASE
To illustrate the use of this clustering technique a study case was carried out using data from a 34-year old female, non-smoker, theatre actress, reporting chronic dysphonia, vocal fatigue, changes in loudness and soaring during speaking or singing as a result of a polyp on the right vocal fold as shown in Figure 3. Data from this patient before (#0E8) and after surgery (#2DC) were introduced in the database as if produced by two different speakers for their comparison against normal and pathological cases as shown in Figure 4.b.
Figure 3. Study case described in the related paper [8]. The left and right templates show images of pre- and post-surgery vocal folds in treating a gelatine-type polyp (pointed by arrow).
The consequence of the comparison is rather interesting. The glottal signature corresponding to #0E8 (encircled in full line) produced from pre-surgery data was labelled by the clustering methodology as member of the subset of
mild pathological cases ( ). After surgery the situation changed essentially as #2DC was allocated inside the grouping of normal phonation subjects encircled in dash-dot, labelled as ( ). The arrow shows the relative transition of the subject’s condition from one to the other case.
Figure 4. Pathologic vs normal clustering of female samples using three distortion parameters (2: jitter, 21: second trough minimum, 42: cover loses). a): overview of the general clustering of normal and pathologic samples. Normal phonation is clustered in the left lower hand side corner (dash-dot: minimum jitter, depth and loses). b): close-up view of a study case in the same 3D representation space from pre-surgery (#0E8 encircled in full line) to post-surgery (#2DC in dot line). The treatment results appear as a translation in the representation space from the mild pathological to the normal cluster.
IV. DISCUSSION
The re-allocation of the same patient’s data after surgery within the normal’s cluster is to be found on the strong changes observed on the respective spectral signatures of the glottal source as derived from pre- and post-surgery voice records, given in Figure 5.a and b. It may be appreciated there that the spectral contents of the glottal source change drastically from before to after surgery conditions. In Figure 5.a the harmonic structure of the
b)
a)
Pathology detection/classification II 185

glottal source between 1500 and 3200 Hz is almost inexistent, whereas it has been completely restored in Figure 5.b. This improvement in voice quality justifies the translation of the associated vector in the 3D representation space of Figure 4 (bottom) from pathologic to normal clusters.
Figure 5. Glottal Source Power Spectral Signature for a pathological case. a) pre-surgery. b) post-surgery. Horizontal axes given in Hz.
V. CONCLUSIONS
Some interesting conclusions may be derived from the work presented. First of all, it has been shown that certain glottal signature parameters are gender-sensitive, allowing unsupervised clustering of male and female voice samples. This sensitivity may be extensible within a larger or smaller extent to other distortion parameters. A direct consequence of this finding is that any parameter template involved in pattern recognition processes using glottal behaviour may be coding not only pathology, but gender, as well as other subject’s characteristics. Therefore gender issues will have to be taken into account as far as pathology detection –and possibly classification- is concerned. Taking these facts in mind it was possible to distribute template vectors corresponding to glottal signature parameters of normal and pathological cases within a representation subspace showing distinct pattern distributions accordingly. Finally a study case helped in testing the ability of the glottal signature to represent dynamic changes in voice quality in pre- and post-surgery. The clustering classified quite accurately
both situations as pertaining to pathologic or normal cases, thus serving as an assessing benchmark for the availing of the surgical treatment of the pathology. This may be of great interest to further improve pathology detection methods.
ACKNOWLEDGMENTS
This work is being funded by grants TIC2003-08756, TEC2006-12887-C02-00 from Plan Nacional de I+D+i, Ministry of Education and Science, CCG06-UPM/TIC-0028 from the Plan Regional de Investigación Científica e Investigación Tecnológica de la Comunidad de Madrid and by project HESPERIA (http.//www.proyecto-hesperia.org) from the Programme CENIT, Centro para el Desarrollo Tecnológico Industrial, Ministry of Industry, Spain.
REFERENCES
[1] Gómez, P., Rodellar, V., Álvarez, A., Lázaro, J. C., Murphy, K., Díaz, F., Fernández, R., “Biometrical Speaker Description based on Vocal Cord Parameterization”, Proc. of the ICASSP’06, Vol. 2, 2006, pp. 1036-1039.
[2] Gómez, P., Fernández, R., Rodellar, V. Mazaira, L. M., Martínez, R., Álvarez, A., Godino, J. I., “Biometry of Voice based on the Glottal-Source Spectral Profile”, Proc. of the SAFE07: Workshop on Signal Processing Applications for public Security and Forensics, Washington DC, April 12-13, 2007, pp. 120-128.
[3] Kuo, J., Holmberg, E. B., Hillman, R. E., “Discriminating Speakers with Vocal Nodules Using Aerodynamic and Acoustic Features”, Proc. of the ICASSP’99, Vol. 1, 15-19 March 1999, pp. 77-80.
[4] Alku, P., “Parameterisation Methods of the Glottal Flow Estimated by Inverse Filtering”, Proc. of VOQUAL’03, Geneva, August 27-29 (2003), pp. 81-87.
[5] http://www.mapaci.com [6] Gómez, P. Álvarez, A., Mazaira, L. M., Fernández,
R., Rodellar, V., “Estimating the Stability and Dispersion of the Biometric Glottal Fingerprint in Continuous Speech”, ISCA Tutorial and Research Workshop NOLISP’07, 22-25 May 2007, Paris, France, paper 11.
[7] Gómez, P., et al., Evaluation of voice pathology based on the estimation of vocal fold biomechanical parameters, Journal of Voice. Vol. 21, No. 4, 2007, pp. 450-476.
[8] Fernández-Baíllo, R., Gómez, P., Ramírez, C., Scola, B., “Pre-post surgery evaluation based on the profile of the glottal source”, Proc. of MAVEBA’07, Florence, December 13-15, 2007 (in these same proceedings).
b)
a)
186 MAVEBA 2007

Models and analysis of vocal emissions for biomedical applications: 5th international workshop: December 13-15, 2007: Firenze, Italy, ed. by C. Manfredi,ISBN 978 88-8453-673-3 (print) ISBN 978-88-8453-674-7 (online)© Firenze university press, 2007.
Abstract: The approximate entropy of vowel phonation spectra has been used to reveal two normal voicing groups in healthy males. An analysis of the corresponding open and closed quotients for the groups shows the first with balanced quotients and the second with asymmetric quotients characterised by pronounced vocal fold open phases. This indicates the second group is impacted by turbulent air flow, which reduces both the spectral structure in and approximate entropy of vowel phonation. The corresponding spectra are presented to confirm the effect. This provides a physiological explanation for the success of approximate entropy as a single figure of merit for voicing quality. Keywords : voicing, entropy, quotients, spectra, physiology
I. INTRODUCTION
Voicing quality in healthy male individuals has recently been quantified using a single figure of merit based on the complexity of extended vowel power spectra [1]. The power spectra were derived from stationarised electro-glottogram (EGG) measurements of sustained /i/ phonation and normalised to counteract the dynamic characteristics of the fundamental frequency. In the form of approximate entropy (ApEn), complexity analysis was then able to divide cohorts of healthy males into two statistically distinct power spectral groups, which were labelled G1 and G2. The former had ‘bright’ spectral characteristics with well defined peaks, whilst the latter exhibited depressed or ‘dull’ spectral characteristics. Fig.1 shows the dominant, bright G2 group had an ApEn that is typically twice that found in the dull G2 group. In subsequent work, the recovery of voicing quality in cancer patients following radiotherapy was studied using the characteristic ApEn values of the G1 and G2 groups as normal reference standards [2]. Many patients presenting with pathologically low ApEn values recovered voicing with normal G1/G2 ApEn levels one year after treatment.
The EGG measurements underpinning these studies are known to correlate well with the glottal waveform, which in turn is a reflection of the physiological process of vocal fold vibration [3]. This paper provides a clinical, explanation for the success of spectral domain complexity analysis using spectral approximate entropy. It also
A PHYSIOLOGICAL BASIS FOR TWO GROUP, HEALTHY MALE VOICING IDENTIFIED USING SPECTRAL APPROXIMATE ENTROPY
C J Moore1, K Manickam1, Slevin N21North Western Medical Physics Department, Christie Hospital, Manchester, United Kingdom
2Department of Radiation Oncology, Christie Hospital, Manchester, United Kingdom
2
4
6
8
0.1 0.2 0.3 0.4 0.5
G2
G1
Fig.1 Dual Gaussian mixture maximum likelihood fit to healthy male ApEn showing dual peaking (G1 and G2) (P<0.001). Ordinate;probability density. Abscissa; ApEn.
provides further evidence for the existence of the G1 and G2 groups of voicing normality. The distinctive G1 and G2 spectral characteristics are shown to be consistent with the time the vocal folds spend in their open or closed phases during phonation. Furthermore, it is shown that it would not have been possible to separate, and therefore establish, the normal G1 and G2 groupings purely from the fundamental frequencies of vowel phonation.
II. METHODS
A cohort of 85 healthy male volunteers was recruited through institutional advertising. An EGG was acquired for each subject using sensors attached across the thyroid cartilages. The sensors were connected to a PC controlled electro-laryngograph under the expert guidance of speech and language therapists. Each subject was asked to phonate the vowel /i/. The EGG impedance and acoustic signals were digitised at a sampling rate of 20 KHz, 16 bits per sample, for a total of approximately 4 seconds recording time. The data-files were transmitted by network to a Pentium PC system for complexity analysis using software written in scientific language IDL.
The distribution of ApEn values was analysed for dual peaking using maximum likelihood [4]. Fundamental frequency (Fo) and vocal fold open and closed quotients (OQ and CQ respectively) were recorded for each subject using the electro-laryngograph.

Fig.2 Histogram of the number of subjects in G1 (ordinate) against time taken (in percentage) for larynx open and close phases (abscissa). Black shaded bars represent closed phase/quotient (CQ) and shaded bars represent opened phase/quotient (OQ).
The average spectrum for each subject, normalised to counter the effects of changing fundamental frequency and transformed onto a harmonic scale (fundamental-harmonic normalization, FHN [1]), was used to form a single image line in the construction of G1 and G2 group FHN-spectrograms.
III. RESULTS
There were no F0 differences between the two normal male groups G1 and G2, which showed mean F0 values of 124 Hz (+/- 28 Hz) and 122 Hz (+/-29Hz) respectively.
Open and close phases/quotients for G1 are shown in Fig.2. Both phases have a relatively symmetrical distribution either side of the 50% mark, with the open quotient only marginally higher than the closed quotient. In contrast, the open and closed quotients for group G2 shown in Fig.3 are clearly separated. The G2 open phase is clearly much longer than the closed phase.
The G1 and G2 group FHN-spectrograms are shown in Fig.4, left and right respectively. These show the Fo peaks of the subjects in each group aligned to form a distinct left hand column, followed by seven further harmonic columns extending to the right The harmonic content of the G2 group is weak and lacking in detail away from Fo. In contrast, the harmonic content of the G1 group maintains its strength across the harmonic range. This matches the observation that some of the volunteers had clear ‘bright’ voicing whilst others were less distinct or ‘dull’.
The group FHN-spectrograms are consistent with a significantly increased open quotient for G2 and an increase in turbulent flow past the vocal folds.
Fig.3 Histogram of number of subjects in G2 (ordinate) against time taken (in percentage) for larynx open and close phases (abscissa). Black shaded bars represent closed phase/quotient (CQ) and shaded bars represent opened phase/quotient (OQ).
Fig.4 Left: G1 male spectrogram. Lines composed of FHN spectra for each subject. Ordinate; arbitrary subject. Abscissa; harmonic scale with fundamental peak forming the leftmost, bright vertical column. Right: G2 male spectrogram composed as for G1. Note the weakness of the harmonics evidenced by fading out as one progresses from left to right.
IV. DISCUSSION
Modern complexity analysis began in earnest in the 1950s when Kolmogorov and Sinai developed their KS entropy statistic. Their aim was to assess non-linear dynamic systems whose complex behaviour showed changes from regular to irregular states. KS entropy is zero for regular systems and positive-finite for irregular systems. Irregular systems are often termed chaotic to distinguish them from ones that are random and characterised by infinite entropy [5]. However, the
0
5
10
15
20
25
30
20 30 40 50 60 70 80 90
0
5
10
15
20
25
30
20 30 40 50 60 70 80 90
CQ CQ
OQ G2
OQG1
188 MAVEBA 2007

calculation of KS entropy for real world signals was delayed, because it requires an impractically large amount of data. Subsequently, Pincus [6] developed a more pragmatic algorithm for calculating the entropy. Since it emerged from heuristic basics, the term ‘approximate’ entropy, or ApEn, is now used to describe his measure.
ApEn measures the degree of irregularity by measuring the frequency with which patterns of a given lengthappear in a data sequence. In a highly irregular sequence, each possible pattern appears with roughly equal frequency, and so gives rise to a high ApEn. In contrast, a highly regular sequence tends to contain a predominance of one or more patterns and a scarcity of other patterns, thus yielding a low ApEn. Finally, a uniform sequence contains just one pattern, the simplest being flat, which results in an effectively zero ApEn. The applicability to voicing data series, to distinguish regular, irregular and random structuring, benefitted from a move to the spectral domain to assess the entire spectral pattern rather than selected peaks [1].
The broad ApEn cases above correspond to the G1 and G2 group spectral features, where G2 is degraded by turbulent flow through vocal folds that are incompletely closing during phonation. Note here that the resultant turbulent flow will inevitably produce acoustic noise that is only random in nature in the time domain. A decrease rather than an increase in ApEn is seen for G2, since the ApEn analysis in this paper is performed in the inverse spectral domain, where noise acts to flatten features. Ultimately, for white noise in the time domain, a uniform spectrum in the spectral domain with zero ApEn would be the result.
Hence the move from full vocal fold closure in the ‘bright’ G1 normal group, to partial vocal fold closure in the ‘dull’ G2 group is effectively charting the decline of voicing to a pathological form, which is reported for radiotherapy patients in [2]. The OC/QC figures are physiological evidence that supports the discovery of G1 and G2 groups, providing a clinical rationale for a discovery initially made using spectral ApEn as a single figure of structural merit.
V. CONCLUSION
Open/closed quotients for healthy males phonating the vowel /i/ show the existence of two groups. One has approximately equal quotients, The other has asymmetric quotients, indicating prolonged vocal fold opening, suggesting a consequent increase in turbulent air flow. The quotient groups correspond to the G1 and G2 groups identified earlier using spectral pattern approximate entropy analysis. Spectral approximate entropy analysis of voicing normality has been shown to be consistent with underlying physiological behaviour.
REFERENCES
[1] C.J. Moore, K. Manickam, T. Willard, S. Jones, N. Slevin, S. Shalet, “Spectral Pattern Complexity Analysis and the Quantification of Voice Normality in Healthy & Radiotherapy Patient Groups”, Medicine Engineering Physics, vol. 26(4), pp.291-301, 2004. [2] C.J. Moore, K. Manickam and N. Slevin, “Collective spectral pattern complexity analysis of voicing in normal males and larynx cancer patients following radiotherapy”, Biomedical Signal Processing and Control, vol. 1(2), pp.113-119, 2006. [3] A.J. Fourcin, “Electrolaryngographic Assessment of Vocal Fold Function”, J Phonetics, vol. 14, pp. 435-442, 1986. [4] W.N. Venables and B.D. Ripley, Modern Applied Statistics, 4th ed, Springer, 2002. [5] A.N. Kolmogorov, “A new metric invariant of transient dynamical systems and automorphisms in Lebesque spaces”, Dokl. Akad. Nauk SSSR, 1958, vol. 119, pp.861-864, 1958. [6] S.M. Pincus, “Approximate Entropy as a Measure of System Complexity”, Proc. Natl. Acad. Sci. USA, vol. 15; 88 (6), pp. 2297-2301, 1991.
ACKNOWLEDGEMENT
This work was supported by the UK Engineering and Physical Sciences Research Council grant number GR/R04713/01.
Pathology detection/classification II 189

190 MAVEBA 2007
Models and analysis of vocal emissions for biomedical applications: 5th international workshop: December 13-15, 2007: Firenze, Italy, ed. by C. Manfredi,ISBN 978 88-8453-673-3 (print) ISBN 978-88-8453-674-7 (online)© Firenze university press, 2007.
Abstract: In this paper an efficient fuzzy wavelet packet (WP) based feature extraction method has been used for the classification of normal voices and pathological voices of patients suffering from unilateral vocal fold paralysis (UVFP). Mother wavelet function of tenth order Daubechies (d10) has been employed to decompose signals in 5 levels. Next, WP coefficients have been used to measure energy and Shannon entropy features at different spectral sub-bands. Consequently, to find discriminant features, signals have been clustered in 2 classes using fuzzy c-means method. The amount of fuzzy membership of pathological and normal signals in their corresponding clusters is considered as a measure to quantify the discrimination ability of features. Thus, considering this measure, an optimal feature vector of length 8 has been chosen to discriminate pathological voices from normal ones. Feature vector obtained by considering nodes’ discriminant ability with classification percentage of 100 has a better performance in comparison with the feature vector including equal portion of nodes for the features of energy and entropy with the approximate classification percentage of 96. The simulation results show that fuzzy WP based feature extraction is an effective tool in voice signal analysis.
Keywords: Voice disorders, feature extraction, wavelet packets, fuzzy sets
I. INTRODUCTION
Unilateral vocal fold paralysis (UVFP) occurs from a dysfunction of the recurrent or vagus nerve innervating the larynx and causes a characteristic breathy voice. UVFP most commonly occurs following a surgical iatrogenic injury to the vagus or recurrent laryngeal nerve resulting in glottal incompetence, either partial or complete, because of the poor or reduced vocal fold closure.
Physiological alterations of vocal cords cause unhealthy patterns of cords’ vibration and the decrease in patients’ speech signal quality known as voice pathologies. Therefore, the detection of incipient damages to the cords is useful in improving the
prognosis, treatment and care of such pathologies. Physicians often use invasive techniques like Endoscopy to diagnose symptoms of voice disorders. It is, however, possible to identify disorders using certain features of speech signal in a non-invasive way [1]. Schuck et al [2] have used Shannon entropy and energy features of wavelet packet decomposition and the best basis algorithm for normal/pathological speech signal classification. Fonseca et al [3] have employed mean square values of reconstructed signals in discrete wavelet transform sub-bands and least square support vector machine (LS-SVM) classifier for identification of signals from patients with vocal fold nodules and normal signals. Guido et al [4] have tried different wavelets on the search for voice disorders. Mother wavelet of Daubechies with support length of 20 (db10) was found as the best wavelet for speech signal analysis among commonly used wavelets. Behroozmand et al [5] have used genetic algorithm for optimal selection of wavelet packet based energy and Shannon entropy features for identification of patients’ speech signal with unilateral vocal fold paralysis (UVFP). The results showed that the decomposition level of five is the best level to analyze pathological speech signals. Local discriminant bases (LDB) and wavelet packet decomposition have been used to demonstrate the significance of identifying discriminant WP subspaces in a work by Umapathy et al [6].
Fuzzy wavelet packet based feature extraction method has been proposed by Li et al and has been applied to biological signal classification [7]. In contrast to the standard methods of feature extraction used in WPs, this method of discriminatory feature extraction from wavelet packet coefficients is based on the fuzzy set criterion. Yang et al [8] have applied fuzzy wavelet packet method to feature extraction from electroencephalogram (EEG) signals. The results show that this method is promising for the extraction of EEG signals in brain-computer interfaces (BCIs).
This work aims to identify patients with UVFP by extracting an effective feature vector containing less number of features and higher discrimination accuracy and lower order of computational complexity (e.g. in comparison with the one obtained by genetic algorithm based optimal feature [5]). It is based on wavelet packet transform (WPT), fuzzy sets, and artificial neural network (ANN) classifier.
FUZZY WAVELET PACKET BASED FEATURE EXTRACTION METHOD APPLIED TO PATHOLOGICAL VOICE SIGNALS CLASSIFICATION
B. S.Aghazadeh 1, H. Khadivi Heris 1, H. Ahmadi2, M. Nikkhah-Bahrami11Department of Mechanical Engineering, Tehran University, Tehran, Iran
2Department of Electrical Engineering, Tehran University, Tehran, Iran

II. METHODS
A. Wavelet Packet Transform
Recently, wavelet packets (WPs) have been widely
used by many researchers to analyze voice and speech
signals. There are many outstanding properties of wavelet
packets, which encourage researchers to employ them in
many widespread fields. It has been shown that sparsity
of coefficients’ matrix, computational efficiency, and
time-frequency analysis can be useful in dealing with
many engineering problems. The most important,
multiresolution property of WPs is helpful in voice signal
synthesis.
The hierarchical WP transform uses a family of
wavelet functions and their associated scaling functions
to decompose the original signal into subsequent sub-
bands. The decomposition process is recursively applied
to the both low and high frequency sub-bands to generate
the next level of the hierarchy. WPs can be described by
the following collection of basis functions:
1 1
22 2 ( 2 ) 2 2
p p p pn n
mW x l h m l W x m (1)
1 1
2 12 2 ( 2 ) 2 2
p p p pn n
mW x l g m l W x m (2)
where p is scale index, l the translation index, h the low-
pass filter and g the high-pass filter with
( ) ( 1) (1 )kg k h k (3)
The WP coefficients at different scales and positions
of a discrete signal can be computed as follows:
,2 ( ). (2 )
p p pn k n
mC f m W m k (4)
1
2 , ,( 2 ).
p pn l n m
mC h m l C (5)
1
2 1, ,( 2 ).
p pn l n m
mC g m l C (6)
For a particular sequence of wavelet packet
coefficients, energy in its corresponding sub-band can be
computed as:
2
,2
1
1n
pn n k
kEnergy C
N (7)
The Shannon entropy as another extracted feature for
classification of signals can be computed through the
following formula:
2 2
, ,
1
log
np p
n n k n kk
Entropy C C (8)
Due to the noise-like effect of irregularities in the
vibration pattern of damaged vocal folds, the distribution
manner of such variations within the whole frequency
range of pathological speech signals is not clearly known.
Therefore, it seems reasonable to use WP rather than
discrete wavelet transform (DWT) to have more detail
sub-bands.
B. Fuzzy Set-Based Feature Selection Criterion
With fuzzy sets we allow any pattern xk to belong to
several classes to varying degrees. Assuming uik a
membership grade of pattern xk to class i we have:
11/ ( 1)
22
1
/
bc
ik k i k jj
u x v x v (9)
where c is the number of clusters, /i
i k ik Av x N is the
mean of class i, Ai is the set of indexes of the training
patterns belonging to class i, Ni is the number of class itraining patterns, . is the Euclidean distance and 1bis the fuzzification factor that modifies the shape of
membership grades. For the labeled training patterns in
feature space, X, we define a membership function based
on the criterion ( ) (0, ]F X N to evaluate the
classification ability of X as follows:
1
( )
i
c
iki k A
F X u (10)
The larger the values of F(X), the higher the
classification (discrimination) abilities of the feature
space X.
In fuzzy set based optimal WP decomposition for
each labeled original signal a full WP decomposition to
maximum level of five has been performed. The mother
wavelet function is chosen to be the tenth order
Daubechies (db10). Consequently, features (i.e. energy
and entropy) of all signals in each node have been
clustered using Fuzzy Clustering Method (FCM). Most
discriminant nodes have been identified according to the
parameter F(X), and the signals’ energy and entropy in
those nodes have been used to construct the feature vector
applied to artificial neural network (ANN) classifier.
C. Database
Used in this study are sustained vowel phonation samples
from subjects from the Kay Elemetrics Disordered Voice
Database [9]. Subjects were asked to sustain the vowel /a/
and voice recordings were made in a sound proof booth
on a DAT recorder at a sampling frequency of 44.1 kHz.
192 MAVEBA 2007

III. RESULTS AND DISCUSSION
Having signals decomposed by mother wavelet of
tenth order Daubechies to 5 levels of decomposition and
having on hand energy and Shannon entropy at each
decomposition sub-band, fuzzy logic based feature
extraction method has been applied to construct an
optimal feature vector of length 8 according to the nodes’
discrimination ability, which can separate normal and
pathological (UVFP) voice signals.
Table 1 shows the most discriminant nodes in terms
of energy or entropy feature, with their discrimination
abilities, ( ( )F X / number of data 100), which are
obtained from fuzzy clustering method.
A feature vector of length 8 has been extracted from
the data: 1) with equal portion of discriminant energy and
entropy nodes, 2) according to the best discriminant
nodes in terms of energy or entropy. Consequently,
approximately 65 percent of data has been used as the
training data set and the remaining 35 percent are set
aside as the test and validation data to train a feedforward
backpropagation multilayer classifier neural network with
3 hidden layers.
Fig. 1 shows the wavelet packet tree and the
participating nodes in feature vector, which are selected
according to their discriminant ability. As can be seen,
selected sub-bands are distributed over the whole
available frequency ranges, which shows that
pathological factors do not influence specific frequencies
which accentuates the role of WP decomposition with
equal decomposition of both high and low frequencies.
As a case in point, the coefficients’ energies of
decomposed voice signals in the most discriminant node
(31) have been illustrated in fig. 2. The efficiency and
discrimination ability of selected node is obvious.
Fig. 1. The most discriminant nodes in terms of signal energy or entropy
TABLE 1
PARTICIPATING NODES AND THEIR DISCRIMINATION
ABILITY
Node Energy Entropy Discrimination
ability (%)
31 * 76.22
34 * 73.32
25 * 67.17
29 * 66.95
28 * 66.61
37 * 66.82
38 * 65.85
17 * 62.71
32 * 61.50
5 * 61.27
Pathology detection/classification II 193

Fig. 2. The discrimination ability of the node (31)
The simulation results show that fuzzy wavelet
packet based feature extraction method and neural
network classifiers are effective tools in voice signal
analysis. Moreover, feature vector obtained considering
nodes’ discriminant ability with classification
percentage of 100 has a better performance in
comparison with the feature vector including equal
portion of nodes for the features of energy and entropy
with the approximate classification percentage of 96.
IV. CONCLUSION
In this study, classification of voice signals into two
groups of normal and patients with unilateral vocal fold
paralysis (UVFP) has been presented. Fuzzy wavelet
packet based feature extraction method has been
utilized to find the optimal feature vector of length 8
from energy and Shannon entropy features in WP
decomposition sub-bands. In the following, the obtained
feature vector has been passed on to a neural network
(NN) classifier. The simulation results show that the
fuzzy wavelet packet based selected optimal feature
vector of length 8 applied to a NN classifier can achieve
a classification accuracy of 100 percent, which despite
its relatively short length, outperforms feature vectors
obtained by other methods.
REFERENCES
[1] M. N. Viera, F. R. Mclnnes, M. A. Jack, “Robust
FO and Jitter estimation in the Pathological voices “, in
Proc. of ICSLP96, Philadelphia, 1996, pp.745 -748.
[2] A. Schuck Jr. , L. V. Guimaraes, J. O. Wisbech,
“Dysphonic voice classification using wavelet packet
transform and artificial neural network” ,in: Proc. of the 25th IEEE Annual EMBS International Conference, Cancum,Mexico, September 2003, pp. 2958-2961.2,
pp.68-73.
[3] Everthon S. Fonseca, Rodrigo C. Guido, Andre C,
Silvestre, Jose Carlos Pereira, “Discrete wavelet
transform and support vector machine applied to
pathological voice signals identification”, in: Proc. of the seventh IEEE International Symposium on Multimedia, ISM’05.
[4] Rodrigo C. Guido, Jose C. Pereira, Everthon
Fonseca, Fabrico L. Sanchez, Lucimar S. Vierira,
“Trying different wavelets on the search for voice
disorders sorting”, in: Proc. of the 37th IEEE International Southeastern Symposium on System Theory, 2005, pp. 495-499.
[5] R. Behroozmand, F. Almasganj, “Optimal selection
of wavelet-packet-based features using genetic
algorithm in pathological assessment of patients’ speech
signal with unilateral vocal fold paralysis”, Computers in Biology and Medicine, Vol. 37, pp. 474-485, 2007.
[6] K. Umapathy, S. Krishnan, “Feature analysis of
pathological speech signals using local discriminant
bases technique”, Med. Bio. Eng. Comput., Vol. 43, pp.
457-464, 2005.
[7] D. Li, W. Pedrycz and N. Pizzi, “Fuzzy wavelet
packet based feature extraction method and its
application to biomedical signal classification”, IEEETransactions on biomedical engineering, Vol. 52 no.6
pp. 1132-1139, 2005.
[8] B. Yang, G. Yan, T. Wu and R. Yan, “Subject-based
feature extraction using fuzzy wavelet packet in brain–
computer interfaces”, Signal processing, 87 (2007)
1569–1574.
[9] Disordered voice database (CD-ROM), Version
1.03, Massachusetts Eye and Ear Infirmary, Kay
Elemetrics Corporation, Boston, MA, Voice and Speech
Lab., October 1994.
194 MAVEBA 2007

Models and analysis of vocal emissions for biomedical applications: 5th international workshop: December 13-15, 2007: Firenze, Italy, ed. by C. Manfredi,ISBN 978 88-8453-673-3 (print) ISBN 978-88-8453-674-7 (online)© Firenze university press, 2007.
MULTIPLE FEATURE SETS AND GENETIC SEARCH BASED
DISCRIMINATION OF PATHOLOGICAL VOICES
M. Bacauskiene †, A. Gelzinis †, M. Kaseta§, M. Kovalenko †, R. Pribuisiene§, V. Uloza§, A. Verikas †‡
†Department of Applied Electronics, Kaunas University of Technology,LT-51368, Studentu 50, Kaunas, Lithuania
‡Intelligent Systems Laboratory, Halmstad University,S-30118, Halmstad, Sweden
§Department of Otolaryngology, Kaunas University of Medicine,LT-50009, Kaunas, Lithuania
[email protected]/[email protected]/[email protected]/[email protected]
Abstract— The effectiveness of ten different featuresets in classification of voice recordings of the sustainedphonation of the vowel sound /a/ into a healthy and patho-logical classes is investigated as well as a new approach tobuilding a sequential committee of support vector ma-chines (SVM) for the classification is proposed. Theoptimal values of hyper-parameters of the committeeand the feature sets providing the best performance arefound during the genetic search. In the experimentalinvestigations performed using 444 voice recordings ofthe sustained phonation of the vowel sound /a/ comingfrom 148 subjects, three recordings from each subject,the correct classification rate of over 92% was obtained.The classification accuracy has been compared with theaccuracy obtained from four human experts.
Keywords—voice pathology; feature selection; geneticsearch; support vector machine
I. Introduction
Automated acoustic analysis of voice is increasinglyused for detecting laryngeal pathologies [1], [2], [3].Time, frequency, and cepstral domains are usually usedto extract features characterizing a voice signal. Analy-sis of the literature related to automated categorizationof voice aiming to detect laryngeal pathologies showsthat the categorization is usually based on one, two orthree types of features. There are no works attemptingto extract a larger variety of features for characterizinga voice signal.
Various classifiers were used to make a decision abouta voice signal represented by a feature vector. Gaus-sian mixture models [4], [5], the linear discriminant [2],k-NN [1], LVQ [3], hidden Markov models [6], a mul-tilayer perceptron [7], and radial basis function net-works are the most popular classifiers applied. Inmost of the studies, a two-class classification prob-
We gratefully acknowledge the support we have receivedfrom the agency for international science and technologydevelopment programmes in Lithuania.
lem is solved, namely, a voice signal is assigned intoa healthy or pathological class. The correct classifica-tion rate obtained in different studies, when solving thetwo-class classification problem, varies in a broad range:85.8% [8], 89.1% [2], 91.3% [7], 96% [3]. Due to a largevariety of data sets used in the different studies, com-parison of the results obtained in the studies is ratherproblematic.
This paper focuses on investigation of usefulness of alarge variety of feature types in the laryngeal diagnos-tics task of categorizing a voice signal into the healthyand pathological classes. A committee of support vectormachines (SVM) [9] is used to make the categorization.To find the optimal values of hyper-parameters of theclassifier and the optimal feature subsets of the varioustypes a genetic search procedure is applied. The exper-imental investigations performed have shown that thetechniques developed allowed to significantly improvethe classification accuracy if compared to the case ofusing the best feature set of a single type.
II. Feature sets and Feature selection
Growing size of data sets in terms of features in-creases the variety of problems characterized by multi-ple feature sets. Voice characterization is also the case.In this study, we used ten different feature sets [10] (inthe parentheses shown is the number of features avail-able):1. pitch and amplitude perturbation measures (24);2. frequency features (100);3. mel-frequency features (35);4. cepstral energy features (100);5. mel-frequency cepstral coefficients (35);6. autocorrelation features (80);7. harmonics to noise ratio in spectral domain (11);8. harmonics to noise ratio in cepstral domain (11);

9. linear prediction coefficients (16);10. linear prediction cosine transform coefficients (16).
It is well known that not all features are useful forclassification. Some of them can even deteriorate theclassification accuracy. Nonetheless the large varietyof techniques available for selecting variables for a sin-gle classifier, works on feature selection for classifica-tion or regression committees are not so numerous [11],[12]. It has been demonstrated that even simple ran-dom sampling in the feature space may be an effectivetechnique for increasing the accuracy of classificationcommittees [13]. In [14], [15], genetic algorithms havebeen used for ensemble feature selection, probably forthe first time, by exploring all possible feature subsets.However, only one ensemble was considered in theseworks. Kim et al. proposed meta-evolutionary ensem-bles considering multiple ensembles simultaneously [16].
When solving multiple feature sets based classifica-tion or prediction tasks, it is desired to exploit all theinformation available with reasonable resources. Clas-sification or prediction based on ensemble aggregatingmembers trained on different feature sets into a parallelstructure is the usual way to solve such tasks. Studyingthe results obtained by the different authors regardingvariable selection for ensembles, it seems that the ge-netic search where a chromosome encodes an ensem-ble is the most promising approach. However, puregenetic search based approaches are computationallyprohibitive for large sets of variables, which is almostalways the case with multiple feature sets. In this work,to mitigate the computational burden problem, a twostage ensemble generation procedure is developed.
III. Procedure
Given a database consisting of L feature sets char-acterizing Q classes, the procedure to generate an en-semble for data classification into Q classes is summa-rized in the following steps. To obtain Q-class classifi-cation, Q(Q − 1)/2 classifiers one-against-one are de-signed. When Q is large the one-against-all scheme canbe applied1. Design an SVM using features of the jth type for
separating data coming from the ith pair of classes.Use the genetic search procedure for the design. Thedesign results into optimal hyper parameter valuesand the optimal feature set F 0
ij consisting of Nij
features.2. Randomly generate K-1 additional sets of features
F 1ij ,...,F
K−1ij of size Nij . Using the feature sets,
train K-1 SVM classifiers to separate the ith pairof classes.
3. Present the training data to all the K classifiers,
calculate outputs and convert them into the poste-rior probabilities. These probabilities will be usedas features in the second stage.
4. Repeat Steps 1 to 3 for all the feature types, j =1, ..., L.
5. Repeat Steps 1 to 4 for all the pairs of classes, i =1, ..., Q(Q − 1)/2.
6. Using the probabilities as input features design anew SVM for separating the ith pair of classes asdescribed in Step 1. The probabilities used are thosederived from outputs of the classifiers designed forseparation at least one class of the ith pair. Thenumber of input features is equal to (2Q−3)∗K∗L .
7. Repeat Step 6 for all the Q(Q−1)/2 pairs of classes.8. The committee decision is obtained by aggregating
decisions obtained from the Q(Q − 1)/2 SVMs.The rationale behind the use of the random feature
sets is to increase diversity of information conveyedfrom the first stage. Each SVM of the first stage gener-ates one feature for the next stage. Some of the featuresmay be redundant. However, since the genetic search isapplied also in the next stage, redundant features areeliminated during the search.
A. Genetic search
Information representation in a chromosome, gen-eration of initial population, evaluation of populationmembers, selection, crossover, mutation, and reproduc-tion are the issues to consider when designing a geneticsearch algorithm.
A chromosome contains all the information neededto build an SVM classifier. We divide the chromosomeinto three parts. One part encodes the regularizationconstant C, one the kernel width parameter σ, andthe third one encodes the inclusion/noninclusion of fea-tures. The binary encoding scheme has been adoptedin this work.
To generate the initial population, the features aremasked randomly and values of the parameters C andσ are chosen randomly from the interval [C0−ΔC,C0+ΔC] and [σ0−Δσ, σ0+Δσ], respectively, where C0 andσ0 are the very approximate parameter values obtainedfrom the experiment.
The fitness function used to evaluate the chromo-somes is given by the correct classification rate of thevalidation set data.
The selection process of a new population is gov-erned by the fitness values. A chromosome exhibiting ahigher fitness value has a higher chance to be includedin the new population. The selection probability of theith chromosome pi is given by
pi =ri∑M
j=1 rj
(1)
196 MAVEBA 2007

where ri is the correct classification rate obtained fromthe classifier encoded in the ith chromosome and M isthe population size.
The crossover operation for two selected chromo-somes is executed with the probability of crossover pc.If a generated random number from the interval [0,1] islarger than the crossover probability pc, the crossoveroperation is executed. Crossover is performed sepa-rately in each part of a chromosome. The crossoverpoint is randomly selected in the “feature mask” partand two parameter parts and the corresponding partsof two chromosomes selected for the crossover operationare exchanged at the selected points.
The mutation operation adopted is such that eachgene is selected for mutation with the probability pm.The mutation operation is executed independently ineach chromosome part. If the gene selected for muta-tion is in the feature part of the chromosome, the valueof the bit representing the feature in the feature mask(0 or 1) is reversed. To execute mutation in the param-eter part of the chromosome, the value of the offspringparameter determined by the selected gene is mutatedby ±Δγ, where γ stands for C or σ, as the case may be.The mutation sign is determined by the fitness valuesof the two chromosomes, namely the sign resulting intoa higher fitness value is chosen. The way of determin-ing the mutation amplitude Δγ is somewhat similar tothat used in [17] and is given by
Δγ = wβ(max(|γ − γp1|, |γ − γp2|)) (2)
where γ is the actual parameter value of the offspring,p1 and p2 stand for parents, β ∈ [0, 1] is a randomnumber, and w is the weight decaying with the iterationnumber:
w = k(1 − t/T ) (3)
where t is the iteration number, k is a constant, and Tis the total number of iterations.
In the reproduction process, the newly generatedoffspring replaces the chromosome with the smallest fit-ness value in the current population, if a generated ran-dom number from the interval [0,1] is larger than thereproduction probability pr or if the fitness value of theoffspring is larger than that of the chromosome withthe smallest fitness value.
IV. Experimental investigations
A. Data used
The mixed gender local database we used in thisstudy contains 444 voice recordings of the sustainedphonation of the vowel sound /a/ (as in the Englishword “large”). The database built by the Departmentof Otolaryngology of the University hospital of Kaunas
University of Medicine, Lithuania is continuously up-dated by appending new recordings. The voice record-ings come from 148 subjects, three recordings from eachsubject. Three separate voice samples were recordedin a sound-proof booth on a digitized Sony Mini DiscRecorder MDS-101 through a D60S Dynamic Vocal(AKG Acoustics) microphone placed at 10.0 cm dis-tance from the mouth. There are 79 subjects repre-senting the pathological and 69 the healthy class. Theaverage length of each recording is 2.4 s. The recordingsare made in the “wav” file format at 44100 samples persecond rate. There are 16 bits allocated for one sam-ple. During preprocessing, the beginning and the endof each recording was eliminated.
B. Results
Since we have a relatively small data set, the leave-one-out approach has been used in the tests. In thefirst set of experiments, a single classifier (SVM) hasbeen used for each type of features. The optimal hyper-parameters of the classifier and the optimal feature sethave been found using the genetic search procedure.Table I presents the results obtained from the tests.In the table, apart from the correct classification rate(CCR), there are also presented the initial N and theselected number of features Ns. As it can be seen fromTable I, the HNR cepstral, Mel coefficients, and Per-turbation features provided the best performance.
TABLE I
The correct classification rate (CCR), the initial (N),
and the selected number of features (Ns) obtained using
a single classifier for each type of features.
N# Type of features N CCR % Ns
1 Perturbation 24 86.22 112 Frequency 100 84.22 503 Mel frequency 35 84.44 154 Cepstrum 100 83.11 525 Mel coefficients 35 87.33 196 Autocorrelation 80 81.78 417 HNR spectral 11 82.44 48 HNR cepstral 11 87.78 49 LP coefficients 16 79.33 810 LPCT coefficients 16 80.67 6
In the next set of experiments, a committee was buildaccording to the proposed designing procedure. Threeversions of committees, with K equal to 0, 1, and 2 wereexplored. Since we have 10 different feature types, thenumber of available input features N for the committeeis 10, 20, and 30, depending on the K value used. Theresults of the tests are summarized in Table II.
Pathology detection/classification II 197
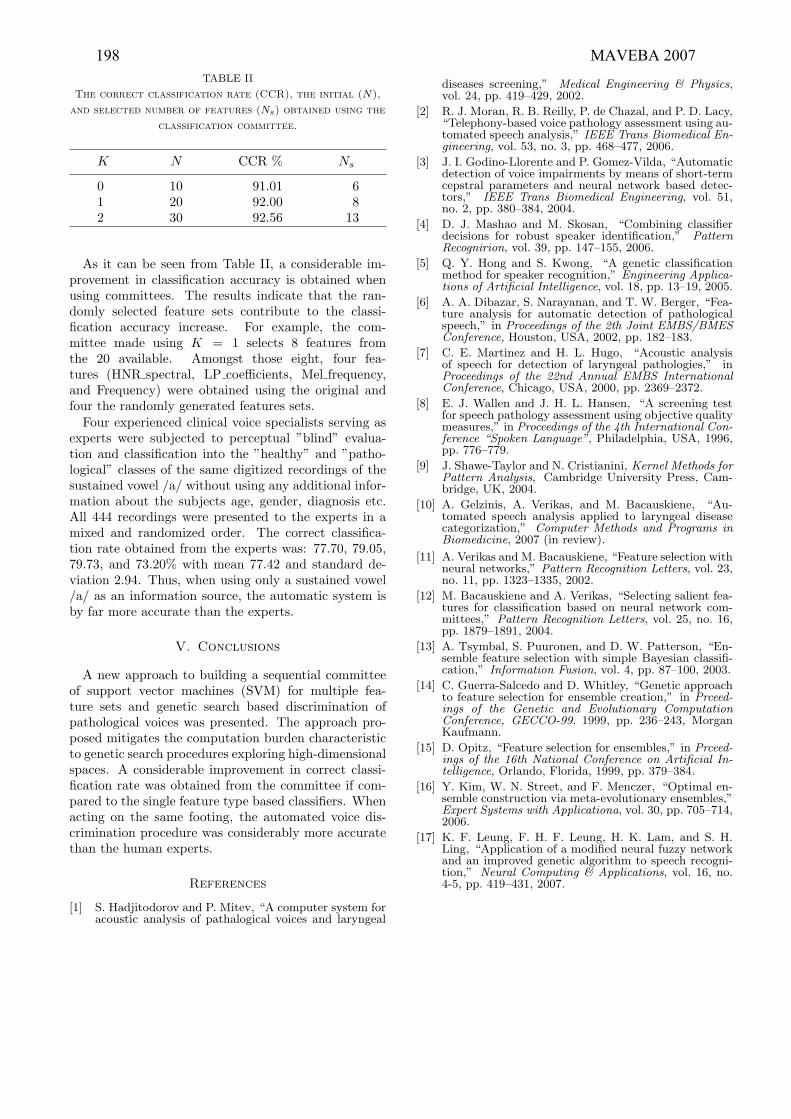
TABLE II
The correct classification rate (CCR), the initial (N),
and selected number of features (Ns) obtained using the
classification committee.
K N CCR % Ns
0 10 91.01 61 20 92.00 82 30 92.56 13
As it can be seen from Table II, a considerable im-provement in classification accuracy is obtained whenusing committees. The results indicate that the ran-domly selected feature sets contribute to the classi-fication accuracy increase. For example, the com-mittee made using K = 1 selects 8 features fromthe 20 available. Amongst those eight, four fea-tures (HNR spectral, LP coefficients, Mel frequency,and Frequency) were obtained using the original andfour the randomly generated features sets.
Four experienced clinical voice specialists serving asexperts were subjected to perceptual ”blind” evalua-tion and classification into the ”healthy” and ”patho-logical” classes of the same digitized recordings of thesustained vowel /a/ without using any additional infor-mation about the subjects age, gender, diagnosis etc.All 444 recordings were presented to the experts in amixed and randomized order. The correct classifica-tion rate obtained from the experts was: 77.70, 79.05,79.73, and 73.20% with mean 77.42 and standard de-viation 2.94. Thus, when using only a sustained vowel/a/ as an information source, the automatic system isby far more accurate than the experts.
V. Conclusions
A new approach to building a sequential committeeof support vector machines (SVM) for multiple fea-ture sets and genetic search based discrimination ofpathological voices was presented. The approach pro-posed mitigates the computation burden characteristicto genetic search procedures exploring high-dimensionalspaces. A considerable improvement in correct classi-fication rate was obtained from the committee if com-pared to the single feature type based classifiers. Whenacting on the same footing, the automated voice dis-crimination procedure was considerably more accuratethan the human experts.
References
[1] S. Hadjitodorov and P. Mitev, “A computer system foracoustic analysis of pathalogical voices and laryngeal
diseases screening,” Medical Engineering & Physics,vol. 24, pp. 419–429, 2002.
[2] R. J. Moran, R. B. Reilly, P. de Chazal, and P. D. Lacy,“Telephony-based voice pathology assessment using au-tomated speech analysis,” IEEE Trans Biomedical En-gineering, vol. 53, no. 3, pp. 468–477, 2006.
[3] J. I. Godino-Llorente and P. Gomez-Vilda, “Automaticdetection of voice impairments by means of short-termcepstral parameters and neural network based detec-tors,” IEEE Trans Biomedical Engineering, vol. 51,no. 2, pp. 380–384, 2004.
[4] D. J. Mashao and M. Skosan, “Combining classifierdecisions for robust speaker identification,” PatternRecognirion, vol. 39, pp. 147–155, 2006.
[5] Q. Y. Hong and S. Kwong, “A genetic classificationmethod for speaker recognition,” Engineering Applica-tions of Artificial Intelligence, vol. 18, pp. 13–19, 2005.
[6] A. A. Dibazar, S. Narayanan, and T. W. Berger, “Fea-ture analysis for automatic detection of pathologicalspeech,” in Proceedings of the 2th Joint EMBS/BMESConference, Houston, USA, 2002, pp. 182–183.
[7] C. E. Martinez and H. L. Hugo, “Acoustic analysisof speech for detection of laryngeal pathologies,” inProceedings of the 22nd Annual EMBS InternationalConference, Chicago, USA, 2000, pp. 2369–2372.
[8] E. J. Wallen and J. H. L. Hansen, “A screening testfor speech pathology assessment using objective qualitymeasures,” in Proceedings of the 4th International Con-ference “Spoken Language”, Philadelphia, USA, 1996,pp. 776–779.
[9] J. Shawe-Taylor and N. Cristianini, Kernel Methods forPattern Analysis, Cambridge University Press, Cam-bridge, UK, 2004.
[10] A. Gelzinis, A. Verikas, and M. Bacauskiene, “Au-tomated speech analysis applied to laryngeal diseasecategorization,” Computer Methods and Programs inBiomedicine, 2007 (in review).
[11] A. Verikas and M. Bacauskiene, “Feature selection withneural networks,” Pattern Recognition Letters, vol. 23,no. 11, pp. 1323–1335, 2002.
[12] M. Bacauskiene and A. Verikas, “Selecting salient fea-tures for classification based on neural network com-mittees,” Pattern Recognition Letters, vol. 25, no. 16,pp. 1879–1891, 2004.
[13] A. Tsymbal, S. Puuronen, and D. W. Patterson, “En-semble feature selection with simple Bayesian classifi-cation,” Information Fusion, vol. 4, pp. 87–100, 2003.
[14] C. Guerra-Salcedo and D. Whitley, “Genetic approachto feature selection for ensemble creation,” in Prceed-ings of the Genetic and Evolutionary ComputationConference, GECCO-99. 1999, pp. 236–243, MorganKaufmann.
[15] D. Opitz, “Feature selection for ensembles,” in Prceed-ings of the 16th National Conference on Artificial In-telligence, Orlando, Florida, 1999, pp. 379–384.
[16] Y. Kim, W. N. Street, and F. Menczer, “Optimal en-semble construction via meta-evolutionary ensembles,”Expert Systems with Applicationa, vol. 30, pp. 705–714,2006.
[17] K. F. Leung, F. H. F. Leung, H. K. Lam, and S. H.Ling, “Application of a modified neural fuzzy networkand an improved genetic algorithm to speech recogni-tion,” Neural Computing & Applications, vol. 16, no.4-5, pp. 419–431, 2007.
198 MAVEBA 2007

A-laryngeal speech


Models and analysis of vocal emissions for biomedical applications: 5th international workshop: December 13-15, 2007: Firenze, Italy, ed. by C. Manfredi,ISBN 978 88-8453-673-3 (print) ISBN 978-88-8453-674-7 (online)© Firenze university press, 2007.
TOWARDS A BASIC PROTOCOL FOR FUNCTIONAL ASSESSMENT OF SUBSTITUTION VOICES: PRELIMINARY RESULTS OF AN
INTERNATIONAL TRIAL
M.B.J.Moerman 1,2, J.P.Martens 3, D.Chevalier4, G.Friedrich5, M.Hess6, G.Lawson7, A.K.Licht6,F.Ogut8, E.Reckenzaun5, M.Remacle7, V.Woisard9, P.H.Dejonckere 2
1Department of ENT/head and Neck Surgery, AZ Jan Palfijn-Maria Middelares Gent, Ghent, Belgium; 2Institute of Phoniatrics, University Medical Centre Utrecht, Utrecht, The Netherlands; 3 Electronics and Information Systems
Department, Ghent Univeristy, Ghent, Belgium; 4Servivce ORL Hopital Huriez CHU, Lille, France; 5Dept of Phoniatrics, Speech and Swallowing,Graz, Austria; 6University Medical Center Hamburg-Eppendorf,
Hamburg,Germany; 7Service ORL et chirurgie cervicofaciale, Cliniques Universitaires UCL de Mont Godinne, Yvoir, Belgique; 8Ege Üniv. KBB Anabilimdal Bornova İzmir; Turkey; 9ORL-Chirurgie cervico-faciale, CHU-hôpital
Larrey, Toulouse, France
Abstract: We performed an international trial with a newly developed multidimensional assessment protocol for substitution voices based on the European Laryngological Society protocol for ‘common dysphonia’. However, as sound production in SV is largely irregular, we needed some adaptations, in particular of the dimensions perception, acoustic analysis and visual evaluation. The protocol consisted of clinical information, the IINFVo perceptual rating scale, visual examination (level and quality of vibration), acoustic registration of vowels, vcv, cvcvcv and text (which was later analysed with the Auditory Model Based Pitch Extractor (AMPEX)), aerodynamic measurements (Vital Capacity, Maximum Phonation Time, and Maximal Intensity), and self-evaluation (of i) voice quality and ii) degree of invalidity). Six centers participated. We retained 96 suitable files (out of 102). Variance analysis demonstrates significance for i) all perceptual parameters (except for Voicing), MPT and Maximal Intensity and ii) type of surgery and/or main anatomical vibration source. There is no correlation at all between the patient’s perception of his /her disability and perceptual parameters, MPT, quality of vibration. Correlation between the acoustical analysis and the subjective rating was only moderate (Pearson < 0.62; standard deviation >1.8).
Keywords : substitution voices, multidimensional protocol, acoustics, perception, dysphonia
I. INTRODUCTION
In 2001 the European Laryngological Society advocated a protocol for a multidimensional voice assessment for
laryngeal dysphonia [1]. This assessment protocol consists of 5 dimensions: perceptual analysis, acoustic measurements, visual evaluation (videostroboscopy), aerodynamic measurements and self-assessment. However, the ELS assessment protocol seems not applicable to substitution voicing (SV). Substitution voicing is defined as voicing without two true vocal folds [2] and occurs after total laryngectomy (esophageal and tracheo-esophageal speech), partial laryngectomy (except for horizontal supraglottic laryngectomy), cordectomy from type III on (in which a large part of the vocalis muscle has been removed), severe laryngeal trauma etc. Most of these voices are rated as a G3 on the GRBAS scale, whereas there exists a large quality variety within SV [3, 4, 5, 6, 7]. Furthermore, the acoustic signal is largely irregular and can not reliably be analyzed by traditional acoustic programs (e.g. Kay elemetrics, EVA). Therefore, we tried to design a clinical assessment protocol for this specific type of severe dysphonia, through i) substituting the perceptual evaluation standard (GRBAS) and the acoustic assessment method, and ii) adapting visual evaluation, aerodynamic measurements and self-assessment. This manuscript describes the preliminary results of an international trial which is still going on.
II. METHODS
Perceptual evaluation scale: A new perceptual evaluation scale, called IINFVo, was proposed and studied for its reliability [8]. In this scale 5 parameters are defined: overall Impression (I), impression of Intelligibility (I), unintended additive noise (N), Fluency (F), Voicing (Vo). Reliability of the scores of both professional and semi-professional jury members was studied on speech samples derived from native Dutch

(Ghent, Belgium) Esophageal (E) and tracheoesophageal (TE) speakers, using i) Pearson correlation, ii) Kendall’s tau (an alternative indicator of inter rater agreement which does not require the scores to be normally distributed) and iii) mean absolute deviation (MAD)between the scores of two raters (this indicator represents the amount of uncertainty on the score on the 0-10 VAS scale). Acoustic analysis: The wav files of the same speech samples were analysed by the auditory model of Van Immerseel and Martens [9]. This auditory model has a built-in pitch extractor, called AMPEX (Auditory Model–Based Pitch Extractor), which has been proven to outperform most other pitch extractors in circumstances with background noise. The auditory model internally works with signal windows that are considerably larger than 10 ms and facilitate the extraction of evidence for pitch values lower than 100 Hz. Every 10 ms, it produces a 27-dimensional feature vector consisting of 23 spectral parameters, a voiced/unvoiced flag (VU = 0 or 1), a fundamental frequency (Fo) or pitch (zero if unvoiced), a voicing evidence (VE) and a frame energy (E). Multicenter trial with the ELS protocol adapted for SV:the ELS protocol for laryngeal dysphonia, modified for SV (consisting of the same 5 dimensions, but with i) substitution of the GRBAS and the traditional acoustic analysis, and ii) adaptation of the other three dimensions) was lately tested by several international centres. Six centres participated in the dimensionsperceptual evaluation, visual evaluation, aerodynamic measurements and self-assessment rating; four centres also participated in the voice recordings. Until now, statistics on the international data comprised correlation and variance analysis.
III. RESULTS
A. perceptual evaluation scaleInter judge agreement, as measured on the ratings of the 102 voices recorded in Ghent, is good for semi-professionals and excellent for professionals [8]. B. acoustic analysisProperly defined acoustic parameters derived from the auditory analysis seem to demonstrate the following(average) ordering of voices according to their over-all quality: (i) normal voicing followed by (ii) voicing with one vocal fold, (iii) TE voicing and (iv) E voicing [2]. However, the demonstrated differences between TE voices and E voices are rather small. C. multicenter trial with the ELS protocol adapted for SVWe collected 102 files (16 female, 85 male, 1 unidentified) from which 2 were not further specified and 4 did not concur with the definition of SV. The
distribution of the 96 remaining samples categorized according to 5 main surgery types was: 11 fronto-lateral laryngectomy/tucker; 11 total laryngectomy with myotomy, 15 total laryngectomy without myotomy and/or with or without pharyngectomy or reconstruction; 22 cricohyoido(epiglotto)pexy; 37 cordectomy (from type III on). This population is largely different from the population recorded in Ghent (the people recorded in Ghent were mainly TL). Perception: An analysis of the correlations between perceptual parameters showed that the highest values are found between ‘General Impression’ and ‘Voicing’ (r=0.83) and between ‘Impression of Intelligibility’ and ‘Fluency’ (r=0.86). Perceptual parameters and type of surgery/anatomical structure: Variance analysis is significant for all perceptual parameters (IINF) except for Vo and the type of surgery. This significance is mainly due to the lower scores of the TL group (with or without myotomy), except for the parameter Noise where CHEP scores worst. Regarding the perceptual parameters and the ‘main vibrating anatomical structure’, vibration at the esophageal segment scores worst. Fig.1gives an example of the perceptual parameter ‘impression of intelligibility’ and the main anatomical vibratory source. This is in agreement with the former acoustic analyses based on the AMPEX model. Aerodynamic measurements: Variance analysis demonstrates a significance level for MPT and i) Type of Surgery (p=0.03) and ii) main anatomical structure producing vibration (p=0.0003). The level of significance for Maximal Intensity is 0.0004 for Type of Surgery and 0.0034 for Main anatomical structure producing vibration. Further analysis demonstrates a significant difference between 1) cordectomy and i) TL (p=0.046) and ii) CHEP (p=0.0002), 2) TL with myotomy and CHEP (p=0.009), 3) CHEP and Tucker/FL (p=0.008). Self-assessment: There is no correlation at all between the patient’s perception of his /her disability andperceptual parameters, MPT, quality of vibration. Acoustics: As the number of TL was not in proportion to the amount of cordectomies and as the AMPEX model was initially trained on the Ghent database (which mainly consisted out of TL-files), we added 19 additional files from the former Ghent database to the international database before performing calculations. The same 8 acoustic parameters as in the Ghent study were extracted from the text passages. Through linear combination of the acoustic features we designed a regression model and applied it on 4 of the 5 subsets (IINFVo), predicting the 5th subset. This was then compared to the subjective ratings of the clinician. Pearson correlation and standard deviation (between the
202 MAVEBA 2007

prediction and the clinician’s score) were only moderate (Pearson < 0.62; standard deviation >1.8). Fig. 2 demonstrates the values for the predictive scores and subjective scores for ‘impression of intelligibility’.
IV. DISCUSSION
The IINFVo rating scale seems to constitute a reliable tool for the perceptual assessment of substitution voices and could form a viable alternative to the GRBAS scale. In contradiction to the original reliability score conducted on the Ghent data, the analysis of the international data demonstrates that correlation between the two ‘I’s is sufficiently low (r=0.7) not to discard anyone of them. As the first I includes all features and reflects a general appreciation of the voice which is similar to the definition of Filter and Hyman, this is in agreement with their statement that ‘Intelligibility’ and ‘Acceptability’ only share 45 % common variance andthus advocate including both in a research design [10]. The highest correlations are now found between ‘Impression of Intelligibility’ and ‘Fluency’ (0.86) and between ‘General Impression’ and ‘Voicing’ (0.83). The latter supports the theory that SV are perceived asqualitatively better (General Impression) when speech is voiced and unvoiced where it is supposed to be voiced or unvoiced. The high correlation between ‘Impression of Intelligibility’ and ‘Fluency’ may support the theory that Intelligibility is mainly determined by the voicing length and fluent speech production and to a lesser extent by voicing itself. Variance analysis suggests that perception can differentiate surgery type and vibration source. Further analysis reveals that this is mainly due to the worst scores for TL patients on the parameters IIFVo and the worst scores for the CH(E)P patients on thedimension Noise. There is only a low agreement between the perceptual evaluation by professionals and the self-evaluation of the patient’s voice (the highest is for ‘Voicing’: 0.46). Together with the fact that there is no correlation at all with the perceived disability, our data could, surprisingly, suggest that oncology patients mainlysuffer from other co-morbidities (e.g. dysphagia, existence of a stoma) or psychological distress. The AMPEX acoustic analysis seems capable of differentiating between various SV types [2]. Preliminary results in this trial however, show only a moderate agreement between the predicted scores andthe subjective rating. There can be various reasons for the low concordance. First, the AMPEX model was formerly trained on mainly laryngectomy speech. Thefact that there are far more cordectomies and partial laryngectomies in the international trial can induce errors. Secondly, the subjective ratings were performed
by only one clinician. Although the clinicians had the availability of reference speech samples for each acoustic feature, there were no real training sessions preceding the rating. For this, we will compare thesubjective scores of the clinician with our personal rating and additionally with an independent jury. If the concordance with these last ratings and the AMPEX is substantially better, we advocate an intensive training of the IINFVo scale, eventually through developing an audio CD in several languages. This of course implies a large database.
Figure 1: gives an example of the perceptual parameter ‘impression of intelligibility’ and the main anatomical vibratory source.
Figure 2: concordance between the acoustically predicted scores and the perceptual evaluation, for the
parameter “impression of intelligibility”
A-laryngeal speech 203

REFERENCES
[1] PH.Dejonckere, P.Bradley, P.Clemente, G.Cornut, L.Crevier-Buchman, G.Friedrich, P.Van De Heyning, M.Remacle, V.Woisard V, “A basic protocol for functional assessment of voice pathology, especially for investigating the efficacy of (phonosurgical) treatments and evaluating new assessments techniques. Guideline elaborated by the Committee on Phoniatrics of the European Laryngological Society (ELS),” Eur. Arch. Otorhinolaryngol. 258, pp.77-82, 2001.
[2] M.Moerman, G.Pieters, JP.Martens, MJ.Van der Borgt, P.Dejonckere, “Objective evaluation of quality of substitution voices,” Eur. Arch. Otorhinolaryngol. , 261 (10), pp. 541-7, 2004.
[3] DG.Deschler, ET.Doherty, CG.Reed, JP.Anthony, MI.Singer, “Tracheoesophageal voice following tubed free radial forearm flap reconstruction of the neopharynx,” Ann Otol Rhinol Laryngol., 103, pp. 929-936, 1994.
[4] J.Robbins, H.B.Fisher, E.Blom, M.I.Singer, “A comparative acoustic study of normal, esophageal and tracheo-esophageal speech production,” Journal of Speech and Hearing Disorders, 49, pp. 202-210, 1984.
[5] WL.Cullinan, CS.Brown, PD.Blalock, “Ratings of intelligibility of esophageal and tracheoesophagealspeech,” Journal of Communication Disorders, 19, pp.185–195, 1986.
[6] ED. Blom, MI.Singer, RS.Hamaker, “A prospective study of tracheoesophageal speech,” Archives of Otolaryngology Head and Neck Surgery, 112, pp. 440–447, 1986.
[7] SE.Williams, TS.Scanio, SI.Ritterman, “Temporal and perceptual characteristics of tracheoesophagealvoice,” Laryngoscope, 99, pp. 846-50, 1989.
[8] MBJ.Moerman, JP.Martens, MJ. Van der Borgt, M.Peleman, M.Gillis, P.H.Dejonckere, “ Perceptual evaluation of substitution voices: development and evaluation of the (I)INFVo rating scale,” Eur. Arch. Otorhinolaryngol. , 263(2), pp.183-7, 2006.
[9] LM.Van Immerseel, JP.Martens, “Pitch and voiced unvoiced determination with an auditory model,” J Acoustical Society Am, 91, pp. 3511-3526, 1992.
[10]MD.Filter & M.Hyman, “Relationship of acoustic parameters and perceptual
[11]rating of esophageal speech,” Perceptual and Motor Skills, 40, pp. 63–68, 1975.
204 MAVEBA 2007

Models and analysis of vocal emissions for biomedical applications: 5th international workshop: December 13-15, 2007: Firenze, Italy, ed. by C. Manfredi,ISBN 978 88-8453-673-3 (print) ISBN 978-88-8453-674-7 (online)© Firenze university press, 2007.
PITCH CONTOUR FROM FORMANTS FOR ALARYNGEAL SPEECH
M. HagmullerSignal Processing and Speech Communication Laboratory, Graz University of Technology, Graz, Austria
Abstract: People without a larynx have to commu-nicate with a substitute voice, where all possibilitieshave major shortcomings. A common problem is thelack of a natural pitch contour. This is either becauseof a constant pitch in the case of an electro-larynx orvery limited control over pitch in case of esophagealor tracheo-esophageal speech. To introduce a morenatural pitch contour, we propose to use the speechformants as a source to generate an articial pitchcontour. Earlier ofine methods to introduce a naturalpitch contour to AL speech have shown, that thissignicantly improves the speech quality. For voicemodication, we use the voice pulse model whichenables us to place voice pulses at arbitrary positionseven when no harmonic voice source is available, whilepreserving the voice identity of the speaker. Informalperceptual evaluations showed that using a formantbased fundamental frequency yields a reasonable pitchcontour and is perceived as an improvement foralaryngeal speech.Keywords: Alaryngeal speech, pitch, formants, en-hancement
I. INTRODUCTION
In case of laryngeal cancer at an advanced stage thelast possibility to stop the further advancement of thecancer, and therefore save a patients life is to remove theentire larynx. This results in the loss of the usual voiceproduction mechanism, based on vibration of the vocalfolds. In addition the trachea is surgically moved to anopening at the neck, called the tracheostoma. As a result,the air is not passing through the vocal tract anymore.
Alaryngeal patients have then to rely on a substitutevoice production mechanism. There are three major meth-ods available:
Electro-larynx (EL): A hand held device, which is heldagainst the neck, produces a buzz-like sound andexcites the vocal tract. Through usual articulationmovements the sound source is modulated andvoiced speech sounds can be formed. Unvoicedsounds are produced as in healthy speech by usingthe air reservoir available in the mouth.
Esophageal voice (ES): Air is swallowed into theesophagus and is released again in a controlledmanner. The false vocal folds are then excited andproduce the source of the speech sound. In healthy,laryngeal speech, the false vocal folds are not used
for phonation, so the patient has to be trained to usethis substitute voice source.
Tracheo-esophageal voice (TE): A valve between thetrachea and the esophagus is surgically inserted. Thevalve allows to let the air from the lungs ow throughthe vocal tract if the tracheostoma is closed whenexhaling. The air ow through the pharynx excitesthe false vocal folds and some kind of oscillation isproduced.
All three of those voices have major shortcomings. Theelectro-larynx voice sounds very mechanical, due to themonotonous sound, which is strictly periodic at a constantpitch. The methods which excite the false vocal folds (ESand TE) have very unstable oscillation patterns, whichresult in a very rough voice. Therefore the fundamentalfrequency (F0) cannot be reliably extracted by means ofdigital signal processing methods. Further, the oscillationcannot be controlled very well, which leads to an incon-sistent pitch contour. To improve the voice one approachwould be to introduce a more natural pitch contour, butthis prosodic information has to be derived from featureother than the fundamental frequency, since this is eitherconstant, or not measurable. The esophageal voice alsosuffers from timing problems, because the amount ofair that can be swallowed limits the duration of speechphrases considerably.
This paper will rst look into related work concerningalaryngeal voice enhancement and prosody in alaryngealspeech. Then we will present a method to introduce apitch contour derived from the speech formants.
II. BACKGROUND AND RELATED WORK
A. Alaryngeal speech
Previous approaches were introducing an articial voic-ing source as a substitute for the bad voicing source ofalaryngeal speech [2], [1]. The voicing source is basedon voicing models such as the Liljencrants-Fant (LF)[5] model. A different approach for voicing substitutionwould be to use prerecorded voice samples of sufcientlength to avoid audible loops. Most benet for the patientis achievable in case it was possible to do extensive voicerecordings prior to surgery and even better prior to thevoice degradation, which in most cases is already severein case of laryngectomy. This would be the best wayto preserve the voice identity of the speaker after theoperation [7].
In [13] the prosody of alaryngeal speech has been in-vestigated. Experiments have been performed to solve the

question whether alaryngeal speakers are able to conveyprosodic information without being able to produce anF0 contour. It was shown that alaryngeal speakers doconvey prosodic information, which can be interpreted bya listener. Further, it was investigated which cues com-municate the pitch-like information. Features consideredwere high frequency intensity and spectral tilt. A majorityof the alarygeal speakers were able to convey accentinformation, without using pitch cues. The study did notshow, though, which features are used for this ’alternative’pitch.
Meltzer et al. [10] performed a study to find out whichtype of enhancement brings the most improvement toelectrolarynx speech. They investigated combinations oflow-frequency boosting, noise-reduction and natural pitch.Listening tests were used to determine the preferred modi-fication method. For the natural pitch experiment the samesentence was uttered by one person with healthy speech,first using the vocal cords and then holding the breath andusing an EL. The natural pitch contour was then appliedthe EL speech utterance. Earlier Ma et al. [9] have alsoperformed similar experiments. Both experiments showthat the substitution of the monotonous EL pitch witha natural pitch contour significantly improves EL speech.For hoarse speech, we have previously shown, that a pitchcontour in the expected frequency range a male speakersimproves the perceived quality of disordered speech [6].
Recent approaches have used energy as a feature toprovide a pitch contour for generating voicing for whis-pered [11] and esophageal speech [8]. While the energycontour may provide reasonable results for whisperedand ES speech, it does not make sense for EL speech.Electro-larynx speech is very limited in expression andenergy modulation is not possible or only very limited.Commercially available ELs, if at all, do only providetwo intensity positions. A high energy position has to beactivated manually by pressing a button. Therefore, otherfeatures have to be used to calculate a pitch contour fromthe speech signal. Taking the formants as a source for thepitch contour seems to be a useful approach.
B. Radiated Voiced Pulse Modeling
A first approach to pitch modification is of coursethe TD-PSOLA approach [12]. While this works for ELspeech, it cannot be used for ES and TE speech, since noreliable pitch mark estimation can be performed. If wewant a pitch modification system to serve as a frameworkfor alaryngeal speech in general, not only EL speech, weneed a different approach. We have chosen the radiatedvoiced pulse modeling approach by Bonada [4], which isbriefl y described below.
If the input signal y[n] consists of the sum of Ridentical input signals x[n] which are delayed by multiplesof Δn,
y[n] = x[n]+x[n−Δn]+x[n−2Δn]+. . .+x[n−(R−1)Δn]
0 1000 2000 3000 4000 5000 6000
−50
0
50
Frequency [Hz]
Am
plitu
de
abs(FFT)
0 1000 2000 3000 4000 5000 6000−6
−4
−2
0
2
4angle(FFT)
Frequency [Hz]
Pha
se
FFTPeaksInterpolated
Fig. 1. Top: Amplitude of FFT of electro-larynx speech.Bottom: Phase of FFT.
then, after some calculation, which can be found in [4],we find that
Y (ejΩ) = X(ejΩ)ejΩΔnR−1
2
sin(0.5ΩΔnR)
sin(0.5ΩΔn)≡
≡ X(ejΩ) sincR(ΩΔn).
The effect of sincR term is that the spectrum of X(ejΩ) issampled. If we assume that the X(ejΩ) only varies slowlywe can estimate X ′(ejΩ) from Y (ejΩ) by interpolatingthe harmonic peaks (see figure 1). The full derivation ofthis assumption including how the phase is dealt with canbe found in [4].
So if the harmonic peaks are interpolated and trans-formed back into the time domain, one can reconstruct thevoice pulses, which were filtered by the vocal tract andradiated by the mouth (see figure 2). The reconstructedpulses can be placed at arbitrary positions, similar to TD-PSOLA [12], while introducing the possibility of complexmodifications. Another advantage of the voiced pulsemodel is, that no pitch marks are needed for the analysisof the signal.
The above method formed the basis of an enhancementapproach for esophageal speech [8]. Since in esophagealspeech harmonic peaks cannot be reliably determinedthe spectral envelope is determined by using a bankof constant bandwidth filters. The phase is derived bysmoothing, shifting and scaling the magnitude envelopeof the spectrum.
The next section will describe the procedure, how theenhancement system for electro-larynx speech is imple-mented.
206 MAVEBA 2007
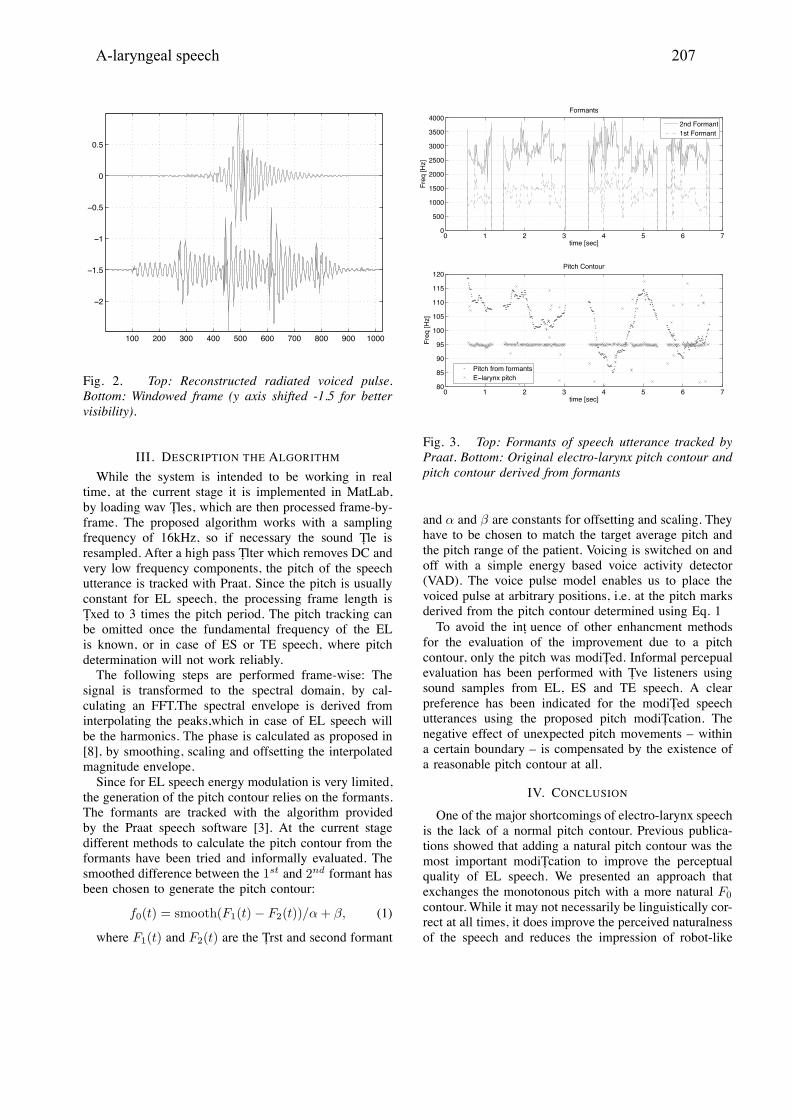
100 200 300 400 500 600 700 800 900 1000
−2
−1.5
−1
−0.5
0
0.5
Fig. 2. Top: Reconstructed radiated voiced pulse.Bottom: Windowed frame (y axis shifted -1.5 for bettervisibility).
III. DESCRIPTION THE ALGORITHM
While the system is intended to be working in realtime, at the current stage it is implemented in MatLab,by loading wav files, which are then processed frame-by-frame. The proposed algorithm works with a samplingfrequency of 16kHz, so if necessary the sound file isresampled. After a high pass filter which removes DC andvery low frequency components, the pitch of the speechutterance is tracked with Praat. Since the pitch is usuallyconstant for EL speech, the processing frame length isfixed to 3 times the pitch period. The pitch tracking canbe omitted once the fundamental frequency of the ELis known, or in case of ES or TE speech, where pitchdetermination will not work reliably.
The following steps are performed frame-wise: Thesignal is transformed to the spectral domain, by cal-culating an FFT.The spectral envelope is derived frominterpolating the peaks,which in case of EL speech willbe the harmonics. The phase is calculated as proposed in[8], by smoothing, scaling and offsetting the interpolatedmagnitude envelope.
Since for EL speech energy modulation is very limited,the generation of the pitch contour relies on the formants.The formants are tracked with the algorithm providedby the Praat speech software [3]. At the current stagedifferent methods to calculate the pitch contour from theformants have been tried and informally evaluated. Thesmoothed difference between the 1st and 2nd formant hasbeen chosen to generate the pitch contour:
f0(t) = smooth(F1(t) − F2(t))/α + β, (1)
where F1(t) and F2(t) are the first and second formant
0 1 2 3 4 5 6 70
500
1000
1500
2000
2500
3000
3500
4000
time [sec]
Fre
q [H
z]
Formants
0 1 2 3 4 5 6 780
85
90
95
100
105
110
115
120
time [sec]
Fre
q [H
z]
Pitch Contour
2nd Formant1st Formant
Pitch from formantsE−larynx pitch
Fig. 3. Top: Formants of speech utterance tracked byPraat. Bottom: Original electro-larynx pitch contour andpitch contour derived from formants
and α and β are constants for offsetting and scaling. Theyhave to be chosen to match the target average pitch andthe pitch range of the patient. Voicing is switched on andoff with a simple energy based voice activity detector(VAD). The voice pulse model enables us to place thevoiced pulse at arbitrary positions, i.e. at the pitch marksderived from the pitch contour determined using Eq. 1
To avoid the infl uence of other enhancment methodsfor the evaluation of the improvement due to a pitchcontour, only the pitch was modified. Informal percepualevaluation has been performed with five listeners usingsound samples from EL, ES and TE speech. A clearpreference has been indicated for the modified speechutterances using the proposed pitch modification. Thenegative effect of unexpected pitch movements – withina certain boundary – is compensated by the existence ofa reasonable pitch contour at all.
IV. CONCLUSION
One of the major shortcomings of electro-larynx speechis the lack of a normal pitch contour. Previous publica-tions showed that adding a natural pitch contour was themost important modification to improve the perceptualquality of EL speech. We presented an approach thatexchanges the monotonous pitch with a more natural F0
contour. While it may not necessarily be linguistically cor-rect at all times, it does improve the perceived naturalnessof the speech and reduces the impression of robot-like
A-laryngeal speech 207

FormantTracking
VPM
Placing ofVoice Pulses
PitchCalculation
Pitch MarkDetermination
VAD
Modified Speech
Original Speech
Fig. 4. Block diagram of electro-larynx enhancementsystem based on voiced pulse modelling.
characteristics especially for EL speech.
Further work
Further research on correct prosody has still to becarried out and is expected to yield an improved under-standing of how ’pitch’ accent is conveyed in alaryngealspeech.
A further shortcoming of EL speech is, that there isno appropriate distinction between voiced and unvoicedsounds. At the moment the whole speech utterance istreated as voiced. A step further would be to introducea distinction between voiced and unvoiced and treatingthem accordingly. A V/UV classifier is needed which isable to correctly label EL speech. Then unvoiced soundscan be left unmodified.
Further work is necessary to improve the sound quality,while preserving the identity of the voice. This includesnoise reduction to suppress the directly radiated noise.This is the energy which is omitted from the EL directlyin the air and is not modulated by the vocal tract.
V. ACKNOWLEDGMENT
This research has been partially supported by the Eu-ropean COST Action 2103.
REFERENCES
[1] Rym Haj Ali and Sofia Ben Jebara. Esophagealspeech enhancement using excitation source syn-thesis and formant patterns modification. In Proc.Int. Conf. on Signal-Image Technology & InternetBased Systems (SITIS), pages 615–624, Hammamed,Tunesia, December 17–21 2006.
[2] Ning Bi and Yingyong Qi. Application of speechconversion to alaryngeal speech enhancement. IEEETransactions on Speech and Audio Processing, 5:97–105, 1997.
[3] Paul Boersma and David Weenink. Praat ver. 4.06,software, downloaded from http://www.praat.org,2007.
[4] Jordi Bonada. High quality voice transformationsbased on modeling radiated voice pulses in fre-quency domain. In Proceedings of 7th InternationalConference on Digital Audio Effects, Naples, Italy,5-8 October 2004.
[5] G. Fant, J. Liljencrants, and Q.-G. Lin. A fourparameter model of glottal fl ow. Technical ReportSTL-QPSR Nos. 2-3, Royal Institute of Technology,Stockholm, Sweden, 1985.
[6] Martin Hagmuller, Horst Hering, Andreas Kropfl ,and Gernot Kubin. Speech watermarking for airtraffic control. In Proc. of 12th European SignalProcessing Conference, pages 1653–1656, Vienna,Austria, September 6–10 2004.
[7] K.M. Houston, R.E. Hillman, J.B. Kobler, and G.S.Meltzner. Development of sound source compo-nents for a new electrolarynx speech prosthesis.In Acoustics, Speech, and Signal Processing, 1999.ICASSP ’99. Proceedings., 1999 IEEE InternationalConference on, volume 4, pages 2347–2350, 1999.
[8] A. Loscos and J. Bonada. Esophageal voice en-hancement by modeling radiated pulses in frequencydomain. In Proceedings of 121st Convention ofthe Audio Engineering Society, San Francisco, CA,USA, October 3-6 2006.
[9] Kun Ma, Pelin Demirel, Carol Espy-Wilson, andJoel MacAuslan. Improvement of electrolaryngealspeech by introducing normal excitation informa-tion. In Proceedings of the European Conferenceon Speech Communication and Technology, pages323–326, Budapest, Hungary, September 1999.
[10] Geoffrey S. Meltzner and Robert E. Hillman. Impactof aberrant acoustic properties on the perception ofsound quality in electrolarynx speech. J Speech LangHear Res, 48(4):766–779, August 2005.
[11] Robert W. Morris and Mark A. Clements. Re-construction of speech from whispers. MedicalEngineering & Physics, 24(7-8):515–520, 2002.
[12] Eric Moulines and Jean Laroche. Non-parametrictechniques for pitch-scale and time-scale modifica-tion of speech. Speech Communication, 16:175–205,1995.
[13] M. A. van Rossum, G. de Krom, S. G. Nooteboom,and H. Quene. ’Pitch’ accent in alaryngeal speech.Journal of Speech, Language and Hearing Research,45:1106–1118, December 2002.
208 MAVEBA 2007

Newborn infant cry


Models and analysis of vocal emissions for biomedical applications: 5th international workshop: December 13-15, 2007: Firenze, Italy, ed. by C. Manfredi,ISBN 978 88-8453-673-3 (print) ISBN 978-88-8453-674-7 (online)© Firenze university press, 2007.
Abstract: An acoustic cry analysis using frequency andtime-frequency tools is developed with the objective ofobtain precise and significant information about theevents that occur and to analyze the effect of noise on the signals. For hungry baby cry signals, spectrogram,coherence function and wavelet packet decompositionwere used on sonorant and non sonorant segmentsand de-noising techniques were applied to remove theunwanted components. Results show that it can beuseful to use those techniques to perform a betteranalysis of the signal and to eliminate the noise, butthe final assessment has to come from the physician’spoint of view.Keywords: Cry analysis, Spectrogram, CoherenceFunction, De-noising, Wavelet Packets
I. INTRODUCTION
Crying can be seen as a complex and dynamicbiological phenomenon. It involves vocalization features,facial expressions and limb movements, all of which mayvary over time. As a signal, crying can be considered as aset of functions that characterizes the acoustic events thatit comprises and the resulting analysis happens to be quitecomplex. Some components appear as a consecutive setof pure tones in a certain type of arrangement whileothers are a mix of noise components and tones, all ofthem happening in different periods of time.
Efforts in crying research to look for possiblerelationships between the cry and the condition of thesubject, mainly babies and infants have been addressing.For example, some studios aim to the effect of age on the measurement of pain in babies by the acoustic analysis of the signal [a] while others are focused on use the crying as an additional means of finding the degree of braindamage in children with malnutrition [b]. The classic toolused to crying analysis has been the sound spectrogram,but in recent years sophisticated frequency and time-frequency techniques have been proved to be efficient onthe acoustic analysis of signals as speech and music.
This paper presents acoustic cry analysis usingfrequency and time-frequency analysis tools in order toobtain precise and significant information about theevents and to analyze the effect of noise on the signals.Compared to the spectrogram, the coherence function andthe wavelet packet type of time-frequency representationare considered.
ANALYSIS OF NOISE IN CRY SIGNAL USING FREQUENCY AND TIME-FREQUENCY TOOLS
F. M. Martínez1, J. J. Azpiroz2, A. E. Martínez11Department of Electrical Engineering, Universidad Autónoma Metropolitana-Iztapalapa, Mexico
2 Medical Imaging and Instrumentation Center, Universidad Autónoma Metropolitana-Iztapalapa, Mexico
II. METHODOS
In this section data aspects and frequency and time-frequency methods are presented. The complete analysis was developed in Matlab.
A. Data
Crying signals are difficult to record; the environmentconditions does not allow to control the noise that arise from the people’s voice, especially the mother, theincidental sounds of the surroundings and even the lack of cooperation of the baby. It has to be noticed that theconditions under recording are uncomfortable for him/her. Long recording sessions (up to a minute) aresuitable for the analysis, however it is not always possibleto achieve; and the classification of the cry is not clear when a possible illness is considered. Baby cry signalstaken from [c] were used for the analysis
B. Spectrogram and Coherence Function
Spectral signal analysis focuses on the relationshipsamong frequency components. Historically the soundspectrogram has been the major tool for analyzing theacoustics of cry [d]. The spectrogram algorithm usuallysplits the signal into overlapping segments by applying a fixed-length window (N). For each segment the discrete-time Fourier transform is calculated, in order to producean estimate of the short-term frequency content, or spectra. The algorithm is repeated iteratively and thespectra are collected to form the spectrogram which is computed from
kky N
kC 22 2(1)
where y is the power density spectrum for aperiodic signal y(n), while Ck are the associated coefficients [e]. The set of parameters used is thefollowing:- sampling frequency = 22050 KHz- nfft = 256- hamming window of nfft length- no overlap between windows.

The coherence function (CF) is a measurement of the
linear dependence between two signals as a function of frequency. It is defined in terms of power spectral densities and the cross spectral density by
( )( )
( ) ( )wRwR
wRwC
yx
xyxy
2
= (2)
where , are autocorrelation functions of
processes X and Y, and
( )wRxx ( )wRyy
( )wRxy is the cross correlation function between both processes [f]. It evaluates how correlated X and Y are in each frequency; the highest coherence function points to a very important presence of this frequency in the signals to be analyzed. CF was obtained from a set of 256 coefficients that covered the frequency bandwith with the use of a Hamming window with no overlap.
C. Time-Frequency decomposition and de-noise
Time-Frequency representations (TFR) allow to see the behavior of a signal in both domains at the same time; although the spectrogram is a kind of TFR, it is based on sine and cosine functions and has important constraints in terms of solving sudden changes or other events. Wavelets are special functions that can provide the TF resolution needed. The wavelet functions can be converted in packets (WP) by setting its time and frequency values and a minimal representation of the data can be obtained by calculating the "best basis", a set of WP selected from applying a particular cost function. The "best basis" is used in applications that include noise reduction and data compression.
The model for the noisy signal is basically of the following form:
s n (3) ( ) = f n( ) + ûe n( )
where time n is equally spaced. The basic model supposes that e(n) is a Gaussian white noise N(0,1) and the noise level is supposed to be equal to 1. The de-noising objective is to suppress the noise part of the signal s and to recover f. De-noising can be accomplished via wavelet-based shrinkage methods. These techniques use wavelets to transform data into a different basis [g]; large coefficients correspond to the signal, and small ones represent mostly noise. The de-noised data is obtained by inverse-transforming the suitably thresholded, or shrunk, coefficients. The threshold can be hard or soft. Hard thresholding can be described as the process of setting to zero the elements whose absolute values are lower than the threshold. Soft thresholding first sets to zero the elements whose absolute values are lower than the threshold, and then shrinks the nonzero coefficients
towards 0. Eight degree Daubechies wavelet was used for a five level WP decomposition with Shannon entropy as cost function. De-nosing was performed by using a sparse norm setting a soft threshold level of 0.4345.
III. RESULTS
Coherence function (CF) was applied to several cry signals in order to get those frequencies highly related, but in most of the cases very low values were found in the complete frequency domain. Signals were segmented by hand and sonorant and non sonorant segments were isolated and analyzed with the CF. Tables 1 and 2 show the resulting values for a hungry baby cry signal. It can be seen that sonorant segments show more correlation than non sonorant ones, although they still have low values; this behavior was repeated in all the crying classes. When low values in CF results are found, several reasons can be addressed. The presence of uncorrelated noise on the signals is a possibility due to the different conditions that makes difficult to record a baby crying; environment components as the sound of the mother´s voice, the baby movements or the record procedure affects the quality of the signal obtained.
In order to assess any possible noise effect, the spectrogram of a non sonorant segment and its WP decomposition were obtained. This segment was de-noised using a Daubechies wavelet and the resulting recovered signal was obtained. To compare the difference, spectrograms of both, original and de-noised signals, were also obtained. Fig.1 shows the hungry baby cry signal, a non sonorant segment and its de-noised version spectrograms, as well as their time versions. It can be seen how the most predominant components are kept in the de-noised signal, but the decomposition also shows high frequency components that are absent on the original signal. In order to visualize the eliminated components, that in certain way can be considered as the noise embedded, the spectrogram of the de-noised and the residual segments are shown in Fig. 2. It is observed that there are high energy components present in both signals and high frequency noise in the residual.
Table 1. Maximal coherence function value of sonorant
segments in a hungry baby cry signal
Sonorant segments
Frequency Coherence Function value
1st – 2nd 1895 0.3239 1st – 3rd 1895 0.4644 1st – 4th 8355 0.1238 1st – 5th 861 0.1248 1st – 6th 8355 0.1938

IV. DISCUSSION Table 2. Maximal coherence function value of non sonorant segments in a hungry baby cry signal
To assess noise presence in a signal where high frequency components are present is not an easy task. It is common to find some noised components assigned to the crying signal and in the spectrogram is not clear where the boundary between both components is. The use of a de-noise technique would allow to identify those noisy components. A noise eliminating method was applied to a segment of crying signal and the resulting de-noised version presented some high frequency components that apparently were absent on the original signal; it can be seen it as a confirmation of the presence of a noise that covered those components, but more experimentation must be done in order to have certitude.
Non Sonorant segments
Frequency Coherence Function value
1st – 2nd 2584 0.1872 1st – 3rd 775 0.2223 1st – 4th 9474 0.1121 1st – 5th 0 0.3237
The selection of the best basis function as well as the de-noising settings is a problem to contend with in this application. In the experiments an eight order Daubechies wavelet was used because it presented adequate properties like to be compactly supported or to have the capability of getting an exact reconstruction; some other wavelets, as symmlet or coiflet, have the same features and their shapes result interesting to use in the analysis of a non sonorant component. Shannon entropy was applied to obtain the WP decomposition and a sparse thresholding method set the de-noise procedure; some other WP de-noise configurations are possible. Although time-frequency analysis shows important improvements on the visualization and processing of the signals, the spectrogram representation is still a useful tool for the detection of trends on the components and, as in this case, to compare the de-noised signals to the original ones.
Fig.1 De-noising analysis of a hungry baby cry signal: a) spectrogram of the complete signal, b) original and de-noised non sonorant segment, c) non sonorant segment spectrogram, d) de-noised non sonorant segment spectrogram
V. CONCLUSION
Frequency and time-frequency analysis were carried
out on non sonorant segments of crying signals. Spectrogram and coherence function showed the presence of noise components and the use of a de-noised method based on the wavelet packet decomposition was applied. Results show that it can be useful to use both techniques to perform a better analysis of the signal. Wavelet decomposition and de-noising techniques have proved to be effective in eliminating unwanted components, but the final assessment has to come from the physician’s point of view. In order to achieve a suitable generalization of the techniques, the data set must be augmented and reference signals have to be considered.
REFERENCES Fig.2 Spectrograms of a) de-noised and b) residual of a non sonorant segment from a hungry baby cry signal
[a] P. Runefors, E. Arnbjörnsson, “A Sound Spectrogram Analysis of Children´s Cying after Painful Stimuli during the First Year pf Life”, Foli Phoniatrica et Logopaedia, Vol.57, No. 2, pp. 90-95, 2005.

[b] K. Juntunen, P. Sirviö, K. Michelsson, “Cry analysis in infants with severe malnutrition”, European Journal of Pediatrics, Vol. 128, No. 4, pp.241-246, 1978. [c] C.A. Reyes, Estudio de las Características Acústicas del Llanto de Bebes para su Aplicación al Reconocimiento Automático del Tipo de Llanto y la Detección de Patologías, INAOE México 2002. [d] C. Guzzo Jr, J. Demarest, M.L. Cannon, “The Cry Spectrogram”, Journal of Med. Soc. NJ, Vol. 80, No.2, pp. 100-107, 1983.
[e] A.V. Oppenheim, and R.W. Schafer, Discrete-Time Signal Processing, Prentice-Hall, Englewood Cliffs, NJ, 1989, pp. 713-718. [f] S.M. Kay, Modern Spectral Estimation, Englewood Cliffs, NJ: Prentice-Hall, 1988. Pg.454. [6] Signal Processing Toolbox (6.7) User´s Guide, The Math Works, Natick, MA, 2007. [7] Wavelet Toolbox (4.07) User´s Guide, The Math Works, Natick, MA, 2007.

Models and analysis of vocal emissions for biomedical applications: 5th international workshop: December 13-15, 2007: Firenze, Italy, ed. by C. Manfredi,ISBN 978 88-8453-673-3 (print) ISBN 978-88-8453-674-7 (online)© Firenze university press, 2007.
BLOOD OXYGENATION VS CRY IN PRETERM NEWBORN INFANTS
L.Bocchi, L.Spaccaterra1, S.Orlandi, F.Acciai, F.Favilli, E.Atrei1, C.Manfredi and G.P.Donzelli1
Department of Electronics and Telecommunications, Università degli Studi di Firenze, Firenze, Italy 1 Department of Pediatrics, AOU A. Meyer – Università degli Studi di Firenze, Firenze, Italy
Abstract: Crying is a physiological action made by the infant to communicate and to draw attention. However, especially for a premature infant, this action requires great effort, which may even have an adverse impact on blood oxygenation. In this work we present first results concerning the evaluation of the distress occurring during cry, as related to possible decrease of cerebral oxygenation. A recording system has been developed, that allows synchronised monitoring of the central blood oxygenation and the audio recording of newborn infant’s cry. A multi-purpose voice analysis tool (BioVoice), characterised by high resolution and tracking capabilities, is applied to new-born infant cries. For these signals, the tool provides also detailed statistics (min and max cry length, maximum energy, etc.), to help diagnosis. BioVoice is completely automatic, working with any sampling frequency and F0, and does not need any manual setting of whatever optionto be made by the user, thus being easily accessible also to non-experts. Some examples are reported, concerning preterm new-born infants. Keywords: newborn cry, blood oxygenation, voice analysis.
I. INTRODUCTION
Infant monitoring in neonatal critical care units is a common procedure in clinical practice. The cerebralblood flow in preterm and full-term newborn infants has been studied extensively, as newborn infants have an impaired auto regulation of the cerebral blood flow. Irregularities in the blood flow and pressure may adversely influence the growth of the child. Some studies have been performed in order to evaluate the blood flow and oxygenation in the newborn by Near Infrared Spectroscopy (NIRS), also as linked to other techniques [1]-[6]. In newborn infants, one of the most common events that may affect the respiratory flow is related to cry. Crying is a physiological action made by the infant to communicate and to draw attention. It involves coordinated actions of many muscles of abdomen, chest, throat and head. This apparatus is obviously controlled by the central nervous system (CNS). Specifically, for a premature infant, crying requires great effort, which may cause distress. Also, preterm
and/or low-birth-weight infants often present respiratory problems, ranging from insufficient ventilation to apnoea, and hence crying implies an effort which may have an adverse impact on blood oxygenation. Acoustic analysis of new-born infant cry signals is thus of importance, as a precocious aid to clinical evaluation of several CNS pathologies. Being easy to perform, cheap and completely non-invasive, it can be successfullyapplied in many circumstances [8]-[14]. A robust high-resolution software tool is proposed here, to track main acoustic parameters of newborn cry. Possible relationship among some cry parameters anddistress is investigated, as related to the decrease of cerebral oxygenation. To this aim, a new recording system has been developed, that allows synchronisedmonitoring of the central blood oxygenation and theaudio recording of infant’s cry emissions. Preliminary results on a data set of 9 preterm infants indicate that in some cases the effort in crying isassociated with a noticeably decrease in the oxygenation level during a cry episode.
II. METHODS
Central blood saturation has been measured with NIRS device (somasensors by INVOS 5100C Somanetics Corp.), that allows for acquiring 1 sample each 5s. A unidirectional microphone (Shure SM58), equipped with US-144 portable audio / MIDI interface (96 kHz / 24-bit recording) has been used to record cry emissions. Audio recording was performed using a multimedia notebook which acquired a single channel audio track, with a sampling rate of 44 kHz and 16 bit resolution. Specific software has been designed and implemented, to allow synchronization with the NIRS device, using a digital output linking the laptop with the input of the NIRS instrument. The software performs a simultaneous recording of the audio channel trough the US-144 board and of the NIRS signal using a RS-232 connection. The NIRS signal is composed of up to four independent channels, each made up of two data, one containing the relative saturation of oxygen, and the other representing the quality of the signal, which can be useful to detect possible artifacts related to patient movement or poor contact of the sensor with the patient. Due to different sampling rates for NIRS and for audio signals, the range for audio analysis is adjusted to the nearest second in the corresponding NIRS recording.As for audio signal analysis, a multi-purpose voice

analysis tool (BioVoice) allows for new-born infant cry analysis, performing F0, noise and resonance frequencies tracking, on signal frames of varying length (even few ms), adaptively tailored to varying signal characteristics. Details are given below. Fundamental frequency F0 - Newborn infant cry is characterised by high fundamental frequency F0 (>300Hz), with abrupt changes and voiced/unvoiced features of very short duration within a single utterance. For analysis, the signal is divided into short frames, whose length adaptively varies according to varying signal characteristics: the higher the F0 the shorter the frame length (kept fixed to 3 pitch periods). A voiced/unvoiced (V/UV) separation algorithm is implemented, to avoid F0 estimation on signal frames that have no harmonic content, where misleading results could be obtained [7]. F0 tracking is achieved by means of a two-step procedure, based on well-established results: the AMDF approach is applied to a wavelet-smoothed SIFT estimation of F0, with optimised and varying adaptive filter order [8]-[10]. Resonance frequencies Fi - Even if vowel frequencies cannot be found in newborn cry, RFs reflect important acoustical characteristics of the vocal tract of the infant. Robust and high-resolution RF estimation is implemented, based on parametric AutoRegressive (AR) PSD evaluation. The AR model order p is automatically selected by the program, according to the relationship: p=2LFs/c, where: Fs=sampling frequency, L=vocal tract length, and c=sound speed [9]. The BioVoice tool is provided with a user-friendly interface (Fig. 1) that allows selecting age, sex and type of vocal emission for each patient, performing computations without any other requirement. The tool automatically adjusts internal settings for optimal frame length, frequency range of analysis and plots. Specifically, the interface allows for: – selecting data (.wav files); – choosing the voice type, ranging from high-pitched
new-born and singers voices to adult voices: the overall allowed F0 range is 40Hz<F0<1300Hz;
– selecting the kind of analysis: single audio file or two files (for comparison purposes).
A notice is added concerning computer time required: for long files (>5s) and high sampling frequency (>40 kHz) the total time could approach 5min in total. A moving bar shows the residual time during computations. A number of ad hoc plots and tables is displayed and saved in printable format, for a visual comparison of results. Specifically, for infant cry, F0, V/UV frames, spectrogram, resonance frequencies are plotted, all in coloured map. Some tables summarise mean, std, max, min values for F0 and F1-F3, as well as cry length and the corresponding maximum energy. These parameters are in fact considered among the most meaningful in newborn cry analysis [8]-[12].
Figure 1 – The user interface for acoustic analysis
III RESULTS
Infants were selected by physicians among patients at the Critical Care Unit of the Children Hospital A.Meyer, in Firenze, Italy. The analysis has been carried out on a group of 9 preterm infants, having a pregnancy period ranging from 23 to 38 weeks and a weight at birth between 590g and 3020g. No relevant pathology was found among the analysed infants. An example is reported, concerning a newborn infant with pregnancy period of 38 weeks and a birth weight of 3020g. The birth was spontaneous. A suspected congenital cardiopathy has been pointed out by clinicians. From our previous studies, the effect of crying seems much larger on central blood saturation than on peripheral saturation. Moreover, tracking the saturation level pointed out an increase of saturation after the episode, which means that the nervous system tries to compensate the loss of oxygen due to crying [14]. The example reported, though relative to an almost full-term newborn, allows pointing out possible distress due to crying, as evidenced by some voice parameters (mainly cry length, F0 melody and RFs), corresponding to a drop in oxygenation levels. For printing reasons, we report here only a subset of the available figures, in a grey scale. Figure 2 shows the plot of the NIRS values (% as referred to saturation) for about 27min of recording, extracted form a longer period. Actually, the new tool allows for simultaneous recording of both NIRS and cry on a range of several hours. As shown in the figure, a remarkable decrease of RO2 occurs around the time instants 0:08:35, 0:15:35 and in the interval 0:21.15-0:24:15, all corresponding to cry episodes, automatically marked by the software. Specifically, the interval 0:23:01-0:23:04 is considered here, and indicated by the arrow in Fig.2. Fig. 3 shows the V/UV parts of the cry episode, as found by the BioVoice tool. An UV segment was found in the range (1.58s-2.3s).

Table 1 reports the information about V/UV segments of the cry that could be of relevance for diagnosis.
Figure 2 – NIRS tracking with a marker for the cry
episode in the interval 0:23:01-0:23:04
0000 0.50.50.50.5 1111 1.51.51.51.5 2222 2.52.52.52.50000
0.10.10.10.1
0.20.20.20.2
0.30.30.30.3
0.40.40.40.4
0.50.50.50.5
0.60.60.60.6
0.70.70.70.7
0.80.80.80.8
0.90.90.90.9
1111
Time [s]Time [s]Time [s]Time [s]
No
rma
lize
d p
ea
k va
lue
sN
orm
aliz
ed
pe
ak
valu
es
No
rma
lize
d p
ea
k va
lue
sN
orm
aliz
ed
pe
ak
valu
es
Voiced and unvoiced parts of the signalVoiced and unvoiced parts of the signalVoiced and unvoiced parts of the signalVoiced and unvoiced parts of the signal
Figure 3 – V/UV parts of the cry signal
TABLE 1 – V/UV characteristics
Fig. 4 shows F0 tracking, performed on the voiced parts of the signal only. F0 is characterized by almost regular rising and falling shape, typical of the newborn infant cry melody. However, notice shorter time duration of each utterance (<1s), and lower F0 mean value, as compared to healthy cry [9]-[14]. In Fig. 5, the spectrogram with the tracking of the first three RFs superimposed is displayed. Notice the almost irregular shape for the RFs, the 3rd one being almost unrecoverable. Moreover, RFs are set to lower frequencies with respect to the healthy cry [9]-[14], as shown in Table 2, where the maximum energy of the signal is also reported. This could be due to the still incomplete vocal tract structure in the newborn, as well as to his/her possible CNS dysfunction. The analysis also suggests that physiological compensation systems are not able to maintain the level of blood oxygenation during crying episodes.
Figure 4 – Fundamental frequency tracking
0000 0.50.50.50.5 1111 1.51.51.51.5 2222 2.52.52.52.50000
1000100010001000
2000200020002000
3000300030003000
4000400040004000
5000500050005000
6000600060006000
7000700070007000
8000800080008000
9000900090009000
10000100001000010000
Time [s]Time [s]Time [s]Time [s]
Fre
qu
en
cy [
Hz]
Fre
qu
en
cy [
Hz]
Fre
qu
en
cy [
Hz]
Fre
qu
en
cy [
Hz]
Spectrogram and resonance frequenciesSpectrogram and resonance frequenciesSpectrogram and resonance frequenciesSpectrogram and resonance frequencies
-70-70-70-70
-60-60-60-60
-50-50-50-50
-40-40-40-40
-30-30-30-30
-20-20-20-20
-10-10-10-10
0000
10101010
20202020
30303030
Figure 5 – Spectrogram and resonance frequencies F1-
F3

TABLE 2 – Summary of main statistics of F0 and for RFs F1-F3, along with maximum power.
IV FINAL REMARKS
First results have been presented, concerning the evaluation of the distress occurring during cry, asrelated to possible decrease of cerebral oxygenation. To this aim, the relationship among some cry parameters and the decrease of cerebral oxygenation is investigated. A synchronisation system has been developed, that allows simultaneously acquiring the central blood oxygenation and the audio recording of infant’s cryemissions. A new robust tool for new-born infant cry analysis is presented. Being completely automatic, the proposed software can be successfully used in a wide range of applications, also in case of highly varying signals, without requiring any manual setting to bemade by the user. Preliminary results on a data set of 9 preterm infants indicate that in some cases the effort in crying isassociated with a noticeably decrease in the oxygenation level during a cry episode and to abnormal cry parameters. Future work will concern adding more parameters foraudio signals analysis, as well as further optimising existing ones. A data base is under construction, in co-operation with the Children Hospital A. Meyer, Firenze, Italy, with the aim of searching for possible correlations also among other signals, such as ECG and peripherical blood oxygenation, as a non-invasive aid to diagnosis.
V REFERENCES
[1] Pryds O. & Edwards, A.D. (1996).Cerebral blood flow in the newborn infant. Archives of Disease in Childhood: fetal and neonatal edition,74(1), 63-69.
[2] Van De Bor M. & Walther F.J.(1991). Cerebral blood flow velocity regulation in preterm infant. Biology of the Neonate, 59, 329-335.
[3] Perry, E.H., Bada H.S., Ray J.D., Korones S.B., Arheart K. & Magill H.L. (1990). Blood pressure increases, birth weigh-dependent stability boundary, and intraventricular haemorrhage. Pediatrics, 85, 727-732.
[4] Friis - Hansen B. (1985). Perinatal brain injury and cerebral blood flow in newborn infant. Acta Paediatrica Scandinavica, 74, 323-331.
[5] Delpy DT., Cope MC., Cady EB, Wyatt JS.,Hamilton PA., Hope PL, Wray S. & Reynolds EO.(1987).Cerebral monitoring in newborn infants by magnetic resonance and near infrared spectroscopy. Scandinavian Journal of Clinical Laboratory Investigation,188, 9-17.
[6] Fort, A. Ismaelli, C. Manfredi, P. Bruscaglioni, “Parametric and non parametric estimation of speechformants: application to infant cry”, Medical Engineering and Physics, vol.18, n.8,pp.677-691, 1996.
[7] J.D.Markel,“The SIFT algorithm for fundamental frequency estimation”, IEEE Trans. Audio & Electroac,20, pp.367-377, 1972.
[8] Fort, C. Manfredi, “Acoustic analysis of new-born infant cry signals”, Medical Engineering and Physics, vol.20, n.6, pp.432-442, 1998.
[9] K. Wermke, W. Mende, C. Manfredi, P. Bruscaglioni, "Developmental Aspects of infant’s Cry melody and Formants", Medical Engineering and Physics, vol.24, n.7-8, pp..501-514, 2002.
[10]Manfredi, V. Tocchioni, L. Bocchi, “A robust tool for newborn infant cry analysis”, 28th Annual Int. Conf. IEEE EMBS, Aug.30- Sept. 3, 2006, New York City, U.S.A. (CD-ROM).
[11]R. Nicollas, M. Ouaknine, A. Giovanni, J. Berger, J.P. To, D. Dumoulin, J.M. Triglia, ” Physiology ofvocal production in the newborn”, in Proc. 3rd Int. Workshop MAVEBA, Firenze, Italy, 10-12 December 2003, pp. 51-54.
[12]D. Escobedo, S. Cano, E. Collo, L. Regueiferos, L.Capdevila, “Rising shift of pitch frequency in the infant cry of some pathologic case”, in Proc. 2nd
Int. Workshop on Models and Analysis of Vocal Emissions for Biomedical Applications, Firenze, Italy, September 2001 (CD-ROM).
[13]http://www.disat.unimib.it/bioacoustics/it[14]L. Bocchi, L. Spaccaterra, F. Favilli, L. Favilli, E.
Atrei, C.Manfredi, G.P. Donzelli, “Monitoring of preterm infants during crying episodes”, 11th
Mediterranean Conference MEDICON 2007, Ljubljana, Slovenia, June 26-30, 2007.
ACKNOWLEDGMENTS
This work has been partially supported by “Ente Cassa di Risparmio di Firenze”, under the project: n. 2006.1517 "Analisi di segnali ed immagini vocali per applicazioni biomediche", 2007, and by COST Action 2103 “Advanced voice function assessment”.
218 MAVEBA 2007

Models and analysis of vocal emissions for biomedical applications: 5th international workshop: December 13-15, 2007: Firenze, Italy, ed. by C. Manfredi,ISBN 978 88-8453-673-3 (print) ISBN 978-88-8453-674-7 (online)© Firenze university press, 2007.
Abstract: The paper assumes the implementation of acry-based classifier for neonatal diagnosis. The maincontribution is concerned with the articulatedprocessing of cry signals, which includes two kinds ofapproaches: a threshold-based classification andANN-based classification. Every one of thoseapproaches makes its own contributions to the cryclassification, both are adequately combined in aclassifier of two-class (pathological and normal).Moreover the use of cry unit as a primary data wasalso an interesting aspect held by the authors. Thisarticulated cry processing is the main body of a newcry-based methodology for neonatal diagnosis, whichwill be presented in a few months by the Group ofSpeech Processing in Cuba.
Keywords: cry analysis, neural networks
I. INTRODUCTION
Since the use of new approaches like ANN´s have beenapplied for cry classification the possibility to make acry-based diagnosis in newborns has become in reality[1-3] [17]. In this paper the state-of-art in cry analysisand new focus of soft computing have been properlycombined, leading up to a suitable articulated processingof the cry signals oriented for a neonatal diagnosis. As itis explained in the main body of paper five specific formsof processing are articulated in one: (1) a digital signalprocessing (acoustic cry parameters extraction and Melfrequency cepstral coefficient (MFCCs) estimation), (2)data management (BDLllanto: a Cuban corpus of crysignals), (3) principal component analysis (PCA), (4)neural network –based classification and (5) a threshold-based decision.
II. METHODS
The basis of the research work was based on thephysioacoustic model for cry production and the Golub’smuscle control model. As it was mentioned above twoclassification approaches are properly articulated 2-in-1:
(1) Threshold-based classifier: the threshold values offour cry features for normality are considered [5-9] [16]:
Voicedness: the ratio of the amount of periodic soundversus the amount of noise. (the higher the voicedness,
the weaker the noise component in comparison to theperiodic sound).Melody: the performance of fundamental frequency overtime, within one cry unit.Stridor: a rapid increase in air pressure causes the vocalcords to enter a turbulent state resulting in a sudden lossof pitch.Shift: a sudden large change in pitch
The procedures for the computation of those attributes arethe same suggested by Cano et al [17] in 2006.
Cry Corpus.The cry samples were taken from a Cuban cry corpus
named BDLLanto database (32 cases: 16 healthy childrenand 16 pathological children). The database includes afriendly user interface, which let the user manageacoustical and clinical information of newborns in anefficient manner. It also incorporates some features ofWeb technologies for Internet facilities.
(2) ANN-based classifier: it consists on a feed-forwardnetwork using the method of scale gradient conjugate(MSGC) as learning algorithm The input vector iscomposed by the Mel frequency cepstral coefficients(MFCCs) [4] [11-13]
Mel Frequency Cepstral Coefficients.The low order cepstral coefficients are sensitive as
overall spectral slope and the high-order cepstralcoefficients are susceptible to noise. This property of thespeech spectrum is captured by the Mel spectrum. Highorder frequencies are weighted on a logarithmic scalewhereas lower order frequencies are weighted on a linearscale. The Mel scale filter bank is a series of L triangularband pass filters that have been designed to simulate theband pass filtering believed to occur in the auditorysystem. This corresponds to series of band pass filterswith constant bandwidth and spacing on a Mel frequencyscale. On a linear frequency scale, this spacing isapproximately linear up to 1 Khz and logarithmic athigher frequencies (to see Fig. 1) [11]
Many speech recognition systems are based on theMFCC approach and its first and second order derivative.The derivative normally approximate through anadjustment in the line of linear regression towards anadjustable size segment of consecutive informationframes. The resolution of time and the smoothness of theestimated derivative depend on the size of the segment.
TOWARDS A CRY CLASSIFICATION BASED ON ARTICULATED SIGNALPROCESSING
Sergio Cano1, IsraelSuaste2, Daniel Escobedo1 and Taco Ekkel3 and Carlos A.Reyes2.1 CENPIS, University of Oriente, Ave Las Américas 90900 Stgo de Cuba, Cuba
2INAOE, Carretera de Cholula s-n, Puebla, Mexico,3Faculty of Informatics, University of Twente, The Netherlands

Fig.1 The Mel Filter Bank
The computation of MFCCs follows the steps:
Converting the signal in small segments
Computing the Discrete Fourier Transform
The spectrum converts into a logarithmic
scale
The scale is transformed into a soft MEL
spectrum
The discrete cosine transform (DCT) is
computed
The above mentioned algorithm is illustrated in Fig. 2.
Fig. 2 The MFCC´s computation from a cry signal
The Artificial Neural Network (ANN)
The use of ANN has been a great impact in the
development of several research areas like computer
vision, autonomous vehicle, pattern recognition,
connected-speech synthesis and more recently into the
classification of cry units [1-2] [4]. In the paper the ANN
structure used is shown in Fig. 3. It corresponds to a
Feed-Forward network in which x1, x2, x3, ..., xn
represent the acoustic features of signals and y1, t2,
y3,...., ym the m classes to be identified. This kind of
supervised ANN has been also used in cry classification
with succeed [11].
Fig.3 A Feed-Forward architecture
In order to increase the efficiency of the learning
process the Method of Scaled Conjugate Gradient
(MSCG) is chosen. [13]. The MSCG algorithm shows a
linear convergence accentuated in most of the problems.
III. RESULTS
Starting from the primary information in BDLlanto, a
segmentation process was developed to generate the cry
units being obtained 73 healthy cry units and 68
pathological cry units (relative to hypoxia). 58 cry units
were chosen (for class) for training and 10 for
classification. The segmentation stage was semi-
automatic combining a begin/end detection (based on
function energy and zero-crossing rate) and a manual
correction to reduce the negative effect of considering
inappropriate sections within the cry unit. In the Figure 4
the scheme of the combined classifier is presented.
N
PBDLlanto
Acoustic
Parameter
Extraction
MFCC
Estimation
Threshold-
Based
Classifier
ANN-based
Classifier
FN1 index
FN2
index
Final
Decision
Stridor, Melody
Voicedness, Shift
Cry Units
PCA
Fig. 4. Block diagram of the combined cry-based
classifier
Starting from the cry units obtained from database a
parameter estimation for every cry unit is done, following
two possible ways:
(a) estimation of 4-acoustic features for the threshold-based classifier: . the estimated feature is then compared
with the normal threshold values associated to each one
of the 4 selected parameters, generating to the exit an
index FN1 with the following gradation:
FN1: 0.25 for 1 parameter altered
0.5 for 2 parameters altered
0.75 for 3 parameters altered
1.0 for 4 parameters altered
0 for no one parameter altered (normality
index)
(b) estimation of MFCC´s for the ANN-based classifier. 500 MFCC´s were computed for each generated cry
unit (because of the differences in time duration among
the cry units it was necessary to normalize and to adjust
the vector of coefficients).
After the initial vector of characteristics was passed
through the analysis of principal components (PCA) the
dimension of the vector was definitively reduced to 50
220 MAVEBA 2007

principal components. Then the input vector to the ANNwas presented, with the following structure: 50 nodes inthe input layer, 15 nodes for the hidden layer and finally2 nodes for the output layer. To detect the cry type in thenewborn the output values of the net are analyzed. Theoutput values of the net are coded between 0 and 1. If thevalue of the output node 1 is bigger than the value of theoutput node 2 the sample is assigned to the class ¨normal¨(N) generating a FN2 index equal to 0, otherwise it isassigned to the class ¨pathologic¨ (P) generating a FN2index equal to 1Finally both FN1 and FN2 indexes are processed in a
decision block (2
21 FNFND += ) resulting in two
classes-based decision with 3 qualitative levels:Normal D <=0.5Moderately- pathologic D = 0.75Pathologic D = 1.0
IV. DISCUSSIONThe following table shows results from the CombinedClassifier.
Table 1. The output results from the combined classsifier.ConfusionMatrix
D index
Normal
Pathology
x<=0.5
0.5<x<=0.75
0.75<x
% ofClassification
Normal 10 10 0 10 0 0 100Pathology 10 2 8 2 7 1 80Total 20 12 7 1 90
The gradation in the D index let physicians to useproperly the output of the cry classifier in order tocompare and to evaluate its "possible meaning" in frontof the results from the neurophysiological evaluation ofthe newborn (how much abnormal the infant cry is fromthe acoustical point of view and its ¨weight¨ fordiagnostic purpose). The need to include more acousticfeatures in cry classifier for better classification ratesproposed and argued by Schonweiller in 1996, is welldemonstrated here. An interesting aspect that deserve tobe commented is the fact that the only two cry unitsmisclassified as normal obtained a FN1 equal to 0.75(significative abnormal for the threshold-based classifier),so both outputs from the classifiers also offer valuableinformation to be considered by the specialists.The soft tools used in the experience were: BDLlantodatabase with 12 seconds- cry recordings of Cubanchildren, BPVOZ soft-package, PCVOX and praatsoftware for the acoustic signal processing. The ANNimplementation (including the MSGC algorithm) wasdone with Neural Network Toolbox from Matlab v. 6.0.[14-15]
V. CONCLUSION
The articulated processing of cry signals was wellimplemented in order to improve the effectiveness of aN/P cry classification, obtaining satisfactory results. Bothoutput indexes FN1 and FN2 offer also valuableinformation for specialists when they analyze themtogether or in separate environment. . The cry unit as abasic element for signal processing displayed also apositive performance during the research experience. Theuse of this articulated-signal processing will be thekeystone for a new cry-based methodology for newborndiagnosis with CNS disorders (based on hypoxia) to beissued by the Group of Speech Processing.
REFERENCES
[1] M. Petroni, A.Maloway, C.Johnnston, B.Stevens:“Identification of Pain Infant Cry Vocalizations UsingArtificial Neural Networks”. The International Infant CryRsearch Group. Applications and Science of ArtificialNeural Networks. The International Society for OpticalEngineering, Volume 2492, 1995, pp 729-738.[2] R. Schonweiller, et al: “Neuronal networks and self-organizing maps: new computing techniques in theacoustic evaluation of the infant cry”. Int. Journal ofPediatric Otorhinolaryngology. Elsevier Science, 38,1996, pp 1-11.[3] I. Suaste, O..Reyes Galaviz, A. Diaz, C.A.ReyesGarcia: Relational Neural-Network for PatternClassification. A.Sanfeliu et al (Eds): CIARP 2004,LNCS 3287, pp 3358-365, 2004.[4] L.Alonso et aal: Reconocimiento de Patrones conRedes Neeuronales. Ed. L.Alonso, Editorial ImprentaCatedral. 2001, pp 337-56.[5] O.Wasz-Hockkert, J.Lind, V.Vuorenkoski,T.Partannen, E.Valanne: “The Infant Cry: ASpectrographic and Auditory Analysis”. SpasticsInternational Medical Publications Laavenham, UK,11968.[6] E.B.Hurlock “Child Development”. Nueva York.McGraw Hill, 1950.[7] P.S.Zeskind, B.Lester: “Acoustic features andauditory perceptions of the Cries of Newborns withPrenatal Complications”. Child Development, pp 580-589, 1978.[8] K.Michelsson “Sound Spectrographic cry analysisof normal and abnormal newborns”, Folia Phoniatria,28, 1982, pp 161-173.[9] D.Escobedo, S,D.Cano, E.Coello, L.Regueiferos, L.Capdevila: “Rising Shift of Pitch Frequency in theInfant Cry of Some Pathologic Cases”. 2nd Int Conf.MAVEBA 2001, Firenze, Italy, 2001.[10] S.D.Cano et al: “The Spectral Analysis of Infant Cry:An Initial Approximation”. Proceedings ofEUROSPEECH´95 (sponsored by ESCA and IEEE),Madrid,Sept.18-21,1995.

[11] J.Orozco, C.Reyes: “Extracción y Análisis de
Características Acústicas del Llanto de Bebés para su
Reconocimiento Automático Basado en Redes
Neuronales”. Tesis de Maestria, INAOE, Puebla, México,
2002.
[12] S.D. Cano et al: “Análisis Preliminar de losresultados de una clasificación de unidades de llantosegún tres arquitecturas de redes neuronales”.
Memorias de TELEC 2002 (CD-rom), Stgo de Cuba,
2002.
[13] M.Moeller: “A Scaled Conjugate GradientAlgorithm for Fast Supervised Learning”. Neural
Networks 6(4), 1993, pp 525-533.
[14] P.Boersmma et al: Praat v. 4.0.27. “Sistema para
hacer fonética por computadora”. University of
Ámsterdam, The Netherlaands. 1992-2002.
[15] The MathWorks, Inc. MATLAB. Neural Network
Toolbox. Version 66.0.0.8. 1984-2004.
[16] T.Ekkel: “Neural Network Based Classification of
Cries from Infants Suffering from Hypoxia-Related CNS
Damage”. Master Thesis, University of Twente. The
Netherlands, 2002.
[17] S.D.Cano et al: “A Combined Classifier of Cry Unitswith New Acoustic Attributes”, in J.F.Martines-Trinidad
et al (Eds.) CIARP 2006, LNCS 4225, pp 416-425, 2006.
222 MAVEBA 2007

Non-human sounds

Models and analysis of vocal emissions for biomedical applications: 5th international workshop: December 13-15, 2007: Firenze, Italy, ed. by C. Manfredi,ISBN 978 88-8453-673-3 (print) ISBN 978-88-8453-674-7 (online)© Firenze university press, 2007.
Abstract: Recent works emphasize the importance ofacoustic cues of species-specificity in primate vocalcommunication. The potential of vocal tract resonancein generating these cues is examined by anatomicallybased vocal tract computational modeling. Truelemurs (genus Eulemur), which occur in Madagascar,show a remarkable species diversity and this makesespecially good model species to study these inter-specific differences. The oral vocal tract of lemurs isrelatively flexible, but the nasal tract also plays acrucial role in their communicative system. Weanalyzed distinctive formant characteristics asproduced by the computational models in order toinvestigate inter- and intra-specific variation in thevocal tract size and shape. Differences inmorphological features between lemur taxa have aninfluence on shaping structural characters of theirvocalizations.Keywords: Prosimians, morphology, Eulemur, vocalbehaviour.
I. INTRODUCTION
The evolution of species-specific traits incommunication signals is the result of complexinteractions of neurocognitive and morphophysicalfactors.In modern studies, the application of the source-filter
model is central insight for the interpretation of mammalvocal production. The application of the source-filtermodel to non-human animals stressed the importance offormants in animal vocal communication [1][2].Several studies demonstrated that formant-like band in
animal sound are the products of the resonance of soundpropagation in the vocal tract. [3][4]However, the communicative importance of formants
in non-humans is less manifest. Still little attention hasbeen dedicated to the role formants play in conveyinginformation. Researchers seem to agree on two kind ofinformation conveyed: individual identity and body size.The fact that formants are influenced by the length of
the vocal tract [5], and thus by body size [6][7], wasinvestigated in some recent studies and it has beendemonstrated that birds and mammals can spontaneouslyperceive formants [8]. Hauser and Fitch [9] alsosuggested that communication via formants belonged toterrestrial vertebrates long time before the origin ofhumans. An open question is whether formants may play
a role in conveying information on species specificity.Investigations of vocalizations in lemurs may havespecial importance because, even if DNA sequenceanalyses have yielded a broad consensus for phylogeneticrelationships between Eulemur, Hapalemur, Lemur andVarecia, further relations between taxa are stillcontroversial [10]. In fact, quantitative analyses ofEulemur species sounds are scarce, it is known that low-pitched sounds emitted by lemurs radiate from thenostrils [11] and that they possess species-specificacoustic features [12].In this paper, we investigate the relevance of vocal
tract morphology in determining differences in formantvalues and formant dispersion in the lemurs ofMadagascar using vocal tract modelling, here applied tothe study of resonances in the nasal airways.
II. METHODS
One specimen per species for Eulemur rubriventer,Eulemur macaco and Eulemur fulvus, belonging to thecollection of dead animals of Dept. Faune, ParcBotanique et Zoologique de Tsimbazaza (Antananarivo,Madagascar) were partially defrozen andtracheotomyzed. The tracheal tube was injected withsilicon rubber until complete filling of the oral and nasalcavities, passing by the larynx, and then clamped. Alllength and dimension measurements of the cast weretaken with a Mitutoyo digital caliper (accurate to 0.01mm). Measurements of the cross-sectional axes of thevocal tract were then taken over the casts (the cross-section was not generally circular), at an increment of 10mm. Cross-sectional areas were calculated starting fromthese measures in Microsoft Excel. Cross-sectional areaswere used to build the vocal tract area function thatrepresents the input of MatLab-based vocal tractmodeling software [13]. Models of oral and nasal tractresonance in lemurs have successfully involved the use ofconcatenated tubes of varying cross-sectional areas [14].Concatenated tube models of the nasal tract of each
taxa were computed and the acoustic response wascompared with formant measures taken from natural callsof the same species. Assuming that vocal tractmorphology of a single dead animal’s vocal tract isrepresentative for each species, we also consideredformants predicted by tubes in which size and length wasrespectively increased and decreased of 10%. Given thatlength scales as the cube root of mass, we estimated to
VOCAL TRACT MODELING AS A TOOL TO INVESTIGATE SPECIES-SPECIFIC CUES IN VOCALIZATION
M. Gamba1, J. Medard2, H. Andriamialison2, G. Rakotoarisoa2, C. Giacoma11Department of Animal and Human Biology, Università degli Studi di Torino, Torino, Italy
2Parc Botanique et Zoologique Tsimbazaza, Rue Fernand Kasanga, Tsimbazaza, Antananarivo 101, Madagascar

take in account a body size variation of approximately30%, reasonably larger than adult natural variation. Foreach model, F1 and F2 were taken in account from thecomputed acoustic response. Comparisons were madebetween F1 and F2 from the computed transfer functionsand real formants for the same species measured onnatural vocalizations. Captive lemurs were recorded inseveral institutions across Europe and United States:Parco Natura Viva (Bussolengo-Vr, Italy), Mulhouse Zoo(France), Rheine Der Naturzoo and Koln Zoo (Germany),Apenheul (Apeldoorn, The Netherlands), St. Louis Zoo(USA), Twycross Zoo, Drusillas Park (Alfrinston),Blackbrook Zoo (Alton Towers), Colchester Zoo, LintonZoo and Banham Zoo (UK), Parc Botanique etZoologique de Tsimbazaza (Antananarivo, Madagascar).All recorded vocalizations were spontaneously emittedand we avoided the use of eliciting stimuli and playbacks.Minimum of 3 vocalizations for 39 lemurs were digitizedand analyzed using Praat 4.6.01 [15].
III. RESULTS
We used the nasal tract length measurements from the3 species to calculate expected formant values based on asimple tube model of the vocal tract [1][6][16]. Thepredicted formant values for a nasal tract length (Fig. 1) of8 cm (congruent for Eulemur rubriventer and Eulemurmacaco) are: 1094 Hz (F1) and 3281 Hz (F2). Thepredicted formant values for a nasal tract length of 9 cm(Fig. 1, resembling Eulemur fulvus) are: 972 Hz (F1) and2917 Hz (F2).
Vocal tract area functions derived from the silicon castwere used to generate computational models for the nasaltracts of Eulemur rubriventer, Eulemur macaco andEulemur fulvus.
The computational model for the supraglottal vocalsystems of the three species considered in this papercomprises a filter consisting of 8 (Eulemur rubriventerand Eulemur macaco) or 9 (Eulemur fulvus) concatenatedtubes. These tubes are approximation of the anatomicalcomponents of the vocal tract: from the glottalconstriction, through the nasopharyngeal cavity, to thenasal chambers and nostrils. As from previous studies,non-human primates vocalize alternatively through theoral or the nasal tract [7][14].
Calculations of acoustic response can be made on thebasis of the anatomically correct concatenated tubesmodel, where fixed-length tubes change in size accordingto anatomical measurements, whereas variation of theseparameters allows their significance to be determined.
The acoustic response of the three nasal tract modelsshowed differences between the species (Fig. 1): 472 Hz(F1) and 2276 Hz (F2) for Eulemur rubriventer, 1097 Hz(F1) and 2420 Hz (F2) for Eulemur macaco; 1005 Hz(F1) and 2263 Hz (F2) for Eulemur fulvus. Concatenated
tubes models in which segments were increased ordecreased of 10% in length and areas (in agreement withobserved body size variation) respectively exhibited firstpeaks in the transfer function at: 447-532 Hz (F1) and2074-2527 Hz (F2) for Eulemur rubriventer, 1010-1204Hz (F1) and 2219-2664 Hz (F2) for Eulemur macaco;918-1105 Hz (F1) and 2063-2508 Hz (F2) for Eulemurfulvus.
Comparisons were made between computed transferfunctions and real formants for the same species. Averageindividual values of F1 and F2, measured from naturalcalls of 15 Eulemur rubriventer, 13 Eulemur macaco and11 Eulemur fulvus specimens were then plotted with theacoustic output of the computational models (Fig. 1).Average F1 and F2 for E. rubriventer were 702+176 Hzand 2576+89 Hz respectively, F1 and F2 for E. macacowere 1311+200 Hz and 2772+117 Hz, 1082+300 Hz and2249+102 Hz Eulemur fulvus.
Fig. 1. Cumulative formant plot showing distribution offirst (F1) and second (F2) formants: 8 cm (�) and 9 cm(�) simple tube models; concatenated tubes modelpredictions for Eulemur rubriventer (�), Eulemurmacaco (�) and Eulemur fulvus (�); formants measuredfrom natural calls for Eulemur rubriventer (�), Eulemurmacaco (�) and Eulemur fulvus (�).
IV. DISCUSSION
Results presented in this paper are in agreement withprevious investigations of lemur vocalisations, whichhave documented that resonance properties of thesupralaryngeal tracts determine formants [14], which areuseful to investigate differences between species.
First formant predicted from the computational modelsshowed remarkable differences between Eulemurrubriventer and Eulemur macaco/Eulemur fulvus.Relatively minor differences were found betweenEulemur macaco and Eulemur fulvus. Second formant ofbetween Eulemur rubriventer and Eulemur fulvus arevery similar and Eulemur macaco exhibited slightlyincreased values.
226 MAVEBA 2007

Computational models indicate that vocal tractmorphology of E. fulvus and E. macaco proportionallyvaries in length and size of the concatenated tubes, whileE. rubriventer actually showed a different formantpattern, reflecting remarkable discrepancies in the nasaltract morphology.
Observing formant variation in natural calls, it ispossible to notice that all species tend to have greatervariation than that predicted by the models, especially forF1. In agreement with model outputs, Eulemurrubriventer and Eulemur macaco/Eulemur fulvus showedremarkable differences for F1. The analysis of the naturalcalls also showed smaller variation than the modelspredicted and that F2 values well separated the threespecies.
A convincing explanation for differences betweenpredicted and natural variation in the F1/F2 plot is thatnot all vocal tract morphological changes are strictlybound to body size variation. In particular, in some non-human primates species body size and vocal tract lengthshow an allometric relationship and this can be welldescribed in those sounds that allows a uniform tubemodel interpretation [6].
In those vocalizations that radiate through the nostrils,concatenated tubes models provided a more reliableprediction of F1 and F2 and the previous assumption doesnot imply that areas of the concatenated tubesproportionally vary with body size.Unfortunately, a precise resolution of this issue was
prevented by a lack of data documenting anydisproportionate anatomical differences between males andfemales, or sub-adults and adults within a prosimianspecies [17].
V. CONCLUSION
Grunt vocalizations from three species of Madagascarlemurs showed consistent species-specific characteristics.
The results showed that a species-specific morphologyof the nasal tract in some lemur species effectivelydetermine formant frequencies in species-typicalvocalizations. The degree of difference between species,as based both on the results of the acoustic analysis andon the acoustic response of vocal tract models changes inrelation to the species.
Differences in morphological features between lemurtaxa have an influence on specific structural characters oftheir vocalizations.
REFERENCES
[1] D. Reby and K. McComb, “Anatomical constraintsgenerate honesty:acoustic cues to age and weight in theroars of red deer stags,” Anim. Behav., vol. 65, pp. 519-530, 2003.[2] E. Vannoni and A.G. McElligott, “Individual acousticvariation in fallow deer (Dama dama) common and harsh
groans: a source-filter theory perspective,” Ethology, vol.113(3), pp. 223-234, 2007.[3] M.J. Owren, R.M. Seyfarth and D.L. Cheney, “Theacoustic features of vowel-like grunt calls in chacmababoons (Papio cynocephalus ursinus),” J. Acoust. Soc.Am., vol. 101, pp. 2951-2963, 1997.[4] D. Rendall, M.J. Owren, E. Weerts, and R.J. Hienz,“Sex differences in the acoustic structure of vowel-likegrunt vocalizations in baboons and their perceptualdiscrimination by baboon listeners,”, ),” J. Acoust. Soc.Am., vol. 115, pp. 411-421, 2004.[5] I.R. Titze, Principles of Voice Production, PrenticeHall: Englewood Cliffs, 1994.[6] W.T. Fitch, “Vocal tract length and formant frequencydispersion correlate with body size in rhesus macaques,”J. Acoust. Soc. Am., Vol 102(2,1), pp. 1213-1222, 1997.[7] W.T. Fitch, “The phonetic potential of nonhumanvocal tracts: comparative cineradiographic observationsof vocalizing animals,” Phonetica, vol. 57, pp. 205-218,2000.[8] W.T. Fitch and J.P. Kelley, “Perception of vocal tractresonances by whooping cranes Grus Americana,”Ethology, vol. 106, pp. 559–574, 2002.[9] M.D. Hauser and W.T. Fitch, “What are the uniquelyhuman components of the language faculty?,” inLanguage evolution, M. Christiansen and S. Kirby, Eds.Oxford: Oxford University Press, 2003, pp. 158–181.[10] J. Pastorini, U. Thalmann, and R.D. Martin, “Amolecular approach to comparative phylogeography ofextant Malagasy lemurs,” Proc. Natl. Acad. Sci. U.S.A.,vol. 100, pp. 5879-5884, 2003.[11] M. Gamba and C. Giacoma, “Key issues in the studyof Primate acoustic signals,” J. Anthropol. Sci., vol. 83,pp. 61-88, 2005.[12] M. Gamba, L. Pozzi, and C. Giacoma, “Lemursuttering and its implications for phylogeneticreconstruction,” Proc. ICVPB Variations across Culturesand Species, pp. 123-126, 2006.[13] Z. Zhang and C.Y. Espy-Wilson, “A vocal tractmodel for American English /l/,” J. Acoust. Soc. Am., vol.115, pp. 1274-1280, 2004.[14] M. Gamba and C. Giacoma, “Vocal tract modelingin a Prosimian Primate: the black and white ruffedlemur,” Acta Acust. United Ac., vol. 92, pp. 749-755,2006.[15] P. Boersma, “Praat, a system for doing phonetics bycomputer,” Glot International, vol. 5, pp. 341-345, 2001.[16] T.R. Harris, W.T. Fitch, L.M. Goldstein, and P.J.Fashing, “Black and white colobus monkey (Colobusguereza) roars as a source of both honest and exaggeratedinformation about body mass,” Ethology, vol. 112, pp.911-920, 2006.[17] E. Ey, D. Pfefferle, J. Fischer. “Do age- and sex-related variations reliably reflect body size in non-humanprimate vocalizations? - a review,” Primates, availableonline. doi: 10.1007/s10329-006-0033-y, 2007.
Non-human sounds 227


Singing voice

Models and analysis of vocal emissions for biomedical applications: 5th international workshop: December 13-15, 2007: Firenze, Italy, ed. by C. Manfredi,ISBN 978 88-8453-673-3 (print) ISBN 978-88-8453-674-7 (online)© Firenze university press, 2007.
OBJECTIVE ANALYSIS OF THE SINGING VOICE AS RELATED TO SINGER POSTURE
T. Sangiorgi, L. Mazzei1, F. Felici1, S. Lapi, G. Testi, C. Manfredi, P. Bruscaglioni2
Department of Electronics and Telecommunications, Università degli Studi di Firenze, Firenze, Italy 1Fiesole School of Music, Fiesole, Firenze, Italy
2Department of Physics, Università degli Studi di Firenze, Firenze, Italy
Abstract: This paper deals with objective analysis of the singing voice, and aims at giving non-professional singers both an aid to improve their voice capabilities and a criterion to prevent a wrong vocal attitude (head, neck, and body posture) that could even cause vocal pathologies. A new standalone application with a user-friendly interface is proposed, for robust and reliable analysis of singing voice characteristics. The tool performs tracking of fundamental frequency and formants, along with an objective measure of main singing voice parameters, such as vibrato rate (V_rate), vibrato extent (V_ext), and vocal intonation (V_int). A side-view camera allows displaying and recording the singer’s posture. Data are collected at the School of Music in Fiesole, Firenze, Italy, under the supervision of a voice teacher and a teacher of Alexander Technique (AT). First results are presented to compare some vocalizations coming both from professional and non-professional singers under different singer’s postures. Keywords: objective voice parameters estimation,singing voice, Alexander Technique.
I. INTRODUCTION
At present, singing is learned basically by means of the perception and the psycho-physical control of the singer during his/her performance. Also, it is mainly up to the singing teacher to perceptually evaluate the quality of a performance. This makes it difficult defining standard procedures and reference values, also because few objective means to evaluate singer capability and improvements are currently available [1-4]. Singing voice results from complex activity of the larynx and of vocal tract articulators, and is characterized by possibly high-pitched, rapidly time-varying signals. In this preliminary study, the basic features of the singing voice are considered, i.e. the fundamental frequency F0 (linked to vocal folds oscillation), along with its modulation in time and frequency, and the formants Fi (resonance frequencies of the vocal tract), along with their energy. Time evolution, standard deviation (std) and maxima of such parameters over the whole vocalization are of
importance for singers, being strictly related to correct vocal emission and hence to singer’s performance. Moreover, V_rate, V_ext and V_int are of importance, in order to give the singer useful information on the degree of achieved professional level, possibly as compared to professional singers [4-6]. The AT postural technique has gained interest among singing teachers, for its possible advantages as a complement to vocal training. The AT is a method of re-education based on creating a dynamical, balanced relationship between head, neck and back, and, as a result, on one's whole body. Recent studies have shown that, after few months of AT application, singing voice becomes more resonant, and singing easier to perform [7-8]. Lessons are entirely practical. The teacher gives students helpful suggestions, also by means of a very skilful and subtle use of the hands. The student is taken through simple movements, like standing up, sitting down or walking, to understand the principles on which the dynamics of the whole body is based. The AT is taught in forty countries around the world. It is studied and taught since many years also at the School of Music in Fiesole, Italy.
II. METHODS
Singing voice signals are analysed by means of a multi-purpose, user-friendly tool, based on robust analysis techniques capable to deal also with high-pitched, quasi-stationary signals, that are among those under study. To track fast signal variations, the signal is divided into short frames, whose length adaptively varies according to varying signal characteristics: the higher the F0 the shorter the frame length (kept fixed to 3 pitch periods). A voiced/unvoiced separation algorithm is implemented, to avoid parameter estimation on signal frames that have no harmonic content. F0 tracking is achieved by means of a robust two-step procedure, based on well-established results [9]. High-resolution formant estimation is implemented, based on parametric AutoRegressive (AR) PSD evaluation. The AR model order p is automatically selected by the program according to subject and signal characteristics, based on a
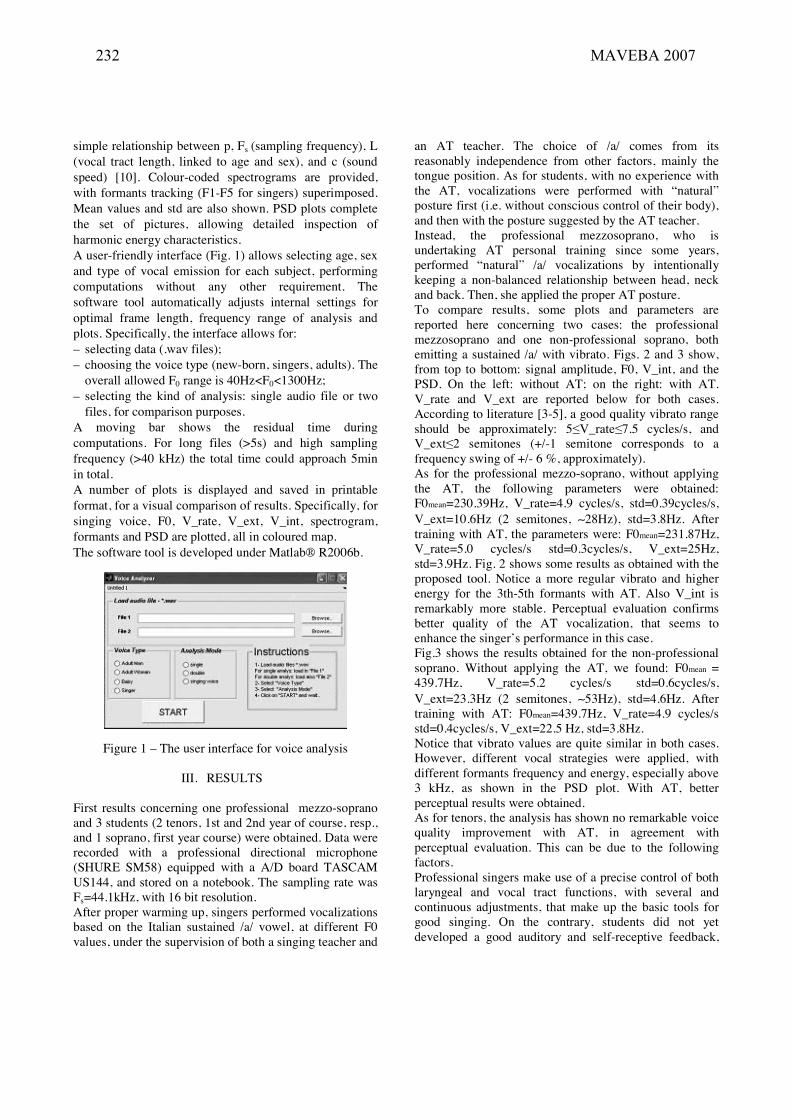
simple relationship between p, Fs (sampling frequency), L (vocal tract length, linked to age and sex), and c (sound speed) [10]. Colour-coded spectrograms are provided, with formants tracking (F1-F5 for singers) superimposed. Mean values and std are also shown. PSD plots complete the set of pictures, allowing detailed inspection of harmonic energy characteristics. A user-friendly interface (Fig. 1) allows selecting age, sex and type of vocal emission for each subject, performing computations without any other requirement. The software tool automatically adjusts internal settings for optimal frame length, frequency range of analysis and plots. Specifically, the interface allows for: – selecting data (.wav files); – choosing the voice type (new-born, singers, adults). The
overall allowed F0 range is 40Hz<F0<1300Hz; – selecting the kind of analysis: single audio file or two
files, for comparison purposes. A moving bar shows the residual time during computations. For long files (>5s) and high sampling frequency (>40 kHz) the total time could approach 5min in total. A number of plots is displayed and saved in printable format, for a visual comparison of results. Specifically, for singing voice, F0, V_rate, V_ext, V_int, spectrogram, formants and PSD are plotted, all in coloured map. The software tool is developed under Matlab® R2006b.
Figure 1 – The user interface for voice analysis
III. RESULTS
First results concerning one professional mezzo-soprano and 3 students (2 tenors, 1st and 2nd year of course, resp., and 1 soprano, first year course) were obtained. Data were recorded with a professional directional microphone(SHURE SM58) equipped with a A/D board TASCAM US144, and stored on a notebook. The sampling rate was Fs=44.1kHz, with 16 bit resolution. After proper warming up, singers performed vocalizations based on the Italian sustained /a/ vowel, at different F0 values, under the supervision of both a singing teacher and
an AT teacher. The choice of /a/ comes from its reasonably independence from other factors, mainly the tongue position. As for students, with no experience with the AT, vocalizations were performed with “natural”posture first (i.e. without conscious control of their body), and then with the posture suggested by the AT teacher. Instead, the professional mezzosoprano, who is undertaking AT personal training since some years, performed “natural” /a/ vocalizations by intentionally keeping a non-balanced relationship between head, neck and back. Then, she applied the proper AT posture. To compare results, some plots and parameters are reported here concerning two cases: the professional mezzosoprano and one non-professional soprano, bothemitting a sustained /a/ with vibrato. Figs. 2 and 3 show, from top to bottom: signal amplitude, F0, V_int, and the PSD. On the left: without AT; on the right: with AT. V_rate and V_ext are reported below for both cases.According to literature [3-5], a good quality vibrato range should be approximately: 5≤V_rate≤7.5 cycles/s, and V_ext≤2 semitones (+/-1 semitone corresponds to a frequency swing of +/- 6 %, approximately). As for the professional mezzo-soprano, without applying the AT, the following parameters were obtained: F0mean=230.39Hz, V_rate=4.9 cycles/s, std=0.39cycles/s, V_ext=10.6Hz (2 semitones, ∼28Hz), std=3.8Hz. After training with AT, the parameters were: F0mean=231.87Hz, V_rate=5.0 cycles/s std=0.3cycles/s, V_ext=25Hz, std=3.9Hz. Fig. 2 shows some results as obtained with the proposed tool. Notice a more regular vibrato and higher energy for the 3th-5th formants with AT. Also V_int is remarkably more stable. Perceptual evaluation confirms better quality of the AT vocalization, that seems to enhance the singer’s performance in this case. Fig.3 shows the results obtained for the non-professional soprano. Without applying the AT, we found: F0mean = 439.7Hz, V_rate=5.2 cycles/s std=0.6cycles/s, V_ext=23.3Hz (2 semitones, ∼53Hz), std=4.6Hz. After training with AT: F0mean=439.7Hz, V_rate=4.9 cycles/s std=0.4cycles/s, V_ext=22.5 Hz, std=3.8Hz. Notice that vibrato values are quite similar in both cases. However, different vocal strategies were applied, with different formants frequency and energy, especially above 3 kHz, as shown in the PSD plot. With AT, better perceptual results were obtained. As for tenors, the analysis has shown no remarkable voice quality improvement with AT, in agreement with perceptual evaluation. This can be due to the following factors. Professional singers make use of a precise control of both laryngeal and vocal tract functions, with several and continuous adjustments, that make up the basic tools for good singing. On the contrary, students did not yetdeveloped a good auditory and self-receptive feedback,
232 MAVEBA 2007

Figure 2 – Professional mezzo-soprano. Left: without AT; Right: with AT
nor a reliable muscular training. This often causes a modified, para-physiological vocal emission, that involves the whole neck and shoulders, and hence an altered global posture. The AT makes unstable the attitudes that are deep-rooted in students’ postural habits and needs great psycho-physical concentration. This fact could even have made unstable the knowledge and compensatory skillsused by students in vocal emissions before the AT teacher suggestion. Finally, the students involved in this experiment being non-professionals, were not accustomed to sing with an audience. The presence of microphone and camera could have further influenced their performance. Notice that, from a perceptive point of view, the AT has softened the onset of the vocalization in most cases. Though very limited in number and in time, first results allow for supposing that, if non-professionals add AT to their vocal training, they could found easier to enter the main functions related to a proper sound emission, and could be facilitated in overcoming limitations, such as limited vocal extension, voice breaks, an improper use of vocal registers, and often vocal fatigue. As functions are
carried out on posture, a good postural balance allows for the cheapest usage of a function, and makes it possible to perform even subtle adjustments. Features of the professional singer were found in agreement to those proposed in literature. If a larger set of data will be available, a reference set for non-professionals could be set up.
IV. FINAL REMARKS
A user-friendly, robust tool for voice analysis has been presented. It allows for the analysis of voice recordings, in a wide range of F0 values, that makes the tool a multi-purpose one. At present, the new tool works off-line. If properly implemented, it would allow for real-time analysis of voice signals.As for singing voice, preliminary results show different F0 and formant strategies, as related to singing technique and/or posture. Hence, it could be of help in giving non-professional singers and singing teachers reliable objective measures of possible improvements during and after training with any teaching technique.
0 0.5 1 1.5
-0.5
0
0.5
1Sustained /a/ with Vibrato
Time [s]
No
rm. A
mp
l.
0 0.5 1 1.5200
230
260
Time [s]
F0
[Hz]
Mean F0 : 230.39 [Hz]
0 0.5 1 1.5220
225
230
235
240
F0
[Hz]
Time [s]
Vocal Intonation
0 1000 2000 3000 4000 5000 6000-50
-40
-30
-20
-10
0dashed: FFT ; solid: AR(44)
Freq. [Hz]
Mea
n P
SD
[d
B]
0 0.2 0.4 0.6 0.8 1 1.2 1.4
-0.50
0.51
Sustained /a/ with Vibrato
Time [s]
No
rm. A
mp
l.
0 0.2 0.4 0.6 0.8 1 1.2 1.4200
230
260
Time [s]
F0
[H
z]
Mean F0 : 231.87 [Hz]
0 0.5 1 1.5215
220
225
230
235
240
245
250
F0
[Hz]
Time [Hz]
Vocal Intonation
0 1000 2000 3000 4000 5000 6000-50
-40
-30
-20
-10
0dashed: FFT ; solid: AR(44)
Freq. [Hz]
Mea
n P
SD
[d
B]
Singing voice 233
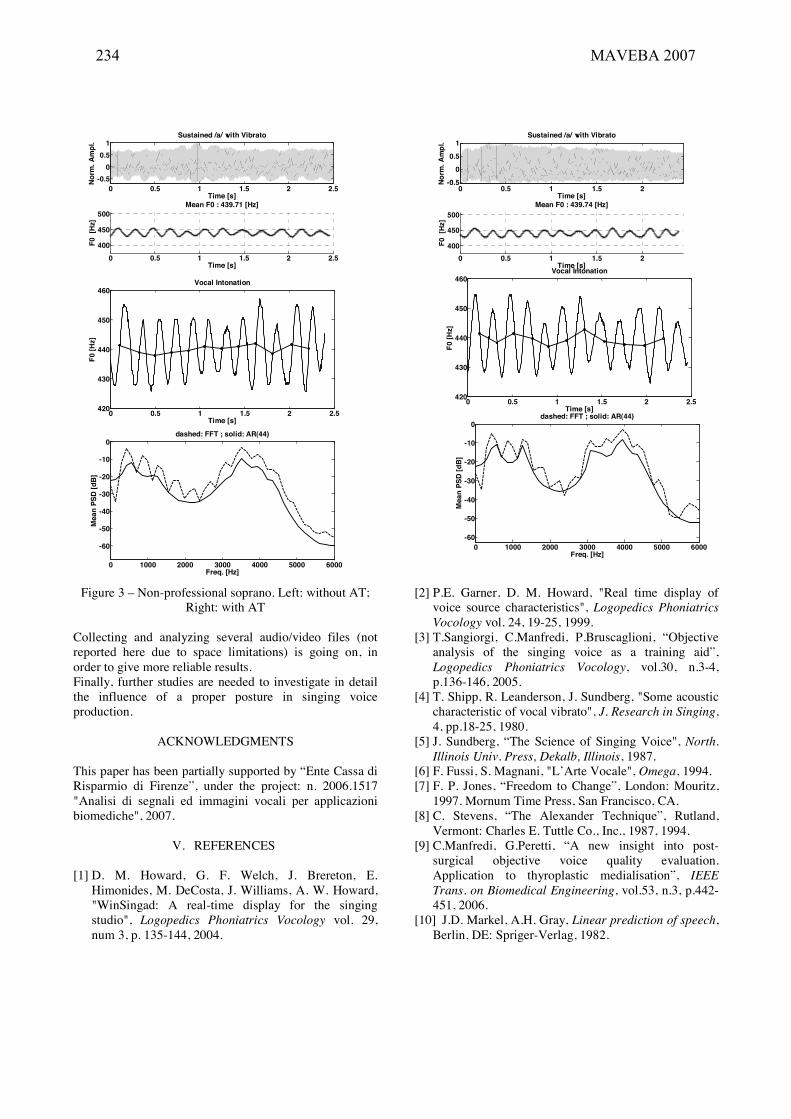
Figure 3 – Non-professional soprano. Left: without AT; Right: with AT
Collecting and analyzing several audio/video files (not reported here due to space limitations) is going on, in order to give more reliable results. Finally, further studies are needed to investigate in detail the influence of a proper posture in singing voice production.
ACKNOWLEDGMENTS
This paper has been partially supported by “Ente Cassa di Risparmio di Firenze”, under the project: n. 2006.1517 "Analisi di segnali ed immagini vocali per applicazioni biomediche", 2007.
V. REFERENCES
[1] D. M. Howard, G. F. Welch, J. Brereton, E. Himonides, M. DeCosta, J. Williams, A. W. Howard, "WinSingad: A real-time display for the singing studio", Logopedics Phoniatrics Vocology vol. 29, num 3, p. 135-144, 2004.
[2] P.E. Garner, D. M. Howard, "Real time display of voice source characteristics", Logopedics Phoniatrics Vocology vol. 24, 19-25, 1999.
[3] T.Sangiorgi, C.Manfredi, P.Bruscaglioni, “Objectiveanalysis of the singing voice as a training aid”, Logopedics Phoniatrics Vocology, vol.30, n.3-4, p.136-146, 2005.
[4] T. Shipp, R. Leanderson, J. Sundberg, "Some acoustic characteristic of vocal vibrato", J. Research in Singing, 4, pp.18-25, 1980.
[5] J. Sundberg, “The Science of Singing Voice", North. Illinois Univ. Press, Dekalb, Illinois, 1987.
[6] F. Fussi, S. Magnani, "L’Arte Vocale", Omega, 1994. [7] F. P. Jones, “Freedom to Change”, London: Mouritz,
1997. Mornum Time Press, San Francisco, CA. [8] C. Stevens, “The Alexander Technique”, Rutland,
Vermont: Charles E. Tuttle Co., Inc., 1987, 1994. [9] C.Manfredi, G.Peretti, “A new insight into post-
surgical objective voice quality evaluation. Application to thyroplastic medialisation”, IEEE Trans. on Biomedical Engineering, vol.53, n.3, p.442-451, 2006.
[10] J.D. Markel, A.H. Gray, Linear prediction of speech, Berlin, DE: Spriger-Verlag, 1982.
0 0.5 1 1.5 2-0.5
0
0.5
1Sustained /a/ with Vibrato
Time [s]
No
rm. A
mp
l.
0 0.5 1 1.5 2
400
450
500
Time [s]
F0
[H
z]
Mean F0 : 439.74 [Hz]
0 0.5 1 1.5 2 2.5420
430
440
450
460
F0
[Hz]
Time [s]
Vocal Intonation
0 1000 2000 3000 4000 5000 6000
-60
-50
-40
-30
-20
-10
0dashed: FFT ; solid: AR(44)
Freq. [Hz]
Mea
n P
SD
[d
B]
0 0.5 1 1.5 2 2.5-0.5
0
0.5
1Sustained /a/ with Vibrato
Time [s]
No
rm. A
mp
l.
0 0.5 1 1.5 2 2.5
400
450
500
Time [s]
F0
[H
z]
Mean F0 : 439.71 [Hz]
0 0.5 1 1.5 2 2.5420
430
440
450
460
F0
[Hz]
Time [s]
Vocal Intonation
0 1000 2000 3000 4000 5000 6000-60
-50
-40
-30
-20
-10
0dashed: FFT ; solid: AR(44)
Freq. [Hz]
Mea
n P
SD
[d
B]
234 MAVEBA 2007

Mozart’s voice

Models and analysis of vocal emissions for biomedical applications: 5th international workshop: December 13-15, 2007: Firenze, Italy, ed. by C. Manfredi,ISBN 978 88-8453-673-3 (print) ISBN 978-88-8453-674-7 (online)© Firenze university press, 2007.
"Mozart's Voice"
A cultural appetizer
Philippe DeJonckere University of Utrecht
Utrecht, The Netherlands
Mozart is mainly known to us as a genius of musical composition, and as a virtuoso keyboard player as well as violinist/violist. He composed major works for voice, but what do we know about his own (singing) voice ?
When searching carefully in contemporary documents, as letters, posters, diaries, written testimonies, we can learn a lot about what and how Mozart himself sang: from his first public performance as a 5-years old choir-boy in Sigismundus Rex Hungariae to the rehearsal of the unfinished Requiem at his home a few hours before his death, where he sang himself the alto part, forced to stop after the first bars of the “Lacrymosa”.
This vocal pilgrimage, with 180 slides and several musical illustrations, provides a fascinating look on Mozart's life and time from a double view-point: the musicological one and that one of the voice scientist.


Models and analysis of vocal emissions for biomedical applications: 5th international workshop: December 13-15, 2007: Firenze, Italy, ed. by C. Manfredi,ISBN 978 88-8453-673-3 (print) ISBN 978-88-8453-674-7 (online)© Firenze university press, 2007.
239
Author Index
Acciai F., 215Aghazadeh B. S., 85Aghazadeh B.S., 191Ahmadi H., 191Airas M., 135Alku P., 135Alpan A., 147Álvarez A., 183Amato F., 29Amir N., 37Amir O., 37Andriamialison H., 225Araújo A., 167, 173Atrei E., 215Avanzini F., 129, 51Azpiroz J.J., 211Bacauskiene M., 195Ben Elhadj Fraj S., 3Berckmans D., 75Bocchi L., 215Brix M., 79Bruscaglioni P., 231Buchaillard S., 79Butenweg C., 127Cadot O., 177Cannataro M., 29Cano S., 219Cantarella G., 113Chaigne A., 177Chevalier D., 201Chytil P., 71Ciota Z., 123Cosentino C., 29Cosi P., 89Costa I.M., 167, 173de Bodt M.S., 93DeJonckere P.H., 21, 201, 237Devillers L., 143Doaré O., 177Donzelli G.P., 215Drake K., 71Drioli C., 89, 129Drioliand C., 51Dubuisson T., 119Dutoit T., 119Ekkel T., 219
Escobedo D., 219Favilli F., 215Felici F., 231Fernández R., 183Fernández-Baillo R., 65Ferrari S., 75Ferrer C.A., 93Fraile R., 25Frauenrath T., 109Frič M., 171Friedrich G., 201Fürst J., 55Gamba M., 225Garozzo A., 29Gelzinis A., 195Giacoma C., 225Goddard J., 33Godino-Llorente J.I., 183, 25Gómez-Vilda P., 25, 65, 183Gömmel A., 127Graville D., 71Grenez F., 3, 101, 147Guarino M., 75Hagmüller M., 205Hernández-Díaz Huici M.E., 93, 139Hess M., 201Horáček J., 43, 55, 105, 177Huici D., 139Jesus L.M.T., 167, 173Jo C., 71Kaseta M., 195Kaymaz Keskinpala H., 157Khadivi Heris H., 85, 191Klečková J., 69, 83Klepáček I., 43Kob M., 109, 127Kovalenko M., 195Kozel K., 55Krutišová J., 69, 83Landau M., 153Lapi S., 231Laukkanen A-M., 105Lawson G., 201Licht A.K., 201Lombardo N., 29Lukkari T., 163Malinen J., 163Manfredi C., 29, 113, 215, 231Manickam K., 187Marchetto E., 129Martens J.P., 201
240 MAVEBA2007
MartensJ.W.M.A.F.,21MartínezA.E., 211MartínezF.,33MartínezF.M.,211MartínezR.,183MarynY.,93MazairaL.M.,183MazzeiL.,231MedardJ.,225MoermanM.,21MoermanM.B.J.,201MontefuscoF.,29MooreC.J.,187MunckK.,61MuñozC.,183MurphyP.J., 17Nikkhah-BahramiM., 85,191OgutF.,201OrlandiS.,215Osma-RuizV.,25PaciG., 89PaloP., 163PavelM., 71PayanY., 79PedersenM.,61PerrierP.,79PopoloP.S.,47PribuisieneR.,195Punčochářová P., 55PützerM.,97RakotoarisoaG.,225RamirezC.,65ReckenzaunE.,201RemacleM.,201ReyesC.A.,219Rufiner H.L., 33Sáenz-LechónN.,25
SalomonR.M.,153, 157SangiorgiT.,231SchlotthauerG.,33SchoentgenJ., 3,101,147SchutteH.K., 171ScolaB.,65ShiaviR.G.,153,157ŠidlofP., 105,177SilvaM.,75SitchiA.,101SlevinN., 187SommavillaG.,89SpaccaterraL.,215ŠramF.,171StylianouY.,7SuasteI.,219ŠvecJ.G.,171TestiG.,231TitzeI.R.,47TorresM.E.,33TradigoG.,29UlozaV.,195VampolaT.,43VainioM., 135VandeHeyningP.,93VasilakisM.,7VeltriP.,29VerhelstW.,139VerikasA., 195VersnelH.,21VidrascuL., 143WaxM.,71WilkesD.M.,153,157WoisardV.,201WokurekW.,11,97WolfM.,37YingthawornsukT.,153,157