Bioinformatics and Multiepitope DNA Immunization to Design Rational Snake Antivenom
Upload
independentCategory
view
3download
0
MODELLING TITYUS SCORPION VENOM AND ANTIVENOM
PHARMACOKINETICS. EVIDENCE OF ACTIVE
IMMUNOGLOBULIN G's F(ab')2 EXTRUSION MECHANISM
FROM BLOOD TO TISSUES.
Authors: C. Sevcik1, G. D'Suze1, P. Díaz1, V. Salazar2, C. Hidalgo1, H. Azpúrua3, N.
Bracho3.
Institutional affiliations: 1Laboratory of Cellular Neuropharmacology, 2Histology
Service from the Centro de Biofísica y Bioquímica and 3Unit of Experimental
Surgery, Instituto Venezolano de Investigaciones Científicas (IVIC), Apartado
21827, Caracas 1020A, Venezuela.
Corresponding Author: Dr. Carlos Sevcik, CBB IVIC, Apartado 21827, Caracas,
1020A, Venezuela
Phone: +58 212 504 1399
Mobile Phone: +58 412 931 9162
Fax: +58 212 504 1764
e-Mail: [email protected]
Running Title: Scorpion venom and ativenom pharmacokinetics.
Key words: Scorpion venom, pharmacokinetics, immunoglobulin transport, IgG, F
(ab')2, antivenom.
1

Abstract
Modelling Tityus scorpion venom and antivenom pharmacokinetics.
Evidence of active immunoglobulin G's F(ab')2 extrusion mechanism from
blood to tissues. We measured pharmacokinetic parameters for T. discrepans
venom in rams. 40, 75 or 100 µg/kg venom were injected subcutaneously in the
inner side of the thigh. Plasma venom content (venenemia) was determined by
enzyme-linked immunosorbent assay (ELISA) from 0 to 300 min after injecting
venom. Venenemia was fit to a 3 compartment model (inoculation site, plasma and
extra vascular extracellular space), it was assumed that the venom may also be
irreversibly removed from plasma. Calculated time course of venom content shows
that at any time no more that 30% of the venom is present in plasma. Venenemia
peaks at 1h and decays afterwards. Fluorescently labelled antivenom [horse anti-
Tityus F(ab')2 or fraction antigen binging, immuglobulin without Fc chain covalently
bound to fluorescine or fluorescamine] pharmacokinetics was determined.
Although F(ab')2 molecular weight is ≥10 times bigger that toxin's, the rate of
outflow of F(ab')2 from blood to tissues was ≈4 times faster than the venom's
outflow. Venom content in the injection site decays exponentially for >6 h, this
prediction was confirmed immunohistochemically. Only ≈5% of the venom is
eliminated in 10 h; ≈80% of the venom is in the tissues after 2 h and remains
there for >10 h.
2

INTRODUCTION
Knowledge of a drug's pharmacokinetics is crucial to understand its action.
Several models have been used (rabbits, rats, mice, guinea pigs) to study venom
pharmacokinetics in scorpions such as Androctonus amoreuxi, Leiurus
quinquestriatus, Buthotus judaïcus, Androctonus crassicauda (Ismail et al., 1980,
1988, 1992, 1994) and Centruroides limpidus limpidus (Calderón-Aranda et al.,
1999). These studies were devised to measure distribution and elimination of 125I
labelled venom injected to experimental animals. Yet, this technique is indirect and
does not distinguish between 125I bound to toxic and non toxic venom components,
and may produce inaccurate results if the isotope is interchanged with proteins of
the host. Thus, the isotope measured in blood may be misleading (Krifi et al.,
2001).
A more direct approach has been used by Santana et al. (1996) and Krifi et al.
(2001) who employed a sandwich type ELISA to measure venom concentration of
Tityus serrulatus and Buthus occitanus tunetanus respectively, obtaining more
accurate values for pharmacokinetic parameters. The results of these authors were
coincident in showing a biphasic time course for both species with a rising phase
followed by a decay, with a maximum concentration between 30 and 60 min and
obtained pharmacokinetic parameters indicative of a fast absorption and high
distribution in tissues.
In this communication we describe experiments on pharmacokinetics of the
3

Tityus discrepans scorpion venom in rams using a modification of the high
sensitivity ELISA method of developed in our laboratory for Tityus venom (D'Suze
et al., 2003). Horse anti-Tityus F(ab')2 (fraction antigen binging, immuglobulin
without Fc chain) was covalently bound to either fluorescine or fluorescamine and
its pharmacokinetics also measured. Although the molecular weight of F(ab')2 is
≥10 times bigger that the toxins, the rate of outflow of F(ab')2 from blood to tissues
was ≈4 times faster than the venom's outflow, suggesting that the antivenom is
actively transported from blood to tissues. Using the experimentally determined
kinetic constants we modelled the distribution of venom and F(ab')2 in the body
and showed that plasma compartment is a transient pathway from the
envenoming site to the target organs, therefore the venenemia underestimates the
amount of venom received; this underestimation grows with envenoming time.
Also, results where F(ab')2 therapy is introduced in the model, remark the
importance of the early use of anti venom, ideally during the first hour of
envenoming.
Materials and Methods
Experimental methods
T. discrepans scorpions were anaesthetised with CO2 and milked monthly for
venom by electrical stimulation. The venom was dissolved in bidistilled water and
centrifuged at 15,000 g for 15 min. The supernatant was freeze-dried and stored at
-80°C until used. Specific anti-T. discrepans F(ab')2 were commercially obtained
horse anti-venom (Suero Anti-escorpiónicoTM, Centro de Biotecnología UCV,
4

Caracas, Venezuela).
Pharmacokinetic parameters were determined for the venom of Tityus
discrepans in rams (≈40 kg). The anaesthesia was induced with propofol (4 mg/kg)
and was maintained with 1 to 2 % isofluorane in 100% O2; hydration was
maintained with a continuous intravenous (iv) infusion of 0.9% NaCl saline at a rate
of 1.6 ml/h/kg plus 8 ml boli of heparinised saline after drawing each blood sample
to replace the plasma volume and to keep the catheter permeable during the
whole procedure. After 5 h of experiment the animals were sacrificed by an
overdose of thiopentone (20 mg/kg iv). The venom was injected subcutaneously in
the inner face of the thigh in doses of either 40, 75 or 100 µg/kg. After
administering the venom (time = 0), 8 ml blood samples were draw at 2 min
intervals during the first 10 min, then at 5 min intervals during the next 20 min and
finally each 10 min up to the end of the experiment. Plasma was separated from
whole blood and kept at -80°C until used.
The concentration of active venom in plasma (called venenemia from know
on) was determined with a modification of the specific sandwich ELISA published
by D'Suze et al. (2003). Maxisorp (Nunc Inc., USA) plates were coated in a wet
chamber for 12 h at 4°C with 10 µg/ml anti-T. discrepans F(ab')2, in 100 mM
carbonate/bicarbonate (pH 9.5) (100 µl/well). The plates were then washed with
washing buffer (50 mM Tris/HCl, pH 8) and the remaining active sites in the wells
were blocked with 3 % skim cow milk (percentages of skim milk always refer to
powdered milk weight in this paper) in washing buffer (100 µl/well, 1 h at 37°C).
After washing 100 µl/well control plasma with a known venom concentration
5

spanning from 0.45 to 166 ng/ml were used as calibration curve. Otherwise 100
µl/well experimental ram plasma was used; the calibration and experimental wells
were incubated 1 h at 37oC. After washing the plates were incubated 1 h at 37oC
with 125 ng/ml anti-Tityus rabbit immunoglobulin G (IgG) produced in our
laboratory; the plates were washed and incubated again (1 h at 37oC, 100 µl/well)
with anti-rabbit IgG conjugated with horse radish peroxidase (HRP) (Zymed
California, EEUU) diluted 1:5000 in washing buffer. The plates were then washed
and developed with ABTS [2,2'-azino-bis(3-ethylbenziazoline-6-sulfonic acid),
Zymed, CA U.S.A.] diluted 1:100 with washing buffer (100 µl/well). The reaction was
halted with 2 N FH (25 µl/well) and the absorbance of the wells was measured at
405 nm with a Multiskan Spectrum spectrophotometer (ThermoLife Sciences,
Basingstoke, UK). This method was found to be better than the one previously
published (D'Suze et al., 2003) since it produces extremely linear calibration curves
with very high correlation.
Fluorescent labeling of antivenom.
The kinetics of F(ab')2 in rams was measured using fluorescent anti venom
labeled with fluorescin or fluorescamine. labeling with fluorescin was done using 2
ampoules of anti venom (10 ml) which were mixed with 4.5 ml of 50 mM sodium
borate buffer pH 9.6 and 0.5 ml of a solution 4% fluorescin in acetone were added
under vigorous agitation in a vortex stirrer. The tube was then completely covered
with aluminum foil and the mixture was left at room temperature (≈22oC) for 6 h
and then at 4oC for 12 to 36 h. The mixture was then washed by ultrafitration with
150 ml of 50 mM sodium borate buffer pH 8 through an AMICON-Millipore
6
membrane (PBDK type, 50 kDa cut-off, 25 mm diameter) under nitrogen pressure
(4 bars) at 10oC in darkness. The labelled material was thus reduced to between 5
and 6 ml and washing buffer was added to make 10 ml. The final product was kept
in a small balloon wrapped in aluminum foil and stored at 4oC for not more than
24 h before using it.
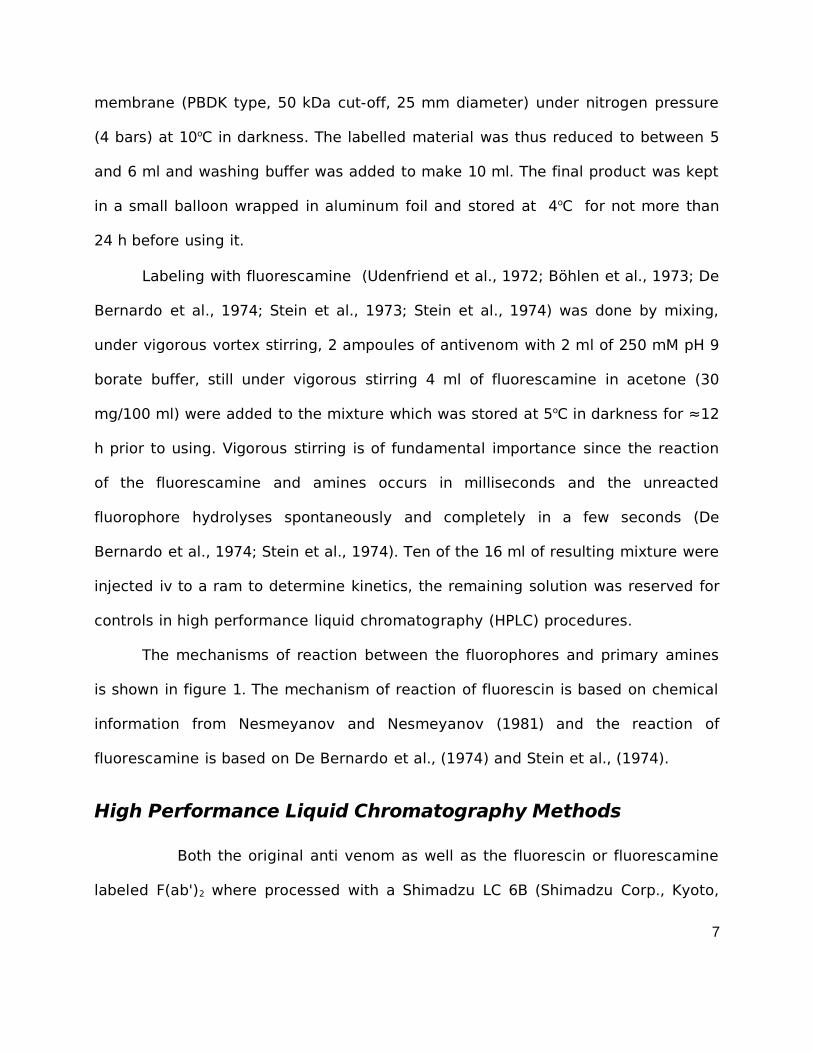
Labeling with fluorescamine (Udenfriend et al., 1972; Böhlen et al., 1973; De
Bernardo et al., 1974; Stein et al., 1973; Stein et al., 1974) was done by mixing,
under vigorous vortex stirring, 2 ampoules of antivenom with 2 ml of 250 mM pH 9
borate buffer, still under vigorous stirring 4 ml of fluorescamine in acetone (30
mg/100 ml) were added to the mixture which was stored at 5oC in darkness for ≈12
h prior to using. Vigorous stirring is of fundamental importance since the reaction
of the fluorescamine and amines occurs in milliseconds and the unreacted
fluorophore hydrolyses spontaneously and completely in a few seconds (De
Bernardo et al., 1974; Stein et al., 1974). Ten of the 16 ml of resulting mixture were
injected iv to a ram to determine kinetics, the remaining solution was reserved for
controls in high performance liquid chromatography (HPLC) procedures.
The mechanisms of reaction between the fluorophores and primary amines
is shown in figure 1. The mechanism of reaction of fluorescin is based on chemical
information from Nesmeyanov and Nesmeyanov (1981) and the reaction of
fluorescamine is based on De Bernardo et al., (1974) and Stein et al., (1974).
High Performance Liquid Chromatography Methods
Both the original anti venom as well as the fluorescin or fluorescamine
labeled F(ab')2 where processed with a Shimadzu LC 6B (Shimadzu Corp., Kyoto,
7

Japan) HPLC system using molecular exclusion Protein-Pak 300SW HPLC (Millipore
Corporation, Waters Chromatography Division, Milford, MA, USA) column eluting a
rate of 0.5 ml/min with 100 mM Tris (2-amino-2-hydroxymethyl-1-3-propanediol)
buffer with F3C.COOH added to give pH 8. In some instances the eluate was
monitored either measuring its absorbance at 280 nm (Shimadzu SPD-6AV,
ultraviolet-visible absorbance detector). For the kinetics experiments fluorescence
(Shimadzu RF-551, Spectrofluorimetric detector) at 516 nm (exciting at 490 nm)
was measured when labeling with fluorescin, or at 475 nm (exciting at 390 nm)
when labeling with fluorescamine.
Histological methods
Organ fixation was initiated by perfusion with 10% w/v formaldehyde buffered
with 1/15 M phosphate buffer pH 7.6 of the sacrificed whole animal; the fixation
was completed by immersion of the tissues in the same fixative and Bouin´s fluid
for 24 h at room temperature. The material was dehydrated with ethanol, clarified
with xylene and embedded in Paraplast. Sections between 4 and 8 m, were
dewaxed in xylene, rehydrated with distilled water. After removal from paraffin
with xylene, the endogenous peroxidase was blocked in all tissues with 3% H2O2 for
30 min in methanol between two ethanol changes during rehydration (Birne et al.,
2001; Farioli-Vecchioli et al., 2001). Antigen was reactivated by boiling in 0.01 M
citrate buffer (pH 6) for 10 min (Farioli-Vecchioli et al., 2001). After antigen
reactivation the slides were extensively washed with phosphate buffered saline.
Unspecific binding sites were blocked using phosphate buffered saline (PBS)
8

containing 5% skim milk, 0.2% triton X-100 for 1 h at room temperature before
incubation with the primary antibody. Slides were incubated overnight at 4oC with
0.2 mg/ml rabbit polyclonal anti-Tityus IgG diluted 1:1000 in PBS containing 2.5%
skim milk and 0.1% triton X-100. A secondary antibody incubation was made for 1
h at room temperature with peroxidase-complexed mouse anti-rabbit IgG diluted
1:500 in PBS containing 1% mouse normal serum. All the incubation steps were
followed by extensive washing in PBS. Sections were then incubated with 10 µl of a
solution containing 8% NiCl2, 1 ml 0.05% 3-diaminobenzidine tetrahydrochloride,
0.02% H2O2 and 50 mM Tris-HCl, pH 7.6, with all components mixed just before use
(Lobo et al., 2001). Finally the sections were washed with 50 mM Tris-HCl buffer, pH
7.6. This method results in a dark brown colour of immunostained antigens. The
sections were counter stained with Mayer´s haematoxylin (Bradbury Gordon,
1990), mounted in Crystal-Mount (Biomedia Corp., Foster City, CA) and made
permanent with Permount (Fisher Scientific, Fair Lawn, NJ).
Numerical methods
The following simultaneous differential equations, were programmed in
Fortran 77 and were fit to the data using the ADAPT II
Pharmacokinetic/Pharmacodynamic Analysis Software (D'Argenio and Schumitzky,
1997) to obtain empirical values of the kinetic constants:
d Mp
d t=ka⋅Minockep⋅Mev−kpekel ⋅Cp⋅Vp
d Minoc
d t=−ka⋅Minoc
d Mev
d t=kpe⋅Mp−kep⋅Mev
[1]
9

Where the symbols are: ka, rate of diffusion of venom from the injection site to
plasma; kel, rate of elimination of venom from plasma; kpe: diffusion rate constant of
venom from plasma to the extra vascular extracellular space; kep: diffusion rate
constant of venom from the extracellular compartment to plasma; Minoc, mass of
venom in the inoculation site; Mp : mass of venom in plasma; Mev: mass of venom in
the extracellular space; Cp, concentration of venom in plasma; Vp, distribution
volume of venom in plasma.
The Adapt II environment was chosen because it is a time-proved freeware
(for nonprofit research) package which simplifies writing the model equations as
Fortran templates, and saves a lot of programming time. The package implements
the simplex algorithm to fit model to datums (Nelder and Mead, 1965), the LSODA
method to solve general differential equations (Hindmarsh, 1982; Petzold, 1983)
and a matricial exponential method to solve linear differential equations (D'Argenio
et al., 1988). The package also permits plotting the fit between model and datums.
The remaining simulations were carried out by solving numerically the kinetic
equations using the Euler method (Carnahan et al., 1969) in 1.8 ms steps,
programmed in C++ using the g++ GNU (www.gnu.org) compiler with the Anjuta
1.2.1 Integrated Development Environment (www.anjuta.org) and plotting data
with OpenOffice.org 1.1 Calc (www.openoffice.org) all under Fedora Core Linux
Release 1.
10

Additional definitions
We will use the term "fabotherapeutic", similar to the recently coined Spanish
"faboterapéutico" (Anonymous, 2002) in reference to the antivenom used, meaning
an antitoxin made of F(ab') or F(ab')2. In the model a “milligram F(ab')2 represents
the amount required to neutralise a milligram of venom. This is due to our
conviction that it is intuitively more informative that moles or milligrams of
fabotherapeutic by itself. Since neither the fabotherapeutic nor the venom are
composed of a single well defined molecule, using precise units are only delusions.
In the case of the anti-Tityus fabotherapeutic used in Venezuela, 1 ampoule of
fabotherapeutic neutralises 1 mg (actually 1.1 mg at the time of manufacture) of
T. discrepans venom. Thus from now on we will express the amounts of
fabotherapeutic used interchangeably as mg of venom neutralised or as ampoules.
Actually, 1 ampoule of antivenom contains 181 mg protein determined by
measuring absorbance at 280 nm.
Statistical procedures
The data were processed using nonparametric statistical procedures.
Data are presented as medians and their 95% confidence interval calculated
with the procedure of Hodges and Lehmann. Statistical significance of
differences was decided with Mann-Whitney (Wilcoxon) test. Linear
regressions were carried out with the Theil procedure. See Hollander and
Wolfe (1973) for all details of nonparametric methods used. Differences
11

between treatments were considered significant if the probability that the
null hypothesis was true was ≤0.05 (P≤0.05, two tails).
Results
Determining Pharmacokinetic Constants for Venom
The top of figure 2 presents a typical fit between the model represented by
equation set [1] and the plasmatic concentration of venom in a ram. Table 1
presents the kinetic constants obtained when equation set [1] was fitted to data of
5 rams as indicated in methods. In addition to the kinetic constants described in
methods, table 1 presents the venom distribution volumes in plasma and in the
extra vascular extracellular space.
Using the model to make inferences
Since for any of the masses in equation set [1] we have that M=V·C; it is trivial
to transform this set into the following system in terms of distribution volumes and
concentrations:
dCp
d t=
ka⋅Minockep⋅Vev⋅Cev
Vp
−kpekel ⋅Cp
d Minoc
d t=−ka⋅Minoc
dCev
d t=
kpe⋅Vp⋅Cp
Vev
−kep⋅Cev
[2]
where the mass in the inoculation site was preserved due to the lack of
12
information on the distribution volume on this compartment. Here: Cev,
concentration of venom in the extra vascular extracellular space; Cp, concentration
of venom in plasma; Vev, distribution volume of venom in the extra vascular
extracellular space. Other symbols as before.
The bottom of figure 2 presents a prediction of Cp and Cev calculated with the
median kinetic parameters in table 1 and with equation set [2]. Both the
experimental and theoretical results in figure 2 are in good agreement between
themselves and with data previously published by other authors (Ismail et al.,
1980, 1988, 1992, 1994; Santana et al., 1996; Calderón-Aranda et al., 1999; Krifi
et al., 2001) in regards with the time course of venenemia.
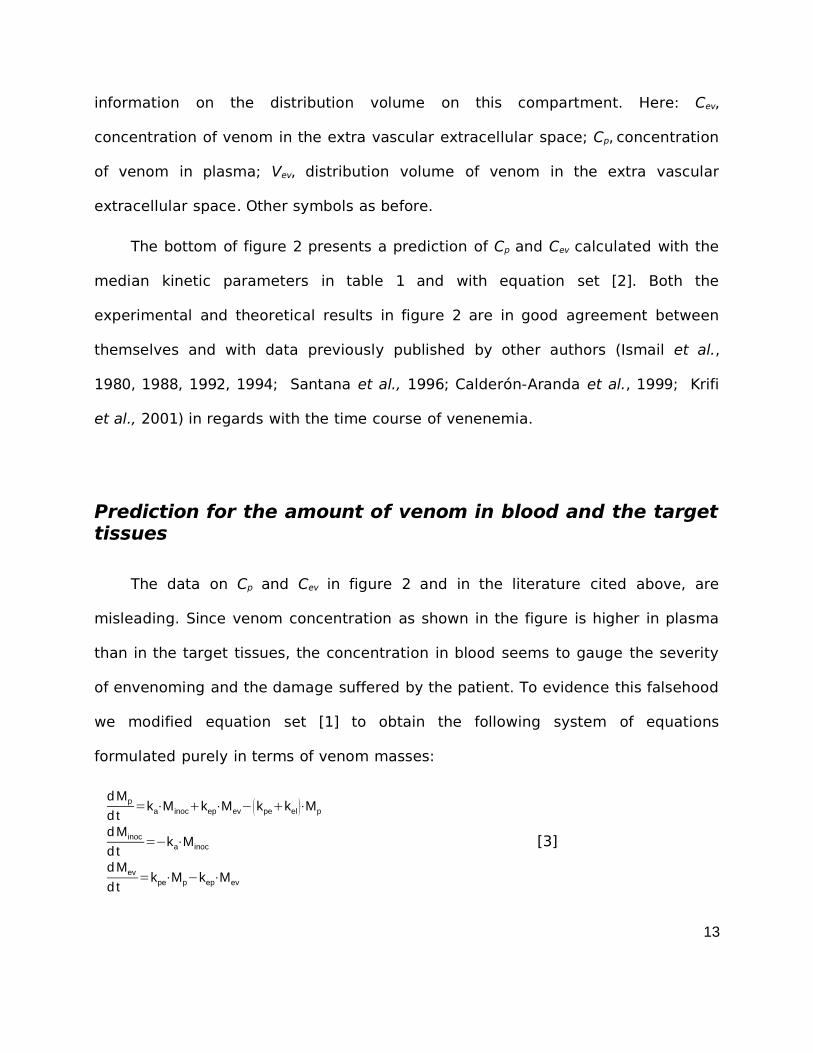
Prediction for the amount of venom in blood and the targettissues
The data on Cp and Cev in figure 2 and in the literature cited above, are
misleading. Since venom concentration as shown in the figure is higher in plasma
than in the target tissues, the concentration in blood seems to gauge the severity
of envenoming and the damage suffered by the patient. To evidence this falsehood
we modified equation set [1] to obtain the following system of equations
formulated purely in terms of venom masses:
d Mp
d t=ka⋅Minockep⋅Mev−kpekel ⋅Mp
d Minoc
d t=−ka⋅Minoc
d Mev
d t=kpe⋅Mp−kep⋅Mev
[3]
13

where all the symbols have the meanings previously described.
Figure 3 presents the results calculated with equation set [3] with 1 mg of
venom administered at time 0. This figure shows that although the time course of
Mp is qualitatively similar to Cp, Mp does not correlate with the time course of Mev at
all. Another unexpected prediction was that Minoc decays exponentially and slowly,
and that by the 5th h an amount of venom still remains at the inoculation site. The
last prediction was confirmed immunohistochemically as it is shown in figure 4,
were the venom was still present in significant amounts at the inoculation site after
5 h.
Determining Pharmacokinetic Constants for anti-T.discrepans F(ab')2
We extended the model to include F(ab')2 assuming that the antivenom does
not diffuse out of the blood compartment, equation set [3] was modified to include
the neutralisation venom-anti venom reaction as follows:
d Mp
d t=ka⋅Minockep⋅Mev−kpekelkf⋅Mfab.p ⋅Mp
d Minoc
d t=−ka⋅Minoc
d Mev
d t=kpe⋅Mp−kep⋅Mev
d Mfab.p
d t=−kf⋅Mp⋅Mfab.p
[4]
where: kf, venom-anti venom reaction rate; Mfab.p, amount of F(ab')2 in plasma. kf
was set as 50,000 min-1.
Figure 5A and 5B presents the predictions of equation set [4]. In both halves
14

of the figure 1 mg venom was administered sc at time 0, but 1 ampoule of
fabotherapeutic was administered iv at minute 60 in 5A and 3 ampoules of
fabotherapeutic were given at the same time in 5B. As seen the predictions of the
model are identical for both situations, and show that although free venom in
plasma drops to 0 immediately when F(ab')2 is injected, the amount in the tissues
descends (but exceedingly slowly) afterwards.
Measuring the diffusion of F(ab')2 into and out of the bloodvessels
The exceedingly slow venom rate of descent in tissues and its insensitivity to
fabotherapeutic dose, is not compatible with the clinical experience when scorpion
victims are subject to early fabotherapy, and prompted to consider that F(ab´)2
may diffuse out of blood vessels to neutralise venom in the extravascular space.
To test this hypothesis we assumed that a two compartment model such as:
dMfab.p
dt=k fd.ep⋅Mfab.e−k fd.pe⋅Mfab.p
dMfab.e
dt=k fd.pe⋅Mfab. p−k fd.ep⋅Mfab.e
[5]
describes the F(ab')2 diffusion from plasma to the extracellular extravascular
space, in absence of venom. Here the new symbols mean: kfd.ep, diffusion rate
constant for F(ab')2 from tissues to blood vessels; kfd.pe: diffusion rate constant for F
(ab')2 from blood vessels to tissues; Mfab.e, amount of F(ab')2 in the extracellular
space. Other symbols as defined before.
The kinetic F(ab')2 parameters were determined with fluorescently labeled
15

antitoxin as indicated in Methods. Figure 6 presents experimental points and lines
fitted to them from two experiments, one labeling with fluorescin and another
labeling with fluorescamine. Table II presents the kinetic data for F(ab')2
determined in 3 rams; 2 of them labeling with fluorescin and one labeling with
fluorescamine.
Predictions of fabotherapy with diffusion of F(ab')2 into andout of the blood vessels
Using the parameters in tables 1 and 2 and the following set of simultaneous
differential equations:
dMp
d t=ka⋅Minockep⋅Mev−kpekelkf⋅Mfab.p ⋅Mp
dMinoc
d t=−ka⋅Minoc
dMev
d t=kpe⋅Mp−kepkf⋅Mfab.e ⋅Mev
dMfab.p
d t=kfd.ep⋅Mfab.e−kfd.pekf⋅Mp ⋅Mfab. p
dMfab.e
d t=kfd.pe⋅Mfab.p−kfd.epkf⋅Mev ⋅Mfab.e
[6]
we modeled the effects of different protocols of administering fabotherapy.
Figure 5C presents results obtained under the same conditions used in figure
5A calculated with equation set [6]; venom parameters were as in table 1, and F
(ab')2 parameters as in table 2. The antivenom readily removes the venom from
plasma and extracellular compartments; the remotion from the extracellular
compartment is slightly faster when 3 ampoules of venom are used (Figure 5D)
instead of 1 (Figure 5C).
16

Modeling Different Fabotherapeutic Protocols.
Figure 7 presents predictions with equation set [6] for different clinical
situations where antivenom is administered. In all panels 1 mg of venom was
received at time 0, followed by 1 ampoule of antivenom 60 min later in 7A or only
½ ampoule in 7B. When insufficient fabotherapeutic is used, plasmatic venom is
initially completely neutralized, but increases again as venom continues diffusing
from the inoculation site to plasma.
In figure 7C 1 ampoule of anitvenom was administered continuously
and at the same rate (mimicking an iv infusion) from minute 60 through minute
150; as seen the area under the venom in organs curve is much larger than in 7A.
A similar situation is depicted in 7D, where ¼ of ampoule was injected iv at minute
60, and the same amount repeated at minutes 90, 120 and 150. As examples of
late fabotherapy, we also modeled situations where 1 ampoule (7D) or 3 ampoules
(7E) of anitvenom were administered 9 h after receiving venom .
Discussion
We have determined the pharmacokinetic constants for Tityus discrepans
scorpion venom and of its F(ab')2 antivenom in rams. The parameters were used in
a model to describe the distribution and dynamics of both the venom and
antivenom under several treatment modalities. We found an excellent agreement
17

between experimentally measured plasmatic venom and antivenom
concentrations with the predictions of the mathematical model used. The model
predicts several unexpected features such as the existence of significant amounts
of venom at the inoculation site 5 h after inoculating the venom. This prediction
was verified experimentally by means of immunohistochemistry (Figure 4).
As shown in table 1 the rate of outflow (kpe) of Tityus venom from plasma is
≈20 times faster that the rate of inflow (kep); this probably results from toxins' high
affinity for tissular receptors. The high affinity (and probably the abundance of
receptors) determines that the distribution volume of venom in the extravascular
space [Ve = 182.8 (117.1, 253.9) lit] is much larger than 4 to 6 lit [10 to 15% of body
weight, Manery, (1954)] as expected for the rams utilised; this overestimation
expresses abundant high affinity extracellular space venom receptors. The venom
distribution in plasma [Vp = 11.2 (2.0, 20.0) lit] is also larger than the expected 2 to
3 lit [5 to 7% of body weight, Manery, (1954)], suggesting that there are high
affinity venom receptors in blood. Much less is known about blood receptors for
Tityus venom, but since the venom has pro- and anticoagulating effects (D'Suze et
al., 2003) they must exist. In contrast with these results, and in spite of the fact
that the outflow and inflow rate constants for F(ab')2 are different, our estimates of
F(ab')2 distribution volumes in plasma and extracellular space are the expected real
volumes of these compartments.
To simplify the solution of the equations, in the calculations using equation
sets [4] and [6] the reaction between F(ab')2 and venom was modeled as
irreversible and with a forward reaction rate kf set to 50,000 min-1. This reaction is
18

reversible with a dissociation constant between 10-8 and 10-11 M, and a forward
reaction rate between 3×10⁵ and 4×10⁸ s-1 (Goldsby et al., 2000). Since the
molecular weight of venom components is ≤10 kDa, the value used in the
calculation is ≈8×10² s-1 which is conservative. Thus, the almost instantaneous
neutralization of venom with F(ab')2 is not a model exaggeration.
Given that the molecular weight of F(ab')2 is ≥10 times higher than venom's
toxins, it was surprising to find that the kinetics of fluorescent F(ab')2 extravasation
was, independently of which fluorophore was used, about 4 fold faster that venom
extravasation. The faster antivenom outflow can only be explained in terms of the
existence of some kind of active mechanism of extrusion of F(ab')2 through the
vascular endothelium. It is known that polymeric immunoglobulin A (IgA) and
immunoglobulin M (IgM) are excreted through epithelia (Bradzaeg, 1981; Hühn and
Kraehenbuhl, 1981; Mostov et al., 1980, 1984) by means of a vesicular mechanism.
This mechanism is similar to what has been called potocytosis in mesothelia. In
potocytosis, when specific membrane receptors recognises a molecule, a special
kind of pit called caveola is formed entrapping the ligand and the receptor; the
caveola is then endocyted and may travel to the opposite side of the cell where it
releases the ligand (Mineo and Anderson, 2001). To our knowledge no such
mechanism has yet been demonstrated for IgG. Potocytotic transcytosis has been
shown to occur for albumin, transthyrein, thrombomodulin, several plasma proteins
and water (Mineo and Anderson, 2001; Bodega et al., 2002; Predescu et al., 2002);
the half time (T½) of internalisation by potocytosis is ≈30 min (Mineo and Anderson,
2001). A vesicular mechanism of transcytosis different from potocytosis occurs in
19

epithelia and mesothelia, it involves clathrine-coated pits; this mechanism of
endocytosis has a T½ of internalisation of ≈6 min (Mineo and Anderson, 2001). The
value of T½ corresponding to kfd.pe in table 2, 14.2 (9.8, 24.8) min, lies in between
the two values cited, making it difficult to decide at the present, between caveolae
and clathrine-coated pits as a candidates to extravasate IgG. Given that the
antivenom is a fabotherapeutic, if an active extrusion mechanism exists, it does
not require IgG's Fc chain and probably means that IgG is transported as a
monomer. In the experiments using fluorescin labelling, the antivenom was
ultrafiltered for over 24 h to eliminate molecules of ≤50 kDa producing pure F(ab')
2 as it was shown by molecular exclusion HPLC (not shown). The data in tables 1
and 2 shows that ka ≅ kfd.ep; this coincidence suggests that after the antivenom is
extravasated, it returns to plasma via the lymph vessels as it is the case for toxins
in elapid snake venoms and other large molecules (White, 1982).
Venom kinetics modeled using the parameters in table 1 predicts that no more
that 30% of the venom is present in plasma at any time. Venenemia peaks at 1 h
and then decays. Only ≈5% of the venom is eliminated in up to 10 h, ≈80% of the
venom is in the tissues after 2 h and remains there for >10 h when venenemia
becomes negligible. Plasma is a transient pathway from the envenoming site to the
target organs, therefore venenemia underestimates the amount of venom
received; this underestimation grows with envenoming time.
The model is able to predict that with an insufficient dose of antivenom
venenemia may be transiently reduced to nil, but that it will increase again as
venom keeps entering plasma from the inoculation site (figure 7B) and due to the
20

rapid F(ab')2 plasma outflow. The sequence of plasmatic venom neutralization
followed be an increase, repeats it self several times when the antivenom needed
to neutralise the venom is fractioned (figure 7D). When figure 7A is compared to
7C and 7D, it becomes evident at the area under the curve of venom mass in
organs is much larger when antivenom is not administered as a single bolus; a
larger area under the curve of venom in organs means that the poison has a
greater chance to harm. Since most of the worst cases of Tityus poisoning in
Venezuela occur in babies and toddlers, diluting the venom in 50 ml of saline, as it
is sometimes advised, may represent an important and unnecessary blood volume
expansion. Figures 7E and 7F indicate that the area under the curve of venom in
organs grows enormously in cases of late antivenom administration, in spite of the
fast outflow of antivenom from plasma and even if the amount of fabotherapeutic
required tho completely neutralise the venom is raised 3 fold. In Venezuela, most
of the clinically severe cases where antivenom administration is delayed as in
figures 7E and 7F, are fatal or become extremely serious, even with
cerebrovascular complications. The present results suggest that this probably
stems from accumulated damage, which includes a generalised inflammatory
syndrome (D'Suze et al., 2003), rather that from the inability to neutralise tissular
venom. There is no replacement for early fabotherapy.
21

Acknowledgements
This work was partly financed by Laboratorios Silanes SA de CV, Mexico and
by the IVIC-Silanes grant for applied projects No. 2001-31. The assistance of Mr.
Moisés Sandoval and Dr. Tatiana Vzentekova is kindly acknowledged.
References
Anonymous (2002). Norma Oficial Mexicana NOM-033-SSA2-2002, Para la
vigilancia, prevención y control de la picadura de alacrán. Secretaría de
Salud, México.
D'Argenio, D.Z. and Schumitzky, A. (1997). ADAPT II.
Pharmacokinetic/Pharmacodynamic Systems Analysis Software. Biomedical
Simulations Resource, Los Angeles, California.
D'Argenio, D.Z., Schumitzky, A. and Wolf, W., 1988. Simulation of linear
compartment models with application to nuclear medicine kinetic modelling.
Comput. Meth. Progrograms Biomed. 27, 47-54.
Birner, P., Ritzi, M., Musahl, C., Knippers, R., Gerdes, J., Voigtländer, T., Budka, H.
and Hainfellner, J. A., 2001. Immunohistochemical detection of cell growth
fraction in formalin-fixed and paraffin-embedded murine tissue. Amer. J.
Pathol. 158, 1991-1996.
22

Bodega, F., Zocchi, L. and Agostoni, M., 2002. Albumin transcytosis in
mesothelium. Am. J. Physiol. Lung Cell. Mol. Physiol. 282, L3-L11.
Böhlen, P., Stein, S., Dairman, W. and Udenfriend, S., 1973. Fluorometric assay of
proteins in the nanogram range. Arch. Biochem. Bioph. 155, 213-220.
Bradbury, P. and Gordon, K.C., 1990. Connective tissue and stains. In: Theory and
Practice of Histological Techniques. (Bancroft, J.D., Stevens, A., eds). 3th.
edition. Pp 119-142. Churchill-Livinstone. London.
Brandzaeg, P., 1981. Transport models for secretory IgA and secretory IgM. Clin.
Exp. Immunol. 44, 221-232.
Calderón-Aranda, E., Rivière, G., Choumet, V., Possani, L. and Bon, C., 1999.
Pharmacokinetics of the toxic fraction of Centruroides limpidus limpidus
venom in experimentally envenomed rabbits and effects of immunotherapy
with specific F(ab´)2. Toxicon 37, 771-782.
Carnahan, B., Luther, H.A. and Wilkes, J.O. 1969. Applied numerical methods. Ch. 6.
Wiley, New York.
De Bernardo, S., Weigele, M., Toome, V., Manhart, K. and Leimgruber, W., 1974.
Studies on the reaction of fluorescamine with primary amines. Arch. Biochem.
Bioph. 163, 390-399.
D'Suze, G., Moncada, S., González, C., Sevcik, C., Aguilar, V. and Alagón, A., 2003.
Relationship between plasmatic levels of various cytokines, tumour necrosis
factor, enzymes, glucose and venom concentration following Tityus scorpion
sting. Toxicon 41, 367-375.
Farioli-Vecchioli, S., Nardacci, R., Falciatori, I. and Stefanini, S., 2001. Catalase
immunocytochemistry allows automatic detection of lung type II alveolar
23
cells. Histochem. Cell. Biol. 115, 333-339.
Goldsby, R.A., Kindt, T.J. and Osborne, B.A., 2000. Kuby immunology. Ch 6.
Freeman, New York.
Hindmarsh. A.C. 1982. Large ordinary differential equation systems and software.
IEEE Cont. Sys. Mag. 2, 24-30.
Hollander, M. and Wolfe, D.A., 1973. Nonparametric Statistical Procedures. Wiley,
New York.
Ismail, M., Abdoulah, M., Morad, A. and Ageel, A., 1980. Pharmacokinetics of 125I-
labelled venom from the scorpion Androctonus amoreuxi (Aud. and Sav.).
Toxicon 18, 301-308.
Ismail, M. Shibl, A.M., Morad, A.M. and Abdullah, M.E., 1983. Pharmacokinetics of 125I
labeled anti venom to the venom from the scorpion Androctonus amoreuxi.
Toxicon 21, 47- 56.
Ismail, M. and Abd-Elsalam, M., 1988. Are the toxicological effects of scorpion
envenomation related to tissue venom concentration? Toxicon 26, 233-256.
Ismail, M., Fatani, J. and Dbees, T., 1992. Experimental treatment protocols for
scorpion envenomation: a review of common therapies and an effect of
kallikrein-kinin inhibitors. Toxicon 30, 1257-1279.
Ismail, M., Abd-Elsalam, M. and Al-Ahaidib, M., 1994. Androctonus crassicauda
(Olivier), a dangerous and unduly neglected scorpion-I. Pharmacological and
clinical studies. Toxicon 32, 1599-1618.
Krifi, M., Miled, K., Abderrazek, M. and El Ayeb, M., 2001. Effects of anti venom on
Buthus occitanus tunetanus (Bot) scorpion venom pharmacokinetics: towards
an optimization of anti venom immunotherapy in a rabbit model. Toxicon 39,
24

1317-1326.
Kühn, L.C. and Kraehenbuhl, J.-P., 1981. The membrane receptor for polymeric
immunoglobulin is structurally related to secretory component. Isolation and
characterization of membrane secretory component from rabbit liver and
mammary gland. J. Biol. Chem. 256, 12490-12495.
Lobo, M.V.T., Alonso, F.J.M., LaTorre, A. and Martín del Río, R., 2001. Taurine levels
and localisation in the stratified squamous epithelia. Histochem. Cell. Biol.
115, 341-347.
Manery, J.F., 1954. Water and electrolyte metabolism. Physiol. Rev. 34, 334-417.
Mineo, C. and Anderson, R.G.W., 2001. Potocytosis. Histochem. Cell. Biol. 116, 109-
118.
Mostov, K.E., Friedlander, M. and Blobel, G., 1984. The receptor for transepithelial
transport of IgA and IgM contains multiple immunoglobulin-like domains.
Nature 308, 37-43.
Mostov, K.E., Kraehenbuhl, J.-P. and Blobel, G., 1980. Receptor-mediated
transcellular transport of immunoglobulin: Synthesis of secretory component
as multiple and larger transmembrane forms. Proc. Nat. Acad. Sci. USA 77,
7257-7261.
Nelder, J. and Mead, R., 1965. A simplex method for function minimization. Comp. J.
7, 308-313.
Nesmeyanov, A.N. and Nesmeyanov, N.A., 1981. Fundamentals of organic
chemistry. Vol. 3. pp 257-259. Mir, Moscow.
Petzold, L.R., 1983. Automatic selection of methods for solving stiff and nonstiff
systems of ordinary differential equations, SIAM J. Sci. Stat. Comput. 4, 136-
25

148.
Predescu, D., Predescu, S. and Malik, A., 2002. Transport of nitrated albumin across
continuous vascular endothelium. Proc. Nat. Acad. Sci. USA 99, 13932-13937.
Stein, S., Böhlen, P., Stone, J., Dairman, W. and Udenfriend, S., 1973. Amino acid
analysis with fluorescamine at the picomole level. Arch. Bioch. Bioph. 155,
202-212.
Stein, S., Böhlen, P. and Udenfriend, S., 1974. Studies on the kinetics of reaction
and hydrolysis of fluorescamine. Arch. Bioch. Bioph. 163, 400-403.
Udenfriend, S., Stein, S., Böhlen, P., Dairman, W., Leimgruber, W. and Weigele, M.,
1972). Fluorescamine: A reagent for assay of amino acids, peptides, proteins,
and primary amines in the picomole range. Science 178, 871- 872.
White, J., 1982. Ophidian envenomation a South Australian perspective. Records
Adelaide Children's Hosp. 2, 311-421.
26

Table 1. Kinetic Parameters for Tityus discrepans VenomDetermined in Rams.
Parameter Value T1/2
ka 1.2∙10-2
(0.78, 1.8)∙10-2 min-157.8
(38.5, 88.9) min
kel 1.03∙10-3
(0.56, 3.0)∙10-3 min-1673.0
(231.0, 1237.8) min
kpe 1.5∙10-2
(0.52, 2.7)∙10-2 min-146.2
(25.7, 133.3) min
kep 4.5∙10-4
(2.0, 20.0)∙10-4 min-11540.3
(346.6, 3465.7) min
Vp 11.2(2.0, 20.0) lit
Ve=Vp∙kpe/kep 182.8(117.1, 253.9) lit
Data presented as medians and their 95% confidence interval (between
parentheses) of 5 experiments
27
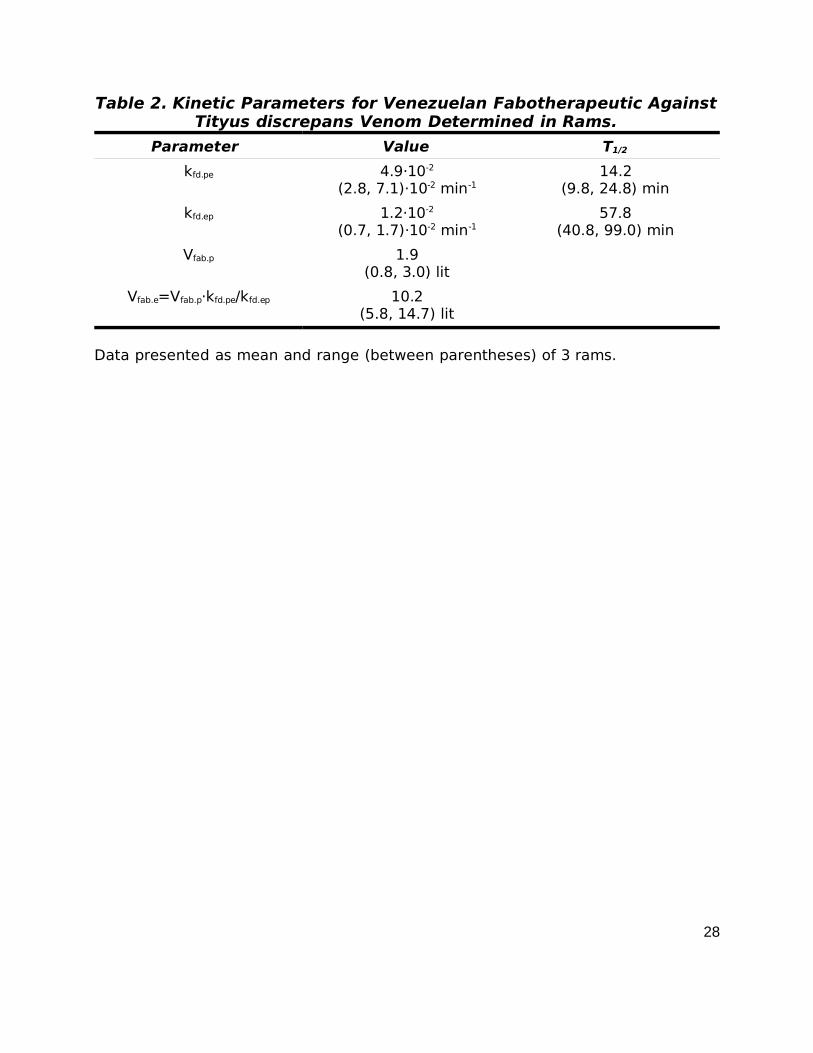
Table 2. Kinetic Parameters for Venezuelan Fabotherapeutic AgainstTityus discrepans Venom Determined in Rams.
Parameter Value T1/2
kfd.pe 4.9∙10-2
(2.8, 7.1)∙10-2 min-114.2
(9.8, 24.8) min
kfd.ep 1.2∙10-2
(0.7, 1.7)∙10-2 min-157.8
(40.8, 99.0) min
Vfab.p 1.9(0.8, 3.0) lit
Vfab.e=Vfab.p∙kfd.pe/kfd.ep 10.2(5.8, 14.7) lit
Data presented as mean and range (between parentheses) of 3 rams.
28

Legends for the figures
Figure 1- Fluorescent labeling of proteins via primary amine reaction with
fluorescine and fluorescamine. R-NH2 represents the primary amine of a
protein. The mechanism of reaction of fluorescin is based on chemical
information from Nesmeyanov and Nesmeyanov (1981) and the reaction of
fluorescamine is from De Bernardo et al., (1974) and Stein et al., (1974).
Figure 2- Time course of plasmatic venom concentrations (venenemia) in
rams. The top of the figure presents the time course venenemia in one of the
rams studied; squares are experimental values, the line was fitted as
indicated in methods to equation set [1]. The bottom of the panel is the time
course of venom concentration in plasma (Cp, solid line) and in the
extracellular extracellular extravascular space (Cev, dashed line) both
calculated by solving numerically equation set [2] with the median kinetic
constants presented in table 1 assuming that 1 mg of venom was
administered at time = 0.
Figure 3- Time course of venom mass distribution in rams. The figure
presents the time courses predicted with equation set [3] with the median
kinetic constants presented in table 1 assuming that 1 mg of venom was
administered at time = 0. The solid line is the amount of venom in plasma;
29

The short dashed line is the amount of venom in the extra vascular
extracellular space; The dotted line is the amount of venom in the inoculation
site; The dash dot dot line is the amount of venom eliminated from plasma.
Abscissa is the amount of venom in mg; ordinate is time in hours. Other
details in the text of the communication.
Figure 4- Immunohistochemical detection of venominthe inoculation site.
Two sections of the subcutaneous connective tissue where the venom was
injected are presented; the venom appears immunochemically stained in
yellowish brown all over the sections; nuclei are greenish blue. A large
lymphatic vessel (LV) containing venom in the haemolymph is presented in
the top section indicating that venom is still absorbed from the tissue in
significant amounts. In contrast with the lymphatic vessels, the plasma
content of an arteriole in the lower section is clear indicating a much lower
venom concentration. The calibration bar (50 mm) in the lower panel is valid
for both photomicrographs, other details in the text of the communication.
Figure 5- Time course of venom mass distribution in rams when F(ab')2 is
injected iv Panels A and B present the time courses predicted with equation
set [4] assuming that the fabotherapeutic does not diffuse out of the blood
vessels. A- 1 mg of venom was administered at time 0 followed by 1 ampoule
of fabotherapeutic. B- 1 mg of venom was administered at time 0 followed by
3 ampoules of fabotherapeutic. Panels C and D present the time courses
predicted with equation set [5] using the diffusion constant for F(ab')2
30

determined experimentally as shown in figure 4. C- 1 mg of venom was
administered at time 0 followed by 1 ampoule of fabotherapeutic. D- 1 mg of
venom was administered at time 0 followed by 3 ampoules of
fabotherapeutic. In all cases the fabotherapeutic was administered iv 60 min
latter. Other details as in figure 2 and in the text.
Figure 6- Time course of fluorescent F(ab')2 injected iv in rams. The
squares are experimental data, the lines were fitted with equation set [6]
using the kinetic parameters in tables 1 and 2. In the top of the figure is one
experiment where the antivenom was labeled with fluorescine. In the bottom
is another experiment labeling the antivenom with fluorescamine. As may be
appreciated the time course of F(ab')2 in plasma is very similar in both cases.
Other details like in figure 3 and in the text of the communication.
Figure 7. Modelling Different Fabotherapeutic Modalities. The figure present
model predictions for the use of insufficient, slow and late administration of F
(ab')2. In all panels 1 mg of venom is administered at time 0. In panels A
trhough D 1antivenom was administered 60 min after venom's
administration. In panel A the ampoule was given as singe iv bolus. In panel B,
only ½ ampoule was given as a single bolus. In panel C, 1 ampoule is
administered as a continuous iv infusion from minute 60 through minute 150.
In panel D, ¼ of ampoule was injected iv at minute 60, and then again at
minutes 90, 120 and 150. In panel E, 1 ampoule of anitvenom was
administered iv 9 h after venom. In panel F, 3 ampoules were administered iv
31

9 h after venom. Other details like in figures 3 and 6, and in the text of the
communication.
32
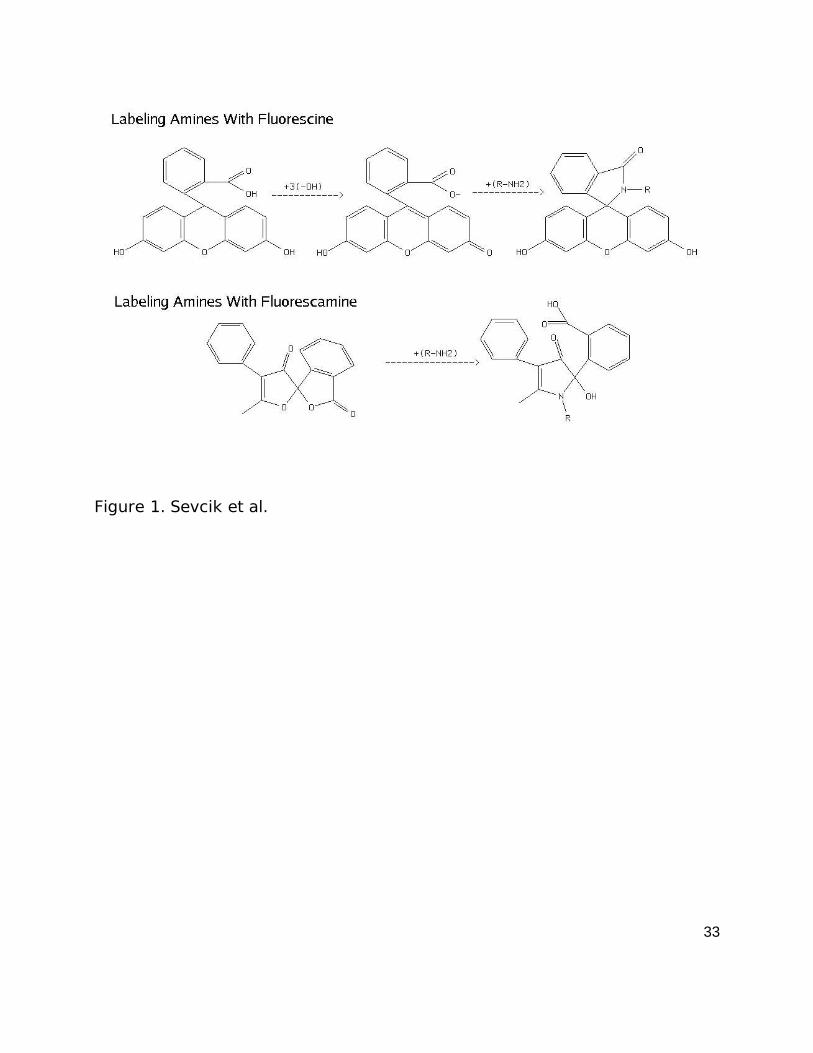
Figure 1. Sevcik et al.
33

Figure 2- C. Sevcik et al.
34
0 100 200 300 400 500 6000
10
20
30
Time (min)
Ven
om
Co
nce
ntr
atio
n (
ng
/ml)

Figure 3- C. Sevcik et al.
35
0 2 4 6 8 100.00
0.20
0.40
0.60
0.80
1.00
Time (hr)
Venom
Mass
(m
g)

Figure 4- C. Sevcik et al.
36

Figure 5- Sevcik et al.
37
0 2 4 6 8 10
0.00
0.20
0.40
0.60
0.80
1.00
A
Time (hr)
Venom
Mass
(m
g)
0 2 4 6 8 10
0.00
0.20
0.40
0.60
0.80
1.00
B
Time (hr)
Venom
Mass
(m
g)
0 2 4 6 8 100.00
0.20
0.40
0.60
0.80
1.00
C
Time (hr)
Venom
Mass
(m
g)
0 2 4 6 8 100.00
0.20
0.40
0.60
0.80
1.00
D
Time (hr)
Venom
Mass
(m
g)

Figure 6. Sevcik et al.
38

Figure 7. Sevcik et al.
39
0 2 4 6 8 10
0.0
0.2
0.4
0.6
0.8
1.0 F
Time (hours)
Ven
om
Mass
(m
g)
0 2 4 6 8 10
0.0
0.2
0.4
0.6
0.8
1.0 E
Time (hours)
Ven
om
Mass
(m
g)
0 1 2 3 4
0.0
0.2
0.4
0.6
0.8
1.0 C
Time (hours)
Ve
no
m M
ass
(m
g)
0 1 2 3 4
0.0
0.2
0.4
0.6
0.8
1.0 D
Time (hours)
Ve
no
m M
ass
(m
g)
0 1 2 3 4
0.0
0.2
0.4
0.6
0.8
1.0 A
Time (hours)
Veno
m M
ass
(m
g)
0 2 4 6 8 10
0.0
0.2
0.4
0.6
0.8
1.0 B
Time (hours)
Ven
om M
ass
(m
g)
Copyright © 2022 FDOKUMEN