
Modelling of the kinetics of colour change in hazelnuts during air roasting
10
Modelling of the kinetics of colour change in hazelnuts during air roasting Ali Do gan Demir a , Jes us Mar ıa Fr ıas Celayeta a , Kevin Cronin a, * , Kamal Abodayeh b a Department of Process Engineering, University College, Cork, Ireland b Prince Sultan College, P.O. Box 66 833, Riyadhv 11586, Saudi Arabia Received 19 October 2001; accepted 4 March 2002 Abstract The colour changes that occur in hazelnuts during the dry roasting process were experimentally studied in order to determine the magnitudes of the parameters for a corresponding colour change model. Roasting times varying from 5 to 1900 min and a number of roasting temperatures in the range from 100 to 180 °C were analysed. The order of the reaction was found by plotting isothermal curves of colour change against time at a number of different roasting temperatures. Statistical analysis of the data demonstrated that the colour parameter, L was best represented by a first-order process. The rate constant was assumed to have an Arrhenius-type dependence on temperature. The activation energy (E a ) and the frequency (pre-exponential) term (k 1 ) were determined as 64.5 kJ mol 1 and 33416.5 s 1 respectively for the conditions studied. Theoretical equations, based on the exponential integral function, to predict first-order quality changes when product temperature is varying exponentially were developed. These equations were validated by comparison with the experimental colour data extracted from the non-isothermal region of the roasting process. Ó 2002 Elsevier Science Ltd. All rights reserved. Keywords: Hazelnut roasting; Colour responses; Quality kinetics; Exponential integral 1. Introduction The world tree nut market is segmented into two major categories; in-shell nuts and shelled tree nuts. The term ‘in-shell’ describes tree nuts that are produced and marketed with the shell intact. Their processing pri- marily involves exterior cleaning and preparation for seasonal market. However the most common form of nuts used in the food-processing sector are shelled nuts. Shelled nuts undergo processes including blanching, dicing, coating, roasting and grinding to fit product formulation needs or give them increased consumer appeal. Roasting is one of the most important processes giving the product the necessary alterations to become value-added nuts. There are two types of nut roasting: dry and oil. Dry roasting involves the heating of nuts using air convection or radiant microwave heat. In the oil method, raw nutmeats are immersed in boiling oil, and then drained to remove excess oil (Somogyi, Bar- rett, & Hui, 1996). Currently, over 4,000,000 tons of nuts are commercially produced throughout the world. 700,000 tons of that figure is hazelnut (Corylus avellana L.), production ( € Ozdemir & Devres, 1999). There are several objectives to hazelnut roasting; one is to ensure that the centre of every nut reaches some minimum temperature to destroy any toxins or allergens that may exist (M€ uller et al., 2000). Wigotzki, Stein- heart, and Paschke (2000) showed that the IgE binding activity of main hazelnut allergens decreased after 15 min roasting at temperatures between 100 and 185 °C and was no longer detectable at 170 °C. Roasting at 100 °C for up to 90 min had no influence on the allergenicity of hazelnut proteins. Another objective of hazelnut roasting is to give the product surface a variety of col- ours such as a whitened, golden yellow, dark roast or very dark roast ( € Ozdemir & Devres, 2000a). Roasting alters and significantly enhances the flavour, colour, texture and appearance of hazelnuts. Roasting also inactivates enzymes that speed up nutrient loss and de- stroys undesirable microorganisms and food contami- nants. Therefore from the quality and safety point of view, the times and temperatures applied are very im- portant factors in hazelnut roasting. Journal of Food Engineering 55 (2002) 283–292 www.elsevier.com/locate/jfoodeng * Corresponding author. Tel.: +353-21-4902644; fax: +353-21- 4270249. E-mail address: [email protected] (K. Cronin). 0260-8774/02/$ - see front matter Ó 2002 Elsevier Science Ltd. All rights reserved. PII:S0260-8774(02)00103-6
-
Upload
independent -
Category
Documents
-
view
0 -
download
0
Transcript of Modelling of the kinetics of colour change in hazelnuts during air roasting

Modelling of the kinetics of colour change in hazelnutsduring air roasting
Ali Do�ggan Demir a, Jes�uus Mar�ııa Fr�ııas Celayeta a, Kevin Cronin a,*, Kamal Abodayeh b
a Department of Process Engineering, University College, Cork, Irelandb Prince Sultan College, P.O. Box 66 833, Riyadhv 11586, Saudi Arabia
Received 19 October 2001; accepted 4 March 2002
Abstract
The colour changes that occur in hazelnuts during the dry roasting process were experimentally studied in order to determine the
magnitudes of the parameters for a corresponding colour change model. Roasting times varying from 5 to 1900 min and a number
of roasting temperatures in the range from 100 to 180 �C were analysed. The order of the reaction was found by plotting isothermalcurves of colour change against time at a number of different roasting temperatures. Statistical analysis of the data demonstrated
that the colour parameter, L was best represented by a first-order process. The rate constant was assumed to have an Arrhenius-type
dependence on temperature. The activation energy (Ea) and the frequency (pre-exponential) term (k1) were determined as 64.5kJmol�1 and 33416.5 s�1 respectively for the conditions studied. Theoretical equations, based on the exponential integral function,
to predict first-order quality changes when product temperature is varying exponentially were developed. These equations were
validated by comparison with the experimental colour data extracted from the non-isothermal region of the roasting process.
� 2002 Elsevier Science Ltd. All rights reserved.
Keywords: Hazelnut roasting; Colour responses; Quality kinetics; Exponential integral
1. Introduction
The world tree nut market is segmented into two
major categories; in-shell nuts and shelled tree nuts. The
term ‘in-shell’ describes tree nuts that are produced and
marketed with the shell intact. Their processing pri-
marily involves exterior cleaning and preparation for
seasonal market. However the most common form of
nuts used in the food-processing sector are shelled nuts.Shelled nuts undergo processes including blanching,
dicing, coating, roasting and grinding to fit product
formulation needs or give them increased consumer
appeal. Roasting is one of the most important processes
giving the product the necessary alterations to become
value-added nuts. There are two types of nut roasting:
dry and oil. Dry roasting involves the heating of nuts
using air convection or radiant microwave heat. In theoil method, raw nutmeats are immersed in boiling oil,
and then drained to remove excess oil (Somogyi, Bar-
rett, & Hui, 1996). Currently, over 4,000,000 tons ofnuts are commercially produced throughout the world.
700,000 tons of that figure is hazelnut (Corylus avellana
L.), production (€OOzdemir & Devres, 1999).There are several objectives to hazelnut roasting; one
is to ensure that the centre of every nut reaches some
minimum temperature to destroy any toxins or allergens
that may exist (M€uuller et al., 2000). Wigotzki, Stein-heart, and Paschke (2000) showed that the IgE bindingactivity of main hazelnut allergens decreased after 15
min roasting at temperatures between 100 and 185 �Cand was no longer detectable at 170 �C. Roasting at 100�C for up to 90 min had no influence on the allergenicityof hazelnut proteins. Another objective of hazelnut
roasting is to give the product surface a variety of col-
ours such as a whitened, golden yellow, dark roast or
very dark roast (€OOzdemir & Devres, 2000a). Roastingalters and significantly enhances the flavour, colour,
texture and appearance of hazelnuts. Roasting also
inactivates enzymes that speed up nutrient loss and de-
stroys undesirable microorganisms and food contami-
nants. Therefore from the quality and safety point of
view, the times and temperatures applied are very im-
portant factors in hazelnut roasting.
Journal of Food Engineering 55 (2002) 283–292
www.elsevier.com/locate/jfoodeng
*Corresponding author. Tel.: +353-21-4902644; fax: +353-21-
4270249.
E-mail address: [email protected] (K. Cronin).
0260-8774/02/$ - see front matter � 2002 Elsevier Science Ltd. All rights reserved.
PII: S0260-8774 (02 )00103-6

In industry, hazelnuts are generally roasted at tem-
peratures between 100 and 180 �C from 5 to 60 min withdry air as the heating medium. There is a choice between
roasting the hazelnuts at low temperatures for longtimes or high temperatures for short times. Low tem-
perature roasting can be considered as an isothermal
process because for the majority of the process, the nut
temperature is almost asymptotically equal to the con-
stant roasting air temperature after the short initial
‘come-up’ temperature period. For this schedule, the
overwhelming majority of the quality changes that occur
during roasting will take place during this ‘isothermal’period. However in high temperature roasting, as the
required process time is much shorter and air tempera-
ture considerably higher, hazelnut temperature mono-
tonically rises throughout the process and quality
changes occur over the entire temperature range. Fig. 1
illustrates the distinction between the two roasting
schedules by showing the centre temperature versus time
profiles of two hazelnuts, which were roasted in a batch
oven at air temperatures of 120 and 180 �C for 60 and 20min respectively. The Biot number for the prevailing
conditions and geometry (using the characteristic di-
mension of volume over heat transfer area) was found to
be 0.42. Therefore it was necessary to take into account
both internal and surface resistance to heat flow which is
normal in the analysis of heat transfer to food systems
with air as the heating medium.
For many roasted products browning (which can beclassified as enzymatic or non-enzymatic) is desirable.
The colour changes during roasting of hazelnuts mainly
relate to non-enzymatic browning. The non-enzymatic
browning is a complex set of reactions including the
pathways of sugar caramelization, Maillard reaction
and oxidation of ascorbic acid. Maillard reaction in-
volves the reaction between the carbonyl group of a
reducing sugar with a free, uncharged amine group of anamino acid or protein with the loss of one mol of water
(Lopez & Pique, 1997). Non-enzymatic browning has a
diminishing effect on the nutritional value due to the
decreased protein digestibility and loss of essential
amino acids (€OOzdemir & Devres, 2000b).Non-enzymatic browning reactions in food systems
are generally considered to be zero- or first-order reac-
tions. According to Heldman and Lund (1992), colourchanges can be modelled by using a first-order reaction
rate and the effect of temperature on non-enzymatic
browning reaction rate is usually expressed using an
Arrhenius-type relationship. Lopez and Pique (1997)
showed that the rate of non-enzymatic browning in-
Nomenclature
a colour dimension
an exponential integral constant
A1 equation constant
b colour dimension
bn exponential integral constantBi Biot number
C equation constant
C1 equation constant
cv coefficient of variation
Cp specific heat capacity (J kg�1 K�1)
Ea activation energy (kJmol�1)
E1 exponential integral
h overall surface heat transfer coefficient(Wm�2 K�1)
k1 frequency factor (s�1)
k thermal conductivity (Wm�1 K�1)
kR reaction rate constant (s�1)
L colour dimension (lightness)
r0 radius (m)
rc thermal rate constant (s�1)
R universal gas constant
(8:314� 10�3 kJmol�1 K�1)
R2 correlation coefficientt time (s, min)
T absolute temperature (K)
T average temperature (�C, K)
Greek symbols
b equation constantq density (kgm�3)
k1 thermal model constant
r standard deviation
Subscripts
1 asymptotic value0 initial
c centre
Fig. 1. Hazelnut temperature profiles versus time for air temperatures
of 120 and 180 �C illustrating the distinction between the two roastingschedules.
284 A.D. Demir et al. / Journal of Food Engineering 55 (2002) 283–292
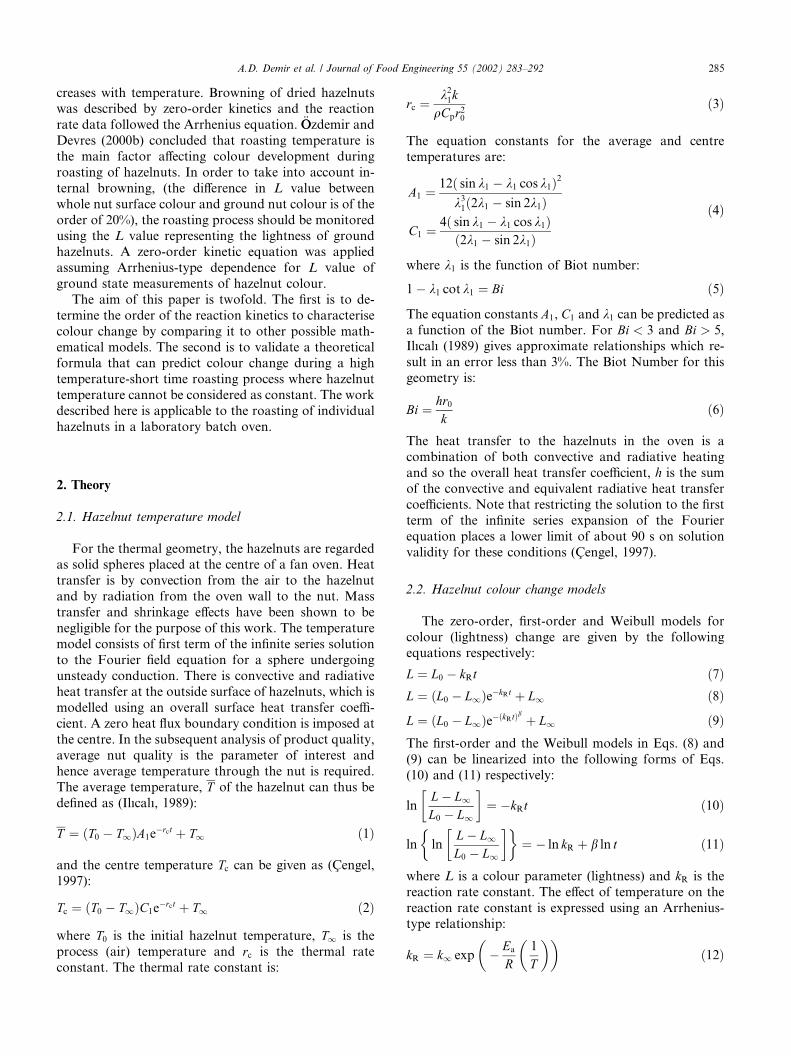
creases with temperature. Browning of dried hazelnutswas described by zero-order kinetics and the reaction
rate data followed the Arrhenius equation. €OOzdemir andDevres (2000b) concluded that roasting temperature is
the main factor affecting colour development during
roasting of hazelnuts. In order to take into account in-
ternal browning, (the difference in L value between
whole nut surface colour and ground nut colour is of the
order of 20%), the roasting process should be monitoredusing the L value representing the lightness of ground
hazelnuts. A zero-order kinetic equation was applied
assuming Arrhenius-type dependence for L value of
ground state measurements of hazelnut colour.
The aim of this paper is twofold. The first is to de-
termine the order of the reaction kinetics to characterise
colour change by comparing it to other possible math-
ematical models. The second is to validate a theoreticalformula that can predict colour change during a high
temperature-short time roasting process where hazelnut
temperature cannot be considered as constant. The work
described here is applicable to the roasting of individual
hazelnuts in a laboratory batch oven.
2. Theory
2.1. Hazelnut temperature model
For the thermal geometry, the hazelnuts are regardedas solid spheres placed at the centre of a fan oven. Heat
transfer is by convection from the air to the hazelnut
and by radiation from the oven wall to the nut. Mass
transfer and shrinkage effects have been shown to be
negligible for the purpose of this work. The temperature
model consists of first term of the infinite series solution
to the Fourier field equation for a sphere undergoing
unsteady conduction. There is convective and radiativeheat transfer at the outside surface of hazelnuts, which is
modelled using an overall surface heat transfer coeffi-
cient. A zero heat flux boundary condition is imposed at
the centre. In the subsequent analysis of product quality,
average nut quality is the parameter of interest and
hence average temperature through the nut is required.
The average temperature, T of the hazelnut can thus bedefined as (Ilıcalı, 1989):
T ¼ T0ð � T1ÞA1e�rct þ T1 ð1Þ
and the centre temperature Tc can be given as (C� engel,1997):
Tc ¼ T0ð � T1ÞC1e�rct þ T1 ð2Þ
where T0 is the initial hazelnut temperature, T1 is the
process (air) temperature and rc is the thermal rateconstant. The thermal rate constant is:
rc ¼k21k
qCpr20ð3Þ
The equation constants for the average and centre
temperatures are:
A1 ¼12 sin k1 � k1 cos k1ð Þ2
k31 2k1 � sin 2k1ð Þ
C1 ¼4 sin k1 � k1 cos k1ð Þ2k1 � sin 2k1ð Þ
ð4Þ
where k1 is the function of Biot number:
1� k1 cot k1 ¼ Bi ð5Þ
The equation constants A1, C1 and k1 can be predicted asa function of the Biot number. For Bi < 3 and Bi > 5,Ilıcalı (1989) gives approximate relationships which re-
sult in an error less than 3%. The Biot Number for this
geometry is:
Bi ¼ hr0k
ð6Þ
The heat transfer to the hazelnuts in the oven is a
combination of both convective and radiative heating
and so the overall heat transfer coefficient, h is the sumof the convective and equivalent radiative heat transfer
coefficients. Note that restricting the solution to the first
term of the infinite series expansion of the Fourier
equation places a lower limit of about 90 s on solution
validity for these conditions (C�engel, 1997).
2.2. Hazelnut colour change models
The zero-order, first-order and Weibull models for
colour (lightness) change are given by the followingequations respectively:
L ¼ L0 � kRt ð7ÞL ¼ L0ð � L1Þe�kRt þ L1 ð8Þ
L ¼ L0ð � L1Þe� kRtð Þb þ L1 ð9ÞThe first-order and the Weibull models in Eqs. (8) and
(9) can be linearized into the following forms of Eqs.
(10) and (11) respectively:
lnL� L1
L0 � L1
� �¼ �kRt ð10Þ
ln lnL� L1
L0 � L1
� �� �¼ � ln kR þ b ln t ð11Þ
where L is a colour parameter (lightness) and kR is thereaction rate constant. The effect of temperature on the
reaction rate constant is expressed using an Arrhenius-type relationship:
kR ¼ k1 exp�� Ea
R1
T
� ��ð12Þ
A.D. Demir et al. / Journal of Food Engineering 55 (2002) 283–292 285
where k1 is the frequency factor, Ea is the activationenergy, and R is the universal gas constant. The term T,
in the index of the exponential function in the equation
is the absolute temperature.
Eqs. (7)–(9) can predict product quality change versus
time once product temperature is constant. For a non-
isothermal process, the reaction rate constant changes
with time (temperature changes with time) and these
equations will be invalid. Theoretical solutions for qual-ity are available for the zero- and first-order quality mod-
els where product temperature is described by Eq. (1)
and quality reaction temperature sensitivity is described
by Eq. (12). The change in a product quality parameter
with respect to time for a non-isothermal (exponential
temperature rise) first-order quality reaction can be de-
scribed by:
The derivation of Eq. (13) is given in Appendix. Thesolution of Eq. (13) is valid for Fourier numbers greater
than 0.2 (C� engel, 1997). Note the solution for a zero-order reaction is a simplified version of Eq. (13). It has
not been possible to obtain a solution for the Weibull
model. The function E1 in Eq. (13) is the exponentialintegral and can be defined by:
E1ðxÞ ¼Z 1
x
e�t
tdt ð14Þ
where x is a positive number. The exponential integral
can be directly evaluated in packages such as Mathem-
atica and a large number of different approximations,
based on simple polynomial and exponential functions,
are available for different ranges of the argument (Ab-
ramowitz & Stegun, 1970). For this work the followingapproximation based on the product of a polynomial
ratio and exponential function will be used:
E1ðxÞ ¼x4 þ a1x3 þ a2x2 þ a3xþ a4x4 þ b1x3 þ b2x2 þ b3xþ b4
e�x
xð15Þ
The error associated with the polynomial ratio in Eq.(15) will be less than 2� 10�8 for all arguments of theexponential integral greater than one. The magnitudes
of the coefficients for both quartic polynomial expres-sions are given in Table 1.
3. Materials and methods
3.1. Physical and thermal properties
Sun dried raw hazelnuts with skin were supplied. Theskins of the hazelnuts were removed by applying hot
glycerine–sodium carbonate solution before roasting. A
digital vernier and a digital analytical balance (Bosch
SAE 200) were used to measure hazelnuts radius and
mass respectively. The average density value for hazel-
nuts was found by weight and volume ratio. The thermal
properties of the hazelnuts were experimentally mea-
sured by a thermal properties meter (Thermolink SensorModel TL-1) before and after the roasting process.
Hazelnuts were placed in an incubator keeping their
initial temperature, T0 at 20 �C.
3.2. Experimental roasting procedure
A Memmert ULP 600 conventional fan oven wasused to carry out the roasting trials. Airflow in the oven
was transverse, i.e. flowing from grooves in the oven
sidewalls, across the rectangular oven compartment.
The air velocity was kept constant at the centre of the
oven by a fan operating at maximum speed throughout
the experiments.
The aim of the experiments was to obtain experi-
mental hazelnut colour versus time curves at five dif-ferent oven temperatures, T1 of 100, 120, 140, 160 and180 �C. These oven temperatures cover the commonlyused temperatures in the hazelnut industry for roasting
(€OOzdemir & Devres, 2000a; Perren & Escher, 1997). Thecorresponding roasting times for these five temperatures
are 1900, 1850, 1610, 850 and 700 min respectively. The
reason for applying very long roasting times was to be
able to observe the exact behaviour of the colour for-mation in hazelnuts over the entire colour range.
As it was not possible to measure colour on-line, an
alternative procedure was employed to obtain the colour
versus time curves. From the initial batch of hazelnuts,
sets consisting of five randomly selected hazelnuts were
assembled. Each set was placed on a small table located
at the geometric centre of the oven. Each of the five
hazelnuts was placed apart with no contact between eachother to prevent any shielding effect on the nuts during
LðtÞ ¼ðL0 � L1Þ exp k1
rcE1 Ea
RT
� � e�Ea=RT1 �
E1 EaRT
� EaRT1
� h in o� exp k1
rcE1 Ea
R T0�T1ð ÞA1þT1½
� � e�Ea=RT1ð ÞE1 Ea
R T0�T1ð ÞA1þT1½ �EaRT1
� h in o� þ L1 ð13Þ
Table 1
Magnitudes of the coefficients of the polynomial approximation for the
exponential integral function
a1 8.5733287401 b1 9.5733223454
a2 18.0590169730 b2 25.6329561486
a3 8.6347608925 b3 21.0996530827
a4 0.2677737343 b4 3.9584969228
286 A.D. Demir et al. / Journal of Food Engineering 55 (2002) 283–292

roasting. A 1.5 mm diameter hole was drilled through
one side of one of the five hazelnuts and a thermocouple
inserted and sealed in there to measure the centre tem-
perature and data-logged by a computer. Fig. 2 shows
the placement of hazelnuts on the table at the centre of
the conventional oven. The reason for forming sets with
five nuts (all with a very similar initial colour and size)
instead of one was to minimize any unexpected colourformation that could result from using a single nut. Each
set was roasted for a given temperature-time combina-
tion to enable the colour versus time curves to be as-
sembled. Table 2 summarizes the number of sets of
hazelnuts and the times that were conducted in the ex-
periments. At the end of each experiment, the roasted
hazelnuts were removed from the oven and placed in a
freezer at 0 �C to prevent any further roasting after re-moving from the oven. They were cooled to room tem-
perature and placed in the incubator until the colour
analysis was undertaken off-line.
3.3. Colour measurement
Colour is a subjective phenomenon, which can be
expressed by visually uniform terms by CIE (Commission
Internationale d’Eclairage): International Commission
on Illumination. The colour of the roasted hazelnuts
was measured with a MINOLTA CR-300 tristumulus
colorimeter (Davidson, Brown, & Landman, 1999). Themeasuring head of the colorimeter CR-300 has an 8-mm
diameter measuring area and uses diffuse illumination
and a 0� viewing angle for accurate measurements. Theinstrument measures four specific wavelengths in the
visible range, specified by CIE. Tristumulus values give
a three-dimensional value for colour in which equal dis-
tances approximate to equal perceived colour differences.
The L, a and b values are the three dimensions of the
measured colour which gives specific colour value of the
material. In Hunter Lab Colour Space, the value L is
known as the degree of lightness or blackness. The
chromatic portion of the colour space is based on rect-
angular Cartesian coordinates (a, b); with red repre-sented byþa, green represented by�a, yellow byþb andblue by �b. The L-value gives a spectrum with a range
from 0 (black) to 100 (white). The a-value represents the
spectrum with a range from �60 (green) to +60 (red) andthe b-value from �60 (blue) to +60 (yellow) (Hutchings,1994).
Before the colour measurements, the colorimeter was
calibrated using a white surface where L ffi 100. Thesurface colour measurement of whole hazelnut kernels
was performed placing each kernel on the 8-mm diam-
eter measuring area. One reading was taken from each
of the five hazelnuts surfaces. The colours of the outside
kernels were measured for each hazelnut roasted at
different oven temperatures for different periods. The
roasted hazelnuts in each set were than ground in a
mill and kept separately in small beakers. The groundhazelnuts were spread on a plate. The colour measure-
ments were repeated by taking five readings from the
different regions in each set.
3.4. Statistical analysis of colour
The L, a and b values obtained from the experi-
ments were analysed by ANOVA, analysis of variance
Fig. 2. The placement of the hazelnuts on the table at the centre of the
conventional oven (front and elevation views).
Table 2
The times (in minutes) applied in the roasting trials of sets of hazelnuts
at different temperatures
Set number Roasting temperatures
100 �C 120 �C 140 �C 160 �C 180 �C
1 0 0 0 0 0
2 40 20 20 15 5
3 80 40 40 30 10
4 120 60 60 40 15
5 160 80 80 45 20
6 200 100 100 60 25
7 240 120 120 75 30
8 280 160 160 90 35
9 320 200 200 105 40
10 340 240 240 120 45
11 360 280 280 150 50
12 400 320 320 180 60
13 440 360 360 210 70
14 500 400 400 250 80
15 600 500 440 280 90
16 700 600 480 310 100
17 800 700 600 340 120
18 900 800 800 480 150
19 1500 1000 1440 600 200
20 1900 1850 1610 850 700
A.D. Demir et al. / Journal of Food Engineering 55 (2002) 283–292 287

technique, to find out the effect of time and temperatureon those responses. From the ANOVA table, the more
sensitive response was selected based on the biggest
range, the highest sensitivity to temperature change ob-
tained from whole and ground hazelnut colour analysis
and the lowest coefficient of variation, cv value (Devore& Farnum, 1999). One of the colour responses between
L, a and b was selected as a significant value which is
more sensitive to time and temperature change and thusrepresenting factor of the colour change in hazelnuts
during roasting.
Hazelnut colour versus time curves available at five
different temperatures, were fitted to the three models
presented in Eqs. (7)–(9). The fit of each of the three
models to the data was assessed at each temperature
by determining the correlation coefficients, (R2) and themean square error values (MSEs), applying one-step re-gression using the package STATISTICA and checked
with EXCEL solver tool. The slopes and intercepts yield
the relevant model parameters (L0, L1 or b) for each case.The best model tomonitor the colour change in hazelnuts
were determined as the model having the highest corre-
lation coefficient, lowest MSE and the less number of
parameters required in one-step regression. The reaction
rate constants, (kR) were obtained from the slopes (Eqs.(7), (10) and (11)) of the selected model. The reaction
rate constants were then checked for the Arrhenius tem-
perature dependence in order to calculate the activation
energy, Ea and the frequency term, k1 (Eq. (12)).
3.5. Non-isothermal colour analysis
A second series of experiments were conducted in
order to assess the validity of Eq. (13). A roasting
temperature of 180 �C was selected. Twenty sets of fivehazelnuts were again assembled. The first set was roasted
for 1 min and the roasting time was incremented by1 min for each successive set. For each set again, a 1.5
mm diameter hole was drilled through one side of one
of the five hazelnuts to measure its centre temperature
and a thermocouple inserted and sealed. The centre tem-
perature profiles were data logged by a computerized
thermocouple. These experiments permitted hazelnut
temperature versus time and colour versus time curves to
be assembled for a high roasting temperature. The colourmeasurements for the roasted sets were repeated as in the
previous part. This time 10 colour measurements were
taken on the whole and ground form hazelnuts.
4. Results and discussion
4.1. Physical and thermal properties
The mean and the standard deviation, r in hazelnutradius were measured as 7.07 and 0.395 mm respec-
tively. The average density value for hazelnuts wasfound as 875 (r ¼ 17:27) kgm�3. Thermal conductiv-
ity, k of hazelnuts was measured as 0.204 (r ¼ 0:0253)Wm�1 K�1. Specific heat capacity, Cp was found to be1994 (r ¼ 188:17) J kg�1 K�1, which results in a thermal
diffusivity, a of 1:17� 10�7 (r ¼ 0:0184) m2 s�1. The
overall heat transfer coefficient for hazelnuts in the oven
was experimentally evaluated as 33.3 Wm�2 K�1. Using
this data, the Biot Number for heat transfer to thehazelnut was evaluated as 1.15 meaning that the factors
A1, C1 and k1 are 0.981, 1.31 and 1.66 respectively. Thethermal rate constant is calculated as 6:52� 10�3 s�1.
4.2. Colour data analysis
Fig. 3 gives the colour formation on hazelnuts roasted
at oven temperatures from 100 to 180 �C, for a variety oftimes ranging from 0 min (not roasted) up to 1900 min.
Due to the long roasting times these can be considered as
isothermal experiments. Fig. 4 shows the colour change
in hazelnuts during roasting at 1-min increments for aroasting time 20 min at an oven temperature of 180 �C.Table 3 shows that the effect of temperature on the col-
our response L is higher for the colour analysis on
ground form hazelnuts than that of whole nuts for the
temperatures chosen. The coefficients of variation in the
colour parameters are lower for the ground form of
hazelnuts. The highest range is in the L values of ground
form hazelnuts with an increase of 9% from whole toground form. Although the range and temperature effect
decreases in a and b values of the ground form hazelnuts
compared to whole nuts, the ratio of standard deviation
to range is smaller in the ground form. The colour re-
Fig. 3. Colour development in hazelnuts during roasting at different
temperatures and various times.
288 A.D. Demir et al. / Journal of Food Engineering 55 (2002) 283–292

sponses L of ground form hazelnuts and b of the wholenuts demonstrate the highest sensitivity to temperature
change. Because of the lowest coefficient of variation and
the most precise response from L, L values of ground
form hazelnuts were used to quantify the colour change
in hazelnuts during roasting.
4.3. Model fitting
Having selected the L value of the ground hazelnutsas the most repeatable indicator of colour change, the
goodness-of-fit of each of the three models was assessed.
Table 4 summarizes the equation parameters, correla-
tion coefficients, R2 and the MSEs, of the three modelsapplied. As it is seen clearly in the table, the overall fit of
the zero-order model is quite poor. The Weibull model
with an offset gives a marginally better fit than the first-
order though at the expense of an extra fitting parameterb. Hence the first-order model with an offset was selectedas the best model representing the colour change in
hazelnuts during roasting. Note that all three models
have very low R2 values at 100 �C due to the relativelysmall colour change that occurs at low roasting
temperatures. Figs. 5–7 show the fit of the zero-order,Fig. 4. The experimental colour development in hazelnuts during
roasting at 180 �C with times of 1-min increments.
Table 3
F-values of the temperature effects from ANOVA factor analysis and some statistical values of the colour responses
Hazelnuts
Whole Ground
L a b L a b
F-value of temperature effect 121.76 48.37 158.12 200.1 44.85 109.9
Standard deviation, r 3.41 1.55 2.77 1.15 0.53 0.86
Range 52.36 17.86 62.13 57.06 13.53 33.95
Standard deviation/range 0.065 0.087 0.045 0.020 0.039 0.025
Coefficient of variation, cv (%) 7.07 15.94 16.36 2.55 7.66 4.21
L, a and b denotes colour responses.
Table 4
Equation parameters, correlation coefficients and MSEs of the colour models
Temperature (�C) Zero-order First-order with offset Weibull model with offset
kR R2 kR R2 kR R2
100 0.00502 0.26561 0.00010 0.25693 0.01411 0.11693
120 0.01628 0.68206 0.00044 0.76299 0.00197 0.60583
140 0.01912 0.52173 0.00101 0.70956 0.06892 0.88898
160 0.03837 0.42559 0.00321 0.70338 0.11361 0.89262
180 0.04301 0.17798 0.00798 0.72164 0.05016 0.70006
Zero-order First-order with offset Weibull model with offset
Mean R2 0.4146 0.6309 0.6409
MSE 0.7975 0.1029 0.0883
L0 72.41 65.73 71.79
L1 – 21.55 18.88
b – – 0.59
A.D. Demir et al. / Journal of Food Engineering 55 (2002) 283–292 289
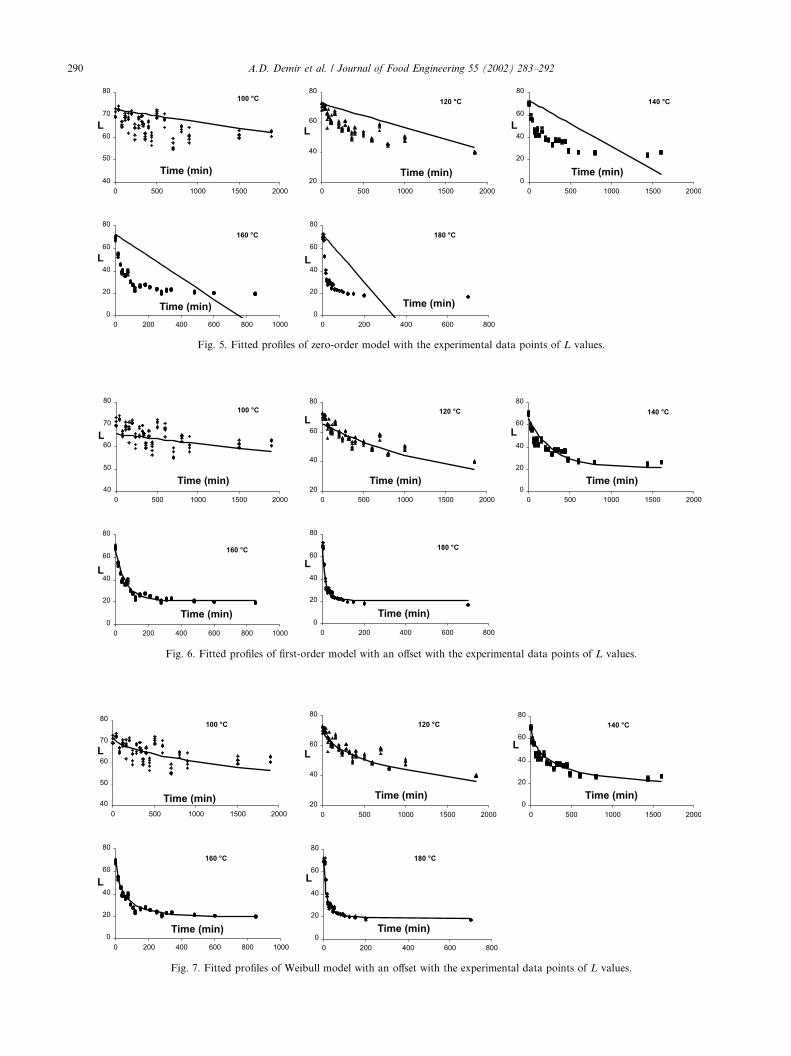
Fig. 5. Fitted profiles of zero-order model with the experimental data points of L values.
Fig. 6. Fitted profiles of first-order model with an offset with the experimental data points of L values.
Fig. 7. Fitted profiles of Weibull model with an offset with the experimental data points of L values.
290 A.D. Demir et al. / Journal of Food Engineering 55 (2002) 283–292

first-order and Weibull models respectively with theexperimental data at each temperature.
4.4. Reaction rate constants and arrhenius temperature
dependence
The Arrhenius temperature dependence of the reac-
tion rate constants was checked with the plot of lnðkRÞversus 1=T . Fig. 8 shows that the reaction rate constantof the first-order model follows the Arrhenius equation,
in this case giving a correlation coefficient value of0.9962. From the slope and intercept of the straight line
described by the Arrhenius equation, the activation
energy, Ea and the frequency term, k1 were determinedas 64.5 kJmol�1 and 33416.5 s�1 respectively. The acti-
vation energies for non-enzymatic browning in foods are
generally between 37.7 and 167.5 kJmol�1 (Heldman &
Lund, 1992).
4.5. Validation of non-isothermal colour change formula
Fig. 9 shows the experimentally measured mean value
of the centre temperatures of the hazelnuts together with
the theoretical hazelnut centre temperature profile ver-
sus time (from Eq. (2)) at an air roasting temperature of
180 �C. The theoretical profile is given for times greaterthan 90 s corresponding to the lower limit on solution
validity. The temperature gradient inside the hazelnut is
very small and the discrepancy between the average
temperature of the nut and temperature at the centre of
the nut is negligible. The corresponding experimental
data points and theoretical hazelnut colour prediction
(Eq. (13)) are shown in Fig. 10. The initial L value, L0was measured as 73.94. As can be seen from the figure
there is a good agreement between the experimental re-
sults and theoretical predictions. The mean square root
error, values between the experimental and the theo-
retically predicted colour change values were calculated
as 0.04.
5. Conclusions
The results of this study showed that the effect of both
roasting air temperature and roasting time is more sig-
nificant for the ground form hazelnut colour analysis
than the whole hazelnuts. Among the colour parametersof L, a and b, L values had the highest sensitivity for the
time and temperature change. Thus L values of ground
hazelnuts were used to monitor the colour change during
hazelnut roasting. Colour change was analysed as a zero
order, first order and Weibull process using isothermal
analysis; the fit of the zero-order model was found to be
unsatisfactory. Although both Weibull and first-order
processes were applicable, the reaction was modelled as afirst-order process due to its greater simplicity. The re-
action kinetics sensitivity to temperature was described
well by the Arrhenius equation. The theoretical formula
(Eq. (13)) to predict the colour change during the non-
isothermal roasting resulted in good agreement with the
experimental curves. Although the work was carried out
on the roasting of single hazelnuts in a batch oven, the
results are capable of being extended to the industrialarena. The development of a validated colour model over
a large roasting temperature range should allow opti-
misation studies to be performed to determine the best
Fig. 8. Plot of reaction rate constants, lnðkRÞ against 1=T to check
Arrhenius temperature dependence.
Fig. 9. The experimental mean centre temperature and theoretical (Eq.
(2)) profiles of roasting performed at 180 �C.
Fig. 10. The profiles of L values measured experimentally and the
exponential integral prediction at 180 �C.
A.D. Demir et al. / Journal of Food Engineering 55 (2002) 283–292 291

roasting schedule in terms of delivering required productcolour. Also the validation of the exponential integral
formula (Eq. (13)) means colour changes can be pre-
dicted theoretically during the heating up and cooling
down parts of the process.
Appendix A
The colour change in hazelnuts during roasting can
be described using a first-order model with an offset:
oLot
¼ �kR Lð � L1Þ ðA:1Þ
Replacing T, in the index of exponential function of Eq.
(12) with Eq. (1) and introducing in Eq. (A.1):
oLot
¼ �k1 exp�� EaR T0 � T1ð ÞA1e�rct þ T1½
�ðL� L1Þ
ðA:2Þ
Call
u ¼ EaR T0 � T1ð ÞA1e�rct þ T1½ ðA:3Þ
Then
ot ¼ 1
u EaR � uT1
� EaRrc
ou ðA:4Þ
Eq. (A.2) becomes:Z L
L0
oLL� L1
¼Z
�k1e�uot ðA:5Þ
Inserting Eqs. (A.3) and (A.4) in Eq. (A.5) and solving:
lnL� L1
L0 � L1
� �¼ � k1
rc
Ze�u
uou
"þ T1
Ze�u
EaR � uT1
� ou#
ðA:6Þ
From the definition of exponential integral function,
(Eq. (14)) Eq. (A.6) can be solved as:
L tð Þ � L1
L0 � L1¼ C exp
k1rc
E1EaRT
� ���
� e�Ea=RT1 �
E1EaRT
�� EaRT1
���ðA:7Þ
where C is a constant. From the initial condition:
at t ¼ 0 L ¼ L0 and T ¼ T0ð � T1ÞA1 þ T1 ðA:8Þ
C can be found as:
C ¼ exp�� k1
rcE1
EaR T0 � T1ð ÞA1 þ T1½
� ��
� e�Ea=RT1 �
E1Ea
R T0 � T1ð ÞA1 þ T1½
�� EaRT1
���ðA:9Þ
Thus, the theoretical formula predicting the colourchange in a non-isothermal process becomes:
References
Abramowitz, M., & Stegun, I. (1970). Handbook of mathematical
functions (pp. 227–253). New York: Dover Publications.
C�engel, Y. A. (1997). Introduction to thermodynamics and heat transfer
(International ed., pp. 465–512). New York: McGraw-Hill.
Davidson, V. J., Brown, R. B., & Landman, J. J. (1999). Fuzzy control
system for peanut roasting. Journal of Food Engineering, 41, 141–
146.
Devore, J. L., & Farnum, N. R. (1999). Applied statistics for engineers
and scientists (pp. 410–430). Pacific Grove, USA: Duxbury Press
ITP.
Heldman, D. R., & Lund, D. B. (1992). Handbook of food engineering
(pp. 40–48). New York: Marcel Dekker, Inc.
Hutchings, J. B. (1994). Food colour and appearance (pp. 112–348).
New York: Blackie Academic and Professional.
Ilıcalı, C. (1989). A simplified analytical model for thawing time
calculation in foods. Journal of Food Science, 54(4), 1031–1039.
Lopez, A., & Pique, M. T. (1997). Influence of the drying conditions on
the hazelnut quality: III Browning. Drying Technology, 15(3–4),
989–1002.
M€uuller, U., L€uuttkopf, D., Hoffman, A., Petersen, A., Becker, W. M.,
Schocker, F., Niggemann, B., Altmann, F., Kolarich, D., Haustein,
D., & Vieths, S. (2000). Allergens in raw and roasted hazelnuts
(Corylus avellana) and their cross-reactivity to pollen. European
Food Research and Technology, 212, 2–12.€OOzdemir, M., & Devres, O. Y. (1999). The thin layer drying
characteristics of hazelnuts during roasting. Journal of Food
Engineering, 42, 225–233.€OOzdemir, M., & Devres, O. (2000a). Analysis of colour development
during roasting of hazelnuts using response surface methodology.
Journal of Food Engineering, 45, 17–24.€OOzdemir, M., & Devres, O. (2000b). Kinetics of colour changes of
hazelnuts during roasting. Journal of Food Engineering, 44, 31–38.
Perren, R., & Escher, F. E. (1997). Investigations on the hot air
roasting of nuts. The Manufacturing Confectioner, 123–127.
Somogyi, L. P., Barrett, D. M., & Hui, Y. H. (1996). Major processed
products, Vol. 2 (pp. 489–538). Pennsylvania: Technomic Publishing.
Wigotzki, M., Steinheart, H., & Paschke, A. (2000). Influence of
varieties, storage and heat treatment on IgE-binding proteins in
hazelnuts. Food and Agricultural Immunology, 12, 217–229.
LðtÞ ¼ðL0 � L1Þ exp k1
rcE1 Ea
RT
� � e�Ea=RT1 �
E1 EaRT
� EaRT1
� h in o� exp k1
rcE1 Ea
R T0�T1ð ÞA1þT1½
� � e�Ea=RT1ð ÞE1 Ea
R T0�T1ð ÞA1þT1½ �EaRT1
� h in o� þ L1 ðA:10Þ
292 A.D. Demir et al. / Journal of Food Engineering 55 (2002) 283–292