Modelling community interactions and social capital dynamics: The case of regional and rural...
22
Modelling community interactions and social capital dynamics: The case of regional and rural communities of Australia Yiheyis T. Maru a, * , Ryan R.J. McAllister b , Mark Stafford Smith c a CSIRO Sustainable Ecosystems, Centre for Arid Zone Research, P.O. Box 2111, Alice Springs, NT 0871, Australia b CSIRO Sustainable Ecosystems, Townsville, CSIRO Davies Lab, Private Mail Bag Aitkenvale Qld 4814, Australia c Desert Knowledge Cooperative Research Centre, P.O. Box 2111, Alice Springs, NT 0871, Australia Received 17 January 2005; received in revised form 13 March 2006; accepted 14 March 2006 Abstract Tension between dominant urban political and economic centres and associated rural com- munities continues despite various programs to decentralisation. This phenomenon is often explained in terms of a core-periphery political economy. To generate complementary explan- atory hypotheses from a social perspective, we examine the impacts of rural–urban community interactions on the development of social norms such as the strength of mutual cooperation. We explore this using deliberately abstracted models of the ‘‘Iterated Prisoners’ Dilemma’’ to represent intra- and inter-community interactions, in regionalised and centralised interaction arrangements. We have considered changes in mutual cooperation as an indicator of social capital dynamics. In our model, increasing interaction of rural communities with urban cen- tres increases ‘‘non-cooperative’’ behaviour of members of the small rural communities. More- over, as the strength of centralisation (the proportion of interaction between each rural community and the urban centre as compared with the interaction among rural communities) increases, cooperative behaviour among the members of smaller rural communities and 0308-521X/$ - see front matter Ó 2006 Elsevier Ltd. All rights reserved. doi:10.1016/j.agsy.2006.03.005 * Corresponding author. Tel.: +61 8 8950 7129; fax: +61 8 8950 7187. E-mail address: [email protected] (Y.T. Maru). www.elsevier.com/locate/agsy Agricultural Systems 92 (2007) 179–200 AGRICULTURAL SYSTEMS
Transcript of Modelling community interactions and social capital dynamics: The case of regional and rural...
AGRICULTURAL
www.elsevier.com/locate/agsy
Agricultural Systems 92 (2007) 179–200
SYSTEMS
Modelling community interactions and socialcapital dynamics: The case of regional and rural
communities of Australia
Yiheyis T. Maru a,*, Ryan R.J. McAllister b,Mark Stafford Smith c
a CSIRO Sustainable Ecosystems, Centre for Arid Zone Research, P.O. Box 2111,
Alice Springs, NT 0871, Australiab CSIRO Sustainable Ecosystems, Townsville, CSIRO Davies Lab, Private Mail Bag Aitkenvale
Qld 4814, Australiac Desert Knowledge Cooperative Research Centre, P.O. Box 2111, Alice Springs, NT 0871, Australia
Received 17 January 2005; received in revised form 13 March 2006; accepted 14 March 2006
Abstract
Tension between dominant urban political and economic centres and associated rural com-munities continues despite various programs to decentralisation. This phenomenon is oftenexplained in terms of a core-periphery political economy. To generate complementary explan-atory hypotheses from a social perspective, we examine the impacts of rural–urban communityinteractions on the development of social norms such as the strength of mutual cooperation.We explore this using deliberately abstracted models of the ‘‘Iterated Prisoners’ Dilemma’’ torepresent intra- and inter-community interactions, in regionalised and centralised interactionarrangements. We have considered changes in mutual cooperation as an indicator of socialcapital dynamics. In our model, increasing interaction of rural communities with urban cen-tres increases ‘‘non-cooperative’’ behaviour of members of the small rural communities. More-over, as the strength of centralisation (the proportion of interaction between each ruralcommunity and the urban centre as compared with the interaction among rural communities)increases, cooperative behaviour among the members of smaller rural communities and
0308-521X/$ - see front matter � 2006 Elsevier Ltd. All rights reserved.
doi:10.1016/j.agsy.2006.03.005
* Corresponding author. Tel.: +61 8 8950 7129; fax: +61 8 8950 7187.E-mail address: [email protected] (Y.T. Maru).
180 Y.T. Maru et al. / Agricultural Systems 92 (2007) 179–200
mutual cooperation with individuals of larger urban centre decreases. Our hypothesis is thatinteraction with urban centres disrupts norms used in resolving local social dilemmas. If so,this partly explains the dissatisfaction expressed in rural–urban relations, which may be a fun-damental emergent property of particular settlement patterns. Understanding these relation-ships could guide better policies to facilitate rural–urban interactions in the worldwidetrend towards regionalism.� 2006 Elsevier Ltd. All rights reserved.
Keywords: Social capital; Social dilemma; Cooperative norms; Rural decline; Core-periphery tension;Modelling
1. Introduction
A decline in the number of rural towns has been a global trend for sometime now.Political-economic factors have been ascribed to this phenomenon. However, there isevidence on the importance of social capital in determining the success or failure ofmany aspects of agriculture and natural resource management (Sobels et al., 2001;Vennesland, 2004; Meinzen-Dick et al., 2004) and the stability of agricultural liveli-hoods of rural communities in semiarid regions (Krishna, 2004). In this paper wedevelop a complementary hypothesis on the dynamics of social capital as an explan-atory factor.
To explore the role of social capital dynamics, we have implemented a theoreticalmodel of social interactions in and between communities of different sizes. Our find-ings corroborate previous results in the literature about community size and longev-ity of memory in developing cooperation. In this introduction we review empiricalstudies on settlement patterns and rural–urban relations in Australia to frame ourresearch questions.
Rural communities refer to people living in small towns and their surroundings.The Australian Bureau of Statistics defines ‘small towns’ as those with a populationof 200–9999 persons. Here we consider areas with a population above 10,000 asforming a hierarchy of urban centres with centralising effect on the smaller towns.
McGregor (2001) identifies three types of small towns in the rangelands of Aus-tralia: Aboriginal settlements, specialist and open service towns. With the exceptionof some residents employed as administrators, teachers, store managers, etc., themajority of people in the Aboriginal settlements have indigenous ‘roots’. Thesetowns often have poor basic services, and possess little economic base other than thatprovided by public funding. Specialist centres are mostly mining towns, which arewell serviced by the mining companies operating in the areas. Many of the open ser-vice towns were established during expansion of the pastoral industry around 1900.As the name suggests, these towns primarily act as service centres to surroundingagricultural and pastoral enterprises.
Despite its popular outback image, Australia is a highly urbanised country. Overthe last century the proportion of people living in and around small towns has sig-nificantly declined leading to a highly centralised settlement pattern (Table 1). At the
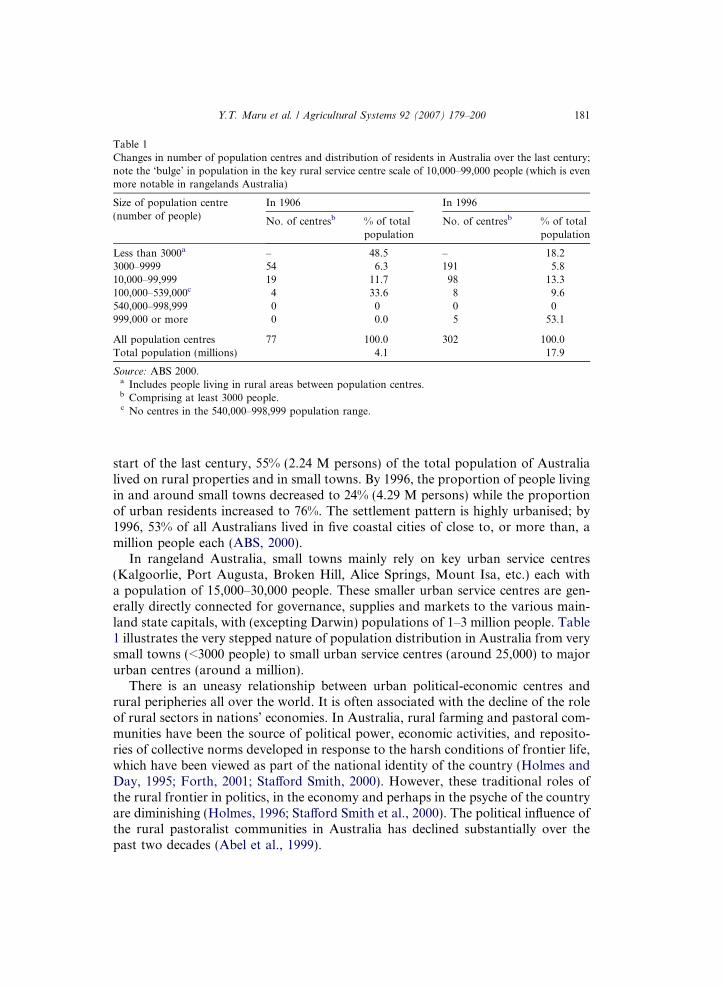
Table 1Changes in number of population centres and distribution of residents in Australia over the last century;note the ‘bulge’ in population in the key rural service centre scale of 10,000–99,000 people (which is evenmore notable in rangelands Australia)
Size of population centre(number of people)
In 1906 In 1996
No. of centresb % of totalpopulation
No. of centresb % of totalpopulation
Less than 3000a – 48.5 – 18.23000–9999 54 6.3 191 5.810,000–99,999 19 11.7 98 13.3100,000–539,000c 4 33.6 8 9.6540,000–998,999 0 0 0 0999,000 or more 0 0.0 5 53.1
All population centres 77 100.0 302 100.0Total population (millions) 4.1 17.9
Source: ABS 2000.a Includes people living in rural areas between population centres.b Comprising at least 3000 people.c No centres in the 540,000–998,999 population range.
Y.T. Maru et al. / Agricultural Systems 92 (2007) 179–200 181
start of the last century, 55% (2.24 M persons) of the total population of Australialived on rural properties and in small towns. By 1996, the proportion of people livingin and around small towns decreased to 24% (4.29 M persons) while the proportionof urban residents increased to 76%. The settlement pattern is highly urbanised; by1996, 53% of all Australians lived in five coastal cities of close to, or more than, amillion people each (ABS, 2000).
In rangeland Australia, small towns mainly rely on key urban service centres(Kalgoorlie, Port Augusta, Broken Hill, Alice Springs, Mount Isa, etc.) each witha population of 15,000–30,000 people. These smaller urban service centres are gen-erally directly connected for governance, supplies and markets to the various main-land state capitals, with (excepting Darwin) populations of 1–3 million people. Table1 illustrates the very stepped nature of population distribution in Australia from verysmall towns (<3000 people) to small urban service centres (around 25,000) to majorurban centres (around a million).
There is an uneasy relationship between urban political-economic centres andrural peripheries all over the world. It is often associated with the decline of the roleof rural sectors in nations’ economies. In Australia, rural farming and pastoral com-munities have been the source of political power, economic activities, and reposito-ries of collective norms developed in response to the harsh conditions of frontier life,which have been viewed as part of the national identity of the country (Holmes andDay, 1995; Forth, 2001; Stafford Smith, 2000). However, these traditional roles ofthe rural frontier in politics, in the economy and perhaps in the psyche of the countryare diminishing (Holmes, 1996; Stafford Smith et al., 2000). The political influence ofthe rural pastoralist communities in Australia has declined substantially over thepast two decades (Abel et al., 1999).
182 Y.T. Maru et al. / Agricultural Systems 92 (2007) 179–200
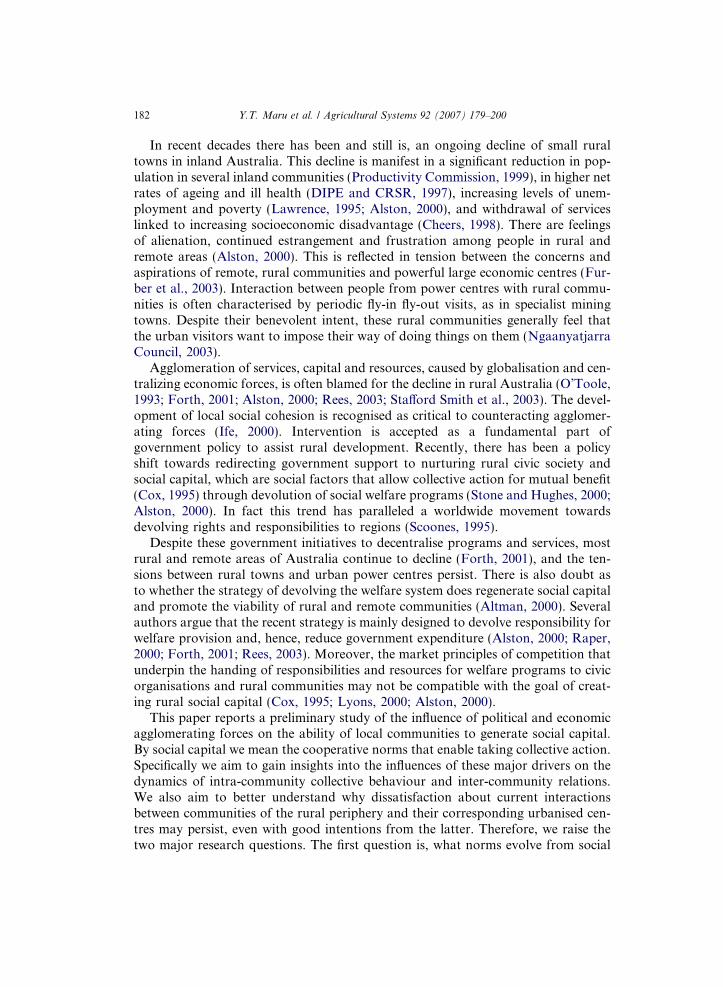
In recent decades there has been and still is, an ongoing decline of small ruraltowns in inland Australia. This decline is manifest in a significant reduction in pop-ulation in several inland communities (Productivity Commission, 1999), in higher netrates of ageing and ill health (DIPE and CRSR, 1997), increasing levels of unem-ployment and poverty (Lawrence, 1995; Alston, 2000), and withdrawal of serviceslinked to increasing socioeconomic disadvantage (Cheers, 1998). There are feelingsof alienation, continued estrangement and frustration among people in rural andremote areas (Alston, 2000). This is reflected in tension between the concerns andaspirations of remote, rural communities and powerful large economic centres (Fur-ber et al., 2003). Interaction between people from power centres with rural commu-nities is often characterised by periodic fly-in fly-out visits, as in specialist miningtowns. Despite their benevolent intent, these rural communities generally feel thatthe urban visitors want to impose their way of doing things on them (NgaanyatjarraCouncil, 2003).
Agglomeration of services, capital and resources, caused by globalisation and cen-tralizing economic forces, is often blamed for the decline in rural Australia (O’Toole,1993; Forth, 2001; Alston, 2000; Rees, 2003; Stafford Smith et al., 2003). The devel-opment of local social cohesion is recognised as critical to counteracting agglomer-ating forces (Ife, 2000). Intervention is accepted as a fundamental part ofgovernment policy to assist rural development. Recently, there has been a policyshift towards redirecting government support to nurturing rural civic society andsocial capital, which are social factors that allow collective action for mutual benefit(Cox, 1995) through devolution of social welfare programs (Stone and Hughes, 2000;Alston, 2000). In fact this trend has paralleled a worldwide movement towardsdevolving rights and responsibilities to regions (Scoones, 1995).
Despite these government initiatives to decentralise programs and services, mostrural and remote areas of Australia continue to decline (Forth, 2001), and the ten-sions between rural towns and urban power centres persist. There is also doubt asto whether the strategy of devolving the welfare system does regenerate social capitaland promote the viability of rural and remote communities (Altman, 2000). Severalauthors argue that the recent strategy is mainly designed to devolve responsibility forwelfare provision and, hence, reduce government expenditure (Alston, 2000; Raper,2000; Forth, 2001; Rees, 2003). Moreover, the market principles of competition thatunderpin the handing of responsibilities and resources for welfare programs to civicorganisations and rural communities may not be compatible with the goal of creat-ing rural social capital (Cox, 1995; Lyons, 2000; Alston, 2000).
This paper reports a preliminary study of the influence of political and economicagglomerating forces on the ability of local communities to generate social capital.By social capital we mean the cooperative norms that enable taking collective action.Specifically we aim to gain insights into the influences of these major drivers on thedynamics of intra-community collective behaviour and inter-community relations.We also aim to better understand why dissatisfaction about current interactionsbetween communities of the rural periphery and their corresponding urbanised cen-tres may persist, even with good intentions from the latter. Therefore, we raise thetwo major research questions. The first question is, what norms evolve from social
Y.T. Maru et al. / Agricultural Systems 92 (2007) 179–200 183
interactions in and between small and large communities? The second question iswhat are the effects of centralisation and regionalisation on the nature of interactionsbetween large urban centres and their rural counterparts?
2. Conceptual framework
2.1. Social capital, rural social dilemmas and game theory
In this section we will elaborate what we mean by social capital: how it is linkedwith our research questions and its representation in game theoretic-modelling. Wedo this to reduce misunderstanding that may arise with different conceptions ofsocial capital.
In the literature the concept of social capital, like many important social notionssuch as sustainable development, has attracted its fair share of review, reinterpreta-tion and critiques (e.g. Putzel, 1997; Arrow, 2000; Grootaert and Van Bastelaer,2001; Sobels, 2002; Hunter, 2004). As Hunter (2004) argues, most of the critiquesof the concept of social capital ‘‘. . .are related to the intellectual struggle, rather thanthe notion itself or the supporting analytical structures.’’
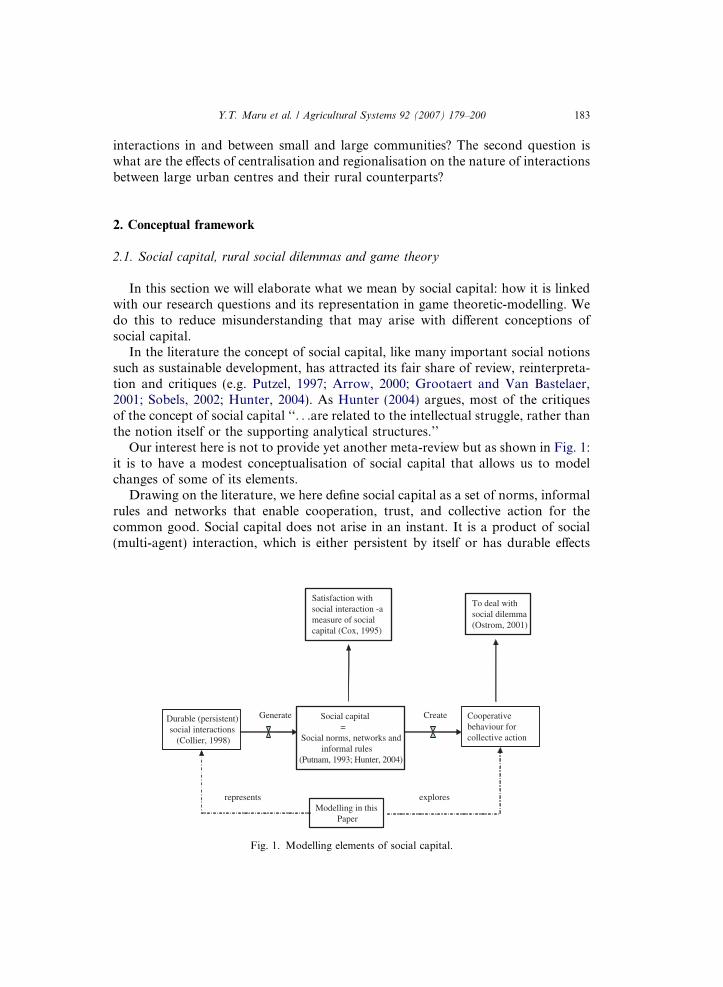
Our interest here is not to provide yet another meta-review but as shown in Fig. 1:it is to have a modest conceptualisation of social capital that allows us to modelchanges of some of its elements.
Drawing on the literature, we here define social capital as a set of norms, informalrules and networks that enable cooperation, trust, and collective action for thecommon good. Social capital does not arise in an instant. It is a product of social(multi-agent) interaction, which is either persistent by itself or has durable effects
Durable (persistent) social interactions
(Collier, 1998)
Social capital =
Social norms, networks andinformal rules
(Putnam, 1993; Hunter, 2004)
Cooperative behaviour for collective action
To deal withsocial dilemma (Ostrom, 2001)
Satisfaction with social interaction -a measure of social capital (Cox, 1995)
Modelling in this Paper
Create
represents
Generate
explores
Fig. 1. Modelling elements of social capital.

184 Y.T. Maru et al. / Agricultural Systems 92 (2007) 179–200
and externalities (Collier, 1998). The levels of cooperation and satisfaction withrepeated social interaction within or between communities are good examples ofindicators of the social capital dynamics of the communities (Cox, 1995; Routledgeand von Amsberg, 2003). Cooperative behaviour allows collective decisions andactions to deal with social dilemmas.
Social dilemmas arise because of the tension between maximizing short term indi-vidual gains and a long term collective good. Social dilemmas are pronounced wherethere are high environmental and economic uncertainties, which are characteristic ofrural and remote livelihoods of inland Australia. As noted in the preceding para-graph social mechanisms for dealing with social dilemmas include networks thatprovide opportunity; trust that prevents opportunistic behaviour and allows cooper-ation; and rules that enable collective action (Collier, 1998; McAllister et al., 2006).Social norms and networks and informal rules form parts of what is often broadlytermed social capital (Putnam, 1993; Coleman, 1990; Ostrom, 1998, 2001; Hunter,2004).
Game theory has long been used to explore the trade-offs between individual andcollective benefits. Many authors have shown how repeating the game can lead to co-operation, provided the interacting individuals are able to learn from their experi-ences of interacting with other individuals (e.g. Axelrod, 1984; Linster, 1992; Bendorand Swistak, 1997; Tesfatsion and Ashlock, 1998). Here, we model repeated anddurable social interactions within and among communities, precursors of social cap-ital, as an iterated prisoner’s dilemma (IPD).
2.2. Iterated prisoners dilemma
In pair-wise interactions between two individuals, each has the opportunity toeither cooperate (C) or defect (D), leading to four possible interactions. Each typeof interaction attracts a payoff as illustrated in Table 2.
In a single encounter with no knowledge of what the other player will do, it is wellknown that the ‘‘Nash Equilibrium’’ is for two rational players to defect, resulting ina total payoff of four units (a solution that is both a Nash equilibrium and Rawlsianefficient). However, two altruistic players would cooperate resulting in a total payoffof 16 (a solution that is both Rawlsian and Pareto efficient). For a payoff matrix to
Table 2The payoff matrix used for the Iterated Prisoner’s Dilemma games in this study
Player B
Cooperate (C) Defect (D)
Player ACooperate 8, 8 (C,C) 0, 9 (C,D)Defect 9, 0 (D,C) 2, 2 (D,D)
If both players choose C, each receives the Reward for mutual cooperation, R = 8 units. If both choose D,each will receive the Punishment for mutual defection, P = 2 units. If one chooses C and the other D, thedefector (D) gets the Temptation, T = 9 units, the co-operator gets the Sucker’s payoff, S = 0.
Y.T. Maru et al. / Agricultural Systems 92 (2007) 179–200 185
satisfy the conditions for constructing a Prisoner’s Dilemma game, it must always bethe case that T > R > P > S; and often that 2R > T + S (Gotts et al., 2003).
Previous work using IPD has shown that as memory of previous interactionsincreases, visibility of actions increases, often leading to high level of cooperationamong a fixed number of interacting individuals (Coleman, 1992; Hegselmann,1996). Similarly, as the number of players decreases for a given level of memory,cooperation also increases. In a series of field studies of such interactions, Ostromet al. (1994) have shown that different circumstances can give rise to different appro-priate underlying pay-off matrices. However, once a payoff matrix is set, different lev-els of memory and number of individuals lead to the evolution over time of differentsocial norms for interactions. It is these norms that we are interested in exploringhere.
3. Modelling design
Communities in regional Australia are faced with a dilemma between maintainingcollective norms and social networks they have developed over the years and con-forming to new norms and social relations. The mechanisms that individuals applyto deal with this dilemma are driven in complex ways by their own behavioural mod-els, their capacity to remember past interactions, the size of community, and by thetype of social interaction. To explore how these four factors (acquired behaviour,memory capacity, community size, and interaction type) drive the dynamics of socialcapital in remote regions, we developed a model based on the Iterated Prisoners’Dilemma (IPD) where individuals dynamically change which mental model theyuse when interacting with others.
3.1. Behavioural types and memory
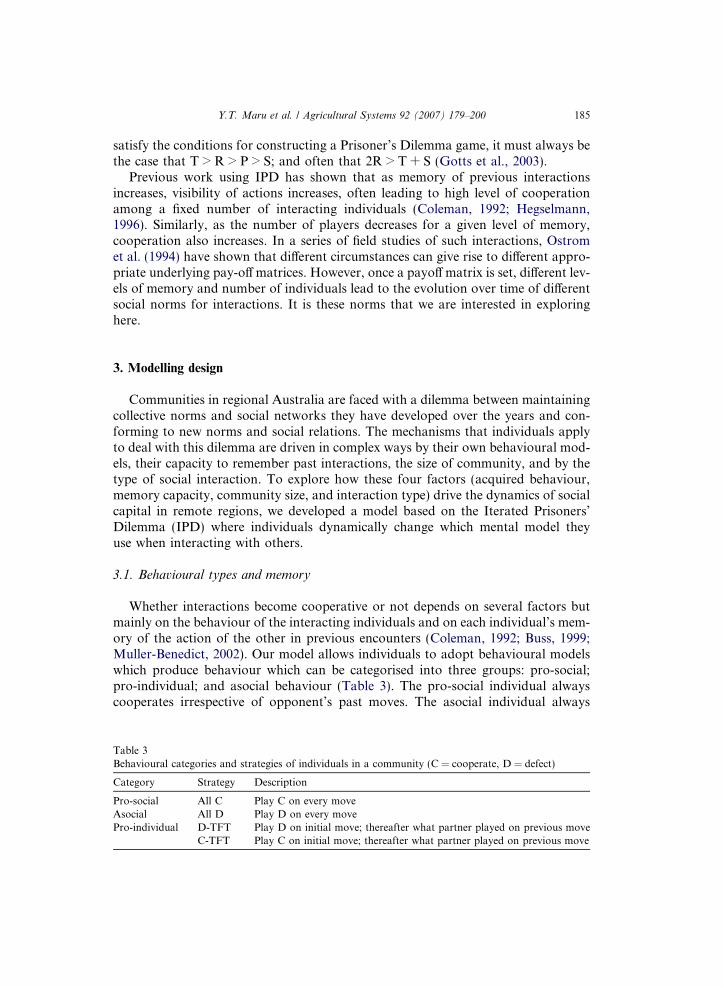
Whether interactions become cooperative or not depends on several factors butmainly on the behaviour of the interacting individuals and on each individual’s mem-ory of the action of the other in previous encounters (Coleman, 1992; Buss, 1999;Muller-Benedict, 2002). Our model allows individuals to adopt behavioural modelswhich produce behaviour which can be categorised into three groups: pro-social;pro-individual; and asocial behaviour (Table 3). The pro-social individual alwayscooperates irrespective of opponent’s past moves. The asocial individual always
Table 3Behavioural categories and strategies of individuals in a community (C = cooperate, D = defect)
Category Strategy Description
Pro-social All C Play C on every moveAsocial All D Play D on every movePro-individual D-TFT Play D on initial move; thereafter what partner played on previous move
C-TFT Play C on initial move; thereafter what partner played on previous move
186 Y.T. Maru et al. / Agricultural Systems 92 (2007) 179–200
defects irrespective of the opponent’s past moves. Pro-individual players’ defaultbehaviour may be either to cooperate or to defect, but they then reciprocate the pre-vious move of their opponent if they remember that interaction. In reality, behav-ioural models are more heterogenous and complex than these; however, thislimited number of behavioural models reflects an even range of personality typeson a scale between cooperative and non-cooperative (i.e. defect), and this is alreadycomplex enough to deliver significant insights.
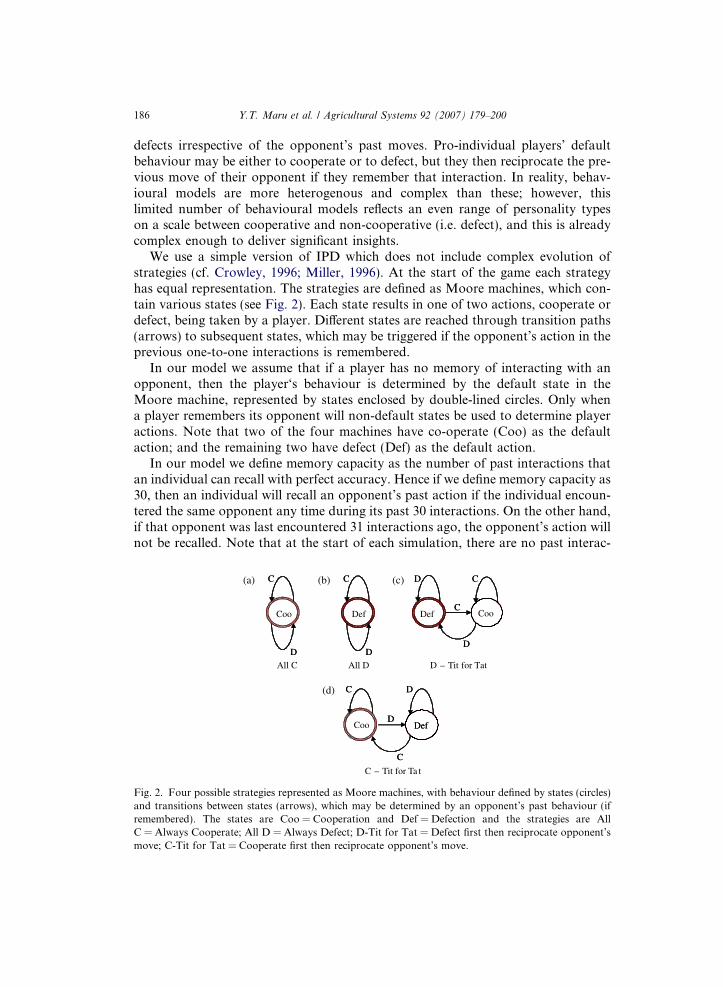
We use a simple version of IPD which does not include complex evolution ofstrategies (cf. Crowley, 1996; Miller, 1996). At the start of the game each strategyhas equal representation. The strategies are defined as Moore machines, which con-tain various states (see Fig. 2). Each state results in one of two actions, cooperate ordefect, being taken by a player. Different states are reached through transition paths(arrows) to subsequent states, which may be triggered if the opponent’s action in theprevious one-to-one interactions is remembered.
In our model we assume that if a player has no memory of interacting with anopponent, then the player‘s behaviour is determined by the default state in theMoore machine, represented by states enclosed by double-lined circles. Only whena player remembers its opponent will non-default states be used to determine playeractions. Note that two of the four machines have co-operate (Coo) as the defaultaction; and the remaining two have defect (Def) as the default action.
In our model we define memory capacity as the number of past interactions thatan individual can recall with perfect accuracy. Hence if we define memory capacity as30, then an individual will recall an opponent’s past action if the individual encoun-tered the same opponent any time during its past 30 interactions. On the other hand,if that opponent was last encountered 31 interactions ago, the opponent’s action willnot be recalled. Note that at the start of each simulation, there are no past interac-
D
C
Coo
D
C(a)
Def
D
C
D
C(b)
C
D
Coo
D
C
DefC
D
D
C(c)
D
C
Def
C
D
CooD
C
Def
C
D(d)
All C All D D – Tit for Tat
C – Tit for Ta t
Fig. 2. Four possible strategies represented as Moore machines, with behaviour defined by states (circles)and transitions between states (arrows), which may be determined by an opponent’s past behaviour (ifremembered). The states are Coo = Cooperation and Def = Defection and the strategies are AllC = Always Cooperate; All D = Always Defect; D-Tit for Tat = Defect first then reciprocate opponent’smove; C-Tit for Tat = Cooperate first then reciprocate opponent’s move.
Y.T. Maru et al. / Agricultural Systems 92 (2007) 179–200 187
tions to remember and for this reason none can be remembered: an individual’smemory requires time for its capacity to be reached.
3.2. Changing ‘norms’: replicator dynamics
While our Moore machines cannot evolve into new and different Mooremachines, we used a version of replicator dynamics to allow the individual playersto change which particular Moore machine they use to make their decisions. Thisis sufficient for our analysis, because we are concerned only with individual choicebetween cooperate and defect. Our replicator dynamics drive change as follows.Every time an interaction between two players occurs, each player generates a payoffas defined by the game’s payoff matrix (Table 2). The payoffs are totalled (in eachiteration of the model) and categorised by both the type of Moore machine involvedand the sub-population or communities in which the individual belongs (Section 3.3describes our sub-populations). After each player has selected an opponent, the aver-age payoff per Moore machine is used to define which machines are the most success-ful. Based on average payoffs, a distribution d 0 of Moore machines is proposed whichrepresents the success of the machines (Bendor and Swistak, 1997),
d 0g;i ¼ dg;i � pg;i=�pg;
where p is the average payoff generated by Moore machine i in community g, �p is theaverage payoff generated by all Moore machines in community g, d is the existingpercentage distribution of Moore machines, and n is the number of types of Mooremachines in the system. Finally the difference between the proposed distribution d 0
and the actual distribution d in the system is calculated. For the actual distributionwithin a community d to move towards that proposed d 0 (ignoring the subscripts),the frequency of some types of Moore machines must increase, while others must de-crease. Players with Moore machines that should decrease, change which Moore ma-chine they use if j(d 0 � d)j is greater than a random number [0,1]. When a playerchanges its Moore machine, it changes to any type of Moore machine with positived with a probability proportional to j(d 0 � d)j (excluding Moore machines whered 0 < d). However, we assume that a player cannot change its Moore machine typeif it is the last of that type in a sub-population; in other words, every population mustalways contain some representation of all possible Moore machine types.
In our game, each player is selected in order. When selected, each player picks anindividual to interact with from a list of possible players at random. The two playerschoose their respective actions based on which type of Moore machine they are usingto define their behaviour, and also any memory they have of their past interactions.Memory refers to the number of previous interactions that players can recall indetermining their actions.
3.3. Community structure and opponent selection
In our model we consider rural towns to be small size communities when com-pared with their large urbanised service centres. The size of a community affects
188 Y.T. Maru et al. / Agricultural Systems 92 (2007) 179–200
the frequency of interaction within the community – the larger the community, thegreater the opportunity for encountering different individuals and the lower the fre-quency of interactions with a particular individual (Putnam, 2000; Routledge andvon Amsberg, 2003).
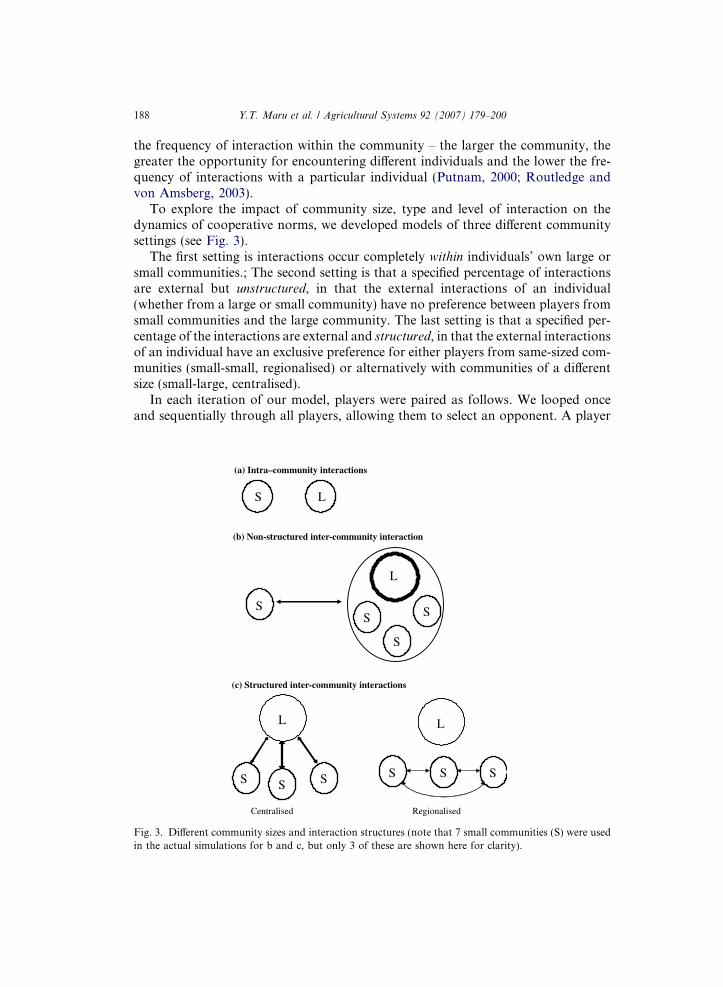
To explore the impact of community size, type and level of interaction on thedynamics of cooperative norms, we developed models of three different communitysettings (see Fig. 3).
The first setting is interactions occur completely within individuals’ own large orsmall communities.; The second setting is that a specified percentage of interactionsare external but unstructured, in that the external interactions of an individual(whether from a large or small community) have no preference between players fromsmall communities and the large community. The last setting is that a specified per-centage of the interactions are external and structured, in that the external interactionsof an individual have an exclusive preference for either players from same-sized com-munities (small-small, regionalised) or alternatively with communities of a differentsize (small-large, centralised).
In each iteration of our model, players were paired as follows. We looped onceand sequentially through all players, allowing them to select an opponent. A player
(a) Intra–community interactions
S
L
S S
(b) Non-structured inter-community interaction
S
L
Centralised
S
L
S S
L
Regionalised
S
L
S S
(c) Structured inter-community interactions
S L
Fig. 3. Different community sizes and interaction structures (note that 7 small communities (S) were usedin the actual simulations for b and c, but only 3 of these are shown here for clarity).
Y.T. Maru et al. / Agricultural Systems 92 (2007) 179–200 189
selecting an opponent did not necessarily prohibit the opponent then selecting thatsame player in the same iteration of the simulation. Each player selected an oppo-nent at random but proportional to the assumed community settings (above). Forexample, if we assume that 50% of interactions are external and centrally structured,then an individual in a small community had a 50% chance selecting an opponentfrom individual within its community, and a 50% chance of selecting an opponentin the large community. We assumed there are 21 other individuals in its own smallcommunity (see Section 3.4 below) so there is a 2.4% chance of interacting with anyone of these. We assumed there are 132 individuals in the large community (see Sec-tion 3.4), so there is a 0.4% chance of interacting with any one of these. Anotherexample: if we assumed that 30% of interactions are external and regionally struc-tured, then an individual in a small community had a 70% chance of selecting anopponent within its community (3.3% for each individual within), and a 30% chanceof selecting an opponent from another small community (0.2% for each individualwithin).
In this paper we do not address precisely what ‘individuals’ and their interactionsmight represent (for example, this could be encounters among representatives oforganisations and agencies, rather than strictly between every individual living ina community); thus the relative size of small and large communities may not be pre-cisely proportional to their populations. This issue has been explored in terms of thenature of interactions with large communities (Sobels, 2002), and we will return tothis issue after exploring the insights to be gained from our simple model.
3.4. Simulations and analysis
In the simulations, a large community is represented by 132 players and the sevensmall communities by 22 players each (i.e., a ratio of 6:1 in size between large andsmall communities). For each scenario, we simulated 1000 iterations with differentrandom number sequences. Because the algorithm is purely stochastic, no two rep-licate simulations are the same, which provides a measure of the level of variationcaused by chance. To compare the level of cooperative behaviour under differentassumptions, we present mean results and their confidence intervals. We can justifypresenting averages because after about 200 iterations our average behaviour tendsto become stable (i.e. behaviour does not depend on the number of iterations). In thiscase presenting averaged results is consistent with other literature (e.g. Janssen, inpress). We present results for the small communities only. We replicated each treat-ment 30 times and calculated mean behaviour using all but the first 300 iterations forall small communities (i.e. giving 30 separate mean estimates). We averaged these 30means to give the overall mean level of behaviour and used the 30 means (i.e. onefrom each replicate) to produce confidence intervals estimated using the percentilebootstrap method (Efron and Tibshirani, 1993).
Two measures of cooperative behaviour are reported from the simulations. Thefirst measure which is mutual cooperation is defined as the percentage of encounterswhere both interacting agents cooperate (Coo–Coo). The second measure is mis-
placed cooperation which refers to the percentage of encounters where an agent from
190 Y.T. Maru et al. / Agricultural Systems 92 (2007) 179–200
the community being considered (usually the small community here) cooperateswhile the other player defects (Coo–Def).
The former (Coo–Coo) provides a measure of intra-community social capital. Weuse this as a proxy for the ability to deal with a social dilemma. The latter (Coo–Def)provides a measure of the extent to which one community may essentially feel ‘chea-ted’ in its interactions with another. We seek to understand the dynamics of cooper-ative and non-cooperative norms within communities in response to different levelsand structures of intercommunity interactions.
4. Results
We explore results for large and small communities separately to show that themodel is consistent with previous findings, then we turn to interactions between com-munities of different sizes.
4.1. Intra – large or small community interactions
Several authors have previously concluded that greater memory coupled with asmaller pool of players can facilitate the development of co-operative norms (seeextensive review article by Gotts et al., 2003). Fig. 4 confirm this result in terms ofintra-community social interaction with different levels of memories.
In the absence of memory (results not shown), there is no motivation for anyplayer (in either small or large communities) to co-operate, and hence large andsmall communities evolve non-cooperative norms along similar paths, typical ofthe Nash equilibrium for one-shot prisoner’s dilemma. Both large and small commu-nities show similar flat lines with zero cooperation.
With memory, co-operative behaviour by large and small communities evolveswith a memory of 20 or 40 iterations (Fig. 4). There is a significantly higher levelof development of a cooperative norm for small compared to large communities.For the small communities the cooperative behaviour is higher when players canremember whether they have encountered an opponent over the last 40 interactionsrather than only over the last 20 interactions. For both levels of memory, coopera-tive behaviour is still increasing for the small communities as the number of interac-tions increases. By contrast, cooperative behaviour rapidly asymptotes close to zerofor the large community at either level of memory.
These simulations illustrate how behaviour can be affected by the level of memory,and how different small communities can track heterogenous patterns (as depicted bythe wide confidence intervals in Fig. 4). We also systematically explored the effect ofdifferent levels of memory on misdirected cooperation and mutual cooperation(Fig. 5). Mutual cooperation for the small community increases rapidly once mem-ory exceeds about 10 iterations, and plateaus at around 66% above a memory level of35 iterations (Fig. 5(a)). In contrast, the percentage of misplaced cooperation stays ataround 16% despite the increasing level of memory of the small community members(Fig. 5(b)).

0 500 1000 15000
20
40
60
80
100
noitarepo-oC
%
0 500 1000 15000
20
40
60
80
100
noitarepo-oC
%
Iterations
(b)
(a)
Fig. 4. Development of cooperative behaviour at memory length of the past (a) 20, (b) 40 iterations,measured as the percentage of interactions which are cooperative. The upper solid line represents the meanbehaviour of the seven small communities, with the fine-dashed line showing one exemplar smallcommunity. The lower solid line is the large community. We present 1500 iterations: the shaded areaindicates iterations 300–1000 which were used to calculate the mean results (see Section 3.4)
Y.T. Maru et al. / Agricultural Systems 92 (2007) 179–200 191
4.2. Inter-community interaction
Intercommunity or external interactions refer to encounters between agents in dif-ferent communities. The interaction can be non-structured or structured.
0 20 40 600
20
40
60
80
noitarepo-oclautuM
%
Memory
0 20 40 600
20
40
60
80
noitarepo- ocdecal psi
M%
Memory
(a) (b)
Fig. 5. Development of (a) mutual cooperation and (b) misplaced cooperation in small communities withincreasing length of memory (solid lines show mean of 30 runs, dotted lines show 95% confidenceintervals).
192 Y.T. Maru et al. / Agricultural Systems 92 (2007) 179–200
4.2.1. Non-structured interactions between communities
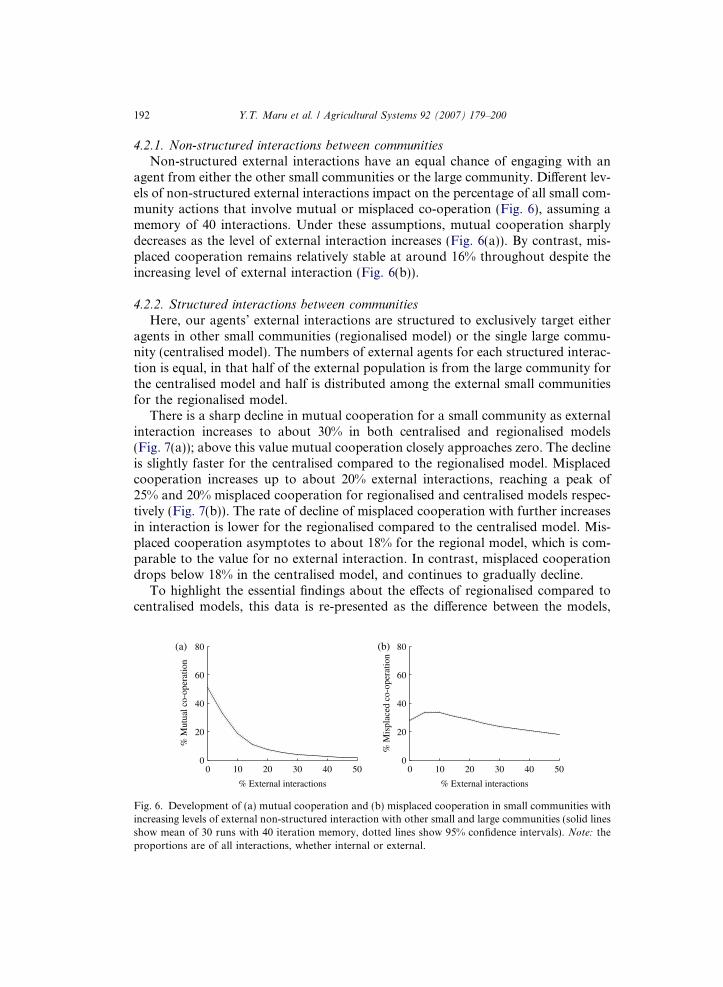
Non-structured external interactions have an equal chance of engaging with anagent from either the other small communities or the large community. Different lev-els of non-structured external interactions impact on the percentage of all small com-munity actions that involve mutual or misplaced co-operation (Fig. 6), assuming amemory of 40 interactions. Under these assumptions, mutual cooperation sharplydecreases as the level of external interaction increases (Fig. 6(a)). By contrast, mis-placed cooperation remains relatively stable at around 16% throughout despite theincreasing level of external interaction (Fig. 6(b)).
4.2.2. Structured interactions between communities
Here, our agents’ external interactions are structured to exclusively target eitheragents in other small communities (regionalised model) or the single large commu-nity (centralised model). The numbers of external agents for each structured interac-tion is equal, in that half of the external population is from the large community forthe centralised model and half is distributed among the external small communitiesfor the regionalised model.
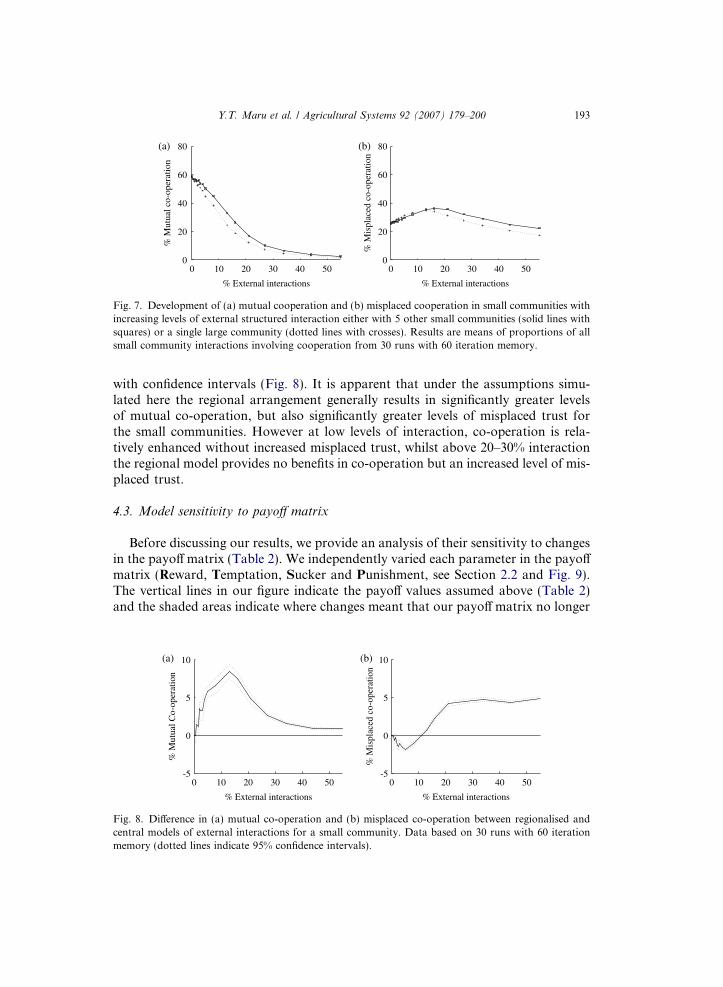
There is a sharp decline in mutual cooperation for a small community as externalinteraction increases to about 30% in both centralised and regionalised models(Fig. 7(a)); above this value mutual cooperation closely approaches zero. The declineis slightly faster for the centralised compared to the regionalised model. Misplacedcooperation increases up to about 20% external interactions, reaching a peak of25% and 20% misplaced cooperation for regionalised and centralised models respec-tively (Fig. 7(b)). The rate of decline of misplaced cooperation with further increasesin interaction is lower for the regionalised compared to the centralised model. Mis-placed cooperation asymptotes to about 18% for the regional model, which is com-parable to the value for no external interaction. In contrast, misplaced cooperationdrops below 18% in the centralised model, and continues to gradually decline.
To highlight the essential findings about the effects of regionalised compared tocentralised models, this data is re-presented as the difference between the models,
0 10 20 30 40 500
20
40
60
80
noitarepo-oclautuM
%
% External interactions
(a) (b)
0 10 20 30 40 500
20
40
60
80
noitarepo-ocde calps i
M%
% External interactions
Fig. 6. Development of (a) mutual cooperation and (b) misplaced cooperation in small communities withincreasing levels of external non-structured interaction with other small and large communities (solid linesshow mean of 30 runs with 40 iteration memory, dotted lines show 95% confidence intervals). Note: theproportions are of all interactions, whether internal or external.
0 10 20 30 40 500
20
40
60
80
noitarepo-oclautuM
%
% External interactions
0 10 20 30 40 500
20
40
60
80
noitarepo-ocde calp si
M%
% External interactions
(b)(a)
Fig. 7. Development of (a) mutual cooperation and (b) misplaced cooperation in small communities withincreasing levels of external structured interaction either with 5 other small communities (solid lines withsquares) or a single large community (dotted lines with crosses). Results are means of proportions of allsmall community interactions involving cooperation from 30 runs with 60 iteration memory.
Y.T. Maru et al. / Agricultural Systems 92 (2007) 179–200 193
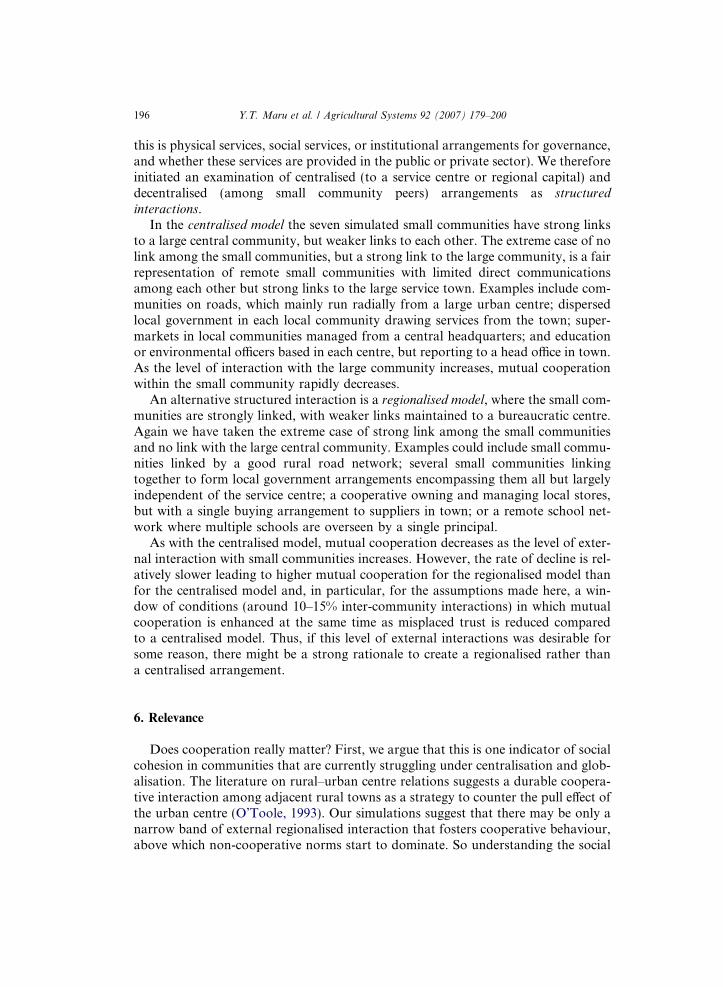
with confidence intervals (Fig. 8). It is apparent that under the assumptions simu-lated here the regional arrangement generally results in significantly greater levelsof mutual co-operation, but also significantly greater levels of misplaced trust forthe small communities. However at low levels of interaction, co-operation is rela-tively enhanced without increased misplaced trust, whilst above 20–30% interactionthe regional model provides no benefits in co-operation but an increased level of mis-placed trust.
4.3. Model sensitivity to payoff matrix
Before discussing our results, we provide an analysis of their sensitivity to changesin the payoff matrix (Table 2). We independently varied each parameter in the payoffmatrix (Reward, Temptation, Sucker and Punishment, see Section 2.2 and Fig. 9).The vertical lines in our figure indicate the payoff values assumed above (Table 2)and the shaded areas indicate where changes meant that our payoff matrix no longer
0 10 20 30 40 50-5
0
5
10
noitarepo-oClautu
M%
% External interactions
(a)
0 10 20 30 40 50-5
0
5
10
noitarepo-ocdecalpsi
M%
% External interactions
(b)
Fig. 8. Difference in (a) mutual co-operation and (b) misplaced co-operation between regionalised andcentral models of external interactions for a small community. Data based on 30 runs with 60 iterationmemory (dotted lines indicate 95% confidence intervals).

7 8 9 10 110
20
40
60
80
100
noitarepo-oc lau tuM
%
Reward: R
(a)
7 8 9 10 110
20
40
60
80
100
noitarepo-oc decalpsiM
%
Reward: R
(b)
8 9 10 11 120
20
40
60
80
100
noitarepo-o c la utuM
%
Temptation: T
(c)
8 9 10 11 120
20
40
60
80
100
noitarepo-oc decalpsiM
%
Temptation: T
(d)
-2 -1 0 1 20
20
40
60
80
100
noitarepo-oc lautuM
%
Sucker: S
(e)
-2 -1 0 1 20
20
40
60
80
100
noitarepo- oc d ec alp siM
%
Sucker: S
(f)
0 1 2 3 40
20
40
60
80
100
noitarepo-oc lautuM
%
Punishment: P
(g)
0 1 2 3 40
20
40
60
80
100
noitarepo-oc dec alpsiM
%
Punishment: P
(h)
Fig. 9. How changes in: (a–b) Reward; (c–d) Temptation; (e–f) Sucker; and (g–h) Punishment payoffvalues affect mutual co-operation and misplaced co-operation within small communities with no externalinteractions.
194 Y.T. Maru et al. / Agricultural Systems 92 (2007) 179–200
satisfied conditions for a prisoner’s dilemma (see Section 2.2). The figure shows 95%confidence intervals around the mean (as defined in Section 3.4). Clearly the assump-

Y.T. Maru et al. / Agricultural Systems 92 (2007) 179–200 195
tions we make in regard to the payoff matrix have significant impact on the results.Interestingly, when we inadvertently violated the payoff matrix conditions for a pris-oner’s dilemma, the trends in sensitivity did not seem to change within our testedrange. Our sensitivity analysis reminds us that our results are the product of ourassumptions, both design and parameter. The assumptions we used were not cali-brated. Rather our approach was to use a model to demonstrate theory.
5. Discussion
We seek to understand the difference in impact of regionalised and centralisedmodels of community interactions on the level of cooperative behaviour in general,and on mutual cooperation in particular as a proxy measure of the dynamics ofsocial capital in interacting communities. This study has deliberately used a gametheory approach to model these interactions, used results from previous studies tovalidate the models, and then run simulations to illustrate that there are significantdifferences between the behaviours of regional and centralised models, which areworth exploring further.
We affirmed previous studies that intra-community interactions, community sizeand memory length are major drivers in cooperative behaviour (Muller-Benedict,2002). Coleman’s (1992) study assumes a community size of up to 10 actors andmemory of six past interactions. In the present study a small community of 22 play-ers develops relatively higher level of mutually cooperative norms over time, with thelevel of cooperation stabilising after about 500 interactions at a level which is depen-dent on memory. Memory of up to about 15 iterations generates little cooperation,but above this cooperation rises rapidly to plateau at about 66% above a memory ofabout 30 iterations. By contrast the level of cooperation in a large community of 132players rapidly stabilises very close to zero at any equivalent level of memory, thanksto the much lower chance of interacting repeatedly with the same player within thetimeframe of the number of iterations remembered. These specific thresholds ofmemory and cooperation are driven by the parameters of the simulation, particularlythe community sizes and pay-off matrix values, but serve to confirm the generalitiesfound by other projects.
The centrepiece and novelty of this study was to start exploring the implicationsof different models of regionalisation. A small community might find itself interact-ing with other small communities and a large urban centre in an unstructured way.To the small community, such a setting creates an increasing opportunity to encoun-ter different players. Encounters with different opponents increases with increasingexternal interaction. This increase in effective size for interaction drives a sharpdecline in mutual cooperation, such that by the time more than 15% of interactionsare occurring outside the community there is little benefit in terms of cooperationover being a larger community.
Attempted decentralisation has been a long-lasting policy in Australia, and widelyaround the world; it is usually accompanied by some degree of service town/servicedsettlement arrangement in order to obtain efficiencies of service delivery (whether
196 Y.T. Maru et al. / Agricultural Systems 92 (2007) 179–200
this is physical services, social services, or institutional arrangements for governance,and whether these services are provided in the public or private sector). We thereforeinitiated an examination of centralised (to a service centre or regional capital) anddecentralised (among small community peers) arrangements as structured
interactions.In the centralised model the seven simulated small communities have strong links
to a large central community, but weaker links to each other. The extreme case of nolink among the small communities, but a strong link to the large community, is a fairrepresentation of remote small communities with limited direct communicationsamong each other but strong links to the large service town. Examples include com-munities on roads, which mainly run radially from a large urban centre; dispersedlocal government in each local community drawing services from the town; super-markets in local communities managed from a central headquarters; and educationor environmental officers based in each centre, but reporting to a head office in town.As the level of interaction with the large community increases, mutual cooperationwithin the small community rapidly decreases.
An alternative structured interaction is a regionalised model, where the small com-munities are strongly linked, with weaker links maintained to a bureaucratic centre.Again we have taken the extreme case of strong link among the small communitiesand no link with the large central community. Examples could include small commu-nities linked by a good rural road network; several small communities linkingtogether to form local government arrangements encompassing them all but largelyindependent of the service centre; a cooperative owning and managing local stores,but with a single buying arrangement to suppliers in town; or a remote school net-work where multiple schools are overseen by a single principal.
As with the centralised model, mutual cooperation decreases as the level of exter-nal interaction with small communities increases. However, the rate of decline is rel-atively slower leading to higher mutual cooperation for the regionalised model thanfor the centralised model and, in particular, for the assumptions made here, a win-dow of conditions (around 10–15% inter-community interactions) in which mutualcooperation is enhanced at the same time as misplaced trust is reduced comparedto a centralised model. Thus, if this level of external interactions was desirable forsome reason, there might be a strong rationale to create a regionalised rather thana centralised arrangement.
6. Relevance
Does cooperation really matter? First, we argue that this is one indicator of socialcohesion in communities that are currently struggling under centralisation and glob-alisation. The literature on rural–urban centre relations suggests a durable coopera-tive interaction among adjacent rural towns as a strategy to counter the pull effect ofthe urban centre (O’Toole, 1993). Our simulations suggest that there may be only anarrow band of external regionalised interaction that fosters cooperative behaviour,above which non-cooperative norms start to dominate. So understanding the social
Y.T. Maru et al. / Agricultural Systems 92 (2007) 179–200 197
dynamics of different communities, and the potential for tension arising from differ-ent linkage arrangements, becomes very important.
Second, cases of all the explicit examples of centralised or regionalised systemsgiven above can be found, more or less fully implemented, somewhere in regionsof remote Australia. However, their common features, in terms of implications forthe social interactions simulated in this paper, have never been systematically inves-tigated. So policy continues to implement different models according to transiententhusiasms without a theoretical rationale for expected success and failure in differ-ent circumstances. Thus we need a basis for predicting what the outcomes of somequite concrete policy investments could be – these policy decisions will continue tobe made every day in ignorance of these possible implications otherwise.
Having made the case for further understanding, it must also be said that thismodel remains highly abstract. To determine whether this approach can contributematerially to the policy decision mentioned above, work is needed to relate theparameters to reality, determine how sensitive the results are to input assumptions,and to explore how different levels of theoretical cooperation might translate intoreal social angst or benefit.
Despite this, mistrust of processes originating in cities remains widespread insmall, close-knit rural communities, even when bureaucrats from those cities are try-ing to hand out help. Perhaps this is not some ignorant irritation, but a very funda-mental product of our rural settlement patterns. An extreme example may be theways in which Australian Indigenous communities make decisions, developed inan era of very small family based clan groups. In these communities, the develop-ment of transaction-rich personal relationships is taken to an even greater extentthan in remote white communities. If resulting rural–urban tensions are emergentproperties of settlement patterns, then we need to understand their origins, and workwith them, rather than railing against them in frustration.
The study has limitations. It is a highly simplified representation of reality. Itignores the possibility of segmentation within communities, particularly in largeurban centres. It assumes interactions as random. It considers error-free interpreta-tion and execution of strategies, and non-failing memory. Future study must aim formore realistic representations of reality. This will be achieved by conducting empir-ical research on the behavioural categories of communities and adding modellingtechniques that reduce the number of the simplifying assumptions.
7. Conclusion
In a world where regionalism and regional development are accelerating para-digms, we need to understand what the subtler social effects of these policies mightbe. Such concerns are especially important in regions with dramatic inequalitiesbetween interacting communities, such as is the case in Australian desert regions(and probably most of the rest of the 40% of the world’s surface that is drylands).
In summary, this preliminary study confirms that there may be fundamental con-sequences of our settlement patterns in rural Australia for some subtle aspects of the
198 Y.T. Maru et al. / Agricultural Systems 92 (2007) 179–200
structure and functioning of our human communities in remote areas. However, agreat deal more theoretical and field work is needed to make the models realisticenough to contribute to decision-making.
Acknowledgements
This work is an offshoot of a research project on Social Adaptation to EcologicalUncertainty in Australian Rangelands funded by the CSIRO Centre for Complex Sys-tems Science. We thank for the funding made available to the project. We are gratefulfor the input from internal referees: Dr. John Ludwig and Dr. Alexander Smajgl. Weare also thankful to Dr. Margaret Friedel for her comments and suggestions.
References
Abel, N., Langston, A., Ive, J., Tatnell, B., Howden, M., 1999. Institutional change for sustainable landuse: a participatory approach from Australia. In: Janssen, M. (Ed.), Complexity and EcosystemManagement. Edward Edgar Publishing, Cheltenham, pp. 286–313.
Australian Bureau of Statistics (ABS), 2000. Australian Social Trends 2000, Population – PopulationCharacteristics: 20th century: Beginning and End. ABS, Canberra.
Alston, M., 2000. Social Capital in Rural Australia, Centre for Rural Social Research. Charles SturtUniversity, Australia.
Altman, J., 2000. Foreword. In: Smith, D.E. (Ed.), Indigenous Families and the Welfare System: TwoCommunity Case Studies. CAEPR Research Monograph No. 17. Centre for Aboriginal EconomicPolicy Research, The Australian National University, Canberra.
Arrow, K.J., 2000. Observations on social capital. In: Dasgupta, P., Serageldin, I. (Eds.), Social Capital: AMultifaceted Perspective. The World Bank, Washington DC, pp. 3–5.
Axelrod, R., 1984. The Evolution of Cooperation. Basic Books, New York.Bendor, J., Swistak, P., 1997. The evolutionary stability of cooperation. American Political Science
Review 9 (2), 97–117.Buss, D.M., 1999. Evolutionary Psychology. The New Science of the Mind. Allyn and Bacon, Boston.Cheers, B., 1998. Welfare Bushed: Social Care in Rural Australia. Ashgate, Aldershot.Coleman, J., 1990. Foundation of Social Theory. Harvard University Press, Cambridge.Coleman, J., 1992. Norm-generating structures. In: Karen, S.C., Margaret, L. (Eds.), The Limit of
Rationality, pp. 250–273.Collier, P., 1998. Social Capital and Poverty. Social Capital Working Paper Series 4.Cox, E., 1995. A Truly Civic Society: Boyer Lectures. Australian Broadcasting Corporation Books,
Sydney.Crowley, P.H., 1996. Evolving cooperation: strategies as hierarchies of rules. BioSystems 37, 67–80.Department of Planning, Infrastructure and Environment (DPIE) and Centre Rural Social Research
(CRSR), 1997. Evaluation of the Rural Communities Access Program, Commonwealth of Australia.Efron, B., Tibshirani, R., 1993. An Introduction to the Bootstrap. Chapman and Hall, New York.Forth, G., 2001. Following the yellow brick road and the future of Australia’s declining country towns. In:
Rogers, M., Collins, Y. (Eds.), The Future of Australia’s Country Towns. La Trobe University Press.Furber, H., Ganter, E., Davies, J., 2003. Harnessing research and jurisdictional collaboration to sustain
governance initiatives. In: Paper to a Conference on Building Effective Indigenous Governance, Jabiru,4–7 November 2003.
Gotts, N.M., Polhill, J.G., Law, A.N.R., 2003. Agent based simulation in the study of social dilemmas.Artificial Intelligence Review 19, 3–92.

Y.T. Maru et al. / Agricultural Systems 92 (2007) 179–200 199
Grootaert, C., Van Bastelaer, T., 2001. Understanding and Measuring Social Capital: A Synthesis ofFindings and Recommendations from the Social Capital Initiative. Working Paper No. 24, The WorldBank Social Development Family, Environmentally and Socially Sustainable Development Network.
Hegselmann, R., 1996. Understanding social dynamics. The cellular automata approach. In: Troitzsch,K.G., Mueller, U., Gilbert, N., Doran, J.E. (Eds.), Social Science Microsimulation. Springer, Berlin,pp. 282–306.
Holmes, J.H., 1996. Changing resource values in Australia’s tropical savannas: priorities in institutionalreform. In: Ash, A. (Ed.), The Future of the Tropical Savannas: An Australian Perspective. CSIRO,Melbourne, pp. 28–46.
Holmes, J.H., Day, P., 1995. Identity lifestyle and survival: value orientations of South Australianpastoralists. The Rangeland Journal 17, 111–127.
Hunter, B., 2004. Taming the Social Capital Hydra? Indigenous Poverty, Social Capital Theory andMeasurement. CAEPR Discussion Paper No. 261/2004. Centre for Aboriginal Economic PolicyResearch, The Australian National University, Canberra.
Ife, J., 2000. Localized needs and a globalised economy: bridging the gap with social work practices.Canadian Social Work 2 (1), 50–64.
Janssen, M.A., Evolution of cooperation in a one-shot prisoner’s dilemma based on recognition oftrustworthy and untrustworthy agents, Journal of Economic Behavior and Organization, in press.
Krishna, A., 2004. Understanding, measuring and utilizing social capital: clarifying concepts andpresenting a field application from India. Agricultural Systems 82, 291–305.
Lawrence, G., 1995. Farm structural adjustment: the imperative for the nineties. Rural Society 2 (4).Linster, B.G., 1992. Evolutionary stability in the infinitely repeated prisoner’s dilemma played by two-
state Moore machines. Southern Economic Journal 58, 880–903.Lyons, M., 2000. Non-profit organisations, social capital and social policy in Australia. In: Ian, Winter
(Ed.), Social Capital and Public Policy in Australia. Australian Institute of Family Studies.Commonwealth of Australia, Canberra, pp. 165–191.
McAllister, R.R.J., Gordon, I.J., Janssen, M.A., Abel, N., 2006. Pastoralists’ responses to variation ofrangeland resources in time and space. Ecological Applications 16 (2), 572–583.
McGregor, C., 2001. An Examination of Support for Local Sustainability Initiatives in Small TownCommunities of the Tropical Savanna Region of Northern Australia. PhD dissertation. James CookUniversity, Townsville.
Meinzen-Dick, R., DiGregorio, M., McCarthy, N., 2004. Methods for studying collective action in ruraldevelopment. Agricultural Systems 82, 197–214.
Miller, J.H., 1996. The coevolution of automata in the repeated prisoner’s dilemma. Journal of EconomicBehaviour and Organisation 29, 87–112.
Muller-Benedict, V., 2002. Xenophobia and social closure: a development of a model from Coleman.Journal of Artificial Societies and Social Simulation 5, 1. Available from: http://jass.soc.surrey.ac.uk/5/1/2.html.
Ngaanyatjarra Council (Aboriginal Corporation), 2003. Doing Business with Government. ConsultancyReport, July 2003.
Ostrom, E., 1998. A behavioural approach to the rational choice theory of collective action. AmericanPolitical Science Review 9 (1), 1–22.
Ostrom, E., 2001. Vulnerability and polycentric governance systems. Update: Newsletter of theInternational Human Dimension. Programme on Global Environmental Change, Bonn.
Ostrom, E., Gardner, R., Walker, J., 1994. Rules, Games, and Common-Pool Resources. University ofMichigan Press, Ann Arbor.
O’Toole, K., 1993. Replacing rurality with human services in Victorian local government. Rural Society 3(3).
Productivity Commission, 1999. Impact of Competition Policy Reform on Rural and regional Australia.Australian Government. Available from: http://www.pc.gov.au/inquiry/compol/finalreport/index.html.
Putnam, R., 1993. Making Democracy Work: Civic Traditions in Modern Italy. Princeton UniversityPress, Princeton.
200 Y.T. Maru et al. / Agricultural Systems 92 (2007) 179–200
Putnam, R., 2000. Bowling Alone: the Collapse and Revival of American Community. Simon andSchuster, New York.
Putzel, J., 1997. Accounting for the ‘dark side’ of social capital: reading Robert Putnam on democracy.Journal of International Development 9 (7), 939–949.
Raper, M., 2000. Social Coalition needs Social Justice. Impact, March, 3.Rees, B., 2003. What’s wrong with rural Australia? Online opinion Australia’s e-journal of social and
political debate. Available from: http://portal.nationalforum.com.au.Routledge, B.R., von Amsberg, J., 2003. Social capital growth. Journal of Monetary Economics 5 (1),
167–193.Scoones, I., 1995. New directions in pastoral development in Africa. In: Scoones, I. (Ed.), Living with
Uncertainty. International Institute for Environment and Development. Intermediate TechnologyPublications, London.
Sobels, J., Curtis, A., Lockie, S., 2001. The role of Landcare group networks in rural Australia: exploringthe contribution of social capital. Journal of Rural Studies 17, 265–276.
Sobels, J., 2002. Can we trust social capital. Journal of Economic Literature XL, 139–154.Stafford Smith, M., 2000. Landscapes, land users and linkages in Northern Australia. In: Proceedings of
Northern Grassy Landscapes Conference, Katherine, September 2000. Tropical Savannas CRC,Darwin.
Stafford Smith, D.M., Morton, S.R., Ash, A.J., 2000. Towards sustainable pastoralism in Australia’srangelands. Australian Environmental Management 7, 190–203.
Stafford Smith, M., Walker, D., Maru, Y., Stoeckl, N., Herr, A., Breen, J., Greiner, R., 2003. Options forunderstanding regional dynamics in northern Australia. Tropical Savannas CRC Regional ModellingScoping Study, Project Final Report. Tropical Savannas CRC, Darwin.
Stone, W., Hughes, J., 2000. What role for social capital in family policy and how does it measure up? In:Proceedings of Family Futures: Issues in Research and Policy. Australian Institute of Family studies,Melbourne.
Tesfatsion, L., Ashlock, D., 1998. A friendly joust of the minds. Complexity 3 (4), 85–89.Vennesland, B., 2004. Social capital and networks in forest-based rural economic development.
Scandinavian Journal of Forest Research 1 (5), 82–89.