
Modeling the performance of a photon counting x-ray detector for CT: Energy response and pulse...
14
Modeling the performance of a photon counting x-ray detector for CT: Energy response and pulse pileup effects Katsuyuki Taguchi, a Mengxi Zhang, Eric C. Frey, and Xiaolan Wang Division of Medical Imaging Physics, The Russell H. Morgan Department of Radiology and Radiological Science, Johns Hopkins University School of Medicine, Baltimore, Maryland 21287 Jan S. Iwanczyk DxRay, Inc., Northridge, California 91324 Einar Nygard Interon, AS, N-1395 Hvalstad, Norway Neal E. Hartsough DxRay, Inc., Northridge, California 91324 Benjamin M. W. Tsui Division of Medical Imaging Physics, The Russell H. Morgan Department of Radiology and Radiological Science, Johns Hopkins University School of Medicine, Baltimore, Maryland 21287 William C. Barber DxRay, Inc., Northridge, California 91324 Received 5 February 2010; revised 18 December 2010; accepted for publication 20 December 2010; published 1 February 2011 Purpose: Recently, photon counting x-ray detectors PCXDs with energy discrimination capabili- ties have been developed for potential use in clinical computed tomography CT scanners. These PCXDs have great potential to improve the quality of CT images due to the absence of electronic noise and weights applied to the counts and the additional spectral information. With high count rates encountered in clinical CT, however, coincident photons are recorded as one event with a higher or lower energy due to the finite speed of the PCXD. This phenomenon is called a “pulse pileup event” and results in both a loss of counts called “deadtime losses” and distortion of the recorded energy spectrum. Even though the performance of PCXDs is being improved, it is essen- tial to develop algorithmic methods based on accurate models of the properties of detectors to compensate for these effects. To date, only one PCXD model DXMCT-1, DxRay, Inc., Northridge, CA has been used for clinical CT studies. The aim of that study was to evaluate the agreement between data measured by DXMCT-1 and those predicted by analytical models for the energy response, the deadtime losses, and the distorted recorded spectrum caused by pulse pileup effects. Methods: An energy calibration was performed using 99m Tc 140 keV, 57 Co 122 keV, and an x-ray beam obtained with four x-ray tube voltages 35, 50, 65, and 80 kVp. The DXMCT-1 was placed 150 mm from the x-ray focal spot; the count rates and the spectra were recorded at various tube current values from 10 to 500 A for a tube voltage of 80 kVp. Using these measurements, for each pulse height comparator we estimated three parameters describing the photon energy-pulse height curve, the detector deadtime , a coefficient k that relates the x-ray tube current I to an incident count rate a by a = k I, and the incident spectrum. The mean pulse shape of all compara- tors was acquired in a separate study and was used in the model to estimate the distorted recorded spectrum. The agreement between data measured by the DXMCT-1 and those predicted by the models was quantified by the coefficient of variation COV, i.e., the root mean square difference divided by the mean of the measurement. Results: Photon energy versus pulse height curves calculated with an analytical model and those measured using the DXMCT-1 were in agreement within 0.2% in terms of the COV. The COV between the output count rates measured and those predicted by analytical models was 2.5% for deadtime losses of up to 60%. The COVs between spectra measured and those predicted by the detector model were within 3.7%–7.2% with deadtime losses of 19%–46%. Conclusions: It has been demonstrated that the performance of the DXMCT-1 agreed exceptionally well with the analytical models regarding the energy response, the count rate, and the recorded spectrum with pulse pileup effects. These models will be useful in developing methods to compen- sate for these effects in PCXD-based clinical CT systems. © 2011 American Association of Physi- cists in Medicine. DOI: 10.1118/1.3539602 Key words: computed tomography, photon counting, pulse pileup 1089 1089 Med. Phys. 38 „2…, February 2011 0094-2405/2011/38„2…/1089/14/$30.00 © 2011 Am. Assoc. Phys. Med.
-
Upload
holmesglen -
Category
Documents
-
view
2 -
download
0
Transcript of Modeling the performance of a photon counting x-ray detector for CT: Energy response and pulse...
Modeling the performance of a photon counting x-ray detector for CT:Energy response and pulse pileup effects
Katsuyuki Taguchi,a� Mengxi Zhang, Eric C. Frey, and Xiaolan WangDivision of Medical Imaging Physics, The Russell H. Morgan Department of Radiology and RadiologicalScience, Johns Hopkins University School of Medicine, Baltimore, Maryland 21287
Jan S. IwanczykDxRay, Inc., Northridge, California 91324
Einar NygardInteron, AS, N-1395 Hvalstad, Norway
Neal E. HartsoughDxRay, Inc., Northridge, California 91324
Benjamin M. W. TsuiDivision of Medical Imaging Physics, The Russell H. Morgan Department of Radiology and RadiologicalScience, Johns Hopkins University School of Medicine, Baltimore, Maryland 21287
William C. BarberDxRay, Inc., Northridge, California 91324
�Received 5 February 2010; revised 18 December 2010; accepted for publication 20 December 2010;published 1 February 2011�
Purpose: Recently, photon counting x-ray detectors �PCXDs� with energy discrimination capabili-ties have been developed for potential use in clinical computed tomography �CT� scanners. ThesePCXDs have great potential to improve the quality of CT images due to the absence of electronicnoise and weights applied to the counts and the additional spectral information. With high countrates encountered in clinical CT, however, coincident photons are recorded as one event with ahigher or lower energy due to the finite speed of the PCXD. This phenomenon is called a “pulsepileup event” and results in both a loss of counts �called “deadtime losses”� and distortion of therecorded energy spectrum. Even though the performance of PCXDs is being improved, it is essen-tial to develop algorithmic methods based on accurate models of the properties of detectors tocompensate for these effects. To date, only one PCXD �model DXMCT-1, DxRay, Inc., Northridge,CA� has been used for clinical CT studies. The aim of that study was to evaluate the agreementbetween data measured by DXMCT-1 and those predicted by analytical models for the energyresponse, the deadtime losses, and the distorted recorded spectrum caused by pulse pileup effects.Methods: An energy calibration was performed using 99mTc �140 keV�, 57Co �122 keV�, and anx-ray beam obtained with four x-ray tube voltages �35, 50, 65, and 80 kVp�. The DXMCT-1 wasplaced 150 mm from the x-ray focal spot; the count rates and the spectra were recorded at varioustube current values from 10 to 500 �A for a tube voltage of 80 kVp. Using these measurements,for each pulse height comparator we estimated three parameters describing the photon energy-pulseheight curve, the detector deadtime �, a coefficient k that relates the x-ray tube current I to anincident count rate a by a=k� I, and the incident spectrum. The mean pulse shape of all compara-tors was acquired in a separate study and was used in the model to estimate the distorted recordedspectrum. The agreement between data measured by the DXMCT-1 and those predicted by themodels was quantified by the coefficient of variation �COV�, i.e., the root mean square differencedivided by the mean of the measurement.Results: Photon energy versus pulse height curves calculated with an analytical model and thosemeasured using the DXMCT-1 were in agreement within 0.2% in terms of the COV. The COVbetween the output count rates measured and those predicted by analytical models was 2.5% fordeadtime losses of up to 60%. The COVs between spectra measured and those predicted by thedetector model were within 3.7%–7.2% with deadtime losses of 19%–46%.Conclusions: It has been demonstrated that the performance of the DXMCT-1 agreed exceptionallywell with the analytical models regarding the energy response, the count rate, and the recordedspectrum with pulse pileup effects. These models will be useful in developing methods to compen-sate for these effects in PCXD-based clinical CT systems. © 2011 American Association of Physi-cists in Medicine. �DOI: 10.1118/1.3539602�
Key words: computed tomography, photon counting, pulse pileup
1089 1089Med. Phys. 38 „2…, February 2011 0094-2405/2011/38„2…/1089/14/$30.00 © 2011 Am. Assoc. Phys. Med.
1090 Taguchi et al.: A photon counting x-ray detector and the models 1090
I. INTRODUCTION
Current multislice x-ray computed tomography �CT� scan-ners provide three-dimensional imaging of the linear attenu-ation coefficient distribution within a patient. The derivedimages accurately delineate organs and tissues, which helpsphysicians make accurate diagnoses. However, there arethree major limitations to current CT technologies: �1� im-ages of linear attenuation coefficients are not tissue-type spe-cific, �2� contrast between certain different tissues is not suf-ficient, and �3� “CT scanning is a relatively high-doseprocedure.”1
In general, linear attenuation coefficients depend on sev-eral factors, such as the chemical composition of the object,the mass density of the object, and the energy of the x-rayphotons. Consequently, the transmitted x-ray spectra carryinformation about tissue types such as fat, muscle, bone,contrast materials, etc. Energy-integrating detectors, whichare used in almost all current CT scanners, measure only theintegrated area under the transmitted x-ray spectrum, andtherefore lose all energy-dependent information. Energy-integrating detectors also add electronic noise and Swanknoise,2 and higher energy photons, which carry less informa-tion about contrast between different tissues and receive alarger weight in the output signal, resulting in increasednoise and reduced contrast. In general, dual-energy CTimaging3 can provide tissue-specific images. However, nei-ther the current dual-kVp nor dual-source techniques4 pro-vide optimal results due to cross-talk between the high andlow energy images and because of the limited number ofresolvable basis functions �only two� for materialdecomposition.3 The presence of contrast media containingelements with high atomic numbers �e.g., iodine or gado-linium� can be identified with a third basis function. Thus, itis desirable to measure the transmitted x-ray photons withmore than two energy windows.
Recently, photon counting x-ray detectors �PCXDs� withenergy discrimination capabilities based on pulse heightanalysis have been developed for medical x-ray imaging.5–14
PCXD-based CT with multiple energy windows has the po-tential to improve the three major limitations listedabove.6,7,15 Electronic and Swank noise affect the measuredenergy, but do not change the output signal intensity �i.e., thecounts�, and the energy overlap in the spectral measurementsis superior to �i.e., smaller than� that from any of the currentdual-energy techniques using integrating detectors. In addi-tion, more than one contrast media could be imaged simul-taneously and would be distinguishable if the detectors hadfour or more energy windows �pulse height comparators�.PCXDs may therefore lead to novel clinical applications.The number of energy windows per detector pixel in PCXDsvaries from 2 to 8, depending on specific detectordesigns.5–14 One PCXD �model DXMCT-1, DxRay, Inc.,Northridge, CA�, which will be used in this study, has beenincorporated into a commercial CT scanner �LightSpeedVCT, GE Healthcare, Waukesha, WI�. This is the only PCXDthat has been used for a clinical dual energy CT study to
5
date.Medical Physics, Vol. 38, No. 2, February 2011
The performance of PCXDs is not flawless, however, es-pecially at the count rates in current clinical CT. Due to thelimited pulse resolving time, quasicoincident photons �over-lapping pulses� can be recorded as a single count with ahigher or lower energy �see Fig. 1�. This phenomenon iscalled pulse pileup and results both in a loss of counts, re-ferred to as deadtime losses, and a distortion of the recordedspectrum.16 The amount of the deadtime losses and the dis-tortion of the recorded spectrum will depend on the incidentcount rate. Using recorded counts without correction couldresult in artifacts in reconstructed images and using the re-corded spectrum in a material decomposition process withoutcompensation or correction could produce inaccuracies. Inaddition, the energy response of PCXDs can be nonlineareven though input count rates are sufficiently low.
Faster detectors with smaller deadtime losses and fewerspectral distortions are being developed, but it may be prac-tically impossible to achieve a linear dynamic range for botha low input count rate of heavily attenuated x-ray beams�e.g., in a coronal projection image through the sternum andbackbone� and a very high input count rate of unattenuatedbeams. Alternatively, hardware-based pileup rejectors can re-duce or eliminate the spectral distortion caused by peakpileup,16 where coincidences during the initial part of pulsesare recorded as a single count at a higher energy than theoriginal pulse’s energies. However, the efficiency of suchrejectors could be limited �e.g., 50%� for variousreasons.16–19 In addition, it is quite challenging to implementpileup rejectors in a PCXD for clinical CT, since they need tooperate at very high count rates. The rejectors would alsoconsume additional power and require considerable space inthe dense parallel channel application-specific integrated cir-cuit �ASIC�, which may degrade the noise performance. Therequired operational count rates for clinical x-ray CT detec-tors can be as large as 3–50 million-counts-per-second-per-square-millimeter �Mcps /mm2� for the attenuated portions ofthe beam when the unattenuated count rate incident onto a
2 2 20
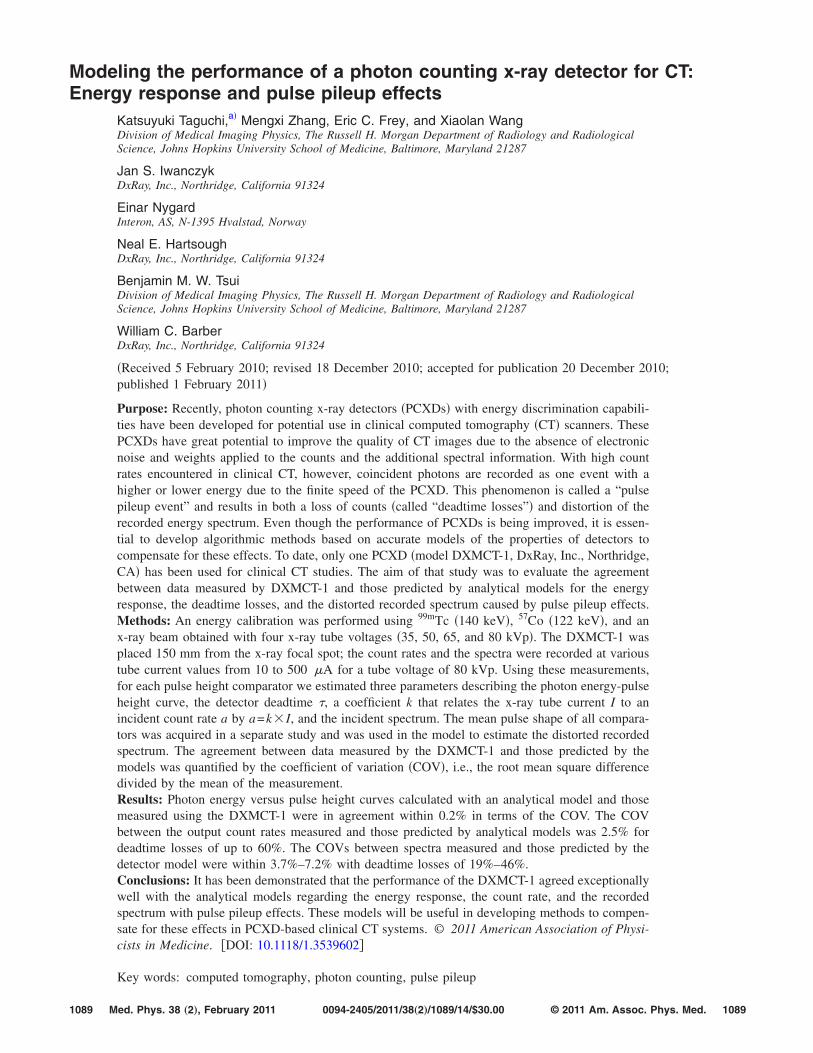
FIG. 1. �Top� The basic architecture of an individual channel in the ASIC.�Bottom� When the pulse height exceeds a given energy threshold value, acount will be added to an associated counter. Coincident photons will berecorded as one event with a higher energy level than the original energies.
bowtie filter is 1 billion cps /mm �or 1000 Mcps /mm �.
1091 Taguchi et al.: A photon counting x-ray detector and the models 1091
Thus, while the detector’s speed and energy response maybe improved in the future, it is also necessary to developalgorithmic methods to compensate for the energy response,the deadtime losses, and the spectral distortions, in order totake full advantage of the energy discrimination capabilitiesof PCXDs. The key to successful compensation methods isdeveloping accurate models of the corresponding propertiesof the PCXDs.
The detection mechanism for most PCXDs can be mod-eled well by either the nonparalyzable or paralyzable model�discussed later�.17 Analytical models of deadtime losseshave been discussed thoroughly for both of these detectormodels.17 Analytical models for spectral distortions have alsobeen discussed in the literature.16,19,21–24 A new model hasrecently been developed for nonparalyzable detectors,25
which takes into account the following factors: the probabil-ity distribution of time intervals between photons, the prob-ability distribution of photon energies, and a more realisticaverage pulse shape. The aim of this study was to evaluatethe agreement between data measured using the DXMCT-1�Refs. 5 and 8� and those estimated from the analytical mod-els for the energy response, deadtime losses, and distortionsin the recorded spectrum.
The structure of this paper is as follows. In Sec. II, wedescribe the DXMCT-1 used in this study and the two detec-tion mechanism models �nonparalyzable and paralyzable�.Section II also includes descriptions of the analytical modelsof the energy response, deadtime losses, and spectral distor-tions. Section III outlines evaluation methods and results arepresented in Sec. IV. In Sec. V, relevant issues are discussedand goals for further research are outlined. Key symbols,abbreviations, and acronyms used in this paper are gatheredin Table I.
II. ANALYTICAL MODELS
In this section we will first explain some of the features ofthe DXMCT-1 including the counting mechanism. We willthen outline the two simplified detection models of countingdetectors: the nonparalyzable and paralyzable models. Fi-nally, we will describe the analytical models for the energyresponse, deadtime losses, and the spectral distortions causedby pulse pileup effects.
II.A. DxRay’s DXMCT-1 PCXD
The PCXD used in this study �model DXMCT-1� wasdeveloped by DxRay, Inc. �Northridge, CA�.5,8 A �3 mmthick cadmium telluride �CdTe� block consisted of 16�16 pixels �pixelated anode� with a pitch of �1 mm. Twosuch blocks were assembled and connected to four ASICs.Each ASIC contained 128 parallel channels, each consistingof an amplifier, a pulse shaper, two digital-to-analog convert-ers �DACs�, two pulse height comparators �energy win-dows�, and two counters per detector pixel �see Fig. 1,top�. Thus, there were 1024 comparators �=16�16 pixels-per-block�2 blocks�2 comparators-per-
pixel� in total in this PCXD. A negative bias voltage wasMedical Physics, Vol. 38, No. 2, February 2011
applied to a continuous metallized thin film cathode on theincident side of the CdTe crystal, creating an electric fieldalong the depth direction of the crystal.
The energy deposited by each x-ray photon generates anelectric charge. The charge then travels within the detectorvolume toward the electrodes and generates a pulse that isprocessed by the ASIC. The height of the pulse generated bya photon is compared with a given energy threshold value. Acount is registered in the counter associated with the givencomparator if the pulse height exceeds the threshold value.Subtracting counts in counters from adjacent energy thresh-old values yields the counts in the energy window defined bythe two threshold values. Thus, the highest energy windowdoes not have an upper bound. The DAC allows for finetuning of the threshold values for each channel in order tocompensate for channel-to-channel variations. The readoutsequencer is operated at 50 MHz, allowing for a completereadout of all the counters in parallel in about 5 �s. Thedetails of the DXMCT-1 architecture have been describedpreviously.5,8
II.B. Nonparalyzable and paralyzable detectionmodels
The detection mechanism for most PCXDs can be mod-eled well to a first approximation by either the nonparalyz-able or paralyzable models,17 although subtle effects oftencause detectors to behave somewhere in-between. When adetector is in the active state, the first photon incident on thedetector will put the detector into the detection �inactive�
TABLE I. Key symbols, abbreviations, and acronyms used in this paper.
Symbols Meanings
� Detector deadtimeMcps, kcps Million- or thousand-counts-per-second, a unit of count
ratesa The true count rates incident onto detectorsaR The recorded count rates by detectorsc1 ,c2 ,c3 Parameters determined for each threshold used in Eq. �1�
to model non-linear relationship between the inputphoton energies and pulse heights.
t1 , t2 , t3 ,b2 Parameters used to model DXMCT-1’s pulse shape withtwo triangles. See Ref. 25 for more details.
NModel�E� The mean number of recorded counts at energy Eincluding pulse pileup effects estimated by Eq. �6�.
NPCXD�E� The mean number of recorded counts at energy Emeasured by DXMCT-1.
S0�E� The probability density function of the incident x-rayspectrum.
Pr�rec �a�� The probability of events being recorded given truecount rate a and deadtime �. See Eq. �3�.
Pr�m �rec� The probability of pileup order m given theevents-of-interest being recorded. See. Equation �7�.
Pr�E �m� The probability of the events-of-interest being recordedat energy E with pileup order m. See Eq. �13�.
RMSD The root mean square differenceCOV The coefficient of variation, i.e., RSMD divided by the
mean of measurements in percentage
state for a finite period of time called the deadtime �or re-
1092 Taguchi et al.: A photon counting x-ray detector and the models 1092
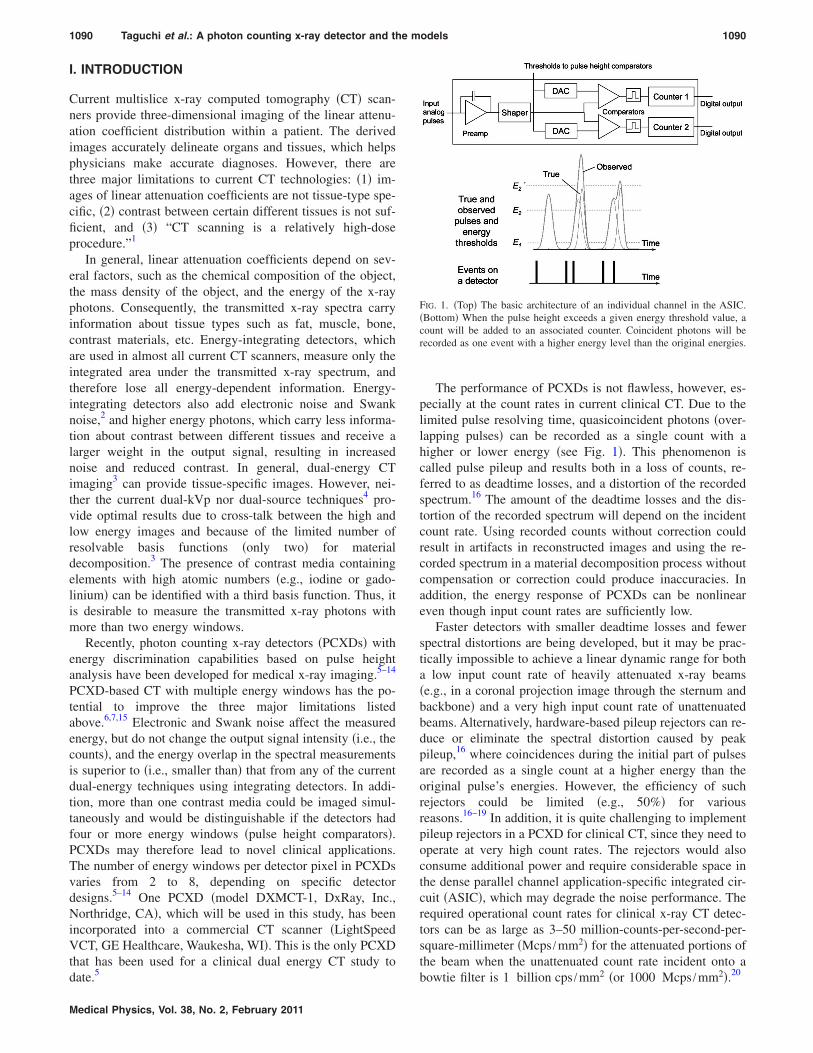
solving time� �. All photons incident on the detector duringthe deadtime contribute �potentially� to the pulse shape of therecorded count. For nonparalyzable detectors, such photonswill not reset the time clock for the deadtime and the detectorwill return to the active state after the deadtime �Fig. 2�. Bycontrast, in paralyzable detectors a detected photon resets thetime clock and the detector returns to the active state at time� after an event if, and only if, there are no additional inci-dent photons during the deadtime interval. For low incidentcount rates �a��1, where a is the incident count rate�, thetwo models provide identical predictions of the count ratelosses.17
Each comparator of the DXMCT-1 detector acts as anindependent pulse height analysis detector with a variabledeadtime. The comparator stays active, while the pulseheight is below a given threshold value. The comparatorswitches to the waiting state when a pulse height exceeds thethreshold energy, and it counts an event when the pulseheight falls below the threshold value. It then becomes activeagain nearly instantly. Therefore, as can be seen in Fig. 1, thedeadtime may depend on the energy threshold values—acomparator with a lower energy threshold value has a longerwaiting time, and, thus, it can be modeled with a larger dead-time �. Moreover, there is no fixed pulse processing time, asit may be extended by coincident photons. Nevertheless, wewill assess both the nonparalyzable and paralyzable detectionmodels to see which one better models the performance ofthe DXMCT-1.
II.C. Energy response
The energy response of the DXMCT-1 involves the fol-lowing factors: a nonlinear photon energy-pulse height re-sponse curve and a shift-variant finite energy resolution. Theenergy of the photon is measured by the height of the pulseH �in millivolts �mV�� generated by the photon. However,the pulse height, especially above 60 keV, may not be lin-early related to energy. Thus, we model the pulse height
FIG. 2. The paralyzable detection model �middle� and the nonparalyzabledetection model �bottom�. Quasicoincident events will result in lost countsand a distorted recorded spectrum.
using the nonlinear relationship,
Medical Physics, Vol. 38, No. 2, February 2011
H�E� = c1 − c2 exp�− c3E� , �1�
where E is the photon energy, H is the measured pulseheight, and c1, c2, c3 are the three parameters that will bedetermined by a calibration procedure for each comparator.The photon energy-pulse height response curves begin tosaturate above 100 keV. This characteristic was chosen bydesign in order to reduce ASIC power consumption whileproviding the energy resolution needed to separate high andlow energy windows for dual energy CT applications.
In general, PCXDs have a finite energy resolution, whichis described by FWHM�E0� /E0 �and often expressed as apercentage�, where FWHM�E0� is the full width at half maxi-mum of the recorded energy spectrum for a monochromaticincident spectrum with energy E0. With a linear system,where the statistical broadening of the peak dominates theenergy resolution, FWHM�E0� is proportional to �E0; thus,the percentage of the energy resolution improves as the pho-ton energy increases.17 In a previous experiment with theDXMCT-1,8 the measured FWHM at 60 keV was 7 keV or11.6%, while the measured FWHM at 122 keV was 35 keVor 28%. This was substantially larger than predicted for alinear system where one would expect a resolution of 7��122 /60=10 keV or 8%�. This larger FWHM resultsfrom the above-discussed nonlinear photon energy-pulseheight relationship. We can model this shift-variant finite en-ergy resolution as shown in Appendix; however, as alsoshown in Appendix, the effect of such energy resolutions onthe predicted spectrum was very limited under the conditionsused in the study. Thus, for the sake of computational effi-ciency, we did not model the finite energy resolution in theremainder of this study.
II.D. Deadtime losses
The recorded count rate aR for a given incident count ratea and deadtime � can be expressed as
aR = a � Pr�rec�a�� , �2�
where Pr�rec �a�� is the probability of events being recorded,as discussed in more detail in Ref. 17, and is given by
Pr�rec�a�� = �1/�1 + a�� nonparalyzable detector
exp�− a�� paralyzable detector. �3�
Here, we provide brief explanations of Eq. �3�, starting withnonparalyzable detectors. When the recorded count rate isaR, the fraction of time that the detector is inactive �dead� isgiven by aR�. Thus, the rate at which counts are lost duringthe time period is aaR�, which is also given by a−aR. Equat-ing these two expressions for the lost count rate, we havea−aR=aaR�. Solving for aR and dividing both sides of theequation by a, we get Pr�rec �a��=aR /a=1 / �1+a��.
Now we consider paralyzable detectors. The distributionfunction �also the probability density function� for time in-
17
tervals between adjacent random events is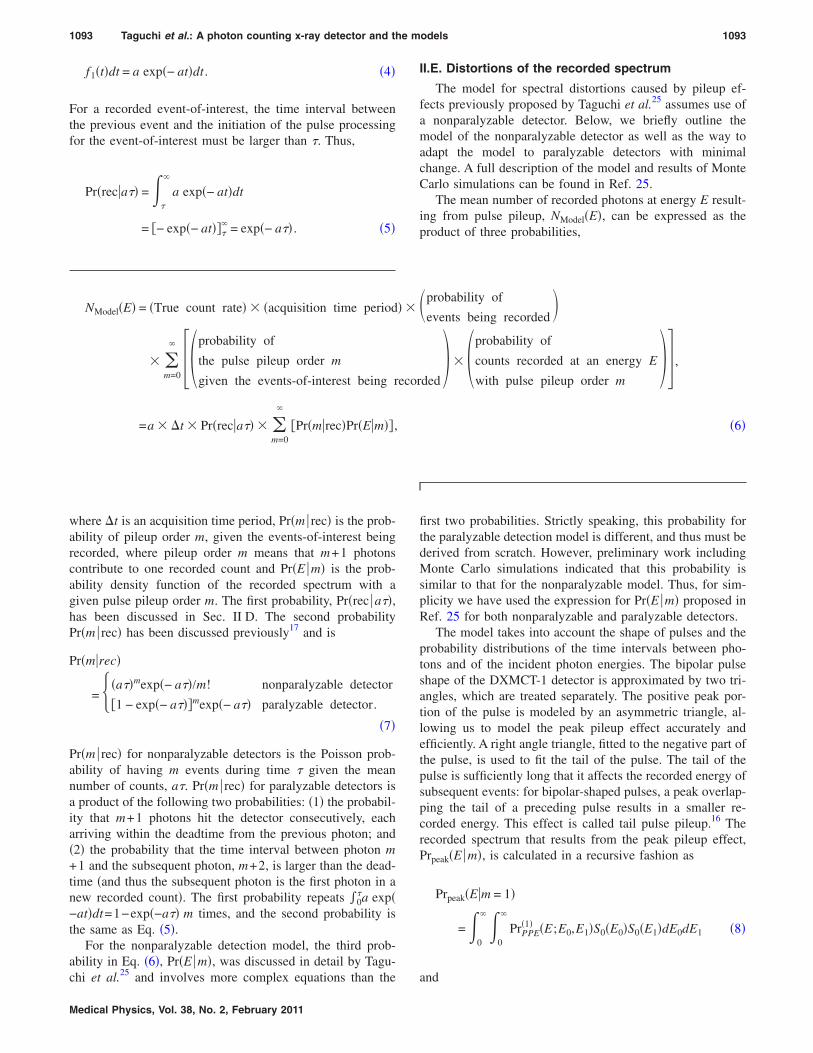
1093 Taguchi et al.: A photon counting x-ray detector and the models 1093
f1�t�dt = a exp�− at�dt . �4�
For a recorded event-of-interest, the time interval betweenthe previous event and the initiation of the pulse processingfor the event-of-interest must be larger than �. Thus,
Pr�rec�a�� = �
�
a exp�− at�dt
= �− exp�− at���� = exp�− a�� . �5�
chi et al. and involves more complex equations than the
Medical Physics, Vol. 38, No. 2, February 2011
II.E. Distortions of the recorded spectrum
The model for spectral distortions caused by pileup ef-fects previously proposed by Taguchi et al.25 assumes use ofa nonparalyzable detector. Below, we briefly outline themodel of the nonparalyzable detector as well as the way toadapt the model to paralyzable detectors with minimalchange. A full description of the model and results of MonteCarlo simulations can be found in Ref. 25.
The mean number of recorded photons at energy E result-ing from pulse pileup, NModel�E�, can be expressed as theproduct of three probabilities,
NModel�E� = �True count rate� � �acquisition time period� � �probability of
events being recorded�
� m=0
� ��probability of
the pulse pileup order m
given the events-of-interest being recorded� � �probability of
counts recorded at an energy E
with pulse pileup order m�� ,
=a � �t � Pr�rec�a�� � m=0
�
�Pr�m�rec�Pr�E�m�� , �6�
where �t is an acquisition time period, Pr�m � rec� is the prob-ability of pileup order m, given the events-of-interest beingrecorded, where pileup order m means that m+1 photonscontribute to one recorded count and Pr�E �m� is the prob-ability density function of the recorded spectrum with agiven pulse pileup order m. The first probability, Pr�rec �a��,has been discussed in Sec. II D. The second probabilityPr�m � rec� has been discussed previously17 and is
Pr�m�rec�
= ��a��mexp�− a��/m! nonparalyzable detector
�1 − exp�− a���mexp�− a�� paralyzable detector.
�7�
Pr�m � rec� for nonparalyzable detectors is the Poisson prob-ability of having m events during time � given the meannumber of counts, a�. Pr�m � rec� for paralyzable detectors isa product of the following two probabilities: �1� the probabil-ity that m+1 photons hit the detector consecutively, eacharriving within the deadtime from the previous photon; and�2� the probability that the time interval between photon m+1 and the subsequent photon, m+2, is larger than the dead-time �and thus the subsequent photon is the first photon in anew recorded count�. The first probability repeats �0
�a exp�−at�dt=1−exp�−a�� m times, and the second probability isthe same as Eq. �5�.
For the nonparalyzable detection model, the third prob-ability in Eq. �6�, Pr�E �m�, was discussed in detail by Tagu-
25
first two probabilities. Strictly speaking, this probability forthe paralyzable detection model is different, and thus must bederived from scratch. However, preliminary work includingMonte Carlo simulations indicated that this probability issimilar to that for the nonparalyzable model. Thus, for sim-plicity we have used the expression for Pr�E �m� proposed inRef. 25 for both nonparalyzable and paralyzable detectors.
The model takes into account the shape of pulses and theprobability distributions of the time intervals between pho-tons and of the incident photon energies. The bipolar pulseshape of the DXMCT-1 detector is approximated by two tri-angles, which are treated separately. The positive peak por-tion of the pulse is modeled by an asymmetric triangle, al-lowing us to model the peak pileup effect accurately andefficiently. A right angle triangle, fitted to the negative part ofthe pulse, is used to fit the tail of the pulse. The tail of thepulse is sufficiently long that it affects the recorded energy ofsubsequent events: for bipolar-shaped pulses, a peak overlap-ping the tail of a preceding pulse results in a smaller re-corded energy. This effect is called tail pulse pileup.16 Therecorded spectrum that results from the peak pileup effect,Prpeak�E �m�, is calculated in a recursive fashion as
Prpeak�E�m = 1�
= 0
� 0
�
PrPPE�1� �E;E0,E1�S0�E0�S0�E1�dE0dE1 �8�
and
1094 Taguchi et al.: A photon counting x-ray detector and the models 1094
Prpeak�E�m � 1� = 0
� 0
�
PrPPE�1� �E;Em−1,E1�
�Prpeak�Em−1�m − 1�S0�E1�dEm−1dE1, �9�
where S0�E� is the probability density function of the trueincident x-ray energy �i.e., the energy spectrum�,
PrPPE�1� �E;Em−1,E1� = d Pr�s1�m��ER�s1;Em−1,E1�=E
ds1ds1
= �m/�m � �� − s1�m−1��ds1
dE�dE �10�
denotes the probability density function of the recorded en-ergy E given the incident energies, Em−1 and E1, with pileuporder m; and
d Pr�s1�m�/ds1 = m/�m � �� − s1�m−1 �11�
is the differential probability density function of time inter-vals, s1, for the pileup order m. The recorded energy ER forthe incident energies, Em−1 and E1, and the time interval ofs1, ER�s1 ;Em−1 ,E1�, can be calculated efficiently thanks tothe approximation by the asymmetric triangle. The super-script �1� means that the pulse pileup order m=1; our pulsepileup model recursively and efficiently calculates the re-corded energy with higher pulse pileup orders with an ap-proximation that a virtual photon with Prpeak�Em−1 �m−1� isincident on the detector at t=0. A thorough description of themodel and results of Monte Carlo simulations were providedin Ref. 25.
Using the Poisson probability that n photons will arrivewithin the time period of the tail of the pulse, t3, for a givencount rate a, the baseline energy shift caused by the tailpileup effect, Prtail�Etail�, is calculated by
Prtail�Etail� = Pr�Etail�n;E��at3� = Pr�n�at3� = �at3�ne−at3/n!,
�12�
where E is the mean energy of the incident spectrum. The
energy shift Etail�n ; E� can be calculated from the geometryof the right angle triangle �see Ref. 25�.
By taking into account the distribution of energy shiftscaused by the tail pileup effect, Prtail�Etail�, on the recordedspectrum, which results from modeling the peak pileup ef-fect, Prpeak�E �m�, we obtain the probability density functionof the recorded energy spectrum including pulse pileup orderm,
Pr�E�m� = −�
�
Prpeak�E − Etail�m�Prtail�Etail�dEtail. �13�
Notice that this model requires relatively modest amountsof information about the PCXD, i.e., the pulse shape and thedeadtime �. Given the estimated incident count rate a andenergy spectrum S0�E�, the model then predicts the distorted
recorded spectrum that results from pulse pileup effects.Medical Physics, Vol. 38, No. 2, February 2011
III. EVALUATION METHODS
In this section we outline the experimental apparatus andsettings used and the data analysis methods used to assessthe energy response, the deadtime losses, and the spectraldistortions caused by pulse pileup effects. Four detector pa-rameters were estimated: c1, c2, and c3 in Eq. �1� were esti-mated via the energy calibration, and the detector deadtime �was estimated from the count rate versus tube current curves.The parameters describing the triangles that approximatedthe pulse shape were not specific to each comparator and weused the same values determined in Ref. 25: t1=0.284��,t2=0.850��, t3=8.253��, and b2=−0.0635. In addition, weassumed that the incident count rate a from an x-ray tubewas proportional to the tube current, I, i.e.,
a = k � I , �14�
where k is the proportionality constant.In short, excluding the pulse shape parameters, we esti-
mated five parameters �c1, c2, c3, �, and k� and the incidentx-ray spectrum S0�E� for each comparator, and we evaluatedthe agreement between the analytical models and the detec-tor outputs. No additional empirical parameters were used inthe models.
Experiments were performed by sweeping the thresholdvoltage settings from 900 to 100 mV with an increment of�2 mV between acquisitions. In these experiments, we ac-quired a set of count data, i.e., the counts in each pixel aboveeach threshold setting, for a given threshold setting. A set ofacquisitions was performed while incrementing the energythreshold settings. The spectral response of a detector with agreater number of energy bins and a single exposure wasthen synthesized from these data. Note that this experimentalprocedure was used in order to assess the spectral responseof the detector. When these detectors are used for CT acqui-sition, the energy threshold value will be fixed and multipleprojections will be acquired over a set of projection views.The number of energy outputs depends on the number ofenergy comparators, and it will likely be under 10 even in thefuture.
III.A. Energy response
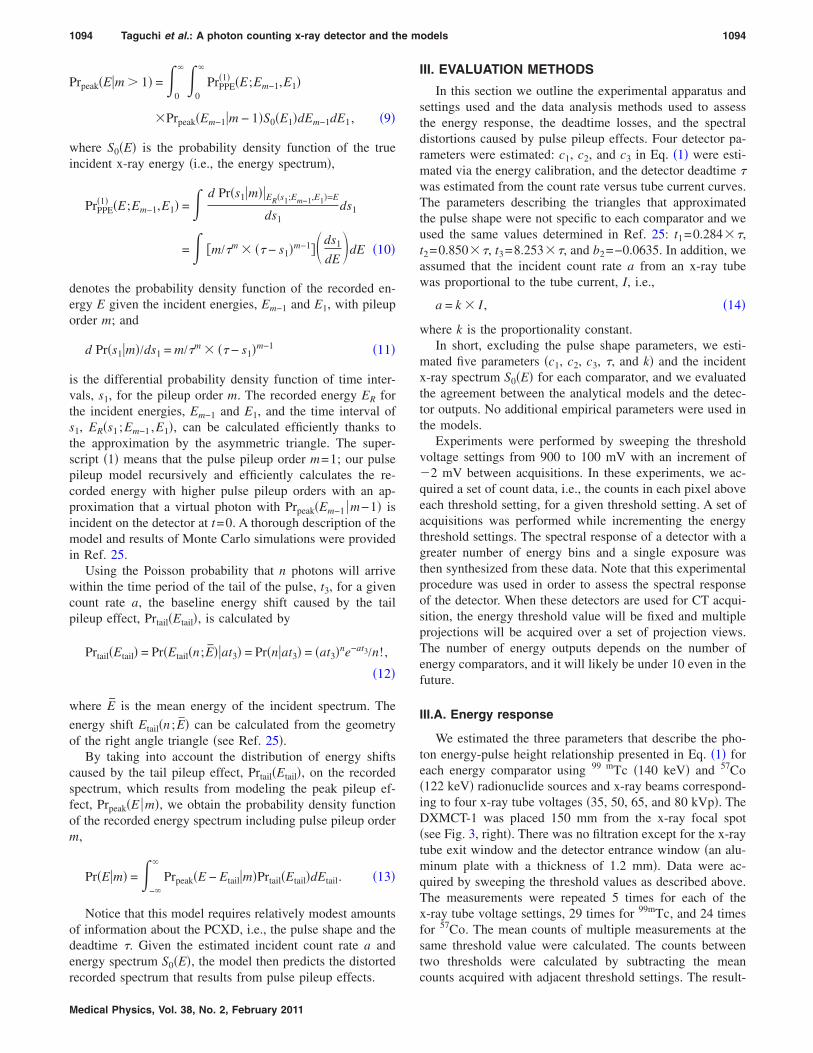
We estimated the three parameters that describe the pho-ton energy-pulse height relationship presented in Eq. �1� foreach energy comparator using 99 mTc �140 keV� and 57Co�122 keV� radionuclide sources and x-ray beams correspond-ing to four x-ray tube voltages �35, 50, 65, and 80 kVp�. TheDXMCT-1 was placed 150 mm from the x-ray focal spot�see Fig. 3, right�. There was no filtration except for the x-raytube exit window and the detector entrance window �an alu-minum plate with a thickness of 1.2 mm�. Data were ac-quired by sweeping the threshold values as described above.The measurements were repeated 5 times for each of thex-ray tube voltage settings, 29 times for 99mTc, and 24 timesfor 57Co. The mean counts of multiple measurements at thesame threshold value were calculated. The counts betweentwo thresholds were calculated by subtracting the mean
counts acquired with adjacent threshold settings. The result-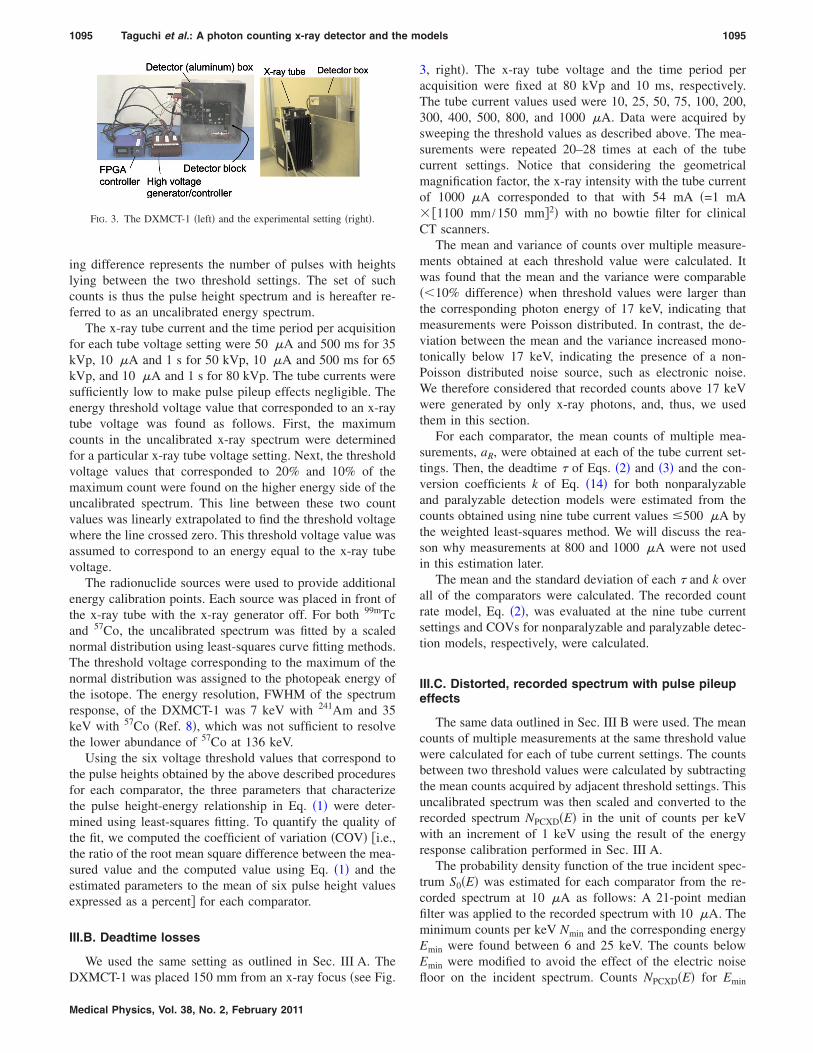
1095 Taguchi et al.: A photon counting x-ray detector and the models 1095
ing difference represents the number of pulses with heightslying between the two threshold settings. The set of suchcounts is thus the pulse height spectrum and is hereafter re-ferred to as an uncalibrated energy spectrum.
The x-ray tube current and the time period per acquisitionfor each tube voltage setting were 50 �A and 500 ms for 35kVp, 10 �A and 1 s for 50 kVp, 10 �A and 500 ms for 65kVp, and 10 �A and 1 s for 80 kVp. The tube currents weresufficiently low to make pulse pileup effects negligible. Theenergy threshold voltage value that corresponded to an x-raytube voltage was found as follows. First, the maximumcounts in the uncalibrated x-ray spectrum were determinedfor a particular x-ray tube voltage setting. Next, the thresholdvoltage values that corresponded to 20% and 10% of themaximum count were found on the higher energy side of theuncalibrated spectrum. This line between these two countvalues was linearly extrapolated to find the threshold voltagewhere the line crossed zero. This threshold voltage value wasassumed to correspond to an energy equal to the x-ray tubevoltage.
The radionuclide sources were used to provide additionalenergy calibration points. Each source was placed in front ofthe x-ray tube with the x-ray generator off. For both 99mTcand 57Co, the uncalibrated spectrum was fitted by a scalednormal distribution using least-squares curve fitting methods.The threshold voltage corresponding to the maximum of thenormal distribution was assigned to the photopeak energy ofthe isotope. The energy resolution, FWHM of the spectrumresponse, of the DXMCT-1 was 7 keV with 241Am and 35keV with 57Co �Ref. 8�, which was not sufficient to resolvethe lower abundance of 57Co at 136 keV.
Using the six voltage threshold values that correspond tothe pulse heights obtained by the above described proceduresfor each comparator, the three parameters that characterizethe pulse height-energy relationship in Eq. �1� were deter-mined using least-squares fitting. To quantify the quality ofthe fit, we computed the coefficient of variation �COV� �i.e.,the ratio of the root mean square difference between the mea-sured value and the computed value using Eq. �1� and theestimated parameters to the mean of six pulse height valuesexpressed as a percent� for each comparator.
III.B. Deadtime losses
We used the same setting as outlined in Sec. III A. The
FIG. 3. The DXMCT-1 �left� and the experimental setting �right�.
DXMCT-1 was placed 150 mm from an x-ray focus �see Fig.
Medical Physics, Vol. 38, No. 2, February 2011
3, right�. The x-ray tube voltage and the time period peracquisition were fixed at 80 kVp and 10 ms, respectively.The tube current values used were 10, 25, 50, 75, 100, 200,300, 400, 500, 800, and 1000 �A. Data were acquired bysweeping the threshold values as described above. The mea-surements were repeated 20–28 times at each of the tubecurrent settings. Notice that considering the geometricalmagnification factor, the x-ray intensity with the tube currentof 1000 �A corresponded to that with 54 mA �=1 mA� �1100 mm /150 mm�2� with no bowtie filter for clinicalCT scanners.
The mean and variance of counts over multiple measure-ments obtained at each threshold value were calculated. Itwas found that the mean and the variance were comparable�10% difference� when threshold values were larger thanthe corresponding photon energy of 17 keV, indicating thatmeasurements were Poisson distributed. In contrast, the de-viation between the mean and the variance increased mono-tonically below 17 keV, indicating the presence of a non-Poisson distributed noise source, such as electronic noise.We therefore considered that recorded counts above 17 keVwere generated by only x-ray photons, and, thus, we usedthem in this section.
For each comparator, the mean counts of multiple mea-surements, aR, were obtained at each of the tube current set-tings. Then, the deadtime � of Eqs. �2� and �3� and the con-version coefficients k of Eq. �14� for both nonparalyzableand paralyzable detection models were estimated from thecounts obtained using nine tube current values 500 �A bythe weighted least-squares method. We will discuss the rea-son why measurements at 800 and 1000 �A were not usedin this estimation later.
The mean and the standard deviation of each � and k overall of the comparators were calculated. The recorded countrate model, Eq. �2�, was evaluated at the nine tube currentsettings and COVs for nonparalyzable and paralyzable detec-tion models, respectively, were calculated.
III.C. Distorted, recorded spectrum with pulse pileupeffects
The same data outlined in Sec. III B were used. The meancounts of multiple measurements at the same threshold valuewere calculated for each of tube current settings. The countsbetween two threshold values were calculated by subtractingthe mean counts acquired by adjacent threshold settings. Thisuncalibrated spectrum was then scaled and converted to therecorded spectrum NPCXD�E� in the unit of counts per keVwith an increment of 1 keV using the result of the energyresponse calibration performed in Sec. III A.
The probability density function of the true incident spec-trum S0�E� was estimated for each comparator from the re-corded spectrum at 10 �A as follows: A 21-point medianfilter was applied to the recorded spectrum with 10 �A. Theminimum counts per keV Nmin and the corresponding energyEmin were found between 6 and 25 keV. The counts belowEmin were modified to avoid the effect of the electric noise
floor on the incident spectrum. Counts NPCXD�E� for Emin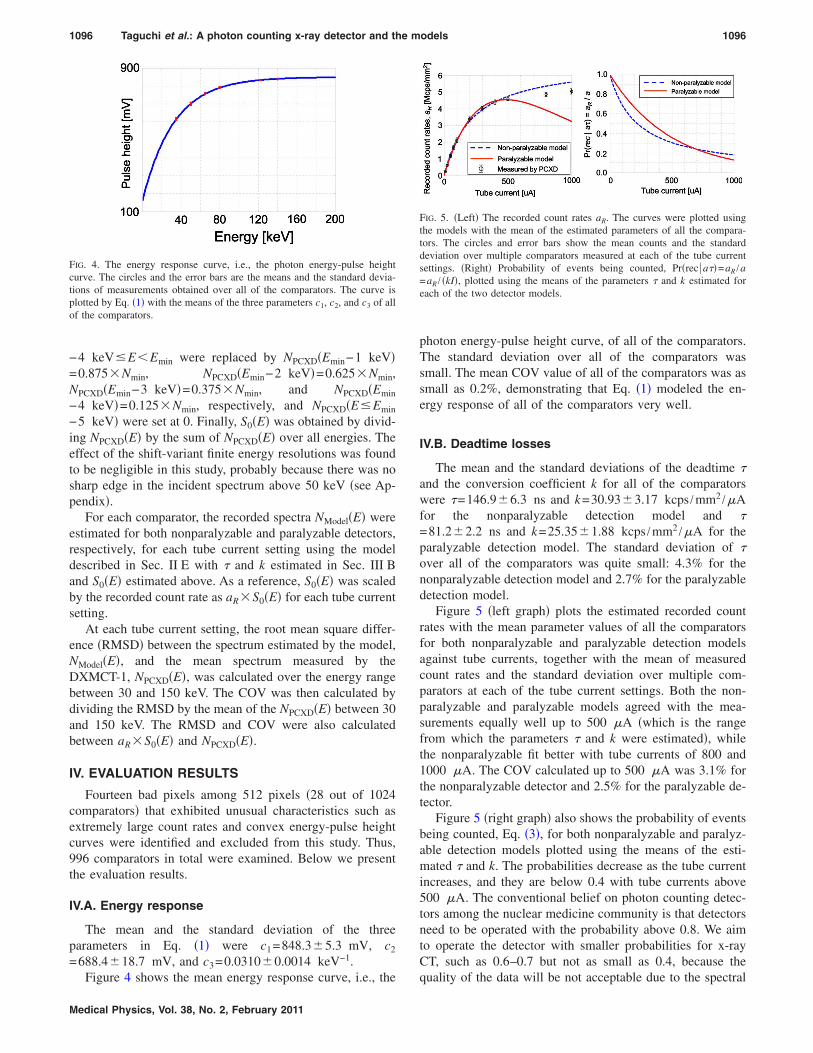
1096 Taguchi et al.: A photon counting x-ray detector and the models 1096
−4 keVEEmin were replaced by NPCXD�Emin−1 keV�=0.875�Nmin, NPCXD�Emin−2 keV�=0.625�Nmin,NPCXD�Emin−3 keV�=0.375�Nmin, and NPCXD�Emin
−4 keV�=0.125�Nmin, respectively, and NPCXD�EEmin
−5 keV� were set at 0. Finally, S0�E� was obtained by divid-ing NPCXD�E� by the sum of NPCXD�E� over all energies. Theeffect of the shift-variant finite energy resolutions was foundto be negligible in this study, probably because there was nosharp edge in the incident spectrum above 50 keV �see Ap-pendix�.
For each comparator, the recorded spectra NModel�E� wereestimated for both nonparalyzable and paralyzable detectors,respectively, for each tube current setting using the modeldescribed in Sec. II E with � and k estimated in Sec. III Band S0�E� estimated above. As a reference, S0�E� was scaledby the recorded count rate as aR�S0�E� for each tube currentsetting.
At each tube current setting, the root mean square differ-ence �RMSD� between the spectrum estimated by the model,NModel�E�, and the mean spectrum measured by theDXMCT-1, NPCXD�E�, was calculated over the energy rangebetween 30 and 150 keV. The COV was then calculated bydividing the RMSD by the mean of the NPCXD�E� between 30and 150 keV. The RMSD and COV were also calculatedbetween aR�S0�E� and NPCXD�E�.
IV. EVALUATION RESULTS
Fourteen bad pixels among 512 pixels �28 out of 1024comparators� that exhibited unusual characteristics such asextremely large count rates and convex energy-pulse heightcurves were identified and excluded from this study. Thus,996 comparators in total were examined. Below we presentthe evaluation results.
IV.A. Energy response
The mean and the standard deviation of the threeparameters in Eq. �1� were c1=848.3�5.3 mV, c2
=688.4�18.7 mV, and c3=0.0310�0.0014 keV−1.
FIG. 4. The energy response curve, i.e., the photon energy-pulse heightcurve. The circles and the error bars are the means and the standard devia-tions of measurements obtained over all of the comparators. The curve isplotted by Eq. �1� with the means of the three parameters c1, c2, and c3 of allof the comparators.
Figure 4 shows the mean energy response curve, i.e., the
Medical Physics, Vol. 38, No. 2, February 2011
photon energy-pulse height curve, of all of the comparators.The standard deviation over all of the comparators wassmall. The mean COV value of all of the comparators was assmall as 0.2%, demonstrating that Eq. �1� modeled the en-ergy response of all of the comparators very well.
IV.B. Deadtime losses
The mean and the standard deviations of the deadtime �and the conversion coefficient k for all of the comparatorswere �=146.9�6.3 ns and k=30.93�3.17 kcps /mm2 /�Afor the nonparalyzable detection model and �=81.2�2.2 ns and k=25.35�1.88 kcps /mm2 /�A for theparalyzable detection model. The standard deviation of �over all of the comparators was quite small: 4.3% for thenonparalyzable detection model and 2.7% for the paralyzabledetection model.
Figure 5 �left graph� plots the estimated recorded countrates with the mean parameter values of all the comparatorsfor both nonparalyzable and paralyzable detection modelsagainst tube currents, together with the mean of measuredcount rates and the standard deviation over multiple com-parators at each of the tube current settings. Both the non-paralyzable and paralyzable models agreed with the mea-surements equally well up to 500 �A �which is the rangefrom which the parameters � and k were estimated�, whilethe nonparalyzable fit better with tube currents of 800 and1000 �A. The COV calculated up to 500 �A was 3.1% forthe nonparalyzable detector and 2.5% for the paralyzable de-tector.
Figure 5 �right graph� also shows the probability of eventsbeing counted, Eq. �3�, for both nonparalyzable and paralyz-able detection models plotted using the means of the esti-mated � and k. The probabilities decrease as the tube currentincreases, and they are below 0.4 with tube currents above500 �A. The conventional belief on photon counting detec-tors among the nuclear medicine community is that detectorsneed to be operated with the probability above 0.8. We aimto operate the detector with smaller probabilities for x-rayCT, such as 0.6–0.7 but not as small as 0.4, because the
FIG. 5. �Left� The recorded count rates aR. The curves were plotted usingthe models with the mean of the estimated parameters of all the compara-tors. The circles and error bars show the mean counts and the standarddeviation over multiple comparators measured at each of the tube currentsettings. �Right� Probability of events being counted, Pr�rec �a��=aR /a=aR / �kI�, plotted using the means of the parameters � and k estimated foreach of the two detector models.
quality of the data will be not acceptable due to the spectral
1097 Taguchi et al.: A photon counting x-ray detector and the models 1097
distortion and lost counts. This is the reason why we esti-mated parameters � and k using measurements with tube cur-rents of up to 500 �A: we think it makes more sense ifdetector parameters are estimated utilizing conditions underwhich the detectors will be operated. Note that the probabil-ity Pr�rec �a�� for the paralyzable detector was larger than forthe nonparalyzable detector when the tube current was lessthan 600 �A. This is because the incident count rate a wasestimated using the estimated conversion coefficient k by a=k� I and the horizontal axis of the plot is the tube currentvalues I. The conversion coefficient k for paralyzable detec-tor is smaller, thus, the estimated value of a was smaller forthe paralyzable detector at a given tube current I than that forthe nonparalyzable detector. If Pr�rec �a�� is plotted againsta�, the probability for the nonparalyzable detector, Eq. �3�top, is always equal to or larger than that for the paralyzabledetector, Eq. �3� bottom.
IV.C. Distorted, recorded spectrum with pulse pileupeffects
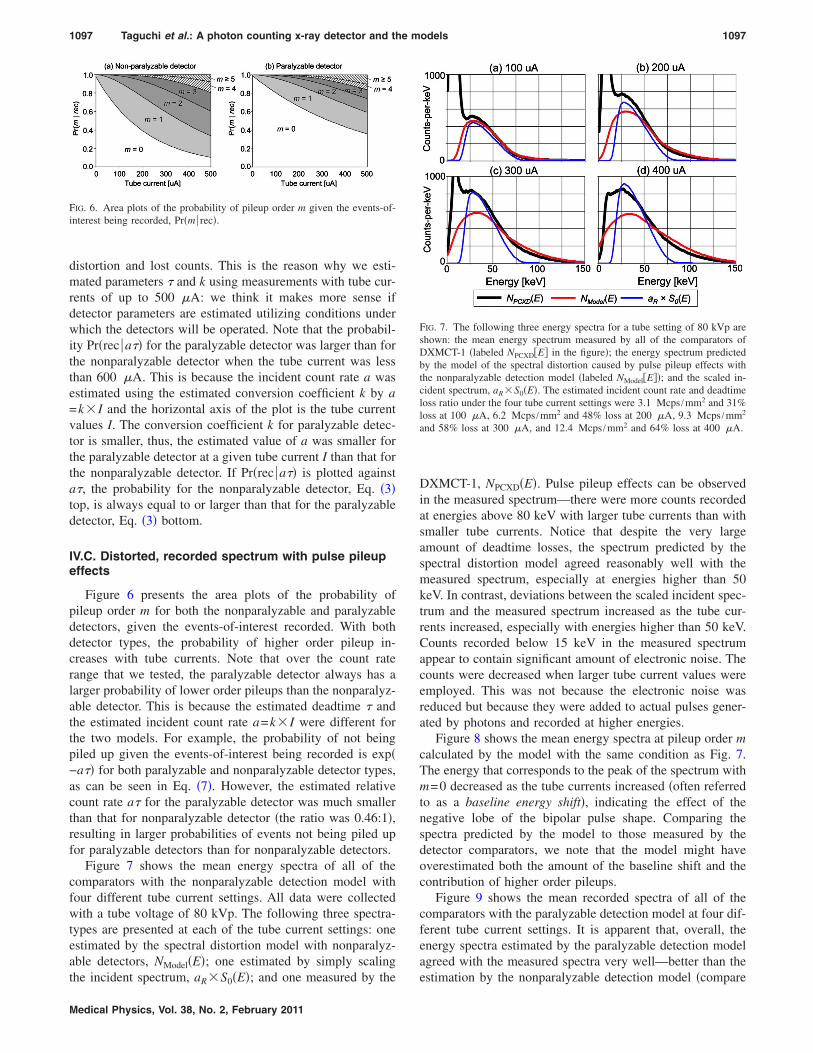
Figure 6 presents the area plots of the probability ofpileup order m for both the nonparalyzable and paralyzabledetectors, given the events-of-interest recorded. With bothdetector types, the probability of higher order pileup in-creases with tube currents. Note that over the count raterange that we tested, the paralyzable detector always has alarger probability of lower order pileups than the nonparalyz-able detector. This is because the estimated deadtime � andthe estimated incident count rate a=k� I were different forthe two models. For example, the probability of not beingpiled up given the events-of-interest being recorded is exp�−a�� for both paralyzable and nonparalyzable detector types,as can be seen in Eq. �7�. However, the estimated relativecount rate a� for the paralyzable detector was much smallerthan that for nonparalyzable detector �the ratio was 0.46:1�,resulting in larger probabilities of events not being piled upfor paralyzable detectors than for nonparalyzable detectors.
Figure 7 shows the mean energy spectra of all of thecomparators with the nonparalyzable detection model withfour different tube current settings. All data were collectedwith a tube voltage of 80 kVp. The following three spectra-types are presented at each of the tube current settings: oneestimated by the spectral distortion model with nonparalyz-able detectors, NModel�E�; one estimated by simply scaling
FIG. 6. Area plots of the probability of pileup order m given the events-of-interest being recorded, Pr�m � rec�.
the incident spectrum, aR�S0�E�; and one measured by the
Medical Physics, Vol. 38, No. 2, February 2011
DXMCT-1, NPCXD�E�. Pulse pileup effects can be observedin the measured spectrum—there were more counts recordedat energies above 80 keV with larger tube currents than withsmaller tube currents. Notice that despite the very largeamount of deadtime losses, the spectrum predicted by thespectral distortion model agreed reasonably well with themeasured spectrum, especially at energies higher than 50keV. In contrast, deviations between the scaled incident spec-trum and the measured spectrum increased as the tube cur-rents increased, especially with energies higher than 50 keV.Counts recorded below 15 keV in the measured spectrumappear to contain significant amount of electronic noise. Thecounts were decreased when larger tube current values wereemployed. This was not because the electronic noise wasreduced but because they were added to actual pulses gener-ated by photons and recorded at higher energies.
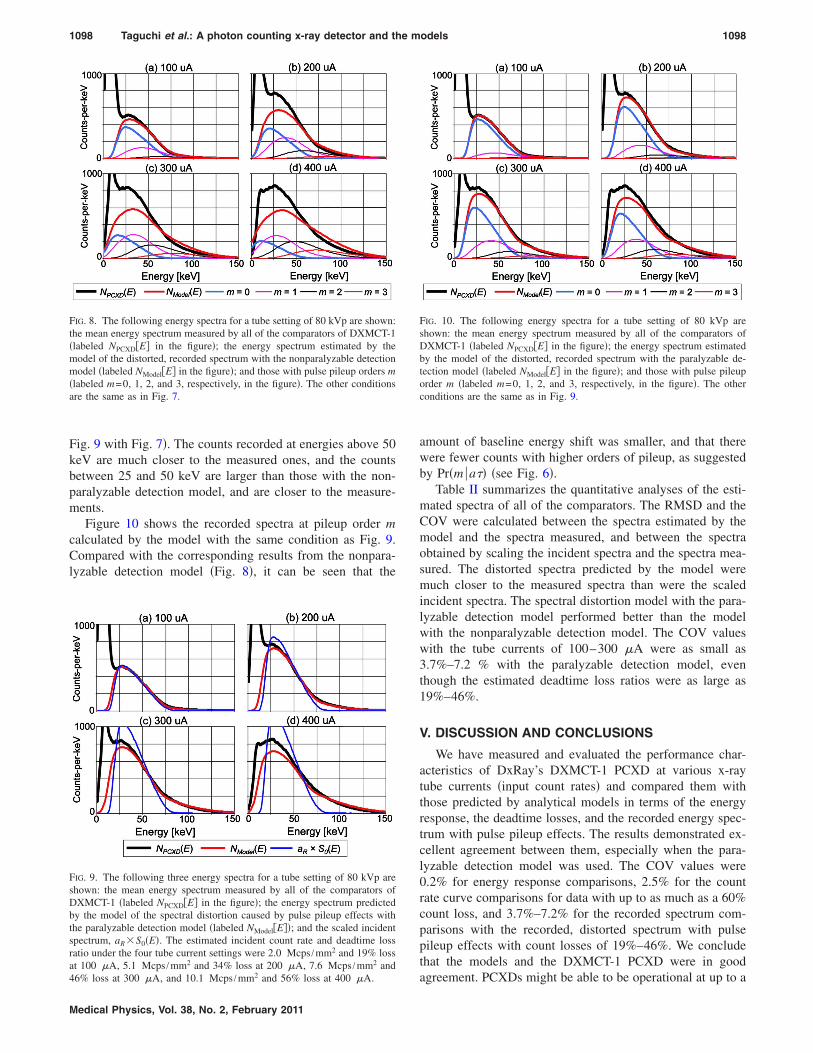
Figure 8 shows the mean energy spectra at pileup order mcalculated by the model with the same condition as Fig. 7.The energy that corresponds to the peak of the spectrum withm=0 decreased as the tube currents increased �often referredto as a baseline energy shift�, indicating the effect of thenegative lobe of the bipolar pulse shape. Comparing thespectra predicted by the model to those measured by thedetector comparators, we note that the model might haveoverestimated both the amount of the baseline shift and thecontribution of higher order pileups.
Figure 9 shows the mean recorded spectra of all of thecomparators with the paralyzable detection model at four dif-ferent tube current settings. It is apparent that, overall, theenergy spectra estimated by the paralyzable detection modelagreed with the measured spectra very well—better than the
FIG. 7. The following three energy spectra for a tube setting of 80 kVp areshown: the mean energy spectrum measured by all of the comparators ofDXMCT-1 �labeled NPCXD�E� in the figure�; the energy spectrum predictedby the model of the spectral distortion caused by pulse pileup effects withthe nonparalyzable detection model �labeled NModel�E��; and the scaled in-cident spectrum, aR�S0�E�. The estimated incident count rate and deadtimeloss ratio under the four tube current settings were 3.1 Mcps /mm2 and 31%loss at 100 �A, 6.2 Mcps /mm2 and 48% loss at 200 �A, 9.3 Mcps /mm2
and 58% loss at 300 �A, and 12.4 Mcps /mm2 and 64% loss at 400 �A.
estimation by the nonparalyzable detection model �compare
1098 Taguchi et al.: A photon counting x-ray detector and the models 1098
Fig. 9 with Fig. 7�. The counts recorded at energies above 50keV are much closer to the measured ones, and the countsbetween 25 and 50 keV are larger than those with the non-paralyzable detection model, and are closer to the measure-ments.
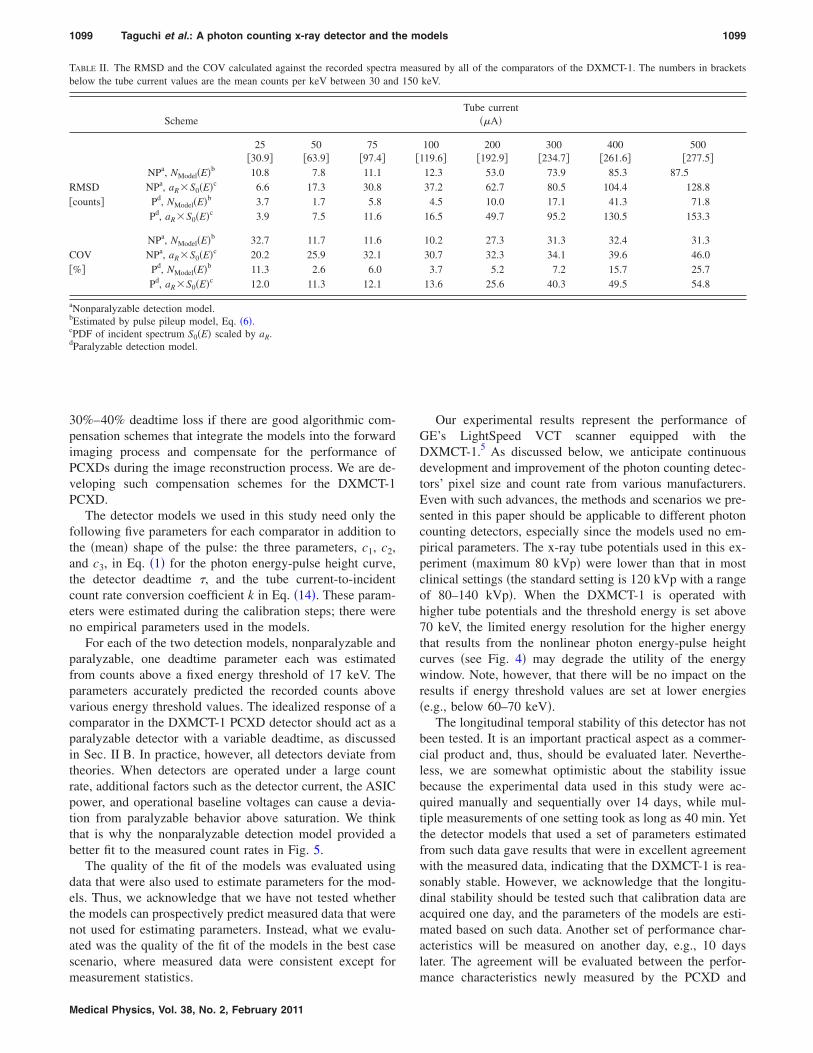
Figure 10 shows the recorded spectra at pileup order mcalculated by the model with the same condition as Fig. 9.Compared with the corresponding results from the nonpara-lyzable detection model �Fig. 8�, it can be seen that the
FIG. 8. The following energy spectra for a tube setting of 80 kVp are shown:the mean energy spectrum measured by all of the comparators of DXMCT-1�labeled NPCXD�E� in the figure�; the energy spectrum estimated by themodel of the distorted, recorded spectrum with the nonparalyzable detectionmodel �labeled NModel�E� in the figure�; and those with pulse pileup orders m�labeled m=0, 1, 2, and 3, respectively, in the figure�. The other conditionsare the same as in Fig. 7.
FIG. 9. The following three energy spectra for a tube setting of 80 kVp areshown: the mean energy spectrum measured by all of the comparators ofDXMCT-1 �labeled NPCXD�E� in the figure�; the energy spectrum predictedby the model of the spectral distortion caused by pulse pileup effects withthe paralyzable detection model �labeled NModel�E��; and the scaled incidentspectrum, aR�S0�E�. The estimated incident count rate and deadtime lossratio under the four tube current settings were 2.0 Mcps /mm2 and 19% lossat 100 �A, 5.1 Mcps /mm2 and 34% loss at 200 �A, 7.6 Mcps /mm2 and
2
46% loss at 300 �A, and 10.1 Mcps /mm and 56% loss at 400 �A.Medical Physics, Vol. 38, No. 2, February 2011
amount of baseline energy shift was smaller, and that therewere fewer counts with higher orders of pileup, as suggestedby Pr�m �a�� �see Fig. 6�.
Table II summarizes the quantitative analyses of the esti-mated spectra of all of the comparators. The RMSD and theCOV were calculated between the spectra estimated by themodel and the spectra measured, and between the spectraobtained by scaling the incident spectra and the spectra mea-sured. The distorted spectra predicted by the model weremuch closer to the measured spectra than were the scaledincident spectra. The spectral distortion model with the para-lyzable detection model performed better than the modelwith the nonparalyzable detection model. The COV valueswith the tube currents of 100–300 �A were as small as3.7%–7.2 % with the paralyzable detection model, eventhough the estimated deadtime loss ratios were as large as19%–46%.
V. DISCUSSION AND CONCLUSIONS
We have measured and evaluated the performance char-acteristics of DxRay’s DXMCT-1 PCXD at various x-raytube currents �input count rates� and compared them withthose predicted by analytical models in terms of the energyresponse, the deadtime losses, and the recorded energy spec-trum with pulse pileup effects. The results demonstrated ex-cellent agreement between them, especially when the para-lyzable detection model was used. The COV values were0.2% for energy response comparisons, 2.5% for the countrate curve comparisons for data with up to as much as a 60%count loss, and 3.7%–7.2% for the recorded spectrum com-parisons with the recorded, distorted spectrum with pulsepileup effects with count losses of 19%–46%. We concludethat the models and the DXMCT-1 PCXD were in good
FIG. 10. The following energy spectra for a tube setting of 80 kVp areshown: the mean energy spectrum measured by all of the comparators ofDXMCT-1 �labeled NPCXD�E� in the figure�; the energy spectrum estimatedby the model of the distorted, recorded spectrum with the paralyzable de-tection model �labeled NModel�E� in the figure�; and those with pulse pileuporder m �labeled m=0, 1, 2, and 3, respectively, in the figure�. The otherconditions are the same as in Fig. 9.
agreement. PCXDs might be able to be operational at up to a
1099 Taguchi et al.: A photon counting x-ray detector and the models 1099
30%–40% deadtime loss if there are good algorithmic com-pensation schemes that integrate the models into the forwardimaging process and compensate for the performance ofPCXDs during the image reconstruction process. We are de-veloping such compensation schemes for the DXMCT-1PCXD.
The detector models we used in this study need only thefollowing five parameters for each comparator in addition tothe �mean� shape of the pulse: the three parameters, c1, c2,and c3, in Eq. �1� for the photon energy-pulse height curve,the detector deadtime �, and the tube current-to-incidentcount rate conversion coefficient k in Eq. �14�. These param-eters were estimated during the calibration steps; there wereno empirical parameters used in the models.
For each of the two detection models, nonparalyzable andparalyzable, one deadtime parameter each was estimatedfrom counts above a fixed energy threshold of 17 keV. Theparameters accurately predicted the recorded counts abovevarious energy threshold values. The idealized response of acomparator in the DXMCT-1 PCXD detector should act as aparalyzable detector with a variable deadtime, as discussedin Sec. II B. In practice, however, all detectors deviate fromtheories. When detectors are operated under a large countrate, additional factors such as the detector current, the ASICpower, and operational baseline voltages can cause a devia-tion from paralyzable behavior above saturation. We thinkthat is why the nonparalyzable detection model provided abetter fit to the measured count rates in Fig. 5.
The quality of the fit of the models was evaluated usingdata that were also used to estimate parameters for the mod-els. Thus, we acknowledge that we have not tested whetherthe models can prospectively predict measured data that werenot used for estimating parameters. Instead, what we evalu-ated was the quality of the fit of the models in the best casescenario, where measured data were consistent except for
TABLE II. The RMSD and the COV calculated against the recorded spectrabelow the tube current values are the mean counts per keV between 30 and
Scheme
25�30.9�
50�63.9�
75�97.4�
NPa, NModel�E�b 10.8 7.8 11.1RMSD NPa, aR�S0�E�c 6.6 17.3 30.8�counts� Pd, NModel�E�b 3.7 1.7 5.8
Pd, aR�S0�E�c 3.9 7.5 11.6
NPa, NModel�E�b 32.7 11.7 11.6COV NPa, aR�S0�E�c 20.2 25.9 32.1�%� Pd, NModel�E�b 11.3 2.6 6.0
Pd, aR�S0�E�c 12.0 11.3 12.1
aNonparalyzable detection model.bEstimated by pulse pileup model, Eq. �6�.cPDF of incident spectrum S0�E� scaled by aR.dParalyzable detection model.
measurement statistics.
Medical Physics, Vol. 38, No. 2, February 2011
Our experimental results represent the performance ofGE’s LightSpeed VCT scanner equipped with theDXMCT-1.5 As discussed below, we anticipate continuousdevelopment and improvement of the photon counting detec-tors’ pixel size and count rate from various manufacturers.Even with such advances, the methods and scenarios we pre-sented in this paper should be applicable to different photoncounting detectors, especially since the models used no em-pirical parameters. The x-ray tube potentials used in this ex-periment �maximum 80 kVp� were lower than that in mostclinical settings �the standard setting is 120 kVp with a rangeof 80–140 kVp�. When the DXMCT-1 is operated withhigher tube potentials and the threshold energy is set above70 keV, the limited energy resolution for the higher energythat results from the nonlinear photon energy-pulse heightcurves �see Fig. 4� may degrade the utility of the energywindow. Note, however, that there will be no impact on theresults if energy threshold values are set at lower energies�e.g., below 60–70 keV�.
The longitudinal temporal stability of this detector has notbeen tested. It is an important practical aspect as a commer-cial product and, thus, should be evaluated later. Neverthe-less, we are somewhat optimistic about the stability issuebecause the experimental data used in this study were ac-quired manually and sequentially over 14 days, while mul-tiple measurements of one setting took as long as 40 min. Yetthe detector models that used a set of parameters estimatedfrom such data gave results that were in excellent agreementwith the measured data, indicating that the DXMCT-1 is rea-sonably stable. However, we acknowledge that the longitu-dinal stability should be tested such that calibration data areacquired one day, and the parameters of the models are esti-mated based on such data. Another set of performance char-acteristics will be measured on another day, e.g., 10 dayslater. The agreement will be evaluated between the perfor-
ured by all of the comparators of the DXMCT-1. The numbers in bracketskeV.
Tube current��A�
100119.6�
200�192.9�
300�234.7�
400�261.6�
500�277.5�
12.3 53.0 73.9 85.3 87.537.2 62.7 80.5 104.4 128.84.5 10.0 17.1 41.3 71.8
16.5 49.7 95.2 130.5 153.3
10.2 27.3 31.3 32.4 31.330.7 32.3 34.1 39.6 46.03.7 5.2 7.2 15.7 25.7
13.6 25.6 40.3 49.5 54.8
meas150
�
mance characteristics newly measured by the PCXD and
1100 Taguchi et al.: A photon counting x-ray detector and the models 1100
those predicted by the models using parameters obtained 10days earlier. The longitudinal temporal stability will be stud-ied in such a manner in the future. Nevertheless, when anx-ray CT system with PCXDs with the features of theDXMCT-1 is developed, acquiring calibration data and up-dating the five detector parameters we used in the models ata reasonable frequency, e.g., every morning, does not seemimpossible, especially if full- or semiautomatic software canbe used.
The fast single photon counting detector technology usedin the DXMCT-1 is being improved at DxRay in terms ofdecreased deadtime, an increased number of pulse heightcomparators per pixel for K-edge CT imaging, a more linearenergy response up to higher energies with reduced per chan-nel power consumption, and smaller pixels for increased out-put count rates per unit area. The estimated incident countrates at �30% count loss with the DXMCT-1 were reason-ably large: 5.1 Mcps /mm2 at 200 �A with 34% loss for theparalyzable detection model and 3.1 Mcps /mm2 at 100 �Awith 31% loss for the nonparalyzable detector model. Asdiscussed in the Introduction, the incident input count ratesto the detector attenuated by a bowtie filter and the patientmay be in the range of 3–50 Mcps /mm2.20 Therefore,achievable improvements in the detector speed with de-creased deadtime and smaller pixels along with algorithmiccompensation schemes to recover the incident input countrates and the incident spectrum may be sufficient to achievethese operational count rates of 3–50 Mcps /mm2. The pho-ton energy-pulse height curve is being improved to have alarger linear range with no saturation up to 150 keV. Theenergy resolution of the DXMCT-1 may be sufficient fordual energy applications where the separation between thelow and high energy images is generally between 55 and 70keV; however, improved energy resolution may be necessaryfor K-edge CT imaging.15 Additionally, more accurate pulsepileup compensation may require improved energy reso-lution at higher energies. The performance of this improveddetector will be evaluated and characterized in future work.
The accuracy of the detector model to predict the re-corded energy spectrum can be improved by considering ad-ditional modeling. Here we discuss three candidate ideas forthe improvement. First, there are factors that might have in-fluenced the recorded spectrum but were not considered inthis study. They include charge sharing, escape peaks orK-shell photoelectron escape x-rays, and electronic noise.The effects of the first two factors are independent of theincident count rates; and thus, they may be included in theincident spectrum in this study because it was estimated fromthe recorded spectrum measured by each comparator. In ad-dition, the contribution of the first two factors might be suf-ficiently small with the current detector design, thanks to alarge pixel pitch of 1 mm. Integrating the models of thosefactors may be desirable and more critical when the incidentspectrum is measured by another detector or the detectorpixel pitch is smaller. Second, the probability Pr�E �m� wasderived previously25 for the nonparalyzable detection model,
which was used for a paralyzable detection model withoutMedical Physics, Vol. 38, No. 2, February 2011
modification in this study. Deriving more accurate probabili-ties from the paralyzable detection model may improve ac-curacy. Third, two count rate curves, estimated by the non-paralyzable and paralyzable detection models, respectively,lie on the opposite side of the measurements acquired by thePCXD �see Fig. 5�. A weighted sum of the two models mayresult in a more accurate modeling of the count rate curve�and possibly the recorded spectrum with pulse pileup ef-fects�. We shall leave these for future work.
ACKNOWLEDGMENTS
The authors at DxRay and at Johns Hopkins Universityacknowledge support in part by NIH/NIBIB Grant No. R44EB008612. We sincerely thank Jochen Cammin, Ph.D.,Somesh Srivastava, Ph.D., and Ronald J. Jaszczak, Ph.D., fortheir helpful discussions and suggestions. We are grateful toZhihui Sun, M.Sc., and Hideaki Tashima, Ph.D., for theirhelp with data acquisitions. Finally, we thank an anonymousreviewer who helped us to improve the quality of the paper.
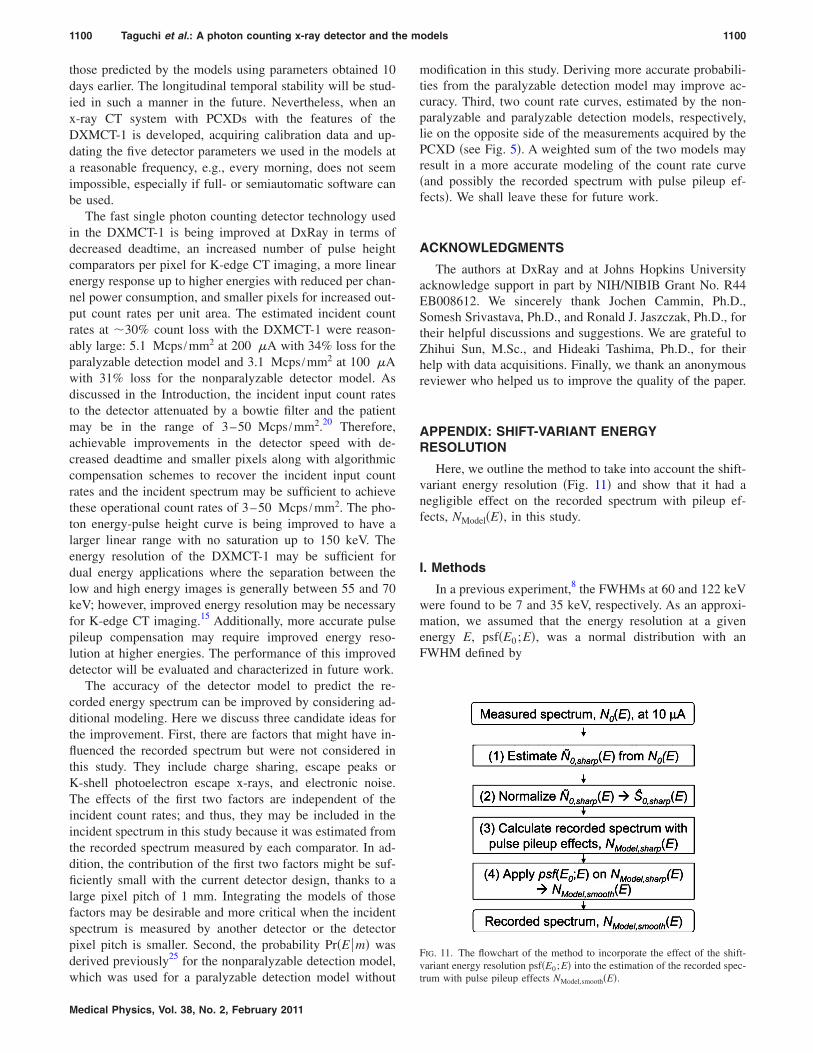
APPENDIX: SHIFT-VARIANT ENERGYRESOLUTION
Here, we outline the method to take into account the shift-variant energy resolution �Fig. 11� and show that it had anegligible effect on the recorded spectrum with pileup ef-fects, NModel�E�, in this study.
I. Methods
In a previous experiment,8 the FWHMs at 60 and 122 keVwere found to be 7 and 35 keV, respectively. As an approxi-mation, we assumed that the energy resolution at a givenenergy E, psf�E0 ;E�, was a normal distribution with anFWHM defined by
FIG. 11. The flowchart of the method to incorporate the effect of the shift-variant energy resolution psf�E0 ;E� into the estimation of the recorded spec-
trum with pulse pileup effects NModel,smooth�E�.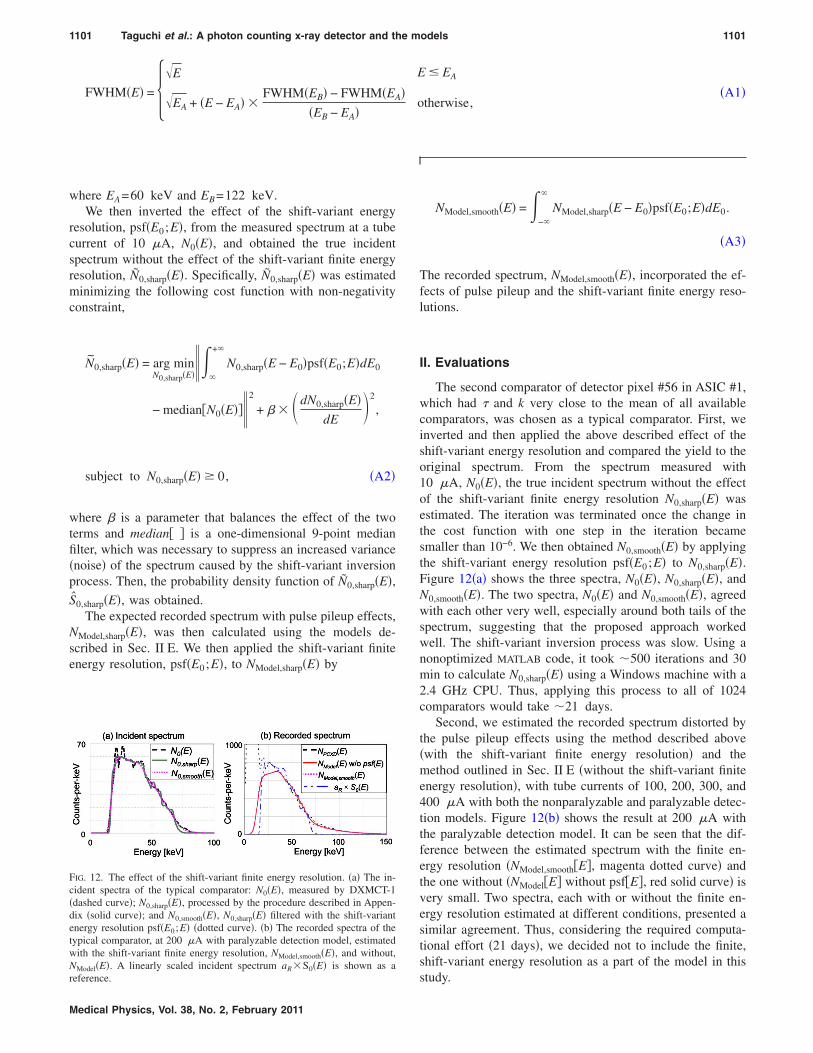
1101 Taguchi et al.: A photon counting x-ray detector and the models 1101
FWHM�E� = ��E E EA
�EA + �E − EA� �FWHM�EB� − FWHM�EA�
�EB − EA�otherwise, � �A1�
where EA=60 keV and EB=122 keV.We then inverted the effect of the shift-variant energy
resolution, psf�E0 ;E�, from the measured spectrum at a tubecurrent of 10 �A, N0�E�, and obtained the true incidentspectrum without the effect of the shift-variant finite energyresolution, Ñ0,sharp�E�. Specifically, Ñ0,sharp�E� was estimatedminimizing the following cost function with non-negativityconstraint,
N0,sharp�E� = arg minN0,sharp�E�
��
+�
N0,sharp�E − E0�psf�E0;E�dE0
− median�N0�E���2
+ � � �dN0,sharp�E�dE
�2
,
subject to N0,sharp�E� 0, �A2�
where � is a parameter that balances the effect of the twoterms and median� � is a one-dimensional 9-point medianfilter, which was necessary to suppress an increased variance�noise� of the spectrum caused by the shift-variant inversionprocess. Then, the probability density function of Ñ0,sharp�E�,S0,sharp�E�, was obtained.
The expected recorded spectrum with pulse pileup effects,NModel,sharp�E�, was then calculated using the models de-scribed in Sec. II E. We then applied the shift-variant finiteenergy resolution, psf�E0 ;E�, to NModel,sharp�E� by
FIG. 12. The effect of the shift-variant finite energy resolution. �a� The in-cident spectra of the typical comparator: N0�E�, measured by DXMCT-1�dashed curve�; N0,sharp�E�, processed by the procedure described in Appen-dix �solid curve�; and N0,smooth�E�, N0,sharp�E� filtered with the shift-variantenergy resolution psf�E0 ;E� �dotted curve�. �b� The recorded spectra of thetypical comparator, at 200 �A with paralyzable detection model, estimatedwith the shift-variant finite energy resolution, NModel,smooth�E�, and without,NModel�E�. A linearly scaled incident spectrum aR�S0�E� is shown as a
reference.Medical Physics, Vol. 38, No. 2, February 2011
NModel,smooth�E� = −�
�
NModel,sharp�E − E0�psf�E0;E�dE0.
�A3�
The recorded spectrum, NModel,smooth�E�, incorporated the ef-fects of pulse pileup and the shift-variant finite energy reso-lutions.
II. Evaluations
The second comparator of detector pixel #56 in ASIC #1,which had � and k very close to the mean of all availablecomparators, was chosen as a typical comparator. First, weinverted and then applied the above described effect of theshift-variant energy resolution and compared the yield to theoriginal spectrum. From the spectrum measured with10 �A, N0�E�, the true incident spectrum without the effectof the shift-variant finite energy resolution N0,sharp�E� wasestimated. The iteration was terminated once the change inthe cost function with one step in the iteration becamesmaller than 10−6. We then obtained N0,smooth�E� by applyingthe shift-variant energy resolution psf�E0 ;E� to N0,sharp�E�.Figure 12�a� shows the three spectra, N0�E�, N0,sharp�E�, andN0,smooth�E�. The two spectra, N0�E� and N0,smooth�E�, agreedwith each other very well, especially around both tails of thespectrum, suggesting that the proposed approach workedwell. The shift-variant inversion process was slow. Using anonoptimized MATLAB code, it took �500 iterations and 30min to calculate N0,sharp�E� using a Windows machine with a2.4 GHz CPU. Thus, applying this process to all of 1024comparators would take �21 days.
Second, we estimated the recorded spectrum distorted bythe pulse pileup effects using the method described above�with the shift-variant finite energy resolution� and themethod outlined in Sec. II E �without the shift-variant finiteenergy resolution�, with tube currents of 100, 200, 300, and400 �A with both the nonparalyzable and paralyzable detec-tion models. Figure 12�b� shows the result at 200 �A withthe paralyzable detection model. It can be seen that the dif-ference between the estimated spectrum with the finite en-ergy resolution �NModel,smooth�E�, magenta dotted curve� andthe one without �NModel�E� without psf�E�, red solid curve� isvery small. Two spectra, each with or without the finite en-ergy resolution estimated at different conditions, presented asimilar agreement. Thus, considering the required computa-tional effort �21 days�, we decided not to include the finite,shift-variant energy resolution as a part of the model in this
study.
1102 Taguchi et al.: A photon counting x-ray detector and the models 1102
a�Electronic mail: [email protected]; Telephone: 1-443-287-2974; Fax:1-410-614-1060.
1F. J. Mettler, P. Wiest, J. Locken, and C. Kelsey, “CT scanning: patterns ofuse and dose,” J. Radiol. Prot. 20, 353–359 �2000�.
2R. K. Swank, “Absorption and noise in x-ray phosphors,” J. Appl. Phys.44, 4199–4203 �1973�.
3R. E. Alvarez and A. Macovski, “Energy-selective reconstructions inx-ray computerised tomography,” Phys. Med. Biol. 21, 733–744 �1976�.
4L. Yu, A. N. Primak, X. Liu, and C. H. McCollough, “Image qualityoptimization and evaluation of linearly mixed images in dual-source,dual-energy CT,” Med. Phys. 36, 1019–1024 �2009�.
5J. S. Iwanczyk, E. Nygard, O. Meirav, J. Arenson, W. C. Barber, N. E.Hartsough, N. Malakhov, and J. C. Wessel, “Photon counting energydispersive detector arrays for x-ray imaging,” IEEE Trans. Nucl. Sci. 56,535–542 �2009�.
6J. P. Schlomka, E. Roessl, R. Dorscheid, S. Dill, G. Martens, T. Istel, C.Baumer, C. Herrmann, R. Steadman, G. Zeitler, A. Livne, and R. Proksa,“Experimental feasibility of multi-energy photon-counting K-edge imag-ing in pre-clinical computed tomography,” Phys. Med. Biol. 53, 4031–4047 �2008�.
7P. M. Shikhaliev, “Energy-resolved computed tomography: first experi-mental results,” Phys. Med. Biol. 53, 5595–5613 �2008�.
8W. C. Barber, E. Nygard, J. S. Iwanczyk, M. Zhang, E. C. Frey, B. M. W.Tsui, J. C. Wessel, N. Malakhov, G. Wawrzyniak, N. E. Hartsough, T.Gandhi, and K. Taguchi, “Characterization of a novel photon countingdetector for clinical CT: count rate, energy resolution, and noise perfor-mance,” SPIE Medical Imaging 2009: Physics of Medical Imaging �SPIE,Lake Buena Vista, FL, 2009�, Vol. 7258, pp. 725824.
9S. Feuerlein, E. Roessl, R. Proksa, G. Martens, O. Klass, M. Jeltsch, V.Rasche, H.-J. Brambs, M. H. K. Hoffmann, and J.-P. Schlomka, “Multi-energy photon-counting K-edge imaging: Potential for improved luminaldepiction in vascular imaging,” Radiology 249, 1010–1016 �2008�.
10Y. Tomita, Y. Shirayanagi, S. Matsui, T. Aoki, and Y. Hatanaka, “X-raycolor scanner with multiple energy discrimination capability,” MedicalImaging 2005: Physics of Medical Imaging �SPIE, San Diego, CA, 2005�,Vol. 5922, p. 59220A.
11Y. Tomita, Y. Shirayanagi, S. Matsui, M. Misawa, H. Takahashi, T. Aoki,and Y. Hatanaka, “X-ray color scanner with multiple energy differentiatecapability,” IEEE Nuclear Science Symposium and Medical Imaging Con-ference �IEEE, Roma, 2004�, Vol. 0–7803–8701–5/04.
12A. P. H. Butler, N. G. Anderson, R. Tipples, N. Cook, R. Watts, J. Meyer,A. J. Bell, T. R. Melzer, and P. H. Butler, “Bio-medical x-ray imagingwith spectroscopic pixel detectors,” Nucl. Instrum. Methods Phys. Res. A
Medical Physics, Vol. 38, No. 2, February 2011
591, 141–146 �2008�.13R. Ballabriga, M. Campbell, E. H. M. Heijne, X. Llopart, and L. Tlustos,
“The Medipix3 prototype, a pixel readout chip working in single photoncounting mode with improved spectrometric performance,” IEEE Trans.Nucl. Sci. 54, 1824–1829 �2007�.
14M. Firsching, A. P. Butler, N. Scott, N. G. Anderson, T. Michel, and G.Anton, “Contrast agent recognition in small animal CT using the Me-dipix2 detector,” Nucl. Instrum. Methods Phys. Res. A 607, 179–182�2009�.
15E. Roessl and R. Proksa, “K-edge imaging in x-ray computed tomographyusing multi-bin photon counting detectors,” Phys. Med. Biol. 52, 4679–4696 �2007�.
16L. Wielopolski and R. P. Gardner, “Prediction of the pulse-height spectraldistribution caused by the peak pile-up effect,” Nucl. Instrum. MethodsPhys. Res. 133, 303–309 �1976�.
17G. F. Knoll, Radiation Detection and Measurement, 3rd ed. �Wiley, NewYork, 2000�.
18P. C. Johns and M. J. Yaffe, “Correction of pulse-height spectra for peakpileup effects using periodic and random pulse generators,” Nucl. In-strum. Methods Phys. Res. A 255, 559–581 �1987�.
19N. P. Barradas and M. A. Reis, “Accurate calculation of pileup effects inPIXE spectra from first principles,” X-Ray Spectrom. 35, 232–237�2006�.
20K. Taguchi, S. Srivastava, H. Kudo, and W. C. Barber, “Enabling photoncounting clinical x-ray CT,” IEEE Nuclear Science Symposium and Medi-cal Imaging Conference �IEEE, Orlando, FL, 2009�, pp. 3581–3585.
21E. C. Frey, X. Wang, Y. Du, K. Taguchi, J. Xu, and B. M. W. Tsui,“Investigation of the use of photon counting detectors with energy dis-crimination capability for material decomposition in micro-computed to-mography,” SPIE Medical Imaging 2007: Physics of Medical Imaging�SPIE, San Diego, CA, 2007�, Vol. 6510, pp. 65100A–65101–65111.
22F. H. Tenney, “Idealized pulse pileup effects on energy spectra,” Nucl.Instrum. Methods Phys. Res. A 219, 165–172 �1984�.
23R. Günzler, V. Schuele, G. Seeliger, M. Weiser, K. Boeringer, S. Kalbi-tzer, and J. Kemmer, “A multisegment annular Si-detector system forRBS analysis,” Nucl. Instrum. Methods Phys. Res. B 35, 522–529 �1988�.
24R. P. Gardner and L. Wielopolski, “A generalized method for correctingpulse-height spectra for the peak pileup effect due to double sum pulses,”Nucl. Instrum. Methods Phys. Res. A 140, 289–296 �1977�.
25K. Taguchi, E. C. Frey, X. Wang, J. S. Iwanczyk, and W. C. Barber, “Ananalytical model of the effects of pulse pileup on the energy spectrumrecorded by energy resolved photon counting x-ray detectors,” Med.Phys. 37, 3957–3969 �2010�.