Notes on Self-Representing, and Other, Information Structures
Upload
independentCategory
view
1download
0
Modeling the dissolved organic carbon output
from a boreal mire using the convection-dispersion
equation: Importance of representing sorption
Alla Yurova,1 Andrey Sirin,2 Ishi Buffam,3 Kevin Bishop,4 and Hjalmar Laudon3
Received 13 September 2007; revised 27 March 2008; accepted 14 April 2008; published 23 July 2008.
[1] In this paper we present a model of the dissolved organic carbon (DOC)concentrations and fluxes in mire water based on the convection-dispersion equation. Thedynamics of sorbed, potentially soluble organic carbon (SPSOC) in the peat matrix aresimulated in parallel with DOC. First, the model is applied solely to stagnant waterconditions in order to interpret the results of laboratory peat incubations, with the focus onsorption processes. Some important model parameters are derived using literature datacomplemented by information from new incubation experiments. Second, the modelis fully applied to simulate the DOC concentrations in the outlet of a steam draining asmall headwater mire in northern Sweden during the period 1993–2001. A relativelygood model fit (mean bias error (MBE) = �0.6–2.2 mg L�1, Willmott index of agreementd > 0.7 for the daily concentrations) was found for all the categories of streamdischarge, except periods with very low flow (q < 0.3 mm d�1). When seekingexplanations for the interannual variability in DOC concentrations, we, like previousauthors, could find the influence of temperature, flow path, and intensity. However, themodel has helped to demonstrate that the system also has a ‘‘memory’’: the store ofsorbed, potentially soluble organic carbon in a year affects the DOC concentrationsand fluxes in the following year.
Citation: Yurova, A., A. Sirin, I. Buffam, K. Bishop, and H. Laudon (2008), Modeling the dissolved organic carbon output from a
boreal mire using the convection-dispersion equation: Importance of representing sorption, Water Resour. Res., 44, W07411,
doi:10.1029/2007WR006523.
1. Introduction
[2] In the boreal systems, the flux of dissolved organiccarbon (DOC) is much greater than the particulate organiccarbon (POC) and dissolved inorganic carbon (DIC) fluxes[Cole et al., 2007; Jonsson et al., 2007]. Export of DOC islikely to occur mainly from areas where flowing waterbypasses the adsorbing mineral soils, i.e., in surface andsubsurface flows from riparian zones and wetlands [e.g.,McKnight and Aiken, 1998; Qualls, 2000]. Field datacollected from various locations within the boreal regionhave highlighted the importance of mire, a specific type ofwetland with a naturally accumulated peat layer at thesurface, as one of the major sources of terrestrially derivedDOC reaching aquatic ecosystems [e.g., Aitkenhead et al.,1999]. The amounts of DOC exported from mires aresufficiently large to be included in regional C balances[e.g., Jonsson et al., 2007] and to contribute to the mire C
balance [Moore et al., 1998; Fraser et al., 2001; Billett etal., 2004; Roulet et al., 2007]. Not only average DOC fluxesare significant, but also interannual variation is comparableto that of vertical net carbon exchange [Roulet et al., 2007;Sagerfors, 2007]. The role of particular environmentalfactors, including temperature and precipitation, in deter-mining the variability of the DOC concentration and fluxesis still open to debate [e.g., Freeman et al., 2001a; Monteithet al., 2007; Worrall et al., 2004; Erlandsson et al., 2008]. Itis widely appreciated that both in situ microbial DOCtransformation (production and mineralization) and hydro-logical transport are important influences on DOC concen-trations [e.g., Tranvik and Jansson, 2002], but the relativecontribution of each factor remains largely unknown.Experimental evidence supports the view that the sorptionequilibrium, based only on physicochemical properties, islikely to be as important for the export of the DOC from thewetland as biotic and hydrological processes [Qualls andRichardson, 2003].[3] The complexity of the problem has encouraged the
development of several process-based models of DOC insoils and stream water [e.g., Grieve, 1991; Neff and Asner,2001; Michalzik et al., 2003; Futter et al., 2007]. Theinterest in modeling terrestrial DOC export and DOCconcentrations in aquatic bodies is spread over manyscientific disciplines (hydrology, geochemistry, soil science,limnology, aquatic chemistry and microbiology, ecosystemscience etc.), which naturally leads to the coexistence of
1Department of Physical Geography and Ecosystems Analysis, LundUniversity, Lund, Sweden.
2Laboratory of Peatland Forestry and Hydrology, Institute of ForestScience, Russian Academy of Sciences, Uspenskoye, Russia.
3Department of Forest Ecology and Management, Swedish University ofAgricultural Sciences, Umea, Sweden.
4Department of Environmental Assessment, Swedish University ofAgricultural Sciences, Uppsala, Sweden.
Copyright 2008 by the American Geophysical Union.0043-1397/08/2007WR006523$09.00
W07411
WATER RESOURCES RESEARCH, VOL. 44, W07411, doi:10.1029/2007WR006523, 2008ClickHere
for
FullArticle
1 of 15

different mathematical formulations of the problem. Thus,much analytical work is needed to transfer achievementsand innovations from one model to another, particularly soif laboratory data are used for modeling the situation in thefield. These difficulties can be, at least partially, avoided byhaving a common mathematical framework. Making ananalogy with similar fields, such as pesticide or nutrienttransport in soil, we believe that the classical convection-dispersion equation [e.g., van Genuchten and Wagenet,1989] is a sensible choice for a common framework that, toour knowledge, has not previously been applied to the DOCproblem.[4] Here we test the ability of the convection-dispersion
equation to reproduce the DOC concentrations observed in aboreal stream draining a mire. The presented model is builtup in two separate stages, the ultimate goal being tosimulate DOC export from boreal mires. First, the modelversion applicable to a situation with stagnant water andconstant temperature is used to explore the implications ofthe model for laboratory incubation studies, includingincubations with peat samples collected from the studiedmire, to help derive the model parameters. Second, thepredictive form of the model is used to simulate DOCbuildup and transport from a small boreal mire in northernSweden during the period 1993–2001.[5] One of our main purposes was to explore the role of
sorption as a major mechanism regulating DOC concentra-tion and release rates. While laboratory studies have shownthat DOC sorption is time-dependent [e.g., Qualls, 2000;D. P. Rasse et al. Sorption and diffusion kinetics of DOC inacid forest soils, manuscript in preparation, 2008], previousDOC models have treated it as an instantaneous process. Inthe model developed by Grieve [1991] (also applied byBoyer et al. [1996]), the ratio between the store of soluble Cand DOC concentration in water is an empirically fittedconstant, while the models of Neff and Asner [2001] andMichalzik et al. [2003] make use of an equilibrium distri-bution constant, based on laboratory soil incubations, torelate the amounts of dissolved and sorbed OC. Here weaim to demonstrate the advantage of the dynamic approachover a static one when modeling DOC sorption. Thisapproach is particularly important when trying to uselaboratory studies to parameterize models. We also advocatehere that temporal variations of sorbed, potentially solubleorganic carbon (SPSOC) are as important to model as thoseof DOC: unlike DOC in flowing water, SPSOC in peatmatrix can accumulate over longer periods (‘‘memoryeffect’’), but being released because of desorption SPSOCaffects strongly the DOC concentration.
2. Model
[6] The complete model formulation includes three keycomponents: heat flux, hydrology, and DOC mass balance.We use the mixed mire water and heat (MMWH) model[Granberg et al., 1999] to describe water fluxes, verticaldistribution of water content in the acrotelm, snow dynam-ics and heat transfer in the peat profile. The system of twomass balance equations, one for the sorbed and one for thedissolved OC, is solved in a 1-D (vertical) peat profile toestimate DOC concentration in the pore water. The model isdeveloped in C++ code (Microsoft Visual C++) and thenumerical solution of the system of DOC and SPSOC mass
balance equations is calculated using the CVODE programpackage [Cohen and Hindmarsh, 1996] (program codesand documentation available at http://www.llnl.gov/casc/sundials/). The vertical resolution of the model is 5 cm inthe acrotelm and 10 cm in the catotelm. The time stepswithin the model are hourly, and the results were analyzedusing daily averaging. Simplified DOC and SPSOC massbalance equations are relevant on their own to application ofthe model under laboratory conditions with constant tem-perature, constant water content and no water flow.
2.1. DOC Concentration
[7] The detailed model equations are given in AppendixA and here we will refer to the relevant equation numbers inAppendix A (e.g., equation (A1)).[8] The model presented here is based on two main
premises:[9] 1. Soluble organic carbon is present in the mire
system in two states: dissolved (DOC) and sorbed, poten-tially soluble, but currently solid (SPSOC). The balancebetween the two phases varies over time, and adsorptionand desorption can be described using first-order kinetics.[10] 2. A convection-dispersion equation can provide a
suitable model of DOC transport. Including the termsaccounting for the adsorption-desorption as well as micro-bial production and mineralization in this equation, accountsfor the full mass balance for DOC which can be resolvedonly in parallel with the mass balance for the sorbed phase(equation system (A1) and (A2)).[11] The underlying concept of the model is the schematic
representation of processes that generate and consume DOCin a mire ecosystem, as presented by Qualls and Richardson[2003]. The processes that contribute to in situ changes inpore water DOC concentration (sorption, microbial trans-formation) are distinguished from the various transportprocesses, including dispersion and advection by bothvertical and horizontal flow (Figure 1a). We model sorptionand microbially mediated transformations of the DOCaccording to the scheme presented in Figure 1b. This partof the model (shaded in Figure 1a) was used alone to studysituations with no water flow, e.g., systems with stagnantwater in laboratory conditions (equations (A7a) and (A7b)).A 1-D hydrological scheme (vertical discretization) wasused here to model water movement in the mire and nolateral import of DOC into the mire from surrounding areaswas assumed, therefore a 1-D form of a 3-D equation systemwas actually solved under field conditions (equations (A6a)and (A6b)).
2.2. Sorption
[12] In our model we use a linear kinetic equation tosimulate the adsorption of soluble organic matter to, and itsdesorption from solid organic matter. Sorption plays a keyrole in controlling the DOC concentration in pore water. Asshown by Qualls [2000] and Qualls and Richardson [2003],peat always contains substantial quantities of potentiallysoluble OC sorbed to solid organic matter (SPSOC); there isalways more of this than the amount dissolved during anysingle leaching event. In laboratory peat incubations, it ispossible to observe the rapid release of DOC into newlyadded pore water. This occurs as previously sorbed DOC isdesorbed, and during the period before DOC concentrationsin the sorbed and dissolved phases reach equilibrium
2 of 15
W07411 YUROVA ET AL.: MODELING DOC OUTPUT FROM A BOREAL MIRE W07411

[Qualls, 2000]. Equilibration is not achieved immediately,and the rate of change in the DOC concentration due tosorption is highest at the beginning of an experiment,decreases during incubation, and is negligible only after2–4 days (e.g., Rasse et al., manuscript in preparation,2008). In this paper we use the term ‘‘first steady state’’for the local equilibrium between the DOC solution and theinitial SPSOC concentration in the peat matrix reached afterthe rapid release of DOC in the initial phase of the exper-
iment; while the ‘‘second phase’’ stands here for the furtherDOC dynamics observed in a long-term laboratory peatincubation (Text S1 in the supplementary materials1).[13] We argue that equilibrium sorption models may not
describe the dynamics of the process adequately, since theyare based on the assumption that exchange between the
Figure 1. (a) Schematic diagram of the model formulation. (b) Schematic diagram of the modeled poolsof soluble organic matter and processes that control microbially mediated transformation (production andmineralization) and abiotic exchanges (adsorption and desorption) between the solid and dissolved phases.
1Auxiliary materials are available in the HTML. doi:10.1029/2007WR006523.
W07411 YUROVA ET AL.: MODELING DOC OUTPUT FROM A BOREAL MIRE
3 of 15
W07411
sorbed and dissolved phases is so rapid that there is alwaysa fixed ratio between the two. Hence, we believe a linearkinetic model is a better when modeling DOC with arelatively high time resolution. On the other hand, werecognize that our assumption about the constant sorptionequilibrium distribution coefficient (KD) is an oversimplifi-cation. There are models that describe the dependency ofKD on the charge of the organic matter [e.g., Tipping andWoof, 1991; Lofts et al., 2001]. These models incorporatethe effects of pH and ionic strength, thus providing a fullersimulation of the sorption.
2.3. Microbially Mediated Transformations
[14] Metabolic transformations mediated by microorgan-isms also strongly affect the DOC balance. Acting at slowerrates than adsorption-desorption processes, such transfor-mations determine the total amount of soluble OC producedby exoenzymatic dissolution of insoluble organic matter. Inaddition, they control the rate of mineralization of DOC andSPSOC.[15] In our simplified model, like many models of soil
organic matter dynamics [e.g., reviewed by Agren et al.,1991], microbial biomass is not explicitly included. Instead,we simulate microbially mediated transformations of theDOC (production and mineralization) that are affectedby temperature (equation (A3)) and the presence of O2
(equation (A4)). We assume first-order kinetics for themineralization of DOC and SPSOC. A zero-order productionconstant is hypothesized on the basis of the assumption thatsubstrates for the formation of DOC are not limited in thepeat organic matter. In our model we made use of separatemineralization rate coefficients for DOC and sorbed poten-tially soluble organic carbon (SPSOC) (equation (A5)), toaccount for the stabilizing effect of sorption on microbialdecomposition [e.g., Kalbitz et al., 2005].[16] Bulk DOC concentration is simulated without spec-
ifying chemical fractions; we deliberately avoided separat-ing organic matter into different fractions. As the modelparameterization presented below is based solely on datafrom laboratory peat incubations in which the bulk DOC ofthe peat solution was measured, the dynamics of short-livedsubstances, such as root exudates and simple products ofdecomposition, cannot be adequately described by thecurrent model formulation.
2.4. Hydrology
[17] Two layers can be distinguished within the peatprofile: the upper, periodically aerated layer consistinglargely of living and lightly decomposed plant material(active layer or acrotelm), which is not usually more than60 cm deep, and the permanently saturated, lower zone,consisting largely of compacted, relatively highly decom-posed plant material (inert layer or catotelm). The hydraulicconductivity is high in the upper acrotelm and usuallydeclines strongly with depth [Ivanov, 1981]. Consequently,water in the acrotelm moves rapidly and usually accountsfor most of the discharge from the mire. For many mires,especially those with a dominantly atmospheric watersupply, the water in the catotelm is mostly stagnant [e.g.,Sirin et al., 1997]; if, however, the underlying mineral soilis highly permeable and/or groundwater upwelling is pres-ent, significant vertical movements can occur [e.g., Reeve etal., 2000; Tsvetkova and Sirin, 2003]. It has also been
suggested that the acrotelm is the major source of DOCwithin mires [e.g., McKnight et al., 1985], since decompo-sition is much slower in the permanently anaerobic layers,where organic matter is aged and the enzymes regulatingorganic matter transformation are suppressed [Freeman etal., 2001a, 2001b], and accumulation of CH4 and CO2
further inhibit decomposition [Blodau et al., 2004].[18] The MMWH hydrological model used here was
designed to simulate the flow and moisture dynamics inacrotelm [Granberg et al., 1999]. A zero flux (imperme-able) lower boundary is placed at the level of constantsaturation, and it is assumed that no flow occurs below this(see Sirin et al. [1997] and Reeve et al. [2000] for anexamination of the validity of this assumption). The modelis based on steady state vertical moisture distribution curves[Romanov, 1961], which was found to be applicable to theparameter values and time step used in this study. Themodel considers variable lateral flow at different levels, toaccount for reduction in hydraulic conductivity with depth[e.g., Ivanov, 1981]. The MMWH model was first devel-oped for the hydrology of an area with prescribed geometryand a single vegetation type [Granberg et al., 1999]. Here itwas applied to the whole mire and model parameterscharacterizing the geometry and hydraulic conductivity ofthe mire were combined into the calibrated parameters a, band lE [Yurova et al., 2007]. In addition, a generalized formof the Manning equation [e.g., Beven, 2001] was appliedhere to describe overland flow, and, consequently, oneadditional lumped multiplier as, accounting for mire surfaceroughness, was added to the model formulation.[19] The heat balance equation was solved in a slightly
different way than in the original MMWH, mainly forpractical reasons. We used a solution presented by R. Waniaet al. (Integrating peatlands and permafrost in a dynamicglobal vegetation model: 1. Land surface processes, sub-mitted to Global Biogechemical Cycles, 2008) and imple-mented it using a C++ program. One important differencefrom the formulation of Granberg et al. [1999] is that thesnow layer and meltwater pooled on the mire surface areincluded as additional layers in the vertical profile whensimulating the heat balance.
3. Model Parameterization
[20] The model parameters and initial conditions neededto solve equations (A6a) and (A6b) in a predictive way aresummarized in Table 1. Four parameters, the sorptionequilibrium distribution coefficient (KD), the initial SPSOCconcentration (s0), and the rates of microbial DOC produc-tion (P), and DOC mineralization (m1), were estimated usingdata obtained from our long-term peat and water incubations(experimental design in supplementary materials, Text S1,and methodology for obtaining the coefficients in supple-mentary materials, Text S2). In addition, we reviewed theavailable literature relating to the rates of DOC release intowater during long-term experiments to obtain ranges ofestimates for two parameters: the DOC production rate (P)and the DOC mineralization rate (m1) (supplementary mate-rials, Text S2).[21] The parameters a, b, as and lE, used in the hydrology
submodel, were optimized by minimizing the mean squareddifference between the modeled and observed specific
4 of 15
W07411 YUROVA ET AL.: MODELING DOC OUTPUT FROM A BOREAL MIRE W07411

discharge. The only three parameters that were adjusted in theDOC concentration submodel were the dispersion coefficientfor overland flow, Ds, the ratio of anoxic to oxic DOCproduction rate, kanP, and the ratio of anoxic to oxic DOCmineralization rate, kanm.
4. Model Analysis on Laboratory Material
[22] In addition to model parameterization, our mainpurpose with the ‘‘stagnant water’’ model version was toexplore the role of sorption as a major mechanism regulat-ing DOC concentration and to find out if sorption alone canaccount for some differences in DOC release rates observedin laboratory conditions. This was achieved by:[23] 1. The partitioning of day-to-day DOC concentration
tendency during the incubations between net sorption (ad-sorption minus desorption) and net microbial production(production minus mineralization) done by numericallyestimating each term in (A7a).[24] 2. Applying differential sensitivity analysis [e.g.,
Saltelli, 2000] to the key model parameters KD, tdes, P andm1 (details in supplementary materials, Text S4, section 1).[25] 3. Evaluating two important characteristics: the DOC
concentration during the first steady state (c1), and the rateof DOC release into the water during the second stage of theincubation Dc�V
Dt�M, as well as their dependency on the initial
SPSOC concentration (s0) and the peat-to-water ratio (M/V)(equations (A8) and (A9)).
5. Modeling Protocol for the Field ModelApplication
[26] The model was run for the Kallkallsmyren mire site(Figure 2; detailed description of the site and the measure-ments can be found in supplementary materials, Text S3)using a series of climate data for temperature, precipitationand potential evapotranspiration recorded at the nearbySvartberget research station [Lofvenius et al., 2003]. Thefollowing model simulations were conducted.[27] 1. Model initialization with climate data from 1986
to 1993, the start of the actual simulation period.[28] 2. A model run (full, kinetic version) for the whole
simulation period (1993–2001).[29] 3. A run with the model equations formulated for the
steady state partitioning between the solid and dissolvedphases (no kinetics, sorption is assumed to be instantaneous).[30] 4. A run with the amount of sorbed organic carbon
held constant and calibrated together with the DOC pro-duction rate (range in Table 2) at the values, which best fitthe data set as a whole. In this the long-term (interannual)memory effect of SPSOC is effectively ‘‘turned off.’’[31] 5. A series of Monte Carlo runs (1000) to determine
the model sensitivity to specific parameters and constants
Table 1. Model Parameters and Constants
Symbol Value Units Description Source
Hydrologya 0.045 cm�1 lumped parameter, equation (1) calibratedb 0.20 cm�1 lumped transmittivity parameter calibrated from the data range of Ivanov
[1981]as 0.11 cm�0.67 h�1 lumped parameter, equation (2) calibratedlE 0.03 - lumped evapotranspiration parameter calibrated from the data range of
Virta [1966], Romanov [1961]f 0.92, 0.98 - porosity: acrotelm, catotelm by analogy [e.g., Granberg et al., 1999]zcat �30 cm acrotelm depth by analogy, as averagesph 90 % proportion of Sphagnum remains in
the peatmeasured
ca 5 % proportion of Carex remains in the peat measuredr 0.02, 0.06 g cm�3 peat density: acrotelm; catotelm by analogy [e.g., Nungesser, 2003]
DOC DynamicsKD 0.033 L g�1 sorption distribution constant estimated from equation (A7b)tdes 0.078 h�1 desorption kinetic constant Rasse et al. (manuscript in preparation, 2008):
surface peat from a mirein Norway
Pbasal 1.4 � 10�3 mg g�1 h�1 microbial DOC productionrate in the acrotelm at 20�C
average Table 2 (second row, fourthcolumn)
fPs 1.8 - correction for the DOCproduction by vegetation
Moore and Dalva [2001], comp. Sphagnumand fibric peat
m1basal 0.4 � 10�4 h�1 DOC mineralization ratein the acrotelm at 20�C
water incubation Table 2
ks 1/6 - the constant reducing the microbialmineralization rate when the solubleOC is sorbed
Kalbitz et al. [2005]: podzol organichorizon
Q10 1.7 - modifier to account for the effect oftemperature on P and m1
Moore and Dalva [2001]: fibric and sapricpeat
kanP 0.07 - ratio of anaerobic to aerobic DOCproduction
calibrated from the data range of Mooreand Dalva [1997]
kanm 1 - ratio of anaerobic to aerobic DOCmineralization
Calibrated from the data range of Mooreand Dalva [1997]
D0 4.3 � 10�2 cm2 h�1 molecular diffusion coefficient Karlstrom [1995]l 10 cm dispersivity Reeve et al. [2001]Ds 0.19 cm2 h�1 surface dispersion coefficient calibrated
W07411 YUROVA ET AL.: MODELING DOC OUTPUT FROM A BOREAL MIRE
5 of 15
W07411

(Table 3, methodology in supplementary materials, Text S4,section 2).[32] The model results were analyzed on the basis of
daily averages. Observed annual DOC fluxes were estimatedon the basis of interpolated DOC concentrations measured
at the stream outlet. To evaluate the annual DOC balancepredicted by the model, the total production and minerali-zation in the acrotelm were simulated separately and thenet production was estimated as the difference betweenthe two summed over a year. Annual net production in
Figure 2. (a) Map of Sweden with study site location. (b) Upper portion of the Nyanget drainage basinat Svartberget near Vindeln, Vasterbotten, in northern Sweden, showing the location of theKallkallsmyren mire and the measurement site at the stream origin. (c) Vegetation map of theKallkallsmyren mire.
6 of 15
W07411 YUROVA ET AL.: MODELING DOC OUTPUT FROM A BOREAL MIRE W07411

the acrotelm was then compared with the stream export(flux) of DOC and the total amounts of SPSOC and DOCstored in the acrotelm as predicted by the model. Inaddition, the annual volume-weighted DOC concentrationswere calculated on the basis of the observed data and modelsimulations, to distinguish the role of concentration changes
from flow on the DOC fluxes. This reveals how the meanconcentrations vary between years. Volume-weighted con-centration (both observed and modeled) was then correlatedto the modeled sum of SPSOC and DOC stored in theacrotelm before the spring flood event, to determine whetherthe latter is related to the former. Simulated volume-weighted
Table 2. Fates of DOC Production, Pbasal, and Mineralization, m1basal, Derived From the Long-Term Laboratory Peat and Water
Incubations at Approximately 20�C
Sample andLocation
Peat-to-WaterRatio (g L�1)
Net DOCReleaseMeasured
(mg g�1 h�1) Pbasal (mg g�1 h�1) m1basala (h�1) Source and Comments
Peat water - - 0.4 � 10�4 This studySurfaceSphagnum peat,smallheadwater mire
10–14 5.0 � 10�4 to 9.6 � 10�4 4.0 � 10�4 to 2.4 � 10�3 . . .�1.0 � 10�4 This study(c0 = 0.3 mg L�1)
SurfaceSphagnum peat,smallheadwater mire
14 2.9 � 10�4 4.2 � 10�4 to 7.1 � 10�4 - This study(c0 = 44 mg L�1)
Fibric Sphagnumpeat, bog
10–100b,c 2.0 � 10�3 3.1 � 10�3 to 1.8 � 10�2 - Moore and Dalva [2001]
Sapric Sphagnumpeat, bog
10–100b 1.3 � 10�3 2.1 � 10�3 to 1.1 � 10�2 - Moore and Dalva [2001]
Surface peaty soilwith 19% OC,river delta
140 2.2 � 10�3 7.6 � 10�3 to 2.3 � 10�2 - Aguilar and Thibodeaux[2005]
Subsurfacefibrous peat,river delta
3.3 � 103 �2.8 � 10�7c 5.8 � 10�7 to 3.6 � 10�6 1.9 � 10�4 to 6.7 � 10�4 Chow et al. [2006]d
Subsurfacefibrous peat,river delta
1.4 � 103 �2.9 � 10�6c 3.3 � 10�6 to 1.9 � 10�5 1.1 � 10�3 to 3.7 � 10�3 Chow et al. [2006]d
Subsurfacefibrous peat,river delta
500 �1.3 � 10�5c 1.4 � 10�6 to 6.7 � 10�5 4.6 � 10�4 to 1.4 � 10�3 Chow et al. [2006]d
aIf no value is given, not detectable by the parameter optimization.bPresented as a range in the source publication [Moore and Dalva, 2001].cFrom day 7 to day 60.dThis study uses different techniques to determine the DOC release rate, so the data on total soluble OC (SPSOC plus DOC) were used for the
calculations here.
Table 3. Range of Parameters and Constants Used in the Sensitivity Analysisa
Parameter RPCC
Parameter Rangea
Source and CommentsMinimum Maximum
Pbasal 0.84 0.4 � 10�3 2.4 � 10�3 Table 2Q10 �0.78 1.6 4 Chow et al. [2006]; Moore and Dalva [1997]kanP 0.64 0.07 1 Bergman [1998]; Moore and Dalva [1997]m1basal �0.54 0.4 � 10�4 1.0 � 10�4 Table 2tdes 0.53 �50% 50% -KD �0.51 0.019 0.091 Qualls [2000]; Rasse et al. (manuscript in preparation, 2008)kanm �0.33 0.07 1 Moore and Dalva [1997]b 0.21 12 34 from optimizationks �0.19 1/6 1/3 Kalbitz et al. [2005]lE 0.13 0.01 0.03 from optimizationas 0.09 0.09 0.6 from optimizationa �0.07 0.0113 0.0693 from optimizationD0 �0.06 1.2 � 10�2 7.2 � 10�2 Karlstrom [1995]Ds 0.05 0.01 1 -l �0.04 0.2 100 Reeve et al. [2001]; Ours et al. [1997]fPs 0.01 1 3 -
aUnits as in Table 1.
W07411 YUROVA ET AL.: MODELING DOC OUTPUT FROM A BOREAL MIRE
7 of 15
W07411

concentrations for each season were correlated to thesimulated stored amounts of SPSOC and DOC in thepreceding seasons. The seasons were defined arbitrarilyas: ‘‘winter,’’ the period when the surface temperature ofthe peat was at or below 0�C; ‘‘spring,’’ the period from thestart of snowmelt till the leveling off of the spring floodflow rate; and ‘‘summer’’ as the rest of the year.[33] To investigate the dynamics of the stream DOC
concentration during hydrological episodes when DOCconcentration was high, two ‘‘rain-driven’’ flow events werechosen to characterize the system behavior. The episodesdiffered in the intensity of the rain event. There was morerainfall during the second event than the first. In bothcases the stream DOC concentration increased with the firstpeak in the discharge. After the second (larger) runoffpeak, the concentration stabilized at approximately the samelevel as prior to the first event (12 July to 30 August 1993,Figure 3a) and dropped about 10 mg L�1 during the secondevent (27 August to 28 September 2001, Figure 3b).
6. Results
6.1. Parameterization Results From LaboratoryIncubations
[34] Our estimate of the sorption distribution coefficientKDwas 0.033 L g�1; lower than that estimated by Rasse et al.(manuscript in preparation, 2008) on the basis of a surface
peat sample from a mire in Norway (KD = 0.091 L g�1). OurKD was also slightly higher than 0.019 L g�1, which is thevalue we calculated using the data by Qualls [2000], whoanalyzed a surface peat sample from a marsh in the Ever-glades (Florida, USA). Our estimate of the initial SPSOCconcentration s0 = 2.0 mg g�1 is close to that in a Lamnelapeat sample from a drained black spruce forest soils inAlaska (s0 = 2.7 mg g�1 [Qualls and Richardson, 2003]).[35] As summarized in Table 2, the rate of microbial
production was substantially higher than the rate of releaseof DOC from peat into water. As interpreted by our model,the rate of release is less than the rate of production becausesoluble OC produced by microbial transformations of thepeat is distributed by sorption between the solid anddissolved phases. In experiments, measurements of DOCin solution will only record the increases in the dissolvedphase.[36] The estimated rate of microbial production we found
in our incubation of surface Sphagnum peat is of the sameorder as that from the sapric Sphagnum peat sampleincubations of Moore and Dalva [2001] (Table 2). A fibricpeat sample [Moore and Dalva, 2001] and a peat samplefrom a river delta [Aguilar and Thibodeaux, 2005] hadhigher rates of microbial production, while a different riverdelta sample [Chow et al., 2006] showed much lowerproduction, resulting in net mineralization. The upper limitfor the mineralization rate in our sample, defined by theoptimization, was 1.0–10�4 h�1. This is of the same order asthe upper range of the decay constant of the slowly decayingDOC fraction in soil and stream water (0.4 � 10�4 h�1)[Qualls, 2000].
6.2. Abiotic Factors Affecting the First (Local) SteadyState DOC Concentration and the Rate of DOC ReleaseDuring the Second Phase of the Long-Term PeatIncubation
[37] As expected on the basis of the formulation of themodel, the amount of DOC that was rapidly released duringthe first phase of incubation (c1) exhibited a linear relation-ship with the amounts of soluble OC originally sorbed onthe peat matrix (Figure 4a). Increases in the ratio of peatmass to water volume resulted in nonlinear increases in theamount of DOC released (Figure 4b). There was also anotable difference in the DOC release rate during the secondphase of incubation depending on the experimental setup.[38] 1. The DOC release rate has a negative linear rela-
tionship to the initial SPSOC concentration, s0 (Figure 4c).The initial SPSOC concentration presumably varies natural-ly among peat samples of different origins and is alsoaffected by the rinsing or washing of the sample before thestart of the experiment. Within the expected natural range ofSPSOC concentrations the effect on DOC release rate ispresumably not high (up to 10%), but it is significant.[39] 2. The DOC release rate is nonlinearly negatively
related to the peat mass-to-water ratio in the experiment, M/V (Figure 4d). For example, DOC release per mass unit ismuch smaller for an unsaturated sample than for a saturatedor flooded sample. This is noteworthy, since here we onlydeal with the adsorption-desorption processes affected bythe relative proportion of the solid phase and the effect ofmoisture on microbial activities is not considered.
Figure 3. Simulated and measured DOC concentrationsfor two episodes: (a) 12 July to 30 August 1993 and (b) 27August to 28 September 2001. The top plots illustrate themeasured total stream discharges plotted with y axisinverted (i.e., with peak flows pointing downward).
8 of 15
W07411 YUROVA ET AL.: MODELING DOC OUTPUT FROM A BOREAL MIRE W07411

6.3. General Agreement Between Simulated andMeasured Discharge, Stream DOC Concentrations,and Fluxes: Error Assessment
[40] The simulated discharge corresponded well withthe measurements at the mire outlet (MBE = �0.11 mm,RMSE = 1.5 mm d = 0.85 mean = 1.1 mm) and nosystematic bias was found for particular periods or dis-charge categories. The largest discrepancies (both negativeand positive) between the modeled and measured dischargeoccurred during the spring flood.[41] Seven years after the start of the simulation (1986)
the model performance was no longer influenced by theinitial conditions. The simulated values for DOC concen-tration from the runs with different initial SPSOC concen-trations converged after about 5 years.[42] We found relatively good agreement between the
simulated and measured DOC concentrations both overall(Figure 5) and for particular events (Figure 3). However, themodel performance varied greatly between the categoriesfor total discharge (Table 4). The model performed verypoorly when the discharge was below 0.3 mm d�1 (Table 4and diamond symbols on Figure 5). Above this threshold,the model performance increased sharply and the best fitbetween the modeled and measured DOC concentrationswas found for the highest discharge category (Table 4).
6.4. Sensitivity Analysis
[43] Sensitivity analysis (Table 3) revealed that the mostinfluential model parameters are the DOC production rate
(Pbasal), its dependence on temperature (Q10, definition inAppendix A), and the parameter accounting for the decreasein the DOC production rate under anaerobic conditions(kanP). Also important, but less so, are the DOC minerali-zation rate (m1basal) and the sorption constants (tdes and KD).The other parameters exerted less influence over the modelperformance.
6.5. Role of Sorption as a Regulator of DOCConcentrations
6.5.1. Peat Incubations[44] Both methods that we used to distinguish sorption
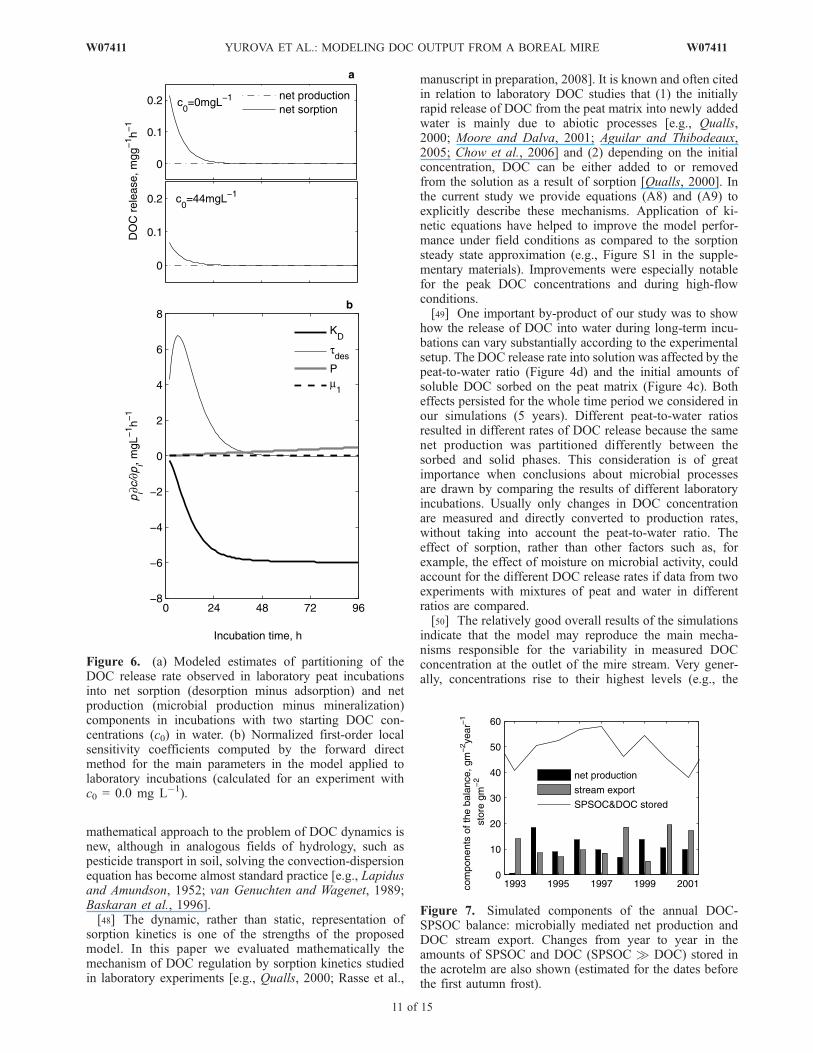
from microbial processes (Figures 6a and 6b) indicated thatthere is a clear division between the two phases of DOCrelease into water during long-term peat incubations. Thefirst phase was short (39 h for the model fitted to ourlaboratory study) and governed solely by sorption, whilefurther, much slower, increases in DOC concentrationduring the second phase were due to microbial activity.The kinetic constant of sorption, tdes, was the most impor-tant parameter for the first 14 h of incubation, after that thesorption distribution coefficient KD was most important(Figure 6b). After 39 h the sensitivity coefficient for theproduction rate P became higher than that for the kineticdesorption tdes coefficient (Figure 6b). The two coefficientsrelated to sorption have distinctly different meanings. Whiletdes is indicative of the time-dependent kinetics of theprocess, KD characterizes the partitioning between the solidand dissolved phase when the system is in a steady state
Figure 4. Simulated effect of the initial soluble solid organic carbon (SPSOC) concentration, and peat-to-water ratio (M/V) (a, b) on the first steady state DOC concentration and (c, d) on the DOC release rateduring the second phase of a long-term peat incubation (KD = 0.033 L g�1, c0 = 0.0 mg L�1, P = 1.0 10�3
mg g�1 h�1, m1 = 4 10�5 h�1, ks = 0.3; M/V = 10.0 g L�1 (Figures 3a and 3c) and s0 = 2.0 mg g�1
(Figures 3b and 3d)). A Sphagnum peat sample with density of 0.02 g cm�3 and porosity 0.98 is saturatedat M/V = 20 g L�1 and oversaturated when M/V is below 20 g L�1. Lines for ‘‘after 20 days’’ and ‘‘after60 days’’ in Figure 3d coincide.
W07411 YUROVA ET AL.: MODELING DOC OUTPUT FROM A BOREAL MIRE
9 of 15
W07411

with respect to sorption. It is therefore possible to distin-guish between the first phase when sorption kinetics dom-inated and the second phase when the observed DOCconcentration was in equilibrium, with adsorptive partition-ing of microbially produced DOC.6.5.2. Mire DOC Concentrations[45] On a daily time step the model performed generally
weaker with an assumption of the sorption steady state ascompared to the standard model version (Table 4). ‘‘Sorp-tion steady state’’ model performance was especially poorfor the highest discharge category (Table 4) and, notably,during some major high and low DOC concentration events(e.g., Figure S2 in supplementary materials). Comparing theresults produced by the full kinetic and the steady state
model versions and averaged over different time intervals,we found that not only day to day but also seasonal andinterannual variations in the DOC concentration are betterpredicted with the full kinetic model (Figure S1 in thesupplementary materials). The model performance wasstrongly degraded under an assumption that the amount ofsorbed potentially soluble OC is constant over the simula-tion period (Table 4 and Figures S1 and S2 in the supple-mentary materials).
6.6. Components of the Annual DOC-SPSOC Balance
[46] Two main simulated components of the annualDOC-SPSOC balance, net microbial production within theacrotelm and stream export, are of a similar order ofmagnitude but are not equal for the years under consider-ation; in fact, the difference between the two can be large(Figure 7). Interannual variation in the volume-weightedDOC concentration reflects the variation in the amounts ofDOC and SPSOC stored within the acrotelm in the previousyear (Figure 8a; the DOC and SPSOC are the modelestimates at the start of the current ‘‘hydrological’’ year,and are also equal to those at the end of the preceding year).The correlation between the volume-weighted stream DOCconcentration in any given season and the store of DOC andSPSOC in the preceding season is high for the winter (r =0.75, P= 5.8� 10�5) and summer (r = 0.87, P= 1.9� 10�5),but lower for the spring (r = 0.40, P = 0.023) (Figure 8b).
7. Discussion
[47] The convection-dispersion equation used in thispaper was developed to describe the transport and trans-formations of DOC in a mire system. To our knowledge this
Figure 5. Simulated (line) versus measured (symbols) DOC concentrations at the outlet ofKallkallsmyren mire. Diamonds, DOC measurements corresponding to stream discharge values lessthan 0.3 mm; crosses, DOC measurements corresponding to stream discharge value greater than 0.3 mm.Arrows point to episodes illustrated in Figure 5. The top plot shows measured stream discharge plottedwith y axis inverted (i.e., with peak flows pointing downward).
Table 4. Quantitative Measures of Model Performance With
Respect to DOC Concentrationsa
Daily DischargeIntervalb (mm) MBE RMSE d
0–0.15 11.8, 13.4, 16.7 16.1, 17.0, 20.7 0.00, 0.00, 0.000.16–0.3 4.0, 5.6, 3.6 11.7, 11.8, 12.0 0.60, 0.63, 0.430.3–0.49 2.2, 3.2, 3.6 7.7, 8.0, 9.9 0.81, 0.80, 0.640.5–1.4 1.3, 3.3, 5.5 8.8, 9.9, 12.6 0.77, 0.72, 0.411.5–23 �0.6, 3.0, 5.7 7.2, 9.9, 12.3 0.90, 0.76, 0.63All 3.4, 5.4, 7.1 10.6, 11.5, 14.0 0.68, 0.58, 0.29
aThe first number (in bold) is from the ‘‘full, kinetic’’ model, the secondnumber is from the ‘‘sorption steady state’’ model, and the third number isfrom the ‘‘constant SPSOC’’ model version. MBE, mean bias error; RMSE,root mean square error; d, Willmott index of agreement Willmott [1982](d = 0, no agreement; d = 1, perfect match) calculated for the wholesimulation period and for particular discharge categories.
bN = 657.
10 of 15
W07411 YUROVA ET AL.: MODELING DOC OUTPUT FROM A BOREAL MIRE W07411
mathematical approach to the problem of DOC dynamics isnew, although in analogous fields of hydrology, such aspesticide transport in soil, solving the convection-dispersionequation has become almost standard practice [e.g., Lapidusand Amundson, 1952; van Genuchten and Wagenet, 1989;Baskaran et al., 1996].[48] The dynamic, rather than static, representation of
sorption kinetics is one of the strengths of the proposedmodel. In this paper we evaluated mathematically themechanism of DOC regulation by sorption kinetics studiedin laboratory experiments [e.g., Qualls, 2000; Rasse et al.,
manuscript in preparation, 2008]. It is known and often citedin relation to laboratory DOC studies that (1) the initiallyrapid release of DOC from the peat matrix into newly addedwater is mainly due to abiotic processes [e.g., Qualls,2000; Moore and Dalva, 2001; Aguilar and Thibodeaux,2005; Chow et al., 2006] and (2) depending on the initialconcentration, DOC can be either added to or removedfrom the solution as a result of sorption [Qualls, 2000]. Inthe current study we provide equations (A8) and (A9) toexplicitly describe these mechanisms. Application of ki-netic equations have helped to improve the model perfor-mance under field conditions as compared to the sorptionsteady state approximation (e.g., Figure S1 in the supple-mentary materials). Improvements were especially notablefor the peak DOC concentrations and during high-flowconditions.[49] One important by-product of our study was to show
how the release of DOC into water during long-term incu-bations can vary substantially according to the experimentalsetup. The DOC release rate into solution was affected by thepeat-to-water ratio (Figure 4d) and the initial amounts ofsoluble DOC sorbed on the peat matrix (Figure 4c). Botheffects persisted for the whole time period we considered inour simulations (5 years). Different peat-to-water ratiosresulted in different rates of DOC release because the samenet production was partitioned differently between thesorbed and solid phases. This consideration is of greatimportance when conclusions about microbial processesare drawn by comparing the results of different laboratoryincubations. Usually only changes in DOC concentrationare measured and directly converted to production rates,without taking into account the peat-to-water ratio. Theeffect of sorption, rather than other factors such as, forexample, the effect of moisture on microbial activity, couldaccount for the different DOC release rates if data from twoexperiments with mixtures of peat and water in differentratios are compared.[50] The relatively good overall results of the simulations
indicate that the model may reproduce the main mecha-nisms responsible for the variability in measured DOCconcentration at the outlet of the mire stream. Very gener-ally, concentrations rise to their highest levels (e.g., the
Figure 6. (a) Modeled estimates of partitioning of theDOC release rate observed in laboratory peat incubationsinto net sorption (desorption minus adsorption) and netproduction (microbial production minus mineralization)components in incubations with two starting DOC con-centrations (c0) in water. (b) Normalized first-order localsensitivity coefficients computed by the forward directmethod for the main parameters in the model applied tolaboratory incubations (calculated for an experiment withc0 = 0.0 mg L�1).
Figure 7. Simulated components of the annual DOC-SPSOC balance: microbially mediated net production andDOC stream export. Changes from year to year in theamounts of SPSOC and DOC (SPSOC � DOC) stored inthe acrotelm are also shown (estimated for the dates beforethe first autumn frost).
W07411 YUROVA ET AL.: MODELING DOC OUTPUT FROM A BOREAL MIRE
11 of 15
W07411

episode in September 1996 in Figure 5) when conditionsfavorable for DOC production (good aeration and suitabletemperatures) are combined with a shift of the flow depth tolayers that were not previously exposed to water flow withinthe mire. Some precipitation is always needed to mobilizethe DOC present in the unsaturated layer and to shift thesorption equilibrium to release SPSOC by adding low-DOCwater. According to the model, this explains the correspon-dence in timing of the initial increase in stream DOCconcentration and the increase in stream discharge follow-ing precipitation events (e.g., Figures 3a and 3b). Strongand prolonged events may, however, reduce the DOCconcentrations (e.g., the 27 August to 28 September eventshown in Figure 3b) through the removal of significantamounts of SPSOC from a particular layer. After the flowceases, there is a build up of new DOC in the pore water;simultaneously, SPSOC may accumulate on the peat matrixas a result of both in situ production and dispersive andadvective exchange with the adjacent layers. The lowestDOC concentrations were observed in the stream during the
spring flood (Figure 5). The flow is so intensive during thisperiod that significant amounts of SPSOC are removed fromthe acrotelm while the concentrations remain low. Thiscould also explain the relatively slow recovery of concen-trations after the spring flood (up to one month).[51] Results of the sensitivity study show that only a few
parameters strongly influence the model output. They arethe DOC production rate and its modifiers that account forthe effects of temperature and anoxic conditions (Table 3).In addition, the model predictions are also largely dependenton the chosen values of DOC mineralization rate and thetwo sorption constants. These parameters require furtherinvestigation to improve model generalization. In particular,although a considerable base of knowledge exists on sorp-tion kinetics and equilibria for DOC in mineral soils, little isknown about these dynamics in peat. This would be afruitful area for further exploration.[52] The balance between the net production of DOC and
SPSOC and the DOC hydrological export, as predicted bythe model (Figure 7), may go some way to explaining theinterannual variability in the total amounts of SPSOC andDOC stored in the acrotelm. Although the amount of storedSPSOC and DOC in the acrotelm is several times largerthan the annual export, the variation in the amount stored asa result of the dominance of either production or export in agiven year is significant and may persist in subsequentyears. The system therefore has a ‘‘memory,’’ as demon-strated by the good correspondence between the simulatedstorage and the observed annual volume-weighted streamDOC concentration (Figure 8a). An example of system‘‘memory’’ has been described by Worrall et al. [2006]discussing the role of drought in a mire in the UK. Unlikethe example by Worrall et al. [2006], the mire we studiedexhibits a link between the summer concentrations and theintensity and duration of the spring flood event, as shownby the very high correlation between the storage of DOCand SPSOC after the spring flood and the volume-weightedsummer stream DOC concentration (Figure 8b, summer).The converse is also true: winter concentrations may bedetermined by the changes in SPSOC amounts during theprevious summer. The situation during the spring flood ismore complicated and the amount of DOC and SPSOCstored in the acrotelm before the event is not such a largedeterminant of the stream DOC concentration during spring(Figure 8b, spring). Both to simulate adequately the DOCconcentrationwith a time step fromdaily to annual (Figures S1and S2 in the supplementary materials) and to diagnoseseasonal and interannual variability in DOC concentrations(Figure 8), explicit modeling of the time-variable SPSOC isneeded.[53] The model presented here is only one particular
realization from the scope of possible formulations of theconvection-dispersion equation, and we would like to stressthat a well-developed theory built on hydrology by the longpractice of solving the convection-dispersion equation [e.g.,van Genuchten and Wagenet, 1989; Selim and Ma, 1998]can be easily used by DOC model developers aiming tohave either more or less detailed models. In particular, it isvery convenient to use this framework for testing the resultsof model simplifications, as we did here by comparingmodel outcomes produced by the sorption steady stateapproximation and a kinetic equation. In many cases the
Figure 8. (a) Interannual variations in the amounts ofSPSOC and DOC (SPSOC � DOC) stored before the startof the hydrological year (spring flood) simulated by themodel. Interannual variation in the volume-weighted annualstream DOC concentration, simulated by the model andcalculated from the interpolated observations. (b) Correla-tion between the amounts of SPSOC and DOC stored in thepreceding season (winter and spring, respectively) and thevolume-weighted seasonal stream DOC concentrations inspring and summer simulated by the model.
12 of 15
W07411 YUROVA ET AL.: MODELING DOC OUTPUT FROM A BOREAL MIRE W07411

numerical solution of the convection dispersion equation isavailable together with hydrological model packages (e.g.,MODFLOW [McDonald and Harbaugh, 1988], TOPOG-Dynamic [Silberstein et al., 1999]), and it is thereforepossible to find a hydrological scheme of appropriatedimensionality and complexity to describe water flow.[54] Other challenges for further model development are
to introduce the DOC ‘‘quality’’ [e.g., as interpreted by theQ theory, Agren and Bosatta, 1998] as well as to describethe dependency of sorption on the charge on the organicmatter [e.g., Lofts et al., 2001] and, especially as influencedby the presence of metal or S ions [e.g., Skyllberg andMagnusson, 1995; Clark et al., 2006].[55] For the mire studied here we hypothesize that the
poor model performance during periods of very low flow(Table 4 and diamonds in Figure 5) has resulted fromexcluding deep flow mechanism from the hydrologicalformulation. The water discharged during such periodsappears to be groundwater from the podzols surroundingthe mire, which has bypassed the peat soils of the mire. Interms of the total DOC budget, the groundwater contribu-tion is rather low, since the flow itself is low; this input is,however, persistent. During periods of low flow, when flowout of the mire virtually ceases, the groundwater bypass canstrongly influence the DOC concentrations at the outlet.This bypass may be related to the hydrochemical anomalyobserved by Sirin et al. [1998] at a depth of 2 m in thecatotelm. We also would like to point that at the currentstage, a choice of the model parameters describing howanaerobic conditions influence the rates of microbial DOCproduction and mineralization is not fully justified, and itcertainly deserves further attention.
8. Conclusions
[56] In this paper we highlighted the importance ofmodeling sorptive exchange as a dynamic process, ratherthan a simple steady state, when considering data fromlaboratory peat incubations. In addition, we demonstratedhow some abiotic factors may, through the action ofsorption, strongly affect the rate of DOC release into water,as observed during long-term laboratory incubations.[57] DOC concentrations recorded during 1993–2001 at
the outlet of a steam draining a small headwater mire innorthern Sweden were simulated here by a newly formulat-ed model based on the convection-dispersion equation.Relatively good agreement between the measured andsimulated DOC concentrations was found both for thewhole simulation period and for particular events. Theresults of this study indicate the following.[58] 1. Sorption is an important process in determining
DOC concentration and fluxes. It may cause a release ofDOC into the peat pore water in some layers and removal inothers, similar in magnitude to the amount of microbiallyproduced DOC. During each event, part of the DOC in thestream export originates from that which was stored in peatpore waters prior to the event, part is released into thesolution from the peat matrix because of desorption and theremainder is newly produced.[59] 2. Interannual variability in the SPSOC and DOC
stores within the acrotelm depends on the conditions formicrobially mediated DOC production and mineralizationduring the current year (temperature, aeration) and flow
intensity. Some ‘‘memory’’ is, however, characteristic of thesystem, meaning that the store in a year affects the concen-trations and fluxes in the following year.
Appendix A: Model Equations
A1. Main State-Variable Equations
[60] The mass balance equation for the concentration ofDOC in pore water, c, can be written in the 3-D form of theconvection-dispersion equation
@ q � cð Þ@t
¼ r q � D � r cð Þ � r q � cð Þ þ tdesr s� KD � cð Þþ P � r� m1 � q � c;
ðA1Þ
where q is volumetric water content, r is peat bulk density,vector q{qx, qy, qz} is composed of water flux in horizontaland vertical directions, D{Dx, Dy, Dz} is a vector ofdispersion coefficients, tdes is the kinetic rate of desorption(or adsorption if the third term in equation (A1) becomesnegative), KD is the distribution constant, characterizing anequilibrium between the sorbed and dissolved phases, P isthe microbial production rate of DOC, and m1 is the first-order microbial DOC mineralization constant.[61] The dispersion coefficient is defined as
D ¼ D0 þ lq
q
������ ;
where D0 is the molecular diffusion coefficient, and l isdispersivity.[62] A mass balance for the concentration of the sorbed
potentially soluble organic carbon (SPSOC), s, leads to
r@s
@t¼ �tdesr s� KD � cð Þ � m2 � r � s; ðA2Þ
where m2 is the first-order microbial mineralization constantfor the SPSOC.[63] A modified van’t Hoff equation is used to account
for the temperature dependency of DOC production andmineralization:
P ¼ Pbasal � QT�Tbasalð Þ=10ð Þ
10
m1 ¼ m1basal � QT�Tbasalð Þ=10ð Þ
10 ; ðA3Þ
where Q10 is the relative rate of increase in metabolic ratesper 10�C increase in temperature, and Tbasal is a referencetemperature (20�C was used here) at which basal rates ofmicrobial DOC production (Pbasal) and mineralization(m1basal) are estimated.[64] The constant fractions kanP and kanm are used to relate
the anoxic rates of DOC production and mineralization tothe corresponding DOC production and mineralization ratesunder aerobic conditions:
for anaerobic conditions
P ¼ P � kanP
m1 ¼ m1 � kanm; ðA4Þ
W07411 YUROVA ET AL.: MODELING DOC OUTPUT FROM A BOREAL MIRE
13 of 15
W07411

[65] The parameter ks is defined as
ks ¼m2
m1
; ðA5Þ
that is, the mineralization rate of SPSOC (m2) is ks times lessthen the mineralization rate of DOC (m1).
A2. Convection-Dispersion Equation for 1-DHydrological Scheme
[66] If a 1-D hydrological scheme (vertical discretization)is used and there is no lateral import of DOC into the mirefrom surrounding areas, the finite difference form of system(A1)–(A2) can be written as
D q � cð ÞDt
¼ Dz
D qDcDz
� �Dz
� qsc
Dz�D qzcð Þ
Dzþ tdesr s� KD � cð Þ
þ P � r� m1q � c ðA6aÞ
rDs
Dt¼ �tdesr s� KD � cð Þ � m2 � r � s; ðA6bÞ
where Dz is the depth of a specific layer, qz is the verticalwater flux and qs is the specific (area) lateral discharge fromthe layer z.
A3. Equations for Interpreting the Results ofLaboratory Peat Incubations With Stagnant Water
[67] Under laboratory conditions there is no advectivewater flow and diffusive mixing within the peat sample canbe considered instantaneous. Therefore, equations (A1) and(A2) can be simplified as
@ac@t
¼ �tdesKD
ac �MV
þ tdes � as þ P �M � m1 � ac ðA7aÞ
@as@t
¼ tdesKD
ac �MV
� tdes � as � m2 � as; ðA7bÞ
where M is the mass of the peat sample, V the volume ofwater added, while ac and as are the amounts of DOC andSPSOC, respectively, defined as ac = cV and as = sM.[68] The analytical solution of equations (A7a) and (A7b)
can then be obtained, assuming that the sorption reactionsystem is in quasi-equilibrium, that is s(t) = KDc(t):
c tð Þ � V ¼ c1 � V � P �Mm1 1þ ksKD
MV
� � !
� exp �m1
1þ ksKDMV
1þ KDMV
!t � t1ð Þ
!
þ P �Mm1 1þ ksKD
MV
� � ; ðA8Þ
where c1 is the DOC concentration at time t1, the end of theinitial phase of incubation when the first steady state isestablished between the sorbed and dissolved phases.
Assuming that the steady state has been reached, c1 canbe calculated from the mass conservation as follows:
c1 ¼s0
MVþ c0
KDMVþ 1
; ðA9Þ
where c0 and s0 are the initial DOC and SPSOCconcentrations, respectively.
[69] Acknowledgments. We are grateful to three anonymous refereesfor revising an earlier version of the manuscript. We also thank DanielRasse for insightful comments and suggestions, as well as for sharing thedata from his ongoing research. This work has been supported by theNECC project funded by the Nordic Center of Excellence (NCoE) PilotProgramme and by the Swedish Research Council for Environment,Agricultural Sciences and Spatial Planning.
ReferencesAgren, G. I., and E. Bosatta (1998), Theoretical Ecosystem Ecology:Understanding Element Cycles, Cambridge Univ. Press, New York.
Agren, G. I., et al. (1991), State-of-the-art of the models of production-decomposition linkages in conifer and grassland ecosystems, Ecol. Appl.,1, 118–138, doi:10.2307/1941806.
Aguilar, L., and L. J. Thibodeaux (2005), Kinetics of the peat soil dissolvedorganic carbon release from bed sediment to water. Part 1. Laboratorysimulation, Chemosphere, 58, 1309–1318, doi:10.1016/j.chemosphere.2004.10.011.
Aitkenhead, J. A., et al. (1999), The relationship between dissolved organiccarbon in streamwater and soil organic carbon pools at different spatialscales, Hydrol. Processes, 13, 1289–1302, doi:10.1002/(SICI)1099-1085(19990615)13:8<1289::AID-HYP766>3.0.CO;2-M.
Baskaran, S., N. S. Bolan, A. Rahman, and R. W. Tillman (1996), Non-equilibrium sorption during the movement of pesticides in soils, Pestic.Sci., 46, 333 –343, doi:10.1002/(SICI)1096-9063(199604)46:4<333::AID-PS361>3.0.CO;2-A.
Bergman, I. (1998), Microbial carbon mineralisation in peat from a borealmixed mire: Regulation by environmental factors, Ph.D. thesis, 33 pp,Swed. Univ. of Agric. Sci., Umea, Sweden.
Beven, K. J. (2001), Rainfall-Runoff Modelling: The Primer, 360 pp., JohnWiley, Chichester, U.K.
Billett, M. F., S. M. Palmer, D. Hope, C. Deacon, R. Storeton-West, K. J.Hargreaves, C. Flechard, and D. Fowler (2004), Linking land-atmosphere-stream carbon fluxes in a lowland peatland system, Global Biogeochem.Cycles, 18, GB1024, doi:10.1029/2003GB002058.
Blodau, C., N. Basiliko, and T. R. Moore (2004), Carbon turnover in peat-land mesocosms exposed to different water table levels, Biogeochemistry,67, 331–351, doi:10.1023/B:BIOG.0000015788.30164.e2.
Boyer, E. W., G. M. Hornberger, K. E. Bencala, and D. McKnight (1996),Overview of a simple model describing variation of dissolved organiccarbon in an upland catchment, Ecol. Modell., 86, 183 –188,doi:10.1016/0304-3800(95)00049-6.
Chow, A. T., K. T. Kenneth, S. Gao, and R. A. Dahlgren (2006), Tempera-ture, water content and wet-dry cycle effect on DOC production andcarbon mineralization in agricultural peat soils, Soil Biol. Biochem.,38, 477–488, doi:10.1016/j.soilbio.2005.06.005.
Clark, J. M., P. J. Chapman, A. L. Heathwaite, and J. K. Adamson (2006),Suppression of dissolved organic carbon by sulfate induced acidificationduring simulated droughts, Environ. Sci. Technol., 40, 1776–1783,doi:10.1021/es051488c.
Cohen, S. D., and A. S. Hindmarsh (1996), CVODE, a stiff/nonstiff ODEsolver in C, Comput. Phys., 10, 138–143.
Cole, J. J., et al. (2007), Plumbing the global carbon cycle: Integratinginland waters into the terrestrial carbon budget, Ecosystems, 10, 171–184,doi:10.1007/s10021-006-9013-8.
Erlandsson, M., et al. (2008), Thirty-five years of synchrony in the organicmatter concentrations of Swedish rivers explained by variation in flowand sulphate, Global Change Biol., 14, 1–8.
Fraser, C. J. D., N. T. Roulet, and T. R. Moore (2001), Hydrology anddissolved organic carbon biogeochemistry in an ombrotrophic bog,Hydrol. Processes, 15, 3151–3166, doi:10.1002/hyp.322.
Freeman, C., C. D. Evans, and D. T. Monteith (2001a), Export of organiccarbon from peat soils, Nature, 412, 785, doi:10.1038/35090628.
Freeman, C., N. Ostle, and H. Kang (2001b), An enzymic ‘latch’ on aglobal carbon store, Nature, 409, 149, doi:10.1038/35051650.
14 of 15
W07411 YUROVA ET AL.: MODELING DOC OUTPUT FROM A BOREAL MIRE W07411

Futter, M. N., D. Butterfield, B. J. Cosby, P. J. Dillon, A. J. Wade, and P. G.Whitehead (2007), Modeling the mechanisms that control in-stream dis-solved organic carbon dynamics in upland and forested catchments,Water Resour. Res., 43, W02424, doi:10.1029/2006WR004960.
Granberg, G., H. Grip, M. O. Lofvenius, I. Sundh, B. H. Svensson, and M.Nilsson (1999), A simple model for simulation of water content, soilfrost, and soil temperatures in boreal mixed mires, Water Resour. Res.,35, 3771–3782.
Grieve, I. C. (1991), A model of dissolved organic carbon concentrations insoil and stream waters, Hydrol. Processes, 5, 301–307, doi:10.1002/hyp.3360050310.
Ivanov, K. E. (1981), Water Movement in Mirelands, Academic, London.Jonsson, A., et al. (2007), Integrating aquatic carbon fluxes in a borealcatchment carbon budget, J. Hydrol., 334, 141–150, doi:10.1016/j.jhydrol.2006.10.003.
Kalbitz, K., D. Schwesig, J. Retnemeyer, and E. Matzer (2005), Stabiliza-tion of the dissolved organic matter by sorption to the mineral soil, SoilBiol. Biochem., 37, 1319–1331, doi:10.1016/j.soilbio.2004.11.028.
Karlstrom, H. (1995), Peat Characteristics: Based on Multivariate DataAnalysis of Magnetic Resonance Spectroscopy Data, 56 pp., Umea Univ.,Umea, Sweden.
Lapidus, L., and N. R. Amundson (1952), Mathematics of adsorption inbeds. VI. The effect of longitudinal diffusion in ion exchange and chro-matographic columns, J. Phys. Chem., 56, 984–988, doi:10.1021/j150500a014.
Lofts, S., E. Tipping, and C. Woof (2001), Modelling the solid-solutionpartitioning of organic matter in European forest soils, Eur. J. Soil Sci.,52, 215–226, doi:10.1046/j.1365-2389.2001.00367.x.
McDonald,M. G., andA.W.Harbaugh (1988), Amodular three-dimensionalfinite-difference ground-water flow model, U. S. Geol. Surv. Tech. WaterResour. Invest., book 6, chap. A1, 586 pp.
McKnight, D., and G. R. Aiken (1998), Sources and age of aquatic humus,in Aquatic Humic Substances Ecology and Biogeochemistry, edited byD. O. Hessen and L. J. Tranvik, pp. 9–39, Springer, New York.
McKnight, D., E. M. Thurman, R. L. Wershaw, and H. Hemond (1985),Biogeochemistry of aquatic humic substances in Thoreau’s bog, Con-cord, Massachusetts, Ecology, 66, 1339–1352, doi:10.2307/1939187.
Michalzik, B., et al. (2003), Modelling the production and transport of dis-solved organic carbon in forest soils, Biogeochemistry, 66, 241–264,doi:10.1023/B:BIOG.0000005329.68861.27.
Monteith, D. T., et al. (2007), Dissolved organic carbon trends resulting fromchanges in atmospheric deposition chemistry, Nature, 450, 537–540,doi:10.1038/nature06316.
Moore, T. R., and M. Dalva (1997), Methane and carbon dioxide exchangepotentials of peat soils in aerobic and anaerobic laboratory incuba-tions, Soil Biol. Biochem., 29, 1157–1164, doi:10.1016/S0038-0717(97)00037-0.
Moore, T. R., and M. Dalva (2001), Some controls on the release of dis-solved organic carbon by plant tissues and soils, Soil Sci., 166, 38–47,doi:10.1097/00010694-200101000-00007.
Moore, T. R., N. T. Roulet, and J. M. Waddington (1998), Uncertainty inpredicting the effect of climatic change on the carbon cycling of Cana-dian peatlands, Clim. Change, 40, 229 – 245, doi:10.1023/A:1005408719297.
Neff, J. C., and G. P. Asner (2001), Dissolved organic carbon in terrestrialecosystems: Synthesis and a model, Ecosystems, 4, 29–48, doi:10.1007/s100210000058.
Nungesser, M. K. (2003), Modelling microtopography in boreal peatlands:Hummocks and hollows, Ecol. Modell., 165, 175–207.
Lofvenius, M. O., M. Kluge, and T. Lundmark (2003), Snow and soil frostdepth in two types of shelterwood and a clear-cut area, Scand. J. For.Res., 18, 54–63, doi:10.1080/0891060310002345.
Ours, D. P., D. I. Siegel, and P. H. Glaser (1997), Chemical dilation and thedual porosity of humified bog peat, J. Hydrol., 196, 348–360,doi:10.1016/S0022-1694(96)03247-7.
Qualls, R. G. (2000), Comparison of the behavior of soluble organic andinorganic nutrients in forest soils, For. Ecol. Manage., 138, 29–50,doi:10.1016/S0378-1127(00)00410-2.
Qualls, R. G., and C. J. Richardson (2003), Factors controlling concentra-tion, export, and decomposition of dissolved organic nutrients in theEverglades of Florida, Biogeochemistry, 62, 197–229, doi:10.1023/A:1021150503664.
Reeve, A. S., D. I. Siegel, and P. H. Glaser (2000), Simulating vertical flowin large peatlands, J. Hydrol., 227, 207–217, doi:10.1016/S0022-1694(99)00183-3.
Reeve, A. S., D. I. Siegel, and P. H. Glaser (2001), Simulating dispersivemixing in large peatlands, J. Hydrol., 242, 103–114, doi:10.1016/S0022-1694(00)00386-3.
Romanov, V. V. (1961), Mire Hydrophysics (in Russian), Hodrometeorol.Publ. House, St. Petersburg, Russia.
Roulet, N. T., et al. (2007), Contemporary carbon balance and late Holo-cene carbon accumulation in a northern peatland, Global Change Biol.,13, 397–411, doi:10.1111/j.1365-2486.2006.01292.x.
Sagerfors, J. (2007), Land-atmosphere exchange of CO2, water and energyat a boreal minerotrophic mire, Ph.D. dissertation, Acta Univ. Agric.Sueciae, Umea, Sweden.
Saltelli, A. (Ed.) (2000), Sensitivity Analysis, 475 pp., John Wiley,Chichester, U.K.
Selim, H. M., and L. Ma (1998), Physical Nonequilibrium in Soils: Model-ing and Application, 520 pp., Ann Arbor Press, Chelsea, Mich.
Silberstein, R. P., et al. (1999), Modelling the effects of soil moisture andsolute conditions on long term tree growth and water use: A case studyfrom the Shepparton irrigation area, Australia, Agric. Water Manage., 39,283–315, doi:10.1016/S0378-3774(98)00083-3.
Sirin, A. A., D. B. Shumov, and L. S. Vlasova (1997), Investigation of bogwater circulation using 3H analysis data, Water Resour., 24, 625–633.
Sirin, A., S. Kohler, and K. Bishop (1998), Resolving flow pathways andgeochemistry in a headwater forested wetland with multiple tracers, inHydrology, Water Resources and Ecology in Headwaters, edited byK. Kovar, IAHS Publ., 248, 337–342.
Skyllberg, U., and T. Magnusson (1995), Cation adsorbed to soil organicmatter—A regulatory factor for the release of organic carbon and hydro-gen ions from soils to water, Water Air Soil Pollut., 85, 1095–1100,doi:10.1007/BF00477127.
Tipping, E., and C. Woof (1991), The distribution of humic substancesbetween the solid and aqueous phases of acid organic soils: A descriptionbased on humic heterogeneity and charge-dependent sorption equilibria,J. Soil Sci., 42, 437–448, doi:10.1111/j.1365-2389.1991.tb00421.x.
Tranvik, L. J., and M. Jansson (2002), Terrestrial export of organic carbon,Nature, 415, 861–862, doi:10.1038/415861b.
Tsvetkova, I., and A. Sirin (2003), The hydrology of the groundwater-fedboreal mire in Zapadnaja Dvina River headwaters (western Russia), inEcohydrological Processes in Northern Wetlands, edited by A. Jarvet andE. Lode, pp. 116–121, Tartu Univ. Press, Tallinn.
van Genuchten, M. T., and R. J. Wagenet (1989), Two-site/two-regionmodels for pesticide transport and degradation: Theoretical developmentand analytical solutions, Soil Sci. Soc. Am. J., 53, 1303–1310.
Virta, J. (1966), Measurement of evapotranspiration and computation ofwater budget in treeless peatlands in the natural state, Comment. Phys.Math., 32, 1–70.
Willmott, C. J. (1982), Some comments on the evaluation of model perfor-mance, Bull. Am. Meteorol. Soc., 63, 1309–1313, doi:10.1175/1520-0477(1982)063<1309:SCOTEO>2.0.CO;2.
Worrall, F., T. Burt, and J. Adamson (2004), Can climate change explainincrease in DOC flux from upland peat catchments?, Sci. Total Environ.,326, 95–112, doi:10.1016/j.scitotenv.2003.11.022.
Worrall, F., T. Burt, and J. Adamson (2006), Long-term changes in hydro-logical pathways in an upland peat catchment-recovery from severedrought?, J. Hydrol., 321, 5–20, doi:10.1016/j.jhydrol.2005.06.043.
Yurova, A., A. Wolf, J. Sagerfors, and M. Nilsson (2007), Variations in netecosystem exchange of carbon dioxide in a boreal mire: Modelingmechanisms linked to water table position, J. Geophys. Res., 112,G02025, doi:10.1029/2006JG000342.
����������������������������K. Bishop and H. Laudon, Department of Environmental Assessment,
Swedish University of Agricultural Sciences, SE-75007 Uppsala, Sweden.
I. Buffam, Department of Forest Ecology and Management, SwedishUniversity of Agricultural Sciences, SE-901 83 Umea, Sweden.
A. Sirin, Laboratory of Peatland Forestry and Hydrology, Institute ofForest Science, Russian Academy of Sciences, Uspenskoye 143030,Russia.
A. Yurova, Department of Physical Geography and EcosystemsAnalysis, Lund University, Solvegatan 12, Lund SE-22362, Sweden.([email protected])
W07411 YUROVA ET AL.: MODELING DOC OUTPUT FROM A BOREAL MIRE
15 of 15
W07411
Copyright © 2022 FDOKUMEN