Modeling of the short wave radiation distribution in an agroforestry system
22
Agricultural and Forest Meteorology 118 (2003) 185–206 Modeling of the short wave radiation distribution in an agroforestry system Wenguang Zhao a,b,∗ , Russell J. Qualls a , Pedro R. Berliner b a Department of Biological and Agricultural Engineering, University of Idaho, P.O. Box 440904, Moscow, ID 83844-0904, USA b Jacob Blaustein Institute for Desert Research, Ben-Gurion University of the Negev, Sede Boker Campus 84990, Israel Received 14 November 2002; received in revised form 28 March 2003; accepted 7 April 2003 Abstract In an agroforestry system, short wave radiation distribution under the canopy of the trees is important to the activity of the annual crops growing beneath. A three-dimensional model is proposed to describe the short wave radiation distribution under the tree canopy in an agroforestry system. In the model, the agroforestry system is assumed to be planted in regular arrays and have spherical crowns. The short wave radiation that reaches a prescribed point on the ground is computed as the integration of radiation from all the differential directions of the whole hemisphere. The canopy depth in each differential direction is computed, and the extinction coefficient of the tree canopy is estimated by computer analysis of photograph images of the tree crowns taken by a conventional camera. A major advantage of this method is that the laborious leaf area index (LAI) and leaf inclination measurement can be eliminated. The model is able to predict both the short wave radiation distributions below the canopy of an agroforestry system at a prescribed time and the diurnal variation of the total hemispherical short wave radiation at a prescribed point below the canopy. Comparison of the modeled results with the measured values showed that the proposed model describes the daily patterns of the short wave radiation under the tree canopy quite well for both discontinuous canopy and overlapping canopy and for different shading conditions. The difference between the modeled daily total values of the short wave radiation under the canopy and the measured daily total values is usually less than 5% of the global radiation. Results from sensitivity analyses of the model to crown radius and canopy gap fraction are reported. © 2003 Elsevier Science B.V. All rights reserved. Keywords: Model; Radiation; Agroforestry; Canopy 1. Introduction Degradation of the environment, increase of pop- ulation and improvement of human quality of life place increasing pressure on agricultural production. However, water resources are limited and distributed unevenly and the quantity of arable land is decreasing as a result of urbanization. Agroforestry is a generic ∗ Corresponding author. Tel.: +1-208-885-7333; fax: +1-208-885-7908. E-mail address: [email protected] (W. Zhao). name given to the intercropping of trees or shrubs with annuals or perennials. It is an old agricultural technology widely used in the tropics, subtropics and temperate zones. In some cases this approach has been adopted because the presence of trees creates the microclimate (Monteith et al., 1991) appropriate for the growing of the intercrops, coffee and cocoa for example (Levasseur and Olivier, 2000; Muschler, 2001), and the partial shade from the upperstorey trees improves the product quality of the under- storey intercrops (Lin et al., 2001). In recent years it has gained in popularity as it has proven to be a 0168-1923/$ – see front matter © 2003 Elsevier Science B.V. All rights reserved. doi:10.1016/S0168-1923(03)00108-4
-
Upload
independent -
Category
Documents
-
view
4 -
download
0
Transcript of Modeling of the short wave radiation distribution in an agroforestry system

Agricultural and Forest Meteorology 118 (2003) 185–206
Modeling of the short wave radiation distributionin an agroforestry system
Wenguang Zhaoa,b,∗, Russell J. Quallsa, Pedro R. Berlinerba Department of Biological and Agricultural Engineering, University of Idaho, P.O. Box 440904, Moscow, ID 83844-0904, USA
b Jacob Blaustein Institute for Desert Research, Ben-Gurion University of the Negev, Sede Boker Campus 84990, Israel
Received 14 November 2002; received in revised form 28 March 2003; accepted 7 April 2003
Abstract
In an agroforestry system, short wave radiation distribution under the canopy of the trees is important to the activity of theannual crops growing beneath. A three-dimensional model is proposed to describe the short wave radiation distribution underthe tree canopy in an agroforestry system. In the model, the agroforestry system is assumed to be planted in regular arrays andhave spherical crowns. The short wave radiation that reaches a prescribed point on the ground is computed as the integrationof radiation from all the differential directions of the whole hemisphere. The canopy depth in each differential direction iscomputed, and the extinction coefficient of the tree canopy is estimated by computer analysis of photograph images of thetree crowns taken by a conventional camera. A major advantage of this method is that the laborious leaf area index (LAI)and leaf inclination measurement can be eliminated. The model is able to predict both the short wave radiation distributionsbelow the canopy of an agroforestry system at a prescribed time and the diurnal variation of the total hemispherical shortwave radiation at a prescribed point below the canopy. Comparison of the modeled results with the measured values showedthat the proposed model describes the daily patterns of the short wave radiation under the tree canopy quite well for bothdiscontinuous canopy and overlapping canopy and for different shading conditions. The difference between the modeled dailytotal values of the short wave radiation under the canopy and the measured daily total values is usually less than 5% of theglobal radiation. Results from sensitivity analyses of the model to crown radius and canopy gap fraction are reported.© 2003 Elsevier Science B.V. All rights reserved.
Keywords:Model; Radiation; Agroforestry; Canopy
1. Introduction
Degradation of the environment, increase of pop-ulation and improvement of human quality of lifeplace increasing pressure on agricultural production.However, water resources are limited and distributedunevenly and the quantity of arable land is decreasingas a result of urbanization. Agroforestry is a generic
∗ Corresponding author. Tel.:+1-208-885-7333;fax: +1-208-885-7908.E-mail address:[email protected] (W. Zhao).
name given to the intercropping of trees or shrubswith annuals or perennials. It is an old agriculturaltechnology widely used in the tropics, subtropics andtemperate zones. In some cases this approach hasbeen adopted because the presence of trees createsthe microclimate (Monteith et al., 1991) appropriatefor the growing of the intercrops, coffee and cocoafor example (Levasseur and Olivier, 2000; Muschler,2001), and the partial shade from the upperstoreytrees improves the product quality of the under-storey intercrops (Lin et al., 2001). In recent yearsit has gained in popularity as it has proven to be a
0168-1923/$ – see front matter © 2003 Elsevier Science B.V. All rights reserved.doi:10.1016/S0168-1923(03)00108-4

186 W. Zhao et al. / Agricultural and Forest Meteorology 118 (2003) 185–206
robust agricultural production system (Garrett andBuck, 1997; Gold, 2001; Muschler and Beer, 2001).Numerous researchers have documented increasedproductivity owing to agroforestry compared to mono-cultures (e.g.Hauser et al., 2000; Visvanath et al.,2000; Ramırez et al., 2001; Kho et al., 2001; Neupanaand Thapa, 2001). Among the benefits of agroforestryto the soil system are: (1) enhanced nutrient recycling;(2) reduced losses in soil nutrient leaching; (3) stimu-lation of higher soil faunal activities; (4) soil erosioncontrol; and (5) improved soil fertility (Kang, 1997).Agroforestry can also act as windbreak to reduce cropdamage and loss of mulch material that may be causedby strong wind (Garrett and Buck, 1997; Oteng’Iet al., 2000). It has also been reported that agroforestrysystems reduce farmers’ dependence on the resourcesof nearby national parks (Murniati et al., 2001).
In arid areas the production of firewood, fodderand grains is limited by the low annual precipitationdepth, and the possibility of using runoff to irri-gate an agroforestry system has been put forward byLövenstein et al. (1991)and successfully tested byDroppelman et al. (2000a,b)in the Turkana regionof Kenya. This system increased the productivityper unit land area when compared to monocultures(Droppelman et al., 2000a,b). The critical aspect forthe successful implementation of such a techniquein arid zones is to minimize the competition for twoof the more limiting factors: solar radiation and wa-ter. One approach to minimize the competition forsolar radiation is by pruning the tree component dur-ing the period of time during which the intercropis growing (Droppelman et al., 2000a). Determiningthe optimum degree and timing of pruning requires alarge number of trials to cover an adequate numberof arrangements of trees and crops, which result inlarge and very expensive field trials. One solution tothis problem is to use simulation models to explorea wide range of designs and test only the best in thefield.
Numerous studies have been carried out and con-siderable efforts have been made in modeling theattenuation of solar radiation by plant canopies. Mostof them have assumed that the plant canopies werehorizontally homogeneous (Sinoquet and Bonhomme,1992). A comprehensive review of these so-called“one-dimensional models” has been presented byLemeur and Blad (1974).
These type of models have also been used to esti-mate radiation in intercropped systems by assumingthat the foliage of the intercropping species are so“well mixed” as to be uniformly distributed both in thevertical and horizontal directions (Rimmington, 1984;Sinoquet et al., 1990). To model the intercroppingsystems in which two species have different foliagedensities and heights, one-dimensional models havealso been used by dividing the vegetation volume intotwo layers, each one containing the foliage of only onespecies which was assumed to be horizontally homo-geneous (e.g. the radiation competition model of treesand grass proposed byMcMurtrie and Wolf, 1983).Other one-dimensional models have considered thedifferent heights of plant species and have divided thecanopy into two layers so that the upper layer containsonly the foliage of the taller species and the lower layeris composed of both species; and both of the layershave been assumed to be horizontally homogeneous(Spitters and Aerts, 1983; Rimmington, 1985). Thistechnique has been extended to a large number of lay-ers so as to represent the vertical changes of the canopy(Ryel et al., 1990) and even to a canopy that wascomposed of six different species (Graf et al., 1990).Kuusk (1992) proposed a sophisticated model forcalculating the absorption profiles within a homoge-neous vegetation canopy based on the Nilson–Kuuskcanopy reflectance model (Nilson and Kuusk, 1989).
It is evident that considerable errors will ap-pear when the attenuation of solar radiation by thecanopies of well-defined row crops is calculated usingone-dimensional models. Simple models of radiationattenuation by hedges that have rectangular or trian-gular shapes have been proposed bySmart (1973),Jackson and Palmer (1979). A model that describesthe canopy as parallel rows with ellipsoidal crosssections has been presented byCharles-Edwards andThorpe (1976)for estimating the radiation absorp-tion and penetration in an apple orchard.Cohen andFuchs (1987)estimated the solar radiation attenua-tion by an orchard canopy using a two-dimensionalmodel assuming that the canopy transmitted partially.Berliner (1988)has modeled the orchard canopy asbeing composed of parallel gapless and opaque cylin-ders of infinite length and with circular cross sectionsuspended a certain height above the ground.
Nearly all two-dimensional models have madethe assumption that the foliage of the canopy is

W. Zhao et al. / Agricultural and Forest Meteorology 118 (2003) 185–206 187
distributed homogeneously in one direction, usuallythe row orientation, and heterogeneously in the other.In an agroforestry system, however, this assumptionis often violated because the distribution of the fo-liage is not homogeneous even in the row direction,especially when the canopy in the row is discontinu-ous, i.e. the diameters of the crowns are smaller thanthe distances between adjacent trees in the row. Thisis almost always true in firewood and fodder orientedrunoff agroforestry systems, where the annual loppingand re-growth of the tree crowns makes the canopydiscontinuous even in the row direction. In this situa-tion, the gaps between crowns will considerably affectthe accuracy of the two-dimensional models. In orderto solve this problem, three-dimensional models areneeded. To date few three-dimensional models havebeen proposed.
Mann et al. (1980)presented a three-dimensionalmodel for cotton and defined the individual plants asellipsoidal spheres with random plant spacing in therow. In their model:
(1) The edge effects were ignored by assuming infi-nite field dimensions.
(2) Diffuse radiation was neglected by consideringonly the direct solar beam.
(3) The probability of a solar ray hitting a leaf wasassumed to be the same whether it passes throughthe edges or the middle of the plant crown.
(4) The result of the model was the sunlit fractionon the whole area (a detailed description of thespatial distribution cannot be obtained).
A three-dimensional model was developed to cal-culate the periods of shadow beneath a tree canopyby assuming the tree crowns were opaque (Quesada etal., 1989). As in Mann’s model, the edge effects anddiffuse radiation were ignored.
Chen et al. (1993)analyzed the leaf area index (LAI)and gap frequency of a computer generated poplartree stand by using a digitized image analysis systemand modeled the light distribution. In their work, thecanopy was created using a three-dimensional crownarchitecture model for poplar trees and the projectionwas made on the ground from the zenith, i.e. the lightsource being assumed to be directly overhead. There-fore, it represented only a special case instead of thereal situations.
Radiation beneath aPinus radiataforest was mod-eled as light passing through a canopy being madeup of a cone atop of a cylinder and balanced upona cylindrical bole (Reid and Ferguson, 1992). Un-like Mann’s model, Reid and Ferguson considered anevenly spaced stand; consequently, the model is likelyto be more useful in predicting the shadow distribu-tion on the ground in an agroforestry system. However,Reid and Ferguson invoked the first three assumptionsas those employed byMann et al. (1980). Problemswith these assumptions are discussed below.
First, in a runoff agroforestry system, due to cli-matic, topographic and geomorphologic factors andthe ratio between runoff generating and receivingareas, the size of the plots is usually quite limited (es-pecially in arid regions). As a result, the edge effectsmay play a significant role.
Secondly, most of the previously described modelsdeveloped radiation penetration (RP) relations onlyfor the direct solar beam, while the penetration ofdiffuse radiation has been neglected. To the annualcrops growing under the shade of the trees in a runoffagroforestry system, diffuse radiation is important,especially during overcast and cloudy days whendiffuse radiation is the main component of global ra-diation. In a study of the stomatal response to photo-synthetically active radiation (PAR) in a cotton field,Petersen et al. (1991)found that the daytime averageof shaded leaf conductance was approximately 40%of that of sunlit leaves. The exclusion of the diffuseradiation in a model may lead to misjudgment whenan optimal model to use light is designed or the lightcompetition is studied (McMurtrie and Wolf, 1983).In forestry systems, the canopy transmittance duringa clear day, when direct radiation is dominant, is dif-ferent from the transmittance during an overcast day,when diffuse radiation is dominant (e.g.Vezina andPech, 1964; Vales and Bunnell, 1988; Eck andDeering, 1992). Additionally, it has been found thatthe transmittance of solar radiation through the canopydown to the forest floor was maintained constantthroughout an overcast day and changed dramatically,from 1.8 to 4.5%, on a clear day as a function of thesolar zenith angle (Eck and Deering, 1992).
Third, the probability of a solar ray hitting a leaf islower when it passes through the edge than throughthe middle of a tree crown, because the radiation beampasses a thinner canopy layer in the former situation

188 W. Zhao et al. / Agricultural and Forest Meteorology 118 (2003) 185–206
than the latter (if the leaves are assumed to be dis-tributed randomly inside the tree crown).
Fourth, a detailed model description of the spatialdistribution of solar radiation under the tree canopyin a runoff agroforestry system is critical in order toaccommodate the light requirement of the annual cropby selecting optimal density and row direction of theforestry system.
We may therefore conclude that none the three-dimensional models mentioned previously is suitablefor our purpose.
Moreover, most of the models described previouslyrequire the leaf area index and the leaf inclination dis-tribution to be determined for use as input parameters.Measurement of LAI and leaf inclination distributionin trees is tedious and extremely difficult, especiallyfor species with large number of small leaves.
The objective of this paper is to present a three-dimensional model that describes the solar radiationtransmission through the discontinuous or overlappedcanopy of an agroforestry system. The trees in the sys-tem are assumed to be planted in regular arrays andhave crowns with regular geometrical features. Thetransmittances of direct and diffuse radiation are mod-eled separately considering the different canopy depthsin the paths of the light beams from different direc-tions. The edge effects of the agroforestry system arealso taken into account. Gap fraction, obtained by ana-lyzing the photographs of tree crowns taken by a con-ventional camera, and crown dimension were used toparameterize the model instead of using LAI and leafinclination. The model is also capable of predictingthe spatial distribution of solar radiation at any timeand of predicting the time variation of solar radiationat any point under the tree canopy in the agroforestrysystem. An experiment was performed to measure theactual transmittance of anAcacia Salignaagroforestrysystem in different tree densities and the results wereused to validate the model.
2. Model description
The solar radiation that reaches the ground or theintercrop below the tree canopy has two sources: thedirect solar radiation and the diffuse radiation that em-anates from the whole sky hemisphere. The penetra-tion of both direct and diffuse radiation through the
canopy layer is affected by the heterogeneous distribu-tion of the leaves in the canopy layer, which causes aheterogeneous distribution of radiation on the ground.
The heterogeneous distribution of direct radiationon the ground can be defined in two scales. The pri-mary scale is a result of canopy geometry relative tosolar position (under the shade of the tree crowns orexposed directly to the sun). The secondary scale isthe sunspots within the shaded area. If date and timeare known, the solar position on the celestial hemi-sphere (altitude and azimuth) can be derived for anyspecific location (longitude and latitude). The model(assuming the regular arrays of trees with regular andwell-defined crown geometry), predicts the position ofthe shade on the ground in an agroforestry system atany given time. The appearance of the sunspots on theshade is irregular due to the discontinuous distribu-tion of leaves in the canopy. Leaf flutter generates ad-ditional temporary sunspots, changing their sizes andmoving their positions. The model presented in thispaper does not predict the exact position and size ofthe sunspots, but instead, the statistical probability offinding a spot on a certain point of the ground (or inother words, the expected average radiation flux onthe point) is modeled taking into account the canopydepth in the ray’s path and the transmitting character-istics of the tree crowns. The transmitting character-istics of the tree crowns are estimated by an analysisof high contrast photographs of the crowns taken by aconventional camera from the ground.
The heterogeneous distribution of diffuse radiationon the ground is modeled similarly to that of directradiation, by dividing the hemisphere into differentialareas so that the radiation from each differential areacan be taken as that from one direction. The total dif-fuse radiation reaching a point on the ground is theintegration of radiation transmitted from the differen-tial areas over the whole hemisphere.
2.1. General
When a beam with the radiation intensityI0 passesthrough a homogeneous medium with the depth ofx,the beam will be attenuated according to Beer’s law:
I = I0e−kx (1)
whereI0 is the radiation intensity before entering themedium,I the radiation intensity out of the medium,

W. Zhao et al. / Agricultural and Forest Meteorology 118 (2003) 185–206 189
x the length of the ray’s path through the medium andk the extinction coefficient which is a constant for acertain medium in a certain direction and depends onlyon the characteristic of the medium.
Numerous researchers have shown that the aboveformula can also be used to describe the radiationpenetration through a canopy with randomly dis-tributed leaves (Isobe, 1962; Monteith, 1965; Reeve,1960; Horie, 1966; Warren Wilson, 1967; Cowan,1968; Isobe, 1969; Bonhomme and Chartier, 1972).In this situation,I/I0 or e−kx represents the gap frac-tion of the canopy, in other words, the probabilitythat the beam can pass through the canopy. In thiscase, the “extinction coefficient”k relates to the gapfraction in an area instead of the radiation intensityon a point. Note that the parameterk is still called“extinction coefficient” in this paper, although it re-lates to the probability that the beam passes througha canopy instead of the proportion of the beam thatpasses through a homogeneous medium.
At any point on the ground below a canopy, incom-ing short wave radiation flux densityQ may be ex-pressed (neglecting the fraction scattered downwardsby the leaves) as:
Q = s + D (2)
wheres is the direct radiation from the sun that passesthrough the canopy and reaches the point andD the dif-fuse radiation from the whole sky that passes throughthe canopy and reaches the point in question.
2.2. Geometrical features
The short wave radiation that reaches an infinitesi-mal horizontal area at point O on the ground originatesfrom the celestial hemisphere. Thus, the total incom-ing short wave radiation received by the area is theintegration of the radiation from the whole celestialhemisphere.
Any point on the celestial hemisphere can be de-fined by its altitude (α) and azimuth (β). A differentialarea dS, with a width of dW which corresponds todα, and a length of dL which corresponds to dβ, onthe hemisphere in the direction (α, β) can be defined(Fig. 1). Q(α, β), s(α, β) and D(α, β) are used torepresent the incoming total short wave radiation,direct radiation, and diffuse radiation flux densities,respectively, from the differential area dS to an area
Fig. 1. Diagram of a differential area, dS, on the hemisphere.
perpendicular to the direction (α, β) above the canopy.Assume that the canopy depth in the direction (α, β)is x(α, β) and the extinction coefficient of the canopyis k. Thus, the radiation received by the horizontalarea, at the point O on the ground in an agroforestrysystem, from the differential area dS is:
dQp = Q(α, β)e−kx(α,β) sinαdS (3)
The total radiation received from the whole hemi-sphere by the horizontal unit area in an agroforestrysystem (Qp) is therefore:
Qp =∫∫
hemisphereQ(α, β)e−kx(α,β) sinαdS
=∫∫
hemisphere[s(α, β)+D(α, β)] e−kx(α,β)sinαdS
=∫∫
hemispheres(α, β)e−kx(α,β) sinαdS
+∫∫
hemisphereD(α, β)e−kx(α,β) sinαdS (4)
Furthermore, since
dS = dW × dL = r2 cosαdαdβ (5)
Eq. (4)can thus be rewritten as:
Qp =∫∫
hemispheres(α, β)e−kx(α,β) sinαdS
+ 1
2r2
∫ π/2
0
∫ 2π
0D(α, β)e−kx(α,β) sin(2α)dβ dα
(6)

190 W. Zhao et al. / Agricultural and Forest Meteorology 118 (2003) 185–206
Assuming that the diffuse radiation flux from the ce-lestial hemisphere is isotropic,D(α, β) is a constantand can be noted asD without the direction variablesα andβ. Therefore,Eq. (6)can be rewritten as:
Qp =∫∫
hemispheres(α, β)e−kx(α,β) sinαdS
+ 1
2r2D
∫ π/2
0
∫ 2π
0e−kx(α,β) sin(2α)dβ dα (7)
The diffuse radiation flux on a horizontal surfaceabove the canopy,D0, can be expressed as:
D0 =∫∫
hemisphereDr2 sinα cosαdβ dα
= Dr2∫ π/2
0
∫ 2π
0sinα cosαdβ dα = πr2D (8)
Therefore,Eq. (7)can be rewritten as:
Qp =∫∫
hemispheres(α, β)e−kx(α,β) sinαdS
+ D0
2π
∫ π/2
0
∫ 2π
0e−kx(α,β) sin(2α)dβ dα
=∫∫
hemispheres(α, β)e−kx(α,β) sinαdS + fttD0
(9)
where
ftt = 1
2π
∫ π/2
0
∫ 2π
0e−kx(α,β) sin(2α)dβ dα (10)
is the fraction of the hemispheric radiation transmittedby the tree canopy.ftt can be applied to both diffuseradiation and atmospheric long wave radiation. Thevalue of ftt lies between 0 and 1. Whenf tt = 0, thetree canopy is closed so that no radiation can passthrough. Whenf tt = 1, the tree canopy is transpar-ent (or no canopy exists at all).ftt can be calculatedaccording toEq. (10), and the computation of theextinction coefficientk and the canopy depthx(α, β)will be described in the following sections.
2.3. The position of the sun on the celestialhemisphere
Eq. (9)contains two terms, direct and diffuse radia-tion. We assume that the direct radiation beam comes
from a point source, which is located in the center ofthe actual sun. The position of the sun on the celestialhemisphere can be calculated according to geographi-cal latitude, local apparent hour angle and declinationof the sun (Paltridge and Platt, 1976):
sin(π
2−z
)=sinγ=sinδ sinΦ+ cosδ cosΦ costh
cosφ = sinδ cosΦ − cosΦ sinφ costhcosγ
sinφ = −cosδ sinthcosγ (11)
wherez is the zenith distance of the sun,γ the altitudeof the sun,φ the azimuth of the sun,δ the declinationof the sun,th the local apparent hour angle andΦ thegeographical latitude.
The declination of the sunδ and the local apparenthour angleth can be estimated empirically (Paltridgeand Platt, 1976). Therefore, the zenith distance of thesunz and the azimuth of the sunφ can be solved byEq. (11).
It should be mentioned that the refraction of the ra-diation beam by the earth’s atmosphere was neglectedin the model. The altitude of the sun actually observedat the ground is slightly larger than estimated. Thedifference ranges from zero at 90◦ solar altitudes toabout 0.5◦ at the horizon and is slightly dependent onpressure and temperature of the atmosphere (Paltridgeand Platt, 1976). These differences have been ignoredin the present model.
It is evident that the direct radiation comes onlyfrom the direction where the sun is located in the ce-lestial hemisphere. Thus, the direct component of ra-diation from the hemisphere can be expressed as:
s(α, β) sinα
={s(γ, φ) sinγ = s0 whenα = γ andβ = φ
0 otherwise
wheres0 is the direct radiation flux on a horizontalsurface above the canopy. Inserting inEq. (9), yields:
Qp = s0 e−kx(γ,φ) + fttD0 (12)
2.4. Modeling of the canopy depth x(α, β)
In the present model, it is assumed that the ground ishorizontal, and that trees are planted in regular arrays

W. Zhao et al. / Agricultural and Forest Meteorology 118 (2003) 185–206 191
and have regularly shaped crowns. Near spherical orellipsoidal shapes are common crown shapes in agro-forestry systems. If we assume that the crowns of thetrees are spherical and neglect the influence of the treetrunks, it is possible to compute the canopy depth thata beam must pass through from any angle of the ce-lestial hemisphere to a given point on the soil surface.We first present the geometry for a single tree, andthen discuss the geometry of the entire agroforestrysystem.
2.4.1. The canopy depth of a single treeConsider a tree, with a height ofH′ and a crown
radius ofr. The horizontal distance between our pointof interest P and the position of the tree is L. Theheight of the center of the tree crown O isH and theelevation angle of this point with respect to P isω.The crown radius angle, the angle between the centerof the crown PO and the tangent line of the crown PA,is ϕ (Fig. 2). Assume a beam, which has an angle ofθ with PO, passes through the tree crown, from C toD. Thus:
H = OE = H ′ − r
PO=√H2 + L2
PA =√H2 + L2 − r2
Fig. 2. Diagram of the canopy depth that a certain radiation must penetrate while passing through a single tree with spherical crown.
tanω = H
L, ω = arctan
H
L(13)
tanϕ = r√H2 + L2 − r2
,
ϕ = arctanr√
H2 + L2 − r2(14)
OB = OP sinθ =√H2 + L2 sinθ
BC =
√OC2 − OB2 =
√r2 − (H2 + L2) sin2 θ
if θ < ϕ
0 if θ ≥ ϕ
x(θ) = CD ={
2√r2 − (H2 + L2) sin2 θ if θ < ϕ
0 if θ ≥ ϕ
(15)
It should be mentioned that CD is the canopy depthfor radiation in the direction of CP passing through thetree of interest and reaching the point P and that CDis not necessarily on the vertical plane OPE. As far asthe angle∠CPO= θ, regardless of any direction in thecore that point to P, the canopy depths are the same.In other words, CD is the same at any position when

192 W. Zhao et al. / Agricultural and Forest Meteorology 118 (2003) 185–206
Fig. 3. Relative location of the point of interest and the trees in an agroforestry system. Ordinal number of rows (r), ordinal number oftrees (t), positions of trees ().
it turns 360◦ around the axis OP. The conditionθ < ϕ
is identical to the condition√H2 + L2 sinθ < r.
2.4.2. The canopy depth in an agroforestry systemWe define the row direction with respect to the north
asβ0(−(π/2) < β0 ≤ (π/2)), the distance betweenrows asR0 and the distance between trunks in a row asT0. For any point P we can define a set of coordinatesaccording to the following rules:
(1) Take the tree nearest to P as the origin.(2) Take the row direction as theY-coordinate.
Accordingly, the location of the point can be ex-pressed as P(x0, y0) (Fig. 3).
Consider a tree located at point E: the ordinal rownumber isi and ordinal trunk number isj from theorigin O(0, 0). The azimuth of the tree relative to P(x0,y0), with respect to the row direction, isβT and thedistance between E(iR0, jT0) and P(x0, y0) is L. Thus,
βT = arctaniR0 − x0
jT0 − y0(16)
L =√(iR0 − x0)2 + (jT0 − y0)2 (17)
Therefore, the altitude angle of the center of the treecrown,ω, and the radius angle of the tree crown,ϕ,can be calculated by combiningEqs. (13) and (17)asgiven in Eq. (18)andEqs. (14) and (17)as given inEq. (19), respectively:
ω = arctanH√
(iR0 − x0)2 + (jT0 − y0)2(18)
ϕ = arctanr√
H2 − r2 + (iR0 − x0)2 + (jT0 − y0)2
(19)
The angleθ between direction (α, β) and the direc-tion to the center of the tree crown may be computedas follows:
cosθ = sinα sinω + cosα cosω cos(β′ − βT)
whereβ′ is the azimuth angle measured from the rowdirection, rather than from the north. Therefore,
sin2 θ = 1 − cos2 θ = 1 − [sinα sinω
+ cosα cosω cos(β − βT − β0)]2 (20)
Thus, the crown of a tree located at row numberi andtrunk numberj has a canopy depth ofxi,j(α, β) in the

W. Zhao et al. / Agricultural and Forest Meteorology 118 (2003) 185–206 193
direction (α, β). UsingEq. (15)with Eq. (17), it canbe expressed as:
xi,j(α, β)
=
2√r2−[H2+(iR0−x0)2+(jT0 − y0)2] sin2 θ
if θ < ϕ
0 if θ ≥ ϕ
(21)
where sin2 θ is calculated according toEq. (20). Thetotal canopy depth in the direction (α, β) is the sumof the canopy depth in this direction of all the trees inthe agroforestry system. That is,
x(α, β) =n∑
i=−m
v∑j=−u
xi,j(α, β) (22)
wheremandnare, respectively, the numbers of rows inthe negative and positiveX-coordinate directions (m ≥0,n ≥ 0); u andv are, respectively, the number of treesin the negative and positiveY-coordinate directions(u ≥ 0, v ≥ 0).
In the special case where there is only one row withu+v+1 trees in the field, then bothmandn are equalto zero. In the special case where there is only one treein the field, thenm, n, u andv are all equal to zero.
2.5. Estimation of the extinction coefficient k
Because the forest canopy contains gaps and discon-tinuities between individual trees and between rows,obtaining its extinction coefficient is not as easy as inhomogeneous mediums. Moreover, the extinction co-efficient k is a function of leaf properties, leaf areaindex, leaf inclination distribution, etc. The extinctioncoefficientk can be determined from LAI and leaf in-clination distribution (e.g.Nilson, 1971; Ross, 1981).However, without expensive, specialized equipment,measuring LAI and leaf inclination distribution in atree canopy is very tiresome, time consuming and, inmost cases, destructive. For some species with a largenumber of small leaves (e.g.Acacia Saligna), the de-termination is extremely difficult. We therefore esti-mated the extinction coefficient of the tree crowns inan agroforestry system using conventional photogra-phy. To this effect we assume that the crowns of the
trees are spherical and the leaves are distributed ran-domly with no preferential direction or inclination.This implies that the radiation extinction through thecrown is independent of the direction of the radiationbeam. In other words, the gap fraction of the crownis independent of the view angle. In practice, leaf di-rection and inclination play a minor role (Monteith,1973; Van Elsacker et al., 1983). It is also assumedthat the leaves of the trees do not transmit short waveradiation. Once a beam hits a leaf, it will be absorbedor reflected by the leaf but cannot pass through theleaf, i.e. short wave radiation can only pass throughthe canopy gaps.
Assume a tree with a spherical crown O that hasa radius ofr and a radiation extinction coefficient ofk. The photographic image of the tree crown (crownprojection) is circular O′ if the body of the camera liesin a plane that is perpendicular to the imaginary linethat connects the center of the crown to the center ofthe lens (Fig. 4).
Let us consider an annular differential area dS onthe crown projection that has a radius ofy′ (whichcorresponds to a radius ofy on the tree crown) with awidth of dy′. The canopy depth on this differential areais x = AC = 2
√r2 − y2. Therefore, the probability
that a ray passes through the canopy without beingblocked by the tree leaves, i.e. the gap fraction of thisdifferential area, can be expressed as:
f = e−kx = e−2k√
r2−y2(23)
The subtotal area of gaps, dG, on the differential an-nulus, dS, is:
dG = f dS = e−2k√
r2−y22πy′ dy′
= 2π e−2k√
r2−y2y′ dy′ (24)
Consequently, the total area of gaps on the whole pho-tographic image of the tree crown,G, is the integrationof dG over the whole photographic image areaS,
G =∫S
f dS =∫ r′
02π e−2k
√r2−y2
y′ dy′ (25)
Noticing the relationship(y′/y) = (r′/r) and the twoboundary conditionsy = 0 wheny′ = 0 andy = r

194 W. Zhao et al. / Agricultural and Forest Meteorology 118 (2003) 185–206
Fig. 4. The relationship of a spherical crown and its projection on a plane perpendicular to the radiation beam.
wheny′ = r′, Eq. (25)can be integrated as:
G =∫ r
02π
r′2
r2e−2k
√r2−y2
y dy
= πr′2
2k2r2[1 − (2kr + 1)e−2kr] (26)
At the same time, the total area of the photographicimage projection of the tree crown is:
A = πr′2 (27)
Therefore,p = G/A is the gap fraction (e.g.Andrieuand Sinoquet, 1993; Chen et al., 1993) or gap fre-quency (e.g.Baret et al., 1993) of the tree crown on thephotographic image. Thus, fromEqs. (26) and (27),we can obtain:
2pk2r2 = 1 − (2kr + 1)e−2kr (28)
where r is the radius of the tree crown that can bemeasured in the field,p the proportion of the gap areato the total area on the projection of the crown that canbe estimated by computer analysis of the digital imageof the tree crown taken by a conventional camera.The extinction coefficient of the canopyk, the only
unknown term, can therefore be obtained by iteration(e.g. using the Newton–Raphson iteration method).
3. Materials and methods
The experiment was carried out at Sede Boker Cam-pus, Israel (30◦52′N, 34◦47′E) between 13 August and18 November 1994. TheAcacia Salignaforest wasplanted during April 1991 in plots with dimensionsof 32 m× 36 m. Trees were planted at three densities,4 m × 1 m, 4 m× 2 m and 4 m× 3 m, and replicatedthree times. The row direction of the agroforestry sys-tem was 90◦, i.e. east–west along with the length ofthe plots. Trees were lopped every spring at a heightof 2 m. The average height of the trees during the pe-riod during which the measurements reported hereinwere carried out was approximately 3.2 m. Measure-ments were collected from one representative plot ineach of the three different planting densities.
Radiation reaching the ground in the forestrysystem is distributed heterogeneously. Sunspots areformed within the shade generated by the crown.These sunspots are not stationary and change theirsize and location due to leaf fluttering. We therefore

W. Zhao et al. / Agricultural and Forest Meteorology 118 (2003) 185–206 195
Fig. 5. A system to measure short wave radiation distribution below the tree canopy.
seek to obtain time averages of radiation flux densityat a prescribed point in space (relative to the trunks ofthe trees). To carry out this measurement, a 7.5 m longtrack was built on which a cart-mounted pyranometermoved. The effective moving distance of the cart was6 m. The movement of the cart was programmed sothat it could be preset to any number of stops alongthe track, and any duration of stay at each stop.Fig. 5shows a photograph of this system.
Two pyranometers (Kipp and Zonnen,1 CM2 andCM5) were calibrated against a secondary standardpyranometer in the Solar Energy Research Center,
1 Mentioning of the brand name and the company is only for theconvenience of the readers, and it does not imply any affiliationor endorsement between the authors and the company.
Jacob Blaustein Institute for Desert Research, SedeBoker Campus, Israel. The time constant of the pyra-nometers (response time to a sudden change of radi-ation exposure) was obtained by covering, and afterreaching a steady output, uncovering them simultane-ously and recording the time series of the output witha Campbell Scientific 21X1 data logger. The CM2responds a little faster than the CM5 to a suddenchange of radiation exposure. Therefore, the CM2was used to measure radiation under the tree canopyby installing it on the moving cart and the CM5was used to measure radiation above the tree canopyby installing it on the top of a fixed pole. The timeconstant of the CM2 was estimated to be 3.1 s. There-fore, 10 s after a sudden radiation change, the voltageoutput of the CM2 reached 96% of its stable value.

196 W. Zhao et al. / Agricultural and Forest Meteorology 118 (2003) 185–206
Based on the above considerations, the CM2 cart-pyranometer was programmed to stop every 0.5 m.At each stop, the pyranometer stayed 60 s. Duringthe first 10 s no measurements were made; thereafter,the output of each pyranometer was measured every0.5 s and averaged over the last 50 s of each stop. Thetrack was installed parallel to the rows of the trees(seeFig. 5). Measurements were collected beneathrepresentation plots in each of the three plantingdensities. The track was sequentially moved to eightdifferent parallel positions spaced 0.5 m apart at eachplot. The track was left in place at each position untila completely cloudless measurement day occurred.Measurement from the cart at 0.5 m increments,and the movement of the track in 0.5 m incrementsprovided a 13× 8 element grid of data points ateach plot with 13 points along the track. Duringthe experiments, the datalogger and the battery werehoused within an enclosure. For demonstration pur-pose, they were temporarily exposed as illustrated inFig. 5.
The fractions of the direct and diffuse radiationin the global radiation were obtained from data col-lected at the nearby Solar Energy Center of the JacobBlaustein Institute for Desert Research, about 50 maway from the place where this experiment was car-ried out. Both the diffuse and global radiation weremeasured with CM5 pyranometers there.
During the measurement period, the heights and thecrown diameters were measured for 10 sample treesin each plot. The crown diameters of the trees weremeasured from three different directions (east–west,north–south and up–down) for each sample tree.Four representative high contrast, black-and-whitephotographs of the crowns in each plot were takenby a conventional 35 mm camera with a 50 mm fo-cal length lens. The photographs were taken with aslight upward angle in order to isolate the crown ofa single tree against the sky. The photographs werescanned into a computer to create a digital image. Thedigital images of the tree crowns, where the blackareas represented leaves and the white areas repre-sented sky, were analyzed using the Erdas Imagine1
software. The image processing software calculatedthe percentage of white area relative to the wholecrown area. The average gap fraction of four im-ages taken from each planting density was used forcomputations.
4. Results and discussion
4.1. Model validation
Figs. 6–8show the comparison of 0.5 h averagevalues between model results and measurements forthe three representative plots. At each plot, four rep-resentative points on the ground were examined indetail. In the figures, the solid line and the dashed lineare the measured and modeled short wave radiationunder the tree canopy, respectively, and the dottedline is the global radiation above the canopy.
4.1.1. 4 m× 1 m densityThe average height of the trees and average crown
radius of the trees were 2.82 and 0.74 m, respectively.The average proportion of the gap area to the totalarea in the photograph of the tree crowns was 39.9%.The extinction coefficient of the tree crown (k), calcu-lated fromEq. (28)using Newton–Raphson iterationmethod, was 0.99 m−1.
Fig. 6(a) and (b)shows the diurnal changes of shortwave radiation flux density in the heavily shaded ar-eas. They represent the points (−1.0, 0) and (−1.0,0.5), respectively (as described inFig. 3), i.e. 1.0 mnorth of the row. The former point was located tothe north of a tree and the latter located to the northin between two trees. On both sites the lowest fluxdensity was registered throughout the day. Generallyspeaking, the modeled curves compare quite wellwith the measurements (both in (a) and (b)), althoughdifferences exist at quite a few individual points (e.g.at 12:30 in (a)). These differences are most probablythe result of the uneven distribution of the gaps andbranches in the canopy. The daily total short wave ra-diation values were integrated from sunrise till sunset(e.g. from 6:00 a.m. to 6:00 p.m.). InFig. 6(a), themodeled daily total short wave radiation (the area be-low the dashed line) was 7.00 MJ m−2, 26.5% of theglobal radiation (26.41 MJ m−2). The measured valuewas 7.12 MJ m−2, 27.0% of the global radiation. Thedifference between the modeled and the measuredvalue was only−0.5%. InFig. 6(b), the modeled dailytotal short wave radiation (the area below the dashedline) was 7.30 MJ m−2, 27.6% of the global radiation.The measured value was 6.77 MJ m−2, 25.6% of theglobal radiation. The difference between them wasonly 2.0%.

W. Zhao et al. / Agricultural and Forest Meteorology 118 (2003) 185–206 197
Fig. 6. Comparison between modeled and measured data below an agroforestry system with 4 m× 1 m density.

198 W. Zhao et al. / Agricultural and Forest Meteorology 118 (2003) 185–206
Fig. 7. Comparison between modeled and measured data below an agroforestry system with 4 m× 2 m density.

W. Zhao et al. / Agricultural and Forest Meteorology 118 (2003) 185–206 199
Fig. 8. Comparison between modeled and measured data below an agroforestry system with 4 m× 3 m density.
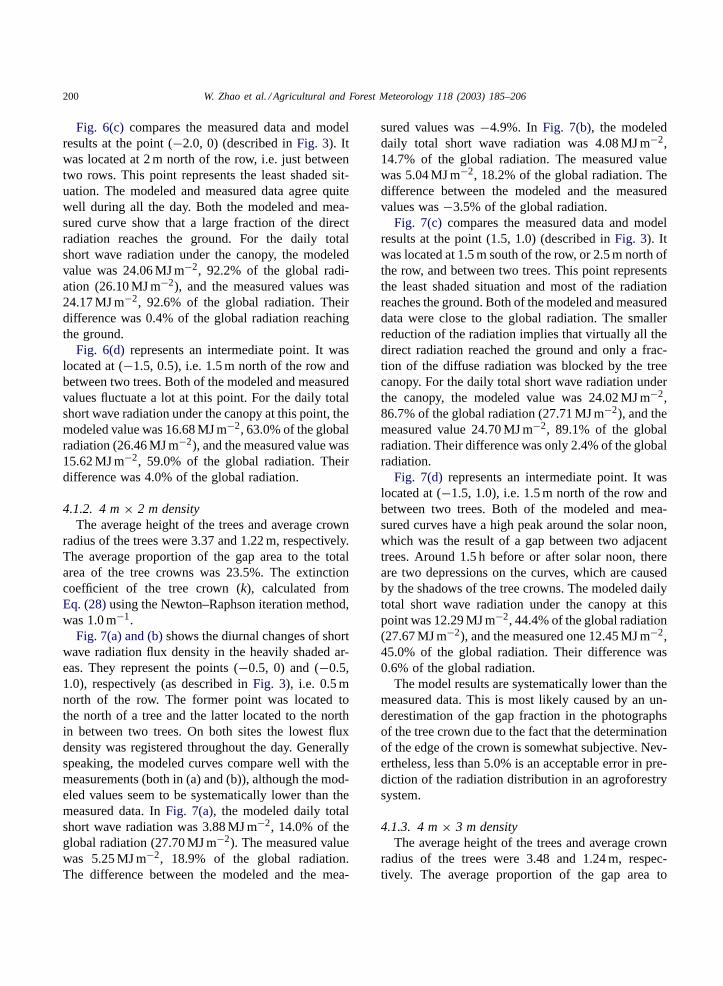
200 W. Zhao et al. / Agricultural and Forest Meteorology 118 (2003) 185–206
Fig. 6(c) compares the measured data and modelresults at the point (−2.0, 0) (described inFig. 3). Itwas located at 2 m north of the row, i.e. just betweentwo rows. This point represents the least shaded sit-uation. The modeled and measured data agree quitewell during all the day. Both the modeled and mea-sured curve show that a large fraction of the directradiation reaches the ground. For the daily totalshort wave radiation under the canopy, the modeledvalue was 24.06 MJ m−2, 92.2% of the global radi-ation (26.10 MJ m−2), and the measured values was24.17 MJ m−2, 92.6% of the global radiation. Theirdifference was 0.4% of the global radiation reachingthe ground.
Fig. 6(d) represents an intermediate point. It waslocated at (−1.5, 0.5), i.e. 1.5 m north of the row andbetween two trees. Both of the modeled and measuredvalues fluctuate a lot at this point. For the daily totalshort wave radiation under the canopy at this point, themodeled value was 16.68 MJ m−2, 63.0% of the globalradiation (26.46 MJ m−2), and the measured value was15.62 MJ m−2, 59.0% of the global radiation. Theirdifference was 4.0% of the global radiation.
4.1.2. 4 m× 2 m densityThe average height of the trees and average crown
radius of the trees were 3.37 and 1.22 m, respectively.The average proportion of the gap area to the totalarea of the tree crowns was 23.5%. The extinctioncoefficient of the tree crown (k), calculated fromEq. (28)using the Newton–Raphson iteration method,was 1.0 m−1.
Fig. 7(a) and (b)shows the diurnal changes of shortwave radiation flux density in the heavily shaded ar-eas. They represent the points (−0.5, 0) and (−0.5,1.0), respectively (as described inFig. 3), i.e. 0.5 mnorth of the row. The former point was located tothe north of a tree and the latter located to the northin between two trees. On both sites the lowest fluxdensity was registered throughout the day. Generallyspeaking, the modeled curves compare well with themeasurements (both in (a) and (b)), although the mod-eled values seem to be systematically lower than themeasured data. InFig. 7(a), the modeled daily totalshort wave radiation was 3.88 MJ m−2, 14.0% of theglobal radiation (27.70 MJ m−2). The measured valuewas 5.25 MJ m−2, 18.9% of the global radiation.The difference between the modeled and the mea-
sured values was−4.9%. In Fig. 7(b), the modeleddaily total short wave radiation was 4.08 MJ m−2,14.7% of the global radiation. The measured valuewas 5.04 MJ m−2, 18.2% of the global radiation. Thedifference between the modeled and the measuredvalues was−3.5% of the global radiation.
Fig. 7(c) compares the measured data and modelresults at the point (1.5, 1.0) (described inFig. 3). Itwas located at 1.5 m south of the row, or 2.5 m north ofthe row, and between two trees. This point representsthe least shaded situation and most of the radiationreaches the ground. Both of the modeled and measureddata were close to the global radiation. The smallerreduction of the radiation implies that virtually all thedirect radiation reached the ground and only a frac-tion of the diffuse radiation was blocked by the treecanopy. For the daily total short wave radiation underthe canopy, the modeled value was 24.02 MJ m−2,86.7% of the global radiation (27.71 MJ m−2), and themeasured value 24.70 MJ m−2, 89.1% of the globalradiation. Their difference was only 2.4% of the globalradiation.
Fig. 7(d) represents an intermediate point. It waslocated at (−1.5, 1.0), i.e. 1.5 m north of the row andbetween two trees. Both of the modeled and mea-sured curves have a high peak around the solar noon,which was the result of a gap between two adjacenttrees. Around 1.5 h before or after solar noon, thereare two depressions on the curves, which are causedby the shadows of the tree crowns. The modeled dailytotal short wave radiation under the canopy at thispoint was 12.29 MJ m−2, 44.4% of the global radiation(27.67 MJ m−2), and the measured one 12.45 MJ m−2,45.0% of the global radiation. Their difference was0.6% of the global radiation.
The model results are systematically lower than themeasured data. This is most likely caused by an un-derestimation of the gap fraction in the photographsof the tree crown due to the fact that the determinationof the edge of the crown is somewhat subjective. Nev-ertheless, less than 5.0% is an acceptable error in pre-diction of the radiation distribution in an agroforestrysystem.
4.1.3. 4 m× 3 m densityThe average height of the trees and average crown
radius of the trees were 3.48 and 1.24 m, respec-tively. The average proportion of the gap area to

W. Zhao et al. / Agricultural and Forest Meteorology 118 (2003) 185–206 201
the total area of the tree crowns was 34.5%. Thecalculated extinction coefficient of the tree crown (k)was 0.70 m−1.
Fig. 8(a) and (b)shows the diurnal changes of shortwave radiation flux density in the heavily shaded ar-eas. They represent the points (1.0, 0) and (1.0, 1.5),respectively (as described inFig. 3), i.e. 1.0 m northof the row. The former point was located to the northof a tree and the latter located to the north in betweentwo trees. On both sites the lowest flux density wasregistered throughout the day. The modeled curvescompare quite well with the measurements at both ofthe two points (both in (a) and (b)). At point (1.0, 0),both the modeled and measured short wave radiationcurves show depressions at solar noon (about 11:40local standard time) and exhibit peaks at about 1.5 hbefore or after solar noon (Fig. 8(a)). At point (1.0,1.5), the opposite characteristics are evident and thepeaks occur around the solar noon (Fig. 8(b)). Thesecharacteristics are shared both by the modeled and themeasured curves. InFig. 8(a), the modeled daily totalshort wave radiation was 6.53 MJ m−2, 40.2% of theglobal radiation (16.23 MJ m−2). The measured valuewas 6.48 MJ m−2, 39.9% of the global radiation. Thedifference between the modeled and the measuredvalue was only 0.3%. InFig. 8(b), the modeled dailytotal short wave radiation was 6.34 MJ m−2, 39.1%of the global radiation. The measured value was6.74 MJ m−2, 41.5% of the global radiation. The dif-ference between the modeled and the measured valuewas−2.4%.
Fig. 8(c)shows the measured data and model resultsat the point (−0.5, 1.5) (described inFig. 3). The mod-eled and measured data agree well during all the day.Both of the modeled and measured curves were closeto the global radiation. The modeled daily total shortwave radiation under the canopy was 14.70 MJ m−2,84.1% of the global radiation (17.49 MJ m−2), and themeasured value 14.83 MJ m−2, 84.8% of the globalradiation. Their difference was 0.7% of the globalradiation.
Fig. 8(d) represents an intermediate point. It waslocated at (0.25, 0.5), i.e. 0.25 m north of the row and0.5 m east of the tree. For the daily total data at thispoint, the modeled value was 8.21 MJ m−2, 50.4% ofthe global radiation (16.30 MJ m−2), and the measuredvalues was 8.73 MJ m−2, 53.6% of the global radia-tion. Their difference was 3.2% of the global radiation.
4.2. Model sensitivity analyses
The model prediction of the short wave radiationthat penetrates below the canopy in an agroforestrysystem may contain errors introduced by errors in themeasurement of crown radiusr, and by errors in thedetermination of the gap fractionp. Crown radius in-fluences model prediction of the radiation penetrationin two ways. First, for a given extinction coefficientk, the model prediction of the RP decreases withincreasing crown radius. Secondly, for a given gapfraction, determined by image analysis, the extinctioncoefficient k calculated viaEq. (28) decreases withincreasing crown radius. The decrease ofk will causean increase in modeled RP. Although the second effectis smaller than the first, it reduces the net effect of thefirst.
The model sensitivities to the change in crown ra-dius were analyzed for combinations of three differ-ent tree planting densities (4 m× 1 m, 4 m× 2 m and4 m × 3 m with east–west row directions), four gapfractions (20, 40, 60 and 80%), and six crown radii(0.1, 0.5, 1.0, 1.5, 2.0 and 2.2 m), for both summer(21 June 1995) and winter (22 December 1995) dates,producing a total of 144 scenarios (Table 1). In eachscenario, the crown radius was increased 0.1 m andthe consequent change in modeled daily RP on a rep-resentative area for one tree (4 m× 1 m, 4 m× 2 m or4 m × 3 m depending on the tree density) was calcu-lated as a percentage of global radiation above the treecanopy. For example, at the tree density 4 m×1 m andp = 20% when crown radiusr increases from 0.05to 0.15 m, the modeled RP decreased 1.80% (from99.78% atr = 0.05 m to 97.98% atr = 0.15 m) insummer and 2.52% (from 99.73% atr = 0.05 m to97.21% atr = 0.15 m) in winter. The negative signsin the table indicate decreases in modeled RP as a re-sult of increases in crown radius.
Table 1reveals some general trends of the modelsensitivity to crown radius. When crown radius issmall, the sensitivity of the model to crown radius issmall. The model sensitivity to crown radius (MStCR)increases with the crown radius at the beginning. Forsome intermediate value of crown radius within therange of crown radii simulated, MStCR reaches itsmost sensitive point (MSP). Thereafter, MStCR de-creases with further increases in crown radius. Theabsolute MStCR values at MSP decrease when gap

202 W. Zhao et al. / Agricultural and Forest Meteorology 118 (2003) 185–206
Table 1The change of modeled penetrated radiation as a result to the change of 0.1 m in crown radius (%)
Tree density Crownradius (m)
p = 20% p = 40% p = 60% p = 80%
Summer Winter Summer Winter Summer Winter Summer Winter
4 m × 1 m 0.1 −1.80 −2.52 −1.35 −1.89 −0.90 −1.26 −0.45 −0.630.5 −6.22 −10.01 −5.17 −8.10 −3.77 −5.75 −2.05 −3.041.0 −5.26 −7.47 −5.15 −7.56 −4.54 −6.75 −3.04 −4.481.5 −4.84 −1.62 −4.84 −2.64 −4.47 −3.65 −3.23 −3.532.0 −3.72 −0.52 −4.08 −1.01 −4.12 −1.92 −3.30 −2.692.2 −0.58 −0.09 −1.67 −0.49 −2.66 −1.35 −2.79 −2.35
4 m × 2 m 0.1 −0.85 −1.28 −0.63 −0.96 −0.42 −0.64 −0.21 −0.320.5 −3.72 −6.28 −2.83 −4.74 −1.92 −3.18 −0.98 −1.611.0 −5.45 −9.24 −4.49 −7.61 −3.27 −5.49 −1.79 −2.971.5 −5.21 −2.78 −4.66 −3.85 −3.70 −3.96 −2.21 −2.812.0 −4.42 −1.01 −4.36 −1.92 −3.78 −2.65 −2.46 −2.412.2 −2.24 −0.48 −3.06 −1.35 −3.15 −2.20 −2.30 −2.26
4 m × 3 m 0.1 −0.60 −0.85 −0.45 −0.64 −0.30 −0.42 −0.14 −0.210.5 −2.94 −4.24 −2.22 −3.20 −1.49 −2.14 −0.74 −1.081.0 −5.19 −7.56 −4.03 −5.86 −2.78 −4.02 −1.44 −2.071.5 −5.75 −5.48 −4.76 −5.17 −3.48 −4.09 −1.90 −2.382.0 −4.47 −1.64 −4.17 −2.58 −3.37 −2.86 −2.02 −2.142.2 −2.73 −0.99 −3.19 −1.98 −2.91 −2.50 −1.90 −2.04
Note: The sensitivity in summer is modeled by using the data on 21 June 1995 at the experiment site. The sensitivity in winter is modeledby using the data on 22 December 1995 at the experiment site.
fraction increase. The absolute MStCR values at MSPalso decrease when tree density decreases. The abso-lute MStCR values at MSP are larger in winter thanthose in summer.
It is interesting to look at the place where MSP ap-pears. When gap fractionp is small (that is 20%), thecrown has large leaf density, and MSP occurs for themaximum crown radius before the tree crowns over-lap, i.e. 0.5, 1.0 and 1.5 m at 4 m× 1 m, 4 m× 2 mand 4 m× 3 m planting densities, respectively, exceptfor the 4 m× 3 m winter case. The exception can beexplained as follows: in winter, when the solar an-gle is smaller, for a crown radius of 1.5 m, the lowerpart of the tree crowns are shaded by the crowns inthe next row to the south. Since a fraction of globalradiation impinges on each row of trees, the reduc-tion in modeled penetrated radiation relative to abovecanopy global radiation, due to an increase in crownradius, is smaller than it would have been if the en-tire crown had been illuminated. For a 1.0 m crownradius, adjacent rows are not shaded, and the reduc-tion in modeled penetrated radiation is larger than the1.5 m crown radius case. After the tree crowns overlapwithin the row, the efficiency of intercepting radiation
as a result of crown dimension increase will be lower.Consequently, the MStCR decreases.
When gap fractionp is large, the crown has smallleaf density, and the radiation interception by a treecrown is limited. Hence, the shade effect is also lim-ited. In addition, overlapping of the tree crowns withinthe row intensifies the leaf density within the over-lapped volume and contributes to interception of ra-diation. These two factors shift the MSP to a largercrown radius as the gap fraction increases, especiallyin summer, when the shade effect is small and inten-sifying leaf density effect is evident.
Among all scenarios listed inTable 1, the model ismost sensitive to a change in crown radius in winter atp = 20%,r = 0.5 m and 4 m× 1 m planting density.The sensitivity at this scenario is about−10%, a 10%reduction of RP resulting from a crown radius increaseof 0.1 m. At the other scenarios, the model is muchless sensitive to crown radius than that.
The model sensitivities to changes in gap fractionwere analyzed for combinations of three different treeplanting densities (4 m×1 m, 4 m×2 m and 4 m×3 mwith east–west row directions), five gap fractions (10,20, 40, 60 and 80%), four crown radii (0.1, 0.5, 1.0

W. Zhao et al. / Agricultural and Forest Meteorology 118 (2003) 185–206 203
Table 2The change of modeled penetrated radiation as a result to the change of 5% in gap fraction (%)
Tree density Gapfraction (%)
r = 0.1 m r = 0.5 m r = 1.0 m r = 1.5 m
Summer Winter Summer Winter Summer Winter Summer Winter
4 m × 1 m 10 0.06 0.01 1.10 1.57 1.15 1.87 1.12 0.3920 0.05 0.01 1.13 1.67 1.38 2.19 1.30 0.6940 0.04 0.01 1.17 1.73 2.01 3.19 2.18 2.1060 0.04 0.01 1.22 1.77 2.82 4.38 3.83 4.8280 0.03 0.01 1.26 1.79 3.80 5.67 6.54 9.15
4 m × 2 m 10 0.03 0.01 0.71 0.97 2.00 3.23 2.14 1.5020 0.03 0.01 0.72 0.98 2.11 3.39 2.47 2.4740 0.02 0.01 0.72 0.99 2.29 3.60 3.23 4.1060 0.02 0.01 0.72 0.99 2.45 3.74 4.08 5.6280 0.02 0.01 0.72 0.99 2.61 3.86 5.04 7.19
4 m × 3 m 10 0.02 0.01 0.49 0.66 1.68 2.51 2.78 3.1120 0.02 0.01 0.49 0.67 1.72 2.56 2.98 3.7540 0.02 0.01 0.49 0.68 1.77 2.61 3.29 4.4960 0.01 0.01 0.49 0.68 1.81 2.64 3.59 5.0580 0.01 0.00 0.49 0.68 1.84 2.67 3.89 5.56
Note: The sensitivity in summer is modeled by using the data on 21 June 1995 at the experiment site. The sensitivity in winter is modeledby using the data on 22 December 1995 at the experiment site.
and 1.5 m) for both summer (21 June 1995) and win-ter (22 December 1995) dates, producing a total of120 scenarios (Table 2). In each scenario, the gap frac-tion was increased 5% and the consequent change inmodeled daily RP on a representative area for onetree (4 m× 1m, 4 m× 2m or 4 m× 3 m dependingon the tree density) was calculated as a percentage ofglobal radiation above the tree canopy. For example,at the tree density 4 m× 1 m andr = 1.5 m whengap fractionp increases from 7.5 to 12.5%, the mod-eled RP increases 1.12% in summer and 0.39% inwinter.
From Table 2 we can see a general trend of thesensitivity of the model to a change in gap fraction.The model sensitivity to gap fraction (MStGF) gener-ally increases with the increasing crown radius. Thisis easier to understand because it is usually more ef-ficient for larger crowns to intercept radiation as a re-sult of a certain gap fraction (i.e. leaf density) change.Therefore, the most sensitive point appears usually atthe largest radius. However, as a result of the shadeeffect described above, MStGF will decrease at lowergap fraction (10 and 20% for example) and largercrown radius (1.5 m for example) and higher tree den-sity (4 m× 1 m for example) as compare to relativelyhigher gap fraction or smaller crown radius or lower
tree density. The shade effect is more evident in winterthat in summer (Table 2).
Among all scenarios listed inTable 2, the model ismost sensitive to a change in gap fraction in winterat p = 80%, r = 1.5 m and 4 m× 1 m planting den-sity. The sensitivity at this scenario is about 9.15%,a percentage of observed RP increase as a result ofgap fraction increases 5%. At the other scenarios, themodel is much less sensitive to gap fraction than that.
The gap fraction was determined by analyzing thedigital image of the tree crown. The image processingsoftware we used, Erdas Imagine, could read the colorof each individual image cell, count the total number ofcells that were black, representing leaves, and the totalnumber of cells that were white, representing gaps inthe canopy, and calculate the percentage of the whitecells to the total number of cells in a prescribed areaof the image occupied by the tree crown. Owing to thehigh contrast of the black-and-white film, there waspractically no error introduced in the computer deter-mination of gap fraction itself. However, selecting rep-resentative sample trees to photograph, and delineatingthe parameters of the crowns within the images, wererather subjective and were the main sources of error. Ina small and homogeneous plot such as where this studywas carried out, by carefully selecting the sample trees

204 W. Zhao et al. / Agricultural and Forest Meteorology 118 (2003) 185–206
and cautiously circling the edge of the crown images,we found that four images for each plot were sufficientfor the accuracy of RP modeling. However, more sam-ple images may be needed if greater heterogeneity ex-ists or if larger plots are modeled.Table 2can also beused as a referencing factor for the number of sampleimages. When MStGF is small, fewer sample imagesare needed, and vice versa. In the cases we studied, a5% error in gap fraction determination could cause anerror of about 2% in the RP modeling results.
For simplicity, the proposed model assumed that thecrowns of the trees were spherical and that the leafangle distribution within the crown was also spheri-cal. Nearly a spherical or ellipsoidal crown shapes arecommon in agroforestry systems as a result of loppingor pruning and subsequent re-growth. This model wasdeveloped for spherical crowns. Ellipsoidal crownsmay occur more frequently than spherical crowns,however, the model is still applicable provided the dif-ference between the long and short axes of the ellip-soidal crown is small, and their average value can beused in lieu of the diameter. When a big difference ex-ists between the long and short axes, this model willresult in prediction errors.
Studies showed that the leaf direction and incli-nation played a minor role in radiation penetrationthrough the canopy (Monteith, 1973; Van Elsackeret al., 1983). By taking more pictures along the direc-tion of the solar beam to determine gap fraction, thismodel may also be used in cases when the leaf an-gle distribution is not spherical. However, this has notbeen tested yet.
5. Conclusions
In this study, a three-dimensional model was devel-oped to describe the short wave radiation distributionunder the canopy of an agroforestry system. The mainparameters used in the model include geographical lo-cation data (longitude, latitude and standard time zoneof the area), agroforestry planting and growing data(number of rows and trees in each row, row direction,distance between rows, distance between trees, aver-age height of the trees and the average crown radiusof the tree canopy), date and time, global and diffuseradiation above the canopy and a few photographicimages of the tree crown. A major advantage of this
method is that the arduous and difficult measurementof LAI and leaf inclination can be replaced by com-puter analysis of the photographs of the tree crowntaken with a conventional camera. The outputs of themodel are the short wave radiation distributions be-low the tree canopy of an agroforestry system at aprescribed time and the daily curve of the short waveradiation at a prescribed point below the tree canopy.The model is valid for both small and large fields. Asan extreme case, it can also be used to describe theshort wave distribution under a single tree.
Comparison of the modeled results with the mea-sured values showed that the proposed model candescribe the daily patterns of short wave radiation un-der the tree canopy not only in heavily or minimallyshaded regions, but also in the transitional regionsfrom heavily to minimally shaded. The modeled andmeasured results exhibit strong agreement for bothdiscontinuous canopies (4 m× 3 m density) and over-lapping canopies (4 m× 1 m density). The peaks andthe valleys of the modeled and measured curves co-incide well especially at the 4 m× 3 m and 4 m× 2 mdensities. The difference between the measured andthe modeled daily total values of the short wave ra-diation under the canopy is not more than±8%, andusually less than 5%, of the global radiation.
Acknowledgements
This research was partially funded within the frame-work of the Joint German-Israeli Research Projects(Project Number: 01314 (GR) DISUM 00028 (MG)).Partial support for this research was also providedby the US National Science Foundation (Grant No.:0096239) and the US National Aeronautics and SpaceAdministration (Grant No.: NAG5-9876). We aregrateful acknowledge Prof. Marc L. Fischer and Prof.Margaret S. Torn (Lawrence Berkeley National Lab-oratory, USA) helpful comments to the manuscripts.We wish to thank Arieh Rogel and Yossi Goldstein(Mashash Farm, Ben-Gurion University of the Negev,Israel) for their help in planting and pruning the trees.
References
Andrieu, B., Sinoquet, H., 1993. Evaluation of structure descriptionrequirements for predicting gap fraction of vegetation canopies.Agric. Forest Meteorol. 65, 207–227.

W. Zhao et al. / Agricultural and Forest Meteorology 118 (2003) 185–206 205
Baret, F., Andrieu, B., Steven, M.D., 1993. Gap frequency andcanopy architecture of sugar beet and wheat crops. Agric. ForestMeteorol. 65, 261–279.
Berliner, P.R., 1988. Contribution of heat dissipated at the soilsurface to the energy balance of a citrus orchard, PhD Thesis,Hebrew University, pp. 20–39, 48.
Bonhomme, R., Chartier, P., 1972. The interpretation and automaticmeasurement of hemispherical photographs to obtain sunlitfoliage area and gap frequency. Israel J. Agric. Res. 22, 53–61.
Charles-Edwards, D.A., Thorpe, M.R., 1976. Interception ofdiffuse and direct-beam radiation by a hedgerow apple orchard.Ann. Bot. 40, 603–609.
Chen, S.G., Impens, I., Ceulemans, R., Kockelbergh, F., 1993.Measurement of gap fraction of fractal generated canopies usingdigitalized image analysis. Agric. Forest Meteorol. 65, 245–259.
Cohen, S., Fuchs, M., 1987. The distribution of leaf area, radiationphotosynthesis and transpiration in a shamouti orange hedgeroworchard, Part I. Agric. Forest Meteorol. 40, 154–162.
Cowan, I.R., 1968. The interception and absorption of radiationin plant stands. J. Appl. Ecol. 5, 367–379.
Droppelman, K.J., Lehmann, J., Ephrath, J.E., Berliner, P.R.,2000a. Water use efficiency and uptake patterns in a runoffagroforestry system in an arid environment. Agroforestry Syst.49, 223–243.
Droppelman, K.J., Ephrath, J.E., Berliner, P.R., 2000b. Tree/cropcomplementarity in an arid zone runoff agroforestry system innorthern Kenya. Agroforestry Syst. 50, 1–16.
Eck, T.F., Deering, D.W., 1992. Canopy albedo and transmittancein a spruce-hemlock forest in mid-September. Agric. ForestMeteorol. 59, 237–248.
Garrett, H.E.G., Buck, L., 1997. Agroforestry practice and policyin the United States of America. Forest Ecol. Manage. 91, 5–15.
Gold, M.V., 2001. Developments in North American agroforestryresearch. In: Proceedings of the Selected Papers from theSixth Biennial North American Agroforestry Conference, 1999.Agroforestry Syst. 53, iii.
Graf, B., Gutierrez, A.P., Rakotobe, O., Zahner, P., Delucchi, V.,1990. A simulation model for the dynamics of rice growth anddevelopment. 2. The competition with weeds for nitrogen andlight. Agric. Syst. 32, 367–392.
Hauser, S., Ndi, J.N., Hulugalle, N.R., 2000. Yields ofmaize/cassava intercrops grown with hedgerowa of threemultipurpose trees on an acid Ultisol of Cameroon. AgroforestrySyst. 49, 111–122.
Horie, T., 1966. Preliminary report of a method for estimatingsunlit leaf area within a corn canopy. J. Agric. Meteorol. 22,45–49.
Isobe, S., 1962. Preliminary studies on physical properties of plantcommunities. Bull. Nat. Inst. Agric. Sci. A9, 29–67.
Isobe, S., 1969. Theory of the light distribution and photosynthesisin canopies of randomly dispersed foliage area. Bull. Nat. Inst.Agric. Sci. A16, 1–25.
Jackson, J.E., Palmer, J.W., 1979. A simple model of lighttransmission and interception by discontinuous canopies. Ann.Bot. 44, 381–387.
Kang, B.T., 1997. Alley cropping—soil productivity and nutrientrecycling. Forest Ecol. Manage. 91, 75–82.
Kho, R.M., Yacouba, B., Yayé, M., Katkoré, B., Mousa, A., Iktam,A., Mayaki, A., 2001. Separating the effect of trees on crops:the case of Faidherbia albida and millet in Niger. AgroforestrySyst. 52, 219–238.
Kuusk, A., 1992. Absorption profiles of shortwave radiation in avegetation canopy. Agric. Forest Meteorol. 62, 194–204.
Lemeur, R., Blad, B.L., 1974. A critical review of light modelsfor estimating the shortwave radiation regime of plant canopies.Agric. Meteorol. 14, 255–265.
Levasseur, V., Olivier, A., 2000. The farming system and traditionalagroforestry systems in the Maya community of San Jose,Belize. Agroforestry Syst. 49, 275–288.
Lin, C.H., McGraw, R.L., Geoge, M.F., Garrett, H.E., 2001.Nutritive quality and morphological development under partialshade of some forage species with agroforestry potential.Agroforestry Syst. 53, 269–281.
Lövenstein, H.M., Berliner, P.R., van Keulen, H., 1991. Runoffagroforestry in arid lands. In: Jarvis, P.G. (Ed.), Agroforestry:Principles and Practice. Amsterdam, Elsevier, pp. 59–70.
Mann, J.E., Curry, G.L., DeMichele, D.W., Baker, D.N., 1980.Light penetration in a row-crop with random plant spacing.Agron. J. 72, 131–142.
McMurtrie, R., Wolf, L., 1983. A model of competition betweentrees and grass for radiation, water and nutrients. Ann. Bot. 52,449–458.
Monteith, J.L., 1965. Light distribution and photosynthesis in fieldcrops. Ann. Bot. 29, 17–37.
Monteith, J.L., 1973. Principles of Environmental Physics. Arnold,London, pp. 208.
Monteith, J.L., Ong, C.K., Corlett, J.E., 1991. Microclimaticinteractions in agroforestry systems. Forest Ecol. Manage. 45,31–44.
Murniati, D., Garrity, P., Gintings, A.N., 2001. The contributionof agroforestry system to reducing farmer’ dependence on theresources of adjacent national parks: a case study from Sumatra,Idonesia. Agroforestry Syst. 52, 171–184.
Muschler, R.G., 2001. Shade improves coffee quality in asub-optical coffee-zone of Costa Rica. Agroforestry Syst. 51,131–139.
Muschler, R., Beer, J., 2001. Multistrata agroforestry systems withperennial crops. Agroforestry Syst. 53, v–vi.
Neupana, R.P., Thapa, G.B., 2001. Impact of agroforestryintervention of farm income under the subsistence farmingsystem of the middle hill, Nepal. Agroforestry Syst. 53, 31–37.
Nilson, T., 1971. A theoretical analysis of the frequency of gapsin plant stands. Agric. Forest Meteorol. 8, 25–38.
Nilson, T., Kuusk, A., 1989. A reflectance model for thehomogeneous plant canopy and its inversion. Remote Sens.Environ. 27, 157–167.
Oteng’I, S.B.B., Stigter, C.J., Ng’ang’a, K.J., Mungai, D.N., 2000.Wind protection in a hedged agroforestry system in semiaridKenya. Agroforestry Syst. 50, 137–156.
Paltridge, G.W., Platt, C.M.R., 1976. Radiative Processes inMeteorology and Climatology, Developments in AtmosphericScience, vol. 5. Elsevier, New York, pp. 60–63, 131.
Petersen, K.L., Moreshet, S., Fuchs, M., 1991. Stomatal responsesof field-grown cotton to radiation and soil moisture. Agron. J.83, 1059–1065.

206 W. Zhao et al. / Agricultural and Forest Meteorology 118 (2003) 185–206
Quesada, F., Somarriba, E., Vargas, E., 1989. Simulationof tree shadows in agroforestry systems. In: Reifsnyder,W.S., Darnhofer, T.O. (Eds.), Meteorology and Agroforestry.International Council for Research in Agroforestry, Nairobi,pp. 157–161.
Ramırez, O.A., Somarriba, E., Ludewigs, T., Ferreira, P., 2001.Financial returns, stability and risk of cacao-plantation-timberagroforestry systems in central America. Agroforestry Syst. 51,141–154.
Reeve, J.E., 1960. Appendix to inclined point quadrats by J.Warren. New Phytol. 59, I.
Reid, R., Ferguson, I.S., 1992. Development and validation ofa simple approach to modeling tree shading in agroforestrysystems. Agroforestry Syst. 20, 243–252.
Rimmington, G.M., 1984. A model of the effect of interspeciescompetition for light on dry-matter production. Aust. J. PlantPhysiol. 11, 277–286.
Rimmington, G.M., 1985. A test of model for light interceptionby mixtures. Aust. J. Plant Physiol. 12, 681–683.
Ross, J., 1981. The radiation regime and the architecture of plantstands. Dr. W. Junk. Publisher, The Hague–Boston–London,pp. 391.
Ryel, R.J., Barnes, P.W., Beyschlag, W., Caldwell, M.M.,Flint, S.D., 1990. Plant competition for light analyzed witha multispecies canopy model. 1. Model development andinfluence of enhanced UV-B conditions on photosynthesis inmixed wheat and wild oat canopies. Oecologia 82, 304–310.
Sinoquet, H., Bonhomme, R., 1992. Modeling radiative transfer inmixed and row intercropping system. Agric. Forest Meteorol.62, 219–240.
Sinoquet, H., Moulia, B., Gastal, F., Bonhomme, R.,Virlet-Grancher, C., 1990. Modeling the radiative balance ofthe components of a well-mixed canopy: application to a whiteclover-tall fescue mixture. Acta Oecologia 11, 469–486.
Smart, R.E., 1973. Sunlight interception by vineyards. Am. J. Enol.Vitcult. 24, 141–153.
Spitters, J.C.T., Aerts, R., 1983. Simulation of competition forlight and water in crop–weed associations. Aspects Appl. Biol.4, 467–483.
Vales, D.J., Bunnell, F.L., 1988. Relationship between transmissionof solar radiation and coniferous forest stand characteristics.Agric. Forest Meteorol. 43, 201–223.
Van Elsacker, P., Keppens, H., Impens, I., 1983. A simplephotographical method for analyzing the radiation interceptionby an individual tree. Agric. Meteorol. 29, 285–298.
Vezina, P.E., Pech, G., 1964. Solar radiation beneath conifercanopies in relation to crown closure. Forest Sci. 10, 443–451.
Visvanath, S., Nair, P.K.R., Kaushik, P.K., Prakasam, U.,2000. Acacia nilotica trees in rice fields: a traditionalagroforestry system in central India. Agroforestry Syst. 50, 157–177.
Warren Wilson, J., 1967. Stand structure and light penetration. III.Sunlit foliage area. J. Appl. Ecol. 4, 159–165.