Modeling learning progressions in epistemic games with epistemic network analysis: Principles for...
24
Paper presented at the Learning Progressions in Science (LeaPS) Conference, June 2009, Iowa City, IA MODELING LEARNING PROGRESSIONS IN EPISTEMIC GAMES WITH EPISTEMIC NETWORK ANALYSIS: PRINCIPLES FOR DATA ANALYSIS AND GENERATION Abstract Epistemic games have been developed to help players develop domain-specific expertise that characterizes how professionals in a particular domain reason, communicate, and act (Shaffer, 2006; Shaffer & Bagley, 2009). Grounded in a sociocultural and sociocognitive approach to learning, epistemic games are designed to foster situated learning that leads to data structures with high levels of dependencies. As one might expect, traditional measurement models struggle to accommodate such contextual dependencies, especially when data are collected at smaller scales and epistemic network analysis (ENA) has been developed to provide a practically feasible modeling alternative (e.g., Rupp et al., 2009; Shaffer et al., in press). In this paper, we describe a research program that addresses key statistical considerations for modeling data from epistemic games using ENA with an eye toward representing different learning progressions of players within such games. Current approaches for representing learning progressions using ENA are juxtaposed with approaches for simulating such data using particular statistical constraints. André A. Rupp, University of Maryland Younyoung Choi, University of Maryland Matthew Gushta, University of Maryland Robert Mislevy, University of Maryland Mary Carolyn Thies, University of Maryland Elizabeth Bagley, University of Wisconsin at Madison Padraig Nash, University of Wisconsin at Madison David Hatfield, University of Wisconsin at Madison Gina Svarovsky, University of Wisconsin at Madison David W. Shaffer, University of Wisconsin at Madison MODELING LEARNING PROGRESSIONS IN EPISTEMIC GAMES WITH EPISTEMIC NETWORK ANALYSIS: PRINCIPLES FOR DATA ANALYSIS AND GENERATION Learning in the 21 st century is increasingly characterized by our ability to make and understand interconnections between concepts, ideas, and conventions across a variety of domains. Consequently, one of the principal challenges of our times is to adequately prepare learners of all ages for challenges in such an increasingly interconnected world, which is heavily permeated by the existence and use of digital tools. Various authors and institutions have proposed taxonomies of so-called 21 st -century skills that are believed to be at the core of relevant expertise that is required for facing the demands of associated 21 st -century tasks (e.g., Partnership for 21 st Century Skills, 2008; Shute, Dennen, Kim, Donmez, & Wang, in press). At a large-scale international level, the recently launched Assessment and Teaching of 21 st Century Skills Project
Transcript of Modeling learning progressions in epistemic games with epistemic network analysis: Principles for...

PaperpresentedattheLearningProgressionsinScience(LeaPS)Conference,June2009,IowaCity,IA
MODELING LEARNING PROGRESSIONS IN EPISTEMIC GAMES WITH EPISTEMIC NETWORK ANALYSIS: PRINCIPLES FOR DATA ANALYSIS AND GENERATION
Abstract
Epistemic games have been developed to help players develop domain-specific expertise that characterizes how professionals in a particular domain reason, communicate, and act (Shaffer, 2006; Shaffer & Bagley, 2009). Grounded in a sociocultural and sociocognitive approach to learning, epistemic games are designed to foster situated learning that leads to data structures with high levels of dependencies. As one might expect, traditional measurement models struggle to accommodate such contextual dependencies, especially when data are collected at smaller scales and epistemic network analysis (ENA) has been developed to provide a practically feasible modeling alternative (e.g., Rupp et al., 2009; Shaffer et al., in press). In this paper, we describe a research program that addresses key statistical considerations for modeling data from epistemic games using ENA with an eye toward representing different learning progressions of players within such games. Current approaches for representing learning progressions using ENA are juxtaposed with approaches for simulating such data using particular statistical constraints.
André A. Rupp, University of Maryland Younyoung Choi, University of Maryland Matthew Gushta, University of Maryland Robert Mislevy, University of Maryland Mary Carolyn Thies, University of Maryland Elizabeth Bagley, University of Wisconsin at Madison Padraig Nash, University of Wisconsin at Madison David Hatfield, University of Wisconsin at Madison Gina Svarovsky, University of Wisconsin at Madison David W. Shaffer, University of Wisconsin at Madison
MODELING LEARNING PROGRESSIONS IN EPISTEMIC GAMES WITH EPISTEMIC NETWORK ANALYSIS: PRINCIPLES FOR DATA ANALYSIS AND GENERATION Learning in the 21st century is increasingly characterized by our ability to make and understand interconnections between concepts, ideas, and conventions across a variety of domains. Consequently, one of the principal challenges of our times is to adequately prepare learners of all ages for challenges in such an increasingly interconnected world, which is heavily permeated by the existence and use of digital tools. Various authors and institutions have proposed taxonomies of so-called 21st-century skills that are believed to be at the core of relevant expertise that is required for facing the demands of associated 21st-century tasks (e.g., Partnership for 21st Century Skills, 2008; Shute, Dennen, Kim, Donmez, & Wang, in press). At a large-scale international level, the recently launched Assessment and Teaching of 21st Century Skills Project

2
(www.atc21s.org), co-sponsored by Cisco, Microsoft, and Intel, certainly represents the largest coordinated effort to date to develop worked examples for a variety of learning and assessment systems in this area. While there is no single definitive list of these skills, most lists focus on expanding traditional concepts of knowledge, skills, and abilities to encompass concepts such as critical and innovative thinking, interpersonal communication and collaboration skills, digital networking and operation skills, intra- and intercultural awareness and identity, and cross-cultural sensibility. Discipline-specific learning as well as learning more generally is not simply restricted to the mastery of concepts and procedures, but includes the ability to think, act, and interact with others in productive ways to solve complex tasks in real-world situations. Becoming an architect, for example, is more than knowing materials properties and tools for computer-aided design. It is being able to see what architects see and being able to frame it in the ways the profession thinks, knowing how to work with and talk with other architects and clients, and using concepts and procedures within the sphere of activities that constitutes architecture. In short, this is what is known as the epistemic frame of the discipline (Shaffer, 2006a, 2006b). Epistemic games have been developed in recent years to help players develop domain-specific expertise that characterizes how professionals in a particular domain reason, communicate, and act (e.g., Shaffer, 2006a; Bagley & Shaffer, 2009). Although there are many games- and simulation-based opportunities for transforming practices, perceptions, and commitments regarding learning in the 21st century (see, e.g., Gee, 2003; Gibson, Aldrich, & Prensky, 2006), epistemic games are explicitly based on theory of learning in the digital age and are designed to allow learners to develop domain-specific expertise under realistic constraints. For example, learners may learn what it is like to think and act like journalists, artists, business managers, or engineers by using digital learning technologies to solve realistic complex performance tasks. This is accomplished by designing the game in such a way that completing it mimics the core experiences that learners outside the gaming environment would have in a professional practicum in the field. The experiences that epistemic games afford and make accessible to learners are characterized by a blend of individual and collaborative work in both real-life and virtual settings. Due to their focus on creating digitally supported learning experiences that adequately mimic the real-life complexities of a profession, epistemic games are different from other types of computer games in important ways. First, the development of expertise in a particular real-life profession is at the heart of playing an epistemic game while only elements of such expertise are typically developed as a side-product in commercial computer games more generally. Notably, though, the objective of epistemic games is not to “train” learners with the purpose of suggesting particular career trajectories to them, but to facilitate the emergence of disciplinary thinking and acting that transfers to other contexts. Second, the decisions that are made in an epistemic game are made under real-life constraints and in real-time, which is contrary to computer games such as SimCity that allow the learner to manipulate time, resources, conditions, and decisions like an omnipotent being.
As one might expect, traditional measurement models with latent variables designed for traditional large-scale assessments struggle to accommodate such contextual dependencies, especially when data are collected at smaller scales. Alternative modeling approaches grounded in non-parametric methods, appear to be more promising for the data structures from epistemic games. In this paper, we specifically describe how one can investigate hypotheses about the

3
learning progressions of different players using a particularly promising alternative modeling method called epistemic network analysis (ENA) (Rupp et al., 2009; Shaffer et al., in press). Rather than providing a set of conclusive answers these daunting questions, we want to describe our research agenda surrounding the modeling of learning progressions in ENA. We do this to show the interconnections between choices made at the game design and data analysis level and to start a focused conversation in the games community about the theoretical potential and practical limitations of different modeling approaches for epistemic games contexts. To frame our discussions about ENA and the surrounding research properly, we need to establish our usage of a few conventions at the outset. First, we will use an epistemic game called Urban Science for illustration at certain points, which mimics the professional practicum experiences of urban planners (see http://epistemicgames.org/eg/ for more information). In Urban Science, learners must use information, tools, and methods typically used by urban planning professionals. For example, learners collect neighbourhood information that is provided to them by virtual characters from stakeholder groups, they collect data via real-life visits to the neighbourhood, they integrate information via a virtual interface that overlays relevant artefacts onto a geographical map of the neighbourhood, and present their results to real-life city council members. During the course of the game, learners work individually and interact with others. This includes other learners as well as mentors that guide them through the game; interaction is conducted either in real-life settings (i.e., meetings) or in virtual settings (e.g., via e-mail or instant messaging).
Second, throughout this paper, we will use the phrase “assessment task” rather broadly to refer to both non-verbal action toward the completion of a particular project component (e.g., researching information to create a preference survey) as well as verbal action (i.e., discursive engagement) between several players or players and mentors (e.g., group discussions about project progress). Similarly, we highlight that one should always distinguish between the epistemic frame / frame elements of a player, which are the hypothesized characteristics of the players themselves, and the model representations of these epistemic frames / frame elements, which are their statistical operationalizations. Specifically, in the context of ENA we represent individual elements of epistemic frames as nodes, which are analogues to traditional latent variables, and represent the constellation of these nodes as a network, which is a visual representation of the association strength between the nodes. Even though this terminological distinction may seem overly complex at first, it is actually very helpful to do so, because it continuously reminds us that statistical operationalizations are always borne out of multiple choices made by the analyst. Of course, even the definition of the hypothesized characteristics of the players that one wants to measure are borne out of multiple choices also. All of these choices have implications for a whole range of statistical analyses that are conducted. In turn, the manner in which these analyses are conducted guides the interpretations that are drawn about players’ epistemic frame developments so that the specifications of the characterizations, their operationalizations, the modeling of their development, and the resulting interpretations cannot be empirically disconnected. They can be temporarily separated for assessment development purposes but they need to be considered en concerto for building the eventual chain of reasoning that is the evidentiary argument or narrative. To present our research program surrounding ENA, the paper is divided into the following three core sections. In the first core section we describe the key statistical features of the data

4
structures from epistemic games, both at specific points in time and cumulatively across different points in time. In the second core section we then describe the key statistics that are defined within ENA for these data structures, both for describing an individual network of a single player and for comparing networks of different players or those of players and experts. In that section we also briefly discuss visual representations of such networks and methodological pathways for developing statistical inference for these statistics. In the third core section we describe how one can model learning progressions in ENA using the data structures described in the first section and the statistics described in the second section. We specifically distinguish between modeling learning progressions using real data and the additional challenges that one needs to face when simulating data that represent distinct learning progressions. We close this paper with a few remarks that relate the research program described in this paper to work in the area of latent-variable modeling.
Data Structures in Epistemic Games In this section we describe the rules for extracting evidence about players’ developing epistemic frame at a single point in time, the evidentiary accumulation across multiple time points, and how epistemic frame representations of players can be compared to external reference points such as expert frames.
Encoding Relevant Evidence at a Single Point in Time in ENA In epistemic games the sequence of activities in the game is divided into time slices. For example, in the latest version of Urban Science, they are defined as fixed 15-minute intervals but they could also be defined as intervals with a coherent theme or activity structure (see, e.g., Bagley, 2009). Within each of the time intervals, the interactions of players are transcribed and then qualitatively coded according to key words that signal the use of particular elements of players’ epistemic frames. In terms of definitional granularity, these elements are currently encoded at two levels, an aggregated macro-level and a disaggregated micro level. At the macro level, the following five elements of the epistemic frame are distinguished, which we will refer to as SKIVE elements for the remainder of the paper:
1. Skills (S): the things that people within the community do. 2. Knowledge (K): the understandings that people in the community share.
3. Identity (I): the way that members of the community see themselves. 4. Values (V): the beliefs that members of the community hold.
5. Epistemology (E): the warrants that justify actions or claims as legitimate within the community.
In the game Urban Science, for example, the five SKIVE elements were derived from Ehrlich (2000) and the National Assessment Governing Board’s (2006) civics framework. At the micro level, these five SKIVE elements can be further broken down into constituent elements that are relevant for performing the tasks in the epistemic game as in the following:
1. Skills (S) (various): being able to communicate clearly, both orally and in writing; being able to collect, organize, and analyze information; being able to think

5
critically and justify different positions; being able to view issues from the perspective of others.
2. Knowledge (K) (terms of art, systems thinking): knowing institutions and processes that drive civic, political and economic decisions; knowing how a community operates, the problems it faces, and the richness of diversity.
3. Identity (I) (as planner, as professional): having a way of seeing oneself that is commensurate with how members of the urban planning community see themselves.
4. Values (V) (working for stakeholders, for the public good, as a team, like a professional): being willing to listen to, and take seriously, the ideas of others.
5. Epistemology (E) (general, planning-specific): being able to understand what counts as relevant evidence that justifies actions as legitimate within the urban planning community.
Independent of which encoding level is used, observable evidence for a player’s reliance on one of the SKIVE elements is recorded by a ‘1’ in the given time slice. Hence, a sequence of observations for a player at the SKIVE macro level may look like the one shown in Table 1.
Table 1 Sample Sequence of Observations at the Macro Level Time Slice S K I V E
1 1 1 0 0 0 2 0 1 0 0 0 3 0 0 0 0 0 4 1 1 1 0 1 : : : : : : T 1 1 0 1 1
From these observations, so-called adjacency matrices are created, which are a statistical representation of the relational structure between the epistemic frame representations. The adjacency matrices contain entries of ‘1’ whenever two frame elements are used by a player concurrently within a time slice, which is determined by whether there are two entries of ‘1’ for two SKIVE elements within a time slice. For example, if there is evidence that a player relies on certain skills and values in responding to an assessment task then there will be an entry of ‘1’ in the adjacency matrix for the cell where S and V intersect. However, there will be entries of ‘0’ for the cells for S and V on the diagonal; Table 2 shows a sample adjacency matrix for time slice 1 for the fictitious player whose data are shown in Table 1.

6
Table 2 Sample Adjacency Matrix for a Single Time Slice S K I V E
S 0 1 0 0 0 K 1 0 0 0 0 I 0 0 0 0 0 V 0 0 0 0 0 E 0 0 0 0 0
Note. This adjacency matrix is for time slice 1 in Table 1.
Accumulating Relevant Evidence over Multiple Points in Time in ENA Since adjacency matrices are available for each time slice, the evidence in them can be accumulated across different time slices, which is achieved by simply summing the individual entries in the matrices across the time slices of interest. This leads to cumulative adjacency matrices, which look like the sample matrix shown in Table 3.
Table 3 Cumulative Adjacency Matrix for Fictitious Player S K I V E
S 0 23 14 7 9 K 23 0 11 3 8 I 14 11 0 16 15 V 7 3 16 0 13 E 9 8 15 13 0
This particular process of coding and accumulation implies that the evidence for individual SKIVE elements, in the absence of other SKIVE elements, is discarded. In other words, time slices where no SKIVE element is used by a player carry the same statistical informational value as time slices where only one SKIVE element is used by a player in isolation. Therefore, data strings of the structure [0,0,0,0,0] are statistically equivalent to data strings [1,0,0,0,0], [0,1,0,0,0], [0,0,1,0,0], [0,0,0,1,0], and [0,0,0,0,1]. The only information that counts as relevant evidence for players’ developing epistemic frame is evidence related to the co-activation of at least two SKIVE elements. However, one could also encode the presence of individual SKIVE elements by including ‘1’s in the diagonal of the adjacency matrices, which would provide information about absolute occurrences as well as co-occurrences.
Key Statistics for Representing Network Structures in ENA For the purpose of this paper it helps to think of classifying the key statistics in ENA according to the type of marginal information they provide about epistemic frame characteristics. Marginal information is information defined across different elements of the data matrix for a player on the basis of the statistical information in cumulative adjacency matrices. Specifically, we will distinguish between statistics that provide global marginal information, univariate marginal information, and bivariate marginal information in this paper. In the following we will denote a network by the letter N and also refer to the statistical representation of a particular SKIVE element in the epistemic frame as a node in the network.

7
Statistics for Global Marginal Information Global marginal information is essentially any information that is computed across different rows of the data matrix (i.e., different time slices) and different columns of the data matrix (i.e., different network nodes) of a player. One of the key global marginal statistics in ENA is the overall weighted density (WD) of the network at any given point in time of the game, including the end of the game play. It is computed as follows:
where is the squared entry in the cumulative adjacency matrix for network nodes k and k’ at time t. Note that diagonal elements in cumulative adjacency matrices currently do not count since they are ‘0’ and that the total sum is divided by two because the cumulative adjacency matrix is symmetric. The overall weighted network density thus represents the average pair-wise association between nodes in the epistemic network. The WD at time t thus operationalizes the average association strength between epistemic frame elements of a player in the epistemic network at time t. Clearly, a normalized version of this statistic that re-scales WD using the number of time slices, for example, is a suitable alternative candidate to account for the fact that the accumulation of evidence naturally grows as the game play progresses.
Statistics for Univariate Marginal Information Univariate marginal information is essentially any information that is computed either row-wise or column-wise for a player. One of the key univariate marginal statistic in ENA is the relative centrality (RC) of each node in the network, which is computed using two parts. The first part is the absolute centrality (AC) of each node in the network, which is computed as follows:
The AC for each node is then rescaled by dividing by the largest observed AC value for any node:
Thus, the RC statistic measures the average association between a node and all other nodes for a network at a given time point. The rescaling makes the RC values for nodes comparable across different time points for the same player or across different players due to the potentially different counts in the cumulative adjacency matrices under these conditions.
Statistics for Bivariate Marginal Information Bivariate marginal information is essentially any information that is computed on pairs of variables rows or columns of a player. The key bivariate marginal statistic in ENA is the re-scaled cumulative association (RCA) between two SKIVE elements, which is computed as follows.

8
That it, it is simply the entry in the cumulative association matrix corresponding to nodes k and k’ divided by the maximum value of any such entries in the matrix at that time point. The rescaling is done to allow for fair comparisons of this statistics across players who may have had different total numbers of co-occurrences of nodes in the network at that point in time.
Visual Representations of Networks in ENA In order to facilitate a presentation of the change in networks over time, it is helpful to visually represent the state of the network at each point in time. Consequently, changes of the network state over time can be represented as short “movies” that show the evolution of the network over the course of the game play. The key idea is to realize that the network is a multidimensional object (e.g., five dimensions when five nodes corresponding to the five SKIVE elements are used) and that visual representations are either two-dimensional or three-dimensional. Hence, any visual representation is technically a projection of the network from a high-dimensional space into a lower-dimensional space, which can be achieved with alternative projection algorithms.
One algorithm that is used frequently for this purpose is the algorithm described in Kawada and Kamai (1989), which uses concepts from physics, specifically a spring-mass model. This algorithm is particularly useful for undirected graphs such as those utilized in ENA, which are graphs where there are no directional relationships between network nodes. Figure 1 shows an evolution of a network for a single player over the course of a game play for a game called Digital Zoo using this algorithm. Only three time points are chosen here for illustration; for the full movie please go to http://www.youtube.com/watch?v=pctE4uXimFw.
Distance Measures for Epistemic Networks in ENA One important decision to be made when modeling learning progressions within ENA is deciding how one compares network representations of the epistemic frames of players. There are essentially three different frames of comparison that are relevant for this purpose, which are comparing the state of the network of player p at time t with…
1. …the state of the network of the sample player p at time t’ (i.e., longitudinal intra-individual comparisons) 2. …the state of the network of a different player p’ at the same time t (i.e., cross-sectional inter-individual comparisons) 3. …the state of the network of an expert e at time t or time t’ (i.e., inter-individual comparisons to a fixed reference point). 4.

9
Figure 1 A developing epistemic frame at early, middle, and late stages of game play. Any comparison involves the use of a particular distance metric along which different distance measures can be compared. There are different distance metrics for computing the difference of
EarlyStage
OfGamePlay
MiddleStage
OfGamePlay
LateStage
OfGamePlay

10
two networks within ENA, whose differences can be best understood by recalling differences in statistical metrics more generally.
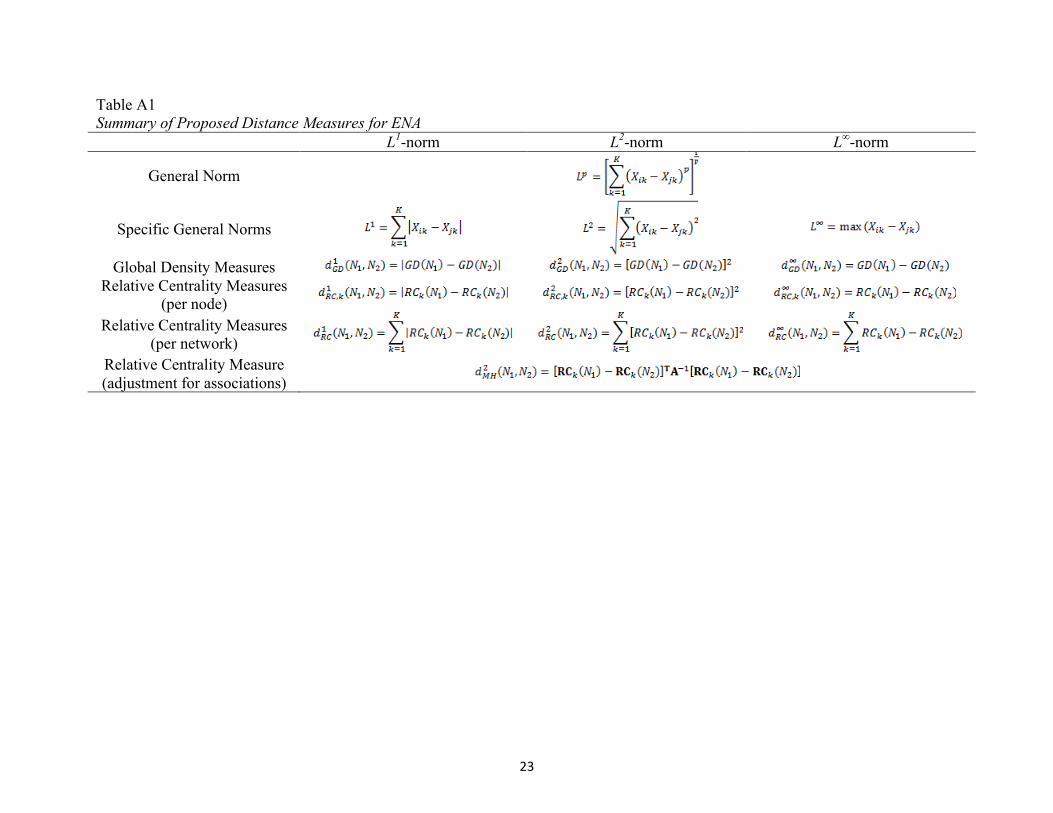
A common class of distance metrics in multivariate data analysis is the class of Minkowski metrics or Lp-norms (e.g., Lattin, Carroll, & Green, 2003), which have the following structure:
In this formula, Xik and Xjk represent the scores for two objects i and j (e.g., two learners) on outcome variable k; there are K such outcome variables in total. Special cases of this metric are the city-block metric that utilizes absolute values for p = 1,
the Euclidian metric based on squared distances for p = 2,
and the supremum metric based on the maximum distance for p = ∞,
Using these distance metrics we can now define different distance measures for ENA based on the particular network statistic that we are interested in; Table A1 shows a summary for the ENA statistics that we introduced earlier using the Minkowski norms for p = 1, p = 2, and p = 3. Thus, if a global marginal statistic such as the WD is chosen, then a set of suitable distance measures could include (1) the absolute value of the difference, (2) the squared difference, or (3) the signed difference between the two WD values for the two networks. If a univariate marginal statistic such as the RC of a node within a network is chosen, then a set of suitable distance metrics could be defined for each node separately or for all nodes jointly. For all nodes separately we could define (1) the absolute value of the difference, (2) the squared difference, or (3) the signed difference between the two RC values for node k for the two networks. Alternatively, we could aggregate the information about the relative centrality up into a global statistic across all nodes of the network. The most natural mechanism for doing so would be to sum up the distance measures for each network node across all nodes in the network. This leads to (1) the sum of the absolute values of all differences across nodes, (2) the sum of all squared differences across nodes, or (3) the sum of all signed difference across nodes. Finally, it may also be desirable to include the information about the association structure between two networks into the computation of relevant distance metrics. In multivariate data analysis the distance metric for this purpose is known as Mahalanobis distance, which effectively weights the squared Euclidian distances by the variance-covariance matrix of the outcome variables. For ENA, the non-parametric analogue would be to weight the Euclidian distances of the RC measures across all nodes in a network by the rescaled cumulative adjacency matrix of the network at the time t. The idea of metrics such as this one is essentially to rescale differences based on the strength of association between the different SKIVE nodes. While the distance metrics that we just described are relatively well understood in multivariate data statistics more generally, we are just beginning to explore how they function in ENA. For

11
example, it is important to empirically study how sensitive interpretations based on these distance measures are to differences of different magnitudes in light of different strengths of associations between different network nodes. A few things are certainly clear from our general knowledge of these statistics, however. For example, distance measures for the L2-norm are always larger in absolute value than distance measures for the L1-norm and both eliminate any signed differences. In contrast, distance measures based on the L∞-norm preserve signed differences but blend out all information except for maximal differences. Alternative metrics based on Lp-norms that preserve signs (e.g., the L3-norm) might be appropriate for the ENA context. Moreover, relationships between norms and certain estimation approaches are well understood in statistics but are not well understood in the ENA literature yet. For example, we know that estimates from an L2-norm estimation in regression analysis are equivalent to maximum likelihood estimates under assumptions of normality. Consequently, we need to explore the nature of similar relationships between different statistics and estimation algorithms in more theoretical depth for ENA also.
Computing Inferential Statistics for Network Statistics One of the core objectives of any statistical analysis is to bound the uncertainty that exists for any interpretations that are made from a sample to the corresponding population. This is done via inferential statistics that lead to commonly used tests such as t-tests, F-tests, or χ2-tests, to name but a few. Generally speaking, the challenge in non-parametric statistics is to develop appropriate empirical sampling distributions for the statistics that one proposes, which is difficult because the weakening of the assumptions about the data that led to their definition makes the use of well-defined sampling distributions impossible. Thus, most sampling distributions for non-parametric statistics are based either on theoretically derived alternative sampling distributions or empirically developed sampling distributions. Utilizing empirically developed sampling distributions is a powerful approach for novel statistics, because their creation does not rely on specific distributional assumptions for the data per se. Instead, the idea is to create replicates of the original data set using some random yet systematic approach, to compute the statistic on each of the replicate data sets to obtain the empirical sampling distribution, and then to compare the original statistic to this distribution. Three core approaches for obtaining empirical sampling distributions that we want to briefly discuss in the context of this paper are (1) jack-knife approaches, (2) bootstrapping approaches, and (3) predictive model checking approaches.
The idea of jack-knife and bootstrapping approaches is to see how much the elimination of particular pieces of information affects the value of the statistic. In jack-knife approaches, one sequentially eliminates a certain number of observations from the data set – typically one – and re-computes the statistic of interest on the remaining data. The distribution of this statistic across all jack-knifed samples is the empirical jack-knifed sampling distribution of the statistic. For example, one could systematically eliminate one time slice at a time for each learner and re-compute an ENA statistics such as the WD on the cumulative adjacency matrix computed on the remaining T – 1 time slices. The distribution of the resulting WD values, of which there will be T, would be an estimate of the empirical jack-knifed sampling distribution for that statistics. In bootstrapping approaches one randomly re-samples new data sets of a particular size from the original data and then computes the statistic of interest on these newly sampled data sets. The distribution of this statistic across all bootstrapped samples is the empirical bootstrapped

12
sampling distribution of the statistic. For example, one could randomly sample with replacement T time slices for each learner from the original data and re-compute an ENA statistics such as the WD on the cumulative adjacency matrix for each new data set. The distribution of the resulting WD values, of which there will be as many as one has taken samples, would be an estimate of the empirical bootstrapped sampling distribution for that statistics. In predictive model checking approaches, on the other hand, one uses the model that one has estimated to predict new data. For each new predicted data set one then computes the statistic of interest. The distribution of this statistic across all predicted samples is the empirical predicted sampling distribution of the statistic. The theoretical requirement for predictive model approaches is, of course, the existence of a particular statistical model with associated parameters that can be used for data generation. Currently, ENA and its associated statistics form a family of descriptive statistics in the absence of a fully parameterized statistical model. Our research agenda aims at developing suitable candidate models over time so that this approach can be implemented alongside jack-knife or bootstrapping methods.
To illustrate the utility of these approaches, Table 4 shows the values of the five SKIVE variables for one player in Urban Science computed across different conditions based on a jack-knife approach. The information in Table 4 is grouped into four sections. At the bottom is the baseline information, which is the total number of time slices for this player (T = 87), the value of the WD at the end of the game play (WD = 88.96), and the RC values for each of the five SKIVE nodes. Clearly, the skills (S) and knowledge (K) nodes are most central followed by the values (V), epistemology (E), and identity (I) nodes. The three remaining groups in the table illustrate the variation of the WD and RC values when certain types of information are deleted from the data for the player. In Group 1, particular types of interactions are removed, in Group 2 a particular number of time slices are removed, and in Group 3 particular types of tasks are removed. In Group 1 and Group 3 there is a row for non-parametric summary statistics of the distributions across the different conditions, namely the median and semi inter-quartile range. In Group 2 the individual rows already contain those summary statistics as they are based on replicating the deletion process multiple times for each amount of missing data.

13
Table 4 Relative Centrality and Density Statistics for One Player using Jack-knife Approaches
Relative Centrality Missing Data Type
Missing Data Subtype # Time Slices
WD S K I V E
Removing Individual & Team
40 34.26 100.00 98.37 19.28 71.22 55.08
Removing Group & Team 48 46.07 100.00 100.00 20.62 84.61 63.75 Removing Individual & Group
61 67.70 99.27 100.00 32.25 86.23 65.76
1
Median (Semi-IQR)
--- 46.06 (8.36)
100.00 (.18))
100.00 (.41)
20.62 (3.24)
84.61 (3.75)
63.75 (2.67)
Median for Missing 1% (Semi-IQR)
86 90.91 (1.16)
99.03 (0.02)
100.00 (0.00)
23.50 (0.21)
85.31 (0.18)
63.51 (0.76)
Median for Missing 5% (Semi-IQR)
82 85.73 (2.14)
98.52 (0.05)
100.00 (0.00)
24.14 (1.09)
85.50 (0.83)
66.38 (1.24)
Median for Missing 10% (Semi-IQR)
78 80.40 (2.34)
98.61 (0.50)
100.00 (0.00)
24.31 (1.54)
85.31 (1.01)
66.51 (1.58)
2
Median for Missing 20% (Semi-IQR)
69 70.73 (2.56)
98.67 (0.53)
100.00 (0.00)
23.87 (4.19)
85.57 (1.67)
66.33 (1.71)
Welcome & Action Report 84 90.91 98.66 100.00 23.87 86.43 66.99 Background Research 73 84.92 98.52 100.00 25.91 88.03 70.91 Site Visit & Virtual Site Visit
66 71.58 99.28 100.00 26.89 86.26 66.86
Reflection on Virtual Site Visit
84 84.14 98.62 100.00 22.48 84.40 63.54
Preference Survey Prep & Cond
81 85.51 100.00 100.00 25.40 86.00 65.29
Reflection on Preference Survey
84 87.15 98.61 100.00 24.90 85.83 67.37
Feedback on Preference Survey
83 84.98 97.83 100.00 25.25 83.64 65.80
Final Plan 82 81.04 99.42 100.00 20.23 83.64 62.98 Final Report 81 80.16 98.51 100.00 18.85 84.60 67.03 Presentation Prep & Practice
79 70.89 100.00 99.16 6.62 74.60 45.33
Presentation & Reflection 78 82.46 98.51 100.00 23.29 86.06 68.45
3
Median (Semi-IQR)
--- 84.14 (2.32)
98.62 (.42)
100.00 (.00)
23.87 (1.99)
85.83 (1.07)
66.86 (1.39)
4 Baseline 87 88.96 100.00 99.34 25.23 85.16 67.02

14
The information across all three groups in Table 4 shows, for example, that the relative ordering of the RC values across the five SKIVE elements is consistent across the different jack-knife conditions even though the values themselves fluctuate somewhat. The information in Group 1 and Group 3 show where the most information about particular SKIVE elements is collected. For example, most information about the identity (I) node is found in team discussions as the values for the node drop most strongly when those are removed from the data set. Such information is also contained in the Final Report and the Presentation Preparation & Practice where players have to draw on all epistemic frame elements in the most connected and integrated manner. Similarly, the information in Group 2 quantifies how much an increase in randomly missing data (i.e., an increase in the number of the deleted time slices) increases the variation in the WD and RC values. In sum, the analyses shown here for selected network statistics are the first steps toward more comprehensive investigations of the behavior of a broader set of network statistics, especially any distance measures that help us to quantify developing expertise over time within a player and with respect to an external reference point such as the network of an expert. In the following section of this paper we are now going to discuss how one can use ENA to simulate data to represent learning progressions.
Modeling Learning Progressions in ENA
Any statistic that is chosen in a modeling process constrains the choices that one can make with respect to how one would like to model the response process for the assessment in question. The focus of this paper is on modeling learning progressions in real data and simulating such learning progressions with an appropriate statistical model. Thus, within the context of ENA, the choice between global, univariate, and bivariate marginal statistics will constrain how we represent and simulate learning progressions.
Modeling Learning Progressions in Real Data using ENA Representing different learning progressions can be done relatively simply using the ENA statistics that we described in the section above. For example, it is possible to compare the global density of a network for a player to the global density of the network of an expert who plays the game concurrently with the player. In Urban Science the experts are playing the roles of mentors in the game such that their interactions with the students are continuously recorded during game play. Thus, differences between network representations of player and mentor networks are dynamic across the course of the game play as both network structures change concurrently. Figure 2 shows the concurrent evolution of a player’s and a mentor’s network over the course of a game play; the network structure is summarized here by the RC values for all five SKIVE.

15
Time Slice
Figure 2 Network evolution for a player and a mentor over the course of game play. Alternatively, one could compare the network structure of a player to a fixed expert network, which would serve as an ideal reference point. Statistically, however, this would simply amount to a rescaling of the individual WD and RC values for the player, which would not be informative beyond the player’s network representation itself. This would change if a global summary statistic for differences in networks such as in Table A1 would be used, which are based on summing up RC values across all nodes. Apart from the statistical work that needs to be done, it is also not clear at this point how different learning progressions would actually look like. In order to gather some empirical evidence that could help describe the learning progressions of individual learners and explore whether there are different latent classes of learners with different types of progressions, ethnographic studies can be used. When framed within epistemic games research, such studies seek to identify the key actions and reflections-on-action in a professional practicum that are leveraging moments for helping learners develop their epistemic frames. Such a study was recently conducted in the context of the urban planning practicum on which the Urban Science game is based (Bagley, 2009; see also Hatfield, 2008, and Svarovsky, 2006, for different games).
Simulating Learning Progressions using ENA Observing different learning progressions in the context of real-life implementations of epistemic games is only one side of the coin of modeling such progressions. The other side of the coin is to simulate data for prototypical learning progressions and to use such data to investigate the performance of different ENA statistics that are applied to them. The crux of this endeavor is to define a statistical model that can be used to simulate the data, which is the same requirement that we encountered above for computing the predictive sampling distribution for statistics. Since ENA is a non-parametric tool it is not possible to use a single model equation with particular settings of model parameters to generate data. Instead, data have to be simulated algorithmically based on desired patterns and marginal constraints, which is where the statistics and principles from the previous section come into play again. In the following, we will describe the simulation

16
of different learning progressions in two steps. The first step requires describing how data structures for ENA could be generated generally and the second step requires describing what the particular patterns of the data need to be to represent particular learning progressions. Simulating Epistemic Games Data for ENA Generally In order to understand how to simulate learning progressions using the approach we will describe, it is helpful to recall the data structure from Table 1 earlier in the paper. Since the data consists of entries of ‘0’ and ‘1’ for any given node and time slice, the objective of data simulation is to generate sequences of ‘0’s and ‘1’s that lead to patterns of values of ENA statistics that properly represent different learning progressions. Formally, such data can be modeled using a Bernoulli distribution. This distribution models the observed values as random draws with a probability of πtk for observing a ‘1’ in time slice t for SKIVE element k; Table 5 represents this idea.
Table 5 Probability Setup for Simulating Epistemic Games Data Time Slice S K I V E
1 π1S π1K π1I π1V π1E 2 π2S π2K π2I π2V π2E 3 π3S π3K π3I π3V π3E 4 π4S π4K π4I π4V π4E : : : : : : T πTS πTK πTI πTV πTE
Thus, the key question becomes how the underlying probabilities for the resulting data matrix should be structured so that an emerging learning progression has the desired structure.
One way of framing this problem is in terms of the kinds of marginal constraints that can be placed on such probabilities. We will distinguish between univariate and bivariate marginal constraints in the following, which leads to the following core approaches:
A. Global Constraints A1. = .5 (completely randomized pattern) for all K nodes and all T time slices.
A2. = proportion of ‘1’s in the data matrix across all K nodes and all T time slices.
B. Univariate Constraints B1a. = proportion of ‘1’s in time slice t across all K nodes.
B1b. = proportion of ‘1s’ in all time slices across all K nodes within a moving window of width (t – c, t + c).
B2a. = proportion of ‘1’s for node k across all T time slices. B2b. = proportion of ‘1’s for node k across all T time slices within a moving window of width (t – c, t + c).
C. Bivariate Constraints C1. = cumulative co-occurrence of nodes k and k’ up to time t.

17
C2. = cumulative co-occurrence of nodes k and k’ within a moving window of width (t – c, t + c).
Note that it is also possible to control marginally for different sets of nodes differently. For example, in a prototypical SKIVE setup for an ENA analysis, one could place marginal constraints of the type B2a on two nodes (e.g., the S and K nodes) while placing a global marginal constraint of the type A2 on the remaining three nodes I, V, and E.
Looking at the above conditions closely, it becomes clear that they allow for different degrees of control over the structure of the resulting cumulative adjacency matrices that one can compute at different points in the game. Since ENA statistics are, in turn, based on the cumulative adjacency matrices it is important to understand whether the amount of control over the structure of the adjacency matrices is sufficiently tight to allow for a meaningfully accurate representation of a particular learning progression. Consider, for example, generating data under univariate constraints as in the constraint set B above. In this case, one would not be able to ensure that the cumulative adjacency matrices have a particular structure, because one would not control the co-occurrences of node elements in any particular time slice. Of course, such co-occurrences would occur by chance but they would not be controlled for during the simulation. Univariate marginal constraints would come into play, however, if the occurrences of individual frame elements were recorded via ‘1’s in each time slice and would get accumulated across time slices in the cumulative adjacency matrices. In contrast, placing bivariate constraints onto the probabilities as in constraint set C theoretically ensures that cumulative adjacency matrices would have the appropriate proportions of co-occurrences between nodes. Simulating Learning Progressions for ENA Specifically The descriptions in the previous subsection have highlighted how one can ensure control over the resulting structure of the cumulative adjacency matrix. In and of itself, this does not represent the simulation of a specific learning progression. Some unspecified learning progression will result from any generated data, but additional constraints are required to place some structure on the data to represent a particular progression. Consequently, a meaningful starting point for simulating data corresponding to different learning progressions is to formulate hypotheses about how different progressions are reflected in the observed data structure and, perhaps, the ENA statistics that are used to summarize these structures. Since different ENA statistics highlight and blend out different characteristics of the data structure, they lead effectively to different representations of different learning progressions.
The following is a set of competing – and differentially plausible – hypotheses about learning progressions that can be used as a starting point for placing constraints on the response probabilities as described above. For example, one could hypothesize that learning means that…
1. …reliance on single frame elements decreases over the course of the game play while the reliance on pairs of frame elements increases. Thus, time slices with all ‘0’s or just one ‘1’ decrease over time. (Quality of Connectedness Hypothesis) 2. …the reliance on pairs of frame elements for each time slice increases over time. Thus, the number of ‘1’s within time slices increases over time. (Quantity of Connectedness Hypothesis)

18
3. …the relative reliance on certain pairs of frame elements increases over the course of the game play. That is, the proportion of ‘1’s for pairs of nodes across time slices increases in a specific pattern. (Proportional Change Hypothesis)
Even though these hypotheses are plausible at first sight, they require further constraints in order to meaningfully represent learning progressions. Specifically, adequate domain-specific expertise does not manifest itself simply in the constant reliance of multiple epistemic frame elements, but in a task-appropriate reliance on these elements. Specific tasks that are presented to players during the course of the game play are designed to elicit particular components of the epistemic frames of players even though inter-individual differences in the activation of epistemic frame elements due to differences in expertise are, of course, expected. It is therefore critical to determine reference points for the operationalization of these hypotheses, which needs to be based on a blend of theoretical and empirical information. Empirically, one could use the data from players who have played the game to determine what reasonable data patterns would be like or one could use data from experts who have played the game. Alternatively, one could use theoretical predictions for what prototypical and aberrant behaviors for particular task types would be for the targeted player group to develop idealized response patterns that serve as a frame of reference. Research is currently needed on prototypical progressions through an epistemic game such as Urban Science to be able to use these progressions for placing constraints on the probabilities for the data matrix as described above.
Conclusion In this paper we have laid out a few key cornerstones for a research agenda that investigates how ENA can be used reliably in the context of epistemic games to support meaningful interpretations about learners’ developing epistemic frames. While we have a reasonably good handle on the kinds of statistics that are used in ENA in other areas such as non-parametric statistics and social network analysis, we are just beginning to explore how their performance can be optimized in the context of epistemic games. A critical link is the usual link between principled assessment design of epistemic games and the statistical analyses that support the interpretations about learners vis-à-vis the games design. In closing, we mention that there is a clear connection between the ENA approach to data analysis and traditional modern latent-variable models for the analysis of discrete response variables. Specifically, cumulative adjacency matrices are non-parametric analogues to covariance matrices, which are used to represent the association structure between latent variables in multidimensional confirmatory factor analysis models (e.g., McDonald, 1999), multidimensional item response theory models (e.g., de Ayala, 2009), or multivariate growth mixture models (e.g., Duncan, Duncan, & Strycker, 2009). The obvious advantage of latent-variable models is their ability to provide a wide range of inferential statistics whose performance under different conditions is reasonably well understood. Their disadvantage is that they require relatively large sample sizes for stable, accurate, and efficient estimation compared to the sample sizes for epistemic game implementations that are currently available.
For example, Figure A1 shows a potential latent-variable model that could be specified, parameterized, and estimated for large data sets from epistemic games. In this specific model we would create five latent variables for different blocks of time slices to represent the five SKIVE

19
elements. Within each block we would have to have several time slices so that a sufficient number of indicators are available for each latent variable. Furthermore, we would have to ensure that the blocks are parallel in design so that certain time slices could be used as anchors to make comparisons across time meaningful. The model would most likely need to contain additional latent variables to absorb residual context effects given that data within a time slices is observed in the same context; these variables are shown at the bottom of the figure. On the top part of the figure, we can also see a higher-order latent variable that might need to be included to keep the number of parameters in the model down to a reasonable number. This latent variable could then also be used to model development over time, which could also vary over the different clusters of data (e.g., classrooms, schools, or even school districts) on which we would need to collected data to have a sufficiently large sample size for reliable estimation. The complexity of this model is relatively daunting given the current implementation scale of epistemic games even though the individual components of the model are well understood by measurement specialists. ENA, in fact, mimics several properties in this model and ENA statistics are closely related in structure and objective to more well-understood statistics in the realm of modern latent-variable modeling. As stated above, cumulative adjacency matrices are non-parametric analogues to covariance matrices and latent-variable models essentially impose restrictions and structures onto covariance matrices. Similarly, modeling change over time using ENA statistics such as RC measures is akin to computing the average covariance of latent variables with other latent variables. In short, it can be seen that ENA is an approach for making relatively complex inferences statistically feasible without reliance on latent variables by using rather simple algorithms and statistics.
Our future research will explore these theoretical relationships in more detail and gather more empirical evidence as to the performance of ENA for supporting interpretations of learners’ developing epistemic frames. Understanding how learning progressions can be appropriately and reliably modeled for epistemic games is critical to further transform the theoretical promise of epistemic games into practical benefits within an accepted disciplinary discourse in the educational measurement community. We are looking forward to working with content specialists, curriculum specialists, learning scientists, and other methodologists in this area and to engage in a spirited interdisciplinary dialogue about how these goals can be achieved.

20
References Bagley, E. (2009). Planning for the future: Designing epistemic games for civic engagement
and ecological understanding. Unpublished manuscript. Bagley, E., & Shaffer, D. W. (2009). When people get in the way: Promoting civic thinking
through epistemic gameplay. International Journal of Gaming and Computer-mediated Simulations, 1, 36-52.
de Ayala, R. J. (2009). The theory and practice of item response theory. New York: The Guilford Press.
Duncan, T. E., Duncan, S. C., & Strycker, L. A. (2009). An introduction to latent variable growth curve modelling: Concepts, Issues, and Applications (2nd ed.). Mahwah, NJ: Erlbaum.
Ehrlich, T. (2000). Civic responsibility and higher education. Phoenix, AZ: American Council on Education and The Oryx Press.
Gee, J. P. (2003). What video games have to teach us about learning and literacy. New York: Palgrave / Macmillan.
Gibson, D., Aldrich, C., & Prensky, M. (Eds.). (2006). Games and simulations in online learning: Research and development frameworks. Hershey, PA: Information Science Publishing.
Hatfield, D. L. (2008). The epistemography of Journalism 335: The complex mechanisms of developing journalistic expertise. Unpublished manuscript.
Kamada, T., & Kawai, S. (1989). An algorithm for drawing general undirected graphs. Information Processing Letters, 31, 7-15.
Lattin, J., Carroll, J. D., & Green, P. E. (2003). Analyzing multivariate data. Belmont, CA: Brooks / Cole.
McDonald, R. J. (1999). Test theory: A unified treatment. Mahwah, NJ: Erlbaum. National Assessment Governing Board (2006). Civics framework for the 2006 National
Assessment of Educational Progress. Retrieved November 11, 2008 from http://www.nagb.org/civics_06.pdf
Partnership for 21st Century Skills (2008). 21st century skills, education, and competitiveness: A resource and policy guide. Tuscon, AZ. Available online at www.21stcenturykills.org
Shaffer, D. W. (2006a). How computer games help children learn. New York: Palgrave / Macmillan.
Shaffer, D. W. (2006b). Epistemic frames for epistemic games. Computers and Education. 46(3), 223-234.
Shaffer, D. W., Hatfield, D., Svarovsky, G. N., Nash, P., Nulty, A., Bagley, E., Franke, K., Rupp, A. A., & Mislevy, R. J. (in press). Epistemic network analysis: A prototype for 21st century assessment of learning. The International Journal of Learning and Media.
Shute, V. J., Dennen, V. P., Kim, Y.-J., Donmez, O., & Wang, C.-Y. (in press). 21st century assessment to promote 21st century learning: The benefits of blinking. In J. Gee (Ed.), Games, learning, assessment. Boston, MA: MIT Press.
Svarovsky, G. N. (2006). The epistemography of BME 201: Building engineers, one participant structure at a time. Unpublished manuscript.

21
Author Notes This work was based, in part, on an invited presentation given at the third meeting of the Assessment Group for Socio-cultural and Games-based Learning sponsored by the John D. and Catherine T. MacArthur foundation in Phoenix, AZ, from May 14-16, 2009. The work at the University of Maryland was funded, in part, by a grant from the Support Program for Advancing Research and Collaboration (SPARC) within the College of Education that was awarded to the first author for 2009. The work at the University of Wisconsin at Madison was funded, in part, by the John D. and Catherine T. MacArthur foundation and the National Science Foundation (REC-0347000). The opinions, findings, and conclusions in this paper do not reflect the views of the funding agencies, cooperating institutions, or other individuals.

22
Appendix
23
Table A1 Summary of Proposed Distance Measures for ENA
L1-norm L2-norm L∞-norm
General Norm
Specific General Norms
Global Density Measures Relative Centrality Measures
(per node)
Relative Centrality Measures (per network)
Relative Centrality Measure (adjustment for associations)

24
Figure A1 Prototypical latent-variable model for modeling epistemic games data.