
Modeling Consumer Health Plan Choice Behavior To Improve Customer Value and Health Plan Market Share
11
Modeling Consumer Health Plan Choice Behavior To Improve Customer Value and Health Plan Market Share Roger Gates DSS RESEARCH AND DIGITALHEALTH.COM Carl McDaniel THE UNIVERSITY OF TEXAS AT ARLINGTON Karin Braunsberger ARKANSAS TECH UNIVERSITY The ability of health-care providers and insurers to survive in today’s groups (Forgionne, 1991). The present study supplements prior research by illustrating how choice-based conjoint analy- highly competitive market requires that they thoroughly understand mar- ketplace needs and use that information to deliver true customer value. sis can be used by managers to create health plans that opti- mize value for the consumer and market share for the organiza- The objective of the present study is to illustrate how choice-based conjoint analysis can be used to create health plans that optimize value for consum- tion offering them. ers and market share for managed care organizations. The use of choice- based conjoint analysis takes the guesswork out of health plan design and Background promotion. By offering insight into consumer reactions to the range of plan feature choices, the research program presented in this article can During the last several decades, numerous developments have help to increase consumer satisfaction while aiding health plans to reach produced enormous changes in the health-care industry. First, their objectives as well. The elimination of crises and ad hoc decision health care is one of the fastest growing sectors in the service making raises the effectiveness and efficiency of managed care programs. industry. As Folland, Goddman, and Stano (1993) point out, J BUSN RES 2000. 48.247–257. 2000 Elsevier Science Inc. All rights approximately 12.5% of all dollars spent on final goods and reserved. services are spent on health care. This is a significant increase from the estimated 8% spent on health care in 1976. Second, a more relaxed regulatory environment combined with oversupply (Steiber, 1987) have led to sharply increased T he ability of health-care providers to survive in today’s competitive pressures for health-care providers (Nelson and highly competitive market requires that they thor- Goldstein, 1989). Competitive dynamism is not only evident oughly understand the needs of consumers and then in the increased number of physicians and hospitals, but also deliver true customer value; that is, managers must effectively in the emergence of such alternative delivery systems as HMOs use their resources to maximize the perceived value of their and walk-in clinics. product offerings to target customers. Historically, health Third, consumers of health-care services have become more plans or health insurance programs were designed on the informed and sophisticated buyers of these services (Andaleeb, basis of the preconceived notions of medical professionals 1994; Nelson and Goldstein, 1989). In addition, customer (Ellsbury and Montano, 1990). Satisfaction delivered by such expectations have grown as their knowledge regarding health- plans was, therefore, a hit-or-miss proposition. Today, deci- care services has expanded (Oliver, 1980). Thus, for a health- sion support systems play an increasingly important role in care coverage organization to take a pro-active stance in today’s management’s design of health plans for various consumer dynamic environment, managers must have knowledge re- garding consumer reactions to alternative choices (Zeithaml and Zeithaml, 1984). Furthermore, research shows that man- Address correspondence to: Dr. R. Gates, DSS Research, E# 101, 711 Lamar Boulevard, Arlington, TX 76011-3854, USA. agers of health-care organizations must continue to monitor Journal of Business Research 48, 247–257 (2000) 2000 Elsevier Science Inc. All rights reserved. ISSN 0148-2963/00/$–see front matter 655 Avenue of the Americas, New York, NY 10010 PII S0148-2963(98)00090-3
Transcript of Modeling Consumer Health Plan Choice Behavior To Improve Customer Value and Health Plan Market Share
Modeling Consumer Health Plan ChoiceBehavior To Improve Customer Value andHealth Plan Market ShareRoger GatesDSS RESEARCH AND DIGITALHEALTH.COM
Carl McDanielTHE UNIVERSITY OF TEXAS AT ARLINGTON
Karin BraunsbergerARKANSAS TECH UNIVERSITY
The ability of health-care providers and insurers to survive in today’s groups (Forgionne, 1991). The present study supplementsprior research by illustrating how choice-based conjoint analy-highly competitive market requires that they thoroughly understand mar-
ketplace needs and use that information to deliver true customer value. sis can be used by managers to create health plans that opti-mize value for the consumer and market share for the organiza-The objective of the present study is to illustrate how choice-based conjoint
analysis can be used to create health plans that optimize value for consum- tion offering them.ers and market share for managed care organizations. The use of choice-based conjoint analysis takes the guesswork out of health plan design and
Backgroundpromotion. By offering insight into consumer reactions to the range ofplan feature choices, the research program presented in this article can During the last several decades, numerous developments havehelp to increase consumer satisfaction while aiding health plans to reach produced enormous changes in the health-care industry. First,their objectives as well. The elimination of crises and ad hoc decision health care is one of the fastest growing sectors in the servicemaking raises the effectiveness and efficiency of managed care programs. industry. As Folland, Goddman, and Stano (1993) point out,J BUSN RES 2000. 48.247–257. 2000 Elsevier Science Inc. All rights approximately 12.5% of all dollars spent on final goods and
reserved. services are spent on health care. This is a significant increasefrom the estimated 8% spent on health care in 1976.
Second, a more relaxed regulatory environment combinedwith oversupply (Steiber, 1987) have led to sharply increased
The ability of health-care providers to survive in today’s competitive pressures for health-care providers (Nelson andhighly competitive market requires that they thor- Goldstein, 1989). Competitive dynamism is not only evidentoughly understand the needs of consumers and then in the increased number of physicians and hospitals, but also
deliver true customer value; that is, managers must effectively in the emergence of such alternative delivery systems as HMOsuse their resources to maximize the perceived value of their and walk-in clinics.product offerings to target customers. Historically, health Third, consumers of health-care services have become moreplans or health insurance programs were designed on the informed and sophisticated buyers of these services (Andaleeb,basis of the preconceived notions of medical professionals 1994; Nelson and Goldstein, 1989). In addition, customer(Ellsbury and Montano, 1990). Satisfaction delivered by such expectations have grown as their knowledge regarding health-plans was, therefore, a hit-or-miss proposition. Today, deci- care services has expanded (Oliver, 1980). Thus, for a health-sion support systems play an increasingly important role in care coverage organization to take a pro-active stance in today’smanagement’s design of health plans for various consumer dynamic environment, managers must have knowledge re-
garding consumer reactions to alternative choices (Zeithamland Zeithaml, 1984). Furthermore, research shows that man-
Address correspondence to: Dr. R. Gates, DSS Research, E# 101, 711 LamarBoulevard, Arlington, TX 76011-3854, USA. agers of health-care organizations must continue to monitor
Journal of Business Research 48, 247–257 (2000) 2000 Elsevier Science Inc. All rights reserved. ISSN 0148-2963/00/$–see front matter655 Avenue of the Americas, New York, NY 10010 PII S0148-2963(98)00090-3
248 J Busn Res R. Gates et al.2000:48:247–257
customer perceptions over time as the environment changes effort was the Employee Health Care Value Survey conductedon behalf of Xerox, GTE, and Digital Equipment Corp. during(Gilbert, Lumpkin, and Dant, 1992). If the environment isthe fall of 1993 (Allen, Darling, McNeill, and Bastien, 1994).neglected, losses of market share and profitability will follow.This survey was completed by 24,306 employees and wasThis focus on consumer perceptions and expectations byused to develop methods for evaluating corporate health-caremanagement is a fairly recent development in the health-carebenefit strategies. This study made it possible to compareindustry (Chakraborty, Ettenson, and Gaeth, 1994). In thehealth plans on more than 60 criteria. Another similar effortpast, employers offered health benefits to their employees,was undertaken by the Commonwealth Fund in 1994 (Davis,selecting both the health-care coverage and the provider ofCollins, Schoen, and Morris, 1995). In this study, 3,000 adultsthat coverage. Consequently, the marketing efforts of health-were surveyed regarding their experiences choosing eithercare coverage providers were usually limited to convincingindemnity or managed care plans and their satisfaction withemployers of the desirability and superiority of their product.those plans.The sales model was very simple and focused almost entirely
One approach to assessing perceptions is to have consum-on selling the health-care coverage product to managementers rate individual plan attributes (Woodside, Nielsen, Wal-decision makers in the employer organization. If the sellingters, and Muller, 1988). Another approach has been to useorganization was successful in getting management to buyopen-ended questions that ask consumers why they chose atheir product, then they were assured of being able to enrollparticular plan (Moustafa, Hopkins, and Klein, 1971). Unfor-100% of the employees, because employers typically offeredtunately, these two approaches fail to capture comprehensivelyonly a single health-care coverage program. Today, however,and realistically the bases that consumers use when makingmore and more employers provide their employees with multi-health-care coverage decisions. This is because asking con-ple health-care coverage choices. Employees can exercise theirsumers to evaluate health plan attributes in isolation frompurchasing power by the choices they make between compet-the many attributes that enter into the health care coverageing plans (Rogers, 1995).decision is unrealistic. Research has shown that health insur-Increasingly, consumers are shifting their dollar from in-ance decisions are based on evaluating combinations of multi-demnity to managed care plans (Altman, 1987; Fein, 1986).ple attributes (France and Grover, 1992). Research has alsoIn 1988, only 29% of the employed and insured populationshown that self-reports of attribute importance often providewere enrolled in managed care plans. This percentage in-poor measures of the true importance of those attributes increased to over 50% in 1994 and is expected to continuethe consumer’s actual decision process (Ettenson, Wagner,to grow rapidly (Davis, Collins, Schoen, and Morris, 1995;and Gaeth, 1988; Fishbein and Ajzen, 1975).Dimmitt, 1995). Thus, providers of health-care coverage are
faced with a more complex marketing problem. Their roleunder the indemnity insurance system is basically restricted Conjoint Choice Modelingto being the payor. However, an organization offering man-aged care coverage must also manage the delivery system. The limitations cited above have led managed care marketersManagement of a managed care organization must also make to use more sophisticated marketing research techniques totheir product’s features (e.g., limited physician networks, ac- improve their level of understanding of consumer health plancess to specialists by referral only, limited hospital networks, choice behavior. A technique that promises to deliver betterand precertification before hospitalization) palatable to the decision-making insights for managers is choice-based con-enrollee (Dimmitt, 1995). Successful marketing efforts for joint analysis.these organizations depend on having better knowledge re- Conjoint analysis is a multivariate technique used specifi-garding consumer needs and wants in order to design a more cally to understand how respondents develop preferences fordesirable product for the target market (Case, 1989; Forgi- products or services. It is based on the simple premise thatonne, 1985; Forgionne, 1991; Explosive Growth in Medicare, consumers evaluate the value or utility of a product/service/
idea (real or hypothetical) by combining the utilities they1996; Weesner, 1990).associate with each level of each attribute. It is unique amongmultivariate methods, because the researcher first constructs
Growing Importance of Marketing a set of hypothetical products or services by combining thepossible attributes at various levels. These hypothetical prod-Research for Managementucts are then presented to respondents who provide onlyDecision Makingtheir over-all evaluations of the hypothetical products/services.
The primary mechanism for managers to learn about consumer Thus, the researcher asks the respondent to perform a veryneeds and to monitor their evolving perceptions of health- realistic task—choosing among a set of products. Respondentscare coverage options is marketing research. Researchers have need not tell the researcher anything else, such as how impor-used a number of techniques in attempts to understand the tant an attribute is or their evaluation of the product on a
number of attribute ratings. Because the researcher constructshealth-care coverage choices made by consumers. One such
249Modeling Consumer Health Plan Choice J Busn Res2000:48:247–257
the sets of hypothetical products/services in a specific manner, Phase One: Focus Groupsthe importance of each attribute and each level of each attri- The first phase involved the identification of the salient attri-bute can be determined from the over-all ratings provided. butes or purchase criteria and the characteristics (relevant
Having determined the contribution of each attribute to the levels) of those attributes that consumers use to select healthconsumer’s over-all evaluation, managers take the following plans. This phase used a series of eight focus groups in thesteps. target city. Participants were adult heads of household who
currently had group health-care coverage through an em-1. Define a health-care plan with the optimum combina-ployer. They were recruited at random by telephone and weretion of features.offered a gratuity to participate.2. Show the relative contributions of each attribute and
each level to the over-all evaluation of the health-careplan. Phase Two: Telephone Survey
3. Use estimates of purchaser or customer judgments to Phase two consisted of a brand/image study of the currentpredict market shares among plans with differing sets market. The first objective of this stage was to obtain demo-of features (other things held constant). graphic data, type of coverage, and self-stated or self-expli-
4. Isolate groups of potential customers who place dif- cated importance ratings of the preliminary attribute list devel-fering importance on the features to define high and oped from the focus group findings. A second goal was tolow potential market segments. assess consumer images of the three major health-care cover-
5. Identify marketing opportunities by exploring the mar- age providers in the market. These organizations are referredket potential for feature combinations not currently to in the results section as Americare, Health Choice, andavailable. ProProvider. The actual names have been disguised to protect
proprietary interests. A final goal was to recruit participantsA study by Chakraborty, Ettenson, and Gaeth (1994) illus-for phase three, the choice-based conjoint exercise that wastrates how choice-based conjoint analysis can be used byto be sent by mail. A questionnaire was developed to addressmanagers to analyze consumer choice in a multiplan environ-the objectives of phase two. It was pretested and refined toment. The present research is an extension of this work. First,facilitate respondent understanding and to enhance the valid-as suggest by Chakraborty and co-workers, the present studyity and reliability of their responses. Qualified respondentsuses a representative sample of all consumers in a geographichad to be 18 years of age or older and be involved in makingarea instead of being restricted to employees of a particularhealth-care insurance coverage decisions for their households.state. Furthermore, the use of random digit dialing approxi-They also had to be currently covered by group health-caremates a random sample. Second, the use of both focus groupscoverage through an employer. All data were collected byand quantitative methods to select and refine salient attributesmeans of central location telephone interviewing using a com-and attribute levels in this study represents an additionalputer-assisted (CAT1) approach. A simple random sampleimprovement. Third, the attribute list and the means of defin-with random digit dialing was used to ensure proper represen-ing and presenting attributes and attribute levels were modi-tation of individuals with unlisted numbers. The over-all com-fied based upon consumer input.pletion rate with seven callbacks was 74%. In total, 800 inter-Based on our analysis, a number of attributes used byviews were completed with qualified respondents. This sampleChakraborty, Ettenson, and Gaeth (1994) were eliminated.size produces a sampling error in the range of 63.5% at 95%Other attributes, not included in Chakraborty and colleaguesconfidence.were added, and the levels of several attributes were presented
in ways we believe and the qualitative analysis shows arePhase Three: Choice-Basedmore understandable to consumers and more likely to elicitConjoint Exercise by Mailmeaningful responses from them. These issues are discussed
in greater detail in the presentation of results. The data gathered in phases one and two provided the inputFinally, the present study carries the research to the next for designing the choice-based conjoint exercise. The 11 attri-
logical step, which is using choice-based conjoint analysis to butes and their associated levels were selected on the basis ofillustrate how health-care coverage plans can be designed by the focus groups and the telephone survey. These attributesmanagers to maximize consumer appeal and optimize market and levels provide the basis for creating 87,480 unique prod-share for a health-care coverage provider. ucts (figure obtained by multiplying the numbers of levels for
each attribute together or 3 3 3 3 3 3 3 3 5 3 3 3 4 32 3 3 3 3 5 87,480). Obviously, consumers cannot evaluateMethodologythousands of products. To make the task more manageable,a design was developed requiring respondents to evaluate onlyThe research was conducted in a metropolitan area with a
population of more than 1,000,000 in the eastern United a very small subset of all possible products. Specifically, thedesign was based on 30 carefully selected choice sets of fourStates. The research was conducted in five phases.
250 J Busn Res R. Gates et al.2000:48:247–257
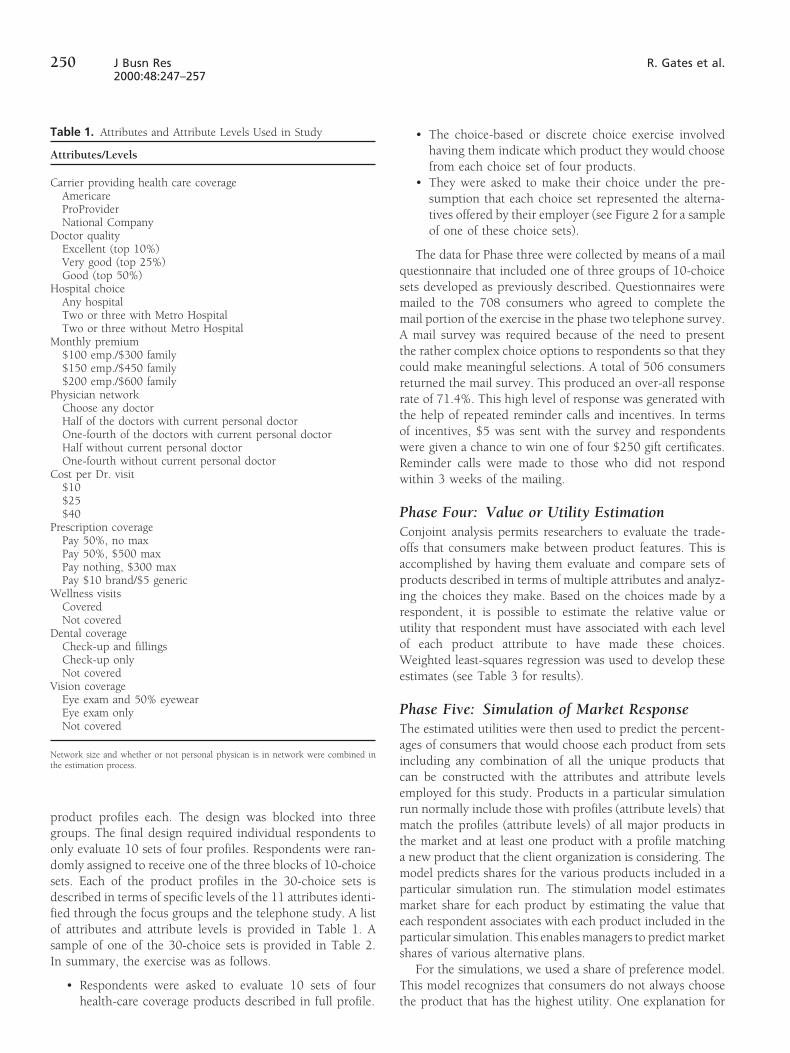
Table 1. Attributes and Attribute Levels Used in Study • The choice-based or discrete choice exercise involvedhaving them indicate which product they would chooseAttributes/Levelsfrom each choice set of four products.
Carrier providing health care coverage • They were asked to make their choice under the pre-Americare sumption that each choice set represented the alterna-ProProvider tives offered by their employer (see Figure 2 for a sampleNational Company
of one of these choice sets).Doctor qualityExcellent (top 10%) The data for Phase three were collected by means of a mailVery good (top 25%)
questionnaire that included one of three groups of 10-choiceGood (top 50%)sets developed as previously described. Questionnaires wereHospital choice
Any hospital mailed to the 708 consumers who agreed to complete theTwo or three with Metro Hospital mail portion of the exercise in the phase two telephone survey.Two or three without Metro Hospital A mail survey was required because of the need to presentMonthly premium
the rather complex choice options to respondents so that they$100 emp./$300 familycould make meaningful selections. A total of 506 consumers$150 emp./$450 family
$200 emp./$600 family returned the mail survey. This produced an over-all responsePhysician network rate of 71.4%. This high level of response was generated with
Choose any doctorthe help of repeated reminder calls and incentives. In termsHalf of the doctors with current personal doctorof incentives, $5 was sent with the survey and respondentsOne-fourth of the doctors with current personal doctorwere given a chance to win one of four $250 gift certificates.Half without current personal doctor
One-fourth without current personal doctor Reminder calls were made to those who did not respondCost per Dr. visit within 3 weeks of the mailing.
$10$25
Phase Four: Value or Utility Estimation$40Prescription coverage Conjoint analysis permits researchers to evaluate the trade-
Pay 50%, no maxoffs that consumers make between product features. This isPay 50%, $500 maxaccomplished by having them evaluate and compare sets ofPay nothing, $300 max
Pay $10 brand/$5 generic products described in terms of multiple attributes and analyz-Wellness visits ing the choices they make. Based on the choices made by a
Covered respondent, it is possible to estimate the relative value orNot covered
utility that respondent must have associated with each levelDental coverageof each product attribute to have made these choices.Check-up and fillings
Check-up only Weighted least-squares regression was used to develop theseNot covered estimates (see Table 3 for results).
Vision coverageEye exam and 50% eyewear
Phase Five: Simulation of Market ResponseEye exam onlyNot covered The estimated utilities were then used to predict the percent-
ages of consumers that would choose each product from setsNetwork size and whether or not personal physican is in network were combined in
including any combination of all the unique products thatthe estimation process.can be constructed with the attributes and attribute levelsemployed for this study. Products in a particular simulationrun normally include those with profiles (attribute levels) that
product profiles each. The design was blocked into threematch the profiles (attribute levels) of all major products in
groups. The final design required individual respondents tothe market and at least one product with a profile matching
only evaluate 10 sets of four profiles. Respondents were ran-a new product that the client organization is considering. The
domly assigned to receive one of the three blocks of 10-choicemodel predicts shares for the various products included in a
sets. Each of the product profiles in the 30-choice sets isparticular simulation run. The stimulation model estimates
described in terms of specific levels of the 11 attributes identi-market share for each product by estimating the value that
fied through the focus groups and the telephone study. A listeach respondent associates with each product included in the
of attributes and attribute levels is provided in Table 1. Aparticular simulation. This enables managers to predict market
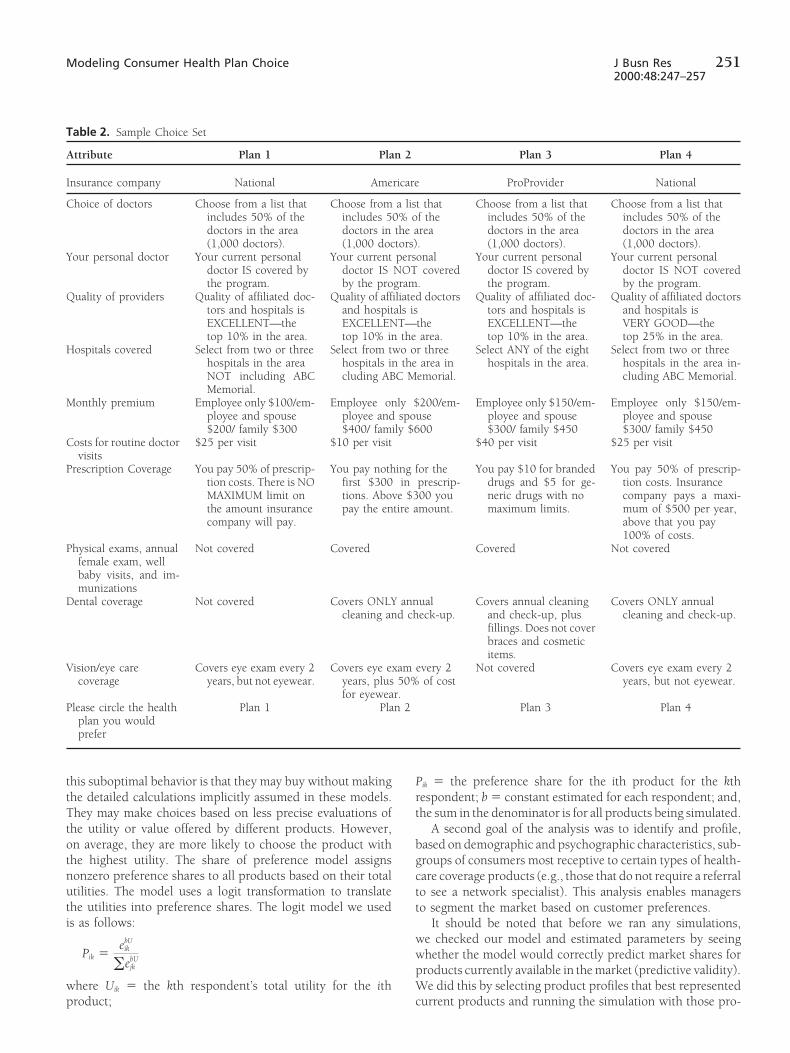
sample of one of the 30-choice sets is provided in Table 2.shares of various alternative plans.
In summary, the exercise was as follows.For the simulations, we used a share of preference model.
This model recognizes that consumers do not always choose• Respondents were asked to evaluate 10 sets of fourhealth-care coverage products described in full profile. the product that has the highest utility. One explanation for
251Modeling Consumer Health Plan Choice J Busn Res2000:48:247–257
Table 2. Sample Choice Set
Attribute Plan 1 Plan 2 Plan 3 Plan 4
Insurance company National Americare ProProvider National
Choice of doctors Choose from a list that Choose from a list that Choose from a list that Choose from a list thatincludes 50% of the includes 50% of the includes 50% of the includes 50% of thedoctors in the area doctors in the area doctors in the area doctors in the area(1,000 doctors). (1,000 doctors). (1,000 doctors). (1,000 doctors).
Your personal doctor Your current personal Your current personal Your current personal Your current personaldoctor IS covered by doctor IS NOT covered doctor IS covered by doctor IS NOT coveredthe program. by the program. the program. by the program.
Quality of providers Quality of affiliated doc- Quality of affiliated doctors Quality of affiliated doc- Quality of affiliated doctorstors and hospitals is and hospitals is tors and hospitals is and hospitals isEXCELLENT—the EXCELLENT—the EXCELLENT—the VERY GOOD—thetop 10% in the area. top 10% in the area. top 10% in the area. top 25% in the area.
Hospitals covered Select from two or three Select from two or three Select ANY of the eight Select from two or threehospitals in the area hospitals in the area in hospitals in the area. hospitals in the area in-NOT including ABC cluding ABC Memorial. cluding ABC Memorial.Memorial.
Monthly premium Employee only $100/em- Employee only $200/em- Employee only $150/em- Employee only $150/em-ployee and spouse ployee and spouse ployee and spouse ployee and spouse$200/ family $300 $400/ family $600 $300/ family $450 $300/ family $450
Costs for routine doctor $25 per visit $10 per visit $40 per visit $25 per visitvisits
Prescription Coverage You pay 50% of prescrip- You pay nothing for the You pay $10 for branded You pay 50% of prescrip-tion costs. There is NO first $300 in prescrip- drugs and $5 for ge- tion costs. InsuranceMAXIMUM limit on tions. Above $300 you neric drugs with no company pays a maxi-the amount insurance pay the entire amount. maximum limits. mum of $500 per year,company will pay. above that you pay
100% of costs.Physical exams, annual Not covered Covered Covered Not covered
female exam, wellbaby visits, and im-munizations
Dental coverage Not covered Covers ONLY annual Covers annual cleaning Covers ONLY annualcleaning and check-up. and check-up, plus cleaning and check-up.
fillings. Does not coverbraces and cosmeticitems.
Vision/eye care Covers eye exam every 2 Covers eye exam every 2 Not covered Covers eye exam every 2coverage years, but not eyewear. years, plus 50% of cost years, but not eyewear.
for eyewear.Please circle the health Plan 1 Plan 2 Plan 3 Plan 4
plan you wouldprefer
this suboptimal behavior is that they may buy without making Pik 5 the preference share for the ith product for the kthrespondent; b 5 constant estimated for each respondent; and,the detailed calculations implicitly assumed in these models.
They may make choices based on less precise evaluations of the sum in the denominator is for all products being simulated.A second goal of the analysis was to identify and profile,the utility or value offered by different products. However,
on average, they are more likely to choose the product with based on demographic and psychographic characteristics, sub-the highest utility. The share of preference model assigns groups of consumers most receptive to certain types of health-nonzero preference shares to all products based on their total care coverage products (e.g., those that do not require a referralutilities. The model uses a logit transformation to translate to see a network specialist). This analysis enables managersthe utilities into preference shares. The logit model we used to segment the market based on customer preferences.is as follows: It should be noted that before we ran any simulations,
we checked our model and estimated parameters by seeingPik 5
ebUik
oebUjk
whether the model would correctly predict market shares forproducts currently available in the market (predictive validity).We did this by selecting product profiles that best representedwhere Uik 5 the kth respondent’s total utility for the ith
product; current products and running the simulation with those pro-
252 J Busn Res R. Gates et al.2000:48:247–257
Table 3. Choice-Based Conjoint Results Showing Estimated Utilities, p values, and Attribute Importance
Attribute Importance Utilities p Value
Carrier providing health care coverage 0.05Americare 0.15 0.01ProProvider 0.18 0.00National Company 0.00
Doctor quality 0.10Excellent (top 10%) 0.36 0.00Very good (top 25%) 0.01 0.92Good (top 50%) 0.00
Hospital choice 0.06Any hospital 0.24 0.01Two or three with Metro Hospital 0.18 0.01Two or three without Metro Hospital 0.00
Monthly premium 0.11$100 emp./$300 family 0.41 0.00$150 emp./$450 family 0.20 0.01$200 emp./$600 family 0.00
Physician network 0.20Choose any doctor 0.73 0.00Half of the doctors with current personal doctor 0.59 0.00One-fourth of the doctors with current personal doctor 0.59 0.00Half without current personal doctor 0.23 0.02One-fourth without current personal doctor 0.00
Cost per Dr. visit 0.13$10 0.48 0.00$25 0.15 0.01$40 0.00
Prescription coverage 0.13Pay 50%, no max 0.13 0.09Pay 50%, $500 max 0.10 0.14Pay nothing, $300 max 0.00Pay $10 brand/$5 generic 0.50 0.00
Wellness visits 0.11Covered 0.42 0.00Not covered 0.00
Dental coverage 0.07Check-up and fillings 0.26 0.00Check-up only 0.06 0.36Not covered 0.00
Vision coverage 0.04Eye exam and 50% eyewear 0.15 0.02Eye exam only 0.13 0.11Not covered 0.00
Network size and whether or not personal physican is in network were combined in the estimation process.
files. The model produced estimates that were remarkably of mention, and the discussion of each item were carefullysimilar to actual shares for the major products in the market. noted. In addition, after completing the open-ended exercise,
participants were asked to rate the importance of each of theitems mentioned in the discussion on a 10-point scale whereResults10 was defined as “very important” and 1 was defined as “very
Attributes and Levels unimportant.” The 11 attributes listed in Table 1 emerged asthe key drivers of consumer choice among health-care cover-The attributes and their associated levels are shown in Tableage alternatives on the basis of the qualitative and the more1. There are 11 attributes identified by means of the processstructured exercises previously described. In addition, the listdescribed in the Methodology section. The qualitative exer-was further refined on the basis of the attribute ratings ob-cises used included having participants name the most impor-tained from the telephone survey.tant plan features or attributes. The focus group tapes were
carefully reviewed, and the items mentioned, their frequency Although we used the attribute list developed by Chakra-
253Modeling Consumer Health Plan Choice J Busn Res2000:48:247–257
borty, Ettenson, and Gaeth (1994) as a point of departure, regard to other attributes. The basic point is that we testedthe levels and identified levels that were clear and meaningfulour list differs markedly from theirs. First, a number of attri-to target individuals.butes were eliminated. For example, the attributes waiting time
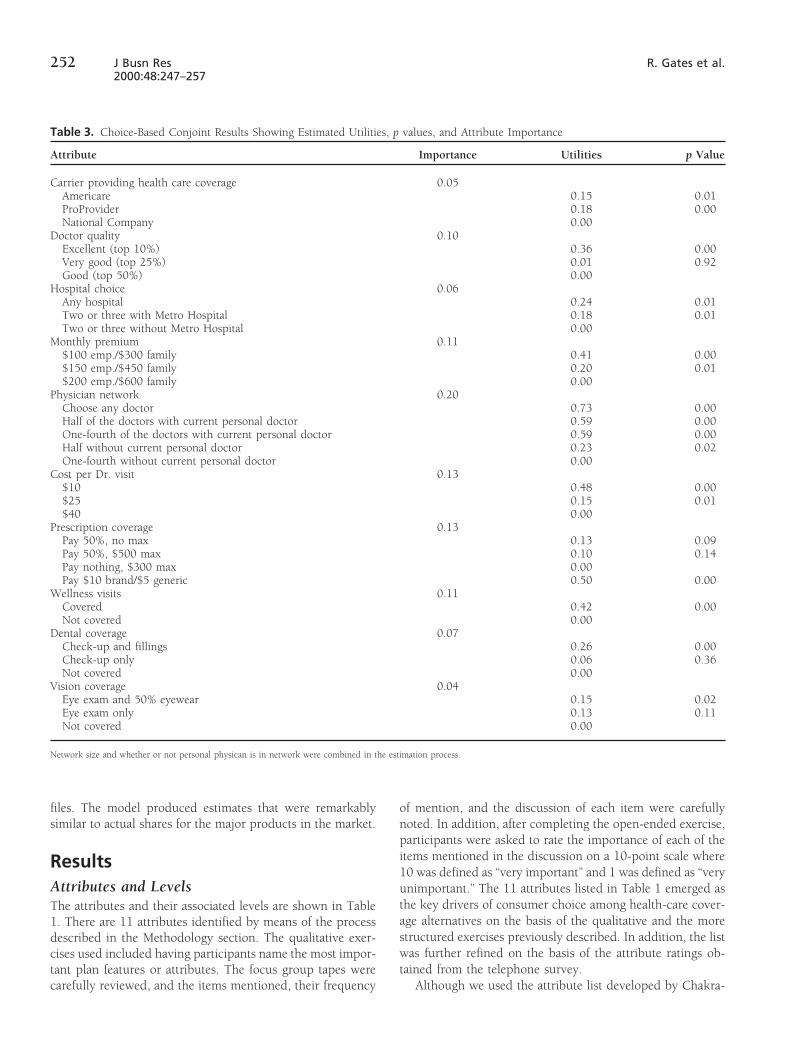
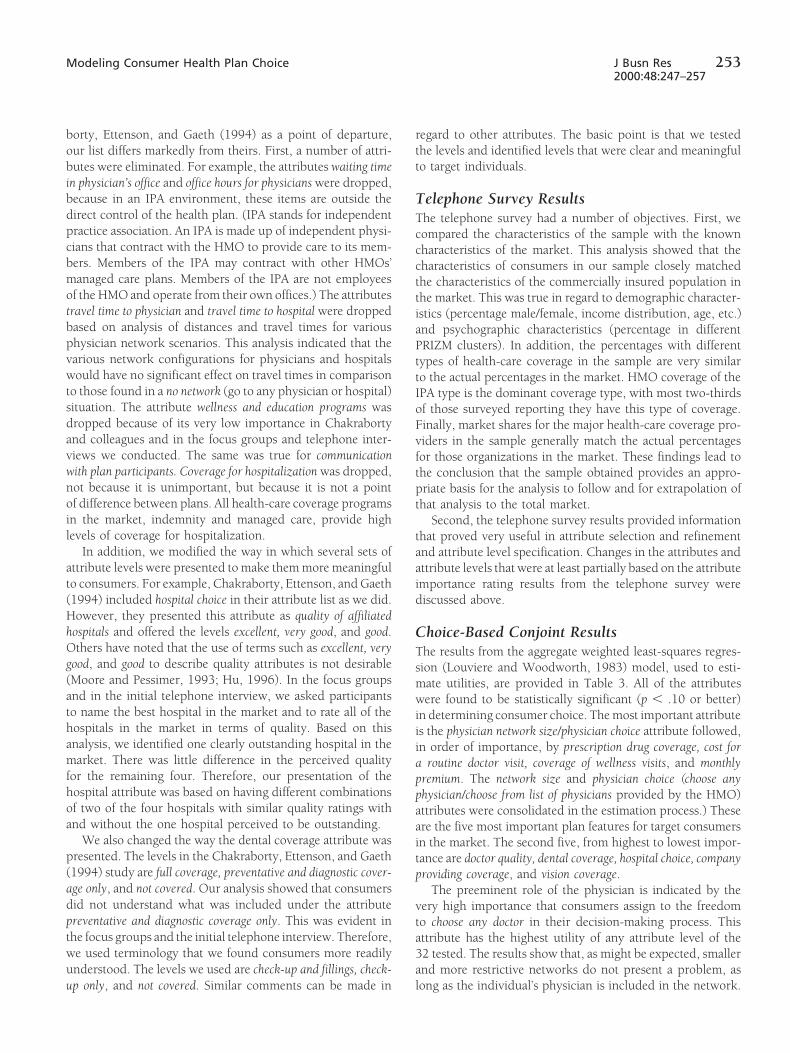
in physician’s office and office hours for physicians were dropped,because in an IPA environment, these items are outside the Telephone Survey Resultsdirect control of the health plan. (IPA stands for independent The telephone survey had a number of objectives. First, wepractice association. An IPA is made up of independent physi- compared the characteristics of the sample with the knowncians that contract with the HMO to provide care to its mem- characteristics of the market. This analysis showed that thebers. Members of the IPA may contract with other HMOs’ characteristics of consumers in our sample closely matchedmanaged care plans. Members of the IPA are not employees the characteristics of the commercially insured population inof the HMO and operate from their own offices.) The attributes the market. This was true in regard to demographic character-travel time to physician and travel time to hospital were dropped istics (percentage male/female, income distribution, age, etc.)based on analysis of distances and travel times for various and psychographic characteristics (percentage in differentphysician network scenarios. This analysis indicated that the PRIZM clusters). In addition, the percentages with differentvarious network configurations for physicians and hospitals types of health-care coverage in the sample are very similarwould have no significant effect on travel times in comparison to the actual percentages in the market. HMO coverage of theto those found in a no network (go to any physician or hospital) IPA type is the dominant coverage type, with most two-thirdssituation. The attribute wellness and education programs was of those surveyed reporting they have this type of coverage.dropped because of its very low importance in Chakraborty Finally, market shares for the major health-care coverage pro-and colleagues and in the focus groups and telephone inter- viders in the sample generally match the actual percentagesviews we conducted. The same was true for communication for those organizations in the market. These findings lead towith plan participants. Coverage for hospitalization was dropped, the conclusion that the sample obtained provides an appro-not because it is unimportant, but because it is not a point priate basis for the analysis to follow and for extrapolation ofof difference between plans. All health-care coverage programs that analysis to the total market.in the market, indemnity and managed care, provide high Second, the telephone survey results provided informationlevels of coverage for hospitalization. that proved very useful in attribute selection and refinement
In addition, we modified the way in which several sets of and attribute level specification. Changes in the attributes andattribute levels were presented to make them more meaningful attribute levels that were at least partially based on the attributeto consumers. For example, Chakraborty, Ettenson, and Gaeth importance rating results from the telephone survey were(1994) included hospital choice in their attribute list as we did. discussed above.However, they presented this attribute as quality of affiliatedhospitals and offered the levels excellent, very good, and good. Choice-Based Conjoint ResultsOthers have noted that the use of terms such as excellent, very The results from the aggregate weighted least-squares regres-good, and good to describe quality attributes is not desirable sion (Louviere and Woodworth, 1983) model, used to esti-(Moore and Pessimer, 1993; Hu, 1996). In the focus groups mate utilities, are provided in Table 3. All of the attributesand in the initial telephone interview, we asked participants were found to be statistically significant (p , .10 or better)to name the best hospital in the market and to rate all of the in determining consumer choice. The most important attributehospitals in the market in terms of quality. Based on this is the physician network size/physician choice attribute followed,analysis, we identified one clearly outstanding hospital in the in order of importance, by prescription drug coverage, cost formarket. There was little difference in the perceived quality a routine doctor visit, coverage of wellness visits, and monthlyfor the remaining four. Therefore, our presentation of the premium. The network size and physician choice (choose anyhospital attribute was based on having different combinations physician/choose from list of physicians provided by the HMO)of two of the four hospitals with similar quality ratings with attributes were consolidated in the estimation process.) Theseand without the one hospital perceived to be outstanding. are the five most important plan features for target consumers
We also changed the way the dental coverage attribute was in the market. The second five, from highest to lowest impor-presented. The levels in the Chakraborty, Ettenson, and Gaeth tance are doctor quality, dental coverage, hospital choice, company(1994) study are full coverage, preventative and diagnostic cover- providing coverage, and vision coverage.age only, and not covered. Our analysis showed that consumers The preeminent role of the physician is indicated by thedid not understand what was included under the attribute very high importance that consumers assign to the freedompreventative and diagnostic coverage only. This was evident in to choose any doctor in their decision-making process. Thisthe focus groups and the initial telephone interview. Therefore, attribute has the highest utility of any attribute level of thewe used terminology that we found consumers more readily 32 tested. The results show that, as might be expected, smallerunderstood. The levels we used are check-up and fillings, check- and more restrictive networks do not present a problem, as
long as the individual’s physician is included in the network.up only, and not covered. Similar comments can be made in
254 J Busn Res R. Gates et al.2000:48:247–257
Obviously, the smaller the network, the less likely it is that basis for differentiation in a situation involving products thatare the same or similar on other salient attributes.a particular individual’s physician will be included. The real
issue is whether or not a more restrictive network forcesthe individual to switch physicians. Examining the utilities Market Simulationsassociated with the doctor quality attribute indicates that lim- One of the great advantages of the conjoint analysis approachiting choice cannot be compensated for by higher clinical from a managerial perspective is that, in addition to providingquality if consumers are forced to change doctors. estimates of the value consumers associate with various prod-
Prescription drug coverage is second in importance. Con- uct features, it also provides a tool that can be used to simulatesumers expressed a strong preference for a prescription drug market response to different product offerings. Simulationsbenefit with fixed co-payments of $10 for branded drugs and can be done for new products being considered by the com-$5 for generic drugs and no annual limit. The other alternatives pany sponsoring the research or for new products introducedall include either relatively low annual limits or heavy out- by the competition. The estimated utilities provide the basis
for estimating market shares for competitive products or differ-of-pocket costs.ent versions of new products being considered by the sponsor-The cost of a doctor visit is the third most important attributeing organization. All that is required is to define the productswith the $10 co-payment by far the most preferred level.to be included in the simulation in terms of specific levels ofCoverage of wellness visits (annual physical, annual female ex-the attributes and attribute levels in question.ams, and well-baby visits) is fourth in importance. Monthly
There are several steps in the process of running the marketpremium rounds out the top five attributes. The one thing allsimulations. First, it is necessary to identify product profilesthese attributes have in common is that they relate to, for thethat match the existing products in the marketplace. In othermost part, routine medical visits and services. These are thewords, we need to describe the current products in terms ofservices that nearly all consumers expect to use and expectthe attributes and attribute levels used in this study (see Tableother family members covered by the program to use over1). The market where this research was conducted is perhapsthe period of a year. Obviously, these are features that mustunique, given that only three companies, each offering a singlebe successfully addressed in any new product.product at the time of the study, control nearly 90% of theInterestingly, although there was much discussion of thegroup health-care coverage business. These products are of-importance of quality in the focus groups, the doctor qualityfered by fictitious companies Americare, ProProvider, andattribute was only sixth in importance. This attribute wasNational. Attribute levels for these three products are shownpresented to consumers as a clinical quality measurement,in Table 4.which is the only real measure of physician technical quality
Second, the sponsor of the research, ProProvider, wantedavailable today. It seems that nearly all consumers believe that
to use the results to estimate the market potential for a newtheir current physician is a quality physician, and the focus
product. The new product differed from existing products,group discussion suggested that they were somewhat skeptical
because it was based on a more limited network of the highestof physician clinical quality measurements being used by hos-
quality physicians in the market. The identification of physi-pitals and managed care organizations today. cians for this limited network product was to be based on
A dental benefit offering coverage for check-ups and fillings clinical measures of technical quality. The initial product de-is seen as valuable to consumers, although the attribute is sign for the new ProProvider product is shown in Table 4seventh in importance. Hospital choice is far less important to along with the profiles for the three existing products in theconsumers than doctor choice. Many recognize that when market. Of course, ProProvider management was very inter-they choose a physician they are effectively choosing a hospi- ested in determining the extent to which the new producttal, because their primary care physician probably has staff would take market share away from its existing product, asprivileges at only one or two hospitals. In addition, many compared to the extent to which it would take market sharerecognize that their physician is likely to refer them to special- from competitive products.ists affiliated with those same hospitals. Third, after profiling the existing products and the new
In this particular market, with a very limited number of product, we ran the market simulations. For the simulations,companies offering health-care coverage, the brand name of we used the share of choice approach and an additive model.the health-care coverage provider is ninth in importance. The However, before running the simulation for the existing prod-importance of this attribute may be significantly greater in ucts and the new product, we ran the simulation for theother markets with different sets of health-care coverage pro- existing products only. This was done to evaluate the pre-viders. Of the attributes tested, vision coverage is last in impor- dictive validity of our model. If the model produced resultstance. We hasten to add that this does not mean that it is an similar to the known market shares for the three existingunimportant attribute, only that it is last in importance among products, then we could feel more comfortable about using
it as a tool to estimate the potential for the new product. Thethe salient attributes. This attribute could be an important

255Modeling Consumer Health Plan Choice J Busn Res2000:48:247–257
Table 4. Profiles for Existing Products and New Product
Attribute Americare National ProProvider ProProvider New
Carrier providing health care coverageAmericare XProProvider X XNational Company X
Doctor qualityExcellent (top 10%) XVery good (top 25%) X X XGood (top 50%)
Hospital choiceAny hospitalTwo or three with Metro Hospital X X XTwo or three without Metro Hospital X
Monthly premium$100 emp./$300 family X$150 emp./$450 family X $175/$525 X$200 emp./$600 family
Physician networkChoose any doctor XHalf of the doctors with current personal doctor XOne-fourth of the doctors with current personal doctorHalf without current personal doctor X XOne-fourth without current personal doctor
Cost per Dr. visit$10$25 X X X$40 X
Prescription coveragePay 50%, no max XPay 50%, $500 max X XPay nothing, $300 maxPay $10 brand/$5 generic X
Wellness visitsCovered X X XNot covered X
Dental coverageCheck-up and fillingsCheck-up onlyNot covered X X X X
Vision coverageEye exam and 50% eyewearEye exam only XNot covered X X X
results of this exercise, shown in Table 5, indicate that the Estimated market shares for the existing products and thenew ProProvider product (see Table 4 for definition) aresimulation model using the estimated utilities produced esti-
mates of the market shares for the three existing products shown in the first line of Table 6. These results show that thevery similar to the known market shares for those products. new product can be expected to garner a market share of
13.6%. Review of the results (compare actual shares in secondline of Table 5 to estimated shares in first line of Table 5)shows that 3.3% comes from the current ProProvider product,Table 5. Actual and Estimated Market Shares7.3% comes from Americare, and 3.0% comes from National.
Group National Americare ProProvider Current In total, 10.3% comes from the competition and only 3.3%from ProProvider and that ProProvider’s total share increases
Estimated 29.5% 51.3% 19.2%from 19.2 to 29.5%.Actual 31.2% 48.7% 20.1%
The simulation model can also be used to estimate market
256 J Busn Res R. Gates et al.2000:48:247–257
Table 6. Estimated Market Shares
Group National Americare ProProvider Current ProProvider New
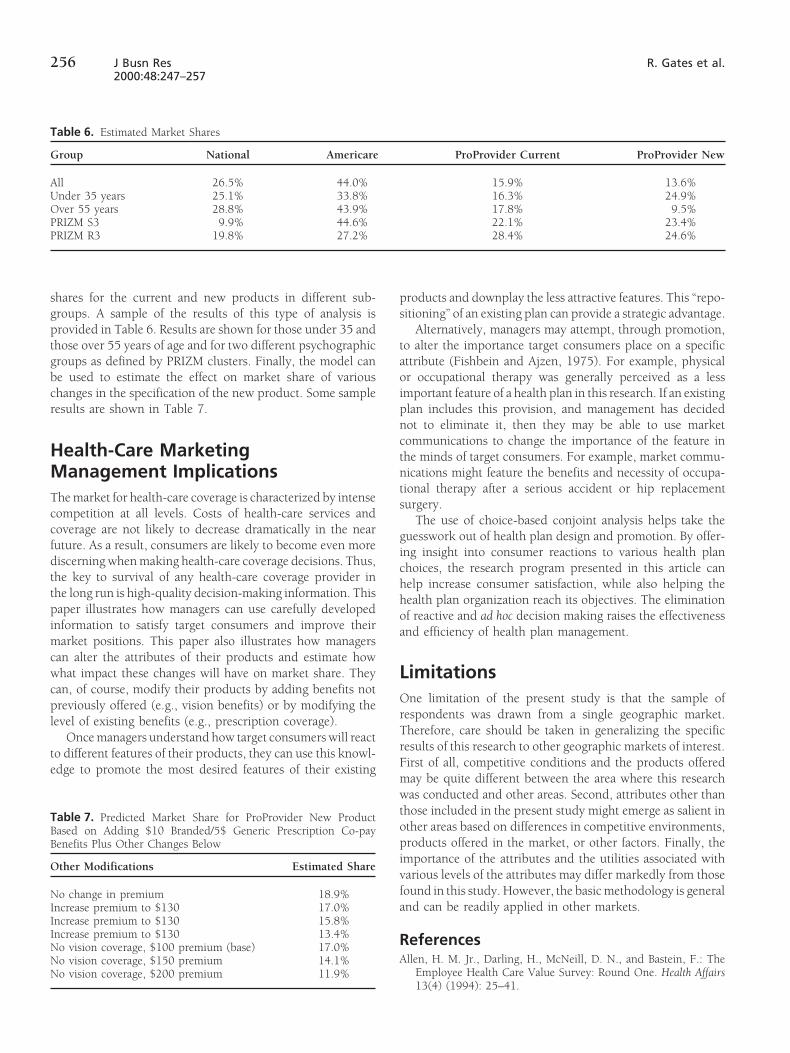
All 26.5% 44.0% 15.9% 13.6%Under 35 years 25.1% 33.8% 16.3% 24.9%Over 55 years 28.8% 43.9% 17.8% 9.5%PRIZM S3 9.9% 44.6% 22.1% 23.4%PRIZM R3 19.8% 27.2% 28.4% 24.6%
shares for the current and new products in different sub- products and downplay the less attractive features. This “repo-sitioning” of an existing plan can provide a strategic advantage.groups. A sample of the results of this type of analysis is
provided in Table 6. Results are shown for those under 35 and Alternatively, managers may attempt, through promotion,to alter the importance target consumers place on a specificthose over 55 years of age and for two different psychographic
groups as defined by PRIZM clusters. Finally, the model can attribute (Fishbein and Ajzen, 1975). For example, physicalor occupational therapy was generally perceived as a lessbe used to estimate the effect on market share of various
changes in the specification of the new product. Some sample important feature of a health plan in this research. If an existingplan includes this provision, and management has decidedresults are shown in Table 7.not to eliminate it, then they may be able to use marketcommunications to change the importance of the feature in
Health-Care Marketing the minds of target consumers. For example, market commu-nications might feature the benefits and necessity of occupa-Management Implicationstional therapy after a serious accident or hip replacement
The market for health-care coverage is characterized by intense surgery.competition at all levels. Costs of health-care services and The use of choice-based conjoint analysis helps take thecoverage are not likely to decrease dramatically in the near guesswork out of health plan design and promotion. By offer-future. As a result, consumers are likely to become even more ing insight into consumer reactions to various health plandiscerning when making health-care coverage decisions. Thus, choices, the research program presented in this article canthe key to survival of any health-care coverage provider in help increase consumer satisfaction, while also helping thethe long run is high-quality decision-making information. This health plan organization reach its objectives. The eliminationpaper illustrates how managers can use carefully developed of reactive and ad hoc decision making raises the effectivenessinformation to satisfy target consumers and improve their and efficiency of health plan management.market positions. This paper also illustrates how managerscan alter the attributes of their products and estimate howwhat impact these changes will have on market share. They Limitationscan, of course, modify their products by adding benefits not
One limitation of the present study is that the sample ofpreviously offered (e.g., vision benefits) or by modifying therespondents was drawn from a single geographic market.level of existing benefits (e.g., prescription coverage).Therefore, care should be taken in generalizing the specificOnce managers understand how target consumers will reactresults of this research to other geographic markets of interest.to different features of their products, they can use this knowl-First of all, competitive conditions and the products offerededge to promote the most desired features of their existingmay be quite different between the area where this researchwas conducted and other areas. Second, attributes other thanthose included in the present study might emerge as salient inTable 7. Predicted Market Share for ProProvider New Productother areas based on differences in competitive environments,Based on Adding $10 Branded/5$ Generic Prescription Co-payproducts offered in the market, or other factors. Finally, theBenefits Plus Other Changes Belowimportance of the attributes and the utilities associated with
Other Modifications Estimated Sharevarious levels of the attributes may differ markedly from thosefound in this study. However, the basic methodology is generalNo change in premium 18.9%and can be readily applied in other markets.Increase premium to $130 17.0%
Increase premium to $130 15.8%Increase premium to $130 13.4% ReferencesNo vision coverage, $100 premium (base) 17.0%
Allen, H. M. Jr., Darling, H., McNeill, D. N., and Bastein, F.: TheNo vision coverage, $150 premium 14.1%Employee Health Care Value Survey: Round One. Health AffairsNo vision coverage, $200 premium 11.9%13(4) (1994): 25–41.

257Modeling Consumer Health Plan Choice J Busn Res2000:48:247–257
Altman, S. H.: Cost Cost Go Away, Is Capitation Here to Stay? Medical Plans. Journal of Health Care Marketing 11 (December1991): 22–38.Healthcare Financial Management 41 (March 1987): 22–24.
Gilbert, F., Lumpkin, J., and Dant, R.: Adaptation and CustomerAndaleeb, S. S.: Hospital Advertising: The Influence of PerceptualExpectations of Health Care Options. Journal of Health Care Mar-and Demographic Factors on Consumer Dispositions. Journal ofketing 12 (September 1992): 46–55.Services Marketing 8(1) (1994): 48–59.
Hair, J. F., Anderson, R., Tatham, R., and Black, W: MultivariateCase, J.: Marketing and Costing Your Cosmetic Dental Services.Data Analysis with Readings. Macmillan, NY. 1992.Dental Management 29 (October 1989): 28–34.
Hu, Clark: Conjoint Analysis Page, http://www.nevada.edu/~huc/html/Chakraborty, G., Ettenson, R., and Gaeth, G.: How Consumers doca.html
Choose Health Insurance. Journal of Health Care Marketing 14Louviere, J., and Woodworth, G.: Design and Analysis of Simulated(Spring 1994): 21–33.
Consumer Choice or Allocation Experiments: An Approach BasedDavis, K., Collins, K. S., Schoen, C., and Morris, C.: Choice Matters: on Aggregate Data. Journal of Marketing Research 20 (November
Enrollees’ Views of Their Health Plans. Health Affairs 14(2) (Sum- 1983): 350–367.mer 1995): 99–112. Moore, W. L., and Pessemier, E. A.: Product Planning and Management.
McGraw-Hill, New York. 1993.Dimmitt, B. S.: The State of Health Care In America 1995: ManagedCare Organizations. Business and Health 13(3) (Special Report Moustafa, A. T., Hopkins, C. E., and Klein, B.: Determinants of1995): 24–27. Choice and Change of Health Insurance Plans. Medical Care 9
(1971): 32–41.Ellsbury, K. E., and Montano, D.E.: Attitudes of Washington StateNelson, C. W., and Goldstein, A. S.: Health Care Quality: The NewPrimary Care Physicians Toward Capitation-Based Insurance
Marketing Challenge. Health Care Management Review 14(2)Plans. Journal of Family Practice 30 (January 1990): 89–94.(1989): 87–95.
Ettenson, R., Wagner, J., and Gaeth, G.: Evaluating the Effect ofOliver, R. L.: A Cognitive Model of the Antecedents and Conse-Country of Origin and the “Made in the USA” Campaign: A
quences of Satisfaction Decisions. Journal of Marketing ResearchConjoint Approach. Journal of Retailing 64 (Spring 1988): 85–100.17 (November 1980): 460–469.
Fein, R.: Medical Care, Medical Costs: The Search for a Health Insurance Rogers, S. A.: Each Managed Care Audience Has Different Percep-Policy. Harvard University Press, Cambridge, MA. 1986. tions. Marketing News 29(7) (March 27 1995): 6.
Fishbein, M., and Ajzen, I.: Belief, Attitude, Intention, and Behavior: Steiber, S. R.: Hospital Advertising Okayed by 62% of Public. Hospi-An Introduction to Theory and Research. Addison-Wesley, Reading, tals 61(5) (April 1987): 81.MA. 1975. Weesner, B. W.: Formulating a Marketing Plan: Finding the Patients
Who Are Looking for You. American Pharmacy 30 (FebruaryFrance, K. R., and Grover, R.: What Is the Health Care Product?1990): 44–49.Journal of Health Care Marketing 12 (June 1992): 31–38.
Woodside, A., Nielsen, R., Walters, F., and Muller, G.: PreferenceFolland, S., Goodman, A. C., and Stano, M.: The Economics of HealthSegmentation of Health Care Services: The Old-Fashioneds, Valueand Health Care. Macmillan, NY. 1993.Conscious, Affluents, and Professional Want-It-Alls. Journal of
Forgionne, G. A.: Designing Prepaid Dental Plans to Meet Consumer Health Care Marketing 8 (June 1988): 14–24.Preferences. Journal of Health Care Marketing 5 (Summer 1985): Zeithaml, C. P., and Zeithaml, V. A.: Environmental Management:39–54. Revising the Marketing Perspective. Journal of Marketing 48
(Spring 1984): 46–53.Forgionne, G. A.: Using Decision Support Systems to Market Prepaid