Modeling and simulation of a stand-alone photovoltaic system using an adaptive artificial neural...
9
See discussions, stats, and author profiles for this publication at: https://www.researchgate.net/publication/271213374 Modeling and Simulation of Standalone Photovoltaic Charging Stations for Electric Vehicles Conference Paper · January 2015 DOI: 10.13140/2.1.1103.9049 CITATIONS 2 READS 362 3 authors, including: Ahmed Nait Sidi Moh Université de Picardie Jules Verne 49 PUBLICATIONS 190 CITATIONS SEE PROFILE Maxime Wack Université de Technologie de Belfort-Montbéliard 121 PUBLICATIONS 696 CITATIONS SEE PROFILE All content following this page was uploaded by Ahmed Nait Sidi Moh on 23 January 2015. The user has requested enhancement of the downloaded file. All in-text references underlined in blue are linked to publications on ResearchGate, letting you access and read them immediately.
Transcript of Modeling and simulation of a stand-alone photovoltaic system using an adaptive artificial neural...
Seediscussions,stats,andauthorprofilesforthispublicationat:https://www.researchgate.net/publication/271213374
ModelingandSimulationofStandalonePhotovoltaicChargingStationsforElectricVehicles
ConferencePaper·January2015
DOI:10.13140/2.1.1103.9049
CITATIONS
2
READS
362
3authors,including:
AhmedNaitSidiMoh
UniversitédePicardieJulesVerne
49PUBLICATIONS190CITATIONS
SEEPROFILE
MaximeWack
UniversitédeTechnologiedeBelfort-Montbéliard
121PUBLICATIONS696CITATIONS
SEEPROFILE
AllcontentfollowingthispagewasuploadedbyAhmedNaitSidiMohon23January2015.
Theuserhasrequestedenhancementofthedownloadedfile.Allin-textreferencesunderlinedinbluearelinkedtopublicationsonResearchGate,lettingyouaccessandreadthemimmediately.
Abstract—Batteries of electric vehicles (BEV) are becoming
more attractive with the advancement of new battery technologies
and promotion of electric vehicles. BEV batteries are recharged on
board vehicles using either the grid (G2V for Grid to Vehicle) or
renewable energies in a stand-alone application (H2V for Home to
Vehicle). This paper deals with the modeling, sizing and control of a
photovoltaic stand-alone application that can charge the BEV at
home. The modeling approach and developed mathematical models
describing the system components are detailed. Simulation and
experimental results are presented and commented.
Keywords— Electric vehicles, photovoltaic energy, lead-acid
batteries, charging process, modeling, simulation, experimental tests.
I. INTRODUCTION
LECTRIC vehicles (EVs) are green transports, and they are
good means to solve transport and environmental
problems. The environmental benefits of EVs increase with
the produced electricity from green sources such as (wind,
solar, small scale hydroelectricity). Green sources are also a
good solution and alternative enabling to avoid the problem of
reliability and safely which can be encountered when grid
power is used to charge EVs [1]. Charging stations provide
power supply for EVs; so, the deployment of complete
infrastructures with sophistic equipments is indispensable for
promoting EVs. However, EV charging process takes much
time than charging process using fuel car [2], and batteries
should be efficiently used since the propulsion of EVs depend
on their energy storage capacity [3, 23].
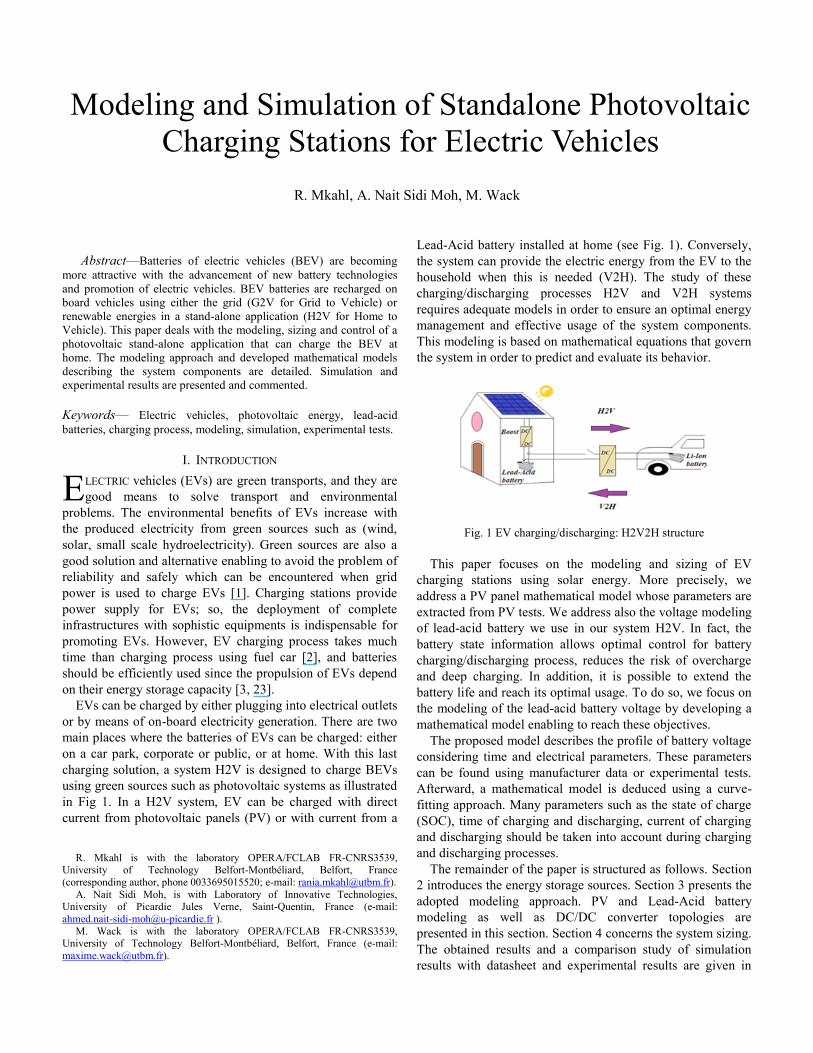
EVs can be charged by either plugging into electrical outlets
or by means of on-board electricity generation. There are two
main places where the batteries of EVs can be charged: either
on a car park, corporate or public, or at home. With this last
charging solution, a system H2V is designed to charge BEVs
using green sources such as photovoltaic systems as illustrated
in Fig 1. In a H2V system, EV can be charged with direct
current from photovoltaic panels (PV) or with current from a
R. Mkahl is with the laboratory OPERA/FCLAB FR-CNRS3539,
University of Technology Belfort-Montbéliard, Belfort, France
(corresponding author, phone 0033695015520; e-mail: [email protected]).
A. Nait Sidi Moh, is with Laboratory of Innovative Technologies, University of Picardie Jules Verne, Saint-Quentin, France (e-mail:
M. Wack is with the laboratory OPERA/FCLAB FR-CNRS3539, University of Technology Belfort-Montbéliard, Belfort, France (e-mail:
Lead-Acid battery installed at home (see Fig. 1). Conversely,
the system can provide the electric energy from the EV to the
household when this is needed (V2H). The study of these
charging/discharging processes H2V and V2H systems
requires adequate models in order to ensure an optimal energy
management and effective usage of the system components.
This modeling is based on mathematical equations that govern
the system in order to predict and evaluate its behavior.
Fig. 1 EV charging/discharging: H2V2H structure
This paper focuses on the modeling and sizing of EV
charging stations using solar energy. More precisely, we
address a PV panel mathematical model whose parameters are
extracted from PV tests. We address also the voltage modeling
of lead-acid battery we use in our system H2V. In fact, the
battery state information allows optimal control for battery
charging/discharging process, reduces the risk of overcharge
and deep charging. In addition, it is possible to extend the
battery life and reach its optimal usage. To do so, we focus on
the modeling of the lead-acid battery voltage by developing a
mathematical model enabling to reach these objectives.
The proposed model describes the profile of battery voltage
considering time and electrical parameters. These parameters
can be found using manufacturer data or experimental tests.
Afterward, a mathematical model is deduced using a curve-
fitting approach. Many parameters such as the state of charge
(SOC), time of charging and discharging, current of charging
and discharging should be taken into account during charging
and discharging processes.
The remainder of the paper is structured as follows. Section
2 introduces the energy storage sources. Section 3 presents the
adopted modeling approach. PV and Lead-Acid battery
modeling as well as DC/DC converter topologies are
presented in this section. Section 4 concerns the system sizing.
The obtained results and a comparison study of simulation
results with datasheet and experimental results are given in
Modeling and Simulation of Standalone Photovoltaic
Charging Stations for Electric Vehicles
R. Mkahl, A. Nait Sidi Moh, M. Wack
E

section 5. Last section concludes the paper and gives some
future directions of this work.
II. ENERGY STORAGE SOURCES
Energy storage system includes different storage
technologies, electrochemical technology (battery), electrical
technology (supercapacitor), and mechanical technology (a
flywheel) as detailed in [4]. To compare the energy storage
sources many parameters can be considered. Among these
parameters we underline energy density, power density, cycle
life performance, cost, environmental impact [5]. The Fig. 2
illustrates the Ragone diagram of different energy storages.
Fig. 2 Ragone plot of energy storage
This diagram shows that supercapacitors (Scaps) have a
very high power density but a very low energy density. The
batteries have a low power density and high energy density.
The batteries are "reversible" generators; they can store
electrical energy in chemical form and return it at any time
when it is needed. The nature of electric vehicles is governed
primarily by the characteristics of the used batteries. The
weight and volume of batteries are usually a decisive factor. A
BEV must satisfy certain conditions: a good specific power for
high accelerations, good specific energy synonymous with
good battery life, stable voltage generating regular
performances, a long lifetime and low maintenance and
recyclable [6].
Batteries currently used in electric vehicles are: Lead-Acid
(LA) battery, Lithium-Ion (Li-Ion) battery, Nickel Metal
Hybrdrure [7], Nickel Cadmium battery [6], and Zink-Air. Li-
Ion battery is the main hope for electric vehicles [8]. It holds a
higher voltage per element, good volume and mass
performance, and a very high specific energy compared to
other types of batteries. It is worth noting that the specific
systems of stationary electricity storage are very different
from the specific systems of embedded systems for which
energies and unit powers are weak. In stationary systems, the
amount of energy and the total power available then become
largely predominant. Lead-Acid batteries have high
availability and they are the least expensive storage batteries
for any application, while still providing reasonable
performance and life characteristics. They are widely used like
the stationary electricity storage in PV systems as given in [9].
III. MODELING OF THE SYSTEM COMPONENTS
In this section, we focus on the modeling of the main
components of charging station. To do so, we present PV and
Lead-Acid battery models and DC/DC converter topologies.
A. PV modeling
Several studies are developed about the mathematical
modeling of the PV cell. A model of the photovoltaic cell with
double diode is developed in [10]. This model consists of a
current source representing the light flux, in parallel with two
diodes. The diode represents the cell behavior in darkness.
Tow resistances, shunt and series resistance are added to
present internal losses. The current-voltage (I-V) equation can
be simplified by considering the shunt resistance as infinity
[11]. Another works have been proposed to simplify the PV
cell by using single-model PV cell with one diode [12]. Like
this last research work, we use a single-model PV cell in order
to formalize the PV solar cell. The equivalent electrical circuit
is presented in Fig. 3.
Fig. 3 Equivalent circuit of a solar cell
The equation of PV module witch expresses the
characteristic current–voltage (I-V) of PV module is given as
follow [13]:
)
)()((1)
)/)()((exp()()( 0
SHmp
smm
s
pSmm
LpmRn
RtItV
nkTn
nRtItVqItIntI
(1)
n : diode ideality factor (1 for an ideal diode)
ns : cells in series
np: cells in parallel
Im: current of PV module
V: voltage of PV module
RSm: series resistance of PV module
RSHm: shunt resistance of PV module
IL : photovoltaic current
I0: reverse saturation current 𝐾𝑇
𝑞: terminal potential (0.0259V at 25C°).
Generally, unless otherwise specified by the manufacturer,
PV module consists of thirty six cells in series (ns =36 cells)
and np=1 cell. The PWX500-12V module is chosen for this
study. The parameters I0, RSm, RSHm of this module are not
given in the data sheet, so we have determined it by using the
functions 'fittype' and 'fit' of Matlab. The parametric
identification is considered by using current-voltage (I-V)
characteristic curve of the module extracted from experimental
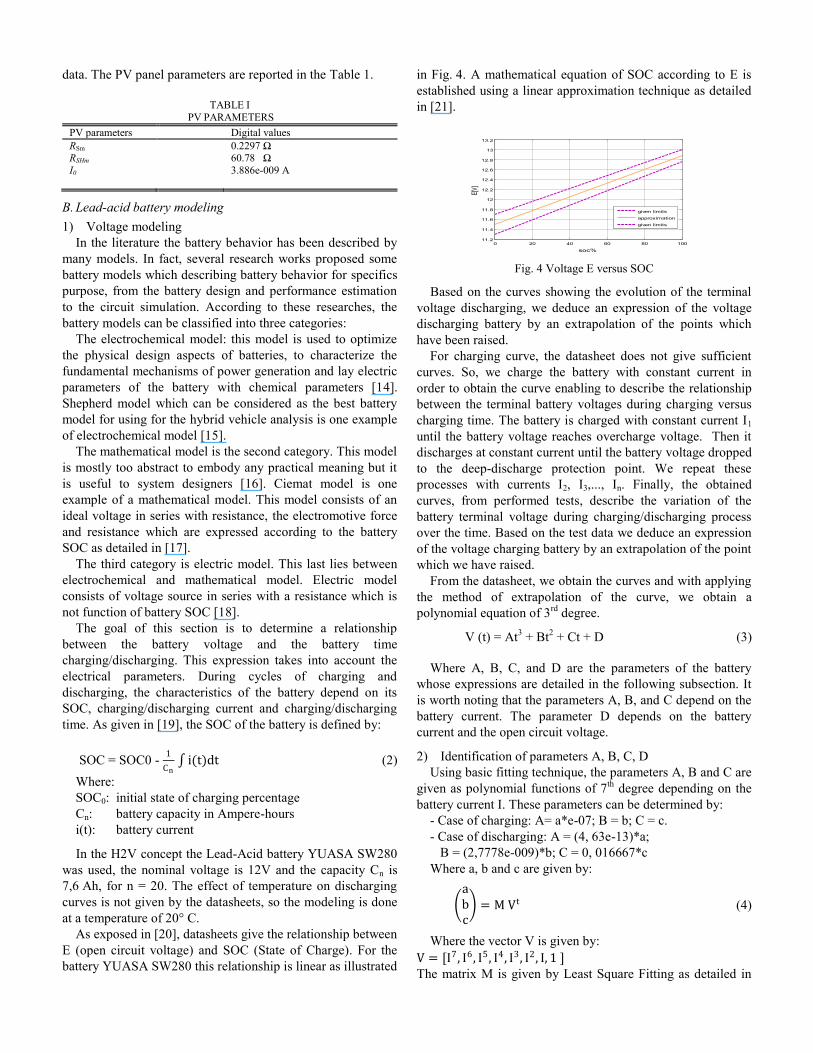
data. The PV panel parameters are reported in the Table 1.
TABLE I
PV PARAMETERS
PV parameters Digital values
RSm 0.2297 Ω RSHm 60.78 Ω
I0 3.886e-009 A
B. Lead-acid battery modeling
1) Voltage modeling
In the literature the battery behavior has been described by
many models. In fact, several research works proposed some
battery models which describing battery behavior for specifics
purpose, from the battery design and performance estimation
to the circuit simulation. According to these researches, the
battery models can be classified into three categories:
The electrochemical model: this model is used to optimize
the physical design aspects of batteries, to characterize the
fundamental mechanisms of power generation and lay electric
parameters of the battery with chemical parameters [14].
Shepherd model which can be considered as the best battery
model for using for the hybrid vehicle analysis is one example
of electrochemical model [15].
The mathematical model is the second category. This model
is mostly too abstract to embody any practical meaning but it
is useful to system designers [16]. Ciemat model is one
example of a mathematical model. This model consists of an
ideal voltage in series with resistance, the electromotive force
and resistance which are expressed according to the battery
SOC as detailed in [17].
The third category is electric model. This last lies between
electrochemical and mathematical model. Electric model
consists of voltage source in series with a resistance which is
not function of battery SOC [18].
The goal of this section is to determine a relationship
between the battery voltage and the battery time
charging/discharging. This expression takes into account the
electrical parameters. During cycles of charging and
discharging, the characteristics of the battery depend on its
SOC, charging/discharging current and charging/discharging
time. As given in [19], the SOC of the battery is defined by:
SOC = SOC0 - 1
Cn i(t)dt (2)
Where:
SOC0: initial state of charging percentage
Cn: battery capacity in Ampere-hours
i(t): battery current
In the H2V concept the Lead-Acid battery YUASA SW280
was used, the nominal voltage is 12V and the capacity Cn is
7,6 Ah, for n = 20. The effect of temperature on discharging
curves is not given by the datasheets, so the modeling is done
at a temperature of 20° C.
As exposed in [20], datasheets give the relationship between
E (open circuit voltage) and SOC (State of Charge). For the
battery YUASA SW280 this relationship is linear as illustrated
in Fig. 4. A mathematical equation of SOC according to E is
established using a linear approximation technique as detailed
in [21].
Fig. 4 Voltage E versus SOC
Based on the curves showing the evolution of the terminal
voltage discharging, we deduce an expression of the voltage
discharging battery by an extrapolation of the points which
have been raised.
For charging curve, the datasheet does not give sufficient
curves. So, we charge the battery with constant current in
order to obtain the curve enabling to describe the relationship
between the terminal battery voltages during charging versus
charging time. The battery is charged with constant current I1
until the battery voltage reaches overcharge voltage. Then it
discharges at constant current until the battery voltage dropped
to the deep-discharge protection point. We repeat these
processes with currents I2, I3,..., In. Finally, the obtained
curves, from performed tests, describe the variation of the
battery terminal voltage during charging/discharging process
over the time. Based on the test data we deduce an expression
of the voltage charging battery by an extrapolation of the point
which we have raised.
From the datasheet, we obtain the curves and with applying
the method of extrapolation of the curve, we obtain a
polynomial equation of 3rd
degree.
V (t) = At3 + Bt
2 + Ct + D (3)
Where A, B, C, and D are the parameters of the battery
whose expressions are detailed in the following subsection. It
is worth noting that the parameters A, B, and C depend on the
battery current. The parameter D depends on the battery
current and the open circuit voltage.
2) Identification of parameters A, B, C, D
Using basic fitting technique, the parameters A, B and C are
given as polynomial functions of 7th
degree depending on the
battery current I. These parameters can be determined by:
- Case of charging: A= a*e-07; B = b; C = c.
- Case of discharging: A = (4, 63e-13)*a;
B = (2,7778e-009)*b; C = 0, 016667*c
Where a, b and c are given by:
abc = M Vt (4)
Where the vector V is given by:
V = [I7, I6, I5, I4, I3, I2, I, 1 ] The matrix M is given by Least Square Fitting as detailed in
0 20 40 60 80 10011.2
11.4
11.6
11.8
12
12.2
12.4
12.6
12.8
13
13.2
soc%
E[V]
given limits
approximation
given limits
[21].
The parameter D represents the starting voltage (voltage at
the beginning of charging/discharging). Experimentally, the
expression of this parameter is given by:
D = E dv (5)
Where E is the open circuit voltage, dv is the initial voltage
drop at the switching on process in the battery.
We use the sign "+" (respectively "-") in the case of the
battery charging (resp. discharging). The initial voltage drop at
the switching on process in the battery is given by:
dv = R.I (6)
R corresponding to the battery resistance which is a
function of the current I. Using the technique of basic fitting
we can find the relationship between R and I. We measure the
values of the open circuit voltage E and the values of the
starting voltage V0 of the battery, then we find dv = E-V0. For
several values of dv, using the equation (6), we calculate the
resistance values for each corresponding values of dv, and
then we find the relationship between R and I using
interpolation method. This calculation is detailed in [21].
C. DC/DC charger topologies
Solar energy is converted to electric energy by the PV
panels. Electric energy is used for recharging Lead-Acid
batteries via DC/DC Boost converter (see Fig. 5-left). Boost
converter is controlled by maximum power point tracking
algorithm (MPPT) for obtaining always the PV maximum
power at PV panel output.
In addition, a Buck- Boost (current-bidirectional converter)
is used for charging embedded Li-Ion battery into the EV from
home energy (H2V). This converter can be used also for
charging Lead-Acid batteries from vehicle battery (V2H)
when it is needed. The Fig. 5-right corresponds to a DC-DC
current-bidirectional converter.
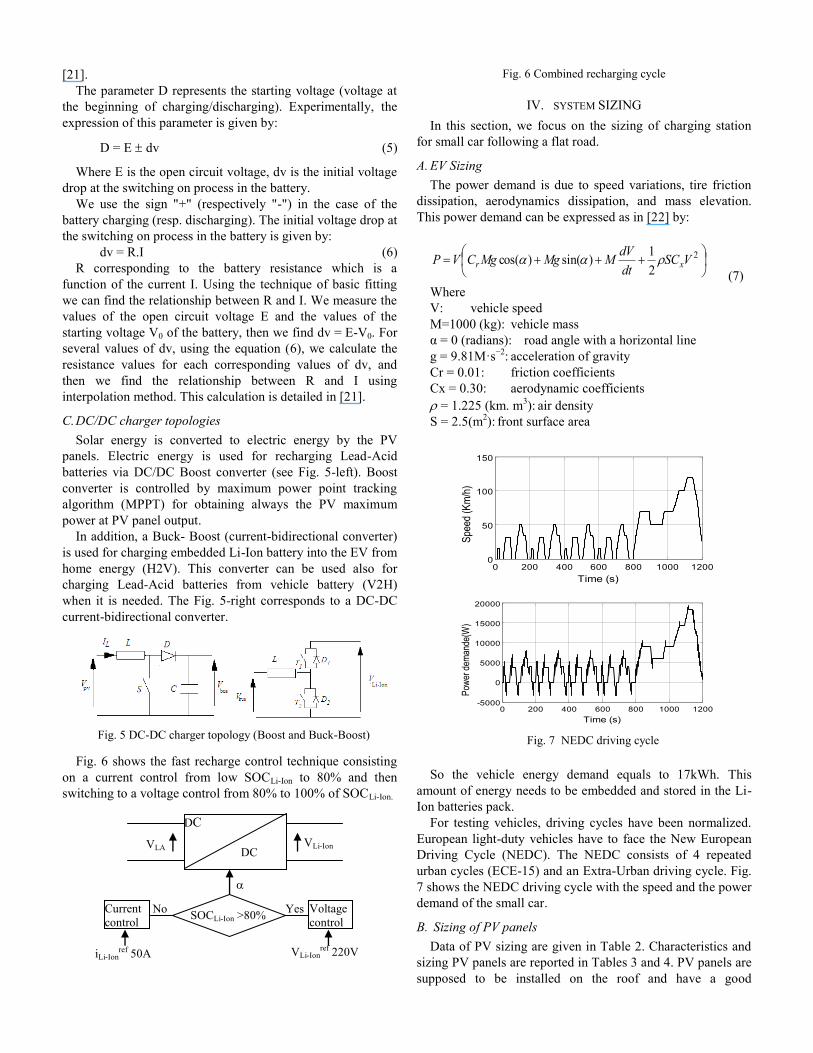
Fig. 6 shows the fast recharge control technique consisting
on a current control from low SOCLi-Ion to 80% and then
switching to a voltage control from 80% to 100% of SOCLi-Ion.
Fig. 6 Combined recharging cycle
IV. SYSTEM SIZING
In this section, we focus on the sizing of charging station
for small car following a flat road.
A. EV Sizing
The power demand is due to speed variations, tire friction
dissipation, aerodynamics dissipation, and mass elevation.
This power demand can be expressed as in [22] by:
2
2
1)sin()cos( VSC
dt
dVMMgMgCVP xr
(7)
Where
V: vehicle speed
M=1000 (kg): vehicle mass
α = 0 (radians): road angle with a horizontal line
g = 9.81M·s−2
: acceleration of gravity
Cr = 0.01: friction coefficients
Cx = 0.30: aerodynamic coefficients
= 1.225 (km. m3): air density
S = 2.5(m2): front surface area
So the vehicle energy demand equals to 17kWh. This
amount of energy needs to be embedded and stored in the Li-
Ion batteries pack.
For testing vehicles, driving cycles have been normalized.
European light-duty vehicles have to face the New European
Driving Cycle (NEDC). The NEDC consists of 4 repeated
urban cycles (ECE-15) and an Extra-Urban driving cycle. Fig.
7 shows the NEDC driving cycle with the speed and the power
demand of the small car.
B. Sizing of PV panels
Data of PV sizing are given in Table 2. Characteristics and
sizing PV panels are reported in Tables 3 and 4. PV panels are
supposed to be installed on the roof and have a good
Fig. 5 DC-DC charger topology (Boost and Buck-Boost)
Fig. 7 NEDC driving cycle
0 200 400 600 800 1000 12000
50
100
150
Time (s)
Spe
ed (
Km
/h)
0 200 400 600 800 1000 1200-5000
0
5000
10000
15000
20000
Time (s)
Pow
er d
eman
de(W
)
Yes
DC
DC
VLA VLi-Ion
Current
control
Voltage
control
VLi-Ionref 220V iLi-Ion
ref 50A
SOCLi-Ion >80% No
orientation for capturing a maximum amount of solar
radiation.
TABLE 2
DATA VALUES FOR PV SIZING PV PARAMETERS
Data Values
Device EV EV
Power of receiver
Usage time Factor Corrector
Radiation Usage time 6 (h)
Factor Corrector 1.3 4704 W
6 h 1.3
5 k Wh/m².j
TABLE 3
CHARACTERISTICS OF SOLAR PANEL PWX500-12V
PWX500-12V Characteristics
Digital values
Power max
Optimal current Optimal voltage Short circuit cure
Open circuit volt
50 W
2.9 A
17.2 V 3.2 A
21.6 V
TABLE 4
SIZING OF SOLAR PANEL PWX500-12V
PWX500-12V Sizing
Digital values
Number of PV
panels
Surface of PV Power max
Weight
148
70 m2 7.4 kWc
1361 kg
C. Sizing of Lead-Acid battery
As underlined previously we use of YUASA SW280 Lead-
Acid battery as the embedded battery into the home. Its
characteristics are reported in Table 5, and sizing results are
presented in Table 6.
TABLE 5
CHARACTERISTICS OF LEAD-ACID BATTERIES YUASA SW280
YUASA SW280 Characteristics Digital values
Voltage 12 V Volume 151x65x99 mm
Weight
Nominal capacity
Energy / Volume
Energy/Weight
Internal resistance of charged battery Maximum discharge current in minute
2.7 kg
7.6 Ah
93 Wh/l
30 Wh/Kg
15 Ω 50A
TABLE 6
SIZING OF LEAD-ACID BATTERIES
YUASA SW280 Sizing Digital values
N° in series 4
N° in parallel Pack voltage
Pack capacity
Pack mass
78 48 V
588 Ah
842.4 kg
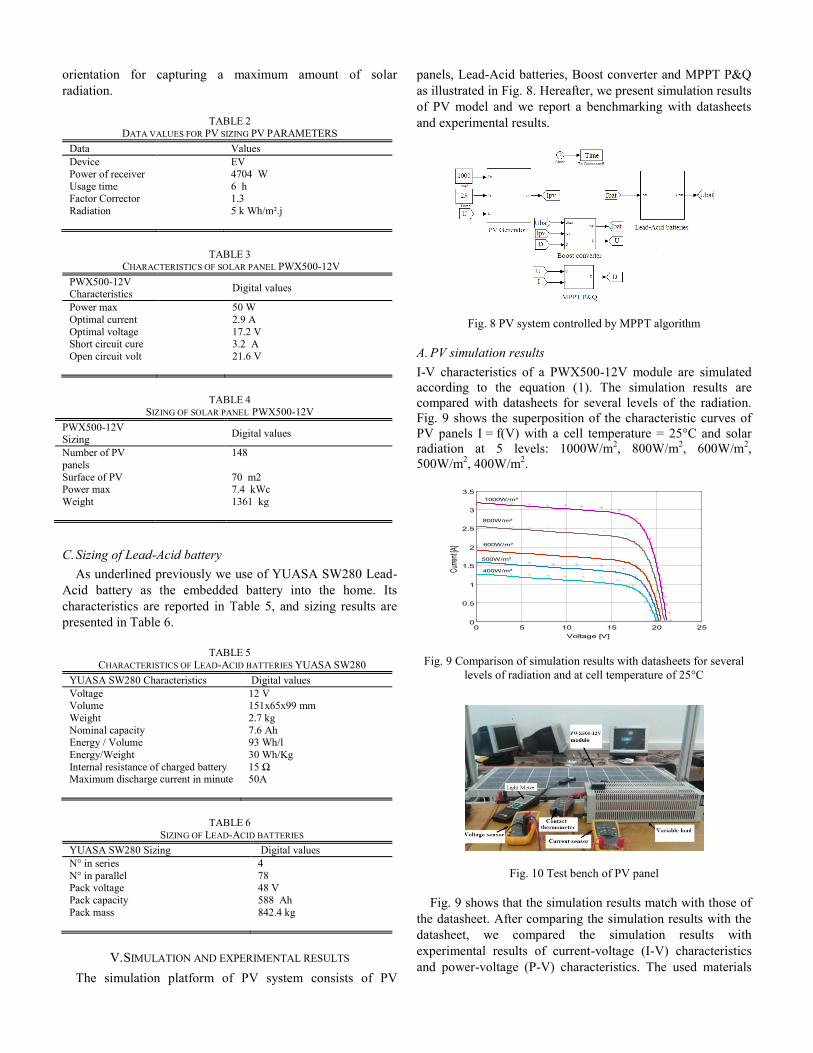
V. SIMULATION AND EXPERIMENTAL RESULTS
The simulation platform of PV system consists of PV
panels, Lead-Acid batteries, Boost converter and MPPT P&Q
as illustrated in Fig. 8. Hereafter, we present simulation results
of PV model and we report a benchmarking with datasheets
and experimental results.
Fig. 8 PV system controlled by MPPT algorithm
A. PV simulation results
I-V characteristics of a PWX500-12V module are simulated
according to the equation (1). The simulation results are
compared with datasheets for several levels of the radiation.
Fig. 9 shows the superposition of the characteristic curves of
PV panels I = f(V) with a cell temperature = 25°C and solar
radiation at 5 levels: 1000W/m2, 800W/m
2, 600W/m
2,
500W/m2, 400W/m
2.
Fig. 9 Comparison of simulation results with datasheets for several
levels of radiation and at cell temperature of 25°C
Fig. 10 Test bench of PV panel
Fig. 9 shows that the simulation results match with those of
the datasheet. After comparing the simulation results with the
datasheet, we compared the simulation results with
experimental results of current-voltage (I-V) characteristics
and power-voltage (P-V) characteristics. The used materials
0 5 10 15 20 250
0.5
1
1.5
2
2.5
3
3.5
Voltage [V]
Cur
rent
[A]
500W/m²
400W/m²
600W/m²
800W/m²
1000W/m²
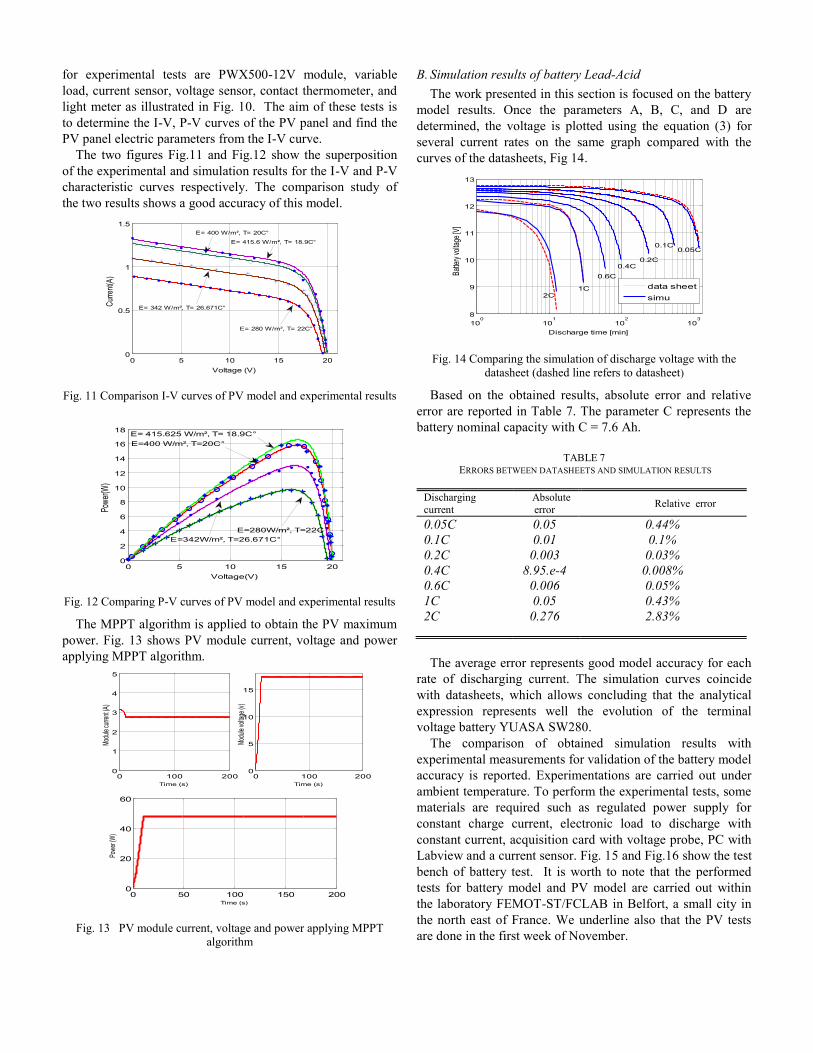
for experimental tests are PWX500-12V module, variable
load, current sensor, voltage sensor, contact thermometer, and
light meter as illustrated in Fig. 10. The aim of these tests is
to determine the I-V, P-V curves of the PV panel and find the
PV panel electric parameters from the I-V curve.
The two figures Fig.11 and Fig.12 show the superposition
of the experimental and simulation results for the I-V and P-V
characteristic curves respectively. The comparison study of
the two results shows a good accuracy of this model.
Fig. 11 Comparison I-V curves of PV model and experimental results
Fig. 12 Comparing P-V curves of PV model and experimental results
The MPPT algorithm is applied to obtain the PV maximum
power. Fig. 13 shows PV module current, voltage and power
applying MPPT algorithm.
Fig. 13 PV module current, voltage and power applying MPPT
algorithm
B. Simulation results of battery Lead-Acid
The work presented in this section is focused on the battery
model results. Once the parameters A, B, C, and D are
determined, the voltage is plotted using the equation (3) for
several current rates on the same graph compared with the
curves of the datasheets, Fig 14.
Fig. 14 Comparing the simulation of discharge voltage with the
datasheet (dashed line refers to datasheet)
Based on the obtained results, absolute error and relative
error are reported in Table 7. The parameter C represents the
battery nominal capacity with C = 7.6 Ah.
TABLE 7
ERRORS BETWEEN DATASHEETS AND SIMULATION RESULTS
Discharging
current
Absolute
error Relative error
0.05C
0.1C
0.2C
0.4C
0.6C
1C
2C EV
0.05
0.01
0.003
8.95.e-4
0.006
0.05
0.276
0.44%
0.1%
0.03%
0.008%
0.05%
0.43%
2.83%
The average error represents good model accuracy for each
rate of discharging current. The simulation curves coincide
with datasheets, which allows concluding that the analytical
expression represents well the evolution of the terminal
voltage battery YUASA SW280.
The comparison of obtained simulation results with
experimental measurements for validation of the battery model
accuracy is reported. Experimentations are carried out under
ambient temperature. To perform the experimental tests, some
materials are required such as regulated power supply for
constant charge current, electronic load to discharge with
constant current, acquisition card with voltage probe, PC with
Labview and a current sensor. Fig. 15 and Fig.16 show the test
bench of battery test. It is worth to note that the performed
tests for battery model and PV model are carried out within
the laboratory FEMOT-ST/FCLAB in Belfort, a small city in
the north east of France. We underline also that the PV tests
are done in the first week of November.
0 5 10 15 200
0.5
1
1.5
Voltage (V)
Cur
rent
(A)
E= 400 W/m², T= 20C°
E= 415.6 W/m², T= 18.9C°
E= 342 W/m², T= 26.671C°
E= 280 W/m², T= 22C°
0 5 10 15 200
2
4
6
8
10
12
14
16
18
Voltage(V)
Pow
er(W
)
E=280W/m², T=22C°
E= 415.625 W/m², T= 18.9C°
E=400 W/m², T=20C°
E=342W/m², T=26.671C°
0 100 2000
1
2
3
4
5
Time (s)
Mod
ule
curre
nt (A
)
0 100 2000
5
10
15
Time (s)
Mod
ule
volta
ge (v
)
0 50 100 150 2000
20
40
60
Time (s)
Pow
er (W
)
100
101
102
103
8
9
10
11
12
13
Discharge time [min]
Batte
ry v
olta
ge [V
]
data sheet
simu2C1C
0.6C
0.4C0.2C
0.05C0.1C
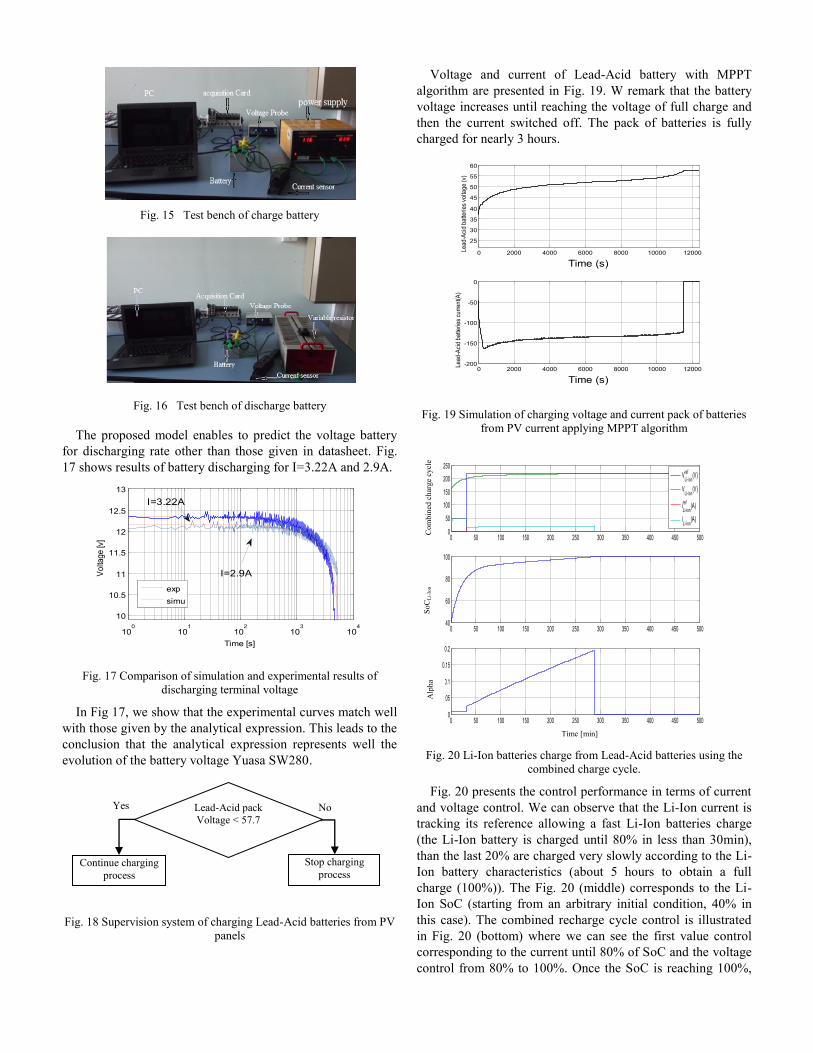
Fig. 15 Test bench of charge battery
Fig. 16 Test bench of discharge battery
The proposed model enables to predict the voltage battery
for discharging rate other than those given in datasheet. Fig.
17 shows results of battery discharging for I=3.22A and 2.9A.
Fig. 17 Comparison of simulation and experimental results of
discharging terminal voltage
In Fig 17, we show that the experimental curves match well
with those given by the analytical expression. This leads to the
conclusion that the analytical expression represents well the
evolution of the battery voltage Yuasa SW280.
Fig. 18 Supervision system of charging Lead-Acid batteries from PV
panels
Voltage and current of Lead-Acid battery with MPPT
algorithm are presented in Fig. 19. W remark that the battery
voltage increases until reaching the voltage of full charge and
then the current switched off. The pack of batteries is fully
charged for nearly 3 hours.
Fig. 19 Simulation of charging voltage and current pack of batteries
from PV current applying MPPT algorithm
Fig. 20 Li-Ion batteries charge from Lead-Acid batteries using the
combined charge cycle.
Fig. 20 presents the control performance in terms of current
and voltage control. We can observe that the Li-Ion current is
tracking its reference allowing a fast Li-Ion batteries charge
(the Li-Ion battery is charged until 80% in less than 30min),
than the last 20% are charged very slowly according to the Li-
Ion battery characteristics (about 5 hours to obtain a full
charge (100%)). The Fig. 20 (middle) corresponds to the Li-
Ion SoC (starting from an arbitrary initial condition, 40% in
this case). The combined recharge cycle control is illustrated
in Fig. 20 (bottom) where we can see the first value control
corresponding to the current until 80% of SoC and the voltage
control from 80% to 100%. Once the SoC is reaching 100%,
100
101
102
103
104
10
10.5
11
11.5
12
12.5
13
Time [s]
Vo
ltag
e [v
]
exp
simu
I=3.22A
I=2.9A
0 2000 4000 6000 8000 10000 12000
25
30
35
40
45
50
55
60
Time (s)
Le
ad
-Aci
d b
atte
rie
s vo
ltag
e (
v)
0 2000 4000 6000 8000 10000 12000-200
-150
-100
-50
0
Time (s)
Le
ad
-Aci
d b
atte
rie
s cu
rre
nt(
A)
0 50 100 150 200 250 300 350 400 450 5000
50
100
150
200
250
Com
bin
ed rechargin
g
cycle
0 50 100 150 200 250 300 350 400 450 50040
60
80
100
SOCLi-Ion
0 50 100 150 200 250 300 350 400 450 5000
0.05
0.1
0.15
0.2
t(s)
VLi-ion
ref(V)
VLi-ion
(V)
iLi-ion
ref(A)
iLi-ion
(A)
Time [min]
SoC
Li-
Ion
C
om
bin
ed c
har
ge
cycl
e A
lpha
Yes No Lead-Acid pack
Voltage < 57.7
Stop charging
process Continue charging
process
the Li-Ion recharge is stopped and the control equals to 0 (the
value of iLi-On(A) in 1st fig., and the value of Alpha in 3
rd fig.).
VI. CONCLUSION
To properly coordinate the operations of all elements of
charging/discharging system H2V and V2H, a modeling and
sizing of the whole system is required to describe and simulate
the behavior of each element. In this paper, we performed a
mathematical modeling of charging station for EV using solar
energy; model parameters of PV panel and Lead-acid battery
are identified using fitting methodology. PV and Lead-Acid
models are validated experimentally. MPPT control method
for obtaining PV maximum power is applied. System sizing is
proposed and finally home batteries pack is charged by PV
current until reaching full charging voltage. The obtained
results show that the batteries Li-Ion can be charged promptly
from the current of Lead-Acid batteries using buck/boost
converter. In our future work, we will focus on the energy
management in both directions H2V2H with a particular
attention to bring to the battery as mean of energy storage.
REFERENCES
[1] M. G. Egan, D. L. O’Sullivan, J. G. Hayes, M.J. Willers, C.P. Henze, Power-factor-corrected single-stage inductive charger for electric
vehicle batteries, IEEE Trans. on Industrial Electronics, 54 (2) (2007)
1217–1226. [2] Z. P . Wang, P. Liu, H. B. Han, C. Lu, T. Xin, Adistribution model of
electric vehicle charging station, Applied Mechanics and Materials, 44–
47 (2011) 1543–1548. [3] A. Ruzmetov, A. Nait Sidi Moh, M. Bakhouya, J. Gaber, M.Wack,
Optimal assignment and charging scheduling of electric vehicles,
International Renewable and Sustainable Energy Conference (IRSEC'13) Ouarzazate, Morocco, 10.1109/IRSEC.2013.6529691
(2013) 537 - 541.
[4] J. Song1, Amir Toliyat1, Dave Tuttle1, Alexis Kwasinski1, A Rapid Charging Station with an Ultracapacitor Energy Storage System for
Plug-In Electrical Vehicles, Electrical Machines and Systems (ICEMS),
2010, International Conference on, (2010) 2003-2007. [5] J. Baker, New technology and possible advances in energy storage,
Energy Policy, 36 (2008) 4368–4373.
[6] A. Boucherit, Conception d’un convertisseur de puissance pour les véhicules électriques multi-sources, Ph. D thesis of University
Technologie de Belfort –Montbéliard, 2011.
[7] J. P. Trovão, P. G. Pereirinha, H. M. Jorge, Design Methodology of Energy Storage Systems for a Small Electric Vehicle, World Electric
Vehicle Journal, 3 (2009) 1-12.
[8] A. Nouh, Contribution au développement d'un simulateur pour les véhicules électriques routiers. Ph. D. thesis, University of Technologie
Belfort-Montbeliard 2008.
[9] A. Cherif, M. Jraidi, A. Dhouib, A battery ageing model using in stand-alone PV systems, Journal of Power Sources, 112 (1) (2002) 49–53.
[10] A. Zegaouia, P. Petita, M. Ailleriea, J-P. Sawickia, J.P Charlesa,
Experimental Validation of Photovoltaic Direct and Reverse Mode Model. Influence of Partial Shading. Energy Procedia 18 (2012) 1247 -
1253.
[11] J. Surya Kumari, Ch. Sai Babu, Mathematical modeling and simulation of photovoltaic cell using Matlab-Simulink environment, International
Journal of Electrical and Computer Engineering, 2 (1) (2012) 26–34.
[12] E. Mboumboue, D. Njomo, Mathematical modeling and digital simulation of PV solar panel using Matlab software, Inter. Journal of
Emerging Technology and Advanced Engineering, 3 (2013) 24–23. [13] S. AGBLI, Modélisation multiphysique des flux énergétiques d’un
couplage photovoltaïque-électrolyseur PEM–Pile à Combustible PEM
en vue d’une application stationnaire, Ph. D. thesis, University of Franche comté 2012.
[14] N. Achaibou, M. Haddadi, A. Malek, Modelling of lead acid
batteries in PV systems, Siencedirecte, Energy Procedia, Clean Energy Solutions for Sustainable Environment (CESSE), 18 (2012) 538–544.
[15] W. Zhoua, H. Yanga, Z. Fang, Battery behaviour prediction and battery
working states analysis of a hybrid solar–wind power generation system, Siencedirecte, Re-newable, 33 (2008) 1413–1423.
[16] R.A Jackey, A Simple effective lead-acid battery modelling process for
electrical system component selection, SAE Technical Paper, 2007. [17] O. Geraud, G. Robin, B. Multon, H. Ben Ahmed, Energy modeling of a
lead-acid battery within hybrid wind/photovoltaic systems, European
Power Electronic Conference 2003, Toulouse, 2003. [18] M. Dürr, A. Cruden, S. Gair, J.R. McDonald, Dynamic model of a lead
acid battery for use in a domestic fuel cell system, Siencedirecte, Journal
of Power Sources, 161 (2006) 1400–1411. [19] M. Coleman, C. K. Lee, C. Zhu, W. G. Hurley, State-of-charge
determination from EMF voltage estimation: Using impedance, terminal
voltage, and current for lead-acid and lithium-ion batteries, IEEE Trans. on Industrial Electronics, 54 (5) (2007) 2550–2557.
[20] Yuasa Battery, SWL Batteries stationnaires étanches au plomb à
recombinaison de gas régulées par soupapes, 2010. [21] R. Mkahl, A. Nait Sidi Moh, Modeling of charging station batteries for
electric vehicles, J. of Asian Electric Vehicles, 11 (2) (2013) 1667–1672.
[22] M. Becherif, M. Y. Ayad, D. Hissel, R. Mkahl, Design and sizing of a
stand-alone recharging point for battery electrical vehicles using
photovoltaic energy, Proceeding of the Vehicle Power and Propulsion
Conference, 10.1109/VPPC.2011.6043075 ( 2011) 1–6. [23] A Ruzmetov, A Nait-Sidi-Moh, M. Bakhouya, J Gaber. A (max - plus)-
based approach for charging management of electric vehicles. In Proc.
of the 2nd World Conference on Complex Systems, Agadir, Morocco. Nov. 2014.
Rania, Mkahl is a PhD student working at the University of Technology
Belfort-Montbéliard (UTBM), Belfort, France. Her PhD thesis is part of a research collaboration between the UTBM and the University of Picardie
Jules Verne (UPJV) – INSSET, Saint Quentin, France. She received her
Master’s degree in Electrical Engineering from the Ecole Centrale of Lyon, France in 2010. Prior to beginning the Master and PhD programs, she worked
as assistant professor at the Tishreen University, Syria. Her main research
interests are modeling, control and management of energy flows H2V and
V2H , charging process of electric vehicles, renewable energy for EV
charging, decision-making, simulation and operations research.
Ahmed, Nait-Sidi-Moh received his Ph.D. degree in 2003 in Computer
Engineering and Automatic Control from the University of Technology of Belfort Montbéliard (UTBM), France. He is currently an Associate Professor
of Computer Engineering at the University of Picardie Jules Verne (UPJV).
Prior to joining the UPJV, he was research scientist and lecturer at the UTBM. He has more than six years’ experiences in participating and working in
European and national/regional projects. He is principal investigator of a
regional project Com-SloT (Community of logistic services on the Internet of Things, 2013-2016). He was Co-PI (UTBM side) of two European projects
ASSET (Advanced Safety and Driver Support in Efficient Road Transport,
FP7-SST, 2008-2011, and TELEFOT (Field Operational Tests of Aftermarket and Nomadic Devises in Vehicles, FP7-ICT, 2008-2012. He is also a member
(UTBM side) of EU EACEA Erasmus Mundus project TARGET (Transfer of
Appropriate Requirements for Global Education and Technology), 2011-2014. His research interests include modeling, analysis and control of discrete
event systems, resources and information sharing, decision-making and
interoperability for service composition, Internet of Things, Geo-positioning and mobility, decision-making and management of EV charging.
Maxime, Wack received his PhD degree in 1981 in computer science from the Université de Technologie de Compiègne (UTC), France. Currently,
he is associate professor-HDR (Habilité à diriger les recherches) at the
laboratory OPERA/FCLAB at the Université de Technologie de Belfort Montbéliard (UTBM). He is the head of the research group
Geopositioning, Embedded systems and mobility (GSEM) at UTBM. He was Co-PI of two European projects ASSET (Advanced Safety and
Driver Support in Efficient Road Transport, FP7-SST, 2008-2011, and
TELEFOT (Field Operational Tests of Aftermarket and Nomadic Devises in Vehicles, FP7-ICT, 2008-2012. He is also a member (UTBM side) of EU
EACEA Erasmus Mundus project TARGET (Transfer of Appropriate
Requirements for Global Education and Technology), 2011-2014. His research interests include information systems, security, digital
signature and certification, ubiquitous and pervasive computing, location
based services and distributed systems, energy.