Model of pore formation in a single cell in a flow-through channel with micro-electrodes
9
Model of pore formation in a single cell in a flow-through channel with micro-electrodes Avigail Kaner & Ido Braslavsky & Boris Rubinsky # Springer Science+Business Media New York 2013 Abstract Microfluidic channels with embedded micro- electrodes are of growing use in devices that aim to electroporate single cells. In this article we present an analysis of pore evolution in a single cell passing by two planar elec- trodes that are separated by a nano-gap. The cell experiences an electric field that changes in time, as it goes over the electrodes in the channel. The nano-gap between the electrodes enhances the electric field’ s strength in the micro-channel, thus enabling the use of low potential difference between the electrodes. By computing the electric field on the surface of the cell we can calculate the pore density, as predicted by the model described by Krassowska and Filev (Biophys. J. 92(2):404–417, 2007). The simulation presented in this article is a useful tool for planning and executing experiments of single-cell electropora- tion in flow-through devices. We demonstrate how different parameters, such as cell size and the size of the gap between the electrodes, change the pore density and show how electropo- ration between micro-electrodes on the same plane is different from conventional electroporation between facing electrodes. Keywords Electroporation . Micro-electroporation . Microfluidics . Single-cell Nomenclature V 0 Electric potential difference between electrodes (V) V ep Characteristic voltage of electroporation (V) V m Transmembrane potential (V) φ Electric potential (V) σ Cell conductivity (S/m) d Membrane thickness (nm) r Cell radius (μ m) α Creation rate coefficient (m −2 sec −1 ) q Constant for pore creation rate (-) 1 Introduction It has been observed as early as 1957 by R. Stämpfli (1957) that applying an electric field above a certain threshold creates pores in the membrane of a cell. The mechanism that underlies the formation of these pores is not yet fully understood but is presumably related to temporary defects in the cell membrane (Weaver 1995, 2003; Chen et al. 2006; Bockmann et al. 2008; Delemotte and Tarek 2012). Electroporation is a reversible process only under a specific set of parameters (strength of electric field and duration of pulse) in which the transmembrane potential does not exceed a certain value. Above a certain threshold the electroporation becomes irre- versible, and the cell dies. In reversible electroporation the sealing of the pores is a rather slow process (tens of seconds to whole minutes), which allows transport of foreign large mole- cules, past the membrane and into the cell (Chernomordik et al. 1987; Glaser et al. 1988; Saulis et al. 1991; Ryttsen et al. 2000). Electroporation procedure is favored over other techniques of delivery into the cell since it is a relatively simple, non–toxic, low–cost method. A. Kaner : I. Braslavsky Bioengineering Program, The Rachel and Selim Benin School of Computer Science and Engineering, The Hebrew University of Jerusalem, Jerusalem 91904, Israel B. Rubinsky (*) Graduate Program in Biophysics, Department of Mechanical Engineering, University of California - Berkeley, Berkeley, CA 94720, USA e-mail: [email protected] I. Braslavsky The Institute of Biochemistry, Food and Nutrition, Robert H. Smith Faculty of Agriculture, Food and Environment, The Hebrew University of Jerusalem, Rehovot 76100, Israel Biomed Microdevices DOI 10.1007/s10544-013-9820-6
Transcript of Model of pore formation in a single cell in a flow-through channel with micro-electrodes
Model of pore formation in a single cellin a flow-through channel with micro-electrodes
Avigail Kaner & Ido Braslavsky & Boris Rubinsky
# Springer Science+Business Media New York 2013
Abstract Microfluidic channels with embedded micro-electrodes are of growing use in devices that aim toelectroporate single cells. In this article we present an analysisof pore evolution in a single cell passing by two planar elec-trodes that are separated by a nano-gap. The cell experiences anelectric field that changes in time, as it goes over the electrodesin the channel. The nano-gap between the electrodes enhancesthe electric field’s strength in the micro-channel, thus enablingthe use of low potential difference between the electrodes. Bycomputing the electric field on the surface of the cell we cancalculate the pore density, as predicted by the model describedby Krassowska and Filev (Biophys. J. 92(2):404–417, 2007).The simulation presented in this article is a useful tool forplanning and executing experiments of single-cell electropora-tion in flow-through devices. We demonstrate how differentparameters, such as cell size and the size of the gap between theelectrodes, change the pore density and show how electropo-ration between micro-electrodes on the same plane is differentfrom conventional electroporation between facing electrodes.
Keywords Electroporation .Micro-electroporation .
Microfluidics . Single-cell
Nomenclature
V0 Electric potential difference between electrodes (V)Vep Characteristic voltage of electroporation (V)Vm Transmembrane potential (V)φ Electric potential (V)σ Cell conductivity (S/m)d Membrane thickness (nm)r Cell radius (μm)α Creation rate coefficient (m−2 sec−1)q Constant for pore creation rate (-)
1 Introduction
It has been observed as early as 1957 by R. Stämpfli (1957) thatapplying an electric field above a certain threshold creates poresin the membrane of a cell. The mechanism that underlies theformation of these pores is not yet fully understood but ispresumably related to temporary defects in the cell membrane(Weaver 1995, 2003; Chen et al. 2006; Bockmann et al. 2008;Delemotte and Tarek 2012). Electroporation is a reversibleprocess only under a specific set of parameters (strength ofelectric field and duration of pulse) in which the transmembranepotential does not exceed a certain value.
Above a certain threshold the electroporation becomes irre-versible, and the cell dies. In reversible electroporation thesealing of the pores is a rather slow process (tens of seconds towhole minutes), which allows transport of foreign large mole-cules, past the membrane and into the cell (Chernomordik et al.1987; Glaser et al. 1988; Saulis et al. 1991; Ryttsen et al. 2000).Electroporation procedure is favored over other techniques ofdelivery into the cell since it is a relatively simple, non–toxic,low–cost method.
A. Kaner : I. BraslavskyBioengineering Program, The Rachel and Selim Benin School ofComputer Science and Engineering, The Hebrew University ofJerusalem, Jerusalem 91904, Israel
B. Rubinsky (*)Graduate Program in Biophysics, Department of MechanicalEngineering, University of California - Berkeley, Berkeley,CA 94720, USAe-mail: [email protected]
I. BraslavskyThe Institute of Biochemistry, Food and Nutrition, Robert H. SmithFaculty of Agriculture, Food and Environment, The HebrewUniversity of Jerusalem, Rehovot 76100, Israel
Biomed MicrodevicesDOI 10.1007/s10544-013-9820-6
Micro–scale electroporation is considered the best genetransfection method in terms of delivery efficiency and viability(Lee et al. 2009). Electroporation of single cells in microfluidicdevices offers a controlled process with high transfection ratesand high cell viability while averting damage that might becaused by joule heating in macro-electroporation methods.
Conventional electroporation methods use cuvettes in orderto perform the procedure on a bulk of cells. The main disad-vantage of the conventional method is that since its protocolcannot be optimal for each cell in the batch, the success of theprocedure is very limited. To address this issue, Huang andRubinsky (Huang and Rubinsky 1999, 2001, 2003) introduceda novel method for electroporation that could improve theelectroporation efficiency by micro-electroporating single cellsin a flow-through device. Each cell can be monitored in realtime and the success of the electroporation can be depictedfrom the change in the electric current that passes through thecell, due to its increased permeability.
Several designs for flow-through micro-electroporation havebeen developed in recent years. Some of these designs focus onanalyzing cellular properties, and as such they use a variety ofcell trapping techniques (Valero et al. 2005, 2008; Khine et al.2007). Other designs, which are more oriented towards celltransfection, find a way to enhance a local electric field insidethemicro-channel as the cell goes by. These devices either embedelectrodes at the top and bottom of the channel (Lin et al. 2001;Lu et al. 2005), or side-by-side electrodes (Huang and Rubinsky2003; Zhan et al. 2009). In order to enhance the electric field inthe micro-channel, the electrodes reside in close proximity and attimes a small flow constriction is designed (Wang and Lu 2006;Cho et al. 2007; Andresen et al. 2010).
Although the electroporation process of single cells inmicrochannels is monitored closely in most devices, one hasto go through a ‘trial and error’ phase in order to realize whatparameters to apply for reversible electroporation. In thisstudy we present both an effective, feasible electroporationdevice, and simulate a model that can be used as a tool forassessing the required experimental setup.
The advantage of the model that was developed by ourgroup (Troszak and Rubinsky 2011) is the relatively strongand localized electric field that is produced by a potentialdifference of merely few volts.
In most of the models that have been developed so far for theelectroporation of a single cell, a uniform field between twoelectrodes is assumed. This however, is not the case in flowthrough devices—the cell travelling through the microchannelexperiences an alternating electric field.
Several models have been described in literature to reveal theunderlying dynamics of the electroporation phenomena. Theproposed models rely upon energy balance theory, or electrome-chanical and stochastic pore population (Crowley 1973; BarnettandWeaver 1991; Freeman et al. 1994), but none of the theorieshas been validated experimentally due to lack of direct proof.
The first group to suggest the use of Smoluchowski’s equation todescribe the dynamics of pore density formation wasPastushenko et al. (1979). Neu and Krassowska (1999) took thisequation and preformed an asymptotic reduction to an ordinarydifferential equation (ODE) that can be utilized to solve in casesof non-uniform electric fields.
The advancement in computational strength in recent yearsallowed researchers to perform more elaborate molecular-dynamics (MD) simulations (Apollonio et al. 2012).Simulations of 512 lipids and duration of 50 nsec have beenachieved by (Bockmann et al. 2008). MD simulations revealthe initial dynamics of pore formation—first a single file ofwater molecules penetrate the membrane and only then does ahydrophilic pore form.
In this work we incorporate the novel configuration of twoplanar electrodes that are separated by a nano-gap with themodel presented by Krassowska and Filev (2007) that describesthe dynamic evolution of pores during an electroporative pulsethat is applied to a single cell.
2 Methods
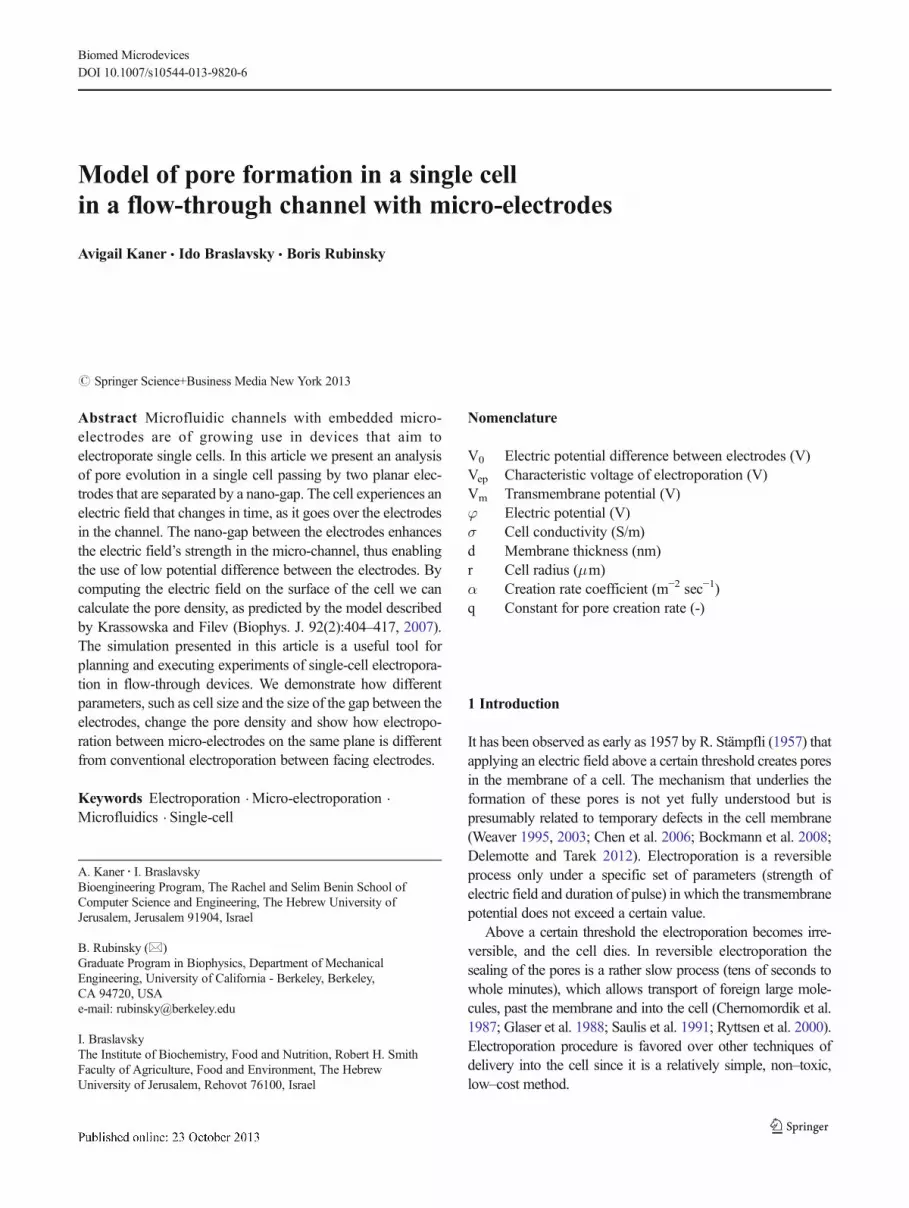
A three-dimensional model of a spherical cell in a microchannelwith two planar electrodes was constructed (Fig. 1). Our as-sumption is that the flow in the channel is fully developed andthe cell travels at a constant speed. We calculate the steady-stateelectric field problem, i.e. solve the Laplace equation:
Fig. 1 Geometry of the simulated model. The cell is colored with red andthe electrodeswith green. The nano-gap between the electrodes is the thinblack line in the midst of the green patch
Table 1 Parameters of the model
Symbol Value Definition
α 1×10⁹m−2s−1 Creation rate coefficient
q 2.46 Constant for pore creation rate
σ 1.45×10⁻⁵S /m Cell conductivity
d 7nm Membrane thickness
Vep 0.285 V Characteristic voltage for electroporation
Biomed Microdevices

∇2ϕ ¼ 0
With ϕ noting the electric potential.Since the velocity of the cell is assumed to be constant at the
x-direction (neglecting movement along y and z—directions),time increments of the simulation are equivalent to spaceincrements. Thus, at each time point we can define the celllocation, regenerate the mesh and solve numerically the electricfield the cell experiences.
To make sure that our solution does not depend on themesh points created at specific time iterations, we predefine a
set of coordinates on the cell surface for which we constantlyevaluate the electric field.
2.1 Boundary conditions
The boundary condition on the channel walls is of electricinsulation. The electrodes are set to be at a constant potentialdifference, meaning:
ϕL ¼ V0 ; a≤x≤b; y ¼ 0; z ¼ 0ð ÞϕR ¼ 0 ; c≤x≤d; y ¼ 0; z ¼ 0ð Þ
�
Fig. 2 Contour plot of the normalelectric field in the range of1e4 V/m to 2e5 V/m
Fig. 3 The electric potential inthe channel. 2 [V] differencebetween the electrodes
Biomed Microdevices

On the boundary of the cell we set a distributed resistance,σ, and membrane thickness d =7 nm.
2.2 Pore formation dynamics
The dynamic evolution of the pores due to the membranepotential it experiences is given by the following equation,
derived in a model of electroporation in a single cell thatKrassowska and Filev introduced (Krassowska and Filev 2007):
dN
dt¼ αe Vm=Vepð Þ2 1−
N
Neq Vmð Þ� �
Neq Vmð Þ ¼ N0eq Vm=Vepð Þ2
a
b
Fig. 4 a The electric potential atsix points on cell surface. b Sixpoints on the cell surface onwhich the potential is shown in a
Biomed Microdevices

Where α and q are constants, as defined in (Table 1). Thepore density is a function of time and coordinates on the cellsurface – N (t , r ). Neq is the equilibrium pore density for agiven voltage Vm. The initial condition is set toN (0, r )=0, i.e.no pores.Vep is the characteristic voltage for electroporation.
The ordinary differential equation above is an asymptoticreduction of the Smoluchowski equation, in the form:
nt þ D∂r −Er
kTn−nr
� �¼ S rð Þ
Where D is the diffusion constant of pores, E(r) is the poreenergy, k is the Boltzmann constant, T is the absolute temper-ature, and S(r) is the source term that represents the creation anddestruction of pores. Subscript t denotes differentiation withrespect to time; differentiation with respect to pore radius isdenoted by ∂r or by subscript r. The pore distribution functionn(r, t) is related to the pore density N(t) by the equation:
N tð Þ ¼Z0
∞
n r; tð Þdr
The model assumes a specific relationship between thepore radius and the pore energy. Neu and Krassowska adoptedthe proposition of Chizmadzhev and colleagues (Abidor 1979;Glaser et al. 1988) that the energy E(r ) of a pore with radius ris the lesser of two curves:
E rð Þ ¼ E�r
r�
� �2
;
The energy of nonconductive (hydrophobic) pores, wherer* and E* are the minimum radius and energy barrier for thecreation of conducting pores, and
E rð Þ ¼ 2πγr − πσr2 þ C
r
� �4
;
Is the energy of conductive (hydrophilic) pores, where γ isthe pore radius energy, σ is the membrane surface tension, and
Fig. 5 Number of pores created at 6 points on cell membranes (points described in Fig. 4b)
Biomed Microdevices

Fig. 6 Total number of pores as afunction of cell size
Fig. 7 Total number of pores as afunction of the potentialdifference between the electrodes
Biomed Microdevices

C is a constant (the third term represents the steric repulsionbetween lipid heads lining the pore).
When in presence of an external transmembrane potential,the pore energy assumes the form of:
φ r; tð Þ ¼ E rð Þ−πapV 2r2
The second term in the equation above is the capacitivecontribution, with ap being a coefficient that is a property ofthe membrane and its aqueous environment.
To simulate this model we used COMSOL 4.3a softwarewith LiveLink to MatLab 2012b. We took advantage of thenovel computing resources of the Amazon Web Services, andran our simulations on the Amazon Elastic Compute Cloud(Amazon EC2).
3 Results
3.1 Electric field and potential on cell in micro-channel
At each time-step of the simulation the electric field in thechannel is calculated. We show the contour plot of the normalelectric field on the cell in the channel, and the potential in thechannel at one point of time in the simulation (Figs. 2 and 3).Looking at 6 fixed points on the cell surface (Fig. 4b), wedemonstrate how the potential at these points changes as the
cell travels along the channel (Fig. 4a). The electric field thatthe cell experiences is not constant, but rather alters in time.
3.2 Number of pores as a function of V
The number of pores as calculated from the equation of poreformation dynamics, at 6 fixed points with a potential differ-ence between the electrodes of 2 V is presented in Fig. 5. Thetotal number of pores in the cell changes as a function of thepotential difference between the electrodes (Fig. 6). As thevoltage increases, so does the number of pores created.
3.3 Number of pores as a function of gap size and cell size
Increasing the cell radius, keeping the dimensions of thechannel constant, results in increasing the number of porescreated in the cell membrane (Fig. 7). The effect of changingthe gap size between the electrodes from 20 nm to 500 nm, canbe seen in Fig. 8.
3.4 Illustration of pore creation in comparison with traditionalelectroporation method
The difference between the model we present here and thetraditional electroporation method (i.e. a cell between twoplanar electrodes, constant in time), is illustrated in Fig. 9. Inthe traditional method, mainly the poles of the cell facing the
Fig. 8 Total number of pores as afunction of gap size
Biomed Microdevices

electrodes are electroporated (Fig. 9b), while the cell travelingthrough the micro-channel is electroporated at different anglesin respect to the electrodes. As the cell goes through thechannel (top-left to bottom-right in Fig. 9a), the pore distribu-tion changes its geometry. The hemisphere of the cell facingthe bottom part of the channel senses the strongest electricfield over time, which causes this part to have eventually thehighest pore distribution.
4 Discussion
These results demonstrate that the nano-gap generates anelectric field that indeed acts as an electroporative pulse on acell travelling through the channel. By changing V (or equiv-alently, the size of the nano-gap) the pore density changes—allowing to choose the amount of pores/mass transfer into thecell. Notably, the size of the cell in themicrochannel also playsa role in the pore density that is created. As the cell is closer tothe channel walls, the higher the magnitude of the electric fieldit experiences.
We have introduced an analysis of pore formation in a cellin a novel microfluidic device, using the model proposed byKrassowska and Filev (2007). Using a dynamic model toassess, as a first approximation, to what extent the cell in themicrochannel is electroporated can be a useful tool for design-ing and choosing the correct experimental parameters. Our
analysis shows that the pore distribution in this scheme isdifferent from the one in the conventional electroporationscheme. This points out that the protocol for electroporationin these kinds of devices should be different and planned inadvance accordingly.
In the traditional analysis of electroporation of a single cellbetween two planar facing electrodes, the polar areas of thecell that face the electrodes are the regions that are mainlyelectroporated. It is assumed that the cell does not move andthat the electric field it experiences during the electric pulse isconstant in time. The electroporation of the cell is not sym-metric—the hyperpolarized pole of the cell (facing the anode)has more pores than the depolarized pole of the cell. In ourmodel, the cell travels along the channel and experiences avarying electric field as it goes by. Consequently, the distri-bution of pores that form on the membrane surface has a morecomplex geometry that varies in time. The hemisphere of thecell that faces the bottom of the channel, where the planarelectrodes reside, experiences a greater electric field in total,and therefore this hemisphere is more perforated. The evolu-tion of pores during the electroporation process in themicrochannel is visibly different than in the traditional elec-troporation process, as seen in the illustration in Fig. 9.
There are several potential applications for the model wepresent here, as described elsewhere (Troszak and Rubinsky2010). We can use our analysis to design a series of electrodesin a channel that can maintain the membrane of the cell open
−2 −1 0 1 2 3 4 5 6 7
x 10−5
−5 0 5x 10
−5
−3
−2
−1
0
1
2
3
x 10−5
Traditional EP pore distribution
xy
z
a
b
Fig. 9 Illustration of number of pores created on cell surface along the channel (a), and in the traditional method of electroporation (b)
Biomed Microdevices
for as long as needed (allowing the pores to shrink in between,to ensure the reversibility of the process). This feature may alsobe used to destroy cells by irreversible electroporation, forapplications such as sterilization of food, water, drugs, etc.
One of the main problems dealing with micro-electrodes ina microfluidic channel with a DC pulse is the degradation ofthe electrodes themselves, and gas bubbles that form in theliquid due to electrolysis. The analysis in this article can befurther developed and implemented for devices that use ACfields, which can overcome the problems the DC pulse poses(Ziv et al. 2009).
Future analysis of our model can take into account the actualmass transfer into the cell, thus enabling to predict the amountof a specific drug, protein, or gene that enters the cell in a givenconfiguration. As a first approximation, we assumed in ourmodel that the flow is laminar and at constant speed. Takinginto account a more elaborate behavior of the flow will alsoallow us to better understand the electroporation procedure thatthe cell undergoes in the channel.
Acknowledgments We would like to thank Jorge Najenson and ElyLevy (CS system group of The Rachel and Selim Benin School ofComputer Science and Engineering at the Hebrew University of Jerusa-lem), for making the computation on the Amazon Elastic Compute Cloud(Amazon EC2) operational, and having the time and patience to assistwith all the technical problems.
References
I. G. Abidor, V. B. Arakelyan, L. V. Chernomordik, Y. A. Chizmadzhev,V. F. Pastushenko,M. R. Tarasevich, Bioelectroch Bioener 6(1), 37–52 (1979)
K. O. Andresen, M. Hansen, M. Matschuk, S. T. Jepsen, H. S. Sorensen,P. Utko, D. Selmeczi, T. S. Hansen, N. B. Larsen, N. Rozlosnik, R.Taboryski, J. Micromech. Microeng. 20(5), (2010)
F. Apollonio, M. Liberti, P. Marracino, L. Mir, Antennas and Propagation(EUCAP), 2012 6th European Conference on, 356–358 (2012)
A. Barnett, J.C. Weaver, Bioelectroch. Bioener. 25(2), 163–182 (1991)
R.A. Bockmann, B.L. de Groot, S. Kakorin, E. Neumann, H. Grubmuller,Biophys. J. 95(4), 1837–1850 (2008)
C. Chen, S.W. Smye, M.P. Robinson, J.A. Evans, Med. Biol. Eng.Comput. 44(1–2), 5–14 (2006)
L.V. Chernomordik, S.I. Sukharev, S.V. Popov, V.F. Pastushenko, A.V.Sokirko, I.G. Abidor, Y.A. Chizmadzhev, Biochim. Biophys. Acta902(3), 360–373 (1987)
Y. H. Cho, S. W. Lee, B. Le Pioufle, N. Takama, S. Takeuchi, T. Fujii, B.J. Kim, Solid-State Sensors, Actuators and Microsystems Confer-ence, 2007. TRANSDUCERS 2007. International, 939–942 (2007)
J.M. Crowley, Biophys. J. 13(7), 711–724 (1973)L. Delemotte, M. Tarek, J. Membrane Biol. 245(9), 531–543 (2012)S.A. Freeman,M.A.Wang, J.C.Weaver, Biophys. J. 67(1), 42–56 (1994)R.W. Glaser, S.L. Leikin, L.V. Chernomordik, V.F. Pastushenko, A.I.
Sokirko, Biochim. Biophys. Acta 940(2), 275–287 (1988)Y. Huang, B. Rubinsky, Biomed. Microdevices 2(2), 145–150 (1999)Y. Huang, B. Rubinsky, Sensor Actuat. A-Phys. 89(3), 242–249 (2001)Y. Huang, B. Rubinsky, Sensor Actuat. A-Phys. 104(3), 205–212 (2003)M. Khine, C. Ionescu-Zanetti, A. Blatz, L.P. Wang, L.P. Lee, Lab Chip
7(4), 457–462 (2007)W. Krassowska, P.D. Filev, Biophys. J. 92(2), 404–417 (2007)W.G. Lee,U.Demirci,A.Khademhosseini, Integr. Biol. 1(3), 242–251 (2009)Y.C. Lin, C.M. Jen, M.Y. Huang, C.Y. Wu, X.Z. Lin, Sensor Actuat. B-
Chem. 79(2–3), 137–143 (2001)H. Lu, M.A. Schmidt, K.F. Jensen, Lab Chip 5(1), 23–29 (2005)J.C. Neu, W. Krassowska, Phys. Rev. E. 59(3), 3471–3482 (1999)V.F. Pastushenko, Y.A. Chizmadzhev, V.B. Arakelyan, Bioelectroch.
Bioener. 6(1), 53–62 (1979)F. Ryttsen, C. Farre, C. Brennan, S.G. Weber, K. Nolkrantz, K. Jardemark,
D.T. Chiu, O. Orwar, Biophys. J. 79(4), 1993–2001 (2000)G. Saulis, M.S. Venslauskas, J. Naktinis, Bioelectroch. Bioener. 26(1), 1–
13 (1991)R. Stampfli, An. da Acad. Brasileira de Ciencias 30(1), 57–63 (1957)G.D. Troszak, B. Rubinsky, Biomed. Microdevices 12(5), 833–840 (2010)G.D. Troszak, B. Rubinsky, PLoS One 6(4), e18523 (2011)A. Valero, F. Merino, F. Wolbers, R. Luttge, I. Vermes, H. Andersson, A.
van den Berg, Lab Chip 5(1), 49–55 (2005)A. Valero, J.N. Post, J.W. van Nieuwkasteele, P.M. ter Braak, W. Kruijer,
A. van den Berg, Lab Chip 8(1), 62–67 (2008)H.Y. Wang, C. Lu, Anal. Chem. 78(14), 5158–5164 (2006)J.C. Weaver, Methods Mol. Biol. 47, 1–26 (1995)J.C. Weaver, IEEE Trans. Dielectr. Electr. Insul. 10(5), 754–768 (2003)Y.H. Zhan, J.Wang, N. Bao, C. Lu, Anal. Chem. 81(5), 2027–2031 (2009)R. Ziv, Y. Steinhardt, G. Pelled, D. Gazit, B. Rubinsky, Biomed.
Microdevices 11(1), 95–101 (2009)
Biomed Microdevices