Model for Total Cost of Ownership Evaluation of Enterprise Resource Planning: Case of Maseno...
226
A MODEL FOR EVALUATING TOTAL COST OF OWNERSHIP OF UNIVERSITY ENTERPRISE RESOURCE PLANNING: CASE OF MASENO UNIVERSITY Patrick Oduor Owoche A thesis submitted in partial fulfillment of the requirements for the degree of Master of Science in Information Technology of Masinde Muliro University of Science and Technology i
-
Upload
independent -
Category
Documents
-
view
2 -
download
0
Transcript of Model for Total Cost of Ownership Evaluation of Enterprise Resource Planning: Case of Maseno...

A MODEL FOR EVALUATING TOTAL COST OF OWNERSHIP OF
UNIVERSITY ENTERPRISE RESOURCE PLANNING: CASE OF MASENO
UNIVERSITY
Patrick Oduor Owoche
A thesis submitted in partial fulfillment of therequirements for the degree of Master of Science inInformation Technology of Masinde Muliro University ofScience and Technology
i

SEPTEMBER, 2013
DECLARATION AND CERTIFICATION
Student’s Declaration
This thesis is my original work prepared with no other than
the indicated sources and support and has not been
presented elsewhere for a degree or any other award.
Signed __________________________________ Date:
_________________________
Patrick Oduor Owoche Reg. No. SIT/G/6/10
The undersigned certify that they have read the thesis and
hereby recommend for acceptance by Masinde Muliro
University of Science and Technology a thesis entitled
“Model for Evaluating Total Cost of Ownership for
ii

University Enterprise Resource Planning: Case of Maseno
University”
Signed __________________________________ Date
__________________________
Mr. Kilwake Humphrey JumaDepartment of Computer ScienceMasinde Muliro University of Science and Technology
Signed __________________________________ Date
__________________________
Prof. Wanyembi GregorySchool of Information Science and Knowledge ManagementUniversity of Kabianga
COPYRIGHT
This thesis is copyright materials protected under the
Berne Convention, the copyright Act 1999 and other
international and national enactments in that behalf, on
intellectual property. It may not be reproduced by any
means in full or in part except for short extracts in fairiii

dealing so for research or private study, critical
scholarly review of discourse with acknowledgement, with
written permission of the Dean School of Graduate Studies
on behalf of both the author and Masinde Muliro University
of Science and Technology.
iv
DEDICATION
I dedicate this thesis to my family and friends for their
continued support and inspiration.
v

ACKNOWLEDGEMENT
My sincere thanks goes to my inspiring and motivating
supervisors Prof. Wanyembi Gregory and Mr. Juma Kilwake,
thanks for being there for me in this academic journey. It
was an honor to be your student.
Also, I would like to express my gratitude to the
management of Maseno University for accepting my request to
collect data within the institution. Furthermore, much
thanks to all the respondents and interviewees for taking
their valuable time in providing important responses to the
questions enabling this study.
May I also thank Mr. George Omwono and Mr. Jerry Owango
both of Maseno University and Mr. Felix Awiti, Assistant
Manager of Kisumu Hotel, for their cooperation during data
collection phase of the research. I would also like to
thank Mr. Rich Kaestner of CoSN for going through my work
and providing me with CoSN TCO case study reports from the
vi

US. Finally, I would like to thank my dear wife Winnie for
her moral support and encouragement during entire process.
Owoche P. O
vii

ABSTRACT
Enterprise Resource Planning, (ERP) makes it possible toimprove institutional efficiency and effectiveness. Thereis, however, a great deal of difficulty reported in thenormative literature when it comes to the evaluation ofinvestments in ERP, with organizations often findingthemselves unable to assess the full implications of theirERP implementation. Organizations looking to reducetechnology costs typically look for ways to reduce theTotal Cost of Ownership (TCO). When properly analyzed, TCOcaptures all direct and indirect costs related toacquiring, configuring, deploying, managing and retiring aparticular asset or system. Each one of these categories isa valuable opportunity to save scarce resources, improve ITand increase productivity. This research is based on costanalysis of an ERP system solution in universities. Itexplores on how to develop a model for evaluating the totalcost of ERP ownership in a university and to provide basisupon which to monitor costs over time. The study sought toidentify the major cost drivers that can influence the TCOof ERP in universities, to analyze the TCO of universityERP and to develop a model for evaluating TCO of universityERP. The study identified the major cost factors that caninfluence TCO in university ERP system as; the number ofimplementation locations, scope of business impact,technology familiarity among users, life cycle oftechnology, and the system support. The proposed TCO modelwas built based on Gartner’s TCO model, the DistributedComputing Chart of Account as the theoretical framework.The proposed TCO model has five cost elements which are;procurement costs, hardware and software acquisition costs,implementation costs, operations and maintenance costs and
viii

end-user usage costs. The model has seventeen nodes andsixty five background factors. The developed TCO model wasused to determine the total cost of owning MasenoUniversity ERP system. The results obtained indicate thatoperations and maintenance account for 51% of the TCO ofERP system followed by end-user usage with 23%. Hardwareand Software Acquisition costs accounted for 16 %,Implementation costs with 7% and the least cost was takenby Procurements costs with 3%. Case study was used ingathering both qualitative and quantitative data fromMaseno University. Maseno University currently comprisesfour campuses; Main Campus, College Campus, Kisumu CityCampus and Homa Bay Campus. Interviews, document analysis,questionnaires as well as observation techniques were usedto gather the research data. It is hoped that the resultsof this study will help higher educational institutionsimprove management of their ERP systems.
TABLE OF CONTENT
DECLARATION AND CERTIFICATION............................ii
COPYRIGHT...............................................iii
DEDICATION...............................................iv
ACKNOWLEDGEMENT...........................................v
ABSTRACT.................................................vi
TABLE OF CONTENT........................................vii
ix

LIST OF TABLES.........................................xiii
LIST OF FIGURES.........................................xiv
ACRONYMS AND ABBREVIATIONS...............................xv
CHAPTER ONE: INTRODUCTION.................................1
1.1.............................. Background to the Study
1
1.2............................. Statement of the Problem
5
1.3........................................... Objectives
6
1.3.1. General Objective..................................6
1.3.2. Specific Objectives................................7
1.4................................... Research Questions
7
1.5................................ Scope and Limitations
7
1.6............................ Significance of the Study
8
x

1.7. .............................. Research Contribution
8
1.8................................. Research Assumptions
8
1.9. ................................ Definition of Terms
8
1.10. Thesis Structure..................................9
CHAPTER TWO: LITERATURE REVIEW...........................11
2.1.............................................. Overview
11
2.2...... Total Cost of Ownership and Enterprise Resource
Planning.................................................11
2.3.................. Total Cost of Ownership Cost Drivers
18
2.4...................... Total Cost of Ownership Analysis
23
2.5........................ Total Cost of Ownership Models
26
xi

2.5.1 Enterprise Resource Planning Total Cost of Ownership
Models27
2.6............... Enterprise Resource Planning Life Cycle
31
2.6.1 Enterprise Resource Planning Acquisition...........32
2.6.2 Enterprise Resource Planning Implementation........35
2.6.3 Operation and Maintenance..........................39
2.6.4 Enterprise Resource Planning End User Usage........41
2.7... Total Cost of Ownership Model Development Framework
43
2.8......................... Maseno University ICT Context
44
2.8.1 Maseno University ERP System.......................46
2.9................................. Theoretical Framework
46
2.10.............................................. Summary
49
CHAPTER THREE: METHODOLOGY...............................51
xii

3.1.............................................. Overview
51
3.2....................................... Research Design
51
3.3............................................ Case Study
52
3.4............................... Population and Sampling
53
3.4.1 Target Population..................................53
3.4.2 The Sample.........................................54
3.4.3 Sample Size........................................54
3.4.4 Sampling Techniques................................55
3.5....................................... Data Collection
56
3.5.1 Instruments........................................56
3.6.................................... Research Procedure
57
3.7....................................... Quality Control
58xiii

3.7. Validity..........................................59
3.7.2 Reliability........................................59
3.8........................ Data Analysis and Presentation
59
3.9................................ Ethical Considerations
60
3.10.............................................. Summary
62
CHAPTER FOUR:PRESENTATION AND INTERPRETATION OF RESULTS. .63
4.1.............................................. Overview
63
4.2...................... Basic Details of the Respondents
63
4.2.1 Age Distribution of the Respondents................63
4.2.2 Departments of the Research Respondents............64
4.2. Gender of Respondents.............................64
4.2.4 Level of Education of the Respondents..............64
4.3. Major Cost Factors Influencing TCO in University ERP
System...................................................65xiv

4.3.1 Number of Implementation Locations................66
4.3.2 Scope of Business to be Impacted..................67
4.3.3 Life Cycle of Technology..........................68
4.3. Technology Familiarity among Users...............69
4.3.5 System Support.....................................70
4.4.... The Total Cost Ownership of Maseno University ERP
System...................................................74
4.4.1 Procurement of the ERP System......................75
4.4.2 Hardware and Software Acquisition..................75
4.4.3 Implementation.....................................77
4.4.4 Operation and Maintenance..........................79
4.4. End-user Usage....................................80
4.5........ Development of the TCO of University ERP Model
84
4.5.1 The Proposed ERP TCO Model.........................85
4.5.2 Background Factors.................................85
4.5.3 Procurement Costs..................................86
4.5.4 Project Management Costs...........................87
4.5.5 Feasibility study costs............................87xv

4.5. Requirements Specification Costs..................88
4.5. Procurement Management Costs......................88
4.5.8 Hardware/Software Acquisition Costs................89
4.5.9 Implementation Costs...............................90
4.5.10Change Management..................................91
4.5.11 Technical Setup................................91
4.5.12 Personnel Restructuring........................91
4.5 Training...........................................91
4.5.14Operation and Maintenance Costs....................92
4.5.15License Agreements.................................93
4.5.16Overheads..........................................93
4.5.17Monitoring, Maintenance and Security...............93
4.5.18Support............................................93
4.5.19Upgrade Costs......................................94
4.5.20End-User Usage.....................................95
4.5.21Summary............................................96
CHAPTER FIVE: SUMMARY, CONCLUSION AND RECOMMENDATIONS....97
5.1..................................... Introduction
97xvi

5.2........................ Summary of Major Findings
97
5.3....................................... Conclusion
100
5.4.................................. Recommendations
101
5.5................. Suggestions for Further Research
102
5.6.......................................... Summary
103
REFERENCES..............................................104
APPENDICES..............................................114
Appendix A: Interview Guideline.........................114
Appendix B: Research Questionnaire......................116
Appendix C: Data Collection Proforma....................123
Appendix D: Maseno University ICT Budget and TCO Costs
Breakdown...............................................127
Appendix E: Research Approval Letters...................131
xvii

xviii

LIST OF TABLES
Table 1: Costs drivers during the acquisition and
implementation phases of ERP.............................22
Table 2: Cost drivers during usage phase of ERP..........23
Table 3: Maseno University ERP System end users..........54
Table 4: Age Distribution of Respondents.................63
Table 5: Departments.....................................64
Table 6: Academic Qualifications of the Respondents .....65
Table 7:Microsoft Dynamics Nav acquisition cost..........68
Table 8: Basic computer maintenance skills survey results69
Table 9: Competency Level of the Respondents.............72
Table 10: Average Hours of an End-user’s downtime........73
Table 11: Installed Hardware in Maseno University ICT
Infrastructure...........................................76
Table 12: Installed Software in Maseno University IS.....76
Table 13: Implementation Status of Maseno University ERP
System...................................................78
Table 14: Five Year TCO of Maseno University ERP System..82
xix

LIST OF FIGURES
Figure 1: List of ERP cost drivers with percentages......21
Figure 2: SAP TCO Framework..............................28
Figure 3: Cost Taxonomy..................................30
Figure 4: TCO in ERP: Life-cycle Cost....................32
Figure 5: Maseno University ICT ‘Organogram’.............45
Figure 6: University ERP Cost Drivers....................66
Figure 7: Five years TCO of Maseno University ERP System.83
Figure 8: Proposed TCO Model.............................86
Figure 9: Procurement Background Factors.................89
Figure 10: Hardware/Software Acquisition Background Factors
.........................................................90
Figure 11: Implementation Costs Background Factors.......92
Figure 12: Operations & Maintenance Costs Background
Factors..................................................94
Figure 13: End-user Usage Costs Background Factors.......96
xx

ACRONYMS AND ABBREVIATIONS
CBS – Cost Breakdown Structure
CIO - Chief Information Officer
COCOMO - Constructive Cost Model
CoSN- Consortium of School Network
CVI -Content Validity Index
DECS - Department of Education and Children’s Services
ERP- Enterprise Resource Planning
FEC - Federal Electronics Challenge
GAAP - Generally Accepted Accounting Principles
GeSCI – Global e-School and Community Initiative
ICT – Information and Communication Technology
IDG - International Data Group
IFRS - International Financial Reporting Standards
IFRS - International Financial Reporting Standards
IS - Information Systems
ITAM -Information Technology Asset Management
LDC- Least Developed Country
MoE- Ministry of Education
MOEST - Ministry of Education Science and Technology
NCST - National Council of Science and Technology
xxi

NETC - Northwest Educational Technology Consortium
OECD - Organization for Economic Co-operation and
Development
OSS- Open Source Software
RICE – Reports, Interfaces, Conversions, and
Extensions.
FRP – Request for Proposal
ROI - Return on Investment
SA- Southern Australia
SCE -Software Cost Estimate
SLA- Service Level Agreement
SPSS -Statistical Package for Social Sciences
TCO –Total Cost of Ownership
TVO -Total Value of Ownership
VOI - Value of Investment
VPN - Virtual Private Network
WBS - Work Breakdown Structure
xxii

CHAPTER ONE
1. INTRODUCTION
The thesis seeks to evaluate an Enterprise Resource
Planning system in a university setup. Specifically, it was
to identify the major cost drivers of a university
Enterprise Resource Planning (ERP) system, analyze the
Total Cost of Ownership (TCO) of ERP system and develop a
model of evaluating the cost of ownership of a university
ERP.
This chapter introduces the study by discussing the
background of the study where existing software costxxiii

estimations approaches and methods are reviewed and the
available cost and value analyst tools in IT investment are
also highlighted. Statement of the problem is stated
followed by statement of general and specific objectives
and the research questions. The chapter then continues with
the scope and limitations and significance of the study.
Towards the end of the chapter justification of the study
is discussed briefly and it ends with research
contributions and assumptions.
1.1. Background to the Study
As Kenyan universities struggle to fulfill the role of
drawing on the advantages and potential of new information
communication technologies (ICT) in ensuring quality and
maintaining high standards for educational practices and
outcome in a spirit of openness, equity and international
cooperation, the sector faces challenges. The most notable
constraint to full exploitation of the ICT facilities is
inadequate funding (Mwiria, 2006). As budgets tighten,xxiv

however, institutions of higher learning are coming under
pressure to articulate the costs and benefits of existing
and planned technology expenditures. Increasingly,
educational decision makers are seeking evidence that their
highly visible investments in technology are meeting
educational needs and that these information technology
(IT) investments are closely monitored and well-managed.
According to a World Bank Institute survey (Gakio, 2006),
the state of ICT infrastructure in African universities can
be summed up as “too little, too expensive, and poorly
managed”.
The adoption of tools to measure the cost and value of ICT
investment in education are becoming more common. Gartner,
a leading IT research firm, came up with the concept of TCO
in 1987. TCO is an analysis meant to uncover all the
lifetime costs that follow from owning certain kinds of
assets. Public sectors have adopted the use of the TCO
concept to assist in making decisions about the value forxxv
money of ICT deployments. TCO is a comprehensive set of
methodologies, models and tools to help organizations
better measure and manage their IT investments (Gartner,
2011). According to Forrester research, TCO requires
significant investments in time and rigor, and TCO is
without a doubt the most thorough and potentially accurate
cost-analysis method available to an IT organization
(Reichman & Staten, 2008).
Several software cost estimate approaches exist, such as
the COCOMO (COnstructive COst MOdel) method and its
successor, COCOMO II, developed by Boehm (1983). The
approach states that under normal circumstances development
costs are a function of project size. The cost driver
‘size’ is viewed as the most dominant cost driver, not only
in COCOMO but also in many other models (Kusters, 1990).
Stensrud (2001) concluded that since most software cost
estimates (SCE) approaches are based upon the use of the
number of lines of source codes (Boehm, 1983) or somexxvi

synthetic variables such as function points (Albrecht &
Gaffney, 1983) to assess the size of the project, these
approaches are not immediately applicable to ERP cost
analysis. An ERP implementation project may contain some
software development, but will also contain substantial
modeling, installation and reorganization effort. It seems
unlikely that a one-dimensional measure of software size
will capture this complexity.
Many analysis tools for measuring IT cost and value have
been developed using a variety of methodologies. Some of
these tools include Total Value of Ownership (TVO), Return
on Investment (ROI) and Value on Investment (VOI). TVO
measures the business value of IT investment decisions
based on a set of defined measures that model the
controllable business activities of an organization (Dell,
2003) while ROI is a project-based financial measure of the
economic return from an investment (Hurwitz, 2009) whereas
VOI goes beyond ROI by including the costs and relatedxxvii

benefits of specific proposed technology projects
investment (CoSN, 2011). VOI is a measurement of the
expected benefit of an investment. Unlike TCO that only
considers the life cycle costs, VOI considers both
financial and intangible benefits.
Whereas there is no literature on TCO use in educational
institutions in Kenya, studies have been carried out in
developed countries. Consortium for School Networking
(CoSN) launched its “Taking TCO to the Classroom” project
in 1999 in the US to help school leaders understand the
long-term costs involved in building and operating a
network of computers. Through these, they will be able to
budget adequately to cover all the associated costs and
build and operate their networks in the most cost-efficient
way to achieve their technology goals (CoSN, 2001).
Peterson (2007) asserts that in developing countries that
have to deal with constrained resources, financialxxviii

allocations to ICT must properly take into account the full
costs of sustainable ICT systems. However, he further
observes that there is a lack of information about ICT
costs that can assist Ministry of Education (MoE) decision
makers to apportion their budgets between competing demands
between the four 'T's' - teachers, textbooks, time and
technology. The World Bank notes that there is very little
data on the costs of deploying computers in developing
country educational contexts (Vital Wave Consulting, 2008).
In Kenya, through session paper No. 2 of 2005, the Ministry
of Education Science and Technology (MOEST, 2005)
highlights the importance of considering the TCO of ICT in
education by emphasizing its importance to budgeting for
ongoing maintenance and support, upgrades, and training of
support personnel and teachers.
ERP is a software solution that integrates information and
business processes to enable information entered once intoxxix

the system to be shared throughout an organization (West &
Daigle, 2004). Universities are implementing ERP system
majorly to integrate different administrative functions
into a more systematic and cost effective approach to gain
a strategic advantage (Rabaa'i, 2009).
Maseno University founded in 1991 lies along the Equator
(00). It is one of the public universities in Kenya. The
University is located in Maseno Township along Kisumu-Busia
road, 25 km from Kisumu City and approximately 370 km west
of Nairobi the capital city of Kenya. The University offers
undergraduate and post-graduate programs in different
disciplines. At the time of this study, Maseno University
had a total student enrolment of 8,000 registered at the
Main Campus, Kisumu City Campus, College Campus and Homa
Bay Campus (MUC, 2013). The core activities and central
administration of the University takes place in the Main
Campus. Apart from academic activities it also runs a
xxx

hospital, and a hotel. The University implemented the
Microsoft Dynamics Nav ERP system in 2008.
1.2. Statement of the Problem
There is little data related to the costs of using ICTs to
support education in Kenya. Few good, reliable cost studies
of ICT in education implementations exist (Trucano, 2011).
Those that do exist measure different things, such as
teaching practices, and issues associated with enhancing a
student’s learning experiences. The MOEST (2005) in session
paper No. 2 of 2005 emphasized the importance of TCO in
education but no empirical research has been conducted to
this effect.
There has been plenty of research in ERP in Kenya (Otieno,
2010, Abdullabhai & Acosta, 2012, Koech, 2012) however, a
clear gap in ERP cost identification, management, and
estimation exists. Such cost analyses are needed if real
costs of operation and maintenance of ICTs to benefitxxxi

education are to be undertaken. Such work is especially
relevant in education systems that exhibit great resource
scarcity (Trucano, 2011). Complete TCO model for evaluation
of ERP in the context of Maseno University and Kenyan setup
would be a big contribution to the literature and could
help to move towards establishing best practices in area of
ICT investment management.
1.3. Objectives
This research was guided by a general objective and three
specific objectives outlined next.
1.3.1. General Objective
To develop a model for evaluating the TCO of ERP system in
a university and to provide basis upon which to monitor
costs over time.
xxxii

1.3.2. Specific Objectives
The specific objectives of the research study are to:
i. Identify the major cost drivers that can influence TCO
in university ERP
ii. Analyze the total cost ownership of ERP in a
university
iii. Develop a model for evaluating the total cost of
ownership of ERP in a university
1.4. Research Questions
i. What are the major cost drivers that influence TCO in a
university ERP?
ii. What is the total cost ownership of ERP in a
university?
iii. How should a model for evaluating the total cost
of ownership of ERP in a university be developed?
1.5. Scope and Limitations
xxxiii

Some of the challenges encountered in ERP implementations
in universities include ERP adoption decisions, ERP
selection, customization procedures, integration aspects,
role of consultants, and ERP system evaluation. However
this study concentrated on the cost analysis of Maseno
University ERP system. The major limitations in the study
were:
i. Given that TCO modeling tracks life-cycle costs,
getting the benefits of cost analysis in a single
year’s budget is not easy.
ii. TCO modeling does not assess how well an ERP system
fits with an institution’s strategic goals.
iii.Environmental or social costs and benefits are not
tracked by TCO modeling.
1.6. Significance of the Study
To develop a TCO model using ERP system dynamics that will
enable organizations to better predict the long-term cost
xxxiv

of ERP implementations, identify key cost drivers of an ERP
deployment and improve decision making process.
1.7. Research Contribution
The study produced a Total Cost of Ownership model that is
detailed and specifically focused on ERP system in
universities.
1.8. Research Assumptions
i) First data is likely to be incomplete or based around
rough estimates
ii) First data helps to focus on what is not know
iii) TCO work should be repeated at regular intervals
iv) TCO analysis should lead to more formal record-
keeping
v) Regular TCO analyses are valuable for monitoring and
tracking changes over time
1.9. Definition of Termsxxxv

Total Cost of Ownership (TCO) is a comprehensive assessment
of information technology (IT) or other costs across
enterprise boundaries over time. For IT, TCO includes
hardware and software acquisition, management and support,
communications, end-user expenses and the opportunity cost
of downtime, training and other productivity losses.
Enterprise Resource Planning (ERP) is a comprehensive,
packaged software solutions that seeks to integrate the
complete range of business’s processes and functions in
order to present a holistic view of the business from a
single information and IT architecture.
Cost Element is a component of total cost of ownership
(TCO), “buckets” of cost that can be quantified.
Cost Drivers are factors or activities that can be changed
and have an impact on the magnitude of the cost element.
Cost Node is a breakdown of TCO cost element into smaller
cost category in line with the project work breakdown
structure (WBS), indicating where costs are allocated. The
xxxvi

breakdown can sometimes be in line with the company's Chart
of Accounts, indicating "what" the costs are for.
1.10. Thesis Structure
In this introductory chapter, the impetus to understand the
background and motivations towards the undertaking the
study were highlighted, presenting the reader with the
research objectives and questions, and potential
contributions from the study as well as the scope and
limitations and research assumptions. By providing a
background to the overall context of the study, the
motivations and rationale for the study are put forth.
2.
Chapter 2 presents a review of the relevant background
literature. The study highlights the total cost of
ownership drivers in ERP deployment, TCO studies, ERP life
cycle as well as review of the TCO model development
framework. Maseno university ERP system and the theoretical
framework are also presented. xxxvii

3.
In Chapter 3, the research methodology is presented. The
methodology used in the study is case study, using a
combination of techniques including interview, survey,
document analysis and observation. The framework used
integrates qualitative and quantitative research
approaches. The research procedure, quality control and
ethical consideration are also presented in this chapter.
4.
Chapter 4 presents the results of qualitative and
quantitative data analysis. The developed TCO model of ERP
system in universities is presented and used to discuss the
background factor.
5.
In chapter 5, findings of the study are summarized and the
conclusion and recommendations of the study outlined.
Finally, the chapter concludes the thesis by presenting the
directions for future research. Other relevant details not
xxxviii

included in the body of the thesis are kept in the
appendices.
CHAPTER TWO
2 LITERATURE REVIEW
2.1 Overview
This chapter starts by looking at the originality,
development and implementation of the concept of TCO in the
IT industry. Discussion on ERP system and its
implementation in universities is presented. TCO cost
drivers and the measurement of cost elements of TCO are
then highlighted. Studies carried out in the field of ERP
TCO are reviewed. The chapter ends with overview of the
theoretical framework for the study.
2.2 Total Cost of Ownership and Enterprise Resource
Planningxxxix

The phrase ‘TCO’ was originally developed by Gartner Group
Inc. a global IT research firm, to refer to all the costs
associated with the use of computer hardware and software
including the administrative costs, license costs,
implementation, hardware and software updates, training,
operations and maintenance, and any other costs associated
with acquiring, deploying, operating, maintaining and
upgrading computer systems in organizations (Moyle, 2004).
Bill Kirwin, the Father of TCO defined TCO as the total
cost of procuring, using, managing and disposing of an
asset over its useful life (Pisello, 2001). The TCO
approach considers software, and the IS it supports, placed
within its organizational context and related to the
business ecosystem from which software, support and
services are drawn (Shaikh & Cornford, 2011). The “total”
in TCO is expressed by use of an extended life cycle model
which recognizes the various stages through which software
goes, from selection through acquisition, implementation,
use and finally decommissioning. In other words TCOxl

reflects a measure of all the costs of procuring software,
installing it and operating it, and finally the retirement
costs found in migrating away from the software. TCO
reveals the balance of the direct qualities of competing
software products such as price, functionality, reliability
and the relationship of the software to the institution’s
wider set of technology platforms, deployed systems,
culture and skills base, and strategic goals, as well as
the ability to access market and community based services
and support (Shaikh & Cornford, 2011).
Total Cost of Ownership (TCO) refers to a useful accounting
system to tally all of the costs associated with a given
asset, particularly accounting for costs beyond just the
initial purchase price. In order to appreciate the total
cost of an asset, costs such as procurement labor,
management and support need to be considered. As well,
computer assets have hidden costs such as shadow support
(peers supporting each other in lieu of formal support) andxli

downtime impacts (Pisello, 2001). Before TCO, many IT
executives and even solution providers were unaware of the
true cost of computing. TCO made everyone poignantly aware
of the issues. In the IT industry, TCO is used to calculate
the total cost of purchasing and of operating a technology
solution over its useful life. TCO provides a realistic and
holistic measure of the long-term costs required to acquire
and operate technology solutions (Hurwitz, 2009). The
purpose of TCO model is to provide an organization’s
executive leadership with financial projections with which
it can make informed IS business decisions related to a
specific project (Konschak, 2010), such as purchase or
upgrade of a system for example. Ellram et al., (2006) in
Supply chain management book lists the following as the
reasons for undertaking TCO analysis:
i. Performance measurement
ii. Framework for cost analysis
iii. Benchmarking performance
iv. More informed decision makingxlii

v. Communication of cost issues internally and with
suppliers
vi. Encourages cross-functional interaction
vii. Support external teams with suppliers
viii. Better insight/understanding of cost drivers
ix. Build a business case
x. Support an outsourcing analysis
xi. Support continuous improvement
xii. Helps identify cost savings opportunities
xiii. Prioritize/focus your time on high potential
opportunities
The concept of TCO has been in existence since 1987;
however its use in education can be traced back to 1998
when CoSN introduced the “Taking TCO to the Classroom” with
the K-12 TCO initiative (CoSN, 2011). CoSN has worked to
develop tools and resources to help ensure that school
leaders budget adequately to support their technology
(Gartner, 2011). CoSN launched its "Taking TCO to thexliii

Classroom" project to provide school leaders with tools to
help them estimate the TCO for their networked computing
infrastructure. Their TCO also includes calculations of
costs that may not turn up in a budget, but that can still
have an impact on school district. In 2003, CoSN produced a
set of online analyst tools including the development of a
TCO framework for use by schools. The TCO tool requires 100
pieces of data to be collected and entered into the
database. The online TCO Tool is a vendor-neutral, free
resource that until 2013 was only available to schools
within the USA (Moyle, 2004).
This online TCO is updated within the USA context using the
US Generally Accepted Accounting Principles (GAAP)
provisions which differ somewhat from International
Financial Reporting Standards. Each country has its own
accounting or costing approaches and, therefore, the CoSN-
Gartner TCO tool is not a generic tool for use outside the
US. Furthermore the tool is customized for educationalxliv

system of US, which is different from other parts of the
world. Moreover, generic TCO model needs to be detailed and
focused for specific projects or areas of study and the
cost estimation method should be customized to local
conditions (Fischer & Lugg, 2006).
Global e-School and Community Initiative (GeSCI) in 2009
developed TCO tools for any educational institution,
school or government planning agency that may be interested
in deploying ICTs for education (Twinomugisha, 2009). GeSCI
appreciates the fact that every region or country has
unique accounting or costing approaches. The tool is,
therefore, not meant as a “one size fits all”, but rather
as a starting point to consider alternatives among
technology platforms and to develop a reasonable cost
estimate. However, the GeSCI TCO tools can only calculate
direct costs of deploying and using ICTs in a classroom. It
does not calculate indirect or opportunity costs. It also
does not calculate cost increases or reductions as a resultxlv

of improved or reduced efficiency. It is not designed for
ERP in universities and as such it is an electronic tool
that is an econometric model for ICTs in Education.
In response to the World Bank finding that there was very
little data on the costs of deploying computers in
developing country school contexts (Trucano, 2011), Vital
Wave Consulting (2008) created a five-year TCO model to
enable government leaders to make accurate and reliable
investment decisions, that illustrates the true relative
costs of hardware, software, teacher training,
connectivity, infrastructure, support and maintenance for
computers installed in developing-country schools. This TCO
model was created based on data inputs from developing-
country technology and education experts specializing in
(or from) countries from a mixture of income levels and
geographic regions including: Chile, China, Dominican
Republic, Georgia, Ghana, India, Pakistan and South Africa
(Vital Wave Consulting, 2008). However the limitation withxlvi

this model is its inability to cover performance or
usability issues and only looks at the costs of technology.
Their TCO model broke down the costs into three categories
as initial costs, recurrent costs and hidden costs. Initial
costs consisted of retrofitting, cabling and wiring,
software, hardware and deployment costs while recurrent
costs were composed of support, training, connectivity,
electricity, consumables and subscription costs while
hidden costs were replacement hardware, damage or theft,
planning, and end-of-life costs.
Even though TCO models developed by Vital Wave (2008) used
data samples from selected developing countries, it was not
detailed enough to pass as a generic TCO model which can
accommodate the varied setting of the countries
represented. Different countries within the developing
world use different accounting standards and different
inflation magnitudes and these waters down the idea of
xlvii

creating a TCO model that can be applied uniformly in
different countries.
Though ERP has gained some prominence in the IS literature
over the past few years and is a significant phenomenon in
practice, ERP systems are not easy to define (Boersma &
Kingma, 2005) and there are various definitions of ERP
systems just as they are complex and dispersed within and
between organizations. Deloitte Consulting (1998) gives a
good starting point by defining ERP as a system of packaged
business software system that allows a company to:
i Automate and integrate the majority of its business
processes
ii Share common data and practices across the entire
enterprise
iii Produce and access information in a real-time
environment
Esteves (1999) defined ERP system as software packages
composed of several modules, such as human resources,xlviii

sales, finance and production, providing cross-organization
integration of data through imbedded business processes.
These software packages can be customized to answer the
specific needs of each organization.
ERP is also defined as a software solution that integrates
information and business processes to enable information
entered once in the system to be shared throughout an
organization (West & Daigle, 2004). ERP is also defined as
a comprehensive, packaged software solution that seeks to
integrate the complete range of a business processes and
functions in order to present a holistic view of the
business from a single information and IT architecture
(Klaus et al., 2000).
From the above definitions it can be seen that the ERP
concept can be viewed from a variety of perspectives.
First, ERP is a product in the form of computer software.
Secondly, ERP can be considered as a development objectivexlix

of mapping all processes and data of an enterprise into a
comprehensive integrative structure. And finally ERP can be
seen as the key element of an infrastructure that delivers
a solution to business (Klaus et al., 2000).
This study adopted Klaus et al.’s (2000) definition of ERP
as a comprehensive, packaged software solution that seeks
to integrate the complete range of a business’s processes
and functions in order to present a holistic view of the
business from a single information and IT architecture.
2.3 Total Cost of Ownership Cost Drivers
Cost factor or cost driver is an activity that can be
changed and have an impact on the magnitude of the cost
element, where cost element is a component of TCO. Cost
element is like a “buckets” of cost that can be quantified.
The ERP TCO cost drivers are spread throughout the life-
cycle phases of the ERP system. According to him, the
events that take place during the concept phase arel

strategic planning and ERP software selection and in the
implementation phase the are activities are deployment,
integration and stabilization while in the post
implementation phase, progress and project evaluation are
done.
Various studies have been carried out on the cost drivers
of ERP TCO. Aberdeen Group (2007) found that the TCO of
ERP of midsize company is among others influenced by:
i) Company size
ii) Number of ERP users
iii) The deployed functionality
iv) Business benefit that are gained from ERP
These findings are in agreement with those of West & Daigle
(2004) who identified the major cost drivers within an
educational ERP life-cycle as:
i) The nature of organization (for example, a large
public, multi-campus system versus a small private li

institution).
ii) The quality and type of technologies, (for
example mainframe versus client-server system).
iii) Management practices (centralized versus
decentralized IT operations).
iv) The life cycle of technologies themselves.
In support of West & Daigle’s (2004) assertion that the
life cycle of technologies themselves is a major cost
driver within an educational ERP life-cycle, various
studies have shown that the life cycle of technologies is a
major cost driver of TCO of ERP system. Keeping old
terminal clients and networking devices eventually incur
increased support and maintenance costs. Research has shown
that older PC’s can cost up to 59% more to support than a
newer one (Cibecs, 2012). As network and terminal devices
age, their support costs increases. Warranties end and new
software can face compatibility problems with older
machines. Older hardware can negatively affect productivitylii

causing user downtime and wasted IT resources because of
increased failures and thus more support requests. Older
hardware are also generally not as environmentally friendly
as newer machines, requiring more energy and offering less
power saving functionality. According to an Intel study,
older PC’s can use an average of 50% more energy than a new
PC (Cibecs, 2012). In tests conducted for energy savings
from energy star-qualified servers study, a newer energy
star-qualified server running a modern operating system
consistently used less power to deliver substantially
better performance, compared to an older non-qualified
model running an older operating system (Cadmus Group,
2010). Reduced risk of incidents/outages and duration of
outage incidents is another benefit that comes with short
hardware refresh cycle. Hardware standardization is another
benefit of an efficient technology refresh policy as it
reduces IT infrastructure complexity. Life cycle of
technology therefore is a major TCO cost driver.
liii

A case study of four ERP implementations done by a vendor
of ERP systems and provider of consultancy services
relating to the implementation of ERP systems suggested the
following as the major TCO cost drivers of the ERP
implementation (Palmberg, 2010):
i) Amount of resources allocated to the project by top
management
ii) Priority of the project in the organization
iii) Skill and experience of the customer project manager
iv) Control and follow-up procedures
v) Communication between stakeholders regarding
expectations and project scope
vi) The amount and complexity of integrations,
customizations, data migration and testing
vii) Type of contract regarding pricing and risk sharing
viii) Change management effort
Another study exploring ERP adoption cost factors (Haddara,
2012) suggested that the ERP cost drivers are as shown inliv

figure 1. In the figure, Haddara show the cost drivers with
the percentages they account for in a typical ERP
deployment, however the end user usage costs such as
training and downtime are not shown, and this makes it
incomplete.
Figure 1: List of ERP cost drivers with percentages(Source: Haddara, 2012)
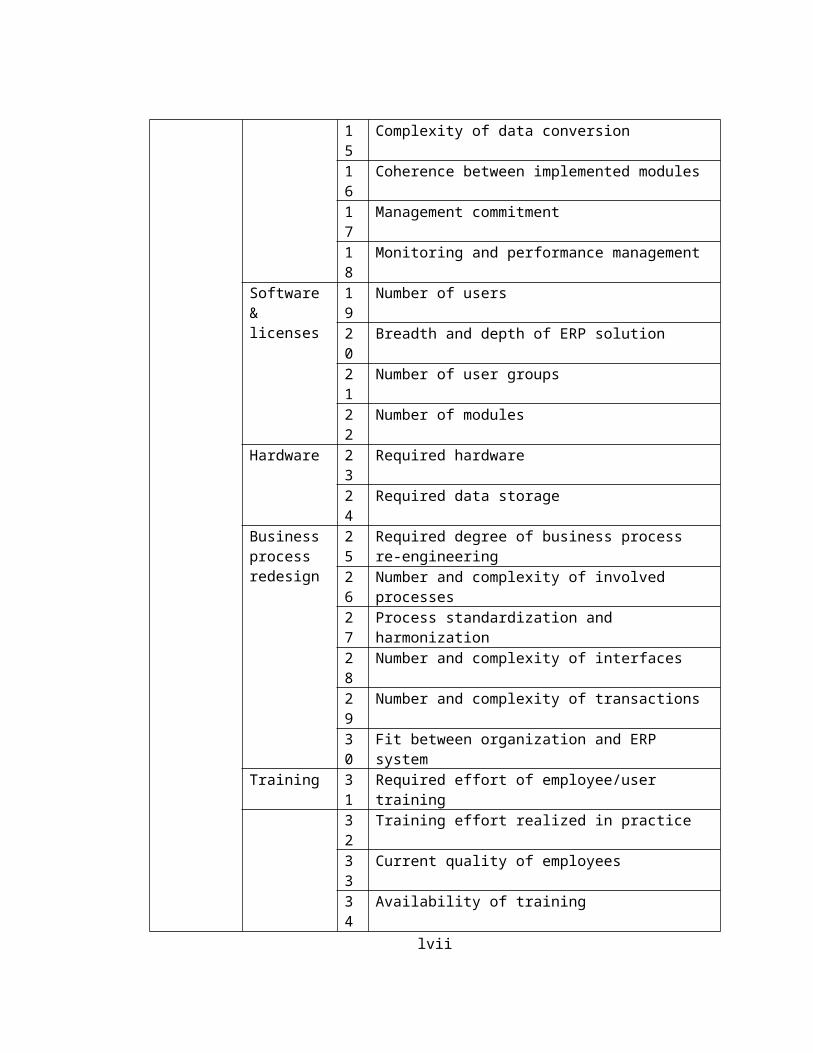
Hest (2013) identified and categorized ERP TCO costs as
acquisition & implementation costs and usage costs. Table
1 show the acquisition & implementation costs and Table 4
has the usage costs. lv

Table 1: Costs drivers during the acquisition andimplementation phases of ERP (Source: Hest, 2013)
Phase Cost category
No.
Cost driver
Acquisition costs
Consultancy
1 Availability of consultants2 Experience and quality of consultants3 Process standardization and
harmonization4 Pressure due to cutting project
duration5 Sound ERP project plan
Other costs
6 Project organization with key decisionmakers/ champion
7 Project organization with key subject matter expert
8 Management commitmentImplementation costs
Consultancy
9 Availability of consultants10
Experience and quality of consultants
11
Process standardization and harmonization
12
Configuration and customization magnitude, number of RICE objects
13
Pressure due to cutting project duration
14
Implementation approach
lvi
15
Complexity of data conversion
16
Coherence between implemented modules
17
Management commitment
18
Monitoring and performance management
Software & licenses
19
Number of users
20
Breadth and depth of ERP solution
21
Number of user groups
22
Number of modules
Hardware 23
Required hardware
24
Required data storage
Business process redesign
25
Required degree of business process re-engineering
26
Number and complexity of involved processes
27
Process standardization and harmonization
28
Number and complexity of interfaces
29
Number and complexity of transactions
30
Fit between organization and ERP system
Training 31
Required effort of employee/user training
32
Training effort realized in practice
33
Current quality of employees
34
Availability of training
lvii

35
Availability of users
Other implementation Costs
36
Maturity of project organization (e.g.contracts)
37
Sound testing plan
Table 2: Cost drivers during usage phase of ERP (Source:Hest, 2013)
Phase Cost Category
Cost driver
UsagePhase Software
& license
38 SaaS contracts39 Future licensing policies40 Introduction of new information
flows and processes
Hardware 41 Frequency of change of hardware 42 Fixed trough service agreement43 Hosting
Training 44 Continuity of employees45 Technology change in ERP software
Usage 46 Cost of facilitating ERP
Maintenance
47 Technology change in ERP software48 Frequency of change in demands49 Availability of updates/new
applications
Support50 Support contracts51 Availability of updates/new
applicationsPersonnel 52 IT personnel
Hest, (2013) categorized cost in three classes as
acquisition phase costs, implementation phase costs and
lviii

usage phase costs together with their cost drivers.
However, just as the other findings highlighted in this
section, Hest (2013) also did not include the downtime as a
cost driver.
2.4 Total Cost of Ownership Analysis
There is no formal work currently available from Kenya on
either TCO per se, or on total cost of ERP ownership. There
is, however, some recent work on TCO in schools emerging
from overseas and particularly the USA, upon which the
study can draw. A study done by Unisys, a technology
company, illustrates their findings of direct and indirect
costs of ICT deployment in an Australian education system
conducted in late 1999-2000 (Moyle, 2004). The findings
shows that direct costs which are the costs of hardware,
software, operations and administration account for 56% of
the TCO while indirect costs, that is the costs of downtime
and end user operations account for 44% of the TCO. A case
study on university ERP conducted at the Albany, Statelix
University of New York revealed TCO cost breakdown with
employee salary taking the lion’s share of TCO with 46%,
equipment and software purchase accounted for 11% and 10%
respectively. Software maintenance consumed 15%, consulting
9%, equipment maintenance took 3%, training and travel
accounted for 4%, while miscellaneous and personal services
each accounted for 1% of the TCO (Fryling, 2010).
A Gartner Group study found that only 20% of TCO lies in
initial acquisition costs; the rest lies in administration
costs (David, 2002). This makes it difficult for
organization to gain a competitive advantage by reducing
the purchase cost of its hardware and software, but they
have significantly greater control of over 80% of IT
expenditure they direct toward administering their IT
system. In another study it was found that licensed
software, licensed software support and professional
services are the three top drivers of costs in IS TCO
expense analysis (Konschak, 2010). In reviewing the cross-lx

organizational scope of this analysis, it becomes clear
that the TCO is driven by processes, people, technology and
tools and comprises all costs expected in a defined
timeframe. The timeframe might cover three, five, or ten
years for some projects.
Case studies of large, medium, and small school districts,
conducted by the CoSN (Kaestner, 2009) indicate that
technology, direct labor and indirect labor share of the
TCO for each is 23 percent for technology (amortized over
useful life), 21 percent for direct labor, and 56 percent
for indirect labor. A TCO case study conducted in
California school district which serves 148,000 students in
kindergarten through grade 12 in an urban setting with 187
schools, including 16 high schools, 23 middle schools and
114 elementary schools revealed that Two-thirds (67.7
percent) of the TCO consisted of indirect costs (Stegman,
2003).
lxi

Based on the TCO model, a study inquired into the captured
expenditure of selected Rwandan higher education
institutions on the major TCO cost drivers. The study
revealed that institutions often succeed in acquiring
computing devices, but they commonly lack the resources
needed for the acquisition of relevant hardware and
software accessories; train staff to utilize the procured
ICT facilities; service and upgrade the facilities acquired
and replace them when they become obsolete; and meet
recurrent costs of electricity and network subscriptions
(Ssempebwa, 2007). This is evidence of under facilitation,
which is due to lack of awareness about the TCO of
functional IS.
Hence, there is need for a strategic framework within which
the total cost of owning a functional IS might be
identified and articulated to pertinent higher education
institutional managers and policy makers.
lxii

2.5 Total Cost of Ownership Models
The Federal Electronics Challenge (FEC) (2007) a
partnership program that encourages USA federal facilities
and agencies to reduce the impacts of electronics during
use defines TCO modeling as a tool that systematically
accounts for all costs related to an IT management
decision. It suggests that TCO includes all costs, direct
and indirect, incurred throughout the life cycle of an
asset. A good TCO model incorporates hardware and software
costs, installation and license tracking, warranties and
maintenance agreements, as well as vendor financing
options. It must also include operational expenditure such
as power, testing, deployment costs, training, education
costs, as well as security assurances and upgrades. Other
major considerations are long term expenses versus up-front
costs, replacement of equipment costs, and future
scalability requirements (Griliches, 2009).
lxiii

Gartner in 2006 provided a ten step process to produce a
reliable estimate of the cost and the duration of ERP
implementation projects (Phelan, 2006). They include:
i) Process design
ii) Core and supplemental staffing needs
iii) Data conversion
iv) Customization and interface development
v) User training
vi) Project management
vii) Organizational change management
viii) Pilot deployment and rollout to remote sites
Gartner’s ten step process is limited to costs associated
with the implementation process and more studies are
required to capture the costs associated with the operation
and maintenance phase of ERP deployment to come up with a
comprehensive TCO of ERP model.
lxiv

2.5.1 Enterprise Resource Planning Total Cost of
Ownership Models
In mid-2004 SAP the world's largest inter-enterprise
software company and the world's fourth-largest independent
software supplier, undertook a major revision of its
thinking on TCO and developed a comprehensive TCO Model
(SAP, 2005). The SAP TCO model has a total of 22 level-
three parameters that cover the key cost factors in
enterprise software implementations as shown in the Figure
2.
The SAP model is very comprehensive and captures most of
the cost associated with the deployment of ERP system.
However the SAP TCO model is vendor dependent and only
available to SAP customers. This limits its adoptions to
non SAP ERP systems.
lxv

Figure 2: SAP TCO Framework (Adopted from: SAP, 2005)
Another comprehensive framework for assessing the cost of
IT investment in organizations was developed by Närman,
Sommestad, Sandgren, & Ekstedt in 2009.
Their framework is intended to support IT investment
decisions by estimating total life cycle costs and the
background factors that influence the costs. The authorslxvi

suggest that organizational factors play a significant role
in the life cycle costs of IT deployment. The framework
incorporates both the technical and organizational factors
in the cost analysis of IT investment. The organizational
factors include change management costs, training costs,
personnel restructuring costs, restructuring costs for
operations and maintenance of organization and post
implementation productivity loss.
On the other hand technical costs are incurred through
technical implementation of the system. The framework goes
an extra mile to include 79 background factors. Background
factors are cost drivers that impact the cost nodes of the
framework one way or another. The cost taxonomy in the
framework consists of 21 elements, as illustrated in Figure
3.
The model is for a general IT deployment and does not
target specifically standard ERP implementation projects.lxvii

However the developers posit the model is suitable for any
Commercial off-the shelf (COTS) software as they have
predictive deployment costs. However, integration costs and
business process re-engineering costs become more notable
cost drivers in such implementations. The authors also
stress the importance of taking the varying uncertainty of
the predictions into account, so that decision makers are
able to determine the risk associated with the investment
decision (Närman et al. 2009).
lxviii

Figure 3: Cost Taxonomy (Source: Närman et al.’s, 2009)
Most of the data on TCO are drawn from the private,
corporate sector (West & Daigle, 2004). The management,
procurement and processing of the nonprofit, academic
culture may be quite different. There are two layers of
bureaucracy i.e. academic and public that is not in private
and corporate sectors where the TCO data are drawn. The
lxix

stake holders in universities especially public
universities are more diverse and their interests may
conflict. The university may want the best value while the
government may require the lowest bid. Faced with such
challenges the vendor or consultant developed TCO may not
be fit for the TCO of university ERP analysis. Furthermore
there is no generic TCO model and the cost estimation
method should be customized to local conditions. In support
of Fischer et al.,(2006), Ferrin (2002) asserts that
research has shown that it is in general very difficult to
make TCO-calculations, and that there is a need for more
case based research to increase knowledge of how cost
drivers work in different settings.
2.6 Enterprise Resource Planning Life Cycle
ERP life cycle includes management from conception to
obsolescence, including ERP revisions and upgrades. Aloini
(2007) identified the phases of ERP life cycle as concept,
implementation and post implementation. In general, an ERPlxx

life cycle consists of three major phases: pre-
implementation, implementation, and post-implementation.
The pre-implementation phase is also known in slightly
varied forms and names such as the planning phase, the
acquisition phase, or the procurement phase. West & Daigle
(2004) identified five major ERP life-cycle component of
TCO analysis as acquisition, implementation, operations,
maintenance and replacement as shown in figure 1. The shape
of graph depicts how the costs are spread over the ERP life
cycle.
In this study the ERP life cycle is discussed under three
phases, which are acquisition (pre-implementation),
implementation and operations and maintenance (post-
implementation).
lxxi

Figure 4: TCO in ERP: Life-cycle Cost (Adopted from: West &Daigle, 2004)
2.6.1 Enterprise Resource Planning Acquisition
The acquisition phase is typically kicked off soon after
the idea of ERP adoption is initiated, which may originate
from the perceived business needs of the institution, or be
inspired by an external party such as a business or IT
consultant. Verville & Halingten, (2003) identifies five
activities that occur during ERP acquisition phase as
planning, information search, selection, evaluation and
negotiation. Another study identified formation of
acquisition team, examination of business requirements and
lxxii

constraints, formulation of evaluation criteria, and
evaluation and selection as the four stages of acquisition
phase (Poon & Yu, 2006) while Bradford (2009) grouped
planning and selection as the two main activities that take
place during pre-implementation phase of ERP life cycle.
This study decomposes the pre-implementation into four
broad categories as feasibility study, requirement
specifications, procurement management and project
management.
i) Feasibility Study
Feasibility study can be defined as the process of
collecting information and data about a proposed
project, then analyzing the same from the financial,
operational, economic and technical aspects, in
addition to sensitivity analysis, in order to be
aware of the extent of such project success, under the
prevailing circumstances in the market (Alehremi, 2009).
The purpose of a feasibility study is to determine
if a business opportunity is possible, practical,lxxiii

and viable (Hoagland & Williamson, 2000). Expenses incurred
in this stage are influenced by vendor maturity,
integration issues and established vendor relationship. For
mature vendor, implemented products will be easily found
and their profile determined as compared to immature
vendor. Established vendor relationship may also lower the
cost of feasibility study since reliability of the vendor
can be ascertained from past transactions.
ii) Software Requirement Specification
ERP requirements specification is a comprehensive
description of the intended purpose and environment for ERP
software under development. It fully describes what the ERP
system software will do and how it will be expected to
perform. The purpose of requirement specification is to:
a. Communicate – explain the application domain under
and the system to be developed.
b. Contractual - may be legally binding and expresses
agreement and a commitmentlxxiv

c. Baseline for evaluating the software - supports
testing and provides basis upon which to verify
whether delivered system meets requirements.
d. Baseline for change control
ERP project costs associated with this stage are those
costs that manage requirements specification. Requirements
specification costs are driven by the number of systems
included in the scenario, departments and units involved,
and the number and depth of function changes.
iii) Project Managements
Effective project management is critical to the success of
ERP implementation (Nah & Delgado, 2006). Due to the large
number of parties involved in an ERP implementation, it is
critical to coordinate project activities across all
affected parties. Project management involves activities
necessary to ensure the successful completion of the
project. Project management activities include projectlxxv

control, project planning, status reporting, issue
management, change management, risk management, and quality
management.
iv) Procurement management
Procurement management is a process by which items are
purchased from external suppliers. The procurement
management process involves managing the ordering, receipt,
review and approval of items from suppliers. It includes
the contract management and change control processes
required to develop and administer contracts or purchase
orders issued by authorized ERP project team members.
Schapper, et al., (2006) asserts that common procurement
management policies are generally constructed from public
confidence, efficiency and effectiveness, policy compliance
elemental objectives.
The ERP project costs in this stage are related to
evaluating offers and drafting agreements. Procurementlxxvi

management costs are determined by the number of potential
vendors. The higher the number of potential vendors the
more resources will be required in the procurement process.
2.6.2 Enterprise Resource Planning Implementation
ERP implementation is a very complex body of work,
which includes several closely related processes
(selection, analysis, customization, support) and
demands both IT and business knowledge. The
implementation stage of the ERP life cycle involves a
number of activities that must be managed effectively
in order for the project to be a success. Bradford
(2009) identified installation, configuration,
customization, testing, change management, interfacing with
other systems and training as the major steps in ERP
implementation phase. Närman et al., (2009) identified
activities that take place during implementation phase as
change management, personnel restructuring, training,
configuration, integration, acceptance testing, migration,lxxvii

installation in live environment, and phasing out the old
system. This study considered organizational change
management, technical setup, personnel restructuring, and
training as the main stages that are performed during
implementation phase.
i) Organizational Change Management
Organizational Change management is a human side of ERP
implementation. It is a structured approach to managing
change in individuals, teams, organizations, and societies
that enables the transition from a current state to a
desired future state (Bradford, 2009). As argued by Umble
et al. (2003), ERP implementation is not just a software
project but an organizational change project. As changes
take place, employees should be coached on why the change
is important. This appreciation will require education;
not just how to execute the new processes, but also why the
new processes are important to the institution and
the employee. Change management costs are affected by thelxxviii

complexity of business process redesign, the geographical
spread of the business locations and the number of units
involved.
ii) Technical Setup
Technical setup focuses on the technical aspects of the
implementation which includes installation, configuration,
customization, and testing (unit, integration, customer
acceptance, security and performance load testing). It is
important to note that installation and
implementation are two different concepts. Bradford
(2009) defines installation as the mechanism of
changing from one software package to another while
keeping problems at a minimum and implementation as the
methods an organization uses to achieve their goals by
transforming the way they carry out operations.
ERP cannot be installed unless there is an instance to run
it. An instance is an installation of ERP software andlxxix

related components. Organizations use a sandbox instance
(development instance) so that configurations and
customization can begin as quickly as possible. Often,
when a company is widely geographically dispersed or
operates as a number of distinctly autonomous
departments, divisions, or entities, separate
instances of the ERP software is required (Bradford,
2009). The ERP software may support the same processes
and the same roles, but may be configured and
customized differently for a variety of reasons.
Bradford argues that when separate instances emerge it
means that the system is going to be really
expensive and become fragmented quickly and another
reengineering effort is right around the corner.
Once the sandbox instance of ERP has been installed,
configuration work begins. Configuration is a major
implementation task in which business and functional
settings in the ERP system are changed to make thelxxx

“out of the box” software support the customer’s
business needs. Configuration does not make any
changes to the core software code, but instead
updates tables with settings and entries specific to
the customer’s business.
Customization follows system configuration. Nicolaou,
(2004) describes customization as the changing of the
software to fit the already existing business processes in
order to cater for organization specific and/or country-
specific requirements. Customization requires programming,
which must be performed by a programmer/developer,
whether in-house (if expertise exists within the
company), or external by a consultant. Customization
is generally done in order to fill gaps found in
requirements analysis or to extend functionality. This
enables organizations to get exactly what they require.
lxxxi

Once the system has been installed, configured and
maybe customized, it must be tested prior to
deployment. Testing confirms that the software behaves as
expected and customer expectations are met. During
testing the project team fine-tunes the configuration
of the software and refines the models for new
business processes. They confirm the software can
meet the previously specified requirements, identifying
gaps not found during the package selection phase.
Loen, (2007) identified costs incurred during the entire
ERP implementation phase and grouped them into two
categories. The first group includes insufficiently
identified costs related to an incorrect calculation of the
direct amount of project work: customization, interaction
and testing, data conversion, data analysis. The second
group is related to interruption possibilities and work
efficiency fluctuations of internal staff members during
the ERP implementation project: trainings, brain drainlxxxii

(employee turnover), and ongoing maintenance. Other costs
that incurred in this phase are configuration, integration,
organization change management, personnel restructuring and
consultancy costs. Monk & Wagner (2006) observes that the
total cost of implementation could be three to five times
the purchase price of the software.
2.6.3 Operation and Maintenance
Operations and maintenance are the main phases of the ERP
lifecycle, as they incur heavy recurring costs over the
ERP’s lifecycle. Both of these phases are process and
people oriented, hence it is difficult to assess hidden
costs, yet in these phases most of the indirect costs
reside and direct costs are shifted away (Havrici, 2011).
Some of the activities that are undertaken in ERP operation
and maintenance phase are license agreement management,
overhead management, monitoring, maintenance and security
management, system support and upgrade.
lxxxiii

Maintenance activities begin shortly after go-live. Typical
maintenance activities include:
i. Preventive maintenance – regular scheduled tasks
that must be performed to keep the system
functioning properly.
ii. Emergency maintenance – restoration work that must
be performed immediately.
iii. Adaptive maintenance – ERP vendors constantly fix
bugs, implement best practices and incorporate the
feedback of their customers in their software.
Organizations choose to upgrade their ERP systems due to
various reasons such as (Bradford, 2009):
i. Competitive advantage - New features and capabilities
give the company an edge over its competitors.
ii. Globalization - Features and updates designed to
increase the flow of information to customers and
business partners can increase the ability to operate
globally.
lxxxiv

iii. Integration - Enhancing the flow of information
between the ERP system and other systems within the
company increases operational efficiency and improves
communication.
iv. Best practices - Incorporating new best practices
allows the firm to operate more efficiently.
v. Cost reduction - Lowering administrative overhead and
improving the support offered by the ERP vendor
results in lower operating costs.
The costs incurred in this phase are both direct and
hidden. End-user training, development of a properly
skilled and trained IT team for internal support, use of
the most suitable implementation strategy, availability and
cost of new upgrades and benchmarking of daily operations
are few centers which require special focus when trying to
identify the hidden costs of the operations and maintenance
phases. Bradford (2009) argues that according to research,
up to 70% of companies’ total ERP costs relate tolxxxv

service and maintenance. In SAP ERP maintenance and
support contracts, the annual maintenance fee is calculated
as a percentage of the software contract value, which is
the total value of all package and named user licenses
minus applicable discounts (SAP, 2013). Annual maintenance
expenses for ERP systems cost approximately 20% of initial
ERP implementation costs and upgrade costs as much as 25-
33% of the initial implementation (Bradford, 2009).
2.6.4 Enterprise Resource Planning End User Usage
End user usage is part of operation and maintenance phase.
Major activities worth noting under end user usage are
people and technology downtime. Downtime as defined by
ITIL is, “The time when a Configuration Item or IT Service
is not available during its Agreed Service Time. The
Availability of an IT Service is often calculated from
Agreed Service Time and Downtime” (ITIL, 11 May 2007).
According to Gartner (2001), downtime is a hidden cost
which results in lost productivity.lxxxvi

Downtime costs in ERP end user usage include lost business
with customers (both short term and long term), employee
time diverted from other tasks to get the IT systems
running again, the value of any lost data, emergency
maintenance fees (particularly if the outage occurs during
off hours) and additional repair costs that may go on even
after service has been restored. Downtime can have subtle,
difficult to measure effects on productivity. Patterson
(2007) asks the question “do employees just do other work
during downtime, or does downtime result in lost work,
psychological impact, so that it takes longer than the
downtime to recover?” The significant downtime cost is lost
employee productivity, which can be measured in terms of
the salaries, wages and benefits of idled people. The
estimate might be somewhat lower if some employees are
still able to do a portion of their work manually or switch
to tasks that require only systems that are still
available. Nonetheless, many organizations have become solxxxvii

dependent on IT that an unavailable system totally idles a
significant portion of the enterprise, when the old manual
processes often no longer exist.
Productivity loss due to end-user downtime is calculated
using burdened salary figures. Burdened salary includes
user compensation, plus the burden of taxes and benefits.
The downtime productivity loss calculation is typically
represented as number of users affected multiplied by the
percent effect on productivity multiplied by the average
burdened salary per hour multiplied by the duration of end-
user downtime (Pisello, 2004), (Martinez, 2009). (Vision,
2008). Mathematically this can be represented as shown in
Equation 1.
Laborcost=P×E×R×H ----------------------------
Equation 1
Where:
P = number of end-users affectedlxxxviii

E = average percentage of time end-users depend on IT
system
R = average employee cost per hour
H = number of hours of unproductive end-user activities
Percentage of user dependency is the percentage of time an
end-user uses the ERP system in a day and number of hours
of productivity loss is the total time spent on non
productive activities.
Another factor that might affect the cost of operation and
maintenance is familiarity with technology among users.
Familiarity measures the user’s perception of how intuitive
the application feels, how easy is to learn, how quick they
can become proficient with application, and how comfortable
they feel using it (Iansiti, 2007).
2.7 Total Cost of Ownership Model Development Framework
Ellram and Siferd (1993) proposed a framework of
development and implementation of TCO concept. According tolxxxix

Ellram et al., first stage is to identify the need and
interest of TCO which must be driven by internal interest
or external pressure. The second stage is to determine the
items of interest. The third stage is to form a TCO team
that represents different expertise of the organization.
The fourth includes identification of relevant costs, which
could be done through a brainstorming session or a cause
and effect diagram. In search for costs which should be
included in TCO model, Ellram et al., (1993) suggests that
it could be helpful to study specific activities. For
example when defining the cost of acquisition, activities
which can be related to the investment of the equipment
should be studied. She further proposed that activities
that are performed during the lifetime of an asset can be
studied in order to specify the cost of ownership. Ellram
et al.’s (1993) framework fell short of linking the cost
breakdown structures (CBS) with project work breakdown
structure (WBS) to capture all events and activities and
resources that can have hidden costs in a project lifexc

cycle. Linking the WBS and CBS makes it easy to identify
the relevant cost items associated with the project. The
CBS can be used to analyze the life cycle costs of the
project to come up with the TCO model.
2.8 Maseno University ICT Context
The University has a large and complex ICT infrastructure
that utilizes both proprietary and open source software.
The university experiences ‘brown outs’ and ‘black outs’ to
the electricity supply frequently and so the power supply
is protected by uninterruptible power supply units. Before
the deployment of the ERP system the university did not
have an integrated IS in place and ICT related services
were being offered by the Department of Computer Science.
Upon receiving ERP system funding from the World Bank, the
university sourced for and acquired Microsoft Dynamics Nav
in the year 2007. Coretec Systems & Solutions, a Microsoft
xci

Dynamics partner in East Africa were given the onus of
supplying and implementing the system.
The Directorate of ICT Services is under staffed with
personnel of ten people with most positions in the
University ICT ‘organogram’ vacant. Figure 5 shows the
University ICT Directorate ‘organogram’. Filled positions
are indicated by bold labels.
xcii

Figure 5: Maseno University ICT ‘Organogram’ (Source:Author)
The web master and lab attendants are not directly involved
with the ERP system and therefore were not included in the
study. Maseno University has five student computer labs of
which only two were networked at the time of the research
and no computer labs was connected to the ERP system at the
time of the study and therefore they were not covered in
the study. The unfilled positions in the ‘organogram’ were
being supported by System Administrator and Assistant
Administrator.
2.8.1 Maseno University ERP System
Maseno University implemented the Microsoft Business
Solution- Microsoft Dynamic in 2007-08, which was the
latest version of Microsoft Dynamics ERP at that time.
Microsoft Dynamics Nav is an ERP solution for small and
mid-sized organizations that automates and streamlinesxciii

business processes (Coretec, 2013). The on-premise delivery
model was used in which the University bought the ERP
software license and installed in the University server
within their compound. The university was responsible for
buying computer hardware and software for these solutions.
They were also responsible for applying any software
upgrades, patches or fixes provided by the software vendor.
Maseno University employed thin client/server technology
where end users through terminal clients request services
from application servers, which in turn get the requested
service-related information from the database servers.
2.9 Theoretical Framework
This study was modeled on the Gartner TCO Model for
distributed computing advanced by Gartner Inc. in 1987 and
has been the leading advocate for its use in IT, as well as
a major developer of TCO methodological tools. The Gartner
TCO model utilizes two major categories to organize costs.
These are direct (budgeted) costs and indirect (unbudgeted)xciv

costs (Gartner, 2001). Direct costs consist of the capital,
fees, and labor costs spent by the corporate IS department,
and business unit IS groups in delivering IT services and
solutions to the organization and users. The direct cost
models typical costs and captures actual costs for all
direct expenses related to the clients (mobile and
desktop), servers, peripherals, and network in the
distributed computing environment and serving the
distributed computing users. Also modeled are the indirect
(unbudgeted) costs which are hidden in most organizations
and are not measured or tracked. Indirect costs include end
user time spent in casual learning, problem determination
and lost productivity during downtime. Gartner’s TCO model
is the industry standard framework and methodology for cost
management (West & Daigle, 2004). The model has been used
in US schools for case studies of California, Minnesota,
Utah, Texas, Wisconsin, Missouri, Pennsylvania and Virginia
school Districts (CoSN, 2011). The TCO model postulates
that the indirect (unbudgeted) costs measure the efficiencyxcv

of IS in delivering expected services to end users. If the
IS management and solutions are efficient, end users are
less likely to be burdened with self and peer support, as
well as downtime. If the IS management and solutions are
inefficient, end users typically must spend more time
supporting themselves and each other (self and peer
support), and are impacted by more downtime. This model was
preferred over the SAP TCO framework model which the
researcher felt was a single vendor TCO model. SAP TCO
Framework is a comprehensive approach to a single vendor
TCO model that can be applied to answer questions about TCO
for customers and prospective users of SAP ERP systems.
(Greenbaum, 2005).
As applied to this study, the budgeted costs are a direct
measure of ERP system spending. Unbudgeted costs can be
viewed as a second order effect of the direct spending, and
as a result of spending too much or too little in budgeted
costs, unbudgeted costs are affected. However, becausexcvi

unbudgeted costs are a second order effect, a causal
relationship, although likely, is not directly measurable
or true. There is logical evidence of the correlation of
best practice direct expenditures and reduced indirect
costs. For example, in a study carried by Intel Corporation
in 2009 revealed that delaying PC deployments shifted costs
into later periods and failed to optimize cash flow from a
discounted cash flow perspective (Mahvi & Zarfaty, 2009).
The short-term gain in delaying PC purchases conserves cash
in the short run but actually is more expensive in the long
run, producing a higher total cost of the life of a PC.
Investing in end-user professional development or product
training for users lowers the TCO. According to Gartner
research, untrained or poorly trained users will cost
significantly more to support than well-trained workers
(Gartner, 2007).
In adopting the Gartner TCO model, the researcher was
conscious of the fact that generic model needs to be xcvii

detailed and focused for specific projects or area of
study, as opposed to Garner’s TCO model that is not focused
on a specific project. For instance, the TCO model for
determining the TCO for data centers will not be
appropriate model for determination of the TCO of a desktop
computer or a TCO model for cloud based ERP system will not
be suitable for an on-premise based ERP system. By getting
the development data from Maseno University in Kenya makes
the developed TCO model to differ from those in existence
which used different data. Ferrin et al. (2002) asserts
that there is a need for more case based research to
increase knowledge of how cost drivers work in different
settings.
2.10 Summary
Literature presented in this chapter indicates there are
emerging interests in the TCO of ERP systems. Literature
reviewed highlights issues that warrant further
consideration with respect to TCO in the context on ERP
cost identification, management, and estimation. Thexcviii

insights gained from the literature should be interpreted
in the light of a number of limitations. The major
limitation, to the researcher's knowledge, there are few
studies that have been conducted in less developed
countries, particularly in Kenya, to address TCO of ERP
systems. These points to the urgent need for understanding
TCO of ERP system analysis in developing countries since
ERP systems are still in early stages in these countries
and face additional challenges related to economic,
cultural and basic infrastructure issues.
Secondly, it is not possible to come up with a generic TCO
model that can be used to address the cost analysis of ERP
systems in different settings, there in need to for more
case based studies that are detailed and specifics to
different ERP system settings.
Lastly, literature review points that only 20% of TCO lies
in initial acquisition costs which cannot be controlled toxcix

gain competitive advantage since they are used in purchase
of technology, but organizations have significantly greater
control of over 80% of IT expenditure they direct toward
administering their IT system. This calls for comprehensive
insight into the background factors that can be controlled
to better manage the operation and maintenance costs of ERP
system.
In light of the gaps identified in literature, this
research aims at filling the gap by developing a TCO model
of ERP system in universities in the local context, (Maseno
University -Kenya).
c

CHAPTER THREE
3 METHODOLOGY
3.1 Overview
This chapter covers the research design that was used to
conduct the study. It begins with a brief overview of the
research design and looks at case study. Population
sampling, target population, sample size and the sample are
closely examined as well as the sampling techniques. This
is followed by a discussion on data collection, data
collection tools and research procedure. Then quality
control is examined in terms of validity and reliability
followed by data analysis and ethical consideration and the
chapter ends with the proposed TCO model.
3.2 Research Design
This study employed both qualitative and quantitative data
collection methods. Yin (2004) considers qualitative data
as non-numeric data and quantitative data as numeric data.
The research was conducted through case study research
101

design. Compared to other methods, the strength of the
case study method is its ability to examine, in-depth, a
“case” within its “real-life” context (Yin, 2003). The case
study research design is intensive, descriptive and
holistic analysis of a single entity or a bounded case
(Oso, 2009). It provides up-to-date information, making it
suitable for the study of contemporary issues (Al-Shehab,
2005). Clearly, the case study research method is
particularly well-suited to IS research, since the object
of our discipline is the study of information systems in
organizations, and interest has shifted to organizational
rather than technical issues (Benbasat, 1987).
3.3 Case Study
With the objective of conducting cost analysis of ERP
systems in universities, a single case study was conducted
in Maseno University. The use of single case study allowed
in-depth understanding of ERP costs. The major concern for
a single case study is whether the findings can be102

generalized. Klein & Myers (1999) in “principle of
Abstraction and Generalization” argue that it is possible
to generalize if the reasoning is logically correct. The
plausibility and strength of the logical reasoning is
according to this view much more important than the number
of samples. A single case study that is supported by other
case studies is usually considered more dependable. When
another case reaches the same conclusions, it confirms the
findings of the first case. Does a case study of one ERP
system implementation transfer to another ERP
implementation? The answer is that it depends on how
similar the two implementations are. For the use of a
single case study in TCO analysis Fischer & Lugg, (2006)
argue that there is no generic TCO model and the cost
estimation method should be customized to local conditions.
In support of Fischer & Lugg, (2006), Ferrin & Plank (2002)
asserts that research has shown that it is in general very
difficult to make TCO-calculations, and that there is a
need for more case based research to increase knowledge of103

how cost drivers work in different settings. For studies of
single cases, judgment should not be made by the evaluator.
Instead, it should be made by those individuals who wish to
apply the evaluation finding to their own situations. That
is, the evaluator should produce and share the information,
but the receiver of the information must determine whether
it applies to their own situation. Because the evaluator
cannot know who his receivers are, he/she must, therefore,
be quite specific both in his description of the attributes
of his case and in his description of the way in which the
treatment influences this case (Kennedy, 1979). This can be
likened to “case law” which refers to that portion of the
law that is built up from specific cases rather than
statutes. These specific cases are resolved on the basis of
statutes, but their interpretations of statutes that are
made in each case set precedence for future cases.
Therefore, for this study no attempt is made to make
generalizations concerning the costs in the TCOs. Instead,
it is shown how factors have affected costs in the examined104

case, and it is up to the reader to determine where these
lessons can be applied in projects outside of the sample of
this research. Hopefully, some of the insights made in this
process can be applied in future projects that are
tolerably similar to the ones under study.
3.4 Population and Sampling
This section considers the target population, the sample,
sample size and sampling techniques
3.4.1 Target Population
The target population for the study consisted of all the 60
ERP end users, eight technical IT staff who interact with
the ERP system directly, the procurement officer and
finance officer of Maseno University. This gives a total
of 70 staff that the study targeted. ERP end-user as used
in this study refers to Maseno university employees who
rely on the ERP system to perform their job roles. Table 4
105

shows the ERP end user distribution in the university at
the time of the study.
Table 3: Maseno University ERP System end users (Source:Author)
Section Number of endusers
Audit 6Finance 32ComputerScience
2
Academic 3Procurement 4Store 2Kisumu Hotel 11Total 60
3.4.2 The Sample
All the eight IT technical staff, procurement officer and
finance officer were interviewed. Questionnaires were used
to gather data from the 60 ERP system end users.
3.4.3 Sample Size
Slovin’s formula was used to calculate the sample size to
be issued with questionnaires from the end users target
106

population of 60 (Ariola, 2006). According to Ariola, 5% is
an allowable error for smaller sample.
n = number of samples
N = total population
e = error tolerance
With
n = 53
N = 60
e = 0.05
3.4.4 Sampling Techniques
This study employed purposive sampling technique to select
the sample. The researcher consciously decided who to
include in the sample. Purposive sampling technique is
mainly used to collect focused information (Oso, 2008). It
was used to select typical and useful cases only. Purposive
107

sampling also saves time. The researcher was convinced that
the target population consists of both IT professionals as
well as non IT professionals. As such the target population
and accessible population cannot be regarded as homogeneous
and they may not have the relevant information required in
the study. Purposive sampling technique was employed as it
guaranteed that the target population held the information
that was useful to the study.
3.5 Data Collection
Data is anything given or admitted as a fact and on which a
research inference is based (Oso & Onen, 2009). It is
anything actual, or assumed, used as a basis for reckoning.
This section describes the instrumentation and research
procedure.
108

3.5.1 Instruments
The study used semi-structured interviews, document
analysis, questionnaires and observation to collect both
quantitative and qualitative data. The selection for these
tools was guided by the nature of the data to be collected,
the time available as well as the objective of the study.
The overall aim of this study was to conduct cost analysis
of a university ERP. The study was mainly concerned with
the procurement process in IT department, acquisition costs
of computing hardware and software and maintenance.
Information on downtime both technological and on end-user,
end-user training, consultancy services, as well as the
salaries of IT support personnel was collected. Data on
policy on the disposal of computing devices was also
captured.
The interviews enabled depth, nuance and complexity in data
to be captured and were generative in that new knowledge
109

was uncovered. Its popularity is linked to its ability to
obtain a range of informant views and to communicate
multiple perspectives on a phenomenon. It provided an
undiluted focus on the informant and offered opportunity
for clarification and greater understanding through use of
follow-up questions (Carcary, 2008).
Supporting documentation is valuable in corroborating the
evidence collected in semi-structured interviews. Kontio
(2004) suggested that interviews provide insightful
observations, while documents provide stable, unobtrusive
and exact case information (Kontio, 2004). These documents
provided a means of triangulation in that they supplied
specific details, and augment and substantiate interview
data. The other data collection method used was structured
questionnaire. This ensured proper completion of the
questionnaire. Section A of the questionnaire contained
basic details of the respondents. Section B contained
questions related to the ERP System end-user training.
110

Section C contained questions related to ERP system
downtime, section D dealt with ERP system end-user support.
3.6 Research Procedure
Data both qualitative and quantitative were collected from
the respondents in the period between the months of
January and April the year 2013 using interviews, document
analysis, questionnaires and observation. The data was
collected by the researcher himself to eliminate biasness
and also to be in control of the study. This data was then
reviewed, validated and the findings synthesized.
Questionnaires were sent to 53 end users as calculated in
section 4.4.3 using Slovin’s formulae and forty two
respondents filled and returned. This is a response rate of
70% which is acceptable in research. The Journal of
American Medical Association stipulates a sufficient
response rate of at least 60% (JAMA, 2008). The researcher
conducted face-to-face interviews with ten respondents who111

were involved in the acquisition, implementation and
operation and maintenance process of the ERP system and
presumably had firsthand knowledge of the costs involved.
Those interviewed, eight were from IT technical staff, a
Procurement Officer and a Finance Officer.
3.7 Quality Control
To control quality, the researcher endeavored to attain
validity and reliability coefficient of at least 0.7.
Validity refers to the ability of an instrument to measure
what it is designed to measure. Validity is defined as the
degree to which the researcher has measured what he has set
out to measure (Kumar, 1999), while reliability is related
to the accuracy of the actual measuring methods.
Reliability is defined as the extent to which a
questionnaire, test, observation or any measurement
procedure produces the same results on repeated trials
(Kumar, 1999). In short, it is the stability or consistency
of scores over time or across raters. These instruments
112

were piloted in the departments that were not included in
the study sample and modified to improve their validity and
reliability coefficient to at least 0.70. Items with
validity and reliability coefficient with at least 0.70 are
accepted as valid and reliable in research (Kathuri, 1993).
The survey included a combination of personal interviews,
which were conducted first so that any changes that were
needed were made to the forms, followed by paper-based and
electronic surveys (email).
3.7.1 Validity
To establish validity, the instrument was given to two
experts to evaluate the relevance of each item on the
scale: very relevant (4), quiet relevant (3), somewhat
relevant (2), and not relevant (1). Validity was determined
using Content Validity Index (CVI). CVI is item rated 3 or
4 by both judges divided by the total number of items in
113

the questionnaire. The CVI obtained was 0.78 which is
acceptable in research.
3.7.2 Reliability
The internal reliability coefficient of the instrument was
ascertained through the Inter-rater Reliability. Kumar
(1999) defines reliability as the degree to which a measure
supplies consistent results. The reliability was assessed
by having two independent judges score the test. The scores
were then compared to determine the consistency of the
rater’s estimates. Correlation between the two ratings was
calculated to determine the level of inter-rater
reliability. Internal reliability of 0.8 was obtained.
3.8 Data Analysis and Presentation
Mathematical, sometimes referred to as classical data
analysis is a methodology in which mathematical models are
applied and used as the basis for analysis. Statistical
tools to be used include:-
114

Tabulation
Pie charts
A statistical software program, SPSS (Statistical Package
for Social Sciences) was also used for in-depth data
analyses.
3.9 Ethical Considerations
The following ethical concerns were addressed when
conducting research:-
i. Voluntary participation
ii. No harm to respondents
iii.Anonymity and confidentiality
iv. Purpose and sponsor
v. Analysis and reporting
First, the researcher ensured that participation is
voluntary. Though this can result in low return rate the
researcher used multiple contacts to encourage high
response rate. A cover letter explaining the study
115

objective in more depth was sent to the possible
participants as first contact. E-mails were sent to
respondents who had not responded in a week’s time as the
second contact. A third email was sent to participants who
had not responded a week later after the end of the survey
to inform them that the study was drawing to a close and
that their input was valuable to the results of the study.
Second ethical guideline is to avoid possible harm to
respondents. This included embarrassment or feeling
uncomfortable about questions. This study did not include
sensitive questions that could have caused embarrassment or
uncomfortable feelings.
A third ethical guideline was to protect a respondent’s
identity. This was accomplished by exercising anonymity and
confidentiality. A survey is anonymous when a respondent
cannot be identified on the basis of a response. A survey
is confidential when a response can be identified with a
116

subject, but the researcher promised not to disclose the
individual’s identity. To avoid confusion, the cover letter
was clearly indicated that the study was to be confidential
in regards to responses and the reporting of results.
Participant identification was to be kept confidential and
was only to be used in determining who had not responded
for follow-up purposes.
The fourth ethical guideline was to let all prospective
respondents know the purpose of the study and the
organization that is sponsoring it. The purpose of the
study was provided in the cover letter indicating a need to
develop a TCO model for university ERP. The cover letter
also explained that the results of the study were to used
in a dissertation as partial fulfillment for a master’s
degree.
The fifth ethical guideline was to accurately report both
the methods and the results of the study. Because117

advancements in academic fields come through honesty and
openness, the researcher assumed the responsibility to
report the study results objectively.
3.10 Summary
Methodology is seen as the cornerstone in every research
project; the way it is understood and handled in a research
project determines its (study) credibility or validity.
This chapter presented a detailed description of the
research methodology. It highlighted the detailed procedure
followed to realize the research objectives. It included
the description of the research design, sampling
techniques, instrumentation as well as data analysis
techniques and ethical considerations. The chapter
identified the different data sources that were utilized in
this research and the overall research plan that was used
in answering the research questions.118

119

CHAPTER FOUR
4 PRESENTATION AND INTERPRETATION OF RESULTS
4.1 Overview
This study investigated the total cost of owning a
university Enterprise Resource Planning case of Maseno
University. This was in light of little data on the cost of
ownership of university ERPs. This chapter presents
analysis and interpretations of study findings using
content analysis. Narrative approach has been used to
present responses from interviewees. The chapter is divided
into four parts in line with the objectives of the study.
The first part deals with the cost drivers that can
influence TCO of a university ERP system. The second part
focuses on the TCO analysis of Maseno University ERP
system. The last section explores the development of TCO
model.
4.2 Basic Details of the Respondents
120

This section highlights the basic details of the
respondents in term of age distribution, department, gender
and academic qualifications.
4.2.1 Age Distribution of the Respondents
Table 4 shows the age distribution of the research
respondents.
Table 4: Age Distribution of Respondents (Source: Author)
Age Frequency
Percentage
21-30 years 19 45.231-40 years 21 50.041-50 years 1 2.4Above 50 years 1 2.4
Total 42 1004.2.2 Departments of the Research Respondents
The researcher collected data from the departments which
were using the ERP system and the distribution of the
respondents is as shown in Table 4. Finance department
recorded the highest number of respondents accounting for
47.6% (20) followed by Kisumu Hotel with 23.8%. Hostels had
only one respondent while academics and procurements
121

accounted for 11.9% and 9.5% respectively. Human Resources
department accounted for 4.8% (2) of the respondents.
Table 5: Departments (Source: Author)
Department Frequency PercentageAcademics 5 11.9 %Finance 20 47.6 %Human Resources 2 4.8 %
Procurement 4 9.5 %Kisumu Hotel 10 23.8 %Hostels 1 2.4 %Total 42 100 %
4.2.3 Gender of Respondents
The ten IT technical staff interviewed ware all male while
in the questionnaire survey 57.2% (24) were male and 42.8%
(18) were female.
4.2.4 Level of Education of the Respondents
Table 6 shows the level of education for the research
respondents. Diploma holders were the majority with 45.2%
(19) with the Masters holders accounting for 11.9% (5).
122

Table 6: Academic Qualifications of the Respondents(Source: Author)
Qualification Frequency
Percentage
Tertiary/Middle-LevelCollege 7 16.7 %
Diploma 19 45.2 %Bachelors 11 26.2 %Masters 5 11.9 %Total 42 100 %
4.3 Major Cost Factors Influencing TCO in University ERP
System
The first objective of the study was to identify the major
cost driver that can influence TCO in university ERP. To
achieve this objective, the researcher conducted ten in-
depth interviews with Maseno University IT technical staff,
procurement officer, and finance officer. As the
researcher needed informants with a background of the
costs, installed hardware and software involved in the ERP
adoptions, all the interviewees were from the ICT,
Procurement and Finance department. The interview topics
123

covered the ERP selection processes, feasibility studies,
budget estimation process, and ex-post investment
evaluation. Forty two end-users were also surveyed to
establish end-user usage. Document analysis and observation
data collection techniques were also employed to supplement
and triangulate the data collected through interviews.
Document analyzed included the ICT department ‘organogram’,
the years 2012/2013 and 2013/2014 ICT Directorate budget,
the ERP project team meetings minutes, the ERP project
progress reports as well as the hardware and software
documentations. Observation was carried out to gather
information on the physical security of the server room,
the installed servers and the system degradations and
outages. In the literature review section 2.6, over 60 TCO
cost drivers were identified. The study used ERP system
expenditure documents, the annual ICT directorate budget,
end user survey, and literature review to establish the
major cost drivers. The study identified 5 major cost
drivers of university ERP system shown in Figure 6. 124
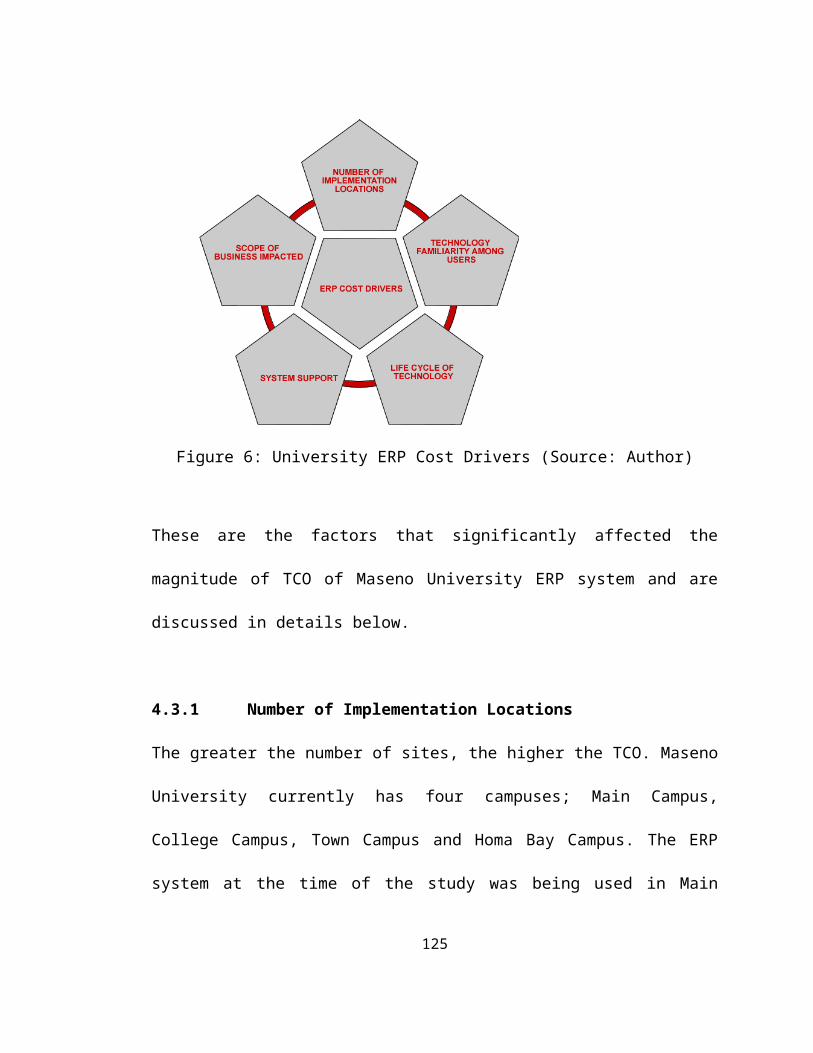
Figure 6: University ERP Cost Drivers (Source: Author)
These are the factors that significantly affected the
magnitude of TCO of Maseno University ERP system and are
discussed in details below.
4.3.1 Number of Implementation Locations
The greater the number of sites, the higher the TCO. Maseno
University currently has four campuses; Main Campus,
College Campus, Town Campus and Homa Bay Campus. The ERP
system at the time of the study was being used in Main
125

Campus, College Campus, City Campus and Kisumu Hotel. The
Main Campus and College Campus are connected using a fiber
optic cable which was acquired at a cost of KES 800,000.
Virtual Private Network (VPN) to link City Campus and
Kisumu Hotel with the Main Campuses in Maseno Township was
being developed at the time of the study which will also
affect the cost of the ERP positively. As discussed in
section 2.2, when a organization is widely
geographically dispersed or operates as a number of
distinctly autonomous departments, divisions, or
entities, separate instances of the ERP software is
required. Separate instances of ERP system makes the system
to be really expensive and become fragmented
quickly; and requires reengineering effort sooner. Cost
of network connectivity and networking devices that link up
the campuses served by the same ERP instance increases the
ERP TCO significantly.
4.3.2 Scope of Business to be Impacted126

The more the modules implemented, the greater the TCO. The
university implemented five modules consisting of:
i. Finance management
ii. Student management
iii. Human resource management
iv. Hotel management add-on
v. Hospital management add-on.
Maseno University paid KES 11,867,240 as software
acquisition for five modules and KES 7,139,287 as
professional fee for technical setup of the five modules.
This attracted KES 1,142,285 as VAT on professional
services at the rate of 16%. The ERP system software
acquisition cost and the corresponding professional fees
and VAT are shown in Table 7.
Table 7:Microsoft Dynamics Nav acquisition cost (Source:Author)
Module ModuleCost
Professional fees
VAT(KES)
Total(KES)
127

(KES) (KES)Financial
Management
3,619,00
01,628,550 260,568
5,508,1
18
Student Management4,821,74
03,134,131 501,461
8,457,3
32Human Resource
Management
1,116,50
0636,405 101,825
1,854,7
30Hotel Management
Add-Ons
1,116,50
0725,725 116,116
1,958,3
41Hospital
Managements Add-Ons
1,193,50
01,014,475 162,316
2,370,2
91
Total11,867,2
407,139,286
1,142,2
86
20,148,
812
The Professional fee was for ERP system technical setup
which comprised of installation, integration, migration,
configuration testing and training. It is evident that the
greater the number of modules implemented the higher the
cost of acquisition and technical setup.
4.3.3 Life Cycle of Technology
128

The life cycle of the technologies themselves is another
critical component. TCO is about life cycle cost of an
asset. Depreciable life, the number of years over which an
asset will be depreciated influences the TCO. Shorter
refresh cycle increases the magnitude of depreciation
charged yearly increasing the TCO but the benefits that
come with shorter refresh cycle offset the cost due to
reduced downtime and maintenance cost and increased uptime
thus increased productivity. Through interview with the
Systems Administrator it was established that Maseno
University does have technology refresh policy but it is
not adhere to. The university has never carried out the
analysis of the deployed IT hardware landscape. Change in
technology is closely associated with life cycle of
technology and will affect the TCO in one way or another.
Abrupt changes before maturity of a particular technology
has the effect of increasing the TCO.
4.3.4 Technology Familiarity among Users129

The study sought to establish how familiar the end-users
were with IT. This was done through a survey and Table 8
shows the outcome of questions on computer basic
maintenance tasks.
Table 8: Basic computer maintenance skills survey results(Source: Author)
Task I don’t need to know this formy job
I don’t understand what this is
I feelconfident
More knowledgeneeded
Setup a new PC 0% 0% 67.6% 32.4%Check existing setup of system 0% 0% 64.7% 25.5%
Understand licensing requirement
0% 0% 38.2% 68.1%
Check network connection 0% 0% 79.4% 17.6%
Change display mode 0% 0% 95.2% 4.8%
Test printing functions 0% 0% 97.1% 2.9%
All the end-users surveyed responses show that they needed
to know all the tasks asked and that they understood what
the tasks were about. However 67.6% indicated that they had
130

confidence in setting up a new PC while 32.4% felt they
needed more knowledge. Checking existing setup of computer
system task showed that 64.7% had confidence and 25.5%
needed more knowledge. Concerning license issues 38.2% had
confidence in their knowledge on license requirement while
61.8% felt more knowledge was required. Those who needed
more knowledge on network connection were 17.6% while 79.4%
had confidence in their ability to execute the task while
97.1% had confidence in their ability to change display
mode and test printing functionality and 2.9% indicated
that more knowledge was needed for the two tasks. These
statistics show that end-users of Maseno University ERP
were familiar with common PC maintenance tasks. This has
the effect of reducing the support requests from help desk
but might create user downtime due self/peer support
activities. It was further established through interview
with Systems Administrator that the university uses
Microsoft Windows OS and Microsoft Office Suite application
programs which have the similar user interfaces as the131

deployed ERP system, Microsoft Dynamics Nav. This lowers
will lower TCO of ERP as it reduces the gradient of the
learning curve.
4.3.5 System Support
System support comprises supporting the technical aspect of
the system so that availability approaches the recommended
five nine (99.999 %) and end-user support so that user
downtime is minimized. End-user training survey of Maseno
University indicates that 73.5% were trained before the
system was implemented while 26.5% were not trained.
Through interview with the IT technical staff, the
researcher established that the end-users were trained only
once and it was one year earlier before the commencement of
ERP system implementation. Inadequate end-user training
increases the TCO. There is a lot of user downtime.
Untrained users may end up needing three to six times as
much support as end-users who have been trained. Lack of
proper training and education can result in loss of132

productivity. The untrained person will either get help
from the help desk or from colleagues. This will either
increase the help desk work load or affect the productivity
of the person who is disturbed by the untrained person.
Respondents were also asked if they had received any form
of end-user ERP training in the past six months and the
results indicate that only 8.8% had trained while 91.2%
said they have not trained. Interviews with IT staff showed
that the University does not have a program for regular
retraining/training of end-users. The mode of training
available is on on-demand basis and induction for new
employees. Through interviews the researcher also
established that no end-user training was carried out in
live environments, i.e. after system testing and go-live.
Go-live is the implementation phase where the ERP system is
opened for use. Some 20.6% of the respondents joined the
university after ERP implementation and 100% of them
indicated that they were inducted into the ERP system
133

usage. The respondents were asked to rate their overall
level competency with the ERP system and the results were
as shown in Table 9.
Table 9: Competency Level of the Respondents (Source:Author)
Frequen
cy
Perce
ntNot very competent 0 0 %Low level competency 0 0 %Moderate level
competency24 57.1%
High level
competency18
42.9
%Expert 0 0 %Total 42 100 %
Not very competent and low level competency both registered
0% whereas moderate level competency and high level
competency had 57.1% and 42.9% respectively. There was no
respondent who returned the level of competency as expert.
These statistics shows that the competency level of the
134

end-users is within acceptable standards though there being
no expert among the user can be taken to indicate that some
ERP tasks will require help desk assistance. This has the
effect of increasing the TCO of ERP. On the question of ERP
end-user training adequacy, the survey shows that 57% felt
the training was not adequate while 43% were of the view
that the training was adequate. Given that more than half
the respondents are of the opinion that training was not
adequate implies further regular training is necessary and
the absence of regular training will put more burden on the
end users who will seek self/peer support which increases
the user downtime affecting the TCO negatively. In-depth
interview with the IT staff revealed that the end-user
support had no dedicated staff. Because of the shortage of
staff end-user support came from system administrator and
his assistant. The survey results show that 100% of the
respondents encounter job tasks that they require technical
support.
135

i) End-user Downtime
End-users were surveyed on how much time they spent on
performing unproductive activities in the computer during
work time and the results are as shown in the Table 10.
Table 10: Average Hours of an End-user’s downtime (Source:Author)
Downtime
Average Hours of an
end-user’s Downtime
per month
Average Hours of
an end-user’s
Downtime per yearSelf
Maintenance1.67 20
Self Support 1.93 23Casual
Learning1.18 14
Peer Support 1.45 17Getting
Support1.34 16
Total 7.57 91
ii) Technology Downtime
136

Downtime expenses are the annual losses in productivity due
to the unavailability of the desktop computer, servers,
network, printers, and applications. Cost is measured as
lost wages (productivity). Through end-user survey it was
established that on average the university experiences
technology downtime of 4 hours and 3 minutes month. Service
degradation experienced by the university on average lasts
for 3hours and 7 minutes a month. This translates to 48
hours and 36 minutes of downtime and 37 hours and 24
minutes of service degradation per year. Technological
downtime affects the employees who rely on the ERP to
perform their job roles. If there is no work around way of
doing the task, then the employee will not be able to
perform his/her duty, then employee downtime will occur.
Downtime increases unbudgeted costs thus increases the TCO
of ERP system.
4.4 The Total Cost Ownership of Maseno University ERP
System 137

The second objective of the study was to determine the
total cost of owning Maseno university ERP system. One of
the challenges in determining the cost of owning Maseno
University ERP system was collecting accurate, reliable
data due to a lack of formal information technology asset
management (ITAM) repository in place to provide data for
the study. The university has no prior cost modeling
experience for TCO process.
This total cost of ownership scenario focused on the cost
of ERP in the university and did not include computing
devices not running the ERP system found within the
university. For example, there are five computer
laboratories used for teaching and learning activities of
which three labs are not networked. The two networked labs
are also not connected to the ERP system and, therefore,
were not included in the TCO project. This TCO scenario did
not include internet and the university website in the
138

analysis. It covered the wide area network that the ERP
system runs on.
4.4.1 Procurement of the ERP System
Feasibility study was carried out where a team of thirteen
committee members visited 3 universities that had
successful implementation of the ERP system. The committee
visited United States International University, KCA
University and Daystar University all located in Nairobi
Kenya. ERP system specification was developed by a
committee of thirteen members. Maseno University is a
public university and the due process of procurement was
conducted in compliance with the Public Procurement and
Disposal Act of 2005 of the Laws of Kenya. The university
settled on Coretec Systems & Solutions to supply Microsoft
Dynamics Nav and the project charter was signed on 11th
December 2007. Feasibility study, requirement139

specification, procurement management and project
management from expenditure estimates and projection in
five years will cost the university KES 3,300,000. This
accounts for 3% of the projected TCO of ERP in a five year
period.
4.4.2 Hardware and Software Acquisition
The university had in place most of the hardware that was
required for the ERP software to run and only acquired what
was not available. There has been continuous investment in
the hardware to optimize the IT productivity of the ERP
system. The university acquired 25 km of fiber optic to
enhance the network efficiency.
The ERP software was acquired at a cost of KES 11,867,240
as shown in Table 7. The client computers were already in
place and where upgrade was needed it was done. The
operating systems for the desktops and laptops was
Microsoft Windows (Microsoft Windows XP and 7) and140

Application software were Microsoft Office Suite (Microsoft
Office 2007 and 2010). The university server runs on
FreeBSD, Microsoft Server 2003 and 2008. Microsoft Server
2003 and 2008 have valid licenses while FreeBSD is open
source software (OSS). Another OSS implemented is Mail
Zimbra which is used for storage and backup and the network
monitoring software is also OSS. Other application software
are PDF reader and WinZip. Tables 11 and 12 shows the
installed hardware and software.
Table 11: Installed Hardware in Maseno University ICTInfrastructure (Source: Author)
Hardware Quantity
i. Servers 2ii. Routers 2iii. Switches
(intelligent)13
iv. Fiber opticcables
25 km
v. Air conditioner 1vi. 48 U Cabinets 2vii. 30 U Cabinets 2viii. 2 U Cabinets 12ix. Network
printers8
x. Desktops 60141

xi. Laptops 3xii. Firewalls 1xiii. Proxy gateway 1
Table 12: Installed Software in Maseno University IS(Source: Author)
System Software Desktop System Software
Application Software
SQL server 2008 Windows 7 Microsoft Dynamics Nav
Windows server 2003
Windows XP Microsoft Office 2010
Windows server 2008
Microsoft Office 2007
FreeBSD (OSS) WinZipMail serverMail Zimbra (OSS)
4.4.3 Implementation
Full implementation of the ERP system was to cover a total
of eleven modules and to be implemented in a period of 14
week from the time the contract charter was signed. The
project charter was signed on 11th December 2007 and the
implementation of the system was delayed due to the post
election violence that occurred in early 2008. Below is a
listed of the sub-modules that were to be implemented.
i. Student Finance
142

ii. Credit Ledger System
iii. Cash Office
iv. Human Resource Module
v. Academic/ Registration Module
vi. Examination Module
vii. Timetable Module
viii. Hostel Module
ix. Welfare Module
x. Instructor/ Student Evaluation Module
xi. Stores Control System
Fourteen weeks with effect from the first week of April
2008 elapsed in the first week of August 2008. Interviews
with the ICT technical staff indicate that most of the ERP
modules have not been implemented fully to date (April
2013) five years later. Out of the eleven modules that were
earmarked for implementation; four are fully implemented
representing 36% implementation. Coretec Systems &
Solutions, the system vendors were part of the
implementation team but they did not participate till full143

implementation was completed. The ongoing implementation is
being conducted by the technical IT staff of the
university. The implementation status as at the time the
interviews were conducted is as shown in the Table 14.
Table 13: Implementation Status of Maseno University ERPSystem (Source: Author)
Module SystemImplementation
Statusa) Student Finance 80%b) Creditors Ledger 100%c) Cash Office 100%d) Human Resource 50%e) Admissions/
Registration40%
f) Examination 40%g) Timetable 0%h) Hostel 100%i) Welfare 0%j) Instructor /Student
Evaluation0%
k) Stores Control 100%
144

The ERP implementation process as stipulated in the
contract was to take fourteen week from the time the
project charter was signed. This however turned out not to
be the case as the implementation process was still going
on five years after the project charter signing. The vendor
left the site before the all the modules were installed and
ongoing implementation is being conducted by the ICT staff.
Microsoft Business Solution – Microsoft Dynamics Nav, the
latest version at that time was delivered to the University
on original CD and license files and the university was to
supply:
i. Qualified staff to implement the system
ii. Project management and control staff
iii. Hardware
iv. Telephone
v. Internet
vi. Test Data
145

The contract included a twelve month warranty. The cost of
implementation was KES 8,281,572. Implementation fees
comprised installation, customization, configuration and
training.
4.4.4 Operation and Maintenance
The ICT directorate of Maseno University had a staff of
nine people at the time of this study. The staff consisted
of ICT Director, System Administrator and his assistant,
three technicians in the network administrations office,
and two technicians in-charge of the city campus. The end-
user support has no dedicated staff and is supported by the
System Administrator. The network support staff has been
trained three times, once during ERP implementation and on
two occasions sponsored by the internet service providers
(ISP). The university has no regular training program for
technical staff and end-users. The System Administrator is
responsible for the training of the end-users on demand
146

basis such as when a new employee is recruited or when
there are changes on the system.
In the budget of ICT directorate of Maseno University,
maintenance had an annual budget of KES 8,100,000 in the
financial year of 2012-2013 and KES 4.5 million in the
budget of 2013-2014. The ERP system contract had an
annual maintenance fee of KES 125,000. The maintenance fee
is to cover annual software maintenance and support; future
updates, off-site and on-site support and off-site backup
services
Overhead costs such as electricity, air conditioning and
physical space cost were not captured in this study as they
were not easy to get. The system is secured by a firewall
and antivirus software both installed in the servers and
the terminals. The server room is physically secured using
burglar proof doors and windows and has two night guards.
Hardware and software upgrades are carried out on the need
basis. Software is upgraded whenever there are new
147

releases. The ERP system software has been undergoing
upgrade whenever a new release is out as that is covered
under maintenance contract.
4.4.5 End-user Usage
Questionnaires were used to collect the data on the end-
user activities. The questionnaire had items that asked the
end-user the average duration spent on the ERP system per
day and to estimate the average time they spent on the
following activities per month at work:
i. Self support (activities, such as backups, loading
software, and organizing files on hard drives).
ii. Peer support - Peer support is the reliance on a
knowledgeable resource, typically the unofficial
“expert” in providing support answers and in
resolving technical issues.. Typical tasks
performed by the end users include troubleshooting
and repair, support, maintenance, installation,
training, and backup management.148

iii. Casual learning – this is the time taken by end-
users in activities such as reading manuals, using
on-line help, trial and error, and other self-
learning methods to learn programs and resolve
issues.
iv. Time to resolution – When stuck on a job related
task, time spent waiting for problems to be
resolved.
Futz factors and application customization information was
not sought since they are not easily quantifiable. Futz
factor is where an end-user uses corporate technology for
his/her own personal use. This cost lies not in the system
itself (it is already purchased) but in the time employees
spend using the system for non work-related activities.
The total cost of owning Maseno University ERP system TCO
was computed using the model developed in the study. Using
the proformas included in Appendix C, and149

the ICT Directorate budget shown in appendix E, the
following first set of TCO figures were collected and the
model populated to give the results shown in the Table 14.
The cost of downtime was computed using equations 1 in
section 2.6.4.
Table 14: Five Year TCO of Maseno University ERP System(Source: Author)
Nodes Costs (KES)
Elements Costs (KES)
Procurement Costs 3,300,000 (3%)Feasibility Study 800,000 Requirement Specification 300,000 Procurement Management 1,000,000 Project Management 1,200,000 Hardware/Software 20,175,600 (16%)Application Software 3,249,000 System Software 8,476,600 Hardware 8,450,000 Implementation Costs 9,541,572 (7%)Technical Setup 8,281,572 Change Management 200,000 Personnel Restructuring 400,000 Testing 60,000 Training 600,000
150

Operations and Maintenance Costs 66,324,720 (51%)Licenses Agreement 925,000 Overheads 4,527,063 Maintenance 31,500,000 Support 28,672,657 Monitoring 300,000 Upgrade 400,000 End-User Usage 29,735,346 (23%)End-user Operations 5,786,604 Downtime 23,948,742 Total 129,077,238
Figure 7 was generated from the Five Year TCO of Maseno
University ERP System presented in table 14, which shows
that the leading cost drivers are operations and
maintenance and end-user usage.
151

3%16%
7%
51%
23%ProcurementHardware/Software AcquisitionImplementation Operations & MaintenanceEnd user Usage
Legend/Key
Figure 7: Five years TCO of Maseno University ERP System(Source: Author)
Straight line method was used to depreciate hardware while
software cost was apportioned equally over the expected
software life cycle. The breakdown of TCO calculations are
shown in appendix E.
4.5 Development of the TCO of University ERP Model
152

Following Ellram et al.’s framework of TCO model
development discussed in section 2.8, the researcher in his
TCO analysis involved the ICT Director, three network
technicians, Systems Administrator and his Deputy, two
maintenance officers, two IT technicians, Procurement
Officer, and a Finance Officer. The researcher conducted
in-depth interviews with the above staff one-on-one on
different occasions between December 2012 and May 2013. The
interviews sought to get information regarding the ERP
system right from feasibility study till the state it was
at the time of interview.
Documents that were analyzed included project team minutes,
ERP System documentations, ERP system contract, the
correspondents between the vendor and the university,
hardware documentation and license agreements.
The researcher used information gather from the interviews
and literature review to come up with the ERP project WBS
and the corresponding CBS. These WBS and CBS were analyzed153

to come up with the cost elements, cost nodes and the
background factors. A cost node is a breakdown of TCO cost
element into smaller cost category in line with the project
work breakdown structure (WBS), indicating where costs are
allocated (Lee, 2007). The breakdown can sometimes be in
line with the organization’s Chart of Accounts, indicating
"what" the costs are for. In theory, cost could be in line
with "who" is spending the cost, "when" costs are being
spent, etc. The background factors are activities and
events that can influence the cost nodes in one way or
another.
4.5.1 The Proposed ERP TCO Model
The basic structure of the TCO model developed has five
cost elements; procurement, hardware/software acquisition,
implementation, operations and maintenance and end user
usage. It has 17 cost nodes and 65 background factors.
Figure 8 show the developed TCO model.
154

4.5.2 Background Factors
The background factors influence the cost nodes of the
model in one way or another. These background factors were
found during the interviews with the IT technical staff
while some came from literature and others came from the
identified WBS and CBS.
155

Figure 8: Proposed TCO Model (Source Author)
4.5.3 Procurement Costs
The procurement life cycle of IT assets begins with
strategic planning and continues through procurement and on
into the planned obsolescence of both hardware and
software. The costs cover a system’s life cycle, from
initial concept to the end of the system’s useful life or
156

the end of a contract. Cost activities that are undertaken
in system life cycle include:
i. Concept initiation
ii. Procurement strategy, planning and initiation
iii. Solicitation process
iv. Cost and payment structure
v. Contract issuance and management
vi. Project launch, implementation and close out.
4.5.4 Project Management Costs
Project management costs involve activities necessary to
ensure the successful completion of the project. Project
management activities include:
i. Project Planning
ii. Project Control
iii. Status Reporting
iv. Issue Management
v. Change Management
vi. Risk Management157

vii. Quality Management.
4.5.5 Feasibility study costs
Feasibility study costs are costs that are used to conduct
the feasibility study. Vendor maturity, integration issues
and the established vendor relationships are the background
cost drivers that determine the feasibility costs..
4.5.6 Requirements Specification Costs
Requirements specification costs these are costs that
manage requirements specification. Requirements
specification costs are driven by the number of systems
included in the scenario, departments and units involved,
and the number and depth of function changes.
4.5.7 Procurement Management Costs
Procurement management costs are incurred in evaluating
offers and drafting agreements. The procurement management158

costs are determined by the number of potential vendors.
The higher the number of potential vendors the more
resources will be required in the procurement process.
Figure 9 shows the procurement management background
factors.
Figure 9: Procurement Background Factors (Source: Author)
4.5.8 Hardware/Software Acquisition Costs
159
Procurement
Project Manageme
nt
Procurement Management
Requirement
Specification
Feasibility
Vendor MaturityIntegration IssuesEstablished Vendor
Relationships
Geographical SpreadNumber of Units
InvolvedNumber of systems involved
Project model
Number of potenetial vendors
Number of systems included
Departments & units
involvedNumber of fucntion changesDepth of function changes

Hardware/Software acquisition costs are initial costs
incurred in procurement of system hardware, System Software
and Application Software. The hardware consists of network
devices such as switches, routers, firewalls, proxies,
servers and client devices such as desktops, laptops,
printers, and so on. The background factors that influence
the cost of technical infrastructure are the depreciable
life and refresh cycle of the hardware.
The system software acquisition costs are influenced by the
number of ERP modules deployed, economic life and the third
party software. Economic life refers to the number of years
in which the software acquisition returns more value to the
owner than it costs to own, operate, and maintain. When
these costs exceed returns, the acquisition is beyond its
economic life. Third party software such as credit card
processing, performance monitoring tool, data mining, just
to name a few may influence the cost of system software.
160

The application software background factors that influence
the costs include license type and number of application
software installed. Figure 10 shows the Hardware and
Software acquisition background factors.
Figure 10: Hardware/Software Acquisition Background Factors(Source: Author)
4.5.9 Implementation Costs
The cost nodes of ERP implementation are organizational
change management, technical setup, personnel restructuring
and training
4.5.10 Change Management161
Hardware/Software
Acquisition costs
Application Software
System Software
Technical Infrastructure
Depreciable LifeRecfresh Cycle
License (propriator/open source)Number of application software
Number of modules includedSoftware economic lifeThird party software

Change management costs are affected by the complexity of
business process redesign, the geographical spread of the
business locations and the number of units involved.
4.5.11 Technical Setup
Technical setup is influenced by the integration costs,
migration costs, configuration costs, customization costs,
testing costs, as well as the cost of phasing out the old
system.
4.5.12 Personnel Restructuring
Personnel restructuring is the process of reconstituting
the employee to accommodate new skills and capabilities
needed to meet expected operational requirements brought
about by ERP system which changes workflow and production
processes. Personnel restructuring costs depends on the
extent of training needed, complexity of process redesign
and technology familiarity among users.
162

4.5.13 Training
Training is influenced by the mode of training, amount of
training needed and availability of relevant skills within
the organization. Inclusion of training in the system
software license also reduces the training costs. Figure 11
shows the implementation background factors
163

Figure 11: Implementation Costs Background Factors (Source:Author)
4.5.14 Operation and Maintenance Costs
The model decomposes operation and maintenance costs to:
i. License agreement costs
ii. Overheads costs
iii. Monitoring, maintenance and security costs 164
Implementation Costs
Personnel Restructurin
g
Change management
Technical setup
TestingIntegration
Migration
Complexity of business process redesignExtent of training
needed
Technology familiarity among users
Complexity of business process redesign
Geographical spreadNumber of units
involved
Training Extent of training neededAmount of training neededTraining included in
license agreement
Mode of training
Technology familiarity among usersAvailability of
relevent skills within the organization
Phasing outConfiguration

iv. Support costs
v. Upgrade costs
4.5.15 License Agreements
License agreements are contracts between the producer and
the consumer of a hardware and/or software, granting the
consumer the right to use the product under specific
conditions. License agreement costs have scope of license
agreement and applicability of enterprise wide license
agreements as the background factors
4.5.16 Overheads
Overhead or overhead costs refers to an ongoing expense of
operating an information system. The term overhead is
usually used when grouping expenses that are necessary to
the continued functioning of the IS but cannot be
immediately associated with the products or services being
offered. Overhead costs are influenced by the amount of
overhead included in license agreement and changes in
hardware.165

4.5.17 Monitoring, Maintenance and Security
Monitoring, maintenance and security costs depends on
amount of special adjustments required, service level
agreement and scenario complexity.
4.5.18 Support
Support costs arise from technology familiarity among
users, support, SLA, support included in the license,
amount of special adjustments required and availability of
relevant skills within the organization.
4.5.19 Upgrade Costs
Upgrade costs involves costs of replacing systems or system
components/modules with a newer version resulting in a
fully functional system satisfying all tests and
requirements. The cost of upgrading for hardware and
software depends on whether future requirements were
considered in the new architecture and the degree of166

customization conducted in the ERP system. Figure 12 shows
the operation and maintenance background factors.
Figure 12: Operations & Maintenance Costs BackgroundFactors (Source: Author)
4.5.20 End-User Usage
End-user usage cost element has two nodes, end-user
operations and downtime and fourteen background factors.
167
Operations and
Maintenance
Monitoring Maintenance & Security
Overheads
Licence agreement
Scope of license agreementApplicability of
enterprise wide license agreement
Service Level Agreements
Scenario complexity
Amount of special adjustments
Amount of Overheads included in license
agreementChanges in hardware
SupportSupport SLA
Support included in licenseAmount of special
adjustment
Technology familiarity among users
Availability of relevent skills within
the organization
Upgrade Upgrade included in license
Upgrade frequencyChange frequency of
business needs
Need to maximize performance
Inclusion of future requirements

End-user operations costs are influenced by the efficiency
of technical support provided to the user, efficiency of
training, efficiency of change management, resistance to
change, and technology familiarity among users.
Unplanned downtime is downtime that occurs as a result of a
failure (for example, a hardware failure or a system
failure caused by improper server configuration) while
planned downtime is downtime that occurs when an
administrator shuts down the system at a scheduled time.
Downtime costs arise from the costs of:
i. Detection,
ii. Containment,
iii. Recovery,
iv. Ex post response,
v. IT productivity loss,
vi. User productivity loss
vii. Gonsequences of business disruption
viii. Lost revenues168

Figure 13 shows end-user usage background factors.
Figure 13: End-user Usage Costs Background Factors (Source:Author)
4.5.21 Summary
In this chapter, data analyses presentation and
interpretation was carried out. The proposed TCO model was
also presented together with the background factors. The169
End User Usage Costs
End -User Operations
DowntimeRecovery
Ex-post response
Efficiency of change management
Efficiency of trainingResistance to changeTechnology familiarity
among users
Detection
Containment
Third-party Lost revenue
IT productivity lossUser productivity loss
Consequences business disruption

findings of this chapter will form the foundation of
Chapter 5.
CHAPTER FIVE
5 SUMMARY, CONCLUSION AND RECOMMENDATIONS
5.1 Introduction
This chapter discusses the summary of major research
findings conclusions, recommendations and suggestions for
further research.
5.2 Summary of Major Findings
This study was carried out to evaluate the total cost of
ownership of university enterprise resource planning with
Maseno University as a case study. A sample of ten IT staff
170

selected from ICT Directorate, Finance and Procurement
department who also took part in ERP implementation were
chosen for the purpose of the study. An interview guide was
used to collect views and opinions from the sample on
procurement, implementation, and operation of the ERP
system. Forty two questionnaires were also given out to the
ERP end-user to collect their views and opinion on the
usability of the system. Documents were also analyzed to
triangulate the information collected through interviews.
The responses were analyzed and narrated.
The first objective of the study was to identify the major
cost drivers of TCO in a university ERP. Data analysis
revealed the five major findings under this objective. It
revealed that major cost drivers that influence the TCO of
a university ERP are:
i. Number of implementation locations
ii. Scope of business to be implemented
iii. Life cycle of technology 171

iv. End-user familiarity with technology
v. System Support
The first cost driver, the number of implementation
locations is in agreement with the major cost drivers
identified by West & Daigle, (2004) discussed in section
2.3 in which they state that the ERP TCO depends on the
nature of the organization (large, public verses small
private). The second cost driver, is dependent on the
number of modules was also established by in a study of ERP
implementation costs in Swiss SMEs discussed in section
2.3.
Unicom, an information technology solutions provider
suggests that establishing a refresh schedule based on
historical performance and usage requirements in 2 to 5
year cycles will improve overall IT infrastructure
performance by reducing downtime and decreasing costs (GTSI
Corp, 2008). Reduction in downtime reduces the magnitude of172

TCO and decreasing operation and maintenance costs also
lowers TCO. This position is in agreement with the third
cost drive, life cycle of technology.
The second objective of the study sought to determine the
total cost of owning the Maseno University ERP system. The
study revealed that the ERP system will cost the university
over a five year period a sum of KES 129,077,238.
Procurement costs accounted for 3%, while hardware and
software acquisition costs tool 16%, implementation costs
took 7% while operations and maintenance took lion’s share
of 51% and end user usage accounted for 23%. This is in
agreement with Gartner’s findings discussed in section 2.3
where Gartner assets that initial acquisition costs
accounts for only 20%. The initial acquisition cost for
this study is procurement and hardware and software
acquisition costs which account for 19% of the five year
TCO. This indicates that the university has significant
control of 81% of the TCO since these costs are173

administrative which can be optimized by employing sound
management practices. Operations and maintenance accounts
for 51% and is where the highest spending lies in agreement
with the literature in section 2.3.
End user usage accounted for 23% of the five years TCO of
ERP, which is more than the percentage taken by initial
acquisition of hardware and software. The theoretical
framework postulated that cutting cost of hardware/software
and system support transfers the costs to the end-users.
The absence of dedicated system support staff and non
adherence to technology refresh cycle explains why the end-
user usage cost is higher than initial hardware/software
acquisition costs.
The third objective of the study was to develop a model for
computing the total cost of ownership of a university ERP
system. The developed TCO model has five cost elements, 17
cost nodes and sixty-five background factors. The174

background factors are included in the model to enable the
decision makers to effectively and efficiently manage the
cost driver with the goal of not just lowering the TCO but
also having an IS that is functioning optimally.
5.3 Conclusion
This study investigated a model for evaluating TCO of
university ERP, case of Maseno University. It was intended
to develop a model for evaluating the TCO of ERP system in
a university and to provide basis upon which to monitor
costs over time. This was in relation to the existence of
clear gap in ERP cost identification, management and
estimation. The study specifically sought to identify the
major cost drivers that can influence TCO in university ERP
system, analyze the total cost of owning a university ERP
system and develop a model for estimating the TCO of ERP in
a university.
175

The first objective of the study sought to identify the
major cost drivers that can influence TCO in university ERP
system. The study established that the major cost drivers
that can influence TCO of ERP in a university are; the
number of implementation locations, the scope of business
impacted, technology familiarity among users, life-cycle of
technology and ERP system support.
The second objective sought to analyze the total cost of
owning a university ERP system. The study revealed that the
procurement costs accounted for 3% of TCO of Maseno
University ERP System while hardware and software
acquisition accounted for 16% and operations and
maintenance took a lion’s share of 51% and implementation
took 7% while end user usage accounted for 23%.
The third objective of the study was to develop a model for
estimating the TCO of ERP in a university. This study has
presented a model for evaluating total cost of ownership176

for University Enterprise Resource Planning. The model has
five cost elements consisting of procurement costs,
hardware and software acquisition costs, implementation
costs, operations and maintenance costs and end-user usage
costs.
The model also has seventeen nodes and sixty five
background factors.
In view of these findings the study concludes that the
developed model for TCO of ERP in a university provides a
solid foundation for making sound decisions concerning ERP
investments in universities.
5.4 Recommendations
The researcher has argued in this report that TCO of ERP
goes beyond purchase price to comprehensively examine all
costs from purchase price to the cost of taking an asset
out of service. The study has also shown that the bulk
(84%) of TCO costs lie in operations and maintenance and
177
end-user usage. It is against this background that the
recommendations below are made. Despite the limitations,
this study should be applied in future projects that are
tolerably similar to the one under study. Basing
generalization on the findings of this study, the
researcher recommends the reduction of TCO through people,
processes and technology as discussed next.
i) People – Institution should invest in its staff by
conducting regular training to end-users and IT
staff to make optimal use of cost-management of
processes and technologies.
ii) Processes – To minimize technology and end-user
downtime, the institutions should automate some
tasks and streamlining others, such as asset
tracking by using ITAM system to software updating.
iii) Technologies – Since labor consumed more than
half of the TCO of ERP cost, institutions should
pump more resources in deploying information
technologies that minimize and in some cases178

eliminate the widest range of labor-intensive tasks
as well as employ best practices in deployment of
technology.
5.5 Suggestions for Further Research
This study focused on a single university that was had
implemented ERP system. Study may be appropriate in future
to:
i. Determine the factors that cause ERP implementation
go beyond the projected time frame.
ii. Develop a model for evaluation of TCO of Cloud
based ERP system.
iii. Assess universities the impact of TCO analysis in
universities.
iv. Develop a model to evaluate the Return on
Investment of ERP investment in universities
5.6 Summary
179

This chapter highlighted the study summary, conclusion and
gave recommendation on how to minimize TCO by universities
and ends by suggesting research areas that can be looked at
in future.
180

REFERENCES
Abdullabhai, M., & Acosta, F. (2012). Impact of adopting
ERPsystems by commercial organizations in Kenya.
Journal of DLSU Business & Economics Review 21.2 , 63-
86.
Aberdeen, G. (2012). A total cost of ownership benchmarking
study for unified communication. Boston: Aberdeen
Group, Inc.
Albrecht, A., & Gaffney, J. (1983, November). Software
Function, Source Lines of Code, and Development Effort
Prediction: A Software Science Validation. IEEE
Transactions on Software Engineering (vol. 9 no. 6) ,
pp. 639-648.
Alehremi, M. (2009). Preparing Feasibility Study for Small
Projects. Retrieved September 1, 2013, from Government
of Ras Ai Khaimah, Department of Economic Development:
http://www.ded.rak.ae/en/knowledgecenter/Documents/Fea
sibility%20Study.pdf
181

Aloini, D., Dulmin, R., & Mininno, V. (2007). Risk
management in ERP project introduction: Review of the
literature. Journal of Information & Management 44 ,
547-567.
Al-Shehab, A., Hughes, R., & Winstanley, G. (2005).
Modeling risks in IS/IT projects through causal and
cognitive mapping. Electronic Journal of Information
Systems Evaluation , 8-10.
Ariola, e. a. (2006). Principles and Methods of Research.
Manila: Rex Bookstore, Inc.,.
Benbasat, I., Goldstein, D. K., & Mead, M. (1987). The case
research strategy in studies of Information Systems.
MIS Quarterly 11, , 369-386.
Boehm, B. (2000). Software cost estimation with Cocomo II.
London: Prentice Hall International, 2000.
Boehm, B. (1983). Software engineering economics. Englewood
Cliffs: Prentice Hall.
182

Procurement Management
Hardware/Software Ongoing Costs
Feasibility Study
Requirement specification
Feasibility Study
Feasibility Study
Project Management
Boersma, K., & Kingma, S. (2005). Developing a cultural
perspective on ERP. Business Process Management
Journal,11(2) , 123-136.
Bradford, M. (2009). Modern ERP: Select, Implement, & Use
Today's Advanced Business System. Raleigh: Lulu
Enterprises.
Cadmus Group, I. (2010). Energy savings fron energy star
qualified servers. United states Environmental
protection Agency.
Carcary, M. (2008). The Evaluation of ICT Investment
Performance in terms of its Functional Deployment.
Limerick: Limerick Institute of Technology.
Cibecs. (2012). The Corporate PC Refresh Project. Retrieved
June 20, 2013, from Cibecs: www.cibecs.com
Coretec. (2013, April 3). Microsoft Dynamics NAV. Retrieved
April 21, 2013, from coretec:
http://coretec.co.ke/index.php/products/prod1/microsof
t-dynamics-nav
183

CoSN. (2001). A School Administrator’s Guide To Planning
for the Total Cost of New Technology Total Cost of New
Technology. Washington: Consortium for School
Networking.
CoSN. (2011, May 5). About TCO. Retrieved June 1, 2011,
from Taking TCO to the Classroom:
http://www.cosn.org/Initiatives/BudgetingwithTotalCost
ofOwnership/AboutTCO/tabid/5134/Default.aspx
Craig, D., Gross, J., Hourigan, T. K., Rogers, T., Swedroe,
B., & Tyagi, C. (2010). Best Practices for Selecting
ERP Software. Focus Research.
David, J. S., Schuff, D., & Louis, R. S. (2002, January).
Managing your IT TCO. Communication of ACM 45 , 1.
Dell. (2003). Total cost of ownership: what is is really?
Round Rock: Dell Inc.
Deloitte, C. (1998). ERP's Second Wave Technical Report.
New York: Deloitte Consulting.
Ellram, L. M., & Siferd, P. S. (1998). Total cost of
ownership: A key concept in strategic cost management 184

decisions. Journal of business logistics; , 55.
Ellram, L. M., Fawcett, S. E., & Ogden, J. A. (2006).
Supply Chain Management: From Vision to
Implementation. Upper Saddle : Pearson.
Esteves, J. M., & Pastor, J. A. (1999). An ERP Life-cycle-
based Research Agenda. . Venice: Campus Nord, Jordi
Girona Salgado.
Esteves, J. M., Carvalho, J. A., & Santos, A. A. (2001).
Towards an ERP Life-Cycle Costs Model. Managing
Information Technology in global economy , 51-58.
Ferrin, B. G., & Plank, R. E. (2002). Total Cost of
Ownership Models: An Exploratory Study. The Journal of
Supply Chain Management , 18-29.
Fischer, R., & Lugg, R. (2006). The real cost of ILS
ownership. . The Bottom Line: Managing Library
Finances , 19 (3), , 111-123.
Fryling, M. (2010). Estimating the impact of enterprise
resource planning project management decisions on
post-implementation maintenance costs: a case study 185

using simulation modelling. Enterprise Information
Systems, 4(4) , 415–445.
Gakio, K. (2006). African tertiary institutions
connectivity survey (ATICS). Gaborone: Cyberplex
Africa,.
Gartner. (2011). IT Definitions and Glossary. Retrieved
April 14, 2011, from Gartner:
http://www.gartner.com/technology/research/it-
glossary/#19_0
Gartner. (2001). TCO Manager for Distributed Computing
Chart of Accounts. Gartner, Inc.
Gartner. (2007). Toolkit Best Practices: Training End
Users. Gartner, Inc.
Greenbaum, J. (2005). Rethinking TCO: Towards a More Viable
and Useful Measure of IT Costs. Berkeley: Enterprise
Applications Consulting.
Griliches, E. (2009). The impact of total cost of ownership
model. Framingham: IDC.
GTSI Corp. (2008). Technology Lifecycle Management. Unicom.186

Haddara, M. (2012). Exploring ERP Adoption Cost Factors.
Journal of Computer Technology and Application 3 ,
250-261.
Havrici, I. (2011, May). What would an ERP take out of my
pockets? Retrieved June 5, 2013, from Ensight
management consultanting: http://www.ensight.ro/
Herbert, A. j. (2006). How to prepare an ERP budget: ten
critical steps. Retrieved May 2013, 20, from
Collegiate project services: www.collegiateproject.com
Hoagland, W. H., & Williamson, L. (2000). Feasibility
Study. Lexington: Department of Agricultural Economics
at the University of Kentucky.
Hurwitz. (2009). The compelling TCO case for cloud
computing in SMB and mid-market enterprises. Needham:
Hurwitz.
Iansiti, M. (2007). ERP end-user business productivity: a
field study of SAP & Microsoft. Boston: Keystone
Strategy.
187

ITIL. (11 May 2007, 11 May 2007 11 May 2007). Glossary of
Terms, Definitions and Acronyms . Retrieved November
30, 2013, from ITIL : http://www.get-best-
practice.co.uk/glossaries.aspx
JAMA. (2008). JAMA Instructions for Submissions. Retrieved
August 2, 2013, from Journal of the American Medical
Association: http://jama.ama-assn.org/misc/i4a.pdf
Kaestner, R. (2009, March 12). Consortium for school
networking initiative. . Retrieved December 20, 2012,
from Taking TCO to the Class: http://www.cosn.org
Kathuri, N. J., & Pals, A. D. (1993). Introduction to
educational research. Nakuru: Egerton.
Kennedy, M. M. (1979). Evaluation Review: Generalizing From
Single Case Studies. Sage Journals , 661-678.
Klaus, H., Rosemann, M., & Gable, G. G. (2000). What is
ERP? Information Systems Frontiers, 2(2) , 141-162.
Klein, H. K., & Myers, M. D. (1999). A Set of Principles
for Conducting and Evaluating Interpretive Field
Studies in Information Systems. MIS Quarterly , 67-94.188

Koech, C. C. (2012). INVESTIGATION OF CRITICAL SUCCESS
FACTORS IN ENTERPRISE Investigation of Critical
Success factors in ERP Systems Implementation in
KenyanUniversities (Case of Kenyatta University).
Kakamega: Masinde Muliro University of Science and
Technology (Unpublished Master Thesis).
Konschak, C., & Felt, P. (2010). Understanding the Total
Cost of Ownership (TCO) analysis for IS in the
healthcare setting. Dallas: Divurgent.
Kontio. (2004). Typical problems in Information Systems – a
multiple case study in six Finnish organisations. 11th
European Conference on Information Technology
Evaluation, (pp. 211-220). Reading: Academic
Conferences.
Kumar, R. (1999). Research Methodology. New Delhi: Sage
Publications India Pvt Ltd.
Kusters, R. J., Genuchten, V. M., & Heemstra, F. J. (1990,
April 3). Are software cost estimations models
189

accurate. Information and Software Technology, Volume
32, Issue 3, April 1990, Pages 187-190 , 187-190.
Lee, S. (2007). Project Management. Boston: Department of
Civil and Environmental Engineering Massachusetts
Institute of Technology.
Lenovo. (2013). Lower TCO, Better Experience. Lenovo.
Mahvi, J., & Zarfaty, A. (2009). Using TCO to Determine PC
Upgrade Cycles. Corporation, Intel.
Martinez, H. (2009, August 6). How Much Does Downtime
Really Cost? Retrieved February 14, 2013, from
Information management: http://www.information-
management.com/infodirect/2009_133/downtime_cost-
10015855-1.html
Maseno. (2013, January 7). Maseno In Brief. Retrieved
February 4, 2013, from Maseno University:
https://www.maseno.ac.ke
MOEST. (2005). ICTs in Education Options Paper. Nairobi:
Government Printing Press.
190

Moyle, K. (2004). Total cost of ownership and open source
software. Adelaide: Department of Education and
Children’s Services South Australia.
MUC. (2013, January 7). Maseno In Brief. Retrieved February
4, 2013, from Maseno University:
https://www.maseno.ac.ke
Mwiria, K. (2006). Partnership for High Education in
Africa. Oxford: James Currey Publishers.
Nah, F. F., & Delgado, S. (2006). Critical Success Factors
for Enterprise Resource Planning Implementation and
Upgrade. Journal of Computer Information Systems ,
100.
Närman, P., Sommestad, T., Sandgren, S., & Ekstedt, M.
(2009). A framework for assessing the cost of IT
investments. Stockholm, Sweden: Industrial Information
and Control Systems, KTH.
Nijland, M. (2003). IT cost benefit management improvement
from a critical Perspective. Electronic Journal of
Information Systems Evaluation , 6.191

Oso, W. Y., & Onen, D. (2009). A general giude to writing
research proposal and report. Nairobi: The Jomo
Kenyatta Foundation.
Otieno, J. O. (2010). Enterprise Resource Planning Systems
Implementation and Upgrade (A Kenyan). Middlesex
University: School of Engineering and Information
Sciences unpublished PHd Thesis.
Palmberg, N., & Rydgård, G. (2010). Assessing the total
cost of ownership of ERP systems:Case study analysis
on the factors behind customer costs in recent minor
implementations. Stockholm: Unpublished Thesis.
Patterson, D. (2002, November). A Simple Way to Estimate
the Cost of Downtime. Retrieved January 4, 2012, from
http://roc.cs.berkeley.edu/projects/downtime
Peterson, A. (2007). Costs of information and communication
technology in developing country school systems: the
experience of Botswana, Namibia and Seychelles.
International Journal of Education and Development
using ICT , 3.192

Phelan, P. (2006). Estimating the Time and Cost of ERP
Implementation Projects Is a 10-Step Process. Gartner
Reseach.
Pisello, T. (2001). Return on Investment For Information
Technology Providers Using ROI as a Selling and
Management Tool. New Canaan: The Information Economics
Press.
Pisello, T., & Quirk, B. (2004, January 5). How to quantify
downtime. Retrieved may 17, 2013, from Network world:
http://www.networkworld.com/careers/2004/0105man.html
Pol, P., & Paturkar, M. (2011). Methods of Fit Gap Analysis
in SAP ERP Projects. Bangalore: Infosys Technologies
Ltd.
Poon, P., & Yu, T. Y. (2006, May 20). Procurement of
Enterprise Resource Planning Systems: Experiences with
Some Hong Kong Companies. ACM , p. 563.
Rabaa'i, A. A. (2009). Identifying Critical Success Factors
of ERP Systems at the Higher Education Sector. Third
International Symposium on Innovation in Information &193

Communication Technology (pp. 5-6). Amman:
Philadelphia University.
Reichman, A., & Staten, J. (2008). TCO is overrated.
Cambridge: Forrester.
RTO/NATO. (2003). Cost Structure and Life Cycle Cost (LCC)
and for Military Systems. Ottawa, Ontario, Canada: St.
Joseph Print Group Inc.
SAP. (2013). SAP Licensing Guide. SAP Ag.
SAP. (2005). TCO Benchmarking,. Atlanta: SAP ASUG.
Shaikh, M., & Cornford, T. (2011). Total cost of ownership
of open source software: a report for the UK Cabinet
Office supported by OpenForum Europe. London: Queen's
Printer and Controller from HMSO.
Ssempebwa, J., Canene, A. P., & Mugabe, M. (2007). ICT
Investment in Rwandan Higher Education: Highlighting
the Cost of Downtime and End-Users’ Operations.
Kampala International University Research Digest , 19-
29.
194

Stegman, E., Fitzgerald, S., & Kaestner, R. (2003).
California District Case Study. Washington: K-12
School Districts.
Stensrud, E. (2001). Alternative approaches to effort
prediction of ERP projects. Information and software
technology, 43 , 413-423.
Trucano, M. (2011, May 17). ICTs in education challenges
and research questions. Retrieved May 20, 2011, from
InforDev: http://www.infodev.org
Twinomugisha, A., & Bassi, R. (2009). A framework for
identifying and assessing technology options, their
benefits, feasibility and total cost of ownership.
Dublin: GeSCI.
Umble, E. J. (2003). Enterprise Resource Planning:
Implementation procedures and Critical Success
Factors. European Journal of Operational Research,
146, , 241-257.
Verville, J., & Halingten, A. (2003). A six-stage model of
the buying process for ERP software. Industrial 195

Marketing Management 32 , 585 – 594.
Villalongo. (2008, March 4). What is Cost breakdown
Structure? Retrieved May 10, 2013, from Answers:
http://wiki.answers.com/Q/What_is_Cost_breakdown_Struc
ture
Vision. (2008). Assessing the Financial Impact of Downtime
Understand the factors that contribute to the cost of
downtime and accurately calculate its total cost in
your organization. Irvine: Vision Solutions.
Vital Wave Consulting. (2008). Affordable Computing for
Schools in Developing Countries: A Total Cost of
Ownership (TCO) Model for Education Officials.
Californi: Vital Wave Consulting.
West, R., & Daigle, S. L. (2004). Astrategic tool for ERP
planning and implementation. California: Educause.
Yin, R. K. (2003). Case Study Methods: Design and Methods,
3rd edition. Thousand Oaks: Sage Publications.
196

APPENDICES
Appendix A: Interview Guideline
Below is a brief interview guideline.
This interview is intended to assist the researcher in
collecting data on the Enterprise Resource Planning (ERP)
Implementation. You have been identified purposely as an
important respondent to the interview questions. The
information you will provide will be treated with utmost
confidentiality and will be used solely for purposes of
this research. If need be, the findings of the research
will be shared. The researcher is a student of Masinde
Muliro University of Science & Technology pursuing Master
of Science in Information Technology.
197

The interviews sought to get the interviewee’s facts and
opinions on the following:
i. Cost elements that should be included in a TCO model.
ii. Cost drivers that can influence the cost elements in a
TCO.
iii. Sequence of activities that take places in the
procurement of hardware and software.
iv. Elements to be include in ERP TCO.
v. Elements to be included in cost of maintenance and the
necessary activities that are performed.
vi. The yearly budget allocated to ICT department and its
breakdown.
vii. The hardware and software installed in the ERP system.
viii. The organogram of Maseno University ICT department.
ix. System support
x. The end-user activities.
xi. The university asset disposal policy.
xii. Past TCO analysis on the university information
system.198

199

Appendix B: Research Questionnaire
Below is the questionnaire that was used to collect research data from end-users.
Patrick Owoche
P. O. Box
2685
Kisumu
6-Feb-13
Dear Sir/Madam
RE: RESEARCH QUESTIONNAIRE
I am a Masters of Information Technology student at Masinde
Muliro University of Science and Technology. My research
topic is “TCO Model for ERP System: Case of Maseno
University”. In order to gather data for research I have
prepared a questionnaire to be filled by Maseno University
ERP end users. I kindly request your assistance in this
academic endeavor by filling in the questionnaire. I would
like to emphasize that your responses are extremely
valuable to me and I would greatly appreciate your
answering all questions. I assure you that the data
200

collected here will be held in confidence. The results of
the study would be used in a thesis as partial fulfillment
for a Master degree.
Thanks in advance.
Kind regards,
Patrick Owoche
Phone +254722843180
Please tick () where appropriate
SECTION A: Basic Details
1. Which department do you work in?
Academics
Finance
Human Resource
Procurement
Hospital
Kisumu Hotel
Hostel
Others (specify):
………………
201

2. Gender
Male Female
3. Age
Less than
20 yrs
21-30 yrs
31-40 yrs
41-50 yrs
Above 50
yrs
4. Level of Education
Doctorate
Masters
Bachelors
Diploma
Tertiary/Middle-level
College
Others (specify):
………………
5. An Enterprise Resource Planning (ERP) is an integrated
information system that serves all departments within an
enterprise/institution. How long have you been using the
Maseno University ERP system?
Less than 6 months
6-12 months
12-18 months
18-24 months
More than 24 months
6. Maseno University implemented the Microsoft Dynamics
NAV, an ERP software product from Microsoft. Which
module of the ERP system do you use? (select ALL that
apply)202

Academic Management
System
Financial System
Procurement System
Hotel Management
System
Hospital System
Hostels Booking
System
Others (specify):
………………
Section B: ERP System End-User Training
7. Have you ever received computer training : (select ALL
that apply)
I have never received
any training
I trained in high
school
I trained at the
university
I trained in a
private computer
college
I trained through
computer based
training
I trained at work
I trained through
friends
Others (specify):
………………
8. When it comes to learning computers, I would prefer to:
(select ALL that apply)
Not learn any more
Teach myself
Work one on one with
someone
203

Attend classes in a
college
Use tutorial software
Be taught by
colleagues at work
Others (Specify):
………………
9. Select a statement that best describes your ability to
execute the listed tasks. Please tick () where
appropriate
I don’tneed to
know thisfor myjob
Ifeelconfident
Moreknowledge
needed
Idon’tunderstandwhatthisis
Can you:
i)
Set up a new pc
204

ii)
Check set up of existing pc system
iii)
Understand licensing requirement
iv)
Check network connection
v)
Change display mode
vi)
Test printing function
10. Which phrase below describes your OVERALL level of
technical skill and knowledge with the ERP system:
Not Very Competent
Low Level Competency
Moderate Level
Competency
High Level Competency
Expert
11. Averagely, how many hours in a day do you use the
ERP system at work:
0-1
2-3
4-5
5 or more205

12. During the ERP system implementation, did you undergo
user training?
Yes No
13. (i) In the past six months, have you received any
form of ERP end user training? If no skip to item number
14.
Yes No
(ii) If yes, what did it entail? ……………………………………
14. (i)Did you join Maseno University after the ERP
system implementation? If no skip to item 15
Yes No
(ii) If yes, did you undergo ERP end-user induction
training?
Yes No
15. If you have ever received ERP end user training, was
it adequate for your job role?
Yes No
206

16. If you have never received ERP user training, then
how did you learn/how are you learning to use the ERP
system?
Computer based
training
Through workmates
Help desk
Others (specify):
………………
207

SECTION C: ERP System Downtime
The term downtime refers to periods when an information
system is unavailable to users.
17. Outage is when network resources are unavailable to
users. Please estimate the number of outages that occur
per month at your place of work (Fill in numbers)
18. On average, how long (in hours) does each outage
last? Fill in numbers
19. Service degradation occurs when there is a severe
decrease in performance on the network - it is available
to users only on a limited basis. Please estimate the
number of service degradation that occur per month at
your place of work (Fill in numbers)
20. On average, how long (in hours) does each service
degradation last? (Fill in numbers)
21. When a computer or network is down what percentage of
the time do you do the following? (Responses should add
to 100%)
(a) Work on other tasks
208

(b) Wait
(c) Do the same task using manual, work around
procedures
SECTION D: ERP System End-User Activities
22. (i) Do you encounter situations where you need help
when using the ERP system? If no skip to item number 24.
Yes No
23. How many hours cumulatively per month do spend on
your own computer for maintenance activities, such as
backups, loading software, and organizing files on hard
drives?
24. How many hours cumulatively per month do you spend
attempting to resolve your own system and application
issues unaided (without service/service desk support or
co-worker assistance)?
25. How many hours cumulatively per month do you spend on
casual learning activities such as reading manuals or
using on-line help?
209

26. How many hours cumulatively per month do you spend
receiving help from workmates, ERP support to solve
system, application and network issues?
27. Whenever you are stuck in a work related ERP task,
averagely how long (in hours) does it take you to get
assistance? (Fill in numbers)
THANK YOU FOR TAKING YOUR TIME TO
RESPOND TO THIS QUESTIONNAIRE
------ END -----
Appendix C: Data Collection Proforma
210

Total Cost Of Ownership Data Collection Proforma for
Software acquisition
COMPONENTS Name Vendor
Date Acquired
UnitCost
Qnty
Amount
Bundled operatingsystems softwareServer operating systems softwareServer operating systems software upgradesDesktop operatingsystems softwareDesktop operatingsystems software upgradesLaptop operating systems softwareLaptop operating systems software upgradesApplications softwareApplications software maintenance & upgrade costsMiddleware
Database softwareConnectivity and communication software
211

Storage back-up softwareUtilities softwareOthers
SUBTOTAL
Software compliance costsCOMPONENTS Name Vendor Date
AcquiredUnit Cost
Qnty Total Cost
Systems monitoring softwareLicense managementLegal costs‘True up’ costsSoftware auditcostsVendor managementSoftware upgrade management costsSoftware migration management costsSUBTOTAL
Hardware212

Components No
.
Name/Model
Vendor
Date Acquired
UnitCost
Qnty
Total Cost
213

Servers 1234
Clients 1234
Laptops 1234
Peripheral devices
123
Printers 1234
Storage 12
Memory 12
Network connectivity hardware
12
3
SUBTOTAL
Hardware procurement and deployment costsComponentTurnoverLegal costsVendor managementSUBTOTAL
214

Combined direct IT labor support costsCOMPONENTSCentral managementCentral help deskTechnical support officersUniversity managementUniversity help desk/in-house technical support officersAsset managementSecurity and virus managementSUBTOTAL
Network IT access and managementCOMPONENTSCaching hardwareCaching softwareBandwidthLegal costsVendor managementSUBTOTAL
Services and Lease CostsCOMPONENTSNetwork service and
215

management feesBundled telecommunication servicesSUBTOTAL
Dedicated IT Running and ‘Housing’ CostsCOMPONENTSElectricityAir-conditioningCabinetsConsumablesDowntimeSUBTOTAL
Formal training and professional developmentCOMPONENTSTechnical trainingProfessional development of end usersSUBTOTAL
216

Appendix D: Maseno University ICT Budget and TCO Costs
Breakdown
MASENO UNIVERSITY ICT DIRECTORATE BUDGET FOR 2012/2013 & 2013/20142012/20
132013/20
14 Ave Five YearsOverheadsElectricity 28,800 60,000 44,400 222,000Stationary 50,000 50,000 50,000 250,000Tel 200,000 192,500 196,250 981,250Computer Material 500,000 500,000 500,000 2,500,000Tel 84,000 84,000 84,000 420,000Uniforms 0 7,500 3,750 18,750Transport 0 50,000 25,000 125,000Total Overhead 864,812 946,013 905,413 4,527,063
Maintenance
Software License1,200,0
001,200,0
00 6,000,000
Software Maintenance1,500,0
001,500,0
00 7,500,000Maintenance of Office Equipment 100,000
1,000,000 550,000 2,750,000
Network Expansion8,000,0
00 800,0004,400,0
00 22,000,000
Total Maintenance8,100,0
004,500,0
006,300,0
00 31,500,000
Capital Expenditure 500,00010,000,
0005,250,0
00 26,250,000
Salaries & Emoluments16,700,
00019,000,
00017,850,
000
Totals 9,464,8
1210,946,
01310,205,
413 51,027,063
217

Salaries + Emoluments
2012/2013 2013/2014 Ave Five Years
Director 1,109,7241,109,7
24 5,548,620Training manager 569,556 569,556 2,847,780Coordinator 569,556 569,556 2,847,780
Sub-Total 2,248,8362,248,8
36 11,244,180Systems Admin 485,904 337,728 411,816 2,059,080Network Admin 325,632 325,632 1,628,160Hardware Maintenance 347,088 485,904 416,496 2,082,480Website Designer 269,688 269,688 1,348,440Ass Web Master 290,856 238,488 264,672 1,323,360Senior Technician 219,252 172,488 195,870 979,350Senior Technician 313,536 196,488 255,012 1,275,060Technician 835,952 172488 504,220 2,521,100Cyber Assistant 879,504 879,504 4,397,520Office Assistant 125,724 125,724 628,620
Total2,818,2
20 2,878,5002,848,3
60 14,241,800
Overall10,918,
22010,918,
220 54,591,100
Others2012/20
13 2013/2014 Ave Five YearsGratituity & Retirement 1101759 614539 858,149 4,290,745Non Use of official car 192000 192,000 960,000Entertainment 84000 216000 150,000 750,000Responsibility allowance 84000 180000 132,000 660,000
218

Tel 60000 72000 66,000 330,000Leave 12800 12800 12,800 64,000Commuting & Millage 52400 1014000 533,200 2,666,000
Total 1394959 23013391,848,1
49 9,240,745
Grand Total4,213,1
79 5,179,8394,696,5
09 23,482,545
Hardware
DeviceQuantity Unit Cost Amount
Personal Computers 65
70,000 3,000,00
0
Laptops 3
80,000 240,
000
Peripheral Devices 180
2,000 360,
000
Printers 8 100,000
800,000
Servers 2 400,000
800,000
Server Rack 1
80,000 80
,000 Network Connectivity hardware
800,000
Routers 2
40,000 80
,000
Switches 13
6,000 78
,000
Bandwidth cost 0 85
-
Proxy Gateway 80
,000
Firewall 1 200,000
200,000
Cabinet- 48 U 2
96,000 192,
000
Cabinet- 30 U 2
45,000 90
,000
219

Cabinet- 2 U 12
10,000 120,
000
Air Conditioner 1 120,000
120,000
Cabling 500,
000
UPS 65
8,000 520,
000
Memory 5
6,000 30
,000
Storage 3 120,000
360,000
Total (Hardware) 8,450,00
0
Software
SoftwareQuantity
UnitCost Amount
Server Software 2
340,000 680,000
Desktop Operating Systems 60
17,500
1,050,000
Ms Office 60
8,500
510,000
Laptop Operating Systems 2
17,500
35,000
Application Software 60
2,000
120,000
Middleware -
Database Software 544,000
Connectivity &Communication Software 1
120,000
120,000
Storage Backup Software 2
5,000
10,000
Anti Virus -
1,500
-
Utility Software 60
3,000
80,000
Total (Software) ,249,000
220

Procurement Costs Year 1 Year 2 Year 3 Year 4 Year 5Feasibility Study
800,000 160,000 160,000 160,000 160,000
160,000
Requirement Specification
300,000 60,000 60,000 60,000 60,000 60,000
Procurement Management
1,000,000 200,000 200,000 200,000 200,000
200,000
Project Management
1,200,000 240,000 240,000 240,000 240,000
240,000
Hardware/SoftwareApplication Software
3,249,000 649,800 649,800 649,800 649,800
649,800
System Software
11,867,240
1,695,320
1,695,320
1,695,320
1,695,320
1,695,320
Hardware
8,450,000
8,450,000
6,760,000
5,408,000
4,326,400
3,461,120
Implementation CostsTechnical Setup
8,281,571
1,656,314
1,656,314
1,656,314
1,656,314
1,656,314
Change Management
200,000 40,000 40,000 40,000 40,000 40,000
Personnel Restructuring
400,000 80,000 80,000 80,000 80,000 80,000
Testing 60,000 12,000 12,000 12,000 12,000 12,000
Training 60
0,000 120,000 120,000 120,000 120,000120,00
0
Operation $ Maintenance costs Year 1 Year 2 Year 3 Year 4 Year 5Licenses Agreement
185,000 185,000 185,000 185,000 185,000
185,000
Overheads 90
5,412 905,413 905,413 905,413 905,413905,41
3
Maintenance 6,300,
0006,300,0
006,300,0
006,300,0
006,300,0
006,300,
000
221

Support 4,696
,5094,696,5
095,166,1
605,682,7
766,251,0
536,876,
159
Monitoring 60,000 60,000 60,000 60,000 60,000 60,000
Upgrade 80,000 80,000 80,000 80,000 80,000 80,000
End-User UsageEnd-user Operations
1,157,320
1,157,321
1,157,321
1,157,321
1,157,321
1,157,321
Downtime 4,789
,748 4,789,7
484,789,7
484,789,7
484,789,7
484,789,
748
Total54,581,80
331,537,4
2530,317,0
7629,481,6
9228,968,3
7028,728,
195
222

Appendix E: Research Approval Letters
223

224

225

226