Model for Estimating Urban Mobility Based on the Records of ...
27
Sustainability 2020, 12, 838; doi:10.3390/su12030838 www.mdpi.com/journal/sustainability Article Model for Estimating Urban Mobility Based on the Records of User Activities in Public Mobile Networks Krešimir Vidović 1 , Marko Šoštarić 2 , Sadko Mandžuka 3 and Goran Kos 4, * 1 Ericsson Nikola Tesla, Krapinska 45, 10000, Zagreb, Croatia; [email protected] 2 Department of Transport planning, Faculty of Transport and Traffic Sciences, University of Zagreb, Vukelićeva 4, 10000 Zagreb, Croatia; [email protected] (M.S.); 3 Department of Intelligent Transport Systems, Faculty of Transport and Traffic Sciences, University of Zagreb, Vukelićeva 4, 10000 Zagreb, Croatia; [email protected] (S.M.) 4 Institute for tourism, Vrhovec 4, 10000 Zagreb, Croatia; [email protected] * Correspondence: [email protected] Received: 20 November 2019; Accepted: 16 January 2020; Published: 22 January 2020 Abstract: Urban mobility of a population is usually estimated within procedures that focus on specific domains, using limited datasets, indicators, and indices related to the targeted subsets of the urban population. This paper proposes a new approach to urban mobility estimation, based on the telecommunication activities within the public mobile telecommunication networks. The urban mobility indicators in this research are generated from a database of mobile phone users call data records and are integrated into the urban mobility index of the population based on the model defined through the adaptive neuro-fuzzy inference system (ANFIS). The following has been considered in the process: an initial fuzzy inference system, model learning, model quality control, limitations, errors, and deficiencies. The model is practically applied in the programming environment, on a set of real word data. The research results prove the following hypothesis set in this paper: the urban mobility of inhabitants in a specific timeframe, can be described with an urban mobility index based on the data on the recorded telecommunication activities of the public mobile communication network users. Keywords: urban mobility estimation; indicators; index; call data records; telecommunications 1. Introduction The sustainable mobility of the urban population is an important and integrated part of social and economic life, directly affecting the economy and life quality, especially in large agglomerations. Therefore, understanding of key urban mobility features has an extremely important role from the perspective of sustainable urban transport organization and development, in line with the objectives of reducing traffic congestions, mitigating negative environmental and health impacts, and achieving transport-related time and cost savings. Urban mobility is the ability of an individual to move within an urban space in an organized and meaningful manner, in line with their physiological, intellectual, and socioeconomic needs and by utilizing the available transport, community, and information communication infrastructure. Urban mobility of the population is usually estimated within the procedures focused on specific domains (traffic, logistics, ecology, society, etc.) using limited datasets, indicators, and indices related to the targeted subgroups of the urban population (public transport users, cyclists, drivers, etc.). The objective and the purpose of the urban mobility estimation is the identification of the weaknesses and strengths of the transport system, with its key or critical elements. Urban mobility estimation provides valuable insight and enables a better understanding of the urban mobility system, thus, establishing the foundation to improve the existing system and
-
Upload
khangminh22 -
Category
Documents
-
view
0 -
download
0
Transcript of Model for Estimating Urban Mobility Based on the Records of ...

Sustainability 2020, 12, 838; doi:10.3390/su12030838 www.mdpi.com/journal/sustainability
Article
Model for Estimating Urban Mobility Based on the Records of User Activities in Public Mobile Networks Krešimir Vidović 1, Marko Šoštarić 2, Sadko Mandžuka 3 and Goran Kos 4,*
1 Ericsson Nikola Tesla, Krapinska 45, 10000, Zagreb, Croatia; [email protected] 2 Department of Transport planning, Faculty of Transport and Traffic Sciences, University of Zagreb,
Vukelićeva 4, 10000 Zagreb, Croatia; [email protected] (M.S.); 3 Department of Intelligent Transport Systems, Faculty of Transport and Traffic Sciences, University of
Zagreb, Vukelićeva 4, 10000 Zagreb, Croatia; [email protected] (S.M.) 4 Institute for tourism, Vrhovec 4, 10000 Zagreb, Croatia; [email protected]
* Correspondence: [email protected]
Received: 20 November 2019; Accepted: 16 January 2020; Published: 22 January 2020
Abstract: Urban mobility of a population is usually estimated within procedures that focus on specific domains, using limited datasets, indicators, and indices related to the targeted subsets of the urban population. This paper proposes a new approach to urban mobility estimation, based on the telecommunication activities within the public mobile telecommunication networks. The urban mobility indicators in this research are generated from a database of mobile phone users call data records and are integrated into the urban mobility index of the population based on the model defined through the adaptive neuro-fuzzy inference system (ANFIS). The following has been considered in the process: an initial fuzzy inference system, model learning, model quality control, limitations, errors, and deficiencies. The model is practically applied in the programming environment, on a set of real word data. The research results prove the following hypothesis set in this paper: the urban mobility of inhabitants in a specific timeframe, can be described with an urban mobility index based on the data on the recorded telecommunication activities of the public mobile communication network users.
Keywords: urban mobility estimation; indicators; index; call data records; telecommunications
1. Introduction
The sustainable mobility of the urban population is an important and integrated part of social and economic life, directly affecting the economy and life quality, especially in large agglomerations. Therefore, understanding of key urban mobility features has an extremely important role from the perspective of sustainable urban transport organization and development, in line with the objectives of reducing traffic congestions, mitigating negative environmental and health impacts, and achieving transport-related time and cost savings. Urban mobility is the ability of an individual to move within an urban space in an organized and meaningful manner, in line with their physiological, intellectual, and socioeconomic needs and by utilizing the available transport, community, and information communication infrastructure. Urban mobility of the population is usually estimated within the procedures focused on specific domains (traffic, logistics, ecology, society, etc.) using limited datasets, indicators, and indices related to the targeted subgroups of the urban population (public transport users, cyclists, drivers, etc.). The objective and the purpose of the urban mobility estimation is the identification of the weaknesses and strengths of the transport system, with its key or critical elements. Urban mobility estimation provides valuable insight and enables a better understanding of the urban mobility system, thus, establishing the foundation to improve the existing system and

Sustainability 2020, 12, 838 2 of 27
create new mobility services through the approach of characteristics for intelligent transport systems. This research paper proposes a new approach to urban mobility estimation based on the data in the recorded telecommunication activities of the public mobile communication network users. The purpose of this research is to verify the potential use of the data on the telecommunication activities of the users in the urban mobility estimation. The research objective is to define a model for estimating the urban mobility of the population as a quantitative parameter derived from the data on the recorded telecommunication activities of the public mobile communication network users (represented by the call data records, CDR), and to define a new index for the urban mobility estimation.
2. Overview of the Previous Research
The scientific community defines urban mobility in multiple ways. It represents the movement of persons between an origin and different destination points, in different time periods, by different transport modes, with different objectives [1,2,3,4,5]. Total mobility is related to an individual and represents the total number of trips within the observed territory, regardless of the transport mode and purpose, usually observed daily [1,6,7,8]. Mobility can also be defined as a measurement of transport system efficiency to connect spatially separated locations, where mobility is used as a key performance indicator of the transport system functionality [9]. It represents a broader concept than transport because it not only relates to the movement itself but also to the potential for movement and the spatial, economic, and social context of movement. Therefore, the concept of mobility, by analogy, is more comprehensive than transport [10]. Every increase in the number of trips, passenger per transport kilometers, and the travel or transport speed contributes to mobility [11,12,13]. Mobility is the key element of the transport system [14]. Finally, urban mobility is defined as the ability of an individual to move in an urban space in an organized and meaningful manner, in line with their physiological, intellectual, and socioeconomic needs utilizing the available transport, community, and information communication infrastructure [15,16].
Galileo Galilei wrote ”Count what can be counted, measure what can be measured and what is not measurable, make measurable” [17]. Urban mobility needs to be assessed in order to identify the weaknesses and strengths of the transport system, to identify key or critical elements, to provide insight and provide a better understanding of the urban mobility, and to create a foundation for upgrading the existing and creating new services in the field of intelligent transport systems.
Research to date has shown that urban mobility is generally estimated by primarily identifying the relevant urban mobility indicators and then forming an urban mobility index (urban mobility assessment). The first step in calculating the urban mobility indicators is to identify and collect urban mobility data [5–6]. Urban mobility data are heterogeneous in nature and are collected from different sources, which are in principle divided into three groups [20]. The first group is the conventional data sources that include the already established data sources, such as sensors on transport infrastructure, meteorological sensors, environmental sensors, etc. [19]. The second group of data sources includes information and communication systems of the urban mobility participants. Examples of such systems are the road infrastructure charging system, smart ticketing system for the urban public passenger transport, and others [21]. The third group of data consists of the so-called new data sources, covering the use of relatively new technologies, which have not been widely used in the urban mobility assessment (e.g., public mobile telecommunications networks, social networks, and autonomous vehicles) [22,23,24,25,26,27,28]. The primary function of the second and third group data sources is not to collect or generate urban mobility data, but, due to nature of the encompassed systems, to generate data usable for performing the urban mobility estimation. One of the data sources in the category of the so-called new sources is data from the public mobile communications networks, whose potential has been recognized by a great number of authors [12,13,22,25,27,29,30,31,32, 33,34,35,36,37,38,39,40,41,42,43,44, 45, 46, 47, 48, 49, 50, 51, 52, 53, 54, 55, 56]. The benefit of using this dataset is the elimination of disadvantages attributed to the conventional urban mobility data collection methods (e.g., surveys, behavioral research, territorially restricted, and cross-sectional measurements), already proven to be economically inefficient because they use a

Sustainability 2020, 12, 838 3 of 27
small sample of respondents, have limited spatial and temporal coverage, and are often conducted within inappropriate time intervals (large gaps between data collection). The general conclusion is that this data source has great potential in the urban mobility research, primarily because it covers a very large population sample and, if linked to the information on base station position, can provide information on the movement of users. In addition, because of an increase in the number of mobile phone users, the difference between the number of the mobile phone owners and the number of persons without a mobile phone has been reduced and almost completely eliminated, thus, making this data source even more suitable for the mobility research. In the last two decades, the authors have paid considerable attention to the possibility of using data from the telecommunication services billing records for monitoring the traffic flows, urban planning, etc. By comparing the indicators generated in the aforementioned manner with the ones generated from the traditional sources, the authors proved that the sample included in the CDR record is representative, the reliability of the method is high, and the correlation coefficient is high. Different indicators have been proposed that can be derived from a data subset, although the procedures for obtaining and calculating them are not unified.
The next step is related to the mobility indicators. An indicator is a generic name for a parameter indicating the state or a change of state in a specific system, i.e., process. An indicator effectively and easily monitors changes over a defined period of time. The aim of the indicator is to present mobility and trends in a concise, simple, and understandable way [13,57,58,59,60,61,62]. The mobility indicators can be grouped according to the domains to which they are assigned. Transport indicators are very significant for the assessment, representing mobility through categories related to the transport aspect and showing the impact of these components on mobility [4,5,14,63,64,65,66,67].
The next step in an urban mobility estimation is to establish an urban mobility index based on the urban mobility data and indicators. The urban mobility index is defined as the result of a fusion of the relational data or mobility indicators, in order to estimate mobility. Indices are used to reduce the complexity and scope of the data and indicators included in the urban mobility assessment. The advantages of using indexes are the following: Their potential to reduce a significant amount of information of a different nature to a single scalar; the possibility to use them for the evaluation of the complex systems as a whole, rather than at the level of the individual components; and the possibility of comparisons of the indices obtained by the same methodology [68]. Several mobility indices can be found in scientific literature, representing mobility through a unique number generated by a corresponding mathematical model from the data, indicators, or other indices, for example, sampling mobility index (SMI) [69], travel time index (TTI) [70], Harde mobility city index [71], urban mobility index [64], smart transport cities [56], etc.
However, the conclusion is that there is generally no accepted index for estimating urban mobility. Existing urban mobility indicators and indices are generally developed for specific cities or urban areas, taking into account the local specificities, making their application limited to that area only. Regardless of the great number of defined mobility indicators, only a limited number is used to develop an urban mobility index. In addition, the choice of the urban mobility indicators is mainly related to the availability of data, i.e., the existence of a certain data source, which can limit the objectivity and comparability of the mobility assessment within urban agglomerations where such data or sources do not exist. Urban mobility assessments mainly use conventional data sources, and the potential of new data sources is not sufficiently exploited [15]. Thus, no studies to date mention the development of an urban mobility index based on the data from the billing records of the public mobile telecommunication networks (CDRs), which could be used for urban mobility estimation as a result of fusion between the relational mobility indicators (number of trips, trip duration, and Euclidean distance).
3. Research Methodology
This section defines the research methodology providing an overview of the methodology and focuses on determining the relation between urban mobility indicators and an urban mobility index as a function of urban mobility assessment process.

Sustainability 2020, 12, 838 4 of 27
3.1. The Methodology Overview
This section defines the methodology for establishing an expert system for the urban mobility index calculation (Figure 1). An expert system is defined as a system in which human knowledge is embedded and applied to solve problems in a specific area, in a way similar to a human expert [72]. A corresponding subset of information was extracted from the telecommunication activity records of the public mobile communication networks, which contained the following information: the time of the telecommunication activity, the location of the base station to which the user was connected while performing the telecommunication activity, and a designation concealing the real identity of the user. The information provided is used to define the following urban mobility indicators: the number of migrations (number of trips), duration, and Euclidean distance. These indicators are used as input for the model. The first indicator represents a number of trips. An algorithm is used to determine this indicator, and the result is a trip matrix whose fields contain the total number of trips between the specific pairs of base stations (in the associated urban space), in a predefined timeframe. The second indicator is a trip duration indicator, calculated as a median value of the duration of the trip carried out over a certain period of time between specific base station pairs. The third indicator represents the (Euclidean) distance between the base station pairs. The calculated indicator values are used as inputs for the calculation within the urban mobility estimation, i.e., they are used as inputs for an expert system-based model, which is to be developed in the next step. The following step defines an expert system that uses the predefined indices, putting them in the appropriate relations in order to assess the overall urban mobility, on the basis of the ”knowledge learned”. The learning includes a process of ”knowledge extraction” from a wide range of experts in the field of urban mobility. Technically, this acquisition of knowledge is carried out through a survey, and an expert system is established based on the survey results, using the fuzzy logic method, i.e., the so-called ANFIS machine learning technique. The result is an expert system that defines and develops a model for calculating an urban mobility index, based on the indicators derived from the telecommunication activity records of the public mobile communication network users. According to the proposed model, the urban mobility index is calculated for each base station pair (of the corresponding urban wholes), and as such, represents a share in the total mobility index, therefore, called a partial index (partiality refers to taking into account only a part of the observed agglomeration space). The values of the partial urban mobility indices are, then, used to calculate the urban mobility index of the whole area for a predefined timeframe.
START
INPUT DATA
Data excerpt loading
Conversion of input data
Base station list and tables
1
1.1
1.2
1.3CALCULATION OF DISTANCE
2
Euclidian distance calculation2.1
DATA SUBSETS3
Data subset creation3.1IDENTIFICATION OF
MIGRATIONS
Identification of stay locations and
migrations4.1
4
DATA CONSOLIDATION AND FILTERING
Temporal ID removal
Mapping distances and base station pairs
Data filtering
5.1
5.2
5.4
5
CALCULATION OF THE INDICATOR VALUES
OD Matrix6.1
CALCULATION OF PARTIAL MOBILITY
INDEX (pIM)
END
Training and testing data sets5.5
6
Distance matrix6.2
Travel time matrix6.3
7
URBAN MOBILITY INDEKS CALCULATION
8
Travel speed calulation5.3
VERIFICATION AND VALIDATION
10
Data normalisation6.4
Spatial decomposition1.4
COEFFICIENT OF SHARE IN TOTAL MOBILITY
9
Figure 1. Flowchart of the urban mobility index determination.

Sustainability 2020, 12, 838 5 of 27
In step 1.1 the input to the model is a subset of the CDR records that are ex-ante anonymized (depersonalized) and from which all information is removed except for the temporary identification of the user, the timing of the telecommunication activity, and the geographical location of the base station to which the user was connected while performing the telecommunication activity. Data taken from [73]. In step 1.2, the data file is transformed into a table. In step 1.3, the base stations stored in the associated table are identified. In step 1.4, the coverage area of each base station is identified, using the so-called Voronoi procedure [42,74,75]. The calculation of the indicators primarily takes place at the level of all base station pairs. In step 2.1, the Euclidean distance between each pair of base stations is calculated in order to get their linear distances. The distance between the two locations is calculated using the Haversin formula [76]. In the next step, the data is divided into subsets, since it is possible to define different timeframes within one day, depending on the purpose of the analysis. In step 4.1, the changes of the location are identified for each trip and user, in every individual dataset [51]. Within the same step, an indicator B, trip duration, is defined as the time difference between the recorded start of the activity at the origin cell and the recorded start of activity at the destination cell for each individual trip. It is calculated by using Relation (1): 𝐵 = 𝛥𝑡(𝑖, 𝑗) = 𝑡(𝑖) − 𝑡(𝑖) (1)
where: • B is an indicator of the duration of the journey for each individual trip; • 𝑡(𝑖) is a time denotement in which the user activity was recorded at the base
station and identified as the trip origin; • 𝑡(𝑖) is a time denotement in which the user activity was recorded at the base
station and identified as the trip destination; • 𝛥𝑡(𝑖, 𝑗) is the travel time between two base stations.
Within steps 5.1 and 5.2, the tables are merged and the redundant data removed. The results of this procedure are the trip values with the assigned distances between the base station pairs. Next, in step 5.3, the travel speed for each individual trip is calculated as a quotient of the linear distance value and Δt, as shown in the Equation (2).
𝐷1(𝑖, 𝑗) = 𝐶(𝑖, 𝑗)𝐵(𝑖, 𝑗) (2)
where:
• 𝐷1(𝑖, 𝑗) is the speed of movement for each individual journey within a timeframe; • 𝐶(𝑖, 𝑗) is the Euclidean distance between base station pairs; • 𝐵(𝑖, 𝑗) is the duration of the journey, for each individual trip within a timeframe.
In step 5.4, the filtering follows. The data in which the time difference between the two recorded
events is less than the defined time threshold is being filtered. All trip durations under 10 minutes, or longer than 60 minutes are also filtered [38,51,74], similar to the data in which the linear spatial distance between the base stations is less than the defined spatial threshold. The spatial threshold is defined as 1 km [38,51,74]. The filtering is done over data in which the calculated travel speed is not realistic in the context of urban migrations. All trips with the travel speed greater than 100 km/h are filtered.
Then, in step 5.5, the dataset is divided into two sets, namely the calibration set, and the model validation set. The calibration set consists of 80% of the total dataset, and the validation set consists of the remaining 20%. All further steps are performed on both datasets for each timeframe. In step 6, the value of the indicator for each timeframe is calculated and the data is stored in three different matrices for each timeframe. The first is the trip matrix (O-D matrix), the second is the distance matrix, and the third is the time matrix. In step 6.1. a trip matrix (O-D Matrix) is defined, containing the sum of all trips between the individual base station pairs within the appropriate time period. The indicator

Sustainability 2020, 12, 838 6 of 27
of the number of trips between the individual base station pairs 𝐴(𝑖, 𝑗) is calculated using Relation (3):
𝐴(𝑖, 𝑗) = 𝑇𝑟𝑖𝑝_𝐼𝐷(𝑖, 𝑗) (3)
where: • 𝐴(𝑖, 𝑗) is the total number of the recorded (registered) trips between the individual
base station pairs (trip matrix); • 𝑇𝑟𝑖𝑝_𝐼𝐷(𝑖, 𝑗) is a trip between two base stations in an appropriate timeframe, all
assumptions being met.
In step 6.2, a distance matrix is calculated, containing distances of all base station pairs between which a trip is generated within an appropriate time period. In step 6.3, a trip duration matrix is formed. It contains values of the median trip duration between all base station pairs for the corresponding time period, calculated according to the methodology described in step 4.1.
The indicator 𝐵 is calculated using Expression (4): 𝐵(𝑖, 𝑗) = ∑ 𝐵(𝑖, 𝑗)𝑛 (4)
as the median value of all travel times between base station pairs within the appropriate time period.
where:
• 𝐵 , is the median value of all travel times between each pair of base stations over a timeframe;
• 𝐵(𝑖, 𝑗) is the value of the trip duration for each individual trip in a timeframe;
• 𝑛 is the number of trips registered between each base station pair in a timeframe.
In step 6.4, the data normalization is performed. Previous steps result in values stored in three matrices, for each time period. Since the day is divided into eight time periods, a total output from the previous step includes a total of 24 matrices (8 × 3), which are then used in the urban mobility index calculation. In order to ensure that the model is applicable to all urban areas, regardless of their size, the obtained data need to be normalized, i.e., reduced to an interval [0,1]. The normalization is performed by normalizing the value of an indicator over a given interval with the highest value of an individual indicator for all eight intervals. The purpose of carrying out the normalization carried in this way is to include specific data in the calculation, i.e., to take into consideration to what extent an individual indicator participates in the total mobility of an urban agglomeration in each individual timeframe, and to identify its maximum. The normalization of the number of trips is performed by identifying the maximum value of the trip number indicator for a specific pair of origins and destinations within all eight time periods. These values are then stored into a new matrix called the matrix of the maximum trip quantities. The normalized trip quantity values are calculated by dividing the indicator values assigned to the eight matrices for each time period with the value of the maximum travel quantity matrix, thus, obtaining the normalized travel matrices for each time period. In step 6.6, the normalization of the trip duration indicators is carried out by identifying the maximum values of the trip duration indicator for each pair of origins and destinations within all predefined time periods, which is called the matrix of the maximum trip duration. This is followed by the calculation of the normalized trip duration value, by dividing the indicator values assigned to the eight matrices for each time period with the value of the maximum trip quantities matrix, thus, obtaining the normalized trip duration matrices for each time period. Then, in step 6.7, a normalization of the distance indicators is carried out. Unlike the two previously described indicators, the value of the distance indicator does not change over time. Therefore, the normalization is calculated in a way to normalize the length of each section between origin and destination pairs

Sustainability 2020, 12, 838 7 of 27
with the length of the total network, i.e., with the total length of all the sections included in the trip during all timeframes.
Next, in step 7, a partial urban mobility index is calculated. The parameter 𝑝𝐼𝑀 , , i.e., the partial urban mobility index for the corresponding base station pair in the appropriate timeframe, is calculated using the model defined in the following sections. The partial urban mobility index is defined as a function of the normalized indicator value, namely the total number of the trips recorded between the individual base station pairs, the median value of the trip duration between the individual base station pairs in a specific timeframe, and the Euclidean distance between the base station pairs, as shown in Expression (5). The result is a parameter within the [0,1] interval, indicating the value of the mobility estimate, with ”0” indicating the lowest and ”1” indicating the highest mobility level. 𝑝𝐼𝑀 , = 𝑓((𝑛𝑜𝑟𝑚𝐴(𝑖, 𝑗),𝑛𝑜𝑟𝑚𝐵 , , 𝑛𝑜𝑟𝑚𝐶(𝑖, 𝑗)) (5)
• 𝑛𝑜𝑟𝑚𝐴( , ) is the normalized value of the number of trips for the corresponding base station pair for all timeframes within one day;
• 𝑛𝑜𝑟𝑚𝐵 , is the normalized value of the median trip duration value for the corresponding base station pair for all timeframes within one day;
• 𝑛𝑜𝑟𝑚𝐶( , ) is the normalized value of the distance indicator for the corresponding base station pair.
In step 8, the urban mobility index (UMI) is calculated for each timeframe, as a median of the partial urban mobility indices between each pair of base stations (urban areas) between which a trip was made during a specific timeframe (O). The urban mobility index can have a value from zero to one, i.e., it can be presented as a percentage with a value of zero to 100%. It is calculated by using Formula (6). UMI is calculated for every specific timeframe:
𝐼𝑀 = ∑ ( , ) [%] (6)
where:
• 𝐼𝑀 is the urban mobility index for the timeframe;
• 𝑝𝐼𝑀 , is the partial urban mobility index for the corresponding base station pair within the appropriate timeframe;
• 𝑛 is the total number of origin and destination pairs for which the mobility assessment was performed.
In step 9, after calculating the partial urban mobility index, an additional urban mobility index can be calculated, in order to provide a broader picture of the urban mobility assessment and to complement the partial mobility index. An additional indicator is called the coefficient of the total mobility share (𝛼 , ). For each base station pair, the following indicators are defined: The number of trips and the Euclidean distance between them. Total mobility can be defined as the product of the number of trips and the distances between the individual base station pairs. The unit for this parameter is a passenger/transport kilometer (pkm). This unit is common in traffic engineering and is based on the number of actually transported passengers, i.e., actually traveled distance [11–13]. The coefficient is calculated using Expression (7): 𝛼( , ) = 𝐴( , ) ∗ 𝐶( , )∑ (𝐴( , ) ∗ 𝐶( , )) (7)
where: • 𝛼 , is the total mobility share coefficient for each origin and destination pair (base
station pair); • 𝐴( , ) is the value of the trip number indicator in a specific timeframe;
Sustainability 2020, 12, 838 8 of 27
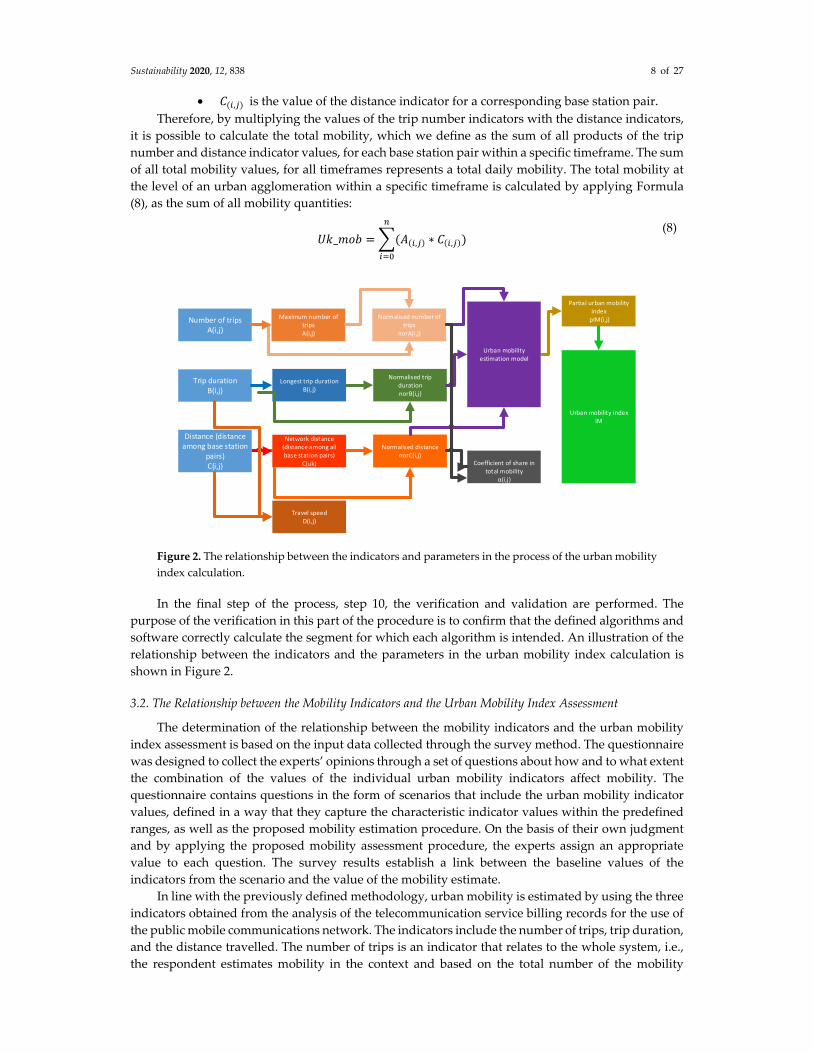
• 𝐶( , ) is the value of the distance indicator for a corresponding base station pair. Therefore, by multiplying the values of the trip number indicators with the distance indicators,
it is possible to calculate the total mobility, which we define as the sum of all products of the trip number and distance indicator values, for each base station pair within a specific timeframe. The sum of all total mobility values, for all timeframes represents a total daily mobility. The total mobility at the level of an urban agglomeration within a specific timeframe is calculated by applying Formula (8), as the sum of all mobility quantities:
𝑈𝑘_𝑚𝑜𝑏 = (𝐴( , ) ∗ 𝐶( , )) (8)
Number of trips A(i,j)
Trip durationB(i,j)
Distance (distance among base station
pairs)C(i,j)
Travel speedD(i,j)
Normalised number of trips
norA(i,j)
Maximum number of tripsA(i,j)
Normalised trip durationnorB(i,j)
Longest trip durationB(i,j)
Network distance (distance among all base station pairs)
C(uk)
Normalised distancenorC(i,j)
Urban mobility estimation model
Partial urban mobility index
pIM(i,j)
Coefficient of share in total mobility
α(i,j)
Urban mobility indexIM
Figure 2. The relationship between the indicators and parameters in the process of the urban mobility index calculation.
In the final step of the process, step 10, the verification and validation are performed. The purpose of the verification in this part of the procedure is to confirm that the defined algorithms and software correctly calculate the segment for which each algorithm is intended. An illustration of the relationship between the indicators and the parameters in the urban mobility index calculation is shown in Figure 2.
3.2. The Relationship between the Mobility Indicators and the Urban Mobility Index Assessment
The determination of the relationship between the mobility indicators and the urban mobility index assessment is based on the input data collected through the survey method. The questionnaire was designed to collect the experts’ opinions through a set of questions about how and to what extent the combination of the values of the individual urban mobility indicators affect mobility. The questionnaire contains questions in the form of scenarios that include the urban mobility indicator values, defined in a way that they capture the characteristic indicator values within the predefined ranges, as well as the proposed mobility estimation procedure. On the basis of their own judgment and by applying the proposed mobility assessment procedure, the experts assign an appropriate value to each question. The survey results establish a link between the baseline values of the indicators from the scenario and the value of the mobility estimate.
In line with the previously defined methodology, urban mobility is estimated by using the three indicators obtained from the analysis of the telecommunication service billing records for the use of the public mobile communications network. The indicators include the number of trips, trip duration, and the distance travelled. The number of trips is an indicator that relates to the whole system, i.e., the respondent estimates mobility in the context and based on the total number of the mobility

Sustainability 2020, 12, 838 9 of 27
participants in a specific time period. Other indicators, i.e., trip duration and distance travelled refer to an individual trip, and the respondent assesses mobility by looking at these values from an end-user perspective. In the survey questionnaire, the number of trips is defined as follows: The indicator of the number of trips refers to the number of movements between the individual urban areas in a defined timeframe. It represents the number of all recorded movements, of all users, between the individual urban areas in an appropriate timeframe [3,36]. Values are categorized as follows [3,5,63,77]: A small number of trips are those which are, during a typical urban day, mainly present during periods when there are usually no trips related to work, entertainment, recreation, commerce or social events. A medium number of trips represents the number of trips, in urban conditions, that is characteristic for the period outside of the peak traffic period. For example, it refers to the number of trips achieved in the period when travelling is usually motivated by commerce, recreation, or social activities. A large number of trips represents the number of trips that is, in urban conditions, characteristic for the peak traffic periods, i.e., periods of a typical day, when residents travel to or from work during peak hours.
The trip duration indicator refers to the duration of each individual trip. However, in order to apply this indicator to all urban surroundings, i.e., in cities of all sizes, it must be relativized by calculating the proportion of a single trip in relation to the longest lasting registered trip, thus, normalizing the value of a single trip duration in relation to the longest trip in a characteristic day. In that sense, the longest trip is the one with the longest duration, while the origin and destination remain within the same urban agglomeration, i.e., the coverage area. For this reason, the value of the trip indicators can be defined as in Table 1.
Table 1. The trip duration indicator (relative value).
Trip duration indicator Trip duration Short trip duration up to 33% of the longest lasting trip
Medium trip duration from 34% to 66% of the longest lasting trip Long trip duration from 67% to 100% of the longest lasting trip
The distance indicator is used as an approximation of the distance travelled [1,3,36]. In the questionnaire, the distance travelled indicator was defined as follows: The distance indicator refers to the distance travelled by the user during the trip between individual urban areas, i.e., it represents the distance between the trip origin and destination. The value of the trip distance indicator can be relativized by calculating the proportion of a single trip in relation to the longest registered trip, thus, normalizing the distance travelled within a single trip with respect to the longest journey in a characteristic day. The longest trip is the one during which the distance travelled is the greatest, with the origin and destination remaining within the same urban agglomeration, i.e., the coverage area. For this reason, the value of the distance indicator is defined as in Table 2.
Table 2. The (traveled) distance indicator.
Traveled distance indicator Trip distance Short distance up to 33% of the longest trip
Medium distance from 34% to 66% of the longest trip Long distance from 67% to 100% of the longest trip
If the value of one of the indicators is equal to zero, the trip did not happen and the mobility is equal to zero, i.e., there is no mobility.
A mobility assessment was then defined. Respondents assigned one of the six predefined mobility ratings to the appropriate scenario, as explained in the following paragraphs. The rating categories, as well as the related descriptions further in text, are based on the ratings related to the service level, service quality, and customer satisfaction [13,53,54]. In ”extremely high mobility”, the traffic system is characterized by the completely free traffic flow and full freedom of maneuvering, where participants choose the speed, the freedom of movement is not disturbed, and waiting times are minimal. The users are extremely satisfied. With ”high mobility” the traffic system is described

Sustainability 2020, 12, 838 10 of 27
by the conditions of the free traffic flow, the freedom of maneuvering is not disturbed, the speed of movement is minimally restricted, the freedom of movement is limited to a small extent and waiting times are rare and short. The users are satisfied. With ”higher medium mobility” the traffic system is described by the stable traffic flow, limited maneuvering freedom and limited speed. Freedom of movement is also limited and waiting times are noticeable. Users are mostly satisfied. With ”lower medium mobility”, the traffic system is dominated by the unstable traffic conditions, with low maneuverability, substantially limited speeds, clearly limited free movement, and higher average waiting times. Users are mostly dissatisfied. In the case of ”low mobility”, the transport system is characterized by the unstable traffic flow with queuing, almost constantly restricted maneuverability, significantly limited movement speed, delays, and long waiting times. Users are dissatisfied. With ”extremely low mobility” the conditions within the transport system encompass a forced traffic flow, with the maneuvering freedom and the freedom of movement completely disabled, movement speed lower than critical speeds, and extremely long waiting times. Users are extremely dissatisfied.
Survey questions were then formed. The questions cover all the permutations of the indicator values included in the mobility assessment. The experts answer the questions basing on their own knowledge and experience, by assigning an appropriate value to the mobility estimate in each question. The questions are designed by using the indicator values shown in Table 3.
Table 3. The indicator values.
Number of trips Trip duration indicator Travel distance indicator Low number of trips Short trip duration Short distance
Medium number of trips Medium trip duration Medium distance High number of trips Long trip duration Long distance
The questions are designed to encompass the values of all the indicators involved, for example, If <number of trips>, <trip duration indicator>and <travelled distance indicator>, mobility is <mobility estimate>.
For example, If <number of trips = low number of trips>, <trip duration indicator = medium trip duration >and <travelled distance indicator = long distance>, mobility is <mobility estimate = choose from value 1 to 6 where “6” is extremely high mobility, “5” represents high mobility, “4” stands for “higher medium mobility”, 3 represents “lower medium mobility”, 2 represents “low mobility”, 1 represents “extremely low mobility”>.
Each indicator has three possible values, whereas the mobility estimate has six values. By permuting all indicator values (33), a total number of 27 questions is set.
The survey included 36 urban mobility professionals, i.e., academics, experts from the private sector, and public sector experts working at the city level.
Although it is common to include a small number of experts, usually six to 10, when using the knowledge extraction method, a high number of experts from different domains of urban mobility are included in the research. In addition, the survey covered different professions working in the field of urban mobility, i.e., 16 experts from the scientific community, 11 experts from the private sector, and nine experts from the public sector.
Interviews with the experts were conducted at planned workshops and through teleconferences. Each workshop was designed in such a way that in the introductory part, a brief presentation of the research objective was given, and the research background was explained. This was followed by a discussion including the potential ambiguities, after which the questionnaire was answered.
This section further explains the segment of mapping the indicator values, obtained from the CDRs of the values available to experts, i.e., the link between the two sets. By the CDR records analysis, i.e., by applying the activities shown in Steps 1 through 6 in the methodology, normalized (numerical) values of the three target indicators were provided (for example: the trip number indicator has a numeric value of 0.12). By using the fuzzy approach, the ”number of trips” indicator value is no longer displayed as a numeric value 0.12 , but as a fuzzy affiliation function ”a low number of trips”. During the knowledge extraction process, the experts were presented with the fuzzy

Sustainability 2020, 12, 838 11 of 27
indicator affiliation function values, thus, ensuring the link between the indicator values calculated by the proposed methodology, using the data from the CDR database together with a set of defined rules for establishing a model, generated as a result of analyzing the experts’ survey responses.
A preliminary result analysis is given below and shown in Table 4. For each scenario, it shows a minimum and maximum mobility rating assigned by the experts, an average rating, and the calculated standard deviation. The distribution of ratings (as a percentage) for each mobility assessment scenario is also presented.
Table 4. Analysis of the results of the survey questionnaire.
Mobility rating No. MIN MAX AVG STDEV 1 2 3 4 5 6
Scen
ario
1 3 6 4.44 1.44 0% 0% 44% 11% 0% 44% 2 3 6 4.22 1.24 0% 0% 44% 11% 22% 22% 3 2 6 4.44 1.18 0% 11% 0% 44% 22% 22% 4 2 5 3.22 1.15 0% 44% 0% 44% 11% 0% 5 2 5 3.11 1.01 0% 33% 33% 22% 11% 0% 6 2 6 3.44 1.18 0% 11% 67% 0% 11% 11% 7 1 3 1.33 0.68 78% 11% 11% 0% 0% 0% 8 1 4 2.00 0.96 33% 44% 11% 11% 0% 0% 9 1 4 2.33 0.96 22% 33% 33% 11% 0% 0%
10 3 6 4.33 0.83 0% 0% 11% 56% 22% 11% 11 2 6 4.33 1.07 0% 11% 0% 44% 33% 11% 12 1 6 4.67 1.43 11% 0% 0% 11% 56% 22% 13 2 4 3.00 0.68 0% 22% 56% 22% 0% 0% 14 3 4 3.11 0.32 0% 0% 89% 11% 0% 0% 15 2 4 3.33 0.83 0% 22% 22% 56% 0% 0% 16 1 6 2.78 1.57 11% 56% 11% 0% 11% 11% 17 1 5 3.00 1.35 11% 33% 22% 11% 22% 0% 18 1 5 3.00 1.07 11% 11% 56% 11% 11% 0% 19 4 6 4.78 0.80 0% 0% 0% 44% 33% 22% 20 4 6 4.89 0.75 0% 0% 0% 33% 44% 22% 21 5 6 5.78 0.42 0% 0% 0% 0% 22% 78% 22 2 4 3.33 0.68 0% 11% 44% 44% 0% 0% 23 2 5 3.67 0.96 0% 11% 33% 33% 22% 0% 24 2 6 4.22 1.15 0% 11% 11% 33% 33% 11% 25 1 5 2.56 1.36 33% 11% 33% 11% 11% 0% 26 1 4 2.67 1.07 11% 44% 11% 33% 0% 0% 27 1 5 3.22 1.24 11% 11% 44% 11% 22% 0%
The preliminary data analysis was made in order to check the consistency of the answers and to identify questions where a pronounced assent or disagreement in the opinion of the experts exists. Certain differences in the opinion of the experts are expected, as they consider mobility from different perspectives, depending on their own expertise. The highest consensus of the experts was recorded for questions 14 (medium number of trips, medium trip duration, and medium distance) and 21 (high number of trips, short trip duration, and long distance). In Question 14, the assigned mobility ratings range from three to four, with an average score of 3.11, while in the Question 21, the responses range from five to six, with an average value of 5.78. In case of several questions, Question 12 (medium number of trips, short trip duration, long distance) and Question 16 (medium number of trips, long trip duration, short distance), the experts assigned the highest and the lowest ratings to the same question, with an average mobility rating of 4.67 in Question 12 and 2.78 in Question 16. In Question 7 (low number of trips, long trip duration, short distance), the highest number of experts (78%) rated the described mobility conditions with rank “one” (low number of trips, long trip duration, short distance), while in the Question 16 (medium number of trips, long trip duration, short distance), the highest number of experts (56%) rated mobility with the rank “two”. The highest number of experts (89%) rated the mobility described in Question 14 (medium number of trips, medium trip duration,

Sustainability 2020, 12, 838 12 of 27
medium distance) with a rank “three”. The highest number of experts (56%) rated mobility described in Question 10 (medium number of trips, short trip duration, short distance) and Question 15 (medium number of trips, medium trip duration, long distance) as rank “four”. The highest number of experts (56%) rated the mobility described in Question 12 (medium number of tips, short trip duration, long distance) as rank “five”. The highest number of experts (78%) rated the mobility described by Question 21 (high number of trips, short trip duration, long distances) with a rank “six”.
4. Model of the Urban Mobility Index
In order to define an urban mobility estimation model, a fuzzy logic method, ANFIS (adaptive neuro-fuzzy inference system), is used. It is a machine learning technique that uses fuzzy logic to transform the given input into the corresponding output values [78,79,80,81,82]. Data showing the relationships between the values of the mobility indicators and the mobility ratings were collected through a survey. The respondents were provided with three descriptive values from a set consisting of three indicators and were required to associate a mobility ranking from one of the six descriptive categories. The descriptive values of the indicators had surrogate numerical values in the interval of [1,3], while the mobility estimate had surrogate numerical values in the interval of [1,6]. Considering that the data are in different ranges (the values of the indicators are represented by the surrogate variables ranging from one to three, and the mobility assessment values in the range of one to six), their normalization was performed. It is common for a set of numeric values to be normalized by subtracting the minimum value of that attribute from all values, in all examples of the dataset, and by dividing the resulting value by a difference between the maximum and minimum attribute values. The values obtained in this manner have the same form of distribution, and all values range from zero to one. It is a desirable and sometimes necessary operation, when modeling with the neural networks or creating regression models [83,84]. Upon the normalization and division of the data into sets, they can be used to model an adaptive neuro-fuzzy inference system as a fuzzy system in which the membership functions are generated by using the learning methods characteristic of the neural networks. Out of the total number of data pairs collected by the survey (36 questionnaires, 27 questions each), a total of 972 data pairs were generated. Out of this number, 654 data pairs are used for learning and 160 for the validation and control (verification). ANFIS modeling is performed as part of the MATLAB software tool [85]. After the completion of the preparatory action, the learning data loading procedure and the validation and verification of the model, the generation of an initial fuzzy inference system takes place using a fixed grid partitioning. A fixed grid partitioning refers to the division of data space into a rectangular grid, which depends on the number of the membership functions and their type. The number of rules increases exponentially by increasing the input variables, so if there is an m of membership functions and n input variables, then the number of fuzzy rules is 𝑚 . Therefore, the use of a fixed grid is limited only to cases where there is a low number of the input variables (less than six), resulting in lower requirements for the computational resources in simulation [86]. The use of the fixed grid partitioning for the systems with a low number of membership functions ensures a small forecasting error and was chosen to be applied in this model.
The initial system defines the initial settings of the membership functions, which may change after the learning has been performed, as a result of the learning itself. This step defines the input parameters as follows: (a) The number of the membership functions, (b) the type of the input membership functions, and (c) the type of output membership functions. The number of the input membership functions is defined by the number of input variables. Three input variables are included in this model: (a) the number of trips in the interval [ 0,1 ], (b) trip duration [ 0,1 ], and (c) distance [ 0,1 ].
The model learning, then, takes place. Before the learning process begins, the following has to be defined: (a) an optimization method, i.e., the selection of the learning method between backpropagation or hybrid learning; (b) the error tolerance; and (c) the number of the model learning epochs. All fuzzy inference systems are learned either by the backpropagation method or by the hybrid method [87–91]. For each of the fuzzy inference systems, three scenarios were defined, therefore, in the first scenario the number of learning epochs was three (a default setting), in the

Sustainability 2020, 12, 838 13 of 27
second scenario the number of learning epochs was ten, and in the third scenario the number of learning epochs was one hundred. On the basis of the result analysis, it was concluded that in this research a hybrid learning method would be used, in which zero error tolerance is defined and the learning takes place within three epochs. Models are evaluated through the learning error (RMSE). During the network learning, the graph shows the value of the error depending on each learning epoch. An example of the graphical representation of an error reduction, while performing the network learning through the 100 epochs for the fuzzy inference system under the ordinal number 27 (settings: the membership functions of the input variables are of a trapezoid type, backpropagation learning, the output function is linear, the epoch number is 100), is shown in Figure 5. The learning result is a 78-node network with 108 linear parameters and 36 nonlinear parameters, i.e., a total of 144 parameters. A total of 654 data pairs were used for the model learning, and 160 data pairs were used for validation. The system resulted in a base of rules containing 27 (3 ) rules. The model has been described with 27 rules, each having its own interval of the mobility estimate output values, depending on the parameter values of the input variables. Within the initial rule base (before the model learning), the values of the target variable are unknown. After the model learning process, ANFIS enables the creation and fine-tuning of rules which describe the behavior of a complex system. A graphical representation of the rules before the model learning (for one candidate system) is shown in Figure 3, and after completing the model learning is shown in Figure 4.
Figure 3. The graphical representation of the rules in the initial fuzzy logic model (1st column = number of trips, 2nd column = trip duration, 3rd column = distance, and 4th column urban mobility estimation).

Sustainability 2020, 12, 838 14 of 27
Figure 4. The graphical representation of the model after the completion of the model learning process (1st column = number of trips, 2nd column = trip duration, 3rd column = distance, and 4th column urban mobility estimation).
The ANFIS model validation and verification process is then performed, i.e., the model forecasting
results are presented and analyzed by comparing the model results obtained from the learning
dataset, the validation dataset, and the model verification dataset. The validation and verification of
the ANFIS model includes two processes: (a) the model validation process and (b) the model
verification process. Model validation is a process used to evaluate the reliability of the model
inference. The difference between the learning phase and the validation phase, at this stage, is that
the model no longer learns, i.e., the weight coefficients over the values, obtained as a result of the
learning are fixed and no longer change. Validation error is defined as the difference between the
value of the output variable of the original and unmodified dataset used for validation, and the
difference between the value of the output variable from the fuzzy inference system using the same
input dataset (validation set). The learning verification error is calculated as the root mean square
error (RMSE). The graphical representation of the learning dataset is shown in Figure 6, the validation dataset
is shown in Figure 7, and the verification dataset is in Figure 8.
Figure 5. A learning error dependent on the number of epochs for the fuzzy inference system number 27.

Sustainability 2020, 12, 838 15 of 27
Figure 6. Learning dataset (training data).
Figure 7. Validation dataset (testing data).
Figure 8. Verification dataset (checking data).

Sustainability 2020, 12, 838 16 of 27
Figure 9. The interrelation between the training dataset and the testing dataset.
Figure 10. The interrelation between the training dataset and the checking dataset.
Figure 9 shows the interrelation between the training dataset and the testing dataset. Figure 10 shows the relationship between the model learning data and the data used to verify the model (checking data). This is followed by the model validation and verification processes [92], performed for each fuzzy inference system. Model validation confirms that the outputs of the statistical model outputs are acceptable with respect to the real data-generating process and model verification. A checking dataset for the model verification is needed, since after a certain point during the training, the model begins overfitting the training dataset. In principle, the model error for the checking dataset tends to decrease as the training takes place, up to the point when the overfitting begins and, then, the model error for the checking data suddenly increases. The overfitting is accounted for by testing the FIS trained on the training data against the checking data and choosing the membership function parameters to be those associated with the minimum checking error, if these errors indicate model overfitting. After completing the model learning process, it appears that the fuzzy inference system has been modified, primarily in terms of changes in the values describing the membership functions of the input and the output variables, as shown in Table 5. The interval values of the functions obtained in this step, represent the final version of each membership function interval.
Table 5. The comparison of the intervals of the input membership functions, before and after the model learning.
Input variable
Fuzzy set Function interval in the initial fuzzy logic system
Membership function interval after the learning process in the chosen fuzzy logic
system
Number of trips
Small number of trips
[ − 0.35 – 0.15 0.15 0.35 ] [ − 0.35 − 0.15 0.1512 0.361 ]
Medium number of
trips [ 0.15 0.35 0.65 0.85 ] [ 0.1501 0.3512 0.6497 0.85 ]
Large amount of trips
[ 0.65 0.85 1.15 1.35 ] [ 0.6473 0.8497 1.15 1.35 ]
Trip duration
Short trip duration
[ − 0.35 − 0.15 0.15 0.35 ] [ − 0.35 − 0.15 0.1514 0.3628 ]
Medium trip duration
[ 0.15 0.35 0.65 0.85 ] [ 0.1501 0.3514 0.6504 0.85 ]
Long trip duration
[ 0.65 0.85 1.15 1.35 ] [ 0.6544 0.8504 1.15 1.35 ]
Distance
Short distance [ − 0,35 − 0.15 0.15 0.35 ] [ − 0.35 − 0.15 0. 1507 0.3568 ] Medium distance
[ 0.15 0.35 0.65 0.85 ] [ 0.1501 0.3507 0.6505 0.85 ]
Long distance [ 0.65 0.85 1.15 1.35 ] [ 0.6558 0.8505 1.15 1.35 ]

Sustainability 2020, 12, 838 17 of 27
The output parameter, an urban mobility estimation function, is based on 27 rules of the fuzzy inference model and is accordingly defined with the 27 membership functions. For illustration, the first value of the membership function is in the interval [ − 0.1402 – 0.1402 – 0.1402 – 4.205e − 07 ], while the last one, the 27th, is in the interval [ 0.1106 0.16 0.1144 0. 1149 ].
A total 32 candidates for the fuzzy inference system have been defined. All fuzzy inference systems have been assigned with the appropriate membership functions, the form of the output variable and the learning (optimization) method have been defined, together with the number of epochs. The systems varied depending on the form of the input membership function (membership function of triangle type, trapezoid type, bell type, Gaussian type, two-parameter Gaussian type, the membership function π, the membership function as a difference of the sigmoidal functions, and the membership function as a product of the sigmoidal functions), then, depending on the type of output membership function (linear or constant), depending on the learning method type (hybrid learning or backpropagation learning), and the number of learning steps (three, 10, or 100). The reliability of each fuzzy system established was tested using the RMSE method, with a learning error included into the analysis. In general, the smallest learning error was recorded in all scenarios where the hybrid learning method was applied and in which the output function was linear. There was also no significant deviation in the number of epochs (learning steps) noticed. This is supported by the previous studies which have shown that in solving the real-world problems, the form of the membership function does not affect the accuracy of the process, i.e., the systems of the external world are relatively insensitive to the membership function form [ 9.65 − 68 ]. Therefore, for the development of an expert system of this type, the most commonly used membership functions in the literature are the triangular or trapezoidal types [ 9.65 − 68 ]. Finally, a fuzzy inference system with the smallest model learning error was selected to establish the urban mobility index. The average model validation error (for the model chosen as optimal) is 0.2103, and the average model validation error is 0.1907. The first-class fuzzy logic Sugeno model was chosen as the most optimal model, which was one where all three entry values are determined with a trapezoid type membership function, and each consists of three overlapping linear type functions. The result is an urban mobility index model. The model defined the individual relationship of each input indicator with respect to the mobility estimates and enables the expression of the urban mobility estimate as a single number, considering the values of all indicators. Figure 11, Figure 12 and Figure 13 graphically show the combined effects of the values of the individual indicators on the overall mobility.
Figure 11. The model result: The relationship between the trip duration indicators and the number of trips with respect to the mobility estimate (taken from the MATLAB v 9.0, 2016 programming tool).

Sustainability 2020, 12, 838 18 of 27
Figure 12. The model result: The relationship between the trip duration indicators and the distance indicators with respect to the mobility estimate (taken from the MATLAB v 9.0, 2016 programming tool).
Figure 13. The model result: The relationship between the trip distance indicators and the number of trips with respect to the mobility estimate (taken from the MATLAB v 9.0, 2016 programming tool).
The urban mobility indicators, which are used as input for the urban mobility estimation model, have been identified in the previous steps of the procedure. These indicators are then included in the model, as the actual values of the indicators obtained from the previous steps. The modeling is then carried out for each base station pair, resulting in the calculation of so-called partial urban mobility indices that represent the mobility estimate for that specific pair of urban areas. The partial urban mobility indices, as the output of the model, are then re-entering the urban mobility assessment process. The extent to which each of them participates in the total mobility is then determined and the final urban mobility index calculated (for the appropriate time period), for the respective urban agglomeration. The proposed model of the mobility estimation, i.e., the urban mobility index is developed for generic cases and the obtained results can be compared between the cities. The application of the proposed urban mobility index enables an objective and comparable passenger mobility assessment within urban agglomerations. The existing models are hardly enable a comparison of different cities and agglomerations.

Sustainability 2020, 12, 838 19 of 27
5. The Application of the Urban Mobility Index Estimation Process
In order to make the proposed methodology applicable for real-world urban mobility estimation, an urban mobility model defined within the previous section needs to be implemented in the programming environment. Following the implementation, the application will be performed using the real-world dataset.
5.1. Process Implementation in a Programming Environment
The urban mobility assessment process implementation was carried out using several programming environments. Dataset loading, adjusting the input data, and decomposing the space were performed using the programming code developed in the R software environment. For visualizing the decomposition of the space, an open source software tool for the geospatial analysis (QGis) was used. Modules for calculating the Euclidean distance between the base stations, representing the values of the ”distance” indicators, were then written in the R programming language. A module was also created to divide the dataset into subsets, according to the defined timeframes. The key part of the programming code is the application of the algorithm to identify migrations, i.e., to identify travelling. The data is then entered into a data consolidation and filtering module, and finally into a module in which the data is divided into the validation and calibration set. The data is then converted from a table into a matrix form and this is followed by the data normalization module. The normalized data is entered into the MATLAB programming language, where the fuzzy inference system is invoked, and the data is entered. The result is a partial urban mobility index stored in a table. The data are then returned to R, where the output vector of the partial urban mobility indices is reduced to an interval of [0,1] and the urban mobility index is calculated. The same procedure is performed using the validation dataset. This is followed by the result visualization and analysis.
5.2. The Application of the Procedure over a Real-world Dataset
In the research, the mobility estimation process was tested using a real publicly available subset of data derived from a telecommunication services billing record of a public mobile telecommunication network, which is available at [73]. The data relate to a part of the urban agglomeration of the city of Shenzhen in China, covering 480 base stations and an area of approximately 900 km2 (30 × 30 km). It is estimated that approximately 1.2 million people live in the area, while approximately 25 million live in the urban agglomeration together with the suburban settlements [73]. The entire urban agglomeration (together with suburban settlements) covers approximately 20,000 m2. The dataset used for the analysis consists of 38,218,717 telecommunication activity records for one characteristic day, for 24 hours. It contains data on the telecommunications activities of approximately 450,000 users, representing 37.5% of the population in the area. On average, the record contains 85 telecommunication activities per user on a typical day. According to the number of the base stations, the coverage area is divided into 480 urban areas. The average surface area covered by one base station is 2.69 km2. The shortest distance between the base station pairs is 0.007 km (the distance between the base station 475 and 476), with a total of 12 base station pairs less than 100 meters apart, and 1345 base station pairs within a kilometer distance. The longest distance is 42.9 km (the distance between base stations 36 and 476). The average distance between all base station pairs in the network is 1.81 km. Next, is the migration identification process. A total of 2,133,369 migrations were identified in the analyzed dataset. By applying the filter, all ineligible migrations were eliminated, leaving those longer than 1 km, lasting between 10 and 60 minutes, and with an average speed less than 100 km/h. As a result of the filtering, almost 95% of the identified migrations were removed, i.e., from 91% to 97% per timeframe, leaving 110,902 migrations. The following is the calculation of the only remaining indicator (medium travel time), normalization of the values of all indicators and the calculation of the partial urban mobility indices for each base station pair. The values of the partial urban mobility index for one timeframe is shown in Figure 14. Using the calculated values of the partial urban mobility indices, the calculation of the urban mobility

Sustainability 2020, 12, 838 20 of 27
index for each timeframe is carried out. The values of the urban mobility index by timeframes for the basic dataset and for the validation dataset are shown in Table 6. The validation of the model uses a dataset consisting of 20% of the total dataset and shows that deviations are possible in the range from 3% to 11%, relative to the value obtained through using the basic dataset. The deviation within seven timeframes does not exceed the value of 7%, and in only one frame has a value greater than 11%. The average deviation for all timeframes is 6%, showing the model reliability of 94%.
The deviation of the urban mobility index value from the basic set with the validation data is given in Figure 15.
Table 6. The values of the urban mobility index by timeframes for the basic dataset and for the dataset used for validation.
O1 O2 O3 O4 O5 O6 O7 O8
IM 51.14% 54.50% 69.02% 64.03% 66.65% 7.,57% 56.14% 52.65% IM (validation) 54.57% 57.83% 70.92% 68.20% 70.13% 69.14% 58.71% 56.59%
Difference 6% 6% 3% 6% 5% −11% 4% 7%
Table 7. The total amount of mobility for each timeframe.
Timeframe O1 O2 O3 O4 O5 O6 O7 O8 Amount of mobility 76.365 114.043 223.260 152.107 192.886 151.974 347.662 301.795
Figure 14. PUMI values for the frame O1.
Figure 15. The comparison of the urban mobility index from the basic dataset with the validation
data.

Sustainability 2020, 12, 838 21 of 27
Next is the calculation of an additional indicator, the coefficient of the total mobility share (𝛼 , ), shown in Table 7. The result is the proportion of each pair of base stations in the total mobility within one timeframe.
An analysis was then performed for each frame, showing the minimum and maximum coefficients (𝛼 , ), for each timeframe. In order to identify the areas where the greatest mobility takes place, a summary table was created containing the sum of all total mobility, for all base station pairs and for all timeframes. This gives an overview of the total urban agglomeration mobility within a 24-hour period. The table is visualized in such a way that the range of colors from red to green is defined, with the associated hues, with the most intense shade of red being a pair of base stations (urban areas) with the smallest product of the number of trips and distances, and green being the pair where the aforementioned value is the highest. The table segment for the first 40 rows and columns of the matrix is shown in Figure 16. The entire table is visualized in Figure 17.
Figure 16. The segment of the total mobility for a sum of values within the frame O1-O8.
Figure 17. The visualisation of an overall urban mobility table (480 × 480) for a sum of values within the frame O1-O8.
1 2 3 4 5 6 7 8 9 10 11 12 13 14 15 16 17 18 19 20 21 22 23 24 25 26 27 28 29 30 31 32 33 34 35 36 37 38 39 401 2,7 23 122 5,8 34 35 4,9 12 18 8,6 45 44 19 513 8 14 9,7 3,7 38 50 259 71 139 214 24 40 38 7,4 4,7 185 26 32 12 48 23 216 8,9 3,5 9,4 9,7 257 15 5,2 5,6 32 10 15 25 33 128 14 4,1 17 7 179 5,5 7,8 17 13 8,6 22 28 20 7,8 38 65 14 49 11 25 14
10 21 49 24 24 4,7 3,2 8,7 5,6 8,4 4,1 31 9,8 42 22 29 3011 16 19 11 2,6 4,2 27 13 3,3 18 12 33 11 11 32 25 30 2112 11 30 11 26 35 8,1 13 6,5 5,613 11 8,4 21 64 87 11 18 59 38 5,3 26 9 8414 8,7 24 21 7,4 14 4,4 17 7,2 5,9 3,6 12 9,4 6,815 41 3,1 11 13 74 9,6 28 27 23 17 17 6,416 3,3 14 7,8 2 35 17 2,8 21 13 16 2217 4,5 6,8 13 12 12 13 28 5,6 26 3018 23 8 55 13 11 2 7,5 35 7,7 3,6 1619 6,1 31 26 47 2,9 20 12 11 9 11 19 3320 7 5,7 10 15 25 9,9 9,6 16 1,3 10 14 12 66 69 46 64 85 2321 7,9 34 14 18 11 11 8,6 18 44 7,6 5,8 32 3,9 8,8 93 65 48 17 16 6,922 47 10 13 42 3,6 26 3,8 20 40 30 8 116 3,423 14 10 8,1 65 10 39 6,1 15 94 11 4,424 18 27 7,7 32 40 12 16 15 4,1 12 1125 8,3 6,4 13 9,8 3,4 18 36 11 7,5 83 6,1 32 5,2 2,6 15 3 9,226 13 10 17 12 18 32 8,6 2,1 15 40 14 42 6627 9,1 10 11 8,3 6,4 8,9 34 7,5 7,5 40 21 14 75 15 174 11 56 3,828 20 21 20 14 13 23 17 23 1,6 60 2,3 67 32 8,5 20 3,129 23 6,5 7 27 5,4 31 14 5,5 10 23 87 6,1 27 4,8 7,4 25 73 412 5,9 23 4030 14 9,6 14 20 32 16 40 7 12 59 11 100 16 230 68 34 3,531 13 15 14 24 52 83 14 56 67 5 2,6 17 23 9,6 11 38 34 3732 30 11 7,8 16 13 22 15 18 54 87 14 2033 21 22 43 18 13 11 18 44 55 127 20 8,9 32 9,7 76 52 198 1234 22 42 8,7 38 7,2 39 21 41 35 90 103 58 13 22 71 391 3,6 6,235 29 42 19 11 11 51 37 18 23 25 90 8,236 95 34 35 81 36 12 88 26 37 130 15 24 7,1 17 54 152 281 18 4,9 3937 15 13 14 3 55 1,2 4 3538 19 109 16 34 14 9,9 13 8,6 22 6,1 12 1,6 43 2339 31 49 23 22 8,7 1,840 11 6,4 22 5 87 1,1
1 2 3 4 5 6 7 8 9 10 11 12 13 14 15 16 17 18 19 20 21 22 23 24 25 26 27 28 29 30 31 32 33 34 35 36 37 38 39 40 41 42 43 44 45 46 47 48 49 50 51 52 53 54 55 56 57 58 59 60 61 62 63 64 65 66 67 68 69 70 71 72 73 74 75 76 77 78 79 80 81 82 83 84 85 86 87 88 89 90 91 92 93 94 95 96 97 98 99 ## ## ## ## ## ## ## ## ## ## ## ## ## ## ## ## ## ## ## ## ## ## ## ## ## ## ## ## ## ## ## ## ## ## ## ## ## ## ## ## ## ## ## ## ## ## ## ## ## ## ## ## ## ## ## ## ## ## ## ## ## ## ## ## ## ## ## ## ## ## ## ## ## ## ## ## ## ## ## ## ## ## ## ## ## ## ## ## ## ## ## ## ## ## ## ## ## ## ## ## ## ## ## ## ## ## ## ## ## ## ## ## ## ## ## ## ## ## ## ## ## ## ## ## ## ## ## ## ## ## ## ## ## ## ## ## ## ## ## ## ## ## ## ## ## ## ## ## ## ## ## ## ## ## ## ## ## ## ## ## ## ## ## ## ## ## ## ## ## ## ## ## ## ## ## ## ## ## ## ## ## ## ## ## ## ## ## ## ## ## ## ## ## ## ## ## ## ## ## ## ## ## ## ## ## ## ## ## ## ## ## ## ## ## ## ## ## ## ## ## ## ## ## ## ## ## ## ## ## ## ## ## ## ## ## ## ## ## ## ## ## ## ## ## ## ## ## ## ## ## ## ## ## ## ## ## ## ## ## ## ## ## ## ## ## ## ## ## ## ## ## ## ## ## ## ## ## ## ## ## ## ## ## ## ## ## ## ## ## ## ## ## ## ## ## ## ## ## ## ## ## ## ## ## ## ## ## ## ## ## ## ## ## ## ## ## ## ## ## ## ## ## ## ## ## ## ## ## ## ## ## ## ## ## ## ## ## ## ## ## ## ## ## ## ## ## ## ## ## ## ## ## ## ## ## ## ## ## ## ## ## ## ## ## ## ## ## ## ## ## ## ## ## ## ## ## ## ## ## ## ##1 3 23 12 32 24 26 79 57 39 29 22 ##2 6 34 35 5 12 18 9 45 44 19 51 25 23 60 21 43 60 62 80 ## ## 52 67 99 95 ## 74 73 77 ## ## 74 ## ##3 8 14 10 4 38 50 ## 71 ## 21 50 30 13 44 39 31 62 30 32 23 56 49 69 ## 49 ## 70 ## 93 86 ## ## ## ## 55 ## ## ## ## ## 654 24 40 38 7 5 18 17 34 72 67 22 45 45 36 81 63 51 26 ## ## 72 ## 89 ## ##5 26 32 12 48 23 21 44 23 59 ## 91 39 ## 30 31 ## ## 72 ## 61 966 9 4 9 10 25 16 55 26 18 27 82 99 ## ## ##7 15 5 6 32 10 15 25 33 12 26 25 15 47 37 ## 47 80 ## 54 ## 92 76 ## ## 92 ## ## ##8 14 4 17 7 17 8 9 48 13 37 11 13 26 35 31 ## 31 23 35 42 52 ## 56 57 ## 65 59 ## ## ##9 5 8 17 13 9 22 28 20 8 38 65 14 49 11 25 14 7 17 29 75 26 22 78 22 39 63 32 89 ## ## 97 26 67 81 ## 60 95 83 ## ## 63 ## ## ## 84 83 ## 91 ##
10 21 49 24 24 5 3 9 6 8 4 31 10 42 22 29 30 41 27 48 13 50 23 23 50 48 34 26 ## 21 21 76 58 ## 39 45 ## 32 94 54 31 42 44 ## ## 49 70 67 ## ## ## 50 ## ## 49 78 ## ## 84 73 ## ## 81 ## 91 ## ##11 16 19 11 3 4 27 13 3 18 12 33 11 11 32 25 30 21 12 16 15 73 32 22 18 ## 29 30 41 59 52 44 20 62 ## ## ## 46 81 55 27 44 59 59 59 87 94 ## ## ## 8112 11 30 11 26 35 8 13 7 6 8 17 51 31 33 32 92 37 50 79 70 74 83 84 90 45 ## ## ## 76 ## ## ## ## ##13 11 8 21 64 87 11 18 59 38 5 26 9 84 14 44 16 20 10 44 22 ## ## ## ## ## 86 ## 85 51 ## ## 90 ## 74 ## 53 58 ##14 9 24 21 7 14 4 17 7 6 4 12 9 7 17 8 20 13 26 30 42 30 ## 71 ## ## ## ## ## ## ## ## ## ## ## ## ##15 41 3 11 13 74 10 28 27 23 17 17 6 15 21 33 13 28 63 26 35 45 62 19 63 65 ## ## 97 ## ## 55 ## 63 ## 72 ## ## ## ## ## ## ## ##16 3 14 8 2 35 17 3 21 13 16 22 49 18 17 27 56 38 41 ## ## ## ## ## ## ## 72 ## ## 57 ##17 4 7 13 12 12 13 28 6 26 30 15 21 30 29 ## 26 37 35 ## 72 ## ## ## ## ## ## ##18 23 8 55 13 11 2 7 35 8 4 16 29 37 46 ## 50 96 ## ## ## ## ## 93 ## ## ## ## ## ## ## ##19 6 31 26 47 3 20 12 11 9 11 19 33 10 29 21 49 70 31 17 ## 31 32 80 29 29 72 69 ## 57 ## ## ## ## ## 62 89 59 ##20 7 6 10 15 25 10 10 16 1 10 14 12 66 69 46 64 85 23 18 26 23 20 23 41 29 35 18 18 48 39 41 ## ## 22 92 25 39 ## 25 ## 53 47 44 96 ## 80 48 ## ## ## ## ## ## ## ## ## 62 ## 54 ## 85 ## ## ## 80 ## 62 ## 84 ##21 8 34 14 18 11 11 9 18 44 8 6 32 4 9 93 65 48 17 16 7 15 19 10 22 17 26 25 17 23 15 15 50 24 ## 45 17 20 ## 17 51 79 88 47 88 51 80 93 ## 74 ## ## ## 51 ## 54 ## 62 ## 78 ## 68 ## ## ## 71 ## 58 ## ## ##22 47 10 13 42 4 26 4 20 40 30 8 ## 3 15 55 ## 36 50 26 35 38 33 83 61 32 42 45 79 78 ## 82 ## ## ## ## ## ## ## 59 ## 63 ## ## ##23 14 10 8 65 10 39 6 15 94 11 4 3 24 19 31 38 61 34 26 65 87 87 ## 51 ## ##24 18 27 8 32 40 12 16 15 4 12 11 27 11 25 29 20 63 64 ## 76 ## ## ## ## ## ## 9725 8 6 13 10 3 18 36 11 8 83 6 32 5 3 15 3 9 20 76 7 14 23 34 90 31 36 30 ## 84 ## ## ## 88 ## ## 75 ## ## ##26 13 10 17 12 18 32 9 2 15 40 14 42 66 11 9 14 17 15 13 13 80 ## 64 ## ## ## 76 ## 88 ## ## 58 ##27 9 10 11 8 6 9 34 8 7 40 21 14 75 15 ## 11 56 4 11 2 7 22 10 22 74 31 8 6 10 11 20 23 36 24 47 ## 99 94 94 94 78 53 ## ## ## 96 ## ## 90 86 8728 20 21 20 14 13 23 17 23 2 60 2 67 32 9 20 3 11 10 33 5 34 21 26 26 15 9 33 37 ## 66 ## ## 85 ## 82 ## ##29 23 7 7 27 5 31 14 6 10 23 87 6 27 5 7 25 73 ## 6 23 40 4 18 41 77 44 6 29 6 5 29 9 33 18 57 21 70 72 ## 71 ## ## ## 50 ## 94 52 ## ## 78 ## ## 65 56 58 73 86 ##30 14 10 14 20 32 16 40 7 12 59 11 ## 16 ## 68 34 4 53 1 66 3 17 8 39 25 56 14 16 7 26 27 46 22 27 63 43 ## 80 ## 94 97 97 83 80 ## 99 ## ## ## 7431 13 15 14 24 52 83 14 56 67 5 3 17 23 10 11 38 34 37 15 33 5 9 22 12 16 57 76 24 15 10 32 20 18 32 25 20 18 31 27 56 44 47 36 38 ## 60 94 ## 78 82 50 69 ## ## ## ## 58 ## ## ## 85 ##32 30 11 8 16 13 22 15 18 54 87 14 20 14 9 4 5 41 14 11 16 18 45 23 53 10 60 22 36 26 39 17 17 63 74 38 72 80 95 ## ## 46 64 96 94 97 50 54 79 ## 54 ## ## 96 ## ## 72 54 ## ## ## ##33 21 22 43 18 13 11 18 44 55 ## 20 9 32 10 76 52 ## 12 12 5 30 8 18 7 19 19 14 50 13 11 13 38 14 17 11 15 17 28 48 43 46 57 ## 43 89 73 46 72 ## ## 45 ## ## ## ##34 22 42 9 38 7 39 21 41 35 90 ## 58 13 22 71 ## 4 6 34 3 73 7 17 11 56 22 24 28 62 34 19 23 24 51 38 40 26 27 33 36 72 63 72 39 98 ## 67 57 ## 61 47 54 ## ## ## ## 49 56 ## ## 5835 29 42 19 11 11 51 37 18 23 25 90 8 7 23 25 5 10 12 9 53 23 43 39 58 41 22 14 13 43 24 33 ## 76 89 ## 85 91 ## ## ## ## ##36 95 34 35 81 36 12 88 26 37 ## 15 24 7 17 54 ## ## 18 5 39 12 39 29 47 40 63 49 20 11 6 20 16 9 34 57 22 37 57 53 39 64 ## ## 66 ## ## 75 ## ## ## ## ##37 15 13 14 3 55 1 4 35 18 7 14 33 28 24 22 46 28 52 57 12 24 17 29 27 95 78 18 37 66 ## 44 54 ## ## ## 56 ## 88 75 81 ## 8438 19 ## 16 34 14 10 13 9 22 6 12 2 43 23 22 9 3 4 11 36 17 17 12 34 19 93 23 58 41 ## 98 ## 46 ## ## ## ##39 31 49 23 22 9 2 9 4 7 4 35 11 7 36 12 13 24 56 15 15 29 39 19 43 14 67 33 42 21 65 53 62 73 82 54 ## 86 ## ## ## ## ## ##40 11 6 22 5 87 1 3 18 11 4 ## 17 17 10 53 25 17 23 18 16 17 28 17 13 38 35 25 30 62 32 25 40 ## 86 71 65 67 52 88 49 75 ## ## 75 ## 83 ##41 60 13 40 14 22 6 18 20 8 82 85 ## 12 9 41 23 52 19 11 35 18 81 66 33 ## 44 93 95 52 ## 65 89 ## 99 ## ## 73 44 98 90 ## ## 62 ## ## ## ## ## 85 ## ##42 39 ## 34 ## 33 10 8 16 9 20 23 36 17 35 ## 8 5 12 26 23 10 28 11 22 21 19 11 42 39 38 17 ## 57 29 32 20 48 32 72 45 67 ## ## ## 98 45 ## ## 45 ## ## ## 89 ## ## ## ## ## ## ## 74 ##43 32 38 18 21 2 60 1 3 7 40 14 13 27 20 13 25 71 15 51 95 19 47 30 22 45 22 66 49 ## 65 86 ## ##44 22 16 13 49 12 14 5 9 4 11 6 4 31 2 42 ## 90 4 30 16 23 30 18 25 9 10 11 52 16 20 18 40 75 57 20 22 22 46 ## 87 42 88 45 87 51 92 71 ## 49 64 ## 73 ## ## ## 59 ##45 20 68 8 35 38 49 11 5 2 91 ## 13 9 20 9 ## 27 58 62 41 22 ## 66 ## 53 ## ## 52 52 48 ## 68 ## ## ## 53 ## 7746 29 12 52 17 12 23 6 5 32 43 36 11 16 37 9 54 9 25 20 23 32 36 18 29 58 41 80 66 86 ## 78 69 ## 50 ## 88 ## 51 ##47 ## 18 8 24 17 18 9 24 10 2 5 1 6 ## 12 7 7 35 13 30 14 24 26 20 10 16 69 24 21 39 37 56 83 47 45 60 51 90 93 ## ## ## ## ## ## ## ## ##48 23 5 30 25 22 7 10 6 20 30 45 12 8 17 6 19 8 26 14 27 30 77 21 28 19 27 50 ## ## ## ## ## ## 84 51 ## ## ## ## ## ## ##49 20 18 6 15 13 4 12 11 30 22 26 7 29 6 30 45 22 38 24 22 26 30 12 35 29 89 85 ## ## ## 48 ## ## ## 53 ## 56 ##50 25 16 17 12 19 24 18 3 3 16 12 9 17 14 14 10 9 24 78 41 12 32 18 28 14 36 32 20 86 57 75 ## ## 96 48 91 ## 47 ## ## ## ## ## ##51 17 16 24 15 15 8 5 13 16 11 8 26 11 41 23 11 10 15 51 12 13 30 41 ## ## ## 64 ## 79 ##52 10 17 19 32 18 3 8 19 16 12 10 28 12 19 69 57 48 72 52 66 62 63 49 46 71 93 ## 7753 26 14 19 27 34 ## 6 9 42 20 28 8 ## 32 17 28 17 21 13 32 14 11 37 14 12 27 35 34 53 ## 40 ## ## 77 45 ## ## 91 76 ## ## 95 73 67 ## ##54 27 76 ## 16 14 5 10 24 12 4 12 3 5 22 4 12 10 58 ## 13 19 69 7 37 22 28 18 20 52 53 15 33 31 17 20 13 34 39 59 46 80 ## 62 ## 64 ## ## 7455 17 16 14 3 6 20 61 40 7 2 1 44 42 ## 8 35 14 24 35 7 19 14 63 17 62 11 38 36 ## 62 44 62 ## 89 ## ## ##56 6 9 10 26 26 7 39 37 9 5 51 3 ## 18 5 19 27 ## 22 21 98 8 ## 26 9 10 86 35 9 42 17 9 19 72 18 21 78 ## 76 ## 42 99 ## ## 53 64 ## ## ## ## ## ## ##57 24 29 11 10 22 11 47 51 68 35 21 30 ## 54 20 6 9 19 17 20 9 2 5 12 13 31 16 ## 31 49 7 20 14 23 19 44 19 43 52 ## 34 51 37 ## 50 ## ## 70 61 ## 7558 19 8 14 27 78 70 8 25 11 ## 16 ## 21 11 30 30 24 99 15 12 36 73 58 62 ## 91 ## ## ## 59 ## ## ## ## ## ## 56 ##59 21 47 14 24 10 10 30 9 41 14 5 6 11 76 10 43 17 98 10 12 13 19 38 28 19 20 10 70 38 19 35 41 ## ## 89 39 57 62 ## ## ## ## ## ## ## ##60 14 32 9 30 6 5 53 21 26 10 43 13 13 18 30 44 51 41 59 48 54 75 75 39 ## 71 65 ##61 27 24 11 16 10 22 13 38 63 23 4 6 ## 16 ## 12 28 13 17 13 18 16 44 11 22 17 13 24 82 24 ## 28 94 79 ## 95 ## ## ## 98 ## ## 78 ## ##62 18 25 19 11 14 15 8 68 13 11 17 4 22 3 55 13 12 ## 7 27 44 16 13 11 ## 10 42 25 54 29 60 ## 59 88 ## ## 69 ##63 33 13 25 20 6 11 37 19 49 26 4 8 7 94 3 3 8 53 13 23 7 33 18 8 20 12 25 25 33 34 ## 66 ## ## ## ## ## 92 ## 45 ## ## ## ## ## 83 ##64 34 30 17 20 67 27 12 29 13 10 22 33 12 23 2 19 10 32 7 15 13 5 42 32 21 40 18 31 17 44 40 56 ## 97 ## ## 70 ## ## 60 5565 24 27 8 22 13 16 5 21 6 17 7 19 5 5 78 17 10 11 21 24 31 28 45 52 ## ## 65 ## 7966 30 13 18 24 24 78 4 12 16 54 13 41 13 51 13 ## 20 12 55 24 16 12 25 25 17 26 48 49 ## 53 66 88 ## 79 ## ## 66 ##67 26 12 16 13 12 38 16 40 13 30 13 21 9 6 10 8 65 8 10 9 4 46 3 10 38 21 32 13 28 35 48 91 ## 56 85 ## 51 ## ##68 15 18 13 10 12 26 41 54 29 98 ## 8 7 21 ## 10 ## 2 13 35 16 39 21 92 ## ## 16 48 18 50 ## 61 40 51 18 4 5 4 25 68 11 28 41 6 32 10 28 51 34 ## 23 84 27 17 19 16 55 24 ## 33 ## ## 84 43 89 87 ## 49 ## 67 ## ## ## 49 ## 52 ## ## 83 ## 96 ## ## 67 69 ## ## ## 48 98 ##69 24 24 13 52 12 17 2 34 2 13 4 ## 6 7 15 36 23 21 16 38 30 10 47 90 ## ## ## 61 ## 78 56 65 ## ## ## ## ##70 15 42 23 12 11 49 ## 24 9 13 26 37 29 27 19 ## 14 26 2 18 ## 6 39 85 54 16 47 21 25 21 13 15 11 46 44 38 31 49 67 79 ## 60 63 ## ## 42 57 ## ## 61 ## ##71 26 29 31 25 ## 8 10 12 12 51 6 6 18 45 8 15 20 73 ## ## 4 25 ## 70 ## 35 86 42 9 40 32 14 14 87 98 61 51 ## ## ## ## ## ## ##72 34 9 18 16 14 12 17 ## 39 30 2 18 16 40 7 6 82 31 44 28 45 40 4 23 27 4 12 24 24 41 19 28 16 14 ## 78 99 ## 60 ## 89 8773 30 14 47 15 11 3 30 27 9 14 2 3 6 15 17 2 17 23 7 6 9 11 21 18 14 15 32 39 58 65 ## ## ## ## ## ## 62 ## ## ##74 67 30 14 13 10 10 40 19 ## 47 45 2 25 ## 41 57 ## 66 28 3 22 40 8 18 ## 11 ## 29 53 ## 47 5 24 32 18 31 50 23 54 29 29 32 89 95 ## 81 47 ## 51 ## ## 80 ## ## ##75 20 20 12 24 14 7 18 5 20 17 23 11 3 25 14 38 8 31 7 22 4 26 23 22 13 22 48 20 17 58 ## 68 64 ## 92 99 50 78 ## 77 ## ## ##76 39 64 53 21 18 11 30 4 82 13 5 6 76 4 98 16 34 22 29 72 24 21 66 4 37 9 ## 10 68 16 45 15 23 23 41 ## 21 58 ## ## ## 59 ## ## 77 ## 69 58 56 ## 76 ## ## ## 80 ##77 31 26 16 14 11 26 5 38 15 22 21 21 23 31 54 8 23 40 37 14 22 7 14 23 35 22 51 18 12 18 23 32 68 ## ## ## ## ## 72 87 ## ## ## ##78 70 16 18 15 16 31 ## 84 27 7 5 59 80 5 11 14 11 26 ## 4 43 91 ## 24 40 84 9 15 31 12 30 38 83 15 24 64 26 45 18 42 ## 57 ## 70 88 86 99 91 ## ## ## ## ## 68 ## 73 79 ##79 61 18 23 18 20 6 34 24 18 10 5 10 44 14 9 73 18 8 23 27 9 15 8 60 9 30 12 11 25 19 5 40 24 72 40 93 74 60 66 ## ## 98 ## ## ## 98 ##80 6 93 11 74 62 4 56 ## ## 41 10 10 ## 26 10 80 ## 79 34 38 13 49 60 7 26 8 23 18 33 10 17 ## 46 ## ## 45 ## ## 98 ## 68 ## ##81 23 75 57 14 18 7 13 78 21 5 34 17 55 ## 47 8 93 11 16 44 11 2 7 10 8 9 81 44 12 5 13 26 21 20 23 27 17 30 27 17 41 38 45 64 ## 60 63 ## 67 72 65 88 5782 40 41 11 9 9 11 13 5 11 10 19 45 15 20 2 9 40 12 16 26 34 3 13 84 10 35 37 29 11 36 17 34 77 41 ## ## 53 54 60 ## ## ## ## 67 ## ##83 20 16 14 42 ## ## 8 17 12 ## 17 19 89 6 50 7 ## 14 18 37 88 9 11 5 17 19 17 15 37 5 89 5 32 26 41 42 44 75 47 96 37 ## 40 56 87 ## 92 ## 95 99 40 ## ## ## ## ## ##84 28 27 20 21 8 26 14 10 40 ## 16 2 13 5 66 21 56 8 23 14 7 33 44 15 62 10 12 24 77 15 19 28 27 22 38 65 23 ## 37 ## 56 37 99 ## ## 42 56 85 68 95 5185 16 13 15 23 7 9 11 19 28 5 12 18 16 4 ## 7 3 11 5 6 19 22 17 4 12 24 39 90 78 22 11 5 18 23 7 12 11 27 7 22 44 27 ## 59 33 9 16 11 24 23 13 30 40 78 60 50 66 ## ## 66 ##86 29 44 47 10 12 8 14 6 ## ## 32 29 9 48 ## ## 35 7 7 29 42 ## 10 31 46 24 37 36 11 15 30 25 4 22 12 60 33 46 14 9 36 ## 58 34 35 27 60 ## 86 70 ## ## ## ## ## ## 47 ## ## ## ## ## 64 99 5087 43 35 25 31 16 9 13 8 13 22 16 29 15 ## 66 20 32 4 5 11 14 63 33 ## 4 62 19 16 59 ## 35 19 32 99 55 47 60 ## ## ##88 45 51 21 15 54 13 12 11 43 27 6 7 83 29 34 5 24 34 ## 8 15 24 11 ## 73 ## 33 ## ## 23 25 29 25 56 12 31 26 30 38 69 ## 70 ## ## ## 8289 65 33 33 20 18 35 8 58 26 46 48 72 64 12 ## 74 44 51 11 12 57 20 13 93 70 23 54 ## 16 23 6 93 28 80 7 79 39 15 6 65 21 ## 62 49 56 55 33 26 38 26 16 66 14 57 99 ## 67 98 67 ## ## 68 ## ## 36 ## ## ## ##90 64 16 16 31 32 35 9 79 28 7 16 8 21 9 40 48 ## ## ## 59 10 71 52 31 3 24 42 3 46 ## 55 58 14 44 ## ## 23 38 64 30 12 7 10 12 62 42 31 25 30 71 24 35 20 66 83 ## 76 33 82 ## ## ## 58 65 55 ##91 45 18 35 85 12 47 7 13 48 25 4 21 7 39 18 3 26 ## 56 5 25 50 25 57 59 16 54 16 78 64 ## 25 25 35 28 34 29 25 88 88 ## ## ## ## 75 ## ##92 36 19 29 10 29 19 45 19 50 18 30 23 51 16 58 52 16 5 25 24 3 2 15 36 35 1 36 7 10 ## 26 28 42 67 23 22 23 20 7 10 45 14 10 18 12 9 7 11 32 ## 94 98 91 ##93 54 20 19 43 6 26 14 37 19 6 20 38 42 4 36 13 55 8 36 3 18 ## 72 ## 34 18 82 ## 41 15 29 15 7 18 19 17 25 84 ## 38 ## 61 ## 60 70 ## ## ## ##94 35 47 21 15 28 15 8 73 19 23 25 23 5 ## 75 22 40 98 45 44 35 15 14 51 48 33 15 48 81 34 ## ## 6 9 65 14 11 ## 96 7 26 34 ## 71 10 17 39 46 19 18 44 31 36 76 67 61 69 90 ## ## ## 40 ##95 29 34 9 34 58 4 ## 12 33 28 3 58 28 12 7 22 16 10 55 20 26 25 9 21 63 43 33 ## 89 82 ##96 20 17 46 16 22 10 6 73 9 8 4 4 15 ## 11 ## 13 39 41 99 14 9 4 57 41 32 22 17 24 98 70 59 36 78 ## 98 ## ## ##97 39 26 48 22 18 18 15 15 13 25 10 22 13 18 12 41 14 20 4 4 38 31 5 28 17 16 9 13 13 ## 17 8 17 40 12 4 25 24 15 18 28 63 19 61 ## ## ## ## ## ## 77 88 ## ## ## ## 74 ##98 17 37 46 30 11 22 21 20 81 7 21 28 6 23 22 7 5 ## 17 37 8 7 2 83 ## 13 52 54 4 21 34 41 41 ## 65 11 19 30 37 ## 36 ## ## 98 63 ## ## ## 67 ## 7099 44 17 42 37 19 45 23 14 16 57 43 20 54 3 12 33 49 9 8 80 8 30 49 55 20 22 81 19 30 56 ## ## 52 49 ## ## ## 93 41 #### 75 25 ## 52 48 59 60 55 63 47 36 67 19 38 ## 9 13 91 ## 29 44 66 33 37 ## 21 20 29 26 5 55 7 16 14 67 6 14 6 29 ## 65 20 21 55 15 26 33 22 73 ## 42 ## 62 91 33 55 76 ## ## 45 52 68 34 ## 65 ## ## ## 96 63 38 ## 88 90## 50 61 12 15 29 74 62 30 57 8 32 4 23 43 35 80 48 63 7 27 34 18 66 40 25 63 47 92 34 ## ## ## ## ## #### 40 39 29 38 49 ## 29 24 21 18 64 23 12 ## 42 17 19 66 61 14 8 1 14 5 24 55 47 56 30 6 9 51 25 10 33 58 22 53 38 98 21 ## 14 34 81 62 ## ## 59 60 74 ## ## 67 ## ## 86 57 ## #### 17 28 64 44 67 25 22 36 3 29 57 12 1 24 45 20 7 3 17 ## 24 14 3 17 48 99 ## 58 ## ## ## ## ## 89 #### 42 28 29 55 10 22 19 18 17 7 54 35 19 18 51 16 7 19 11 5 38 4 5 11 14 9 1 4 15 46 22 ## ## ## 8 ## 28 21 12 10 50 14 91 27 33 60 99 ## ## ## ## ## ## ## ## 54## 46 23 18 14 13 24 20 19 98 20 4 11 7 13 26 8 9 2 53 74 3 37 4 44 5 38 5 ## ## 33 79 23 19 16 81 54 13 8 10 10 20 15 34 61 41 49 63 79 ## ## ## ## ## ## ## ## ## ## 74## 23 35 81 44 20 31 24 30 16 28 9 69 11 90 12 50 21 ## 10 ## 24 2 25 19 ## 7 44 25 ## ## 25 45 17 41 18 11 19 18 18 48 20 26 46 48 27 98 39 62 68 39 ## 64 ## 72 ## ## 68 ## ## 52 ## ## 98 ## ## 75## 62 85 34 30 12 47 32 64 56 9 35 12 15 7 9 16 18 27 13 14 23 18 77 68 9 31 7 53 19 1 13 15 63 3 3 13 43 6 ## 13 ## 8 ## ## ## 25 41 7 21 14 12 10 37 13 17 21 38 19 26 18 25 ## 47 49 86 40 ## ## 79 86 ## ## 61 ## ## #### 38 26 52 31 14 51 10 22 19 73 24 80 99 3 7 12 23 6 3 10 8 36 50 69 17 27 26 69 3 70 9 9 15 19 28 33 35 11 36 35 77 55 ## ## ## 67## ## 18 12 30 35 47 31 10 22 26 15 28 43 10 22 18 4 30 53 39 59 ## 8 ## ## 21 6 21 45 19 25 9 5 3 26 20 9 12 37 10 ## 37 68 79 47 30 4 13 32 71 32 16 34 28 30 22 15 40 11 16 40 43 14 38 ## ## 74 ## ## ## ## 55 94 45 ## 63 ## ## ## 66## 50 53 22 31 15 20 15 17 14 17 8 8 76 ## 26 87 16 ## 11 21 15 15 2 32 5 6 21 6 69 ## 2 19 11 ## 5 24 94 5 19 23 12 18 70 17 14 22 20 12 17 ## 87 65 73 82 68 ## ## 84 87 62 58 86 ## 74 86 94 ## 57 93 ## ## ## 65## 26 49 58 15 22 38 21 74 25 22 49 18 51 14 29 34 88 ## ## ## 54 27 ## 51 14 21 4 7 5 10 25 43 ## 31 20 41 21 7 61 37 ## 26 14 44 8 ## 11 39 13 43 60 32 13 45 19 27 11 33 23 88 26 41 25 ## ## ## 56 ## ## ## 67 64 ## 63 96 ## 92 94 93 ## #### 21 23 30 28 23 20 16 14 37 ## 61 66 11 16 7 ## 56 15 81 7 14 85 7 19 9 4 5 90 42 2 ## 19 27 6 13 8 5 22 17 8 26 22 32 17 29 67 39 14 24 17 50 63 38 ## ## ## 91 99 62 42 84 ## #### ## 56 42 62 27 59 29 39 17 24 62 53 11 ## ## 30 26 42 34 6 26 12 15 25 3 7 17 4 5 13 ## ## 35 ## 67 3 ## 47 42 57 ## 14 16 12 17 56 19 ## 51 46 24 42 65 52 28 40 49 30 61 78 57 81 55 99 56 48 ## ## 92 ## 75 ## 80 44 ## 61 #### 66 25 29 39 53 31 36 25 11 12 ## 25 ## 41 ## 17 2 13 23 23 55 1 14 22 98 83 14 ## ## 26 23 18 3 20 42 ## 32 61 60 53 11 60 10 16 49 26 39 77 ## ## ## ## 44 ## ## 62 ## 74 ## #### 20 33 16 15 19 14 ## 13 25 18 19 39 18 51 9 7 25 15 3 3 66 24 3 9 11 7 39 50 61 9 ## 58 31 16 16 ## 7 9 19 14 14 16 33 24 21 ## 20 28 61 45 50 31 33 35 96 70 67 76 72 89 66 54 94 62 54 ## ## ## 63 99 ## 58 ## ## 99## 61 30 49 ## 47 18 19 51 26 8 33 55 19 17 83 18 26 23 20 26 21 10 32 4 34 13 73 10 12 44 50 4 80 16 62 53 57 64 ## 70 28 8 56 10 18 79 35 ## 33 11 31 16 58 96 30 ## 94 ## 69 ## 74 64 55 ## 81 83 54 #### 31 64 26 46 31 40 5 16 57 26 8 97 29 9 39 10 31 14 16 28 37 9 7 11 41 9 38 30 ## 4 ## ## 84 42 18 6 91 24 27 45 24 34 67 ## 61 ## 67 37 ## ## 75 83 47 34 60 44 ## ## 71## 35 35 33 24 19 15 82 17 19 41 13 72 29 38 15 75 31 13 69 11 8 47 17 2 20 18 11 3 10 9 4 21 65 8 29 39 4 16 5 ## 49 79 40 10 6 33 22 26 24 59 74 91 ## 31 ## 73 81 52 60 38 ## 64 ## 44 89 ## ## ## 66 #### 66 48 46 26 22 6 51 35 44 10 32 29 72 64 24 27 28 4 2 3 34 3 16 3 9 24 7 31 41 67 12 94 30 14 30 26 70 44 60 ## 72 ## 56 68 97 ## 83 ## 40 ## 32 ## 62 ## 63 ## 57 86 55 44 #### 40 20 25 61 10 31 29 12 10 41 14 4 80 38 23 27 57 44 23 8 26 54 72 4 3 8 12 23 9 20 7 1 14 8 6 11 36 8 ## 23 9 9 22 30 27 86 90 91 ## 51 86 55 78 ## 92 ## ## ## 91 ## ## ## #### 23 15 13 30 21 15 26 14 ## 43 65 5 38 ## 45 5 14 31 ## 62 16 9 30 15 25 11 13 4 9 7 20 10 13 17 13 63 15 26 8 21 23 45 13 29 16 ## 55 ## 43 45 66 61 ## 93 72 70 79 85 ## 63 80 ## 49 ## ## 81 ## #### 58 31 ## 61 60 31 68 23 31 ## 12 23 14 62 37 42 17 34 63 ## 8 ## 7 39 19 28 81 41 75 18 33 22 8 33 2 36 9 6 47 67 10 78 26 81 26 25 11 18 26 17 18 70 32 69 38 98 ## 94 39 97 ## ## 93 ## ## ## 96 ## ## 84## 72 52 17 ## 23 47 33 46 50 61 55 23 33 77 34 84 9 ## ## 18 53 66 5 82 23 20 10 71 61 35 26 27 8 43 23 27 32 73 38 32 63 67 ## 27 49 ## 83 ## 94 ## ## 66 ## ## ## ## ## ## #### 55 41 37 29 32 99 22 11 7 17 12 24 68 32 11 10 23 18 25 8 10 15 5 5 53 27 26 25 10 15 25 96 8 15 30 37 87 54 57 42 #### 33 20 58 36 51 79 ## 31 19 ## 22 21 9 26 29 30 35 55 22 29 34 39 10 57 30 5 58 63 11 46 9 9 7 7 15 7 3 36 15 12 13 8 9 4 38 37 13 53 11 12 96 59 ## 53 ## 78 #### 43 35 30 14 18 8 52 19 9 12 10 11 6 12 21 32 ## ## 10 7 58 4 8 10 21 6 9 43 57 89 24 19 42 16 27 39 50 45 93 52 30 ## 51 ## 50 ## 57 92 #### 20 96 58 16 20 16 31 ## 34 37 21 32 11 23 18 8 22 14 20 ## 85 15 43 16 27 2 9 20 24 74 43 9 8 12 56 19 53 25 19 ## ## 28 92 54 54 45 ## 53 ## ## ## ## 45 81## 22 43 42 17 ## 47 87 ## 12 ## ## 57 17 19 22 53 43 16 4 8 46 97 ## ## 19 ## 17 20 43 21 30 44 ## 40 ## 70 74 ## ## 50 ## 83 88 90 ## 38 51 80 ## 85 74## 20 22 27 24 26 13 36 11 35 15 10 15 11 28 33 12 6 50 ## 86 5 34 12 ## ## 16 27 2 31 57 65 22 68 11 11 86 34 31 ## ## 11 ## 36 40 54 92 20 25 25 26 ## 35 ## ## ## 93 64 84 52 ## ## ## ## 62 42 ## ## 75## 39 33 53 13 28 20 21 35 14 48 31 10 16 4 9 ## 48 75 8 5 58 4 3 4 3 17 6 31 49 8 29 2 18 38 16 34 ## ## 62 15 72 30 23 28 29 33 9 24 ## 29 28 97 35 28 37 64 30 66 99 99 ## 53 ## ## ## ## 62 ## 89## 30 67 14 63 17 ## 9 76 ## 65 9 8 7 16 82 15 34 15 53 21 53 40 14 14 6 ## 7 7 36 4 10 37 7 ## 27 28 36 75 6 34 19 40 38 ## 10 10 34 22 16 25 18 21 85 61 65 53 66 38 ## 43 67 68 55 69 48 77 95 55 ## ## 85 ## 74## 22 19 28 17 33 35 24 16 12 28 63 39 8 6 21 11 31 65 9 23 20 11 11 14 45 12 19 6 45 27 16 ## 35 23 ## 27 16 ## ## 24 27 59 77 12 20 29 38 42 75 ## ## 67 88 ## 98 ## 64## 22 21 39 51 69 25 17 ## 46 26 28 42 31 18 6 7 38 14 14 73 15 11 11 17 11 34 24 72 5 30 ## 26 3 5 17 3 20 14 24 23 30 19 ## ## 58 22 47 71 37 14 11 17 7 17 19 8 17 20 9 42 ## ## ## 73 56 66 96 94 43 ## ## 48## 68 ## 32 ## ## 13 17 27 ## 16 12 29 22 9 16 82 51 20 86 11 7 23 21 20 6 6 7 ## 84 21 ## 96 3 9 37 12 4 2 14 ## 55 38 12 ## 47 20 76 21 15 21 10 9 21 85 ## 40 79 92 73 66 56 ## ## ## 39 ## 92 57 ## 60 ## ## ## 91 93 99 51## 34 14 12 23 29 9 10 14 31 22 92 15 14 11 72 53 26 15 53 ## ## 46 16 12 7 21 31 7 21 28 13 18 18 ## 34 ## 40 93 ## 14 ## 33 65 16 9 17 7 17 27 34 62 ## 83 82 ## 58 93 74 42 #### 47 30 25 41 12 36 28 14 10 31 53 89 ## 64 21 12 99 23 87 ## 9 ## 15 18 27 33 31 ## 8 3 6 12 10 14 5 ## ## 62 47 65 ## 11 18 ## 29 23 10 ## ## 46 43 45 57 ## 64 ## 62 ## 60 60 66## ## 12 11 11 24 9 12 ## 62 55 9 33 16 20 ## 16 3 35 26 22 42 26 4 21 78 4 5 20 17 ## ## 44 38 26 59 ## 69 31 31 23 22 20 25 22 32 19 32 66 74 31 32 46 45 91 85 67 95 87## 47 23 23 28 24 17 20 18 55 18 15 21 10 88 ## 16 82 16 76 43 52 63 16 23 57 19 56 47 39 ## 27 5 9 12 29 8 23 3 42 17 4 12 25 84 30 17 15 21 65 26 45 7 ## 23 20 28 38 42 47 18 41 24 40 40 ## 82 50 ## ## 48 68 ## ## 89 ## 76 ## 41 ## ## 59## 61 28 79 16 52 42 58 ## 94 25 33 38 88 74 17 22 4 7 24 85 ## 37 12 17 23 56 70 65 73 53 ## ## ## 91 87 #### 40 53 88 ## 93 28 29 20 22 ## 53 17 35 13 23 51 71 34 64 18 30 17 12 49 19 7 21 25 46 71 19 97 ## ## 68 29 37 32 4 33 25 31 36 15 3 1 33 5 10 ## ## 6 4 12 ## 26 45 61 67 50 39 37 70 22 40 33 19 46 33 99 56 ## ## 64 54 ## 68 ## ## ## ## ## 50 71## 34 20 23 23 9 15 46 ## 43 ## 52 62 17 14 ## 3 25 44 15 ## 75 ## 84 ## ## 38 61## 25 35 ## 31 35 35 37 16 15 43 55 12 10 10 26 20 73 22 28 69 22 28 41 ## ## ## 22 9 8 14 17 8 71 78 10 83 4 14 70 56 29 92 26 14 5 ## 14 20 49 48 ## 54 95 ## 42 30 ## 91 95 56 84 52 ## ## ## ## 35 51 61 #### 27 72 36 27 45 53 33 21 15 59 26 16 46 35 7 15 11 55 66 ## 25 ## 8 9 22 39 15 98 47 81 8 8 3 6 42 5 31 8 27 22 81 17 ## 50 84 30 46 28 81 38 43 92 ## 87 43 ## 82 86## 23 56 22 84 48 38 22 77 27 28 26 23 18 31 15 ## 10 9 50 29 10 19 99 44 7 10 10 9 69 41 11 45 37 14 70 ## 52 23 83 51 6 18 6 86 14 50 8 11 ## 11 23 8 63 69 41 54 76 55 ## ## 56 80 ## 85 41 ## ## ## 99 41## 41 39 26 29 77 37 10 7 78 10 5 13 97 ## 42 8 46 7 4 18 56 89 8 4 20 37 19 13 56 7 11 27 64 23 13 32 10 21 36 19 62 ## ## 43 68 84 ## 48 79 57 52 59 #### 49 25 ## 59 61 33 93 43 45 61 51 10 24 12 34 35 36 22 30 16 49 9 63 21 38 18 26 11 22 89 13 7 ## 17 ## 70 ## 8 16 25 27 11 7 13 40 8 69 33 56 51 ## 95 22 43 36 44 41 48 55 72 68 ## ## 62 ## ## 79 78 54 ## 98 76 ## 70 80 82 83 67 70 #### 39 31 58 54 18 25 34 31 41 14 17 10 16 30 41 33 9 15 31 10 17 28 12 37 48 25 ## 19 16 ## 49 ## ## 15 13 24 17 ## 22 25 14 40 30 13 56 48 37 28 22 3 31 30 27 50 18 8 16 36 19 ## 8 88 76 ## 72 ## ## ## ## ## ## 60 66 99## 39 47 85 39 18 34 32 67 30 33 36 20 17 15 14 23 16 25 6 70 36 10 9 41 9 39 ## 22 ## ## 23 95 11 19 ## 12 29 22 34 6 80 45 5 20 28 13 86 ## 39 13 16 42 7 28 ## 73 49 28 60 94 38 ## 93 ## 59 ## ## 94 58 ## ## ## 61 ## 95## 53 80 41 21 36 19 50 46 9 32 16 12 13 52 19 ## 15 42 9 21 62 19 8 32 4 25 30 11 31 18 3 26 30 4 12 47 4 5 7 44 9 52 ## ## 95 71 ## 53 ## ## ## ## ## 60## 28 ## 61 ## ## 43 39 41 32 23 13 12 31 66 26 18 15 62 54 8 12 23 41 17 14 49 48 19 12 7 ## 14 38 54 54 ## 6 39 10 ## ## 30 77 51 36 24 27 30 29 15 6 16 84 20 4 19 30 24 26 26 24 47 51 87 33 ## 53 38 ## ## ## ## ## 80 87 ## 56 ## 62## 56 29 31 17 ## 23 33 15 12 49 18 42 12 24 18 30 63 13 9 ## 14 ## 69 26 ## 32 20 36 14 24 6 28 16 3 35 6 75 11 25 17 57 26 19 39 67 60 26 33 79 ## 37 83 47 ## ## 76## 43 ## 85 53 19 50 50 20 26 30 59 18 38 35 33 42 76 42 10 28 18 32 12 ## 9 ## ## 53 30 ## 10 42 6 15 21 16 3 86 21 94 5 23 18 20 50 63 19 11 25 12 46 91 ## 76 23 ## ## 34 ## 87## 71 49 34 28 53 41 28 39 13 29 44 25 26 6 14 40 70 47 35 12 15 60 5 16 7 18 6 ## 14 ## ## 4 10 42 9 31 6 41 8 16 41 25 6 19 54 60 72 ## ## 83 98 83## 46 34 32 50 20 52 16 77 50 17 24 32 ## 15 93 22 24 29 18 21 22 31 22 27 12 27 72 40 38 46 24 22 21 8 44 79 11 16 39 6 13 14 99 9 6 6 10 6 46 ## 61 ## 62 ## 38 91 72 48 55 32 ## ## 71 49 ## ## 80 97 #### ## 56 68 80 82 21 35 48 13 24 53 90 56 20 16 21 38 ## 39 24 39 64 43 15 26 30 15 79 6 32 22 18 2 16 26 16 3 32 28 18 5 25 28 48 20 ## 56 67 ## 88 ## 61 92 96 91 ## ## 67## 69 52 13 12 ## 19 68 70 17 95 72 14 19 35 65 81 11 17 7 11 3 43 26 2 14 37 21 14 7 26 6 28 27 ## ## 43 85 ## 41 97 #### 54 ## ## 52 39 38 39 46 13 22 39 24 9 23 15 16 12 22 55 41 61 5 30 27 53 18 55 11 10 8 20 63 39 7 16 7 37 5 10 9 54 63 43 50 86 46 65 31 ## #### 68 50 49 28 15 15 24 14 21 23 29 55 16 19 41 11 34 37 23 41 16 12 71 46 12 5 19 18 35 63 7 42 54 ## ## 61 83 ## ## #### ## 55 57 52 18 90 79 12 23 16 40 21 18 9 53 28 14 20 17 18 12 45 31 22 48 12 34 6 26 63 11 13 8 39 7 23 56 22 55 ## 67 77## ## 14 35 13 46 22 32 20 30 23 28 23 8 16 12 7 4 11 19 27 20 24 29 74 54 57## 28 28 39 35 35 30 34 44 35 28 22 21 36 43 35 42 27 7 27 12 32 66 5 55 23 13 6 16 22 32 21 58 ## 46 ## ## ## #### 33 52 42 29 37 50 19 39 72 34 26 30 73 17 40 12 19 20 21 30 38 41 14 5 10 41 ## ## 76 7 4 4 30 74 30 6 11 35 ## 34 36 59 78 60 ## 52 41 ## 54 84 72 48 ## ## #### 32 33 60 39 25 22 55 44 19 23 16 15 16 18 24 8 16 6 55 20 35 40 9 24 39 38 10 25 30 46 42 66 38 39 50 59 95 ## ## 94 75 37 ## 49 93## 26 64 27 15 13 13 38 12 23 12 25 41 25 32 82 10 7 27 24 13 8 9 23 2 11 4 4 1 12 6 28 4 18 12 6 22 ## 38 35 82 98 ## 32 97 ## ## 40 #### 44 43 51 22 23 25 32 ## 45 18 16 77 13 ## 40 ## 5 23 11 19 45 72 43 22 10 45 4 5 49 9 84 23 6 4 15 ## 32 54 ## 38 77 59 61 82 88 80 ## 35 ## ## 96## 76 38 31 29 16 16 66 23 23 68 20 31 18 15 51 15 81 28 79 11 20 5 21 22 2 22 9 5 41 20 12 88 37 45 41 50 76 ## 49 ## ## 97 #### 87 24 28 47 14 54 17 12 69 33 10 39 26 20 17 56 37 22 16 6 32 11 ## 93 ## 92 14 22 8 8 ## 45 2 55 ## 92 36 ## 55 77 68 67 ## ## ## 85 ## ## 66 61 58## 42 55 61 97 21 26 20 26 16 38 19 62 25 6 19 5 15 9 16 3 12 12 39 57 ## 60 ## 66 ## 62 ## 81 70 #### ## 71 51 18 54 42 36 67 43 ## 27 28 17 14 15 16 36 14 76 19 15 47 39 20 31 11 22 5 4 6 3 7 22 51 48 52 31 35 20 63 80 #### 51 67 22 64 74 12 87 24 31 50 47 32 29 35 62 35 11 41 42 56 77 18 98 59 ## ## 84 ## ## 74 78 ## #### 88 57 45 65 60 39 97 99 18 12 12 16 16 28 21 15 22 19 15 24 8 12 4 20 8 12 18 26 7 59 68 51 ## ## 97 ## ## #### 30 76 44 33 39 38 34 34 32 26 26 56 45 25 12 31 34 81 24 30 28 15 10 18 3 31 53 10 3 23 10 18 60 ## ## 29 50 76 73 ## ## ## ## 38 #### 74 ## ## 53 38 22 ## 20 88 54 64 40 13 8 13 12 20 6 37 18 34 15 48 20 67 49 #### 60 28 82 66 67 31 58 58 ## 34 22 59 89 22 33 20 18 11 9 6 41 ## 42 ## 67 ## 74 42 ## 76## 88 42 78 33 32 35 39 35 44 22 44 15 32 17 81 13 8 17 7 5 36 25 13 5 4 2 54 ## 70 47 37 20 30 27 95 ## ## 60## ## 73 59 56 98 37 20 15 ## 58 24 51 11 11 13 14 7 43 11 14 24 4 24 9 13 7 9 28 ## ## ## 35 ## 47 76## 25 56 36 33 14 16 11 22 48 10 8 60 51 11 18 19 15 19 54 ## 28 45 23 83## ## 28 51 49 35 22 28 25 23 15 31 17 39 36 66 9 29 11 9 14 20 5 33 9 16 ## 78 ## 63 95 46 ## 97## 48 60 39 21 83 25 32 18 27 13 19 10 31 28 21 27 31 41 28 29 18 10 7 25 7 17 20 16 31 4 3 6 21 10 76 61 88 ## 41 53 58 ## 30 82 ## 39 ## 36 82## 59 63 24 ## 69 45 30 70 39 32 ## 79 48 18 17 12 61 26 53 15 18 44 25 ## 5 5 16 ## 88 ## 74 75 #### 76 82 66 79 21 34 32 17 26 ## 47 9 35 9 38 10 20 71 20 10 19 43 56 51 52 53 48 29## 46 59 20 30 51 57 ## 27 32 16 15 22 19 11 28 44 7 43 20 24 6 66 22 16 25 22 56 6 84 49 ## ## 46 88 ## 37 78 75 26 ## #### 36 46 ## 23 56 43 28 34 54 45 33 23 46 20 31 33 ## 39 50 71 29 ## 18 10 ## ## 77 ## 97 ## ## ## 36 39 39## ## 76 ## 31 22 ## 78 24 46 14 29 49 88 66 ## 59 63 55 7 52 11 29 23 40 45## 42 ## 95 ## ## 74 ## 60 37 23 25 22 30 58 68 74 ## 96 78 69 ## 3 3 3## 60 80 ## 48 35 34 66 55 62 22 50 62 35 35 17 64 47 69 25 ## ## ## ## ## ## ## 14 16 5 22 10 13 31 39 14 60 38 55 37 38 ## 36## 63 ## 90 ## ## ## ## 40 45 ## 26 49 35 67 ## 46 ## ## ## ## ## ## 90 74 11 22 5 15 87 31 98 11 21## 38 53 32 60 61 49 32 46 32 29 46 25 43 60 60 39 ## ## 27 3 6 3 12 21 41 36 58## 41 83 76 ## 68 91 35 68 29 35 21 81 36 26 58 ## 52 16 28 45 ## 27 ## 21 30 13 20 31 84 24 30 32 ## #### 49 ## 41 50 49 30 46 95 ## 33 ## 62 ## ## ## 15 3 9 67 16 27 13 28 28 73 68 33 #### 95 57 32 28 51 ## 46 57 50 34 44 51 27 67 25 74 35 34 24 10 4 2 10 12 30 12 10 19 37 58 20 53 83## 84 45 53 76 ## ## 11 19 13 1 1 11 13 18 45 34 10 15 24 11 61 ## 16 62 38 38 33 32## 79 34 73 53 81 37 11 5 11 2 9 16 22 28 12 15 25 25 35 53 95 61 41 40## ## 52 64 75 45 63 26 2 18 3 19 15 11 13 4 6 7 14 7 31 12 74 63 42 37 39 21 15 9 20 30 27 15 50 76 ## 77## 39 65 40 69 49 58 50 30 63 21 74 20 11 16 13 33 2 18 9 87 17 32 33 16 42 22 87 64 21 ## 63 17 ## 59 59 53## 45 ## 57 ## 56 ## ## 94 64 34 50 ## 52 46 52 8 2 6 3 44 3 17 18 ## 34 7 20 63 13 77 74 64 15 18 14 47 45 47 90 76 18 29 ## 40## 93 44 85 88 91 41 36 42 80 37 61 67 4 14 4 6 12 4 ## 5 10 52 31 29 23 48 16 85 ## 33 ## 89 45 41 59## ## 88 ## 77 58 60 96 ## 51 84 ## ## ## 87 68 42 36 40 13 2 5 12 8 34 9 82 13 ## 16 59 26 39 37## 39 84 50 58 66 66 62 29 62 5 6 15 5 12 15 31 23 60 10 10 54 76 41 66 56 72## ## 72 ## 84 70 ## 60 43 63 50 15 4 5 16 4 12 7 52 14 12 35 26 14 20 30 25 69 17## ## 71 ## 70 66 46 ## ## 58 54 ## 5 6 7 19 5 7 3 4 7 23 4 9 22 19 31 31 22 38 17 24 21 51 12 ## 41## ## 89 42 96 84 73 ## 21 36 34 5 19 26 24 11 22 7 9 10 10 11 24 22 15 8 97 59## ## ## ## ## ## ## ## 41 42 70 57 53 44 39 17 ## ## 40 9 13 7 9 10 64 19 13 18 7 17 10 11 15 26 61 54 ## ## 11 12 52 82 ## 33 #### 44 41 ## ## 80 85 ## 64 99 48 49 9 37 7 8 9 7 62 11 4 9 62 8 8 37 24 35 9 16 24 37 16 20 8 34 55 15 ## 11 59 39 20 71 18 ## 30 82 83 32 64 66 52 53## 73 43 ## 38 45 46 67 52 51 ## 93 57 73 13 16 13 15 8 11 11 19 3 9 89 19 12 30 29 36 ## 20 52 26 21 13 59 69## 90 46 47 ## ## 84 ## 38 66 ## 39 73 39 7 10 5 7 8 12 15 6 2 10 12 19 32 35 14 10 7 6 36 6 31 94 4 16 41 9 35 11 58 17 56 46 36 39 17 55 10 53 10 16 19 17 78 72 62 42 16 61 72 53 74## 69 40 81 78 53 81 66 39 55 31 37 35 6 10 11 25 7 8 6 3 9 25 32 32 42 78 88 17 11 12 47 24 89 49 52 #### ## 88 83 38 ## ## 57 ## 39 31 3 9 6 8 17 25 32 6 9 7 12 24 ## 39 78 88 67 78 53 75 66 35 29 45 74 #### ## 79 60 87 78 25 24 67 7 13 10 35 30 10 21 15 91 27 17 ## 28 88 65 71 25 75 37## ## ## 77 41 61 10 5 25 4 2 2 7 8 22 12 8 13 20 30 15 23 ## 29 95## 63 ## 42 63 59 71 99 30 53 32 ## 15 28 19 20 4 3 5 7 28 21 23 49 39 ## 38 11 44 15 54 43 22 27 13 14 32 ## 18 33 42 22 24 13 40 57## ## 72 ## 77 91 ## 50 28 88 61 58 85 63 3 21 17 8 18 25 10 5 30 11 29 14 8 7 61 14 16 85 23 32 36 #### 48 52 70 49 17 10 8 18 17 12 12 14 20 46 65 11 8 8 6 16 10 6 8 18 51 67 21 12 12## ## ## ## ## 75 ## 60 22 4 5 7 69 18 20 5 14 7 18 34 38 41 40 15 25 33 26 20 30 31## 50 99 66 ## 63 38 ## 48 40 33 21 15 40 46 68 12 13 19 18 30 19 16 12 5 12 49 88 10 24 11 7 16 38 23 34 25 16 60 27 56## 50 46 ## 98 49 86 ## ## 15 7 21 29 3 32 17 88 15 27 26 26 33 19 10 18 21 21 69 10 27 5 93 68 5 11 8 17 22 27 30 37 13 20 54 32 32 58 35 24 43 44 32 44## ## 94 42 89 70 ## 46 ## ## 9 19 33 4 9 8 16 47 7 13 6 32 74 20 26 50 48 12 72 63 56## 26 37 19 7 9 12 14 9 3 11 7 7 15 30 13 36 63 92 40## 44 44 72 57 41 33 44 67 ## ## 40 4 12 60 6 4 11 13 5 18 16 56 25 7 20 53 24 51 29 60 48## 77 ## 79 ## ## 28 49 62 65 80 39 87 9 4 14 28 6 46 64 16 64 12 6 25 57 39 9 15 22 40 49 19 87 35 91 63 49## 72 ## 69 ## 69 25 8 21 3 31 16 18 ## 22 11 6 22 34 57 ## 34 18 14 87 12 12 98## 86 46 48 ## 73 ## 36 18 6 8 2 5 4 2 23 3 28 51 16 19 29 36 50 26 47 30 9 44 22 60 93 41## ## 54 92 50 96 ## 9 16 8 11 12 11 6 9 37 8 73 17 39 55 35 11 19 12 9 ## 72 25 46 ## 10 38 36 26 36 41## ## 52 86 42 65 ## ## 37 90 53 61 38 37 70 39 3 6 4 8 15 62 2 24 8 17 14 3 ## 10 43 8 10 ## 41 10 4 28 77 19 7 13 13 28 29 77 43 14## ## 84 93 ## 83 46 55 61 51 11 14 22 8 7 10 7 13 1 12 1 21 19 13 40 98 2 11 19 70 7 54 8 33 5 10 29 67 21 18 25 ## 23 32 26 46 51 89## 75 ## ## ## 73 ## 91 ## 52 18 13 9 5 29 5 12 9 7 19 1 12 24 3 94 33 60 45 10 5 37 18 29 66 28 23 10 46 26 35 22 #### 82 ## 78 78 85 89 49 ## 51 ## ## 45 ## ## ## ## 16 6 24 8 23 17 26 47 4 12 6 2 ## 11 2 ## 13 13 14 58 43 28 60 16 49 25 12 11 32 19 21 65 30## 53 ## 51 94 ## ## ## ## ## 69 42 4 13 41 22 11 6 31 14 35 17 32 17 38 23 ## 45 54 ## 59 82## ## 46 48 70 84 77 ## 90 67 51 94 ## 8 38 5 3 4 8 11 7 10 9 34 5 18 7 6 10 26 68 63 11 55 20 31## ## ## 93 79 ## ## 26 71 34 49 17 16 19 2 5 7 14 15 10 19 10 20 28 16 45 52 51 27 81 56 81 #### ## 63 95 ## ## ## 36 28 ## 36 81 6 9 13 38 9 3 27 25 47 67 39 25 37 53 31 42 47 9 97 50 48 ## 55 48 37 55 64 69 #### 94 ## 89 43 35 39 54 35 76 70 12 5 5 7 3 12 36 14 5 3 12 34 70 68 17 21 9 9 13 40 14 22 96 21 32 29 74 37## ## ## ## ## 75 45 79 ## ## ## ## 63 40 49 65 41 23 11 41 21 9 31 22 5 14 5 7 7 32 9 52 31 49 19 15 21 35 29 20 25 16 53 82 46 15 38 36 33 13## ## ## ## 96 66 68 87 80 66 31 6 19 9 45 19 12 5 11 17 6 26 31 7 38 19 54 59 15 29 23 24 12 58 46 13 28 17 49 32 71 42 55 12 57 ## 73## ## ## 48 ## 44 ## 80 63 95 57 54 38 33 94 47 8 6 5 7 31 3 3 13 7 8 13 4 20 2 15 23 15 6 25 13 66 62 93 30 29 12 33 #### ## ## 43 ## ## ## ## 72 45 35 45 23 26 3 2 9 5 15 29 13 13 44 28 66 34 ## 8 17 15 76 64 18 42 22 93 98 #### ## 55 ## 78 ## 93 59 53 86 79 79 ## 83 ## ## ## 55 43 45 47 77 ## 30 56 44 3 11 33 5 ## 89 8 12 9 29 7 11 15 24 73 27 35 33 47 19 27 28 22 15 31 57 33 48## ## ## 62 ## ## 45 ## 55 84 ## ## 50 68 25 14 ## 3 6 3 4 23 5 ## 8 ## 8 30 24 32 39 6 64 32 53 91## ## 70 75 64 ## 65 90 58 35 64 ## 69 56 15 10 7 11 2 9 5 9 35 48 19 23 6 20 29 31 12 23 15 31 17 18 22 33## ## 91 ## ## 38 45 ## 43 82 ## 74 99 39 10 61 ## 19 23 42 32 16 9 8 26 6 32 40 28 23 20 22 73 25 45 50 47 ## 22 #### 51 94 50 90 34 36 ## 77 40 42 ## 35 84 21 26 20 16 2 4 91 94 10 19 14 20 16 42 35 23 83 53 13 19 ## 40 22 10 28 20 78 24 15 25 22 27 #### 72 ## 90 ## ## 94 39 ## ## ## ## ## ## ## ## ## ## ## ## ## ## 36 19 6 73 60 92 47 28 15 5 5 5 49 ## 11 16 10 18 25 45 26 32 49 ## 38## 97 ## 80 65 90 36 68 31 57 29 62 38 52 68 72 44 25 28 16 9 4 27 7 21 6 14 3 12 3 9 19 10 32 28 8 70 53 14 ## 38 ## 27 8 64 50 61 17 71 45 35 35## ## 96 ## 67 57 38 61 30 14 13 2 5 16 8 30 19 46 17 10 92 28 6 68 19 ## ## 56 83 13 43 28 20 34 59 44 70 48 60## ## ## ## 49 ## 60 68 95 19 13 56 98 22 17 24 26 41 32 15 3 54 46 3 10 19 ## 90 26 39 67 52 87 13 19 33 23 46 16 10 83 9 67## ## ## ## ## ## 13 22 45 49 1 8 54 67 4 23 42 4 74 9 26 18 22 7 23 36 28 33## 56 ## ## 92 ## ## ## 37 66 ## 75 ## 38 22 23 14 12 2 6 43 32 43 62 32 12 13 ## 51 47 12 37 14 #### 79 46 ## 58 35 ## 87 52 19 16 17 4 9 6 3 16 34 4 10 4 77 22 12 35 22 13 ## 8 37 19 36 18 23 25 42## ## ## 91 ## 75 80 14 21 20 29 19 9 11 7 9 23 11 14 5 22 10 6 31 32 22 77 46 56 16 ## 31 36 23 48 71 6 28 19 43 57 32 53 51 27 48 30 62 69## 50 ## 53 33 46 64 21 19 9 4 10 6 19 14 16 22 70 12 20 11 ## 75 56 60 73 ## 40 10 91 33 53## ## 89 87 78 14 9 22 48 5 32 90 44 ## 27 ## 12 29 33 56 32 ## 21 75## ## ## ## 47 34 79 7 16 32 35 6 34 ## 16 36 23 69 76 4 11 38 32 24 77 53 67 ## 85 ## 23 70 34## ## ## 60 22 16 13 31 6 3 12 29 4 32 12 26 40 ## 10 6 35 17 22 ## 37 47 66## ## 89 78 83 81 ## 43 25 25 25 30 12 13 10 33 5 60 10 47 ## 31 45 15 54 ## ## 16 21 26 68 61 52## 27 18 4 32 26 28 3 32 67 26 54 5 14 68## ## 95 74 ## 47 57 50 72 40 37 10 11 9 3 5 6 6 15 3 5 10 5 45 4 20 42 59 13 50 24 28 27 ## 27 41 9 70 14 14 7 19 39 #### 96 ## 70 33 77 50 40 20 15 9 15 8 5 8 12 52 15 61 11 35 6 7 52 9 ## 96 54 70 11 16 83## ## 70 75 ## 52 53 76 92 34 ## 92 ## 52 15 31 4 12 32 49 15 34 10 3 12 3 26 22 5 13 ## 11 15 7 13 30 24 ## 26 7 70 24 74 32 62 94 98 9 11 52 ## ## 93 48 27 30 ## 63## 56 82 ## ## ## 49 ## 96 97 38 14 7 13 38 27 8 25 65 69 7 18 48 40 13 33 12 38 14 26 30 36 35 17 35 36 39 54 16 24 33 39## ## 91 84 58 85 93 ## 51 ## 70 52 24 37 ## ## 39 67 23 14 3 19 11 42 31 39 10 41 43 42 9 34 18 23 65 15 21 11 51## ## ## 91 ## 33 73 24 48 38 24 40 8 55 66 55 60 47 62 25 49 29 17 31 73 49 20 86## 85 38 39 17 16 38 81 20 ## 26## 96 64 ## 57 ## 89 72 57 ## ## 93 55 64 ## 80 56 53 ## 84 37 20 17 20 50 41 45 7 22 33 90 32 39 12 98 24 14 19 7 43 12 24 13 46 5 30 23 34 10 31 8 66## 57 ## ## ## ## 43 92 ## ## 56 ## 50 59 47 ## 68 32 38 10 10 20 7 8 10 13 18 15 2 33 27 2 57 8 9 12 ## 17 19 66 46 7 36 13 44 12 12 42 ## 18 42 13 56 61 29 45 43 32 49## 93 45 ## 39 64 87 ## 62 62 79 42 66 51 15 82 9 10 5 71 27 6 28 5 5 64 3 17 ## 30 58 6 22 40 91 10 ## 20 37 63 23 26 36 ## 29 66 40 57 22 36 ## 19 30 8 64 97 40 66## 90 80 80 ## 73 ## 49 ## 76 68 ## 17 11 12 19 ## 19 11 68 6 29 88 20 24 83 12 7 27 19 38 45 71 38 76 15 63 10 24 91 56 69 57 37## 65 ## 49 95 93 59 35 26 ## 19 16 19 15 ## ## 12 29 18 29 18 27 10 38 4 28 59 6 18 6 29 23 65 9 23 27## 54 ## 56 86 ## 40 11 29 7 20 34 1 4 32 13 24 17 61 8 12 18 11 6 9 #### ## ## ## ## ## 97 56 38 29 12 25 17 39 28 6 23 46 3 54 37 22 12 13 19 39 9 11 25 48 8 41 15 23 49## ## ## 52 57 ## 68 55 40 78 39 65 2 3 44 23 30 11 5 13 4 12 9 19 17 6 21 13 10 30## ## ## ## 71 ## 60 ## 16 19 10 46 17 48 35 11 82 26 39 17 32 6 72 52 12 29 24 35 44 26 56 ## 19 65## ## 84 ## ## ## ## 65 77 86 76 ## 51 34 90 16 24 8 34 10 22 35 68 45 10 27 74 37 17 48 ## 20 69 9 15 59 77 37 52 29 46## 54 78 42 60 93 41 ## 47 42 38 60 26 37 10 4 ## 33 58 30 17 75## 81 ## ## 43 33 24 16 14 14 9 16 33 12 6 40 38 ## 20 8 47 7 20 59 11 7 27 7 28 18 68## ## ## 69 47 97 25 20 44 3 21 37 2 5 99 10 33 38 44 ## 19 27 58 36 39## ## 78 ## ## ## ## 74 86 66 ## 56 75 17 42 33 10 6 7 5 4 14 42 3 21 27 3 42 28 11 57 25 6 28 43 64 25## ## ## ## 54 48 ## 74 78 ## ## 20 15 11 18 11 51 50 9 14 24 16 93 38 50 14 50 17 29 26 24 ## 83## 86 49 20 17 7 13 8 45 49 37 6 10 5 16 63 3 38 71 13 46 30 33## 87 50 56 ## 88 47 ## ## ## ## 49 ## 91 60 15 26 23 5 30 41 39 34 3 22 16 9 18 46 97 9 17 34 17 27 27 13 13 31 33## ## 86 55 57 ## ## 72 95 ## 83 22 13 28 14 14 13 21 6 50 2 31 66 3 9 14 11 13 8 18 20 10 30 32 50## ## ## 39 37 45 60 ## 56 12 29 5 70 11 18 52 60 3 10 24 36 8 13 4 26 47 15 78 32 7 25 20 22 40 12 14 23 35 10 33 18 17 39 28 61 11 49## ## ## ## 39 ## 88 58 ## ## 40 ## ## 78 ## 90 37 11 32 28 18 16 9 23 21 9 7 9 36 36 37 39 40 18 ## 52 40 43 59 23 45 55 8## ## ## ## 72 90 69 77 ## ## 59 52 63 66 9 12 11 9 24 35 70 93 ## 54 53 20 78 ## 74 50## 60 46 ## 45 54 27 14 33 30 17 10 17 44 4 15 39 6 57 14 8 11 87 10 6 14 56 10 32 13 14 7 7 ## 30 72 51## ## ## 95 ## ## ## ## ## ## 62 ## 91 ## 12 26 11 33 11 18 6 43 54 38 10 61 55 23 24 76 48 20 49 32 47 28 16 28 12 ## 25 25 11 18 12 40 43 31 20 74 22 68 24 14 36 20 40## ## ## ## 88 88 73 49 77 59 ## 55 13 23 33 34 41 31 28 27 44 9 39 43 9 13 3 64 24 18 3 57 18 15 17 46 57 18 80 46 12 11 67 16 27 26 69 55 56 54## ## ## ## ## ## ## 49 ## ## ## ## 50 34 62 6 38 3 23 49 16 59 4 52 10 31 13 11 40 21 45 29 49 23## ## ## ## ## 18 18 4 90 32 33 47 12 5 2 53 44 60 8 9 19 56 ## 7 59 19 5 52 27 6 16 52 29 49## ## ## 25 20 15 39 10 10 27 5 19 9 16 54 28 48 ## 75 49 5 42 25 10 18 28 28 10 64## ## 61 ## ## 66 54 47 15 79 37 8 19 26 11 23 18 15 8 24 12 25 17 94## ## ## ## ## ## 82 47 ## 71 96 43 48 58 88 65 26 21 80 24 21 39 21 6 19 17 43 13 46 17 18 16 34 33 5 5 59 50 4 41 75 64 11 16 16 16 41 35 30 ## ## 47 61 73 61## ## ## ## 47 86 64 40 69 22 42 41 49 ## 40 11 17 ## 44 5 60 19 2 2 2 7 5 19 23 24 7 35 58 16 11 9 26 23 44 62 30 90 31 78 38 41 77 36 37## ## ## 87 ## ## 99 ## 22 68 56 78 79 41 5 33 4 61 40 41 56 29 11 26 ## 48 ## 95 39 44 34 97## 60 ## 62 59 83 67 50 74 35 14 23 15 13 9 13 19 9 5 2 5 49 14 66 42 62 ## 97 17 32 24 11 5 54 33 33 18 12 65## ## 82 77 ## 87 31 71 9 14 8 21 18 54 53 46 3 35 4 18 ## 54 5 27 ## 78 10 11 ## 87 44 10 ## 8 13 14 ## 22 30 28 19 30## ## 94 59 73 84 49 57 6 21 25 23 46 8 55 17 49 40 68 6 ## 58 41 ## 24 41 10 30 58 36 31## 90 93 42 74 ## 98 20 13 18 52 10 47 46 18 26 17 23 19 24 17 ## 16 15 25 51 78 45 8 52 45 10 67 35 10 10 39## 65 57 ## 26 14 18 15 5 20 60 15 2 13 4 3 4 47 6 37 57 ## 25 6 6 49 20 19 66 99## 59 88 ## ## ## 83 52 14 36 44 3 13 97 13 3 23 ## 1 17 3 7 ## 10 5 6 6 75 34 6 31 10 10 23 17 27 52 17 23 38## ## ## ## 76 ## ## 9 22 3 3 10 3 20 52 14 ## 18 15 54 19 28 19 21 67 61## ## ## ## ## 78 70 ## ## 95 ## 47 46 66 ## 30 24 5 12 27 22 18 38 22 4 3 11 43 7 32 40 53 37 19 21 21 20 23 44## ## 98 8 31 50 87 13 57 17 11 8 49 32 8 35 10 46 48 43 93 6 13 18## 50 ## ## 91 91 ## ## 41 38 80 36 20 5 8 37 4 27 24 3 39 45 19 49 6 35 71 ## 57 34 5 59 47 15 75 18 4 50 ## 35 74 27 10 36 34 14 59 ## 46 24 22 66 65 64 #### 95 58 88 84 ## ## 58 ## 82 63 ## 23 18 19 5 16 24 49 26 30 3 5 7 36 19 12 ## 44 28 44 42 26 46 17 44 24 20## 88 ## 53 ## 83 ## 76 ## ## 49 ## ## 55 71 87 54 11 15 5 22 12 8 38 31 32 47 3 5 35 12 3 4 16 3 18 4 8 62 22 56 32 14 ## 28 10 26 38## ## ## ## 99 ## ## ## 97 78 82 ## 52 46 ## 94 31 32 26 36 47 54 2 18 5 37 59 6 31 ## ## 48 11 38 ## 78 #### ## ## ## ## ## ## 64 96 ## ## 85 73 40 46 26 66 47 41 40 42 1 5 9 13 9 86 52 33 22 10 14## 67 69 ## 66 88 28 21 12 42 32 30 13 18 30 71 10 11 16 8 9 49 35 85 22 23 68 17 17 18## ## ## 85 ## 65 ## 62 68 61 35 9 51 29 ## 22 12 26 52 8 17 10 14 35 5 22 8 36 55 26 16 17 44 51 57 36 32 30 17## ## ## ## ## ## ## 62 93 ## ## 55 ## ## 86 ## 80 25 31 33 15 58 ## 3 56 23 62 17 20 1 ## 34 51 7 45 7 29 53 6 75 80 53 13## ## ## ## ## 64 ## ## 49 ## 79 30 71 24 46 4 4 45 58 24 76 17 63 ## 55 81 6 7 8 7 59 10 8 8 29 74 7 57 19 32 88 48 38## ## ## ## 97 ## ## 92 ## ## 75 34 54 41 92 34 32 21 52 33 5 27 16 2 88 30 32 13 4 80 37 3 76 46 2 55 15 10 26 7 70 15 70 33 10 36 7 94 35 5 70 24 34 46 91## ## 66 48 51 33 74 55 26 11 60 48 64 48 42 10 ## 69 19 48 13 64 47 22 47 22 11 64 14 78 ## 40## 57 49 92 67 61 47 44 20 32 80 10 33 9 31 38 16 5 31 25 50 ## 35 11 64 23 11 49 10 26 5 26 10 5 11 21 ## 28 55## 60 98 ## 59 91 ## ## ## 91 47 85 ## 66 29 26 62 19 51 10 24 59 35 12 58 24 24 16 76 14 27 29 42 74 2 12 2 19 19 19 61 61 4 52 ## 54 38 23 19 ## 24## ## ## 60 ## ## ## ## 38 43 49 31 96 48 40 18 3 42 ## 3 45 15 67 89 29 86 52 75 ## 28 7 28 19 22## ## 45 75 ## 48 ## ## ## ## 98 44 17 26 14 44 7 20 29 ## 33 30 13 22 5 10 11 70 19 3 13 ## 34 43## 92 69 ## ## 59 62 84 57 84 73 58 7 25 18 9 8 33 12 35 ## ## 31 5 45 23 50 ## 9 30 10 51 ## 12 45 54 4 ## ## 38 99## ## ## ## ## 73 47 ## ## ## 72 13 9 6 30 17 19 3 78 49 32 4 22 22 60 6 37 19 49 17 58 ## 4 15 32 16 23 32## 76 ## 63 78 38 32 24 7 15 23 11 32 21 3 ## 58 11 45## ## 48 ## 52 43 ## ## ## 88 69 54 65 57 ## 59 27 18 79 3 9 46 3 10 11 25 55 82 45 11 24 73 43 44 48## ## 62 27 29 20 25 33 37 18 20 70 11 26 12 5 15 25 84 ## 45 12 41 11 50 77 99 7 22 45 17 24 79 24 29 86 47 33 17## ## 58 ## ## 38 25 98 72 18 62 29 29 13 46 37 94 15 11 8 9 ## 94 44 63 37## ## ## ## ## 60 63 49 47 55 75 78 22 77 19 43 22 42 57 16 28 9 58 65 20 24 27 7 13 ## 42 17 3 15 37## ## ## 53 ## ## 21 15 13 24 23 4 43 20 17 3 32 6 39 33 26 39 33 97## ## 93 ## 80 ## ## ## ## ## ## ## ## 72 24 25 13 14 15 16 8 5 33 ## 23 28 22 59 8 10 8 20 17 49 11 19 14 49## ## 76 63 41 18 13 7 15 6 14 23 6 32 26 34 26 8 24 23 20## 96 ## 91 ## ## 85 63 83 66 8 10 20 32 36 13 16 6 17 5 11 69 30 6 45 76 27 18 41 32 23 17 76 5 39 31 38 83## ## ## ## ## 68 ## ## ## 81 63 52 ## ## 29 30 33 99 49 27 49 21 23 ## ## 36 25 10 23 2 ## 8 7 52 ## 38 7 24 9 10 36 61## ## ## ## ## ## 32 24 53 62 22 20 48 21 ## 24 3 28 21 54 ## 59 61 ## 29 20 8 12 ## 11 94 26 15 49## 77 ## 51 ## ## 94 ## 49 49 52 80 ## 65 75 60 32 19 7 29 68 81 20 4 22 87 ## 16 ## 38 21 42 67 31 68 7 49 72 36## 71 71 ## 58 73 91 ## 54 32 53 7 11 9 6 6 6 14 13 7 71 18 5 49 46 9 2 8 15 35 9 43 3 51 66 30## ## 62 99 ## ## ## ## ## 33 85 58 75 51 ## 55 83 ## 81 19 71 8 29 75 1 28 40 11 67 98 6 ## 10 9 66 73 38## 92 47 ## ## 92 8 98 9 34 33 11 71 13 10 9 12 46 4 78 34 35 17 14 12 14 37 27 52 70## ## ## 53 ## 85 97 89 ## 84 45 58 84 31 23 34 58 11 18 5 14 12 59 22 48 4 26 44 5 5 18 10 38 ## 16 10 76 7 40 23 53## ## 73 ## 65 67 ## ## ## 97 ## 49 ## 24 58 20 50 22 ## ## 17 78 3 35 18 63 60 14 ## 41 20 2 21 13 28 39 8 13 52 31 11 53 4 27 53 49 57 25## ## 73 ## ## ## 59 ## 59 ## 49 65 48 35 32 47 14 20 3 35 15 63 5 31 78 76 58## ## 97 ## ## ## ## 32 ## 93 66 83 31 79 34 19 32 10 11 94 43 55 ## 41 30 16 27 25 27 48 30## 81 ## 53 90 ## ## 21 18 8 9 22 22 31 20 33 8 18 11 34 ## 70 25 12 68 6 1 10 31 8 16 32 49 11 44 6 16 75## 56 83 ## ## ## 99 ## 97 ## 41 ## ## 8 43 6 6 34 37 ## ## 6 24 20 47 12 77 64 2 16 22 91 22 4 12 24 9 20 46 14 45 48 73 12 14 9 19 14 6 71 68 48## ## 96 62 ## ## ## ## ## ## ## 52 69 68 93 ## 36 24 17 9 34 16 27 5 14 5 15 44 17 ## 49 8 12 39 48## ## 63 ## ## 59 ## ## ## ## 98 44 33 47 48 27 37 97 27 8 24 3 84 24 10 26 2 9 67 42 17 38 15 38 7 12 9## ## ## ## ## 54 84 ## ## ## 73 45 55 21 20 17 11 17 9 54 5 25 7 16 21 24 24 7 ## 19 15 7 6 65 8 21 41 4 ## 33## 65 ## 62 92 97 ## 78 ## 60 59 90 33 43 37 41 23 27 3 23 3 ## 22 17 10 34 14 12 16 12 24 18 14 7 10 7 20 30 45## ## ## 45 ## 53 ## ## 75 46 ## 55 33 33 48 81 25 19 43 9 11 22 78 45 49 5 12 19 27 45 28## ## ## ## 78 ## ## 59 83 45 ## 47 8 57 17 4 37 29 47 54 17 78 ## 10 16 17 50 5 54 59## ## ## ## ## ## ## 95 ## ## 56 79 55 37 42 6 15 23 22 15 26 50 50 18 70 12 13## ## ## 63 ## ## ## ## 43 79 41 44 39 86 12 14 87 26 67 7 5 45 14 7 51 92 24 6 19 62 34## 68 96 58 42 85 67 94 55 32 20 42 6 72 14 28 98 79 5 46 24 6 81 16 31 11 78 ## 3 9 12 9 12## 69 ## ## ## 73 ## 97 20 85 43 21 16 21 6 27 24 31 5 26 4 22 7 17 9 15 64 8 34 96 50 9 #### 72 ## ## ## ## ## 96 ## ## 66 85 57 51 54 42 13 18 6 29 11 12 80 44 8 9 65## 65 95 ## 59 73 ## 7 8 4 8 70 3 9 78## 59 63 64 92 61 84 72 75 62 30 35 17 43 44 14 12 5 27 47 27 33 21 14## ## ## ## ## 94 98 ## ## 67 ## 98 ## ## 98 87 64 76 31 59 27 53 14 22 6 7 23 10 76 31 ## 18 19 6 37 41## 66 69 ## ## ## ## ## 23 7 35 53 62 59 9 37 10 82 19 29 3 30 59 9 7 38 26 10 6 52 44 51 10 9 35 89 5 24 21 82## ## ## ## ## ## ## ## 91 89 ## 23 43 12 48 56 52 33 26 35 7 5 47 11 6 4 4 19 34 22 5 7 26 35 21## 96 ## 56 95 21 43 48 4 12 29 14 24 43 34## ## ## ## ## ## ## ## ## ## ## 90 91 32 84 90 77 78 59 92 93 98 41 28 49 15 30 37 7 29 66 13 12 8 22 15 6 35 49## ## 99 67 ## ## 96 ## ## ## ## 96 46 38 ## 89 87 49 ## 30 78 8 50 31 6 40 12 34 61 61 43 20 85 18 50 15 14 ## 31 81 53 29## 92 ## ## ## ## 60 54 73 44 ## 53 11 ## 8 15 62 6 16 5 7 6 6 6 7 7 51 49## ## ## 51 ## ## 89 ## ## 53 84 11 13 20 15 14 17 97 24 51 37 15 15 11 2 50 50 15 7 16 25 20 32## ## ## ## ## ## ## 40 ## 30 37 ## 20 33 9 63 59 63 15 52 55 30 ## 27 5 7 49 10 ## 16 4 43 3 9 11 3 25 80 ## 19 42 46## 74 72 ## ## ## ## 72 68 51 26 24 47 6 13 9 68 ## 19 66 9 60 34 27 9 ## 25 ## 53 78 58## ## 96 ## ## ## ## 67 99 79 74 23 88 20 50 35 12 10 16 81 ## 4 2 4 44 58 45 31 38 24 60 13 23## ## ## ## ## ## ## ## 53 22 62 33 7 ## 34 7 37 ## 33 12 35 17 5 16 6 8 10 19 26## ## ## ## 70 50 ## 40 57 ## ## 51 49 54 7 11 23 5 9 23 9 14 11 25 4 10 15## ## ## 46 99 ## ## 94 75 34 76 13 11 36 17 8 9 50 33 74 6 44 31 31 39 96 8 96 32 15 10 77## ## 46 43 65 ## 59 19 10 9 25 16 93 17 15 31 39 ## 47 32 69 68 30 30 18 67 12 26 12 80 12 53## ## ## 84 ## ## 67 ## 58 31 27 18 58 43 54 12 30 ## 19 52 28 ## 17 19 70 63 95 32 72 35 13 7 9 20 22 55 43 97 12 33 36## ## ## ## ## ## 73 ## ## 29 33 15 21 54 58 63 21 31 31 33 11 37 36 36 32 6 34 32 42 36 35 21## 48 59 ## ## ## 40 21 41 15 54 28 6 50 42 26 96 36 23 34 10 53 54 50## ## 73 ## ## 51 ## ## 61 86 ## ## ## 28 36 17 24 13 10 20 21 38 23 38 17 7 47 98 40 7 46 29 8 31 7 5 11 28 3 ## 57 9 50 48 42## ## ## ## ## 65 ## 57 ## 42 27 97 83 9 ## 46 5 6 ## 16 9 17 9 4 8 16 62 43 14## ## ## ## ## ## ## ## ## 16 61 34 4 13 5 22 7 6 14 21 31 4## ## ## ## 68 ## 82 20 35 ## 22 ## 13 16 3 11 4 61 12 17 54 39 8 45 83 44 17## ## ## ## ## ## ## 61 59 37 ## ## 97 44 61 18 24 28 ## 68 9 49 56 3 43 54 59 73 10 29 34 47 54## ## ## 73 ## 52 ## ## 59 61 ## ## 29 59 40 33 24 19 91 29 27 85 24 79 75 #### ## ## 53 48 81 31 39 17 14 10 21 69 20 41 89 33 17 78 10 10 31## ## ## 53 ## 95 77 ## 87 65 69 30 ## 25 14 44 46 5 81 4 21 66 66 74 66 66 ## 89 ## 38 57 31 29 5 31 18 76 81 98 71 56 16 50## ## 80 ## ## ## ## 45 30 12 26 3 34 ## 48 16 65 9 22 42## ## ## 54 ## ## 81 56 57 37 56 47 52 ## 62 34 35 14 12 30 11 ## 55 50 35 43 8 38 45 52 95 4 2 11 20 16 45 22## ## 66 ## ## ## 22 23 14 36 13 13 48 26 21 22 29 56 6 ## 5 34## 67 ## ## ## 62 7 17 24 10 ## 47 ## 51 13 39 6## ## ## 67 73 64 ## 79 ## ## ## 52 98 80 ## 93 ## 24 56 23 ## 13 13 82 24 38 51 10 10 18 29 7 9 15 5 19 9 6 78## ## ## ## 55 41 66 50 ## 52 14 12 47 25 7 43 20 5 40 48 22 17 34 7 ## 12 36 26 4 33 5 20 38 19 69 16## 59 ## ## ## ## ## ## ## 83 ## 26 26 59 36 47 20 34 25 12 31 32 56 69 42 29 10 6## ## ## 67 69 46 89 58 60 86 51 32 31 64 23 25 ## 7 12 23 36 55 7 4 ## 15 88 21## ## ## ## ## ## ## 57 ## 37 ## ## 34 ## 18 36 70 18 43 6 16 27 4 21 31 47 12 11 21 13 22 ## 62 7## ## ## 89 80 82 87 38 65 43 ## 16 13 10 10 15 12 6 18 16 32 56 7 83 5 19 19 27 25 73 22 7 21 26 2 69 ## 58 51 20 6 9 13 21 23 23## ## ## ## ## ## 67 98 82 50 75 56 32 29 20 42 16 68 13 38 14 5 34 17 39 ## 33 7 5 37 3 62 46 5 2 55 11 4 ## 12 33## 68 ## 68 ## 91 11 19 28 35 36 23 53 27 33 21 13 5 18 ## 13 11 35 1 58 6 4 14 54 17 19 22## ## ## ## ## ## ## ## ## ## ## ## 32 98 64 ## 99 35 23 10 7 15 29 13 ## 83 ## 62 10 76 5 4 28 ## 3 28## ## ## ## 47 ## 87 78 52 53 29 32 73 50 37 27 10 7 38 12 11 37 48 17 65 32 6 42## 68 61 97 70 ## 78 ## ## 53 ## 33 7 19 20 35 29 8 52 9 7 93 22 28 6 8 28## 69 ## ## ## ## ## ## ## ## ## 70 55 8 26 19 23 36 85 74 13 45 51 51 39 16 ## 16 8 29 3 24 11 6 2 10 18 54## 63 ## 52 ## 53 46 49 39 14 14 9 8 7 10 12 30 20 21 19 10 43 4 70 72 56 14 9 39 19 78## ## ## ## 65 ## ## ## 77 85 88 81 84 ## 67 23 21 42 17 18 29 17 6 14 27 13 ## 26 92 14 65 31 3 33 32 33 39## ## ## ## ## ## ## ## 92 ## ## ## 99 ## 37 ## ## 26 22 25 ## 48 8 9 35 ## 35 22 51 73 53 46 26 28 50 24 37 27 23 19 16 3 18 35 25 28 26 3 82 44 72 31 52 24 27## ## ## ## 49 75 63 23 38 27 30 14 53 17 60 39 23 29 94 20 28 33 16 18## ## ## ## ## 87 60 32 26 27 12 20 13 37 11 20 69 3 30 25 36 15 2 33 34 16 17 23## 88 87 ## ## ## 77 80 ## ## ## ## 49 24 35 16 ## 35 30 5 10 13 5 30 67 38 40 12 #### ## ## ## 98 ## 45 92 ## 36 34 62 74 60 35 8 42 15 31 3 23 22 26 ## 66 19## 90 90 79 84 46 78 93 77 33 20 22 17 14 17 79 25 36 5 64 25 6 27 ## 74 14 55 23 84 25 65 13 49 46 90 11 12 44## 58 ## 53 47 67 14 8 76 20 12 27 83 71 23 22 6 45 53 26 77 2 9 38 11 41 36 35## 69 ## ## 53 ## ## ## ## 69 56 64 81 ## 34 20 26 16 13 64 8 14 57 25 72 40 69 8 20 40 15 17 29 41 7 5 50 7 34 ## 62 44 5 26 42 9 51 8## ## ## ## ## ## 80 91 90 ## 79 40 91 36 62 31 23 40 18 ## 10 12 34 29 34 34 81 ## 10 68 5 5 35 36 22 28 34## ## ## ## ## ## 68 ## 72 ## ## 69 62 19 61 65 11 12 21 14 7 51 ## 22 63 73 5 17 3 33 6 34 27 36 38 44## ## ## 77 ## 28 40 21 76 18 29 35 ## 19 54 79 5 26 50 14 10 5 28 34 40 77 22 15 36 33 63## 70 57 79 79 ## 60 16 11 46 19 33 75 84 65 21 38 16 38 10 20 74 21 49 11 1 56 5 6 ## 34 28 33 27## 94 58 62 54 87 54 54 ## 44 52 73 84 20 11 10 8 40 31 93 35 66 41 33 ## 16 9 44 28 63 15 13 65 12 6 17 60 11 23## ## 76 ## ## 60 62 24 22 24 33 61 25 16 19 9 13 77 38 16 20 18 ## 13 15 16 35 10 11 14 15 23 24## ## 67 ## 61 69 ## ## 46 20 26 67 ## 12 26 27 92 11 43 9 41 47 12 3 14 28 14 30 17 72 44 14## ## ## 37 38 71 79 17 63 20 40 7 31 26 14 54 55 5 55 12 14 27 22 41 40 39 ## 39 16 85 35 30 60 15 51 85## ## ## ## ## ## 74 ## ## ## 40 53 67 ## ## 54 81 66 59 15 47 86 19 9 28 18 ## 18 6 68 ## 39 18 44 6 ## 33 5 7 25 32 45 22 6 9 27## ## ## 93 81 99 93 ## 61 39 65 76 66 38 48 11 20 14 30 84 21 ## ## 11 45 77 5 16 10 72 47 ## 5 3 13 28 61 2 42 4 7 23 ## 36## ## ## 53 50 60 52 81 ## 36 34 40 10 35 14 30 37 35 43 64 29 20 6 20 40 33 67 10 ## 26 ## 4 54 90 42 15 26 64 9 19## 68 ## 69 ## 66 55 ## ## 62 14 77 53 31 19 39 34 56 5 8 5 23 8 6 48 3 46 51 21 46 14 10 33## ## ## 79 ## 49 58 34 53 18 22 27 57 18 53 38 36 ## 75 52 8 22 16 18 23 4 13 11 15 57 ## 31## ## 97 80 ## ## 55 ## ## ## 88 88 15 40 42 58 80 45 80 43 20 24 ## 30 30 ## 21 50 64 22 8 ## 37 25 6 16 66 28 15 97 27 71 5 14 9 ## 32 35 48 26## ## ## 85 86 83 59 58 24 29 15 94 50 71 7 94 55 49 72 ## ## 35 56 46 28 58 19 16## ## 60 ## ## ## 54 ## 48 65 48 41 57 81 ## 46 87 38 9 48 8 72 17 ## 50 94 5 41 11 10 47 23 34 33 51 14 23 21 26 5 74## 93 ## ## 75 ## ## 52 95 ## 74 44 25 23 35 30 19 15 13 13 40 54 15 52 53 79 11 27 6 31 18 ## 52 38 31 41 62 ## 7 48 22## ## ## 43 46 80 86 60 34 14 21 13 37 28 20 10 34 18 19 ## 35 19 54 16 67 5 32 23 4 16 23 2 20 10 48 35## ## ## ## ## ## ## ## ## 68 77 88 ## 47 87 78 34 27 62 19 44 28 54 57 ## 22 12 20 13 35 11 19 23 6 59 33 28 4 7 18 53 19 31 17## ## ## ## 93 23 99 30 23 51 53 7 15 17 13 21 ## 23 14 58 23 ## 52 63 1 56## 75 67 ## ## ## ## 61 ## 88 71 ## 51 ## 79 ## ## 90 28 20 36 91 67 11 7 25 94 32 ## 24 76 16 36 13 25 41 16 10 50 5 57 10 37 73 ## 13 16## ## 98 ## 54 ## 85 42 68 62 25 24 19 49 18 66 31 40 17 12 21 17 37## ## 55 44 21 67 94 ## 16 37 11 27 19 5 48 10 18 21 55 19 97 12 38 78 69 83 44## 84 ## ## 77 95 79 45 13 14 35 20 35 26 25 28 14 20 33 10 11 81 74 46 13 13 42 14 25 68 83 39## 76 ## ## ## ## 62 95 ## ## 49 52 42 9 24 25 10 8 12 4## 61 56 58 ## ## 87 ## 96 68 23 12 24 19 23 25 20 37 10 67 33 24 32 62 19 30 52 7 60 82 7 7 #### 95 72 ## 68 ## 96 ## ## 97 ## ## ## ## 47 56 33 37 26 24 67 28 23 33 44 14 43 28 42 29 36 6 8 41 5 6 33 15 15 79 27 18 18## ## 43 ## 47 43 10 71 67 12 50 ## 9 23 46 26## ## ## 90 77 67 77 85 67 12 10 13 12 14 ## 54 20 ## 28 69 13 ## 47 ## 4 75 41 ## 12 58 22 38 ## ## 40## 59 ## ## 79 76 47 81 16 31 78 32 33 23 16 21 15 62 9 7 13 3 20 2## ## ## ## ## ## ## ## 42 40 36 52 32 25 36 11 44 19 10 8 15 38 22 7 24 ## 29 14## 60 ## 48 49 58 ## 27 80 19 37 24 69 91 17 7 63 11 16 34 12 2 3 ## 67 54## 66 ## 58 16 16 10 8 32 38 31 58 42 28 9 7 8 16 17 4 54 19 20 20## 68 70 78 61 99 44 42 34 41 24 27 7 59 15 68 15 39 64 20 35 5 4 49 37 62 45 18## 74 47 ## ## 37 ## ## ## ## 31 32 93 16 13 11 54 17 27 9 17 9 9## ## ## 88 ## ## ## 73 50 92 27 27 14 32 18 58 72 63 74 27## ## ## 64 ## ## 86 78 ## ## 80 ## 60 34 44 49 19 30 19 9 17 82 18 30 53 23 61 22 73 19 22 3 15 ## 28 7 7 49 3 1 7 5 9 41 53 32## ## ## ## ## ## ## ## 19 35 52 20 16 32 19 34 25 62 52 49 40 39 ## 98 10 42 9 ## 14 30 39 20## 97 52 64 ## ## 29 52 43 33 54 9 10 8 17 27 26 44 28 10 9 38 40 17 18 3 15## 78 ## 66 94 42 21 ## 35 26 13 25 11 21 56 44 24 50 24 49## ## ## ## ## 71 ## 79 ## ## ## ## 61 ## ## ## ## ## 26 53 48 56 35 70 ## 41 18 91 53 ## 21 ## 62 20 ## 9 54 60 12 11 71 36 ## 83 50 66 ## 60 22 ## 53 8 50 98 60 67## 89 28 72 22 39 13 10 9 87 22 11 18 76 34 8 54## 61 89 ## 50 99 41 18 32 28 18 63 50 40 27 12 3 70## 85 89 ## ## ## ## 96 96 ## 34 11 20 18 ## 17 ## 12 73 54 72 4 5 66 12 6 32 54## ## 90 ## ## ## 70 34 15 9 17 19 44 35 13 51 6 24 ## 6 39 30 64 18 56## ## ## 91 43 15 17 57 29 17 25 18 51 ## 52 41 33 48## ## 91 ## 83 48 92 24 36 84 47 30 45 56 53 31 27 33 14 34 42 8 14 47 21 8 17 32 7## 81 33 39 33 27 21 38 22 37 54 26 62 72 52## 94 61 ## 55 ## ## ## ## 46 ## ## 88 94 44 28 38 15 ## 15 28 ## 42 62 72 59 74 63 45 28 25 50 63 14 ## 44 15 ## 7 12 26 61 35 5 6 8 42 29 34## ## ## 69 ## 87 56 80 26 ## 79 46 11 33 51 27 4## 81 ## ## ## 90 ## 17 49 24 72 16 29 39 38 20 18 36 46 10 63 8 12## ## ## 98 ## ## 59 ## ## 29 86 40 38 14 82 71 88 22 ## ## 34 41 46 55 49 24 56 52 4 5## 61 90 61 60 53 54 38 42 36 28 79 65 27 60 55 58## ## ## ## ## ## 65 66 ## ## 66 89 76 43 61 69 29 64 28 23 30 13 37 2 5## ## ## ## ## ## ## 70 ## ## 83 ## 48 50 28 32 61 30 22 ## 49 26 21 52 33 29 42 25 11 24 27 14 1## ## ## 68 75 72 69 ## 72 ## 58 65 ## 63 ## 57 28 78 40 44 18 13 18 39 18 32 11 29 47 5## 77 ## ## ## ## ## ## ## ## ## ## 93 62 ## 61 91 44 32 82 29 20 17 40 45 45 47 37 42 4 4## ## 79 ## ## 32 48 33 41 23 ## 42 24 41 28 31 21 52## ## ## 57 60 36 85 26 40 17 45 31 63 28 20 23 24 35 28 12 71 15 28 1 1## 73 ## ## ## ## ## 80 34 37 24 80 30 34 41 98 52 34 35 ## 13 9 14 6## 80 ## 93 64 75 75 25 23 91 33 50 36## 77 ## ## ## 73 ## ## ## ## ## 77 28 ## ## 68 59 17 ## 16 53 39 15 77 44 50 32 23 11 7 5 8 1## 76 71 ## ## ## 95 70 ## 24 25 16 82 38 5## ## 68 ## ## 86 49 86 74 38 43 27 ## 23 38 79 ## 19 ## 69 27 45 9 2## ## ## 22 50 41 22 45 62 21 41 27 21 3## 41 ## 44 ## 54 18 91 46 28 35 23 20 39 39 7## 59 37 57 69 36 34 34 88 17 50 5## ## 69 76 56 29 72 46 47 15 41 32## ## 81 ## 79 43 35 38 16 61 42 41 95 9## ## ## 45 34 31 81 26 20 60 45 74 26 18 72## ## 93 38 37 ## 38 53 40 24 49 3 9## 70 98 30 90 46 33 45 78 80 31 3## ## ## ## 51 59 83 48 76 35 35 41## 82 83 ## ## 82 87 74 22 43 77 65 81 24 6## ## 37 59 72 6 8

Sustainability 2020, 12, 838 22 of 27
The procedure was validated using a validation dataset, derived from the basic set. This proves the hypothesis set in this research paper, that the mobility of the urban residents over a period of time can be described by an urban mobility index based on the information from the recorded telecommunication activities of the users of the public mobile communication network.
6. Conclusions
The purpose of this paper was to prove the potential of telecommunication users’ activities data (call data records) to support the provision of an urban mobility estimate, then, to identify urban mobility indicators, to define the process of their calculation, and a model which can estimate urban mobility based on the parameters of the indicators. The defined goal of research was to establish a process of the passenger urban mobility estimate as a quantitative measure of the process of urban migrations caused by socioeconomic activities, one which is in the function of determining a new urban mobility estimation index. A structured record of users’ activities within a public mobile communication network used for the purpose of charging telecommunication services was used as a primary research material. An algorithm that uses this information as a basis to identify the movement of users within an urban agglomeration covered by this research was developed. On the basis of the information about the identified migrations, the indicators of urban movement were defined, and the process of their calculation was determined and validated. This was followed by a procedure in which the relationships between the values of urban mobility indicators and values of mobility estimation were determined. This relation was defined though the method of surveys. The survey was defined in such a way so that through several questions expert opinions could be gathered on how and to what degree the combination of values of certain urban mobility indicators affects mobility. According to their own judgement, experts allocated an appropriate value to each question using the suggested procedure for mobility estimation. The method of fuzzy logic, that is, the ANFIS (adaptive neuro-fuzzy inference system) method which functions on the principle of applying conclusion methods which characterize neural networks with the goal of determining parameters of an indirect conclusion system (fuzzy inference system, FIS) was used. The result is a system that permits the usage of well-known neural network learning algorithms, ones that cannot be used in fuzzy logic systems, while at the same preserving the possibility of using fuzzy logic. The answers of experts were used as an initial collection of data to establish the model. The model was described with 27 rules, each of which has its own interval of exit mobility estimate values dependent on entry parameter values of entry indicators, defined with a total of 32 fuzzy logic systems which were assigned their appropriate affiliation functions. A form of the exit variable and a learning (optimization) method, as well as the number of epochs, were defined. Each of the established fuzzy logic systems were tested for reliability using the RMSE method. The smallest learning mistake was generally observed in all scenarios which used the hybrid learning method and in which the exit function was in linear form. The average model validation error (for a model chosen as optimal) was 0.2103, and the average model validation error was 0.1907. As the most optimal model, the first-class fuzzy logic Sugeno model was chosen, one in which all three entry values were determined with a trapezoid type affiliation function, and each consisted of three overlapping linear type functions. A hybrid learning model with three learning epochs was used. The result of the model is an estimate of urban mobility for the matching pair of urban areas (partial mobility index), which is then used to calculate the mobility index of the entire urban agglomeration in the process of urban mobility estimation. Implementation of the urban mobility estimation process was executed using several programming environments. Data collection loading, entry data table conversion, and creating the base cell table, as well as the decomposition of space was handled with a programming code developed in the R programming environment. The open source geographic analysis programming tool QGis was used for space decomposition visualization. Validation was executed though several steps. Validation of the ANFIS model was part of an integral process of forming the fuzzy logic system. This was followed by the validation of algorithms which were defined as part of the mobility validation procedure. The purpose of the validation in this part of the procedure was to confirm that the defined algorithms and the written programming support had been correctly calculating the

Sustainability 2020, 12, 838 23 of 27
segment they were assigned to. The validation of all algorithms was successful, confirming that all written algorithms properly executed their assigned operations. The validation of the model results followed. According to the indicator calculation, a data segment of 20% for each timeframe was extracted, and partial indexes and the urban mobility index were calculated accordingly. The results found in that data were compared with the results from the remaining data in the segment, and the discrepancy between results was determined. The procedure of the urban mobility estimation was applied on a real publicly available subsegment of data taken from a record used to charge telecommunication services within a public mobile communication network. The result of the research have proven the hypothesis of this scientific research paper which states that the mobility of inhabitants within an urban environment can in a specific timeframe be described with an index of urban mobility, based on the recorded telecommunication activities of users in a public mobile communication network. The goal of the paper was fulfilled and the possibility of application of telecommunication users’ activities data for the purpose of an urban mobility estimate was proven. Indicators of urban mobility and the process of their calculations were defined, followed by a model which can estimate urban mobility on the basis of the values of these indicators, i.e., a procedure of the population’s urban mobility estimates as a quantitative measure of urban migrations caused by socioeconomic activities. Future research should focus on eliminating some of the perceived limitations of the existing research. The input dataset could be upgraded to include the telecommunications network records from the signaling area (e.g., GPEH, CTR, and CTUM), which, in line with the nature of the telecommunications network operation, provide a significant amount of user activity records similar to the CDR database. Further development and improvement of the methodology should also focus on the substitution of the linear distance between the base stations, which now represents the distance, with the movement along the infrastructure (e.g., the road distance between the base stations). In addition, research should focus on segregation of movements by transport modes in order to include the impact of multimodality in the urban mobility index. [93,94].
Author Contributions: Conceptualization, K.V. and S.M.; development and design of the methodology, K.V., M.S., and S.M.; creation of models, K.V.; writing of original draft, K.V. and M.S.; investigation, M.S.; creation of models, M.S.; validation S.M. and G.K.; supervision, S.M.; data curation, G.K.; formal analysis, G.K.; visualization, G.K.; writing—review and editing, G.K. All authors have read and approved the final manuscript.
Funding: This research received no external funding.
Conflicts of Interest: The authors declare no conflict of interest.
References
1. Brčić, D.; Ševrović, M. Logistika Prijevoza Putnika; Fakultet prometnih znanosti Sveučilišta u Zagrebu: Zagreb, Croatia, 2012.
2. Kuhle, O. Mobilities, Networks, Geographies; Routledge: London, UK, 2008; pp. 429–430. 3. Hanson, S.; Giuliano, G. The Geography of Urban Transportation; The Guliford Press: London, UK, 2004. 4. Gillis, D.; Semanjski, I.; Lauwers, D. How to Monitor Sustainable Mobility in Cities? Literature Review in
the frame of Creating a set of Sustainable Mobility Indicators. Sustainability 2016, 8, 1, 1-30. 5. Casey, J.; Norwood, J.L.; National Research Council. In Key Transportation Indicators; National Academy
Press: Washington, DC, USA, 2002. 6. Brčić, D.; Šoštarić, M. Parkiranje i garaže; Fakultet prometnih znanosti Sveučilišta u Zagrebu: Zagreb,
Croatia, 2012. 7. Amaral, R.R.; Šemanjski, I.; Gautama, S.; Aghezzaf, E.H. Urban Mobility and City Logistics—Trends and
Case Study. Promet Traffic Traffico 2018, 30, 613–622. 8. Novačko, L.; Šimunović, L.; Krasić, D. Estimation of Origin.Destination Trip Matrices for Small Cities.
Promet Traffic Transp. 2014, 26, 419–428. 9. EL Rashidy, R.A.; Grant Muller, S. A Network Mobility Indicator using a Fuzzy Logic Approach. In
Proceedings of the TRB 93rd Annual Meeting Compendium of Papers, Transportation Research Board, Washington, DC, USA, 12–16 January 2014, pp. 1–14.

Sustainability 2020, 12, 838 24 of 27
10. Gudmundsson, H. Making Concepts Matter: Sustainable Mobility and Indicator Systems in Transport Policy. Int. Soc. Sci. J. 2003, 55, 199–217.
11. Litman, T. Developing Indicators for Comprehensive and Sustainable Transport Planning. Transp. Res. Rec. 2008, 2017, 10–15.
12. Litman, T. Well Measured—Developing Indicators for Sustainable and Livable Transport Planning; Victoria Transport Policy Institute: Melbourne, Australia, 2015.
13. Litman, T. Measuring Transportation: Traffic, Mobility and Accessibility. Inst. Transp. Eng. 2003, 73, 28–32. 14. Kaprias, I.; Eden, N.; Tsakerestos, A.; Gal-Tzur, A.; Gerstenberger, M.; Hoadley, S.; Lefebre, P.; Ledoux, J.;
Bell, M. Development and Application of an Evoluation Framework for Urban Traffic Management and Intelligent Transport Systems. Procedia Soc. Behav. Sci. 2012, 48, 3102–3112.
15. Vidović, K.; Šoštarić, M.; Budimir, D. An Overview of Indicators and Indices Used for Urban Mobility Assessment. Promet Traffic Transp. 2019, 31–36, 703–714.
16. Vidović, K.; Mandžuka, S.; Brčić, D. Estimation of Urban Mobility Using Public Mobile Network. In Proceedings of the 2017 International Symposium ELMAR, Zadar, Croatia, 18–20 September 2017; pp. 21–24.
17. Zelenika, R. Metodologija i tehnologija izrade znanstvenog i stručnog djela; Ekonomski fakultet Sveučilišta u Rijeci: Rijeka, Croatia, 2000.
18. Zhang, D.; Huang, J.; Li, Y.; Zhang, F.; Xu, C.; He, T. Exploring Human Mobility with Multi-source Data at Extremely Large Metropolitan Scales. In Proceedings of the 20th Annual International Conference on Mobile Computing and Networking, MobiCom’14, Maui, HI, USA, 7-11 September 2014; pp. 201–212.
19. Lopes, J.; Bento, J.; Huang, E.; Antoniou, C.; Ben-Akiva, M. Traffic and Mobility Data Collection for Real-Time Applications. In Proceedings of the 13th International IEEE Conference on Intelligent Transportation Systems, Funchal, Portugal, 19–22 September 2010; pp. 216–223.
20. Chen, C.; Ma, J.; Susilo, Y.; Liu, Y.; Wang, M. The Promises of Big Data and Small Data for Travel Behavior (aka Human Mobility) analysis. Transp. Res. Part C 2016, 68, 285–299.
21. Prabha, R.; Kabadi, M.G. Overview of Data Collection Methods for Intelligent Transportation Systems. Int. J. Eng. Sci. 2016, 5, 16–20.
22. González, M.C.; Hidalgo, C.A.; Barabási, A.-L. Understanding Individual Human Mobility Patterns. Nature 2008, 453, 779–782.
23. Wang, H.; Calabrese, F.; Di Lorenzo, G.; Ratti, C. Transportation Mode Inference from Anonymized and Aggregated Mobile Phone Call Detail Records. In Proceedings of the 13th International IEEE Conference on Intelligent Transportation Systems, Funchal, Portugal, 19–22 September 2010; pp. 318–323.
24. Frias-Martinez, V.; Soguero, C.; Frias-Martinez, E. Estimation of Urban Commuting Patterns using Cellphone Network Data. In Proceedings of the ACM SIGKDD International Workshop on Urban Computing, UrbComp ‘12, Beijing, China, August 2012; pp. 9–16.
25. Calabrese, F.; Diao, M.; Di Lorenzo, G.; Ferreira, J.; Ratti, C. Understanding Individual Mobility Patterns from Urban Sensing Data: A Mobile Phone Trace Example. Transp. Res. Part C 2013, 26, 301–313.
26. Chen, C.; Bian, L.; Ma, J. From Traces to Trajectories: How well can we guess activity locations from mobile phone traces? Transp. Res. Part C Emerg. Technol. 2014, 46, 326–337.
27. Çolak, S.; Alexander, L.P.; Alvim, B.G.; Mehndiretta, S.R.; Gonzalez, M.C. Analyzing Cell Phone Location Data for Urban Travel: Current Methods, Limitations and Opportunities. In Proceedings of the Conference of European Statisticians, Washington, DC, USA, 29 April–1 May 2015; pp. 1–17.
28. Dumbliauskas, V.; Grigonis, V.; Barauskas, A. Application of Google-based Data for Travel Time Analysis: Kaunas City Case Study. Promet Traffic Transp. 2017, 29, 613–621.
29. Allen, I.E.; Seaman, C.a. Likert Scales and Data Analysis. Qual. Prog. 2007, 40, 64–65. 30. Candia, J.; González, M.C.; Wang, P.; Schoenharl, T.; Madey, G.; Barabási, A.-L. Uncovering Individual and
Collective Human Dynamics from Mobile Phone Records. J. Phys. A Math. Theor. 2008, 41, 224015. 31. Caceres, N.; Wideberg, J.P.; Benitez, F.G. Review of Traffic Data Estimation Extracted from Cellular
Networks. IET Intell. Transp. Syst. 2008, 2, 179–192. 32. Caceres, N.; Wideberg, J.P.; Benitez, F.G. Deriving Origin-Destination Data from a Mobile Phone Network.
IET Intell. Transp. Syst. 2007, 1, 15–26. 33. Ahas, R.; Aasa, A.; Mark, Ü.; Pae, T.; Kull, A. Seasonal Tourism Spaces in Estonia: Case Study with Mobile
Positioning Data. Tour. Manag. 2007, 28, 898–910.

Sustainability 2020, 12, 838 25 of 27
34. Ratti, C.; Sevtsuk, A.; Huang, S.; Pailer, R. Mobile Landscapes: Graz in Real Time. In Location Based Services and TeleCartography; Gartner, G., Cartwright, W., Peterson, M.P., Eds.; Springer: Berlin, Germany, 2007; pp. 433–444.
35. Calabrese, F.; Ratti, C._ Real Time Rome. Networks and Communication Studies, NETCOM. 2006, 20, 3–4. 36. Williams, N.E.; Thomas, T.A.; Dunbar, M.; Eagle, N.; Dobra, A. Measures of Human Mobility Using Mobile
Phone Records Enhanced with GIS Data. PLoS ONE 2015, 10, 1–16. 37. Calabrese, F.; Di Lorenzo, G. Estimating Origin-Destination Flows using Mobile Phone Location Data. Cell
2011, 10, 36–44. 38. Dash, M.; Koo, K.K.; Decraene, J.; Yap, G.-E.; Wu, W.; Gomes, J.B.; Shi-Nash, A.; Li, X. CDR-To-MoVis:
Developing a Mobility Visualisation System from CDR Data. In Proceedings of the 2015 IEEE 31st International Conference on Data Engineering, Seoul, Korea, 13–17 April 2015; pp. 1452–1455.
39. Pulselli, R.M.; Puselli, F.M.; Ratti, C.; Tiezzi, E. Dissipative Structures for Understanding Cities: Resource Flows and Mobility Patterns. In Proceedings of the 1st International Conference on Built Environment Complexity, Becon 2005, University of Liverpool, Liverpool, UK, 11–14 September 2005; pp. 271–279.
40. Reades, J.; Calabrese, F.; Sevtsuk, A.; Ratti, C. Cellular Census: Explorations in Urban Data Collection. IEEE Pervasive Comput. 2007, 6, 30–38.
41. Zakon o elektroničkim komunikacijama.[ Law on electronic communication] Narodne Novine [The People's Newspaper] 2014, 71, Available online: https://www.zakon.hr/z/1181/Zakon-o-elektroni%C4%8Dkim-komunikacijama-2014-2017 (accessed on 18 April 2017).
42. Liu, L.; Biderman, A.; Ratti, C. Urban Mobility Landscape: Real Time Monitoring of Urban Mobility Patterns. In Proceedings of the 11th International Conference on Computers in Urban Planning and Urban Management, Hong Kong, China, June 2019; pp. 1–16.
43. Iqbal, M.S.; Choudhury, C.F.; Wang, P.; González, M.C. Development of Origin-Destination Matrices using Mobile Phone Call Data. Transp. Res. Part C Emerg. Technol. 2014, 40, 63–74.
44. Wang, P.; Hunter, T.; Bayen, A.M.; Schechtner, K.; González, M.C. Understanding Road Usage Patterns in Urban Areas. Sci. Rep. 2012, 2, 1001.
45. Alexander, L.; Jiang, S.; Murga, M.; González, M.C. Origin-Destination Trips by Purpose and Time of Day Inferred from Mobile Phone Data. Transp. Res. Part C Emerg. Technol. 2015, 58, 240–250.
46. Trevisani, E.; Vitaletti, A. Cell-ID Location Technique, Limits and Benefits: An Experimental Study. In Proceedings of the Sixth IEEE Workshop on Mobile Computing Systems and Applications, Windermere, Cumbria, UK, 3 December 2004; pp. 51–60.
47. Chaoming, S.; Qu, Z.; Blumm, N.; Barabási, A-L. Limits of Predictability in Human Mobility. Science 2010, 327, 1018–1021.
48. Bengtsson, L.; Lu, X.; Garfield, R. Internal Population Displacement in Haiti; Earthquakes Columbia University: New York, NY, USA, 14 May 2010.
49. Thiessenhusen, K.U.; Schäfer, R.P.; Lang, T. Traffic Data from Cell Phones: A Comparison with Loops and Probe Vehicle Data; Institute of Transport Research, German Aerospace Center: Cologne, Germany, 2003.
50. Ygnace, J.-L. Travel Time/Speed Estimates on the French Rhone Corridor Network Using Cellular Phones as Probes, Final Report, Serti V Program STRIP.; Institut national de recherch sur les transports et leur securite: Lyon, France, 2001.
51. Vidović, K.; Lučić, A.; Šarić, D. Methodology of O-D Matrix Determination from Telecommunication Charging Data Records. In Zbornik radova 36. Skupa o prometnim sustavima s međunarodnim sudjelovanjem KoREMA “Automatizacija u prometu 2016”, Proceedings of 36. skup o prometnim sustavima s međunarodnim sudjelovanjem KoREMA “Automatizacija u prometu 2016”, Krapina, Croatia, Maribor, Slovenia, 9–12 November 2016; Šakić, Ž., Ed.; KoREMA: Zagreb, Croatia, 2016; pp. 22–25.
52. Wesolowski, A.; Eagle, N.; Noor, A.M.; Snow, R.W.; Buckee, C.O. The Impact of Biases in Mobile Phone Ownership on Estimates of Human Mobility. J. Roy. Soc. Interface 2013, 10, 1–6.
53. National Research Council. Highway Capacity Manual (HCM); Transportation Research Board (TRB), National Academies of Science: Washington, DC, USA, 2010.
54. Dadić, I.; Kos, G.; Ševrović, M. Teorija prometnog toka; Fakultet prometnih znanosti Sveučilišta u Zagrebu: Zagreb, Croatia, 2014.
55. Sakai, T.; Yamada-Kawai, K.; Matsumoto, H.; Uchida, T. New Measure of the Level of Service for Basic Expressway Segments Incorporating Customer Satisfaction. Procedia Soc. Behav. Sci. 2011, 16, 57–68.

Sustainability 2020, 12, 838 26 of 27
56. Morfoulaki, M.; Tyrinopoulos, Y.; Aifadopoulou, G. Estimation of Satisfied Customers in Public Transport Systems: A New Methodological Approach. J. Transp. Res. Forum 2007, 46, 63–72.
57. Kos, G.; Brlek, P.; Poic, K.; Vidović, K. Correct Temporary Regulation in Cities in the Function of Traffic Safety. In Proceedings of the 11th International Symposium Road Accidents Prevention, Novi Sad, Serbia, 11–12 October 2012; Faculty of Technical Sciences: Novi Sad, Serbia, 2012.
58. Marsden, G.; Snell, C. The Role of Indicatiors, Targets and Monitoring in Decision-Support for Transport. Eur. J. Transp. Infrastruct. Res. 2009, 9, 219–236.
59. Alberti, M. Measuring Urban Sustainability. Environ. Impact Assess. Rev. 1996, 16, 381–424. 60. Marsden Sotirios, G.T. Improved Indicators for Sustainable Transport and Planning: Measuring Wider
Economic Benefits of Transport—A Case Study in Good Practice for Indicator Selection; Institute for Transport Studies, University of Leeds: Leeds, UK, 2008.
61. Anastasi, G.; Antonelli, M.; Bechini, A.; Brienza, S.; D’Andrea, E. Urban and Social Sensing for Sustainable Mobility in Smart Cities. In Proceedings of the 2013 Sustainable Internet and ICT for Sustainability (SustainIT), Palermo, Italy, 30–31 October 2013.
62. Huang, L.; Jianguo, W.; Yan, L. Defining and Measuring Urban Sustainability: A Review of Indicator. Landsc. Ecol. 2015, 30, 1175–1193.
63. Costa, M.S.; Silva, A.N.R.; Ramos, R.A.R. Sustainable Urban Mobility: A Comparative Study and the Basis for a Management System in Brazil and Portugal. Urban Transp. XI Urban Transp. Environ. 21st Century 2005, 77, 323–332.
64. Kaparias, I.; Bell, M.G.H. Key Performance Indicators for Traffic Management and Intelligent Transport Systems Deliverable; Imperial College London: London, UK, 2011.
65. Cianfano, M.; Gentile, G.; Nussio, F.; Tuffanelli, G.; Rossi, P.; Vergini, R.; Terenzi, G. Transport and Mobility Indicators Based on Traffic Measures – Good Practices Guidebook; Citeair: Rome, Italy, 2011.
66. Nicolas, J.P.; Pochet, P.; Poimboeuf, H. Towards Sustainable Mobility Indicators: Application to the Lyons Concurbation. Transp. Policy 2003, 10, 197–208.
67. Imran, M.; Low, N. Time to Change the Old Paradigm: Promoting Sustainable Urban Transport. World Transp. Policy Pract. 2003, 9, 32–39.
68. Zeitman, J.; Rilett, L.R. Sustainable Transportation: Conceptualization and Performance Measures; Texas Transportation Institute: Austin, TX, USA, 2002.
69. Frei, F. Sampling Mobility Index: Case Study in Assis-Brazil. Transp. Res. Part A Policy Pract. 2006, 40, 792–799.
70. Cortright, J. Measuring Urban Transportation Performance; Rockefeller Foundation: New York, NY, USA, 2010.
71. Murr, S.; Phillips, S. The Proposal of a Shared Mobility City Index to Support Investment Decision Making for Carsharing. World Acad. Sci. Eng. Technol. Int. J. Soc. Behav. Educ. Econ. Bus. Ind. Eng. 2016, 10, 636–643.
72. Liao, S.H. Expert System Methodologies and Application—A Decade Review from 1995–2004. Expert Syst. Appl. 2005, 28, 93–103.
73. Zhang, D.; Zhao, J.; Zhang, F.; He, T. UrbanCPS: A Cyber-Physical System based on Multi-source Big Infrastructure Data for Heterogeneous Model Integration. In Proceedings of the ACM/IEEE Sixth International Conference on Cyber-Physical Systems, ICCPS ‘15, Seattle, WA, USA, 14–16 April 2015; pp. 238–247.
74. Filić, M.; Filjar, R.; Vidović, K. Graphical Presentation on Origin-Destination Martix in R Statistical Environment. In Zbornik radova 36. Skupa o prometnim sustavima s međunarodnim sudjelovanjem KoREMA “Automatizacija u prometu 2016”, Proceedings of 36. skup o prometnim sustavima s međunarodnim sudjelovanjem KoREMA “Automatizacija u prometu 2016”, Krapina, Croatia, Maribor, Slovenia, 9–12 November 2016; Šakić, Ž. Ed.; KoREMA: Zagreb, Croatia, 2016; pp. 26–29.
75. Filjar, R.; Filić, M.; Lučić, K.; Vidović, K.; Šarić, D. Anatomy of Origin-Destination Matrix Derived from GNSS Alternatives. Coordinates 2016, XII, 8–10.
76. Watson, F. Text-Book on Spherical Astronomy; Cambridge University Press: Cambridge, UK, 1937. 77. Brčić, D.; Šimunović, L.; Slavulj, M. Upravljanje prijevoznom potražnjom u gradovima; Fakultet prometnih
znanosti Sveučilišta u Zagrebu: Zagreb, Croatia, 2016. 78. Ross, T.J. Fuzzy Logic with Engineering Applications, 2nd ed.; John Wiley & Sons Ltd.: Chichester, UK, 2004. 79. Hrvatska enciklopedija, Leksikografski zavod Miroslav Krleža. Available online:
https://www.enciklopedija.hr/natuknica.aspx?id=68389 (accessed on 18 April 2017).

Sustainability 2020, 12, 838 27 of 27
80. Dernoncourt, F. Introduction to Fuzzy Logic Control; Massachusetts Institute of Technology: Boston, MA, USA, 2010; pp. 1–12.
81. Yager, R.R. An Introduction to Fuzzy Set Theory. Adv. Human Factors Ergon. 1986, 6, 29–39. 82. Ibrahim, A. Fuzzy Logic for Embedded Systems Application; Elsevier: New York, NY, USA, 2004. 83. Benšić, M.; Šuvak, N. Primjenjena Statistika; Sveučilište, J.J., Ed.; Strossmayera u Osijeku: Osijek, Croatia,
2013. 84. McKillup, S. Statistics Explained: An Introductory Guide for Life Scientists; Cambridge University Press:
Cambridge, UK, 2012. 85. Turevskiy, A. Fuzzy Logic Toolbox User’s Guide; MathWorks: Natick, MA, USA, 2012. 86. Vaidhehi, V. The Role of Dataset in Training ANFIS System for Course Advisor. Int. J. Innov. Res. Adv. Eng.
2014, 1, 249–253. 87. Jang, J.S.R. ANFIS: Adaptive-Network-Based Fuzzy Inference System. IEEE Trans. Syst. Man. Cybern. 1993,
23, 665–685. 88. Jang, J.S.R.; Sun, C.T. Neuro-Fuzzy Modeling and Control. Proc. IEEE 1995, 83, 378–406. 89. Jang, J.R.; Sun, C.T.; Mizutani, E. Neuro-Fuzzy and Soft Computing, 1st ed.; Prentice-Hall Inc.: Upper Saddle
River, NJ, USA, 1997; pp. 1–614. 90. Gorzalczany, M.B. Computational Intelligence Systems and Application; Physica-Verlag: Heidelberg, Germany,
2002. 91. Foong, K.C.; Chee, C.T.; Wei, L.S. Adaptive Network Fuzzy Inference System (ANFIS) Handoff Algorithm.
In Proceedings of the 2009 International Conference on Future Computer and Communication, Kuala Lumpar, Malaysia, 3–5 April 2009; pp. 195–198.
92. Sarle, W.S. Stopped Training and Other Remedies for Overfitting. In Proceedings of the 27th Symposium on the Interface of Computing Science and Statistics, 1995; pp. 352–360.
93. Vidovic, K.; Mandzuka, S.; Sostaric, M. Expert System for Urban Multimodal Mobility Estimation Based on Information from Public Mobile Network. In Proceedings of the Computational Science and Its Applications—ICCSA 2019 19th International Conference, Saint Petersburg, Russia, 1–4 July 2019; pp. 3–11.
94. Šimunović, L.; Bošnjak, I.; Mandžuka, S. Intelligent transport systems and pedestrian traffic. Promet Traffic Transp. 2009, 21, 141–152.
© 2020 by the authors. Licensee MDPI, Basel, Switzerland. This article is an open access article distributed under the terms and conditions of the Creative Commons Attribution (CC BY) license (http://creativecommons.org/licenses/by/4.0/).