Model-based Systems Engineering maturity improvement in ...
225
MODEL-BASED SYSTEMS ENGINEERING MATURITY IMPROVEMENT IN INDUSTRY Inaugural-Dissertation zur Erlangung des Doktorgrades der Mathematisch-Naturwissenschaftlichen Fakultät der Universität zu Köln vorgelegt von Tiago Luiz Buarque de Amorim aus Recife, Brasilien Mai 2021
-
Upload
khangminh22 -
Category
Documents
-
view
0 -
download
0
Transcript of Model-based Systems Engineering maturity improvement in ...

M O D E L - B A S E D S Y S T E M S E N G I N E E R I N GM AT U R I T Y I M P R O V E M E N T I N I N D U S T RY
Inaugural-Dissertation
zur
Erlangung des Doktorgrades
der Mathematisch-Naturwissenschaftlichen Fakultät
der Universität zu Köln
vorgelegt von
Tiago Luiz Buarque de Amorim
aus Recife, Brasilien
Mai 2021

Als Dissertation genehmigt vonder Mathematisch-Naturwissenschaftlichen Fakultät
der Universität zu Köln
1. Gutachter Prof. Dr. Andreas Vogelsang, Universität zu Köln
2. Gutachter Prof. Dr. Sjaak Brinkkemper, Universiteit Utrecht
Tag der mündlichen Prüfung: 29. Juli 2021
ii

There is no knowledgethat is not power.
— Rudolph Waldo Emerson

A B S T R A C T
Two things about change are valid in any scenario; it will happenand seldomly comes without challenges. That is also the case for or-ganizations that must continuously change to tackle the increasingcomplexity of systems and market pressure. Model-based SystemsEngineering (MBSE) is often suggested as a coping mechanism forthe challenges of engineering contemporary complex systems. It advo-cates the integrated use of models throughout all phases of the systemdevelopment life-cycle. Although many practitioners agree with thetechniques’ potential benefits, companies struggle to achieve MBSEadoption in a timely and effective way, diminishing investment re-turns. Additionally, MBSE comprehensive coverage is a double-edgedsword, meaning teams struggle with selecting methods best alignedwith their adoption goal, i.e., not all MBSE methods are fit to deliverthe pursued benefits.
In this thesis, our contribution is four-fold. First, we perform astudy to investigate the forces that prevent or impede the adoptionof MBSE in embedded systems companies. We contrast the hinderingforces with issues and challenges driving these companies towardsintroducing MBSE. Our results are based on 20 interviews with ex-perts from 10 companies. Our findings show that forces preventingMBSE adoption relate to immature tooling, uncertainty about thereturn-on-investment, and fears on migrating existing data and pro-cesses. On the other hand, MBSE adoption also has strong drivers,and participants have high expectations mainly concerning managingcomplexity, easily adhering to new regulations, and reducing costs.
Second, we aim to discover the best practices and strategies toimplement MBSE methods in embedded systems companies. Usingan inductive-deductive research approach, we conducted 14 semi-structured interviews with experts from 10 companies. Moreover, weanalyzed the data and drew conclusions validated by practitionersthrough an online questionnaire in a triangulation fashion. Our find-ings are summarized in an empirically validated list of 18 best prac-tices for MBSE adoption and a prioritized list of the six most importantbest practices.
Third, we propose a method value ascription model to describeelements and relations that play a significant role when a develop-ment team considers which methods to adopt. The model comprisesthe classic cost-benefit appraisal and relevant aspects such as context,
iv

adoption goal, and method characteristics. All other thesis contribu-tions have relations to the model elements, thus, unifying the wholework.
Last, we aim to relate goals driving MBSE method adoption andcandidate solutions, thus providing suggestions that highest yield theexpected benefits. For this means, we propose a goal-benefit modeland respective operationalization method. The model relates benefitsgenerated by MBSE methods with adoption goals and organizationcontext. Our approach delivers a prioritized list of MBSE methodswhich can be transformed into an improvement roadmap. The ap-proach was applied in six case studies in systems development teamslocated in Germany and Brazil. It was assessed positively by the casestudy participants, who confirmed that the approach indeed supportsgoal-oriented MBSE method selection and improvement process. Wealso provide a sensitivity analysis to validate the goal-benefit model.
We expect that our work brings new perspectives and venues forthe MBSE and process improvement research community and helpspractitioners in their never-ending quest to keep up with change.
v

Z U S A M M E N FA S S U N G
Zwei Dinge in Bezug auf Veränderungen sind in jedem Szenario gül-tig: Sie werden stattfinden und bringen zwangsläufig Herausforde-rungen mit sich. Dies gilt auch für Unternehmen und Organisationen,die zum einen die ständig steigende Komplexität von Softwaresyste-men beherrschen müssen und zugleich dem Druck des Absatzmark-tes unterliegen. Eine Methodik um die ingenieurtechnischen Heraus-forderungen die im Rahmen der Entwicklung moderner komplexerSoftwaresysteme auftreten zu bewältigen, ist das Modellbasierte Sys-tems Engineering (MBSE). MBSE zielt darauf ab formale Modelledurchgängig in alle Phasen des Softwareentwicklungsprozesses zuintegrieren. Obwohl die potenziellen Vorteile der MBSE Techniken inder Praxis bekannt sind, haben Unternehmen Schwierigkeiten, MBSEzeitnah und effektiv einzuführen, was sich negativ auf das Kosten-Nutzen-Verhältnis auswirkt. Darüber hinaus ist der flächendeckendeEinsatz von MBSE ein zweischneidiges Schwert, da die Teams zumeinen mit der Auswahl der richtigen Methoden, die am besten zuihrem Adoptionsziel passen, kämpfen, zum anderen aber nicht alleMBSE-Methoden geeignet sind, den angestrebten Nutzen zu liefern.
Der Beitrag dieser Arbeit lässt sich in vier Schritte aufteilen. Imersten Schritt haben wir eine Studie durchgeführt um zu untersuchenwelche übergeordneten Einflüsse die Einführung von MBSE in Unter-nehmen verhindern oder erschweren. Die erschwerenden Einflüssestehen den Problemen und Herausforderungen in der Entwicklunggegenüber, die die Unternehmen motivieren MBSE zu adoptieren.Unsere Ergebnisse basieren auf 20 Interviews mit Expert:innen aus10 verschiedenen Unternehmen die eingebettete Systeme entwickeln.Die Ergebnisse zeigen, dass unausgereifte Werkzeuge, Unsicherheitenin Bezug auf das Kosten-Nutzen-Verhältnis der MBSE Einführungund Angst vor der Migration bestehender Daten die Hauptgründesind, MBSE Techniken nicht einzuführen. Andererseits konnten auchstark treibende Faktoren für die Einführung von MBSE identifiziertwerden und die Teilnehmer formulieren hohe Erwartungen, vor allemin Bezug auf das Komplexitätsmanagement, das einfachere Einhaltenneuer Regularien und die Reduzierung von Kosten.
Im zweiten Schritt extrahieren und beschreiben wir Strategien undBest Practices um Methoden des MBSE in Unternehmen, die sich aufeingebettete Systeme spezialisiert haben, zu implementieren. UnterVerwendung eines induktiv-deduktiven Forschungsansatzes führtenwir 14 semistrukturierte Interviews mit Expert:innen aus 10 Unterneh-
vi

men durch, analysierten die Daten und zogen Schlussfolgerungen, diewiederum mittels einer Triangulationsmethode von Praktiker:innenin Form eines Online-Fragebogens validiert wurden. Die Ergebnissesind in einer empirisch validierten Liste von 18 Best Practices für dieMBSE-Einführung und einer priorisierten Liste der sex wichtigstenBest Practices zusammengefasst.
Im dritten Schritt schlagen wir ein Modell für die Zuschreibung vonMethodenwerten vor, um Elemente und Beziehungen zu beschreiben,die eine wichtige Rolle spielen, wenn ein Entwicklungsteam über-legt, welche Methoden es übernehmen soll. Das Modell umfasst dieklassische Kosten-Nutzen-Abwägung und relevante Aspekte wie denKontext, das Ziel der Einführung und die Eigenschaften der Methode.Alle anderen Beiträge der Dissertation haben Beziehungen zu denModellelementen und vereinheitlichen so die gesamte Arbeit.
Schlussendlich setzen wir die Ziele, die die Einführung von MBSE-Methoden vorantreiben, mit den Lösungsvorschlägen in Beziehung,um die Vorschläge mit dem höchsten erwartbaren Nutzen zu extrahie-ren. Um dies zu erreichen präsentieren wir ein Ziel-Nutzen-Modellund eine entsprechende Operationalisierungsmethode. Das Modellsetzt den durch MBSE-Methoden generierten Nutzen mit den Adopti-onszielen und dem Organisationskontext in Beziehung. Unser Ansatzliefert eine priorisierte Liste von MBSE-Methoden, die in eine Road-map zur Verbesserung der Entwicklungsprozess umgewandelt wer-den kann. Um den Ansatz zu evaluieren wurde er im Rahmen vonsechs Fallstudien in verschiedenen Entwicklungsteams in Deutsch-land sowie in Brasilien angewendet. Der Ansatz wurde von allenTeilnehmer:innen durchweg positiv bewertet. Dies bestätigt, dass derentwickelte Ansatz einen gewinnbringenden Beitrag zur zielgerich-teten MBSE-Methodenauswahl- und Verbesserung liefert. Zusätzlichwurde der Ansatz in Form einer Sensitivitätsanalyse validiert.
Wir erwarten, dass unsere Arbeit neue Perspektiven für die Wis-senschaftscommunity im MBSE- und Prozessverbesserungs-Bereichbringt und Praktiker:innen unterstützt die ständig wandelnden Her-ausforderungen im dynamischen Umfeld der Softwareentwicklungzu meistern.
vii


A C K N O W L E D G M E N T S
First, I want to thank Prof. Dr. Andreas Vogelsang, who had faith inmy capabilities when he decided to have me as a Doctor student backin 2017, and Prof. Dr. Sjaak Brinkkemper, who accepted the duty tobe the second evaluator of this work.
I also want to thank:
• Prof. Dr. Edna Dias Canedo, whose support allowed me to doan exchange program in Brazil and put me in contact with manyindustrial partners.
• Dr. Martin Becker, who hired me when I finished my Master’sdegree back in 2013, kick-starting my career as a researcher.
• Industrial partners and study participants who willingly donatetheir time for this work.
• Alexandra Elbakyan for creating the Sci-Hub, “the first websitein the world to provide mass & public access to research papers”,and André Miede for creating the LaTeX template used in thisthesis.
• My working colleagues at TU Berlin and Universität zu Köln.
I am thankful to my family, my friends, and my fiancée Blenda.
ix


C O N T E N T S
1 introduction 1
1.1 Context . . . . . . . . . . . . . . . . . . . . . . . . . . . . 1
1.2 Problem statement . . . . . . . . . . . . . . . . . . . . . 2
1.3 Contributions of this thesis . . . . . . . . . . . . . . . . 4
1.4 Research methodology . . . . . . . . . . . . . . . . . . . 7
1.5 Outline . . . . . . . . . . . . . . . . . . . . . . . . . . . . 11
1.6 Publications . . . . . . . . . . . . . . . . . . . . . . . . . 12
2 foundational theory 15
2.1 Terminology . . . . . . . . . . . . . . . . . . . . . . . . . 15
2.2 Model-based systems engineering . . . . . . . . . . . . 17
2.3 Maturity models . . . . . . . . . . . . . . . . . . . . . . . 23
2.4 Model-based Systems Engineering Maturity Model . . 24
3 forces that drive or prevent mbse adoption in
embedded industry 31
3.1 Introduction . . . . . . . . . . . . . . . . . . . . . . . . . 31
3.2 Forces on MBSE adoption . . . . . . . . . . . . . . . . . 33
3.3 Study approach . . . . . . . . . . . . . . . . . . . . . . . 35
3.4 Results . . . . . . . . . . . . . . . . . . . . . . . . . . . . 42
3.5 Discussion . . . . . . . . . . . . . . . . . . . . . . . . . . 52
4 strategies and best practices for mbse adoption 55
4.1 Introduction . . . . . . . . . . . . . . . . . . . . . . . . . 55
4.2 Study approach . . . . . . . . . . . . . . . . . . . . . . . 56
4.3 Results and discussion . . . . . . . . . . . . . . . . . . . 62
4.4 Using best practices to mitigate MBSE adoption hinder-ing forces . . . . . . . . . . . . . . . . . . . . . . . . . . . 78
5 method value ascription 83
5.1 Introduction . . . . . . . . . . . . . . . . . . . . . . . . . 83
5.2 Core constructs . . . . . . . . . . . . . . . . . . . . . . . 85
5.3 Relation to strategies and best practices for MBSE adop-tion . . . . . . . . . . . . . . . . . . . . . . . . . . . . . . 87
5.4 Relation to forces that drive or prevent MBSE adoption 87
6 goal-benefit decision calculus for mbse method
selection 91
6.1 Introduction . . . . . . . . . . . . . . . . . . . . . . . . . 91
6.2 Study approach . . . . . . . . . . . . . . . . . . . . . . . 93
6.3 The goal-benefit decision calculus . . . . . . . . . . . . 95
6.4 Validation . . . . . . . . . . . . . . . . . . . . . . . . . . 108
6.5 Discussion . . . . . . . . . . . . . . . . . . . . . . . . . . 124
xi

xii contents
6.6 Relation between the approach and the method valueascription model . . . . . . . . . . . . . . . . . . . . . . 128
7 state of the art 131
7.1 Model-based systems engineering adoption . . . . . . . 132
7.2 Context modeling . . . . . . . . . . . . . . . . . . . . . . 136
7.3 Goal modeling . . . . . . . . . . . . . . . . . . . . . . . . 138
7.4 Method selection . . . . . . . . . . . . . . . . . . . . . . 142
7.5 Benefits Management . . . . . . . . . . . . . . . . . . . . 146
8 conclusions and outlook 153
8.1 Summary . . . . . . . . . . . . . . . . . . . . . . . . . . . 153
8.2 Outlook . . . . . . . . . . . . . . . . . . . . . . . . . . . . 157
a model-based systems engineering maturity model 161
b interview guide 169
c questionnaire 173
c.1 Preamble . . . . . . . . . . . . . . . . . . . . . . . . . . . 173
c.2 Demographic questions . . . . . . . . . . . . . . . . . . 173
c.3 MBSE Adoption Best Practices . . . . . . . . . . . . . . 174
c.4 Adoption best practices prioritization . . . . . . . . . . 175
d code book 177
e refined mbse adoption goal and team’s benefit
potential from case studies of chapter 6 179
f evidence for the relations between mbse adop-tion hindering forces and best practices 187
bibliography 193

L I S T O F F I G U R E S
Figure 2.1 Representation of modeling initiatives(Ameller, 2009). . . . . . . . . . . . . . . . . . . 18
Figure 2.2 Hierarchy of UML 2.2 diagrams. . . . . . . . . 19
Figure 2.3 SysML diagram types, shown as a class dia-gram (MBSE and SysML). . . . . . . . . . . . . . 20
Figure 2.4 Example of a Simulink block diagram mod-eling the dual-clutch control of an automatictransmission system of a vehicle with two sep-arate clutches (Minh, Moustafa, and Tamre, 2017). 21
Figure 2.5 Focus area maturity model meta-model. . . . . 24
Figure 2.6 MBSE MM engineering functions representedin the V-model. . . . . . . . . . . . . . . . . . . 25
Figure 2.7 Overview of the Model-based Systems Engi-neering Maturity Model. . . . . . . . . . . . . . 26
Figure 3.1 Timeline of change depicting when each forceis triggered. . . . . . . . . . . . . . . . . . . . . 36
Figure 3.2 MBSE adoption forces diagram. . . . . . . . . . 37
Figure 3.3 Analysis process to retrieve the first level codesfrom the interviews. . . . . . . . . . . . . . . . . 41
Figure 3.4 Analysis process to retrieve the second levelcodes from the interviews. . . . . . . . . . . . . 42
Figure 3.5 Number of quotations related to MBSE adop-tion forces. . . . . . . . . . . . . . . . . . . . . . 43
Figure 3.6 Fishbone diagram overview of MBSE adoptionforces. . . . . . . . . . . . . . . . . . . . . . . . . 45
Figure 3.7 Word cloud of MBSE descriptions. . . . . . . . 46
Figure 4.1 Research workflow. . . . . . . . . . . . . . . . . 58
Figure 4.2 Questionnaire results for Piloting group.1 . . . 64
Figure 4.3 Questionnaire results for Tools and processgroup.2 . . . . . . . . . . . . . . . . . . . . . . . 69
Figure 4.4 Questionnaire results for Knowledge buildinggroup.3 . . . . . . . . . . . . . . . . . . . . . . . 70
Figure 4.5 Questionnaire results for Management group.4 73
Figure 4.6 Percentage of respondents rating each bestpractice as one of the “five most important.” . 77
Figure 4.7 Relation between hindering force and mitigat-ing best practice. . . . . . . . . . . . . . . . . . . 79
Figure 4.8 Expanded research method workflow. . . . . . 80
Figure 5.1 Method value ascription model. . . . . . . . . . 84
xiii

xiv list of figures
Figure 5.2 Forces on MBSE adoption and Strategies and BestPractices in relation to the model. . . . . . . . . 89
Figure 6.1 The goal-benefit meta-model elements and re-spective relations. . . . . . . . . . . . . . . . . . 95
Figure 6.2 The hierarchical structure of attributes of thegoal-benefit meta-model. . . . . . . . . . . . . . 101
Figure 6.3 Workflow of the instantiation method. . . . . . 104
Figure 6.4 Workflow of the task Prioritize candidate capabil-ities. . . . . . . . . . . . . . . . . . . . . . . . . . 107
Figure 6.5 Capabilities assessed by MBSE experts on thetask Assess candidate capabilities affordances. . . . 110
Figure 6.6 Distribution of weight-sum points amount percandidate capability assigned by MBSE experts. 110
Figure 6.7 Case study 1 - Maturity Profile. . . . . . . . . . 114
Figure 6.8 Case study 1 - (a) blue capabilities: currentteam MBSE maturity profile, (b) green andyellow capabilities: candidate capabilities foradoption, (c) yellow capabilities: five first pri-oritized capabilities. . . . . . . . . . . . . . . . . 115
Figure 6.9 Case study 2 - (a) blue capabilities: currentteam MBSE maturity profile, (b) green andyellow capabilities: candidate capabilities foradoption, (c) yellow capabilities: five first pri-oritized capabilities. . . . . . . . . . . . . . . . . 116
Figure 6.10 Case study 3 - (a) blue capabilities: currentteam MBSE maturity profile, (b) green andyellow capabilities: candidate capabilities foradoption, (c) yellow capabilities: five first pri-oritized capabilities for both goals. . . . . . . . 118
Figure 6.11 Case study 4 - (a) blue capabilities: currentteam MBSE maturity profile, (b) green andyellow capabilities: candidate capabilities foradoption, (c) yellow capabilities: five first pri-oritized capabilities. . . . . . . . . . . . . . . . . 119
Figure 6.12 Case study 5 - (a) blue capabilities: currentteam MBSE maturity profile, (b) green andyellow capabilities: candidate capabilities foradoption, (c) yellow capabilities: five first pri-oritized capabilities. . . . . . . . . . . . . . . . . 120
Figure 6.13 Case study 6 - (a) blue capabilities: currentteam MBSE maturity profile, (b) green andyellow capabilities: candidate capabilities foradoption, (c) yellow capabilities: five first pri-oritized capabilities. . . . . . . . . . . . . . . . . 121

Figure 6.14 Elements of the approach in relation to thevalue method ascription model (cf. Chapter 5). 129
Figure 7.1 Inhibitors to MBSE adoption (from (Bone andCloutier, 2010)). . . . . . . . . . . . . . . . . . . 133
Figure 7.2 Overview of the Business Motivation Model. . 139
Figure 7.3 Overview of the KAOS meta-model (Dardenne,van Lamsweerde, and Fickas, 1993). . . . . . . 141
Figure 7.4 Elements of the Goal Structuring Notation. . . 141
Figure 7.5 Method rationale as constituted by goals, val-ues and their relationships (Ågerfalk and Wis-trand, 2003). . . . . . . . . . . . . . . . . . . . . 143
Figure 7.6 The five axes represent the factors used to dis-tinguish between agile methods (toward thegraph’s center) and plan-driven methods (thatappear towards the periphery) (Boehm andTurner, 2003). . . . . . . . . . . . . . . . . . . . 145
Figure 7.7 Benefits Dependency Network meta-model(Peppard, 2017). . . . . . . . . . . . . . . . . . . 147
Figure 7.8 Benefits Dependency Map example. . . . . . . 149
Figure 7.9 Results Chain Modeling example (adaptedfrom (Torpp, 1999)). . . . . . . . . . . . . . . . . 150
Figure 8.1 Relations between all contributions of this thesis.156
Figure D.1 Codebook mindmap. . . . . . . . . . . . . . . . 178
L I S T O F TA B L E S
Table 1.1 Data collection methods used in this thesis . . 10
Table 1.2 Categorization of the studies included in thisthesis . . . . . . . . . . . . . . . . . . . . . . . . 11
Table 3.1 Study participants . . . . . . . . . . . . . . . . . 39
Table 4.1 Research objective. . . . . . . . . . . . . . . . . 57
Table 4.2 Interview participants. . . . . . . . . . . . . . . 59
Table 4.3 Organization size of the questionnaire respon-dents (i.e., number of employees). . . . . . . . 60
Table 4.4 Organization size of the questionnaire respon-dents (i.e., number of employees). . . . . . . . 61
Table 4.5 Best practices addressing MBSE adoption hin-dering forces. . . . . . . . . . . . . . . . . . . . 81
Table 6.1 Case study participants - demographic data. . 108
xv

Table 6.3 Weight-points sum of Candidate capability affor-dances artifact from the task Assess candidate ca-pabilities affordances. . . . . . . . . . . . . . . . . 111
Table 6.4 AHP pairwise comparison from task Refine goalfrom case study 1. . . . . . . . . . . . . . . . . . 113
Table 6.5 Instance of Team’s benefit potential, output of thetask Characterize team context from case study 1. 113
Table 6.6 Instance of Goal refinement for each goal of thecase studies. . . . . . . . . . . . . . . . . . . . . 122
Table 6.7 Top 5 capabilities from the sensitivity analysisone-at-a-time for each competitive priority plusRefined MBSE adoption goal from case study 1. . 123
Table 7.1 Hutchinson’s responses and related best prac-tices. . . . . . . . . . . . . . . . . . . . . . . . . . 136
Table 7.2 Equivalence of elements from the approachproposed in this thesis (cf. Chapter 6) and theelements of Benefits Management diagrams. . 152
Table A.1 The positioning of the capabilities according tomaturity levels. . . . . . . . . . . . . . . . . . . 162
Table A.2 The MBSE MM capabilities description. . . . . 163
Table E.1 Refined MBSE adoption goal and Team’s BenefitPotential of Case Study 1. . . . . . . . . . . . . . 180
Table E.2 Refined MBSE adoption goal and Team’s BenefitPotential of Case Study 2. . . . . . . . . . . . . . 181
Table E.3 Refined MBSE adoption goal and Team’s BenefitPotential of Case Study 3. . . . . . . . . . . . . . 182
Table E.4 Refined MBSE adoption goal and Team’s BenefitPotential of Case Study 4. . . . . . . . . . . . . . 183
Table E.5 Refined MBSE adoption goal and Team’s BenefitPotential of Case Study 5. . . . . . . . . . . . . . 184
Table E.6 Refined MBSE adoption goal and Team’s BenefitPotential of Case Study 6. . . . . . . . . . . . . . 185
A C R O N Y M S
AHP Analytic hierarchy process
MBSE Model-based Systems Engineering
MBSE MM Model-based Systems Engineering Maturity Model
BDM Benefit Dependency Map
xvi

acronyms xvii
UML Unified Modeling Language
OMG Object Management Group
XP eXtreme Programming
SE Systems Engineering
MDD Moldel-driven Development
MBE Model-based Engineering
CMMI Capability Maturity Model Integration


1I N T R O D U C T I O N
The topic of this thesis is Model-based Systems Engineering (MBSE)maturity improvement in industry. In this chapter, we present thereasons why teams are impelled to adopt MBSE methods (Section 1.1),why adopting MBSE is not so trivial, and the value of its investiga-tion (Section 1.2). In Section 1.3, we present the contributions of thisthesis towards solving the presented problems. In Section 1.4, wepresent a summary of the research methods applied when investi-gating the aforementioned problems. Finally, this thesis outline isdescribed in Section 1.5, and the material published during this thesiswork is presented in Section 1.6.
1.1 context
Many development teams face problems with the increasing complex-ity of software-intensive systems, their interdisciplinary development,and the vast amount of mainly text-based specifications. Addition-ally, as new functionalities are replicated by market competitors andsoon become a commodity, teams are pushed to deliver in less time togain competitive advantage, and nevertheless with top quality. Thesesystems are usually safety-critical, and a small misshapen can compro-mise the whole organization’s image. All this needs to be addressedat a global-dictated market-compatible cost which shrinks at everynew development cycle. For instance, an European car manufacturerbuilds products having over 200 control units, delivering 400 func-tionalities (e. g., breaking, accelerating, pedestrian collision mitigation,audio, GPS), built-in 2.000 software components working with 10.000
signals. These are added 30.000 mechanical parts allowing a combina-tion of 1.000.000 different types of vehicles (i. e., customization) whichcan be selected on their website (Batejat, 2019).
A solution to cope with the problems mentioned above is Model-based Systems Engineering (MBSE), whose methods are applied in theconceptual design, continues throughout development and later lifecycle phases (INCOSE, 2007). MBSE is the formalized application ofmodeling to support system requirements, design, analysis, verifica-tion, and validation activities. In this approach, models (as opposed todocuments) serve as blueprints for developers to write code, provideformalization, tackle complexity, and enhance the system’s under-
1

2 introduction
standing. Specialized tools automate much of the non-creative work(which translates to gains in productivity and quality) and generateartifacts (e. g., code) based on the models. MBSE foster artifact reuse,improves product quality, and shortens time to market (Carroll andMalins, 2016).
However, MBSE is complex (as the problem types it proposesto solve), making teams struggle to sow the benefits of the newlyadopted methods. Additionally, teams are resistant to change, andmanagers are not sure which methods to adopt.
1.1.1 Model-based Systems Engineering
Model-based Systems Engineering (MBSE) is a term that predicates theuse of modeling to analyze and document critical aspects of systemsengineering. It is broad in scope, spanning the whole developmentlife-cycle, and covers levels from system-of-systems to individual com-ponents. MBSE is a model-centric approach providing a single pointof truth reflected in a set of living artifacts.
Compared to document-centric development, MBSE supports engi-neers with automation capabilities (e. g., code generation, documentderivation) and enhanced analysis capabilities (e. g., behavioral anal-ysis, performance analysis, simulation). The use of models (and as-sociated tools) brings benefits for product quality and process qual-ity (Chaudron, Heijstek, and Nugroho, 2012).
UML and SysML are standardized graphical modeling languagesfor MBSE to define different models, processes, procedures, and oper-ations. While UML is predominantly used for software development,SysML also encompasses the physical aspects of a system. Prominenttool vendors, such as IBM, Oracle, Microsoft, or the Eclipse Founda-tion offer tooling solutions for MBSE. More information on MBSE isprovided in Section 2.2.
1.2 problem statement
An increasing number of software-intensive cyber-physical systemsdevelopment teams recognize the complexity of integrating compo-nents of heterogeneous domains, disciplines, and vendors (Vogelsanget al., 2017). Additionally, fierce market competition pushes teams toreinvent their processes to, at least, keep up with the never-endingincreasing demands.
MBSE has been proposed as a solution for aligning the engineeringprocess of these systems by using well-defined and agreed-on models

1.2 problem statement 3
consistently through all development phases and domains. Althoughmany practitioners agree with the arguments on MBSE methods’ poten-tial benefits, companies struggle with their adoption. Process changesare required in all system life-cycle phases, including a shift in thedevelopment paradigm (i.e., abstract thinking (Hutchinson, Whittle,and Rouncefield, 2014)) and new tools application. Projects are notlikely to meet their cost and delivery targets when adoption is carriedout poorly.
In any case, introducing process change in an already running andestablished development team is not friction-less (Conner, 1993; Ham-mer, 2007). Micromanagement is required to tackle hurdles and psy-chological barriers, and this becomes more critical when it comes tosuch a complex change as MBSE adoption (Vogelsang et al., 2017).However, other methodologies, such as agile practices, have beenadopted much faster. So, what are the reasons and factors that pre-vent or impede companies from adopting MBSE?
problem statement 1 : We need to understand how to efficientlyintroduce new MBSE methods in development teams.
Development teams adopt MBSE methods for many reasons. Some-times their goal is to enhance the product’s properties (e.g., quality,desirable functionalities). Perhaps they seek to increase the develop-ment process efficiency (e.g., cost, lead time). Others might need totackle problems related to systems’ complexity (e.g., interdisciplinarydevelopment, the vast amount of text-based specifications) (Vogelsanget al., 2017).
MBSE offers methods for the whole system development life-cycle.Specific MBSE methods and techniques may not be suitable in all situ-ations, and with so many possibilities, it is hard to know which meth-ods to adopt. Managers might be tempted to go for a low-hanging fruitstrategy, which is cheap, easy, and has high implementation successrate. However, considering the adoption goal, will the team harvestthe expected benefits? If the answer is no, the initiative might feel likea waste of time (i.e., new processes but same issues). Thus, there isa need to assess which MBSE methods should be implemented ac-cording to the team’s context, and considering associated costs andbenefits (Chaudron, Heijstek, and Nugroho, 2012).
The alignment importance with the team’s adoption goal is empha-sized in a report released by the Project Management Institute (PMI)1,projects and programs that are aligned with a team’s strategy arecompleted successfully more often than projects that are misaligned(77% vs. 56%). At the same time, only 60% of strategic initiatives meet
1 https://www.pmi.org/

4 introduction
their original goals and business intent. The report states that mostexecutives admit a disconnection between strategy formulation andimplementation (PMI, 2017).
The Model-based Systems Engineering Maturity Model (MBSE MM)is a possible solution for the aforementioned issue. The MBSE MM
is a descriptive and prescriptive (Pöppelbuß and Röglinger, 2011)focus area maturity model (van Steenbergen et al., 2010, 2013). It isdescriptive because it can assess and describe the team’s current MBSEcapabilities. It is prescriptive because it provides a maturity path withrequirements; thus, one can see the possible next possible capabilitiesto be adopted. Additionally, the complexity and pervasiveness ofMBSE are reflected in the six engineering functions and fifteen focusareas of the MBSE MM. However, the MBSE MM does not provide anysystematic method to select improvement measures i. e., it lacks built-in contingency to guide tailoring (Conboy and Fitzgerald, 2010) suchas a decision calculus (Little, 1970; Peterson, 2017; Pöppelbuß andRöglinger, 2011) After assessing the maturity profile of a team, thereare still many possibilities to progress; therefore, the problem is onlypartially addressed.
problem statement 2 : We need a method to provide decisionsupport when selecting the MBSE methods that are most ap-propriate for each team considering respective contextual char-acteristics and adoption goal.
1.3 contributions of this thesis
This thesis goal can be summarized into investigating MBSE adoptionby development teams. We combined the specific study goals fromeach chapter with the following three goals, which we address in thisthesis.
g1 : Understanding the forces that drive MBSE adoption.
g2 : Identifying strategies and best practices to increase the successrate of MBSE adoption.
g3 : Designing and evaluating an approach for selecting MBSE meth-ods that yield the maximum benefit for a team according toadoption goals and contextual characteristics.
In the following two subsections, we describe the contributions ofthis thesis in detail. We differentiate between two types of contribu-tions, namely Major contributions and Minor contributions. The formeris strictly related to the main goals driving the research, whilst thelatter are contributions required to achieve the former, but they donot have enough substance to be categorized as the major contribu-

1.3 contributions of this thesis 5
tions. In this thesis, we provide the following solutions for the statedproblems:
1.3.1 Major contributions
In this subsection, we describe the major contributions of this thesis.
m1 : forces that drive or prevent model-based systems
engineering adoption in the embedded systems industry.We investigate the forces that prevent or impede the adoption of MBSE
in companies that develop embedded software systems. We contrastthese hindering forces with issues and challenges that drive thesecompanies towards introducing MBSE. Our results are based on 20
interviews with experts from 10 organizations in Germany. We ana-lyze the results utilizing thematic coding and categorize the identifiedforces into inertia and anxiety forces, which prevent MBSE adoption,as well as push and pull forces, which drive the companies towardsMBSE adoption. We frame the results with the coding of what theinterviewees considered as MBSE. Forces that prevent MBSE adoptionrelate mainly to immature tooling, uncertainty about the return-on-investment, and fears on migrating existing data and processes. Onthe other hand, MBSE adoption also has strong drivers, and partici-pants have high expectations mainly concerning managing complexity,adhering to new regulations, and detecting bugs earlier. We observedthat the hindering forces are much more concrete and MBSE-specificcompared with the fostering forces, which are very generic (e.g., in-crease in product quality, managing complexity, supporting reuse).From this, we conclude that bad experiences and frustration aboutMBSE adoption originate from misleading or too optimistic expecta-tions. Nevertheless, companies should not underestimate the neces-sary efforts for convincing employees and addressing their anxiety.This major contribution is presented in Chapter 3.
m2 : strategies and best practices for model-based sys-tems engineering adoption in embedded systems indus-try. Our goal was to find out what was tried, what worked, whatdid not work, how the problems were solved, what can be recom-mended, and what should be avoided when adopting MBSE in or-ganizations that develop embedded systems. For this purpose, weconducted 14 semi-structured interviews with experts from embed-ded systems organizations. From these interviews, we extracted 18
best practices fitted for tackling MBSE adoption challenges. Sequen-tially, we validated and prioritized the best practices with an online

6 introduction
questionnaire answered by MBSE practitioners. Our findings provideinput for planning MBSE adoption based on the knowledge of prac-titioners that went through the experience of implementing MBSE inalready established embedded systems development organizations.This contribution is presented in Chapter 4.
m3 : a method value ascription model . We propose a modelfor method value ascription. MBSE encompasses many methods, anddeciding which ones are the most interesting for a team requiresproper value appraisal. Thus, understanding the mechanics of methodvalue ascription helps to deliver better decision-making for an effec-tive MBSE adoption. Additionally, we relate the other contributions ofthis thesis to the model elements. This contribution is presented inChapter 5.
m4 : a goal-benefit decision calculus approach to sup-port mbse methods selection. We propose a decision calcu-lus approach to prioritize candidate capabilities from the MBSE MM
according to the development team adoption goal and context. Theapproach is composed of a model and an instantiation method. Themodel breaks down the adoption goal into so-called competitive pri-orities related to benefits afforded by capabilities upon their imple-mentation. The instantiation method guides the weight assignmentof the model relations according to the relevance of the elementstowards their neighbors. According to the assigned weights, pointsare distributed along the resulting graph, from the adoption goal tothe competitive priorities, benefits, and candidate capabilities. As aresult, candidate capabilities are prioritized according to the overallpoints they collect, reflecting their relevance towards the adoptiongoal and the team’s context. The approach was applied in six devel-opment teams in Brazil and Germany, whose members evaluated theapproach helpful. This contribution can be broken down into:
• A goal-benefit decision calculus approach to support MBSEmethods selection. The approach is composed of:
– A goal-benefit meta-model that relates MBSE methods withbenefits, competitive priorities, and finally with the adop-tion goal.
– A method for instantiating the meta-model and assign-ing quantitative impact measures to the model’s relations,which is used to derive a prioritized list of MBSE processimprovement candidates.

1.4 research methodology 7
• Qualitative and quantitative evaluations of the approach basedon six case studies and an analysis of the model.
We want to support teams when choosing which MBSE techniquesto adopt with this approach. This contribution is described in detailin Chapter 6.
1.3.2 Minor contributions
This subsection describes contributions that support the main contri-butions but could be considered less relevant or novel.
m1 : adaptation of the forces model to mbse method
adoption. The forces model (Klement, 2018) was initially devisedto describe the forces that affect buyer decision towards new prod-ucts. These are forces to have in mind when devising and promotingproducts. We extended it and use it to describe the forces towardsmethod adoption, in special MBSE adoption. The re-purposing of thisframework in Chapter 3 is a minor contribution of this thesis.
m2 : elicitation of model-based systems engineering ben-efits . As part of the design of the MBSE goal-benefit meta-modelmentioned in the previous subsection, we needed to investigate inthe literature the tangible benefits that a team would enjoy upon theMBSE method adoption. As a result, we elicited ten benefits which arethoroughly described in Chapter 2.2.2.
m3 : expert assessment of mbse mm capabilities affor-dances . As part of the approach creation from Chapter 6, weasked five MBSE experts to assess the relationship between the capabil-ities from the MBSE MM and the elicited MBSE benefits. The results canbe seen in Table 6.3 This assessment enriches the MBSE MM, whichcan be bundle up with more information. Also, it sheds light on thecapabilities that can yield the highest benefits in general.
1.4 research methodology
The presented work was performed with the industry’s stark collab-oration since our research questions explored gaps relevant to practi-tioners. During our research, we employed some methods for acquir-ing empirical evidence. These methods are briefly described in the

8 introduction
following and are described in depth in the respective chapters. Asummary of methods and subjects can be seen in Table 1.1.
1.4.1 Interviews
Interviews were used as the primary source of empirical evidence inmajor contributions M1: Forces that drive and prevent MBSE adoptionin the embedded systems industry (cf. Chapter 3) and M2: Strategies andbest practices for model-based systems engineering adoption in embeddedsystems industry. (cf. Chapter 4). The method provides insights intothe examined topic and gives essential information to understand thephenomenon in its real context (Dresch, Lacerda, and Antunes, 2015;Runeson and Höst, 2008). In both cases, we had an inductive andexploratory goal (Shields and Rangarjan, 2013). The interviews wereconducted in a semi-structured fashion using a guide structured alonga funnel model (Bryman, 2015; Runeson and Höst, 2008). They startedwith general questions about the participant’s context, understandingof MBSE concepts, and afterward going into detail about specifictopics such as employee training, MBSE integration, or experiences inthe past.
The interviews were analyzed using qualitative coding (Neuman,2010) and managed using the qualitative data analysis tool ATLAS.ti2.The analysis started with the involved researchers working on thesame small set of interviews. The results were discussed and mergedin a meeting to homogenize the codes understanding (Weston et al.,2001) (i.e., what/how to look for). The remaining interviews weretackled in a cross-analysis fashion.
1.4.2 Surveys
We used surveys in major contributions M2: Strategies and best practicesfor Model-based systems engineering adoption in embedded systems industry.(cf. Chapter 4) and M4: A goal-benefit decision calculus approach to supportMBSE methods selection (cf. Chapter 6). They are shortly described inthe following paragraphs.
For contribution M2: Strategies and best practices for Model-based sys-tems engineering adoption in embedded systems industry., we surveyedMBSE practitioners to validate the elicited best practices in a deduc-tive triangulation fashion. In the survey, we asked subjects to evaluatetheir agreement towards the best practices. The survey was conducted
2 http://atlasti.com

1.4 research methodology 9
using Google Forms3 and the respondents were screened from tworesearch projects mailing list, CrESt4 and SPEDiT5, and two MBSE dis-cussion groups from a business and employment-oriented social net-work6. Our anonymous questionnaire had three parts. In the first part,we asked for demographic data (team size, industry sector) and addeda yes/no question whether the respondent has ever participated orobserved some endeavor to introduce Model-based Engineering in ateam. We used this question to exclude respondents without properexperience. In the second part, we asked the respondents to expresstheir agreement with each best practice using a Likert scale (Likert,1932) with four levels: Strongly Disagree, Disagree, Agree, Strongly Agree.Lastly, we asked the respondents to select up to five best practicesthey considered most important. More details about this survey isdisclosed in Chapter 4.
For contribution M4: A goal-benefit decision calculus approach to sup-port MBSE methods selection, we performed a survey with MBSE spe-cialists to assess which benefits adopted MBSE capabilities could af-ford. In a single-round survey (Pan et al., 1996) fashion, five MBSE
experts were sent through e-mail a spreadsheet file containing a ca-pability for each row and benefits for columns. They were asked tostate whether the capability could produce the benefit and to whichintensity. We collected their answers and aggregated the values usingthe median. More details about this survey can be seen in Chapter 6.
1.4.3 Case studies
We conduct six case studies as part of contribution M4: A goal-benefitdecision calculus approach to support MBSE methods selection (cf. Chap-ter 6) to corroborate the fulfillment of the proposed approach designrequirements. In these case studies, we applied the approach in de-velopment teams and collected their feedback about the deliveredresults and the approach itself. The case studies were carried out inBrazil and Germany and were selected from the author’s researchcolleagues’ contacts. The participants were debriefed over the modeland the method in a pitch meeting to present the approach. Once alltasks were performed, we held a meeting to present the results andcollect the participants’ impressions of the approach.
3 https://www.google.com/forms/about/4 https://crest.in.tum.de/5 https://spedit.in.tum.de/6 https://www.linkedin.com/

10 introduction
Table 1.1: Data collection methods used in this thesis
Chapter Methods Data Sources
Chapter 3 Stakeholder Interviews 20 participants
Chapter 4 Stakeholder Interviews 14 participants
Survey 40 participants
Chapter 6 Case study 6 development teams
Survey 5 participants
1.4.4 Categorization of research methods
We classify our studies according to dimensions proposed by (Rune-son and Höst, 2008) and (Stol and Fitzgerald, 2015), which aim toclassify research methods in software engineering and are explainedin the following:
• Obtrusiveness (O)This dimension describes the researchers control level within astudy setting (e. g., variables, confounding factors).
• Generalization (G)This dimension describes the results’ applicability, either “uni-versal” or “particular”.
• Research setting (RS)This dimension classifies the study environment regarding itsrealness. There are four categories to choose from, “natural” forfield studies, “contrived” for a more artificial, somewhat a re-search lab environment, “no empirical setting” (e. g., derivation ofa conceptual framework from literature), and “setting indepen-dent” which is fit for surveys with large sample size.
• Focus (F)This dimension put emphasis on the most generalizable featureof the study and it is divided in three categories, ‘actor’ (e. g., sur-veys), “context” (e. g., field studies), and “behavior” (e. g., experi-mental studies).
• Purpose (P)The study purpose can be classified in four types, “exploratory”,“descriptive”, “explanatory”, and “improving”.

1.5 outline 11
The studies performed in this thesis can be classified in the presentedframework as described in Table 1.2.
Table 1.2: Categorization of the studies included in this thesis
(O) (G) (RS) (F) (P)
Chapter 3
Interviews unobtrusive particular natural behavior exploratory
Chapter 4
Interviews unobtrusive universal natural behavior improving
Survey unobtrusive universal natural behavior descriptive
Chapter 6
Case study unobtrusive particular natural context explanatory
Survey unobtrusive particular natural context descriptive
1.5 outline
This thesis is organized as explained in the following:
Chapter 2 (Foundational theory) presents the knowledge needed tounderstand concepts and terminologies used throughout this thesis.We explain the required concepts of MBSE, give an introduction onFocus Area Maturity Models, and explain the MBSE MM.
Chapter 3 (Forces that drive or prevent Model-based SystemsEngineering adoption in the embedded systems industry) presentsan empirical study on the societal forces that hinder or fosterMBSE adoption. The study was based on 20 interviews made withpractitioners and seasoned researchers.
Chapter 4 (Strategies and best practices for Model-based SystemsEngineering adoption in embedded systems industry) presents 18
best practices that practitioners should adhere when adopting MBSE
for increased efficiency and efficacy.
Chapter 5 (Method value ascription) introduces a model to describedhow teams ascribe value to adoption candidate methods accordingto adoption goal, methods intrinsic characteristics, context and

12 introduction
associated costs.
Chapter 6 (Goal-benefit decision calculus for MBSE method selection)introduces a goal-benefit decision calculus method for selecting MBSE
methods based on the development team adoption goal and context.
Chapter 7 (State of the art) describes the current state of the artstructured along with the contributions of this thesis consideringempirical work on MBSE adoption, context modeling, goal modeling,method selection, and Benefits Management.
Chapter 8 (Conclusions and outlook) summarizes this thesis by pre-senting its contributions, limitations and directions for future work.
1.6 publications
The work presented in this dissertation was developed between May2017 and July 2020 at the Technical University of Berlin (DaimlerCenter for Automotive Information Technology Innovations) and be-tween August 2020 and May 2021 at the University of Cologne. In thissection, we present the work published during this time.
1.6.1 Core publications
Some ideas and representations have appeared in the publicationslisted below:
• T. Amorim et al. (2019). “Strategies and Best Practices forModel-based Systems Engineering Adoption in EmbeddedSystems Industry.” In: Proceedings of the 41st ACM/IEEE Interna-tional Conference on Software Engineering: Software Engineering inPractice (ICSE-SEIP’19)
My contributions: As the first author, I wrote the wholepaper text, performed the interviews thematic coding togetherwith two other authors, elicited the best practices from thecodes and verbatim, and designed, conducted, and analyzedthe survey data. This paper was republished later in anotherconference: T. Amorim et al. (2020). “Strategies and BestPractices for MBSE Adoption in Embedded Systems Industry.”In: Proceedings of the Software Engineering 2020, Fachtagung desGI-Fachbereichs Softwaretechnik

1.6 publications 13
• A. Vogelsang et al. (2017). “Should I Stay or Should I Go? OnForces that Drive and Prevent MBSE Adoption in the EmbeddedSystems Industry.” In: Proceedings of the 18th International Confer-ence of Product-Focused Software Process Improvement (PROFES’17)
My contributions: As the second author, I performed theinterviews thematic coding with two other authors and wrotea significant part of the text, contributing with ideas for theresearch methodology (e. g., cross-analysis of the interviews)and data representation, such as diagrams and tables.
1.6.2 Additional publications
Following publications were developed during the aforementionedperiod, but their topic differs from this thesis topic.
• A. Boll et al. (2021). “Characteristics, Potentials, and Limitationsof Open Source Simulink Projects for Empirical Research.” In:Software and Systems Modeling
• H. Martin et al. (2020). “Combined automotive safety and se-curity pattern engineering approach.” In: Reliability Engineeringand System Safety 198
• T. Amorim et al. (2017). “Systematic Pattern Approach for Safetyand Security Co-engineering in the Automotive Domain.” In:Proceedings of the 36th International Conference on Computer Safety,Reliability, and Security (SAFECOMP’17)
1.6.3 Supervised works
As part of this work, the following master theses were supervised bythe author and successfully completed:
• D. Büch, Unternehmensorientierte Optimierung des Entwick-lungsprozesses anhand eines Reifegradmodells fur Modell-basiertesSystems Engineering (Company-oriented optimization of the de-velopment process using a maturity model for model-based sys-tems engineering), Technische Universität Berlin, 2018
• K. Miroshnichenko, Erweiterung eines MBSE Reifegradmodells umMethoden zur Modellierung von Produktlinien (Extension of anMBSE maturity model to include methods for modeling of prod-uct lines), Technische Universität Berlin, 2018


2F O U N D AT I O N A L T H E O RY
This chapter presents the knowledge required to understand the workpresented in this thesis. In Section 2.1 we clarify terms that can havemany interpretations. In Section 2.2, we define MBSE, its characteris-tics, and shed light on important aspects. In Section 2.3 we explainwhat a maturity model is, discourse about different types and theircharacteristics. In Section 2.4 we introduce the MBSE MM, which is partof the approach presented in Chapter 6.
2.1 terminology
In this section, we clarify some terms used throughout this thesis.
organization companies, governments, non-governmental orga-nizations, or development teams.
development team any systems or software development team.This term can also be referred to as only team.
process is a series of actions undertaken to achieve a result (Cam-bridge University Press, 2020). In the context of this thesis, we usethe term process as in the development process, which is the set ofsteps required to develop software or systems. A process encompassesmethods that are applied in tasks. A process can contain sub-processes.For example Verification and Validation process is contained in theSystem development process.
process improvement is the modification of the developmentteam’s current process to achieve more efficiency and effectiveness.Improvement can be sometimes hard to measure locally, some pro-cesses are labor-intensive, and at first, one could think that there wasno improvement, but this extra effort pays off in other phases of de-velopment (i. e., extra analysis on early phases represents more effortwhich compensates for less effort with design issues further on).
15

16 foundational theory
maturity indicates the degree of development from an initial stateto a more skillful and capable state (Mettler and Winter, 2010). Itdefines how complex a process is in process maturity, described on amaturity model, in an ordinal capability scale.
maturity improvement is the adoption of methods that afforda development team with more sophisticated capabilities.
method are techniques and procedures applied in the executionof processes. An approach performing a software/systems develop-ment project, based on a specific way of thinking, consisting of guide-lines, rules, and heuristics, structured systematically in terms of de-velopment activities, with related development work products anddeveloper roles (played by humans or automated tools) (Brinkkemper,Saeki, and Harmsen, 2001).
Method adoption is the adoption of a method by a developmentteam to improve its processes. Legacy methods with similar objectivesare dropped.
capability is the ability to achieve a specific goal, making use ofthe available resources (Bharadwaj, 2000).
model is the description or specification of a system and its respec-tive environment. A model is created to represent a specific categoryof information (Miller and Mukerji, 2003) and is a simplification ofreality (Booch, Rumbaugh, and Jacobson, 2005). A model can be tex-tual (e. g., programming language), purely graphical (e. g., electronicdiagram) or have both elements (e. g., UML diagram). The modelsconsidered in this thesis are composed of drawings and text, whichcan be in natural language or use a modeling language.
benefit is a value created as a result of the successful completionof a project (PMI, 2017) (e.g., process adoption). A benefit is: (1) al-ways positive, (2) the goal of method adoption, and (3) contributes tomeeting at least one competitive priority. The benefits of MBSE adop-tion are described further (cf. Section 2.2.2) and plays a pivotal role inour approach (cf. Chapter 6).
adoption goal is an envisioned development team’s future stateachieved through method adoption. It can be about changing (e.g., de-veloping new lines of business, exploring new markets) or maintain-

2.2 model-based systems engineering 17
ing its current position relative to its market and competition (OMG,2010).
2.2 model-based systems engineering
Model-based Systems Engineering (MBSE) is the formalized applica-tion of modeling to support system requirements, design, analysis,verification, and validation activities beginning in the conceptual de-sign phase and continuing throughout development and later life cy-cle phases (INCOSE, 2007). MBSE is a term that predicates modelingto analyze and document critical aspects of the systems engineeringlifecycle. It is broad in scope, spanning the SE lifecycle, and coverslevels from system-of-systems to individual components. MBSE is amodel-centric approach providing a single point of truth reflected ina set of living artifacts.
In traditional document-centric development, systems engineersfocus on the development of textual specifications and design docu-mentation. MBSE fosters a coherent system model development con-taining requirements, design, analysis, and verification information.The model serves as a single-source-of-truth and is the primary artifactproduced by systems engineering tasks. Using the same model ele-ments, the system model holds discipline-specific views of the system(e. g., system behavior, software, hardware, safety, security) and createsa common standards-based approach to design that can be program-matically validated to remove inconsistencies. This feature improvessystem analysis reducing the number of defect types commonly in-jected in a traditional document-based approach. Additionally, thesystem model provides consistent propagation of corrections and in-corporation of new information and design decisions. Documenta-tion, when needed, is generated from the system model (Kaslow et al.,2017).
The use of models to support systems engineering started with theModel Driven Architecture, which encompasses a set of Object Manage-ment Group (OMG) standards. Later, the term Moldel-driven Devel-opment (MDD) was coined for describing an approach for softwaredevelopment that includes standards and methods to make the devel-opment process faster, less prone to errors, and easier to understand.Further, the Model-driven Engineering (MDE) was created to includeengineering steps into the MDD. Finally, the Model-based Engineering(MBE) was created to define any engineering performed using mod-els.
The difference between model-based and model-driven is that arti-facts are generated from models (i. e., like an automated step, implies

18 foundational theory
MBE
MDE
MDD
MDA
Figure 2.1: Representation of modeling initiatives (Ameller, 2009).
automation) in the latter. In the former, models can also be used asblueprints for developing the system. For instance, in model-driventesting, the tests are generated from models. Thus, Model-based Engi-neering (MBE) subsumes all other terms (cf. Figure 2.1).
Additionally, MBSE supports engineers with automation capabilities(e.g., code generation, document derivation) and enhanced analysis ca-pabilities (e.g., behavioral analysis, performance analysis, simulation).MBSE is widely used in some application domains as an integral partof development (Bone and Cloutier, 2010). Prominent tool vendors,such as Matlab, IBM, Oracle, Microsoft, or the Eclipse Foundation,offer tooling solutions for MBSE.
2.2.1 MBSE modeling languages
MBSE encompasses many modeling languages, being UML, SysML,and Simulink the most popular ones. In the following paragraphs, wedescribe their most significant characteristics.

2.2 model-based systems engineering 19
10/28/2020 2880px-UML_diagrams_overview.svg.png (2880×1604)
https://upload.wikimedia.org/wikipedia/commons/thumb/e/ed/UML_diagrams_overview.svg/2880px-UML_diagrams_overview.svg.png 1/1
Figure 2.2: Hierarchy of UML 2.2 diagrams.
the unified modeling language is a graphical modelinglanguage for designing software. It may be used to visualize, spec-ify, construct, and document the artifacts of software-intensive sys-tems (Booch, Rumbaugh, and Jacobson, 2005). Unified Modeling Lan-guage (UML) is appropriate for modeling different types of systems,ranging from enterprise information systems to distributed Web-based applications and even to hard real-time embedded systems.It addresses the views needed to develop and then deploy systems.The UML diagrams are divided into two types, namely structural andbehavioral. They are depicted in Figure 2.2
sysml (short for “Systems Modeling Language”) is a general-purpose graphical modeling language for specifying, analyzing, de-signing, and verifying complex systems that may include hardware,software, information, personnel, procedures, and facilities (Fosse andBayer, 2016). It is a profile of UML 2 (i. e., a generic extension mecha-nism for customizing UML models for particular domains and plat-forms). It was developed by the SysML Partners’ SysML Open SourceSpecification Project in 2003 and was adapted and adopted by theOMG in 2006. While UML is predominantly used for software devel-opment, SysML also encompasses physical aspects of a system andallows the integration of heterogeneous domains in a unified modelat a high abstraction level. The languages’ graphical models are in-tended to cover all development phases of a system. At the writing ofthis thesis, the SysML version is 1.6.

20 foundational theory
Figure 2.3: SysML diagram types, shown as a class diagram (MBSE andSysML).
simulink is a Matlab-based graphical programming environmentfor modeling, simulating, and analyzing multi-domain dynamical sys-tems. Its primary interface is a graphical block diagramming tool anda customizable set of block libraries. Different kinds of blocks can beconnected via ports to transmit outputs and receive inputs, yielding adata flow-oriented model. Subsystems are special blocks that containanother Simulink diagram, thus enabling hierarchical modeling. Fig-ure 2.4 shows an example of a Simulink diagram (taken from Minh,Moustafa, and Tamre, 2017). The model shows a dual-clutch controlof an automatic transmission system of a vehicle with two separateclutches. Blocks of various types are connected via signal lines. Thefour smaller blocks on the left side are inport blocks, transportinginput values from the model’s context. One of them is the car’s cur-rent speed (VehSpd), which is further processed to compute the nextgear shift. Also, three outport blocks (same symbol as inports butwith incoming signal lines) transport output values of the model to itscontext. The four rectangular blocks shaded in gray are subsystems.The subsystems are part of the model, and the contained behaviorcan be displayed on request. The other shapes represent basic blocks(i.e., non-composite blocks). The pentagon at the top (trq_dem) is agoto block that transports its signal to some other part of the model(to a point deeper in one of the subsystems). The triangle (Tmax) is again block, which multiplies a signal with a constant. The black baris a multiplexer block, which combines inputs with the same datatype and complexity into a vector output. The rectangle with the label“[0,1]” is a saturation block, which produces an output signal with theinput signal’s value bounded to some upper and lower values.

2.2 model-based systems engineering 21
Figure 2.4: Example of a Simulink block diagram modeling the dual-clutchcontrol of an automatic transmission system of a vehicle with twoseparate clutches (Minh, Moustafa, and Tamre, 2017).
2.2.2 MBSE benefits
MBSE is vast; thus, one can speak of many benefits that can be har-vested upon the adoption of its methods. Nevertheless, at the sametime, not all methods deliver the same benefits. Thus we see as afundamental part of understanding MBSE also understanding the per-ceived associated benefits, and in a second moment, associate methodsto these benefits. For instance, Easier handling of complexity (Asan, Al-brecht, and Bilgen, 2014) is a benefit generated by MBSE models andtools that support impact, coverage, and consistency analysis. Thebenefits associated with MBSE adoption considered in this thesis weregathered through an extensive MBSE literature survey. The collectionand presentation of this information is a minor contribution of thisthesis and are listed below:
• Easier reuse of existing artifacts (Salimi and Salimi, 2017): Modelsare known to improve reuse. Within the MBSE paradigm, func-tions are encapsulated, have well-defined interfaces, and aretraced to diagrams that explain their usage. Reusing good qual-ity artifacts improves the system’s quality by diminishing thecode subject to failure.
• Better communication (Hutchinson et al., 2011): Models enhancestakeholders understanding. The many types of diagrams usedin MBSE represent different views of the systems and are lessambiguous than the natural language used in document-basedartifacts. The models from different engineering areas are linked,providing a better overview of the whole system. These charac-teristics improve communication among stakeholders.

22 foundational theory
• Better understanding of problem domain (Boehm, Gray, and Seewaldt,1984): Using models, engineers can better grasp the problem athand, which leads to less “gold plating”, fewer missing features,fewer validation issues, and requirements change.
• Better understanding of solution space (Harvey and Liddy, 2014):Models can represent more information to the eyes at once com-pared to document-based specification, which requires thoroughskimming. Thus domains that developed reliable modeling op-tions did not go back to document-based (e.g., circuit boards).Product functions can be better selected, become market com-petitive, and are eventually copied by competitors.
• Better estimates (cost, the impact of req. changes) (Dabkowski et al.,2013): Compared to the document-centric approach, MBSE shiftspart of the effort from development to design tasks; thus, engi-neers get a good grasp of systems at early stages of the lifecycle.This benefit allows more precise estimates (i.e., effort estima-tion deviation gets lower while the deadline meeting rate getshigher). Additionally, MBSE eases integration which contributesto adherence to the estimates.
• Less defects (McConnell, 2004): Employing MBSE can diminish de-fects in various ways: test cases can be automatically generated,defects due to inconsistency and test coverage are tackled bytraceability of elements, and reuse guarantees defect-free code.
• Easier handling of complexity (Asan, Albrecht, and Bilgen, 2014): Cur-rent systems are built with more control units than the previousgeneration. Additionally, aggressive competition requires engi-neers to combine functionalities to create new features, whichadds to the complexity (Vogelsang, 2019). MBSE addresses thisissue through traceability which allows automated checks, savesinformation-seek effort, and decreases inconsistencies betweenartifacts.
• Improved verification & validation (McConnell, 2004): MBSE mod-els can represent different views of a system, thus helping tocommunicate better what is understood from stakeholders andthe environment. The traceability between the models enablesautomatic verification. Validation is enhanced with better waysto represent the requirements as well as simulations.

2.3 maturity models 23
• Improved quality of specification (Fosse and Bayer, 2016): This bene-fit is achieved through specialized tools that can perform manytypes of analysis in models, i. e., incomplete and inconsistent re-quirements can be automatically detected. Additionally, the myr-iad of views provided by MBSE supports and amplifies humanthinking, reasoning, and cooperation (Bubenko and Kirikova,1999).
• Efficient certification (Helle, 2012): Models ease the process ofgenerating (e.g., simulations), gathering (i.e., traceability) andreusing evidence. The generation of documents for this meanscan be automated.
2.3 maturity models
Maturity models are used to assess the process maturity of a devel-opment team and to guide further improvement. Two approaches forimplementing maturity models exist.
With a top-down approach, a fixed number of maturity stages orlevels is specified first and further corroborated with characteristics(typically in the form of specific assessment items) that support theinitial assumptions about how maturity evolves. Prominent examplesof are CMMI (Kneuper, 2008) or SPICE (ISO/IEC, 2003).
When using a bottom-up approach, distinct characteristics or assess-ment items are determined first and clustered in a second step intomaturity levels to induce a more general view of the different stepsof maturity evolution. They are distinguished from fixed-level matu-rity models, such as CMMI, in that they are suited to the incrementalimprovement of functional domains. One class of these bottom-upmaturity models is the Focus Area type (van Steenbergen et al., 2010,2013), where capabilities are defined for different focus areas and ar-ranged in a progressing order that can be mapped to maturity levels(cf. Figure 2.5). This type of maturity model effectively defines a do-main and provides development teams with implementable practicesand processes. Maturity models from several application areas suchas Software Product Management or Enterprise Architecture employfocus area design (see (Sanchez-Puchol and Pastor-Collado, 2017) fora comprehensive survey).

24 foundational theory
83
Figure 2.5: Focus area maturity model meta-model.
2.4 model-based systems engineering maturity model
The MBSE MM was created during the project SPES20201. It is a focus
area maturity model which uses the SPES methodology (Broy et al.,2012; Pohl et al., 2016) as a reference framework. In the MBSE MM,functional domains are named engineering function to emphasize therelation to engineering phases in the development process (cf. Fig-ure 2.6). The MBSE MM consists of 6 engineering functions that groupa total of 15 focus areas addressing the different activities that modelscan support.
Each focus area has a set of capabilities, indexed by A – G, whichdescribes a piece of an artifact or a capacity to perform methods (e.g.,automatic analysis, simulate) onto these artifacts at different stages ofmodeling support. The capabilities are positioned against each otherin a maturity matrix (cf. Figure 2.7). For example, the less mature ca-pability (i. e., A) in the focus area Goal Modeling is “Stakeholder goalsregarding the function and quality of the system under considerationhave been identified and documented”. The following capabilitiesof the focus area characterize increasing use and analysis of modelsup to F: “The goal models are analyzed automatically in terms ofconsistency, satisfiability, and completeness”.
1 http://spes2020.informatik.tu-muenchen.de/spes_xt-home.html

2.4 model-based systems engineering maturity model 25
84Figure 2.6: MBSE MM engineering functions represented in the V-model.
Capabilities located in higher levels of maturity may depend oncapabilities on lower levels of maturity. Capabilities at the same levelhave no dependencies among each other. The maturity level describeshow well MBSE practices are implemented. Improvement actions areassociated with the capabilities to guide the development team in theincremental development of the engineering function. An overviewof the MBSE MM can be seen in Figure 2.7.
Regarding its possible use, maturity models can be descriptive, pre-scriptive, or comparative (de Bruin et al., 2005). A maturity model issaid to be descriptive when used for assessing the development team’scurrent state. If it suggests improvements, the model is prescriptive,and when it can be used to compare the processes of different organi-zations, it is also comparative. The MBSE MM is entirely descriptiveand partially prescriptive. Partially prescriptive because the modellacks guidance on selecting the subsequent capabilities to implement.It is not comparative because the MBSE MM was created to fit manydevelopment contexts, and there is no need to achieve maturity levels.Thus, some organizations might lack maturity in some focus areasbecause of business goal misalignment.
2.4.1 Engineering functions and focus areas
The MBSE MM comprises six engineering functions with 15 focus areas.The focus areas have different capabilities amount, as modeling is notequally distributed over different engineering functions. For instance,Requirements modeling has many practices while System Testingand Integration has only a tiny amount. The engineering functionsand focus areas are depicted in Figure 2.7 and are described in thefollowing paragraphs:

26 foundational theory
Perfil d
e m
atu
rida
de
–To
p 5
–O
bje
tivo
1
1
Op
era
tion
al C
onte
xt
Conte
xt
Analy
sis
Kn
ow
ledg
e C
onte
xt
Sco
pin
g
Go
al M
ode
ling
Sce
na
rio M
ode
ling
Re
qu
irem
en
ts M
ode
ling
Sys. F
un
ctio
nM
ode
ling
Sys. F
un
ctio
nS
pecific
atio
n
Event C
hain
Modelin
g
Mode M
odelin
g
Log
. Arc
hite
ctu
reM
ode
ling
Log
. Co
mp
on
en
tM
ode
ling
Syste
m B
eha
vio
rT
estin
g
Te
chn
ica
l Arc
hite
ctu
reM
ode
ling
Te
chn
ica
l Co
mp
on
en
tM
ode
ling
Require
ments
Syste
m
Fu
nctio
ns
Arc
hite
ctu
re
Testin
g
Technic
al
Imple
menta
tion
AB
CD
EF
G
AB
CD
AB
CD
E
AB
CD
EF
AB
CD
EF
G
AB
CD
EG
F
AB
CD
AB
CD
EF
AB
CD
AB
CD
AB
CD
EF
G
AB
CD
E
AB
CD
AB
CD
EF
AB
CD
Engin
eering fu
nctio
nFo
cus area
Cap
abilities
Figure2.
7:Overview
ofthe
Model-based
Systems
EngineeringM
aturityM
odel.

2.4 model-based systems engineering maturity model 27
context analysis This engineering function groups capabili-ties related to modeling and context analysis of the system-under-development. The model differentiates two types of context:
• Operational Context encompasses actors and external systemsthat interact with the system at runtime.
• Knowledge Context describes relevant sources of information forthe development of the system (e.g., stakeholders, standards,laws).
requirements This engineering function encompasses capabili-ties related to modeling and requirement analysis of the system-under-development from different perspectives.
• Scoping contains capabilities related to understanding the re-sponsibilities and features of the system.
• Goal Modeling refers to stakeholder goals and their interdepen-dencies.
• Scenario Modeling addresses desired interaction patterns betweenthe system and its context entities.
• Requirements Specification contains capabilities related to specificdesired properties of the system at its interface.
system functions Capabilities of this engineering function arerelated to modeling and analyzing the system-under-development’suser-observable functions (or features).
• System Function Modeling contains capabilities to provide anoverview of all functions and their interplay.
• System Function Specification refers to the maturity of a singlefunction specification.
• Event Chain Modeling addresses the necessary flow of informa-tion within the system to implement a function.
• Mode Modeling contains capabilities related to describing opera-tional states of the system and their transitions.
architecture Capabilities related to modeling and analyzingthe internal architecture of the system-under-development in terms ofinteracting (logical) components.
• Logical Architecture Modeling contains capabilities providing anoverview over all components and their interplay.
• Logical Component Modeling refers to the specification maturityof components.

28 foundational theory
technical implementation Capabilities related to model-ing and analyzing the technical architecture of the system-under-development in terms of physical devices and their communication.
• Technical Architecture Modeling contains capabilities to provide anoverview of all technical components and their communication(e.g., electronic computing units (ECUs), bus systems, sensors,actuators).
• Technical Component Modeling refers to the specification maturityof technical components.
integration and testing Capabilities related to modeling andanalyzing testing and integration activities.
• System Behavior Testing contains capabilities to test desired be-havior of the system-under-development.
• System Quality Testing refers to testing desired qualities (a.k.a.non-function properties) of the system-under-development.
The capabilities of the MBSE MM are listed in Table A.2 and thepositioning of the capabilities according to maturity levels is depictedin Table A.1.
2.4.2 Capabilities
The engineering functions have one or more focus areas, which aresliced into several capability levels. The capability levels are describedusing letters (e.g,. ‘A’, ‘B’, ‘C’), and the alphabetic order defines thematurity of the capability, being the ones that appear earlier of lowermaturity (i.e., refinement, formalism, automation) compared to onesthat appear later. The granularity of the capabilities was defined toconsider small development steps towards the most mature focus areacapability (the longest being eight maturity levels). The descriptionof the capabilities defines either (1) how the information is stored(documents or models) or (2) how the information can be manipu-lated (static or dynamic analysis). The following capability types aredescribed in the model.
• identified and documented: this capability type is usually per-formed using natural language and non-MBSE oriented tools.Such tasks encompass eliciting information from externalsources as well as refinement and further development of ex-isting artifacts. Although these capabilities do not employ mod-els or specialized tools, the information acquired is needed for

2.4 model-based systems engineering maturity model 29
more mature ones. For instance: “The vision of the system underconsideration is identified and documented” - Scoping SCO A.
• modeled: information is modeled using computer-aided designtools and formal languages. For instance: “Objectives, sub-goalsand their interrelationships are modeled” - Goal Modeling GOM E.
• is executable: this activity allows the design tool to execute themodels. For instance: “The behavior of the logical components isdescribed so that it is executable” - Logical Component ModelingLCM E.
• analyzed automatically: properties of the system (e.g., inconsis-tency, incompleteness) are analyzed automatically using toolsupport. For instance: “The behavior of individual groups of log-ical components is analyzed automatically” - Logical ArchitectureModeling LAM F.
• generated automatically: based on models; artifacts are automati-cally generated using tool support (e.g., code, documents, othermodels). For instance: “The mapping of SW elements (resource-consuming elements) to the given execution platform (resource-providing elements) is generated automatically (deployment model)”- Deployment DEP C.
• can be simulated: capabilities of this type enable model simula-tion, allowing engineers to identify design errors. For instance:“The model of the system functions can be simulated together with adescription of the context” - System Function Modeling SFM D.
All capabilities, when adopted, add new procedures to the set ofexisting ones, except for capabilities of the modeled type, which somewill replace existing tasks. A description of all MBSE MM capabilitiescan be seen in Table A.2.


3F O R C E S T H AT D R I V E O R P R E V E N T M O D E L - B A S E DS Y S T E M S E N G I N E E R I N G A D O P T I O N I N E M B E D D E DS Y S T E M S I N D U S T RY
MBSE comprises a set of models and techniques that is often suggestedas a solution to cope with the challenges of engineering complex sys-tems. Although many practitioners agree on the techniques’ potentialbenefits, companies struggle with the adoption of MBSE. In this chap-ter, we investigate the forces that prevent or impede the adoption ofMBSE in companies that develop embedded software systems. Wecontrast the hindering forces with issues and challenges that drivethese companies towards introducing MBSE. Our results are basedon 20 interviews with experts from 10 organizations. Through ex-ploratory research, we analyze the results employing thematic coding.Forces that prevent MBSE adoption relate mainly to immature tooling,uncertainty about the return-on-investment, and fears on migratingexisting data and processes. On the other hand, MBSE adoption alsohas strong drivers, and participants have high expectations mainlyconcerning managing complexity, adhering to new regulations, andreducing costs. We conclude that bad experiences and frustrationabout MBSE adoption originate from false or too high expectations.Nevertheless, companies should not underestimate the necessary ef-forts for convincing employees and addressing their anxiety.
This chapter is based on previous publication (Vogelsang et al.,2017).
3.1 introduction
Model-based Systems Engineering (MBSE) describes models andmodel-based techniques to develop complex systems, which aremainly driven by software (Broy et al., 2012). MBSE tackles thosesystems’ complexity through an interrelated set of models, which con-nects all development activities and provides comprehensive analyses.Many companies face problems with the increasing complexity ofsoftware-intensive systems, their interdisciplinary development, andthe massive amount of mainly text-based specifications. Such hur-dles are especially true for embedded software systems (Broy, 2006).Model-based techniques offer a solution to managing these problems,and companies are attracted to its benefits.
31

32 forces that drive or prevent mbse adoption in embedded industry
Despite the envisioned MBSE benefits, companies are strugglingwith implementing their methods within development teams. Ofcourse, organizational change is never easy (Conner, 1993; Hammer,2007); however other methodologies, such as agile practices, have beenadopted much faster. So, what are the reasons and factors that preventor impede companies from adopting MBSE?
In this chapter, we investigate the forces that prevent or impedethe adoption of MBSE in companies that develop embedded systems.We contrast forces that hinder its adoption with forces that drivecompanies towards introducing MBSE.
Our results are based on 20 interviews with experts from 10 organi-zations in Germany. We analyze the results through thematic codingand categorize the identified forces into inertia and anxiety forces,which prevent MBSE adoption, and push and pull forces, which drivethe companies towards MBSE adoption. We frame the results with thecoding of what the interviewees considered as MBSE. Our scientificcontributions are the following:
• We present a set of hindering and fostering forces on MBSEadoption in the industry. These results were extracted from in-terviews with 20 experts from 10 organizations located in Ger-many.
• We analyze these forces to differentiate between MBSE specificforces and forces inherent to any kind of methodological change.
Forces that prevent MBSE adoption relate mainly to immaturetooling, uncertainty about the return-on-investment, and fears onmigrating existing data and processes. On the other hand, MBSEadoption also has strong drivers, and participants have high ex-pectations mainly concerning managing complexity, adhering tonew regulations, and detecting bugs earlier. We observed that thehindering forces are much more concrete and MBSE-specific thanthe fostering forces, which are often very generic (e. g., increase inproduct quality, managing complexity, supporting reuse). Frequently,the interviewees could not even tell why or which part of MBSEcontributes to the expected benefits.
From this, we conclude that bad experiences and frustration aboutMBSE adoption originate from false or too high expectations. Never-theless, companies should not underestimate the necessary efforts forconvincing employees and addressing their anxiety.

3.2 forces on mbse adoption 33
3.2 forces on mbse adoption
In studies of customer demand and motivation, there is a model calledForces of Progress (Klement, 2018), which is used to define the emo-tional forces that generate and shape customers’ high-level demandfor a product. In this model, there are two groups of opposing forces.One group, which works to generate demand, is composed of twoforces, namely push and pull. The other group is responsible for reduc-ing and blocking demand and is also composed of two forces, namelyinertia and anxiety. These forces are felt by customers differently whilesearching, choosing, and using a new product.
Likewise, when development teams face process change, their as-sociates experience similar forces towards the endeavor, which is nodifferent for MBSE adoption. In the following, we explain how theseforces play when considering organizational change and their relationto the topic of this chapter.
3.2.1 Push force
Change does not take place while the current solution works fine.When this is not the case, the push force comes into play. The pushforce is generated by feeling that things currently are not sufficientanymore, either because the environment changed or the shortcom-ings of the current methods are not satisfactory. Then developmentteams feel impelled to change, to seek something else that might workbetter. Push can be internal or external:
• Internal Push this force emanates from frustration with the cur-rent way of doing things. Rather, they experienced a combina-tion of circumstances that made them think, “I don’t like howthings are; I want to make a change”. In a systems engineeringdevelopment team, bottlenecks in the current process are phe-nomena delivering push force.
• External Push the outside world is forcing development teams tochange. Something in the environment changed, and the old wayof solving their problems needs to change. New requirementsfrom stakeholders are examples of how this force is triggered(e. g., compliance with regulations).

34 forces that drive or prevent mbse adoption in embedded industry
3.2.2 Pull force
While push force starts the change movement, the pull force steersand directs it. There are two kinds of pull forces:
• An idea of better life Development teams do not change for thesake of changing; they do to help make their lives better. Whenthey have the right methods for their problem, they can dothings they could not before. The idea of this better life is whatpulls them to take action. For instance, managers hear about thebenefits of MBSE thus seeking to adopt it to keep competitivewithin its market.
• Preference for a particular solution Self-improvement motivatesdevelopment teams to begin searching for and using a new so-lution; however, many factors play a role while choosing one.The context of the pull force shapes the desire to change, thusaffecting the choosing criteria. Considering MBSE context, thisforce will steer an organization to select some specific methodor tool.
3.2.3 Anxiety force
The anxiety force is associated with how or if a novel solution candeliver the expected benefits. It can happen in two situations, first,before deciding which solution should the selected, and later whilefamiliarity with the product requires time. These two types are de-scribed in the following:
• Anxiety-in-choice, which boils up to feelings of uncertainty aboutwhether a particular novel solution will deliver the expectedbenefits and help us achieve our goals. After the choice is made,the anxiety-in-choice largely vanishes, and the second type ofanxiety might kick in. Managers feel this force due to unsurenessof the efficacy of the new methods and if the methods are trulydelivering the expected benefits.
• Anxiety-in-use. This form of anxiety takes place, as the namesays, during the use of the solution and is generated by someproperties of the new solution that we are not completely com-fortable with it. Engineers used to the old way of doing thingsare prone to feel this force with the new methods when they getfrustrated in some activity.

3.3 study approach 35
3.2.4 Inertia force
Inertia, as the name says, is the tendency to do nothing or to remainunchanged. Inertia is experienced in two different ways:
• Habits-in-choice are the forces that prevent development teamsfrom switching the current way of doing things to a novel way.This force is experienced at the decision time for the new so-lution. The possible cumbersome needed translation of file for-mats between new and old tools is an example of a situationthat triggers habits-in-choice.
• Habits-in-use is a force that takes place after the solution is im-plemented. Individuals start to use the solutions as planned,but sometimes they start to go slowly back to the old ways ofdoing things. These phenomena happen because keeping theirold habits is easier. For instance, engineers might still use doc-uments in parallel to the models to store information. In orderto overcome this force, engineers should be helped to drop oldhabits and develop new ones (e. g., training).
We created a quadrant diagram that groups the forces accordingto triggers and forces type (cf. Figure 3.2). On the vertical axis, wecategorize the forces in two types, either hindering or fostering MBSE
adoption. On the horizontal axis, we describe the triggers of theseforces, either due to events in the present (i. e., Current Situation) ordue to events in the future (i. e., Envisioned Solution). Additionally, weplaced the forces in a timeline that displays the event of organizationalchange to depict when each force kicks in (cf. 3.1). Two events aredepicted in this timeline, namely Decision to change and New solutionin place.
3.3 study approach
In this section, we describe how the study was designed and con-ducted.
3.3.1 Research questions
We structure our research by two research questions that focus onhindering and fostering forces of MBSE adoption.
• RQ0: What means model-based engineering for practitioners?

36 forces that drive or prevent mbse adoption in embedded industry
An
xiety::An
xiety-in-u
se
Decisio
n to
ch
ange
New
solu
tion
in
place
An
xiety::An
xiety-in-ch
oice
Inertia::H
abits-in
-use
Inertia::H
abits-in
-cho
iceP
ush
::Intern
al
Pu
ll::An
ide
a for a b
etter lifeP
ull::P
reference fo
r a particu
lar solu
tion
Pu
sh::Extern
al
…Timelin
e
Figure3.
1:Timeline
ofchange
depictingw
heneach
forceis
triggered.

3.3 study approach 37
TriggersFo
rces
Current Situation Envisioned SolutionFo
ster
ing
Push PullH
ind
erin
g
Inertia Anxiety
Figure 3.2: MBSE adoption forces diagram.
• RQ1: What are perceived forces that prevent MBSE adoption inthe industry?
– RQ1.1: What are habits and inertia that prevent MBSE adop-tion?
– RQ1.2: What are anxiety factors that prevent MBSE adop-tion?
• RQ2: What are the perceived forces that foster MBSE adoptionin the industry?
– RQ2.1: What are the perceived issues that push the industrytowards MBSE?
– RQ2.2: What MBSE benefits are perceived as most attrac-tive?
3.3.2 Research design
This work is an exploratory research (Shields and Rangarjan, 2013) basedon semi-structured interviews. The method provides insights into theexamined topic and gives essential information to understand thephenomenon in its real context (Dresch, Lacerda, and Antunes, 2015;Runeson and Höst, 2008). For performing the interviews, we devel-oped an interview guide (Bryman, 2015). The interview guide wasstructured along a funnel model (Runeson and Höst, 2008) starting

38 forces that drive or prevent mbse adoption in embedded industry
with general questions about the participant’s context, understandingof MBSE concepts, and afterward going into detail about specific top-ics such as employee training, MBSE integration, or experiences in thepast.
3.3.3 Study participants
The interview participants were selected from personal contacts of theauthors and industrial partners that participate in a German researchproject1 that has a focus on MBSE adoption in practice. The intervie-wee selection was based on two criteria: First, the interviewee shouldhave several years of work experience. Second, the interviewee shouldwork in an environment where MBSE adoption is a realistic option.In our case, we, therefore, restricted the group of interviewees to peo-ple working on embedded systems or in the context of embeddedsystems. Interviewees did not need to have adopted MBSE in theircontext; however, 13 of the 20 interviewees stated that they alreadyhave experiences in adopting MBSE. Table 3.1 provides an overviewof the participants and their context. The interviews were conductedby two of the authors from May to December 2016.
3.3.4 Interviews
There were 20 face-to-face interviews. Every interview took aroundone hour. In consent with the interviewee, the interviewer took notesfor detailed analysis. All interview notes were managed using thequalitative data analysis tool ATLAS.ti2. The interview guideline canbe seen in Appendix B.
3.3.5 Analysis
Three researchers analyzed the interviews using qualitative cod-ing (Neuman, 2010). Neither of them participated in the interviewphase. The study was framed using the framework of Forces on MBSEAdoption (see Section 3.2) with the following codes: {Push, Pull, Inertia,Anxiety}. The analysis started with all three researchers working onthe same five interviews. The results were later discussed and mergedin a meeting. The discussions helped to homogenize the codes amongthe researchers (Weston et al., 2001) (i. e., what/how to look for oneach force). The remaining 15 interviews were tackled in a cross-
1 https://spedit.in.tum.de/2 http://atlasti.com

3.3 study approach 39
Table 3.1: Study participants
ID IndustrySector
Type ofCompany
Role ofParticipant
MBSEAttitude
P1 Tool vendor OEM Technical Sales neutral
P2 Tool vendor Academic Professor neutral
P3 R&D ser-vices
SME Manager neutral
P4 Automotive OEM Head of Development positive
P5 Automotive OEM Systems Engineer neutral
P6 Medical SME Head of SW Development positive
P7 Medical SME Head of QA positive
P8 Automotive Supplier Function Architect negative
P9 Automotive OEM SW Architect neutral
P10 Automotive OEM Function Architect positive
P11 Research Academic Professor negative
P12 Avionics Supplier Technical Project Man-ager
neutral
P13 Automotive Supplier Developer positive
P14 Avionics OEM SW Developer neutral
P15 Avionics Supplier SW Developer negative
P16 Avionics OEM Team Lead neutral
P17 Electronics OEM Head of SW Development neutral
P18 Avionics SME Head of System Engineer-ing
negative
P19 Robotics OEM Team Lead positive
P20 Automotive OEM Research and Develop-ment
negative

40 forces that drive or prevent mbse adoption in embedded industry
analysis fashion (cf. Figure 3.3). The interviews were divided equallyinto three groups (A, B, C), and each researcher coded the interviewtranscripts of two groups (i. e., AB, BC, or AC) individually the sameway as before. Then, each researcher merged the results and judgedexisting conflicts of the group he did not work on (a researcher codinginterviews of groups AB merged the results of interviews in group C).In a round with all three researchers, the unresolved conflicts wereironed out. Finally, the codes were divided into three groups {Pull, In-ertia, (Anxiety, Push)} and each researcher worked on the quotationsof codes of a group individually, performing open coding to createsecond-level codes (cf. Figure 3.4). We present the results in Section 3.4by reporting the codes with the number of related quotations and thenumber of interviews in which the code appeared. The quotations’number indicates the code’s significance overall interviews, and thenumber of interviews indicates the pervasiveness of the code withinthe interviews. The codebook can be seen in Appendix D.
3.3.6 Threats to validity
The validity of our results are subject to the following threats:
Subject selection bias. Since this is an exploratory study, we selecteda convenience sample of project partners and friends as study subjects.Although we selected study participants from a broad spectrum ofcompanies and industrial domains, the results may be influenced bythe fact that all study participants work in Germany. Additionally,the interviewees were selected from an environment where MBSEadoption is a realistic option.
Researcher bias. Our study was carried out in the context of a projecton transferring MBSE into practice, which means that the authorshave a positive attitude towards MBSE in general. Additionally, someinterviewees are also partners in this project; however, we interviewedpeople from companies not involved in the project. In order to reduceresearcher bias, the interviews were conducted by two researcherswho took notes independently.
Reactivity refers to how much of the observations are caused becausethe interviewers are present. Investigators can impact both the en-vironment and the people being observed. Getting rid of reactivitythreats is impossible; however, the investigator should be aware of itand how it influences what is observed. Thus, validity is threatened bythe possibility of misunderstandings between interviewees and the re-searchers. In order to minimize this risk, the study goal was explainedto the participants before the interview. Steps taken to improve thereliability of the interview guide included a review and a pilot test.

3.3 study approach 41
Res
earc
h M
eth
od
olo
gy –
1st
leve
l co
din
g
Gro
up
A
Gro
up
B
Gro
up
C
Gro
up
A
Gro
up
B
Gro
up
B
Gro
up
C
Gro
up
A
Gro
up
C
Gro
up
A
Gro
up
B
Gro
up
C
Co
de
d
inte
rvie
ws
Co
des
m
erge
d5
inte
rvie
ws
pe
r gr
ou
p
1st
Leve
l co
des
15
1st
leve
l co
din
g
Mer
gin
g co
de
s
Figu
re3
.3:A
naly
sis
proc
ess
tore
trie
veth
efir
stle
velc
odes
from
the
inte
rvie
ws.

42 forces that drive or prevent mbse adoption in embedded industryResearch Methodology – 2nd level coding
Push
Anxiety
Inertia
Pull
Push codes
Anxiety codes
Inertia codes
Pull codes
2nd levelcodes
1st levelcodes
17
2nd levelcoding
Figure 3.4: Analysis process to retrieve the second level codes from the inter-views.
We followed several strategies proposed by Maxwell (Maxwell, 2012)to mitigate the threats. The interviews were conducted as part of alarger project, where we established a long-term involvement of thestudy subjects. As part of this, we presented our study in the projectcontext, where the project partners reviewed the results. We substan-tiate our assertions by providing quasi-statistics on the frequency ofcode occurrences in the interview data. To further validate our results,we compared them with existing studies on development methodologyadoption.
External validity. We expect that our results represent the Germanembedded systems industry; however, we cannot generalize the re-sults to other countries or other types of systems engineering.
3.4 results
In this section, we present the results of our study. In the followingsubsection, we present an overview of the results and the definitionof MBSE according to the study’s participants. Further, we describehow each force influences the adoption of MBSE supported by theverbatim of the interviews.

3.4 results 43
Figure 3.5: Number of quotations related to MBSE adoption forces.
3.4.1 Overview
In total, we coded 242 quotations. Their distribution between theforces can be seen in Figure 3.5. The fostering (131 times) and hin-dering (111) forces were mentioned to a similar amount. Quotationscategorized as pull (94) are almost triple of push (37). These num-bers can be compared to the quotations on inertia (51) and anxiety(58). Overall, pull forces were coded most, representing 39% of allquotations.
To analyze the general attitude of a participant towards MBSE adop-tion, we divided the number of coded quotations related to fosteringforces (push and pull) by the total number of quotations coded forthat participant. We considered a participant to have a positive atti-tude when fostering forces was higher than 60%, a neutral attitudefor ratios between 60% and 40%, and a negative attitude for a ratiosmaller than 40%. As depicted in Table 3.1, we had a relatively bal-anced set of participants concerning MBSE attitude. For 9 out of the20 interviews, we coded a similar number of fostering and hinder-ing forces (i. e., neutral attitude). In 6 interviews, the fostering forcesdominated (i. e., positive attitude), and in 5 interviews, the hinderingforces dominated (i. e., negative attitude).
The results of the last step of the coding process generated similarcodes in different categories (e. g., Tooling Shortcomings from Anxiety

44 forces that drive or prevent mbse adoption in embedded industry
category and Immature tooling or Incompatibility with existing tools,both from Inertia category). Although similar names, these codesencompass disjoint characteristics, and their coexistence serves a pur-pose. All codes created during the analysis can be seen in Figure 3.6.
3.4.2 Definition of MBSE
In this section, we try to answer RQ0: What means model-based engineer-ing for practitioners?. In the interviews, we did not refer to any specificMBSE approach. We did this on purpose to identify forces indepen-dent from any concrete technique or tooling. Additionally, comparingthe results would have been much harder due to the large variety ofMBSE approaches and flavors. Nevertheless, we asked the intervie-wees to define MBSE. The result can be seen in Figure 3.7, where aword cloud representation of terms mentioned more than two timesis depicted.
The word cloud shows the close association of MBSE with graphi-cal models. Especially graphic descriptions of architectures and pro-cesses were mentioned several times. However, some intervieweesmentioned that “graphical representation is only a part of MBSE, noteverything” (P12) and others pointed out that MBSE should not bedeformed to graphical programming. The only reference to a specificinstance of MBSE in the word cloud is given by Simulink. Simulink3
is a widely used tool in the embedded systems domain for model-ing, simulating, and analyzing dynamic systems. Interestingly, theinterviewees mentioned that using Simulink is not considered as do-ing MBSE (e. g., P4:“Pure implementation with Simulink is graphical pro-gramming, not MBSE.”, P16:“Simulink is model-based engineering but notmodel-based systems engineering”). UML/SysML, which we expectedto appear more often in the characterization of MBSE, was only men-tioned rarely; however, notation was mentioned several times. Theterm information model was used a few times as an essential part ofan MBSE approach. P7: “A core topic of MBSE is the information modelthat specifies and relates all development artifacts.” Apart from that, theinterviewees frequently mentioned several well-known properties re-lated to MBSE, such as abstraction, formalization, and comprehension. Insummary, the results show that our interviewees were not biased bya specific MBSE flavor or approach that they previously had in mindwhen answering our questions. However, the variety of answers alsoshows that MBSE is still far away from common understanding.
3 https://de.mathworks.com/products/simulink.html

3.4 results 45
MB
SETr
adit
ion
al
RO
I un
cert
ain
ty (1
9)
Ro
le m
isu
nd
erst
and
ings
(8)
Gro
win
g co
mp
lexi
ty (1
1)
Qu
alit
y is
sues
(6
)
Co
mp
ly w
ith
reg
ula
tio
n (3
)
Tim
e p
ress
ure
(4
)
Dem
and
by
inte
rnal
act
ors
(4)
Mo
du
lari
zati
on
(3)
Inef
fici
ent
test
ing
(2)
Mar
ket
pre
ssu
re (
1)
Lack
of
trac
eab
ility
(1)
Pu
sh (
37
)
Imm
atu
re t
oo
ling
(9)
Bad
exp
erie
nce
s (6
)
Do
ub
ts a
bo
ut
imp
rove
men
ts (1
1)
Inco
mp
atib
ility
wit
h e
xist
ing
too
ls (7
)
Ch
angi
ng
way
of
thin
kin
g (7
)In
suff
icie
nt
trai
nin
g (6
)
Lear
nin
g n
ew t
oo
ls (5
)
Skill
s o
f em
plo
yee
s (1
9)
Too
ling
sho
rtco
min
gs (1
2)
Larg
e tr
ain
ing
effo
rts
(10
)
Met
ho
do
logy
sh
ort
com
ings
(11
)
Mig
rati
on
issu
es (
6)
Team
co
mp
eten
ce lo
ss (
3)
An
xiet
y (6
0)
Co
st r
edu
ctio
n (
6)
Effi
cien
t ce
rtif
icat
ion
(8)
Incr
ease
in p
rod
uct
qu
alit
y (1
0)
Do
cum
enta
tio
n s
up
po
rt (
10
)
Earl
y fe
edb
ack
on
co
rrec
tnes
s (
15
)
Easi
er h
and
ling
of
com
ple
xity
(19
)
Imm
atu
re m
eth
od
olo
gies
(4
)
Mig
rati
on
is n
eed
ed (
4)
Dev
elo
pm
ent
pro
cess
do
es n
ot
fit
(3)
Mis
sin
g ex
cite
men
t (3
)N
o s
up
po
rt (
2)
Iner
tia
(51
)
Pu
ll (9
4)
Po
siti
ve e
xper
ien
ces
(4)
Co
de
gen
erat
ion
(4)
Bet
ter
ove
rvie
w t
hro
ugh
ab
stra
ctio
n (4
)
Sup
po
rt o
f re
use
(3
)
Figu
re3
.6:F
ishb
one
diag
ram
over
view
ofM
BSE
adop
tion
forc
es.

46 forces that drive or prevent mbse adoption in embedded industry
Figure 3.7: Word cloud of MBSE descriptions.
In the following, the forces found in the study are subsequentlydescribed and explained using the information from the interviewtranscripts and the interpretations from coding and analysis.
3.4.3 Hindering Force: Inertia
With 51 distinct quotations, inertia forces were mentioned fewer timesthan forces related to anxiety (60 quotations). We structured theinertia-related quotations concerning four inertia topics.
tooling inertia (21 coded quotations from 15 inter-views) With 21 quotations, tooling inertia was the most frequentlymentioned inertia force. Tooling inertia describes phenomena of thecurrent in-house tooling environment that made our participants re-frain from adopting MBSE. Tooling inertia includes resistance againstlearning new tools and potential incompatibilities of MBSE tools withcurrent tools.
“People preferred using Excel instead of the new MBSE tool” (P8)
“Especially elderly employees who are used to textual specifications havedifficulties with drawing tools” (P15)

3.4 results 47
“It is not possible to connect/trace the models with artifacts in other tools.”(P5)
Apart from learning and integrating new tools, our participantsalso reported on employees’ resistance if MBSE tools are immature.Especially tools with poor user experience, low stability, and missingessential features are significant factors in why employees resist MBSEadoption.
“Tool is not user friendly. Things are distributed over several menus; youhave to look for everything.” (P5)
“We are working in teams. That is why we need a tool with fine-grainedaccess rights and control.” (P10)
We classified immature tooling as inertia force because the expecta-tion of missing essential features makes the current situation look notso bad. We will see that tooling issues were also mentioned in thecontext of anxiety. In these cases, interviewees mentioned fears thatthe currently available tools cannot fulfill the promises of MBSE.
context inertia (18 coded quotations from 13 inter-views) A second inertia force mentioned quite often was contextinertia, which describes people refraining from MBSE adoption be-cause they believe it does not fit their current business situation. Themost mentioned in this category was doubts about whether MBSEwould improve the current situation.
“It needs a huge emergency to justify the costs of introducing an MBSEtool.” (P7)
“Currently, problems are not so urgent yet. Therefore, there is not muchwillingness to act.” (P20)
Another aspect that makes people refrain from MBSE adoption isthe potential need to migrate old data or legacy systems or whenit seems that the current development process does not fit MBSEtechniques.
“Legacy problems are a huge hurdle because, in general, the old way ofworking must further be maintained and supported.” (P20)
“MBSE adoption would have caused changes in our development process.Therefore, we did not do it.” (P2)
personal inertia (16 coded quotations from 9 inter-views) Personal inertia captures forces related to an individual’spersonality and experiences that hold him/her back from adoptingMBSE. In our study, these forces were lead by the resistance againstlearning a new way of thinking.

48 forces that drive or prevent mbse adoption in embedded industry
“MBSE is not just about changing the notation; it is about changing theway of how I think about systems” (P2)
“Abstractions in MBSE are not easy to comprehend.” (P12)
Similarly, if people had negative experiences with MBSE or relatedtechniques, they have a personal reluctance against adopting MBSEin their current situation.
maturity inertia (12 coded quotations from 8 inter-views) Maturity inertia was the least mentioned in our interviews.Participants were critical about a potential MBSE adoption if they hadthe impression that: The MBSE methodology is not mature enough.There has not been sufficient training before. There is no support fromexperts.
“We first need a common terminology between employees of different de-partments” (P7)
“The support for debugging problems is very limited” (P9)
3.4.4 Hindering Force: Anxiety
Anxiety is a force related to expectations and fears that make MBSEadoption less appealing. These expectations originate from uncertain-ties that are still to be clarified or a false perception of reality. Westructured the anxiety-related quotations into the following topics:
roi uncertainty (19 coded quotations from 12 inter-views) Return on investment (ROI) is the benefit resulting from aninvestment. Any development team introducing MBSE will incur costspread in several factors such as training, tooling, migration, or lowerproductivity. Many interviewees were concerned that the investmentsin introducing MBSE will not pay off.
“[It will costs us] A large sum in the million range" (P7)
“Coaching on the job is very important, but it costs a lot" (P2)
skills of employees (19 coded quotations from 11 inter-views) Some interviewees fear that (some of) the employees intheir company may lack the necessary skills to adopt MBSE efficiently.This shortcoming can negatively influence the introduction of MBSEin two different ways: Either those employees do not adopt MBSE, orthey misapply them.
“Mechanical engineers know CAD modeling but do not know modeling ofbehavior" (P1)

3.4 results 49
“Modeling should not be an end in itself" (P16)
tooling shortcomings (12 coded quotations from 8 in-terviews) The interviewees perceived problems with tooling as areason for not introducing MBSE. The interviewees fear that currenttool solutions do not address a significant part of the developmentprocess and the envisioned benefits of MBSE. Thus, extra work wouldbe necessary to fill the gaps (e. g., migration of data between MBSEtools and current tools).
“Everything in one tool? Nobody wants that" (P5)
“Performance of the tools [is a challenge for introducing MBSE]" (P7)
methodology shortcomings (11 coded quotations from 6
interviews) Many interviewees emphasized the lack of maturityon the current MBSE methodology. This category can be interpreted intwo ways. Either the methodology is incomplete, or the knowledge ofpractitioners is immature. Besides, concerns about the lack of tailoredapproaches for MBSE introduction were pointed out.
“A consistent methodology is lacking, resulting in uncertainties" (P1)
“There are no process models that integrate MBSE properly." (P11)
large training efforts (10 coded quotations from 5 in-terviews) This category grouped perceived potential problemsrelated to training the team on using MBSE and its respective tools.Some of the codes were related to training costs and had intersec-tions with ROI uncertainty. Other codes were related to the fear ofunsuccessful training.
“Training is necessary: How do I bring my employees to the same level asthe experts?" (P7)
“Employees will not accept MBSE if no training is provided before." (P7)
Besides these categories, interviewees also mentioned potentialteam competence loss (3 times coded from 3 interviews) and newresponsibilities in the team that could cause role misunderstandings (8times coded from 5 interviews). The interviewees perceived migrationissues (6 times coded from 6 interviews) of projects that started withtraditional development method to MBSE.
3.4.5 Fostering Force: Push
With 37 distinct quotations, push was the force with the smallest num-ber of quotations. We structured push forces within three categories:

50 forces that drive or prevent mbse adoption in embedded industry
product push (20 coded quotations from 10 interviews)We grouped here codes related to product-oriented push forces. Grow-ing complexity (11 coded / 8 interviews) of the software was the codewith most quotations within the push forces. As systems become moresoftware-intensive, tackling the growing complexity is currently a realchallenge; thus, development teams feel the need to shift to bettersolutions.
“Increasing complexity of products [pushes us towards MBSE]" (P1)
“Complex software, especially with concurrency [pushes us towardsMBSE]" (P3)
Other codes were quality issues (6/3) within the product or its spec-ification and the need for modularization (3/3) in order to make certifi-cation and reuse more efficient.
stakeholder enforcement (8 coded quotations from 4
interviews) Some interviewees mentioned that they are forced orpushed towards MBSE by recommendations or stakeholders’ requests.Demands by internal actors (4/3) such as developers or managementpush companies towards MBSE adoption as well as legal requirementsto comply with regulations (3/1). Market pressure (1) was mentionedconcerning issues with acquiring talented employees:
“We have to be modern; otherwise we will not get good people anymore"(P2)
process push (7 coded quotations from 4 interviews)Deficiencies of the current process were only mentioned a few timesas forces that push companies towards MBSE. The codes were timepressure (4/3), inefficient testing (2/2), and lack of traceability (1).
“We have no idea what happens when something changes" (P5)
“[We have] Large amounts of requirements; how can the tester handlethis?" (P5)
In summary, interviewees provided more push forces related toissues with the product instead of issues with the process.
3.4.6 Fostering Force: Pull
We identified several factors of envisioned benefits that drive com-panies towards MBSE adoption. A majority of the interviewees’ re-sponses are related to envisioned improvements of the developmentprocess, which is interesting since process issues were only mentioneda few times as push factors.

3.4 results 51
easier handling of complexity (19 coded quotations
from 12 interviews) With each new function to integrate, thecomplexity of software increases. Managing the different softwarecomponents gets more and more complicated. The interviewees seegreat opportunities in MBSE to support this challenge. Due to manypossible variants of products, the complexity of software increases inmany companies.
“[MBSE will help us to] understand highly complex issues or illustratesomething" (P15)
“[MBSE will support the] management of product line and variability"(P1)
early feedback on correctness (15 coded quotations
from 10 interviews) The desire for early feedback and front-loading was also a stark pull factor. Early verification on higher levelsof development was specially mentioned to improve the developmentprocess and, finally the product.
“Early verification and simulation saves time in the end" (P7)
“[MBSE will provide] better quality due to early fault detection" (P4)
“[MBSE will] Enable automatic verification" (P6)
documentation support (10 coded quotations from 7 in-terviews) The interviewees expect support to create and man-age documentation. The increasing complexity of software develop-ment has complicated the management of System Requirements doc-uments.
“[MBSE will provide] better documentation" (P13)
“[MBSE will] generate documentation and code" (P12)
increase in product quality (10 coded quotations from 5
interviews) The interviewees expected to deliver better productsby introducing MBSE, which includes the final product and interme-diate development artifacts.
“[MBSE will] improve the quality of requirement documents" (P10)
efficient certification (8 coded quotations from 5 in-terviews) Some interviewees envision that MBSE will make it eas-ier to certify software-intensive products. Some interviewees specif-ically mentioned that MBSE would enable a modular certification,where only parts of the product are certified and not the entire prod-uct.

52 forces that drive or prevent mbse adoption in embedded industry
“[MBSE is] necessary to comply with regulatory requirements" (P6)
“[MBSE will enable] modular certification and parallel development" (P6)
Additional, less frequently mentioned, pull factors include cost re-duction (6 coded quotations), positive experiences (4), code generation (4),better overview through abstraction (4), and support of reuse (3).
3.5 discussion
The results show that people from the industry have high hopes andexpectations for MBSE. However, several hurdles need to be addressedwhen adopting MBSE, some of which are very generic. These prob-lems are sometimes even part of human nature and its natural resis-tance to change in general.
3.5.1 Relation to existing evidence
When comparing our results to related studies on forces of adoptingdevelopment methodologies in the industry, we can identify somegeneral patterns. Hohl et al. (Hohl et al., 2016) report on forces pre-venting the adoption of agile development in the automotive do-main. They also report on inertia and anxiety forces resisting a neces-sary change of mindset or limited organizational restructuring accep-tance. Additionally, the current development process was perceivedas good enough. The same forces also appeared in our study. Riungu-Kalliosaari et al. (Riungu-Kalliosaari et al., 2016) performed a casestudy on the adoption of DevOps in industry, where they identifiedfive high-level adoption challenges. Three of these challenges werealso mentioned as inertia or anxiety factors in our study, namely deep-seated company culture, industry constraints and feasibility, and unclearmethodology. Parallels can also be found in the work of Bauer andVetrò (Bauer and Vetrò, 2016) concerning the adoption of structuredreuse approaches in the industry.
Similarly, we also found common and generic goals (i. e., pull forces)that focus on many process improvement activities. Schmitt andDiebold (Schmitt and Diebold, 2016) have analyzed common improve-ment goals that are usually considered when improving the develop-ment process. The pull factors that we extracted in our study are partof the main goals elicited by Schmitt and Diebold (especially qualityand time-to-market)
When focusing on the forces specific to MBSE that did not appear(so strongly) in the related studies, some factors remain. The incom-patibility of MBSE tools with existing tools is a specific inertia force

3.5 discussion 53
that prevents MBSE adoption. The second force of inertia specificallyreported for MBSE adoption is adopting a new way of thinking, es-pecially concerning abstractions. The anxiety forces that we identifiedwere rather generic such that we did not identify any MBSE specificanxiety forces. Interestingly, loss of competencies or loss of power, atypical anxiety factor, was not often mentioned.
3.5.2 Impact for industry
MBSE streamlines the activities in all phases of the software lifecy-cle. It replaces document-based systems engineering and automatesseveral tasks (e. g., code generation). A development team transition-ing from document-based to model-based will require changes in allsoftware development stages, including tools, processes, artifacts, anddeveloping paradigms.
Our interviewees focused more on push forces related to the prod-uct and not so much on the process. One might infer that engineersrecognize their products’ growing complexity, but they cannot linkit to the current processes’ shortcomings. Perhaps they believe theprocesses are okay, since it has been functioning correctly until now,and the problem is the product, which is getting more challenging todevelop.
The results support decision-making and are an initial step towardsefficiently introducing MBSE in companies. Implementing change isalways a hassle; therefore, companies should manage expectationsby setting concrete improvement goals, relating them to concreteMBSE techniques, and making changes step-by-step. Many intervie-wees mentioned that MBSE adoption should best be piloted in smallprojects with a clear scope. For ordinary organizational hinderingforces, the state-of-the-art provides many methods. They are also rele-vant and are also affected by the MBSE specific ones.
We placed the forces in a timeline of change depicting when theyare triggered (cf. 3.1). The goal is to help practitioners be attentivewhen the forces are expected to kick in and mitigate the hinderingforce towards adoption.
3.5.3 Impact for academia
MBSE complexity raises uncertainties towards the effort and successof its introduction. These uncertainties can be mitigated by knowl-edge building. Misunderstandings of MBSE, its tools, and processeswere quoted often, which means research is not correctly reaching

54 forces that drive or prevent mbse adoption in embedded industry
practitioners. This problem is not limited to the MBSE domain butto research in general. With a clear idea of the forces fostering andhindering MBSE introduction, the next step is to understand how tomanage those factors, mitigate them when necessary, or strengthenthose that contribute to successful MBSE introduction. The resultsprovide promising research directions based on real industry needs.

4S T R AT E G I E S A N D B E S T P R A C T I C E S F O RM O D E L - B A S E D S Y S T E M S E N G I N E E R I N GA D O P T I O N I N E M B E D D E D S Y S T E M S I N D U S T RY
MBSE advocates the integrated use of models throughout all devel-opment phases of a system development life-cycle. It is also oftensuggested as a solution to cope with the challenges of engineeringcomplex systems. However, MBSE adoption is no trivial task, and com-panies, especially large ones, struggle to achieve it in a timely andeffective way. We aim to discover the best practices and strategies toimplement MBSE in companies that develop embedded software sys-tems. Using an inductive-deductive research approach, we conducted14 semi-structured interviews with experts from10 companies. Fur-ther, we analyzed the data and drew some conclusions validated byan online questionnaire in a triangulation fashion. Our findings aresummarized in an empirically validated list of 18 best practices forMBSE adoption and a prioritized list of the six most important bestpractices. Raising engineers’ awareness regarding MBSE advantagesand acquiring experience through small projects are considered themost critical practices to increase MBSEadoption’s success.
This chapter is partly based on previous publication (Amorim et al.,2019).
4.1 introduction
Model-based Systems Engineering (MBSE) is the formalized applica-tion of modeling to support system requirements, design, analysis,verification, and validation activities. It begins in the conceptual de-sign phase and continues throughout development and later life cyclephases (INCOSE, 2007). MBSE is part of a long-term trend towardsmodel-centric approaches adopted by other engineering disciplines,including mechanical, electrical, and software.
In this approach, models (as opposed to document-centric ap-proaches) serve as blueprints for developers to write code, provideformalization, tackle complexity, and enhance the system’s under-standing. Specialized tools automate much of the non-creative work(which translates to gains in productivity and quality) and generate
55

56 strategies and best practices for mbse adoption
code based on the models. MBSE fosters artifact reuse, improves prod-uct quality, and shortens time to market (Carroll and Malins, 2016).
Despite the aforementioned benefits, adopting MBSE is a complextask, especially for large and established companies (Vogelsang et al.,2017). Process changes are required in all system life-cycle phases anda shift in the development paradigm (i.e., abstract thinking (Hutchin-son, Whittle, and Rouncefield, 2014)), and the application of newtools. Projects are not likely to meet their cost and delivery targetwhen adoption is carried out poorly.
Our goal was to find out what was tried, what worked, what didnot work, how the problems were solved, what can be recommended,and what should be avoided when adopting MBSE in organizationsthat develop embedded systems. For this purpose, we conducted 14
semi-structured interviews with experts from embedded systems or-ganizations. From these interviews, we extracted 18 best practicesfitted for tackling MBSE adoption challenges. Sequentially, we vali-dated and prioritized the best practices with the help of an on-linequestionnaire, which MBSE practitioners answered.
Our findings provide input for planning MBSE adoption based onpractitioners’ knowledge that went through the experience of imple-menting MBSE in already established embedded systems develop-ment organizations.
This chapter presents the following contributions:
• A granular set of MBSE adoption strategies and best practicesderived from real field experience validated by practitionersthrough a questionnaire.
• A prioritized list of the six most important best practices.
• The findings shed light on MBSE adoption issues and how prac-titioners overcame them.
We expect that this knowledge can help organizations to adopt MBSEin a cost-effective and timely manner.
4.2 study approach
In this section we describe how the study was designed.
4.2.1 Research objective
The research objective is summarized in terms of the Goal-Question-Metric (Basili, 1992) (a.k.a. GQM) template in Table 4.1.

4.2 study approach 57
Table 4.1: Research objective.
4.2.2 Research design
For this study, we devised an inductive-deductive research approachin a triangulation fashion (Denzin, 2006) composed of three mainactivities as depicted in Figure 4.1. Inductive reasoning is used tobuild hypotheses and theories. However, inductive reasoning allowsfor the conclusion to be false (Copi, 2003), thus we applied deductivereasoning to our findings. Such measure also addresses some threatsto validity (cf. Section 4.2.3). The activities are described in detail inthe following paragraphs.
4.2.2.1 Inductive reasoning
At the inductive phase, we followed an exploratory research ap-proach (Shields and Rangarjan, 2013) to identify MBSE adoptionstrategies and best practices from the experience of experts. Themethod provides insights into the examined topic and gives es-sential information to understand the phenomenon in its real con-text (Dresch, Lacerda, and Antunes, 2015; Runeson and Höst, 2008).Semi-structured interviews were used to collect the data, qualitativecoding analysis (Neuman, 2010) was used to analyze the data.
interview with practitioners . We conducted 14 face-to-faceinterviews, each taking around 60 minutes. We developed an in-terview guide (Bryman, 2015) that was structured along a funnelmodel (Runeson and Höst, 2008). It started with general questionsabout the participant’s context and the understanding of MBSE. After-ward, detail about specific topics such as employee training, processand tooling selection, and adoption experiences. The interviewee selec-tion was based on two criteria: First, the interviewee should have work

58 strategies and best practices for mbse adoption
Interview with
Practitioners
Qualitative CodingAnalysis
Verbatim ofInterviews
Adoption Strategies andBest Practices
Application ofValidation
Questionnaire
ValidatedResults
Activities Outputs
InductiveReasoning
Deductive
Reasoning
Figure 4.1: Research workflow.

4.2 study approach 59
Table 4.2: Interview participants.
ID IndustrySector
Type ofCompany
Role ofParticipant
P1 Tool vendor OEM Technical Sales
P2 Tool vendor Academic Professor
P3 R&D services SME Manager
P4 Automotive OEM Head of Development
P5 Automotive OEM Systems Engineer
P6 Medical SME Head of SW Development
P7 Automotive Supplier Function Architect
P8 Automotive OEM SW Architect
P9 Research Academic Professor
P10 Automotive Supplier Developer
P11 Avionics OEM Team Lead
P12 Electronics OEM Head of SW Development
P13 Avionics SME Head of System Engineering
P14 Robotics OEM Team Lead
experience of several years. Second, the interviewee should work inan environment where MBSE adoption is a realistic option. Therefore,we restricted the group of interviewees to people working on embed-ded systems or within this context. The participants were screenedfrom work contacts of the authors and industrial partners that partici-pated in a research project1 with a focus on MBSE adoption in practice.Table 4.2 provides an overview of the participants and respective de-mographic data. In consent with the interviewee, the interviewer tooknotes for detailed analysis. The outcome of this activity is the Verbatimof Interviews (cf. Figure 4.1), which is input for the next activity.
qualitative coding analysis . Three researchers analyzed theinterviews using qualitative coding (Neuman, 2010) and managedusing the qualitative data analysis tool ATLAS.ti2. Neither of themparticipated in the interview phase. The analysis started with all three
1 https://spedit.in.tum.de/2 http://atlasti.com

60 strategies and best practices for mbse adoption
researchers working on the same five interviews. The results were laterdiscussed and merged in a meeting. We used the discussions to ho-mogenize the understanding of the codes among the researchers (We-ston et al., 2001) (i.e., what/how to look for). The remaining interviewswere tackled in a cross-analysis fashion. In a round with all three re-searchers, the unresolved conflicts were ironed out. The outcome ofthis activity was a list of Adoption Strategies and Best Practices for MBSEadoption (cf. Figure 4.1).
4.2.2.2 Deductive reasoning
Rather than obtaining new information, our goal in this phase wasto validate our previous finding through triangulation (Denzin, 2006).For this mean, a questionnaire was built based on the previous activityfindings and distributed among practitioners.
application of validation questionnaire . The question-naire respondents were screened from two research projects mailinglist, CrESt3 and SPEDiT4, and two MBSE discussion groups from abusiness and employment-oriented social network5. Our anonymousquestionnaire had three parts. In the first part, we asked for demo-graphic data (i. e., organization size (cf. Table 4.3), industry sector(cf. Table 4.4)) and added a yes/no question whether the respondenthas ever participated or observed some endeavor to introduce Model-based Engineering in an organization. We used this question to ex-clude respondents without proper experience. We had 40 respondentsin total; three were excluded.
Table 4.3: Organization size of the questionnaire respondents (i.e., numberof employees).
Organization size Percentages
1-20 13,5%
21-100 13,5%
101-1000 10,8%
>1000 62,2%
3 https://crest.in.tum.de/4 https://spedit.in.tum.de/5 https://www.linkedin.com

4.2 study approach 61
Table 4.4: Organization size of the questionnaire respondents (i.e., numberof employees).
Industry sector Percentages
Automotive 35,1%
Others 29,7%
Academia 21,6%
Energy 8,1%
Manufacturing 5,4%
In the second part, we asked the respondents to express their agree-ment with each best practice (BP) using a Likert scale (Likert, 1932)with four levels: Strongly Disagree, Disagree, Agree, Strongly Agree. Inthe last part, we asked the respondents to select up to 5 BPs theyconsidered most important.
Section 4.3 contains the output of all activities and respective dis-cussions.
4.2.3 Threats to validity
The validity of our results is subject to the following threats:
Sampling bias. All interview subjects work in Germany (omissionbias). They were selected from a convenience sample of project part-ners and professional contacts (inclusion bias). To mitigate these is-sues, we created the questionnaire and distributed it to a broaderaudience (i.e., triangulation).
Researcher bias. To mitigate this threat, the interviews were con-ducted by two researchers who took notes independently. Further,the interpretation presented in this chapter was validated with MBSE
practitioners through a questionnaire.
Research method. To minimize misunderstandings between inter-viewees and the researchers, the study goal was explained to theparticipants before the interview. Steps taken to improve the relia-bility of the interview guide included a review and a pilot test. Wefollowed several strategies as proposed by Maxwell (Maxwell, 2012)to mitigate threats.

62 strategies and best practices for mbse adoption
External validity. We expect that our results represent the embed-ded systems industry; thus, we cannot generalize the results to othertypes of industry.
4.2.4 Availability of data
Due to the unreasonable effort necessary for anonymizing the inter-view transcripts, we do not disclose them. However, we disclose theinterview guideline (cf. Appendix B), and the questionnaire (cf. Ap-pendix C).
4.3 results and discussion
In this section, we present and discuss our findings, which are shapedin the form of Best Practices and are classified into four groups:
• Piloting - what to care about at the first attempts
• Tool and process - selection and adoption decisions
• Knowledge building - development of team competence
• Management - human resources motivation and support
This section is divided as follows. The next subsection presents allbest practices; the following four subsections describe the groups andassociated best practices. We present quotes as evidence and the resultof the questionnaire. We also discuss related existing work. In the lastsubsection, we present the Best Practices list with the top six mostselected best practices.
4.3.1 Summary of Best Practices
The identified best practices and their respective groups are summa-rized below:
Piloting
BP01: The organization should start adopting MBSE with new projects.
BP02: The pilot project should create real value for the organization(i.e., no didactic project).
BP03: The pilot project should have enough budget and time allocatedto bear the overhead of adoption.
BP04: No translation of old artifacts except for reusable artifacts.

4.3 results and discussion 63
BP05: Start small in terms of the project and team size in order toacquire some experience.
Tools and Process
BP06: Tools with open interfaces and homogeneous work-flow arepreferred.
BP07: All engineers should have access to the tools.
BP08: Tool acquisition is very costly therefore should be thoroughlyplanned.
BP09: Have the new MBSE processes well documented so you betterunderstand what tool you will need.
Knowledge building
BP10: All engineers should get, at least, basic training in MBSE.
BP11: Using examples that are familiar to the domain of the organiza-tion eases the understanding. Model some existing artifacts foruse as examples.
BP12: Many strategies can be used to build knowledge of an organiza-tion, the context should be taken into consideration.
BP13: There should be a planned form of later evaluation to fill even-tual gaps.
Management
BP14: Make the advantages of MBSE clear.
BP15: Have technically prepared people to support your engineers (i.e.,not sales personnel).
BP16: Bring everyone to adoption (i.e., avoid creating castes).
BP17: If you have good engineers, let them do the work for you, it ischeaper, and they will engage more (i.e., empowering).
BP18: Management should unify all employees towards adoption.
4.3.2 Piloting
This subsection describes best practices related to the initial attemptto implement MBSE and how to harvest benefits from it. Thequestionnaire results for this group’s best practices are depictedin Figure 4.2. The respondents agreed with most of the BPs. BP03
got the most agreement rate (95%) among its peers. On the otherhand, 38% of the participants disagreed with BP04. We hypothesizethat respondents that have no reuse culture in their organizations arelikely to disagree with this BP.

64 strategies and best practices for mbse adoption
51%
43%
41%
62%
51%
38%
19%
54%
24%
41%
11%
32%
5%
11%
8%
0% 20% 40% 60% 80% 100%
BP05: Start small in terms of project andteam size in order to acquire some…
BP04: No translation of old artifacts exceptfor reusable artifacts.
BP03: The pilot project should have enoughbudget and time allocated to bear the…
BP02: The pilot project should create realvalue for the organization (i.e., no didactic…
BP01: The organization should startadopting MBSE with new projects.
Strongly Disagree Disagree Agree Strongly Agree
Figure 4.2: Questionnaire results for Piloting group.6
BP01: The organization should start adopting MBSE with newprojects.
“New projects with MBSE” (P14)
“Do not recycle the past” (P9)
“No migration of old projects” (P8)
“New start in new project preferred” (P1)
“Set up own project for method development instead of accompanyingfrom series development” (P3)
“Remove [team] from the existing organization, set up your project, therest continues as before. Within a few years, new product generation hashigher market share.” (P10)
Introducing MBSE through new projects was a good practicepointed out by many interviewees. By doing so, the effort wouldnot be wasted with the re-work of existing artifacts that might justbe archived soon. Starting from scratch also prevents developers fromshortcutting the workflow with information already documented,thus compromising learning the method (i.e., there is no documentversion for referencing the possible incomplete information). Addi-tionally, already running projects have fixed budgets and deadlinesthat do not consider such overhead. Meeting those constraints getsmore challenging when the engineers need to concentrate on learningMBSE.
“Legacy stay where they are” (P14)
6 BP02 and BP04 received 3% and 6% respectively of ‘Strongly Disagree’.

4.3 results and discussion 65
“Existing projects remained in old surroundings and were graduallyarchived” (P1)
“Backwards compatibility, so that only changes need to be redesigned(includes not only code, but also specs, tests, test infrastructure)” (P10)
As MBSE became more pervasive in the organizations, the olddocument-based projects were naturally phased out. Exceptions forthis are Product Line intensive organizations or organizations withhigh reuse levels. In this case, translating the existing document-basedartifacts that are meant to be reused to model-based artifacts is arecommended practice.
BP02: The pilot project should create real value for the organization(i.e., no didactic project).
“Start with a concrete project” (P9)
Learning MBSE through a real-life project with real deadlinesand milestones is reportedly better than learning through mock-upprojects and generic examples. The real-life setting boosts engineers’motivation since their work is already producing something useful.Additionally, real projects are related to the domain of the organiza-tion.
BP03: The pilot project should have enough budget and time allo-cated to bear the overhead of adoption.
“The first projects must be able to bear the burden.” (P9)
“Business case because of investment hurdle in the beginning” (P12)
The effort needed by engineers to learn should be consideredwhen deciding for the pilot project, which must bear the burden,i.e., managers should avoid using critical (time-wise, business-wise,technology-wise) projects. By doing so, managers can mitigate therisk of a project failing to meet its constraints or MBSE being notadequately implemented.
BP04: No translation of old artifacts except for reusable artifacts.
“Parts with reuse are taken over” (P14)
“It started with reverse engineering. The existing system was clusteredaccording to the information model” (P7)
Despite the support for using new projects, converting the existingdocument-based artifacts prone to reuse was also a strategy presentedby some respondents. Such artifacts are well detailed, allowing thedeveloper to concentrate on the methodology rather than the content.Moreover, the newly created models can be compared to the existing

66 strategies and best practices for mbse adoption
document-based version to verify and validate them. It is crucial tochoose artifacts reused in future MBSE projects; otherwise, the effortwill be used for learning purposes.
BP05: Start small in terms of the project and team size in order toacquire some experience.
“Only 1-2 people, then the rest of the team” (P14)
“Start in some areas that you can better oversee [...] Best to start inindividual areas according to company guidelines” (P6)
“Often pilot installation to gain experience, then expansion companies-wide” (P1)
“It is advisable to start with a partial introduction first, later through aconsistent MBE. - needed breath” (P2)
“Introduction as ‘submarine project’ by a dedicated developer, then appli-cation in own department, now overarching roll-out.” (P5)
“If necessary implementation strategy with 3-4 months observation ofwhat the developer does, and then decide how to improve the process withMBE” (P2)
Starting with a small and highly motivated group of employeesin a grassroots strategy fashion is likely to increase success. Suchpractice allows the implementation in an easily controlled settingand identifies characteristics exclusive to the organization (currentprocesses and auxiliary tools) and its domain (development of DSL).Thus, issues can be identified with more precision and addressedpromptly. Once the small group develops acquaintance with the newtasks and tools, the implementation should be rolled out to the restof the team.
Related work. Investments in training, tools, and modeling envi-ronments should be considered in the projects selected for initiallyapplying MBSE. Expectations should be handled, and proper time isgiven for the effort to pay dividends (Fosse and Bayer, 2016). The ex-perience of Fosse and Bayer (Fosse and Bayer, 2016) made the authorssupport the “learning by doing” strategy in real-life projects by keep-ing the focus on project deliverables and modeling as needed. Accord-ing to the authors, the pressure to deliver real engineering productsforces discovery and resolution of problems not likely encountered ina didactic-only project. The authors stated that it is possible to yieldcommunication and understanding improvement at an earlier stageby focusing on the description first and then analyzing it. Hutchinsonet al. (Hutchinson, Whittle, and Rouncefield, 2014) state that “start-ing small” when adopting MDE and then growing, thus committing

4.3 results and discussion 67
more resources on a broader scale, is a helpful response towards MDEadoption. Hammer (Hammer, 2007) states that one unit’s pioneeringpositive experiences can energize an entire organization.
4.3.3 Tools and process
Tools are an essential cornerstone of MBSE. Traceability, simulation,automatization of tasks are among the things that are only possiblewith the use of specialized tools. However, tool licenses are expensive,and new tools require learning investment. Rolling back tool acquisi-tion is very costly; thus, wise decisions can save time and resources.Proper tool selection requires identifying what capabilities the organi-zation would like to develop by implementing MBSE and acquiringthe tools to help it fulfill its goal.
Figure 4.3 shows the survey results for Tools and process bestpractices. We can see a reasonable agreement rate among therespondents and very few disagreement responses.
BP06: Tools with open interfaces and homogeneous work-flow arepreferred.
“Customers want homogeneous toolchain but open interfaces” (P1)
“Often the entire toolchain is replaced” (P1)
Because MBSE is complex and encompasses the complete systemdevelopment life-cycle, supporting toolchains are often equallyproblematic. Several tools are currently required to do the jobbecause existing ones are not developed enough to cover the wholelife cycle. For this matter, import and export features must allowthe work to continue in further design phases without much ado;thus, interoperability through open interfaces becomes desirable. Byseeking open interface tools, the organization protects itself frommany problems using exclusive proprietary tools.
BP07: All engineers should have access to the tools.
“The worker level must also get the tools” (P9)
“Tool usage for all developers who use the tools” (P6)
MBSE tools should be widely available for all engineers. Failing todo so can create two classes of engineers, and this could jeopardizethe adoption. However, some engineers are mainly producing modelswhile others are mostly consuming them for some activity. Therefore,understanding how the tools and models are going to be used can

68 strategies and best practices for mbse adoption
lower acquisition costs.
BP08: Tool acquisition is very costly therefore should be thoroughlyplanned.
“Develop an adoption strategy” (P8)
“Development of a holistic approach/methodology” (P1)
Defining the new processes well and in advance is highlyrecommended. Planning should be done considering the full imple-mentation of the processes and tools. This measure avoids realizing ata later point in time that the decisions taken when planning the MBSEadoption (tools to be acquired, processes to adopt, training contents)are not fit for further intended process maturity. This mishappen’sconsequences can be manifold: from extra effort to work out toolinter-interoperability, until costs with redundant tool acquirementand waste of time with training.
BP09:Have the new MBSE processes well documented so you betterunderstand what tool you will need.
“If the standard process is well documented, the MBE implementation willwork easier.” (P1)
Organizations that have their current development process de-scribed and documented as it is performed have less trouble whenimplementing MBSE. The tasks and artifacts to be replaced can bestraightforwardly identified, and the consequences of the change areeasily identified.
“First the process was set, then the tool decision” (P7)
In MBSE, tools and processes are highly intertwined. It is not un-common that tool manufacturers also provide the process workflowspecially designed to be used with their tool. Thus, tool selectionis also a contributing factor when choosing which MBSE process toadopt.
“Tool support for automation of work” (P12)
Automation of work is one of the best features provided by MBSE.The formality of models allows tools to automatically verify manyproperties that otherwise would require intensive human labor.While some capabilities are indispensable, others might be just niceto have. Understanding which features bring the best benefits tothe organization helps achieve a better cost-benefit relation whendeciding on tool adoption.

4.3 results and discussion 69
51%
54%
57%
68%
43%
32%
24%
22%
3%
14%
16%
11%
0% 20% 40% 60% 80% 100%
BP09: Have the new MBSE processes welldocumented so you better understand…
BP08: Tool acquisition is very costlytherefore should be thoroughly planned.
BP07: All engineers should have access tothe tools.
BP06: Tools with open interfaces andhomogeneous work-flow are preferred.
Strongly Disagree Disagree Agree Strongly Agree
Figure 4.3: Questionnaire results for Tools and process group.7
Related work. In the Jet Propulsion Laboratory of NASA (Fosse andBayer, 2016), MBSE teams were organized in a 3-tier fashion, with asmall set of core modelers, a large set of modeling-savvy SEs, withina large set of project personnel. In this sort of team arrangement, ev-eryone needs some training, but not to the same depth. The authorsof (Carroll and Malins, 2016) cite three points that must be takeninto account: (1) the existing process should be well documented andshould cover the whole life-cycle otherwise is quite complicated tounderstand what needs to be adapted, (2) the MBSE model manage-ment processes (i.e., creation, update, and maintenance of models)should be defined thereto derive engineering artifacts, (3) investmentin full-scale MBSE tool (i.e., not RE management tools) that are acces-sible to all team members is necessary. Whittle et al. (Whittle et al.,2017) stress the importance of social and organizational factors forthe selection and development of tools. They found in their studythat it is better to “Match tools to people, not the other way around”and to “more focus on processes, less on tools”. Our interviews’ pro-vided answers reflect the opinion that the exchange of information(i.e., models) between tools is a problem that must be addressed byproper import/export mechanisms and open interfaces. In a previousstudy, we have seen that tool incompatibility is one of the significantforces that hinder companies from adopting MBSE solutions (Vogel-sang et al., 2017). Research has developed alternatives that may fit theMBSE paradigm better. Seamless MBSE may be supported by multi-ple tools manipulating models in a common model repository insteadof importing/exporting models (cf. projectional editors (Voelter et al.,2014)).
7 BP07 and BP09 received 3% of ‘Strongly Disagree’ each.

70 strategies and best practices for mbse adoption
68%
56%
51%
41%
24%
22%
43%
49%
5%
22%
5%
11%
0% 20% 40% 60% 80% 100%
BP13: There should be a planned form oflater evaluation to fill eventual gaps.
BP12: Many strategies can be used to buildknowledge of an organization, the context
should be taken into consideration.
BP11: Using examples that are familiar tothe domain of the organization eases the
understanding. Model some existing…
BP10: All engineers should get, at least,basic training in MBSE.
Strongly Disagree Disagree Agree Strongly Agree
Figure 4.4: Questionnaire results for Knowledge building group.8
4.3.4 Knowledge building
Training can be carried out in many ways. In this subsection, we willpresent different views and strategies, which sometimes can also becontradictory. This phenomenon does not invalidate them, as thereader should realize that the organization’s context influences thebest approach. The questionnaire answers had an excellent agreementrate with the best practices, the minor being 78% rate of ’Agree’.The exception is BP12, which received 22% ‘Disagree’s. (cf. Figure 4.4).
BP10: All engineers should get, at least, basic training in MBSE.
“Training, training, training!” (P1)
“Basic training for all users of MBSE” (P6)
“Everyone who uses MBSE should be trained in the methodology” (P8)
“Broad basic training of all employees - Everyone should have the sameunderstanding” (P9)
Basic training should be provided to all employees. Nevertheless,the required knowledge will vary among team members (i.e., noteveryone will require the same type of knowledge or in the samedepth). For instance, developing complete models requires muchmore in-depth knowledge than only understanding them.
8 BP13 received 3% of ‘Strongly Disagree’.

4.3 results and discussion 71
BP11: Using examples that are familiar to the domain of the orga-nization eases the understanding. Model some existing artifacts foruse as examples.
“Examples from similar industry help” (P9)
“Catching up with experiences/feedback from the network (from the sameindustry)” (P13)
“[Training team] has modeled examples of clients and then presented them[sic] to the client (we will show you how we do it)” (P2)
The overall understanding can be enhanced by modeling somerequirements that are familiar to the developers. The effort requiredto understand what is being modeled (i.e., domain) is diminished;thus, trainees can concentrate solely on the modeling concepts. If anorganization has no prior knowledge in MBSE or modeling in general,it helps when some experts model small parts of existing systemsfrom the organization as examples to transfer and demonstrate theidea of MBSE.
BP12: Many strategies can be used to build knowledge of an orga-nization, the context should be taken into consideration.
“F2F, except perhaps for basics” (P6)
“Face-to-Face Seminar with exercises” (P7)
“Deeper training of individual employee, who then pass on their knowledgein the team” (P9)
Depending on the team dynamics, it is possible to concentrate thetraining on a small group of participants, and later those people willbe responsible for disseminating the knowledge to the bigger group.This strategy fits very well when the piloting is also performed with asmall part of the team. Other interviewees said that training should bedone with face-to-face seminars followed by exercises. As we can see,both approaches seem to work; therefore, the context should drivesuch type of decision.
“Per tool training e.g. Doors9” (P7)
“Model should be the reference. To do this, connect other tools (e.g., im-porting Doors9 for initial filling, then only update exports back to Doors,generated code frames force interface fidelity)” (P5)
Tool and process are very intertwined in MBSE; thus, trainingshould mind the tools used. The training should emphasize the model,showing there should not be co-existing two artifacts with the samepurpose, namely a document-based version and a model-based ver-
9 https://www.ibm.com/us-en/marketplace/rational-doors

72 strategies and best practices for mbse adoption
sion. The verbatim above gives the example of a requirements model-ing tool (Doors).
“Strategic cooperation, introductory consulting [...] Coaching during theintroduction has proven very successful” (P1)
Training provided by external consultancy guarantees a minimalhomogeneous level of knowledge throughout all employees. Expe-rienced consultants are very efficient and can transmit knowledgevery efficiently. However, one should have in mind that participantP1 works with technical sales.
BP13: There should be a planned form of later evaluation to filleventual gaps.
“Continuous explanation of the methodology” (P1)
“Accompanying technical monitoring of work results; is not happeningsystematically.” (P5)
Training is an ongoing process, which includes returning totraining concepts at a further point in time and assessing theengineers’ knowledge (e.g., through the quality of the artifacts beingproduced). This procedure is necessary to be put into practice and isnot happening systematically.
Related work. The training activities should use real examplessince they are much more effective at conveying understanding andbuilding support (Fosse and Bayer, 2016). According to (Carroll andMalins, 2016), the organization should nurture a cadre of trainedsystems engineers with at least moderate skill in employing MBSEtools and techniques and whose MBSE roles are delineated fromthe more traditional roles. For the engineering staff a basic level oftraining in the MBSE processes (so that they understand the value ofthe models and what to expect from the systems engineers) and howto read MBSE artifacts (so that they can interpret the informationprovided from the MBSE processes). Although the awareness towardstraining, 62% of “MBSE active users” surveyed by (Motamedian,2013) never received official training from their organization, and just2% had a complete technical course sponsored by their organization.In line with the reported best practices, several works exist that reporton the efficient transfer of MBSE methodologies by remodeling partsof existing systems from companies (e.g., (Böhm et al., 2014)). Toolvendors usually provide training for the methodology and workflowto be used with their products (Hoffmann, 2012).

4.3 results and discussion 73
30%
32%
22%
68%
59%
38%
49%
58%
32%
32%
30%
14%
19%
8%
0% 20% 40% 60% 80% 100%
BP18: Management should unify allemployees towards adoption.
BP17: If you have good engineers let themdo the work for you, it is cheaper and they…
BP16: Bring everyone to adoption (i.e.,avoid creating castes).
BP15: Have technically prepared people tosupport your engineers (i.e., not sales…
BP14: Make the advantages of MBSE clear.
Strongly Disagree Disagree Agree Strongly Agree
Figure 4.5: Questionnaire results for Management group.10
4.3.5 Management
Although the current state of the practice has achieved some degreeof automatization in systems engineering, its tasks are still human-intensive. Thus, introducing process change in an already runningand established organization is not frictionless (Conner, 1993; Ham-mer, 2007). In an ideal world, everyone would jump in the adoptionboat without hesitating and be fully motivated; the reality says thatmanagement should care for the team vibe towards the adoption.Micromanagement is required to tackle hurdles and psychologicalbarriers, especially when it comes to such a complex change as MBSEadoption (Vogelsang et al., 2017). This section is about strategies tomanage the overall mood and expectations of the ones affected byMBSE adoption.
The questionnaire results showed that BP16, B17, and BP18 receivedmany disagreement votes. Although most of the respondents stillagreed with them (i.e., at least 68% of agreement rate). One hypothesisis that they are context-dependent. On the other hand, BP14 and BP15
got almost no disagreeing votes. (cf. Figure 4.5)
BP14: Make the advantages of MBSE clear.
“Advantages of simulation were made visible” (P11)
“Good examples show: project for new methods tools, then show that itworks (utility and acceptance).” (P13)
10 BP17 and BP18 received 5% and 2% respectively of ‘Strongly Disagree’ each.

74 strategies and best practices for mbse adoption
“Representation as a means of unique selling proposition. Works, but eachdeveloper must be convinced individually.” (P10)
The way people perceive the MBSE introduction can become anobstacle; thus, it is imperative to manage the mood of those involved,especially in the very beginning, when everything is experimental.The advantages of the approach should be made clear, also emphasiz-ing benefits for the employees. By doing so, organizations can fosterengineers’ acceptance and collaboration towards MBSE adoption.
“Every few years new product generation, e.g., because of Platform changesthrough technical advances (multicore ...) or new system approaches thataffect many functions. Then there is a break in the system concepts; manyhave to be taken in hand because you can introduce new methods.” (P10)
As technology evolves, new paradigms need to be adopted tokeep up with the market. Pairing such changes with MBSE adoptionimproves its acceptance by surfing on the already needed changeatmosphere. However, a paradigm shift may be time-consuming;thus, this strategy is not fit for all situations.
BP15: Have technically prepared people to support your engineers(i.e., not sales personnel).
“Tool sellers sometimes only send sales personnel, can not answer technicalquestions, does not make a good impression.” (P13)
The engineers will have specific technical doubts about the model-ing environment. Therefore, having prepared people to support themis fundamental. Sales personnel are usually not prepared enough forthis task, and failing to do so might raise skepticism towards theadoption.
BP16: Bring everyone to adoption (i.e., avoid creating castes).
“Avoid living apart, everyone has to go!!!” (P9)
Other best practices enforced that all employees should receiveaccess to the tools (BP07) and basic training (BP10). The problem ofnot doing so is creating two classes of engineers (i.e., those workingwith MBSE and those that are not), which can jeopardize theirmotivation. Albeit, it is not uncommon for teams working in differenttechnologies in the same organization. Another exception is when thestrategy trains few engineers, which will pass the knowledge to theothers. This point should be considered with reservations.
BP17: If you have good engineers let them do the work for you, itis cheaper, and they will engage more (i.e., empowering).

4.3 results and discussion 75
“Information model developed itself” (P7)
“[The knowledge was created by the] developers available or self-built (i.e.,only UML and the DSLs)” (P4)
Some organizations had their developers learning about modelsautonomously (i.e., the knowledge was organically developed). Thatis not so surprising since, in technological areas, engineers need to belearning new technologies all the time.
BP18: Management should unify all employees towards adoption.
“Guidance from management important to bring everyone on the sameplatform” (P6)
Implementing MBSE involves engineers from different phases ofsoftware development and different fields of engineering. Theseprofessionals are usually not working together on an everyday basis.Filling this gap is the duty of management, thus uniting the wholeteam towards MBSE adoption.
Related work. In a previous work (Vogelsang et al., 2017), we iden-tified forces that work towards hindering or fostering the adoption ofMBSE and their origin. Hindering forces can be classified as either In-ertia or Anxiety. The former is triggered by the feeling that the currentsolution is “good enough” and habits that keep people from tryingout something new. The latter is triggered by fears that MBSE adop-tion will not pay off, mainly caused by uncertainties and perceptionflaws (Vogelsang et al., 2017). Motamedian (Motamedian, 2013) hadin his survey questioned subjects about barriers using MBSE. The sec-ond and third reasons most voted were “the lack of perceived value ofMBSE” and “resistance to change”, the need to micromanage the en-gineers’ expectations and motivation toward the process of adoption.Some ideas are just standard process-changing measures with MBSEflavor, which was something also found by Hutchinson et al. (Hutchin-son, Whittle, and Rouncefield, 2014) Nevertheless, the emphasis andalignment with other phenomena increase their relevance thus areworth mentioning. The challenges that arise (Vogelsang et al., 2017)are due to the nature of the current context, the shift to MBSE (e.g.,compile development skills vs. abstraction skills), and the human-in-the-loop. Hammer (Hammer, 2007) pointed out that the adoptioninitiative has to have an owner (e. g., a senior executive) who has theresponsibility and authority to ensure that the process delivers results.He also said that efforts that lack the backing of senior executives arelikely to fail.

76 strategies and best practices for mbse adoption
4.3.6 Most important Best Practices
Besides validating our interview findings, we used the questionnaireto discover which best practices are considered the most important.For this means, we asked the respondents to select among all BPs thefive most important when adopting MBSE. The results can be seenin Figure 4.6. Of the six most selected, three were from the Pilotinggroup, one from the Knowledge building group, and two from theManagement group. The BPs are discussed in the following underthis light:
bp14 Make the advantages of MBSE clear. The most important BPis related to increasing the engineers’ motivation towards MBSEadoption by making them understand its benefits. Engineers areless likely to withstand the hurdles of adoption if they cannotperceive its benefits (Vogelsang et al., 2017). Systems Engineer-ing is a human-intensive activity; thus, the engineers’ collabora-tion is crucial for adoption success.
bp05 Start small in terms of the project and team size in order to ac-quire some experience. This best practice is about using a smallsetting to understand the best way to introduce MBSE consider-ing the organization context. Through experimenting, managerscan understand which tools, languages, and styles are best fit-ted for the organization and its respective domains and currentprocesses.
bp02 The pilot project should create real value for the organization(i.e., no didactic project). This best practice is about makingthe adoption efforts meaningful and relevant right from thebeginning. By working into something used in a productionsetting, the employees have to learn and employ MBSE. If itis just for learning, there are no consequences if the project isincomplete or not well done, making the learning incomplete. Italso gives room for procrastination (i.e., learning later when itis necessary).
bp03 The pilot project should have enough budget and time allo-cated to bear the overhead of adoption. This BP relates to theeffort required by the engineers to develop their MBSE skills.The project selected to pilot the adoption should have its budgetplanned to cover the learning curve costs, and the delivery ofits artifacts should be planned accordingly. Time-critical projectsshould be avoided. If the project selected is not fit, the engineerswill drop the MBSE techniques in favor of already established

4.3 results and discussion 77
24%
54%
38%
0%
59%
27%
27%
16%
14%
32%
24%
3%
14%
65%
32%
5%
14%
19%
0% 10% 20% 30% 40% 50% 60% 70%
BP01: The organization should start adoptingMBSE with new projects.
BP02: The pilot project should create real valuefor the organization (i.e., no didactic project).
BP03: The pilot project should have enoughbudget and time allocated to bear the overhead…
BP04: No translation of old artifacts except forresusable artifacts.
BP05: Start small in terms of the project and teamsize in order to acquire some experience.
BP06: Tools with open interfaces andhomogeneous work-flow are preferred.
BP07: All engineers should have access to thetools.
BP08: Tool acquisition is very costly thereforeshould be thoroughly planned.
BP09: Have the new MBSE processes welldocumented so you better understand what…
BP10: All engineers should get, at least, basictraining in MBSE.
BP11: Using examples that are familiar to thedomain of the organization eases the…
BP12: Many strategies can be used to buildknowledge of an organization, the context…
BP13: There should be a planned form of laterevaluation to fill eventual gaps.
BP14: Make the advantages of MBSE clear to theusers.
BP15: Have technically prepared people tosupport your engineers (i.e., not sales personnel).
BP16: Bring everyone to adoption (i.e., avoidcreating castes).
BP17: If you have good engineers let them do thework for you, it is cheaper and they will engage…
BP18: Management should unify all employeestowards adoption.
Figure 4.6: Percentage of respondents rating each best practice as one of the“five most important.”

78 strategies and best practices for mbse adoption
development methods to achieve celerity gains and meet dead-lines. The adoption is very likely to fail.
bp10 All engineers should get, at least, basic training in MBSE. Ina system development project, different skill sets are masteredby different professionals who specialize in specific parts ofthe life-cycle (e.g., development, testing, design). Despite theirskill focus, all professionals have an overall system developmentknowledge, which helps them understand the big picture, andthe same should happen with MBSE. Although not all engineersrequire excellent modeling skills, everyone should be able to, atleast, read and understand the models.
bp15 Have technically prepared people to support your engineers(i.e., not sales personnel). Providing appropriate support to en-gineers helps to speed up adoption. This practice also hinderspossible frustrations during learning, thus keeping their moralehigh and transmits the message that they are not on their own.
As for the least important best practices, BP04: No translation of oldartifacts except for reusable artifacts was not selected as “most important”by any of the respondents. BP12: Many strategies can be used to buildknowledge of an organization, the context should be taken into considerationwas selected only once.
4.4 using best practices to mitigate mbse adoption hin-dering forces
This section relates the strategies and best practices presented in thischapter with the hindering forces towards MBSE adoption from Chap-ter 3. Our goal is to propose mitigation strategies for the hinderingforces using the elicited best practices.
The interview participants from this chapter study are a subset ofthe Chapter 3 study. We correlate the issues (i. e., hindering forces)with the solutions (i. e., best practices) when the respective codesemerge from the same participants during the interviews. We as-sume that the person experiencing and relating the issues have betterknowledge to propose solutions. For instance, interview participantP11 provided the following statement: “The first projects must be ableto bear the burden”, which was used as evidence for the Best PracticeBP03: The pilot project should have enough budget and time allocated to bearthe overhead of adoption.. The same participant stated: “It is a mistaketo believe that an advantage will be felt in the first project”, which wasused to determine the anxiety hindering force ROI uncertainty. Thus,

4.4 using best practices to mitigate mbse adoption hindering forces 79
Interviewparticipant
Hindering Forces
Best Practices
Quotes
Figure 4.7: Relation between hindering force and mitigating best practice.
we claim that BP03 can be applied to mitigate the anxiety hinderingforce ROI uncertainty. The relation between hindering force, best prac-tice, and interview participant is depicted in Figure 4.7. The relationsthat could be drawn this way between best practices and hinderingforces are listed in Table 4.5. Not all best practices are present in theaforementioned table because we could not find evidence in the inter-views relating them to hindering forces. From the 18 identified bestpractices we could only find evidence to relate 13. We also did notfind any evidence for a best practice addressing the No support andBad experiences inertia forces. Moreover, the relations presented in thistable are not comprehensive.
All interviews’ verbatim used as evidence for the correlationspresent in Table 4.5 can be seen in Appendix F. This contributionextends the previously presented research workflow (cf. Figure 4.1)merging it with the tasks from Chapter 3 and adding a new task,namely Analysis between BP and Forces, as can be seen in Figure 4.8.

80 strategies and best practices for mbse adoption
Interview with
Practitioners
Qualitative Coding
Analysis
Verbatim ofInterviews
Adoption Strategies andBest Practices
Application ofValidation
Questionnaire
Validated Best Practices
Deductive
Reasoning
Forces influencingadoption
Analysis between BP and Forces
Relations between BP and Forces
Inductive
Reasoning
Outputs:
Activities:
Figure 4.8: Expanded research method workflow.

4.4 using best practices to mitigate mbse adoption hindering forces 81
Tabl
e4
.5:B
est
prac
tice
sad
dres
sing
MBS
Ead
opti
onhi
nder
ing
forc
es.
Forc
es/B
est
Prac
tice
sBP
01
BP0
3BP
05
BP0
7BP
08
BP0
9BP
10
BP1
1BP
12
BP1
3BP
14
BP1
6BP
17
Iner
tia
Forc
esD
oubt
sab
out
impr
ovem
ents
xx
xx
xIm
mat
ure
tool
ing
xx
xIn
com
pati
bilit
yw
ith
exis
ting
tool
sx
xC
hang
ing
the
way
ofth
inki
ngx
xx
Insu
ffici
ent
trai
ning
xx
xx
Bad
expe
rien
ces
Lear
ning
new
tool
sx
xx
xIm
mat
ure
met
hodo
logi
esx
xx
Mig
rati
onis
need
edx
Dev
elop
men
tpr
oces
sdo
esno
tfit
xM
issi
ngex
cite
men
tx
xN
osu
ppor
t
Anx
iety
Forc
esR
OI
unce
rtai
nty
xx
xx
xx
Skill
sof
empl
oyee
sx
xx
Tool
ssh
ortc
omin
gsx
xx
Met
hodo
logy
shor
tcom
ings
xx
Larg
etr
aini
ngef
fort
sx
Rol
em
isun
ders
tand
ings
xx
xx
Mig
rati
onis
sues
xx
Team
Com
pete
nce
loss
xx
xx


5M E T H O D VA L U E A S C R I P T I O N
When the options are numerous, knowing how to ascribe valueproperly is fundamental to achieve optimal decision-making results.Projects failing to do so can incur undesirable consequences, ulti-mately hindering goal achievement. An instance of this problem isMBSE method selection. Lacking the needed domain knowledge tochoose methods and poorly defined adoption goals can lead to the se-lection of quick-wins that are sure to achieve successful implementationbut without necessarily addressing the motivation for the adoptionitself. In order to avoid such pitfall, we need to model the relevantelements related to the method value ascription process. Our goalis to provide a model which makes explicit much of the knowledgeinvolved in the method value ascription process, i. e., value ascriptionmechanisms, motivational and influencing factors.
5.1 introduction
MBSE encompasses many methods used throughout the whole systemdevelopment life cycle. Deciding which ones are the most interestingfor a systems development team requires their proper value appraisal.Thus, understanding the mechanics of method value ascription helpsto produce better decision-making for an effective MBSE adoption.
Value is a relational and emergent characteristic. It is relational be-cause an object has value when ascribed by an agent and is emergentbecause it emerges from how well something affordances match thegoals and needs of a given agent in a given context. Therefore, anobject may have different values to different agents, or even accordingto different goals of the same agent (Sales et al., 2018).
Value is represented by the Valuation relationship element (cf. Fig-ure 5.1) which connects the Team and Value method. The Valuationrelationship is made of Costs and Benefits. The latter is related to howmethods’ intrinsic characteristics help the teams achieve their adop-tion goals within a specific context. The former are expenditures re-quired to implement and execute the method. We consider value as inutility value, to not mistake with other kinds of values (e. g., exchangevalue).
83
84 method value ascription
Figure5.
1:Method
valueascription
model.

5.2 core constructs 85
5.2 core constructs
In this section, we describe the core constructs of the method valueascription model, which is depicted in Figure 5.1. In the following sub-section we describe the elements of the model and next we describethe characteristics of their relations.
5.2.1 Elements
team . is a development team ascribing value to the Value methodwhich is characterized by the Valuation relationship element. It alsodefines the Adoption goal and has a Team’s context.
value method. is the object of value ascription, i. e., the methodundergoing evaluation. It is related to the Team through the Valuationrelationship and it has Value method qualities.
valuation relationship. is a significance attached to a Valuemethod by the Team. It is composed of the Team perception of Costsand Benefits related to the Value method adoption.
value method qualities . are intrinsic properties of the Valuemethod which are independent of the Context. It has direct influenceon the perception of Benefits. For instance, the acquired benefit ofimproved communication upon the adoption of a method is a methodquality.
adoption goal . is the reason why a Team ascribes value to a Valuemethod. It is influenced by the Context and it composes the perceptionof the Benefits by the Team.
context. is the interrelated conditions in which something existsor occurs (Merriam-Webster, 2021). It influences the value ascriptionbecause they change the Benefits perception, the Adoption goal defini-tion, and the Costs. Context is divided into two sub-types, namelyEnvironment Context and Team’s Context, which are described in detailin the following:
• Environment context represents everything outside the bound-aries of the Team and the Value method (e. g., stakeholders, com-municating systems, regulations, market competitors).

86 method value ascription
• Team’s context are Team characteristics (e. g., size, employedmethods, members experience, employee turnover).
In general, a team has little influence in the environment context whilehaving a high capacity to change its context.
benefits . are relational properties from Value method qualitieswithin a Context that allows a Team to achieve an Adoption goal. To-gether with the Costs, it composes the Valuation relationship.
costs . are the resources the Team must concede in order to adoptand put into practice the Value method. Together with the Benefits, itcomposes the Valuation relationship. Costs can be of three differenttypes:
• Price. is the monetary expenditure required to have the methodimplemented in a team (e. g., tool acquisition, training, infras-tructure, licenses).
• Effort. is the workload required to learn, put into use, or ac-quire the value method. It has qualitative dependency on theValue method qualities and can be of the following types (Kambil,Ginsberg, and Bloch, 1996):
– Acquisition effort: the time and cost needed to search for,evaluate and get the value object.
– Operations and maintenance efforts: the maintenance anddisposal costs, and the time to learn how to use the valueobject, the wait for it to perform, and monitoring.
– Complementary effort: The time and cost needed to findand acquire complementary products or services associatedwith the method and its respective adoption goal.
• Risk. This cost is related to the probability of not fulfilling thegoal with the Value method or the sacrifices to be more strenu-ous than predicted. It has qualitative dependency on the Valuemethod qualities and can be classified in the following dimen-sions (Kambil, Ginsberg, and Bloch, 1996):
– Safety: physical risks related to the application of the valuemethod.
– Financial: the risk that the price paid is higher than usual.
– Selection: the risk of not choosing the best alternative forfulfilling Adoption goal.

5.3 relation to strategies and best practices for mbse adoption 87
– Delay: the risk that the Value method will take more timethan expected to be implemented or it will not performon-time, thus incurring opportunity costs.
– Functional: related to the risk that the Value method will notperform as predicted, now or in the future.
5.2.2 Relations
Three labels are used in the model’s associations, namely q dep, +qdep, and -q dep. The first characterizes relationships with a qualitativeinfluence on other elements, either positive or negative, the secondlabel represents positive qualitative influence, and the third is usedto represent negative influence relationships. For instance, Costs has a-q dep relation to the Valuation relationship while Benefits has a +q deprelationship. Context has a q dep relationship since it can have eitherpositive or negative influence.
5.3 relation to strategies and best practices for model-based systems engineering adoption
The benefits of employing empirically validated strategies and bestpractices in order to address MBSE adoption challenges are thor-oughly discussed in Chapter 4. Their relation to the method valueascription model is represented through the inverse qualitative depen-dency (i. e., -q dep) that the Costs element has with the MBSE Strategiesand Best Practices. When development teams follow those, the Effortrequired to adopt a method is diminished since efficiency is increased,the associated Risk are mitigated, and the Price for adoption is dimin-ished (e. g., less expenditure in training). The aforementioned relationcan be seen in Figure 5.2.
5.4 relation to forces that drive or prevent model-based systems engineering adoption
The MBSE adoption forces (cf. Chapter 3) are emergent motivationsoriginated from the method adoption endeavor, thus consequences ofits dynamics. The forces relations towards the method value ascriptionmodel elements are described in the following:
• MBSE Internal Push Force originates from within the organiza-tion, thus receiving positive qualitative dependency from theTeam’s context.

88 method value ascription
• MBSE External Push Force is directly influenced by the Environ-ment Context since factors outside the organization boundariesboost this force.
• MBSE Pull Force has direct qualitative dependency relation tothe perceived Benefits upon method adoption.
• MBSE Anxiety Force is related to the Risk element. Fears that thenew MBSE methods will not be able to fulfill the expectationsfuel this force.
• MBSE Inertia Force is related to the Effort element since the ef-forts associated with the adoption of new MBSE methods boostthis force. The model depicts this through a positive qualitativerelation with Effort.
The aforementioned relations are depicted in Figure 5.2.

5.4 relation to forces that drive or prevent mbse adoption 89
Figu
re5
.2:F
orce
son
MBS
Ead
optio
nan
dSt
rate
gies
and
Best
Prac
tices
inre
lati
onto
the
mod
el.


6G O A L - B E N E F I T D E C I S I O N C A L C U L U S F O RM O D E L - B A S E D S Y S T E M S E N G I N E E R I N G M E T H O DS E L E C T I O N
Model-based systems engineering (MBSE) methods can address manydevelopment challenges of modern systems. However, due to its com-prehensive coverage, teams are struggling with selecting methodsbest aligned with their adoption goal, i. e., not all methods are fitto deliver the pursued benefits. This chapter aims to relate goals thatdrive MBSE method adoption and candidate solutions, thus providingsuggestions that highest yield the expected benefits. For this means,we propose a goal-benefit model and respective operationalizationmethod. The model relates MBSE methods with benefits generatedupon their adoption and finally with adoption goals. Our approachresults in a prioritized list of MBSE methods ready to be transformedinto an improvement roadmap. The approach was applied in six de-velopment teams located in Germany and Brazil. We also provide asensitivity analysis to validate the model quantitatively. The approachwas assessed positively by the practitioners involved in our case study,who stated that it supports the goal-oriented MBSE method adoptionand improvement process.
6.1 introduction
Process change is challenging (Conner, 1993; Hammer, 2007), espe-cially for complex changes such as adopting MBSE whose numerousmethods and processes encompass methods in all phases of the prod-uct development life-cycle (Amorim et al., 2019; Vogelsang et al., 2017;Whittle et al., 2017).
Teams adopt MBSE methods for many reasons. Sometimes their goalis to enhance the developed system’s properties (e.g., quality, desir-able functionalities). Perhaps they pursue to increase the developmentprocess’ efficiency (e.g., cost, lead time). Others might need to tackleproblems related to the complexity of new systems (e.g., interdisci-plinary development, the massive amount of text-based specifications)(Vogelsang et al., 2017).
Managers are unsure which MBSE methods to adopt. They mightbe tempted to go for a low-hanging fruit strategy, which is cheap, easy,
91

92 goal-benefit decision calculus for mbse method selection
and has high implementation success. However, considering goal sat-isfaction, will the expected benefits be harvested? As a result, manyteams make little progress in their attempts to transform businessprocesses (Hammer, 2007).
Understanding the team adoption goal towards MBSE adoptionhelps identify which methods bring the most benefits and build astrong business case for the initiative. According to a report releasedby the Project Management Institute (PMI)1, projects and programsthat are aligned with an organization’s strategy are completed suc-cessfully more often than projects that are misaligned (77% vs. 56%).At the same time, only 60% of strategic initiatives meet their originalgoals and business intent. The report states that most executives ad-mit that their organizations fall short and that there is a disconnectionbetween strategy formulation and implementation (PMI, 2017). Nev-ertheless, linking adoption goals to methods is not straightforward.Goals are usually formulated on a high level of abstraction, whichleads to myriads of ways to accomplish them.
The Model-based systems engineering maturity model (MBSE MM)is a possible solution for this problem (cf. Section 2.4). It provides aframework to assess the capabilities implemented in a developmentteam. From the non-implemented capabilities, managers can choosewhich ones to adopt. However, how to choose the methods is not partof the MBSE MM, i. e., it lacks built-in contingency to guide tailoring(Conboy and Fitzgerald, 2010) such as a decision calculus (Little, 1970;Pöppelbuß and Röglinger, 2011). The absence of these mechanismsdiminishes the MBSE MM efficacy and can hinder its use.
Therefore, we propose a decision calculus approach to prioritizecandidate capabilities from the MBSE MM according to the develop-ment team adoption goal and context. The approach is composed of amodel and an instantiation method. The model breaks down the adop-tion goal into so-called competitive priorities (Krajewski and Ritzman,2018), which are related to benefits afforded by capabilities upon theirimplementation. The instantiation method guides the weight assign-ment of the model relations according to the relevance of the elementstowards their neighbors. According to the assigned weights, pointsare distributed along the resulting graph, from the adoption goal tothe competitive priorities, benefits, and candidate capabilities. As aresult, candidate capabilities are prioritized according to the overallpoints they collect, reflecting their relevance towards the adoptiongoal and the team’s context. With this approach, we want to supportteams choosing MBSE methods to adopt. The main contributions ofthis chapter are:
1 https://www.pmi.org/

6.2 study approach 93
• A goal-benefit decision calculus approach to support MBSEmethods selection. The approach is composed of:
– A goal-benefit meta-model that relates MBSE methods withbenefits, competitive priorities, and finally with the adop-tion goal.
– A method for instantiating the meta-model through assign-ing quantitative impact measures its relations, which isused to derive a prioritized list of MBSE process improve-ment candidates.
• Qualitative and quantitative evaluations of the approach basedon six case studies and an analysis of the model.
6.2 study approach
In this chapter, we pursue to answer the following research question:
How to select model-based systems engineering methods thathighest yield expected benefits?
We answer this question through the creation of artifacts, namely amodel and a method to operationalize the model. The approach mustrepresent the relations between what is intended to achieve throughMBSE adoption and the possible ways to do so. The next logical step isto evaluate if the proposed solution is fit. For this means we will usethe Guidelines of Modeling (Becker, Rosemann, and Uthmann, 2000)which prescribes guidelines to ameliorate the quality of informationmodels. The framework has three basic guidelines, namely economicefficiency, relevance, and correctness, which will be used as design re-quirements that the resulting approach of this study must fulfill. Inthe following we derive requirements from the respective guidelines:
R1. The approach must be cost-effective.
– Verification: feedback from case study participants.
R2. The approach must react to different types of relationships be-tween input and output variables.
– Verification: one-at-a-time sensitivity analysis (Saltelli, 2008).
R3. The approach must improve decision-making.
– Verification: feedback from case study participants.
94 goal-benefit decision calculus for mbse method selection
The research described in this chapter was conducted in an iterativefashion, which was composed of the following tasks and the respectivesections describing their outcomes:
• Understanding the constructs (cf. Section 6.3.1)
• Creating a model for the relations between these constructs (cf.Section 6.3.1)
• Developing a structured method for instantiating the model (cf.Section 6.3.2)
• Running an instantiation of the model in six case study (cf. Sec-tion 6.4.1)
• Performing a quantitative analysis of the model (cf. Section 6.4.2)
6.2.1 Threats to validity
Construct validity. If the constructs discussed during the case studyare not interpreted in the same way by the researcher and the partici-pants, there is a threat to construct validity. Thus, the approach andrelated concepts were explained through a workshop, and all stepswere taken with our supervision. We also performed a literature re-view to understand the constructs and their relations properly. TheMBSE experts, which participated in the task Assess Benefits againstcandidate capabilities, were directly involved in constructing the ma-turity model, which rules out stark misunderstandings of concepts.Additionally, their answers were aggregated using the median, thusenhancing this validity.
Researcher bias. Confirmation bias was mitigated through multiplesources of evidence, namely, feedback from the case study participantsand quantitative analysis of the approach’s execution. Additionally,we asked case study participants questions written with differentwording to prove the same point.
Participant bias. Member checking was used to ask respondents togive systematic feedback on the analysis proposed by researcherswhen possible. It was systematic in the semi-structured interviewprocess. We avoided implying a right answer through open-endedquestions and asking people to rate their responses on a scale. Thepanel description (cf. Table 6.1) shows diversity of data sources. Weasked the participants to write down their answers before sayingthem aloud to avoid a cognitive bias known as anchoring (Simmons,

6.3 the goal-benefit decision calculus 95
Figure 6.1: The goal-benefit meta-model elements and respective relations.
LeBoeuf, and Nelson, 2010) in which the first answer gravitates to thenext ones.
6.3 the goal-benefit decision calculus
Pöppelbuß and Röglinger (Pöppelbuß and Röglinger, 2011) proposeda set of design principles for developing maturity models. One ofthese was the inclusion of a decision calculus (Little, 1970) for prescrip-tive maturity models. A decision calculus is a quantitative decisionsupport model that helps evaluate different alternatives concerninggiven objectives to derive an optimal recommendation (Bennett andAnderson, 1995; Peterson, 2017). In the context of the MBSE MM, thismechanism would help decision-makers to select the capabilities thatare the most interesting to have their maturity further developed,according to the goal of the adoption strategy.
Therefore, we propose a goal-benefit decision calculus to charac-terize and break down relations between adoption goals and MBSE
methods into a hierarchical structure of attributes. Such structure al-lows to systematically decompose and identify lower-level attributes(benefits capabilities affordances) which contribute to the achievementof higher-level attributes (competitive priorities), allowing a shift fromrather abstract concepts like managerial considerations to more con-crete attributes (Vetschera, 2006). The proposed decision calculus iscomposed of a goal-benefit model and an instantiation method.
In the following, we describe the model structure. Further, we pro-pose a workflow to instantiate the model and generate recommenda-tions.

96 goal-benefit decision calculus for mbse method selection
6.3.1 Model elements and relations
The model is composed of four types of elements, namely MBSE adop-tion goal, Competitive priorities, Benefits, and Candidate capabilities. Theirrelations are depicted in Figure 6.1. The model forms a hierarchicaltree structure of attributes, each level having specific considerations(cf. Figure 6.2). In the following, we describe the elements in detailand their relations.
6.3.1.1 MBSE adoption goal
The adoption goal is the reason why a team is undertaking the MBSEadoption project. Not being able to fulfill the goal is deemed a failure.The goal defines the “to-be” state after the method adoption benefitsare harvested and are created based on the “as-is” state. Goals aredefined on high levels of granularity using natural language; thus,they can be interpreted and fulfilled in many ways (i.e., verificationand validation challenge). This element is placed on the top of thetree structure (cf. Figure 6.2). Examples of adoption goals not limitedto MBSE can be found in (Xu and Ramesh, 2007).
6.3.1.2 Competitive priorities
Competitive priorities are defined as the dimensions that a produc-tion system must possess to support the markets’ demands in whichan organization wishes to compete (Krajewski and Ritzman, 2018).Measures of competitive priorities fit in manufacturing strategy the-ory and are used to audit an organization’s manufacturing strategy.Choices on which competitive priorities to emphasize should guideand constrain the design and operating decisions facing manufactur-ing executives (Ward et al., 2007). Four competitive priorities can berelated to goals towards MBSE method adoption (Beck, 2000; Jitpai-boon, 2014):
• Cost is the invested value to deliver the product to the customer;thus, it influences profit. Lower costs are equivalent to higherefficiency. Are dimensions of Cost (Foo and Friedman, 1992;Hayes and Weelwright, 1984): manufacturing cost, value-added,selling price, running cost, service cost, and profit. In MBSE, costreduction is achieved by optimizing the work (e. g., traceability,automatization).
• Quality is described in terms of non-functional requirements.Regulations dictate acceptance levels of quality for potentially

6.3 the goal-benefit decision calculus 97
hazardous products/services. Quality can increase the costs (i.e.,more reviews and scrutiny), but better methods and tools canincrease quality without increasing running costs (through au-tomated and dynamic analysis). More dimensions of this com-petitive priority can be found in (ISO/IEC, 2010).
• Lead time defines the time it takes to develop a product (i.e.,how fast a new product can be delivered). Additionally, better-prepared competitors are likely to fulfill the needs of potentialcustomers in advance. Refinements of Lead time are manufac-turing lead time, due date performance, rate of product intro-duction, delivery lead time, frequency of delivery. Automationplays a significant role in MBSE methods in diminishing theLead time.
• Scope is described in terms of the desirability of functional re-quirements. The product/service needs to provide what the userneeds and what the customer wants, which should not be mis-taken with project scope size. This dimension involves require-ments elicitation, verification, and validation activities. Modelsare better ways to verify the feasibility of new functionalities.
Competitive priorities relate to the MBSE adoption goal, and MBSEbenefits. This element populates the second level of the model tree(cf. Figure 6.2).
6.3.1.3 Benefits
A benefit is a value that is created as a result of the successful comple-tion of a project, e.g., method adoption (PMI, 2017). A benefit is a pos-itive attribute that may support the adoption goal. For instance, Easierhandling of complexity (Asan, Albrecht, and Bilgen, 2014) is a benefitgenerated by MBSE models and tools that support impact, coverage,and consistency analysis. The benefits associated with MBSE adop-tion used by this approach were collected from the literature and aredescribed in more detail in Section 2.2.2. In our model, benefits relateto Competitive priorities, and Candidate capabilities (cf. Figure 6.1). In thefollowing, we list these benefits and discuss some of their competitivepriorities relations, which are not comprehensive and can change asnew tools, methods, and systems are created.
• Easier reuse of existing artifacts (Salimi and Salimi, 2017)
– Cost: reuse efforts are smaller than developing fromscratch (Northrop, 2006).

98 goal-benefit decision calculus for mbse method selection
– Quality: reusing good quality artifacts improves the sys-tem’s quality by diminishing the area of the code subject tofailure.
– Lead Time: reused parts are less prone to unplanned defectfixing and integration efforts are smaller than developingfrom scratch, enhancing chances of achieving deadlines.
– Scope: is not directly related to this benefit because reusecan make product owners too clingy to their already exist-ing “free” functionalities and poorly grasp what the realdesire of the market is.
• Better communication (Hutchinson et al., 2011)
– Cost: communication issues can generate rework.
– Quality: communication issues can lead to defect injec-tion (Dowson, 1997).
– Lead Time: rework due to miscommunication impacts thetime required to complete a system.
– Scope: better requirements are likely to come up whenengineers can communicate better.
• Better understanding of problem domain (Boehm, Gray, and See-waldt, 1984)
– Cost: poor understanding of the problem at hand usuallyleads to rework. Less iterations are required to reach asatisfactory level.
– Quality: since the team will focus on relevant problems,more time is available to guarantee quality.
– Lead Time: clear problem domains are less likely to bringnew requirements during development, enhancing chancesof achieving deadlines.
– Scope: the better one understands the problem domain,easier it is to propose more aligned solutions.
• Better understanding of solution space (Harvey and Liddy, 2014)
– Cost: new requirements are less likely to be discovered atlate stages of development.
– Quality: requirements are more likely to be well described,thus providing less room for mistaken design decisions.
– Lead Time: good knowledge of what should be donemakes it easier to reach agreed deadlines.
– Scope: good understanding of the solution space increaseschances of having good ideas for new functionalities.

6.3 the goal-benefit decision calculus 99
• Better estimates (cost, impact of req. changes) (Dabkowski et al.,2013)
– Cost: less risk to overrun budget.
– Quality: when estimates are short, quality assurance activ-ities might suffer to make the project fit agreed deliverydates .
– Lead Time: well estimated targets are more likely to bereached.
– Scope: receives little contribution from this benefit.
• Less defects (McConnell, 2004)
– Cost: less effort fixing bugs, less defects found at laterstage of development process (Afzal et al., 2013), less defectfound by system users.
– Quality: better system quality.
– Lead Time: less time needed to fix bugs, thus more likelyto reach targets.
– Scope: less needed time for defect fixing is equal to moreproject time available to develop better functionalities.
• Easier handling of complexity (Asan, Albrecht, and Bilgen, 2014)
– Cost: less project navigation and tracing efforts.
– Quality: less defects due to missing information.
– Lead Time: less time consumed tackling complexity.
– Scope: more project time available to develop better func-tionalities.
• Improved verification & validation (McConnell, 2004)
– Cost: less effort required to perform these tasks.
– Quality: less risk of missing requirements implementationor misunderstandings.
– Lead Time: evidence of the requirements implementationcan be easily collected.
– Scope: better ways to describe requirements fosters newinteresting functionalities.
• Improved quality of specification (Fosse and Bayer, 2016)
– Cost: rework due to poor specification is mitigated.
– Quality: better specification requires less ad hoc decision-making for filling gaps, thus fewer opportunities to injectdefects.

100 goal-benefit decision calculus for mbse method selection
– Lead Time: less effort is required to make sense of goodspecification.
– Scope: better specification encompasses more informationwhich is the input for creating better functionalities.
• Efficient certification (Helle, 2012)
– Cost: reuse of previous certification artifacts and automa-tion has implications on cost
– Quality: tools to generate evidence also uncover qualityissues.
– Lead Time: certification takes time but evidence can be gen-erated at early stages of development (through simulationor automated checks).
– Scope: more project time available to develop better func-tionalities.
6.3.1.4 Candidate capabilities
Candidate capabilities are the units of MBSE methods and the solutionspace of the adoption initiative (i.e., MBSE methods not employed bythe team). They generate benefits that can (or not) help the team toreach its method adoption goal. The capabilities used in this approachare from the MBSE MM (cf. Section 2.4).
6.3.1.5 Hierarchical levels
The elements and their relationships form a three-level hierarchicaltree (cf. Figure 6.2). Each level is documented in an artifact whichis the output of a task of the instantiation method (cf. Section 6.3.2).The relations between elements are defined using either Analytic hi-erarchy process (AHP) (Saaty, 1980) or the no-low-high scale, which aredescribed in the following:
• Analytic Hierarchy Process (Saaty, 1980) is a method to sup-port multiple-criteria decision analysis. It works by building ahierarchical model of properties to reason a decision. The maindecision is placed at the graph’s root, while possible solutionsare placed at the leaves. Connecting them are the propertiesof the solutions. Then, the properties’ importance is comparedin a pairwise fashion (i. e., is property A more important thanproperty B) and to which magnitude, expressed in an ordinalscale from 1 to 9. The comparisons are translated to weights thatare assigned to the properties through the connecting edges.The parent importance is propagated to the children nodes pro-

6.3 the goal-benefit decision calculus 101
Quality
Benefit1
CostScope
Capability1
MBSE adoption
goal
Lead Time
Benefit2 Benefit3 …
Capability2 Capability3 …
Goal levelRefined MBSEadoption goalAHP - %
Team levelTeam’s benefitpotentialno-low-high (0, 1, 2)
Capability affordances levelCandidate capabilitiesaffordancesno-low-high (0, 1, 2)
Figure 6.2: The hierarchical structure of attributes of the goal-benefit meta-model.
portionally to the assigned weights until all edges have beenconsidered when reaching the leaves (i.e., solution). In the end,the leaf’s values should sum up to the root’s importance.
• No-low-high scale is a three-level scale for defining relation-ships, and it describes if there is no relation, if the relationshipstrength is low, or if it is high. This scale has little room for mis-takes and provides the granularity required for this model. Thescale can be translated to numbers for quantitative use, assign-ing zero for no relation, one for low, and two for high. This scaleis used to define the Team’s context and the Capability affordances.Other established frameworks use a similar scale (Horkoff et al.,2014), such as in the Business Intelligence Model, which uses atwo-grade scale to describe influence relationships among goals(i. e., weak positive and strong positive).
The hierarchical levels of the model (cf. Figure 6.2) are described inthe following:
goal level . This level represents the refinement of the goalin competitive priorities. By refinement, we mean: when trying toachieve the goal, how each competitive priority should be considered.Every goal delivers a specific set of relations between those entities.The Goal level encompasses the MBSE adoption goal, the four com-petitive priorities, and the valuation of the relation between both. Thislevel is developed during the task Define MBSE adoption goal, and Re-fine MBSE adoption goal. There are two artifacts related to this level,

102 goal-benefit decision calculus for mbse method selection
namely the MBSE adoption goal, and the Refined MBSE adoption goal(cf. Section 6.3.2). The relations value is defined in percentages, andthere are four relationships of this kind in the model, one for eachcompetitive priority.
team level . The relations between competitive priorities and ben-efits represent how the latter contribute to the former based on theteam’s contextual and intrinsic characteristics. The model considersthese factors in the assessment of the Team context relations (i.e., a cost-efficient team will most likely benefit less from cost-related benefits).This relation is described using the no-low-high scale. There are fortyrelationships of this kind in the model (i.e., four competitive prioritiestimes ten benefits). These values are defined in the task Characterizeteam context and belong to the Team’s context artifact (cf. Section 6.3.2).
capability affordances level . The relations of this level ex-ists between benefits and capabilities and represent the benefits gener-ated by adopting the respective capability. The value of the relationsis context-independent; thus, reuse is possible, but the candidate ca-pabilities selected are team-specific (i. e., must be composed of non-implemented capabilities). It is defined using the same scale as theTeam level relations (i.e., no-low-high scale). The number of these rela-tions in the model is 10*(the number of candidate capabilities). Thislevel is defined during the task Assess candidate capabilities affordancesand the values are store in the Candidate capabilities affordances, andCapabilities affordances repository artifacts (cf. Section 6.3.2).
6.3.2 The instantiation method
In this subsection, we describe a method to guide the instantiatingof the model. When the model is instantiated, values are assigned tothe relations quantifying those regarding refinement/contribution/-generation. The method’s outcome is a list of candidate capabilitiesprioritized according to their contribution towards the adoption goal.In the following, we describe the actors involved and the workflowtasks (cf. Figure 6.3). Later, we describe each task in detail. A runningexample of the method is provided in case study 1 (cf. Section 6.4.1.2).
6.3.2.1 Actors
Three groups of actors participate in the method execution:

6.3 the goal-benefit decision calculus 103
• Team members. are the actors belonging to the team adoptingthe MBSE methods. Participants of this group are system en-gineers, developers, team leaders, and managers. Having morethan one participant from this group when performing the tasksenhances the approach’s results, and their answers should bediscussed to reach a consensus.
• Researchers. encompasses the individuals applying the ap-proach. This group participates in all tasks, either actively orsupporting the other actors.
• MBSE Experts. are professionals with deep knowledge of MBSEmethods, their application in teams, and the benefits these meth-ods can deliver. They are consultants, researchers, instructors,among others.
6.3.2.2 Tasks
In this subsection, we describe the tasks required to instantiate themeta-model. Dependencies between tasks can be seen in Figure 6.3.
assess team process maturity. In this task, the process ma-turity of the team is assessed using the MBSE MM. Researchers askteam members through interviews whether they produce or manip-ulate specific artifacts described by the MBSE MM capabilities. Ifthey answer yes, the capability is considered implemented. In case ofdoubt or lacking understanding, the researchers should ask the teammembers for artifacts related to the capabilities (e. g., documents ormodels with the required information is documented). The outcomeof this task is the current maturity profile of the team processes. Teammembers fit for this task are engineers performing the processes.
Output: Maturity profile – This artifact describes all the implementedcapabilities in a team.
select candidate capabilities . The candidate capabilities areselected from the MBSE MM based on the Maturtity profile. Any non-implemented capability can be a candidate. The number of candidatecapabilities to be selected is not fixed and depends on the allocatedeffort for MBSE adoption. We suggest selecting at least two candidatecapabilities per focus area for each adoption iteration (i.e., a team hav-ing Operational context focus area until OPC C implemented wouldselect as candidate capabilities OPC D and OPC E). Other capabili-

104 goal-benefit decision calculus for mbse method selection
Candidatecapabilitiesaffordances
Prioritized listof candidatecapabilities
Assess team processmaturity
Maturityprofile
Prioritize candidatecapabilities
Define MBSEadoption goal
Refine goal
MBSE adoptiongoal
Refined MBSEadoption goal
Characterize teamcontext
Team's benefitpotential
Assess candidatecapabilitiesaffordances
Select candidatecapabilities
Candidatecapabilities
Goal specificTeam specific
Artifact
Task
Capabilityaffordancesrepository
Repository
MBSE MaturityModel
Figure 6.3: Workflow of the instantiation method.

6.3 the goal-benefit decision calculus 105
ties can be added to the pool in a new run of the approach in thesubsequent iterations.
Input: Maturity profile.
Output: Candidate capabilites – This artifact is a subset of unimple-mented capabilities in the team.
assess candidate capabilities affordances . At this task,MBSE experts assess the magnitude of the benefits each candidatecapabilities can generate when implemented in a team. For each pair(candidate capability, benefit), experts characterize the generation ofbenefits using the no-low-high scale (cf. Section 6.3.1.5). Moreover, theiranswers are aggregated using the median. The benefits generated bythe candidate capabilities are not team-specific; thus, this task canbe performed without considering the team context. Therefore, theoutcome of this task can be reused in multiple case studies.
Input: Candidate capabilities.
Output: Candidate capabilities affordances.
define mbse adoption goal . The team members should de-scribe, using natural language, the team’s main goal for adoptingMBSE methods. If many goals are elicited, the most important goalshould be selected (there are many techniques to prioritize goals,which is out of this approach’s scope). Participants with managerialroles are the best fit for this task.
Output: MBSE adoption goal.
refine goal . This task outcome is the refinement of the adoptiongoal into competitive priorities (cf. Section 6.3.1.2). The goal describedin natural language can be interpreted in many ways; thus, a crispierunderstanding is sine qua non. Hereby Analytical Hierarchy Process(AHP) (Saaty, 1980) is used, a method designed to compare the im-portance of properties in a pairwise fashion. Team members comparecompetitive priorities with each other regarding their importance to-wards achieving the goal. After the calculation, the relevance of eachcompetitive priority is delivered in percentages. Team members hav-ing managerial roles should perform this task, and their answers mustachieve a consensus. The researchers assist this task.
Input: MBSE adoption goal.
Output: Refined MBSE adoption goal.
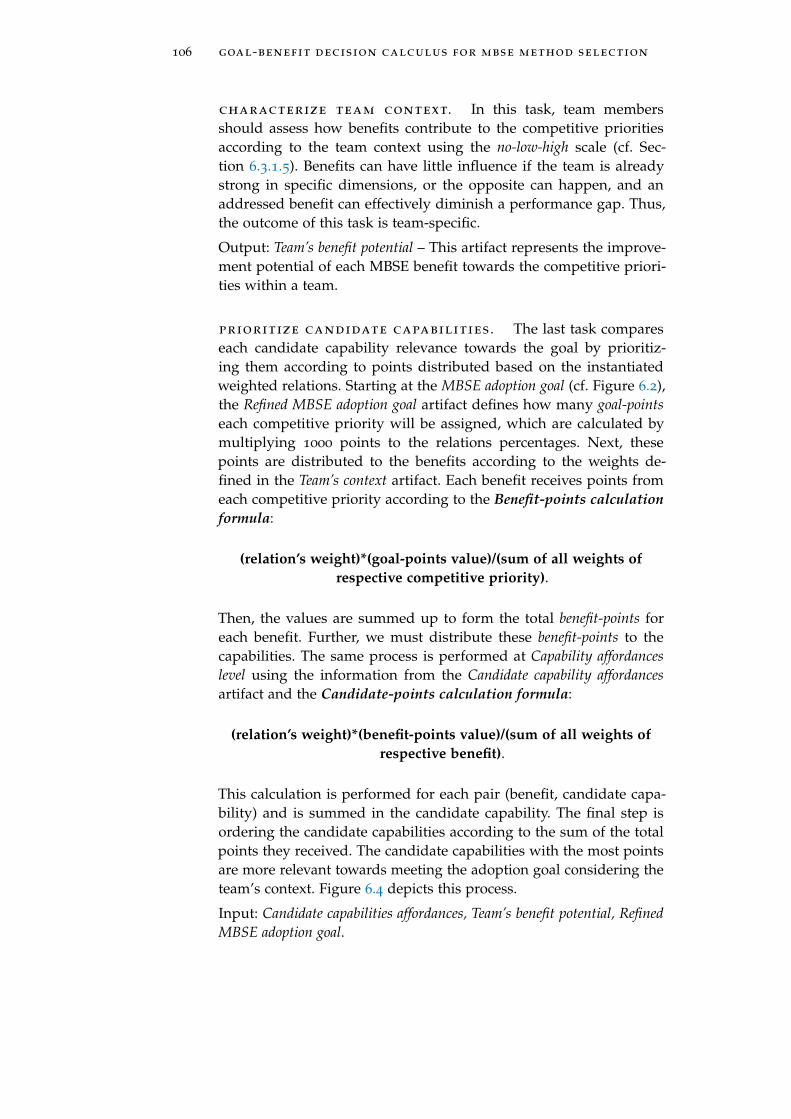
106 goal-benefit decision calculus for mbse method selection
characterize team context. In this task, team membersshould assess how benefits contribute to the competitive prioritiesaccording to the team context using the no-low-high scale (cf. Sec-tion 6.3.1.5). Benefits can have little influence if the team is alreadystrong in specific dimensions, or the opposite can happen, and anaddressed benefit can effectively diminish a performance gap. Thus,the outcome of this task is team-specific.
Output: Team’s benefit potential – This artifact represents the improve-ment potential of each MBSE benefit towards the competitive priori-ties within a team.
prioritize candidate capabilities . The last task compareseach candidate capability relevance towards the goal by prioritiz-ing them according to points distributed based on the instantiatedweighted relations. Starting at the MBSE adoption goal (cf. Figure 6.2),the Refined MBSE adoption goal artifact defines how many goal-pointseach competitive priority will be assigned, which are calculated bymultiplying 1000 points to the relations percentages. Next, thesepoints are distributed to the benefits according to the weights de-fined in the Team’s context artifact. Each benefit receives points fromeach competitive priority according to the Benefit-points calculationformula:
(relation’s weight)*(goal-points value)/(sum of all weights ofrespective competitive priority).
Then, the values are summed up to form the total benefit-points foreach benefit. Further, we must distribute these benefit-points to thecapabilities. The same process is performed at Capability affordanceslevel using the information from the Candidate capability affordancesartifact and the Candidate-points calculation formula:
(relation’s weight)*(benefit-points value)/(sum of all weights ofrespective benefit).
This calculation is performed for each pair (benefit, candidate capa-bility) and is summed in the candidate capability. The final step isordering the candidate capabilities according to the sum of the totalpoints they received. The candidate capabilities with the most pointsare more relevant towards meeting the adoption goal considering theteam’s context. Figure 6.4 depicts this process.
Input: Candidate capabilities affordances, Team’s benefit potential, RefinedMBSE adoption goal.

6.3 the goal-benefit decision calculus 107
Benefit-points calculation formula
Candidate-points calculation formula
Candidate-points
Refined MBSE adoption goal
Team’s context
Benefit-pointsCandidate capability
affordances
artifact
task
Figure 6.4: Workflow of the task Prioritize candidate capabilities.
Output: Prioritized list of candidate capabilities – The list is prioritizedaccording to the importance of fulfilling the adoption goal.
The tasks Define MBSE adoption goal and Refine goal are goal-specific.Characterize team context, Assess team process maturity, and Select can-didate capabilities are team specific. The outcome of Assess candidatecapabilities affordances can be reused with different teams.
6.3.2.3 Other elements of the workflow
Two elements represented in the workflow provide support to thedevelopment of the activities. The MBSE MM is required for runningthe approach and is described in detail in Section 2.4. The Capability af-fordance repository is the repository where the output of the task Assesscandidate capabilities affordances is stored for future use. The Candidatecapability affordances artifact is not context-specific, meaning that an-other run of the approach (with the same team or with another team)can re-use the assessment of the same previously assessed candidatecapability. This work collected 53 capability affordances that can bereused and enhanced in the approach further execution (cf. Table 6.3).

108 goal-benefit decision calculus for mbse method selection
Table 6.1: Case study participants - demographic data.
ID Industry Team size Role of participants
CS1 Automotive 5 Process manager, architect
CS2 Government 8 Process analyst, project manager
CS3 Education 9 Project manager, architect, devel-oper
CS4 Defense 6 Project and product manager
CS5 Defense 4 Systems manager
CS6 Defense 12 Project manager
6.4 validation
In this section, we aim to prove that the approach fits its purpose. Thusit needs to adhere to the requirements defined in Section 6.2. Thissection is divided in two subsections, namely Qualitative evaluationand Quantitative evaluation. In the former, we report applying theapproach in real development teams in six case studies where wecollected the participants’ impression regarding the approach itselfand delivered results. Our intention was to verify requirements R1and R3. In the latter, we provide an analysis of the model based onmetrics regarding its use. The intention was to verify requirement R2.
6.4.1 Qualitative evaluation
In this section, we provide evidence that the approach fulfills the re-quirements R1: The approach must be cost-effective and R3: The approachmust improve decision-making. We seek to achieve this through six casestudies in which we applied the approach in real-life developmentteams and collected their feedback about the delivered results and theexperience of applying the approach. The case studies were carriedout in teams located in Brazil and Germany. A demographic sum-mary of the teams that participated in the case studies can be seen inTable 6.1.
The case study participants were debriefed over the model andmethod in a pitch meeting to present the approach. For the task Refinegoal, the participants performed the AHP method using an online

6.4 validation 109
tool2 to generate the values. We put together this task’s results foreach goal in Table 6.6 for comparing how each team refined theirgoals towards competitive priorities. The Team’s benefit potential foreach case study can be seen in Appendix E.
Once all tasks were performed (cf. Section 6.2) we held a meetingto present the results and collect the impressions of the participantstowards the approach. These findings and how they corroborate to thefulfillment of the aforementioned design requirements are describedat the end of each case study in a paragraph named Reflections on themodel.
We provide a running example in case study 1 described in moredetail than the other case studies (cf. Section 6.4.1.2). In the followingsubsections, we describe the task Assess candidate capabilities affordances,and how the case studies were performed.
6.4.1.1 Expert assessment
For the case studies, we selected 53 candidate capabilities (cf. Fig-ure 6.5) to be evaluated by MBSE experts at the task Assess candidatecapabilities affordances. We canvass the opinion of five MBSE expertsin a single-round survey (Pan et al., 1996). They were sent throughe-mail a spreadsheet file containing a capability for each row andbenefits for columns which they should grade their relation using theno-low-high scale (cf. Section 6.3.1.5). We collected their answers andaggregated the values using the median. The experts selected for thisassessment were directly involved in developing the MBSE MM andhad a deep knowledge of the capabilities. However, any MBSE expertwith solid methods knowledge and experience would be fit for theassessment and eventual discrepancies would be ironed out throughthe responses median.
The sum of points assigned to each of the 53 capabilities can be seenin Table 6.3. The distribution of the values per capability followed anormal distribution (i.e., bell-shaped curve) as shown in Figure 6.6.Therefore, the MBSE experts were neither optimistic nor pessimisticabout the capabilities affordances. The criteria for selecting these can-didate capabilities were based on the case studies teams’ current matu-rity profile and the next two unimplemented respective capabilities ofeach focus area. The candidate capabilities for each case study can beseen in Figures 6.8-(b), 6.9-(b), 6.10-(b), 6.11-(b), 6.12-(b), and 6.13-(b).
2 https://bpmsg.com/academic/ahp_calc.php

110 goal-benefit decision calculus for mbse method selection
Expert assessment – Capacidades candidatas
6
Operational ContextContext
Analysis Knowledge Context
Scoping
Goal Modeling
Scenario Modeling
Requirements Modeling
Sys. Function Modeling
Sys. Function Specification
Event Chain Modeling
Mode Modeling
Log. Architecture Modeling
Log. Component Modeling
System Behavior Testing
Technical Architecture Modeling
Technical Component Modeling
Requirements
System
Functions
Architecture
Testing
Technical
Implementation
A B C D E F G
A B C D
A B C D E
A B C D E F
A B C D E F G
A B C D E GF
A B C D
A B C D E F
A B C D
A B C D
A B C D E F G
A B C D E
A B C D
A B C D E F
A B C D
Figure 6.5: Capabilities assessed by MBSE experts on the task Assess candidatecapabilities affordances.
Any idea how I could use this?
0
1
2
3
4
5
6
7
1 2 3 4 5 6 7 8 9 10 11 12 13 14 15 16 17 18 19
Nu
mb
er
of
ocu
rran
ces
Value sum of Candidate capability affordances per capability
Figure 6.6: Distribution of weight-sum points amount per candidate capabil-ity assigned by MBSE experts.

6.4 validation 111
Table 6.3: Weight-points sum of Candidate capability affordances artifact fromthe task Assess candidate capabilities affordances.
Cap. weight-sum Cap. weight-sum Cap. weight-sum
LAM G 19 LAM E 11 SCM C 9
SBT C 17 RM B 11 TAM C 9
RM C 16 OPC D 11 MM C 9
LCM E 16 OPC E 11 GOM D 8
OPC F 15 SFS B 11 LCM A 8
TAM C 14 SCM D 11 LCM B 8
RM D 14 LCM C 11 SCM G 8
LAM D 14 SCM B 10 GOM F 8
SFS C 14 ECM C 10 GOM E 7
SFS D 14 RM A 10 TAM A 7
SFM C 13 SFM B 10 MM A 7
SCM A 13 ECM B 10 KNC C 7
SBT B 13 TAM B 10 SFS A 6
MM D 13 TCM B 10 GOM B 5
OPC C 12 ECM A 9 GOM A 4
OPC B 12 LAM A 9 KNC D 4
LAM C 12 GOM C 9 KNC B 3
LAM F 12 MM B 9 - -

112 goal-benefit decision calculus for mbse method selection
6.4.1.2 Case study 1 (CS1)
This case study is described with greater detail to serve as a runningexample. In this case study, the approach was applied to a systemdevelopment team of a Tier-1 manufacturer of rolling element bear-ings for automotive, aerospace, and industrial uses. The case studystarted with the task Assess team process maturity which was performedthrough face-to-face interviews with four systems engineers. The out-come of this task is the team’s Maturity profile (cf. Figure 6.7). Duringthe task Select candidate capabilities 23 candidates capabilities were con-sidered by the researchers for this case study (cf. Figure 6.8-(b)).
The remaining tasks were performed through two teleconferences,lasting one hour each, with two participants; a process managementspecialist and an architect. We started with the activity Define adoptiongoal. The participants explained that the team needed to improveinterdisciplinary work between system development and softwaredevelopment. After some brainstorming rounds, the goal was finallydefined as:
“Enhance communication between software and systemdevelopment teams.”
The MBSE adoption goal was used as input for the next task, Refine goal.The pairwise comparison of each competitive priority can be seenin Table 6.4, and the calculated result in percentages in Table 6.6. Atfirst, the participants were surprised that Scope (53.6%) was rankedhigher than Quality (29.8%), but when revisiting the evaluation, theystated that Scope was more important than Quality for a scale of 3
(cf. Table 6.4). Then they realized their assumption was based on theteam’s priorities in which Quality is more important than Scope, butconsidering the adoption goal, Scope was more important. Neverthe-less, Quality was ranked second most important competitive priority.Next, we performed the activity Characterize team context. The resultof this activity can be seen in Table 6.5.
Finally, the task Prioritize candidate capabilities was performed. Thefirst five items from the Prioritized list of candidate capabilities belongto four focus areas; the first capability from Requirements Modeling,two capabilities from Operational Context, and one capability from Sys-tem Function Modeling and Systems Function Specification. The last twocapabilities had requirements not yet present in the team; thus, therequired capabilities must be implemented before they are considered.The five first prioritized capabilities can be seen in Figure 6.8-(c).
reflection on the model : The participants stated that the ap-proach “helps assess the team priorities in the first place” and “proposes how

6.4 validation 113
Table 6.4: AHP pairwise comparison from task Refine goal from case study 1.
Pairwise comparison Answer How much more?
Cost or Quality Quality 5
Cost or Lead Time Lead Time 5
Cost or Scope Scope 7
Quality or Lead Time Quality 5
Quality or Scope Scope 3
Lead Time or Scope Scope 5
Table 6.5: Instance of Team’s benefit potential, output of the task Characterizeteam context from case study 1.
MBSE benefit Cost Quality Lead Time Scope
Easier reuse of existingartifacts
2 2 1 0
Better communication 0 2 1 2
Better understanding ofproblem domain
1 1 1 1
Better understanding ofsolution space
0 1 2 2
Better estimates 2 1 1 0
Less defects 2 2 1 0
Easier handling of com-plexity
1 2 1 1
Improved verification &validation
2 2 1 0
Improved quality ofspecification
1 1 1 1
Efficient certification 1 2 1 1
Sum 14 16 11 8

114 goal-benefit decision calculus for mbse method selection
Maturity profile CS1
80Figure 6.7: Case study 1 - Maturity Profile.
the team could evolve its processes”. They also said that “the results werea good starting point when deciding how to execute MBSE process maturityimprovement”. These statements are evidence that the approach fulfillsrequirement R3. The participants rated the approach cost-efficient,thus fulfilling requirement R1.
6.4.1.3 Case study 2 (CS2)
Case study 2 team develops educational management informationsystems for a university with functionalities such as course registeringand grade management. The complete method was performed inone face-to-face meeting, which lasted around two and a half hours.Three participants attended the meeting, namely a project manager,an architect, and a developer. After performing the task Assess teamprocess maturity and having in hands the maturity profile of the team(cf. Figure 6.9-(a)) we selected 24 candidate capabilities (cf. Figure 6.9-(b)). The team members were concerned with not having enoughdocumentation available to understand the systems once someoneleft the team, i. e., loss of knowledge due to employee turnover.Additionally, much effort was required to transfer knowledge to newteam members. The following goal was defined based on the issuementioned above:
“Improve knowledge transfer of the systems to new team mem-bers.”

6.4 validation 115
Prioritize candidate capabilities (2/2)
2626
Operational ContextContext
Analysis Knowledge Context
Scoping
Goal Modeling
Scenario Modeling
Requirements Modeling
Sys. Function Modeling
Sys. Function Specification
Event Chain Modeling
Mode Modeling
Log. Architecture Modeling
Log. Component Modeling
System Behavior Testing
Technical Architecture Modeling
Technical Component Modeling
Requirements
System
Functions
Architecture
Testing
Technical
Implementation
A B C D E F G
A B C D
A B C D E
A B C D E F
A B C D E F G
A B C D E GF
A B C D
A B C D E F
A B C D
A B C D
A B C D E F G
A B C D E
A B C D
A B C D E F
A B C D
Figure 6.8: Case study 1 - (a) blue capabilities: current team MBSE maturityprofile, (b) green and yellow capabilities: candidate capabilitiesfor adoption, (c) yellow capabilities: five first prioritized capabili-ties.
The Refined MBSE adoption goal artifact had Quality as the leadingcompetitive priority with 45% followed by Lead Time with 35.3% (cf.Table 6.6). The Prioritized list of candidate capabilities had two capabil-ities from System Behavior Testing focus area among their five bestscoring. This is reasonable since Quality was rated the most importantcompetitive priority towards goal achievement. Other relevant focusarea were Systems Function Specification, Requirements Modeling andOperational Context (cf. Figure 6.9-(c)). From all these, only the Systemsfunction specification capability requires a previous unimplementedcapability (SFS C).
reflection on the model : The participants found the ap-proach quite helpful since it “led them to reflect on the team’s currentsituation within the questions raised”. The results were considered rele-vant because they “were aligned with the problems identified by the teambeforehand”. They said the approach provided them with a directionto tackle those issues (compliance with R3). The approach consumeda reasonable amount of time in the participants’ eyes, thus complyingwith R1.
6.4.1.4 Case study 3 (CS3)
The team from case study 3 develops information systems for a gov-ernment agency. Their duties include the creation of systems to sup-

116 goal-benefit decision calculus for mbse method selection
CPD – Capacidades candidatas e top 5
9
Operational ContextContext
Analysis Knowledge Context
Scoping
Goal Modeling
Scenario Modeling
Requirements Modeling
Sys. Function Modeling
Sys. Function Specification
Event Chain Modeling
Mode Modeling
Log. Architecture Modeling
Log. Component Modeling
System Behavior Testing
Technical Architecture Modeling
Technical Component Modeling
Requirements
System
Functions
Architecture
Testing
Technical
Implementation
A B C D E F G
A B C D
A B C D E
A B C D E F
A B C D E F G
A B C D E GF
A B C D
A B C D E F
A B C D
A B C D
A B C D E F G
A B C D E
A B C D
A B C D E F
A B C D
Figure 6.9: Case study 2 - (a) blue capabilities: current team MBSE maturityprofile, (b) green and yellow capabilities: candidate capabilitiesfor adoption, (c) yellow capabilities: five first prioritized capabili-ties.
port regulations and decrees. At the interview time, eight engineersworked on this team. We performed the tasks in two face-to-facemeetings with a duration of one hour each. In the first meeting, weperformed the task Assess team process maturity with two team mem-bers, namely a project manager and a requirements engineer. In thesecond meeting, we executed the rest of the tasks with the sameproject manager from the first meeting and a process analyst. Beforethe second meeting, we asked the participants to think about adoptiongoals and provided them with a spreadsheet to describe the relationsbetween competitive priorities and benefits. We asked them to definethose relations in the same way as the task Characterize team context,so they could reflect on their own, thus avoiding the “anchoring ef-fect” (Simmons, LeBoeuf, and Nelson, 2010), and diminish the taskduration (results can be seen in Appendix E). Twenty-one candidatecapabilities were considered for this case study.
When asked to produce method adoption goals, the participantsstated they had rework problems due to miscommunication andpoorly described requirements. They also had effort estimation is-sues. In a dead-lock to decide between both issues we proposed towork with two goals (cf. Table 6.6):
CS3_G1: “Reduce rework due to communication issues and scopedefinition”

6.4 validation 117
CS3_G2: “Improve effort estimation”.
We performed the task Refine adoption goal twice, one time for eachgoal. Both goals delivered slightly similar results (cf. Table 6.6), be-ing Lead time the most important competitive priority (CS3_G1: 50.3%and CS3-G2: 68%). For CS3_G1, Scope was the second most importantwhile Quality was the third, whilst for CS3_G2 the opposite happened.Moreover, Quality had a similar percentage in both goals (CS3_G1:13.7% and CS3_G2: 14.9%). After performing the task Prioritize can-didate capabilities for each goal, we found out that the first five mostimportant capabilities were the same for both goals (cf. Figure 6.10-(c)),although they featured in different order. This outcome was expecteddue to both goals’ Refined MBSE goal adoption similarities. The resultssuggested adopting 2 capabilities from Requirements Modeling and onecapability from Logical Component Modeling, Logical Architecture Mod-eling, and System Behavior Testing. However, the last two capabilitieshave requirements not present in the current team’s Maturity profile,namely LAM G and SBT B.
reflection on the model : The participants agreed with the ap-proach results, especially regarding system testing capabilities. Theystated that “the results help decide the next improvement steps” and rec-ommended the approach use in their team. They said “the approachidentified many improvement points that were under the radar” (thus com-pliance with R3). The approach application using two goals was anexciting experience. Compared to the other “one-goal” case studies,the extra effort was not significant; only the tasks Define MBSE adop-tion goal, Refine goal, and Prioritize candidate capabilities needed to beexecuted twice. The participants disclosed that the time required toperform the approach was acceptable (compliance with R1).
6.4.1.5 Case study 4 (CS4)
The team of the case study four developed systems for military op-erations. It was composed of six team members and applied Scrumdevelopment methodology. We performed all workflow steps (cf. Sec-tion 6.3.2) in a single face-to-face meeting lasting one and a half-hour.A single team member with the roles of project and product managerparticipated in the case study. Since the team worked under an agilemethodology, few artifacts besides code were produced used. Thus,very few capabilities were marked as being present (cf. Figure 6.11-(a))since MBSE MM is artifact-oriented (cf. Section 2.4). After performing

118 goal-benefit decision calculus for mbse method selection
Perfil de maturidade – Top 5 – Objetivo 2
19
Operational ContextContext
Analysis Knowledge Context
Scoping
Goal Modeling
Scenario Modeling
Requirements Modeling
Sys. Function Modeling
Sys. Function Specification
Event Chain Modeling
Mode Modeling
Log. Architecture Modeling
Log. Component Modeling
System Behavior Testing
Technical Architecture Modeling
Technical Component Modeling
Requirements
System
Functions
Architecture
Testing
Technical
Implementation
A B C D E F G
A B C D
A B C D E
A B C D E F
A B C D E F G
A B C D E GF
A B C D
A B C D E F
A B C D
A B C D
A B C D E F G
A B C D E
A B C D
A B C D E F
A B C D
Figure 6.10: Case study 3 - (a) blue capabilities: current team MBSE maturityprofile, (b) green and yellow capabilities: candidate capabilitiesfor adoption, (c) yellow capabilities: five first prioritized capabil-ities for both goals.
the maturity assessment, 24 candidate capabilities were selected (cf.Figure 6.11-(b)).
The team adoption goal was defined as:
“Automate system analysis”.
Next, the participant applied AHP to refine the goal’s relation withthe competitive priorities (cf. Table 6.6). Quality was defined as themost important competitive priority with 68.0% of relevance, followedby Lead Time (19.8%), and not so far Scope (13.0%) (cf. Table 6.6). Be-longed to the five first from the Prioritized list of candidate capabilitiesa capability from Scenario Modelling focus area which the team hadno capability insofar (cf. Figure 6.11). The same for System BehaviorTesting. Other focus areas from this set of capabilities were Require-ments Modeling, System Function Specification, and Logical ArchitectureModeling (cf. Figure 6.11-(c)).
reflections on the model : The case study 4 participant statedthat “the model presents things that could be done and currently are not”.The approach makes improvement opportunities explicit; thus, adher-ence to requirement R3. The participant suggested that “identify anddocument” capabilities should be split (i.e., identifying without docu-menting shall be possible). He also suggested that the approach couldsupport partial capability implementation. Considering the team’s de-

6.4 validation 119
DSOpTer – Perfil de maturidade, capacidades candidatas e
top 5
26
Operational ContextContext
Analysis Knowledge Context
Scoping
Goal Modeling
Scenario Modeling
Requirements Modeling
Sys. Function Modeling
Sys. Function Specification
Event Chain Modeling
Mode Modeling
Log. Architecture Modeling
Log. Component Modeling
System Behavior Testing
Technical Architecture Modeling
Technical Component Modeling
Requirements
System
Functions
Architecture
Testing
Technical
Implementation
A B C D E F G
A B C D
A B C D E
A B C D E F
A B C D E F G
A B C D E GF
A B C D
A B C D E F
A B C D
A B C D
A B C D E F G
A B C D E
A B C D
A B C D E F
A B C D
Figure 6.11: Case study 4 - (a) blue capabilities: current team MBSE maturityprofile, (b) green and yellow capabilities: candidate capabilitiesfor adoption, (c) yellow capabilities: five first prioritized capabil-ities.
velopment methodology, i. e., Scrum, receiving such feedback seemsreasonable. We see this as a granularity issue on the capabilities’ de-scription. If a capability can be partially implemented, it should bebroken down into two full-implementable and less complex capabili-ties. The participant perceived the time spent to execute the approachcompatible with the perceived benefits (thus adherence to require-ment R1).
6.4.1.6 Case study 5 (CS5)
The team from case study five developed recruiting and staff mo-bilization information systems for military operations and had fourmembers. Most of their work at the time was related to systems de-velopment for replacing analogical business processes. The case studydata was gathered in one and a half-hour long face-to-face interviewwith the system manager.
The team member stated that the team adoption goal was:
“Improve the ability of the team”.
This goal is quite generic, and it is yet not clear which benefits canhelp fulfill it. Further, we performed the task Refine goal and the re-sults put great emphasis on Lead Time (43.4%), Scope (34.6%), andQuality(18.3%) (cf. Table 6.6). From the prioritized list of candidate

120 goal-benefit decision calculus for mbse method selection
SERMILMOB – Perfil de maturidade,
capacidades candidatas e top 5 capacidades
32
Operational ContextContext
Analysis Knowledge Context
Scoping
Goal Modeling
Scenario Modeling
Requirements Modeling
Sys. Function Modeling
Sys. Function Specification
Event Chain Modeling
Mode Modeling
Log. Architecture Modeling
Log. Component Modeling
System Behavior Testing
Technical Architecture Modeling
Technical Component Modeling
Requirements
System
Functions
Architecture
Testing
Technical
Implementation
A B C D E F G
A B C D
A B C D E
A B C D E F
A B C D E F G
A B C D E GF
A B C D
A B C D E F
A B C D
A B C D
A B C D E F G
A B C D E
A B C D
A B C D E F
A B C D
Figure 6.12: Case study 5 - (a) blue capabilities: current team MBSE maturityprofile, (b) green and yellow capabilities: candidate capabilitiesfor adoption, (c) yellow capabilities: five first prioritized capabil-ities.
capabilities, among the first five (cf. Figure 6.12-(c)) were two capa-bilities from the Requirements Modeling focus area (RM C and RM D).According to the Maturity profile, the team had only two implementedcapabilities from this focus area, and further development would mostlikely bring great benefit towards the adoption goal.
reflections on the model : The participant perceived the ap-proach “very important” and it “gives the opportunity to think” aboutthe processes of the team. He also said that it “shows the things thatare done well, and what possible improvement points are” (adherence toR3). He suggested a more elaborate description considering capabilityadoption and stated the execution effort was acceptable (complianceto R1).
6.4.1.7 Case study 6 (CS6)
Case study six was performed in a team specialized in system cyber-security. Its twelve members’ duty was to support other teams in thesame organization regarding cyber-security. Their duties involved in-spection of files for malware and proof testing other teams developedsystems. Much of the work they need to carry was mainly repeti-tive, and any software development was for internal use (e.g., scripts).This setting could be seen in their Maturity profile (cf. Figure 6.13-(a)),

6.4 validation 121
DSSegCyber – Perfil de maturidade, capacidades candidatas
e top 5 capacidades
38
Operational ContextContext
Analysis Knowledge Context
Scoping
Goal Modeling
Scenario Modeling
Requirements Modeling
Sys. Function Modeling
Sys. Function Specification
Event Chain Modeling
Mode Modeling
Log. Architecture Modeling
Log. Component Modeling
System Behavior Testing
Technical Architecture Modeling
Technical Component Modeling
Requirements
System
Functions
Architecture
Testing
Technical
Implementation
A B C D E F G
A B C D
A B C D E
A B C D E F
A B C D E F G
A B C D E GF
A B C D
A B C D E F
A B C D
A B C D
A B C D E F G
A B C D E
A B C D
A B C D E F
A B C D
Figure 6.13: Case study 6 - (a) blue capabilities: current team MBSE maturityprofile, (b) green and yellow capabilities: candidate capabilitiesfor adoption, (c) yellow capabilities: five first prioritized capabil-ities.
which disclosed a high degree of automation. We interviewed theteam’s project manager in a face-to-face meeting lasting one and ahalf hours. Only nine candidate capabilities were selected for this casestudy due to the high maturity level of its processes. The participantdefined the MBSE adoption goal as
“Bring greater automation to artifact treatment tasks”.
After performing the “Refine goal” task (cf. Table 6.6), Quality wasdefined as the most important competitive priority (61%) followedby Scope as second (26.2%). After the Prioritize candidate capabilitiestask, the five best-ranked candidate capabilities were two from LogicalArchitecture Modeling and one from Operational Context, RequirementModeling, and Mode Modeling (cf. Figure 6.13-(c)).
reflection on the model : The case study participant statedthat “without doubt the approach helps to decide the next improvement steps”(compliance to R3). He declared that he would have liked to spendmore time applying the approach, i. e., the approach application wasperceived to be hastily, and he would have liked to discuss the con-cepts in more detail. We were trying to apply the approach usingless time as possible to make it compliant with R1. Anyhow, his re-marks are valid, and perhaps we should be more sensitive to the teammembers’ need for more discussion.

122 goal-benefit decision calculus for mbse method selection
Table 6.6: Instance of Goal refinement for each goal of the case studies.
Goal/Competitive priority Cost Lead T. Quality Scope
CS1: Enhance communicationbetween software and system de-velopment teams.
4.7% 11.9% 29.8% 53.6%
CS2: Improve knowledge trans-fer.
3.7% 35.3% 45.0% 16.0%
CS3-1: Reduce rework due tocommunication issues and scopedefinition.
3.6% 50.3% 13.7% 32.4%
CS3-2: Improve effort estima-tion.
5.4% 68.0% 14.9% 11.7%
CS4: Automate system analysis. 4.9% 19.8% 62.3% 13.0%
CS5: Improve ability of the team. 3.7% 43.4% 18.3% 34.6%
CS6: Automate artifact treat-ment tasks.
3.0% 9.8% 61.0% 26.2%
Average: 4.1% 34.1% 35.0% 26.8%

6.4 validation 123
Table 6.7: Top 5 capabilities from the sensitivity analysis one-at-a-time foreach competitive priority plus Refined MBSE adoption goal fromcase study 1.
Posi. Cost Quality Lead time Scope CS1
1. SFS D SFS C SFS D RM B SFS C
2. SFS C SFS D SFS C SFS D SFS D
3. SFM C SFM C SFM C SFS C RM B
4. LAM C LAM C OPC C RM A OPC C
5. OPC C OPC C LAM C OPC C SFM C
6.4.2 Quantitative evaluation
In this subsection, we intend to test if the approach adheres to therequirement R2. The approach must react to different types of relationshipsbetween input and output variables. For this means, we would like to testhow different values attributed to competitive priorities could changethe prioritization of candidate capabilities. One way to achieve this isthrough sensitivity analysis which performs the role of ordering thestrength and relevance of the inputs in determining the variation inthe output (Vetschera, 2006). We selected one of the most commonapproaches called One-at-a-time (OAT) sampling (Saltelli, 2008) whereonly one parameter changes values between consecutive simulations.We decided to change the importance of competitive priorities tosimulate the influence of different goal refinements in the approachoutput. For this simulation we used the Team’s benefit potential values(cf. Table 6.5) and candidate capability set from the case study 1 (cf.Section 6.4.1.2). We also added the results of the Refined MBSE adoptiongoal from case study 1 (CS1) to the comparison.
The simulations consisted of selecting one competitive priority togive the most significant importance, whilst the other competitive pri-orities were given equal priority compared to each other during thetask Refine goal. This rating resulted in 750 points for the most impor-tant competitive priority and 83 points for the others. We repeated thistask four times, one for each competitive priority. Then we analyzedthe five first candidate capabilities from the task Prioritize candidatecapabilities for each of these configurations (cf. Table 6.7).
In this analysis, the capabilities System Function Specification C andD, SFS C and SFS D for short, were ranked most relevant twice each(SFS C in the Quality and CS1 groups, and SFS D in the Cost and

124 goal-benefit decision calculus for mbse method selection
Lead time groups), and were present in all groups. This outcome is nosurprise since these capabilities can deliver many benefits with stronginfluence, i. e., they summed many points from the MBSE expert as-sessment (cf. Table 6.3). Together with capability OPC C, they werealways present in all groups (cf. Table 6.7). The Scope group had twocapabilities from the Requirements Management focus area (i.e., RM Aand RM B) as most important while only the CS1 group had RM B inits list. This focus area is essential for choosing the best features, thusthe high performance in this group. With this analysis, we present evi-dence that the model complies with requirement R2. The analysis wasdone considering the case study 1 team-specific relations between ben-efits and competitive priorities. Different teams with distinct valuesfor the relations would provide other results; thus, the same analysisbetween different case studies would not make sense.
6.5 discussion
This section discusses cross-case studies impressions, the approachmechanics, its novelty, and limitations.
6.5.1 Cross-case analysis
Concomitantly while presenting the case studies, we discussed theparticularities found during their execution in a paragraph namedReflections on the model. In this subsection, we would like to discussand compare cross-case studies impressions.
A thing that caught our attention after performing the task Refinegoal was that in all case studies, the competitive priority Cost wascategorized as the least important (cf. Table 6.6). We have a coupleof hypotheses regarding this phenomenon. One hypothesis is that theteams did not face fierce market competition regarding the developedsystem’s cost; perhaps they only provided services on a fixed contractwith little room to benefit from this competitive priority. Anotherhypothesis is that the case study participants did not belong to ahierarchy level where cost is of concern; thus, emphasizing the othercompetitive priorities. A third hypothesis is a perception that processimprovement is a costly endeavor; thus, people hardly see it as a wayto save money, although better processes are meant to reduce costs.We cannot be sure of the cause, and further empirical research isneeded to assess these hypotheses.
During the case studies, the task execution order was not alwaysthe same, and this happened due to the availability of case study

6.5 discussion 125
participants or the limited interview time available. In case study 2
(cf. Section 6.4.1.3), the task Characterize team context was executedbefore task Define MBSE adoption goal and the MBSE adoption goaldefined by the team gave us the impression that the participants wereinfluenced by what they learned during the approach execution whendefining the goal. A similar phenomenon happened in case study 4,where the goal definition seemed influenced by capability descriptionduring the task Assess team process maturity. To prevent such issues,we believe that the most appropriate task order would be first toperform the Define MBSE adoption goal task, then Characterize teamcontext and finally Assess team process maturity. This ordering shallprevent influence in the goal definition regarding the MBSE benefitsand capability description.
The approach was designed to be executed considering a singleMBSE adoption goal. However, in case study 3 (cf. Section 6.4.1.4),we performed the approach using two goals. The team was unableto decide on a single goal; then, we suggested trying with both. Forthis, we executed the tasks Refined MBSE adoption goal and Prioritizecandidate capabilities one time for each goal. Since both goals werefor the same team, the other tasks needed to be executed only once.The five best candidate capabilities were similar for both adoptiongoals since the Refined MBSE adoption goal artifact for both goals weresimilar (cf. Table 6.6). In the end, it became clear which capabilitieswere very interesting for both goals, and this gave the team higherassurance on the results. However, we still think that deciding ona single goal is better, and using two goals makes interpreting theresults less objective.
We also perceived differences in the approach execution concerningdevelopment methodology. In case study 4 (cf. Section 6.4.1.5), duringthe task Assess team process maturity, few capabilities could be checkedas implemented in the team. The reason for this phenomenon was theteam’s development methodology, namely Scrum. Agile methodolo-gies advocate minimal use of artifacts, so the team’s effort is solelyfocused on system development (Beck, 2000). In turn, the capabilitiesof the MBSE MM are verified through the existence of artifacts createdin the development process. We believe this is a limitation of the MBSEMM, which might need to be modified for considering artifact-lowmethodologies (Wagenaar et al., 2018).
6.5.2 Approach mechanics
The type of problem we are proposing to solve can be classified as amulti-attribute problem with a given set of alternatives (Franco and

126 goal-benefit decision calculus for mbse method selection
Montibeller, 2011; Vetschera, 2006). The set comprises capabilities thatcould be implemented in a development team, and the attributes arebenefits afforded once these capabilities are implemented, which mustbe aligned with the adoption goal.
The approach accuracy relies on the team context perception by theteam members, thus gathering as many associates as possible fromrelevant roles enriches the approach’s outcome. A drawback is theapproach execution cost increase. The participant’s experience shouldalso be of concern; more senior associates usually can provide betteranswers.
The amount of points a candidate capability receives as a result ofthe task Prioritize candidate capabilities is variable and depends on thetotal number of selected candidate capabilities. Thus, the points a can-didate capability receives can only be used to compare different “runs”of the approach when considering the same candidate capabilities.
The Candidate capability affordances artifact contains information onthe benefits each candidate capability can deliver and their respectiveintensity, using the no-low-high numeric scale (cf. Section 6.3.1.5).The sum of these values in each capability can reach up to 20 (i.e.,at most 2 per relationship times ten benefits). Within this selectedset of 53 capabilities from the case studies (cf. Section 6.4.1.1), thecapability with the highest value had 19, while the capability with theleast got only 3 (cf. Table 6.3). Such difference is realistic since somekey capabilities can greatly benefit some teams (especially ones withhigher maturity e.g., LAM G) while others deliver just little benefits.This phenomenon consequence is that these lower-scoring capabilitiesare less likely to be prioritized than the high-scoring ones.
Considering the benefits side of the same relation, the value sumrange depends on the number of capabilities considered. For the 53
candidate capabilities, this value can range between zero and 106
(i.e., 53 capabilities times 2). The benefit with highest value sum wasImproved verification and validation with 67, followed closely by Improvedquality of specification (66) and Better communication (65). Summinghigher values means that many capabilities can deliver this benefitor with stronger intensity. The benefit with the least value sum wasEasier reuse of existing artifacts (43).
The instantiation method execution (cf. Figure 6.3) required be-tween one hour and a half, and four hours for the case studies. Thetask Refine goal requires six tool-supported comparisons between com-petitive priorities using AHP. Characterize team context requires assess-ment of 40 relations in a three-degree scale. Assess candidate capabilitiesaffordaces requires the assessment of 800 relations when applied inthe whole model (80 capabilities times 10 Benefits). The small amount

6.5 discussion 127
of time needed for running the approach, the relatively few assess-ment units, and the possibility of reuse is additional evidence that theapproach fulfills the requirement R1.
An improvement opportunity for the approach that we realized af-ter the case studies is replacing the Scope competitive priority namefor something more intuitive. Scope is usually associated with the sizeof a project or systems, while in our approach, the term is used todefine the capacity to produce market-competitive functionalities. Attimes, we needed to remind the case study participants, not consid-ering the times we did not perceive the misunderstanding and thatno amendment was made. The problem was not the concept but thename, which was misleading at times. Perhaps using a different namesuch as Functionality could prevent that.
6.5.3 The approach novelty
Our approach segments and relates different domains (organizational,MBSE) and allows experts’ knowledge reuse by non-experts. Thatis the main difference from other prioritization techniques, whichrequires knowledge about the elements in question and the moti-vation for their prioritization at the same time. Our approach usesAHP to refine the process improvement goal in the four competitivepriorities. Process engineering approaches are using AHP to supportsoftware process prioritization (Lorenz and Brasil, 2014) and businessprocess re-engineering (Rao, Mansingh, and Osei-Bryson, 2012). How-ever, AHP requires executors to have in-depth knowledge about theassessment’s goal and elements. The executors, in our case, are theteam members who know the former but not the latter. Thus, we needexperts to report the gains related to capability implementation. Ourapproach tackles this issue by collecting and linking the MBSE experts’knowledge with the team members’ context and goal knowledge. Asmore MBSE expert assessments are gathered, the more robust andprecise the approach becomes. The Candidate capability affordances canbe reused in different teams and enhanced through further expertanalysis. Additionally, AHP is not adequate with many options be-cause the number of comparisons increases drastically, and the focusis lost among all the possibilities.
6.5.4 Limitations
In any process adoption endeavor, several factors need to be takeninto account (e.g., project constraints), many of which are not currently

128 goal-benefit decision calculus for mbse method selection
contemplated by our approach. Thus, the approach’s results shouldnot be taken as it is, but be used as a starting point for discussions onMBSE method adoption. Further dimensions not considered in thismodel but relevant when adopting MBSE are costs, project availabilityfor piloting, time flexibility, knowledge of the team, and criticality ofprojects (Amorim et al., 2019; Vogelsang et al., 2017).
6.6 relation between the goal-benefit model and the
method value ascription model
The goal-benefit elements instantiates the method value ascriptionmodel elements (cf. Chapter 5) as seen in Figure 6.14. The approachelements are depicted using the orange color, elements in blue arerelated to the MBSE MM (MBSE Candidate Capabilities, MBSE MaturityModel, and Team’s MBSE Maturity Profile). The Adoption goal element,which is an essential part for method value ascription, is instantiatedby the Refined MBSE adoption goal. The Value Methods are instantiatedby the MBSE Candidate Capabilities selected after the Assess team processmaturity task is performed. The MBSE Benefits instantiate the Benefitselements which, together with the Costs element, builds the ValuationRelationship. The Value Method Qualities is instantiated by the Capabilityaffordances. The Team’s Context is composed of two elements, the Team’sbenefit potential and the Team’s MBSE Maturity Profile.

6.6 relation between the approach and the method value ascription model 129
Figu
re6
.14
:Ele
men
tsof
the
appr
oach
inre
lati
onto
the
valu
em
etho
das
crip
tion
mod
el(c
f.C
hapt
er5
).


7S TAT E O F T H E A RT
This chapter presents the relevant work related to this thesis’s topic,namely studies on MBSE adoption experiences, adoption best practices,and method selection. After summarizing each work, we provide aparagraph to discuss the relation with our thesis. Our goal was todescribe the relevance of selected work units and compare it to thecontributions of this thesis.
Section 7.1 outlines works on MBSE adoption. Based on empiricalsurveys, the selected studies attempting to extract impressions frompractitioners’ experiences towards MBSE adoption. Additionally, someworks present best practices and strategies to improve adoption suc-cess. This subsection strongly relates to Chapter 3, where we analyzethe forces that foster and hinders MBSE adoption in embedded systemsorganizations, and Chapter 4, where we present eighteen strategiesand best practices improving the adoption endeavor efficiency.
Section 7.2 outlines work on organizational context modeling andits influence on method selection. We show that the definition offactors is very domain-dependent, and their relation with methodselection is not easy to establish due to domain-specific characteristics.In Chapter 5, we denote the relevance of the context towards methodvalue ascription and differentiate it between environment and teamcontext. In Chapter 6, the team’s context is modeled in two ways,through the Maturity profile and the Team’s benefit potential.
Section 7.3 outlines work on goal modeling and respective con-crete actions towards goal fulfillment. We show that the proposedmodels are pretty good for informative and elicitation purposes, butthey lack prioritization methods or more sophisticated decision sup-port. In Chapter 5, we describe how the goal influences the benefits’perception. In Chapter 6, the MBSE adoption goal is refined usingcompetitive priorities and related to benefits harvested upon methodadoption.
Section 7.4 outlines work on method selection rationale in differentsoftware engineering domains. We show that the current work is rele-vant but too specific or general. However, the selected approaches pro-vided us with suitable material for building our approach (cf. Chap-ter 6) fitted for our needs.
131

132 state of the art
Section 7.5 outlines work on the area of Benefits Management. Welook into the most prominent diagrams, namely the Benefits Depen-dency Network, the Benefits Dependency Map, and the Results ChainModeling. Finally, we compare these diagrams elements with the goal-benefit model elements proposed in Chapter 6.
7.1 model-based systems engineering adoption
MBSE method adoption is not so straightforward, thus several worksaddress this topic.
Bone and Cloutier , 2010 report on a survey conducted by theOMG, in which participants were asked about MBSE adoption withintheir organization. The main reason to adopt MBSE was “to improvethe quality of requirements and design to reduce downstream de-fects”, which was selected by 72.9% of the respondents. Culture andgeneral resistance to change was identified in the study as the largestinhibitor for MBSE adoption (cf. Figure 7.1). The study found thatSysML is being used primarily for large-scale systems. Their resultsshow overall satisfaction with MBSE (respondents rated satisfactionwith 3.77 out of 5.00 points). Despite the high satisfaction of respon-dents, inertia is difficult to overcome in larger companies. They con-cluded that issues with MBSE adoption and usage might lie outsideof MBSE and SysML.
Relation to our thesis. Their study scope and findings have someoverlaps with our studies scope (e. g., inhibitors for MBSE adoption)and findings in both of our studies (cf. Chapter 3 and Chapter 4).However, we had a more exploratory (i. e., open coding (DeCuir-Gunby, Marshall, and Mcculloch, 2011)) approach using interviewswhilst they built hypotheses before gathering empirical evidencethrough surveys. We used surveys to confirm our theory building (cf.Chapter 4).
Motamedian , 2013 performed an applicability analysis for MBSE.Similar to the results of Bone and Cloutier (Bone and Cloutier, 2010),Motamedian found that MBSE is widely used in specific applicationareas. She reported that 50–80% of respondents declared using MBSEin real programs or projects work in defense and aircraft industries. Incontrast, overall responses, only around 10% of participants claimedthat they use MBSE in their organization. The study identified lack ofrelated knowledge and skills as the main barrier to MBSE introduction.She also reports on an online survey among MBSE practitioners. The

7.1 model-based systems engineering adoption 133
Figure 7.1: Inhibitors to MBSE adoption (from (Bone and Cloutier, 2010)).
author’s goals were: (1) to highlight the position of MBSE in realprojects, (2) to assess the popularity rate of MBSE concept amongengineers, and (3) the usage besides the advantages (i.e., barriers andconcerns of using “modeling language” and “modeling tools”) inMBSE efforts among various industries.
Relation to our thesis. The aforementioned study overlaps with ourswhen looking for barriers and concerns to MBSE introduction. In ourwork, we used the term hindering forces (cf. Chapter 3) and their find-ing as the main barrier for adoption was the same as ours (i. e., Skillof employees).
Fosse and Bayer , 2016 present in an MBSE workshop thelessons learned while implementing MBSE in the Jet PropulsionLaboratory of the American National Space Agency (NASA) at theMars2020 project. The MBSE adoption goals of the aforementionedproject were (1) achieve better awareness of the technical baseline,(2) improve the communication, understanding, and visibility of thedesign, (3) focus on heritage design deviations, and (4) let productsdrive model implementation. They list and discuss the benefits ofMBSE, compares it to traditional Systems Engineering (SE),
Relation to our thesis. Although their study is not peer-reviewed andcomprises only a single case study, the project that they analyzed(MARS2020) was very relevant, many of their findings are alignedto ours (i. e., their lessons learned matched with many of our strate-

134 state of the art
gies and best practices (cf. Chapter 4)). Further work is required toguarantee generalization.
Carroll and Malins , 2016 describe the benefits of MBSEadoption extracted from a series of case studies. At the end of thestudy, the authors present a list of implementation lessons drawnfrom the findings. For them, the cultural changes necessary to imple-ment an MBSE approach successfully (roles, rewards, behavior, andsupport at all levels) were described as the most difficult challengesto overcome.
Relation to our thesis. Our list of strategies and best practices (cf.Chapter 4) is similar to the implementation lessons presented by theauthors. They also elicited benefits of MBSE adoption, which is not thefocus of our research, but it is part of our approach for selecting MBSE
methods (cf. Chapter 6).
(Kuhn , Murphy, and Thompson, 2012) and (Aranda ,Damian , and Borici , 2012) reported on the experience of usingMBSE in large companies. Kuhn et al. (Kuhn, Murphy, and Thompson,2012) focus on contextual forces and frictions of MBSE adoption inlarge companies. They found that diffing in product lines, problem-specificlanguages and types, live modeling, and traceability between artifacts arethe main drivers for adopting MBSE. Aranda et al. (Aranda, Damian,and Borici, 2012) focus more on developers and infrastructure changes.They conclude that MBSE brings developers closer, disrupts organiza-tional structures, and achieves productivity improvements.
Relation to our thesis. The frictions, drivers, and contextual forcesfrom (Kuhn, Murphy, and Thompson, 2012) are very similar to thehindering and fostering forces in our work (cf. Chapter 3). The authorsfrom (Aranda, Damian, and Borici, 2012) also investigated the benefitsof adoption, similar to our minor contribution (cf. Section 2.2.2).
karban et al . (Karban et al . , 2010) reported on the advan-tages of MBSE introduction with a concrete example. They analyzedthe development of a telescope system with SysML modeling. As thisis a complex system, it was necessary to model variants of function,interfaces, and structure. The introduction of MBSE was evaluatedvery positively.
Relation to our thesis. This report of a successful MBSE adoptionshed light on the fostering forces (especially pull) that makes MBSEadoption

7.1 model-based systems engineering adoption 135
Hohl et al . , 2016 did a similar work as we and inspired thecategorization schema from Chapter 3. They performed their studyusing similar categorization of motivational factors for process change(i. e., Forces of Progress (Klement, 2018)). In their case, the processadoption was agile methods.
Relation to our thesis. The authors consider two extra forces, triggers,a fostering force, and context, which is a hindering force. We did notinclude these in our analysis because the trigger and the push forceare very similar, and the context force bears similarities to the othertwo hindering forces. Additionally, context can be a fostering force attimes.
hutchinson et al . published many papers that focus on theadoption of Model-Driven Engineering (MDE) in the context ofsoftware development (Hutchinson, Rouncefield, and Whittle, 2011;Hutchinson, Whittle, and Rouncefield, 2014; Hutchinson et al., 2011;Whittle, Hutchinson, and Rouncefield, 2014; Whittle et al., 2017). Theirresearch comprises case studies built around semi-structured inter-views and online surveys devised to gather information about MDEusage through closed questions (e.g., diagrams used for modeling,modeling languages, MDE purpose of use). In (Hutchinson, Rounce-field, and Whittle, 2011), the authors describe the practices of threecommercial organizations as they adopted MBSE. In (Hutchinson,Whittle, and Rouncefield, 2014), their findings are summarized intoten dimensions of organizational attitude to MDE adoption, half beinghelpful responses and the other half being unhelpful.
Relation to our thesis. The authors’ responses are described in ageneral manner. Table 7.1 provides the relations between their help-ful responses and the best practices described by us in Chapter 6.In (Hutchinson et al., 2011; Whittle, Hutchinson, and Rouncefield,2014), the authors state that MDE should be tried on projects that“can not fail”. We also reported similar finding as presented by BP02.In (Whittle et al., 2017), they present a taxonomy of MDE tool relatedissues; ‘Chaining tools together’ and ‘Flexibility of tools’ are coveredby BP06, ‘Sustainability of tools over the long term’ and ‘How to se-lect tools’ are related to BP08. Albeit the intersection of our findingswith the work of the aforementioned authors, our contribution goesfurther:
• Their focus was MDE (a software development methodologythat encompasses models and code generation) whilst our focusis on MBSE (a systems engineering methodology devised forcovering mechatronics, electronic, and software parts). MDE isa subset of MBSE (i.e., MDE ⊆ MBSE).

136 state of the art
Table 7.1: Hutchinson’s responses and related best practices.
Response Best practice
Adaptive BP14, BP16, BP17
Business led -
Committed BP03, BP07, BP10, BP18
Iterative BP05
Progressive BP05
• Their case study findings are based on anecdotal evidence,whilst we used questionnaires to empirically validate and gener-alize our conclusions with practitioners in a triangulation (Den-zin, 2006) fashion (i.e., the questionnaire was built based on theconclusions we derived from the interviews (cf. Section 4.2)).
• Their findings are laid out within discussions of case studieswhilst we provide a crisp list of best practices and a prioritizedlist of the six most important ones, aiming to help practitionersknow where to focus.
other studies Besides these meta-studies on MBSE adoption,several case studies exist on applying model-based techniques to com-plex systems in different domains (e.g., telescope systems (Karbanet al., 2010), railway (Böhm et al., 2014), automotive (Vogelsang, Fem-mer, and Winkler, 2015), maritime traffic (Vogelsang et al., 2014)). Notspecific to MBSE, but technology transfer, in general, is the focus ofDiebold et al. (Diebold, Vetrò, and Fernández, 2015). They identifiedbarriers to knowledge transfer in two German research projects andpointed out solutions. Besides, they propose an evaluation frameworkfor assessing technology transfer in software engineering projects.
7.2 context modeling
In this section, we discuss the relevant studies on attempts to shapethe solution space of method adoption and maturity models basedon situational factors (e.g., team size, development philosophy, team’ssector).

7.2 context modeling 137
situational method engineering provides a solution to theproblem of selection, creation, or modification of methods for or-ganizations or their projects based on their contextual characteris-tics (Henderson-Sellers et al., 2014). It is an extension of the MethodEngineering (Brinkkemper, 1996) and has been the focus of numer-ous authors (Henderson-Sellers and Ralyté, 2010). In this approach,method fragments (or method chunks) are selected from a methoddatabase to build tailored methods according to the organization pur-pose and context. The situational method engineering puts greateremphasis on the organization context during its execution.
Relation to our thesis. The aforementioned approach focuses on in-house construction as opposed to the adoption of ready-made meth-ods. We are interested in the problem of method selection, but notin the creation or modification, since we use capabilities defined bythe MBSE MM (cf. Section 2.4). The contingency for method selectionproposed by the situational method engineering is not applicablewithout further ado.
bekkers et. al . The authors have extensive work on organiza-tion situational context and software product management processimprovement. In (Bekkers et al., 2008), the authors analyzed whichsituational factors influence process selection of software product man-agement method fragments (Brinkkemper, 1996). Their results are 27
situational factors in 5 categories and respective influence levels onthe method selection. In (Bekkers and Spruit, 2010; Bekkers et al.,2010), the authors propose the Situational Assessment Method forthe Software Product Management Maturity Matrix. The proposedapproach helps software product managers evaluating and improv-ing their processes through recommendations based on the context ofthe organization and the organization itself. These recommendationsdetermine which capabilities from the maturity matrix are adequateto the organization being assessed.
Relation to our thesis. The authors’ work is very similar to oursin many points; both seek ways to select the best suitable methodsaccording to the organizational context, and both work with focus areamaturity models (the MBSE MM in our case). Our work differentiatesfrom theirs on considering the team adoption goal and the benefitsgenerated by the methods.
baars and mijnhardt In (Baars et al., 2016), the authors ana-lyzed the influence of organizational characteristics in an informationsecurity focus area maturity matrix. They conclude that the maturityframework has a poor model fit and should consider differences be-

138 state of the art
tween characteristics of organizations. Further, in (Mijnhardt, Baars,and Spruit, 2016), the authors propose a model for relating measurableorganizational characteristics in the context of the aforementionedmaturity framework. These characteristics help SMEs distinguish andprioritize risk mitigation.
Relation to our thesis. The goals and elements of their studies arevery similar to ours, i. e., selecting best fitting capabilities from a ma-turity matrix. A plus point of their work is that they describe crispymeasurements for the situational factors, making their approach moreprecise. However, they also do not consider the adoption goal forcapability selection.
clarke and o’connor (Clarke and O’Connor, 2012) proposesa reference framework of situational factors affecting the software de-velopment process. The resulting framework was built by applyingdata coding techniques from grounded theory into related research.The framework consists of eight classifications and 44 factors, suchas the nature of the application(s) under development, team size,requirements volatility, and personnel experience. They claim theirframework provides support for practitioners defining and maintain-ing software development processes.
Relation to our thesis. The problem with situational factors is thatthey are domain-specific, and their influence on capabilities is hard tovalidate empirically. We initially wanted to work in this direction, butwe soon realized that situational factors could have different meaningsin different contexts. When defining Team’s benefit potential, situationalfactors are implicitly considered in our approach (cf. Chapter 6), and,from our point of view, this is the most appropriate way to acknowl-edge them.
7.3 goal modeling
Goal modeling aims to break down goals into sub-goals and relatethem to concrete activities for their fulfillment. In Requirements En-gineering, it helps to understand and document the stakeholders’goals towards a system, which provides means for deriving systemsrequirements (Horkoff and Yu, 2011; Van Lamsweerde, 2001). Thefollowing frameworks were investigated to understand how these re-lations could be modeled and which parts could be interesting for ourapproach presented in Chapter 6.

7.3 goal modeling 139
Figure 7.2: Overview of the Business Motivation Model.
business motivation model (OMG, 2010) provides a structurefor developing, communicating, and managing business plans. Themodel defines “Ends” and “Means” elements (cf. Figure 7.2). The for-mer describes the envisioned state an organization wants to achieve,to either change or maintain its current position relative to its marketand competition. The latter describes how the organization choosesto achieve the former and is composed of Mission, Course of Action,and Directives. Ends are refined in Vision and Desired Results, andDesired Results as Goals and Objectives.
Relation to our thesis. The Desired Result from the End element isvery similar to the MBSE adoption goal element of the goal-benefitmodel from Chapter 6. The Course of Action from the Means elementis analogous to the Candidate Capabilities of the same model. TheBusiness Motivation Model does a great job relating these elements.However, this model does not provide tools for comparing strategies.
the istar framework (Yu et al., 2011) is a modeling languagethat helps to understand the problem domain by modeling the as-is and to-be situations. It was created for modeling organizationalenvironments and encompasses information systems (i. e., resources),

140 state of the art
actors and their goals (i. e., goal, soft goal), and tasks. The model repre-sents actors depending on each other to perform tasks, use resources,and finally achieve their goals. The model exposes dependencies be-tween these elements, which are many times competing.
Relation to our thesis. The iStar framework is very efficient for iden-tifying stakeholders’ goal and their relations, enabling engineers tobetter reason about systems. In our approach, we consider a singlegoal and stakeholder (i. e., MBSE adopting organization), and ourconcern is how to relate the MBSE methods with the adoption goalmeaningfully.
the kaos framework (Van Lamsweerde, 2001) is a goal model-ing framework for requirements engineering. KAOS is an acronym forKnowledge Acquisition in autOmated Specification. The frameworkhas four types of interlinked models, namely the goal model, the respon-sibility model, the object model, and the operation model (cf. Figure 7.3).The goal element can be either refined into subgoals describing howit can be reached or justified by higher-level goals that explain itsintroduction. The goal refinement ends either at an expectation (whenrelated to an environment agent), a requirement (related to a systemagent), or a domain property.
Relation to our thesis. The KAOS framework makes explicit the justi-fication of system requirements by linking them to higher-level goals.The goal of our approach (cf. Chapter 6) is to link MBSE methodswith adoption goals to provide decision support when selecting thosemethods. Thus, the KAOS framework helped us to see the possiblekinds of relations that goals can have.
goal structuring notation The Goal structuring notation(GSN) is a modeling language for documenting safety, security, anddependability arguments. The diagrams are built through logic-basedmaps and are used to compose assurance cases for critical systems.They depict design goals related to strategies, assumptions, solutions,and justifications (cf. Figure 7.4). GSN is used within the Nuclear,Defence, Aerospace and Rail domains.
Relation to our thesis. The GSN bears a similar goal as our approachpresented in Chapter 6, namely the relation between goal and concretesteps. Their purpose is different, however. In GSN, this relation servesto provide arguments that the respective goal is fulfilled, whilst in ourapproach, the purpose is to assess the best way of achieving the goalconsidering the candidate solutions.

7.3 goal modeling 141
Figure 7.3: Overview of the KAOS meta-model (Dardenne, van Lamsweerde,and Fickas, 1993).
Figure 7.4: Elements of the Goal Structuring Notation.

142 state of the art
gqm+strategies (Basili et al., 2007) is an extension of the Goal-Question-Metric approach (Basili, Caldiera, and Rombach, 1994) tosupport organizational goals. This approach links software measure-ment goals to the software organization’s higher-level goals and fur-ther goals and business-level strategies. These relationships allowhigher-level decisions to be supported by measurement data. Elementsof this approach are strategy, goals, assumptions, and context. Goalsare differentiated into growth goals, success goals, maintenance goals,and specific focus goals.
Relation to our thesis. The approach proposed is very similar to ours(cf. Chapter 6) in the sense that both seek to link organizational-levelgoals to ways to achieve these goals. While the author’s approachis very general and its implementation requires further ado, our ap-proach is MBSE specific and can be easily used without any deviations.There are extensions to address rationales of decisions in a more con-crete manner, such as (Mandic and Gvozdenovic, 2017; Trendowicz,Heidrich, and Shintani, 2011). However, they still require further adoand the participation of domain specialists. Also, the rationale of deci-sions does not reach the level of granularity we believe is reasonable.
7.4 method selection
In this subsection, we discourse about method selection work.
ågerfalk and wistrand (Ågerfalk and Wistrand, 2003) pro-pose the inclusion of the rationality dimension in the description ofmethods. This dimension shall store the method creator’s values andassumptions about the problem domain when creating the method.It is divided into two different kinds of sub-rationale: method pre-scriptions anchored in goals, referred to as goal rationale, and goalsanchored in values, namely value rationale (cf. Figure 7.5). In theirmodel, goal achievement relations describe hierarchies between goals,and values are related to each other by a value anchoring relation.
Relation to our thesis. The reason for using a particular method canbe based on its contribution to other higher-level goals and its real-ization of (parts of) the method’s underlying philosophy as expressedby identified values. The proposed approach bears some similarity toours (cf. Chapter 6). However, this approach does not compare meth-ods to select the most interesting ones for the organization. Also, thevalue of a method is not static and depends on the organization’s goaland context (cf. Chapter 5).

7.4 method selection 143
Figure 7.5: Method rationale as constituted by goals, values and their rela-tionships (Ågerfalk and Wistrand, 2003).
conboy and fitzgerald (Conboy and Fitzgerald, 2010) devel-oped a framework to improve eXtreme Programming (XP) (Beck andAndres, 2004) method tailoring effectiveness. They extracted best prac-tices from a literature review and interviews with researchers andvalidated their findings with practitioners, which are summarized inthe following set of recommendations for research and practice:
• Explicit statement of method boundaries: teams had difficultyidentifying where XP should and should not be applied.
• Contingency built into the method itself to guide tailoring: tai-loring efforts were based on team members’ opinions and pref-erences.
• Clear description of method rationale behind method practices:advantages and disadvantages of each practice was unclear.
• Independence of individual method practices: the social andsofter nature of XP practices makes it very difficult to identifyco-dependencies and knock-on effects between practices.
• Identification of project context dependencies: XP adoption deci-sion rarely involved a formal analysis of situational dependen-cies and was often driven by one single “champion” withoutinput from team members or stakeholders.

144 state of the art
• Familiarity with a range of methods and method fragments: eas-ier practices were selected due to developers’ lack of knowledgeof all XP practices.
• Disciplined and purposeful approach to method tailoring: in-consistent adoption of practices across different team membersand difficulty monitoring adherence.
Relation to our thesis. The issues found by Conboy and Fitzgeraldare partially because of the characteristics of XP, partially due to issuesrelated to bad practices in methods adoption. In our exploratory stud-ies we found similar kind of problems (cf. Chapter 3) and proposedrespective solutions (cf. Chapter 4). Additionally, their study designbears some similarities to ours.
boehm and turner (Boehm and Turner, 2003) devised an ap-proach for selecting between agile and planned practices based onidentifying situational dependencies. The approach considers fivecritical agility and plan-driven factors: team size, project criticality,requirement change rate, personnel experience, and chaos thrivingorganizational culture (cf. Figure 7.6). It also comprises a risk assess-ment scheme composed of three classes of risk items:
• Environmental risk: technology uncertainties, many stakehold-ers, and complex system of systems.
• Agile risks: scalability, simple design, personnel turnover, andlack of skilled people in agile methods.
• Plan-driven risks: rapid change, demand for fast results, emer-gent requirements, lack of skilled people in plan-driven meth-ods.
Teams can use the approach to balance agile and plan-driven meth-ods in a customized software development strategy. The authors claimtheir approach can help organizations and projects take advantage ofagile and plan-driven methods’ benefits while mitigating many oftheir drawbacks.
Relation to our thesis. Context modeling and decision support ap-proach to select methods that best fit a team was also pursued by us(cf. Chapter 6). Boehm and Turner’s focus was between agile and plan-drive development whilst our approach was solely on MBSE methods.
huang and han (Huang and Han, 2006) proposes a decisionsupport model for determining the priorities of the Capability Matu-

7.4 method selection 145
Figure 7.6: The five axes represent the factors used to distinguish between ag-ile methods (toward the graph’s center) and plan-driven methods(that appear towards the periphery) (Boehm and Turner, 2003).

146 state of the art
rity Model Integration (CMMI) process areas. Their methods are basedon the fourteen general system characteristics from the Function PointAnalysis method (Garmus and Herron, 2001). In the original method,these characteristics are used for calibration (i. e., value adjustment fac-tor) when evaluating the overall complexity of a software application.The authors use the same scale and assessment concepts.
Relation to our thesis. In this study, the authors had the same goalas our contribution in Chapter 6, namely to provide decision supportfor selecting methods. Both methods use a maturity model to assessthe current state and possible development paths, their work focusingon the CMMI framework while we aimed for the MBSE MM. Like us,they assessed the characteristics of the methods with experts, andthey also have a small context assessment represented. However, ourwork focused on the adoption goal, while their work focused on thedeveloped system characteristics.
7.5 benefits management
Benefits Management (or Benefits Realization Management) is aproject management discipline aiming to close the gap between strat-egy planning and project execution by ensuring the implementationof the most valuable initiatives (Badewi, 2016; Breese et al., 2016; Serraand Kunc, 2015). It comprises structured processes to define and alignproject outcomes, costs, benefits, and business strategy. At the projectplanning phase, benefits identification and quantification can helpidentify a preferred investment option and deliver the best return.Such information is a building block for the justification of a projectand becomes part of the business case, which is a significant partof our approach presented in Chapter 6. Established project manage-ment methodologies recognize the importance of benefits manage-ment (Frederiksz, Hedeman, and van Heemst, 2010; Sowden, 2011).
Several benefit modeling diagrams are described in the literaturehaving elements representing benefits and their relation to decisionsand solutions. These diagrams help to identify and display the ben-efits aligned with the expectations of the sponsor and stakeholders.They can be used to validate the project scope, identify associated ben-efits and cost areas of the project, and be used as a starting point inpreparing project plans. In the following, we present three diagramsand compare them with our approach.
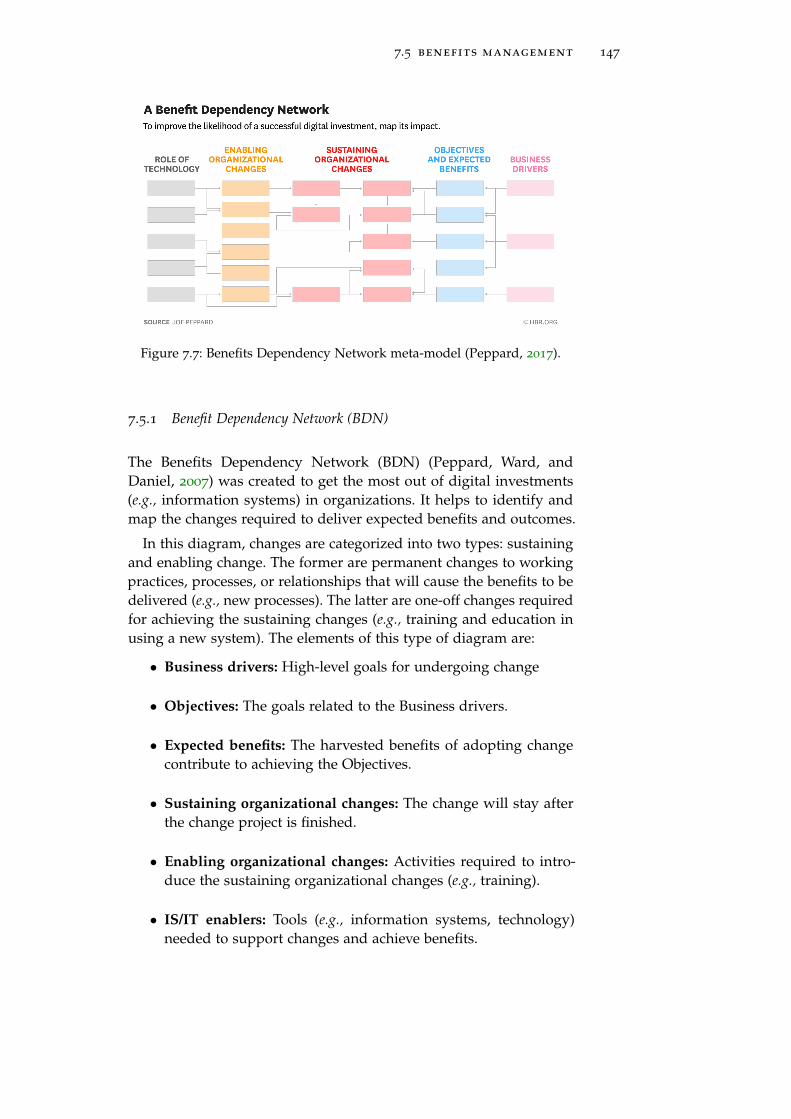
7.5 benefits management 147
9/10/2020 W160516_PEPPARD_BENEFITDEPENDENCY.png (1400×751)
https://hbr.org/resources/images/article_assets/2016/05/W160516_PEPPARD_BENEFITDEPENDENCY.png 1/1Figure 7.7: Benefits Dependency Network meta-model (Peppard, 2017).
7.5.1 Benefit Dependency Network (BDN)
The Benefits Dependency Network (BDN) (Peppard, Ward, andDaniel, 2007) was created to get the most out of digital investments(e.g., information systems) in organizations. It helps to identify andmap the changes required to deliver expected benefits and outcomes.
In this diagram, changes are categorized into two types: sustainingand enabling change. The former are permanent changes to workingpractices, processes, or relationships that will cause the benefits to bedelivered (e.g., new processes). The latter are one-off changes requiredfor achieving the sustaining changes (e.g., training and education inusing a new system). The elements of this type of diagram are:
• Business drivers: High-level goals for undergoing change
• Objectives: The goals related to the Business drivers.
• Expected benefits: The harvested benefits of adopting changecontribute to achieving the Objectives.
• Sustaining organizational changes: The change will stay afterthe change project is finished.
• Enabling organizational changes: Activities required to intro-duce the sustaining organizational changes (e.g., training).
• IS/IT enablers: Tools (e.g., information systems, technology)needed to support changes and achieve benefits.

148 state of the art
The first three elements (Business drivers, Objectives, and Expectedbenefits) define the reasons to change. The Sustaining organizationalchanges explain the processes that require change, and the last twoelements (Enabling organizational changes and IS/IT enablers) definehow to achieve it.
The BDN is instantiated from right to left (cf. Figure 7.7). It startsat the business drivers and the objectives and expected benefits, andmap the sustaining organizational changes (i.e., required changes tostructures, processes, work practices), and enabling organizationalchanges (i.e., what is required to sustain those changes). Further, mea-sures and responsibilities for benefits and changes are assigned andtime scales established.
The approach’s goal is to align investment objectives with criticalbusiness drivers, which helps organizations avoid digital investmentsto be steered by technology (left-hand side of the network) but drivenby business demand (right-hand side of the network). The BDN wassuccessfully used for streamlining patient administration in a hospital,implementing a customer-relationship-management (CRM) systemin a financial services organization, rolling out a global enterprise-resource-planning (ERP) system for a pharmaceutical company, andpromoting collaboration in a technology company (Peppard, 2017).
7.5.2 Benefits Dependency Map (BDM)
Benefit Dependency Map (BDM) (Bradley, 2010) is a goal-benefit mod-eling technique useful for relating project tasks and outputs to abusiness’s strategic objectives. It shows business change necessaryto achieve objectives through benefits and makes priorities clearer,thus helping planning. Benefits are the measurable addition of value(i. e., End benefits) and are often dependent on other benefits (i. e., In-termediate benefits) that must be realized first. Benefits are realizedfrom Enablers to Business change, to Benefits, i. e., from left to right.Enablers and Business changes leading to major benefits should beprioritized.
When read from left-to-right, the BDM shows reasons for pusuingchange. In the opposite direction, the diagram shows how the bene-fits are to be achieved. An example of a BDM diagram can be seenin Figure 7.8. The elements belonging to the BDM diagram are betterexplained in the following.
• Objective: End goal of the initiative.
• End benefit: The benefits required to fulfill the goal.

7.5 benefits management 149
New shipping provider
Training on new shipping
systems
Implementing new shipping
system
New shipping provider
implemented
Update shipping options
Delivery time reduced by
30%
Invoicing process begins
sooner
Differentiation from slowercompetition
Increased customer referrals
Increased availability for rush projects
Spend less time tracking
shipments
Increasecustomer
satisfaction
Increased access to liquid
resources
Business changes Intermediate benefits End benefits ObjectiveEnabler
Figure 7.8: Benefits Dependency Map example.
• Intermediate benefit: Benefits that either contribute to the endbenefit or put the company at an advantage. Intermediate bene-fits
• Business changes/outputs: Tasks (e.g., develop training, imple-ment systems or processes) and artifacts (e.g., documents, projectoutputs) that generate benefits
• Enabler: The element (e.g., systems, processes) required toachieve the goal. They might be either purchased or createdfrom scratch.
7.5.3 Results Chain Modeling (RC)
Results Chain Modeling (Torpp, 1999) is a benefit modeling techniquethat shows the connections between activities, outcomes, and asso-ciated assumptions (cf. Figure 7.9). Through this model’s buildingprocess, activities required to be performed and the respective out-comes to be achieved become explicit, and the realization of benefitsbecomes easier to manage. The following elements belong to thismodel:
• Activity: used to characterize the work that contributes to anoutcome. It can be used to represent activities, projects, pro-grams. The square form represents this element.
• Outcome: represents the result or outcome of an activity. Thereare two types of outcomes, intermediate ones and ultimate. Acircle form represents this element.

150 state of the art
I1Implementcustomer
informationsystem
I3 Train
representatives in cross-selling
I2Reengineer
downstream processes.
O5Increased
personalizedservice
O9Increased
sale of new products
O8 Increased “life cycle”
product opportunities
identified
O4Decreasedoperation
costs
O3 Decreased number of
reps
O2 Decreased customer
service time
O1 Increased
accessibility of customer
information to representative
O6 Increased customer
satisfaction
O7 Maintained customer
base
A1The
infrastructure is fit for the
planned traffic
Figure 7.9: Results Chain Modeling example (adapted from (Torpp, 1999)).
• Assumption: describes any consideration required to achieve anoutcome that is not in control. Among the benefit modeling tech-niques presented in this section, the RCM is the only one withsuch an element. A hexagon is used to represent this element.
Activities are described using an imperative verb (e.g., document,identify, test). Outcomes are defined using the past tense of a verb (e.g.,created, reduced). Activities are connected to outcomes by arrowsdenoting their output. There are no connections between activities,and an outcome can be connected to other outcomes (i.e., can generatedifferent outcomes). The result chain model is read from left to right.The primary benefit of a project is the outcomes depicted on theright side of the model. Other outcomes are considered intermediate.Although dependency between elements is explicit, this model doesnot contemplate a timeline (i.e., when the outcome is achieved orwhen an activity should be performed compared to other not directlyconnected activities).
7.5.4 Comparison of benefits management diagram elements and the pro-posed approach
The presented diagrams have similar elements, and they also sharea resemblance with the model elements proposed in this thesis (cf.Chapter 6), which are compared in Table 7.2. These diagrams haveelements representing benefits and their relation to decisions andsolutions.

7.5 benefits management 151
The relations are not one-to-one. For instance, our approach’s equiv-alent of benefits relates to two elements in the BDM, namely End Ben-efit and Intermediate Benefits. The former, together with the Bondingobjective, could be related to the Competitive priorities. The BDNrequires three elements before benefits are delivered, the BDM needstwo, our approach has only one (Candidate capabilities).
In contrast, Investment objectives from BDN and Bounding objec-tives from BDM are related to both the Adoption goal and Competi-tive priorities. The Outcome element from RC diagram relates to threeother elements of our approach. Despite the small variety of elements,this diagram has an element type not present in the others diagrams,namely, the Assumption element, which provides a rationale for thechain of relations. The previously described GSN notation also hasan Assumption element. In our approach, assumptions are implicitlyconsidered when defining the relations weights between the elements.
These diagrams had a significant influence on our approach de-sign. However, besides documenting the relations between elements,these diagrams do not provide quantitative decision support. Ourapproach differentiates itself for using competitive priorities as mid-dleware between adoption goals and benefits, weighted relations, anda quantitative prioritization mechanism.

152 state of the art
Table 7.2: Equivalence of elements from the approach proposed in this thesis(cf. Chapter 6) and the elements of Benefits Management diagrams.
Our approach BDN BDM RC
MBSE adoptiongoal
InvestmentObjectives
Boundingobjective
Outcome
Competitivepriorities
Investmentobjectives
Boundingobjective, Endbenefit
Outcome
Benefits Benefits End benefit,Intermediatebenefit
Outcome
Candidatecapabilities
Businesschanges,Enablingchanges, IS/ITenablers
Businesschange,Enabler
Activity
– – – Assumption

8C O N C L U S I O N S A N D O U T L O O K
In this chapter, we summarize the contributions of this thesis, dis-cuss possible improvements of the presented work, and directions forfurther research.
8.1 summary
The work of this thesis was built around the problem statements “Weneed to understand how to efficiently introduce new MBSE methods in devel-opment teams”, and “We need a method to provide decision support whenselecting the MBSE methods that are most appropriate for each team consider-ing respective contextual characteristics and adoption goal” (cf. Section 1.2).We claimed the solutions proposed by this thesis and respective sup-porting evidence address the aforementioned problems. In the follow-ing, we conclude that the contributions provided in this thesis supportthese claims.
8.1.1 Forces that drive or prevent Model-based Systems Engineering adop-tion in embedded systems industry
In Chapter 3, we investigated the motivational forces that either propelor prevent MBSE adoption. Four research questions guided our efforts,and their answers are given in the following:
rq1 : what are perceived forces that prevent mbse adop-tion in the industry?
• RQ1.1: What are habits and inertia that prevent MBSE adop-tion? – Practitioners were not so sure about the benefits of adopt-ing MBSE; thus, Doubts about improvements was the code mostpresent in inertia category. Issues regarding tools such as therisk of Incompatibility with existing tools, and the perception thatthe available tools are still too immature (i. e., Imature tooling)were both the next two factors in this category preventing MBSEadoption.
153

154 conclusions and outlook
• RQ1.2: What are anxiety factors that prevent MBSE adoption?– Concerns that MBSE method adoption investments would notpay off were the main anxiety factor (i. e., ROI uncertainty). Therespondents were also worried that the MBSE way of developingsystems could diminish the engineers’ skills (i. e., Skills of employ-ees). Like in inertia force, the tool was also a strong anxiety factor(i. e., Tooling shortcomings).
Uncertainty regarding benefits delivery was the starkest concernin both categories. This finding could be related either due to ex-pectations misconception or fears steaming from reported or experi-enced unsuccessful adoption endeavors. Tool-related concerns werealso prominent; non-seamless toolchains can increase effort due to in-formation transfer or by requiring re-work with multiple tools. MBSEis very tool intensive, and this concern can come from a misconceptionof the maturity of the current tools.
rq2 : what are perceived forces that foster mbse adop-tion in the industry?
• RQ2.1: What are perceived issues that push the industry to-wards MBSE? – A trend of current systems is the Growing com-plexity, and this is the main reason why teams are moving to-wards MBSE adoption. Are also highly relevant in this categorythe Quality issues, which relates to the aforementioned increaseof complexity, and the Time pressure which is a reflection of fiercemarket competition.
• RQ2.2: What MBSE benefits are perceived as most attractive?– In the push category, the Easier handling of complexity that MBSEis able to provide is considered the most relevant. Additionally,practioners see value in MBSE due to Early feedback on correctness,and Documentation support.
The results show that system complexity issues are the main driverfor practitioners to seek MBSE methods in both fostering forces cate-gories.
Organizational change is never easy, especially when trying to in-troduce complex approaches such as MBSE. In Chapter 3, we lookedfor the reasons and factors that either prevent or foster companiesfrom adopting MBSE. For this means, we created a forces frameworkfor analyzing 20 interviews, which were coded in several discussionrounds. Based on our results, practitioners may challenge their deci-sion processes and adoption strategies. Researchers may study ourresults and find evidence to quantify and detail the considerations ofpractitioners. We conclude that bad experiences and frustration about

8.1 summary 155
MBSE adoption originate from false or too high expectations. Never-theless, companies should not underestimate the necessary efforts forconvincing employees and addressing their anxiety.
8.1.2 Strategies and best practices for Model-based Systems Engineeringadoption in embedded systems industry
The complexity and pervasiveness MBSE creates challenges that,when not adequately addressed, can jeopardize its implementation indevelopment teams. In Chapter 4, we identified strategies and bestpractices for MBSE adoption through a series of interviews. Thesepractices were then classified into four big groups: piloting, knowl-edge building, tools and process, and management. Further, they werediscussed, compared to related work, and summarized. These sum-maries were used to build a questionnaire in which each respondentcould express their level of agreement with the best practice. Then, weidentified which hindering forces (cf. Chapter 3) could be mitigatedby the best practices using the interview verbatim quotes as evidence(cf. Appendix F).
Learning from others’ experience and applying proven best prac-tices can save effort and enhance success chances. In the long run,benefits outweigh the costs and hurdles; however, it is necessary toidentify success factors and share best practices enabling efficient andeffective MBSE adoption in the industry. Not surprisingly, most of thebest practices address organizational aspects of the adoption, such ashow to pilot an MBSE adoption initiative, how to transfer knowledge,and what role the management has to play.
8.1.3 Method value ascription
In Chapter 5, we proposed a model to describe the elements and re-spective relations that influence the method value ascription by a de-velopment team. The model considers associated costs and perceivedbenefits upon method adoption and helped us better understand therole of its elements, interplay, and gaps that still need to be addressedby future work (i. e., costs). Further, we identified the relations to thisthesis other contributions towards the model elements (cf. Figure 8.1).

156 conclusions and outlook
Figure8.
1:Relations
between
allcontributionsof
thisthesis.

8.2 outlook 157
8.1.4 Goal-benefit decision calculus for Model-based Systems Engineeringmethod selection
Realizing abstract goals to concrete actions is never an easy task. Thischaracteristic is especially true when the solution space is vast, anddomain knowledge is required, which is the case of Model-basedsystems engineering method adoption. In Chapter 6, we proposeda decision calculus approach for development teams to trace theadoption goal to MBSE methods. The approach is composed of agoal-benefit model and an instantiation method. It can prioritize thesolution space by breaking down the adoption goals into competi-tive priorities and benefits afforded by methods upon adoption. Theinstantiation method describes how to assign weights to the model el-ement relations, representing their relevance towards neighbors. Oncethe model is instantiated, we can distribute points to the candidatemethods that can be prioritized accordingly. The approach was ap-plied in six case studies in development teams located in Brazil andGermany.
According to the case study participants’ feedback, the proposedapproach provides decision support, which helps to compose thebusiness case and enhance confidence in decision-making. We alsoanalyzed the model regarding its inputs and outputs, which showedthat the model could prescribe diverse solutions to different cases.The contribution of this work is to provide structured thinking fordecision-makers to deliver more reliable method adoption businessplans.
8.2 outlook
This section discusses improvement opportunities for the presentedwork and proposes directions for future research.
8.2.1 Investigate adoption forces further
The results presented in Chapter 3 lays the stepping stones to un-derstand further the dynamics of MBSE adoption. We could analyzethe data to investigate correlations between roles and the identifiedcategories and dependencies between the forces as future work. Addi-tionally, the research community may create mechanisms to identifythe forces within development teams more effectively and systemat-ically, analyze how hindering forces can be further mitigated, andunderstand how to harvest fostering forces synergy.

158 conclusions and outlook
8.2.2 Horizontal extension of the decision model
Many existing maturity models have the same shortcoming as theMBSE MM; they lack proper guidance in selecting and prioritizingactual improvement measures (Pöppelbuß and Röglinger, 2011). Al-though the approach presented in Chapter 6 was created having theMBSE MM as a reference framework, we believe that after some modifi-cations, the same rationale could be used with other frameworks andeven for other domains (e. g., Software Product Management (van deWeerd, Bekkers, and Brinkkemper, 2010)). This possibility is especiallytrue considering focus area maturity models. Hereby domain-specificbenefits need to be elicited, and competitive priorities might need tobe added or removed when adapting the current model.
8.2.3 Vertical extension of the decision model
As demonstrated in Chapter 5, a method’s value is composed notonly from the generated benefits upon its adoption but also the re-lated costs, and the latter is not considered by the approach presentedin this thesis (cf. Chapter 6). As future work, we would like to cre-ate a cost model that can be merged into the current approach, thusturning it into a goal-cost/benefit model. We have found studies thathave started to define the cost of modeling (UML, for instance (Jo-lak et al., 2017)), and we might need to pursue a similar path if wewant to define the cost for implementing and adopting the MBSE MM
capabilities.
8.2.4 Model context further
The context plays a significant role in the whole topic of this thesis.However, modeling it is challenging; many authors have elicited con-textual factors that could influence adopting new methods (Clarkeand O’Connor, 2012). However, they were only successful at identi-fying possible context characteristics without properly relating themto decisions towards the methods, with very few exceptions (Bekkerset al., 2008). In our approach, we model the development team contextin two ways, through the assessment of the Maturity Profile and theTeam’s benefits potential (cf. Chapter 6). We do not model the environ-ment, although we recognize its influence on method value ascription(cf. Chapter 5). We see this as a research venue opportunity that isvery incipient, not only regarding maturity models but in the softwareengineering field as a whole.

8.2 outlook 159
8.2.5 Perform longitudinal studies
In this thesis, we provide solutions for the planning phase of the MBSE
method adoption (cf. Chapter 6). As future work, we could assesshow the team perceives the recommended capabilities after they areadopted. Of course, confounding variables must be managed to avoidmisperceptions, for instance, due to poor adoption process.
8.2.6 Perform expert assessment in all MBSE MM capabilities.
As part of the work performed in Chapter 6 we asked MBSE expertsto evaluate the benefits generated by the 53 capabilities from theMBSE MM (cf. Section 6.4.1.1). At the time, we did not perform thistaks for the whole MBSE MM to save the experts from the hassle ofassessing unnecessary capabilities. However, this assessment is a fun-damental part of the approach, and when non-assessed capabilitiesare selected to become candidates in future runs, their assessmentwill be required. The lack of this information adds an extra layer ofwork for someone employing the approach, which might hinder itsapplication. Assessing the whole set of capabilities from the MBSE MM
is needed in future work.
8.2.7 Develop benefits monitoring metrics
In order to verify if the team harvested the benefits from the imple-mented capabilities (cf. Chapter 6), metrics such as Key PerformanceIndicators (KPI) need to be defined. Such information is missing andis a beneficial research venue to be pursued. However, defining thesemetrics is not trivial since every team is different, and these character-istics also change over time. For instance, how a KPI for the benefit“Better communication” would look like?


AM O D E L - B A S E D S Y S T E M S E N G I N E E R I N GM AT U R I T Y M O D E L
The MBSE MM and its capabilities are described in Table A.1 and Ta-ble A.2.
161
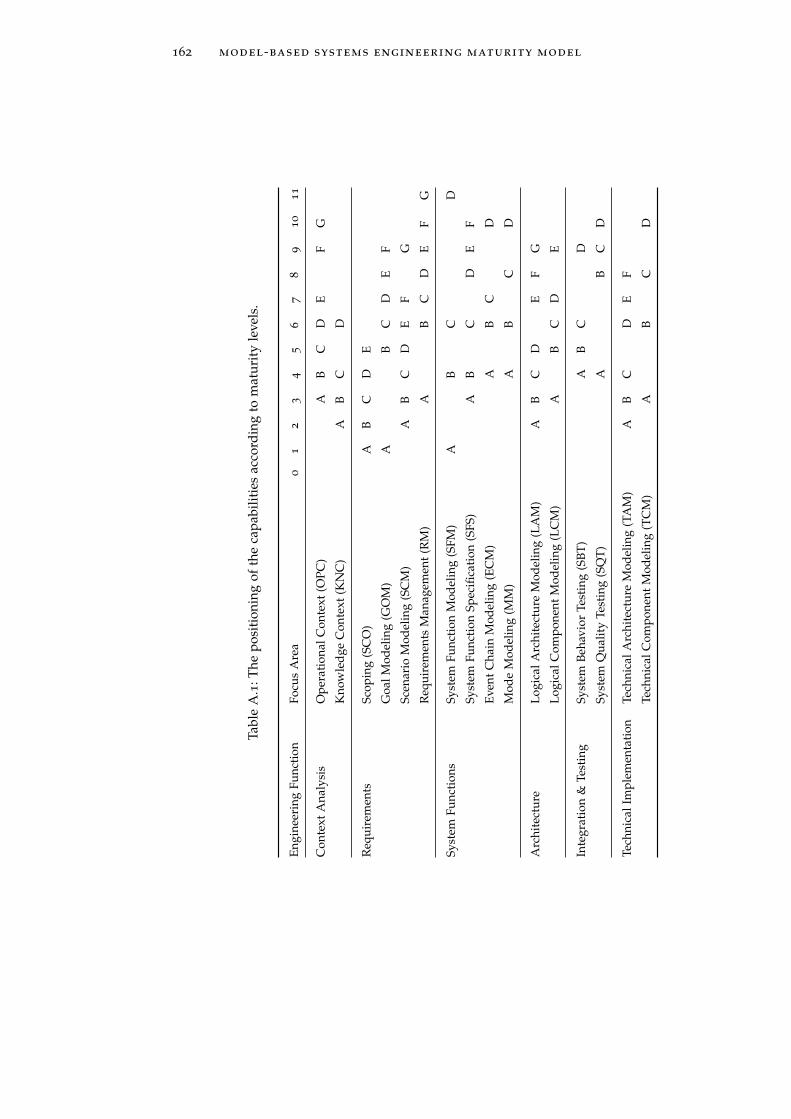
162 model-based systems engineering maturity model
Tabl
eA
.1:T
hepo
siti
onin
gof
the
capa
bilit
ies
acco
rdin
gto
mat
urit
yle
vels
.
Engi
neer
ing
Func
tion
Focu
sA
rea
01
23
45
67
89
10
11
Con
text
Ana
lysi
sO
pera
tion
alC
onte
xt(O
PC)
AB
CD
EF
G
Kno
wle
dge
Con
text
(KN
C)
AB
CD
Req
uire
men
tsSc
opin
g(S
CO
)A
BC
DE
Goa
lMod
elin
g(G
OM
)A
BC
DE
F
Scen
ario
Mod
elin
g(S
CM
)A
BC
DE
FG
Req
uire
men
tsM
anag
emen
t(R
M)
AB
CD
EF
G
Syst
emFu
ncti
ons
Syst
emFu
ncti
onM
odel
ing
(SFM
)A
BC
D
Syst
emFu
ncti
onSp
ecifi
cati
on(S
FS)
AB
CD
EF
Even
tC
hain
Mod
elin
g(E
CM
)A
BC
D
Mod
eM
odel
ing
(MM
)A
BC
D
Arc
hite
ctur
eLo
gica
lArc
hite
ctur
eM
odel
ing
(LA
M)
AB
CD
EF
G
Logi
calC
ompo
nent
Mod
elin
g(L
CM
)A
BC
DE
Inte
grat
ion
&Te
stin
gSy
stem
Beha
vior
Test
ing
(SBT
)A
BC
D
Syst
emQ
ualit
yTe
stin
g(S
QT)
AB
CD
Tech
nica
lIm
plem
enta
tion
Tech
nica
lArc
hite
ctur
eM
odel
ing
(TA
M)
AB
CD
EF
Tech
nica
lCom
pone
ntM
odel
ing
(TC
M)
AB
CD

model-based systems engineering maturity model 163
Tabl
eA
.2:T
heM
BSE
MM
capa
bilit
ies
desc
ript
ion.
Con
text
Ana
lysi
sA
BC
DE
FG
Ope
rati
onal
Con
text
(OPC
)A
ctor
san
dex
-te
rnal
syst
ems
iden
tified
and
docu
men
ted
Act
ors
and
ex-
tern
alsy
stem
sm
odel
ed
Con
text
func
-ti
ons
and
dat
aid
entifi
edan
ddo
cum
ente
d
Con
text
beha
v-io
rid
entifi
edan
ddo
cum
ente
d
Con
text
func
-ti
ons
and
dat
am
odel
ed
Con
text
beha
v-io
rm
odel
edC
onte
xtbe
hav-
ior
exec
utab
le
Kno
wle
dge
Con
text
(KN
C)
Sour
ces
ofpo
ssib
lere
-qu
irem
ents
are
iden
tified
and
docu
men
ted
Rel
atio
nshi
psbe
twee
nre
-qu
irem
ents
and
thei
rso
urce
sid
entifi
edan
ddo
cum
ente
d
Impo
rtan
cean
dvo
lati
lity
ofth
ere
quir
emen
tso
urce
sid
entifi
edan
ddo
cum
ente
d
Req
uire
men
tso
urce
san
dth
eir
rela
tion
toth
ere
quir
e-m
ents
mod
eled
--
-
Req
uire
men
tsA
BC
DE
FG
Scop
ing
(SC
O)
Syst
emvi
sion
iden
tified
and
docu
men
ted
Gen
eral
solu
-ti
onco
ncep
tid
entifi
edan
ddo
cum
ente
d
Use
rcl
asse
san
dth
eir
prop
erti
esid
entifi
edan
ddo
c-um
ente
d
Purp
ose
and
ex-
plic
itex
clus
ions
ofsy
stem
sid
en-
tified
and
docu
-m
ente
d
Dev
elop
men
tco
nstr
aint
sid
entifi
edan
ddo
cum
ente
d
--

164 model-based systems engineering maturity model
Goa
lMod
elin
g(G
OM
)St
akeh
old
ergo
als
rega
rdin
gfu
ncti
onan
dqu
alit
yid
entifi
edan
ddo
cum
ente
d
sub-
goal
sth
atar
ene
cess
ary
toac
hiev
est
ake-
hold
ergo
als
iden
tified
and
docu
men
ted
Rel
atio
nshi
psbe
twee
ngo
als,
syst
emfu
nc-
tion
s,an
den
viro
nmen
-ta
lre
sour
ces
iden
tified
and
docu
men
ted
Infl
uenc
eof
sys-
tem
prop
erti
esin
stak
ehol
der
goal
sid
entifi
edan
ddo
cum
ente
d
Stak
ehol
der
goal
s,su
b-go
als,
and
thei
rre
-la
tion
ship
sm
odel
ed
Qua
lity
is-
sues
ingo
ald
escr
ipti
ons
auto
mat
ical
lyan
alyz
e
-
Scen
ario
Mod
elin
g(S
CM
)Sc
enar
ios
iden
tified
and
docu
men
ted
Scen
ario
exce
p-ti
ontr
igge
rsid
entifi
edan
ddo
cum
ente
d
Alt
erna
tive
sce-
nari
osin
case
ofex
cept
ions
iden
-tifi
edan
ddo
cu-
men
ted
Dep
end
enci
esbe
twee
nsc
enar
-io
sid
entifi
edan
ddo
cum
ente
d
Scen
ario
sm
od-
eled
Dep
end
enci
esbe
twee
nsc
enar
-io
sid
entifi
edan
ddo
cum
ente
d
Qua
lity
issu
esin
scen
ario
sau
tom
atic
ally
anal
yzed
Req
uire
men
tsSp
ecifi
ca-
tion
(RS)
Req
uire
men
tsid
entifi
edan
ddo
cum
ente
d
Func
tion
alre
quir
emen
tsm
odel
ed
Qua
lity
requ
ire-
men
tsm
odel
edQ
ualit
yis
sues
infu
ncti
onal
requ
irem
ents
auto
mat
ical
lyan
alyz
ed
Qua
lity
issu
esin
qual
ity
re-
quir
emen
tsau
tom
atic
ally
anal
yzed
Com
plet
enes
san
dco
rrec
tnes
sof
func
tion
alre
quir
emen
ts1
auto
mat
ical
lyan
alyz
ed
Com
plet
enes
san
dco
rrec
t-ne
ssof
qual
ity
requ
irem
ents
1
auto
mat
ical
lyan
alyz
ed
Syst
emFu
ncti
ons
AB
CD
EF
G
Syst
emFu
ncti
onM
odel
-in
g(S
FM)
Syst
emfu
nc-
tion
sid
entifi
edan
ddo
cum
ente
d
Dep
end
enci
esbe
twee
nsy
s-te
mfu
ncti
ons
iden
tified
and
docu
men
ted
Des
crib
esy
stem
func
tion
san
dth
eir
dep
end
en-
cies
mod
eled
The
syst
emfu
ncti
ons
to-
geth
erw
ith
ad
escr
ipti
onof
the
cont
ext
sim
ulat
ed
--
-
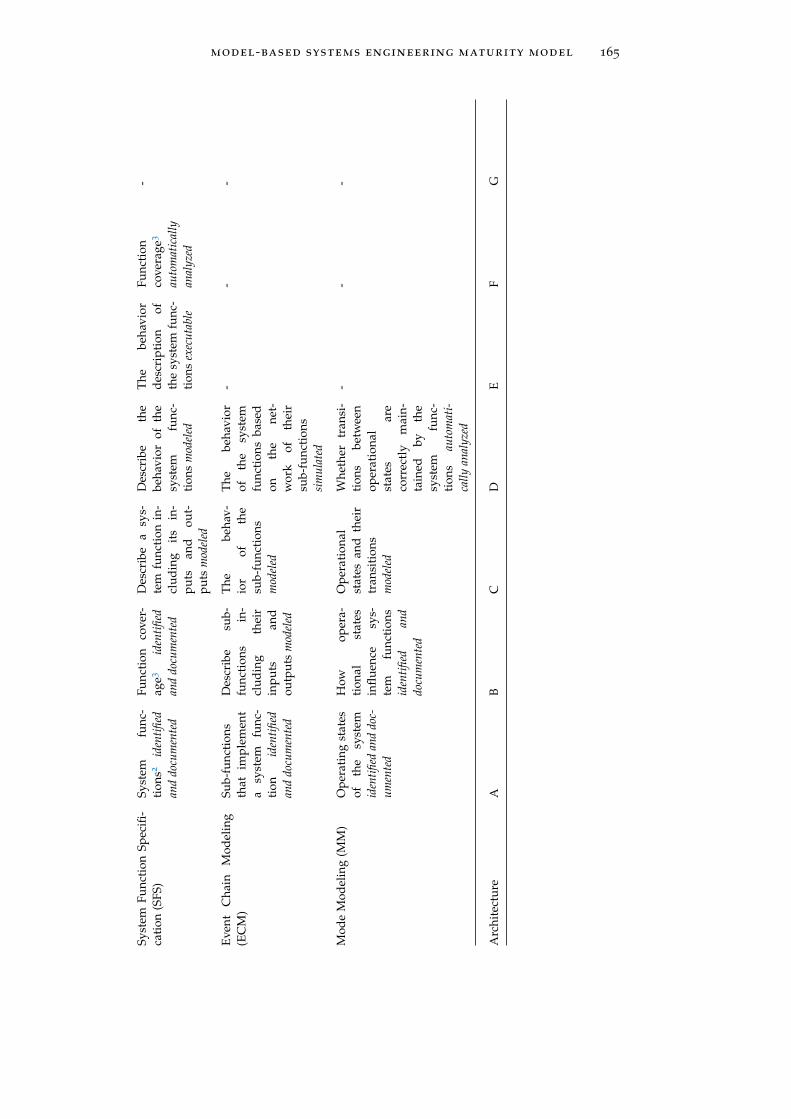
model-based systems engineering maturity model 165
Syst
emFu
ncti
onSp
ecifi
-ca
tion
(SFS
)Sy
stem
func
-ti
ons2
iden
tified
and
docu
men
ted
Func
tion
cove
r-ag
e3id
entifi
edan
ddo
cum
ente
d
Des
crib
ea
sys-
tem
func
tion
in-
clud
ing
its
in-
puts
and
out-
puts
mod
eled
Des
crib
eth
ebe
havi
orof
the
syst
emfu
nc-
tion
sm
odel
ed
The
beha
vior
des
crip
tion
ofth
esy
stem
func
-ti
ons
exec
utab
le
Func
tion
cove
rage
3
auto
mat
ical
lyan
alyz
ed
-
Eve
ntC
hain
Mod
elin
g(E
CM
)Su
b-fu
ncti
ons
that
impl
emen
ta
syst
emfu
nc-
tion
iden
tified
and
docu
men
ted
Des
crib
esu
b-fu
ncti
ons
in-
clud
ing
thei
rin
puts
and
outp
uts
mod
eled
The
beha
v-io
rof
the
sub-
func
tion
sm
odel
ed
The
beha
vior
ofth
esy
stem
func
tion
sba
sed
onth
ene
t-w
ork
ofth
eir
sub-
func
tion
ssi
mul
ated
--
-
Mod
eM
odel
ing
(MM
)O
pera
ting
stat
esof
the
syst
emid
entifi
edan
ddo
c-um
ente
d
How
oper
a-ti
onal
stat
esin
flue
nce
sys-
tem
func
tion
sid
entifi
edan
ddo
cum
ente
d
Ope
rati
onal
stat
esan
dth
eir
tran
siti
ons
mod
eled
Whe
ther
tran
si-
tion
sbe
twee
nop
erat
iona
lst
ates
are
corr
ectl
ym
ain-
tain
edby
the
syst
emfu
nc-
tion
sau
tom
ati-
cally
anal
yzed
--
-
Arc
hite
ctur
eA
BC
DE
FG

166 model-based systems engineering maturity model
Log
ical
Arc
hite
ctur
eM
odel
ing
(LA
M)
The
dec
ompo
si-
tion
ofth
esy
s-te
min
tolo
gi-
cal
com
pone
nts
iden
tified
and
doc-
umen
ted
Alie
nlo
gica
lco
mpo
nent
sid
entifi
edan
ddo
cum
ente
d
The
rela
tion
betw
een
logi
cal
com
pone
nts
and
syst
emfu
ncti
ons
that
they
real
ize
iden
tified
and
docu
men
ted
Dep
end
enci
esbe
twee
nlo
gica
lco
mpo
nent
sid
entifi
edan
ddo
cum
ente
d
Log
ical
com
po-
nent
san
dth
eir
dep
end
enci
esm
odel
ed
The
beha
v-io
rof
logi
cal
com
pone
ntcl
uste
rsto
chec
kfo
rin
tegr
a-ti
onpr
oble
ms
auto
mat
ical
lyan
alyz
ed
The
logi
cal
com
pone
nts
toge
ther
wit
ha
des
crip
tion
ofth
eco
ntex
tsi
mul
ated
Log
ical
Com
pone
ntM
odel
ing
(LC
M)
Log
ical
com
po-
nent
san
dth
eir
inte
rfac
esid
en-
tified
and
docu
-m
ente
d
Log
ical
com
po-
nent
san
dth
eir
inte
rfac
esm
od-
eled
Log
ical
com
po-
nent
sin
terf
ace
prop
erti
es4
iden
-tifi
edan
ddo
cu-
men
ted
Beh
avio
rof
log-
ical
com
pone
nts
mod
eled
The
beha
vior
de-
scri
ptio
nof
log-
ical
com
pone
nts
exec
utab
le
--
Inte
grat
ion
&Te
stin
gA
BC
DE
FG
Syst
emB
ehav
ior
Test
ing
(SBT
)Te
stca
ses
iden
-tifi
edan
ddo
cu-
men
ted
The
rela
tion
-sh
ipbe
twee
nte
stca
ses
and
asso
ciat
edsy
s-te
mm
odel
s5
iden
tified
and
docu
men
ted
Test
case
sfo
rch
ecki
ngsy
s-te
mbe
havi
orm
odel
ed
Test
case
sfr
omsy
stem
and
/or
cont
ext
auto
mat
-ic
ally
gene
rate
d
--
-

model-based systems engineering maturity model 167
Syst
emQ
ualit
yTe
stin
g(S
QT)
Test
case
sto
chec
ksy
s-te
mqu
alit
ies6
iden
tified
and
docu
men
ted
The
rela
tion
ship
betw
een
test
case
sfo
rch
eck-
ing
qual
itie
san
das
soci
ated
syst
emm
odel
s7
iden
tified
and
docu
men
ted
Des
crib
ete
stca
ses
for
chec
k-in
gsy
stem
qual
ities
mod
eled
Test
case
sfo
rch
ecki
ngsy
s-te
mqu
alit
ies
from
syst
eman
d/o
rco
ntex
tau
tom
atic
ally
gene
rate
d
--
-
Tech
nica
lIm
plem
enta
-ti
onA
BC
DE
FG
Tech
nica
lA
rchi
tect
ure
Mod
elin
g(T
AM
)D
ecom
posi
tion
ofth
esy
stem
into
tech
nica
lco
mpo
nent
sid
entifi
edan
ddo
cum
ente
d
Sens
ors
and
actu
ator
sth
atin
terf
ace
wit
hth
eex
ecu-
tion
plat
form
iden
tified
and
docu
men
ted
The
rela
tion
betw
een
tech
ni-
cal
com
pone
nts
and
logi
cal
com
pone
nts
orfu
ncti
ons
that
they
real
ize
iden
tified
and
docu
men
ted
The
map
ping
oflo
gica
lin
put
and
outp
uts
toin
puts
and
out-
puts
ofte
chni
cal
com
pone
nts
iden
tified
and
docu
men
ted
For
each
tech
ni-
cal
com
pone
nt,
we
whe
ther
the
com
pone
ntca
nbe
assi
gned
toex
actl
yon
een
-gi
neer
ing
dis
ci-
plin
e8id
entifi
edan
ddo
cum
ente
d
The
tech
nica
lco
mpo
nent
san
dth
eir
rela
-ti
ons
mod
eled
-
Tech
nica
lC
ompo
nent
Mod
elin
g(T
CM
)In
put
and
out-
put
sign
als
for
each
tech
nica
lco
mpo
nent
iden
tified
and
docu
men
ted
Des
crib
eth
ein
-te
rfac
eof
tech
ni-
cal
com
pone
nts
mod
eled
Des
crib
eth
ebe
-ha
vior
ofte
chni
-ca
lco
mpo
nent
sm
odel
ed
The
beha
vior
des
crip
tion
ofte
chni
cal
com
pone
nts
exec
utab
le
--
-

168 model-based systems engineering maturity model
1w
.r.t.
the
oper
atio
nalc
onte
xt,g
oals
,or
desc
ribe
dsc
enar
ios
2th
ena
me,
ade
scri
ptio
n,th
efu
ncti
on’s
purp
ose,
invo
lved
acto
rs,a
ndpr
e-an
dpo
st-c
ondi
tion
s3
whi
chre
quir
emen
ts,s
cena
rios
,or
goal
sth
esy
stem
func
tion
fulfi
lls4
assu
med
prop
erti
esab
out
com
pone
ntin
puts
and
guar
ante
edpr
oper
ties
ofco
mpo
nent
outp
uts
5(e
.g.,
requ
irem
ents
,fun
ctio
ns,o
rco
mpo
nent
s)6
(i.e
.,no
n-fu
ncti
onal
requ
irem
ents
)7
(e.g
.,re
quir
emen
ts,f
unct
ions
,or
com
pone
nts)
8(e
.g.,
mec
hani
cal,
elec
tric
al,s
oftw
are)

BI N T E RV I E W G U I D E
This appendix presents the interview guide used in the studies fromChapter 3 and Chapter 4.
1. Preamble
• The aim of the interview is identifying the introductionneeds and hurdles at interested companies.
• All data concerning individuals will remain anonymous.
2. Information about the participants - Questions concerning thesize of the company and the current state of MBSE projects.
2.1. What do you develop in your company?
2.2. How big are company and development teams?
2.3. Who are the decision-makers for an MBSE introduction?
2.4. Who is involved in decision making?
2.5. What is your definition of MBSE?
2.6. What is the current state of introduction of MBSE in thecompany?
3. Motivation and needs Questions about motivation and needs ofintroduction of MBSE.
3.1. What makes MBSE interesting to you?
3.2. How urgent is the MBSE demand due to the mentionedadvantages?
3.3. How does such an issue develop in the company?
3.4. What are the costs?
4. Hurdles and overcoming Questions about introducing MBSEfrom today’s view and possible approaches to overcome.
4.1. What challenges do you see in an MBSE introduction?
4.2. What influences of hurdles did you identify concerning theintroduction of MBSE?
4.3. What measures do you plan to overcome the hurdles?
4.4. Where do you see the big challenges in your daily work?
5. Employee training Importance of training in the introductionprocess.
169

170 interview guide
5.1. What knowledge does the company have concerningMBSE?
5.2. Which employee groups should be trained differentiatedfor MBSE?
5.3. Where should be the focus of the training be placed?
5.4. How many employees should be trained? (also in % of allusers)
5.5. What is the expected financial effort and expenditure oftime for the training per employee?
5.6. Is online training required?
6. Integration Integration of the methods and tools in existing land-scapes.
6.1. Do you want to migrate or translate data?
6.2. Do interfaces exist with other internal systems?
6.3. Expected changes in the process.
6.4. Expected organizational changes.
6.5. Expected financial effort and expenditure of time for inte-gration.
7. Questions directed to system developers Specific questions tothe developers who use or are supposed to use MBSE.
7.1. What is the object of development you are working on?
7.2. For which steps in the process are you responsible?
7.3. How closely do you work with your customers?
7.4. Are there special requirements for processes, methods ordocumentation?
7.5. Which tools do you use?
7.6. What do you get from outside? In which form?
8. Questions if you introduced MBSE. This chapter is omitted ifMBSE has not yet been introduced. The aim is to determine theexperiences in terms of “Lessons Learned” with the partial orcomplete introduction of MBSE in the.
8.1. How do you use model-based development?
8.2. Which tools are you already using for MBSE?
8.3. What are the benefits to the development process?
8.4. Were the expectations met? Which were not?
8.5. Can the benefits be quantified?

interview guide 171
8.6. Were there unexpected annoyances in the use of methodsand tools? How did you avoid them?
8.7. Were there unexpected additional uses when using themethods and tools?
8.8. How has your work changed with the model-based ap-proaches?
8.9. What were the hurdles during the introduction?
8.10. How were the hurdles overcome?
8.11. How did you build the necessary knowledge?
8.12. Would you introduce the methods and tools, again?
8.13. What new challenges do you see for the future?
9. Wrap-Up
9.1. Is there anything else you can tell me about the subject?


CQ U E S T I O N N A I R E
In this chapter we present the questionnaire used in the surveyfrom Chapter 4.
c.1 preamble
Survey on MBSE Adoption Best Practices
Dear MBSE practitioner,My name is Tiago Amorim and I am a PhD candidate at TU-Berlinwith the topic MBSE maturity improvement roadmap. Currently I amdoing a research on MBSE adoption strategies and best practices inEmbedded Systems Industry and I have collected some findings that Iwould like to validate with practitioners which have some experiencewith MBSE adoption.
I prepared a very FAST (i.e., 10 min. max.) survey (Google Forms)and I ask you to answer it and share it with relevant peers as muchas possible.Of course, the survey is anonymous and we will only report aggre-gated values.The survey must be answered BEFORE 03.05, 23:59.
For further questions: [email protected]
Thank you for your collaboration.Tiago Amorim
c.2 demographic questions
1. What is your Industry Sector?
2. What is your role in your organization?
3. How big is your organization (employees)?
◦ 1-20
◦ 21-100
◦ 101-1000
◦ > 1000
173

174 questionnaire
4. Have you ever participated or observed some endeavor to intro-duce Model-based Engineering in a company?
c.3 mbse adoption best practices
How strongly do you agree that the following strategies help adoptingModel-based System Engineering (MBSE) in companies? (StronglyDisagree, Disagree, Agree, Strongly Agree)
c.3.1 Piloting
B The organization should start adopting MBSE as part of a newproject.
B The pilot project should create real value for the organization(i.e., no didactic project).
B The pilot project should have enough budget and time allocatedto bear the overhead of adoption.
B No translation of old artifacts except for reusable artifacts.
B Start small in terms of project and team size in order to acquiresome experience
c.3.2 Tools and processes
B Used tools should have open interfaces and homogeneous work-flows.
B The whole tool chain should be replaced.
B Many tools might be required.
B All engineers should have access to the tools.
B Tool acquisition should be thoroughly planned.
B The new MBSE processes should be well documented to betterunderstand what tool is required.
c.3.3 Knowledge building
B All engineers should get, at least, basic training in MBSE.
B Use training examples from the domain of the organization toease the understanding.

C.4 adoption best practices prioritization 175
B The context of an organization should affect the strategy to buildknowledge of an organization.
B There should be a planned form of later evaluation to fill even-tual gaps
c.3.4 Management
B Make the advantages of MBSE clear to the users.
B Have technically prepared people to support your engineers (i.e.,not sales personnel).
B Bring everyone to adoption (i.e., avoid creating castes).
B If you have good engineers let them do the work for you, it ischeaper and they will engage more (i.e., empowering).
B Management should unify all employees towards adoption
c.4 adoption best practices prioritization
From the best practices you read in the previous section, which doyou consider most important? Select up to 5 options.
� The pilot project should create real value for the organization(i.e., no didactic project).
� The pilot project should have enough budget and time allocatedto bear the overhead of adoption.
� No translation of old artifacts except for reusable artifacts.
� Start small in terms of project and team size in order to acquiresome experience
� The organization should start adopting MBSE as part of a newproject.
� Used tools should have open interfaces and homogeneous work-flows.
� The whole tool chain should be replaced.
� Many tools might are required.
� All engineers should have access to the tools.
� Tool acquisition should be thoroughly planned.
� The new MBSE processes should be well documented to betterunderstand what tool is required.
� All engineers should get, at least, basic training in MBSE.

176 questionnaire
� Use training examples from the domain of the organization toease the understanding.
� The context of an organization should affect the strategy to buildknowledge of an organization.
� There should be a planned form of later evaluation to fill even-tual gaps.
� Make the advantages of MBSE clear to the users.
� Have technically prepared people to support your engineers (i.e.,not sales personnel).
� Bring everyone to adoption (i.e., avoid creating castes).
� If you have good engineers let them do the work for you, it ischeaper and they will engage more (i.e., empowering).
� Management should unify all employees towards adoption

DC O D E B O O K
This appendix presents the codebook used in Chapter 3 through amind map diagram (cf. Figure D.1).
177
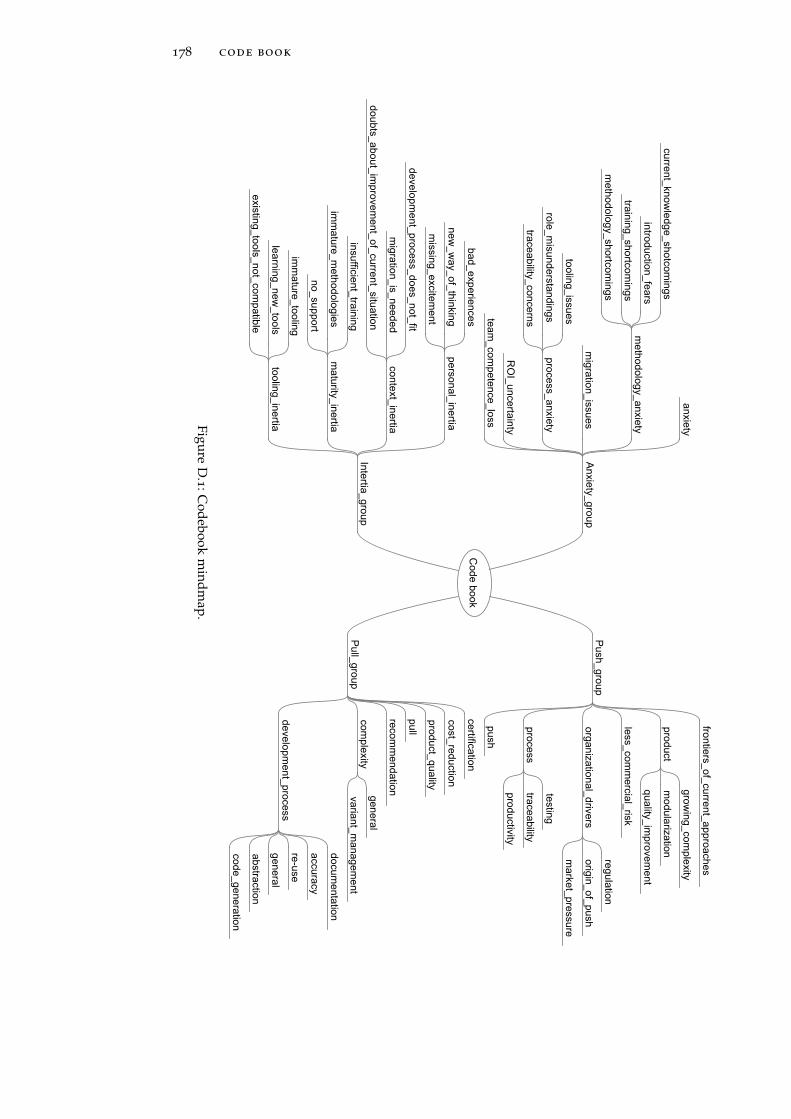
178 code book
FigureD
.1:C
odebookm
indmap.

ER E F I N E D M B S E A D O P T I O N G O A L A N D T E A M ’ SB E N E F I T P O T E N T I A L F R O M C A S E S T U D I E S O FC H A P T E R 6
In this Appendix, we present the Refined MBSE adoption goal and Team’sBenefit Potential from case studies of Chapter 6.
179

180 refined mbse adoption goal and team’s benefit potential from case studies of chapter 6
Table E.1: Refined MBSE adoption goal and Team’s Benefit Potential of CaseStudy 1.
Goal: Enhance communication between software and system development teams.
Competitive Priorities Cost Quality Lead time Scope
Goal Refinement 4,7% 11,9% 29,8% 53,6%
Benefits
Easier reuse of existing artifacts 2 2 1 0
Better communication 0 2 1 2
Better understanding of problem domain 1 1 1 1
Better understanding of solution space 0 1 2 2
Better estimates 2 1 1 0
Less defects 2 2 1 0
Easier handling of complexity 1 2 1 1
Improved V&V 2 2 1 0
Improved quality of specification 1 1 1 1
Efficient certification 1 2 1 1
Sum: 14 16 11 8

refined mbse adoption goal and team’s benefit potential from case studies of chapter 6 181
Table E.2: Refined MBSE adoption goal and Team’s Benefit Potential of CaseStudy 2.
Goal: Improve knowldge transfer.
Competitive Priorities Cost Quality Lead time Scope
Goal Refinement 3,7% 45,0% 35,3% 16,0%
Benefits
Easier reuse of existing artifacts 1 2 2 0
Better communication 1 2 1 1
Better understanding of problem domain 2 2 2 2
Better understanding of solution space 1 2 2 2
Better estimates (cost, impact of req. changes) 2 1 2 2
Less defects 2 1 2 0
Easier handling of complexity 1 0 2 2
Improved V&V 1 2 2 0
Improved quality of specification 1 2 2 2
Efficient certification 0 0 0 0
Sum: 12 14 17 11

182 refined mbse adoption goal and team’s benefit potential from case studies of chapter 6
Table E.3: Refined MBSE adoption goal and Team’s Benefit Potential of CaseStudy 3.
Goal1: Improve effort estimation.
Goal2: Reduce rework due to communication issues and scope definition.
Competitive Priorities Cost Quality Lead time Scope
Goal Refinement 1 5,4% 11,7% 68,0% 14,9%
Goal Refinement 2 3,6% 13,7% 50,3% 32,4%
Benefits
Easier reuse of existing artifacts 1 2 2 0
Better communication 1 2 2 1
Better understanding of problem domain 1 2 2 0
Better understanding of solution space 1 2 2 1
Better estimates (cost, impact of req. changes) 1 2 2 0
Less defects 1 2 2 0
Easier handling of complexity 1 2 2 1
Improved V&V 1 2 1 1
Improved quality of specification 1 2 1 0
Efficient certification 0 0 0 0
Sum: 9 18 18 4

refined mbse adoption goal and team’s benefit potential from case studies of chapter 6 183
Table E.4: Refined MBSE adoption goal and Team’s Benefit Potential of CaseStudy 4.
Goal: Automate system analysis.
Competitive Priorities Cost Quality Lead time Scope
Goal Refinement 4,9% 62,3% 19,8% 13,0%
Benefits
Easier reuse of existing artifacts 2 1 2 0
Better communication 1 2 2 0
Better understanding of problem domain 1 2 1 2
Better understanding of solution space 1 2 2 1
Better estimates (cost, impact of req. changes) 1 1 0 1
Less defects 2 2 1 2
Easier handling of complexity 2 2 2 1
Improved V&V 1 2 1 1
Improved quality of specification 1 2 1 1
Efficient certification 0 0 0 0
Sum: 12 16 12 9

184 refined mbse adoption goal and team’s benefit potential from case studies of chapter 6
Table E.5: Refined MBSE adoption goal and Team’s Benefit Potential of CaseStudy 5.
Goal: Improve ability of the team.
Competitive Priorities Cost Quality Lead time Scope
Goal Refinement 3,7% 18,3% 43,4% 34,6%
Benefits
Easier reuse of existing artifacts 2 1 2 1
Better communication 0 1 1 1
Better understanding of problem domain 2 2 2 2
Better understanding of solution space 2 2 2 2
Better estimates (cost, impact of req. changes) 0 0 0 0
Less defects 2 1 2 2
Easier handling of complexity 0 1 1 1
Improved V&V 2 2 2 2
Improved quality of specification 2 2 2 2
Efficient certification 0 0 0 0
Sum: 12 12 14 13

refined mbse adoption goal and team’s benefit potential from case studies of chapter 6 185
Table E.6: Refined MBSE adoption goal and Team’s Benefit Potential of CaseStudy 6.
Goal: Automate artifact treatment activities.
Competitive Priorities Cost Quality Lead time Scope
Goal Refinement 3,0% 61,0% 9,8% 26,2%
Benefits
Easier reuse of existing artifacts 1 2 1 2
Better communication 0 1 1 2
Better understanding of problem domain 1 2 2 2
Better understanding of solution space 1 2 2 2
Better estimates (cost, impact of req. changes) 1 2 2 2
Less defects 1 2 2 1
Easier handling of complexity 1 2 2 2
Improved V&V 1 2 1 2
Improved quality of specification 1 2 2 2
Efficient certification 1 2 1 2
Sum: 9 19 16 19


FE V I D E N C E F O R T H E R E L AT I O N S B E T W E E N M B S EA D O P T I O N H I N D E R I N G F O R C E S A N D B E S TP R A C T I C E S
In this appendix, we present the participants’ interview quotes whichserve as evidence for how best practices can be used to mitigate MBSEadoption hindering forces, as described in Section 4.4. The informa-tion is organized considering each best practice; then, for each par-ticipant quote related to the best practice, the following code is used:BPXX_PYY, where XX denotes the best practice and YY indicates theparticipant number. Then, quotes of the participants related to hin-dering forces are presented using the code GROUP:FORCE, whereGROUP can be either Anxiety or Inertia, and FORCE is the force’sname. For instance, BP01_P01 indicates a quote related to Best Practice01 and interview participant 01. In the following, quotes are listed.
BP01: The organization should start adopting MBSE with new projects.
BP01_P01“New start in new project preferred”, “Existing projects remainedin old surroundings and were gradually archived”
• Anxiety:Methodology shortcomings “There is a lack of a consis-tent methodology - thus uncertainties” / “The demarcation of themethod against the processes is rarely solved”
• Anxiety:Role misunderstanding “There is a lack of understandingof one’s own role in the overall context. The people in training do notunderstand the incorporation of their role”
BP01_P03“Set up own project for method development instead of accompa-nying from series development”
• Inertia:Doubts about improvements - “Low acceptance in themeantime”
• Inertia:Imature tooling / Inertia:Learning new tools - “Usersfirst chose Excel before because of startup problems”
• Inertia:Incompatibility with existing tools - “Tedious develop-ment and testing of methodology; Efforts for specific tool extensionsthrough plugins”
• Inertia:Imature methodologies / Inertia:Imature tooling -“Method problems (and also some general tool problems) were noted,but could not be solved (despite support hotline)”
187

188 evidence for the relations between mbse adoption hindering forces and best practices
BP01_P11“Do not recycle the past” - Anxiety:Skill of employees - “De-cision not yet taken to switch to new plan, not sure if that works”
BP01_P13“Remove [team] from existing organization, set up your ownproject, the rest continues as before. Within a few years, new product gen-eration has higher market share.”, “Backwards compatibility, so that onlychanges need to be redesigned (includes not only code, but also specs, tests,test infrastructure)”
• Anxiety:Skill of employees / Anxiety:Tooling shortcomings /Anxiety:Role misunderstandings / Anxiety:Team competenceloss - “Usually, developers are in several projects. But: two methods,different tools => is not good”
• Inertia:Migration is needed - “Legacy problem is real hurdle: oldapproach must continue to be used and maintained”
BP03: The pilot project should have enough budget and time allocated to bearthe overhead of adoption.
BP03_P11“The first projects must be able to bear the burden.” - Anxi-ety:ROI uncertainty - “It is a mistake to believe that an advantage will befelt in the first project”
BP03_P17“Business case because of investment hurdle in the beginning”
• Inertia:Development process does not fit - “Established and cer-tified processes. Change costs money”.
• Anxiety:ROI uncertainty - “Can this be recovered through sav-ings?”
BP05: Start small in terms of project and team size in order to acquire someexperience.
BP05_P01“Often pilot installation to gain experience, then expansioncompanies-wide”
• Inertia:Doubts about Improvements - “Developer with Simulinkknow-how (just one example): Understanding, but doubting the mean-ing (‘as before, just a bit more abstract - where is the benefit?’)”
• Anxiety:Methodology shortcomings - “There is a lack of a con-sistent methodology - thus uncertainties” / “The demarcation of themethod against the processes is rarely solved”
BP05_P02“It is advisable to start with a partial introduction first, laterthrough a consistent MBE. - needed breath” - “If necessary implementationstrategy with 3-4 months observation of what the developer does, and thendecide how to improve the process with MBE”

evidence for the relations between mbse adoption hindering forces and best practices 189
• Inertia:Immature tooling - “Insufficient tools made the introductiondifficult or impossible (instability or bad GUI)”
• Inertia:Incompatibility with existing tools - “Lack of integrationwith existing tools has made the introduction difficult or stopped de-velopment process does not fit - The process of avionics is so slow thatchanges can only be introduced step by step”
• Anxiety:ROI uncertainty - “Often the hurdles were not overcome,because the conversion would have become much more expensive forthe company”
BP05_P05“Introduction as ‘submarine project’ by dedicated developer,then application in own department, now overarching roll-out.” - Iner-tia:Immature methododlogies - “Resistances due to misunderstandings/ overlaps with existing MBW work in Simulink”
BP05_P06“Start in some areas that you can better oversee [...] Best to startin individual areas according to company guidelines” - Anxiety:Skill ofemployees / Anxiety:Migration issues - “Not all at once, people do notwant that either”
BP05_P19“Only 1-2 people, then the rest of the team”
• Anxiety:ROI uncertainty - “Doubts about usability, use, flexibility”• Anxiety:ROI uncertainty / Anxiety:Methodology shortcom-
ings - “Doubts about maturity, scalability”• Anxiety:Skill of employees / Anxiety:Methodology shortcom-
ings - “Maintainability: Stability of the language, uncertainty overtime and between colleagues”
• Anxiety:Methodology shortcomings - “Maintainability open, notclear if someone can later use the formal language”
BP07: All engineers should have access to the tools.
BP07_P11“The worker level must also get the tools” - Anxiety:Role mis-understandings / Anxiety:Team competence loss - “Avoid division inthe team (worker / modeler)”
BP08: Tool acquisition is very costly therefore should be thoroughly planned.
BP08_P01“Development of a holistic approach/methodology” - Iner-tia:Learning new tools / Inertia: Missing excitement - “Complex toolswith a lack of intuitive operation”
BP08_P09“Develop an adoption strategy”
• Anxiety:ROI uncertainty - “Introduction costs (tools, training)”

190 evidence for the relations between mbse adoption hindering forces and best practices
• Anxiety:Tooling shortcomings - “Tools (Cost, maturity, ‘lock-in’fears, integrability, qualification)”/ “But still trouble with tools: opera-tion incomprehensible, can do more than necessary”
BP09: Have the new MBSE processes well documented so you better under-stand what tool you will need.
BP09_P01“If the standard process is well documented, the MBE implemen-tation will work easier.” - Anxiety:Methodology shortcomings - “Thereis a lack of a consistent methodology - thus uncertainties” / “The demarcationof the method against the processes is rarely solved”
BP09_P08“First the process was set, then the tool decision”
• Inertia:Doubts about improvements - “Introduction costs (tools,training) - It takes a great emergency to justify the cost of implement-ing Doors (including the cost of creating the information model)”
• Anxiety:Tooling shortcomings - “I need tools to compare my mod-els with reality”
BP10_P17“Tool support for automation of work” - Anxiety:ROI uncer-tainty - “Can this be recovered through savings?”
BP10: All engineers should get, at least, basic training in MBSE.
BP10_P01“Training, training, training!”
• Inertia:Insufficient training - “Inadequate training”• Inertia:Immature methodology - “Unclear terminology”• Inertia:Missing excitement - “Complex tools with a lack of intuitive
operation”• Anxiety:Role misunderstandings - “The people in training do not
understand the incorporation of their role”
BP10_P06“Basic training for all users of MBSE” - Inertia:Immature tool-ing / Inertia:Learning new tools - “EA not user friendly. Issues dis-tributed over many menus, you always have to search.”
BP10_P11“Broad basic training of all employees - Everyone should have thesame understanding”
• Inertia:Changing the way of thinking - “For many MA some-thing completely new [...] is outside your comfort zone”
• Anxiety:Role misunderstandings / Anxiety:Team competenceloss - “Avoid division in the team (worker / modeler)”

evidence for the relations between mbse adoption hindering forces and best practices 191
BP11: Using examples that are familiar to the domain of the organizationeases the understanding. Model some existing artifacts for using as examples.
BP11_P02“[Training team] has modeled examples of clients and then pre-sented them [sic] to the client (we’ll show you how we do it)”
• Inertia:Doubts about improvements - “The user of the MBE (de-veloper) must be convinced that the added value must be clear to him,then it’s easier”
• Anxiety:ROI uncertainty - “‘Coaching on the job’ at launch is im-portant, but it costs a lot”
BP11_P11“Examples from similar industry help” - Inertia:Changing wayof thinking - “For many MA something completely new [...] is outside yourcomfort zone”
BP12: Many strategies can be used to build knowledge of an organization,the context should be taken into consideration.
BP12_P05 “Model should be reference. To do this, connect other tools (e.g.,importing Doors for initial filling, then only update exports back to Doors,generated code frames force interface fidelity)” - Inertia:Insufficient train-ing - “In one department: Low willingness to abstraction and the need toquickly get technical discussions”
BP12_P08“Face-to-Face Seminar with exercises” “Per tool training e.g.Doors” - Anxiety:Large training efforts - “Training necessary: How do Ibring my engineers to the same level as the experts?”
BP13: There should be a planned form of later evaluation to fill eventualgaps.
BP13_P01“Continuous explanation of the methodology” - Iner-tia:Insufficient training - “Inadequate training”
BP13_P05“Accompanying technical monitoring of work results; is not hap-pening systematically.” - Inertia:Insufficient training - “In one depart-ment: Low willingness to abstraction and the need to quickly get technicaldiscussions”
BP14: Make the advantages of MBSE clear.
BP14_P18“Good examples show: project for new methods tools, then showthat it works (utility and acceptance).” - Inertia:Doubts about improve-ments / Inertia:Learning new tools “As with any change a certain denialattitude. Especially with older developers who work textually - they are diffi-

192 evidence for the relations between mbse adoption hindering forces and best practices
cult to convince of a new tool. The benefits should already be felt directly forthem”
BP14_P13“Every few years new product generation, e.g. because of Platformchanges through technical advances (multicore ...) or new system approachesthat affect many functions. Then there is a break in the system concepts,many have to be taken in hand, because you can introduce new methods.”“Representation as a means of unique selling proposition. Works, but eachdeveloper must be convinced individually.”
• Inertia:Doubts about improvements - “Problem still not felt, thenlittle action readiness./Justification Benefits vs. Effort is difficult.”
• Inertia:Changing the way of thinking - “Difficult to tell success-ful and experienced people: ‘That’s how you have to do it’. Psychologi-cal problem.”
• Anxiety:ROI uncertainty/migration issues - “Architecturalchanges are heavy. Then high benefits must be demonstrated”
BP14_P16“Advantages of simulability were made visible” - Anxiety:ROIuncertainty / Anxiety:Skill of employees - “Benefit of the model basednot quite clear, costs a lot. Alternatives unclear.”
BP16: Bring everyone to adoption (i.e., avoid creating castes).
BP16_P11“Avoid living apart, everyone has to go!!!” - Anxiety:Role mis-understandings / Anxiety:Team competence loss - “Avoid division inthe team (worker / modeler)”
BP17: If you have good engineers let them do the work for you, it is cheaper,and they will engage more (i.e., empowering).
BP17_P08“Information model developed itself” - Inertia:Insufficienttraining - “Standardization of the language between the MA necessary”

B I B L I O G R A P H Y
Afzal, W., R. Torkar, R. Feldt, and T. Gorschek (2013). “Predictionof Faults-Slip-Through in Large Software Projects: An EmpiricalEvaluation.” In: Software Quality Journal 22.
Ågerfalk, P. J. and K. Wistrand (2003). “Systems Development MethodRationale: A Conceptual Framework for Analysis.” In: Proceedingsof the 5th International Conference on Enterprise Information Systems(ICEIS’03).
Ameller, D. (2009). “Considering Non-Functional Requirements inModel-Driven Engineering.” MA thesis. Llenguatges i Sistemes In-formàtics (LSI).
Amorim, T., H. Martin, Z. Ma, C. Schmittner, D. Schneider, G. Macher,B. Winkler, M. Krammer, and C. Kreiner (2017). “Systematic PatternApproach for Safety and Security Co-engineering in the Automo-tive Domain.” In: Proceedings of the 36th International Conference onComputer Safety, Reliability, and Security (SAFECOMP’17).
Amorim, T., A. Vogelsang, F. Pudlitz, P. Gersing, and J. Philipps (2019).“Strategies and Best Practices for Model-based Systems EngineeringAdoption in Embedded Systems Industry.” In: Proceedings of the 41stACM/IEEE International Conference on Software Engineering: SoftwareEngineering in Practice (ICSE-SEIP’19).
– (2020). “Strategies and Best Practices for MBSE Adoption in Em-bedded Systems Industry.” In: Proceedings of the Software Engineering2020, Fachtagung des GI-Fachbereichs Softwaretechnik.
Aranda, J., D. Damian, and A. Borici (2012). “Transition to model-driven engineering.” In: Proceedings of the 15th ACM/IEEE Interna-tional Conference on Model Driven Engineering Languages and Systems(MODELS’12).
Asan, E., O. Albrecht, and S. Bilgen (2014). “Handling Complexity inSystem of Systems Projects – Lessons Learned from MBSE Efforts inBorder Security Projects.” In: Complex Systems Design & Management.
193

194 bibliography
Baars, T., F. Mijnhardt, K. Vlaanderen, and M. Spruit (2016). “An an-alytics approach to adaptive maturity models using organizationalcharacteristics.” In: Decision Analytics 3.
Badewi, A. (2016). “The impact of project management (PM) and ben-efits management (BM) practices on project success: Towards de-veloping a project benefits governance framework.” In: InternationalJournal of Project Management 34.4.
Basili, V. R. (1992). Software modeling and measurement: the Goal/Ques-tion/Metric paradigm. Tech. rep. University of Maryland.
Basili, V. R., G. Caldiera, and H. D. Rombach (1994). “The Goal Ques-tion Metric Approach.” In: Encyclopedia of Software Engineering. Wi-ley.
Basili, V., J. Heidrich, M. Lindvall, J. Munch, M. Regardie, and A.Trendowicz (2007). “GQM+Strategies – Aligning Business Strate-gies with Software Measurement.” In: Proceedings of the 1st Interna-tional Symposium on Empirical Software Engineering and Measurement(ESEM’07).
Batejat, F. (2019). Build a car with graphs. Graph Tour 2019 Volvo Cars.url: https://neo4j.com/videos/graph-tour-2019-volvo-cars/(visited on 05/22/2021).
Bauer, V. and A. Vetrò (2016). “Comparing reuse practices in two largesoftware-producing companies.” In: Journal of Systems and Software117.
Beck, K. (2000). Extreme Programming Explained: Embrace Change.Addison-Wesley Longman Publishing Co., Inc.
Beck, K. and C. Andres (2004). Extreme Programming Explained: EmbraceChange (2nd Edition). Addison-Wesley Professional.
Becker, J., M. Rosemann, and C. von Uthmann (2000). “Guidelinesof Business Process Modeling.” In: Business Process Management:Models, Techniques, and Empirical Studies. Springer Berlin Heidelberg.
Bekkers, W. and M. Spruit (2010). “The Situational AssessmentMethod put to the test: Improvements based on case studies.” In:Proceedings of the 4th International Workshop on Software Product Man-agement (IWSPM’10).

bibliography 195
Bekkers, W., I. v. d. Weerd, S. Brinkkemper, and A. Mahieu (2008).“The Influence of Situational Factors in Software Product Manage-ment: An Empirical Study.” In: Proceedings of the 2nd InternationalWorkshop on Software Product Management (IWSPM’08).
Bekkers, W., M. Spruit, I. D. Weerd, R. V. Vliet, and A. Mahieu (2010).“A Situational Assessment Method for Software Product Manage-ment.” In: Proceeding of the European Conference on Information Sys-tems (ECIS’10).
Bennett, P. D. and P. F. Anderson (1995). Dictionary of Marketing Terms.NTC Business Books.
Bharadwaj, A. S. (2000). “A Resource-Based Perspective on Informa-tion Technology Capability and Firm Performance: An EmpiricalInvestigation.” In: MIS Quarterly 24.1.
Boehm, B. W., T. E. Gray, and T. Seewaldt (1984). “Prototyping vs.Specifying: A Multi-project Experiment.” In: Proceedings of the 7thInternational Conference on Software Engineering (ICSE’84).
Boehm, B. and R. Turner (2003). “Using risk to balance agile andplan-driven methods.” In: Computer 36.6.
Böhm, W., M. Junker, A. Vogelsang, S. Teufl, R. Pinger, and K. Rahn(2014). “A Formal Systems Engineering Approach in Practice: AnExperience Report.” In: Proceedings of the 1st International Workshopon Software Engineering Research and Industrial Practices (SER&IPs’14).
Boll, A., F. Brokhausen, T. Amorim, T. Kehrer, and A. Vogelsang(2021). “Characteristics, Potentials, and Limitations of Open SourceSimulink Projects for Empirical Research.” In: Software and SystemsModeling.
Bone, M. and R. Cloutier (2010). “The current state of model basedsystems engineering: Results from the OMG SysML request forinformation 2009.” In: Proceedings of the 8th Conference on SystemsEngineering Research (CSER’10).
Booch, G., J. Rumbaugh, and I. Jacobson (2005). Unified Modeling Lan-guage User Guide, The (2nd Edition) (Addison-Wesley Object TechnologySeries). Addison-Wesley Professional.
Bradley, Gerald (2010). Fundamentals of Benefit Realization. Tso.

196 bibliography
Breese, R., S. Jenner, C. Serra, J. Thorp, and A. Badewi (2016). Aunified view of benefits management/benefits realization management to beintegrated into PMI standards. Tech. rep. Sheffield Hallam University.
Brinkkemper, S. (1996). “Method engineering: engineering of informa-tion systems development methods and tools.” In: Information andSoftware Technology 38.4.
Brinkkemper, S., M. Saeki, and F. Harmsen (2001). “A Method En-gineering Language for the Description of Systems DevelopmentMethods.” In: Proceedings of the 23rd International Conference on Ad-vanced Information Systems Engineering (CAiSE’01).
Broy, M. (2006). “Challenges in automotive software engineering.” In:Proceedings of the 28th International Conference on Software Engineering(ICSE’06).
Broy, M., W. Damm, S. Henkler, K. Pohl, A. Vogelsang, and T. Weyer(2012). “Introduction to the SPES Modeling Framework.” In: Model-Based Engineering of Embedded Systems. Springer Berlin Heidelberg.
Bryman, A. (2015). Social research methods. Oxford university press.
Bubenko, J. A. and M. Kirikova (1999). “Improving the Quality ofRequirements Specifications by Enterprise Modelling.” In: Perspec-tives on Business Modelling: Understanding and Changing Organisations.Springer Berlin Heidelberg.
Cambridge University Press (2020). Cambridge Dictionary. url:https : / / dictionary . cambridge . org / dictionary/ (visited on10/20/2020).
Carroll, E. R. and R. J. Malins (2016). Systematic Literature Review:How is Model-Based Systems Engineering Justified? Tech. rep. SandiaNational Laboratories.
Chaudron, M. R., W. Heijstek, and A. Nugroho (2012). “How Effectiveis UML Modeling?” In: Software and Systems Modeling 11.
Clarke, P. and R. V. O’Connor (May 2012). “The Situational FactorsThat Affect the Software Development Process: Towards a Compre-hensive Reference Framework.” In: Information and Software Technol-ogy 54.5.

bibliography 197
Conboy, K. and B. Fitzgerald (2010). “Method and Developer Charac-teristics for Effective Agile Method Tailoring: A Study of XP ExpertOpinion.” In: ACM Transactions on Software Engineering and Method-ology 20.1.
Conner, D. R. (1993). Managing at the Speed of Change. Random House.
Copi, I.M. (2003). Essentials of Logic. Pearson Prentice Hall.
Dabkowski, M., J. Estrada, B. Reidy, and R. Valerdi (2013). “NetworkScience Enabled Cost Estimation in Support of MBSE.” In: ProcediaComputer Science 16.
Dardenne, A., A. van Lamsweerde, and S. Fickas (1993). “Goal-directed requirements acquisition.” In: Science of Computer Program-ming 20.1.
DeCuir-Gunby, J., P. Marshall, and A. Mcculloch (May 2011). “Devel-oping and Using a Codebook for the Analysis of Interview Data:An Example from a Professional Development Research Project.”In: Field Methods Journal 23.
Denzin, N.K. (2006). Sociological Methods: A Sourcebook. Methodologicalperspectives. Aldine Transaction.
Diebold, P., A. Vetrò, and D. M. Fernández (2015). “An ExploratoryStudy on Technology Transfer in Software Engineering.” In: Pro-ceedings of the 9th ACM/IEEE International Symposium on EmpiricalSoftware Engineering and Measurement (ESEM’15).
Dowson, M. (1997). “The Ariane 5 Software Failure.” In: ACM SIG-SOFT Software Engineering Notes 22.2.
Dresch, A., D. P. Lacerda, and J. A. V. Antunes (2015). “Design Sci-ence Research.” In: Design Science Research: A Method for Science andTechnology Advancement. Springer International Publishing.
Foo, G. and D. J. Friedman (1992). “Variability and Capability: TheFoundation of Competitive Operations Performance.” In: AT&TTechnical Journal 71.4.
Fosse, E. and T. Bayer (2016). Model-based Systems Engineering MBSE101. Incose International Workshop. url: https://www.omgwiki.org/MBSE/lib/exe/fetch.php?media=mbse:2016_iw-mbse_101.
pdf (visited on 05/22/2021).

198 bibliography
Franco, L. A. and G. Montibeller (2011). “Problem Structuring for Mul-ticriteria Decision Analysis Interventions.” In: Wiley Encyclopedia ofOperations Research and Management Science. John Wiley & Sons, Inc.
Frederiksz, H., B. Hedeman, and G. V. van Heemst (2010). ProjectManagement Based on PRINCE2 2009 Edition. Van Haren Publishing.
Garmus, D. and D. Herron (2001). Function Point Analysis: MeasurementPractices for Successful Software Projects. Addison-Wesley LongmanPublishing Co., Inc.
Hammer, M. (2007). “The Process Audit.” In: Harvard Business Review.
Harvey, D. and T. Liddy (2014). “Architecting the Problem Space –Model-Based User Needs Analysis.” In: Proceedings of the 4th AsiaPacific Conference on Research in Industrial and Systems Engineering(APCORISE’14).
Hayes, R. H. and S. C. Weelwright (1984). Restoring Our CompetitiveEdge: Competing Through Manufacturing. John Wiley & Sons, Inc.
Helle, P. (2012). “Automatic SysML-based Safety Analysis.” In: Pro-ceedings of the 5th International Workshop on Model Based Architectingand Construction of Embedded Systems.
Henderson-Sellers, B. and J. Ralyté (2010). “Situational Method Engi-neering: State-of-the-Art Review.” In: Journal of Universal ComputerScience 16.3.
Henderson-Sellers, B., J. Ralyte, P. J. Agerfalk, and M. Rossi (2014).Situational Method Engineering. Springer Publishing Company Inc.
Hoffmann, H. (2012). “Deploying model-based systems engineeringwith IBM Rational; solutions for systems and software engineer-ing.” In: Proceedings of the 31st IEEE/AIAA Digital Avionics SystemsConference (DASC’12).
Hohl, P., J. M, K. Schneider, and M. Stupperich (2016). “Forces thatprevent agile adoption in the automotive domain.” In: Proceedingsof the 17th International Conference of Product-Focused Software ProcessImprovement (PROFES’16).
Horkoff, J. and E. K. Yu (2011). “Analyzing goal models: differentapproaches and how to choose among them.” In: Proceedings of theACM Symposium on Applied Computing (SAC’11).

bibliography 199
Horkoff, J., D. Barone, L. Jiang, E. Yu, D. Amyot, A. Borgida, and J.Mylopoulos (2014). “Strategic Business Modeling: Representationand Reasoning.” In: Software and Systems Modeling 13.
Huang, S. and W. Han (2006). “Selection priority of process areasbased on CMMI continuous representation.” In: Information & Man-agement 43.3.
Hutchinson, J., M. Rouncefield, and J. Whittle (2011). “Model-drivenEngineering Practices in Industry.” In: Proceedings of the 33rd Inter-national Conference on Software Engineering (ICSE’11).
Hutchinson, J., J. Whittle, and M. Rouncefield (2014). “Model-drivenengineering practices in industry: Social, organizational and man-agerial factors that lead to success or failure.” In: Science of ComputerProgramming 89.
Hutchinson, J., J. Whittle, M. Rouncefield, and S. Kristoffersen (2011).“Empirical assessment of MDE in industry.” In: Proceedings of the33rd International Conference on Software Engineering (ICSE’11).
INCOSE (2007). Systems engineering vision 2020. Tech. rep. Interna-tional Council on Systems Engineering.
ISO/IEC (2003). ISO/IEC 15504:2004 Information technology – Processassessment – Part 4: Guidance on use for process improvement and processcapability determination. Tech. rep. International Organization forStandardization, Geneva, Switzerland.
ISO/IEC (2010). ISO/IEC 25010 System and software quality models.Tech. rep. International Organization for Standardization, Geneva,Switzerland.
Jitpaiboon, T. (2014). “The Study of Competitive Priorities and Infor-mation Technology Selection: Exploring Buyer and Supplier Perfor-mance.” In: Journal of International Technology and Information Man-agement 23.
Jolak, R., E. Umuhoza, T. Ho-Quang, M. R. V. Chaudron, and M.Brambilla (2017). “Dissecting Design Effort and Drawing Effort inUML Modeling.” In: Proceedings of the 43rd Euromicro Conference onSoftware Engineering and Advanced Applications (SEAA’17).
Kambil, A., A. Ginsberg, and M. Bloch (1996). “Re-Inventing ValuePropositions.” In: NYU Stern School of Business Research Paper Series.

200 bibliography
Karban, R., T. Weilkiens, R. Hauber, and R. Diekmann (2010). MBSEPractices in Telescope Modeling. Tech. rep.
Kaslow, D., B. Ayres, P. T. Cahill, L. Hart, and R. Yntema (2017). “AModel-Based Systems Engineering (MBSE) approach for definingthe behaviors of CubeSats.” In: Proceedings of the IEEE AerospaceConference.
Klement, A. (2018). When Coffee and Kale Compete: Become Great at Mak-ing Products People Will Buy. CreateSpace Independent PublishingPlatform.
Kneuper, R. (2008). CMMI: Improving Software and Systems DevelopmentProcesses Using Capability Maturity Model Integration. Rocky Nook.
Krajewski, L. and L. Ritzman (2018). Operations management : strategyand analysis. Addison-Wesley.
Kuhn, A., G. C. Murphy, and C. A. Thompson (2012). “An exploratorystudy of forces and frictions affecting large-scale model-driven de-velopment.” In: Proceedings of the ACM/IEEE 15th International Con-ference on Model Driven Engineering Languages and Systems (MOD-ELS’12).
Likert, R. (1932). “A technique for the measurement of attitudes.” In:Archives of Psychology 22.140.
Little, J. D. C. (1970). “Models and Managers: The Concept of a Deci-sion Calculus.” In: Management Science 16.8.
Lorenz, W. and M. B. Brasil (2014). “Activity-Based Software ProcessLines Tailoring.” In: International Journal of Software Engineering andKnowledge Engineering 24.
MBSE and SysML. Accessed: 17.05.2021. url: https://www.visual-paradigm.com/guide/sysml/mbse-and-sysml/.
Mandic, V. and N. Gvozdenovic (2017). “An extension of theGQM+Strategies approach with formal causal reasoning.” In: In-formation and Software Technology 88.
Martin, H., Z. Ma, C. Schmittner, B. Winkler, M. Krammer, D. Schnei-der, T. Amorim, G. Macher, and C. Kreiner (2020). “Combined au-tomotive safety and security pattern engineering approach.” In:Reliability Engineering and System Safety 198.

bibliography 201
Maxwell, J. A. (2012). Qualitative research design: An interactive approach.Vol. 41. Sage publications.
McConnell, S. (2004). Code Complete, Second Edition. Microsoft Press.
Merriam-Webster (2021). “Context.” In: Merriam-Webster.com dictionary.url: https://www.merriam- webster.com/dictionary/context(visited on 05/24/2021).
Mettler, T. and R. Winter (2010). “Towards a Classification of MaturityModels in Information Systems.” In: Management of the Intercon-nected World. Physica-Verlag HD.
Mijnhardt, F., T. Baars, and M. Spruit (2016). “Organizational charac-teristics influencing sme information security maturity.” In: Journalof Computer Information Systems 56.2.
Miller, J. and J. Mukerji (2003). MDA Guide Version 1.0.1. Tech. rep.Object Management Group (OMG).
Minh, V. T., A. Moustafa, and M. Tamre (2017). “Design and simula-tions of dual clutch transmission for hybrid electric vehicles.” In:International Journal of Electric and Hybrid Vehicles 9.4.
Motamedian, B. (2013). “MBSE Applicability Analysis.” In: Interna-tional Journal of Scientific and Engineering Research.
Neuman, W. L. (2010). Social Research Methods: Qualitative and Quanti-tative Approaches. Alpha Books.
Northrop, L. M. (2006). “Software product lines: reuse that makes busi-ness sense.” In: Proceedings of the 15th Australian Software EngineeringConference (ASWEC’06).
OMG (2010). Business Motivation Model - Version 1.1. Object Manage-ment Group.
PMI (2017). PMI’s Pulse of the Profession. Project Management Institute.
Pan, S. Q., M. Vega, A. J. Vella, B. H. Archer, and G. R. Parlett (1996).“A mini-Delphi approach: An improvement on single round tech-niques.” In: Progress in Tourism and Hospitality Research 2.1.
Peppard, J. (2017). A Tool to Map Your Next Digital Initiative. HarvardBusiness Review.

202 bibliography
Peppard, J., J. Ward, and E. Daniel (2007). “Managing the realization ofbusiness benefits from IT investments.” In: MIS Quarterly Executive6.1.
Peterson, M. (2017). An introduction to decision theory. Second edi-tion. Cambridge introductions to philosophy. Cambridge UniversityPress.
Pohl, K., M. Broy, H. Daembkes, and H. Hönninger (2016). AdvancedModel-Based Engineering of Embedded Systems, Extensions of the SPES2020 Methodology. Springer.
Pöppelbuß, J. and M. Röglinger (2011). “What makes a useful matu-rity model? a framework of general design principles for maturitymodels and its demonstration in business process management.” In:Proceeding of the European Conference on Information Systems (ECIS’11).
Rao, L., G. Mansingh, and K. Osei-Bryson (2012). “Building On-tology Based Knowledge Maps to Assist Business Process Re-Engineering.” In: Decision Support Systems 52.
Riungu-Kalliosaari, L., S. Mäkinen, L. E. Lwakatare, J. Tiihonen, andT. Männistö (2016). “DevOps Adoption Benefits and Challenges inPractice: A Case Study.” In: Proceedings of the 17th International Con-ference of Product-Focused Software Process Improvement (PROFES’16).
Runeson, P. and M. Höst (2008). “Guidelines for conducting and re-porting case study research in software engineering.” In: EmpiricalSoftware Engineering 14.2.
Saaty, T. L. (1980). The analytic hierarchy process : planning, priority set-ting, resource allocation. McGraw-Hill International Book Co.
Sales, T. P., F. A. Baião, G. Guizzardi, J. P. A. Almeida, N. Guarino,and J. Mylopoulos (2018). “The Common Ontology of Value andRisk.” In: Proceedings of the 37th International Conference on ConceptualModeling (ER’18).
Salimi, F. and F. Salimi (2017). A Systems Approach to Managing theComplexities of Process Industries. Elsevier Science.
Saltelli, A. (2008). Global sensitivity analysis: the primer. John Wiley &Sons, Inc.

bibliography 203
Sanchez-Puchol, F. and J. A. Pastor-Collado (2017). “Focus Area Ma-turity Models: A Comparative Review.” In: Information Systems.
Schmitt, A. and P. Diebold (2016). “Why Do We Do Software ProcessImprovement?” In: Proceedings of the 17th International Conference ofProduct-Focused Software Process Improvement (PROFES’16).
Serra, C. E. M. and M. Kunc (2015). “Benefits Realisation Managementand its influence on project success and on the execution of businessstrategies.” In: International Journal of Project Management 33.1.
Shields, P. and N. Rangarjan (2013). A Playbook for Research Methods:Integrating Conceptual Frameworks and Project Management. New Fo-rums.
Simmons, J. P., R. A. LeBoeuf, and L. D. Nelson (2010). “The effectof accuracy motivation on anchoring and adjustment: do peopleadjust from provided anchors?” In: Journal of Personality and SocialPsychology 99.6.
Sowden, R. (2011). Managing Successful Programmes. TSO.
Stol, K. and B. Fitzgerald (2015). “A Holistic Overview of SoftwareEngineering Research Strategies.” In: Proceeding of the 3rd IEEE/ACMInternational Workshop on Conducting Empirical Studies in Industry(CESI’15).
Torpp, J. (1999). The informaton paradox. McGraw-Hill Inc.,US.
Trendowicz, A., J. Heidrich, and K. Shintani (2011). “Aligning Soft-ware Projects with Business Objectives.” In: Proceedings of the 21stInternational Workshop on Software Measurement and the InternationalConference on Software Process and Product Measurement (IWSM-MENSURA’11).
Van Lamsweerde, A. (2001). “Goal-Oriented Requirements Engineer-ing: A Guided Tour.” In: Proceedings of the 5th IEEE InternationalSymposium on Requirements Engineering (RE’01).
Vetschera, R. (2006). “Preference-Based Decision Support in SoftwareEngineering.” In: Value-Based Software Engineering. Springer BerlinHeidelberg.

204 bibliography
Voelter, M., J. Siegmund, T. Berger, and B. Kolb (2014). “Towards User-Friendly Projectional Editors.” In: Software Language Engineering.Springer International Publishing.
Vogelsang, A. (2019). “Feature Dependencies in Automotive SoftwareSystems: Extent, Awareness, and Refactoring.” In: Journal of Systemsand Software.
Vogelsang, A., H. Femmer, and C. Winkler (2015). “Systematic Elicita-tion of Mode Models for Multifunctional Systems.” In: Proceedings ofthe 21st International Working Conference on Requirement Engineering:Foundation for Software Quality (REFSQ’15).
Vogelsang, A., S. Eder, G. Hackenberg, M. Junker, and S. Teufl (2014).“Supporting Concurrent Development of Requirements and Archi-tecture: A Model-based Approach.” In: Proceedings of the 3rd Inter-national Conference on Model-Driven Engineering and Software Develop-ment (MODELSWARD’14).
Vogelsang, A., T. Amorim, F. Pudlitz, P. Gersing, and J. Philipps (2017).“Should I Stay or Should I Go? On Forces that Drive and PreventMBSE Adoption in the Embedded Systems Industry.” In: Proceed-ings of the 18th International Conference of Product-Focused SoftwareProcess Improvement (PROFES’17).
Wagenaar, Gerard, Sietse Overbeek, Garm Lucassen, Sjaak Brinkkem-per, and Kurt Schneider (2018). “Working software over comprehen-sive documentation – Rationales of agile teams for artefacts usage.”In: Journal of Software Engineering Research and Development 6.1, p. 7.
Ward, P. T., J. K. McCreery, L. P. Ritzman, and D. Sharma (2007).“Competitive Priorities in Operations Management.” In: DecisionSciences 29.4.
Weston, C., T. Gandell, J. Beauchamp, L. McAlpine, C. Wiseman, andC. Beauchamp (2001). “Analyzing Interview Data: The Develop-ment and Evolution of a Coding System.” In: Qualitative Sociology24.3.
Whittle, J., J. E. Hutchinson, and M. Rouncefield (2014). “The State ofPractice in Model-Driven Engineering.” In: IEEE Software 31.3.
Whittle, J., J. Hutchinson, M. Rouncefield, H. Burden, and R. Heldal(2017). “A Taxonomy of Tool-related Issues Affecting the Adoptionof Model-driven Engineering.” In: Software and System Modeling 16.2.

bibliography 205
Xu, P. and B. Ramesh (2007). “Software Process Tailoring: An Empiri-cal Investigation.” In: Journal of Management Information Systems.
Yu, E., P. Giorgini, N. Maiden, and J. Mylopoulos (2011). Social Model-ing for Requirements Engineering. The MIT Press.
de Bruin, T., M. Rosemann, R. Freeze, and U. Kulkarni (2005). “Un-derstanding the main phases of developing a maturity assessmentmodel.” In: Proceedings of the 16th Australasian Conference on Informa-tion Systems (ACIS’05).
van Steenbergen, M., R. Bos, S. Brinkkemper, I. van de Weerd, andW. Bekkers (2010). “The Design of Focus Area Maturity Models.”In: Proceedings of the 5th International Conference on Global Perspectiveson Design Science Research (DESRIST’10).
– (2013). “Improving IS Functions Step by Step: the Use of Focus AreaMaturity Models.” In: Scandinavian Journal of Information Systems25.2.
van de Weerd, I., W. Bekkers, and S. Brinkkemper (2010). “Developinga Maturity Matrix for Software Product Management.” In: SoftwareBusiness. Springer Berlin Heidelberg.


E R K L Ä R U N G Z U R D I S S E RTAT I O N
„Hiermit versichere ich an Eides statt, dass ich die vorliegendeDissertation selbstständig und ohne die Benutzung anderer als derangegebenen Hilfsmittel und Literatur angefertigt habe. Alle Stellen,die wörtlich oder sinngemäß aus veröffentlichten und nicht veröf-fentlichten Werken dem Wortlaut oder dem Sinn nach entnommenwurden, sind als solche kenntlich gemacht. Ich versichere an Eidesstatt, dass diese Dissertation noch keiner anderen Fakultät oderUniversität zur Prüfung vorgelegen hat; dass sie - abgesehen vonunten angegebenen Teilpublikationen und eingebundenen Artikelnund Manuskripten - noch nicht veröffentlicht worden ist sowie,dass ich eine Veröffentlichung der Dissertation vor Abschluss derPromotion nicht ohne Genehmigung des Promotionsausschussesvornehmen werde. Die Bestimmungen dieser Ordnung sind mirbekannt. Darüber hinaus erkläre ich hiermit, dass ich die Ordnungzur Sicherung guter wissenschaftlicher Praxis und zum Umgang mitwissenschaftlichem Fehlverhalten der Universität zu Köln gelesenund sie bei der Durchführung der Dissertation zugrundeliegendenArbeiten und der schriftlich verfassten Dissertation beachtet habeund verpflichte mich hiermit, die dort genannten Vorgaben beiallen wissenschaftlichen Tätigkeiten zu beachten und umzusetzen.Ich versichere, dass die eingereichte elektronische Fassung dereingereichten Druckfassung vollständig entspricht."
Teilpublikationen:
• Tiago Amorim et al. (2019). “Strategies and Best Practices forModel-based Systems Engineering Adoption in Embedded Sys-tems Industry.” In: Proceedings of of the 41st ACM/IEEE Interna-tional Conference on Software Engineering (ICSE’19)
• Andreas Vogelsang et al. (2017). “Should I Stay or Should I Go?On Forces that Drive and Prevent MBSE Adoption in the Em-bedded Systems Industry.” In: Proceedings of of the 18th Interna-tional Conference of Product-Focused Software Process (PROFES’17)
Köln, May 2021