Missouri State and Local Spending: A 50-State Comparison for 2012
11
extension.missouri.edu > community and leadership > local government and public policy > mp760 LOCAL GOVERNMENT AND PUBLIC POLICY Missouri State and Local Spending: A 50-State Comparison for 2012 M issourians care about the amount of taxes they pay and the way the money is spent, but few know how much their state and local governments spend for various services or how these amounts compare with government spending in other states. State and local governments have limited budgets. They often have to make trade-offs, spending less on one service in favor of another. States differ in needs and priorities, but there are broad categories of expenditures that are common to all: total spending, education services, social services and income maintenance, transportation, public safety, environment and housing, government administration and general expenditures, and debt service. State and local government expenditures can be compared and ranked by looking at spending per $100 of personal income and spending per capita for each category. Knowing the median expenditure is also helpful for comparisons. The median is the halfway point between the upper and lower halves of a data sample. Because this paper examines state and local government expenditures for all 50 states (the District of Columbia is not included), the median falls between the 25th and 26th ranked states. Information used in this comparison is from the 2012 Census of Government released by the U.S. Bureau of the Census in December of 2014. This is the most recent and complete set of data available for all states. Changes in taxes will affect how expenditures are allocated. Although states have made changes to tax laws since 2012, their overall net revenue change has been small (Rofool, 2015). The exceptions are California and Kansas. California increased both its sales and income taxes, effective in 2013. Kansas lowered income taxes, effective in 2013. Although the dollar amount of expenditures has changed since 2012, the relative ranking for most states has probably not changed more than a rank or two on a given expenditure. Overview Missouri is a relatively low-tax state, ranking 43rd in state and local taxes as a percentage of income. It is not surprising then that, overall, Missouri state and local governments spend less per $100 of personal income than many other states. The state ranks 32nd in total expenditures per $100 of personal income. It also spends less per capita than most other states, ranking 41st in total state and local spending per capita. Written by Grichawat Lowatcharin, Graduate Research Assistant, Truman School of Public Affairs Judith I. Stallman, Professor in Agricultural and Applied Economics, Truman School of Public Affairs and a Community Development Extension Specialist Missouri expenditures at a glance Missouri ranks below the national median in overall spending by state and local governments. For Missouri state and local governments combined, the single largest expenditure is education. Missouri ranks 31st in the nation on education expenditures per $100 of personal income. Missouri ranks 44th in education expenditures per capita. Among the 50 states, Missouri state and local governments rank • 32nd in total state and local expenditures with $17.80 per $100 of personal income and 41st in total state and local expenditures per capita with $7,108. • 31st in educational expenditures with $6.14 per $100 of personal income and 44th in education expenditures per capita with $2,452. • 22nd in social services and income maintenance expenditures per $100 of personal income at $5.63. It ranks 28th in spending per capita. Missouri’s slow recovery from the recession might contribute to its ranking above the median for spending on social services and income maintenance. • 32nd in transportation expenditures per $100 of personal income at $1.38 and 33rd in spending per capita. • 27th in public safety expenditures per $100 of personal income at $1.42 and 35th in public safety expenditures per capita at $568. • 41st in environmental and housing expenditures per $100 of personal income at $1.11. • 43rd in government administration and general expenditures per $100 of personal income at $1.42. In summary, Missouri ranks low in many categories because it is a relatively low-tax state. Missouri ranks 43rd in state and local taxes as a percentage of personal income.
Transcript of Missouri State and Local Spending: A 50-State Comparison for 2012

extension.missouri.edu > community and leadership > local government and public policy > mp760
LOCAL GOVERNMENT AND
PUBLIC POLICY
■
■ ■ ■
Missouri State and Local Spending: A 50-State Comparison for 2012
Missourians care about the amount of taxes they pay and the way the money is spent, but few know how much their state and local governments
spend for various services or how these amounts compare with government spending in other states.
State and local governments have limited budgets. They often have to make trade-offs, spending less on one service in favor of another.
States differ in needs and priorities, but there are broad categories of expenditures that are common to all: total spending, education services, social services and income maintenance, transportation, public safety, environment and housing, government administration and general expenditures, and debt service.
State and local government expenditures can be compared and ranked by looking at spending per $100 of personal income and spending per capita for each category.
Knowing the median expenditure is also helpful for comparisons. The median is the halfway point between the upper and lower halves of a data sample. Because this paper examines state and local government expenditures for all 50 states (the District of Columbia is not included), the median falls between the 25th and 26th ranked states.
Information used in this comparison is from the 2012 Census of Government released by the U.S. Bureau of the Census in December of 2014. This is the most recent and complete set of data available for all states. Changes in taxes will affect how expenditures are allocated. Although states have made changes to tax laws since 2012, their overall net revenue change has been small (Rofool, 2015). The exceptions are California and Kansas. California increased both its sales and income taxes, effective in 2013. Kansas lowered income taxes, effective in 2013. Although the dollar amount of expenditures has changed since 2012, the relative ranking for most states has probably not changed more than a rank or two on a given expenditure.
Overview Missouri is a relatively low-tax state, ranking 43rd in state
and local taxes as a percentage of income. It is not surprising
then that, overall, Missouri state and local governments spend less per $100 of personal income than many other states. The state ranks 32nd in total expenditures per $100 of personal income. It also spends less per capita than most other states, ranking 41st in total state and local spending per capita.
Written byGrichawat Lowatcharin, Graduate Research Assistant, Truman School of Public AffairsJudith I. Stallman, Professor in Agricultural and Applied Economics, Truman School of Public Affairs and a Community Development Extension Specialist
Missouri expenditures at a glance
Missouri ranks below the national median in overall spending by state and local governments. For Missouri state and local governments combined, the single largest expenditure is education. Missouri ranks 31st in the nation on education expenditures per $100 of personal income. Missouri ranks 44th in education expenditures per capita.
Among the 50 states, Missouri state and local governments rank
• 32nd in total state and local expenditures with $17.80 per $100 of personal income and 41st in total state and local expenditures per capita with $7,108.
• 31st in educational expenditures with $6.14 per $100 of personal income and 44th in education expenditures per capita with $2,452.
• 22nd in social services and income maintenance expenditures per $100 of personal income at $5.63. It ranks 28th in spending per capita. Missouri’s slow recovery from the recession might contribute to its ranking above the median for spending on social services and income maintenance.
• 32nd in transportation expenditures per $100 of personal income at $1.38 and 33rd in spending per capita.
• 27th in public safety expenditures per $100 of personal income at $1.42 and 35th in public safety expenditures per capita at $568.
• 41st in environmental and housing expenditures per $100 of personal income at $1.11.
• 43rd in government administration and general expenditures per $100 of personal income at $1.42.
In summary, Missouri ranks low in many categories because it is a relatively low-tax state. Missouri ranks 43rd in state and local taxes as a percentage of personal income.

mp760 University of Missouri Extensionpage 2
Missouri’s comparatively low expenditures per $100 of personal income might be the result of one or more of these factors:
• Missouri might be highly efficient in managing public expenditures.
• Some public services might cost less to provide in Missouri than in other states. For example, building highways might cost less per mile in Missouri than in Colorado because of differences in climate and terrain.
• Missouri ranks 18th in population among all states and might enjoy economies of scale in providing some public services.
• Missouri might have invested in infrastructure and programs in the past, so that same level of expenditure is not needed now.
• Missourians might prefer lower taxes or lower levels of certain public services than do citizens of some other states.
• The state and local governments might have allowed the private sector to provide some services that other states provide publicly.
• Missouri might be neglecting needed public investments in the short run and ignoring problems this could create in the long run.
• The state might be neglecting the needs of certain citizens whose votes do not reach a majority that would allow them to vote for the programs they need.
The first four factors might be viewed as positive reasons for low expenditures, whereas the last two might be indicators of future problems. The middle two might simply reflect philosophical differences between states.
The United States ranks low on government expenditures, federal, state and local governments combined, as a percentage of gross domestic product. In
2012, government spending accounted for 40 percent of gross domestic product in the United States, which ranks 25th among 30 countries that are members of the Organization for Economic Cooperation and Development. Countries ranking lower than the U.S. include Estonia, Slovak Republic, Switzerland, Australia and Mexico (OECD, 2014).
Trends in state expenditures From 2005 to 2014, expenditures by the state of Missouri
increased from approximately $19.5 billion to about $23.2 billion (not adjusted for inflation), according to the State of Missouri Comprehensive Annual Fiscal Report (Missouri Office of Administration, 2014). This does not include the expenditures listed as “business-type,” such as unemployment compensation, other insurance programs, lottery expenses, veterans’ homes, etc.
This increase in expenditures is probably due to several factors:
• Inflation• Population growth• Increased demand for some public services because of
citizens’ growing incomes or changing expectations for services
• Increased mandates from the federal government over the years.
The relative amounts the state spends on various programs have changed over time (Figure 1). For example, human services are now a larger percentage of state expenditures than they were in 2005. They reached their lowest point in 2007 at about 45.8 percent of state expenditures. In 2014, they were about 53.7 percent of state expenditures.
100%
90%
80%
70%
60%
50%
40%
30%
20%
10%
2005 2006 2007 2008 2009 2010 2011 2012 2013 2014
Human services
Education
Transportation and law enforcement
Natural and economic resources
General government
Capital outlay
Debt service
Fiscal year
Figure 1. State government expenditures by functions from 2005 to 2014.Source: State of Missouri Office of Administration (2014).

mp760 University of Missouri Extensionpage 3
Establishing a basis of comparison
Comparing expenditures across states might seem straightforward, but specific types of expenditures are not uniform from state to state. A basis of comparison allows for uniform state-to-state comparisons. This publication uses the following conventions for such comparisons.
State and local expenditures are reported together rather than separately.
In some states, a given expenditure is the responsibility of either the state government or the local government. In others, it is a shared responsibility. For example, Virginia’s roads are the responsibility of state government, but in Missouri the responsibility is shared between state and local governments. To compare highway expenditures across states, all such expenditures — both state and local — must be included. Any federal dollars administered by the state or local governments are counted as expenditures by governments within the state.
Similar expenditures are aggregated.
For example, regulatory expenditures are aggregated into public safety expenditures along with police, fire and corrections. Natural resources and parks and recreation are aggregated into environment and housing spending.
Expenditures on individuals and businesses are aggregated.
Some expenditures directly benefit individuals or businesses; some benefit both. Highways benefit both individuals and
businesses. It might seem that only expenditures that benefit individuals should be included in the per capita calculation and expenditures that benefit businesses should be calculated separately as an average per business. All expenditures ultimately benefit individuals, because businesses are owned by individuals (whether as proprietors or stockholders) and individuals buy goods and services from businesses. Additionally, data are not available to separate expenditures for businesses and individuals.
All expenditures are counted.
All expenditures are included, even though some expenditures benefit people and businesses from outside the state. These benefits cannot be separated because of lack of information on out-of-state benefits. For example, highway expenditures benefit not only Missourians but also people traveling through Missouri and out-of-state-businesses shipping products into or through Missouri. In this way, Missourians benefit from the highway expenditures of other states.
Expenditures are compared per $100 of personal income.
The dollar value of expenditures per $100 of personal income is a useful way of comparing expenditures among states. This comparison is helpful because average incomes vary among states.
Missouri ranks 31st in the nation in per capita income (Table 1). Several of the nation’s poorest states are just to the south of Missouri and in the West (Figure 2). The second poorest tier of states is in the Southeast and the Mid-Plains regions.
Expenditures are also compared per resident.
Another way of comparing expenditures across states is by calculating the average expenditure for an individual resident of the state, or a per capita expenditure. Because state populations vary, comparing total expenditures by each state is not useful.
The per capita calculation does not reflect the distribution of expenditures among different groups within the state, such as low-, medium- and high-income groups. It also does not imply that every citizen is a recipient of every expenditure; it is an average.
States with large populations might also have economies of scale in some public services, which would mean their per capita costs would be lower. As the most populous state, California has the potential for economies of scale in many services.
It is possible for a high-income state to rank low on expenditures per $100 of income and higher on expenditures per capita. A low-income state might show the opposite rankings — high on expenditures per $100 of income and lower on expenditures per capita.
Figure 2. Per capita income in 2012.Source: Bureau of Economic Analysis (2014)
Table 1. Per capita income in 2012.
United States average $44,200
Median $43,271 (Texas) $42,475 (Wisconsin)
Maximum $60,223 (Connecticut)
Minimum $33,446 (Mississippi)
Missouri rank $39,933 (31st)
Source: Bureau of Economic Analysis (2014)

mp760 University of Missouri Extensionpage 4
The federal government provides a large proportion of the funds for human services. It should be noted that funds from the federal government administered by the state are counted as state expenditures. Debt service is the smallest spending category but is the only other category that increased over the years, from 1.3 percent in 2005 to 1.9 percent in 2014.
Although state spending on education increased from $5.7 billion in 2005 to $6.4 billion in 2014, the percentage of state money spent on education declined from 29.1 percent of state expenditures in 2005 to about 27.7 percent in 2014. Education spending peaked in 2008 at about 30.3 percent of state expenditures. State spending on transportation and law enforcement dropped from 6.0 percent of the state budget in 2005 to 5.8 percent in 2014; it peaked at about 7.6 percent in 2010. State spending on capital outlays also dropped from 4.8 percent in 2005 to 3.7 percent in 2014. General government expenditures declined from 4.4 percent of state expenditures in 2005 to 3.6 percent in 2014.
Because these data are based on the state report, the data are aggregated into slightly different categories in Figure 1 than the rest of the publication. To compare across states, the rest of the publication uses data from the Census of Government.
Local government expenditures In 2012, local government expenditures in Missouri
reached approximately $21.9 billion. Education expenditures accounted for 49 percent of total local government expenditures. Public safety expenditures were 11 percent and those on social services and income maintenance were 10 percent. Expenditures for environmental and housing and for governmental administration and miscellaneous were each 9 percent of overall local government spending in 2012.
Local expenditures vary by the type of local government because they have different responsibilities (Figure 3). Education expenditures are distributed to school districts. Almost all school district expenditures, including bus service, are classified as education expenditures. The largest expenditures for counties are social services and income maintenance, followed by transportation, public safety and government administration. The major expenditures of municipal governments are public safety, transportation, housing and the environment, which includes parks, sewer and waste.
Townships in Missouri are largely responsible for the construction and maintenance of roads. Most counties in Missouri do not have townships. Although Figure 3 shows that special districts have expenditures in many areas, most special districts exist for a single purpose and expenditures in that district are for that purpose. Missouri has more than 1,800 special districts for purposes ranging from water, sewer, fire and hospital, as well as various economic development zones, airports and port authorities (U.S. Bureau of the Census, 2013).
Total state and local expenditures Although there are many similarities in the structure
of expenditures among states, there are also important differences. Two states with similar total spending might allocate that spending differently to match their citizens’ needs and desired services. Citizens of one state might want greater levels of government services than citizens of another state.
Missouri state and local governments spent $17.80 per $100 of personal income in fiscal year 2012 and ranked 32nd among all states (Table 2). In 2002, the state ranked 44th in the nation. We are using the Census Bureau’s category, “direct general expenditures,” which only excludes expenditures from insurance funds, such as unemployment
70%
80%
90%
100% Education and libraries
Social services and income support
Transportation
Public safety
Environmental and housing
Governmental administration
Interest on general debt
County Municipality Township Special district School district
Other expenditures
60%
50%
40%
30%
20%
10%
Figure 3. Expenditures of local governments in 2012.Source: U.S. Bureau of the Census (2014)

mp760 University of Missouri Extensionpage 5
and workers’ compensation, and government-owned utilities (mainly at the local government level). This definition is broader than Missouri’s definition of expenditures from the general fund. These expenditures include any federal funds that are administered by the state.
Nationally, the average total state and local expenditures per $100 of personal income were $18.65. When comparing expenditures per $100 of personal income, Alaska ranks highest at $34.70 per $100 of personal income (Figure 4). Alaska is a large state with difficult terrain, a harsh climate and a small population, so the cost of serving its population is high. New Hampshire spent the least at $15.17 per $100 of personal income. New Hampshire, like Missouri, is a low-tax state.
Missouri state and local governments spent a total of $7,108 per capita in 2012, which puts the state at 41st nationally. In 2002, Missouri’s per capita expenditures ranked 45th in the nation. Alaska had the highest expenditure per capita at $17,319 in 2012. Idaho, a poor state at 48th in per capita income, had the lowest expenditure per capita with $6,252 (Table 2).
Because Missouri is a low-tax state with a relatively large population (18th largest state population in the country), it is not surprising that it ranks low in total expenditures per $100 of personal income and per capita spending.
Education Education is the largest expenditure for Missouri’s state
and local governments combined. In 2012, allocations for education totaled about 34 percent of total state and local expenditures in Missouri, divided among the following categories:
Elementary and secondary education 64 percent
Higher education 29 percent
Other education expenditures 5 percent
Public libraries 2 percent
In some states, the state finances the majority of kindergarten through 12th grade (K-12) education; in others, most K-12 education expenditures are local. In Missouri, K-12 education is financed by both state and local governments with the state and school districts providing 28 and 72 percent of expenditures, respectively. Missouri community colleges are financed by local and state taxes, and other higher education is financed by the state and student fees.
Expenditures on education in the United States ranged from $9.21 per $100 of personal income in Alaska to $4.79 in Florida, with a national average of $6.35 per $100 of personal income. The median expenditure was between $6.56 in New Jersey and $6.52 in Rhode Island (Figure 5). Missouri spent $6.14 per $100 of personal income on education, ranking 31st in the nation (Table 3). In 2002, Missouri ranked 36th. Table 2. Total expenditures.
Expenditures per $100 of income
Expenditures per capita
United States average $18.65 $8,243.18
Median
$19.09 (Minnesota) $18.70 (North Carolina)
$8,013.16 (Nebraska) $7,983.10 (Illinois)
Maximum $34.70 (Alaska) $17,319.09 (Alaska)
Minimum $15.17 (New Hampshire)
$6,251.54 (Idaho)
Missouri rank $17.80 (32nd) $7,107.67 (41st)
Source: U.S. Bureau of the Census (2014)
Figure 4. Total state and local expenditures per $100 of personal income.Source: U.S. Bureau of the Census (2014)
Table 3. Education expenditures.
Expenditures per $100 of income
Expenditures per capita
United States average $6.35 $2,805.72
Median
$6.56 (New Jersey) $6.52 (Rhode Island)
$2,852.10 (Washington) $2,837.16 (Arkansas)
Maximum $9.21 (Alaska) $4,598.81 (Alaska)
Minimum $4.79 (Florida) $1,964.16 (Florida)
Missouri rank $6.14 (31st) $2,451.84 (44th)
Source: U.S. Bureau of the Census (2014)
Figure 5. Education expenditures per $100 of personal income.Source: U.S. Bureau of the Census (2014)

mp760 University of Missouri Extensionpage 6
Missouri spent $2,452 per capita on education in 2012 and ranked 44th nationally; in 2002, it was 37th. The U.S. average was $2,806 per capita, and expenditures ranged from $4,599 per capita in Alaska to $1,964 in Florida (Table 3).
Social services and income maintenance
Social services and income maintenance in Missouri accounted for 32 percent of state and local spending in 2012, divided among the following categories:
Public welfare 62 percent
Hospitals 24 percent
Public health services and efforts 14 percent
Employment security administration and veterans’ services
Less than 1 percent
The level of benefits provided and the percentage of the population eligible to participate in the programs affect spending levels for social services and income maintenance. Many of these programs also receive a large proportion of their funding from the federal government, and those revenues are included in this ranking.
In 2012, social services and income maintenance expenditures per $100 of personal income ranged from $9.05 in Mississippi to $3.00 in North Dakota (Figure 6). The median expenditure was between $5.37 in California and $5.31 in Hawaii. The national average was $5.27 (Table 4). Missouri ranked 22nd, with expenditures of $5.63 per $100 of personal income on social services. Missouri ranked 27th in 2002. Missouri’s recovery from the recession has been slower than some other states, which might explain its rise in the rankings.
Per capita expenditures on social services and income maintenance ranged from the high in New York to the low in Nevada. With per capita expenditures of $2,247, Missouri ranked 28th per capita in the nation. In 2002, Missouri ranked 26th in per capita expenditures on social services.
Poverty is a larger problem in some areas of Missouri than in others. The U.S. Department of Agriculture
classifies 14 rural counties in southeastern and southern Missouri and St. Louis City as persistent poverty areas (Farrigan, 2015). The percentage of the population living below the poverty level in these counties has been 20 percent or higher since 1980. There are other counties in Missouri that currently have poverty rates above 20 percent, likely made worse by the recession and slow recovery.
TransportationIn Missouri, transportation accounted for about 7.7
percent of total state and local expenditures in 2012, divided among the following categories:
Highways 89 percent
Airports 10 percent
Water transport Less than 1 percent
Parking facilities Less than 1 percent
Missouri’s transportation expenditures of $1.38 per $100 of personal income ranked 32nd nationally in 2012 (Table 5). In 2002, the state ranked 24th in transportation expenditures, just above the national median.
Alaska and Connecticut ranked highest and lowest, respectively, in transportation expenditures per $100 of personal income (Figure 7). Alaska’s expenditure of $4.81 per $100 of personal income was more than $1 higher than that of second-ranked North Dakota’s $3.42. The national average transportation expenditure was $1.35 per $100 of personal income and the median states were New Mexico and Virginia.
The low expenditure per $100 of income on transportation in Connecticut is not surprising because it is a small state with dense population and high income. It also relies on rail for commuting more than many other states. The high expenditure by Alaska could also be expected given the state’s size and low population density. Not only are its roads costly, but its transportation system includes many small airports. North Dakota, also a large state with low population density, ranks second in transportation spending both per $100 of income and per capita. Part of
Table 4. Social services and income maintenance expenditures.
Expenditures per $100 of income
Expenditures per capita
United States average $5.27 $2,331.18
Median
$5.37 (California) $5.31 (Hawaii)
$2,276.16 (Arkansas) $2,273.47 (Tennessee)
Maximum $9.05 (Mississippi)
$3,760.11 (New York)
Minimum $3.00 (North Dakota) $1,426.85 (Nevada)
Missouri rank $5.63 (22nd) $2,246.74 (28th)
Source: U.S. Bureau of the Census (2014)
Figure 6. Social services and income maintenance expenditures per $100 of personal income.Source: U.S. Bureau of the Census (2014)

mp760 University of Missouri Extensionpage 7
the transportation spending in North Dakota might be due to recent demand for oil extraction.
Missouri ranked 33rd in transportation expenditures per capita with an expenditure of $550. In 2002, it ranked 21st. Expenditures per capita ranged from $2,400 in Alaska to $387 in Michigan. The 2012 median transportation expenditure per capita fell between $642 in Mississippi and $641 in New York, and the national average per capita expenditure was $597 (Table 5).
Public safety Public safety expenditures make up about 8 percent
of Missouri state and local budgets, divided among the following categories:
Police protection 49 percent
Corrections 25 percent
Fire protection 23 percent
Protective inspections and regulatory functions 3 percent
With 2012 expenditures of $1.42 per $100 of personal income, Missouri ranked 27th in expenditures on public safety (Table 6). In 2002, Missouri ranked 34th. The national median was $1.48 in Utah and Virginia and the national average was $1.63 (Figure 8). As in other categories, Alaska ranked highest in public safety expenditures per $100 of personal income while North Dakota spent the least.
With public safety expenditures of $568 per capita, Missouri ranked 35th in the nation. In 2002, the state ranked 32nd (Table 6). The 2012 median per capita expenditure was between $598 and $596. The $1,158 expenditure by Alaska was more than $100 higher than that of second-ranked California’s $1,043. Indiana had the lowest public safety expenditure per capita (Table 6).
Nationally, homeland security concerns have increased public safety expenditures, and concerns about food, consumer goods and environmental safety have increased inspections and regulatory functions.
Environment and housing Missouri state and local governments devote about 6
percent of their budgets to environmental and housing programs, divided among these categories:
Sewerage 31 percent
Housing and community development 25 percent
Parks and recreation 23 percent
Natural resources 15 percent
Solid waste management 6 percent
Housing and community development spending includes public housing, urban renewal and rural redevelopment. Natural resources expenditures include flood control, environmental protection and soil and water conservation. Agricultural programs and the state’s share of support for the Missouri Agricultural Extension Service and the Missouri Agricultural Experiment Station also fall under natural resources spending. Sewerage and solid
Figure 7. Transportation maintenance expenditures per $100 of personal income.Source: U.S. Bureau of the Census (2014)
Table 5. Transportation expenditures.
Expenditures per $100 of income
Expenditures per capita
United States average $1.35 $596.71
Median
$1.52 (New Mexico) $1.51 (Virginia)
$641.83 (Mississippi) $641.00 (New York)
Maximum $4.81 (Alaska) $2,400.11 (Alaska)
Minimum $0.83 (Connecticut) $386.51 (Michigan)
Missouri rank $1.38 (32nd) $549.63 (33rd)
Source: U.S. Bureau of the Census (2014)
Table 6. Public safety expenditures.
Expenditures per $100 of income
Expenditures per capita
United States average $1.63 $718.54
Median $1.48 (Utah) $1.48 (Virginia)
$598.13 (Vermont) $595.79 (Georgia)
Maximum $2.32 (Alaska) $1,158.38 (Alaska
Minimum $1.00 (North Dakota) $443.36 (Indiana)
Missouri rank $1.42 (27th) $567.97 (35th)
Source: U.S. Bureau of the Census (2014)
Figure 8. Corporate income and franchise taxes as percentage of income.Source: U.S. Bureau of the Census (2014)
mp760 University of Missouri Extensionpage 8
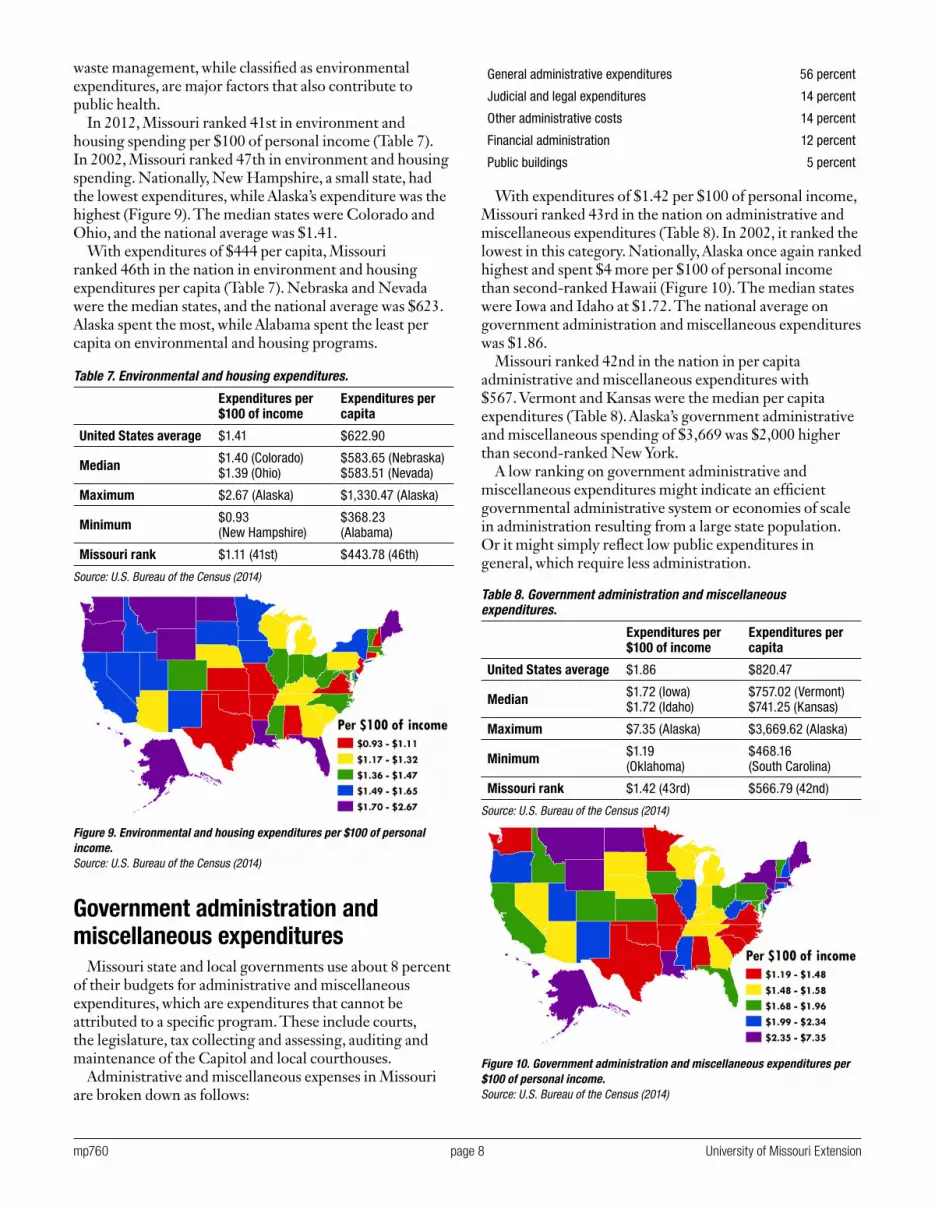
waste management, while classified as environmental expenditures, are major factors that also contribute to public health.
In 2012, Missouri ranked 41st in environment and housing spending per $100 of personal income (Table 7). In 2002, Missouri ranked 47th in environment and housing spending. Nationally, New Hampshire, a small state, had the lowest expenditures, while Alaska’s expenditure was the highest (Figure 9). The median states were Colorado and Ohio, and the national average was $1.41.
With expenditures of $444 per capita, Missouri ranked 46th in the nation in environment and housing expenditures per capita (Table 7). Nebraska and Nevada were the median states, and the national average was $623. Alaska spent the most, while Alabama spent the least per capita on environmental and housing programs.
Government administration and miscellaneous expenditures
Missouri state and local governments use about 8 percent of their budgets for administrative and miscellaneous expenditures, which are expenditures that cannot be attributed to a specific program. These include courts, the legislature, tax collecting and assessing, auditing and maintenance of the Capitol and local courthouses.
Administrative and miscellaneous expenses in Missouri are broken down as follows:
General administrative expenditures 56 percent
Judicial and legal expenditures 14 percent
Other administrative costs 14 percent
Financial administration 12 percent
Public buildings 5 percent
With expenditures of $1.42 per $100 of personal income, Missouri ranked 43rd in the nation on administrative and miscellaneous expenditures (Table 8). In 2002, it ranked the lowest in this category. Nationally, Alaska once again ranked highest and spent $4 more per $100 of personal income than second-ranked Hawaii (Figure 10). The median states were Iowa and Idaho at $1.72. The national average on government administration and miscellaneous expenditures was $1.86.
Missouri ranked 42nd in the nation in per capita administrative and miscellaneous expenditures with $567. Vermont and Kansas were the median per capita expenditures (Table 8). Alaska’s government administrative and miscellaneous spending of $3,669 was $2,000 higher than second-ranked New York.
A low ranking on government administrative and miscellaneous expenditures might indicate an efficient governmental administrative system or economies of scale in administration resulting from a large state population. Or it might simply reflect low public expenditures in general, which require less administration.
Table 7. Environmental and housing expenditures.
Expenditures per $100 of income
Expenditures per capita
United States average $1.41 $622.90
Median $1.40 (Colorado) $1.39 (Ohio)
$583.65 (Nebraska) $583.51 (Nevada)
Maximum $2.67 (Alaska) $1,330.47 (Alaska)
Minimum $0.93 (New Hampshire)
$368.23 (Alabama)
Missouri rank $1.11 (41st) $443.78 (46th)
Source: U.S. Bureau of the Census (2014)
Figure 9. Environmental and housing expenditures per $100 of personal income.Source: U.S. Bureau of the Census (2014)
Figure 10. Government administration and miscellaneous expenditures per $100 of personal income.Source: U.S. Bureau of the Census (2014)
Table 8. Government administration and miscellaneous expenditures.
Expenditures per $100 of income
Expenditures per capita
United States average $1.86 $820.47
Median $1.72 (Iowa) $1.72 (Idaho)
$757.02 (Vermont) $741.25 (Kansas)
Maximum $7.35 (Alaska) $3,669.62 (Alaska)
Minimum $1.19 (Oklahoma)
$468.16 (South Carolina)
Missouri rank $1.42 (43rd) $566.79 (42nd)
Source: U.S. Bureau of the Census (2014)

mp760 University of Missouri Extensionpage 9
Interest on general debt State and local governments have three major revenue
sources: taxes and fees, revenues from other governments, and debt. Governments can issue bonds, especially for capital outlays, and the capital and interest are later repaid from taxes and fees. Interest on bonds is considered an additional expenditure for governments and an indicator of the amount of government borrowing. Some states tightly restrict the bonding authority of the state and local governments. They might only allow bonds that are repaid with fees or revenues generated by the project and disallow bonds repaid with general revenues, which lowers interest payments.
Missouri’s debt service was 4 percent of state and local government spending in 2012. More than $1.00 in interest spending per $100 of personal income in 2012 separated the high in Rhode Island to the low in Wyoming (Table 9). The median states were New Jersey and Missouri. This represents a significant jump for Missouri, which ranked 43rd in 2002.
Missouri ranked 27th in interest expenditures per capita at $281. In 2002, the state ranked 40th. The median was between Virginia and Indiana. Rhode Island paid the most interest per capita, and Wyoming paid the least.
Higher interest payments do not necessarily indicate mismanagement. The state might be investing for the future by building infrastructure. During the recession, some states and local governments took advantage of the low interest rates to borrow money and build infrastructure, such as roads, bridges and school.
In Missouri, debt management is just one factor influencing the state’s high bond rating. This rating “is derived from the state’s very conservative approach to debt, both in amounts owed and in provision for repayment, as well as its long record of well-managed and balanced financial operations despite current and ongoing pressures” (Business Journal, 2002, p. 30).
Other expenditures: Utility and enterprise
Utility and enterprise expenditures are not part of direct general expenditures because these revenues often go directly back to the utility or enterprise. The census reports them as a separate expenditure category. States vary as to whether they have public ownership of utilities and enterprises, and rankings in this category in part reflect how many utilities and enterprises in the state are publicly or privately owned. Unlike some states, Missouri not does have state liquor stores, which are included in this category. Publicly owned utilities in Missouri are owned by local governments rather than the state, and not all local governments own utilities.
In 2012, Missouri spent $1.16 per $100 of personal income and shared the median with Kansas in utility and enterprise expenditures (Table 10). In 2002, Missouri ranked 31st. Across the United States, Maine had the lowest expenditure per $100 of personal income (Figure 12). Maine does not have state liquor stores, mainly just water
Table 9. Interest on general debt.
Expenditures per $100 of income
Expenditures per capita
United States average $0.79 $347.65
Median $0.72 (New Jersey) $0.70 (Missouri)
$299.49 (Virginia) $298.25 (Indiana)
Maximum $1.29 (Rhode Island)
$595.80 (Rhode Island)
Minimum $0.26 (Wyoming) $135.98 (Wyoming)
Missouri rank $0.70 (26th) $280.94 (27th)
Source: U.S. Bureau of the Census (2014)
Figure 11. Interest expenditures on general debt per $100 of income.Source: U.S. Bureau of the Census (2014)
Table 10. Utility and enterprise expenditures.
Expenditures per $100 of income
Expenditures per capita
United States average $1.54 $680.90
Median
$1.16 (Missouri) $1.14 (Kansas)
$492.81 (Vermont) $490.59 (Minnesota)
Maximum $4.88 (Nebraska)
$2,242.48 (Nebraska)
Minimum $0.31 (Maine) $124.83 (Maine)
Missouri rank $1.16 (25th) $463.16 (29th)
Source: U.S. Bureau of the Census (2014)
Figure 12. Current charges and enterprise revenues as percentage of income.Source: U.S. Bureau of the Census (2014)

mp760 University of Missouri Extensionpage 10
utilities that are publicly owned. Nebraska’s expenditure of $4.88 per $100 of personal income was $1.24 above second-ranked Tennessee’s $3.64. Nebraska is the only state where all electrical utilities are publicly owned (Nebraska Power Association, 2015).
Missouri ranked 29th in the nation in utility and enterprise expenditures, more than $200 lower than the national average of $681 (Table 10). First-ranked Nebraska spent $2,242 per capita on utilities and enterprises, $700 more per capita than second-ranked New York.
Other expenditures: Insurance trusts Insurance trusts are not part of general expenditures,
because those premiums are collected for a specific purpose and can only be used for that purpose under the law. In 2012, insurance trust expenditures in Missouri fell in the following categories:
Employee retirement 75 percent
Unemployment compensation 25 percent
Workers’ compensation 1 percent
With an expenditure of $2.13 per $100 of personal income, Missouri ranked 28th in insurance trust expenditures (Figure 13). The national average was $2.50. Ohio ranked highest, and New Hampshire spent the least.
With expenditures of $849 per capita, Missouri ranked 26th in the nation in 2012 (Table 11). Louisiana and
Missouri had the median per capita trust expenditures with $895 and $849, respectively. The national average was $1,104, and New York had the highest trust expenditure in the nation with $1,846 per capita (Figure 13). Nebraska had the lowest with $544 per capita.
Summary In 2012, Missouri’s state and local governments spent
approximately $43 billion, not including insurance trust funds and expenditures by utilities. These expenditures include federal revenues of approximately $11.5 billion administered by the state and local governments. Compared with other states, Missouri ranked 32nd in total state and local expenditures per $100 of personal income and 41st in state and local expenditures per capita.
Missouri ranks low among states in a country that ranks low among its peers. The United States ranks sixth lowest among 30 members of the Organization for Economic Cooperation and Development in federal, state and local government expenditures as a percentage of gross national product (OECD, 2014).
The categories of expenditures in which Missouri ranked highest per $100 of personal income put it at or just above the median. Missouri ranks 22nd in social services and income maintenance expenditures per $100 of personal income and 26th in interest on general debt.
Missouri ranks in the lowest 40 percent of the nation on education services at 31st and transportation at 32nd. Missouri ranks in the lowest 20 percent in environmental and housing spending, 41st and 43rd on government administrative and general spending per $100 of personal income, respectively.
Missouri’s low rank in many categories might be the result of one or more of the following factors:
• Management might be highly efficient; the state might have lower costs than other states.
• Given the population of the state, there might be economies of scale at play in some public services.
• The state might have invested in infrastructure in the past so it now has what it needs.
• Missourians might prefer lower taxes or lower levels of certain public services than citizens of other states (Missouri ranks 43rd in state and local taxes as a percentage of income).
• Some services that are publicly provided in other states might be privately provided in Missouri.
• Missourians might be neglecting needed public investments in the short run, which might require increased expenditures in the long run.
• Missourians might be disregarding the needs of certain citizens whose votes do not reach a majority, which would allow them to vote for the programs that they need.
The first four factors might be viewed as positive reasons for low expenditures. The last two might indicate future problems caused by low expenditures. The middle two might simply reflect differing attitudes among states.
Table 11. Insurance trust expenditures.
Expenditures per $100 of income
Expenditures per capita
United States average $2.50 $1,103.98
Median $2.24 (Wyoming) $2.20 (Louisiana)
$894.87 (Louisiana) $849.36 (Missouri)
Maximum $3.74 (Ohio)
$1,846.10 (New York)
Minimum $1.14 (New Hampshire)
$543.98 (Nebraska)
Missouri rank $2.13 (28th) $849.36 (26th)
Source: U.S. Bureau of the Census (2014)
Figure 13. Insurance trust expenditures per $100 of personal income.Source: U.S. Bureau of the Census (2014)

page 11
■
■ ■ ■
ALSO FROM MU EXTENSION PUBLICATIONS
MP742 Missouri State and Local Spending: A 50-State Comparison for 2002MP743 Missouri State and Local Taxes and Revenues: A 50-State Comparison for 2002MP761 Missouri State and Local Taxes and Revenues: A 50-State Comparison for 2012
extension.missouri.edu | 800-292-0969
mp760 New 9/15/Web
Missouri’s ranking on total state and local expenditures per $100 of income increased from 44th in 2002 to 32nd in 2012, whereas Missouri’s state and local tax ranking decreased from 42nd to 43rd over the same period. The increase in expenditure ranking, even with a decrease in tax ranking, might be due to several factors.
From 2002 to 2012, Missouri’s ranking on income per capita fell from 29th to 31st in the nation. Among 18 states that rank lower than Missouri in total expenditures per $100 of personal income, six of them are the wealthiest:
• Connecticut: 1st in per capita income• Massachusetts: 2nd• New Jersey: 4th• Maryland: 6th• New Hampshire: 8th• Virginia: 10th
These differences in per capita income help to explain Missouri’s change in ranking. Federal revenues also play a role, because states with higher federal revenues might have higher expenditures per capita. States were also affected by the recession at different times. States whose economies were not as seriously affected or recovered more rapidly than Missouri might show lower expenditures per $100 of income. If their incomes grew and they did not increase expenditures at the same rate, their rankings fell.
ReferencesBureau of Economic Analysis. 2012. “Local Area Personal
Income.” http://www.bea.gov/iTable/iTable.cfm?ReqID=70&step=1#reqid=70&step=1&isuri=1 (accessed July 15, 2015).
Business Journal. 19 September 2002. “Fitch rates Missouri’s refunding bonds AAA.” http://www.
bizjournals.com/ kansascity/stories/2002/09/16/daily30.html (accessed November 2004).
Farragan, Tracey. 2015. Rural Poverty and Well-Being: Geography of Poverty. Economic Research Service, United States Department of Agriculture. http://www.ers.usda.gov/topics/rural-economy-population/rural-poverty-well-being/geography-of-poverty.aspx (accessed May 2015)
Nebraska Power Association. 2015. Public Power—How Nebraskans Benefit. http://www.nepower.org/ (accessed May 2015)
Organization for Economic Cooperation and Development (OECD). 2014. OECD Fact Book 2014: Economic, Environmental and Social Statistics. OECD Publishing. http://dx.doi.org/10.1787/factbook-2014-en (accessed May 2015)
Rafool, Mandy. 2015. “State Tax Actions, 2014.” National Conference of State Legislatures. January. http://www.ncsl.org/research/fiscal-policy/state-tax-actions-2014.aspx. (accessed July 15, 2015)
State of Missouri Office of Administration. 2014. Comprehensive Annual Financial Report, Fiscal Year Ended June 30, 2014. http://oa.mo.gov/accounting/reports
U.S. Bureau of the Census. 2013. Individual State Descriptions: 2012. 2012 Census of Governments: G12-CG-ISD. September 2013. http://www2.census.gov/govs/cog/2012isd.pdf
U.S. Bureau of the Census. 2014. 2012 Census of Governments: State & Local Finances. http://www.census.gov/govs/local/
Preparation of this publication was supported by University of Missouri Community Development Extension, the Department of Agricultural and Applied Economics and the Truman School of Public Affairs.