Minth Group 敏实集团 (425 HK)
17
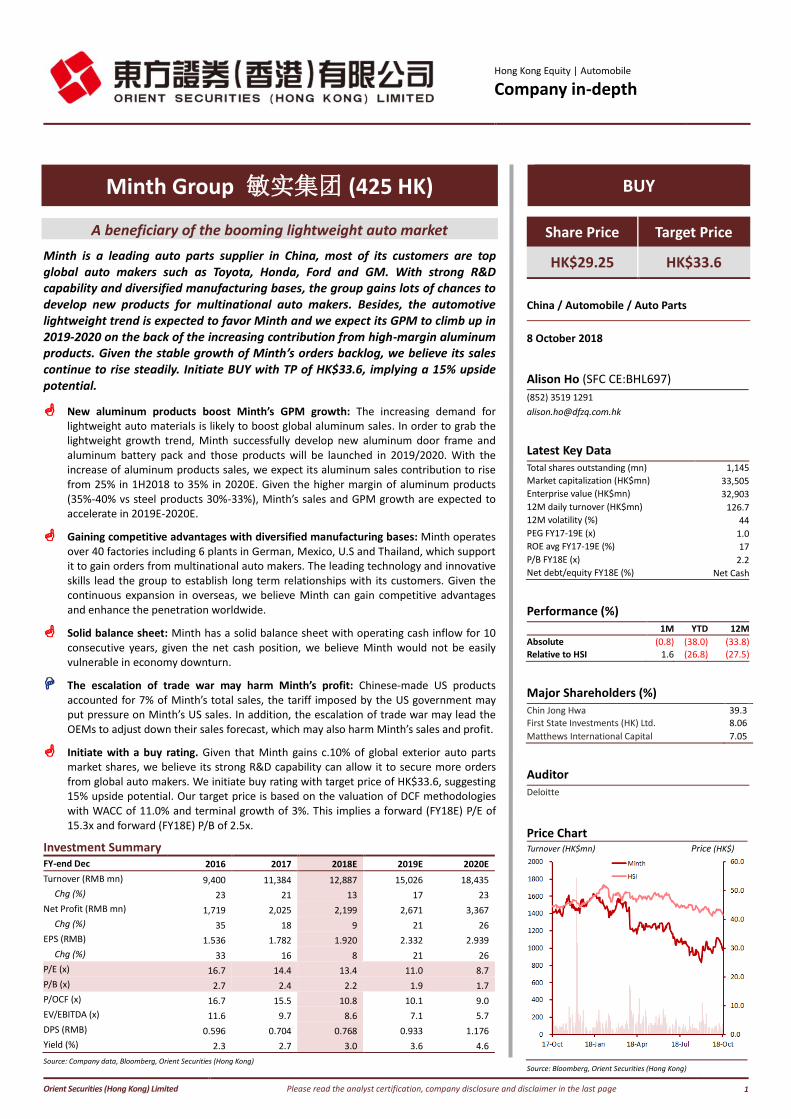
Hong Kong Equity | Automobile Company in-depth Orient Securities (Hong Kong) Limited Please read the analyst certification, company disclosure and disclaimer in the last page 1 Minth Group 敏实集团 (425 HK) A beneficiary of the booming lightweight auto market Minth is a leading auto parts supplier in China, most of its customers are top global auto makers such as Toyota, Honda, Ford and GM. With strong R&D capability and diversified manufacturing bases, the group gains lots of chances to develop new products for multinational auto makers. Besides, the automotive lightweight trend is expected to favor Minth and we expect its GPM to climb up in 2019-2020 on the back of the increasing contribution from high-margin aluminum products. Given the stable growth of Minth’s orders backlog, we believe its sales continue to rise steadily. Initiate BUY with TP of HK$33.6, implying a 15% upside potential. New aluminum products boost Minth’s GPM growth: The increasing demand for lightweight auto materials is likely to boost global aluminum sales. In order to grab the lightweight growth trend, Minth successfully develop new aluminum door frame and aluminum battery pack and those products will be launched in 2019/2020. With the increase of aluminum products sales, we expect its aluminum sales contribution to rise from 25% in 1H2018 to 35% in 2020E. Given the higher margin of aluminum products (35%-40% vs steel products 30%-33%), Minth’s sales and GPM growth are expected to accelerate in 2019E-2020E. Gaining competitive advantages with diversified manufacturing bases: Minth operates over 40 factories including 6 plants in German, Mexico, U.S and Thailand, which support it to gain orders from multinational auto makers. The leading technology and innovative skills lead the group to establish long term relationships with its customers. Given the continuous expansion in overseas, we believe Minth can gain competitive advantages and enhance the penetration worldwide. Solid balance sheet: Minth has a solid balance sheet with operating cash inflow for 10 consecutive years, given the net cash position, we believe Minth would not be easily vulnerable in economy downturn. The escalation of trade war may harm Minth’s profit: Chinese-made US products accounted for 7% of Minth’s total sales, the tariff imposed by the US government may put pressure on Minth’s US sales. In addition, the escalation of trade war may lead the OEMs to adjust down their sales forecast, which may also harm Minth’s sales and profit. Initiate with a buy rating. Given that Minth gains c.10% of global exterior auto parts market shares, we believe its strong R&D capability can allow it to secure more orders from global auto makers. We initiate buy rating with target price of HK$33.6, suggesting 15% upside potential. Our target price is based on the valuation of DCF methodologies with WACC of 11.0% and terminal growth of 3%. This implies a forward (FY18E) P/E of 15.3x and forward (FY18E) P/B of 2.5x. Investment Summary FY-end Dec 2016 2017 2018E 2019E 2020E Turnover (RMB mn) 9,400 11,384 12,887 15,026 18,435 Chg (%) 23 21 13 17 23 Net Profit (RMB mn) 1,719 2,025 2,199 2,671 3,367 Chg (%) 35 18 9 21 26 EPS (RMB) 1.536 1.782 1.920 2.332 2.939 Chg (%) 33 16 8 21 26 P/E (x) 16.7 14.4 13.4 11.0 8.7 P/B (x) 2.7 2.4 2.2 1.9 1.7 P/OCF (x) 16.7 15.5 10.8 10.1 9.0 EV/EBITDA (x) 11.6 9.7 8.6 7.1 5.7 DPS (RMB) 0.596 0.704 0.768 0.933 1.176 Yield (%) 2.3 2.7 3.0 3.6 4.6 Source: Company data, Bloomberg, Orient Securities (Hong Kong) BUY Share Price Target Price HK$29.25 HK$33.6 China / Automobile / Auto Parts 8 October 2018 Alison Ho (SFC CE:BHL697) (852) 3519 1291 [email protected] Latest Key Data Total shares outstanding (mn) 1,145 Market capitalization (HK$mn) 33,505 Enterprise value (HK$mn) 32,903 12M daily turnover (HK$mn) 126.7 12M volatility (%) 44 PEG FY17-19E (x) 1.0 ROE avg FY17-19E (%) 17 P/B FY18E (x) 2.2 Net debt/equity FY18E (%) Net Cash Performance (%) 1M YTD 12M Absolute (0.8) (38.0) (33.8) Relative to HSI 1.6 (26.8) (27.5) Major Shareholders (%) Chin Jong Hwa 39.3 First State Investments (HK) Ltd. 8.06 Matthews International Capital 7.05 Auditor Deloitte Price Chart Turnover (HK$mn) Price (HK$) Source: Bloomberg, Orient Securities (Hong Kong)
-
Upload
khangminh22 -
Category
Documents
-
view
2 -
download
0
Transcript of Minth Group 敏实集团 (425 HK)
Hong Kong Equity | Automobile Company in-depth
Orient Securities (Hong Kong) Limited Please read the analyst certification, company disclosure and disclaimer in the last page 1
Minth Group 敏实集团 (425 HK)
A beneficiary of the booming lightweight auto market
Minth is a leading auto parts supplier in China, most of its customers are top global auto makers such as Toyota, Honda, Ford and GM. With strong R&D capability and diversified manufacturing bases, the group gains lots of chances to develop new products for multinational auto makers. Besides, the automotive lightweight trend is expected to favor Minth and we expect its GPM to climb up in 2019-2020 on the back of the increasing contribution from high-margin aluminum products. Given the stable growth of Minth’s orders backlog, we believe its sales continue to rise steadily. Initiate BUY with TP of HK$33.6, implying a 15% upside potential.
New aluminum products boost Minth’s GPM growth: The increasing demand for lightweight auto materials is likely to boost global aluminum sales. In order to grab the lightweight growth trend, Minth successfully develop new aluminum door frame and aluminum battery pack and those products will be launched in 2019/2020. With the increase of aluminum products sales, we expect its aluminum sales contribution to rise from 25% in 1H2018 to 35% in 2020E. Given the higher margin of aluminum products (35%-40% vs steel products 30%-33%), Minth’s sales and GPM growth are expected to accelerate in 2019E-2020E.
Gaining competitive advantages with diversified manufacturing bases: Minth operates over 40 factories including 6 plants in German, Mexico, U.S and Thailand, which support it to gain orders from multinational auto makers. The leading technology and innovative skills lead the group to establish long term relationships with its customers. Given the continuous expansion in overseas, we believe Minth can gain competitive advantages and enhance the penetration worldwide.
Solid balance sheet: Minth has a solid balance sheet with operating cash inflow for 10 consecutive years, given the net cash position, we believe Minth would not be easily vulnerable in economy downturn.
The escalation of trade war may harm Minth’s profit: Chinese-made US products accounted for 7% of Minth’s total sales, the tariff imposed by the US government may put pressure on Minth’s US sales. In addition, the escalation of trade war may lead the OEMs to adjust down their sales forecast, which may also harm Minth’s sales and profit.
Initiate with a buy rating. Given that Minth gains c.10% of global exterior auto parts market shares, we believe its strong R&D capability can allow it to secure more orders from global auto makers. We initiate buy rating with target price of HK$33.6, suggesting 15% upside potential. Our target price is based on the valuation of DCF methodologies with WACC of 11.0% and terminal growth of 3%. This implies a forward (FY18E) P/E of 15.3x and forward (FY18E) P/B of 2.5x.
Investment Summary FY-end Dec 2016 2017 2018E 2019E 2020E
Turnover (RMB mn) 9,400 11,384 12,887 15,026 18,435
Chg (%) 23 21 13 17 23
Net Profit (RMB mn) 1,719 2,025 2,199 2,671 3,367
Chg (%) 35 18 9 21 26
EPS (RMB) 1.536 1.782 1.920 2.332 2.939
Chg (%) 33 16 8 21 26
P/E (x) 16.7 14.4 13.4 11.0 8.7
P/B (x) 2.7 2.4 2.2 1.9 1.7
P/OCF (x) 16.7 15.5 10.8 10.1 9.0
EV/EBITDA (x) 11.6 9.7 8.6 7.1 5.7
DPS (RMB) 0.596 0.704 0.768 0.933 1.176
Yield (%) 2.3 2.7 3.0 3.6 4.6
Source: Company data, Bloomberg, Orient Securities (Hong Kong)
BUY
Share Price Target Price
HK$29.25 HK$33.6
China / Automobile / Auto Parts
8 October 2018
Alison Ho (SFC CE:BHL697)
(852) 3519 1291
Latest Key Data Total shares outstanding (mn) 1,145
Market capitalization (HK$mn) 33,505
Enterprise value (HK$mn) 32,903
12M daily turnover (HK$mn) 126.7
12M volatility (%) 44
PEG FY17-19E (x) 1.0
ROE avg FY17-19E (%) 17
P/B FY18E (x) 2.2
Net debt/equity FY18E (%) Net Cash
Performance (%)
1M YTD 12M
Absolute (0.8) (38.0) (33.8)
Relative to HSI 1.6 (26.8) (27.5)
Major Shareholders (%)
Chin Jong Hwa 39.3
First State Investments (HK) Ltd. 8.06
Matthews International Capital 7.05
Auditor
Deloitte
Price Chart
Turnover (HK$mn) Price (HK$)
Source: Bloomberg, Orient Securities (Hong Kong)

Hong Kong Equity | Automobile Company in-depth
See last page for disclaimer. 2
Source: Company data, Orient Securities (Hong Kong)
Stable growth of top 20 OEMs support tier-1 auto parts suppliers
EMEA vehicle sales growth outperformed the global auto market in 2017
The sales volume of global passenger cars and light commercial vehicles rose by 2.4% yoy,
to 86.05mn units in 2017, according to JATO Dynamics. Among which, China/EMEA/Japan,
accounted for 30%/24%/6% market shares, delivered stable growth last year. However,
the second largest auto market – USA dropped by 2% yoy in 2017, mainly due to the
customers’ loyalty, who prefer to keep the vehicles longer. We observed that the auto
markets in European countries, like Germany/France/Italy with growth of 3%/5%/7%,
outperformed Japan and China’s growth of 2.3%, mainly due to their ongoing recoveries.
In 2017, China remains the largest auto market in the world.
Global cars sales growth is expected to slow down in 2018
According to VDA (a German automotive industry association), the global car market is
expected to slow down and it estimated that the sales volume only grow by 1% yoy in
2018. Given the haze of Brexit, UK auto market is expected to decline and it may drag
down European’s sales. On the other hand, we saw that China auto market started to
slow down since 6/2018 and the monthly auto sales declined in Jul and Aug, we believe
the US-China trade war may continue to weaken China’s auto sales. Given an expected
slow growth of global car sales, we believe global auto parts sales would increase at a
slow pace in 2018E.
Most of the top 20 car manufacturers delivered stable growth in 7M 2018
The top 20 car makers accounted for 76% market shares in 7M2018. Most of them
recorded stable growth of 5%-10% yoy in 7M2018. However, US brand - Ford, ranking No.
3, performed badly and dropped 6.5% yoy in 7M2018, it was mainly due to the rising
demand for electric cars driven by an increase of oil price, we believe it will continue to
under pressure after US-China trade war kicked off. On the other hand, the Chinese
brand - Geely was up by 43% yoy in 7M2018, which was the fast growing brand among
the top 20 car makers. Thanks to the debut of long awaited model - Lynk & Co. 03
(Sedan), VF11 (MPV), Bin Rui (Sedan) and SX11 (small SUV) in 2H2018, we expect it to
maintain sales momentum in 2018. With a steady growth of most of top 20 car makers,
we believe it would support tier-one auto parts suppliers’ sales growth in 2018.
Figure 1: Top 10 regions, new car sales in 2017 Figure 2: Global car sales by brands in 7M2018
Sales Volume (million)
Market Shares YOY growth (%)
1 China 25.8 30.0% 2.3
2 USA 17.23 20.0% (2.0)
3 Japan 5.16 6.0% 2.3
4 Germany 3.71 4.3% 3.0
5 India 3.61 4.2% 9.0
6 UK 2.9 3.4% (5.0)
7 France 2.54 3.0% 5.0
8 Brazil 2.17 2.5% 9.0
9 Italy 2.15 2.5% 7.0
10 Canada 2.05 2.4% 5.0
Source: Carsalesbase, Orient Securities (Hong Kong) Source: Daimler AG , Orient Securities (Hong Kong)
Figure 3: Auto makers’ market shares in
7M2018
Toyota
Volkswagen
Ford
Honda Nissan
Hyundai
Chevrolet
KIA
Renault
Mercedes Peugeot
BMW
Audi
Maruti
Mazda
Fiat
Suzuki
Skoda
-10
-5
0
5
10
15
- 5 10 15 20
YO
Y g
row
th
Market shares ranking
Top 10 players 11-20 players
Stable growth
Robust growth
Diminished growth
Geely delivered 31% growth
Auto makers Market Shares
Top 5 players 34%
Top 10 players 51%
Top 20 players 76%
Hong Kong Equity | Automobile Company in-depth
See last page for disclaimer. 3
Source: Company data, Orient Securities (Hong Kong)
Minth Group – One of the top auto parts suppliers in the world
Minth – with 10% global market share
Minth is the leading supplier of exterior auto parts with global market share of 10% in
1H2018. The company established in 1992 and started to engage in the design,
manufacture and sale of passenger vehicle exterior auto-parts in 1997. Minth provides
the products, including trims, body structural parts, decorative parts and seat frame
systems for passenger cars. The top 10 global automakers such as Toyota, Honda, Ford
and Volkswagen AG and leading Chinese automakers such as Shanghai Automobile and
ChangAn Automobile are its customers. The group is headquartered in Ningbo and is
listed in Hong Kong Stock exchange since 2005. Up to 1H2018, Minth operates over 30
factories in China and 6 factories in US, Germany, Thailand and Mexico.
Gaining competitive advantages via products differentiation
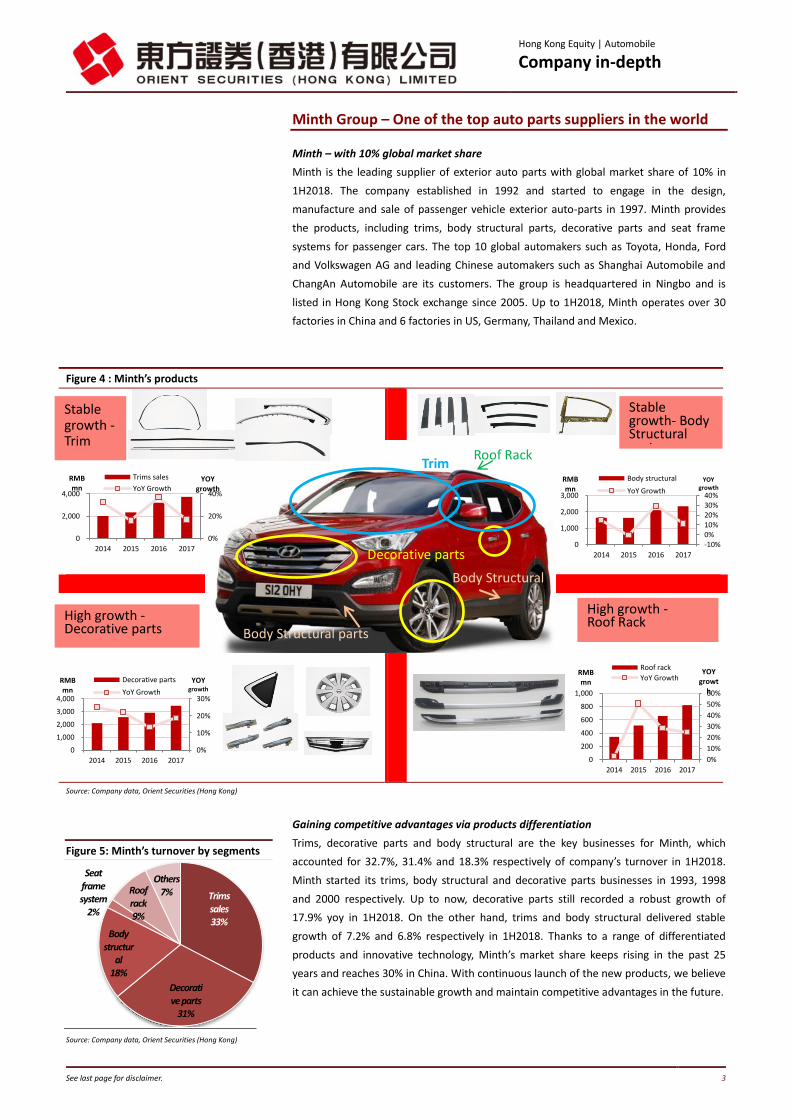
Trims, decorative parts and body structural are the key businesses for Minth, which
accounted for 32.7%, 31.4% and 18.3% respectively of company’s turnover in 1H2018.
Minth started its trims, body structural and decorative parts businesses in 1993, 1998
and 2000 respectively. Up to now, decorative parts still recorded a robust growth of
17.9% yoy in 1H2018. On the other hand, trims and body structural delivered stable
growth of 7.2% and 6.8% respectively in 1H2018. Thanks to a range of differentiated
products and innovative technology, Minth’s market share keeps rising in the past 25
years and reaches 30% in China. With continuous launch of the new products, we believe
it can achieve the sustainable growth and maintain competitive advantages in the future.
Figure 4 : Minth’s products
Source: Company data, Orient Securities (Hong Kong)
Figure 5: Minth’s turnover by segments
Stable growth - Trim
High growth - Decorative parts
Stable growth- Body Structural parts
High growth - Roof Rack
Trim
Decorative parts
Body Structural parts
Body Structural
parts
0%
20%
40%
0
2,000
4,000
2014 2015 2016 2017
YOY growth
RMB mn
Trims sales
YoY Growth
0%
10%
20%
30%
0
1,000
2,000
3,000
4,000
2014 2015 2016 2017
YOY growth
RMB mn
Decorative parts
YoY Growth
-10%0%10%20%30%40%
0
1,000
2,000
3,000
2014 2015 2016 2017
YOY growth
RMB mn
Body structural
YoY Growth
0%
10%
20%
30%
40%
50%
60%
0
200
400
600
800
1,000
2014 2015 2016 2017
YOY growt
h
RMB mn
Roof rack
YoY Growth
Roof Rack
Trims sales 33%
Decorative parts
31%
Body structur
al 18%
Seat frame system
2%
Roof rack 9%
Others 7%
Hong Kong Equity | Automobile Company in-depth
See last page for disclaimer. 4
Auto market trend: Shift to lightweight materials
Increasing the use of lightweight materials to reduce CO2 emissions
Vehicles contributed 12% of total carbon dioxide (CO2) emissions in EU, according to
European commission. In order to reduce the pollution, EU legislation targets to reduce
the vehicles’ fleet average by 40% from 158.7g CO2/km in 2007 to 95g CO2/km in 2021,
the penalty should be paid by car manufacturers if they fail to meet the target. To avoid
the punishment, car manufacturers tend to use lightweight materials to reduce car
weight. The statistic shows that every 100kg vehicle weight losing results in the reduction
of 0.7L/km oil consumption, indicating lowering CO2 emission. The lightweight materials
can also save fuel consumption and improve the car speed, we believe the increasing use
of lightweight materials will become the big trend in automotive market going forwards.
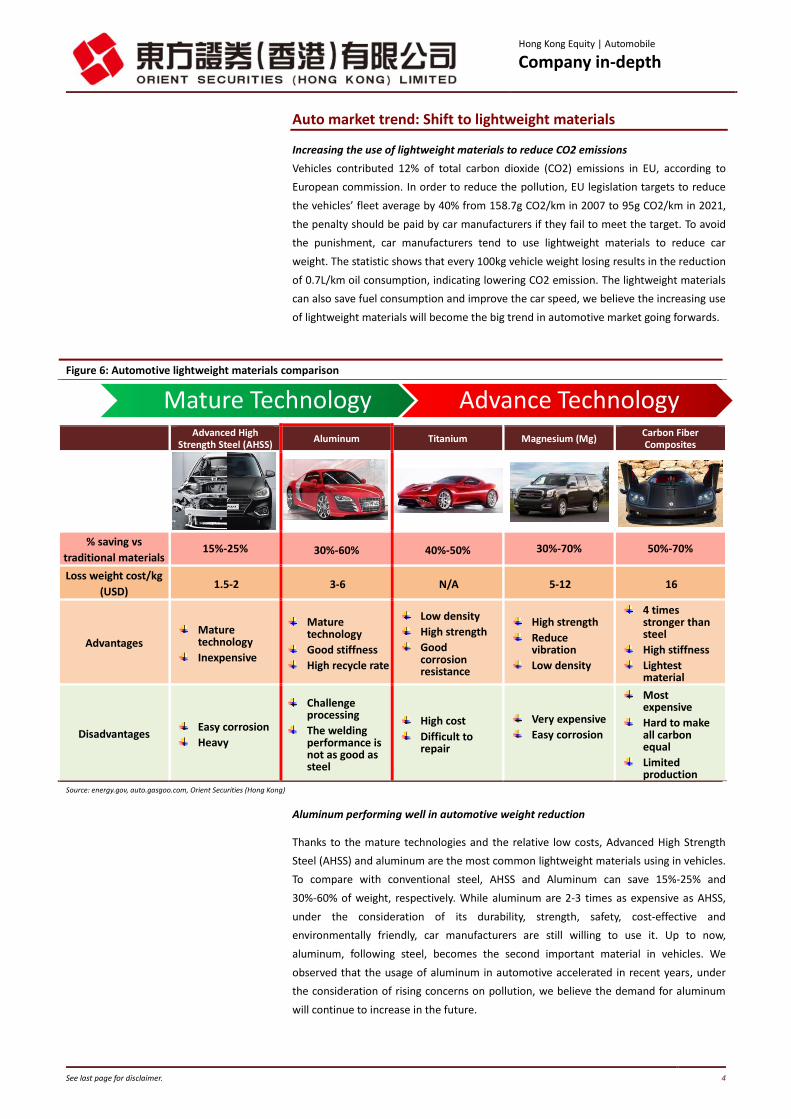
Aluminum performing well in automotive weight reduction
Thanks to the mature technologies and the relative low costs, Advanced High Strength
Steel (AHSS) and aluminum are the most common lightweight materials using in vehicles.
To compare with conventional steel, AHSS and Aluminum can save 15%-25% and
30%-60% of weight, respectively. While aluminum are 2-3 times as expensive as AHSS,
under the consideration of its durability, strength, safety, cost-effective and
environmentally friendly, car manufacturers are still willing to use it. Up to now,
aluminum, following steel, becomes the second important material in vehicles. We
observed that the usage of aluminum in automotive accelerated in recent years, under
the consideration of rising concerns on pollution, we believe the demand for aluminum
will continue to increase in the future.
Figure 6: Automotive lightweight materials comparison
Advanced High
Strength Steel (AHSS) Aluminum Titanium Magnesium (Mg)
Carbon Fiber Composites
% saving vs
traditional materials 15%-25% 30%-60% 40%-50% 30%-70% 50%-70%
Loss weight cost/kg
(USD) 1.5-2 3-6 N/A 5-12 16
Advantages Mature
technology
Inexpensive
Mature technology
Good stiffness
High recycle rate
Low density
High strength
Good corrosion resistance
High strength
Reduce vibration
Low density
4 times stronger than steel
High stiffness
Lightest material
Disadvantages Easy corrosion
Heavy
Challenge processing
The welding performance is not as good as steel
High cost
Difficult to repair
Very expensive
Easy corrosion
Most expensive
Hard to make all carbon equal
Limited production
Source: energy.gov, auto.gasgoo.com, Orient Securities (Hong Kong)
Mature Technology Advance Technology

Hong Kong Equity | Automobile Company in-depth
See last page for disclaimer. 5
Growing penetration rate of aluminum materials
Increasing aluminum utilization in vehicles
To deal with the strict regulations, car makers are unavoidable to increase their spending
on lightweight materials. According to aluminum insider, the car manufacturers are
willing to pay US$4-12/kg for weight reduction currently, and luxury car makers even are
willing to pay more. According to ducker worldwide, the car makers spent GBP397 per
vehicle on aluminum material in North America in 2015, given the growing demand for
aluminum products; the aluminum content is expected to increase to GBP 466/car and
GBP 520/car in 2020 and 2025, respectively, in North America. Hence, we believe Minth
would be one of the beneficiaries of the growing demand for the aluminum auto parts.
A shifting from steel to aluminum for wheel and body structures
According to Ducker worldwide, steel sheet is the most important material using in
vehicles in 2015, which accounted for 41% of total vehicle weight composition. However,
under consideration of its heavy weight, the car makers would speed up shifting from
steel sheet to other lightweight materials such as aluminum and Magnesium. Ducker
worldwide expected that the steel sheet proportion may decrease from 41% in 2015 to
28% in 2025. On the other hand, aluminum would become the second import material
for passenger vehicles and its contribution may increase from 10% in 2015 to 16% in
2025. Given an increase use of lightweight materials, the average car weight is expected
to reduce by 7% from 3,835lbs in 2015 to 3,554lbs in 2025. Figure 8 shows that car
makers may focus increasing their aluminum content in wheel and body and IP structures.
Given that Minth is leading wheel and body and IP structures suppliers, the increasing
demand for aluminum products is likely to boost Minth’s upcoming sales.
Figure 7: North America light vehicle aluminum content Figure 8: Automotive aluminum content in 2015 and 2020E
Source: Drivealuminum, ducker worldwide, Orient Securities (Hong Kong)
Source: Drivealuminum, ducker worldwide, Orient Securities (Hong Kong)
Figure 9: Automotive materials in 2015 Figure 10: Automotive materials in 2025E
Source: Drivealuminum, ducker worldwide, Orient Securities (Hong Kong)
Source: Drivealuminum, ducker worldwide, Orient Securities (Hong Kong)
2% 3%
30%
21% 11%
9%
1% 2% 5%
2% 7%
7%
10% 1%
24%
18% 14%
7%
1% 2%
5%
2%
13% 3%
Body and IP structures
All other components
Engines
Transmissions & Driveline
Wheels
Heat Exchangers
Heat Shields
Cradles/sub-frames
Steering
Brakes
Closures
Bumper & Crash Boxes
258 306
340 397
466 520
0
100
200
300
400
500
600
2000 2005 2010 2015 2020E 2025E
Net pounds per vehicle
2015
2020E
Aluminum 16%
Steel Sheet 28%
GEN 3 Steel 4%
All other Steel 15%
Iron Casting 8%
Magnesium 1%
Other Metals 5%
Polymers 10%
Glass 1% Other
Materials 12%
2025 3554 lbs Aluminum
10%
Steel Sheet 41%
GEN 3 Steel 0%
All other Steel 16% Iron
Casting 8%
Magnesium 0%
Other Metals
4%
Polymers 8%
Glass 2%
Other Materials
11%
2015 3835 lbs
Increase aluminum proportion
Hong Kong Equity | Automobile Company in-depth
See last page for disclaimer. 6
Source: Company data, Orient Securities (Hong Kong)
Source: Company data, Orient Securities (Hong Kong)
Minth achieves customers and geographical diversification
Achieving customers’ diversification
Minth started to enter into exterior auto parts market in 1997. GM and VW became its
first batch customers in 1998, the company then successfully entered into Mazda, Honda,
Ford, Suzuki‘s purchasing system in 1999-2002. Up to now, Minth’s customers accounted
for 80% of global auto market sales, thanks to the large customers’ base, it would be
easier for Minth to diversify single customer risk. Since most of top 20 car makers have
stable growth in 7M2018, which support Minth’s sales in 2018.
Geographical diversification helps to minimize the risk from trade war
Minth achieved a geographical diversification as 61.5% of its revenue came from China
and 38.5% are from overseas (Europe, North America and Asia Pacific) in 1H2018. Given
the imposition of tariff on Chinese products by the US government, we believe it may put
pressure on Minth’s US sales since Chinese-made US products accounted for c.7% of the
its total revenue in 1H2018 (implying RMB420 mn). In order to minimize the impact from
US-China trade war, the company plans to 1) move its US products’ manufacturing bases
from China to Mexico/Thailand and 2) increase US investments in the long term. While
we believe the tariff would drag down Minth’s US sales in the short term, its markets and
manufacturing bases diversification may allow Minth to reduce the impact from trade
war in the long term.
>40 manufacturing bases over the world
Minth operates over 40 manufacturing plants, including 6 plants in overseas. Its factories
are strategically located closing to its customers, which not only reduces the logistic costs
and transportation time, but also keeps the close relationship with its customers. Minth
plans to expand its footprint in North China as well as overseas in the near future, we
believe this can help it to secure more orders and enhance the penetration rate.
China 61%
North Americ
a 20%
Europe 14%
Asia Pacific
5%
Figure 11: Key Milestones –Customers list
Figure 12: Turnover by geography
Figure 13: Manufacturing plants location
Source: Company data, Orient Securities (Hong Kong)
1998 •GM & VW
1999 •Mazda & Honda
2002 •Ford & Suzuki
2003 •Nissan
2004 •Toyota and Mitsubishi
2005 •BMW
2006 •PSA & Kia
China Factories Overseas factories + technical centers
Mexico - Manufacturing base
Thailand -Manufacturing base
U.S. - Manufacturing base + Technical center
Germany - Manufacturing base + Technical center
Japan – Technical center

Hong Kong Equity | Automobile Company in-depth
See last page for disclaimer. 7
Lightweight Products
Mature technology lets Minth to keep close relationship with customers
Maintaining long term relationship with global auto makers
Minth stated that the auto makers normally would invite 2 to 3 tier-one suppliers and 3
to 5 tier-two/tier-three suppliers to work with them for developing auto parts for new
car models, the suppliers’ products quality/ design capability/ financial position/ stability
/ costs would be the main criteria that would be considered by the auto makers for
choosing suppliers. Minth, as a Tier-one auto parts supplier, has already entered into the
key global auto makers’ purchasing system for more than 10 years, its mature technology
and extensive experiences also allow it to gain opportunities to cooperate with global
luxury brands.
Spending around 24 months on the new products development
After getting the request by auto makers, Minth would base on 1) the new car models, 2)
planned production volume and 3) target markets to evaluate which materials and
technology to be involved in the production. Then Minth would provide the sample to
car makers for testing, if the customers are satisfied with the result, they would sign a
contract with Minth. Minth then starts to prepare the production facilities and the period
from getting the contracts to production may need 24 months.
Figure 14: Business Model of Minth
Source: Company data, Orient Securities (Hong Kong)
1 st stage – 2 months
1. Invited by automakers for designs of products
1. Minth will negotiate the product price, quantity, payment terms and delivery time with customers
2. After the agreement is signed, Minth will prepare mould, production plan, product sample and product testing.
4 methods to get contract
2. Directly get the contracts
4. Minth provides new products proposal to auto makers directly
3. Bids through tenders
Getting Contract Signing agreement with clients
Production
2nd stage – 6-24 months 3rd stage
Process
3. The customers will visit Minth for checking the production facilities, testing and quality control procedures, system, etc.
Delivery
1. Minth will base on the agreed quantity and schedule to ship the goods to customers
2. Minth will provide the after-sales services to customers
Projects working with customers
Auto camera
ACC Radome
Lightweight products Intelligent auto parts
Hong Kong Equity | Automobile Company in-depth
See last page for disclaimer. 8
Source: Internet data , Orient Securities (Hong Kong)
Source: Internet data, Orient Securities (Hong Kong)
Minth Focuses on lightweight and electric products development
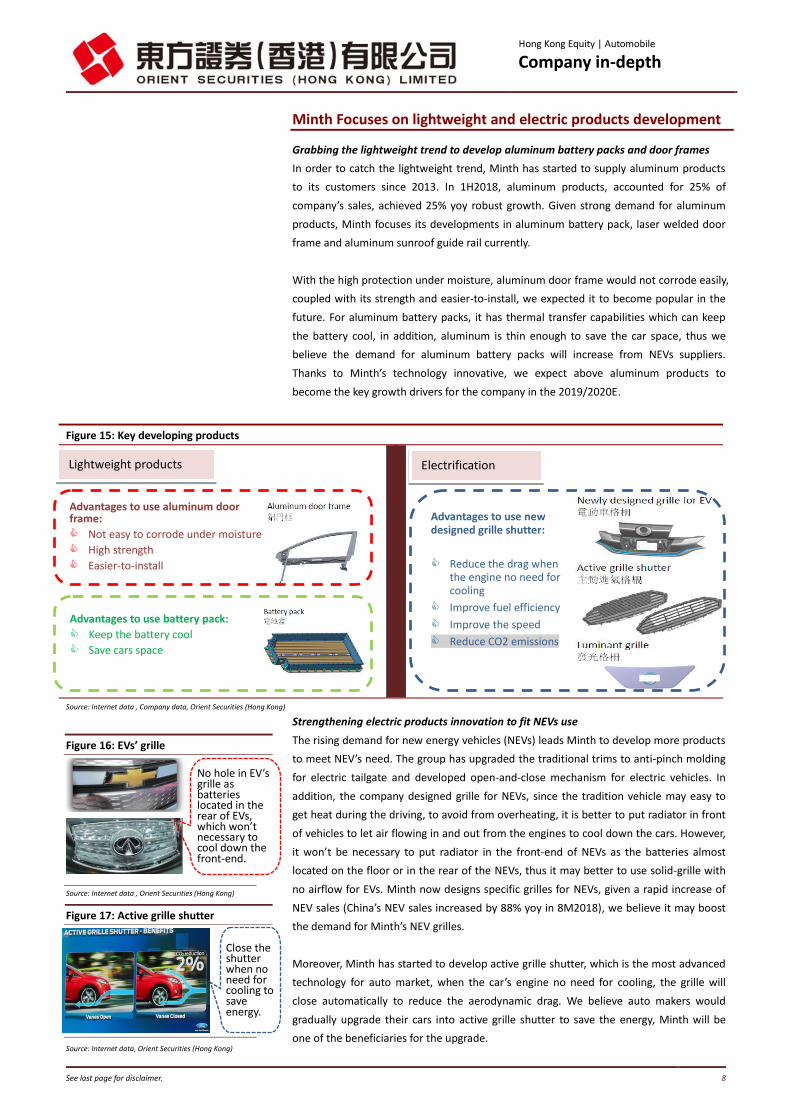
Grabbing the lightweight trend to develop aluminum battery packs and door frames
In order to catch the lightweight trend, Minth has started to supply aluminum products
to its customers since 2013. In 1H2018, aluminum products, accounted for 25% of
company’s sales, achieved 25% yoy robust growth. Given strong demand for aluminum
products, Minth focuses its developments in aluminum battery pack, laser welded door
frame and aluminum sunroof guide rail currently.
With the high protection under moisture, aluminum door frame would not corrode easily,
coupled with its strength and easier-to-install, we expected it to become popular in the
future. For aluminum battery packs, it has thermal transfer capabilities which can keep
the battery cool, in addition, aluminum is thin enough to save the car space, thus we
believe the demand for aluminum battery packs will increase from NEVs suppliers.
Thanks to Minth’s technology innovative, we expect above aluminum products to
become the key growth drivers for the company in the 2019/2020E.
Strengthening electric products innovation to fit NEVs use
The rising demand for new energy vehicles (NEVs) leads Minth to develop more products
to meet NEV’s need. The group has upgraded the traditional trims to anti-pinch molding
for electric tailgate and developed open-and-close mechanism for electric vehicles. In
addition, the company designed grille for NEVs, since the tradition vehicle may easy to
get heat during the driving, to avoid from overheating, it is better to put radiator in front
of vehicles to let air flowing in and out from the engines to cool down the cars. However,
it won’t be necessary to put radiator in the front-end of NEVs as the batteries almost
located on the floor or in the rear of the NEVs, thus it may better to use solid-grille with
no airflow for EVs. Minth now designs specific grilles for NEVs, given a rapid increase of
NEV sales (China’s NEV sales increased by 88% yoy in 8M2018), we believe it may boost
the demand for Minth’s NEV grilles.
Moreover, Minth has started to develop active grille shutter, which is the most advanced
technology for auto market, when the car’s engine no need for cooling, the grille will
close automatically to reduce the aerodynamic drag. We believe auto makers would
gradually upgrade their cars into active grille shutter to save the energy, Minth will be
one of the beneficiaries for the upgrade.
Figure 15: Key developing products
Source: Internet data , Company data, Orient Securities (Hong Kong)
Figure 16: EVs’ grille
Figure 17: Active grille shutter
Lightweight products
No hole in EV’s grille as batteries located in the rear of EVs, which won’t necessary to cool down the front-end.
Advantages to use aluminum door frame:
Not easy to corrode under moisture
High strength
Easier-to-install
Advantages to use battery pack:
Keep the battery cool
Save cars space
Electrification
Advantages to use new designed grille shutter:
Reduce the drag when the engine no need for cooling
Improve fuel efficiency
Improve the speed
Reduce CO2 emissions
Close the shutter when no need for cooling to save energy.

Hong Kong Equity | Automobile Company in-depth
See last page for disclaimer. 9
Strong order backlog with increasing dollar content per car
Automotive cameras orders and ACC emblems are under development
Given the increase concern on safety and to avoid the car accidents, the demand for auto
cameras is increasing. Minth grabs the opportunities and develops camera module, the
group claimed that it has secured new orders from a Japanese OEM and a Chinese OEM,
we believe its camera module sales to grow significantly after 2020E. In addition, the
group has designed a series of new ACC emblems with radar wave, power and heat
radiation technologies for global OEMs, the products are still in the developing stage. We
expect the new products to support Minth’s sales growth after 2020E.
Order Backlog keeps at a highest level
Minth expected its new order intake to reach 5.5bn (+10% yoy) in 2018E, up to 1H2018,
the company has achieved RMB3 bn, implying 54.5% of the target. For the order backlog,
35% of which are aluminum products and 5% of which are new star products like ACC
emblem, battery pack, camera module and aluminum door frame. Minth guided that it
has secured aluminum battery packs orders from 3 OEMs and the new products will start
to be delivered in 1H2019, it expected the product’s annual production volume to reach
250,000 units after mass production. On the other hand, Minth also secured 900,000
units for aluminum door frames from one OEM, the new products are expected to be
delivered in 2H2020 and it would contribute RMB600-800mn revenue per annum to the
company. Thanks to the strong aluminum order backlog, we expect the aluminum’s
revenue contribution to rise from 25% in 20181H to 35% in 2020E.
An expected increase of GPM on the back of increase aluminum products
Minth’s dollar content per car was around RMB380 in 2017, with increase sales of
aluminum products, Minth expected its dollar content per car to increase to
RMB400-450 in 2020E/2021E. Given the higher GPM of aluminum products, the increase
contribution from aluminum products would result in a rising of overall GPM.
Figure 18: Key intelligent products
Source: Company data, Orient Securities (Hong Kong)
Figure 19: Order Backlog & new order intake Figure 20: Dollar content per car
Source: Company source, Orient Securities (Hong Kong)
Source: Company source, Orient Securities (Hong Kong)
Intelligent products
Hong Kong Equity | Automobile Company in-depth
See last page for disclaimer. 10
New products drive Minth’s revenue growth
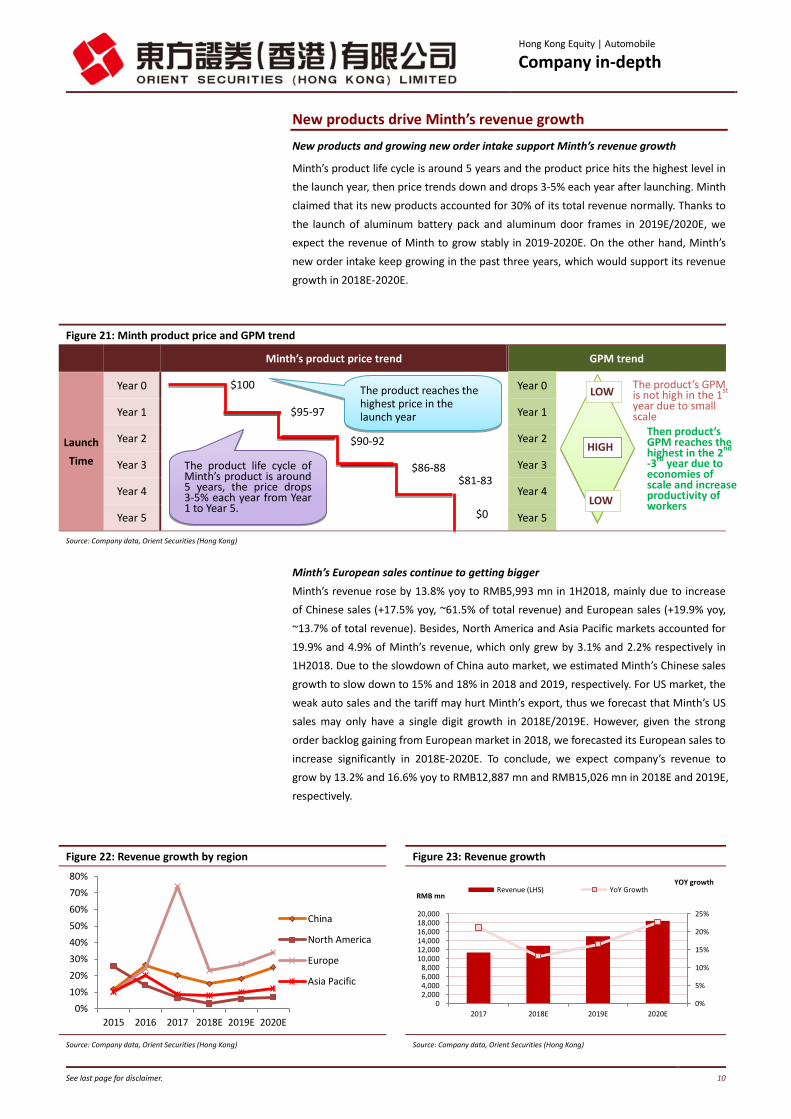
New products and growing new order intake support Minth’s revenue growth
Minth’s product life cycle is around 5 years and the product price hits the highest level in
the launch year, then price trends down and drops 3-5% each year after launching. Minth
claimed that its new products accounted for 30% of its total revenue normally. Thanks to
the launch of aluminum battery pack and aluminum door frames in 2019E/2020E, we
expect the revenue of Minth to grow stably in 2019-2020E. On the other hand, Minth’s
new order intake keep growing in the past three years, which would support its revenue
growth in 2018E-2020E.
Minth’s European sales continue to getting bigger
Minth’s revenue rose by 13.8% yoy to RMB5,993 mn in 1H2018, mainly due to increase
of Chinese sales (+17.5% yoy, ~61.5% of total revenue) and European sales (+19.9% yoy,
~13.7% of total revenue). Besides, North America and Asia Pacific markets accounted for
19.9% and 4.9% of Minth’s revenue, which only grew by 3.1% and 2.2% respectively in
1H2018. Due to the slowdown of China auto market, we estimated Minth’s Chinese sales
growth to slow down to 15% and 18% in 2018 and 2019, respectively. For US market, the
weak auto sales and the tariff may hurt Minth’s export, thus we forecast that Minth’s US
sales may only have a single digit growth in 2018E/2019E. However, given the strong
order backlog gaining from European market in 2018, we forecasted its European sales to
increase significantly in 2018E-2020E. To conclude, we expect company’s revenue to
grow by 13.2% and 16.6% yoy to RMB12,887 mn and RMB15,026 mn in 2018E and 2019E,
respectively.
Figure 22: Revenue growth by region Figure 23: Revenue growth
Source: Company data, Orient Securities (Hong Kong) Source: Company data, Orient Securities (Hong Kong)
Figure 21: Minth product price and GPM trend
Minth’s product price trend GPM trend
Launch
Time
Year 0 Year 0
Year 1 Year 1
Year 2 Year 2
Year 3 Year 3
Year 4 Year 4
Year 5 Year 5
Source: Company data, Orient Securities (Hong Kong)
0%
10%
20%
30%
40%
50%
60%
70%
80%
2015 2016 2017 2018E 2019E 2020E
China
North America
Europe
Asia Pacific
0%
5%
10%
15%
20%
25%
02,0004,0006,0008,000
10,00012,00014,00016,00018,00020,000
2017 2018E 2019E 2020E
YOY growth
RMB mn Revenue (LHS) YoY Growth
$100
$95-9775
$90-92
$86-88 $81-83
$0
The product reaches the highest price in the launch year
The product life cycle of Minth’s product is around 5 years, the price drops 3-5% each year from Year 1 to Year 5.
The product’s GPM is not high in the 1
st
year due to small scale
Then product’s GPM reaches the highest in the 2
nd
-3rd
year due to economies of scale and increase productivity of workers
LOW
HIGH
LOW

Hong Kong Equity | Automobile Company in-depth
See last page for disclaimer. 11
GPM is expected to rebound in 2H2018
China and European markets’ GPMs outperform N.A and Asia markets’
Figure 24 shows that Minth is gaining higher GPMs in China and European market, the
management explained that its China production plants have mature technology, smooth
operation as well as experienced workers, its average utilization rate in China plants
reaches 80%, hence the Chinese-made products normally can have higher GPMs. Besides,
as its Germany plant only contributes c.1% revenue to company, most of its European
products are imported from low-cost China plants, thus it can enjoy a higher GPM in
Europe.
For North American market, Minth started to operate the new aluminum factory in
Mexico in the end of 2016, the low utilization rate (50%-60%) and a relative low yield
rate of that factory dragged down the N.A. market’s GPM. Minth stated that it has just
transferred a team of experienced management and staffs to Mexico, thus we believe
N.A. market’s GPM will improve gradually in 2019-2020 resulting from the improvement
of operation.
GPM reaches the highest level in year-2 and year-3 of product lifecycle
Due to the economies of scale and an increase the productivity of workers, Minth can
gain the highest GPMs via year-2 and year-3 launch products. Then the old products (4-5
years launching period)’s GPM would drop significantly as a result of lower price. Minth
stated that its GPM declines in 2017 and 20181H due to a relative large portion of old
products sold. Given the increase contribution of new aluminum products, we expect its
GPM to improve in 2019-2020E.
GPM is expected to go up on the back of growing aluminum products sales
Minth’s GPM dropped by 0.4ppt to 33.4% in 1H2018, mainly due to 1) the ASP decline of
old products, 2)price hike of raw materials and 3) appreciation of RMB in 1H2018. Among
which, Minth achieved higher GPMs in China (~36.1%) and Europe (~36.6%), but the
GPMs in North America only reached 24.3%, mainly due to the depreciation of USD, low
utilization rate and yield rate of Mexico plants. Thanks to the appreciation of USD in the
2H2018, we estimate the N.A market GPM to rebound in 2H2018. In addition, the GPM
of aluminum products is around 35%-40% vs steel products’ 30%-33%, the growing
aluminum order backlog is expected to boost Minth’s GPM growth in 2019E and 2020E.
To conclude, we forecasted the gross profit of Minth to grow by 14.5% and 18.5% yoy to
RMB4,408 mn and RMB5,226 mn in 2018E and 2019E, respectively. The GPMs is
expected to increase by 0.4ppt and 0.6ppt to 34.2% and 34.8% in 2018 and 2019E,
respectively.
Figure 24: GPM by region Figure 25: Gross profit
Source: Company data, Orient Securities (Hong Kong) Source: Company data, Orient Securities (Hong Kong)
33%
33%
34%
34%
35%
35%
36%
36%
0
1,000
2,000
3,000
4,000
5,000
6,000
7,000
2017 2018E 2019E 2020E
YOY growth
RMB mn Gross Profit (LHS) GPM (%) (RHS)
25%
30%
35%
40%
45%
2015 2016 2017 2018E 2019E 2020E
China
North America
Europe
Asia Pacific
Hong Kong Equity | Automobile Company in-depth
See last page for disclaimer. 12
Source: Company data, Orient Securities (Hong Kong)
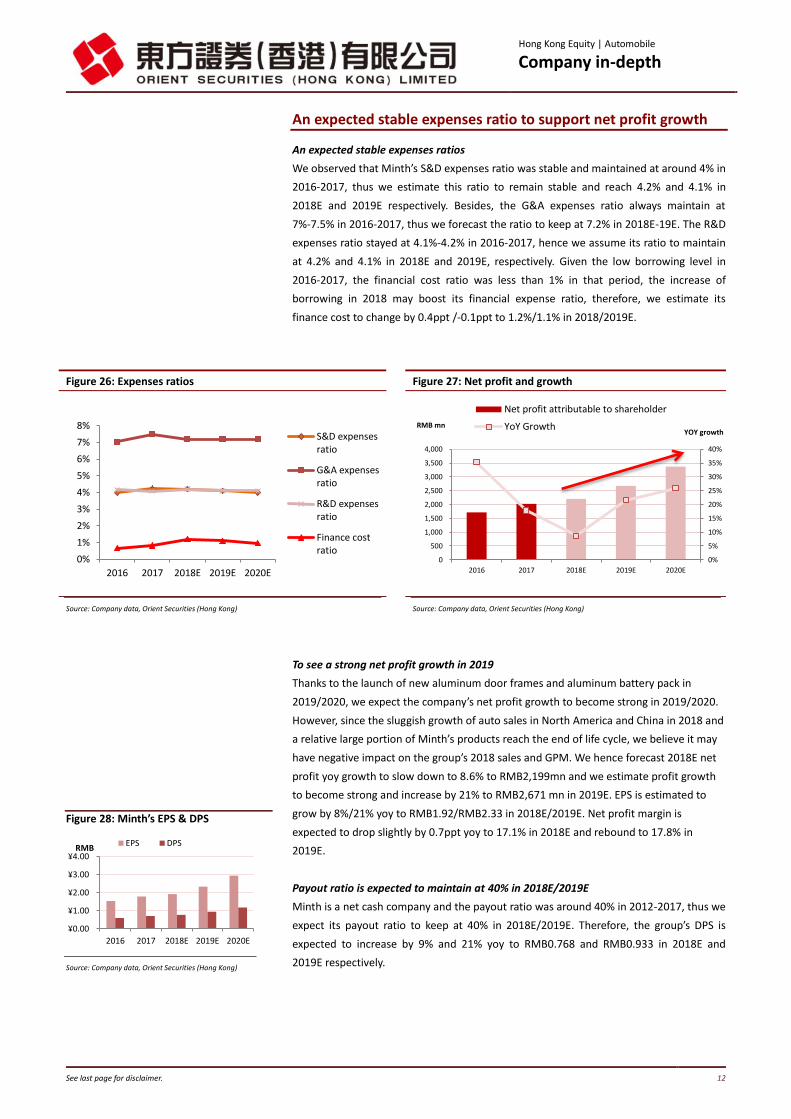
An expected stable expenses ratio to support net profit growth
An expected stable expenses ratios
We observed that Minth’s S&D expenses ratio was stable and maintained at around 4% in
2016-2017, thus we estimate this ratio to remain stable and reach 4.2% and 4.1% in
2018E and 2019E respectively. Besides, the G&A expenses ratio always maintain at
7%-7.5% in 2016-2017, thus we forecast the ratio to keep at 7.2% in 2018E-19E. The R&D
expenses ratio stayed at 4.1%-4.2% in 2016-2017, hence we assume its ratio to maintain
at 4.2% and 4.1% in 2018E and 2019E, respectively. Given the low borrowing level in
2016-2017, the financial cost ratio was less than 1% in that period, the increase of
borrowing in 2018 may boost its financial expense ratio, therefore, we estimate its
finance cost to change by 0.4ppt /-0.1ppt to 1.2%/1.1% in 2018/2019E.
To see a strong net profit growth in 2019
Thanks to the launch of new aluminum door frames and aluminum battery pack in
2019/2020, we expect the company’s net profit growth to become strong in 2019/2020.
However, since the sluggish growth of auto sales in North America and China in 2018 and
a relative large portion of Minth’s products reach the end of life cycle, we believe it may
have negative impact on the group’s 2018 sales and GPM. We hence forecast 2018E net
profit yoy growth to slow down to 8.6% to RMB2,199mn and we estimate profit growth
to become strong and increase by 21% to RMB2,671 mn in 2019E. EPS is estimated to
grow by 8%/21% yoy to RMB1.92/RMB2.33 in 2018E/2019E. Net profit margin is
expected to drop slightly by 0.7ppt yoy to 17.1% in 2018E and rebound to 17.8% in
2019E.
Payout ratio is expected to maintain at 40% in 2018E/2019E
Minth is a net cash company and the payout ratio was around 40% in 2012-2017, thus we
expect its payout ratio to keep at 40% in 2018E/2019E. Therefore, the group’s DPS is
expected to increase by 9% and 21% yoy to RMB0.768 and RMB0.933 in 2018E and
2019E respectively.
¥0.00
¥1.00
¥2.00
¥3.00
¥4.00
2016 2017 2018E 2019E 2020E
RMB EPS DPS
Figure 26: Expenses ratios Figure 27: Net profit and growth
Source: Company data, Orient Securities (Hong Kong) Source: Company data, Orient Securities (Hong Kong)
Figure 28: Minth’s EPS & DPS
0%
1%
2%
3%
4%
5%
6%
7%
8%
2016 2017 2018E 2019E 2020E
S&D expensesratio
G&A expensesratio
R&D expensesratio
Finance costratio
0%
5%
10%
15%
20%
25%
30%
35%
40%
0
500
1,000
1,500
2,000
2,500
3,000
3,500
4,000
2016 2017 2018E 2019E 2020E
YOY growth RMB mn
Net profit attributable to shareholder
YoY Growth

Hong Kong Equity | Automobile Company in-depth
See last page for disclaimer. 13
Solid balance sheet to protect Minth from economy downturn
Strong operating cash inflow
Minth recorded operating cash inflow from 2011-2017, with an expected steady profit
growth in 2018/2019, we expect the group’s operating cash inflow to increase
continuously and reach RMB2,718 mn and RMB2,911 mn in 2018E and 2019E
respectively.
Continuous expansion in overseas to increase penetration rate
In order to increase the penetration rate, Minth plans to expand new factories in
northern China and overseas, we estimate its CAPEX to remain high and reach 2 bn in
2018E and 2019E. To control the CAPEX, Minth stated that it will set up a 3-5 year
maintenance plan to extend its old machines’ life to 20 years, therefore, we believe the
company’s CAPEX will decrease in 2020.
Maintaining a net cash position
Minth has strong balance sheet and it was in a net cash position in the past 10 years.
Given an overseas expansion and an increase of R&D costs for developing aluminum
products, the company’s borrowing increase rapidly from RMB2,494 mn in 2017 to
RMB4,088 mn in 1H2018. While we estimate its borrowing to keep increasing due to
continuous investment on the new products, it may still in net cash position on the back
of strong operating cash inflow in 2018E-2020E.
Figure 29: Cash Flow Figure 30: Capital expenditure
Source: Company data, Orient Securities (Hong Kong) Source: Company data, Orient Securities (Hong Kong)
Figure 31: Loan and borrowings Figure 32: Net cash level
Source: Company data, Orient Securities (Hong Kong) Source: Company data, Orient Securities (Hong Kong)
(4,000)
(2,000)
0
2,000
4,000
2015 2016 2017 2018E 2019E 2020E
RMB mn Total Cash Flow from Operation
Total Cash Flow from investment
Total Cash Flow from Finance
0
500
1,000
1,500
2,000
2,500
2015 2016 2017 2018E 2019E 2020E
RMB mn
0
1,000
2,000
3,000
4,000
5,000
6,000
2016 2017 2018E 2019E 2020E
RMB mn
0
500
1,000
1,500
2,000
2,500
3,000
3,500
2011 2012 2013 2014 2015 2016 2017 2018E 2019E 2020E
RMB Mil Net Cash
Hong Kong Equity | Automobile Company in-depth
See last page for disclaimer. 14
Discount rate 11.0% PV of FCF (HK$m) 20,201 Terminal value (HK$m) 33,147 Total PV of FCF (HK$m) 53,348 Net Cash/Net Debt (HK$m) 1,603 NAV Price/Share (HK$) 47.97 Current NAV Discount (%) -39% Target NAV Discount (%) -30%
Target Price (HK$) 33.6 Upside Potential 15% Source: Company data, Orient Securities (Hong Kong)
Valuation: Apply DCF to value the stock
We value Minth based on the below assumptions:
1) The increase contribution from aluminum products leads to higher GPMs in
2019E-2020E.
2) The increase of utilization rate and yield rate of Mexico plants in 2019-2020E.
3) The expenses ratios would be stable.
4) The USD appreciates in the 2H2018.
5) The company would be in a net cash position in 2019-2020E.
The fair value of Minth is HK$33.6 based on DCF methodology
The two-stage DCF model will be applied in Minth’s valuation, the first stage is from
2018E to 2027E and the second stage is after 2027E.
We applied WACC of 11% in valuation. The assumption is based on cost of equity
of 13.39% with the risk free rate of 3.6%, market risk premium of 10.4% and beta
of 0.94, according to Bloomberg data. The after-tax cost of debt assumed to be
3.1%, subject to tax rate of 16% and debt-to-equity ratio of 30%. We assume a
terminal growth rate of 3% after 2027.
The NAV price is expected to be HK$48.4 per share, equivalent to 40% discount to
current share price, we would set 30% discount to its NAV as our target price after
take into consideration of market volatilities and trade war uncertainties, which
equivalent to HK$33.6 per share. This implies 15.3x 2018E P/E , 2.5x 2018E P/B and
3.0% 2018E dividend yield.
Figure 33: Key DCF assumptions
Figure 34: DCF forecasts
RMB $mn 2018E 2019E 2020E 2021E 2022E 2023E 2024E 2025E 2026E 2027E Pre-tax profit 2,706 3,286 4,142 5,078 5,798 6,631 7,632 8,833 10,274 12,031 Taxes paid (433) (526) (663) (813) (928) (1,061) (1,221) (1,413) (1,644) (1,925) Depreciation and amortization 635 769 899 987 1,054 1,115 1,183 1,230 1,269 1,317 Change in working capital (428) (557) (978) (1,007) (809) (955) (1,136) (1,362) (1,644) (1,998) Others 239 (61) (132) (214) (311) (413) (531) (662) (802) (961) Operating cash flow 2,718 2,911 3,269 4,032 4,804 5,316 5,926 6,625 7,454 8,462 CAPEX (2,047) (2,047) (1,547) (1,347) (1,347) (1,547) (1,347) (1,347) (1,547) (1,347) Annual Free Cash Flow (RMBmn) 671 865 1,722 2,685 3,457 3,769 4,579 5,278 5,907 7,116 Annual Free Cash Flow (HK$mn) 766 986 1,964 3,062 3,943 4,299 5,223 6,020 6,737 8,116 Discounted free cash flow(HK$mn) 690 800 1,436 2,017 2,340 2,298 2,516 2,612 2,634 2,858 Source: Company data, Orient Securities (Hong Kong)
Hong Kong Equity | Automobile Company in-depth
See last page for disclaimer. 15
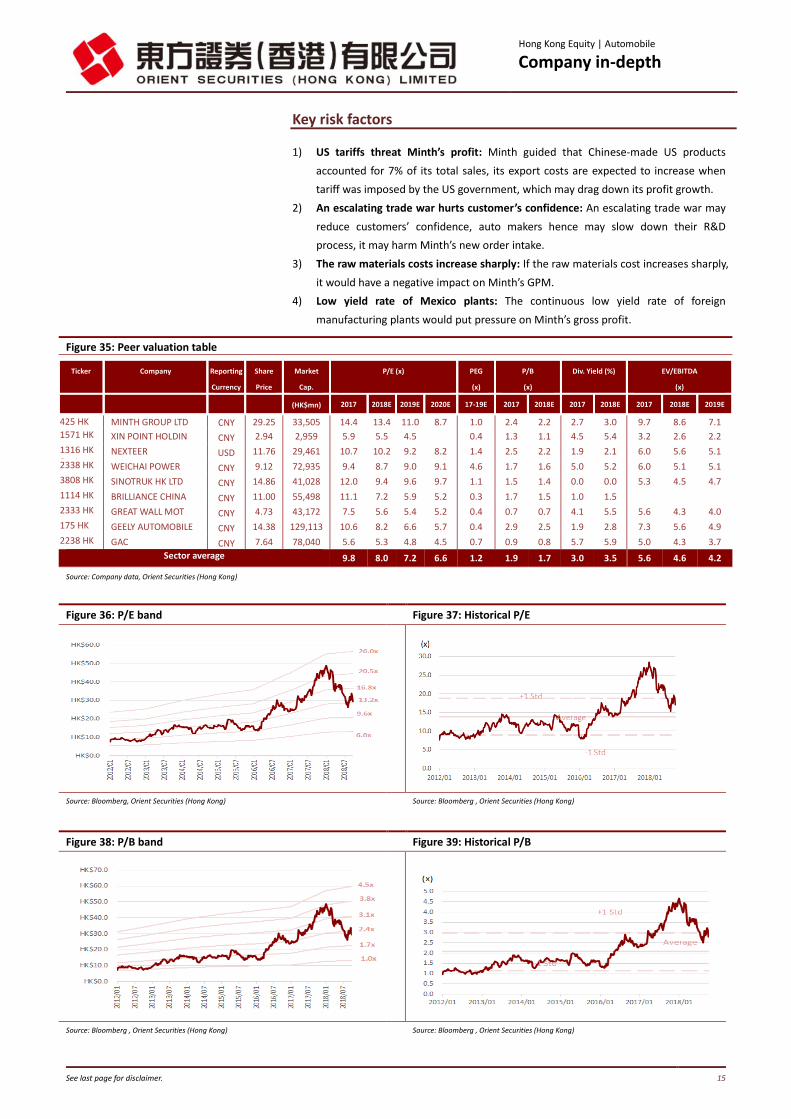
Key risk factors
1) US tariffs threat Minth’s profit: Minth guided that Chinese-made US products
accounted for 7% of its total sales, its export costs are expected to increase when
tariff was imposed by the US government, which may drag down its profit growth.
2) An escalating trade war hurts customer’s confidence: An escalating trade war may
reduce customers’ confidence, auto makers hence may slow down their R&D
process, it may harm Minth’s new order intake.
3) The raw materials costs increase sharply: If the raw materials cost increases sharply,
it would have a negative impact on Minth’s GPM.
4) Low yield rate of Mexico plants: The continuous low yield rate of foreign
manufacturing plants would put pressure on Minth’s gross profit.
Figure 38: P/B band Figure 39: Historical P/B
Source: Bloomberg , Orient Securities (Hong Kong) Source: Bloomberg , Orient Securities (Hong Kong)
Figure 35: Peer valuation table
Ticker Company Reporting
Currency
Share
Price
Market
Cap.
P/E (x)
PEG
(x)
P/B
(x)
Div. Yield (%) EV/EBITDA
(x)
(HK$mn) 2017 2018E 2019E 2020E 17-19E 2017 2018E 2017 2018E 2017 2018E 2019E
425 HK Equity
MINTH GROUP LTD CNY 29.25 33,505 14.4 13.4 11.0 8.7 1.0 2.4 2.2 2.7 3.0 9.7 8.6 7.1
1571 HK Equity
XIN POINT HOLDIN CNY 2.94 2,959 5.9 5.5 4.5 0.4 1.3 1.1 4.5 5.4 3.2 2.6 2.2
1316 HK Equity
NEXTEER USD 11.76 29,461 10.7 10.2 9.2 8.2 1.4 2.5 2.2 1.9 2.1 6.0 5.6 5.1
2338 HK Equity
WEICHAI POWER CNY 9.12 72,935 9.4 8.7 9.0 9.1 4.6 1.7 1.6 5.0 5.2 6.0 5.1 5.1
3808 HK Equity
SINOTRUK HK LTD CNY 14.86 41,028 12.0 9.4 9.6 9.7 1.1 1.5 1.4 0.0 0.0 5.3 4.5 4.7
1114 HK Equity
BRILLIANCE CHINA CNY 11.00 55,498 11.1 7.2 5.9 5.2 0.3 1.7 1.5 1.0 1.5
2333 HK Equity
GREAT WALL MOT CNY 4.73 43,172 7.5 5.6 5.4 5.2 0.4 0.7 0.7 4.1 5.5 5.6 4.3 4.0
175 HK Equity
GEELY AUTOMOBILE CNY 14.38 129,113 10.6 8.2 6.6 5.7 0.4 2.9 2.5 1.9 2.8 7.3 5.6 4.9
2238 HK Equity
GAC CNY 7.64 78,040 5.6 5.3 4.8 4.5 0.7 0.9 0.8 5.7 5.9 5.0 4.3 3.7
Sector average
9.8 8.0 7.2 6.6 1.2 1.9 1.7 3.0 3.5 5.6 4.6 4.2
Source: Company data, Orient Securities (Hong Kong)
HK$
Figure 36: P/E band Figure 37: Historical P/E
Source: Bloomberg, Orient Securities (Hong Kong) Source: Bloomberg , Orient Securities (Hong Kong)
Hong Kong Equity | Automobile Company in-depth
See last page for disclaimer. 16
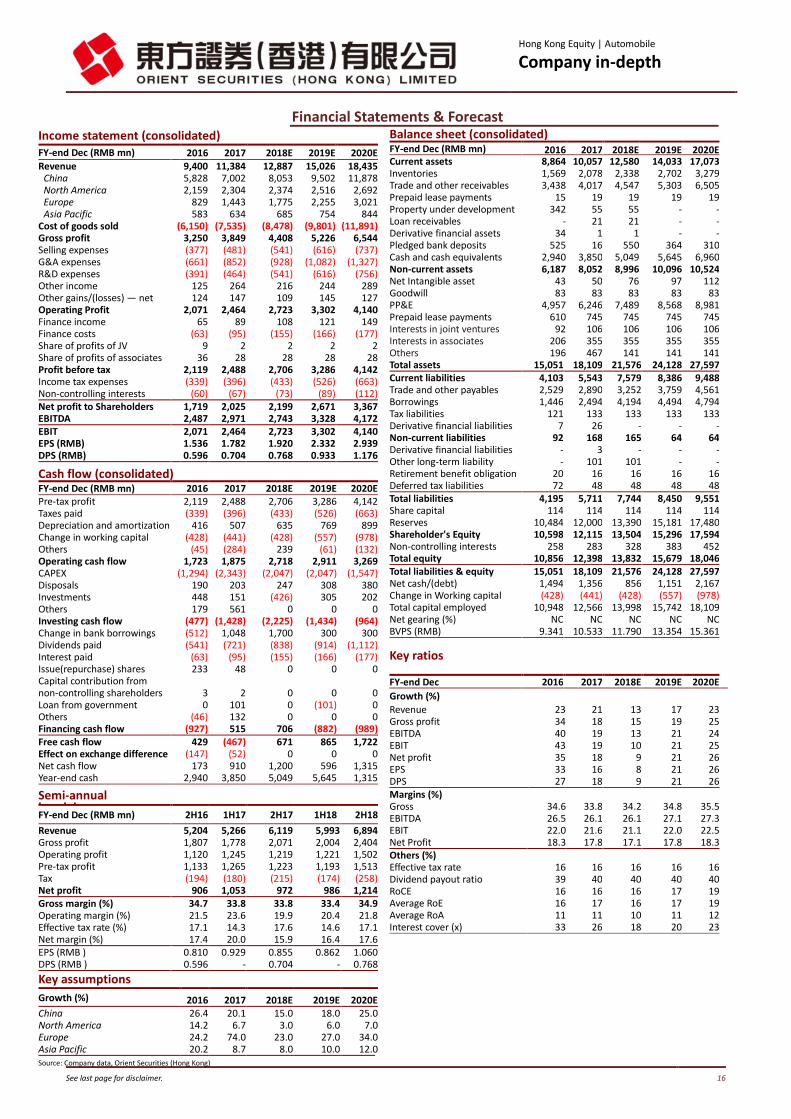
Financial Statements & Forecast Income statement (consolidated)
FY-end Dec (RMB mn) 2016 2017 2018E 2019E 2020E Revenue 9,400 11,384 12,887 15,026 18,435 China 5,828 7,002 8,053 9,502 11,878 North America 2,159 2,304 2,374 2,516 2,692 Europe 829 1,443 1,775 2,255 3,021 Asia Pacific 583 634 685 754 844 Cost of goods sold (6,150) (7,535) (8,478) (9,801) (11,891) Gross profit 3,250 3,849 4,408 5,226 6,544 Selling expenses (377) (481) (541) (616) (737) G&A expenses (661) (852) (928) (1,082) (1,327) R&D expenses (391) (464) (541) (616) (756) Other income 125 264 216 244 289 Other gains/(losses) — net 124 147 109 145 127 Operating Profit 2,071 2,464 2,723 3,302 4,140 Finance income 65 89 108 121 149 Finance costs (63) (95) (155) (166) (177) Share of profits of JV 9 2 2 2 2 Share of profits of associates 36 28 28 28 28 Profit before tax 2,119 2,488 2,706 3,286 4,142 Income tax expenses (339) (396) (433) (526) (663) Non-controlling interests (60) (67) (73) (89) (112) Net profit to Shareholders 1,719 2,025 2,199 2,671 3,367 EBITDA 2,487 2,971 2,743 3,328 4,172 EBIT 2,071 2,464 2,723 3,302 4,140 EPS (RMB) 1.536 1.782 1.920 2.332 2.939 DPS (RMB) 0.596 0.704 0.768 0.933 1.176 Cash flow (consolidated)
FY-end Dec (RMB mn) 2016 2017 2018E 2019E 2020E Pre-tax profit 2,119 2,488 2,706 3,286 4,142 Taxes paid (339) (396) (433) (526) (663) Depreciation and amortization 416 507 635 769 899 Change in working capital (428) (441) (428) (557) (978) Others (45) (284) 239 (61) (132) Operating cash flow 1,723 1,875 2,718 2,911 3,269 CAPEX (1,294) (2,343) (2,047) (2,047) (1,547) Disposals 190 203 247 308 380 Investments 448 151 (426) 305 202 Others 179 561 0 0 0 Investing cash flow (477) (1,428) (2,225) (1,434) (964) Change in bank borrowings (512) 1,048 1,700 300 300 Dividends paid (541) (721) (838) (914) (1,112) Interest paid (63) (95) (155) (166) (177) Issue(repurchase) shares 233 48 0 0 0 Capital contribution from non-controlling shareholders 3 2 0 0 0 Loan from government 0 101 0 (101) 0 Others (46) 132 0 0 0 Financing cash flow (927) 515 706 (882) (989) Free cash flow 429 (467) 671 865 1,722 Effect on exchange difference (147) (52) 0 0 0 Net cash flow 173 910 1,200 596 1,315 Year-end cash 2,940 3,850 5,049 5,645 1,315 Semi-annual breakdown
FY-end Dec (RMB mn) 2H16 1H17 2H17 1H18 2H18
Revenue 5,204 5,266 6,119 5,993 6,894 Gross profit 1,807 1,778 2,071 2,004 2,404 Operating profit 1,120 1,245 1,219 1,221 1,502 Pre-tax profit 1,133 1,265 1,223 1,193 1,513 Tax (194) (180) (215) (174) (258) Net profit 906 1,053 972 986 1,214 Gross margin (%) 34.7 33.8 33.8 33.4 34.9 Operating margin (%) 21.5 23.6 19.9 20.4 21.8 Effective tax rate (%) 17.1 14.3 17.6 14.6 17.1 Net margin (%) 17.4 20.0 15.9 16.4 17.6 EPS (RMB ) 0.810 0.929 0.855 0.862 1.060 DPS (RMB ) 0.596 - 0.704 - 0.768 Key assumptions Growth (%) 2016 2017 2018E 2019E 2020E China 26.4 20.1 15.0 18.0 25.0 North America 14.2 6.7 3.0 6.0 7.0 Europe 24.2 74.0 23.0 27.0 34.0 Asia Pacific 20.2 8.7 8.0 10.0 12.0 Source: Company data, Orient Securities (Hong Kong)
Balance sheet (consolidated)
FY-end Dec (RMB mn) 2016 2017 2018E 2019E 2020E Current assets 8,864 10,057 12,580 14,033 17,073 Inventories 1,569 2,078 2,338 2,702 3,279 Trade and other receivables 3,438 4,017 4,547 5,303 6,505 Prepaid lease payments 15 19 19 19 19 Property under development 342 55 55 - - Loan receivables - 21 21 - - Derivative financial assets 34 1 1 - - Pledged bank deposits 525 16 550 364 310 Cash and cash equivalents 2,940 3,850 5,049 5,645 6,960 Non-current assets 6,187 8,052 8,996 10,096 10,524 Net Intangible asset 43 50 76 97 112 Goodwill 83 83 83 83 83 PP&E 4,957 6,246 7,489 8,568 8,981 Prepaid lease payments 610 745 745 745 745 Interests in joint ventures 92 106 106 106 106 Interests in associates 206 355 355 355 355 Others 196 467 141 141 141 Total assets 15,051 18,109 21,576 24,128 27,597 Current liabilities 4,103 5,543 7,579 8,386 9,488 Trade and other payables 2,529 2,890 3,252 3,759 4,561 Borrowings 1,446 2,494 4,194 4,494 4,794 Tax liabilities 121 133 133 133 133 Derivative financial liabilities 7 26 - - - Non-current liabilities 92 168 165 64 64 Derivative financial liabilities - 3 - - - Other long-term liability - 101 101 - - Retirement benefit obligation 20 16 16 16 16 Deferred tax liabilities 72 48 48 48 48 Total liabilities 4,195 5,711 7,744 8,450 9,551 Share capital 114 114 114 114 114 Reserves 10,484 12,000 13,390 15,181 17,480 Shareholder's Equity 10,598 12,115 13,504 15,296 17,594 Non-controlling interests 258 283 328 383 452 Total equity 10,856 12,398 13,832 15,679 18,046 Total liabilities & equity 15,051 18,109 21,576 24,128 27,597 Net cash/(debt) 1,494 1,356 856 1,151 2,167 Change in Working capital (428) (441) (428) (557) (978) Total capital employed 10,948 12,566 13,998 15,742 18,109 Net gearing (%) NC NC NC NC NC BVPS (RMB) 9.341 10.533 11.790 13.354 15.361 Key ratios
FY-end Dec 2016 2017 2018E 2019E 2020E
Growth (%) Revenue 23 21 13 17 23 Gross profit 34 18 15 19 25 EBITDA 40 19 13 21 24 EBIT 43 19 10 21 25 Net profit 35 18 9 21 26 EPS 33 16 8 21 26 DPS 27 18 9 21 26 Margins (%) Gross 34.6 33.8 34.2 34.8 35.5 EBITDA 26.5 26.1 26.1 27.1 27.3 EBIT 22.0 21.6 21.1 22.0 22.5 Net Profit 18.3 17.8 17.1 17.8 18.3 Others (%) Effective tax rate 16 16 16 16 16 Dividend payout ratio 39 40 40 40 40 RoCE 16 16 16 17 19 Average RoE 16 17 16 17 19 Average RoA 11 11 10 11 12 Interest cover (x) 33 26 18 20 23
Hong Kong Equity | Automobile Company in-depth
17
Analyst Certification
I, Alison Ho(Ho Tsz Ying), being the person primarily responsible for the content of this research report, in whole or in part, hereby certify that:
(1) all of the views expressed in this report accurately reflect my personal view about the subject company(ies) and its (or their) securities;
(2) no part of my compensation was, is, or will be, directly or indirectly, related to the specific recommendations or views expressed in this report, or our Investment Banking Department;
(3) I am not, directly or indirectly, supervised by or reporting to our Investment Banking Department;
(4) the subject company(ies) do(es) not fall into the restriction of the quiet period as defined in paragraph 16.5(g) of SFC Code of Conduct;
(5) I and my associates do not deal in or trade in the stock(s) covered in this report within 30 calendar days prior to the date of issue of the report;
(6) I and my associates do not serve as an officer(s) of the listed company(ies) covered in this report; and
(7) I and my associates have no financial interests in relation to the listed company (ies) covered in this report.
Meanings of Orient Securities Ratings
Buy – Describes stocks that we expect to provide a total return of >10% within a 12-month period.
Accumulate – Describes stocks that we expect to provide a total return of >0% within a 12-month period.
Hold – Describes stocks that we expect to provide a total return of between -20% and +20% within a 12-month period.
Sell – Describes stocks that we expect to provide a total return of <0% within a 12-month period.
Disclosure & Disclaimer
Orient Securities (Hong Kong) Limited does and seeks to do business with the company or companies covered in this report. As a result, investors should be aware that the firm may have a conflict of interest that could affect the objectivity of this report. Investors should consider this report as only a single factor in making their investment decision.
Orient Securities (Hong Kong) Limited and its affiliates, officers, directors, and employees may from time to time have long or short positions in securities, warrants, futures, options, derivatives or other financial instruments referred to in this report.
In no event will Orient Securities (Hong Kong) Limited or any other member of Orient Securities (Hong Kong) Limited be liable or responsible for loss of any kind, whether direct, indirect, consequential or incidental, resulting from the act or omission of any third party occurring in reliance upon the contents of this report.
Any information provided in this research report is for information purpose only and have no regards to the investment objectives, financial situation or risk tolerance level of any specific recipient and does not constitute any solicitation or any offer to buy or sell any securities or any other financial instruments. Before entering into any investment contract, individual should exercise judgment or seek for professional advice when necessary. Orient Securities (Hong Kong) Limited may not execute transactions for individual(s) in the securities/instruments mentioned.
Although the information in this report is obtained or complied from sources that Orient Securities (Hong Kong) Limited believes to be reliable, no representation or warranty, either expressed or implied, is provided in relation to the accuracy, completeness or reliability of the materials contained in this report. All price-related information is indicative only, and value of the investment(s) referred to in this report and the income from them may fluctuate because of changes in foreign exchange rates, market indexes, relevant operational / financial conditions of the company and other factors. Information contained in this report may change at any time and Orient Securities (Hong Kong) Limited gives no undertaking to provide notice of any such change. Past performance is not a guide to future performance, future returns are not guaranteed, and a loss of original capital may occur.
This report is not directed to, or intended for distribution to or use by, any person or entity who is a citizen or resident of or located in any locality, state, country or other jurisdiction where such distribution, publication, availability or use would be contrary to any law, regulation, rule or other registration or licensing requirement.
Investment(s) in securities / financial instructions put through/execute outside Hong Kong are subject to the applicable laws and regulations of the relevant overseas jurisdiction, the entity issuing this research report and the analyst(s) authoring this research report are not subject to all the disclosures and other regulatory requirements in other countries.
This report may not be copied, reproduced, distributed, redistribute or published by any person for any purpose without the prior written consent of Orient Securities (Hong Kong) Limited. All rights are reserved.
![[review/resenha] TOLKIEN, J. R. R. Beowulf: A Translation and Commentary together with Sellic Spell. Londres: HarperCollins, 2014, 425 p.](https://static.fdokumen.com/doc/165x107/631f571bd10f1687490fc0e8/reviewresenha-tolkien-j-r-r-beowulf-a-translation-and-commentary-together.jpg)