Minimal Model of Strategy Switching in the Plus-Maze Navigation Task
12
Minimal model of strategy switching in the plus-maze navigation task Denis Sheynikhovich 1 , Laurent Doll´ e 2 , Ricardo Chavarriaga 3 , Angelo Arleo 1 1 Laboratoire de Neurobiologie des Processus Adaptatifs UPMC-Paris 6 CNRS UMR 7102, 9 quai St. Bernard, 75005 Paris-France 2 Institut des Syst` emes Intelligents et de Robotique UPMC-Paris 6 CNRS UMR 7222, 4 place Jussieu, 75252 Paris cedex 05-France 3 CNBI-EPFL, CH-1015 Lausanne, Switzerland Abstract. Prefrontal cortex (PFC) has been implicated in the ability to switch behavioral strategies in response to changes in reward contin- gencies. A recent experimental study has shown that separate subpop- ulations of neurons in the prefrontal cortex were activated when rats switched between allocentric place strategies and egocentric response strategies in the plus maze. In this paper we propose a simple neural- network model of strategy switching, in which the learning of the two strategies as well as learning to select between those strategies is gov- erned by the same temporal-difference (TD) learning algorithm. We show that the model reproduces the experimental data on both behavioral and neural levels. On the basis of our results we derive testable prediction concerning a spatial dynamics of the phasic dopamine signal in the PFC, which is thought to encode reward-prediction error in the TD-learning theory. 1 Introduction The ability to switch between different navigational strategies for reaching the goal is crucial for adaptive spatial behavior. Large body of animal studies sug- gest a large variety of navigational strategies, which depend on sensory input of different modalities [1]. Existing lines of experimental research focus on (i) how the different strategies are implemented in the brain and what memory systems support them [2–5]; and (ii) what is the mechanism of selection between different strategies and corresponding memory systems during ongoing behavior [6–8]. In particular, a series of animal studies in the plus maze (Fig. 1A) provided an insight into the role of hippocampus (HPC), dorsolateral striatum (DLS) and prefrontal cortex (PFC) in learning the tasks in which changing reward contin- gency forced the animals to use either a place strategy or a response strategy. In the plus maze, the place strategies can be defined as approaching a particular place associated with reward, e.g. the end of the East arm in the case of strategy ’go East’ (Fig. 1C). The response strategies can be defined as making a particu- lar egocentric turn at the center, e.g. ’turn left’ strategy (Fig. 1D). Note that if animals start their trial in the North position, both strategies lead to the same
-
Upload
college-de-france -
Category
Documents
-
view
1 -
download
0
Transcript of Minimal Model of Strategy Switching in the Plus-Maze Navigation Task

Minimal model of strategy switching in the
plus-maze navigation task
Denis Sheynikhovich1, Laurent Dolle2, Ricardo Chavarriaga3, Angelo Arleo1
1Laboratoire de Neurobiologie des Processus Adaptatifs UPMC-Paris 6CNRS UMR 7102, 9 quai St. Bernard, 75005 Paris-France
2 Institut des Systemes Intelligents et de Robotique UPMC-Paris 6CNRS UMR 7222, 4 place Jussieu, 75252 Paris cedex 05-France
3 CNBI-EPFL, CH-1015 Lausanne, Switzerland
Abstract. Prefrontal cortex (PFC) has been implicated in the abilityto switch behavioral strategies in response to changes in reward contin-gencies. A recent experimental study has shown that separate subpop-ulations of neurons in the prefrontal cortex were activated when ratsswitched between allocentric place strategies and egocentric responsestrategies in the plus maze. In this paper we propose a simple neural-network model of strategy switching, in which the learning of the twostrategies as well as learning to select between those strategies is gov-erned by the same temporal-difference (TD) learning algorithm. We showthat the model reproduces the experimental data on both behavioral andneural levels. On the basis of our results we derive testable predictionconcerning a spatial dynamics of the phasic dopamine signal in the PFC,which is thought to encode reward-prediction error in the TD-learningtheory.
1 Introduction
The ability to switch between different navigational strategies for reaching thegoal is crucial for adaptive spatial behavior. Large body of animal studies sug-gest a large variety of navigational strategies, which depend on sensory input ofdifferent modalities [1]. Existing lines of experimental research focus on (i) howthe different strategies are implemented in the brain and what memory systemssupport them [2–5]; and (ii) what is the mechanism of selection between differentstrategies and corresponding memory systems during ongoing behavior [6–8]. Inparticular, a series of animal studies in the plus maze (Fig. 1A) provided aninsight into the role of hippocampus (HPC), dorsolateral striatum (DLS) andprefrontal cortex (PFC) in learning the tasks in which changing reward contin-gency forced the animals to use either a place strategy or a response strategy. Inthe plus maze, the place strategies can be defined as approaching a particularplace associated with reward, e.g. the end of the East arm in the case of strategy’go East’ (Fig. 1C). The response strategies can be defined as making a particu-lar egocentric turn at the center, e.g. ’turn left’ strategy (Fig. 1D). Note that ifanimals start their trial in the North position, both strategies lead to the same

location. In contrast, the two strategies lead to different locations if the startingposition is South, permitting the dissociation between the two strategies.
E. Place ’west’
C. Place ’east’
W E
N
S
B. Response ’right’
D. Response ’left’
A.
Fig. 1. Experimental setup in the plus-maze task [8]. A. Plus maze. B-E. Learningtasks testing response strategies (B,D) and place strategies (C,E). In (B,C) and (D,E)lower paths are consistent, while upper paths are inconsistent.
Experimental studies in the plus maze have shown that rats with inacti-vated HPC were strongly biased towards response strategies, while they werebiased towards place strategies when DLS was inactivated [4, 5]. In other ex-perimental environments a double dissociation between HPC and DLS has beendemonstrated in place-learning and response-learning tasks, respectively [2, 3].Moreover, recent electrophysiological recordings of PFC neurons while rats werenavigating in the plus maze have demonstrated that different neuronal popula-tions were active depending on which strategy is currently in use [8]. When ratshad learned that the correct strategy was a place-based one, a subpopulationof neurons were highly active. When the reward contingency changed so thatthe response-based behavior was the only valid strategy, another subpopulationbecame active, while neurons in the first subpopulation became silent. In addi-tion to being a suitable experimental setup for studying strategy learning andswitching, the plus maze is also attractive from the modeling point of view. Thisis because the analysis of strategy switching and its neural correlates can be per-formed at a well defined location (the cross point) where behavior is crucial forsuccessful performance (in contrast to, e.g., water maze where no such locationcan be identified).
The experimental data reviewed above suggest a two-level hierarchical orga-nization of spatial behavior in the plus maze. On the first level, different neuronalnetworks (located in e.g. HPC or DLS) learn corresponding navigational strate-gies taking a particular sensory modality as an input. On the second level, aneural network (located in the PFC) learns to choose which strategy is moresuccessful and gives the control of the behavior to that strategy [9]. In a simpleway, a behavioral strategy can be considered as a rule that determines which of

the available motor actions should be performed when a particular sensory in-put is observed. Similarly, the strategy switching can be described as the choiceof one of the available strategies, given the sensory input. From a theoreticalpoint of view, these two learning tasks are identical, assuming that availablemotor actions (first level) or available strategies (second level) are encoded bythe activities of neural populations.
Here we were interested to see how far we can go in explaining the behavioraland neural data by suggesting the learning algorithm is identical on both levels.The learning algorithm we use is a standard temporal-difference (TD) learningrule called Q-learning [10]. At the core of TD-learning algorithms is the mini-mization of a so-called reward-prediction error which is proposed to be coded bythe phasic activity of dopaminergic (DA) neurons in the ventral tegmental area(VTA) [11]. We have analyzed the learning dynamics of the reward-predictionerror in our model and compared the error propagation on the two levels. Our re-sults suggest that a two-level organization of behavioral control with TD-learningon each level is compatible with principal experimental results [4, 8]. In addition,our model generated testable predictions concerning differences in DA signalingbetween HPC and PFC.
2 Model
Our neural network model of navigation consists of three interconnected subnet-works responsible for response strategy, place strategy and strategy selection,respectively (Fig. 2). The response-strategy subnetwork learns egocentric move-ments such as, e.g., turning left, while the place-strategy subnetwork learns toenter a particular arm. The strategy-selection network learns to choose whichstrategy will take control of behavior on each time step. In our model, the threesubnetworks functionally correspond to different neural structures in the ratbrain that are implicated in spatial learning. Namely, the response subnetworkcorresponds to the DLS, the place network corresponds to the HPC, while theselection network corresponds to the PFC.
Each of the three subnetworks has the same simple architecture of a single-layer perceptron in which learning occurs according to a TD learning rule. Theinput layer encodes sensory input to the network, while the output layer rep-resents actions that this network generates. The subnetworks are hierarchicallyorganized in two levels: the two subnetworks of the lower level learn the placeand response strategies, while a single subnetwork of the upper level (strategyselection network) learns to select which of the two subnetworks of the lowerlevel will take control over behavior. The selection is assumed to occur by in-hibiting the motor output of the non-winner strategy. Below we describe theinputs, outputs, and learning in the different subnetworks.
2.1 Place learning
Place strategy was implemented as follows. Input to the network was representedby the activities of Npc place cells with Gaussian spatial receptive fields, centers
motoraction
motoraction
SC PC
Place network
Response Place
Response network(DLS)
Strategy selection network (PFC)
(HPC)
RAC PAC
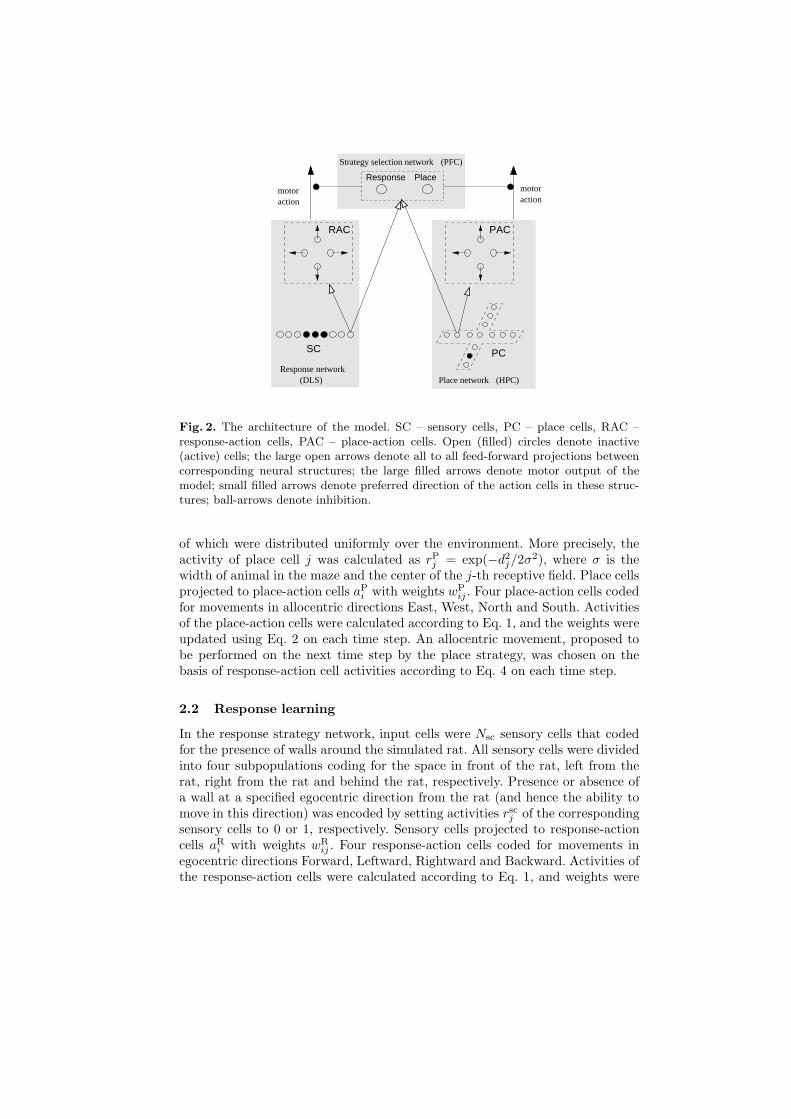
Fig. 2. The architecture of the model. SC – sensory cells, PC – place cells, RAC –response-action cells, PAC – place-action cells. Open (filled) circles denote inactive(active) cells; the large open arrows denote all to all feed-forward projections betweencorresponding neural structures; the large filled arrows denote motor output of themodel; small filled arrows denote preferred direction of the action cells in these struc-tures; ball-arrows denote inhibition.
of which were distributed uniformly over the environment. More precisely, theactivity of place cell j was calculated as rP
j = exp(−d2j/2σ2), where σ is the
width of animal in the maze and the center of the j-th receptive field. Place cellsprojected to place-action cells aP
i with weights wPij . Four place-action cells coded
for movements in allocentric directions East, West, North and South. Activitiesof the place-action cells were calculated according to Eq. 1, and the weights wereupdated using Eq. 2 on each time step. An allocentric movement, proposed tobe performed on the next time step by the place strategy, was chosen on thebasis of response-action cell activities according to Eq. 4 on each time step.
2.2 Response learning
In the response strategy network, input cells were Nsc sensory cells that codedfor the presence of walls around the simulated rat. All sensory cells were dividedinto four subpopulations coding for the space in front of the rat, left from therat, right from the rat and behind the rat, respectively. Presence or absence ofa wall at a specified egocentric direction from the rat (and hence the ability tomove in this direction) was encoded by setting activities rsc
j of the correspondingsensory cells to 0 or 1, respectively. Sensory cells projected to response-actioncells aR
i with weights wRij . Four response-action cells coded for movements in
egocentric directions Forward, Leftward, Rightward and Backward. Activities ofthe response-action cells were calculated according to Eq. 1, and weights were

updated using Eq. 2 on each time step. An egocentric movement, proposed to beperformed on the next time step by the place strategy, was chosen on the basisof response-action cell activities according to Eq. 4 on each time step.
2.3 Strategy-selection learning
In the strategy selection network, input was represented by the combined ac-tivities of Npc + Nsc input cells from place and response strategy networks. Anintuition for this particular choice of input is the following: given all availableinformation at the current state, the selection network decides which strategyshould be chosen to take control over behavior. Input cells projected to strategy-selective (action) cells aS
i with weights wSij . Two strategy-selective cells coded
for place and response strategies, respectively. Activities of the strategy-selectivecells were calculated according to Eq. 1, and the weights were updated using Eq. 2on each time step. One of the strategies (the winner strategy) was selected onthe basis of activities of the strategy-selective cells according to Eq. 4 on eachtime step. The next movement actually performed by the simulated rat was theone proposed by the winner strategy.
2.4 Experimental setup and simulation procedure
All simulations were performed in a simulated plus-maze environment (Fig. 1A)with length L between the ends of the opposite arms (in arbitrary units, see allparameter values in Table 1). All results were averaged over 100 simulated rats.The noise in the model comes from (i) pseudo-random choice in starting positionand (ii) stochastic action choice, see Section 2.5 below.
At the start of a trial, each simulated rat was put in one of the startingpositions (either N or S in Fig. 1A) and allowed to reach one of the goal arms(either E or W in Fig. 1A). Starting positions were chosen in a pseudo randomorder, while the goal position on each trial was chosen depending on the rewardcontingency (see Fig. 1B). For example, if the task was ‘response right’ and thestarting position was S, then the goal position was set to be E. If a simulatedrat started from position S (N), the entrance to northern (southern) arm fromthe center was blocked.
The simulated rats were tested in either strategy switches or strategy re-versals. During strategy switches, different simulated rats were first trained ineither place or response task (see Fig. 1B). After 200 trials of training the taskwas changed to the task of the other type (if it was a response task in the firstphase, it changed to a place task for the second phase, and vice versa). Duringstrategy reversals, the first phase of training was the same as during strategyswitches; however, in the second phase the task was of the same type but witha different reward contingency (if it was, e.g., a ‘response left’ task in the firstphase, it changed to ‘response right’ for the second phase).
Upon reaching the goal arm, the rat was given reward Rt = R (see Eq. 3below and Table 1) and a new trial started. All other actions resulted in Rt = 0.
An attempt to backtrack, or reaching the arm opposite to the goal arm resultedin starting a new trial (backtracks were not counted as trials).
2.5 Learning equations
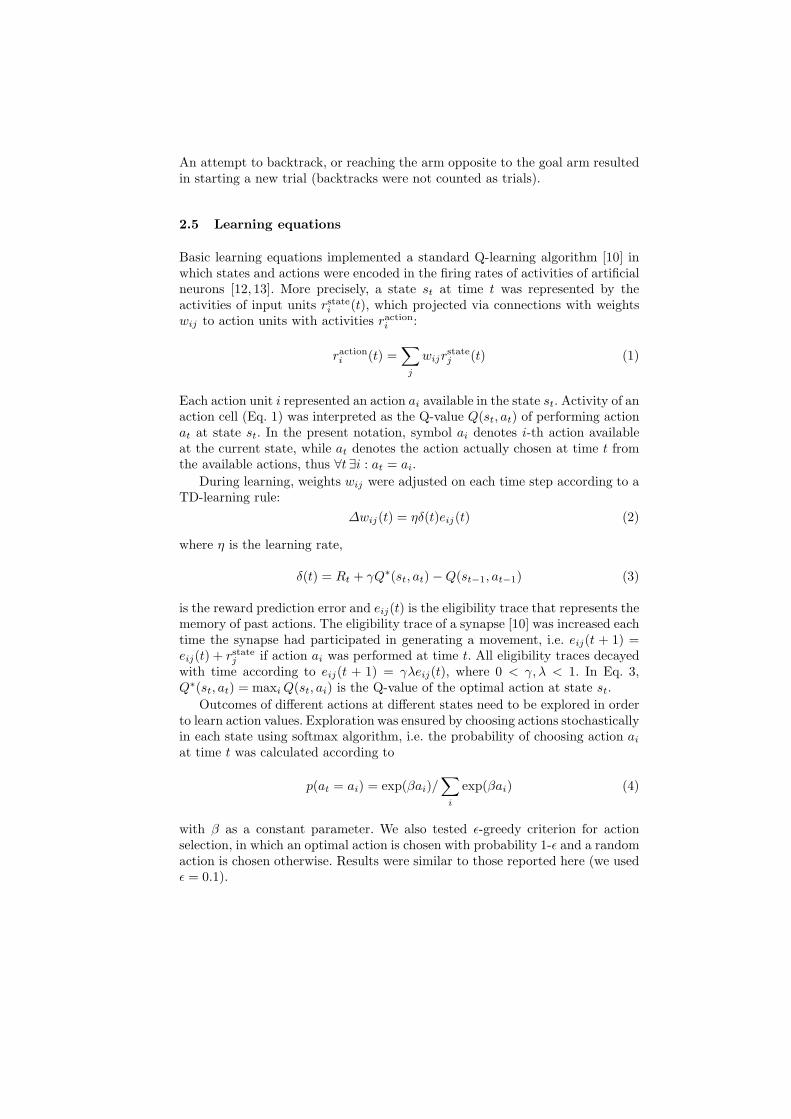
Basic learning equations implemented a standard Q-learning algorithm [10] inwhich states and actions were encoded in the firing rates of activities of artificialneurons [12, 13]. More precisely, a state st at time t was represented by theactivities of input units rstate
i (t), which projected via connections with weightswij to action units with activities raction
i :
ractioni (t) =
∑
j
wijrstatej (t) (1)
Each action unit i represented an action ai available in the state st. Activity of anaction cell (Eq. 1) was interpreted as the Q-value Q(st, at) of performing actionat at state st. In the present notation, symbol ai denotes i-th action availableat the current state, while at denotes the action actually chosen at time t fromthe available actions, thus ∀t ∃i : at = ai.
During learning, weights wij were adjusted on each time step according to aTD-learning rule:
∆wij(t) = ηδ(t)eij(t) (2)
where η is the learning rate,
δ(t) = Rt + γQ∗(st, at) − Q(st−1, at−1) (3)
is the reward prediction error and eij(t) is the eligibility trace that represents thememory of past actions. The eligibility trace of a synapse [10] was increased eachtime the synapse had participated in generating a movement, i.e. eij(t + 1) =eij(t) + rstate
j if action ai was performed at time t. All eligibility traces decayedwith time according to eij(t + 1) = γλeij(t), where 0 < γ, λ < 1. In Eq. 3,Q∗(st, at) = maxi Q(st, ai) is the Q-value of the optimal action at state st.
Outcomes of different actions at different states need to be explored in orderto learn action values. Exploration was ensured by choosing actions stochasticallyin each state using softmax algorithm, i.e. the probability of choosing action ai
at time t was calculated according to
p(at = ai) = exp(βai)/∑
i
exp(βai) (4)
with β as a constant parameter. We also tested ǫ-greedy criterion for actionselection, in which an optimal action is chosen with probability 1-ǫ and a randomaction is chosen otherwise. Results were similar to those reported here (we usedǫ = 0.1).

Maze length L 7.0Size of input populations Npc, Nac 13Q-learning parameters γ, λ 0.9Reward for reaching the goal R 10.0Learning rate η 0.05Softmax parameter β (selection network/strategy networks) 1.0 / 4.0Place field width σ 0.4
Table 1. Model parameters.
3 Results
3.1 Learning switches and reversals
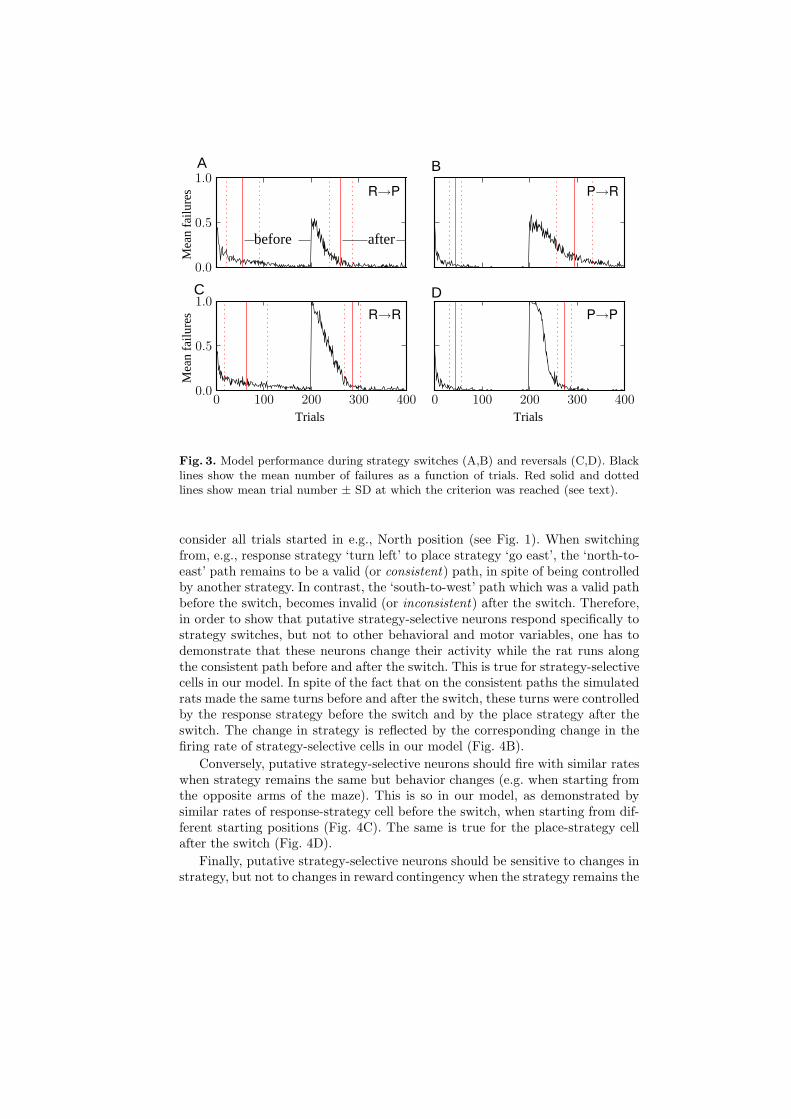
Learning performance was estimated by calculating a mean number of failuresacross training trials, for strategy switches and for reversals (Fig. 3). An outcomeof a trial was defined as a failure if the simulated rat reached the arm oppositeto the goal arm at the end of the trial, and a success when the rewarded arm wasreached. Criterion of 80% of correct trials in the last 40 trials [8] was reachedwithin less than 100 trials for switches and reversals (red solid lines in Fig. 3),similarly to rats. For the purposes of subsequent analysis, we defined a ‘before’phase as the period between the trial in which the criterion was reached forthe first time and the trial where task contingencies changed; an ‘after’ phasecorresponded to the period after the trial when the criterion was reached afterthe contingency change and until the end of training (see Fig. 3A).
3.2 Activity of modeled prefrontal neurons during behavior
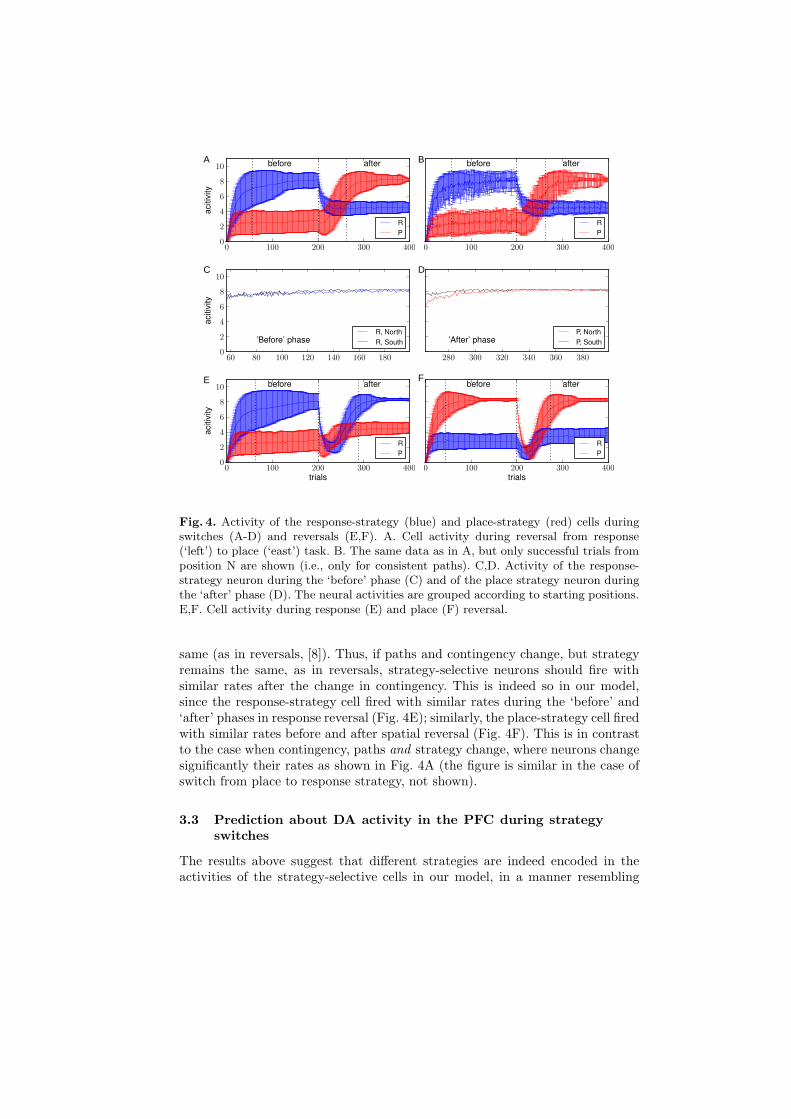
Next, we analyzed the activity of strategy-selective neurons during behavior. Thefocus was on the activity at the choice point of the simulated maze, since only atthis position a difference in the activities is crucial for successful performance.During switches from a response to a place strategy, the response-strategy neu-ron was significantly more active than the place-strategy neuron during ‘before’phase, while the activity pattern reversed during the ‘after’ phase (Fig. 4A).In the model, this is a consequence of the fact that for a reward contingencycorresponding to response strategy, place strategy is able to correctly predictreward only in approximately half of the trials. Conversely, when the contin-gency corresponds to the place strategy, reward predictability of the responsestrategy is only about half of that of the place strategy. The activity of thestrategy selective neurons in our model resembled the persistently changing cellsrecorded by Rich & Shapiro (2009) [8] (≈24% of all cells recorded from PFCduring strategy switches). Persistently changing cells were defined as cells thatfired at significantly different rates during the ‘before’ and ‘after’ phases.
The advantage of the experimental setup used by Rich & Shapiro (2009)is that the selectivity of neural activity to a particular strategy can be disso-ciated from the selectivity to other behavioral variables. To clarify this idea,
A
C D
BM
ean
failu
res
Mea
n fa
ilure
s
Trials Trials
afterbefore
Fig. 3. Model performance during strategy switches (A,B) and reversals (C,D). Blacklines show the mean number of failures as a function of trials. Red solid and dottedlines show mean trial number ± SD at which the criterion was reached (see text).
consider all trials started in e.g., North position (see Fig. 1). When switchingfrom, e.g., response strategy ‘turn left’ to place strategy ‘go east’, the ‘north-to-east’ path remains to be a valid (or consistent) path, in spite of being controlledby another strategy. In contrast, the ‘south-to-west’ path which was a valid pathbefore the switch, becomes invalid (or inconsistent) after the switch. Therefore,in order to show that putative strategy-selective neurons respond specifically tostrategy switches, but not to other behavioral and motor variables, one has todemonstrate that these neurons change their activity while the rat runs alongthe consistent path before and after the switch. This is true for strategy-selectivecells in our model. In spite of the fact that on the consistent paths the simulatedrats made the same turns before and after the switch, these turns were controlledby the response strategy before the switch and by the place strategy after theswitch. The change in strategy is reflected by the corresponding change in thefiring rate of strategy-selective cells in our model (Fig. 4B).
Conversely, putative strategy-selective neurons should fire with similar rateswhen strategy remains the same but behavior changes (e.g. when starting fromthe opposite arms of the maze). This is so in our model, as demonstrated bysimilar rates of response-strategy cell before the switch, when starting from dif-ferent starting positions (Fig. 4C). The same is true for the place-strategy cellafter the switch (Fig. 4D).
Finally, putative strategy-selective neurons should be sensitive to changes instrategy, but not to changes in reward contingency when the strategy remains the
C D
BA
E F
Fig. 4. Activity of the response-strategy (blue) and place-strategy (red) cells duringswitches (A-D) and reversals (E,F). A. Cell activity during reversal from response(‘left’) to place (‘east’) task. B. The same data as in A, but only successful trials fromposition N are shown (i.e., only for consistent paths). C,D. Activity of the response-strategy neuron during the ‘before’ phase (C) and of the place strategy neuron duringthe ‘after’ phase (D). The neural activities are grouped according to starting positions.E,F. Cell activity during response (E) and place (F) reversal.
same (as in reversals, [8]). Thus, if paths and contingency change, but strategyremains the same, as in reversals, strategy-selective neurons should fire withsimilar rates after the change in contingency. This is indeed so in our model,since the response-strategy cell fired with similar rates during the ‘before’ and‘after’ phases in response reversal (Fig. 4E); similarly, the place-strategy cell firedwith similar rates before and after spatial reversal (Fig. 4F). This is in contrastto the case when contingency, paths and strategy change, where neurons changesignificantly their rates as shown in Fig. 4A (the figure is similar in the case ofswitch from place to response strategy, not shown).
3.3 Prediction about DA activity in the PFC during strategy
switches
The results above suggest that different strategies are indeed encoded in theactivities of the strategy-selective cells in our model, in a manner resembling

BA.
Fig. 5. A. Evolution of the distance between peak δ location and the goal across trialsfor place-strategy network (red) and strategy-selection network (black). The distanceis measured by fractions of total distance L of the maze: 0 corresponds to reward site,while 1 corresponds to start position. The starting positions were either N or S inpseudo-random order, the goal warm was fixed (E). B. Evolution of Q-values of theresponse strategy (blue) and place strategy (red) across trials. For this simulation, wedecreased the learning rate to η = 0.001 in order to minimize the influence of noise.The starting position (south) and goal location (north) were constant for all trials.
the strategy encoding by the rat PFC neurons [8]. It is interesting to see whatpredictions can be derived from this simple model. The principal feature of theTD learning algorithm that is used in our model to learn strategies and strat-egy selection is the reliance on the reward-prediction error δ (Eq. 3). It hasbeen hypothesized that activities of dopaminergic neurons in the VTA encodethe reward-prediction error [11]. This hypothesis is supported by experimentaldata from conditioning experiments showing that DA activity is increased im-mediately after reward delivery in the beginning of learning, while after learningthe increase in DA activity occurs upon the presentation of a reward predictingstimulus, i.e. before the reward is received [14]. If this hypothesis is true, thenreward propagation dynamics in our model may suggest how DA activity shouldchange during goal learning in our plus-maze navigation task
In order to describe the reward propagation dynamics, we measured the evo-lution across trials of the mean distance between the location where δ was max-imal and the goal location for the place-strategy network and strategy selectionnetwork during a stable performance session (i.e., 400 trials with pseudo-randomstarting positions and a fixed goal arm). Similarly to what has been observed inthe conditioning experiments [14], the peak of δ propagated from the reward siteto locations closer to the starting position (Fig. 5A). In terms of DA signaling,this corresponds to the shift of a peak in DA activity away from the reward sitewith training. Moreover, in our simulation the peak of δ shifted further fromthe goal in the place strategy network than in the strategy selection network (asshown by the difference between the red and black lines in Fig. 5A). Thus, thegeneral testable prediction derived from our model is that propagation of thepeak DA signal in the prefrontal cortex will be limited by the choice point of themaze.

4 Discussion
We presented a simple model of strategy switching in the plus maze in whichplace and response strategies, as well as selection between those strategies, werelearned using a standard Q-learning TD algorithm. The architecture of the modelcan be directly mapped to the architecture of neuronal networks implicated innavigation. In spite of its simplicity, the model has been able to learn success-fully spatial reversals, response reversals and strategy switches in the simulatedplus maze task. The learning time was comparable to the learning time of realrats in behavioral experiments [8]. Moreover, activities of strategy-selective cellsin the selection model were similar to those of strategy-selective biological neu-rons recorded from the PFC of behaving rats. In addition, a testable predictionconcerning DA signaling in the PFC has been derived from our modeling results.
There are several limitations of the presented model in relation to availableexperimental data concerning the role of prefrontal cortex in behavior. First, it isknown that strategy switches and reversals in the plus maze are mediated by dif-ferent subareas of the prefrontal cortex, medial PFC (mPFC) and orbito-frontal(OFC) cortex, respectively [6, 7]. Moreover, there is experimental evidence sug-gesting hierarchical organization of these two subareas [15]. In our model, bothswitches and reversals are learned within a single network which can be consid-ered as a combined model of mPFC/OFC. We will address the differential rolesof mPFC and OFC in future versions of the model. Second, it has been shownthat when rats were trained to perform multiple strategy switches, lesions tomPFC did not impair switching performance after the third switch. These datasuggest that by the third switch rats acquired a mPFC-independent strategy(possibly depending on reactive or habitual mechanisms) which allowed themto immediately switch strategy when reward was not obtained in the predictedlocation. Our model can not explain these data, since from the point of view ofthe selection network all switches are identical. Finally, our model is only par-tially consistent with the data suggesting that place strategy is preferred early intraining, while this preference shifts towards response strategy with prolongedtraining [4]. In Fig. 5B, we plot the evolution of the Q-values for the responseand place strategies (which are equal to the activities of strategy-selective cellsin the selection network) across trials. The Q-value for the response strategy atthe asymptote of training is higher than that for the place strategy, consistentwith the preference for the response strategy after overtraining. However, thisresult is the consequence of the particular model of the sensory input that wechosen for the response-strategy network and hence is not general enough toprovide a valid explanation for the experimental data. A more detailed model ofsensory input (see, e.g. [13]) may be required to make a stronger claim.
The architecture of the model presented here is similar to a model proposedpreviously [16, 17]. However, the learning algorithm is substantially simplifiedand is identical in the strategy learning networks and in strategy selection net-work, greatly simplifying the analysis of the model. In addition, we provide acomparison between strategy selective neurons in our model with new data fromexperimentally recorded mPFC neurons. Finally, we note that the number of

input cells in the model can be increased without decreasing the model’s per-formance. We used a small number of cells to speed up simulations, but anynumber of input cells can be used.
References
1. Arleo, A., Rondi-Reig, L.: Multimodal sensory integration and concurrent nav-igation strategies for spatial cognition in real and artificial organisms. J IntegrNeurosci 6 (2007) 327–366
2. White, N.M., McDonald, R.J.: Multiple parallel memory systems in the brain ofthe rat. Neurobiol Learn Mem. 77 (2002) 125–184
3. Packard, M.G., Hirsh, R., White, N.M.: Differential effects of fornix and caudatenucleus lesions on two radial maze tasks: evidence for multiple memory systems.J Neurosci 9 (1989) 1465–72
4. Packard, M.G., McGaugh, J.L.: Inactivation of hippocampus or caudate nucleuswith lidocaine differentially affects expression of place and response learning. Neu-robiol Learn Mem. 65 (1996) 65–72
5. Chang, Q., Gold, P.E.: Intra-hippocampal lidocaine injections impair acquisitionof a place task and facilitate acquisition of a response task in rats. Behav BrainRes 144 (2003) 19–24
6. Ragozzino, M.E., Detrick, S., Kesner, R.P.: Involvement of the Prelimbic-Infralimbic areas of the rodent prefrontal cortex in behavioral flexibility for placeand response learning. J Neurosci. 19 (1999) 4585–4594
7. Rich, E.L., Shapiro, M.L.: Prelimbic/infralimbic inactivation impairs memory formultiple task switches, but not flexible selection of familiar tasks. J Neurosci. 27
(2007) 4747–55.8. Rich, E.L., Shapiro, M.: Rat prefrontal cortical neurons selectively code strategy
switches. J Neurosci. 29 (2009) 7208–19.9. Miller, E.K., Cohen, J.D.: An integrative theory of prefrontal cortex function.
Annu. Rev. Neurosci. 24 (2001) 167–20210. Sutton, R., Barto, A.G.: Reinforcement Learning - An Introduction. MIT Press,
Cambridge, MA (1998)11. Schultz, W., Dayan, P., Montague, P.R.: A neural substrate of prediction and
reward. Science. 275 (1997) 1593–159912. Arleo, A., Gerstner, W.: Spatial cognition and neuro-mimetic navigation: A model
of hippocampal place cell activity. Biol Cybern 83 (2000) 287–29913. Sheynikhovich, D., Chavarriaga, R., Strosslin, T., Arleo, A., Gerstner, W.: Is
there a geometric module for spatial orientation? Insights from a rodent navigationmodel. Psychol Rev. 116 (2009) 540–566
14. Schultz, W.: Predictive reward signal of dopamine neurons. J Neurophysiol. 80
(1998) 1–2715. Young, J.J., Shapiro, M.L.: Double dissociation and hierarchical organization of
strategy switches and reversals in the rat PFC. Behav Neurosci. 123 (2009) 1028–1035
16. Chavarriaga, R., Strosslin, T., Sheynikhovich, D., Gerstner, W.: A computationalmodel of parallel navigation systems in rodents. Neuroinformatics 3 (2005) 223–242
17. Dolle, L., Khamassi, M., Girard, B., Guillot, A., Chavarriaga, R.: Analyzing inter-actions between navigation strategies using a computational model of action selec-tion. Volume Lecture Notes in Computer Science: Spatial Cognition VI., Springer(2008) 71–86