Mineralogy and chemistry of Late Pliocene-Early Pleistocene paleosols on Mount Kenya: Weathering...
13
This article appeared in a journal published by Elsevier. The attached copy is furnished to the author for internal non-commercial research and education use, including for instruction at the authors institution and sharing with colleagues. Other uses, including reproduction and distribution, or selling or licensing copies, or posting to personal, institutional or third party websites are prohibited. In most cases authors are permitted to post their version of the article (e.g. in Word or Tex form) to their personal website or institutional repository. Authors requiring further information regarding Elsevier’s archiving and manuscript policies are encouraged to visit: http://www.elsevier.com/authorsrights
Transcript of Mineralogy and chemistry of Late Pliocene-Early Pleistocene paleosols on Mount Kenya: Weathering...
This article appeared in a journal published by Elsevier. The attachedcopy is furnished to the author for internal non-commercial researchand education use, including for instruction at the authors institution
and sharing with colleagues.
Other uses, including reproduction and distribution, or selling orlicensing copies, or posting to personal, institutional or third party
websites are prohibited.
In most cases authors are permitted to post their version of thearticle (e.g. in Word or Tex form) to their personal website orinstitutional repository. Authors requiring further information
regarding Elsevier’s archiving and manuscript policies areencouraged to visit:
http://www.elsevier.com/authorsrights
Author's personal copy
Mineralogy and chemistry of Late Pliocene–Early Pleistocene paleosols on MountKenya: Weathering indices of relative age and paleoenvironmental reconstruction
W.C. Mahaney a,b,⁎, T.S. Hamilton c, R.W. Barendregt d, R.G.V. Hancock e,f, P. Costa g,h
a Quaternary Surveys, 26 Thornhill Ave, Thornhill, Ontario L4J1J4, Canadab Department of Geography, York University, N. York, Ontario M3J 1P3, Canadac Camosun College, Department of Chemistry and Geoscience, Camosun College Lansdowne Campus, 3100 Foul Bay Rd., Victoria, British Columbia V8P 5J2, Canadad University of Lethbridge, Department of Geography, Lethbridge, Alberta T1K 3M4, Canadae Medical Physics and Applied Radiation Sciences, McMaster University, Hamilton, Ontario L8S 4K1, Canada,f Department of Anthropology, McMaster University, Hamilton, Ontario L8S 4K1, Canadag University of Lisbon, Department of Geology, Lisbon, Portugalh Department of Geography, Dundee University, Dundee, Scotland, UK
a b s t r a c ta r t i c l e i n f o
Article history:Received 20 February 2013Received in revised form 4 August 2013Accepted 6 August 2013Available online 20 August 2013
Keywords:Fe/Al extractsTropical mountain glaciationLate Pliocene/Early-mid Quaternary paleosolsEarly-mid Quaternary paleoclimate
Iron and Al extracts as weathering indices in paleosols have been used in many localities to determine relativeage, transformation of total chemical element concentrations to secondary forms, translocation of organically-complexed Al and long-standing inundation of soils with groundwater. On Mt. Kenya, a succession of paleosolsstraddling the Olduvai subchron are here analyzed to determine the degree to which Fe/Al extracts assistpaleoenvironmental reconstruction, especially relative age determination, genesis and translocation of alterationproducts and the effect of paleoclimatic deterioration with the advent of glaciation ca. 2.0 Ma, and possiblybefore. Warmer/humid climate from the onset of the Plio-Pleistocene to the Olduvai subchron, thereafterreverting to a long episode of oscillating drier/wetter ice age perturbations is written into the profile morphol-ogies, mineralogies and chemistries supporting earlier stratigraphic interpretations.
© 2013 Elsevier B.V. All rights reserved.
1. Introduction
Iron and Al extracts have been used in a number of different latitudebelts, on a range of lithologies from equator to pole to reconstructpedogenic trends related to time and climate (Blume and Schwertmann,1969; Alexander, 1974; Parfitt and Childs, 1988; Mahaney et al., 1991,1999; Pai et al., 2004; Mahaney et al., 2006; Schülli-Maurer et al., 2007;Mahaney et al., 2009, 2010, 2012). Over the last four decades, threeextracts of Fe andAl includingNa-pyrophosphate (Fep/Alp), acid ammo-nium oxalate (Feo/Alo) and Na-dithionite (Fed/Ald), each have beentaken from stratigraphically important suites of soils/paleosols to deter-mine relative age, translocation of organic carbon, reduction in lattice Fewith weathering and relative increases in secondary hematite plusgoethite. Originally it was thought that Fep approximated organically-complexed Fe (McKeague and Day, 1966), a relationship later shownto be in error (Parfitt and Childs, 1988). Na-pyrophosphate extracts ofAl (Alp), long considered an approximation of organically-complexedAl, have been shown (Parfitt and Childs, 1988; Mahaney et al., 2009)to be an accurate proxy for organic carbon translocation in a variety of
different environments. Acid ammonium oxalate extracts of both Feoand Alo, originally considered to represent amorphous forms of bothelements, are now known to approximate the concentration offerrihydrite (5Fe2O3∙9H2O) in paleosols (Parfitt and Childs, 1988).Walker (1983) asserted that soils with high magnetite concentrationsare prone to erroneously elevated values of Feo due to oxalate–magnetiteinteractions; however, as discussed later, samples here with highconcentrations of magnetite, do not show anomalous values. The Aloconcentration represents a mass of secondary Al products (Mahaneyand Fahey, 1988; Birkeland et al., 1989; Mahaney et al., 2009), whichwhen compared with Alp (Alo − Alp) yields an approximation ofallophane and imogolite (Parfitt and Childs, 1988). Sodium dithioniteextracts of Fed represent the sum total of secondary Fe – namely,hematite + goethite + ferrihydrite – and for Ald, a partial extract ofsecondary crystalline Al. Concentrations of Ald continue to be reportedalthough their importance in stratigraphic work is uncertain and theseextract values should be used with caution (Birkeland et al., 1989).
Given the uncertainty and adjustments that have been made withthe use of Fe and Al extracts, the work of Parfitt and Childs (1988)established a firm footing for several extracts of both elements. Where-as, Fep is of uncertain use, Feo and Fed concentrations yield approximatevalues for ferrihydrite (secondary hydroxide) and Fed, the sum total ofextractable crystalline Fe, respectively. Because Fed has been known tomeasure concentrations of secondary Fe since the seminal work ofMehra and Jackson (1960), many workers have concentrated on using
Geomorphology 204 (2014) 217–228
⁎ Corresponding author at: Department of Geography, York University, N. York, Ontario,Canada, M3J 1P3.
E-mail addresses: [email protected] (W.C. Mahaney), [email protected](T.S. Hamilton), [email protected] (R.W. Barendregt), [email protected](R.G.V. Hancock), [email protected] (P. Costa).
0169-555X/$ – see front matter © 2013 Elsevier B.V. All rights reserved.http://dx.doi.org/10.1016/j.geomorph.2013.08.006
Contents lists available at ScienceDirect
Geomorphology
j ourna l homepage: www.e lsev ie r .com/ locate /geomorph
Author's personal copy
it to measure concentrations of secondary hematite, goethite andferrihydrite in soils and paleosols. Despite the partial solubility offerrihydrite, the ratio Feo/Fed is often used to approximate the build-upof ferrihydrite against ferrihydrite + goethite + hematite over time.Since Feo has an affinity for water-saturated conditions, correspondingincreases of Feo in a section probably indicate phreatic conditions or aperched water table (Mahaney and Fahey, 1988) at some time in thepast rather than reaction with magnetite. Given the variable but lowconcentrations of magnetite reported here, the Feo trends should betreated with caution as values may likely be overestimates of Feo insome horizons. However, to test the possibility of Feo reacting withmagnetite we ranked Feo against Fet (Feo/Fet) in three sections havinga magnetite increase downward to determine if Feo increased withdepth. Despite a gradual increase of magnetite with depth, the ratioFeo/Fet does not show corresponding or anomalous behavior.
When coupledwith total Fe (Fet) it is possible to calculate the relativeage of soil formation using the function Fed/Fet (Mahaney et al., 1999,2010) which measures the slow release of goethite + hematite +ferrihydrite with time. Similarly the arithmetic function Fed − Feo, nor-mally used to calculate the approximate concentration of goethite plushematite minus ferrihydrite, can be used with certainty in this instance.Lattice Fe (Fet − Fed), which diminishes with age, should be inverselyrelated over time barring redox fluctuations caused by a drop in thewater table.
Within the Al extract group, the concentration Alp acts as a proxy fororganic carbon and the ratio Alp/Alt may be used to test movementwithin a section or profile. Thus, increases in Alp down-profile areapproximated with translocation of organic carbon, which remainsone of the principal tests of a spodic horizon in Spodosols (Podzols)(Soil Classification Working Group, 1998; NRCS, 2004).
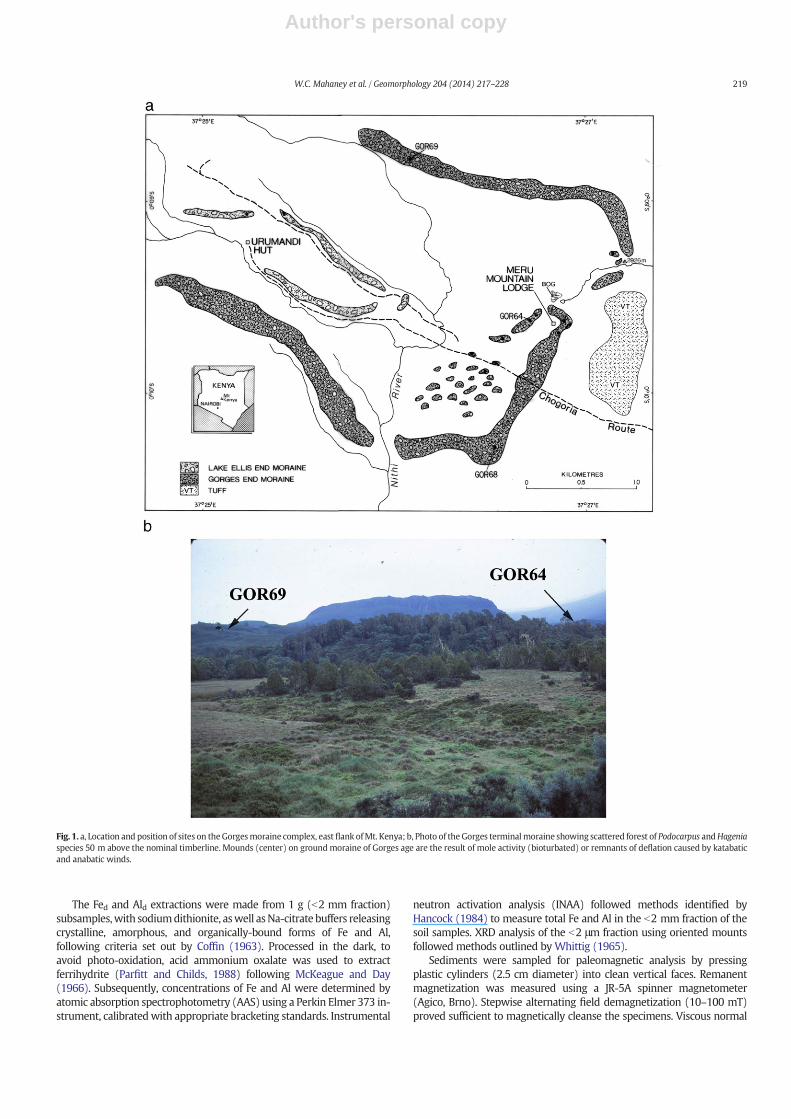
Extracts of Fe and Al are used here, along with other mineral andchemical data, as age and paleoenvironmental indicators for theweathering of sediments in the oldest EarlyQuaternarymoraine complexon Mount Kenya (Fig. 1a location; Fig. 1b topography). These residualchemical parameters also establish relativeweathering indices betweenburied and relict paleosols and test organically-complexed Al as a proxyindicator of movement of organic carbon from surface epipedons forboth relict (exposed) and buried profiles into subsurface horizons.Since the arithmetic function Alo − Alp is considered a proxy for totalallophane and imogolite (Parfitt and Childs, 1988), these two commonpoorly crystalline clay mineral concentrations were monitored downsection at the three sites. Because both allophane and imogolite havebeen shown to undergo high rates of release in tephra-rich sediment(Hiradate et al., 2010), the trend of these common aluminosilicateweathering products from the top (low tephra) to bottom (higher teph-ra) in the three sections analyzed here, was established to test inferredallophane/imogolite distributions.
Furthermore, given the local stratigraphy and chronology establishedby Mahaney et al. (2013a), a test of climate and time factors onweathering and their influence on soil/paleosol morphogenesis isattempted.
2. Regional geology
Mount Kenya, part of the Central Plateau of East Africa, is a volcaniccenter with an intense and complex tectonic history since its inceptionduring the EarlyMiocene (Baker, 1967; Schluter, 1997). The Eastern Riftvalley of Neogene age follows an older Cretaceous rift lineament, withlavas issuing from fractures producing major mountains such as theAberdares and Mount Kenya with the summit for the latter just over5100 m asl.
The Mount Kenya massif is a volcanic succession with a thicknessof ~6200 m overlying the African basement series (Baker, 1967;Vernacombe, 1983; Ries et al., 1992). Outpourings of Late Miocene toPliocene mafic volcanics, sourced from the mantle (Rogers, 2006;Dawson, 2008),were accompanied by eruption of tuffs and agglomerate
in the early phase of mountain building. The mountain entered a majorconstructive phase bymid-Pliocene time, undergoing a final eruption ofthemain vent at ~2.71 Ma (Veldkamp et al., 2007), the later event coin-ciding with net updoming of the Eastern Rift Valley. Mount Kenya musthave been close to its present elevation or higher to allow glaciation tostart by ~2.0 Ma or before (Mahaney, 1990). Estimates of erosion of thesummit area of the mountain vary from N2000 m (Gregory, 1921) tob1000 m (Mahaney, 1990) but the present valley floors were wellincised by the time of the Olduvai Event (~2 Ma). The mountain hasbeen stable since Late Pliocene timewithminor faulting showing offsetsof only tens of meters (Mahaney et al., 2011).
The history of glaciation on Mt. Kenya is extensive. The oldest glaci-ations named, from oldest to youngest, Pre-Gorges, Gorges and LakeEllis [Fig. 2 (Mahaney, 1990; Mahaney et al., 2013a)], are known onlyfrommoraines on the eastern (Gorges Valley, Fig. 1a, b) and southeast-ern flanks of themountain and are important in the context of this studybecause they represent the early stage of glacial growth on one of thehighest tropical mountains on Earth. Herein, normally magnetizedglacigenic sediments and bedrock with reversed overprints are, inturn, overlain with either reversed or normal beds/horizons consideredto represent the Olduvai subchron with Late Matuyama overprints. Theinherent test here involves a correlation of paleomagnetic data(Mahaney et al., 2013a) against characteristics of the paleosol profileand chemical signatures of Fe/Al extracts as indices of weathering andtranslocation.
Is the long punctuated weathering history of these multistorypedostratigraphic complexes coevalwith the paleomagnetic chronology?Are loess-stripping/deflation episodes (Barendregt and Mahaney, 1988;Mahaney et al., 1997) as described in other similar-age profiles fromthis region recognizable in this paleosol sequence or are they different?These are some of the questions that prompted the analyses describedbelow.
3. Materials and methods
On Mt. Kenya, sample pits were excavated and cleaned back toexpose fresh sediment in the oldest terminal moraine system in GorgesValley (Fig. 1). Of the 26 sections of Gorges-age moraine examined onthe eastern flank of the mountain, three (GOR64, 68, 69) were selectedin lower Gorges Valley for detailed pedological, petrographical andchemical analyses, as reported here. The soil descriptions used aregenetic and follow guidelines set out by the NRCS (2004, and SoilSurvey Staff, 2010). Some exceptions in horizon nomenclature applyhere insofar as horizon designations follow the Canadian system(i.e. Ah for humus rich A horizons), Cox for oxide-rich C horizons(Birkeland, 1999). The ‘ox’ designation implies a yellow-reddish colorstronger than 10YR 5 or so. The designation ‘m’ refers to cementedmaterial (Schoeneberger et al., 2002; Soil Survey Staff, 2010). Soil colorassessments follow the color chip system of Oyama and Takehara(1970). At least 500 g samples were collected from each horizon ineach section to allow for particle size, clay mineral, and geochemicalanalysis of total Fe and Al. Particle size analysis followed proceduresoutlined by Day (1965). Samples were wet sieved to separate sandsfrom clay plus silt, the sands subsequently dried and weighed out tothe nearest hundredth of a gram. The silt/sand boundary of 63 μmfollows the Wentworth scale; the silt/clay division used is 2 μm (NRCS,2004).
Organic carbon was determined by loss on ignition (LOI) at 400 °Cafter 15 h following procedures outlined by USDA (NRCS, 2004);while total N was measured by Leco CHN Autoanalyzer. Total C andCEC were cross-checked with organic C to ensure no carbonate waspresent. Cation exchange capacity (CEC)was determined by the ammo-nium acetate method of Peech et al. (1947) and Schollenberger andSimon (1945). The pH of the b2 mm fraction was determined by elec-trode on a 1:5 solution (10 gmass:50 ml distilled H2O) and the concen-tration of total salts by conductivity (Bower and Wilcox, 1965).
218 W.C. Mahaney et al. / Geomorphology 204 (2014) 217–228
Author's personal copy
The Fed and Ald extractions were made from 1 g (b2 mm fraction)subsamples,with sodiumdithionite, aswell asNa-citrate buffers releasingcrystalline, amorphous, and organically-bound forms of Fe and Al,following criteria set out by Coffin (1963). Processed in the dark, toavoid photo-oxidation, acid ammonium oxalate was used to extractferrihydrite (Parfitt and Childs, 1988) following McKeague and Day(1966). Subsequently, concentrations of Fe and Al were determined byatomic absorption spectrophotometry (AAS) using a Perkin Elmer 373 in-strument, calibratedwith appropriate bracketing standards. Instrumental
neutron activation analysis (INAA) followed methods identified byHancock (1984) to measure total Fe and Al in the b2 mm fraction of thesoil samples. XRD analysis of the b2 μm fraction using oriented mountsfollowed methods outlined by Whittig (1965).
Sediments were sampled for paleomagnetic analysis by pressingplastic cylinders (2.5 cm diameter) into clean vertical faces. Remanentmagnetization was measured using a JR-5A spinner magnetometer(Agico, Brno). Stepwise alternating field demagnetization (10–100 mT)proved sufficient to magnetically cleanse the specimens. Viscous normal
Fig. 1. a, Location and position of sites on theGorgesmoraine complex, east flank ofMt. Kenya; b, Photo of theGorges terminalmoraine showing scattered forest of Podocarpus andHageniaspecies 50 m above the nominal timberline. Mounds (center) on groundmoraine of Gorges age are the result of mole activity (bioturbated) or remnants of deflation caused by katabaticand anabatic winds.
219W.C. Mahaney et al. / Geomorphology 204 (2014) 217–228
Author's personal copy
overprints were removed by 20 mT demagnetization, followingmethodsoutlined in Nelson et al. (2009) and Duk-Rodkin et al. (2010).
Data were compiled in Excel spreadsheets that were later exportedto Statistica 10.0 for more detailed and precise statistical analyses.After this stage, charts were plotted and correlations attempted.
4. Results
4.1. Stratigraphy
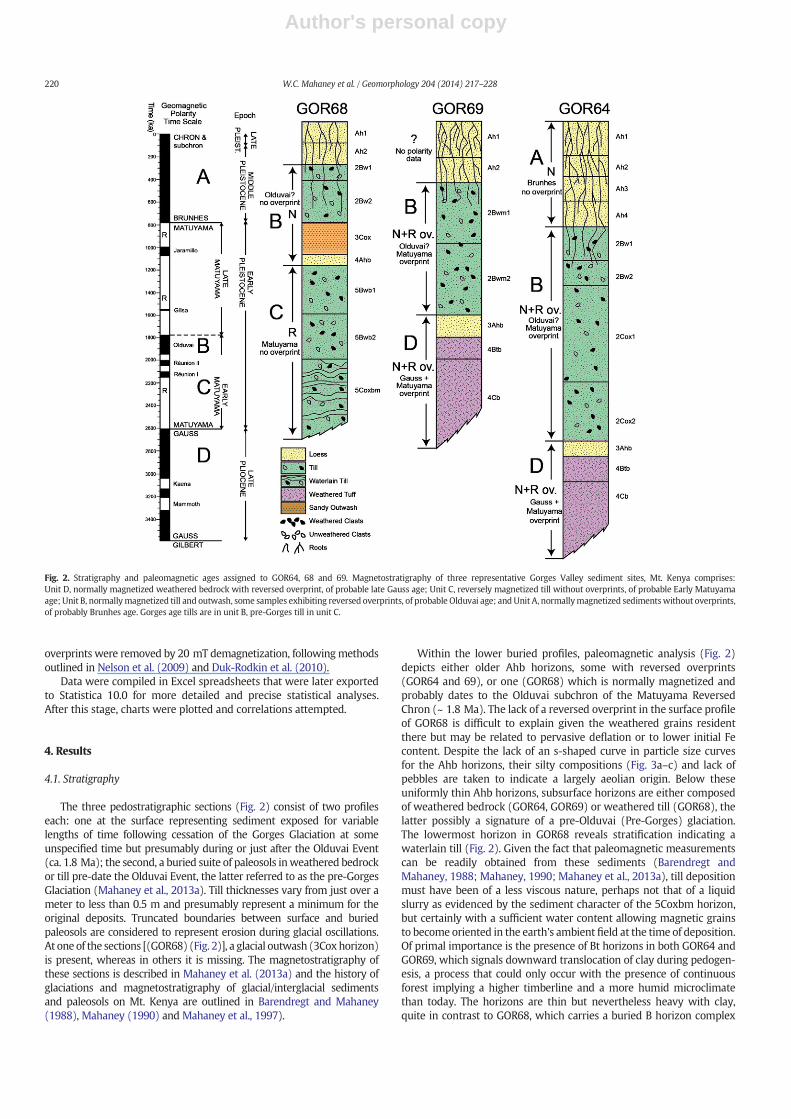
The three pedostratigraphic sections (Fig. 2) consist of two profileseach: one at the surface representing sediment exposed for variablelengths of time following cessation of the Gorges Glaciation at someunspecified time but presumably during or just after the Olduvai Event(ca. 1.8 Ma); the second, a buried suite of paleosols inweathered bedrockor till pre-date the Olduvai Event, the latter referred to as the pre-GorgesGlaciation (Mahaney et al., 2013a). Till thicknesses vary from just over ameter to less than 0.5 m and presumably represent a minimum for theoriginal deposits. Truncated boundaries between surface and buriedpaleosols are considered to represent erosion during glacial oscillations.At one of the sections [(GOR68) (Fig. 2)], a glacial outwash (3Coxhorizon)is present, whereas in others it is missing. The magnetostratigraphy ofthese sections is described in Mahaney et al. (2013a) and the history ofglaciations and magnetostratigraphy of glacial/interglacial sedimentsand paleosols on Mt. Kenya are outlined in Barendregt and Mahaney(1988), Mahaney (1990) and Mahaney et al., 1997).
Within the lower buried profiles, paleomagnetic analysis (Fig. 2)depicts either older Ahb horizons, some with reversed overprints(GOR64 and 69), or one (GOR68) which is normally magnetized andprobably dates to the Olduvai subchron of the Matuyama ReversedChron (~ 1.8 Ma). The lack of a reversed overprint in the surface profileof GOR68 is difficult to explain given the weathered grains residentthere but may be related to pervasive deflation or to lower initial Fecontent. Despite the lack of an s-shaped curve in particle size curvesfor the Ahb horizons, their silty compositions (Fig. 3a–c) and lack ofpebbles are taken to indicate a largely aeolian origin. Below theseuniformly thin Ahb horizons, subsurface horizons are either composedof weathered bedrock (GOR64, GOR69) or weathered till (GOR68), thelatter possibly a signature of a pre-Olduvai (Pre-Gorges) glaciation.The lowermost horizon in GOR68 reveals stratification indicating awaterlain till (Fig. 2). Given the fact that paleomagnetic measurementscan be readily obtained from these sediments (Barendregt andMahaney, 1988; Mahaney, 1990; Mahaney et al., 2013a), till depositionmust have been of a less viscous nature, perhaps not that of a liquidslurry as evidenced by the sediment character of the 5Coxbm horizon,but certainly with a sufficient water content allowing magnetic grainsto become oriented in the earth's ambient field at the time of deposition.Of primal importance is the presence of Bt horizons in both GOR64 andGOR69, which signals downward translocation of clay during pedogen-esis, a process that could only occur with the presence of continuousforest implying a higher timberline and a more humid microclimatethan today. The horizons are thin but nevertheless heavy with clay,quite in contrast to GOR68, which carries a buried B horizon complex
Fig. 2. Stratigraphy and paleomagnetic ages assigned to GOR64, 68 and 69. Magnetostratigraphy of three representative Gorges Valley sediment sites, Mt. Kenya comprises:Unit D, normally magnetized weathered bedrock with reversed overprint, of probable late Gauss age; Unit C, reversely magnetized till without overprints, of probable Early Matuyamaage; Unit B, normallymagnetized till and outwash, some samples exhibiting reversed overprints, of probable Olduvai age; and Unit A, normallymagnetized sedimentswithout overprints,of probably Brunhes age. Gorges age tills are in unit B, pre-Gorges till in unit C.
220 W.C. Mahaney et al. / Geomorphology 204 (2014) 217–228
Author's personal copy
complete with etched and corroded grains but without any evidence ofclay movement.
The relative ages of loesses, paleosols, and tills described here wereestablished by paleomagnetic analysis and are shown to range fromthe early Matuyama (2.6 Ma) for the initial stages of weathering, tothe mid-Matuyama for the initiation of major glaciations on the moun-tain. The Gorges glaciations and associated interglacial deposits range inage from the mid-Matuyama to the early Brunhes Chron (~0.78 Ma).These relative ages can be further tested by examining variations inconcentrations of Fed/Fet, as well as other mineral and chemical trends.
4.2. Profile morphology
The three sections reveal similar stacks of profiles, the surfacepaleosols consisting of admixtures of aeolian-influxed sedimentmarkedby Ah horizons forming surface pedon epipedons. Below, the B and Chorizons are comprised either of till (GOR64 and GOR69), or till and/or outwash (GOR68). Grouped together, the surface profiles representthe bulk of sediment weathered over a period of b2.0 Ma. Below, inthe buried units, similar successions of 3Ahb (GOR64 and GOR69) and4Ahb (GOR68) horizons consist of loess overlying buried B and C
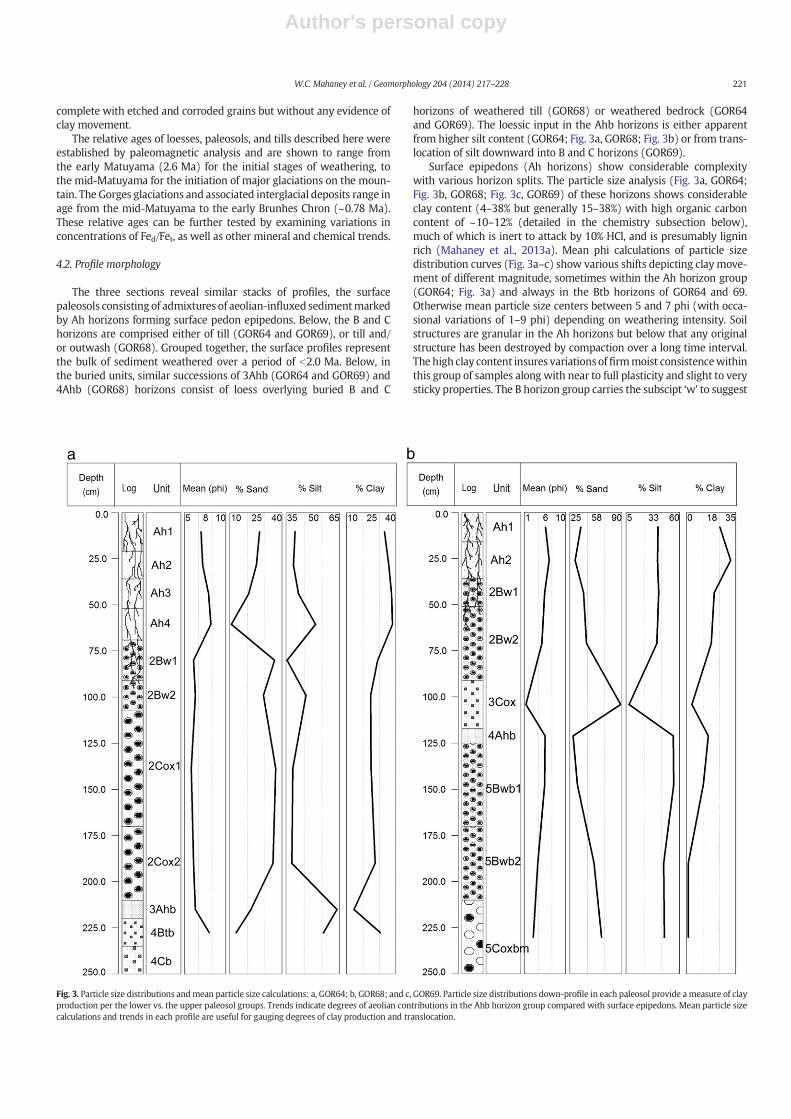
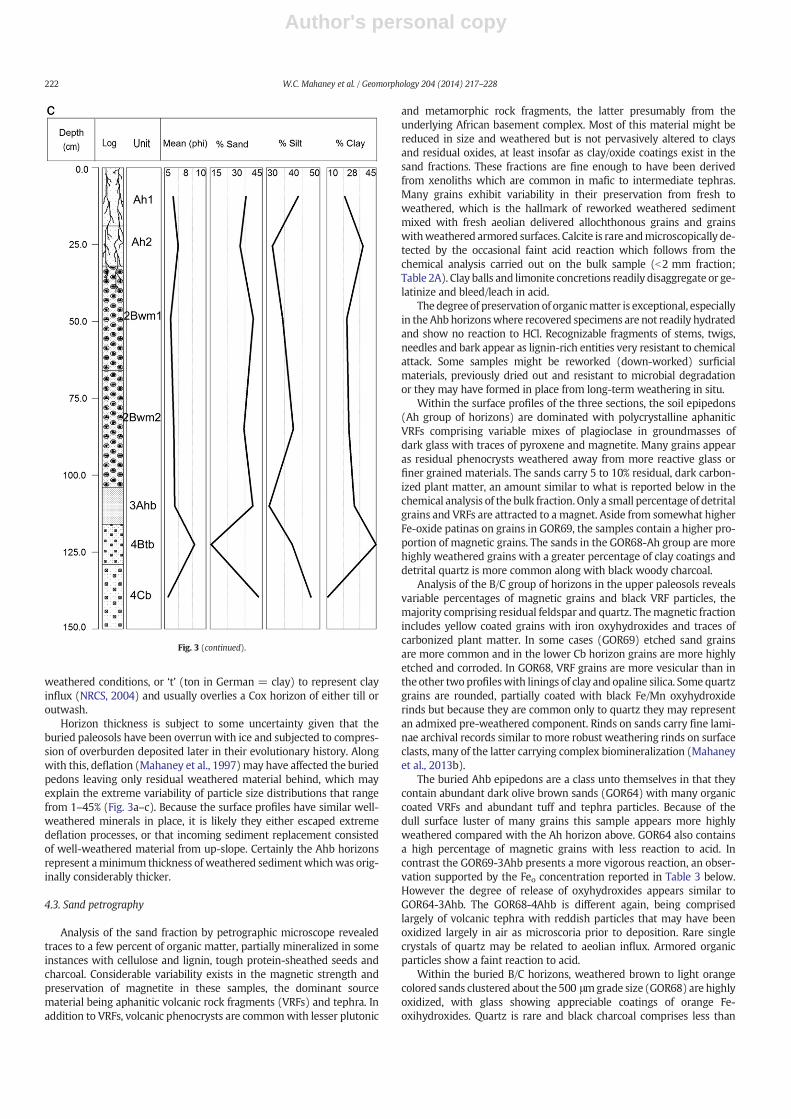
horizons of weathered till (GOR68) or weathered bedrock (GOR64and GOR69). The loessic input in the Ahb horizons is either apparentfrom higher silt content (GOR64; Fig. 3a, GOR68; Fig. 3b) or from trans-location of silt downward into B and C horizons (GOR69).
Surface epipedons (Ah horizons) show considerable complexitywith various horizon splits. The particle size analysis (Fig. 3a, GOR64;Fig. 3b, GOR68; Fig. 3c, GOR69) of these horizons shows considerableclay content (4–38% but generally 15–38%) with high organic carboncontent of ~10–12% (detailed in the chemistry subsection below),much of which is inert to attack by 10% HCl, and is presumably ligninrich (Mahaney et al., 2013a). Mean phi calculations of particle sizedistribution curves (Fig. 3a–c) show various shifts depicting clay move-ment of different magnitude, sometimes within the Ah horizon group(GOR64; Fig. 3a) and always in the Btb horizons of GOR64 and 69.Otherwise mean particle size centers between 5 and 7 phi (with occa-sional variations of 1–9 phi) depending on weathering intensity. Soilstructures are granular in the Ah horizons but below that any originalstructure has been destroyed by compaction over a long time interval.The high clay content insures variations offirmmoist consistencewithinthis group of samples along with near to full plasticity and slight to verysticky properties. The B horizon group carries the subscipt ‘w’ to suggest
Fig. 3. Particle size distributions andmean particle size calculations: a, GOR64; b, GOR68; and c, GOR69. Particle size distributions down-profile in each paleosol provide ameasure of clayproduction per the lower vs. the upper paleosol groups. Trends indicate degrees of aeolian contributions in the Ahb horizon group compared with surface epipedons. Mean particle sizecalculations and trends in each profile are useful for gauging degrees of clay production and translocation.
221W.C. Mahaney et al. / Geomorphology 204 (2014) 217–228
Author's personal copy
weathered conditions, or ‘t’ (ton in German = clay) to represent clayinflux (NRCS, 2004) and usually overlies a Cox horizon of either till oroutwash.
Horizon thickness is subject to some uncertainty given that theburied paleosols have been overrun with ice and subjected to compres-sion of overburden deposited later in their evolutionary history. Alongwith this, deflation (Mahaney et al., 1997)may have affected the buriedpedons leaving only residual weathered material behind, which mayexplain the extreme variability of particle size distributions that rangefrom 1–45% (Fig. 3a–c). Because the surface profiles have similar well-weathered minerals in place, it is likely they either escaped extremedeflation processes, or that incoming sediment replacement consistedof well-weathered material from up-slope. Certainly the Ahb horizonsrepresent aminimum thickness of weathered sedimentwhichwas orig-inally considerably thicker.
4.3. Sand petrography
Analysis of the sand fraction by petrographic microscope revealedtraces to a few percent of organic matter, partially mineralized in someinstances with cellulose and lignin, tough protein-sheathed seeds andcharcoal. Considerable variability exists in the magnetic strength andpreservation of magnetite in these samples, the dominant sourcematerial being aphanitic volcanic rock fragments (VRFs) and tephra. Inaddition to VRFs, volcanic phenocrysts are commonwith lesser plutonic
and metamorphic rock fragments, the latter presumably from theunderlying African basement complex. Most of this material might bereduced in size and weathered but is not pervasively altered to claysand residual oxides, at least insofar as clay/oxide coatings exist in thesand fractions. These fractions are fine enough to have been derivedfrom xenoliths which are common in mafic to intermediate tephras.Many grains exhibit variability in their preservation from fresh toweathered, which is the hallmark of reworked weathered sedimentmixed with fresh aeolian delivered allochthonous grains and grainswithweathered armored surfaces. Calcite is rare andmicroscopically de-tected by the occasional faint acid reaction which follows from thechemical analysis carried out on the bulk sample (b2 mm fraction;Table 2A). Clay balls and limonite concretions readily disaggregate or ge-latinize and bleed/leach in acid.
The degree of preservation of organicmatter is exceptional, especiallyin the Ahb horizonswhere recovered specimens are not readily hydratedand show no reaction to HCl. Recognizable fragments of stems, twigs,needles and bark appear as lignin-rich entities very resistant to chemicalattack. Some samples might be reworked (down-worked) surficialmaterials, previously dried out and resistant to microbial degradationor they may have formed in place from long-term weathering in situ.
Within the surface profiles of the three sections, the soil epipedons(Ah group of horizons) are dominated with polycrystalline aphaniticVRFs comprising variable mixes of plagioclase in groundmasses ofdark glass with traces of pyroxene and magnetite. Many grains appearas residual phenocrysts weathered away from more reactive glass orfiner grained materials. The sands carry 5 to 10% residual, dark carbon-ized plant matter, an amount similar to what is reported below in thechemical analysis of the bulk fraction.Only a small percentage of detritalgrains and VRFs are attracted to a magnet. Aside from somewhat higherFe-oxide patinas on grains in GOR69, the samples contain a higher pro-portion of magnetic grains. The sands in the GOR68-Ah group are morehighly weathered grains with a greater percentage of clay coatings anddetrital quartz is more common along with black woody charcoal.
Analysis of the B/C group of horizons in the upper paleosols revealsvariable percentages of magnetic grains and black VRF particles, themajority comprising residual feldspar and quartz. Themagnetic fractionincludes yellow coated grains with iron oxyhydroxides and traces ofcarbonized plant matter. In some cases (GOR69) etched sand grainsare more common and in the lower Cb horizon grains are more highlyetched and corroded. In GOR68, VRF grains are more vesicular than inthe other twoprofileswith linings of clay and opaline silica. Somequartzgrains are rounded, partially coated with black Fe/Mn oxyhydroxiderinds but because they are common only to quartz they may representan admixed pre-weathered component. Rinds on sands carry fine lami-nae archival records similar to more robust weathering rinds on surfaceclasts, many of the latter carrying complex biomineralization (Mahaneyet al., 2013b).
The buried Ahb epipedons are a class unto themselves in that theycontain abundant dark olive brown sands (GOR64) with many organiccoated VRFs and abundant tuff and tephra particles. Because of thedull surface luster of many grains this sample appears more highlyweathered compared with the Ah horizon above. GOR64 also containsa high percentage of magnetic grains with less reaction to acid. Incontrast the GOR69-3Ahb presents a more vigorous reaction, an obser-vation supported by the Feo concentration reported in Table 3 below.However the degree of release of oxyhydroxides appears similar toGOR64-3Ahb. The GOR68-4Ahb is different again, being comprisedlargely of volcanic tephra with reddish particles that may have beenoxidized largely in air as microscoria prior to deposition. Rare singlecrystals of quartz may be related to aeolian influx. Armored organicparticles show a faint reaction to acid.
Within the buried B/C horizons, weathered brown to light orangecolored sands clustered about the 500 μmgrade size (GOR68) are highlyoxidized, with glass showing appreciable coatings of orange Fe-oxihydroxides. Quartz is rare and black charcoal comprises less than
Fig. 3 (continued).
222 W.C. Mahaney et al. / Geomorphology 204 (2014) 217–228
Author's personal copy
5% of the material. The lower Bwb horizon (5Bwb2) in GOR68 is lessweathered and shows an affinity with the Ahb horizon above whichsuggests the wetting depth may extend to contact with the underlying5Coxbm horizon. Similar coated grains, as in the upper 5Bwb1 horizonin GOR68, appear in GOR64, with a high percentage of magnetic grainswith a faint reaction of acid implying carbonized organic fragments.
4.4. Clay mineralogy
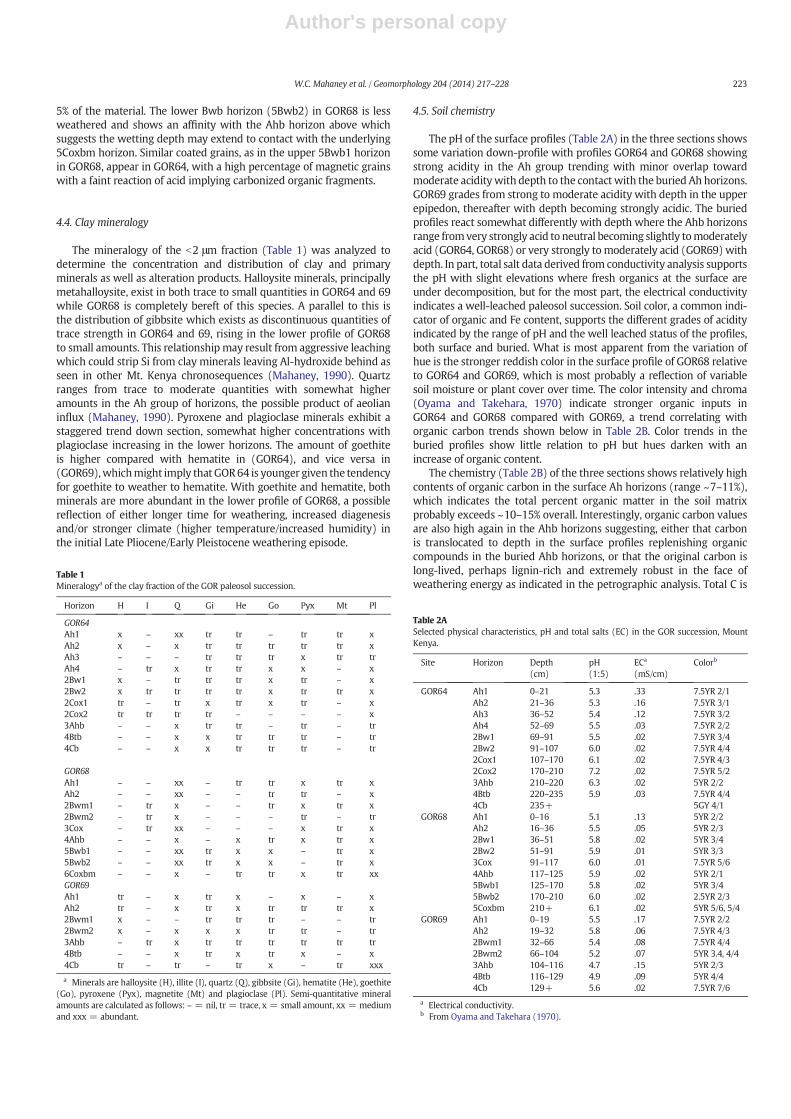
The mineralogy of the b2 μm fraction (Table 1) was analyzed todetermine the concentration and distribution of clay and primaryminerals as well as alteration products. Halloysite minerals, principallymetahalloysite, exist in both trace to small quantities in GOR64 and 69while GOR68 is completely bereft of this species. A parallel to this isthe distribution of gibbsite which exists as discontinuous quantities oftrace strength in GOR64 and 69, rising in the lower profile of GOR68to small amounts. This relationshipmay result from aggressive leachingwhich could strip Si from clay minerals leaving Al-hydroxide behind asseen in other Mt. Kenya chronosequences (Mahaney, 1990). Quartzranges from trace to moderate quantities with somewhat higheramounts in the Ah group of horizons, the possible product of aeolianinflux (Mahaney, 1990). Pyroxene and plagioclase minerals exhibit astaggered trend down section, somewhat higher concentrations withplagioclase increasing in the lower horizons. The amount of goethiteis higher compared with hematite in (GOR64), and vice versa in(GOR69),whichmight imply that GOR64 is younger given the tendencyfor goethite to weather to hematite. With goethite and hematite, bothminerals are more abundant in the lower profile of GOR68, a possiblereflection of either longer time for weathering, increased diagenesisand/or stronger climate (higher temperature/increased humidity) inthe initial Late Pliocene/Early Pleistocene weathering episode.
4.5. Soil chemistry
The pH of the surface profiles (Table 2A) in the three sections showssome variation down-profile with profiles GOR64 and GOR68 showingstrong acidity in the Ah group trending with minor overlap towardmoderate aciditywith depth to the contactwith the buried Ah horizons.GOR69 grades from strong to moderate acidity with depth in the upperepipedon, thereafter with depth becoming strongly acidic. The buriedprofiles react somewhat differently with depth where the Ahb horizonsrange fromvery strongly acid to neutral becoming slightly tomoderatelyacid (GOR64, GOR68) or very strongly to moderately acid (GOR69) withdepth. In part, total salt data derived from conductivity analysis supportsthe pH with slight elevations where fresh organics at the surface areunder decomposition, but for the most part, the electrical conductivityindicates a well-leached paleosol succession. Soil color, a common indi-cator of organic and Fe content, supports the different grades of acidityindicated by the range of pH and the well leached status of the profiles,both surface and buried. What is most apparent from the variation ofhue is the stronger reddish color in the surface profile of GOR68 relativeto GOR64 and GOR69, which is most probably a reflection of variablesoil moisture or plant cover over time. The color intensity and chroma(Oyama and Takehara, 1970) indicate stronger organic inputs inGOR64 and GOR68 compared with GOR69, a trend correlating withorganic carbon trends shown below in Table 2B. Color trends in theburied profiles show little relation to pH but hues darken with anincrease of organic content.
The chemistry (Table 2B) of the three sections shows relatively highcontents of organic carbon in the surface Ah horizons (range ~7–11%),which indicates the total percent organic matter in the soil matrixprobably exceeds ~10–15% overall. Interestingly, organic carbon valuesare also high again in the Ahb horizons suggesting, either that carbonis translocated to depth in the surface profiles replenishing organiccompounds in the buried Ahb horizons, or that the original carbon islong-lived, perhaps lignin-rich and extremely robust in the face ofweathering energy as indicated in the petrographic analysis. Total C is
Table 1Mineralogya of the clay fraction of the GOR paleosol succession.
Horizon H I Q Gi He Go Pyx Mt Pl
GOR64Ah1 x – xx tr tr – tr tr xAh2 x – x tr tr tr tr tr xAh3 – – – tr tr tr x tr trAh4 – tr x tr tr x x – x2Bw1 x – tr tr tr x tr – x2Bw2 x tr tr tr tr x tr tr x2Cox1 tr – tr x tr x tr – x2Cox2 tr tr tr tr – – – – x3Ahb – – x tr tr – tr – tr4Btb – – x x tr tr tr – tr4Cb – – x x tr tr tr – tr
GOR68Ah1 – – xx – tr tr x tr xAh2 – – xx – – tr tr – x2Bwm1 – tr x – – tr x tr x2Bwm2 – tr x – – – tr – tr3Cox – tr xx – – – x tr x4Ahb – – x – x tr x tr x5Bwb1 – – xx tr x x – tr x5Bwb2 – – xx tr x x – tr x6Coxbm – – x – tr tr x tr xxGOR69Ah1 tr – x tr x – x – xAh2 tr – x tr x tr tr tr x2Bwm1 x – – tr tr tr – – tr2Bwm2 x – x x x tr tr – tr3Ahb – tr x tr tr tr tr tr tr4Btb – – x tr x tr x – x4Cb tr – tr – tr x – tr xxx
a Minerals are halloysite (H), illite (I), quartz (Q), gibbsite (Gi), hematite (He), goethite(Go), pyroxene (Pyx), magnetite (Mt) and plagioclase (Pl). Semi-quantitative mineralamounts are calculated as follows: – = nil, tr = trace, x = small amount, xx = mediumand xxx = abundant.
Table 2ASelected physical characteristics, pH and total salts (EC) in the GOR succession, MountKenya.
Site Horizon Depth(cm)
pH(1:5)
ECa
(mS/cm)Colorb
GOR64 Ah1 0–21 5.3 .33 7.5YR 2/1Ah2 21–36 5.3 .16 7.5YR 3/1Ah3 36–52 5.4 .12 7.5YR 3/2Ah4 52–69 5.5 .03 7.5YR 2/22Bw1 69–91 5.5 .02 7.5YR 3/42Bw2 91–107 6.0 .02 7.5YR 4/42Cox1 107–170 6.1 .02 7.5YR 4/32Cox2 170–210 7.2 .02 7.5YR 5/23Ahb 210–220 6.3 .02 5YR 2/24Btb 220–235 5.9 .03 7.5YR 4/44Cb 235+ 5GY 4/1
GOR68 Ah1 0–16 5.1 .13 5YR 2/2Ah2 16–36 5.5 .05 5YR 2/32Bw1 36–51 5.8 .02 5YR 3/42Bw2 51–91 5.9 .01 5YR 3/33Cox 91–117 6.0 .01 7.5YR 5/64Ahb 117–125 5.9 .02 5YR 2/15Bwb1 125–170 5.8 .02 5YR 3/45Bwb2 170–210 6.0 .02 2.5YR 2/35Coxbm 210+ 6.1 .02 5YR 5/6, 5/4
GOR69 Ah1 0–19 5.5 .17 7.5YR 2/2Ah2 19–32 5.8 .06 7.5YR 4/32Bwm1 32–66 5.4 .08 7.5YR 4/42Bwm2 66–104 5.2 .07 5YR 3.4, 4/43Ahb 104–116 4.7 .15 5YR 2/34Btb 116–129 4.9 .09 5YR 4/44Cb 129+ 5.6 .02 7.5YR 7/6
a Electrical conductivity.b From Oyama and Takehara (1970).
223W.C. Mahaney et al. / Geomorphology 204 (2014) 217–228
Author's personal copy
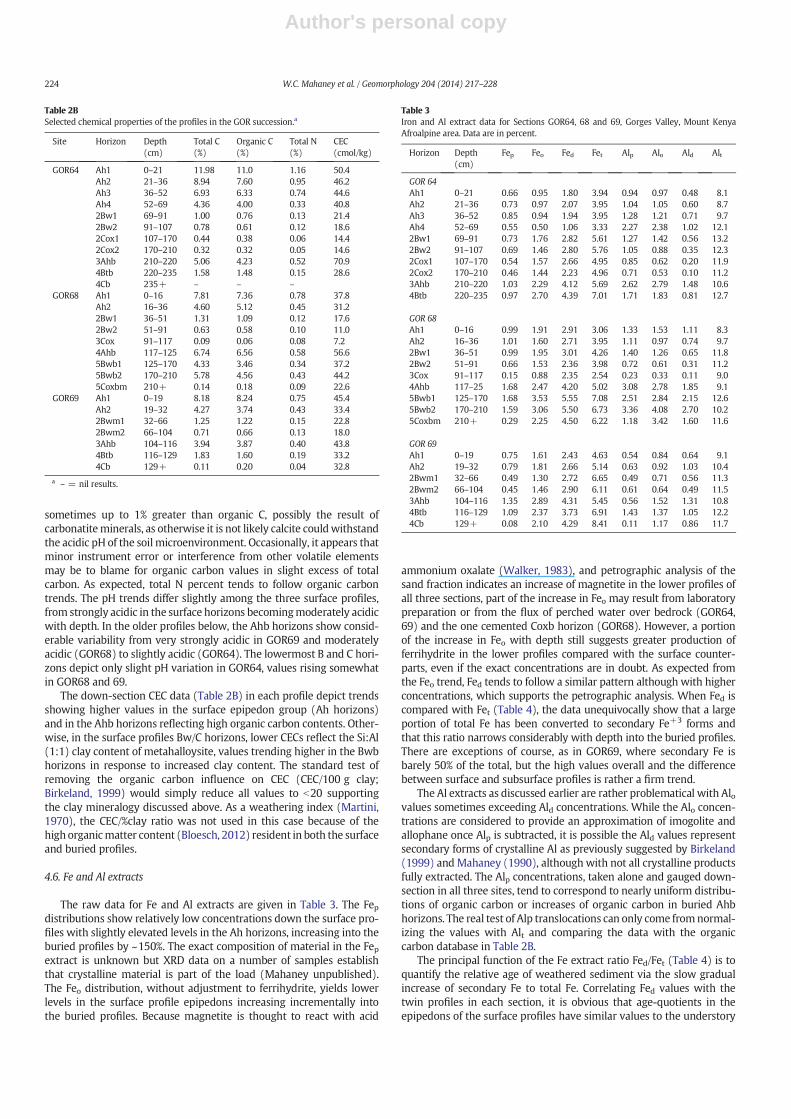
sometimes up to 1% greater than organic C, possibly the result ofcarbonatiteminerals, as otherwise it is not likely calcite couldwithstandthe acidic pH of the soil microenvironment. Occasionally, it appears thatminor instrument error or interference from other volatile elementsmay be to blame for organic carbon values in slight excess of totalcarbon. As expected, total N percent tends to follow organic carbontrends. The pH trends differ slightly among the three surface profiles,from strongly acidic in the surface horizons becomingmoderately acidicwith depth. In the older profiles below, the Ahb horizons show consid-erable variability from very strongly acidic in GOR69 and moderatelyacidic (GOR68) to slightly acidic (GOR64). The lowermost B and C hori-zons depict only slight pH variation in GOR64, values rising somewhatin GOR68 and 69.
The down-section CEC data (Table 2B) in each profile depict trendsshowing higher values in the surface epipedon group (Ah horizons)and in the Ahb horizons reflecting high organic carbon contents. Other-wise, in the surface profiles Bw/C horizons, lower CECs reflect the Si:Al(1:1) clay content of metahalloysite, values trending higher in the Bwbhorizons in response to increased clay content. The standard test ofremoving the organic carbon influence on CEC (CEC/100 g clay;Birkeland, 1999) would simply reduce all values to b20 supportingthe clay mineralogy discussed above. As a weathering index (Martini,1970), the CEC/%clay ratio was not used in this case because of thehigh organicmatter content (Bloesch, 2012) resident in both the surfaceand buried profiles.
4.6. Fe and Al extracts
The raw data for Fe and Al extracts are given in Table 3. The Fepdistributions show relatively low concentrations down the surface pro-files with slightly elevated levels in the Ah horizons, increasing into theburied profiles by ~150%. The exact composition of material in the Fepextract is unknown but XRD data on a number of samples establishthat crystalline material is part of the load (Mahaney unpublished).The Feo distribution, without adjustment to ferrihydrite, yields lowerlevels in the surface profile epipedons increasing incrementally intothe buried profiles. Because magnetite is thought to react with acid
ammonium oxalate (Walker, 1983), and petrographic analysis of thesand fraction indicates an increase of magnetite in the lower profiles ofall three sections, part of the increase in Feo may result from laboratorypreparation or from the flux of perched water over bedrock (GOR64,69) and the one cemented Coxb horizon (GOR68). However, a portionof the increase in Feo with depth still suggests greater production offerrihydrite in the lower profiles compared with the surface counter-parts, even if the exact concentrations are in doubt. As expected fromthe Feo trend, Fed tends to follow a similar pattern although with higherconcentrations, which supports the petrographic analysis. When Fed iscompared with Fet (Table 4), the data unequivocally show that a largeportion of total Fe has been converted to secondary Fe+3 forms andthat this ratio narrows considerably with depth into the buried profiles.There are exceptions of course, as in GOR69, where secondary Fe isbarely 50% of the total, but the high values overall and the differencebetween surface and subsurface profiles is rather a firm trend.
The Al extracts as discussed earlier are rather problematical with Alovalues sometimes exceeding Ald concentrations. While the Alo concen-trations are considered to provide an approximation of imogolite andallophane once Alp is subtracted, it is possible the Ald values representsecondary forms of crystalline Al as previously suggested by Birkeland(1999) and Mahaney (1990), although with not all crystalline productsfully extracted. The Alp concentrations, taken alone and gauged down-section in all three sites, tend to correspond to nearly uniform distribu-tions of organic carbon or increases of organic carbon in buried Ahbhorizons. The real test of Alp translocations can only come fromnormal-izing the values with Alt and comparing the data with the organiccarbon database in Table 2B.
The principal function of the Fe extract ratio Fed/Fet (Table 4) is toquantify the relative age of weathered sediment via the slow gradualincrease of secondary Fe to total Fe. Correlating Fed values with thetwin profiles in each section, it is obvious that age-quotients in theepipedons of the surface profiles have similar values to the understory
Table 2BSelected chemical properties of the profiles in the GOR succession.a
Site Horizon Depth(cm)
Total C(%)
Organic C(%)
Total N(%)
CEC(cmol/kg)
GOR64 Ah1 0–21 11.98 11.0 1.16 50.4Ah2 21–36 8.94 7.60 0.95 46.2Ah3 36–52 6.93 6.33 0.74 44.6Ah4 52–69 4.36 4.00 0.33 40.82Bw1 69–91 1.00 0.76 0.13 21.42Bw2 91–107 0.78 0.61 0.12 18.62Cox1 107–170 0.44 0.38 0.06 14.42Cox2 170–210 0.32 0.32 0.05 14.63Ahb 210–220 5.06 4.23 0.52 70.94Btb 220–235 1.58 1.48 0.15 28.64Cb 235+ – – –
GOR68 Ah1 0–16 7.81 7.36 0.78 37.8Ah2 16–36 4.60 5.12 0.45 31.22Bw1 36–51 1.31 1.09 0.12 17.62Bw2 51–91 0.63 0.58 0.10 11.03Cox 91–117 0.09 0.06 0.08 7.24Ahb 117–125 6.74 6.56 0.58 56.65Bwb1 125–170 4.33 3.46 0.34 37.25Bwb2 170–210 5.78 4.56 0.43 44.25Coxbm 210+ 0.14 0.18 0.09 22.6
GOR69 Ah1 0–19 8.18 8.24 0.75 45.4Ah2 19–32 4.27 3.74 0.43 33.42Bwm1 32–66 1.25 1.22 0.15 22.82Bwm2 66–104 0.71 0.66 0.13 18.03Ahb 104–116 3.94 3.87 0.40 43.84Btb 116–129 1.83 1.60 0.19 33.24Cb 129+ 0.11 0.20 0.04 32.8
a – = nil results.
Table 3Iron and Al extract data for Sections GOR64, 68 and 69, Gorges Valley, Mount KenyaAfroalpine area. Data are in percent.
Horizon Depth(cm)
Fep Feo Fed Fet Alp Alo Ald Alt
GOR 64Ah1 0–21 0.66 0.95 1.80 3.94 0.94 0.97 0.48 8.1Ah2 21–36 0.73 0.97 2.07 3.95 1.04 1.05 0.60 8.7Ah3 36–52 0.85 0.94 1.94 3.95 1.28 1.21 0.71 9.7Ah4 52–69 0.55 0.50 1.06 3.33 2.27 2.38 1.02 12.12Bw1 69–91 0.73 1.76 2.82 5.61 1.27 1.42 0.56 13.22Bw2 91–107 0.69 1.46 2.80 5.76 1.05 0.88 0.35 12.32Cox1 107–170 0.54 1.57 2.66 4.95 0.85 0.62 0.20 11.92Cox2 170–210 0.46 1.44 2.23 4.96 0.71 0.53 0.10 11.23Ahb 210–220 1.03 2.29 4.12 5.69 2.62 2.79 1.48 10.64Btb 220–235 0.97 2.70 4.39 7.01 1.71 1.83 0.81 12.7
GOR 68Ah1 0–16 0.99 1.91 2.91 3.06 1.33 1.53 1.11 8.3Ah2 16–36 1.01 1.60 2.71 3.95 1.11 0.97 0.74 9.72Bw1 36–51 0.99 1.95 3.01 4.26 1.40 1.26 0.65 11.82Bw2 51–91 0.66 1.53 2.36 3.98 0.72 0.61 0.31 11.23Cox 91–117 0.15 0.88 2.35 2.54 0.23 0.33 0.11 9.04Ahb 117–25 1.68 2.47 4.20 5.02 3.08 2.78 1.85 9.15Bwb1 125–170 1.68 3.53 5.55 7.08 2.51 2.84 2.15 12.65Bwb2 170–210 1.59 3.06 5.50 6.73 3.36 4.08 2.70 10.25Coxbm 210+ 0.29 2.25 4.50 6.22 1.18 3.42 1.60 11.6
GOR 69Ah1 0–19 0.75 1.61 2.43 4.63 0.54 0.84 0.64 9.1Ah2 19–32 0.79 1.81 2.66 5.14 0.63 0.92 1.03 10.42Bwm1 32–66 0.49 1.30 2.72 6.65 0.49 0.71 0.56 11.32Bwm2 66–104 0.45 1.46 2.90 6.11 0.61 0.64 0.49 11.53Ahb 104–116 1.35 2.89 4.31 5.45 0.56 1.52 1.31 10.84Btb 116–129 1.09 2.37 3.73 6.91 1.43 1.37 1.05 12.24Cb 129+ 0.08 2.10 4.29 8.41 0.11 1.17 0.86 11.7
224 W.C. Mahaney et al. / Geomorphology 204 (2014) 217–228
Author's personal copy
horizons extendingwith depth to theAhbhorizons. There are variationswhere the quotient drops (GOR64) with depth in the Ah horizon com-plex, whereas in others (GOR68) it rises, or remains uniform (GOR69).Within the Bw group of horizons in the surface profiles, Fed whileelevated, is seen to remain uniform (GOR64, GOR69), or increase withdepth (GOR68), the latter signifying an increase in age. Within theburied profiles, Fed is either elevated (GOR64, GOR69) compared withthe surface profiles, or remains relatively the same (GOR68). To somedegree the increase in Fed is registered by stronger yellow–red colors(Table 2A) as in GOR64 and 69 while in other cases (GOR68) colorsvary somewhat but remain essentially the same throughout.
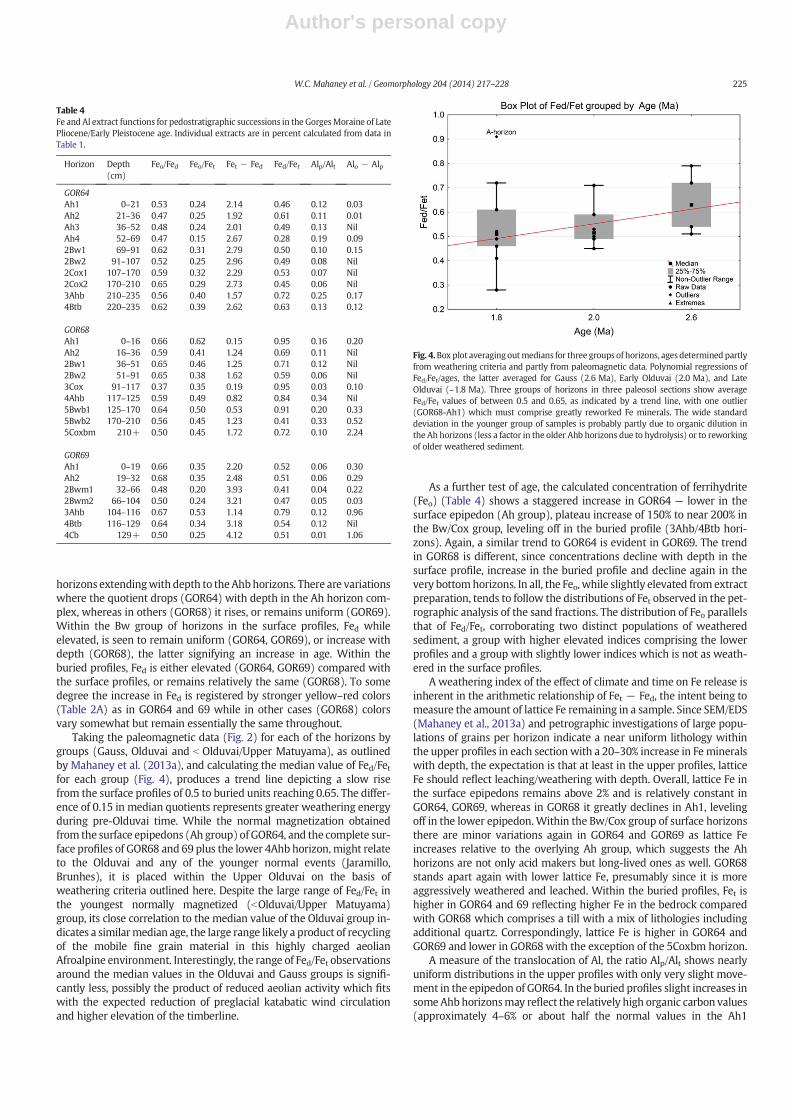
Taking the paleomagnetic data (Fig. 2) for each of the horizons bygroups (Gauss, Olduvai and b Olduvai/Upper Matuyama), as outlinedby Mahaney et al. (2013a), and calculating the median value of Fed/Fetfor each group (Fig. 4), produces a trend line depicting a slow risefrom the surface profiles of 0.5 to buried units reaching 0.65. The differ-ence of 0.15 in median quotients represents greater weathering energyduring pre-Olduvai time. While the normal magnetization obtainedfrom the surface epipedons (Ah group) of GOR64, and the complete sur-face profiles of GOR68 and 69 plus the lower 4Ahb horizon,might relateto the Olduvai and any of the younger normal events (Jaramillo,Brunhes), it is placed within the Upper Olduvai on the basis ofweathering criteria outlined here. Despite the large range of Fed/Fet inthe youngest normally magnetized (bOlduvai/Upper Matuyama)group, its close correlation to the median value of the Olduvai group in-dicates a similarmedian age, the large range likely a product of recyclingof the mobile fine grain material in this highly charged aeolianAfroalpine environment. Interestingly, the range of Fed/Fet observationsaround the median values in the Olduvai and Gauss groups is signifi-cantly less, possibly the product of reduced aeolian activity which fitswith the expected reduction of preglacial katabatic wind circulationand higher elevation of the timberline.
As a further test of age, the calculated concentration of ferrihydrite(Feo) (Table 4) shows a staggered increase in GOR64 — lower in thesurface epipedon (Ah group), plateau increase of 150% to near 200% inthe Bw/Cox group, leveling off in the buried profile (3Ahb/4Btb hori-zons). Again, a similar trend to GOR64 is evident in GOR69. The trendin GOR68 is different, since concentrations decline with depth in thesurface profile, increase in the buried profile and decline again in thevery bottomhorizons. In all, the Feo, while slightly elevated from extractpreparation, tends to follow the distributions of Fet observed in the pet-rographic analysis of the sand fractions. The distribution of Feo parallelsthat of Fed/Fet, corroborating two distinct populations of weatheredsediment, a group with higher elevated indices comprising the lowerprofiles and a group with slightly lower indices which is not as weath-ered in the surface profiles.
A weathering index of the effect of climate and time on Fe release isinherent in the arithmetic relationship of Fet − Fed, the intent being tomeasure the amount of lattice Fe remaining in a sample. Since SEM/EDS(Mahaney et al., 2013a) and petrographic investigations of large popu-lations of grains per horizon indicate a near uniform lithology withinthe upper profiles in each section with a 20–30% increase in Femineralswith depth, the expectation is that at least in the upper profiles, latticeFe should reflect leaching/weathering with depth. Overall, lattice Fe inthe surface epipedons remains above 2% and is relatively constant inGOR64, GOR69, whereas in GOR68 it greatly declines in Ah1, levelingoff in the lower epipedon.Within the Bw/Cox group of surface horizonsthere are minor variations again in GOR64 and GOR69 as lattice Feincreases relative to the overlying Ah group, which suggests the Ahhorizons are not only acid makers but long-lived ones as well. GOR68stands apart again with lower lattice Fe, presumably since it is moreaggressively weathered and leached. Within the buried profiles, Fet ishigher in GOR64 and 69 reflecting higher Fe in the bedrock comparedwith GOR68 which comprises a till with a mix of lithologies includingadditional quartz. Correspondingly, lattice Fe is higher in GOR64 andGOR69 and lower in GOR68 with the exception of the 5Coxbm horizon.
A measure of the translocation of Al, the ratio Alp/Alt shows nearlyuniform distributions in the upper profiles with only very slight move-ment in the epipedon of GOR64. In the buried profiles slight increases insome Ahbhorizonsmay reflect the relatively high organic carbon values(approximately 4–6% or about half the normal values in the Ah1
Fig. 4.Box plot averagingoutmedians for three groups of horizons, ages determined partlyfrom weathering criteria and partly from paleomagnetic data. Polynomial regressions ofFed/Fet/ages, the latter averaged for Gauss (2.6 Ma), Early Olduvai (2.0 Ma), and LateOlduvai (~1.8 Ma). Three groups of horizons in three paleosol sections show averageFed/Fet values of between 0.5 and 0.65, as indicated by a trend line, with one outlier(GOR68-Ah1) which must comprise greatly reworked Fe minerals. The wide standarddeviation in the younger group of samples is probably partly due to organic dilution inthe Ah horizons (less a factor in the older Ahb horizons due to hydrolysis) or to reworkingof older weathered sediment.
Table 4Fe and Al extract functions for pedostratigraphic successions in the GorgesMoraine of LatePliocene/Early Pleistocene age. Individual extracts are in percent calculated from data inTable 1.
Horizon Depth(cm)
Feo/Fed Feo/Fet Fet − Fed Fed/Fet Alp/Alt Alo − Alp
GOR64Ah1 0–21 0.53 0.24 2.14 0.46 0.12 0.03Ah2 21–36 0.47 0.25 1.92 0.61 0.11 0.01Ah3 36–52 0.48 0.24 2.01 0.49 0.13 NilAh4 52–69 0.47 0.15 2.67 0.28 0.19 0.092Bw1 69–91 0.62 0.31 2.79 0.50 0.10 0.152Bw2 91–107 0.52 0.25 2.96 0.49 0.08 Nil2Cox1 107–170 0.59 0.32 2.29 0.53 0.07 Nil2Cox2 170–210 0.65 0.29 2.73 0.45 0.06 Nil3Ahb 210–235 0.56 0.40 1.57 0.72 0.25 0.174Btb 220–235 0.62 0.39 2.62 0.63 0.13 0.12
GOR68Ah1 0–16 0.66 0.62 0.15 0.95 0.16 0.20Ah2 16–36 0.59 0.41 1.24 0.69 0.11 Nil2Bw1 36–51 0.65 0.46 1.25 0.71 0.12 Nil2Bw2 51–91 0.65 0.38 1.62 0.59 0.06 Nil3Cox 91–117 0.37 0.35 0.19 0.95 0.03 0.104Ahb 117–125 0.59 0.49 0.82 0.84 0.34 Nil5Bwb1 125–170 0.64 0.50 0.53 0.91 0.20 0.335Bwb2 170–210 0.56 0.45 1.23 0.41 0.33 0.525Coxbm 210+ 0.50 0.45 1.72 0.72 0.10 2.24
GOR69Ah1 0–19 0.66 0.35 2.20 0.52 0.06 0.30Ah2 19–32 0.68 0.35 2.48 0.51 0.06 0.292Bwm1 32–66 0.48 0.20 3.93 0.41 0.04 0.222Bwm2 66–104 0.50 0.24 3.21 0.47 0.05 0.033Ahb 104–116 0.67 0.53 1.14 0.79 0.12 0.964Btb 116–129 0.64 0.34 3.18 0.54 0.12 Nil4Cb 129+ 0.50 0.25 4.12 0.51 0.01 1.06
225W.C. Mahaney et al. / Geomorphology 204 (2014) 217–228
Author's personal copy
horizons of the surface paleosols). Movement of organic carbon is notregistered in either of the two Btb horizons in GOR64 and GOR69despite themovement of clay. The very lowvalues of Alp probably reflectmicrobial activity with a nearly steno soil temperature estimated to beabout ~8 °C, nearly unvarying throughout the year (Mahaney, 1990).
Concentrations of Alo vary somewhat erratically and tend to increasein the Ahb horizons. Similarly, crystalline Al given by\Ald\ depicts anerratic trend with depth in the profiles. While Ald was formerly consid-ered to amount to secondary Al oxides (McKeague and Day, 1966) itoften exhibits lower values than amorphous Al (Alo). Because the Alovalues obtained here often exceed the crystalline Al (Ald) concentrations,only the latter are used in soil classification studies (NRCS, 2004). Asreported elsewhere (Parfitt and Childs, 1988; Birkeland et al., 1989;Mahaney, 1990; Mahaney et al., 1999) it appears that Na-dithionitefails to extract all secondary crystalline Al. However, Parfitt and Childs(1988) consider Alo — Alp to approximate released allophane plusimogolite, two widespread but poorly crystalline aluminosilicate prod-ucts. While calculations of this arithmetic function appear staggeredthrough the sections (Table 4), depicting nil to 0.3% in the surfacepaleosol profiles, values increase markedly in the lower buried profilesfrom nil to 2.2%. The significance of the Al profile variation is that somehorizons appear to have been more chemically active than others andalso that the older buried profile in GOR64 may, in fact, be youngerthan GOR68 and GOR69, as suggested somewhat by the topographicdisplacement of moraine fronts shown in Fig. 1a.
5. Discussion
Unlike other paleosol sequences (Mahaney et al., 1999; Schülli-Maurer et al., 2007) where Fed/Fet increases with time in achronosequence, the data presented here show two populations ofpaleosols in the GOR group: upper and lower, with the upper groupcontaining reworked material from below and from other surroundingwell weathered sites. In a two-dimensional sense, reworking ofmaterialfrom below into the upper profiles may be related to deflation prior tothe ingress of glaciation, but in a three-dimensional sense, materialcould be transferred laterally within horizons and in tandem withgroundwater fluxes. The increase of Fed in the lower horizons mightbe partly due to an increased content of Fe-bearing minerals, loss of Sifrom leaching and/or a more humid and warmer preglacial climate.This trend is paralleled by a sharp increase in Feo in the lower profiles,which is a product of additional ferrihydrite release and/or sample prep-aration. Spikes in the concentration of Feo with depth (Mahaney andFahey, 1988) in any of the profiles may well signal strong reducing con-ditions with perched water at some time in the past and/or fluctuationsin magnetite content of the parent materials. The Feo trends in all threesections are only interrupted with ‘spikes’ in the 5Bwb1 horizon ofGOR68, possibly the 3Ahb horizon of GOR69 and the 4Btb horizon ofGOR64, all known to have higher magnetite, thus confirming theycould result from sample preparation. Otherwise the Feo trend withdepth in all three profiles is one of slow decline with depth away fromthe acid producing Ah and Ahb horizons followed by an increase inthe buried profiles. Clearly this is a situationwhere length ofweatheringtime (surface pedons b2.0 Ma) comes close to equalingweathering in aburied suite of older paleosols (buried pedons) forming in awarmer andpresumably wetter climate over a much shorter time frame (~0.5 Ma).
Variations in lattice Fe (Fet − Fed) may have involved reworking ofold grains into younger epipedons (i.e. GOR68-Ah1), whereas in otherprofiles the surface epipedons are slightly lower in lattice Fe or aboutthe same as compared with the subsurface horizons. The GOR69 profileshows a reduction of lattice Fe in theAh1 followed by increases below inthe upper profile, presumably a response to increasedweathering in thesurface or incorporation of pre-weathered materials by aeolian influx.Within the lower profiles, lattice Fe shows either a sharp reduction inthe Ahb horizons (GOR64, GOR69) compared with the Btb horizonsbelow or a slight reduction with a slow increase into the bottom of the
profile (i.e. GOR68). In all, considering the greater loss of lattice Fe inthe lower group of paleosols, the data argue for well-weatheredsediment with high ratios of Fed/Fet, the result of a long and variableweathering trend, first under a warmer and more humid preglacialclimate followed by episodic weathering, faster under interglacialclimates and slower under glacial ones. Even given increased Fet in thelower profiles, whether straight from bedrock (GOR64, GOR69) ormixed with glacial debris (GOR68), the early and largely pre-Olduvaiweathering episode was shorter than the post-Olduvai Event butappears to have been influenced by a more aggressive paleoclimate inthe former which supports previous microscopic and chemical (SEM/EDS) investigations of Mahaney et al. (2013a). The Fe data furthersuggest that some pre-weathered grains in the lower profile foundtheir way into the upper profile either by glacial mixing or by aeoliantransport.
The Alp data strongly suggest little release of organically-bound Alwhich is curious because of the inordinately high Alt throughout. HighAl might result from Si leaching, and given the high rate of etchingand corrosion (Mahaney et al., 2013a) seen throughout all threesections, it is likely Si removal has increased the concentration of Alt.Little Alp also might be attributed to microbial action over time.
Calculations of goethite/goethite + hematite made by Kämpf andSchwertmann (1983) in tropical soils showed that goethite is moreresponsive to moisture, organic carbon and low pH whereas highertemperature favors the formation of secondary hematite. Analysis ofthe raw data in the GOR sequence shows that Fed-Feo values increasewith depth into the lower profiles in all three sections with somereworking of weathered products from the buried unit into the groundpaleosol (upper unit). Presumably, these values are underestimations ifone accepts themagnetite/oxalate overestimation of Feo, but the data doindicate an excess of hematite over goethite, a trend supported by theXRD analysis of the clay fraction (Table 1). While the 3000 m elevationon Mount Kenya is not inherently a kaolinite-forming climate, XRDanalysis of the clay fraction in the GOR group clearly shows an excessof hematite over goethite (Table 1) in the lower profiles, a trend seenelsewhere (Kämpf and Schwertmann, 1983), all of which stronglysuggest a stronger (warmer-wetter) climate during the morphogenesisof the buried paleosols.
Similarly, the ratio Feo/Fed, the ‘activity ratio’ of Dormaar and Lutwick(1983), formerly considered to measure the conversion of amorphousFe (Feo) to crystalline forms (Fed), is now sometimes used to illustratea reduction in Feo over time (Mahaney et al., 1999; Schülli-Maureret al., 2007). This ratio is not readily applicable here given the variabilityof Feo and lack of trends with depth among all three sections. If therewere truly a large scale influx of freshmaterials to the surface epipedonsin all three profiles, and if Feo/Fed is higher in younger sediment, thisratio should identify the aeolian input.
The wetting depth in paleosols, often marked by the depth of rootpenetration, here coincides with ~80 cm in GOR68, ~90 cm in GOR64and ~50 cm in GOR69. While these depths may likely have changedduring various glacial episodes, they appear to coincide closely withdepletions in Alp (Table 3). Because the paleosols are clay rich, it maybe that wetting depths established in the first 100 kyr weatheringepisode become locked in place with little variation barring a largescale influx of soil water during one or more interglacials. To firm-upestimates of wetting depths from proxy Alp trends one would need towork out field capacities and permanent wilting points of moisture inthe profiles.
The presence of an older, buried till in the GOR68 section emphati-cally demonstrates that a glaciation preceded the Gorges event(Mahaney, 1990; Mahaney et al., 2013a). The question is when andhow extensive was it? The presence of glacially-crushed grains inEarly Quaternary lahars on the mountain (Mahaney, 1990) may wellcorrelate with till in the lower profile of GOR68. The higher Fed valuesin the buried unit C, relative to the Gorges till within the surface profiles(unit B), argue for an older age for this lower till. Despite the attempt to
226 W.C. Mahaney et al. / Geomorphology 204 (2014) 217–228
Author's personal copy
use Feo (Dahms et al., 2012), along with other oxihydroxides as along-lived (~1 Ma) chronometer in the European Alps and the RockyMountains of N. America, we used only the Fed/Fet function, since Feois partially soluble and subject to unknown rates of solution duringinterglacial periods and here it is compromised by the prevalence andpersistence of primary magnetite.
To understand how andwhen glaciation began onMount Kenya it isnecessary to understand the exact timing of construction of the massifto an altitude that fostered retention of snow and development ofglaciers. Assuming the mountain reached its maximum elevation atthe time the plug rock crystallized at 2.71 Ma (Veldkamp et al., 2007),revised from 2.65 Ma (Everden and Curtis, 1965)], surfaces must havebecome stable soon thereafter allowing weathering to ensue in stablesites along with early glaciation. It is this earliest glaciation in theEarly Pleistocene, or perhaps series of episodic ice advances, that is cen-tral to the discussion here. Late Pliocene/Early Pleistocene paleoclimatereconstructions using global benthic 18O trends (Lisiecki and Raymo,2005) invoke small amplitude climatic oscillations from cool/dry towarm/wet for much of East Africa, reverting after the Olduvai Event tocold/drier climate that probably led to early glaciation on themountain.This trend is similar to the sequence of a dry climate deduced for thewest flank of Mt. Kenya (Mahaney et al., 2011) during the EarlyPliocene, reverting to a less dry climate toward the close of the epochat the boundary with the Pleistocene. In this low elevation grasslandenvironment the first ingress of loess from Pleistocene glaciation ledto the development of argillic (Bt) horizons that may well have devel-oped in conjunction with punctuated humid intervals prior to andacross the Olduvai Event (Lisiecki and Raymo, 2005). It is these Bt hori-zons on the west flank of the mountain that probably correlate withsimilar weathering records (Btb horizons) in Gorges Valley (Mahaneyet al., 2011). The Btb horizons in GOR64 and GOR69 probably formedduring the high amplitude climatic intervals of 2.7–2.5 and 1.9–1.7 Mainterbedded with periods of aridification, as determined from detailedanalysis of lacustrine records (Trauth et al., 2005).
Assuming the drier intervals in the Early Pleistocene correlate withglaciation, humid intervals with interglacial climates, it is likely thatthe earliest Pleistocene glaciations (pre-Gorges and Gorges) correlatewith the first arid period of 2.5–1.9 Ma, the post-Gorges weatheringwith a drier interval (b1.7 Ma., Trauth et al., 2005). If this correlationis correct, then the Btb horizons in the GOR64 and GOR69 profiles hadto form for themost part prior to 2.5 Ma, and the inference of expandedforest changing the microclimate at the site is on reasonably firmground.
In summary, with some variability down profile in all three sections,the petrography shows a mix of weathered/fresh grains with a multi-tude of xenoliths and preweathered fragments that have likely beenextensively reworked by aeolian and glacial processes, some manytimes over. Other grains appear to have lost armored surfaces, presentingfresh fragments that seemout of place in profiles that have been exposedto the subaerial atmosphere for variable lengths of time since the GaussNormal Chron.
6. Conclusions
The build-up and distribution of Fe and Al extract concentrationsover time present some unexpected twists to what are usually straight-forward trends. The usual case on Mount Kenya is for fresh sedimentsuperposed on older tills to yield lower Fed values, the result of deflationduring times of severe downturn in climate with the advent of ice inthe upper catchments. While this occurred in nearby areas (Mahaney,1990; Mahaney et al., 1997) it does not seem to have affected thethree sections described here. What is outstanding is the degree towhich old grains are recycled from weathered bedrock and older tillbodies into younger tills/outwash and aeolian sediment (surfaceepipedons) and later subjected to further weathering. While wettingdepths are tentatively identified halfway into the surface profiles
there is little in the Fe release data to indicate much of a shift inweathering intensity over time.
While problems persist with the precisemeaning of Alo and Ald overtime, Alp (raw data) shows some variation, partly responding toweathering depth and partly also to presumed microbial action, whichwith given soil temperatures of +10 °C at 3000 m is likely intense(viz: Mahaney, 1990). The Fed/Fet ratio as a geochronometer yieldshigh ratios with some minor variations in the upper profiles of allthree sections indicating a long weathering history, the product ofepisodic changes in climate from the Olduvai Event to the present.Increases in the ratio at depth in the older suite of paleosols may resultpartly from increased primary Fe-bearing minerals in the sedimentsand partly from a climate more ameliorative to weathering. Other Feextract trends and arithmetic functions tend to support the Fed/Fetinterpretations. Variations in Feo/Fed are probably related to partialdissolution of ferrihydrite, with possible reaction to differential groundwater invasion and sample preparation.
Acknowledgments
This research was funded by Quaternary Surveys, Toronto. Aresearch grant from the National Scientific and Engineering ResearchCouncil of Canada (NSERC) to RWB in support of this work is gratefullyacknowledged.
References
Alexander, E.B., 1974. Extractable iron in relation to soil age on terraces along the TruckeeRiver, Nevada. Soil Sci. Soc. Am. Proc. 38, 121–124.
Baker, B.H., 1967. Geology of the Mt. Kenya area. Geology Report 79.Kenya GeologicalSurvey, Nairobi (78 pp.).
Barendregt, R.W.,Mahaney,W.C., 1988. Paleomagnetismof selectedQuaternary sedimentson Mount Kenya, East Africa; a reconnaissance study. J. Afr. Earth Sci. 7, 219–225.
Birkeland, P.W., 1999. Soils and Gemorphology. Oxford University Press, Oxford, U.K.(430pp.).
Birkeland, P.W., Burke, R.M., Benedict, J.B., 1989. Pedogenic gradients for Fe and Alaccumulation and P depletion in arctic and alpine soils as a function of time andclimate. Quatern. Res. 32, 193–204.
Bloesch, P.M., 2012. Prediction of the CEC to clay ratio using mid-infrared spectroscopy.Soil Res. 50 (1), 1–6. http://dx.doi.org/10.1071/SR11137.
Blume, H.P., Schwertmann, U., 1969. Genetic evaluation of profile distribution of alumi-num, iron and manganese oxides. Soil Sci. Soc. Am. Proc. 33, 438–444.
Bower, C.A., Wilcox, L.V., 1965. Soluble salts. In: Black, C.A. (Ed.), Methods of soil analysis.American Society of Agronomy, Madison, Wisc., pp. 933–951.
Coffin, D.E., 1963. Amethod for the determination of free iron in soils and clays. Can. J. SoilSci. 43, 7–17.
Dahms, D., Favilli, F., Krebs, R., Egli, M., 2012. Soil weathering and accumulation rates ofoxalate-extractable phases derived from alpine chronosequences of up to 1 Ma inage. Geomorphology 151-152, 99–113.
Dawson, J.B., 2008. The Gregory Rift Valley and Neogene—Recent volcanoes of NorthernTanzania. Geological Society, London, Memoirs, 33 (102 pp.).
Day, P.E., 1965. Particle fractionation and particle size analysis. In: Black, C.A. (Ed.),Methods of Soil Analysis. American Society of Agronomy, Madison, Wisconsin,pp. 545–567.
Dormaar, J.F., Lutwick, L.E., 1983. Extractable Fe and Al as an indicator for buried soilhorizons. Catena 10, 167–173.
Duk-Rodkin, A., Barendregt, R.W.,White, J.M., 2010. An extensive Late Cenozoic terrestrialrecord of multiple glaciations in the Tintina Trench, west-central Yukon, Canada. Can.J. Earth Sci. 47 (7), 967–1002.
Everden, J.F., Curtis, G.H., 1965. The potassium-argon dating of late Cenozoic rocks in EastAfrica and Italy. Curr. Anthropol. 6, 343–385.
Gregory, J.W., 1921. The Rift Valleys and Geology of East Africa. Geological Society, London(479 pp.).
Hancock, R.G.V., 1984. On the source of clay used for Cologne Roman pottery.Archaeometry 26, 210–217.
Hiradate, S., Hirai, H., Hashimoto, H., 2010. Direct determination of allophane andimogolite in Andosols using nuclear magnetic resonance spectroscopy. WorldCongress of Soil Science, 1–6 August, Brisbane, Australia (published on DVD).
Kämpf, N., Schwertmann, U., 1983. Geothite and hematite in a climosequence in southernBrazil and their application in classification of kaolinitic soils. Geoderma 29, 27–39.
Lisiecki, L.E., Raymo, M.E., 2005. A Pliocene/Pleistocene stack of 57 globally distributedbenthic oxygen-18 records. Paleoceanography 20 (PA1003), 1–17.
Mahaney, W.C., 1990. Ice on the Equator. Wm Caxton Press, Ellison Bay, Wisc.(386 pp.).Mahaney, W.C., Fahey, B.D., 1988. Extractable Fe and Al in Late Pleistocene and Holocene
paleosols on Niwot Ridge, Colorado Front Range. Catena 15, 17–26.Mahaney,W.C.,Hancock, R.G.V., Sanmugadas, K., 1991. Extractable Fe–Al and geochemistry
of Late Pleistocenepaleosols in the Dalijia Shan, western China. J. Southeast Asian EarthSci. 6, 75–82.
227W.C. Mahaney et al. / Geomorphology 204 (2014) 217–228
Author's personal copy
Mahaney, W.C., Vortisch, W., Barendregt, R.W., 1997. Relative age of loess and till in twoQuaternary paleosols in Gorges Valley, Mount Kenya, East Africa. J. Quat. Sci. 12,61–72.
Mahaney, W.C., Sanmugadas, K., Hancock, R.G.V., 1999. Extractable Fe and Al of soils inthe Middle Teton chronosequence, western Wyoming, U.S.A. Z. Geomorphol. 43,393–407.
Mahaney, W.C., Falen, A.L., Fosberg, M.A., Hancock, R.G.V., 2006. Later Pleistocene andHolocene soils in Mammoth Basin and Green River areas, Wind River Mountains,Wyoming. Z. Gletscherk. Glazialgeol. 39, 161–181.
Mahaney, W.C., Dohm, J.M., Kapran, B., Hancock, R.G.V., Milner, M.W., 2009. Secondary Feand Al in Antarctic paleosols: correlation to Mars with prospect for the presence oflife. Icarus 203, 320–330.
Mahaney, W.C., Kalm, V., Hancock, R.G.V., Michel, F., Kapran, B., 2010. Geochemistry andextractable Fe and Al in cold temperature soils of northwestern Siberia. J. Quat. Sci.25, 178–179.
Mahaney, W.C., Barendregt, R.W., Villeneuve, M., Dostal, J., Hamilton, T.S., Milner, M.W.,2011. Late Neogene volcanics and interbedded palaeosols near Mount Kenya. In:Van Hinsbergen, D.J.J., Buiter, S.J.H., Torsvik, T.H., Gaina, C., Webb, S.J. (Eds.), TheFormation and Evolution of Africa: A Synopsis of 3.8 Ga of Earth History. GeologicalSociety, London, pp. 301–318.
Mahaney, W.C., Krinsley, D.H., Allen, C.C.R., Langworthy, K., Ditto, J., Milner, M.W., 2012.Weathering rind: archives of paleoenvironments on Mount Kenya, East Africa.Journal of Geology 120, 591–602.
Mahaney, W.C., Barendregt, R.W., Hamilton, T.S., Hancock, R.G.V., Tessler, D., Costa, P.J.M.,2013a. Stratigraphy of the Gorges Moraine System, Mount Kenya: paleosol recordand paleoclimate. J. Geol. Soc. http://dx.doi.org/10.1144/jgs2012-079.
Mahaney, W.C., Krinsley, D.H., Allen, C.C.R., 2013b. Biomineralization of weathered rockrinds: examples from the lower Afroalpine zone on Mount Kenya. Geomicrobiology30, 1–11.
Martini, J.A., 1970. Allocation of cation exchange capacity to soil fractions in seven surfacesoils from Panama and the application of a cation exchange factor as a weatheringindex. Soil Sci. 109, 324–331.
McKeague, A., Day, J., 1966. Dithionite and oxalate extractable Fe and Al as aids in differ-entiating various classes of soils. Can. J. Soil Sci. 46, 13–22.
Mehra, O.P., Jackson, M.L., 1960. Iron oxide removal from soils and clays by a dithionite–citrrate system buffered with sodium bicarbonate. National Conf. on Clays and ClayMinerals, 1958. Pergamon, London, pp. 317–327.
National Soil Survey Center (NRCS), 2004. Soil Survey Laboratory Methods Manual. In:Burt, R. (Ed.), Soil Survey Investigations Report no. 42, version 4.0. U.S.D.A. (700 pp.).
Nelson, F.E., Barendregt, R.W., Villeneuve, M., 2009. Stratigraphy of the Fort Selkirkvolcanogenic complex in Central Yukon and its paleoclimatic significance: Ar/Arand paleomagnetic data. Can. J. Earth Sci. 46, 381–401.
Oyama, M., Takehara, H., 1970. Standard Soil Color Charts. Japan Research Council forAgriculture, Forestry and Fisheries.
Pai, C.-W.,Wang,M.-K., Shuang, S.-Y., King, H.-B., 2004. Free and non-crystalline Fe-oxidesto total iron concentration ratios correlated with 14C ages of three forest soils inCentral Taiwan. Soil Sci. 169, 582–589.
Parfitt, R.L., Childs, C.W., 1988. Estimation of forms of Fe and Al: a review and analysis of con-trasting soils by dissolution and Moessbauer methods. Aust. J. Soil Res. 26, 121–144.
Peech, M.L., Alexander, T., Dean, L.A., Reed, J.F., 1947. Methods of soil analyses for soilfertility investigations. Circ, 757. USDA, Washington, D.C. 25.
Ries, A.C., Vernacombe, J.R., Price, R.C., Shackleton, R.M., 1992. Geochronology andgeochemistry of the rocks associated with a late proterozoic ophiolite in WestPokot, NW Kenya. J. Afr. Earth Sci. 14, 25–35.
Rogers, N.W., 2006. Basaltic magmatism and the geodynamics of the East African Riftsystem. In: Yirgu, G., Ebinger, G., Maguire, C.J., P.K.H. (Eds.), The Afar Volcanic Prov-ince within the East African Rift System. Special Publication, 259. Geological Societyof London, London, pp. 77–93.
Schluter, Thomas, 1997. Geology of East Africa (with contributions by Craig Hampton).Science Publishers, Stuttgart (484 pp.).
Schoeneberger, P.J., Wysocki, D.A., Benham, E.C., Broderson, W.D. (Eds.), 2002. Field bookfor describing and sampling soils, Version 2.0. Natural Resources ConservationService, National Soil Survey Center, Lincoln, NE.
Schollenberger, C.J., Simon, R.H., 1945. Determination of exchange capacity andexchangeable bases in soils—ammonium acetate method. Soil Sci. 59, 13–24.
Schülli-Maurer, I., Sauer, D., Stahr, K., Sperstad, R., Sorensen, R., 2007. Soil formation inmarine sediments and beach deposits of southern Norway: investigations of soilchronosequences in the Oslofjord region. Rev. Mex. Cienc. Geol. 24, 237–246.
Soil Classification Working Group, 1998. The Canadian System of Soil Classification,Agriculture and Agri-Food Canada Publication 16463rd ed. (187 pp.).
Soil Survey Staff, 2010. Keys to Soil Taxonomy, 11th ed. U.S. Gov. Printing Office,Washington, D.C.
Trauth, M.H., Maslin, M.A., Deino, A., Strecker, M.R., 2005. Late Cenozoic moisture historyof East Africa. Science 309, 2051–2053.
Veldkamp, A., Buis, E., Wijbrans, J.R., Olago, D.O., Boshoven, E.H., Marée, M., Van den Bergvan Saparoea, R.M., 2007. Late Cenozoic fluvial dynamics of the River Tana, Kenya, anuplift dominated record. Quat. Sci. Rev. 26, 2897–2912.
Vernacombe, J.R., 1983. A proposed continental margin in the Precambrian of WesternKenya. Geol. Rundsch. 72, 663–670.
Walker, A., 1983. The effects of magnetite on oxalate- and dithionite-extractable iron. SoilSci. Soc. Am. J. 47, 1022–1025.
Whittig, L.D., 1965. X-ray diffraction techniques for numerical identification and mineral-ogical composition. In: Black, C.A. (Ed.), Methods of Soil Analysis. American Society ofAgronomy, Madison, Wisc., pp. 671–696.
228 W.C. Mahaney et al. / Geomorphology 204 (2014) 217–228